Exhibit 99.1
MANAGEMENT’S DISCUSSION AND ANALYSIS OF
FINANCIAL CONDITION AND RESULTS OF OPERATIONS
This Management’s Discussion and Analysis (‘‘MD&A’’) is intended to help the reader understand Triple Flag Precious Metals Corp. (‘‘TF Precious Metals’’), its operations, financial performance and the present and anticipated future business environment. This MD&A, which has been prepared as of August 8, 2023, should be read in conjunction with the unaudited condensed interim consolidated financial statements of TF Precious Metals as at and for the three and six months ended June 30, 2023 (the “Interim Financial Statements”), which have been prepared in accordance with International Accounting Standard (“IAS”) 34, “Interim Financial Reporting”, as issued by the IASB. The unaudited condensed consolidated interim financial statements have been prepared on a basis consistent with the audited consolidated financial statements of TF Precious Metals as at December 31, 2022 and for the years ended December 31, 2022 and 2021 (the “Annual Financial Statements”), which have been prepared in accordance with International Financial Reporting Standards as issued by the International Accounting Standards Board (“IFRS”). Certain notes to the Annual Financial Statements are specifically referred to in this MD&A. All amounts in this MD&A are in U.S. dollars unless otherwise indicated. References to “US$”, “$” or “dollars” are to United States dollars, references to “C$” are to Canadian dollars and references to “A$” are to Australian dollars. In this MD&A, all references to ‘‘Triple Flag’’, the ‘‘Company’’, ‘‘we’’, ‘‘us’’ or ‘‘our’’ refer to TF Precious Metals together with its subsidiaries, on a consolidated basis.
This MD&A contains forward-looking information. Forward-looking information is necessarily based on a number of opinions, estimates and assumptions that we considered appropriate and reasonable as of the date such statements were made, and are subject to known and unknown risks, uncertainties, assumptions and other factors that may cause the actual results, level of activity, performance or achievements to be materially different from those expressed or implied by such forward-looking information, including but not limited to the risk factors described in the ‘‘Risk Factors” section of the Company’s most recent annual information form (“AIF”) available from time to time on SEDAR at www.sedar.com and on EDGAR at www.sec.gov. There can be no assurance that such forward-looking information will prove to be accurate, as actual results and future events could differ materially from those anticipated in such information. Accordingly, users should not place undue reliance on forward-looking information, which speaks only as of the date made. See ‘‘Forward-Looking Information’’ in this MD&A.
Non-IFRS Financial Performance Measures
We use certain non-IFRS financial performance measures in our MD&A. For a detailed description of each of the non-IFRS financial performance measures used in this MD&A and a detailed reconciliation to the most directly comparable measure under IFRS, please refer to the “Non-IFRS Financial Performance Measures” section of this MD&A. The non-IFRS financial performance measures set out in this MD&A are intended to provide additional information to investors and do not have any standardized meaning under IFRS, and therefore may not be comparable to other issuers, and should not be considered in isolation or as a substitute for measures of performance prepared in accordance with IFRS.
3 | |
3 | |
5 | |
6 | |
7 | |
7 | |
Portfolio of Streaming and Related Interests and Royalty Interests | 8 |
10 | |
11 | |
15 | |
15 | |
17 | |
21 | |
22 | |
22 | |
25 | |
25 | |
26 | |
27 | |
30 | |
30 | |
31 | |
31 |
2
Triple Flag is a gold-focused streaming and royalty company offering bespoke financing solutions to the metals and mining industry. Our mission is to be a preferred funding partner to mining companies throughout the commodity cycle by providing customized streaming and royalty financing, while offering value beyond capital as partners via our networks, capabilities and sustainability support.
From our inception in 2016 to our position now as an emerging senior streaming and royalty company, we have invested in and systematically developed a long-life, low-cost, high-quality diversified portfolio of streams and royalties providing exposure primarily to gold and silver. We acquired Maverix Metals Inc. (“Maverix”), a royalty and streaming company, earlier this year and our portfolio is now comprised of 229 assets, consisting of 15 streams and 214 royalties. These investments are tied to mining assets at various stages of the mine life cycle.
Asset Count |
| |
Producing |
| 29 |
Development & Exploration |
| 200 |
Total |
| 229 |
Our portfolio is underpinned by a stable base of cash flow generating streams and royalties and is designed to grow intrinsically over time through exposure to potential mine life extensions, exploration success, new mine builds and throughput expansions. In addition, we are focused on further enhancing portfolio quality by executing accretive investments to grow the scale and quality of our portfolio of precious metal streams and royalties. We believe we have a differentiated approach to deal origination and due diligence, increasing the applicability of stream and royalty financing to an underserved mining sector, expanding the application of this form of financing through bespoke deal generation for miners while creating a high-quality, gold-focused portfolio of streams and royalties for our investors. We focus on ‘‘per share’’ metrics with the objective that accretive new investments are pursued with careful management of the capital structure to effectively compete for quality assets without incurring long-term financial leverage.
The market prices of gold and silver are primary, uncontrollable drivers of our profitability and ability to generate free cash flow.
The following table sets forth the average gold and silver prices, and the average exchange rate between the Canadian and U.S. dollars, for the periods indicated.
| | Three months ended | | Six months ended | ||||
| | June 30 | | June 30 | ||||
Average Metal Prices/Exchange Rates |
| 2023 |
| 2022 | | 2023 | | 2022 |
Gold (US$/oz)1 |
| 1,976 |
| 1,871 | | 1,932 | | 1,874 |
Silver (US$/oz)2 |
| 24.13 |
| 22.60 | | 23.31 | | 23.32 |
Exchange rate (US$/C$)3 |
| 1.3428 |
| 1.2768 | | 1.3477 | | 1.2715 |
| 1. | Based on the London Bullion Market Association (“LBMA”) PM fix. |
| 2. | Based on the LBMA fix. |
| 3. | Based on the Bank of Canada daily average exchange rate. |
Gold
The market price of gold is subject to volatile price movements over short periods of time and can be affected by numerous macroeconomic factors including, but not limited to, the value of the U.S. dollar; the sale or purchase of gold by central banks and financial institutions, interest rates, inflation or deflation, global and regional supply and demand and global political and economic conditions. The market price of gold is a significant contributor to the performance of our gold streams and royalty portfolio.
During the three months ended June 30, 2023, the gold price ranged from $1,900 to $2,048 per ounce, averaging $1,976 per ounce for the period, a 6% increase from the same period in the prior year. During the six months ended June 30, 2023, the gold price ranged from $1,811 to $2,048 per ounce, averaging $1,932 per ounce for the period, a 3% increase from the same period in the prior year. As at June
3
30, 2023, the gold price was $1,912 per ounce (based on the LBMA PM fix). The gold price performed well during the quarter amidst a backdrop of continued central bank buying, a relatively stable US dollar and interest rates, and event risk hedging. Also during the quarter, physically-backed global gold ETFs saw net outflows in June, reversing their three-month inflow streak. All regions except Asia experienced outflows in June, and June’s outflow caused global gold ETF demand during the first half of 2023 to turn negative.
Silver
The market price of silver is also subject to volatile price movements. Silver, often considered a proxy for gold with a high level of correlation to the metal, is predominantly used in industrial applications and silver demand is also correlated to the Industrial Index. A rebound of manufacturing activity is expected to have a positive effect on silver as silver has many uses. The market price of silver is driven by factors similar to those influencing the market price of gold, as stated above. The market price of silver is a significant contributor to the performance of our silver streams.
During the three months ended June 30, 2023, the silver price ranged from $22.34 to $26.03 per ounce, averaging $24.13 per ounce for the period, a 7% increase from the same period in the prior year. During the six months ended June 30, 2023, the silver price ranged from $20.09 to $26.03 per ounce, averaging $23.31 per ounce for the period, in line with the same period in the prior year As at June 30, 2023, the silver price was $22.47 per ounce (based on the LBMA fix). Similar to gold, silver was influenced by safe-haven buying and exchange traded fund flows.
Currency Exchange Rates
We are subject to minimal currency fluctuations as all our revenue and cost of sales are denominated in U.S. dollars, with the majority of general administration costs denominated in Canadian dollars. The Company monitors foreign currency risk as part of its risk management program. As at June 30, 2023, there were no hedging programs in place for non-U.S. dollar expenses.
4
Financial and Operating Highlights
Three and six months ended June 30, 2023 compared to three and six months ended June 30, 2022
| | Three months ended | | Six months ended |
| ||||||||
| | June 30 | | June 30 | | ||||||||
($ thousands except GEOs, per share metrics and asset margin) |
| 2023 | | 2022 | | 2023 |
| 2022 |
| ||||
IFRS measures: | | | | | | | | | | | | | |
Revenue | | $ | 52,591 | | $ | 36,490 | | $ | 102,860 | | $ | 74,245 | |
Gross Profit | |
| 26,947 | | | 21,282 | | | 49,820 | |
| 42,826 | |
Depletion | |
| 15,740 | | | 11,485 | | | 31,668 | |
| 24,664 | |
General administration costs | |
| 5,184 | | | 3,382 | | | 10,856 | |
| 7,457 | |
Net Earnings | |
| 16,034 | | | 10,922 | | | 32,568 | |
| 26,811 | |
Net Earnings per Share – basic and diluted | |
| 0.08 | | | 0.07 | | | 0.17 | |
| 0.17 | |
Operating Cash Flow | |
| 40,875 | | | 29,940 | | | 79,744 | |
| 56,299 | |
Operating Cash Flow per Share | |
| 0.20 | | | 0.19 | | | 0.40 | |
| 0.36 | |
| | | | | | | | | | | | | |
Non-IFRS measures1: | |
|
| | | | | | | |
|
| |
GEOs | |
| 26,616 | | | 19,507 | | | 53,215 | |
| 39,620 | |
Adjusted Net Earnings | |
| 17,660 | | | 14,854 | | | 31,175 | |
| 30,326 | |
Adjusted Net Earnings per Share | |
| 0.09 | | | 0.10 | | | 0.16 | |
| 0.19 | |
Adjusted EBITDA | |
| 41,630 | | | 28,144 | | | 78,720 | |
| 58,601 | |
Free Cash Flow | |
| 40,875 | | | 29,940 | | | 79,744 | |
| 56,299 | |
Asset Margin | |
| 91 | % | | 90 | % | | 89 | % |
| 91 | % |
| 1. | GEOs, adjusted net earnings, adjusted net earnings per share, adjusted EBITDA, free cash flow and asset margin as presented above and in the following discussion are non-IFRS financial performance measures with no standardized meaning under IFRS and therefore may not be comparable to similar measures presented by other issuers. For further information and a detailed reconciliation of each non-IFRS measure to the most directly comparable IFRS measure, see ‘‘Non-IFRS Financial Performance Measures’’ in this MD&A. |
5
The following charts highlight our recent quarterly performance. In the three months ended June 30, 2023 we generated record quarterly operating cash flow, revenue, adjusted net earnings, adjusted EBITDA and GEOs.
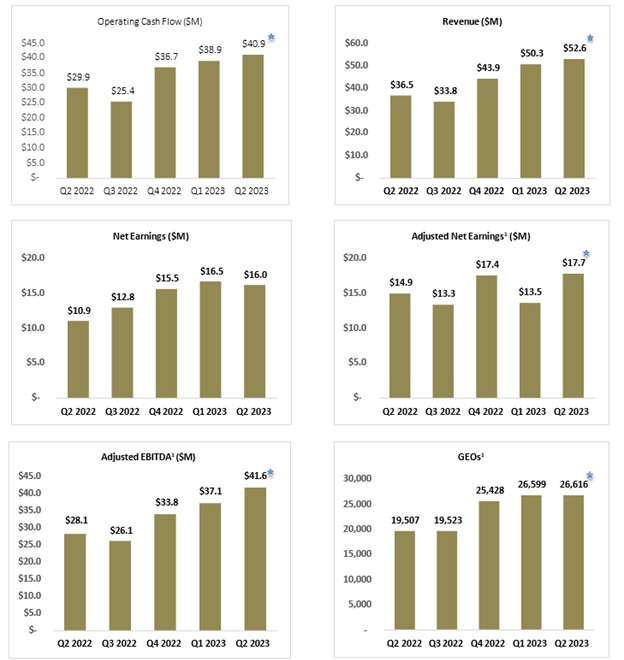
* Indicates quarterly record.
1GEOs, adjusted EBITDA and adjusted net earnings as presented above are non-IFRS financial performance measures with no standardized meaning under IFRS and, therefore, may not be comparable to similar measures presented by other issuers. For further information and a detailed reconciliation of each non-IFRS measure to the most directly comparable IFRS measure, see ‘‘Non-IFRS Financial Performance Measures’’ in this MD&A.
6
The following contains forward-looking information. Reference should be made to the “Forward-Looking Information” and “Technical and Third-Party Information” sections at the end of this MD&A.
The following table provides our full year 2023 guidance, which remains unchanged.
|
| 2023 Guidance |
GEOs1 |
| 100,000 to 115,0002 |
Depletion | | $65 million to $71 million |
| | $21 million to $22 million comprising: |
| | Cash: $16 million to $17 million |
General administration costs | | Non-Cash: ~$5 million |
Australian Cash Tax Rate3 | | ~25% |
1. | GEOs as presented above and in the following discussion is a non-IFRS financial performance measure with no standardized meaning under IFRS and therefore may not be comparable to similar measures presented by other issuers. For further information and a detailed reconciliation of GEOs to the most directly comparable IFRS measure, see ‘‘Non-IFRS Financial Performance Measures’’ in this MD&A. |
2. | Assumed commodity prices of $1,850/oz gold, $22.00/oz silver, $4.00/lb copper and $100/carat for diamonds. |
3. | Australian Cash Taxes are payable for Triple Flag’s Australian royalty interests. |
Our 2023 outlook on stream and related interests and royalty interests is based on publicly available forecasts of the owners or operators of properties on which we have stream and royalty interests and which we believe to be reliable. When publicly available forecasts on properties are not available, we obtain internal forecasts from the owners or operators, or use our own best estimate. We conduct our own independent analysis of this information to reflect our expectations based on an operator’s historical performance and track record of replenishing Mineral Reserves and the operator’s publicly disclosed guidance on future production, the conversion of Mineral Resources to Mineral Reserves, timing risk adjustments, drill results, our view on opportunities for mine plan optimization and other factors. We may also make allowances for the risk of uneven stream deliveries to factor in the potential for timing differences risking the attainment of public guidance ranges. Achievement of the GEOs and the other metrics set forth in the guidance above is subject to risks and uncertainties, including changes in commodity prices and the ability of operators to attain the results set out in their forecasts. Accordingly, we can provide no assurance that the actual GEOs and such other metrics for 2023 will be in the ranges set forth above. In addition, we may revise our guidance during the year to reflect more current information. If we are unable to achieve our anticipated guidance, or if we revise our guidance, our future results of operations may be adversely affected and our share price may decline.
For the second half of 2023, gold, silver, copper, diamond and royalty revenues have been converted to GEOs using commodity prices of $1,900 per ounce of gold, $23.00 per ounce of silver, $3.50 per pound of copper and $110.00 per carat for diamonds.
We believe strong performance in the field of sustainability is critical to the long-term success of our organization, the mining industry and host communities. Strong sustainability performance (including Environmental, Social and Governance (“ESG”)) helps ensure that the mines and projects we invest in are developed and operated responsibly to protect worker health and safety as well as the environment; social impacts are identified, managed, and mitigated; human rights are respected; and benefits accrue to local communities and a broad range of stakeholders. Investing in the pursuit of sensible best practices is simply good business for a long-term focused organization such as Triple Flag. We can help enhance our mining partners’ privilege to operate and assist their efforts for decarbonization as a capital provider, while maintaining the carbon neutral status of our attributable production associated with our investing activities for our investors.
We do not invest in oil, gas or coal. For investments in the non-core portion of our portfolio that is not comprised of precious metals, we prioritize copper, nickel and related metals that will create the electrification infrastructure needed for the green economy of our future. When conducting due diligence, we engage with experienced ESG practitioners who complement our considerable team experience and capabilities in this area, and who understand and can apply sound judgment about the potential materiality of short- and
7
long-term risks so that we can avoid investing in projects that adversely impact the environment and local stakeholders. We aim to achieve net-zero emissions by 2050 and are actively exploring pathways to achieve this target.
Sustainability Report
Early this July, we published our third annual Sustainability Report, “Progress In Motion.” Our report provides detailed disclosures on our sustainability approach, climate strategy, governance, and ESG initiatives we undertook during 2022. To guide our reporting and strategy development, we refer to the recommendations of the Global Reporting Initiative (“GRI”) Standards, the Sustainability Accounting Standards Board (“SASB”), and the Task Force on Climate-related Financial Disclosures (“TCFD”). We have continued our commitment to the United Nations Global Compact (“UNGC”) corporate responsibility initiative and its principles in the areas of human rights, labor, the environment, and anti-corruption through the United Nations Sustainable Development Goals (“SDGs”).
On May 11, 2023, Canada passed the Modern Slavery Act (“the Act”) to address the use of forced and child labour in global supply chains. The Company is currently reviewing implications of the Act on its reporting disclosures and working towards ensuring compliance with the Act by May 31, 2024, as required.
In 2022, we targeted two new SDGs where we could make the most impact: industry, innovation, and infrastructure (SDG 9) and sustainable cities and communities (SDG 11). Our SDG 9 impact involved promoting the adoption of clean technologies, such as the desalination water recycling plant at our Cerro Lindo mine. For SDG 11, we aimed to reduce economic and community loss caused by disasters, with 2022 initiatives including support for Northparkes flood relief and the Canadian Red Cross Ukrainian humanitarian effort. In 2022, we also performed a TCFD-informed assessment of our partners’ short-, medium-, and long-term carbon reduction objectives. We are proud that, in 2022, all 15 of our producing partners aligned with the Paris Agreement to reach net-zero carbon emissions by 2050.
Diversity, Equity, and Inclusion
During the second quarter, we hosted several employee training sessions on topics of diversity, equity, and inclusion. Our colleagues were invited to share about their heritage and ethnicity, offering our team the valuable opportunity to learn from different cultural perspectives. We observed the end of Ramadan by sharing ethnic foods prepared by each member of our team.
In May, Elizabeth Wademan was elected by shareholders to our Board of Directors, joining the Audit & Risk Committee and the Compensation & Talent Committee. With her election, we have exceeded our target of 30% female Board members two years ahead of the targeted date. We will be reviewing this target in light of our recent achievement.
Other Initiatives
In lieu of meeting fees, Triple Flag makes quarterly donations to a charity of each Director’s choosing. This quarter, Triple Flag donated at the behest of the Directors to Toronto Sick Kids, Canadian Mental Health Association, Doctors without Borders, the Walrus, Pheasants Forever, Ukraine World Foundation, and the Alzheimer Society.
Portfolio of Streaming and Related Interests and Royalty Interests
The following tables present our revenue and GEOs sold by asset for the periods indicated. GEOs are based on stream and related interests and royalty interests and are calculated on a quarterly basis by dividing all revenue from such interests for the quarter by the average gold price during that quarter. The gold price is determined based on the LBMA PM fix. For periods longer than one quarter, GEOs are summed for each quarter in the period.
8
Three and six months ended June 30, 2023 compared to three and six months ended June 30, 2022
| | Three months ended June 30 | | Six months ended June 30 | ||||||||
Revenue ($000s) |
| 2023 | | 2022 | | 2023 |
| 2022 | ||||
Streaming and Related Interests | | | | | | | | | | | | |
Cerro Lindo | | $ | 8,012 | | $ | 10,049 | | $ | 21,987 | | $ | 22,402 |
Northparkes | |
| 9,006 | | | 6,340 | | | 14,195 | |
| 13,210 |
ATO | |
| 5,617 | | | 4,846 | | | 11,727 | |
| 5,616 |
RBPlat | |
| 3,163 | | | 3,377 | | | 6,037 | |
| 7,609 |
Moss | |
| 2,952 | | | — | | | 5,946 | |
| — |
Buriticá | |
| 2,825 | | | 1,125 | | | 5,617 | |
| 3,635 |
Auramet | |
| 2,390 | | | — | | | 4,850 | |
| — |
Renard | |
| 1,989 | | | 2,287 | | | 4,124 | |
| 4,630 |
Other1 | |
| 2,925 | | | 733 | | | 5,669 | |
| 1,206 |
| | $ | 38,879 | | $ | 28,757 | | $ | 80,152 | | $ | 58,308 |
Royalty Interests | |
|
| | | | | | | |
|
|
Fosterville | | $ | 3,354 | | $ | 4,517 | | $ | 5,036 | | $ | 8,587 |
Beta Hunt | |
| 2,853 | | | — | | | 4,687 | |
| — |
Young-Davidson | |
| 1,383 | | | 1,411 | | | 2,569 | | $ | 2,936 |
Other2 | |
| 6,122 | | | 1,805 | | | 10,416 | |
| 4,414 |
| | | 13,712 | | | 7,733 | | | 22,708 | | | 15,937 |
Total | | $ | 52,591 | | $ | 36,490 | | $ | 102,860 | | $ | 74,245 |
| | Three months ended June 30 | | Six months ended June 30 | ||||||||
Revenue ($000s) |
| 2023 | | 2022 | | 2023 |
| 2022 | ||||
Gold | | $ | 33,856 | | $ | 21,412 | | $ | 60,324 | | $ | 40,600 |
Silver | |
| 16,232 | | | 12,564 | | | 37,749 | |
| 28,554 |
Other3 | |
| 2,503 | | | 2,514 | | | 4,787 | |
| 5,091 |
Total | | $ | 52,591 | | $ | 36,490 | | $ | 102,860 | | $ | 74,245 |
| 1. | Includes revenue from El Mochito, Gunnison, La Colorada and Pumpkin Hollow. |
| 2. | Includes revenue from Dargues, Eagle River, Hemlo, Henty and Stawell and other royalties, including royalties acquired pursuant to the Maverix acquisition. |
| 3. | Includes copper and diamonds. |
9
| | Three months ended June 30 | | Six months ended June 30 | ||||
GEOs (ounces) |
| 2023 | | 2022 | | 2023 |
| 2022 |
Streaming and Related Interests | | | | | | | | |
Cerro Lindo |
| 4,054 | | 5,372 | | 11,448 |
| 11,952 |
Northparkes |
| 4,558 | | 3,389 | | 7,304 |
| 7,049 |
ATO |
| 2,843 | | 2,591 | | 6,076 |
| 3,001 |
RBPlat |
| 1,601 | | 1,805 | | 3,122 |
| 4,059 |
Moss |
| 1,494 | | — | | 3,077 |
| — |
Buriticá |
| 1,430 | | 602 | | 2,908 |
| 1,939 |
Auramet |
| 1,210 | | — | | 2,512 |
| — |
Renard |
| 1,006 | | 1,223 | | 2,136 |
| 2,471 |
Other1 |
| 1,481 | | 392 | | 2,933 |
| 644 |
|
| 19,677 | | 15,374 | | 41,516 |
| 31,115 |
Royalty Interests | | | | | | | | |
Fosterville |
| 1,697 | | 2,415 | | 2,587 |
| 4,583 |
Beta Hunt |
| 1,443 | | — | | 2,414 |
| — |
Young-Davidson |
| 700 | | 754 | | 1,327 |
| 1,567 |
Other2 |
| 3,099 | | 964 | | 5,371 |
| 2,355 |
|
| 6,939 | | 4,133 | | 11,699 |
| 8,505 |
Total |
| 26,616 | | 19,507 | | 53,215 |
| 39,620 |
| | Three months ended June 30 | | Six months ended June 30 | ||||
GEOs (ounces) |
| 2023 | | 2022 | | 2023 |
| 2022 |
Gold |
| 17,134 | | 11,446 | | 31,139 |
| 21,669 |
Silver |
| 8,215 | | 6,717 | | 19,600 |
| 15,234 |
Other3 |
| 1,267 | | 1,344 | | 2,476 |
| 2,717 |
Total |
| 26,616 | | 19,507 | | 53,215 |
| 39,620 |
| 1. | Includes revenue from El Mochito, Gunnison, La Colorada and Pumpkin Hollow. |
| 2. | Includes revenue from Dargues, Eagle River, Hemlo, Henty and Stawell and other royalties, including royalties acquired pursuant to the Maverix acquisition. |
| 3. | Includes copper and diamonds. |
For the six months ended June 30, 2023
Acquisition of Agbaou Royalty
On June 23, 2023, the Company entered into an agreement with Auramet Capital Partners, L.P. (“Auramet”) for the acquisition of the 2.5% net smelter return (“NSR”) royalty it held on the Agbaou mine in Côte d’Ivoire, operated by Allied Gold Corp (“Agbaou Royalty”). The NSR royalty provides Triple Flag with an entitlement to 2.5% of net smelter returns from future production at the Agbaou mine. Triple Flag acquired the Agbaou Royalty for a total consideration of $15.5 million of which $13.5 million was paid in cash and remaining paid through an in-kind contribution of an asset held by the Company. The Agbaou Royalty was recorded as mineral interest.
Acquisition of Maverix
On January 19, 2023, the Company acquired all of the issued and outstanding common shares of Maverix pursuant to the terms of an arrangement agreement dated November 9, 2022 (the “Agreement”). Pursuant to the Agreement, Maverix shareholders had the option to receive either 0.36 of a TF Precious Metals common share or $3.92 in cash per Maverix common share, in each case subject to pro-ration such that the aggregate cash consideration would not exceed 15% of the total consideration and the aggregate share consideration does not exceed 85% of the total consideration. In addition, (i) holders of options to acquire Maverix Shares received fully vested
10
replacement options to acquire Triple Flag Shares; and (ii) the restricted share units (“RSUs”) of Maverix outstanding immediately prior to the effective time of the transaction, whether vested or unvested, were assigned and transferred by the holder to Maverix in exchange for a cash payment and each RSU was immediately cancelled. The outstanding Maverix warrants (the “Maverix Warrants”) (5,000,000 Maverix share warrants outstanding with an exercise price of $3.28 per Maverix Share outstanding as of the closing date) were automatically adjusted in accordance with their terms, such that if and when exercised, Maverix warrant holders would receive a total of 1,800,000 Triple Flag shares at an exercise price of $9.11 per Triple Flag Share. The Maverix Warrants were exercised on April 12, 2023.
In connection with the closing, Triple Flag paid $86.7 million issued 45,097,390 common shares to all former Maverix shareholders and incurred $5.8 million of transaction costs. The transaction was accounted for as an asset acquisition on January 19, 2023. Following the completion of the acquisition, Maverix Metals Inc. became a wholly-owned subsidiary of Triple Flag.
The transaction was accounted for as an asset acquisition on January 19, 2023, with mineral interests of $587.8 million and is described in Note 4 of the Interim Financial Statements. The other net assets acquired in the transaction included cash and cash equivalents, amounts receivable, prepaid gold interests and loans receivable of approximately $68.9 million, amounts payable and other liabilities, lease liabilities and income tax payable of $11.9 million. The other liabilities included change of control under the terms of Maverix’s employment agreements.
Operating Assets – Performance
Our business is organized into a single operating segment, consisting of acquiring and managing precious metals and other high-quality streams and royalties. Our chief operating decision-maker, the CEO, makes capital allocation decisions, reviews operating results and assesses performance.
Asset Performance — Streams and related assets (producing)
1. | Cerro Lindo (Operator: Nexa Resources S.A.) |
Under the stream agreement with Nexa Resources S.A. (“Nexa”), we receive 65% of payable silver produced from the Cerro Lindo mine until 19.5 million ounces have been delivered and 25% thereafter. Typically, deliveries under the stream lag production by up to 4 months. As at June 30, 2023, 13.2 million ounces of silver had been delivered under the stream agreement with Nexa since inception.
For the three months ended June 30, 2023, we sold 337,096 ounces of silver delivered under the agreement, a 35% decrease from the ounces of silver sold for the same period in the prior year, driven by lower deliveries mainly due to Cyclone Yaku as described further below. For the three months ended June 30, 2023, we sold 308,170 of the silver delivered under the agreement, a 29% decrease from the ounces sold for the same period in the prior year. GEOs sold were 4,054 for the three months ended June 30, 2023, compared to 5,372 for the same period in the prior year, driven by lower deliveries.
For the six months ended June 30, 2023, we sold the 966,757 ounces of silver delivered under the agreement, largely in line with the silver sold for the same period in the prior year. GEOs sold were 11,448 for the six months ended June 30, 2023, compared to 11,952 for the same period in the prior year.
Cerro Lindo was impacted in mid-March by unusual heavy rainfall levels and overflowing rivers caused by Cyclone Yaku. Following this event, operations were temporarily suspended to allow time for dewatering, which was completed within 15 days. Nexa has maintained 2023 guidance for Cerro Lindo, despite this interruption.
2. | Northparkes (Operator: China Molybdenum Co., Ltd) |
Under the stream agreement with China Molybdenum Co., Ltd (“CMOC”), we receive 54% of the payable gold until an aggregate of 630,000 ounces have been delivered and 27% of payable gold thereafter, and 80% of the payable silver produced until an aggregate of 9 million ounces of silver have been delivered to us, and 40% of the payable silver thereafter for the remainder of the life of the mine. Typically, deliveries under the stream lag production by 2 months. As at June 30, 2023, 34,540 ounces of gold and 625,744 ounces of silver had been delivered under the stream agreement with CMOC since inception.
11
For the three months ended June 30, 2023, we sold the 3,657 ounces of gold and 70,857 ounces of silver delivered to the Company. This compares to 2,691 ounces of gold and 56,307 ounces of silver delivered and sold for the same period in the prior year. GEOs sold were 4,558 for the three months ended June 30, 2023, compared to 3,389 for the same period in the prior year.
For the six months ended June 30, 2023, we sold the 5,930 ounces of gold and 116,157 ounces of silver delivered to the Company. This compares to 4,728 ounces of gold and 99,864 ounces of silver delivered and sold for the same period in the prior year. GEOs sold were 7,304 for the six months ended June 30, 2023, compared to 7,049 for the same period in the prior year.
Northparkes has now mobilized surface mining equipment for the commencement of open pit mining at E31, which hosts higher gold grades than the ore reserve average.
3. | RBPlat PGM Operations (Operator: Royal Bafokeng Platinum Limited) |
Under the stream agreement with Royal Bafokeng Platinum Limited (“RBPlat”), we receive 70% of the payable gold until 261,000 ounces are delivered and 42% of payable gold thereafter on the RBPlat PGM Operations. Typically, deliveries under the stream lag production by 5 months. As at June 30, 2023, 24,891 ounces of gold had been delivered under the stream agreement with RBPlat since inception.
For the three months ended June 30, 2023, we sold the 1,600 ounces of gold delivered by RBPlat under the stream agreement, an 11% decrease from the ounces delivered and sold for the same period in the prior year. GEOs sold were 1,601 for the three months ended June 30, 2023, compared to 1,805 for the same period in the prior year.
For the six months ended June 30, 2023, we sold the 3,135 ounces of gold delivered by RBPlat under the stream agreement, a 22% decrease from the ounces delivered and sold for the same period in the prior year. GEOs sold were 3,122 for the six months ended June 30, 2023, compared to 4,059 for the same period in the prior year.
Impala Platinum Limited (“Implats”) has secured control of Royal Bakofeng Platinum (“RBPlat”), thereby concluding a prolonged competitive process. Implats is one of the world’s largest integrated PGM producers and brings a strong balance sheet as well as a track record of excellent operational performance and productivity at neighboring mines. RBPlat’s assets are contiguous and complementary to Implats’ operations, securing a significant Western Limb production base. We are encouraged by the outlook for this asset, particularly as the Styldrift mine ramps up to nameplate hoisting capacity of 230kt per month.
4. | Altan Tsagaan Ovoo (“ATO”) (Operator: Steppe Gold) |
Under the stream agreement with Steppe Gold, we receive 25% of the payable gold until 46,000 ounces of gold have been delivered and 25% of payable gold thereafter subject to an annual cap of 7,125 ounces, and 50% of the payable silver until 375,000 ounces of silver have been delivered and 50% of payable silver thereafter subject to an annual cap of 59,315 ounces produced from the ATO mine in Mongolia. As at June 30, 2023, 22,534 ounces of gold and 55,237 ounces of silver had been delivered under the stream agreement with Steppe Gold since inception.
For the three months ended June 30, 2023, we sold the 2,678 ounces of gold and 14,609 ounces of silver delivered to the Company under stream and related interests, compared to the 2,610 ounces of gold and 417 ounces of silver sold for the same period in the prior year, respectively. GEOs sold were 2,843 for the three months ended June 30, 2023, compared to 2,591 for the same period in the prior year.
For the six months ended June 30, 2023, we sold the 5,895 ounces of gold and 15,006 ounces of silver delivered to the Company under stream and related interests, compared to the 2,978 ounces of gold and 3,514 ounces of silver sold for the same period in the prior year, respectively. GEOs sold were 6,076 for the six months ended June 30, 2023, compared to 3,001 for the same period in the prior year.
Current operations at ATO are on track to achieve their target of 25,000-30,000 ounces of gold for 2023. On July 11th, Steppe Gold announced it had signed a binding term sheet for $150 million in financing to fully fund the construction and completion of the Phase 2 mine and mill expansion at ATO. As per disclosures from the operator, upon planned completion in 2025, the Phase 2 expansion
12
project is expected to generate a total of 1,237,000 ounces of gold equivalent (“Au Eq”) recovered over 12 years, at an average of 103,000 ounces Au Eq per annum.
5. | Buriticá (Operator: Zijin Mining Group Co.) |
Under the stream agreement with Zijin Mining Group Co., we receive 100% of payable silver based on a fixed silver-to-gold ratio of 1.84 over the life of the asset. On average, deliveries under the stream lag production by 3 months. As at June 30, 2023, 1.1 million ounces of silver had been delivered under the stream agreement with RBPlat since inception.
For the three months ended June 30, 2023, we sold the 118,626 ounces of silver delivered under the agreement, a 126% increase from the same period in the prior year. GEOs sold were 1,430 for the three months ended June 30, 2023, compared to 602 for the same period in the prior year.
For the six months ended June 30, 2023, we sold the 246,865 ounces of silver delivered under the agreement, a 57% increase from the same period in the prior year. GEOs sold were 2,908 for the six months ended June 30, 2023, compared to 1,939 for the same period in the prior year.
6. | Renard (Operator: Stornoway Diamond Corporation) |
Under the stream agreement with Stornoway Diamond Corporation we receive 4% of payable carats over the life of the asset.
For the three months ended June 30, 2023, there were 19,595 diamond carats attributable to the Company under the agreement, a 7% increase from the same period in the prior year. GEOs sold were 1,006 for the three months ended June 30, 2023, compared to 1,223 for the same period in the prior year, largely driven by a higher ratio of gold prices to diamond prices, partially offset by a higher volume of payable carats.
For the six months ended June 30, 2023, there were 37,517 diamond carats attributable to the Company under the agreement, an 8% increase from the same period in the prior year. GEOs sold were 2,136 for the six months ended June 30, 2023, compared to 2,471 for the same period in the prior year, largely driven by a higher ratio of gold prices to diamond prices, partially offset by a higher volume of payable carats.
On June 23, 2023, Renard mine voluntarily evacuated due to forest fires located 50km northwest of the operation near its main access road. Mining operations resumed on July 1st with the process plant restarting on July 4th following the reopening of the access road and fuel deliveries. As a result of this temporary cessation of operations, a modest reduction in diamond deliveries is anticipated in the third quarter of 2023.
7. | Moss (Operator: Elevation Gold Mining Corporation) |
Pursuant to the Maverix acquisition, the Company acquired a silver stream on the Moss Mine, located in Arizona, USA. Under the agreement we receive 100% of payable silver produced from the Moss mine until 3.5 million ounces have been delivered under the agreement and 50% thereafter. As at June 30, 2023, 1.0 million ounces of silver had been delivered under the stream agreement since inception.
For the three months ended June 30, 2023, we sold 768 ounces of gold and 61,646 ounces of silver delivered to the Company under stream and related agreements, resulting in GEOs of 1,494 sold.
For the six months ended June 30, 2023, we sold 1,474 ounces of gold and 132,932 ounces of silver delivered to the Company under stream and related agreements, resulting in GEOs of 3,077 sold.
Asset Performance — Royalties (Producing)
1. | Fosterville Gold Mine (Operator: Agnico Eagle Mines Limited, effective February 8, 2022) |
13
We own a 2% NSR royalty interest in Agnico Eagle Mines Limited’s (“Agnico Eagle") Fosterville mine in Australia. On July 26, 2023, Agnico Eagle reported second quarter 2023 results. For the three months ended June 30, 2023, Fosterville milled 176,000 tonnes of ore at an average grade of 14.77 g/t Au resulting in gold production of 81,813 ounces compared to 122,000 tonnes of ore milled for the same period in the prior year at an average grade of 22.24 g/t Au resulting in gold production of 86,065 ounces.
For the six months ended June 30, 2023, Fosterville milled 324,000 tonnes of ore at an average grade of 16.49 g/t Au resulting in gold production of 168,371 ounces compared to 213,000 tonnes of ore milled for the same period in the prior year at an average grade of 24.76 g/t Au resulting in gold production of 167,892 ounces.
GEOs earned were 1,697 and 2,587 for the three and six months ended June 30, 2023, respectively, compared to 2,415 and 4,583 respectively for the prior year.
Fosterville celebrated the production of its 4 millionth ounce of gold in March, 2023. Noise prohibition was lifted in June, 2023 and normal operation has resumed. Production is on track for the year with its 2023 guidance remaining unchanged.
2. | Beta Hunt (Operator: Karora Resources Inc.) |
Pursuant to the Maverix acquisition, the Company acquired 3.25% GRR and 1.5% NSR royalties on all gold production and aggregate 1.5% NSR royalties on all Nickel production from the Beta Hunt mine, located in Australia. On May 15, 2023, Karora Resources Inc. reported first quarter 2023 results. For the three months ended March 31, 2023, Beta Hunt milled 298,300 tonnes of ore at an average grade of 2.92 g/t, resulting in 26,577 ounces of gold produced.
GEOs earned were 1,443 and 2,414 for the three and six months ended June 30, 2023, respectively.
Beta Hunt is on track to achieve its full year production guidance.
3. | Young-Davidson Gold Mine (Operator: Alamos Gold Inc.) |
We own a 1.5% NSR royalty interest in Alamos Gold Inc.’s (“Alamos Gold”) Young-Davidson mine in Canada. On July 26, 2023, Alamos Gold reported second quarter 2023 results. For the three months ended June 30, 2023, Young-Davidson processed 696,718 tonnes of ore at an average grade of 2.13 g/t Au and a recovery of 91%, resulting in gold production of 45,200 ounces, compared to 705,014 tonnes of ore processed for the same period in the prior year at an average grade of 2.25 g/t Au and a recovery of 91%, resulting in gold production of 46,400 ounces.
For the six months ended June 30, 2023, Young-Davidson processed 1,398,672 tonnes of ore at an average grade of 2.18 g/t Au and a recovery of 91%, resulting in gold production of 90,200 ounces, compared to 1,442,742 tonnes of ore processed for the same period in the prior year at an average grade of 2.32 g/t Au and a recovery of 91%, resulting in gold production of 98,300 ounces.
GEOs earned were 700 and 1,327 for the three and six months ended June 30, 2023, respectively, compared to 754 and 1,567 respectively for the prior year.
Young-Davidson had a strong second quarter with mining rates exceeding targeted rates. Higher grades are expected to drive stronger production in the second half of the year and Young-Davidson is on track to achieve its full-year production guidance.
14
The following table summarizes other financial assets as at June 30, 2023 and December 31, 2022:
|
| As at |
| As at | ||
($ thousands) | | June 30, 2023 | | December 31, 2022 | ||
Investments1 | | $ | 8,085 | | $ | 5,372 |
Prepaid gold interest – Steppe Gold2 | |
| — | |
| 4,534 |
Prepaid gold interests – Auramet Capital Partners3 | |
| 40,976 | |
| — |
Total financial assets | |
| 49,061 | |
| 9,906 |
| 1 | Investments comprise equity interests and warrants in publicly traded and private companies and have been recorded at fair value. The fair value of the public equity investments is classified as level 1 of the fair value hierarchy because the main valuation inputs used are quoted prices in active markets, the fair value of the warrants is classified as level 2 because one or more of the significant inputs are based on observable market data, and the fair value of the private equity investments is classified as level 3 of the fair value hierarchy because the relevant observable inputs are not available. Refer to Note 12 of the Interim Financial Statements for additional details. During the six months ended June 30, 2023, the Company subscribed for 15,384,615 shares of Monarch Corporation for C$1 million through a private placement. |
| 2 | On September 26, 2022, the Company entered into an agreement with Steppe Gold to acquire a prepaid gold interest. The Company made a cash payment of $4.8 million to acquire the prepaid gold interest in exchange for delivery of 3,000 ounces of gold that were delivered by Steppe Gold in 8 monthly deliveries. The final delivery was made in May, 2023.The Steppe Gold Prepaid Gold Interest was accounted for as a financial asset at fair value through profit or loss and fair value was calculated based on the London Bullion Market Association PM fix on the last trading day of the quarter. |
| 3 | On January 19, 2023, as part of the Maverix acquisition, the Company acquired a prepaid gold interest with Auramet Capital Partners, L.P., a subsidiary of Auramet International LLC (“Auramet”). The contract requires Auramet to deliver 1,250 ounces of gold to Triple Flag per quarter. Triple Flag is required to make ongoing cash payments equal to 16% of the spot gold price for each gold ounce delivered. On and after ten years and 50,000 ounces of gold have been delivered to Triple Flag (since inception), Auramet shall have the option to terminate the stream for a cash payment of $5 million less certain cash flows related to the gold deliveries. As at June 30, 2023, 40,000 ounces of gold were yet to be delivered under the contract. The Auramet Prepaid Gold Interest is accounted for as a financial asset at fair value through profit or loss. |
The change in fair value of financial assets for the three months ended June 30, 2023 was $954 loss (2022: $3,834 loss), and for the six months ended June 30, 2023 was $2,699 gain (2022: $4,492 loss).
Financial Condition and Shareholders’ Equity Review
Summary Balance Sheet
The following table presents summarized consolidated balance sheet information as at June 30, 2023 and December 31, 2022:
|
| As at |
| As at | ||
($ thousands) | | June 30, 2023 | | December 31, 2022 | ||
Cash and cash equivalents | | $ | 16,438 | | $ | 71,098 |
Other current assets | |
| 32,737 | |
| 19,509 |
Non-current assets | |
| 1,873,584 | |
| 1,246,424 |
Total assets | | $ | 1,922,759 | | $ | 1,337,031 |
| | | | | | |
Current liabilities | | $ | 10,607 | | $ | 12,586 |
Long-term debt | |
| 65,000 | |
| — |
Other non-current liabilities | |
| 6,185 | |
| 5,966 |
Total liabilities | |
| 81,792 | |
| 18,552 |
Total shareholders’ equity | |
| 1,840,967 | |
| 1,318,479 |
Total liabilities and shareholders’ equity | | $ | 1,922,759 | | $ | 1,337,031 |
15
Total assets were $1,922.8 million as at June 30, 2023, compared to $1,337.0 million as at December 31, 2022. Our asset base primarily consists of non-current assets such as mineral interests, which consist of our interests in streams and related interests and royalties. Our asset base also includes current assets, which generally include cash and cash equivalents, receivables, metal inventory and financial assets. The increase in total assets from December 31, 2022 was largely driven by the mineral interests acquired pursuant to the Maverix acquisition.
Total liabilities were $81.8 million as at June 30, 2023, compared to $18.6 million as at December 31, 2022. The increase in total liabilities largely related to the net drawdown from the Credit Facility to partially fund the Maverix acquisition, net of subsequent repayments. Total liabilities consist largely of long-term debt, amounts payable and accrued liabilities, deferred tax liabilities and lease obligations. For information about the Credit Facility, see “Liquidity and Capital Resources” below.
Total shareholders’ equity as at June 30, 2023 was $1,841.0 million, compared to $1,318.5 million as at December 31, 2022. The increase in shareholders’ equity largely reflects additional equity issued pursuant to the Maverix acquisition and income generated during the period net of dividends paid.
Shareholders’ Equity
As at June 30, 2023 |
| Number of shares |
Common shares |
| 201,928,136 |
As at December 31, 2022 |
| Number of shares |
Common shares |
| 155,685,593 |
In November 2022, Triple Flag received approval from the TSX to renew its normal course issuer bid (“NCIB”). Under the NCIB, the Company may acquire up to 2,000,000 of its common shares from time to time in accordance with the NCIB procedures of the TSX. Repurchases under the NCIB are authorized until November 14, 2023. Daily purchases on the TSX will be limited to 9,186 common shares, representing 25% of the average daily trading volume of the common shares on the TSX for the period from May 1, 2022 to October 31, 2022 (being 36,744 common shares), except where purchases are made in accordance with the “block purchase exemption” of the TSX rules. All common shares that are repurchased by the Company under the NCIB will be cancelled. For the three and six months ended June 30, 2023, the Company purchased 720,440 and 911,646, respectively of its common shares under the normal course issuer bid (“NCIB”) for $10.5 million and $13.1 million respectively. Triple Flag may purchase a remaining 919,332 common shares out of the authorized total of 2,000,000.
On June 30, 2023, in connection with the NCIB, the Company entered into an Automatic Share Purchase Plan (“ASPP”) with the designated broker responsible for the NCIB. The ASPP is intended to allow for the purchase of its common shares under the NCIB at times when the Company would ordinarily not be permitted to purchase its common shares due to regulatory restrictions and customary self-imposed blackout periods. On June 30, 2023, the Company instructed the designated broker to make purchases under the ASPP during the period between July 1, 2023 to August 10, 2023. The Company has recorded a liability of $1.3 million reflecting the obligation to purchase shares under ASPP as at June 30, 2023.
As at August 8, 2023, 201,882,220 common shares are issued and outstanding and stock options are outstanding to purchase a total of 5,015,773 common shares.
For the three and six months ended June 30, 2023, we declared and paid dividends in United States dollars totaling $10.1 million and $20.1 million, respectively (2022: $7.4 million and $14.8 million, respectively). For the three and six months ended June 30, 2023, no shares were issued from treasury for participation in the Dividend Reinvestment Plan.
16
Condensed Consolidated Statements of Income
Three and six months ended June 30, 2023 compared to three and six months ended June 30, 2022
The following table presents summarized consolidated statements of income information for the three months ended March 31, 2023 and 2022:
| | Three months ended | | Six months ended | ||||||||
| | June 30 | | June 30 | ||||||||
($ thousands except share and per share information) |
| 2023 |
| 2022 |
| 2023 |
| 2022 | ||||
Revenue | | $ | 52,591 | | $ | 36,490 | | $ | 102,860 | | | 74,245 |
Cost of sales |
| | 25,644 | | | 15,208 | | | 53,040 | | | 31,419 |
Gross profit |
| | 26,947 | | | 21,282 | | | 49,820 |
| | 42,826 |
| | | | | | | | | | | | |
General administration costs |
| | 5,184 | | | 3,382 | | | 10,856 |
| | 7,457 |
Business development costs |
| | 782 | | | 1,090 | | | 2,355 |
| | 1,238 |
Sustainability initiatives |
| | 104 | | | 243 | | | 222 |
| | 383 |
Operating income |
| | 20,877 | | | 16,567 | | | 36,387 |
| | 33,748 |
| | | | | | | | | | | | |
Loss on disposition of mineral interest |
| | (1,000) | | | — | | | (1,000) |
| | 2,099 |
(Decrease) increase in fair value of financial assets |
| | (954) | | | (3,834) | | | 2,699 |
| | (4,492) |
Finance costs, net |
| | (1,269) | | | (442) | | | (2,578) |
| | (979) |
Foreign currency translation gain (loss) |
| | 6 | | | (100) | | | 52 |
| | (153) |
Other expenses |
| | (3,217) | | | (4,376) | | | (827) |
| | (3,525) |
Earnings before income taxes |
| | 17,660 | | | 12,191 | | | 35,560 |
| | 30,223 |
Income tax expense |
| | (1,626) | | | (1,269) | | | (2,992) |
| | (3,412) |
Net earnings | | $ | 16,034 | | $ | 10,922 | | $ | 32,568 | | $ | 26,811 |
Weighted average shares outstanding – basic | |
| 202,041,353 | | | 156,013,933 | | | 196,938,120 | |
| 156,020,615 |
Weighted average shares outstanding – diluted | |
| 202,383,167 | | | 156,044,014 | | | 197,133,344 | |
| 156,034,617 |
Earnings per share – basic and diluted | | $ | 0.08 | | $ | 0.07 | | $ | 0.17 | | $ | 0.17 |
Three months ended June 30, 2023 compared to three months ended June 30, 2022
Revenue was $52.6 million, a quarterly record, an increase of 44% from $36.5 million for the same period in the prior year largely due to $14.0 million revenue from streams, royalties and related interests acquired pursuant to the Maverix acquisition, $1.3 million higher revenue due to higher silver prices, $1.0 million higher revenue due to higher gold prices, and $0.6 million higher revenue due to higher volume from streams and related interests, partially offset by $0.4 million lower revenue due to lower diamond prices and $0.2 million lower revenue from royalties. Higher revenue from streams and related interests was largely driven by higher deliveries from Northparkes, partially offset by lower deliveries from Cerro Lindo. Lower revenue from royalties was driven by lower attributable ounces from Fosterville.
Market gold price and gold sales volume for our streams were $1,976 per ounce and 7,634 ounces, respectively, compared to $1,871 per ounce and 7,312 ounces, respectively, in the prior year. Market silver price and silver sales volume were $24.13 per ounce and 661 thousand ounces, respectively, compared to $22.60 per ounce and 586 thousand ounces, respectively, in the prior year.
Cost of sales primarily represented the price of metals acquired under the stream agreement, non-cash cost of sales related to prepaid gold interests, as well as the depletion expense for streams and royalties, all of which are calculated based on units of metal sold or attributable royalty ounces. Cost of sales was $25.6 million (including depletion) from streams and related interests and royalties, compared to $15.2 million (including depletion) from streams and royalties for the same period in the prior year. The increase in cost of sales for the three months ended June 30, 2023 was largely due to cost of sales associated with streams, royalties and related interests acquired pursuant to the Maverix acquisition and cost of sales associated with higher metal deliveries from streams and related interests, partially offset by lower cost of sales due to lower attributable ounces from royalties.
17
Gross profit was $26.9 million, an increase of 27% from $21.3 million for the same period in the prior year. The increase was largely driven by gross profit from newly acquired assets pursuant to the Maverix acquisition, higher gross profit from the Northparkes and Buriticá streams due to higher deliveries at higher metal prices, partially offset by lower gross profit from the ATO stream due to lower deliveries and from Fosterville due to lower attributable ounces.
General administration costs were $5.2 million, compared to $3.4 million for the same period in the prior year. Higher costs for the three months ended June 30, 2023 were largely due to higher employee costs and higher office, insurance and other expenses driven by various public company costs, including directors’ and officers’ liability insurance costs relating to an increase in the number of directors and the US listing, and higher professional services as we continued to grow the business. Business development costs were $0.8 million, compared to $1.1 million for the same period in the prior year. Business development costs represent ongoing business development costs incurred throughout the year including use of third-party service providers, net of costs capitalized, and costs reimbursed from our counterparties.
Sustainability initiatives represent costs incurred to acquire carbon offsets to counter our carbon footprint, which consists of not only the greenhouse gas emissions associated with our direct business activities, but also includes our share of emissions associated with production of our attributable metals by our counterparties, to the point of saleable metals. Sustainability initiatives also include partial funding of a bursary program in South Africa, community investments around Northparkes, and various social initiatives including donations and administration costs relating to the ESG program. For the three months ended June 30, 2023, expenditures on various sustainability initiatives were $104 thousand, compared to $243 thousand for the same period in the prior year.
Loss on disposition of mineral interests of $1.0 million represents the loss on the Eastern Borosi NSR due to a buyback (“Eastern Borosi Buyback”). On April 18, 2023, Calibre Mining Corp announced that it had commenced mining at the Eastern Borosi open pit.
Decrease in fair value of financial assets for the three months ended June 30, 2023 represents change in the fair value of prepaid gold interests and in the fair value of our equity investments.
Finance costs, net were $1.3 million, compared to $0.4 million for the same period in the prior year. The finance costs largely reflect interest charges and standby fees on the Credit Facility, net of interest earned. Higher finance costs were driven by interest charges on a higher drawn balance of the Credit Facility.
Income tax expense was $1.6 million, compared to $1.3 million for the same period in the prior year. The increase in income tax expense was driven by sales mix, partially offset by tax recovery associated with increased general administration costs and business development costs.
Net earnings were $16.0 million, compared to $10.9 million for the same period in the prior year. Higher net earnings in 2023 were driven by higher gross profit, partially offset by higher general administration and finance costs. Net earnings in 2023 were also impacted by a loss on disposition of mineral interests of $1.0 million and decrease in fair value of financial assets of $1.0 million. Net earnings for the same period in the prior year included a decrease in fair value of financial assets of $3.8 million.
Six months ended June 30, 2023 compared to six months ended June 30, 2022
Revenue was $102.9 million, an increase of 39% from $74.2 million for the same period in the prior year largely due to $27.1 million revenue from streams, royalties and related interests acquired pursuant to the Maverix acquisition, $5.9 million higher revenue due to higher volume from streams and related interests and $1.3 million higher revenue due to higher gold prices, partially offset by $4.5 million lower revenue from royalties, and $0.9 million lower revenue due to lower diamond prices.
Higher revenue from streams and related interests was largely driven by higher deliveries from ATO and Buriticá, partially offset by lower deliveries from RBPlat. Lower revenue from royalties was driven by lower attributable ounces from Fosterville.
Market gold price and gold sales volume for our streams were $1,932 per ounce and 13,817 ounces, respectively, compared to $1,874 per ounce and 13,248 ounces, respectively, in the prior year. Market silver price and silver sales volume were $23.31 per ounce and 1.6 million ounces, respectively, compared to $23.32 per ounce and 1.2 million ounces, respectively, in the prior year.
18
Cost of sales primarily represented the price of metals acquired under the stream agreement, non-cash cost of sales related to prepaid gold interests, as well as the depletion expense for streams and royalties, all of which are calculated based on units of metal sold or attributable royalty ounces. Cost of sales was $53.0 million (including depletion) from streams and related interests and royalties, compared to $31.4 million (including depletion) from streams and royalties for the same period in the prior year. The increase in cost of sales for the six months ended June 30, 2023 was largely due to cost of sales associated with streams, royalties and related interests acquired pursuant to the Maverix acquisition and cost of sales associated with higher metal deliveries from streams and related interests.
Gross profit was $49.8 million, an increase of 16% from $42.8 million for the same period in the prior year. The increase was largely driven by gross profit from newly acquired assets pursuant to the Maverix acquisition, higher gross profit from the ATO and Buriticá streams due to higher deliveries at higher metal prices, partially offset by lower gross profit from Fosterville due to lower attributable ounces.
General administration costs were $10.9 million, compared to $7.5 million for the same period in the prior year. Higher costs for the six months ended June 30, 2023 were largely due to higher employee costs and higher office, insurance and other expenses driven by various public company costs, including directors’ and officers’ liability insurance costs relating to an increase in the number of directors and the US listing, and higher professional services as we continued to grow the business. Business development costs were $2.4 million, compared to $1.2 million for the same period in the prior year. Business development costs represent ongoing business development costs incurred throughout the year including use of third-party service providers, net of costs capitalized, and costs reimbursed from our counterparties.
For the six months ended June 30, 2023, expenditures on various sustainability initiatives were $222 thousand, compared to $383 thousand for the same period in the prior year.
Loss on disposition of mineral interests of $1.0 million represents the loss on the Eastern Borosi Buyback. 2022 included a gain of $2.1 million on partial disposition of the Talon royalty.
Increase in fair value of financial assets for the six months ended June 30, 2023 represents change in the fair value of prepaid gold interests and in the fair value of our equity investments.
Finance costs, net were $2.6 million, compared to $1.0 million for the same period in the prior year. The finance costs largely reflect interest charges and standby fees on the Credit Facility, net of interest earned. Higher finance costs were driven by interest charges on a higher drawn balance of the Credit Facility.
Income tax expense was $3.0 million, compared to $3.4 million for the same period in the prior year. The decrease in income tax expense was driven by sales mix, as well as tax recovery associated with increased general administration costs and business development costs.
Net earnings were $32.6 million, compared to $26.8 million for the same period in the prior year. Higher net earnings in 2023 were driven by higher gross profit, partially offset by higher general administration costs, higher business development costs, higher finance costs. Net earnings in 2023 were impacted by a $1.0 million loss on disposition of mineral interests and increase in fair value of financial assets of $2.7 million. Net earnings for the same period in the prior year included a gain of $2.1 million on disposition of mineral interests and decrease in fair value of financial assets of $4.5 million.
19
Condensed Statements of Cash Flows
Three and six months ended June 30, 2023 compared to three and six months ended June 30, 2022
The following table presents summarized consolidated statements of cash flow information for the three and six months ended June 30, 2023 and June 30, 2022:
| | Three months ended | | | Six months ended | |||||||
| | June 30 | | | June 30 | |||||||
($ thousands) |
| 2023 | | 2022 | | 2023 |
| 2022 | ||||
Operating cash flow before working capital and taxes | | $ | 43,232 | | $ | 29,528 | | $ | 81,821 | | $ | 60,960 |
Income taxes paid | |
| (1,857) | | | (1,815) | | | (3,083) | |
| (3,485) |
Change in working capital | |
| 500 | | | 2,227 | | | 1,006 | |
| (1,176) |
Operating cash flow | |
| 40,875 | | | 29,940 | | | 79,744 | |
| 56,299 |
Net Cash used in investing activities | |
| (24,726) | | | (5,434) | | | (179,971) | |
| (6,161) |
Net Cash (used in) from financing activities | |
| (21,442) | | | (8,086) | | | 45,546 | |
| (16,301) |
Effect of exchange rate changes on cash and cash equivalents | |
| 19 | | | (121) | | | 21 | |
| (78) |
(Decrease) Increase in cash during the period | |
| (5,274) | | | 16,299 | | | (54,660) | |
| 33,759 |
Cash and cash equivalents at beginning of period | |
| 21,712 | | | 58,132 | | | 71,098 | |
| 40,672 |
Cash and cash equivalents at end of period | | $ | 16,438 | | $ | 74,431 | | $ | 16,438 | | $ | 74,431 |
Three months ended June 30, 2023 compared to three months ended June 30, 2022
Operating cash flow was $40.9 million, a quarterly record, an increase of 37% from $29.9 million for the same period in the prior year. The increase was due to higher operating cash flow before working capital and taxes. Operating cash flow before working capital and taxes was $43.2 million, an increase of 46% from $29.5 million for the same period in the prior year. The increase was driven by higher cash flows from streams, royalties and related interests acquired pursuant to the Maverix acquisition, partially offset by lower cash flows from royalties and higher general administration costs.
Net cash used in investing activities was $24.7 million for the three months ended June 30, 2023, compared to $5.4 million for the same period in the prior year. Net cash used in investing activities in the three months ended June 30, 2023, included $17.6 million for asset acquisitions in the Agbaou Royalty and Clean Air Metals royalty, and $8.8 million of long-term loans, partially offset by $2 million of proceeds from the Eastern Borosi Buyback. Net cash used in investing activities for the same period in the prior year largely included $5.2 million of funding for the Sofia NSR Royalty acquisition and $0.2 million of stream funding for the Pumpkin Hollow gold and silver stream.
Net cash used in financing activities was $21.4 million for the three months ended June 30, 2023, compared to $8.1 million for the same period in the prior year. Net cash used in financing activities for the three months ended June 30, 2023, largely consisted of Credit Facility repayments of $20 million, $10.5 million paid to purchase shares under the NCIB, dividend payments of $10.1 million, as well as interest payments of $2.1 million, partially offset by $16.4 million of proceeds from the exercise of options and warrants, and $5 million of drawdown from the Credit Facility. Net cash used in financing activities for the same period in the prior year largely consisted of dividend payments of $7.4 million, interest payments of $0.5 million and $0.1 million paid to purchase shares under the NCIB program.
Six months ended June 30, 2023 compared to six months ended June 30, 2022
Operating cash flow was $79.7 million, an increase of 42% from $56.3 million for the same period in the prior year. The increase was due to higher operating cash flow before working capital and taxes, and higher working capital adjustments. Operating cash flow before working capital and taxes was $81.8 million, an increase of 34% from $61.0 million for the same period in the prior year. The increase was driven by higher cash flows from streams, royalties and related interests acquired pursuant to the Maverix acquisition, partially offset by higher general administration and business development costs.
Net cash used in investing activities was $179.9 million for the six months ended June 30, 2023, compared to $6.2 million for the same period in the prior year. Net cash used in investing activities in the six months ended June 30, 2023, included $146 million net cash
20
outflows pursuant to the Maverix acquisition, $17.6 million of asset acquisitions for the Agbaou Royalty and Clean Air metals royalty, and $17 million of long-term loans, partially offset by $2 million of proceeds from the Eastern Borosi Buyback. Net cash used in investing activities for the same period in the prior year included $8.9 million of funding for the Beaufor royalty acquisition including transaction costs, $5.2 million of funding for the Sofia NSR Royalty acquisition, $0.4 million of stream funding for the Pumpkin Hollow gold and silver stream, and C$3 million for the AndeX Equity Interest, partially offset by $4.5 million received for the Talon Royalty Buydown, proceeds of C$3.7 million for the disposition of 5,000,000 Talon Shares and C$4.2 million for the disposition of 6,444,786 GoldSpot shares.
Net cash from financing activities was $45.6 million for the six months ended June 30, 2023, compared to $16.3 million net cash used in financing activities for the same period in the prior year. Net cash from financing activities for the six months ended June 30, 2023, largely consisted of $115 million drawdowns from the Credit Facility and $17.2 million of proceeds from the exercise of options and warrants, partially offset by Credit Facility repayments of $50 million, dividend payments of $20.1 million, $13.1 million paid to purchase shares under the NCIB, as well as interest payments of $3.2 million. Net cash used in financing activities for the same period in the prior year largely consisted of dividend payments of $14.8 million, interest payments of $1.0 million and $0.3 million paid to purchase shares under the NCIB program.
Liquidity and Capital Resources
As of June 30, 2023, our cash and cash equivalents were $16.4 million, compared to $71.1 million as at December 31, 2022. Significant variations in the liquidity and capital resources during the period are explained in the ‘‘Condensed Statements of Cash Flows’’ section of this MD&A.
Our primary uses of capital are to finance operations, acquire new stream and related interests and royalty assets, general working capital and payment of dividends. Our objectives when managing capital are to ensure that we will continue to have enough liquidity to achieve our acquisition growth strategy, finance working capital requirements and provide returns to our shareholders. The timing of metal sales from inventory from our stream and related interests is based on commercial considerations, including our assessment of market conditions and our financial requirements. We believe our cash on hand, estimated cash flow from royalties and the sales of metal credits will be sufficient to fund our anticipated operating cash requirements, payment of dividends and share repurchases under the NCIB for the next twelve months and beyond.
Credit Facility
The Company currently has a Credit Facility of $500 million with an additional uncommitted accordion of up to $200 million for a total availability of up to $700 million, maturing on August 30, 2026. As at June 30, 2023, the Credit Facility balance was $65 million.
Finance costs, net relating to the Credit Facility for the three and six months ended June 30, 2023 were $1.3 million and $2.6 million respectively, including amortization of debt issuance costs and standby fees. This compares to finance costs of $0.4 million and $1 million respectively for the three and six months ended June 30, 2022, including interest charges, amortization of debt issuance costs and standby fees. The Credit Facility includes covenants that require us to maintain certain financial ratios, including leverage ratios, as well as certain non-financial requirements. As at June 30, 2023, all such ratios and requirements were met. The Credit Facility is used for general corporate purposes and investments in the mineral industry, including the acquisition of streams and related interests and royalties.
21
| | 2023 | | 2022 | | 2021 | ||||||||||
|
| Q2 |
| Q1 |
| Q4 |
| Q3 |
| Q2 |
| Q1 |
| Q4 |
| Q3 |
IFRS measures: | | | | | | | | | | | | | | | | |
Cash and cash equivalents |
| 16,438 |
| 21,712 |
| 71,098 |
| 82,703 |
| 74,431 |
| 58,132 |
| 40,672 |
| 26,705 |
Total assets |
| 1,922,759 |
| 1,924,417 |
| 1,337,031 |
| 1,325,499 |
| 1,318,244 |
| 1,311,462 |
| 1,303,409 |
| 1,297,722 |
Revenue |
| 52,591 |
| 50,269 |
| 43,886 |
| 33,754 |
| 36,490 |
| 37,755 |
| 36,990 |
| 37,126 |
Net earnings |
| 16,034 |
| 16,534 |
| 15,460 |
| 12,815 |
| 10,922 |
| 15,889 |
| 13,381 |
| 5,128 |
Earnings per share (basic and diluted) |
| 0.08 |
| 0.09 |
| 0.10 |
| 0.08 |
| 0.07 |
| 0.10 |
| 0.09 |
| 0.03 |
Operating cash flow |
| 40,875 |
| 38,870 |
| 36,721 |
| 25,356 |
| 29,940 |
| 26,359 |
| 28,997 |
| 29,455 |
Operating cash flow per share |
| 0.20 |
| 0.20 |
| 0.24 |
| 0.16 |
| 0.19 |
| 0.17 |
| 0.19 |
| 0.19 |
| | | | | | | | | | | | | | | | |
Non-IFRS measures3: |
|
|
|
|
|
|
|
|
|
|
|
|
|
|
|
|
GEOs |
| 26,616 |
| 26,599 |
| 25,428 |
| 19,523 |
| 19,507 |
| 20,113 |
| 20,605 |
| 20,746 |
Adjusted Net Earnings |
| 17,660 |
| 13,516 |
| 17,429 |
| 13,258 |
| 14,854 |
| 15,471 |
| 13,409 |
| 13,714 |
Adjusted Net Earnings per share |
| 0.09 |
| 0.07 |
| 0.11 |
| 0.09 |
| 0.10 |
| 0.10 |
| 0.09 |
| 0.09 |
Adjusted EBITDA |
| 41,630 |
| 37,090 |
| 33,848 |
| 26,054 |
| 28,144 |
| 30,457 |
| 28,880 |
| 29,549 |
| | | | | | | | | | | | | | | | |
Average gold price4 |
| 1,976 |
| 1,890 |
| 1,726 |
| 1,729 |
| 1,871 |
| 1,877 |
| 1,795 |
| 1,790 |
Average silver price5 |
| 24.13 |
| 22.55 |
| 21.17 |
| 19.23 |
| 22.60 |
| 24.01 |
| 23.33 |
| 24.36 |
| 1. | All amounts in thousands of U.S. dollars except for GEOs, per share information, and average gold and silver price. |
| 2. | Sum of all the quarters may not add up to the annual total due to rounding. |
| 3. | GEOs, adjusted net earnings, adjusted net earnings per share and adjusted EBITDA as presented above are non-IFRS financial performance measures with no standardized meaning under IFRS and therefore may not be comparable to similar measures presented by other issuers. For further information and a detailed reconciliation of GEOs, adjusted net earnings, adjusted net earnings per share and adjusted EBITDA to the most directly comparable IFRS measure, see ‘‘Non-IFRS Financial Performance Measures’’ in this MD&A. |
| 4. | Based on the LBMA PM fix. |
| 5. | Based on the LBMA fix. |
In the second quarter of 2023, we generated record GEOs, revenues and operating cash flow; acquired the Agbaou Royalty and participated in the execution of the Nevada Copper financing package. In the first quarter of 2023 we completed the Maverix acquisition. In the fourth quarter of 2022, we increased our NSR royalty on Nevada Copper’s open pit project, provided remaining funding for the Nevada Copper gold and silver stream and acquired the royalty on the Thunder Bay North Project. In the third quarter of 2022, we listed our shares on the New York Stock exchange and acquired the Steppe Gold Prepaid Gold Interest and in the second quarter of 2022, we acquired the Sofia NSR royalty. In the first quarter of 2022, we acquired the Beaufor royalty. In the fourth quarter of 2021, we completed the Chilean royalty acquisition for $4.9 million. In the third quarter of 2021, we repaid the remaining balance on our Credit Facility, and paid our inaugural dividend.
From time to time, we may be involved in disputes with other parties arising in the ordinary course of business that may result in litigation. If we are unable to resolve these disputes favorably, it may have a material adverse impact on our financial condition, cash flow and results of operations. We record a liability when it is probable that a loss has been incurred and the amount can be reasonably estimated. We are not currently involved in any material legal proceedings.
Contractual Obligations and Commitments
In the normal course of business, we enter into contracts that give rise to commitments for future minimum payments.
22
As of June 30, 2023, we had significant commitments to make per-ounce cash payments for precious metals, copper and diamonds pursuant to the terms of the metals purchase and sale agreements, as detailed in the following table:
|
| |
| Inception |
| |
| Attributable volume |
| Per unit |
| |
| | Commodity | | date | | Unit | | purchased | | cash payment | | Term |
Stream Interests |
|
|
|
|
|
|
|
|
|
|
|
|
Cerro Lindo |
| Silver |
| Dec. 20, 2016 |
| Ounce |
| 65%1 | | 10% of monthly average |
| Life of mine |
ATO |
| Gold |
| Aug. 11, 2017 |
| Ounce |
| 25%2 | | 17% of spot |
| Life of mine |
ATO |
| Silver |
| Aug. 11, 2017 |
| Ounce |
| 50%3 | | 17% of spot |
| Life of mine |
Renard |
| Diamond |
| Nov. 29, 2017 |
| Carat |
| 4% | | Lesser of 40% of achieved sales price or $40 |
| Life of mine |
Pumpkin Hollow |
| Gold |
| Dec. 21, 2017 |
| Ounce |
| 97.5%4 | | 5% of spot |
| Life of mine |
Pumpkin Hollow |
| Silver |
| Dec. 21, 2017 |
| Ounce |
| 97.5%4 | | 5% of spot |
| Life of mine |
Gunnison |
| Copper |
| Oct. 30, 2018 |
| Pound |
| 16.5%5 | | 25% of spot |
| Life of mine |
Buriticá |
| Silver |
| Mar. 15, 2019 |
| Ounce |
| 100%6 |
| 5% of spot |
| Life of mine |
RBPlat |
| Gold |
| Jan. 23, 2020 |
| Ounce |
| 70%7 |
| 5% of spot |
| Life of mine |
Northparkes |
| Gold |
| Jul. 10, 2020 |
| Ounce |
| 54%8 |
| 10% of spot |
| Life of mine |
Northparkes |
| Silver |
| Jul. 10, 2020 |
| Ounce |
| 80%8 |
| 10% of spot |
| Life of mine |
La Bolsa |
| Gold |
| Jan. 19, 20239 |
| Ounce |
| 5% | | Lesser of $450 and spot |
| Life of mine |
La Colorada |
| Gold |
| Jan. 19, 20239 |
| Ounce |
| 100% | | Lesser of $650 and spot |
| Life of mine |
El Mochito |
| Silver |
| Jan 19, 20239 |
| Ounce |
| 25% | | 25% of spot |
| Life of mine |
Moss |
| Silver |
| Jan 19, 20239 |
| Ounce |
| 100%10 |
| 20% of spot |
| Life of mine |
| | | | | | | | | | | | |
Prepaid interests |
|
|
|
|
|
|
|
|
|
|
|
|
Auramet |
| Gold |
| Jan 19, 20239 |
| Ounce |
| 1,250 ounces per quarter |
| 16% of spot |
| Until certain commercial conditions are achieved11 |
| 1. | 65% of payable silver produced from Cerro Lindo until 19.5 million ounces have been delivered and 25% thereafter. |
| 2. | 25% of gold from ATO until 46,000 ounces of gold have been delivered and thereafter 25% of gold subject to an annual cap of 7,125 ounces. |
23
| 3. | 50% of silver from ATO until 375,000 ounces of silver have been delivered and thereafter 50% of silver subject to an annual cap of 59,315 ounces. |
| 4. | Streamed gold is to be based on a fixed gold-to-copper ratio (being 162.5 ounces of gold for each million pounds of payable copper over the life of the asset) multiplied by a 97.5% gold stream percentage and streamed silver is to be based on a fixed silver-to-copper ratio (being 3,131 ounces of silver for each million pounds of payable copper over the life of the asset) multiplied by a 97.5% silver stream percentage. |
| 5. | The stream percentage of refined copper produced from the Gunnison mine ranges from 3.5% to 16.5% depending on the Gunnison mine’s total production capacity, with the stream percentage starting at 16.5% and decreasing as the Gunnison mine’s production capacity increases. We have the option to increase our stream participation percentage by paying an additional deposit of an amount up to $65 million. |
| 6. | Streamed silver is to be based on a fixed silver-to-gold ratio of 1.84 over the life of the asset. |
| 7. | 70% of the payable gold until 261,000 ounces have been delivered and 42% thereafter. |
| 8. | 54% of the payable gold produced from the Northparkes mine until 630,000 ounces have been delivered and 27% thereafter; 80% of payable silver produced from the Northparkes mine until 9 million ounces have been delivered and 40% thereafter. |
| 9. | Acquired pursuant to the Maverix acquisition |
| 10. | 100% of payable silver production from Moss until 3.5 million ounces have been delivered and 50% thereafter. |
| 11. | On and after September 27, 2031 and the delivery of 50,000 ounces of gold |
Investments in Stream and Royalty Interests
As of June 30, 2023, we had commitments related to the acquisition of streams and royalties as detailed in the following table:
Company |
| Project (Asset) |
| Payments |
| Triggering Event | |
AuRico Metals Inc. |
| Kemess Project | | $ | 10 million |
| Positive construction decision |
| | | | $ | 10 million |
| 1st anniversary |
| | | | $ | 12.5 million |
| 2nd anniversary |
| | | | $ | 12.5 million |
| 3rd anniversary |
Nevada Copper Inc. |
| Tedeboy Area | | $ | 5 million |
| Payment contingent upon commencement of commercial production |
Stornoway Diamond Corporation |
| Renard | | C$ | 2.6 million |
| Working capital funding request initiated from Stornoway |
DS McKinnon Holdings Limited |
| Hemlo | | C$ | 50,000 |
| For each 100,000 ounces of gold produced by the Hemlo mine in excess of 675,000 ounces |
154619 Canada Inc. |
| Eagle River | | C$ | 50,000 |
| For each 50,000 ounces of gold produced by the Eagle River mine in excess of 207,000 ounces |
Coeur Mining, Inc. |
| Silvertip | |
| Payment of deferred equity consideration |
| Payment contingent upon commencement of commercial production and cumulative throughput of 400,000 tonnes of ore |
Newmont Corporation |
| Portfolio of royalties | |
| Up to $15 million |
| Payment contingent upon achievement of certain production milestones |
Barrick Gold Corporation | | Portfolio of royalties | | | Up to $10 million | | Payment contingent upon certain commercial conditions |
Orion Minerals Ltd. |
| Prieska Copper-Zinc Mine | |
| A$10 million |
| Contingent upon obtaining relevant exchange control approvals and certain other conditions1 |
Orion Minerals Ltd. |
| Prieska Copper-Zinc Mine | |
| $80 million |
| Contingent upon obtaining relevant exchange control approvals; the mine development being fully funded and other commercial conditions |
| 1 | The transaction closed subsequent to June 30, 2023, as certain conditions were met. We expect to fund the royalty in the coming months. |
24
The commitments which are noted in the table above are expected to be funded from operating cash flow over the next few years.
Contractual Obligations and Commitments
($ thousands) |
| Less than 1 year |
| 1–3 years |
| 3–5 years |
| More than 5 years |
| Total | |||||
Lease1 | | $ | 376 | | $ | 623 | | $ | 755 | | $ | 528 | | $ | 2,282 |
Lease interest1 | |
| 67 | |
| 293 | |
| 115 | |
| 26 | |
| 501 |
Debt repayments2 | |
| — | |
| — | |
| 65,000 | |
| — | |
| 65,000 |
Debt interest | |
| 4,581 | |
| 9,137 | |
| 764 | |
| — | |
| 14,482 |
Standby charges | |
| 1,718 | |
| 3,426 | |
| 286 | |
| — | |
| 5,430 |
| | $ | 6,742 | | $ | 13,479 | | $ | 66,920 | | $ | 554 | | $ | 87,695 |
| 1. | We are committed to minimum amounts under long-term lease agreements for office space. |
| 2. | Represents the Credit Facility, which matures on August 30, 2026. Subsequent to the quarter-end, the Company has repaid $5 million under the Credit Facility, leaving $60 million drawn. |
Off-Balance Sheet Arrangements or Commitments
We have not entered into any off-balance sheet arrangements or commitments other than as set forth under ‘‘Contractual Obligations and Commitments’’.
Contingencies
Contingencies can be either possible assets or possible liabilities arising from past events which, by their nature, will be resolved only when one or more future events, not wholly within our control, occur or fail to occur. The assessment of such contingencies inherently involves the exercise of significant judgment and estimates of the outcome of future events. Refer to Note 20 to the Annual Financial Statements for further details on the contingencies.
We are not aware of any known trends, commitments (other than as described above), events or uncertainties that will materially affect the Company.
We are in the business of rational risk-taking in pursuit of value creation. Effective risk management is core to the attainment of those often-competing priorities. The ability to deliver on our vision and strategic objectives depends on our ability to understand and effectively respond to and mitigate the risks or uncertainties we face. For additional information about these risks see the “Risk and Risk Management” section of the Company’s most recent Annual Report and the “Risk Factors” section of the Company’s most recent AIF, both of which are available from time to time on SEDAR at www.sedar.com and on EDGAR at www.sec.gov. Also see the “Cautionary Statement on Forward-Looking Information” in this MD&A.
Internal Controls over Financial Reporting
The Chief Executive Officer and Chief Financial Officer of the Company are responsible for designing internal controls over financial reporting or causing them to be designed under their supervision in order to provide reasonable assurance regarding the reliability of financial reporting and the preparation of financial statements for external purposes in accordance with IFRS. The Company’s internal control framework was designed based on the Committee of Sponsoring Organizations (COSO) of the Treadway Commission 2013 Framework.
Limitation on Scope of Design and Evaluation of Internal Control Over Financial Reporting
On January 19, 2023, the Company acquired all of the common shares of Maverix and commenced consolidating the assets, liabilities and results of operations of Maverix in its financial reporting. Management has determined to limit the scope of the design and evaluation of the Company’s internal control over financial reporting to exclude the controls, policies and procedures of Maverix, the results of which are included in the consolidated financial statements of the Company for the three and six months ended June 30, 2023. This
25
scope limitation is in accordance with National Instrument 52-109 – Certification of Disclosure in Issuers’ Annual and Interim Filings, which allows an issuer to limit its design and evaluation of internal control over financial reporting to exclude the controls, policies and procedures of a company acquired not more than 365 days before the end of the financial period to which the applicable certifications relate. The scope limitation is primarily based on the time required to assess Maverix’s controls, policies and procedures in a manner consistent with the Company’s other operations. Commencing January 1, 2024, Maverix will be included in the scope of the design and evaluation of the Company’s internal control over financial reporting.
The operations of Maverix represented 28% and 22% of the Company’s consolidated revenues and net earnings respectively for the three months ended June 30, 2023 and represented 27% and 25% of the Company’s consolidated revenues and net earnings respectively for the six months ended June 30, 2023. The operations of Maverix represented 33% and 4% of the Company’s consolidated assets and liabilities respectively as at June 30, 2023. The table that follows presents a summary of financial information for Maverix.
|
| Three months ended | | Six months ended |
($ thousands) | | June 30, 2023 | | June 30, 2023 |
Revenue |
| 14,961 | | 28,134 |
Net earnings |
| 3,536 | | 8,144 |
|
| As at |
($ thousands) | | June 30, 2023 |
Current assets |
| 20,482 |
Non-current assets |
| 639,531 |
Current liabilities |
| 3,301 |
Non-current liabilities |
| 342 |
There was no change in the Company’s internal controls over financial reporting that occurred during the three months ended June 30, 2023 that has materially affected, or is reasonably likely to materially affect, the Company’s internal controls over financial reporting.
Disclosure Controls and Procedures
Disclosure controls and procedures have been designed to provide reasonable assurance that all relevant information required to be disclosed by the Company is accumulated and communicated to senior management as appropriate to allow timely decisions regarding required disclosure.
Limitations of Controls and Procedures
The Company’s management, including the Chief Executive Officer and Chief Financial Officer, believe that any internal controls over financial reporting and disclosure controls and procedures, no matter how well designed, can have inherent limitations. Therefore, even those systems determined to be effective can provide only reasonable assurance that the objectives of the control system are met.
IFRS Critical Accounting Policies and Accounting Estimates
Management has discussed the development and selection of our critical accounting estimates with the Audit & Risk Committee and Board of Directors, and the Audit & Risk Committee has reviewed the disclosure relating to such estimates in conjunction with its review of this MD&A. The accounting policies and methods we utilize determine how we report our financial condition and results of operations, and they may require management to make estimates or rely on assumptions about matters that are inherently uncertain. The consolidated financial statements have been prepared in accordance with IFRS as issued by the International Accounting Standards Board under the historical cost convention, as modified by revaluation of certain financial assets. Our significant accounting policies are disclosed in Note 3 to the Annual Financial Statements, including a summary of current and future changes in accounting policies, which are included in Note 5 to the Annual Financial Statements.
26
Critical Accounting Estimates and Judgments
Certain accounting estimates have been identified as being “critical” to the presentation of our financial condition and results of operations because they require us to make subjective and/or complex judgments about matters that are inherently uncertain; or there is a reasonable likelihood that materially different amounts could be reported under different conditions or using different assumptions and estimates. Our significant accounting judgments, estimates and assumptions are disclosed in Note 3 to the Annual Financial Statements.
Non-IFRS Financial Performance Measures
Gold Equivalent Ounces (“GEOs”)
GEOs are a non-IFRS measure that is based on stream and royalty interests and calculated on a quarterly basis by dividing all revenue from such interests for the quarter by the average gold price during such quarter. The gold price is determined based on the LBMA PM fix. For periods longer than one quarter, GEOs are summed for each quarter in the period. Management uses this measure internally to evaluate our underlying operating performance across our stream and royalty portfolio for the reporting periods presented and to assist with the planning and forecasting of future operating results. GEOs are intended to provide additional information only and do not have any standardized definition under IFRS and should not be considered in isolation or as a substitute for measures of performance prepared in accordance with IFRS. The measures are not necessarily indicative of gross profit or operating cash flow as determined under IFRS. Other companies may calculate these measures differently. The following table reconciles GEOs to revenue, the most directly comparable IFRS measure:
| | 2023 | ||||
| | Three months | | Three months | | Six months |
($ thousands, except average gold price and GEOs information) |
| ended June 30 | | ended March 31 |
| ended June 30 |
Revenue |
| 52,591 | | 50,269 |
| — |
Average gold price per ounce |
| 1,976 | | 1,890 |
| — |
GEOs |
| 26,616 | | 26,599 |
| 53,215 |
|
| 2022 | ||||
| | Three months | | Three months | | Six months |
($ thousands, except average gold price and GEOs information) | | ended June 30 | | ended March 31 | | ended June 30 |
Revenue |
| 36,490 |
| 37,755 |
| — |
Average gold price per ounce |
| 1,871 |
| 1,877 |
| — |
GEOs |
| 19,507 |
| 20,113 |
| 39,620 |
Adjusted Net Earnings (Loss) and Adjusted Net Earnings (Loss) per Share
Adjusted net earnings (loss) is a non-IFRS financial measure, which excludes the following from net earnings (loss):
| ● | impairment charges |
| ● | gain/loss on sale or disposition of assets/mineral interests |
| ● | foreign currency translation gains/losses |
| ● | increase/decrease in fair value of financial assets |
| ● | non-recurring charges; and |
| ● | impact of income taxes on these items |
Management uses this measure internally to evaluate our underlying operating performance for the reporting periods presented and to assist with the planning and forecasting of future operating results. Management believes that adjusted net earnings (loss) is a useful measure of our performance because impairment charges, gain/loss on sale or disposition of assets/mineral interests, foreign currency translation gains/losses, increase/decrease in fair value of financial assets and non- recurring charges do not reflect the underlying operating performance of our core business and are not necessarily indicative of future operating results. The tax effect is also excluded to reconcile the amounts on a post- tax basis, consistent with net earnings. Management’s internal budgets and forecasts and public guidance do not reflect the types of items we adjust for. Consequently, the presentation of adjusted net earnings (loss) enables users to better understand the underlying operating performance of our core business through the eyes of management. Management periodically
27
evaluates the components of adjusted net earnings based on an internal assessment of performance measures that are useful for evaluating the operating performance of our business and a review of the non-IFRS measures used by industry analysts and other streaming and royalty companies. Adjusted net earnings (loss) is intended to provide additional information only and does not have any standardized definition under IFRS and should not be considered in isolation or as a substitute for measures of performance prepared in accordance with IFRS. The measures are not necessarily indicative of gross profit or operating cash flow as determined under IFRS. Other companies may calculate these measures differently. The following table reconciles adjusted net earnings to net earnings, the most directly comparable IFRS measure.
Reconciliation of Net Earnings to Adjusted Net Earnings
| | Three months ended | | Six months ended | ||||||||
| | June 30 | | June 30 | ||||||||
($ thousands, except share and per share information) |
| 2023 |
| 2022 |
| 2023 |
| 2022 | ||||
Net earnings | | $ | 16,034 | | $ | 10,922 | | $ | 32,568 | | $ | 26,811 |
Loss (gain) on disposition of mineral interests | |
| 1,000 | | | — | | | 1,000 | |
| (2,099) |
Foreign currency translation (gains) losses | |
| (6) | | | 100 | | | (52) | |
| 153 |
(Increase) decrease in fair value of financial assets | |
| 954 | | | 3,834 | | | (2,699) | |
| 4,492 |
Income tax effect | |
| (322) | | | (2) | | | 358 | |
| 969 |
Adjusted net earnings | | | 17,660 |
| | 14,854 |
| $ | 31,175 |
| $ | 30,326 |
Weighted average shares outstanding – basic | |
| 202,041,353 | | | 156,013,933 | | | 196,938,120 | |
| 156,020,615 |
Net earnings per share | | | 0.08 | | | 0.07 | | $ | 0.17 | | $ | 0.17 |
Adjusted net earnings per share | | | 0.09 | | | 0.10 | | $ | 0.16 | | $ | 0.19 |
Free Cash Flow
Free cash flow is a non-IFRS measure that deducts acquisition of other assets (excluding acquisition of financial assets or mineral interests) from operating cash flow. Management believes this to be a useful indicator of our ability to operate without reliance on additional borrowing or usage of existing cash. Free cash flow is intended to provide additional information only and does not have any standardized definition under IFRS and should not be considered in isolation or as a substitute for measures of performance prepared in accordance with IFRS. The measure is not necessarily indicative of operating profit or operating cash flow as determined under IFRS. Other companies may calculate this measure differently. The following table reconciles free cash flow to operating cash flow, the most directly comparable IFRS measure:
| | Three months ended | | Six months ended | ||||||||
| | June 30 | | June 30 | ||||||||
($ thousands) |
| 2023 | | 2022 | | 2023 |
| 2022 | ||||
Operating cash flow | | $ | 40,875 | | $ | 29,940 | | $ | 79,744 | | $ | 56,299 |
Acquisition of other assets | |
| — | | | — | | | — | |
| — |
Free cash flow | | $ | 40,875 | | $ | 29,940 | | $ | 79,744 | | $ | 56,299 |
Adjusted EBITDA
Adjusted EBITDA is a non-IFRS financial measure, which excludes the following from net earnings:
| ● | income tax expense |
| ● | finance costs, net |
| ● | depletion and amortization |
| ● | impairment charges |
| ● | gain/loss on sale or disposition of assets/mineral interests |
| ● | foreign currency translation gains/losses |
| ● | increase/decrease in fair value of financial assets; |
| ● | non-cash cost of sales related to prepaid gold interests; and |
| ● | non-recurring charges |
28
Management believes that adjusted EBITDA is a valuable indicator of our ability to generate liquidity by producing operating cash flow to fund working capital needs, service debt obligations and fund acquisitions. Management uses adjusted EBITDA for this purpose. Adjusted EBITDA is also frequently used by investors and analysts for valuation purposes whereby adjusted EBITDA is multiplied by a factor or ‘‘multiple’’ that is based on an observed or inferred relationship between adjusted EBITDA and market values to determine the approximate total enterprise value of a company.
In addition to excluding income tax expense, finance costs, net and depletion and amortization, adjusted EBITDA also removes the effect of impairment charges, gain/loss on sale or disposition of assets/mineral interests, foreign currency translation gains/losses, increase/decrease in fair value of financial assets, non-cash cost of sales related to prepaid gold interests and non-recurring charges. We believe these items provide a greater level of consistency with the adjusting items included in our adjusted net earnings reconciliation, with the exception that these amounts are adjusted to remove any impact of income tax expense as they do not affect adjusted EBITDA. We believe this additional information will assist analysts, investors and our shareholders to better understand our ability to generate liquidity from operating cash flow, by excluding these amounts from the calculation as they are not indicative of the performance of our core business and not necessarily reflective of the underlying operating results for the periods presented.
Adjusted EBITDA is intended to provide additional information to investors and analysts and does not have any standardized definition under IFRS and should not be considered in isolation or as a substitute for measures of performance prepared in accordance with IFRS. Adjusted EBITDA is not necessarily indicative of operating profit or operating cash flow as determined under IFRS. Other companies may calculate adjusted EBITDA differently. The following table reconciles adjusted EBITDA to net earnings, the most directly comparable IFRS measure.
Reconciliation of Net Earnings to Adjusted EBITDA
| | Three months ended | | Six months ended | ||||||||
| | June 30 | | June 30 | ||||||||
($ thousands) |
| 2023 | | 2022 | | 2023 |
| 2022 | ||||
Net earnings | | $ | 16,034 | | $ | 10,922 | | | 32,568 | | | 26,811 |
Finance costs, net | |
| 1,269 | | | 442 | | | 2,578 | |
| 979 |
Income tax expense | |
| 1,626 | | | 1,269 | | | 2,992 | |
| 3,412 |
Depletion and amortization | |
| 15,832 | | | 11,577 | | | 31,852 | |
| 24,853 |
Loss (gain) on disposition of mineral interests | |
| 1,000 | | | — | | | 1,000 | |
| (2,099) |
Foreign currency translation (gain) loss | |
| (6) | | | 100 | | | (52) | |
| 153 |
(Increase) decrease in fair value of financial assets | |
| 954 | | | 3,834 | | | (2,699) | |
| 4,492 |
Non-cash cost of sales related to prepaid gold interests | |
| 4,921 | | | — | | | 10,481 | |
| — |
Adjusted EBITDA | | $ | 41,630 | | $ | 28,144 | | | 78,720 | | | 58,601 |
Gross Profit Margin and Asset Margin
Gross profit margin is an IFRS financial measure which we define as gross profit divided by revenue. Asset margin is a non-IFRS financial measure which we define by taking gross profit and adding back depletion and non-cash cost of sales related to prepaid gold interests and dividing by revenue. We use gross profit margin to assess profitability of our metal sales and use asset margin to evaluate our performance in increasing revenue, containing costs and providing a useful comparison to our peers. Asset margin is intended to provide additional information only and does not have any standardized definition under IFRS and should not be considered in isolation or as a substitute for measures of performance prepared in accordance with IFRS. The following table reconciles asset margin to gross profit margin, the most directly comparable IFRS measure:
29
| | Three months ended | | Six months ended |
| ||||||||
| | June 30 | | June 30 |
| ||||||||
($ thousands except Gross profit margin and Asset margin) |
| 2023 | | 2022 | | 2023 |
| 2022 |
| ||||
Revenue | | $ | 52,591 | | $ | 36,490 | | $ | 102,860 | | $ | 74,245 | |
Cost of sales | |
| 25,644 | | | 15,208 | | | 53,040 | |
| 31,419 | |
Gross profit | |
| 26,947 | | | 21,282 | | | 49,820 | |
| 42,826 | |
Gross profit margin | |
| 51 | % | | 58 | % | | 48 | % |
| 58 | % |
Gross profit | | $ | 26,947 | | $ | 21,282 | | $ | 49,820 | | $ | 42,826 | |
Add: Depletion | |
| 15,740 | | | 11,485 | | | 31,668 | |
| 24,664 | |
Add: Non-cash cost of sales related to prepaid gold interests | |
| 4,921 | | | — | | | 10,481 | |
| — | |
| |
| 47,608 | | | 32,767 | | | 91,969 | |
| 67,490 | |
Revenue | |
| 52,591 | | | 36,490 | | | 102,860 | |
| 74,245 | |
Asset margin | |
| 91 | % | | 90 | % | | 89 | % |
| 91 | % |
Public Securities Filings and Regulatory Announcements
Additional information related to Triple Flag, including the Company’s most recent AIF, is available on SEDAR at www.sedar.com and on EDGAR at www.sec.gov. These documents contain descriptions of certain of Triple Flag’s stream and royalty interests, as well as a description of risk factors affecting the Company. For additional information, please see our website at www.tripleflagpm.com. The content of any website referred to in this report is not incorporated by reference in, and does not form part of, this report.
This MD&A contains “forward-looking information” within the meaning of applicable Canadian securities laws and “forward-looking statements” within the meaning of the United States Private Securities Litigation Reform Act of 1995, respectively (collectively referred to herein as “forward-looking information”). Forward-looking information may be identified by the use of forward-looking terminology such as “plans”, “targets”, “expects”, “is expected”, “budget”, “scheduled”, “estimates”, “outlook”, “forecasts”, “projection”, “prospects”, “strategy”, “intends”, “anticipates”, “believes”, or variations of such words and phrases or terminology which states that certain actions, events or results “may”, “could”, “would”, “might”, “will”, “will be taken”, “occur” or “be achieved”. Forward-looking information in this MD&A include, but are not limited to, statements with respect to the Company’s annual guidance, operational and corporate developments for the Company, developments in respect of the Company’s portfolio of royalties and streams and those developments at certain of the mines, projects or properties that underlie the Company’s interest, strengths, characteristics and expected benefits and synergies of the acquisition of Maverix Metals Inc., and our assessments of, and expectations for, future periods (including, but not limited to, the long-term production outlook for GEOs). Our assessments of and expectations for future periods described in this MD&A, including our future financial outlook and anticipated events or results, business, financial position, business strategy, growth plans, and strategies, budgets, operations, financial results, taxes, dividend policy, plans and objectives, are considered forward-looking information. In addition, any statements that refer to expectations, intentions, projections or other characterizations of future events or circumstances contain forward-looking information. Statements containing forward-looking information are not historical facts but instead represent management’s expectations, estimates and projections regarding possible future events or circumstances.
The forward-looking information included in this MD&A is based on our opinions, estimates and assumptions in light of our experience and perception of historical trends, current conditions and expected future developments, as well as other factors that we currently believe are appropriate and reasonable in the circumstances. The forward-looking statements contained in this MD&A are also based upon the ongoing operation of the properties in which we hold a stream, royalty or other similar interest by the owners or operators of such properties in a manner consistent with past practice; the accuracy of public statements and disclosures made by the owners or operators of such underlying properties; and the accuracy of publicly disclosed expectations for the development of underlying properties that are not yet in production. These assumptions include, but are not limited to, the following: assumptions in respect of current and future market conditions and the execution of our business strategies, that operations, or ramp-up where applicable, at properties in which we hold a royalty, stream or other interest, continue without further interruption through the period and the absence of any other factors that could cause actions, events or results to differ from those anticipated, estimated, intended or implied. Despite a careful process to prepare and review the forward-looking information, there can be no assurance that the underlying opinions, estimates and assumptions will prove to be correct. Forward-looking information is also subject to known and unknown risks, uncertainties and other factors that may cause the actual results, level of activity, performance or achievements to be materially different from those expressed or implied by such forward-looking information. Such risks, uncertainties and other factors include, but are not limited to, those set forth
30
under the caption “Risk Factors” in our most recently filed AIF which is available on SEDAR at www.sedar.com and on EDGAR at www.sec.gov. For clarity, Mineral Resources that are not Mineral Reserves do not have demonstrated economic viability and inferred resources are considered too geologically speculative for the application of economic considerations.
Although we have attempted to identify important risk factors that could cause actual results or future events to differ materially from those contained in forward-looking information, there may be other risk factors not presently known to us or that we presently believe are not material that could also cause actual results or future events to differ materially from those expressed in such forward-looking information. There can be no assurance that such information will prove to be accurate, as actual results and future events could differ materially from those anticipated in such information. Accordingly, readers should not place undue reliance on forward-looking information, which speaks only as of the date made. The forward-looking information contained in this MD&A represents our expectations as of the date of this MD&A and is subject to change after such date. We disclaim any intention or obligation or undertaking to update or revise any forward-looking information whether as a result of new information, future events or otherwise, except as required by applicable securities laws. All of the forward-looking information contained in this MD&A is expressly qualified by the foregoing cautionary statements.
Cautionary Statement to U.S. Investors
Information contained or referenced in this MD&A or in the documents referenced herein concerning the properties, technical information and operations of Triple Flag has been prepared in accordance with requirements and standards under Canadian securities laws, which differ from the requirements of the U.S. Securities and Exchange Commission (“SEC”) under subpart 1300 of Regulation S-K (“S-K 1300”). Because the Company is eligible for the Multijurisdictional Disclosure System adopted by the SEC and Canadian Securities Administrators, Triple Flag is not required to present disclosure regarding its mineral properties in compliance with S-K 1300. Accordingly, certain information contained in this MD&A may not be comparable to similar information made public by US companies subject to reporting and disclosure requirements of the SEC.
Technical and Third-Party Information
Triple Flag does not own, develop or mine the underlying properties on which it holds stream or royalty interests. As a royalty or stream holder, Triple Flag has limited, if any, access to properties included in its asset portfolio. As a result, Triple Flag is dependent on the owners or operators of the properties and their qualified persons to provide information to Triple Flag or on publicly available information to prepare disclosure pertaining to properties and operations on the properties on which Triple Flag holds stream, royalty or other similar interests. Triple Flag generally has limited or no ability to independently verify such information. Although Triple Flag does not believe that such information is inaccurate or incomplete in any material respect, there can be no assurance that such third-party information is complete or accurate.
31