4955 |
Not Applicable | |||
(State or other jurisdiction of incorporation or organization) |
(Primary Standard Industrial Classification Code Number) |
(I.R.S. Employer Identification Number) |
Paul M. Tiger Andrea M. Basham Freshfields Bruckhaus Deringer US LLP 601 Lexington Avenue New York, NY 10022 (212) 277-4000 |
Jonathan Grant Fraser Bourne McCarthy Tétrault LLP 66 Wellington Street West, Suite 5300, TD Bank Tower Box 48 Toronto, Ontario M5K 1E6 Tel: (416) 362-1812 |
† |
The term “new or revised financial accounting standard” refers to any update issued by the Financial Accounting Standards Board to its Accounting Standards Codification after April 5, 2012. |
| ||||||||
Title of Each Class of Securities to be Registered |
Amount to be Registered(1) |
Proposed Maximum Offering Price Per Share |
Proposed Maximum Aggregate Offering Price(2) |
Amount of Registration Fee | ||||
Common shares without par value(3) |
11,021,923 |
$13.29 |
$146,481,356.67 |
$13,578.82 | ||||
| ||||||||
|
(1) |
The common shares being registered hereunder are being registered for sale by the selling shareholder named in the prospectus or its permitted assignees. Under Rule 416 of the Securities Act of 1933, as amended, the shares being registered include such indeterminate number of common shares as may be issuable with respect to the shares being registered in this registration statement as a result of any stock splits, stock dividends or other similar event. |
(2) |
The proposed maximum offering price per share and the proposed maximum aggregate offering price have been estimated solely for the purpose of calculating the amount of the registration fee in accordance with Rule 457(c) under the Securities Act of 1933, as amended, using the average of the high and low prices as reported on The New York Stock Exchange on November 12, 2021. |
(3) |
Represents common shares issuable upon conversion or redemption of an outstanding unsecured convertible note or pursuant to any other term of the unsecured convertible note, including as a result of any of the payment-in-kind provisions |
PRELIMINARY PROSPECTUS |
SUBJECT TO COMPLETION, DATED NOVEMBER 17, 2021 |
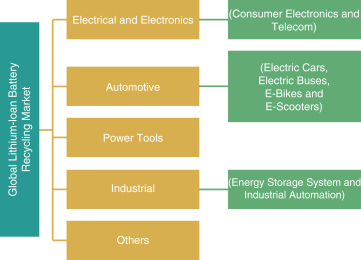
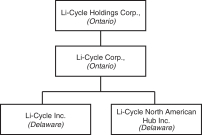
1 | ||||
11 | ||||
14 | ||||
16 | ||||
34 | ||||
35 | ||||
35 | ||||
36 | ||||
37 | ||||
46 | ||||
50 | ||||
59 | ||||
80 | ||||
90 | ||||
101 | ||||
105 | ||||
110 | ||||
114 | ||||
117 | ||||
119 | ||||
124 | ||||
128 | ||||
132 | ||||
133 | ||||
133 | ||||
134 | ||||
135 | ||||
F-1 |
• | not being required to comply with the auditor attestation requirements for the assessment of our internal control over financial reporting provided by Section 404 of the Sarbanes-Oxley Act of 2002; |
• | reduced disclosure obligations regarding executive compensation; and |
• | not being required to hold a nonbinding advisory vote on executive compensation or seek shareholder approval of any golden parachute payments not previously approved. |
• | the sections of the Exchange Act regulating the solicitation of proxies, consents or authorizations in respect of a security registered under the Exchange Act; |
• | the sections of the Exchange Act requiring insiders to file public reports of their stock ownership and trading activities and liability for insiders who profit from trades made in a short period of time; and |
• | the rules under the Exchange Act requiring the filing with the Securities and Exchange Commission (the “SEC”) of quarterly reports on Form 10-Q containing unaudited financial and other specified information, or current reports on Form 8-K, upon the occurrence of specified significant events. |
Issuer |
Li-Cycle Holdings Corp. |
Securities that may be offered and sold from time to time by the selling shareholder |
Up to 11,021,923 common shares issuable upon conversion of the Spring Creek Capital Convertible Note or pursuant to any other term of the Spring Creek Capital Convertible Note, including as a result of any of the PIK provisions of the Spring Creek Capital Convertible Note, which was issued to the selling shareholder in a transaction exempt from registration pursuant to Section 4(a)(2) of the Securities Act. |
Offering prices |
The securities offered by this prospectus may be offered and sold at prevailing market prices, privately negotiated prices or such other prices as the selling shareholder may determine. See “ Plan of Distribution |
Common shares outstanding before this offering |
163,179,555 common shares (as of October 18, 2021). |
Common shares outstanding after this offering |
174,201,478 common shares (as of October 18, 2021). |
Registration rights granted to the selling shareholder |
We are registering the offer and sale of securities covered by this prospectus to satisfy certain registration rights we have granted to the selling shareholder. See the section titled “ Description of Securities — Registration Rights |
Dividend policy |
Our board of directors will evaluate whether or not to pay dividends and, if so, whether to pay dividends on a quarterly, semi-annual or annual basis, depending on our results, financial condition, market conditions, contractual obligations, legal restrictions and other factors deemed relevant by the board of directors. See “ Dividend Policy |
Use of proceeds |
We will not receive any proceeds from the sale of shares by the selling shareholder. See “ Use of Proceeds |
Market for our common shares |
Our common shares are listed on the New York Stock Exchange under the symbol “LICY”. |
Risk factors |
Investing in our securities involves substantial risks. See “ Risk Factors |
Three Months Ended July 31, |
Nine Months Ended July 31, |
Year Ended October 31, |
||||||||||||||||||||||||||
2021 |
2020 |
2021 |
2020 |
2020 |
2019 |
2018 |
||||||||||||||||||||||
(dollar amounts in thousands, except share and per share data) |
||||||||||||||||||||||||||||
Revenues |
$ | 1,709 | 182 | $ | 2,984 | $ | 323 | $ | 792 | $ | 48 | $ | 6 | |||||||||||||||
Operating expenses |
$ | 7,929 | 1,905 | 20,819 | 4,968 | 9,934 | 4,112 | 881 | ||||||||||||||||||||
Other (income) expenses |
$ | 676 | 88 | 3,756 | 197 | 134 | 37 | 34 | ||||||||||||||||||||
Net loss |
$ | (6,897 | ) | (1,811 | ) | (21,591 | ) | (4,842 | ) | (9,276 | ) | (4,101 | ) | (909 | ) | |||||||||||||
Basic and diluted loss per share of Li-Cycle Corp. |
$ | (2.88 | ) | (0.86 | ) | $ | (9.10 | ) | $ | (2.35 | ) | $ | (4.48 | ) | $ | (2.28 | ) | $ | (0.53 | ) | ||||||||
Weighted average number of common shares of Li-Cycle Corp. outstanding |
2,394,475 | 2,100,603 | 2,732,731 | 2,057,723 | 2,068,952 | 1,801,338 | 1,700,751 |
As of July 31, 2021 |
As of October 31, |
|||||||||||
2020 |
2019 |
|||||||||||
(dollar amounts in thousands) |
||||||||||||
Current assets |
$ | 15,021 | $ | 2,698 | $ | 4,983 | ||||||
Non-current assets |
34,391 | 9,461 | 1,061 | |||||||||
Total assets |
49,412 | 12,159 | 6,044 | |||||||||
Current liabilities |
21,917 | 6,596 | 2,304 | |||||||||
Non-current liabilities |
25,154 | 4,122 | 479 | |||||||||
Total liabilities |
47,070 | 10,719 | 2,783 | |||||||||
Shareholders’ equity |
$ | 2,342 | $ | 1,441 | $ | 3,261 |
Three Months Ended July 31, |
Nine Months Ended July 31, |
Year Ended October 31, |
||||||||||||||||||||||||||
2021 |
2020 |
2021 |
2020 |
2020 |
2019 |
2018 |
||||||||||||||||||||||
(dollar amounts in thousands) |
||||||||||||||||||||||||||||
Cash flows used in operating activities |
$ | (5,245 | ) | $ | (2,161 | ) | $ | (16,567 | ) | $ | (7,654 | ) | $ | (7,429 | ) | $ | (4,568 | ) | $ | (686 | ) | |||||||
Cash flows used in investing activities |
$ | (5,298 | ) | $ | (836 | ) | (12,050 | ) | (1,748 | ) | (5,108 | ) | (998 | ) | (244 | ) | ||||||||||||
Cash flows from financing activities |
$ | 6,568 | $ | 294 | 30,304 | 9,502 | 9,417 | 7,164 | 3,111 | |||||||||||||||||||
Net change in cash |
$ | (3,975 | ) | $ | (2,703 | ) | $ | 1,687 | $ | 100 | $ | (3,120 | ) | $ | 1,598 | $ | 2,181 |
Three Months Ended June 30, 2021 |
Six Months Ended June 30, 2021 |
For the Period from July 31, 2020 (inception) through December 31, 2020 |
||||||||||
Unaudited |
Unaudited |
|||||||||||
Statement of Operations Data: |
||||||||||||
Operating costs |
$ | (1,809,124 | ) | $ | (6,079,798 | ) | $ | (460,977 | ) | |||
|
|
|
|
|
|
|||||||
Other income (expense): |
||||||||||||
Interest Income |
8,286 | 80,300 | 74,412 | |||||||||
Offering costs allocated to warrant liability |
— | — | (693,847 | ) | ||||||||
Change in fair value of warrant liability |
(23,690,000 | ) | (21,390,000 | ) | (22,540,000 | ) | ||||||
|
|
|
|
|
|
|||||||
Total Other Income (expense) |
(23,681,714 | ) | (21,309,700 | ) | (23,159,435 | ) | ||||||
|
|
|
|
|
|
|||||||
Net loss |
$ |
(25,490,838 |
) |
$ |
(27,389,498 |
) |
$ |
(23,620,412 |
) | |||
|
|
|
|
|
|
|||||||
Weighted average shares outstanding of Class A redeemable ordinary shares |
30,000,000 | 30,000,000 | 30,000,000 | |||||||||
|
|
|
|
|
|
|||||||
Basic and diluted net income per share, Class A |
$ |
0.00 |
$ |
0.00 |
$ |
0.00 |
||||||
|
|
|
|
|
|
|||||||
Weighted average shares outstanding of Class B non-redeemable ordinary shares |
7,500,000 | 7,500,000 | 7,500,000 | |||||||||
|
|
|
|
|
|
|||||||
Basic and diluted net loss per share, Class B |
$ |
(3.40 |
) |
$ |
(0.26 |
) |
$ |
(3.16 |
) | |||
|
|
|
|
|
|
As of June 30, 2021 |
As of December 31, 2020 |
|||||||
Unaudited |
||||||||
(dollars in thousands) |
||||||||
Balance Sheet Data: |
||||||||
Cash |
$ | 563 | $ | 971,607 | ||||
Prepaid expenses |
303,958 | 381,749 | ||||||
Investments in Trust Account |
300,154,668 | 300,074,392 | ||||||
|
|
|
|
|||||
Total Assets |
$ |
300,459,189 |
$ |
301,427,748 |
||||
|
|
|
|
|||||
Total Liabilities |
78,216,827 |
51,795,888 |
||||||
|
|
|
|
|||||
Commitment and Contingencies |
||||||||
Class A ordinary shares subject to possible redemption, 24,724,236 and 24,463,185 shares at $10.00 per share as of June 30, 2021 and December 31, 2020, respectively |
$ | 217,242,360 | $ | 244,631,850 | ||||
|
|
|
|
|||||
Total Shareholders’ Equity |
5,000,002 |
5,000,010 |
||||||
|
|
|
|
|||||
Total Liabilities and Shareholders’ Equity |
$ |
300,459,189 |
$ |
301,427,748 |
||||
|
|
|
|
Six Months Ended June 30, 2021 |
For the Period from July 31, 2020 (inception) through December 31, 2020 |
|||||||
Unaudited |
||||||||
Statement of Cash Flows Data: |
||||||||
Cash Flows used in Operating Activities |
$ | (971,044 | ) | $ | (481,818 | ) | ||
|
|
|
|
|||||
Cash Flows used in Investing Activities |
— | (300,000,000 | ) | |||||
Cash Flows provided by Financing Activities |
— | 301,453,425 | ||||||
|
|
|
|
Final Redemption US$ |
||||
Total assets |
$ | 571,390,810 | ||
Total liabilities |
$ | 99,964,624 | ||
Total equity |
$ | 471,426,186 |
Final Redemption US$ |
||||
Revenue |
$ | 2,983,747 | ||
Net loss |
$ | (48,980,281 | ) | |
Loss per common share — basic and diluted |
$ | (0.30 | ) | |
Weighted average shares outstanding, basic and diluted |
163,179,553 |
Final Redemption US$ |
||||
Revenue |
$ | 792,254 | ||
Net loss |
$ | (187,306,071 | ) | |
Loss per common share — basic and diluted |
$ | (1.15 | ) | |
Weighted average shares outstanding, basic and diluted |
163,179,553 |
• | Economically recycle and recover lithium-ion batteries and lithium-ion battery materials and meet customers’ business needs; |
• | Effectively introduce methods for higher recovery rates of lithium-ion batteries and solutions to recycling; |
• | Complete the construction of its future facilities, including the Rochester Hub, the Arizona Spoke and the Alabama Spoke, at a reasonable cost and on a timely basis; |
• | Invest and keep pace in technology, research and development efforts, and the expansion and defense of its intellectual property portfolio; |
• | Secure and maintain required strategic supply arrangements; |
• | Effectively compete in the markets in which it operates; and |
• | Attract and retain management or other employees who possess specialized knowledge and technical skills. |
• | political, civil and economic instability; |
• | corruption risks; |
• | trade, customs and tax risks; |
• | currency exchange rates and currency controls; |
• | limitations on the repatriation of funds; |
• | insufficient infrastructure; |
• | restrictions on exports, imports and foreign investment; |
• | increases in working capital requirements related to long supply chains; |
• | changes in labor laws and regimes and disagreements with the labor force; |
• | difficulty in protecting intellectual property rights; and |
• | different and less established legal systems. |
• | equipment failures; |
• | personnel shortage; |
• | labor disputes; or |
• | transportation disruptions. |
• | the COVID-19 pandemic and its impact on the markets and economies in which we operate; |
• | our actual or anticipated operating performance and the operating performance of our competitors; |
• | failure of securities analysts to initiate or maintain coverage of us, changes in financial estimates by any securities analysts who follow our company, or our failure to meet the estimates or the expectations of investors; |
• | any major change in our board of directors, management, or key personnel; |
• | market conditions in our industry; |
• | general economic conditions such as recessions, interest rates, fuel prices, international currency fluctuations; |
• | rumors and market speculation involving us or other companies in our industry; |
• | announcements by us or our competitors of significant innovations, new products, services or capabilities, acquisitions, strategic investments, partnerships, joint ventures or capital commitments; |
• | the legal and regulatory landscape and changes in the application of existing laws or adoption of new laws that impact our business; |
• | legal and regulatory claims, litigation, or pre-litigation disputes and other proceedings; |
• | other events or factors, including those resulting from war, incidents of terrorism, or responses to these events; and |
• | sales or expected sales of our common shares by us, our officers, directors, significant stockholders, and employees. |
• | a limited availability of market quotations for our securities; |
• | a limited amount of news and analyst coverage for the Company; and |
• | a decreased ability to obtain capital or pursue acquisitions by issuing additional equity or convertible securities. |
• | our existing shareholders’ proportionate ownership will decrease; |
• | the amount of cash available per share, including for payment of dividends in the future, may decrease; |
• | the relative voting strength of each previously outstanding share may be diminished; and |
• | the market price of our shares may decline. |
• | discuss future expectations; |
• | contain projections of future results of operations or financial condition; or |
• | state other “forward-looking” information. |
• | changes adversely affecting the industry in which we operate; |
• | our ability to achieve our business strategies or to manage our growth; |
• | general economic conditions; |
• | the effects of the COVID-19 pandemic on the global economy, on the markets in which we compete and on our business; |
• | our ability to maintain the listing of our securities on NYSE; |
• | our ability to retain our key employees; |
• | our ability to recognize the anticipated benefits of the Business Combination; and |
• | the outcome of any legal proceedings or arbitrations that may be instituted against us or in which we may be involved. |
As at July 31, 2021 (US$ in millions) |
Actual |
Pro forma for Business Combination and PIPE financing |
||||||
Cash |
$ | 2.4 | $ | 530.2 | ||||
Other current assets |
$ | 12.7 | $ | 6.8 | ||||
Non-current assets |
$ | 34.4 | $ | 34.4 | ||||
|
|
|
|
|||||
Total assets |
$ | 49.4 | $ | 571.4 | ||||
|
|
|
|
|||||
Accounts payable and accrued liabilities |
$ | 15.8 | $ | 9.6 | ||||
Restricted share units |
$ | 3.3 | $ | — | ||||
Lease liabilities |
$ | 16.2 | $ | 16.2 | ||||
Loans payable |
$ | 11.5 | $ | 11.5 | ||||
Restoration provisions |
$ | 0.3 | $ | 0.3 | ||||
Warrant liability |
$ | — | $ | 62.3 | ||||
|
|
|
|
|||||
Total liabilities |
$ | 47.1 | $ | 100.0 | ||||
|
|
|
|
|||||
Share capital |
$ | 37.8 | $ | 660.0 | ||||
Contributed surplus |
$ | 1.0 | $ | 2.3 | ||||
Accumulated deficit |
$ | (36.1 | ) | $ | (190.5 | ) | ||
Accumulated other comprehensive income |
$ | (0.3 | ) | $ | (0.3 | ) | ||
|
|
|
|
|||||
Total shareholders’ equity |
$ | 2.3 | $ | 471.4 | ||||
|
|
|
|
|||||
Total liabilities and shareholders’ equity |
$ | 49.4 | $ | 571.4 | ||||
|
|
|
|
• | Li-Cycle’s shareholders prior to the Business Combination had, immediately following the Business Combination, the greatest voting interest in the combined entity relative to other shareholders (including following the redemptions discussed below under “Liquidity and Capital Resources — Sources of Liquidity”); |
• | the largest individual minority shareholder of the combined entity was a shareholder of Li-Cycle prior to the Business Combination; |
• | the senior management of Li-Cycle became the senior management of Li-Cycle Holdings following the Business Combination; |
• | Prior to the Business Combination, Li-Cycle was larger than Peridot based on historical total assets and revenues; and |
• | Li-Cycle’s operations comprise the ongoing operations of Li-Cycle Holdings Corp. |
Final Redemption |
||||||||||||||||||||||||
Li-Cycle Holdings Corp. US$ (A) |
Li-Cycle Corp. US$ (B) |
Peridot Acquisition Corp US$ (C) |
Transaction Accounting Adjustments US$ |
Pro Forma Balance Sheet US$ |
||||||||||||||||||||
Assets |
||||||||||||||||||||||||
Current assets |
||||||||||||||||||||||||
Cash |
1 | 2,350,722 | 563 | 315,490,000 | (2 | ) | ||||||||||||||||||
(54,000,000 | ) | (3 | ) | |||||||||||||||||||||
(33,793,998 | ) | (4 | ) | |||||||||||||||||||||
300,154,668 | (4 | ) | 530,201,956 | |||||||||||||||||||||
Cash and securities held in Trust Account |
300,154,668 | (300,154,668 | ) | (4 | ) | — | ||||||||||||||||||
Accounts receivable |
3,255,981 | 3,255,981 | ||||||||||||||||||||||
Prepayments and deposits |
7,911,436 | 303,958 | (6,176,806 | ) | (3 | ) | 2,038,588 | |||||||||||||||||
Inventory |
1,502,921 | 1,502,921 | ||||||||||||||||||||||
|
|
|
|
|
|
|
|
|
|
|||||||||||||||
1 | 15,021,060 | 300,459,189 | 221,519,196 | 536,999,446 | ||||||||||||||||||||
|
|
|
|
|
|
|
|
|
|
|||||||||||||||
Non-current assets |
||||||||||||||||||||||||
Plant and equipment |
18,113,712 | 18,113,712 | ||||||||||||||||||||||
Right of use assets |
16,277,652 | 16,277,652 | ||||||||||||||||||||||
|
|
|
|
|
|
|
|
|
|
|||||||||||||||
— | 34,391,364 | — | — | 34,391,364 | ||||||||||||||||||||
|
|
|
|
|
|
|
|
|
|
|||||||||||||||
1 | 49,412,424 | 300,459,189 | 221,519,196 | 571,390,810 | ||||||||||||||||||||
|
|
|
|
|
|
|
|
|
|
|||||||||||||||
Liabilities |
||||||||||||||||||||||||
Current liabilities |
||||||||||||||||||||||||
Accounts payable and accrued liabilities |
15,778,982 | 5,386,827 | (5,386,827 | ) | (3 | ) | ||||||||||||||||||
(6,176,806 | ) | (3 | ) | 9,602,176 | ||||||||||||||||||||
Restricted share units |
3,259,010 | (3,259,010 | ) | (5 | ) | — | ||||||||||||||||||
Lease liabilities |
1,190,086 | 1,190,086 | ||||||||||||||||||||||
Loans payable |
1,688,853 | 1,688,853 | ||||||||||||||||||||||
|
|
|
|
|
|
|
|
|
|
|||||||||||||||
— | 21,916,931 | 5,386,827 | (14,822,643 | ) | 12,481,115 | |||||||||||||||||||
|
|
|
|
|
|
|
|
|
|
|||||||||||||||
Non-current liabilities |
||||||||||||||||||||||||
Lease liabilities |
15,044,408 | 15,044,408 | ||||||||||||||||||||||
Loan payable |
— | 9,776,681 | 9,776,681 | |||||||||||||||||||||
Restoration provisions |
332,420 | 332,420 | ||||||||||||||||||||||
Class A ordinary shares subject to possible redemption |
— | 217,242,360 | (1 | ) | ||||||||||||||||||||
— | (33,776,260 | ) | (4 | ) | ||||||||||||||||||||
— | (183,466,100 | ) | (4 | ) | — | |||||||||||||||||||
Warrant liability |
62,330,000 | 62,330,000 | ||||||||||||||||||||||
Deferred underwriting fee payable |
— | 10,500,000 | (10,500,000 | ) | (3 | ) | — | |||||||||||||||||
|
|
|
|
|
|
|
|
|
|
|||||||||||||||
— | 25,153,509 | 72,830,000 | (10,500,000 | ) | 87,483,509 | |||||||||||||||||||
|
|
|
|
|
|
|
|
|
|
|||||||||||||||
— | 47,070,440 | 78,216,827 | (25,322,643 | ) | 99,964,624 | |||||||||||||||||||
|
|
|
|
|
|
|
|
|
|
|||||||||||||||
Class A ordinary shares subject to possible redemption |
217,242,360 | (217,242,360 | ) | (1 | ) | — |
Final Redemption |
||||||||||||||||||||||||
Li-Cycle Holdings Corp. US$ (A) |
Li-Cycle Corp. US$ (B) |
Peridot Acquisition Corp US$ (C) |
Transaction Accounting Adjustments US$ |
Pro Forma Balance Sheet US$ |
||||||||||||||||||||
Shareholders’ equity |
||||||||||||||||||||||||
Share capital — Li-Cycle Corp. |
37,805,879 | (37,805,879 | ) | (5 | ) | — | ||||||||||||||||||
Share capital — Peridot Acquisition Corp. |
1,578 | (1,578 | ) | (4 | ) | — | ||||||||||||||||||
Share capital — Li-Cycle Holdings Corp. |
1 | 37,805,879 | (5 | ) | ||||||||||||||||||||
3,259,010 | (5 | ) | ||||||||||||||||||||||
794,328 | (5 | ) | ||||||||||||||||||||||
315,490,000 | (2 | ) | ||||||||||||||||||||||
(38,113,173 | ) | (3 | ) | |||||||||||||||||||||
183,448,362 | (4 | ) | ||||||||||||||||||||||
56,008,334 | (4 | ) | ||||||||||||||||||||||
(51,009,910 | ) | (4 | ) | |||||||||||||||||||||
152,285,376 | (6 | ) | ||||||||||||||||||||||
1,578 | (4 | ) | 659,969,785 | |||||||||||||||||||||
Contributed surplus |
952,441 | 56,008,334 | (56,008,334 | ) | (4 | ) | ||||||||||||||||||
2,124,321 | (5 | ) | ||||||||||||||||||||||
794,328 | (5 | ) | 2,284,434 | |||||||||||||||||||||
Accumulated deficit |
(36,119,724 | ) | (51,009,910 | ) | 51,009,910 | (4 | ) | |||||||||||||||||
(2,124,321 | ) | (5 | ) | |||||||||||||||||||||
(152,285,376 | ) | (6 | ) | (190,529,421 | ) | |||||||||||||||||||
Accumulated other comprehensive income |
(296,612 | ) | (296,612 | ) | ||||||||||||||||||||
|
|
|
|
|
|
|
|
|
|
|||||||||||||||
1 | 2,341,984 | 5,000,002 | 464,084,199 | 471,426,186 | ||||||||||||||||||||
|
|
|
|
|
|
|
|
|
|
|||||||||||||||
1 | 49,412,424 | 300,459,189 | 221,519,196 | 571,390,810 | ||||||||||||||||||||
|
|
|
|
|
|
|
|
A. |
Derived from the audited statement of financial position of Li-Cycle Holdings Corp. as of May 31, 2021 prepared under IFRS. |
B. |
Derived from the unaudited condensed consolidated interim statement of financial position of Li-Cycle Corp as of July 31, 2021 which was prepared in US dollars and under IFRS. |
C. |
Derived from the unaudited condensed interim statement of financial position of Peridot Acquisition Corp. (“Peridot”) as of June 30, 2021 which was prepared under US GAAP. Except as noted in Note 1, there was no other material adjustment made to convert Peridot’s balance sheet from US GAAP to IFRS. |
1. |
Peridot’s Class A ordinary shares subject to possible redemption balance of US$217,242,360 was classified as a temporary equity under US GAAP and should be classified as a liability under IFRS because the right to redeem was at the option of the holder. |
2. |
On February 16, 2021, Li-Cycle Corp. entered into a definitive business combination agreement with Peridot Acquisition Corp. Li-Cycle Corp. is expected to receive approximately US$582 million in gross transaction proceeds after redemption by Peridot Acquisition Corp.’s shareholders, and 100% of Li-Cycle Corp.’s existing shares will roll into the combined company, Li-Cycle Holdings Corp. Out of the US$582 million in gross proceeds, US$266.4 million will come from Peridot’s existing cash balance while the remaining US$315.5 million is expected to come from private investments in public equity. |
3. |
Li-Cycle Corp. was identified as the acquirer for accounting purposes. An expected $55 million of fees relating to the raising of capital via share issuance is presented as a reduction of share capital on the pro forma combined balance sheet. US$10.5 million of the fees have been recorded as deferred underwriting fee payable on Peridot’s balance sheet as of June 30, 2021. US$6.4 million of fees have been incurred to date |
and $1.0 million has been paid by Peridot Acquisition Corp. as of June 30, 2021. The remaining US$38.1 million of expected fees have been deducted directly against share capital of Li-Cycle Holdings Corp. on the pro forma combined balance sheet. Out of the remaining US38.1 million, $6.2 million was recorded in prepayments and deposits and in accounts payable and accrued liabilities in the interim statement of financial position of Li-Cycle Corp. as of July 31, 2021. |
4. |
In connection with the shareholder meeting held by Peridot to approve the Business Combination, a total of 3,377,626 Class A Shares were redeemed by Peridot, resulting in a total redemption payment of approximately $33.8 million, while the remaining US$266.4 million of cash and securities held in trust account will become cash of the combined entity, Li-Cycle Holdings Corp. US$183.5 million of Peridot’s Class A ordinary shares which were subject to possible redemption but not redeemed (18,346,610 shares at US$10.00 per share) will become part of the permanent share capital of the combined entity, Li-Cycle Holdings Corp. Peridot’s existing share capital of US$1,578 and contributed surplus of US$58,008,334 will be added to the share capital balance of Li-Cycle Holdings Corp. and Peridot’s existing accumulated deficit of US$51,009,910 will be deducted from the share capital balance of Li-Cycle Holdings Corp. |
5. |
All of Li-Cycle Corp.’s existing fully diluted shares will be exchanged for shares or stock options of Li-Cycle Holdings Corp. Li-Cycle Corp.’s existing share capital of US$37,805,879 as of July 31, 2021 will become part of the share capital of the combined entity, Li-Cycle Holdings Corp. All restricted share units will be exercised upon the business combination transaction, so Li-Cycle Corp.’s restricted share units balance of US$3,259,010 are added to the share capital balance of Li-Cycle Holdings Corp. Accelerated vesting of Li-Cycle Corp.’s existing stock options would result in an additional expense of $2,124,321. For the portion of Li-Cycle Corp.’s existing stock options which are surrendered in exchange for shares, $794,328 of contributed surplus would be added to the share capital balance of Li-Cycle Holdings Corp. The remaining stock options of Li-Cycle Corp. would be converted into stock options of Li-Cycle Holdings Corp. at the exchange ratio of 39.91. |
6. |
Li-Cycle Corp. was identified as the acquirer for accounting purposes. The acquisition of Peridot Acquisition Corp. is outside the scope of IFRS 3, “Business Combinations,” and it is accounted for as an equity-settled, share-based payment transaction in accordance with IFRS 2, “Share-based Payments” (“IFRS 2”). Li-Cycle Holdings Corp. is considered to be a continuation of Li-Cycle Corp., with the net identifiable assets of Peridot Acquisition Corp. deemed to have been acquired by Li-Cycle Corp. in exchange for shares of Li-Cycle Corp. Under IFRS 2, the transaction is measured at the fair value of the consideration deemed to have been issued by Li-Cycle Corp. in order to acquire 100% of Peridot Acquisition Corp. Any difference in the fair value of the consideration deemed to have been issued by Li-Cycle Corp. and the fair value of Peridot Acquisition Corp.’s identifiable net assets represents a listing service received by Li-Cycle Corp., recorded through profit and loss, summarized as follows: |
As at July 31, 2021 | ||||
Peridot’s existing assets to be acquired |
$ | 266,665,191 | (1) | |
Cash from private investment in public equity |
315,490,000 | |||
Peridot’s existing liabilities to be assumed |
(78,216,827 | ) | ||
|
|
|||
Net assets to be acquired by Li-Cycle Corp. |
503,938,364 | |||
Total consideration deemed to be issued by Li-Cycle Corp. |
656,223,740 | (1)(2) | ||
|
|
|||
Excess of fair value of shares issued over net assets acquired |
$ | 152,285,376 |
(1) | Adjusted for $33.8 million cash payout upon redemption by Peridot’s shareholders |
(2) | Based on an estimated fair value of Li-Cycle’s business on a pre-money basis, calculated using generally accepted valuation methodologies. |
Final Redemption |
||||||||||||||||||||||||
Li-Cycle Holdings Corp. US$ (A) |
Li-Cycle Corp. US$ (B) |
Peridot Acquisition Corp. US$ (C) |
Transaction Accounting Adjustments US$ |
Pro Forma Income Statement US$ |
||||||||||||||||||||
Revenue |
||||||||||||||||||||||||
Product sales |
2,682,531 | 2,682,531 | ||||||||||||||||||||||
Recycling services |
301,216 | — | 301,216 | |||||||||||||||||||||
|
|
|
|
|
|
|
|
|
|
|||||||||||||||
— | 2,983,747 | — | — | 2,983,747 | ||||||||||||||||||||
Expenses |
||||||||||||||||||||||||
Professional fees |
4,095,596 | 5,756,638 | 9,852,234 | |||||||||||||||||||||
Employee salaries and benefits, net |
5,358,953 | 5,358,953 | ||||||||||||||||||||||
Raw materials, supplies and finished goods |
4,876,561 | 4,876,561 | ||||||||||||||||||||||
Research and development, net |
1,928,582 | 1,928,582 | ||||||||||||||||||||||
Share-based compensation |
1,307,874 | 1,307,874 | ||||||||||||||||||||||
Office and administrative |
987,820 | 323,160 | 1,310,980 | |||||||||||||||||||||
Depreciation, net |
788,830 | 788,830 | ||||||||||||||||||||||
Freight and shipping |
587,953 | 587,953 | ||||||||||||||||||||||
Marketing |
465,269 | 465,269 | ||||||||||||||||||||||
Plant facilities |
232,358 | 232,358 | ||||||||||||||||||||||
Travel and entertainment |
188,712 | 188,712 | ||||||||||||||||||||||
|
|
|
|
|
|
|
|
|
|
|||||||||||||||
— | 20,818,508 | 6,079,798 | — | 26,898,306 | ||||||||||||||||||||
|
|
|
|
|
|
|
|
|
|
|||||||||||||||
Loss from operations |
— | (17,834,761 | ) | (6,079,798 | ) | — | (23,914,559 | ) | ||||||||||||||||
|
|
|
|
|
|
|
|
|
|
|||||||||||||||
Other (income) expense |
||||||||||||||||||||||||
Interest expense |
788,335 | 788,335 | ||||||||||||||||||||||
Interest income |
(1,725 | ) | (80,300 | ) | (82,025 | ) | ||||||||||||||||||
Fair value gain on warrant liability |
21,390,000 | 21,390,000 | ||||||||||||||||||||||
Fair value loss on restricted share units |
2,433,196 | 2,433,196 | ||||||||||||||||||||||
Foreign exchange loss |
536,216 | 536,216 | ||||||||||||||||||||||
|
|
|
|
|
|
|
|
|
|
|||||||||||||||
— | 3,756,022 | 21,309,700 | — | 25,065,722 | ||||||||||||||||||||
|
|
|
|
|
|
|
|
|
|
|||||||||||||||
Net loss |
— | (21,590,783 | ) | (27,389,498 | ) | — | (48,980,281 | ) | ||||||||||||||||
|
|
|
|
|
|
|
|
|||||||||||||||||
Weighted average shares outstanding, basic and diluted |
34,122,374 | (1 | ) | |||||||||||||||||||||
97,508,179 | (2 | ) | ||||||||||||||||||||||
31,549,000 | (3 | ) | 163,179,553 | |||||||||||||||||||||
Loss per common share — basic and diluted |
(0.30 | ) | ||||||||||||||||||||||
|
|
|
|
|
|
|
|
A. |
There was no statement of operations prepared for Li-Cycle Holdings Corp. as it was incorporated on February 12, 2021 for the purpose of the Business Combination and had no operations between February 12 and May 31, 2021. |
B. |
Derived from the unaudited condensed consolidated interim statement of loss and comprehensive loss of Li-Cycle Corp. for the nine months ended July 31, 2021, which was prepared in US dollars and under IFRS. |
C. |
Derived from the unaudited condensed interim statement of operations of Peridot Acquisition Corp. for the six months ended June 30, 2021, which was prepared under US GAAP. There was no material adjustment made to convert Peridot’s statement of operations from US GAAP to IFRS. |
1. |
In connection with the shareholder meeting held by Peridot to approve the Business Combination, a total of 3,377,626 Class A Shares were redeemed by Peridot, resulting in a total redemption payment of approximately $33.8 million, while the remaining 26,622,374 of Class A shares will be converted into Class A shares of the combined entity, Li-Cycle Holdings Corp. In addition, 7,500,000 of Class B shares of Peridot Acquisition Corp. will be converted into 7,500,000 of Class A shares of the combined entity, Li-Cycle Holdings Corp. upon closing. |
2. |
Li-Cycle Corp.’s existing shareholders will exchange 2,552,450 fully diluted shares of Li-Cycle Corp. for the shares of the combined entity, Li-Cycle Holdings Corp., at an Exchange Ratio of approximately 1:39.91, as determined per the Plan of Arrangement, resulting in 97,508,179 shares of Li-Cycle Holdings Corp. and 4,242,707 stock options of Li-Cycle Holdings Corp. for the existing shareholders of Li-Cycle Corp. |
3. |
31,549,000 shares of the combined entity, Li-Cycle Holdings Corp., will be issued to the new investors at US$10 per share for a total of US$315.5 million of Private Investment in Public Equity. |
Final Redemption |
||||||||||||||||||||||||
Li-Cycle Holdings Corp. US$ (A) |
Li-Cycle Corp. US$ (B) |
Peridot Acquisition Corp. US$ (C) |
Transaction Accounting Adjustments US$ |
Pro Forma Income Statement US$ |
||||||||||||||||||||
Revenue |
||||||||||||||||||||||||
Product sales |
554,914 | 554,914 | ||||||||||||||||||||||
Recycling services |
237,340 | — | 237,340 | |||||||||||||||||||||
|
|
|
|
|
|
|
|
|
|
|||||||||||||||
— | 792,254 | — | — | 792,254 | ||||||||||||||||||||
Expenses |
||||||||||||||||||||||||
Professional fees |
2,962,261 | 348,854 | 693,847 | (4 | ) | 4,004,962 | ||||||||||||||||||
Listing expense |
— | 152,285,376 | (5 | ) | 152,285,376 | |||||||||||||||||||
Employee salaries and benefits, net |
2,819,195 | 2,819,195 | ||||||||||||||||||||||
Depreciation |
1,095,250 | 1,095,250 | ||||||||||||||||||||||
Research and development, net |
776,668 | 776,668 | ||||||||||||||||||||||
Raw materials and supplies |
577,859 | 577,859 | ||||||||||||||||||||||
Plant facilities and others |
390,687 | 390,687 | ||||||||||||||||||||||
Marketing |
365,820 | 365,820 | ||||||||||||||||||||||
Share-based compensation |
332,634 | 2,124,321 | (2 | ) | 2,456,955 | |||||||||||||||||||
Office and administrative |
316,401 | 112,123 | 428,524 | |||||||||||||||||||||
Travel and entertainment |
160,332 | 160,332 | ||||||||||||||||||||||
Freight and shipping |
137,010 | 137,010 | ||||||||||||||||||||||
|
|
|
|
|
|
|
|
|
|
|||||||||||||||
— | 9,934,117 | 460,977 | 155,103,544 | 165,498,638 | ||||||||||||||||||||
|
|
|
|
|
|
|
|
|
|
|||||||||||||||
Loss from operations |
— | (9,141,863 | ) | (460,977 | ) | (155,103,544 | ) | (164,706,384 | ) | |||||||||||||||
|
|
|
|
|
|
|
|
|
|
|||||||||||||||
Other (income) expense |
||||||||||||||||||||||||
Interest expense |
529,700 | 529,700 | ||||||||||||||||||||||
Interest income |
(34,403 | ) | (74,412 | ) | (108,815 | ) | ||||||||||||||||||
Fair value loss on restricted share units |
84,454 | 84,454 | ||||||||||||||||||||||
Fair value loss on warrant liability |
22,540,000 | 22,540,000 | ||||||||||||||||||||||
Offering costs allocated to warrant liability |
693,847 | (693,847 | ) | (4 | ) | — | ||||||||||||||||||
Foreign exchange (gain) loss |
(445,652 | ) | (445,652 | ) | ||||||||||||||||||||
|
|
|
|
|
|
|
|
|
|
|||||||||||||||
— | 134,099 | 23,159,435 | (693,847 | ) | 22,599,687 | |||||||||||||||||||
|
|
|
|
|
|
|
|
|
|
|||||||||||||||
Net loss |
— | (9,275,962 | ) | (23,620,412 | ) | (154,409,697 | ) | (187,306,071 | ) | |||||||||||||||
|
|
|
|
|
|
|
|
|
|
|||||||||||||||
Weighted average shares outstanding, basic and diluted |
34,122,374 | (1 | ) | |||||||||||||||||||||
97,508,179 | (2 | ) | ||||||||||||||||||||||
31,549,000 | (3 | ) | 163,179,553 | |||||||||||||||||||||
Loss per common share — basic and diluted |
(1.15 | ) | ||||||||||||||||||||||
|
|
|
|
|
|
|
|
|
|
A. |
There was no statement of operations prepared for Li-Cycle Holdings Corp. as it was incorporated on February 12, 2021 for the purpose of the Business Combination and had no operations between February 12 and May 31, 2021. |
B. |
Derived from the audited consolidated statement of loss and comprehensive loss of Li-Cycle Corp. for the year ended October 31, 2020, which was prepared in US dollars and under IFRS. |
C. |
Derived from the audited statement of operations of Peridot Acquisition Corp. for the year ended December 31, 2020, which was prepared under US GAAP. There was no material adjustment made to convert Peridot’s statement of operations from US GAAP to IFRS. |
1. |
In connection with the shareholder meeting held by Peridot to approve the Business Combination, a total of 3,377,626 Class A Shares were redeemed by Peridot, resulting in a total redemption payment of approximately $33.8 million, while the remaining 26,622,374 of Class A shares will be converted into Class A shares of the combined entity, Li-Cycle Holdings Corp. In addition, 7,500,000 of Class B shares of Peridot Acquisition Corp. will be converted into 7,500,000 of Class A shares of the combined entity, Li-Cycle Holdings Corp. upon closing. |
2. |
Li-Cycle Corp.’s existing shareholders will exchange 2,552,450 fully diluted shares of Li-Cycle Corp. for the shares of the combined entity, Li-Cycle Holdings Corp., at an Exchange Ratio of approximately 1:39.91, as determined per the Plan of Arrangement, resulting in 97,508,179 shares of Li-Cycle Holdings Corp. and 4,242,707 stock options of Li-Cycle Holdings Corp. for the existing shareholders of Li-Cycle Corp. Accelerated vesting of Li-Cycle Corp.’s existing stock options upon the business combination transaction would result in an additional expense of $2,124,321. |
3. |
31,549,000 shares of the combined entity, Li-Cycle Holdings Corp., will be issued to the new investors at US$10 per share for a total of US$315.5 million of Private Investment in Public Equity. |
4. |
Peridot’s offering costs allocated to warrant liability of US$693,847 was classified under other (income) expenses under US GAAP and should be classified as professional fees expense under IFRS based on the nature of the expense. |
5. |
Li-Cycle Corp. was identified as the acquirer for accounting purposes. The acquisition of Peridot Acquisition Corp. is outside the scope of IFRS 3, “Business Combinations,” and it is accounted for as an equity-settled, share-based payment transaction in accordance with IFRS 2, “Share-based Payments” (“IFRS 2”). Li-Cycle Holdings Corp. is considered to be a continuation of Li-Cycle Corp., with the net identifiable assets of Peridot Acquisition Corp. deemed to have been acquired by Li-Cycle Corp. in exchange for shares of Li-Cycle Corp. Under IFRS 2, the transaction is measured at the fair value of the consideration deemed to have been issued by Li-Cycle Corp. in order to acquire 100% of Peridot Acquisition Corp. Any difference in the fair value of the consideration deemed to have been issued by Li-Cycle Corp. and the fair value of Peridot Acquisition Corp.’s identifiable net assets represents a listing service received by Li-Cycle Corp., recorded through profit and loss, summarized as follows: |
As at July 31, 2021 | ||||
Peridot’s existing assets to be acquired |
$ | 266,665,191 | (1) | |
Cash from private investment in public equity |
315,490,000 | |||
Peridot’s existing liabilities to be assumed |
(78,216,827 | ) | ||
|
|
|||
Net assets to be acquired by Li-Cycle Corp. |
503,938,364 | |||
Total consideration deemed to be issued by Li-Cycle Corp. |
656,223,740 | (1)(2) | ||
|
|
|||
Excess of fair value of shares issued over net assets acquired |
$ | 152,285,376 |
(1) | Adjusted for $33.8 million cash payout upon redemption by Peridot’s shareholders |
(2) | Based on an estimated fair value of Li-Cycle’s business on a pre-money basis, calculated using generally accepted valuation methodologies. |
• | seamless and efficient coordination of shipments; |
• | logistics partners to support transporting batteries from around the world; |
• | a knowledgeable team to assist the customer in understanding packaging and documentation requirements; |
• | managing storage and logistics with respect to specialized containers and shipment of large format, high voltage batteries used for EVs and energy storage; and |
• | compliance with applicable regional, state, provincial and country regulations. |
• | completes the development and construction of the Rochester Hub; |
• | completes the development and construction of the Arizona Spoke and Alabama Spoke; |
• | expands globally with the deployment of additional Spokes and Hubs, including through acquisitions and/or through joint ventures or other contractual arrangements; |
• | continues to invest in its technology, R&D efforts and the expansion of its intellectual property portfolio; |
• | increases its investment in logistics infrastructure for transportation of intermediate products from Spokes to Hubs; |
• | obtains, maintains and improves its operational, financial and management information systems; |
• | hires additional personnel; and |
• | operates as a public company. |
• | Li-Cycle’s shareholders prior to the Business Combination will have the greatest voting interest in the combined entity relative to other shareholders (including following the redemptions discussed under “Management’s Discussion and Analysis of Financial Condition and Results of Operations — Liquidity and Capital Resources — Sources of Liquidity |
• | the largest individual minority shareholder of the combined entity is an existing shareholder of Li-Cycle; |
• | The Company’s senior management will be the senior management of Li-Cycle; |
• | Li-Cycle is the larger entity based on historical total assets and revenues; and |
• | Li-Cycle’s operations will comprise the ongoing operations of the Company. |
• | political, civil and economic instability; |
• | corruption risks; |
• | trade, customs and tax risks; |
• | currency exchange rates and currency controls; |
• | limitations on the repatriation of funds; |
• | insufficient infrastructure; |
• | restrictions on exports, imports and foreign investment; |
• | increases in working capital requirements related to long supply chains; |
• | changes in labor laws and regimes and disagreements with the labor force; |
• | difficulty in protecting intellectual property rights; and |
• | different and less established legal systems. |
Three months ended July 31, |
$ Change |
% Change |
Nine months ended July 31, |
$ Change |
% Change |
|||||||||||||||||||||||||||
2021 |
2020 |
2021 |
2020 |
|||||||||||||||||||||||||||||
(dollar amounts in thousands, except share and per share data) |
||||||||||||||||||||||||||||||||
Revenues |
1,709 | 182 | 1,527 | 840 | % | 2,984 | 323 | 2,661 | 824 | % | ||||||||||||||||||||||
Product sales |
1,594 | 107 | 1,487 | 1389 | % | 2,683 | 185 | 2,497 | 1349 | % | ||||||||||||||||||||||
Recycling Services |
116 | 75 | 41 | 55 | % | 301 | 138 | 163 | 118 | % | ||||||||||||||||||||||
Operating expenses |
7,930 | 1,905 | 6,025 | 316 | % | 20,819 | 4,968 | 15,850 | 319 | % | ||||||||||||||||||||||
Employee salaries and benefits, net |
2,482 | 547 | 1,935 | 354 | % | 5,359 | 1,416 | 3,943 | 279 | % | ||||||||||||||||||||||
Raw materials, supplies and finished goods |
2,261 | 142 | 2,119 | 1491 | % | 4,877 | 345 | 4,532 | 1315 | % | ||||||||||||||||||||||
Professional fees |
1,176 | 897 | 279 | 31 | % | 4,096 | 1,560 | 2,535 | 163 | % | ||||||||||||||||||||||
Research and development, net |
577 | (283 | ) | 859 | 1,929 | (19 | ) | 1,948 | ||||||||||||||||||||||||
Share-based compensation |
298 | 57 | 241 | 420 | % | 1,308 | 220 | 1,087 | 493 | % | ||||||||||||||||||||||
Office and administrative |
369 | 65 | 304 | 470 | % | 988 | 134 | 853 | 635 | % | ||||||||||||||||||||||
Depreciation, net |
273 | 328 | (55 | ) | (17 | %) | 789 | 717 | 72 | 10 | % | |||||||||||||||||||||
Freight and shipping |
155 | (5 | ) | 161 | 588 | 57 | 531 | 926 | % | |||||||||||||||||||||||
Marketing |
160 | 66 | 95 | 145 | % | 465 | 189 | 277 | 147 | % | ||||||||||||||||||||||
Plant facilities |
75 | 60 | 15 | 25 | % | 232 | 224 | 9 | 4 | % | ||||||||||||||||||||||
Travel and entertainment |
103 | 31 | 72 | 234 | % | 189 | 126 | 63 | 50 | % | ||||||||||||||||||||||
Other (income) expenses |
676 | 88 | 588 | 667 | % | 3,756 | 197 | 3,559 | 1804 | % | ||||||||||||||||||||||
Foreign exchange (gain) loss |
(214 | ) | (74 | ) | (141 | ) | 190 | % | 536 | (109 | ) | 646 | -591 | % | ||||||||||||||||||
Interest expense |
383 | 165 | 218 | 132 | % | 788 | 341 | 448 | 131 | % | ||||||||||||||||||||||
Interest income |
(1 | ) | (3 | ) | 2 | -82 | % | (2 | ) | (34 | ) | 32 | -95 | % | ||||||||||||||||||
Fair value loss on restricted share units |
509 | — | 509 | 100 | % | 2,433 | — | 2,433 | 100 | % | ||||||||||||||||||||||
Net loss |
(6,897 | ) | (1,811 | ) | (5,086 | ) | 281 | % | (21,591 | ) | (4,842 | ) | (16,748 | ) | 346 | % | ||||||||||||||||
Foreign currency translation adjustment |
0 | 250 | (250 | ) | (100 | %) | 0 | (277 | ) | 277 | (100 | %) | ||||||||||||||||||||
Comprehensive loss |
(6,897 | ) | (1,561 | ) | (5,336 | ) | 342 | % | (21,591 | ) | (5,119 | ) | (16,471 | ) | 322 | % | ||||||||||||||||
Basic and diluted loss per share |
(2.88 | ) | (0.86 | ) | (2.02 | ) | 234 | % | (9.10 | ) | (2.35 | ) | (6.75 | ) | 287 | % | ||||||||||||||||
Weighted average number of common shares outstanding |
2,394,475 | 2,100,603 | 293,872 | 14 | % | 2,372,731 | 2,057,723 | 315,008 | 15 | % |
Three months ended July 31, |
Nine months ended July 31, |
|||||||||||||||
2021 |
2020 |
2021 |
2020 |
|||||||||||||
(dollar amounts in thousands) |
||||||||||||||||
Net loss |
(6,897 | ) | (1,811 | ) | (21,591 | ) | (4,842 | ) | ||||||||
Depreciation, gross |
698 | 328 | 1,831 | 717 | ||||||||||||
Interest expense (income), gross |
428 | 162 | 900 | 307 | ||||||||||||
Share-based compensation |
298 | 57 | 1,308 | 220 | ||||||||||||
Foreign exchange (gain) loss |
(214 | ) | (74 | ) | 536 | (109 | ) | |||||||||
Fair value loss on restricted share units |
509 | — | 2,433 | — | ||||||||||||
Forfeited SPAC transaction cost |
— | — | 2,000 | — | ||||||||||||
Adjusted EBITDA loss |
(5,178 | ) | (1,338 | ) | (12,583 | ) | (3,708 | ) |
Year Ended October 31, |
$ Change |
% Change |
||||||||||||||
2020 |
2019 |
|||||||||||||||
(dollar amounts in thousands, except share and per share data) |
||||||||||||||||
Revenues |
$ | 792 | $ | 48 | $ | 744 | 1,550 | % | ||||||||
Product sales |
555 | — | 555 | % | ||||||||||||
Recycling Services |
237 | 48 | 189 | 394 | % | |||||||||||
Operating expenses |
9,934 | 4,113 | 5,821 | 142 | % | |||||||||||
Professional fees |
2,962 | 547 | 2,415 | 441 | % | |||||||||||
Employee salaries and benefits, net |
2,819 | 608 | 2,211 | 364 | % | |||||||||||
Depreciation |
1,095 | 184 | 911 | 495 | % | |||||||||||
Research and development, net |
777 | 2,112 | (1,335 | ) | (63 | )% | ||||||||||
Raw materials and supplies |
578 | — | 578 | |||||||||||||
Plant facilities and other |
391 | — | 391 | |||||||||||||
Marketing |
366 | 66 | 300 | 455 | % | |||||||||||
Share-based compensation |
333 | 97 | 236 | 243 | % | |||||||||||
Office and administrative |
316 | 355 | (39 | ) | (11 | )% | ||||||||||
Travel and entertainment |
160 | 138 | 22 | 16 | % | |||||||||||
Freight and shipping |
137 | 6 | 131 | 2,183 | % | |||||||||||
Other (income) expenses |
134 | 36 | 98 | 272 | % | |||||||||||
Interest expense |
530 | 60 | 470 | 783 | % | |||||||||||
Interest income |
(34 | ) | (24 | ) | (10 | ) | 42 | % | ||||||||
Fair value loss on cash-settled share-based compensation |
84 | — | 84 | |||||||||||||
Foreign exchange gain |
(446 | ) | — | (446 | ) | |||||||||||
Net loss |
(9,276 | ) | (4,101 | ) | (5,175 | ) | 126 | % | ||||||||
Foreign currency translation adjustment |
(219 | ) | (37 | ) | (182 | ) | 492 | % | ||||||||
Comprehensive loss |
$ | (9,495 | ) | $ | (4,138 | ) | $ | (5,357 | ) | 129 | % | |||||
Basic and diluted loss per share |
$ | (4.48 | ) | $ | (2.28 | ) | $ | (2.20 | ) | 97 | % | |||||
Weighted average number of common shares outstanding |
2,068,952 | 1,801,338 | 267,614 | 15 | % |
Year Ended October 31, |
$ Change |
% Change |
||||||||||||||
2019 |
2018 |
|||||||||||||||
(dollar amounts in thousands, except share and per share data) |
||||||||||||||||
Revenues |
$ | 48 | $ | 6 | $ | 42 | 738 | % | ||||||||
Product sales |
0 | 0 | — | % | ||||||||||||
Recycling Services |
48 | 6 | 42 | 738 | % | |||||||||||
Operating expenses |
4,112 | 881 | 3,231 | 367 | % | |||||||||||
Professional fees |
547 | 77 | 470 | 613 | % | |||||||||||
Employee salaries and benefits, net |
608 | 202 | 406 | 201 | % | |||||||||||
Depreciation |
184 | — | 184 | |||||||||||||
Research and development, net |
2,112 | 397 | 1,715 | 432 | % | |||||||||||
Marketing |
66 | 34 | 31 | 91 | % | |||||||||||
Share-based compensation |
97 | 27 | 71 | 267 | % | |||||||||||
Office and administrative |
355 | 94 | 262 | 280 | % | |||||||||||
Travel and entertainment |
138 | 51 | 87 | 172 | % | |||||||||||
Freight and shipping |
6 | — | 6 | |||||||||||||
Other (income) expenses |
37 | 34 | 3 | 9 | % | |||||||||||
Interest expense |
60 | 39 | 21 | 54 | % | |||||||||||
Interest income |
(24 | ) | (5 | ) | (18 | ) | 332 | % | ||||||||
Fair value loss on cash-settled share-based compensation |
— | — | — | |||||||||||||
Foreign exchange gain |
— | — | — | |||||||||||||
Net loss |
(4,101 | ) | (909 | ) | (3,192 | ) | 351 | % | ||||||||
Foreign currency translation adjustment |
(37 | ) | 126 | (163 | ) | (129 | )% | |||||||||
Comprehensive loss |
$ | (4,138 | ) | $ | (783 | ) | $ | (3,192 | ) | 351 | % | |||||
Basic and diluted loss per share |
$ | (2.28 | ) | $ | (0.53 | ) | $ | (1.74 | ) | 326 | % | |||||
Weighted average number of common shares outstanding |
1,801,338 | 1,700,751 | 100,587 | 6 | % |
Three months ended July 31, |
Nine months ended July 31, |
|||||||||||||||
2021 |
2020 |
2021 |
2020 |
|||||||||||||
(in thousands) |
(in thousands) |
|||||||||||||||
Cash flows used in operating activities |
$ | (5,245 | ) | $ | (2,161 | ) | $ | (16,567 | ) | $ | (7,654 | ) | ||||
Cash flows used in investing activities |
(5,298 | ) | (836 | ) | (12,050 | ) | (1,748 | ) | ||||||||
Cash flows from financing activities |
6,568 | 294 | 30,304 | 9,502 | ||||||||||||
Net change in cash |
$ | (3,975 | ) | $ | (2,703 | ) | $ | 1,687 | $ | 100 |
Year Ended October 31, |
|||||||||||||||
2020 |
2019 |
2019 |
2018 |
|||||||||||||
(in thousands) |
(in thousands) |
|||||||||||||||
Cash flows used in operating activities |
$ | (7,429 | ) | $ | (4,568 | ) | $ | (4,568 | ) | $ | (686 | ) | ||||
Cash flows used in investing activities |
(5,108 | ) | (998 | ) | (998 | ) | (244 | ) | ||||||||
Cash flows from financing activities |
9,417 | 7,164 | 7,164 | 3,111 | ||||||||||||
— | — | — | ||||||||||||||
Net change in cash |
$ | (3,120 | ) | $ | 1,598 | $ | 1,598 | $ | 2,181 |
Payment due by period |
||||||||||||||||||||
(in thousands) |
||||||||||||||||||||
Contractual Obligations |
Total |
Less than 1 year |
1 - 3 years |
3 - 5 years |
More than 5 years |
|||||||||||||||
Accounts payable and accrued liabilities |
$ | 15,779 | $ | 15,779 | $ | — | $ | — | — | |||||||||||
Lease liabilities |
22,621 | 2,155 | 5,592 | 4,697 | 10,177 | |||||||||||||||
Loan payable |
11,466 | 7,012 | 4,454 | — | — | |||||||||||||||
Restoration provisions |
332 | — | 81 | 53 | 198 | |||||||||||||||
Restricted share units |
3,259 | 3,259 | — | — | — | |||||||||||||||
|
|
|
|
|
|
|
|
|
|
|||||||||||
Total as of July 31, 2021 |
53,457 |
28,205 |
10,127 |
4,750 |
10,375 |
(1) | On August 3, 2021, Li-Cycle North America Hub, Inc., a wholly-owned subsidiary of Li-Cycle, entered into a ground lease for the lands on which Li-Cycle intends to construct its Rochester Hub. Li-Cycle North America Hub, Inc.’s lease liabilities in connection with the ground lease will be as follows: (i) less than 1 year: $450,000; (ii) 1 – 3 years: $900,000; (iii) 3 – 5 years: $900,000; and (iv) more than 5 years: $7,050,000. Under a guaranty dated as of August 3, 2021, Li-Cycle has agreed to guarantee the performance of Li-Cycle North America Hub, Inc.’s obligations under the lease. |
(2) | On September 7, 2021, Li-Cycle Inc. entered into a warehouse lease for the Arizona Spoke. The Arizona Spoke warehouse lease covers approximately 67,000 square feet and has an original term of 5 years 3 months plus a renewal term totaling 5 additional years. The lease increases the Company’s contractual obligations by undiscounted cash flows of approximately $3.7 million over the original term of the lease. Li-Cycle has guaranteed the performance of Li-Cycle Inc.’s obligations under the lease. |
(3) | On September 8, 2021, Li-Cycle Inc. entered into a premises lease for the Alabama Spoke. The Alabama Spoke premises lease covers approximately 108,000 square feet and has an original term of 20 years plus multiple renewal terms totaling 10 additional years. The lease increases the Company’s contractual obligations by undiscounted cash flows of approximately $21.0 million over the original term of the lease. Li-Cycle has guaranteed the performance of Li-Cycle Inc.’s obligations under the lease. |
• | 163,179,555 common shares, which are listed on the New York Stock Exchange under the symbol “LICY”. |
• | 23,000,000 warrants (of which 15,000,000 are public warrants and 8,000,000 are private placement warrants), which are listed on the New York Stock Exchange under the symbol “LICY.WS”. Each warrant is exercisable for a common share at a price of $11.50, subject to adjustment. |
• | 5,296,553 stock options to purchase 5,296,553 common shares. |
Directors and Executive Officers |
Age |
Position/Title | ||||
Ajay Kochhar |
29 | Director and President and Chief Executive Officer | ||||
Tim Johnston |
35 | Director and Executive Chairman | ||||
Mark Wellings |
57 | Director | ||||
Rick Findlay |
64 | Director | ||||
Anthony Tse |
50 | Director | ||||
Alan Levande |
64 | Director | ||||
Scott Prochazka |
54 | Director | ||||
Bruce MacInnis |
62 | Chief Financial Officer | ||||
Kunal Phalpher |
37 | Chief Strategy Officer | ||||
Chris Biederman |
36 | Chief Technology Officer | ||||
Carl DeLuca |
53 | General Counsel and Corporate Secretary | ||||
Lauren Choate |
63 | Chief People Officer |
• | appointing our President and Chief Executive Officer; |
• | developing the corporate goals and objectives that our President and Chief Executive Officer is responsible for meeting and reviewing the performance of our President and Chief Executive Officer against such corporate goals and objectives; |
• | taking steps to satisfy itself as to the integrity of our President and Chief Executive Officer and other executive officers and that our President and Chief Executive Officer and other executive officers create a culture of integrity throughout the organization; |
• | reviewing and approving our code of conduct and reviewing and monitoring compliance with the code of conduct and our enterprise risk management processes; |
• | reviewing and approving management’s strategic and business plans and our financial objectives, plans and actions, including significant capital allocations and expenditures; and |
• | reviewing and approving material transactions not in the ordinary course of business. |
• | Ajay Kochhar, Chief Executive Officer; |
• | Tim Johnston, Executive Chairman; |
• | Bruce MacInnis, Chief Financial Officer; |
• | Kunal Phalpher, Chief Strategy Officer; and |
• | Chris Biederman, Chief Technology Officer. |
• | provide market-competitive compensation opportunities in order to attract and retain talented, high-performing and experienced executive officers, whose knowledge, skills and performance are critical to our success; |
• | motivate these executive officers to achieve our business objectives; |
• | align the interests of our executive officers with those of our shareholders by tying a meaningful portion of compensation directly to the long-term value and growth of our business; |
• | continue to foster an entrepreneurial and results-driven culture; and |
• | provide the appropriate balance of short and long-term incentives to encourage appropriate levels of risk-taking and prudent decision-making by the executive team. |
• | Share Options |
• | SARs |
• | Restricted Shares and RSUs non-transferable common shares that remain forfeitable unless and until specified conditions are met, and which may be subject to a purchase price. RSUs are contractual promises to deliver common shares in the future, which may also remain forfeitable unless and until specified conditions are met. |
• | Other Share or Cash Based Awards |
• | Dividend Equivalents |
Name and Principal Position |
Number of Shares Owned (#) |
Percentage of Total Shares Outstanding (%) (1) |
Special Voting Rights |
Number of Securities Underlying Options |
Option Exercise Price ($) |
Option Expiration Date |
||||||||||||||||||
Ajay Kochhar, President and Chief Executive Officer (2) |
24,908,409 | 15.26 | % | None | 159,640 | $ | 0.02 | April 11, 2023 | ||||||||||||||||
139,685 | $ | 0.37 | July 19, 2024 | |||||||||||||||||||||
176,871 | $ | 10.93 | August 10, 2031 | |||||||||||||||||||||
Tim Johnston, Executive Chairman (3) |
11,092,964 | 6.80 | % | None | 339,100 | $ | 0.02 | September 12, 2022 | ||||||||||||||||
159,640 | $ | 0.02 | April 11, 2023 | |||||||||||||||||||||
199,550 | $ | 0.37 | July 19, 2024 | |||||||||||||||||||||
176,871 | $ | 10.93 | August 10, 2031 | |||||||||||||||||||||
Bruce MacInnis, Chief Financial Officer |
— | — | None | 310,928 | $ | 10.93 | August 10, 2031 | |||||||||||||||||
Kunal Phalpher, Chief Commercial Officer |
304,272 | 0.19 | % | None | 159,640 | $ | 0.02 | April 11, 2023 | ||||||||||||||||
139,685 | $ | 0.37 | July 19, 2024 | |||||||||||||||||||||
67,365 | $ | 10.93 | August 10, 2031 | |||||||||||||||||||||
Chris Biederman, Chief Technology Officer |
106,141 | 0.07 | % | None | 67,365 | $ | 10.93 | August 10, 2031 | ||||||||||||||||
Carl DeLuca, General Counsel, Corporate Secretary |
— | — | None | 102,470 | $ | 10.93 | August 10, 2031 | |||||||||||||||||
Lauren Choate, Chief People Officer |
500 | — | None | 98,278 | $ | 10.93 | August 10, 2031 |
(1) | The ownership percentage set out in this column is based on a total of 163,179,555 outstanding common shares as of October 18, 2021, following the closing of the Business Combination, in each case rounded down to the nearest hundredth. |
(2) | The number of shares owned include 45,797 common shares owned directly by Mr. Kochhar and 24,862,612 common shares owned by 2829908 Delaware LLC, a Delaware limited liability company, which is a wholly-owned subsidiary of Maplebriar Holdings Inc., a corporation organized under the laws of the Province of Ontario (“Maplebriar Holdings”), having a sole shareholder, The Kochhar Family Trust, an irrevocable trust established under the laws of the Province of Ontario, Canada (the “Trust”). There is an oral agreement among Mr. Kochhar, the Trust, Maplebriar Holdings, and 2829908 Delaware LLC, that grants Mr. Kochhar the sole power to control the voting and disposition of the common shares of the Company held by 2829908 Delaware LLC. Mr. Kochhar is one of three trustees of the Trust, along with Mr. Kochhar’s brother and father, and the beneficiaries of the Trust are principally relatives of Mr. Kochhar. There is an oral agreement among Mr. Kochhar, the Trust, Maplebriar Holdings and 2829908 Delaware LLC that grants Mr. Kochhar the sole power to control the voting and disposition of the common shares held by 2829908 Delaware LLC. Mr. Kochhar is a Director and the President and Chief Executive Officer of the Company. |
(3) | The number of shares owned include 45,797 common shares owned directly by Mr. Johnston and 11,047,167 common shares owned by Keperra Holdings Ltd., a Guernsey corporation (“Keperra”). Mr. Johnston is the sole shareholder of Keperra. Artemis Nominees Limited is a nominee company that holds legal title to 100 shares of Keperra as nominee of and trustee for Mr. Johnston. Mr. Johnston is a Director and the Executive Chairman of the Company. |
• | each person known by us to be the beneficial owner of more than 5% of our issued and outstanding common shares; |
• | each of our executive officers and directors; and |
• | all our executive officers and directors as a group. |
Name and Address of Beneficial Owner |
Number of Common Shares Beneficially Owned |
Percentage of Outstanding Common Shares (1) |
||||||
Directors and Executive Officers |
||||||||
Ajay Kochhar (2) |
25,207,734 | 15.4 | % | |||||
Tim Johnston (3) |
11,851,254 | 7.3 | % | |||||
Mark Wellings (4) |
274,541 | * | ||||||
Rick Findlay (5) |
822,415 | * | ||||||
Anthony Tse (6) |
227,844 | * | ||||||
Alan Levande (7) |
933,660 | * | ||||||
Scott Prochazka (8) |
30,000 | * | ||||||
Bruce MacInnis (9) |
0 | * | ||||||
Kunal Phalpher (10) |
603,597 | * | ||||||
Chris Biederman (11) |
106,141 | * | ||||||
Carl DeLuca (12) |
0 | * | ||||||
Lauren Choate (13) |
500 | |||||||
All directors and executive officers post-Business Combination as a group (12 individuals) |
40,307,860 | 24.7 | % | |||||
Five Percent or Greater Shareholders |
||||||||
TechMet Limited (14) |
12,969,674 | 7.9 | % | |||||
Louis M. Bacon (15) |
13,030,398 | 8.0 | % |
* | Less than 1 percent |
(1) | Based upon a total of 163,179,555 common shares outstanding as of October 18, 2021. |
(2) | Ajay Kochhar’s 25,207,734 shares beneficially owned include (1) 45,797 common shares owned directly by Mr. Kochhar, (2) 24,862,612 common shares owned by 2829908 Delaware LLC, a Delaware limited liability company, which is a wholly-owned subsidiary of Maplebriar Holdings Inc., a corporation organized under the laws of the Province of Ontario (“Maplebriar Holdings”), having a sole shareholder, The Kochhar Family Trust, an irrevocable trust established under the laws of the Province of Ontario, Canada (the “Trust”), and (3) 299,325 common shares subject to stock options held by Mr. Kochhar which includes options to acquire (i) 159,640 common shares at a price of US$0.02 per share until April 11, 2023, and (ii) 139,685 common shares at a price of US$0.36 per share until July 19, 2024. There is an oral agreement among Mr. Kochhar, the Trust, Maplebriar Holding, and 2829908 Delaware LLC, that grants Mr. Kochhar the sole power to control the voting and disposition of the common shares of the Company held by 2829908 Delaware LLC. Mr. Kochhar is one of three trustees of the Trust, along with Mr. Kochhar’s brother and father, and the beneficiaries of the Trust are principally relatives of Mr. Kochhar. There is an oral agreement among Mr. Kochhar, the Trust, Maplebriar Holdings and 2829908 Delaware LLC that grants Mr. Kochhar the sole power to control the voting and disposition of the common shares held by 2829908 Delaware LLC. Mr. Kochhar is a Director and the President and Chief Executive Officer of the Company. |
(3) | Tim Johnston’s 11,851,254 shares beneficially owned include (1) 45,797 common shares owned directly by Mr. Johnston, (2) 11,047,167 common shares owned by Keperra Holdings Ltd., a Guernsey corporation (“Keperra”) and (3) 758,290 common shares subject to stock options, which includes options to acquire (i) 399,100 common shares at a price of US$0.02 per share until September 12, 2022, (ii) 159,640 common shares at a price of US$0.02 per share until April 11, 2023, and (iii) 199,550 common shares at a price of US$0.36 per share until July 19, 2024. Mr. Johnston is the sole shareholder of Keperra. Artemis Nominees Limited is a nominee company that holds legal title to 100 shares of Keperra as nominee of and trustee for Mr. Johnston. Mr. Johnston is a Director and the Executive Chairman of the Company. |
(4) | Mark Wellings’ 274,541 shares beneficially owned include (1) 7,304 common shares owned directly by Mr. Wellings, (2) 180,234 common shares owned by ZCR Corp., a holding company wholly owned by Mr. Wellings, 18,000 of which were purchased through the PIPE Financing, and (3) options to acquire 87,003 common shares at a price of US$0.37 per share until July 19, 2024. Mr. Wellings is a director of the Company. |
(5) | Rick Findlay’s 822,415 shares beneficially owned include (1) 523,090 owned directly, including 13,000 acquired through the PIPE Financing and (2) 299,325 common shares subject to stock options, which includes options to acquire (i) 159,640 common shares at a price of US$0.02 per share until April 11, 2023 and (ii) 139,685 common shares at a price of US$0.37 per share until July 19, 2024. Mr. Findlay is a Director of the Company. |
(6) | Of the 227,844 common shares beneficially owned by Anthony Tse, 18,000 were acquired through the PIPE Financing. Mr. Tse is a Director of the Company. |
(7) | Alan Levande beneficially owns 933,660 common shares. Mr. Levande was previously the Chief Executive Officer and Chairman of the board of directors of Peridot prior to the consummation of the Business Combination and is currently a Director of the Company. |
(8) | Scott Prochazka beneficially owns 30,000 common shares directly. Mr. Prochazka previously served as a Director of Peridot and is currently a Director of the Company. |
(9) | Bruce MacInnis is the Chief Financial Officer of the Company. |
(10) | Kunal Phalpher beneficially owns 603,597 common shares consisting of (1) 304,272 common shares owned directly by Mr. Phalpher, and (2) 299,325 common shares subject to stock options, which includes options to acquire (i) 159,640 common shares at a price of US$0.02 per share until April 11, 2023 and (ii) 139,685 common shares at a price of US$0.37 per share until July 19, 2024. Mr. Phalpher is the Chief Strategy Officer of the Company. |
(11) | Chris Biederman beneficially owns 106,141 common shares which he owns directly. Mr. Biederman is the Chief Technology Officer of the Company. |
(12) | Carl DeLuca is the General Counsel and Corporate Secretary of the Company. |
(13) | Lauren Choate is the Chief People Officer of the Company. |
(14) | According to a Schedule 13G filed with the SEC on August 17, 2021, as of August 17, 2021, TechMet Limited beneficially owned 12,969,674 common shares. The business address of TechMet Limited is Suite 22, 20 lower Baggott Street, Dublin 2, D02 X658 Ireland. |
(15) | According to a Schedule 13G filed with the SEC on August 20, 2021, as of August 20, 2021, Louis M. Bacon beneficially owned 13,030,398 common shares consisting of (1) 5,225,000 common shares held by MMF LT, LLC, a Delaware limited liability company (“MMF”) inclusive of 75,000 common shares issuable upon exercise of warrants to purchase common shares, and (2) 7,805,398 common shares held by Moore Strategic Ventures, LLC, a Delaware limited liability company (“MSV”). Kendall Capital Markets, LLC, a Delaware limited liability company (“KCM”) and MSV may be deemed to be the beneficial owner of the 7,805,398 common shares held by MSV. Each of Moore Capital Management, LP, a Delaware limited partnership (“MCM”), Moore Global Investments, LLC, a Delaware limited liability company (“MGI”), Moore Capital Advisors, L.L.C., a Delaware limited liability company (“MCA”), MMF and Mr. Bacon may be deemed to be the beneficial owner of 5,225,000 Shares held by MMF, inclusive of 75,000 common shares issuable upon exercise of warrants to purchase common shares. Mr. Bacon controls the general partner of MCM, is the chairman and director of MCA, and is the indirect majority owner of MMF. MCM, the investment manager of MMF, has voting and investment control over the shares held by MMF. MGI and MCA are the sole owners of MMF. KCM, the investment manager of MSV, has voting and investment control over the shares held by MSV. Louis M. Bacon controls KCM and may be deemed the beneficial owner of the shares held by MSV. The business address of MCM, MMF, MGI, MCA, MSV, KCM, and Mr. Bacon is Eleven Times Square, New York, New York 10036. |
Name of Selling Shareholder |
Securities Beneficially Owned prior to this Offering Common Shares |
Maximum Number of Securities to Be Sold in this Offering Common Shares |
Securities Beneficially Owned after this Offering Common Shares |
|||||||||
Spring Creek Capital, LLC (1) |
7,466,017 | 11,021,923 | 0 |
(1) | The number of securities shown as beneficially owned by Spring Creek Capital, LLC prior to this offering consists of the minimum number of shares that Spring Creek Capital, LLC is entitled to receive upon conversion of the note based on a conversion price of $13.43 per share. See “Summary — Background of the Offering” for a description of the terms of the Spring Creek Capital Convertible Note. The maximum number of securities to be sold in this offering as shown in this prospectus includes common shares issuable pursuant to the PIK provisions of the Spring Creek Capital Convertible Note. The address for Spring Creek Capital, LLC identified in this footnote is 4111 East 37th Street North, Wichita, Kansas 67220. |
• | purchases by a broker-dealer as principal and resale by such broker-dealer for its own account pursuant to this prospectus; |
• | ordinary brokerage transactions and transactions in which the broker solicits purchasers; |
• | block trades in which the broker-dealer so engaged will attempt to sell the securities as agent but may position and resell a portion of the block as principal to facilitate the transaction; |
• | an over-the-counter distribution in accordance with the rules of NYSE; |
• | through trading plans entered into by a selling shareholder pursuant to Rule 10b5-1 under the Exchange Act that are in place at the time of an offering pursuant to this prospectus and any applicable prospectus supplement hereto that provide for periodic sales of their securities on the basis of parameters described in such trading plans; |
• | to or through broker-dealers; |
• | in “at the market” offerings, as defined in Rule 415 under the Securities Act, at negotiated prices, |
• | at prices prevailing at the time of sale or at prices related to such prevailing market prices, including sales made directly on a national securities exchange or sales made through a market maker other than on an exchange or other similar offerings through sales agents; |
• | directly to purchasers, including through a specific bidding, auction or other process or in privately negotiated transactions; |
• | in options transactions; |
• | through a combination of any of the above methods of sale; or |
• | any other method permitted pursuant to applicable law. |
• | the specific securities to be offered and sold; |
• | the names of the selling shareholders; |
• | the respective purchase prices and public offering prices, the proceeds to be received from the sale, if any, and other material terms of the offering; |
• | settlement of short sales entered into after the date of this prospectus; |
• | the names of any participating agents or broker-dealers; and |
• | any applicable commissions, discounts, concessions and other items constituting compensation from the selling shareholders. |
• | the issuer of the securities that was formerly a shell company has ceased to be a shell company; |
• | the issuer of the securities is subject to the reporting requirements of Section 13 or 15(d) of the Exchange Act; |
• | the issuer of the securities has filed all Exchange Act reports and material required to be filed, as applicable, during the preceding 12 months (or such shorter period that the issuer was required to file such reports and materials), other than Form 8-K reports; and |
• | at least one year has elapsed from the time that the issuer filed current Form 10 type information with the SEC reflecting its status as an entity that is not a shell company. |
• | 1% of the total number of shares then outstanding, which was 375,000 shares on the record date; or |
• | the average weekly reported trading volume of the common shares during the four calendar weeks preceding the filing of a notice on Form 144 with respect to the sale. |
USD |
||||
SEC registration fee |
$ | 13,578.82 | ||
FINRA filing fee |
$ | 22,472.20 | ||
Legal fees and expenses |
* | |||
Accounting fees and expenses |
* | |||
Printing expenses |
* | |||
Transfer agent fees and expenses |
* | |||
Miscellaneous expenses |
* | |||
Total |
$ | * |
* |
The fees are calculated based on the securities offered and the number of issuances and accordingly cannot be defined at this time. |
Page |
||||
Index to Unaudited Financial Statements of Peridot Acquisition Corp. as of and for the Three and Six Months Ended June 30, 2021 |
||||
F-1 | ||||
F-2 | ||||
F-3 | ||||
F-4 | ||||
F-5 | ||||
Audited Financial Statements of Peridot Acquisition Corp. as of December 31, 2020 and for the period from July 31, 2020 (Inception) through December 31, 2020 |
||||
F-22 | ||||
F-23 | ||||
F-24 | ||||
F-25 | ||||
F-26 | ||||
F-27 | ||||
Index to Audited Financial Statements of Li-Cycle Corp. as of and for the years ended October 31, 2020 and October 31, 2019 |
||||
F-45 | ||||
F-46 | ||||
F-47 | ||||
F-48 | ||||
F-49 | ||||
F-50 | ||||
Unaudited Financial Statements of Li-Cycle Corp. as of and for the Three and Nine Months ended July 31, 2021 and 2020 |
||||
F-82 | ||||
F-83 | ||||
F-84 | ||||
F-85 | ||||
F-86 | ||||
Index to Audited Financial Statements of Li-Cycle Holdings Corp. as of May 31, 2021 |
||||
F-100 | ||||
F-101 | ||||
F-102 |
June 30, 2021 |
December 31, 2020 |
|||||||
(Unaudited) |
(Audited) |
|||||||
ASSETS |
||||||||
Current assets |
||||||||
Cash |
$ | 563 | $ | 971,607 | ||||
Prepaid expenses |
303,958 | 381,749 | ||||||
|
|
|
|
|||||
Total current assets |
304,521 | 1,353,356 | ||||||
Cash and marketable securities held in Trust Account |
300,154,668 | 300,074,392 | ||||||
|
|
|
|
|||||
TOTAL ASSETS |
$ |
300,459,189 |
$ |
301,427,748 |
||||
|
|
|
|
|||||
LIABILITIES AND SHAREHOLDERS’ EQUITY |
||||||||
Current liabilities |
||||||||
Accounts payable and accrued expenses |
$ | 5,386,827 | $ | 355,888 | ||||
|
|
|
|
|||||
Total current liabilities |
5,386,827 | 355,888 | ||||||
|
|
|
|
|||||
Warrant liability |
62,330,000 | 40,940,000 | ||||||
Deferred underwriting fee payable |
10,500,000 | 10,500,000 | ||||||
|
|
|
|
|||||
Total Liabilities |
78,216,827 |
51,795,888 |
||||||
|
|
|
|
|||||
Commitments and Contingencies |
||||||||
Class A ordinary shares subject to possible redemption 21,724,236 and 24,463,185 shares at redemption value of $10.00 per share as of June 30, 2021 and December 31, 2020, respectively |
217,242,360 | 244,631,850 | ||||||
Shareholders’ Equity |
||||||||
Preference shares, $0.0001 par value; 1,000,000 shares authorized; no shares issued and outstanding |
— | — | ||||||
Class A ordinary shares, $0.0001 par value; 300,000,000 shares authorized; 8,275,764 and 5,536,815 shares issued and outstanding (excluding 21,724,236 and 24,463,185 shares subject to possible redemption) as of June 30, 2021 and December 31, 2020, respectively. |
828 | 554 | ||||||
Class B ordinary shares, $0.0001 par value; 30,000,000 shares authorized; 7,500,000 shares issued and outstanding as of June 30, 2021 and December 31, 2020, respectively |
750 | 750 | ||||||
Additional paid-in capital |
56,008,334 | 28,619,118 | ||||||
Accumulated deficit |
(51,009,910 | ) | (23,620,412 | ) | ||||
|
|
|
|
|||||
Total Shareholders’ Equity |
5,000,002 |
5,000,010 |
||||||
|
|
|
|
|||||
TOTAL LIABILITIES AND SHAREHOLDERS’ EQUITY |
$ |
300,459,189 |
$ |
301,427,748 |
||||
|
|
|
|
Three Months Ended June 30, 2021 |
Six Months Ended June 30, 2021 |
|||||||
Operational costs |
$ | 1,809,124 | $ | 6,079,798 | ||||
|
|
|
|
|||||
Loss from operations |
(1,809,124 | ) | (6,079,798 | ) | ||||
Other expense: |
||||||||
Interest earned on marketable securities held in Trust Account |
8,284 | 80,276 | ||||||
Interest income – bank |
2 | 24 | ||||||
Change in fair value of warrant liability |
(23,690,000 | ) | (21,390,000 | ) | ||||
|
|
|
|
|||||
Other expense, net |
(23,681,714 | ) | (21,309,700 | ) | ||||
Net loss |
$ |
(25,490,838 |
) |
$ |
(27,389,498 |
) | ||
|
|
|
|
|||||
Weighted average shares outstanding, Class A redeemable ordinary shares |
30,000,000 | 30,000,000 | ||||||
|
|
|
|
|||||
Basic and diluted income per share, Class A redeemable ordinary shares |
$ |
0.00 |
$ |
0.00 |
||||
|
|
|
|
|||||
Weighted average shares outstanding, Class A and Class B non-redeemable ordinary shares |
7,500,000 | 7,500,000 | ||||||
|
|
|
|
|||||
Basic and diluted net loss per share, Class B non-redeemable ordinary shares |
$ |
(3.40 |
) |
$ |
(3.66 |
) | ||
|
|
|
|
Class A Ordinary Shares |
Class B Ordinary Shares |
Additional Paid-in Capital |
Accumulated Deficit |
Total Shareholders’ Equity |
||||||||||||||||||||||||
Shares |
Amount |
Shares |
Amount |
|||||||||||||||||||||||||
Balance — January 1, 2021 |
5,536,815 |
$ |
554 |
7,500,000 |
$ |
750 |
$ |
28,619,118 |
$ |
(23,620,412 |
) |
$ |
5,000,010 |
|||||||||||||||
Change in value Class A ordinary shares subject to redemption |
189,866 | 19 | — | — | 1,898,641 | — | 1,898,660 | |||||||||||||||||||||
Net income |
— | — | — | — | — | (1,898,660 | ) | (1,898,660 | ) | |||||||||||||||||||
|
|
|
|
|
|
|
|
|
|
|
|
|
|
|||||||||||||||
Balance – March 31, 2021 (unaudited) |
5,726,681 |
$ |
573 |
7,500,000 |
$ |
750 |
$ |
30,517,759 |
$ |
(25,519,072 |
) |
$ |
5,000,010 |
|||||||||||||||
Change in value of Class A ordinary shares subject to redemption |
2,549,083 | 255 | — | — | 25,490,575 | — | 25,490,830 | |||||||||||||||||||||
Net loss |
— | — | — | — | — | (25,490,838 | ) | (25,490,838 | ) | |||||||||||||||||||
|
|
|
|
|
|
|
|
|
|
|
|
|
|
|||||||||||||||
Balance – June 30, 2021 |
8,275,764 |
$ |
828 |
7,500,000 |
$ |
750 |
$ |
56,008,334 |
$ |
(51,009,910 |
) |
$ |
5,000,002 |
|||||||||||||||
|
|
|
|
|
|
|
|
|
|
|
|
|
|
Cash Flows from Operating Activities: |
||||
Net loss |
$ | (27,389,498 | ) | |
Adjustments to reconcile net loss to net cash used in operating activities: |
||||
Change in fair value of warrant liability |
21,390,000 | |||
Interest earned on marketable securities held in Trust Account |
(80,276 | ) | ||
Changes in operating assets and liabilities: |
||||
Prepaid expenses |
77,791 | |||
Accounts payable and accrued expenses |
5,030,939 | |||
|
|
|||
Net cash used in operating activities |
(971,044 |
) | ||
|
|
|||
Net Decrease in Cash |
(971,044 |
) | ||
Cash – Beginning of period |
971,607 | |||
|
|
|||
Cash – End of period |
$ |
563 |
||
|
|
|||
Non-Cash investing and financing activities: |
||||
Change in value of Class A ordinary shares subject to possible redemption |
$ | (27,389,489 | ) | |
|
|
Three Months Ended June 30, 2021 |
Six Months Ended June 30, 2021 |
|||||||
Redeemable Class A Ordinary Shares |
||||||||
Numerator: Earnings allocable to Redeemable Class A Ordinary Shares |
||||||||
Interest Income |
$ | 8,286 | $ | 80,300 | ||||
|
|
|
|
|||||
Net Income allocable to shares subject to redemption |
$ | 8,286 | $ | 80,300 | ||||
Denominator: Weighted Average Redeemable Class A Ordinary Shares |
||||||||
Redeemable Class A Ordinary Shares, Basic and Diluted |
30,000,000 | 30,000,000 | ||||||
Earnings/Basic and Diluted Redeemable Class A Ordinary Shares |
$ | 0.00 |
$ | 0.00 |
||||
Non-Redeemable Class B Ordinary Shares |
||||||||
Numerator: Net Loss minus Redeemable Net Earnings |
||||||||
Net Loss |
$ | (25,490,838 | ) | $ | (27,389,498 | ) | ||
Less: Redeemable Net Earnings |
(8,286 | ) | (80,300 | ) | ||||
|
|
|
|
|||||
Non-Redeemable Net Loss |
$ | (25,499,124 | ) | $ | (27,469,798 | ) | ||
Denominator: Weighted Average Non-Redeemable Class B Ordinary Shares |
||||||||
Non-Redeemable Class B Ordinary Shares, Basic and Diluted |
7,500,000 | 7,500,000 | ||||||
Loss/Basic and Diluted Non-Redeemable Class B Ordinary Shares |
$ | (3.40 |
) |
$ | (3.66 |
) |
• | in whole and not in part; |
• | at a price of $0.01 per warrant; |
• | upon a minimum of 30 days’ prior written notice of redemption to each warrant holder; and |
• | if, and only if, the closing price of the Class A ordinary shares equals or exceeds $18.00 per share (as adjusted for share sub-divisions, share dividends, reorganizations, recapitalizations and the like) for any 20 trading days within a 30-trading day period ending three trading days before the Company sends the notice of redemption to the warrant holders. |
• | in whole and not in part; |
• | at $0.10 per warrant upon a minimum of 30 days’ prior written notice of redemption; provided that holders will be able to exercise their warrants on a cashless basis prior to redemption and receive that number of shares determined based on the redemption date and the fair market value of the Class A ordinary shares; |
• | if, and only if, the closing price of the Class A ordinary shares equals or exceeds $10.00 per share (as adjusted for share sub-divisions, share dividends, reorganizations, recapitalizations and the like) for any 20 trading days within a 30-trading day period ending three trading days before the Company sends the notice of redemption to the warrant holders; and |
• | if the closing price of the Class A ordinary shares for any 20 trading days within a 30-trading day period ending on the third trading day prior to the date on which the Company sends the notice of redemption to the warrant holders is less than $18.00 per share (as adjusted for share sub-divisions, share dividends, reorganizations, recapitalizations and the like), the Private Placement Warrants must also be concurrently called for redemption on the same terms as the outstanding Public Warrants, as described above. |
Held-To-Maturity |
Level |
Amortized Cost |
Gross Holding Gain |
Fair Value |
||||||||||||||
Assets: |
||||||||||||||||||
June 30, 2021 |
U.S. Treasury Securities (Mature on 4/1/2021) | 1 | $ | — | $ | — | $ | 300,154,484 | ||||||||||
December 31, 2020 |
U.S. Treasury Securities (Mature on 4/1/2021) | 1 | $ | 300,074,208 | $ | 15,764 | $ | 300,089,972 | ||||||||||
Liabilities: |
||||||||||||||||||
June 30, 2021 |
Warrant Liability – Public Warrants | 1 | $ | 40,650,000 | ||||||||||||||
June 30, 2021 |
Warrant Liability – Private Placement Warrants | 2 | $ | 21,680,000 | ||||||||||||||
December 31, 2020 |
Warrant Liability – Public Warrants | 1 | $ | 26,700,000 | ||||||||||||||
December 31, 2020 |
Warrant Liability – Private Placement Warrants | 2 | $ | 14,240,000 |
Private Placement |
Public |
Warrant Liabilities |
||||||||||
Fair value as of January 1, 2021 |
$ | 14,240,000 | $ | 26,700,000 | $ | 40,940,000 | ||||||
Change in valuation inputs or other assumptions |
7,440,000 | 13,950,000 | 21,390,000 | |||||||||
Fair value as of June 30, 2021 |
$ | 21,680,000 | $ | 40,650,000 | $ | 62,330,000 |
• | Peridot will continue as a corporation existing under the laws of the Province of Ontario (the “Continuance” and Peridot as so continued, “Peridot Ontario”), and in connection therewith, (x) the Class A ordinary shares, par value $0.0001 per share, of Peridot (the “Class A Shares”), the Class B ordinary shares, par value $0.0001 per share, of Peridot (the “Class B Shares”), and the warrants to purchase Class A Shares, in each case, issued and outstanding immediately prior to the Continuance will convert into an equal number of Class A common shares, Class B common shares and warrants to purchase Class A common shares of Peridot Ontario; |
• | following the Continuance and any forfeiture by Peridot Acquisition Sponsor, LLC, a Delaware limited liability company (the “Sponsor”), of Class B common shares of Peridot Ontario, as described below under “Sponsor Letter Agreement”, the Class B common shares will convert into Class A common shares of Peridot Ontario on a one-for-one basis; |
• | Peridot Ontario and Newco will amalgamate (the “Amalgamation” and Peridot Ontario and Newco as so amalgamated, “Amalco”), and in connection therewith, the Class A common shares and warrants to purchase Class A common shares will convert into an equivalent number of common shares of Amalco (the “Amalco Shares”) and warrants to purchase an equivalent number of Amalco Shares; and |
• | following the Amalgamation, the preferred shares of Li-Cycle will convert into common shares of Li-Cycle and, on the terms and subject to the conditions set forth in a Plan of Arrangement, Amalco will acquire all of the issued and outstanding common shares of Li-Cycle from Li-Cycle’s shareholders |
ASSETS |
||||
Current assets |
||||
Cash |
$ | 971,607 | ||
Prepaid expenses |
381,749 | |||
|
|
|||
Total Current Assets |
1,353,356 | |||
Cash and marketable securities held in Trust Account |
300,074,392 | |||
|
|
|||
TOTAL ASSETS |
$ |
301,427,748 |
||
|
|
|||
LIABILITIES AND SHAREHOLDERS’ EQUITY |
||||
Current liabilities |
||||
Accrued expenses |
$ | 355,888 | ||
|
|
|||
Total Current Liabilities |
355,888 | |||
|
|
|||
Warrant liability |
40,940,000 | |||
Deferred underwriting fee payable |
10,500,000 | |||
|
|
|||
Total Liabilities |
51,795,888 |
|||
|
|
|||
Commitments and Contingencies |
||||
Class A ordinary shares subject to possible redemption, 24,463,185 shares at $10.00 per share |
244,631,850 | |||
Shareholders’ Equity |
||||
Preference shares, $0.0001 par value; 1,000,000 shares authorized; no shares issued and outstanding |
— | |||
Class A ordinary shares, $0.0001 par value; 300,000,000 shares authorized; 5,536,815 shares issued and outstanding (excluding 24,463,185 shares subject to possible redemption) |
554 | |||
Class B ordinary shares, $0.0001 par value; 30,000,000 shares authorized; 7,500,000 shares issued and outstanding |
750 | |||
Additional paid-in capital |
28,619,118 | |||
Accumulated deficit |
(23,620,412 | ) | ||
|
|
|||
Total Shareholders’ Equity |
5,000,010 |
|||
|
|
|||
TOTAL LIABILITIES AND SHAREHOLDERS’ EQUITY |
$ |
301,427,748 |
||
|
|
Formation and operational costs |
$ | 460,977 | ||
|
|
|||
Loss from operations |
(460,977 |
) | ||
Other income (expense): |
||||
Interest earned - bank |
20 | |||
Interest earned on marketable securities held in Trust Account |
74,392 | |||
Change in fair value of warrant liability |
(22,540,000 | ) | ||
Offering costs allocated to warrant liability |
(693,847 | ) | ||
|
|
|||
Net Loss |
$ |
(23,620,412 |
) | |
|
|
|||
Weighted average shares outstanding of Class A redeemable ordinary shares |
30,000,000 | |||
|
|
|||
Basic and diluted net income per share, Class A |
$ |
0.00 |
||
|
|
|||
Weighted average shares outstanding of Class B non-redeemable ordinary shares |
7,500,000 | |||
|
|
|||
Basic and diluted net loss per share, Class B |
$ |
(3.16 |
) | |
|
|
Class A Ordinary Shares |
Class B Ordinary Shares |
Additional Paid in |
Accumulated |
Total Shareholders’ |
||||||||||||||||||||||||
Shares |
Amount |
Shares |
Amount |
Capital |
Deficit |
Equity |
||||||||||||||||||||||
Balance — July 31, 2020 (inception) |
— |
$ |
— |
— |
$ |
— |
$ |
— |
$ |
— |
$ |
— |
||||||||||||||||
Issuance of Class B ordinary shares to Sponsor |
— | — | 8,625,000 | 863 | 24,137 | — |
25,000 | |||||||||||||||||||||
Sale of 30,000,000 Units, net of underwriting discounts, offering costs and fair value of warrant liability |
30,000,000 | 3,000 | — | — | 271,624,272 | — | 271,627,272 | |||||||||||||||||||||
Excess of cash received over fair value of private placement warrants |
— | — | — | — | 1,600,000 | — | 1,600,000 | |||||||||||||||||||||
Forfeiture of Founder Shares |
— | — | (1,125,000 | ) | (113 | ) | 113 | — | — | |||||||||||||||||||
Ordinary shares subject to possible redemption |
(24,463,185 | ) | (2,446 | ) | — | — | (244,629,404 | ) | — | (244,631,850 | ) | |||||||||||||||||
Net loss |
— | — | — | — | — | (23,620,412 | ) | (23,620,412 | ) | |||||||||||||||||||
|
|
|
|
|
|
|
|
|
|
|
|
|
|
|||||||||||||||
Balance — December 31, 2020 |
5,536,815 |
$ |
554 |
7,500,000 |
$ |
750 |
$ |
28,619,118 |
$ |
(23,620,412 |
) |
$ |
5,000,010 |
|||||||||||||||
|
|
|
|
|
|
|
|
|
|
|
|
|
|
Cash Flows from Operating Activities: |
||||
Net loss |
$ | (23,620,412 | ) | |
Adjustments to reconcile net loss to net cash used in operating activities: |
||||
Formation costs paid by Sponsor |
5,000 | |||
Interest earned on marketable securities held in Trust Account |
(74,392 | ) | ||
Change in fair value of warrant liability |
22,540,000 | |||
Offering costs allocable to warrant liability |
693,847 | |||
Changes in operating assets and liabilities: |
||||
Prepaid expenses |
(381,749 | ) | ||
Accrued expenses |
355,888 | |||
|
|
|||
Net cash used in operating activities |
(481,818 |
) | ||
|
|
|||
Cash Flows from Investing Activities: |
||||
Investment of cash in Trust Account |
(300,000,000 | ) | ||
|
|
|||
Net cash used in investing activities |
(300,000,000 |
) | ||
|
|
|||
Cash Flows from Financing Activities: |
||||
Proceeds from sale of Units, net of underwriting discounts paid |
294,000,000 | |||
Proceeds from sale of Private Placement Warrants |
8,000,000 | |||
Proceeds from promissory note – related party |
67,081 | |||
Repayment of promissory note – related party |
(119,331 | ) | ||
Payments of offering costs |
(494,325 | ) | ||
|
|
|||
Net cash provided by financing activities |
301,453,425 |
|||
|
|
|||
Net Change in Cash |
971,607 |
|||
Cash – Beginning |
— | |||
|
|
|||
Cash – Ending |
$ |
971,607 |
||
|
|
|||
Non-Cash Investing and Financing Activities: |
||||
Offering costs paid directly by Sponsor from proceeds of issuance of Class B ordinary shares |
$ | 20,000 | ||
|
|
|||
Initial classification of ordinary shares subject to possible redemption |
$ | 267,553,420 | ||
|
|
|||
Change in value of ordinary shares subject to possible redemption |
$ | (22,921,570 | ) | |
|
|
|||
Initial classification of warrant liability |
$ | 18,400,000 | ||
|
|
|||
Deferred underwriting fee payable |
$ | 10,500,000 | ||
|
|
|||
Payment of offering costs through promissory note – related party |
$ | 52,250 | ||
|
|
F-28 |
F-29 |
F-30 |
As Previously Reported |
Adjustments |
As Restated |
||||||||||
Balance sheet as of September 28, 2020 (audited) |
||||||||||||
Warrant Liability |
$ | — | $ | 18,400,000 | $ | 18,400,000 | ||||||
Class A Ordinary Shares Subject to Possible Redemption |
285,953,420 | (18,400,000 | ) | 267,553,420 | ||||||||
Class A Ordinary Shares |
140 | 184 | 324 | |||||||||
Additional Paid-in Capital |
5,004,002 | 693,663 | 5,697,665 | |||||||||
Accumulated Deficit |
(5,000 | ) | (693,847 | ) | (698,847 | ) | ||||||
Balance sheet as of September 30, 2020 (unaudited) |
||||||||||||
Warrant Liability |
$ | — | $ | 18,860,000 | $ | 18,860,000 | ||||||
Class A Ordinary Shares Subject to Possible Redemption |
285,947,270 | (18,860,000 | ) | 267,087,270 | ||||||||
Class A Ordinary Shares |
141 | 188 | 329 | |||||||||
Additional Paid-in Capital |
5,010,151 | 1,153,659 | 6,163,810 | |||||||||
Accumulated Deficit |
(11,151 | ) | (1,153,847 | ) | (1,164,998 | ) | ||||||
Balance sheet as of December 31, 2020 (audited) |
||||||||||||
Warrant Liability |
$ | — | $ | 40,940,000 | $ | 40,940,000 | ||||||
Class A Ordinary Shares Subject to Possible Redemption |
285,571,850 | (40,940,000 | ) | 244,631,850 | ||||||||
Class A Ordinary Shares |
144 | 410 | 554 | |||||||||
Additional Paid-in Capital |
5,385,681 | 23,233,437 | 28,619,118 | |||||||||
Accumulated Deficit |
(386,565 | ) | (23,233,847 | ) | (23,620,412 | ) | ||||||
Statement of Operations from July 31, 2020 (inception) to September 30, 2020 (unaudited) |
||||||||||||
Change in fair value of warrant liability |
$ | — | $ | (460,000 | ) | $ | (460,000 | ) | ||||
Net loss |
(11,151 | ) | (1,153,847 | ) | (1,164,998 | ) | ||||||
Weighted average shares outstanding of Class A redeemable ordinary shares |
30,000,000 | — | 30,000,000 | |||||||||
Basic and diluted net loss per share, Class A |
(0.00 | ) | — | (0.00 | ) | |||||||
Weighted average shares outstanding of Class B non-redeemable ordinary shares |
7,500,000 | — | 7,500,000 | |||||||||
Basic and diluted net loss per share, Class B |
(0.00 | ) | (0.16 | ) | (0.16 | ) | ||||||
Statement of Operations from July 31, 2020 (inception) to December 31, 2020 (audited) |
||||||||||||
Change in fair value of warrant liability |
$ | — | $ | 22,540,000 | $ | (22,540,000 | ) |
F-31 |
As Previously Reported |
Adjustments |
As Restated |
||||||||||
Net loss |
(386,565 | ) | (23,233,847 | ) | (23,620,412 | ) | ||||||
Weighted average shares outstanding of Class A redeemable ordinary shares |
30,000,000 | — | 30,000,000 | |||||||||
Basic and diluted net earnings per share, Class A |
0.00 | — | 0.00 | |||||||||
Weighted average shares outstanding of Class B non-redeemable ordinary shares |
7,500,000 | — | 7,500,000 | |||||||||
Basic and diluted net loss per share, Class B |
(0.06 | ) | (3.10 | ) | (3.16 | ) | ||||||
Cash Flow Statement for the Period from July 31, 2020 (inception) to September 30, 2020 (unaudited) |
||||||||||||
Net income (loss) |
$ | (11,151 | ) | $ | (1,153,847 | ) | $ | (1,164,998 | ) | |||
Change in fair value of warrant liability |
— | (460,000 | ) | (460,000 | ) | |||||||
Offering costs allocated to warrant liability |
— | 693,847 | 693,847 | |||||||||
Initial classification of warrant liability |
— | 18,400,000 | 18,400,000 | |||||||||
Initial classification of common stock subject to possible redemption |
285,953,420 | (18,400,000 | ) | 267,553,420 | ||||||||
Change in value of common stock subject to possible redemption |
(6,150 | ) | (460,000 | ) | (466,150 | ) | ||||||
Cash Flow Statement for the Period from July 31, 2020 (inception) to December 31, 2020 (audited) |
||||||||||||
Net income (loss) |
(386,565 | ) | (23,233,847 | ) | (23,620,412 | ) | ||||||
Change in fair value of warrant liability |
— | 22,540,000 | 22,540,000 | |||||||||
Offering costs allocated to warrant liability |
— | 693,847 | 693,847 | |||||||||
Initial classification of warrant liability |
— | 18,400,000 | 18,400,000 | |||||||||
Initial classification of common stock subject to possible redemption |
285,953,420 | (18,400,000 | ) | 267,553,420 | ||||||||
Change in value of common stock subject to possible redemption |
(381,570 | ) | (22,540,000 | ) | (22,921,570 | ) |
F-32 |
F-33 |
F-34 |
For the Period from July 31, 2020 (inception) Through December 31, 2020 |
||||
Redeemable Class A Ordinary Shares |
||||
Numerator: Earnings allocable to Redeemable Class A Ordinary Shares |
||||
Interest Income |
$ | 74,412 | ||
|
|
|||
Net Earnings |
$ |
74,412 |
||
|
|
|||
Denominator: Weighted Average Redeemable Class A Ordinary Shares |
||||
Redeemable Class A Ordinary Shares, Basic and Diluted |
30,000,000 | |||
Earnings/Basic and Diluted Redeemable Class A Ordinary Shares |
0.00 |
|||
|
|
|||
Non-Redeemable Class B Ordinary Shares |
||||
Numerator: Net Loss minus Redeemable Net Earnings |
||||
Net Loss |
$ | (23,620,412 | ) | |
Redeemable Net Earnings |
$ | (74,412 | ) | |
|
|
|||
Non-Redeemable Net Loss |
$ |
(23,694,824 |
) | |
|
|
|||
Denominator: Weighted Average Non-Redeemable Class B Ordinary Shares |
||||
Non-Redeemable Class B Ordinary Shares, Basic and Diluted |
7,500,000 | |||
Loss/Basic and Diluted Non-Redeemable Class B Ordinary Shares |
$ |
(3.16 |
) | |
|
|
F-35 |
F-36 |
F-37 |
F-38 |
• | in whole and not in part; |
F-39 |
• | at a price of $0.01 per warrant; |
• | upon a minimum of 30 days’ prior written notice of redemption to each warrant holder; and |
• | if, and only if, the closing price of the Class A ordinary shares equals or exceeds $18.00 per share (as adjusted for share sub-divisions, share dividends, reorganizations, recapitalizations and the like) for any 20 trading days within a 30-trading day period ending three trading days before the Company sends the notice of redemption to the warrant holders. |
• | in whole and not in part; |
• | at $0.10 per warrant upon a minimum of 30 days’ prior written notice of redemption; provided that holders will be able to exercise their warrants on a cashless basis prior to redemption and receive that number of shares determined based on the redemption date and the fair market value of the Class A ordinary shares; |
• | if, and only if, the closing price of the Class A ordinary shares equals or exceeds $10.00 per share (as adjusted for share sub-divisions, share dividends, reorganizations, recapitalizations and the like) for any 20 trading days within a 30-trading day period ending three trading days before the Company sends the notice of redemption to the warrant holders; and |
• | if the closing price of the Class A ordinary shares for any 20 trading days within a 30-trading day period ending on the third trading day prior to the date on which the Company sends the notice of redemption to the warrant holders is less than $18.00 per share (as adjusted for share sub-divisions, share dividends, reorganizations, recapitalizations and the like), the Private Placement Warrants must also be concurrently called for redemption on the same terms as the outstanding Public Warrants, as described above. |
F-40 |
Level 1: | Quoted prices in active markets for identical assets or liabilities. An active market for an asset or liability is a market in which transactions for the asset or liability occur with sufficient frequency and volume to provide pricing information on an ongoing basis. | |
Level 2: | Observable inputs other than Level 1 inputs. Examples of Level 2 inputs include quoted prices in active markets for similar assets or liabilities and quoted prices for identical assets or liabilities in markets that are not active. | |
Level 3: | Unobservable inputs based on our assessment of the assumptions that market participants would use in pricing the asset or liability. |
F-41 |
Held-To-Maturity |
Level |
Amortized Cost |
Gross Holding Gain |
Fair Value |
||||||||||||||||
Assets: |
||||||||||||||||||||
U.S. Treasuries held in Trust Account |
Mature on 04/01/2021 | 1 | $ | 300,074,208 | $ | 15,764 | $ | 300,089,972 | ||||||||||||
Liabilities: |
||||||||||||||||||||
Public Warrants |
1 | $ | 26,700,000 | |||||||||||||||||
Private Placement Warrants |
2 | $ | 14,240,000 |
Input |
September 28, 2020 (Initial Measurement) |
|||
Risk-free interest rate |
0.4 | % | ||
Expected term to business combination (years) |
1 | |||
Expected volatility |
15.0 | % | ||
Exercise price |
$ | 11.50 | ||
Fair value of Units |
$ | 9.95 |
F-42 |
Private Placement |
Level |
Public |
Level |
Warrant Liabilities |
||||||||||||||||
Fair value |
$ | — | $ | — | $ | — | ||||||||||||||
Initial measurement on September 28, 2020 |
6,400,000 | 3 | 12,000,000 | 3 | 18,400,000 | |||||||||||||||
Fair Value as of September 30, 2020 |
6,560,000 | 3 | 12,300,000 | 3 | 18,860,000 | |||||||||||||||
Change in valuation inputs or other assumptions |
7,680,000 | 14,400,000 | 22,080,000 | |||||||||||||||||
Fair value as of December 31, 2020 |
$ | 14,240,000 | 2 | $ | 26,700,000 | 1 | $ | 40,940,000 |
• | Peridot will continue as a corporation existing under the laws of the Province of Ontario (the “Continuance” and Peridot as so continued, “Peridot Ontario”), and in connection therewith, |
F-43 |
(x) the Class A ordinary shares, par value $0.0001 per share, of Peridot (the “Class A Shares”), the Class B ordinary shares, par value $0.0001 per share, of Peridot (the “Class B Shares”), and the warrants to purchase Class A Shares, in each case, issued and outstanding immediately prior to the Continuance will convert into an equal number of Class A common shares, Class B common shares and warrants to purchase Class A common shares of Peridot Ontario; |
• | following the Continuance and any forfeiture by Peridot Acquisition Sponsor, LLC, a Delaware limited liability company (the “Sponsor”), of Class B common shares of Peridot Ontario, as described below under “Sponsor Letter Agreement”, the Class B common shares will convert into Class A common shares of Peridot Ontario on a one-for-one |
• | Peridot Ontario and Newco will amalgamate (the “Amalgamation” and Peridot Ontario and Newco as so amalgamated, “Amalco”), and in connection therewith, the Class A common shares and warrants to purchase Class A common shares will convert into an equivalent number of common shares of Amalco (the “Amalco Shares”) and warrants to purchase an equivalent number of Amalco Shares; and |
• | following the Amalgamation, the preferred shares of Li-Cycle will convert into common shares of Li-Cycle and, on the terms and subject to the conditions set forth in a Plan of Arrangement, Amalco will acquire all of the issued and outstanding common shares of Li-Cycle from Li-Cycle’s shareholders in exchange for Amalco Shares having an aggregate equity value of $975 million assuming a $10 per share equity value (the “Share Exchange”). |
F-44 |
2020 |
2019 | |||||||||||
Notes | $ |
$ | ||||||||||
Assets |
||||||||||||
Current assets |
||||||||||||
Cash |
||||||||||||
Accounts receivable |
4 | |||||||||||
Prepayments and deposits |
||||||||||||
Inventory |
5 | |||||||||||
|
|
|
|
|||||||||
|
|
|
|
|||||||||
Non-current assets |
||||||||||||
Plant and equipment |
6 | |||||||||||
Right of use assets |
11 | — | ||||||||||
|
|
|
|
|||||||||
|
|
|
|
|||||||||
|
|
|
|
|||||||||
Liabilities |
||||||||||||
Current liabilities |
||||||||||||
Accounts payable and accrued liabilities |
14 | |||||||||||
Restricted share units |
9 | — | ||||||||||
Lease liabilities |
12 | — | ||||||||||
Loans payable |
8 | |||||||||||
Deferred government funding |
18 | — |
||||||||||
|
|
|
|
|||||||||
|
|
|
|
|||||||||
Non-current liabilities |
||||||||||||
Lease liabilities |
12 | — | ||||||||||
Loan payable |
8 | — | ||||||||||
Restoration provisions |
13 | — | ||||||||||
Convertible debt |
8 | — |
||||||||||
Conversion feature of convertible debt |
8 | — |
||||||||||
|
|
|
|
|||||||||
|
|
|
|
|||||||||
|
|
|
|
|||||||||
Shareholders’ equity |
||||||||||||
Share capital |
9 | |||||||||||
Contributed surplus |
9 | |||||||||||
Accumulated deficit |
( |
) |
( |
) | ||||||||
Accumulated other comprehensive loss |
( |
) |
( |
) | ||||||||
|
|
|
|
|||||||||
|
|
|
|
|||||||||
|
|
|
|
2020 |
2019 | 2018 | ||||||||||||
Notes | $ |
$ | $ | |||||||||||
Revenue |
||||||||||||||
Product sales |
— | — | ||||||||||||
Recycling services |
||||||||||||||
|
|
|
|
|
|
|||||||||
Expenses |
||||||||||||||
Professional fees |
||||||||||||||
Employee salaries and benefits, net |
18 | |||||||||||||
Depreciation |
— | |||||||||||||
Research and development, net |
18 | |||||||||||||
Raw materials and supplies |
— | — | ||||||||||||
Plant facilities |
— | — | ||||||||||||
Marketing |
||||||||||||||
Share-based compensation |
9 | |||||||||||||
Office and administrative |
||||||||||||||
Travel and entertainment |
||||||||||||||
Freight and shipping |
— | |||||||||||||
|
|
|
|
|
|
|||||||||
|
|
|
|
|
|
|||||||||
Loss from operations |
( |
) |
( |
) | ( |
) | ||||||||
|
|
|
|
|
|
|||||||||
Other (income) expense |
||||||||||||||
Interest expense |
||||||||||||||
Interest income |
( |
) |
( |
) | ( |
) | ||||||||
Fair value loss on restricted share units |
— | — | ||||||||||||
Foreign exchange gain |
( |
) |
— | — | ||||||||||
|
|
|
|
|
|
|||||||||
|
|
|
|
|
|
|||||||||
Net loss |
( |
) |
( |
) | ( |
) | ||||||||
Other comprehensive income (loss) |
||||||||||||||
Foreign currency translation adjustment |
( |
) |
( |
) | ||||||||||
|
|
|
|
|
|
|||||||||
Comprehensive loss |
( |
) |
( |
) | ( |
) | ||||||||
|
|
|
|
|
|
|||||||||
Loss per common share - basic and diluted |
16 | ( |
) |
( |
) | ( |
) | |||||||
|
|
|
|
|
|
Number of common shares |
Share capital Amounts |
Contributed surplus |
Accumulated deficit |
Accumulated other comprehensive income (loss) |
Total | |||||||||||||||||||||||
Notes | $ | $ | $ | $ | $ | |||||||||||||||||||||||
Balance, October 31, 2017 |
— | ( |
) | ( |
) | |||||||||||||||||||||||
Share-based compensation |
— | — | — | — | ||||||||||||||||||||||||
Shares issued for cash |
— | — | — | |||||||||||||||||||||||||
Share issue costs |
— | ( |
) | — | — | — | ( |
) | ||||||||||||||||||||
Comprehensive income (loss) |
— | — | — | ( |
) | ( |
) | |||||||||||||||||||||
|
|
|
|
|
|
|
|
|
|
|
|
|||||||||||||||||
Balance, October 31, 2018 |
( |
) | ( |
) | ||||||||||||||||||||||||
Share-based compensation |
— | — | — | — | ||||||||||||||||||||||||
Shares issued for cash |
— | — | — | |||||||||||||||||||||||||
Shares issued for non-cash costs |
— | — | — | |||||||||||||||||||||||||
Comprehensive loss |
— | — | — | ( |
) | ( |
) | ( |
) | |||||||||||||||||||
|
|
|
|
|
|
|
|
|
|
|
|
|||||||||||||||||
Balance, October 31, 2019 |
( |
) | ( |
) | ||||||||||||||||||||||||
Share-based compensation |
9 | — |
— |
— |
— |
|||||||||||||||||||||||
Shares issued for cash |
9 | — |
— |
— |
||||||||||||||||||||||||
Conversion of convertible debt |
9 | — |
— |
— |
||||||||||||||||||||||||
Share-based professional fees |
— |
— |
— |
— |
||||||||||||||||||||||||
Comprehensive loss |
— |
— |
— |
( |
) |
( |
) |
( |
) | |||||||||||||||||||
|
|
|
|
|
|
|
|
|
|
|
|
|||||||||||||||||
Balance, October 31, 2020 |
( |
) |
( |
) |
||||||||||||||||||||||||
|
|
|
|
|
|
|
|
|
|
|
|
2020 |
2019 | 2018 | ||||||||||||||
Notes | $ |
$ | $ | |||||||||||||
Operating activities |
||||||||||||||||
Net loss for the year |
( |
) |
( |
) | ( |
) | ||||||||||
Items not affecting cash |
||||||||||||||||
Share-based compensation |
9 | |||||||||||||||
Depreciation |
||||||||||||||||
Amortization of government grants |
18 | ( |
) |
( |
) | ( |
) | |||||||||
Loss on disposal of assets |
||||||||||||||||
FX (gain) loss on translation |
( |
) |
( |
) | ||||||||||||
Share-based professional fees |
7 | |||||||||||||||
Fair value loss on restricted share units |
||||||||||||||||
Interest and accretion on convertible debt |
8 | |||||||||||||||
|
|
|
|
|
|
|||||||||||
( |
) |
( |
) | ( |
) | |||||||||||
Changes in non-cash working capital items |
||||||||||||||||
Accounts receivable |
( |
) |
( |
) | ( |
) | ||||||||||
Prepayments and deposits |
( |
) |
( |
) | ( |
) | ||||||||||
Inventory |
( |
) |
( |
) | ||||||||||||
Accounts payable and accrued liabilities |
||||||||||||||||
|
|
|
|
|
|
|||||||||||
( |
) |
( |
) | ( |
) | |||||||||||
|
|
|
|
|
|
|||||||||||
Investing activity |
||||||||||||||||
Purchases of plant and equipment |
6 | ( |
) |
( |
) | ( |
) | |||||||||
|
|
|
|
|
|
|||||||||||
Financing activities |
20 | |||||||||||||||
Proceeds from share issuance, net of share issue costs |
9 | |||||||||||||||
Proceeds from loans payable |
8 | |||||||||||||||
Proceeds from government grants |
||||||||||||||||
Proceeds from convertible debt |
||||||||||||||||
Repayment of lease liabilities |
( |
) |
||||||||||||||
Repayment of loans payable |
8 | ( |
) |
|||||||||||||
|
|
|
|
|
|
|||||||||||
|
|
|
|
|
|
|||||||||||
Net change in cash |
( |
) |
||||||||||||||
Cash, beginning of year |
||||||||||||||||
|
|
|
|
|
|
|||||||||||
Cash, end of year |
||||||||||||||||
|
|
|
|
|
|
|||||||||||
Non-cash financing activities |
||||||||||||||||
Shares issued for non-cash costs |
1. |
Nature of operations and going concern |
(i) | Li-Cycle Corp. (“Li-Cycle” or the “Company”) was incorporated under the laws of Ontario on |
(ii) |
Going concern |
2. |
Significant accounting policies |
(i) | Assets and liabilities were translated at the closing rate at end of each reporting period. |
(ii) | Items recognized in the statement of net loss and comprehensive loss were translated at the exchange rate at the time of transaction. |
(iii) | Equity items have been translated using the historical rate at the time of transaction. |
(iv) | All resulting exchange differences were recognised in other comprehensive income. |
(a) |
Statement of compliance |
(b) |
Basis of consolidation |
Company |
Location | Ownership interest | ||||||
Li-Cycle Inc. |
% | |||||||
Li-Cycle North America Hub, Inc. |
% |
(c) |
Basis of preparation |
(d) |
Cash |
(e) |
Inventories |
(f) |
Convertible debt instruments |
(g) |
Loss per share |
(h) |
Plant and equipment |
Vehicles |
||
Plant equipment |
||
Storage containers |
||
Leasehold improvements |
(i) |
Financial instruments |
(i) | those to be measured subsequently at fair value, either through profit or loss (“FVTPL”) or through other comprehensive income (“FVTOCI”); and |
(ii) | those to be measured subsequently at amortized cost. |
(i) | amortized cost; |
(ii) | FVTPL, if the Company has made an irrevocable election at the time of recognition, or when required (for items such as instruments held for trading or derivatives); or, |
(iii) | FVTOCI, when the change in fair market value is attributable to changes in the Company’s credit risk. |
Financial Instrument |
Measurement | |
Cash |
||
Trade accounts receivables |
||
Other accounts receivables |
||
Accounts payable and accrued liabilities |
||
Restricted share units |
||
Loans payable |
||
Lease liabilities |
||
Convertible debt |
||
Conversion feature of convertible debt |
(j) |
Foreign currencies |
(k) |
Government assistance and investment tax credits |
(l) |
Impairment of long-term non-financial assets |
(m) |
Income taxes |
(n) |
Provisions |
(o) |
Related party transactions |
(p) |
Research and development expense |
• | the technical feasibility of completing the intangible asset so that it will be available for use or sale; |
• | the intention to complete the intangible asset and use or sell it; |
• | the ability to use or sell the intangible asset; |
• | how the intangible asset will generate probable future economic benefits; |
• | the availability of adequate technical, financial and other resources to complete the development and to use or sell the intangible asset; and |
• | the ability to measure reliably the expenditure attributable to the intangible asset during its development. |
(q) |
Revenue recognition |
• | Services of recycling lithium-ion batteries which includes coordination of logistics and destruction of batteries |
• | Sales of products which includes black mass, shredded metal and plastic |
(r) |
Share capital |
(s) |
Financing costs |
(t) |
Share-based compensation |
(u) |
Significant accounting estimates and judgments |
(a) | the determination and valuation of deferred income tax assets and liabilities; |
(b) | the determination of the useful life and impairment of the plant and equipment; |
(c) | the valuation and measurement of the convertible debt and the related conversion feature; |
(d) | the valuation and recognition of ITCs; and |
(e) | the valuation of share-based compensation. |
(a) | the determination of the functional currency of the Company and its subsidiaries; |
(b) | the determination of the revenue recognition policy with regards to transaction price; |
(c) | the evaluation of the Company’s ability to continue as a going concern; and |
(d) | the valuation of inventory with regards to incremental cost to completion for raw materials and determination of net realizable value. |
(v) |
Leases |
• | Fixed lease payments (including in-substance fixed payments), less any lease incentives receivable; |
• | Variable lease payments that depend on an index or rate, initially measured using the index or rate at the commencement date; |
• | The amount expected to be payable by the lessee under residual value guarantees; |
• | The exercise price of purchase options, if the lessee is reasonably certain to exercise the options; and |
• | Payments of penalties for terminating the lease, if the lease term reflects the exercise of an option to terminate the lease. |
• | The lease term has changed or there is a significant event or change in circumstances resulting in a change in the assessment of exercise of a purchase option, in which case the lease liability is remeasured by discounting the revised lease payments using a revised discount rate. |
• | The lease payments change due to changes in an index or rate or a change in expected payment under a guaranteed residual value, in which cases the lease liability is remeasured by discounting the revised lease payments using an unchanged discount rate (unless the lease payments change is due to a change in a floating interest rate, in which case a revised discount rate is used). |
• | A lease contract is modified and the lease modification is not accounted for as a separate lease, in which case the lease liability is remeasured based on the lease term of the modified lease by discounting the revised lease payments using a revised discount rate at the effective date of the modification. |
(w) |
Restoration provisions |
(x) |
Intangible assets |
No intangible assets have been recognized to date. |
(i) |
IFRS 16 Leases |
• | Requires the Company to recognise the cumulative effect of initially applying IFRS 16 as an adjustment to the opening balance of retained earnings at the date of initial application. |
• | Does not permit restatement of comparatives, which continue to be presented under IAS 17 and IFRIC 4. |
Impact |
of the new definition of a lease |
Impact |
on Lessee Accounting |
Former operating leases |
a) | Recognises right-of-use |
b) | Recognises depreciation of right-of-use |
c) | Separates the total amount of cash paid into a principal portion (presented within financing activities) and interest (presented within financing activities) in the consolidated statement of cash flows. |
• | The Company has applied a single discount rate to a portfolio of leases with reasonably similar characteristics. |
• | The Company has elected not to recognise right-of-use |
• | The Company has excluded initial direct costs from the measurement of the right-of-use |
• | The Company has used hindsight when determining the lease term when the contract contains options to extend or terminate the lease. |
Financial |
impact of the initial application of IFRS 16 |
Operating lease commitments as of October 31, 2019 |
||||
Short term leases and leases of low-value assets |
( |
) | ||
Effect of discounting the above amounts |
( |
) | ||
|
|
|||
Lease liabilities recognized at November 1, 2019 |
||||
|
|
(ii) |
Annual Improvements to IFRS Standards 2015–2017 |
IFRIC |
23 Uncertainty over Income Tax Treatments |
• | determine whether uncertain tax positions are assessed separately or as a group; and |
• | assess whether it is probable that a tax authority will accept an uncertain tax treatment used, or proposed to be used, by an entity in its income tax filings: |
• | If yes, the Company should determine its accounting tax position consistently with the tax treatment used or planned to be used in its income tax filings. |
• | If no, the Company should reflect the effect of uncertainty in determining its accounting tax position using either the most likely amount or the expected value method. |
(iii) |
Accounting standards or interpretations issued but not yet effective |
Amendments |
to IFRS 3 Definition of a business |
Amendments |
to IAS 1 and IAS 8 Definition of material |
Interest |
Rate Benchmark Reform |
Amendments to IFRS 16 COVID-19 Related Rent Concessions |
Interest Rate Benchmark Reform – Phase 2 |
Amendments to IAS 37 – Onerous Contracts—Cost of Fulfilling a Contract |
Amendments to IAS 16 – Property, Plant and Equipment—Proceeds before Intended Use |
Amendments |
to IFRS 3 – Reference to the Conceptual Framework |
Amendments |
to IAS 1 – Classification of Liabilities as Current or Non-current |
4. |
Accounts receivable |
2020 |
2019 | |||||||
$ |
$ | |||||||
Trade receivables |
||||||||
Harmonized Sales Taxes receivable |
||||||||
Investment tax credits receivable |
— |
|||||||
Other receivables |
— | |||||||
|
|
|
|
|||||
|
|
|
|
Aging Summary |
2020 |
2019 | ||||||
$ |
$ | |||||||
Current |
||||||||
1-30 days |
— |
|||||||
31-60 days |
||||||||
61-90 days |
— |
— | ||||||
91 days and over |
||||||||
|
|
|
|
|||||
|
|
|
|
5. |
Inventory |
2020 |
2019 | |||||||
$ |
$ | |||||||
Raw material |
||||||||
Finished goods |
||||||||
|
|
|
|
|||||
|
|
|
|
6. |
Plant and equipment |
Plant equipment |
Storage containers |
Vehicles | Leasehold improvements |
Total | ||||||||||||||||
$ | $ | $ | $ | $ | ||||||||||||||||
Cost |
||||||||||||||||||||
At October 31, 2018 |
— | — | — | |||||||||||||||||
Additions |
||||||||||||||||||||
Foreign Exchange on Translation |
||||||||||||||||||||
|
|
|
|
|
|
|
|
|
|
|||||||||||
At October 31, 2019 |
||||||||||||||||||||
Additions |
||||||||||||||||||||
Disposals |
( |
) | — | — | — | ( |
) | |||||||||||||
Foreign Exchange on Translation |
( |
) | ||||||||||||||||||
|
|
|
|
|
|
|
|
|
|
|||||||||||
At October 31, 2020 |
||||||||||||||||||||
|
|
|
|
|
|
|
|
|
|
|||||||||||
Accumulated depreciation |
||||||||||||||||||||
At October 31, 2018 |
— | — | — | — | — | |||||||||||||||
Depreciation |
( |
) | ( |
) | ( |
) | ( |
) | ( |
) | ||||||||||
Foreign Exchange on Translation |
( |
) | ( |
) | ( |
) | ( |
) | ( |
) | ||||||||||
|
|
|
|
|
|
|
|
|
|
|||||||||||
At October 31, 2019 |
( |
) | ( |
) | ( |
) | ( |
) | ( |
) | ||||||||||
Depreciation |
( |
) | ( |
) | ( |
) | ( |
) | ( |
) | ||||||||||
Disposals |
— | — | — | |||||||||||||||||
Foreign Exchange on Translation |
( |
) | ( |
) | ( |
) | ||||||||||||||
|
|
|
|
|
|
|
|
|
|
|||||||||||
At October 31, 2020 |
( |
) |
( |
) |
( |
) |
( |
) |
( |
) | ||||||||||
|
|
|
|
|
|
|
|
|
|
|||||||||||
Carrying amounts |
||||||||||||||||||||
At October 31, 2018 |
— | — | — | |||||||||||||||||
At October 31, 2019 |
||||||||||||||||||||
At October 31, 2020 |
||||||||||||||||||||
|
|
|
|
|
|
|
|
|
|
7. |
Related party transactions |
2020 |
2019 | 2018 | ||||||||||
$ |
$ | $ | ||||||||||
Salaries |
||||||||||||
Share-based compensation |
||||||||||||
Fees and benefits |
||||||||||||
|
|
|
|
|
|
|||||||
|
|
|
|
|
|
2020 |
2019 | 2018 | ||||||||||
$ |
$ | $ | ||||||||||
Accounts payable and accrued liabilities |
||||||||||||
Restricted share units |
||||||||||||
|
|
|
|
|
|
|||||||
Outstanding balances at October 31 |
||||||||||||
|
|
|
|
|
|
8. |
Convertible debt and loans payable |
(i) |
Convertible debt |
2020 |
2019 | 2018 | ||||||||||
$ |
$ | $ | ||||||||||
Proceeds of issue of convertible loan notes |
||||||||||||
Transaction costs |
||||||||||||
|
|
|
|
|
|
|||||||
Net Proceeds from issue of convertible loan notes |
||||||||||||
|
|
|
|
|
|
|||||||
Convertible component |
||||||||||||
Transaction costs related to equity component |
||||||||||||
Conversion into common shares |
( |
) |
||||||||||
|
|
|
|
|
|
|||||||
Total convertion feature of convertible debt |
||||||||||||
|
|
|
|
|
|
|||||||
Liability component at date of issue (net of transaction costs) |
||||||||||||
Prior year interest plus accretion |
2020 |
2019 | 2018 | ||||||||||
$ |
$ | $ | ||||||||||
Accrued interest at |
||||||||||||
Accretion expense during the year |
||||||||||||
Conversion into common shares |
( |
) |
||||||||||
Foreign Exchange on Translation |
( |
) |
( |
) | ( |
) | ||||||
|
|
|
|
|
|
|||||||
Carrying amount of liability component at October 31 |
||||||||||||
|
|
|
|
|
|
(ii) |
BDC Capital Loan |
(iii) |
Loans payable |
2020 |
2019 | |||||||
$ |
$ | |||||||
Loan payable, due on demand bearing interest at |
||||||||
Loan payable, due on demand bearing interest at |
||||||||
|
|
|
|
|||||
|
|
|
|
9. |
Share capital |
Number of stock options |
Weighted average exercise price per stock option |
|||||||
$ | ||||||||
Balance – October 31, 2017 |
||||||||
Granted |
||||||||
|
|
|
|
|||||
Balance – October 31, 2018 |
||||||||
Granted |
||||||||
|
|
|
|
|||||
Balance – October 31, 2019 |
||||||||
Granted |
||||||||
|
|
|
|
|||||
Balance – October 31, 2020 |
||||||||
|
|
|
|
Number of stock options |
Exercise price | |||||||
$ | ||||||||
Expiration dates |
||||||||
|
||||||||
|
||||||||
|
||||||||
|
||||||||
|
Number of stock options |
Exercise price | |||||||
$ | ||||||||
|
||||||||
|
||||||||
|
||||||||
|
|
|||||||
|
|
Risk free interest rate |
||
Expected life of options |
||
Expected dividend yield |
||
Expected stock price volatility |
||
Expected forfeiture rate |
10. |
Financial instruments and financial risk factors |
• | Level 1 fair value measurements are those derived from quoted prices (unadjusted) in active markets for identical assets or liabilities; |
• | Level 2 fair value measurements are those derived from inputs other than quoted prices included within Level 1 that are observable for the asset or liability, either directly (i.e. as prices) or indirectly (i.e. derived from prices); and |
• | Level 3 fair value measurements are those derived from valuation techniques that include inputs for the asset or liability that are not based on observable market data (unobservable inputs). |
Balance | Quoted prices in active markets for identical assets |
Significant other observable inputs (Level 2) |
Significant unobservable inputs (Level 3) |
|||||||||||||
$ | $ | $ | $ | |||||||||||||
As at October 31, 2020 |
||||||||||||||||
Accounts receivable |
— | — | ||||||||||||||
|
|
|
|
|
|
|
|
|||||||||
— | — | |||||||||||||||
|
|
|
|
|
|
|
|
|||||||||
As at October 31, 2019 |
||||||||||||||||
Accounts receivable |
— | — | ||||||||||||||
|
|
|
|
|
|
|
|
|||||||||
— | — | |||||||||||||||
|
|
|
|
|
|
|
|
Balance | Quoted prices in active markets for identical assets |
Significant other observable inputs (Level 2) |
Significant unobservable inputs (Level 3) |
|||||||||||||
$ | $ | $ | $ | |||||||||||||
As at October 31, 2020 |
||||||||||||||||
Restricted share units |
— | — | ||||||||||||||
|
|
|
|
|
|
|
|
|||||||||
— | — | |||||||||||||||
|
|
|
|
|
|
|
|
|||||||||
As at October 31, 2019 |
||||||||||||||||
Conversion feature of convertible debt |
— | — | ||||||||||||||
|
|
|
|
|
|
|
|
|||||||||
— | — | |||||||||||||||
|
|
|
|
|
|
|
|
Carrying amount |
Contractual cash flows |
Year 1 | Year 2 | Year 3 | Year 4 | Year 5 | Thereafter | |||||||||||||||||||||||||
$ | $ | $ | $ | $ | $ | $ | $ | |||||||||||||||||||||||||
As at October 31, 2020 |
||||||||||||||||||||||||||||||||
Accounts payable and accrued liabilities |
— | — | — | — | — | |||||||||||||||||||||||||||
Restricted share units |
— | — | — | — | — | |||||||||||||||||||||||||||
Lease liabilities |
||||||||||||||||||||||||||||||||
Loan payable |
— | — | — | — | ||||||||||||||||||||||||||||
Restoration provisions |
— | — | — | |||||||||||||||||||||||||||||
|
|
|
|
|
|
|
|
|
|
|
|
|
|
|
|
|||||||||||||||||
|
|
|
|
|
|
|
|
|
|
|
|
|
|
|
|
|||||||||||||||||
As at October 31, 2019 |
||||||||||||||||||||||||||||||||
Accounts payable and accrued liabilities |
— | — | — | — | — | |||||||||||||||||||||||||||
Convertible debt |
— | — | — | — | — | |||||||||||||||||||||||||||
Conversion feature of convertible debt |
— | — | — | — | — | — | — | |||||||||||||||||||||||||
Loan payable |
||||||||||||||||||||||||||||||||
|
|
|
|
|
|
|
|
|
|
|
|
|
|
|
|
|||||||||||||||||
1,715,559 | ||||||||||||||||||||||||||||||||
|
|
|
|
|
|
|
|
|
|
|
|
|
|
|
|
11. |
Right-of-use assets |
Premises | Equipment | Total | ||||||||||
Cost |
||||||||||||
At November 1, 2019 |
||||||||||||
Additions & modifications |
Premises | Equipment | Total | ||||||||||
Foreign Exchange on Translation |
( |
) | ||||||||||
|
|
|
|
|
|
|||||||
At October 31, 2020 |
||||||||||||
|
|
|
|
|
|
|||||||
Accumulated depreciation |
||||||||||||
At November 1, 2019 |
— | — | — | |||||||||
Depreciation |
( |
) | ( |
) | ( |
) | ||||||
Foreign Exchange on Translation |
( |
) | ( |
) | ( |
) | ||||||
|
|
|
|
|
|
|||||||
At October 31, 2020 |
( |
) |
( |
) |
( |
) | ||||||
|
|
|
|
|
|
|||||||
Carrying amounts |
||||||||||||
At November 1, 2019 |
||||||||||||
|
|
|
|
|
|
|||||||
At October 31, 2020 |
||||||||||||
|
|
|
|
|
|
12. |
Lease liabilities |
Maturity analysis | Year 1 | Year 2 | Year 3 | Year 4 | Year 5 | Thereafter | Total | |||||||||||||||||||||
Undiscounted | $ | $ | $ | $ | $ | $ | $ | |||||||||||||||||||||
Premises |
||||||||||||||||||||||||||||
Equipment |
— | |||||||||||||||||||||||||||
|
|
|
|
|
|
|
|
|
|
|
|
|
|
|||||||||||||||
Total |
||||||||||||||||||||||||||||
|
|
|
|
|
|
|
|
|
|
|
|
|
|
Lease liabilities | Current | Non-Current |
Total | |||||||||
Discounted | $ | $ | $ | |||||||||
Premises |
||||||||||||
Equipment |
||||||||||||
|
|
|
|
|
|
|||||||
Total |
||||||||||||
|
|
|
|
|
|
13. |
Restoration provisions |
Restoration provisions at October 31, 2019 and 2018 |
$ | |||
Initial recognition in 2020 |
||||
|
|
|||
Restoration provisions at October 31, 2020 |
$ |
|||
|
|
14. |
Accounts payable and accrued liabilities |
2020 |
2019 | |||||||
$ |
$ | |||||||
Accounts payable |
||||||||
Accrued expenses |
||||||||
Accrued compensation |
||||||||
|
|
|
|
|||||
|
|
|
|
15. |
Commitments |
16. |
Loss per share |
2020 |
2019 | 2018 | ||||||||||
Net loss |
$ |
( |
) |
$ | ( |
) | $ | ( |
) | |||
Weighted average number of ordinary shares |
||||||||||||
|
|
|
|
|
|
|||||||
Basic and diluted loss per share |
$ |
( |
) |
$ | ( |
) | $ | ( |
) | |||
|
|
|
|
|
|
2020 |
2019 | 2018 | ||||||||||
Stock options |
||||||||||||
Convertible debt |
— |
|||||||||||
Restricted share units |
— | — | ||||||||||
|
|
|
|
|
|
|||||||
|
|
|
|
|
|
17. |
Segment reporting |
Canada | United States | Total | ||||||||||
$ | $ | $ | ||||||||||
For the year ended October 31, 2020 |
||||||||||||
Revenue |
— | |||||||||||
Non-current assets |
||||||||||||
For the year ended October 31, 2019 |
||||||||||||
Revenue |
— | |||||||||||
Non-current assets |
— | |||||||||||
For the year ended October 31, 2018 |
||||||||||||
Revenue |
— | |||||||||||
Non-current assets |
— | |||||||||||
|
|
|
|
|
|
18. |
Government funding |
2020 |
2019 | 2018 | ||||||||||
$ |
$ | $ | ||||||||||
Research and development expenses, gross |
||||||||||||
Less: Government grants |
( |
) |
( |
) | ( |
) | ||||||
Less: Investment tax credits |
— |
( |
) | ( |
) | |||||||
|
|
|
|
|
|
|||||||
Research and development expenses, net |
||||||||||||
|
|
|
|
|
|
2020 |
2019 | 2018 | ||||||||||
$ |
$ | $ | ||||||||||
Current |
||||||||||||
Non-current |
||||||||||||
|
|
|
|
|
|
|||||||
Deferred government funding at October 31 |
||||||||||||
|
|
|
|
|
|
19. |
Income taxes |
2020 |
2019 | 2018 | ||||||||||
$ |
$ | $ | ||||||||||
Net loss and comprehensive loss for the period before tax |
( |
) |
( |
) | ( |
) | ||||||
Statutory tax rates |
% |
% | % | |||||||||
|
|
|
|
|
|
|||||||
( |
) |
( |
) | ( |
) | |||||||
Change in unrecognized deferred tax amounts |
||||||||||||
Non-deductible item and others |
||||||||||||
|
|
|
|
|
|
|||||||
Income tax expense |
||||||||||||
|
|
|
|
|
|
2020 |
2019 | 2018 | ||||||||||
$ |
$ | $ | ||||||||||
Tax losses and credits carryforwards |
||||||||||||
Reserves and provisions |
||||||||||||
Plant and equipment, due to differences in amortization |
( |
) |
( |
) | ||||||||
Right of use assets, net of lease liabilities |
( |
) |
||||||||||
|
|
|
|
|
|
|||||||
Deferred tax assets not recognized |
( |
) |
( |
) | ( |
) | ||||||
|
|
|
|
|
|
|||||||
|
|
|
|
|
|
20. |
Notes to the Consolidated Statements of Cash Flows |
Restricted share units |
Lease liabilities |
Loans payable |
Restoration provisions |
Convertible debt |
Conversion feature of convertible debt |
Deferred government funding |
||||||||||||||||||||||
Balance, October 31, 2017 |
||||||||||||||||||||||||||||
|
|
|
|
|
|
|
|
|
|
|
|
|
|
|||||||||||||||
Cash changes: |
||||||||||||||||||||||||||||
Proceeds from convertible debt |
||||||||||||||||||||||||||||
Proceeds from government grants |
||||||||||||||||||||||||||||
|
|
|
|
|
|
|
|
|
|
|
|
|
|
|||||||||||||||
Total changes from financing cash flows |
||||||||||||||||||||||||||||
|
|
|
|
|
|
|
|
|
|
|
|
|
|
Restricted share units |
Lease liabilities |
Loans payable |
Restoration provisions |
Convertible debt |
Conversion feature of convertible debt |
Deferred government funding |
||||||||||||||||||||||
Non-cash changes: |
||||||||||||||||||||||||||||
Accrued interest and accretion |
||||||||||||||||||||||||||||
Amortization of government grants |
( |
) | ||||||||||||||||||||||||||
|
|
|
|
|
|
|
|
|
|
|
|
|
|
|||||||||||||||
Balance, October 31, 2018 |
||||||||||||||||||||||||||||
|
|
|
|
|
|
|
|
|
|
|
|
|
|
|||||||||||||||
Cash changes: |
||||||||||||||||||||||||||||
Proceeds from loans payable |
||||||||||||||||||||||||||||
Proceeds from government grants |
||||||||||||||||||||||||||||
|
|
|
|
|
|
|
|
|
|
|
|
|
|
|||||||||||||||
Total changes from financing cash flows |
||||||||||||||||||||||||||||
|
|
|
|
|
|
|
|
|
|
|
|
|
|
|||||||||||||||
Non-cash changes: |
||||||||||||||||||||||||||||
Accrued interest and accretion |
||||||||||||||||||||||||||||
Amortization of government grants |
( |
) | ||||||||||||||||||||||||||
Foreign Exchange on Translation |
( |
) | ||||||||||||||||||||||||||
|
|
|
|
|
|
|
|
|
|
|
|
|
|
|||||||||||||||
Balance, October 31, 2019 |
||||||||||||||||||||||||||||
|
|
|
|
|
|
|
|
|
|
|
|
|
|
|||||||||||||||
Cash changes: |
||||||||||||||||||||||||||||
Repayments of lease liabilities |
( |
) | ||||||||||||||||||||||||||
Proceeds from loans payable |
||||||||||||||||||||||||||||
Repayment of loans payable |
( |
) | ||||||||||||||||||||||||||
Proceeds from government grants |
||||||||||||||||||||||||||||
|
|
|
|
|
|
|
|
|
|
|
|
|
|
|||||||||||||||
Total changes from financing cash flows |
( |
) | ||||||||||||||||||||||||||
|
|
|
|
|
|
|
|
|
|
|
|
|
|
|||||||||||||||
Non-cash changes: |
||||||||||||||||||||||||||||
New leases |
||||||||||||||||||||||||||||
Grant of restricted share units |
||||||||||||||||||||||||||||
Fair value loss on restricted share units |
||||||||||||||||||||||||||||
Accrued interest and accretion |
||||||||||||||||||||||||||||
Foreign exchange gain on lease liabilities |
( |
) | ||||||||||||||||||||||||||
New restoratiion provisions |
||||||||||||||||||||||||||||
Conversion of convertible debt |
( |
) | ( |
) | ||||||||||||||||||||||||
Amortization of government grants |
( |
) | ||||||||||||||||||||||||||
Foreign Exchange on Translation |
( |
) | ( |
) | ||||||||||||||||||||||||
|
|
|
|
|
|
|
|
|
|
|
|
|
|
|||||||||||||||
Balance, October 31, 2020 |
||||||||||||||||||||||||||||
|
|
|
|
|
|
|
|
|
|
|
|
|
|
21. |
Subsequent events |
Notes |
July 31, 2021 $ |
October 31, 2020 $ |
||||||||||
Assets |
||||||||||||
Current assets |
||||||||||||
Cash |
|
|
||||||||||
Accounts receivable |
|
3 | |
|||||||||
Prepayments and deposits |
|
4 | |
|||||||||
Inventory |
|
5 | |
|||||||||
|
|
|
|
|
|
|||||||
|
|
|||||||||||
|
|
|
|
|
|
|||||||
Non-current assets |
|
|
||||||||||
Plant and equipment |
|
6 | |
|||||||||
Right of use assets |
|
7 | |
|||||||||
|
|
|
|
|
|
|||||||
|
|
|||||||||||
|
|
|
|
|
|
|||||||
|
|
|||||||||||
|
|
|
|
|
|
|||||||
Liabilities |
|
|
||||||||||
Current liabilities |
|
|
||||||||||
Accounts payable and accrued liabilities |
|
|
||||||||||
Restricted share units |
|
9 | |
|||||||||
Lease liabilities |
|
11 | |
|||||||||
Loans payable |
|
8 | |
|||||||||
|
|
|
|
|
|
|||||||
|
|
|||||||||||
|
|
|
|
|
|
|||||||
Non-current liabilities |
|
|
||||||||||
Lease liabilities |
|
11 | |
|||||||||
Loans payable |
|
8 | |
|||||||||
Restoration provisions |
|
|
||||||||||
|
|
|
|
|
|
|||||||
|
|
|||||||||||
|
|
|
|
|
|
|||||||
|
|
|||||||||||
|
|
|
|
|
|
|||||||
Shareholders’ equity |
|
|
||||||||||
Share capital |
|
9 | |
|||||||||
Contributed surplus |
|
9 | |
|||||||||
Accumulated deficit |
|
|
( |
) |
( |
) | ||||||
Accumulated other comprehensive loss |
|
|
( |
) |
( |
) | ||||||
|
|
|
|
|
|
|||||||
|
|
|||||||||||
|
|
|
|
|
|
|||||||
|
|
|||||||||||
|
|
|
|
|
|
Three months ended July 31, |
Nine months ended July 31, |
|||||||||||||||||||
Notes |
2021 $ |
2020 $ |
2021 $ |
2020 $ |
||||||||||||||||
Revenue |
||||||||||||||||||||
Product sales |
|
|
||||||||||||||||||
Recycling services |
|
|
||||||||||||||||||
|
|
|
|
|
|
|
|
|
|
|||||||||||
|
|
|||||||||||||||||||
Expenses |
|
|
||||||||||||||||||
Employee salaries and benefits, net |
|
|
||||||||||||||||||
Raw materials, supplies and finished goods |
|
|
||||||||||||||||||
Professional fees |
|
|
||||||||||||||||||
Research and development, net |
|
|
( |
) | ( |
) | ||||||||||||||
Share-based compensation |
|
9 | |
|||||||||||||||||
Office and administrative |
|
|
||||||||||||||||||
Depreciation, net |
|
6,7 | |
|||||||||||||||||
Freight and shipping |
|
|
( |
) | ||||||||||||||||
Marketing |
|
|
||||||||||||||||||
Plant facilities |
|
|
||||||||||||||||||
Travel and entertainment |
|
|
||||||||||||||||||
|
|
|
|
|
|
|
|
|
|
|||||||||||
|
|
|||||||||||||||||||
|
|
|
|
|
|
|
|
|
|
|||||||||||
Loss from operations |
|
|
( |
) |
( |
) | ( |
) |
( |
) | ||||||||||
|
|
|
|
|
|
|
|
|
|
|||||||||||
Other (income) expense |
|
|
||||||||||||||||||
Foreign exchange (gain) loss |
|
|
( |
) | ( |
) | ( |
) | ||||||||||||
Interest expense |
|
|
||||||||||||||||||
Interest income |
|
|
( |
) |
( |
) | ( |
) |
( |
) | ||||||||||
Fair value loss on restricted share units |
|
|
— | — | ||||||||||||||||
|
|
|
|
|
|
|
|
|
|
|||||||||||
|
|
|||||||||||||||||||
|
|
|
|
|
|
|
|
|
|
|||||||||||
Net loss |
|
|
( |
) |
( |
) | ( |
) |
( |
) | ||||||||||
Other comprehensive income (loss) |
|
|
||||||||||||||||||
Foreign currency translation |
|
|
— |
— |
( |
) | ||||||||||||||
|
|
|
|
|
|
|
|
|
|
|||||||||||
Comprehensive loss |
|
|
( |
) |
( |
) ) |
( |
) |
( |
) | ||||||||||
|
|
|
|
|
|
|
|
|
|
|||||||||||
Loss per common share - basic and diluted |
|
13 | |
( |
) |
( |
) | ( |
) |
( |
) | |||||||||
|
|
|
|
|
|
|
|
|
|
Notes |
Number of common shares |
Share capital $ |
Contributed surplus $ |
Accumulated deficit $ |
Accumulated other comprehensive income (loss) $ |
Total $ |
||||||||||||||||||||||
|
|
|
|
|
|
|
|
|
|
|
|
|
|
|
|
|
||||||||||||
Balance, October 31, 2020 |
( |
) | ( |
) | ||||||||||||||||||||||||
Stock option expense |
9 | — |
— |
— |
— |
|||||||||||||||||||||||
Exercise of stock options |
|
|
9 |
|
|
|
|
|
|
|
|
|
|
|
( |
) |
|
|
— |
|
|
|
— |
|
|
|
|
|
Shares issued for cash |
9 | — |
— |
— |
||||||||||||||||||||||||
Shares issued for non-cash costs |
9 | ( |
) |
— |
— |
— |
||||||||||||||||||||||
Comprehensive loss |
— |
— |
— |
( |
) |
— |
( |
) | ||||||||||||||||||||
|
|
|
|
|
|
|
|
|
|
|
|
|||||||||||||||||
Balance, July 31 , 2021 |
( |
) |
( |
) |
||||||||||||||||||||||||
|
|
|
|
|
|
|
|
|
|
|
|
|||||||||||||||||
Notes |
Number of common shares |
Share capital $ |
Contributed surplus $ |
Accumulated deficit $ |
Accumulated other comprehensive income (loss) $ |
Total $ |
||||||||||||||||||||||
Balance, October 31, 2019 |
( |
) | ( |
) | ||||||||||||||||||||||||
Stock option expense |
9 | — | — | — | — | |||||||||||||||||||||||
Shares issued for cash |
9 | — | — | — | ||||||||||||||||||||||||
Shares issuable for non-cash cost s |
|
|
9 |
|
|
|
— |
|
|
|
— |
|
|
|
|
|
|
|
— |
|
|
|
— |
|
|
|
|
|
Conversion of convertible debt |
9 | — | — | — | ||||||||||||||||||||||||
Comprehensive loss |
— | — | — | ( |
) | ( |
) | ( |
) | |||||||||||||||||||
|
|
|
|
|
|
|
|
|
|
|
|
|||||||||||||||||
Balance, July 31 , 2020 |
( |
) | ( |
) | ||||||||||||||||||||||||
|
|
|
|
|
|
|
|
|
|
|
|
Three months ended July 31 , |
Nine months ended July 31 , |
|||||||||||||||||||
2021 |
2020 |
2021 |
2020 |
|||||||||||||||||
Notes | $ |
$ |
$ |
$ |
||||||||||||||||
Operating activities |
||||||||||||||||||||
Net loss for the period |
( |
) |
( |
) | ( |
) |
( |
) | ||||||||||||
Items not affecting cash |
||||||||||||||||||||
Share-based compensation |
9 | |||||||||||||||||||
Depreciation |
6, |
|||||||||||||||||||
Amortization of government grants |
( |
) |
( |
) | ( |
) |
( |
) | ||||||||||||
Loss on disposal of assets |
— |
— | — | |||||||||||||||||
FX (gain) loss on translation |
( |
) | ( |
) | ||||||||||||||||
Fair value loss on restricted share units |
— | — | ||||||||||||||||||
Share-based professional fees |
|
|
9 |
|
|
|
— |
|
|
|
|
|
|
|
— |
|
|
|
|
|
Interest and accretion on convertible debt |
— |
— | — |
|||||||||||||||||
|
|
|
|
|
|
|
|
|||||||||||||
( |
) |
( |
) | ( |
) |
( |
) | |||||||||||||
Changes in non-cash working capital items |
||||||||||||||||||||
Accounts receivable |
( |
) | ( |
) |
||||||||||||||||
Prepayments and deposits |
( |
) |
( |
) | ( |
) |
( |
) | ||||||||||||
Inventory |
( |
) |
( |
) | ( |
) |
( |
) | ||||||||||||
Accounts payable and accrued liabilities |
||||||||||||||||||||
|
|
|
|
|
|
|
|
|||||||||||||
( |
) |
( |
) | ( |
) |
( |
) | |||||||||||||
|
|
|
|
|
|
|
|
|||||||||||||
Investing activity |
||||||||||||||||||||
Purchases of plant and equipment |
6 | ( |
) |
( |
) | ( |
) |
( |
) | |||||||||||
Proceeds from disposal of plant and equipment |
— |
— | — | |||||||||||||||||
|
|
|
|
|
|
|
|
|||||||||||||
( |
) |
( |
) | ( |
) |
( |
) | |||||||||||||
Financing activities |
||||||||||||||||||||
Proceeds from share issuance, net of share issue costs |
9 | — |
— | |||||||||||||||||
Proceeds from exercise of stock options |
|
|
9 |
|
|
|
|
|
|
|
— |
|
|
|
|
|
|
|
— |
|
Proceeds from loans payable |
8 |
|||||||||||||||||||
Proceeds from government grants |
||||||||||||||||||||
Repayment of lease liabilities |
( |
) |
( |
) | ( |
) |
( |
) | ||||||||||||
Repayment of loans payable |
( |
) |
( |
) | ( |
) |
( |
) | ||||||||||||
|
|
|
|
|
|
|
|
|||||||||||||
|
|
|
|
|
|
|
|
|||||||||||||
Net change in cash |
( |
) |
( |
) | ||||||||||||||||
Cash, beginning of period |
||||||||||||||||||||
|
|
|
|
|
|
|
|
|||||||||||||
Cash, end of period |
||||||||||||||||||||
|
|
|
|
|
|
|
|
|||||||||||||
Non-cash investing activities |
||||||||||||||||||||
Accrual for purchase of plant and equipment |
— | — | ||||||||||||||||||
Non-cash financing activities |
||||||||||||||||||||
Equity issued for non-cash costs |
— |
— |
1. |
Nature of operations and going |
(i) | Li-Cycle Corp. (“Li-Cycle” or the “Company”) was incorporated under the Business Corporations Act a nada. |
(ii) |
Going concern |
2. |
Significant accounting policies |
(a) |
Statement of compliance |
(b) |
Basis of consolidation |
Company |
Location |
Ownership interest |
||||
Li-Cycle Inc. |
% | |||||
Li-Cycle North America Hub, Inc. |
% | |||||
Li-Cycle Holdings Corp. |
% |
(c) |
Basis of preparation |
(i) |
Assets and liabilities were translated at the closing rate at end of each reporting period; |
(ii) |
Items recognized in the statement of loss and comprehensive loss were translated at the exchange rate at the time of transaction; |
(iii) |
Equity items have been translated using the historical rate at the time of transaction; |
(iv) |
All resulting exchange differences were recognized in other comprehensive loss. |
3. |
Accounts receivable |
July 31, 2021 $ |
October 31, 2020 $ |
|||||||
Trade receivables |
||||||||
Harmonized Sales Taxes receivable |
||||||||
Other receivables |
||||||||
|
|
|
|
|||||
|
|
|
|
4. |
Prepayments and deposits |
July 31, 2021 $ |
October 31, 2020 $ |
|||||||
|
|
|
|
|||||
Prepaid lease deposits |
||||||||
Prepaid transaction costs |
— | |||||||
Other prepaids |
||||||||
|
|
|
|
|||||
|
|
|
|
5. |
Inventory |
July 31, 2021 $ |
October 31, 2020 $ |
|||||||
Raw material |
||||||||
Finished goods |
||||||||
|
|
|
|
|||||
|
|
|
|
6. |
Plant and equipment |
Plant equipment $ |
Storage containers $ |
Vehicles $ |
Leasehold improvements $ |
Total $ |
||||||||||||||||
Cost |
||||||||||||||||||||
At October 31, 2020 |
||||||||||||||||||||
Additions |
— |
|||||||||||||||||||
Disposals |
— | — | ( |
) | — | ( |
) | |||||||||||||
|
|
|
|
|
|
|
|
|
|
|||||||||||
At July 31 , 2021 |
||||||||||||||||||||
|
|
|
|
|
|
|
|
|
|
|||||||||||
Accumulated depreciation |
||||||||||||||||||||
At October 31, 2020 |
( |
) | ( |
) | ( |
) | ( |
) | ( |
) | ||||||||||
Depreciation expensed |
( |
) | ( |
) | ( |
) | ( |
) | ( |
) | ||||||||||
Depreciation capitalized into Inventory |
( |
) | ( |
) | ( |
) | ( |
) | ( |
) | ||||||||||
Disposals |
— | — | — | |||||||||||||||||
|
|
|
|
|
|
|
|
|
|
|||||||||||
At July 31 , 2021 |
( |
) |
( |
) |
( |
) |
( |
) |
( |
) | ||||||||||
|
|
|
|
|
|
|
|
|
|
|||||||||||
Carrying amounts |
||||||||||||||||||||
At October 31, 2020 |
||||||||||||||||||||
At July 31 , 2021 |
||||||||||||||||||||
|
|
|
|
|
|
|
|
|
|
7. |
Right-of-use assets |
Premises | Equipment | Total | ||||||||||
Cost |
$ | $ | $ | |||||||||
At October 31, 2020 |
||||||||||||
Additions & modifications |
||||||||||||
|
|
|
|
|
|
|
|
|
|
|
|
|
At July 31 , 2021 |
||||||||||||
|
|
|
|
|
|
|||||||
Accumulated depreciation |
||||||||||||
At October 31, 2020 |
( |
) | ( |
) | ( |
) | ||||||
Depreciation expensed |
( |
) | ( |
) | ( |
) | ||||||
Depreciation capitalized into Inventory |
( |
) | ( |
) | ( |
) | ||||||
|
|
|
|
|
|
|||||||
At July 31 , 2021 |
( |
) |
( |
) |
( |
) | ||||||
|
|
|
|
|
|
|||||||
Carrying amounts |
||||||||||||
At October 31, 2020 |
||||||||||||
|
|
|
|
|
|
|||||||
At July 31 , 2021 |
||||||||||||
|
|
|
|
|
|
|
|
|
|
|
|
|
8. |
Loans Payable |
BDC Loan |
Other |
Total |
||||||||||
$ |
$ |
$ |
||||||||||
Balance at October 31, 2020 |
||||||||||||
Proceeds from loans payable |
||||||||||||
Repayment of loans payable |
( |
) | ( |
) | ( |
) | ||||||
Foreign exchange gain or loss |
||||||||||||
|
|
|
|
|
|
|||||||
Balance at July 31 , 2021 |
||||||||||||
|
|
|
|
|
|
(i) |
BDC Capital Loan |
(Ii) |
Promissory Notes |
9. |
Share capital |
Number of stock options |
Weighted average exercise price per stock option |
|||||||
Balance – October 31, 2020 |
||||||||
Granted |
||||||||
Exercised |
|
|
( |
) |
|
|
|
|
Forfeited |
( |
) | ||||||
|
|
|
|
|||||
Balance – July 31 , 2021 |
|
|
Number of stock option s |
|
|
Exercise |
| ||
$ |
||||||||
Expiration dates |
||||||||
|
||||||||
|
||||||||
|
||||||||
|
||||||||
|
||||||||
|
||||||||
|
||||||||
|
||||||||
|
||||||||
|
||||||||
|
|
|
|
|||||
|
|
|
|
|
|
|
|
|
Risk free interest rate |
% | |||
Expected life of options |
||||
Expected dividend yield |
% | |||
Expected stock price volatility |
% | |||
Expected forfeiture rate |
% |
10. |
Financial instruments and financial risk factors |
• |
Level 1 fair value measurements are those derived from quoted prices (unadjusted) in active markets for identical assets or liabilities; |
• |
Level 2 fair value measurements are those derived from inputs other than quoted prices included within Level 1 that are observable for the asset or liability, either directly (i.e. as prices) or indirectly (i.e. derived from prices); and |
• |
Level 3 fair value measurements are those derived from valuation techniques that include inputs for the asset or liability that are not based on observable market data (unobservable inputs). |
Balance $ |
Quoted prices in active markets for identical assets (Level 1) $ |
Significant other observable inputs (Level 2) $ |
Significant unobservable inputs (Level 3) $ |
|||||||||||||
As at July 31 , 2021 |
||||||||||||||||
Accounts receivable |
— | — | ||||||||||||||
|
|
|
|
|
|
|
|
|||||||||
— | — | |||||||||||||||
|
|
|
|
|
|
|
|
|||||||||
As at October 31, 2020 |
||||||||||||||||
Accounts receivable |
— | — | ||||||||||||||
|
|
|
|
|
|
|
|
|||||||||
— | — | |||||||||||||||
|
|
|
|
|
|
|
|
Balance $ |
Quoted prices in active markets for identical assets (Level 1) $ |
Significant other observable inputs (Level 2) $ |
Significant unobservable inputs (Level 3) $ |
|||||||||||||
As at July 31 , 2021 |
||||||||||||||||
Restricted share units |
— | — | ||||||||||||||
|
|
|
|
|
|
|
|
|||||||||
— | — | |||||||||||||||
|
|
|
|
|
|
|
|
|||||||||
As at October 31, 2020 |
||||||||||||||||
Restricted share units |
— | — | ||||||||||||||
|
|
|
|
|
|
|
|
|||||||||
— | — | |||||||||||||||
|
|
|
|
|
|
|
|
11. |
Lease liabilities |
Maturity analysis Undiscounted |
Year 1 $ |
Year 2 $ |
Year 3 $ |
Year 4 $ |
Year 5 $ |
Thereafter $ |
Total $ |
|||||||||||||||||||||
Premises |
||||||||||||||||||||||||||||
Equipment |
— | |||||||||||||||||||||||||||
Total |
||||||||||||||||||||||||||||
Lease liabilities Discounted |
Current $ |
Non-Current $ |
Total $ |
|||||||||
Premises |
||||||||||||
Equipment |
||||||||||||
Total |
||||||||||||
12. |
Commitments |
13. |
Loss per share |
Three months ended July 31 , |
Nine months ended July 31, |
|||||||||||||||
2021 |
2020 | 2021 |
2020 | |||||||||||||
Net loss |
$ |
( |
) |
$ | ( |
) | $ |
( |
) |
$ | ( |
) | ||||
Weighted average number of ordinary shares |
||||||||||||||||
Basic and diluted loss per share |
$ |
( |
) |
$ | ( |
) | $ |
( |
) |
$ | ( |
) | ||||
Three months ended July 31 , |
Nine months ended July 31, |
|||||||||||||||
2021 |
2020 | 2021 |
2020 | |||||||||||||
Stock options |
||||||||||||||||
Restricted share units |
||||||||||||||||
14. |
Segment reporting |
Canada $ |
United States $ |
Total $ |
||||||||||
For the nine months ended July 31 , 2021 |
||||||||||||
Revenue |
||||||||||||
Non-current assets |
||||||||||||
For the nine months ended July 31 , 2020 |
||||||||||||
Revenue |
— | |||||||||||
Non-current assets |
||||||||||||
For the year ended October 31, 2020 |
||||||||||||
Revenue |
— | |||||||||||
Non-current assets |
||||||||||||
|
|
|
|
|
|
Three months ended July 31, |
Nine months ended July 31, |
|||||||||||||||
2021 |
2020 |
2021 |
2020 |
|||||||||||||
% |
% |
% |
% |
|||||||||||||
|
|
|
|
|
|
|
|
|||||||||
Revenue |
||||||||||||||||
Customer A |
% |
% |
% |
% | ||||||||||||
Customer B |
% |
% |
% |
% | ||||||||||||
Accounts Receivable |
||||||||||||||||
Customer A |
% |
% | ||||||||||||||
Customer B |
% |
% | ||||||||||||||
|
|
|
|
|
|
|
|
15. |
Subsequent events |
![]() |
Deloitte LLP 8 Adelaide Street West Suite 200 Toronto, ON M5H 0A9 Canada Tel: 416-601-6150 Fax: 416-601-6151 www.deloitte.ca |
As of May 31, 2021 |
||||
$ |
||||
Assets |
||||
Current Assets |
||||
Cash |
||||
Total Assets |
||||
Shareholder’s Equity |
||||
Share capital |
||||
Total Liabilities and Shareholder’s Equity |
||||
1. |
Organization |
2. |
Summary of significant accounting policies |
(a) |
Statement of Compliance |
(b) |
Cash |
3. |
Subsequent events |
Exhibit No. |
Description | |
101.INS | Inline XBRL Instance Document | |
101.SCH | Inline XBRL Taxonomy Extension Schema Document | |
101.CAL | Inline XBRL Taxonomy Extension Calculation Linkbase Document | |
101.DEF | InlineXBRL Taxonomy Extension Definition Linkbase Document | |
104 | Cover Page Interactive Data File. The cover page XBRL tags are embedded within the inline XBRL document. |
* | To be filed by amendment. |
** | Previously filed. |
† | Indicates management contract or compensatory plan or arrangement. |
†† | Certain of the exhibits and schedules to these exhibits have been omitted in accordance with Regulation S-K Item 601(a)(5). The registrant agrees to furnish a copy of all omitted exhibits and schedules to the SEC upon its request. |
††† | Pursuant to Item 601(b)(10)(iv) of Regulation S-K, portions of this exhibit have been omitted because Li-Cycle Corp. customarily and actually treats the omitted portions as private or confidential, and such portions are not material and would likely cause it competitive harm if publicly disclosed. Li-Cycle Holdings Corp. will supplementally provide an unredacted copy of this exhibit to the SEC or its staff upon request. |
• | Any preliminary prospectus or prospectus of the undersigned registrant relating to the offering required to be filed pursuant to Rule 424; |
• | Any free writing prospectus relating to the offering prepared by or on behalf of the undersigned registrant or used or referred to by the undersigned registrant; |
• | The portion of any other free writing prospectus relating to the offering containing material information about the undersigned registrant or its securities provided by or on behalf of the undersigned registrant; and |
• | Any other communication that is an offer in the offering made by the undersigned registrant to the purchaser. |
Li-Cycle Holdings Corp. | ||||
By: | /s/ Ajay Kochhar | |||
Name: | Ajay Kochhar | |||
Title: | Co-Founder, President & CEO and Executive Director |
Signature |
Capacity |
Date | ||
/s/ Ajay Kochhar Ajay Kochhar |
Co-Founder, President & CEO andExecutive Director (Principal Executive Officer) |
November 17, 2021 | ||
/s/ Bruce MacInnis Bruce MacInnis |
Chief Financial Officer (Principal Financial and Accounting Officer) |
November 17, 2021 | ||
/s/ Mark Wellings Mark Wellings |
Non-Executive Director |
November 17, 2021 | ||
/s/ Rick Findlay Rick Findlay |
Non-Executive Director |
November 17, 2021 | ||
/s/ Alan Levande Alan Levande |
Non-Executive Director |
November 17, 2021 | ||
/s/ Scott Prochazka Scott Prochazka |
Non-Executive Director |
November 17, 2021 | ||
/s/ Anthony Tse Anthony Tse |
Non-Executive Director |
November 17, 2021 |
PUGLISI & ASSOCIATES | ||||
By: | /s/ Donald J. Puglisi | |||
Name: | Donald J. Puglisi | |||
Title: | Managing Director |