0001828791FYfalsehttp://fasb.org/us-gaap/2022#OtherLiabilitiesCurrent00018287912022-01-012022-12-3100018287912022-06-30iso4217:USD0001828791us-gaap:CommonClassAMember2023-02-28xbrli:shares0001828791us-gaap:CommonClassBMember2023-02-2800018287912021-01-012021-12-3100018287912020-01-012020-12-31iso4217:USDxbrli:shares00018287912022-12-3100018287912021-12-310001828791us-gaap:CommonClassAMember2022-12-310001828791us-gaap:CommonClassAMember2021-12-310001828791us-gaap:CommonClassBMember2022-12-310001828791us-gaap:CommonClassBMember2021-12-310001828791us-gaap:ConvertiblePreferredStockMember2019-12-310001828791us-gaap:MemberUnitsMember2019-12-310001828791dsp:MembersEquityMember2019-12-3100018287912019-12-310001828791dsp:MembersEquityMember2020-01-012020-12-310001828791us-gaap:ConvertiblePreferredStockMember2020-12-310001828791us-gaap:MemberUnitsMember2020-12-310001828791us-gaap:CommonStockMemberus-gaap:CommonClassAMember2020-12-310001828791us-gaap:CommonStockMemberus-gaap:CommonClassBMember2020-12-310001828791us-gaap:AdditionalPaidInCapitalMember2020-12-310001828791us-gaap:RetainedEarningsMember2020-12-310001828791dsp:MembersEquityMember2020-12-310001828791us-gaap:TreasuryStockCommonMember2020-12-310001828791us-gaap:NoncontrollingInterestMember2020-12-3100018287912020-12-310001828791dsp:MembersEquityMember2021-01-012021-12-310001828791us-gaap:ConvertiblePreferredStockMember2021-01-012021-12-310001828791us-gaap:MemberUnitsMember2021-01-012021-12-310001828791us-gaap:CommonStockMemberus-gaap:CommonClassBMember2021-01-012021-12-310001828791us-gaap:AdditionalPaidInCapitalMember2021-01-012021-12-310001828791us-gaap:CommonStockMemberus-gaap:CommonClassAMember2021-01-012021-12-310001828791us-gaap:TreasuryStockCommonMember2021-01-012021-12-310001828791us-gaap:RetainedEarningsMember2021-01-012021-12-310001828791us-gaap:NoncontrollingInterestMember2021-01-012021-12-310001828791us-gaap:ConvertiblePreferredStockMember2021-12-310001828791us-gaap:MemberUnitsMember2021-12-310001828791us-gaap:CommonStockMemberus-gaap:CommonClassAMember2021-12-310001828791us-gaap:CommonStockMemberus-gaap:CommonClassBMember2021-12-310001828791us-gaap:AdditionalPaidInCapitalMember2021-12-310001828791us-gaap:RetainedEarningsMember2021-12-310001828791dsp:MembersEquityMember2021-12-310001828791us-gaap:TreasuryStockCommonMember2021-12-310001828791us-gaap:NoncontrollingInterestMember2021-12-310001828791us-gaap:CommonStockMemberus-gaap:CommonClassAMember2022-01-012022-12-310001828791us-gaap:AdditionalPaidInCapitalMember2022-01-012022-12-310001828791us-gaap:CommonStockMemberus-gaap:CommonClassBMember2022-01-012022-12-310001828791us-gaap:TreasuryStockCommonMember2022-01-012022-12-310001828791us-gaap:RetainedEarningsMember2022-01-012022-12-310001828791us-gaap:NoncontrollingInterestMember2022-01-012022-12-310001828791us-gaap:ConvertiblePreferredStockMember2022-12-310001828791us-gaap:MemberUnitsMember2022-12-310001828791us-gaap:CommonStockMemberus-gaap:CommonClassAMember2022-12-310001828791us-gaap:CommonStockMemberus-gaap:CommonClassBMember2022-12-310001828791us-gaap:AdditionalPaidInCapitalMember2022-12-310001828791us-gaap:RetainedEarningsMember2022-12-310001828791dsp:MembersEquityMember2022-12-310001828791us-gaap:TreasuryStockCommonMember2022-12-310001828791us-gaap:NoncontrollingInterestMember2022-12-310001828791us-gaap:CommonClassAMember2021-02-120001828791us-gaap:CommonClassBMember2021-02-1200018287912021-02-120001828791dsp:ContinuingMembersClassBUnitsMemberdsp:ViantTechnologyLLCMember2022-01-012022-12-31xbrli:pure0001828791dsp:ContinuingMembersClassBUnitsMemberdsp:ViantTechnologyLLCMember2021-02-120001828791us-gaap:CommonClassBMemberdsp:ViantTechnologyLLCMember2021-02-122021-02-120001828791us-gaap:OverAllotmentOptionMember2021-02-122021-02-120001828791us-gaap:OverAllotmentOptionMember2021-02-120001828791dsp:MembersEquityClassAUnitsMemberdsp:ViantTechnologyLLCMember2021-02-122021-02-120001828791us-gaap:CommonClassAMember2021-02-122021-02-120001828791dsp:MembersEquityClassAUnitsMember2021-02-122021-02-120001828791us-gaap:CommonClassBMember2021-02-122021-02-12dsp:impression0001828791srt:MinimumMember2022-01-012022-12-310001828791srt:MaximumMember2022-01-012022-12-310001828791dsp:IncentiveUnitsMember2021-01-012021-12-310001828791dsp:PhantomUnitPlanMember2021-01-012021-12-310001828791us-gaap:IPOMember2020-12-310001828791us-gaap:IPOMember2021-02-280001828791us-gaap:ComputerEquipmentMembersrt:MinimumMember2022-01-012022-12-310001828791us-gaap:ComputerEquipmentMembersrt:MaximumMember2022-01-012022-12-310001828791us-gaap:SoftwareAndSoftwareDevelopmentCostsMember2022-01-012022-12-310001828791dsp:CapitalizedSoftwareDevelopmentCostsMember2022-01-012022-12-310001828791dsp:FurnitureFixturesAndOfficeEquipmentMember2022-01-012022-12-31dsp:reportingUnit0001828791dsp:PaycheckProtectionProgramLoanMember2020-04-142020-04-1400018287912022-01-010001828791us-gaap:CreditConcentrationRiskMemberus-gaap:AccountsReceivableMember2022-01-012022-12-31dsp:Customer0001828791us-gaap:CreditConcentrationRiskMemberus-gaap:AccountsReceivableMember2021-01-012021-12-310001828791us-gaap:CreditConcentrationRiskMemberus-gaap:AccountsReceivableMemberdsp:CustomerOneMember2021-01-012021-12-310001828791us-gaap:CreditConcentrationRiskMemberus-gaap:AccountsReceivableMemberdsp:CustomerTwoMember2021-01-012021-12-310001828791us-gaap:RevenueFromContractWithCustomerMemberdsp:AdvertisingAgencyOneMemberdsp:AdvertisingAgencyRiskMember2021-01-012021-12-310001828791us-gaap:RevenueFromContractWithCustomerMemberdsp:AdvertisingAgencyRiskMemberdsp:AdvertisingAgencyTwoMember2022-01-012022-12-310001828791us-gaap:RevenueFromContractWithCustomerMemberdsp:AdvertisingAgencyRiskMemberdsp:AdvertisingAgencyTwoMember2021-01-012021-12-310001828791dsp:AccountsPayableAndAccruedLiabilitiesCurrentMemberus-gaap:SupplierConcentrationRiskMember2022-12-31dsp:Supplier0001828791dsp:AccountsPayableAndAccruedLiabilitiesCurrentMemberus-gaap:SupplierConcentrationRiskMemberdsp:SupplierOneMember2022-01-012022-12-310001828791dsp:AccountsPayableAndAccruedLiabilitiesCurrentMemberus-gaap:SupplierConcentrationRiskMember2021-12-310001828791dsp:AccountsPayableAndAccruedLiabilitiesCurrentMemberus-gaap:SupplierConcentrationRiskMemberdsp:SupplierOneMember2021-01-012021-12-310001828791dsp:ViantTechnologyLLCMember2022-12-310001828791dsp:SecuredOvernightFinancingRateSOFRMember2022-01-012022-12-310001828791us-gaap:TransferredOverTimeMember2022-01-012022-12-310001828791us-gaap:TransferredOverTimeMember2021-01-012021-12-310001828791us-gaap:TransferredOverTimeMember2020-01-012020-12-310001828791us-gaap:TransferredAtPointInTimeMember2022-01-012022-12-310001828791us-gaap:TransferredAtPointInTimeMember2021-01-012021-12-310001828791us-gaap:TransferredAtPointInTimeMember2020-01-012020-12-310001828791us-gaap:LongTermContractWithCustomerMember2022-12-310001828791us-gaap:LongTermContractWithCustomerMember2021-12-310001828791dsp:CapitalizedSoftwareDevelopmentCostsMember2022-12-310001828791dsp:CapitalizedSoftwareDevelopmentCostsMember2021-12-310001828791us-gaap:ComputerEquipmentMember2022-12-310001828791us-gaap:ComputerEquipmentMember2021-12-310001828791us-gaap:SoftwareAndSoftwareDevelopmentCostsMember2022-12-310001828791us-gaap:SoftwareAndSoftwareDevelopmentCostsMember2021-12-310001828791dsp:FurnitureFixturesAndOfficeEquipmentMember2022-12-310001828791dsp:FurnitureFixturesAndOfficeEquipmentMember2021-12-310001828791us-gaap:LeaseholdImprovementsMember2022-12-310001828791us-gaap:LeaseholdImprovementsMember2021-12-310001828791dsp:PlatformOperationsMember2022-01-012022-12-310001828791dsp:PlatformOperationsMember2021-01-012021-12-310001828791dsp:PlatformOperationsMember2020-01-012020-12-310001828791us-gaap:SellingAndMarketingExpenseMember2022-01-012022-12-310001828791us-gaap:SellingAndMarketingExpenseMember2021-01-012021-12-310001828791us-gaap:SellingAndMarketingExpenseMember2020-01-012020-12-310001828791dsp:TechnologyAndDevelopmentMember2022-01-012022-12-310001828791dsp:TechnologyAndDevelopmentMember2021-01-012021-12-310001828791dsp:TechnologyAndDevelopmentMember2020-01-012020-12-310001828791us-gaap:GeneralAndAdministrativeExpenseMember2022-01-012022-12-310001828791us-gaap:GeneralAndAdministrativeExpenseMember2021-01-012021-12-310001828791us-gaap:GeneralAndAdministrativeExpenseMember2020-01-012020-12-310001828791srt:MaximumMember2022-12-310001828791us-gaap:StandbyLettersOfCreditMember2022-12-310001828791dsp:AdelphicMember2022-01-012022-12-310001828791dsp:AdelphicMember2021-01-012021-12-310001828791us-gaap:DevelopedTechnologyRightsMember2022-01-012022-12-310001828791us-gaap:DevelopedTechnologyRightsMember2022-12-310001828791us-gaap:CustomerRelationshipsMember2022-01-012022-12-310001828791us-gaap:CustomerRelationshipsMember2022-12-310001828791us-gaap:TrademarksAndTradeNamesMember2022-01-012022-12-310001828791us-gaap:TrademarksAndTradeNamesMember2022-12-310001828791us-gaap:DevelopedTechnologyRightsMember2021-01-012021-12-310001828791us-gaap:DevelopedTechnologyRightsMember2021-12-310001828791us-gaap:CustomerRelationshipsMember2021-01-012021-12-310001828791us-gaap:CustomerRelationshipsMember2021-12-310001828791us-gaap:TrademarksAndTradeNamesMember2021-01-012021-12-310001828791us-gaap:TrademarksAndTradeNamesMember2021-12-310001828791us-gaap:RevolvingCreditFacilityMember2022-12-310001828791us-gaap:RevolvingCreditFacilityMember2021-12-310001828791dsp:PaycheckProtectionProgramLoanMember2022-12-310001828791dsp:PaycheckProtectionProgramLoanMember2021-12-310001828791us-gaap:RevolvingCreditFacilityMemberdsp:LoanAgreementMemberdsp:PNCBankMember2019-10-310001828791us-gaap:RevolvingCreditFacilityMemberdsp:LoanAgreementMemberus-gaap:FederalFundsEffectiveSwapRateMemberdsp:PNCBankMember2019-10-312019-10-310001828791us-gaap:RevolvingCreditFacilityMemberdsp:LoanAgreementMemberdsp:PNCBankMemberus-gaap:LondonInterbankOfferedRateLiborSwapRateMember2019-10-312019-10-310001828791us-gaap:RevolvingCreditFacilityMemberdsp:LoanAgreementMemberdsp:PNCBankMember2019-10-312019-10-310001828791us-gaap:RevolvingCreditFacilityMemberdsp:LoanAgreementMemberus-gaap:FederalFundsEffectiveSwapRateMembersrt:MinimumMemberdsp:PNCBankMember2019-10-312019-10-310001828791us-gaap:RevolvingCreditFacilityMemberdsp:LoanAgreementMembersrt:MaximumMemberus-gaap:FederalFundsEffectiveSwapRateMemberdsp:PNCBankMember2019-10-312019-10-310001828791us-gaap:RevolvingCreditFacilityMemberdsp:LoanAgreementMembersrt:MinimumMemberdsp:PNCBankMemberus-gaap:LondonInterbankOfferedRateLiborSwapRateMember2019-10-312019-10-310001828791us-gaap:RevolvingCreditFacilityMemberdsp:LoanAgreementMembersrt:MaximumMemberdsp:PNCBankMemberus-gaap:LondonInterbankOfferedRateLiborSwapRateMember2019-10-312019-10-310001828791us-gaap:RevolvingCreditFacilityMemberdsp:LoanAgreementMemberus-gaap:FederalFundsEffectiveSwapRateMemberdsp:PNCBankMember2022-01-012022-12-310001828791us-gaap:RevolvingCreditFacilityMemberdsp:LoanAgreementMemberdsp:PNCBankMemberus-gaap:LondonInterbankOfferedRateLiborSwapRateMember2022-01-012022-12-310001828791us-gaap:RevolvingCreditFacilityMemberdsp:LoanAgreementMemberdsp:PNCBankMember2022-12-310001828791us-gaap:RevolvingCreditFacilityMember2022-01-012022-12-310001828791dsp:PaycheckProtectionProgramLoanMember2020-04-140001828791us-gaap:PrincipalForgivenessMemberdsp:PaycheckProtectionProgramLoanMember2022-01-012022-12-310001828791dsp:AccruedInterestForgivenessMemberdsp:PaycheckProtectionProgramLoanMember2022-01-012022-12-310001828791dsp:UnitRepurchaseAgreementMemberdsp:TwoThousandSixteenConvertiblePreferredUnitsMemberdsp:FormerHoldcosMember2022-01-012022-12-310001828791dsp:UnitRepurchaseAgreementMemberdsp:TwoThousandNineteenConvertiblePreferredUnitsMemberdsp:FourBrothers2LimitedLiabilityCompanyMember2022-12-310001828791dsp:TwoThousandSixteenConvertiblePreferredUnitsMemberdsp:FormerHoldcosMember2022-12-310001828791dsp:TwoThousandNineteenFormerHoldcoTransactionMemberdsp:FourBrothers2LimitedLiabilityCompanyMember2022-01-012022-12-310001828791dsp:TwoThousandNineteenFormerHoldcoTransactionMemberdsp:FourBrothers2LimitedLiabilityCompanyMember2022-12-310001828791dsp:TwoThousandNineteenFormerHoldcoTransactionMember2019-01-012019-12-310001828791dsp:TwoThousandNineteenFormerHoldcoTransactionMember2022-12-310001828791us-gaap:MarketApproachValuationTechniqueMember2022-01-012022-12-310001828791us-gaap:IncomeApproachValuationTechniqueMember2022-01-012022-12-310001828791us-gaap:USTreasuryNotesSecuritiesMember2022-01-012022-12-310001828791us-gaap:MeasurementInputRiskFreeInterestRateMember2022-12-310001828791us-gaap:MeasurementInputOptionVolatilityMember2022-12-310001828791us-gaap:MeasurementInputDiscountForLackOfMarketabilityMember2022-12-3100018287912020-10-012020-10-310001828791dsp:PreferredUnitholdersMember2020-10-012020-10-310001828791dsp:CommonUnitholdersMember2020-10-012020-10-310001828791dsp:PhantomUnitPlanMember2020-01-010001828791dsp:PhantomUnitPlanMember2020-01-012020-01-010001828791dsp:TwoThousandAndTwentyOneLongTermIncentivePlanMemberus-gaap:CommonClassAMember2021-02-120001828791dsp:TwoThousandAndTwentyOneLongTermIncentivePlanMemberus-gaap:CommonClassAMember2021-02-122021-02-120001828791dsp:TwoThousandAndTwentyOneLongTermIncentivePlanMemberus-gaap:CommonClassAMembersrt:MaximumMember2021-01-012021-12-310001828791dsp:TwoThousandAndTwentyOneLongTermIncentivePlanMemberus-gaap:RestrictedStockUnitsRSUMember2021-02-122021-02-120001828791dsp:TwoThousandAndTwentyOneLongTermIncentivePlanMember2022-12-310001828791us-gaap:RestrictedStockUnitsRSUMember2021-12-310001828791us-gaap:RestrictedStockUnitsRSUMember2022-01-012022-12-310001828791us-gaap:RestrictedStockUnitsRSUMember2022-12-310001828791dsp:NonqualifiedStockOptionsMember2021-12-310001828791dsp:NonqualifiedStockOptionsMember2021-01-012021-12-310001828791dsp:NonqualifiedStockOptionsMember2022-01-012022-12-310001828791dsp:NonqualifiedStockOptionsMember2022-12-310001828791us-gaap:DomesticCountryMember2022-12-310001828791us-gaap:DomesticCountryMember2021-12-310001828791us-gaap:StateAndLocalJurisdictionMember2022-12-310001828791us-gaap:StateAndLocalJurisdictionMember2021-12-310001828791us-gaap:DomesticCountryMemberus-gaap:ResearchMember2022-12-310001828791us-gaap:ResearchMemberus-gaap:StateAndLocalJurisdictionMember2022-12-310001828791us-gaap:CommonClassAMember2022-01-012022-12-310001828791us-gaap:CommonClassAMember2021-01-012021-12-310001828791us-gaap:CommonClassAMember2020-01-012020-12-310001828791us-gaap:RestrictedStockUnitsRSUMember2022-01-012022-12-310001828791us-gaap:RestrictedStockUnitsRSUMember2021-01-012021-12-310001828791us-gaap:RestrictedStockUnitsRSUMember2020-01-012020-12-310001828791dsp:NonqualifiedStockOptionsMember2022-01-012022-12-310001828791dsp:NonqualifiedStockOptionsMember2021-01-012021-12-310001828791dsp:NonqualifiedStockOptionsMember2020-01-012020-12-310001828791us-gaap:CommonClassBMember2022-01-012022-12-310001828791us-gaap:CommonClassBMember2021-01-012021-12-310001828791us-gaap:CommonClassBMember2020-01-012020-12-310001828791dsp:ViantTechnologyIncMemberdsp:ViantTechnologyLLCMember2022-01-012022-12-310001828791dsp:ViantTechnologyIncMemberdsp:ViantTechnologyLLCMember2022-12-310001828791dsp:ViantTechnologyIncMemberdsp:ViantTechnologyLLCMember2021-01-012021-12-310001828791dsp:ViantTechnologyIncMemberdsp:ViantTechnologyLLCMember2021-12-310001828791us-gaap:NoncontrollingInterestMemberdsp:ViantTechnologyLLCMember2022-01-012022-12-310001828791us-gaap:NoncontrollingInterestMemberdsp:ViantTechnologyLLCMember2022-12-310001828791us-gaap:NoncontrollingInterestMemberdsp:ViantTechnologyLLCMember2021-01-012021-12-310001828791us-gaap:NoncontrollingInterestMemberdsp:ViantTechnologyLLCMember2021-12-310001828791dsp:ViantTechnologyLLCMember2022-01-012022-12-310001828791dsp:ViantTechnologyLLCMember2021-01-012021-12-310001828791dsp:ViantTechnologyLLCMember2021-12-310001828791dsp:MembersEquityClassBUnitsMember2022-01-012022-12-310001828791dsp:MeredithCorporationMember2022-12-310001828791dsp:MeredithCorporationMember2021-12-310001828791dsp:MeredithCorporationMember2022-01-012022-12-310001828791dsp:MeredithCorporationMember2021-01-012021-12-310001828791dsp:MeredithCorporationMember2020-01-012020-12-31

________________________________________________
FISCAL YEAR 2022 ANNUAL FINANCIAL REPORT
UNITED STATES
SECURITIES AND EXCHANGE COMMISSION
Washington, D.C. 20549
FORM 10-K
| | | | | |
| x | ANNUAL REPORT PURSUANT TO SECTION 13 OR 15(d) OF THE SECURITIES EXCHANGE ACT OF 1934 |
For the fiscal year ended December 31, 2022
OR
| | | | | |
| o | TRANSITION REPORT PURSUANT TO SECTION 13 OR 15(d) OF THE SECURITIES EXCHANGE ACT OF 1934 |
For the transition period from__________to__________
Commission File Number: 001-40015
__________________________________________________________________________
Viant Technology Inc.
(Exact name of registrant as specified in its charter)
_____________________________________________________________________________
| | | | | | | | |
| Delaware | | 85-3447553 |
(State or other jurisdiction of
incorporation or organization) | | (I.R.S. Employer
Identification No.) |
| 2722 Michelson Drive, Suite 100 Irvine, CA, 92612 | |
| (Address of principal executive offices and zip code) |
| (949) 861-8888 | |
| (Registrant’s telephone number, including area code) |
Securities registered pursuant to Section 12(b) of the Act:
| | | | | | | | | | | | | | |
| Title of each class | | Trading Symbol(s) | | Name of each exchange on which registered |
| Class A common stock, par value $0.001 per share | | DSP | | The Nasdaq Stock Market LLC |
| | | | (Nasdaq Global Select Market) |
Securities registered pursuant to Section 12(g) of the Act: None
Indicate by check mark if the registrant is a well-known seasoned issuer, as defined in Rule 405 of the Securities Act. Yes o No x
Indicate by check mark if the registrant is not required to file reports pursuant to Section 13 or 15(d) of the Act. Yes o No x
Indicate by check mark whether the registrant: (1) has filed all reports required to be filed by Section 13 or 15(d) of the Securities Exchange Act of 1934 during the preceding 12 months (or for such shorter period that the registrant was required to file such reports), and (2) has been subject to such filing requirements for the past 90 days. Yes x No o
Indicate by check mark whether the registrant has submitted electronically every Interactive Data File required to be submitted pursuant to Rule 405 of Regulation S-T (§232.405 of this chapter) during the preceding 12 months (or for such shorter period that the registrant was required to submit such files). Yes x No o
Indicate by check mark whether the registrant is a large accelerated filer, an accelerated filer, a non-accelerated filer, smaller reporting company, or an emerging growth company. See the definitions of “large accelerated filer,” “accelerated filer,” “smaller reporting company,” and “emerging growth company” in Rule 12b-2 of the Exchange Act.
| | | | | | | | | | | | | | | | | |
| Large accelerated filer | o | Accelerated filer | o | Emerging growth company | x |
| Non-accelerated filer | x | Smaller reporting company | x | | |
If an emerging growth company, indicate by check mark if the registrant has elected not to use the extended transition period for complying with any new or revised financial accounting standards provided pursuant to Section 13(a) of the Exchange Act. o
Indicate by check mark whether the registrant has filed a report on and attestation to its management’s assessment of the effectiveness of its internal control over financial reporting under Section 404(b) of the Sarbanes-Oxley Act (15 U.S.C. 7262(b)) by the registered public accounting firm that prepared or issued its audit report. o
If securities are registered pursuant to Section 12(b) of the Act, indicate by check mark whether the financial statements of the registrant included in the filing reflect the correction of an error to previously issued financial statements. o
Indicate by check mark whether any of those error corrections are restatements that required a recovery analysis of incentive-based compensation received by any of the registrant's executive officers during the relevant recovery period pursuant to §240.10D-1(b).
Indicate by check mark whether the registrant is a shell company (as defined in Rule 12b-2 of the Act). Yes o No x
The aggregate market value of the voting and non-voting common equity held by non-affiliates of the registrant, based on the closing price of the registrant's Class A common stock on the Nasdaq Global Select Market on June 30, 2022, the last business day of the registrant’s most recently completed second fiscal quarter, was approximately $71.7 million.
As of February 28, 2023, there were 14,647,798 shares and 47,082,260 shares of the registrant’s Class A and Class B common stock, respectively, $0.001 par value per share, outstanding.
DOCUMENTS INCORPORATED BY REFERENCE
Portions of the registrant’s definitive Proxy Statement for its 2023 Annual Meeting of Stockholders, which the registrant intends to file pursuant to Regulation 14A with the Securities and Exchange Commission no later than 120 days after the registrant’s fiscal year ended December 31, 2022, are incorporated by reference into Part III of this Annual Report on Form 10-K.
VIANT TECHNOLOGY INC.
SPECIAL NOTE REGARDING FORWARD-LOOKING STATEMENTS
This Annual Report on Form 10-K (“Annual Report”) contains forward-looking statements within the meaning of Section 27A of the Securities Act of 1933, as amended (the “Securities Act”), and Section 21E of the Securities Exchange Act of 1934, as amended (the “Exchange Act”), which statements involve substantial risks and uncertainties. Forward-looking statements generally relate to future events or our future financial or operating performance and may include statements concerning, among other things, our business strategy (including anticipated trends and developments in, and management plans for, our business and the markets in which we operate), financial results, the sufficiency of our cash and cash equivalents and cash provided by sales of our products and services to meet our liquidity needs, the impact of macroeconomic and geopolitical events, including the ongoing COVID-19 pandemic, labor shortages, inflation and monetary supply shifts, rising interest rates, tightening of credit markets, recession risks, and potential disruptions from the Russia-Ukraine conflict, on our business, operations, and the markets and communities in which we, our clients, and partners operate, results of operations, revenues, operating expenses, capital expenditures, sales and marketing initiatives and competition.
In some cases, you can identify forward-looking statements by words such as “may,” “will,” “should,” “could,” “intend,” “consider,” “expect,” “plan,” “anticipate,” “believe,” “estimate,” “predict” or “continue” or the negative or plural of these words or other similar terms or expressions. All statements other than statements of historical fact are forward-looking statements, which speak only as of the date they are made, and are not guarantees of future performance. Forward-looking statements contained in this Annual Report include, but are not limited to, statements about: our future financial performance, including our revenue, cost of revenue, gross profit, contribution excluding traffic acquisition costs (“contribution ex-TAC”), adjusted EBITDA, and operating expenses; trends in our key business measures; the sufficiency of our cash and cash equivalents and cash provided by sales of our products and services to meet our liquidity needs; market trends; our market position and opportunity; our growth strategy and business aspirations for our demand side platform in enabling the programmatic purchase of advertising in the digital advertising industry; our product strategy; our efforts to enhance the security and privacy of our platform; the potential impacts of macroeconomic and geopolitical events, including the COVID-19 pandemic and related public health measures on our business, the business of our customers, suppliers and channel partners, and the economy; our ability to attract new customers and retain existing customers; our ability to successfully expand into our existing markets and into new markets; our ability to effectively manage our growth and future expenses; and the impact of recent accounting pronouncements on our consolidated financial statements.
Such statements are not guarantees of future performance and involve a number of assumptions, risks and uncertainties that could cause actual results to differ materially from expected results. As a result, you should not put undue reliance on any forward-looking statement. These forward-looking statements are included throughout this Annual Report. Factors that could cause our actual results to differ materially from those expressed or implied in such forward-looking statements include, but are not limited to, the risk factors discussed in the “Risk Factors” section of this Annual Report.
The forward-looking statements contained in this Annual Report are based on historical performance and management’s current plans, estimates and expectations in light of information currently available to us and are subject to uncertainty and changes in circumstances. There can be no assurance that future developments affecting us will be those that we have anticipated. Actual results may differ materially from these expectations due to changes in global, regional or local political, economic, business, competitive, market, regulatory and other factors, many of which are beyond our control, as well as the other factors described in the section entitled “Risk Factors.” Additional factors or events that could cause our actual results to differ may also emerge from time to time, and it is not possible for us to predict all of them. Should one or more of these risks or uncertainties materialize, or should any of our assumptions prove to be incorrect, our actual results may vary in material respects from what we may have expressed or implied by these forward-looking statements. We may not actually achieve the plans, intentions, or expectations disclosed in our forward-looking statements, and we caution that you should not place undue reliance on any of our forward-looking statements. Any forward-looking statement made by us in this Annual Report speaks only as of the date on which we make it. We undertake no obligation to publicly update any forward-looking statement, whether as a result of new information, future developments or otherwise, except as may be required by applicable securities laws. You should read this Annual Report, and the documents that we reference in this Annual Report and have filed with the Securities and Exchange Commission (“SEC”), with the understanding that our actual future results, performance, and events and circumstances may be materially different from what we expect.
RISK FACTOR SUMMARY
Our business is subject to numerous risks and uncertainties, including those described in the “Risk Factors” section of this Annual Report. You should carefully consider these risks and uncertainties when investing in our Class A common stock. Some of the principal risks and uncertainties include the following:
•Our success and revenue growth are dependent on adding new customers, effectively educating and training our existing customers on how to make full use of our platform and increasing usage of our platform by our customers;
•We may not realize the expected benefits of an industry shift away from cookie-based consumer tracking as such shift may not occur as rapidly as we expect or may not be realized at all;
•If we fail to innovate and make the right investment decisions in our offerings and platform, we may not attract and retain customers and our revenue and results of operations may decline;
•The market for programmatic advertising is evolving. If this market develops slower or differently than we expect, our business, operating results and financial condition would be adversely affected;
•We receive a significant amount of revenue from a select number of advertising agency holding companies, owning various advertising agencies, and the loss of advertising agencies as customers could harm our business, operating results and financial condition;
•We often have long sales cycles, which can result in significant time between initial contact with a prospect and execution of a customer agreement, making it difficult to project when, if at all, we will obtain new customers and when we will generate revenue from those customers;
•The effects of macroeconomic conditions and geopolitical events, such as economic recessions and the COVID-19 pandemic, have had, and could in the future have, an adverse impact on our business, operating results and financial condition;
•If our access to advertising inventory is diminished or fails to grow, our revenue could decline and our growth could be impeded;
•If our access to people-based data is diminished, the effectiveness of our platform would be decreased, which could harm our operating results and financial condition;
•We are subject to stringent and changing obligations related to data privacy and security. Our actual or perceived failure to comply with such obligations could lead to regulatory investigations or actions, litigation, fines and penalties, disruptions of our business operations, reputational harm, loss of customers or sales, revenue declines, increase the cost of data, reduce the availability of data, reduce our ability to utilize or disclose data, adversely affect the demand for our products and services, or other adverse business consequences;
•Our business or ability to operate our platform could be impacted by changes in the technology industry by technology companies, end users, or government regulation. Such developments, including the restriction of “third-party cookies,” could cause instability in the advertising technology industry;
•A significant inadvertent disclosure or breach of our information technology systems or data, or of the security of our or our customers’, suppliers’, or other third parties’ upon which we rely could be detrimental to our business, reputation and results of operations;
•Our proprietary rights may be difficult to enforce, which could enable others to copy or use aspects of our technology without compensating us, thereby eroding our competitive advantages and harming our business;
•The market price of our Class A common stock has been and may continue to be volatile or may decline regardless of our operating performance; and
•We are a “controlled company” within the meaning of the listing standards of the Nasdaq Global Select Market and, as a result, qualify for, and rely on, exemptions from certain corporate governance requirements.
PART I
Item 1. Business.
Our Company
We are an advertising technology company. Our cloud-based demand side platform ("DSP"), Adelphic, enables the programmatic purchase of advertising, which is the electronification of the digital advertising buying process. Programmatic advertising is rapidly taking market share from traditional ad sales channels, which require more staffing, offer less transparency, and involve higher costs to buyers.
Adelphic is used by marketers and their advertising agencies to centralize the planning, buying and measurement of their digital advertising across most channels. Through our omni-channel platform, a marketer can easily buy ads on desktop, mobile, connected TV, linear TV, in-game, streaming audio and digital billboards.
Adelphic is an easy-to-use self-service platform that provides our customers with transparency and control over their advertising campaigns. Our platform offers customers unique visibility across a variety of inventory, allowing them to create customized audience segments and leverage our people-based and strategic partner data to reach target audiences at scale. Our platform delivers a full suite of forecasting, reporting and built-in automation that provides our customers with insights into available inventory based on the desired target audience. We offer advanced forecasting and reporting that empowers our customers with functionality designed to ensure they can accurately measure and improve their return-on-advertising spend (“ROAS”) across channels.
Marketers use our platform to deliver advertising campaigns to their desired target audience across channels and formats. Through platform integrations, we offer our customers access to omnichannel advertising inventory, which refers to media available across devices, channels and formats. This includes access to approximately 300 million unique desktop and mobile users, approximately 115 million connected TV households, approximately 112 million linear TV households, over 200 million unique digital audio users, and approximately 158,000 unique digital billboards in the United States. Our platform supports a full range of transaction types including real-time bidding, private marketplace and programmatic guaranteed, allowing customers to easily source and integrate ad inventory directly from publishers and private marketplaces.
We enable deep data access through our data integrations to authenticate user identities across a range of devices. Our matching of people-based identifiers enables us to be the nexus point with more than 70 data partners, providing customers with deep access to people-based data across market verticals such as automotive, entertainment, professional services, retail, consumer packaged goods, travel and tourism, and healthcare. Our proprietary identity graph has linked approximately 115 million households to an estimated 1 billion connected devices and is combined with access to approximately 280,000 audience attributes in the United States, which we believe makes it one of the largest in the industry.
Our customers are advertising buyers including large advertising holding companies, independent advertising agencies, mid-market advertising service organizations as well as marketers that rely on our self-service platform for their programmatic ad buying needs. We are a trusted partner to our customers and have had a customer satisfaction rating of 90% or greater for the last four years based on Viant’s Annual Adelphic Customer Satisfaction Survey. Many of our customers use us as their primary DSP.
Our platform is built on people-based data. Using our identity resolution capabilities and identity graph, marketers and their advertising agencies can identify targeted consumers using real-world identifiers rather than relying primarily on cookies to track users. We believe the industry is shifting to a people-based framework to replace cookies in delivering personalized advertising, particularly for identification. People-based data allows marketers to deliver personalized advertising while being able to accurately link ad impressions across multiple devices and to customer sales and measure the impact of their ad spend. In addition, people-based data can offer greater transparency to consumers with respect to who is collecting their data and what it is being used for and can offer more robust choices to delete or stop use of their data for personalized advertising. Many of our competitors rely on cookies for the targeting and measurement of digital advertising but this technology has not been effective at accurately measuring the real impact of a marketer’s ad spend on their business results. Apple’s web browser, Safari, and other web browsers currently do not allow third-party cookies. Google has announced plans to start phasing out (and eventually entirely disallowing) third-party cookies in their Chrome browser in 2024. Moreover, certain state data privacy laws, including in California and Colorado, require websites and apps to enable consumers to opt-out of the transfer of their personal information used for digital advertising, which could further undermine cookie-based tracking and targeted marketing. This market change has created an increase in demand by marketers actively looking for platforms like ours that offer an alternative to cookie-based tracking, which we believe is strengthening our strategic position.
Programmatic advertising has proven its value to marketers and an increasing number of organizations are devoting more of their digital ad spend to it. The digital ecosystem continues to evolve and with it, programmatic advertising, creating new opportunities and needs for marketers and their agencies. The U.S. programmatic advertising market is expected to grow from $114.7 billion in 2021 to $168.0 billion in 2024, a 14% compound annual growth rate (“CAGR”), according to eMarketer, a market research company that provides insights and trends related to digital marketing, media and commerce. We focus on ad buyers and believe that our
solutions will accelerate the shift of advertising budgets to programmatic advertising. Additionally, as marketers desire more control over programmatic advertising and move some functions of programmatic ad buying in-house, our platform is designed to address these needs and expand our market opportunity.
Our total revenue was $197.2 million, $224.1 million and $165.3 million for the fiscal years ended December 31, 2022, 2021 and 2020, respectively, representing a decrease of 12.0% from fiscal 2021 to fiscal 2022 and an increase of 35.6% from fiscal 2020 to fiscal 2021. We recorded net losses of $48.1 million and $37.6 million and net income of $20.6 million, and adjusted EBITDA of $(6.1) million, $37.1 million, and $31.8 million for the years ended December 31, 2022, 2021 and 2020, respectively.
Adjusted EBITDA is a financial measure not presented in accordance with generally accepted accounting principles in the United States of America (“GAAP”). For a definition of adjusted EBITDA, an explanation of our management’s use of this measure and a reconciliation of adjusted EBITDA to our net income or net loss, see “Management’s Discussion and Analysis of Financial Condition and Results of Operations—Key Operating and Financial Performance Measures—Use of Non-GAAP Financial Measures.”
Our Industry
We believe the key industry trends shaping the advertising market include:
Advertising dollars shifting toward programmatic advertising: We believe the advertising industry is still in the early stages of a shift toward programmatic advertising. The ability to transact through real-time-bidding platforms has evolved beyond banner advertising to be used across a wide range of advertising channels and formats, including desktop, mobile, connected TV, linear TV, in-game, streaming audio and digital billboards. U.S. programmatic advertising is experiencing a rapid increase in adoption and, according to eMarketer, is expected to grow at a 14% CAGR from 2021 to 2024, reaching $148.8 billion in 2023 and $168.0 billion by 2024. U.S. programmatic advertising is forecasted to represent 41% of total U.S. media spend by 2024, increasing from 38% in 2021. The TV industry is undergoing significant disruptions as internet-enabled connected TV has become a preferred vehicle for streaming video content. The amount of connected TV users in the U.S. is forecasted to increase from approximately 218 million, or 65% of the U.S. population, in 2021 to approximately 242 million, or 70% of the U.S. population, in 2026, according to eMarketer. Connected TV also provides a number of benefits to advertisers, including more accurate control of scale, addressability and measurement. Marketers are increasingly investing in connected TV as more inventory becomes available. According to eMarketer, 80% of connected TV ad spend was transacted programmatically in 2021 and the share of programmatic is expected to increase to nearly 91% in 2024. In addition, connected TV ad spend is expected to grow from $17.2 billion in 2021 to $43.6 billion in 2026, a 20% CAGR.
Strong marketer demand for ROAS measurement across all channels: Marketers are looking for a centralized view of their customers, while connecting online and offline purchases to accurately measure ROAS. ROAS is a critical metric for marketing campaigns. Insights from ROAS across all campaigns inform marketers about what they are getting for their money across all media investments near real-time. Hence, marketers seek tools to track their ROAS across all channels. We believe people-based platforms are able to provide a more accurate measurement of ROAS as compared to cookie-based platforms.
Demand for scaled people-based platforms: Advertising has become more data driven and marketers need to be able to target audiences at the individual and household level while respecting consumer privacy. Internet advertisers in the past have capitalized on anonymous data from cookies to gain insights into users and ad performance. However, increased privacy concerns and changing requirements of browser providers including Google (Chrome) and Apple (Safari) are causing marketers to reduce their reliance on vendors and platforms that primarily utilize cookies for device identification. In today’s connected world, marketers need to be able to identify their customers and connect with them across most channels, devices and formats. This, we believe, will drive an industry shift away from cookie-based DSPs to scaled people-based DSPs.
Brands directly selecting advertising platform solutions: Marketers are increasingly becoming directly involved in the selection of their advertising platform solutions as they seek to reduce costs, better leverage their customer data and gain more control over their advertising. These factors have also led to an increase in marketers moving programmatic ad buying functions in-house. The automation of ad-buying technology has enabled fast, accurate and cost-effective decision-making, resulting in ad buying becoming a skillset that an increasing number of chief marketing officers want to fully own. According to the most recent survey by the Interactive Advertising Bureau, an advertising business organization that develops industry standards, conducts research, and provides legal support for the online advertising industry, in 2019, 18% of U.S. brands had completely moved programmatic ad buying in-house, and 51% of U.S. brands had moved a portion of their programmatic ad buying in-house.
Our Market Opportunity
We believe that over the long term, our total addressable market is the total global advertising market, which eMarketer has forecasted to grow from $930 billion in 2023 to $1.15 trillion in 2026, a 7% CAGR. Currently, our focus is primarily on the U.S.
market, which eMarketer has forecasted to grow from $344 billion in 2023 to $452 billion in 2026 in the United States, a 9% CAGR, broken into the following segments:
•Desktop and Mobile: U.S. desktop and mobile advertising are forecasted to grow from a $245 billion market in 2023 to a $333 billion market in 2026, an 11% CAGR.
•Connected TV: U.S. connected TV advertising is forecasted to be a $27 billion market in 2023 and forecasted to grow to $44 billion in 2026, a 17% CAGR. Connected TV includes over-the-top (“OTT”) content delivered through a connected device over the internet.
•Linear TV: U.S. linear TV advertising is forecasted to be a $62.4 billion market in 2023 and forecasted to be a $62.1 billion market in 2026, a negative 0.2% CAGR.
•Streaming Audio: U.S. digital audio advertising is forecasted to be a $7 billion market in 2023 and forecasted to grow to $9 billion in 2026, a 9% CAGR.
•Digital Billboards: U.S. billboard advertising is forecasted to be a $3 billion market in 2023 and forecasted to grow to $4 billion in 2026, a 10% CAGR.
The forecasts for each segment above include both programmatic and non-programmatic digital advertising. In recent years, programmatic advertising has represented an increasing portion of total U.S. media spend. eMarketer estimates that the U.S. programmatic advertising market, as represented by the segments above, will grow from $115 billion in 2021 to $168 billion in 2024, a 14% CAGR.
Our Solution
We make it easy to buy an ad across a wide range of advertising channels and formats, and help brands measure the impact of their ad spend by providing electronic buying and measurement of all advertising. Our platform enables marketers and their advertising agencies to plan, buy and measure campaigns across channels. Integrated with our people-based capabilities, we provide our customers with a full suite of forecasting, reporting and automation functionality to make informed decisions around their advertising investments. We provide superior customer service to ensure our customers have the level of support required for their unique business needs. Viant is driven to be a leader in innovation, automation, transparency, customer focus and responsible media.
Holistic, Omnichannel DSP: Marketers and their agencies can use our integrated platform to efficiently manage omnichannel campaigns and access metrics from each channel to inform decisions in other channels. Our integrations enable the purchase of advertising media across desktop, mobile, connected TV, linear TV, in-game, streaming audio and digital billboards. Our technology leverages artificial intelligence (“AI”) and machine learning to identify the best supply partners, formats and impressions based on our customers’ goals.
Viant Household ID™ (“VHHID”): Our proprietary people-based innovation that combines digital and personal identifiers into a normalized household profile that provides known customer data insights and optimized bid decisions for target audiences, accurate reach and frequency management across omnichannel supply including cookieless channels like CTV, Safari and mobile app and holistic measurement of conversions across all devices and context. Whether online or in-store, we can attribute conversions to media investments. The VHHID not only captures the ad exposure as the impression is delivered, but can also connect that ad exposure to an outcome which significantly differentiates our DSP technology.
World Without Cookies Release/People-Based Advertising: Released in 2021, our World Without Cookies feature integrates a people-based, household approach directly into the Adelphic DSP. By unifying the VHHID throughout Adelphic, World Without Cookies empowers marketers to manage reach and frequency at the household level, reducing waste and improving the customer experience. In a recent study, marketers using our World Without Cookies feature saw over 200% more conversions and reached 40% more households compared to traditional cookie-based platforms, and decreased frequency by 28%.
Viant Identity Graph: Our proprietary, established identity resolution capabilities power our identity graph, which reduces or eliminates the need for cookies by enabling matching of people-based identifiers that anchor digital identifiers and allow marketers to reach targeted consumers in a privacy-conscious manner, irrespective of device or channel. Our proprietary identity graph has linked approximately 115 million U.S. households to approximately 1 billion connected devices. This process provides access to an estimated 280,000 audience attributes using our proprietary people-based, household profile, the VHHID, allowing marketers to reach real consumers, not proxies, whether they are at home or away. The VHHID provides known insights for optimized bid decisions and touchpoint collection across consumer pathways for holistic targeting and measurement across channels.
Advanced Reporting and Measurement: We invest heavily in our measurement capabilities, as we believe advertising should be driving a positive return. Our self-service campaign analysis and data intelligence tool empowers customers with differentiated insights, including conversion lift, multi-touch attribution, foot-traffic data reports, digital-out-of-home lift, sales reporting and ROAS analytics. Leveraging our people-based framework and machine learning algorithms, our platform provides marketers real-time
actionable insights throughout an advertising campaign. Our built-in automation enables marketers to optimize digital campaigns designed to achieve their key performance indicator (“KPI”) goals.
Onboarding: We enable marketers to safely and securely onboard their first-party data to gain a view into their customers’ top attributes, create targeting segments and easily activate and measure these customer segments. Our simple interface allows marketers to upload audience data with ease and create a unique segment or build lookalike audiences without the need for a separate data management platform. Our data integrations provide marketers with high match rates, which provides scalable and meaningful audience insights for segmentation, targeting and measuring key outcomes both online and offline.
Flexible Customer Engagement Models: Our DSP and related services are available through several levels of best-in-class customer service, from a self-service interface, providing customers with transparency and control over their advertising campaigns and underlying data infrastructure, to a fully managed end-to-end solution, providing an experienced support team for audiences, execution and advanced reporting.
Our Strengths
We believe the following attributes and capabilities provide us with long-term competitive advantages:
•Scalable Self-Service Platform: We offer a self-service platform that enables customers to operate their ad campaigns without extensive involvement of our staff. This dynamic allows us to add new customers and allows customers to scale their spend on our platform in a manner that grows our revenue faster than the growth of our personnel costs.
•Centralized Platform: We believe our DSP and related services enable our customers to plan, buy and measure advertising across more channels than our competitors and to centralize the purchase of each type of programmatic media on a single platform. Our supply integrations provide customers with access to approximately 300 million unique desktop and mobile users, approximately 115 million connected TV households, 112 million linear TV households, over 200 million unique digital audio users, and approximately 158,000 unique digital billboards, in the United States.
•Proprietary Technology: We leverage a robust suite of proprietary tools and products to enable our customers to utilize our platform and services. We are constantly iterating and developing new tools and products while utilizing our patented technologies and processes. As of December 31, 2022, we held 37 issued patents and 11 additional pending patent applications, which cover many of our proprietary products. As new offerings are developed, we continue to file and obtain patents on the most valuable and innovative products developed at our Company.
•Machine Learning Capabilities: We enable the use of machine learning, workflow automation, automated reporting and other functionalities that allow our customers to update and make thousands of changes automatically to help achieve their desired business outcomes. We believe these capabilities make our customers’ lives easier and improve the performance of their campaigns.
•Advanced Reporting and Measurement: We invest heavily in our measurement capabilities, as we believe this will increase our customers’ usage of our DSP and related services. Our platform measures ROAS across all channels and empowers our customers with real-time insights leveraging people-based data, including foot-traffic reports and multi-touch attribution analytics. Our advanced reporting functionality uses our identity graph that has linked approximately 115 million households to an estimated 1 billion connected devices and is combined with access to approximately 280,000 audience attributes in the United States to provide marketers with a holistic view of measurement across all channels.
•Differentiated People-Based Capabilities: Our platform leverages a people-based framework. We integrate with over 70 data partners using people-based identifiers. We believe this allows for a much more effective and privacy-friendly approach to advertising than using cookies for identification. Our DSP and related services are built on a foundation of user consent with advanced consumer opt-out capabilities to keep privacy and security on the forefront.
•Experienced Management Team: Our management team has deep and extensive experience in the advertising technology sector, which we believe provides us with a competitive advantage. The experience of our management team has allowed us to continue to be innovative in developing solutions for our customers.
•Business Model: Because we are a self-service platform, as we add new customers and as customers increase the use of our platform, we are able to demonstrate strong operating leverage.
Our Growth Strategy
We believe that the advertising market is in the early stages of a shift toward programmatic advertising. We intend to capitalize on this opportunity by pursuing the following strategies:
•Continue to invest in our customers’ success: Our platform provides extensive functionality designed to provide our customers with a high level of control and enable them to run efficient ad campaigns. We continue to enhance new customer onboarding and support while investing in training and education for customers to maximize their success with our platform.
•Add new customers and increase our customers’ usage of our platform: We continue to add functionality to our platform to attract new customers and encourage our customers to increase their usage of our platform. We believe many advertisers are in the early stages of moving a greater percentage of their advertising budgets to programmatic channels. By providing solutions for the planning, buying and measuring of their media spend across all channels, we believe we are well positioned to capture the increase in programmatic budgets from new and existing customers.
•Continue to strengthen our omnichannel partnerships: We believe we have one of, if not the largest breadth of advertising inventory across channels in our industry landscape. We will continue to invest in the integration of new supply partners across all channels, further broadening and deepening our supply of advertising inventory.
•Expand our sales and marketing investment: We intend to continue to expand sales and marketing efforts to increase awareness and consideration of our platform and promote the advantages of our people-based framework as cookie-based options continue to decline.
•Extend our leadership position in people-based advertising: We believe there is significant value in continuing to invest in enhancing our identity resolution capabilities through additional people-based data integrations.
•Invest in growth through acquisitions: We also intend to invest in acquisitions that will allow us to offer new products and capitalize on our large and growing market opportunity. To the extent we find attractive acquisition candidates and business opportunities in the future, we may continue to acquire complementary businesses, products and technologies.
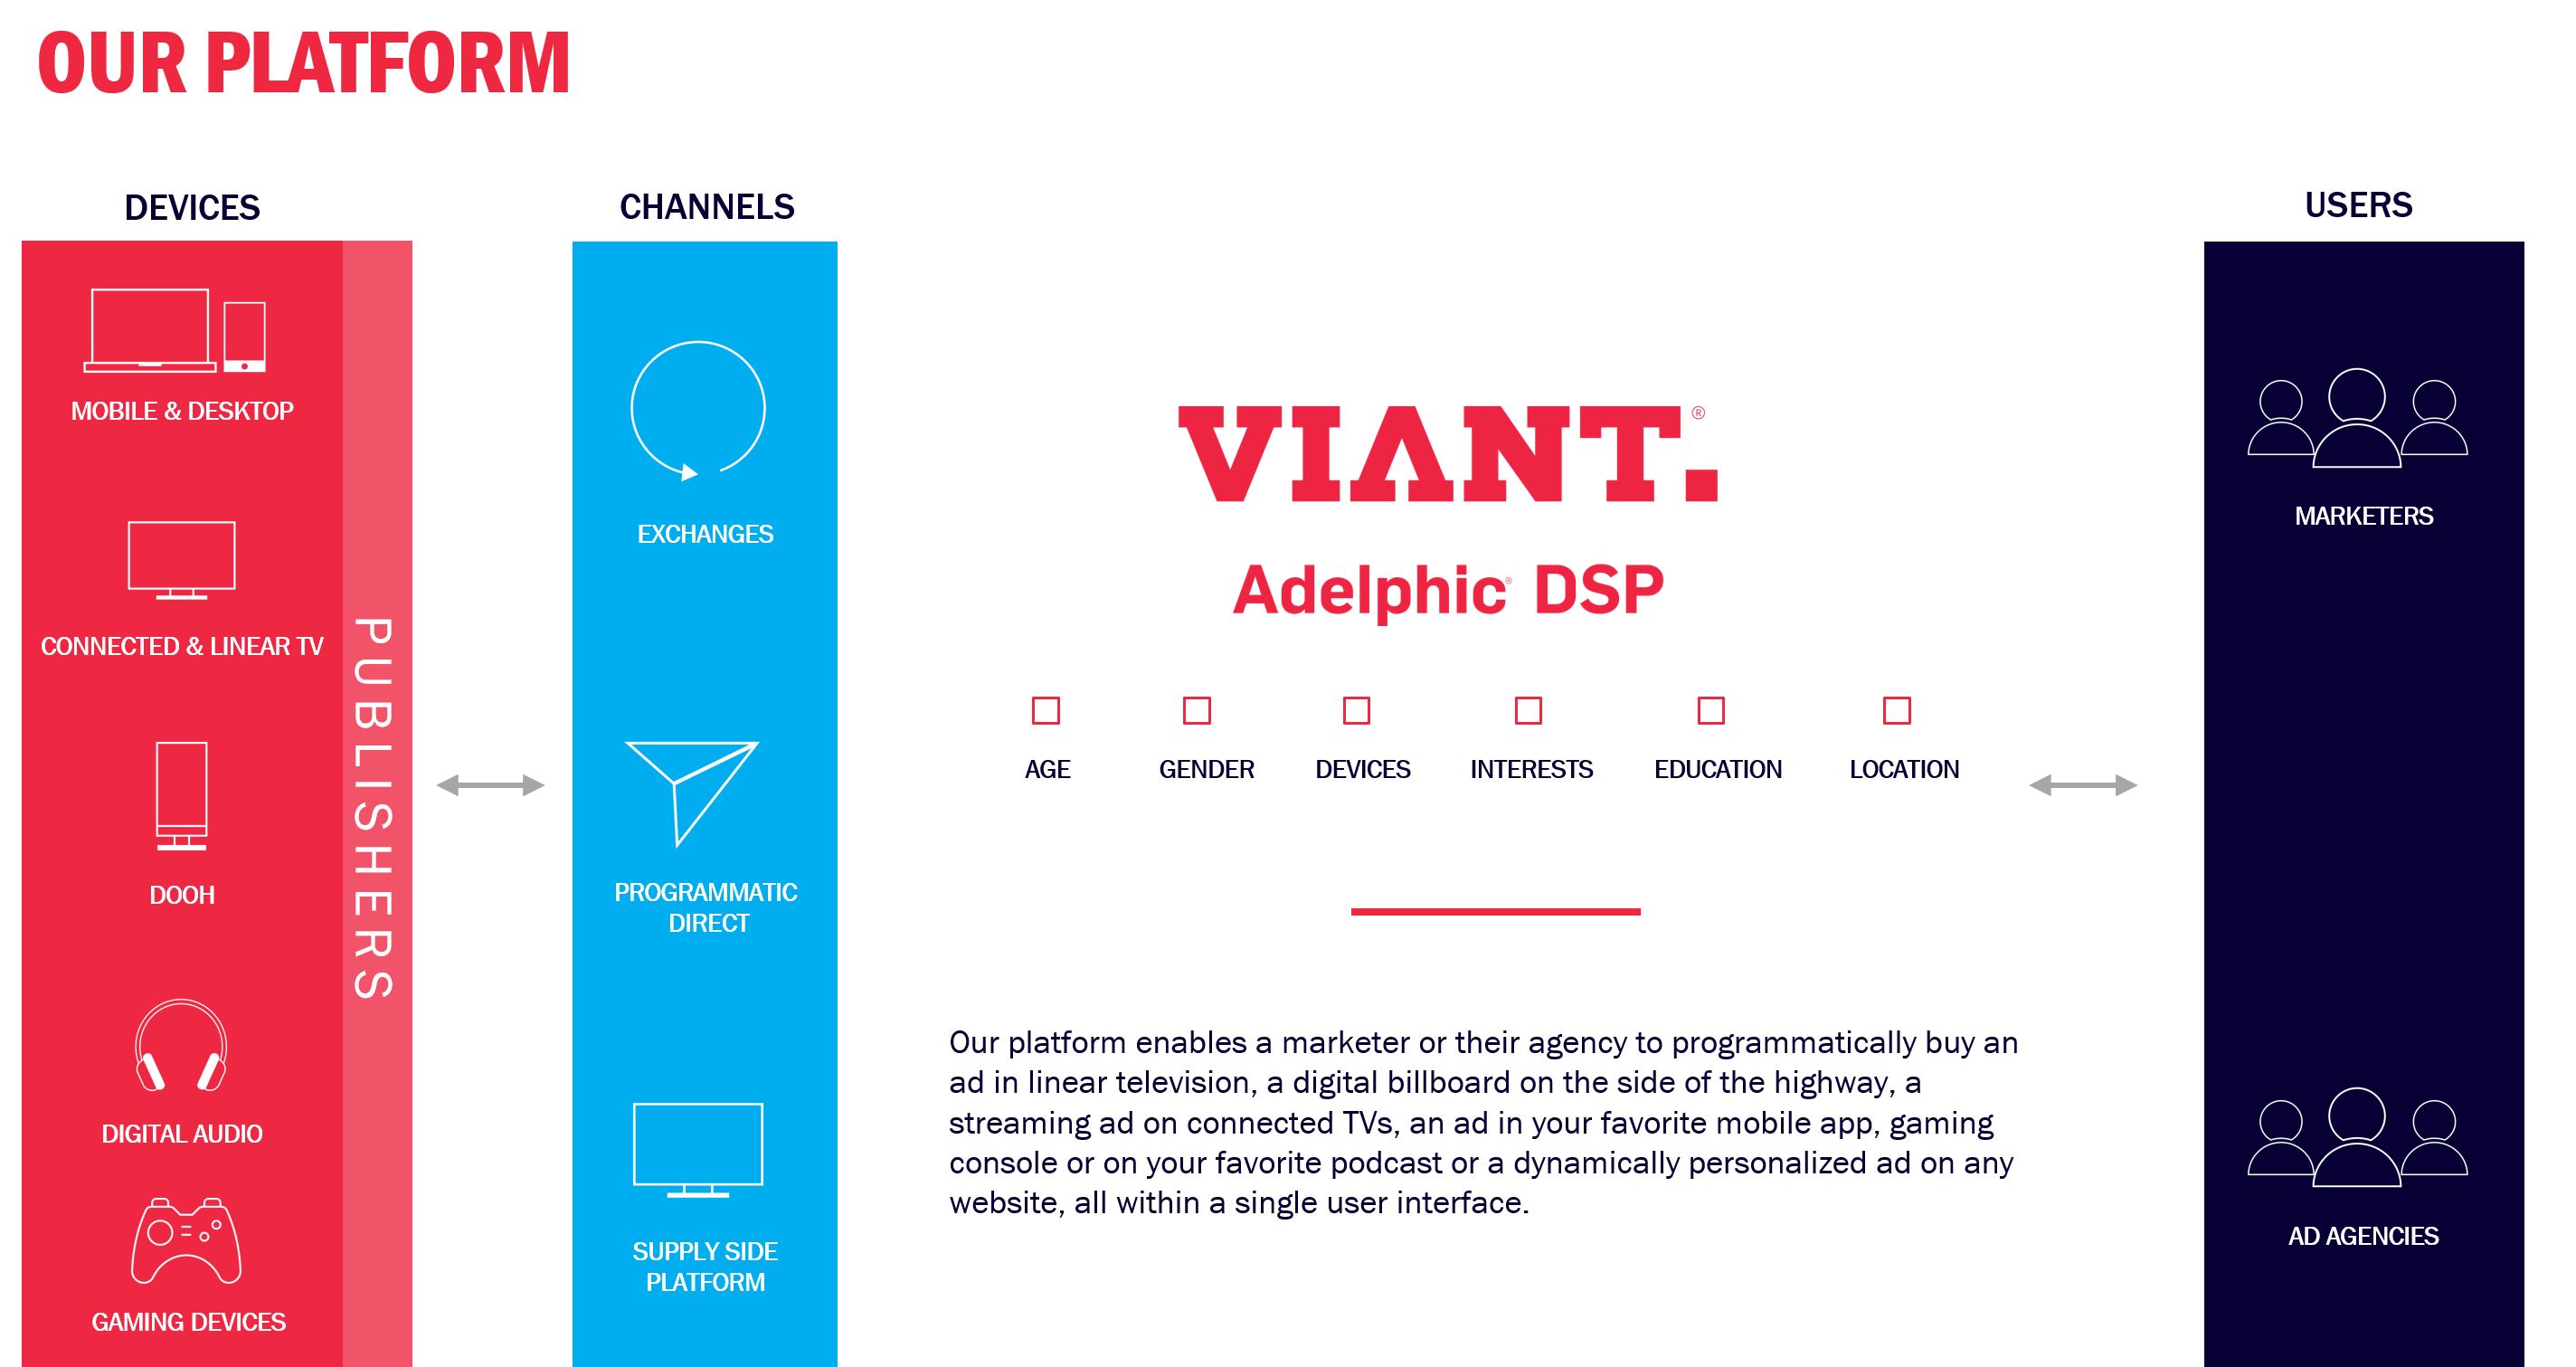
Our Platform
Viant's DSP, Adelphic, enables a marketer or their agency to programmatically buy an ad in linear television, a digital billboard on the side of the highway, a streaming ad on connected TVs, an ad in a mobile application, creatively within gameplay, during a
podcast or other streaming audio, or a dynamically personalized ad on any website, all within a single user interface. As illustrated by the graphic above, we believe that our platform sits at the center of the digital advertising ecosystem.
The key components of our platform include:
•Interoperable DSP. Our holistic, omnichannel DSP enables brands and agencies to seamlessly target and measure key audiences across leading supply from premium publishers within connected TV ("CTV"), digital out-of-home, mobile, audio, in-game, desktop and more without having to constantly switch between platforms.
•Comprehensive Forecasting. Our platform allows customers to plan future marketing campaigns based on desired targeting tactics by utilizing historical bid request data to project performance onto available inventory. Customers can easily apply multiple data segmentation filters and see what ad inventory is available and at what price.
•Ease of Use. Our intuitive user interface enables marketers to seamlessly move from forecasting to launching live advertising campaigns. This reduces the time from planning a campaign to execution, helping marketers to fluidly execute deterministic cross-channel campaigns using a variety of quality data and supply partners to reach their target audience.
•Campaign Decisioning. We offer the ability to continuously measure and optimize campaigns by leveraging powerful KPIs directly within platform reports. Marketers have the ability to optimize campaigns in-flight, even if they have already started. This granular decision-making ability provides customers more accurate and real-time understanding over the performance of their live campaigns.
Viant Household ID: The Adelphic platform has exclusive access to the VHHID, making it a people-based DSP, already operating in cookieless environments including CTV and mobile applications. The VHHID powers data, channel and publisher interoperability providing simple and effective advertising. Marketers can easily sync customer data, build custom audiences, extend target audiences and understand audience insights seamlessly within our platform.
•Cookieless Solution. The VHHID provides marketers the scalability, addressability, measurability and privacy compliance for success today. This patented technology unlocks many benefits such as:
•built-in cross-device conversion tracking, allowing marketers to target all eligible devices in a household to drive conversions;
•universal frequency management at scale, eliminating the need to control frequency in silos based on channel and/or device limitations; and
•tracking uniformity and identity persistence across all browsers and tracking environments with otherwise fragmented identifiers.
•Onboarding. Through our simple interface, marketers can upload and leverage their first-party data using the VHHID. This enables marketers to onboard their first-party data and instantly gain a view into their customers’ top attributes, create targeting segments and easily activate and measure these customer segments across cookieless environments.
•Lookalike Modeling. We help expand the reach of an existing audience segment or prospect list for new customers for extended scale of critical audiences.
•People-Based Targeting and Data Integrations. Viant’s people-based approach allows brands to connect with real households and individuals with accurate reach and frequency. Our integrations with more than 70 data providers allow for extensive audience data mapping, giving users the ability to target consumers based on purchase behaviors, location, TV viewership insights and much more. Superior integrations with TV viewership data providers present users with one of the most established, scaled and accurate CTV footprints in the market.
Advanced Reporting: We close the loop on digital and traditional media by linking advertising spend to online and offline sales.
•Reach and Frequency. Our platform accurately measures how many households and unique users an advertising campaign reached and the frequency of exposures.
•Cross-Channel Reporting. Our cross-channel reporting capabilities equip customers to analyze cross-device and cross-channel campaign impact on sales and other KPIs.
•TV vs Digital Reporting. Our TV vs digital reporting provides insights into the impact connected and linear television advertising has on driving digital engagement like website visits or conversions, as well as offline sales. These insights create better visibility into the true ROAS of TV ad campaigns.
•Multi-Touch Attribution. Our multi-touch attribution provides customers the ability to receive insights into where target audiences are interacting with brands, the impact of touchpoints across channels and devices and the order of steps along the conversion journey. The resulting holistic view of ad performance enables customers to close the loop on measurement and better link spend to sales.
•Conversion Lift. Our conversion lift reporting helps advertisers understand the impact of media in driving conversions. Ghost bids are a control group made up of consumers who were within the campaign targeting criteria and active on the programmatic network, on whom a bid request was placed to show them the campaign ad, but the bid was lost. Those impressions are then passively tracked and included in the control group. By leveraging ghost bids to create a control group, customers can see how much impact their media has in driving incremental conversions and use these insights to refine their optimization strategy for better results and investment impact.
•Foot Traffic Attribution. Our foot traffic data reporting capabilities allow customers to analyze the impact of their ad campaigns on driving visits to a physical location.
•Digital Billboard Reporting. Our digital billboard reporting provides a holistic view of ad spend, giving customers real-time insights into their digital billboard ad performance and helping customers optimize budgets by allocating ad spend on effective digital billboards and venue types.
Our platform is built with ad buyers in mind and offers many in-depth features that give buyers the highest levels of control, which helps ensure they are running the most efficient campaigns possible. This includes:
•Bulk Functionality: Our platform is built to ease the lives of programmatic traders. With Adelphic, traders can mass edit ad orders and campaigns, instead of making individual changes one at a time, saving significant time. For example, if a trader wants to change the bid price for all 1,000 of their ad orders, they could simply download, complete and upload a form, rather than wasting time by editing each ad order one by one.
•Application Integration Interfaces (“API”) Capabilities: Adelphic provides ease of integration using APIs and tools. The API capabilities provide bilateral data syndication into or out of the platform for trafficking and reporting in formats easily accepted by business intelligence teams for programmatic traders. With these, traders can maintain customer identities with a fully integrated platform that links devices and offline activities to real people and seamlessly execute and measure campaigns.
•Machine Learning Algorithms: Our built-in advanced machine learning technology analyzes millions of impressions and data points every second. Our algorithms find optimal bid prices for maximizing performance and scale across all major KPIs, allowing our customers to strengthen their campaign efforts and build confidence in programmatic campaign performance.
Our Technology and Development
Rapid and continuing innovation is a core driver of our business success and our corporate culture. Our product and engineering team is responsible for the design, development and testing of our platform. We are committed to continuous innovation and rapid introduction of new technologies, features and functionality that bring value to our customers. We expect technology and development expense and capitalized software development costs to increase as we continue to invest in the development of our platform to support additional features and functions, such as enhancement of our user interface and automation functions, and to increase the number of advertising and data inventory integrations in various channels.
The technical infrastructure for our platform is currently managed through third-party web hosting services providers. We generally enter into one- to three-year agreements with our web hosting providers.
Our Customers
Our customers consist of purchasers of programmatic advertising inventory. We define an active customer as a customer that had total aggregate contribution ex-TAC of at least $5,000 through our platform during the previous twelve months. We had 326 and 309 active customers for the years ended December 31, 2022 and 2021, respectively, in each case consisting of advertising buyers, including large advertising holding companies, independent advertising agencies, mid-market advertising service organizations as well as marketers relying on our self-service platform for their programmatic ad buying needs. For a detailed discussion of active customers, see “Management’s Discussion and Analysis of Financial Condition and Results of Operation—Key Operating and Financial Performance Measures—Active Customers and Average Contribution ex-TAC per Active Customer.” Contribution ex-TAC is a non-GAAP financial measure. For a detailed discussion of our key operating and financial performance measures and a reconciliation of contribution ex-TAC to the most directly comparable financial measure calculated in accordance with GAAP, see “Management’s Discussion and Analysis of Financial Condition and Results of Operation—Key Operating and Financial Performance Measures—Use of Non-GAAP Financial Measures.”
Many of the advertising agencies that we work with are owned by holding companies, where decision-making is generally highly decentralized such that purchasing decisions are made, and relationships with advertisers are located, at the agency, local branch or division level. Our customer count includes only those parties with which we have a billing relationship. We contract with our customers either through master service agreements or insertion orders. Our agreements do not contain any material commitments on behalf of customers to use our platform to purchase ad inventory or use other features. Our agreements with customers generally do not have a specified term and are generally terminable at any time by either party upon specified notice periods, typically ranging from 30 to 90 days. Insertion orders are generally limited in scope and can be reduced or canceled by a buyer without penalty. See “Risk Factors—Risks Related to Our Business and Operations—We receive a significant amount of revenue from a select number of advertising agency holding companies, owning various advertising agencies, and the loss of advertising agencies as customers could harm our business, operating results and financial condition.” for additional discussion of our customer relationships with advertising agencies.
Our Advertising and Data Supply
We obtain digital advertising inventory primarily through our integrations with supply side platforms and directly with publishers. We believe that our integrations across every channel give us one of the most robust omnichannel integrations of any single platform. These suppliers provide us with access to a breadth of programmatic advertising inventory across desktop, mobile, connected TV, linear TV, in-game, streaming audio and digital billboards.
We enable deep data access through our integrations with over 70 leading data companies, giving our customers access to data across key industry verticals, including retail, consumer packaged goods, travel and healthcare. Customers onboard their own first-party data onto our platform, without the need of a separate data management platform.
Sales and Marketing
We sell our platform through a direct sales team focused on business development across all markets, including sales to new customers and revenue growth within existing customers. We have an experienced sales team focused on selling access to our platform in our target markets, building and nurturing relationships with global brands and agencies. We use a consultative sales approach focused on educating existing and potential customers on our platform capabilities, and training clients to use our platform. We offer a formal certification program, Programmatic University and Adelphic Certification, which covers programmatic industry trends, technology capabilities and time-saving workflows and have an online knowledge base with robust documentation. We provide dedicated customer support and work with customers as they set up and optimize their campaigns, assist with delivery against KPIs and goals, and provide post-campaign support and recommendations.
We tailor our contracts and terms to the needs of our customers, including by offering our two different pricing options: a percentage of spend option and a fixed cost per mille (“CPM”) option. Customers can use our platform on a self-service basis or can enlist our services to execute their campaigns.
Our marketing efforts are focused on increasing awareness and consideration for our brands, executing thought-leadership initiatives, participating in industry events, creating comprehensive sales support materials generating new customer leads. We seek to accomplish these objectives by presenting at industry conferences, hosting customer conferences, publishing white papers and research, public relations activities, advertising campaigns, and social media presence.
Privacy and Data Protection
In the ordinary course of our business, we may collect, receive, compile, use, store, process, share, dispose of, disclose, retain, transfer, and destroy (“Process”) personal information, as defined under various applicable laws. Accordingly, we are subject to numerous data privacy and security obligations, including federal, state, local, and foreign laws, regulations, guidance, and industry standards related to data privacy, security, and protection. Such obligations may include, without limitation, the Federal Trade Commission Act, the Telephone Consumer Protection Act of 1991, the Children’s Online Privacy Protection Act of 1998, the Controlling the Assault of Non-Solicited Pornography And Marketing Act of 2003, the California Consumer Privacy Act of 2018 (“CCPA”), as amended by the California Privacy Rights Act of 2020 ("CPRA"), the European Union’s General Data Protection Regulation 2016/679 (“EU GDPR”), the EU GDPR as it forms part of United Kingdom (“UK”) law by virtue of section 3 of the European Union (Withdrawal) Act 2018 (“UK GDPR”), the ePrivacy Directive, and the Payment Card Industry Data Security Standard (“PCI DSS”). In addition, many U.S. states have enacted or proposed data privacy laws. For example, Virginia passed the Consumer Data Protection Act, and Colorado passed the Colorado Privacy Act, both operative in 2023, and similar comprehensive privacy laws are being considered in several other states, as well as at the local and federal level.
The CCPA and CPRA are examples of the increasingly stringent and evolving regulatory frameworks related to personal information Processing that may increase our compliance obligations and exposure for any noncompliance. For example, the CCPA imposes obligations on covered businesses to provide specific disclosures related to a business’s Processing of personal information and to respond to certain requests from California residents related to their personal information (for example, requests to know of the
business’s personal information Processing activities, to delete the individual’s personal information, and to opt out of certain personal information disclosures). The CCPA was amended by the CPRA, which went into effect on January 1, 2023. The CPRA expanded the protections provided under the CCPA, including, for example, by giving California residents the ability to limit use of certain sensitive personal information, establishing restrictions on personal information retention, expanding the types of data breaches that are subject to the CCPA’s private right of action, and establishing a new California Privacy Protection Agency to implement and enforce the law. U.S. federal and state consumer protection laws also require us to publish statements that accurately and fairly describe how we handle personal information and choices individuals may have about the way we handle their personal information. A failure to comply with applicable privacy laws may lead to the defense of costly regulatory actions. For example, the CCPA provides for civil penalties ranging from $2,500 - $7,500 per violation (with increased material risk where numerous violations have occurred on a large scale), and a private right of action for data breaches which may include an award of statutory damages.
Foreign data privacy and security laws impose significant and complex compliance obligations on entities that are subject to those laws. For example, the EU GDPR applies to any company established in the European Economic Area (“EEA”) and to companies established outside the EEA that Process personal information in connection with the offering of goods or services to data subjects in the EEA or the monitoring of the behavior of data subjects in the EEA. These obligations may include limiting personal information Processing to only what is necessary for specified, explicit, and legitimate purposes; requiring a legal basis for personal information Processing; requiring the appointment of a data protection officer in certain circumstances; increasing transparency obligations to data subjects; requiring data protection impact assessments in certain circumstances; limiting the collection and retention of personal information; increasing rights for data subjects; formalizing a heightened and codified standard of data subject consents; requiring the implementation and maintenance of technical and organizational safeguards for personal information; mandating notice of certain personal information breaches to the relevant supervisory authority(ies) and affected individuals; and mandating the appointment of representatives in the UK and/or the EU in certain circumstances.
See "Risk Factors—Risks Related to Data Privacy" for additional information about the laws, obligations and limitation to which we are subject and about the risks to our business associated with such laws, obligations and limitations.
Competition
Our industry is highly competitive and fragmented. We compete with large, privately-held companies, such as Yahoo DSP, along with public companies such as The Trade Desk, and with divisions of large, well-established companies such as Google and Amazon. The competitive landscape in recent years has been affected by consolidation and limited investment in new startups in our industry and there are few competitors with self-service capabilities. Our long history and time in the market with customers has given us significant advantages in terms of platform development and expertise, as well as a long development lead ahead of new entrants. We believe that we compete primarily based on the performance of campaigns running on our platform, capabilities of our platform, our identity resolution capabilities, our omnichannel capabilities and our advance reporting capabilities. We believe that we are differentiated from our competitors in the following areas:
•we are an independent technology company focused on serving advertising agencies and marketers on the buy-side of our industry;
•our platform is self-service and easy to use;
•we offer our DSP in an integrated manner with our people-based capabilities, so customers do not need to use separate providers for onboarding client information and ad and data purchasing services;
•our platform provides comprehensive access to a wide range of inventory types across a broad range of channels;
•our platform provides comprehensive access to a wide range of data partners across a broad range of industry verticals and channels to enable precise audience targeting and measurement;
•our identity resolution capabilities help marketers plan, buy and measure their campaigns more effectively;
•we provide extensive customer service and satisfaction; and
•we provide flexible pricing options to support our customer’s needs.
Our Human Capital
We are a founder-led business and believe our employees and culture are key to our success. Our business and our culture are anchored on four core values that embody our resourceful mentality: “Live,” “Lead,” “Create” and “Figure It Out.” We believe we attract talented employees to our company and sophisticated customers to our platform in large part because of our vision and unwavering commitment to using cutting-edge technologies to create products that help advance the advertising industry.
As of December 31, 2022, we had approximately 308 employees in 11 offices across the United States. Our team draws from a broad spectrum of backgrounds and experiences across technology and advertising industries.
Diversity and Inclusion
We are committed to fostering a culture of inclusion where all employees feel valued and included. We believe our greatest asset is the people who work for us, and as part of our investment in our people, we prioritize diversity and inclusion. Our goal is to create a culture where we value, respect, and provide fair treatment and opportunities for all employees. Each year, we conduct an annual survey to give employees the opportunity to provide feedback on our management team and culture. This survey helps drive new programs that continue the development of our inclusive culture. Our leaders review the survey feedback and work with their teams to initiate new initiatives based on the results.
We are committed to developing a diverse environment through recruiting, development programs, community involvement and fostering conversations about differences.
Talent Development
Even though we have been around for over 20 years, our culture still reflects an entrepreneurial spirit. We empower employees to develop their skills and abilities by following our core values and acting on great ideas regardless of their role or function. We encourage employees at all levels to be creative and come up with ideas that can help the business grow. We work to provide an environment where talented individuals and teams can take control of their career growth. We provide a wide range of learning and development opportunities in both individual and group settings.
Compensation and Benefits
We provide compensation and benefits programs to help meet the needs of our employees and reward their efforts and contributions. We use internal and external resources to help develop plans that are fair and reward our employees’ commitment and performance with the goal of attracting and retaining high performing individuals.
In addition to salaries, we provide competitive compensation programs that are in line with our peers and industry. These programs may include bonuses, equity awards, 401(k) plan, healthcare and insurance benefits, flexible spending accounts, paid time off, family leave and employee assistance programs among many others.
Health, Safety and Wellness
We strive to provide a work environment where our employees feel safe and are comfortable working. In response to the COVID-19 pandemic, we immediately implemented a teleworking program that complied with all applicable government regulations and protected our employees while allowing them to continue to be effective in their jobs. We continue to stay updated on changes in government regulations and implement them to meet our employees’ changing health and wellness needs.
Climate Change and Sustainability
We are launching initiatives that aim to drive sustainability and reduce both our and our partners' environmental impact. We have announced a commitment to be carbon neutral with respect to all known and measurable emissions from our energy usage by the end of 2023 through the purchase of requisite qualified RECs. In addition, to support our partners in reducing their GHG emissions and meeting their goals of carbon neutrality, we launched a customer carbon reduction program on February 7, 2023 called Adtricity. Adtricity aims to deliver RECs to our customers based on their media spend with us. We have also joined Ad Net Zero and the IAB Tech Lab - Sustainability Working Group to drive cross-industry action around sustainability initiatives in the advertising industry.
Intellectual Property
The protection of our technology and intellectual property is an important component of our success. We rely on intellectual property laws, including trade secret, copyright, patent and trademark laws in the United States and abroad, and use contracts, confidentiality procedures, non-disclosure agreements, employee disclosure and invention assignment agreements and other contractual rights to protect our intellectual property.
As of December 31, 2022, we held 37 issued patents, 11 pending patent applications and 323 issued trademarks. Our issued patents are scheduled to expire between 2025 and 2038. We continually review our development efforts to assess the existence and patentability of new intellectual property. In addition to the intellectual property relating to the operation of Viant, Adelphic, and our people-based framework, we own intellectual property related to our owned site, Myspace.com. Of our issued patents, 22 relate to our platform and our people-based framework, and 15 relate to Myspace.com.
Corporate Information
We were founded in 1999 by Tim, Chris and Russ Vanderhook who continue to lead our company today. We have been at the forefront of digital advertising technology since our inception and have demonstrated our ability to grow, thrive, and innovate as competitors have come and gone. In 2011, we acquired the social network website Myspace.com. In 2011, Tim and Chris Vanderhook
started Xumo, a connected TV streaming service, which was acquired by Comcast Corp. in 2020. In 2015, we completed our first people-based integration. We remained independent until 2016, when Time Inc. acquired a 60% interest in our company through our subsidiary, Viant Technology Holding Inc. (the “Former Holdco”). That interest was later acquired by Meredith Corporation when it acquired Time Inc. in 2018. In 2017, we purchased Adelphic, a DSP. Since the Adelphic acquisition, we have materially transformed from a full-service provider of digital advertising solutions into a leading DSP that enables marketers and their advertising agencies to centralize the planning, buying and measurement of their media investments using a people-based framework. We have grown from a business operating from a home office to a company with approximately 308 employees in 11 offices throughout the United States at the end of 2022. In 2019, we entered into an agreement that resulted in the retirement of the Former Holdco’s interest in our company and Tim Vanderhook, Chris Vanderhook and Capital V LLC (formerly Four Brothers 2 LLC) (the “Vanderhook Parties”) acquired that 60% interest in our company (the “2019 Former Holdco transaction”), allowing it to once again become an independent company. Viant Technology Inc. was incorporated in Delaware on October 9, 2020. In connection with the consummation of our initial public offering (the “IPO”), we became the sole managing member of Viant Technology LLC. We completed the IPO of our Class A common stock on February 12, 2021. Our principal executive offices are located at 2722 Michelson Drive, Suite 100, Irvine, CA 92612 and our telephone number is (949) 861-8888. Our website address is www.viantinc.com. Our design logo, “Viant,” and our other registered and common law trade names, trademarks and service marks are the property of Viant Technology Inc.
The SEC maintains a website at www.sec.gov that contains reports, information statements and other information regarding issuers that file electronically with the SEC. Our Annual Report can be downloaded from the SEC’s website. We will file with or furnish to the SEC periodic reports and other information. We furnish or make available to our stockholders annual reports containing our audited consolidated financial statements prepared in accordance with GAAP. We also furnish or make available to our stockholders quarterly reports containing our unaudited interim financial information, for the first three fiscal quarters of each fiscal year. We make our periodic reports and other information filed with or furnished to the SEC pursuant to Section 13(a) or 15(d) of the Exchange Act, available, free of charge, through our website, www.viantinc.com, as soon as reasonably practicable after those reports and other information are electronically filed with or furnished to the SEC. Information contained on our website or linked therein or otherwise connected thereto does not constitute part of nor is it incorporated by reference into this Annual Report.
Emerging Growth Company
We are an “emerging growth company” as defined in the Jumpstart Our Business Startups Act of 2012 (“JOBS Act”). We may take advantage of certain exemptions from various public company reporting requirements, including not being required to have our internal control over financial reporting audited by our independent registered public accounting firm under Section 404 of the Sarbanes-Oxley Act of 2002 (the “Sarbanes-Oxley Act”), reduced disclosure obligations regarding executive compensation in our periodic reports and proxy statements, and exemptions from the requirements of holding a nonbinding advisory vote on executive compensation and any golden parachute payments. We may take advantage of these exemptions until December 31, 2026 or until we are no longer an “emerging growth company,” whichever is earlier. We will cease to be an emerging growth company prior to the end of such period if certain earlier events occur, including if we become a “large accelerated filer” as defined in Rule 12b-2 under the Exchange Act, our annual gross revenues exceed $1.235 billion or we issue more than $1.0 billion of non-convertible debt in any three-year period.
In addition, the JOBS Act provides that an emerging growth company may take advantage of an extended transition period for complying with new or revised accounting standards. This provision allows an emerging growth company to delay the adoption of accounting standards until those standards would otherwise apply to private companies. We have elected to take advantage of this extended transition period, and as a result, we will comply with new or revised accounting standards on the relevant dates on which adoption is required for private companies. Refer to Note 2—Basis of Presentation and Summary of Significant Accounting Policies to our consolidated financial statements included elsewhere in this Annual Report for additional information.
Item 1A. Risk Factors.
Investing in our Class A common stock involves a high degree of risk. You should carefully consider the following risks and uncertainties described below, together with all other information contained in this Annual Report and in our other public filings, including our consolidated financial statements and the related notes appearing at the end of this Annual Report. The occurrence of any of the following risks, as well as any risks or uncertainties not currently known to us or that we currently do not believe to be material, could materially and adversely affect our business, prospects, financial condition, results of operations and cash flow, in which case, the trading price of our Class A common stock could decline and you could lose all or part of your investment.
Risks Related to Our Business and Operations
Our success and revenue growth are dependent on adding new customers, effectively educating and training our existing customers on how to make full use of our platform and increasing usage of our platform by our customers.
Our success is dependent on regularly adding new customers and our ability to increase our customers’ usage of our platform, continuously enhance and improve our offerings and platform, build our brand, scale our technology capabilities, add functionality to and improve the performance of Adelphic, and address technological and industry advancements, including the use of artificial intelligence. Our contracts and relationships with customers generally do not include long-term or exclusive obligations requiring them to use our platform or maintain or increase their use of our platform. Our customers typically have relationships with numerous providers and can use both our platform and those of our competitors without incurring significant costs or disruption. Our customers may also choose to decrease their overall advertising spend for any reason, including if they do not believe they are receiving a sufficient ROAS. Accordingly, we must continually work to win new customers and retain existing customers, increase their usage of our platform and capture a larger share of their advertising spend. For those customers utilizing our self-service capabilities, we may not be successful at educating and training customers, particularly our newer customers, on how to use our platform, in particular our advanced reporting tools, in order for our customers to get the most benefit from our platform and increase their usage. If these efforts are unsuccessful or customers decide not to continue to maintain or increase their usage of our platform for any other reason, or if we fail to attract new customers, our revenue could fail to grow or decline, which would materially and adversely harm our business, operating results and financial condition. If customers representing a significant portion of our business decide to materially reduce their use of our platform or cease using our platform altogether, our revenue could be significantly reduced, which could have a material adverse effect on our business, operating results and financial condition. We may not be able to replace customers who decrease or cease their usage of our platform with new customers that will use our platform to the same extent or at all.
We may not realize the expected benefits of an industry shift away from cookie-based consumer tracking as such shift may not occur as rapidly as we expect or may not be realized at all.
We expect to benefit as compared to others in our industry from marketers reducing their reliance on vendors and advertising technology platforms that utilize third-party cookies for tracking. However, the shift away from cookie-based consumer tracking may not happen as rapidly as we expect and such shift may not occur at all. For example, in July 2022, Google announced that its previously announced timeline of blocking third-party cookies by 2022 would be delayed until the second half of 2024. Additionally, even if the shift away from cookie-based consumer tracking does occur, we may not be as successful in growing our business and increasing our revenue as we expect. For example, marketers may not shift their business away from our competitors if our competitors are successful in developing alternative products or services that are not significantly reliant on the cookie-based framework, which could harm our business.
If we fail to innovate and make the right investment decisions in our offerings and platform, we may not attract and retain customers and our revenue and results of operations may decline.
Our industry is subject to rapid and frequent changes in technology, evolving customer needs and the frequent introduction by our competitors of new and enhanced offerings. We must regularly make investment decisions regarding offerings and technology to maintain the technological competitiveness of our products and services and meet customer demand and evolving industry standards. The complexity and uncertainty regarding the development of new technologies and the extent and timing of market acceptance of innovative products and services create difficulties in maintaining this competitiveness. The success of any enhancement or new solution depends on many factors, including timely completion, adequate quality testing, appropriate introduction and market acceptance. Without the timely introduction of new products, services and enhancements, our offerings could become technologically or commercially obsolete over time, in which case our revenue and operating results would suffer. If new or existing competitors have more attractive offerings, we may lose customers or customers may decrease their use of our platform. New customer demands, superior competitive offerings or new industry standards could require us to make unanticipated and costly changes to our platform or business model.
If we fail to enhance our current products and services or fail to develop new products to adapt to our rapidly changing industry or to evolving customer needs, demand for our platform could decrease and our business, operating results and financial condition may be adversely affected.
The market for programmatic advertising is evolving. If this market develops slower or differently than we expect, our business, operating results and financial condition would be adversely affected.
We derive revenue from the programmatic purchase of advertising on our platform. We expect that programmatic ad buying will continue to be our primary source of revenue for the foreseeable future, and that our revenue growth will largely depend on increasing our customers’ usage of our platform. While the market for programmatic ad buying for desktop and mobile ads is relatively established, the market in other channels is still emerging, and our current and potential customers may not shift quickly enough to programmatic ad buying from other buying methods, which could reduce our growth potential. If the market for programmatic ad buying deteriorates or develops more slowly than we expect, it could reduce demand for our platform, and our business, growth prospects and financial condition would be adversely affected.
In particular, the market for programmatic advertising across most advertising channels, including connected TV, linear TV, in-game, streaming audio and digital billboard channels is an emerging market. Our ability to provide capabilities across most advertising channels, which we refer to as omnichannel, may be constrained if we are not able to maintain or grow advertising inventory for such channels, and some of our omnichannel offerings may not gain market acceptance. We may not be able to accurately predict changes in overall industry demand for the channels in which we operate and cannot assure you that our investment in channel development will correspond to any such changes. For example, the growth in demand for our connected TV offering may not continue. Furthermore, if our channel mix changes due to a shift in customer demand, such as customers shifting their usage more quickly or more extensively than expected to channels in which we have relatively less functionality, features or inventory, such as linear TV, then demand for our platform could decrease, and our business, financial condition and results of operations could be adversely affected.
We receive a significant amount of revenue from a select number of advertising agency holding companies, owning various advertising agencies, and the loss of advertising agencies as customers could harm our business, operating results and financial condition.
A significant amount of our revenue comes from advertising agencies. We had 326 active customers for the year ended December 31, 2022, consisting primarily of advertising agencies. Many of these agencies are owned by advertising agency holding companies, where decision making is generally highly decentralized such that purchasing decisions are made, and relationships with marketers are located, at the agency, local branch or division level. If all of our individual customer contractual relationships were aggregated at the holding company level, one advertising agency holding company would represent 13.5% of our revenue for fiscal 2022. Due to the highly decentralized operations and decision-making at the agencies owned by each of these advertising agency holding companies, we consider the individual agencies rather than the holding company to be our customers.
Often, we enter into separate contracts and billing relationships with the individual agencies and account for them as separate customers. However, some holding companies for these agencies may choose to exert control over the individual agencies in the future. If so, any loss of relationships with such holding companies and, consequently, of their agencies, local branches or divisions, as customers could significantly harm our business, operating results and financial condition.
We do not have exclusive relationships with advertising agencies and we depend on agencies to work with us as they embark on advertising campaigns for their clients. The loss of such agencies could significantly harm our business, operating results and financial condition. If we fail to maintain satisfactory relationships with an advertising agency, we risk losing business from the marketers represented by that agency.
Marketers may change advertising agencies. If a marketer switches from an agency that utilizes our platform to one that does not, we could lose revenue from that marketer. In addition, some advertising agencies have strong relationships with competing DSPs or other platforms and may direct their marketers to such other platforms. If a significant number of marketers and their agencies begin to utilize competing platforms for the administration of their advertising campaigns, our business, financial condition and results of operations could be adversely affected.
We often have long sales cycles, which can result in significant time between initial contact with a prospect and execution of a customer agreement, making it difficult to project when, if at all, we will obtain new customers and when we will generate revenue from those customers.
Our sales cycle, from initial contact to contract execution and implementation, can take significant time. As part of our sales cycle, we may incur significant expenses before we generate any revenue from a prospective customer. The substantial time and money spent on our sales efforts may not generate significant revenue. If conditions in the marketplace, generally or with a specific prospective customer, change negatively, it is possible that we will be unable to recover any of these expenses. Our sales efforts
involve educating our customers about the use, technical capabilities and benefits of our platform. Many of our prospective customers undertake a lengthy evaluation process that involves assessing our platform against the offerings of our competitors. As a result, it is difficult to predict when we will obtain new customers and begin generating revenue from these new customers. Even if our sales efforts result in obtaining a new customer, the customer controls when and to what extent it uses our platform and therefore the amount of revenue we generate, and it may not sufficiently justify the expenses incurred to acquire the customer and the related training support. As a result, we may not be able to add customers, or generate revenue, as quickly as we may expect, which could harm our growth prospects.
The effects of macroeconomic conditions and geopolitical events, such as economic recessions and the COVID-19 pandemic, have had, and could in the future have, an adverse impact on our business, operating results and financial condition.
Our business and operations have been and could in the future be adversely affected by macroeconomic conditions and geopolitical events, such as rising interest rates, inflationary pressures, labor shortages, shortages of goods and services, supply chain constraints, the COVID-19 pandemic, and the ongoing Russia-Ukraine conflict. A recession, depression, or other economic slowdown resulting from macroeconomic conditions and geopolitical events could materially and adversely affect our business and that of our customers or potential customers and our results could fluctuate unpredictably.
Our business depends on the overall demand for advertising and on the economic health of our customers that benefit from our platform. Economic downturns or unstable market conditions may cause our customers to decrease their advertising budgets, which could reduce usage of our platform and adversely affect our business, operating results and financial condition. Our customers’ and potential customers’ businesses or cash flows have recently been and may continue to be negatively impacted by the economic uncertainty related to, among other things, inflation and monetary supply shifts, labor shortages, supply shortages, tightening of credit markets, the COVID-19 pandemic and the ongoing Russia-Ukraine conflict, which has led and may continue to lead them to reduce their advertising spending and delay their advertising initiatives or technology spending, or attempt to renegotiate contracts and obtain concessions, which may materially and negatively impact our business, operating results and financial condition. Our customers may also seek adjustments to their payment terms, delay making payments or default on their payables, any of which may impact the timely receipt and/or collectability of our receivables. Typically, we are contractually required to pay advertising inventory and data suppliers within a negotiated period of time, regardless of whether our customers pay us on time, or at all, and we may not be able to renegotiate better terms. As a result, our financial condition and results of operations may be adversely impacted if the business or financial condition of our customers and marketers is negatively affected by macroeconomic conditions and geopolitical events. During the second half of 2022, we observed decreases in revenue that we attribute to marketers in certain industry verticals, particularly those in the jobs, entertainment, retail, automotive, and consumer products industries, decreasing or pausing their advertising spend due to the impacts of recent macroeconomic conditions.
Economic uncertainty caused by macroeconomic and geopolitical conditions can also make it more difficult to forecast revenue and operating results and to make decisions regarding operational cost structures and investments. We have committed, and we plan to continue to commit, resources to grow our business, including to further develop our platform and systems, and such investments may be impacted by adverse macroeconomic conditions and geopolitical events.
Customers have the option to use our platform on a self-service basis, which requires us to commit substantial time and expenses toward training potential customers on how to make full use of our platform. If we fail to offer sufficient customer training and support for our platform, we may not be able to attract new customers or maintain our current customers.
Because we operate a platform that has many powerful and complex tools and that customers can choose to use on a self-service basis, we are often required to spend a substantial amount of time and effort educating and training current customers and potential customers on how to make full use of our platform. Because potential customers may already be trained to use our competitors’ platforms, we are also required to spend a significant amount of time cultivating relationships with those potential customers to ensure they understand the potential benefits of our platform and this relationship building process can take many months and may not result in us winning an opportunity with any given potential customer. As a result, customer training and support is critical for the successful and continued use of our platform and for maintaining and increasing spend through our platform from existing and new customers.
Providing this training and support requires that our platform operations personnel have specific domain knowledge and expertise, making it more difficult for us to hire qualified personnel and to scale up our support operations due to the extensive training required. The importance of high-quality customer service will increase as we expand our business and pursue new customers. If we are not responsive and proactive regarding our customers’ advertising needs, or do not provide effective support for our customers’ advertising campaigns, our ability to retain our existing customers could suffer and our reputation with existing or potential customers could be harmed, which would negatively impact our business.
We are subject to payment-related risks and if our customers do not pay, or dispute their invoices, our business, operating results and financial condition may be adversely affected.
Many of our contracts with advertising agencies provide that if the marketer does not pay the agency, the agency is not liable to us, and we must seek payment solely from the marketer, a type of arrangement called sequential liability. The credit risk associated with these arrangements may vary depending on the nature and credit risk of an advertising agency’s aggregated marketer base and the credit risk of the agency itself. We may also be involved in disputes with agencies and their marketers over the operation of our platform, the terms of our agreements or our billings for purchases made by them through our platform. When we are unable to collect or make adjustments to our bills to customers, we incur write-offs for bad debt, which could have a material adverse effect on our results of operations for the periods in which the write-offs occur. In the future, bad debt may exceed reserves for such contingencies and our bad debt exposure may increase over time. Any increase in write-offs for bad debt could have a materially negative effect on our business, operating results and financial condition.
Furthermore, we are generally contractually required to pay suppliers of advertising inventory and data within a negotiated period of time, regardless of whether our customers pay us on time, or at all. While we attempt to negotiate long payment periods with our suppliers and shorter periods from our customers, we are not always successful. As a result, our accounts payable are often due on shorter cycles than our accounts receivables, requiring us to remit payments from our own funds, and accept the risk of bad debt.
Due to this potential imbalance in our collections and payments, we may rely on our credit facility to partially or completely fund our working capital requirements. As we continue to grow, our business may not generate sufficient cash flow from operations and future borrowings may not be available to us under the credit facility in an amount sufficient to fund our working capital needs. If our cash flows and credit facility borrowings are insufficient to fund our working capital requirements, we may not be able to grow at the rate we currently expect or at all. In addition, in the absence of sufficient cash flows from operations, we might be unable to meet our obligations under our credit facility and we may be at risk of default thereunder. We may not be able to access additional financing or increase our borrowing or borrowing capacity under our current or any future credit facility on commercially reasonable terms or at all.
If our access to advertising inventory is diminished or fails to grow, our revenue could decline and our growth could be impeded.
We must maintain a consistent supply of ad inventory. Our success depends on our ability to secure inventory on reasonable terms across a broad range of advertising inventory partners in various verticals and formats. The amount, quality and cost of inventory available to us can change at any time. If our relationships with any of our significant suppliers were to cease, or if the material terms of these relationships were to change unfavorably, our business would be negatively impacted. Our suppliers are generally not bound by long-term contracts. We may not have access to a consistent supply of inventory on favorable terms or at all. Inventory suppliers control the sales process for the inventory they supply, and their processes may not always work in our favor. For example, suppliers may place restrictions on the use of their inventory, including prohibiting the placement of advertisements on behalf of specific marketers.
As new types of inventory, such as digital advertising for television, become more readily available, we will need to expend significant resources to ensure we have access to such new inventory. Although television advertising is a large market, only a relatively small percentage of it is currently purchased programmatically. We are investing heavily in our programmatic television offering, including by adding new features, functions and integrations to our platform. If the digital television advertising market does not grow as we anticipate or we fail to successfully serve such a market, our growth prospects could be harmed.
Our success depends on consistently adding valued inventory in a cost-effective manner. If we are unable to maintain a consistent supply of inventory for any reason, customer retention and loyalty, and our operating results and financial condition could be harmed.
If our access to people-based data is diminished, the effectiveness of our platform would be decreased, which could harm our operating results and financial condition.
Much of the data that we use is obtained through integrations with third-party data suppliers. We are dependent upon our ability to obtain necessary data licenses on commercially reasonable terms. We could suffer material adverse consequences if we were unable to obtain data through our integrations with data suppliers. Our ability to serve particular customers is also enhanced when such customers upload their own first-party data. Our operation of our platform and access to data could be negatively affected if, due to legal, contractual, privacy, reputational, market optics, competition or other economic concerns, third parties cease entering into data integration agreements with us or customers cease uploading their data to our platform. Additionally, we could terminate relationships with our data suppliers if they fail to adhere to our data quality and privacy standards.
Laws in the United States (including the CCPA, as amended by the CPRA) and other jurisdictions such as Europe (including GDPR, ePrivacy Directive) and increased regulatory activity has focused on third-party data suppliers. These laws pose additional and material compliance risks to such suppliers, and they may not be able to comply with such laws, which would limit our ability to obtain data that is necessary to operate our core business. For example, some data suppliers are required to register as data brokers
under California and Vermont privacy laws, file reports with regulators and expose themselves to increased scrutiny. In addition, we may face compliance risks and limitations on our ability to use certain data provided by our third-party suppliers if those suppliers have not complied with applicable privacy laws, provided appropriate notice to data subjects, obtained necessary consents, or established a legal basis for the transfer and processing of the data by us.
Furthermore, digital advertising and in-app advertising are largely dependent on established technology companies and their operation of the most commonly used internet browsers (Chrome, Firefox, Internet Explorer and Safari), devices, operating systems (such as Android and iOS) and applications. These companies may change the operations or policies of their browsers, devices and operating systems in a manner that fundamentally changes our ability to operate our platform or use or collect data. Users of these browsers, devices or operating systems may also adjust their behaviors and use of technology in ways that change our ability to collect data. Digital advertising and in-app advertising are also dependent, in part, on internet protocols and the practices of internet service providers, including IP address allocation. Changes that these providers make to their practices, or adoption of new internet protocols, may materially limit or alter the availability of data. For example, Apple introduced an iOS update in April 2021 that only allows tracking of user activity after an opt-in by users, and Google has announced that it will introduce similar changes that will provide users with the ability to opt-out of tracking across devices using the Android operating system. Individuals may increasingly resist the collection, use, and sharing of personal data to deliver targeted advertising. Individuals are increasingly becoming aware of options related to consent, “do not track” mechanisms, and “ad-blocking” software, any of which could materially impact our and our data supplier’s ability to collect, use and disclose personal data. A limitation or alteration of the availability of data in any of these or other instances may have a material impact on the advertising technology industry, which could decrease advertising budgets and subsequently reduce our revenue and adversely affect our business, operating results and financial condition. Please see “—Risks Related to Data Privacy” for additional discussion of the laws and regulations governing the collection of data to which we are or may become subject and about the risks to our business associated with such laws and regulations.
If we were to lose access to significant amounts of the data that enables our people-based framework, or the compliance obligations for our suppliers or us become too onerous, our ability to provide products and services to our customers could be materially and adversely impacted, which could be materially adverse to our business, operating results and financial condition.
If we do not effectively grow and train our sales and support teams, we may be unable to add new customers or increase usage of our platform by our existing customers and our business will be adversely affected.
We are substantially dependent on our sales and support teams to obtain new customers and to increase usage of our platform by our existing customers. We believe that there is significant competition for sales personnel with the skills and technical knowledge that we require. Our ability to achieve revenue growth will depend, in large part, on our success in recruiting, training, integrating and retaining sufficient numbers of sales personnel to support our growth. Due to the complexity of our platform, a significant time lag exists between the hiring date of sales and support personnel and the time when they become fully productive. Our recent and planned hires may not become productive as quickly as we expect, and we may be unable to hire or retain sufficient numbers of qualified individuals in the markets where we do business or plan to do business. If we are unable to hire and train sufficient numbers of effective sales personnel, or the sales personnel are not successful in obtaining new customers or increasing our existing customers’ spend with us, our business will be adversely affected.
Our initiatives to reduce our operating expenses and the associated workforce reduction announced on December 9, 2022 could disrupt our business, may not result in our anticipated savings, and could result in total costs and expenses that are greater than expected.
As a result of recent adverse economic trends, such as inflationary pressures, rising interest rates, and other macroeconomic and geopolitical events, we have initiated a cost reduction initiative aimed at reducing our operating expenses and sharpening our focus on key growth priorities in light of the current macroeconomic environment. As part of that initiative, we announced a reduction in force involving approximately 13.0% of our then-current workforce on December 9, 2022. Our workforce reduction could yield unanticipated consequences, such as attrition beyond planned staff reductions, increased difficulties in our day-to-day operations and reduced employee morale. If employees who were not affected by the reductions in force seek alternative employment, this could result in us seeking contractor support at unplanned additional expense or harm our productivity. Our workforce reductions could also harm our ability to attract and retain qualified management, sales and operational personnel who are critical to our business. Further, we may incur additional expenses not currently contemplated due to events associated with the reduction in force, which could result in losses in future periods. We also may not realize, in full or in part, the anticipated benefits and savings from the reduction in force due to unforeseen difficulties, delays or unexpected costs. Our ongoing and future initiatives to re-balance our cost structure may be disruptive to our operations and could result in increased costs in the short-term before significant benefits are achieved.
Our corporate culture has contributed to our success and, if we are unable to maintain it, whether as a result of corporate growth or reduction in force, our business, operating results and financial condition could be harmed.
We had approximately 308 employees in the United States as of December 31, 2022. We believe our corporate culture has been critical to our success and we have invested substantial time and resources in building our team within our company culture. However, it may be difficult to maintain our culture, whether as a result of corporate growth or reduction in force, which could reduce our ability to innovate and operate effectively and proactively focus on and pursue our corporate objectives. The failure to maintain the key aspects of our culture could result in decreased employee satisfaction, increased difficulty in attracting top talent, increased turnover and degraded quality of customer service, all of which are important to our success and to the effective execution of our business strategy. In the event we are unable to maintain our corporate culture, our business, operating results and financial condition could be harmed.
We allow our customers and suppliers to utilize APIs, with our platform, which could result in outages or security breaches and negatively impact our business, operating results and financial condition.
The use of APIs by our customers and suppliers has significantly increased in recent years. Our APIs allow customers and suppliers to build their own media buying and data management interface by using our APIs to develop custom integration of their business with our platform. The increased use of APIs increases security and operational risks to our systems, including the risk for cyber-attacks (including denial-of-service attacks), malicious internet-based activity online and offline fraud, and other similar activities threaten the confidentiality, integrity, and availability of our platform. Furthermore, while APIs allow customers and suppliers greater ease and power in accessing our platform, they also increase the risk of overusing our systems, potentially causing outages. We have experienced system slowdowns due to customer or supplier overuse of our systems through our APIs. While we have taken measures intended to decrease security and outage risks associated with the use of APIs, such measures may not be successful. Our failure to prevent outages or security breaches resulting from API use could result in government enforcement actions against us, claims for damages by consumers and other affected individuals, costs associated with investigation, notification, mitigation, and remediation, damage to our reputation and loss of goodwill, any of which could have a material adverse impact on our business, operating results and financial condition.
Operational and performance issues with our platform, whether actual or perceived, including a failure to respond to technological changes or to upgrade our technology systems, may adversely affect our business, operating results and financial condition.
We depend upon the sustained and uninterrupted performance of our platform to manage our inventory supply, acquire inventory for each campaign; collect, process and interpret data; and optimize campaign performance in real time and provide billing information to our financial systems. If our platform cannot scale to meet demand, if there are errors in our execution of any of these functions on our platform, or if we experience outages, then our business may be harmed.
Our platform is complex and multifaceted, and operational and performance issues could arise both from the platform itself or from outside factors, such as cyberattacks or other third-party attacks. Errors, failures, vulnerabilities or bugs have been found in the past, and may be found in the future. We have not always been able in the past and may be unable in the future to detect vulnerabilities in our information technology systems (including our products), and vulnerabilities may not be detected until after a security incident has occurred. Further, we may experience delays in developing and deploying remedial measures designed to address any such identified vulnerabilities. Our platform also relies on third-party technology and systems to perform properly, and our platform is often used in connection with computing environments utilizing different operating systems, system management software, equipment and networking configurations, which may cause errors in, or failures of, our platform or such other computing environments. Operational and performance issues with our platform could include the failure of our user interface, outages, errors during upgrades or patches, discrepancies in costs billed versus costs paid, unanticipated volume overwhelming our databases, server failure, or catastrophic events affecting one or more server facilities. While we have built redundancies in our systems, full redundancies do not exist. Some failures will shut our platform down completely, others only partially. We provide service level agreements to some of our customers, and if our platform is not available for specified amounts of time, we may be required to provide credits or other financial compensation to our customers.
As we grow our business, we expect to continue to invest in technology services and equipment. Without these improvements, our operations might suffer from unanticipated system disruptions, slow transaction processing, unreliable service levels, impaired quality or delays in reporting accurate information regarding transactions in our platform, any of which could negatively affect our reputation and ability to attract and retain customers. In addition, the expansion and improvement of our systems and infrastructure may require us to commit substantial financial, operational and technical resources, with no assurance our business will grow. If we fail to respond to technological change or to adequately maintain, expand, upgrade and develop our systems and infrastructure in a timely fashion, our growth prospects and results of operations could be adversely affected.
Operational and performance issues with our platform could also result in negative publicity, damage to our brand and reputation, loss of or delay in market acceptance of our platform, increased costs or loss of revenue, the obligation to issue credits, loss of the ability to access our platform, loss of competitive position or claims by customers for losses sustained by them. Alleviating
problems resulting from such issues could require significant expenditures of capital and other resources and could cause interruptions, delays or the cessation of our business, any of which may adversely affect our operating results and financial condition.
We are dependent on the continued availability of third-party hosting and transmission services. Operational issues with, or changes to the costs of, our third-party data center providers could harm our business, reputation or results of operations.
We currently serve our platform functions from third-party data center hosting facilities operated by Google Cloud Platform and Amazon Web Services, and we primarily use shared servers in such facilities. We are dependent on these third parties to provide continuous power, cooling, humidity control, internet connectivity and physical and technological security for our servers, and our operations depend, in part, on their ability to protect these facilities against any damage or interruption from natural disasters, such as earthquakes and hurricanes, power or telecommunication failures, criminal acts and similar events. In the event that any of our third-party facilities arrangements is terminated, or if there is a lapse of service or damage to a facility, we could experience interruptions in our platform as well as delays and additional expenses in arranging new facilities and services.
Any damage to, or failure of, the systems of our third-party providers could result in interruptions to our platform. Despite precautions taken at our data centers, the occurrence of spikes in usage volume, a natural disaster, such as earthquakes or hurricane, an act of terrorism, vandalism or sabotage, a decision to close a facility without adequate notice, or other unanticipated problems at a facility could result in lengthy interruptions in the availability of our platform. Even with current and planned disaster recovery arrangements, our business could be harmed. Also, in the event of damage or interruption, our insurance policies may not adequately compensate us for any losses that we may incur. These factors in turn could further reduce our revenue, subject us to liability and cause us to issue credits or cause customers to stop using our platform, any of which could materially and adversely affect our business.
We incur significant costs with our third-party data hosting services. If the costs for such services increase due to vendor consolidation, regulation, contract renegotiation, or otherwise, we may not be able to increase the fees for our products and services to cover the changes. As a result, our operating results may be significantly worse than forecasted.
If the non-proprietary technology, software, products and services that we use are unavailable, have future terms we cannot agree to, or do not perform as we expect, our business, operating results and financial condition could be harmed.
We depend on various third-party open source and proprietary technologies, software, products and services, including for critical features and functionality of our platform and API technology, payment processing, payroll and other professional services. Identifying, negotiating, complying with and integrating with third-party terms and technology are complex, costly and time-consuming matters. Failure by third-party providers to maintain, support or secure their technology either generally or for our accounts specifically, or downtime, errors or defects in their products or services, could materially and adversely impact our platform, our administrative obligations or other areas of our business. Having to replace any third-party providers or their technology, products or services could result in outages or difficulties in our ability to provide our services, and our business, operating results and financial condition could be harmed.
Our failure to meet content and inventory standards and provide services that our customers and inventory suppliers trust, could harm our brand and reputation and negatively impact our business, operating results and financial condition.
We do not provide or control the content of the advertisements we serve or that of the websites providing the inventory. Our customers provide the advertising content and inventory suppliers provide the inventory. Both customers and inventory suppliers are concerned about being associated with content they consider inappropriate, competitive or inconsistent with their brands, or illegal, and they are hesitant to spend money without guaranteed brand security. For example, our customers expect that ad placements will not be misrepresented, such as auto-play in banner placements marketed as pre-roll inventory. Consequently, our reputation depends in part on providing services that our customers and inventory suppliers trust, and we have contractual obligations to meet content and inventory standards. We contractually prohibit the misuse of our platform by agencies (and their marketer customers) and inventory suppliers. Additionally, we use our proprietary technology and third-party services to, and we participate in industry co-ops that work to, detect malware and other content issues as well as click fraud (whether by humans or software known as “bots”) and to block fraudulent inventory. Despite such efforts, our customers may inadvertently purchase inventory that proves to be unacceptable for their campaigns, in which case we may not be able to recoup the amounts paid to inventory suppliers. Preventing and combating fraud is an industry-wide issue that requires constant vigilance, as well as a balancing of cost effectiveness and risk, and we may not be fully successful in our efforts to combat fraud. We may provide access to inventory that is objectionable to our customers or we may serve advertising that contains malware or objectionable content to our inventory suppliers, which could harm our or our customers’ brand and reputation, cause customers to decrease or terminate their relationship with us, cause suppliers to decrease or terminate the inventory supplied to us or their relationship with us, or otherwise negatively impact our business, operating results and financial condition. In addition, we may terminate MSAs or IOs in the event clients violate our ad policies or other contract terms, which could harm our business, operating results and financial condition.
We face potential liability and harm to our business based on the human factor of inputting information into our platform.
We or our customers set up campaigns on our platform using a number of available variables. While our platform includes several checks and balances, it is possible for human error to result in significant over-spending. We offer a number of protections such as daily or overall spending caps, but despite these protections, the ability for overspend exists. For example, campaigns which last for a period of time can be set to pace evenly or as quickly as possible. If a customer with a high credit limit enters an incorrect daily cap with a campaign set to a rapid pace, it is possible for a campaign to accidentally go significantly over budget. Our potential liability for such errors may be higher when they occur in situations in which we are executing purchases on behalf of a customer rather than the customer using the self-service feature of our platform. While our customer contracts state that customers are responsible for media purchased through our platform, we are ultimately responsible for paying the inventory providers and we may be unable to collect when such issues occur.
Future acquisitions, strategic investments or alliances could disrupt our business and harm our business, operating results and financial condition.
We have acquired businesses and technologies to grow our business. To the extent we find suitable and attractive acquisition candidates and business opportunities in the future, we may continue to acquire other complementary businesses, products and technologies and enter into joint ventures or similar strategic relationships. We have no present commitments or agreements to enter into any such acquisitions or make any such investments. However, if we identify an appropriate acquisition candidate, we may not be successful in negotiating the terms or financing of the acquisition, and our due diligence may fail to identify all of the problems, liabilities or other shortcomings or challenges of an acquired business, product or technology, including issues related to intellectual property, product quality or architecture, regulatory compliance practices, revenue recognition or other accounting practices, tax liabilities, actual or threatened litigation, privacy or cybersecurity issues or employee or customer issues. Future or past business transactions (such as acquisitions or integrations) could expose us to additional cybersecurity risks and vulnerabilities, as our systems could be negatively affected by vulnerabilities present in acquired or integrated entities’ systems and technologies. We may not be able to successfully integrate the services, products and personnel of any acquired business into our operations. In addition, any future acquisitions, joint ventures or similar relationships may cause a disruption in our ongoing business and distract our management. Further, we may be unable to realize the revenue improvements, cost savings and other intended benefits of any such transaction. Acquisitions involve numerous other risks, any of which could harm our business, including:
•regulatory hurdles;
•failure of anticipated benefits to materialize;
•diversion of management time and focus from operating our business to addressing acquisition integration challenges;
•retention of employees from the acquired company;
•cultural challenges associated with integrating employees from the acquired company into our organization;
•integration of the acquired company’s accounting, management information, human resources and other administrative systems;
•the need to implement or improve controls, procedures and policies at a business that prior to the acquisition may have lacked effective controls, procedures and policies;
•coordination of product development and sales and marketing functions;
•liability for activities of the acquired company before the acquisition, including known and unknown liabilities;
•litigation or other claims in connection with the acquired company, including claims from terminated employees, former stockholders or other third parties; and
•negative reception to an acquisition by clients, suppliers, vendors, or investors.
Failure to appropriately mitigate these risks or other issues related to such strategic investments and acquisitions could result in reducing or completely eliminating any anticipated benefits of transactions, and harm our business generally. Future acquisitions could also result in dilutive issuances of our equity securities, the incurrence of debt, contingent liabilities, amortization or the impairment of goodwill, any of which could harm our business, operating results and financial condition.
Our future success depends on the continuing efforts of our key employees, including Tim Vanderhook and Chris Vanderhook, and our ability to attract, hire, retain and motivate highly skilled employees in the future.
We are a founder-led business and our future success depends on the continuing efforts of our executive officers and other key employees, including Tim Vanderhook, our chief executive officer, and Chris Vanderhook, our chief operating officer. We rely on the leadership, knowledge and experience that our executive officers provide. They foster our corporate culture, which has been
instrumental to our ability to attract and retain new talent. We also rely on employees in our engineering, technical, product development, support and sales teams to attract and retain key customers.
The market for talent in our key areas of operations, including California, is intensely competitive, which could increase our costs to attract and retain talented employees. As a result, we may incur significant costs to attract and retain employees, including significant expenditures related to salaries and benefits and compensation expenses related to equity awards, and we may lose new employees to our competitors or other companies before we realize the benefit of our investment in recruiting and training them. We have at times experienced employee turnover. Because of the complexity of our platform, new employees often require significant training and, in many cases, take significant time before they achieve full productivity. Our account managers, for instance, need to be trained quickly on the features of our platform since failure to offer high-quality support may adversely affect our relationships with our customers.
Employee turnover, including changes in our management team, could disrupt our business. None of our founders or other key employees has an employment agreement for a specific term, and any of our employees may terminate his or her employment with us at any time. The loss of one or more of our executive officers, especially Tim Vanderhook and Chris Vanderhook, or our inability to attract and retain highly skilled employees could have an adverse effect on our business, operating results and financial condition.
We face liabilities arising out of our ownership and operation of Myspace.com.
In 2011, we acquired Myspace LLC, which owns Myspace.com. We have faced and may continue to face claims, investigations, or lawsuits or incur liability as a result of content published or made available on Myspace.com, including claims for defamation, intellectual property rights, including copyright infringement, rights of publicity and privacy, illegal content, misinformation, content regulation and personal injury torts. The laws relating to the liability of providers of online products or services for activities of the people who use them remain somewhat unsettled, both within the United States and internationally. This risk is enhanced in certain jurisdictions outside the United States where our protection from liability for third-party actions may be unclear or where we may be less protected under local laws than we are in the United States. For example, in April 2019, the European Union passed a directive expanding online platform liability for copyright infringement and regulating certain uses of news content online, which member states had to implement by June 2021. In addition, there have been various Congressional efforts, executive actions, and civil litigation efforts to restrict the scope of the protections available to online platforms under Section 230 of the Communications Decency Act, and our current protections from liability for third-party content in the United States could decrease or change, or if courts begin to interpret this law more narrowly than they have historically done. We could incur significant costs investigating and defending claims related to content published or made available on Myspace.com and, if we are found liable, could face significant damages.
In late 2011, shortly after we acquired Myspace LLC, the Federal Trade Commission (“FTC”) initiated an investigation of the entity relating to certain of its historical privacy practices in place between 2008 and 2010. In connection with its 2012 settlement, Myspace LLC agreed to a consent order barring it from misrepresenting the extent to which it protects the privacy of users’ personal information or the extent to which it belongs to or complies with any privacy, security or other compliance program. The order also mandates Myspace LLC establish a comprehensive privacy program designed to protect consumers’ information, and to obtain biennial assessments of its privacy program by independent, third-party auditors for 20 years. The order terminates in August 2032.
If Myspace LLC fails to comply with the mandates of the consent order, or if Myspace LLC is found to be in violation of the consent order or other requirements, we may be subject to regulatory or governmental investigations or lawsuits, which may result in significant monetary fines, judgments, or other penalties, and we may also be required to make additional changes to our business practices.
Myspace.com has been and may in the future be subject to cybersecurity incidents or data breaches. In 2016, we discovered a third-party cyber-attack in which Myspace.com usernames, passwords and email addresses were stolen from the old Myspace.com platform prior to June 11, 2013. While we took steps to remediate the attack, including notifying and invalidating the passwords of known affected users, any present failure to prevent or mitigate security breaches and improper access to or disclosure of the data on Myspace.com could result in litigation, indemnity obligations, regulatory enforcement actions, investigations, fines, penalties, mitigation and remediation costs, disputes, reputational harm, diversion of management’s attention, and other liabilities and damage to our business. Myspace.com may also face operational or performance issues. For example, as a result of a server migration project in 2019, older photo, video or audio files of some users were lost.
Myspace.com has in the past been, and may in the future be, the subject of unfavorable publicity regarding, for example, its privacy practices, site quality and site operational matters. Myspace.com may also face negative publicity relating to content or information that is published or made available on the platform, including defamation, dissemination of misinformation or news hoaxes, discrimination, violations of intellectual property rights, violations of rights of publicity and privacy, hate speech or other types of content. Any such negative publicity could damage our reputation and the reputation of our primary business, which could adversely affect our business and financial results.
The market in which we participate is intensely competitive, and we may not be able to compete successfully with our current or future competitors.
We operate in a highly competitive and rapidly changing industry that is subject to changing technology and customer demands and that includes many companies providing competing solutions. With the introduction of new technologies and the influx of new entrants into the market, we expect competition to persist and intensify in the future, which could harm our ability to increase revenue and maintain profitability. Furthermore, our brand promotion activities may not yield any increased revenue, and even if they do, any increased revenue may not offset the expenses we incurred in building our brand.
We compete with large privately-held companies such as Yahoo DSP, with public companies such as The Trade Desk, and with divisions of large, well-established companies such as Google and Amazon. Our current and potential competitors may have significantly more financial, technical, marketing and other resources than we have, allowing them to devote greater resources to the development, promotion, sale and support of their products and services. They may also have more extensive customer bases and broader supplier relationships than we have. As a result, these competitors may be better able to respond quickly to new technologies, develop deeper marketer relationships or offer services at lower prices. Increased competition may result in reduced pricing for our platform, increased sales and marketing expense, longer sales cycles or a decrease of our market share, any of which could negatively affect our revenue and future operating results and our ability to grow our business. These companies may also have greater brand recognition and longer histories than we have and may actively seek to serve our market and have the power to significantly change the nature of the marketplace to their advantage. Some of our larger competitors, particularly those that are divisions of large companies, have substantially broader product offerings and may leverage their relationships based on other products or incorporate functionality into existing products to gain business in a manner that may discourage customers from using our platform, including through selling at zero or negative margins or product bundling with other services they provide at reduced prices. Customers may prefer to purchase advertising from social medial platforms or other closed platforms, which they cannot acquire through our platform. Potential customers may also prefer to purchase from their existing platform rather than a new platform regardless of product performance or features. These larger competitors often have broader product lines and market focus and may therefore not be as susceptible to downturns in a particular market. We may also experience negative market perception as a result of being a smaller company than our larger competitors.
In addition, we derive a significant portion of our revenue from advertising in the desktop and mobile and connected TV channels, which are rapidly evolving, highly competitive, complex and fragmented. We face significant competition in these markets which we expect will intensify in the future. While fewer of our competitors currently have capability in other channels such as linear TV, in-game streaming audio and digital billboard channels, we also expect to face additional competition in those channels in the future.
Risks Related to Data Privacy
We are subject to stringent and changing obligations related to data privacy and security. Our actual or perceived failure to comply with such obligations could lead to regulatory investigations or actions, litigation, fines and penalties, disruptions of our business operations, reputational harm, loss of customers or sales, revenue declines, increase the cost of data, reduce the availability of data, reduce our ability to utilize or disclose data, adversely affect the demand for our products and services, or other adverse business consequences.
We may collect, store, use, transmit, disclose, or otherwise process (collectively, "Process") personal information and other sensitive data such as confidential business data, trade secrets, and intellectual property, from and about our customers, employees, service providers, and other third parties. Our handling of this data is subject to a wide variety of federal, state, local, and foreign laws regulations, guidance, industry standards, external and internal privacy and security policies, certifications, documents, contracts, and other obligations that govern the Processing of personal information by us and on our behalf.
U.S. federal, state, and local governments, and foreign governments, have adopted or proposed numerous laws relating to the Processing of personal information relating to individuals and households, including contact information and other data for marketing, advertising and other communications with individuals and businesses. The legal landscape for data privacy issues worldwide is complex, continually evolving and often conflicting, and is likely to remain uncertain for the foreseeable future.
In the United States, various laws and regulations apply to the Processing of personal information. For example, U.S. federal and state legislatures, along with regulatory authorities, have recently increased their focus on the collection and use of personal information, including relating to “interest-based” or “targeted” advertising. As an example, California enacted the CCPA, which requires covered businesses to, among other things, provide disclosures to California consumers and grant California consumers a right to opt-out of “sales” of personal information, a concept that is broadly defined. The CPRA, which came into effect on January 1, 2023, expands the CCPA by, among other things, providing consumers with a right to opt-out of “sharing” of personal information with third parties, requiring additional protections for sensitive personal information, creating new data subject rights, creating a new state rulemaking and enforcement agency for the CPRA, expanding potential liability for violations and giving consumers rights to opt out of additional forms of data sharing with third parties. Other states have enacted data privacy laws, such as Virginia, Colorado,
Utah, and Connecticut. In addition, other comprehensive data privacy and security laws have been proposed at the federal, state, and local levels in recent years, which could lead to a varied and complex regulatory landscape and further complicate our compliance efforts.
Outside the United States, an increasing number of laws, regulations, and industry standards may apply to our data privacy and security practices. For example, the European Union’s General Data Protection Regulation (“EU GDPR”) and the United Kingdom’s GDPR (“UK GDPR”) imposes strict requirements applicable to the Processing of individuals’ personal information, respectively, in the European Economic Area (“EEA”) and the United Kingdom (“UK”). The EU GDPR imposes strict requirements for Processing the personal information of individuals and includes significant penalties for noncompliance of up to the greater of €20 million or 4% of an enterprise’s global turnover (or revenue) for the preceding fiscal year. Companies that violate the GDPR can also face prohibitions on data processing and other corrective action, such as class action brought by classes of data subjects or by consumer protection organizations authorized at law to represent their interests. Additionally, Member States may assess other penalties for noncompliance. Additionally, several European legislative proposals could significantly affect our business. For example, the ePrivacy Regulation, which would repeal that European Union Directive 2002/58/EC (ePrivacy Directive), could impose new obligations or limitations in areas affecting our business, notably with respect to the use of cookies. There is also a proposed regulation related to artificial intelligence (“AI”) that, if adopted, could impose onerous obligations related to the use of AI-related systems. We may have to change our business practices to comply with such obligations. These changes to the regulatory landscape, coupled with EU and UK regulators’ increasing focus on compliance with requirements related to the online behavioral advertising ecosystem could, limit the ability to obtain data through integrations with data suppliers, divert the attention of our technology personnel, adversely affect our margins, subject us to liabilities, and may require us to make significant operational changes.
Furthermore, we are subject to evolving laws and regulations regarding data localization and cross-border transfers of personal information, which could make it more difficult or impossible for us to transfer personal information across jurisdictions in a manner that complies with local laws (such as transferring or receiving personal information that originates in the EU). For example, absent appropriate safeguards or other circumstances, the EU GDPR generally restricts the transfer of personal information to countries outside of the EEA, such as the United States, which the European Commission does not consider to provide an adequate level of data privacy and security protections. The European Commission released a set of “Standard Contractual Clauses” that are designed to be a valid mechanism by which entities can transfer personal information out of the EEA to jurisdictions that the European Commission has not found to provide an adequate level of protection. Currently, these Standard Contractual Clauses are a valid mechanism to transfer personal information outside of the EEA. The Standard Contractual Clauses, however, require parties that rely upon that legal mechanism to comply with additional obligations, such as conducting transfer impact assessments to determine whether additional security measures are necessary to protect the at-issue personal information. Moreover, due to potential legal challenges, there exists some uncertainty regarding whether the Standard Contractual Clauses will remain a valid mechanism for transfers of personal information out of the EEA. In addition, laws in Switzerland and the UK similarly restrict transfers of personal information outside of those jurisdictions to countries such as the United States that do not provide an adequate level of personal information protection and certain countries outside Europe (e.g., Russia, China) have also passed or are considering laws requiring local data residency or otherwise impeding the transfer of personal information across borders.
If we cannot implement a valid compliance mechanism for cross-border data transfers from the EEA, the UK or other jurisdictions to the United States, or if the requirements for a legally-compliant transfer are too onerous, we may face increased exposure to regulatory actions, substantial fines, and injunctions against Processing or transferring personal information from Europe or elsewhere. For example, some European regulators have prevented companies from transferring personal data out of Europe for allegedly violating the GDPR’s cross-border data transfer limitations. The inability to import personal information to the United States could significantly and negatively impact our business operations, including by limiting our ability to collaborate with parties that are subject to European and other data privacy and security laws, limiting our ability to obtain inventory or data from suppliers operating in Europe, or requiring us to increase our personal information processing capabilities and infrastructure in Europe and/or elsewhere at significant expense
In addition, privacy advocates and industry groups have proposed, and may propose in the future, industry standards with which we are legally or contractually bound to comply. Additionally, we may make statements about our data Processing practices and our compliance with, or our ability to facilitate our customers’ compliance with, these standards. For example, we have committed to comply, and generally require our customers and the third parties upon which we rely to comply, with applicable self-regulatory principles, such as the Network Advertising Initiative’s Code of Conduct and the Digital Advertising Alliance’s Self-Regulatory Principles for Online Behavioral Advertising in the United States, and similar self-regulatory principles in Europe and Canada adopted by the local Digital Advertising Alliance. These self-regulatory bodies impose additional requirements related to the Processing of personal information, such as providing notice about our use of cookies and other technologies. Some of these self-regulatory bodies can discipline members, which could result in fines, penalties, and/or public censure. Additionally, some of these self-regulatory bodies might refer violations of their requirements to the Federal Trade Commission or other regulatory bodies. See “—Our business or ability to operate our platform could be impacted by changes in the technology industry by technology companies, end users, or government regulation. Such developments, including the restriction of “third-party cookies,” could cause instability in the advertising technology industry.”
Similarly, there has been increasing global scrutiny over online political advertising, and online political advertising laws are rapidly evolving. For example, publishers of online content have imposed varying prohibitions and restrictions on the types and breadth of political advertising allowed on their platforms. The lack of uniformity and increasing requirements for transparency and disclosure could adversely impact the demand for political advertising services and increase our operating and compliance costs.
Because the interpretation and application of privacy and data protection laws, regulations and standards are uncertain and quickly changing, it is possible that these obligations may be interpreted and applied in manners that are, or are asserted to be, inconsistent with our practices. Preparing for and complying with these obligations requires significant resources. Further, adaptation of the digital advertising marketplace requires increasingly significant collaboration between participants in the market, such as publishers and marketers. Failure of the industry to adapt to changes in data privacy and security obligations and user response to such changes could negatively impact inventory, data, and demand. We cannot control or predict the pace or effectiveness of such adaptation, and we cannot predict the impact such changes may have on our business. In addition, it may be necessary for us to fundamentally change our business activities, information technologies, systems, and practices, and to those of any third parties that Process personal information on our behalf.
Although we endeavor to comply with all applicable data privacy and security obligations, we may at times fail or be perceived to have failed to do so. Moreover, despite our efforts, our customers, personnel or third parties upon whom we rely may fail to comply with such obligations, which could negatively impact our business operations and compliance posture. For example, any failure by a third-party processor to comply with applicable law, regulations, or contractual obligations could result in adverse effects, including inability to operate our business and proceedings against us by governmental entities or others. Any inability, or perceived inability, to address or comply with applicable data privacy or security obligations could result in significant consequences, including, but not limited to, government enforcement actions (e.g., investigations, fines, penalties, audits, inspections, and similar); litigation (including class-related claims); additional reporting requirements and/or oversight; bans on Processing personal information; and orders to destroy or not use personal information. Any of these events could have a material adverse effect on our reputation, business, or financial condition, including but not limited to: loss of customers; additional costs and liabilities; damage our reputation; reduction in sales and demand for our platform; and harm our business.
We have in the past been, and may in the future be, subject to enforcement actions, investigations, litigation, or other inquiries regarding our data privacy and security practices. For example, the FTC investigated our wholly owned subsidiary, Myspace LLC, and filed a complaint shortly after we acquired them in late 2011. See “—We face liabilities arising out of our ownership and operation of Myspace.com.” Additionally, advocacy organizations have also filed complaints with data protection authorities against advertising technology companies, arguing that certain of these companies’ practices do not comply with the EU GDPR and/or the UK GDPR. It is possible that investigations or enforcement actions will involve our practices or practices similar to ours and we could be subject to similar investigations or enforcement actions in the future.
Our business or ability to operate our platform could be impacted by changes in the technology industry by technology companies, end users, or government regulation. Such developments, including the restriction of “third-party cookies,” could cause instability in the advertising technology industry.
Digital advertising and in-app advertising are largely dependent on established technology companies and their operation of the most commonly used Internet browsers (Chrome, Firefox, Internet Explorer and Safari), devices and their operating systems (Android and iOS). These companies may change the operations or policies of their browsers, devices and operating systems in a manner that fundamentally changes our ability to operate our platform or collect data. Users of these browsers, devices or operating systems may also adjust their behaviors and use of technology in ways that change our ability to collect data. Digital advertising and in-app advertising are also dependent, in part, on internet protocols and the practices of internet service providers, including IP address allocation. Changes that these providers make to their practices, or adoption of new internet protocols, may materially limit or alter the availability or quality of data. A limitation or alteration of the availability of data in any of these or other instances may have a material impact on the advertising technology industry, which could decrease advertising budgets and subsequently reduce our revenue and adversely affect our business, operating results and financial condition.
For example, browser providers have recently enacted changes restricting the use of third-party cookies in their browsers, which may cause instability in the digital advertising market. Execution and measurement in digital advertising relies to a significant extent on the use of cookies, pixels and other similar technology, including mobile device identifiers that are provided by mobile operating systems for advertising purposes, which we refer to collectively as cookies, to collect data about users and devices. Although our business is less reliant on cookies than some of our competitors because we do not need cookies for marketers and their advertising agencies to identify consumers with our identity resolution capabilities and identity graph, we do use third-party cookies. Third-party cookies are cookies owned and used by parties other than the owners of the website visited by the internet user, in connection with our business for execution of obtaining information about consumers, and for delivering digital advertising. Apple introduced an iOS update in April 2021 that requires users to opt-in to tracking of their activity across devices. Google has also introduced ad blocking software in its Chrome web browser that will block certain ads based on quality standards established under a multi-stakeholder coalition. Additionally, the Safari browser currently blocks third-party cookies by default and has recently added
controls that algorithmically block or limit some cookies. Other browsers have added similar controls. These actions will have significant impacts on the digital advertising and marketing ecosystems in which we operate, which could cause changes in advertising budget allocations and thereby could negatively impact our business. In addition, these browser providers may frequently delay or change their previously announced operations or policies. For example, in June 2021, Google announced that it would delay its timeline of blocking third-party cookies by 2022 until 2023, and in 2022 further indicated that it will not begin blocking cookies until 2024.
For in-app advertising, data regarding interactions between users and devices are tracked mostly through stable, pseudonymous mobile device identifiers that are built into the device operating system with privacy controls that allow users to express a preference with respect to data collection for advertising, including to disable the identifier. These identifiers and privacy controls are defined by the developers of the mobile platforms and could be changed by the mobile platforms in a way that may negatively impact our business. Privacy aspects of other channels for programmatic advertising, such as connected TVs or over-the-top video, are still developing. Technical or policy changes, including regulation or industry self-regulation, could harm our growth in those channels.
Digital advertising is also subject to government regulation which may impact our ability to collect and use data. As the collection and use of data for digital advertising has received ongoing media attention over the past several years, some government regulators, such as the FTC, and privacy advocates have raised significant concerns around observed data. There has been an array of ‘do-not-track’ efforts, suggestions and technologies introduced to address these concerns and individuals are increasingly aware of these options. For example, the EU and the UK, regulators are increasingly focusing on compliance with requirements related to the behavioral, interest-based, or tailored advertising ecosystem. It is anticipated that the ePrivacy Regulation and national implementing laws will replace the current national laws implementing the ePrivacy Directive. Compliance with these laws may require us to make significant operational changes, limit the effectiveness of our activities, divert the attention of our technology personnel, adversely affect our margins, and subject us to liabilities. Outside of Europe, other laws further regulate behavioral, interest-based, or tailored advertising, making certain online advertising activities more difficult and subject to additional scrutiny. For example, the CCPA grants California residents the right to opt-out of a company’s sharing of personal data for advertising purposes in exchange for money or other valuable consideration. However, the regulatory and self-regulatory landscape is inherently uncertain, and there is no consensus definition of tracking, nor agreement on what would be covered by ‘do-not-track’ functionality. There is activity by the major internet browsers to default set on ‘do-not-track’ functionality, including by Safari and Firefox. It is not clear if other internet browsers will follow.
Limitations on our or our customers’ ability to collect and use data for advertising, whether imposed by established technology companies or U.S. legislation, or otherwise, may impact the performance of our platform.
A significant inadvertent disclosure or breach of our information technology systems or data, or of the security of our or our customers’, suppliers’, or other third parties’ upon which we rely could be detrimental to our business, reputation and results of operations.
Our business requires the processing of proprietary, confidential, and sensitive data, including personal information, intellectual property and trade secrets. We rely upon third party service providers and technologies to operate critical business systems to process such data, including, without limitation, third-party providers of cloud-based infrastructure such as Google Cloud Platform and Amazon Web Services, employee email, and other functions. We may share or receive sensitive data with or from third parties. Our ability to monitor these third parties’ security practices is limited, and these parties may not have adequate information security measures in place. If our third-party service providers experience a security incident or other interruption, we could experience adverse consequences. While we may be entitled to damages if our third-party service providers fail to satisfy their privacy or security-related obligations to us, any award may be insufficient to cover our damages, or we may be unable to recover such award
Our data processing activities have made, and may in the future make, us and the third parties upon which we rely a target of cyber-attacks, malicious internet-based activity, online and offline fraud, and other similar activities by third parties. We and the third parties upon which we rely face a variety of evolving threats, which could cause security breaches. In recent years, the frequency, severity and sophistication of cyber-attacks, computer malware, viruses, social engineering, and other intentional misconduct has significantly increased, and these threats are becoming increasingly difficult to detect. These threats come from a variety of sources, including traditional computer hackers, threat actors, and personnel (such as through theft or misuse). We and the third parties upon which we rely may be subject to a variety of evolving threats, including but not limited to social-engineering attacks (including through phishing attacks), malicious code (such as viruses and worms), malware (including as a result of advanced persistent threat intrusions), denial-of-service attacks (such as credential stuffing), personnel misconduct or error, ransomware attacks, supply-chain attacks, software bugs, server malfunctions, software or hardware failures, loss of data or other information technology assets, adware, telecommunications failures, earthquakes, fires, floods, and other similar threats. Threat actors, nation-states, and nation-state-supported actors now engage, and are expected to continue to engage, in cyber-attacks, including for geopolitical reasons and in connection with military conflicts and operations. During times of war and other major conflicts, we and the third parties upon which we rely may be vulnerable to heightened risk of these attacks, including cyber-attacks that could materially disrupt our systems and operations, supply chain, and ability to conduct our business.
Ransomware attacks are becoming increasingly prevalent and severe and can lead to significant interruptions in our operations, loss of data and income, reputational harm, and diversion of funds. Extortion payments may alleviate the negative impact of a ransomware attack, but we may be unwilling or unable to make such payments due to, for example, applicable laws or regulations prohibiting such payments. Similarly, supply-chain attacks have increased in frequency and severity, and third parties and infrastructure in our supply chain or our third-party partners’ supply chains may become compromised or contain exploitable defects or bugs that could result in a breach of or disruption to our information technology systems (including our products/services) or the third-party information technology systems that support us and our services.
Any of the previously identified or similar threats, whether actual or perceived, could cause a security breach or other interruption, resulting in the unauthorized, unlawful, or accidental acquisition, disclosure, modification, misuse, destruction, disclosure of, encryption of, or loss of data.
We may incur significant costs in protecting against such security breaches. Furthermore, certain data privacy and security obligations may require us to implement and maintain specific security measures. Although we have taken measures to protect our systems from such threats, these measures may not be effective. For example, in 2016, we discovered a breach of information from our Myspace databases resulting in the unauthorized access and offer for sale of approximately 360 million Myspace user account email addresses, usernames, and hashed passwords. See “—We face liabilities arising out of our ownership and operation of Myspace.com.” Additionally, we have not always been able in the past and may be unable in the future to detect vulnerabilities in our information technology systems (including those that are part of or that support our services) because such threats and techniques to exploit them change frequently, are often sophisticated in nature, and may not be detected until after a security breach has occurred. Further, we may experience delays in developing and deploying remedial measures designed to address any such identified vulnerabilities.
Any security breach of our or the third parties’ upon which we rely information technology systems or data could result in adverse consequences, including but not limited to litigation, indemnity obligations, enforcement actions, investigations, fines, penalties, mitigation and remediation costs, disputes, reputational harm, diversion of management’s attention, operational disruptions, decreased revenue, and reduced demand for our platform. Further, applicable data privacy and security obligations may require us to notify relevant stakeholders of security incidents. Such disclosures are costly, and the disclosures or the failure to comply with such requirements could lead to adverse consequences.
Furthermore, our contracts may not contain limitations of liability, and even where they do, there can be no assurance that limitations of liability in our contracts are sufficient to protect us from liabilities, damages, or claims related to our data privacy and security obligations. Additionally, our insurance coverage may not be adequate or sufficient to protect us from or to mitigate liabilities arising out of our privacy and security practices, that such coverage will continue to be available on commercially reasonable terms or at all, or that such coverage will pay future claims.
Risks Related to Our Intellectual Property
Our proprietary rights may be difficult to enforce, which could enable others to copy or use aspects of our technology without compensating us, thereby eroding our competitive advantages and harming our business.
Our success depends, in part, on our ability to protect proprietary methods and technologies that we develop or otherwise acquire, so that we can prevent others from using our inventions and proprietary information. If we fail to protect our intellectual property rights adequately, our competitors might gain access to our technology and our business might be adversely affected. We rely upon a combination of patent, trademark, copyright and trade secret laws, as well as third-party confidentiality and non-disclosure agreements, to establish and protect our proprietary rights. Establishing trade secret, copyright, trademark, domain name, and patent protection can be difficult and expensive, and the laws, procedures and restrictions may provide only limited protection. It may be possible for unauthorized third parties to copy or reverse engineer aspects of our technology or otherwise obtain and use information that we regard as proprietary, or to develop technologies similar or superior to our technology or design around our proprietary rights, despite the steps we have taken to protect our proprietary rights. Our contracts with our employees and contractors that relate to intellectual property issues generally restrict the use of our confidential information solely in connection with our services. However, the theft or misuse of our proprietary information could occur by employees or contractors who have access to our technology.
While we have issued patents and patent applications pending, we may be unable to obtain patent protection for the technology covered in our patent applications or such patent protection may not be obtained quickly enough to meet our business needs. Furthermore, the patent prosecution process is expensive, time-consuming, and complex, and we may not be able to prepare, file, prosecute, maintain, and enforce all necessary or desirable patent applications at a reasonable cost or in a timely manner. The scope of patent protection also can be reinterpreted after issuance and issued patents may be invalidated. Even if our patent applications do issue as patents, they may not issue in a form that is sufficiently broad to protect our technology, prevent competitors or other third parties from competing with us or otherwise provide us with any competitive advantage.
Policing unauthorized use of our technology is difficult. In addition, the laws of some foreign countries may not be as protective of intellectual property rights as those of the United States, and mechanisms for enforcement of our proprietary rights in such countries may be inadequate. If we are unable to protect our proprietary rights (including in particular, the proprietary aspects of our platform) we may find ourselves at a competitive disadvantage to others who have not incurred the same level of expense, time and effort to create and protect their intellectual property.
We are subject to third party claims for alleged infringement of their proprietary rights, which would result in additional expense and potential damages.
There is significant patent and other intellectual property development activity in the digital advertising industry. Third-party intellectual property rights may cover significant aspects of our technologies or business methods or block us from expanding our offerings. Our success depends on the continual development of our platform. From time to time, we receive claims from third parties that our platform and underlying technology infringe or violate such third parties’ intellectual property rights. To the extent we gain greater public recognition, we may face a higher risk of being the subject of intellectual property claims. In addition, various "non-practicing entities" that own patents and other intellectual property rights often attempt to aggressively assert their rights in order to extract value from technology companies. Furthermore, from time to time we may introduce or acquire new products, including in areas where we historically have not competed, which could increase our exposure to patent and other intellectual property claims from competitors and non-practicing entities. The cost settling or of defending against intellectual property claims, whether or not the claims have merit, is significant, regardless of whether we are successful in our defense, and could divert the attention of management, technical personnel and other employees from our business operations. Litigation regarding intellectual property rights is inherently uncertain due to the complex issues involved, and we may not be successful in defending ourselves in such matters. Additionally, we may be obligated to indemnify our customers or inventory and data suppliers in connection with any such litigation. If we are found to infringe these rights, we could potentially be required to cease utilizing portions of our platform. We may also be required to develop alternative non-infringing technology, which could require significant time and expense. Alternatively, we could be required to pay royalty payments, either as a one-time fee or ongoing, as well as damages for past use that was deemed to be infringing. If we cannot license or develop technology for any allegedly infringing aspect of our business, we would be forced to limit our service and may be unable to compete effectively. Any of these results could harm our business.
We face potential liability and harm to our business based on the nature of our business and the content on our platform.
Advertising often results in litigation relating to copyright or trademark infringement, public performance royalties or other claims based on the nature and content of advertising that is distributed through our platform. Though we contractually require clients to represent to us that they have the rights necessary to serve advertisements through our platform, we do not independently verify whether we are permitted to deliver, or review the content of, such advertisements. If any of these representations are untrue, we may be exposed to potential liability and our reputation may be damaged. While our customers are typically obligated to indemnify us, such indemnification may not fully cover us, or we may not be able to collect. In addition to settlement costs, we may be responsible for our own litigation costs, which can be extensive.
Risks Related to Our Capital Structure and Related Tax Matters
We depend on distributions from Viant Technology LLC to pay any dividends, if declared, taxes and other expenses, including payments under the Tax Receivable Agreement.
Viant Technology Inc. is a holding company and its only business is to act as the managing member of Viant Technology LLC, and its only material assets are Class A units representing approximately 23.7% of the membership interests of Viant Technology LLC as of December 31, 2022. Viant Technology Inc. does not have any independent means of generating revenue. We anticipate that Viant Technology LLC will continue to be treated as a partnership for U.S. federal income tax purposes and, as such, generally will not be subject to any entity-level U.S. federal income tax. Instead, taxable income will be allocated to the members of Viant Technology LLC. Accordingly, Viant Technology Inc. is required to pay income taxes on its allocable share of any net taxable income of Viant Technology LLC. We cause Viant Technology LLC to make distributions to each of its members, including Viant Technology Inc., in an amount intended to enable each member to pay all applicable taxes on taxable income allocable to such member and to allow Viant Technology Inc. to make payments under a tax receivable agreement (the "Tax Receivable Agreement") we entered into on February 9, 2021, in connection with our IPO, with Viant Technology LLC, continuing members of Viant Technology LLC and the representative of such continuing members of Viant Technology LLC (the "TRA Representative"). In addition, Viant Technology LLC reimburses Viant Technology Inc. for corporate and other overhead expenses. If the amount of tax distributions to be made exceeds the amount of funds available for distribution, Viant Technology Inc. shall receive the full amount of its tax distribution before the other members receive any distribution and the balance, if any, of funds available for distribution shall be distributed to the other members pro rata in accordance with their assumed tax liabilities. To the extent that Viant Technology Inc. needs funds, and Viant Technology LLC is restricted from making such distributions under applicable laws or regulations, or is otherwise unable to provide such funds, it could materially and adversely affect Viant Technology Inc.’s ability to pay dividends and taxes and other expenses, including payments under the Tax Receivable Agreement, and affect our liquidity and financial condition.
The Internal Revenue Service (“IRS”) might challenge the tax basis step-ups and other tax benefits we received in connection with our IPO and the related transactions and in connection with future acquisitions of Viant Technology LLC units.
The Viant Technology LLC units held directly by the members of Viant Technology LLC other than Viant Technology Inc., including the Vanderhook Parties, may in the future be exchanged for shares of our Class A common stock or, at our election, cash. Those exchanges may result in increases in the tax basis of the assets of Viant Technology LLC that otherwise would not have been available. These increases in tax basis are expected to increase (for tax purposes) Viant Technology Inc.’s depreciation and amortization and, together with other tax benefits, reduce the amount of tax that Viant Technology Inc. would otherwise be required to pay, although it is possible that the IRS might challenge all or part of these tax basis increases or other tax benefits, and a court might sustain such a challenge. Viant Technology Inc.’s ability to achieve benefits from any tax basis increases or other tax benefits will depend upon a number of factors, as discussed below, including the timing and amount of our future income.
We will not be reimbursed for any payments previously made under the Tax Receivable Agreement if the basis increases or other tax benefits described above are successfully challenged by the IRS or another taxing authority. As a result, in certain circumstances, payments could be made under the Tax Receivable Agreement in excess of our ultimate cash tax savings.
We are required to pay over to continuing members of Viant Technology LLC most of the tax benefits we receive from tax basis step-ups (and certain other tax benefits) attributable to its acquisition of units of Viant Technology LLC, and the amount of those payments are expected to be substantial.
Viant Technology Inc. has entered into a Tax Receivable Agreement with Viant Technology LLC, continuing members of Viant Technology LLC (not including Viant Technology Inc.) and the TRA Representative. The Tax Receivable Agreement provides for payment by Viant Technology Inc. to continuing members of Viant Technology LLC (not including Viant Technology Inc.) of 85% of the amount of the net cash tax savings, if any, that Viant Technology Inc. realizes (or, under certain circumstances, is deemed to realize) as a result of increases in tax basis (and utilization of certain other tax benefits) resulting from (i) Viant Technology Inc.’s acquisition of Viant Technology LLC units from pre-IPO members of Viant Technology LLC in connection with the IPO and in future exchanges and (ii) any payments Viant Technology Inc. makes under the Tax Receivable Agreement (including tax benefits related to imputed interest). Viant Technology Inc. will retain the benefit of the remaining 15% of these net cash tax savings.
The term of the Tax Receivable Agreement will continue until all tax benefits that are subject to the Tax Receivable Agreement have been utilized or have expired, unless we exercise our right to terminate the Tax Receivable Agreement (or it is terminated due to a change in control or our breach of a material obligation thereunder), in which case, Viant Technology Inc. will be required to make the termination payment specified in the Tax Receivable Agreement. In addition, payments we make under the Tax Receivable Agreement will be increased by any interest accrued from the due date (without extensions) of the corresponding tax return. The actual future payments to the continuing members of Viant Technology LLC will vary based on the factors discussed below, and estimating the amount and timing of payments that may be made under the Tax Receivable Agreement is by its nature imprecise, as the calculation of amounts payable depends on a variety of factors and future events. We expect to receive distributions from Viant Technology LLC in order to make any required payments under the Tax Receivable Agreement. However, we may need to incur debt to finance payments under the Tax Receivable Agreement to the extent such distributions or our cash resources are insufficient to meet our obligations under the Tax Receivable Agreement as a result of timing discrepancies or otherwise.
The actual increase in tax basis, as well as the amount and timing of any payments under the Tax Receivable Agreement, will vary depending on a number of factors, including the price of our Class A common stock at the time of the exchange; the timing of future exchanges; the extent to which exchanges are taxable; the amount and timing of the utilization of tax attributes; the amount, timing and character of Viant Technology Inc.’s income; the U.S. federal, state and local tax rates then applicable; the amount of each exchanging unitholder’s tax basis in its units at the time of the relevant exchange; the depreciation and amortization periods that apply to the increases in tax basis; the timing and amount of any earlier payments that Viant Technology Inc. may have made under the Tax Receivable Agreement and the portion of Viant Technology Inc.’s payments under the Tax Receivable Agreement that constitute imputed interest or give rise to depreciable or amortizable tax basis. We expect that, as a result of the increases in the tax basis of the tangible and intangible assets of Viant Technology LLC attributable to the exchanged Viant Technology LLC interests, and certain other tax benefits, the payments that Viant Technology Inc. will be required to make to the holders of rights under the Tax Receivable Agreement will be substantial. There may be a material negative effect on our financial condition and liquidity if, as described below, the payments under the Tax Receivable Agreement exceed the actual benefits Viant Technology Inc. receives in respect of the tax attributes subject to the Tax Receivable Agreement and/or distributions to Viant Technology Inc. by Viant Technology LLC are not sufficient to permit Viant Technology Inc. to make payments under the Tax Receivable Agreement.
In certain circumstances, payments under the Tax Receivable Agreement may be accelerated and/or significantly exceed the actual tax benefits, if any, that Viant Technology Inc. actually realizes.
The Tax Receivable Agreement provides that if (i) Viant Technology Inc. exercises its right to early termination of the Tax Receivable Agreement in whole (that is, with respect to all benefits due to all beneficiaries under the Tax Receivable Agreement) or in part (that is, with respect to some benefits due to all beneficiaries under the Tax Receivable Agreement), (ii) Viant Technology Inc.
experiences certain changes in control, (iii) the Tax Receivable Agreement is rejected in certain bankruptcy proceedings, (iv) Viant Technology Inc. fails (subject to certain exceptions) to make a payment under the Tax Receivable Agreement within 180 days after the due date or (v) Viant Technology Inc. materially breaches its obligations under the Tax Receivable Agreement, Viant Technology Inc. will be obligated to make an early termination payment to holders of rights under the Tax Receivable Agreement equal to the present value of all payments that would be required to be paid by Viant Technology Inc. under the Tax Receivable Agreement. The amount of such payments will be determined on the basis of certain assumptions in the Tax Receivable Agreement, including (i) the assumption that Viant Technology Inc. would have enough taxable income in the future to fully utilize the tax benefit resulting from the tax assets that are the subject of the Tax Receivable Agreement, (ii) the assumption that any item of loss deduction or credit generated by a basis adjustment or imputed interest arising in a taxable year preceding the taxable year that includes an early termination will be used by Viant Technology Inc. ratably from such taxable year through the earlier of (x) the scheduled expiration of such tax item or (y) 15 years; (iii) the assumption that any non-amortizable assets are deemed to be disposed of in a fully taxable transaction on the fifteenth anniversary of the earlier of the basis adjustment and the early termination date; (iv) the assumption that U.S. federal, state and local tax rates will be the same as in effect on the early termination date, unless scheduled to change; and (v) the assumption that any units of Viant Technology LLC (other than those held by Viant Technology Inc.) outstanding on the termination date are deemed to be exchanged for an amount equal to the market value of the corresponding number of shares of Class A common stock on the termination date. Any early termination payment may be made significantly in advance of the actual realization, if any, of the future tax benefits to which the termination payment relates. The amount of the early termination payment is determined by discounting the present value of all payments that would be required to be paid by Viant Technology Inc. under the Tax Receivable Agreement at a rate equal to the lesser of (a) 6.5% and (b) the Secured Overnight Financing Rate, as reported by the Wall Street Journal plus 400 basis points.
Moreover, as a result of an elective early termination, a change in control or Viant Technology Inc.’s material breach of its obligations under the Tax Receivable Agreement, Viant Technology Inc. could be required to make payments under the Tax Receivable Agreement that exceed its actual cash savings under the Tax Receivable Agreement. Thus, Viant Technology Inc.’s obligations under the Tax Receivable Agreement could have a substantial negative effect on its financial condition and liquidity and could have the effect of delaying, deferring or preventing certain mergers, asset sales, or other forms of business combinations or changes of control. We may not be able to finance any early termination payment. It is also possible that the actual benefits ultimately realized by us may be significantly less than were projected in the computation of the early termination payment. We will not be reimbursed if the actual benefits ultimately realized by us are less than were projected in the computation of the early termination payment.
Payments under the Tax Receivable Agreement will be based on the tax reporting positions that we will determine and the IRS or another tax authority may challenge all or part of the tax basis increases, as well as other related tax positions we take, and a court could sustain such challenge. If any tax benefits that have given rise to payments under the Tax Receivable Agreement are subsequently disallowed, Viant Technology Inc. would be entitled to reduce future amounts otherwise payable to a holder of rights under the Tax Receivable Agreement to the extent the holder has received excess payments. However, the required final and binding determination that a holder of rights under the Tax Receivable Agreement has received excess payments may not be made for a number of years following commencement of any challenge, and Viant Technology Inc. will not be permitted to reduce its payments under the Tax Receivable Agreement until there has been a final and binding determination, by which time sufficient subsequent payments under the Tax Receivable Agreement may not be available to offset prior payments for disallowed benefits. Viant Technology Inc. will not be reimbursed for any payments previously made under the Tax Receivable Agreement if the basis increases described above are successfully challenged by the IRS or another taxing authority. As a result, in certain circumstances, payments could be made under the Tax Receivable Agreement that are significantly in excess of the benefit that Viant Technology Inc. actually realizes in respect of the increases in tax basis (and utilization of certain other tax benefits) and Viant Technology Inc. may not be able to recoup those payments, which could adversely affect Viant Technology Inc.’s financial condition and liquidity.
In certain circumstances, Viant Technology LLC will be required to make distributions to us and the existing members of Viant Technology LLC, and the distributions that Viant Technology LLC will be required to make may be substantial.
Viant Technology LLC is expected to continue to be treated as a partnership for U.S. federal income tax purposes and, as such, is not subject to U.S. federal income tax. Instead, taxable income is allocated to members, including Viant Technology Inc. Pursuant to the Viant Technology LLC Operating Agreement, Viant Technology LLC makes tax distributions to its members, including Viant Technology Inc., which generally are pro rata based on the ownership of Viant Technology LLC units, calculated using an assumed tax rate, to help each of the members to pay taxes on that member’s allocable share of Viant Technology LLC’s net taxable income. Under applicable tax rules, Viant Technology LLC is required to allocate net taxable income disproportionately to its members in certain circumstances. Because tax distributions are determined based on the member who is allocated the largest amount of taxable income on a per unit basis and on an assumed tax rate that is the highest possible rate applicable to any member, but are made pro rata based on ownership of Viant Technology LLC units, Viant Technology LLC is required to make tax distributions that, in the aggregate, likely exceed the aggregate amount of taxes payable by its members with respect to the allocation of Viant Technology LLC income.
Funds used by Viant Technology LLC to satisfy its tax distribution obligations are not available for reinvestment in our business. Moreover, the tax distributions Viant Technology LLC is required to make may be substantial, and may significantly exceed (as a percentage of Viant Technology LLC’s income) the overall effective tax rate applicable to a similarly situated corporate taxpayer. In addition, because these payments are calculated with reference to an assumed tax rate, and because of the disproportionate allocation of net taxable income, these payments likely significantly exceed the actual tax liability for many of the existing members of Viant Technology LLC.
As a result of potential differences in the amount of net taxable income allocable to us and to the existing members of Viant Technology LLC, as well as the use of an assumed tax rate in calculating Viant Technology LLC’s distribution obligations, we may receive distributions significantly in excess of our tax liabilities and obligations to make payments under the Tax Receivable Agreement. We may choose to manage these excess distributions through a number of different approaches, including by applying them to general corporate purposes.
If Viant Technology LLC were to become a publicly traded partnership taxable as a corporation for U.S. federal income tax purposes, Viant Technology Inc. and Viant Technology LLC might be subject to potentially significant tax inefficiencies, and Viant Technology Inc. would not be able to recover payments previously made by it under the Tax Receivable Agreement, even if the corresponding tax benefits were subsequently determined to have been unavailable due to such status.
We intend to operate such that Viant Technology LLC does not become a publicly traded partnership taxable as a corporation for U.S. federal income tax purposes. A “publicly traded partnership” is an entity that otherwise would be treated as a partnership for U.S. federal income tax purposes, the interests of which are traded on an established securities market or readily tradable on a secondary market or the substantial equivalent thereof. Under certain circumstances, exchanges of Viant Technology LLC units pursuant to the Viant Technology LLC Operating Agreement or other transfers of Viant Technology LLC units could cause Viant Technology LLC to be treated like a publicly traded partnership. From time to time the U.S. Congress has considered legislation to change the tax treatment of partnerships and there can be no assurance that any such legislation will not be enacted or if enacted will not be adverse to us.
If Viant Technology LLC were to become a publicly traded partnership taxable as a corporation for U.S. federal income tax purposes, significant tax inefficiencies might result for Viant Technology Inc. and Viant Technology LLC, including as a result of Viant Technology Inc.’s inability to file a consolidated U.S. federal income tax return with Viant Technology LLC. In addition, Viant Technology Inc. may not be able to realize tax benefits covered under the Tax Receivable Agreement and would not be able to recover any payments previously made by it under the Tax Receivable Agreement, even if the corresponding tax benefits (including any claimed increase in the tax basis of Viant Technology LLC’s assets) were subsequently determined to have been unavailable.
Risks Related to Our Financial Position and Capital Requirements
We may experience fluctuations in our operating results, which could make our future operating results difficult to predict or cause our operating results to fall below securities analysts’ and investors’ expectations.
Our quarterly and annual operating results have fluctuated in the past and we expect our future operating results to fluctuate due to a variety of factors, many of which are beyond our control. In particular, we offer our customers a choice of two different pricing options: a percentage of spend option and a fixed CPM pricing option. We also offer our customers the ability to use our services to aid them in data management, media execution and advanced reporting. Our revenue and contribution ex-TAC vary across these different pricing and service options, and therefore our results may vary based on the mix of pricing and service options chosen by customers in any given period. The varying nature of our pricing mix between periods may make it more difficult for us to forecast our future operating results. Further, variation in our pricing mix may make it more difficult to make comparisons between prior, current and future periods. Period-to-period comparisons of our operating results should not be relied upon as an indication of our future performance. Fluctuations in our operating results could cause our performance to fall below the expectations of securities analysts and investors, and adversely affect the price of our Class A common stock. Because our business is changing and evolving rapidly, and the macroeconomic and geopolitical environment continues to evolve as a result of the COVID-19 pandemic, labor shortages, inflation and monetary supply shifts, rising interest rates, tightening of credit markets, and potential disruptions from the ongoing Russia-Ukraine conflict, our historical operating results may not be necessarily indicative of our future operating results. In addition to changes in terms of mix of our different pricing options, factors that may cause our operating results to fluctuate include the following:
•changes in demand for our platform, including those related to the seasonal nature of our customers’ spending on digital advertising campaigns;
•changes in our pricing policies, the pricing policies of our competitors and the pricing or availability of inventory, data or other third-party services;
•changes in our customer base and platform offerings;
•the addition or loss of advertising agencies and marketers as customers;
•changes in advertising budget allocations, agency affiliations or marketing strategies;
•changes to our channel mix (including, for example, changes in demand for connected TV);
•changes and uncertainty in the regulatory and business environment for us or customers (for example, when Apple or Google change policies for their browsers and operating systems);
•changes in the economic prospects of marketers or the economy generally (due to COVID-19, labor shortages, inflation and monetary supply shifts, rising interest rates, tightening of credit markets, and potential disruptions from the ongoing Russia-Ukraine conflict or otherwise), which could alter marketers’ spending priorities, or could increase the time or costs required to complete advertising inventory sales;
•changes in the availability of advertising inventory or in the cost of reaching end consumers through digital advertising;
•disruptions or outages on our platform;
•the introduction of new technologies or offerings by our competitors;
•changes in our capital expenditures as we acquire the hardware, equipment and other assets required to support our business;
•timing differences between our payments for advertising inventory and our collection of related advertising revenue;
•the length and unpredictability of our sales cycle;
•costs related to acquisitions of businesses or technologies, or employee recruiting; and
•shifting views and behaviors of consumers concerning use of data.
Based upon the factors above and others beyond our control, we have a limited ability to forecast our future revenue, costs and expenses, and, as a result, our operating results may, from time to time, fall below our estimates or the expectations of securities analysts and investors.
We may not be able to secure additional financing on favorable terms, or at all, to meet our future capital needs, which may in turn impair our growth.
We intend to continue to grow our business, which may require additional capital to develop new features or enhance our platform, improve our operating infrastructure, finance working capital requirements or acquire complementary businesses and technologies. Accordingly, we may need to engage in additional equity or debt financings to secure additional capital. If we raise additional funds through future issuances of equity or convertible debt securities, our existing stockholders could suffer significant dilution, and any new equity securities we issue could have rights, preferences and privileges superior to those of holders of our Class A common stock. Any debt financing that we secure in the future could involve restrictive covenants relating to our capital raising activities and other financial and operational matters, which may make it more difficult for us to obtain additional capital and to pursue business opportunities. If we are unable to secure additional funding on favorable terms, or at all, when we require it, our ability to continue to grow our business to react to market conditions could be impaired and our business may be harmed.
If we continue to grow our business and increase our offerings, our costs will increase and we may not be able to generate sufficient revenue to sustain profitability and failure to manage growth effectively could cause our business to suffer.
We have expended significant resources in the past to grow our business and increase the offerings of our platform. While we have recently implemented cost reduction initiatives aimed at reducing our operating expenses and sharpening our focus on key growth priorities in light of the current macroeconomic environment, if we continue to grow our business, it could require substantial financial and other resources to, among other things:
•develop our platform, including by investing in our engineering team, creating, acquiring or licensing new products or features, and improving the functionality, availability and security of our platform;
•improve our technology infrastructure, including investing in internal technology development and acquiring outside technologies;
•cover general and administrative expenses, including legal, accounting and other expenses necessary to support a larger organization;
•cover sales and marketing expenses, including a significant expansion of our direct sales organization;
•cover expenses relating to data collection and consumer privacy compliance, including additional infrastructure, automation and personnel; and
•explore strategic acquisitions.
Investing in the foregoing, however, may not yield anticipated returns. Consequently, as our costs increase, we may not be able to generate sufficient revenue to achieve or sustain profitability.
Further, to manage our growth effectively, we must continually evaluate and evolve our organization. We must manage our employees, operations, finances, technology and development and capital investments efficiently. Our efficiency, productivity and the quality of our platform and customer service may be adversely impacted if we do not train our new personnel, particularly our sales and support personnel, quickly and effectively, or if we fail to appropriately coordinate across our organization. Additionally, rapid growth may place a strain on our resources, infrastructure and ability to maintain the quality of our platform. Failure to manage our growth effectively could cause our business to suffer and have an adverse effect on our operating results and financial condition.
We are a party to a revolving credit agreement, which contains a number of covenants that may restrict our current and future operations and could adversely affect our ability to execute business needs.
Our revolving credit and security agreement and guaranty (the “Loan Agreement”) with PNC Bank, National Association (“PNC Bank”) contains a number of covenants that limit our ability and our subsidiaries’ ability to, among other things, incur indebtedness, create liens, make investments, merge with other companies, dispose of our assets, prepay other indebtedness and make dividends and other distributions. The terms of our Loan Agreement may restrict our current and future operations and could adversely affect our ability to finance our future operations or capital needs or to execute business strategies in the means or manner desired. In addition, complying with these covenants may make it more difficult for us to successfully execute our business strategy, invest in our growth strategy and compete against companies who are not subject to such restrictions. The Loan Agreement also contains a financial covenant that requires us to maintain a minimum fixed charge coverage ratio of 1.40 to 1 when undrawn availability under the Loan Agreement is less than 25%. We may not be able to generate sufficient cash flow or sales to meet the financial covenant or pay the principal or interest under the Loan Agreement.
If we are unable to comply with our payment requirements, our lender may accelerate our obligations under our Loan Agreement and foreclose upon the collateral, or we may be forced to sell assets, restructure our indebtedness or seek additional equity capital, which would dilute our stockholders’ interests. If we fail to comply with our covenants under the Loan Agreement, it could result in an event of default under the agreement and our lender could make the entire debt immediately due and payable. If this occurs, we might not be able to repay our debt or borrow sufficient funds to refinance it. Even if new financing is available, it may not be on terms that are acceptable to us.
The phase out of the London Interbank Offered Rate (“LIBOR”), or the replacement of LIBOR with a different reference rate, may increase the interest rates used in our revolving credit facility.
Interest rates under the Loan Agreement governing our revolving credit facility are based on LIBOR which is the basic rate of interest used in lending between banks on the London interbank market and is widely used as a reference for setting the interest rate on loans globally. ICE Benchmark Administration, the administrator of LIBOR, has ceased the publication of certain tenors of U.S. dollar LIBOR after December 31, 2021, and plans to cease the publication of all other tenors of U.S. dollar LIBOR after June 30, 2023. It is unclear if new methods of calculating LIBOR will be established such that it continues to exist after 2023. The U.S. Federal Reserve has begun publishing a Secured Overnight Funding Rate which is currently intended to serve as an alternative reference rate to LIBOR. If the method for calculation of LIBOR changes, if LIBOR is no longer available, or if lenders have increased costs due to changes in LIBOR, we may suffer from potential increases in interest rates on our borrowings. Further, we will need to renegotiate our Loan Agreement that utilizes LIBOR as a factor in determining the interest rate to replace LIBOR with the new standard that is established.
Seasonal fluctuations in advertising activity could have a material impact on our revenue, cash flow and operating results.
Our revenue, cash flow, operating results and other key operating and performance measures may vary from quarter to quarter due to the seasonal nature of our customers’ spending on advertising campaigns. For example, in prior years, customers tended to devote more of their advertising budgets to the fourth calendar quarter to coincide with consumer holiday spending. Historically, the fourth quarter has reflected our highest level of advertising activity for the year. In contrast, the first quarter of the calendar year has typically been the slowest in terms of advertising spend. Political advertising could also cause our revenue to increase during election cycles and decrease during other periods, making it difficult to predict our revenue, cash flow, and operating results, all of which could fall below our expectations.
Risks Related to Ownership of Our Class A Common Stock
The market price of our Class A common stock has been and may continue to be volatile or may decline regardless of our operating performance.
The market price of equity securities of technology companies has historically experienced high levels of volatility. The closing price of our Class A common stock since first trading on February 10, 2021 through February 28, 2023 has ranged from a low of $3.15 to a high of $68.31. The market price of our Class A common stock could be subject to wide fluctuations in response to the risk factors listed in this section and others beyond our control. Further, stock markets may experience extreme price and volume fluctuations that can affect the market prices of equity securities. These fluctuations can be unrelated or disproportionate to the operating performance of those companies. For instance, if the stock market for technology companies, or the stock market generally, experiences a loss of investor confidence, the trading price of our Class A common stock could decline for reasons unrelated to our business, operating results or financial condition. The trading price of our Class A common stock might also decline in reaction to events that affect other companies in our industry even if these events do not directly affect us. In the past, stockholders have filed securities class action litigation following periods of market volatility. If we were to become involved in securities litigation, it could subject us to substantial costs, divert resources and the attention of management from our business, and adversely affect our business.
Sales of substantial blocks of our Class A common stock into the public market, or the perception that such sales might occur, could cause the market price of our Class A common stock to decline.
Sales of substantial blocks of our Class A common stock into the public market, or the perception that such sales might occur, in particular sales by our directors, officers or other affiliates, could cause the market price of our Class A common stock to decline and could impair our ability to raise capital through the sale of additional equity securities.
We are a “controlled company” within the meaning of the listing standards of the Nasdaq Global Select Market (“Nasdaq”) and, as a result, qualify for, and rely on, exemptions from certain corporate governance requirements.
The Vanderhook Parties hold a majority of the voting power of our outstanding common stock through their ownership of our Class B common stock. As a result, we qualify as a “controlled company” within the meaning of the corporate governance standards of Nasdaq. Under these rules, a listed company of which more than 50% of the voting power with respect to the election of directors is held by an individual, group or another company is a “controlled company” and may elect not to comply with certain corporate governance requirements, including the requirement that (i) a majority of our board of directors consist of independent directors, (ii) director nominees be selected or recommended to the board of directors entirely by independent directors and (iii) the compensation committee be composed entirely of independent directors. Currently, our compensation committee does not consist entirely of independent directors and our directors are not nominated or selected entirely by independent directors. Accordingly, you may not have the same protections afforded to stockholders of companies that are subject to all of the corporate governance requirements of Nasdaq.
Insiders have substantial control over our company, which could limit your ability to influence the outcome of key decisions, including a change of control.
Through their ownership of Class B common stock, the Vanderhook Parties control 71.5% of the voting power of our common stock in the election of directors as of December 31, 2022. This control will limit or preclude your ability to influence corporate matters for the foreseeable future. These stockholders will be able to influence or control matters requiring approval by our stockholders, including the election of directors and the approval of mergers, acquisitions or other extraordinary transactions. Their interests may differ from yours and they may vote in a manner that is adverse to your interests. This control may deter, delay or prevent a change of control of our company, deprive our stockholders of an opportunity to receive a premium for their Class A common stock as part of a sale of our company and may ultimately affect the market price of our Class A common stock.
Our charter documents and Delaware law could discourage takeover attempts and other corporate governance changes.
Our amended and restated certificate of incorporation and amended and restated bylaws contain provisions that could delay or prevent a change in control of our company. These provisions could also make it difficult for stockholders to elect directors that are not nominated by the current members of our board of directors or take other corporate actions, including effecting changes in our management. These provisions include the following provisions that:
•provide that our board of directors will be classified into three classes with staggered, three-year terms and that directors may only be removed for cause after the Vanderhook Parties collectively cease to beneficially own a majority of the combined voting power of our Class A and Class B Common Stock (the “Triggering Event”);
•permit the board of directors to establish the number of directors and fill any vacancies and newly created directorships;
•provide that, after the Triggering Event, vacancies on our board of directors may be filled only by a majority of directors then in office, even though less than a quorum;
•prohibit cumulative voting in the election of directors;
•require super-majority voting to amend our certificate of incorporation and bylaws;
•authorize the issuance of “blank check” preferred stock that our board of directors could use to implement a stockholder rights plan;
•eliminate the ability of our stockholders to call special meetings of stockholders;
•specify that special meetings of our stockholders can be called only by our board of directors, the chairman of our board of directors, or our chief executive officer with the concurrence of a majority of our board of directors;
•prohibit stockholder action by written consent after the Triggering Event, which requires all stockholder actions to be taken at a meeting of our stockholders;
•permit our board of directors to alter our bylaws without obtaining stockholder approval;
•reflect the dual class structure of our common stock, as discussed above; and
•establish advance notice requirements for nominations for election to our board of directors or for proposing matters that can be acted upon by stockholders at annual stockholder meetings.
In addition, as a Delaware corporation, we are subject to Section 203 of the Delaware General Corporation Law. These provisions may prohibit large stockholders, in particular those owning 15% or more of our outstanding voting stock, from merging or combining with us for a period of time. In addition, our credit facility includes, and other debt instruments we may enter into in the future may include, provisions entitling the lenders to demand immediate repayment of all borrowings upon the occurrence of certain change of control events relating to our company, which also could discourage, delay or prevent a business combination transaction.
Our amended and restated certificate of incorporation includes an exclusive forum clause, which could limit our stockholders’ ability to obtain a favorable judicial forum for disputes with us.
Our amended and restated certificate of incorporation provides that the Court of Chancery of the State of Delaware shall be the sole and exclusive forum for any complaint asserting any internal corporate claims, including claims in the right of the Company that are based upon a violation of a duty by a current or former director, officer, employee or stockholder in such capacity, or as to which the Delaware General Corporation Law confers jurisdiction upon the Court of Chancery. In addition, our amended and restated certificate of incorporation provides that the federal district courts of the United States will be the exclusive forum for resolving any complaint asserting a cause of action arising under the Securities Act. We note, however, that there is uncertainty as to whether a court would enforce this provision and that investors cannot waive compliance with the federal securities laws and the rules and regulations thereunder. Section 22 of the Securities Act creates concurrent jurisdiction for state and federal courts over all suits brought to enforce any duty or liability created by the Securities Act or the rules and regulations thereunder. This forum selection provision will not apply to claims brought to enforce a duty or liability created by the Exchange Act.
This choice of forum provision may limit a stockholder’s ability to bring a claim in other judicial forums for disputes with us or our directors, officers or other employees, which may discourage lawsuits against us and our directors, officers and other employees in jurisdictions other than Delaware, or federal courts, in the case of claims arising under the Securities Act. Alternatively, if a court were to find the choice of forum provision contained in our amended and restated certificate of incorporation to be inapplicable or unenforceable in an action, we may incur additional costs associated with resolving such action in other jurisdictions, which could have a material adverse effect on our business, financial condition or results of operations.
Any person or entity purchasing or otherwise acquiring any interest in shares of our capital stock is deemed to have notice of and consented to the foregoing provisions. The exclusive forum clause may limit our stockholders’ ability to obtain a favorable judicial forum for disputes with us.
General Risk Factors
Our business is subject to a wide range of laws and regulations, many of which are evolving, and failure to comply with such laws and regulations could harm our business, financial condition, and results of operations.
Our business is subject to regulation by various federal, state, local and foreign governmental agencies, including agencies responsible for monitoring and enforcing employment and labor laws, consumer protection laws, anti-bribery and anti-corruption laws, import and export controls, federal securities laws, and tax laws and regulations. These laws and regulations govern a wide range of topics, including those related to matters beyond our core products and services. For instance, new regulations, laws, policies, and international accords relating to environmental and social matters, including sustainability, climate change, human capital, and
diversity, are being developed and formalized in the United States, Europe and elsewhere, which may entail specific, target-driven frameworks and/or disclosure requirements. We have implemented environmental and social programs, adopted reporting frameworks and principles, and announced a number of goals and initiatives, including those related to environmental sustainability and diversity. The implementation of these goals and initiatives may require considerable investments, and our goals, with all of their contingencies, dependencies, and in certain cases, reliance on third-party verification and/or performance, are complex and ambitious, and we may not achieve them. Additionally, our current programs, reporting frameworks, and principles may not be in compliance with any new environmental and social laws and regulations that may be promulgated in the United States and elsewhere, and the costs of changing any of our current practices to comply with any new legal and regulatory requirements in the United States and elsewhere may be substantial. Furthermore, industry and market practices may further develop to become even more robust than what is required under any new laws and regulations and may impose added costs on our business and could require us to make changes to our business or platform. Noncompliance with applicable regulations or requirements could subject us to investigations, enforcement actions, sanctions, fines, damages, penalties, injunctions or termination of contracts. Any such matters could have a material adverse effect on our business, results of operations and financial condition.
Reduced reporting and disclosure requirements applicable to us as an emerging growth company and a smaller reporting company could make our Class A common stock less attractive to investors.
We are an emerging growth company (an “EGC”) as defined in the Jumpstart Our Business Startups Act of 2012 (the “JOBS Act”) and, for as long as we continue to be an EGC, we may choose to continue to take advantage of exemptions from various reporting requirements applicable to other public companies. Consequently, we are not required to have our independent registered public accounting firm audit our internal control over financial reporting under Section 404 of the Sarbanes-Oxley Act and we are subject to reduced disclosure obligations regarding executive compensation in our periodic reports and proxy statements and exemptions from the requirements of holding a nonbinding advisory vote on executive compensation and stockholder approval of any golden parachute payments not previously approved. In addition, the JOBS Act provides that an EGC can take advantage of an extended transition period for complying with new or revised accounting standards. We have elected to take advantage of the extended transition period. As a result, our consolidated financial statements may not be comparable to companies that comply with new or revised accounting pronouncements as of the dates such pronouncements are effective for public companies. We could be an EGC until December 31, 2026. We will cease to be an EGC upon the earliest of: (i) until December 31, 2026, (ii) the first fiscal year after our annual gross revenue is $1.235 billion or more, (iii) the date on which we have, during the previous three-year period, issued more than $1 billion in nonconvertible debt securities or (iv) the end of any fiscal year in which the market value of our Class A common stock held by non-affiliates exceeded $700.0 million as of the end of the second quarter of that fiscal year.
We are also a “smaller reporting company” as defined in the Exchange Act. We may take advantage of certain of the scaled disclosures available to smaller reporting companies as long as we qualify as a smaller reporting company, even after we are no longer an EGC, including not being required to comply with the auditor attestation requirements of Section 404 of the Sarbanes-Oxley Act and reduced disclosure obligations regarding executive compensation in our periodic reports and proxy statements.
If we fail to maintain or implement effective internal controls, we may not be able to report financial results accurately or on a timely basis, or to detect fraud, which could have a material adverse effect on our business and the per share price of our Class A common stock.
The Sarbanes-Oxley Act requires, among other things, that we maintain effective disclosure controls and procedures, and internal control over financial reporting. We are continuing to develop and refine our disclosure controls and other procedures that are designed to ensure that information required to be disclosed by us in the reports that we will file with the SEC is recorded, processed, summarized and reported within the time periods specified in SEC rules and forms. We are also continuing to improve our internal control over financial reporting. We have expended, and anticipate that we will continue to expend, significant resources in order to maintain and improve the effectiveness of our disclosure controls and procedures and internal control over financial reporting.
Our current controls and any new controls that we develop may become inadequate because of changes in conditions in our business. Further, weaknesses in our disclosure controls or our internal control over financial reporting may be discovered in the future. Any failure to develop or maintain effective controls, or any difficulties encountered in their implementation or improvement, could harm our operating results or cause us to fail to meet our reporting obligations and may result in a restatement of our consolidated financial statements for prior periods. Any failure to implement and maintain effective internal control over financial reporting could also adversely affect the results of management reports and independent registered public accounting firm audits of our internal control over financial reporting that we are or will be required to include in our periodic reports that will be filed with the SEC. Ineffective disclosure controls and procedures, and internal control over financial reporting could also cause investors to lose confidence in our reported financial and other information, which would likely have a negative effect on the market price of our Class A common stock. In addition, if we are unable to continue to meet these requirements, we may not be able to remain listed on Nasdaq.
Our independent registered public accounting firm is not required to audit the effectiveness of our internal control over financial reporting until after we are no longer an EGC and a smaller reporting company. At such time, our independent registered public
accounting firm may issue an opinion on our internal controls over financial reporting that is adverse in the event it is not satisfied with the level at which our internal control over financial reporting is documented, designed or operating.
Any failure to maintain effective disclosure controls and internal control over financial reporting could have a material and adverse effect on our business and operating results and cause a decline in the market price of our Class A common stock.
If securities or industry analysts do not publish research or reports about our business, or publish inaccurate or unfavorable research reports about our business, our share price and trading volume could decline.
The trading market for our Class A common stock partially depends on the research and reports that securities or industry analysts publish about us or our business. We do not have any control over these analysts.
If one or more of the analysts who cover us should downgrade our shares or change their opinion of our business prospects, our share price would likely decline. If one or more of these analysts ceases coverage of our company or fails to regularly publish reports on us, we could lose visibility in the financial markets, which could cause our share price or trading volume to decline.
Item 1B. Unresolved Staff Comments.
None.
Item 2. Properties.
Our headquarters are located in Irvine, California, where we occupy facilities totaling approximately 56,000 square feet under a lease that expires in May 2031. We currently lease 11 other office spaces across the United States and we do not own any real property. We believe that our current facilities are adequate to meet our current needs.
Item 3. Legal Proceedings.
From time to time, we are involved in various legal proceedings arising in the ordinary course of business. We are not currently a party to any litigation the outcome of which, we believe, if determined adversely to us, would individually or taken together have a material adverse effect on our business, operating results, cash flows, or financial condition. Defending any such proceedings is costly and can impose a significant burden on management and employees. The results of any current or future litigation cannot be predicted with certainty, and regardless of the outcome, litigation can have an adverse impact on us because of defense and settlement costs, diversion of management resources, and other factors.
Item 4. Mine Safety Disclosures.
Not applicable.
PART II
Item 5. Market for Registrant’s Common Equity, Related Stockholder Matters and Issuer Purchases of Equity Securities.
Market Information
Our Class A common stock has been listed on Nasdaq under the symbol “DSP” since February 10, 2021. There is no market for our Class B common stock. Each share of Class B common stock has no economic rights but entitles its holders to one vote on all matters to be voted on by our stockholders generally.
Holders
As of February 28, 2023, there was one stockholder of record of our Class A common stock and four holders of record of our Class B common stock. Because many of our shares of Class A common stock are held by brokers and other institutions on behalf of stockholders, we are unable to estimate the total number of stockholders represented by these record holders.
Dividends
We have not paid any cash dividends on our capital stock and have no present intention to pay cash dividends on our capital stock. Any determination to pay dividends to holders of our capital stock will be at the discretion of our board of directors and will depend upon many factors, including our financial condition, results of operations, projections, liquidity, earnings, legal requirements, restrictions in our existing and any future debt, including pursuant to the Loan Agreement with PNC Bank, and other factors that our board of directors deems relevant.
Purchases of Equity Securities by the Issuer and Affiliated Purchasers
None.
Item 6. Reserved.
MANAGEMENT’S DISCUSSION AND ANALYSIS OF
FINANCIAL CONDITION AND RESULTS OF OPERATIONS
(tabular dollars in thousands, except for per share data)
Item 7. Management’s Discussion and Analysis of Financial Condition and Results of Operations.
The following Management’s Discussion and Analysis of Financial Condition and Results of Operations of Viant Technology Inc. and its subsidiaries (“Viant,” “we,” “us,” “our” or the “Company”) should be read in conjunction with, and is qualified in its entirety by reference to, our consolidated financial statements and the related notes included within this Annual Report. In addition to historical financial information, the following discussion and analysis contains forward-looking statements that involve risks and uncertainties which could cause our actual results to differ materially from those anticipated in these forward-looking statements, including, but not limited to, risks and uncertainties discussed under the heading “Special Note Regarding Forward-Looking Statements” and “Risk Factors” and discussed elsewhere in this Annual Report. Additionally, our historical results are not necessarily indicative of the results that may be expected for any period in the future.
The following discusses our financial condition and results of operations for our fiscal year ended December 31, 2022 compared to our fiscal year ended December 31, 2021 as well as discussions of our financial condition and results of operations for our fiscal year ended December 31, 2021 compared to our fiscal year ended December 31, 2020.
Overview
We are an advertising technology company. Our cloud-based demand side platform ("DSP"), Adelphic, enables the programmatic purchase of advertising, which is the electronification of the digital advertising buying process. Programmatic advertising is rapidly taking market share from traditional ad sales channels, which require more staffing, offer less transparency and involve higher costs to buyers.
Adelphic is used by marketers and their advertising agencies to centralize the planning, buying and measurement of their digital advertising across most channels. Through our omni-channel platform, a marketer can easily buy ads on desktop, mobile, connected TV, linear TV, in-game, streaming audio and digital billboards.
Adelphic is an easy-to-use self-service platform that provides our customers with transparency and control over their advertising campaigns. Our platform offers customers unique visibility across a variety of inventory, allowing them to create customized audience segments and leverage our people-based and strategic partner data to reach target audiences at scale. Our platform delivers a full suite of forecasting, reporting and built-in automation that provides our customers with insights into available inventory based on the desired target audience. We offer advanced forecasting and reporting that empowers our customers with functionality designed to ensure they can accurately measure and improve their ROAS across channels.
We generate revenue by charging platform fees and service fees pursuant to agreements that enable a wide variety of marketers and their agencies to select the mix of pricing and service options that suits their unique business and advertising budget.
These options consist of a percentage of spend pricing option and a fixed cost per mille (“CPM”) pricing option. Customers who prefer to use our platform on a self-service basis to execute their advertising campaigns enter into master service agreements (“MSAs”) with us, and we generate revenue under these arrangements by charging a platform fee that is primarily a percentage of spend. Customers who prefer to use our fixed CPM pricing option enter into insertion order (“IO”) arrangements with us, and we generate revenue by charging these customers a platform fee at a price for every 1,000 impressions an ad receives. We also offer different service options to our customers accessing our platform under an MSA or an IO to enable them to use our services to aid them in data management, media execution and advanced reporting. When customers utilize our services, we generate revenue by charging a service fee separate from the platform fee consisting of (1) a fee that represents a percentage of spend; (2) a flat monthly fee covering services in connection with data management and advanced reporting; or (3) a fixed CPM that is inclusive of media, other direct costs and services.
We believe that offering a mix of pricing and service options provides greater flexibility and access to our platform for marketers and their advertising agencies seeking to plan, buy, and measure programmatic campaigns.
Our financial results for the fiscal years ended December 31, 2022 and 2021 include:
•Revenue of $197.2 million and $224.1 million for the years ended December 31, 2022 and 2021, respectively, representing a decrease of 12.0%;
•Gross profit of $80.4 million and $94.5 million for the years ended December 31, 2022 and 2021, respectively, representing a decrease of 14.9%;
•Contribution ex-TAC* of $124.7 million and $141.5 million for the years ended December 31, 2022 and 2021, respectively, representing a decrease of 11.9%;
•Net loss of $48.1 million and $37.6 million for the years ended December 31, 2022 and 2021, respectively;
•Non-GAAP net income (loss)* of $(15.8) million and $23.9 million for the years ended December 31, 2022 and 2021, respectively; and
MANAGEMENT’S DISCUSSION AND ANALYSIS OF
FINANCIAL CONDITION AND RESULTS OF OPERATIONS
(tabular dollars in thousands, except for per share data)
•Adjusted EBITDA* of $(6.1) million and $37.1 million for the years ended December 31, 2022 and 2021, respectively.
*Contribution ex-TAC, non-GAAP net income (loss) and adjusted EBITDA are non-GAAP financial measures. For a detailed discussion of our key operating and financial performance measures and a reconciliation of contribution ex-TAC, non-GAAP net income (loss) and adjusted EBITDA to the most directly comparable financial measures calculated in accordance with GAAP, see “—Key Operating and Financial Performance Measures—Use of Non-GAAP Financial Measures.”
Factors Affecting Our Performance
Impact of Macroeconomic and Geopolitical Conditions
Macroeconomic conditions and geopolitical events, including the COVID-19 pandemic, inflation and monetary supply shifts, rising interest rates, tightening of credit markets, recession risks, labor shortages, shortages of goods and services, supply chain disruptions, and potential disruptions from the Russia-Ukraine conflict, continue to impact our business and the business of our customers, while also disrupting sales channels and advertising and marketing activities. While our number of active customers for the year ended December 31, 2022 has increased by nearly 6% compared to the year ended December 31, 2021, we have observed decreases in revenue that we attribute to marketers in certain industry verticals decreasing or pausing their advertising spend due to the impacts of these macroeconomic conditions. We continue to actively monitor the impact of these macroeconomic factors on our results of operations, financial condition and cash flows, and on our clients, partners, industry and employees, and have slowed the pace of further investments in sales and marketing as a result of these factors. The extent of the impact of these factors on our operational and financial performance, including our ability to execute our business strategies and initiatives in the expected time frame, will depend on future developments, which are uncertain and cannot be predicted. Due to the nature of our business, the effect of these macroeconomic conditions and geopolitical events may not be fully reflected in our results of operations until future periods.
In the fourth quarter of 2022, we initiated a cost reduction plan aimed at reducing our operating expenses and sharpening our focus on key growth priorities in light of these macroeconomic conditions. This included a reduction of our global employee headcount by approximately 13% and total restructuring charges included in our consolidated statements of operations for the year ended December 31, 2022 of $1.4 million, consisting primarily of cash severance payments, employee benefits, and related costs.
See “Risk Factors—The effects of macroeconomic conditions and geopolitical events, such as economic recessions and the COVID-19 pandemic and other adverse market events have had, and could in the future have, an adverse impact on our business, operating results and financial condition” for further discussion of the potential impacts of macroeconomic and geopolitical events on our business, financial condition and results of operations.
Attract, Retain and Grow our Customer Base
Our recent growth has been driven by expanding the usage of our platform by our existing customers as well as adding new customers. We believe that our customers value our solutions, as our number of active customers for the year ended December 31, 2022 was 326, increasing by 17 active customers, or 6%, from the year ended December 31, 2021. We further evaluate our customers' usage of our platform and assess our market penetration and scale based on the percentage change in advertiser spend. We define advertiser spend as the total amount billed to our customers for activity on our platform inclusive of the costs of advertising media, third-party data, other add-on features and our platform fee we charge clients. Advertiser spend increased 15% for the year ended December 31, 2022 from the year ended December 31, 2021. While we observed strong growth in advertiser spend compared to the prior-year periods, we observed a deceleration in spending throughout the third and fourth quarters of 2022 due to challenging macroeconomic conditions. The deceleration, which was most pronounced in the retail industry vertical, may continue into future periods as macroeconomic and geopolitical conditions continue or worsen. The percentage change in advertiser spend is a key measure used by our management and our board of directors to evaluate the demand for our products and to assess whether we are increasing market share. Our management uses this key metric to develop short- and long-term operational plans and make strategic decisions regarding future enhancements to our software. We believe the percentage change in advertiser spend across our platform is a useful metric for investors because it allows investors to evaluate our operational performance in the same manner as our management and board of directors. For a detailed discussion of our key operating measures including the definition of active customers, see “—Key Operating and Financial Performance Measures—Use of Non-GAAP Financial Measures.”
We continue to add functionality to our platform to encourage our customers to increase their usage of our platform. We believe many advertisers are in the early stages of moving a greater percentage of their advertising budgets to programmatic channels. By providing solutions for the planning, buying and measuring of their media spend across most channels, we believe that we are well positioned to capture more of our customers’ programmatic budgets. Further, we intend to continue to grow our sales and marketing efforts to increase awareness of our DSP, Adelphic, and highlight the advantages of our people-based framework as cookie-based
MANAGEMENT’S DISCUSSION AND ANALYSIS OF
FINANCIAL CONDITION AND RESULTS OF OPERATIONS
(tabular dollars in thousands, except for per share data)
options become increasingly limited. As a result, future revenue growth depends upon our ability to retain our existing customers and increase their usage of our platform as well as add new customers.
Investment in Growth
We believe that the advertising market is in the early stages of a shift toward programmatic advertising. We plan to invest for long-term growth. We anticipate that our operating expenses will continue to increase in the foreseeable future as we invest in platform operations, technology and development to enhance our product capabilities including the integration of new advertising channels, and in sales and marketing to acquire new customers and increase our customers’ usage of our platform. We believe that these investments will contribute to our long-term growth, although they may have a negative impact on our profitability in the near-term.
Growth of the Digital Advertising Market
We expect to continue to benefit from overall adoption of programmatic advertising by marketers and their agencies. Any material change in the growth rate of digital advertising or the rate of adoption of programmatic advertising, including expansion of new programmatic channels, could affect our performance. Recent years have shown that advertising spend is closely tied to advertisers’ financial performance, and a downturn, either generally or in one or more of the industries in which our customers operate, could adversely impact the digital advertising market and our operating results.
Seasonality
In the advertising industry, companies commonly experience seasonal fluctuations in revenue, as many marketers allocate the largest portion of their budgets to the fourth quarter of the calendar year in order to coincide with increased holiday purchasing. Historically, the fourth quarter has reflected our highest level of advertising activity for the year. We generally expect the subsequent first quarter to reflect lower activity levels, but this trend may be masked due to the continued growth of our business. In addition, historical seasonality may not be predictive of future results given the potential for changes in advertising buying patterns and consumer activity due to the potential impacts of the evolving macroeconomic and geopolitical conditions discussed above. Political advertising could also cause our revenue to increase during election cycles and decrease during other periods, making it difficult to predict our revenue, cash flow, and operating results, all of which could fall below our expectations. We expect our revenue to continue to fluctuate based on seasonal factors that affect the advertising industry as a whole.
Components of Our Results of Operations
We have one primary business activity and operate in a single operating and reportable segment.
Revenue
We generate revenue by providing marketers and their advertising agencies with the ability to plan, buy and measure their digital advertising campaigns using our people-based DSP. We charge platform fees and service fees pursuant to agreements with our customers that enable them to select their preferred mix of pricing and service options.
We generate platform fees pursuant to MSAs, which allow customers to use our platform on a self-service basis in connection with our percentage of spend pricing option, and IOs, where we charge customers a platform fee at a price for every 1,000 impressions an ad receives in connection with the fixed CPM pricing option. We also generate service fees pursuant to MSAs and IOs for data management, media execution and advanced reporting service options that are available to customers under our percentage of spend and fixed CPM pricing options.
We recognize revenue when we transfer control of promised services directly to our customers in an amount that reflects the consideration to which we expect to be entitled in exchange for those services. For the percentage of spend pricing option, we recognize platform fees as revenue at the point in time when a purchase by the customer occurs through our platform. Revenue is reported net of amounts incurred and payable to suppliers for the cost of advertising media, third-party data and other add-on features (collectively, “traffic acquisition costs” or “TAC”) since we arrange for the transfer of TAC from the supplier to the customer through the use of our platform and do not control such features prior to transfer to the customer.
For the fixed CPM pricing option, we recognize platform fees revenue at the point in time when the advertising impressions are delivered to the customer. This revenue is reported gross of any amounts incurred and payable to suppliers for TAC, since we control such features prior to transfer to the customer.
For data management, media execution and advanced reporting service options, we recognize service fees as revenue over time on a ratable basis over the term of the agreement.
MANAGEMENT’S DISCUSSION AND ANALYSIS OF
FINANCIAL CONDITION AND RESULTS OF OPERATIONS
(tabular dollars in thousands, except for per share data)
We expect the portion of our revenue derived from the percentage of spend pricing option to increase in the aggregate over time, which would reduce the percentage of revenue that we recognize on a gross basis in connection with the fixed CPM pricing option.
See “Critical Accounting Estimates—Revenue Recognition” for a description of our revenue recognition policies.
Operating Expenses
We classify our operating expenses into the following four categories. Each expense category includes overhead such as rent and occupancy charges, which is allocated based on headcount.
Platform Operations. Platform operations expense represents our cost of revenues, which consists of TAC, hosting costs, personnel costs, depreciation of capitalized software development costs related to our platform, customer support costs and allocated overhead. TAC recorded in platform operations consist of amounts incurred and payable to suppliers for costs associated with our fixed CPM pricing option. Personnel costs within platform operations include salaries, bonuses, stock-based compensation and employee benefit costs primarily attributable to personnel who directly support our platform.
Other than TAC, many of the costs included in platform operations expense do not increase or decrease proportionately with increases or decreases in our revenue. We expect platform operations expenses to increase in future periods, including as a result of stock-based compensation and depreciation of capitalized software development costs as we continue to invest in the development of our platform to add new features and functions, increase the number of advertising media and data suppliers, ramp up the volume of advertising spend on our platform resulting in increased volumes of transactions, and hire additional personnel to support our customers.
Sales and Marketing. Sales and marketing expense consists primarily of personnel costs, including salaries, bonuses, stock-based compensation, employee benefit costs and commissions for our sales personnel. Sales and marketing expense also includes costs for market development programs, advertising, promotional and other marketing activities and allocated overhead. Commissions are expensed as incurred.
Our sales and marketing organization focuses on marketing our platform to increase its adoption by existing and new customers. As a result, we expect sales and marketing expenses to increase in future periods, including as a result of stock-based compensation, as we increase our sales and marketing team and our focus on market development programs. Sales and marketing expense as a percentage of revenue may fluctuate from period to period based on revenue levels and the timing of our investments in our sales and marketing functions as these investments may vary in scope and scale over time.
Technology and Development. Technology and development expense consists primarily of personnel costs, including salaries, bonuses, stock-based compensation and employee benefit costs associated with the ongoing development and maintenance of our platform and allocated overhead. Technology and development costs are expensed as incurred, except to the extent that such costs are associated with software development that qualifies for capitalization, which are then recorded as capitalized software included in "Property, equipment, and software, net", on the consolidated balance sheets. We record depreciation for capitalized software development costs not related to our platform within technology and development expense.
We believe that continued investment in our platform is critical to attaining our strategic objectives and long-term growth. We therefore expect technology and development expense to increase as we continue to invest in the development of our platform to support and maintain additional features and functions, increase the number of advertising media and data suppliers, and ramp up the volume of advertising spend on our platform.
General and Administrative. General and administrative expense consists primarily of personnel costs, including salaries, bonuses, stock-based compensation and employee benefit costs associated with our executive, accounting, finance, legal, human resources and other administrative personnel. Additionally, this includes accounting, legal and other professional services fees, insurance expense, bad debt expense and allocated overhead.
Total Other Expense (Income), Net
Interest expense (income), net. Interest expense (income), net primarily consists of interest income on our cash and cash equivalents and interest expense on our long-term debt and revolving credit facility under the Loan Agreement with PNC Bank.
Other expense (income), net. Other expense (income), net consists primarily of miscellaneous expenses not attributable to operations and foreign currency exchange gains and losses.
Gain on extinguishment of debt. Gain on extinguishment of debt consists of the gain recognized from the forgiveness of the PPP Loan in whole, including all accrued unpaid interest.
MANAGEMENT’S DISCUSSION AND ANALYSIS OF
FINANCIAL CONDITION AND RESULTS OF OPERATIONS
(tabular dollars in thousands, except for per share data)
Results of Operations
The following tables set forth our consolidated results of operations, our consolidated results of operations as a percentage of revenue, and the impact of stock-based compensation, depreciation and amortization on each operating expense line item for the fiscal years ended December 31, 2022 and 2021:
| | | | | | | | | | | |
| Year Ended December 31, |
| 2022 | | 2021 |
| Consolidated Statements of Operations Data: | | | |
| Revenue | $ | 197,168 | | | $ | 224,127 | |
Operating expenses(1): | | | |
| Platform operations | 116,725 | | | 129,604 | |
| Sales and marketing | 63,957 | | | 65,042 | |
| Technology and development | 21,294 | | | 25,372 | |
| General and administrative | 44,452 | | | 46,904 | |
| Total operating expenses | 246,428 | | | 266,922 | |
| Loss from operations | (49,260) | | | (42,795) | |
| Total other expense (income), net | (1,171) | | | (5,186) | |
| Net loss | (48,089) | | | (37,609) | |
| Less: Net loss attributable to noncontrolling interests | (36,176) | | | (29,867) | |
| Net loss attributable to Viant Technology Inc. | $ | (11,913) | | | $ | (7,742) | |
| | | | | | | | | | | |
| Year Ended December 31, |
| 2022 | | 2021 |
| (% of revenue*) |
| Consolidated Statements of Operations Data: | | | |
| Revenue | 100 | % | | 100 | % |
Operating expenses(1): | | | |
| Platform operations | 59 | % | | 58 | % |
| Sales and marketing | 32 | % | | 29 | % |
| Technology and development | 11 | % | | 11 | % |
| General and administrative | 23 | % | | 21 | % |
| Total operating expenses | 125 | % | | 119 | % |
| Loss from operations | (25) | % | | (19) | % |
| Total other expense (income), net | (1) | % | | (2) | % |
| Net loss | (24) | % | | (17) | % |
| Less: Net loss attributable to noncontrolling interests | (18) | % | | (13) | % |
| Net loss attributable to Viant Technology Inc. | (6) | % | | (3) | % |
*Percentages may not sum due to rounding
MANAGEMENT’S DISCUSSION AND ANALYSIS OF
FINANCIAL CONDITION AND RESULTS OF OPERATIONS
(tabular dollars in thousands, except for per share data)
(1)Stock-based compensation, depreciation, and amortization factored into the operating expense line item as follows:
| | | | | | | | | | | |
| Year Ended December 31, |
| 2022 | | 2021 |
| Stock-based compensation: | | | |
| Platform operations | $ | 4,761 | | | $ | 13,096 | |
| Sales and marketing | 9,010 | | | 25,639 | |
| Technology and development | 5,323 | | | 12,373 | |
| General and administrative | 9,807 | | | 17,714 | |
| Total stock-based compensation | $ | 28,901 | | | $ | 68,822 | |
| | | | | | | | | | | |
| Year Ended December 31, |
| 2022 | | 2021 |
| Depreciation: | | | |
| Platform operations | $ | 9,786 | | | $ | 7,688 | |
| Sales and marketing | — | | | — | |
| Technology and development | 1,646 | | | 1,599 | |
| General and administrative | 580 | | | 625 | |
| Total depreciation | $ | 12,012 | | | $ | 9,912 | |
| | | | | | | | | | | |
| Year Ended December 31, |
| 2022 | | 2021 |
| Amortization: | | | |
| Platform operations | $ | 700 | | | $ | 700 | |
| Sales and marketing | — | | | — | |
| Technology and development | — | | | — | |
| General and administrative | 419 | | | 529 | |
| Total amortization | $ | 1,119 | | | $ | 1,229 | |
Comparison of the Fiscal Years Ended December 31, 2022, 2021 and 2020
Revenue
| | | | | | | | | | | | | | | | | | | | | | | | | | | | | | | | | | | | | | | | | |
| Year Ended December 31, | | 2022 vs 2021
Change | | 2021 vs 2020
Change |
| 2022 | | 2021 | | 2020 | | $ | | % | | $ | | % |
| Revenue | $ | 197,168 | | | $ | 224,127 | | | $ | 165,251 | | | $ | (26,959) | | | (12) | % | | $ | 58,876 | | | 36 | % |
Revenue decreased by $27.0 million, or 12%, during the year ended December 31, 2022 compared to the year ended December 31, 2021. This decrease in revenue was primarily due to certain marketers in the jobs, entertainment, retail, automotive, and consumer products industry verticals being impacted by the ongoing adverse effects of labor shortages, inflation and monetary supply shifts, rising interest rates, the tightening of credit markets, and other adverse macroeconomic and geopolitical developments potentially indicative of an economic slowdown or recession. This resulted in revenue decreasing across these industry verticals by a combined 32% from the prior-year period. Despite the uncertainty that comes with such an environment, we have continued to experience increased demand for our people-based advertising products and services, as evidenced by a 15% increase in revenue from the prior-year period from marketers in industry verticals other than jobs, entertainment, retail, automotive, and consumer products, the continued growth of several of our industry verticals including financial services, public services, travel and political, and an increase in our active customers to 326 for the year ended December 31, 2022 compared to 309 for the year ended December 31, 2021. Additionally, approximately 84% of our revenue for the year ended December 31, 2022 came from customers that had been customers in the year ended December 31, 2021.
MANAGEMENT’S DISCUSSION AND ANALYSIS OF
FINANCIAL CONDITION AND RESULTS OF OPERATIONS
(tabular dollars in thousands, except for per share data)
Revenue increased by $58.9 million, or 36% during the year ended December 31, 2021 compared to the year ended December 31, 2020. In fiscal 2021, reduced COVID-19-related restrictions contributed to increased revenue and demand for our people-based advertising products and services, and our customers increased usage of our platform. During fiscal 2020, our revenue was adversely impacted by the COVID-19 pandemic, as certain marketers in the travel and tourism, automotive and retail industries decreased or paused their advertising spending, resulting in a 25% revenue decrease across these customer verticals compared to fiscal 2019. During fiscal 2021, the travel and tourism and retail industry verticals increased by 51% compared to fiscal 2020. Approximately 89% of our revenue for the year ended December 31, 2021 came from customers that had been customers in the fiscal year ended December 31, 2020.
Operating Expenses
Platform Operations
| | | | | | | | | | | | | | | | | | | | | | | | | | | | | | | | | | | | | | | | | |
| Year Ended December 31, | | 2022 vs 2021
Change | | 2021 vs 2020
Change |
| 2022 | | 2021 | | 2020 | | $ | | % | | $ | | % |
| Traffic acquisition costs | $ | 72,440 | | | $ | 82,627 | | | $ | 54,735 | | | $ | (10,187) | | | (12) | % | | $ | 27,892 | | | 51 | % |
| Other platform operations | 44,285 | | | 46,977 | | | 33,525 | | | (2,692) | | | (6) | % | | 13,452 | | | 40 | % |
| Total platform operations | $ | 116,725 | | | $ | 129,604 | | | $ | 88,260 | | | $ | (12,879) | | | (10) | % | | $ | 41,344 | | | 47 | % |
| Percentage of revenue | 59 | % | | 58 | % | | 53 | % | | | | | | | | |
Platform operations expense decreased by $12.9 million, or 10%, during the year ended December 31, 2022 compared to the year ended December 31, 2021. This decrease was primarily driven by a $10.2 million decrease in TAC, a variable function of revenue related to our fixed CPM pricing option and certain arrangements related to our percentage of spend pricing option and an $8.3 million decrease in stock-based compensation expense primarily driven by restricted stock units ("RSUs") that were granted in connection with our IPO, a portion of which became fully vested during the prior year. This decrease was partially offset by a $2.1 million increase in depreciation, a $1.8 million increase in cloud costs due to continued enhancements to our cloud infrastructure, a $1.3 million increase in third-party costs in support of our Adelphic platform, a $0.1 million increase in facilities expense, and a $0.1 million increase in travel and entertainment expenses.
Platform operations expense increased by $41.3 million, or 47%, during the year ended December 31, 2021 compared to the year ended December 31, 2020. The change was primarily driven by a $27.9 million increase in TAC, a variable function of revenue, as well as an increase in other platform operations driven by a $13.1 million increase in stock-based compensation related to our 2021 LTIP and a $1.0 million increase in depreciation, partially offset by a decrease of $0.7 million in cloud costs due to continued efforts to increase cloud infrastructure efficiencies.
Sales and Marketing
| | | | | | | | | | | | | | | | | | | | | | | | | | | | | | | | | | | | | | | | | |
| Year Ended December 31, | | 2022 vs 2021
Change | | 2021 vs 2020
Change |
| 2022 | | 2021 | | 2020 | | $ | | % | | $ | | % |
| Sales and marketing | $ | 63,957 | | | $ | 65,042 | | | $ | 28,887 | | | $ | (1,085) | | | (2) | % | | $ | 36,155 | | | 125 | % |
| Percentage of revenue | 32 | % | | 29 | % | | 17 | % | | | | | | | | |
Sales and marketing expense decreased by $1.1 million, or 2%, during the year ended December 31, 2022 compared to the year ended December 31, 2021. This decrease was primarily due to a $16.6 million decrease in stock-based compensation driven by RSUs that were granted in connection with our IPO, a portion of which became fully vested during the prior year, partially offset by a $7.4 million increase in personnel costs driven by increased headcount, a $5.2 million increase in advertising expense, a $1.8 million increase in travel and entertainment expenses, a $0.4 million increase in software license expenses, a $0.4 million increase in facilities expense, and a $0.2 million increase in consulting expenses.
Sales and marketing expense increased by $36.2 million, or 125%, during the year ended December 31, 2021 compared to the year ended December 31, 2020. This increase was primarily due to a $25.6 million increase in stock-based compensation, a $6.4 million increase in personnel costs and overhead, which was allocated to sales and marketing as a result of the departments’ increased headcount relative to other departments, a $2.9 million increase in advertising, a $0.2 million increase in facilities expense, a $0.2 increase in software license expenses and a $0.8 million increase in travel and entertainment expenses.
MANAGEMENT’S DISCUSSION AND ANALYSIS OF
FINANCIAL CONDITION AND RESULTS OF OPERATIONS
(tabular dollars in thousands, except for per share data)
Technology and Development
| | | | | | | | | | | | | | | | | | | | | | | | | | | | | | | | | | | | | | | | | |
| Year Ended December 31, | | 2022 vs 2021
Change | | 2021 vs 2020
Change |
| 2022 | | 2021 | | 2020 | | $ | | % | | $ | | % |
| Technology and development | $ | 21,294 | | | $ | 25,372 | | | $ | 8,698 | | | $ | (4,078) | | | (16) | % | | $ | 16,674 | | | 192 | % |
| Percentage of revenue | 11 | % | | 11 | % | | 5 | % | | | | | | | | |
Technology and development expense decreased by $4.1 million, or 16%, during the year ended December 31, 2022 compared to the year ended December 31, 2021. This decrease was primarily attributable to a $7.0 million decrease in stock-based compensation driven by RSUs that were granted in connection with our IPO, a portion of which became fully vested during the prior year, partially offset by a $1.1 million increase in personnel costs driven by increased headcount, a $1.0 million increase in cloud infrastructure costs, a $0.5 million increase in consulting expenses, a $0.1 million increase in travel and entertainment expenses and a $0.1 million increase in facilities expense.
Technology and development expense increased by $16.7 million, or 192%, during the year ended December 31, 2021 compared to the year ended December 31, 2020. This increase was primarily attributable to a $12.4 million increase in stock-based compensation, a $3.8 million increase in personnel costs as a result of an increase in headcount to support our continued investment in developed technology and a $0.4 million increase in software and license expenses.
General and Administrative
| | | | | | | | | | | | | | | | | | | | | | | | | | | | | | | | | | | | | | | | | |
| Year Ended December 31, | | 2022 vs 2021
Change | | 2021 vs 2020
Change |
| 2022 | | 2021 | | 2020 | | $ | | % | | $ | | % |
| General and administrative | $ | 44,452 | | | $ | 46,904 | | | $ | 17,639 | | | $ | (2,452) | | | (5) | % | | $ | 29,265 | | | 166 | % |
| Percentage of revenue | 23 | % | | 21 | % | | 11 | % | | | | | | | | |
General and administrative expense decreased by $2.5 million, or 5%, during the year ended December 31, 2022 compared to the year ended December 31, 2021. This decrease was primarily attributable to a $7.9 million decrease in stock-based compensation driven by RSUs that were granted in connection with our IPO, a portion of which became fully vested during the prior year, partially offset by a $1.5 million increase in personnel costs driven by increased headcount, a $1.4 million increase in bad debt reserves, a $1.3 million increase in travel and entertainment expenses, a $0.8 million increase in business insurance and tax, legal, and consulting expenses associated with general corporate and compliance matters, a $0.2 million increase in software license and subscription costs, a $0.1 million increase in recruiting expenses, and a $0.1 million increase in facilities expense.
General and administrative expense increased by $29.3 million, or 166%, during the year ended December 31, 2021 compared to the year ended December 31, 2020. This increase was primarily attributable to a $17.7 million increase in stock-based compensation, a $5.6 million increase in insurance, legal and accounting expenses associated with being a publicly traded company, a $3.3 million increase in personnel costs due to the increase in headcount, a $1.4 million increase in recruiting expenses, a $0.5 million increase in bad debt expense due to recoveries of bad debt in a prior year, a $0.2 million increase in dues and subscriptions and a $0.3 million increase in software and license expenses.
Total Other Expense (Income), Net
| | | | | | | | | | | | | | | | | | | | | | | | | | | | | | | | | | | | | | | | | |
| Year Ended December 31, | | 2022 vs 2021
Change | | 2021 vs 2020
Change |
| 2022 | | 2021 | | 2020 | | $ | | % | | $ | | % |
| Total other expense (income), net | $ | (1,171) | | | $ | (5,186) | | | $ | 1,129 | | | $ | 4,015 | | | (77) | % | | $ | (6,315) | | | (559) | % |
| Percentage of revenue | (1) | % | | (2) | % | | 1 | % | | | | | | | | |
Total other income, net decreased by $4.0 million, or 77%, during the year ended December 31, 2022 compared to the year ended December 31, 2021. The decrease from the prior year was primarily due to a $6.1 million prior-year gain on debt extinguishment which was a result of the forgiveness of our Paycheck Protection Program Loan (the “PPP Loan”), partially offset by a
MANAGEMENT’S DISCUSSION AND ANALYSIS OF
FINANCIAL CONDITION AND RESULTS OF OPERATIONS
(tabular dollars in thousands, except for per share data)
$1.9 million increase in interest income. For additional information regarding the forgiveness of our PPP Loan, refer to Note 8—Revolving Credit Facility and PPP Loan to our consolidated financial statements included elsewhere in this Annual Report.
Total other expense (income), net decreased by $6.3 million, or 559%, during the year ended December 31, 2021 compared to the year ended December 31, 2020. This decrease was primarily due to a $6.1 million gain on debt extinguishment as a result of the forgiveness of Company’s PPP Loan and related accrued interest and a $0.2 decrease in interest expense attributable to an amendment to our Loan Agreement with PNC Bank which decreased the applicable margin on the loan.
MANAGEMENT’S DISCUSSION AND ANALYSIS OF
FINANCIAL CONDITION AND RESULTS OF OPERATIONS
(tabular dollars in thousands, except for per share data)
Quarterly Results of Operations
The following tables set forth our unaudited quarterly consolidated statements of operations data for each quarter of our fiscal years ended December 31, 2022 and 2021. The information for each of these quarters has been prepared on a basis consistent with our consolidated financial statements and, in our opinion, includes all adjustments, consisting only of normal recurring adjustments necessary for the fair presentation of the financial information contained in those statements. The following unaudited consolidated quarterly financial data should be read in conjunction with our annual audited consolidated financial statements and the related notes included elsewhere in this Annual Report. These quarterly results are not necessarily indicative of our operating results for a full year or any future period.
| | | | | | | | | | | | | | | | | | | | | | | | | | | | | | | | | | | | | | | | | | | | | | | | | | |
| | Three Months Ended, |
| | December 31,
2022 | | September 30,
2022 | | June 30,
2022 | | March 31,
2022 | | December 31,
2021 | | September 30,
2021 | | June 30,
2021 | | March 31,
2021 |
| | (in thousands, except per share/unit data) |
| Revenue | | $ | 54,509 | | | $ | 48,830 | | | $ | 51,200 | | | $ | 42,629 | | | $ | 82,715 | | | $ | 50,857 | | | $ | 50,411 | | | $ | 40,144 | |
Operating expenses(1): | | | | | | | | | | | | | | | | |
| Platform operations | | 32,051 | | | 27,530 | | | 30,950 | | | 26,194 | | | 44,578 | | | 28,967 | | | 31,715 | | | 24,344 | |
| Sales and marketing | | 15,966 | | | 16,949 | | | 17,286 | | | 13,756 | | | 15,173 | | | 15,131 | | | 20,553 | | | 14,185 | |
| Technology and development | | 5,704 | | | 5,576 | | | 5,011 | | | 5,003 | | | 4,851 | | | 6,590 | | | 8,031 | | | 5,900 | |
| General and administrative | | 9,994 | | | 11,650 | | | 11,725 | | | 11,083 | | | 10,428 | | | 11,981 | | | 14,075 | | | 10,420 | |
| Total operating expenses | | 63,715 | | | 61,705 | | | 64,972 | | | 56,036 | | | 75,030 | | | 62,669 | | | 74,374 | | | 54,849 | |
| Income (loss) from operations | | (9,206) | | | (12,875) | | | (13,772) | | | (13,407) | | | 7,685 | | | (11,812) | | | (23,963) | | | (14,705) | |
| Total other expense (income), net | | (1,198) | | | (449) | | | 320 | | | 156 | | | 169 | | | 348 | | | (5,868) | | | 165 | |
| Net income (loss) | | (8,008) | | | (12,426) | | | (14,092) | | | (13,563) | | | 7,516 | | | (12,160) | | | (18,095) | | | (14,870) | |
| Less: Net income (loss) attributable to noncontrolling interests | | (5,815) | | | (9,300) | | | (10,691) | | | (10,371) | | | 5,962 | | | (9,623) | | | (14,440) | | | (11,766) | |
| Net income (loss) attributable to Viant Technology Inc. | | $ | (2,193) | | | $ | (3,126) | | | $ | (3,401) | | | $ | (3,192) | | | $ | 1,554 | | | $ | (2,537) | | | $ | (3,655) | | | $ | (3,104) | |
Earnings (loss) per Class A common stock/unit—basic(2) | | $ | (0.15) | | | $ | (0.22) | | | $ | (0.24) | | | $ | (0.23) | | | $ | 0.11 | | | $ | (0.20) | | | $ | (0.32) | | | $ | (0.27) | |
Earnings (loss) per Class A common stock/unit—diluted(2) | | $ | (0.15) | | | $ | (0.22) | | | $ | (0.24) | | | $ | (0.23) | | | $ | 0.11 | | | $ | (0.20) | | | $ | (0.32) | | | $ | (0.27) | |
MANAGEMENT’S DISCUSSION AND ANALYSIS OF
FINANCIAL CONDITION AND RESULTS OF OPERATIONS
(tabular dollars in thousands, except for per share data)
| | | | | | | | | | | | | | | | | | | | | | | | | | | | | | | | | | | | | | | | | | | | | | | | | | |
| | Three Months Ended, |
| | December 31,
2022 | | September 30,
2022 | | June 30,
2022 | | March 31,
2022 | | December 31,
2021 | | September 30,
2021 | | June 30,
2021 | | March 31,
2021 |
| | (as a percentage of revenue*) |
| Revenue | | 100 | % | | 100 | % | | 100 | % | | 100 | % | | 100 | % | | 100 | % | | 100 | % | | 100 | % |
Operating expenses(1): | | | | | | | | | | | | | | | | |
| Platform operations | | 59 | % | | 56 | % | | 60 | % | | 61 | % | | 54 | % | | 57 | % | | 63 | % | | 61 | % |
| Sales and marketing | | 29 | % | | 35 | % | | 34 | % | | 32 | % | | 18 | % | | 30 | % | | 41 | % | | 35 | % |
| Technology and development | | 10 | % | | 11 | % | | 10 | % | | 12 | % | | 6 | % | | 13 | % | | 16 | % | | 15 | % |
| General and administrative | | 18 | % | | 24 | % | | 23 | % | | 26 | % | | 13 | % | | 24 | % | | 28 | % | | 26 | % |
| Total operating expenses | | 117 | % | | 126 | % | | 127 | % | | 131 | % | | 91 | % | | 123 | % | | 148 | % | | 137 | % |
| Income (loss) from operations | | (17) | % | | (26) | % | | (27) | % | | (31) | % | | 9 | % | | (23) | % | | (48) | % | | (37) | % |
| Total other expense (income), net | | (2) | % | | (1) | % | | 1 | % | | — | % | | — | % | | 1 | % | | (12) | % | | — | % |
| Net income (loss) | | (15) | % | | (25) | % | | (28) | % | | (32) | % | | 9 | % | | (24) | % | | (36) | % | | (37) | % |
| Less: Net income (loss) attributable to noncontrolling interests | | (11) | % | | (19) | % | | (21) | % | | (24) | % | | 7 | % | | (19) | % | | (29) | % | | (29) | % |
| Net income (loss) attributable to Viant Technology Inc. | | (4) | % | | (6) | % | | (7) | % | | (7) | % | | 2 | % | | (5) | % | | (7) | % | | (8) | % |
•Percentages may not sum due to rounding
(1)The impact of stock-based compensation, depreciation and amortization on each operating expense line item for each quarter of our fiscal years ended December 31, 2022 and 2021 is set forth below:
| | | | | | | | | | | | | | | | | | | | | | | | | | | | | | | | | | | | | | | | | | | | | | | | | | |
| | Three Months Ended, |
| | December 31,
2022 | | September 30,
2022 | | June 30,
2022 | | March 31,
2022 | | December 31,
2021 | | September 30,
2021 | | June 30,
2021 | | March 31,
2021 |
| | (in thousands) |
| Stock-based compensation: | | | | | | | | | | | | | | | | |
| Platform operations | | $ | 1,139 | | | $ | 1,233 | | | $ | 1,303 | | | $ | 1,086 | | | $ | 1,253 | | | $ | 3,142 | | | $ | 5,540 | | | $ | 3,161 | |
| Sales and marketing | | 2,081 | | | 2,324 | | | 2,426 | | | 2,179 | | | 2,053 | | | 4,859 | | | 11,914 | | | 6,813 | |
| Technology and development | | 1,299 | | | 1,430 | | | 1,425 | | | 1,169 | | | 1,390 | | | 3,015 | | | 5,029 | | | 2,939 | |
| General and administrative | | 2,527 | | | 2,724 | | | 2,614 | | | 1,942 | | | 1,935 | | | 4,399 | | | 7,203 | | | 4,177 | |
| Total stock-based compensation | | $ | 7,046 | | | $ | 7,711 | | | $ | 7,768 | | | $ | 6,376 | | | $ | 6,631 | | | $ | 15,415 | | | $ | 29,686 | | | $ | 17,090 | |
| Depreciation: | | | | | | | | | | | | | | | | |
| Platform operations | | $ | 2,567 | | | $ | 2,510 | | | $ | 2,573 | | | $ | 2,136 | | | $ | 2,264 | | | $ | 2,080 | | | $ | 1,766 | | | $ | 1,578 | |
| Sales and marketing | | — | | | — | | | — | | | — | | | — | | | — | | | — | | | — | |
| Technology and development | | 396 | | | 432 | | | 223 | | | 595 | | | 414 | | | 421 | | | 383 | | | 381 | |
| General and administrative | | 145 | | | 147 | | | 153 | | | 136 | | | 132 | | | 164 | | | 168 | | | 161 | |
| Total depreciation | | $ | 3,108 | | | $ | 3,089 | | | $ | 2,949 | | | $ | 2,867 | | | $ | 2,810 | | | $ | 2,665 | | | $ | 2,317 | | | $ | 2,120 | |
| Amortization: | | | | | | | | | | | | | | | | |
| Platform operations | | $ | 175 | | | $ | 175 | | | $ | 175 | | | $ | 175 | | | $ | 175 | | | $ | 175 | | | $ | 175 | | | $ | 175 | |
| Sales and marketing | | — | | | — | | | — | | | — | | | — | | | — | | | — | | | — | |
| Technology and development | | — | | | — | | | — | | | — | | | — | | | — | | | — | | | — | |
| General and administrative | | 102 | | | 102 | | | 102 | | | 112 | | | 133 | | | 132 | | | 132 | | | 132 | |
| Total amortization | | $ | 277 | | | $ | 277 | | | $ | 277 | | | $ | 287 | | | $ | 308 | | | $ | 307 | | | $ | 307 | | | $ | 307 | |
See Note 4, Note 6 and Note 10 to our consolidated financial statements included elsewhere in this Annual Report for more information regarding depreciation, amortization and stock-based compensation expense, respectively.
MANAGEMENT’S DISCUSSION AND ANALYSIS OF
FINANCIAL CONDITION AND RESULTS OF OPERATIONS
(tabular dollars in thousands, except for per share data)
(2)See Note 2 to our consolidated financial statements included elsewhere in this Annual Report for a description of the earnings (loss) per share/unit—basic and diluted computations.
MANAGEMENT’S DISCUSSION AND ANALYSIS OF
FINANCIAL CONDITION AND RESULTS OF OPERATIONS
(tabular dollars in thousands, except for per share data)
Quarterly Non-GAAP Financial Measures
We monitor certain non-GAAP financial measures such as contribution ex-TAC, adjusted EBITDA and adjusted EBITDA as a percentage of contribution ex-TAC when evaluating our quarterly results of operations to help us evaluate growth trends, establish budgets, measure the effectiveness of our sales and marketing efforts and assess our operational efficiencies. Reconciliations of these non-GAAP financial measures for each quarter of our fiscal years ended December 31, 2022 and 2021 to the most directly comparable financial measures calculated and presented in accordance with GAAP are provided in the financial tables presented below. For a description of management’s use of each non-GAAP financial measure contained in this Annual Report, see “—Key Operating and Financial Performance Measures—Use of Non-GAAP Financial Measures.”
| | | | | | | | | | | | | | | | | | | | | | | | | | | | | | | | | | | | | | | | | | | | | | | | | | |
| | Three Months Ended, |
| | December 31,
2022 | | September 30,
2022 | | June 30,
2022 | | March 31,
2022 | | December 31,
2021 | | September 30,
2021 | | June 30,
2021 | | March 31,
2021 |
| Operating and Financial Performance Measures | | | | | | | | | | | | | | | | |
| Gross profit | | $ | 22,458 | | | $ | 21,300 | | | $ | 20,250 | | | $ | 16,435 | | | $ | 38,137 | | | $ | 21,890 | | | $ | 18,696 | | | $ | 15,800 | |
| Contribution ex-TAC | | $ | 33,378 | | | $ | 32,071 | | | $ | 31,735 | | | $ | 27,544 | | | $ | 48,483 | | | $ | 34,077 | | | $ | 32,199 | | | $ | 26,741 | |
| Net income (loss) | | $ | (8,008) | | | $ | (12,426) | | | $ | (14,092) | | | $ | (13,563) | | | $ | 7,516 | | | $ | (12,160) | | | $ | (18,095) | | | $ | (14,870) | |
| Adjusted EBITDA | | $ | 2,630 | | | $ | (1,804) | | | $ | (3,077) | | | $ | (3,881) | | | $ | 17,426 | | | $ | 6,454 | | | $ | 8,346 | | | $ | 4,882 | |
| Net income (loss) as a percentage of gross profit | | (36) | % | | (58) | % | | (70) | % | | (83) | % | | 20 | % | | (56) | % | | (97) | % | | (94) | % |
| Adjusted EBITDA as a percentage of contribution ex-TAC | | 8 | % | | (6) | % | | (10) | % | | (14) | % | | 36 | % | | 19 | % | | 26 | % | | 18 | % |
Contribution ex-TAC
The following table sets forth a reconciliation of revenue to gross profit to contribution ex-TAC for the periods presented:
| | | | | | | | | | | | | | | | | | | | | | | | | | | | | | | | | | | | | | | | | | | | | | | | | | |
| | Three Months Ended, |
| | December 31,
2022 | | September 30,
2022 | | June 30,
2022 | | March 31,
2022 | | December 31,
2021 | | September 30,
2021 | | June 30,
2021 | | March 31,
2021 |
| Revenue | | $ | 54,509 | | | $ | 48,830 | | | $ | 51,200 | | | $ | 42,629 | | | $ | 82,715 | | | $ | 50,857 | | | $ | 50,411 | | | $ | 40,144 | |
| Less: Platform operations | | (32,051) | | | (27,530) | | | (30,950) | | | (26,194) | | | (44,578) | | | (28,967) | | | (31,715) | | | (24,344) | |
| Gross profit | | 22,458 | | | 21,300 | | | 20,250 | | | 16,435 | | | 38,137 | | | 21,890 | | | 18,696 | | | 15,800 | |
| Add: Other platform operations | | 10,920 | | | 10,771 | | | 11,485 | | | 11,109 | | | 10,346 | | | 12,187 | | | 13,503 | | | 10,941 | |
| Contribution ex-TAC | | $ | 33,378 | | | $ | 32,071 | | | $ | 31,735 | | | $ | 27,544 | | | $ | 48,483 | | | $ | 34,077 | | | $ | 32,199 | | | $ | 26,741 | |
MANAGEMENT’S DISCUSSION AND ANALYSIS OF
FINANCIAL CONDITION AND RESULTS OF OPERATIONS
(tabular dollars in thousands, except for per share data)
Adjusted EBITDA
The following table sets forth a reconciliation of net income (loss) to adjusted EBITDA for the periods presented:
| | | | | | | | | | | | | | | | | | | | | | | | | | | | | | | | | | | | | | | | | | | | | | | | | | |
| | Three Months Ended, |
| | December 31,
2022 | | September 30,
2022 | | June 30,
2022 | | March 31,
2022 | | December 31,
2021 | | September 30,
2021 | | June 30,
2021 | | March 31,
2021 |
| Net income (loss) | | $ | (8,008) | | | $ | (12,426) | | | $ | (14,092) | | | $ | (13,563) | | | $ | 7,516 | | | $ | (12,160) | | | $ | (18,095) | | | $ | (14,870) | |
| Add: | | | | | | | | | | | | | | | | |
| Interest expense (income), net | | (1,199) | | | (455) | | | 21 | | | 152 | | | 161 | | | 227 | | | 241 | | | 235 | |
| Depreciation and amortization | | 3,385 | | | 3,366 | | | 3,226 | | | 3,154 | | | 3,118 | | | 2,972 | | | 2,624 | | | 2,427 | |
| Stock-based compensation | | 7,046 | | | 7,711 | | | 7,768 | | | 6,376 | | | 6,631 | | | 15,415 | | | 29,686 | | | 17,090 | |
Restructuring(1) | | 1,406 | | | — | | | — | | | — | | | — | | | — | | | — | | | — | |
| Less: | | | | | | | | | | | | | | | | |
| Gain on extinguishment of debt | | — | | | — | | | — | | | — | | | — | | | — | | | (6,110) | | | — | |
| Adjusted EBITDA | | $ | 2,630 | | | $ | (1,804) | | | $ | (3,077) | | | $ | (3,881) | | | $ | 17,426 | | | $ | 6,454 | | | $ | 8,346 | | | $ | 4,882 | |
(1)Restructuring charges consisted of non-recurring cash severance payments, employee benefits, and related costs in connection with a reduction in force implemented during the fourth quarter of 2022.
Adjusted EBITDA as a percentage of contribution ex-TAC
The following table sets forth a reconciliation of net income (loss) as a percentage of gross profit to adjusted EBITDA as a percentage of contribution ex-TAC for the periods presented:
| | | | | | | | | | | | | | | | | | | | | | | | | | | | | | | | | | | | | | | | | | | | | | | | | | |
| | Three Months Ended, |
| | December 31,
2022 | | September 30,
2022 | | June 30,
2022 | | March 31,
2022 | | December 31,
2021 | | September 30,
2021 | | June 30,
2021 | | March 31,
2021 |
| Gross profit | | $ | 22,458 | | | $ | 21,300 | | | $ | 20,250 | | | $ | 16,435 | | | $ | 38,137 | | | $ | 21,890 | | | $ | 18,696 | | | $ | 15,800 | |
| Net income (loss) | | $ | (8,008) | | | $ | (12,426) | | | $ | (14,092) | | | $ | (13,563) | | | $ | 7,516 | | | $ | (12,160) | | | $ | (18,095) | | | $ | (14,870) | |
| Net income (loss) as a percentage of gross profit | | (36) | % | | (58) | % | | (70) | % | | (83) | % | | 20 | % | | (56) | % | | (97) | % | | (94) | % |
Contribution ex-TAC(1) | | $ | 33,378 | | | $ | 32,071 | | | $ | 31,735 | | | $ | 27,544 | | | $ | 48,483 | | | $ | 34,077 | | | $ | 32,199 | | | $ | 26,741 | |
Adjusted EBITDA(2) | | $ | 2,630 | | | $ | (1,804) | | | $ | (3,077) | | | $ | (3,881) | | | $ | 17,426 | | | $ | 6,454 | | | $ | 8,346 | | | $ | 4,882 | |
| Adjusted EBITDA as a percentage of contribution ex-TAC | | 8 | % | | (6) | % | | (10) | % | | (14) | % | | 36 | % | | 19 | % | | 26 | % | | 18 | % |
(1)For a reconciliation of contribution ex-TAC to the most directly comparable financial measure calculated in accordance with GAAP, see “—Contribution ex-TAC.”
(2)For a reconciliation of adjusted EBITDA to the most directly comparable financial measure calculated in accordance with GAAP, see “—Adjusted EBITDA.”
MANAGEMENT’S DISCUSSION AND ANALYSIS OF
FINANCIAL CONDITION AND RESULTS OF OPERATIONS
(tabular dollars in thousands, except for per share data)
Non-GAAP net income (loss)
The following table sets forth a reconciliation of net income (loss) to non-GAAP net income (loss) for the periods presented:
| | | | | | | | | | | | | | | | | | | | | | | | | | | | | | | | | | | | | | | | | | | | | | | | | | |
| | Three Months Ended, |
| | December 31,
2022 | | September 30,
2022 | | June 30,
2022 | | March 31,
2022 | | December 31,
2021 | | September 30,
2021 | | June 30,
2021 | | March 31,
2021 |
| Net income (loss) | | $ | (8,008) | | | $ | (12,426) | | | $ | (14,092) | | | $ | (13,563) | | | $ | 7,516 | | | $ | (12,160) | | | $ | (18,095) | | | $ | (14,870) | |
| Add back: Stock-based compensation | | 7,046 | | | 7,711 | | | 7,768 | | | 6,376 | | | 6,631 | | | 15,415 | | | 29,686 | | | 17,090 | |
| Add back: Restructuring | | 1,406 | | | — | | | — | | | — | | | — | | | — | | | — | | | — | |
| Less: Gain on extinguishment of debt | | — | | | — | | | — | | | — | | | — | | | — | | | (6,110) | | | — | |
Less: Income tax effect related to Viant Technology Inc.'s share of adjustments(1) | | (16) | | | 281 | | | 390 | | | 416 | | | (759) | | | (163) | | | (250) | | | (66) | |
| Non-GAAP net income (loss) | | $ | 428 | | | $ | (4,434) | | | $ | (5,934) | | | $ | (6,771) | | | $ | 13,388 | | | $ | 3,092 | | | $ | 5,231 | | | $ | 2,154 | |
(1)The estimated income tax effect of our share of non-GAAP reconciling items are calculated using assumed blended tax rates of 45% and 24% for the years ended December 31, 2022 and 2021, respectively, which represent our expected corporate tax rates, excluding discrete and non-recurring tax items.
MANAGEMENT’S DISCUSSION AND ANALYSIS OF
FINANCIAL CONDITION AND RESULTS OF OPERATIONS
(tabular dollars in thousands, except for percentages and per share data)
Key Operating and Financial Performance Measures
Use of Non-GAAP Financial Measures
We monitor certain non-GAAP financial measures to help us evaluate growth trends, establish budgets, measure the effectiveness of our sales and marketing efforts and assess our operational efficiencies. We believe these measures enhance an overall understanding of our performance and investors’ ability to review our business from the same perspective as management and facilitate comparisons of this period’s results with prior periods on a consistent basis by excluding items that management does not believe are indicative of our ongoing operating performance. These non-GAAP financial measures include contribution ex-TAC, average contribution ex-TAC per active customer, adjusted EBITDA, adjusted EBITDA as a percentage of contribution ex-TAC, non-GAAP net income (loss), non-GAAP earnings (loss) per share of Class A common stock—basic and diluted, and non-GAAP operating expenses, each of which are discussed immediately following the table below, along with the operational performance measure of active customers. Reconciliations of these non-GAAP financial measures to the most directly comparable financial measures calculated and presented in accordance with GAAP are provided in the financial tables presented below. There are limitations in using non-GAAP financial measures which are not prepared in accordance with GAAP, as they may be different from non-GAAP financial measures used by other companies and may exclude certain items that may have a material impact upon our reported financial results. The presentation of this additional information is not meant to be considered in isolation or as a substitute for the directly comparable financial measures prepared in accordance with GAAP.
| | | | | | | | | | | | | | | | | |
| Year Ended December 31, | | |
| 2022 | | 2021 | | Change (%) |
| Operating and Financial Performance Measures | | | | | |
| Gross profit | $ | 80,443 | | | $ | 94,523 | | | (15) | % |
| Contribution ex-TAC | $ | 124,728 | | | $ | 141,500 | | | (12) | % |
| Net loss | $ | (48,089) | | | $ | (37,609) | | | (28) | % |
| Adjusted EBITDA | $ | (6,132) | | | $ | 37,108 | | | (117) | % |
| Net loss as a percentage of gross profit | (60) | % | | (40) | % | | (50) | % |
| Adjusted EBITDA as a percentage of contribution ex-TAC | (5) | % | | 26 | % | | (119) | % |
| Non-GAAP net income (loss) | $ | (15,810) | | | $ | 23,865 | | | (166) | % |
| Total operating expenses | $ | 246,428 | | | $ | 266,922 | | | (8) | % |
| Non-GAAP operating expenses | $ | 130,860 | | | $ | 104,392 | | | 25 | % |
| Earnings (loss) per share—basic | $ | (0.84) | | | $ | (0.63) | | | (33) | % |
| Earnings (loss) per share—diluted | $ | (0.84) | | | $ | (0.63) | | | (33) | % |
| Non-GAAP earnings (loss) per share—basic | $ | (0.17) | | | $ | 0.31 | | | (155) | % |
| Non-GAAP earnings (loss) per share—diluted | $ | (0.17) | | | $ | 0.30 | | | (157) | % |
| Active customers | 326 | | | 309 | | | 6 | % |
| Average gross profit per active customer | $ | 247 | | | $ | 306 | | | (19) | % |
| Average contribution ex-TAC per active customer | $ | 383 | | | $ | 458 | | | (16) | % |
Contribution ex-TAC
Contribution ex-TAC is a non-GAAP financial measure. Gross profit is the most comparable GAAP financial measure, which is calculated as revenue less platform operations expense. In calculating contribution ex-TAC, we add back other platform operations expense to gross profit. Contribution ex-TAC is a key profitability measure used by our management and board of directors to understand and evaluate our operating performance and trends, develop short- and long-term operational plans and make strategic decisions regarding the allocation of capital. In particular, we believe that contribution ex-TAC can provide a measure of period-to-period comparisons for all pricing options within our business. Accordingly, we believe that this measure provides information to investors and the market in understanding and evaluating our operating results in the same manner as our management and board of directors.
Our use of contribution ex-TAC has limitations as an analytical tool and you should not consider it in isolation or as a substitute for analysis of our financial results as reported under GAAP. A potential limitation of this non-GAAP financial measure is that other companies, including companies in our industry that have similar business arrangements, may define contribution ex-TAC differently, which may make comparisons difficult. Because of these and other limitations, you should consider our non-GAAP financial measures only as supplemental to other GAAP-based financial performance measures, including revenue, gross profit, net income (loss) and
MANAGEMENT’S DISCUSSION AND ANALYSIS OF
FINANCIAL CONDITION AND RESULTS OF OPERATIONS
(tabular dollars in thousands, except for percentages and per share data)
cash flows. For a reconciliation of contribution ex-TAC to the most directly comparable financial measure calculated in accordance with GAAP, see “—Average contribution ex-TAC per active customer.”
Active customers
We define an active customer as a customer that had total aggregate contribution ex-TAC of at least $5,000 through our platform during the previous twelve months. For purposes of this definition, a customer that operates under any of our pricing options that equals or exceeds the aforementioned contribution ex-TAC threshold is considered an active customer. Active customers is a key measure used by our management and board of directors to understand and evaluate our operating performance and trends, develop short- and long-term operational plans and make strategic decisions regarding future enhancements to our platform. We believe active customers is a useful metric for investors because it allows investors to evaluate the Company’s operational performance in the same manner as our management and board of directors. Active customers is an operational metric calculated using contribution ex-TAC, a non-GAAP financial measure. For a reconciliation of contribution ex-TAC to the most directly comparable financial measure calculated in accordance with GAAP, see “—Average contribution ex-TAC per active customer.”
Average contribution ex-TAC per active customer
We define average contribution ex-TAC per active customer as contribution ex-TAC for the trailing 12-month period presented divided by active customers. Average gross profit per active customer is the most comparable GAAP measure, which we define as gross profit for the trailing 12-month period presented divided by active customers. We believe that the total number of active customers and average contribution ex-TAC per active customer are measures of our ability to increase revenue and profitability and the effectiveness of our sales force, although we expect these measures to fluctuate based on the seasonality in our business. Customers that generated less than $5,000 in contribution ex-TAC in the trailing 12-month period were not material in the aggregate in any period.
The following table presents the calculation of gross profit, the reconciliation of gross profit to contribution ex-TAC, average gross profit per active customer, and average contribution ex-TAC per active customer in each case for the periods presented:
| | | | | | | | | | | | | | | | | |
| Year Ended December 31, |
| 2022 | | 2021 | | 2020 |
| Revenue | $ | 197,168 | | | $ | 224,127 | | | $ | 165,251 | |
| Less: Platform operations | (116,725) | | | (129,604) | | | (88,260) | |
| Gross profit | 80,443 | | | 94,523 | | | 76,991 | |
| Add: Other platform operations | 44,285 | | | 46,977 | | | 33,525 | |
| Contribution ex-TAC | $ | 124,728 | | | $ | 141,500 | | | $ | 110,516 | |
| | | | | |
| Active customers | 326 | | 309 | | 264 |
| Average gross profit per active customer | $ | 247 | | | $ | 306 | | | $ | 292 | |
| Average contribution ex-TAC per active customer | $ | 383 | | | $ | 458 | | | $ | 419 | |
MANAGEMENT’S DISCUSSION AND ANALYSIS OF
FINANCIAL CONDITION AND RESULTS OF OPERATIONS
(tabular dollars in thousands, except for percentages and per share data)
Non-GAAP Operating Expenses
Non-GAAP operating expenses is a non-GAAP financial measure. Total operating expenses is the most comparable GAAP financial measure. Non-GAAP operating expenses is defined by us as total operating expenses plus other expense (income), net less TAC, stock-based compensation, depreciation, amortization, and certain other items that are not related to our core operations, such as restructuring charges, and transaction expenses. Non-GAAP operating expenses is a key component in calculating adjusted EBITDA, which is one of the measures we use to provide our quarterly and annual business outlook to the investment community. Additionally, non-GAAP operating expenses is used by our management and board of directors to understand and evaluate our operating performance and trends, to prepare and approve our annual budget and to develop short- and long-term operational plans. We believe that the elimination of depreciation, amortization, stock-based compensation, TAC and certain other items not related to our core operations provides another measure for period-to-period comparisons of our business, provides additional insight into our discretionary costs and is a useful metric for investors because it allows them to evaluate our operational performance in the same manner as our management and board of directors.
Our use of non-GAAP operating expenses has limitations as an analytical tool and you should not consider it in isolation or as a substitute for analysis of our financial results as reported under GAAP. A potential limitation of this non-GAAP financial measure is that other companies, including companies in our industry that have similar business arrangements, may define non-GAAP operating expenses differently, which may make comparisons difficult. Because of these and other limitations, you should consider our non-GAAP financial measures only as supplemental to other GAAP-based financial performance measures, including revenue, gross profit, net income (loss) and cash flows.
The following table presents a reconciliation of total operating expenses to non-GAAP operating expenses for the periods presented:
| | | | | | | | | | | | | | | | | |
| Year Ended December 31, |
| 2022 | | 2021 | | 2020 |
| Operating expenses: | | | | | |
| Platform operations | $ | 116,725 | | | $ | 129,604 | | | $ | 88,260 | |
| Sales and marketing | 63,957 | | | 65,042 | | | 28,887 | |
| Technology and development | 21,294 | | | 25,372 | | | 8,698 | |
| General and administrative | 44,452 | | | 46,904 | | | 17,639 | |
| Total operating expenses | 246,428 | | | 266,922 | | | 143,484 | |
| Add: | | | | | |
| Other expense, net | 310 | | | 60 | | | 91 | |
| Less: | | | | | |
| Traffic acquisition costs | (72,440) | | | (82,627) | | | (54,735) | |
| Stock/unit-based compensation | (28,901) | | | (68,822) | | | — | |
| Restructuring | (1,406) | | | — | | | — | |
| Depreciation and amortization | (13,131) | | | (11,141) | | | (10,106) | |
| Non-GAAP operating expenses | $ | 130,860 | | | $ | 104,392 | | | $ | 78,734 | |
Adjusted EBITDA and adjusted EBITDA as a percentage of contribution ex-TAC
Adjusted EBITDA is a non-GAAP financial measure defined by us as net income (loss) before interest expense (income), net, income tax benefit (expense), depreciation, amortization, stock-based compensation and certain other items that are not related to our core operations, such as restructuring charges, transaction expenses and the extinguishment of debt. Net income (loss) is the most comparable GAAP financial measure. Adjusted EBITDA as a percentage of contribution ex-TAC is a non-GAAP financial measure we calculate by dividing adjusted EBITDA by contribution ex-TAC for the period or periods presented.
Adjusted EBITDA and adjusted EBITDA as a percentage of contribution ex-TAC are used by our management and board of directors to understand and evaluate our core operating performance and trends, to prepare and approve our annual budget and to develop short- and long-term operational plans. In particular, we believe that the exclusion of the amounts eliminated in calculating adjusted EBITDA can provide a measure for period-to-period comparisons of our business. Adjusted EBITDA as a percentage of contribution ex-TAC, a non-GAAP financial measure, is used by our management and board of directors to evaluate adjusted EBITDA relative to our profitability after costs that are directly variable to revenues, which comprise TAC. Accordingly, we believe
MANAGEMENT’S DISCUSSION AND ANALYSIS OF
FINANCIAL CONDITION AND RESULTS OF OPERATIONS
(tabular dollars in thousands, except for percentages and per share data)
that adjusted EBITDA and adjusted EBITDA as a percentage of contribution ex-TAC provide information to investors and the market in understanding and evaluating our operating results in the same manner as our management and board of directors.
Our use of adjusted EBITDA and adjusted EBITDA as a percentage of contribution ex-TAC has limitations as an analytical tool, and you should not consider these measures in isolation or as a substitute for analysis of our financial results as reported under GAAP. Some of these potential limitations include:
•other companies, including companies in our industry that have similar business arrangements, may report adjusted EBITDA or adjusted EBITDA as a percentage of contribution ex-TAC, or similarly titled measures but calculate them differently, which reduces their usefulness as comparative measures;
•although depreciation and amortization are non-cash charges, the assets being depreciated and amortized may have to be replaced in the future, and adjusted EBITDA does not reflect cash capital expenditure requirements for such replacements or for new capital expenditure requirements; and
•adjusted EBITDA does not reflect changes in, or cash requirements for, our working capital needs or the potentially dilutive impact of stock-based compensation.
Because of these and other limitations, you should consider our non-GAAP financial measures only as supplemental to other GAAP-based financial performance measures, including revenue, net income (loss) and cash flows.
The following table sets forth a reconciliation of net income (loss) to adjusted EBITDA for the periods presented:
| | | | | | | | | | | | | | | | | |
| Year Ended December 31, |
| 2022 | | 2021 | | 2020 |
| Net income (loss) | $ | (48,089) | | | $ | (37,609) | | | $ | 20,638 | |
| Add back: | | | | | |
| Interest expense (income), net | (1,481) | | | 864 | | | 1,038 | |
| Depreciation and amortization | 13,131 | | | 11,141 | | | 10,106 | |
| Stock/unit-based compensation | 28,901 | | | 68,822 | | | — | |
Restructuring(1) | 1,406 | | | — | | | — | |
| Less: | | | | | |
| Gain on extinguishment of debt | — | | | (6,110) | | | — | |
| Adjusted EBITDA | $ | (6,132) | | | $ | 37,108 | | | $ | 31,782 | |
(1)Restructuring charges consisted of non-recurring cash severance payments, employee benefits, and related costs in connection with a reduction in force implemented during the fourth quarter of 2022.
The following table presents the calculation of net income (loss) as a percentage of gross profit and the calculation of adjusted EBITDA as a percentage of contribution ex-TAC for the periods presented:
| | | | | | | | | | | | | | | | | |
| Year Ended December 31, |
| 2022 | | 2021 | | 2020 |
| Gross profit | $ | 80,443 | | | $ | 94,523 | | | $ | 76,991 | |
| Net income (loss) | $ | (48,089) | | | $ | (37,609) | | | $ | 20,638 | |
| Net income (loss) as a percentage of gross profit | (60) | % | | (40) | % | | 27 | % |
Contribution ex-TAC(1) | $ | 124,728 | | | $ | 141,500 | | | $ | 110,516 | |
| Adjusted EBITDA | $ | (6,132) | | | $ | 37,108 | | | $ | 31,782 | |
| Adjusted EBITDA as a percentage of contribution ex-TAC | (5) | % | | 26 | % | | 29 | % |
(1)For a reconciliation of contribution ex-TAC to the most directly comparable financial measure calculated in accordance with GAAP, see “—Average contribution ex-TAC per active customer.”
Non-GAAP net income (loss)
Non-GAAP net income (loss) is a non-GAAP financial measure defined by us as net income (loss) adjusted to eliminate the impact of stock-based compensation and certain other items that are not related to our core operations, such as restructuring charges, transaction expenses and the extinguishment of debt. Net income (loss) is the most comparable GAAP financial measure. Non-GAAP
MANAGEMENT’S DISCUSSION AND ANALYSIS OF
FINANCIAL CONDITION AND RESULTS OF OPERATIONS
(tabular dollars in thousands, except for percentages and per share data)
net income (loss) is a key measure used by our management and board of directors to evaluate operating performance, generate future operating plans and make strategic decisions regarding the allocation of capital. In particular, we believe that the elimination of stock-based compensation, gain on debt extinguishment, and certain other items that are not related to our core operations provides measures for period-to-period comparisons of our business and additional insight into our core controllable costs. Accordingly, we believe that non-GAAP net income (loss) provides information to investors and the market generally in understanding and evaluating our results of operations in the same manner as our management and board of directors.
Our use of non-GAAP net income (loss) has limitations as an analytical tool and you should not consider it in isolation or as a substitute for analysis of our financial results as reported under GAAP. A potential limitation of this non-GAAP financial measure is that other companies, including companies in our industry that have similar business arrangements, may define non-GAAP net income (loss) differently, which may make comparisons difficult. Because of these and other limitations, you should consider our non-GAAP financial measures only as supplemental to other GAAP-based financial performance measures, including revenue, gross profit, net income (loss) and cash flows.
The following table sets forth a reconciliation of net income (loss) to non-GAAP net income (loss) for the periods presented:
| | | | | | | | | | | | | | | | | |
| Year Ended December 31, |
| 2022 | | 2021 | | 2020 |
| Net income (loss) | $ | (48,089) | | | $ | (37,609) | | | $ | 20,638 | |
| Add back: Stock/unit-based compensation | 28,901 | | | 68,822 | | | — | |
| Add back: Restructuring | 1,406 | | | — | | | — | |
| Less: Gain on extinguishment of debt | — | | | (6,110) | | | — | |
Less: Income tax effect related to Viant Technology Inc.’s share of adjustments(1) | 1,972 | | | (1,238) | | | — | |
| Non-GAAP net income (loss) | $ | (15,810) | | | $ | 23,865 | | | $ | 20,638 | |
(1)The estimated income tax effect of our share of non-GAAP reconciling items are calculated using assumed blended tax rates of 45% and 24% for the years ended December 31, 2022 and 2021, respectively, which represent our expected corporate tax rates, excluding discrete and non-recurring tax items.
Non-GAAP earnings (loss) per share of Class A common stock—basic and diluted
Non-GAAP earnings (loss) per share of Class A common stock—basic and diluted is a non-GAAP financial measure defined by us as earnings (loss) per share of Class A common stock—basic and diluted, adjusted to eliminate the impact of stock-based compensation and certain other items that are not related to our core operations, such as restructuring charges, transaction expenses and the extinguishment of debt. Earnings (loss) per share of Class A common stock—basic and diluted is the most comparable GAAP financial measure. Non-GAAP earnings (loss) per share of Class A common stock—basic and diluted is used by our management and board of directors to evaluate operating performance, generate future operating plans and make strategic decisions regarding the allocation of capital. In particular, we believe that the elimination of stock-based compensation, gain on extinguishment of debt and certain other items that are not related to our core operations provides measures for period-to-period comparisons of our business and provides additional insight into our core controllable costs. Accordingly, we believe that non-GAAP earnings (loss) per share of Class A common stock—basic and diluted provides information to investors and the market generally in understanding and evaluating our results of operations in the same manner as our management and board of directors.
Our use of non-GAAP earnings (loss) per share of Class A common stock—basic and diluted has limitations as an analytical tool, and you should not consider it in isolation or as a substitute for analysis of our financial results as reported under GAAP. Some of these potential limitations include:
•other companies, including companies in our industry that have similar business arrangements, may report non-GAAP earnings (loss) per share of Class A common stock—basic and diluted or similarly titled measures, but calculate them differently, which reduces their usefulness as comparative measures;
•although the stock-based compensation related to the LTIP referred to above is non-cash in nature, non-GAAP earnings (loss) per share of Class A common stock—basic and diluted does not reflect its impact on net income (loss) attributable to all common stockholders; and
•although the gain on debt extinguishment related to the forgiveness of our PPP Loan and related accrued interest is non-cash in nature, non-GAAP earnings (loss) per share of Class A common stock—basic and diluted does not reflect its impact on net income (loss) attributable to all common stockholders.
MANAGEMENT’S DISCUSSION AND ANALYSIS OF
FINANCIAL CONDITION AND RESULTS OF OPERATIONS
(tabular dollars in thousands, except for percentages and per share data)
Because of these and other limitations, you should consider our non-GAAP financial measures only as supplemental to other GAAP-based financial performance measures, including earnings (loss) per share of Class A common stock—basic and diluted.
Basic non-GAAP earnings (loss) per share of Class A common stock is calculated by dividing the non-GAAP net income (loss) attributable to Class A common stockholders by the number of weighted-average shares of Class A common stock outstanding. Shares of our Class B common stock do not share in our earnings or losses and are therefore not participating securities. As such, separate presentation of basic and diluted non-GAAP earnings (loss) of Class B common stock under the two-class method has not been presented.
Diluted non-GAAP earnings (loss) per share of Class A common stock adjusts the basic non-GAAP earnings (loss) per share for the potential dilutive impact of common shares such as equity awards using the treasury-stock method and Class B common stock using the if-converted method. Diluted non-GAAP earnings (loss) per share of Class A common stock considers the impact of potentially dilutive securities except in periods in which there is a loss because the inclusion of the potential common shares would have an anti-dilutive effect. Shares of our Class B common stock, RSUs and nonqualified stock options are considered potentially dilutive shares of Class A common stock. For the years ended December 31, 2022 and 2021, Class B common stock and nonqualified stock options amounts have been excluded from the computation of diluted earnings (loss) per share of Class A common stock because the effect would have been anti-dilutive under the if-converted and treasury stock method, respectively.
MANAGEMENT’S DISCUSSION AND ANALYSIS OF
FINANCIAL CONDITION AND RESULTS OF OPERATIONS
(tabular dollars in thousands, except for percentages and per share data)
The following table presents the reconciliations of earnings (loss) per share of Class A common stock—basic and diluted to non-GAAP earnings (loss) per share of Class A common stock—basic and diluted for the years ended December 31, 2022 and 2021.
| | | | | | | | | | | | | | | | | |
| Year Ended December 31, 2022 |
| Earnings
(Loss) per
Share | | Adjustments | | Non-GAAP
Earnings (Loss)
per Share |
| Numerator | | | | | |
| Net loss | $ | (48,089) | | | $ | — | | | $ | (48,089) | |
| Adjustments: | | | | | |
| Add back: Stock-based compensation | — | | | 28,901 | | | 28,901 | |
| Add back: Restructuring | — | | | 1,406 | | | 1,406 | |
Income tax benefit (expense) related to Viant Technology Inc.'s share of adjustments (1) | — | | | 1,972 | | | 1,972 | |
| Non-GAAP net income (loss) | (48,089) | | | 32,279 | | | (15,810) | |
Less: Net income (loss) attributable to noncontrolling interests (2) | (36,176) | | | 22,811 | | | (13,365) | |
| Net income (loss) attributable to Viant Technology Inc.—basic | (11,913) | | | 9,468 | | | (2,445) | |
| Add back: Reallocation of net loss attributable to noncontrolling interest from the assumed exchange of RSUs for Class A common stock | — | | | — | | | — | |
| Income tax benefit (expense) from the assumed exchange of RSUs for Class A common stock | — | | | — | | | — | |
| Net income (loss) attributable to Viant Technology Inc.—diluted | $ | (11,913) | | | $ | 9,468 | | | $ | (2,445) | |
| Denominator | | | | | |
| Weighted-average shares of Class A common stock outstanding —basic | 14,185 | | | | | 14,185 | |
| Effect of dilutive securities: | | | | | |
| Restricted stock units | — | | | | | — | |
| Nonqualified stock options | — | | | | | — | |
| Weighted-average shares of Class A common stock outstanding —diluted | 14,185 | | | | | 14,185 | |
| | | | | |
| Earnings (loss) per share of Class A common stock—basic | $ | (0.84) | | | $ | 0.67 | | | $ | (0.17) | |
| Earnings (loss) per share of Class A common stock—diluted | $ | (0.84) | | | $ | 0.67 | | | $ | (0.17) | |
| | | | | |
| Anti-dilutive shares excluded from earnings (loss) per share of Class A common stock—diluted: | | | | | |
| Restricted stock units | 3,928 | | | | | 3,928 | |
| Nonqualified stock options | 3,661 | | | | | 3,661 | |
| Shares of Class B common stock | 47,082 | | | | | 47,082 | |
| Total shares excluded from earnings (loss) per share of Class A common stock—diluted | 54,671 | | | | | 54,671 | |
(1)The estimated income tax effect of our share of non-GAAP reconciling items are calculated using an assumed blended tax rate of 45%, which represents our expected corporate tax rate, excluding discrete and non-recurring tax items.
(2)The adjustment to net income (loss) attributable to noncontrolling interests represents stock-based compensation and restructuring charges attributed to the noncontrolling interests of our company outstanding during the period.
MANAGEMENT’S DISCUSSION AND ANALYSIS OF
FINANCIAL CONDITION AND RESULTS OF OPERATIONS
(tabular dollars in thousands, except for percentages and per share data)
| | | | | | | | | | | | | | | | | |
| Year Ended December 31, 2021 |
| Earnings
(Loss) per
Share | | Adjustments | | Non-GAAP
Earnings (Loss)
per Share |
| Numerator | | | | | |
| Net loss | $ | (37,609) | | | $ | — | | | $ | (37,609) | |
| Adjustments: | | | | | |
| Add back: Stock-based compensation | — | | | 68,822 | | | 68,822 | |
| Less: Gain on extinguishment of debt | — | | | (6,110) | | | (6,110) | |
Income tax benefit (expense) related to Viant Technology Inc.'s share of adjustments (1) | — | | | (1,238) | | | (1,238) | |
| Non-GAAP net income (loss) | (37,609) | | | 61,474 | | | 23,865 | |
Less: Net income (loss) attributable to noncontrolling interests (2) | (29,867) | | | 49,897 | | | 20,030 | |
| Net income (loss) attributable to Viant Technology Inc.—basic | (7,742) | | | 11,577 | | | 3,835 | |
| Add back: Reallocation of net loss attributable to noncontrolling interest from the assumed exchange of RSUs for Class A common stock | — | | | 253 | | | 253 | |
| Income tax benefit (expense) from the assumed exchange of RSUs for Class A common stock | — | | | (62) | | | (62) | |
| Net income (loss) attributable to Viant Technology Inc.—diluted | $ | (7,742) | | | $ | 11,768 | | | $ | 4,026 | |
| Denominator | | | | | |
| Weighted-average shares of Class A common stock outstanding —basic | 12,364 | | | | | 12,364 | |
| Effect of dilutive securities: | | | | | |
| Restricted stock units | — | | | | | 1,088 | |
| Nonqualified stock options | — | | | | | 8 | |
| Weighted-average shares of Class A common stock outstanding —diluted | 12,364 | | | | | 13,460 | |
| | | | | |
| Earnings (loss) per share of Class A common stock—basic | $ | (0.63) | | | $ | 0.94 | | | $ | 0.31 | |
| Earnings (loss) per share of Class A common stock—diluted | $ | (0.63) | | | $ | 0.93 | | | $ | 0.30 | |
| | | | | |
| Anti-dilutive shares excluded from earnings (loss) per share of Class A common stock—diluted: | | | | | |
| Restricted stock units | 3,033 | | | | | — | |
| Nonqualified stock options | 220 | | | | | — | |
| Shares of Class B common stock | 47,107 | | | | | 47,107 | |
| Total shares excluded from earnings (loss) per share of Class A common stock—diluted | 50,360 | | | | | 47,107 | |
(1)The estimated income tax effect of our share of non-GAAP reconciling items are calculated using an assumed blended tax rate of 24%, which represents our expected corporate tax rate, excluding discrete and non-recurring tax items.
(2)The adjustment to net income (loss) attributable to noncontrolling interests represents stock-based compensation and gain on extinguishment of debt attributed to the noncontrolling interests of our company outstanding during the period.
MANAGEMENT’S DISCUSSION AND ANALYSIS OF
FINANCIAL CONDITION AND RESULTS OF OPERATIONS
(tabular dollars in thousands, except for percentages and per share data)
Liquidity and Capital Resources
As of December 31, 2022, we had cash and cash equivalents of $206.6 million and working capital, consisting of current assets less current liabilities, of $227.7 million.
Our primary sources of cash are revenues derived from the programmatic purchase of advertising on our platform and our existing cash and cash equivalents, although we have, and may in the future, address our liquidity needs by utilizing our borrowing capacity under our Loan Agreement with PNC Bank, obtaining debt financing from other sources, or raising additional funds by issuing equity.
Our primary uses of cash are capital expenditures to develop our software in support of enhancing our technology platform; purchases of property and equipment in support of our expanding headcount as a result of our growth; the payment of debt obligations used to finance our operations, capital expenditures, platform development and rapid growth; and future minimum payments under our non-cancelable operating leases. We intend to continue investing in critical areas of our business in 2023 to further accelerate demand for our product and growth across the platform.
As of December 31, 2022, our material cash requirements from known contractual obligations included future minimum payments under our non-cancelable operating leases, which we estimate will be approximately $4.6 million in 2023, $4.4 million in 2024, $4.3 million in 2025, $4.3 million in 2026, and $4.2 million in 2027, as well as non-cancelable contractual agreements related to the hosting of our data storage processing, storage, and other computing services. As of December 31, 2022, we had $6.7 million in hosting commitments due by the first quarter of 2024.
On February 9, 2021, in connection with our IPO, we entered into the Tax Receivable Agreement with Viant Technology LLC, continuing members of Viant Technology LLC and the TRA Representative, as described under Note 11—Income Taxes and Tax Receivable Agreement to our consolidated financial statements included elsewhere in this Annual Report. As of December 31, 2022, we concluded that it was more likely than not that our deferred tax assets subject to the Tax Receivable Agreement would not be realized. Therefore, we currently do not expect to make payments under our Tax Receivable Agreement based on our estimates of future taxable income. As of December 31, 2022, the total unrecorded liability for our Tax Receivable Agreement is approximately $10.3 million.
We assess our liquidity in terms of our ability to generate cash sufficient to fund our short- and long-term cash requirements. As such, we project our anticipated cash requirements as well as cash flows generated from operating activities to meet those needs. We believe our existing cash and cash equivalents, cash flow from revenues derived from the programmatic purchase of advertising on our platform, and the undrawn availability under our revolving credit facility from the Loan Agreement with PNC Bank will be sufficient to meet our cash requirements over the next 12 months. We believe we will meet longer-term expected future cash requirements and obligations beyond the next 12 months through a combination of existing cash and cash equivalents, cash flow from operations, the undrawn availability under our credit facility and issuances of equity securities or debt offerings. Our ability to fund longer-term operating needs will depend on our ability to generate positive cash flows through programmatic advertising purchases on our platform, our ability to access the capital markets, and other factors, including those discussed under the section titled “Risk Factors.”
We did not have any other off-balance sheet arrangements as of December 31, 2022 other than the minimum payments under the operating leases, hosting arrangements, and the indemnification agreements described in Note 15—Guarantees and Indemnities to our consolidated financial statements included elsewhere in this Annual Report.
We are a holding company with no operations of our own and are dependent on distributions from Viant Technology LLC to pay our taxes and satisfy any current or future cash requirements. Our Loan Agreement with PNC Bank imposes, and any future credit facilities may impose, limitations on our ability and the ability of Viant Technology LLC to pay dividends to third parties.
Revolving Credit Facility
Our Loan Agreement with PNC Bank provides us with access to a $40.0 million senior secured revolving credit facility through October 31, 2024 and is collateralized by security interests in substantially all of our assets. As of December 31, 2022, there was no outstanding balance and up to $39.6 million of undrawn availability under the Loan Agreement. As of December 31, 2021, we had a balance of $17.5 million of outstanding borrowings and up to $22.5 million of undrawn availability under the Loan Agreement. We repaid all outstanding borrowings under our revolving credit facility as of December 31, 2022.
The Loan Agreement contains customary conditions to borrowings, events of default and covenants, and also contains a financial covenant requiring us not to exceed a maximum leverage ratio at any time our undrawn availability under the Loan Agreement is less than 25%. As of December 31, 2022, we were in compliance with this covenant, and we do not believe this covenant or any other provision in the Loan Agreement will materially impact our liquidity or otherwise restrict our ability to execute on our business plan during or beyond the next 12 months.
For further discussion of our Loan Agreement with PNC Bank, refer to Note 8—Revolving Credit Facility and PPP Loan to our consolidated financial statements included elsewhere in this Annual Report.
MANAGEMENT’S DISCUSSION AND ANALYSIS OF
FINANCIAL CONDITION AND RESULTS OF OPERATIONS
(tabular dollars in thousands, except for percentages and per share data)
Cash Flows
Fiscal 2022 Changes in Cash Flows
Cash flows from operating, investing and financing activities for the fiscal years ended December 31, 2022 and 2021, as reflected in the consolidated statements of cash flows included in Item 8 of this Annual Report, are summarized in the following table:
| | | | | | | | | | | |
| Year Ended December 31, |
| 2022 | | 2021 |
| Consolidated Statements of Cash Flows Data | | | |
| Cash flows provided by (used in) operating activities | $ | (3,530) | | | $ | 28,665 | |
| Cash flows used in investing activities | (8,826) | | | (7,372) | |
| Cash flows provided by (used in) financing activities | (19,551) | | | 207,558 | |
| Increase (decrease) in cash and cash equivalents | $ | (31,907) | | | $ | 228,851 | |
Cash Flows Provided by (Used in) Operating Activities
Our cash flows from operating activities have been primarily influenced by growth in our operations, increases or decreases in collections from our customers and related payments to our suppliers of advertising media and data. Cash flows from operating activities have been affected by changes in our working capital, particularly changes in accounts receivable, accounts payable and accrued liabilities. The timing of cash receipts from customers and payments to suppliers can significantly impact our cash flows from operating activities. We typically pay suppliers in advance of collections from our customers. Our collection and payment cycles can vary from period to period. In addition, we expect seasonality to impact cash flows from operating activities on a quarterly basis.
Our cash flows used in operating activities for fiscal 2022 was $3.5 million, a net decrease of $32.2 million, or 112%, from cash flows provided by operating activities for fiscal 2021 of $28.7 million. Cash flows used in operating activities during fiscal 2022 resulted primarily from:
•a decrease of $48.1 million from net loss;
•an increase of $46.7 million due to non-cash add back adjustments to net loss primarily comprised of $28.9 million for stock-based compensation, $13.1 million for depreciation and amortization, and $2.9 million of amortization of operating lease assets;
•an increase of $6.1 million from changes in working capital (excluding deferred revenue, other liabilities, and operating lease liabilities), including a net increase of $4.2 in accounts receivable, prepaid assets and other assets primarily related to lower sales and timing of customer collections due to seasonal fluctuations, as well as an increase of $2.0 million in accounts payable, accrued liabilities and accrued compensation primarily related to timing of payments;
•a decrease in deferred revenue of $6.4 million primarily related to a modification agreement with a customer whereby we paid a sum to the customer in exchange for the full, final and immediate termination of certain deferred revenue liabilities;
•a decrease in operating lease liabilities of $1.6 million; and
•a decrease in other liabilities of $0.3 million.
During the year ended December 31, 2021, cash provided by operating activities of $28.7 million resulted primarily from a net loss of $37.6 million offset by non-cash add back adjustments to net loss of $68.8 million for stock-based compensation, $11.1 million for depreciation and amortization, $0.3 million in other liabilities, $0.2 million in a loss on disposal of assets, $0.1 million in recovery of doubtful accounts, and a gain on debt extinguishment of $6.1 million, offset by a decrease in net working capital (excluding deferred revenue and other liabilities) of $6.2 million and deferred revenue of $1.8 million.
Cash Flows Used in Investing Activities
Our primary investing activities have consisted of capital expenditures to develop our software in support of enhancing our technology platform and purchases of property and equipment in support of our growth. We capitalize certain costs associated with creating and enhancing internally developed software related to our technology infrastructure that are recorded within property, equipment and software, net. These costs include personnel and related employee benefit expenses for employees who are directly associated with and who devote time to software development projects. Purchases of property and equipment and capitalized software development costs may vary from period-to-period due to the timing of the expansion of our operations, the addition or reduction of
MANAGEMENT’S DISCUSSION AND ANALYSIS OF
FINANCIAL CONDITION AND RESULTS OF OPERATIONS
(tabular dollars in thousands, except for percentages and per share data)
headcount and our software development cycles. As a result of capitalization of stock-based compensation in future periods and the growth of our business, we expect our capital expenditures and our investment activity to continue to increase.
Our cash flows used in investing activities for fiscal 2022 was $8.8 million, a net increase of $1.5 million, or 20%, from cash flows used in investing activities for fiscal 2021 of $7.4 million. Cash flows used in investing activities during fiscal 2022 resulted primarily from:
•$8.1 million of investments in capitalized software to develop our software in support of enhancing our technology platform; and
•$0.8 million of purchases of property and equipment.
During the year ended December 31, 2021, cash used in investing activities of $7.4 million resulted primarily from investments in capitalized software development costs.
Cash Flows Provided by (Used in) Financing Activities
Our financing activities consisted primarily of proceeds from borrowings and repayments of our debt, issuances of our equity, and payments of member distributions. Net cash provided by or used in financing activities has been and will be used to finance our operations, capital expenditures, platform development, and our growth.
Our cash flows used in financing activities for fiscal 2022 was $19.6 million, a net decrease of $227.1 million, or 109%, from cash flows provided by financing activities for fiscal 2021 of $207.6 million. The decrease in cash flows for the year ended December 31, 2022 compared to the prior period in 2021 is primarily a result of the $232.5 million of proceeds from our IPO that closed in February 2021, net of underwriting discounts and commissions and the $17.5 million repayment of our revolving credit facility during the year ended December 31, 2022.
During the year ended December 31, 2021, cash provided by financing activities of $207.6 million resulted primarily from $232.5 million of IPO proceeds, net of underwriting discounts and commissions, partially offset by payments of $2.6 million in related offering costs, $7.3 million in payments of member tax distributions and $15.0 million in taxes paid related to the net share settlement of equity awards.
Fiscal 2021 Changes in Cash Flows
For the comparison of fiscal 2021 to fiscal 2020, refer to Part II, Item 7 "Management's Discussion and Analysis of Financial Condition and Results of Operations— Liquidity and Capital Resources" included in our Annual Report on Form 10-K for our fiscal year ended December 31, 2021, filed with the SEC on March 10, 2022 under the subheading "Liquidity and Capital Resources".
Critical Accounting Estimates
Our consolidated financial statements are prepared in accordance with GAAP. The preparation of these consolidated financial statements requires us to make estimates and assumptions that affect the reported amounts of assets, liabilities, revenue, expenses and related disclosures. We evaluate our estimates and assumptions on an ongoing basis. Our estimates are based on historical experience and various other assumptions that we believe to be reasonable under the circumstances. Our actual results could differ from these estimates.
An accounting policy is deemed to be critical if it requires an accounting estimate to be made on assumptions about matters that are highly uncertain at the time the estimate is made and have had or are reasonably likely to have a material impact on our financial condition or results of operations. We believe that the assumptions and estimates associated with the evaluation of revenue recognition criteria, including the determination of revenue recognition net versus gross assessment in our revenue arrangements, the assumptions used in the valuation models to determine the fair value of common units and stock-based compensation, and internal use software have the greatest potential impact on our consolidated financial statements. Therefore, we consider these to be our critical accounting policies and estimates.
See Note 2—Basis of Presentation and Summary of Significant Accounting Policies to our consolidated financial statements included elsewhere in this Annual Report for additional information on the significant accounting policies and methods used in the preparation of our consolidated financial statements.
Revenue Recognition
We generate our revenue by providing marketers and advertising agencies with the ability to plan, buy and measure their digital advertising campaigns using our people-based DSP, Adelphic. Our platform enables marketers to reach their target audience across desktop, mobile, connected TV, linear TV, in-game, streaming audio and digital billboards.
MANAGEMENT’S DISCUSSION AND ANALYSIS OF
FINANCIAL CONDITION AND RESULTS OF OPERATIONS
(tabular dollars in thousands, except for percentages and per share data)
We apply a five-step approach as defined in Financial Accounting Standards Board (“FASB”) Accounting Standards Codification (“ASC”) 606, Revenue from Contracts with Customers (“ASC 606”), in determining the amount and timing of revenue to be recognized:
•Identification of a contract with a customer;
•Identification of the performance obligations in the contract;
•Determination of the transaction price;
•Allocation of the transaction price to the performance obligations in the contract; and
•Recognition of revenue when or as the performance obligations are satisfied.
We make our platform available through different pricing options to tailor to multiple customer types and needs. These options consist of a percentage of spend option and a fixed CPM pricing option. “CPM” refers to a payment option in which customers pay a price for every 1,000 impressions an ad receives. We generate revenue when our platform is used on a self-service basis by charging a platform fee that is a percentage of spend as well as fees for additional features such as data and advanced reporting. We also offer our customers the ability to use our services to aid in data management, media execution and advanced reporting. When customers utilize our services, we generate revenue by charging a (1) separate service fee that represents a percentage of spend in addition to the platform fee; or (2) a fixed CPM that is inclusive of media, other direct costs and services.
We maintain agreements with our customers in the form of MSAs in connection with the percentage of spend pricing option, as well as instances where we charge our customers a flat monthly fee for services in connection with data management and advanced reporting. We maintain IOs in connection with the fixed CPM pricing option, which set out the terms of the relationship and use of our platform. The nature of our performance obligations is to enable customers to plan, buy and measure advertising campaigns using our platform and provide campaign execution services as requested.
For the percentage of spend pricing option, we typically bill customers a platform fee, and in certain instances an additional service fee, which is based on a specified percentage of the customer’s purchases through the platform as well as fees for additional features such as data and advanced reporting, plus the cost of TAC. We recognize revenue at the point in time when a purchase by the customer occurs through our platform.
The determination of whether revenue for the percentage of spend pricing option should be reported on a gross or net basis is based on an assessment of whether we are acting as the principal or an agent in the transaction. In determining whether we are acting as the principal or an agent, we follow the accounting guidance for principal-agent considerations. Making such determinations involves judgment and is based on an evaluation of the terms of each arrangement, none of which are considered presumptive or determinative.
In instances discussed above related to the percentage of spend pricing option, we typically act as an agent because we arrange for the transfer of such costs from the supplier to the customer through the use of our platform and do not control such features prior to transfer to the customer. We do not have primary responsibility for meeting customer specifications and do not have discretion in establishing the price of TAC related to this pricing option. As we act as the agent in these arrangements, we report revenue on a net basis. In certain arrangements, we act as a principal in percentage of spend arrangements because (i) we control the advertising inventory before it is transferred to our clients; (ii) we bear sole responsibility for fulfillment of the advertising promise and inventory risks and (iii) we have full discretion in establishing prices. As we act as the principal in these arrangements, we report revenue and the related costs incurred on a gross basis.
For the fixed CPM pricing option, we typically bill customers a fixed CPM price based on advertising impressions delivered through the platform and recognize revenue at the point in time when the advertising impressions are delivered. In certain cases, we also provide third party data segments and measurement reporting, which are recognized at the point in time they are delivered to the customer. We have the primary responsibility for meeting customer specifications and have discretion in establishing the price of TAC related to this pricing option. As we act as the principal in these arrangements, we report revenue and the related costs incurred on a gross basis.
We invoice our customers on a monthly basis for all pricing options. Invoice payment terms, negotiated on a customer-by-customer basis, are typically 30 to 60 days. Advertising agency customers typically have sequential liability terms, which means payments are not due to us from our advertising agency customer until the advertising agency customer has received payment from its customer, the advertiser.
There are no contract assets recorded on the consolidated balance sheets because our right to any unbilled consideration for performance obligations satisfied is only conditional upon the passage of time. Contract liabilities, or deferred revenue, are recorded for amounts that are collected in advance of the satisfaction of performance obligations. These liabilities are classified as current if the respective performance obligations are anticipated to be satisfied during the succeeding 12-month period per the terms of the contract, and the remaining portion is recorded as non-current deferred revenue in the consolidated balance sheets.
MANAGEMENT’S DISCUSSION AND ANALYSIS OF
FINANCIAL CONDITION AND RESULTS OF OPERATIONS
(tabular dollars in thousands, except for percentages and per share data)
ASC 606 provides various optional practical expedients. We elected the use of the practical expedient relating to the disclosure of remaining performance obligations within a contract and will not disclose remaining performance obligations for contracts with an original expected duration of one year or less.
Internal Use Software
We capitalize certain costs associated with creating and enhancing internally developed software. These costs include personnel and related employee benefits expenses for employees who are directly associated with and who devote time to software development projects. Software development costs that do not qualify for capitalization are expensed as incurred and recorded in technology and development expense in the consolidated statements of operations.
Software development activities typically consist of three stages: (1) the planning phase; (2) the application and infrastructure development stage; and (3) the post implementation stage. Costs incurred in the planning and post implementation phases, including costs associated with training and repairs and maintenance of the developed technologies, are expensed as incurred. We capitalize costs associated with software developed when the preliminary project stage is completed, management implicitly or explicitly authorizes and commits to funding the project and it is probable that the project will be completed and perform as intended. Costs incurred in the application and infrastructure development phases, including significant enhancements and upgrades, are capitalized. Capitalization ends once a project is substantially complete and the software is ready for its intended purpose, at which point the software begins to be depreciated over its estimated useful life.
JOBS Act Accounting Election
On April 5, 2012, the JOBS Act was signed into law. The JOBS Act contains provisions that, among other things, reduce certain reporting requirements for qualifying public companies. As an “emerging growth company,” we may, under Section 7(a)(2)(B) of the Securities Act, delay adoption of new or revised accounting standards applicable to public companies until such standards would otherwise apply to private companies. An “emerging growth company” is one with less than $1.235 billion in annual sales, has less than $700.0 million in market value of shares of common stock held by non-affiliates and issues less than $1.0 billion of non-convertible debt over a three-year period. We will remain an emerging growth company until December 31, 2026, or sooner if we no longer qualify. We may take advantage of this extended transition period until the first to occur of the date that we (i) are no longer an “emerging growth company” or (ii) affirmatively and irrevocably opt out of this extended transition period.
We have elected to take advantage of the benefits of this extended transition period. Until the date that we are no longer an “emerging growth company” or affirmatively and irrevocably opt out of the exemption provided by Securities Act Section 7(a)(2)(B), upon issuance of a new or revised accounting standard that applies to our consolidated financial statements and that has a different effective date for public and private companies, the Company will disclose the date on which adoption is required for non-emerging growth companies and the date on which we will adopt the recently issued accounting standard. As part of this election, we are delaying the adoption of accounting guidance related to leases and implementation costs incurred in cloud computing arrangements that currently applies to public companies. We are assessing the impact this guidance will have on our consolidated financial statements. See Note 2—Basis of Presentation and Summary of Significant Accounting Policies to our consolidated financial statements included elsewhere in this Annual Report for additional information.
Recently Issued Accounting Pronouncements
For information regarding recently issued accounting pronouncements, see Note 2—Basis of Presentation and Summary of Significant Accounting Policies to our consolidated financial statements included elsewhere in this Annual Report.
Item 7A. Quantitative and Qualitative Disclosures About Market Risk
Our operations are primarily within the United States, and we are exposed to market risks in the ordinary course of our business, including the effects of interest rate changes, foreign currency fluctuations and inflation.
Interest Rate Risk
We are exposed to market risk from changes in interest rates on our Loan Agreement, which accrues interest at a variable rate. We have not used any derivative financial instruments to manage our interest rate risk exposure. Based upon the principal balance owed on our revolving credit facility as of December 31, 2022, a hypothetical one percentage point increase or decrease in the interest rate under our revolving credit facility would result in a de minimis change in interest expense for the year ended December 31, 2022.
Item 8. Financial Statements and Supplementary Data
INDEX TO FINANCIAL STATEMENTS
REPORT OF INDEPENDENT REGISTERED PUBLIC ACCOUNTING FIRM
To the stockholders and the Board of Directors of Viant Technology Inc.
Opinion on the Financial Statements
We have audited the accompanying consolidated balance sheets of Viant Technology Inc. and subsidiaries (the "Company") as of December 31, 2022 and 2021, the related consolidated statements of operations, convertible preferred units and equity, and cash flows, for each of the three years in the period ended December 31, 2022, and the related notes (collectively referred to as the "financial statements"). In our opinion, the financial statements present fairly, in all material respects, the financial position of the Company as of December 31, 2022 and 2021, and the results of its operations and its cash flows for each of the three years in the period ended December 31, 2022, in conformity with accounting principles generally accepted in the United States of America.
Change in Accounting Principle
As discussed in Note 2 to the financial statements, the Company changed its method of accounting for leases in 2022, due to the adoption of Accounting Standards Update No. 2016-02, Leases (Topic 842).
Basis for Opinion
These financial statements are the responsibility of the Company's management. Our responsibility is to express an opinion on the Company's financial statements based on our audits. We are a public accounting firm registered with the Public Company Accounting Oversight Board (United States) (PCAOB) and are required to be independent with respect to the Company in accordance with the U.S. federal securities laws and the applicable rules and regulations of the Securities and Exchange Commission and the PCAOB.
We conducted our audits in accordance with the standards of the PCAOB. Those standards require that we plan and perform the audit to obtain reasonable assurance about whether the financial statements are free of material misstatement, whether due to error or fraud. The Company is not required to have, nor were we engaged to perform, an audit of its internal control over financial reporting. As part of our audits, we are required to obtain an understanding of internal control over financial reporting but not for the purpose of expressing an opinion on the effectiveness of the Company’s internal control over financial reporting. Accordingly, we express no such opinion.
Our audits included performing procedures to assess the risks of material misstatement of the financial statements, whether due to error or fraud, and performing procedures that respond to those risks. Such procedures included examining, on a test basis, evidence regarding the amounts and disclosures in the financial statements. Our audits also included evaluating the accounting principles used and significant estimates made by management, as well as evaluating the overall presentation of the financial statements. We believe that our audits provide a reasonable basis for our opinion.
/s/ Deloitte & Touche LLP
Costa Mesa, California
March 2, 2023
We have served as the Company's auditor since 2020.
VIANT TECHNOLOGY INC.
CONSOLIDATED STATEMENTS OF OPERATIONS
(in thousands, except per share/unit data)
| | | | | | | | | | | | | | | | | |
| Year Ended December 31, |
| 2022 | | 2021 | | 2020 |
| Revenue | $ | 197,168 | | | $ | 224,127 | | | $ | 165,251 | |
| Operating expenses: | | | | | |
| Platform operations | 116,725 | | | 129,604 | | | 88,260 | |
| Sales and marketing | 63,957 | | | 65,042 | | | 28,887 | |
| Technology and development | 21,294 | | | 25,372 | | | 8,698 | |
| General and administrative | 44,452 | | | 46,904 | | | 17,639 | |
| Total operating expenses | 246,428 | | | 266,922 | | | 143,484 | |
| Income (loss) from operations | (49,260) | | | (42,795) | | | 21,767 | |
| Interest expense (income), net | (1,481) | | | 864 | | | 1,038 | |
| Other expense | 310 | | | 60 | | | 91 | |
| Gain on extinguishment of debt | — | | | (6,110) | | | — | |
| Total other expense (income), net | (1,171) | | | (5,186) | | | 1,129 | |
| Net income (loss) | (48,089) | | | (37,609) | | | 20,638 | |
| Less: Net loss attributable to noncontrolling interests | (36,176) | | | (29,867) | | | — | |
| Net loss attributable to Viant Technology Inc. | $ | (11,913) | | | $ | (7,742) | | | $ | — | |
| Earnings (loss) per Class A common stock/unit: | | | | | |
| Basic | $ | (0.84) | | | $ | (0.63) | | | $ | 20.64 | |
| Diluted | $ | (0.84) | | | $ | (0.63) | | | $ | 20.64 | |
| Weighted-average Class A common stock/units outstanding: | | | | | |
| Basic | 14,185 | | 12,364 | | 400 |
| Diluted | 14,185 | | 12,364 | | 1,000 |
The accompanying notes are an integral part of these consolidated financial statements.
VIANT TECHNOLOGY INC.
CONSOLIDATED BALANCE SHEETS
(in thousands, except share data)
| | | | | | | | | | | |
| As of December 31, |
| 2022 | | 2021 |
| Assets | | | |
| Current assets: | | | |
| Cash and cash equivalents | $ | 206,573 | | | $ | 238,480 | |
| Accounts receivable, net of allowances | 101,658 | | | 110,739 | |
| Prepaid expenses and other current assets | 6,631 | | | 2,967 | |
| Total current assets | 314,862 | | | 352,186 | |
| Property, equipment, and software, net | 23,106 | | | 22,331 | |
| Operating lease assets | 26,441 | | | — | |
| Intangible assets, net | 667 | | | 1,786 | |
| Goodwill | 12,422 | | | 12,422 | |
| Other assets | 385 | | | 406 | |
| Total assets | $ | 377,883 | | | $ | 389,131 | |
| Liabilities and stockholders' equity | | | |
| Liabilities | | | |
| Current liabilities: | | | |
| Accounts payable | $ | 37,063 | | | $ | 32,877 | |
| Accrued liabilities | 35,063 | | | 34,086 | |
| Accrued compensation | 9,162 | | | 12,247 | |
| Current portion of deferred revenue | 123 | | | 1,317 | |
| Current portion of operating lease liabilities | 3,711 | | | — | |
| Other current liabilities | 1,995 | | | 2,531 | |
| Total current liabilities | 87,117 | | | 83,058 | |
| Long-term debt | — | | | 17,500 | |
| Long-term portion of deferred revenue | — | | | 5,234 | |
| Long-term portion of operating lease liabilities | 24,998 | | | — | |
| Other long-term liabilities | — | | | 765 | |
| Total liabilities | 112,115 | | | 106,557 | |
| Commitments and contingencies (Note 14) | | | |
| Stockholders’ equity | | | |
Preferred stock, $0.001 par value | — | | | — | |
Authorized shares — 10,000,000 | | | |
Issued and outstanding — none | | | |
Class A common stock, $0.001 par value | 15 | | | 14 | |
Authorized shares — 450,000,000 | | | |
Issued — 14,783,886 and 13,920,868 | | | |
Outstanding — 14,643,798 and 13,704,638 | | | |
Class B common stock, $0.001 par value | 47 | | | 47 | |
Authorized shares — 150,000,000 | | | |
Issued and outstanding — 47,082,260 and 47,107,130 | | | |
| Additional paid-in capital | 95,922 | | | 82,888 | |
| Accumulated deficit | (36,261) | | | (20,139) | |
Treasury stock, at cost; 140,088 and 216,230 shares held | (475) | | | (2,648) | |
| Total stockholders' equity attributable to Viant Technology Inc. | 59,248 | | | 60,162 | |
| Noncontrolling interests | 206,520 | | | 222,412 | |
| Total equity | 265,768 | | | 282,574 | |
| Total liabilities and stockholders' equity | $ | 377,883 | | | $ | 389,131 | |
The accompanying notes are an integral part of these consolidated financial statements.
VIANT TECHNOLOGY INC.
CONSOLIDATED STATEMENTS OF CONVERTIBLE PREFERRED UNITS AND EQUITY
(in thousands)
| | | | | | | | | | | | | | | | | | | | | | | | | | | | | | | | | | | | | | | | | | | | | | | | | | | | | | | | | | | | | | | | | | | | | | | | | | | | | | | | | | | | | | | | | | | | |
| Convertible
Preferred Units | | | Common
Units | | Class A
Common Stock | | Class B
Common Stock | | Additional
Paid-In
Capital | | Accumulated
Deficit | | Members'
Equity | | Treasury
Stock | | Noncontrolling
Interests | | Total
Equity |
| Units | | Amount | | | Units | | Amount | | Shares | | Amount | | Shares | | Amount | | | | | Shares | | Amount | | |
| Balance as of December 31, 2019 | 600 | | 7,500 | | | | 400 | | — | | | — | | — | | | — | | — | | | — | | | — | | | 15,205 | | | — | | — | | | — | | | 15,205 | |
| Accrued member tax distributions | | | | | | | | | | | | | | | | | | | | | | (10,726) | | | | | | | | | (10,726) | |
| Member dividends | | | | | | | | | | | | | | | | | | | | | | (5,000) | | | | | | | | | (5,000) | |
| Net income | | | | | | | | | | | | | | | | | | | | | | 20,638 | | | | | | | | | 20,638 | |
| Balance as of December 31, 2020 | 600 | | 7,500 | | | | 400 | | — | | | — | | — | | | — | | — | | | — | | | — | | | 20,117 | | | — | | — | | | — | | | 20,117 | |
| Net income prior to Reorganization Transactions | | | | | | | | | | | | | | | | | | | | | | 669 | | | | | | | | | 669 | |
| Effect of Reorganization Transactions | (600) | | (7,500) | | | | (400) | | — | | | | | | | 48,936 | | 49 | | | 28,237 | | | | | (20,786) | | | | | | | | | 7,500 | |
| Issuance of Class A common stock in initial public offering, net of underwriting and offering costs | | | | | | | | | | 11,500 | | 12 | | | (1,500) | | (2) | | | 228,175 | | | | | | | | | | | | | 228,185 | |
| Exchange of Class B common stock for Class A common stock | | | | | | | | | | 329 | | — | | | (329) | | — | | | | | | | | | | | | | | | — | |
| Issuance of common stock in connection with equity- based compensation plans | | | | | | | | | | 2,092 | | 2 | | | | | | | (2) | | | | | | | | | | | | | — | |
| Repurchase of treasury stock in connection with the taxes paid related to net share settlement of equity awards | | | | | | | | | | | | | | | | | | | | | | | | (915) | | (15,045) | | | | | (15,045) | |
Reissuance of treasury stock in connection with equity- based compensation plans | | | | | | | | | | | | | | | | | | | | (12,397) | | | | | 699 | | 12,397 | | | | | — | |
Allocation of equity to noncontrolling interests | | | | | | | | | | | | | | | | | | (252,948) | | | | | | | | | | | 252,948 | | | — | |
Accrued member tax distributions | | | | | | | | | | | | | | | | | | (413) | | | | | | | | | | | | | (413) | |
Stock-based compensation | | | | | | | | | | | | | | | | | | 79,839 | | | | | | | | | | | | | 79,839 | |
Net loss | | | | | | | | | | | | | | | | | | | | (7,742) | | | | | | | | | (30,536) | | | (38,278) | |
| Balance as of December 31, 2021 | — | | — | | | | — | | — | | | 13,921 | | 14 | | | 47,107 | | 47 | | | 82,888 | | | (20,139) | | | — | | | (216) | | (2,648) | | | 222,412 | | | 282,574 | |
| Issuance of Class A stock in connection with equity- based compensation plans | | | | | | | | | | 838 | | 1 | | | | | | | (1) | | | | | | | | | | | | | — | |
| Exchange of Class B common stock for Class A common stock | | | | | | | | | | 25 | | | | (25) | | | | | | | | | | | | | | | | — | |
| Repurchase of treasury stock in connection with the taxes paid related to net share settlement of equity awards | | | | | | | | | | | | | | | | | | | | | | | | (424) | | (2,036) | | | | | (2,036) | |
Reissuance of treasury stock in connection with equity- based compensation plans | | | | | | | | | | | | | | | | | | | | (4,209) | | | | | 500 | | 4,209 | | | | | — | |
Allocation of equity to noncontrolling interests | | | | | | | | | | | | | | | | | | (20,284) | | | | | | | | | | | 20,284 | | | — | |
Accrued member tax distributions | | | | | | | | | | | | | | | | | | (11) | | | | | | | | | | | | | (11) | |
Stock-based compensation | | | | | | | | | | | | | | | | | | 33,330 | | | | | | | | | | | | | 33,330 | |
Net loss | | | | | | | | | | | | | | | | | | | | (11,913) | | | | | | | | | (36,176) | | | (48,089) | |
| Balance as of December 31, 2022 | — | | $ | — | | | | — | | $ | — | | | 14,784 | | $ | 15 | | | 47,082 | | $ | 47 | | | $ | 95,922 | | | $ | (36,261) | | | $ | — | | | (140) | | $ | (475) | | | $ | 206,520 | | | $ | 265,768 | |
VIANT TECHNOLOGY INC.
CONSOLIDATED STATEMENTS OF CASH FLOWS
(in thousands)
| | | | | | | | | | | | | | | | | |
| Year Ended December 31, |
| 2022 | | 2021 | | 2020 |
| Cash flows provided by (used in) operating activities: | | | | | |
| Net income (loss) | $ | (48,089) | | | $ | (37,609) | | | $ | 20,638 | |
| Adjustments to reconcile net income (loss) to net cash provided by (used in) operating activities: | | | | | |
| Depreciation and amortization | 13,131 | | | 11,141 | | | 10,106 | |
| Stock/unit-based compensation | 28,901 | | | 68,822 | | | — | |
| Provision for (recovery of) doubtful accounts | 1,260 | | | (107) | | | (584) | |
| Loss on disposal of assets | 588 | | | 188 | | | 61 | |
| Gain on extinguishment of debt | — | | | (6,110) | | | — | |
| Amortization of operating lease assets | 2,861 | | | — | | | — | |
| Changes in operating assets and liabilities: | | | | | |
| Accounts receivable | 7,821 | | | (20,865) | | | (21,099) | |
| Prepaid expenses and other assets | (3,642) | | | (750) | | | (252) | |
| Accounts payable | 4,215 | | | 3,404 | | | 8,995 | |
| Accrued liabilities | 860 | | | 9,728 | | | 1,736 | |
| Accrued compensation | (3,118) | | | 2,319 | | | 1,323 | |
| Deferred revenue | (6,428) | | | (1,786) | | | (1,694) | |
| Operating lease liabilities | (1,561) | | | — | | | — | |
| Other liabilities | (329) | | | 290 | | | (355) | |
| Net cash provided by (used in) operating activities | (3,530) | | | 28,665 | | | 18,875 | |
| Cash flows used in investing activities: | | | | | |
| Purchases of property and equipment | (758) | | | (441) | | | (434) | |
| Capitalized software development costs | (8,068) | | | (6,931) | | | (7,407) | |
| Net cash used in investing activities | (8,826) | | | (7,372) | | | (7,841) | |
| Cash flows provided by (used in) financing activities: | | | | | |
| Proceeds from Paycheck Protection Program Loan | — | | | — | | | 6,035 | |
| Proceeds from issuance of common stock, net of underwriting discounts | — | | | 232,500 | | | — | |
| Payment of member tax distributions | (15) | | | (7,289) | | | (5,547) | |
| Payment of member dividends | — | | | — | | | (5,000) | |
| Payment of offering costs | — | | | (2,608) | | | (1,708) | |
| Taxes paid related to net share settlement of equity awards | (2,036) | | | (15,045) | | | — | |
| Repayment of revolving credit facility | (17,500) | | | — | | | — | |
| Net cash provided by (used in) financing activities | (19,551) | | | 207,558 | | | (6,220) | |
| Net increase (decrease) in cash and cash equivalents | (31,907) | | | 228,851 | | | 4,814 | |
| Cash and cash equivalents at beginning of period | 238,480 | | | 9,629 | | | 4,815 | |
| Cash and cash equivalents at end of period | $ | 206,573 | | | $ | 238,480 | | | $ | 9,629 | |
| Supplemental disclosure of cash flow information: | | | | | |
| Cash paid for interest | $ | 238 | | | $ | 660 | | | $ | 1,065 | |
| Supplemental disclosure of non-cash investing and financing activities: | | | | | |
| Accrued member tax distributions | — | | | 5 | | | 6,878 | |
| Operating lease assets obtained in exchange for operating lease liabilities | 8,307 | | | — | | | — | |
| Deferred offering costs recorded in accounts payable and accrued liabilities | — | | | — | | | 529 | |
| Stock-based compensation included in capitalized software development costs | 4,429 | | | 11,017 | | | — | |
| Capitalized assets financed by accounts payable and accrued liabilities | 503 | | | 356 | | | — | |
| Noncash gain on extinguishment of debt related to Paycheck Protection Program loan | — | | | 6,110 | | | — | |
The accompanying notes are an integral part of these consolidated financial statements.
VIANT TECHNOLOGY INC.
NOTES TO THE CONSOLIDATED FINANCIAL STATEMENTS
(tabular dollars in thousands, except for per share/unit data)
1. Nature of Operations
Viant Technology Inc. (the “Company,” “we,” “us,” “our” or “Viant”) was incorporated in the State of Delaware on October 9, 2020. The Company operates a demand side platform, Adelphic, that is used by marketers and their advertising agencies to centralize the planning, buying and measurement of their advertising across most channels, including desktop, mobile, connected TV, linear TV, in-game, streaming audio and digital billboards.
On February 9, 2021, the Securities and Exchange Commission (“SEC”) declared effective the Company’s Form S-1 related to the initial public offering ("IPO") of its Class A common stock. The closing date of the IPO was February 12, 2021, and in connection with the closing and the corporate reorganization (the “Reorganization Transactions”), the following actions were taken:
•The Company amended and restated its certificate of incorporation, under which the Company is authorized to issue up to 450,000,000 shares of Class A common stock, up to 150,000,000 shares of Class B common stock, and up to 10,000,000 shares of preferred stock;
•The limited liability company agreement of Viant Technology LLC was amended and restated (as amended and restated, the “Viant Technology LLC Agreement”) to, among other things, provide for Class A units and Class B units and appoint the Company as the sole managing member of Viant Technology LLC;
•The Viant Technology LLC Agreement classified the interests acquired by the Company as Class A units, reclassified the interests held by the continuing members of Viant Technology LLC as Class B units, and permits the continuing members of Viant Technology LLC to exchange Class B units for shares of Class A common stock of Viant Technology Inc. on a one-for-one basis or, at the election of Viant Technology Inc., for cash at the current fair value on the date of the exchange. Immediately following such reclassification, the continuing members held 48,935,559 Class B units. For each membership unit of Viant Technology LLC that was reclassified as a Class B unit, the Company issued one corresponding share of our Class B common stock to the continuing members, or 48,935,559 shares of Class B common stock in total;
•The Company issued and sold 10,000,000 shares of its Class A common stock to the underwriters at an IPO price of $25.00 per share, for gross proceeds of $250.0 million before deducting underwriting discounts and commissions of $17.5 million;
•The Company used the net proceeds of $232.5 million to acquire 10,000,000 newly issued Class A units of Viant Technology LLC at a per-unit price equal to the per-share price paid by the underwriters for shares of our Class A common stock;
•The underwriters exercised their option to purchase 1,500,000 additional shares of Class A common stock from the selling stockholders in the IPO. The Company did not receive any proceeds from the sale of shares by the selling stockholders. Pursuant to such exercise, the selling stockholders exchanged the corresponding number of Class B units for the shares of Class A common stock, the corresponding number of shares of Class B common stock were automatically retired, and 1,500,000 Class A units were issued to the Company;
•The Class B stockholders and Class A stockholders initially had 80.5% and 19.5%, respectively, of the combined voting power of the Company’s common stock. The Class A common stock outstanding represents 100% of the rights of the holders of all classes of the Company’s outstanding common stock to share in distributions from the Company, except for the right of Class B stockholders to receive the par value of the Class B common stock upon our liquidation, dissolution or winding up or an exchange of Class B units;
•The Company entered into a Registration Rights Agreement with the Class B stockholders to provide for certain rights and restrictions after the IPO; and
•Viant Technology LLC’s 2020 Equity Based Incentive Compensation Plan (the “Phantom Unit Plan”) was terminated and replaced with the Company’s 2021 Long Term Incentive Plan (the “LTIP”).
Immediately following the closing of the IPO, Viant Technology LLC became the predecessor of the Company for financial reporting purposes. Viant Technology Inc. is a holding company, and its sole material asset is its equity interest in Viant Technology LLC. As the sole managing member of Viant Technology LLC, the Company operates and controls all of the business and affairs of Viant Technology LLC. The Reorganization Transactions are accounted for as a reorganization of entities under common control. As a result, the consolidated financial statements of the Company recognize the assets and liabilities received in the Reorganization Transactions at their historical carrying amounts, as reflected in the historical consolidated financial statements of Viant Technology LLC. The Company consolidates Viant Technology LLC in its consolidated financial statements and records a noncontrolling interest related to the Class B units held by the Class B stockholders on its consolidated balance sheets, and statements of operations.
VIANT TECHNOLOGY INC.
NOTES TO THE CONSOLIDATED FINANCIAL STATEMENTS
(tabular dollars in thousands, except for per share/unit data)
2. Basis of Presentation and Summary of Significant Accounting Policies
Basis of Presentation and Principles of Consolidation
The accompanying consolidated financial statements are prepared in accordance with accounting principles generally accepted in the United States of America (“GAAP”) and include the operations of the Company, Viant Technology LLC and its wholly owned subsidiaries. Viant Technology LLC is considered a variable interest entity (“VIE”). The Company is the primary beneficiary and sole managing member of Viant Technology LLC and has decision making authority that significantly affects the economic performance of the entity. As a result, the Company consolidates Viant Technology LLC. All intercompany balances and transactions have been eliminated in consolidation.
Viant Technology LLC has been determined to be the predecessor for accounting purposes and, accordingly, the consolidated financial statements for periods prior to the IPO and the related Reorganization Transactions have been adjusted to combine the previously separate entities for presentation purposes. Amounts for the period prior to February 12, 2021 presented in the consolidated financial statements and notes to consolidated financial statements herein represent the historical operations of Viant Technology LLC. The amounts as of December 31, 2022 and December 31, 2021 and the operations since February 12, 2021 reflect the consolidated operations of the Company.
Management believes that the accompanying consolidated financial statements reflect the adjustments necessary for the fair statement of its consolidated balance sheets as of December 31, 2022 and 2021, statements of operations for the years ended December 31, 2022, 2021 and 2020, and cash flows for the years ended December 31, 2022, 2021 and 2020.
Use of Estimates
The preparation of our consolidated financial statements in conformity with GAAP requires management to make estimates and assumptions that affect the reported amounts of assets and liabilities and disclosures of contingent assets and liabilities at the date of the consolidated financial statements and the reported amounts of revenue and expenses during the reporting period. On an ongoing basis, management evaluates its estimates, primarily those related to revenue recognition, stock-based compensation, income taxes, allowances for doubtful accounts, the useful lives of capitalized software development costs and other property, equipment and software and assumptions used in the impairment analyses of long-lived assets and goodwill. These estimates are based on historical data and experience, as well as various other factors that management believes to be reasonable under the circumstances, the results of which form the basis for making judgments about the carrying amount of assets and liabilities that are not readily apparent from other sources. Actual results may differ from these estimates under different assumptions or conditions.
As of December 31, 2022, the impact of widespread macroeconomic and geopolitical uncertainties, including the continuing impact of COVID-19, labor shortages, inflation and monetary supply shifts, rising interest rates, tightening of credit markets, recession risks, and potential disruptions from the Russia-Ukraine conflict, on our business continues to evolve. As a result, many of our estimates and assumptions consider macroeconomic and geopolitical factors in the market, which require increased judgment and carry a higher degree of variability and volatility. As events continue to evolve and additional information becomes available on the potential impact on our business of global economic and business events, our estimates may change materially in future periods.
Comprehensive Income (Loss)
For the periods presented, net income (loss) is equal to comprehensive income (loss).
Segment Information
The Company has a single reportable operating segment which operates an enterprise technology platform, Adelphic, that enables marketers and their advertising agencies to automate and centralize the planning, buying and measurement of their video, audio and display ads across all channels, including desktop, mobile, connected TV, linear TV, in-game, streaming audio and digital billboards in the United States. In reaching this conclusion, management considers the definition of the chief operating decision maker (“CODM”), how the business is defined by the CODM, the nature of the information provided to the CODM and how that information is used to make operating decisions, allocate resources and assess performance. The Company’s CODM is comprised of the chief executive officer and chief operating officer. The results of operations provided to and analyzed by the CODM are at the consolidated level and accordingly, key resource decisions and assessment of performance are performed at the consolidated level. The Company assesses its determination of operating segments at least annually.
Revenue Recognition
The Company generates its revenue by providing marketers and advertising agencies with the ability to plan, buy and measure their digital advertising campaigns using its people-based DSP, Adelphic. Our platform enables marketers to reach their target audience across desktop, mobile, connected TV, linear TV, in-game, streaming audio and digital billboards.
VIANT TECHNOLOGY INC.
NOTES TO THE CONSOLIDATED FINANCIAL STATEMENTS
(tabular dollars in thousands, except for per share/unit data)
The Company applies a five-step approach as defined in Financial Accounting Standards Board (“FASB”) Accounting Standards Codification (“ASC”) 606, Revenue from Contracts with Customers (“ASC 606”), in determining the amount and timing of revenue to be recognized:
•Identification of a contract with a customer;
•Identification of the performance obligations in the contract;
•Determination of the transaction price;
•Allocation of the transaction price to the performance obligations in the contract; and
•Recognition of revenue when or as the performance obligations are satisfied.
We make our platform available through different pricing options to tailor to multiple customer types and customer needs. These options consist of a percentage of spend option and a fixed cost per mille (“CPM”) pricing option. CPM refers to a payment option in which customers pay a price for every 1,000 impressions an ad receives. We generate revenue when our platform is used on a self-service basis by charging a platform fee that is a percentage of spend as well as fees for additional features such as data and advanced reporting. We also offer our customers the ability to use our services to aid in data management, media execution and advanced reporting. When customers utilize our services, we generate revenue by charging a (1) separate service fee that represents a percentage of spend in addition to the platform fee; or (2) a fixed CPM that is inclusive of media, other direct costs and services.
We maintain agreements with our customers in the form of master service agreements (“MSA”) in connection with the percentage of spend pricing option, as well as instances where we charge our customers a flat monthly fee for services in connection with data management and advanced reporting. We maintain insertion orders (“IO”) in connection with the fixed CPM pricing option, which set out the terms of the relationship and use of our platform. The nature of our performance obligations is to enable customers to plan, buy and measure advertising campaigns using our platform and provide campaign execution services as requested.
For the percentage of spend pricing option, we typically bill customers a platform fee, and in certain instances an additional service fee, which is based on a specified percentage of the customer’s purchases through the platform as well as fees for additional features such as data and advanced reporting, plus the cost of TAC, as defined below. We recognize revenue at the point in time when a purchase by the customer occurs through our platform.
The determination of whether revenue for the percentage of spend pricing option should be reported on a gross or net basis is based on an assessment of whether we are acting as the principal or an agent in the transaction. In determining whether we are acting as the principal or an agent, we follow the accounting guidance for principal-agent considerations. Making such determinations involves judgment and is based on an evaluation of the terms of each arrangement, none of which are considered presumptive or determinative.
In instances discussed above related to the percentage of spend pricing option, we typically act as an agent because we arrange for the transfer of such costs from the supplier to the customer through the use of our platform and do not control such features prior to transfer to the customer. We do not have primary responsibility for meeting customer specifications and do not have discretion in establishing the price of TAC related to this pricing option. As we act as the agent in these arrangements, we report revenue on a net basis. In certain arrangements, we act as a principal in percentage of spend arrangements because (i) we control the advertising inventory before it is transferred to our clients; (ii) we bear sole responsibility for fulfillment of the advertising promise and inventory risks and (iii) we have full discretion in establishing prices. As we act as the principal in these arrangements, we report revenue and the related costs incurred on a gross basis.
For the fixed CPM pricing option, we typically bill customers a fixed CPM price based on advertising impressions delivered through the platform and recognize revenue at the point in time when the advertising impressions are delivered. In certain cases, we also provide third party data segments and measurement reporting, which are recognized at the point in time they are delivered to the customer. We have the primary responsibility for meeting customer specifications and have discretion in establishing the price of TAC related to this pricing option. As we act as the principal in these arrangements, we report revenue and the related costs incurred on a gross basis.
The Company invoices its customers on a monthly basis for all pricing options. Invoice payment terms, negotiated on a customer-by-customer basis, are typically 30 to 60 days. Advertising agency customers typically have sequential liability terms, which means payments are not due to the Company from its advertising agency customer until the advertising agency customer has received payment from its customer, the advertiser.
There are no contract assets recorded on the consolidated balance sheets because the Company’s right to any unbilled consideration for performance obligations satisfied is only conditional upon the passage of time. Contract liabilities, or deferred revenue, are recorded for amounts that are collected in advance of the satisfaction of performance obligations. These liabilities are classified as current if the respective performance obligations are anticipated to be satisfied during the succeeding 12-month period per the terms of the contract, and the remaining portion is recorded as non-current deferred revenue in the consolidated balance sheets.
VIANT TECHNOLOGY INC.
NOTES TO THE CONSOLIDATED FINANCIAL STATEMENTS
(tabular dollars in thousands, except for per share/unit data)
ASC 606 provides various optional practical expedients. The Company elected the use of the practical expedient relating to the disclosure of remaining performance obligations within a contract and will not disclose remaining performance obligations for contracts with an original expected duration of one year or less.
Operating Expenses
We classify our operating expenses into the following four categories. Each expense category includes overhead such as rent and occupancy charges, which is allocated based on headcount.
Platform Operations. Platform operations expense represents our cost of revenues, which consists of TAC, hosting costs, personnel costs, depreciation of capitalized software development costs, customer support costs and allocated overhead. TAC recorded in platform operations consists of amounts incurred and payable to suppliers for costs associated with our fixed CPM pricing option. Personnel costs within platform operations include salaries, bonuses, stock/unit-based compensation and employee benefit costs primarily attributable to personnel who directly support our platform.
Sales and Marketing. Sales and marketing expense consists primarily of personnel costs, including salaries, bonuses, stock/unit-based compensation, employee benefit costs and commissions for our sales personnel. Sales and marketing expense also includes costs for market development programs, advertising, promotional and other marketing activities and allocated overhead. Commissions are expensed as incurred.
The Company incurred advertising costs of $9.3 million, $4.1 million, and $1.2 million for the years ended December 31, 2022, 2021 and 2020, respectively, related to the promotion of the Company, its brands, products and services to potential customers. Advertising costs are expensed as incurred and recorded in sales and marketing expense within the consolidated statements of operations.
Technology and Development. Technology and development expense consists primarily of personnel costs, including salaries, bonuses, stock/unit-based compensation and employee benefit costs associated with the ongoing development and maintenance of our platform and allocated overhead. Technology and development costs are expensed as incurred, except to the extent that such costs are associated with software development that qualifies for capitalization, which are then recorded as capitalized software development costs included in "Property, equipment, and software, net", on the consolidated balance sheets. We record depreciation for capitalized software not related to our platform within technology and development expense.
General and Administrative. General and administrative expense consists primarily of personnel costs, including salaries, bonuses, stock/unit-based compensation and employee benefit costs associated with our executive, accounting, finance, legal, human resources, and other administrative personnel. Additionally, this includes accounting, legal and other professional services fees, insurance expense, bad debt expense and allocated overhead.
Stock-Based Compensation
Stock-based compensation relates to equity awards granted under the Company’s 2021 LTIP, which is measured and recognized in the consolidated financial statements based on the fair value of the equity awards granted. Since inception of the 2021 LTIP, the Company has only granted restricted stock units (“RSUs”) and nonqualified stock options. The fair value of RSUs is calculated using the closing market price of the Company’s Class A common stock on the date of grant. The fair value of nonqualified stock options is estimated using the Black Scholes option pricing model. The Black Scholes option pricing model is impacted by the fair value of the Company’s Class A common stock, as well as changes in certain assumptions, including but not limited to, the expected Class A common stock price volatility over the term of the nonqualified stock options, the expected term of the nonqualified stock options, the risk-free interest rate, and the expected dividend yield. The Company records compensation for all equity awards under the 2021 LTIP under the straight-line attribution method over the requisite service period. The Company has elected the accounting policy to account for forfeitures within stock-based compensation as they occur.
A portion of RSUs granted during the year ended December 31, 2021 to certain employees and board members, pursuant to the 2021 LTIP, vested upon expiration of the 180 day IPO lock-up period during the fiscal year ended December 31, 2021. The remainder of RSUs and nonqualified stock options granted to employees will vest through the applicable vesting dates. RSUs generally vest over a period of four years, contingent upon employment on the vesting date. RSUs awarded to board members upon their appointment will vest on the third anniversary of the grant date and RSUs awarded to board members annually will vest on the first anniversary of the grant date. Nonqualified stock options will generally vest based on four years of continuous service and have 10 year contractual terms.
Unit-Based Compensation
The Company adopted the Limited Liability Company Agreement (the “Viant Technology LLC Agreement”) on October 4, 2016, under which it issued common unit awards, subject to vesting and other terms, to certain executives of the Company and to Viant Technology Equity Plan LLC, which issued incentive units in the form of profit interests to certain employees of the Company.
VIANT TECHNOLOGY INC.
NOTES TO THE CONSOLIDATED FINANCIAL STATEMENTS
(tabular dollars in thousands, except for per share/unit data)
The Company records compensation for all common unit awards and incentive units granted to employees of the Company, which is measured and recognized on a graded-vesting attribution basis over the requisite service period based on the fair value of the awards at the grant date. The Company has elected the accounting policy to account for forfeitures within unit-based compensation as they occur.
During the years ended December 31, 2020 and 2019, the Company was privately held with no active public market for our common units. Therefore, in determining the fair value of equity-based awards, the Company utilized valuations prepared by an independent third party. The independent third party performed the valuations in a manner consistent with the American Institute of Certified Public Accountants Practice Aid, Valuation of Privately-Held Company Equity Securities Issued as Compensation (“Practice Aid”). In conducting the valuations, the Company considered all objective and subjective factors that it believed to be relevant in the valuation conducted, including management’s best estimate of our business condition, prospects and operating performance at the valuation dates. There are significant judgments and estimates inherent in these valuations. These judgments and estimates include assumptions regarding our future operating performance, industry growth, average selling price, and the timing of a potential initial public offering or other liquidity event.
The Company determined the fair value of equity awards using a combination of the market and income approach. The market approach and the income approach are both acceptable valuation methods in accordance with the Practice Aid. There are two general methodologies under the market approach: (i) guideline public company method, and (ii) guideline merged and acquired company method. Both methods generate a marketable equity fair value indication using market-based information available to market participants. Under the income approach, the enterprise value can be estimated using the discounted cash flow method, which involves estimating the future cash flows of a business for a discrete period and discounting them to their present value.
As provided in the Practice Aid, there are several approaches for allocating enterprise value of a privately held company to the outstanding equity of the Company. The Company selected the Option Pricing Model (“OPM”) which treats common equity and preferred equity as call options on the enterprise’s value. The exercise prices associated with these call options vary according to the liquidation preference of the preferred equity, the preferred equity conversion price, the exercise prices of common equity options and other features of a company’s equity capital structure.
Earnings (Loss) Per Share
Basic earnings (loss) per share is calculated by dividing the earnings (loss) attributable to Class A common stockholders by the number of weighted-average shares of Class A common stock outstanding. The Company’s RSUs, nonqualified stock options and shares of Class B common stock do not share in the earnings or losses of the Company and are therefore not participating securities. As such, separate presentation of basic and diluted earnings (loss) per share of RSUs, nonqualified stock options and Class B common stock under the two-class method has not been presented.
Diluted earnings per share adjusts the basic earnings (loss) per share calculation for the potential dilutive impact of common shares such as equity awards using the treasury-stock method. Diluted earnings per share considers the impact of potentially dilutive securities except in periods in which there is a loss because the inclusion of the potential common shares would have an anti-dilutive effect. Shares of our Class B common stock, RSUs, and nonqualified stock options are considered potentially dilutive shares of Class A common stock; however, related amounts have been excluded from the computation of diluted earnings per share of Class A common stock because the effect would have been anti-dilutive under the if-converted method and treasury-stock method.
Earnings (Loss) Per Unit
Basic earnings (loss) per unit is calculated by dividing the earnings (loss) attributable to common unitholders by the number of weighted-average common units outstanding. The Company applies the two-class method to allocate earnings between common and convertible preferred units.
Diluted earnings per unit adjusts the basic earnings (loss) per unit attributable to common unitholders and the weighted-average number of units of common units outstanding for the potential dilutive impact of common units, using the treasury-stock method, and convertible preferred units using the if-converted method. Diluted earnings per unit considers the impact of potentially dilutive securities except in periods in which there is a loss because the inclusion of the potential common units would have an anti-dilutive effect.
VIANT TECHNOLOGY INC.
NOTES TO THE CONSOLIDATED FINANCIAL STATEMENTS
(tabular dollars in thousands, except for per share/unit data)
Cash and Cash Equivalents
The Company considers cash in bank accounts, money market funds, and highly liquid debt instruments with an original maturity of less than 90 days to be cash and cash equivalents. Due to the short-term nature of cash and cash equivalents the carrying amounts approximate fair value.
Accounts Receivable, Net of Allowances
Accounts receivable are recorded at the invoiced amount, net of an allowance for doubtful accounts, and are unsecured and do not bear interest. The Company performs credit evaluations of its customers and certain advertisers when the Company’s agreements with its customers contain sequential liability terms that provide that the customer payments are not due to the Company until the customer has received payment from its customers (advertisers). The allowance for doubtful accounts is based on the best estimate of the amount of probable credit losses in existing accounts receivable. The allowance for doubtful accounts is determined based on historical collection experience and the review in each period of the status of the then-outstanding accounts receivable, while taking into consideration current customer information, subsequent collection history and other relevant data. Account balances are charged off against the allowance when the Company believes it is probable the receivable will not be recovered. Recoveries of accounts receivable previously written off are recorded when received.
The following table presents changes in the allowance for doubtful accounts:
| | | | | | | | | | | |
| Year Ended December 31, |
| 2022 | | 2021 |
| Beginning balance | $ | 54 | | | $ | 335 | |
| Provision for (recovery of) doubtful accounts | 1,260 | | | (107) | |
| Write-offs, net of recoveries | (299) | | | (174) | |
| Ending balance | $ | 1,015 | | | $ | 54 | |
Deferred Offering Costs
Deferred offering costs consisted primarily of accounting, legal, and other costs related to our IPO. As of December 31, 2020, the Company capitalized $2.2 million of deferred offering costs within prepaid expenses and other current assets in the consolidated balance sheet. Upon consummation of the IPO in February 2021, total deferred offering costs of $4.3 million were reclassified as additional paid-in capital within stockholders’ equity and recorded against the proceeds from the IPO.
Property, Equipment and Software, Net
Property, equipment and software are recorded at historical cost, less accumulated depreciation. Depreciation is computed using the straight-line method based upon the following estimated useful lives:
| | | | | |
| Years |
| Computer equipment | 3-5 |
| Purchased software | 3 |
| Capitalized software development costs | 3 |
| Furniture, fixtures and office equipment | 10 |
| Leasehold improvements | * |
*Leasehold improvements are depreciated on a straight-line basis over the term of the lease, or the useful life of the assets, whichever is shorter.
Repair and maintenance costs are charged to expense as incurred, while replacements and improvements are capitalized. When assets are retired or otherwise disposed of, the cost and related accumulated depreciation are removed from the accounts and any resulting gain or loss is recorded in other expense (income), net within the consolidated statements of operations.
Capitalized Software Development Costs
The Company capitalizes certain costs associated with creating and enhancing internally developed software related to the Company’s technology infrastructure and such costs are recorded within property, equipment and software, net. These costs include personnel and related employee benefit expenses for employees who are directly associated with and who devote time to software
VIANT TECHNOLOGY INC.
NOTES TO THE CONSOLIDATED FINANCIAL STATEMENTS
(tabular dollars in thousands, except for per share/unit data)
development projects. Software development costs that do not qualify for capitalization are expensed as incurred and recorded in technology and development expense in the consolidated statements of operations.
Software development activities typically consist of three stages: (1) the planning phase; (2) the application and infrastructure development stage; and (3) the post implementation stage. Costs incurred in the planning and post implementation phases, including costs associated with training and repairs and maintenance of the developed technologies, are expensed as incurred. The Company capitalizes costs associated with software developed when the preliminary project stage is completed, management implicitly or explicitly authorizes and commits to funding the project and it is probable that the project will be completed and perform as intended. Costs incurred in the application and infrastructure development phases, including significant enhancements and upgrades, are capitalized. Capitalization ends once a project is substantially complete and the software is ready for its intended purpose. Software development costs are depreciated using a straight-line method over the estimated useful life, commencing when the software is ready for its intended use. The straight-line recognition method approximates the manner in which the expected benefit will be derived.
Capitalized Interest
The Company capitalizes interest on borrowings related to eligible capital expenditures including development costs related to internal use software which is recorded within property, equipment and software, net. Capitalized interest is added to the cost of the qualified assets and depreciated over the estimated useful lives of the assets.
Impairment of Long-Lived Assets
Long-lived assets consist of property, equipment and software and intangible assets with estimable useful lives subject to depreciation and amortization. The Company reviews long-lived assets for impairment whenever events or changes in circumstances indicate that the carrying amount of an asset or asset group may not be recoverable. Recoverability of an asset or asset group to be held and used is measured by a comparison of the carrying amount of an asset or asset group to the estimated undiscounted future cash flows expected to be generated by the asset or asset group. If the carrying amount of the asset or asset group exceeds its estimated future cash flows, an impairment charge is recognized in the amount by which the carrying amount of the asset or asset group exceeds the fair value of the asset or asset group.
Goodwill
Goodwill is tested at least annually for impairment as of the first day of the fourth fiscal quarter, or more frequently if indicators of impairment exist during the fiscal year. Events or circumstances which could trigger an impairment review include a significant adverse change in legal factors or in the business climate, loss of key customers, an adverse action or assessment by a regulator, unanticipated competition, a loss of key personnel, significant changes in the manner of the Company’s use of the acquired assets or the strategy for the Company’s overall business, significant negative industry or economic trends, or significant underperformance relative to expected historical or projected future results of operations. The Company assesses its conclusion regarding reporting units in conjunction with its annual goodwill impairment test and has determined that it has one reporting unit for the purposes of allocating and testing goodwill.
When testing goodwill for impairment, the Company first performs a qualitative assessment. If the Company determines it is more likely than not that a reporting unit’s fair value is less than its carrying amount, then a one-step impairment test is required. If the Company determines it is not more likely than not a reporting unit’s fair value is less than its carrying amount, then no further analysis is necessary. To identify whether a potential impairment exists, the Company compares the estimated fair value of the reporting unit with its carrying amount, including goodwill. If the estimated fair value of the reporting unit exceeds its carrying amount, goodwill is not considered to be impaired. If, however, the fair value of the reporting unit is less than its carrying amount, then such balance would be recorded as an impairment loss. Any impairment loss is limited to the carrying amount of goodwill within the entity.
Paycheck Protection Program Loan
On April 14, 2020, the Company received the proceeds from a loan in the amount of approximately $6.0 million (the “PPP Loan”) from PNC Bank, as lender, pursuant to the Paycheck Protection Program (“PPP”) of the Coronavirus Aid, Relief, and Economic Security Act (the “CARES Act”). The Company accounted for the PPP Loan as a financial liability in accordance with ASC Topic 470, Debt. Accordingly, the PPP Loan was recognized within long-term debt and current portion of long-term debt in the Company’s consolidated balance sheet and the related accrued interest was included within accrued liabilities in the Company’s consolidated balance sheet as of December 31, 2020. In June 2021, the Company received a notice of forgiveness of the PPP Loan in whole, including all accrued unpaid interest. The forgiveness of the loan is recognized within "Gain on extinguishment of debt" on the consolidated statement of operations for the year ended December 31, 2021. Refer to Note 8—Revolving Credit Facility and PPP Loan for additional information.
VIANT TECHNOLOGY INC.
NOTES TO THE CONSOLIDATED FINANCIAL STATEMENTS
(tabular dollars in thousands, except for per share/unit data)
Fair Value of Financial Instruments
The framework for measuring fair value and related disclosure requirements about fair value measurements are provided in ASC 820, Fair Value Measurement (“ASC 820”). This pronouncement defines fair value as the price that would be received to sell an asset or paid to transfer a liability (an exit price) in the principal or most advantageous market for the asset or liability in an orderly transaction between market participants on the measurement date. The fair value hierarchy prescribed by ASC 820 contains three input levels as follows:
•Level 1: Unadjusted quoted prices in active markets for identical assets or liabilities accessible to the reporting entity at the measurement date.
•Level 2: Other than quoted prices included in Level 1 inputs that are observable for the asset or liability, either directly or indirectly, for substantially the full term of the asset or liability.
•Level 3: Unobservable inputs for the asset or liability used to measure fair value to the extent that observable inputs are not available, thereby allowing for situations in which there is little, if any, market activity for the asset or liability at the measurement date.
The carrying amounts of the Company’s cash and cash equivalents, accounts receivable, accounts payable, accrued compensation and accrued liabilities approximate fair value due to the short-term nature of these instruments.
Financial Instruments Not Recorded at Fair Value on a Recurring Basis
Certain financial instruments, including debt, are not measured at fair value on a recurring basis in the consolidated balance sheets. The fair value of debt was estimated using primarily level 2 inputs including quoted market prices or discounted cash flow analyses, based on estimated incremental borrowing rates for similar types of borrowing arrangements. As of December 31, 2022, there was no outstanding balance under the Loan Agreement.
Assets and Liabilities Recorded at Fair Value on a Non-Recurring Basis
Certain assets and liabilities, including goodwill and intangible assets, are subject to measurement at fair value on a non-recurring basis if there are indicators of impairment or if they are deemed to be impaired as a result of an impairment review.
Leases
At the beginning of fiscal 2022, the Company adopted new lease accounting guidance issued by the FASB. The most significant change requires lessees to record the present value of operating lease payments as operating lease assets and lease liabilities on its balance sheet and disclose key information about leasing arrangements.
We adopted the new guidance using the modified retrospective method at the beginning of fiscal 2022. As such, the consolidated balance sheets for prior periods are not comparable to our fiscal 2022 periods. The Company adopted the new guidance by applying the package of practical expedients permitted under the transition guidance, which allowed the Company to carry forward its original assessment of whether:
•our existing arrangements are or contain leases;
•our existing arrangements are operating or finance leases; and
•to capitalize initial direct costs.
The adoption of the new guidance resulted in the recognition of operating lease assets of approximately $21.0 million and operating lease liabilities of approximately $22.0 million, which were measured by the present value of the remaining minimum lease payments. In accordance with the guidance, the Company elected the practical expedient to exclude leases with a term of less than one year from the measurement of operating lease assets and lease liabilities. The Company also elected the practical expedient that allows lessees the option to account for lease and non-lease components together as a single component for all real estate classes of underlying assets. At adoption, in the consolidated balance sheet, we also reclassified deferred rent of approximately $1.0 million for operating leases at the end of the fiscal year ended December 31, 2021 from other current liabilities (current portion) and other long-term liabilities (non-current portion) to current portion of operating lease liabilities and long-term portion of operating lease liabilities, respectively. The impact on the Company’s consolidated statements of operations and cash flows was not material.
The present value of the lease payments was calculated using the Company’s incremental borrowing rate applicable to the lease, which is determined by estimating what it would cost the Company to borrow a collateralized amount equal to the total lease payments over the lease term based on the contractual terms of the lease and the location of the leased asset.
We determine whether an arrangement is a lease at the contract inception date. Our leases may require us to make fixed rental payments or variable lease payments, which are based on a variety of factors including property values, tax and utility rates, property
VIANT TECHNOLOGY INC.
NOTES TO THE CONSOLIDATED FINANCIAL STATEMENTS
(tabular dollars in thousands, except for per share/unit data)
services fees, and other factors. Since these costs are variable in nature, they are excluded from the measurement of the reported operating lease assets and liabilities and are expensed as incurred. The Company records rent expense for operating leases, some of which have escalating rent payments, on a straight-line basis over the lease term.
Concentration of Risk
Financial instruments that potentially subject the Company to concentration of risk consist principally of cash and cash equivalents and accounts receivable. The Company maintains its cash with financial institutions and its cash levels exceed the Federal Deposit Insurance Corporation (FDIC) federally insured limits. Accounts receivable include amounts due from customers with principal operations primarily in the United States.
As of December 31, 2022, no individual customers accounted for more than 10.0% of consolidated accounts receivable. As of December 31, 2021, two individual customers accounted for 13.2% and 12.3% of consolidated accounts receivable. For the years ended December 31, 2022, 2021, and 2020, no individual customers accounted for more than 10.0% of consolidated revenue.
The following table provides the Company’s concentrations of credit risk with respect to advertising agency holding companies as a percentage of the Company’s total revenues.
| | | | | | | | | | | |
| Year Ended
December 31, |
| 2022 | | 2021 |
| Advertising Agency Holding Company | | | |
| A | <10.0 % | | 15.5 | % |
| B | 13.5 | % | | 14.2 | % |
As of December 31, 2022, one supplier accounted for 24.6% of consolidated accounts payable and accrued liabilities. As of December 31, 2021, one supplier accounted for 16.8% of consolidated accounts payable and accrued liabilities..
Related Party Relationships
Capital V LLC (formerly Four Brothers 2 LLC), the holder of Class B common stock as of December 31, 2022, is controlled by the Company’s co-founders, Tim Vanderhook and Chris Vanderhook, and therefore is considered a related party. Refer to Note 9—Convertible Preferred Units and Common Units and Note 16—Related Parties for additional information.
Income Taxes
The Company is the managing member of Viant Technology LLC and, as a result, consolidates the financial results of Viant Technology LLC in the consolidated financial statements. Viant Technology LLC is a pass-through entity for U.S. federal and most applicable state and local income tax purposes following a corporate reorganization effected in connection with our initial public offering. As an entity classified as a partnership for tax purposes, Viant Technology LLC is not subject to U.S. federal and certain state and local income taxes. Any taxable income or loss generated by Viant Technology LLC is passed through to and included in the taxable income or loss of its members, including us. The Company is taxed as a corporation and pays corporate federal, state and local taxes with respect to income allocated from Viant Technology LLC, based on Viant Technology Inc.'s 23.7% interest in Viant Technology LLC.
The Company accounts for income taxes under the asset and liability method, which requires the recognition of deferred tax assets and liabilities (“DTAs” and “DTLs”) for the expected future tax consequences of events that have been included in the financial statements. Under this method, we determine DTAs and DTLs on the basis of the differences between the financial statement and tax bases of assets and liabilities by using enacted tax rates in effect for the year in which the differences are expected to reverse. The effect of a change in tax rates on DTAs and DTLs is recognized in income in the period that includes the enactment date. We recognize DTAs to the extent that we believe that these assets are more likely than not to be realized. In making such a determination, we consider all available positive and negative evidence, including future reversals of existing taxable temporary differences, projected future taxable income, tax-planning strategies, carryback potential if permitted under the tax law and results of recent operations. If we determine that we would be able to realize our DTAs in the future in excess of their net recorded amount, we would make an adjustment to the DTA valuation allowance, which would reduce the provision for income taxes.
The Company records uncertain tax positions in accordance with ASC 740 on the basis of a two-step process in which (1) we determine whether it is more likely than not that the tax positions will be sustained on the basis of the technical merits of the position and (2) for those tax positions that meet the more-likely-than-not recognition threshold, we recognize the largest amount of tax benefit that is more than 50 percent likely to be realized upon ultimate settlement with the related tax authority.
VIANT TECHNOLOGY INC.
NOTES TO THE CONSOLIDATED FINANCIAL STATEMENTS
(tabular dollars in thousands, except for per share/unit data)
Tax Receivable Agreement
The Company expects to obtain an increase in its share of tax basis in the net assets of Viant Technology LLC when Class B units are exchanged by the holders of Class B units for shares of Class A common stock of the Company and upon other qualifying transactions. Each change in outstanding shares of Class A common stock of the Company results in a corresponding increase or decrease in the Company's ownership of Class A units of Viant Technology LLC. The Company intends to treat any exchanges of Class B units as direct purchases of LLC interests for U.S. federal income tax purposes. These increases in tax basis may reduce the amounts that the Company would otherwise pay in the future to various taxing authorities. They may also decrease gains (or increase losses) on future dispositions of certain capital assets to the extent tax basis is allocated to those capital assets.
In connection with the IPO, the Company entered into a Tax Receivable Agreement (“TRA”) with Viant Technology LLC and the holders of Class B units of Viant Technology LLC. In the event that such parties exchange any or all of their Class B units for Class A common stock, the TRA requires the Company to make payments to such holders for 85% of the tax benefits realized, or in some cases deemed to be realized, by the Company by such exchange as a result of (i) increases in the Company’s tax basis of its ownership interest in the net assets of Viant Technology LLC resulting from any redemptions or exchanges of noncontrolling interest, (ii) tax basis increases attributable to payments made under the TRA and (iii) deductions attributable to imputed interest pursuant to the TRA (the “TRA Payments”). The annual tax benefits are computed by calculating the income taxes due, including such tax benefits and the income taxes due without such benefits. The Company expects to benefit from the remaining 15% of any tax benefits that it may actually realize. The TRA Payments are not conditioned upon any continued ownership interest in Viant Technology LLC or the Company. To the extent that the Company is unable to timely make payments under the TRA for any reason, such payments generally will be deferred and will accrue interest until paid.
The timing and amount of aggregate payments due under the TRA may vary based on a number of factors, including the amount and timing of the taxable income the Company generates each year and the tax rate then applicable. The Company calculates the liability under the TRA using a TRA model, which includes an assumption related to the fair market value of assets. The payment obligations under the TRA are obligations of the Company and not of Viant Technology LLC. Payments are generally due under the TRA within a specified period of time following the filing of the Company’s tax return for the taxable year with respect to which the payment obligation arises, although interest on such payments will begin to accrue at a rate of the Secured Overnight Financing Rate plus 500 basis points from the due date (without extensions) of such tax return.
The TRA provides that if (i) certain mergers, asset sales, other forms of business combinations, or other changes of control were to occur, (ii) there is a material breach of any material obligations under the TRA; or (iii) the Company elects an early termination of the TRA, then the TRA will terminate and the Company's obligations, or the Company's successor’s obligations, under the TRA will accelerate and become due and payable, based on certain assumptions, including an assumption that the Company would have sufficient taxable income to fully utilize all potential future tax benefits that are subject to the TRA and that any Class B units that have not been exchanged are deemed exchanged for the fair market value of the Company's Class A common stock at the time of termination.
Treasury Stock
We account for treasury stock under the cost method. When treasury stock is re-issued at a price higher than its cost, the difference is recorded as a component of additional paid-in-capital in our consolidated balance sheets. When treasury stock is re-issued at a price lower than its cost, the difference is recorded as a component of additional paid-in-capital to the extent that there are previously recorded gains to offset the losses. If there are no treasury stock gains in additional paid-in-capital, the losses upon re-issuance of treasury stock are recorded as an increase in accumulated deficit in our consolidated balance sheets.
JOBS Act Election as an Emerging Growth Company
On April 5, 2012, the Jumpstart Our Business Startups Act (the “JOBS Act”) was signed into law. The JOBS Act contains provisions that, among other things, reduce certain reporting requirements for qualifying public companies. As an “emerging growth company,” the Company may, under Section 7(a)(2)(B) of the Securities Act of 1933, as amended (the “Securities Act”), delay adoption of new or revised accounting standards applicable to public companies until such standards would otherwise apply to private companies. An “emerging growth company” is one with less than $1.235 billion in annual sales, has less than $700 million in market value of its shares of common stock held by non-affiliates and issues less than $1 billion of non-convertible debt over a three-year period. The Company may take advantage of this extended transition period until the first to occur of the date that it (i) is no longer an “emerging growth company” or (ii) affirmatively and irrevocably opts out of this extended transition period.
The Company has elected to take advantage of the benefits of this extended transition period. Until the date that the Company is no longer an “emerging growth company” or affirmatively and irrevocably opts out of the exemption provided by Securities Act Section 7(a)(2)(B), upon issuance of a new or revised accounting standard that applies to its consolidated financial statements and that has a different effective date for public and private companies, the Company will disclose the date on which it will adopt the recently issued accounting standard.
VIANT TECHNOLOGY INC.
NOTES TO THE CONSOLIDATED FINANCIAL STATEMENTS
(tabular dollars in thousands, except for per share/unit data)
Recently Issued Accounting Pronouncements
Financial Instruments—Credit Losses
In June 2016, the FASB issued Accounting Standards Update (“ASU”) No. 2016-13, Financial Instruments—Credit Losses (Topic 326). ASU 2016-13 revises the impairment model to utilize an expected loss methodology in place of the currently used incurred loss methodology, which will result in more timely recognition of losses on financial instruments. The guidance is effective for the Company’s annual reporting period beginning after December 15, 2022 and interim reporting periods within that annual reporting period. The Company adopted this ASU effective January 1, 2023. The adoption of this ASU did not have a material impact on the Company’s consolidated financial statements.
Recently Adopted Accounting Pronouncements
Leases
In February 2016, the FASB issued ASU No. 2016-02, Leases (Topic 842), which requires an entity to recognize right-of-use assets and lease liabilities on its balance sheet and disclose key information about leasing arrangements. The guidance offers specific accounting guidance for a lessee, lessor, and sale and leaseback transactions. Lessees and lessors are required to disclose qualitative and quantitative information about leasing arrangements to enable a user of the financial statements to assess the amount, timing and uncertainty of cash flows arising from leases. Leases will be classified as either finance or operating, with the classification affecting the pattern of expense recognition in the income statement. As a part of the Company’s election under the JOBS Act, the guidance is effective for the Company’s annual reporting period beginning after December 15, 2021 and interim reporting periods within the annual period beginning after December 15, 2022. The Company adopted Topic 842 effective January 1, 2022 utilizing the modified retrospective transition method. The adoption of Topic 842 had a material impact on the Company’s consolidated balance sheet as certain of our operating lease commitments were recognized as right-of-use assets and lease liabilities. This new guidance did not have a material impact upon the Company’s consolidated statement of operations. We elected the package of practical expedients permitted under the transition guidance within Topic 842, which allowed us to carry forward prior conclusions about lease identification, classification and initial direct costs for leases entered into prior to adoption of Topic 842. Additionally, we elected to not separate lease and non-lease components for all of our leases. For leases with a term of 12 months or less, we elected the short-term lease exemption, which allowed us to not recognize right-of-use assets or lease liabilities for qualifying leases existing at transition and new leases we may enter into in the future.
Intangibles
In September 2018, the FASB issued ASU No. 2018-15, Intangibles—Goodwill and Other—Internal Use Software (Subtopic 350-40): Customer’s Accounting for Implementation Costs Incurred in a Cloud Computing Arrangement That Is a Service Contract (a consensus of the FASB Emerging Issues Task Force), which aligns the requirements for capitalizing implementation costs incurred in a hosting arrangement that is a service contract with the requirements for capitalizing implementation costs incurred to develop or obtain internal use software. Early adoption is permitted and can be applied prospectively to all implementation costs incurred after the date of adoption or retrospectively. The Company adopted this ASU prospectively on January 1, 2021, and the adoption of this ASU did not have a material impact on the consolidated financial statements.
Codification Improvements
In October 2020, the FASB issued ASU No. 2020-10, Codification Improvements, which updates various codification topics by clarifying disclosure requirements to align with the SEC's regulations. The guidance is effective for the Company’s annual reporting period beginning after December 15, 2021 and interim reporting periods within the annual period beginning after December 15, 2022. Effective January 1, 2022, we adopted this standard on a prospective basis. The adoption of this ASU did not have a material impact on the consolidated financial statements.
Income Taxes
In December 2020, the FASB issued ASU No. 2019-12, Income Taxes (Topic 740): Simplifying the Accounting for Income Taxes. The guidance removes certain exceptions to the general principles in Topic 740 and also clarifies and amends existing guidance to improve consistent application. The Company adopted ASU 2019-12 prospectively on January 1, 2021, and the adoption of this ASU did not have a material impact on the consolidated financial statements.
Issuer’s Accounting for Certain Modifications or Exchanges of Freestanding Equity-Classified Written Call Options
In May 2021, the FASB issued ASU No. 2021-04, Issuer’s Accounting for Certain Modifications or Exchanges of Freestanding Equity-Classified Written Call Options, which clarifies an issuer’s accounting for modifications or exchanges of freestanding equity-classified written call options that remain equity classified after modifications or exchanges. The ASU requires issuers to account for
VIANT TECHNOLOGY INC.
NOTES TO THE CONSOLIDATED FINANCIAL STATEMENTS
(tabular dollars in thousands, except for per share/unit data)
the modifications or exchanges based on the economic substance of the modification or exchange and whether the transaction was done to issue equity, to issue or modify debt, or for other reasons. We adopted this standard prospectively on January 1, 2022. The adoption did not have an impact on the consolidated financial statements.
3. Revenue
The Company recognizes revenue in accordance with ASC 606. Although the Company maintains agreements with its customers in multiple contractual forms, the overall promise within each of the contract types is to provide customers the ability to plan, buy and measure their digital advertising campaigns using our platform. Refer to Note 2—Basis of Presentation and Summary of Significant Accounting Policies for additional information
The disaggregation of revenue was as follows:
| | | | | | | | | | | | | | | | | |
| Year Ended December 31, |
| 2022 | | 2021 | | 2020 |
| Over time | $ | 800 | | | $ | 3,880 | | | $ | 4,612 | |
| Point in time | 196,368 | | | 220,247 | | | 160,639 | |
| Total revenue | $ | 197,168 | | | $ | 224,127 | | | $ | 165,251 | |
Revenue for unsatisfied performance obligations expected to be recognized in the future for contracts with an original expected duration of greater than one year was $0.1 million and $6.6 million as of December 31, 2022 and 2021, respectively. These amounts do not include contracts with an original expected duration of less than one year, which is the majority of the Company’s contracts. The decrease from the prior year end was primarily due to an agreement modification whereby the Company agreed to a $6.2 million cash settlement with one of its customers in exchange for the full, final and immediate termination of certain deferred revenue liabilities. The remaining decrease was due to the recognition of revenue during the normal course of business. As of December 31, 2022, all of the remaining balance is expected to be recognized within one year.
The following table summarizes the changes in deferred revenue balances:
| | | | | | | | | | | |
| Year Ended December 31, |
| 2022 | | 2021 |
| Beginning balance | $ | 6,551 | | | $ | 8,337 | |
| Agreement modification | (6,163) | | | — | |
| Recognition of deferred revenue | (265) | | | (1,786) | |
| Deferral of revenue | — | | | — | |
| Ending balance | $ | 123 | | | $ | 6,551 | |
The revenue recognized consisted of the Company satisfying performance obligations during the normal course of business. Deferred revenue that is anticipated to be recognized during the succeeding 12-month period is recorded in "Current portion of deferred revenue" and the remaining amount is recorded in "Long-term portion of deferred revenue" within the consolidated balance sheets.
VIANT TECHNOLOGY INC.
NOTES TO THE CONSOLIDATED FINANCIAL STATEMENTS
(tabular dollars in thousands, except for per share/unit data)
4. Property, Equipment and Software, Net
Major classes of property, equipment and software were as follows:
| | | | | | | | | | | |
| As of December 31, |
| 2022 | | 2021 |
| Capitalized software development costs | $ | 72,988 | | | $ | 61,490 | |
| Computer equipment | 1,116 | | | 1,823 | |
| Purchased software | 32 | | | 32 | |
| Furniture, fixtures and office equipment | 1,226 | | | 1,159 | |
| Leasehold improvements | 2,571 | | | 2,178 | |
| Total property, equipment and software | 77,933 | | | 66,682 | |
| Less: Accumulated depreciation | (54,827) | | | (44,351) | |
| Total property, equipment and software, net | $ | 23,106 | | | $ | 22,331 | |
Depreciation recorded in the consolidated statements of operations was as follows:
| | | | | | | | | | | | | | | | | |
| Year Ended December 31, |
| 2022 | | 2021 | | 2020 |
| Platform operations | $ | 9,786 | | | $ | 7,688 | | | $ | 6,638 | |
| Sales and marketing | — | | | — | | | — | |
| Technology and development | 1,646 | | | 1,599 | | | 1,608 | |
| General and administrative | 580 | | | 625 | | | 631 | |
| Total | $ | 12,012 | | | $ | 9,912 | | | $ | 8,877 | |
Interest cost recorded in the consolidated balance sheets and consolidated statements of operations was as follows:
| | | | | | | | | | | | | | | | | |
| Year Ended December 31, |
| 2022 | | 2021 | | 2020 |
| Amount charged to expense | $ | 450 | | | $ | 865 | | | $ | 1,055 | |
| Amount capitalized within property, equipment and software, net | 4 | | | 20 | | | 31 | |
| Total interest cost | $ | 454 | | | $ | 885 | | | $ | 1,086 | |
5. Leases
At the beginning of fiscal 2022, the Company adopted new FASB guidance that requires lessees to record the present
value of operating lease payments as right-of-use assets and lease liabilities on the balance sheet. Refer to Note 2—Basis of Presentation and Summary of Significant Accounting Policies for additional information.
Lessee Arrangements
The Company has operating leases for its office space, which have remaining lease terms of up to eight years. The Company does not have finance leases.
Some of our leases include renewal options to extend the leases for up to five years and/or termination options to terminate the leases within one year. If it is reasonably certain that a renewal or termination option will be exercised, the exercise of the option is considered in calculating the term of the lease.
During the year ended December 31, 2022, the Company entered into an operating lease for office space in New York. In conjunction with this lease, PNC Bank, National Association (“PNC Bank”) issued a standby letter of credit for the amount of $0.4 million in favor of the lessor, to satisfy the security deposit of the leased property.
As of December 31, 2022, our operating leases had a weighted-average remaining lease term of approximately seven years and a weighted-average incremental borrowing rate of 3.5%.
VIANT TECHNOLOGY INC.
NOTES TO THE CONSOLIDATED FINANCIAL STATEMENTS
(tabular dollars in thousands, except for per share/unit data)
Cash paid for amounts included in the measurement of operating lease liabilities was $2.3 million for the year ended December 31, 2022.
The components of lease expense were as follows:
| | | | | |
| Year Ended December 31, |
| 2022 |
| Operating lease cost | $ | 3,669 | |
| Short-term lease cost | 1,399 | |
| Variable lease cost | 124 | |
| $ | 5,192 | |
Future minimum lease payments as of December 31, 2022 were as follows:
| | | | | |
| As of December 31, |
| Year | 2022 |
| 2023 | $ | 4,648 | |
| 2024 | 4,385 | |
| 2025 | 4,270 | |
| 2026 | 4,257 | |
| 2027 | 4,182 | |
| Thereafter | 10,811 | |
| Total undiscounted future lease payments | 32,553 | |
| Less: Imputed interest | (3,844) | |
| Present value of operating lease liabilities | 28,709 | |
| Less: Operating lease liabilities, current | (3,711) | |
| Operating lease liabilities, noncurrent | $ | 24,998 | |
Disclosures related to periods prior to the adoption of ASC 842
For the years ended December 31, 2021 and 2020, rent expense was $4.4 million and $4.2 million, respectively, recorded on a straight-line basis over the lease term. Deferred rent is the difference between cash payments for rent and the expense recorded. The current portion of deferred rent was $0.2 million as of December 31, 2021 and the non-current portion of deferred rent was $0.8 million as of December 31, 2021. These balances were reclassified upon the adoption of ASC842 and are included in the respective current and long-term portion of operating lease liabilities in the consolidated balance sheets.
Future minimum payments under the Company’s non-cancelable operating leases, primarily related to office space, as of December 31, 2021 are as follows:
| | | | | |
| As of December 31, |
| Year | 2021 |
| 2022 | $ | 3,039 | |
| 2023 | 3,953 | |
| 2024 | 3,060 | |
| 2025 | 2,991 | |
| 2026 | 2,974 | |
| Thereafter | 13,739 | |
| Total minimum payments | $ | 29,756 | |
VIANT TECHNOLOGY INC.
NOTES TO THE CONSOLIDATED FINANCIAL STATEMENTS
(tabular dollars in thousands, except for per share/unit data)
6. Goodwill and Intangible Assets, Net
The Company’s goodwill balance of $12.4 million as of December 31, 2022 and 2021, was recorded as part of the Company’s February 2017 acquisition of Adelphic. The goodwill balance was determined based on the excess of the purchase price over the fair value of the identifiable net assets acquired and represents its future revenue and earnings potential and certain other assets acquired that do not meet the recognition criteria, such as assembled workforce.
Goodwill is tested for impairment at least annually as of the first day of the fourth fiscal quarter, or more frequently if indicators of impairment exist during the fiscal year. Refer to Note 2—Basis of Presentation and Summary of Significant Accounting Policies for additional information. The Company performed an impairment test of its goodwill as of the first day of the fourth fiscal quarter in accordance with the policy. The results of this test indicated that the Company’s goodwill was not impaired. No goodwill impairment was recorded for the years ended December 31, 2022, 2021 or 2020. As of December 31, 2022, there is no accumulated goodwill impairment loss.
Intangible assets primarily consist of acquired developed technology, customer relationships, trade names and trademarks resulting from business combinations and acquired patent intangible assets, which are recorded at acquisition-date fair value, less accumulated amortization. The Company determines the appropriate useful life of its intangible assets by performing an analysis of expected cash flows of the acquired assets. Intangible assets are amortized over their estimated useful lives using a straight-line method, which approximates the pattern in which the economic benefits are consumed. No impairment was recorded for intangible assets or other long-lived assets during the years ended December 31, 2022, 2021 or 2020.
The balances of intangibles assets and accumulated amortization are as follows:
| | | | | | | | | | | | | | | | | | | | | | | |
| As of December 31, 2022 |
| Remaining
Weighted-
Average
Useful Life
(years) | | Gross
Amount | | Accumulated
Amortization | | Net
Carrying
Amount |
| Developed technology | 0.1 | | $ | 4,927 | | | $ | (4,869) | | | $ | 58 | |
| Customer relationships | 1.1 | | 2,300 | | | (1,944) | | | 356 | |
| Trademarks/tradenames | 3.2 | | 1,400 | | | (1,147) | | | 253 | |
| Total | | | $ | 8,627 | | | $ | (7,960) | | | $ | 667 | |
| | | | | | | | | | | | | | | | | | | | | | | |
| As of December 31, 2021 |
| Remaining
Weighted-
Average
Useful Life
(years) | | Gross
Amount | | Accumulated
Amortization | | Net
Carrying
Amount |
| Developed technology | 1.1 | | $ | 4,927 | | | $ | (4,169) | | | $ | 758 | |
| Customer relationships | 2.1 | | 2,300 | | | (1,615) | | | 685 | |
| Trademarks/tradenames | 4.0 | | 1,400 | | | (1,057) | | | 343 | |
| Total | | | $ | 8,627 | | | $ | (6,841) | | | $ | 1,786 | |
Amortization recorded in the consolidated statements of operations was as follows:
| | | | | | | | | | | | | | | | | |
| Year Ended December 31, |
| 2022 | | 2021 | | 2020 |
| Platform operations | $ | 700 | | | $ | 700 | | | $ | 700 | |
| Sales and marketing | — | | | — | | | — | |
| Technology and development | — | | | — | | | — | |
| General and administrative | 419 | | | 529 | | | 529 | |
| Total | $ | 1,119 | | | $ | 1,229 | | | $ | 1,229 | |
VIANT TECHNOLOGY INC.
NOTES TO THE CONSOLIDATED FINANCIAL STATEMENTS
(tabular dollars in thousands, except for per share/unit data)
Estimated future amortization of intangible assets as of December 31, 2022 is as follows:
| | | | | |
| As of December 31, |
| Year | 2022 |
| 2023 | $ | 467 | |
| 2024 | 107 | |
| 2025 | 80 | |
| 2026 | 13 | |
| 2027 | — | |
| Thereafter | — | |
| Total | $ | 667 | |
7. Accrued Liabilities
The Company’s accrued liabilities consisted of the following:
| | | | | | | | | | | |
| As of December 31, |
| 2022 | | 2021 |
| Accrued traffic acquisition costs | $ | 29,631 | | | $ | 30,942 | |
| Other accrued liabilities | 5,432 | | | 3,144 | |
| Total accrued liabilities | $ | 35,063 | | | $ | 34,086 | |
8. Revolving Credit Facility and PPP Loan
The Company’s debt and revolving credit facilities consisted of the following:
| | | | | | | | | | | |
| As of December 31, |
| 2022 | | 2021 |
| Revolving credit facility | $ | — | | | $ | 17,500 | |
| PPP Loan | — | | | — | |
| Total debt | — | | | 17,500 | |
| Less: Current portion of long-term debt | — | | | — | |
| Total long-term debt | $ | — | | | $ | 17,500 | |
Revolving Credit Facility
On October 31, 2019, we entered into an asset-based revolving credit and security agreement (the “Loan Agreement”) with PNC Bank. The Loan Agreement provides a senior secured revolving credit facility of up to $40.0 million with a maturity date of October 31, 2024. The Loan Agreement is collateralized by security interests in substantially all of our assets.
Advances under the Loan Agreement bear interest through maturity at a variable rate based upon our selection of either a Domestic Rate or a LIBOR Rate, plus an applicable margin (“Domestic Rate Loans” and “LIBOR Rate Loans”). The Domestic Rate is defined as a fluctuating interest rate equal to the greater of (1) the base commercial lending rate of PNC Bank, (2) the overnight federal funds rate plus 0.50% and (3) the Daily LIBOR Rate plus 1.00%. The effective weighted average interest rate for the year ended December 31, 2022 was 0.69%. The applicable margin is between 0.75% to 1.25% for Domestic Rate Loans and between 1.75% and 2.25% for LIBOR Rate Loans based on maintaining certain undrawn availability ratios. The applicable margin as of December 31, 2022 was equal to 0.75% for Domestic Rate Loans and 1.75% for LIBOR Rate Loans. The facility fee for undrawn amounts under the Loan Agreement is 0.375% per annum. We will be required to pay customary letter of credit fees, as necessary.
The Loan Agreement contains customary conditions to borrowings, events of default and covenants, including covenants that restrict our ability to sell assets, make changes to the nature of the business, engage in mergers or acquisitions, incur, assume or permit to exist additional indebtedness and guarantees, create or permit to exist liens, pay dividends, issue equity instruments, make distributions or redeem or repurchase capital stock or make other investments, and engage in transactions with affiliates. The Loan
VIANT TECHNOLOGY INC.
NOTES TO THE CONSOLIDATED FINANCIAL STATEMENTS
(tabular dollars in thousands, except for per share/unit data)
Agreement also requires that we maintain compliance with a minimum Fixed Charge Coverage Ratio (as defined in the Loan Agreement) of 1.40 to 1.00 at any time undrawn availability under the Loan Agreement is less than 25%. As of December 31, 2022, we were in compliance with all covenants.
On May 6, 2022, the Company fully paid off the outstanding balance of advances under our revolving credit facility, and the carrying value as of December 31, 2022 was zero.
The carrying value as of December 31, 2021 was $17.5 million, which was recorded in “Long-term debt” on the consolidated balance sheet and approximated its fair value as the interest rate is variable and approximates prevailing market interest rates for similar debt arrangements. The fair value of debt was estimated using primarily Level 2 inputs including quoted market prices or discounted cash flow analyses, based on estimated incremental borrowing rates for similar types of borrowing arrangements.
PPP Loan
On April 14, 2020, the Company received proceeds from the PPP Loan in the amount of approximately $6.0 million from PNC Bank, as lender, pursuant to the Paycheck Protection Program of the Coronavirus Aid, Relief, and Economic Security Act ("CARES Act"). The PPP Loan, which was evidenced by a note dated April 11, 2020, bore interest at an annual rate of 1.0% and matured on April 11, 2022. No interest or principal was due during the first fifteen months after April 11, 2020, although interest continued to accrue over this fifteen-month deferral period.
Proceeds from loans granted under the CARES Act were to be used for payroll, costs to continue employee group health care benefits, rent, utilities and certain other qualified costs (collectively, “qualifying expenses”). The Company used the PPP Loan proceeds for qualifying expenses. In June 2021, the Company received notice of forgiveness of the PPP Loan in whole, including all accrued unpaid interest and recorded the forgiveness of approximately $6.0 million of principal and $0.1 million of accrued interest in "Gain on extinguishment of debt" in the consolidated statements of operations for the year ended December 31, 2021.
9. Convertible Preferred Units and Common Units
2016 and 2019 Convertible Preferred Units
Pursuant to the Unit Repurchase Agreement completed on October 31, 2019, the 600,000 2016 convertible preferred units representing the Former Holdco’s ownership interest were retired by Viant Technology LLC, and Viant Technology LLC sold 600,000 2019 convertible preferred units to Capital V LLC.
The 2016 convertible preferred units held by the Former Holdco had a liquidation preference of $190.65 per unit. Each preferred unit was convertible at the option of the holder at any time into one common unit by written notice to Viant Technology LLC.
The liquidation preference provisions of the 2016 convertible preferred units held by the Former Holdco were considered contingent redemption provisions because there were certain elements that were not solely within the control of Viant Technology LLC, such as a change in control of Viant Technology LLC. Accordingly, Viant Technology LLC has presented these 2016 convertible preferred units within the mezzanine portion of the accompanying consolidated balance sheets.
The 2019 convertible preferred units held by Capital V LLC have a liquidation preference equal to the initial capital contribution plus an annual preferred return available to the holders only upon liquidation, which is calculated on a daily basis by multiplying the accrued stated value of the unit on the first day of each calendar quarter by 0.028% (10% divided by 360). The accrued stated value is calculated as $12.50 per preferred unit plus the accrued return. Each preferred unit may be converted at the option of the holder at any time into one common unit by written notice to Viant Technology LLC.
The liquidation preference provisions of the 2019 convertible preferred units held by Capital V LLC are considered contingent redemption provisions because there are certain elements that are not solely within the control of Viant Technology LLC, such as a change in control of Viant Technology LLC. Accordingly, the Company has presented the 2019 convertible preferred stock within the mezzanine portion of the accompanying consolidated balance sheets.
The 2019 convertible preferred units were issued at an implied discount of $27.6 million, representing a beneficial conversion feature recorded in additional paid-in capital of the same amount. A beneficial conversion feature is measured as the difference between the effective conversion price of the 2019 convertible preferred units, $12.50 per unit, and the fair value of the common units into which the preferred units are convertible at issuance, $58.43 per unit. Since the 2019 convertible preferred units are perpetual in that they have no stated maturity date and are immediately convertible at any time, the discount upon issuance was immediately and fully amortized as a deemed dividend on the issuance date.
The fair value of common units was derived using the Black-Scholes-Merton option valuation model, which incorporated a combination of the market approach and income approach weighted at 50% to each approach. The valuation model requires the
VIANT TECHNOLOGY INC.
NOTES TO THE CONSOLIDATED FINANCIAL STATEMENTS
(tabular dollars in thousands, except for per share/unit data)
Company to make assumptions and judgments regarding the variables used in the calculation. These variables include the expected term, expected volatility, expected risk-free interest rate and other relevant inputs. Expected term is based on the estimated liquidation event occurrence.
Expected volatility is based on 3.25-year historical volatility of guideline companies commensurate with the time period. The expected risk-free rate is based on the yield of 3-year U.S. Treasury notes as of the valuation date.
The following outlines the option valuation assumptions used in the fair value calculation of common units:
| | | | | |
| Risk-free interest rate | 2.28 | % |
| Volatility | 70 | % |
| Expected term | < 2 years |
| Discount for lack of marketability | 29 | % |
Common Units
There were 400,000 common units authorized, issued and outstanding as of December 31, 2020. Distributions to members, as determined and approved by the board of managers, are made to holders of preferred and common units in proportion to their holdings of common units then outstanding on an as-converted basis. All profit and loss allocations, including those made as a result of a capital transaction, will be made pursuant to the provisions of the Viant Technology LLC Agreement.
Member Dividend Distributions
In October 2020, Viant Technology LLC’s board of managers declared and approved a distribution of $5.0 million to the holders of preferred and common units in accordance with the provisions of the Viant Technology LLC Agreement, resulting in payment of $3.0 million to the preferred unitholders and $2.0 million to the common unitholders.
In connection with the IPO in February 2021, the preferred and common units of Viant Technology LLC were converted to Class B units and thus have no balance as of December 31, 2022 and 2021. Refer to Note 12—Earnings (Loss) Per Share/Unit for additional information.
10. Stock-based Compensation
During the year ended December 31, 2020, employees and other service providers were eligible to be granted profit interests in the form of common units under an equity incentive plan or other arrangement approved by the board of managers. The recipients of the common units were not required to make any capital contributions in exchange for their units.
Stock-based compensation recorded in the consolidated statements of operations was as follows:
| | | | | | | | | | | | | | | | | |
| Year Ended December 31, |
| 2022 | | 2021 | | 2020 |
| Platform operations | $ | 4,761 | | | $ | 13,096 | | | $ | — | |
| Sales and marketing | 9,010 | | | 25,639 | | | — | |
| Technology and development | 5,323 | | | 12,373 | | | — | |
| General and administrative | 9,807 | | | 17,714 | | | — | |
| Total | $ | 28,901 | | | $ | 68,822 | | | $ | — | |
Phantom Unit Plan and 2021 LTIP
On January 1, 2020, Viant Technology LLC formalized the 2020 Equity Based Incentive Compensation Plan (the “Phantom Unit Plan”), under which Viant Technology LLC was authorized to issue 12,500,000 phantom units. Upon the occurrence of a liquidation event, the units will participate in any increase in the fair value of the entity above the stated distribution threshold of $100 million. The units vest on a quarterly basis over four years, and all units granted to an employee, whether vested or unvested, automatically forfeit upon termination of employment for any reason. Based on the terms of the Phantom Unit Plan and unit award grants, no compensation cost was recorded in the consolidated statement of operations for the year ended December 31, 2020.
In connection with the IPO, which occurred on February 12, 2021, the Phantom Unit Plan was replaced by the 2021 LTIP. The aggregate maximum number of shares of the Company’s Class A common stock that may be issued pursuant to stock awards under the 2021 LTIP, or the Share Reserve, is 11,787,112 shares of Class A common stock. The Share Reserve will automatically increase
VIANT TECHNOLOGY INC.
NOTES TO THE CONSOLIDATED FINANCIAL STATEMENTS
(tabular dollars in thousands, except for per share/unit data)
on January 1 of each year commencing on January 1, 2022 and ending with a final increase on January 1, 2031 in an amount equal to 5% of the total number of shares of capital stock outstanding on December 31st of the preceding calendar year; provided, however, that the Company’s board of directors may provide that there will not be a January 1st increase in the Share Reserve in a given year or that the increase will be less than 5% of the shares of capital stock outstanding on the preceding December 31st.
On February 12, 2021, 6.2 million RSUs were granted under the Company’s 2021 LTIP. The Company is authorized to grant RSUs, incentive stock options, nonqualified stock options, stock appreciation rights, restricted stock awards, and performance stock awards under its 2021 LTIP. As of December 31, 2022, the Company has currently only granted RSUs and nonqualified stock options. Under the Company’s 2021 LTIP, 4.4 million shares remained available for grant as of December 31, 2022.
Stock-based Compensation
RSUs
The following summarizes RSU activity:
| | | | | | | | | | | |
| Number of Shares
(in thousands) | | Weighted-
Average
Grant-Date Fair
Value |
| RSUs outstanding as of December 31, 2021 | 3,033 | | | $ | 24.29 | |
| Granted | 3,023 | | | 5.96 | |
| Vested | (1,338) | | 24.26 | |
| Canceled/forfeited | (790) | | 12.38 | |
| RSUs outstanding as of December 31, 2022 | 3,928 | | $ | 12.59 | |
The total fair value of RSUs, as of their respective vesting dates, during the year ended December 31, 2022 was $7.5 million. As of December 31, 2022, the Company had unrecognized stock-based compensation relating to RSUs of approximately $41.1 million, which is expected to be recognized over a weighted-average period of 2.5 years.
Nonqualified Stock Options
The following summarizes nonqualified stock option activity:
| | | | | | | | | | | | | | | | | | | | | | | |
| Number of Options
(in thousands) | | Weighted-Average
Exercise Price | | Weighted-Average
Remaining Contractual Term
(years) | | Aggregate Intrinsic Value
(in thousands) |
| Options outstanding as of December 31, 2021 | 220 | | $ | 15.88 | | | 9.7 | | $ | 20 | |
| Granted | 4,101 | | 5.98 | | | | | |
| Exercised | — | | — | | | | | |
| Canceled | (648) | | 8.32 | | | | | |
| Expired | (12) | | 15.51 | | | | | |
| Options outstanding as of December 31, 2022 | 3,661 | | $ | 6.14 | | | 9.2 | | $ | — | |
| | | | | | | |
| Vested and exercisable | 44 | | $ | 18.55 | | | 4.0 | | $ | — | |
The weighted-average grant date fair value of options granted during the year ended December 31, 2022 was $3.50 per share. As of December 31, 2022, the Company had unrecognized stock-based compensation relating to unvested nonqualified stock options of approximately $10.3 million, which is expected to be recognized over a weighted-average period of 3.2 years.
The following table presents the assumptions used in the Black-Scholes model to determine the fair value of nonqualified stock options for the years ended December 31, 2022 and 2021.
VIANT TECHNOLOGY INC.
NOTES TO THE CONSOLIDATED FINANCIAL STATEMENTS
(tabular dollars in thousands, except for per share/unit data)
| | | | | | | | | | | |
| Year Ended December 31, |
| 2022 | | 2021 |
| Risk free interest rate | 1.4% - 2.8% | | 1.2 | % |
| Expected volatility | 61.5% - 62.7% | | 61.1 | % |
| Expected term (in years) | 5.9 - 6.0 | | 5.9 |
| Expected dividend yield | 0.0 | % | | 0.0 | % |
Risk-Free Interest Rate. The Company bases the risk-free interest rate assumption for equity awards on the rates for U.S. Treasury securities with maturities similar to those of the expected term of the award being valued.
Expected Volatility. Due to the limited trading history of the Company’s common stock, the expected volatility assumption is based on volatilities of a peer group of similar companies whose share prices are publicly available. The Company will continue to apply this process until a sufficient amount of historical information regarding the volatility of the Company’s own stock price becomes available.
Expected Term. Given the insufficient historical data relating to nonqualified stock option exercises, the expected term assumption is based on expected terms of a peer group of similar companies whose expected terms are publicly available. The Company will continue to apply this process until a sufficient amount of historical information regarding the Company’s nonqualified stock option exercises becomes available.
Expected Dividend Yield. The Company’s expected dividend yield assumption is zero as it has never paid dividends and has no present intention to do so in the future.
Issuance of Shares
Upon vesting of shares under the LTIP, we will issue treasury stock. If treasury stock is not available, Class A common stock will be issued.
11. Income Taxes and Tax Receivable Agreement
The provision for income taxes differs from the amount of income tax computed by applying the applicable U.S. statutory federal income tax rate of 21% to income before provision of income taxes due to Viant Technology LLC’s pass-through structure for U.S. income tax purposes and the valuation allowance against the deferred tax asset in the current and prior-year periods, as well as a pass-through permanent difference related to the forgiveness of the PPP Loan in the prior-year periods. The Company did not recognize an income tax benefit (expense) on its share of pre-tax book income (loss), exclusive of the noncontrolling interest of 76.3% due to the full valuation allowance against its deferred tax assets, resulting in an effective tax rate ("ETR") of 0.0% for the 12 months ended December 31, 2022 and 2021.
The Company is the managing member of Viant Technology LLC and, as a result, consolidates the financial results of Viant Technology LLC in the consolidated financial statements. Viant Technology LLC is a pass-through entity for U.S. federal and most applicable state and local income tax purposes following a corporate reorganization effected in connection with the IPO. As an entity classified as a partnership for tax purposes, Viant Technology LLC is not subject to U.S. federal and certain state and local income taxes. Prior to the IPO during 2021, the Company did not exist and thus no income tax expense was recognized for Viant Technology LLC for the period ended December 31, 2020. Subsequent to the IPO, any taxable income or loss generated by Viant Technology LLC is passed through to and included in the taxable income or loss of its members, including the Company. The Company is taxed as a corporation and pays corporate federal, state and local taxes with respect to income allocated from Viant Technology LLC, based on Viant Technology, Inc.'s 23.7% economic interest in Viant Technology LLC.
VIANT TECHNOLOGY INC.
NOTES TO THE CONSOLIDATED FINANCIAL STATEMENTS
(tabular dollars in thousands, except for per share/unit data)
The provision for income taxes attributable to the Company consisted of the following for the years ended December 31, 2022 and 2021:
| | | | | | | | | | | |
| Year Ended December 31, |
| 2022 | | 2021 |
| Current: | $ | — | | | $ | — | |
| U.S. federal income tax | — | | | — | |
| State and local income tax | — | | | — | |
| Foreign income tax | — | | | — | |
| | | |
| Deferred: | | | |
| U.S. federal income tax | — | | | — | |
| State and local income tax | — | | | — | |
| Foreign income tax | — | | | — | |
| | | |
| Income tax (benefit) provision | $ | — | | | $ | — | |
The effective tax rate for the years ended December 31, 2022 and 2021 was 0.0%. A reconciliation of the statutory tax rate to the effective tax rate for the years presented are as follows:
| | | | | | | | | | | |
| Year Ended December 31, |
| 2022 | | 2021 |
| Income tax benefit (expense) at federal statutory rate | 21.0 | % | | 21.0 | % |
| Income passed through to noncontrolling interests | (15.8) | % | | (16.7) | % |
| State and local taxes, net of federal benefit | 0.8 | % | | 0.6 | % |
| Permanent items | (0.3) | % | | 0.7 | % |
| Stock-based compensation | (2.9) | % | | (3.2) | % |
| Credits | 0.8 | % | | — | % |
| Other, net | 0.9 | % | | — | % |
| Valuation allowance | (4.5) | % | | (2.4) | % |
| Total effective rate | 0.0 | % | | 0.0 | % |
VIANT TECHNOLOGY INC.
NOTES TO THE CONSOLIDATED FINANCIAL STATEMENTS
(tabular dollars in thousands, except for per share/unit data)
Set forth below are the tax effects of temporary differences that give rise to a significant portion of the deferred tax assets and deferred tax liabilities.
| | | | | | | | | | | |
| Year Ended December 31, |
| 2022 | | 2021 |
| Deferred tax assets | | | |
| Net operating loss carryforwards | $ | 2,561 | | | $ | 1,321 | |
| Tax credits | 800 | | | — | |
| Investment in Partnership | 7,866 | | | 7,909 | |
| Other, net | 253 | | | 108 | |
| Subtotal | 11,480 | | | 9,338 | |
| Valuation allowance | (11,480) | | | (9,338) | |
| Total deferred tax assets | — | | | — | |
| | | |
| Deferred tax liabilities | | | |
| Other, net | — | | | — | |
| Total deferred tax liabilities | — | | | — | |
| Net deferred tax (liabilities) assets | $ | — | | | $ | — | |
In assessing the realizability of deferred tax assets, the Company considers whether it is probable that some or all of the deferred tax assets will not be realized. In determining whether the deferred taxes are realizable, the Company considers the period of expiration of the tax asset, historical and projected taxable income, and tax liabilities for the tax jurisdiction in which the tax asset is located. Valuation allowances are provided to reduce the amounts of deferred tax assets to an amount that is more likely than not to be realized based on an assessment of positive and negative evidence, including estimates of future taxable income necessary to realize future deductible amounts. As of December 31, 2022 and 2021, the Company has recorded a valuation allowance against its deferred tax assets of $11.5 million and $9.3 million, respectively, as management cannot conclude whether it is more likely than not that these deferred tax assets will be realized.
As of December 31, 2022 and 2021, the Company has federal net operating losses of approximately $10.4 million and $5.5 million, respectively. As of December 31, 2022 and 2021, the Company has state net operating losses of approximately $6.1 million and $8.1 million, respectively. The federal net operating losses carry forward indefinitely and state net operating losses begin to expire in 2031. As of December 31, 2022, the Company has federal and state research and development tax credits of approximately $0.5 million and $0.3 million, respectively. The federal credits will begin to expire in 2042 and the state credits carryforward until exhausted.
As of December 31, 2022 and 2021, the Company has no significant unrecognized tax benefits and has not recorded interest and penalties related to uncertain tax positions.
The Company is subject to U.S. federal and state income taxes. The Company's U.S. federal and state returns are open to examination for all periods ending December 31, 2020 and thereafter. However, to the extent allowed by law the tax authorities may have the right to examine prior periods where net operating losses were generated and carried forward, and make adjustments up to the amount of the net operating loss or credit carry forward amount.
12. Earnings (Loss) Per Share/Unit
Prior to the Reorganization Transactions that occurred on February 12, 2021, the Viant Technology LLC membership structure included certain convertible preferred units and common units. As a result of the Reorganization Transactions, Class B units of Viant Technology LLC are exchangeable in the future for Class A common stock of the Company. As the conversion of Viant Technology LLC preferred and common units to Class B units was not done in a proportionate manner with respect to the rights and economic interests of the former Viant Technology LLC unit holders compared to those of the new Class B unit/shareholders in Viant Technology LLC and Viant Technology Inc., we do not believe it is appropriate to retrospectively adjust these units. Accordingly, the earnings per unit calculation presented for the year ended December 31, 2020 reflect units of the membership structure prior to the Reorganization Transactions.
For the years ended December 31, 2022 and 2021, basic net loss per share has been calculated by dividing net loss attributable to Class A common stockholders for the period subsequent to the Reorganization Transactions, by the weighted average number of shares of Class A common stock outstanding for the same period. Shares of Class A common stock are weighted for the portion of the
VIANT TECHNOLOGY INC.
NOTES TO THE CONSOLIDATED FINANCIAL STATEMENTS
(tabular dollars in thousands, except for per share/unit data)
period in which the shares were outstanding. Diluted net loss per share has been calculated in a manner consistent with that of basic net loss per share while considering all potentially dilutive shares of Class A common stock outstanding during the period.
For the year ended December 31, 2020, basic earnings (loss) per unit represents net income (loss) divided by the weighted-average number of units outstanding. Diluted net income (loss) per share has been computed in a manner consistent with that of basic net loss per share while considering all shares of potentially dilutive common units that were outstanding during the period, inclusive of the convertible preferred units using the if-converted method and the incentive common units using the treasury stock method, if dilutive. For the year ended December 31, 2020, there were no potential dilutive units related to incentive common units as they were all issued as of the beginning of the year.
The undistributed earnings for year ended December 31, 2020 have been allocated based on the participation rights of the convertible preferred and common units as if the earnings for the period have been distributed. As the participation in distributed and undistributed earnings is identical for both classes, the distributed and undistributed earnings are allocated on a proportionate basis.
The following table presents the calculation of basic and diluted net earnings (loss) per share/unit for the years ended December 31, 2022, 2021, and 2020. Refer to Note 2—Basis of Presentation and Summary of Significant Accounting Policies for additional information related to basic and diluted earnings (loss) per share/unit.
| | | | | | | | | | | | | | | | | |
| Year Ended December 31, |
| 2022 | | 2021 | | 2020 |
| Numerator | | | | | |
| Net income (loss) | $ | (48,089) | | | $ | (37,609) | | | $ | 20,638 | |
| Less: Dividend paid to preferred unitholders | — | | | — | | | (3,000) | |
| Adjusted net income (loss) attributable to common unitholders | (48,089) | | | (37,609) | | | 17,638 | |
| Less: Dividend paid to common unitholders | — | | | — | | | (2,000) | |
| Undistributed earnings (loss) attributable to all unitholders | (48,089) | | | (37,609) | | | 15,638 | |
| Less: Undistributed earnings attributable to participating securities | — | | | — | | | (9,383) | |
| Less: Net loss attributable to noncontrolling interests | (36,176) | | | (29,867) | | | — | |
| Net income (loss) attributable to Viant Technology Inc./common unitholders | $ | (11,913) | | | $ | (7,742) | | | $ | 6,255 | |
| Denominator | | | | | |
| Weighted-average shares of Class A common stock/units outstanding—basic | 14,185 | | 12,364 | | 400 |
| Effect of dilutive securities: | | | | | |
| Convertible preferred units | — | | — | | 600 |
| Weighted-average shares of Class A common stock/units outstanding—diluted | 14,185 | | 12,364 | | 1,000 |
| Earnings (loss) per Class A common stock/unit—basic | | | | | |
| Distributed earnings per unit—basic | $ | — | | | $ | — | | | $ | 5.00 | |
| Undistributed earnings (loss) per unit—basic | (0.84) | | | (0.63) | | | 15.64 | |
| Total earnings (loss) per Class A common stock/unit—basic | $ | (0.84) | | | $ | (0.63) | | | $ | 20.64 | |
| Earnings (loss) per Class A common stock/unit—diluted | | | | | |
| Total earnings (loss) per Class A common stock/unit—diluted | $ | (0.84) | | | $ | (0.63) | | | $ | 20.64 | |
| Anti-dilutive shares/units excluded from earnings (loss) per share of Class A common stock/unit—diluted: | | | | | |
| Restricted stock units | 3,928 | | 3,033 | | — |
| Nonqualified stock options | 3,661 | | 220 | | — |
| Shares of Class B common stock | 47,082 | | 47,107 | | — |
| Total shares excluded from earnings (loss) per share of Class A common stock/unit—diluted | 54,671 | | 50,360 | | — |
VIANT TECHNOLOGY INC.
NOTES TO THE CONSOLIDATED FINANCIAL STATEMENTS
(tabular dollars in thousands, except for per share/unit data)
13. Noncontrolling Interests
We are the sole managing member of Viant Technology LLC and, as a result, consolidate the financial results of Viant Technology LLC. We report noncontrolling interests representing the economic interests in Viant Technology LLC held by the other members of Viant Technology LLC. The Viant Technology LLC Agreement classifies the interests acquired by the Company as Class A units, reclassified the interests held by the continuing members of Viant Technology LLC as Class B units and permits the continuing members of Viant Technology LLC to exchange Class B units for shares of Class A common stock on a one-for-one basis or, at the election of Viant Technology Inc., for cash at the current fair value on the date of the exchange. Changes in the Company’s ownership interest in Viant Technology LLC while retaining control of Viant Technology LLC will be accounted for as equity transactions. As such, future redemptions or direct exchanges of Class B units in Viant Technology LLC by the other members and future issuances of Class A common stock under the LTIP will result in a change in ownership, where the Company will rebalance the noncontrolling interest, offset by a change in additional-paid-in-capital.
The following table summarizes the ownership of Viant Technology LLC.
| | | | | | | | | | | | | | | | | | | | | | | |
| As of December 31, 2022 | | As of December 31, 2021 |
| Owner | Units Owned | | Ownership
Percentage | | Units Owned | | Ownership
Percentage |
| Viant Technology Inc. | 14,643,798 | | 23.7 | % | | 13,704,638 | | 22.5 | % |
| Noncontrolling interests | 47,082,260 | | 76.3 | % | | 47,107,130 | | 77.5 | % |
| Total | 61,726,058 | | 100.0 | % | | 60,811,768 | | 100.0 | % |
During the year ended 2022, noncontrolling interests exchanged 24,870 Class B units of Viant Technology, LLC for 24,870 shares of the Company’s Class A common stock, which also resulted in the cancellation of 24,870 shares of the Company’s Class B common stock that was previously held by noncontrolling interests with no additional consideration provided.
The following table presents the effect of changes in the Company’s ownership interest in Viant Technology LLC on the Company’s equity for the years indicated.
| | | | | | | | | | | |
| Year Ended December 31, |
| 2022 | | 2021 |
| Net loss attributable to Viant Technology Inc. | $ | (11,913) | | | $ | (7,742) | |
| Transfers to noncontrolling interests: | | | |
| Decrease in the additional-paid-in-capital of Viant Technology Inc. resulting from ownership changes in Viant Technology LLC | (20,284) | | | (44,361) | |
| Change from net loss attributable to Viant Technology Inc. and transfers to noncontrolling interests | $ | (32,197) | | | $ | (52,103) | |
14. Commitments and Contingencies
Lease Commitments
As of December 31, 2022, the Company had non-cancelable operating lease commitments for office space that have been recorded as operating lease liabilities. Refer to Note 5—Leases for additional information.
Hosting Commitments
As of December 31, 2022, the Company had non-cancelable contractual agreements related to the hosting of our data storage processing, storage, and other computing services. We had $6.7 million in commitments as of December 31, 2022, due by the first quarter of 2024.
Legal Matters
From time to time, the Company is subject to various legal proceedings and claims, either asserted or unasserted, that arise in the ordinary course of business. Although the outcome of the various legal proceedings and claims cannot be predicted with certainty, management does not believe that any of these proceedings or other claims will have a material effect on the Company’s business, financial condition, results of operations or cash flows.
VIANT TECHNOLOGY INC.
NOTES TO THE CONSOLIDATED FINANCIAL STATEMENTS
(tabular dollars in thousands, except for per share/unit data)
15. Guarantees and Indemnities
The Company has made no significant contractual guarantees for the benefit of third parties. However, in the ordinary course of business, the Company may provide indemnifications of varying scope and terms to customers, vendors, lessors, business partners and other parties with respect to certain matters, including, but not limited to, losses arising out of breach of such agreements, services to be provided by the Company or from intellectual property infringement claims made by third parties. In addition, the Company has entered into indemnification agreements with directors and certain officers and employees that will require the Company, among other things, to indemnify them against certain liabilities that may arise by reason of their status or service as directors, officers or employees. The Company is not aware of indemnification claims that could have a material effect on the Company’s consolidated financial statements. Accordingly, no amounts for any obligation have been recorded as of December 31, 2022 and 2021.
16. Related Parties
The Company had a balance of $0.2 million and $0.3 million as of December 31, 2022 and December 31, 2021, respectively, payable to related parties for expenses they incurred on our behalf, which was recorded within "Accrued liabilities" on the consolidated balance sheets. The related expense incurred by the Company was $1.0 million and $0.3 million for the years ended December 31, 2022 and 2021, respectively.
The Company recorded no revenue from its transactions with related parties during the years ended December 31, 2022, 2021, and 2020. The Company recorded no purchases from related parties during the years ended December 31, 2022, 2021, and 2020.
As of December 31, 2022 and 2021, no amounts were due to or due from related parties, other than those mentioned above.
Item 9. Changes in and Disagreements with Accountants on Accounting and Financial Disclosure.
None.
Item 9A. Controls and Procedures.
Evaluation of Disclosure Controls and Procedures
Our management, with the participation of our chief executive officer and chief financial officer, has evaluated the effectiveness of our disclosure controls and procedures (as defined in Rules 13a-15(e) and 15d-15(e) under the Exchange Act), as of the end of the period covered by this Annual Report. Based on such evaluation, our chief executive officer and chief financial officer have concluded that as of December 31, 2022, our disclosure controls and procedures are designed at a reasonable assurance level and are effective to provide reasonable assurance that information we are required to disclose in reports that we file or submit under the Exchange Act is recorded, processed, summarized and reported within the time periods specified in the rules and forms of the SEC, and that such information is accumulated and communicated to our management, including our chief executive officer and chief financial officer, as appropriate, to allow timely decisions regarding required disclosure.
Management's Report on Internal Control Over Financial Reporting
Our management is responsible for establishing and maintaining adequate internal control over financial reporting (as defined in Rules 13a-15(f) and 15d-15(f) under the Exchange Act). We maintain internal control over financial reporting designed to provide reasonable assurance regarding the reliability of financial reporting and the preparation of financial statements for external purposes in accordance with GAAP.
Internal control over financial reporting includes maintaining records that, in reasonable detail, accurately and fairly reflect our transactions; providing reasonable assurance that transactions are recorded as necessary for the preparation of consolidated financial statements in accordance with accounting principles generally accepted in the United States of America; providing reasonable assurance that receipts and expenditures of company assets are made in accordance with management authorization; and providing reasonable assurance that unauthorized acquisition, use or disposition of company assets that could have a material effect on the consolidated financial statements would be prevented or detected on a timely basis. Because of its inherent limitations, internal control over financial reporting is not intended to provide absolute assurance that a misstatement of our consolidated financial statements would be prevented or detected.
Under the supervision and with the participation of our chief executive officer and chief financial officer, our management conducted an evaluation of the effectiveness of our internal control over financial reporting based on the criteria set forth in “Internal Control—Integrated Framework” issued by the Committee of Sponsoring Organizations of the Treadway Commission (2013 framework). Based on this assessment, our management concluded that our internal control over financial reporting was effective at the reasonable assurance level as of December 31, 2022.
Attestation Report of the Independent Registered Public Accounting Firm
This Annual Report does not include an attestation report of our registered public accounting firm regarding internal control over financial reporting due to an exemption established by the JOBS Act for “emerging growth companies” and because we qualify as a “non-accelerated filer” (i.e., we do not qualify as either an “accelerated filer” or a “large accelerated filer” as defined in Rule 12b-2 under the Exchange Act).
Changes in Internal Control over Financial Reporting
There was no change in our internal control over financial reporting (as defined in Rules 13a-15(d) and 15d-15(d) under the Exchange Act) during the period covered by this Annual Report that has materially affected, or is reasonably likely to materially affect, our internal control over financial reporting.
Limitations on the Effectiveness of Disclosure Controls and Procedures
Our management, including our chief executive officer and chief financial officer, does not expect that our disclosure controls and procedures or internal control over financial reporting will prevent all errors and all fraud. A control system, no matter how well designed and implemented, can provide only reasonable, not absolute, assurance that the control system’s objectives will be met. Further, the design of a control system must reflect the fact that there are resource constraints and the benefits of controls must be considered relative to their costs. Because of the inherent limitations in all control systems, no evaluation of controls can provide absolute assurance that all control issues within a company are detected. The inherent limitations include the realities that judgments in decision-making can be faulty and that breakdowns can occur because of simple errors or mistakes. Controls can also be circumvented by the individual acts of some persons, by collusion of two or more people, or by management override of the controls. Because of the inherent limitations in a cost-effective control system, misstatements due to error or fraud may occur and may not be detected. Also,
projections of any evaluation of effectiveness to future periods are subject to the risk that controls may become inadequate because of changes in conditions or that the degree of compliance with the policies or procedures may deteriorate.
Item 9B. Other Information.
None.
Item 9C. Disclosure Regarding Foreign Jurisdictions that Prevent Inspections.
Not applicable.
PART III
Item 10. Directors, Executive Officers and Corporate Governance.
The information required by this item is incorporated by reference to the definitive Proxy Statement for our 2023 Annual Meeting of Stockholders, which will be filed with the SEC no later than 120 days after December 31, 2022.
We have adopted a written Code of Business Conduct and Ethics (our “Code of Conduct”) that applies to all officers, directors and employees, including our principal executive officer, principal financial and accounting officer, or persons performing similar functions. The Code of Conduct is available on our website at www.viantinc.com. If we make any substantive amendments to the Code of Conduct or grant any waiver from a provision of the Code of Conduct to any executive officer or director, we will promptly disclose the nature of the amendment or waiver on our website or in a Current Report on Form 8-K.
Item 11. Executive Compensation.
The information required by this item is incorporated by reference to the definitive Proxy Statement for our 2023 Annual Meeting of Stockholders, which will be filed with the SEC no later than 120 days after December 31, 2022.
Item 12. Security Ownership of Certain Beneficial Owners and Management and Related Stockholder Matters.
The information required by this item is incorporated by reference to the definitive Proxy Statement for our 2023 Annual Meeting of Stockholders, which will be filed with the SEC no later than 120 days after December 31, 2022.
Item 13. Certain Relationships and Related Transactions, and Director Independence.
The information required by this item is incorporated by reference to the definitive Proxy Statement for our 2023 Annual Meeting of Stockholders, which will be filed with the SEC no later than 120 days after December 31, 2022.
Item 14. Principal Accountant Fees and Services.
The information required by this item is incorporated by reference to the definitive Proxy Statement for our 2023 Annual Meeting of Stockholders, which will be filed with the SEC no later than 120 days after December 31, 2022.
PART IV
Item 15. Exhibits and Financial Statement Schedules.
(a)The following documents are filed as a part of this Annual Report:
(1)Financial Statements
See Index to Consolidated Financial Statements at Part II, Item 8 of this Annual Report.
(2)Financial Statement Schedules
The financial statement schedules are omitted as they are either not applicable or the information required is presented in the financial statements and notes thereto under Part II, Item 8 of this Annual Report.
(3)Exhibits:
The documents listed in the following Exhibit Index of this Annual Report are incorporated by reference or are filed with this Annual Report, in each case as indicated therein (numbered in accordance with Item 601 of Regulation S-K).
Exhibit Index
| | | | | | | | |
Exhibit
Number | | Description |
| | |
| 3.1 | | |
| 3.2 | | |
| 4.1 | | |
| 10.1 | | |
| 10.2 | | |
| 10.3 | | |
| 10.4 | | |
| 10.5+ | | |
| 10.6 | | Revolving Credit and Security Agreement and Guaranty, dated as of October 31, 2019, by and among Viant Technology LLC, Viant US LLC, Adelphic LLC, Myspace LLC and each additional Borrower from time to time party thereto, PNC Bank, National Association, as Agent and each additional Lender from time to time party thereto (incorporated by reference to Exhibit 10.5 to the Company’s Registration Statement on Form S-1 (File No. 333-252117), filed on February 1, 2021) |
| 10.7 | | First Amendment to Revolving Credit and Security Agreement and Guaranty, dated as of April 13, 2020, by and among Viant Technology LLC, Viant US LLC, Adelphic LLC and Myspace LLC, as Borrowers, and PNC Bank, National Association, as Agent and Lender (incorporated by reference to Exhibit 10.6 to the Company’s Registration Statement on Form S-1 (File No. 333-252117), filed on February 1, 2021) |
| 10.8 | | Second Amendment to Revolving Credit and Security Agreement and Guaranty, dated as of April 30, 2020, by and among Viant Technology LLC, Viant US LLC, Adelphic LLC and Myspace LLC, as Borrowers, and PNC Bank, National Association, as Agent and Lender (incorporated by reference to Exhibit 10.7 to the Company’s Registration Statement on Form S-1 (File No. 333-252117), filed on February 1, 2021) |
| | | | | | | | |
| 10.9 | | Third Amendment to Revolving Credit and Security Agreement and Guaranty, dated as of May 29, 2020, by and among Viant Technology LLC, Viant US LLC, Adelphic LLC and Myspace LLC, as Borrowers, and PNC Bank, National Association, as Agent and Lender (incorporated by reference to Exhibit 10.8 to the Company’s Registration Statement on Form S-1 (File No. 333-252117), filed on February 1, 2021) |
| 10.10 | | Fourth Amendment to Revolving Credit and Security Agreement and Guaranty, dated as of January 29, 2021, by and among Viant Technology LLC, Viant US LLC, Adelphic LLC, Myspace LLC and the Company, as Borrowers, and PNC Bank, National Association, as Agent and Lender (incorporated by reference to Exhibit 10.9 to the Company’s Registration Statement on Form S-1 (File No. 333-252117), filed on February 1, 2021) |
| 10.11 | | Fifth Amendment to Revolving Credit and Security Agreement and Guaranty, dated as of October 15, 2021, by and among Viant Technology LLC, Viant US LLC, Adelphic LLC, Myspace LLC and the Company, as Borrowers, and PNC Bank, National Association, as Agent and Lender (incorporated by reference to Exhibit 10.1 to the Company’s Quarterly Report on Form 10-Q (File No. 001-40015) for the quarter ended September 30, 2021, filed on November 10, 2021) |
| 10.12+ | | |
| 10.13+ | | |
| 10.14 | | |
| 10.15+ | | |
| 10.16+ | | |
| 10.17+ | | |
| 10.18+ | | |
| 10.19+ | | |
| 10.20+ | | |
| 21.1 | | |
| 23.1* | | |
| 31.1* | | |
| 31.2* | | |
| 32.1*† | | |
| 32.2*† | | |
| 101.INS | | Inline XBRL Instance Document |
| 101.SCH | | Inline XBRL Taxonomy Extension Schema Document |
| 101.CAL | | Inline XBRL Taxonomy Extension Calculation Linkbase Document |
| 101.DEF | | Inline XBRL Taxonomy Definition Linkbase Document |
| 101.LAB | | Inline XBRL Taxonomy Extension Labels Linkbase Document |
| 101.PRE | | Inline XBRL Taxonomy Extension Presentation Linkbase Document |
| 104 | | Cover Page Interactive Data File (formatted as inline XBRL and contained in Exhibit 101) |
*Filed herewith.
+Indicates management contract or compensatory plan, contract or arrangement.
†The certifications furnished in Exhibits 32.1 and 32.2 hereto are deemed to accompany this Annual Report on Form 10-K and will not be deemed “filed” for purposes of Section 18 of the Exchange Act, except to the extent that the registrant specifically incorporates it by reference.
Item 16. Form 10-K Summary.
None.
SIGNATURES
Pursuant to the requirements of Section 13 or 15(d) of the Securities Exchange Act of 1934, the registrant has duly caused this report to be signed on its behalf by the undersigned, thereunto duly authorized.
| | | | | | | | |
| VIANT TECHNOLOGY INC. |
| | |
Date: March 2, 2023 | By: | /s/ Tim Vanderhook |
| | Tim Vanderhook |
| | Chief Executive Officer and Chairman |
| | (Principal Executive Officer) |
Pursuant to the requirements of the Securities Exchange Act of 1934, this report has been signed below by the following persons on behalf of the registrant in the capacities and on the dates indicated.
| | | | | | | | | | | | | | |
| Name | | Title | | Date |
| | | | |
| /s/ Tim Vanderhook | | Chief Executive Officer and Chairman (Principal Executive Officer) | | March 2, 2023 |
| Tim Vanderhook | | | | |
| | | | |
| /s/ Larry Madden | | Chief Financial Officer (Principal Financial and Accounting Officer) | | March 2, 2023 |
| Larry Madden | | | | |
| | | | |
| /s/ Chris Vanderhook | | Chief Operating Officer and Director | | March 2, 2023 |
| Chris Vanderhook | | | | |
| | | | |
| /s/ Max Valdes | | Director | | March 2, 2023 |
| Max Valdes | | | | |
| | | | |
| /s/ Elizabeth Williams | | Director | | March 2, 2023 |
| Elizabeth Williams | | | | |
| | | | |
| /s/ Vivian Yang | | Director | | March 2, 2023 |
| Vivian Yang | | | | |