REGISTRATION STATEMENT PURSUANT TO SECTION 12(b) OR (g) OF THE SECURITIES EXCHANGE ACT OF 1934 |
ANNUAL REPORT PURSUANT TO SECTION 13 OR 15(d) OF THE SECURITIES EXCHANGE ACT OF 1934 |
TRANSITION REPORT PURSUANT TO SECTION 13 OR 15(d) OF THE SECURITIES EXCHANGE ACT OF 1934 |
SHELL COMPANY REPORT PURSUANT TO SECTION 13 OR 15(d) OF THE SECURITIES EXCHANGE ACT OF 1934 |
Title of each class |
Trading Symbol |
Name of each exchange on which registered | ||
Large Accelerated Filer |
☐ | ☒ | Non-accelerated Filer |
☐ | ||||||
Emerging growth company |
☐ U.S. GAAP |
☒ |
☐ Other | ||||||
by the International Accounting Standards Board |
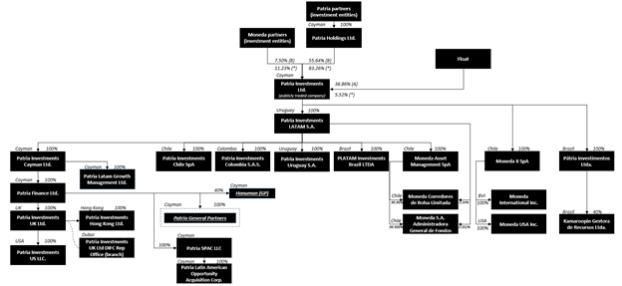
(1) | 11,437,198 Class B common shares of the 81,900,000 Class B common shares beneficially owned by Patria Holdings Limited are held of record by SPV PHL, which is a wholly owned subsidiary of Patria Holdings Limited. |
(2) | References to (A) stand for Class A common shares, (B) stand for Class B common shares, and (*) stand for voting power. |
For the Years Ended December 31, |
||||||||||||||||||||
2021 |
2020 |
2019 |
Change 2021/2020 |
Change 2020/2019 |
||||||||||||||||
(in US$ millions) |
||||||||||||||||||||
Revenue from management fees(1) |
144.7 | 112.9 | 104.9 | 31.8 | 8.0 | |||||||||||||||
Revenue from incentive fees |
4.9 | 3.5 | 18.1 | 1.4 | (14.6 | ) | ||||||||||||||
Revenue from advisory and other ancillary fees |
0.7 | 2.5 | 1.0 | (1.8 | ) | 1.5 | ||||||||||||||
Taxes on revenue—management fees |
(3.6 | ) | (3.1 | ) | (2.9 | ) | (0.5 | ) | (0.2 | ) | ||||||||||
Taxes on revenue—incentive fees |
(0.2 | ) | (0.4 | ) | (2.1 | ) | 0.2 | 1.7 | ||||||||||||
Taxes on revenue—advisory and other ancillary fees |
(0.1 | ) | (0.4 | ) | (0.1 | ) | 0.3 | (0.3 | ) | |||||||||||
Personnel expenses(2) |
(79.8 | ) | (27.2 | ) | (36.9 | ) | (52.6 | ) | 9.7 | |||||||||||
Officers’ Fund—long-term benefit plan(3) |
2.2 | 0.4 | (1.0 | ) | 1.8 | 1.4 | ||||||||||||||
Performance Share Plan(4) |
0.8 | — | — | 0.8 | — | |||||||||||||||
Performance fee compensation(5) |
30.2 | — | — | 30.2 | — | |||||||||||||||
Carry bonus provision |
0.9 | — | — | 0.9 | — | |||||||||||||||
Deferred consideration on acquisition(6) |
2.0 | — | — | 2.0 | — | |||||||||||||||
Administrative expenses |
(14.4 | ) | (14.6 | ) | (15.7 | ) | 0.2 | 1.1 | ||||||||||||
Brand amortization(7) |
0.3 | — | — | 0.3 | — | |||||||||||||||
Amortization of placement agents and rebate fees |
(2.5 | ) | (2.3 | ) | (2.3 | ) | (0.2 | ) | — | |||||||||||
Fee Related Earnings (FRE |
86.0 |
71.3 |
63.0 |
14.7 |
8.3 |
(1) | Increase in management fee revenues from prior year mainly due to an increase in capital deployed by Private Equity Fund VI and management fees for December 2021 from Moneda acquisition. |
(2) | Personnel expenses consist of (1) fixed compensation costs comprised of salaries and wages, (2) variable compensation costs comprised of partners’ compensation, rewards and bonuses and employee profit sharing, (3) social security contribution and payroll taxes and (4) other short- and long-term benefits. The increase is due mainly to the change in our compensation structure post-IPO. |
(3) | Personnel expenses have been adjusted to remove the Officer’s Fund tracking shares. This amount reflects the valuation change of such tracking shares in the period. |
(4) | Personnel expenses have been adjusted to remove the impact from granting rights to the share-based incentive plan introduced. The amount reflects the equity recognized based on expected vesting criteria being met. |
(5) | This expense refers to a carried interest share held by a related party (representing our senior managing directors and employees in Patria Brazilian Private Equity III, Ltd.) that gives it the right to up to 35% of the performance fees recognized from PBPE Fund III (Ontario), L.P. As of December 31, 2021, we had a payable balance of US$11.6 million. |
(6) | Our acquisition of Moneda included US$58.7 million expected to be paid to former shareholders of Moneda in exchange for future services, which are payable in two installments due December 2, 2023 and December 2, 2024. This expense will be recognized as a compensation expense as the employees render services. For the year ended December 31, 2021, US$2.0 million was recognized as an expense in our income statement. |
(7) | This amount refers to the amortization of intangibles (brands) associated with Patria’s acquisition of Moneda. |
For the Years Ended December 31, |
||||||||||||||||||||
2021 |
2020 |
2019 |
Change 2021/2020 |
Change 2020/2019 |
||||||||||||||||
(in US$ millions) |
||||||||||||||||||||
Fee Related Earnings (FRE) |
86.0 |
71.3 |
63.0 |
14.7 |
8.3 |
|||||||||||||||
|
|
|
|
|
|
|
|
|
|
|||||||||||
Revenue from performance fees |
89.3 | — | 4.8 | 89.3 | (4.8 | ) | ||||||||||||||
Taxes on revenue—performance fees |
(0.2 | ) | — | (0.5 | ) | (0.2 | ) | 0.5 | ||||||||||||
Performance fee compensation |
(30.2 | ) | — | — | (30.2 | ) | — | |||||||||||||
Carry bonus provision |
(0.9 | ) | — | — | (0.9 | ) | — | |||||||||||||
Other income/(expenses) |
(12.5 | ) | (2.0 | ) | 0.1 | (10.5 | ) | (2.1 | ) | |||||||||||
IPO expenses and non-recurring transaction costs |
11.8 | 2.1 | — | 9.7 | 2.1 | |||||||||||||||
Net financial income/(expense) |
(0.3 | ) | (0.2 | ) | (0.2 | ) | (0.1 | ) | 0.0 | |||||||||||
Current income tax expense |
(1.7 | ) | (0.9 | ) | (3.8 | ) | (0.8 | ) | 2.9 | |||||||||||
|
|
|
|
|
|
|
|
|
|
|||||||||||
Distributable Earnings (DE) |
141.3 |
70.3 |
63.4 |
71.0 |
6.9 |
|||||||||||||||
|
|
|
|
|
|
|
|
|
|
• | the impact of the COVID-19 outbreak on general economic and business conditions in Brazil, Chile, Latin America and globally, and any restrictive measures imposed by governmental authorities in response to the outbreak; |
• | our ability to implement, in a timely and efficient manner, any measure necessary to respond to, or reduce the impacts of the COVID-19 outbreak on our business, operations, cash flow, prospects, liquidity and financial condition; |
• | general economic, financial, political, demographic and business conditions in Latin America, as well as any other macroeconomic factors in the countries we may serve in the future and their impact on our business; |
• | fluctuations in exchange rates, interest and inflation in Latin America and any other countries we may serve in the future; |
• | our ability to find suitable assets for investment; |
• | our ability to manage operations at our current size or manage growth effectively; |
• | our ability to successfully expand in Latin America and other new markets; |
• | the fact that we will rely on our operating subsidiaries to provide us with distributions to fund our operating activities, which could be limited by law, regulation or otherwise; |
• | our ability to arrange financing and maintain sufficient levels of cash flow to implement our expansion plan; |
• | our ability to adapt to technological changes in the financial services sector; |
• | the availability of qualified personnel and the ability to retain such personnel; |
• | our capitalization and our funds’ and portfolio companies’ level of indebtedness; |
• | the interests of our controlling shareholders; |
• | changes in the laws and regulations applicable to the private investment market in Brazil, Chile and in the other countries we operate; |
• | risk associated with our international operations; |
• | our ability to compete and conduct our business in the future; |
• | changes in our businesses; |
• | government interventions, resulting in changes in the economy, taxes, rates or regulatory environment; |
• | our ability to effectively market and maintain a positive brand image; |
• | the availability and effective operation of management information systems and other technology; |
• | our ability to comply with applicable cybersecurity, privacy and data protection laws and regulations; |
• | changes in client demands and preferences and technological advances, and our ability to innovate to respond to such changes; |
• | our ability to attract and maintain the services of our senior management and key employees; |
• | changes in labor, distribution and other operating costs; |
• | our compliance with, and changes to, government laws, regulations and tax matters that currently apply to us; |
• | other factors that may affect our financial condition, liquidity and results of operations; and |
• | other risk factors discussed under “Item 3. Key Information—D. Risk Factors.” |
A. |
Directors and Senior Management |
B. |
Advisers |
C. |
Auditors |
A. |
Offer Statistics |
B. |
Method and Expected Timetable |
A. |
[Reserved] |
B. |
Capitalization and Indebtedness |
C. |
Reasons for the Offer and Use of Proceeds |
D. |
Risk Factors |
• | The global outbreak of the novel coronavirus, or “COVID-19,” has caused severe disruptions in Latin America and global economies and is adversely impacting, and may continue to adversely impact, our performance and results of operations. The global impact of the outbreak continues to rapidly evolve, and many countries have instituted quarantines, restrictions on travel, closed financial markets and/or restricted trading, and closed or limited hours of operations of non-essential businesses. Such actions are creating severe economic contraction and adversely impacting many industries. |
• | Difficult market and geopolitical conditions can adversely affect our business in many ways, each of which could materially reduce our revenue, earnings and cash flow and adversely affect our financial prospects and condition. We may need to reduce our fixed costs and other expenses in order to maintain profitability, including by cutting back or eliminating the use of certain services or service providers, or terminating the employment of a significant number of our personnel that, in each case, could be important to our business and without which our operating results could be adversely affected. |
• | A period of economic slowdown, which may be across one or more industries, sectors or geographies, could contribute to adverse operating performance for certain of our funds’ investments, which would adversely affect our operating results and cash flows. To the extent global markets enter a period of slower growth relative to recent years, such period of economic slowdown (which may be across one or more industries, sectors or geographies), may contribute to poor financial results at our funds’ portfolio companies, which may result in lower investment returns for our funds. |
• | An increase in interest rates and other changes in the debt financing markets could negatively impact the ability of our funds and their portfolio companies to obtain attractive financing or refinancing and could increase the cost of such financing if it is obtained, which could lead to lower-yielding investments and potentially decrease our net income. If our funds are unable to obtain committed debt financing for potential acquisitions, can only obtain debt financing at an increased interest rate or on unfavorable terms or the ability to deduct corporate interest expense is substantially limited, our funds may face increased competition from strategic buyers of assets who may have an overall lower cost of capital or the ability to benefit from a higher amount of cost savings following an acquisition, or may have difficulty completing otherwise profitable acquisitions or may generate profits that are lower than would otherwise be the case, each of which could lead to a decrease in our revenues. |
• | If we cannot make the necessary investments to keep pace with rapid developments and change in our industry, the use of our services could decline, reducing our revenues. The revenues that we earn are driven in part by the pace at which our funds make investments and the size of those investments, and a decline in the pace or the size of such investments may reduce our revenues. The market environment for private equity transactions, for example, recently has been and continues to be characterized by relatively high prices, which can make the deployment of capital more difficult. |
• | Our revenue, earnings, net income and cash flow can all vary materially and be volatile from time to time, which may make it difficult for us to achieve steady earnings growth on a quarterly basis and may cause the price of our Class A common shares to decline. Achieving steady growth in net income and cash flow on a quarterly basis may be difficult, which could in turn lead to large adverse movements or general increased volatility in the price of our Class A common shares. |
• | Governments have a high degree of influence in Brazil, Chile and the other economies in which we operate. The effects of this influence and political and economic conditions in Brazil, Chile and other Latin American countries could harm us and the trading price of our Class A common shares. Recent economic and political instability in Brazil in general has led to a negative perception of the Brazilian economy and higher volatility in the Brazilian securities markets, which also may adversely affect us and our Class A common shares. |
• | Developments and the perceptions of risks in other countries, including other emerging markets, the United States and Europe, may harm the economy of Brazil and the other countries in which we operate and the trading price of our Class A common shares. Crises and political instability in other emerging market countries, the United States, Europe or other countries, including increased international trade tensions and protectionist policies, could decrease investor demand for securities offered by companies with significant operations in Brazil, Chile and other Latin American countries, such as our Class A common shares. |
• | The ongoing economic uncertainty and political instability in Brazil, including as a result of ongoing corruption investigations, may harm us and the price of our Class A common shares. Brazil’s political environment has historically influenced, and continues to influence, the performance of the country’s economy. Political crises have affected and continue to affect the confidence of investors and the general public, which have historically resulted in economic deceleration and heightened volatility in the securities offered by companies with significant operations in Brazil. |
• | Inflation and government measures to curb inflation may adversely affect the economies and capital markets in some of the countries in which we operate, and as a result, harm our business and the trading price of our Class A common shares. In the past, high levels of inflation have adversely affected the economies and financial markets of some of the countries in which we operate, particularly Argentina and Brazil, and the abilities of their governments to create conditions that stimulate or maintain economic growth. |
• | Exchange rate instability may have adverse effects on the Brazilian economy, our business and the trading price of our Class A common shares. The Brazilian government has implemented various economic plans and used various exchange rate policies, including sudden devaluations, periodic mini-devaluations (during which the frequency of adjustments has ranged from daily to monthly), exchange controls, dual exchange rate markets and a floating exchange rate system. |
• | Patria Holdings owns the majority of our issued and outstanding Class B common shares, which represents approximately 83.3% of the voting power of our issued share capital, and controls all matters requiring shareholder approval. Patria Holdings’ ownership and voting power limits your ability to influence corporate matters. |
• | The dual class structure of our share capital has the effect of concentrating voting control with Patria Holdings; this will limit or preclude your ability to influence corporate matters. Due to the ten-to-one |
• | We are a Cayman Islands exempted company with limited liability. The rights of our shareholders, including with respect to fiduciary duties and corporate opportunities, may be different from the rights of shareholders governed by the laws of U.S. jurisdictions. In particular, as a matter of Cayman Islands law, directors of a Cayman Islands company owe fiduciary duties to the Company and, separately, a duty of care, diligence and skill to the Company. |
• | Performance Revenues and Incentive Fees COVID-19 pandemic on our portfolio companies due to the depreciation of the real |
• | Management Fees COVID-19 pandemic is slowing our anticipated capital raising pace for new or successor funds, which may result in delayed or decreased management fees. In addition, in light of the recent decline in public equity markets and other components of their investment portfolios, fund investors may become restricted by their asset allocation policies to invest in new or successor funds that we provide. As described above, we may also experience a decline in the pace of our investments and, if our funds are unable to deploy capital at a pace that is sufficient to offset the pace of our realizations, our fee revenues could decrease. |
• | Investment Performance COVID-19 and related public health restrictions. If the disruptions caused by COVID-19 continue, the businesses of impacted portfolio companies could suffer materially, which would decrease the value of our funds’ investments, most of which are in local currency, which were severely depreciated with the pandemic. Furthermore, such negative market conditions could potentially result in a portfolio company entering bankruptcy proceedings, thereby potentially resulting in a complete loss of the fund’s investment in such portfolio company and a significant negative impact to the investment fund’s performance and consequently to our operating results and cash flow, as well as to our reputation. |
• | Liquidity COVID-19 could lead to lower interest income for our credit funds. Further, dislocation and contraction of short-term liquidity in the credit markets has impacted, and if sustained will likely continue to impact, the value of credit assets held by our real estate debt and credit funds, such funds’ ability to sell assets at attractive prices or in a timely manner in order to avoid losses and the likelihood of margin calls. In addition, a sudden contraction of liquidity in the credit markets, including as a result of overwhelming desire for liquidity on the part of market participants, is likely to exacerbate the likelihood of forced sales of assets and margins calls, which would result in further declines in the value of assets. |
• | Operational Risks COVID-19 pandemic. In addition, third-party service providers on whom we have become increasingly reliant for certain aspects of our business, including for the administration of certain funds, as well as for certain information systems and technology could be impacted by an inability to perform due to COVID-19 restrictions or by failures of, or attacks on, their information systems and technology. |
• | Employee-Related Risks COVID-19 presents a significant threat to our employees’ well-being. Our key employees or executive officers may become sick or otherwise unable to perform their duties for an extended period of time. In addition, extended public health restrictions and remote working arrangements may impact employee morale and productivity. In addition to any potential impact of such extended illness on our operations, we may be exposed to the risk of litigation by our employees against us for, among other things, failure to take adequate steps to protect their well-being, particularly in the event they become sick after a return to the office. The negative impact on net accrued performance that occurred as a result of COVID-19 pandemic on portfolio companies and the depreciation of the real |
• | economic slowdown in Brazil, Chile and internationally; |
• | changes in interest rates and/or a lack of availability of credit in Brazil, Chile and internationally; |
• | commodity price volatility; |
• | foreign exchange volatility; |
• | public health crises, such as the ongoing COVID-19 pandemic; and |
• | changes in law and/or regulation, and uncertainty regarding government and regulatory policy. |
• | a number of our competitors in some of our businesses may have greater financial, technical, marketing and other resources and more personnel than we do; |
• | some of our funds may not perform as well as competitors’ funds or other available investment products; |
• | several of our competitors have significant amounts of capital, and many of them have similar investment objectives to ours, which may create additional competition for investment opportunities and may reduce the size and duration of pricing inefficiencies that many alternative investment strategies seek to exploit; |
• | some of our competitors, particularly strategic competitors, may have a lower cost of capital, which may be exacerbated to the extent by any changes to applicable tax laws that may come into effect (including with respect to the deductibility of interest expense); |
• | some of our competitors may have access to funding sources that are not available to us, which may create competitive disadvantages for us with respect to investment opportunities; |
• | some of our competitors may be subject to less regulation and accordingly may have more flexibility to undertake and execute certain businesses or investments than we can and/or bear less compliance expense than we do; |
• | some of our competitors may have more flexibility than us in raising certain types of investment funds under the investment management contracts they have negotiated with their investors; |
• | some of our competitors may have higher risk tolerances, different risk assessments or lower return thresholds, which could allow them to consider a wider variety of investments and to bid more aggressively than us for investments that we want to make; |
• | some of our competitors may be more successful than us in the development and implementation of new technology to address investor demand for product and strategy innovation; |
• | there are relatively few barriers to entry impeding new alternative asset fund management firms, and the successful efforts of new entrants into our various businesses, including former “star” portfolio managers at large diversified financial institutions as well as such institutions themselves, is expected to continue to result in increased competition; |
• | some of our competitors may have better expertise or be regarded by investors as having better expertise in a specific asset class or geographic region than we do; |
• | our competitors that are corporate buyers may be able to achieve synergistic cost savings in respect of an investment, which may provide them with a competitive advantage in bidding for an investment; |
• | some investors may prefer to invest with an investment manager that is not publicly traded or is smaller with only one or two investment products that it manages; and |
• | other industry participants will from time to time seek to recruit our investment professionals and other employees away from us. |
• | we may create new funds in the future that reflect a different asset mix and different investment strategies, as well as a varied geographic and industry exposure as compared to our present funds, and any such new funds could have different returns from our existing or previous funds; |
• | despite periods of volatility, market conditions have been largely favorable in recent years, which has helped to generate positive performance, particularly in our private equity, infrastructure, credit and real estate businesses, but there can be no assurance that such conditions will repeat or that our current or future investment funds will avail themselves of comparable market conditions; |
• | the rates of returns of our carry funds reflect unrealized gains as of the applicable measurement date that may never be realized, which may adversely affect the ultimate value realized from those funds’ investments; |
• | competition for investment opportunities resulting from, among other things, the increased amount of capital invested in alternative investment funds continues to increase; |
• | our investment funds’ returns in some years benefited from investment opportunities and general market conditions that may not repeat themselves, our current or future investment funds might not be able to avail themselves of comparable investment opportunities or market conditions, and the circumstances under which our current or future funds may make future investments may differ significantly from those conditions prevailing in the past; |
• | newly established funds may generate lower returns during the period in which they initially deploy their capital; and |
• | the rates of return reflect our historical cost structure, which may vary in the future due to various factors elsewhere in this annual report and other factors beyond our control, including changes in laws. |
• | currency exchange matters, including fluctuations in currency exchange rates and costs associated with conversion of investment principal and income from one currency into another; |
• | less developed or efficient financial markets than in the United States, which may lead to potential price volatility and relative illiquidity; |
• | the absence of uniform accounting, auditing and financial reporting standards, practices and disclosure requirements and less government supervision and regulation; |
• | changes in laws or clarifications to existing laws that could impact our tax treaty positions, which could adversely impact the returns on our investments; |
• | a less developed legal or regulatory environment, differences in the legal and regulatory environment or enhanced legal and regulatory compliance; |
• | heightened exposure to corruption risk in non-U.S. markets; |
• | political hostility to investments by foreign or private equity investors; |
• | reliance on a more limited number of commodity inputs, service providers and/or distribution mechanisms; |
• | higher rates of inflation; |
• | higher transaction costs; |
• | difficulty in enforcing contractual obligations; |
• | fewer investor protections and less publicly available information in respect of companies in non-U.S. markets; |
• | certain economic and political risks, including potential exchange control regulations and restrictions on non-U.S. investments and repatriation of profits on investments or of capital invested, the risks of political, economic or social instability, the possibility of expropriation or confiscatory taxation and adverse economic and political developments; and |
• | the possible imposition of non-U.S. taxes or withholding on income and gains recognized with respect to such securities. |
• | Ownership of infrastructure assets may present risk of liability for personal and property injury or impose significant operating challenges and costs with respect to, for example, compliance with zoning, environmental or other applicable laws; |
• | Infrastructure asset investments may face development and construction risks including, without limitation: (1) labor disputes, shortages of material and skilled labor, or work stoppages; (2) slower than projected construction progress and the unavailability or late delivery of necessary equipment: (3) less than optimal coordination with public utilities in the relocation of their facilities; (4) adverse weather conditions and unexpected construction conditions; (5) accidents or the breakdown or failure of construction equipment or processes; (6) catastrophic events such as explosions, fires, terrorist activities and other similar events; and (7) delays in the issuance of the licenses and approvals needed for the development of the infrastructure. These risks could result in substantial unanticipated delays or expenses (which may exceed expected or forecasted budgets) and, under certain circumstances, could prevent completion of construction activities once undertaken. Certain infrastructure asset investments may remain in development or construction phases for a prolonged period and, accordingly, may not be cash-generative for a prolonged period. Recourse against the contractor may be subject to liability caps or may be subject to default or insolvency on the part of the contractor. Investments under development or investments acquired to be developed may receive little or no cash flow from the date of acquisition through the date of completion of development and may experience operating deficits after the date of completion. Market conditions may change during the course of construction that make such development less attractive than at the time it was commenced. In addition, there are risks inherent in the construction work that may give rise to claims or demands against a fund’s portfolio company. When completing an acquisition or making an investment in a project to be developed, value may be ascribed to infrastructure projects that do not achieve successful implementation, potentially resulting in a lower than expected internal rate of return over the life of the investment or in a total loss of the capital invested in such infrastructure project; |
• | The operation of infrastructure assets is exposed to potential unplanned interruptions caused by significant catastrophic or force majeure events. These risks could, among other effects, adversely impact the cash flows available from investments in infrastructure assets, cause personal injury or loss of life, damage property, or instigate disruptions of service. In addition, the cost of repairing or replacing damaged assets could be considerable. Repeated or prolonged service interruptions may result in permanent loss of customers, litigation, or penalties for regulatory or contractual noncompliance. Chile lies on the Nazca tectonic plate, making it one of the world’s most seismically active regions. Our financial and operating performance in Chile may be adversely affected by force majeure events, such as natural disasters. Natural disasters such as earthquakes and floods may cause widespread damage which could impair the asset quality of our loan portfolio and could have an adverse impact on the economy of the affected region. Force majeure events that are incapable of, or too costly to, cure may also have a permanent adverse effect on an investment; |
• | The management of the business or operations of an infrastructure asset may be contracted to a third-party management company unaffiliated with us. Although it would be possible to replace any such operator, the failure of such operator to adequately perform its duties or to act in ways that are in our best interest, or the breach by an operator of applicable agreements or laws, rules and regulations, could have an adverse effect on the investment’s financial condition or results of operations. Infrastructure investments may involve the subcontracting of design and construction activities in respect of projects, and as a result our investments, are subject to the risks that contractual provisions passing liabilities to a subcontractor could be ineffective, the subcontractor fails to perform services which it has agreed to perform and the subcontractor becomes insolvent; and |
• | Infrastructure projects may have a substantial environmental impact. Land acquisition is often a significant issue when building a new project. Community and environmental groups may raise protests, which may be successful in attracting publicity and persuading governments to take action. Infrastructure projects may attract strong opposition from environmental groups for allegedly generating greater levels of air or water pollution, poor visual impact, effects on local population, flora and fauna, etc. Further, there can be no guarantee that all costs and risks regarding compliance with environmental laws and regulations can be identified. Standards are set by these laws and regulations regarding certain aspects of health and environmental quality, and they provide for penalties and other liabilities for the violation of such standards, and establish, in certain circumstances, joint and several obligations to remediate and rehabilitate current and former facilities and locations where operations are, or were, conducted or where materials were disposed of. New and more stringent environmental and health and safety laws, regulations and permit requirements or stricter interpretations of current laws or regulations could (1) impose substantial additional costs on potential infrastructure investments, (2) create liabilities which did not exist at the time of an acquisition and that could not have been foreseen and (3) otherwise place a fund investment at a competitive disadvantage compared to alternative forms of infrastructure. Required expenditures for environmental compliance have adversely impacted investment returns in a number of segments of the infrastructure industry. Certain industries will continue to face considerable oversight from environmental regulatory authorities and significant influence from non-governmental organizations and special interest groups. Compliance with such current or future environmental requirements does not ensure that the operations of certain invested companies will not cause injury to the environment or to people under all circumstances. Moreover, failure to comply with any such requirements could have a material adverse effect on a fund investment, and there can be no assurance that certain fund investments will at all times comply with all applicable environmental laws, regulations and permit requirements. Past practices or future operations of certain fund investments could also result in material personal injury or property damage claims. Any noncompliance with these laws and regulations could subject the infrastructure funds and their properties to material penalties or other liabilities. In addition, infrastructure funds may be exposed to substantial risk of loss from environmental claims arising from certain of their investments involving undisclosed or unknown environmental, health or other related matters. |
• | growth or downturn of the relevant economy; |
• | interest rates and monetary policies; |
• | exchange rates and currency fluctuations; |
• | inflation; |
• | liquidity of the capital and lending markets; |
• | import and export controls; |
• | exchange controls and restrictions on remittances abroad and payments of dividends; |
• | modifications to laws and regulations according to political, social and economic interests; |
• | fiscal policy and changes in tax laws and related interpretations by tax authorities; |
• | economic, political and social instability, including general strikes and mass demonstrations; |
• | the regulatory framework governing the financial services industry; |
• | labor and social security regulations; |
• | energy and water shortages and rationing; |
• | commodity prices; |
• | public health, including as a result of epidemics and pandemics, such as the COVID-19 pandemic; |
• | changes in demographics; and |
• | other political, diplomatic, social and economic developments in or affecting Latin America. |
• | are not required to have a board that is composed of a majority of “independent directors,” as defined under the rules of such exchange; |
• | are not required to have a compensation committee that is composed entirely of independent directors; and |
• | are not required to have a nominating and corporate governance committee that is composed entirely of independent directors. |
• | duty to act in good faith in what the director or officer believes to be in the best interests of the company as a whole; |
• | duty to exercise powers for the purposes for which those powers were conferred and not for a collateral purpose; |
• | directors should not properly fetter the exercise of future discretion; |
• | duty to exercise powers fairly as between different sections of shareholders; |
• | duty to exercise independent judgment; and |
• | duty not to put themselves in a position in which there is a conflict between their duty to the company and their personal interests. |
• | the ability of our board of directors to determine the powers, preferences and rights of preference shares and to cause us to issue the preference shares without shareholder approval; and |
• | a two-class common share structure, as a result of which Patria Holdings generally will be able to control the outcome of all matters requiring shareholder approval, including the election of directors and significant corporate transactions, such as a merger or other sale of our company or its assets. |
• | have sufficient knowledge and experience to make a meaningful evaluation of our Class A common shares, the merits and risks of investing in our Class A common shares and the information contained in this annual report; |
• | have access to, and knowledge of, appropriate analytical tools to evaluate, in the context of its particular financial situation, an investment in our Class A common shares and the impact our Class A common shares will have on its overall investment portfolio; |
• | have sufficient financial resources and liquidity to bear all of the risks of an investment in our Class A common shares; |
• | understand thoroughly the terms of our Class A common shares and be familiar with the behavior of any relevant indices and financial markets; and |
• | be able to evaluate (either alone or with the help of a financial adviser) possible scenarios for economic, interest rate and other factors that may affect its investment and its ability to bear the applicable risks. |
A. |
History and Development of the Company |
• | an exemption from the auditor attestation requirements of Section 404 of the Sarbanes-Oxley Act of 2002, as amended, or the “Sarbanes-Oxley Act,” in the assessment of our internal control over financial reporting, which would otherwise apply in connection with the filing of our second annual report on Form 20-F following consummation of our initial public offering; |
• | reduced disclosure about our executive compensation arrangements in our periodic reports, proxy statements and registration statements; and |
• | exemptions from the requirements of holding non-binding advisory votes on executive compensation and golden parachute arrangements. |
B. |
Business Overview |
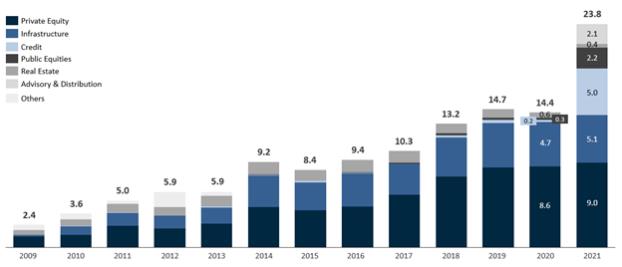
(1) | There can be no guarantee that we will achieve comparable growth metrics in the future. Others includes discontinued strategies such as hedge funds. |
• | Our tailored thesis formulation process, which balances macroeconomic analyses to address regional comparative advantages and shortcomings with thoughtful market targeting and sector focus. This approach seeks to identify sectors that are large, growing and resilient where supply-side fragmentation would allow for market consolidation. In general, our investment theses focus on the acquisition of several small to medium cap companies, on average approximately six companies per thesis, to consolidate a fragmented market; |
• | Sourcing of specific investment targets based on our team’s extensive professional networks followed by a disciplined investment selection process, which involves a due diligence process focused on mitigating legal, financial and operational risks as well as producing a detailed business plan for the relevant company to deliver the targeted returns. The combination of proprietary sourcing with an operationally intensive due diligence process seeks to ensure that potential investment targets are companies with successful owner-operators interested in partnering with us to seek market consolidation and growth; |
• | Acquisition of a control position, at an attractive entry price, in companies where execution risk is mitigated by the collaboration between such owner-operator and our team. A key differentiating aspect of our strategy is the focus on partnerships with established owner-operators striving to support the growth of profitable businesses rather than making outright acquisitions; |
• | Intense hands-on operational involvement in portfolio companies, working alongside management to drive revenue growth, consolidate markets through add-on acquisitions and also drive synergies, gains of scale and other efficiency-enhancing initiatives. We develop detailed business plans, have strong alignment with owner-operators’ long-term plans and onboard strong, experienced management teams, including certain of our key executives as part of the thesis development, usually in C-level or director positions; |
• | Capital allocation to portfolio companies at a gradual pace, consistent with our investment approach based on the consolidation of fragmented markets. This staged deployment allows us to mitigate execution and foreign exchange risks, while seeking optimized returns by redirecting capital allocation to our best-performing investment theses; and |
• | Understanding and mapping potential exit strategies since the initial stages of the development of the investment thesis and throughout the entire investment cycle, which involves establishing domestic and international relationships with potential “target buyers” from the start of our investment analysis. |
(1) | Considers Funds I-VI and Smart Fit co-invest. |
(2) | Companies that have less than 24 months since our initial investment were not considered because the MOIC does not reflect the thesis performance, given that they did not have time to mature. We believe that without those adjustments the analysis would not properly present our MOIC. Private Equity Funds IV and V are still not fully invested, which distorts the analysis against funds I-III, therefore they consider the commitment instead of invested capital to capture the full size of the investment thesis. Loss Ratio considers Loss Cash over Invested Capital (Cash) for companies with less than 1.0x MOIC. Success, or Home-Run Ratio considers committed capital over committed capital for companies with more than 2.0x MOIC. |
(3) | Considers in-house dedicated team and professionals seconded to portfolio companies. |
(4) | Countries where our portfolio companies are located. |
• | Growth |
• | Development premium de-risking projects or assets, and addressing bottlenecks, gaps and inefficiencies in several segments. Approximately two-thirds of our investments in infrastructure were made through new platforms we created, where, in general, we hold a controlling stake; |
• | Sound capital structure |
• | Operation and efficiency gains |
• | Platforms |
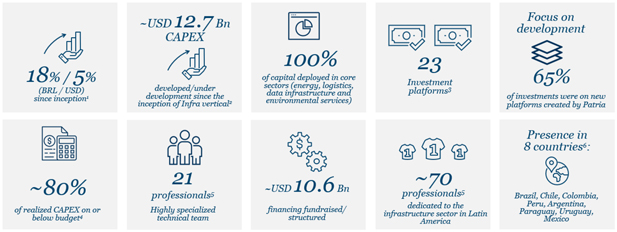
(1) | Cash-weighted pooled net IRR as of December 31, 2021. |
(2) | Includes committed capex that will be deployed in the future. As of June 30, 2021. |
(3) | Includes divested platforms. |
(4) | As of March 2020. |
(5) | Includes professionals seconded to portfolio companies. |
(6) | Countries where our portfolio companies are located. |
Cash-weighted Net IRR Patria vs. PME MSCI | Private Equity |
Cash-weighted Net IRR Patria vs. PME MSCI | Infrastructure | |
|
|
(1) | Since inception to December 31, 2021. |
(2) | Includes professionals seconded to portfolio companies. |
(1) | Source: IBGE, CEPEA/ESALQ USP and Patria Research. Patria invested sectors are equally-weighted average of healthcare and education, agribusiness, logistics and storage, food beverage, and pharma & cosmetics. Patria core sectors: (i) Healthcare – e.g., Healthcare Services, Healthcare Products, Pharmaceutical Distributor, Fitness Clubs and Ophthalmic Services since 1994. (ii) Food and Beverage – e.g., Food Retail, Food Distributor and Food Producer since 1999. (iii) Agribusiness – e.g., Agriculture Inputs and Agriculture Inputs Distributor since 2011. (iv) Business Services – e.g., IT and Logistics since 1994. Other sectors are equally-weighted average of outsourcing services, fuels and lubricants, clothing & footwear, appliances & furniture, office material & IT, and manufacturing such as tobacco, printing and media, metals, electronic products, machinery, and automobile. |
(2) | Since inception, as of December 31, 2021. Source: Capital IQ. Benchmarks: (1) Healthcare: MSCI ACWI/Health Care (Sector) Index (MXWD0HC); MSCI EM/Health Care (Sector) Index (MXEF0HC); RUSSELL 3000 Health Care Sector; (2) MSCI ACWI Agriculture & Food Chain Index; MSCI EM Agriculture & Food Chain Index; RUSSELL 3000 Agriculture Fishing & Ranching Industry; (3) F&B MSCI ACWI/Food Bev & Tobacco (Industry Group) Index, MSCI EM/Food Bev & Tobacco (Industry Group) Index and RUSSELL 3000 Foods Industry, (EM/Information Tech (Sect 4) MSCI ACWI IMI/Air Freight & Logistics(Sub-Industry) Index combined with MSCI ACWI/Information Tech (Sector) Index (MXWD0IT) to represent business services sector; MSCI EM IMI/Air Freight & Logistics(Industry) combined with MSCI or) Index (MXEF0IT) to represent business services sector; RUSSELL 3000 Transportation Miscellaneous Industry combined with RUSSELL 3000 Technology Sector to represent business services sector. |
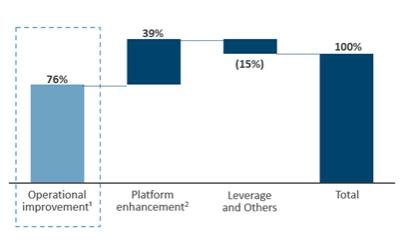
(1) | Revenue growth and margin expansion. |
(2) | Multiple expansion, capital call and change in ownership. |
(1) | As of December 31, 2021. |
(1) | The real |
(1) | Includes indirect investors and direct co-investors in portfolio companies. Excludes Moneda Asset Management as combination was completed in December 2021. |
(1) | Includes indirect investors and direct co-investors in portfolio companies. |
• | Sharing interesting co-investment opportunitiesco-investment opportunities to our LPs; |
• | Acting as a thought partner to our clients |
• | Our robust and structured reporting process |
• | Impact core business Real benefits for people, communities, the market and the countries where they operate. |
• | Risk management Do the right thing; |
• | ESG Initiatives Turning ideas into real business opportunities. |
Investments |
• IFC exclusion list is applicable to all investment screening processes; • Due Diligence with ESG factors to foster adherence to our policies; • Analysis of key ESG issues are a part of our investment committee decisions; • Have records of our investment committee review on the ESG topics; and • Evaluation of ESG opportunities that can generate results. | |
Monitoring |
• ESG topics follow-up by the ESG Forum (institutional KPIs) and by our management committee;• Business units are responsible for ESG risk management and monitoring; and • Annual reports. | |
Divestments |
• At the end of the investment cycle, we provide our potential buyers or future investors with information and reports about each company’s ESG risks and opportunities, managing practices and monitoring results |
• | Management committee. |
• | ESG forum |
• | Compliance committee |
• | Portfolio companies |
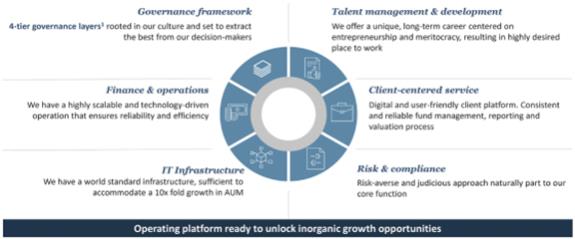
(1) | 4-tier governance layers refer to the type of capacities present in our governance—strategy, protection, investment & divestment, managerial execution. |
• | the Brazilian Regulated Entity is authorized to perform portfolio management services for all types of investment funds in Brazil, or “Investment Funds;” and |
• | the Brazilian Regulated Entity is authorized to provide fiduciary administration services for Brazilian investment funds. |
• | Hong Kong: license Type 1 Dealing in Securities, issued by the SFC (Securities and Futures Commission); |
• | Dubai: category 4 DIFC Investment Advisory License, issued by the Dubai International Financial Centre; |
• | U.K.: authorized as a MiFID Exempt CAD Firm by the FCA, an Exempt CAD firm with limited core Markets in Financial Instruments Directive (MiFID) activities and services: 1. A1 (Reception and transmission of orders in relation to one or more financial instruments); and 2. A5 (Investment advice); and |
• | Uruguay: authorized as a portfolio manager by the Central Bank of Uruguay. The license was granted on March 11, 2022. |
• | regulating the Brazilian capital markets, in accordance with Brazilian Law. No. 6,404, of December 15, 1976 (Brazilian Corporation Law) and Law No. 6,385, of December 7, 1976 (Brazilian Securities Law); |
• | setting rules governing the operation of the securities market; |
• | defining the types of financial institutions that may carry out activities in the securities market, as well as the kinds of transactions that they may perform and services that they may provide in such market; |
• | controlling and supervising the Brazilian securities market through, among others: |
• | the approval, suspension and delisting of publicly held companies; |
• | the authorization of brokerage firms to operate in the securities market and public offering of securities; |
• | the supervision of the activities of publicly held companies, stock exchange markets, commodities and future markets, financial investment funds and variable income funds; |
• | the requirement of full disclosure of relevant events that affect the market, as well as the publication of annual and quarterly reports by publicly held companies; |
• | the imposition of penalties; and |
• | permanently supervising the activities and services of the securities market, as well as the dissemination of information related to the market and the amounts traded therein, to market participants. |
• | limits fines imposed by the CVM to the greater of the following amounts: R$50.0 million, twice the value of the irregular transaction or offering, three times the amount of the economic gain improperly obtained or loss improperly avoided, or twice the damage caused by the irregular conduct. Repeat offenders may be subject to triple the amounts above; |
• | provides for the suspension, disqualification and prohibition from engaging in certain activities or transactions in the banking or securities market for a period of up to 20 years; |
• | imposes coercive or precautionary fines of up to the greater of between (1) 0.1% of the prior fiscal year’s consolidated revenues of the economic group of the fined entity and (2) R$100,000.00; |
• | prohibits offending institutions from participating in securities markets; and |
• | provides the CVM with the authority to ban the accused from contracting with official Brazilian financial institutions and participating in public bidding processes for a period of up to five years; |
• | gains obtained or attempted to be gained by the offender; |
• | economic capability to comply; |
• | severity of the offense; |
• | actual losses; |
• | any recurrence of the offense; and |
• | the offender’s cooperativeness with the investigation. |
• | identify and maintain up-to-date |
• | keep up-to-date |
• | adopt anti-money laundering, or “AML,” internal control policies and procedures that are compatible with the size of the company; |
• | register and maintain up-to-date |
• | comply with COAF’s requests and obligations; |
• | pay special attention to any transaction that, considering the provisions set forth by competent authorities, may indicate the existence of a money laundering crime; and |
• | confirm to the applicable regulatory agency that no offending transactions have occurred. |
• | Risk-Based Approach. |
• | Exchange of information between entities of the same conglomerate. |
• | Detailing duties of the officer responsible for AML/CFT and the possibility of appointing a single officer for the conglomerate. |
• | Regulation of the obligations arising from Law No. 13,810/2019. |
• | Definition of steps for KYC procedures. |
• | Identification of Ultimate Beneficial Owner(s). CVM-authorized manager) or certain foreign investors. |
• | Alternative onboarding systems and simplified onboarding process for nonresident investors. |
• | Regulated entities that have no direct relationship with investors. |
• | dealing in securities as agent or as principal, but only where the person dealing holds himself or herself out as dealing in securities at prices determined generally and continuously, or holds himself or herself out as engaging in the business of underwriting securities or regularly solicits members of the public to induce them to buy or subscribe for securities and the dealing results from such solicitation; |
• | arranging deals in securities (i.e., making arrangements in relation to securities with a view to another person (whether as a principal or an agent), buying, selling, subscribing for, or underwriting in securities, or a person who participates in the arrangements of buying, selling, subscribing for or underwriting securities); |
• | managing securities belonging to another person in circumstances involving the exercise of discretion; and |
• | investment advice (i.e., advising in relation to securities but only if the advice is given to someone in their capacity as investor or potential investor or in their capacity as agent for an investor or a potential investor and the advice is on the merits of that person (whether acting as principal or agent) buying, selling, subscribing for or underwriting a particular security or exercising any right conferred by a security to buy, sell, subscribe for or underwrite a security). |
• | to have anti-money laundering officers appointed; i.e., an anti-money laundering compliance officer, a money laundering reporting officer and a deputy money laundering reporting officer, or the “AML Officers;” |
• | to adopt and implement anti-money laundering, the countering of terrorist and counter proliferation financing, or “AML/CTF/CPF,” policies and procedures providing for the application of know-your-client, or “KYC,” client identification and verification procedures, a clearly documented “risk-based approach” to AML/CTF/CPF (including country risk analysis to identify acceptable countries determined by the Registered Person to have a “low risk” of money laundering, terrorist financing and proliferation financing), targeted financial sanctions screening processes, staff training and awareness, AML/CTF/CPF record keeping and internal reporting procedures in place to identify and report any suspicious activity; and |
• | to monitor, assess and test the AML/CTF/CPF procedures to ensure continuing internal compliance with all laws and regulations in relation to AML/CTF/CPF and any related sanctions under Cayman Islands law. |
• | provide investment advice on securities: delivering personalized recommendations that best suit the objectives and needs of clients in such matters of purchase, sale, lease, exchange or loan of securities, both publicly and privately offered, as well as maintaining or exercising any right conferred by such securities; |
• | channel orders received from clients: channel to brokers such previously received orders from clients, for their execution both in formal trading markets (regulated and supervised by the financial authorities of the country where they are located) and outside the sphere of such markets (over-the-counter markets-OTC); |
• | refer clients to other financial institutions: connect the client with such institutions and provide the necessary assistance to open an account in the respective institution; and |
• | prepare investment reports and financial analysis relating to local or foreign securities markets, and to deliver general or non-personalized recommendations relating to securities. |
• | have anti-money laundering officers appointed; |
• | adopt and implement anti-money laundering, the countering of terrorist and counter proliferation financing, or “AML/CTF/CPF,” policies and procedures providing for the application of know-your-client” “KYC,” client identification and verification procedures, a clearly documented “risk-based approach” to AML/CTF/CPF (including country risk analysis to identify acceptable countries determined by the portfolio manager to have a “low risk” of money laundering, terrorist financing and proliferation financing), targeted financial sanctions screening processes, staff training and awareness, AML/CTF/CPF record keeping and internal reporting procedures in place to identify and report any suspicious activity; and |
• | monitor, assess and test the AML/CTF/CPF procedures to ensure continuing internal compliance with all laws and regulations in relation to AML/CTF/CPF and any related sanctions under Uruguayan law; and |
• | produce reports of suspicious operations before the corresponding authority of the CBU, according to the Uruguay AML Regime. |
C. |
Organizational Structure |
D. |
Property, Plants and Equipment |
A. |
Operating Results |
For the Years Ended December 31, |
||||||||||||||||||||
2021 |
2020 |
2019 |
2021/2020 Change |
2020/2019 Change |
||||||||||||||||
(in US$ millions) |
||||||||||||||||||||
Assets Under Management (AUM) |
23,815.1 |
14,407.9 |
14,748.4 |
9,407.3 |
(340.5 |
) | ||||||||||||||
Private Equity AUM |
9,017.2 | 8,627.2 | 8,510.6 | 390.0 | 116.6 | |||||||||||||||
Infrastructure AUM |
5,059.9 | 4,710.0 | 4,764.8 | 349.9 | (54.8 | ) | ||||||||||||||
Credit AUM |
4,981.4 | 242.0 | 298.5 | 4,739.4 | (56.5 | ) | ||||||||||||||
Public Equities AUM |
2,245.0 | 259.5 | 228.0 | 1,985.5 | 31.5 | |||||||||||||||
Real Estate AUM |
365.7 | 569.2 | 946.5 | (203.5 | ) | (377.3 | ) | |||||||||||||
Advisory & Distribution AUM |
2,146.0 | — | — | 2,146.0 | — | |||||||||||||||
Fee Earning AUM |
17,929.9 |
7,712.9 |
6,869.5 |
10,217.0 |
843.4 |
|||||||||||||||
Private Equity AUM |
4,941.9 | 3,346.9 | 2,958.3 | 1,595.0 | 388.6 | |||||||||||||||
Infrastructure AUM |
3,520.6 | 3,318.2 | 3,186.8 | 202.4 | 131.4 | |||||||||||||||
Credit AUM |
4,926.8 | 115.5 | 15.9 | 4,811.3 | 99.6 | |||||||||||||||
Public Equities AUM |
2,239.2 | 256.4 | 126.8 | 1,982.7 | 129.6 | |||||||||||||||
Real Estate AUM |
413.5 | 675.8 | 581.7 | (262.3 | ) | 94.2 | ||||||||||||||
Advisory & Distribution AUM |
1,887.9 | — | — | 1,887.9 | — | |||||||||||||||
Performance Revenue Eligible AUM |
15,893.1 |
12,292.0 |
12,480.9 |
3,601.1 |
(188.9 |
) | ||||||||||||||
Private Equity AUM |
8,294.0 | 7,757.1 | 7,460.9 | 536.9 | 296.2 | |||||||||||||||
Infrastructure AUM |
3,974.7 | 3,849.1 | 4,071.2 | 125.6 | (222.1 | ) | ||||||||||||||
Credit AUM |
2,345.1 | 235.7 | 298.5 | 2,109.4 | (62.8 | ) | ||||||||||||||
Public Equities AUM |
1,122.3 | 169.6 | 130.4 | 952.7 | 39.2 | |||||||||||||||
Real Estate AUM |
157.0 | 280.5 | 519.9 | (123.5 | ) | (239.4 | ) | |||||||||||||
Advisory & Distribution AUM |
— | — | — | — | — | |||||||||||||||
Net Accrued Performance Fee |
348.1 |
276.4 |
291.9 |
71.7 |
(15.5 |
) |
Private Equity |
Infra- structure |
Credit |
Public Equities |
Real Estate |
Advisory & Distribution |
Total |
||||||||||||||||||||||
(in US$ millions) |
||||||||||||||||||||||||||||
AUM as of December 31, 2020 |
8,627.2 |
4,710.0 |
242.0 |
259.5 |
569.2 |
— |
14,407.9 |
|||||||||||||||||||||
|
|
|
|
|
|
|
|
|
|
|
|
|
|
|||||||||||||||
Acquisitions |
— | — | 4,733.0 | 2,088.0 | — | 2,146.0 | 8,967.0 |
|||||||||||||||||||||
Inflows |
14.9 | 138.6 | — | 21.8 | — | — | 175.3 |
|||||||||||||||||||||
Outflows |
(180.1 | ) | (45.0 | ) | (32.4 | ) | — | (5.9 | ) | — | (263.4 |
) | ||||||||||||||||
Valuation Impact |
1,058.3 | 416.8 | (9.8 | ) | (84.2 | ) | (49.5 | ) | — | 1,331.6 |
||||||||||||||||||
Foreign Exchange (FX) |
(533.1 | ) | (219.0 | ) | (18.3 | ) | (11.6 | ) | (22.1 | ) | — | (804.2 |
) | |||||||||||||||
Funds capital variation |
30.0 | 58.5 | 66.9 | (28.5 | ) | (126.0 | ) | — | 0.9 |
|||||||||||||||||||
AUM as of December 31, 2021 |
9,017.2 |
5,059.9 |
4,981.4 |
2,245.0 |
365.7 |
2,146.0 |
23,815.1 |
|||||||||||||||||||||
|
|
|
|
|
|
|
|
|
|
|
|
|
|
Private Equity |
Infra- structure |
Credit |
Public Equities |
Real Estate |
Advisory & Distribution |
Total |
||||||||||||||||||||||
(in US$ millions) |
||||||||||||||||||||||||||||
AUM as of December 31, 2019 |
8,510.6 |
4,764.8 |
298.5 |
228.0 |
946.5 |
— |
14,748.4 |
|||||||||||||||||||||
|
|
|
|
|
|
|
|
|
|
|
|
|
|
|||||||||||||||
Acquisitions |
— | — | — | — | — | — | — |
|||||||||||||||||||||
Inflows |
— | 1,215.5 | — | 62.0 | 144.5 | — | 1,422.0 |
|||||||||||||||||||||
Outflows |
(136.3 | ) | (856.3 | ) | — | — | (45.6 | ) | — | (1,038.2 |
) | |||||||||||||||||
Valuation Impact |
1,852.3 | 34.9 | 10.2 | 64.5 | (402.8 | ) | — | 1,559.0 |
||||||||||||||||||||
Foreign Exchange (FX) |
(1,741.2 | ) | (694.1 | ) | (51.3 | ) | (80.2 | ) | (82.8 | ) | — | (2,649.6 |
) | |||||||||||||||
Funds capital variation |
141.8 | 245.2 | (15.4 | ) | (14.7 | ) | 9.4 | — | 366.3 |
|||||||||||||||||||
AUM as of December 31, 2020 |
8,627.2 |
4,710.0 |
242.0 |
259.5 |
569.2 |
— |
14,407.9 |
|||||||||||||||||||||
|
|
|
|
|
|
|
|
|
|
|
|
|
|
Private Equity |
Infra- structure |
Credit |
Public Equities |
Real Estate |
Advisory & Distribution |
Total |
||||||||||||||||||||||
(in US$ millions) |
||||||||||||||||||||||||||||
FEAUM as of December 31, 2020 |
3,346.9 |
3,318.2 |
115.5 |
256.4 |
675.8 |
— |
7,712.9 |
|||||||||||||||||||||
|
|
|
|
|
|
|
|
|
|
|
|
|
|
|||||||||||||||
Acquisitions |
— | — | 4,733.2 | 2,080.8 | — | 1,887.9 | 8,701.9 | |||||||||||||||||||||
Inflows |
1,670.6 | 393.9 | 123.1 | 23.5 | 11.1 | — |
2,222.2 | |||||||||||||||||||||
Outflows |
(74.1 | ) | (197.3 | ) | (3.6 | ) | (25.1 | ) | (238.1 | ) | — |
(538.2 | ) | |||||||||||||||
Valuation Impact |
0.0 | 2.5 | (30.3 | ) | (77.5 | ) | (23.7 | ) | — |
(129.0 | ) | |||||||||||||||||
Foreign Exchange (FX) and Other |
(1.6 | ) | 3.3 | (11.2 | ) | (18.9 | ) | (11.6 | ) | — |
(40.0 | ) | ||||||||||||||||
|
|
|
|
|
|
|
|
|
|
|
|
|
|
|||||||||||||||
FEAUM as of December 31, 2021 |
4,941.9 |
3,520.6 |
4,926.8 |
2,239.2 |
413.5 |
1,887.9 |
17,929.9 |
|||||||||||||||||||||
|
|
|
|
|
|
|
|
|
|
|
|
|
|
Private Equity |
Infra- structure |
Credit |
Public Equities |
Real Estate |
Advisory & Distribution |
Total |
||||||||||||||||||||||
(in US$ millions) |
||||||||||||||||||||||||||||
FEAUM as of December 31, 2019 |
2,958.3 |
3,186.8 |
15.9 |
126.8 |
581.7 |
— |
6,869.5 |
|||||||||||||||||||||
|
|
|
|
|
|
|
|
|
|
|
|
|
|
|||||||||||||||
Acquisitions |
— | — | — | — | — | — | — | |||||||||||||||||||||
Inflows |
401.7 | 687.6 | 133.0 | 144.5 | 171.7 | — | 1,538.6 | |||||||||||||||||||||
Outflows |
(1.1 | ) | (493.8 | ) | — | — | (18.2 | ) | — | (513.0 | ) | |||||||||||||||||
Valuation Impact |
— | — | — | 61.3 | — | — | 61.3 | |||||||||||||||||||||
Foreign Exchange (FX) and Other |
(12.0 | ) | (62.5 | ) | (33.4 | ) | (76.2 | ) | (59.4 | ) | — | (243.5 | ) | |||||||||||||||
|
|
|
|
|
|
|
|
|
|
|
|
|
|
|||||||||||||||
FEAUM as of December 31, 2020 |
3,346.9 |
3,318.2 |
115.5 |
256.4 |
675.8 |
— |
7,712.9 |
|||||||||||||||||||||
|
|
|
|
|
|
|
|
|
|
|
|
|
|
Private Equity |
Infra- structure |
Credit |
Public Equities |
Real Estate |
Advisory & Distribution |
Total |
||||||||||||||||||||||
(in US$ millions) |
||||||||||||||||||||||||||||
PREAUM as of December 31, 2020 |
7,757.1 |
3,849.1 |
235.7 |
169.6 |
280.5 |
— |
12,292.0 |
|||||||||||||||||||||
|
|
|
|
|
|
|
|
|
|
|
|
|
|
|||||||||||||||
Acquisitions |
— | — | 2,102.4 | 1,019.7 | — | — | 3,122.1 | |||||||||||||||||||||
Inflows |
— | — | — | 14.2 | — | — | 14.2 | |||||||||||||||||||||
Outflows |
(171.6 | ) | (38.6 | ) | (32.4 | ) | — | (3.6 | ) | — | (246.3 | ) | ||||||||||||||||
Valuation Impact |
1,168.2 | 315.9 | (9.6 | ) | (55.0 | ) | (10.2 | ) | — | 1,409.2 | ||||||||||||||||||
Foreign Exchange (FX) |
(482.6 | ) | (146.5 | ) | (85.3 | ) | (7.6 | ) | (7.8 | ) | — | (729.8 | ) | |||||||||||||||
Funds capital variation |
22.9 | (5.1 | ) | 134.3 | (18.6 | ) | (101.9 | ) | — | 31.6 | ||||||||||||||||||
|
|
|
|
|
|
|
|
|
|
|
|
|
|
|||||||||||||||
PREAUM as of December 31, 2021 |
8,294.0 |
3,974.7 |
2,345.1 |
1,122.3 |
157.0 |
— | 15,893.1 |
|||||||||||||||||||||
|
|
|
|
|
|
|
|
|
|
|
|
|
|
Private Equity |
Infra- structure |
Credit |
Public Equities |
Real Estate |
Advisory & Distribution |
Total |
||||||||||||||||||||||
(in US$ millions) |
||||||||||||||||||||||||||||
PREAUM as of December 31, 2019 |
7,460.9 |
4,071.2 |
298.5 |
130.4 |
519.9 |
— |
12,480.9 |
|||||||||||||||||||||
|
|
|
|
|
|
|
|
|
|
|
|
|
|
|||||||||||||||
Acquisitions |
— | — | — | — | — | — | — | |||||||||||||||||||||
Inflows |
— | 908.2 | — | 38.5 | — | — | 946.7 | |||||||||||||||||||||
Outflows |
(129.6 | ) | (639.0 | ) | — | — | (21.9 | ) | — | (790.5 | ) | |||||||||||||||||
Valuation Impact |
1,853.3 | (42.9 | ) | 3.8 | 40.0 | (173.5 | ) | — | 1,680.7 | |||||||||||||||||||
Foreign Exchange (FX) |
(1,509.1 | ) | (477.9 | ) | (51.2 | ) | (30.2 | ) | (45.5 | ) | — | (2,113.9 | ) | |||||||||||||||
Funds capital variation |
81.6 | 29.5 | (15.4 | ) | (9.1 | ) | 1.5 | — | 88.1 | |||||||||||||||||||
|
|
|
|
|
|
|
|
|
|
|
|
|
|
|||||||||||||||
PREAUM as of December 31, 2020 |
7,757.1 |
3,849.1 |
235.7 |
169.6 |
280.5 |
— |
12,292.0 |
|||||||||||||||||||||
|
|
|
|
|
|
|
|
|
|
|
|
|
|
(in US$ millions) |
||||
Net accrued performance fee as of December 31, 2020 |
276.4 |
|||
|
|
|||
Private Equity Fund III |
(55.4 | ) | ||
Private Equity Fund IV |
(0.0 | ) | ||
Private Equity Fund V |
40.8 | |||
Private Equity Fund VI |
28.9 | |||
Infrastructure II |
0.1 | |||
Infrastructure III |
51.8 | |||
Infrastructure IV |
5.1 | |||
Agribusiness I |
(0.0 | ) | ||
Alturas II |
0.4 | |||
|
|
|||
Net accrued performance fee as of December 31, 2021 |
348.1 |
|||
|
|
(in US$ millions) |
||||
Net accrued performance fee as of December 31, 2019 |
291.8 |
|||
|
|
|||
Private Equity Fund III |
(18.6 | ) | ||
Private Equity Fund IV |
(86.8 | ) | ||
Private Equity Fund V |
119.4 | |||
Private Equity Fund VI |
13.9 | |||
Infrastructure II |
(0.2 | ) | ||
Infrastructure III |
(44.1 | ) | ||
Infrastructure IV |
1.0 | |||
Agribusiness I |
(0.0 | ) | ||
|
|
|||
Net accrued performance fee as of December 31, 2020 |
276.4 |
|||
|
|
For the Years Ended December 31, |
||||||||||||||||||||
2021 |
2020 |
2019 |
Change 2021/2020 |
Change 2020/2019 |
||||||||||||||||
(in US$ millions) |
||||||||||||||||||||
Net income for the year |
121.3 | 61.9 | 60.9 | 59.4 | 1.0 | |||||||||||||||
Fee Related Earnings (FRE)(1) |
86.0 | 71.3 | 63.0 | 14.7 | 8.3 | |||||||||||||||
Distributable Earnings (DE)(2) |
141.3 | 70.3 | 63.4 | 71.0 | 6.9 |
(1) | Reconciled as income before income tax less revenue from performance fees net of taxes, other income/(expenses) and net financial income/(expense), plus personnel expenses related to Officers’ fund long-term benefit plan, performance share plan, performance fee compensation, deferred consideration and carry bonus provision, plus amortization of contractual rights and brand amortization. For a reconciliation of our FRE to income before income tax for the year, see “—Fee Related Earnings (FRE)” below. |
(2) | Reconciled as net income adjusted for deferred taxes, amortization of contractual rights, personnel expenses related to Officers’ fund long-term benefit plan, Deferred Consideration and Performance share Plan, and non-recurring expenses mainly consisting of transaction costs and initial public offering expenses. For a reconciliation of our DE to net income for the year, see “—Distributable Earnings (DE)” below. |
For the Years Ended December 31, |
||||||||||||||||||||
2021 |
2020 |
2019 |
Change 2021/2020 |
Change 2020/2019 |
||||||||||||||||
(in US$ millions) |
||||||||||||||||||||
Income before income tax |
121.6 |
65.0 |
64.5 |
56.6 |
0.5 |
|||||||||||||||
|
|
|
|
|
|
|
|
|
|
|||||||||||
Revenue from performance fees |
(89.3 | ) | — | (4.9 | ) | (89.3 | ) | 4.9 | ||||||||||||
Taxes on revenue—performance fees |
0.2 | — | 0.5 | 0.2 | (0.5 | ) | ||||||||||||||
Officers’ fund—long-term benefit plan |
2.2 | 0.4 | (1.0 | ) | 1.8 | 1.4 | ||||||||||||||
Performance Share Plan |
0.8 | — | — | 0.8 | — | |||||||||||||||
Performance fee compensation |
30.2 | — | — | 30.2 | — | |||||||||||||||
Deferred Consideration on acquisition |
2.0 | — | — | 2.0 | — | |||||||||||||||
Carry bonus provision |
0.9 | — | — | 0.9 | — | |||||||||||||||
Amortization of contractual rights |
4.3 | 3.7 | 3.8 | 0.6 | (0.1 | ) | ||||||||||||||
Brand amortization |
0.3 | — | — | 0.3 | — | |||||||||||||||
Other income/(expenses) |
12.5 | 2.0 | (0.1 | ) | 10.5 | 2.1 | ||||||||||||||
Net financial income/(expense) |
0.3 | 0.2 | 0.2 | 0.1 | — | |||||||||||||||
|
|
|
|
|
|
|
|
|
|
|||||||||||
Fee Related Earnings |
86.0 |
71.3 |
63.0 |
14.7 |
8.2 |
|||||||||||||||
|
|
|
|
|
|
|
|
|
|
For the Years Ended December 31, |
||||||||||||||||||||
2021 |
2020 |
2019 |
Change 2021/2019 |
Change 2019/2018 |
||||||||||||||||
(in US$ millions) |
||||||||||||||||||||
Net income for the year |
121.3 |
61.9 |
60.9 |
59.4 |
1.0 |
|||||||||||||||
|
|
|
|
|
|
|
|
|
|
|||||||||||
Deferred income tax expenses |
(1.3 | ) | 2.2 | (0.3 | ) | (3.5 | ) | 2.5 | ||||||||||||
Amortization of contractual rights |
4.3 | 3.6 | 3.8 | 0.7 | (0.2 | ) | ||||||||||||||
Officers’ fund—long-term benefit plan |
2.2 | 0.4 | (1.0 | ) | 1.8 | 1.4 | ||||||||||||||
Deferred consideration |
2.0 | — | — | 2.0 | — | |||||||||||||||
Performance Share Plan |
0.8 | — | — | 0.8 | — | |||||||||||||||
Brand amortization |
0.3 | — | — | 0.3 | — | |||||||||||||||
IPO expenses and non-recurring transaction costs |
11.8 | 2.2 | — | 9.6 | 2.2 | |||||||||||||||
|
|
|
|
|
|
|
|
|
|
|||||||||||
Distributable Earnings |
141.3 |
70.3 |
63.4 |
71.0 |
6.9 |
|||||||||||||||
|
|
|
|
|
|
|
|
|
|
For the Years Ended December 31, |
||||||||||||
2021 |
2020 |
Variation (%) |
||||||||||
(in US$ millions, except for percentages) |
||||||||||||
Income Statement Data: |
||||||||||||
Net Revenue from services |
235.5 |
115.0 |
104.8 |
% | ||||||||
|
|
|
|
|
|
|||||||
Cost of services rendered |
(86.7 |
) |
(33.2 |
) |
161.1 |
% | ||||||
|
|
|
|
|
|
|||||||
Personnel expenses |
(47.6 | ) | (27.2 | ) | 75.0 | % | ||||||
Deferred consideration on acquisition |
(2.0 | ) | — | n.m. | ||||||||
Amortization of intangible assets |
(6.9 | ) | (6.0 | ) | 15.0 | % | ||||||
Carried interest allocation |
(30.2 | ) | — | n.m. | ||||||||
Gross profit |
148.8 |
81.8 |
81.9 |
% | ||||||||
|
|
|
|
|
|
|||||||
Operating income and expenses |
(26.9 |
) |
(16.7 |
) |
61.1 |
% | ||||||
Administrative expenses |
(14.4 | ) | (14.6 | ) | (1.4 | )% | ||||||
Other income/(expenses) |
(12.5 | ) | (2.0 | ) | n.m. | |||||||
|
|
|
|
|
|
|||||||
Operating income before net financial income/(expense) |
121.9 |
65.2 |
87.0 |
% | ||||||||
|
|
|
|
|
|
|||||||
Net financial income/(expense) |
(0.3 | ) | (0.2 | ) | 50.0 | % | ||||||
Income before income tax |
121.7 |
65.0 |
87.2 |
% | ||||||||
|
|
|
|
|
|
|||||||
Income tax |
(0.4 | ) | (3.1 | ) | (87.1 | )% | ||||||
|
|
|
|
|
|
|||||||
Net income for the year |
121.3 |
61.9 |
96.0 |
% | ||||||||
|
|
|
|
|
|
|||||||
Owners of the Parent |
122.5 | 62.2 | 96.9 | % | ||||||||
Non-controlling interests |
(1.3 | ) | (0.3 | ) | n.m. |
For the Years Ended December 31, |
||||||||||||
2021 |
2020 |
Variation (%) |
||||||||||
(in US$ millions, except forpercentages) |
||||||||||||
Revenue from management fees |
144.7 | 112.9 | 28.2 | % | ||||||||
Private Equity |
82.2 | 56.9 | 44.5 | % | ||||||||
Infrastructure |
46.8 | 44.7 | 4.7 | % | ||||||||
Credit |
4.8 | 0.5 | n.m. | |||||||||
Real Estate |
7.7 | 10.8 | (28.7 | )% | ||||||||
Public Equities |
3.0 | — | n.m. | |||||||||
Advisory and Distribution |
0.2 | — | n.m. | |||||||||
Revenue from incentive fees |
4.9 | 3.5 | 40.0 | % | ||||||||
Private Equity |
0.1 | 3.5 | (97.1 | )% | ||||||||
Infrastructure |
— | — | n.m. | |||||||||
Credit |
2.9 | — | n.m. | |||||||||
Real Estate |
— | — | n.m. | |||||||||
Public Equities |
1.9 | — | n.m. | |||||||||
Advisory and Distribution |
— | — | n.m. | |||||||||
Revenue from performance fees(1) |
89.3 | — | n.m. | |||||||||
Private Equity |
89.1 | — | n.m. | |||||||||
Infrastructure |
— | — | n.m. | |||||||||
Credit |
— | — | n.m. | |||||||||
Real Estate |
0.2 | — | n.m. | |||||||||
Public Equities |
— | — | n.m. | |||||||||
Advisory and Distribution |
— | — | n.m. | |||||||||
Fund fees |
238.9 |
116.4 |
105.2 |
% | ||||||||
|
|
|
|
|
|
|||||||
Revenue from advisory and other ancillary fees |
0.7 | 2.5 | (72.0 | )% | ||||||||
Taxes on revenue—performance fees |
(0.2 | ) | — | n.m. | ||||||||
Taxes on revenue—incentive fees |
(0.2 | ) | (0.4 | ) | (50.0 | )% | ||||||
Taxes on revenue—management fees |
(3.6 | ) | (3.1 | ) | 16.1 | % | ||||||
Taxes on advisory and other ancillary fees |
(0.1 | ) | (0.4 | ) | (75.0 | )% | ||||||
Net Revenues from services |
235.5 |
115.0 |
104.8 | % | ||||||||
|
|
|
|
|
|
|||||||
Brazil Revenue(2) |
25.7 | 28.5 | (9.8 | )% | ||||||||
British Virgin Islands |
2.3 | — | n.m. | |||||||||
Cayman Islands(3) |
200.7 | 86.5 | 132.0 | % | ||||||||
Chile(4) |
5.2 | — | n.m. | |||||||||
United States of America(5) |
1.6 | — | n.m. |
(1) | Performance fees and incentive fees are primarily generated when the return of the investment funds exceeds the performance hurdle set out in the related charters. Since the investment funds’ performance are susceptible to market volatility and to factors out of our control, the related fees fall under the variable consideration defined in IFRS 15. According to the referred standard, we recognize these fees at a point in time when the related uncertainties are resolved, the likelihood of a claw-back or reversal is improbable and the likely amount of the transaction prices can be estimated without significant chance of reversal, indicating high probability of economic benefits and cash inflow to us. |
(2) | Our Brazil revenue consists primarily of management and performance fees received by our Brazilian entities relating to the services provided to our funds. |
(3) | Our Cayman Islands revenue consists of management and performance fees received by our Cayman Islands entities relating to the services provided to our funds. |
(4) | Our Chile revenue consists of management, incentive, financial advisory and other fees for December from Moneda acquisition. |
(5) | Our United States revenue consists of management and incentive fees for December from Moneda acquisition. |
For the Years Ended December 31, |
||||||||||||
2020 |
2019 |
Variation (%) |
||||||||||
(in US$ millions, except for percentages) |
||||||||||||
Income Statement Data: |
||||||||||||
Net Revenue from services |
115.0 |
123.2 |
(7 |
)% | ||||||||
Cost of services rendered |
(33.2 |
) |
(43.0 |
) |
(23 |
)% | ||||||
Personnel expenses |
(27.2 | ) | (36.9 | ) | (26 | )% | ||||||
Amortization of intangible assets |
(6.0 | ) | (6.1 | ) | (2 | )% | ||||||
Gross profit |
81.8 |
80.2 |
2 |
% | ||||||||
|
|
|
|
|
|
|||||||
Operating income and expenses |
(16.7 |
) |
(15.6 |
) |
6 |
% | ||||||
Administrative expenses |
(14.6 | ) | (15.7 | ) | (7 | )% | ||||||
Other income/(expenses) |
(2.0 | ) | 0.1 | n.m. | ||||||||
|
|
|
|
|
|
|||||||
Operating income before net financial income/(expense) |
65.2 |
64.6 |
1 |
% | ||||||||
Net financial income/(expense) |
(0.2 | ) | (0.2 | ) | n.m. | |||||||
Income before income tax |
65.0 | 64.4 | 1 | % | ||||||||
Income tax |
(3.1 | ) | (3.5 | ) | (11 | )% | ||||||
|
|
|
|
|
|
|||||||
Net income for the year |
61.9 |
60.9 |
2 |
% | ||||||||
|
|
|
|
|
|
|||||||
Owners of the Parent |
62.2 | 58.5 | 6 | % | ||||||||
Non-controlling interests |
(0.3 | ) | 2.4 | n.m. |
For the Years Ended December 31, |
||||||||||||
2020 |
2019 |
Variation (%) |
||||||||||
(in US$ millions, except for percentages) |
||||||||||||
Revenue from management fees |
112.9 | 104.9 | 8 | % | ||||||||
Private Equity |
56.9 | 50.6 | 12 | % | ||||||||
Infrastructure |
44.7 | 37.6 | 19 | % | ||||||||
Country-specific Products |
11.3 | 16.7 | (32 | )% | ||||||||
Revenue from incentive fees |
3.5 | 18.1 | (81 | )% | ||||||||
Private Equity |
3.5 | — | n.m. | |||||||||
Infrastructure |
— | — | — | |||||||||
Country-specific Products |
— | 18.1 | n.m. | |||||||||
Revenue from performance fees |
— | 4.9 | n.m. | |||||||||
Private Equity |
— | 4.9 | n.m. | |||||||||
Infrastructure |
— | — | — | |||||||||
Country-specific Products |
— | — | — | |||||||||
Fund fees |
116.4 |
127.8 |
(9 |
)% | ||||||||
Revenue from advisory and other ancillary fees |
2.5 | 1.0 | 150 | % | ||||||||
Taxes on revenue—performance fees |
— | (0.5 | ) | n.m. | ||||||||
Taxes on revenue—incentive fees |
(0.4 | ) | (2.0 | ) | (80 | )% | ||||||
Taxes on revenue—management fees |
(3.1 | ) | (2.9 | ) | (7 | )% | ||||||
Taxes on advisory and other ancillary fees |
(0.4 | ) | (0.1 | ) | 300 | % | ||||||
Net Revenues from services |
115.0 |
123.2 |
(7 |
)% | ||||||||
|
|
|
|
|
|
|||||||
Brazil Revenue(1) |
28.5 | 35.9 | (21 | )% | ||||||||
|
|
|
|
|
|
|||||||
Cayman Islands Revenue(2) |
86.5 | 87.3 | (1 | )% | ||||||||
|
|
|
|
|
|
(1) | Our Brazil revenue consists of management, performance, incentive, advisory and other ancillary fees received by our Brazilian entities relating to the services provided to our funds. |
(2) | Our Cayman Islands revenue consists of management, performance and incentive fees received by our Cayman Islands entities relating to the services provided to our funds. |
B. |
Liquidity and Capital Resources |
• | consideration payable on the acquisition of Moneda; |
• | paying operating costs, including compensation and bonuses; |
• | engaging in mergers and acquisitions pursuant to our inorganic growth strategy; and |
• | paying dividends to our shareholders. |
For the Years Ended December 31 |
||||||||||||
2021 |
2020 |
2019 |
||||||||||
(in US$ millions) |
||||||||||||
Cash flows provided by operating activities |
107.4 | 52.7 | 44.5 | |||||||||
Cash flows provided by/used in investing activities |
(284.1 | ) | 23.5 | 11.3 | ||||||||
Cash flows provided by/used in financing activities |
177.9 | (66.2 | ) | (53.8 | ) |
C. |
Research and Development, Patents and Licenses, etc. |
D. |
Trend Information |
E. |
Critical Accounting Estimates |
A. |
Directors and Senior Management |
Name |
Age |
Position | ||
Olimpio Matarazzo Neto | 62 | Chairman | ||
Otavio Lopes Castello Branco Neto | 64 | Director | ||
Alexandre Teixeira de Assumpção Saigh | 54 | Director | ||
Pablo Echeverría Benítez | 58 | Director | ||
Sabrina Bridgett Foster | 48 | Independent Director(1) | ||
Jennifer Anne Collins | 47 | Independent Director(1) | ||
Glen George Wigney | 66 | Independent Director(1) |
(1) | Member of the Audit Committee. |
Name |
Age |
Position | ||
Alexandre Teixeira de Assumpção Saigh | 54 | Chief Executive Officer | ||
Marco Nicola D’Ippolito | 45 | Chief Financial Officer | ||
André Mauricio de Camargo Penalva | 49 | Head of Sales and Distribution | ||
Ricardo Leonel Scavazza | 44 | Chief Executive Officer and Chief Investments Officer of Private Equity | ||
Andre Franco Sales | 48 | Chief Executive Officer and Chief Investment Officer of Infrastructure | ||
Daniel Rizardi Sorrentino | 41 | Brazil’s Country Manager | ||
Jose Augusto Gonçalves de Araujo Teixeira | 43 | Head of Marketing and Products | ||
Ana Paula Alves dos Santos | 54 | Head of Human Resources | ||
Marcelo Augusto Spinardi | 38 | Head of Finance | ||
Paulo Eduardo de Freitas Cirulli | 40 | Chief Compliance Officer | ||
Pedro Rufino Carvalho da Silva | 40 | Global General Counsel | ||
Peter Paul Lorenço Estermann | 64 | Chief of Private Equity Portfolio Management |
B. |
Compensation |
C. |
Board Practices |
• | Nasdaq Rule 5605(b), which requires that independent directors comprise a majority of a company’s board of directors. As allowed by the laws of the Cayman Islands, independent directors do not comprise a majority of our board of directors; |
• | Nasdaq Rule 5605(e)(1), which requires that a company have a nominations committee comprised solely of “independent directors” as defined by Nasdaq. As allowed by the laws of the Cayman Islands, we do not have a nominations committee nor do we have any current intention to establish one; |
• | Nasdaq Rule 5605(d) & (e), which require that compensation for our executive officers and selection of our director nominees be determined by a majority of independent directors. As allowed by the laws of the Cayman Islands, we do not have a nomination and corporate governance committee or remuneration committee nor do we have any current intention to establish either; and |
• | Nasdaq Rule 5635, which requires that a listed issuer obtain shareholder approval prior to an issuance of securities in connection with: (i) the acquisition of the stock or assets of another company; (ii) equity-based compensation of officers, directors, employees or consultants; (iii) a change of control; and (iv) transactions other than public offerings. Pursuant to the laws of the Cayman Islands and our Articles of Association, we are not required to obtain any such approval. |
Board Diversity Matrix (as of December 31, 2021) |
||||||||||||||
Country of Principal Executive Offices |
Cayman Islands | |||||||||||||
Foreign Private Issuer |
Yes (the Cayman Islands) | |||||||||||||
Disclosure Prohibited under Home Country Law |
No | |||||||||||||
Total Number of Directors |
7 | |||||||||||||
Female |
Male |
Non-Binary |
Did Not Disclose Gender |
|||||||||||
Part I: Gender Identity |
||||||||||||||
Directors |
2 | 5 | 0 | 0 | ||||||||||
Part II: Demographic Background |
||||||||||||||
Underrepresented Individual in Home Country Jurisdiction |
0 | |||||||||||||
LGBTQ+ |
0 | |||||||||||||
Did not Disclose Demographic Background |
0 |
• | the appointment, compensation, retention and oversight of any auditor or accounting firm engaged for the purpose of preparing or issuing an audit report or performing other audit, review or attest services; |
• | pre-approving the audit services and non-audit services to be provided by our independent auditor before the auditor is engaged to render such services; |
• | reviewing and discussing with the independent auditor its responsibilities under generally accepted auditing standards, the planned scope and timing of the independent auditor’s annual audit plan(s) and significant findings from the audit; |
• | obtaining and reviewing a report from the independent auditor describing all relationships between the independent auditor and the Company consistent with the applicable PCAOB requirements regarding the independent auditor’s communications with the audit committee concerning independence; |
• | confirming and evaluating the rotation of the audit partners on the audit engagement team as required by law; |
• | reviewing with management and the independent auditor, in separate meetings whenever the audit committee deems appropriate, any analyses or other written communications prepared by the management and/or the independent auditor setting forth significant financial reporting issues and judgments made in connection with the preparation of the financial statements, including analyses of the effects of alternative IFRS methods on the financial statements; and other critical accounting policies and practices of the Company; |
• | reviewing, in conjunction with the Chief Executive Officer and Chief Financial Officer of the Company, the Company’s disclosure controls and procedures and internal control over financial reporting; |
• | establishing procedures for the receipt, retention and treatment of complaints received by the Company regarding accounting, internal accounting controls or auditing matters, and the confidential, anonymous submission by employees of the Company of concerns regarding questionable accounting or auditing matters; and |
• | approving or ratifying any related party transaction (as defined in our related party transaction policy) in accordance with our related party transaction policy. |
D. |
Employees |
As of December 31, 2021 |
||||||||
Function |
Number of Employees |
% of Total |
||||||
Management |
37 | 9 | % | |||||
Investment |
115 | 30 | % | |||||
Sales & IR |
58 | 15 | % | |||||
General and Administrative |
180 | 46 | % | |||||
|
|
|
|
|||||
Total |
390 |
100 |
% | |||||
|
|
|
|
E. |
Share Ownership |
A. |
Major Shareholders |
• | each person, or group of affiliated persons, known by us to own beneficially 5% or more of our issued and outstanding shares; |
• | each of our executive officers and directors individually; and |
• | all executive officers and directors as a group. |
Shares Beneficially Owned |
% of Total Voting Power(1) |
|||||||||||||||||||
Class A |
Class B |
|||||||||||||||||||
Shareholders |
Shares |
% |
Shares |
% |
||||||||||||||||
5% Shareholders |
||||||||||||||||||||
Patria Holdings Limited(2) |
— | — | % | 81,900,000 | 88.1 | % | 83.3 | % | ||||||||||||
Blackstone PAT Holdings IV, L.L.C.(3) |
6,544,619 | 12.1 | % | — | — | % | 0.7 | % | ||||||||||||
Entities affiliated with Adage Capital Partners, L.P.(4) |
2,677,765 | 4.9 | % | — | — | % | 0.3 | % | ||||||||||||
Entities affiliated with Capital Research Global Investors(5) |
5,021,580 | 9.3 | % | — | — | % | 0.5 | % | ||||||||||||
Entities affiliated with Capital International Investors(6) |
3,280,360 | 6.0 | % | — | — | % | 0.3 | % | ||||||||||||
Entities affiliated with Wellington Management Group LLP(7) |
3,508,750 | 6.5 | % | — | — | % | 0.4 | % | ||||||||||||
Entities affiliated with FMR LLC(8) |
5,424,750 | 10.0 | % | — | — | % | 0.6 | % | ||||||||||||
Executive Officers and Directors |
||||||||||||||||||||
Alexandre Teixeira de Assumpção Saigh(2)(9) |
— | — | % | 81,900,000 | 88.1 | % | 83.3 | % | ||||||||||||
Olimpio Matarazzo Neto(2)(9) |
— | — | % | 81,900,000 | 88.1 | % | 83.3 | % | ||||||||||||
Otavio Lopes Castello Branco Neto(9) |
— | — | % | — | — | % | — | % | ||||||||||||
Pablo Echeverría Benítez(10) |
— | — | % | 3,617,260 | 3.9 | % | 3.7 | % | ||||||||||||
Sabrina Bridgett Foster |
— | — | % | — | — | % | — | % | ||||||||||||
Jennifer Anne Collins |
— | — | % | — | — | % | — | % | ||||||||||||
Glen George Wigney |
— | — | % | — | — | % | — | % | ||||||||||||
Marco Nicola D’Ippolito(9) |
— | — | % | — | — | % | — | % | ||||||||||||
André Mauricio de Camargo Penalva(9) |
— | — | % | — | — | % | — | % | ||||||||||||
Ricardo Leonel Scavazza(9) |
— | — | % | — | — | % | — | % | ||||||||||||
Andre Franco Sales(9) |
— | — | % | — | — | % | — | % | ||||||||||||
Daniel Rizardi Sorrentino(9) |
— | — | % | — | — | % | — | % | ||||||||||||
Jose Augusto Gonçalves de Araujo Teixeira(9) |
— | — | % | — | — | % | — | % | ||||||||||||
Ana Paula Alves dos Santos |
— | — | % | — | — | % | — | % | ||||||||||||
Marcelo Augusto Spinardi |
— | — | % | — | — | % | — | % | ||||||||||||
Paulo Eduardo de Freitas Cirulli |
— | — | % | — | — | % | — | % | ||||||||||||
Pedro Rufino Carvalho da Silva |
— | — | % | — | — | % | — | % | ||||||||||||
Peter Paul Lorenço Estermann |
— | — | % | — | — | % | — | % | ||||||||||||
All directors and executive officers as a group (18 persons) |
— | — | % | 85,517,260 | 92.0 | % | 87.0 | % |
* | Represents beneficial ownership of less than 1% of our issued and outstanding common shares. |
(1) | Percentage of total voting power represents voting power with respect to all of our Class A common shares and Class B common shares, as a single class. Holders of our Class B common shares are entitled to 10 votes per share, whereas holders of our Class A common shares are entitled to one vote per share. For more information about the voting rights of our Class A common shares and Class B common shares, see “Item 10. Additional Information—B. Memorandum and Articles of Association—Voting Rights.” |
(2) | Consists of 70,462,802 Class B common shares held of record by Patria Holdings Limited and 11,437,198 Class B common shares held of record by SPV PHL, which is a wholly owned subsidiary of Patria Holdings Limited. Alexandre Teixeira de Assumpção Saigh and Olimpio Matarazzo Neto are controlling shareholders of Patria Holdings Limited (the “Patria Holdings Controlling Shareholders”). Patria Holdings Limited is the sole shareholder of SPV PHL. The Patria Holdings Controlling Shareholders have beneficial ownership of the Class B common shares held of record by Patria Holdings Limited. Each of the Patria Holding Controlling Shareholders disclaims ownership of the Class B common shares except to the extent he has a pecuniary interest therein. The address of each of Patria Holdings Limited, SPV PHL and each Patria Holdings Controlling Shareholders is c/o Patria Holdings Limited, 18 Forum Lane, 3rd floor, Camana Bay, PO Box 757, KY1-9006, Grand Cayman, Cayman Islands. |
(3) | This information is based solely on the Schedule 13G filed with the SEC on February 11, 2022 on behalf of Blackstone PAT Holdings IV, L.L.C., Blackstone Holdings IV L.P., Blackstone Holdings IV GP L.P., Blackstone Holdings IV GP Management (Delaware) L.P., Blackstone Holdings IV GP Management L.L.C., Blackstone Inc., Blackstone Group Management L.L.C. and Stephen A. Schwarzman. Blackstone Holdings IV L.P. is the sole member of Blackstone PAT Holdings IV, L.L.C. Blackstone Holdings IV GP L.P. is the general partner of Blackstone Holdings IV L.P. Blackstone Holdings IV GP Management (Delaware) L.P. is the general partner of Blackstone Holdings IV GP L.P. Blackstone Holdings IV GP Management L.L.C. is the general partner of Blackstone Holdings IV GP Management (Delaware) L.P. The sole member of Blackstone Holdings IV GP Management L.L.C. is Blackstone Inc. The sole holder of the Series II preferred stock of Blackstone Inc. is Blackstone Group Management L.L.C. Blackstone Group Management L.L.C. is wholly owned by Blackstone’s senior managing directors and controlled by its founder, Stephen A. Schwarzman. Each of the Blackstone entities described in this footnote and Mr. Schwarzman (other than to the extent it or he directly holds securities as described herein) may be deemed to beneficially own the shares directly or indirectly controlled by such Blackstone entities or him, but each disclaims beneficial ownership of such shares. The address of each of such Blackstone entities and Mr. Schwarzman is c/o The Blackstone Group Inc., 345 Park Avenue, New York, NY 10154. |
(4) | This information is based solely on the Schedule 13G filed with the SEC on February 10, 2022 on behalf of Adage Capital Partners, L.P., Adage Capital Partners GP, L.L.C., Adage Capital Advisors, L.L.C., Robert Atchinson and Phillip Gross. Adage Capital Partners, L.P., a Delaware limited partnership, or “ACP,” Adage Capital Partners GP, L.L.C., a limited liability company organized under the laws of the State of Delaware, or “ACPGP,” as general partner of ACP with respect to the Class A common shares directly owned by ACP, Adage Capital Advisors, L.L.C., a limited liability company organized under the laws of the State of Delaware “ACA,” as managing member of ACPGP, general partner of ACP, with respect to the Class A common shares directly owned by ACP, Robert Atchinson, as managing member of ACA, managing member of ACPGP, general partner of ACP with respect to the Class A common shares directly owned by ACP, and Phillip Gross, as managing member of ACA, managing member of ACPGP, general partner of ACP with respect to the Class A common shares directly owned by ACP. The address of the business office of each of these entities and individuals is 200 Clarendon Street, 52nd Floor, Boston, Massachusetts 02116. |
(5) | This information is based solely on the Schedule 13G filed with the SEC on February 11, 2022 on behalf of Capital Research Global Investors. Capital Research Global Investors, or “CRGI,” is a division of Capital Research and Management Company, or “CRMC,” as well as its investment management subsidiaries and affiliates Capital Bank and Trust Company, Capital International, Inc., Capital International Limited, Capital International Sàrl, Capital International K.K., and Capital Group Private Client Services, Inc., or together with CRMC, the “investment management entities.” CRGI’s divisions of each of the investment management entities collectively provide investment management services under the name “Capital Research Global Investors.” The address of each of such entities is 333 South Hope Street, 55th Fl, Los Angeles, CA 90071. |
(6) | This information is based solely on the Schedule 13G filed with the SEC on February 11, 2022 on behalf of Capital International Investors. Capital International Investors, or “CII,” is a division of Capital Research and Management Company, or “CRMC,” as well as its investment management subsidiaries and affiliates Capital Bank and Trust Company, Capital International, Inc., Capital International Limited, Capital International Sarl, Capital International K.K., and Capital Group Private Client Services, Inc., or together with CRMC, the “investment management entities.” CII’s divisions of each of the investment management entities collectively provide investment management services under the name “Capital International Investors.” The address of each of such entities is 333 South Hope Street, 55th Fl, Los Angeles, CA 90071. |
(7) | This information is based solely on the Schedule 13G filed with the SEC on February 14, 2022 on behalf of Wellington Management Group LLP, Wellington Group Holdings LLP, Wellington Investment Advisors Holdings LLP and Wellington Management Company LLP. These securities as to which a Schedule 13G was filed by Wellington Management Group LLP, as parent holding company of certain holding companies and the Wellington Investment Advisers, are owned of record by clients of the Wellington Investment Advisers. Wellington Investment Advisors Holdings LLP controls directly, or indirectly through Wellington Management Global Holdings, Ltd., the Wellington Investment Advisers. Wellington Investment Advisors Holdings LLP is owned by Wellington Group Holdings LLP. Wellington Group Holdings LLP is owned by Wellington Management Group LLP. The address of each of such entities is c/o Wellington Management Company LLP, 280 Congress Street, Boston, MA 02210. |
(8) | This information is based solely on the Schedule 13G filed with the SEC on January 10, 2022 on behalf of FMR LLC and Abigail P. Johnson. Consists of 5,424,750 Class A common shares held of record by FMR LLC. Abigail P. Johnson is a Director, the Chairman and the Chief Executive Officer of FMR LLC. Members of the Johnson family, including Abigail P. Johnson, are the predominant owners, directly or through trusts, of Series B voting common shares of FMR LLC, representing 49% of the voting power of FMR LLC. The Johnson family group and all other Series B shareholders have entered into a shareholders’ voting agreement under which all Series B voting common shares will be voted in accordance with the majority vote of Series B voting common shares. Accordingly, through their ownership of voting common shares and the execution of the shareholders’ voting agreement, members of the Johnson family may be deemed, under the Investment Company Act of 1940, to form a controlling group with respect to FMR LLC. Neither FMR LLC nor Abigail P. Johnson has the sole power to vote or direct the voting of the shares owned directly by the various investment companies registered under the Investment Company Act, or “Fidelity Funds,” advised by Fidelity Management & Research Company LLC, or “FMR Co. LLC,” a wholly owned subsidiary of FMR LLC, which power resides with the Fidelity Funds’ Boards of Trustees. FMR Co. LLC carries out the voting of the shares under written guidelines established by the Fidelity Funds’ Boards of Trustees. The address of each of such entities is c/o 245 Summer Street, Boston, MA 02210. |
(9) | While these executive officers and directors do not own common shares in Patria Investments Limited directly, part of them own equity interests in Patria Holdings Limited. These executive officers and directors disclaim beneficial ownership of the shares held by Patria Holdings Limited except to the extent, if any, of their respective pecuniary interest therein. |
(10) | While Mr. Benítez does not own common shares in Patria Investments Limited directly, he owns equity interests in Inversiones Sao Paulo SpA, which is a shareholder of Patria Investments Limited. Mr. Benítez disclaims beneficial ownership of the shares held by Inversiones Sao Paulo SpA except to the extent, if any, of his respective pecuniary interest therein. The address of such entity is Camino El Golf 1863 House 11, Zapallar, Valparaiso, Chile. |
B. |
Related Party Transactions |
C. |
Interests of Experts and Counsel |
A. |
Consolidated Statements and Other Financial Information |
• | On December 16, 2019, the Brazilian Federal Revenue Service issued a tax assessment notice against one of our subsidiaries (Patria Investimentos Ltda.), to demand the collection of Social Integration Program, or “PIS,” and Social Security Financing Contribution, or “COFINS,” allegedly due on exported financial advice and consultancy services to Patria Finance Limited in 2015 and 2016. An aggravated penalty of 150% was applied in connection with a supposed fraud and sham allegation and certain executive directors were also deemed jointly liable in connection with such allegations. The administrative court has not yet issued a final decision in regard to this administrative proceeding. As of December 31, 2021, the estimated value involved in this proceeding was US$4.7 million (R$26.6 million). Based on the advice of our external counsel, we believe that the risk of loss in this proceeding is possible, and no provision had to be recorded. |
• | On December 16, 2019, the Brazilian Federal Revenue Service also issued a tax claim against one of our subsidiaries (Patria Investimentos Ltda.), to demand the collection of social security contributions on profit sharing program payments and signing bonus in 2015 and 2016. We filed our defense and a decision by the administrative court is currently pending. |
• | In 2017 and 2018, the Municipality of São Paulo filed six administrative proceedings against one of our subsidiaries (Patria Investimentos Ltda.), questioning the exemption of municipal tax over services, or “ISS.” In 2019, the Municipality of São Paulo obtained favorable administrative decisions. In light of the outcome of the administrative proceedings, our subsidiaries filed legal proceedings to revert the administrative decisions and such legal proceedings are currently ongoing. As of December 31, 2021, our external legal counsel assessed the risk of loss relating to these lawsuits as possible and evaluated the potential loss in an aggregated amount of US$4.5 million (R$24.9 million). We do not believe that these judicial proceedings are material considering that none of them, individually, involve amounts above R$10 million. |
B. |
Significant Changes |
A. |
Offering and Listing Details |
B. |
Plan of Distribution |
C. |
Markets |
D. |
Selling Shareholders |
E. |
Dilution |
F. |
Expenses of the Issue |
A. |
Share Capital |
B. |
Memorandum and Articles of Association |
• | 500,000,000 shares are designated as Class A common shares; and |
• | 250,000,000 shares are designated as Class B common shares. |
• | class consents from the holders of Class A common shares or Class B common shares, as applicable, shall be required for any variation to the rights attached to their respective class of shares, however, the directors may treat any two or more classes of shares as forming one class if they consider that all such classes would be affected in the same way by the proposal; |
• | the rights conferred on holders of Class A common shares shall not be deemed to be varied by the creation or issue of further Class B common shares and vice versa; and |
• | the rights attaching to the Class A common shares and the Class B common shares shall not be deemed to be varied by the creation or issue of shares with preferred or other rights, including, without limitation, shares with enhanced or weighted voting rights. |
• | increase its share capital by such sum, to be divided into shares of such amount, as the resolution shall prescribe; |
• | consolidate and divide all or any of its share capital into shares of a larger amount than its existing shares; |
• | convert all or any of its paid-up shares into stock and reconvert that stock into paid-up shares of any denomination; |
• | subdivide its existing shares or any of them into shares of a smaller amount, provided that in the subdivision the proportion between the amount paid and the amount, if any, unpaid on each reduced share shall be the same as it was in the case of the share from which the reduced share is derived; or |
• | cancel any shares which, at the date of the passing of the resolution, have not been issued or agreed to be issued to any person and diminish the amount of its share capital by the amount of the shares so canceled. |
• | issue shares on terms that they are to be redeemed or are liable to be redeemed; |
• | purchase its own shares (including any redeemable shares); and |
• | make a payment in respect of the redemption or purchase of its own shares in any manner authorized by the Companies Act, including out of its own capital. |
• | a fee of such maximum sum as the Nasdaq may determine to be payable or such lesser sum as the board of directors may from time to time require is paid to Patria in respect thereof; |
• | the instrument of transfer is lodged with Patria, accompanied by the certificate (if any) for the common shares to which it relates and such other evidence as our board of directors may reasonably require to show the right of the transferor to make the transfer; |
• | the instrument of transfer is in respect of only one class of shares; |
• | the instrument of transfer is properly stamped, if required; |
• | the common shares transferred are free of any lien in favor of Patria; and |
• | in the case of a transfer to joint holders, the transfer is not to more than four joint holders. |
• | the names and addresses of the shareholders, a statement of the shares held by each member, and of the amount paid or agreed to be considered as paid, on the shares of each member; |
• | whether voting rights attach to the shares in issue; |
• | the date on which the name of any person was entered on the register as a member; and |
• | the date on which any person ceased to be a member. |
• | an exempted company does not have to file information related to its shareholders with the Registrar of Companies; |
• | an exempted company’s register of shareholders is not open to inspection; |
• | an exempted company does not have to hold an annual general meeting; |
• | an exempted company may obtain an undertaking against the imposition of any future taxation (such undertakings are usually given for 20 years in the first instance); |
• | an exempted company may register by way of continuation in another jurisdiction and be deregistered in the Cayman Islands; |
• | an exempted company may register as a limited duration company; and |
• | an exempted company may register as a segregated portfolio company. |
• | Patria is not proposing to act illegally or ultra vires |
• | the shareholders have been fairly represented at the meeting in question; |
• | the arrangement is such that may be reasonably approved by an intelligent and honest man of that class acting in respect of his interest; and |
• | the arrangement is not one that would more properly be sanctioned under some other provision of the Companies Act or that would amount to a “fraud on the minority.” |
• | a company is acting or proposing to act illegally or beyond the scope of its authority; |
• | the act complained of, although not beyond the scope of its authority, could be effected duly if authorized by more than a simple majority vote that has not been obtained; and |
• | those who control the company are perpetrating a “fraud on the minority.” |
• | Nasdaq Rule 5605(b), which requires that independent directors comprise a majority of a company’s board of directors. As allowed by the laws of the Cayman Islands, independent directors do not comprise a majority of our board of directors; |
• | Nasdaq Rule 5605(e)(1), which requires that a company have a nominations committee comprised solely of “independent directors” as defined by Nasdaq. As allowed by the laws of the Cayman Islands, we do not have a nominations committee nor do we have any current intention to establish one; |
• | Nasdaq Rule 5605(d) & (e), which require that compensation for our executive officers and selection of our director nominees be determined by a majority of independent directors. As allowed by the laws of the Cayman Islands, we do not have a nomination and corporate governance committee or remuneration committee nor do we have any current intention to establish either; and |
• | Nasdaq Rule 5635, which requires that a listed issuer obtain shareholder approval prior to an issuance of securities in connection with: (i) the acquisition of the stock or assets of another company; (ii) equity-based compensation of officers, directors, employees or consultants; (iii) a change of control; and (iv) transactions other than public offerings. Pursuant to the laws of the Cayman Islands and our Articles of Association, we are not required to obtain any such approval. |
C. |
Material Contracts |
D. |
Exchange controls |
E. |
Taxation |
• | certain financial institutions; |
• | insurance companies; |
• | real estate investment trusts or regulated investment companies; |
• | dealers or traders in securities that use a mark-to-market |
• | persons holding Class A common shares as part of a hedging transaction, straddle, wash sale, conversion transaction or other integrated transaction, or persons entering into a constructive sale with respect to the Class A common shares; |
• | persons whose functional currency for U.S. federal income tax purposes is not the U.S. dollar; |
• | tax-exempt entities, including an “individual retirement account” or “Roth IRA;” |
• | entities classified as partnerships for U.S. federal income tax purposes; |
• | persons that own or are deemed to own ten percent or more of our stock, by vote or value; or |
• | persons holding our Class A common shares in connection with a trade or business conducted outside of the United States. |
• | an individual that is a citizen or resident of the United States; |
• | a corporation, or other entity taxable as a corporation, created or organized in or under the laws of the United States, any state therein or the District of Columbia; or |
• | an estate or trust the income of which is subject to U.S. federal income taxation regardless of its source. |
F. |
Dividends and Paying Agents |
G. |
Statement by Experts |
H. |
Documents on Display |
I. |
Subsidiary Information |
As of December 31, 2021 |
||||||||||||||||||||||||||||||||
Balance in each exposure currency(1) |
Total Balance |
Exchange |
||||||||||||||||||||||||||||||
Variation impact considering 10% change in the year end rates |
||||||||||||||||||||||||||||||||
BRL |
HKD |
CLP |
COP |
GBP |
USD |
USD |
||||||||||||||||||||||||||
Cash and cash equivalents |
112 | 10,367 | 5,380,931 | 380,196 | 460 | 6,893 | 15,264 | 838 | ||||||||||||||||||||||||
Client funds on deposit |
— | — | 66,672,455 | — | — | — | 78,163 | 7,817 | ||||||||||||||||||||||||
Short term investments |
44,202 | — | 2,279,681 | — | — | 141,272 | 151,866 | 1,059 | ||||||||||||||||||||||||
Accounts receivable |
22,741 | 6 | 6,908,891 | 113,854 | — | 95,911 | 108,115 | 1,220 | ||||||||||||||||||||||||
Projects Advance |
4,120 | 237 | (1,168 | ) | 469 | 32 | 3,124 | 3,935 | 81 | |||||||||||||||||||||||
Deposit/guarantee on lease agreement |
85 | 264 | 1,847,751 | 81,908 | 180 | 566 | 3,043 | 248 | ||||||||||||||||||||||||
Client funds payable |
— | — | 66,672,455 | — | — | — | 78,163 | (7,817 | ) | |||||||||||||||||||||||
Long-term investments |
3,508 | — | 63,614 | — | — | 17,574 | 18,278 | 70 | ||||||||||||||||||||||||
Carried interest allocation |
— | — | — | — | — | 11,582 | 11,582 | — | ||||||||||||||||||||||||
Consideration payable on acquisition |
— | — | — | — | — | 16,437 | 16,437 | — | ||||||||||||||||||||||||
Contingent consideration payable on acquisition |
— | — | — | — | — | 25,775 | 25,775 | — | ||||||||||||||||||||||||
Suppliers and occupancy costs |
2,811 | 196 | 921,549 | 86,553 | 200 | 5,472 | 7,372 | (190 | ) | |||||||||||||||||||||||
|
|
|||||||||||||||||||||||||||||||
Net Impact |
3,326 |
|||||||||||||||||||||||||||||||
|
|
(1) | References to (1) BRL are to the Brazilian Real |
As of December 31, 2020 |
||||||||||||||||||||||||||||||||
Balance in each exposure currency(1) |
Total Balance |
Exchange |
||||||||||||||||||||||||||||||
Variation impact considering 10% change in the year end rates |
||||||||||||||||||||||||||||||||
BRL |
HKD |
CLP |
COP |
GBP |
USD |
USD |
||||||||||||||||||||||||||
(in US$ thousands) |
||||||||||||||||||||||||||||||||
Cash and cash equivalents |
626 | 6,755 | 49,702 | 27,512 | 44 | 12,922 | 14,052 | 113 | ||||||||||||||||||||||||
Short term investments |
4,782 | — | — | — | — | 9,009 | 9,929 | 92 | ||||||||||||||||||||||||
Accounts receivable |
45,327 | 6 | 38,527 | 132,631 | 14 | 37,180 | 46,015 | 884 | ||||||||||||||||||||||||
Projects Advance |
1,995 | 44 | — | 3,972 | 7 | 1,371 | 1,772 | 39 | ||||||||||||||||||||||||
Other assets |
5,979 | 9 | 10,525 | 177,044 | 64 | 2,938 | 4,243 | 131 | ||||||||||||||||||||||||
Personnel and related taxes |
41,308 | 2,308 | 121,634 | 1,409,774 | 509 | 4,806 | 14,329 | (952 | ) | |||||||||||||||||||||||
Taxes payable |
4,906 | 122 | 10,791 | 159,553 | 36 | — | 1,070 | (107 | ) | |||||||||||||||||||||||
Other liabilities |
12,436 | 480 | 12,644 | 10,042 | 174 | 6,573 | 9,287 | (271 | ) | |||||||||||||||||||||||
|
|
|||||||||||||||||||||||||||||||
Net impact |
(71 |
) | ||||||||||||||||||||||||||||||
|
|
(1) | References to (1) BRL are to the Brazilian Real |
A. |
Debt Securities |
B. |
Warrants and Rights |
C. |
Other Securities |
D. |
American Depositary Shares |
A. |
Defaults |
B. |
Arrears and Delinquencies |
ITEM 14. |
MATERIAL MODIFICATIONS TO THE RIGHTS OF SECURITY HOLDERS AND USE OF PROCEEDS |
A. |
Material Modifications to Instruments |
B. |
Material Modifications to Rights |
C. |
Withdrawal or Substitution of Assets |
D. |
Change in Trustees or Paying Agents |
E. |
Use of Proceeds |
A. |
Disclosure Controls and Procedures |
B. |
Management’s Annual Report on Internal Control Over Financial Reporting |
C. |
Attestation Report of the Registered Public Accounting Firm |
D. |
Changes in Internal Control Over Financial Reporting |
(i) | the development of a matrix of risks and controls for material account balances, classes of transactions, disclosures and relevant assertions; |
(ii) | the implementation of new processes and procedures in our financial reporting closing process to provide additional levels of review by IFRS experienced personnel, including specific review and approval procedures for manual journal entries; and |
(iii) | the implementation of monitoring controls such as self-assessments and action plans to remediate deficiencies. |
2021 |
2020 |
|||||||
(in US$ thousands) |
||||||||
Audit fees |
514 | 913 | ||||||
Audit-related fees |
780 | — | ||||||
Tax fees |
80 | 12 | ||||||
All other fees |
— | — | ||||||
Total |
1,374 |
925 |
||||||
• | Nasdaq Rule 5605(b), which requires that independent directors comprise a majority of a company’s board of directors. As allowed by the laws of the Cayman Islands, independent directors do not comprise a majority of our board of directors; |
• | Nasdaq Rule 5605(e)(1), which requires that a company have a nominations committee comprised solely of “independent directors” as defined by Nasdaq. As allowed by the laws of the Cayman Islands, we do not have a nominations committee nor do we have any current intention to establish one; |
• | Nasdaq Rule 5605(d) & (e), which require that compensation for our executive officers and selection of our director nominees be determined by a majority of independent directors. As allowed by the laws of the Cayman Islands, we do not have a nomination and corporate governance committee or remuneration committee nor do we have any current intention to establish either; and |
• | Nasdaq Rule 5635, which requires that a listed issuer obtain shareholder approval prior to an issuance of securities in connection with: (i) the acquisition of the stock or assets of another company; (ii) equity-based compensation of officers, directors, employees or consultants; (iii) a change of control; and (iv) transactions other than public offerings. Pursuant to the laws of the Cayman Islands and our Articles of Association, we are not required to obtain any such approval. |
* | Filed with this Annual Report on Form 20-F. |
† | Certain provisions, exhibits and schedules have been omitted pursuant to Item 601(b)(2) of Regulation S-K. |
PATRIA INVESTMENTS LIMITED April 27, 2022 | ||
By: |
/s/ Alexandre Teixeira de Assumpção Saigh | |
Name: Alexandre Teixeira de Assumpção Saigh | ||
Title: Chief Executive Officer |
By: |
/s/ Marco Nicola D’Ippolito | |
Name: Marco Nicola D’Ippolito | ||
Title: Chief Financial Officer |
Page |
||||
Audited Consolidated Financial Statements—Patria Investments Limited |
||||
F-2 |
||||
F-3 |
||||
F-4 |
||||
F-5 |
||||
F-6 |
||||
F-7 |
||||
F-8 |
|
Deloitte Touche Tohmatsu Dr. Chucri Zaidan Avenue, 1.240 - 4 th to 12th floors - Golden Tower04711-130 - São Paulo - SP Brazil Tel.: + 55 (11) 5186-1000 Fax: + 55 (11) 5181-2911 www.deloitte.com.br |
Assets |
Note |
12/31/2021 |
12/31/2020 |
|||||||
Cash and cash equivalents |
6 | |||||||||
Short term investments |
12(a) | |||||||||
Client funds on deposit |
7 | |||||||||
Accounts receivable |
8 | |||||||||
Project advances |
9 | |||||||||
Other current assets |
10 | |||||||||
Recoverable taxes |
11 | |||||||||
|
|
|
|
|||||||
Current assets |
||||||||||
|
|
|
|
|||||||
Accounts receivable |
8 | |||||||||
Deferred tax assets |
18 | |||||||||
Project advances |
9 | |||||||||
Other non-current assets |
10 | |||||||||
Long-term investments |
12(b) | |||||||||
Property and equipment |
13 | |||||||||
Intangible assets |
14 | |||||||||
|
|
|
|
|||||||
Non-current assets |
||||||||||
|
|
|
|
|||||||
Total assets |
||||||||||
|
|
|
|
Liabilities and equity |
Note |
12/31/2021 |
12/31/2020 |
|||||||
Client funds payable |
7 | |||||||||
Consideration payable on acquisition |
28 | |||||||||
Personnel and related taxes payable |
15 | |||||||||
Taxes payable |
16 | |||||||||
Dividends payable |
27(c) | |||||||||
Other current liabilities |
17 | |||||||||
Carried interest allocation |
22(a) | |||||||||
|
|
|
|
|||||||
Current liabilities |
||||||||||
|
|
|
|
|||||||
Contingent consideration payable on acquisition |
28 | |||||||||
Personnel liabilities |
15 | |||||||||
Deferred consideration payable |
28 | |||||||||
Deferred tax liabilities |
18 | |||||||||
Other non-current liabilities |
17 | |||||||||
|
|
|
|
|||||||
Non-current liabilities |
||||||||||
|
|
|
|
|||||||
Total liabilities |
||||||||||
|
|
|
|
|||||||
Capital |
27(a) | |||||||||
Additional paid-in capital |
27(b) | |||||||||
Other reserves |
27(d) | |||||||||
Retained earnings |
||||||||||
Cumulative translation adjustment |
27(g) | ( |
) | ( |
) | |||||
|
|
|
|
|||||||
Equity attributable to the owners of the Company |
||||||||||
Non-controlling interests |
27(h) | |||||||||
|
|
|
|
|||||||
Equity |
||||||||||
|
|
|
|
|||||||
Total liabilities and equity |
||||||||||
|
|
|
|
Note |
2021 |
2020 |
2019 |
|||||||||||
Net revenue from services |
21 |
|||||||||||||
Cost of services rendered |
( |
) |
( |
) |
( |
) | ||||||||
Personnel expenses |
22 | ( |
) | ( |
) | ( |
) | |||||||
Deferred consideration |
28 | ( |
) | |||||||||||
Amortization of intangible assets |
22 | ( |
) | ( |
) | ( |
) | |||||||
Carried interest allocation |
22(a) | ( |
) | |||||||||||
Gross profit |
||||||||||||||
Operating income and expenses |
( |
) |
( |
) |
( |
) | ||||||||
Administrative expenses |
23 | ( |
) | ( |
) | ( |
) | |||||||
Other income/(expenses) |
24 | ( |
) | ( |
) | |||||||||
Operating income before net financial income/(expense) |
||||||||||||||
Net financial income/(expense) |
25 | ( |
) | ( |
) | ( |
) | |||||||
Income before income tax |
||||||||||||||
Income tax |
26 | ( |
) | ( |
) | ( |
) | |||||||
Net income for the year |
||||||||||||||
Attributable to: |
||||||||||||||
Owners of the Company |
||||||||||||||
Non-controlling interests |
( |
) | ( |
) | ||||||||||
Basic and diluted earnings per thousand shares |
27(e) |
|||||||||||||
2021 |
2020 |
2019 |
||||||||||
Net income for the year |
||||||||||||
Items that will be reclassified to the income statement: |
||||||||||||
Currency translation adjustment |
( |
) | ( |
) | ( |
) | ||||||
Currency translation adjustment – non-controlling interests |
( |
) | ( |
) | ( |
) | ||||||
Total comprehensive income |
||||||||||||
Attributable to: |
||||||||||||
Owners of the Company |
||||||||||||
Non-controlling interests |
( |
) | ( |
) |
Attributable to owners |
||||||||||||||||||||||||||||||||||
Notes |
Capital |
Additional paid-in capital |
Other reserves |
Retained earnings |
Cumulative translation adjustment |
Equity attributable to owners of the Parent |
Non- controlling interests |
Total Equity |
||||||||||||||||||||||||||
Balance at December 31, 2018 |
— |
( |
) |
|||||||||||||||||||||||||||||||
|
|
|
|
|
|
|
|
|
|
|
|
|
|
|
|
|||||||||||||||||||
Cumulative translation adjustment |
27(g) | — | — | — | — | ( |
) | ( |
) | ( |
) | ( |
) | |||||||||||||||||||||
Net income for the year |
— | — | — | — | ||||||||||||||||||||||||||||||
Dividends distributed |
27(c) | — | — | — | ( |
) | — | ( |
) | ( |
) | ( |
) | |||||||||||||||||||||
|
|
|
|
|
|
|
|
|
|
|
|
|
|
|
|
|||||||||||||||||||
Balance at December 31, 2019 |
— |
( |
) |
|||||||||||||||||||||||||||||||
|
|
|
|
|
|
|
|
|
|
|
|
|
|
|
|
|||||||||||||||||||
Cumulative translation adjustment |
27(g) | — | — | — | ( |
) | ( |
) | ( |
) | ( |
) | ( |
) | ||||||||||||||||||||
Net income for the year |
— | — | — | — | ( |
) | ||||||||||||||||||||||||||||
Dividends declared |
27(c) | — | — | — | ( |
) | — | ( |
) | — | ( |
) | ||||||||||||||||||||||
Dividends paid |
— | — | — | ( |
) | — | ( |
) | ( |
) | ( |
) | ||||||||||||||||||||||
|
|
|
|
|
|
|
|
|
|
|
|
|
|
|
|
|||||||||||||||||||
Balance at December 31, 2020 |
— |
( |
) |
|||||||||||||||||||||||||||||||
|
|
|
|
|
|
|
|
|
|
|
|
|
|
|
|
|||||||||||||||||||
Cumulative translation adjustment |
27(g) | — | — | — | — | ( |
) | ( |
) | ( |
) | ( |
) | |||||||||||||||||||||
Share Split |
( |
) | — | — | — | — | — | — | ||||||||||||||||||||||||||
Capital issuance |
27(a) | — | — | — | — | |||||||||||||||||||||||||||||
Transaction costs |
27(a)/27(b) | — | ( |
) | — | — | — | ( |
) | — | ( |
) | ||||||||||||||||||||||
Net income for the year |
— | — | — | ( |
) | |||||||||||||||||||||||||||||
Dividends declared and paid |
27(c) | — | — | — | ( |
) | ( |
) | ( |
) | ||||||||||||||||||||||||
Grant of share based incentive plan |
27(d) | — | — | — | — | — | ||||||||||||||||||||||||||||
Changes in interest of subsidiaries |
5(o) | — | — | — | — | ( |
) | — | ||||||||||||||||||||||||||
|
|
|
|
|
|
|
|
|
|
|
|
|
|
|
|
|||||||||||||||||||
Balance at December 31, 2021 |
( |
) |
||||||||||||||||||||||||||||||||
|
|
|
|
|
|
|
|
|
|
|
|
|
|
|
|
Note |
2021 |
2020 |
2019 |
|||||||||||
Cash flows from operating activities |
||||||||||||||
Net income for the period |
||||||||||||||
Adjustments to net income for the year |
||||||||||||||
Depreciation expense |
13/23 | |||||||||||||
Amortization expense |
14/22/23 | |||||||||||||
IPO expenses accrual |
24 | — | — | |||||||||||
Loss on transfer of investment |
24 | — | — | |||||||||||
Net financial investment income |
25 | ( |
) | ( |
) | ( |
) | |||||||
Valuation adjustment of long-term investments |
25 | ( |
) | |||||||||||
Interest expense on lease liabilities |
25 | |||||||||||||
Deferred income taxes expense |
26 | ( |
) | ( |
) | |||||||||
Current income taxes expense |
26 | |||||||||||||
Share based incentive plan |
27(d) | — | — | |||||||||||
Other non-cash effects |
( |
) | ( |
) | ( |
) | ||||||||
Changes in operating assets and liabilities |
||||||||||||||
Accounts receivable |
( |
) | ( |
) | ( |
) | ||||||||
Projects advances |
( |
) | ||||||||||||
Recoverable taxes |
( |
) | ( |
) | ||||||||||
Personnel and related taxes payable |
||||||||||||||
Carried interest allocation |
22(a) | — | — | |||||||||||
Deferred consideration payable on acquisition |
28 | — | — | |||||||||||
Taxes payable and deferred taxes |
||||||||||||||
Payment of income taxes |
( |
) | ( |
) | ( |
) | ||||||||
Other assets and liabilities |
( |
) | ( |
) | ||||||||||
Payment of placement agent fees |
17 | ( |
) | ( |
) | ( |
) | |||||||
Net cash provided by operating activities |
||||||||||||||
|
|
|
|
|
|
|||||||||
Cash flows from investing activities |
||||||||||||||
Decrease (increase) in short term investments |
( |
) | ||||||||||||
Decrease (increase) in short-term investment – loan |
— | ( |
) | |||||||||||
Decrease (increase) in long-term investments |
( |
) | ||||||||||||
Acquisition of subsidiaries, net of cash acquired |
28 | ( |
) | — | — | |||||||||
Acquisition of property and equipment |
13 | ( |
) | ( |
) | ( |
) | |||||||
Acquisition of software and computer programs |
14 | ( |
) | ( |
) | |||||||||
Net cash provided by investing activities |
( |
) |
||||||||||||
|
|
|
|
|
|
|||||||||
Cash flows from financing activities |
||||||||||||||
IPO proceeds |
— | — | ||||||||||||
IPO transaction costs |
( |
) | — | — | ||||||||||
Dividends paid |
27(c) | ( |
) | ( |
) | ( |
) | |||||||
Payments related to P2 Group purchase |
— | — | ( |
) | ||||||||||
Lease payments |
( |
) | ( |
) | ( |
) | ||||||||
Interest paid on lease liabilities |
17 | ( |
) | ( |
) | ( |
) | |||||||
Net cash used in financing activities |
( |
) |
( |
) | ||||||||||
|
|
|
|
|
|
|||||||||
Foreign exchange variation on cash and cash equivalents in foreign currencies |
( |
) | ( |
) | ( |
) | ||||||||
|
|
|
|
|
|
|||||||||
Increase in cash and cash equivalents |
||||||||||||||
|
|
|
|
|
|
|||||||||
Cash and cash equivalents at the beginning of the year |
6 | |||||||||||||
Cash and cash equivalents at the end of the year |
6 | |||||||||||||
|
|
|
|
|
|
|||||||||
Increase in cash and cash equivalents |
||||||||||||||
|
|
|
|
|
|
|||||||||
Non-cash operating and investing activity |
||||||||||||||
Transfer of long-term investment with a corresponding decrease in liability |
12 | — | ||||||||||||
Addition of right of use assets |
13 | |||||||||||||
Accrued placement agent liabilities with a corresponding increase in intangible |
13 | — | — | |||||||||||
Dividends declared |
27(c) | — | — | |||||||||||
IPO transaction costs decrease in assets with corresponding decrease in equity |
27(a)/27(b) | — | — | |||||||||||
IPO transaction costs accrual increase in liability with corresponding decrease in equity |
27(a)/27(b) | — | — | |||||||||||
Changes in interest of subsidiaries |
— | — | ||||||||||||
Acquisition of subsidiaries through share issuance |
28 | — | — | |||||||||||
Contingent consideration payable on acquisition |
28 | — | — | |||||||||||
Consideration payable on acquisition |
28 | — | — |
1 |
General information |
2 |
Presentation of financial statements |
a. |
Statement of compliance and basis of preparation |
b. |
Functional and presentation currency |
c. |
Use of estimates and judgments |
(i) | employee profit-sharing, long-term benefits, and bonus accruals, where management considered the expected results and targets to estimate the accruals; |
(ii) | the useful lives of tangible and intangible assets and impairment analysis of such assets; |
(iii) | the assessment of the recoverability of deferred tax assets, where management considered cash flow projections, income and expenses growth rates and timing for utilization of the net operating losses and temporary differences, as well as any cap for compensation; |
(iv) | the assessment and measurement of risk regarding provisions and contingencies, where management, supported by the opinion of its legal counsel, determined the likelihood of losses and the probable cash outcome expected for each claim; |
(v) | revenue recognition, where management determined the multiple elements in the contracts and the criteria and timing for revenue recognition; |
(vi) |
the fair value of financial instruments, and the share based incentive plan, where management determined the methodology and the inputs to the model, including observable and unobservable inputs; |
(vii) |
estimates and assumptions to determine the recoverable amount of cash-generating units used in the assessment for impairment of goodwill. |
3 |
Segment information |
4 |
Significant accounting policies |
a. |
Consolidation |
b. |
Business Combinations |
• | fair values of the assets transferred |
• | liabilities incurred to the former owners of the acquired business |
• | equity interests issued by the Group, and |
• | fair value of any assets or liability resulting from a contingent consideration arrangement. |
c. |
Goodwill |
d. |
Cash and cash equivalents |
e. |
Client funds on deposit and client funds payable |
f. |
Financial instruments |
(i) |
Financial assets |
• | amortized cost |
• | fair value through profit or loss (FVTPL) |
• | fair value through other comprehensive income (FVOCI). |
• | the entity’s business model for managing the financial asset |
• | the contractual cash flow characteristics of the financial asset. |
(ii) |
Financial liabilities |
g. |
Impairment losses |
h. |
Property and equipment |
Facilities |
||
Machinery and equipment |
||
Furniture and fixtures |
||
Building improvements (*) |
||
Office equipment - Electronic equipment |
||
Office equipment - IT equipment |
||
Office equipment - Telephone equipment |
(*) | Building improvements are depreciated over 10 years or based on the duration of the lease, whichever is shorter. |
i. |
Intangible assets |
The | Group has the following intangible assets with finite useful lives: |
(i) | placement agent fees, which are amortized over the terms of the respective investment funds, with average estimated term of |
(ii) | software, with estimated useful life of |
(iii) | contractual rights to earn future fee income relating to the acquisition of P2 Brasil Private Infrastructure General Partner II Ltd. and P2 Brasil Holding Ltd. (collectively the “P2 Group”), which are amortized over the respective contractual periods of the underlying investment funds of |
(iv) | Intangible assets acquired through business combination are recognized at fair value at the acquisition date. They have a finite useful life and are subsequently carried at cost less accumulated amortization and impairment losses. Amortization details are as follows: |
• |
Non-contractual customer relationships acquired are expected to be amortized on a straight line basis (MAM I: |
• | Brands acquired are expected to be amortized on a straight line over |
j. |
Employees’ benefits |
(i) |
Short-term employee benefits |
(ii) |
Long-term employee benefits - equity incentive program |
• |
• |
• |
• |
TSR; and |
• |
The impact of any time vesting conditions (i.e. remaining an employee of the entity over a specified time). |
(iii) |
Other long-term employee benefits – Officers’ Fund |
k. |
Provisions, contingent assets and contingent liabilities |
• | Contingent Assets: are not recognized, except if the realization of the asset is virtually certain. |
• | Provisions: are recognized in the financial statements when, based on Management’s assessment supported by the opinion of the legal counsel, the risk of an unfavorable outcome in a judicial or administrative proceeding is considered probable, and whenever the amounts involved can be reliably measured. |
• | Contingent Liabilities: are disclosed in the notes to the financial statements when, based on Management’s assessment supported by the opinion of the legal counsel, the risk of an unfavorable outcome in a judicial or administrative proceeding is considered possible. The contingent liabilities for which the risk of an unfavorable outcome in a judicial or administrative proceeding is considered remote are neither accounted for nor disclosed. |
l. |
Leases |
m. |
Revenues |
n. |
Financial income and expenses |
o. |
Income tax expenses – current and deferred |
p. |
Foreign-currency transactions |
q. |
Dividends |
r. |
Amendments to IFRSs that are mandatorily effective for annual periods beginning on January 1, 2021 |
• |
Amendments to IFRS 16 – COVID-19-related |
• |
Interest Rate Benchmark Reform – Amendments to IFRS 4, IFRS 7, IFRS 9, IFRS 16 and IAS 39. |
s. |
New standards and interpretations not yet adopted– applicable and mandatory for fiscal years beginning on or after January 1, 2022 |
• |
IFRS 17 – Insurance Contracts. |
• |
Amendments to IFRS 3 – Reference to the Conceptual Framework. |
• |
Amendments to IAS 1 – Classification of Liabilities as Current or Non-current. |
• |
Amendments to IAS 1 - Disclosure of accounting policies |
• |
Annual Improvements to IFRS Standards 2018–2020 (IFRS9, IFRS 16, IFRS 1 and IAS 41). |
• |
Amendments to IAS 8 – Definition of Accounting Estimates |
• |
Amendments to IAS 12 – Deferred Tax related to Assets and Liabilities arising from a Single Transaction |
• |
Amendments to IAS 16 – Property, Plant and Equipment: Proceeds before intended use. |
• |
Amendments to IAS 37 – Cost of Fulfilling a Contract - Onerous Contracts. |
5 |
Consolidation and subsidiaries |
Functional Currency |
Equity interest (direct or indirect) (%) |
|||||||||||
December 31, 2021 |
December 31, 2020 |
|||||||||||
Subsidiaries |
||||||||||||
Patria Finance Ltd. |
(a) | % | % | |||||||||
Patria Brazilian Private Equity III, Ltd. |
(b) | % | % | |||||||||
PBPE General Partner IV, Ltd. |
(c) | % | % | |||||||||
PBPE General Partner V, Ltd. |
(d) | % | % | |||||||||
Patria Brazilian Private Equity General Partner VI, Ltd. |
(e) | % | % | |||||||||
Patria Brazil Real Estate Fund General Partner II, Ltd. |
(f) | % | % | |||||||||
Patria Brazil Real Estate Fund General Partner III Ltd. |
(g) | % | % | |||||||||
Patria Brazil Retail Property Fund General Partner, Ltd. |
(h) | % | % | |||||||||
Patria Investments UK Ltd. |
(i) | % | % | |||||||||
Patria Investments US LLC |
(j) | % | % | |||||||||
Patria Investments Colombia S.A.S. |
(k) | % | % | |||||||||
Infrastructure II GP, Ltd. |
(l) | % | % | |||||||||
Infrastructure III SLP Ltd. |
(m) | % | % | |||||||||
Patria Infrastructure General Partner IV Ltd. |
(n) | % | % | |||||||||
Pátria Investimentos Ltda. |
(o) | % | % | |||||||||
Pátria Companhia Securitizadora de Créditos Imobiliários |
(p) | % | ||||||||||
Patria Investments Latam S.A. * |
(q) | % | % | |||||||||
Patria Investments Uruguay S.A. * |
(r) | % | % | |||||||||
Patria Investments Cayman Ltd. |
(s) | % | % | |||||||||
Patria Investments Chile SpA |
(t) | % | % | |||||||||
Patria Investments Hong Kong, Ltd. |
(u) | % | % | |||||||||
Patria Farmland General Partner, Ltd. |
(v) | % | % | |||||||||
Platam Investments Brazil Ltda. |
(w) | % | % | |||||||||
Patria Constructivist Equity Fund General Partner, Ltd. |
(x) | % | % | |||||||||
Patria Constructivist Equity Fund General Partner II, Ltd. |
(y) | % | % | |||||||||
PI General Partner V Ltd. |
(z) | % | % | |||||||||
PPE General Partner VII, Ltd. * |
(aa) | % | ||||||||||
PI Renewables General Partner, Ltd. * |
(bb) | % | ||||||||||
Patria Latam Growth Management Ltd. * |
(cc) | % | ||||||||||
Patria SPAC LLC * |
(dd) | % | ||||||||||
Patria Latin American Opportunity Acquisition Corp. * |
(ee) | % | ||||||||||
Moneda Asset Management SpA |
(ff) | % | ||||||||||
Moneda Corredores de Bolsa Limitada |
(gg) | % | ||||||||||
Moneda S.A. Administradora General De Fondos |
(hh) | % | ||||||||||
Moneda II SpA |
(ii) | % | ||||||||||
Moneda International Inc. |
(jj) | % | ||||||||||
Moneda USA Inc. |
(kk) | % |
(a) | Patria Finance Ltd.: |
(b) | Patria Brazilian Private Equity III, Ltd. |
(c) | PBPE General Partner IV, Ltd. (formerly Patria Brazilian Private Equity General Partner IV, Ltd.) |
(d) | PBPE General Partner V, Ltd. (formerly Patria Brazilian Private Equity General Partner V, Ltd.) |
(e) | Patria Brazilian Private Equity General Partner VI, Ltd. |
(f) | Patria Brazil Real Estate Fund General Partner II Ltd. |
(g) | Patria Brazil Real Estate Fund General Partner III Ltd. |
(h) | Patria Brazil Retail Property Fund General Partner, Ltd. |
(i) | Patria Investments UK Ltd. |
(j) | Patria Investments US LLC: |
(k) | Patria Investments Colombia S.A.S. |
(l) | Infrastructure GP II, Ltd. (formerly Patria Infrastructure General Partner II Ltd.) |
(m) | Infrastructure III SLP Ltd. (formerly Patria Infrastructure General Partner III Ltd.) |
(n) | Patria Infrastructure General Partner IV Ltd.: |
(o) | Pátria Investimentos Ltda. (“PILTDA”): non-controlling interest in PILTDA held by Blackstone and the non-controlling interest in PILTDA held by a related party of Patria Holdings Ltd (the “Related Party”) were reorganized as follows: (i) the direct interest held by Blackstone in PILTDA was contributed to the Company in exchange for three Class A common shares issued to Blackstone; and (ii) the direct interest held by the Related Party was redeemed in its entirety at par value for a promissory note, and Patria Holdings Ltd contributed the promissory note to the Company, in consideration for which the Company issued seven Class B common shares. This transaction was completed on June 1, 2021. |
(p) | Pátria Companhia Securitizadora de Créditos Imobiliários: |
(q) | Patria Investments Latam S.A. (formerly Zedra S.A.): |
(r) | Patria Investments Uruguay S.A. (formerly Improdem S.A.) |
(s) | Patria Investments Cayman Ltd.: |
(t) | Patria Investments Chile SpA: |
(u) | Patria Investments Hong Kong, Ltd.: |
(v) | Patria Farmland General Partner, Ltd.: |
(w) | Platam Investments Brazil Ltda.: |
(x) | Patria Constructivist Equity Fund General Partner, Ltd.: |
(y) |
Patria Constructivist Equity Fund General Partner II, Ltd.: |
(z) |
PI General Partner V Ltd. (formerly Patria Infrastructure Special Limited Partner V Ltd.): |
(aa) |
PPE General Partner VII, Ltd.: |
(bb) |
PI Renewables General Partner, Ltd.: |
(cc) |
Patria Latam Growth Management Ltd.: |
(dd) |
Patria SPAC LLC: |
(ee) |
Patria Latin American Opportunity Acquisition Corp.: |
(ff) |
Moneda Asset Management SpA (“MAM I”): |
(gg) |
Moneda Corredores de Bolsa Limitada (“MCB”): |
(hh) |
Moneda S.A. Administradora General de Fondos (“MAGF”): |
(ii) |
Moneda II SpA (“MAM II”): |
(jj) |
Moneda International Inc.: |
(kk) |
Moneda USA Inc.: |
(*) |
These companies (note 5 (q) and note 5 (r)) acquired during 2020 and notes 5 (aa) to 5 (ee) established during 2021) did not have any operations and/or material assets and liabilities, and the acquisition amounts were not material. Therefore, the disclosure requirements were not applicable (IFRS 3 – Business Combinations). |
6 |
Cash and cash equivalents |
2021 |
2020 |
|||||||
Bank accounts |
||||||||
Mutual fund shares |
||||||||
Cash |
||||||||
|
|
|
|
|||||
Cash and cash equivalents |
||||||||
|
|
|
|
7 |
Client funds on deposit and client funds payable |
2021 |
2020 |
|||||||
Client funds on deposit |
||||||||
Other receivables from clients (a) |
|
|
|
|
|
|
|
|
|
|
|
|
|||||
Client funds on deposit and other receivables |
||||||||
|
|
|
|
2021 |
2020 |
|||||||
Client funds payable (a) |
||||||||
|
|
|
|
|||||
Client funds payable |
||||||||
|
|
|
|
(a) | Other receivables from clients are unsettled trade receivables from brokerage activities for client transactions on an exchange that are entered into and recorded on the date of the transaction. The value of the client trades is payable or receivable until settlement of the transactions occur. |
8 |
Accounts receivable |
2021 |
2020 |
|||||||
Current (a) |
||||||||
Non-current (b) |
||||||||
|
|
|
|
|||||
Accounts receivable |
||||||||
|
|
|
|
(a) | An amount of US$ million reflected under current balances is related to performance fees receivable determined in accordance with the investment funds offering documents, based on the expected value for which it is highly probable that a significant reversal will not subsequently occur. In addition, management fees of US$ million from prior years are related to management fees from PBPE Fund IV (Ontario), L.P. (“PBPE Fund IV”), which are due by December 31, 2022 noting that the receipt date was renegotiated based on the estimated date of realization of PBPE Fund IV’s investments |
(b) | The non-current balance is equal to management fees receivable of US$ |
9 |
Project advances |
2021 |
2020 |
|||||||
Current |
||||||||
Non-current |
||||||||
|
|
|
|
|||||
Project advances |
||||||||
|
|
|
|
10 |
Other assets |
2021 |
2020 |
|||||||
Advances to suppliers (a) |
||||||||
Advances to employees |
||||||||
Prepaid expenses (b) |
||||||||
Officer’s Fund (c) |
||||||||
IPO costs (d) |
||||||||
Other current assets |
||||||||
|
|
|
|
|||||
Other current assets |
||||||||
|
|
|
|
|||||
Prepaid expenses (b) |
||||||||
Deposit/guarantee on lease agreements (e) |
||||||||
|
|
|
|
|||||
Other non-current assets |
||||||||
|
|
|
|
(a) |
Advances to suppliers are advances paid for services not yet received. The Company reviews such amounts and records the portion related to the year in the income statement on an accrual basis. |
(b) |
Prepaid expenses are composed mainly of IT services paid in advance, such as renewal of licenses and technical support services. These items will be recorded as administrative expenses in the year they are related to. |
(c) | The balance of US$ |
(d) | IPO costs related to the Company’s Initial Public Offering (IPO), which was concluded on January 21, 2021. The December 31, 2020 amounts are costs allocated to the primary offering and have been transferred to equity as transaction costs upon IPO’s conclusion. |
(e) | Deposits and guarantees on lease agreements are subject to reimbursement at the end of the lease contract period. Interest is not charged on these deposits. |
11 |
Recoverable Taxes |
2021 |
2020 |
|||||||
Income tax and social contribution recoverable |
||||||||
Other recoverable taxes |
||||||||
Recoverable Taxes |
||||||||
12 |
Investments |
a. |
Short-term investments |
2021 |
2020 |
|||||||
Securities (a) |
||||||||
Short-term investments |
||||||||
(a) | Short-term investments are liquid investment funds, with portfolios made of term deposits, equities, government bonds, and other short-term liquid securities. |
b. |
Long-term investments |
2021 |
2020 |
|||||||
Patria Growth Capital Fund I Fundo de Investimento em Participações Multiestratégia (a) |
||||||||
Patria Infra Energia Core FIP EM Infraestrutura |
||||||||
Patria Crédito Estruturado Fundo de Investimento em Direitos Creditorios |
||||||||
Patria Brazil Real Estate Fund II, L.P. (b) |
||||||||
Patria Infra Energia Core Feeder FIP |
||||||||
Patria Private Equity Fund VI, L.P. |
||||||||
PBPE Fund V (Ontario), L.P. (formerly Patria Brazilian Private Equity Fund V, L.P.) |
||||||||
PBPE Fund IV (Ontario), L.P. (formerly Patria Brazilian Private Equity Fund IV, L.P.) |
||||||||
Patria Infra Energia Core Feeder II FIP |
||||||||
PI Fund II (Ontario), L.P. (formerly Patria Infrastructure Fund II, L.P.) |
||||||||
PI Fund III (Ontario), L.P. (formerly Patria Infrastructure Fund III, L.P.) |
||||||||
Patria Brazil Real Estate Fund III, L.P. |
||||||||
PBPE Fund III (Ontario), L.P. (b) (formerly Patria Brazilian Private Equity Fund III, L.P.) |
||||||||
Patria Infrastructure Fund IV, L.P. |
||||||||
Patria lnfrastructure II LAP Co-lnvest UK, L.P. |
||||||||
Patria Alphaville Co-Invest, L.P. |
||||||||
Patria Farmland Fund I, L.P. |
||||||||
Other investments |
||||||||
Long-term investments |
||||||||
(a) | Patria Growth Capital Fund I Fundo de Investimento em Participações Multiestratégia was incorporated to include investments relating to the launch of a new growth equity strategy for venture capital transactions. During November 2021, a minority investment interest was acquired through fully owned holding entity Inicio Participações S.A. in Startse Informações e Sistemas S/A (“Startse”), a late-stage venture capital entity in Brazil encompassing an education platform and a crowdfunding platform for startups. |
(b) | This company is subject to a participating share held by a related party in Patria Brazilian Private Equity III, Ltd., and Patria Brazil Real Estate Fund General Partner II, Ltd. that gives it the right to all returns and the related asset. Consequently, the Group has recorded a liability in the same amount (see notes 17b and 30c). |
13 |
Property and equipment |
Changes in cost |
2021 |
|||||||||||||||||||||||||||
Opening balance |
Additions |
Disposals |
Transfer |
Acquisitions of subsidiaries |
CTA (*) |
Closing balance |
||||||||||||||||||||||
Furniture and fixtures |
( |
) | — | ( |
) | |||||||||||||||||||||||
Building improvements |
( |
) | ( |
) | ||||||||||||||||||||||||
Office equipment |
( |
) | ( |
) | ||||||||||||||||||||||||
Right-of-use |
( |
) | — | ( |
) | |||||||||||||||||||||||
Total - Cost of fixed assets |
( |
) |
( |
) | ||||||||||||||||||||||||
Changes in accumulated depreciation |
2021 |
|||||||||||||||||||||||||||
Opening balance |
Additions |
Disposals |
Transfer |
Acquisitions of subsidiaries |
CTA (*) |
Closing balance |
||||||||||||||||||||||
(-) Furniture and fixtures |
( |
) | ( |
) | — | ( |
) | ( |
) | |||||||||||||||||||
(-) Building improvements |
( |
) | ( |
) | — | ( |
) | ( |
) | |||||||||||||||||||
(-) Office equipment |
( |
) | ( |
) | — | ( |
) | ( |
) | |||||||||||||||||||
(-) Right-of-use |
( |
) | ( |
) | — | ( |
) | ( |
) | |||||||||||||||||||
Total - Accumulated depreciation |
( |
) |
( |
) |
— |
( |
) | ( |
) | |||||||||||||||||||
Property and equipment, net |
( |
) |
( |
) | ||||||||||||||||||||||||
(*) | CTA – Cumulative translation adjustment |
Changes in cost |
2020 |
|||||||||||||||||||||||
Opening balance |
Additions |
Disposals |
Transfer |
CTA (*) |
Closing balance |
|||||||||||||||||||
Furniture and fixtures |
— | — | ( |
) | ||||||||||||||||||||
Building improvements |
— | — | ( |
) | ||||||||||||||||||||
Office equipment |
— | — | ( |
) | ||||||||||||||||||||
Right-of-use |
— | — | ( |
) | ||||||||||||||||||||
Total - Cost of fixed assets |
— |
— |
( |
) |
||||||||||||||||||||
Changes in accumulated depreciation |
2020 |
|||||||||||||||||||||||
Opening balance |
Additions |
Disposals |
Transfer |
CTA (*) |
Closing balance |
|||||||||||||||||||
(-) Furniture and fixtures |
( |
) | ( |
) | — | — | ( |
) | ||||||||||||||||
(-) Building improvements |
( |
) | ( |
) | — | — | ( |
) | ||||||||||||||||
(-) Office equipment |
( |
) | ( |
) | — | — | ( |
) | ||||||||||||||||
(-) Right-of-use |
( |
) | ( |
) | — | — | ( |
) | ||||||||||||||||
Total - Accumulated depreciation |
( |
) |
( |
) |
— |
— |
( |
) | ||||||||||||||||
Property and equipment, net |
( |
) |
— |
— |
( |
) |
||||||||||||||||||
Changes in cost |
2019 |
|||||||||||||||||||||||||||||||
Opening balance |
Adoption of IFRS 16 |
Adjusted opening balance |
Additions |
Disposals |
Transfer |
CTA (*) |
Closing balance |
|||||||||||||||||||||||||
Furniture and fixtures |
— | ( |
) | ( |
) | |||||||||||||||||||||||||||
Building improvements |
— | — | — | ( |
) | |||||||||||||||||||||||||||
Office equipment |
— | — | ( |
) | ( |
) | ||||||||||||||||||||||||||
Right-of-use |
— | — | — | — | ||||||||||||||||||||||||||||
Total - Cost of fixed assets |
( |
) |
— |
( |
) |
|||||||||||||||||||||||||||
Changes in accumulated depreciation |
2019 |
|||||||||||||||||||||||||||||||
Opening balance |
Adoption of IFRS 16 |
Adjusted opening balance |
Additions |
Disposals |
Transfer |
CTA (*) |
Closing balance |
|||||||||||||||||||||||||
(-) Furniture and fixtures |
( |
) | — | ( |
) | ( |
) | — | — | ( |
) | |||||||||||||||||||||
(-) Building improvements |
( |
) | — | ( |
) | ( |
) | — | — | ( |
) | |||||||||||||||||||||
(-) Office equipment |
( |
) | — | ( |
) | ( |
) | — | — | ( |
) | |||||||||||||||||||||
(-) Right-of-use |
— | — | — | ( |
) | — | — | ( |
) | |||||||||||||||||||||||
Total - Accumulated depreciation |
( |
) |
— |
( |
) |
( |
) |
— |
— |
( |
) | |||||||||||||||||||||
Property and equipment, net |
( |
) |
( |
) |
— |
( |
) |
|||||||||||||||||||||||||
(a) | The Group is the lessee in lease agreements for which the underlying assets are the office spaces located in São Paulo, Grand Cayman, Montevideo, London and Santiago. Depreciation expense relating to these assets was recognized in 2021 for the amount of US$ 20 and note 23. |
(b) | Following is the breakdown of the total Property and equipment assets by region: |
2021 |
2020 |
|||||||
Brazil |
||||||||
Cayman Islands |
||||||||
Chile |
||||||||
Other |
||||||||
Balance |
||||||||
14 |
Intangible assets |
2021 |
||||||||||||||||||||||||||||
Changes in costs |
Opening balance |
Additions |
Disposals |
Transfer |
Acquisitions of subsidiaries |
CTA (*) |
Closing balance |
|||||||||||||||||||||
Placement agents (a) |
— | — | — | ( |
) | |||||||||||||||||||||||
Contractual rights (b) |
— | — | — | — | — | |||||||||||||||||||||||
Non-contractual customer relationships (c) |
— | — | — | — | ( |
) |
||||||||||||||||||||||
Software |
( |
) | ( |
) | ||||||||||||||||||||||||
Brands |
— | — | — | — | ( |
) |
||||||||||||||||||||||
Goodwill (d) |
— | — | — | — | ( |
) |
||||||||||||||||||||||
Total - Cost of intangible assets |
( |
) |
( |
) |
||||||||||||||||||||||||
2021 |
||||||||||||||||||||||||||||
Changes in accumulated amortization |
Opening balance |
Additions |
Disposals |
Transfer |
Acquisitions of subsidiaries |
CTA (*) |
Closing Balance |
|||||||||||||||||||||
(-) Placement agents (a) |
( |
) | ( |
) | — | — | — | ( |
) | |||||||||||||||||||
(-) Contractual rights (b) |
( |
) | ( |
) | — | — | — | — | ( |
) | ||||||||||||||||||
(-) Non-contractual customer relatio nships (c) |
— | ( |
) | — | — | — | — | ( |
) | |||||||||||||||||||
(-) Software |
( |
) | ( |
) | ( |
) | ( |
) | ( |
) | ||||||||||||||||||
(-) Brands |
— | ( |
) | — | — | — | — | ( |
) | |||||||||||||||||||
Total - Accumulated amortization |
( |
) |
( |
) |
( |
) |
( |
) |
( |
) | ||||||||||||||||||
Intangible assets, net |
( |
) |
— |
( |
) |
( |
) |
|||||||||||||||||||||
2020 |
||||||||||||||||||||||||
Changes in costs |
Opening balance |
Additions |
Disposals |
Transfer |
CTA (*) |
Closing Balance |
||||||||||||||||||
Placement agents (a) |
— | — | ( |
) | ||||||||||||||||||||
Contractual rights (b) |
— | — | — | — | ||||||||||||||||||||
Software |
— | — | ( |
) | ||||||||||||||||||||
Total - Cost of intangible assets |
— |
— |
( |
) |
||||||||||||||||||||
2020 |
||||||||||||||||||||||||
Changes in accumulated amortization |
Opening Balance |
Additions |
Disposals |
Transfer |
CTA (*) |
Closing Balance |
||||||||||||||||||
(-) Placement agents (a) |
( |
) | ( |
) | — | — | ( |
) | ||||||||||||||||
(-) Contractual rights (b) |
( |
) | ( |
) | — | — | — | ( |
) | |||||||||||||||
(-) Software |
( |
) | ( |
) | — | — | ( |
) | ||||||||||||||||
Total - Accumulated amortization |
( |
) |
( |
) |
— |
— |
( |
) | ||||||||||||||||
Intangible assets, net |
( |
) |
— |
— |
||||||||||||||||||||
2019 |
||||||||||||||||||||||||
Changes in costs |
Opening balance |
Additions |
Disposals |
Transfer |
CTA (*) |
Closing Balance |
||||||||||||||||||
Placement agents (a) |
— | — | ( |
) | ||||||||||||||||||||
Contractual rights (b) |
— | — | — | — | ||||||||||||||||||||
Software |
( |
) | — | ( |
) | |||||||||||||||||||
Total - Cost of intangible assets |
( |
) |
— |
( |
) |
|||||||||||||||||||
2019 |
||||||||||||||||||||||||
Changes in accumulated amortization |
Opening Balance |
Additions |
Disposals |
Transfer |
CTA (*) |
Closing Balance |
||||||||||||||||||
(-) Placement agents (a) |
( |
) | ( |
) | — | — | ( |
) | ||||||||||||||||
(-) Contrac t ual rights (b) |
( |
) | ( |
) | — | — | — | ( |
) | |||||||||||||||
(-) Software |
( |
) | ( |
) | — | — | ( |
) | ||||||||||||||||
Total - Accumulated amortization |
( |
) |
( |
) |
— |
— |
( |
) | ||||||||||||||||
Intangible assets, net |
( |
) |
( |
) |
— |
|||||||||||||||||||
(a) | Placement agents refer to amounts capitalized relating to agreements with investment placement agents relating to fundraising. These assets are amortized based on the estimated duration of the respective investment funds. In case of an early liquidation of an investment fund, the amortization period is also adjusted. |
2022 |
2023 |
2024 |
2025 |
2026 |
2027 |
2028 |
2029 |
2030 |
2031 |
Total |
||||||||||||||||||||||||||||||||||
Placement agent fees |
||||||||||||||||||||||||||||||||||||||||||||
(b) |
Contractual rights refer to the management of the Infrastructure GP II, Ltd. |
(c) | Non-contractual customer relationships refer to client relationships of Moneda, acquired for the benefit of the Group through the business combination through rendering of ordinary business activities by Moneda entities. |
(d) | The Group recognized goodwill in the current year as disclosed above on the acquisition of Moneda (note 28). None of the goodwill recognized is deductible for tax purposes. impairment losses on goodwill were recognized in the current year. All goodwill recognized relates to the Moneda business combination of which management has determined the recoverable amount of MAM I and MAM II based on value in use. Key assumptions to determine the value in use includes discounted cash flow calculations based on current and past performance forecasts and considering current market indicators listed below for the respective countries in which the entities operate. There were no changes to assumptions between acquisition date (December 1, 2021) and reporting date (December 31, 2021). |
Inputs to determine value in use |
||||
Forecast period |
||||
GDP Growth rate - Chile |
||||
GDP Growth rate - United States of America |
||||
Annual inflation rate – Chile |
||||
Annual inflation rate – United States of America |
||||
USD/CLP average exchange rate |
||||
Discount rate |
(e) |
Following is the breakdown of intangible assets by region: |
2021 |
2020 |
|||||||
Brazil |
||||||||
Cayman Islands |
||||||||
Chile * |
||||||||
Other |
— | |||||||
Balance |
||||||||
* |
Goodwill and any fair value adjustments to assets and liabilities allocated to Chile relates to the business combination transaction with Moneda for acquisition of MAM I by Patria Investments Latam S.A. as disclosed under note 28. |
15 |
Personnel and related taxes payable |
2021 |
2020 |
|||||||
Personnel and related taxes |
||||||||
Accrued vacation and related charges |
||||||||
Employee profit sharing (a) |
||||||||
Officers’ Fund (b) |
||||||||
Personnel and related taxes payable - current liabilities |
||||||||
Officers’ Fund (b) |
||||||||
Strategic Bonus (c) |
||||||||
Personnel - non-current liabilities |
||||||||
(a) | The Group recognizes a provision for payment of profit sharing to employees, according to conditions approved by management, which is recorded as personnel expenses in the consolidated income statement. The amount of US$ |
(b) | Represents the amount of accrued employee benefits related to the Officers’ Fund, as described in note 30(b). |
(c) |
The Group delivers certain long-term employee benefits (“Strategic Bonus”) for a portion of its employees. MAM I is responsible for the operation and settlement of the Strategic Bonus with the objective to retain key or strategic employees and provide alignment between employees and clients. The Strategic Bonus was incorporated on December 15, 2017 and requires employees to remain in employment until the payment date of the Strategic Bonus, being February 28, 2023. |
16 |
Taxes payable |
2021 |
2020 |
|||||||
Taxes on revenues |
||||||||
Income taxes |
||||||||
Other taxes payable |
||||||||
Taxes payable |
||||||||
17 |
Other liabilities |
2021 |
2020 |
|||||||
Placement agent fees |
||||||||
Suppliers |
||||||||
Advances from customers |
||||||||
Occupancy costs |
||||||||
Lease liabilities (a) |
||||||||
Other current liabilities |
||||||||
Other current liabilities |
||||||||
Investment fund participating share in Patria Brazilian Private Equity III, Ltd., and Patria Brazil Real Estate Fund General Partner II, Ltd. (b) |
||||||||
Lease liabilities (a) |
||||||||
Other non-current liabilities |
||||||||
Other non-current liabilities |
||||||||
(a) | The Group is the lessee in lease agreements for which the underlying assets are the office spaces located in São Paulo, Grand Cayman, Montevideo, London and Santiago. See note 20. |
(b) | This liability refers to a participating share held by a related party in Patria Brazilian Private Equity III, Ltd., and Patria Brazil Real Estate Fund General Partner II, Ltd. that gives it the right to all returns and the related investment in PBPE Fund III (Ontario), L.P. and Patria Brazil Real Estate Fund II, L.P. For more details, see note 12(b). |
18 |
Deferred taxes |
2021 |
2020 |
|||||||
Deferred tax on the provision for employee profit sharing and other personnel accruals (a) |
||||||||
Deferred tax on management fee provision(a) |
— | |||||||
Deferred tax on accruals for expenses |
— |
|||||||
Deferred tax on tax depreciation of fixed assets |
( |
) | — | |||||
Deferred tax on performance fees - IFRS 15 |
( |
) | — | |||||
Deferred tax on gain from bargain purchase (b) |
( |
) | — | |||||
Deferred tax on initial application of IFRS 16 * |
( |
) | ( |
) | ||||
Other deferred taxes |
( |
) | ||||||
Deferred taxes |
||||||||
(a) | Deferred tax is calculated on temporary differences in the provision for employee profit-sharing and management fee write-offs. |
(b) |
On December 26, 2016, Moneda Servicios y Asesorías merged with Moneda Asset Management SpA. As a result of the merger, a gain from bargain purchase was generated, considering that the total value of the investment made by the merging company in the shares or social rights of the merged company was less than the tax value of the tax assets, as of the date of merger. The gain from bargain purchase is distributed among all the non-monetary assets received due to the merger for tax purposes. If there is a difference compared to the tax value of the assets, after adjusting non-monetary assets, the difference is considered income subject to taxation. Accordingly, it is treated as deferred income and amortized across a maximum of 10 consecutive business years. |
Deferred tax assets |
Employee profit sharing provision |
Management fee provision |
Taxable Goodwill |
Tax on Accrual for expenses |
Tax depreciation of fixed assets |
IFRS 15 |
Gain from bargain purchase |
Impact of IFRS 16 |
Other |
Total |
||||||||||||||||||||||||||||||
As of December 31, 2018 |
( |
) |
||||||||||||||||||||||||||||||||||||||
(Charged)/credited |
||||||||||||||||||||||||||||||||||||||||
- to profit or loss |
( |
) | — | — | — | — | ||||||||||||||||||||||||||||||||||
- directly to equity / CTA |
— | — | — | — | — | — | — | ( |
) | — | ( |
) | ||||||||||||||||||||||||||||
As of December 31, 2019 |
( |
) |
( |
) |
||||||||||||||||||||||||||||||||||||
(Charged)/credited |
||||||||||||||||||||||||||||||||||||||||
- to profit or loss |
( |
) | ( |
) | ( |
) | — | — | — | — | ( |
) | ( |
) | ||||||||||||||||||||||||||
- directly to equity / CTA |
( |
) | ( |
) | ( |
) | — | — | — | — | ( |
) | ||||||||||||||||||||||||||||
As of December 31, 2020* |
( |
) |
||||||||||||||||||||||||||||||||||||||
(Charged)/credited |
||||||||||||||||||||||||||||||||||||||||
- to profit or loss |
( |
) | — | ( |
) | ( |
) | ( |
) | |||||||||||||||||||||||||||||||
- directly to equity / CTA |
( |
) | — | ( |
) | ( |
) | ( |
) | ( |
) | |||||||||||||||||||||||||||||
As of December 31, 2021 |
( |
) |
( |
) |
( |
) |
( |
) |
( |
) |
||||||||||||||||||||||||||||||
* |
Deferred tax liability balances (US$ 185) were reclassified to deferred tax assets considering taxes are for the same taxable entity and taxation authority |
19 |
Provisions and contingent liabilities |
20 |
Commitments |
a. |
Lease commitments |
2021 |
2020 |
|||||||
Right-of-use |
||||||||
(-) Depreciation of right-of-use |
( |
) | ( |
) | ||||
Right-of-use |
||||||||
Lease liabilities (current) (a) |
||||||||
Lease liabilities (non-current) (a) |
||||||||
Lease liabilities |
||||||||
2021 |
2020 |
2019 |
||||||||||
Depreciation of right-of-use (b) |
( |
) | ( |
) | ( |
) | ||||||
Interest on lease liabilities (b) |
( |
) | ( |
) | ( |
) |
(a) |
The principal amount paid in 2021 and 2020 on leases was US$ |
(b) |
Depreciation of right-of-use |
21 |
Revenue from services |
2021 |
2020 |
2019 |
||||||||||
Revenue from management fees |
||||||||||||
Revenue from incentive fees |
||||||||||||
Revenue from performance fees (a) |
— | |||||||||||
Fund fees |
||||||||||||
Revenue from advisory and other ancillary fees |
||||||||||||
Total gross revenue from services |
||||||||||||
Taxes on revenue - management fees |
( |
) | ( |
) | ( |
) | ||||||
Taxes on revenue - incentive fees |
( |
) | ( |
) | ( |
) | ||||||
Taxes on revenue - performance fees |
( |
) | — | ( |
) | |||||||
Taxes on revenue - advisory and other ancillary fees |
( |
) | ( |
) | ( |
) | ||||||
Taxes on revenue |
( |
) |
( |
) |
( |
) | ||||||
Revenue from services |
||||||||||||
The following is the breakdown of revenue by region (b): |
||||||||||||
Brazil |
||||||||||||
British Virgin Islands |
— | — | ||||||||||
Cayman Islands |
||||||||||||
Chile |
— | — | ||||||||||
United States of America |
— | — | ||||||||||
Net revenue from services |
||||||||||||
(a) | Performance fees are primarily generated when the return of the investment funds surpass the performance hurdle set out in the related charters. Since the investment funds’ performance are susceptible to market volatility and to factors out of the Group’s control, the related fees fall under the variable consideration defined in IFRS 15. According to the referred standard, the Group recognizes these fees at a point in time when the related uncertainties are resolved, the likelihood of a claw-back or reversal is improbable and the likely amount of the transaction prices can be estimated without significant chance of reversal, indicating high probability of economic benefits and cash inflow to the Group. An amount of US$ |
(b) | Disclosure of revenue by geographic location is based on the registered domicile of the manager receiving fees. The investment funds managed by the Group attract and retain many global investors that represent the Group’s portfolio of clients. None of the Group’s individual clients represents more than % of the total revenues for the presented years. |
22 |
Cost of services rendered |
2021 |
2020 |
2019 |
||||||||||
Salaries and wages |
( |
) | ( |
) | ( |
) | ||||||
Partners’ compensation (note 30(a)) |
( |
) | ( |
) | ( |
) | ||||||
Officers’ Fund |
( |
) | ( |
) | ||||||||
Rewards and bonuses |
( |
) | ( |
) | ( |
) | ||||||
Social security contributions and payroll taxes |
( |
) | ( |
) | ( |
) | ||||||
Carried interest bonuses |
( |
) | — | — | ||||||||
Share based incentive plan (note 27(d)) |
( |
) | — | — | ||||||||
Strategic Bonus |
( |
) | — | — | ||||||||
Other short-term benefits |
( |
) | ( |
) | ( |
) | ||||||
Personnel expenses |
( |
) |
( |
) |
( |
) | ||||||
Amortization of placement agents’ fees (note 14) |
( |
) | ( |
) | ( |
) | ||||||
Rebate fees |
( |
) | ( |
) | ( |
) | ||||||
Amortization of contractual rights (note 14) |
( |
) | ( |
) | ( |
) | ||||||
Amortization of non-contractual customer relationships (note 14) |
( |
) | — | — | ||||||||
Amortization of intangible assets |
( |
) |
( |
) |
( |
) | ||||||
Carried interest allocation (a) |
( |
) |
— |
— |
||||||||
Deferred consideration (b) |
( |
) |
— | — | ||||||||
Costs of services rendered |
( |
) |
( |
) |
( |
) | ||||||
(a) | This expense refers to a carried interest share held by a related party (representing the Group’s senior managing directors and employees) in Patria Brazilian Private Equity III, Ltd. that gives it the right to up to |
(b) | Refer to note 28 for details on deferred consideration accrued. |
23 |
Administrative expenses |
2021 |
2020 |
2019 |
||||||||||
Professional services |
( |
) | ( |
) | ( |
) | ||||||
IT and telecom services |
( |
) | ( |
) | ( |
) | ||||||
Depreciation of right-of-use |
( |
) | ( |
) | ( |
) | ||||||
Travel expenses |
( |
) | ( |
) | ( |
) | ||||||
Depreciation of property and equipment |
( |
) | ( |
) | ( |
) | ||||||
Occupancy expenses |
( |
) | ( |
) | ( |
) | ||||||
Taxes and contributions |
( |
) | ( |
) | ( |
) | ||||||
Brand amortization |
( |
) | — | — | ||||||||
Marketing and events |
( |
) | ( |
) | ( |
) | ||||||
Materials and supplies |
( |
) | ( |
) | ( |
) | ||||||
Software amortization |
( |
) | ( |
) | ( |
) | ||||||
Other administrative expenses |
( |
) | ( |
) | ( |
) | ||||||
Administrative expenses |
( |
) |
( |
) |
( |
) | ||||||
24 |
Other income/(expenses) |
2021 |
2020 |
2019 |
||||||||||
Net loss on sale of property and equipment (a) |
( |
) | — | ( |
) | |||||||
Net gain on sale of subsidiary (b) |
— | — | ||||||||||
Net loss on transfer of investment (c) |
( |
) | — | — | ||||||||
IPO expenses and IPO related bonuses (d) |
( |
) | ( |
) | — | |||||||
Transaction costs (e) |
( |
) | ||||||||||
Other |
( |
) | ||||||||||
Other income/(expenses) |
( |
) |
( |
) |
||||||||
(a) |
Loss on sale of property and equipment was recognized on retirement of right of use assets related to the lease of the London office, terminated in May 2021. |
(b) |
Gain on sale of subsidiary was recognized related to sale of Pátria Companhia Securitizadora de Créditos Imobiliários as disclosed under note 5 (p). |
(c) |
Net loss on transfer of investment fund, Patria Infra Energia Core FIP EM Infraestrutura from PILTDA to Patria Finance Ltd. The loss results mainly from the decrease in unit price between acquisition date and transfer date. |
(d) | IPO expenses and IPO-related bonuses were recognized related to the Company’s Initial Public Offering which concluded on January 21, 2021. The amount was considered according to the costs allocated to the secondary offering and includes non-cash expenses of US$ |
(e) | Transaction costs relate to expenses incurred on acquisition of subsidiaries for business combination. |
25 |
Net financial income/(expense) |
2021 |
2020 |
2019 |
||||||||||
Net financial investment income |
||||||||||||
Valuation adjustment on long-term investments |
( |
) | ||||||||||
Net exchange variation |
||||||||||||
Banking fees |
( |
) | ( |
) | ( |
) | ||||||
Interest on le a se liabilities |
( |
) | ( |
) | ( |
) | ||||||
Other financial income/(expenses) |
( |
) | ( |
) | ||||||||
Net financial income/(expense) |
( |
) |
( |
) |
( |
) | ||||||
26 |
Income taxes expenses |
Reconciliation of income tax |
2021 |
2020 |
2019 |
|||||||||
Income before income taxes |
||||||||||||
Bermuda (2020)/Cayman Islands (2021) statutory income tax |
— | — | — | |||||||||
Impact of difference in tax rates of foreign subsidiaries |
( |
) | ( |
) | ||||||||
Nondeductible expenses |
( |
) | ( |
) | ( |
) | ||||||
Total income taxes |
( |
) |
( |
) |
( |
) | ||||||
Current |
( |
) | ( |
) | ( |
) | ||||||
Deferred |
( |
) | ||||||||||
Effective tax rate |
% |
% |
% | |||||||||
27 |
Equity |
(a) |
Capital |
2021 |
2020 |
|||||||||||||||
Shares |
Capital (US$) |
Shares |
Capital (US$) |
|||||||||||||
Total |
||||||||||||||||
Class A |
||||||||||||||||
Class B |
||||||||||||||||
(b) |
Additional paid-in capital |
2021 |
2020 |
|||||||
Class A |
||||||||
Class B |
||||||||
Total |
||||||||
(c) |
Dividends |
Shareholder |
2021 |
2020 |
2019 |
|||||||||||||||||||||
US$* | US$* | US$* | ||||||||||||||||||||||
Class A |
||||||||||||||||||||||||
Class B |
||||||||||||||||||||||||
Total |
||||||||||||||||||||||||
(*) |
Per thousand shares after share split, see note 27(a). |
(d) |
Share based incentive plan |
PSUs | ||||
Outstanding, December 31, 2020 |
||||
|
|
|||
Granted |
||||
|
|
|||
Forfeited |
( |
) | ||
|
|
|||
Outstanding, December 31, 2021 |
(e) |
Earnings per share (basic and diluted) |
2021 |
2020 |
2019 |
||||||||||
Net income for the year attributable to the Owners of the Company |
||||||||||||
Basic and diluted weighted average number of shares |
||||||||||||
Basic and diluted earnings per thousand shares |
||||||||||||
|
|
|
|
|
|
(f) |
Adjustments regarding the initial application of IFRS 16 |
(g) |
Cumulative Translation Adjustments |
(h) |
Non-controlling interests |
Equity(*) |
Income (Loss) (*) |
|||||||||||||||||||
Interest |
2021 |
2020 |
2021 |
2020 |
||||||||||||||||
Non-controlling interest in Patria Investimentos Ltda. |
% |
( |
) | ( |
) | |||||||||||||||
|
|
|
|
|
|
|
|
* | Commencing June 1, 2021 the Company now holds |
28 |
Business combinations |
Acquisition date fair value of each major class of identifiable assets and liabilities recognized |
||||||||||||
MAM I December 1, 2021 |
MAM II December 1, 2021 |
Total |
||||||||||
Total purchase consideration |
||||||||||||
Cash consideration paid |
||||||||||||
Consideration payable |
||||||||||||
Share issued |
||||||||||||
Contingent consideration payable |
||||||||||||
Total purchase consideration |
||||||||||||
The assets and liabilities recognized as a result of the acquisition are as follows: |
||||||||||||
Cash and cash equivalents |
||||||||||||
Accounts receivable |
||||||||||||
Working Capital ( a ) |
( |
) | ( |
) |
( |
) | ||||||
Intangible assets: non-contractual customer relationships |
||||||||||||
Intangible assets: brands |
||||||||||||
Fixed assets |
||||||||||||
Tax assets and liabilities |
( |
) |
||||||||||
Other assets and other liabilities |
( |
) | ||||||||||
Net identifiable assets acquired |
||||||||||||
Goodwill |
||||||||||||
Net assets acquired |
||||||||||||
a) |
The majority of working capital assumed from MAM I and MAM II includes current trade accounts payables (suppliers) in addition to client funds payable and other current liabilities offset by short term investments, client funds on deposit and other current financial assets. No contingent liabilities nor indemnification assets were acquired as part of the business combination. |
29 |
Financial instruments |
(a) |
Financial instruments by categories |
Financial assets |
2021 |
2020 |
||||||
Financial assets at amortized cost |
||||||||
Accounts receivable |
||||||||
Project advances |
||||||||
Client funds on deposit |
||||||||
Deposit/guarantee on lease agreement |
||||||||
Financial assets at fair value through profit or loss |
||||||||
Cash and bank accounts |
||||||||
Mutual fund shares |
||||||||
Short term investments |
||||||||
Long-term investments |
||||||||
Financial liabilities |
||||||||
Financial liabilities at amortized cost |
||||||||
Client funds payable |
||||||||
Lease liabilities |
||||||||
Placement agent |
||||||||
Suppliers and occupancy costs |
||||||||
Carried interest allocation |
||||||||
Consideration payable on acquisition |
||||||||
Financial liabilities at fair value through profit or loss |
||||||||
Investment fund participating shares in Patria Brazilian Private Equity General Partner III, Ltd., and Patria Brazil Real Estate Fund II, L.P. |
||||||||
Contingent consideration payable on acquisition |
(b) |
Financial instruments measured at fair value |
• | Level 1 |
• | Level 2 |
• | Level 3 |
2021 |
||||
Fair value at the beginning of the year |
||||
Contingent purchase consideration |
||||
Payments |
||||
Change in fair value - discounting |
||||
(c) |
Financial instruments measured at amortized costs |
(d) |
Risk management |
(i) | Credit risk |
(ii) | Liquidity risk |
(iii) | Market risk |
i. |
Credit risk |
Overdue |
Due in |
|||||||||||||||||||||||||||||||||||||||||||
Less than 90 days |
91 to 180 days |
181 to 270 days |
271 to 360 days |
Over 360 days |
01 to 90 days |
91 to 180 days |
181 to 270 days |
271 to 360 days |
Over 360 days |
Total |
||||||||||||||||||||||||||||||||||
Accounts Receivable (a) |
||||||||||||||||||||||||||||||||||||||||||||
Project Advances |
— | — | — | — | — | — | ||||||||||||||||||||||||||||||||||||||
Total |
||||||||||||||||||||||||||||||||||||||||||||
(a) | Non-current balances are related to management fees receivable from fund PBPE Fund IV (Ontario), L.P. in a single installment on December 31, 2023. In addition, management fees of US$ |
Overdue |
Due in |
|||||||||||||||||||||||||||||||
Less than 90 days |
01 to 90 days |
91 to 180 days |
91 to 180 days |
181 to 270 days |
271 to 360 days |
Over 360 days |
Total |
|||||||||||||||||||||||||
Accounts Receivable (a) |
— |
— |
— |
|||||||||||||||||||||||||||||
Project Advances |
— |
— |
— |
— |
— |
|||||||||||||||||||||||||||
Total |
— |
— |
— |
|||||||||||||||||||||||||||||
ii. |
Liquidity Risk |
Expected liabilities to be paid in |
||||||||||||||||||||||||
01 to 60 days |
61 to 120 days |
121 to 180 days |
181 to 360 days |
Over 360 days |
Total |
|||||||||||||||||||
Suppliers and occupancy costs |
— | — | — | — | ||||||||||||||||||||
Placement agents’ fees |
— | — | — | — | ||||||||||||||||||||
Investment fund participating shares |
— | — | — | — | ||||||||||||||||||||
Leases (a) |
||||||||||||||||||||||||
Carried interest allocation |
— | — | — | — | ||||||||||||||||||||
Consideration payable on acquisition |
— | — | — | — | ||||||||||||||||||||
Contingent consideration payable on acquisition (a) |
— | — | — | — | ||||||||||||||||||||
Total |
||||||||||||||||||||||||
(a) | Amounts reflect un discounted future cash outflows to settle financial liabilities. |
Expected liabilities to be paid in |
||||||||||||||||||||||||
01 to 60 days |
61 to 120 days |
121 to 180 days |
181 to 360 days |
Over 360 days |
Total |
|||||||||||||||||||
Dividends payable |
— | — | — | — | ||||||||||||||||||||
Suppliers and occupancy costs |
— | — | — | — | ||||||||||||||||||||
Placement agents’ fees |
— | — | ||||||||||||||||||||||
Investment fund participating shares |
— | — | — | — | ||||||||||||||||||||
Leases (a) |
||||||||||||||||||||||||
Total |
||||||||||||||||||||||||
iii. |
Market risk |
Balance in each exposure currency |
Total Balance USD |
Exchange Variation impact considering 10% change in the year end rates. |
||||||||||||||||||||||||||||||
BRL(a) |
HKD (b) |
CLP (c) |
COP (d) |
GBP (e) |
USD |
|||||||||||||||||||||||||||
Cash and cash equivalents |
||||||||||||||||||||||||||||||||
Client funds on deposit |
— | — | — | — | — | |||||||||||||||||||||||||||
Short term investments |
— | — | — | |||||||||||||||||||||||||||||
Accounts receivable |
— | |||||||||||||||||||||||||||||||
Projects Advance |
( |
) | ||||||||||||||||||||||||||||||
Deposit/guarantee on lease agreement |
||||||||||||||||||||||||||||||||
Client funds payable |
— | — | — | — | — | ( |
) | |||||||||||||||||||||||||
Long-term investments |
— | — | — | |||||||||||||||||||||||||||||
Carried interest allocation |
— | — | — | — | — | — | ||||||||||||||||||||||||||
Consideration payable on acquisition |
— | — | — | — | — | — | ||||||||||||||||||||||||||
Contingent consideration payable on acquisition |
— | — | — | — | — | — | ||||||||||||||||||||||||||
Suppliers and occupancy costs |
( |
) | ||||||||||||||||||||||||||||||
Net Impact |
||||||||||||||||||||||||||||||||
(a) | BRL - Brazilian Real, (b) HKD - Hong Kong dollar, (c) CLP - Chilean Peso, (d) COP - Colombian Peso, (e) GBP - Pound Sterling |
30 |
Related parties |
(a) |
Directors’ and Officers’ compensation |
2021 |
2020 |
2019 |
||||||||||
Directors’ and officers’ compensation |
( |
) | ( |
) | ( |
) | ||||||
(b) |
Officers’ Fund |
2021 |
2020 |
|||||||
Other Assets |
||||||||
Personnel current liabilities |
||||||||
Personnel non-current liabilities |
||||||||
(c) |
Long-term investments |
(d) |
Carried interest allocation |
(e) |
Share based incentive plan |
|
(f) |
Strategic Bonus |
(g) |
Lease commitments |
(h) |
Building improvements |
(i) |
Professional services |
31 |
Events after the reporting period |