REGISTRATION STATEMENT PURSUANT TO SECTION 12(b) OR 12(g) OF THE SECURITIES EXCHANGE ACT OF 1934 |
ANNUAL REPORT PURSUANT TO SECTION 13 OR 15(d) OF THE SECURITIES EXCHANGE ACT OF 1934 |
TRANSITION REPORT PURSUANT TO SECTION 13 OR 15(d) OF THE SECURITIES EXCHANGE ACT OF 1934 |
SHELL COMPANY REPORT PURSUANT TO SECTION 13 OR 15(d) OF THE SECURITIES EXCHANGE ACT OF 1934 |
Title of each class |
Trading Symbol(s) |
Name of each exchange on which registered | ||
Class A ordinary shares, par value US$0.000005 per share) |
||||
US$0.000005 per share* |
* |
|
Large accelerated filer ☐ |
Accelerated filer ☐ |
Emerging growth company |
☒ |
International Financial Reporting Standards as issued |
Other ☐ | ||||
by the International Accounting Standards Board ☐ |
Page |
||||||
1 |
||||||
2 |
||||||
3 |
||||||
Item 1. |
3 |
|||||
Item 2. |
3 |
|||||
Item 3. |
3 |
|||||
Item 4. |
60 |
|||||
Item 4A. |
97 |
|||||
Item 5. |
98 |
|||||
Item 6. |
114 |
|||||
Item 7. |
124 |
|||||
Item 8. |
126 |
|||||
Item 9. |
127 |
|||||
Item 10. |
128 |
|||||
Item 11. |
142 |
|||||
Item 12. |
143 |
|||||
146 |
||||||
Item 13. |
146 |
|||||
Item 14. |
146 |
|||||
Item 15. |
146 |
|||||
Item 16A. |
147 |
|||||
Item 16B. |
148 |
|||||
Item 16C. |
148 |
|||||
Item 16D. |
148 |
|||||
Item 16E. |
148 |
|||||
Item 16F. |
149 |
|||||
Item 16G. |
149 |
|||||
Item 16H. |
149 |
|||||
Item 16I. |
149 |
|||||
150 |
||||||
Item 17. |
150 |
|||||
Item 18. |
150 |
|||||
Item 19. |
150 |
|||||
154 |
• | “ADRs” are to the American depositary receipts which may evidence the ADSs; |
• | “ADSs” are to the American depositary shares, each of which represents ten Class A ordinary shares; |
• | “China” or the “PRC” are to the People’s Republic of China, excluding, for the purposes of this annual report only, Hong Kong, Macau and Taiwan; |
• | “Class A ordinary shares” refer to our Class A ordinary shares, par value US$0.000005 per share; |
• | “Class B ordinary shares” refer to our Class B ordinary shares, par value US$0.000005 per share; |
• | “FYP” are to first year premiums, which include all premiums that policyholders are obligated to pay for short-term policies and the premiums that policyholders are obligated to pay in the first policy year for long-term policies; |
• | “ordinary shares” are to our Class A ordinary shares and Class B ordinary shares, par value US$0.000005 per share; |
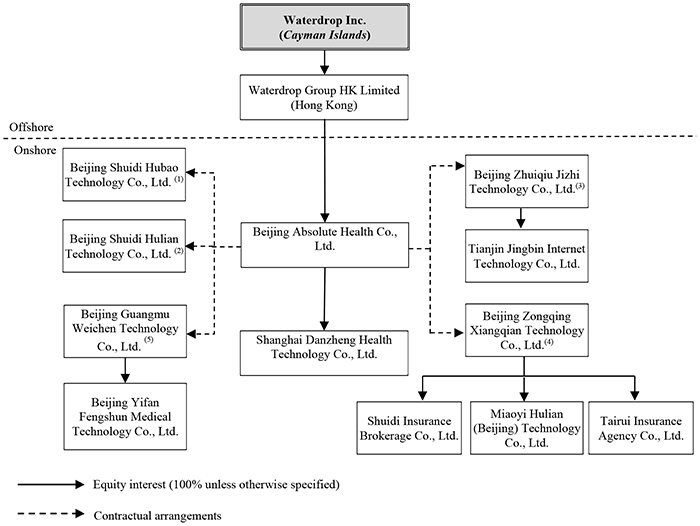
• | “the VIEs” are to Beijing Zhuiqiu Jizhi Technology Co., Ltd., or Zhuiqiu Jizhi, Beijing Shuidi Hubao Technology Co., Ltd., or Shuidi Hubao, Beijing Shuidi Hulian Technology Co., Ltd., or Shuidi Hulian, Beijing Zongqing Xiangqian Technology Co., Ltd., or Zongqing Xiangqian, and Beijing Guangmu Weichen Technology Co., Ltd., or Guangmu Weichen; |
• | “our WFOE” are to Beijing Absolute Health Co., Ltd., or Absolute Health; |
• | “RMB” and “Renminbi” are to the legal currency of China; |
• | “US$,” “U.S. dollars,” “$,” and “dollars” are to the legal currency of the United States; and |
• | “Waterdrop,” “we,” “us,” “our company” and “our” are to Waterdrop Inc., our Cayman Islands holding company and its subsidiaries, and, in the context of describing the consolidated financial information, its consolidated variable interest entities and the subsidiaries of the consolidated variable interest entities in China, including, but not limited to, the VIEs. |
• | our mission, goals and strategies; |
• | our future business development, financial conditions and results of operations; |
• | the expected growth of the insurance and online healthcare industry in China; |
• | our expectations regarding demand for and market acceptance of our products and services; |
• | our expectations regarding our relationships with consumers, insurance carriers and other partners; |
• | competition in our industry; |
• | our proposed use of proceeds; and |
• | relevant government policies and regulations relating to our industry. |
Item 1. |
Identity of Directors, Senior Management and Advisers |
Item 2. |
Offer Statistics and Expected Timetable |
Item 3. |
Key Information |
(1) | Mr. Peng Shen holds 100% of the equity interests in Beijing Shuidi Hubao Technology Co., Ltd. |
(2) | Mr. Peng Shen and Mr. Wei Ran, an employee of the Company, each holds 99% and 1% of the equity interests in Beijing Shuidi Hulian Technology Co., Ltd. |
(3) | Mr. Peng Shen and Mr. Guang Yang, each holds 99% and 1% of the equity interests in Beijing Zhuiqiu Jizhi Technology Co., Ltd. |
(4) | Mr. Peng Shen and Mr. Wei Ran, an employee of the Company, each holds 99% and 1% of the equity interests in Beijing Zongqing Xiangqian Technology Co., Ltd. |
(5) | Ms. Xiaolei Sun and Ms. Nian Liu, both employees of the Company, each holds 99% and 1% of the equity interests in Beijing Guangmu Weichen Technology Co., Ltd. |
Years Ended December 31, |
||||||||||||
2019 |
2020 |
2021 |
||||||||||
(RMB in millions) |
||||||||||||
Capital contributions from Parent to its subsidiaries |
1,468 | 1,555 | 2,679 | |||||||||
Loans from its subsidiaries to Parent |
— | — | 382 | |||||||||
Loans repayment received by its subsidiaries from Parent |
— | — | 35 | |||||||||
Loans from its subsidiaries to the VIEs and their subsidiaries |
892 | 1,477 | 4,418 | |||||||||
Loans repayment received by subsidiaries from VIEs and their subsidiaries |
367 | 372 | 3,010 | |||||||||
Service fees received by WOFE from the VIEs and their subsidiaries * |
— | 455 | 718 |
* | The cash flows between our WFOE, and the VIEs and their subsidiaries included the service fees paid for services contemplated by the exclusive business cooperation agreements. |
Taxation Scenario (1) |
||||
Statutory Tax and Standard Rates |
||||
Hypothetical pre-tax earnings(2) |
100 | % | ||
Tax on earnings at statutory rate of 25% (3) |
(25 | %) | ||
Net earnings available for distribution |
75 | % | ||
Withholding tax at standard rate of 10% (4) |
(7.5 | %) | ||
Net distribution to Parent/Shareholders |
67.5 | % |
(1) | For purposes of this example, the tax calculation has been simplified. The hypothetical book pre-tax earnings amount, not considering timing differences, is assumed to equal taxable income in China. |
(2) | Under the terms of VIE agreements, our WFOE may charge the VIEs for services provided to the VIEs. These fees shall be recognized as expenses of the VIEs, with a corresponding amount as service income by our WFOE and eliminate in consolidation. For income tax purposes, our our WFOE and the VIEs file income tax returns on a separate company basis. The fees paid are recognized as a tax deduction by the VIEs and as income by our WFOE and are tax neutral. |
(3) | Certain of our subsidiaries qualifies for a 15% preferential income tax rate in China. However, such rate is subject to qualification, is temporary in nature, and may not be available in a future period when distributions are paid. For purposes of this hypothetical example, the table above reflects a maximum tax scenario under which the full statutory rate would be effective. |
(4) | The PRC Enterprise Income Tax Law imposes a withholding income tax of 10% on dividends distributed by a foreign invested enterprise, or FIE, to its immediate holding company outside of China. A lower withholding income tax rate of 5% is applied if the FIE’s immediate holding company is registered in Hong Kong or other jurisdictions that have a tax treaty arrangement with China, subject to a qualification review at the time of the distribution. For purposes of this hypothetical example, the table above assumes a maximum tax scenario under which the full withholding tax would be applied. |
As of December 31, 2021 |
As of December 31, 2020 |
|||||||||||||||||||||||||||||||||||||||
Parent |
Non-VIE subsidiaries |
VIEs and their subsidiaries |
Elimination |
Consolidated |
Parent |
Non-VIE subsidiaries |
VIEs and their subsidiaries |
Elimination |
Consolidated |
|||||||||||||||||||||||||||||||
(RMB in thousands) | ||||||||||||||||||||||||||||||||||||||||
Cash and cash equivalents |
8,483 | 78,047 | 731,189 | — | 817,719 | 32,145 | 273,876 | 755,941 | — | 1,061,962 | ||||||||||||||||||||||||||||||
Restricted cash |
— | — | 667,664 | — | 667,664 | — | 7,830 | 253,557 | — | 261,387 | ||||||||||||||||||||||||||||||
Short-term investments |
414,921 | 1,202,990 | 351,451 | — | 1,969,362 | 653,609 | 265,161 | 274,390 | — | 1,193,160 | ||||||||||||||||||||||||||||||
Accounts receivable |
— | 8,608 | 635,235 | — | 643,843 | — | 3,147 | 536,644 | — | 539,791 | ||||||||||||||||||||||||||||||
Current contract assets |
— | — | 563,611 | — | 563,611 | — | — | 824,544 | — | 824,544 | ||||||||||||||||||||||||||||||
Amount due from related parties |
— | — | 1,049 | — | 1,049 | — | — | 813 | — | 813 | ||||||||||||||||||||||||||||||
Prepaid expense and other assets |
14,993 | 39,361 | 315,440 | — | 369,794 | — | 31,183 | 619,897 | — | 651,080 | ||||||||||||||||||||||||||||||
Amounts due from the entities within our Group |
1,786 | 4,323,023 | 121 | (4,324,930 | ) | — | 2,073 | 2,517,756 | 127,405 | (2,647,234 | ) | — | ||||||||||||||||||||||||||||
Non-current contract assets |
— | — | 29,889 | — | 29,889 | — | — | 24,006 | — | 24,006 | ||||||||||||||||||||||||||||||
Property, equipment and software, net |
— | 31,506 | 13,256 | — | 44,762 | — | 19,553 | 9,171 | — | 28,724 | ||||||||||||||||||||||||||||||
Intangible assets, net |
— | 20,535 | 53,202 | (16,984 | ) | 56,753 | — | 25,986 | 49,406 | (22,358 | ) | 53,034 | ||||||||||||||||||||||||||||
Long-term investments |
1,912 | — | 9,900 | — | 11,812 | 1,957 | — | 784 | — | 2,741 | ||||||||||||||||||||||||||||||
Investment in Non-VIE subsidiaries |
3,883,806 | — | — | (3,883,806 | ) | — | 2,551,008 | — | — | (2,551,008 | ) | — | ||||||||||||||||||||||||||||
Investment in VIEs |
— | (1,341,046 | ) | — | 1,341,046 | — | — | (87,217 | ) | — | 87,217 | — | ||||||||||||||||||||||||||||
Right of use assets, net |
— | 28,503 | 30,578 | — | 59,081 | — | 39,940 | 20,754 | — | 60,694 | ||||||||||||||||||||||||||||||
Deferred tax assets |
— | — | 11,840 | — | 11,840 | — | — | — | — | — | ||||||||||||||||||||||||||||||
Goodwill |
— | — | 3,420 | — | 3,420 | — | — | 3,119 | — | 3,119 | ||||||||||||||||||||||||||||||
|
|
|
|
|
|
|
|
|
|
|
|
|
|
|
|
|
|
|
|
|||||||||||||||||||||
Total assets |
4,325,901 |
4,391,527 |
3,417,845 |
(6,884,674 |
) |
5,250,599 |
3,240,792 |
3,097,215 |
3,500,431 |
(5,133,383 |
) |
4,705,055 |
||||||||||||||||||||||||||||
|
|
|
|
|
|
|
|
|
|
|
|
|
|
|
|
|
|
|
|
|||||||||||||||||||||
Amount due to related parties |
— | 20,449 | — | — | 20,449 | — | 9,789 | — | — | 9,789 | ||||||||||||||||||||||||||||||
Insurance premium payables |
— | — | 685,028 | — | 685,028 | — | — | 607,326 | — | 607,326 | ||||||||||||||||||||||||||||||
Deferred revenue |
— | — | 803 | — | 803 | — | — | 22,017 | — | 22,017 | ||||||||||||||||||||||||||||||
Accrued expenses and other current liabilities |
3,734 | 81,580 | 413,438 | — | 498,752 | 60,480 | 87,915 | 447,211 | — | 595,606 | ||||||||||||||||||||||||||||||
Current lease liabilities |
— | 27,661 | 16,452 | — | 44,113 | — | 25,957 | 10,594 | — | 36,551 | ||||||||||||||||||||||||||||||
Amounts due to the entities within our Group |
348,741 | 1,491 | 3,617,123 | (3,967,355 | ) | — | — | 21,559 | 2,266,999 | (2,288,558 | ) | — | ||||||||||||||||||||||||||||
Non-current lease liabilities |
— | 1,556 | 12,921 | — | 14,477 | — | 19,528 | 8,181 | — | 27,709 | ||||||||||||||||||||||||||||||
Deferred tax liabilities |
— | — | 13,126 | 425 | 13,551 | — | 425 | 225,320 | — | 225,745 | ||||||||||||||||||||||||||||||
|
|
|
|
|
|
|
|
|
|
|
|
|
|
|
|
|
|
|
|
|||||||||||||||||||||
Total liabilities |
352,475 |
132,737 |
4,758,891 |
(3,966,930 |
) |
1,277,173 |
60,480 |
165,173 |
3,587,648 |
(2,288,558 |
) |
1,524,743 |
||||||||||||||||||||||||||||
|
|
|
|
|
|
|
|
|
|
|
|
|
|
|
|
|
|
|
|
For the year ended December 31, 2021 |
For the year ended December 31, 2020 |
For the year ended December 31, 2019 |
||||||||||||||||||||||||||||||||||||||||||||||||||||||||||
Parent |
Non-VIE subsidiaries |
VIEs and their subsidiaries |
Elimination |
Consolidated |
Parent |
Non-VIE subsidiaries |
VIEs and their subsidiaries |
Elimination |
Consolidated |
Parent |
Non-VIE subsidiaries |
VIEs and their subsidiaries |
Elimination |
Consolidated |
||||||||||||||||||||||||||||||||||||||||||||||
(RMB in thousands) | ||||||||||||||||||||||||||||||||||||||||||||||||||||||||||||
Operating revenue, net |
2,279 |
757,798 |
3,193,807 |
(747,970 |
) |
3,205,914 |
— |
535,486 |
3,035,904 |
(543,442 |
) |
3,027,948 |
— |
154,890 |
1,511,010 |
(154,935 |
) |
1,510,965 |
||||||||||||||||||||||||||||||||||||||||||
Operating costs |
— | (171,728 | ) | (882,747 | ) | — | (1,054,475 | ) | — | (150,457 | ) | (591,801 | ) | — | (742,258 | ) | — | (62,659 | ) | (228,651 | ) | — | (291,310 | ) | ||||||||||||||||||||||||||||||||||||
Sales and marketing expenses |
(10,902 | ) | (161,598 | ) | (2,932,269 | ) | — | (3,104,769 | ) | (4,538 | ) | (59,354 | ) | (2,066,643 | ) | — | (2,130,535 | ) | (1,927 | ) | (40,540 | ) | (1,014,027 | ) | — | (1,056,494 | ) | |||||||||||||||||||||||||||||||||
General and administrative expenses |
(214,856 | ) | (208,605 | ) | (853,908 | ) | 746,847 | (530,522 | ) | (211,596 | ) | (123,631 | ) | (583,583 | ) | 511,639 | (407,171 | ) | (19,834 | ) | (87,915 | ) | (201,044 | ) | 165,798 | (142,995 | ) | |||||||||||||||||||||||||||||||||
Research and development expenses |
(25,056 | ) | (329,291 | ) | (24,643 | ) | — | (378,990 | ) | (13,279 | ) | (202,495 | ) | (28,456 | ) | — | (244,230 | ) | (8,329 | ) | (152,291 | ) | (54,026 | ) | — | (214,646 | ) | |||||||||||||||||||||||||||||||||
|
|
|
|
|
|
|
|
|
|
|
|
|
|
|
|
|
|
|
|
|
|
|
|
|
|
|
|
|
|
|||||||||||||||||||||||||||||||
Total operating costs and expenses |
(250,814 |
) |
(871,222 |
) |
(4,693,567 |
) |
746,847 |
(5,068,756 |
) |
(229,413 |
) |
(535,937 |
) |
(3,270,483 |
) |
511,639 |
(3,524,194 |
) |
(30,090 |
) |
(343,405 |
) |
(1,497,748 |
) |
165,798 |
(1,705,445 |
) | |||||||||||||||||||||||||||||||||
|
|
|
|
|
|
|
|
|
|
|
|
|
|
|
|
|
|
|
|
|
|
|
|
|
|
|
|
|
|
|||||||||||||||||||||||||||||||
Operating (loss)/income |
(248,535 |
) |
(113,424 |
) |
(1,499,760 |
) |
(1,123 |
) |
(1,862,842 |
) |
(229,413 |
) |
(451 |
) |
(234,579 |
) |
(31,803 |
) |
(496,246 |
) |
(30,090 |
) |
(188,515 |
) |
13,262 |
10,863 |
(194,480 |
) | ||||||||||||||||||||||||||||||||
|
|
|
|
|
|
|
|
|
|
|
|
|
|
|
|
|
|
|
|
|
|
|
|
|
|
|
|
|
|
|||||||||||||||||||||||||||||||
Equity in loss of subsidiaries and VIEs |
(1,332,101 | ) | (1,250,773 | ) | — | 2,582,874 | — | (286,022 | ) | (287,649 | ) | — | 573,671 | — | (292,523 | ) | (116,494 | ) | — | 409,017 | — | |||||||||||||||||||||||||||||||||||||||
|
|
|
|
|
|
|
|
|
|
|
|
|
|
|
|
|
|
|
|
|
|
|
|
|
|
|
|
|
|
|||||||||||||||||||||||||||||||
Net (loss)/income |
(1,574,080 |
) |
(1,332,101 |
) |
(1,253,808 |
) |
2,585,909 |
(1,574,080 |
) |
(663,869 |
) |
(286,022 |
) |
(253,807 |
) |
539,829 |
(663,869 |
) |
(321,535 |
) |
(292,523 |
) |
(184,632 |
) |
477,155 |
(321,535 |
) | |||||||||||||||||||||||||||||||||
|
|
|
|
|
|
|
|
|
|
|
|
|
|
|
|
|
|
|
|
|
|
|
|
|
|
|
|
|
|
For the year ended December 31, 2021 |
For the year ended December 31, 2020 |
For the year ended December 31, 2019 |
||||||||||||||||||||||||||||||||||||||||||||||||||||||||||
Parent |
Non-VIE subsidiaries |
VIEs and their subsidiaries |
Elimination |
Consolidated |
Parent |
Non-VIE subsidiaries |
VIEs and their subsidiaries |
Elimination |
Consolidated |
Parent |
Non-VIE subsidiaries |
VIEs and their subsidiaries |
Elimination |
Consolidated |
||||||||||||||||||||||||||||||||||||||||||||||
(RMB in thousands) | ||||||||||||||||||||||||||||||||||||||||||||||||||||||||||||
Net cash provided by/(used in) operating activities |
320,097 | (497,069 | ) | (919,680 | ) | — | (1,096,652 | ) | (28 | ) | (224,548 | ) | (552,532 | ) | — | (777,108 | ) | (2,827 | ) | (148,151 | ) | (381,917 | ) | — | (532,895 | ) | ||||||||||||||||||||||||||||||||||
Net cash (used in)/provided by investing activities |
(2,458,126 | ) | (2,376,786 | ) | (99,240 | ) | 4,087,254 | (846,898 | ) | (2,209,098 | ) | (1,391,055 | ) | (277,521 | ) | 2,659,973 | (1,217,701 | ) | (1,434,140 | ) | (680,046 | ) | 75,528 | 1,992,703 | (45,955 | ) | ||||||||||||||||||||||||||||||||||
Net cash provided by/(used in) financing activities |
2,128,529 | 2,670,120 | 1,408,275 | (4,087,254 | ) | 2,119,670 | 2,048,986 | 1,556,899 | 1,104,978 | (2,659,973 | ) | 2,050,890 | 1,491,983 | 1,467,522 | 505,973 | (1,992,703 | ) | 1,472,775 |
For the Year Ended December 31, |
||||||||||||||||||||
2018 |
2019 |
2020 |
2021 |
|||||||||||||||||
RMB |
RMB |
RMB |
RMB |
US$ |
||||||||||||||||
(in thousands, except for share and per share data) |
||||||||||||||||||||
Operating revenue, net |
238,149 |
1,510,965 |
3,027,948 |
3,205,914 |
503,078 |
|||||||||||||||
Operating costs and expenses |
||||||||||||||||||||
Operating costs |
(45,932 | ) | (291,310 | ) | (742,258 | ) | (1,054,475 | ) | (165,470 | ) | ||||||||||
Sales and marketing expenses |
(184,943 | ) | (1,056,494 | ) | (2,130,535 | ) | (3,104,769 | ) | (487,206 | ) | ||||||||||
General and administrative expenses |
(126,242 | ) | (142,995 | ) | (407,171 | ) | (530,522 | ) | (83,250 | ) | ||||||||||
Research and development expenses |
(69,196 | ) | (214,646 | ) | (244,230 | ) | (378,990 | ) | (59,472 | ) | ||||||||||
|
|
|
|
|
|
|
|
|
|
|||||||||||
Total operating costs and expenses |
(426,313 |
) |
(1,705,445 |
) |
(3,524,194 |
) |
(5,068,756 |
) |
(795,398 |
) | ||||||||||
|
|
|
|
|
|
|
|
|
|
|||||||||||
Operating loss |
(188,164 |
) |
(194,480 |
) |
(496,246 |
) |
(1,862,842 |
) |
(292,320 |
) | ||||||||||
|
|
|
|
|
|
|
|
|
|
|||||||||||
Other income/(expenses) |
||||||||||||||||||||
Interest income |
2,428 | 10,533 | 26,515 | 48,662 | 7,636 | |||||||||||||||
Fair value change of warrant |
— | — | (150,685 | ) | — | — | ||||||||||||||
Foreign currency exchange gain/(loss) |
66 | 4,152 | (1,335 | ) | 9,349 | 1,467 | ||||||||||||||
Others, net |
(1,967 | ) | 817 | 8,052 | 9,764 | 1,532 | ||||||||||||||
|
|
|
|
|
|
|
|
|
|
|||||||||||
Loss before income tax, and share of results of equity method investee |
(187,637 |
) |
(178,978 |
) |
(613,699 |
) |
(1,795,067 |
) |
(281,685 |
) | ||||||||||
|
|
|
|
|
|
|
|
|
|
|||||||||||
Income tax (expense)/benefit |
(21,503 | ) | (142,528 | ) | (50,155 | ) | 220,987 | 34,678 | ||||||||||||
Share of results of equity method investee |
(54 | ) | (29 | ) | (15 | ) | — | — | ||||||||||||
|
|
|
|
|
|
|
|
|
|
|||||||||||
Net loss attributable to Waterdrop Inc. |
(209,194 |
) |
(321,535 |
) |
(663,869 |
) |
(1,574,080 |
) |
(247,007 |
) | ||||||||||
|
|
|
|
|
|
|
|
|
|
|||||||||||
Deemed dividend on modification on preferred shares |
— |
— |
(67,975 | ) | — | — | ||||||||||||||
Deemed dividend upon issuance of warrants |
— | — | (90,268 | ) | — | — | ||||||||||||||
Preferred shares redemption value accretion |
(22,230 | ) | (136,839 | ) | (285,668 | ) | (152,287 | ) | (23,897 | ) | ||||||||||
|
|
|
|
|
|
|
|
|
|
|||||||||||
Net loss attributable to ordinary shareholders |
(231,424 |
) |
(458,374 |
) |
(1,107,780 |
) |
(1,726,367 |
) |
(270,904 |
) | ||||||||||
|
|
|
|
|
|
|
|
|
|
|||||||||||
Weighted average number of ordinary shares used in computing net loss per share |
||||||||||||||||||||
Basic and diluted |
839,572,645 | 1,203,526,000 | 1,174,583,516 | 2,990,507,749 | 2,990,507,749 | |||||||||||||||
Net loss per share attributable to ordinary shareholders |
||||||||||||||||||||
Basic and diluted |
(0.28 | ) | (0.38 | ) | (0.94 | ) | (0.58 | ) | (0.09 | ) |
As of December 31, |
||||||||||||||||
2019 |
2020 |
2021 |
||||||||||||||
RMB |
RMB |
RMB |
US$ |
|||||||||||||
(in thousands) |
||||||||||||||||
Selected Consolidated Balance Sheet Data: |
||||||||||||||||
Cash and cash equivalents |
964,476 | 1,061,962 | 817,719 | 128,318 | ||||||||||||
Restricted cash |
329,676 | 261,387 | 667,664 | 104,771 | ||||||||||||
Short-term investments |
60,278 | 1,193,160 | 1,969,362 | 309,036 | ||||||||||||
Accounts receivable |
252,499 | 539,791 | 643,843 | 101,033 | ||||||||||||
Contract assets |
617,688 | 848,550 | 593,500 | 93,133 | ||||||||||||
|
|
|
|
|
|
|
|
|||||||||
Total assets |
2,555,906 |
4,705,055 |
5,250,599 |
823,933 |
||||||||||||
|
|
|
|
|
|
|
|
|||||||||
Insurance premium payables (1) |
320,327 | 607,326 | 685,028 | 107,496 | ||||||||||||
Deferred revenue (2) |
21,670 | 22,017 | 803 | 126 | ||||||||||||
Accrued expenses and other current liabilities (3) |
496,530 | 595,606 | 498,752 | 78,265 | ||||||||||||
Deferred tax liabilities (4) |
167,601 | 225,745 | 13,551 | 2,126 | ||||||||||||
|
|
|
|
|
|
|
|
|||||||||
Total liabilities |
1,054,394 |
1,524,743 |
1,277,173 |
200,416 |
||||||||||||
|
|
|
|
|
|
|
|
|||||||||
Total mezzanine equity |
2,207,831 |
4,837,336 |
— |
— |
||||||||||||
|
|
|
|
|
|
|
|
|||||||||
Total shareholders’ (deficit)/equity |
(706,319 |
) |
(1,657,024 |
) |
3,973,426 |
623,517 |
||||||||||
|
|
|
|
|
|
|
|
(1) | Includes amounts of the consolidated VIEs and subsidiaries of VIEs without recourse to the Company of RMB320.2 million, RMB607.3 million and RMB685.0 million as of December 31, 2019, 2020 and 2021, respectively. |
(2) | Includes amounts of the consolidated VIEs and subsidiaries of VIEs without recourse to the Company of RMB21.7 million, RMB22.0 million and RMB0.8 million as of December 31, 2019, 2020 and 2021, respectively. |
(3) | Includes amounts of the consolidated VIEs and subsidiaries of VIEs without recourse to the Company of RMB428.8 million, RMB447.2 million and RMB413.4 million as of December 31, 2019, 2020 and 2021, respectively. |
(4) | Includes amounts of the consolidated VIEs and subsidiaries of VIEs without recourse to the Company of RMB167.2 million, RMB225.3 million and RMB13.1 million as of December 31, 2019, 2020 and 2021, respectively. |
For the Year Ended December 31, |
||||||||||||||||||||
2018 |
2019 |
2020 |
2021 |
|||||||||||||||||
RMB |
RMB |
RMB |
RMB |
US$ |
||||||||||||||||
(in thousands) |
||||||||||||||||||||
Net cash used in operating activities |
(211,029 | ) | (532,895 | ) | (777,108 | ) | (1,096,652 | ) | (172,089 | ) | ||||||||||
Net cash provided by/(used in) investing activities |
31,988 | (45,955 | ) | (1,217,701 | ) | (846,898 | ) | (132,897 | ) | |||||||||||
Net cash provided by financing activities |
362,669 | 1,472,775 | 2,050,890 | 2,119,670 | 332,622 | |||||||||||||||
Effect of exchange rate changes on cash and cash equivalents |
(1,973 | ) | 27,342 | (26,884 | ) | (14,086 | ) | (2,209 | ) | |||||||||||
|
|
|
|
|
|
|
|
|
|
|||||||||||
Net increase in cash and cash equivalents and restricted cash |
181,655 | 921,267 | 29,197 | 162,034 | 25,427 | |||||||||||||||
Total cash and cash equivalents and restricted cash at beginning of year |
191,230 | 372,885 | 1,294,152 | 1,323,349 | 207,662 | |||||||||||||||
|
|
|
|
|
|
|
|
|
|
|||||||||||
Total cash and cash equivalents and restricted cash at end of year |
372,885 | 1,294,152 | 1,323,349 | 1,485,383 | 233,089 | |||||||||||||||
|
|
|
|
|
|
|
|
|
|
• | Our business and growth are significantly affected by the future prospects of third-party insurance brokerage and agency, medical crowdfunding and healthcare industries, which are rapidly evolving. |
• | Our limited operating history and evolving business model make it difficult to evaluate our business and future prospects and the risks and challenges we may encounter. |
• | We face intense competition and could lose market share, which could adversely affect our results of operations. |
• | We have a history of net losses and negative cash flows from operating activities, which may continue in the future. |
• | We face uncertainties relating to the change of regulatory regime. |
• | We face reputational, monetary, and legal risks in relation to our discontinuation of the Waterdrop Mutual Aid business. |
• | The administration, interpretation and enforcement of the regulations applicable to us are evolving and involve uncertainties. We may not be able to stay in constant compliance with the rapidly evolving regulations. |
• | Any lack of requisite approvals, licenses or permits applicable to our business operation may have a material and adverse impact on our business and results of operations. |
• | We have been or may be subject to penalties for failure to manage our personnel engaging in insurance brokerage activities. |
• | We face reputational, monetary, and legal risks in relation to our discontinuation of the Waterdrop Mutual Aid business. |
• | Our historical growth rate may not be indicative of our future performance and if we fail to effectively manage our growth, our business, financial condition and results of operations could be adversely affected. |
• | We are a Cayman Islands holding company with no equity ownership in the VIEs and we conduct our operations in China primarily through (i) our PRC subsidiaries and (ii) the VIEs, with which we have maintained contractual arrangements. Investors in our ADSs thus are not purchasing equity interest in our operating entities in China but instead are purchasing equity interest in a Cayman Islands holding company. If the PRC government finds that the agreements that establish the structure for operating our business do not comply with the PRC laws and regulations, or if these regulations or their interpretations change in the future, we could be subject to severe penalties or be forced to relinquish our interests in those operations. Our holding company, our PRC subsidiaries, the VIEs, and investors of our company face uncertainty about potential future actions by the PRC government that could affect the enforceability of the contractual arrangements with the VIEs and, consequently, significantly affect the financial performance of the VIEs and our company as a whole. |
• | Changes in China’s economic, political or social conditions or government policies could have a material adverse effect on our business and operations. |
• | PRC government’s significant authority in regulating our operations and its oversight and control over securities offerings conducted overseas by, and foreign investment in, China-based issuers could significantly limit or completely hinder our ability to offer or continue to offer securities to investors. Implementation of industry-wide regulations in this nature may cause the value of such securities to significantly decline. |
• | Risks and uncertainties arising from the legal system in China, including risks and uncertainties regarding the enforcement of laws and quickly evolving rules and regulations in China, could result in a material adverse change in our operations and the value of our ADSs. |
• | We may rely on dividends and other distributions on equity paid by our PRC subsidiaries to fund any cash and financing requirements we may have, and any limitation on the ability of our PRC subsidiaries to make payments to us could have a material and adverse effect on our ability to conduct our business. |
• | Our auditor is currently not subject to inspections by the PCAOB. Our ADSs may be delisted under the Holding Foreign Companies Accountable Act. The delisting of our ADSs, or the threat of their being delisted, may materially and adversely affect the value of your investment. Additionally, the inability of the PCAOB to conduct inspections deprives our investors with the benefits of such inspections. |
• | Our ADSs will be prohibited from trading in the United States under the Holding Foreign Companies Accountable Act, in 2024 if the PCAOB is unable to inspect or fully investigate auditors located in China, or in 2023 if proposed changes to the law are enacted. The delisting of our ADSs, or the threat of their being delisted, may materially and adversely affect the value of your investment. |
• | The trading price of the ADSs is likely to be volatile, which could result in substantial losses to investors. |
• | If securities or industry analysts cease to publish research or reports about our business, or if they adversely change their recommendations regarding the ADSs, the market price for the ADSs and trading volume could decline. |
• | Our dual-class voting structure will limit your ability to influence corporate matters and could discourage others from pursuing any change of control transactions that holders of our Class A ordinary shares and ADSs may view as beneficial. |
• | operational and compliance challenges caused by distance, language, and cultural differences; |
• | the resources required to build a local management team in each new market and to localize our service offerings to appeal to consumers in that market; |
• | compliance challenges caused by unfamiliar laws and regulations; |
• | competition with businesses that understand local markets better than we do, that have pre-existing relationships with potential consumers in those markets, or that are favored by government or regulatory authorities in those markets; |
• | international geopolitical tensions; |
• | political, social and economic instability in any jurisdiction where we operate; |
• | international export controls and economic and trade sanctions; |
• | legal uncertainty including uncertainty resulting from unique local laws or a lack of clear legal precedent; |
• | regulatory press and licenses requirements from local authorities in insurance, crowdfunding or other industries; |
• | fluctuations in currency exchange rates; |
• | managing operations in markets in which offline activities are favored over online platform or service; |
• | adverse tax consequences, including the complexities of foreign value added tax systems, and restrictions on the repatriation of earnings; |
• | increased financial accounting and reporting burdens, and complexities associated with implementing and maintaining adequate internal controls; |
• | difficulties in implementing and maintaining the financial systems and processes needed to enable compliance across multiple offerings and jurisdictions; and |
• | reduced or varied protection for intellectual property rights in some markets. |
• | exercise effective control over the VIEs; |
• | receive substantially all of the economic benefits and bear the obligation to absorb substantially all of the losses of the VIEs; and have an exclusive option to purchase all or part of the equity interests and assets in the VIEs when and to the extent permitted by PRC law. |
• | revoking the business licenses and/or operating licenses of such entities; |
• | imposing fines on us; |
• | confiscating any of our income that they deem to be obtained through illegal operations; |
• | discontinuing or placing restrictions or onerous conditions on our operations; |
• | placing restrictions on our right to collect revenues; |
• | shutting down our servers or blocking our app/websites; |
• | requiring us to restructure our ownership structure or operations; |
• | restricting or prohibiting our use of the proceeds from our financing activities to finance the business and operations of the VIEs and their subsidiaries; or |
• | taking other regulatory or enforcement actions that could be harmful to our business. |
• | variations in our revenues, earnings, cash flow; |
• | fluctuations in operating metrics; |
• | announcements of new investments, acquisitions, strategic partnerships or joint ventures by us or our competitors; |
• | announcements of new solutions and services and expansions by us or our competitors; |
• | termination or non-renewal of contracts or any other material adverse change in our relationship with our key customers or strategic investors; |
• | changes in financial estimates by securities analysts; |
• | detrimental negative publicity about us, our competitors or our industry; |
• | additions or departures of key personnel; |
• | release of lockup or other transfer restrictions on our outstanding equity securities or sales of additional equity securities; |
• | regulatory developments affecting us or our industry; and |
• | potential litigation or regulatory investigations. |
• | we have instructed the depositary that we do not wish a discretionary proxy to be given; |
• | we have informed the depositary that there is substantial opposition as to a matter to be voted on at the meeting; |
• | a matter to be voted on at the meeting would have a material adverse impact on shareholders; or |
• | the voting at the meeting is to be made on a show of hands. |
• | the rules under the Exchange Act requiring the filing with the SEC of quarterly reports on Form 10-Q or current reports on Form 8-K; |
• | the sections of the Exchange Act regulating the solicitation of proxies, consents, or authorizations in respect of a security registered under the Exchange Act; |
• | the sections of the Exchange Act requiring insiders to file public reports of their stock ownership and trading activities and liability for insiders who profit from trades made in a short period of time; |
• | the selective disclosure rules by issuers of material nonpublic information under Regulation FD; and |
• | certain audit committee independence requirements in Rule 10A-3 of the Exchange Act. |
Item 4. |
Information on the Company |
For the Years Ended December 31, |
||||||||||||||||||||||||
2019 |
2020 |
2021 |
||||||||||||||||||||||
FYP |
(RMB million) |
(%) |
(RMB million) |
(%) |
(RMB million) |
(%) |
||||||||||||||||||
Short-term insurance |
6,118 | 91.7 | 11,916 | 82.6 | 13,717 | 83.8 | ||||||||||||||||||
Long-term insurance |
550 | 8.3 | 2,510 | 17.4 | 2,646 | 16.2 | ||||||||||||||||||
Total |
6,668 |
100.0 |
14,426 |
100.0 |
16,363 |
100.0 |
||||||||||||||||||
|
|
|
|
|
|
|
|
|
|
|
|
For the Years Ended December 31, |
||||||||||||||||||||||||
Number of Policies |
(thousand) |
(%) |
(thousand) |
(%) |
(thousand) |
(%) |
||||||||||||||||||
|
|
|
|
|
|
|
|
|
|
|
|
|||||||||||||
Short-term insurance |
10,638 |
98.9 |
17,007 |
96.6 |
18,254 |
96.6 |
||||||||||||||||||
Long-term insurance |
118 |
1.1 |
605 |
3.4 |
633 |
3.4 |
||||||||||||||||||
Total |
10,756 |
100.0 |
17,612 |
100.0 |
18,887 |
100.0 |
||||||||||||||||||
|
|
|
|
|
|
|
|
|
|
|
|
For the Years Ended December 31, |
||||||||||||||||||||||||
2019 |
2020 |
2021 |
||||||||||||||||||||||
FYP |
(RMB million) |
(%) |
(RMB million) |
(%) |
(RMB million) |
(%) |
||||||||||||||||||
Health insurance |
||||||||||||||||||||||||
Medical insurance |
5,339 | 80.1 | 10,426 | 72.3 | 11,003 | 67.3 | ||||||||||||||||||
Casualty insurance |
527 | 7.9 | 1,280 | 8.9 | 1,194 | 7.3 | ||||||||||||||||||
Critical illness insurance |
699 | 10.5 | 1,907 | 13.2 | 2,833 | 17.3 | ||||||||||||||||||
Life insurance |
103 | 1.5 | 813 | 5.6 | 1,333 | 8.1 | ||||||||||||||||||
Total |
6,668 |
100.0 |
14,426 |
100.0 |
16,363 |
100.0 |
||||||||||||||||||
|
|
|
|
|
|
|
|
|
|
|
|
For the Years Ended December 31, |
||||||||||||||||||||||||
2019 |
2020 |
2021 |
||||||||||||||||||||||
Number of Polices |
(thousand) |
(%) |
(thousand) |
(%) |
(thousand) |
(%) |
||||||||||||||||||
Health insurance |
||||||||||||||||||||||||
Medical insurance |
8,406 |
78.2 |
13,571 |
77.0 |
14,577 |
77.2 |
||||||||||||||||||
Casualty insurance |
1,743 |
16.2 |
3,162 |
18.0 |
2,386 |
12.6 |
||||||||||||||||||
Critical illness insurance |
584 |
5.4 |
681 |
3.9 |
1,609 |
8.5 |
||||||||||||||||||
Life insurance |
23 |
0.2 |
198 |
1.1 |
315 |
1.7 |
||||||||||||||||||
Total |
10,756 |
100.0 |
17,612 |
100.0 |
18,887 |
100.0 |
||||||||||||||||||
|
|
|
|
|
|
|
|
|
|
|
|
• | the ownership structures of the VIEs in China and our WFOE currently do not and will not result in violation of any explicit provisions of PRC laws, rules or regulations currently in effect; and |
• | each of the agreements under the contractual arrangements among our WFOE, the VIEs and their respective shareholders governed by PRC law, rules and regulations currently is valid, binding and enforceable, and will not result in violation of any explicit provisions of PRC laws, rules or regulations currently in effect. |
Item 4A. |
Unresolved Staff Comments |
Item 5. |
Operating and Financial Review and Prospects |
For the Year Ended December 31, |
||||||||||||||||||||||||||||
2019 |
2020 |
2021 |
||||||||||||||||||||||||||
RMB |
% |
RMB |
% |
RMB |
US$ |
% |
||||||||||||||||||||||
(in thousands, except for percentage data) |
||||||||||||||||||||||||||||
Operating revenue, net: |
||||||||||||||||||||||||||||
Brokerage income |
||||||||||||||||||||||||||||
Short-term insurance brokerage income |
1,134,984 | 75.1 | 2,045,191 | 67.6 | 2,037,677 | 319,756 | 63.6 | |||||||||||||||||||||
Long-term insurance brokerage income |
173,192 | 11.5 | 650,129 | 21.5 | 789,790 | 123,935 | 24.6 | |||||||||||||||||||||
|
|
|
|
|
|
|
|
|
|
|
|
|
|
|||||||||||||||
Subtotal |
1,308,176 | 86.6 | 2,695,320 | 89.1 | 2,827,467 | 443,691 | 88.2 | |||||||||||||||||||||
|
|
|
|
|
|
|
|
|
|
|
|
|
|
|||||||||||||||
Management fee income |
142,683 | 9.4 | 109,828 | 3.6 | 2,745 | 431 | 0.1 | |||||||||||||||||||||
Technical service income |
51,705 | 3.4 | 194,130 | 6.4 | 243,542 | 38,217 | 7.6 | |||||||||||||||||||||
Other revenues |
8,401 | 0.6 | 28,670 | 0.9 | 132,160 | 20,739 | 4.1 | |||||||||||||||||||||
|
|
|
|
|
|
|
|
|
|
|
|
|
|
|||||||||||||||
Total |
1,510,965 |
100.0 |
3,027,948 |
100.0 |
3,205,914 |
503,078 |
100.0 |
|||||||||||||||||||||
|
|
|
|
|
|
|
|
|
|
|
|
|
|
For the Year Ended December 31, |
||||||||||||||||||||||||||||
2019 |
2020 |
2021 |
||||||||||||||||||||||||||
RMB |
% |
RMB |
% |
RMB |
US$ |
% |
||||||||||||||||||||||
(in thousands, except for percentage data) |
||||||||||||||||||||||||||||
Operating costs and expenses: |
||||||||||||||||||||||||||||
Operating costs. |
291,310 | 19.3 | 742,258 | 24.5 | 1,054,475 | 165,470 | 32.9 | |||||||||||||||||||||
Sales and marketing expenses |
1,056,494 | 69.9 | 2,130,535 | 70.4 | 3,104,769 | 487,206 | 96.8 | |||||||||||||||||||||
General and administrative expenses |
142,995 | 9.5 | 407,171 | 13.4 | 530,522 | 83,250 | 16.5 | |||||||||||||||||||||
Research and development expenses |
214,646 | 14.2 | 244,230 | 8.1 | 378,990 | 59,472 | 11.8 | |||||||||||||||||||||
|
|
|
|
|
|
|
|
|
|
|
|
|
|
|||||||||||||||
Total operating costs and expenses: |
1,705,445 |
112.9 |
3,524,194 |
116.4 |
5,068,756 |
795,398 |
158.0 |
|||||||||||||||||||||
|
|
|
|
|
|
|
|
|
|
|
|
|
|
For the Year Ended December 31, |
||||||||||||||||||||||||||||
2019 |
2020 |
2021 |
||||||||||||||||||||||||||
RMB |
% |
RMB |
% |
RMB |
US$ |
% |
||||||||||||||||||||||
(in thousands, except for percentage data) |
||||||||||||||||||||||||||||
Operating revenue, net |
1,510,965 |
100.0 |
3,027,948 |
100.0 |
3,205,914 |
503,078 |
100.0 |
|||||||||||||||||||||
Operating costs and expenses |
||||||||||||||||||||||||||||
Operating costs |
(291,310 | ) | (19.3 | ) | (742,258 | ) | (24.5 | ) | (1,054,475 | ) | (165,470 | ) | (32.9 | ) | ||||||||||||||
Sales and marketing expenses (l) |
(1,056,494 | ) | (69.9 | ) | (2,130,535 | ) | (70.4 | ) | (3,104,769 | ) | (487,206 | ) | (96.8 | ) | ||||||||||||||
General and administrative expenses |
(142,995 | ) | (9.5 | ) | (407,171 | ) | (13.4 | ) | (530,522 | ) | (83,250 | ) | (16.5 | ) | ||||||||||||||
Research and development expenses |
(214,646 | ) | (14.2 | ) | (244,230 | ) | (8.1 | ) | (378,990 | ) | (59,472 | ) | (11.8 | ) | ||||||||||||||
|
|
|
|
|
|
|
|
|
|
|
|
|
|
|||||||||||||||
Total operating costs and expenses: |
(1,705,445 |
) |
(112.9 |
) |
(3,524,194 |
) |
(116.4 |
) |
(5,068,756 |
) |
(795,398 |
) |
(158.0 |
) | ||||||||||||||
|
|
|
|
|
|
|
|
|
|
|
|
|
|
|||||||||||||||
Operating loss |
(194,480 |
) |
(12.9 |
) |
(496,246 |
) |
(16.4 |
) |
(1,862,842 |
) |
(292,320 |
) |
(58.0 |
) | ||||||||||||||
|
|
|
|
|
|
|
|
|
|
|
|
|
|
|||||||||||||||
Other income/(expenses) |
||||||||||||||||||||||||||||
Interest income |
10,533 | 0.7 | 26,515 | 0.9 | 48,662 | 7,636 | 1.5 | |||||||||||||||||||||
Fair value change of warrant |
— | — | (150,685 | ) | (5.0 | ) | — | — | — | |||||||||||||||||||
Foreign currency exchange gain/(loss) |
4,152 | 0.3 | (1,335 | ) | (0.0 | ) | 9,349 | 1,467 | 0.3 | |||||||||||||||||||
Others, net |
817 | 0.1 | 8,052 | 0.3 | 9,764 | 1,532 | 0.3 | |||||||||||||||||||||
|
|
|
|
|
|
|
|
|
|
|
|
|
|
|||||||||||||||
Loss before income tax, and share of results of equity method investee |
(178,978 |
) |
(11.8 |
) |
(613,699 |
) |
(20.2 |
) |
(1,795,067 |
) |
(281,685 |
) |
(55.9 |
) | ||||||||||||||
|
|
|
|
|
|
|
|
|
|
|
|
|
|
|||||||||||||||
Income tax (expense)/benefit |
(142,528 | ) | (9.4 | ) | (50,155 | ) | (1.7 | ) | 220,987 | 34,678 | 6.9 | |||||||||||||||||
Share of results of equity method investee |
(29 | ) | (0.0 | ) | (15 | ) | (0.0 | ) | — | — | — | |||||||||||||||||
|
|
|
|
|
|
|
|
|
|
|
|
|
|
|||||||||||||||
Net loss attributable to Waterdrop Inc |
(321,535 |
) |
(21.2 |
) |
(663,869 |
) |
(21.9 |
) |
(1,574,080 |
) |
(247,007 |
) |
(49.0 |
) | ||||||||||||||
|
|
|
|
|
|
|
|
|
|
|
|
|
|
|||||||||||||||
Deemed dividend on modification on preferred shares |
— | — | (67,975 | ) | (2.2 | ) | — | — | — | |||||||||||||||||||
Deemed dividend upon issuance of warrants |
— | — | (90,268 | ) | (3.0 | ) | — | — | — | |||||||||||||||||||
Preferred shares redemption value accretion |
(136,839 | ) | (9.1 | ) | (285,668 | ) | (9.4 | ) | (152,287 | ) | (23,897 | ) | (4.8 | ) | ||||||||||||||
|
|
|
|
|
|
|
|
|
|
|
|
|
|
|||||||||||||||
Net loss attributable to ordinary shareholders |
(458,374 |
) |
(30.3 |
) |
(1,107,780 |
) |
(36.5 |
) |
(1,726,367 |
) |
(270,904 |
) |
(53.8 |
) | ||||||||||||||
|
|
|
|
|
|
|
|
|
|
|
|
|
|
|||||||||||||||
Other comprehensive income/(loss): |
||||||||||||||||||||||||||||
Foreign currency translation adjustment |
27,771 | 1.8 | (14,008 | ) | (0.5 | ) | (36,640 | ) | (5,750 | ) | (1.1 | ) | ||||||||||||||||
Unrealized gains on available for sale investments, net of tax |
209 | 0.0 | 1,724 | 0.1 | 192 | 30 | 0.0 | |||||||||||||||||||||
|
|
|
|
|
|
|
|
|
|
|
|
|
|
|||||||||||||||
Total comprehensive loss |
(293,555 |
) |
(19.4 |
) |
(676,153 |
) |
(22.3 |
) |
(1,610,528 |
) |
(252,727 |
) |
(50.1 |
) | ||||||||||||||
|
|
|
|
|
|
|
|
|
|
|
|
|
|
(1) | The breakdown of sales and marketing expenses is as follows: |
For the Year Ended December 31, |
||||||||||||||||
2019 |
2020 |
2021 |
||||||||||||||
RMB |
RMB |
RMB |
US$ |
|||||||||||||
(in thousands) |
||||||||||||||||
Marketing expenses for user acquisition and brand building |
793,419 | 1,743,014 | 2,232,942 | 350,397 | ||||||||||||
Payroll and related expenses for employees |
201,147 | 210,308 | 295,434 | 46,360 | ||||||||||||
Expenses of facilities and equipment |
11,333 | 17,274 | 21,023 | 3,299 | ||||||||||||
Promotional rewards to our users |
25,701 | 43,652 | 10,896 | 1,710 | ||||||||||||
Outsourced sales and marketing service fee to third parties |
11,685 | 94,218 | 507,421 | 79,625 | ||||||||||||
Others |
13,209 | 22,069 | 37,053 | 5,815 | ||||||||||||
|
|
|
|
|
|
|
|
|||||||||
Total sales and marketing expenses |
1,056,494 |
2,130,535 |
3,104,769 |
487,206 |
||||||||||||
|
|
|
|
|
|
|
|
For the Year Ended December 31, |
||||||||||||||||
2019 |
2020 |
2021 |
||||||||||||||
RMB |
RMB |
RMB |
US$ |
|||||||||||||
Selected Consolidated Cash Flow Data: |
(in thousands) |
|||||||||||||||
Net cash used in operating activities |
(532,895 | ) | (777,108 | ) | (1,096,652 | ) | (172,089 | ) | ||||||||
Net cash used in investing activities |
(45,955 | ) | (1,217,701 | ) | (846,898 | ) | (132,897 | ) | ||||||||
Net cash provided by financing activities |
1,472,775 | 2,050,890 | 2,119,670 | 332,622 | ||||||||||||
Effect of exchange rate changes on cash and cash equivalents |
27,342 | (26,884 | ) | (14,086 | ) | (2,209 | ) | |||||||||
|
|
|
|
|
|
|
|
|||||||||
Net increase in cash and cash equivalents and restricted cash |
921,267 | 29,197 | 162,034 | 25,427 | ||||||||||||
Total cash and cash equivalents and restricted cash at beginning of year |
372,885 | 1,294,152 | 1,323,349 | 207,662 | ||||||||||||
|
|
|
|
|
|
|
|
|||||||||
Total cash and cash equivalents and restricted cash at end of year |
1,294,152 | 1,323,349 | 1,485,383 | 233,089 | ||||||||||||
|
|
|
|
|
|
|
|
Directors and Executive Officers |
Age |
Position/Title | ||
Peng Shen | 34 | Chairman of the Board of Directors and Chief Executive Officer | ||
Guang Yang | 36 | Director and General Manager of Insurance Marketplace | ||
Yao Hu | 35 | Director and General Manager of Crowdfunding and Healthcare | ||
Haiyang Yu | 39 | Director | ||
Kai Huang | 35 | Director | ||
Nina Zhou | 46 | Director | ||
Heping Feng | 62 | Independent Director | ||
Chenyang Wei | 49 | Independent Director | ||
Kangping Shi | 46 | Chief Financial Officer | ||
Hui Teng | 43 | Chief Actuary |
Name |
Ordinary Shares Underlying Options |
Exercise Price (US$/Share) |
Date of Grant |
Date of Expiration |
||||||||||||
Yao Hu |
* | 0.003 | September 1, 2018 | September 1, 2028 | ||||||||||||
* | 0.08 | March 25, 2021 | March 25, 2031 | |||||||||||||
Kangping Shi |
* | 0.003 | November 16, 2020 | November 16, 2030 | ||||||||||||
* | 0.08 | March 25, 2021 | March 25, 2031 | |||||||||||||
Hui Teng |
* | 0.003 | May 1, 2020 | May 1, 2030 | ||||||||||||
* | 0.003 | October 31, 2020 | October 31, 2030 | |||||||||||||
* | 0.08 | March 25, 2021 | March 25, 2031 | |||||||||||||
Heping Feng |
* | 0.08 | June 25, 2021 | June 25, 2030 | ||||||||||||
Chenyang Wei |
* | 0.08 | June 25, 2021 | June 25, 2030 | ||||||||||||
All directors and executive officers as a group |
18,420,000 |
Less | than 1% of our total ordinary shares on an as-converted basis outstanding as of March 31, 2022. |
• | appointing the independent auditors and pre-approving all auditing and non-auditing services permitted to be performed by the independent auditors; |
• | reviewing with the independent auditors any audit problems or difficulties and management’s response; |
• | discussing the annual audited financial statements with management and the independent auditors; |
• | reviewing the adequacy and effectiveness of our accounting and internal control policies and procedures and any steps taken to monitor and control major financial risk exposures; |
• | reviewing and approving all proposed related party transactions; |
• | meeting separately and periodically with management and the independent auditors; and |
• | monitoring compliance with our code of business conduct and ethics, including reviewing the adequacy and effectiveness of our procedures to ensure proper compliance. |
• | reviewing and approving, or recommending to the board for its approval, the compensation for our chief executive officer and other executive officers; |
• | reviewing and recommending to the board for determination with respect to the compensation of our non-employee directors; |
• | reviewing periodically and approving any incentive compensation or equity plans, programs or similar arrangements; and |
• | selecting compensation consultant, legal counsel or other adviser only after taking into consideration all factors relevant to that person’s independence from management. |
• | selecting and recommending to the board nominees for election by the shareholders or appointment by the board; |
• | reviewing annually with the board the current composition of the board with regards to characteristics such as independence, knowledge, skills, experience and diversity; |
• | making recommendations on the frequency and structure of board meetings and monitoring the functioning of the committees of the board; and |
• | advising the board periodically with regards to significant developments in the law and practice of corporate governance as well as our compliance with applicable laws and regulations, and making recommendations to the board on all matters of corporate governance and on any remedial action to be taken. |
• | convening shareholders’ annual and extraordinary general meetings and reporting its work to shareholders at such meetings; |
• | declaring dividends and distributions; |
• | appointing officers and determining the term of office of the officers; |
• | exercising the borrowing powers of our company and mortgaging the property of our company; and |
• | approving the transfer of shares in our company, including the registration of such shares in our share register. |
Function |
Number of Employees |
|||
Operating |
1,696 | |||
Sales and marketing |
581 | |||
General and administrative |
286 | |||
Research and development |
373 | |||
|
|
|||
Total |
2,936 |
|||
|
|
• | each of our directors and executive officers; and |
• | each of our principal shareholders who beneficially own more than 5% of our total issued and outstanding shares. |
Ordinary Shares Beneficially Owned |
||||||||||||||||||||
Class A Ordinary Shares |
Class B Ordinary Shares |
Total Ordinary Shares on an As-converted Basis |
% of Total Ordinary Shares on an As- converted Basis |
% of Aggregate Voting Power† |
||||||||||||||||
Directors and Executive Officers**: |
||||||||||||||||||||
Peng Shen(1) |
159,835,949 | 801,904,979 | 961,740,928 | 24.5 | 71.3 | |||||||||||||||
Guang Yang(2) |
— | — | — | — | — | |||||||||||||||
Yao Hu(3) |
* | — | * | * | — | |||||||||||||||
Haiyang Yu |
— | — | — | — | — | |||||||||||||||
Kai Huang |
— | — | — | — | — | |||||||||||||||
Nina Zhou |
— | — | — | — | — | |||||||||||||||
Heping Feng |
|
* |
|
* | — | * | — | |||||||||||||
Chenyang Wei |
* | * | — | * | — | |||||||||||||||
Kangping Shi |
* | * | — | * | — | |||||||||||||||
Hui Teng |
|
* |
|
* | — | * | — | |||||||||||||
All Directors and Executive Officers as a Group |
167,265,909 | 801,904,979 | 969,170,888 | 24.6 | 71.3 | |||||||||||||||
Principal Shareholders: |
||||||||||||||||||||
Neptune Max Holdings Limited(l) |
— | 801,904,979 | 801,904,979 | 20.4 | 69.7 | |||||||||||||||
Entities affiliated with Tencent(4) |
830,085,007 | — | 830,085,007 | 21.1 | 8.0 | |||||||||||||||
Investment funds affiliated with Boyu Capital(5) |
470,735,258 | — | 470,735,258 | 12.0 | 4.5 | |||||||||||||||
Investment funds affiliated with Gaorong Capital(6) |
238,203,080 | — | 238,203,080 | 6.1 | 2.3 | |||||||||||||||
Swiss Re Principal Investments Company Asia Pte. Ltd.(7) |
206,362,384 | — | 206,362,384 | 5.2 | 2.0 |
Notes: |
* | Less than 1% of our total ordinary shares on an as-converted basis outstanding as of March 31, 2022. |
** | Except as indicated otherwise below, the business address of our directors and executive officers is Block C, Wangjing Science and Technology Park, No. 2 Lize Zhonger Road, Chaoyang District, Beijing, China. The business address of Mr. Kai Huang is Suite 3601B-3604, 36/F, Tower 2, Jing An Kerry Centre, 1539 Nanjing West Road, Jing An District, Shanghai, China. The business address of Mr. Haiyang Yu is 29/F, Three Pacific Place, No. 1 Queen’s Road East, Wanchai, Hong Kong. The business address of Ms. Nina Zhou is 12 Marina View, #16-01, Asia Square Tower 2, Singapore. The business address of Mr. Heping Feng is Room 1401, Beijing Mansion, 58 Dong Si Huan Zhong Road, Chaoyang District, Beijing, China. The business address of Mr. Chenyang Wei is Shuangqing Building 2-801, 77 Shuangqing Road, Haidian District, Beijing, China. |
† | For each person or group included in this column, percentage of total voting power represents voting power based on both Class A and Class B ordinary shares held by such person or group with respect to all outstanding shares of our Class A and Class B ordinary shares as a single class. Each holder of our Class A ordinary shares is entitled to one vote per share. Each holder of our Class B ordinary shares is entitled to nine votes per share. Our Class B ordinary shares are convertible at any time by the holder into Class A ordinary shares on a one-for-one |
(1) | Represents (i) 801,904,979 Class B Ordinary Share held of record by Neptune Max Holdings Limited, a British Virgin Islands company. Neptune Max Holdings Limited is 99% owned by a family trust set up by Mr. Shen and 1% owned by Mr. Shen. Mr. Shen acts as the sole director of Neptune Max Holdings Limited, and possesses the sole voting power over the shares held by Neptune Max Holdings Limited; (ii) 86,386,000 Class A Ordinary Shares held of record by Proton Fortune Holdings Limited, a British Virgin Islands company that is 98% owned by a family trust set up by Mr. Guang Yang, 1% owned by Mr. Guang Yang, and 1% owned by Mr. Shen. Mr. Shen owns 100% of the voting power of Proton Fortune Holdings Limited and acts as the sole director of Proton Fortune Holdings Limited; (iii) 73,445,939 Class A Ordinary Shares held of record by Xibo Holdings Limited, a British Virgin Islands company that is 98% owned by a family trust set up by Mr. Yao Hu, 1% owned by Mr. Yao Hu, and 1% owned by Mr. Shen. Mr. Shen owns 100% of the voting power of Xibo Holdings Limited and acts as the sole director of Xibo Holdings Limited; and (iv) 4,010 Class A Ordinary Shares directly held by Maple Ocean L.P., a British Virgin Islands limited partnership. First Principles Z Holdings Limited, a British Virgin Islands company, is the general partner of Maple Ocean L.P. Mr. Shen acts as the sole director of First Principles Z Holdings Limited. |
(2) | See Footnote (1) above. |
(3) | See Footnote (1) above. Represents the Class A ordinary shares Mr. Hu has the right to acquire within 60 days through the exercise of options. |
(4) | Represents (i) 805,085,007 Class A ordinary shares directly held by Image Frame Investment (HK) Limited, a company incorporated in Hong Kong, and (ii) 25,000,000 Class A ordinary shares represented by 2,500,000 ADSs, directly held by Tencent Mobility Limited, a company incorporated in Hong Kong. Information regarding beneficial ownership is reported as of May 6, 2021. Image Frame Investment (HK) Limited and Tencent Mobility Limited are investing entities wholly owned by Tencent Holdings Limited. Tencent Holdings Limited is a limited liability company incorporated in the Cayman Islands and is listed on the Hong Kong Stock Exchange. The registered address of Image Frame Investment (HK) Limited, Tencent Mobility Limited and Tencent Holdings Limited is 29/F, Three Pacific Place, No. 1 Queen’s Road East, Wanchai, Hong Kong. |
(5) | Represents (i) 434,235,258 Class A ordinary shares directly held by Harmonious Ocean Limited, an exempted company with limited liability incorporated under the laws of the Cayman Islands, and (ii) 36,500,000 Class A ordinary shares represented by 3,650,000 ADSs, directly held by Boyu Capital Opportunities Master Fund. Boyu Capital Fund IV, L.P., a limited partnership organized under the laws of the Cayman Islands, holds 100% of the outstanding shares of Harmonious Ocean Limited. Boyu Capital General Partner IV, Ltd., an exempted company incorporated under the laws of the Cayman Islands, is the general partner of Boyu Capital Fund IV, L.P. Boyu Capital Group Holdings Ltd., an exempted company incorporated under the laws of the Cayman Islands, holds 100% of the outstanding shares of Boyu Capital General Partner IV, Ltd. XYXY Holdings Ltd., a company incorporated in the British Virgin Islands, is the controlling shareholder of Boyu Capital Group Holdings Ltd. Mr. Xiaomeng Tong holds 100% of the outstanding shares in XYXY Holdings Ltd. The registered office of Harmonious Ocean Limited is do Maples Corporate Services Limited, PO Box 309 Ugland House, Grand Cayman, KY1-1104, Cayman Islands. |
(6) | Represents (i) 118,230,053 Class A ordinary shares directly held by Gaorong Technology Consulting Limited, a company limited by shares incorporated under the laws of the British Virgin Islands, (ii) 86,052,718 Class A ordinary shares directly held by Gaorong Group Holdings Limited, a company limited by shares incorporated under the laws of the British Virgin Islands, (iii) 31,880,733 Class A ordinary shares directly held by Banyan Partners Fund III, L.P., an exempted partnership with limited liability formed under the laws of the Cayman Islands, and (iv) 2,039,576 Class A ordinary shares held by Banyan Partners Fund III-A, L.P., an exempted partnership with limited liability formed under the laws of the Cayman Islands. Information regarding beneficial ownership is reported as of December 31, 2021, based on the information contained in the Schedule 13G jointly filed by Gaorong Technology Consulting Limited and others with SEC on February 11, 2022. |
(7) | Represents 206,362,384 Class A ordinary shares directly held by Swiss Re Principal Investments Company Asia Pte. Ltd., a corporation incorporated under the laws of Singapore. Information regarding beneficial ownership is reported as of December 31, 2021, based on the information contained in the Schedule 13G jointly filed by Swiss Re Ltd and others with SEC on January 28, 2022. Swiss Re Principal Investments Company Asia Pte. Ltd. is an investment entity indirectly wholly owned by Swiss Re Ltd, a company limited by shares with its registered office in Zurich, Switzerland, with its shares listed on the SIX Swiss Exchange and trading under the symbol SREN. |
Item 8. |
Financial Information |
Item 9. |
The Offer and Listing |
Item 10. |
Additional Information |
• | the instrument of transfer is lodged with us, accompanied by the certificate for the ordinary shares to which it relates and such other evidence as our board of directors may reasonably require to show the right of the transferor to make the transfer; |
• | the instrument of transfer is in respect of only one class of ordinary shares; |
• | the instrument of transfer is properly stamped, if required; |
• | in the case of a transfer to joint holders, the number of joint holders to whom the ordinary share is to be transferred does not exceed four; and |
• | a fee of such maximum sum as the New York Stock Exchange may determine to be payable or such lesser sum as our directors may from time to time require is paid to us in respect thereof. |
• | the designation of the series; |
• | the number of shares of the series; |
• | the dividend rights, dividend rates, conversion rights, voting rights; and |
• | the rights and terms of redemption and liquidation preferences. |
• | authorize our board of directors to issue preferred shares in one or more series and to designate the price, rights, preferences, privileges and restrictions of such preferred shares without any further vote or action by our shareholders; and |
• | limit the ability of shareholders to requisition and convene general meetings of shareholders. |
• | does not have to file an annual return of its shareholders with the Registrar of Companies; |
• | is not required to open its register of members for inspection; |
• | does not have to hold an annual general meeting; |
• | may obtain an undertaking against the imposition of any future taxation (such undertakings are usually given for 20 years in the first instance); |
• | may register by way of continuation in another jurisdiction and be deregistered in the Cayman Islands; |
• | may register as a limited duration company; and may register as a segregated portfolio company. |
• | the statutory provisions as to the required majority vote have been met; |
• | the shareholders have been fairly represented at the meeting in question and the statutory majority are acting bona fide without coercion of the minority to promote interests adverse to those of the class; |
• | the arrangement is such that may be reasonably approved by an intelligent and honest man of that class acting in respect of his interest; and the arrangement is not one that would more properly be sanctioned under some other provision of the Companies Act. |
• | a company acts or proposes to act illegally or ultra vires (and is therefore incapable of ratification by the shareholder); |
• | the act complained of, although not ultra vires, could only be effected duly if authorized by more than a simple majority vote that has not been obtained; and those who control the company are perpetrating a “fraud on the minority.” |
• | banks and other financial institutions; |
• | insurance companies; |
• | pension plans; |
• | cooperatives; |
• | regulated investment companies; |
• | real estate investment trusts; |
• | broker-dealers; |
• | traders that elect to use a mark-to-market |
• | certain former U.S. citizens or long-term residents; |
• | tax-exempt entities (including private foundations); |
• | holders who acquire their ADSs or ordinary shares pursuant to any employee share option or otherwise as compensation; |
• | investors that will hold their ADSs or ordinary shares as part of a straddle, hedge, conversion, constructive sale or other integrated transaction for U.S. federal income tax purposes; |
• | investors that have a functional currency other than the U.S. dollar; |
• | persons holding their ADSs or ordinary shares in connection with a trade or business conducted outside the United States; |
• | persons that actually or constructively own 10% or more of our stock (by vote or value); or |
• | partnerships or other entities taxable as partnerships for U.S. federal income tax purposes, or persons holding the ADSs or ordinary shares through such entities, all of whom may be subject to tax rules that differ significantly from those discussed below. |
• | an individual who is a citizen or resident of the United States; |
• | a corporation (or other entity treated as a corporation for U.S. federal income tax purposes) created in or organized under the law of the United States or any state thereof or the District of Columbia; |
• | an estate the income of which is includible in gross income for U.S. federal income tax purposes regardless of its source; or |
• | a trust (A) the administration of which is subject to the primary supervision of a U.S. court and which has one or more U.S. persons who have the authority to control all substantial decisions of the trust or (B) that has otherwise validly elected to be treated as a U.S. person under the Code. |
• | the excess distribution or gain will be allocated ratably over the U.S. Holder’s holding period for the ADSs or ordinary shares; |
• | the amount allocated to the current taxable year and any taxable years in the U.S. Holder’s holding period prior to the first taxable year in which we are a PFIC (each, a “pre-PFIC year”) will be taxable as ordinary income; and |
• | the amount allocated to each prior taxable year, other than a pre-PFIC year, will be subject to tax at the highest tax rate in effect for individuals or corporations, as appropriate, for that year, increased by an additional tax equal to the interest on the resulting tax deemed deferred with respect to each such taxable year. |
For the Year Ended December 31, |
||||||||||||||||||||||||
2019 |
2020 |
2021 |
||||||||||||||||||||||
RMB in thousands |
% |
RMB in thousands |
% |
RMB in thousands |
% |
|||||||||||||||||||
Customer A |
667,376 | 44.2 | 602,985 | 19.9 | 240,650 | 7.5 | ||||||||||||||||||
Customer B |
331,533 | 21.9 | 753,456 | 24.9 | 457,995 | 14.3 | ||||||||||||||||||
Customer C |
52,754 | 3.5 | 335,514 | 11.1 | 367,434 | 11.5 | ||||||||||||||||||
|
|
|
|
|
|
|
|
|
|
|
|
|||||||||||||
1,051,663 | 69.6 | 1,691,955 | 55.9 | 1,066,079 | 33.3 | |||||||||||||||||||
|
|
|
|
|
|
|
|
|
|
|
|
As of December 31, |
||||||||||||||||
2020 |
2021 |
|||||||||||||||
RMB in thousands |
% |
RMB in thousands |
% |
|||||||||||||
Customer A |
258,060 | 18.6 | 134,292 | 10.9 | ||||||||||||
Customer B |
411,637 | 29.7 | 190,284 | 15.4 | ||||||||||||
Customer C |
118,887 | 8.6 | 109,676 | 8.9 | ||||||||||||
|
|
|
|
|
|
|
|
|||||||||
788,584 | 56.9 | 434,252 | 35.2 | |||||||||||||
|
|
|
|
|
|
|
|
Service |
Fees | |
Issuance of ADSs (e.g., an issuance of ADS upon a deposit of Class A ordinary shares, upon a change in the ADS(s)-to-Class |
Up to US$0.05 per ADS issued | |
Cancellation of ADSs (e.g., a cancellation of ADSs for delivery of deposited property, upon a change in the ADS(s)-to-Class |
Up to US$0.05 per ADS cancelled | |
Distribution of cash dividends or other cash distributions (e.g., upon a sale of rights and other entitlements) | Up to US$0.05 per ADS held | |
Distribution of ADSs pursuant to (i) stock dividends or other free stock distributions, or (ii) exercise of rights to purchase additional ADSs | Up to US$0.05 per ADS held | |
Distribution of securities other than ADSs or rights to purchase additional ADSs (e.g., upon a spin-off) |
Up to US$0.05 per ADS held | |
ADS Services | Up to US$0.05 per ADS held on the applicable record date(s) established by the depositary | |
Registration of ADS transfers (e.g., upon a registration of the transfer of registered ownership of ADSs, upon a transfer of ADSs into DTC and vice versa, |
Up to US$0.05 per ADS (or fraction thereof) transferred | |
Conversion of ADSs of one series for ADSs of another series (e.g., upon conversion of Partial Entitlement ADSs for Full Entitlement ADSs, or upon conversion of Restricted ADSs (each as defined in the Deposit Agreement) into freely transferable ADSs, and vice versa). | Up to US$0.05 per ADS (or fraction thereof) converted |
• | taxes (including applicable interest and penalties) and other governmental charges; |
• | the registration fees as may from time to time be in effect for the registration of Class A ordinary shares on the share register and applicable to transfers of Class A ordinary shares to or from the name of the custodian, the depositary or any nominees upon the making of deposits and withdrawals, respectively; |
• | certain cable, telex and facsimile transmission and delivery expenses; |
• | the fees, expenses, spreads, taxes and other charges of the depositary and/or service providers (which may be a division, branch or affiliate of the depositary) in the conversion of foreign currency; |
• | the reasonable and customary out-of-pocket |
• | the fees, charges, costs and expenses incurred by the depositary, the custodian, or any nominee in connection with the ADR program. |
2020 |
2021 |
|||||||||||||||
(in thousands) |
||||||||||||||||
Audit fees (1) |
US$ | 768 | US$ | 1,967 | ||||||||||||
All other fees (2) |
US$ | 27 | US$ | — |
(1) | “Audit fees” means the aggregate fees billed in each of the fiscal years listed for professional services rendered by our principal auditors for the audit of our annual financial statements and assistance with and review of documents filed with the SEC. In 2020 and 2021, the audit refers to financial audit. |
(2) | “All other fees” means the aggregate fees billed in each of the fiscal years listed for professional services rendered by our principal auditors associated with certain permitted tax services. |
Period |
(a) Total Number of ADSs Purchased |
(b) Average Price Paid per ADS (US$) |
(c) Total Number of ADSs Purchased as Part of Publicly Announced Plans or Programs |
(d) Maximum Dollar Value of ADSs that May Yet be Purchased Under the Plans or Programs (US$ in thousands) |
||||||||||||
September 1 – September 30, 2021 |
492,496 | 2.78 | 492,496 | 48,630 | ||||||||||||
October 1 – October 31, 2021 |
— | N/A | 492,496 | 48,630 | ||||||||||||
November 1 – November 30, 2021 |
— | N/A | 492,496 | 48,630 | ||||||||||||
December 1 – December 31, 2021 |
868,127 | 1.39 | 1,360,623 | 47,421 | ||||||||||||
January 1 – January 31, 2022 |
246,768 | 1.39 | 1,607,391 | 47,078 | ||||||||||||
February 1 – February 28, 2022 |
566,891 | 1.58 | 2,174,282 | 46,182 | ||||||||||||
March 1 – March 31, 2022 |
912,140 | 1.38 | 3,086,422 | 44,924 | ||||||||||||
|
|
|
|
|
|
|
|
|||||||||
Total |
3,086,422 |
1.64 |
3,086,422 |
N/A | ||||||||||||
|
|
|
|
|
|
|
|
Item 17. |
Financial Statements |
Item 18. |
Financial Statements |
Item 19. |
Exhibits |
* | Filed with this Annual Report on Form 20-F. |
** | Furnished with this Annual Report on Form 20-F. |
Waterdrop Inc. | ||||
By: | /s/ Peng Shen | |||
Name: | Peng Shen | |||
Title: | Chairman of the Board of Directors and Chief Executive Office |
PAGE | ||||
F-2 |
||||
F-3 |
||||
F-6 |
||||
F-7 |
||||
F-8 |
||||
F-10 |
||||
F-52 |
As of December 31, |
||||||||||||
2020 |
2021 |
|||||||||||
RMB |
RMB |
USD |
||||||||||
(Note 2) |
||||||||||||
Assets |
||||||||||||
Current assets |
||||||||||||
Cash and cash equivalents |
||||||||||||
Restricted cash |
||||||||||||
Short-term investments |
||||||||||||
Accounts receivable |
||||||||||||
Current contract assets |
||||||||||||
Amount due from related parties |
||||||||||||
Prepaid expense and other assets |
||||||||||||
|
|
|
|
|
|
|||||||
Total current assets |
||||||||||||
|
|
|
|
|
|
|||||||
Non-current assets |
||||||||||||
Non-current contract assets |
||||||||||||
Property, equipment and software, net |
||||||||||||
Intangible assets, net |
||||||||||||
Long-term investments |
||||||||||||
Right of use assets, net |
||||||||||||
Deferred tax assets |
— | |||||||||||
Goodwill |
||||||||||||
Total non-current assets |
||||||||||||
|
|
|
|
|
|
|||||||
Total assets |
||||||||||||
|
|
|
|
|
|
As of December 31, |
||||||||||||
2020 |
2021 |
|||||||||||
RMB |
RMB |
USD |
||||||||||
(Note 2) |
||||||||||||
Liabilities, Mezzanine Equity and Shareholders’ (Deficit)/Equity |
||||||||||||
Current liabilities |
||||||||||||
Amount due to related parties (including amounts of the consolidated VIEs and subsidiaries of VIEs without recourse to the Company of RMB |
||||||||||||
Insurance premium payables (including amounts of the consolidated VIEs and subsidiaries of VIEs without recourse to the Company of RMB respectively) |
||||||||||||
Deferred revenue (including amounts of the consolidated VIEs and subsidiaries of VIEs without recourse to the Company of RMB |
||||||||||||
Accrued expenses and other current liabilities (including amounts of the consolidated VIEs and subsidiaries of VIEs without recourse to the Company of RMB 2021, respectively) |
||||||||||||
Current lease liabilities (including amounts of the consolidated VIEs and subsidiaries of VIEs without recourse to the Company of RMB |
||||||||||||
|
|
|
|
|
|
|||||||
Total current liabilities |
||||||||||||
|
|
|
|
|
|
|||||||
Non-current liabilities |
||||||||||||
Non-current lease liabilities (including amounts of the consolidated VIEs and subsidiaries of VIEs without recourse to the Company of RMB |
||||||||||||
Deferred tax liabilities (including amounts of the consolidated VIEs and subsidiaries of VIEs without recourse to the Company of RMB |
||||||||||||
Total non-current liabilities |
||||||||||||
|
|
|
|
|
|
|||||||
Total liabilities |
||||||||||||
|
|
|
|
|
|
As of December 31, |
||||||||||||
2020 |
2021 |
|||||||||||
RMB |
RMB |
USD |
||||||||||
(Note 2) |
||||||||||||
Liabilities, Mezzanine Equity and Shareholders’ (Deficit)/Equity (Continued) |
||||||||||||
Commitments and contingencies (Note 20) |
||||||||||||
Mezzanine equity |
||||||||||||
Series Pre-A convertible redeemable preferred shares (US$ |
||||||||||||
Series A convertible redeemable preferred shares (US$ |
||||||||||||
Series A+ convertible redeemable preferred shares (US$ |
||||||||||||
Series B convertible redeemable preferred shares (US$ |
||||||||||||
Series C convertible redeemable preferred shares (US$ |
||||||||||||
Series C+ convertible redeemable preferred shares (US$ |
||||||||||||
Series C++ convertible redeemable preferred shares (US$ |
||||||||||||
Series D convertible redeemable preferred shares (US$ |
||||||||||||
|
|
|
|
|
|
|||||||
Total mezzanine equity |
||||||||||||
|
|
|
|
|
|
|
||||||
Shareholders’ (deficit)/equity |
||||||||||||
Ordinary shares (US$ issued and outstanding as of December 31, 2020; as of December 31, 2021; ordinary shares issued and outstanding as of December 31, 2021) |
||||||||||||
Additional paid-in capital |
— | |||||||||||
Accumulated other comprehensive income/(loss) |
( |
) | ( |
) | ||||||||
Accumulated deficit |
( |
) | ( |
) | ( |
) | ||||||
|
|
|
|
|
|
|||||||
Total shareholders’ (deficit)/equity |
( |
) |
||||||||||
|
|
|
|
|
|
|||||||
Total liabilities, mezzanine equity and shareholders’ (deficit)/equity |
||||||||||||
|
|
|
|
|
|
Year Ended December 31, |
||||||||||||||||
2019 |
2020 |
2021 |
||||||||||||||
RMB |
RMB |
RMB |
USD |
|||||||||||||
(Note 2) |
||||||||||||||||
Operating revenue, net |
||||||||||||||||
|
|
|
|
|
|
|
|
|||||||||
Operating costs and expenses |
||||||||||||||||
Operating costs |
( |
) | ( |
) | ( |
) | ( |
) | ||||||||
Sales and marketing expenses |
( |
) | ( |
) | ( |
) | ( |
) | ||||||||
General and administrative expenses |
( |
) | ( |
) | ( |
) | ( |
) | ||||||||
Research and development expenses |
( |
) | ( |
) | ( |
) | ( |
) | ||||||||
|
|
|
|
|
|
|
|
|||||||||
Total operating costs and expenses |
( |
) |
( |
) |
( |
) |
( |
) | ||||||||
|
|
|
|
|
|
|
|
|||||||||
Operating loss |
( |
) |
( |
) |
( |
) |
( |
) | ||||||||
|
|
|
|
|
|
|
|
|||||||||
Other income/(expenses) |
||||||||||||||||
Interest income |
||||||||||||||||
Fair value change of warrant |
— | ( |
) | — | — | |||||||||||
Foreign currency exchange gain/(loss) |
( |
) | ||||||||||||||
Others, net |
||||||||||||||||
|
|
|
|
|
|
|
|
|||||||||
Loss before income tax, and share of results of equity method investee |
( |
) |
( |
) |
( |
) |
( |
) | ||||||||
|
|
|
|
|
|
|
|
|||||||||
Income tax (expense)/bebefit |
( |
) | ( |
) | ||||||||||||
Share of results of equity method investee |
( |
) | ( |
) | — | — | ||||||||||
|
|
|
|
|
|
|
|
|||||||||
Net loss attributable to Waterdrop Inc. |
( |
) |
( |
) |
( |
) |
( |
) | ||||||||
|
|
|
|
|
|
|
|
|||||||||
Deemed dividend on modification on preferred shares |
— | ( |
) | — | — | |||||||||||
Deemed dividend upon issuance of warrants |
— | ( |
) | — | — | |||||||||||
Preferred shares redemption value accretion |
( |
) | ( |
) | ( |
) | ( |
) | ||||||||
|
|
|
|
|
|
|
|
|||||||||
Net loss attributable to ordinary shareholders |
( |
) |
( |
) |
( |
) |
( |
) | ||||||||
|
|
|
|
|
|
|
|
|||||||||
Other comprehensive income/(loss): |
||||||||||||||||
Foreign currency translation adjustment |
( |
) | ( |
) | ( |
) | ||||||||||
Unrealized gains on available for sale investments, net of tax |
||||||||||||||||
|
|
|
|
|
|
|
|
|||||||||
Total comprehensive loss |
( |
) |
( |
) |
( |
) |
( |
) | ||||||||
|
|
|
|
|
|
|
|
|||||||||
Weighted average number of ordinary shares used in computing net loss per share |
||||||||||||||||
Basic and diluted |
||||||||||||||||
Net loss per share attributable to ordinary shareholders |
||||||||||||||||
Basic and diluted |
( |
) | ( |
) | ( |
) | ( |
) |
Ordinary shares |
Treasury stock |
Additional paid-in capital |
Accumulated other comprehensive income/(loss) |
Accumulated deficit |
Total shareholders’ (deficit)/equity |
|||||||||||||||||||||||||||
Number |
Amount |
Number |
Amount |
|||||||||||||||||||||||||||||
RMB |
RMB |
RMB |
RMB |
RMB |
RMB |
|||||||||||||||||||||||||||
Balance at January 1, 2019 |
— | — | ( |
) |
( |
) |
( |
) | ||||||||||||||||||||||||
Preferred shares redemption value accretion |
— | — | — | — | ( |
) | — | ( |
) | ( |
) | |||||||||||||||||||||
Share-based payment compensation |
— | — | — | — | — | — | ||||||||||||||||||||||||||
Net loss for the year |
— | — | — | — | — | — | ( |
) | ( |
) | ||||||||||||||||||||||
Other comprehensive income |
— | — | — | — | — | — | ||||||||||||||||||||||||||
|
|
|
|
|
|
|
|
|
|
|
|
|
|
|
|
|||||||||||||||||
Balance at December 31, 2019 |
— |
— |
— |
( |
) |
( |
) | |||||||||||||||||||||||||
|
|
|
|
|
|
|
|
|
|
|
|
|
|
|
|
|||||||||||||||||
Preferred shares redemption value accretion |
— | — | — | — | ( |
) | — | ( |
) | ( |
) | |||||||||||||||||||||
Share-based payment compensation |
— | — | — | — | — | — | ||||||||||||||||||||||||||
Net loss for the year |
— | — | — | — | — | — | ( |
) | ( |
) | ||||||||||||||||||||||
Deemed dividend on modification on preferred shares (Note 16) |
— | — | — | — | — | — | ( |
) | ( |
) | ||||||||||||||||||||||
Deemed dividend upon issuance of warrants (Note 16) |
— | — | — | — | — | — | ( |
) | ( |
) | ||||||||||||||||||||||
Other comprehensive loss |
— | — | — | — | — | ( |
) | — | ( |
) | ||||||||||||||||||||||
|
|
|
|
|
|
|
|
|
|
|
|
|
|
|
|
|||||||||||||||||
Balance at December 31, 2020 |
— |
— |
— |
( |
) |
( |
) | |||||||||||||||||||||||||
Preferred shares redemption value accretion |
— | — | — | ( |
) | ( |
) | ( |
) | |||||||||||||||||||||||
Share-based payment compensation |
— | — | — | |||||||||||||||||||||||||||||
Issuance of ordinary shares, net of issuance cost of RMB (Note 15) |
— | — | — | — | ||||||||||||||||||||||||||||
Conver s ion of convertible redeemable preferred shares upon initial public offering (Note 16) |
— | — | — | — | ||||||||||||||||||||||||||||
Share repurchase |
— | — | ( |
) | — | * |
( |
) | — | — | ( |
) | ||||||||||||||||||||
Exercise of share options (Note 17) |
— | — | — | — | — | |||||||||||||||||||||||||||
Net loss for the year |
— | — | — | ( |
) | ( |
) | |||||||||||||||||||||||||
Other comprehensive loss |
— | — | — | ( |
) | ( |
) | |||||||||||||||||||||||||
|
|
|
|
|
|
|
|
|
|
|
|
|
|
|
|
|||||||||||||||||
Balance at December 31, 2021 |
( |
) |
— |
( |
) |
( |
) |
|||||||||||||||||||||||||
|
|
|
|
|
|
|
|
|
|
|
|
|
|
|
|
* |
Less than RMB1 thousand |
Year Ended December 31, |
||||||||||||||||
2019 |
2020 |
2021 |
||||||||||||||
RMB |
RMB |
RMB |
USD |
|||||||||||||
(Note 2) |
||||||||||||||||
Cash flows from operating activities: |
||||||||||||||||
Net loss |
( |
) | ( |
) | ( |
) | ( |
) | ||||||||
Adjustments to reconcile net loss to net cash used in operating activities: |
||||||||||||||||
Depreciation of property, equipment and software |
||||||||||||||||
Amortization of intangible assets |
— | |||||||||||||||
Fair value change of warrant |
— | — | — | |||||||||||||
Share of results of equity method investee |
— | — | ||||||||||||||
Share-based compensation expense |
||||||||||||||||
Loss from disposal of property and equipment |
||||||||||||||||
(Gain)/loss from disposals of subsidiaries |
— | ( |
) | |||||||||||||
Impairment loss |
— | — | ||||||||||||||
Changes in operating assets and liabilities: |
||||||||||||||||
Accounts receivable |
( |
) | ( |
) | ( |
) | ( |
) | ||||||||
Contract assets |
( |
) | ( |
) | ||||||||||||
Prepaid expense and other assets |
( |
) | ( |
) | ||||||||||||
Amount due from/to related party |
||||||||||||||||
Deferred revenue |
( |
) | ( |
) | ( |
) | ||||||||||
Insurance premium payables |
||||||||||||||||
Deferred tax assets |
— | — | ( |
) | ( |
) | ||||||||||
Deferred tax liabilities |
( |
) | ( |
) | ||||||||||||
Accrued expenses and other current liabilities |
( |
) | ( |
) | ||||||||||||
Right of use assets, net |
( |
) | ( |
) | ||||||||||||
Operating lease liabilities |
( |
) | ( |
) | ||||||||||||
|
|
|
|
|
|
|
|
|||||||||
Net cash used in operating activities |
( |
) |
( |
) |
( |
) |
( |
) | ||||||||
|
|
|
|
|
|
|
|
|||||||||
Cash flows from investing activities: |
||||||||||||||||
Purchase of property, equipment and software. |
( |
) | ( |
) | ( |
) | ( |
) | ||||||||
Disposal of property, equipment and software |
— | — | ||||||||||||||
Purchase of intangible assets |
— | — | ( |
) | ( |
) | ||||||||||
Purchase of short-term investments |
( |
) | ( |
) | ( |
) | ( |
) | ||||||||
Proceeds from maturity of short-term investments |
||||||||||||||||
Purchase of long-term investments |
( |
) | — | ( |
) | ( |
) | |||||||||
Acquisitions of subsidiaries, net of cash acquired |
( |
) | ( |
) | ||||||||||||
Disposal of subsidiaries, net of cash disposed |
— | — | — | |||||||||||||
Loans to related parties |
( |
) | ( |
) | — | — | ||||||||||
Repayment of loans to related parties |
— | — | ||||||||||||||
|
|
|
|
|
|
|
|
|||||||||
Net cash used in investing activities |
( |
) |
( |
) |
( |
) |
( |
) | ||||||||
|
|
|
|
|
|
|
|
Year Ended December 31, |
||||||||||||||||
2019 |
2020 |
2021 |
||||||||||||||
RMB |
RMB |
RMB |
USD |
|||||||||||||
(Note 2) |
||||||||||||||||
Cash flows from financing activities: |
||||||||||||||||
Proceeds from issuance of convertible redeemable preferred shares, net |
— | — | ||||||||||||||
Proceeds from initial public offering, net of offering cost |
— | — | ||||||||||||||
Repayment of short-term borrowings |
( |
) | — | — | — | |||||||||||
Proceeds from exercise of share option |
— | |||||||||||||||
Payment for share repurchase |
— | — | ( |
) | ( |
) | ||||||||||
Principal payments under finance lease obligation |
( |
) | ( |
) | ( |
) | ( |
) | ||||||||
|
|
|
|
|
|
|
|
|
|
|
|
|
|
|
|
|
Net cash provided by financing activities |
||||||||||||||||
|
|
|
|
|
|
|
|
|||||||||
Effect of exchange rate changes on cash and cash equivalents |
( |
) | ( |
) | ( |
) | ||||||||||
|
|
|
|
|
|
|
|
|||||||||
Net increase in cash and cash equivalents and restricted cash |
||||||||||||||||
|
|
|
|
|
|
|
|
|||||||||
Total cash and cash equivalents and restricted cash at beginning of year |
||||||||||||||||
Total cash and cash equivalents and restricted cash at end of year |
||||||||||||||||
Reconciliation to amounts on consolidated balance sheets: |
||||||||||||||||
Cash and cash equivalents |
||||||||||||||||
Restricted cash |
||||||||||||||||
|
|
|
|
|
|
|
|
|
|
|
|
|
|
|
|
|
Total cash and cash equivalents and restricted cash at end of year |
||||||||||||||||
Supplemental disclosure of cash flow information |
||||||||||||||||
Cash paid for interest |
— | — | — | |||||||||||||
Cash paid for income tax |
||||||||||||||||
Supplemental disclosure of non-cash investing and financing activities |
||||||||||||||||
Accrued expenses and other current liabilities related to purchase of property and equipment |
||||||||||||||||
Accrued expenses and other current liabilities related to acquisitions of subsidiaries |
— | — | — | |||||||||||||
Issuance of preferred share upon conversion of warrant |
— | — | — |
1. |
Principal activities and reorganization |
(a) |
History and Reorganization |
1. |
Principal activities and reorganization (continued) |
(a) |
History and Reorganization (continued) |
Name of Company |
Date of Incorporation/ Establishment |
Place of Incorporation/ Establishment |
Percentage Of Direct or Indirect Economic Interest |
Principal Activities | ||||||||||
Principal Subsidiaries |
||||||||||||||
Waterdrop Group HK Limited (“Waterdrop HK”) |
||||||||||||||
Absolute Health |
Research and development service for the Group | |||||||||||||
VIEs and its principal subsidiaries |
||||||||||||||
Zongqing Xiangqian |
Operating management service for the Group | |||||||||||||
Shuidi Hubao |
Medical crowdfunding platform services | |||||||||||||
Shuidi Hulian |
||||||||||||||
Shuidi Insurance Brokerage Co., Ltd |
1 |
The business was terminated in March, 2021. |
2. |
Summary of Significant Accounting Policies |
(a) |
Basis of Presentation |
(b) |
Basis of Consolidation |
2. |
Summary of Significant Accounting Policies (continued) |
(b) |
Basis of Consolidation (continued) |
2. |
Summary of Significant Accounting Policies (continued) |
(b) |
Basis of Consolidation (continued) |
• | revoke or refuse to grant or renew the Group’s business and operating licenses; |
• | restrict or prohibit related party transactions between the wholly-owned subsidiaries of the Group and the VIEs; |
• | impose fines, confiscate income or other requirements which the Group may find difficult or impossible to comply with; |
• | require the Group to alter, discontinue or restrict its operations; |
• | restrict or prohibit the Group’s ability to finance its operations; |
• | place restrictions on the Group’s right to collect revenues; |
• | shut down the Group’s servers or blocking the Group’s app/websites; or |
• | take other regulatory or enforcement actions against the Group that could be harmful to the Group’s business. |
2. |
Summary of Significant Accounting Policies (continued) |
(b) |
Basis of Consolidation (continued) |
As of December 31, |
||||||||
2020 |
2021 |
|||||||
RMB |
RMB |
|||||||
ASSETS |
||||||||
Current assets |
||||||||
Cash and cash equivalents |
||||||||
Restricted cash |
||||||||
Short-term investments |
||||||||
Accounts receivable |
||||||||
Current contract assets |
||||||||
Other current assets |
||||||||
|
|
|
|
|||||
Total current assets |
||||||||
|
|
|
|
|||||
Non-current assets |
||||||||
Non-current contract assets |
||||||||
Intangible assets, net |
||||||||
Deferred tax assets |
— | |||||||
Other non-current assets |
||||||||
|
|
|
|
|||||
Total non-current assets |
||||||||
|
|
|
|
|||||
Total assets |
||||||||
|
|
|
|
|||||
LIABILITIES |
||||||||
Current liabilities |
||||||||
Insurance premium payables |
||||||||
Deferred revenue |
||||||||
Accrued expenses and other current liabilities |
||||||||
Current lease liabilities |
||||||||
|
|
|
|
|||||
Total current liabilities |
||||||||
|
|
|
|
|||||
Total non-current liabilities |
||||||||
|
|
|
|
|||||
Total liabilities |
||||||||
|
|
|
|
2. |
Summary of Significant Accounting Policies (continued) |
(b) |
Basis of Consolidation (continued) |
Year Ended December 31, |
||||||||||||
2019 |
2020 |
2021 |
||||||||||
RMB |
RMB |
RMB |
||||||||||
Operating revenue, net |
||||||||||||
Net income/(loss) |
( |
) | ||||||||||
Net cash used in operating activities |
( |
) | ( |
) | ( |
) | ||||||
Net cash provided by/(used in) investing activities |
( |
) | ( |
) | ||||||||
Net cash used in financing activities |
( |
) |
(c) |
Use of Estimates |
(d) |
Comprehensive Income and Foreign Currency Translation |
2. |
Summary of Significant Accounting Policies (continued) |
(d) |
Comprehensive Income and Foreign Currency Translation (continued) |
(e) |
Convenience Translation |
(f) |
Cash and Cash Equivalents |
(g) |
Restricted Cash |
(h) |
Short-term Investments |
(i) |
Accounts Receivable |
2. |
Summary of Significant Accounting Policies (continued) |
(i) |
Accounts Receivable (continued) |
(j) |
Fair Value Measurement |
• | Level 1—inputs are based upon unadjusted quoted prices for identical assets or liabilities traded in active markets. |
• | Level 2—inputs are based upon quoted prices for similar assets and liabilities in active markets, quoted prices for identical or similar assets and liabilities in markets that are not active and model-based valuation techniques for which all significant assumptions are observable in the market or can be corroborated by observable market data for substantially the full term of the assets or liabilities. |
• | Level 3—inputs are generally unobservable and typically reflect management’s estimates of assumptions that market participants would use in pricing the asset or liability. The fair value are therefore determined using model based valuation techniques that include option pricing models, discounted cash flow models, and similar techniques. |
(k) |
Financial Instruments |
2. |
Summary of Significant Accounting Policies (continued) |
(l) |
Property, Equipment and Software, Net |
Category |
Estimated useful life |
Residual value | ||||
Office furniture and equipment |
% | |||||
Computer and electronic equipment |
% | |||||
Leasehold improvements |
||||||
Software |
(m) |
Intangible Assets, Net |
(n) |
Asset Acquisition |
(o) |
Long-Term Investments |
2. |
Summary of Significant Accounting Policies (continued) |
(o) |
Long-Term Investments (continued) |
(p) |
Short-Term Borrowings |
(q) |
Insurance Premium Payables |
(r) |
Share-Based Compensation |
2. |
Summary of Significant Accounting Policies (continued) |
(r) |
Share-Based Compensation (continued) |
(s) |
Revenue recognition |
2. |
Summary of Significant Accounting Policies (continued) |
(s) |
Revenue recognition (continued) |
2. |
Summary of Significant Accounting Policies (continued) |
(s) |
Revenue recognition (continued) |
2. |
Summary of Significant Accounting Policies (continued) |
(s) |
Revenue recognition (continued) |
Year Ended December 31, |
||||||||||||
2019 |
2020 |
2021 |
||||||||||
RMB |
RMB |
RMB |
||||||||||
Operating revenue |
||||||||||||
Insurance brokerage income |
||||||||||||
Short-term insurance brokerage income |
||||||||||||
Long-term insurance brokerage income |
||||||||||||
|
|
|
|
|
|
|||||||
Subtotal |
||||||||||||
|
|
|
|
|
|
|||||||
Management fee income |
||||||||||||
Technical service income |
||||||||||||
Other revenues |
||||||||||||
|
|
|
|
|
|
|||||||
Total |
||||||||||||
|
|
|
|
|
|
2. |
Summary of Significant Accounting Policies (continued) |
(s) |
Revenue recognition (continued) |
December 31, 2020 |
December 31, 2021 |
|||||||
RMB |
RMB |
|||||||
Contract assets |
||||||||
Less: Allowance for uncollectible accounts |
||||||||
|
|
|
|
|||||
Total |
||||||||
|
|
|
|
(t) |
Operating cost |
(u) |
Sales and Marketing Expenses |
(v) |
Research and Development Expenses |
2. |
Summary of Significant Accounting Policies (continued) |
(v) |
Research and Development Expenses (continued) |
(w) |
Taxation |
(x) |
Net Loss Per Share |
(y) |
Leases |
2. |
Summary of Significant Accounting Policies (continued) |
(y) |
Leases (continued) |
(z) |
Significant Risk and Uncertainties |
Year Ended December 31, |
||||||||||||||||||||||||
2019 |
2020 |
2021 |
||||||||||||||||||||||
RMB |
% |
RMB |
% |
RMB |
% |
|||||||||||||||||||
Customer A |
||||||||||||||||||||||||
Customer B |
||||||||||||||||||||||||
Customer C |
||||||||||||||||||||||||
|
|
|
|
|
|
|
|
|
|
|
|
|||||||||||||
|
|
|
|
|
|
|
|
|
|
|
|
As of December 31, |
||||||||||||||||
2020 |
2021 |
|||||||||||||||
RMB |
% |
RMB |
% |
|||||||||||||
Customer A |
||||||||||||||||
Customer B |
||||||||||||||||
Customer C |
||||||||||||||||
|
|
|
|
|
|
|
|
|||||||||
|
|
|
|
|
|
|
|
2. |
Summary of Significant Accounting Policies (continued) |
(z) |
Significant Risk and Uncertainties (continued) |
(aa) |
Recent Accounting Pronouncements not yet adopted |
3. |
Acquisitions and disposal of subsidiary |
3. |
Acquisitions and disposal of subsidiary (continued) |
As of December 31, |
||||||||
2020 |
2021 |
|||||||
Cash |
||||||||
Intangible assets-Insurance agency licenses |
||||||||
Intangible assets- Medical institution license |
||||||||
Intangible assets- Trademark and software copyright |
||||||||
Total assets acquired |
||||||||
Deferred tax liabilities |
( |
) | ( |
) | ||||
Accrued expenses and other current liabilities |
( |
) | ||||||
Total liabilities assumed |
( |
) |
( |
) | ||||
Net assets acquired |
4. |
Short-term Investments |
As of December 31, |
||||||||
2020 |
2021 |
|||||||
RMB |
RMB |
|||||||
Held-to-maturity |
||||||||
Available-for-sale |
||||||||
Total |
||||||||
5. |
Prepaid Expense and Other Assets |
As of December 31, |
|||||||||
2020 |
2021 |
||||||||
RMB |
RMB |
||||||||
Fund receivable from external payment network providers (1) |
|||||||||
Advances to suppliers |
|||||||||
Prepayments and deposits |
|||||||||
Value-added tax recoverable |
|||||||||
Claims receivable on behalf of insurers |
|||||||||
Others |
|||||||||
Total |
|||||||||
Less: impairment provision (2) |
( |
) | |||||||
Prepaid expense and other assets, net |
|||||||||
(1) | The Group opened accounts with external online payment service providers to collect and transfer insurance premiums to insurance companies, as well as to collect donor’s donation and mutual aid funds prior to transferring them to custodian bank. The balance of funds receivable from external payment network providers mainly includes accumulated amounts of donation, mutual aid fund received at the balance sheet date, which were subsequently transferred to the Group’s bank accounts or custodian accounts if they related to donor’s donations. The balance also includes insurance premium collected by the Group on behalf of insurance companies but not yet transferred to the insurance companies deposited in accounts of external online payment service providers. The amount w settled shortly after year end. as |
(2) | Impairme A provision of RMBnt provision for the y e ars ended December 31, 2020 and 2021 re RMB respectively. 2021 . |
6. |
Fair Value of Assets and Liabilities |
December 31, 2020 |
Level 1 |
Level 2 |
Level 3 |
Balance at Fair Value |
||||||||||||
RMB |
RMB |
RMB |
RMB |
|||||||||||||
Assets |
||||||||||||||||
Available for sale investments |
||||||||||||||||
Total Assets |
||||||||||||||||
Liabilities |
||||||||||||||||
Share-based compensation liabilities |
||||||||||||||||
Total Liabilities |
||||||||||||||||
6. |
Fair Value of Assets and Liabilities (continued) |
December 31, 2021 |
Level 1 |
Level 2 |
Level 3 |
Balance at Fair Value |
||||||||||||
RMB |
RMB |
RMB |
RMB |
|||||||||||||
Assets |
||||||||||||||||
Available-for-sale investments |
||||||||||||||||
|
|
|
|
|
|
|
|
|||||||||
Total Assets |
||||||||||||||||
|
|
|
|
|
|
|
|
Share-based compensation liabilities |
||||
Balance as of December 31, 2019 |
||||
Changes in estimated fair value |
||||
Addition in share-based compensation liabilities |
||||
|
|
|||
Balance as of December 31, 2020 |
||||
|
|
|||
Changes in estimated fair value |
||||
Addition in share-based compensation liabilities |
||||
Foreign currency translation adjustment |
( |
) | ||
Reclassification of share-based compensation liabilities to equity |
( |
) | ||
|
|
|||
Balance as of December 31, 2021 |
||||
|
|
Financial instrument |
Unobservable Input |
Inputs as of December 31, 2020 | ||
Share-based compensation liabilities |
Risk free rate of interest | |||
Volatility | ||||
Dividend yield | ||||
Life of options | ||||
Fair value of underlying ordinary shares | $ |
7. |
Property, Equipment and Software, Net |
As of December 31, |
||||||||
2020 |
2021 |
|||||||
RMB |
RMB |
|||||||
Computer and electronic equipment |
||||||||
Office furniture and equipment |
||||||||
Leasehold improvements |
||||||||
Software |
||||||||
|
|
|
|
|||||
Total |
||||||||
Less: accumulated depreciation |
( |
) | ( |
) | ||||
|
|
|
|
|||||
Property, equipment and software, net |
||||||||
|
|
|
|
8. |
Intangible Assets, Net |
As of December 31, |
||||||||
2020 |
2021 |
|||||||
RMB |
RMB |
|||||||
Brokerage licenses |
||||||||
Insurance adjusting license |
||||||||
Insurance agency license |
||||||||
Trademark and software copyright |
||||||||
Medical institution license |
||||||||
|
|
|
|
|||||
Total |
||||||||
|
|
|
|
|||||
Less: Accumulated amortization |
( |
) | ( |
) | ||||
Less: Impairment |
( |
) | ||||||
|
|
|
|
|||||
Intangible assets, net |
||||||||
|
|
|
|
9. |
Long-Term Investments |
Equity securities without readily determinable fair value |
Equity Method |
Total |
||||||||||
RMB |
RMB |
RMB |
||||||||||
Balances at January 1, 2019 |
||||||||||||
Additions |
— | |||||||||||
Share of results of equity method investee |
— | ( |
) | ( |
) | |||||||
|
|
|
|
|
|
|||||||
Balances at December 31, 2019 |
||||||||||||
|
|
|
|
|
|
|||||||
Share of results of equity method investee |
— | ( |
) | ( |
) | |||||||
Disposal |
( |
) | ( |
) | ( |
) | ||||||
Foreign currency translation adjustment |
( |
) | — | ( |
) | |||||||
|
|
|
|
|
|
|||||||
Balances at December 31, 2020 |
— |
|||||||||||
|
|
|
|
|
|
|||||||
Additions |
— | |||||||||||
Impairment |
( |
) | — | ( |
) | |||||||
Foreign currency translation adjustment |
( |
) | — | ( |
) | |||||||
Balances at December 31, 2021 |
— |
10. |
Accrued Expenses and Other Current Liabilities |
As of December 31, |
||||||||
2020 |
2021 |
|||||||
RMB |
RMB |
|||||||
Accrued marketing and customer service expenses (1) |
||||||||
Payable related to mutual aid plans and medical crowdfunding (2) |
||||||||
Payroll and welfare payable |
||||||||
Tax payable |
||||||||
Payable related to services fee |
||||||||
Share-based compensation liabilities |
— | |||||||
Advance from customer (3) |
— | |||||||
Others |
||||||||
|
|
|
|
|||||
Total |
||||||||
|
|
|
|
(1) |
Amount represents the accrued channel cost and customer service expense payable to third-party companies. |
10. |
Accrued Expenses and Other Current Liabilities (continued) |
(2) |
Amount represents the fund collected through the third-party external payment network providers that have not transferred to the custodian bank and the accrued payable for medical expense and one-year health insurance related to termination of mutual aid. The accrued payable for medical expense and one-year health insurance related to termination of mutual aid as of the year ended December 31, 2020 and 2021 are RMB |
(3) |
Amount represents the membership fee received from the participants related to the upgraded mutual aid plan. The amount is refundable during the initial waiting period and recorded as advance from customers. Advance s from customers for the year ended December 31, 2021 were RMB |
11. |
Segment Information |
12. |
Employee Benefits |
13. |
Related Party Balances and Transactions |
Entity or individual name |
Relationship with the Group | |
Shen Peng | Chief Executive Officer and the Founder | |
Tencent Holdings Limited and its subsidiaries (“Tencent Group”) | Shareholder of the Group |
13. |
Related Party Balances and Transactions (continued) |
(1) | Service provided by related parties: |
Year ended December 31, |
||||||||||||
2019 |
2020 |
2021 |
||||||||||
RMB |
RMB |
RMB |
||||||||||
Marketing services from Tencent Group (1) |
||||||||||||
Payment processing fee to Tencent Group (2) |
||||||||||||
Others |
||||||||||||
|
|
|
|
|
|
|||||||
Total |
||||||||||||
|
|
|
|
|
|
(1) | The Company entered into a series of cooperation agreements with Tencent Group since 2020. The Company uses Tencent Group as its platform to provide marketing service. |
(2) | The Company entered into a series of agreements with Tencent Group in 2016. The Company uses Tenpay (from Tencent Group) as one of its payment processing platforms to collect cash from insurance policy holders, participa of its mutual aid plan, and users on its medical crowdfunding platform. Tencent Group charges service fee for each transaction processed. n ts |
(2) | Service provided to related parties: |
Year ended December 31, |
||||||||||||
2019 |
2020 |
2021 |
||||||||||
RMB |
RMB |
RMB |
||||||||||
Advertising services to Tencent Group |
||||||||||||
|
|
|
|
|
|
|||||||
Total |
||||||||||||
|
|
|
|
|
|
(3) | Amount due from related parties: |
As of December 31, |
||||||||
2020 |
2021 |
|||||||
RMB |
RMB |
|||||||
Tencent Group (1) |
||||||||
|
|
|
|
|||||
Total |
||||||||
|
|
|
|
(1) |
In addition, prepayments of RMB |
13. |
Related Party Balances and Transactions (continued) |
(4) | Amount due to related parties: |
As of December 31, |
||||||||
2020 |
2021 |
|||||||
RMB |
RMB |
|||||||
Cloud technology services from Tencent Group |
||||||||
|
|
|
|
|||||
Total |
||||||||
|
|
|
|
14. |
Income Taxes |
Year ended December 31, |
||||||||||||
2019 |
2020 |
2021 |
||||||||||
RMB |
RMB |
RMB |
||||||||||
Current income tax |
||||||||||||
Deferred income tax |
( |
) | ||||||||||
|
|
|
|
|
|
|||||||
Income tax expense/(benefit) |
( |
) | ||||||||||
|
|
|
|
|
|
14. |
Income Taxes (continued) |
For the Year ended December 31, |
||||||||||||
2019 |
2020 |
2021 |
||||||||||
RMB |
RMB |
RMB |
||||||||||
Loss before income tax |
( |
) | ( |
) | ( |
) | ||||||
Tax benefit at EIT tax rate of (1) |
( |
) | ( |
) | ( |
) | ||||||
Expenses not deductible for tax purposes |
||||||||||||
Research and development super deduction |
( |
) | ( |
) | ( |
) | ||||||
Effect of different tax rates of subsidiaries operating in other jurisdictions |
||||||||||||
Effect of PRC preferential tax rates |
||||||||||||
Changes in valuation allowance |
||||||||||||
|
|
|
|
|
|
|||||||
Income tax expense/(benefit) |
( |
) | ||||||||||
|
|
|
|
|
|
(1) | The Group’s major operations during the years ended December 31, 2019, 2020 and 2021 were conducted in PRC, and thus all losses were attributable to the Group’s operations in the PRC (or foreign operation). Accordingly, the Group prepared its tax rate reconciliation starting with the PRC statutory tax rate during the years ended December 31, 2019, 2020 and 2021. |
As of December 31, |
||||||||
2020 |
2021 |
|||||||
RMB |
RMB |
|||||||
Deferred tax assets |
||||||||
Deductible advertising expenses exceeding the tax limit (2) |
||||||||
Accrued expenses |
||||||||
Other deductible expenses exceeding the tax limit (2) |
||||||||
Provisions for the prepayments and other non-current assets |
— | |||||||
Operating loss carry forward |
||||||||
Less: valuation allowances |
( |
) | ( |
) | ||||
|
|
|
|
|||||
Total deferred tax assets |
||||||||
|
|
|
|
|||||
Deferred tax liabilities |
||||||||
Intangible assets |
||||||||
Contract assets |
||||||||
Advance from customer |
||||||||
|
|
|
|
|||||
Total deferred tax liabilities |
||||||||
|
|
|
|
As of December 31, |
||||||||
2020 |
2021 |
|||||||
RMB |
RMB |
|||||||
Classification in the consolidated balance sheets: |
||||||||
Deferred tax assets |
— | |||||||
Deferred tax liabilities |
14. |
Income Taxes (continued) |
As of December 31, |
||||||||
2020 |
2021 |
|||||||
RMB |
RMB |
|||||||
Balance at the beginning of the year |
||||||||
Additions |
||||||||
Reversals |
( |
) | ( |
) | ||||
|
|
|
|
|||||
Balance at end of the year |
||||||||
|
|
|
|
(2) | Deferred income tax assets are recognized for advertising expenses and other deductible expenses that exceeds the tax deduction limit in a particular tax year to the extent that the realization of the related tax benefits through future taxable income is probable. Advertising expenses carry-forwards are permanently available for use by the Group. Other deductible expenses (mainly charitable donations) carry forwards generally expire within 3 years. |
14. |
Income Taxes (continued) |
15. |
Ordinary Shares |
16. |
Convertible Redeemable Preferred Shares |
16. |
Convertible Redeemable Preferred Shares (continued) |
16. |
Convertible Redeemable Preferred Shares (continued) |
16. |
Convertible Redeemable Preferred Shares (continued) |
16. |
Convertible Redeemable Preferred Shares (continued) |
Series Pre-A |
Series A |
Series A+ |
Series B |
Series C |
Series C+ |
Series C++ |
Series D |
Total |
||||||||||||||||||||||||||||
RMB |
RMB |
RMB |
RMB |
RMB |
RMB |
RMB |
||||||||||||||||||||||||||||||
Balances as of January 1, 2019 |
||||||||||||||||||||||||||||||||||||
Settlement of Series B convertible redeemable preferred shares subscription receivable |
||||||||||||||||||||||||||||||||||||
Issuance of convertible redeemable preferred shares |
||||||||||||||||||||||||||||||||||||
Accretion on convertible redeemable preferred shares to redemption value |
||||||||||||||||||||||||||||||||||||
Balances as of December 31, 2019 |
||||||||||||||||||||||||||||||||||||
Issuance of convertible redeemable preferred shares |
||||||||||||||||||||||||||||||||||||
Deemed dividend on modification on preferred shares |
||||||||||||||||||||||||||||||||||||
Exercise of warrant |
||||||||||||||||||||||||||||||||||||
Accretion on convertible redeemable preferred shares to redemption value |
||||||||||||||||||||||||||||||||||||
Balances as of December 31, 2020 |
||||||||||||||||||||||||||||||||||||
Accretion on convertible redeemable preferred shares to redemption value |
||||||||||||||||||||||||||||||||||||
Converted into ordinary shares 1 |
( |
) | ( |
) | ( |
) | ( |
) | ( |
) | ( |
) | ( |
) | ( |
) | ( |
) | ||||||||||||||||||
Balances as of December 31, 2021 |
||||||||||||||||||||||||||||||||||||
1 |
Upon the completion of the initial public offering, all of the Company’s Preferred Share were converted into |
17. |
Share-Based Compensation |
17. |
Share-Based Compensation (continued) |
Number of shares |
||||
Outstanding as of December 31, 2020 |
||||
Vested |
||||
Outstanding as of December 31, 2021 |
17. |
Share-Based Compensation (continued) |
Number of Options |
Weighted Average Exercise Price |
Weighted Average remaining contractual life |
Weighted Average Grant- date Fair Value |
Aggregate Intrinsic Value |
||||||||||||||||
RMB |
RMB |
|||||||||||||||||||
Outstanding as of December 31, 2019 |
||||||||||||||||||||
Granted |
— |
— |
||||||||||||||||||
Exercised |
— |
— |
— |
— |
— |
|||||||||||||||
Forfeited |
( |
) | — | — | ||||||||||||||||
|
|
|
|
|
|
|
|
|
|
|||||||||||
Outstanding as of December 31, 2020 |
||||||||||||||||||||
|
|
|
|
|
|
|
|
|
|
|||||||||||
Granted |
— | — | ||||||||||||||||||
Exercised |
( |
) | — | — | ||||||||||||||||
Forfeited |
( |
) | — | — | ||||||||||||||||
|
|
|
|
|
|
|
|
|
|
|||||||||||
Outstanding as of December 31, 2021 |
||||||||||||||||||||
|
|
|
|
|
|
|
|
|
|
|||||||||||
Exercisable as of December 31, 2021 |
Year ended December 31 |
||||||||
2020 |
2021 |
|||||||
Risk free rate of interest |
% | % | ||||||
Volatility |
% | % | ||||||
Dividend yield |
||||||||
Exercise multiples |
||||||||
Life of options (years) |
||||||||
Fair value of underlying ordinary shares |
$ | $ |
17. |
Share-Based Compensation (continued) |
(1) | Risk free rate of interest |
(2) | Volatility |
(3) | Dividend yield |
(4) | Exercise multiples |
(5) | Fair value of underlying ordinary shares |
17. |
Share-Based Compensation (continued) |
Year ended December 31, |
||||||||
2020 |
2021 |
|||||||
RMB |
RMB |
|||||||
Sales and marketing expenses |
||||||||
General and administrative expenses |
||||||||
Research and development expenses |
||||||||
|
|
|
|
|||||
|
|
|
|
18. |
Net Loss Per Share |
Year ended December 31, |
||||||||||||
2019 |
2020 |
2021 |
||||||||||
RMB |
RMB |
RMB |
||||||||||
Numerator: |
||||||||||||
Net loss for the period attributable to Waterdrop Inc. |
( |
) | ( |
) | ( |
) | ||||||
Deemed dividend |
— | ( |
) | |||||||||
Change in redemption value in preferred shares |
( |
) | ( |
) | ( |
) | ||||||
|
|
|
|
|
|
|||||||
Net loss attributable to ordinary shareholders for computing basic and diluted net loss per ordinary shares |
( |
) | ( |
) | ( |
) | ||||||
|
|
|
|
|
|
|||||||
Denominator: |
||||||||||||
Weighted average ordinary shares outstanding used in computing basic and diluted net loss per ordinary shares |
||||||||||||
Net loss per ordinary share attributable to ordinary shareholders basic and diluted |
( |
) | ( |
) | ( |
) |
Year ended December 31, |
||||||||||||
2019 |
2020 |
2021 |
||||||||||
RMB |
RMB |
RMB |
||||||||||
Shares issuable upon exercise of share options |
||||||||||||
Shares issuable upon vesting of nonvested restricted shares |
— | |||||||||||
Shares issuable upon conversion of Series pre-A convertible preferred shares |
||||||||||||
Shares issuable upon conversion of Series A convertible preferred shares |
||||||||||||
Shares issuable upon conversion of Series A+ convertible preferred shares |
||||||||||||
Shares issuable upon conversion of Series B convertible preferred shares |
||||||||||||
Shares issuable upon conversion of Series C convertible preferred shares |
||||||||||||
Shares issuable upon conversion of Series C+ convertible preferred shares |
||||||||||||
Shares issuable upon conversion of Series C++ convertible preferred shares |
— | |||||||||||
Shares issuable upon conversion of Series D convertible preferred shares |
— |
19. |
Leases |
Year ended December 31, |
||||||||||||
2019 |
2020 |
2021 |
||||||||||
RMB |
RMB |
RMB |
||||||||||
Operating leases-Weighted average remaining lease term |
||||||||||||
Financing leases-Weighted average remaining lease term |
||||||||||||
Operating leases-Weighted average discount rate |
% | % | % | |||||||||
Financing leases-Weighted average discount rate |
% | % | % |
Year ended December 31, |
||||||||||||
2019 |
2020 |
2021 |
||||||||||
RMB |
RMB |
RMB |
||||||||||
Operating lease cost |
||||||||||||
Financing lease cost: |
||||||||||||
Amortization of right-of-use |
||||||||||||
Interest on lease liabilities |
||||||||||||
Short-term lease cost |
||||||||||||
|
|
|
|
|
|
|||||||
Total |
||||||||||||
|
|
|
|
|
|
Year ended December 31, |
||||||||||||
2019 |
2020 |
2021 |
||||||||||
RMB |
RMB |
RMB |
||||||||||
Cash paid for operating leases |
||||||||||||
Cash paid for financing leases: |
||||||||||||
Operating cash flows from finance leases |
||||||||||||
Financing cash flows from finance leases |
Year ended December 31, |
||||||||||||
2019 |
2020 |
2021 |
||||||||||
RMB |
RMB |
RMB |
||||||||||
Operating leases |
||||||||||||
Financing leases |
— |
19. |
Leases (continued) |
As of December 31, |
||||||||
2021 |
||||||||
Operating Leases |
Financing Leases |
|||||||
RMB |
RMB |
|||||||
2021 |
||||||||
2022 |
||||||||
2023 |
||||||||
2024 |
||||||||
2025 and thereafter |
||||||||
Subtotal |
||||||||
Less: imputed interest |
( |
) | ( |
) | ||||
|
|
|
|
|||||
Lease liabilities |
||||||||
|
|
|
|
20. |
Commitments and Contingencies |
21. |
Statutory Reserves and Restricted Net Asset |
21. |
Statutory Reserves and Restricted Net Asset (continued) |
As of December 31, |
||||||||||||
2020 |
2021 |
|||||||||||
RMB |
RMB |
USD |
||||||||||
(Note 2) |
||||||||||||
Assets |
||||||||||||
Current assets |
||||||||||||
Cash and cash equivalents |
||||||||||||
Short-term investments |
||||||||||||
Prepaid expense and other assets |
||||||||||||
Amount due from its subsidiaries and the consolidated VIEs |
||||||||||||
Total current assets |
||||||||||||
Non-current assets |
||||||||||||
Long-term investments |
||||||||||||
Total non-current assets |
||||||||||||
Total assets |
||||||||||||
Liabilities |
||||||||||||
Current liabilities |
||||||||||||
Accrued expenses and other current liabilities |
||||||||||||
Amount due to its subsidiaries and the consolidated VIEs |
||||||||||||
Total current liabilities |
||||||||||||
Total liabilities |
||||||||||||
Mezzanine equity |
||||||||||||
Series Pre-A convertible redeemable preferred shares (US$ |
||||||||||||
Series A convertible redeemable preferred shares (US$ |
||||||||||||
Series A+ convertible redeemable preferred shares (US$ |
||||||||||||
Series B convertible redeemable preferred shares (US$ |
||||||||||||
Series C convertible redeemable preferred shares (US$ |
||||||||||||
Series C+ convertible redeemable preferred shares (US$ |
||||||||||||
Series C++ convertible redeemable preferred shares (US$ |
||||||||||||
Series D convertible redeemable preferred shares (US$ |
||||||||||||
Total mezzanine equity |
||||||||||||
Shareholders’ (Deficit)/Equity: |
||||||||||||
Ordinary shares (US$ , and outstanding as of December 31, 2020; A ordinary shares authorize d , d , 1; ares authorize d, s B ordinary sh ares issued and ou tstanding as of December 31, 20 21) |
||||||||||||
Additional paid-in capital |
— | |||||||||||
Accumulated other comprehensive income/(loss) |
( |
) | ( |
) | ||||||||
Accumulated deficit |
( |
) | ( |
) | ( |
) | ||||||
Total shareholders’ (deficit)/equity |
( |
) |
||||||||||
Total liabilities, mezzanine equity and shareholders’ (deficit)/equity |
||||||||||||
Year ended December 31, |
||||||||||||||||
2019 |
2020 |
2021 |
||||||||||||||
RMB |
RMB |
RMB |
USD |
|||||||||||||
(Note 2) |
||||||||||||||||
Operating revenue, net |
— | — | ||||||||||||||
Operating costs and expenses |
( |
) | ( |
) | ( |
) | ( |
) | ||||||||
Interest income |
||||||||||||||||
Fair value change of warrant |
— | ( |
) | |||||||||||||
Foreign currency exchange loss |
( |
) | ( |
) | ( |
) | ( |
) | ||||||||
Income tax expense |
( |
) | ( |
) | ||||||||||||
Others, net |
— | — | ||||||||||||||
Equity in loss of subsidiaries and VIEs |
( |
) | ( |
) | ( |
) | ( |
) | ||||||||
Net loss |
( |
) |
( |
) |
( |
) |
( |
) | ||||||||
Deemed dividend on modification on preferred shares |
— | ( |
) | |||||||||||||
Deemed dividend upon issuance of warrants |
— | ( |
) | |||||||||||||
Preferred shares redemption value accretion |
( |
) | ( |
) | ( |
) | ( |
) | ||||||||
Net loss attributable to ordinary shareholders |
( |
) |
( |
) |
( |
) |
( |
) | ||||||||
Other comprehensive income/(loss) |
||||||||||||||||
Foreign currency transaction adjustments |
( |
) | ( |
) | ( |
) | ||||||||||
Unrealized gains on available-for-sale investments, net of tax |
||||||||||||||||
Total comprehensive loss |
( |
) |
( |
) |
( |
) |
( |
) | ||||||||
Year ended December 31, |
||||||||||||||||
2019 |
2020 |
2021 |
||||||||||||||
RMB |
RMB |
USD |
||||||||||||||
(Note 2) |
||||||||||||||||
Cash Flows from Operating Activities: |
( |
) |
( |
) |
||||||||||||
Cash Flows from Investing Activities: |
||||||||||||||||
Purchase of short-term investments |
— | ( |
) | ( |
) | ( |
) | |||||||||
Cash received from loan repayment |
— | |||||||||||||||
Investment in subsidiaries |
( |
) | ( |
) | ( |
) | ( |
) | ||||||||
Net cash used in investing activities |
( |
) |
( |
) |
( |
) |
( |
) | ||||||||
Cash Flows from Financing Activities: |
||||||||||||||||
Proceeds from issuance of convertible redeemable preferred shares, net |
||||||||||||||||
Proceeds from exercise of share option |
— | — | ||||||||||||||
Payment for share repurchase |
— | — | ( |
) | ( |
) | ||||||||||
Proceeds from initial public offering, net |
— | — | ||||||||||||||
Net cash provided by financing activities |
||||||||||||||||
Effect of exchange rate changes on cash and cash equivalents |
( |
) | ( |
) | ( |
) | ||||||||||
Net increase/(decrease) in cash and cash equivalents and restricted cash |
( |
) |
( |
) |
( |
) | ||||||||||
Total cash and cash equivalents and restricted cash at beginning of year |
||||||||||||||||
Total cash and cash equivalents and restricted cash at end of year |
||||||||||||||||
1. | Schedule I has been provided pursuant to the requirements of Rule 12-04(a) and 5-04(c) of Regulation S-X, which require condensed financial information as to the financial position, changes in financial position and results of operations of a parent company as of the same dates and for the same periods for which audited consolidated financial statements have been presented when the restricted net assets of consolidated subsidiaries exceed 25 percent of consolidated net assets as of the end of the most recently completed fiscal year. |
2. | The condensed financial information of Waterdrop Inc. has been prepared using the same accounting policies as set out in the accompanying consolidated financial statements except that the equity method has been used to account for investments in its subsidiaries. |
3. | Certain information and footnote disclosures normally included in financial statements prepared in accordance with U.S. GAAP have been condensed or omitted. The footnote disclosures contain supplemental information relating to the operations of the Group and, as such, these statements should be read in conjunction with the notes to the consolidated financial statements of the Group as of December 31, 2020 and 2021 and the years ended 2019, 2020 and 2021. No dividend was paid by the Group’s subsidiaries to Waterdrop Inc. in 2019, 2020 and 2021. |
4. | As of December 31, 2021, there were no material contingencies, significant provisions of long term obligations, and mandatory dividend or redemption requirements of redeemable shares or guarantees of the Group, except for those which have been separately disclosed in the Consolidated Financial Statement, if any. |