Delaware |
6282 |
86-3906032 | ||
(State or other jurisdiction of incorporation or organization) |
(Primary Standard Industrial Classification Code Number) |
(I.R.S. Employer Identification No.) |
Large accelerated filer | ☐ | Accelerated filer | ☐ | |||
☒ | Smaller reporting company | |||||
Emerging growth company |
| ||||||||
Title of Each Class of Securities to be Registered |
Amount to be Registered |
Proposed Maximum Offering Price per Share |
Proposed Maximum Aggregate Offering Price |
Amount of Registration Fee | ||||
Class A common stock, par value $0.0001 per share |
2,500,000 (1) |
$15.645 (2) |
$39,112,500.00 (2) |
$3,625.73(3) | ||||
| ||||||||
|
(1) |
Pursuant to Rule 416(a) under the Securities Act of 1933, as amended, this Registration Statement also covers such additional shares of Class A common stock as may be issued to prevent dilution of the shares of Class A common stock covered hereby resulting from stock splits, stock dividends, or similar transactions. |
(2) |
Estimated solely for purposes of determining the registration fee. This amount was calculated in accordance with Rule 457(c) of the Securities Act and based on the average high and low sale prices of the registrant’s common shares of beneficial interest as reported on the New York Stock Exchange on September 29, 2021. |
(3) |
The registration fee has been calculated in accordance with Rule 457(o) under the Securities Act of 1933, as amended. Pursuant to Rule 457(p) of the rules and regulations under the Securities Act of 1933, as amended, the Registration Fee of $3,625.73 due for the registration of the securities to be registered pursuant to this registration statement is offset in its entirety by the registration fee previously paid by the registrant under Registration Statement No. 333-257190, which was initially filed on June 17, 2021 and declared effective on August 2, 2021. |
Page |
||||
ii | ||||
iii | ||||
iv | ||||
v | ||||
xiii | ||||
1 | ||||
20 | ||||
21 | ||||
22 | ||||
63 | ||||
64 | ||||
74 | ||||
76 | ||||
77 | ||||
79 | ||||
86 | ||||
92 | ||||
110 | ||||
132 | ||||
154 | ||||
161 | ||||
164 | ||||
180 | ||||
186 | ||||
194 | ||||
201 | ||||
203 | ||||
204 | ||||
F-1 |
• | “ Adjusted EBITDA non-GAAP measure, is used to assess the Company’s ability to service its borrowings. Adjusted EBITDA is derived from and reconciled to, but not equivalent to, its most directly comparable GAAP measure of net income (loss) before income taxes. Adjusted EBITDA represents Distributable Earnings plus (a) interest expense, (b) income tax expense (benefits), and (c) depreciation and amortization. |
• | “ Adjusted Revenues non-GAAP measure, is used to assess the net revenue expected to be received by the Company. Adjusted Revenues are derived from and reconciled to, but not equivalent to its most directly comparable GAAP measure of total revenues, net. Adjusted Revenues differ from total revenues computed in accordance with GAAP as it excludes reimbursed expenses and dealer manager revenues, if applicable, that have an offsetting amount included within expenses on the consolidated and combined statement of operations. |
• | “ Adjusted Compensation non-GAAP measure, is used to assess the net cash settled compensation to be paid by the Company. Adjusted Compensation is derived from and reconciled to, but not equivalent to its most directly comparable GAAP measure of compensation and benefits. Adjusted Compensation differs from compensation and benefits computed in accordance with GAAP as it excludes equity compensation expense and compensation and benefits reimbursed through the receipt of administrative revenues. The administrative revenues reflect allocable compensation and expenses incurred by certain professionals of the Company and reimbursed by products managed by the Company. |
• | “ Advisers Act |
• | “ Altimar |
• | “ Altimar Founders |
• | “ Altimar Sponsor |
• | “ assets under management AUM |
• | “ AUM not yet paying fees |
• | “ available capital |
• | “ BCA Business Combination Agreement |
• | “ BDC |
• | “ BDC Part I Fees |
• | “ BDC Part II Fees |
• | “ Blue Owl |
• | “ Blue Owl Carry |
• | “ Blue Owl Carry Common Units |
• | “ Blue Owl GP |
• | “ Blue Owl Holdings |
• | “ Blue Owl Holdings Common Units |
• | “ Blue Owl Operating Group |
• | “ Blue Owl Operating Partnerships |
• | “ Blue Owl Limited Partnership Agreements |
• | “ Blue Owl Securities |
• | “ Board |
• | “ Business Combination |
• | “ Business Combination Date |
• | “ Business Services Platform |
• | “ Capital Commitments |
• | “ carried interest carried interest allocations |
• | “ Class A Shares |
• | “ Class B Shares |
• | “ Class C Shares |
• | “ Class D Shares |
• | “ Class E Shares |
• | “ Class E-1 SharesClass E-1 common stock of the Company. |
• | “ Class E-2 SharesClass E-2 common stock of the Company. |
• | “ Closing |
• | “ common stock Class E-1 common stock and the Class E-2 common stock, collectively. |
• | “ Common Unit |
• | “ Company Registrant our we us |
• | “ DE non-GAAP measure, which is used to assess performance and amounts available for dividends to members. DE is derived from and reconciled to, but not equivalent to its most directly comparable GAAP measure of net income (loss) before income taxes. Distributable Earnings is FRE less current income taxes and includes (other than with respect to Owl Rock) net realized gains, realized performance income and performance related compensation. DE differs from income before taxes computed in accordance with GAAP as it adjusts for certain items that we believe are indicative of our ability to make our dividend payments. Our presentation of DE represents our operating performance, as further adjusted for performance income and performance related compensation, as applicable. Management believes that these adjustments enable investors to better understand the Company’s earnings that are available for distribution. |
• | “ DGCL |
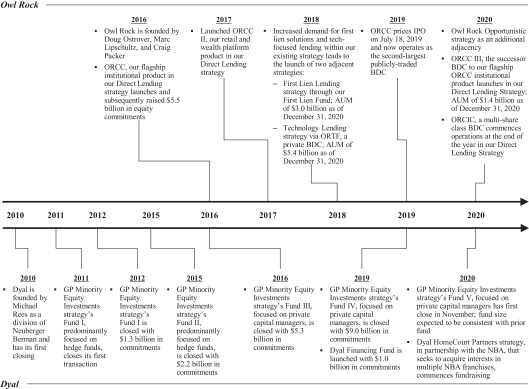
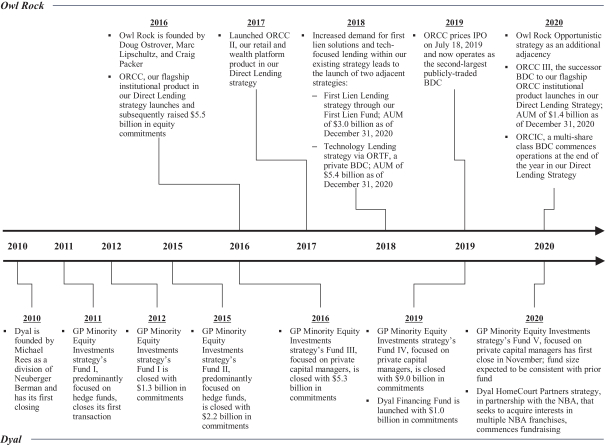
• | “Direct Lending” refers to our Direct Lending products, which offer private credit solutions to middle-market companies through four investment strategies: diversified lending, technology lending, first lien lending and opportunistic lending. Direct Lending products comprise the pre-Business combination Owl Rock business. |
• | “ dollars |
• | “ Domestication |
• | “ Dyal Dyal Capital pre-Closing reorganization, to Dyal Capital Partners and the entities and personnel comprising the Dyal business of Neuberger Berman Group LLC, and, following the Business Combination, to Dyal Capital Partners, the GP Capital Solutions product of Blue Owl. |
• | “ Dyal Equity Funds |
• | “ Dyal Equityholders |
• | “ Dyal Financing Fund |
• | “ Dyal HomeCourt Fund |
• | “ Dyal Principals |
• | “ Electing Owl Rock Equityholders |
• | “ fee paying AUM FPAUM |
• | “ fee related earnings non-GAAP measure, is used to assess our operating performance by determining whether recurring revenue, primarily consisting of management fees, is sufficient to cover operating expenses and to generate profits. FRE is derived from and reconciled to, but not equivalent to its most directly comparable GAAP measure of net income (loss) before income taxes. FRE differs from income before taxes computed in accordance with GAAP as it adjusts for transaction-related charges, equity-based compensation, non-controlling interests in subsidiaries of the Company and certain other items that we believe reflects our operating performance. Other than for Owl Rock, the calculation of FRE also adjusts for performance income, performance related compensation and investment net gains (losses). Management believes that adding these adjustments assist in clarifying stable and predictable cash flows that cover operating expenses and lead to the generation of profits. |
• | “ our funds co-managed by Blue Owl, Owl Rock or Dyal. |
• | “ FIC Assets |
• | “ FINRA |
• | “ GAAP |
• | “ GP Debt Financing strategy |
• | “ GP Minority Equity Investments strategy |
• | “ incentive fees |
• | “ Investment Company Act |
• | “ Investor Rights Agreement |
• | “ IPO |
• | “ long dated |
• | “ management fees |
• | “ NBA |
• | “ Neuberger |
• | “ NYSE |
• | “ our BDCs |
• | “ Owl Rock |
• | “ Owl Rock BDCs |
• | “ Owl Rock Capital carve-out of Owl Rock Group and its consolidated operating subsidiaries (which carve-out excludes such operating subsidiaries constituting FIC assets) after giving effect to a pre-Closing reorganization. |
• | “ Owl Rock Capital Partners |
• | “ Owl Rock Equityholders |
• | “ Owl Rock Feeder |
• | “ Owl Rock Group |
• | “ Owl Rock Principals |
• | “ partner manager |
• | “ performance income |
• | “ permanent capital lock-up periods. Such products may be required, or elect, to return all or a portion of capital gains and investment income. Permanent capital may be subject to management fee step downs or roll-offs over time. |
• | “ PIPE Investment |
• | “ PIPE Investors |
• | “ PIPE Securities |
• | “ Plan |
• | “ Plan Administrator |
• | “ portfolio companies portfolio investments |
• | “ Private Placement Warrants |
were subsequently converted into warrants to purchase Class A Shares in connection with the Business Combination. |
• | “ Public Shareholders |
• | “ Public Warrants |
• | “ reimbursed expenses |
• | “SEC” |
• | “ Securities Act |
• | “ Seller Earnout Securities |
• | “ Seller Earnout Shares E-1 common stock and Series E-2 common stock that were issued to the Owl Rock Equityholders that are not Electing Owl Rock Equityholders in connection with the Business Combination. For the avoidance of doubt, a “Seller Earnout Share” shall refer to either (i) one share of Series E-1 common stock or (ii) one share of Series E-2 common stock, as applicable. |
• | “ Seller Earnout Units E-1 Units and Series E-2 Units of each of Blue Owl Holdings and Blue Owl Carry that will be issued to the Dyal Equityholders and the Electing Owl Rock Equityholders in connection with the Business Combination in lieu of Seller Earnout Shares. |
• | “ Specified Interests |
• | “ Subscription Agreements |
• | “Tax Receivable Agreement TRA 8-K, filed with the SEC on May 21, 2021, as the same may be amended, modified, supplemented or waived from time to time in accordance with its terms. The agreement requires Blue Owl GP to pay to such members (or their owners) 85% of the amount of tax savings, if any, that the Company realizes (or is deemed to realize in certain circumstances) as a result of (i) increases in tax basis resulting from the Business Combination, (ii) certain tax attributes of the Blue Owl Operating Group (or certain corporations acquired in connection with the Business Combination) existing prior to the Business Combination, and (iii) tax benefits attributable to payments made under the TRA. |
• | “ Trust Account |
• | “ transfer agent |
• | “ UBT |
• | “ Warrant Agent |
• | “ Warrants |
• | “ Working Capital |
• | the anticipated growth rate and market opportunity of Blue Owl; |
• | various conflicts of interest that could arise among us, our funds, affiliates, investors and partner managers; |
• | our success in retaining or recruiting, or changes required in, our officers, key employees or directors; |
• | our directors and officers potentially having conflicts of interest with our business, as a result of which they would receive compensation; |
• | intense competition and competitive pressures from other companies in the industry in which we operate; |
• | factors relating to our business, operations and financial performance, including market conditions and global and economic factors beyond our control; |
• | the impact of COVID-19 and related changes in base interest rates and significant market volatility on our business, our industry and the global economy; |
• | increased costs related to being a public company; |
• | the effect of legal, tax and regulatory changes; and |
• | other factors detailed under the section entitled “ Risk Factors. |
Blue Owl AUM: $62.4 billion | ||
Direct Lending Products AUM: $31.2 billion |
GP Capital Solutions Products AUM: $31.2 billion | |
Diversified Lending Commenced 2016 AUM: $19.8 billion |
GP Minority Equity Commenced 2010 AUM: $30.0 billion | |
Technology Lending Commenced 2018 AUM: $6.2 billion |
GP Debt Financing Commenced 2019 AUM: $1.0 billion | |
First Lien Lending Commenced 2018 AUM: $3.2 billion |
Professional Sports Minority Investments Commenced 2021 AUM: $0.2 billion | |
Opportunistic Lending Commenced 2020 AUM: $1.9 billion |
Co-Investments and Structured EquityNot Yet Launched |
• | Diversified Lending: |
• | Technology Lending: |
• | First Lien Lending: |
• | Opportunistic Lending: (iv) debtor-in-possession |
• | GP Minority Equity Investments: closed-end permanent capital funds. A fundamental component of the fundraising efforts for our investment programs is the ability to identify and execute co-investment opportunities for our investors. We may offer, from time-to-time co-investment opportunities in certain fund investments, generally with no management or performance-based fee. |
• | GP Debt Financing: |
• | Professional Sports Minority Investments: pre-approved us as a prospective buyer of NBA franchises and waived both its requirement that any minority owner own a stake in a single franchise and its limitation on any team having more than 25 individual beneficial owners. The NBA has also provided pre-approval for us to own interests in multiple NBA franchises. We believe having these approvals and waivers already established will provide selling owners with more certainty of our ability to close on any investment and will make us the buyer of choice when a minority interest in an NBA franchise becomes available. Our investments in the NBA are intended to provide low correlation to other asset classes and long-term value appreciation. The first of such funds was launched in June 2021, and is currently seeking potential investments. |
• | Co-Investment and Structured Equity: mid-life investments, access to potential strategic partners for knowledge and intellectual property transfer and liquidity to |
existing fund investors. Our investment objective is to generate compelling investment returns, similar to traditional buy-out funds but with mitigated downside risk and faster return of capital. |
• | Serve as a total solution provider, allowing for a broader view of market opportunities |
• | Expansive product set provides flexibility to help meet private capital managers’ and borrowers’ needs |
• | Extensive senior-level relationships with alternative asset managers, sponsors and other direct lenders that potentially create enhanced sourcing through multiple touchpoints |
• | Scaled platform creates ability to competitively access unique opportunities in the market |
• | Large deal funnel that allows for high degree of selectivity when considering investment opportunities |
• | Relationship-oriented approach with significant involvement from founders through the investment process |
• | Strong culture of risk management founded on continuous, pro-active evaluation of portfolio positions and multiple layers of portfolio review |
• | Industry leading management team and deeply experienced team of investment professionals solely dedicated to direct lending |
• | shifting allocations by retail and institutional investors; |
• | rotation into alternatives given the search for yield and reliability of returns; |
• | rising need for private debt driven by sponsor demand; |
• | evolving landscape of the private debt market; |
• | de-leveraging of the global banking system; and |
• | increasing need for flexible capital solutions by GPs |
• | Sponsor-driven demand for debt capital |
• | Evolving financial and strategic objectives of GPs: |
commitments, new product launches, geographic expansion and opportunistic acquisitions will only amplify as the industry expands. We also believe the desire by GPs and founders to crystallize value, optimize ownership structures and create long-term employee incentive mechanisms to ensure successful succession will remain a relevant activity driver as the first generation of leaders near retirement age. |
• | Increasing Diversity within Private Debt |
• | Favorable positioning in the capital structure. sub-sector, with a risk / return of 0.43 and median net IRR of 8.9%. We believe this favorable risk / return profile of our Direct Lending business will continue to attract investors. Since our private debt strategies primarily operate in the senior secured lending space, and our target companies are in the upper middle market, we have a prime position within the capital structure of established companies. The relative seniority of our products is especially relevant, and can provide a greater degree of certainty for ROIC in periods of market turmoil. |
• | Stability of cash flows from prudently structured portfolios. GP-funded commitments. |
• | Pension plans |
• | Insurance companies Low-rate environments have pressured insurers to seek alpha generation through higher-return alternatives, in order to generate adequate yield to satisfy their asset-liability matching requirements. Alternatives have also gained favor as a way to further diversify insurance companies’ asset portfolios. |
• | Management fees are generally based upon a defined percentage of average fair value of gross assets (excluding cash) or average fair value of gross assets (excluding cash) plus undrawn commitments in the case of our BDCs, or fair value of gross assets (excluding cash), fair value of investments plus undrawn commitments, or invested capital in the case of our Private Debt funds and Managed Accounts, investment cost for our GP Debt Financing strategy, and capital committed during the |
investment period, and thereafter generally based on the cost of unrealized investments, in the case of our GP Minority Equity Investments strategy, or based upon a defined percentage of the aggregate acquisition value adjusted for the cost of investment in the case of our Dyal HomeCourt Fund. Our management fees also include BDC Part I Fees. |
• | BDC Part I Fees refers to a quarterly incentive fee on the net investment income of ORCC, ORCC II, ORTF and ORCIC (and, should such BDC become publicly listed in the future, ORCC III), subject to a fixed hurdle rate. These fees are classified as management fees as they are predictable and recurring in nature, not subject to contingent repayment, and cash-settled each quarter. |
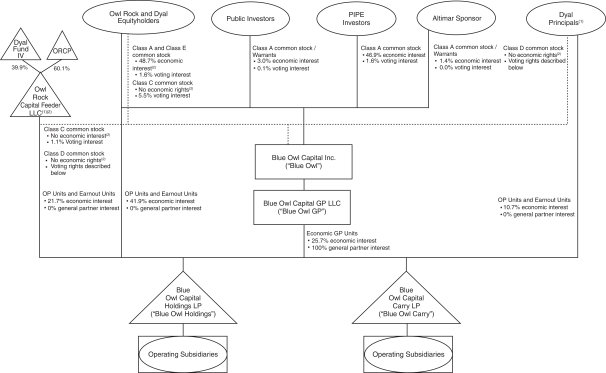
* | Economic interests and voting rights do not include Class A Shares issuable upon the exercise of warrants or shares of common stock or Common Units issuable in respect of Seller Earnout Securities, as applicable, or shares issuable in respect of the special incentive award. For further detail regarding the special incentive award, refer to “ Blue Owl’s Management’s Discussion and Analysis of Financial Condition and Results of Operations—Results of Operations—Expenses |
(1) | Owl Rock Principals and Dyal Principals collectively represent 90% of the voting interests in Blue Owl. |
(2) | Ownership percentages based on ownership of common units of Owl Rock Capital Feeder LLC. |
(3) | Class C Shares and Class D Shares represent non-economic interests in Blue Owl (other than the right to receive the par value of such shares in connection with the liquidation, dissolution or winding up of Blue Owl) and are exchangeable for Class A Shares and Class B Shares, respectively, together with an equal number of Common Units. |
Issuer |
Blue Owl Capital Inc. |
Class A Shares offered under the Plan. |
Up to 2,500,000 shares of common stock |
Use of proceeds |
To the extent that shares of common stock used to fund the Plan are purchased on the open market, there will be no proceeds to us from the purchase of those shares. The net proceeds to us from the sale of newly issued shares of common stock issued under the Plan will be used for general corporate purposes. |
Market for our shares of common stock |
Our Class A Shares are currently listed on the NYSE under the symbol “OWL.” |
Risk factors |
Any investment in the securities offered hereby is speculative and involves a high degree of risk. You should carefully consider the information set forth under “ Risk Factors |
($ amounts in thousands) |
June 30, 2021 (Unaudited) |
December 31, 2020 |
December 31, 2019 |
December 31, 2018 |
||||||||||||
Consolidated statements of financial condition data |
||||||||||||||||
Total assets |
$ | 6,872,237 | $ | 121,597 | $ | 56,718 | $ | 44,449 | ||||||||
Debt obligations, net |
683,338 | 356,386 | 287,104 | 29,676 | ||||||||||||
Total liabilities |
2,488,490 | 622,758 | 407,215 | 117,054 | ||||||||||||
Member’s deficit prior to the Business Combination |
— | (507,687 | ) | (352,756 | ) | (69,916 | ) | |||||||||
Total shareholders’ equity attributable to Blue Owl Capital Inc. |
1,099,762 | — | — | — | ||||||||||||
Non-controlling interests |
3,283,985 | 6,526 | 2,259 | |
(2,689 |
) | ||||||||||
Total shareholder’s equity (deficit) |
4,383,747 | (501,161 | ) | (350,497 | ) | (72,605 | ) |
For the Six Months Ended June 30, |
For the Years Ended December 31, |
|||||||||||||||||||
($ amounts in thousands) |
2021 |
2020 |
2020 |
2019 |
2018 |
|||||||||||||||
(Unaudited) |
||||||||||||||||||||
Consolidated statements of operations data |
||||||||||||||||||||
Total revenues, net |
$ | 287,484 | $ | 89,766 | $ | 249,815 | $ | 190,850 | $ | 121,249 | ||||||||||
Total expenses |
1,357,265 | 99,259 | 308,542 | 163,483 | 122,888 | |||||||||||||||
Other income (loss) |
(507,236 | ) | (11,880 | ) | (23,816 | ) | (6,662 | ) | (1,128 | ) | ||||||||||
|
|
|
|
|
|
|
|
|
|
|||||||||||
Net income (loss) before income taxes |
(1,577,017 | ) | (21,373 | ) | (82,543 | ) | 20,705 | (2,767 | ) | |||||||||||
Income tax (benefit) expense |
(29,011 | ) | (93 | ) | (102 | ) | 240 | (180 | ) | |||||||||||
|
|
|
|
|
|
|
|
|
|
|||||||||||
Net income (loss) including non-controlling interests |
(1,548,006 | ) | (21,280 | ) | (82,441 | ) | 20,465 | (2,587 | ) | |||||||||||
|
|
|
|
|
|
|
|
|
|
|||||||||||
Net (income) loss attributed to non-controlling interests |
1,225,076 | 1,777 | 4,610 | 2,493 | 4,635 | |||||||||||||||
|
|
|
|
|
|
|
|
|
|
|||||||||||
Net income (loss) attributable to Blue Owl Capital Inc. (after May 19, 2021)/Owl Rock Capital (prior to May 19, 2021) |
$ | (322,930 | ) | $ | (19,503 | ) | $ | (77,831 | ) | $ | 22,958 | $ | 2,048 | |||||||
|
|
|
|
|
|
|
|
|
|
• | Volatile economic and market conditions, which could cause fund investors to delay making new commitments to alternative investment funds or limit the ability of our existing funds to deploy capital; |
• | Intense competition among alternative asset managers may make fundraising and the deployment of capital more difficult, thereby limiting our ability to grow or maintain our FPAUM. Competition may be amplified by changes in fund investor allocations away from alternative asset managers; |
• | Continuation or amplification of general trends within the investment management industry towards lower fees including through direct reductions, deferrals, rebates or other means, which may also result in our competitors operating based on fee structures with which we are unable to successfully compete. |
In response to those trends, we may, in certain cases, lower the fees we charge or grant fee reductions or holidays for a period of time in order to remain competitive; |
• | A change in terms for how we assess management fees for certain of our funds or strategies; |
• | Poor performance of one or more of our funds, either relative to market benchmarks or in absolute terms (e.g., based on market value or net asset value of our BDC’s shares), or compared to our competitors may cause fund investors to regard our funds less favorably than those of our competitors, thereby adversely affecting our ability to raise new or successor funds; |
• | Our funds may engage in strategic transactions or other dispositions that reduce the cost basis upon which we charge management fees with respect to one or more of our funds. For example, a fund may sell all or a portion of its interests in portfolio companies that causes such fund’s management fee base to be reduced; and |
• | Certain of our funds contain “key person” provisions or other provisions allowing investors to take actions following certain specified events. The occurrence of one or more of those events prior to the end of a fund’s investment period could result in the termination of a fund’s investment period and a material decrease in the management fees paid by such fund or, in certain cases, cessation of the funds. |
• | A number of our competitors may have or are perceived to have more expertise or financial, technical, marketing and other resources and more personnel than we do; |
• | Some of our funds may not perform as well as competitors’ funds or other available investment products; |
• | Several of our competitors have raised significant amounts of capital, and many of them have similar investment objectives to ours, which may create additional competition for investment opportunities; |
• | Some of our competitors may have lower fees or alternative fee arrangements that potential clients of ours may find more appealing; |
• | Some of our competitors may have a lower cost of capital and access to funding sources that are not available to us, which may create competitive disadvantages for us with respect to our funds, including our funds that directly use leverage or rely on debt financing of their portfolio investments to generate superior investment returns; |
• | Some of our competitors may have higher risk tolerances, different risk assessments or lower return thresholds than us, which could allow them to consider a wider variety of investments and to bid more aggressively than us or to agree to less restrictive legal terms and protections for investments that we want to make; |
• | Some of our competitors may be subject to less regulation or conflicts of interest and, accordingly, may have more flexibility to undertake and execute certain businesses or investments than we do, bear less compliance expense than we do or be viewed differently in the marketplace; |
• | Some of our competitors may have more flexibility than us in raising and deploying certain types of funds under the investment management contracts they have negotiated with their fund investors; and |
• | Some of our competitors may offer a broader investment platform and more partnership opportunities to portfolio companies than we are able to offer. |
• | combining the leadership teams and corporate cultures of Dyal and Owl Rock; |
• | the diversion of management’s attention from ongoing business concerns and performance shortfalls at one or both of the businesses as a result of the devotion of management’s attention to the Business Combination or integration of the businesses; |
• | managing a larger combined business; |
• | maintaining employee morale and retaining key management and other employees at the combined company, including by offering sufficiently attractive terms of employment; |
• | retaining existing business and operational relationships, and attracting new business and operational relationships; |
• | the possibility of faulty assumptions underlying expectations regarding the integration process; |
• | consolidating corporate and administrative infrastructures and eliminating duplicative operations; |
• | managing expense loads and maintaining currently anticipated operating margins given that our two businesses are different in nature and therefore may require additional personnel and compensation expenses, which expenses may be borne by us, rather than our funds; |
• | difficulty replicating or replacing functions, systems and infrastructure provided by Neuberger or certain of its affiliates or the loss of benefits from Neuberger’s global contracts; and |
• | unanticipated issues in integrating information technology, communications and other systems. |
• | the required investment of capital and other resources; |
• | the diversion of management’s attention from our core businesses; |
• | the assumption of liabilities in any acquired business; |
• | the disruption of our ongoing businesses; |
• | entry into markets or lines of business in which we may have limited or no experience, and which may subject us to new laws and regulations which we are not familiar, or from which we are currently exempt; |
• | increasing demands on our operational and management systems and controls; |
• | compliance with or applicability to our businesses or our funds’ portfolio companies of regulations and laws, including, in particular, local regulations and laws (for example, consumer protection related laws) and the impact that noncompliance or even perceived noncompliance could have on us and our funds’ portfolio companies; |
• | conflicts between business lines in deal flow or objectives; |
• | we may be dependent upon, and subject to liability, losses or reputational damage relating to, systems, controls and personnel that are not under our control; |
• | potential increase in fund investor concentration; and |
• | the broadening of our geographic footprint, increasing the risks associated with conducting operations in foreign jurisdictions where we currently have little or no presence, such as different legal, tax and regulatory regimes and currency fluctuations, which require additional resources to address. |
• | maintaining adequate financial, regulatory (legal, tax and compliance) and business controls; |
• | providing current and future fund investors and shareholders with accurate and consistent reporting; |
• | implementing new or updated information and financial systems and procedures; and |
• | training, managing and appropriately sizing our work force and other components of our businesses on a timely and cost-effective basis. |
• | market conditions during previous periods may have been significantly more favorable for generating positive performance than the market conditions we may experience in the future; |
• | our funds’ rates of returns, which are calculated on the basis of net asset value of the funds’ investments, reflect unrealized gains, which may never be realized; |
• | our funds’ returns have previously benefited from investment opportunities and general market conditions that may not recur, including the availability of debt capital on attractive terms and the availability of distressed debt opportunities, and we may not be able to achieve the same returns or profitable investment opportunities or deploy capital as quickly; |
• | the historical returns that we present in this proxy statement derive largely from the performance of our earlier funds, whereas future fund returns will depend increasingly on the performance of our newer funds or funds not yet formed, which may have little or no realized investment track record; |
• | our funds’ historical investments were made over a long period of time and over the course of various market and macroeconomic cycles, and the circumstances under which our current or future funds may make future investments may differ significantly from those conditions prevailing in the past; |
• | the attractive returns of certain of our funds have been driven by the rapid return on invested capital, which has not occurred with respect to all of our funds and we believe is less likely to occur in the future; |
• | in recent years, there has been increased competition for investment opportunities resulting from the increased amount of capital invested in alternative funds and high liquidity in debt markets, and the increased competition for investments may reduce our returns in the future; and |
• | our newly established funds may generate lower returns during the period that they take to deploy their capital. |
• | a classified board of directors with three-year staggered terms, which could delay the ability of stockholders to change the membership of a majority of the Board; |
• | the ability of the Board to issue shares of preferred stock, including “blank check” preferred stock and to determine the price and other terms of those shares, including preferences and voting rights, without stockholder approval, which could be used to significantly dilute the ownership of a hostile acquirer; |
• | the limitation of the liability of, and the indemnification of, our directors and officers; |
• | the right of the Board to elect a director to fill a vacancy created by the expansion of the Board or the resignation, death or removal of a director, which prevents stockholders from being able to fill vacancies on the Board; |
• | the requirement that directors may only be removed from the Board for cause; |
• | the inability of stockholders to act by written consent following the Sunset Date; |
• | the requirement that a special meeting of stockholders may be called only by the Board, the chairman of the Board of directors or Blue Owl’s chief executive officer, which could delay the ability of stockholders to force consideration of a proposal or to take action, including the removal of directors; |
• | controlling the procedures for the conduct and scheduling of the Board and stockholder meetings; |
• | the ability of the Board of directors to amend the bylaws, which may allow the Board to take additional actions to prevent an unsolicited takeover and inhibit the ability of an acquirer to amend the bylaws to facilitate an unsolicited takeover attempt; and |
• | advance notice procedures with which stockholders must comply to nominate candidates to the Board or to propose matters to be acted upon at a stockholders’ meeting, which could preclude stockholders from bringing matters before annual or special meetings of stockholders and delay changes in the composition of the Board and also may discourage or deter a potential acquirer from conducting a solicitation of proxies to elect the acquirer’s own slate of directors or otherwise attempting to obtain control of the Company. |
• | the impact of COVID-19 pandemic on Blue Owl’s business; |
• | the inability to recognize the anticipated benefits of the Business Combination, which may be affected by, among other things, competition, Blue Owl’s inability to grow and manage growth profitably, and retain its key employees; |
• | changes in applicable laws or regulations; |
• | risks relating to the uncertainty of Blue Owl’s projected financial information; and |
• | risks related to the organic and inorganic growth of Blue Owl’s business and the timing of expected business milestones. |
• | eliminate the risk and cost of storing certificates in a secure place; |
• | eliminate the cost associated with replacing lost, stolen, or destroyed certificates; and |
• | move shares electronically to a broker or to other registered accounts. |
• | Full and Partial Dividend Reinvestment |
• | Ability to Buy Fractional Shares |
• | Price Discount |
• | Automated Transactions |
• | Safekeeping |
• | Because the prices at which shares are purchased are determined as of specified dates or as of dates otherwise beyond your control, you may lose some advantages otherwise available to you in being able to select the timing of your investments. For example, because the price charged to you for shares purchased on the open market is the average price paid by the Plan Administrator to obtain shares for all participants who acquire shares through the Plan on the same day, you may pay a higher price for shares purchased under the Plan than you would for shares purchased on the investment date outside of the Plan. |
• | You will incur transaction and trading fees (which include any applicable brokerage commissions the Plan Administrator is required to pay) when dividends are reinvested through the Plan, which will result in less than the entire amount of your dividend being reinvested to purchase our Class A Shares. |
• | We do not pay interest on funds we hold pending investment. |
• | Sales of shares for participants via batch order or market order are irrevocable and will be made at market prices at the time of sale. |
• | To sell your shares through a broker of your choice, you must first request either that (a) your broker electronically transfers your shares to the Plan Administrator or (b) the Plan Administrator electronically transfers your shares to your broker. |
• | Shares held in the Plan by the Plan Administrator are not covered by the customer protection provisions of the Securities Investor Protection Act of 1970 relating to customers of failed securities broker-dealer firms. |
• | The reinvestment option you elect will apply to all of your Class A Shares, whether held through book-entry DRS or in the Plan. |
• | Full Dividend Reinvestment |
• | Partial Dividend Reinvestment |
• | No Dividend Reinvestment |
• | Batch Order (mail) – A |
• | Market Order (online or telephone) – |
through Computershare Investor Center at www.computershare.com/investor. Market order sales are also available by calling the Plan Administrator at (866) 293-6077 and placing the sale order through the telephone interactive voice response (“IVR”) or speaking to a customer service representative. Market order sale requests received through Computershare Investor Center or by telephone will be placed promptly upon receipt during market hours (normally 9:30 a.m. to 4:00 p.m. Eastern Time). Any orders received after 4:00 p.m. Eastern Time will be placed promptly on the next day the market is open. The Plan Administrator will use commercially reasonable efforts to honor requests by participants to cancel market orders placed outside of market hours. Depending on the number of shares being sold and current trading volume in the shares, a market order may only be partially filled or not filled at all on the trading day in which it is placed, in which case the order, or remainder of the order, as applicable, will be cancelled at the end of such day. To determine if your shares were sold, you should check your account online at www.computershare.com/investor or call the Plan Administrator directly at (866) 690-7918. If your market order sale was not filled and you still want the shares to be sold, you will need to re-enter the sale request. Sales proceeds will equal the market price of the sale obtained by the Plan Administrator’s broker, less a transaction fee of $25.00, plus a trading fee of $0.12 per share* sold, and you will be responsible for paying these fees. |
• | Day Limit Order (online or telephone) – |
• | Good-‘Til – Canceled (GTC) Limit Order (online or telephone) – |
• | Internet. |
• | Written Inquiries. |
• | Telephone Inquiries. |
• | The reverse recapitalization of Owl Rock; |
• | The acquisition of Dyal; and |
• | The issuance of Altimar common stock in the PIPE Investment |
• | Owl Rock is a leading alternative asset management firm focused on providing direct lending solutions to U.S. middle market companies. Owl Rock’s breadth of lending product offerings enables us to offer a holistic platform to the middle market, which establishes Owl Rock as a partner of choice for private-equity sponsored companies as well as other businesses primarily in non-cyclical, recession-resistant businesses. Owl Rock provides these loans primarily by utilizing permanent capital vehicles funded by our high-quality, largely institutional investor base. By utilizing these permanent capital vehicles and long-duration capital funds, Owl Rock believes its business provides a high degree of earnings stability and predictability. Owl Rock investors include a diversified mix of institutional investors, including prominent domestic public and private pension funds, endowments, foundations, institutional-quality family offices, asset managers and insurance companies, as well as high net worth and retail clients, distributed through many well-known wealth management firms. |
• | Dyal is a leading capital solutions provider to large, multi-product private markets managers. Dyal acquires minority equity stakes in, or provides debt financing to, established alternative asset managers worldwide (the “GP Capital Solutions”). Dyal is expanding its existing GP Capital Solutions strategies to provide capital to its managers’ seasoned portfolio companies through co-investments or structured equity. Dyal is also in the process of leveraging its significant experience in serving as a minority partner to alternative asset management firms by launching a strategy that will seek to acquire minority equity stakes in National Basketball Association (“NBA”) teams. All of its existing or emerging strategies make or will make, as the case may be, investments through long-term capital or permanent capital vehicles with a set of geographically diverse and high-quality investors. |
• | the accompanying notes to the unaudited pro forma condensed combined financial statements; |
• | the historical financial statements of Altimar Acquisition Corporation as of, and for the fiscal year ended December 31, 2020, included or incorporated by reference in the Blue Owl Capital Inc. Current Report on Form 8-K dated May 21, 2021; |
• | The historical unaudited financial statements of Blue Owl Capital, Inc., as of, and for the six months ended June 30, 2021, included in this prospectus; |
• | the historical financial statements of Owl Rock, as of, and for the fiscal year ended December 31, 2020, included in this prospectus; |
• | the historical financial statements of Dyal, as of, and for the fiscal year ended, December 31, 2020, included in this prospectus; |
• | the historical unaudited financial statements of Dyal, as of, and for the three months ended, March 31, 2021, included in this prospectus; |
• | the sections entitled “Blue Owl’s Management’s Discussion and Analysis of Financial Condition and Results of Operations”, “Dyal’s Management’s Discussion and Analysis of Financial Condition and Results of Operations” |
• | “Owl Rock’s Management’s Discussion and Analysis of Financial Condition and Results of Operations” |
Economic Interests in Blue Owl |
Economic Interests in Blue Owl Operating Group (2) |
|||||||
% |
% |
|||||||
Altimar Public Shareholders |
2.8 | % | 0.7 | % | ||||
Sponsor and Independent Directors |
1.3 | % | 0.3 | % | ||||
PIPE Investors |
43.6 | % | 11.2 | % | ||||
Owl Rock and Dyal Equity Holders and other Owl Rock Professionals (1) |
52.3 | % | 87.7 | % | ||||
|
|
|
|
|||||
Closing Shares |
100.0 |
% |
100.0 |
% | ||||
|
|
|
|
(1) | Represents a cash settled award that converted into 9.05 million shares of Class A Shares upon Closing. Please refer to “Blue Owl Capital Inc. Notes to Consolidated and Combined Financial Statements ” included in this prospectus. |
(2) | Assumes the exchange of 100% of the Common Units that were outstanding at Closing for shares of Blue Owl common stock (inclusive of Seller Earnout Securities). Please refer to “The Business Combination Agreement—Related Agreements—Exchange Agreement” included as Annex C of the Altimar Acquisition Corporation Proxy Statement/Prospectus on Form S-4 filed on April 22, 2021. |
For the period from January 1, 2021 to May 18, 2021 |
For the Six Months Ended June 30, 2021 |
For the period from January 1, 2021 to May 18, 2021 |
For the Six Months Ended June 30, 2021 |
||||||||||||||||||||||||||||||||
Altimar Acquisition Corporation (Historical) (US GAAP) |
Blue Owl Capital Inc. (Prior to May 19, 2021, Owl Rock) (Historical) (US GAAP) |
Pro Forma Transaction Accounting Adjustments |
Pro Forma Combined Altimar and Blue Owl |
Dyal Capital Partners (Historical) (US GAAP) |
Perimeter Adjustments |
Dyal PPA Adjustments |
Dyal Pro Forma Transaction Adjustments |
Pro Forma Combined |
||||||||||||||||||||||||||||
Revenues |
||||||||||||||||||||||||||||||||||||
Management fees (includes BDC Part I fees) |
$ | — | $ | 236,848 | $ | — | $ | 236,848 | $ | 114,180 | $ | — | $ | — | $ | — | $ | 351,028 | ||||||||||||||||||
Administrative, transaction and other fees |
— | 50,636 | — | 50,636 | 9,451 | — | — | — | 60,087 | |||||||||||||||||||||||||||
|
|
|
|
|
|
|
|
|
|
|
|
|
|
|
|
|
|
|||||||||||||||||||
Total Revenues, Net |
$ |
— |
$ |
287,484 |
$ |
— |
$ |
287,484 |
$ |
123,631 |
$ |
— |
$ |
— |
$ |
— |
$ |
411,115 |
||||||||||||||||||
Expenses |
||||||||||||||||||||||||||||||||||||
Compensation and benefits |
— | 1,269,549 | (3,677 | ) (gg) |
1,265,872 | 82,938 | — | — | (1,169,798 | ) (gg) |
179,012 | |||||||||||||||||||||||||
Amortization of intangible assets |
— | 21,336 | — | 21,336 | — | — | 70,124 | (ee) |
— | 91,460 | ||||||||||||||||||||||||||
General, administrative and other expenses |
385 | 66,380 | (36,102 | ) (aa) |
30,663 | 20,422 | — | — | — | 51,085 | ||||||||||||||||||||||||||
|
|
|
|
|
|
|
|
|
|
|
|
|
|
|
|
|
|
|||||||||||||||||||
Total Expenses |
$ |
385 |
$ |
1,357,265 |
$ |
(39,779 |
) |
$ |
1,317,871 |
$ |
103,360 |
$ |
— |
$ |
70,124 |
$ |
(1,169,798 |
) |
$ |
321,557 |
||||||||||||||||
Other income (expense) |
||||||||||||||||||||||||||||||||||||
Net losses on retirement of debt |
— | (16,145 | ) | — | (16,145 | ) | — | — | — | — | (16,145 | ) | ||||||||||||||||||||||||
Interest expense |
— | (11,675 | ) | (845 | ) (ff) |
(12,520 | ) | — | — | — | — | (12,520 | ) | |||||||||||||||||||||||
Net gains (losses) on investments |
46 | — | (46 | ) (hh) |
— | 3,438 | (3,063 | ) (dd) |
— | — | 375 | |||||||||||||||||||||||||
Change in TRA liability |
— | (1,146 | ) | — | (1,146 | ) | — | — | — | — | (1,146 | ) | ||||||||||||||||||||||||
Change in warrant liability |
13,767 | (15,300 | ) | — | (1,533 | ) | — | — | — | — | (1,533 | ) | ||||||||||||||||||||||||
Change in Earnout Securities liability |
— | (462,970 | ) | — | (462,970 | ) | — | — | — | — | (462,970 | ) | ||||||||||||||||||||||||
|
|
|
|
|
|
|
|
|
|
|
|
|
|
|
|
|
|
|||||||||||||||||||
Total Other Income (Loss) |
13,813 |
(507,236 |
) |
(891 |
) |
(494,314 |
) |
3,438 |
(3,063 |
) |
— |
— |
(493,939 |
) | ||||||||||||||||||||||
|
|
|
|
|
|
|
|
|
|
|
|
|
|
|
|
|
|
|||||||||||||||||||
Income (Loss) Before Income Taxes |
$ |
13,428 |
$ |
(1,577,017 |
) |
$ |
38,888 |
$ |
(1,524,701 |
) |
$ |
23,709 |
$ |
(3,063 |
) |
$ |
(70,124 |
) |
$ |
1,169,798 |
$ |
(404,381 |
) | |||||||||||||
Income tax expense (benefit) |
— | (29,011 | ) | 5,532 | (bb) |
(23,479 | ) | 3,689 | — | — | — | (19,790 | ) | |||||||||||||||||||||||
|
|
|
|
|
|
|
|
|
|
|
|
|
|
|
|
|
|
For the period from January 1, 2021 to May 18, 2021 |
For the Six Months Ended June 30, 2021 |
For the period from January 1, 2021 to May 18, 2021 |
For the Six Months Ended June 30, 2021 |
||||||||||||||||||||||||||||||||
Altimar Acquisition Corporation (Historical) (US GAAP) |
Blue Owl Capital Inc. (Prior to May 19, 2021, Owl Rock) (Historical) (US GAAP) |
Pro Forma Transaction Accounting Adjustments |
Pro Forma Combined Altimar and Blue Owl |
Dyal Capital Partners (Historical) (US GAAP) |
Perimeter Adjustments |
Dyal PPA Adjustments |
Dyal Pro Forma Transaction Adjustments |
Pro Forma Combined |
||||||||||||||||||||||||||||
Consolidated and Combined Net Income (Loss) |
$ |
13,428 |
$ |
(1,548,006 |
) |
$ |
33,356 |
$ |
(1,501,222 |
) |
$ |
20,020 |
$ |
(3,063 |
) |
$ |
(70,124 |
) |
$ |
1,169,798 |
$ |
(384,591 |
) | |||||||||||||
Net (income) loss attributable to noncontrolling interests |
— | 1,225,076 | 51 | (bb) |
1,225,127 | (111 | ) | (208 | ) (dd) |
52,072 | (cc) |
(871,379 | ) (cc) |
280,317 | ||||||||||||||||||||||
(125,184 | ) (cc) |
(125,184 | ) | |||||||||||||||||||||||||||||||||
|
|
|
|
|
|
|
|
|
|
|
|
|
|
|
|
|
|
|||||||||||||||||||
Net Income (Loss) Attributable to Blue Owl Capital Inc. |
$ |
13,428 |
$ |
(322,930 |
) |
$ |
(91,777 |
) |
$ |
(401,279 |
) |
$ |
19,909 |
$ |
(3,271 |
) |
$ |
(18,052 |
) |
$ |
298,419 |
$ |
(104,274 |
) | ||||||||||||
|
|
|
|
|
|
|
|
|
|
|
|
|
|
|
|
|
|
|||||||||||||||||||
Pro Forma Earnings Per Share |
||||||||||||||||||||||||||||||||||||
Basic and Diluted |
$ | (0.32 | ) | |||||||||||||||||||||||||||||||||
Pro Forma Number of Shares Used in Computing EPS |
||||||||||||||||||||||||||||||||||||
Basic and Diluted (#) |
329,055,258 |
For the Year Ended December 31, 2020 |
|||||||||||||||||||||||||||||||||
Altimar Acquisition Corporation (Historical) (US GAAP) |
Blue Owl Capital Inc. (Prior to May 19, 2021, Owl Rock) (Historical) (US GAAP) |
Pro Forma Transaction Accounting Adjustments |
Pro Forma Combined Altimar and Blue Owl |
Dyal Capital Partners (Historical) (US GAAP) |
Perimeter Adjustments |
Dyal PPA Adjustments |
Dyal Pro Forma Transaction Adjustments |
Pro Forma Combined |
||||||||||||||||||||||||||||
Revenues |
||||||||||||||||||||||||||||||||||||
Management fees (includes BDC Part I fees) |
$ | — | $ | 194,906 | $ | — | $ | 194,906 | $ | 284,691 | $ | — | $ | — | $ | — | $ | 479,597 | ||||||||||||||||||
Administrative, transaction and other fees |
— | 54,909 | — | 54,909 | 25,030 | (800 | ) (dd) |
— | — | 79,139 | ||||||||||||||||||||||||||
|
|
|
|
|
|
|
|
|
|
|
|
|
|
|
|
|
|
|||||||||||||||||||
Total Revenues, Net |
$ |
— |
$ |
249,815 |
$ |
— |
$ |
249,815 |
$ |
309,721 |
$ |
(800 |
) |
$ |
— |
$ |
— |
$ |
558,736 |
|||||||||||||||||
Expenses |
||||||||||||||||||||||||||||||||||||
Compensation and benefits |
— | 240,731 | 3,677 | (gg) |
244,408 | 187,527 | (212 | ) (dd) |
— | 1,126,413 | (gg) |
1,558,136 | ||||||||||||||||||||||||
Amortization of intangible assets |
— | — | — | — | — | — | 185,473 | (ee) |
— | 185,473 | ||||||||||||||||||||||||||
General, administrative and other expenses |
300 | 67,811 | 36,102 | (aa) |
104,213 | 26,217 | — | — | — | 130,430 | ||||||||||||||||||||||||||
|
|
|
|
|
|
|
|
|
|
|
|
|
|
|
|
|
|
|||||||||||||||||||
Total Expenses |
$ |
300 |
$ |
308,542 |
$ |
39,779 |
$ |
348,621 |
$ |
213,744 |
$ |
(212 |
) |
$ |
185,473 |
$ |
1,126,413 |
$ |
1,874,039 |
|||||||||||||||||
Other income (expense) |
||||||||||||||||||||||||||||||||||||
Net losses on retirement of debt |
— | — | — | — | — | — | — | — | — | |||||||||||||||||||||||||||
Interest expense |
— | (23,816 | ) | (647 | ) (ff) |
(24,463 | ) | — | — | — | — | (24,463 | ) | |||||||||||||||||||||||
Net gains (losses) on investments |
38 | — | (38 | ) (hh) |
— | 1,542 | (1,291 | ) (dd) |
— | — | 251 | |||||||||||||||||||||||||
Change in TRA liability |
— | — | — | — | — | — | — | — | — | |||||||||||||||||||||||||||
Change in warrant liability |
(5,020 | ) | — | — | (5,020 | ) | — | — | — | — | (5,020 | ) | ||||||||||||||||||||||||
Change in Earnout Securities liability |
— | — | — | — | — | — | — | — | — | |||||||||||||||||||||||||||
|
|
|
|
|
|
|
|
|
|
|
|
|
|
|
|
|
|
|||||||||||||||||||
Total Other Income (Loss) |
(4,982 |
) |
(23,816 |
) |
(685 |
) |
(29,483 |
) |
1,542 |
(1,291 |
) |
— |
— |
(29,232 |
) | |||||||||||||||||||||
|
|
|
|
|
|
|
|
|
|
|
|
|
|
|
|
|
|
|||||||||||||||||||
Income (Loss) Before Income Taxes |
$ |
(5,282 |
) |
$ |
(82,543 |
) |
$ |
(40,464 |
) |
$ |
(128,289 |
) |
$ |
97,519 |
$ |
(1,879 |
) |
$ |
(185,473 |
) |
$ |
(1,126,413 |
) |
$ |
(1,344,535 |
) | ||||||||||
Income tax expense (benefit) |
— | (102 | ) | (24,772 | ) (bb) |
(24,874 | ) | 8,435 | — | — | — | (16,439 | ) | |||||||||||||||||||||||
|
|
|
|
|
|
|
|
|
|
|
|
|
|
|
|
|
|
|||||||||||||||||||
Consolidated and Combined Net Income (Loss) |
$ |
(5,282 |
) |
$ |
(82,441 |
) |
$ |
(15,692 |
) |
$ |
(103,415 |
) |
$ |
89,084 |
$ |
(1,879 |
) |
$ |
(185,473 |
) |
$ |
(1,126,413 |
) |
$ |
(1,328,096 |
) | ||||||||||
Net (income) loss attributable to noncontrolling interests |
— | 4,610 | (9,749 | ) (bb) |
(5,139 | ) | 548 | (761 | ) (dd) |
137,725 | (cc) |
839,163 | (cc) |
995,492 | ||||||||||||||||||||||
23,956 | (cc) |
23,956 | ||||||||||||||||||||||||||||||||||
|
|
|
|
|
|
|
|
|
|
|
|
|
|
|
|
|
|
For the Year Ended December 31, 2020 |
|||||||||||||||||||||||||||||||||
Altimar Acquisition Corporation (Historical) (US GAAP) |
Blue Owl Capital Inc. (Prior to May 19, 2021, Owl Rock) (Historical) (US GAAP) |
Pro Forma Transaction Accounting Adjustments |
Pro Forma Combined Altimar and Blue Owl |
Dyal Capital Partners (Historical) (US GAAP) |
Perimeter Adjustments |
Dyal PPA Adjustments |
Dyal Pro Forma Transaction Adjustments |
Pro Forma Combined |
||||||||||||||||||||||||||||
Net Income (Loss) Attributable to Blue Owl Capital Inc. |
$ |
(5,282 |
) |
$ |
(77,831 |
) |
$ |
(1,485 |
) |
$ |
(84,598 |
) |
$ |
89,632 |
$ |
(2,640 |
) |
$ |
(47,748 |
) |
$ |
(287,250 |
) |
$ |
(332,604 |
) | ||||||||||
|
|
|
|
|
|
|
|
|
|
|
|
|
|
|
|
|
|
|||||||||||||||||||
Pro Forma Earnings Per Share |
||||||||||||||||||||||||||||||||||||
Basic |
$ | (1.01 | ) | |||||||||||||||||||||||||||||||||
Diluted |
$ | (1.06 | ) | |||||||||||||||||||||||||||||||||
Pro Forma Number of Shares Used in Computing EPS |
||||||||||||||||||||||||||||||||||||
Basic (#) |
329,055,258 | |||||||||||||||||||||||||||||||||||
Diluted (#) |
1,252,092,338 |
• | Altimar changed its jurisdiction of incorporation by deregistering as an exempted company in the Cayman Islands and continuing and domesticating as a corporation under the laws of the State of Delaware, upon which Altimar changed its name to “Blue Owl Capital Inc.” (referred to herein as “Blue Owl”), and adopted the Blue Owl Charter and the Blue Owl Bylaws; |
• | Blue Owl’s wholly owned subsidiary, Blue Owl GP, serves as the general partner of Blue Owl Holdings and Blue Owl Carry; |
• | Blue Owl Holdings acquired (i) the Owl Rock Business and (ii) the Dyal Capital Partners division of Neuberger (i.e., Dyal) (subject to, in each case, interests representing Specified Interests, as defined in this prospectus), and Blue Owl and Blue Owl Holdings are responsible for all liabilities and obligations related to the Owl Rock Business and the Dyal Business except as specifically described herein; |
• | Blue Owl Carry acquired 15% of the carried interest, incentive fees and any other incentive-based allocations or fees (net of certain investor and third party arrangements) arising in respect of all existing and future Owl Rock and Dyal funds, except that 100% of the fees (net of certain investor and third party arrangements) from the Owl Rock BDCs are being contributed to Blue Owl Holdings as described above. Certain of these amounts acquired by Blue Owl Carry may instead be acquired and/or held by Blue Owl Holdings. Blue Owl has not acquired any portion of the carried interest attributable to the Dyal Equity Funds or any portion of the carried interest attributable to existing or future co-investments or secondary transactions related to the Dyal Equity Funds. For clarity, a secondary-transaction vehicle related to a Dyal Equity Fund includes any continuation fund or other fund whose primary purpose is to acquire directly or indirectly all or a portion of the assets of, or interests in, such fund. |
• | In exchange for the assets and businesses contributed to Blue Owl and its subsidiaries, (a) the Owl Rock Equityholders were paid an implied equity value of approximately $5,467 million (inclusive of the Owl Rock special incentive award granted on September 15, 2020 (the “Owl Rock Special Incentive Award”)), consisting of (i) $350 million of cash consideration (subject to adjustment) and (ii) the remainder in shares of Class A Shares or Common Units, as applicable, and (b) the Dyal Equityholders were paid an implied equity value of approximately $6,683 million, consisting of (i) $896 million of cash consideration (subject to adjustment) and (ii) the remainder in Common Units; |
• | Blue Owl contributed all amounts at the Closing then available in Altimar’s Trust Account (plus the proceeds of any equity financing received in connection with the PIPE Investment), net of amounts required (a) to make the cash consideration payments contemplated by the preceding bulleted item and (b) to redeem 17,838,736 shares at a redemption price of $10 per share by Altimar shareholders exercising their respective redemption rights, to Blue Owl GP, which contributed any such amounts to |
Blue Owl Holdings and Blue Owl Carry to pay the transaction expenses of Altimar, Neuberger and Owl Rock and otherwise for general corporate purposes; |
• | Blue Owl issued 100.0 million Seller Earnout Securities (in the aggregate) to the Owl Rock Equityholders and the Dyal Equityholders; |
• | Blue Owl adopted the 2021 Equity Incentive Plan (as defined within the accompanying notes to the historical unaudited financial statements of Blue Owl Capital, Inc. included in this prospectus) for itself and its subsidiaries; and |
• | Blue Owl, the Blue Owl Operating Partnerships, the Owl Rock Equityholders, the Dyal Equityholders, the Altimar Sponsor and certain other persons entered into the Related Agreement further described in the “Business Combination Agreement |
• | Altimar’s unaudited condensed statement of operations; |
• | Blue Owl’s unaudited consolidated and combined statement of operations; and |
• | Dyal’s unaudited condensed combined statement of operations. |
• | Altimar’s audited condensed statement of operations; |
• | Owl Rock’s audited consolidated and combined statement of operations; and |
• | Dyal’s audited condensed combined statement of operations. |
($ in thousands) |
Six Months Ended June 30, 2021 |
Year Ended December 31, 2020 |
||||||
Historical consolidated and combined net income (loss) before NCI |
$ | (1,514,558 | ) | $ | 1,361 | |||
Less: |
||||||||
NCI in lower tiered partnerships |
2,093 | (4,397 | ) | |||||
Tax distributions for Seller Earnout Units |
165 | — | ||||||
Plus: |
||||||||
Impact of pro forma adjustments |
1,136,344 | (1,353,582 | ) | |||||
|
|
|
|
|||||
Allocable income (loss) |
$ | (380,472 | ) | $ | (1,347,823 | ) | ||
Continuing members’ economic interest in Blue Owl Partnerships |
74.3 | % | 74.3 | % | ||||
|
|
|
|
|||||
Income (loss) allocated to non-controlling interest |
$ | (282,524 | ) | $ | (1,000,844 | ) | ||
Plus: |
||||||||
NCI in lower tiered partnerships |
2,093 | (4,397 | ) | |||||
Tax distributions for Seller Earnout Units |
165 | — | ||||||
Income tax expense adjustment |
(51 | ) | 9,749 | |||||
|
|
|
|
|||||
Total income attributable to non-controlling interest |
$ | (280,317 | ) | $ | (995,492 | ) |
Identifiable Intangible Assets |
Fair Value (in millions) |
Useful life (in years) |
Amortization Expense for the six months ended June 30, 2021 |
Amortization Expense for the year ended December 31, 2020 |
||||||||||||
Trademarks |
$ | 66.7 | 7 | $ | 4.7 | $ | 9.5 | |||||||||
Investment management agreements |
1,859.9 | 2-20 | 71.6 | 145.3 | ||||||||||||
Institutional investor relationships |
306.6 | 10 | 15.1 | 30.7 | ||||||||||||
|
|
|
|
|
|
|||||||||||
Total |
$ | 2,233.2 | $ | 91.5 | $ | 185.5 | ||||||||||
|
|
|
|
|
|
1. | Management determined that the economic shares include 320.0 million Class A Shares and 9.05 million RSUs that were fully vested as of the Closing. |
2. | The 100.0 million Seller Earnout Securities were allocated among the Stockholders, on a pro rata basis. The shares will vest in two series, Series E-1 and Series E-2 based on the vesting conditions that follow. If at any time following the Closing, the volume weighted average price (“VWAP”) of Class A Shares of Blue Owl is equal to at least $12.50 per share over any twenty (20) consecutive trading days following the Closing, the Series E-1 Shares will vest; and (ii) if the VWAP of the Class A Shares of Blue Owl is equal to at least $15.00 per share over any twenty (20) consecutive trading days following the Closing, the Series E-2 Shares will vest. The Seller Earnout Securities shall be entitled to receive, ratably with participating shares, dividends and other distributions prior to vesting, at which point they become issued common stock. For the avoidance of doubt, if the Series E-1 and Series E-2 Shares expire without vesting, the holders are not entitled to the dividends referenced above. The Series E-1 and Series E-2 Shares, which are contingently returnable, are currently excluded from the basic and diluted calculations given that the vesting conditions have not been satisfied. On July 21, 2021, Series E-1 series of Seller Earnout Securities vested as they met the vesting conditions described above. |
3. | Existing shareholders have rights to exchange the pre-existing voting units to Class A and B Shares on a one-for-one exchange basis. Upon full exchange, Class A and B Shares shall be increased by 923.0 million. |
4. | The 14.2 million of Public Warrants and Private Placement Warrants with an exercisable price at $11.50 are not converted to Class A Shares at Closing. The warrant effects are excluded from the diluted loss per share calculation, since the inclusion would be anti-dilutive for the six months ended June 30, 2021 and for the year ended December 31, 2020. |
($ in thousands, except share and per share amounts ) |
Six Months Ended June 30, 2021 |
Year Ended December 31, 2020 |
||||||
Basic and Diluted Net Income (Loss) Per Class A Share |
||||||||
Numerator |
||||||||
Net income (loss) |
$ | (384,591 | ) | $ | (1,328,096 | ) | ||
Less: Net income (loss) attributable to non-controlling interest |
(280,317 | ) | (995,492 | ) | ||||
|
|
|
|
|||||
Net income (loss) attributable to Class A common stockholders-basic |
$ | (104,274 | ) | $ | (332,604 | ) | ||
|
|
|
|
|||||
Denominator |
||||||||
Weighted-average shares of Class A common stock outstanding-basic |
329,055 | 329,055 | ||||||
Weighted-average shares of Class A common stock outstanding-diluted |
329,055 | 1,252,092 | ||||||
Basic net income (loss) per share |
$ | (0.32 | ) | $ | (1.01 | ) | ||
|
|
|
|
|||||
Diluted net income (loss) per share |
$ | (0.32 | ) | $ | (1.06 | ) | ||
|
|
|
|
Blue Owl AUM: $62.4 billion | ||
Direct Lending Products AUM: $31.2 billion |
GP Capital Solutions Products AUM: $31.2 billion | |
Diversified Lending Commenced 2016 AUM: $19.8 billion |
GP Minority Equity Commenced 2010 AUM: $30.0 billion | |
Technology Lending Commenced 2018 AUM: $6.2 billion |
GP Debt Financing Commenced 2019 AUM: $1.0 billion | |
First Lien Lending Commenced 2018 AUM: $3.2 billion |
Professional Sports Minority Investments Commenced 2021 AUM: $0.2 billion | |
Opportunistic Lending Commenced 2020 AUM: $1.9 billion |
Co-Investments and Structured EquityNot Yet Launched |
• | Diversified Lending: |
• | Technology Lending: |
sciences, healthcare, media, consumer electronics, semi-conductor, internet commerce and advertising, environmental, aerospace and defense industries and sectors. Our Technology Lending strategy is offered to investors through our technology-focused BDC. |
• | First Lien Lending: |
• | Opportunistic Lending: (iv) debtor-in-possession |
• | GP Minority Equity Investments: closed-end permanent capital funds. A fundamental component of the fundraising efforts for our investment programs is the ability to identify and execute co-investment opportunities for our investors. We may offer, from time-to-time co-investment opportunities in certain fund investments, generally with no management or performance-based fee. |
• | GP Debt Financing: |
management company in the event that certain minimum coverage ratios are not maintained. Our investment objective is to generate current income by targeting investment opportunities with attractive risk-adjusted returns. We expect that the loans will be made to allow borrowers to support business growth, fund GP commitments, and launch new strategies. The GP Debt Financing strategy allows Dyal to offer a comprehensive suite of solutions to such private capital managers. To date, certain loans to private capital managers through the GP Debt Financing Strategy have been made in combination with another Dyal fund making an equity investment in the same private capital manager. |
• | Professional Sports Minority Investments: pre-approved us as a prospective buyer of NBA franchises and waived both its requirement that any minority owner own a stake in a single franchise and its limitation on any team having more than 25 individual beneficial owners. The NBA has also provided pre-approval for us to own interests in multiple NBA franchises. We believe having these approvals and waivers already established will provide selling owners with more certainty of our ability to close on any investment and will make us the buyer of choice when a minority interest in an NBA franchise becomes available. Our investments in the NBA are intended to provide low correlation to other asset classes and long-term value appreciation. The first of such funds was launched in June 2021, and is currently seeking potential investments. |
• | Co-Investment and Structured Equity: mid-life investments, access to potential strategic partners for knowledge and intellectual property transfer and liquidity to existing fund investors. Our investment objective is to generate compelling investment returns, similar to traditional buy-out funds but with mitigated downside risk and faster return of capital. |
• | Serve as a total solution provider, allowing for a broader view of market opportunities |
• | Expansive product set provides flexibility to help meet private capital managers’ and borrowers’ needs |
• | Extensive senior-level relationships with alternative asset managers, sponsors and other direct lenders that potentially create enhanced sourcing through multiple touchpoints |
• | Scaled platform creates ability to competitively access unique opportunities in the market |
• | Large deal funnel that allows for high degree of selectivity when considering investment opportunities |
• | Relationship-oriented approach with significant involvement from founders through the investment process |
• | Strong culture of risk management founded on continuous, pro-active evaluation of portfolio positions and multiple layers of portfolio review |
• | Industry leading management team and deeply experienced team of investment professionals solely dedicated to direct lending |
• | shifting allocations by retail and institutional investors; |
• | rotation into alternatives given the search for yield and reliability of returns; |
• | rising need for private debt driven by sponsor demand; |
• | evolving landscape of the private debt market; |
• | de-leveraging of the global banking system; and |
• | increasing need for flexible capital solutions by GPs |
• | Sponsor-driven demand for debt capital |
acquisitions and leverage their equity investments with secured loans provided by our product offerings. Furthermore, we believe if strong growth in fundraising in the private equity industry continues, it will naturally drive sponsor demand for financing solutions for their equity investments. We also believe continued growth in the private equity industry will facilitate increased demand by sponsor-owned U.S. middle market companies for financing solutions as they continue to require access to debt capital for operational and financing purposes. We believe that an expanding middle-market as well as the growing capital base of the private equity industry will support the continued demand for private debt. |
• | Evolving financial and strategic objectives of GPs: |
• | Increasing Diversity within Private Debt |
• | Favorable positioning in the capital structure. sub-sector, with a risk / return of 0.43 and median net IRR of 8.9%. We believe this favorable risk / return profile of our Direct Lending business will continue to attract investors. Since our private debt strategies primarily operate in the senior secured lending space, and our target companies are in the upper middle market, we have a prime position within the capital structure of established companies. The relative seniority of our products is especially relevant, and can provide a greater degree of certainty for ROIC in periods of market turmoil. |
• | Stability of cash flows from prudently structured portfolios. GP-funded commitments. |
• | Pension plans |
• | Insurance companies Low-rate environments have pressured insurers to seek alpha generation through higher-return alternatives, in order to generate adequate yield to satisfy their asset-liability matching requirements. Alternatives have also gained favor as a way to further diversify insurance companies’ asset portfolios. |
• | Management fees are generally based upon a defined percentage of average fair value of gross assets (excluding cash) or average fair value of gross assets (excluding cash) plus undrawn commitments in |
the case of our BDCs, or fair value of gross assets (excluding cash), fair value of investments plus undrawn commitments, or invested capital in the case of our Private Debt funds and Managed Accounts, investment cost for our GP Debt Financing strategy, and capital committed during the investment period, and thereafter generally based on the cost of unrealized investments, in the case of our GP Minority Equity Investments strategy, or based upon a defined percentage of the aggregate acquisition value adjusted for the cost of investment in the case of our Dyal HomeCourt Fund. Our management fees also include BDC Part I Fees. |
• | BDC Part I Fees refers to a quarterly incentive fee on the net investment income of ORCC, ORCC II, ORTF and ORCIC (and, should such BDC become publicly listed in the future, ORCC III), subject to a fixed hurdle rate. These fees are classified as management fees as they are predictable and recurring in nature, not subject to contingent repayment, and cash-settled each quarter. |
Three Months Ended June 30, |
Six Months Ended June 30, |
|||||||||||||||
(dollars in thousands) |
2021 | 2020 | 2021 | 2020 | ||||||||||||
Net Income (Loss) Attributable to Blue Owl Capital Inc. (After May 19, 2021) / Owl Rock (Prior to May 19, 2021) |
$ | (362,344 | ) | $ | (12,443 | ) | $ | (322,930 | ) | $ | (19,503 | ) | ||||
Fee-Related Earnings(1) |
$ | 98,133 | $ | (6,504 | ) | $ | 144,481 | $ | (7,716 | ) | ||||||
Distributable Earnings(1) |
$ | 85,138 | $ | (12,492 | ) | $ | 125,390 | $ | (19,603 | ) |
(1) | For the specific components and calculations of these Non-GAAP measures, as well as a reconciliation of these measures to the most comparable measure in accordance with GAAP, see “—Non-GAAP Analysis” and “—Non-GAAP Reconciliations.” |
Blue Owl AUM: $62.4 billion | ||
Direct Lending Products AUM: $31.2 billion |
GP Capital Solutions Products AUM: $31.2 billion | |
Diversified Lending Commenced 2016 AUM: $19.8 billion |
GP Minority Equity Commenced 2010 AUM: $30.0 billion | |
Technology Lending Commenced 2018 AUM: $6.2 billion |
GP Debt Financing Commenced 2019 AUM: $1.0 billion | |
First Lien Lending Commenced 2018 AUM: $3.2 billion |
Professional Sports Minority Investments Commenced 2021 AUM: $0.2 billion | |
Opportunistic Lending Commenced 2020 AUM: $1.9 billion |
Co-Investments and Structured EquityNot Yet Launched |
Three Months Ended June 30, 2021 | Three Months Ended June 30, 2020 | |||||||||||||||||||||||||||||||||||||||
(dollars in millions) |
Diversified Lending |
Technology Lending |
First Lien Lending |
Opportunistic Lending |
Direct Lending AUM |
Diversified Lending |
Technology Lending |
First Lien Lending |
Opportunistic Lending |
Direct Lending AUM |
||||||||||||||||||||||||||||||
Beginning Balance |
$ | 17,714 | $ | 5,536 | $ | 3,147 | $ | 1,380 | $ | 27,777 | $ | 13,155 | $ | 3,754 | $ | 2,655 | $ | — | $ | 19,564 | ||||||||||||||||||||
New capital raised |
258 | 1 | — | 490 | 749 | 589 | 100 | — | — | 689 | ||||||||||||||||||||||||||||||
Change in debt |
1,763 | 572 | 69 | (2 | ) | 2,402 | 43 | 19 | (6 | ) | — | 56 | ||||||||||||||||||||||||||||
Distributions |
(146 | ) | (21 | ) | (29 | ) | — | (196 | ) | (256 | ) | (10 | ) | (10 | ) | — | (276 | ) | ||||||||||||||||||||||
Change in value |
203 | 145 | 30 | 46 | 424 | 361 | 66 | 49 | — | 476 | ||||||||||||||||||||||||||||||
|
|
|
|
|
|
|
|
|
|
|
|
|
|
|
|
|
|
|
|
|||||||||||||||||||||
Ending Balance |
$ | 19,792 | $ | 6,233 | $ | 3,217 | $ | 1,914 | $ | 31,156 | $ | 13,892 | $ | 3,929 | $ | 2,688 | $ | — | $ | 20,509 | ||||||||||||||||||||
|
|
|
|
|
|
|
|
|
|
|
|
|
|
|
|
|
|
|
|
Six Months Ended June 30, 2021 | Six Months Ended June 30, 2020 | |||||||||||||||||||||||||||||||||||||||
(dollars in millions) |
Diversified Lending |
Technology Lending |
First Lien Lending |
Opportunistic Lending |
Direct Lending AUM |
Diversified Lending |
Technology Lending |
First Lien Lending |
Opportunistic Lending |
Direct Lending AUM |
||||||||||||||||||||||||||||||
Beginning Balance |
$ | 17,234 | $ | 5,387 | $ | 3,014 | $ | 1,466 | $ | 27,101 | $ | 12,490 | $ | 3,491 | $ | 2,655 | $ | — | $ | 18,636 | ||||||||||||||||||||
New capital raised |
444 | 8 | — | 532 | 984 | 752 | 317 | — | — | 1,069 | ||||||||||||||||||||||||||||||
Change in debt |
2,008 | 662 | 194 | (133 | ) | 2,731 | 1,079 | 114 | 53 | — | 1,246 | |||||||||||||||||||||||||||||
Distributions |
(293 | ) | (36 | ) | (48 | ) | — | (377 | ) | (408 | ) | (19 | ) | (16 | ) | — | (443 | ) | ||||||||||||||||||||||
Change in value |
399 | 212 | 57 | 49 | 717 | (21 | ) | 26 | (4 | ) | — | 1 | ||||||||||||||||||||||||||||
|
|
|
|
|
|
|
|
|
|
|
|
|
|
|
|
|
|
|
|
|||||||||||||||||||||
Ending Balance |
$ | 19,792 | $ | 6,233 | $ | 3,217 | $ | 1,914 | $ | 31,156 | $ | 13,892 | $ | 3,929 | $ | 2,688 | $ | — | $ | 20,509 | ||||||||||||||||||||
|
|
|
|
|
|
|
|
|
|
|
|
|
|
|
|
|
|
|
|
Three Months Ended June 30, 2021 | Three Months Ended June 30, 2020 | |||||||||||||||||||||||||||||||||||||||
(dollars in millions) |
Diversified Lending |
Technology Lending |
First Lien Lending |
Opportunistic Lending |
Direct Lending FPAUM |
Diversified Lending |
Technology Lending |
First Lien Lending |
Opportunistic Lending |
Direct Lending FPAUM |
||||||||||||||||||||||||||||||
Beginning Balance |
$ | 14,146 | $ | 4,696 | $ | 2,386 | $ | 243 | $ | 21,471 | $ | 10,668 | $ | 3,592 | $ | 1,880 | $ | — | $ | 16,140 | ||||||||||||||||||||
New capital raised / deployed |
1,537 | 551 | 145 | 273 | 2,506 | 886 | (46 | ) | 42 | — | 882 | |||||||||||||||||||||||||||||
Distributions |
(169 | ) | (26 | ) | (15 | ) | — | (210 | ) | (170 | ) | (16 | ) | — | — | (186 | ) | |||||||||||||||||||||||
Change in value |
200 | 145 | 12 | 38 | 395 | (383 | ) | 66 | 41 | — | (276 | ) | ||||||||||||||||||||||||||||
|
|
|
|
|
|
|
|
|
|
|
|
|
|
|
|
|
|
|
|
|||||||||||||||||||||
Ending Balance |
$ | 15,714 | $ | 5,366 | $ | 2,528 | $ | 554 | $ | 24,162 | $ | 11,001 | $ | 3,596 | $ | 1,963 | $ | — | $ | 16,560 | ||||||||||||||||||||
|
|
|
|
|
|
|
|
|
|
|
|
|
|
|
|
|
|
|
|
Six Months Ended June 30, 2021 | Six Months Ended June 30, 2020 | |||||||||||||||||||||||||||||||||||||||
(dollars in millions) |
Diversified Lending |
Technology Lending |
First Lien Lending |
Opportunistic Lending |
Direct Lending FPAUM |
Diversified Lending |
Technology Lending |
First Lien Lending |
Opportunistic Lending |
Direct Lending FPAUM |
||||||||||||||||||||||||||||||
Beginning Balance |
$ | 13,536 | $ | 4,772 | $ | 2,392 | $ | 162 | $ | 20,862 | $ | 10,337 | $ | 3,228 | $ | 1,713 | $ | — | $ | 15,278 | ||||||||||||||||||||
New capital raised / deployed |
2,073 | 429 | 133 | 353 | 2,988 | 1,108 | 368 | 273 | — | 1,749 | ||||||||||||||||||||||||||||||
Distributions |
(290 | ) | (49 | ) | (20 | ) | — | (359 | ) | (424 | ) | (27 | ) | — | — | (451 | ) | |||||||||||||||||||||||
Change in value |
395 | 214 | 23 | 39 | 671 | (20 | ) | 27 | (23 | ) | — | (16 | ) | |||||||||||||||||||||||||||
|
|
|
|
|
|
|
|
|
|
|
|
|
|
|
|
|
|
|
|
|||||||||||||||||||||
Ending Balance |
$ | 15,714 | $ | 5,366 | $ | 2,528 | $ | 554 | $ | 24,162 | $ | 11,001 | $ | 3,596 | $ | 1,963 | $ | — | $ | 16,560 | ||||||||||||||||||||
|
|
|
|
|
|
|
|
|
|
|
|
|
|
|
|
|
|
|
|
Three Months Ended June 30, 2021 | Three Months Ended June 30, 2020 | |||||||||||||||||||||||||||||||||||||||
(dollars in millions) |
GP Minority Equity |
GP Debt Financing |
Professional Sports Minority Investments |
Co-Investments and Structured Equity |
GP Capital Solutions AUM |
GP Minority Equity |
GP Debt Financing |
Professional Sports Minority Investments |
Co-Investments and Structured Equity |
GP Capital Solutions AUM |
||||||||||||||||||||||||||||||
Beginning Balance |
$ | 29,176 | $ | 1,020 | $ | — | $ | — | $ | 30,196 | $ | 22,751 | $ | 1,014 | $ | — | $ | — | $ | 23,765 | ||||||||||||||||||||
New capital raised |
326 | — | 155 | — | 481 | 149 | — | — | — | 149 | ||||||||||||||||||||||||||||||
Distributions |
(130 | ) | — | — | — | (130 | ) | (586 | ) | — | — | — | (586 | ) | ||||||||||||||||||||||||||
Change in value |
663 | 1 | — | — | 664 | (264 | ) | (4 | ) | — | — | (268 | ) | |||||||||||||||||||||||||||
|
|
|
|
|
|
|
|
|
|
|
|
|
|
|
|
|
|
|
|
|||||||||||||||||||||
Ending Balance |
$ | 30,035 | $ | 1,021 | $ | 155 | $ | — | $ | 31,211 | $ | 22,050 | $ | 1,010 | $ | — | $ | — | $ | 23,060 | ||||||||||||||||||||
|
|
|
|
|
|
|
|
|
|
|
|
|
|
|
|
|
|
|
|
Six Months Ended June 30, 2021 | Six Months Ended June 30, 2020 | |||||||||||||||||||||||||||||||||||||||
(dollars in millions) |
GP Minority Equity |
GP Debt Financing |
Professional Sports Minority Investments |
Co-Investments and Structured Equity |
GP Capital Solutions AUM |
GP Minority Equity |
GP Debt Financing |
Professional Sports Minority Investments |
Co-Investments and Structured Equity |
GP Capital Solutions AUM |
||||||||||||||||||||||||||||||
Beginning Balance |
$ | 25,211 | $ | 1,009 | $ | — | $ | — | $ | 26,220 | $ | 21,990 | $ | 1,011 | $ | — | $ | — | $ | 23,001 | ||||||||||||||||||||
New capital raised |
1,237 | — | 155 | — | 1,392 | 219 | — | — | — | 219 | ||||||||||||||||||||||||||||||
Distributions |
(204 | ) | — | — | — | (204 | ) | (607 | ) | — | — | — | (607 | ) | ||||||||||||||||||||||||||
Change in value |
3,791 | 12 | — | — | 3,803 | 448 | (1 | ) | — | — | 447 | |||||||||||||||||||||||||||||
|
|
|
|
|
|
|
|
|
|
|
|
|
|
|
|
|
|
|
|
|||||||||||||||||||||
Ending Balance |
$ | 30,035 | $ | 1,021 | $ | 155 | $ | — | $ | 31,211 | $ | 22,050 | $ | 1,010 | $ | — | $ | — | $ | 23,060 | ||||||||||||||||||||
|
|
|
|
|
|
|
|
|
|
|
|
|
|
|
|
|
|
|
|
Three Months Ended June 30, 2021 | Three Months Ended June 30, 2020 | |||||||||||||||||||||||||||||||||||||||
(dollars in millions) |
GP Minority Equity |
GP Debt Financing |
Professional Sports Minority Investments |
Co-Investments and Structured Equity |
GP Capital Solutions FPAUM |
GP Minority Equity |
GP Debt Financing |
Professional Sports Minority Investments |
Co-Investments and Structured Equity |
GP Capital Solutions FPAUM |
||||||||||||||||||||||||||||||
Beginning Balance |
$ | 17,892 | $ | 738 | $ | — | $ | — | $ | 18,630 | $ | 17,240 | $ | 295 | $ | — | $ | — | $ | 17,535 | ||||||||||||||||||||
New capital raised / deployed |
242 | 30 | — | — | 272 | 9 | 50 | — | — | 59 | ||||||||||||||||||||||||||||||
Distributions |
— | (245 | ) | — | — | (245 | ) | (153 | ) | — | — | — | (153 | ) | ||||||||||||||||||||||||||
|
|
|
|
|
|
|
|
|
|
|
|
|
|
|
|
|
|
|
|
|||||||||||||||||||||
Ending Balance |
$ | 18,134 | $ | 523 | $ | — | $ | — | $ | 18,657 | $ | 17,096 | $ | 345 | $ | — | $ | — | $ | 17,441 | ||||||||||||||||||||
|
|
|
|
|
|
|
|
|
|
|
|
|
|
|
|
|
|
|
|
Six Months Ended June 30, 2021 | Six Months Ended June 30, 2020 | |||||||||||||||||||||||||||||||||||||||
(dollars in millions) |
GP Minority Equity |
GP Debt Financing |
Professional Sports Minority Investments |
Co-Investments and Structured Equity |
GP Capital Solutions FPAUM |
GP Minority Equity |
GP Debt Financing |
Professional Sports Minority Investments |
Co-Investments and Structured Equity |
GP Capital Solutions FPAUM |
||||||||||||||||||||||||||||||
Beginning Balance |
$ | 17,050 | $ | 558 | $ | — | $ | — | $ | 17,608 | $ | 17,251 | $ | 295 | $ | — | $ | — | $ | 17,546 | ||||||||||||||||||||
New capital raised / deployed |
1,074 | 209 | — | — | 1,283 | 18 | 50 | — | — | 68 | ||||||||||||||||||||||||||||||
Distributions |
10 | (244 | ) | — | — | (234 | ) | (173 | ) | — | — | — | (173 | ) | ||||||||||||||||||||||||||
|
|
|
|
|
|
|
|
|
|
|
|
|
|
|
|
|
|
|
|
|||||||||||||||||||||
Ending Balance |
$ | 18,134 | $ | 523 | $ | — | $ | — | $ | 18,657 | $ | 17,096 | $ | 345 | $ | — | $ | — | $ | 17,441 | ||||||||||||||||||||
|
|
|
|
|
|
|
|
|
|
|
|
|
|
|
|
|
|
|
|
MoIC | IRR | |||||||||||||||||||||||||||||||||||||||||||
(dollars in millions) |
Year of Inception |
AUM | Capital Raised (1) |
Invested Capital (2) |
Realized Proceeds (3) |
Unrealized Value (4) |
Total Value |
Gross (5) | Net (6) | Gross (7) | Net (8) | |||||||||||||||||||||||||||||||||
Diversified Lending |
||||||||||||||||||||||||||||||||||||||||||||
Owl Rock Capital Corp. (ORCC) |
2016 | $ | 14,062 | $ | 5,983 | $ | 5,995 | $ | 1,657 | $ | 5,843 | $ | 7,500 | 1.32x | 1.25x | 11.4 | % | 9.0 | % | |||||||||||||||||||||||||
Owl Rock Capital Corp. II (ORCC II) (9) |
2017 | $ | 2,552 | $ | 1,390 | $ | 1,363 | $ | 200 | $ | 1,358 | $ | 1,558 | N/A | 1.14x | N/A | 7.2 | % | ||||||||||||||||||||||||||
Technology Lending |
||||||||||||||||||||||||||||||||||||||||||||
Owl Rock Technology Finance Corp. (ORTF) |
2018 | $ | 6,232 | $ | 3,171 | $ | 2,142 | $ | 169 | $ | 2,336 | $ | 2,505 | 1.22x | 1.17x | 18.1 | % | 13.5 | % | |||||||||||||||||||||||||
First Lien Lending (10) |
||||||||||||||||||||||||||||||||||||||||||||
Owl Rock First Lien Fund Levered |
2018 | $ | 2,784 | $ | 986 | $ | 813 | $ | 61 | $ | 853 | $ | 914 | 1.16x | 1.13x | 11.4 | % | 8.8 | % | |||||||||||||||||||||||||
Owl Rock First Lien Fund Unlevered |
2019 | $ | 175 | $ | 144 | $ | 4 | $ | 147 | $ | 151 | 1.08x | 1.05x | 5.8 | % | 3.7 | % |
(1) | Includes reinvested dividends, if applicable. |
(2) | Invested capital includes capital calls, reinvested dividends and periodic investor closes, as applicable. |
(3) | Realized proceeds represent the sum of all cash distributions to investors. |
(4) | Unrealized value represents the product’s NAV. There can be no assurance that unrealized values will be realized at the valuations indicated. |
(5) | Gross multiple of invested capital (“MoIC”) is calculated by adding total realized proceeds and unrealized values of a product’s investments and dividing by the total amount of invested capital. Gross MoIC is before giving effect to management fees (including BDC Part I Fees) and BDC Part II Fees. |
(6) | Net MoIC measures the aggregate value generated by a product’s investments in absolute terms. Net MoIC is calculated by adding total realized proceeds and unrealized values of a product’s investments and dividing by the total amount of invested capital. Net MoIC is calculated after giving effect to fees, as applicable, and all other expenses. |
(7) | Gross IRR is an annualized since inception gross internal rate of return of cash flows to and from the product and the product’s residual value at the end of the measurement period. Gross IRR reflects returns to fee-paying investors. Gross IRRs are calculated before giving effect to management fees (including BDC Part I Fees) and BDC Part II Fees, as applicable. |
(8) | Net IRRs are calculated consistent with gross IRRs, but after giving effect to management fees (including BDC Part I Fees) and BDC Part II Fees, as applicable, and all other expenses. An individual investor’s IRR may be different to the reported IRR based on the timing of capital transactions. |
(9) | For the purposes of calculating Gross IRR, the expense support provided to the fund would be impacted when assuming a performance excluding management fees (including BDC Part I Fees) and BDC Part II Fees, and therefore is not applicable to ORCC II. |
(10) | Owl Rock First Lien Fund is comprised of three feeder funds: Onshore Levered, Offshore Levered and Insurance Unlevered. The gross and net MoIC and IRR presented in the chart are for Onshore Levered and Insurance Unlevered as those are the largest of the levered and unlevered feeder funds. The gross and net MoIC for the Offshore Levered feeder fund is 1.15x and 1.10x, respectively. The gross and net IRR for the Offshore Levered feeder is 10.7% and 6.9%, respectively. All other values for Owl Rock First Lien Fund Levered are for Onshore Levered and Offshore Levered combined. AUM is presented as the aggregate of the three Owl Rock First Lien Fund feeders. Owl Rock First Lien Fund Unlevered Investor equity and note commitments are both treated as capital for all values. |
(dollars in millions) |
Year of Inception |
AUM | Capital Raised |
Invested Capital (2) |
Realized Proceeds (3) |
Unrealized Value (4) |
Total Value |
Net MoIC (5) |
Net IRR (6) |
|||||||||||||||||||||||||||
GP Minority Equity(1) |
||||||||||||||||||||||||||||||||||||
Dyal I |
2011 | $ | 846 | $ | 1,284 | $ | 1,248 | $ | 583 | $ | 614 | $ | 1,197 | 0.96x | -0.9 | % | ||||||||||||||||||||
Dyal II |
2014 | $ | 2,108 | $ | 2,153 | $ | 1,846 | $ | 396 | $ | 1,543 | $ | 1,939 | 1.05x | 1.7 | % | ||||||||||||||||||||
Dyal III |
2015 | $ | 7,946 | $ | 5,318 | $ | 3,241 | $ | 2,344 | $ | 3,955 | $ | 6,299 | 1.94x | 24.3 | % | ||||||||||||||||||||
Dyal IV |
2018 | $ | 10,873 | $ | 9,041 | $ | 3,094 | $ | 1,760 | $ | 2,759 | $ | 4,519 | 1.46x | 61.7 | % | ||||||||||||||||||||
Dyal V |
2020 | $ | 2,943 | $ | 2,883 | $ | 124 | $ | — | $ | 184 | $ | 184 | NM | NM |
(1) | Valuation-related amounts and performance metrics are presented on a quarter lag and are exclusive of investments made by us and the related carried interest vehicles of the respective products. |
(2) | Invested capital includes capital calls. |
(3) | Realized proceeds represent the sum of all cash distributions to investors. |
(4) | Unrealized value represents the product’s NAV. There can be no assurance that unrealized values will be realized at the valuations indicated. |
(5) | Net MoIC measures the aggregate value generated by a product’s investments in absolute terms. Net MoIC is calculated by adding total realized proceeds and unrealized values of a product’s investments and dividing by the total amount of invested capital. Net MoIC is calculated after giving effect to fees, as applicable, and all other expenses. |
(6) | Net IRR is an annualized since inception net internal rate of return of cash flows to and from the product and the product’s residual value at the end of the measurement period. Net IRRs reflect returns to all investors. Net IRRs are calculated after giving effect to fees, as applicable, and all other expenses. An individual investor’s IRR may be different to the reported IRR based on the timing of capital transactions. |
Three Months Ended June 30, | ||||||||||||
(dollars in thousands) |
2021 | 2020 | $ Change | |||||||||
Revenues |
||||||||||||
Management fees, net (includes BDC Part I fees of $36,073 and $2,424) |
$ | 142,135 | $ | 36,837 | $ | 105,298 | ||||||
Administrative, transaction and other fees |
37,125 | 3,661 | 33,464 | |||||||||
|
|
|
|
|
|
|||||||
Total Revenues, Net |
179,260 | 40,498 | 138,762 | |||||||||
|
|
|
|
|
|
|||||||
Expenses |
||||||||||||
Compensation and benefits |
1,221,565 | 32,269 | 1,189,296 | |||||||||
Amortization of intangible assets |
21,336 | — | 21,336 | |||||||||
General, administrative and other expenses |
51,520 | 15,595 | 35,925 | |||||||||
|
|
|
|
|
|
|||||||
Total Expenses |
1,294,421 | 47,864 | 1,246,557 | |||||||||
|
|
|
|
|
|
|||||||
Other Income (Loss) |
||||||||||||
Net losses on retirement of debt |
(16,145 | ) | — | (16,145 | ) | |||||||
Interest expense |
(5,817 | ) | (5,986 | ) | 169 | |||||||
Change in TRA liability |
(1,146 | ) | — | (1,146 | ) | |||||||
Change in warrant liability |
(15,300 | ) | — | (15,300 | ) | |||||||
Change in Earnout Securities liability |
(462,970 | ) | — | (462,970 | ) | |||||||
|
|
|
|
|
|
|||||||
Total Other Income (Loss) |
(501,378 | ) | (5,986 | ) | (495,392 | ) | ||||||
|
|
|
|
|
|
|||||||
Income (Loss) Before Income Taxes |
(1,616,539 | ) | (13,352 | ) | (1,603,187 | ) | ||||||
Income tax expense (benefit) |
(29,199 | ) | (47 | ) | (29,152 | ) | ||||||
|
|
|
|
|
|
|||||||
Consolidated and Combined Net Income (Loss) |
(1,587,340 | ) | (13,305 | ) | (1,574,035 | ) | ||||||
Net (income) loss attributable to noncontrolling interests |
1,224,996 | 862 | 1,224,134 | |||||||||
|
|
|
|
|
|
|||||||
Net Income (Loss) Attributable to Blue Owl Capital Inc. (After May 19, 2021) / Owl Rock (Prior to May 19, 2021) |
$ | (362,344 | ) | $ | (12,443 | ) | $ | (349,901 | ) | |||
|
|
|
|
|
|
Six Months Ended June 30, | ||||||||||||
(dollars in thousands) |
2021 | 2020 | $ Change | |||||||||
Revenues |
||||||||||||
Management fees, net (includes BDC Part I fees of $64,987 and $6,351) |
$ | 236,848 | $ | 73,684 | $ | 163,164 | ||||||
Administrative, transaction and other fees |
50,636 | 16,082 | 34,554 | |||||||||
|
|
|
|
|
|
|||||||
Total Revenues, Net |
287,484 | 89,766 | 197,718 | |||||||||
|
|
|
|
|
|
|||||||
Expenses |
||||||||||||
Compensation and benefits |
1,269,549 | 64,444 | 1,205,105 | |||||||||
Amortization of intangible assets |
21,336 | — | 21,336 | |||||||||
General, administrative and other expenses |
66,380 | 34,815 | 31,565 | |||||||||
|
|
|
|
|
|
|||||||
Total Expenses |
1,357,265 | 99,259 | 1,258,006 | |||||||||
|
|
|
|
|
|
|||||||
Other Income (Loss) |
||||||||||||
Net losses on retirement of debt |
(16,145 | ) | — | (16,145 | ) | |||||||
Interest expense |
(11,675 | ) | (11,880 | ) | 205 | |||||||
Change in TRA liability |
(1,146 | ) | — | (1,146 | ) | |||||||
Change in warrant liability |
(15,300 | ) | — | (15,300 | ) | |||||||
Change in Earnout Securities liability |
(462,970 | ) | — | (462,970 | ) | |||||||
|
|
|
|
|
|
|||||||
Total Other Income (Loss) |
(507,236 | ) | (11,880 | ) | (495,356 | ) | ||||||
|
|
|
|
|
|
|||||||
Income (Loss) Before Income Taxes |
(1,577,017 | ) | (21,373 | ) | (1,555,644 | ) | ||||||
Income tax expense (benefit) |
(29,011 | ) | (93 | ) | (28,918 | ) | ||||||
|
|
|
|
|
|
|||||||
Consolidated and Combined Net Income (Loss) |
(1,548,006 | ) | (21,280 | ) | (1,526,726 | ) | ||||||
Net (income) loss attributable to noncontrolling interests |
1,225,076 | 1,777 | 1,223,299 | |||||||||
|
|
|
|
|
|
|||||||
Net Income (Loss) Attributable to Blue Owl Capital Inc. |
$ | (322,930 | ) | $ | (19,503 | ) | $ | (303,427 | ) | |||
|
|
|
|
|
|
Three Months Ended June 30, | Six Months Ended June 30, | |||||||||||||||
(dollars in thousands) |
2021 | 2020 | 2021 | 2020 | ||||||||||||
Adjusted Revenues |
$ | 171,541 | $ | 36,939 | $ | 275,310 | $ | 81,601 | ||||||||
Adjusted Expenses |
(71,556 | ) | (44,305 | ) | (129,055 | ) | (91,094 | ) | ||||||||
Less: Noncontrolling interests included in Fee-Related Earnings |
(1,852 | ) | 862 | (1,774 | ) | 1,777 | ||||||||||
|
|
|
|
|
|
|
|
|||||||||
Fee-Related Earnings |
$ | 98,133 | $ | (6,504 | ) | $ | 144,481 | $ | (7,716 | ) | ||||||
|
|
|
|
|
|
|
|
|||||||||
Distributable Earnings |
$ | 85,138 | $ | (12,492 | ) | $ | 125,390 | $ | (19,603 | ) | ||||||
|
|
|
|
|
|
|
|
Three Months Ended June 30, |
Six Months Ended June 30, |
|||||||||||||||
(dollars in thousands) |
2021 | 2020 | 2021 | 2020 | ||||||||||||
Direct Lending Products |
||||||||||||||||
Diversified lending |
$ | 83,773 | $ | 23,577 | $ | 160,251 | $ | 48,476 | ||||||||
Technology lending |
16,727 | 10,212 | 30,584 | 19,379 | ||||||||||||
First lien lending |
3,817 | 3,048 | 7,632 | 5,829 | ||||||||||||
Opportunistic lending |
741 | — | 1,304 | — | ||||||||||||
|
|
|
|
|
|
|
|
|||||||||
Management Fees, Net |
105,058 | 36,837 | 199,771 | 73,684 | ||||||||||||
Administrative, transaction and other fees |
29,406 | 102 | 38,462 | 7,917 | ||||||||||||
|
|
|
|
|
|
|
|
|||||||||
Adjusted Revenues - Direct Lending Products |
134,464 | 36,939 | 238,233 | 81,601 | ||||||||||||
|
|
|
|
|
|
|
|
|||||||||
GP Capital Solutions Products |
||||||||||||||||
GP minority equity investments |
36,341 | — | 36,341 | — | ||||||||||||
GP debt financing |
736 | — | 736 | — | ||||||||||||
|
|
|
|
|
|
|
|
|||||||||
Management Fees, Net |
37,077 | — | 37,077 | — | ||||||||||||
Administrative, transaction and other fees |
— | — | — | — | ||||||||||||
|
|
|
|
|
|
|
|
|||||||||
Adjusted Revenues - GP Capital Solutions Products |
37,077 | — | 37,077 | — | ||||||||||||
|
|
|
|
|
|
|
|
|||||||||
Total Adjusted Revenues |
$ | 171,541 | $ | 36,939 | $ | 275,310 | $ | 81,601 | ||||||||
|
|
|
|
|
|
|
|
Three Months Ended June 30, |
Six Months Ended June 30, |
|||||||||||||||
(dollars in thousands) |
2021 | 2020 | 2021 | 2020 | ||||||||||||
Adjusted Compensation and Benefits |
$ | 56,141 | $ | 29,311 | $ | 100,681 | $ | 58,645 | ||||||||
Adjusted General, Administrative and Other Expenses |
15,415 | 14,994 | 28,374 | 32,449 | ||||||||||||
|
|
|
|
|
|
|
|
|||||||||
Total Adjusted Expenses |
$ | 71,556 | $ | 44,305 | $ | 129,055 | $ | 91,094 | ||||||||
|
|
|
|
|
|
|
|
Three Months Ended June 30, | Six Months Ended June 30, | |||||||||||||||
(dollars in thousands) |
2021 | 2020 | 2021 | 2020 | ||||||||||||
GAAP Income (Loss) Before Income Taxes |
$ | (1,616,539 | ) | $ | (13,352 | ) | $ | (1,577,017 | ) | $ | (21,373 | ) | ||||
Less: Net (income) loss allocated to noncontrolling interests included in Fee-Related Earnings |
(1,852 | ) | 862 | (1,774 | ) | 1,777 | ||||||||||
Plus: Equity-based compensation |
1,158,597 | — | 1,158,597 | — | ||||||||||||
Plus: Amortization of intangible assets |
21,336 | — | 21,336 | — | ||||||||||||
Plus: Business Combination-related expenses |
35,213 | — | 36,103 | — | ||||||||||||
Plus: Interest expense |
5,817 | 5,986 | 11,675 | 11,880 | ||||||||||||
Less: Net losses on early retirement of debt |
16,145 | — | 16,145 | — | ||||||||||||
Less: Change in TRA liability |
1,146 | — | 1,146 | — | ||||||||||||
Less: Change in warrant liability |
15,300 | — | 15,300 | — | ||||||||||||
Less: Change in Earnout Securities liability |
462,970 | — | 462,970 | — | ||||||||||||
|
|
|
|
|
|
|
|
|||||||||
Fee-Related Earnings |
98,133 | (6,504 | ) | 144,481 | (7,716 | ) | ||||||||||
Less: Interest expense |
(5,817 | ) | (5,986 | ) | (11,675 | ) | (11,880 | ) | ||||||||
Less: Taxes and TRA payable |
(7,178 | ) | (2 | ) | (7,416 | ) | (7 | ) | ||||||||
|
|
|
|
|
|
|
|
|||||||||
Distributable Earnings |
85,138 | (12,492 | ) | 125,390 | (19,603 | ) | ||||||||||
Plus: Interest expense |
5,817 | 5,986 | 11,675 | 11,880 | ||||||||||||
Plus: Taxes and TRA payable |
7,178 | 2 | 7,416 | 7 | ||||||||||||
Plus: Fixed assets depreciation and amortization |
135 | 229 | 265 | 459 | ||||||||||||
|
|
|
|
|
|
|
|
|||||||||
Adjusted EBITDA |
$ | 98,268 | $ | (6,275 | ) | $ | 144,746 | $ | (7,257 | ) | ||||||
|
|
|
|
|
|
|
|
Three Months Ended June 30, | Six Months Ended June 30, | |||||||||||||||
(dollars in thousands) |
2021 | 2020 | 2021 | 2020 | ||||||||||||
GAAP Revenues |
$ | 179,260 | $ | 40,498 | $ | 287,484 | $ | 89,766 | ||||||||
Less: Administrative and other expenses |
(7,719 | ) | (3,559 | ) | (12,174 | ) | (8,165 | ) | ||||||||
|
|
|
|
|
|
|
|
|||||||||
Adjusted Revenues |
$ | 171,541 | $ | 36,939 | $ | 275,310 | $ | 81,601 | ||||||||
|
|
|
|
|
|
|
|
Three Months Ended June 30, | Six Months Ended June 30, | |||||||||||||||
(dollars in thousands) |
2021 | 2020 | 2021 | 2020 | ||||||||||||
GAAP Expenses |
$ | 1,294,421 | $ | 47,864 | $ | 1,357,265 | $ | 99,259 | ||||||||
Less: Administrative and other expenses |
(7,719 | ) | (3,559 | ) | (12,174 | ) | (8,165 | ) | ||||||||
Less: Equity-based compensation |
(1,158,597 | ) | — | (1,158,597 | ) | — | ||||||||||
Less: Amortization of intangible assets |
(21,336 | ) | — | (21,336 | ) | — | ||||||||||
Less: Business Combination-related expenses |
(35,213 | ) | — | (36,103 | ) | — | ||||||||||
|
|
|
|
|
|
|
|
|||||||||
Adjusted Expenses |
$ | 71,556 | $ | 44,305 | $ | 129,055 | $ | 91,094 | ||||||||
|
|
|
|
|
|
|
|
• | Grow our existing investment management business. |
• | Expand, or acquire, into businesses that are complementary to our existing investment management businesses or other strategic growth initiatives. |
• | Pay operating expenses, including cash compensation to our employees. |
• | Repay debt obligations and interest thereon. |
• | Opportunistically repurchase Class A Shares pursuant to the Share Repurchase Program (as defined below). |
• | Pay income taxes and amounts due under the TRA. |
• | Pay dividends to holders of our Class A Shares, as well as make corresponding distributions to holders of Common Units at the Blue Owl Operating Group level. |
• | Fund investment commitments to existing or future products. |
• | The amount and timing of our income will impact the payments to be made under the TRA. To the extent that we do not have sufficient taxable income to utilize the amortization deductions available as a result of the increased tax basis in the Blue Owl Operating Partnerships’ assets, payments required under the TRA would be reduced. |
• | The price of our Class A Shares at the time of any exchange will determine the actual increase in tax basis of the Blue Owl Operating Partnerships’ assets resulting from such exchange; payments under the TRA resulting from future exchanges, if any, will be dependent in part upon such actual increase in tax basis. |
• | The composition of the Blue Owl Operating Group assets at the time of any exchange will determine the extent to which we may benefit from amortizing the increased tax basis in such assets and thus will impact the amount of future payments under the TRA resulting from any future exchanges. |
• | The extent to which future exchanges are taxable will impact the extent to which we will receive an increase in tax basis of the Blue Owl Operating Group assets as a result of such exchanges, and thus will impact the benefit derived by us and the resulting payments, if any, to be made under the TRA. |
• | The tax rates in effect at the time any potential tax savings are realized, which would affect the amount of any future payments under the TRA. |
Six Months Ended June 30, | ||||||||||||
(dollars in thousands) |
2021 | 2020 | $ Change | |||||||||
Net cash provided by (used in): |
||||||||||||
Operating activities |
$ | 18,320 | $ | (23,863 | ) | $ | 42,183 | |||||
Investing activities |
(977,440 | ) | (42 | ) | (977,398 | ) | ||||||
Financing activities |
1,383,523 | 23,100 | 1,360,423 | |||||||||
|
|
|
|
|
|
|||||||
Net Change in Cash and Cash Equivalents |
$ | 424,403 | $ | (805 | ) | $ | 425,208 | |||||
|
|
|
|
|
|
• | GP Minority Equity Investments— |
classes. Our investment objective is to generate compelling cash yield by collecting a set percentage of contractually fixed management fees, a set percentage of carried interest and return on balance sheet investments made by underlying managers. We primarily focus on acquiring minority positions in large, multi-product alternative asset managers who continue to gain a disproportionate proportion of the assets flowing into private investment strategies and exhibit high levels of stability. Our inaugural funds followed a hedge fund manager-focused investment program that has since evolved into a private capital manager-focused investment program, as implemented by our later funds. Our GP Minority Equity Investments strategy is offered to investors through our closed-end permanent capital funds. A fundamental component of the fundraising efforts for our investment programs is the ability to identify and execute co-investment opportunities for our investors. We may offer, from time-to-time co-investment opportunities in certain fund investments, generally with no management or performance-based fee. As of March 31, 2021, our funds include Dyal Fund I, a $1.3 billion fund predominately focused on hedge funds, Dyal Fund II, a $2.2 billion fund predominately focused on hedge funds, Dyal Fund III, a $5.3 billion fund focused on private capital managers, Dyal Fund IV, a $9.0 billion fund focused on private capital managers and Dyal Fund V, which is still open for investors but currently has raised $2.6 billion, and is also focused on private capital managers. |
• | GP Debt Financing |
• | Professional Sports Minority Investments pre-approved us as a prospective buyer of NBA franchises and waived both its requirement that any minority owner own a stake in a single franchise and its limitation on any team having more than 25 individual beneficial owners. The NBA has also provided pre-approval for us to own interests in multiple NBA franchises. We believe having these approvals and waivers already established will provide selling owners with more certainty of our ability to close on any investment and will make us the buyer of choice when a minority interest in an NBA franchise becomes available. Our investments in the NBA are intended to provide low correlation to other asset classes and long-term value appreciation. |
• | Co-Investment and Structured Equitymid-life investments, access to potential strategic partners for knowledge and intellectual property transfer and liquidity to existing fund investors. Our investment objective is to generate compelling investment returns, similar to traditional buy-out funds but with mitigated downside risk and faster return of capital. |
• | Client Development & Marketing Support |
• | Product Development |
• | Talent Management in-depth peer benchmarking. |
• | Business Strategy bolt-on transactions. This support may include sourcing proprietary and intermediated opportunities, reviewing a potential deal’s strategic rationale, supporting business due diligence, gathering market intelligence, and providing valuation guidance and deal structuring advice. |
• | Operational Advisory in-house and external vendors to support their efforts and provide analysis for various partner manager projects, which may include helping their portfolio companies through the use of data science specialists, technology service firms and consultants. In addition, the team seeks to leverage a preferred provider network of service providers to assist our partners and provide additional external support. |
GP Minority Equity Investments |
GP Debt Financing |
Total |
||||||||||
($ amounts in millions) | ||||||||||||
AUM at December 31, 2020 |
$ | 22,814 | $ | 1,010 | $ | 23,825 | ||||||
Net change to total commitments |
913 | — | 913 | |||||||||
|
|
|
|
|
|
|||||||
AUM at March 31, 2021 |
$ | 23,727 | $ | 1,010 | $ | 24,737 | ||||||
|
|
|
|
|
|
|||||||
Average AUM |
$ | 23,271 | $ | 1,010 | $ | 24,281 | ||||||
|
|
|
|
|
|
GP Minority Equity Investments |
GP Debt Financing |
Total |
||||||||||
($ amounts in millions) | ||||||||||||
AUM at December 31, 2019 |
$ | 20,685 | $ | 1,010 | $ | 21,695 | ||||||
Net change to total commitments |
15 | — | 15 | |||||||||
|
|
|
|
|
|
|||||||
AUM at March 31, 2020 |
$ | 20,700 | $ | 1,010 | $ | 21,710 | ||||||
|
|
|
|
|
|
|||||||
Average AUM |
$ | 20,692 | $ | 1,010 | $ | 21,703 | ||||||
|
|
|
|
|
|
GP Minority Equity Investments |
GP Debt Financing |
Total |
||||||||||
($ amounts in millions) | ||||||||||||
Fee Paying AUM at December 31, 2020 |
$ | 17,166 | $ | 558 | $ | 17,724 | ||||||
Net change to fee paying investor capital base |
734 | 179 | 913 | |||||||||
|
|
|
|
|
|
|||||||
Fee Paying AUM at March 31, 2021 |
$ | 17,900 | $ | 737 | $ | 18,637 | ||||||
|
|
|
|
|
|
|||||||
Average Fee Paying AUM |
$ | 17,533 | $ | 648 | $ | 18,181 | ||||||
|
|
|
|
|
|
GP Minority Equity Investments |
GP Debt Financing |
Total |
||||||||||
($ amounts in millions) | ||||||||||||
Fee Paying AUM at December 31, 2019 |
$ | 17,251 | $ | 295 | $ | 17,546 | ||||||
Net change to fee paying investor capital base |
5 | — | 5 | |||||||||
|
|
|
|
|
|
|||||||
Fee Paying AUM at March 31, 2020 |
$ | 17,256 | $ | 295 | $ | 17,551 | ||||||
|
|
|
|
|
|
|||||||
Average Fee Paying AUM |
$ | 17,254 | $ | 295 | $ | 17,548 | ||||||
|
|
|
|
|
|
LP Contribution Date of Initial Investment |
Dollars in Millions |
|||||||||||||||||||||||||||||||
LP Commitments |
LP Contributions |
LP Distributions |
NAV |
Net IRR |
Net TVPI |
Net DPI |
||||||||||||||||||||||||||
Actual as of December 31, 2020 1 |
||||||||||||||||||||||||||||||||
Dyal I |
11/22/2011 | 1,274 | 1,248 | 583 | 618 | -0.8 | % | 0.96x | 0.47x | |||||||||||||||||||||||
Dyal II |
12/29/2014 | 2,139 | 1,846 | 336 | 1,495 | -0.3 | % | 0.99x | 0.18x | |||||||||||||||||||||||
Dyal III |
6/26/2015 | 5,279 | 3,241 | 2,266 | 3,958 | 25.1 | % | 1.92x | 0.70x | |||||||||||||||||||||||
Dyal IV |
6/11/2018 | 8,920 | 2,787 | 498 | 3,494 | 69.1 | % | 1.43x | 0.18x |
1. |
Contributions (Called Capital), Distributions (Cash Distributed) and NAV figures as well as performance metrics are exclusive of GP activity. |
Three Months Ended March 31, |
Favorable (Unfavorable) |
|||||||||||||||
2021 |
2020 |
$ Change |
% Change |
|||||||||||||
Revenues |
||||||||||||||||
Management fees, net |
$ | 75,472 | $ | 70,607 | $ | 4,865 | 7 | % | ||||||||
Administrative, transaction and other fees |
6,520 | 5,821 | 699 | 12 | % | |||||||||||
|
|
|
|
|||||||||||||
Total revenues |
81,992 |
76,428 |
5,564 |
7 | % | |||||||||||
Operating expenses |
||||||||||||||||
Compensation and benefits |
55,323 | 47,578 | 7,745 | 16 | % | |||||||||||
General, administrative, and other expenses |
14,026 | 6,913 | 7,113 | 103 | % | |||||||||||
|
|
|
|
|||||||||||||
Total operating expenses |
69,349 |
54,491 |
14,858 |
27 | % | |||||||||||
|
|
|
|
Three Months Ended March 31, |
Favorable (Unfavorable) |
|||||||||||||||
2021 |
2020 |
$ Change |
% Change |
|||||||||||||
Operating income |
12,643 |
21,937 |
(9,294 |
) |
-42 | % | ||||||||||
Net gains (losses) from investment activities |
2,314 | (85 | ) | 2,399 | NM | |||||||||||
|
|
|
|
|||||||||||||
Income before income tax expense |
14,957 |
21,852 |
(6,895 |
) |
-32 | % | ||||||||||
Income tax expense (benefit) |
2,181 | 1,984 | 197 | 10 | % | |||||||||||
|
|
|
|
|||||||||||||
Net income |
12,776 |
19,868 |
(7,092 |
) |
-36 | % | ||||||||||
Net gain (loss) attributable to non-controlling interests |
144 | (454 | ) | 598 | NM | |||||||||||
|
|
|
|
|||||||||||||
Net income attributable to Dyal |
$ |
12,632 |
$ |
20,322 |
$ |
(7,690 |
) |
-38 | % | |||||||
|
|
|
|
Twelve Months Ended December 31, |
Favorable (Unfavorable) |
|||||||||||||||
2020 |
2019 |
$ Change |
% Change |
|||||||||||||
Revenues |
||||||||||||||||
Management fees, net |
$ | 284,691 | $ | 313,354 | $ | (28,663 | ) | -9 | % | |||||||
Incentive fees |
2,354 | 626 | 1,728 | NM | ||||||||||||
Administrative, transaction and other fees |
22,676 | 18,350 | 4,326 | 24 | % | |||||||||||
|
|
|
|
|||||||||||||
Total revenues |
309,721 |
332,330 |
(22,609 |
) |
-7 |
% | ||||||||||
Operating expenses |
||||||||||||||||
Compensation and benefits |
187,527 | 194,970 | (7,443 | ) | -4 | % | ||||||||||
General, administrative, and other expenses |
26,217 | 32,290 | (6,073 | ) | -19 | % | ||||||||||
|
|
|
|
|||||||||||||
Total operating expenses |
213,744 |
227,260 |
(13,516 |
) |
-6 |
% | ||||||||||
Operating income |
95,977 |
105,070 |
(9,093 |
) |
-9 |
% | ||||||||||
Net gains (losses) from investment activities |
1,542 | (1,564 | ) | 3,106 | NM | |||||||||||
|
|
|
|
|||||||||||||
Income before income tax expense |
97,519 |
103,506 |
(5,987 |
) |
-6 |
% | ||||||||||
Income tax expense (benefit) |
8,435 | 9,094 | (659 | ) | -7 | % | ||||||||||
|
|
|
|
|||||||||||||
Net income |
89,084 |
94,412 |
(5,328 |
) |
-6 |
% | ||||||||||
Net loss attributable to non-controlling interests |
(548 | ) | (792 | ) | 244 | 31 | % | |||||||||
|
|
|
|
|||||||||||||
Net income attributable to Dyal |
$ |
89,632 |
$ |
95,204 |
$ |
(5,572 |
) |
-6 |
% | |||||||
|
|
|
|
Three Months Ended March 31, |
Year Ended December 31, |
|||||||||||||||||||
2021 |
2020 |
2020 |
2019 |
2018 |
||||||||||||||||
Income before income tax expense |
$ |
14,957 |
$ |
21,852 |
$ |
97,519 |
$ |
103,506 |
$ |
53,002 |
||||||||||
Adjustments: |
||||||||||||||||||||
Equity based compensation |
4,500 | — | 3,000 | — | — | |||||||||||||||
Net (gains) losses from investment activities |
(2,314 | ) | 85 | (1,542 | ) | 1,564 | (627 | ) | ||||||||||||
Incentive fees |
— | — | (2,354 | ) | (626 | ) | — | |||||||||||||
Incentive fee related compensation |
— | — | 1,549 | 376 | — | |||||||||||||||
|
|
|
|
|
|
|
|
|
|
|||||||||||
Fee Related Earnings |
$ |
17,143 |
$ |
21,937 |
$ |
98,172 |
$ |
104,820 |
$ |
52,375 |
||||||||||
|
|
|
|
|
|
|
|
|
|
|||||||||||
Fee Related Earnings |
$ | 17,143 | $ | 21,937 | $ | 98,172 | $ | 104,820 | $ | 52,375 | ||||||||||
Adjustments: |
||||||||||||||||||||
Incentive fees |
— | — | 2,354 | 626 | — | |||||||||||||||
Incentive fee related compensation |
— | — | (1,549 | ) | (376 | ) | — | |||||||||||||
Net realized gains |
1,119 | 249 | 692 | 833 | 557 | |||||||||||||||
Current income tax (expense) benefit |
(2,353 | ) | (1,968 | ) | (8,334 | ) | (8,982 | ) | (5,197 | ) | ||||||||||
|
|
|
|
|
|
|
|
|
|
|||||||||||
Distributable Earnings |
$ |
15,909 |
$ |
20,218 |
$ |
91,335 |
$ |
96,921 |
$ |
47,735 |
||||||||||
|
|
|
|
|
|
|
|
|
|
Three Months Ended March 31, |
Year Ended December 31, |
|||||||||||||||||||
2021 |
2020 |
2020 |
2019 |
2018 |
||||||||||||||||
Distributable Earnings |
$ | 15,909 | $ | 20,218 | $ | 91,335 | $ | 96,921 | $ | 47,735 | ||||||||||
Current income tax expense (benefit) |
2,353 | 1,968 | 8,334 | 8,982 | 5,197 | |||||||||||||||
|
|
|
|
|
|
|
|
|
|
|||||||||||
Adjusted EBITDA |
$ |
18,262 |
$ |
22,186 |
$ |
99,669 |
$ |
105,903 |
$ |
52,932 |
||||||||||
|
|
|
|
|
|
|
|
|
|
|||||||||||
Total revenues |
$ | 81,992 | $ | 76,428 | $ | 309,721 | $ | 332,330 | $ | 197,767 | ||||||||||
Adjustments: |
||||||||||||||||||||
Administrative, transaction and other fees |
(6,520 | ) | (5,821 | ) | (22,676 | ) | (18,350 | ) | (12,889 | ) | ||||||||||
|
|
|
|
|
|
|
|
|
|
|||||||||||
Adjusted Revenues |
$ |
75,472 |
$ |
70,607 |
$ |
287,045 |
$ |
313,980 |
$ |
184,878 |
||||||||||
|
|
|
|
|
|
|
|
|
|
|||||||||||
Compensation and benefits |
$ | 55,323 | $ | 47,578 | $ | 187,527 | $ | 194,970 | $ | 114,680 | ||||||||||
Adjustments: |
||||||||||||||||||||
Equity based compensation |
(4,500 | ) | — | (3,000 | ) | — | — | |||||||||||||
Business Services Platform reimbursed compensation and benefits |
(6,648 | ) | (5,491 | ) | (22,004 | ) | (17,225 | ) | (11,608 | ) | ||||||||||
|
|
|
|
|
|
|
|
|
|
|||||||||||
Adjusted Compensation |
$ |
44,175 |
$ |
42,087 |
$ |
162,523 |
$ |
177,745 |
$ |
103,072 |
||||||||||
|
|
|
|
|
|
|
|
|
|
Three Months Ended March 31, |
Favorable (Unfavorable) |
|||||||||||||||
2021 |
2020 |
$ Change |
% Change |
|||||||||||||
Net cash used in operating activities |
$ | (98,961 | ) | $ | (135,809 | ) | $ | 36,848 | 27 | % | ||||||
Net cash used in investing activities |
(520 | ) | (830 | ) | 310 | 37 | % | |||||||||
Net cash provided by financing activities |
99,481 | 136,549 | (37,068 | ) | -27 | % | ||||||||||
|
|
|
|
|||||||||||||
Net change in cash and cash equivalents |
$ |
— |
$ |
(90 |
) |
$ |
90 |
100 |
% | |||||||
|
|
|
|
Three Months Ended March 31, |
Favorable (Unfavorable) |
|||||||||||||||
2021 |
2020 |
$ Change |
% Change |
|||||||||||||
Cash flows from operating activities: |
||||||||||||||||
Net income |
$ | 12,776 | $ | 19,868 | $ | (7,092 | ) | -36 | % | |||||||
Adjustments to reconcile net income to net cash provided by (used in) operating activities: |
||||||||||||||||
Net (gains) losses from investment activities |
(2,314 | ) | 85 | (2,399 | ) | NM | ||||||||||
Equity based compensation |
4,500 | — | 4,500 | NM | ||||||||||||
Cash flows due to changes in operating assets and liabilities: |
||||||||||||||||
Management fees receivable, net |
(17,004 | ) | (30,126 | ) | 13,122 | 44 | % | |||||||||
Due from affiliates |
(8,818 | ) | (7,425 | ) | (1,393 | ) | -19 | % | ||||||||
Incentive fees receivable |
2,236 | — | 2,236 | NM | ||||||||||||
Prepaid assets |
21,000 | — | 21,000 | NM | ||||||||||||
Other assets |
1,332 | 18 | 1,314 | NM | ||||||||||||
Accrued compensation and benefits |
(120,755 | ) | (115,933 | ) | (4,822 | ) | -4 | % | ||||||||
Accrued expenses and other payables |
6,953 | (2,545 | ) | 9,498 | NM | |||||||||||
Distributions from equity method investments |
1,133 | 249 | 884 | NM | ||||||||||||
|
|
|
|
|||||||||||||
Net cash used in operating activities |
$ |
(98,961 |
) |
$ |
(135,809 |
) |
$ |
36,848 |
27 |
% | ||||||
|
|
|
|
Three Months Ended March 31, |
Favorable (Unfavorable) |
|||||||||||||||
2021 |
2020 |
$ Change |
% Change |
|||||||||||||
Cash flows from investing activities: |
||||||||||||||||
Purchases of equity method investments |
$ | (520 | ) | $ | (830 | ) | $ | 310 | 37 | % | ||||||
|
|
|
|
|||||||||||||
Net cash used in investing activities |
$ |
(520 |
) |
$ |
(830 |
) |
$ |
310 |
37 |
% | ||||||
|
|
|
|
Three Months Ended March 31, |
Favorable (Unfavorable) |
|||||||||||||||
2021 |
2020 |
$ Change |
% Change |
|||||||||||||
Cash flows from financing activities: |
||||||||||||||||
Distributions to non-controlling interests |
$ | — | $ | (2 | ) | $ | 2 | 100 | % | |||||||
Net transfer from Parent |
99,481 | 136,551 | (37,070 | ) | -27 | % | ||||||||||
|
|
|
|
|||||||||||||
Net cash provided by financing activities |
$ |
99,481 |
$ |
136,549 |
$ |
(37,068 |
) |
-27 |
% | |||||||
|
|
|
|
Twelve Months Ended December 31, |
Favorable (Unfavorable) |
|||||||||||||||
2020 |
2019 |
$ Change |
% Change |
|||||||||||||
Net cash provided by (used in) operating activities |
$ | (3,755 | ) | $ | 165,521 | $ | (169,276 | ) | NM | |||||||
Net cash used in investing activities |
(5,400 | ) | (5,070 | ) | (330 | ) | -7 | % | ||||||||
Net cash provided by (used in) financing activities |
9,065 | (167,166 | ) | 176,231 | NM | |||||||||||
|
|
|
|
|||||||||||||
Net change in cash and cash equivalents |
$ |
(90 |
) |
$ |
(6,715 |
) |
$ |
6,625 |
99 |
% | ||||||
|
|
|
|
Twelve Months Ended December 31, |
Favorable (Unfavorable) |
|||||||||||||||
2020 |
2019 |
$ Change |
% Change |
|||||||||||||
Cash flows from operating activities: |
||||||||||||||||
Net income |
$ | 89,084 | $ | 94,412 | $ | (5,328 | ) | -6 | % | |||||||
Adjustments to reconcile net income to net cash provided by (used in) operating activities: |
||||||||||||||||
Net (gains) losses from investment activities |
(1,542 | ) | 1,564 | (3,106 | ) | NM | ||||||||||
Equity based compensation |
3,000 | — | 3,000 | NM | ||||||||||||
Cash flows due to changes in operating assets and liabilities: |
||||||||||||||||
Management fees receivable, net |
(37,231 | ) | (79 | ) | (37,152 | ) | NM | |||||||||
Due from affiliates |
(5,086 | ) | (767 | ) | (4,319 | ) | NM | |||||||||
Incentive fees receivable |
(1,728 | ) | (626 | ) | (1,102 | ) | -176 | % | ||||||||
Prepaid assets |
(21,000 | ) | — | (21,000 | ) | NM | ||||||||||
Other assets |
(1,382 | ) | 133 | (1,515 | ) | NM | ||||||||||
Accrued compensation and benefits |
(15,169 | ) | 66,618 | (81,787 | ) | NM | ||||||||||
Accrued expenses and other payables |
(12,837 | ) | 3,694 | (16,531 | ) | NM | ||||||||||
Due to affiliates |
— | (381 | ) | 381 | 100 | % | ||||||||||
Distributions from equity method investments |
136 | 953 | (817 | ) | -86 | % | ||||||||||
|
|
|
|
|||||||||||||
Net cash provided by (used in) operating activities |
$ |
(3,755 |
) |
$ |
165,521 |
$ |
(169,276 |
) |
NM | |||||||
|
|
|
|
Twelve Months Ended December 31, |
Favorable (Unfavorable) |
|||||||||||||||
2020 |
2019 |
$ Change |
% Change |
|||||||||||||
Cash flows from investing activities: |
||||||||||||||||
Purchases of equity method investments |
$ | (5,400 | ) | $ | (5,070 | ) | $ | (330 | ) | -7 | % | |||||
|
|
|
|
|||||||||||||
Net cash used in investing activities |
$ |
(5,400 |
) |
$ |
(5,070 |
) |
$ |
(330 |
) |
-7 |
% | |||||
|
|
|
|
Twelve Months Ended December 31, |
Favorable (Unfavorable) |
|||||||||||||||
2020 |
2019 |
$ Change |
% Change |
|||||||||||||
Cash flows from financing activities: |
||||||||||||||||
Contributions from non-controlling interests |
$ | — | $ | 26 | $ | (26 | ) | -100 | % | |||||||
Distributions to non-controlling interests |
(5 | ) | — | (5 | ) | NM | ||||||||||
Net transfer from (to) Parent |
9,070 | (167,192 | ) | 176,262 | NM | |||||||||||
|
|
|
|
|||||||||||||
Net cash provided (used in) financing activities |
$ |
9,065 |
$ |
(167,166 |
) |
$ |
176,231 |
NM | ||||||||
|
|
|
|
Twelve Months Ended December 31, |
Favorable (Unfavorable) |
|||||||||||||||
2019 |
2018 |
$ Change |
% Change |
|||||||||||||
Net cash provided by operating activities |
$ | 165,521 | $ | 66,393 | $ | 99,128 | 149 | % | ||||||||
Net cash used in investing activities |
(5,070 | ) | (3,876 | ) | (1,194 | ) | -31 | % | ||||||||
Net cash used in financing activities |
(167,166 | ) | (75,400 | ) | (91,766 | ) | -122 | % | ||||||||
|
|
|
|
|||||||||||||
Net change in cash and cash equivalents |
$ |
(6,715 |
) |
$ |
(12,883 |
) |
$ |
6,168 |
48 |
% | ||||||
|
|
|
|
Twelve months ended December 31 |
Favorable (Unfavorable) |
|||||||||||||||
2019 |
2018 |
$ Change |
% Change |
|||||||||||||
Cash flows from operating activities: |
||||||||||||||||
Net income |
$ | 94,412 | $ | 47,875 | $ | 46,537 | 97 | % | ||||||||
Adjustments to reconcile net income to net cash provided by (used in) operating activities: |
||||||||||||||||
Net (gains) losses from investment activities |
1,564 | (627 | ) | 2,191 | NM | |||||||||||
Cash flows due to changes in operating assets and liabilities: |
||||||||||||||||
Management fees receivable, net |
(79 | ) | 312 | (391 | ) | NM | ||||||||||
Due from affiliates |
(767 | ) | (5,639 | ) | 4,872 | 86 | % | |||||||||
Incentive fees receivable |
(626 | ) | — | (626 | ) | NM | ||||||||||
Other assets |
133 | (639 | ) | 772 | NM | |||||||||||
Accrued compensation and benefits |
66,618 | 18,618 | 48,000 | NM | ||||||||||||
Accrued expenses and other payables |
3,694 | 5,333 | (1,639 | ) | -31 | % | ||||||||||
Due to affiliates |
(381 | ) | (7 | ) | (374 | ) | NM | |||||||||
Distributions from equity method investments |
953 | 1,167 | (214 | ) | -18 | % | ||||||||||
|
|
|
|
|||||||||||||
Net cash provided by operating activities |
$ |
165,521 |
$ |
66,393 |
$ |
99,128 |
149 |
% | ||||||||
|
|
|
|
As at March 31, |
||||||||
2021 |
2020 |
|||||||
Dollars in Millions |
||||||||
Dyal Obligations |
||||||||
Unfunded Capital Commitments |
$ | 9.5 | $ | 14.1 | ||||
Part of Blue Owl |
2.7 | 7.1 |
Name |
Age |
Position with Blue Owl | ||
Douglas I. Ostrover | 58 | Chief Executive Officer and Director | ||
Marc S. Lipschultz | 52 | Co-President and Director | ||
Michael Rees | 46 | Co-President and Director | ||
Craig W. Packer | 54 | Senior Managing Director and Director | ||
Sean Ward | 43 | Senior Managing Director and Director | ||
Alan J. Kirshenbaum | 49 | Chief Financial Officer | ||
Andrew Laurino | 45 | Senior Managing Director | ||
Andrew R. Polland | 46 | Chief Operating Officer | ||
Junot Foradada | 40 | Chief Accounting Officer | ||
Neena A. Reddy | 43 | General Counsel and Secretary | ||
Dana Weeks | 50 | Director | ||
Claudia Holz | 63 | Director | ||
Andrew S. Komaroff | 52 | Director | ||
Stacy Polley | 52 | Director |
• | maintain open communications with the independent accountants, internal auditors or other personnel responsible for the internal audit function outside valuation experts, executive management, and the Board; |
• | meet separately, from time to time, with management, internal auditors or other personnel responsible for the internal audit function and the independent accountants to discuss matters warranting attention by the audit committee; |
• | regularly report committee actions to the Board and make recommendations as the audit committee deems appropriate; |
• | review the financial results presented in all reports filed with the SEC; |
• | review reports issued by regulatory examinations and consider the results of those reviews to determine if any findings could have a material effect on the Company’s financial statements or its internal controls and procedures; |
• | discuss the Company’s disclosure, oversight of and conformity with the Company’s Code of Business Conduct and Code of Ethics, and matters that may have a material effect on the Company’s financial statements, operations, compliance policies, and programs; |
• | review and reassess the adequacy of the audit committee’s charter at least annually and recommend any changes to the full Board; and |
• | take other actions required of the audit committee by law, applicable regulations, or as requested by the Board. |
• | the presumption that directors are acting in good faith, on an informed basis, and with a view to the interests of Blue Owl has been rebutted; and |
• | it is proven that the director’s act or failure to act constituted a breach of his or her fiduciary duties as a director and such breach involved intentional misconduct, fraud or a knowing violation of law. |
• | an annual cash retainer of $150,000 per year for service as a member of the Board; and |
• | an annual equity grant of restricted stock units equal to $100,000, which fully vest one year following the date of grant, subject to the Board member’s continued service on our board. |
Year |
Salary(1) ($) |
Non-Equity Incentive Compensation(2) ($) |
Stock Awards(3) ($) |
All Other Compensation(4) ($) |
Total ($) |
|||||||||||||||||||
Doug Ostrover |
||||||||||||||||||||||||
Chief Executive Officer |
2020 | $ | 513,958 | $ | 5,238,236 | $ | — | $ | 58,201 | $ | 5,810,395 | |||||||||||||
Michael Rees |
||||||||||||||||||||||||
Co-President |
2020 | $ | 500,000 | $ | 41,412,500 | $ | 99,520,200 | $ | 11,087,500 | $ | 152,520,200 | |||||||||||||
Sean Ward |
||||||||||||||||||||||||
Senior Managing Director |
2020 | $ | 500,000 | $ | 12,712,500 | $ | 21,461,400 | $ | 3,337,500 | $ | 38,011,400 |
(1) | Amounts in this column reflect the base salaries paid to our Named Executive Officers. The base salary amount for each Named Executive Officer was determined on a discretionary basis. |
(2) | Amounts in this column reflect the discretionary cash bonuses earned by each Named Executive Officer for the fiscal year ended December 31, 2020. With respect to Mr. Ostrover, the aggregate amount of these discretionary cash bonuses, the discretionary base salaries described in note (1) above and any other discretionary compensation paid to Mr. Ostrover (and two other employees who are subject to the cap described in this note (2)) cannot exceed a specified annual cap. The annual cap is set forth in Owl Rock Feeder’s operating agreement and, for any given fiscal year, equals seven and a half percent of the gross revenue generated by Owl Rock in such fiscal year. |
(3) | Amounts in this column represent the grant date fair value of certain interests in Dyal (the “Dyal SLP Units”) granted to Messrs. Rees and Ward on November 3, 2020, computed in accordance with ASC Topic 718, which are being treated as “profits interests” for U.S. federal income tax purposes. |
(4) | Amounts in this column reflect the premiums paid by Owl Rock for an umbrella liability insurance policy established for the benefit of Mr. Ostrover and the tax gross-ups paid to Mr. Ostrover to cover the costs of the employee portion of the related payroll taxes due in respect of Mr. Ostrover’s compensation earned for the fiscal year ended December 31, 2020. For Messrs. Rees and Ward, amounts in this column reflect an employer contribution of $37,500 to a 401(k) plan maintained by Neuberger, and the payment of a bonus in an amount equal to $11,050,000 and $3,300,000, respectively, with respect to each such Named Executive Officer’s performance of services in Q1 2021 that was paid in advance in 2020. In addition, Neuberger may provide investment offerings to Messrs. Rees and Ward without charging management or performance fees consistent with the terms offered to other employees of Neuberger who meet the same applicable legal requirements. |
Stock Awards |
||||||||
Name |
Number of Share or Units of Stock That Have Not Vested(1) |
Market Value of Shares or Units of Stock That Have Not Vested(2) ($) |
||||||
Michael Rees |
55,289 | $ | 99,520,200 | |||||
Sean Ward |
11,923 | $ | 21,461,400 |
(1) | Represents the Dyal SLP Units held by Messrs. Rees and Ward. The units represent non-voting partnership interests in Dyal SLP. The units had no liquidation value on the date of grant, but instead provide for rights to distributions of certain future profits as specified in the Dyal SLP agreements. The Dyal SLP Units are subject to certain forfeiture conditions that will lapse in four equal annual installments beginning on November 3, 2027, subject to the relevant Named Executive Officer’s continued employment with Blue Owl; provided that such forfeiture conditions may be waived at any time by Dyal SLP without the consent of Blue Owl. On December 21, 2020, Mr. Rees transferred 24,880 Dyal SLP Units to a single-member limited liability company for estate planning purposes. |
(2) | There is no public market for the Dyal SLP Units. The market value shown above represents the fair value of the units as determined as of the grant date of November 3, 2020 under GAAP. The grant date fair value of the units was determined by using an independent valuation specialist who used a market approach to estimate enterprise value and an option-pricing method or OPM to allocate the value. The assumptions underlying the estimation of the fair value of the partnership interests were complex and subjective. The assumptions included, but were not limited to, assumptions regarding the selection of appropriate financial metric multiples and estimations of the amount at which the Company would be valued in a hypothetical transaction. There was no valuation of the units subsequent to the grant date and the value as of December 31, 2020 could vary from the grant date value listed here. |
• | 2,500,000,000 Class A Shares, |
• | 350,000,000 Class B Shares, |
• | 1,500,000,000 Class C Shares, |
• | 350,000,000 Class D Shares, |
• | 100,000,000 Class E Shares, which consists of 50,000,000 Series E-1 Shares and 50,000,000 Series E-2 Shares; and |
• | 100,000,000 shares of preferred stock. |
• | make nominations in the election of directors; |
• | propose that a director be removed; or |
• | propose any other business to be brought before an annual or special meeting of stockholders. |
• | the stockholder’s name and address; |
• | the number of shares beneficially owned by the stockholder and evidence of such ownership; |
• | the names of all persons with whom the stockholder is acting in concert and a description of all arrangements and understandings with those persons; |
• | a description of any agreement, arrangement or understanding reached with respect to shares of our stock, such as borrowed or loaned shares, short positions, hedging or similar transactions; |
• | a description of the business or nomination to be brought before the meeting and the reasons for conducting such business at the meeting; and |
• | any material interest of the stockholder in such business. |
• | any breach of his duty of loyalty to us or our stockholders; |
• | acts or omissions not in good faith, or which involve intentional misconduct or a knowing violation of law; |
• | unlawful payments of dividends or unlawful stock repurchases or redemptions as provided in Section 174 of the DGCL; or |
• | any transaction from which the director derived an improper personal benefit. |
• | amendment of organizational documents that are disproportionately adverse to Neuberger, as an equityholder; |
• | creation of new employee equity incentive plans or amendments to existing employee equity incentive plans, including by expansion of pool sizes; |
• | dividends and stock repurchases beyond an approved policy or on a non-pro rata basis; |
• | acquisitions/investments in excess of $2 billion and 20% of the total value of Blue Owl’s outstanding Class A common stock (subject to certain walls, conflicts of interest and confidentiality requirements) (assuming an exchange of all Common Units immediately prior to the time of determination); |
• | amendments to make less restrictive the restrictive covenant arrangements of any Key Individual; |
• | material related-party agreements or transactions between Blue Owl and the former Owl Rock or Dyal Principals (or amendments thereto); |
• | entering into a new business line that subjects Neuberger to a new regulatory regime; |
• | for three years after May 19, 2021, the merger or sale of all or a majority of Blue Owl’s common stock or Common Units or assets at a valuation below $13.50 per Class A Share and Class B common stock (assuming an exchange of all Common Units immediately prior to the time of determination); and |
• | for five years after May 19, 2021, for any issuance of equity securities that are dilutive to Blue Owl or its subsidiaries to any Key Individual under any employee equity incentive plan, other than as part of a broad-based compensation program generally applicable to employees of Blue Owl or its subsidiaries (and subject to certain further limitations under such broad-based program). |
• | annual aggregate cash compensation for the Key Individuals that exceeds 4% of the management fee revenue of Blue Owl and its subsidiaries; and |
• | Blue Owl Carry’s aggregate share of carried interest in any private equity-style fund sponsored by Blue Owl or its subsidiaries to be less than 15% of the total carried interest in such fund (in each case net of certain investor and other third party arrangements). |
• | in whole and not in part; |
• | at a price of $0.01 per warrant; |
• | upon a minimum of 30 days’ prior written notice of redemption to each warrant holder; and |
• | if, and only if, the reported last sale price of the Class A Shares equals or exceeds $18.00 per share (as adjusted for adjustments to the number of shares issuable upon exercise or the exercise price of a warrant as described under the heading “ —Warrants—Public Shareholders’ Warrants-Anti-Dilution Adjustments |
• | in whole and not in part; |
• | at $0.10 per warrant upon a minimum of 30 days’ prior written notice of redemption provided |
• | if, and only if, the last sale price of our Class A Shares equals or exceeds $10.00 per public share (as adjusted for adjustments to the number of shares issuable upon exercise or the exercise price of a warrant as described under the heading “ —Warrants-Public Shareholders’ Warrants-Anti-Dilution Adjustments |
Redemption Date |
Fair Market Value of Class A Common Stock |
|||||||||||||||||||||||||||||||||||
(period to expiration of warrants) |
£ $10.00 |
$11.00 |
$12.00 |
$13.00 |
$14.00 |
$15.00 |
$16.00 |
$17.00 |
³ $18.00 |
|||||||||||||||||||||||||||
60 months |
0.261 | 0.281 | 0.297 | 0.311 | 0.324 | 0.337 | 0.348 | 0.358 | 0.361 | |||||||||||||||||||||||||||
57 months |
0.257 | 0.277 | 0.294 | 0.310 | 0.324 | 0.337 | 0.348 | 0.358 | 0.361 | |||||||||||||||||||||||||||
54 months |
0.252 | 0.272 | 0.291 | 0.307 | 0.322 | 0.335 | 0.347 | 0.357 | 0.361 | |||||||||||||||||||||||||||
51 months |
0.246 | 0.268 | 0.287 | 0.304 | 0.320 | 0.333 | 0.346 | 0.357 | 0.361 | |||||||||||||||||||||||||||
48 months |
0.241 | 0.263 | 0.283 | 0.301 | 0.317 | 0.332 | 0.344 | 0.356 | 0.361 | |||||||||||||||||||||||||||
45 months |
0.235 | 0.258 | 0.279 | 0.298 | 0.315 | 0.330 | 0.343 | 0.356 | 0.361 | |||||||||||||||||||||||||||
42 months |
0.228 | 0.252 | 0.274 | 0.294 | 0.312 | 0.328 | 0.342 | 0.355 | 0.361 | |||||||||||||||||||||||||||
39 months |
0.221 | 0.246 | 0.269 | 0.290 | 0.309 | 0.325 | 0.340 | 0.354 | 0.361 | |||||||||||||||||||||||||||
36 months |
0.213 | 0.239 | 0.263 | 0.285 | 0.305 | 0.323 | 0.339 | 0.353 | 0.361 | |||||||||||||||||||||||||||
Redemption Date |
Fair Market Value of Class A Common Stock |
|||||||||||||||||||||||||||||||||||
(period to expiration of warrants) |
£ $10.00 |
$11.00 |
$12.00 |
$13.00 |
$14.00 |
$15.00 |
$16.00 |
$17.00 |
³ $18.00 |
|||||||||||||||||||||||||||
33 months |
0.205 | 0.232 | 0.257 | 0.280 | 0.301 | 0.320 | 0.337 | 0.352 | 0.361 | |||||||||||||||||||||||||||
30 months |
0.196 | 0.224 | 0.250 | 0.274 | 0.297 | 0.316 | 0.335 | 0.351 | 0.361 | |||||||||||||||||||||||||||
27 months |
0.185 | 0.214 | 0.242 | 0.268 | 0.291 | 0.313 | 0.332 | 0.350 | 0.361 | |||||||||||||||||||||||||||
24 months |
0.173 | 0.204 | 0.233 | 0.260 | 0.285 | 0.308 | 0.329 | 0.348 | 0.361 | |||||||||||||||||||||||||||
21 months |
0.161 | 0.193 | 0.223 | 0.252 | 0.279 | 0.304 | 0.326 | 0.347 | 0.361 | |||||||||||||||||||||||||||
18 months |
0.146 | 0.179 | 0.211 | 0.242 | 0.271 | 0.298 | 0.322 | 0.345 | 0.361 | |||||||||||||||||||||||||||
15 months |
0.130 | 0.164 | 0.197 | 0.230 | 0.262 | 0.291 | 0.317 | 0.342 | 0.361 | |||||||||||||||||||||||||||
12 months |
0.111 | 0.146 | 0.181 | 0.216 | 0.250 | 0.282 | 0.312 | 0.339 | 0.361 | |||||||||||||||||||||||||||
9 months |
0.090 | 0.125 | 0.162 | 0.199 | 0.237 | 0.272 | 0.305 | 0.336 | 0.361 | |||||||||||||||||||||||||||
6 months |
0.065 | 0.099 | 0.137 | 0.178 | 0.219 | 0.259 | 0.296 | 0.331 | 0.361 | |||||||||||||||||||||||||||
3 months |
0.034 | 0.065 | 0.104 | 0.150 | 0.197 | 0.243 | 0.286 | 0.326 | 0.361 | |||||||||||||||||||||||||||
0 months |
— | — | 0.042 | 0.115 | 0.179 | 0.233 | 0.281 | 0.323 | 0.361 |
• | each person known to the Company to be the beneficial owner of more than 5% of any class of the Company’s voting common stock; |
• | each of the Company’s executive officers and directors; and |
• | all executive officers and directors of the Company as a group. |
Name of Beneficial Owner(1) |
Class A Common Stock Beneficially Owned |
Class C Common Stock Beneficially Owned |
Class D Common Stock Beneficially Owned |
Combined Total Voting Power |
||||||||||||||||||||||||
Shares |
Percent |
Shares |
Percent |
Shares |
Percent |
|||||||||||||||||||||||
Directors and Executive Officers of Blue Owl |
||||||||||||||||||||||||||||
Douglas I. Ostrover(2), † |
— | — | 112,040,000 | 17.0 | % | 168,620,200 | 54.9 | % | 50.6 | % | ||||||||||||||||||
Marc S. Lipschultz(3) |
— | — | — | — | 0 | * | * | |||||||||||||||||||||
Michael Rees(4) |
— | — | — | — | 138,274,050 | 45.1 | % | 40.6 | % | |||||||||||||||||||
Alan J. Kirshenbaum(5) |
— | — | — | — | 0 | * | * | |||||||||||||||||||||
Craig W. Packer(6) |
— | — | — | — | 0 | * | * | |||||||||||||||||||||
Sean Ward(7) |
— | — | — | — | 0 | * | * | |||||||||||||||||||||
Dana Weeks |
— | — | — | — | — | — | — | |||||||||||||||||||||
Claudia Holz |
— | — | — | — | — | — | — | |||||||||||||||||||||
Andrew S. Komaroff |
— | — | — | — | — | — | — | |||||||||||||||||||||
Andrew Laurino(8) |
— | — | — | — | 0 | * | * | |||||||||||||||||||||
Andrew Polland(9) |
— | — | — | — | 0 | * | * | |||||||||||||||||||||
Junot Foradada |
— | — | — | — | — | — | — | |||||||||||||||||||||
Neena A. Reddy |
— | — | — | — | — | — | — | |||||||||||||||||||||
Stacy Polley |
— | — | — | — | — | — | — | |||||||||||||||||||||
All Directors and Executive Officers of Blue Owl as a Group (14 Individuals) |
— | — | 112,040,000 | 17.0 | % | 306,894,250 | 100.0 | % | 91.1 | % |
Name of Beneficial Owner(1) |
Class A Common Stock Beneficially Owned |
Class C Common Stock Beneficially Owned |
Class D Common Stock Beneficially Owned |
Combined Total Voting Power |
||||||||||||||||||||||||
Shares |
Percent |
Shares |
Percent |
Shares |
Percent |
|||||||||||||||||||||||
Five Percent Holders: |
||||||||||||||||||||||||||||
Owl Rock Capital Feeder LLC(2)(10) † |
— | — | 112,040,000 | 17.0 | % | 168,620,200 | 54.9 | % | 50.6 | % | ||||||||||||||||||
BB Holdings AA LP and Affiliates(11) |
50,000,000 | 14.0 | % | — | — | — | — | * | ||||||||||||||||||||
Dyal Capital SLP LP(12) |
— | — | — | — | 138,274,050 | 45.1 | % | 40.6 | % | |||||||||||||||||||
NBSH Blue Investments, LLC(13) |
— | — | 465,321,476 | 70.6 | % | — | — | 4.6 | % | |||||||||||||||||||
PSPE II Limited(14) |
60,878,106 | 17.0 | % | — | — | — | — | * | ||||||||||||||||||||
Brown University(15) |
35,386,965 | 10.4 | % | — | — | — | — | — | ||||||||||||||||||||
Quantum Strategic Partners Ltd.(16) |
18,377,239 | 5.1 | % | — | — | — | — | — | ||||||||||||||||||||
MSD Owl Rock Investments, LLC(17) |
— | — | 39,890,204 | 6.1 | % | — | — | — | ||||||||||||||||||||
CH Investment Partners, L.L.C.(18) |
19,012,947 | 5.32 | % | — | — | — | — | * | ||||||||||||||||||||
Koch Industries, Inc.(19) |
64,767,525 | 18.13 | % | — | — | — | — | * |
† | The number of shares and class ownership percentages reported for Mr. Ostrover excludes 69,555,831 Common Units and 2,793,656 Seller Earnout Units, each of which represents the right to receive one Common Unit and one Class D Share, subject to certain vesting conditions, in each case, held by Owl Rock Capital Feeder LLC on behalf of Mr. Ostrover, his spouse or one or more vehicles controlled by him, as limited partners of Owl Rock Capital Partners. The number of shares and class ownership percentages reported for Mr. Lipschultz excludes 56,909,319 Common Units and 2,285,719 Seller Earnout Units, each of which represents the right to receive one Common Unit and one Class D Share, subject to certain vesting conditions, in each case, held by Owl Rock Capital Feeder LLC on behalf of Mr. Lipschultz, his spouse or a vehicle controlled by him, as limited partners of Owl Rock Capital Partners. The number of shares and class ownership percentages reported for Mr. Kirshenbaum excludes 4,974,296 Common Units and 199,789 Seller Earnout Units, each of which represents the right to receive one Common Unit and one Class D Share, subject to certain vesting conditions, in each case, indirectly held by Owl Rock Capital Partners as a member of Owl Rock Capital Feeder LLC on behalf of Mr. Kirshenbaum or a vehicle controlled by him, as limited partners of Owl Rock Capital Partners. The number of shares and class ownership percentages reported for Mr. Packer excludes 33,724,040 Common Units and 1,354,500 Seller Earnout Units, each of which represents the right to receive one Common Unit and one Class D Share, subject to certain vesting conditions, in each case, indirectly held by Owl Rock Capital Partners as a member of Owl Rock Capital Feeder LLC on behalf of Mr. Packer. Each such person disclaims beneficial ownership of all such shares and units, except to the extent of his pecuniary interest therein. See footnotes 2, 3, 5, 6 and 10 for additional detail. |
* | Less than one percent. |
(1) | Unless otherwise noted, each of Blue Owl’s directors, officers and five percent holders is 399 Park Avenue, 38th Floor, New York, NY 10019. |
(2) | Owl Rock Capital Partners, as the managing member of Owl Rock Capital Feeder LLC, exercises voting control over 37,046,780 Class D Shares, 37,046,780 Common Units and 1,487,955 Seller Earnout Units on behalf of Mr. Ostrover; 15,120,008 Class D Shares, 15,120,008 Common Units and 607,283 Seller Earnout Units on behalf of Mr. Ostrover’s spouse, Julie J. Ostrover; and 17,389,042 Class D Shares, 17,389,042 Common Units and 698,417 Seller Earnout Units on behalf of The Douglas I. Ostrover 2016 Descendants’ Trust over which Mr. Ostrover has sole investment and voting power. Due to certain provisions in the organizational documents of Owl Rock Capital Partners LP, Mr. Ostrover may be deemed to beneficially own the Class C Shares and Class D Shares, the Common Units and the Seller Earnout Units held by Owl Rock Capital Feeder LLC. Mr. Ostrover expressly disclaims beneficial ownership of the shares and units |
held by Owl Rock Capital Feeder LLC, including any Class A Shares or Class B Shares that may be acquired upon exchange of Common Units and Class C Shares or Class D Shares, as applicable, and Common Units and Class C Shares and Class D Shares issuable in respect of the Seller Earnout Units upon the satisfaction of certain vesting conditions, in each case, except to the extent of his pecuniary interest therein. |
(3) | Owl Rock Capital Partners, as the managing member of Owl Rock Capital Feeder LLC, will exercise voting control over 22,508,407 Class D Shares, 22,508,407 Common Units and 904,033 Seller Earnout Units on behalf of Mr. Lipschultz; 23,296,213 Class D Shares, 23,296,213 Common Units and 935,674 Seller Earnout Units on behalf of Mr. Lipschultz’s spouse, Jennifer Lipschultz, and 11,104,699 Class D Shares, 11,104,699 Common Units and 446,012 Seller Earnout Units on behalf of the Lipschultz Family OR Trust over which Mr. Lipschultz has sole investment and voting power. Mr. Lipschultz expressly disclaims beneficial ownership of the Class C Shares and Class D Shares, the Common Units and any Seller Earnout Shares held by Owl Rock Capital Feeder LLC, and any Class A Shares or Class B Shares that may be acquired upon exchange of Common Units and Class C Shares or Class D Shares, as applicable, held by Owl Rock Capital Feeder and Common Units and Class C Shares and Class D Shares issuable in respect of the Seller Earnout Units upon the satisfaction of certain vesting conditions, in each case, except to the extent of his pecuniary interest therein. |
(4) | Dyal Capital SLP LP holds 76,450,340 Class D Shares, 76,450,340 Common Units and 3,021,752 Seller Earn Out Units on behalf of Mr. Rees, his spouse, or one or more entities controlled by him. The foregoing amounts reflect an estimate and are subject to change. By virtue of Mr. Rees’s indirect control of the general partner of and his indirect interests in Dyal SLP, Mr. Rees may be deemed to beneficially own the Class D Shares beneficially owned by Dyal Capital SLP LP. Mr. Rees disclaims beneficial ownership of the Class D Shares held by Dyal Capital SLP LP, except to the extent of his pecuniary interest therein. The number of shares and class ownership percentages reported for Mr. Rees exclude the 5,465,377 Class D Shares issuable upon the vesting of the Seller Earnout Units held by Dyal Capital SLP LP. The business address for each of Mr. Rees and Dyal Capital SLP LP is 1290 Avenue of the Americas, New York, NY 10104. |
(5) | Owl Rock Capital Partners, as the managing member of Owl Rock Capital Feeder LLC, will exercise voting control over 84,310 Class D Shares, 84,310 Common Units and 3,386 Seller Earnout Units on behalf of Mr. Kirshenbaum; 2,529,303 Class D Shares, 2,529,303 Common Units and 101,588 Seller Earnout Units on behalf of the Alan Kirshenbaum 2015 Family Trust and 2,360,683 Class D Shares, 2,360,683 Common Units and 94,815 Seller Earnout Units on behalf of Kirshenbaum 2019 Family Trust, in each case, over which Mr. Kirshenbaum has sole investment and voting power. Mr. Kirshenbaum expressly disclaims beneficial ownership of the Class C Shares and Class D Shares, the Common Units and any Seller Earnout Shares held by Owl Rock Capital Feeder LLC, and any Class A Shares or Class B Shares that may be acquired upon exchange of Common Units and Class C Shares or Class D Shares, as applicable, held by Owl Rock Capital Feeder and Common Units and Class C Shares and Class D Shares issuable in respect of the Seller Earnout Units upon the satisfaction of certain vesting conditions, in each case, except to the extent of his pecuniary interest therein. |
(6) | Owl Rock Capital Partners, as the managing member of Owl Rock Capital Feeder LLC, will exercise voting control over 24,610,278 Class D Shares, 24,610,278 Common Units and 988,453 Seller Earnout Units on behalf of Mr. Packer; 4,223,776 Class D Shares, 4,223,776 Common Units and 169,645 Seller Earnout Units on behalf of Packer Family Trust 2017, over which Mr. Packer has sole investment and voting power; and 4,889,986 Class D Shares, 4,889,986 Common Units and 196,403 Seller Earnout Units on behalf of Mr. Packer’s spouse, Suzanne Packer. Mr. Packer expressly disclaims beneficial ownership of the Class C Shares and Class D Shares, the Common Units and any Seller Earnout Shares held by Owl Rock Capital Feeder LLC, and any Class A Shares or Class B Shares that may be acquired upon exchange of Common Units and Class C Shares or Class D Shares, as applicable, held by Owl Rock Capital Feeder and Common Units and Class C Shares and Class D Shares issuable in respect of the Seller Earnout Units upon the satisfaction of certain vesting conditions, in each case, except to the extent of his pecuniary interest therein. |
(7) | The number of shares and class ownership percentages reported for Sean Ward excludes 16,160,597 Class D Shares, 16,160,597 Common Units and 651,637 Seller Earnout Units, each of which represents the right to receive one Common Unit and one Class D Share, subject to certain vesting conditions, in each case, held |
by Dyal Capital SLP LP on behalf of Sean Ward, his spouse or one or more entities controlled by him. Sean Ward disclaims beneficial ownership of all such shares and units, except to the extent of his pecuniary interest therein. |
(8) | The number of shares and class ownership percentages reported for Andrew Laurino excludes 10,425,842 Class D Shares, 10,425,842 Common Units and 420,397 Seller Earnout Units, each of which represents the right to receive one Common Unit and one Class D Share, subject to certain vesting conditions, in each case, held by Dyal Capital SLP LP on behalf of Andrew Laurino, his spouse or one or more entities controlled by him. Andrew Laurino disclaims beneficial ownership of all such shares and units, except to the extent of his pecuniary interest therein. |
(9) | The number of shares and class ownership percentages reported for Andrew Polland excludes 234,487 Class D Shares, 234,487 Common Units and 9,455 Seller Earnout Units, each of which represents the right to receive one Common Unit and one Class D Share, subject to certain vesting conditions, in each case, held by Dyal Capital SLP LP on behalf of Andrew Polland, his spouse or one or more entities controlled by him. Andrew Polland disclaims beneficial ownership of all such shares and units, except to the extent of his pecuniary interest therein. |
(10) | Owl Rock Capital Partners, as the managing member of Owl Rock Capital Feeder LLC, will exercise voting control over 168,620,200 Class D Shares and 6,772,500 Seller Earn Out Units, each of which represents the right to receive one Common Unit and one Class D Share, on behalf of the ORC Principals and 112,040,000 Class C Shares and 4,500,000 Seller Earnout Units, each of which represents the right to receive one Common Unit and one Class C Share, subject to certain vesting conditions, on behalf of Dyal Capital Partners IV Holdings (A) LP. Owl Rock Capital Partners is managed by Owl Rock Capital Partners (GP) LLC, which is governed by an executive committee comprised of Messrs. Ostrover, Lipschultz and Packer with decisions over certain matters requiring the vote of Mr. Ostrover. As such, Mr. Ostrover may be deemed to beneficially own all such shares and units. Each of these individuals and entities disclaims any beneficial ownership of these shares and units, except to the extent of their pecuniary interest therein. |
(11) | Based solely upon information contained in the Schedule 13G filed with the SEC on June 1, 2021. Includes 3,500,000 Class A Shares held by BB Holdings AC LP, a Delaware limited partnership (“BB Holdings AC”), 2,000,000 Class A Shares held by Glide Path Solutions 2021 LP, a Delaware limited partnership (“Glide Path Solutions 2021”), 4,500,000 Class A Shares held by Glide Path Solutions 2020 LP, a Delaware limited partnership (“Glide Path Solutions 2020”), 20,000,000 Class A Shares held by BB Holdings AA LP, a Delaware limited partnership (“BB Holdings AA” and, together with BB Holdings AC, Glide Path Solutions 2021 and Glide Path Solutions 2020, the “ICQ Limited Partnerships”), 10,000,000 Class A Shares held by Co-Investment Portfolio 2021 LP, a Delaware limited partnership (“Co-Investment Portfolio 2021”) and 10,000,000 Class A Shares held by Tactical Opportunities Portfolio 2020 LP, a Delaware limited partnership (“Tactical Opportunities 2020” and, together with Co-Investment Portfolio 2021 and the ICQ Limited Partnerships, the “Limited Partnerships”). ICQ BB GP, LLC, a Delaware limited liability company (“ICQ BB”), is the general partner of the ICQ Limited Partnerships, Co-Investment Portfolio GP II LP, a Delaware limited partnership (“Co-Investment Portfolio GP”), is the general partner of Co-Investment Portfolio 2021, ICQ Co-Investment II TT GP LLC, a Delaware limited liability company (“ICQ Co-Investment”), is the general partner of Co-Investment Portfolio GP, Tactical Opportunities Portfolio GP, LP, a Delaware limited partnership (“Tactical Opportunities Portfolio GP”), is a the general partner of Tactical Opportunities 2020 and ICQ Tactical Opportunities TT GP, LLC, a Delaware limited liability company (“ICQ Tactical Opportunities” and, together with ICQ BB and ICQ Co-Investment, the “General Partners”) is the general partner of Tactical Opportunities Portfolio GP. Divesh Makan, a citizen of the United States, is the managing member of each of the General Partners and may be deemed to have voting, investment, and dispositive power with respect to the shares held by the Limited Partnerships. The address of the foregoing entities and person is c/o ICONIQ Capital, 394 Pacific Avenue, 2nd Floor, San Francisco, CA 94111. |
(12) | By virtue of his indirect control of the general partner of, and his indirect interest in, Dyal Capital SLP LP, Mr. Rees may be deemed to beneficially own the Class D Shares, the Common Units and the Seller Earnout Units beneficially owned by Dyal Capital SLP LP. Mr. Rees disclaims beneficial ownership of the shares and units held by Dyal Capital SLP LP, including and any Class B common stock that may be acquired upon |
exchange of Common Units and Class D Shares, and any Common Units and Class C Shares and Class D Shares issuable in respect of the Seller Earnout Units upon the satisfaction of certain vesting conditions, in each case, except to the extent of his pecuniary interest therein. The number of shares and class ownership percentages reported for Dyal Capital SLP LP exclude the 10,930,754 Class D Shares issuable upon the vesting of the Seller Earnout Units held by Dyal Capital SLP LP. The business address for each of Mr. Rees and Dyal Capital SLP LP is 1290 Avenue of the Americas, New York, NY 10104. |
(13) | By virtue of the control of NBSH Blue Investments, LLC by affiliates of NBSH Acquisition, LLC, NBSH Acquisition, LLC may be deemed to beneficially own the Class C Shares beneficially owned by NBSH Blue Investments, LLC. Three or more individuals are expected to have decision making authority with respect to the Class C Shares held indirectly by NBSH Acquisition, LLC, and therefore no individual is a beneficial holder of the shares held by NBSH Acquisition, LLC. The business address for each of NBSH Acquisition, LLC and NBSH Blue Investments, LLC is 1290 Avenue of the Americas, New York, NY 10104. |
(14) | Based solely upon information contained in the Schedule 13G filed with the SEC on May 28, 2021, by Blue Pool Capital Limited, a company incorporated in Hong Kong (“BPCL”), Blue Pool Management Ltd., a Cayman Islands exempted company (“BPM”) and Oliver Paul Weisberg, a citizen of the Hong Kong Special Administrative Region of the People’s Republic of China (“Mr. Weisberg”). PSPE II Limited is an exempted company organized under the laws of the Cayman Islands. BPCL is the investment manager of PSPE II Limited and, in such capacity, exercises voting and investment power over the Shares held for the account of PSPE II Limited. BPM is the sole shareholder of BPCL. Mr. Weisberg is the sole shareholder and a director of BPM. Mr. Weisberg is also a director of BPCL. The number of shares and class ownership percentages reported for Blue Pool Capital Limited exclude 2,795,082 Class A Shares issuable upon conversion of Seller Earnout Shares upon the satisfaction of certain vesting conditions. The principal business address of each of the Reporting Persons is 25/F Hysan Place, 500 Hennessy Road, Causeway Bay, Hong Kong. |
(15) | Based solely upon information contained in the Schedule 13G filed with the SEC on June 17, 2021, by Brown University, a private, non-profit educational institution organized under the laws of the State of Rhode Island. The number of shares and class ownership percentages reported for Brown University exclude 1,702,898 Class A Shares issuable upon conversion of Seller Earnout Shares upon the satisfaction of certain vesting conditions. Three or more individuals are expected to have decision making authority with respect to the Class A Shares held by Brown University, and therefore no individual is a beneficial holder of the shares held by Brown University. The address of Brown University is 121 South Main Street, 9th Floor, Providence, RI 02903. |
(16) | The number of shares and class ownership percentages reported for Quantum Strategic Partners Ltd. excludes 843,750 Class A Shares issuable upon conversion of Seller Earnout Shares upon the satisfaction of certain vesting conditions. Soros Fund Management LLC (“SFM LLC”) serves as principal investment manager to Quantum Strategic Partners Ltd. As such, SFM LLC has been granted investment advisory discretion over all portfolio investments held for the account of such entities. George Soros serves as Chairman of SFM LLC and may be deemed to beneficially own all of the shares held by Quantum Strategic Partners Ltd. The address of Quantum Strategic Partners Ltd. is c/o Walkers Corporate Limited, Cayman Corporate Centre, 27 Hospital Road, George Town, Grand Cayman KY1-9008, Cayman Islands. |
(17) | The common stock owned by MSD Owl Rock Investments, LLC (“MSD Owl Rock”) is comprised of 39,890,204 Class C Shares. The shares are held of record by MSD Owl Rock. MSD Private Capital Investments, L.P., a Delaware limited partnership, is the sole owner of MSD Owl Rock and may be deemed to beneficially own the securities beneficially owned by MSD Owl Rock. MSD Capital, L. P. (“MSD Capital”) is the investment manager of MSD Owl Rock and the general partner of MSD Private Capital Investments, L.P., and may be deemed to beneficially own the securities beneficially owned by MSD Owl Rock. MSD Capital Management, LLC (“MSD Capital Management”), is the general partner of MSD Capital, and may be deemed to beneficially own the securities beneficially owned by MSD Capital. Each of John C. Phelan and Marc R. Lisker is a manager of, and may be deemed to beneficially own the securities beneficially owned by MSD Capital Management. Michael S. Dell is the controlling member of MSD Capital Management and may be deemed to beneficially own securities beneficially owned by MSD Capital Management. Each of Messrs. Dell, Phelan and Lisker disclaims beneficial ownership of such securities |
except to the extent of any pecuniary interest therein. The address of the principal business office of MSD Capital, L.P. is 645 Fifth Avenue, 21st Floor, New York, NY 10022. |
(18) | Based solely upon information contained in the Schedule 13G jointly filed with the SEC on July 6, 2021, by and on behalf of each of Blue Warehouse L.L.C., a Delaware limited liability company (“Blue Warehouse”), Blue Investors L.L.C., a Delaware limited liability company (“Blue Investors”), CHCP Direct Investors (Owl Rock), a Delaware limited partnership (“Direct Investors”, and collectively with Blue Warehouse and Blue Investors, the “Funds”), Oak Lawn Direct Investors GP, L.L.C., a Delaware limited liability company (“Oak Lawn”), CH Investment Partners, L.L.C., a Delaware limited liability company (“CHIP”), I35 Advisors, Inc., a Texas corporation (“I35”), Kirk L. Rimer and Michael R. Silverman (Blue Warehouse, Blue Investors, Direct Investors, Oak Lawn, CHIP, I35, Mr. Rimer and Mr. Silverman are collectively referred to herein as the “Reporting Persons”). |
(19) | Based solely upon information contained in the Schedule 13G jointly filed with the SEC on September 30, 2021 by Koch Industries, Inc. (“Koch Industries”) with respect to (i) 7,167,817 shares of Class A Common Stock of Issuer held by Koch Financial Assets III, LLC (“KFA”) and (ii) 28,799,854 shares of Class A Common Stock of Issuer held by Koch Companies Defined Benefit Master Trust (“Koch Pension”). Koch Industries may be deemed to beneficially own the Issuer securities beneficially owned by (i) KFA as a result of its 100% ownership of KFA and (ii) the Koch Pension because of the involvement of certain of Koch Industries’ employees on Koch Pension’s investment committee. |
• | the timing of exchanges of Common Units for our Class A and Class B Shares (or cash) under the Exchange Agreement—for instance, the increase in any tax deductions will vary depending on the fair value, which may fluctuate over time, of the relevant Common Units at the time of each exchange; |
• | the price of our Class A Shares and Class B Shares at the time of the exchange—the increase in any tax deductions, as well as the tax basis increase in other assets or other tax attributes, is proportional to the price of our Class A Shares and Class B Shares at the time of the exchange; |
• | the extent to which such exchanges are taxable—if an exchange is not taxable for any reason, an increase in the tax basis of the assets of the Blue Owl Operating Partnerships (and thus increased deductions) may not be available as a result of such exchange; and |
• | the amount and timing of our income—we will be required to pay 85% of the cash tax savings, if any, as and when realized. |
• | any person who is, or at any time during the applicable period was, one of Blue Owl’s executive officers or a member of the Blue Owl Board; |
• | any person who is known by Blue Owl to be the beneficial owner of more than five percent (5%) of our voting stock; |
• | any immediate family member of any of the foregoing persons, which means any child, stepchild, parent, stepparent, spouse, sibling, mother-in-law, father-in-law, daughter-in-law, brother-in-law sister-in-law |
• | any firm, corporation or other entity in which any of the foregoing persons is a partner or principal or in a similar position or in which such person has a 10 percent (10%) or greater beneficial ownership interest. |
• | financial institutions or financial services entities; |
• | broker-dealers; |
• | governments or agencies or instrumentalities thereof; |
• | regulated investment companies; |
• | real estate investment trusts; |
• | expatriates or former long-term residents of the United States; |
• | persons that actually or constructively own five percent or more (by vote or value) of our shares; |
• | persons that acquired our common stock or warrants pursuant to an exercise of employee share options, in connection with employee share incentive plans or otherwise as compensation; |
• | insurance companies; |
• | dealers or traders subject to a mark-to-market |
• | persons holding our common stock or warrants as part of a “straddle,” constructive sale, hedge, conversion or other integrated or similar transaction; |
• | U.S. holders (as defined below) whose functional currency is not the U.S. dollar; |
• | partnerships (or entities or arrangements classified as partnerships or other pass-through entities for U.S. federal income tax purposes) and any beneficial owners of such entities or arrangements; |
• | tax-exempt entities; |
• | controlled foreign corporations; and |
• | passive foreign investment companies. |
• | an individual who is a citizen or resident of the United States; |
• | a corporation (or other entity taxable as a corporation) organized in or under the laws of the United States, any state thereof or the District of Columbia; |
• | an estate the income of which is includible in gross income for U.S. federal income tax purposes regardless of its source; or |
• | a trust, if (i) a court within the United States is able to exercise primary supervision over the administration of the trust and one or more United States persons (as defined in the Code) have authority to control all substantial decisions of the trust or (ii) it has a valid election in effect under Treasury Regulations to be treated as a United States person. |
• | a non-resident alien individual (other than certain former citizens and residents of the United States subject to U.S. tax as expatriates); |
• | a foreign corporation; or |
• | an estate or trust that is not a U.S. holder; |
• | the gain is effectively connected with the conduct by the non-U.S. holder of a trade or business within the United States (and, under certain income tax treaties, is attributable to a United States permanent establishment or fixed base maintained by the non-U.S. holder); or |
• | we are or have been a “United States real property holding corporation” for U.S. federal income tax purposes at any time during the shorter of the five-year period ending on the date of disposition or the period that the non-U.S. holder held our common stock, and, in the case where shares of our common stock are regularly traded on an established securities market, the non-U.S. holder has owned, directly or constructively, more than 5% of our common stock at any time within the shorter of the five-year period preceding the disposition or such non-U.S. holder’s holding period for the shares of our common stock. |
Pages(s) |
||||
F-3 | ||||
F-4 | ||||
F-5 | ||||
F-8 | ||||
F-9 |
Page(s) |
||||
F-37 |
||||
F-38 |
||||
F-39 |
||||
F-40 |
||||
F-41 |
||||
F-42 |
F-55 |
||||
F-56 |
||||
F-57 |
||||
F-58 |
||||
F-59 |
||||
F-70 |
||||
F-71 |
||||
F-72 |
||||
F-73 |
||||
F-74 |
||||
F-75 |
June 30, 2021 |
December 31, 2020 |
|||||||
Assets |
||||||||
Cash and cash equivalents |
$ | $ | ||||||
Due from related parties |
||||||||
Operating lease assets |
||||||||
Deferred tax assets |
||||||||
Intangible assets, net |
||||||||
Goodwill |
||||||||
Other assets, net |
||||||||
Total Assets |
$ |
$ |
||||||
Liabilities |
||||||||
Debt obligations, net |
$ | $ | ||||||
Accrued compensation |
||||||||
Operating lease liabilities |
||||||||
Deferred tax liabilities |
||||||||
TRA liability (includes $ |
||||||||
Warrant liability, at fair value |
||||||||
Earnout Securities liability, at fair value |
||||||||
Accounts payable, accrued expenses and other liabilities |
||||||||
Total Liabilities |
||||||||
Commitments and Contingencies (Note 11) |
||||||||
Shareholders’ Equity (Deficit) |
||||||||
Members’ deficit prior to the Business Combination |
— | ( |
) | |||||
Class A Shares, par value $ |
||||||||
Class C Shares, par value $ |
||||||||
Class D Shares, par value $ |
||||||||
Class E Shares, par value $ |
||||||||
Additional paid-in capital |
||||||||
Accumulated deficit |
( |
) | ||||||
Total Shareholders’ Equity Attributable to Blue Owl Capital Inc. |
||||||||
Shareholders’ equity attributable to noncontrolling interests |
||||||||
Total Shareholders’ Equity (Deficit) |
( |
) | ||||||
Total Liabilities and Shareholders’ Equity (Deficit) |
$ |
$ |
||||||
Three Months Ended June 30, |
Six Months Ended June 30, |
|||||||||||||||
2021 |
2020 |
2021 |
2020 |
|||||||||||||
Revenues |
||||||||||||||||
Management fees, net (includes BDC Part I Fees of $ |
$ | $ | $ | $ | ||||||||||||
Administrative, transaction and other fees |
||||||||||||||||
|
|
|
|
|
|
|
|
|||||||||
Total Revenues, Net |
||||||||||||||||
|
|
|
|
|
|
|
|
|||||||||
Expenses |
||||||||||||||||
Compensation and benefits |
||||||||||||||||
Amortization of intangible assets |
||||||||||||||||
General, administrative and other expenses |
||||||||||||||||
|
|
|
|
|
|
|
|
|||||||||
Total Expenses |
||||||||||||||||
|
|
|
|
|
|
|
|
|||||||||
Other Income (Loss) |
||||||||||||||||
Net losses on retirement of debt |
( |
) | ( |
) | ||||||||||||
Interest expense |
( |
) | ( |
) | ( |
) | ( |
) | ||||||||
Change in TRA liability |
( |
) | ( |
) | ||||||||||||
Change in warrant liability |
( |
) | ( |
) | ||||||||||||
Change in Earnout Securities liability |
( |
) | ( |
) | ||||||||||||
|
|
|
|
|
|
|
|
|||||||||
Total Other Income (Loss) |
( |
) |
( |
) |
( |
) |
( |
) | ||||||||
|
|
|
|
|
|
|
|
|||||||||
Income (Loss) Before Income Taxes |
( |
) |
( |
) |
( |
) |
( |
) | ||||||||
Income tax expense (benefit) |
( |
) | ( |
) | ( |
) | ( |
) | ||||||||
|
|
|
|
|
|
|
|
|||||||||
Consolidated and Combined Net Income (Loss) |
( |
) |
( |
) |
( |
) |
( |
) | ||||||||
Net (income) loss attributable to noncontrolling interests |
||||||||||||||||
|
|
|
|
|
|
|
|
|||||||||
Net Income (Loss) Attributable to Blue Owl Capital Inc. (After May 19, 2021) / Owl Rock (Prior to May 19, 2021) |
$ |
( |
) |
$ |
( |
) |
$ |
( |
) |
$ |
( |
) | ||||
|
|
|
|
|
|
|
|
|||||||||
May 19, 2021 through June 30, 2021 |
||||||||||||||||
Net Loss Attributable to Class A Shares |
$ |
( |
) |
|||||||||||||
|
|
|||||||||||||||
Net Loss per Class A Share |
||||||||||||||||
Basic |
$ | ( |
) | |||||||||||||
|
|
|||||||||||||||
Diluted |
$ | ( |
) | |||||||||||||
|
|
|||||||||||||||
Weighted-Average Class A Shares(1) |
||||||||||||||||
Basic |
||||||||||||||||
|
|
|||||||||||||||
Diluted |
||||||||||||||||
|
|
(1) | Includes |
Three Months Ended June 30, |
Six Months Ended June 30, |
|||||||||||||||
2021 |
2020 |
2021 |
2020 |
|||||||||||||
Members’ Deficit Prior to the Business Combination |
||||||||||||||||
Beginning balance |
$ | ( |
) | $ | ( |
) | $ | ( |
) | $ | ( |
) | ||||
Distributions |
( |
) | ( |
) | ( |
) | ( |
) | ||||||||
Comprehensive income (loss) prior to the Business Combination Date |
( |
) | ( |
) | ||||||||||||
Transfer of predecessor members’ deficit to additional paid-in capital and noncontrolling interests |
— | — | ||||||||||||||
|
|
|
|
|
|
|
|
|||||||||
Ending Balance |
$ |
$ |
( |
) |
$ |
$ |
( |
) | ||||||||
|
|
|
|
|
|
|
|
|||||||||
Class A Shares Par Value |
||||||||||||||||
Beginning balance |
$ | $ | $ | $ | ||||||||||||
Impact of the Business Combination |
— | — | ||||||||||||||
|
|
|
|
|
|
|
|
|||||||||
Ending Balance |
$ |
$ |
$ |
$ |
||||||||||||
|
|
|
|
|
|
|
|
|||||||||
Class C Shares Par Value |
||||||||||||||||
Beginning balance |
$ | $ | $ | $ | ||||||||||||
Impact of the Business Combination |
— | — | ||||||||||||||
|
|
|
|
|
|
|
|
|||||||||
Ending Balance |
$ |
$ |
$ |
$ |
||||||||||||
|
|
|
|
|
|
|
|
|||||||||
Class D Shares Par Value |
||||||||||||||||
Beginning balance |
$ | $ | $ | $ | ||||||||||||
Impact of the Business Combination |
— | — | ||||||||||||||
|
|
|
|
|
|
|
|
|||||||||
Ending Balance |
$ |
$ |
$ |
$ |
||||||||||||
|
|
|
|
|
|
|
|
|||||||||
Class E Shares Par Value |
||||||||||||||||
Beginning balance |
$ | $ | $ | $ | ||||||||||||
Impact of the Business Combination |
— | — | ||||||||||||||
|
|
|
|
|
|
|
|
|||||||||
Ending Balance |
$ |
$ |
$ |
$ |
||||||||||||
|
|
|
|
|
|
|
|
Three Months Ended June 30, |
Six Months Ended June 30, |
|||||||||||||||
2021 |
2020 |
2021 |
2020 |
|||||||||||||
Additional Paid-in Capital |
||||||||||||||||
Beginning balance |
$ | $ | $ | $ | ||||||||||||
Transfer of predecessor Owl Rock members’ deficit to additional paid-in capital and noncontrolling interests |
( |
) | — | ( |
) | — | ||||||||||
Cash proceeds from the Business Combination |
— | — | ||||||||||||||
Offering costs related to the Business Combination |
( |
) | — | ( |
) | — | ||||||||||
Allocation of cash proceeds to warrant liability |
( |
) | — | ( |
) | — | ||||||||||
Allocation of cash proceeds to Earnout Securities liability for Class E Shares issued in connection with the Business Combination |
( |
) | — | ( |
) | — | ||||||||||
Deferred taxes and TRA liability recognized in the Business Combination (excluding Dyal Acquisition) |
— | — | ||||||||||||||
Reallocation between additional paid-in capital and noncontrolling interests related to the Business Combination |
( |
) | — | ( |
) | — | ||||||||||
Equity-based compensation |
— | — | ||||||||||||||
|
|
|
|
|
|
|
|
|||||||||
Ending Balance |
$ |
$ |
$ |
$ |
||||||||||||
|
|
|
|
|
|
|
|
|||||||||
Accumulated Deficit |
||||||||||||||||
Beginning balance |
$ | $ | $ | $ | ||||||||||||
Comprehensive loss following the Business Combination Date |
( |
) | — | ( |
) | — | ||||||||||
|
|
|
|
|
|
|
|
|||||||||
Ending Balance |
$ |
( |
) |
$ |
$ |
( |
) |
$ |
||||||||
|
|
|
|
|
|
|
|
|||||||||
Total Shareholders’ Equity Attributable to Blue Owl Capital Inc. |
$ |
$ |
$ |
$ |
||||||||||||
|
|
|
|
|
|
|
|
|||||||||
Shareholders’ Equity Attributable to Noncontrolling Interests |
||||||||||||||||
Beginning balance |
$ | $ | $ | $ | ||||||||||||
Transfer of predecessor Owl Rock member’ deficit to additional paid-in capital and noncontrolling interests |
( |
) | — | ( |
) | — | ||||||||||
Common Units issued as consideration related to the Dyal Acquisition |
— | — | ||||||||||||||
Acquisition of noncontrolling interests in the Blue Owl Operating Group in connection with the Business Combination |
( |
) | — | ( |
) | — | ||||||||||
Allocation to Earnout Securities liability for Seller Earnout Units issued in connection with the Business Combination |
( |
) | — | ( |
) | — | ||||||||||
Reallocation between additional paid-in capital and noncontrolling interests related to the Business Combination |
— | — | ||||||||||||||
Contributions |
||||||||||||||||
Distributions |
( |
) | — | ( |
) | ( |
) | |||||||||
Equity-based compensation |
— | — | ||||||||||||||
Comprehensive income (loss) |
( |
) | ( |
) | ( |
) | ( |
) | ||||||||
|
|
|
|
|
|
|
|
|||||||||
Ending Balance |
$ |
$ |
$ |
$ |
||||||||||||
|
|
|
|
|
|
|
|
|||||||||
Total Shareholders’ Equity |
$ |
$ |
$ |
$ |
||||||||||||
|
|
|
|
|
|
|
|
|||||||||
Cash Dividends Paid per Class A Share |
$ |
$ |
$ |
$ |
Three Months Ended June 30, |
Six Months Ended June 30, |
|||||||||||||||
2021 |
2020 |
2021 |
2020 |
|||||||||||||
Number of Class A Shares |
||||||||||||||||
Beginning balance |
||||||||||||||||
Impact of the Business Combination |
— | — | ||||||||||||||
|
|
|
|
|
|
|
|
|||||||||
Ending Balance |
||||||||||||||||
|
|
|
|
|
|
|
|
|||||||||
Number of Class C Shares |
||||||||||||||||
Beginning balance |
||||||||||||||||
Impact of the Business Combination |
— | — | ||||||||||||||
|
|
|
|
|
|
|
|
|||||||||
Ending Balance |
||||||||||||||||
|
|
|
|
|
|
|
|
|||||||||
Number of Class D Shares |
||||||||||||||||
Beginning balance |
||||||||||||||||
Impact of the Business Combination |
— | — | ||||||||||||||
|
|
|
|
|
|
|
|
|||||||||
Ending Balance |
||||||||||||||||
|
|
|
|
|
|
|
|
|||||||||
Number of Class E Shares |
||||||||||||||||
Beginning balance |
||||||||||||||||
Impact of the Business Combination |
— | — | ||||||||||||||
|
|
|
|
|
|
|
|
|||||||||
Ending Balance |
||||||||||||||||
|
|
|
|
|
|
|
|
Six Months Ended June 30, |
||||||||
2021 |
2020 |
|||||||
Cash Flows from Operating Activities |
||||||||
Consolidated and combined net income (loss) |
$ | ( |
) | $ |
( |
) | ||
Adjustments to reconcile consolidated and combined net income (loss) to net cash from operating activities: |
||||||||
Amortization of intangible assets |
||||||||
Equity-based compensation |
||||||||
Depreciation and amortization of fixed assets |
||||||||
Amortization of debt discounts and deferred financing costs |
||||||||
Non-cash lease expense |
( |
) | ||||||
Net losses on retirement of debt |
||||||||
Change in TRA liability |
||||||||
Change in warrant liability |
||||||||
Change in Earnout Securities liability |
||||||||
Deferred income taxes |
( |
) | ||||||
Changes in operating assets and liabilities: |
||||||||
Due from related parties |
( |
) | ||||||
Other assets, net |
( |
) | ||||||
Accrued compensation |
||||||||
Accounts payable, accrued expenses and other liabilities |
( |
) | ( |
) | ||||
|
|
|
|
|||||
Net Cash Provided by (Used in) Operating Activities |
( |
) | ||||||
|
|
|
|
|||||
Cash Flows from Investing Activities |
||||||||
Purchase of fixed assets |
( |
) | ( |
) | ||||
Purchase of investments |
( |
) | ||||||
Cash consideration paid for Dyal Capital, net of cash consideration received |
( |
) | ||||||
|
|
|
|
|||||
Net Cash Provided by (Used in) Investing Activities |
( |
) |
( |
) | ||||
|
|
|
|
|||||
Cash Flows from Financing Activities |
||||||||
Cash proceeds from the Business Combination |
||||||||
Offering costs related to the Business Combination |
( |
) | ||||||
Acquisition of noncontrolling interests in the Blue Owl Operating Group in connection with the Business Combination |
( |
) | ||||||
Proceeds from debt obligations |
||||||||
Debt issuance costs |
( |
) | ( |
) | ||||
Repayments of debt obligations, including prepayment costs |
( |
) | ( |
) | ||||
Distributions to members prior to the Business Combination |
( |
) | ( |
) | ||||
Contributions from noncontrolling interests |
||||||||
Distributions to noncontrolling interests |
( |
) | ( |
) | ||||
|
|
|
|
|||||
Net Cash Provided by (Used in) Financing Activities |
||||||||
|
|
|
|
|||||
Net Increase (Decrease) in Cash and Cash-equivalents |
( |
) | ||||||
|
|
|
|
|||||
Cash and cash-equivalents, beginning of period |
||||||||
|
|
|
|
|||||
Cash and Cash-equivalents, End of Period |
$ |
$ |
||||||
|
|
|
|
|||||
Supplemental Information |
||||||||
Cash paid for interest |
$ | $ | ||||||
Cash paid for income taxes |
$ | $ |
• | Class A Shares– |
• | Class B Shares– |
• | Class C Shares– |
Shareholders do not participate in the earnings of the Registrant, as the holders of such shares participate directly in the economics of the Blue Owl Operating Group through their Common Units holdings. For every Common Unit held by non-Principals, |
• | Class D Shares – |
• | Class E Shares – |
• | RSUs – |
• | Warrants – |
June 30, 2021 |
||||
Class A Shares |
||||
Class C Shares |
||||
Class D Shares |
||||
Class E Shares |
||||
Series E-1 |
||||
Series E-2 |
||||
RSUs |
||||
Warrants |
• | GP Units – |
• | Common Units – non-Principal or Class B Shares if held by a Principal. Common Unit exchanges may be settled in cash only at the election of the Company’s Exchange Committee, which is comprised of independent members of the Board, and can only be funded from proceeds of a new permanent equity offering. Common Units held by non-Principals are exchangeable for shares of the Registrant after the six-month |
• | Seller Earnout Units – |
Units |
June 30, 2021 |
|||
GP Units |
||||
Common Units |
||||
Seller Earnout Units |
||||
Series E-1(1) |
||||
Series E-2(2) |
(1) | Includes E-1) in the Blue Owl Operating Group. |
(2) | Includes E-2) in the Blue Owl Operating Group. |
Consideration |
||||
Equity consideration(1) |
$ | |||
Cash consideration(2) |
||||
Tax receivable agreement(3) |
||||
Earnout Securities(3) |
||||
Total Consideration |
$ |
|||
Net Identifiable Assets Acquired and Goodwill |
||||
Assets acquired: |
||||
Due from related parties |
$ | |||
Intangible assets |
||||
Deferred tax asset |
||||
Other assets, net |
||||
Total assets acquired |
||||
Liabilities assumed: |
||||
Accrued compensation |
||||
Deferred tax liability |
||||
Accounts payable, accrued expenses and other liabilities |
||||
Total liabilities assumed |
||||
Net Identifiable Assets Acquired |
$ |
|||
Goodwill(4) |
$ |
|||
(1) | Represents share consideration issued to the Dyal Capital selling shareholders based on the fair value of the acquired business, reflecting a discount for lack of control. |
(2) | Includes cash consideration paid to reimburse seller for certain pre-acquisition expenses, net of cash received in the Business Combination. |
(3) | The TRA and Earnout Securities represent contingent consideration. See Note 9 for additional information on the valuation of these instruments. |
(4) | Goodwill represents the amount of total consideration in excess of net identifiable assets acquired. None of the goodwill balance is expected to be deductible by the Blue Owl Operating Partnerships for tax purposes. |
June 30, 2021 |
Useful Life (in years) |
Remaining Weighted-Average Amortization Period as of June 30, 2021 |
||||||||||
Investment management agreements |
$ | |||||||||||
Institutional investor relationships |
||||||||||||
Trademarks |
||||||||||||
Total Intangible Assets |
||||||||||||
Less: accumulated amortization |
( |
) | ||||||||||
Total Intangible Assets, Net |
$ |
|||||||||||
Period |
Amortization |
|||
July 1, 2021 to December 31, 2021 |
$ | |||
2022 |
||||
2023 |
||||
2024 |
||||
2025 |
||||
Thereafter |
||||
Total |
$ |
|||
June 30, 2021 |
||||||||||||||||||||||||
Current Maturity Date |
Aggregate Facility Size |
Outstanding Debt |
Amount Available(1) |
Net Carrying Value |
Average Interest Rate(2) |
|||||||||||||||||||
2031 Notes |
6/10/2031 | $ | $ | $ | $ | % | ||||||||||||||||||
Revolving Credit Facility |
4/15/2024 | % | ||||||||||||||||||||||
Total |
$ |
$ |
$ |
$ |
||||||||||||||||||||
(1) | Amount available is reduced by outstanding letters of credit related to certain leases. |
(2) | Average interest rate noted above, excludes the impact of deferred financing costs and discounts. |
December 31, 2020 |
||||||||||||||||||||||||
Current Maturity Date |
Aggregate Facility Size |
Outstanding Debt |
Amount Available(1) |
Net Carrying Value |
Average Interest Rate(2) |
|||||||||||||||||||
Revolving Credit Facility #1 |
2/28/2022 | $ | $ | $ | $ | % | ||||||||||||||||||
Revolving Credit Facility #2 |
8/20/2021 | % | ||||||||||||||||||||||
Term Loan |
10/25/2029 | % | ||||||||||||||||||||||
|
|
|
|
|
|
|
|
|||||||||||||||||
Total |
$ |
$ |
$ |
$ |
||||||||||||||||||||
|
|
|
|
|
|
|
|
(1) | Amount available is reduced by outstanding letters of credit related to certain leases. |
(2) | Average interest rate noted above, excludes the impact of deferred financing costs. |
Lease Cost |
Three Months Ended June 30, 2021 |
Six Months Ended June 30, 2021 |
||||||
Operating lease cost |
$ | $ | ||||||
Short term lease cost |
||||||||
|
|
|
|
|||||
Net Lease Cost |
$ | $ | ||||||
|
|
|
|
Supplement Lease Cash Flow Information |
Three Months Ended June 30, 2021 |
Six Months Ended June 30, 2021 |
||||||
Cash paid for amounts included in the measurement of lease liabilities: |
||||||||
Operating cash flows for operating leases |
$ | $ | ||||||
Right-of-use |
||||||||
Operating leases |
$ | $ |
Lease Term and Discount Rate |
June 30, 2021 |
|||
Weighted-average remaining lease term: |
||||
Operating leases |
||||
Weighted-average discount rate: |
||||
Operating leases |
% |
Future Maturity of Operating Lease Payments |
Operating Leases |
|||
July 1, 2021 to December 31, 2021 |
$ | |||
2022 |
||||
2023 |
||||
2024 |
||||
2025 |
||||
Thereafter |
||||
|
|
|||
Total Lease Payments |
||||
Imputed interest |
( |
) | ||
|
|
|||
Total Lease Liabilities |
$ |
|||
|
|
Three Months Ended June 30, |
Six Months Ended June 30, |
|||||||||||||||
(dollars in thousands) |
2021 |
2020 |
2021 |
2020 |
||||||||||||
Direct Lending Products |
||||||||||||||||
Diversified lending |
$ | $ | $ | $ | ||||||||||||
Technology lending |
||||||||||||||||
First lien lending |
||||||||||||||||
Opportunistic lending |
||||||||||||||||
Management Fees, Net |
||||||||||||||||
Administrative, transaction and other fees |
||||||||||||||||
Total GAAP Revenues—Direct Lending Products |
||||||||||||||||
GP Capital Solutions Products |
||||||||||||||||
GP minority equity investments |
||||||||||||||||
GP debt financing |
||||||||||||||||
Management Fees, Net |
||||||||||||||||
Administrative, transaction and other fees |
||||||||||||||||
Total GAAP Revenues—GP Capital Solutions Products |
||||||||||||||||
Total GAAP Revenues |
$ |
$ |
$ |
$ |
||||||||||||
Six Months Ended June 30, |
||||||||
(dollars in thousands) |
2021 |
2020 |
||||||
Management Fees Receivable |
||||||||
Beginning balance |
$ | $ | ||||||
Ending balance |
$ | $ | ||||||
Administrative, Transaction and Other Fees Receivable |
||||||||
Beginning balance |
$ | $ | ||||||
Ending balance |
$ | $ | ||||||
Unearned Management Fees |
||||||||
Beginning balance |
$ | $ | ||||||
Ending balance |
$ | $ |
(dollars in thousands) |
June 30, 2021 |
December 31, 2020 |
||||||
Fixed assets, net: |
||||||||
Leasehold improvements |
$ | $ | ||||||
Furniture and fixtures |
||||||||
Computer equipment |
||||||||
Computer software |
||||||||
Accumulated depreciation and amortization |
( |
) | ( |
) | ||||
Fixed assets, net |
||||||||
Prepaid assets |
||||||||
Investments (includes $ |
||||||||
Deferred Business Combination-related expenses |
||||||||
Other |
||||||||
Total Other Assets, Net |
$ |
$ |
||||||
Three Months Ended June 30, |
Six Months Ended June 30, |
|||||||||||||||
(dollars in thousands) |
2021 |
2020 |
2021 |
2020 |
||||||||||||
Common Units |
$ | $ | $ | $ | ||||||||||||
Seller Earnout Units |
||||||||||||||||
Equity-Based Compensation Expense |
$ |
$ |
$ |
$ |
||||||||||||
Corresponding tax benefit |
$ | $ | $ | $ | ||||||||||||
Common Units |
Seller Earnout Units |
Equity-Classified RSUs |
||||||||||||||||||||||
Unvested |
Weighted-Average Grant Date Fair Value Per Unit |
Unvested |
Weighted-Average Grant Date Fair Value Per Unit |
Unvested |
Weighted-Average Grant Date Fair Value Per Unit |
|||||||||||||||||||
December 31, 2020 |
$ | $ | $ | |||||||||||||||||||||
Granted |
||||||||||||||||||||||||
Vested |
( |
) | ( |
) | ||||||||||||||||||||
June 30, 2021 |
$ |
$ |
$ |
|||||||||||||||||||||
• | Level I—Quoted prices that are available in active markets for identical financial assets or liabilities as of the reporting date. |
• | Level II—Valuations obtained from independent third-party pricing services, the use of models or other valuation methodologies based on pricing inputs that are either directly or indirectly market |
observable as of the measurement date. These financial assets and liabilities exhibit higher levels of liquid market observability as compared to Level III financial assets and liabilities. |
• | Level III—Pricing inputs that are unobservable in the market and includes situations where there is little, if any, market activity for the financial asset or liability. The inputs into the determination of fair value of financial assets and liabilities in this category may require significant management judgment or estimation. The fair value of these financial assets and liabilities may be estimated using a combination of observed transaction prices, independent pricing services, models or other valuation methodologies based on pricing inputs that are neither directly nor indirectly market observable (e.g., cash flows, implied yields). |
June 30, 2021 |
||||||||||||||||
(dollars in thousands) |
Level I |
Level II |
Level III |
Total |
||||||||||||
Liabilities, at Fair Value |
||||||||||||||||
TRA liability |
$ | $ | $ | $ | ||||||||||||
Warrant liability |
||||||||||||||||
Earnout Securities liability |
||||||||||||||||
|
|
|
|
|
|
|
|
|||||||||
Total Liabilities, at Fair Value |
$ |
$ |
$ |
$ |
||||||||||||
|
|
|
|
|
|
|
|
Level III Liabilities |
||||||||||||||||
(dollars in thousands) |
TRA Liability |
Warrant Liability |
Earnout Securities Liability |
Total |
||||||||||||
Beginning balance |
$ | $ | $ | $ | ||||||||||||
Impact of the Business Combination |
||||||||||||||||
Unrealized (gains) losses |
||||||||||||||||
|
|
|
|
|
|
|
|
|||||||||
Ending Balance |
$ |
$ |
$ |
$ |
||||||||||||
|
|
|
|
|
|
|
|
|||||||||
Net change in unrealized (gains) losses held as of the reporting date |
$ | $ | $ | $ | ||||||||||||
|
|
|
|
|
|
|
|
Fair Value |
Valuation Technique |
Significant Unobservable Inputs |
Input |
Impact to Valuation from an Increase in Input | ||||||||||||
(dollars in thousands) |
||||||||||||||||
TRA liability |
$ | |
Discounted cash flow |
|
Discount rate | % | Decrease | |||||||||
Warrant liability |
|
Monte Carlo simulation |
|
Volatility | % | Increase | ||||||||||
Risk-free rate | % | Increase | ||||||||||||||
Earnout Securities liability |
|
Monte Carlo simulation |
|
Volatility | % | Increase | ||||||||||
Risk-free rate | % | Increase | ||||||||||||||
Discount for lack of marketability |
% | Decrease | ||||||||||||||
Total Liabilities, at Fair Value |
$ |
|||||||||||||||
(dollars in thousands) |
Potential Payments Under the Tax Receivable Agreement |
|||
July 1, 2021 to December 31, 2021 |
$ | |||
2022 |
||||
2023 |
||||
2024 |
||||
2025 |
||||
Thereafter |
||||
Total Payments |
||||
Less adjustment to fair value for contingent consideration |
( |
) | ||
Total TRA Liability |
$ |
|||
(dollars in thousands) |
June 30, 2021 |
December 31, 2020 |
||||||
Management fees |
$ | $ | ||||||
Administrative fees and other expenses paid on behalf of the Company’s products and other related parties |
||||||||
Due from Related Parties |
$ |
$ |
||||||
For the Period from May 19, 2021 to June 30, 2021 |
Net Loss Attributable to Class A Shareholders |
Weighted-Average Class A Shares Outstanding |
Loss Per Class A Share |
Number of Units Excluded from Diluted Calculation |
||||||||||||
(dollars in thousands, except per share amounts) |
||||||||||||||||
Basic |
$ |
( |
) |
$ |
( |
) |
||||||||||
|
|
|
|
|
|
|||||||||||
Effect of dilutive securities: |
||||||||||||||||
Common Units |
( |
) | — | |||||||||||||
Warrants |
— | — | ||||||||||||||
Earnout Securities |
— | — | ||||||||||||||
|
|
|
|
|||||||||||||
Diluted |
$ |
( |
) |
$ |
( |
) |
||||||||||
|
|
|
|
|
|
December 31, 2020 |
December 31, 2019 |
|||||||
Assets |
||||||||
Cash and cash-equivalents |
$ | $ | ||||||
Due from affiliates, net |
||||||||
Other assets |
||||||||
Total assets |
$ | $ | ||||||
Liabilities |
||||||||
Accounts payable, accrued expenses and other liabilities |
$ | $ | ||||||
Accrued compensation |
||||||||
Debt obligations, net |
||||||||
Total liabilities |
|
|
||||||
Commitments and contingencies (Note 8) |
||||||||
Members’ capital (deficit) |
||||||||
Members’ capital (deficit) attributed to members of Owl Rock Capital and sole member Owl Rock Capital Securities LLC |
( |
) | ( |
) | ||||
Non-controlling interests |
||||||||
Total members’ capital (deficit) |
( |
) | ( |
) | ||||
Total liabilities and members’ capital (deficit) |
$ | $ | ||||||
For the Years Ended December 31, |
||||||||||||
2020 |
2019 |
2018 |
||||||||||
Revenues |
||||||||||||
Management fees, net (includes BDC Part I fees of $ |
$ | $ | $ | |||||||||
Administrative, transaction and other fees |
||||||||||||
Total revenues, net |
||||||||||||
Expenses |
||||||||||||
Compensation and benefits |
|
|
||||||||||
General, administrative and other expenses |
||||||||||||
Total expenses |
|
|||||||||||
Interest expense |
||||||||||||
Net income (loss) before income taxes |
( |
) | ( |
) | ||||||||
Income tax expense (benefit) |
( |
) | ( |
) | ||||||||
Net income (loss) including non-controlling interests |
( |
) | ( |
) | ||||||||
Net (income) loss attributed to non-controlling interests |
||||||||||||
Net income (loss) attributable to members of Owl Rock Capital and sole member of Owl Rock Capital Securities LLC |
$ | ( |
) | $ | $ | |||||||
Members of Owl Rock Capital |
||||||||||||||||||||
Securities Sole Member |
Sponsor B Units |
Class A Units |
Non-controlling Interests |
Total |
||||||||||||||||
Members’ capital (deficit) at December 31, 2017 |
$ | $ | ( |
) | $ | ( |
) | $ | $ | ( |
) | |||||||||
Contributions |
|
|||||||||||||||||||
Distributions |
( |
) | ( |
) | ( |
) | ( |
) | ||||||||||||
Net income (loss) |
|
( |
) | ( |
) | |||||||||||||||
Members’ capital (deficit) at December 31, 2018 |
$ | |
$ | ( |
) | $ | ( |
) | $ | ( |
) | $ | ( |
) | ||||||
Contributions |
|
|
||||||||||||||||||
Distributions |
( |
) | ( |
) | ( |
) | ( |
) | ||||||||||||
Net income (loss) |
( |
) | ||||||||||||||||||
Members’ capital (deficit) at December 31, 2019 |
$ | $ | ( |
) | $ | ( |
) | $ | $ | ( |
) | |||||||||
Contributions |
||||||||||||||||||||
Distributions |
( |
) | ( |
) | ( |
) | ( |
) | ( |
) | ||||||||||
Net income (loss) |
( |
) | ( |
) | ( |
) | ( |
) | ||||||||||||
Members’ capital (deficit) at December 31, 2020 |
$ | $ | ( |
) | $ | ( |
) | $ | $ | ( |
) | |||||||||
For the Years Ended December 31, |
||||||||||||
2020 |
2019 |
2018 |
||||||||||
Cash flows from operating activities |
||||||||||||
Net income (loss) including non-controlling interests |
$ | ( |
) | $ | $ | ( |
) | |||||
Adjustments to reconcile net income (loss) to net cash from operating activities: |
||||||||||||
Depreciation and amortization |
||||||||||||
Amortization of deferred financing costs |
||||||||||||
Changes in operating assets and liabilities: |
||||||||||||
Due from affiliates, net |
( |
) | ( |
) | ( |
) | ||||||
Other assets |
( |
) | ||||||||||
Accounts payable, accrued expenses and other liabilities |
( |
) | ||||||||||
Accrued compensation |
||||||||||||
Net cash provided by (used in) operating activities |
||||||||||||
Cash flows from investing activities |
||||||||||||
Purchase of fixed assets |
( |
) | ( |
) | ( |
) | ||||||
Proceeds from promissory note |
( |
) | — | — | ||||||||
Repayments of promissory note |
— | — | ||||||||||
Net cash provided by (used in) investing activities |
( |
) | ( |
) | ( |
) | ||||||
Cash flows from financing activities |
||||||||||||
Proceeds from debt obligations |
||||||||||||
Repayments of debt obligations |
( |
) | ( |
) | ( |
) | ||||||
Deferred financing costs |
( |
) | ( |
) | ( |
) | ||||||
Contributions |
||||||||||||
Distributions |
( |
) | ( |
) | ( |
) | ||||||
Net cash provided by (used in) financing activities |
( |
) | ( |
) | ( |
) | ||||||
Net increase (decrease) in cash and cash-equivalents |
( |
) | ||||||||||
Cash and cash-equivalents, beginning of the year |
||||||||||||
Cash and cash-equivalents, end of the year |
$ | $ | $ | |||||||||
Supplemental and Non-Cash Information |
||||||||||||
Non-cash contributions (capital contribution receivable) |
$ | $ | $ | |||||||||
Cash paid for interest |
$ | $ | $ | |||||||||
Cash paid for income taxes |
$ | $ | $ | — |
1. |
Organization and Business Description |
2. |
Summary of Significant Accounting Policies |
3. |
Other Assets |
December 31, 2020 |
December 31, 2019 |
|||||||
Deferred transaction costs |
$ | $ | ||||||
Fixed assets, net |
|
|
||||||
Deferred tax assets |
||||||||
Contributions receivable |
||||||||
Other assets |
||||||||
Total |
$ | $ | ||||||
December 31, 2020 |
December 31, 2019 |
|||||||
Leasehold improvements |
$ | $ | ||||||
Furniture and fixtures |
|
|
||||||
Computer equipment |
||||||||
Computer software |
||||||||
Fixed assets |
||||||||
Accumulated depreciation and amortization |
( |
) | ( |
) | ||||
Fixed assets, net |
$ | $ | ||||||
4. |
Debt Obligations, Net |
December 31, 2020 |
||||||||||||||||||||||||
Current Maturity Date |
Aggregate Facility Size |
Outstanding Debt |
Amount Available (1) |
Net Carrying Value (2) |
Interest Rate (3) |
|||||||||||||||||||
Revolving Credit Facility #1 |
2 | $ | $ | $ | $ | % | ||||||||||||||||||
Revolving Credit Facility #2 |
1 | % | ||||||||||||||||||||||
Term Loan |
9 | % | ||||||||||||||||||||||
Total |
$ | $ | $ | $ | ||||||||||||||||||||
(1) | Amount available is reduced by outstanding letters of credit. |
(2) | The carrying values of the Revolving Credit Facility #1, Revolving Credit Facility #2, and Term Loan are presented net of capitalized and unamortized deferred financing costs of $ |
(3) | Average interest rate noted above, excludes impact of deferred financing and unused commitment fees. |
December 31, 2019 |
||||||||||||||||||||||||
Current Maturity Date |
Aggregate Facility Size |
Outstanding Debt |
Amount Available (1) |
Net Carrying Value (2) |
Interest Rate (3) |
|||||||||||||||||||
Revolving Credit Facility #1 |
2 | $ | $ | $ | $ | % | ||||||||||||||||||
Revolving Credit Facility #2 |
1 | % | ||||||||||||||||||||||
Term Loan |
9 | % | ||||||||||||||||||||||
Total |
$ | $ | $ | $ | ||||||||||||||||||||
(1) | Amount available is reduced by outstanding letters of credit. |
(2) | The carrying values of the Revolving Credit Facility #1, Revolving Credit Facility #2, and Term Loan are presented net of capitalized and unamortized deferred financing costs of $ |
(3) | Average interest rate noted above, excludes impact of deferred financing and unused commitment fees. |
5. |
Members’ Capital (Deficit) |
December 31, 2020 |
December 31, 2019 |
|||||||||||||||
Units |
Economic Interest % |
Units |
Economic Interest % |
|||||||||||||
Sponsor B Units |
% | % | ||||||||||||||
Class A Units |
|
% | |
% | ||||||||||||
Total |
% | % | ||||||||||||||
6. |
Related Party Transactions |
December 31, 2020 |
December 31, 2019 |
|||||||
Management and BDC Part I Fees receivable |
$ | $ | ||||||
Payments made on behalf of and amounts due from Owl Rock products and other amounts due |
|
|
||||||
Total |
$ | $ | ||||||
7. |
Income Taxes |
For the Years Ended December 31, |
||||||||||||
2020 |
2019 |
2018 |
||||||||||
Current: |
||||||||||||
U.S. federal income tax (benefit) |
$ | $ | $ | |||||||||
State and local income tax (benefit) |
|
|||||||||||
Foreign income tax (benefit) |
||||||||||||
Deferred: |
||||||||||||
U.S. federal income tax (benefit) |
||||||||||||
State and local income tax (benefit) |
( |
) | ( |
) | ||||||||
Foreign income tax (benefit) |
||||||||||||
( |
) | |
( |
) | ||||||||
Total: |
||||||||||||
U.S. federal income tax (benefit) |
||||||||||||
State and local income tax (benefit) |
( |
) | ( |
) | ||||||||
Foreign income tax (benefit) |
||||||||||||
$ | ( |
) | $ | $ | ( |
) | ||||||
For the Years Ended December 31, |
||||||||||||
2020 |
2019 |
2018 |
||||||||||
Income tax expense (benefit) at statutory rate |
( |
)% | |
% | ( |
)% | ||||||
Non-taxable income resulting from use of state and local business apportionment factors and permanent items related to compensation |
|
% | ( |
)% | |
% | ||||||
Transaction costs |
% | % | % | |||||||||
Impact of the Company’s subsidiary’s local taxes |
( |
)% | % | ( |
)% | |||||||
Provision to return adjustments and other |
% | % | ( |
)% | ||||||||
Total effective rate |
( |
)% | % | ( |
)% | |||||||
December 31, 2020 |
December 31, 2019 |
|||||||
Deferred tax assets: |
||||||||
Net operating losses |
$ | $ | ||||||
Deferred compensation |
||||||||
Basis difference in subsidiaries |
||||||||
Other |
||||||||
Total gross deferred tax assets |
||||||||
Valuation allowance |
||||||||
Total deferred tax assets, net |
$ | $ | ||||||
Deferred tax liabilities |
$ | $ | ||||||
8. |
Commitments and Contingencies |
Year Ended December 31, |
Amount |
|||
2021 |
$ | |||
2022 |
||||
2023 |
||||
2024 |
||||
2025 |
||||
Thereafter |
|
|||
Total |
$ | |||
9. |
Subsequent Events |
(Unaudited) March 31, 2021 |
December 31, 2020 |
|||||||
Assets |
||||||||
Equity method investments |
$ | 29,137 | $ | 27,436 | ||||
Receivables: |
||||||||
Management fees |
54,325 | 37,321 | ||||||
Incentive fees |
118 | 2,354 | ||||||
Due from affiliates |
26,534 | 17,716 | ||||||
Prepaid assets |
— | 21,000 | ||||||
Other assets |
556 | 1,888 | ||||||
|
|
|
|
|||||
Total assets |
$ | 110,670 | $ | 107,715 | ||||
|
|
|
|
|||||
Liabilities and Equity |
||||||||
Liabilities: |
||||||||
Accrued compensation and benefits |
$ | 20,052 | $ | 140,807 | ||||
Accrued expenses and other payables |
15,619 | 8,666 | ||||||
|
|
|
|
|||||
Total liabilities |
$ | 35,671 | $ | 149,473 | ||||
Commitments and contingencies (note 9) |
||||||||
Equity: |
||||||||
Net Parent investment |
$ | 71,080 | $ | (45,533 | ) | |||
Non-controlling interest |
3,919 | 3,775 | ||||||
|
|
|
|
|||||
Total Equity |
$ | 74,999 | $ | (41,758 | ) | |||
|
|
|
|
|||||
Total Liabilities and Equity |
$ | 110,670 | $ | 107,715 | ||||
|
|
|
|
2021 |
2020 |
|||||||
Revenues |
||||||||
Management fees, net |
$ | 75,472 | $ | 70,607 | ||||
Administrative, transaction and other fees |
6,520 | 5,821 | ||||||
|
|
|
|
|||||
Total revenues |
81,992 | 76,428 | ||||||
|
|
|
|
|||||
Operating expenses |
||||||||
Compensation and benefits |
55,323 | 47,578 | ||||||
General, administrative, and other expenses |
14,026 | 6,913 | ||||||
|
|
|
|
|||||
Total operating expenses |
69,349 | 54,491 | ||||||
|
|
|
|
|||||
Operating income |
12,643 | 21,937 | ||||||
Net gains (losses) from investment activities |
2,314 | (85 | ) | |||||
|
|
|
|
|||||
Income before income tax expense |
14,957 | 21,852 | ||||||
Income tax expense |
2,181 | 1,984 | ||||||
|
|
|
|
|||||
Net income |
12,776 | 19,868 | ||||||
Net gain (loss) attributable to non-controlling interests |
144 | (454 | ) | |||||
|
|
|
|
|||||
Net income attributable to Dyal |
$ | 12,632 | $ | 20,322 | ||||
|
|
|
|
Net Parent Investment |
Non-controlling Interest |
Total Equity |
||||||||||
Balance at December 31, 2019 |
$ | (147,235 | ) | $ | 4,328 | $ | (142,907 | ) | ||||
Net income |
20,322 | (454 | ) | 19,868 | ||||||||
Distributions to non-controlling interests |
— | (2 | ) | (2 | ) | |||||||
Net transfer from Parent |
136,551 | — | 136,551 | |||||||||
|
|
|
|
|
|
|||||||
Balance at March 31, 2020 |
$ | 9,638 | $ | 3,872 | $ | 13,510 | ||||||
|
|
|
|
|
|
|||||||
Net Parent Investment |
Non-controlling Interest |
Total Equity |
||||||||||
Balance at December 31, 2020 |
$ | (45,533 | ) | $ | 3,775 | $ | (41,758 | ) | ||||
Net income |
12,632 | 144 | 12,776 | |||||||||
Equity based compensation |
4,500 | — | 4,500 | |||||||||
Net transfer from Parent |
99,481 | — | 99,481 | |||||||||
|
|
|
|
|
|
|||||||
Balance at March 31, 2021 |
$ | 71,080 | $ | 3,919 | $ | 74,999 | ||||||
|
|
|
|
|
|
2021 |
2020 |
|||||||
Cash flows from operating activities: |
||||||||
Net income |
$ | 12,776 | $ | 19,868 | ||||
Adjustments to reconcile net income to net cash provided by (used in) operating activities: |
||||||||
Net (gains) losses from investment activities |
(2,314 | ) | 85 | |||||
Equity based compensation |
4,500 | — | ||||||
Cash flows due to changes in operating assets and liabilities: |
||||||||
Management fees receivable, net |
(17,004 | ) | (30,126 | ) | ||||
Due from affiliates |
(8,818 | ) | (7,425 | ) | ||||
Incentive fees receivable |
2,236 | — | ||||||
Prepaid assets |
21,000 | — | ||||||
Other assets |
1,332 | 18 | ||||||
Accrued compensation and benefits |
(120,755 | ) | (115,933 | ) | ||||
Accrued expenses and other payables |
6,953 | (2,545 | ) | |||||
Distributions from equity method investments |
1,133 | 249 | ||||||
|
|
|
|
|||||
Net cash provided by (used in) operating activities |
(98,961 | ) | (135,809 | ) | ||||
|
|
|
|
|||||
Cash flows from investing activities: |
||||||||
Purchases of equity method investments |
(520 | ) | (830 | ) | ||||
|
|
|
|
|||||
Net cash used in investing activities |
(520 | ) | (830 | ) | ||||
|
|
|
|
|||||
Cash flows from financing activities: |
||||||||
Distributions to non-controlling interests |
— | (2 | ) | |||||
Net transfer from Parent |
99,481 | 136,551 | ||||||
|
|
|
|
|||||
Net cash provided by (used in) financing activities |
99,481 | 136,549 | ||||||
|
|
|
|
|||||
Net decrease in cash and cash equivalents |
— | (90 | ) | |||||
Cash and cash equivalents, beginning of the period |
— | 90 | ||||||
|
|
|
|
|||||
Cash and cash equivalents, end of the period |
$ | — | $ | — | ||||
|
|
|
|
|||||
Supplemental disclosure of cash flow information: |
||||||||
Cash paid during the period for: |
||||||||
Income tax |
$ | 3,849 | $ | 3,722 | ||||
Supplemental disclosures of noncash activities: |
||||||||
Equity based compensation |
$ | 4,500 | $ | — |
Three Months Ended March 31, |
||||||||
2021 |
2020 |
|||||||
Contractual Revenues |
||||||||
Management fees, net |
$ | 75,472 | $ | 70,607 | ||||
Administrative, transaction and other fees |
6,520 | 5,821 | ||||||
|
|
|
|
|||||
Total contractual revenues |
$ | 81,992 | $ | 76,428 | ||||
|
|
|
|
|||||
Non-Contractual Revenues |
||||||||
Net gains (losses) from investment activities |
2,314 | (85 | ) | |||||
|
|
|
|
|||||
Total non-contractual revenues |
$ | 2,314 | $ | (85 | ) | |||
|
|
|
|
|||||
Total Contractual and Non-Contractual Revenues |
$ | 84,306 | $ | 76,343 | ||||
|
|
|
|
March 31, |
December 31, |
|||||||
2021 |
2020 |
|||||||
Assets |
||||||||
Equity method investments |
$ | 4,803 | $ | 4,627 | ||||
|
|
|
|
|||||
Total assets |
$ | 4,803 | $ | 4,627 | ||||
|
|
|
|
March 31, 2021 |
||||||||
Equity interests |
Maximum exposure |
|||||||
Total private funds |
$ | 24,334 | $ | 83,855 | ||||
|
|
|
|
December 31, 2020 |
||||||||
Equity interests |
Maximum exposure |
|||||||
Total private funds |
$ | 22,810 | $ | 69,479 | ||||
|
|
|
|
March 31 |
December 31, |
|||||||
2021 |
2020 |
|||||||
Accrued expenses and other payables: |
||||||||
Revenue share payable |
$ | 4,615 | $ | 2,538 | ||||
Placement fees payable |
10,417 | 4,045 | ||||||
Taxes payable |
588 | 2,083 | ||||||
|
|
|
|
|||||
Total accrued expenses and other payables |
$ | 15,619 | $ | 8,666 | ||||
|
|
|
|
Three Months Ended March 31, |
||||||||
2021 |
2020 |
|||||||
Current: |
||||||||
U.S. |
$ | 2,286 | $ | 1,906 | ||||
Foreign |
67 | 62 | ||||||
Deferred: |
||||||||
U.S. |
(172 | ) | 16 | |||||
Foreign |
— | — | ||||||
|
|
|
|
|||||
Income tax expense (benefit) |
$ | 2,181 | $ | 1,984 | ||||
|
|
|
|
March 31, 2021 |
December 31, 2020 |
|||||||
Due from affiliates: |
||||||||
Reimbursements receivable from funds |
$ | 26,534 | $ | 17,716 | ||||
|
|
|
|
|||||
Total due from affiliates |
$ | 26,534 | $ | 17,716 | ||||
|
|
|
|
Number (Units) |
Weighted- Average Grant Date Fair Value Per Unit ($) |
|||||||
Nonvested Award Units at January 1, 2021 |
100,000 | 1,800 | ||||||
Granted |
— | — | ||||||
Vested |
— | — | ||||||
Forfeited |
— | — | ||||||
|
|
|
|
|||||
Nonvested Award Units at March 31, 2021 |
100,000 | $ | 1,800 | |||||
|
|
|
|
December 31, 2020 |
December 31, 2019 |
|||||||
Assets |
||||||||
Cash |
$ | — | $ | 90 | ||||
Equity method investments |
27,436 | 20,630 | ||||||
Receivables: |
||||||||
Management fees |
37,321 | 90 | ||||||
Incentive fees |
2,354 | 626 | ||||||
Due from affiliates |
17,716 | 12,630 | ||||||
Prepaid assets |
21,000 | — | ||||||
Other assets |
1,888 | 506 | ||||||
|
|
|
|
|||||
Total assets |
$ | 107,715 | $ | 34,572 | ||||
|
|
|
|
|||||
Liabilities and Equity |
||||||||
Liabilities: |
||||||||
Accrued compensation and benefits |
$ | 140,807 | $ | 155,976 | ||||
Accrued expenses and other payables |
8,666 | 21,503 | ||||||
|
|
|
|
|||||
Total liabilities |
$ | 149,473 | $ | 177,479 | ||||
Commitments and contingencies (note 9) |
||||||||
Equity: |
||||||||
Net Parent investment |
$ | (45,533 | ) | $ | (147,235 | ) | ||
Non-controlling interest |
3,775 | 4,328 | ||||||
|
|
|
|
|||||
Total Equity |
$ | (41,758 | ) | $ | (142,907 | ) | ||
|
|
|
|
|||||
Total Liabilities and Equity |
$ | 107,715 | $ | 34,572 | ||||
|
|
|
|
2020 |
2019 |
2018 |
||||||||||
Revenues |
||||||||||||
Management fees, net |
$ | 284,691 | $ | 313,354 | $ | 184,878 | ||||||
Incentive fees |
2,354 | 626 | — | |||||||||
Administrative, transaction and other fees |
22,676 | 18,350 | 12,889 | |||||||||
|
|
|
|
|
|
|||||||
Total revenues |
309,721 | 332,330 | 197,767 | |||||||||
|
|
|
|
|
|
|||||||
Operating expenses |
||||||||||||
Compensation and benefits |
187,527 | 194,970 | 114,680 | |||||||||
General, administrative, and other expenses |
26,217 | 32,290 | 30,712 | |||||||||
|
|
|
|
|
|
|||||||
Total operating expenses |
213,744 | 227,260 | 145,392 | |||||||||
|
|
|
|
|
|
|||||||
Operating income |
95,977 | 105,070 | 52,375 | |||||||||
Net gains (losses) from investment activities |
1,542 | (1,564 | ) | 627 | ||||||||
|
|
|
|
|
|
|||||||
Income before income tax expense |
97,519 | 103,506 | 53,002 | |||||||||
Income tax expense (benefit) |
8,435 | 9,094 | 5,127 | |||||||||
|
|
|
|
|
|
|||||||
Net income |
89,084 | 94,412 | 47,875 | |||||||||
Net loss attributable to non-controlling interests |
(548 | ) | (792 | ) | (480 | ) | ||||||
|
|
|
|
|
|
|||||||
Net income attributable to Dyal |
$ | 89,632 | $ | 95,204 | $ | 48,355 | ||||||
|
|
|
|
|
|
Net Parent Investment |
Non-controlling Interest |
Total Equity |
||||||||||
Balance at December 31, 2017 |
$ | (37,652 | ) | $ | 5,994 | $ | (31,658 | ) | ||||
Cumulative effect adjustment upon adoption of new accounting standard (ASU 2014-09) |
(10,970 | ) | — | (10,970 | ) | |||||||
Net income |
48,355 | (480 | ) | 47,875 | ||||||||
Contributions from non-controlling interests |
— | — | — | |||||||||
Distributions to non-controlling interests |
— | (420 | ) | (420 | ) | |||||||
Net transfer to Parent |
(74,980 | ) | — | (74,980 | ) | |||||||
|
|
|
|
|
|
|||||||
Balance at December 31, 2018 |
$ | (75,247 | ) | $ | 5,094 | $ | (70,153 | ) | ||||
|
|
|
|
|
|
|||||||
Net income |
95,204 | (792 | ) | 94,412 | ||||||||
Contributions from non-controlling interests |
— | 26 | 26 | |||||||||
Distributions to non-controlling interests |
— | — | — | |||||||||
Net transfer to Parent |
(167,192 | ) | — | (167,192 | ) | |||||||
|
|
|
|
|
|
|||||||
Balance at December 31, 2019 |
$ | (147,235 | ) | $ | 4,328 | $ | (142,907 | ) | ||||
|
|
|
|
|
|
|||||||
Net income |
89,632 | (548 | ) | 89,084 | ||||||||
Contributions from non-controlling interests |
— | — | — | |||||||||
Distributions to non-controlling interests |
— | (5 | ) | (5 | ) | |||||||
Equity based compensation |
3,000 | — | 3,000 | |||||||||
Net transfer from Parent |
9,070 | — | 9,070 | |||||||||
|
|
|
|
|
|
|||||||
Balance at December 31, 2020 |
$ | (45,533 | ) | $ | 3,775 | $ | (41,758 | ) | ||||
|
|
|
|
|
|
2020 |
2019 |
2018 |
||||||||||
Cash flows from operating activities: |
||||||||||||
Net income |
$ | 89,084 | $ | 94,412 | $ | 47,875 | ||||||
Adjustments to reconcile net income to net cash provided by (used in) operating activities: |
||||||||||||
Net (gains) losses from investment activities |
(1,542 | ) | 1,564 | (627 | ) | |||||||
Equity based compensation |
3,000 | — | — | |||||||||
Cash flows due to changes in operating assets and liabilities: |
||||||||||||
Management fees receivable, net |
(37,231 | ) | (79 | ) | 312 | |||||||
Due from affiliates |
(5,086 | ) | (767 | ) | (5,639 | ) | ||||||
Incentive fees receivable |
(1,728 | ) | (626 | ) | — | |||||||
Prepaid assets |
(21,000 | ) | — | — | ||||||||
Other assets |
(1,382 | ) | 133 | (639 | ) | |||||||
Accrued compensation and benefits |
(15,169 | ) | 66,618 | 18,618 | ||||||||
Accrued expenses and other payables |
(12,837 | ) | 3,694 | 5,333 | ||||||||
Due to affiliates |
— | (381 | ) | (7 | ) | |||||||
Distributions from equity method investments |
136 | 953 | 1,167 | |||||||||
|
|
|
|
|
|
|||||||
Net cash provided by (used in) operating activities |
(3,755 | ) | 165,521 | 66,393 | ||||||||
|
|
|
|
|
|
|||||||
Cash flows from investing activities: |
||||||||||||
Purchases of equity method investments |
(5,400 | ) | (5,070 | ) | (3,876 | ) | ||||||
|
|
|
|
|
|
|||||||
Net cash used in investing activities |
(5,400 | ) | (5,070 | ) | (3,876 | ) | ||||||
|
|
|
|
|
|
|||||||
Cash flows from financing activities: |
||||||||||||
Contributions from non-controlling interests |
— | 26 | — | |||||||||
Distributions to non-controlling interests |
(5 | ) | — | (420 | ) | |||||||
Net transfer from (to) Parent |
9,070 | (167,192 | ) | (74,980 | ) | |||||||
|
|
|
|
|
|
|||||||
Net cash provided by (used in) financing activities |
9,065 | (167,166 | ) | (75,400 | ) | |||||||
|
|
|
|
|
|
|||||||
Net decrease in cash and cash equivalents |
(90 | ) | (6,715 | ) | (12,883 | ) | ||||||
Cash and cash equivalents, beginning of the year |
90 | 6,805 | 19,688 | |||||||||
|
|
|
|
|
|
|||||||
Cash and cash equivalents, end of the year |
$ | — | $ | 90 | $ | 6,805 | ||||||
|
|
|
|
|
|
|||||||
Supplemental disclosure of cash flow information: |
||||||||||||
Cash paid during the year for: |
||||||||||||
Income tax |
$ | 8,496 | $ | 8,035 | $ | 4,840 | ||||||
Supplemental disclosures of noncash activities: |
||||||||||||
Equity based compensation |
$ | 3,000 | $ | — | $ | — | ||||||
Cumulative effect adjustment upon adoption of new accounting standard (ASU 2014-09) |
$ | — | $ | — | $ | 10,970 |
(1) |
Business Overview |
(2) |
Summary of Significant Accounting Policies |
(a) |
Basis of Presentation |
(b) |
Use of Estimates |
(c) |
Concentrations of Risk |
(d) |
Principles of Consolidation |
(e) |
Cash |
(f) |
Equity Method Investments |
(g) |
Management Fees Receivables |
(h) |
Non-controlling Interest |
(i) |
Net Parent Investment |
(j) |
Adoption of New Accounting Standard |
For the year ended December 31, 2018 |
||||||||||||
Pre-Adoption ASU 2014-09 |
Reclassifications and Adjustments |
Post-Adoption ASU 2014-09 |
||||||||||
Revenues: |
||||||||||||
Management fees, net |
$ | 182,716 | $ | 2,162 | $ | 184,878 | ||||||
Administrative, transaction and other fees |
12,149 | 740 | 12,889 | |||||||||
|
|
|
|
|
|
|||||||
Total revenues |
$ | 194,865 | $ | 2,902 | $ | 197,767 | ||||||
|
|
|
|
|
|
|||||||
Operating expenses: |
||||||||||||
Compensation and benefits |
$ | 114,680 | $ | — | $ | 114,680 | ||||||
General, administrative and other expenses |
24,447 | 6,265 | 30,712 | |||||||||
|
|
|
|
|
|
|||||||
Total operating expenses |
139,127 | 6,265 | 145,392 | |||||||||
|
|
|
|
|
|
|||||||
Operating income |
$ | 55,738 | $ | (3,363 | ) | $ | 52,375 | |||||
|
|
|
|
|
|
(k) |
Revenue Recognition |
For the Years Ended December 31, |
||||||||||||
2020 |
2019 |
2018 |
||||||||||
Contractual Revenues |
||||||||||||
Management fees, net |
$ | 284,691 | $ | 313,354 | $ | 184,878 | ||||||
Incentive fees |
2,354 | 626 | — | |||||||||
Administrative, transaction and other fees |
22,676 | 18,350 | 12,889 | |||||||||
|
|
|
|
|
|
|||||||
Total contractual revenues |
$ | 309,721 | $ | 332,330 | $ | 197,767 | ||||||
|
|
|
|
|
|
|||||||
Non-Contractual Revenues |
||||||||||||
Net gains (losses) from investment activities |
1,542 | (1,564 | ) | 627 | ||||||||
|
|
|
|
|
|
|||||||
Total non-contractual revenues |
$ | 1,542 | $ | (1,564 | ) | $ | 627 | |||||
|
|
|
|
|
|
|||||||
Total Contractual and Non-Contractual Revenues |
$ | 311,263 | $ | 330,766 | $ | 198,394 | ||||||
|
|
|
|
|
|
(l) |
Equity Based Compensation |
(m) |
Income Taxes |
(n) |
Distributions from Equity Method Investments |
(o) |
New Accounting Standards Not Yet Adopted |
(3) |
Equity Method Investments |
December 31, 2020 |
December 31, 2019 |
|||||||||
Assets |
| |||||||||
Investments |
$ | 4,443,424 | $ | 3,419,512 | ||||||
Other assets |
306,805 | 89,682 | ||||||||
|
|
|
|
|||||||
Total assets |
$ | 4,750,229 | $ | 3,509,194 | ||||||
|
|
|
|
|||||||
Liabilities and Partners’ Capital |
| |||||||||
Debt |
$ | 522,707 | $ | 672,714 | ||||||
Other liabilities |
54,399 | 65,529 | ||||||||
|
|
|
|
|||||||
Total liabilities |
577,106 | 738,243 | ||||||||
|
|
|
|
|||||||
Partners’ Capital |
4,173,123 | 2,770,951 | ||||||||
|
|
|
|
|||||||
Total liabilities and partners’ capital |
$ | 4,750,229 | $ | 3,509,194 | ||||||
|
|
|
|
Years Ended December 31, |
||||||||||||
2020 |
2019 |
2018 |
||||||||||
Investment income |
$ | 273,151 | $ | 196,559 | $ | 181,010 | ||||||
Expenses |
97,851 | 98,179 | 87,914 | |||||||||
|
|
|
|
|
|
|||||||
Net investment income |
175,300 | 98,379 | 93,096 | |||||||||
Net realized and unrealized gains (losses) |
7,311 | (409,181 | ) | (110,064 | ) | |||||||
|
|
|
|
|
|
|||||||
Net income (loss) |
$ | 182,611 | $ | (310,802 | ) | $ | (16,968 | ) | ||||
|
|
|
|
|
|
(4) |
Variable Interest Entities |
December 31, 2020 |
December 31, 2019 |
|||||||
Assets |
||||||||
Equity method investments |
$ | 4,627 | $ | 5,304 | ||||
|
|
|
|
|||||
Total assets |
$ | 4,627 | $ | 5,304 | ||||
|
|
|
|
December 31, 2020 |
||||||||
Equity interests |
Maximum exposure |
|||||||
Total private funds |
$ | 22,810 | $ | 69,479 | ||||
|
|
|
|
December 31, 2019 |
||||||||
Equity interests |
Maximum exposure |
|||||||
Total private funds |
$ | 15,326 | $ | 27,571 | ||||
|
|
|
|
(5) |
Accrued Expenses and Other Payables |
December 31, 2020 |
December 31, 2019 |
|||||||
Accrued expenses and other payables: |
||||||||
Revenue share payable |
$ | 2,538 | $ | 9,836 | ||||
Placement fees payable |
4,045 | 9,422 | ||||||
Taxes payable |
2,083 | 2,245 | ||||||
|
|
|
|
|||||
Total accrued expenses and other payables |
$ | 8,666 | $ | 21,503 | ||||
|
|
|
|
(6) |
Income Taxes |
For the Years Ended December 31, |
||||||||||||
2020 |
2019 |
2018 |
||||||||||
Current: |
||||||||||||
U.S. |
$ | 8,086 | $ | 8,725 | $ | 5,056 | ||||||
Foreign |
248 | 257 | 140 | |||||||||
Deferred: |
||||||||||||
U.S. |
101 | 112 | (69 | ) | ||||||||
Foreign |
— | — | — | |||||||||
|
|
|
|
|
|
|||||||
Income tax expense (benefit) |
$ | 8,435 | $ | 9,094 | $ | 5,127 | ||||||
|
|
|
|
|
|
(7) |
Related Party Transactions |
December 31, 2020 |
December 31, 2019 |
|||||||
Due from affiliates: |
||||||||
Reimbursements receivable from funds |
$ | 17,716 | $ | 12,630 | ||||
|
|
|
|
|||||
Total due from affiliates |
$ | 17,716 | $ | 12,630 | ||||
|
|
|
|
(8) |
Equity Based Compensation |
Number (Units) |
Weighted- Average Grant Date Fair Value Per Unit ($) |
|||||||
Nonvested Award Units at January 1, 2020 |
— | $ | — | |||||
Granted |
100,000 | 1,800 | ||||||
Vested |
— | — | ||||||
Forfeited |
— | — | ||||||
|
|
|
|
|||||
Nonvested Award Units at December 31, 2020 |
100,000 | $ | 1,800 | |||||
|
|
|
|
(9) |
Commitments and Contingencies |
(10) |
Merger Agreement |
(11) |
Subsequent Events |
Item 13. |
Other Expenses of Issuance and Distribution. |
Securities and Exchange Commission registration fee |
$ | 3,625.73 | ||
Accounting fees and expenses |
$ | 60,000.00 | ||
Legal fees and expenses |
$ | 100,000.00 | ||
Financial printing and miscellaneous expenses |
$ | 150,000.00 | ||
Total |
$ | 313,625.73 | ||
Item 14. |
Indemnification of Directors and Officers. |
Item 15. |
Recent Sales of Unregistered Securities. |
Item 16. |
Exhibits and Financial Statements. |
Exhibit Number |
Description | |
21.1 | List of Subsidiaries (incorporated by reference to Exhibit 21.1 of Blue Owl Capital Inc. Registration Statement on Form S-1 filed on June 17, 2021) | |
23.1* | ||
23.2* | ||
101.INS | Inline XBRL Instance Document (the instance document does not appear in the Interactive Data File because its XBRL tags are embedded within the Inline XBRL document) | |
101.SCH | Inline XBRL Taxonomy Extension Schema Document. | |
101.CAL | Inline XBRL Taxonomy Extension Calculation Linkbase Document. | |
101.DEF | Inline XBRL Taxonomy Extension Definition Linkbase Document. | |
101.LAB | Inline XBRL Taxonomy Extension Label Linkbase Document. | |
101.PRE | Inline XBRL Taxonomy Extension Presentation Linkbase Document. | |
104 | Cover Page Interactive Data File (formatted as Inline XBRL and contained in Exhibit 101). |
† | Certain of the exhibits and schedules to this Exhibit have been omitted in accordance with Regulation S-K Item 601(a)(5). The Registrant agrees to furnish a copy of all omitted exhibits and schedules to the SEC upon its request. |
+ | Indicates a management or compensatory plan. |
* | Filed herewith |
Item 17. |
Undertakings. |
(1) | To file, during any period in which offers or sales are being made, a post-effective amendment to this registration statement: (i) to include any prospectus required by Section 10(a)(3) of the Securities Act of 1933; (ii) to reflect in the prospectus any facts or events arising after the effective date of the registration statement (or the most recent post-effective amendment thereof) which, individually or in the aggregate, represent a fundamental change in the information set forth in the registration statement (notwithstanding the foregoing, any increase or decrease in the volume of securities offered (if the total dollar value of securities offered would not exceed that which was registered) and any deviation from the low or high end of the estimated maximum offering range may be reflected in the form of prospectus filed with the SEC pursuant to Rule 424(b) if, in the aggregate, the changes in volume and price represent no more than a 20% change in the maximum aggregate offering price set forth in the “Calculation of Registration Fee” table in the effective registration statement); and (iii) to include any material information with respect to the plan of distribution not previously disclosed in the registration statement or any material change to such information in the registration statement. |
(2) | That, for the purpose of determining any liability under the Securities Act of 1933, each such post-effective amendment shall be deemed to be a new registration statement relating to the securities offered therein, and the offering of such securities at that time shall be deemed to be the initial bona fide |
(3) | To remove from registration by means of a post-effective amendment any of the securities being registered which remain unsold at the termination of the offering. |
(4) | That, for the purpose of determining liability of the registrant under the Securities Act to any purchaser in the initial distribution of securities, in a primary offering of securities of the undersigned registrant pursuant to this registration statement, regardless of the underwriting method used to sell the securities to the |
purchaser, if the securities are offered or sold to such purchaser by means of any of the following communications, the undersigned registrant will be a seller to the purchaser and will be considered to offer or sell such securities to such purchaser: (i) any preliminary prospectus or prospectus of the undersigned registrant relating to the offering required to be filed pursuant to Rule 424; (ii) any free writing prospectus relating to the offering prepared by or on behalf of the undersigned registrant or used or referred to by the undersigned registrant; (iii) the portion of any other free writing prospectus relating to the offering containing material information about the undersigned registrant or its securities provided by or on behalf of the undersigned registrant; and (iv) any other communication that is an offer in the offering made by the undersigned registrant to the purchaser. |
(5) | That, for the purpose of determining liability under the Securities Act of 1933 to any purchaser, each prospectus filed pursuant to Rule 424(b) as part of a registration statement relating to an offering, other than registration statements relying on Rule 430B or other than prospectuses filed in reliance on Rule 430A, shall be deemed to be part of and included in the registration statement as of the date it is first used after effectiveness. Provided, however, that no statement made in a registration statement or prospectus that is part of the registration statement or made in a document incorporated or deemed incorporated by reference into the registration statement or prospectus that is part of the registration statement will, as to a purchaser with a time of contract of sale prior to such first use, supersede or modify any statement that was made in the registration statement or prospectus that was part of the registration statement or made in any such document immediately prior to such date of first use. |
(6) | That, prior to any public reoffering of the securities registered hereunder through use of a prospectus which is a part of this registration statement, by any person or party who is deemed to be an underwriter within the meaning of Rule 145(c), the registrant undertakes that such reoffering prospectus will contain the information called for by the applicable registration form with respect to reofferings by persons who may be deemed underwriters, in addition to the information called for by the other items of the applicable form. |
(7) | That every prospectus (i) that is filed pursuant to the immediately preceding paragraph, or (ii) that purports to meet the requirements of Section 10(a)(3) of the Securities Act and is used in connection with an offering of securities subject to Rule 415, will be filed as a part of an amendment to the registration statement and will not be used until such amendment has become effective, and that for the purpose of determining any liability under the Securities Act of 1933, each such post-effective amendment shall be deemed to be a new registration statement relating to the securities offered therein, and the offering of such securities at that time shall be deemed to be the initial bona fide |
(8) | To respond to requests for information that is incorporated by reference into the prospectus pursuant to Items 4, 10(b), 11 or 13 of this Form, within one business day of receipt of such request, and to send the incorporated documents by first-class mail or other equally prompt means. This includes information contained in documents filed subsequent to the effective date of the registration statement through the date of responding to the request. |
(9) | To supply by means of a post-effective amendment all information concerning a transaction, and the company being acquired involved therein, that was not the subject of, and included in, this registration statement when it became effective. |
(10) | Insofar as indemnification for liabilities arising under the Securities Act of 1933 may be permitted to directors, officers, and controlling persons of the registrant pursuant to the foregoing provisions, or otherwise, the registrant has been advised that in the opinion of the Securities and Exchange Commission, such indemnification is against public policy as expressed in the Securities Act of 1933 and is, therefore, unenforceable. In the event that a claim for indemnification against such liabilities (other than the payment by the registrant of expenses incurred or paid by a director, officer, or controlling person of the registrant in the successful defense of any action, suit, or proceeding) is asserted by such director, officer, or controlling person in connection with the securities being registered, the registrant will, unless in the opinion of its counsel the matter has been settled by controlling precedent, submit to a court of appropriate jurisdiction the question whether such indemnification by it is against public policy as expressed in the Securities Act of 1933 and will be governed by the final adjudication of such issue. |
BLUE OWL CAPITAL INC. | ||
By: | /s/ Neena A. Reddy | |
Name: Neena A. Reddy | ||
Title: General Counsel and Secretary |
Name |
Position |
Date | ||
/s/ Douglas I. Ostrover | Chief Executive Officer and Director | October 4, 2021 | ||
Douglas I. Ostrover | ||||
/s/ Marc S. Lipschultz | Co-President and Director |
October 4, 2021 | ||
Marc S. Lipschultz | ||||
/s/ Michael Rees | Co-President and Director |
October 4, 2021 | ||
Michael Rees | ||||
/s/ Junot Foradada | Chief Accounting Officer |
October 4, 2021 | ||
Junot Foradada | ||||
/s/ Alan J. Kirshenbaum | Chief Financial Officer |
October 4, 2021 | ||
Alan J. Kirshenbaum | ||||
/s/ Sean Ward | Director |
October 4, 2021 | ||
Sean Ward | ||||
/s/ Craig W. Packer | Director |
October 4, 2021 | ||
Craig W. Packer |
Name |
Position |
Date | ||
/s/ Dana Weeks | Director |
October 4, 2021 | ||
Dana Weeks | ||||
/s/ Claudia Holz | Director | October 4, 2021 | ||
Claudia Holz | ||||
/s/ Andrew S. Komaroff | Director | October 4, 2021 | ||
Andrew S. Komaroff | ||||
/s/ Stacy Polley | Director | October 4, 2021 | ||
Stacy Polley |