Exhibit 99.1
INVESTOR PRESENTATION OCTOBER 2O21 Okada Manila: Growth and Value Creation Opportunity
Important Information for Investors and Stockholders this Presentation This presentation (this "Presentation") relates to a proposed business combination (the "Business Combination") between 26 Capital Acquisition Corp. ("26 Capital") and Okada Manila International Inc. (“OMI” or the "Company") and is for informational purposes only. Forward - Looking Statements Certain statements, estimates, targets and projections in this Presentation may be considered forward - looking statements. Forward - looking statements generally relate to future events or 26 Capital’s or the Company's future financial or operating performance. For example, projections of the Company's future financial results and other metrics, statements regarding the satisfaction of closing conditions to the Business Combination and the timing of the completion of the Business Combination, statements regarding anticipated growth in the industry in which the Company operates, and anticipated growth in demand for the Company's services, are forward - looking statements. In some cases, you can identify forward - looking statements by terminology such as "may", "should", "could", "might", "plan", "possible", "project", "strive", "budget", "forecast", "expect", "intend", "will", "estimate", "anticipate", "believe", "predict", "potential" or "continue", or the negatives of these terms or variations of them or similar terminology. Such forward - looking statements are subject to risks, uncertainties, and other factors which could cause actual results to differ materially from those expressed or implied by such forward - looking statements. These forward - looking statements are based upon estimates and assumptions that, while considered reasonable by 26 Capital and its management, and the Company and its management, as the case may be, are inherently uncertain. Factors that may cause actual results to differ materially from current expectations include, but are not limited to: (i) the occurrence of any event, change or other circumstances that could give rise to the termination of definitive agreements with respect to the Business Combination; (ii) the outcome of any legal proceedings that may be instituted against 26 Capital, the Company, the combined company or others following the announcement of the Business Combination; (iii) the inability to complete the Business Combination due to the failure to obtain approval of the stockholders of 26 Capital; (iv) the inability of the Company to satisfy other conditions to closing; (v) changes to the proposed structure of the Business Combination that may be required or appropriate as a result of applicable laws or regulations or as a condition to obtaining regulatory approval of the Business Combination; (vi) the ability to meet stock exchange listing standards following the consummation of the Business Combination; (vii) the risk that the Business Combination disrupts current plans and operations of the Company as a result of the announcement and consummation of the Business Combination; (viii) the ability to recognize the anticipated benefits of the Business Combination, which may be affected by, among other things, competition, the ability of the combined company to grow and manage growth profitably, maintain relationships with customers and suppliers and retain its management and key employees, and the costs related to the Business Combination; (ix) changes in applicable laws or regulations; (x) the possibility that the Company or the combined company may be adversely affected by other economic, business, regulatory, and/or competitive factors; (xi) the Company's estimates of expenses and profitability: (xii) the evolution of the markets in which the Company competes; (xiii) the ability of the Company to implement its strategic initiatives and continue to innovate its existing products; (xiv) the ability of the Company to satisfy regulatory requirements; (xv) the impact of the COVID - 19 pandemic on the Company's and the combined company's business; and (xvi) other risks and uncertainties set forth in the section entitled "Risk Factors" and "Cautionary Note Regarding Forward - Looking Statements" in 26 Capital’s final prospectus filed with the SEC on January 19, 2021 in connection with 26 Capital’s initial public offering (“26 Capital’s Prospectus”), and other risks and uncertainties indicated from time to time in other documents filed or to be filed with the U.S. Securities and Exchange Commission (the “SEC”) by 26 Capital or the Company. If any of these risks materialize or if 26 Capital’s or the Company's assumptions prove incorrect, actual results could differ materially from the results implied by these forward - looking statements. There may be additional risks that are not presently known to 26 Capital or the Company or that 26 Capital or the Company currently believes are immaterial that could also cause actual results to differ from those contained in the forward - looking statements. ln addition, forward - looking statements reflect 26 Capital’s and the Company's expectations, plans or forecasts of future events and views as of the date of this Presentation. Forward - looking statements speak only as of the date they are made, and 26 Capital and the Company undertake no obligation, and expressly disclaim any obligation, to update, alter or otherwise revise any forward - looking statements, whether as the result of new information, future events or otherwise, except as required by law. Nothing in this Presentation should be regarded as a representation by any person that the forward - looking statements set forth herein will be achieved or that any of the contemplated results of such forward - looking statements will be achieved. You should not place undue reliance on forward - looking statements, which speak only as of the date they are made. Neither 26 Capital nor the Company undertakes any duty to update these forward - looking statements. Financial Information; Non - IFRS Financial Measures The financial information and data contained in this Presentation has not been audited in accordance with the standards of the Public Company Accounting Oversight Board and does not conform to Regulation S - X. Accordingly, such information and data may not be included in, may be adjusted in, or may be presented differently in, any proxy statement, registration statement, or prospectus to be filed with the SEC relating to the proposed Business Combination. This Presentation includes certain financial measures not presented in accordance with International Financial Reporting Standards (“IFRS”), including EBITDA, EBITDA margin, and certain ratios and other metrics derived therefrom. These non - IFRS financial measures are not measures of financial performance in accordance with IFRS and may exclude items that are significant in understanding and assessing the Company's financial results. Therefore, these measures should not be considered in isolation or as an alternative to net income, cash flows from operations or other measures of profitability, liquidity or performance under IFRS. You should be aware that the Company's presentation of these measures may not be comparable to similarly - titled measures used by other companies. In addition, the conversion of the Company's financial statements into IFRS and the audit of the financial statements may impact how the Company currently calculates its non - IFRS financial measures, and we cannot assure you that there would not be differences, and such differences could be material. 26 Capital and the Company believe these non - IFRS measures of financial results provide useful information to management and investors regarding certain financial and business trends relating to the Company's financial condition and results of operations. 26 Capital and the Company believe that the use of these non - IFRS financial measures provides an additional tool for investors to use in evaluating ongoing operating results and trends in and in comparing the Company's financial measures with other similar companies, many of which present similar non - IFRS financial measures to investors. These non - IFRS financial measures are subject to inherent limitations as they reflect the exercise of judgments by management about which expense and income are excluded or included in determining these non - IFRS financial measures. Additionally, there can be no assurance that the Company will not modify the presentation of these or similar non - IFRS measures in the future, including to make adjustments for future expenses or other items that the Company believes are appropriate in comparing its operating performance across reporting periods on a consistent basis This Presentation also includes certain projections of non - IFRS financial measures. Due to the high variability and difficulty in making accurate forecasts and projections of some of the information excluded from these projected measures, together with some of the excluded information not being ascertainable or accessible, 26 Capital and the Company are unable to quantify certain amounts that would be required to be included in the most directly comparable IFRS financial measures without unreasonable effort. Consequently, no disclosure of estimated comparable IFRS measures is included and no reconciliation of the forward - looking non - IFRS financial measures is included. For the same reasons, the Company is unable to address the probable significance of the unavailable information, which could be material to future results. DISCLAIMERS 2
Use of Projections This presentation contains financial forecasts for the Company with respect to certain financial results for the Company's fiscal years 2021 through 2026. Neither 26 Capital's nor the Company's independent auditors have audited, studied, reviewed, compiled or performed any procedures with respect to the projections for the purpose of their inclusion in this Presentation, and accordingly, they did not express an opinion or provide any other form of assurance with respect thereto for the purpose of this Presentation. These projections are forward - looking statements included for illustrative purposes only and should not be relied upon as being necessarily indicative of future results. In this Presentation, certain of the above - mentioned projected information has been provided for purposes of providing comparisons with historical data. The assumptions and estimates underlying the prospective financial information are inherently uncertain and are subject to a wide variety of significant business, economic and competitive risks and uncertaint ies that could cause actual results to differ materially from those contained in the prospective financial information. Accordingly, there can be no assurance that the prospective results are indicative of the future performance of the Company or that actual results will not differ materially from those presented in the prospective financial information. Inclusion of the prospective financial information in this Presentation should not be regarded as a representation by any person that the results contained in the prospective financial information will be achieved. Industry and Market Data In this Presentation, the Company relies on and refers to certain information and statistics obtained from third - party sources which they believe to be reliable . Neither 26 Capital nor the Company has independently verified the accuracy or completeness of any such third - party information . This data is subject to change . In addition, this Presentation does not purport to be all - inclusive or to contain all of the information that may be required to make a full analysis of the Company or the Business Combination . The recipient should make its own evaluation of the Company and of the relevance and adequacy of the information and should make such other investigations as it deems necessary . Trademarks This Presentation may contain trademarks, service marks, trade names and copyrights of other companies, which are the property of their respective owners. Solely for convenience, some of the trademarks, service marks, trade names and copyrights referred to in this presentation may be listed without the TM, SM © or ® symbols, but 26 Capital and the Company will assert, to the fullest extent under applicable law, the rights of the applicable owners, if any, to these trademarks, service marks, trade names and copyrights. Additional Information and Where to Find I t This Presentation does not constitute (i) solicitation of a proxy, consent or authorization with respect to any securities or in respect of the proposed transaction or (ii) an offer to sell or exchange, or the solicitation of an offer to buy or exchange, any security of 26 Capital, OMI, the combined company or any of their respective affiliates, nor shall there be any sale of any such securities in any state or jurisdiction in which such offer, solicitation, sale or exchange would be unlawful prior to registration or qualification under the securities laws of any such state or jurisdiction. No offer of securities shall be made except by means of a prospectus meeting the requirements of the Securities Act of 1933, as amended. In connection with the proposed Business Combination, the Company intends to file a registration statement on Form F - 4 with the SEC, which will include a document that serves as a prospectus of the Company and as a proxy statement of 26 Capital, referred to as a proxy statement/prospectus. A proxy statement/prospectus will be sent to all 26 Capital stockholders. 26 Capital and the Company also will file other documents regarding the proposed Business Combination with the SEC. This Presentation does not contain all the information that should be considered concerning the proposed Business Combination and is not intended to form the basis of any investment decision or any other decision in respect of the proposed Business Combination. Before making any voting or investment decision, investors and security holders of 26 Capital are urged to read the registration statement, the proxy statement/prospectus and all other relevant documents filed or that will be filed with the SEC in connection with the proposed Business Combination as they become available because they will contain important information about the proposed Business Combination. Investors and security holders will be able to obtain free copies of the registration statement. The proxy statement/prospectus and all other relevant documents filed or that will be filed with the SEC by 26 Capital and the Company through the website maintained by the SEC at www.sec.gov. In addition, the documents filed by 26 Capital with the SEC may be obtained free of charge from the investor relations page or 26 Capital’s website at https://wwwspac26.com or upon written request to 701 Brickell Avenue, Suite 1550, Miami, Florida 33131, USA. Participants in the Solicitation 26 Capital, OMI and their respective directors, executive officers and other members of their management and employees may be deemed to be participants in the solicitation of proxies from 26 Capital’s stockholders in connection with the proposed Business Combination. Investors and security holders may obtain more detailed information regarding the names, affiliations, and interests of 26 Capital’s directors and executive officers in 26 Capital’s Prospectus and other relevant materials to be filed with the SEC in connection with the Business Combination when they become available. Information concerning the interests of participants in the solicitation, which may, in some cases, be different than those of 26 Capitals equity holders generally, will be set forth in the proxy statement/prospectus relating to the proposed Business Combination when it becomes available. DISCLAIMERS (cont.) 3
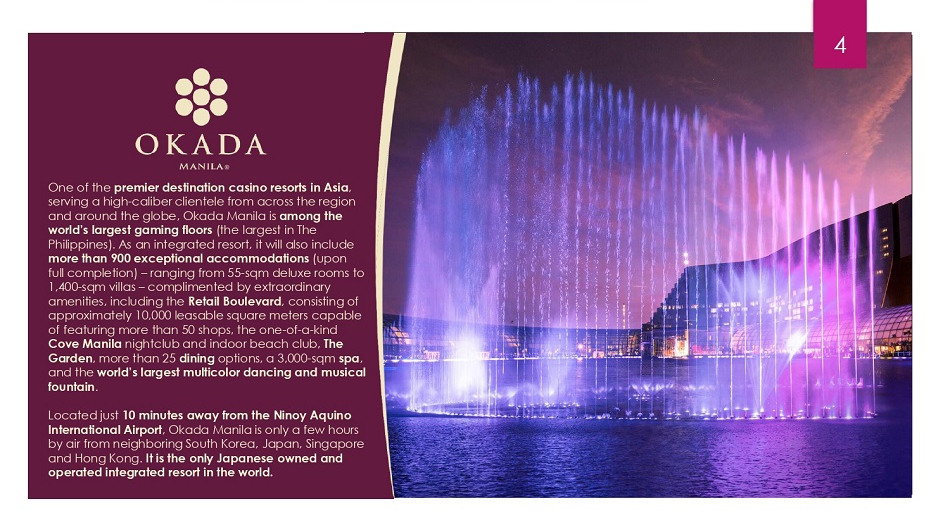
One of the premier destination casino resorts in Asia , serving a high - caliber clientele from across the region and around the globe, Okada Manila is among the world’s largest gaming floors (the largest in The Philippines). As an integrated resort, it will also include more than 900 exceptional accommodations (upon full completion) – ranging from 55 - sqm deluxe rooms to 1,400 - sqm villas – complimented by extraordinary amenities, including the Retail Boulevard , consisting of approximately 10,000 leasable square meters capable of featuring more than 50 shops, the one - of - a - kind Cove Manila nightclub and indoor beach club, The Garden , more than 25 dining options, a 3,000 - sqm spa , and the world’s largest multicolor dancing and musical fountain . Located just 10 minutes away from the Ninoy Aquino International Airport , Okada Manila is only a few hours by air from neighboring South Korea, Japan, Singapore and Hong Kong. It is the only Japanese owned and operated integrated resort in the world. 4
A GEN D A Executive Summary Property Positioning and Overview Gaming Market Overview Business Outlook Appendix 5
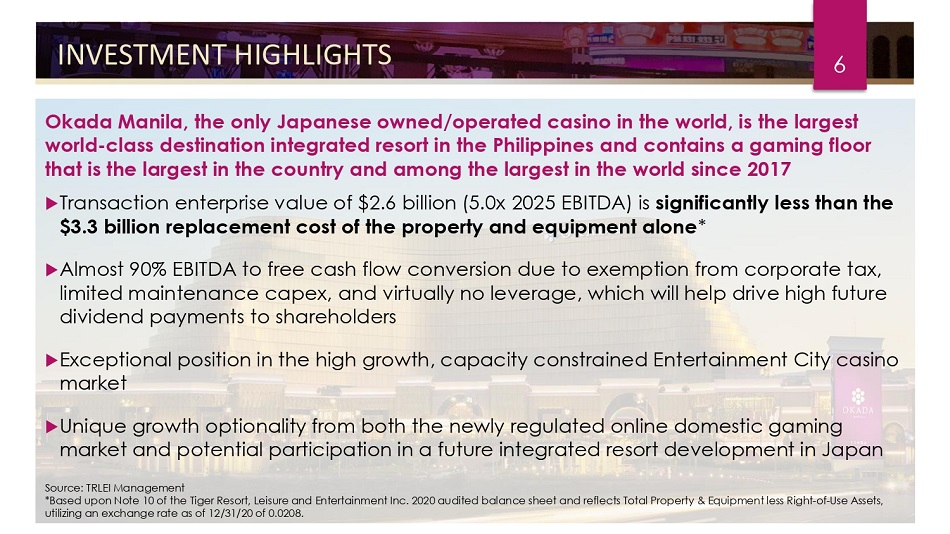
INVESTMENT HIGHLIGHTS 6 Okada Manila, the only Japanese owned/operated casino in the world, is the largest world - class destination integrated resort in the Philippines and contains a gaming floor that is the largest in the country and among the largest in the world since 2017 Transaction enterprise value of $2.6 billion (5.0x 2025 EBITDA) is significantly less than the $3.3 billion replacement cost of the property and equipment alone * Almost 90 % EBITDA to free cash flow conversion due to exemption from corporate tax, limited maintenance capex, and virtually no leverage, which will help drive high future dividend payments to shareholders Exceptional position in the high growth, capacity constrained Entertainment City casino market Unique growth optionality from both the newly regulated online domestic gaming market and potential participation in a future integrated resort development in Japan Source: TRLEI Management *Based upon Note 10 of the Tiger Resort, Leisure and Entertainment Inc. 2020 audited balance sheet and reflects Total Property & Equipment less Right - of - Use Assets, utilizing an exchange rate as of 12/31/20 of 0.0208.

BYR ON Y IP President OKADA MANILA MANAGEMENT 7 Okada Manila is managed by a successful and accomplished team whose members are known for their decades of experience in the Asian gaming and hospitality sectors, as well as their financial and legal experience and expertise JOSEPH JOEMER C. PEREZ Vice President, Legal and Compliance T OJI T A K EU C HI Executive Officer & Head of the Corporate Planning Division and Board Member Prior to joining Universal Entertainment (the Japanese parent of Okada Manila) in 2009, Mr. Takeuchi worked at KPMG Japan, as well as in the financial and entertainment & gaming sectors in Japan. He has served in various senior management roles at Universal Entertainment. He received a B.S. in Economics from Shorter College (Georgia) and a B.S. in Economics from Sophia University (Tokyo). HANS VAN DER SANDE Chief Financial Officer Joined Okada Manila as COO in 2018 and promoted to President in 2020 after more than a decade in investment banking with Union Gaming Securities Asia, Deutsche Bank and TD Securities in Hong Kong, Sydney, New York and Toronto. He received a Bachelor of Commerce from Queen’s University and an MBA from the Yale School of Management. J o i n e d O k ad a M an il a a s CF O in 2015 after more than 15 years as a corporate lawyer and investment banker in New York and Japan, i n c l u d i n g w i t h U B S a n d Deutsche Bank. He received a B. A . i n E c onom i c s fro m C o l u m b i a Un i v e rs i t y , a LL . M. from the Graduate School of L a w a t t h e Un i v e rs i t y o f T o k y o a n d h i s J. D . fro m Ha rv a r d L a w School. Over 16 years of experience in the practice of law, leading the legal team for litigation, regulatory compliance, contract management and negotiation, and corporate matters. He received a B.S. in Political Science (magna cum laude) from the University of the Philippines and attended the University of the Philippines College of Law – LL.B. (cum laude).
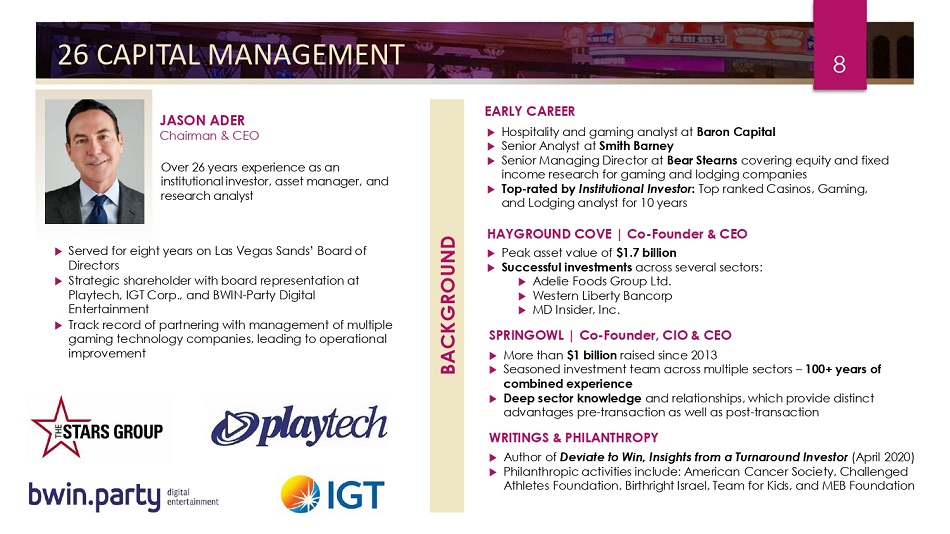
JASON ADER Chairman & CEO 26 CAPITAL MANAGEMENT 8 Served for eight years on Las Vegas Sands’ Board of Directors Strategic shareholder with board representation at Playtech, IGT Corp., and BWIN - Party Digital Entertainment Track record of partnering with management of multiple gaming technology companies, leading to operational improvement Over 26 years experience as an institutional investor, asset manager, and research analyst BACKGROUND HAYGROUND COVE | Co - Founder & CEO Peak asset value of $1.7 billion Successful investments across several sectors: Adelie Foods Group Ltd. Western Liberty Bancorp MD Insider, Inc. SPRINGOWL | Co - Founder, CIO & CEO More than $1 billion raised since 2013 Seasoned investment team across multiple sectors – 100+ years of combined experience Deep sector knowledge and relationships, which provide distinct advantages pre - transaction as well as post - transaction WRITINGS & PHILANTHROPY Author of Deviate to Win, Insights from a Turnaround Investor (April 2020) Philanthropic activities include: American Cancer Society, Challenged Athletes Foundation, Birthright Israel, Team for Kids, and MEB Foundation EARLY CAREER Hospitality and gaming analyst at Baron Capital Senior Analyst at Smith Barney Senior Managing Director at Bear Stearns covering equity and fixed income research for gaming and lodging companies Top - rated by Institutional Investor : Top ranked Casinos, Gaming, and Lodging analyst for 10 years
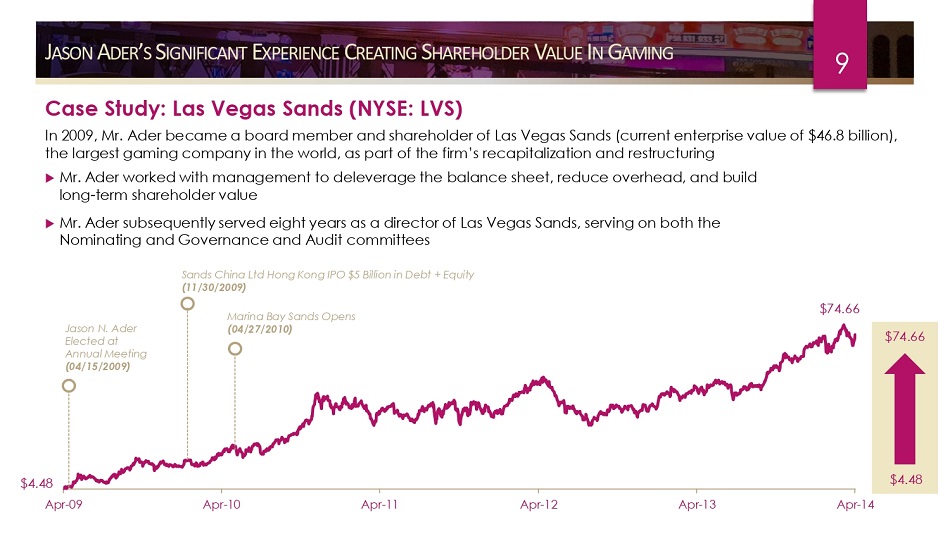
Case Study: Las Vegas Sands (NYSE: LVS) In 2009, Mr. Ader became a board member and shareholder of Las Vegas Sands (current enterprise value of $46.8 billion), the largest gaming company in the world, as part of the firm’s recapitalization and restructuring Mr. Ader worked with management to deleverage the balance sheet, reduce overhead, and build long - term shareholder value Mr. Ader subsequently served eight years as a director of Las Vegas Sands, serving on both the Nominating and Governance and Audit committees Sands China Ltd Hong Kong IPO $5 Billion in Debt + Equity (11/30/2009) Apr - 09 A p r - 1 0 A p r - 1 1 A p r - 1 2 A p r - 1 3 A p r - 1 4 $74.66 $4.48 $74 . 66 $4 . 48 Jason N. Ader Elected at Annual M ee t i ng (04/15/2009) Marina Bay Sands Opens (04/27/2010) J ASON A DER ’ S S IGNIFICANT E XPERIENCE C REATING S HAREHOLDER V ALUE I N G AMING 9
ONLY JAPANESE OWNED AND OPERATED IR IN THE WORLD 10 Okada Manila is the only Japanese owned and operated integrated resort in the world, which we believe will give it an advantage with respect to winning a license to develop a casino and an integrated resort in Japan Okada Manila is owned by Universal Entertainment Corporation (UEC), a publicly listed company in Japan UEC, the only Japanese company with experience owning and operating a casino resort, is led by renowned systems engineer Mr. Jun Fujimoto; and as a result of his efforts it currently possesses multiple patents that allow Okada Manila to use proprietary gaming systems and automation technology for the purpose of enhancing its operational efficiency; while they also contributed to the development of Okada Manila’s strong position UEC exemplifies the Japanese reputation of providing the finest luxury and guest experience in the leisure, entertainment, and hospitality sector
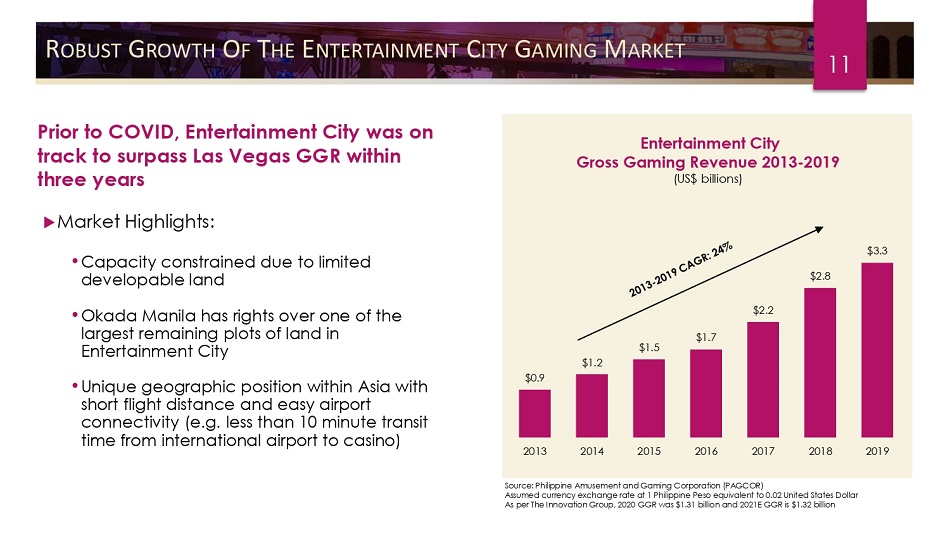
11 R OBUST G ROWTH O F T HE E NTERTAINMENT C ITY G AMING M ARKET Entertainment City Gross Gaming Revenue 2013 - 2019 (US$ billions) $0 . 9 $1 . 2 $1 . 5 $1 . 7 $2 . 2 $2 . 8 $3 . 3 2013 2014 2015 2016 2017 2018 2019 Prior to COVID, Entertainment City was on track to surpass Las Vegas GGR within three years Market Highlights: • Capacity constrained due to limited developable land • Okada Manila has rights over one of the largest remaining plots of land in Entertainment City • Unique geographic position within Asia with short flight distance and easy airport connectivity (e.g. less than 10 minute transit time from international airport to casino) Source: Philippine Amusement and Gaming Corporation (PAGCOR) Assumed currency exchange rate at 1 Philippine Peso equivalent to 0.02 United States Dollar As per The Innovation Group, 2020 GGR was $1.31 billion and 2021E GGR is $1.32 billion
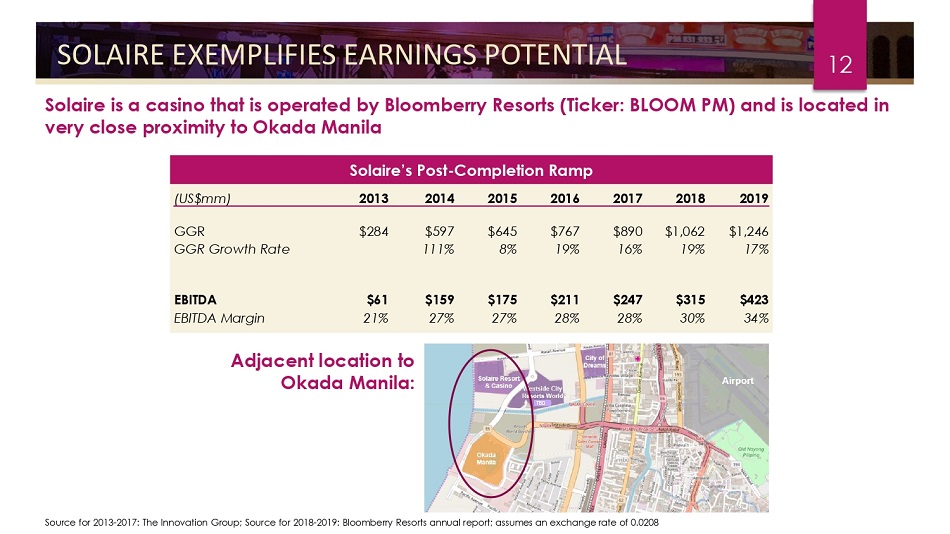
Solaire’s Post - Completion Ramp (US$mm) 2013 2014 2015 2016 2017 2018 2019 GGR $284 $597 $645 $767 $890 $1,062 $1,246 GGR Growth Rate 111% 8% 19% 16% 19% 17% EBITDA $61 $159 $175 $211 $247 $315 $423 EBITDA Margin 21% 27% 27% 28% 28% 30% 34% SOLAIRE EXEMPLIFIES EARNINGS POTENTIAL 12 Solaire is a casino that is operated by Bloomberry Resorts (Ticker: BLOOM PM) and is located in very close proximity to Okada Manila Adjacent location to Okada Manila: TBD Source for 2013 - 2017: The Innovation Group; Source for 2018 - 2019: Bloomberry Resorts annual report; assumes an exchange rate of 0.0208
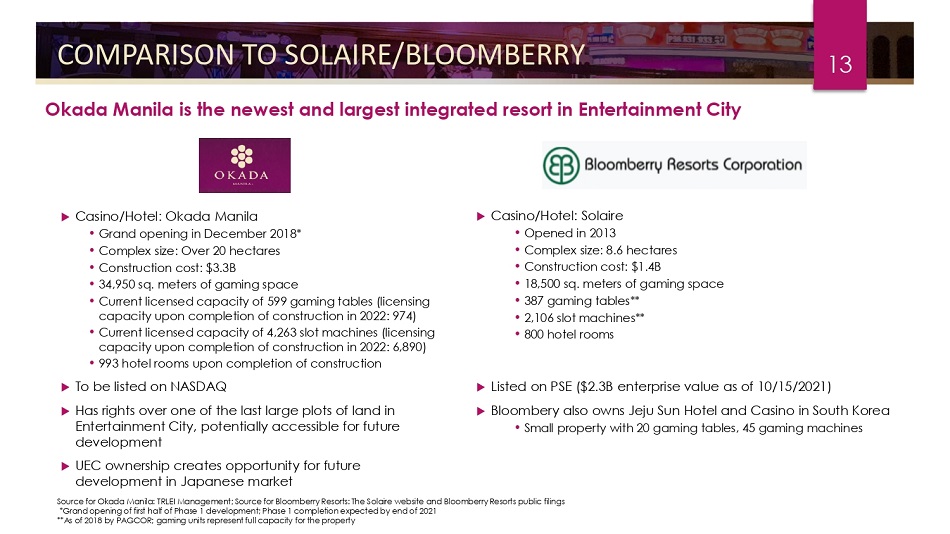
COMPARISON TO SOLAIRE/BLOOMBERRY 13 Casino/Hotel: Okada Manila • Grand opening in December 2018* • Complex size: Over 20 hectares • Construction cost: $3.3B • 34,950 sq. meters of gaming space • Current licensed capacity of 599 gaming tables (licensing capacity upon completion of construction in 2022: 974) • Current licensed capacity of 4,263 slot machines (licensing capacity upon completion of construction in 2022: 6,890) • 993 hotel rooms upon completion of construction To be listed on NASDAQ Has rights over one of the last large plots of land in Entertainment City, potentially accessible for future development UEC ownership creates opportunity for future development in Japanese market Okada Manila is the newest and largest integrated resort in Entertainment City Casino/Hotel: Solaire • Opened in 2013 • Complex size: 8.6 hectares • Construction cost: $1.4B • 18,500 sq. meters of gaming space • 387 gaming tables** • 2,106 slot machines** • 800 hotel rooms Listed on PSE ($2.3B enterprise value as of 10/15/2021) Bloombery also owns Jeju Sun Hotel and Casino in South Korea • Small property with 20 gaming tables, 45 gaming machines Source for Okada Manila: TRLEI Management; Source for Bloomberry Resorts: The Solaire website and Bloomberry Resorts public filings *Grand opening of first half of Phase 1 development; Phase 1 completion expected by end of 2021 **As of 2018 by PAGCOR; gaming units represent full capacity for the property
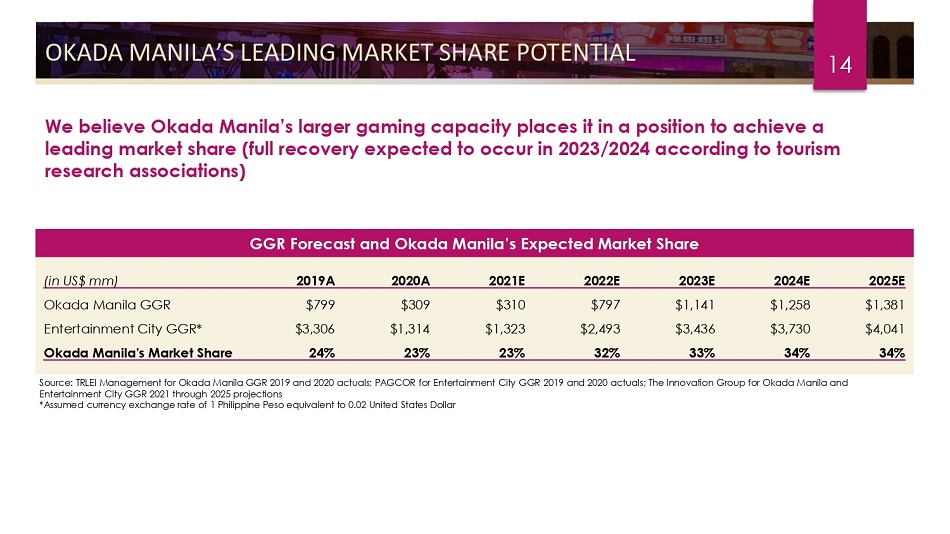
OKADA MANILA’S LEADING MARKET SHARE POTENTIAL 14 We believe Okada Manila’s larger gaming capacity places it in a position to achieve a leading market share (full recovery expected to occur in 2023/2024 according to tourism research associations) GGR Forecast and Okada Manila’s Expected Market Share (in US$ mm) 2019A 2020A 2021E 2022E 2023E 2024E 2025E Okada Manila GGR $799 $309 $310 $797 $1,141 $1,258 $1,381 Entertainment City GGR* $3,306 $1,314 $1,323 $2,493 $3,436 $3,730 $4,041 Okada Manila's Market Share 24% 23% 23% 32% 33% 34% 34% Source: TRLEI Management for Okada Manila GGR 2019 and 2020 actuals; PAGCOR for Entertainment City GGR 2019 and 2020 actuals; The Innovation Group for Okada Manila and Entertainment City GGR 2021 through 2025 projections *Assumed currency exchange rate of 1 Philippine Peso equivalent to 0.02 United States Dollar
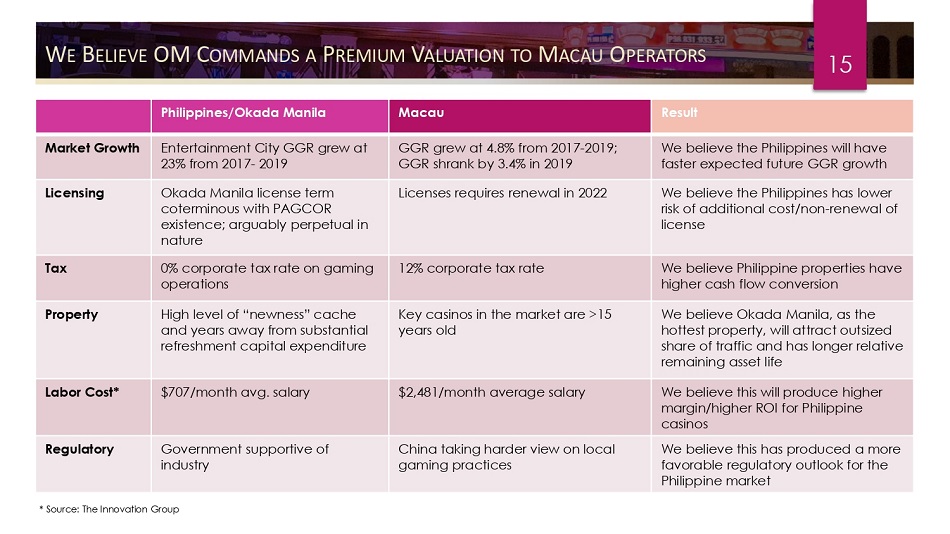
15 W E B ELIEVE OM C OMMANDS A P REMIUM V ALUATION TO M ACAU O PERATORS Philippines/Okada Manila Macau Result Market Growth Entertainment City GGR grew at 23% from 2017 - 2019 GGR grew at 4.8% from 2017 - 2019; GGR shrank by 3.4% in 2019 We believe the Philippines will have faster expected future GGR growth Licensing Okada Manila license term coterminous with PAGCOR existence; arguably perpetual in nature Licenses requires renewal in 2022 We believe the Philippines has lower risk of additional cost/non - renewal of license Tax 0% corporate tax rate on gaming operations 12% corporate tax rate We believe Philippine properties have higher cash flow conversion Property High level of “newness” cache and years away from substantial refreshment capital expenditure Key casinos in the market are >15 years old We believe Okada Manila, as the hottest property, will attract outsized share of traffic and has longer relative remaining asset life Labor Cost* $707/month avg. salary $2,481/month average salary We believe this will produce higher margin/higher ROI for Philippine casinos Regulatory Government supportive of industry China taking harder view on local gaming practices We believe this has produced a more favorable regulatory outlook for the Philippine market * Source: The Innovation Group
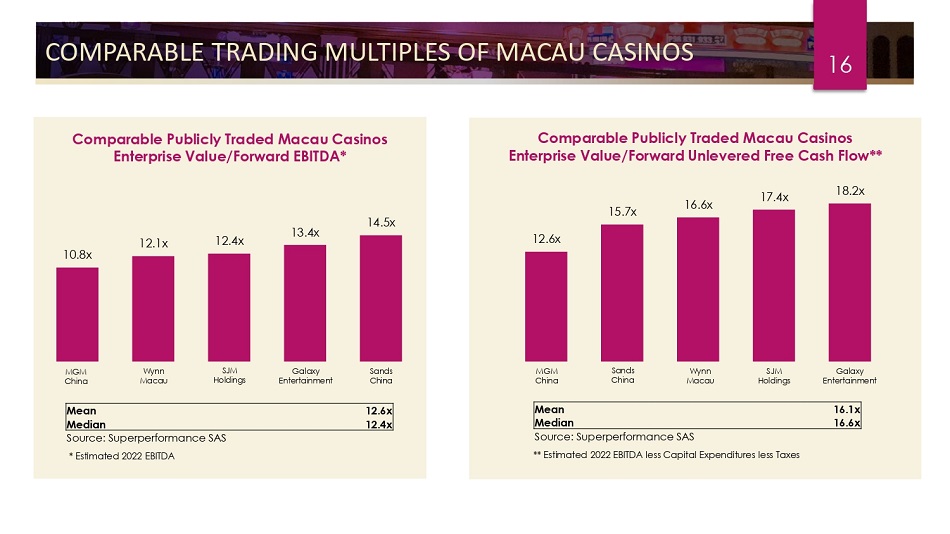
COMPARABLE TRADING MULTIPLES OF MACAU CASINOS 16 Comparable Publicly Traded Macau Casinos Enterprise Value/Forward EBITDA* Comparable Publicly Traded Macau Casinos Enterprise Value/Forward Unlevered Free Cash Flow** Mean 12.6x Median 12.4x Source: Superperformance SAS * Estimated 2022 EBITDA ** Estimated 2022 EBITDA less Capital Expenditures less Taxes Mean 16.1x Median 16.6x Source: Superperformance SAS MGM Ch i n a SJM Holdings Wynn M aca u San d s C h i n a Galaxy E n t e rt a i n m en t 12 . 6x 15 . 7x 16 . 6x 17 . 4x 18 . 2x 10 . 8x 12 . 1x 12 . 4x 13 . 4x 14 . 5x MGM C h i n a Wynn M aca u SJM Holdings Galaxy E n t e rt a i n m en t San d s C h i n a
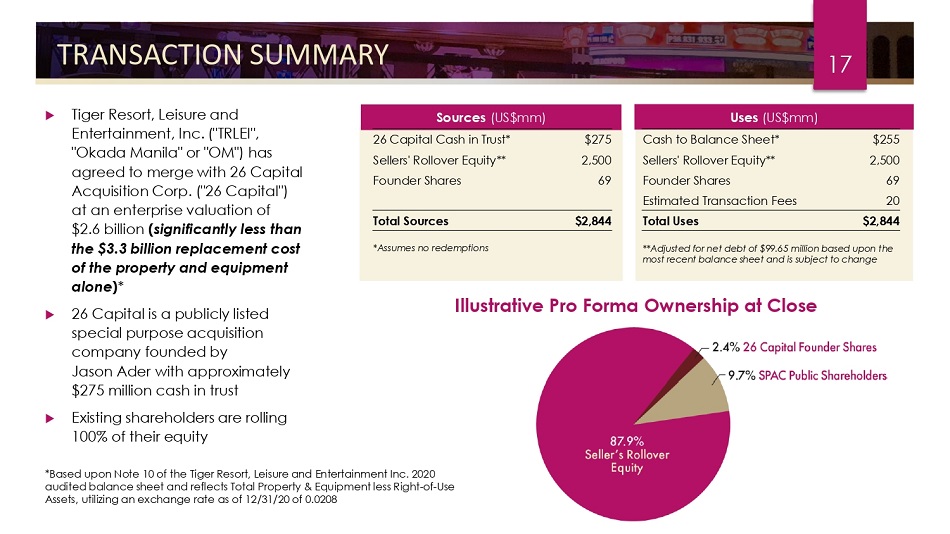
Sources (US$mm 26 Capital Cash in Trust* ) $275 Uses (US$mm) Cash to Balance Sheet* $255 Sellers' Rollover Equity** 2,500 Sellers' Rollover Equity** 2,500 Founder Shares 69 Founder Shares 69 Estimated Transaction Fees 20 Total Sources $2,844 Total Uses $2,844 *Assumes no redemptions ** Adjusted for net debt of $99.65 million based upon the most recent balance sheet and is subject to change TRANSACTION SUMMARY 17 Tiger Resort, Leisure and Entertainment, Inc. ("TRLEI", "Okada Manila" or "OM") has agreed to merge with 26 Capital Acquisition Corp. ("26 Capital") at an enterprise valuation of $ 2 . 6 billion ( significantly less than the $ 3 . 3 billion replacement cost of the property and equipment alone ) * 26 Capital is a publicly listed special purpose acquisition company founded by Jason Ader with approximately $275 million cash in trust Existing shareholders are rolling 100% of their equity Illustrative Pro Forma Ownership at Close *Based upon Note 10 of the Tiger Resort, Leisure and Entertainment Inc. 2020 audited balance sheet and reflects Total Property & Equipment less Right - of - Use Assets, utilizing an exchange rate as of 12/31/20 of 0.0208
S PONSOR H AS A P ROVEN T RACK R ECORD C REATING V ALUE W ITH G AMING A SSETS 18 Jason Ader and his team are making a long - term commitment to Okada Manila and are dedicated to creating value. They offer: A successful track record of creating value in gaming assets investment Deep industry relationships and sector experience, which may facilitate further growth opportunities and enhancements The ability to bring best operating practices that may help maximize productivity across the full spectrum of gaming, hospitality, retail, and entertainment offerings of Okada Manila Institutional investors and capital markets relationships, which may assist in future growth opportunities and may help leverage Okada Manila’s operating expertise across the Asia Pacific region Extensive experience in developing online gaming businesses Significant experience and success in Asia and a possession of a deep understanding of the manner in which business is conducted in the region
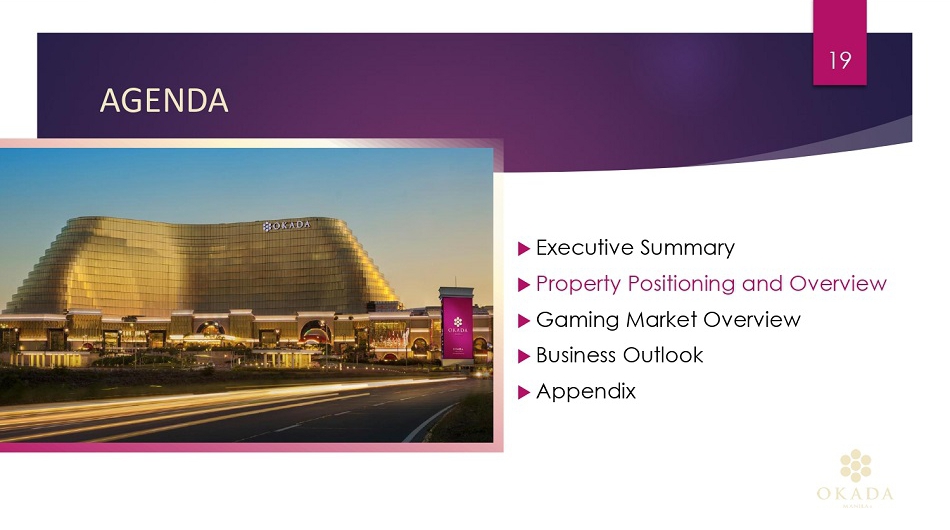
A GEN D A Executive Summary Property Positioning and Overview Gaming Market Overview Business Outlook Appendix 19
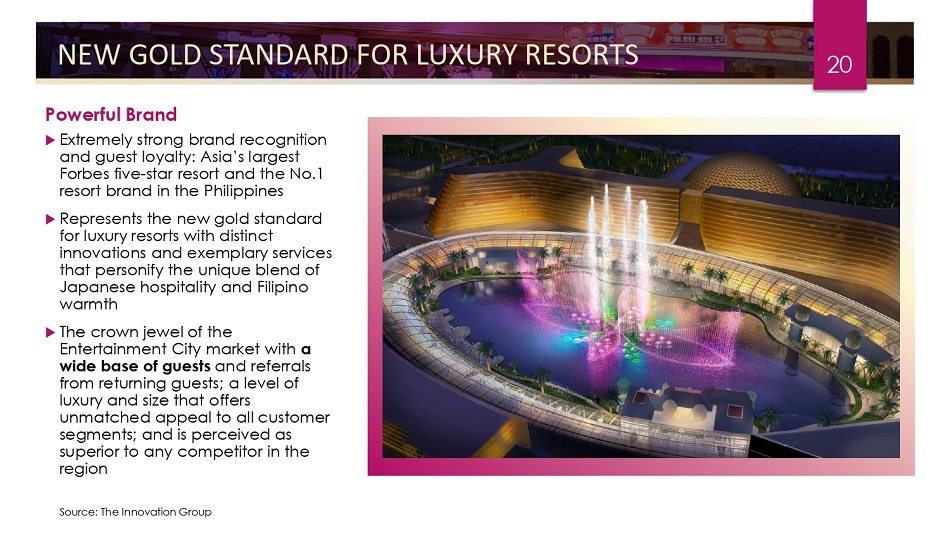
NEW GOLD STANDARD FOR LUXURY RESORTS 20 Powerful Brand Extremely strong brand recognition and guest loyalty: Asia’s largest Forbes five - star resort and the No.1 resort brand in the Philippines Represents the new gold standard for luxury resorts with distinct innovations and exemplary services that personify the unique blend of Japanese hospitality and Filipino warmth The crown jewel of the Entertainment City market with a wide base of guests and referrals from returning guests; a level of luxury and size that offers unmatched appeal to all customer segments; and is perceived as superior to any competitor in the region Source: The Innovation Group
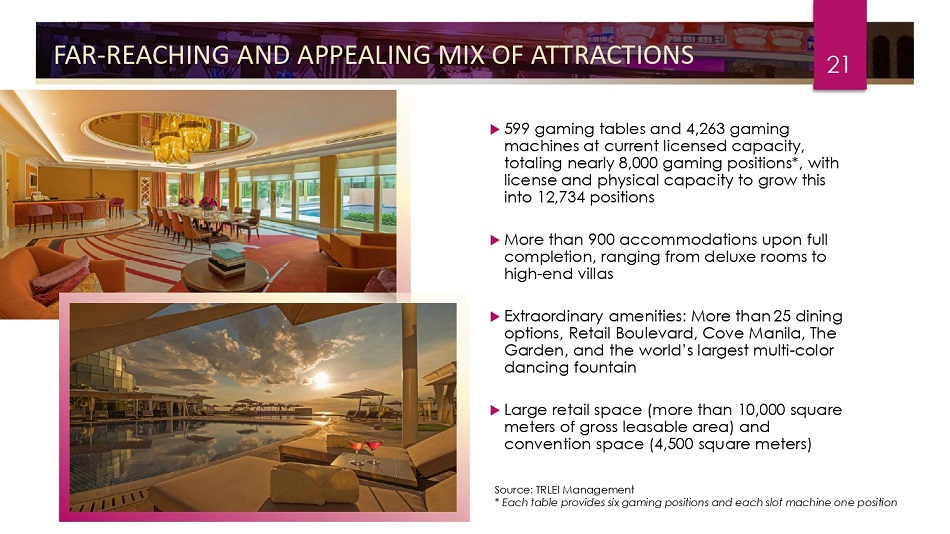
FAR - REACHING AND APPEALING MIX OF ATTRACTIONS 21 599 gaming tables and 4,263 gaming machines at current licensed capacity, totaling nearly 8,000 gaming positions*, with license and physical capacity to grow this into 12,734 positions More than 900 accommodations upon full completion, ranging from deluxe rooms to high - end villas Ex t r a o rd ina ry a m eni t ies : M o re t h a n 2 5 d ining options, Retail Boulevard, Cove Manila, The Garden, and the world’s largest multi - color dancing fountain Large retail space (more than 10,000 square meters of gross leasable area) and convention space (4,500 square meters) Source: TRLEI Management * Each table provides six gaming positions and each slot machine one position
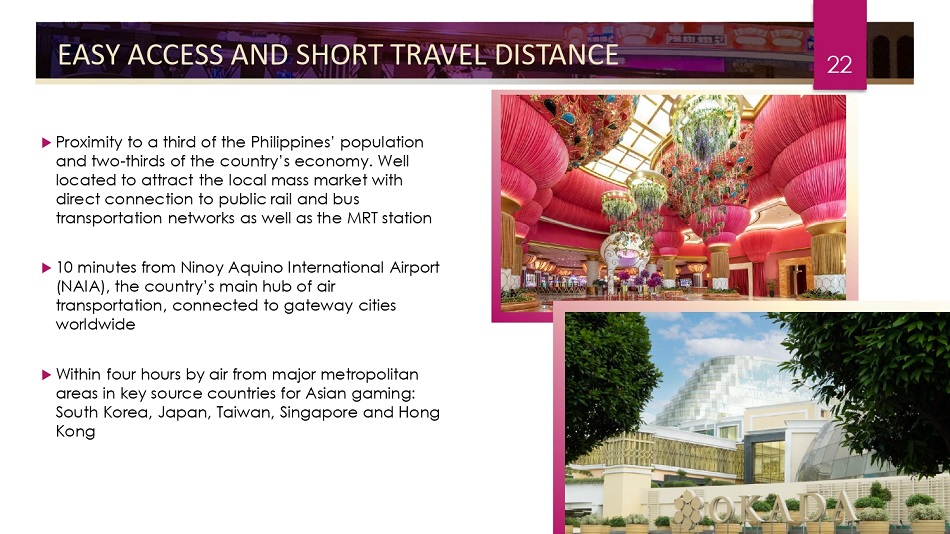
EASY ACCESS AND SHORT TRAVEL DISTANCE 22 Proximity to a third of the Philippines’ population and two - thirds of the country’s economy. Well located to attract the local mass market with direct connection to public rail and bus transportation networks as well as the MRT station 10 minutes from Ninoy Aquino International Airport (NAIA), the country’s main hub of air transportation, connected to gateway cities worldwide Within four hours by air from major metropolitan areas in key source countries for Asian gaming: South Korea, Japan, Taiwan, Singapore and Hong Kong
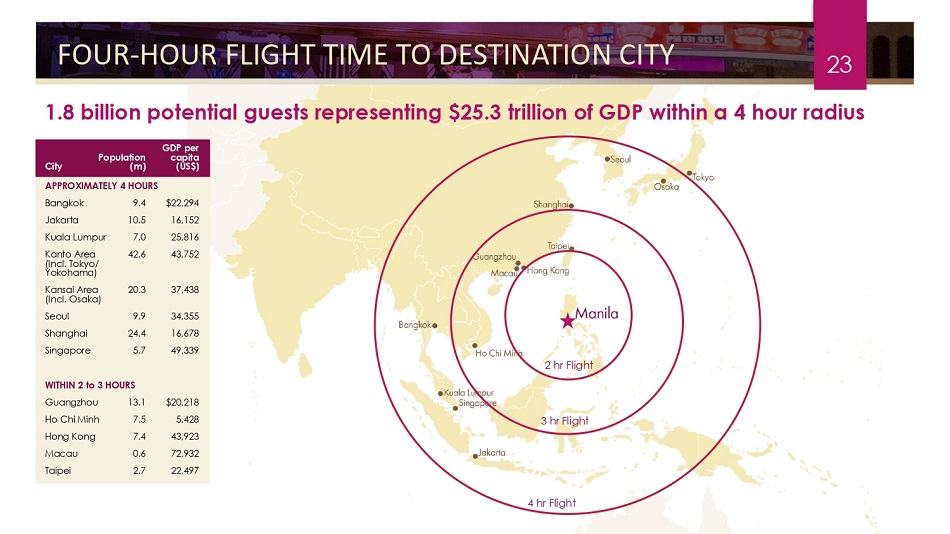
FOUR - HOUR FLIGHT TIME TO DESTINATION CITY 23 GDP per Population capita 4 hr Flight City (m) (US$) APPROXIMATELY 4 HOURS Bangkok 9.4 $22,294 Jakarta 10.5 16,152 Kuala Lumpur 7.0 25,816 Kanto Area ( I n cl. T ok y o/ Y oko h a m a) 42.6 43,752 Kansai Area ( I n cl. O s aka) 20.3 37,438 Seoul 9.9 34,355 Shanghai 24.4 16,678 Singapore 5.7 49,339 2 hr Flight WITHIN 2 to 3 HOURS Guangzhou 13.1 $20,218 Ho Chi Minh 7.5 5,428 3 hr Flight Hong Kong 7.4 43,923 Macau 0.6 72,932 Taipei 2.7 22,497 1.8 billion potential guests representing $25.3 trillion of GDP within a 4 hour radius
ONLINE OPPORTUNITY 24 Philippine Online Gaming Licenses Philippines Inland Gaming Operator (PIGO): Available since late 2020, allowed to serve domestic demand of VIP and premium guests Substantial Market Potential Online gaming is a flourishing industry in the Philippines, with revenues showing exponential growth in 2020 compared to previous years, with near - term growth anticipated to continue at similar levels Online gaming has been gaining traction among Filipinos, especially among the younger generations, boding well for sustainable growth in the future Improving Internet infrastructures in the country will upgrade the player experience and pave the way for future growth Government support and desire to grow online opportunities could replicate the success that the government achieved with its push to develop a land based gaming market Source: The Innovation Group
OKADA MANILA’S IGAMING OPERATIONS 25 One of the first properties in Entertainment City to be granted a PIGO license Current forecast and the financial projections herein only assume serving domestic iGaming demand of VIP guests, however there may be significant upside potential as the PIGO market has recently opened up more broadly to serve the demand of domestic mass guests Total Addressable Market has substantial growth potential (over $560 million*) as the PIGO license has recently expanded from current VIP and Premium players to the general market in the Philippines The coupling of Okada Manila’s advanced technology with the 26 Capital team’s extensive experience in developing online gaming businesses may add substantial and sustainable growth for both the near - term as well as the longer term The Philippines government has expressed a strong desire to grow the domestic iGaming market; expansion of iGaming outside of the domestic market may also be possible *Source: The Innovation Group
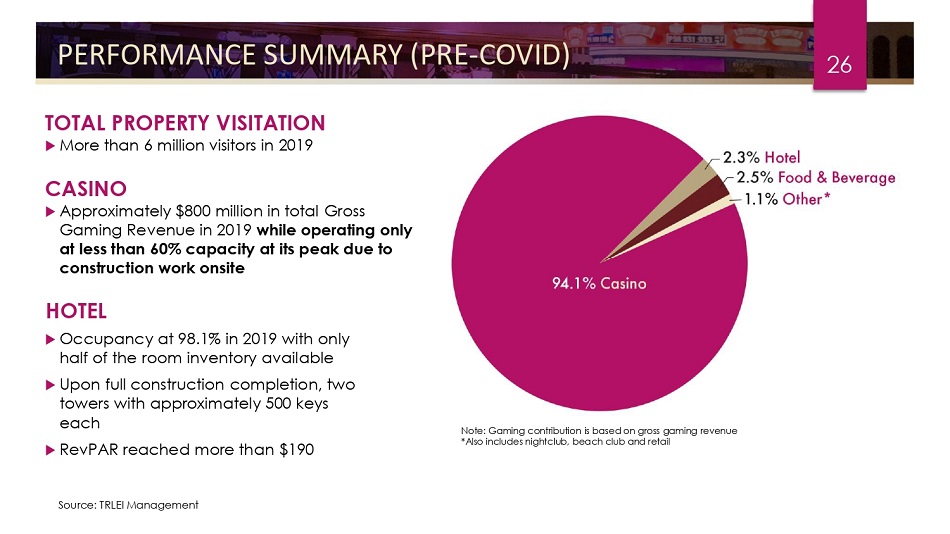
PERFORMANCE SUMMARY (PRE - COVID) 26 HOTEL Occupancy at 98.1% in 2019 with only half of the room inventory available Upon full construction completion, two towers with approximately 500 keys each RevPAR reached more than $190 TOTAL PROPERTY VISITATION More than 6 million visitors in 2019 CASINO Approximately $800 million in total Gross Gaming Revenue in 2019 while operating only at less than 60% capacity at its peak due to construction work onsite Note: Gaming contribution is based on gross gaming revenue *Also includes nightclub, beach club and retail Source: TRLEI Management
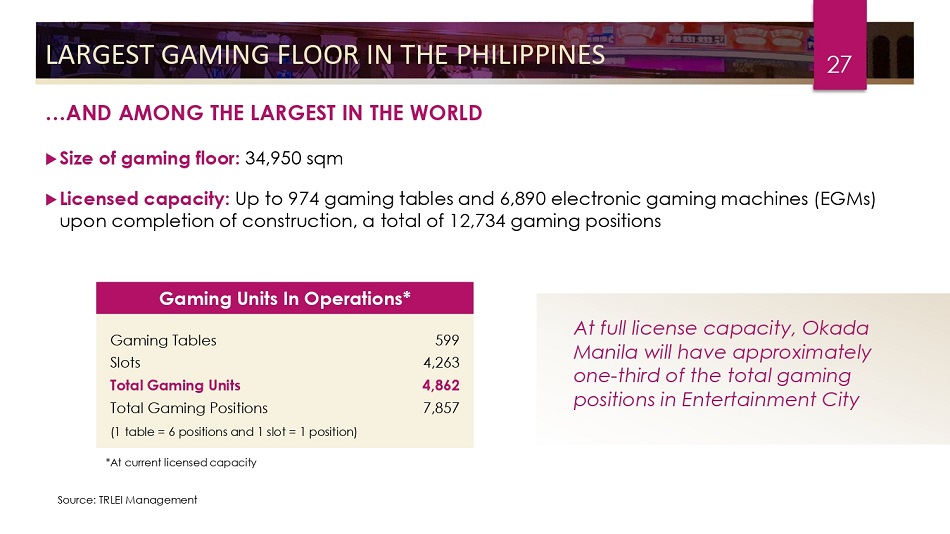
Gaming Units In Operations* Gaming Tables 599 Slots 4,263 Total Gaming Units 4,862 Total Gaming Positions 7,857 (1 table = 6 positions and 1 slot = 1 position) LARGEST GAMING FLOOR IN THE PHILIPPINES 27 …AND AMONG THE LARGEST IN THE WORLD Size of gaming floor: 34,950 sqm Licensed capacity: Up to 974 gaming tables and 6,890 electronic gaming machines (EGMs) upon completion of construction, a total of 12,734 gaming positions At full license capacity, Okada Manila will have approximately one - third of the total gaming positions in Entertainment City *At current licensed capacity Source: TRLEI Management
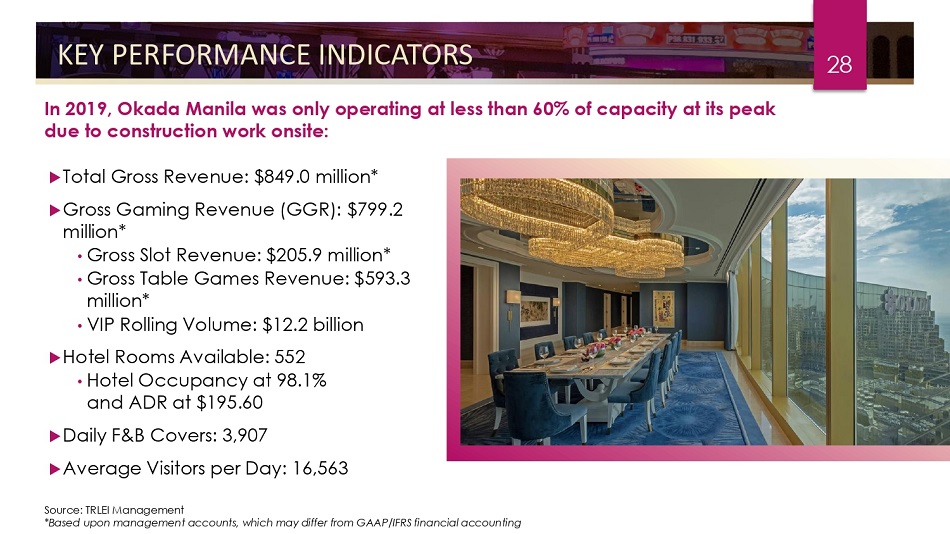
KEY PERFORMANCE INDICATORS 28 In 2019, Okada Manila was only operating at less than 60% of capacity at its peak due to construction work onsite: Total Gross Revenue: $849.0 million* Gross Gaming Revenue (GGR): $799.2 million* • Gross Slot Revenue: $205.9 million* • Gross Table Games Revenue: $593.3 million* • VIP Rolling Volume: $12.2 billion Hotel Rooms Available: 552 • Hotel Occupancy at 98.1% and ADR at $195.60 Daily F&B Covers: 3,907 Average Visitors per Day: 16,563 Source: TRLEI Management *Based upon management accounts, which may differ from GAAP/IFRS financial accounting
A GEN D A Executive Summary Property Positioning and Overview Gaming Market Overview Business Outlook Appendix 29
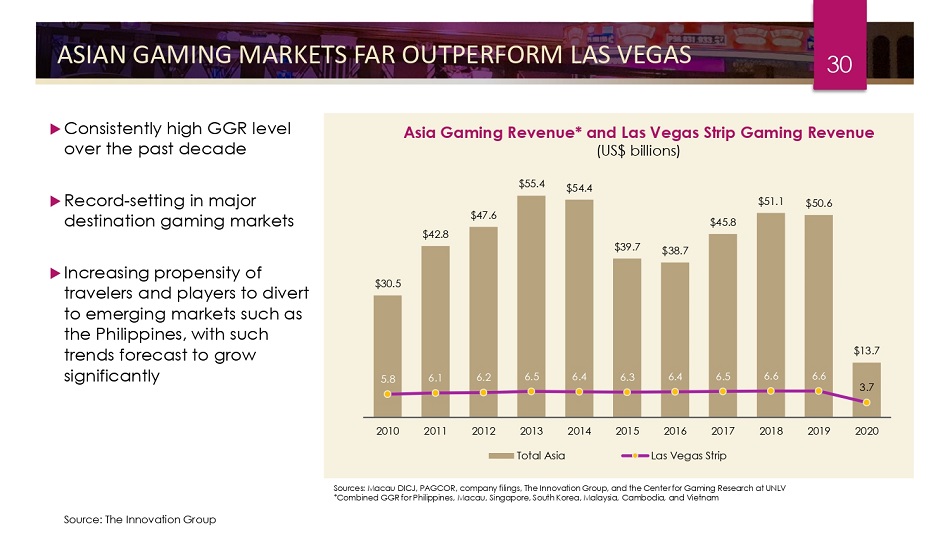
ASIAN GAMING MARKETS FAR OUTPERFORM LAS VEGAS 30 Consistently high GGR level over the past decade Record - setting in major destination gaming markets Increasing propensity of travelers and players to divert to emerging markets such as the Philippines, with such trends forecast to grow significantly $30 . 5 $42 . 8 $47 . 6 $55 . 4 $54 . 4 $39 . 7 $38 . 7 $45 . 8 $51.1 $50.6 $13 . 7 5 . 8 6 . 1 6 . 2 6 . 5 6 . 4 6 . 3 6 . 4 6 . 5 6 . 6 6 . 6 3 . 7 201 0 201 1 2012 201 4 201 5 201 6 201 7 201 8 201 9 2020 2013 Total Asia Las Vegas Strip Asia Gaming Revenue* and Las Vegas Strip Gaming Revenue (US$ billions) Sources: Macau DICJ, PAGCOR, company filings, The Innovation Group, and the Center for Gaming Research at UNLV *Combined GGR for Philippines, Macau, Singapore, South Korea, Malaysia, Cambodia, and Vietnam Source: The Innovation Group
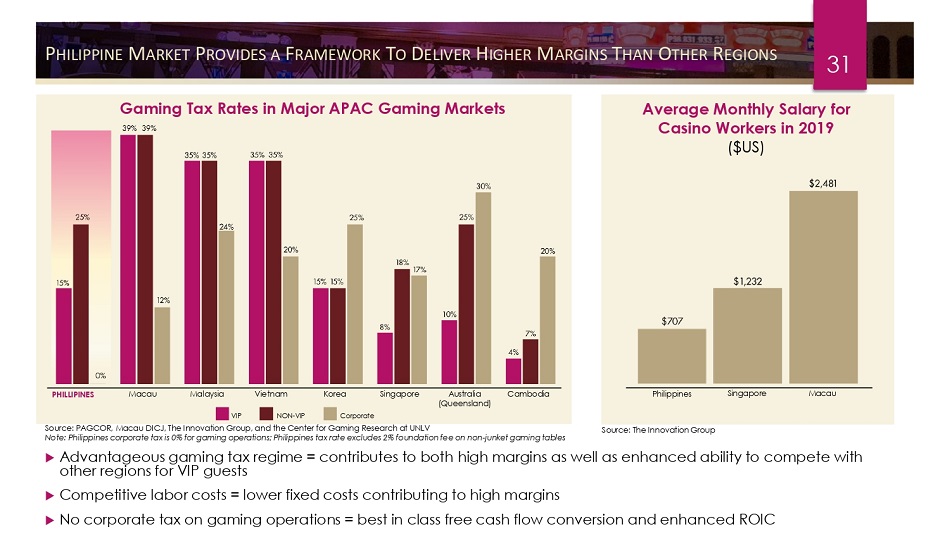
P HILIPPINE M ARKET P ROVIDES A F RAMEWORK T O D ELIVER H IGHER M ARGINS T HAN O THER R EGIONS 31 Advantageous gaming tax regime = contributes to both high margins as well as enhanced ability to compete with other regions for VIP guests Competitive labor costs = lower fixed costs contributing to high margins No corporate tax on gaming operations = best in class free cash flow conversion and enhanced ROIC Gaming Tax Rates in Major APAC Gaming Markets Average Monthly Salary for Casino Workers in 2019 ($US) PHILLIPINES M aca u Australia ( Q u een s l a n d ) Singapore C a mbo d i a Malaysia Vietnam Korea V I P NO N - V I P C o rp o r a t e Singapore M aca u Philippines Source: PAGCOR, Macau DICJ, The Innovation Group, and the Center for Gaming Research at UNLV Note: Philippines corporate tax is 0% for gaming operations; Philippines tax rate excludes 2% foundation fee on non - junket gaming tables So u r c e : T h e I n n ov a t i on G ro u p
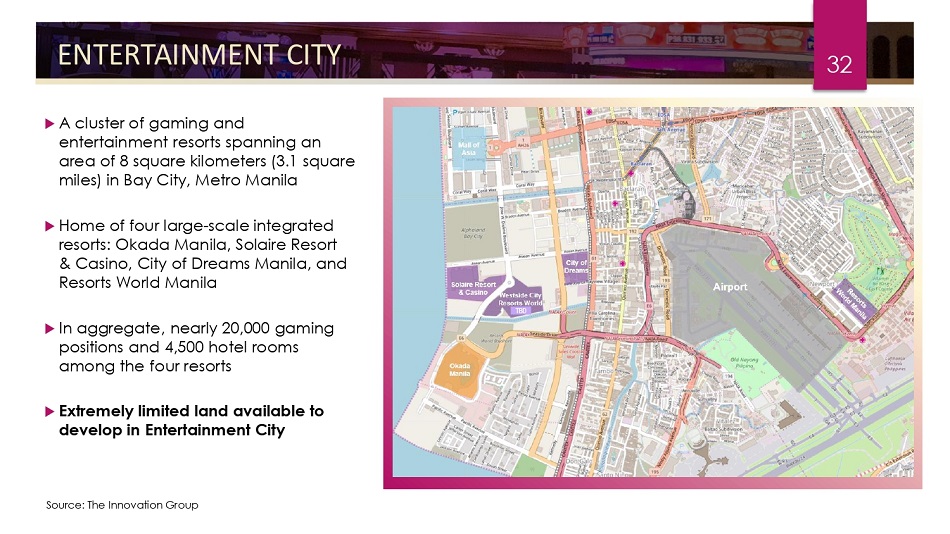
ENTERTAINMENT CITY 32 A cluster of gaming and entertainment resorts spanning an area of 8 square kilometers (3.1 square miles) in Bay City, Metro Manila Home of four large - scale integrated resorts: Okada Manila, Solaire Resort & Casino, City of Dreams Manila, and Resorts World Manila In aggregate, nearly 20,000 gaming positions and 4,500 hotel rooms among the four resorts Extremely limited land available to develop in Entertainment City TBD Source: The Innovation Group
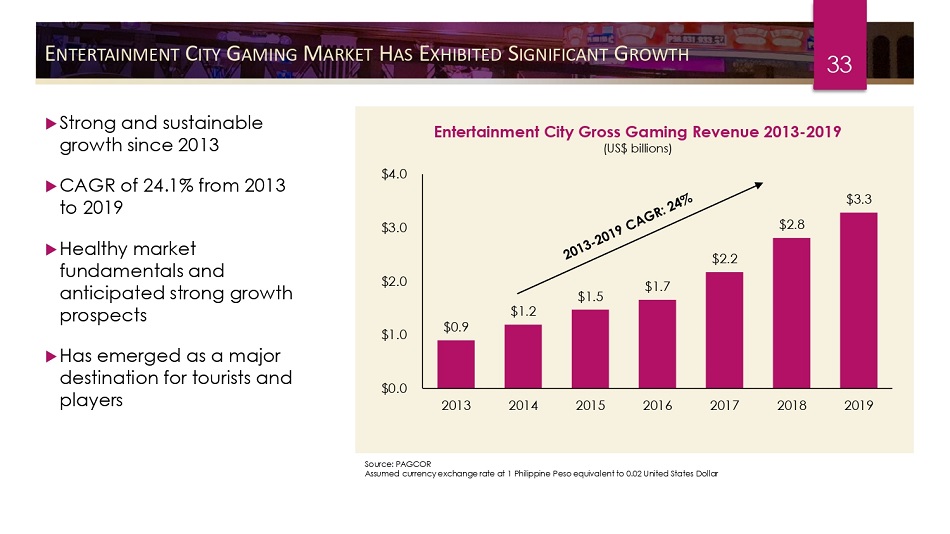
E NTERTAINMENT C ITY G AMING M ARKET H AS E XHIBITED S IGNIFICANT G ROWTH 33 Strong and sustainable growth since 2013 CAGR of 24.1% from 2013 to 2019 Healthy market fundamentals and anticipated strong growth prospects Has emerged as a major destination for tourists and players Entertainment City Gross Gaming Revenue 2013 - 2019 (US$ billions) $0 . 9 $1 . 2 $1 . 5 $ 1 . 7 $2 . 2 $2 . 8 $3 . 3 $0.0 $1.0 $2.0 $3.0 $4.0 20 1 3 20 1 4 20 1 5 20 1 6 20 1 7 20 1 8 20 1 9 So u r c e : P A GC O R Assumed currency exchange rate at 1 Philippine Peso equivalent to 0.02 United States Dollar
IMPACTS OF COVID - 19 34 While Metro Manila has experienced a number of lockdowns and restrictions, Okada Manila’s revenues have quickly recovered and profitable operations quickly resumed after each easing Recovery factors and pace to expect (full recovery expected to occur in 2023/2024 according to tourism research associations): • Local gaming demand factors: local employment, average income, perception of safety, ease of access, and pent - up demand for entertainment; expected to recover quickly • Tourist recovery factors: tourist sentiment, spending for leisure activities, international travel policies, added travel requirements, and recovery of airlift; expected to recover at a relatively low pace, but prioritized segments such as VIP and High Roller guests are anticipated to benefit from assisted travel arrangements and recover at a higher pace • Given the property’s large size and capacity, social distancing and casino capacity constraints are unlikely to have any material impact on Okada Manila Source: The Innovation Group
A GEN D A Executive Summary Property Positioning and Overview Gaming Market Overview Business Outlook Appendix 35
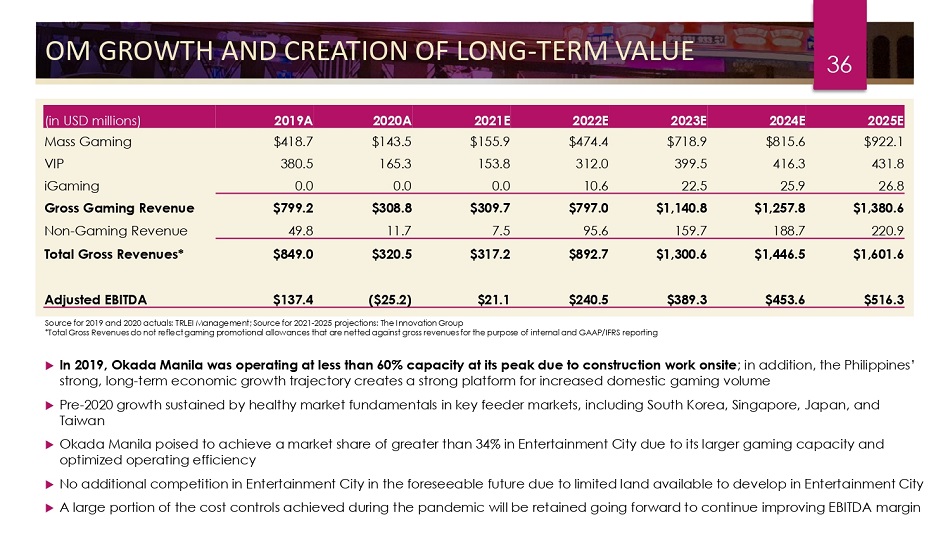
OM GROWTH AND CREATION OF LONG - TERM VALUE 36 In 2019, Okada Manila was operating at less than 60% capacity at its peak due to construction work onsite ; in addition, the Philippines’ strong, long - term economic growth trajectory creates a strong platform for increased domestic gaming volume Pre - 2020 growth sustained by healthy market fundamentals in key feeder markets, including South Korea, Singapore, Japan, and Taiwan Okada Manila poised to achieve a market share of greater than 34% in Entertainment City due to its larger gaming capacity and optimized operating efficiency No additional competition in Entertainment City in the foreseeable future due to limited land available to develop in Entertainment City A large portion of the cost controls achieved during the pandemic will be retained going forward to continue improving EBITDA margin (in USD millions) 2019A 2020A 2021E 2022E 2023E 2024E 2025E Mass Gaming $418.7 $143.5 $155.9 $474.4 $718.9 $815.6 $922.1 VIP 380.5 165.3 153.8 312.0 399.5 416.3 431.8 iGaming 0.0 0.0 0.0 10.6 22.5 25.9 26.8 Gross Gaming Revenue $799.2 $308.8 $309.7 $797.0 $1,140.8 $1,257.8 $1,380.6 Non - Gaming Revenue 49.8 11.7 7.5 95.6 159.7 188.7 220.9 Total Gross Revenues* $849.0 $320.5 $317.2 $892.7 $1,300.6 $1,446.5 $1,601.6 Adjusted EBITDA $137.4 ($25.2) $21.1 $240.5 $389.3 $453.6 $516.3 Source for 2019 and 2020 actuals: TRLEI Management; Source for 2021 - 2025 projections: The Innovation Group *Total Gross Revenues do not reflect gaming promotional allowances that are netted against gross revenues for the purpose of internal and GAAP/IFRS reporting
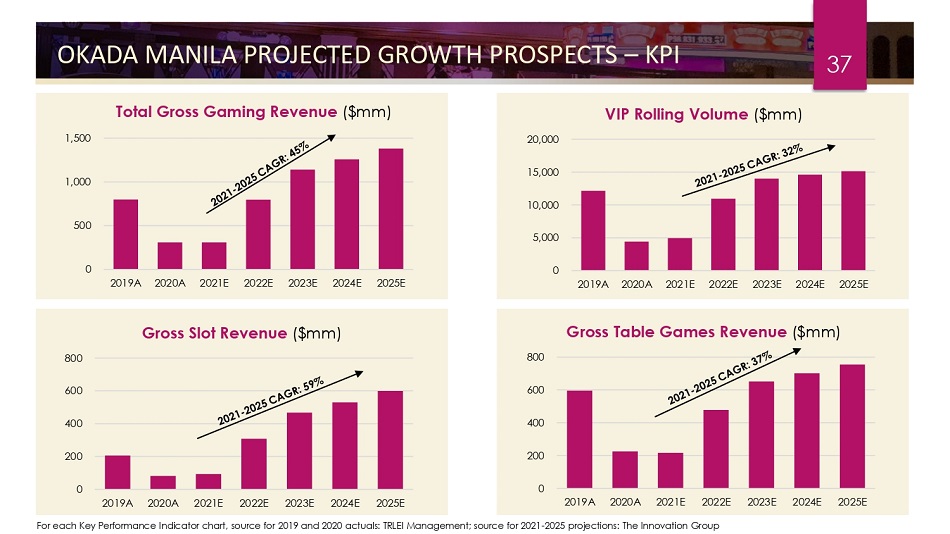
OKADA MANILA PROJECTED GROWTH PROSPECTS – KPI 37 For each Key Performance Indicator chart, source for 2019 and 2020 actuals: TRLEI Management; source for 2021 - 2025 projections: The Innovation Group Total Gross Gaming Revenue ($mm) 1,500 1,000 500 0 2019A 2020A 2021E 2022E 2023E 2024E 2025E 0 5 , 00 0 10 , 00 0 15 , 00 0 20 , 00 0 2019 A 2020 A 2021 E 2022 E 2023 E 2024 E 2025E VIP Rolling Volume ($mm) Gross Slot Revenue ($mm) 800 600 400 200 0 2019A 2020A 2021E 2022E 2023E 2024E 2025E Gross Table Games Revenue ($mm) 800 600 400 200 0 2019A 2020A 2021E 2022E 2023E 2024E 2025E
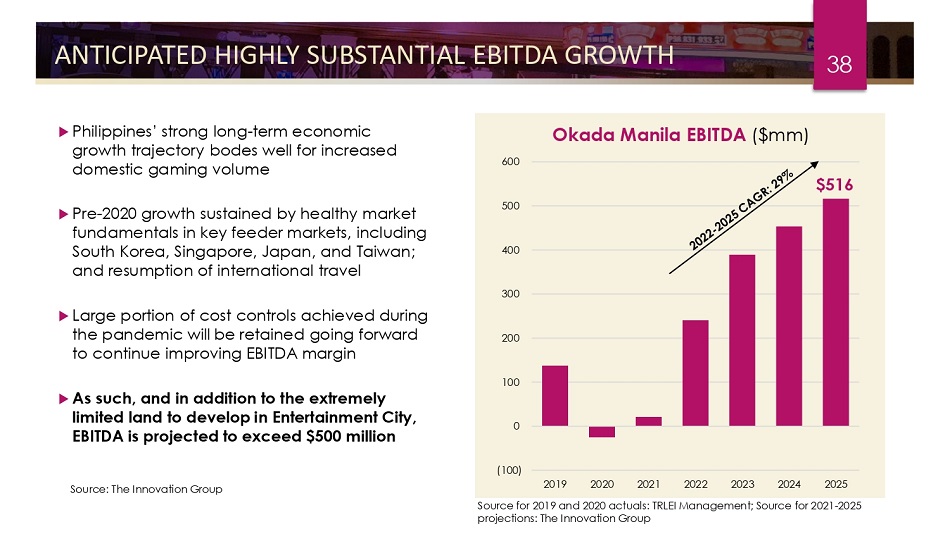
ANTICIPATED HIGHLY SUBSTANTIAL EBITDA GROWTH 38 Philippines’ strong long - term economic growth trajectory bodes well for increased domestic gaming volume Pre - 2020 growth sustained by healthy market fundamentals in key feeder markets, including South Korea, Singapore, Japan, and Taiwan; and resumption of international travel Large portion of cost controls achieved during the pandemic will be retained going forward to continue improving EBITDA margin As such, and in addition to the extremely limited land to develop in Entertainment City, EBITDA is projected to exceed $500 million Okada Manila EBITDA ($mm) 600 $516 500 400 300 200 100 0 (100) 2019 2020 2021 2022 2023 2024 2025 Source: The Innovation Group Source for 2019 and 2020 actuals: TRLEI Management; Source for 2021 - 2025 projections: The Innovation Group
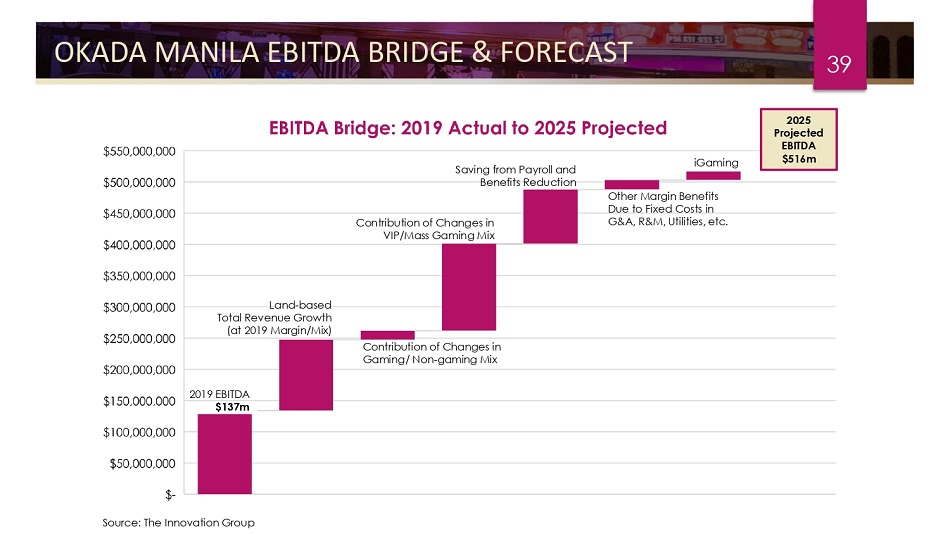
OKADA MANILA EBITDA BRIDGE & FORECAST 39 Contribution of Changes in V I P / M a s s G am i ng Mi x Saving from Payroll and B en e f i t s Redu c t i on Other Margin Benefits Due to Fixed Costs in G&A, R&M, Utilities, etc. iGaming 2025 Projected EBITDA $516m Land - ba s ed Total Revenue Growth (at 2019 Margin/Mix) Contribution of Changes in Gaming/ Non - gaming Mix 201 9 EB I T DA $137m Source: The Innovation Group
AREAS OF POTENTIAL REVENUE UPSIDE 40 We believe additional revenue upside may result from: Acceleration of COVID relief measures (vaccination, treatment, etc.) within Philippines and feeder countries, and corresponding faster recovery timeline High - potential revenue streams • Okada Manila’s iGaming license positions it to benefit from the future growth of online gaming • Targeting High Roller guests directly instead of as junket players to improve margins • Amplifying local and mass play promotional efforts Maintaining COVID - era margin optimization Continued diversification into non - gaming revenue streams to further differentiate the property and increase market share
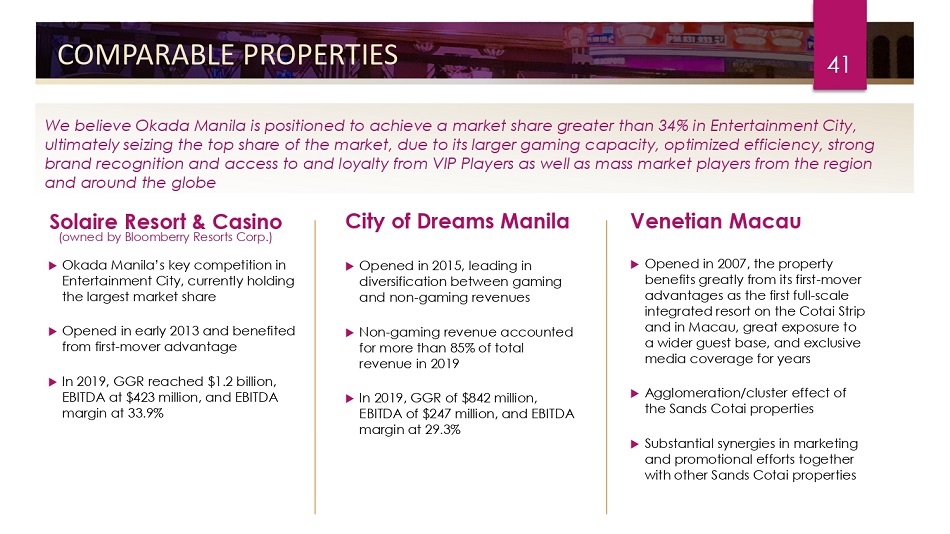
COMPARABLE PROPERTIES 41 Solaire Resort & Casino (owned by Bloomberry Resorts Corp.) Okada Manila’s key competition in Entertainment City, currently holding the largest market share Opened in early 2013 and benefited from first - mover advantage In 2019 , GGR reached $ 1 . 2 billion, EBITDA at $ 423 million, and EBITDA margin at 33 . 9 % City of Dreams Manila Venetian Macau Opened in 2015, leading in diversification between gaming and non - gaming revenues Non - gaming revenue accounted for more than 85% of total revenue in 2019 In 2019, GGR of $842 million, EBITDA of $247 million, and EBITDA margin at 29.3% Opened in 2007, the property benefits greatly from its first - mover advantages as the first full - scale integrated resort on the Cotai Strip and in Macau, great exposure to a wider guest base, and exclusive media coverage for years Agglomeration/cluster effect of the Sands Cotai properties Substantial synergies in marketing and promotional efforts together with other Sands Cotai properties We believe Okada Manila is positioned to achieve a market share greater than 34% in Entertainment City, ultimately seizing the top share of the market, due to its larger gaming capacity, optimized efficiency, strong brand recognition and access to and loyalty from VIP Players as well as mass market players from the region and around the globe
A GEN D A Executive Summary Property Positioning and Overview Gaming Market Overview Business Outlook Appendix 42
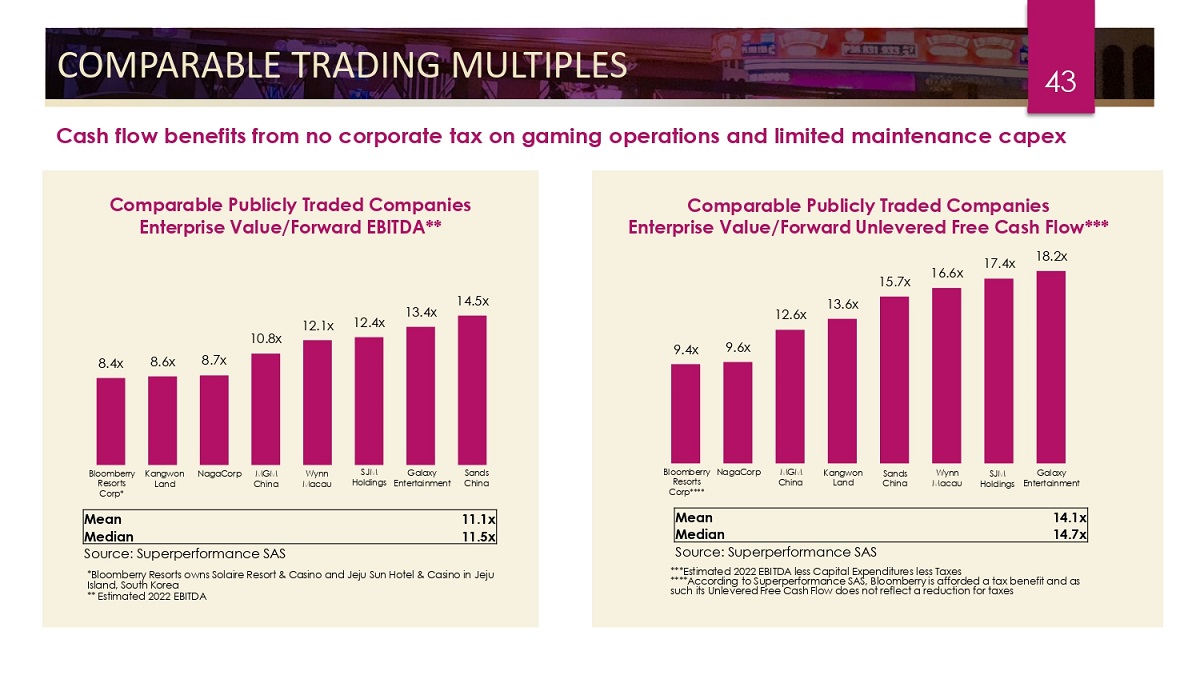
8 . 4x 8 . 6 x 8 . 7x 10 . 8x 12 . 1 x 12 . 4x 13 . 4 x 14 . 5x 9 . 4x 9 . 6x 12 . 6x 13 . 6x 15 . 7 x 16 . 6x 17 . 4x 18 . 2 x COMPARABLE TRADING MULTIPLES 43 Comparable Publicly Traded Companies Enterprise Value/Forward EBITDA** Comparable Publicly Traded Companies Enterprise Value/Forward Unlevered Free Cash Flow*** Mean 11.1x Median 11.5x Source: Superperformance SAS *Bloomberry Resorts owns Solaire Resort & Casino and Jeju Sun Hotel & Casino in Jeju Island, South Korea ** Estimated 2022 EBITDA ***Estimated 2022 EBITDA less Capital Expenditures less Taxes ****According to Superperformance SAS, Bloomberry is afforded a tax benefit and as such its Unlevered Free Cash Flow does not reflect a reduction for taxes Mean 14.1x Median 14.7x Source: Superperformance SAS Bloomberry Kangwon NagaCorp MGM R es o r t s L and C h i na Corp* Wynn M a c au SJM Galaxy Sands Holdings Entertainment China Kan g w o n Land B loo m b e r r y Na g a C o rp M GM R es o r t s C h i na Corp**** Wynn M a c au Sands C h i na SJM Galaxy Holdings Entertainment Cash flow benefits from no corporate tax on gaming operations and limited maintenance capex
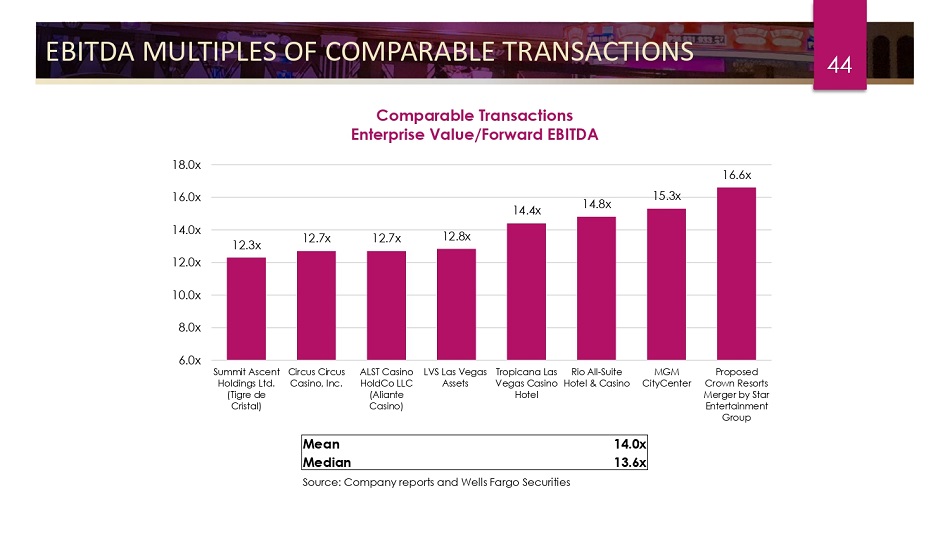
EBITDA MULTIPLES OF COMPARABLE TRANSACTIONS 44 Comparable Transactions Enterprise Value/Forward EBITDA 12 . 3x 12 . 7x 12 . 7x 12 . 8x 14 . 4x 14 . 8x 15 . 3x 16 . 6x 1 2 . 0 x 1 0 . 0 x 8 . 0x 6 . 0x 1 4 . 0 x 1 6 . 0 x 1 8 . 0 x Summit Ascent Circus Circus Hold i n gs Ltd. C asi n o, I n c. ( T ig r e de Cristal) ALST C a s i n o Hold C o LLC (Aliante Casino) As s e t s LVS Las Vegas T r o p ica n a L a s R io A l l - S u i t e Vegas Casino Hotel & Casino Hotel MGM CityCenter Proposed Crown Resorts Merger by Star Entertainment Group Mean 14.0x Median 13.6x Source: Company reports and Wells Fargo Securities
Thank You