0001819574FY2024falseP1MP6MP12M0.3333http://fasb.org/us-gaap/2023#PropertyPlantAndEquipmentAndFinanceLeaseRightOfUseAssetAfterAccumulatedDepreciationAndAmortizationhttp://fasb.org/us-gaap/2023#PropertyPlantAndEquipmentAndFinanceLeaseRightOfUseAssetAfterAccumulatedDepreciationAndAmortizationiso4217:USDxbrli:sharesiso4217:USDxbrli:sharesbark:productCategorybark:segmentbark:financialInstitutionxbrli:purebark:plaintiffbark:defendant00018195742023-04-012024-03-310001819574bark:CommonStockParValue00001Member2023-04-012024-03-310001819574bark:WarrantsEachWarrantExercisableForOneShareOfCommonStockAtAnExercisePriceOf1150PerShareMember2023-04-012024-03-3100018195742023-09-3000018195742024-05-2900018195742024-03-3100018195742023-03-3100018195742022-04-012023-03-3100018195742021-04-012022-03-310001819574us-gaap:RedeemableConvertiblePreferredStockMember2021-03-310001819574us-gaap:CommonStockMember2021-03-310001819574us-gaap:TreasuryStockCommonMember2021-03-310001819574us-gaap:AdditionalPaidInCapitalMember2021-03-310001819574us-gaap:RetainedEarningsMember2021-03-3100018195742021-03-310001819574us-gaap:RetainedEarningsMember2021-04-012022-03-310001819574us-gaap:CommonStockMember2021-04-012022-03-310001819574us-gaap:AdditionalPaidInCapitalMember2021-04-012022-03-310001819574us-gaap:RedeemableConvertiblePreferredStockMember2021-04-012022-03-310001819574us-gaap:RedeemableConvertiblePreferredStockMember2022-03-310001819574us-gaap:CommonStockMember2022-03-310001819574us-gaap:TreasuryStockCommonMember2022-03-310001819574us-gaap:AdditionalPaidInCapitalMember2022-03-310001819574us-gaap:RetainedEarningsMember2022-03-3100018195742022-03-310001819574us-gaap:RetainedEarningsMember2022-04-012023-03-310001819574us-gaap:CommonStockMember2022-04-012023-03-310001819574us-gaap:AdditionalPaidInCapitalMember2022-04-012023-03-310001819574us-gaap:RedeemableConvertiblePreferredStockMember2023-03-310001819574us-gaap:CommonStockMember2023-03-310001819574us-gaap:TreasuryStockCommonMember2023-03-310001819574us-gaap:AdditionalPaidInCapitalMember2023-03-310001819574us-gaap:RetainedEarningsMember2023-03-310001819574us-gaap:RetainedEarningsMember2023-04-012024-03-310001819574us-gaap:CommonStockMember2023-04-012024-03-310001819574us-gaap:AdditionalPaidInCapitalMember2023-04-012024-03-310001819574us-gaap:TreasuryStockCommonMember2023-04-012024-03-310001819574us-gaap:RedeemableConvertiblePreferredStockMember2024-03-310001819574us-gaap:CommonStockMember2024-03-310001819574us-gaap:TreasuryStockCommonMember2024-03-310001819574us-gaap:AdditionalPaidInCapitalMember2024-03-310001819574us-gaap:RetainedEarningsMember2024-03-310001819574bark:TwoThousandTwentyFiveConvertibleNotesMember2023-04-012024-03-310001819574bark:TwoThousandTwentyFiveConvertibleNotesMember2022-04-012023-03-310001819574bark:TwoThousandTwentyFiveConvertibleNotesMember2021-04-012022-03-310001819574us-gaap:FairValueMeasurementsRecurringMemberus-gaap:FairValueInputsLevel1Memberus-gaap:MoneyMarketFundsMember2024-03-310001819574us-gaap:FairValueMeasurementsRecurringMemberus-gaap:MoneyMarketFundsMemberus-gaap:FairValueInputsLevel2Member2024-03-310001819574us-gaap:FairValueInputsLevel3Memberus-gaap:FairValueMeasurementsRecurringMemberus-gaap:MoneyMarketFundsMember2024-03-310001819574us-gaap:FairValueMeasurementsRecurringMemberus-gaap:MoneyMarketFundsMember2024-03-310001819574us-gaap:FairValueMeasurementsRecurringMemberus-gaap:FairValueInputsLevel1Member2024-03-310001819574us-gaap:FairValueMeasurementsRecurringMemberus-gaap:FairValueInputsLevel2Member2024-03-310001819574us-gaap:FairValueMeasurementsRecurringMemberus-gaap:FairValueInputsLevel3Member2024-03-310001819574us-gaap:FairValueMeasurementsRecurringMember2024-03-310001819574us-gaap:FairValueMeasurementsRecurringMemberus-gaap:FairValueInputsLevel1Memberbark:PublicWarrantMember2024-03-310001819574us-gaap:FairValueMeasurementsRecurringMemberbark:PublicWarrantMemberus-gaap:FairValueInputsLevel2Member2024-03-310001819574us-gaap:FairValueInputsLevel3Memberus-gaap:FairValueMeasurementsRecurringMemberbark:PublicWarrantMember2024-03-310001819574us-gaap:FairValueMeasurementsRecurringMemberbark:PublicWarrantMember2024-03-310001819574us-gaap:FairValueMeasurementsRecurringMemberus-gaap:FairValueInputsLevel1Memberbark:PrivateWarrantMember2024-03-310001819574us-gaap:FairValueMeasurementsRecurringMemberbark:PrivateWarrantMemberus-gaap:FairValueInputsLevel2Member2024-03-310001819574us-gaap:FairValueInputsLevel3Memberus-gaap:FairValueMeasurementsRecurringMemberbark:PrivateWarrantMember2024-03-310001819574us-gaap:FairValueMeasurementsRecurringMemberbark:PrivateWarrantMember2024-03-310001819574us-gaap:FairValueMeasurementsRecurringMemberus-gaap:FairValueInputsLevel1Memberus-gaap:MoneyMarketFundsMember2023-03-310001819574us-gaap:FairValueMeasurementsRecurringMemberus-gaap:MoneyMarketFundsMemberus-gaap:FairValueInputsLevel2Member2023-03-310001819574us-gaap:FairValueInputsLevel3Memberus-gaap:FairValueMeasurementsRecurringMemberus-gaap:MoneyMarketFundsMember2023-03-310001819574us-gaap:FairValueMeasurementsRecurringMemberus-gaap:MoneyMarketFundsMember2023-03-310001819574us-gaap:FairValueMeasurementsRecurringMemberus-gaap:FairValueInputsLevel1Member2023-03-310001819574us-gaap:FairValueMeasurementsRecurringMemberus-gaap:FairValueInputsLevel2Member2023-03-310001819574us-gaap:FairValueMeasurementsRecurringMemberus-gaap:FairValueInputsLevel3Member2023-03-310001819574us-gaap:FairValueMeasurementsRecurringMember2023-03-310001819574us-gaap:FairValueMeasurementsRecurringMemberus-gaap:FairValueInputsLevel1Memberbark:PublicWarrantMember2023-03-310001819574us-gaap:FairValueMeasurementsRecurringMemberbark:PublicWarrantMemberus-gaap:FairValueInputsLevel2Member2023-03-310001819574us-gaap:FairValueInputsLevel3Memberus-gaap:FairValueMeasurementsRecurringMemberbark:PublicWarrantMember2023-03-310001819574us-gaap:FairValueMeasurementsRecurringMemberbark:PublicWarrantMember2023-03-310001819574us-gaap:FairValueMeasurementsRecurringMemberus-gaap:FairValueInputsLevel1Memberbark:PrivateWarrantMember2023-03-310001819574us-gaap:FairValueMeasurementsRecurringMemberbark:PrivateWarrantMemberus-gaap:FairValueInputsLevel2Member2023-03-310001819574us-gaap:FairValueInputsLevel3Memberus-gaap:FairValueMeasurementsRecurringMemberbark:PrivateWarrantMember2023-03-310001819574us-gaap:FairValueMeasurementsRecurringMemberbark:PrivateWarrantMember2023-03-310001819574us-gaap:CustomerConcentrationRiskMemberus-gaap:AccountsReceivableMemberbark:TwoCustomersMember2023-04-012024-03-310001819574us-gaap:CustomerConcentrationRiskMemberus-gaap:AccountsReceivableMemberbark:TwoCustomersMember2022-04-012023-03-310001819574bark:SegmentConcentrationRiskMemberbark:CommerceSegmentMemberus-gaap:AccountsReceivableMember2023-04-012024-03-310001819574bark:SegmentConcentrationRiskMemberbark:CommerceSegmentMemberus-gaap:AccountsReceivableMember2022-04-012023-03-310001819574bark:TwoSuppliersMemberbark:FinishedGoodsPurchasedMemberus-gaap:SupplierConcentrationRiskMember2023-04-012024-03-310001819574bark:TwoSuppliersMemberbark:FinishedGoodsPurchasedMemberus-gaap:SupplierConcentrationRiskMember2022-04-012023-03-310001819574us-gaap:AccountsPayableMemberus-gaap:SupplierConcentrationRiskMemberbark:OneSupplierMember2023-04-012024-03-310001819574us-gaap:AccountsPayableMemberbark:TwoSuppliersMemberus-gaap:SupplierConcentrationRiskMember2022-04-012023-03-310001819574us-gaap:SoftwareAndSoftwareDevelopmentCostsMember2024-03-310001819574us-gaap:MachineryAndEquipmentMember2024-03-310001819574us-gaap:FurnitureAndFixturesMember2024-03-310001819574srt:MinimumMember2023-04-012024-03-310001819574srt:MaximumMember2023-04-012024-03-310001819574srt:DirectorMember2023-04-012024-03-3100018195742020-11-200001819574bark:ToysAndAccessoriesMemberbark:DirectToConsumerSegmentMember2023-04-012024-03-310001819574bark:ToysAndAccessoriesMemberbark:DirectToConsumerSegmentMember2022-04-012023-03-310001819574bark:ToysAndAccessoriesMemberbark:DirectToConsumerSegmentMember2021-04-012022-03-310001819574bark:DirectToConsumerSegmentMemberbark:ConsumablesMember2023-04-012024-03-310001819574bark:DirectToConsumerSegmentMemberbark:ConsumablesMember2022-04-012023-03-310001819574bark:DirectToConsumerSegmentMemberbark:ConsumablesMember2021-04-012022-03-310001819574bark:DirectToConsumerSegmentMember2023-04-012024-03-310001819574bark:DirectToConsumerSegmentMember2022-04-012023-03-310001819574bark:DirectToConsumerSegmentMember2021-04-012022-03-310001819574bark:CommerceSegmentMember2023-04-012024-03-310001819574bark:CommerceSegmentMember2022-04-012023-03-310001819574bark:CommerceSegmentMember2021-04-012022-03-310001819574us-gaap:SoftwareAndSoftwareDevelopmentCostsMember2023-03-310001819574us-gaap:MachineryAndEquipmentMember2023-03-310001819574us-gaap:FurnitureAndFixturesMember2023-03-310001819574us-gaap:LeaseholdImprovementsMember2024-03-310001819574us-gaap:LeaseholdImprovementsMember2023-03-310001819574us-gaap:ConstructionInProgressMember2024-03-310001819574us-gaap:ConstructionInProgressMember2023-03-310001819574bark:TwoThousandTwentyFiveConvertibleNotesMemberus-gaap:ConvertibleDebtMember2024-03-310001819574bark:TwoThousandTwentyFiveConvertibleNotesMemberus-gaap:ConvertibleDebtMember2023-03-310001819574bark:TwoThousandTwentyFiveConvertibleNotesMemberus-gaap:ConvertibleDebtMember2020-11-270001819574bark:TwoThousandTwentyFiveConvertibleNotesMemberus-gaap:ConvertibleDebtMember2020-11-272020-11-270001819574bark:TwoThousandTwentyFiveConvertibleNotesMemberus-gaap:ConvertibleDebtMember2023-12-012023-12-010001819574bark:TwoThousandTwentyFiveConvertibleNotesMemberus-gaap:ConvertibleDebtMember2022-12-012022-12-010001819574bark:TwoThousandTwentyFiveConvertibleNotesMemberus-gaap:ConvertibleDebtMember2023-11-020001819574bark:TwoThousandTwentyFiveConvertibleNotesMemberus-gaap:ConvertibleDebtMember2023-11-010001819574bark:TwoThousandTwentyFiveConvertibleNotesMemberus-gaap:ConvertibleDebtMember2023-11-022023-11-020001819574us-gaap:LineOfCreditMemberbark:WesternAllianceAgreementMemberus-gaap:RevolvingCreditFacilityMember2017-10-310001819574us-gaap:LineOfCreditMemberbark:WesternAllianceAgreementMemberus-gaap:PrimeRateMemberus-gaap:RevolvingCreditFacilityMember2023-04-012024-03-310001819574us-gaap:LineOfCreditMemberbark:WesternAllianceAgreementMemberus-gaap:RevolvingCreditFacilityMember2024-03-310001819574us-gaap:LineOfCreditMemberbark:WesternAllianceAgreementMemberus-gaap:RevolvingCreditFacilityMember2023-04-012024-03-310001819574us-gaap:LineOfCreditMemberbark:WesternAllianceAgreementMemberus-gaap:RevolvingCreditFacilityMember2023-03-310001819574bark:StockRepurchaseProgramMember2023-08-170001819574us-gaap:CommonStockMemberbark:StockRepurchaseProgramMember2023-04-012024-03-310001819574us-gaap:CommonStockMemberbark:StockRepurchaseProgramMember2024-03-310001819574bark:TwoThousandTwentyOneEquityIncentivePlanMember2021-06-010001819574bark:TwoThousandElevenStockIncentivePlanMember2021-06-012021-06-010001819574bark:TwoThousandTwentyOneEquityIncentivePlanMember2021-06-012021-06-010001819574bark:TwoThousandTwentyOneEquityIncentivePlanMember2023-04-012023-04-300001819574bark:TwoThousandTwentyOneEquityIncentivePlanMember2024-03-310001819574bark:TwoThousandElevenStockIncentivePlanMember2024-03-310001819574bark:A2011And2021PlansMember2021-06-010001819574bark:A2011And2021PlansMember2021-06-012021-06-010001819574us-gaap:ShareBasedCompensationAwardTrancheOneMemberbark:A2011And2021PlansMember2021-06-012021-06-010001819574us-gaap:ShareBasedCompensationAwardTrancheTwoMemberbark:A2011And2021PlansMember2021-06-012021-06-010001819574us-gaap:RestrictedStockUnitsRSUMemberbark:A2011And2021PlansMember2021-06-012021-06-010001819574us-gaap:EmployeeStockMember2021-06-012021-06-300001819574srt:MinimumMember2021-06-012021-06-300001819574us-gaap:EmployeeStockMember2023-04-012023-04-300001819574us-gaap:EmployeeStockMember2024-03-310001819574us-gaap:EmployeeStockMember2023-04-012024-03-310001819574us-gaap:EmployeeStockMember2022-04-012023-03-310001819574us-gaap:EmployeeStockOptionMember2023-04-012024-03-310001819574us-gaap:EmployeeStockOptionMember2022-04-012023-03-310001819574us-gaap:EmployeeStockOptionMember2021-04-012022-03-310001819574us-gaap:RestrictedStockUnitsRSUMember2023-03-310001819574us-gaap:RestrictedStockUnitsRSUMember2023-04-012024-03-310001819574us-gaap:RestrictedStockUnitsRSUMember2024-03-310001819574us-gaap:RestrictedStockUnitsRSUMember2022-04-012023-03-310001819574us-gaap:RestrictedStockUnitsRSUMember2021-04-012022-03-310001819574srt:ChiefExecutiveOfficerMemberbark:MarketBasedAwardsMember2022-04-152022-04-150001819574bark:MarketBasedAwardsMember2022-04-150001819574bark:MarketBasedAwardsMemberbark:StockPriceExceeds800PerShareMember2022-04-152022-04-150001819574bark:MarketBasedAwardsMemberbark:StockPriceExceeds1200PerShareMember2022-04-152022-04-150001819574bark:MarketBasedAwardsMemberbark:StockPriceExceeds1600PerShareMember2022-04-152022-04-150001819574bark:MarketBasedAwardsMember2023-04-012024-03-310001819574us-gaap:GeneralAndAdministrativeExpenseMember2023-04-012024-03-310001819574us-gaap:GeneralAndAdministrativeExpenseMember2022-04-012023-03-310001819574us-gaap:GeneralAndAdministrativeExpenseMember2021-04-012022-03-310001819574us-gaap:SellingAndMarketingExpenseMember2023-04-012024-03-310001819574us-gaap:SellingAndMarketingExpenseMember2022-04-012023-03-310001819574us-gaap:SellingAndMarketingExpenseMember2021-04-012022-03-310001819574bark:ManagementIncentiveProgramAwardsMember2023-04-012024-03-310001819574bark:ManagementIncentiveProgramAwardsMember2022-04-012023-03-310001819574bark:ManagementIncentiveProgramAwardsMember2021-04-012022-03-310001819574bark:MarketBasedAwardsMember2022-04-012023-03-310001819574bark:MarketBasedAwardsMember2021-04-012022-03-310001819574us-gaap:EmployeeStockMember2021-04-012022-03-310001819574us-gaap:EquipmentMember2024-03-3100018195742024-03-202024-03-200001819574bark:LegacyBARKFounderMember2024-03-202024-03-200001819574us-gaap:DomesticCountryMember2024-03-310001819574us-gaap:StateAndLocalJurisdictionMember2024-03-310001819574us-gaap:ForeignCountryMember2024-03-310001819574us-gaap:DomesticCountryMember2023-03-310001819574us-gaap:StateAndLocalJurisdictionMember2023-03-310001819574us-gaap:RedeemableConvertiblePreferredStockMember2023-04-012024-03-310001819574us-gaap:RedeemableConvertiblePreferredStockMember2022-04-012023-03-310001819574us-gaap:RedeemableConvertiblePreferredStockMember2021-04-012022-03-310001819574us-gaap:EmployeeStockOptionMember2023-04-012024-03-310001819574us-gaap:EmployeeStockOptionMember2022-04-012023-03-310001819574us-gaap:EmployeeStockOptionMember2021-04-012022-03-310001819574us-gaap:RestrictedStockUnitsRSUMember2023-04-012024-03-310001819574us-gaap:RestrictedStockUnitsRSUMember2022-04-012023-03-310001819574us-gaap:RestrictedStockUnitsRSUMember2021-04-012022-03-310001819574us-gaap:WarrantMember2023-04-012024-03-310001819574us-gaap:WarrantMember2022-04-012023-03-310001819574us-gaap:WarrantMember2021-04-012022-03-310001819574us-gaap:ConvertibleDebtSecuritiesMember2023-04-012024-03-310001819574us-gaap:ConvertibleDebtSecuritiesMember2022-04-012023-03-310001819574us-gaap:ConvertibleDebtSecuritiesMember2021-04-012022-03-310001819574us-gaap:EmployeeStockMember2023-04-012024-03-310001819574us-gaap:EmployeeStockMember2022-04-012023-03-310001819574us-gaap:EmployeeStockMember2021-04-012022-03-310001819574us-gaap:SubsequentEventMember2024-06-0300018195742024-01-012024-03-31
UNITED STATES
SECURITIES AND EXCHANGE COMMISSION
WASHINGTON, DC 20549
FORM 10-K
(Mark One)
☒ ANNUAL REPORT PURSUANT TO SECTION 13 OR 15(d) OF THE SECURITIES EXCHANGE ACT OF 1934
For the fiscal year ended March 31, 2024
OR ☐ TRANSITION REPORT PURSUANT TO SECTION 13 OR 15(d) OF THE SECURITIES EXCHANGE ACT OF 1934
For the transition period from to
Commission File Number: 001-39691
BARK, INC.
(Exact name of registrant as specified in its charter)
| | | | | |
| Delaware | 85-1872418 |
(State or Other Jurisdiction
of Incorporation) | (IRS Employer
Identification No.) |
120 Broadway, Floor 12 | 10271 |
New York, NY |
(Address of principal executive offices) | (Zip Code) |
(855) 501-2275
(Registrant’s telephone number, including area code)
Securities registered pursuant to Section 12(b) of the Act:
| | | | | | | | | | | | | | |
| Title of each class | | Trading Symbol(s) | | Name of each exchange on which registered |
| Common Stock, par value $0.0001 | | BARK | | New York Stock Exchange |
| Warrants, each warrant exercisable for one share of Common Stock at an exercise price of $11.50 per share | | BARK WS | | New York Stock Exchange |
Indicate by check mark if the registrant is a well-known seasoned issuer, as defined in Rule 405 of the Securities Act. Yes ☐ No ☒
Indicate by check mark if the registrant is not required to file reports pursuant to Section 13 or Section 15(d) of the Act. Yes ☐ No ☒
Indicate by check mark whether the registrant (1) has filed all reports required to be filed by Section 13 or 15(d) of the Securities Exchange Act of 1934 during the preceding 12 months (or for such shorter period that the registrant was required to file such reports), and (2) has been subject to such filing requirements for the past 90 days. Yes ☒ No ☐
Indicate by check mark whether the registrant has submitted electronically every Interactive Data File required to be submitted pursuant to Rule 405 of Regulation S-T (§232.405 of this chapter) during the preceding 12 months (or for such shorter period that the registrant was required to submit such files). Yes ☒ No ☐
Indicate by check mark whether the registrant is a large accelerated filer, an accelerated filer, a non-accelerated filer, a smaller reporting company, or an emerging growth company. See the definitions of “large accelerated filer,” “accelerated filer,” “smaller reporting company,” and “emerging growth company” in Rule 12b-2 of the Exchange Act.
| | | | | | | | | | | |
| Large accelerated filer | ☐ | Accelerated filer | ☐ |
| Non-accelerated filer | ☐ | Small reporting company | ☒ |
| | Emerging growth company | ☐ |
If an emerging growth company, indicate by check mark if the registrant has elected not to use the extended transition period for complying with any new or revised financial accounting standards provided pursuant to Section 13(a) of the Exchange Act. ☐
Indicate by check mark whether the registrant has filed a report on and attestation to its management’s assessment of the effectiveness of its internal control over financial reporting under Section 404(b) of the Sarbanes-Oxley Act (15 U.S.C.7262(b)) by the registered public accounting firm that prepared or issued its audit report. Yes ☒ No ☐
If securities are registered pursuant to Section 12(b) of the Act, indicate by check mark whether the financial statements of the registrant included in the filing reflect the correction of an error to previously issued financial statements.☐
Indicate by check mark whether any of those error corrections are restatements that required a recovery analysis of incentive-based compensation received by any of the registrant’s executive officers during the relevant recovery period pursuant to §240.10D-1(b).☐
Indicate by check mark whether the registrant is a shell company (as defined in Rule 12b-2 of the Exchange Act). Yes ☐ No ☒
The aggregate market value of the registrant’s voting and non-voting equity held by non-affiliates of the registrant (without admitting that any person whose securities are not included in such calculation is an affiliate) computed by reference to the price at which the common stock was last sold as of the last business day of the registrant’s most recently completed second fiscal quarter was approximately $214.7 million.
As of May 29, 2024, there were 175,616,406 shares of the registrant’s common stock, par value of $0.0001 per share, outstanding.
DOCUMENTS INCORPORATED BY REFERENCE
Portions of the proxy statement with respect to the Company’s 2024 Annual Meeting of Stockholders (the “2024 Proxy Statement”) are incorporated by reference into Part III of this Form 10-K.
TABLE OF CONTENTS
CAUTIONARY NOTE REGARDING FORWARD-LOOKING STATEMENTS
This Annual Report on Form 10-K, including, without limitation, statements under the heading “Management's Discussion and Analysis of Financial Condition and Results of Operations,” includes forward-looking statements within the meaning of Section 27A of the Securities Act of 1933, as amended, (the “Securities Act”) and Section 21E of the Securities Exchange Act of 1934, as amended, (the “Exchange Act”). These forward-looking statements can be identified by the use of forward-looking terminology, including the words “believes,” “estimates,” “anticipates,” “expects,” “intends,” “plans,” “may,” “will,” “potential,” “projects,” “predicts,” “continue,” “could” or “should,” or, in each case, their negative or other variations or comparable terminology. There can be no assurance that actual results will not materially differ from expectations. Such statements include, but are not limited to, any statements relating to our financial and business performance, market acceptance and the anticipated success of our business model, and our ability to expand the scope of our offerings. These statements are based on management's current expectations, but actual results may differ materially due to various factors.
The forward-looking statements contained in this annual report on Form 10-K are based on our current expectations and beliefs concerning future developments and their potential effects on us. Future developments affecting us may not be those that we have anticipated. These forward-looking statements involve a number of risks, uncertainties (some of which are beyond our control) and other assumptions that may cause actual results or performance to be materially different from those expressed or implied by these forward-looking statements. These risks and uncertainties include, but are not limited to, those factors described under Part I, Item 1A: “Risk Factors.” Should one or more of these risks or uncertainties materialize, or should any of our assumptions prove incorrect, actual results may vary in material respects from those projected in these forward-looking statements. We undertake no obligation to update or revise any forward-looking statements, whether as a result of new information, future events or otherwise, except as may be required under applicable securities laws. These risks and others described under Part I, Item 1A: “Risk Factors” may not be exhaustive.
By their nature, forward-looking statements involve risks and uncertainties because they relate to events and depend on circumstances that may or may not occur in the future. We caution you that forward-looking statements are not guarantees of future performance and that our actual results of operations, financial condition and liquidity, and developments in the industry in which we operate may differ materially from those made in or suggested by the forward-looking statements contained in this annual report on Form 10-K. In addition, even if our results or operations, financial condition and liquidity, and developments in the industry in which we operate are consistent with the forward-looking statements contained in this annual report on Form 10-K, those results or developments may not be indicative of results or developments in subsequent periods.
ITEM 1. BUSINESS
Unless otherwise expressly stated or the context otherwise requires, when we refer to “we,” “our,” “us,” or “BARK” in this annual report on Form 10-K, we mean BARK, Inc. and its consolidated subsidiaries.
Overview
Our mission is to make all dogs happy
We believe that dogs and humans are better together and we aspire to be the world’s favorite dog brand. We are a team of dog-obsessed people committed to delivering personalization at scale by satisfying each dog’s distinct personality, preferences, and needs with the best products and services. Since our founding in 2011, we have happily served millions of dogs and their people.
We are a vertically integrated, omnichannel brand serving dogs across two key categories: toys & accessories and consumables. All of our products are designed, developed, and branded BARK. We leverage an ever-growing
collection of first-party data, customer insights, and machine learning to deliver personalized products and experiences tailored to the needs of each and every dog we serve. Our products are sold Direct-to-Consumer (“DTC”) and through our network of retail partners, which currently spans over 40,000 doors nationwide.
We began our journey with BarkBox – a monthly-themed subscription of toys and treats, tailored to the needs of each customer based on their dog’s size, play style, allergies, and more. By viewing each dog as an individual, and by creating magical experiences for our customers, we have been able to build lasting relationships with millions of dogs and their parents. Our customer service (“Happy Team”) proactively engages around 200,000 customers each month. We use the valuable data from these customer interactions to inform the design and development of future products, and we leverage it along with machine learning technology to recommend additional products to our customers through cross-selling and Add-to-Box (“ATB”).
More recently, we have entered exciting, and much larger categories in the consumables space, which include kibble, treats, toppers, supplements, and dental products. This expansion has significantly increased our total addressable market and the number of customers we can serve. We believe that our growing first-party dataset, strong brand, and loyal customer base afford us a meaningful advantage and opportunity to win market share in these newer categories.
Our Industry
Large, growing, and resilient market for pet products:
According to the American Pet Products Association (“APPA”), annual spend on pets in the U.S. was approximately $147 billion in 2023, an increase of over $10 billion, or approximately 7%, compared to 2022.
Dogs are the most popular pet in the U.S.:
According to the 2022-23 APPA Survey, dogs are the most popular pet in the U.S., with more than 65 million households having a dog as a member of their family. We believe we have an opportunity to significantly expand our customer base, both in the U.S. and globally.
An accelerating shift to digital and e-commerce:
E-commerce sales continue to grow faster than the overall retail sales market and are increasingly taking significant share from brick-and-mortar retail. Sales of dog-related products have mirrored this trend as dog owners increasingly shift a greater share of their dog-related purchasing to online options and subscription-based offerings across all categories. According to the market research firm Packaged Facts, an estimated 37% of all pet product sales occurred online in 2023. By 2028, Packaged Facts estimates roughly 44% of all U.S. pet sales will occur online.
Our Segments and Products
We operate two business segments: direct to consumer and commerce. Our DTC business drives the majority of our revenues and represented 89.0% of total revenue in fiscal 2024.
Our commerce business, which reflects the sale of BARK products in retail stores and other e-tailers, significantly broadens our customer reach and raises awareness for the BARK brand. Today, BARK products are sold in over 40,000 retail doors, including Target, Walmart, Kroger, Petco, and PetSmart. This segment represented 11.0% of our total revenue in fiscal 2024. We see a significant opportunity to grow our presence in retail. Today, the majority of our commerce revenue consists of selling our toys in retail. Recently, we began selling our new treat offering in over 2,400 Target and PetSmart doors nationwide. The Company anticipates further expanding its consumables presence in retail in the future.
Our Key Products:
Toys & Accessories (“toys”)—The majority of our revenue in the toys category is derived from BarkBox and Super Chewer, which are subscription products that feature monthly themed boxes of premium-quality BARK toys
and treats that are delivered directly to a dog’s home. Customers have the option to subscribe to these products on a one month, six month, or twelve month basis. During the life of their subscription, we offer our customers incremental products via ATB, which allows us to cross-sell customers our full portfolio of products including kibble, treats, toppers, dental, and more. Over the years, we have become increasingly more effective at cross-selling to customers. Total cross sell revenue was $38 million in fiscal 2024.
We also sell toys through our network of retail partners. Today, the commerce segment accounts for 11% of total revenue. This distribution channel allows us to reach new customers and introduce them to the BARK brand.
Our toys & accessories category also includes revenue derived from the sale of other products such as beds, leashes, apparel, and other accessories.
This category generated approximately $284.7 million of revenue in fiscal 2024, down 7% compared to fiscal 2023. The allocation between Toys & Accessories and Consumables includes estimates and was determined utilizing data on stand-alone selling prices that the Company charges for similar offerings, and also reflects historical pricing practices.
Consumables—The majority of our consumables revenue today is derived from the treats and chews that are included in our BarkBox and Super Chewer boxes. Over the past several years, the Company has expanded into new and larger consumables markets such as kibble, toppers, supplements and dental products. The Company sells its consumables products both DTC (through Bark.co) and through its retail footprint.
Treats— Includes treats and chews included in our BarkBox and Super Chewer boxes, as well as the sale of treats on our consumables website. Many of our treats feature monthly themes, similar to our toys. Today, BARK is one of the largest treat brands in the U.S. by revenue. The Company also began selling its treats in over 2,400 doors nationwide this year.
Toppers—Includes meal-enhancing sprinkles, broths, and bites that are added to a dog’s food to enhance the flavor of their food. These toppers are often single ingredient proteins that can be easily added to a dog’s existing meal plan. Toppers are particularly beneficial for picky eaters.
Supplements—Includes a variety of dog supplements such as hip and joint support, and skin and coat support. These products are often targeted at specific breeds that are prone to certain ailments.
Kibble—We sell a variety of kibble, priced to compete with the mass premium category. While our kibble can be purchased on an individual basis, we often recommend meal plans consisting of a mix of kibble, toppers, and/or supplements based on the characteristics and personalities of each dog. For example, because German Shepherds are prone to hip issues, we often recommend hip and joint support supplements with the purchase of their kibble. If that dog is also a picky eater, we will recommend adding one of our toppers. This increases our average order value and margin profile.
Dental—Also known as BARK Bright, this category includes a variety of chews and toothpastes aimed at improving your dog’s dental health. BARK Bright eliminates the arduous task of brushing a dog’s teeth while still effectively fighting germs and bad breath. Our BARK Bright dental kit provides an innovative regimen for dog dental care.
Overall, we see significant runway in our consumables category long-term, and anticipate the majority of our future growth may be driven by these product categories.
BARK Air—Announced in April 2024, BARK Air is a first-of-its kind air travel experience tailored to dogs. The Company partnered with a jet charter company to begin offering premium flights for customers and their dogs. Interested parties can book flights at dogsflyfirst.com. Our charter partner is responsible for all aircraft, crew, maintenance, and insurance, allowing BARK to focus on creating a great travel experience for dogs and their people worldwide. We believe this initiative exemplifies the Company’s dog-first approach to curating the best products and services.
Our Strengths
Ever-Growing Data Drives Personalization at Scale:
We know the names, age, breed, birthdays, play style, allergies, and more for over 6 million dogs. We believe that this is a key competitive advantage as it enables us to deliver highly personalized products and experiences for each and every dog that we serve. We are able to tailor our products to each customer by collecting proprietary product and customer data with each interaction. We also leverage our machine learning technology and first-party data set to compare dogs’ attributes against our available inventory when recommending products for purchase via cross-selling or ATB. In addition, we believe that personalization requires more than curation. We apply our data-driven customization approach to our product design and development as well, so that our products themselves, and not just our recommendations, are tailored to meet particular dog attributes that have been expressed to us.
Deep Customer Relations Drive Retention and Lifetime Value:
Our strong customer relationships are at the heart of what we do. Our Happy Team proactively engages hundreds of thousands of customers each month. We get to know their dog’s preferences based on breed, size, age, play style, allergies, and more. This allows us to personalize our products and experiences for each customer, which we believe drives stronger retention and lifetime value.
Vertically Integrated:
All of our products are designed, developed, and branded BARK, which drives higher margins, compared to companies that primarily sell third-party products. We believe that our data and insights have enabled us to design and make superior products for dogs as well as to create new products that dogs and their dog parents love. By employing an in-house team of world-class designers to design our products and having them made exclusively for us, rather than selling third-party products, we have created a collection of high-quality, unique, and cleverly-themed products, with strong brand association and higher potential for profitability. By designing our own products, we have the opportunity to achieve higher price points, therefore expanding our gross margins.
Omnichannel:
While the majority of our revenues are driven by our DTC business, we derived $54 million, or 11.0% of our revenue from the sale of BARK products in retail stores and other e-tailers in fiscal 2024. The Company currently sells products in over 40,000 retail doors nationwide, including Target, Walmart, Kroger, Petco, and PetSmart. We believe that these partnerships significantly broaden our customer reach and raise awareness for the BARK brand. We believe that this business also serves to introduce first-time customers to BARK who later could become loyal subscribers of our DTC business.
Growth Opportunities
We strive to be a dog parent’s partner from those first days with a puppy throughout their dog’s entire adult life. BARK seeks to be there every step of the way serving dogs with the best products and services. Our ambition is to grow BARK to be the world’s favorite dog brand. We are focused on several key areas that we believe will be significant drivers to our business, long-term.
Growth across our consumables products:
While we are one of the largest treat companies in the U.S. by revenue today, we have only just begun to tap into the broader consumables opportunity. With the introduction of innovative new products across kibble, toppers, supplements, and dental products, we have significantly increased our addressable market and the number of customers we can serve. In the near-term, one of our biggest opportunities is to grow our consumables presence in retail. We currently sell our treats across 2,400 Target and PetSmart doors, and aim to expand our consumables presence across our retail footprint. We are also seeing healthy growth in our newer consumables categories across our DTC segment. While these product lines are relatively small for BARK today, we see significant a opportunity to grow these products, long-term.
Unified Customer Experience Expected to Enhance Cross-Selling and Awareness:
Historically, BARK operated five siloed businesses and customer experiences – BarkBox, SuperChewer, BarkBright, BarkFood, and BarkShop. Each of these businesses had distinct websites, dashboards, and logins. We are currently in the process of unifying our brand under the bark.co domain so all of our products are sold under one roof. This will improve the customer experience, raise awareness of our full suite of products, and enhance our cross-selling capabilities. We anticipate migrating all of our platforms to bark.co this fiscal year.
Our People and Culture
The Team
As dog people, BARK employees join the company because they are aligned with our mission to make all dogs happy. The work we are doing is inherently joyful, optimistic, and humorous because our primary customers, dogs, possess those same characteristics. To that end, our company culture is centered around service, creativity, and a high level of ambition to serve all dogs and their humans.
At the end of fiscal 2024, BARK employed approximately 708 full-time and part-time employees, with 377 employees based in the U.S. and 331 employees based in the Philippines. Our employee population includes approximately 393 BARK Happy Ambassadors and their leadership, 76 engineers, data scientists, and technology staff, 59 designers and creative team members, 81 operations and fulfillment center employees, and 101 marketing, general, and administrative employees. As of March 31, 2024, 68% of our employees, 38% of our management team, and 43% of our Board of Directors identified as female or nonbinary.
Employee Engagement
Team communication is frequent and direct, allowing for a high level of transparency and feedback. We engage with employees through periodic surveys to measure employee engagement, receive feedback, and respond to employee concerns effectively. We leverage these data points to continuously evolve our policies and practices to meet employee needs and align with BARK team values. Though most of the team has worked remotely since March 2020, we currently use our offices in New York, New York and Columbus, Ohio for regular team collaboration, all hands meetings, workshops and more.
Diversity, Equity, and Inclusion
At BARK, we recognize that people, like dogs, should be celebrated for their differences and the diverse life experiences they bring to work each day. We advocate for and celebrate a culture of inclusiveness for all people regardless of race, gender, sexual orientation, family status, religion, ethnicity, national origin, physical ability, veteran status, age, or love of cats as we work toward one common goal: to make every single dog as happy as they make us. We do this by focusing on four key areas:
•Diversity Sourcing & Recruitment: Promote an inclusive approach to hiring diverse talent through our recruiting processes and sourcing pools.
•Continuous Learning & Communication: Make diversity and inclusion everyone’s responsibility by providing training and educational opportunities.
•Employee Resource Groups: Provide employees with opportunities and resources to build a shared, supportive community while also advancing the team’s Diversity Equity and Inclusion mission.
•Accountability: Ensure accountability while committing to focus on retention, advancement, and equity.
BARK is committed to paying employees fairly for their work. Our Total Rewards team determines and regularly reviews all compensation based on a leveling and benchmarking system guided by market insights from third-party experts and tools. On a regular basis, we review all grants of equity for parity across gender and race to ensure that we are taking a consistent approach to compensation for all team members based on market data, role, and level.
Manufacturing
BARK purchases substantially all of its merchandise directly from third-party manufacturers. Some of these suppliers operate their own manufacturing facilities and others subcontract the manufacturing to other parties. BARK’s manufacturers generally agree to terms that are substantially similar to its standard manufacturer terms, which govern its business relationships. BARK has long-standing relationships with a base of vendors that BARK believes to be mutually satisfactory.
All of our exclusive products are required to be produced according to BARK’s specifications, and our manufacturers warrant that such products will perform in accordance with BARK’s specifications. Our manufacturing and supplier contracts are generally on multi-year terms and provide BARK with the additional right to terminate the agreement for uncured material breaches. We require that all of our manufacturers comply with applicable laws and BARK generally has the right to audit the suppliers’ facilities.
Distribution and Inventory Management
BARK currently utilizes global third-party logistics providers to warehouse and distribute finished products from their distribution facilities to support BARK’s domestic operations. These logistics providers manage various distribution activities including product receipt, warehousing, assembly, certain limited product inspection activities, and coordinating outbound shipping.
BARK manages its inventory levels by analyzing product sell-through, forecasting demand, analyzing product ratings, and placing orders with our manufacturers before BARK receives firm orders from customers to ensure sufficient availability.
Trademarks and Other Intellectual Property
We believe that our rights to our intellectual property, including trademarks and domain names, as well as contractual provisions and restrictions on access to our proprietary technology, are important to our marketing efforts to develop brand recognition and differentiate our brand from competitors. BARK owns a number of trademarks that have been registered, or for which registration applications are pending, in the United States as well as in certain foreign jurisdictions. These registered or pending trademarks, standardized and stylized, include, among others, “BARK,” “BARKBOX,” “BARK BRIGHT,” “BARKEATS,” “BARK SUPER CHEWER,” “SUPER CHEWER,” and “BARKPOST.” The current registrations of these trademarks are effective for varying periods of time and may be renewed periodically, provided that we, as the registered owner, or our licensees where applicable, comply with all applicable renewal requirements including, where necessary, the continued use of the trademarks in connection with similar goods. We expect to pursue additional trademark registrations to the extent we believe such registrations would be beneficial and cost-effective.
In addition to trademark protection, we own numerous domain names, including www.bark.co, www.air.bark.co www.barkbox.com, www.barkshop.com, and www.dogsflyfirst.com. We also enter into, and rely on, confidentiality and proprietary rights agreements with our employees, consultants, contractors and business partners to protect our trade secrets, proprietary technology and other confidential information. We further control the use of our proprietary technology and intellectual property through provisions in both customer terms of use on our websites and in agreements with our vendors.
We believe that our intellectual property has substantial value and has significantly contributed to BARK’s success to date. We continually engage with manufacturers to develop and market better quality dog products under our brand names to better serve our customers at a lower price.
Competition
The dog products industry is highly competitive, fragmented, and spread across four primary segments:
•supermarkets, warehouse clubs, and mass merchants;
•specialty pet store chains;
•traditional or neighborhood pet stores; and
•subscription service businesses and e-tailers.
We believe that the principal competitive factors in BARK’s market are product selection and quality, customer service, price, brand awareness and loyalty, reliability and trust, convenience, and speed at which orders are delivered to our customers. We believe that BARK differentiates itself from our competitors by the strength of our brand, customer relationships and engagement, proprietary branded products, data-driven design and marketing, and achieving a high level of performance with regard to these competitive factors.
Government Regulation
Our business is subject to foreign and domestic laws and regulations applicable to companies conducting business on the Internet. Jurisdictions vary as to how, or whether, existing laws governing areas such as personal privacy and data security, consumer protection or sales, and other taxes, among other areas, apply to the Internet and e-commerce, and these laws are continually evolving. Related laws may govern the manner in which we store or transfer sensitive information, or impose obligations on us in the event of a security breach or an inadvertent disclosure of such information. International jurisdictions impose different, and sometimes more stringent, consumer and privacy protections. Additionally, tax regulations in jurisdictions where we do not currently collect state or local taxes may subject us to the obligation to collect and remit such taxes, or to additional taxes, or to requirements intended to assist jurisdictions with their tax collection efforts. New legislation or regulations, the application of laws from jurisdictions whose laws do not currently apply to our business, or the application of existing laws and regulations to the Internet and e-commerce generally could result in significant additional taxes on our business. Further, we could be subject to fines or other payments for any past failures to comply with these requirements. The continued growth of and demand for e-commerce is likely to result in more laws and regulations that impose additional compliance burdens on e-commerce companies.
In addition, we are subject to a broad range of federal, state, local, and foreign laws and regulations intended to protect public health, natural resources and the environment. Our operations, including our manufacturing outsourcing partners, are subject to regulation by OSHA, the FDA, the USDA, and by various other federal, state, local, and foreign authorities regarding the processing, packaging, storage, distribution, advertising, labeling and import of its products, including food safety standards.
Public Filings
Copies of the our annual report on Form 10-K, quarterly reports on Form 10-Q, current reports on Form 8-K and amendments to those reports are made available free of charge at https://investors.bark.co/financials/sec-filings/default.aspx as soon as reasonably practicable after being filed electronically with the United States Securities and Exchange Commission (the “SEC”). Our reports are also available free of charge on the SEC’s website, www.sec.gov. Information on our website is not incorporated into this Form 10-K.
ITEM 1A. RISK FACTORS
An investment in our securities involves a high degree of risk. You should carefully consider the risks described below, as well as the other information in this annual report on Form 10-K, including our consolidated financial statements and the related notes and "Management's Discussion and Analysis of Financial Condition and Results of Operations." Our business, prospects, financial condition, or operating results could be harmed by any of these risks, as well as other risks not known to us or that we consider immaterial as of the date of this annual report on form 10-K. The trading price of our securities could decline due to any of these risks, and, as a result, you may lose all or part of your investment. Additional risks and uncertainties not presently known to us or that we currently deem immaterial may also impair our business operations. This annual report on Form 10-K also contains forward-looking statements that involve risks and uncertainties. Our actual results could differ materially from those anticipated in the forward-looking statements as a result of a number of factors, including the risks described below. See also "Cautionary Note Regarding Forward-Looking Statements.”
Risks Related to Our Strategy
Our future operating performance is subject to numerous challenges and uncertainties.
Our past operating performance may not be indicative of our future operating performance, which will depend on our ability to leverage our competitive strengths and execute on our strategy. Our competitive strengths include: our proprietary product and customer data; strong customer relationships; vertically integrated design, development and manufacturing of our products; and omnichannel approach including both direct to consumer and retail sales. Our strategy is to expand into new product categories, in particular the consumables category; create a unified customer experience; and focus on the path to profitability. Our ability to leverage our competitive strengths and execute on our strategy is subject to numerous challenges and uncertainties including, but not limited to, the following:
•costs or other issues with acquiring new customers and retaining existing customers;
•adverse impacts on shipping and fulfillment services and costs;
•changes in trends and consumer preferences;
•interruptions in our business due to technology failures, cybersecurity breaches or labor shortages;
•our ability to retain existing suppliers and attract new suppliers and scale our supply chain;
•our ability to develop a unified, scalable, high-performance technology and fulfillment infrastructure;
•our ability to hire and retain talented, experienced people at all levels of our organization; and
•changes in the macro-economic environment, such as inflation, increasing interest rates, instability in the banking system or financial markets, changes in the labor markets, and political, economic and social instability, such as war in Israel and the Ukraine or pandemics such as COVID 19, in particular as such changes impact consumer discretionary spending.
If we fail to meet the challenges or navigate the uncertainties described above, as well as those described elsewhere in this “Risk Factors” section, our business, financial condition and results of operations will be materially adversely affected.
We may fail to acquire new customers in a cost-effective manner.
In order to expand our customer base, we must appeal to customers who have historically purchased their dog products from other retailers, such as traditional brick and mortar retailers or the websites of our competitors. While we believe that many of our new customers originate from word-of-mouth and other non-paid referrals from our current customers, we have made, and expect to continue to make, significant investments to acquire new customers. We must be able to appropriately, effectively and efficiently allocate our marketing spend for multiple products, including: accurately identifying, targeting and reaching our audience of current and potential customers with our marketing messages; selecting the right marketplace, media and specific media vehicle in which to advertise; adapting quickly to changes in the algorithmic logic, privacy policies, and other procedures used by search engines, social media platforms and other third party platforms; identifying the most effective and efficient level of spending in each marketplace, media and specific media vehicle; determining the appropriate creative message and media mix for advertising, marketing and promotional expenditures; managing marketing costs, including creative and media expenses, in order to maintain acceptable customer acquisition costs; differentiating our products as compared to other products; creating greater brand awareness; driving traffic to our websites, and websites of our retail partners and adapting our marketing tactics as e-commerce, search, and social networking evolve. Also, search engines, social media platforms frequently update and change the logic that determines the placement and display of results of a user’s search, such that the purchased or algorithmic placement of links to our websites can be negatively affected. Moreover, a search engine or social media platform could, for competitive or other purposes, alter its search algorithms or results, causing our websites to place lower in search query results. In addition, social networking and e-commerce channels continue to rapidly evolve, including with regard to their policies and procedures, and we may be unable to cost-effectively develop or maintain a presence within these channels. If the costs of acquiring new customers exceeds our expectations, we may not be able to acquire the necessary number of customers who purchase products in volumes sufficient to grow our business and generate the scale necessary to achieve operational efficiency and/or our margins could decrease, which could have a material adverse effect on our business, financial condition and results of operations.
We may be unable to maintain a high level of customer engagement or protect our brand and reputation.
Our strong customer relationships and our brand and reputation are the basis for the high-level customer engagement that drives increases to our average order volume and our overall growth. A significant portion of our revenue is recurring revenue from subscription customers, especially those customers who are highly engaged and purchase our add-to-box offerings which include toys, treats, toppers, dental and other products. Maintaining and protecting our brand and reputation depends largely on our ability to provide our customers with an engaging and personalized customer experience, including valued services, high-quality merchandise, appropriate prices and highly-trained customer support representatives. Customer complaints or negative reviews or publicity about our products, services, merchandise, monthly themes, delivery times, or customer support, especially on social media platforms, could harm our brand and reputation and diminish customer use of our services and the trust that our customers place in us. Also, if our customers no longer find our products appealing or appropriately priced, they may make fewer purchases and may cancel their subscriptions or stop purchasing products. Even if our existing customers continue to find our offerings appealing, they may decide to reduce their subscription and purchase less merchandise over time as their interest in new dog products declines. Failure to maintain our high level of engagement and protect our brand and reputation with our customers would cause our revenue to decrease, which could have a material adverse effect on our business, financial condition and results of operations.
We may not be able to accurately predict consumer trends, successfully introduce new products, improve existing products, or expand into new offerings.
Our growth depends, in part, on our ability to successfully introduce new products to our existing BarkBox and Super Chewer subscriptions and Toys & accessories and Consumables categories, and to improve and reposition our existing products to meet the requirements of our customers and the needs of their dogs. To be successful, we must accurately predict and respond to evolving consumer trends, demands and preferences, including predicting monthly themes for our BarkBox and Super Chewer subscriptions that will resonate with customers as timely and clever. The development and introduction of new products and expansion into new offerings also involves considerable costs. Any new product or offering may not generate sufficient customer interest to become a profitable product or to cover the costs of its development and promotion and could result in a decrease in customer retention, a reduction in purchases or negatively affect our brand and reputation. If we are unable to anticipate, identify, develop or market products, or create new offerings that respond to changes in customer requirements and preferences, or if our new product introductions, repositioned products, or new offerings fail to gain consumer acceptance, we may be unable to grow our business as anticipated, or our revenue, margins and profitability may decline or not improve, which could materially adversely affect our business, financial condition and results of operations.
Our success depends on the continuing efforts of our key employees and our ability to attract and retain highly skilled personnel and senior management.
Our ability to maintain our competitive position is largely dependent on the contributions of our senior management and other key personnel. In addition, our future success depends on our continuing ability to attract, develop, motivate and retain highly qualified and skilled employees. The market for such positions is competitive, in particular, due to the ongoing labor market effects or continuing distortions from the COVID-19 pandemic. Qualified individuals are in high demand and we may incur significant costs to attract and retain them. In addition, the loss of any of our senior management or other key employees or our inability to recruit and develop mid-level managers could impede our ability to execute our business plan and we may be unable to find adequate replacements. All of our employees are at-will employees, meaning that they may terminate their employment relationship with us at any time, and their knowledge of our business and industry could be extremely difficult to replace. If we fail to retain talented senior management and other key personnel, or if we do not succeed in attracting well-qualified employees or retaining and motivating existing employees, our business, financial condition, and results of operations could be materially adversely affected.
We face challenges due to our reliance on third party sales channels to sell and distribute our products.
We sell some of our products through a network of retailers and e-tailers (in addition to our direct sales channel). Our products are available through Amazon.com as well as in retail locations including Target, Petco,
PetSmart, Costco, Walmart, Kroger and CVS, and many others. We depend on these indirect sales channel partners to distribute and sell our products to dog parents, which subjects us to a number of challenges, including:
•the sales and business practices, reputation or failure to comply with laws and regulations, of or by our sales channel partners, of which we may or may not be aware, may affect our business and reputation;
•adverse changes in our relationships with our sales channel partners could impact sales of our products;
•economic conditions, labor issues, natural disasters, regional or global pandemics, evolving consumer preferences, and purchasing patterns of our distribution partners, or competition between our sales channels, could result in sales channel disruption;
•our sales channel partners, who also sell products offered by our competitors, and in the case of retailer house brands, may also be our competitors, which sales may compete with our own products;
•certain of our sales channel partners could decide to de-emphasize the product categories that we offer, change their algorithmic logic, policies or procedures making our products harder for customers to find, or remove them from e-commerce sites altogether; and
•building relationships with new channel partners or adapting to new distribution and marketing models in order to expand into new product categories and markets may require significant management attention and operational resources, and affect our accounting, including revenue recognition, gross margins, and the ability to make comparisons from period to period.
If we fail to effectively meet the challenges described above our business and future operating results will be materially adversely affected.
Risks Related to the Macro-Economic Environment
We rely on consumer discretionary spending, which may be adversely affected by economic downturns and other macroeconomic conditions or trends.
Our business depends on consumer discretionary spending. Some of the factors that may negatively influence consumer spending include high levels of unemployment; higher consumer debt levels; reductions in net worth, declines in asset values, and related market uncertainty; home foreclosures and reductions in home values; fluctuating interest rates and credit availability; bank failures; global pandemics, and the loosening of restrictions as the pandemic conditions improve; fluctuating fuel and other energy costs; fluctuating commodity prices; and the high rate of inflation and general uncertainty regarding the overall future political and economic environment. Furthermore, any increases in consumer discretionary spending during times of crisis may be temporary, such as those related to government stimulus programs or remote-work environments, and consumer spending may decrease when those programs or circumstances end. In addition, economic conditions in certain regions may be affected by natural disasters, such as hurricanes, tropical storms, earthquakes, and wildfires; other public health crises; and other major unforeseen events. Consumer purchases of discretionary items, including the merchandise that we offer, generally decline during recessionary periods or periods of economic uncertainty, when disposable income is reduced or when there is a reduction in consumer confidence. Any decline in consumer discretionary spending could negatively impact our revenue, which could have a material adverse effect on our business, financial condition and results of operations.
We may continue to be impacted by the COVID-19 global pandemic.
The extent to which the COVID-19 pandemic may continue to impact our business will depend on future developments related to any resurgence or geographic spread of the disease, any mutations or emergence of new diseases, and the duration and severity of potential outbreaks. In the past, the COVID-19 pandemic resulted in travel restrictions, required social distancing, business closures, governmental and business disruptions, and other actions taken by the United States government and the governments of other countries. The COVID-19 pandemic has disrupted the global supply chain and may continue to cause disruptions to our operations. Many of our personnel continue to work remotely, which could have a negative impact on the execution of our business plans and operations. Natural disasters, power outages, connectivity issues, or other events that impact our employees’ ability to work remotely, could disrupt business for a substantial period of time. The increase in remote working may also result in consumer privacy, IT security and fraud concerns as well as increase our exposure to potential wage and hour issues. While conditions appear to have improved, the COVID-19 pandemic has had, and continues to have, unprecedented and unexpected effects on the global economy, civil society, labor markets, and certain industries. As
a result, it is difficult to predict the magnitude or scope of the adverse impacts that these effects may have directly, or indirectly, on our business, operating results and financial condition in the future.
Risks Related to our Manufacturing, Inventory and Supply Chain
Our business critically relies on a limited number of suppliers, manufacturers, and logistics partners.
We rely on a limited number of contract manufacturers, suppliers and logistics providers to manufacture and transport our products. We do not currently have alternative or replacement providers and we do not generally maintain long-term supply contracts with any of these providers. We face a number of risks relating to these providers, including:
•our suppliers, manufacturers or logistics partners could be impacted by a natural disaster, an epidemic or pandemic, or other interruptions at a particular location;
•our manufacturers and suppliers are primarily located in Asia, which introduces risks related to geopolitical developments and differences in regulatory standards and legal systems;
•our existing supply channels may not be able to satisfy a significant increase in demand for our products, or we may need to replace an existing manufacturer or supplier. It could take a significant amount of time to identify a manufacturer or supplier that has the capability and resources to manufacture our products to our specifications in sufficient volume, and with acceptable quality control, technical capabilities, responsiveness and service, financial stability, regulatory compliance, and labor and other ethical practices;
•our current product purchases are centralized among a few manufacturers and suppliers to realize substantial cost savings, which exposes us to credit and other risks, including insolvency, financial difficulties, supply chain delays or other factors which may result in our manufacturers or suppliers not being able to fulfill the terms of their agreements with us; and
•we have signed a number of contracts whose performance depends upon third party suppliers delivering products on schedule to meet our contractual commitments. Concentration in the number of our manufacturers and suppliers could lead to delays in the delivery of products or components, and possible resultant breaches of contracts that we have entered into with our customers; increases in the prices we must pay for products; problems with product quality; and other concerns.
Any of the above risks could delay delivery of our products to customers in a timely and cost effective manner, which could have a material adverse effect on our business, financial condition and results of operations.
We face challenges due to limited control over our suppliers, contract manufacturers, and logistics partners.
We have limited control over our suppliers, contract manufacturers, and logistics partners, which subjects us to the following risks, many of which materialized during the COVID-19 pandemic, including: failure to satisfy demand for our products; reduced control over delivery timing, product reliability, the manufacturing process and components used in our products; limited ability to develop comprehensive manufacturing specifications that take into account any materials shortages or substitutions; variance in the manufacturing capability of our third-party manufacturers; price increases; failure of a significant supplier, manufacturer, or logistics partner to perform its obligations for technical, market, or other reasons; misappropriation of our intellectual property; changes in local economic conditions in the jurisdictions where our suppliers, manufacturers, and logistics partners are located; the imposition of new laws and regulations, including those relating to labor conditions, quality and safety standards, imports, duties, tariffs, taxes, and other charges on imports, as well as trade restrictions and restrictions on currency exchange or the transfer of funds; and insufficient warranties and indemnities on components supplied to our manufacturers or performance by our partners. If we fail to meet the challenges described above, our business and future operating results will be materially adversely affected.
Shipping, which is subject to numerous risks, is a critical part of our business.
We currently rely on third-party national, regional and local logistics providers to deliver our products. We may not be able to negotiate acceptable pricing and other terms with these providers, or these providers may experience performance problems or other difficulties in processing our orders or delivering our products to customers. In addition, our ability to receive inbound inventory efficiently and ship merchandise to customers may be negatively affected by factors beyond our and these providers’ control, including inclement weather, natural disasters, fire, flood, power loss, earthquakes, pandemics, acts of war or terrorism or other events specifically impacting our or
other shipping partners, such as labor disputes, financial difficulties, system failures and other disruptions to the operations of the shipping companies on which we rely. We are also subject to risks of damage or loss during delivery by our shipping vendors. If the products ordered by our customers are not delivered in a timely fashion or are damaged or lost during the delivery process, our customers could become dissatisfied and cease buying our products. Further, there may continue to be disruptions and delays in national, regional and local shipping, which may negatively impact our customers’ experience. Changes to the terms of our shipping arrangements and delays or failures in delivery of our products may have a material adverse effect on our margins and profitability, which could adversely affect our business, financial condition and results of operations.
We may be unable to manage the complexities created by our omnichannel operations.
Our omnichannel operations, such as offering our products through our websites, on third party websites and in traditional brick and mortar stores, create additional complexities in our ability to manage inventory levels, as well as certain operational issues, including timely shipping and refunds. Accordingly, our success depends to a large degree on continually evolving the processes and technology that enable us to plan and manage inventory levels and fulfill orders, address any related operational issues and further align channels to optimize our omnichannel operations. If we are unable to successfully manage these complexities, it may have a material adverse effect on our business, financial condition, operating results and prospects.
If we are unable to implement appropriate systems, procedures and controls, we may not be able to successfully offer our products, grow our business and account for transactions in an appropriate and timely manner.
Our ability to successfully offer our products, grow our business and account for transactions in an appropriate and timely manner requires an effective planning and management process and certain other automated management and accounting systems. We currently do not have a fully integrated enterprise resource planning system and certain other automated management and accounting systems. We periodically update our operations and financial systems, procedures and controls; however, our current procedures may not scale proportionately with our business growth or with becoming a public company. Our systems will continue to require automation, modifications and improvements to respond to current and future changes in our business. Failure to implement in a timely manner appropriate internal systems, procedures and controls could materially and adversely affect our business, financial condition and results of operations.
We may not be able to successfully optimize, operate and manage our fulfillment centers and shipping services.
If we do not optimize and operate our fulfillment centers and shipping services successfully and efficiently, it could result in excess or insufficient fulfillment capacity, an increase in costs and/or inventory shrinkage or impairment charges or harm to our business in other ways. In addition, if we do not have sufficient fulfillment or shipping capacity or experience a problem fulfilling or shipping orders in a timely manner, our customers may experience delays in receiving their purchases, which could harm our reputation and our relationship with our customers. We also anticipate the need to add additional fulfillment center and shipping capacity as our business continues to grow. We may not be able to locate suitable facilities or services on commercially acceptable terms in accordance with our expansion plans, or recruit qualified managerial and operational supply personnel to support our expansion plans. If we are unable to secure new facilities for the expansion of our fulfillment and shipping operations, recruit qualified personnel to support any such facilities, or effectively control expansion-related expenses, our business, financial condition, and results of operations could be materially adversely affected.
Risk Related to Our Industry
Our estimate of the size of our addressable market may prove to be inaccurate.
Data for retail sales of dog products is collected for most, but not all channels, and as a result, it is difficult to accurately estimate the size of the market and predict with certainty the rate at which the market for our products will grow, if at all. While our market size estimate was made in good faith and is based on assumptions and estimates we believe to be reasonable, this estimate may not be accurate. If our estimates of the size of our addressable market are not accurate, our potential for future growth may be less than we currently anticipate, which could have a material adverse effect on our business, financial condition, and results of operations.
We may not be able to compete effectively in the dog products and services retail industry.
The dog products and services retail industry, in particular on the Internet, is highly competitive and we expect this competition to continue to increase. We compete with pet product retail stores, supermarkets, warehouse clubs
and other mass and general retail and online merchandisers. We also compete with a number of specialty dog supply stores and independent dog stores, catalog retailers and other specialty e-tailers. As we expand our offerings, such as consumables and BARK Air, we will face additional competition. For example, in the consumables category, there are numerous brands and products that compete for shelf space and sales, with competition based primarily upon brand recognition and loyalty, product packaging, quality and innovation, taste, nutrition, breadth of product line, price and convenience. Many of these current competitors have, and potential competitors may have, longer operating histories, greater brand recognition, larger fulfillment infrastructures, greater technical capabilities, significantly greater financial, marketing and other resources and larger customer bases than we do, allowing our competitors to derive greater net sales and profits from their existing customer base, acquire customers at lower costs or respond more quickly than we can to new or emerging technologies and changes in consumer preferences or habits. Our competitors may engage in more extensive research and development efforts, undertake more far-reaching marketing campaigns and adopt more aggressive pricing policies (including but not limited to predatory pricing policies and the provision of substantial discounts), allowing them to build larger customer bases or generate gross profit from their customer bases more effectively than we do. Current and future competitors may also make strategic acquisitions or establish cooperative relationships among themselves or with others. If we fail to compete effectively, or are required to offer promotions and other incentives or adopt more aggressive pricing strategies, our operating margins could decrease, which could materially adversely affect our business, financial condition and results of operations.
Risks Related to Information Technology and Cybersecurity
We are subject to risks related to online payment methods.
We currently accept payments using a variety of methods, including credit card, debit card, PayPal, Venmo, Apple Pay, Shop Pay and gift cards. As we offer new payment options to customers, we may be subject to additional regulations, compliance requirements, fraud and other risks. For certain payment methods, we pay interchange and other fees, which may increase over time and raise our operating costs and lower profitability. We are also subject to payment card association operating rules and certification requirements, including the Payment Card Industry Data Security Standard and rules governing electronic funds transfers, which could change or be reinterpreted to make it difficult or impossible for us to comply. Furthermore, as our business changes, we may be subject to different rules under existing standards, which may require new assessments that involve costs above what we currently pay for compliance. In the future, as we offer new payment options to customers, including by way of integrating emerging mobile and other payment methods, we may be subject to additional regulations, compliance requirements and fraud, if our customers re-use their login and password information across multiple websites, exposing us to breaches on other sites. If we fail to comply with the rules or requirements of any provider of a payment method we accept, if the volume of fraud in our transactions limits or terminates our rights to use payment methods we currently accept, or if a data breach occurs relating to our payment systems, we may, among other things, be subject to fines or higher transaction fees and may lose, or face restrictions placed upon, our ability to accept credit card payments from customers or facilitate other types of online payments. If any of these events were to occur, our business, financial condition, and results of operations could be materially adversely affected.
We rely on software-as-a-service (“SaaS”) technologies from third parties.
We rely on SaaS technologies from third parties in order to operate critical functions of our business, including financial management services, credit card processing, customer relationship management services, supply chain services and data storage services. If these services become unavailable due to extended outages or interruptions or because they are no longer available on commercially reasonable terms or prices, or for any other reason, our expenses could increase, our ability to manage our finances could be interrupted, our processes for managing sales of our offerings and supporting our customers could be impaired, our ability to communicate with our suppliers could be weakened and our ability to access or save data stored to the cloud may be impaired until equivalent services, if available, are identified, obtained and implemented. We are also subject to certain standard terms and conditions with these providers, who have broad discretion to change their terms of service and other policies with respect to us, which may be unfavorable. Any failure to maintain successful partnerships with our SaaS providers could impact our success and materially adversely affect our business, financial condition and results of operations.
Limitations on our use of “cookies” may impact our ability to cost-effectively acquire new customers.
Federal and state governmental authorities continue to evaluate the privacy implications inherent in the use of third-party “cookies” and other methods of online tracking for behavioral advertising and other purposes. The U.S. government has enacted, or has considered or is considering legislation or regulations that could significantly restrict the ability of companies and individuals to engage in these activities, such as by regulating the level of consumer notice and consent required before a company can employ cookies or other electronic tracking tools or the use of data gathered with such tools. Additionally, some providers of consumer devices and web browsers have implemented, or announced plans to implement, means to make it easier for Internet users to prevent the placement of cookies or to block other tracking technologies, which if widely adopted could result in making cookies and other methods of online tracking significantly less effective. This regulation of the use of cookies and other current online tracking and advertising practices or the loss of our ability to make effective use of services that employ such technologies could limit our ability to acquire new customers on cost-effective terms, which could materially adversely affect our business, financial condition, and results of operations.
We may be unable to maintain and scale our technology.
Our reputation and ability to acquire, retain and serve our customers depends on the reliable performance of our websites and mobile application and our cloud-based solutions. The operation of these systems, and the consolidation of our websites, is complex and could result in operational failures. Interruptions or delays in these systems, or in the consolidation of our websites, whether due to system failures, computer viruses, physical or electronic break-ins, undetected errors, design faults or other unexpected events or causes, could affect the security or availability of our websites and mobile application and prevent our customers from accessing our websites and mobile application. If sustained or repeated, these performance issues could reduce the attractiveness of our products and services. In addition, the costs and complexities involved in consolidating our websites or expanding and upgrading our systems may prevent us from doing so in a timely manner and may prevent us from adequately meeting the demand placed on our systems. Any web or mobile platform interruption or inadequacy that causes performance issues or interruptions in the availability of our websites or mobile application could reduce consumer satisfaction and result in a reduction in the number of customers using our products and services, which could have a material adverse effect on our business, financial condition and results of operations.
Our disaster recovery arrangements may be insufficient.
The occurrence of a natural disaster, power loss, telecommunications failure, data loss, computer virus, an act of terrorism, cyberattack, vandalism or sabotage, act of war or any similar event, or a decision to close the third-party data centers on which we normally operate or the facilities of any other third-party provider without adequate notice or other unanticipated problems at these facilities could result in lengthy interruptions in the availability of our websites and mobile application. Cloud computing, in particular, is dependent upon having access to an Internet connection in order to retrieve data. If a natural disaster, pandemic (such as the COVID-19 pandemic), blackout or other unforeseen event were to occur that disrupted our ability to obtain an Internet connection, we may experience a slowdown or delay in our operations. While we have some limited disaster recovery arrangements in place, our preparations may not be adequate to account for disasters or similar events that may occur in the future and may not effectively permit us to continue operating in the event of any problems with respect to our systems or those of our third-party data centers or any other third-party facilities. Our disaster recovery and data redundancy plans may be inadequate, and our business interruption insurance may not be sufficient to compensate us for the losses that could occur. If any such event were to occur to our business, our operations could be impaired, which could have a material adverse effect on our business, financial condition, and results of operations.
The security of our and our partners’ computer networks and databases containing personal information may be compromised.
In the ordinary course of business, we and our vendors collect, process, and store certain personal information and other data relating to individuals, such as our customers and employees, including customer payment card information. We rely substantially on commercially available systems, software, tools, and monitoring to provide security for our processing, transmission, and storage of personal information and other confidential information. We, or our vendors, may suffer a data compromise from hackers or other unauthorized parties who gain access to personal information or other data, including payment card data or confidential business information, which may not be discovered in a timely fashion. In addition, cyber-attacks such as ransomware attacks could lock us out of our information systems and disrupt our operations. The techniques used to obtain unauthorized access or to sabotage
systems change frequently and generally are not identified until they are launched against a target, and we, and our vendors, may be unable to anticipate these techniques or to implement adequate preventative measures. We may not have the resources or technical sophistication to anticipate or prevent rapidly evolving types of cyber-attacks. As our business partners have moved to remote work in response to the COVID-19 pandemic, they may be more vulnerable to cyber-attacks. In addition, our vendors, or other third parties with whom we do business may attempt to circumvent security measures in order to misappropriate personal information, confidential information, or other data, or may inadvertently release or compromise such data. Compromise of our data security by third parties with whom we do business, failure to prevent or mitigate the loss of personal or business information, and delays in detecting or providing prompt notice of any such compromise or loss may disrupt our operations, damage our reputation, and subject us to litigation, government action, or other additional costs and liabilities that could materially adversely affect our business, financial condition, and results of operations.
Risks Related to Our Intellectual Property
We may be unable to adequately protect our intellectual property rights.
We rely on trademark, copyright and patent law, trade secret protection, agreements and other methods with our employees and others to protect our proprietary rights. Effective intellectual property protection may not be available in every country and the protection of our intellectual property rights may require significant financial, managerial and operational expenditures. In addition, our efforts may not prevent third parties from infringing or misappropriating our intellectual property rights and any of our intellectual property rights could be challenged by others or invalidated through administrative processes or litigation. Our patent and trademark applications may never be granted and the process of obtaining patent protection is expensive and time-consuming. We may be unable to prosecute all necessary or desirable patent applications at a reasonable cost or in a timely manner. Even if issued, these patents may not adequately protect our intellectual property, as the legal standards relating to the validity, enforceability and scope of patent protection are uncertain. In addition, others may independently develop or otherwise acquire equivalent or superior technology. Our confidentiality agreements may not effectively prevent disclosure of our proprietary information, technologies and processes and may not provide an adequate remedy in the event of unauthorized disclosure of such information. We might be required to spend significant resources to monitor and protect our intellectual property rights and we may be unable to discover or determine the extent of any infringement, misappropriation or other violation of our intellectual property rights and other proprietary rights. Failure to protect our intellectual property rights or costs associated with such protection could have a material adverse effect on our business, financial condition, and results of operations.
We may be subject to intellectual property infringement claims or other allegations.
Third parties have from time to time claimed, and may claim in the future, that we have infringed their intellectual property rights. These claims, whether meritorious or not, could be time-consuming, result in considerable litigation costs, injunctions against us or the payment of damages or royalties by us, require significant amounts of management time or divert significant operational resources or cause expensive changes to our business model. In addition, we may be unable to obtain or utilize on terms that are favorable to us, or at all, licenses or other rights with respect to intellectual property we do not own. These risks have been amplified by the increase in third parties whose sole or primary business is to assert such claims. Any payments we are required to make and any injunctions against us could materially adversely affect our business, financial condition, and results of operations.
Risks Related to Government Regulation and Legal Proceedings
We are subject to federal and state and foreign laws and regulations relating to privacy, data protection, advertising and consumer protection.
We rely on a variety of marketing techniques, including email and social media marketing and postal mailings, which are subject to various federal and state laws and regulations. A variety of federal and state laws and regulations also govern our collection, use, retention, sharing and security of consumer data, particularly in the context of the online advertising that we rely on to attract new customers. These laws and regulations are constantly evolving and subject to potentially differing interpretations, in particular from one jurisdiction to another, and may conflict with other laws and regulations. In addition, various federal and state legislative and regulatory bodies, or self-regulatory organizations, may expand current laws or regulations, enact new laws or regulations or issue revised rules or guidance regarding privacy, data protection, consumer protection, and advertising. For example, the State of California enacted the California Consumer Privacy Act of 2018 (the “CCPA”), which requires companies that
process information on California residents make new disclosures to customers about the collection of their data, use and sharing practices, and allow customers to opt out of certain data sharing with third parties and provides a new cause of action for data breaches. Further, the California Privacy Rights Act (the “CPRA”) significantly amends the CCPA and imposes additional data protection obligations on companies doing business in California, including additional consumer rights processes and opt outs for certain uses of sensitive data. It also creates a new California Privacy Protection Agency specifically tasked to enforce the law, which could result in increased regulatory scrutiny of businesses in the areas of data protection and security. Similar laws have been proposed in other states and at the federal level, and if passed, such laws may have potentially conflicting requirements that could make compliance challenging. Our practices and procedures to comply with these laws and regulations may not always be effective, particularly as the legal landscape continues to evolve. In addition, some of our internal processes are manual, which could result in employee error and internal compliance failures. Any failure, or perceived failure, to comply with our posted privacy policies or with any federal or state privacy or consumer protection-related laws, regulations, industry self-regulatory principles, industry standards or codes of conduct, regulatory guidance, orders to which we may be subject or other legal obligations relating to privacy or consumer protection could adversely affect our reputation, brand and business, and may result in claims, liabilities, proceedings or actions against us by governmental entities,customers, suppliers or others, or may require us to change our operations and/or cease using certain data. Any such claims, proceedings or actions could further harm our reputation and brand, force us to incur significant expenses in defense of such proceedings or actions, distract our management, increase our costs of doing business, result in a loss of customers and suppliers and result in the imposition of monetary penalties. We may also be contractually required to indemnify and hold harmless third parties from the costs or consequences of our non-compliance with any laws, regulations or other legal obligations relating to privacy or consumer protection or any inadvertent or unauthorized use or disclosure of data that we store or handle as part of operating our business. Any harm to our reputation or brand, being subject to regulatory action and incurring related fees, distraction of our management and loss of customers or suppliers could have a material adverse effect on our business, financial condition and results of operations.
We are subject to product safety, labor, or other laws.
The products we sell to our customers are subject to regulation by the Federal Consumer Product Safety Commission, the Federal Trade Commission, and similar state and international regulatory authorities. As such, our products could be subject to recalls and other remedial actions. Product safety, labeling, and licensing concerns may result in our voluntarily removing selected products from our inventory. Recalls or voluntary removal of products can result in, among other things, lost sales, diverted resources, potential harm to our reputation, increased customer service costs and legal expenses. In addition, some of the merchandise we sell may expose us to product liability claims, litigation or regulatory actions. Although we maintain liability insurance, we cannot be certain that our coverage will be adequate for liabilities actually incurred or that insurance will continue to be available to us on economically reasonable terms or at all. In addition, some of our agreements with our vendors may not indemnify us from product liability for a particular vendor’s merchandise or our vendors may not have sufficient resources or insurance to satisfy their indemnity and defense obligations. In addition, failure of our vendors to comply with applicable laws and regulations and contractual requirements could lead to litigation against us, resulting in increased legal expenses. Furthermore, the failure of any vendors to provide safe and humane factory conditions at their facilities could damage our reputation with our customers and result in legal claims against us. Our international relationships also require us to overcome logistical and other challenges based on differing languages, cultures, legal and regulatory schemes and time zones. Foreign labor laws, standards and customs may vary greatly from those in the U.S. The U.S. or foreign countries could enact legislation or impose regulations, including unfavorable labor regulations, tax policies or economic sanctions that could have an adverse impact on our ability to conduct our business in the countries in which we have relationships. The difficulties inherent in complying with labor, safety and other laws, or consequences resulting from any failure to comply with those laws could result in increased costs, disruptions in our relationships with our vendors, and harm to our brand and reputation, which could have a material adverse effect on our business, financial condition and results of operations.
We are subject to extensive governmental regulation.
We are subject to a broad range of federal, state, local, and foreign laws and regulations intended to protect public and worker health and safety, natural resources and the environment. Our operations, including our manufacturing partners, are subject to regulation by the Occupational Safety and Health Administration, the Food
and Drug Administration, the Department of Agriculture and by various other federal, state, local and foreign authorities regarding the processing, packaging, storage, distribution, advertising, labeling and export of our products, including food safety standards. In addition, we and our manufacturing partners are subject to additional regulatory requirements, including environmental, health and safety laws and regulations administered by the U.S. Environmental Protection Agency, state, local and foreign environmental, health and safety legislative and regulatory authorities and the National Labor Relations Board, covering such areas as discharges and emissions to air and water, the use, management, disposal and remediation of, and human exposure to, hazardous materials and wastes, and public and worker health and safety. Violations of, or liability under, any of these laws and regulations may result in administrative, civil or criminal fines, penalties or sanctions against us, revocation or modification of applicable permits, licenses or authorizations, environmental, health and safety investigations or remedial activities, voluntary or involuntary product recalls, warning or untitled letters or cease and desist orders against operations that are not in compliance, among other things. Such laws and regulations generally have become more stringent over time and may become more so in the future, and we may incur (directly, or indirectly through our manufacturing partners) material costs to comply with current or future laws and regulations or in any required product recalls. Complying with the current laws and regulations, and potential future changes to these laws and regulations, or failing to comply with these laws and regulations, could impose significant limitations and/or require changes to our business, which may involve substantial expenses, make our business more costly and less efficient to conduct, and compromise our growth strategy, which could have a material adverse effect on our business, financial condition and results of operations.
We may be adversely affected by changes in tax laws, rules or regulations.
Existing tax laws, rules or regulations are subject to interpretation by tax authorities or amendment, repeal, or new enactments. For example, the 2018 U.S. Supreme Court decision in South Dakota v. Wayfair, Inc. required us to collect sales tax in many jurisdictions despite our lack of a physical presence in such jurisdictions. Also, the 2017 Tax Cuts and Jobs Act may limit our ability to use our substantial net operating losses to offset potential future taxable income, which is further dependent upon by our ability to generate taxable income before the expiration dates of the net operating losses, and we cannot predict with certainty when, or whether, we will generate sufficient taxable income to use all of our net operating losses. We are currently monitoring changes in the tax landscape, however, it is difficult to predict whether such changes could materially adversely affect our financial condition and results of operations.
Future litigation could have a material adverse effect on our business.
Lawsuits and other administrative, regulatory, or legal proceedings that may arise in the course of our operations can involve substantial costs, including the costs associated with investigation, litigation and possible settlement, judgment, penalty or fine. In addition, the stock market has recently experienced extreme price and volume fluctuations and companies have experienced fluctuations in their stock prices that have often been unrelated or disproportionate to their operating results. Under these circumstances, stockholders may sometimes institute securities class action litigation against such companies. Any litigation or other administrative, regulatory, or legal proceedings against us could result in substantial costs, and divert management’s attention and resources. Although we generally maintain insurance to mitigate certain costs, there can be no assurance that costs associated with lawsuits or other legal proceedings will not exceed the limits of our insurance policies. Moreover, we may be unable to continue to maintain our existing insurance at a reasonable cost, if at all, or to secure additional coverage, which may result in costs associated with lawsuits and other legal proceedings being uninsured. Our business, financial condition and results of operations could be materially adversely affected if fees associated with lawsuits or other legal proceedings or a judgment, penalty or fine is not fully or is only partially covered by insurance.
General Risk Related to Our Business
Our estimates or judgments relating to our critical accounting policies could prove to be incorrect.
We prepare our financial statements in accordance with U.S. GAAP, which requires our management to make estimates, judgments, and assumptions that affect the amounts reported in our consolidated financial statements and accompanying notes. We base our estimates on historical experience and on various other assumptions that we believe to be reasonable under the circumstances, see “Management’s Discussion and Analysis of Financial Condition and Results of Operations.” The results of these estimates form the basis for making judgments about the carrying values of assets, liabilities, and equity as of the date of the financial statements, and the amount of revenue
and expenses, during the periods presented, that are not readily apparent from other sources. Significant assumptions and estimates used in preparing our consolidated financial statements include those related to determination of fair value of the Company’s allowance for uncollectible accounts receivable, excess and obsolete inventory reserve, stock-based compensation, stand-alone selling price of Direct to Consumer offerings, the fair value of right-of-use assets, and the valuation of embedded derivatives. If our assumptions change or if actual circumstances differ from those in our assumptions, our operating results could fall below the expectations of industry or financial analysts and investors, resulting in a decline in the trading price of our common stock.
We may be unable to accurately forecast our revenue and appropriately plan for our expenses in the future.
Revenue is difficult to forecast with certainty because it depends on a number of factors, some of which are outside of our control, including the volume, timing, and type of orders we receive and increased third party costs or transportation and freight costs. Many of these factors are uncertain and are likely to fluctuate significantly from period to period. We base our expense levels and investment plans on our estimates of revenues and gross margins, and many of our expenses, such as office leases, manufacturing costs and personnel costs, will be relatively fixed in the short term and will increase as we continue to make investments in our business and hire additional personnel. If our revenue forecasts do not cover our planned operating expenses, our business and future operating results will be materially adversely affected.
We have in the past and may in the future identify material weaknesses in our internal control over financial reporting.
In order to maintain effective internal control over financial reporting, we must perform system and process evaluations, document our controls and perform testing of our key controls over financial reporting to allow for management and our independent public accounting firm to report on the effectiveness of our internal control over financial reporting. In the past, we have identified material weaknesses in our internal control over financial reporting which we have remedied. If we, or our independent registered public accounting firm, identify deficiencies in our internal control over financial reporting in the future that are deemed to be material weaknesses, our investors could lose confidence in our reported financial information, we may be required to restate those financial statements, the market price of our stock may decline and we could be subject to lawsuits, sanctions or investigations by regulatory authorities, which would require additional financial and management resources and otherwise could have a material adverse effect on our business, financial condition or results of operations.
Certain of our key performance indicators are subject to inherent challenges in measurement, and real or perceived inaccuracies.
We track certain key performance indicators, including metrics such as average order value and customer acquisition costs, with internal systems and tools. Estimates or similar metrics published by third parties may differ from our reported key performance indications, due to differences in sources, methodologies, or assumptions. For example, we rely on third-party marketing analytics systems to identify marketing spend by channel, which we then reconcile across a number of systems. In addition, we rely on third-party warehouse and fulfillment providers to communicate the receiving and shipping information that drives active customer count and related data. Our internal systems and tools have a number of limitations, and our methodologies for tracking these metrics may change over time, which could result in unexpected changes to our key performance indicators, including the metrics or estimates that we publicly disclose. While these metrics or estimates are based on what we believe to be reasonable estimates for the applicable period of measurement, there are inherent challenges in measuring our key performance indicators. Some of these challenges include manual reconciliation of information provided by different input systems, resulting in undetected errors. If our key performance indicators are not accurate representations of our business, or if investors do not perceive our key performance indicators to be accurate, or if we discover material inaccuracies with respect to these numbers, our reputation may be significantly harmed, which could have a material adverse effect on our business, financial condition and results of operations.
We have a history of losses and we may be unable to achieve or sustain profitability.
We expect our operating expenses to increase over the next several years as we increase our advertising, expand into new markets, expand our offerings, hire additional personnel, incur additional expenses related to being a public company and continue to develop features on our websites and mobile applications. In particular, we intend to continue to invest substantial resources to grow and diversify our product offerings and in marketing to acquire new
customers. Our operating expenses may also be adversely impacted by increased costs and delays in launching in new markets and expanding fulfillment center capacity, in particular as a result of the COVID-19 pandemic and other macro-economic conditions. Our future growth and operating performance must eventually offset our operating losses or we may not be able to achieve or sustain profitability.
We may fail to manage or integrate acquisitions of, or investments in, new or complementary businesses, facilities, technologies or products, or through strategic alliances.
From time to time, we may consider opportunities to acquire or make investments in complementary businesses, facilities, technologies, offerings, or products, or enter into strategic alliances, in order to enhance our capabilities, expand our outsourcing and supplier network, complement our current products or expand the breadth of our offerings. Acquisitions, investments and other strategic alliances involve numerous risks, including: problems integrating the acquired business, facilities, technologies, customers, partners or products, issues maintaining uniform standards, procedures, controls and policies; unanticipated costs; diversion of management’s attention from our existing business; adverse effects on existing business relationships with suppliers, manufacturing partners, and retail partners; challenges with entering new markets in which we may have limited or no experience; potential loss of key employees of acquired businesses; and increased legal, accounting and compliance costs. Failure to integrate acquired businesses, facilities, technologies and products effectively could materially and adversely affect our business, financial condition, and results of operations.
Our operating flexibility may be limited by our credit facilities and debt instruments.
Our revolving credit facility and the indenture governing our 2025 Convertible Notes both limit our ability to, among other things: incur or guarantee additional debt; make certain investments and acquisitions; incur certain liens or permit them to exist; enter into certain types of transactions with affiliates; merge or consolidate with another company; and transfer, sell or otherwise dispose of assets, including our cash. In addition, if our stock price does not meet the conversion price of the 2025 Convertible Notes, then we will have to repay the principal of the 2025 Convertible Notes in cash, which we may not have available. Our revolving credit facility also contains covenants requiring us to satisfy certain financial covenants. These limitations, requirements and costs may affect our ability to obtain future financing, pursue attractive business opportunities, maintain flexibility in planning for, and reacting to, changes in business conditions, which could have a material adverse effect on our business, financial condition, and results of operations.
We may not be able to raise the capital we need to grow our business.
In the future, we could be required to raise capital through public or private financing or other arrangements. Such financing may not be available on acceptable terms, or at all, and our failure to raise capital when needed could harm our business. We may sell common stock, convertible securities and other equity securities in one or more transactions at prices and in a manner as we may determine from time to time. If we sell any such securities in subsequent transactions, investors in our common stock may be materially diluted. New investors in such subsequent transactions could gain rights, preferences and privileges senior to those of holders of our common stock. Debt financing, if available, may involve restrictive covenants and could reduce our operational flexibility or profitability. If we cannot raise funds on acceptable terms, we may be forced to raise funds on undesirable terms, or our business may contract or we may be unable to grow our business or respond to competitive pressures, any of which could have a material adverse effect on our business, financial condition, and results of operations.
Risks Relating to Ownership of Our Common Stock
Our stock price may be volatile or decline regardless of our operating performance.
The market price of our common stock may fluctuate significantly or decline in response to numerous factors, many of which are beyond our control, including: actual or anticipated fluctuations in our revenue and results of operations; financial projections we may provide to the public, any changes in these projections or our failure to meet these projections; failure of securities analysts to maintain coverage of BARK, changes in financial estimates or ratings by any securities analysts who follow BARK or our failure to meet the estimates or the expectations of investors; announcements by us or our competitors of significant acquisitions, strategic partnerships, joint ventures, or capital commitments; changes in operating performance and stock market valuations of other retail or technology companies generally, or those in our industry in particular; price and volume fluctuations in the overall stock market, including as a result of trends in the economy as a whole; trading volume of our common stock; the inclusion,
exclusion or removal of our common stock from any indices; changes in members of our Board of Directors or management; transactions in our common stock by directors, officers, affiliates and other major investors; lawsuits threatened or filed against us; changes in laws or regulations applicable to our business; changes in our capital structure, such as future issuances of debt or equity securities; short sales, hedging and other derivative transactions involving our capital stock; general economic conditions in the U.S. or global markets; other events or factors, such as the COVID-19 pandemic, the war in the Ukraine, increased inflation, bank failures, incidents of terrorism or responses to these events; and the other events or factors described in this “Risk Factors” section.
An active trading market for our common stock may not be sustained.
Our common stock is listed on the NYSE under the symbol “BARK.” An active trading market for our common stock may not be sustained. Accordingly, there may not be a liquid trading market in which to sell your shares of our common stock when desired or at acceptable prices.
Sales of shares by existing stockholders may cause our stock price to decline.
If our existing stockholders sell or indicate an intention to sell substantial amounts of our common stock in the public market, the trading price of our common stock could decline. In addition, shares underlying any outstanding options and restricted stock units will become eligible for sale if exercised or settled, as applicable, and to the extent permitted by the provisions of various vesting agreements and Rule 144 of the Securities Act. All the shares of common stock subject to stock options outstanding and reserved for issuance under our equity incentive plans have been registered on Form S-8 under the Securities Act and such shares are eligible for sale in the public markets, subject to Rule 144 limitations applicable to affiliates. If these additional shares are sold, or if it is perceived that they will be sold in the public market, the trading price of our common stock could decline.
Securities or industry analysts may not publish accurate or favorable research about BARK.
The trading market for our common stock is influenced in part by the research and reports that securities or industry analysts may publish about us, our business, our market, or our competitors. If one or more of the analysts initiate research with an unfavorable rating or downgrade our common stock, provide a more favorable recommendation about our competitors, or publish inaccurate or unfavorable research about our business, the price of our common stock could decline.
Our certificate of incorporation may prevent us from receiving the benefit of certain corporate opportunities.
The “corporate opportunity” doctrine provides that corporate fiduciaries, as part of their duty of loyalty to the corporation and its stockholders, may not take for themselves an opportunity that in fairness should belong to the corporation. Section 122(17) of the DGCL, however, expressly permits a Delaware corporation to renounce in its certificate of incorporation any interest or expectancy of the corporation in, or in being offered an opportunity to participate in, specified business opportunities or specified classes or categories of business opportunities that are presented to the corporation or its officers, directors or stockholders. Article THIRTEENTH of our certificate of incorporation provides that doctrine of corporate opportunity shall not apply with respect to us or any of our officers or directors, or any of their respective affiliates. As a result, we may be not be offered certain corporate opportunities which could be beneficial to our company and our stockholders. While it is difficult at this time to predict how this provision may adversely impact our stockholders, it is possible that we could not be offered the opportunity to participate in a future transaction that might have resulted in a financial benefit to us, which could, in turn, result in a material adverse effect on our business, financial condition, results of operations, or prospects.
Delaware law, our certificate of incorporation and bylaws may impede a merger, tender offer, or proxy contest.
Our certificate of incorporation and amended and restated bylaws contain provisions that could depress the trading price of our common stock by impeding a change in control of BARK or changes in our management that our stockholders may deem advantageous. These provisions include: a classified board; removal of directors only for cause or a super majority vote; super majority vote required to amend of certain provisions of our certificate of incorporation and any provisions of our bylaws; issuance of “blank check” preferred stock authorized; stockholders may not call special stockholder meetings; stockholder action by written consent prohibited; indemnification of our director and officers; Board of Directors is expressly authorized to make, alter, or repeal our bylaws; and advance notice requirements for nominations for election to our Board of Directors or for proposing matters that can be acted upon by stockholders at annual stockholder meetings.
Substantially all disputes between BARK and our stockholders are subject to exclusive forum provisions.
Our certificate of incorporation provides that, unless we consent in writing to the selection of an alternative forum, the Court of Chancery of the State of Delaware is the exclusive forum for any derivative action or proceeding brought on our behalf, any action asserting a breach of fiduciary duty, any action asserting a claim against us arising pursuant to the Delaware General Corporation Law, our certificate of incorporation or our bylaws or any action asserting a claim against us that is governed by the internal affairs doctrine. Any person or entity purchasing or otherwise acquiring any interest in any of our securities shall be deemed to have notice of and consented to these provisions. These exclusive-forum provisions may limit a stockholder’s ability to bring a claim in a judicial forum of its choosing for disputes with us or our directors, officers or other employees, which may discourage lawsuits against us and our directors, officers and other employees. This choice of forum provision does not preclude or contract the scope of exclusive federal or concurrent jurisdiction for any actions brought under the Securities Act or the Exchange Act. Accordingly, our exclusive forum provision will not relieve us of our duties to comply with the federal securities laws and the rules and regulations thereunder, and our stockholders will not be deemed to have waived our compliance with these laws, rules and regulations.
We do not intend to pay dividends for the foreseeable future.
We currently intend to retain any future earnings to finance the operation and expansion of our business and we do not expect to declare or pay any dividends in the foreseeable future. Moreover, the terms of our revolving credit facility may restrict our ability to pay dividends, and any additional debt we may incur in the future may include similar restrictions. As a result, stockholders must rely on sales of their common stock after price appreciation as the only way to realize any future gains on their investment.
Ownership of our stock is concentrated among our current officers, directors and their respective affiliates.
Our existing executive officers, directors and their respective affiliates, together as a group, beneficially own a significant amount of the outstanding shares of our common stock. This group, if it acts together, could have the ability to influence matters requiring stockholder approval, including the election of directors, amendment of our certificate of incorporation and approval of significant corporate transactions. As a result, this group could, for example, delay or prevent a change in control of BARK and the approval of certain transactions.
We may issue additional shares of common stock or other equity securities, which would dilute your ownership interests and could depress the market price of our common stock.
We currently have options, RSUs and warrants outstanding that are convertible into shares of our common stock. In addition, our 2025 Convertible Notes are convertible based on outstanding principal balance and accrued interest. We also have the ability to issue equity awards that are convertible into shares of our common stock under our 2021 Equity Incentive Plan and under our Employee Stock Purchase Plan, see Note 6 — Debt, and Note 9 — Stock-Based Compensation Plans, to our consolidated financial statements set forth in this quarterly report on Form 10-K. We may issue additional shares of common stock or other equity securities of equal or senior rank in the future in connection with, among other things, future acquisitions or repayment of outstanding indebtedness, without stockholder approval, in a number of circumstances. Our issuance of additional shares of common stock or other equity securities of equal or senior rank would dilute our existing shareholders and may cause the market price of our common stock to decline.
Risks Related to the 2025 Convertible Notes
Our obligation to redeem the 2025 Convertible Notes may not protect holders.
Our obligation to offer to redeem the 2025 Convertible Notes upon the occurrence of a fundamental change will be triggered only by certain specified transactions. The term “fundamental change” is limited to certain specified transactions and may not include other events that might adversely affect our financial condition or the market value of the 2025 Convertible Notes or our common stock. Our obligation to offer to redeem the new notes upon a fundamental change would not necessarily afford holders of the 2025 Convertible Notes protection in the event of a highly leveraged transaction, reorganization, merger or similar transaction involving us.
There is no existing public trading market for the 2025 Convertible Notes.
No market for the 2025 Convertible Notes exists and may not develop. Even if a market develops, it may not persist. We do not intend to apply for listing of the 2025 Convertible Notes on any securities exchange or other
market. The liquidity of any trading market and the trading price of the 2025 Convertible Notes may be adversely affected by changes in our financial performance or prospects and by changes in the financial performance of or prospects for companies in our industry generally.
ITEM 1B. UNRESOLVED STAFF COMMENTS
None.
ITEM 1C. CYBERSECURITY
Risk Management and Strategy
We recognize that our customers have a legitimate expectation of safety and privacy when they do business with us. We deploy considerable resources to protect customer data and privacy because our business depends on our customers’ trust. We recognize that there is a cost and risk associated with every piece of data our customers entrust us with, so we take measures to minimize what is collected to only what we need to provide a great experience and meet our legal and regulatory requirements. In addition, we have integrated cybersecurity risk management into our broader risk management framework through our (i) regular enterprise risk management updates to the Audit Committee, (ii) information technology and security related internal controls and (iii) incident response and vulnerability management programs.
We actively assess, identify, and manage material risks associated with cybersecurity threats. Our information security, finance, procurement, legal and other cross-functional teams work together to continuously evaluate and address cybersecurity risks in alignment with our business objectives and operational needs. All employees are required to complete annual information security training and periodic training specifically related to phishing. We have an enterprise-wide Information Security Incident Response Plan (“Incident Response Plan”) which describes the detailed processes and procedures that should be followed in the event of an information security incident. We periodically perform tabletop exercises with management participation to be able to effectively respond to an information security incident and evaluate and improve the Incident Response Plan. We use various security tools and processes to help prevent, identify, escalate, investigate, resolve and recover from identified vulnerabilities and security incidents in a timely manner, including, but not limited to, internal reporting, monitoring and detection and vulnerability tools.
We also engage with a range of external experts, including cybersecurity assessors, consultants, and auditors in evaluating and testing our information security processes. These partnerships enable us to leverage specialized knowledge and insights, with a goal of ensuring our cybersecurity strategies and processes remain at the forefront of industry best practices. Our collaboration with these third-parties includes regular audits, threat assessments, and consultation on security enhancements.
In order to mitigate data or security incidents that may originate from third-party vendors or suppliers, we conduct both privacy and information security assessments to properly identify, prioritize, assess and remediate any third-party risks, and require information security and privacy addenda to our contracts where applicable.
The nature of our business exposes us to cybersecurity threats and attacks that can lead to the unauthorized acquisition or access, compromise, loss, misuse or theft of our data, including personal information, confidential information or intellectual property. To date risks from cybersecurity threats, including as a result of any previous cybersecurity incidents, have not materially affected our business strategy, results of operations, or financial condition. See Part 1, Item 1A, Risk Factors, in this Annual Report on Form 10-K for a discussion of cybersecurity risks.
Governance
Our Board of Directors (the “Board”) is ultimately responsible for the risk oversight of the company, including, cybersecurity and privacy risks. Our Board has delegated responsibility for oversight of cybersecurity risks to the Audit Committee. The Audit Committee is composed of board members with diverse expertise enabling its members to oversee cybersecurity risks effectively. Our Audit Committee’s responsibilities include reviewing the
Company’s cybersecurity and other information technology risks, controls and procedures, including the Company’s plans to mitigate cybersecurity risks and to respond to data breaches.
At the management level, a management steering committee comprised of our Chief Financial Officer, Controller, and General Counsel is briefed quarterly by our Director of Information Security. Our Director of Information Security also prepares a quarterly Information Security Risk Report, which is provided to the management steering committee in advance of its quarterly meeting and also made available to the members of the Audit Committee. Our current Director of Information Security has 16 years of industry experience leading large-scale security initiatives, enhancing infrastructure defenses and instilling a culture of security awareness across all employee levels. Additionally, our Director of Information Security holds standard industry security certifications, including CISSP (Certified Information Systems Security Professional).
The Audit Committee will receive reports, briefings and presentations from senior management, including our Director of Information Security, at periodic committee meetings, including, on a rotating basis, in-depth presentations on specific areas of risk and regular enterprise risk management updates as needed.
In addition to scheduled meetings, significant developments or incidents, even if immaterial to us, are reviewed regularly by a cross-functional team, including the Chief Financial Officer and the General Counsel, to determine whether further escalation to the Audit Committee and/or the Board is appropriate, ensuring the Audit Committee’s and the Board’s oversight is timely and responsive. Our Incident Response Plan also includes immediate actions to mitigate the impact and strategies for remediation and prevention of future incidents.
ITEM 2. PROPERTIES
We currently maintain our executive offices at 120 Broadway, Floor 12, New York, NY. In addition, we lease and operate fulfillment centers in three locations, at which we receive products from vendors, ship products to customers, and receive and process returns from customers. We also lease and operate a customer service center in Columbus, Ohio. We believe these properties are suitable and adequate for our current business operations. The following table sets forth the location, use and size of certain of our properties as of May 31, 2024:
| | | | | | | | | | | | | | | | | | | | |
| Location | | Use | | Ownership Status | | Approximate
Area in
Square Feet |
| New York, New York | | Office Space | | Leased | | 5,500 |
| New York, New York | | Office Space | | Leased | | 51,220 |
| New York, New York | | Photo Studio | | Leased | | 1,850 |
| Columbus, Ohio | | Warehouse and distribution Center | | Leased | | 97,934 |
| Columbus, Ohio | | Office Space | | Leased | | 34,238 |
| Hebron, Kentucky | | Warehouse and distribution Center | | Leased | | 201,600 |
| Las Vegas, Nevada | | Warehouse and distribution Center | | Leased | | 400,593 |
ITEM 3. LEGAL PROCEEDINGS
On March 20, 2024, three alleged shareholders filed a putative class action complaint in the lawsuit styled Kenville v. Northern Star Sponsor LLC, et al., Case No. 2024-276, which is pending in the Delaware Court of Chancery. The complaint is brought against (a) certain officers and directors of Northern Star Acquisition Corp. at the time of its proposed acquisition of Legacy BARK, (b) Northern Star Sponsor, LLC, and (c) two of the founders of Legacy BARK. The alleged class consists of Company stockholders who held stock as of the redemption deadline and who elected not to redeem all or some of their stock, and the claims alleged are for breach of fiduciary duty, aiding and abetting breach of fiduciary duty, and unjust enrichment. At this time, the Company is not able to quantify any potential liability in connection with this litigation because the case is in its early stages.
In addition, we are from time to time subject to, and are presently involved in, litigation and other legal proceedings in the ordinary course of business. While it is not possible to determine the outcome of any legal proceedings brought against us, we believe that, except for the matter described above, there are no pending lawsuits or claims that, individually or in the aggregate, may have a material effect on our business, financial condition or operating results. Our views and estimates related to these matters may change in the future, as new events and circumstances arise and as the matters continue to develop.
ITEM 4. MINE SAFETY DISCLOSURES
Not applicable.
PART II.
ITEM 5. MARKET FOR REGISTRANT’S COMMON EQUITY, RELATED STOCKHOLDER MATTERS AND ISSUER PURCHASES OF EQUITY SECURITIES.
Market Information
Our common stock and warrants to purchase common stock are traded on the New York Stock Exchange under the symbols “BARK” and “BARK WS,” respectively.
Holders
As of May 29, 2024 there were approximately 104 stockholders of record. The actual number of stockholders is greater than this number of record holders, and includes stockholders who are beneficial owners, but whose shares are held in “street name” by banks, brokers and other financial institutions. This number of holders of record also does not include stockholders whose shares may be held in trust by other entities.
Dividend Policy
We have not declared or paid any cash dividends on our common stock to date. We may retain future earnings, if any, for future operations, expansion and debt repayment and we do not anticipate declaring or paying any cash dividends in the foreseeable future. Payment of cash dividends, if any, in the future will be at the discretion of our Board of Directors and will depend on then-existing conditions, including our financial condition, results of operations, contractual restrictions and other factors our Board of Directors may deem relevant. In addition our ability to pay dividends is limited by covenants in our existing outstanding indebtedness.
Recent Sales of Unregistered Securities and Use of Proceeds
None.
Issuer Purchases of Equity Securities
During the three months ended March 31, 2024, we repurchased $1.8 million of common stock, or approximately 1.6 million shares, under our repurchase program. As a result, $1.6 million remained available under the current authorization. A summary of our repurchases of common stock is as follows:
| | | | | | | | | | | | | | | | | | | | | | | | | | |
Period | | Total Number of Shares Purchased | | Average Price Paid Per Share | | Total Number of Shares Purchased as Part of Publicly Announced Plans or Programs | | Approximate Dollar Value that May Yet be Purchased Under the Plans or Programs (in thousands) |
January 1-31, 2024 | | — | | $— | | — | | $— |
February 1-29, 2024 | | 1,575,905 | | 1.12 | | 1,575,905 | | 1,587 |
March 1-31, 2024 | | — | | — | | — | | — |
Total | | 1,575,905 | | $1.12 | | 1,575,905 | | $1,587 |
| | | | | | | | |
| | | | | | | | |
| | | | | | | | |
Performance Graph
The graph below compares the cumulative total stockholder return on our common stock with the cumulative total return on the Standard & Poor’s (“S&P”) 500 index and the S&P Retail Internet Select Industry index. The graph assumes an initial investment of $100 in our common stock at the market close on December 18, 2020, which was the first day on which our common stock commenced trading on its own through March 31, 2024 the last business day of our fiscal year. Data for the S&P 500 and the S&P Retail Internet Select Industry index assume reinvestment of dividends. Total return equals stock price appreciation plus reinvestment of dividends. The stock price performance of the graph above is not necessarily indicative of future stock price performance.
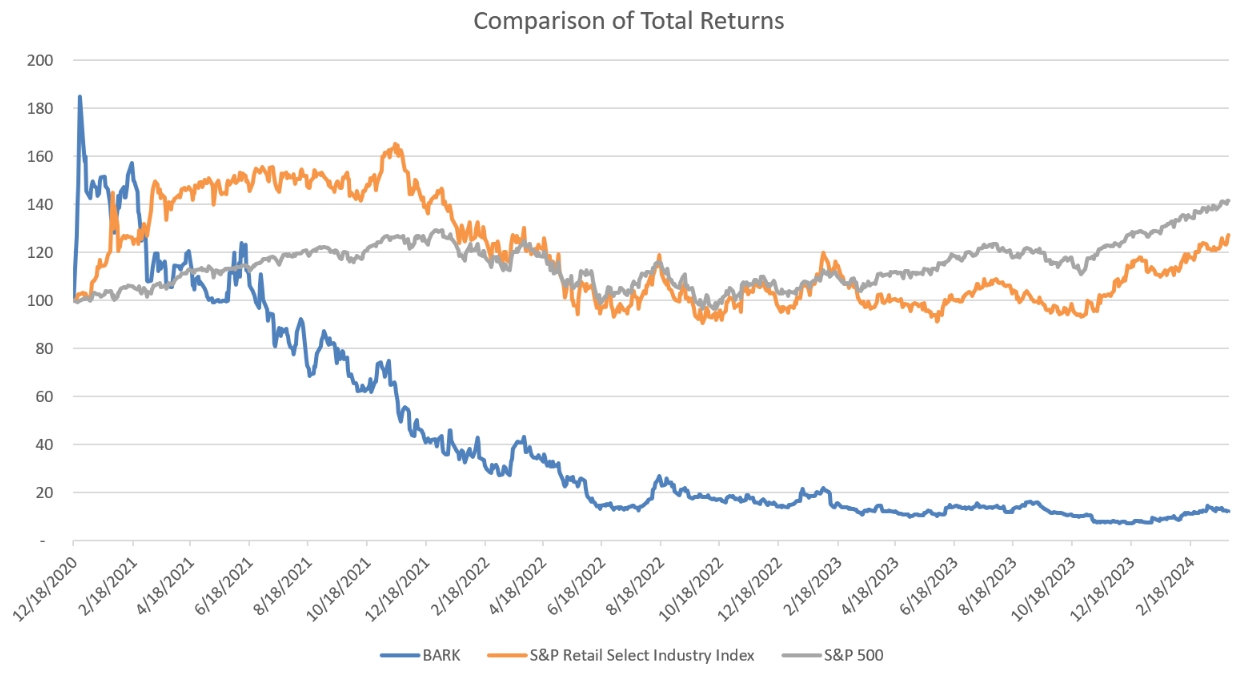
The information under “Comparison of Total Returns” is not deemed to be “soliciting material” or “filed” with the SEC or subject to Regulation 14A or 14C, or to the liabilities of Section 18 of the Exchange Act, and is not to be incorporated by reference in any filing of BARK under the Securities Act or the Exchange Act, whether made before or after the date of this Annual Report and irrespective of any general incorporation language in those filings.
ITEM 6. [RESERVED]
Not applicable.
ITEM 7. MANAGEMENT’S DISCUSSION AND ANALYSIS OF FINANCIAL CONDITION AND RESULTS OF OPERATIONS
The following discussion and analysis provides information which management believes is relevant to an assessment and understanding of our consolidated results of operations and financial condition. The discussion should be read in conjunction with the audited consolidated financial statements and notes thereto contained in this Annual Report on Form 10-K. This discussion contains forward-looking statements and involves numerous risks and uncertainties, including, but not limited to, those described in the “Risk Factors” sections of this Annual Report on Form 10-K. Actual results may differ materially from those contained in any forward-looking statements. Unless the context otherwise requires, references to “we”, “us”, “our”, “the Company” and “BARK” are intended to mean the business and operations of BARK, Inc. and its consolidated subsidiaries. The audited consolidated financial statements as of March 31, 2024 and 2023 and for the fiscal years ended March 31, 2024, 2023 and 2022, respectively, present the financial position and results of operations and cash flows of BARK, Inc. and its wholly-owned subsidiaries.
Overview
We believe that dogs and humans are better together and we aspire to be the world’s favorite dog brand. We are a team of dog-obsessed people committed to delivering personalization at scale by satisfying each dog’s distinct personality, preferences, and needs with the best products and services. Since our founding in 2011, we have happily served millions of dogs and their people.
We are a vertically integrated, omnichannel brand serving dogs across two key categories: toys & accessories and consumables. All of our products are designed, developed, and branded by BARK. We leverage an ever-growing collection of first-party data, customer insights, and machine learning to deliver personalized products and experiences tailored to the needs of each and every dog we serve. Our products are sold direct-to-consumer (“DTC”) and through our network of retail partners, which currently spans over 40,000 doors nationwide.
We began our journey with BarkBox – a monthly-themed subscription of toys and treats, tailored to the needs of each customer based on their dog’s size, play style, allergies, and more. By viewing each dog as an individual, and by creating magical experiences for our customers, we have been able to build lasting relationships with millions of dogs and their parents. Our customer service (“Happy Team”) proactively engages around 200,000 customers each month. We use the valuable data from these customer interactions to inform the design and development of future products, and we leverage it along with machine learning technology to recommend additional products to our customers through cross-selling and Add-to-Box (“ATB”).
More recently, we have entered exciting, and much larger categories in the consumables space, which include kibble, treats, toppers, supplements, and dental products. This expansion has significantly increased our total addressable market and the number of customers we can serve. We believe that our growing first-party dataset, strong brand, and loyal customer base afford us a meaningful advantage and opportunity to win market share in these newer categories.
Factors Affecting Our Performance
We believe that our performance and future success depend on several factors that present significant opportunities for us but also pose risks and challenges, including those discussed below and in the section of this Annual Report on Form 10-K titled “Risk Factors.”
Investments in growth
Our ability to increase the number of total orders and cross category purchasing is a key factor in our future growth and will be driven by our marketing and from the development of new products, primarily in the consumables space. As a result, we expect to continue to focus on long-term growth through investments in product offerings and the dog and dog parent experience. We are working to enhance our offerings and expand the breadth of the products and offerings especially in consumables. We expect to make additional investments in marketing to acquire new customers.
Expansion of new offerings
Another key factor in our future performance is our ability to increase our average order value (“AOV”), which involves introducing new products into our portfolio. We expect to continue to invest in the expansion of our product offerings, particularly in the consumables space, as we seek to attract new customers as well as growing sales with our existing customers. This expansion may require additional financial investments in headcount, marketing, customer acquisition expenses, operational capabilities and inventory. If we are unable to generate sufficient demand for these new offerings, we may not recover the financial investments and revenue may not increase as desired.
Certain macroeconomic and global events, conditions and challenges
In the past, we have experienced increases in inbound freight costs due to the challenges in the import market, as transpacific ships and trade lanes continue to be overburdened with volume and experience a significant shortage of equipment and capacity due to macroeconomic challenges affecting the global supply chain, including, for example, the COVID-19 pandemic. Increases in freight costs and supply chain disruptions may continue and could impact our business, in particular as a result of global conditions that are created or driven by market factors or international events, such as increased inflation, war in Israel and the Ukraine and rising tensions between the U.S. and China.
Macroeconomic conditions and the related effects on levels of consumer spending impact our business as purchases of discretionary items tend to decline when disposable income is lower or when there are recessions, inflationary pressures or other economic uncertainty. Inflation, rising interest rates, higher fuel and energy costs and commodity prices, reductions in net worth based on market declines and uncertainty, home prices, credit availability and consumer debt levels, political instability due to war or other geopolitical factors and other macroeconomic pressures and general uncertainty regarding the overall future economic environment have led to recession fears and created a challenging environment.
We cannot predict the duration or magnitude of the risks and challenges discussed above. Please refer to the “Cautionary Note Regarding Forward-Looking Statements” and those factors described under “Risk Factors” in this Annual Report on Form 10-K.
Key Performance Indicators
We use the following key financial and operating metrics to evaluate our business and operations, measure our performance, identify trends affecting our business, project our future performance, and make strategic decisions. These key financial and operating metrics should be read in conjunction with the following discussion of our results of operations and financial condition together with our consolidated financial statements and the related notes and other financial information included elsewhere in this Annual Report on Form 10-K may not be comparable to similarly titled performance indicators used by other companies.
| | | | | | | | | | | | | | | | | | | | |
| | | | Fiscal Year Ended |
| | | | March 31, |
| | | | | | 2024 | | 2023 |
| Total Orders (in thousands) | | | | | | 13,924 | | 14,888 |
| Average Order Value | | | | | | $31.34 | | $31.70 |
| Direct to Consumer Gross Profit (in thousands) | | | | | | $278,868 | | $285,328 |
| Direct to Consumer Gross Margin | | | | | | 63.9% | | 60.5% |
Total Orders
We define Total Orders as the total number of orders shipped in a given period. These include all orders across all of our product categories, regardless of whether they are purchased on a subscription, auto-ship, or one-off basis.
Average Order Value
Average Order Value (“AOV”) is Direct to Consumer revenue for the period divided by Total Orders for the same period.
Components of Our Results of Operations
We operate with two reportable segments: Direct to Consumer and Commerce, to reflect the way our Chief Executive Officer, who is our Chief Operating Decision Maker (“CODM”), reviews and assesses the performance of the business.
Revenue
The Company generates revenue through its Direct to Consumer and Commerce segments, each of which participate in the sale of the Company’s Toys & Accessories and Consumables product lines. See below for additional information.
Toys & Accessories (“toys”)—The majority of our revenue in the toys category is derived from BarkBox and Super Chewer, which are subscription products that feature monthly themed boxes of premium-quality BARK toys and treats that are delivered directly to a dog’s home. Customers have the option to subscribe to these products on a one month, six month, or twelve month basis. Subscription revenue is recognized at a point in time as control is transferred to the subscriber upon delivery of each monthly box. During the life of their subscription, we offer customers incremental products via ATB, which allows us to cross-sell customers into our full portfolio of products, including kibble, treats, toppers, dental and more. ATB revenue is recognized at a point in time as control is transferred to the customer upon delivery of goods to the subscriber.
We also sell toys through our Commerce segment which is a network of retail partners and online major market places. This distribution channel allows us to reach new customers and introduce them to the BARK brand. Commerce revenue derived from our retail partners is recognized net of estimates for sales returns, discounts, markdowns and allowances, after the goods are shipped, or when the retail customer picks up the goods directly from one of our distribution points and control of the goods is transferred to the customer. Online marketplaces revenue is recognized upon delivery of goods to the end customer.
Our toys category also includes revenue derived from the sale of other products such as beds, leashes, apparel, and other miscellaneous products.
Consumables—The majority of our consumables revenue today is derived from the treats and chews that are included in our BarkBox and Super Chewer boxes. Over the past several years, the Company has expanded into new and larger consumables markets such as kibble, toppers, supplements and dental products. To sell these products, the Company recently launched a new website, www.bark.co, which contains the majority of its consumables portfolio, all of which can be purchased on a recurring, auto-ship, or one-off basis. Revenue related to BARK.co is recognized at a point in time, as control is transferred to the customer upon each delivery.
Treats— Includes treats and chews included in our BarkBox and Super Chewer boxes, as well as the sale of treats on our consumables website. Many of our treats feature monthly themes, similar to our toys. Today, BARK is one of the largest treat brands in the U.S. by revenue. The Company recently began selling its treats through 2,400 Target and PetSmart doors nationwide and anticipates further retail distribution in the future.
Toppers—Includes meal-enhancing sprinkles, broths and bites that are added to a dog’s food to enhance the flavor of their food. These toppers are often single ingredient proteins that can be easily added to a dog’s existing meal plan. Toppers are particularly beneficial for picky eaters.
Supplements—Includes a variety of dog supplements such as hip and joint support, and skin and coat support. These products are often targeted at specific breeds that are prone to certain ailments.
Kibble—We sell a variety of kibble, priced to compete with the mass premium category. While our kibble can be purchased on an individual basis, we entered this market with a breed-based approach that recommends meal plans
consisting of a mix of kibble, toppers, and supplements based on the characteristics and personalities of various dog breeds. For example,because German Shepherds are prone to hip issues, we recommend hip and joint support supplements with the purchase of their kibble. If that dog is also a picky eater, we will recommend adding one of our toppers. This enhances our average order value and margin profile.
Dental—Also known as BARK Bright, this category includes a variety of chews and toothpastes aimed at improving your dog’s dental health. BARK Bright eliminates the arduous task of brushing a dog’s teeth while still effectively fighting germs and bad breath. Our BARK Bright dental kit provides an innovative regimen for dog dental care.
Overall, we see significant runway in our consumables category long-term, and anticipate the majority of our future growth may be driven by these product categories.
BARK Air—A first-of-its kind air travel experience tailored to dogs. The Company partnered with a jet charter company to begin offering premium flights for customers and their dogs. Interested parties can book flights at dogsflyfirst.com. Our charter partner is responsible for all aircraft, crew, maintenance, and insurance, allowing BARK to focus on creating a great travel experience for dogs and their people worldwide. We believe this initiative exemplifies the Company’s dog-first approach to curating the best products and services.
Cost of Revenue
Cost of revenue primarily consists of the purchase price of inventory sold, inbound freight costs associated with inventory, shipping supply costs, and inventory shrinkage costs.
Operating Expenses
Operating expenses consist of general and administrative and advertising and marketing expenses.
General and Administrative
General and administrative expenses consists primarily of compensation and benefit expenses, including stock-based compensation, fulfillment and shipping costs, which represent costs incurred in operating and staffing fulfillment and customer service centers, including costs attributable to receiving, inspecting, picking, packaging and preparing customer orders for shipment, outbound freight costs associated with shipping orders to customers, and responding to inquiries from customers. General and administrative expenses also includes fees charged by third parties that provide payment processing services, office expense, including rent, insurance and professional service fees.
Advertising and Marketing
Advertising and marketing expense consists primarily of internet advertising, promotional items, agency fees, other marketing costs and compensation and benefits expenses, including stock-based compensation expense, for employees engaged in advertising and marketing.
Interest Income
Interest income primarily consists of income earned on our money market funds and interest-bearing deposit accounts.
Interest Expense
Interest expense primarily consists of interest incurred under our 2025 Convertible Notes, and amortization of debt issuance costs.
Other Income, Net
Other income, net, primarily consists of changes in the fair value of our warrant liabilities and loss on extinguishment of debt.
Results of Operations
We operate in two reportable segments to reflect the way our CODM reviews and assesses the performance of the business. See Note 2, “Summary of Significant Accounting Policies,” in our audited consolidated financial statements for the fiscal years ended March 31, 2024, 2023, and 2022 included elsewhere in this Annual Report on Form 10-K. | | | | | | | | | | | | | | | | | | | | | | | | | | | | | |
| Fiscal Year Ended
March 31, | | | | |
| 2024 | | 2023 | | 2022 | | 2024 vs 2023 | | 2023 vs 2022 |
| (in thousands) | | | | |
| Consolidated Statement of Operation Data: | | | | | | | | | |
| Revenue | | | | | | | | | |
| Direct to Consumer | $ | 436,446 | | | $ | 471,994 | | | $ | 448,074 | | | (7.5) | % | | 5.3 | % |
| Commerce | 53,738 | | | 63,321 | | | 59,332 | | | (15.1) | % | | 6.7 | % |
| Total revenue | 490,184 | | | 535,315 | | | 507,406 | | | (8.4) | % | | 5.5 | % |
| Cost of revenue | | | | | | | | | |
| Direct to Consumer | 157,578 | | | 186,666 | | | 187,991 | | | (15.6) | % | | (0.7) | % |
| Commerce | 30,454 | | | 40,534 | | | 37,309 | | | (24.9) | % | | 8.6 | % |
| Total cost of revenue | 188,032 | | | 227,200 | | | 225,300 | | | (17.2) | % | | 0.8 | % |
| Gross profit | 302,152 | | | 308,115 | | | 282,106 | | | (1.9) | % | | 9.2 | % |
| Operating expenses: | | | | | | | | | |
| | | | | | | | | |
| Advertising and marketing | 79,282 | | | 68,807 | | | 74,417 | | | 15.2 | % | | (7.5) | % |
| General and administrative | 268,390 | | | 303,139 | | | 301,870 | | | (11.5) | % | | 0.4 | % |
| Total operating expenses | 347,672 | | | 371,946 | | | 376,287 | | | (6.5) | % | | (1.2) | % |
| Loss from operations | (45,520) | | | (63,831) | | | (94,181) | | | (28.7) | % | | (32.2) | % |
| Interest income | 7,533 | | | 1,056 | | | — | | | 613.4 | % | | N/M |
| Interest expense | (4,351) | | | (5,428) | | | (5,464) | | | (19.8) | % | | (0.7) | % |
Other income, net | 5,328 | | | 6,684 | | | 31,346 | | | (20.3) | % | | (78.7) | % |
| Net loss before income taxes | (37,010) | | | (61,519) | | | (68,299) | | | (39.8) | % | | (9.9) | % |
| Provision for income taxes | — | | | — | | | — | | | 0.0 | % | | 0.0 | % |
| Net loss | $ | (37,010) | | | $ | (61,519) | | | $ | (68,299) | | | (39.8) | % | | (9.9) | % |
| | | | | | | | | |
N/M means not meaningful. | | | | | | | | | |
| | | | | | | | | |
Comparison of the Fiscal Years Ended March 31, 2024 and March 31, 2023
Revenue
| | | | | | | | | | | | | | | | | | | | | | | |
| Fiscal Year Ended
March 31, | | | | |
| 2024 | | 2023 | | $ Change | | % Change |
| ( in thousands) | | |
| Revenue | | | | | | | |
| | | | | | | |
| | | | | | | |
| | | | | | | |
| Direct to Consumer | 436,446 | | | 471,994 | | | (35,548) | | | (7.5) | % |
| Commerce | 53,738 | | | 63,321 | | | (9,583) | | | (15.1) | % |
| Total revenue | $ | 490,184 | | | $ | 535,315 | | | $ | (45,131) | | | (8.4) | % |
| Percentage of Revenue | | | | | | | |
| Direct to Consumer | 89.0 | % | | 88.2 | % | | | | |
| Commerce | 11.0 | % | | 11.8 | % | | | | |
Direct to Consumer revenue decreased by $35.5 million, or 7.5%, for the fiscal year ended March 31, 2024 compared to the fiscal year ended March 31, 2023. This decrease was primarily driven by a 6.5%, or $1.0 million decrease in Total Orders, in addition to a $0.36 or 1.1% decrease in AOV.
Commerce revenue decreased by $9.6 million, or 15.1%, for the fiscal year ended March 31, 2024 compared to the fiscal year ended March 31, 2023. This decrease was primarily driven by a decrease in sales volume related to inventory reduction initiatives by our retail partners, and macroeconomic pressures on our more discretionary categories.
Gross Profit
| | | | | | | | | | | | | | | | | | | | | | | |
| Fiscal Year Ended
March 31, | | | | |
| 2024 | | 2023 | | $ Change | | % Change |
| ( in thousands) | | |
| Gross Profit | | | | | | | |
| Direct to Consumer | $ | 278,868 | | | $ | 285,328 | | | $ | (6,460) | | | (2.3) | % |
| Commerce | 23,284 | | | 22,787 | | | 497 | | | 2.2 | % |
| Total gross profit | $ | 302,152 | | | $ | 308,115 | | | $ | (5,963) | | | (1.9) | % |
| Percentage of revenue | 61.6 | % | | 57.6 | % | | | | |
Direct to Consumer gross profit decreased by $6.5 million, and Commerce gross profit increased by $0.5 million, for the fiscal year ended March 31, 2024 compared to the fiscal year ended March 31, 2023. The decrease in Direct to Consumer gross profit is primarily attributable to a decrease in revenue. The increase in Commerce gross profit is primarily attributable to inbound freight and product cost improvements.
Gross profit as a percentage of revenue increased 410 basis points for the fiscal year ended March 31, 2024 compared to the fiscal year ended March 31, 2023. Direct to Consumer gross margin was 63.9%, 340 basis points and Commerce gross margin was 43.3%, 730 basis points higher than the same period last year, respectively. The increase in gross margin is primarily attributable to lower inbound freight and product cost improvements.
Operating Expenses
General and Administrative Expense
| | | | | | | | | | | | | | | | | | | | | | | |
| Fiscal Year Ended
March 31, | | | | |
| 2024 | | 2023 | | $ Change | | % Change |
| ( in thousands) | | |
Other general and administrative | 128,576 | | | 146,135 | | | (17,559) | | | (12.0) | % |
Shipping and fulfillment | 139,814 | | | 157,004 | | | (17,190) | | | (10.9) | % |
Total General and administrative | $ | 268,390 | | | $ | 303,139 | | | $ | (34,749) | | | (11.5) | % |
| Percentage of revenue | 54.8 | % | | 56.6 | % | | | | |
General and administrative expense decreased by $34.7 million, or 11.5%, for the fiscal year ended March 31, 2024 compared to the fiscal year ended March 31, 2023. This decrease during the period was primarily due to a decrease of $17.2 million in shipping and fulfillment expense due to lower volumes and lower rates from vendor consolidation, decreased rent and office expense of $3.5 million and decreased donation expense of $1.5 million. Additionally, as a result of our cost cutting initiatives announced in February of fiscal year 2023 and July of fiscal year 2024, compensation expense decreased $8.7 million due to a decrease in headcount, and consulting and legal fees decreased of $5.1 million.
Advertising and Marketing
| | | | | | | | | | | | | | | | | | | | | | | |
| Fiscal Year Ended
March 31, | | | | |
| 2024 | | 2023 | | $ Change | | % Change |
| ( in thousands) | | |
| Advertising and marketing | $ | 79,282 | | | $ | 68,807 | | | $ | 10,475 | | | 15.2 | % |
| Percentage of revenue | 16.2 | % | | 12.9 | % | | | | |
Advertising and marketing expense increased by $10.5 million, or 15.2%, for the fiscal year ended March 31, 2024 compared to the fiscal year ended March 31, 2023. The increase is attributable to increased marketing spend.
Interest Income
| | | | | | | | | | | | | | | | | | | | | | | |
| Fiscal Year Ended
March 31, | | | | |
| 2024 | | 2023 | | $ Change | | % Change |
| ( in thousands) | | |
Interest income | $ | 7,533 | | | $ | 1,056 | | | $ | 6,477 | | | N/M |
| Percentage of revenue | 1.5 | % | | 0.2 | % | | | | |
N/M means not meaningful | | | | | | | |
Interest income increased by $6.5 million for the fiscal year ended March 31, 2024 compared to the fiscal year ended March 31, 2023. This increase is due to the interest earned on our money market account and interest-bearing checking accounts.
Interest Expense
| | | | | | | | | | | | | | | | | | | | | | | |
| Fiscal Year Ended
March 31, | | | | |
| 2024 | | 2023 | | $ Change | | % Change |
| ( in thousands) | | |
Interest expense | $ | (4,351) | | | $ | (5,428) | | | $ | 1,077 | | | (19.8) | % |
| Percentage of revenue | (0.9) | % | | (1.0) | % | | | | |
Interest expense decreased by $1.1 million, or 19.8%, for the fiscal year ended March 31, 2024 compared to the fiscal year ended March 31, 2023. Interest expense for each period is derived from the Company’s 2025 Convertible Notes. This decrease is attributable to the partial debt extinguishment in early November 2023, decreasing interest expense for the remainder of the fiscal year.
Other Income, net
| | | | | | | | | | | | | | | | | | | | | | | |
| Fiscal Year Ended
March 31, | | | | |
| 2024 | | 2023 | | $ Change | | % Change |
| ( in thousands) | | |
Other income, net | 5,328 | | | 6,684 | | | $ | (1,356) | | | (20.3) | % |
| Percentage of revenue | 1.1 | % | | 1.2 | % | | | | |
Other income, net decreased by $1.4 million for the fiscal year ended March 31, 2024 compared to the fiscal year ended March 31, 2023. The decrease in other income, net was primarily due to the $2.6 million decrease of income related to the changes in fair value of our warrant liabilities, offset by the gain on extinguishment of debt for $1.8 million.
Comparison of the Fiscal Years Ended March 31, 2023 and March 31, 2022
Revenue
| | | | | | | | | | | | | | | | | | | | | | | |
| Fiscal Year Ended
March 31, | | | | |
| 2023 | | 2022 | | $ Change | | % Change |
| ( in thousands) | | |
| Revenue | | | | | | | |
| Direct to Consumer | $ | 471,994 | | | $ | 448,074 | | | $ | 23,920 | | | 5.3 | % |
| Commerce | 63,321 | | | 59,332 | | | 3,989 | | | 6.7 | % |
| Total revenue | $ | 535,315 | | | $ | 507,406 | | | $ | 27,909 | | | 5.5 | % |
| Percentage of Revenue | | | | | | | |
| Direct to Consumer | 88.2 | % | | 88.3 | % | | | | |
| Commerce | 11.8 | % | | 11.7 | % | | | | |
Direct to Consumer revenue increased by $23.9 million, or 5.3%, for the fiscal year ended March 31, 2023 compared to the fiscal year ended March 31, 2022. This increase was primarily driven by a $2.18 or 7.3% increase in Average Order Value, due to increased shipping fees and cross selling offset by a 1.8% or 0.3 million decrease in Subscription Shipments during the period.
Commerce revenue increased by $4.0 million, or 6.7%, for the fiscal year ended March 31, 2023 compared to the fiscal year ended March 31, 2022. This increase was primarily driven by the addition of new retail partners since March 31, 2022, as well as volume increases amongst existing retail partners during the period.
Gross Profit
| | | | | | | | | | | | | | | | | | | | | | | |
| Fiscal Year Ended
March 31, | | | | |
| 2023 | | 2022 | | $ Change | | % Change |
| ( in thousands) | | |
| Gross Profit | | | | | | | |
| Direct to Consumer | $ | 285,328 | | | $ | 260,083 | | | $ | 25,245 | | | 9.7 | % |
| Commerce | 22,787 | | | 22,023 | | | 764 | | | 3.5 | % |
| Total gross profit | $ | 308,115 | | | $ | 285,106 | | | $ | 26,009 | | | 9.2 | % |
| Percentage of revenue | 57.6 | % | | 55.6 | % | | | | |
Direct to Consumer and Commerce gross profit increased by $25.2 million and $0.8 million, respectively, for the fiscal year ended March 31, 2023 compared to the fiscal year ended March 31, 2022, driven by the $27.9 million increase in revenue during the period, lower costs from our suppliers and a decrease in inventory write-down charges.
Gross profit as a percentage of revenue increased to 57.6% for the fiscal year ended March 31, 2023 compared to 55.6% for the fiscal year ended March 31, 2022. The increase in Direct to Consumer gross profit is primarily attributable to higher subscription AOV, lower costs from our suppliers and a decrease in inventory write-down expenditures.
Operating Expenses
General and Administrative Expense
| | | | | | | | | | | | | | | | | | | | | | | |
| Fiscal Year Ended
March 31, | | | | |
| 2023 | | 2022 | | $ Change | | % Change |
| ( in thousands) | | |
| General and administrative | $ | 303,139 | | | $ | 301,870 | | | $ | 1,269 | | | 0.4 | % |
| Percentage of revenue | 56.6 | % | | 59.5 | % | | | | |
General and administrative expense increased by $1.3 million, or 0.4%, for the fiscal year ended March 31, 2023 compared to the fiscal year ended March 31, 2022. This increase during the period was primarily due to an increase of $2.1 million in right-of-use asset impairment and increased depreciation charges in connection with vacating our prior headquarters, and $1.8 million restructuring costs relating to the cost reduction initiative announced in February 2023. These increases were offset by a decrease in shipping and fulfillment costs which decreased $1.6 million from $158.6 million as of March 31, 2022 to $157.0 million as of March 31, 2023 due to improvements in our distribution network planning, and better shipping rates in addition to a decrease in professional and legal fees attributable to costs incurred in the prior year associated with the Merger.
Advertising and Marketing
| | | | | | | | | | | | | | | | | | | | | | | |
| Fiscal Year Ended
March 31, | | | | |
| 2023 | | 2022 | | $ Change | | % Change |
| ( in thousands) | | |
| Advertising and marketing | $ | 68,807 | | | $ | 74,417 | | | $ | (5,610) | | | (7.5) | % |
| Percentage of revenue | 12.9 | % | | 14.7 | % | | | | |
Advertising and marketing expense decreased by $5.6 million, or 7.5%, for the fiscal year ended March 31, 2023 compared to the fiscal year ended March 31, 2022. The decrease during the period is attributable to a lower media spend in connection with acquiring fewer subscribers during the period.
Interest Income | | | | | | | | | | | | | | | | | | | | | | | |
| Fiscal Year Ended
March 31, | | | | |
| 2023 | | 2022 | | $ Change | | % Change |
| ( in thousands) | | |
| Interest income | $ | 1,056 | | | $ | — | | | $ | 1,056 | | | N/M |
| Percentage of revenue | 0.2 | % | | — | % | | | | |
Interest income increased by $1.1 million for the fiscal year ended March 31, 2023 compared to the fiscal year ended March 31, 2022. The increase was attributable to interest derived from our money market account and interest-bearing checking accounts.
Interest Expense
| | | | | | | | | | | | | | | | | | | | | | | |
| Fiscal Year Ended
March 31, | | | | |
| 2023 | | 2022 | | $ Change | | % Change |
| ( in thousands) | | |
| Interest expense | $ | (5,428) | | | $ | (5,464) | | | $ | (36) | | | (0.7) | % |
| Percentage of revenue | (1.0) | % | | (1.1) | % | | | | |
Interest expense was relatively flat for the fiscal year ended March 31, 2023 compared to the fiscal year ended March 31, 2022.
Other Income (Expense), Net
| | | | | | | | | | | | | | | | | | | | | | | |
| Fiscal Year Ended
March 31, | | | | |
| 2023 | | 2022 | | $ Change | | % Change |
| ( in thousands) | | |
| Other income (expense), net | 6,684 | | | 31,346 | | | $ | (24,662) | | | N/M |
| Percentage of revenue | 1.2 | % | | 6.2 | % | | | | |
N/M means not meaningful. | | | | | | | |
Other income (expense), net decreased by $24.7 million for the fiscal year ended March 31, 2023 compared to the fiscal year ended March 31, 2022. The decrease in other income (expense), net was primarily due to the $27.8 million decrease of income related to the changes in fair value of our warrant liabilities, offset by an increase in other income of $1.1 million. Additionally, in fiscal 2022 the Company incurred $2.0 million of expense related to the loss on extinguishment of debt incurred from conversion of the convertible promissory notes issued in 2019 and 2020 in connection with the Merger during the prior period.
Non-GAAP Financial Measures
We report our financial results in accordance with U.S. GAAP. However, management believes that Adjusted Net Loss, Adjusted Net Loss Margin, Adjusted Net Loss Per Common Share, Adjusted EBITDA, Adjusted EBITDA Margin, and Free Cash Flow, all non-GAAP financial measures (together the “Non-GAAP Measures”), provide investors with additional useful information in evaluating our performance.
We calculate Adjusted Net Loss as net loss, adjusted to exclude: (1) stock-based compensation expense, (2) change in fair value of warrants and derivatives, (3) sales and use tax (income) expense, (4) restructuring charges related to reduction in force payments, (5) (gain) loss on extinguishment of debt, (6) duplicate rent expense incurred as a result of relocating our corporate headquarters, (7) asset impairment charges, (8) transaction costs associated with the Merger, (9) demurrage fees related to freight, (10) technology transformations and (11) other items (as defined below).
We calculate Adjusted Net Loss Margin by dividing Adjusted Net Loss for the period by Revenue for the period.
We calculate Adjusted Net Loss Per Common Share by dividing Adjusted Net Loss for the period by weighted average common shares used to compute net loss per share attributable to common stockholders for the period.
We calculate Adjusted EBITDA as net loss, adjusted to exclude: (1) interest income, (2) interest expense (3) depreciation and amortization expense, (4) stock-based compensation expense, (5) change in fair value of warrants and derivatives, (6) sales and use tax (income) expense, (7) restructuring charges related to reduction in force
payments, (8) (gain) loss on extinguishment of debt, (9) duplicate rent expense incurred during the relocation of our corporate headquarters, (10) impairment of assets (11) transaction costs (12) demurrage fees related to freight, (13) technology transformation and (14) other items (as defined below).
We calculate Adjusted EBITDA Margin by dividing Adjusted EBITDA for the period by revenue for the period.
We calculate Free Cash Flow as net cash provided by (used in) operating activities less capital expenditures.
The Non-GAAP Measures are financial measures that are not required by, or presented in accordance with U.S. GAAP. We believe that the Non-GAAP Measures, when taken together with our financial results presented in accordance with U.S. GAAP, provide meaningful supplemental information regarding our operating performance and facilitates internal comparisons of our historical operating performance on a more consistent basis by excluding certain items that may not be indicative of our business, results of operations or outlook. In particular, we believe that the use of the Non-GAAP Measures are helpful to our investors as they are measures used by management in assessing the health of our business, determining incentive compensation and evaluating our operating performance, as well as for internal planning and forecasting purposes.
The Non-GAAP Measures are presented for supplemental informational purposes only, have limitations as an analytical tool and should not be considered in isolation or as a substitute for financial information presented in accordance with U.S. GAAP. Some of the limitations of the Non-GAAP Measures include that (1) the measures do not properly reflect capital commitments to be paid in the future, (2) although depreciation and amortization are non-cash charges, the underlying assets may need to be replaced and Adjusted EBITDA and Adjusted EBITDA Margin do not reflect these capital expenditures, (3) Adjusted EBITDA and Adjusted EBITDA Margin do not consider the impact of stock-based compensation expense, which is an ongoing expense for our company, (4) Adjusted EBITDA and Adjusted EBITDA Margin do not reflect other non-operating expenses, including interest expense, and (5) Free cash flow does not represent the total residual cash flow available for discretionary purposes and does not reflect our future contractual commitments. In addition, our use of the Non-GAAP Measures may not be comparable to similarly titled measures of other companies because they may not calculate the Non-GAAP Measures in the same manner, limiting their usefulness as a comparative measure. Because of these limitations, when evaluating our performance, you should consider the Non-GAAP Measures alongside other financial measures, including our net loss and other results stated in accordance with U.S. GAAP.
The following table presents a reconciliation of Adjusted net loss to net loss, the most directly comparable financial measure stated in accordance with U.S. GAAP, and the calculation of net loss margin, Adjusted net loss margin and Adjusted net loss per common share for the periods presented:
Adjusted Net Loss
| | | | | | | | | | | | | | | | | | | | |
| | Fiscal Year Ended
March 31, |
| | 2024 | | 2023 | | 2022 |
| | | |
| Net loss | | $ | (37,010) | | | $ | (61,519) | | | $ | (68,299) | |
| Stock-based compensation expense | | 12,931 | | | 14,811 | | | 17,861 | |
| Change in fair value of warrants and derivatives | | (2,738) | | | (5,350) | | | (33,196) | |
Sales and use tax (income) expense (1) | | (487) | | | (365) | | | 648 | |
| Restructuring | | 1,660 | | | 1,763 | | | 86 | |
(Gain) loss on extinguishment of debt | | (1,828) | | | — | | | 2,024 | |
| Duplicate headquarters rent | | 93 | | | 1,747 | | | — | |
Impairment of assets (2) | | 3,079 | | | 2,065 | | | — | |
Transaction costs (3) | | — | | | — | | | 6,053 | |
Demurrage fees (4) | | — | | | — | | | 2,610 | |
Technology transformation (5) | | 684 | | | — | | | — | |
Other Items (6) | | 3,594 | | | 1,784 | | | 4,544 | |
| Adjusted net loss | | $ | (20,022) | | | $ | (45,064) | | | $ | (67,669) | |
| Net loss margin | | (7.55) | % | | (11.49) | % | | (13.46) | % |
| Adjusted net loss margin | | (4.08) | % | | (8.42) | % | | (13.34) | % |
| | | | | | |
| Adjusted net loss per common share - basic and diluted | | $ | (0.11) | | | $ | (0.26) | | | $ | (0.43) | |
| Weighted average common shares used to compute adjusted net loss per share attributable to common stockholders - basic and diluted | | 177,260,581 | | 176,717,509 | | 156,201,601 |
The following table presents a reconciliation of Adjusted EBITDA to net loss, the most directly comparable financial measure stated in accordance with U.S. GAAP, and the calculation of net loss margin and Adjusted EBITDA margin for the periods presented:
Adjusted EBITDA
| | | | | | | | | | | | | | | | | | | | |
| | Fiscal Year Ended March 31 |
| | 2024 | | 2023 | | 2022 |
| | (in thousands) |
| Net loss | | $ | (37,010) | | | $ | (61,519) | | | $ | (68,299) | |
Interest income | | (7,533) | | | (1,056) | | | — | |
| Interest expense | | 4,351 | | | 5,428 | | | 5,464 | |
| Depreciation and amortization expense | | 12,602 | | | 9,427 | | | 4,403 | |
| Stock-based compensation expense | | 12,931 | | | 14,811 | | | 17,861 | |
| Change in fair value of warrants and derivatives | | (2,738) | | | (5,350) | | | (33,196) | |
Sales and use tax (income) expense (1) | | (487) | | | (365) | | | 648 | |
| Restructuring | | 1,660 | | | 1,763 | | | 86 | |
(Gain) loss on extinguishment of debt | | (1,828) | | | — | | | 2,024 | |
| Duplicate headquarters rent | | 93 | | | 1,747 | | | — | |
Impairment of assets (2) | | 3,079 | | | 2,065 | | | — | |
Transaction costs (3) | | — | | | — | | | 6,053 | |
Demurrage fees (4) | | — | | | — | | | 2,610 | |
Technology transformation (5) | | 684 | | | — | | | — | |
Other items (6) | | 3,594 | | | 1,784 | | | 4,544 | |
| Adjusted EBITDA | | $ | (10,602) | | | $ | (31,265) | | | $ | (57,802) | |
| Net loss margin | | (7.55) | % | | (11.49) | % | | (13.46) | % |
| Adjusted EBITDA margin | | (2.16) | % | | (5.84) | % | | (11.39) | % |
(1)Sales and use tax (income) expense relates to recording a liability for sales and use tax we did not collect from our customers. Historically, we had collected state or local sales, use, or other similar taxes in certain jurisdictions in which we only had physical presence. On June 21, 2018, the U.S. Supreme Court decided, in South Dakota v. Wayfair, Inc. that state and local jurisdictions may, at least in certain circumstances, enforce a sales and use tax collection obligation on remote vendors that have no physical presence in such jurisdiction. A number of states have positioned themselves to require sales and use tax collection by remote vendors and/or by online marketplaces. The details and effective dates of these collection requirements vary from state to state and accordingly, we recorded a liability in those periods in which we created economic nexus based on each state’s requirements. Accordingly, we now collect, remit, and report sales tax in all states that impose a sales tax. Subsequently, as certain of these liabilities are waived by tax authorities or the applicable statute of limitations expires, the related accrued liability is reversed.
(2)For the fiscal year ended March 31, 2024 impairment of assets is the non-cash impairment of previously capitalized software and prepaid software licenses. For the fiscal year ended March 31, 2023 impairment of assets is the impairment of the right-of-use asset associated with our previous headquarters which we vacated.
(3)Transaction costs represent non-recurring consulting and advisory costs with respect to the merger agreement entered into with Northern Star Acquisition Corp. on December 16, 2020.
(4)Demurrage fees are raised when the full container is not moved out of the port/terminal for unpacking within the allowed free days offered by the shipping line. The charge is levied by the shipping line to the importer.
(5)Includes consulting fees related to technology transformation activities, and payroll costs for employees that dedicate significant time to this project. We believe that these costs are discrete and non-recurring in nature, as they relate to a one-time unification of our product offerings on our new commerce platform. As such, they are not normal, recurring operating expenses and are not reflective of ongoing trends in the cost of doing business.
(6)For the fiscal year ended March 31, 2024, other items is comprised of non-recurring retention payments to management of $1.4 million, executive transition costs of $1.3 million, warehouse restructuring costs of $0.8 million, and legal settlements of $0.1 million. For the fiscal year ended March 31, 2023, other items comprised of executive transition costs of $1.7 million and tax penalties of $0.1 million. For fiscal year ended March 31, 2022, other items is comprised of executive transition costs of $1.9 million, costs related to unrealized business ventures of $1.8 million, SOX implementation fees of $0.7 million, and loss on exercise of warrants of $0.1 million.
The following table presents a reconciliation of Free Cash Flow to Net cash provided by (used in) operating activities, the most directly comparable financial measure prepared in accordance with U.S. GAAP, for each of the periods indicated:
Free Cash Flow
| | | | | | | | | | | | | | | | | |
| Fiscal Year Ended March 31 |
| 2024 | | 2023 | | 2022 |
| Free cash flow reconciliation: | | | | | |
| Net cash provided by (used in) operating activities | $ | 6,060 | | | $ | 4,694 | | | $ | (172,338) | |
| Capital expenditures | (8,831) | | | (21,320) | | | (21,172) | |
| Free cash flow | $ | (2,771) | | | $ | (16,626) | | | $ | (193,510) | |
| | | | | |
| | | | | |
| | | | | |
| | | | | |
| | | | | |
| | | | | |
| | | | | |
| | | | | |
| | | | | |
| | | | | |
| | | | | |
| | | | | |
| | | | | |
| | | | | |
| | | | | |
| | | | | |
| | | | | |
| | | | | |
| | | | | |
| | | | | |
| | | | | |
| | | | | |
| | | | | |
| | | | | |
| | | | | |
| | | | | |
| | | | | |
| | | | | |
| | | | | |
| | | | | |
| | | | | |
Liquidity and Capital Resources
As of March 31, 2024, we had cash and cash equivalents of approximately $125.5 million. We expect that our cash and cash equivalents, together with cash provided by our operating activities and proceeds from borrowings (as defined below), will be sufficient to fund our operations for at least the next 12 months. We are required to comply with certain financial and non-financial covenants related to our borrowing agreements, which we are in compliance with as of March 31, 2024 and expect to be in compliance with during the next 12 months.
Our material cash requirements include our lease arrangements for corporate offices, warehouses and certain equipment. As of March 31, 2024, we had fixed lease payment obligations of $47.9 million, with $5.3 million payable within 12 months.
2025 Convertible Notes
On November 27, 2020, the Company issued $75.0 million aggregate principal amount of 2025 Convertible Notes (the “2025 Convertible Notes”) to Magnetar Capital, LLC (“Magnetar”) under an indenture, dated as of November 27, 2020, between Legacy BARK and U.S. Bank National Association, as trustee and collateral agent (the “Indenture”). The Company received net proceeds of approximately $74.7 million from the sale of the 2025 Convertible Notes, after deducting fees and expenses of approximately $0.3 million. The Company recorded the expenses as a discount to the note and will amortize the expenses over the term of the note. The 2025 Convertible Notes will mature on December 1, 2025, unless earlier converted, redeemed or repurchased.
The 2025 Convertible Notes are governed by the Indenture. The 2025 Convertible Notes bear interest at the annual rate of 5.50%, payable entirely in payment-in-kind annually on December 1 of each year commencing December 1, 2021, compounded annually. As of March 31, 2024, the effective interest rate is 6.60%. The accrued interest of $2.1 million and $4.4 million was paid-in-kind through an increase of the outstanding principal on the 2025 Convertible Notes on December 1, 2023 and 2022, respectively.
If the 2025 Convertible Notes are not converted into common stock by the maturity date, the Company must repay the outstanding principal amount plus accrued interest.
The 2025 Convertible Notes contain call and put options to be settled in cash contingent upon the occurrence of a change of control and a default interest rate increase of 3.0% applicable upon the occurrence of an event of default that when evaluated under the guidance of ASC 815, Derivatives and Hedging, are embedded derivatives requiring bifurcation at fair value. The fair value calculation includes Level 3 inputs including the estimated fair value of the
Company’s common stock and assumptions regarding the probability that the contingent call or put will be exercised or an event of default will occur. Management determined that the probability that the contingent events will occur was near zero at inception and has remained near zero as of March 31, 2024. Therefore, the Company did not record a derivative liability related to these features as of March 31, 2024. The Company will assess the probability of occurrence quarterly during the term of the 2025 Convertible Notes.
On November 2, 2023, the Company repurchased $45.0 million of the $83.5 million of outstanding aggregate principal amount of 5.50% Convertible Secured Notes due 2025 (the “2025 Convertible Notes”) from entities affiliated with Magnetar Financial, LLC (collectively, the “Holders”), pursuant to the terms and conditions of a negotiated notes purchase agreement (the “Agreement”) among the Company and the Holders.
Pursuant to the Agreement, the Company repurchased $45.0 million in aggregate principal amount of the 2025 Convertible Notes plus $2.2 million of accrued and unpaid interest thereon to, but excluding the repurchase date, from the Holders for a total cash purchase price of $44.4 million. In addition, $1.0 million of unamortized deferred financing fees were derecognized from the Company’s balance sheet on the date of extinguishment. The accelerated deferred financing fees were recognized as a component of gain on extinguishment of debt. The Company recognized a gain on debt extinguishment of $1.8 million in connection with the repurchase. If a Change of Control (as defined in the Indenture) of the Company occurs at any time after the date of the Agreement and prior to the December 1, 2025 maturity date of the Notes, the Holders are also entitled to receive an additional cash “true-up” payment from the Company, totaling, in the aggregate for all Holders, either (i) $11.3 million in the case that the Company elects to redeem all of the Notes outstanding at the time of such Change of Control or (ii) $4.5 million in the case that the Holders elect to require the Company to repurchase all of the 2025 Convertible Notes outstanding at the time of such Change of Control any other case, in each case, in accordance with the terms and conditions specified in the Agreement.
As of March 31, 2024 and March 31, 2023, the Company had $40.6 million and $83.5 million, respectively, of outstanding borrowings under the note purchase agreement governing the purchase and sale of the 2025 Convertible Notes agreement.
Western Alliance Bank—Line of Credit and Term Loan
In October 2017, the Company entered into a loan and security agreement and issued a warrant to purchase preferred stock (“Initial Western Alliance Warrant”) to Western Alliance Bank (“Western Alliance”), which provides for a revolving line of credit (as amended, the “Credit Facility”) in an aggregate principal amount of up to $35.0 million, subject to borrowing base limitations derived from advance rates derived from the Company’s eligible subscription revenues and eligible accounts receivable. The Credit Facility has been amended several times, most recently in December 2023. After giving effect to this most recent amendment, the maturity date of the Credit Facility is December 13, 2024. Certain of the Company’s obligations to Western Alliance and under the Credit Facility are guaranteed by certain of its subsidiaries and secured by substantially all of their assets.
The interest rate for borrowings under the Credit Facility is equal to (a)(i) the greater of the prime rate that is published in the Money Rates section of The Wall Street Journal from time to time and (ii) five and one quarter percent (5.25%), plus (ii) half of one percent (0.50%), per annum.
The Credit Facility has a borrowing base subject to an amount equal to eighty percent (80.00%) of the Company’s trailing three months of subscription revenue and an amount equal to (80.00%) of certain of the Company’s customer accounts receivable when a collateral audit is performed and sixty percent (60.00%) when no such collateral audit is performed. Western Alliance has first perfected security in substantially all of the Company’s assets, including its rights to its intellectual property.
The Credit Facility requires the Company to comply with certain financial and performance covenants, including, among other things, minimum cash deposits with Western Alliance. The Credit Facility also contains affirmative and negative covenants customary for financings of this type, including, among other things, limitations or prohibitions on repurchasing common shares, declaring and paying dividends and other distributions, making payments in respect of subordinated debt or our 2025 Convertible Notes, incurring indebtedness, making loans and investments, incurring liens, or entering into mergers, asset sales and transactions with affiliates.
As of March 31, 2024 and March 31, 2023, there were no outstanding borrowings under the Credit Facility.
Cash Flows
Comparison of the Fiscal Years Ended March 31, 2024, 2023 and 2022.
The following table summarizes our cash flows for the fiscal years ended March 31, 2024, 2023 and 2022:
| | | | | | | | | | | | | | | | | |
| Fiscal Year Ended March 31 |
| 2024 | | 2023 | | 2022 |
| (in thousands) |
| Net cash provided by (used in) operating activities | $ | 6,060 | | | $ | 4,694 | | | $ | (172,338) | |
| Net cash used in investing activities | (8,831) | | | (21,145) | | | (21,172) | |
| Net cash provided by (used in) financing activities | (49,615) | | | (2,099) | | | 355,458 | |
| Effect of exchange rate changes on cash | 24 | | | (62) | | | — | |
| Net increase (decrease) in cash and restricted cash | $ | (52,362) | | | $ | (18,612) | | | $ | 161,948 | |
Cash flows provided by (used in) Operating Activities
Net cash flows in operating activities represent the cash receipts and disbursements related to our activities other than investing and financing activities.
Net cash flows used in operating activities is derived by adjusting our net loss for:
•non-cash operating items such as depreciation and amortization, stock-based compensation and other non-cash income or expenses; and
•changes in operating assets and liabilities reflect timing differences between the receipt and payment of cash associated with transactions.
For the fiscal year ended March 31, 2024, net cash provided by operating activities was $6.1 million. The $6.1 million of net cash provided by operating activities consisted of net loss of $37.0 million adjusted for non-cash charges totaling $30.5 million and a net decrease of $12.5 million in our net operating assets and liabilities. The non-cash charges primarily consisted of $12.9 million for stock based compensation, $12.6 million for depreciation and amortization, and $4.1 million of non-cash lease expense. The decrease in our net operating assets and liabilities was primarily driven by a reduction in inventory of $40.7 million offset by a decrease of accounts payable and accrued expenses of $17.8 million.
For the fiscal year ended March 31, 2023, net cash provided by operating activities was $4.7 million. The $4.7 million of net cash provided by operating activities consisted of net loss of $61.5 million adjusted for non-cash charges totaling $26.3 million and a net increase of $39.9 million in our net operating assets and liabilities. The non-cash charges primarily consisted of $14.8 million for stock based compensation, $9.4 million for depreciation and amortization, and $4.9 million of non-cash lease expense. The increase in our net operating assets and liabilities was driven by a reduction in inventory of $33.5 million and proceeds from tenant improvement allowances of $7.4 million.
For the fiscal year ended March 31, 2022, net cash used in operating activities was $172.3 million. The $172.3 million of net cash used in operating activities consisted of net loss of $68.3 million adjusted for non-cash charges totaling $7.6 million and a net decrease of $111.6 million in our net operating assets and liabilities. The non-cash charges primarily consisted of $33.2 million for changes in fair value of warrants, $17.9 million for stock based compensation, $2.0 million loss on extinguishment of debt and $4.4 million for depreciation and amortization. The decrease in our net operating assets and liabilities was driven by the increase in inventory of $82.9 million to support current demand. Additionally, accounts payable and accrued expenses increased by $13.5 million related to increased expenditures to support general business growth, as well as the timing of payments, other liabilities of $12.6 million, prepaid expenses and other current assets of $1.1 million, and accounts receivable of $1.1 million.
The decrease in our net operating assets and liabilities was partially offset by the change in deferred revenue of $4.4 million.
Cash flows used in Investing Activities
For the fiscal year ended March 31, 2024, net cash used in investing activities was $8.8 million, primarily due to capital expenditures for software implementations and other capital expenditures.
For the fiscal year ended March 31, 2023, and 2022, net cash used in investing activities was $21.1 million and $21.2 million, respectively, primarily due to capital expenditures for warehouse machinery, leasehold improvements, equipment, and software implementations.
Cash flows provided by (used in) Financing Activities
For the fiscal year ended March 31, 2024, net cash used in financing activities was $49.6 million, primarily due to the partial payment of long-term debt of $42.3 million and payments to repurchase common stock of $6.2 million.
For the fiscal year ended March 31, 2023, net cash used in financing activities was $2.1 million, primarily due to payments for finance lease obligations.
For the fiscal year ended March 31, 2022, net cash provided by financing activities was $355.5 million, primarily due to proceeds of $227.1 million proceeds from the Merger and proceeds from the PIPE of $200.0 million. The increase in cash provided by financing activities was partially offset by the repayments of outstanding borrowings on our line of credit of $34.3 million, payments of transaction costs of $25.2 million, payment of deferred underwriting fees $8.9 million, and repayment of the outstanding Paycheck Protection Program loan of $5.2 million.
Off-Balance Sheet Arrangements
We did not have during the periods presented, and we do not currently have, any off-balance sheet financing arrangements or any relationships with unconsolidated entities or financial partnerships, including entities sometimes referred to as structured finance or special purpose entities, that were established for the purpose of facilitating off-balance sheet arrangements or other contractually narrow or limited purposes.
Critical Accounting Policies and Estimates
This discussion and analysis of financial condition and results of operation is based upon our audited consolidated financial statements, which have been prepared in accordance with U.S. GAAP. The preparation of these financial statements requires us to make estimate and assumptions that affect the reported amounts of assets and liabilities and the disclosure of contingent assets and liabilities. We also make estimates and assumptions on revenue generated and reported expenses incurred during the reporting periods, Our estimates are based on our historical experience and on various other factors that we believe are reasonable under the circumstances. The results of these estimates form the basis for making judgments about the carrying value of assets and liabilities that are not readily apparent from other sources. Actual results may differ from these estimates. Our critical accounting policies are described in greater details in Note 2 — Summary of Significant Accounting Policies to our consolidated financial statements included in this Annual Report on Form 10-K.
Critical accounting estimates are defined as those reflective of significant judgments, estimates and uncertainties, which may result in materially different results under different assumptions and conditions. We have listed below our critical accounting estimates that we believe to have the greatest potential impact on our audited consolidated financial statements. Historically, our assumptions, judgments and estimates relative to our critical accounting estimates have not differed materially from actual results.
Revenue Recognition
Our primary sources of revenue are from sales of toys and accessories and consumables through our Direct to Consumer and Commerce segments. We recognize revenue upon delivery of products and services to our customer, as applicable. The recognition of revenue is determined through application of the following five-step model:
•Identification of the contract(s) with customers, as applicable;
•Identification of the performance obligation(s) in the contract;
•Determination of the transaction price;
•Allocation of the transaction price to the performance obligation(s) in the contract; and
•Recognition of revenue when or as the performance obligation(s) is satisfied.
Discounts are considered fixed consideration and represent a fixed reduction to revenue for each performance obligation. The sales returns and chargebacks allowance is considered to be contingent and represents a component of variable consideration. The estimated consideration reflects potential sales returns and chargebacks as a reduction in the transaction price. We have determined that the expected value method will provide the best predictor for a refund liability associated with sales returns and chargebacks. The expected value method estimates variable consideration based on the range of possible outcomes and the probabilities of each outcome and is most appropriate when an entity has a large number of contracts that have similar characteristics. The estimate is recorded in total for sales transactions recorded in the current period and, in effect, represents a reduction in the transaction price at the time of sale.
Our contract liability represents cash collections from our customers prior to delivery of subscription products, which is recorded as deferred revenue on the consolidated balance sheets. Deferred revenue is recognized as revenue upon the delivery of the box or product.
Inventories
Inventories consist principally of finished goods, and represent products available for sale and are accounted for using the first-in, first-out (“FIFO”) method and valued at the lower of cost or net realizable value. Inventory costs consist of product and inbound shipping and handling costs. We assess the valuation of inventory and periodically write down the value for estimated excess and obsolete inventory based upon estimates of future demand and market conditions. Inventory valuation requires us to make judgments, based on information available at each reporting period. Inventory valuation losses are recorded as cost of revenues.
We review current business trends and forecasts, and inventory aging to determine adjustments which we estimate will be needed to liquidate existing excess inventories and record inventories at either the lower of cost or net realizable value or the lower of cost or market, as applicable. We believe that all inventory write-downs required at March 31, 2024, have been recorded. Our historical estimates of inventory reserves have not differed materially from actual results. If market conditions were to change, including as a result of the current war in the Ukraine and its broader macroeconomic implications or the COVID-19 pandemic and the supply chain and logistics disruptions globally, it is possible that the required level of inventory reserves may need to be adjusted.
Recent Accounting Pronouncements
A description of recently issued accounting pronouncements that may potentially impact our financial position and results of operations is disclosed in Note 2 — Summary of Significant Accounting Policies in our audited consolidated financial statements contained in this Annual Report on Form 10-K.
JOBS Act Accounting Election
We were an “emerging growth company”, as defined in the Jumpstart Our Business Startups Act of 2012 (the “JOBS Act”). However, based on the market value of our common stock held by non-affiliates as of September 30, 2021, we became a large accelerated filer and thus ceased to be an emerging growth company on March 31, 2022. As a result, we were required to adopt new or revised accounting standards as required by public companies,
including those standards which we had previously deferred pursuant to the JOBS Act. Additionally, we are no longer able to take advantage of the reduced regulatory and reporting requirements of emerging growth companies.
ITEM 7A. QUANTITATIVE AND QUALITATIVE DISCLOSURES ABOUT MARKET RISK
Interest Rate Risk
As of March 31, 2024, we had cash and cash equivalents of approximately $125.5 million consisting of bank deposits and money market accounts. Due to the short-term duration of our cash equivalents, we have not been exposed, nor do we anticipate being exposed, to material risks due to changes in interest rates. A hypothetical 10% increase in interest rates during any of the periods presented would not have had a material impact on our consolidated financial statements.
We are primarily exposed to changes in short-term interest rates with respect to our cost of borrowing under our Western Alliance Agreement. As of March 31, 2024 there are no outstanding borrowings under the Credit Facility. We monitor our cost of borrowing under our facility, taking into account our funding requirements, and our expectations for short-term rates in the future. A hypothetical 10% change in the interest rate on our Western Alliance Agreement for all periods presented would not have a material impact on our consolidated financial statements.
Inflation Risk
We do not believe that inflation has had a material effect on our business, financial condition, or results of operations. Nonetheless, if our costs were to become subject to significant inflationary pressures, we may not be able to fully offset such higher costs through price increases. Our inability or failure to do so could harm our business, financial condition, and results of operations. Please refer to the Part I, Item 1A: “Risk Factors” in this Annual Report on Form 10-K for further information.
Foreign Exchange Risk
We operate our business primarily within the United States and currently execute the majority of our transactions in U.S. dollars. As a result, we have only limited foreign translation or exchange risk, which we do not expect to have a material impact on our consolidated financial statements. We have not utilized hedging strategies with respect to such limited foreign translation or exchange risk.
ITEM 8. FINANCIAL STATEMENTS AND SUPPLEMENTARY DATA
BARK, INC.
INDEX TO CONSOLIDATED FINANCIAL STATEMENTS
REPORT OF INDEPENDENT REGISTERED PUBLIC ACCOUNTING FIRM
To the Shareholders and the Board of Directors of BARK, Inc. and subsidiaries
Opinion on the Financial Statements
We have audited the accompanying consolidated balance sheets of BARK, Inc. and subsidiaries (the "Company") as of March 31, 2024 and 2023, the related consolidated statements of operations and comprehensive loss, stockholders’ equity (deficit), and cash flows, for each of the three years in the period ended March 31, 2024, and the related notes (collectively referred to as the "financial statements"). In our opinion, the financial statements present fairly, in all material respects, the financial position of the Company as of March 31, 2024 and 2023, and the results of its operations and its cash flows for each of the three years in the period ended March 31, 2024, in conformity with accounting principles generally accepted in the United States of America.
We have also audited, in accordance with the standards of the Public Company Accounting Oversight Board (United States) (PCAOB), the Company's internal control over financial reporting as of March 31, 2024, based on criteria established in Internal Control — Integrated Framework (2013) issued by the Committee of Sponsoring Organizations of the Treadway Commission and our report dated June 3, 2024, expressed an unqualified opinion on the Company's internal control over financial reporting.
Basis for Opinion
These financial statements are the responsibility of the Company's management. Our responsibility is to express an opinion on the Company's financial statements based on our audits. We are a public accounting firm registered with the PCAOB and are required to be independent with respect to the Company in accordance with the U.S. federal securities laws and the applicable rules and regulations of the Securities and Exchange Commission and the PCAOB.
We conducted our audits in accordance with the standards of the PCAOB. Those standards require that we plan and perform the audit to obtain reasonable assurance about whether the financial statements are free of material misstatement, whether due to error or fraud. Our audits included performing procedures to assess the risks of material misstatement of the financial statements, whether due to error or fraud, and performing procedures that respond to those risks. Such procedures included examining, on a test basis, evidence regarding the amounts and disclosures in the financial statements. Our audits also included evaluating the accounting principles used and significant estimates made by management, as well as evaluating the overall presentation of the financial statements. We believe that our audits provide a reasonable basis for our opinion.
Critical Audit Matter
The critical audit matter communicated below is a matter arising from the current-period audit of the financial statements that was communicated or required to be communicated to the audit committee and that (1) relates to accounts or disclosures that are material to the financial statements and (2) involved our especially challenging, subjective, or complex judgments. The communication of critical audit matters does not alter in any way our opinion on the financial statements, taken as a whole, and we are not, by communicating the critical audit matter below, providing a separate opinion on the critical audit matter or on the accounts or disclosures to which it relates.
Inventory – Excess and Obsolete Inventory — Refer to Note 2 to the financial statements
Critical Audit Matter Description
Inventories consist principally of finished goods valued at the lower of cost or net realizable value using the first-in, first-out (“FIFO”) method. The Company assesses the valuation of inventory and periodically writes down the value for estimated excess and obsolete inventory. Inventory valuation requires the Company to make judgments, based on information available at each reporting period. The Company reviews current business trends and forecasts, and inventory aging to determine adjustments which it estimates will be needed for inventories that are expected to be
written off or otherwise disposed of in order to record inventories at the lower of cost or net realizable value, as applicable. The excess and obsolete inventory reserve totaled $3.5 million and $4.0 million for the year ended March 31, 2024, and 2023 and ending inventory totaled $84.2 million and $124.3 million as of March 31, 2024, and 2023.
Given the significant judgments made by management to estimate the valuation of excess and obsolete inventory, performing audit procedures to evaluate the reasonableness of management’s estimates and assumptions required a high degree of auditor judgment and an increased extent of effort.
How the Critical Audit Matter Was Addressed in the Audit
Our audit procedures related to the excess and obsolete inventory reserve included the following procedures:
•We tested the effectiveness of management’s controls over the review of excess and obsolete inventory.
•We evaluated management’s ability to accurately forecast future revenue by comparing actual revenue results to management’s historical forecasts.
•We compared actual inventory sales and write-off activity in the current year to the excess and obsolete inventory estimated by the Company in the prior year to evaluate management’s ability to accurately estimate net realizable value.
•We selected a sample of inventory items and evaluated historical sales performance relative to management’s conclusions on the ability to sell through the inventory on-hand.
•We obtained the Company’s estimated excess and obsolete inventory calculation and tested the mathematical accuracy.
•We inquired of planning and operations personnel to determine whether the information communicated supported or contradicted the conclusions reached by finance and accounting in the excess and obsolete inventory analysis.
•We considered if there were changes in the business during the year or through report date that may impact realizability of inventory and thus information that may contradict the excess and obsolete inventory analysis through reading of minutes of the Board of Directors meetings, press releases and Company website postings.
/s/ Deloitte & Touche LLP
New York, New York
June 3, 2024
We have served as the Company's auditor since 2015.
REPORT OF INDEPENDENT REGISTERED PUBLIC ACCOUNTING FIRM
To the Shareholders and the Board of Directors of BARK, Inc., and subsidiaries
Opinion on Internal Control over Financial Reporting
We have audited the internal control over financial reporting of BARK, Inc., and subsidiaries (the “Company”) as of March 31, 2024, based on criteria established in Internal Control — Integrated Framework (2013) issued by the Committee of Sponsoring Organizations of the Treadway Commission (COSO). In our opinion, the Company maintained, in all material respects, effective internal control over financial reporting as of March 31, 2024 based on criteria established in Internal Control — Integrated Framework (2013) issued by COSO.
We have also audited, in accordance with the standards of the Public Company Accounting Oversight Board (United States) (PCAOB), the consolidated financial statements as of and for the year ended March 31, 2024, of the Company and our report dated June 3, 2024, expressed an unqualified opinion on those financial statements.
Basis for Opinion
The Company’s management is responsible for maintaining effective internal control over financial reporting and for its assessment of the effectiveness of internal control over financial reporting, included in the accompanying Management’s Report on Internal Control over Financial Reporting. Our responsibility is to express an opinion on the Company’s internal control over financial reporting based on our audit. We are a public accounting firm registered with the PCAOB and are required to be independent with respect to the Company in accordance with the U.S. federal securities laws and the applicable rules and regulations of the Securities and Exchange Commission and the PCAOB.
We conducted our audit in accordance with the standards of the PCAOB. Those standards require that we plan and perform the audit to obtain reasonable assurance about whether effective internal control over financial reporting was maintained in all material respects. Our audit included obtaining an understanding of internal control over financial reporting, assessing the risk that a material weakness exists, testing and evaluating the design and operating effectiveness of internal control based on the assessed risk, and performing such other procedures as we considered necessary in the circumstances. We believe that our audit provides a reasonable basis for our opinion.
Definition and Limitations of Internal Control over Financial Reporting
A company’s internal control over financial reporting is a process designed to provide reasonable assurance regarding the reliability of financial reporting and the preparation of financial statements for external purposes in accordance with generally accepted accounting principles. A company’s internal control over financial reporting includes those policies and procedures that (1) pertain to the maintenance of records that, in reasonable detail, accurately and fairly reflect the transactions and dispositions of the assets of the company; (2) provide reasonable assurance that transactions are recorded as necessary to permit preparation of financial statements in accordance with generally accepted accounting principles, and that receipts and expenditures of the company are being made only in accordance with authorizations of management and directors of the company; and (3) provide reasonable assurance regarding prevention or timely detection of unauthorized acquisition, use, or disposition of the company’s assets that could have a material effect on the financial statements.
Because of its inherent limitations, internal control over financial reporting may not prevent or detect misstatements. Also, projections of any evaluation of effectiveness to future periods are subject to the risk that controls may become inadequate because of changes in conditions, or that the degree of compliance with the policies or procedures may deteriorate.
/s/ Deloitte & Touche LLP
New York, New York
June 3, 2024
BARK, INC.
CONSOLIDATED BALANCE SHEETS (In thousands, except share and per share data) | | | | | | | | | | | |
| March 31, | | March 31, |
| 2024 | | 2023 |
| ASSETS | | | |
| CURRENT ASSETS: | | | |
| Cash and cash equivalents | $ | 125,495 | | | $ | 177,911 | |
| Accounts receivable—net | 7,696 | | | 6,554 | |
| Prepaid expenses and other current assets | 4,379 | | | 3,552 | |
| Inventory | 84,177 | | | 124,336 | |
| Total current assets | 221,747 | | | 312,353 | |
| PROPERTY AND EQUIPMENT—NET | 25,540 | | | 39,851 | |
| INTANGIBLE ASSETS—NET | 11,921 | | | 4,090 | |
| OPERATING LEASE RIGHT-OF-USE ASSETS | 32,793 | | | 36,892 | |
| OTHER NONCURRENT ASSETS | 6,587 | | | 7,234 | |
| TOTAL ASSETS | $ | 298,588 | | | $ | 400,420 | |
LIABILITIES AND STOCKHOLDERS’ EQUITY | | | |
| CURRENT LIABILITIES: | | | |
| Accounts payable | $ | 13,737 | | | $ | 34,370 | |
| Operating lease liabilities, current | 5,294 | | | 5,484 | |
| Accrued and other current liabilities | 30,490 | | | 31,975 | |
| Deferred revenue | 25,957 | | | 27,772 | |
| Total current liabilities | 75,478 | | | 99,601 | |
| LONG-TERM DEBT | 39,926 | | | 81,221 | |
| OPERATING LEASE LIABILITIES | 42,599 | | | 47,240 | |
| OTHER LONG-TERM LIABILITIES | 1,202 | | | 1,821 | |
| Total liabilities | 159,205 | | | 229,883 | |
COMMITMENTS AND CONTINGENCIES (Note 11) | | | |
| STOCKHOLDERS’ EQUITY: | | | |
Common stock, par value $0.0001 per share—500,000,000 shares authorized; 175,533,136 shares issued and outstanding as of March 31, 2024 and 500,000,000 shares authorized; 177,647,754 shares issued and outstanding as of March 31, 2023. | 1 | | | 1 | |
Treasury stock, at cost, 4,643,589 and 0 shares, respectively | (6,225) | | | — | |
| Additional paid-in capital | 492,427 | | | 480,370 | |
| Accumulated deficit | (346,820) | | | (309,834) | |
| Total stockholders’ equity | 139,383 | | | 170,537 | |
| TOTAL LIABILITIES, AND STOCKHOLDERS’ EQUITY | $ | 298,588 | | | $ | 400,420 | |
See notes to the consolidated financial statements.
BARK, INC.
CONSOLIDATED STATEMENTS OF OPERATIONS AND COMPREHENSIVE LOSS
(In thousands, except share and per share data)
| | | | | | | | | | | | | | | | | | | | |
| | Fiscal Year Ended |
| | March 31, | | March 31, | | March 31, |
| | 2024 | | 2023 | | 2022 |
| REVENUE | | $ | 490,184 | | | $ | 535,315 | | | $ | 507,406 | |
| COST OF REVENUE | | 188,032 | | | 227,200 | | | 225,300 | |
| Gross profit | | 302,152 | | | 308,115 | | | 282,106 | |
| OPERATING EXPENSES: | | | | | | |
| | | | | | |
| Advertising and marketing | | 79,282 | | | 68,807 | | | 74,417 | |
| General and administrative | | 268,390 | | | 303,139 | | | 301,870 | |
| Total operating expenses | | 347,672 | | | 371,946 | | | 376,287 | |
| LOSS FROM OPERATIONS | | (45,520) | | | (63,831) | | | (94,181) | |
INTEREST INCOME | | 7,533 | | | 1,056 | | | — | |
INTEREST EXPENSE | | (4,351) | | | (5,428) | | | (5,464) | |
OTHER INCOME—NET | | 5,328 | | | 6,684 | | | 31,346 | |
| NET LOSS BEFORE INCOME TAXES | | (37,010) | | | (61,519) | | | (68,299) | |
| PROVISION FOR INCOME TAXES | | — | | | — | | | — | |
| NET LOSS AND COMPREHENSIVE LOSS | | $ | (37,010) | | | $ | (61,519) | | | $ | (68,299) | |
| | | | | | |
Net loss per common share attributable to common stockholders—basic and diluted | | $ | (0.21) | | | $ | (0.35) | | | $ | (0.44) | |
Weighted average common shares used to compute net loss per share attributable to common stockholders—basic and diluted | | 177,260,581 | | | 176,717,509 | | | 156,201,601 | |
| | | | | | |
| | | | | | |
See notes to the consolidated financial statements.
BARK, INC.
CONSOLIDATED STATEMENTS OF STOCKHOLDERS' EQUITY (DEFICIT)
(In thousands, except share data)
| | | | | | | | | | | | | | | | | | | | | | | | | | | | | | | | | | | | | | | | | | | | | | | | | | | | | | | | | | | | | | | |
| | Convertible Redeemable Preferred Stock | | | Common Stock | | | | Treasury Stock | | Additional Paid-in Capital | | Accumulated Deficit | | Total Stockholders’ Equity (Deficit) |
| | Shares | | Amount | | | Shares | | Amount | | | | | | Shares | | Amount | | | |
| | | | | | | | | | | | | | | | | | | | | | | |
| | | | | | | | | | | | | | | | | | | | | | | |
| | | | | | | | | | | | | | | | | | | | | | | |
| | | | | | | | | | | | | | | | | | | | | | | |
| | | | | | | | | | | | | | | | | | | | | | | |
| | | | | | | | | | | | | | | | | | | | | | | |
| | | | | | | | | | | | | | | | | | | | | | | |
| | | | | | | | | | | | | | | | | | | | | | | |
| Balance - March 31, 2021 | | 7,752,515 | | | $ | 59,987 | | | | 48,071,777 | | | $ | — | | | | | | | $ | — | | | $ | — | | | $ | 20,984 | | | $ | (179,954) | | | $ | (158,970) | |
| Net loss | | — | | | — | | | | — | | | — | | | | | | | — | | | — | | | — | | | (68,299) | | | (68,299) | |
| Issuance for stock options exercised | | — | | | — | | | | 7,322,814 | | | — | | | | | | | — | | | — | | | 3,300 | | | — | | | 3,300 | |
| Issuance for warrants exercised | | — | | | — | | | | 1,931,621 | | | — | | | | | | | — | | | — | | | 1,019 | | | — | | | 1,019 | |
| Restricted Share Vesting | | — | | | — | | | | 7,307 | | | — | | | | | | | — | | | — | | | — | | | — | | | — | |
| Restricted shares held for taxes | | — | | | — | | | | (20,546) | | | — | | | | | | | — | | | — | | | (222) | | | — | | | (222) | |
| Stock-based compensation expense | | — | | | — | | | | — | | | — | | | | | | | — | | | — | | | 17,861 | | | — | | | 17,861 | |
| Conversion of Preferred Stock | | (7,752,515) | | | (59,987) | | | | 7,752,515 | | | — | | | | | | | — | | | — | | | 59,987 | | | — | | | 59,987 | |
| Conversion of Convertible Notes | | — | | | — | | | | 1,135,713 | | | — | | | | | | | — | | | — | | | 12,128 | | | — | | | 12,128 | |
| PIPE Issuance | | — | | | — | | | | 20,000,000 | | | — | | | | | | | — | | | — | | | 200,000 | | | — | | | 200,000 | |
| Net equity infusion from the Merger | | — | | | — | | | | 89,088,942 | | | 1 | | | | | | | — | | | — | | | 150,256 | | | — | | | 150,257 | |
| Balance - March 31, 2022 | | — | | | $ | — | | | | 175,290,143 | | | $ | 1 | | | | | | | — | | | $ | — | | | $ | 465,313 | | | $ | (248,253) | | | $ | 217,061 | |
| Net loss | | — | | | — | | | | — | | | — | | | | | | | — | | | — | | | — | | | (61,519) | | | (61,519) | |
| Issuance for stock options exercised | | — | | | — | | | | 1,643,626 | | | — | | | | | | | — | | | — | | | 1,018 | | | — | | | 1,018 | |
| Issuance for common stock vested | | — | | | — | | | | 1,369,854 | | | — | | | | | | | — | | | — | | | 145 | | | — | | | 145 | |
| Issuance of common stock in connection with the employee stock purchase plan | | — | | | — | | | | 109,186 | | | — | | | | | | | — | | | — | | | — | | | — | | | — | |
| Common stock withheld for tax upon release | | — | | | — | | | | (765,055) | | | — | | | | | | | — | | | — | | | (917) | | | — | | | (917) | |
| Stock-based compensation | | — | | | — | | | | — | | | — | | | | | | | — | | | — | | | 14,811 | | | — | | | 14,811 | |
| Cumulative translation adjustment | | — | | | — | | | | — | | | — | | | | | | | — | | | — | | | — | | | (62) | | | (62) | |
| Balance - March 31, 2023 | | — | | | $ | — | | | | 177,647,754 | | | $ | 1 | | | | | | | — | | | $ | — | | | $ | 480,370 | | | $ | (309,834) | | | $ | 170,537 | |
| Net Loss | | — | | | — | | | | — | | | — | | | | | | | — | | | — | | | — | | | (37,010) | | | (37,010) | |
| Issuance for stock options exercised | | — | | | — | | | | 126,816 | | | — | | | | | | | — | | | — | | | 108 | | | — | | | 108 | |
| Issuance for common stock vested | | — | | | — | | | | 2,793,320 | | | — | | | | | | | — | | | — | | | — | | | — | | | — | |
| Issuance of common stock in connection with the employee stock purchase plan | | — | | | — | | | | 545,133 | | | — | | | | | | | — | | | — | | | 489 | | | — | | | 489 | |
| Common stock withheld for tax upon release | | — | | | — | | | | (936,298) | | | — | | | | | | | — | | | — | | | (1,409) | | | — | | | (1,409) | |
| Excise tax | | — | | | — | | | | — | | | — | | | | | | | — | | | — | | | (62) | | | — | | | (62) | |
| Purchase of treasury stock | | — | | | — | | | | — | | | — | | | | | | | (4,643,589) | | | (6,225) | | | — | | | — | | | (6,225) | |
| Stock-based compensation | | — | | | — | | | | — | | | — | | | | | | | — | | | — | | | 12,931 | | | — | | | 12,931 | |
| Cumulative translation adjustment | | — | | | — | | | | — | | | — | | | | | | | — | | | — | | | — | | | 24 | | | 24 | |
| Balance - March 31, 2024 | | — | | | $ | — | | | | 180,176,725 | | | $ | 1 | | | | | | | (4,643,589) | | | $ | (6,225) | | | $ | 492,427 | | | $ | (346,820) | | | $ | 139,383 | |
See notes to the consolidated financial statements.
BARK, INC.
CONSOLIDATED STATEMENTS OF CASH FLOWS
(In thousands)
| | | | | | | | | | | | | | | | | | | | | | | |
| Fiscal Year ended | | | | | | |
| March 31, | | March 31, | | March 31, | | | | | | |
| 2024 | | 2023 | | 2022 | | | | | | |
| CASH FLOWS FROM OPERATING ACTIVITIES: | | | | | | | | | | | |
| Net loss | $ | (37,010) | | | $ | (61,519) | | | $ | (68,299) | | | | | | | |
| Adjustments to reconcile net loss to cash used in operating activities: | | | | | | | | | | | |
| Depreciation & amortization | 12,602 | | | 9,427 | | | 4,403 | | | | | | | |
| Impairment of assets | 3,079 | | | 2,065 | | | — | | | | | | | |
| Amortization of deferred financing fees and debt discount | 578 | | | 676 | | | 829 | | | | | | | |
| Bad debt expense | 154 | | | 178 | | | 307 | | | | | | | |
| Stock-based compensation expense | 12,931 | | | 14,811 | | | 17,861 | | | | | | | |
Loss on disposal of assets | 72 | | | — | | | — | | | | | | | |
| (Decrease) increase in inventory reserves | (548) | | | (4,768) | | | 7,223 | | | | | | | |
| Loss on exercise of equity classified warrants | — | | | — | | | 101 | | | | | | | |
(Gain) loss on extinguishment of debt | (1,828) | | | — | | | 2,024 | | | | | | | |
| Change in fair value of warrant liabilities and derivatives | (2,738) | | | (5,350) | | | (33,196) | | | | | | | |
| Paid in kind interest on convertible notes | 2,119 | | | 4,354 | | | 4,171 | | | | | | | |
Non-cash lease expense | 4,100 | | | 4,902 | | | 3,836 | | | | | | | |
| Changes in operating assets and liabilities: | | | | | | | | | | | |
| Accounts receivable | (1,296) | | | 3,019 | | | (1,115) | | | | | | | |
| Inventory | 40,706 | | | 33,549 | | | (82,884) | | | | | | | |
| Prepaid expenses and other current assets | (1,074) | | | 2,554 | | | (1,055) | | | | | | | |
| Other assets | 700 | | | (133) | | | (314) | | | | | | | |
| Accounts payable and accrued expenses | (17,779) | | | 457 | | | (13,503) | | | | | | | |
| Deferred revenue | (1,814) | | | (3,778) | | | 4,372 | | | | | | | |
| Operating lease liabilities | (4,830) | | | (3,281) | | | (4,541) | | | | | | | |
| Proceeds from tenant improvement allowances | — | | | 7,351 | | | — | | | | | | | |
| Other liabilities | (2,064) | | | 180 | | | (12,558) | | | | | | | |
| Net cash provided by (used in) operating activities | 6,060 | | | 4,694 | | | (172,338) | | | | | | | |
| | | | | | | | | | | |
| CASH FLOWS FROM INVESTING ACTIVITIES: | | | | | | | | | | | |
| Capital expenditures | (8,831) | | | (21,320) | | | (21,172) | | | | | | | |
| Proceeds from sale of investments | — | | | 175 | | | — | | | | | | | |
| Net cash used in investing activities | (8,831) | | | (21,145) | | | (21,172) | | | | | | | |
| | | | | | | | | | | |
| CASH FLOWS FROM FINANCING ACTIVITIES: | | | | | | | | | | | |
| Payments of finance fees | — | | | — | | | (642) | | | | | | | |
| Payments of transaction costs | — | | | — | | | (25,244) | | | | | | | |
| Payment of deferred underwriting fees | — | | | — | | | (8,902) | | | | | | | |
| Payment of restricted stock units held for taxes | (1,409) | | | (917) | | | (222) | | | | | | | |
| Payment of finance lease obligations | (215) | | | (2,345) | | | (588) | | | | | | | |
| Proceeds from equity infusion from the Merger, net of redemptions | — | | | — | | | 227,092 | | | | | | | |
| Proceeds from PIPE issuance | — | | | — | | | 200,000 | | | | | | | |
| Proceeds from the exercise of stock options | 108 | | | 1,018 | | | 3,300 | | | | | | | |
| Proceeds from issuance of common stock under ESPP | 489 | | | 145 | | | — | | | | | | | |
| Proceeds from the exercise of warrants | — | | | — | | | 121 | | | | | | | |
| Payments to repurchase common stock | (6,225) | | | — | | | — | | | | | | | |
| Excise tax from stock repurchases | (63) | | | — | | | — | | | | | | | |
| Payments of long-term debt | (42,300) | | | — | | | (39,457) | | | | | | | |
| Net cash (used in) provided by financing activities | (49,615) | | | (2,099) | | | 355,458 | | | | | | | |
| | | | | | | | | | | |
| | | | | | | | | | | | | | | | | | | | | | | |
| Effect of exchange rate changes on cash | 24 | | | (62) | | | — | | | | | | | |
| | | | | | | | | | | |
| NET (DECREASE) INCREASE IN CASH, CASH EQUIVALENTS AND RESTRICTED CASH | (52,362) | | | (18,612) | | | 161,948 | | | | | | | |
| CASH, CASH EQUIVALENTS AND RESTRICTED CASH—BEGINNING OF PERIOD | 183,067 | | | 201,679 | | | 39,731 | | | | | | | |
| CASH, CASH EQUIVALENTS AND RESTRICTED CASH—END OF PERIOD | $ | 130,705 | | | $ | 183,067 | | | $ | 201,679 | | | | | | | |
| | | | | | | | | | | |
| | | | | | | | | | | |
| RECONCILIATION OF CASH, CASH EQUIVALENTS AND RESTRICTED CASH: | | | | | | | | | | | |
| Cash and cash equivalents | 125,495 | | | 177,911 | | | 199,397 | | | | | | | |
| Restricted cash—Prepaid expenses and other current assets | 5,210 | | | 5,156 | | | 2,282 | | | | | | | |
| Total cash, cash equivalents and restricted cash | $ | 130,705 | | | $ | 183,067 | | | $ | 201,679 | | | | | | | |
| | | | | | | | | | | |
| SUPPLEMENTAL DISCLOSURES OF CASH FLOW INFORMATION: | | | | | | | | | | | |
| Cash paid for interest | $ | 2,385 | | | $ | 283 | | | $ | 852 | | | | | | | |
| NON-CASH INVESTING AND FINANCING ACTIVITIES: | | | | | | | | | | | |
| Purchases of property and equipment included in accounts payable and accrued liabilities | $ | 4 | | | $ | 131 | | | $ | 339 | | | | | | | |
| Establishment of operating lease | $ | — | | | $ | 25,628 | | | $ | — | | | | | | | |
| Lease modification and termination | $ | — | | | $ | 3,532 | | | $ | — | | | | | | | |
| Conversion of preferred stock to common stock | $ | — | | | $ | — | | | $ | 59,987 | | | | | | | |
| Issuance of common stock related to convertible notes | $ | — | | | $ | — | | | $ | 13,367 | | | | | | | |
| Capital contribution related to extinguishment of debt | $ | — | | | $ | — | | | $ | 536 | | | | | | | |
| Issuance of common stock related to cashless exercise of liability classified warrants | $ | — | | | $ | — | | | $ | 595 | | | | | | | |
| | | | | | | | | | | |
See notes to the consolidated financial statements.
BARK, INC.
NOTES TO THE CONSOLIDATED FINANCIAL STATEMENTS
1.ORGANIZATION AND DESCRIPTION OF BUSINESS
BARK, Inc., is an omnichannel brand serving dogs across two categories, toys and accessories, and consumables. The Company is located and headquartered in New York, New York.
BARK, Inc. was incorporated in Delaware on July 8, 2020 as Northern Star Acquisition Corp. (“Northern Star”) as a special purpose acquisition company with the purpose of effecting a merger with one or more operating businesses. On June 1, 2021, Northern Star completed the acquisition of Barkbox, Inc., a Delaware corporation (“Legacy BARK” and the acquisition, the “Merger”), pursuant to that certain Agreement and Plan of Reorganization (the “Merger Agreement”), dated December 16, 2020, by and among Northern Star, NSAC Merger Sub Corp. and wholly-owned subsidiary of Northern Star (“Merger Sub”), and Legacy Bark. Following the Merger, the Company’s legal name became “The Original BARK Company,” and in November 2021 changed its name to BARK, Inc. The Merger between Northern Star and Legacy BARK was accounted for as a reverse recapitalization.
Throughout the notes to the consolidated financial statements, unless otherwise noted, the “Company,” “we,” “us” or “our” and similar terms refer to Legacy BARK and its subsidiaries prior to the consummation of the Merger, and BARK and its subsidiaries after the consummation of the Merger.
2.SUMMARY OF SIGNIFICANT ACCOUNTING POLICIES
Basis of Presentation—The consolidated financial statements and accompanying notes have been prepared in accordance with accounting principles generally accepted in the United States of America (U.S. GAAP) as determined by the Financial Accounting Standards Board (“FASB”). Certain prior year information has been reclassified to conform to the current year presentation. These reclassifications had no effect on previously reported results of operations or accumulated deficit.
Use of Estimates—The preparation of the consolidated financial statements in conformity with U.S. GAAP and regulations of the U.S. Securities and Exchange Commission requires management to make estimates and assumptions that affect the reported amounts of assets and liabilities and the disclosure of contingent assets and liabilities at the date of the consolidated financial statements and the reported amounts of revenues and expenses during the reporting period covered by the financial statements and accompanying notes. The most significant estimates relate to determination of fair value of the Company’s allowance for uncollectible accounts receivable, excess and obsolete inventory reserve, stock-based compensation, fair value of right-of-use assets, stand-alone selling price of Direct-to-Consumer offerings and the valuation of embedded derivatives. Management evaluates its estimates and assumptions on an ongoing basis using historical experience and other factors, including the current economic environment, and records adjustments when facts and circumstances dictate. As future events and their effects cannot be determined with precision, actual results could differ from those estimates.
Principles of Consolidation—The consolidated financial statements include the accounts of the Company and its wholly owned subsidiaries. All intercompany balances and transactions have been eliminated in consolidation.
Reclassification of Prior Year Balances—Certain prior year amounts have been reclassified for consistency with the current year presentation. These reclassifications have no impact on the amount of total revenues or net income. Beginning in fiscal 2024, the interest income and interest expense line items were presented on the Consolidated Statements of Operations and Comprehensive Loss.
Liquidity and Capital Resources— Since inception, the Company has funded its operations primarily with cash flows from operations and issuances of preferred stock and convertible notes. The Company recognized net loss of $37.0 million, $61.5 million, and $68.3 million for the years ended March 31, 2024, 2023 and 2022, respectively. The Company expects that the its cash resources will be sufficient to meet our liquidity, capital
expenditure, and anticipated working capital requirements through the date which is twelve months from the date of filing this annual report.
As of March 31, 2024, the Company had no obligations, assets or liabilities, which would be considered off-balance sheet arrangements. The Company does not participate in transactions that create relationships with unconsolidated entities or financial partnerships, often referred to as variable interest entities, which would have been established for the purpose of facilitating off-balance sheet arrangements.
Segments—The Company has determined that its Chief Executive Officer is the Chief Operating Decision Maker (“CODM”). The Company operates and manages the business as two reporting segments: Direct to Consumer and Commerce. See Note 15 for further details.
Fair Value of Financial Instruments—The Company’s financial instruments, including cash and cash equivalents, accounts receivable, prepaid expenses and other current assets, accounts payable, and accrued expenses, are carried at historical cost. At March 31, 2024 and 2023, the carrying amounts of these instruments approximated their fair values because of their short-term nature. The carrying amounts of the Company’s long-term debt approximate fair value based on consideration of current borrowing rates available to the Company.
Assets and liabilities recorded at fair value on a recurring basis in the consolidated balance sheets are categorized based upon the level of judgment associated with the inputs used to measure their fair values. Fair value is defined as the exchange price that would be received for an asset or an exit price that would be paid to transfer a liability in the principal or most advantageous market for the asset or liability in an orderly transaction between market participants on the measurement date. Valuation techniques used to measure fair value must maximize the use of observable inputs and minimize the use of unobservable inputs. The authoritative guidance on fair value measurements establishes a three-tier fair value hierarchy for disclosure of fair value measurements as follows:
Level 1—Inputs are unadjusted, quoted prices in active markets for identical assets or liabilities at the measurement date;
Level 2—Inputs are observable, unadjusted quoted prices in active markets for similar assets or liabilities, unadjusted quoted prices for identical or similar assets or liabilities in markets that are not active, or other inputs that are observable or can be corroborated by observable market data for substantially the full term of the related assets or liabilities; and
Level 3—Unobservable inputs that are supported by little or no market data for the related assets or liabilities.
The categorization of a financial instrument within the valuation hierarchy is based upon the lowest level of input that is significant to the fair value measurement.
The following summarizes assets and liabilities that are measured at fair value on a recurring basis, by level, within the fair value hierarchy (in thousands):
| | | | | | | | | | | | | | | | | | | | | | | |
| As of March 31, 2024 |
| Level 1 | | Level 2 | | Level 3 | | Total |
| Assets | | | | | | | |
Money market funds(1) | $ | 52,900 | | | $ | — | | | $ | — | | | $ | 52,900 | |
| $ | 52,900 | | | $ | — | | | $ | — | | | $ | 52,900 | |
| | | | | | | |
| Liabilities | | | | | | | |
Public warrant liability(2) | $ | 254 | | | $ | — | | | $ | — | | | $ | 254 | |
Private warrant liability(2) | — | | | 137 | | | — | | | 137 | |
| $ | 254 | | | $ | 137 | | | $ | — | | | $ | 391 | |
| | | | | | | | | | | | | | | | | | | | | | | |
| As of March 31, 2023 |
| Level 1 | | Level 2 | | Level 3 | | Total |
| Assets | | | | | | | |
Money market funds(1) | $ | 155 | | | $ | — | | | $ | — | | | $ | 155 | |
| $ | 155 | | | | | | | $ | 155 | |
| | | | | | | |
| Liabilities | | | | | | | |
Public warrant liability(2) | $ | 2,035 | | | $ | — | | | $ | — | | | $ | 2,035 | |
Private warrant liability(2) | — | | | 1,094 | | | — | | | 1,094 | |
| $ | 2,035 | | | $ | 1,094 | | | $ | — | | | $ | 3,129 | |
______________
(1)As of March 31, 2024 and March 31, 2023, the Company had cash equivalents held in a money market account. The Company has concluded that due to the highly liquid nature of the money market account, the carrying value approximates fair value, which represents a Level 1 input. The balance of cash equivalents held in the money market account is included in cash and cash equivalents.
(2)Included in accrued and other current liabilities.
The Company’s outstanding warrants include publicly-traded warrants (the “Public Warrants”) which were issued as one-third of a warrant per unit issued during the Company’s initial public offering on November 10, 2020 (the “IPO”), and warrants sold in a private placement to Northern Star’s sponsor (the “Private Warrants”).
The Company evaluated its warrants under Accounting Standards Codification (“ASC”) 815-40, Derivatives and Hedging—Contracts in Entity’s Own Equity (ASC 815), and concluded that they do not meet the criteria to be classified in stockholders’ equity. Since the Public Warrants and Private Warrants meet the definition of a derivative under ASC 815, the warrants have been recorded as current liabilities on the balance sheet at fair value upon issuance, with subsequent changes in their respective fair values recognized in other income, net on the consolidated statements of operations and comprehensive loss at each reporting date. See further disclosure on the change in fair value of Public and Private Warrant liabilities within Note 13, “Other Income - Net.”
Cash and Cash Equivalents—Cash and cash equivalents represent cash and highly liquid investments with an original contractual maturity at the date of purchase of three months or less. As of March 31, 2024 and 2023, cash consists primarily of checking and operating accounts.
Restricted Cash—The Company has restricted cash with a bank related to lease security deposits. As of each of March 31, 2024, and 2023, the Company has classified $5.2 million within prepaid expenses and other current assets, as restricted cash.
Accounts Receivable—Net—Accounts receivable are stated at net realizable value. On a periodic basis, management evaluates its accounts receivable and determines whether to provide an allowance or if any accounts should be written off based on a past history of write-offs, collections and current credit conditions. A receivable is considered past due if the Company has not received payments based on agreed-upon terms. The Company generally does not require any security or collateral to support its receivables. The Company performs ongoing evaluations of its customers. As of March 31, 2024 and 2023, the Company had an allowance for doubtful accounts of approximately $0.2 million and $0.2 million, respectively.
Concentration of Credit Risk and Major Customers and Suppliers—Financial instruments that potentially subject the Company to concentrations of credit risk consist primarily of cash and cash equivalents and accounts receivable.The Company maintains cash and cash equivalents with two financial institutions.
The Company’s accounts receivable are derived from sales contracts with large retail customers. The Company maintains reserves for potential credit losses on customer accounts when deemed necessary.
Significant customers are those that represent more than 10% of the Company’s total revenues or gross accounts receivable balance at each balance sheet date. For the fiscal years ended March 31, 2024, 2023 and 2022 the Company did not have any customers that accounted for 10% or more of total revenues. The Company had two
customers that accounted for 54% and two customers that accounted for 58% of gross accounts receivable as of March 31, 2024 and 2023, respectively. The Company’s accounts receivable relates to sales to customers within the Commerce segment, which represented 11.0% and 11.8% of total revenue for the fiscal years ended March 31, 2024 and 2023, respectively.
Significant suppliers are those that represent more than 10% of the Company’s total finished goods purchased or accounts payable at each balance sheet date. During each of the fiscal years ended March 31, 2024 and 2023, the Company had two suppliers that accounted for 31% of total finished goods purchased and two suppliers that accounted for 31% of total finished goods purchased. The Company had one supplier that accounted for 17% of the accounts payable balance and two suppliers that accounted for 41% of the accounts payable balance as of March 31, 2024 and 2023, respectively.
Property and Equipment—Net—Property and equipment are stated at cost less accumulated depreciation and amortization. Depreciation, and amortization is provided for using the straight-line method over the estimated useful lives of the assets. Leasehold improvements are amortized using the straight-line method over the shorter of the lease term or estimated useful life of the asset. Depreciation, and amortization expense includes the amortization of finance lease assets. Costs of maintenance and repairs that do not improve or extend the lives of the respective assets are expensed as incurred. Upon retirement or sale, the cost and related accumulated depreciation and amortization are removed from the consolidated balance sheets and the resulting gain or loss is reflected in general and administrative expenses in the consolidated statements of operations and comprehensive loss.
The estimated useful lives for significant property and equipment categories are as follows:
| | | | | | | | |
| Asset Class | | Useful Life |
| Computer equipment, software, and domain names | | 3 years |
| Warehouse machinery and equipment | | 5 years |
| Furniture and fixtures | | 5 years |
| Leased equipment and leasehold improvements | | Shorter of remaining lease term or estimated useful life |
Long-Lived Assets and Intangible Assets—Net—The Company capitalizes qualifying internally-developed software development costs incurred during the application development stage, as long as it is probable the project will be completed, and the software will be used to perform the function intended. Capitalization of such costs ceases once the project is substantially complete and ready for its intended use. Costs related to maintenance of internal-use software are expensed in the period incurred. Capitalized costs are amortized over the project’s estimated useful life of three years. Software development costs consist primarily of salary and benefits for the Company’s development staff and third-party contractors’ fees. Capitalized software development costs are included in intangible assets on the consolidated balance sheets and amortized to depreciation expense included in general and administrative expenses on the consolidated statement of operations and comprehensive loss for the fiscal years ended March 31, 2024, 2023, and 2022. The Company assesses long-lived assets for impairment in accordance with the provisions of ASC 360, Property, Plant and Equipment. A long-lived asset (asset group) is tested for recoverability whenever events or changes in circumstances indicate that its carrying amount may not be recoverable. The carrying amount of a long-lived asset is not recoverable if it exceeds the sum of the undiscounted future cash flows expected to result from the use and eventual disposition of the asset. The amount of impairment loss, if any, is measured as the difference between the carrying value of the asset and its estimated fair value. The Company estimates fair value based on the best information available, making necessary estimates, judgments and projections. For purposes of these tests, long-lived assets must be grouped with other assets and liabilities at the lowest level for which identifiable cash flows are largely independent of the cash flows of other assets and liabilities.
Leases—The Company determines if an arrangement is a lease at inception, and leases are classified at commencement as either operating or finance leases.
Right-of-use (“ROU”) assets and lease liabilities are recognized at commencement date based on the present value of the future minimum lease payments over the lease term. ROU assets also include any lease payments made. Operating lease ROU assets are presented separately in non-current assets and finance lease ROU assets are included
in property and equipment, net on the Company’s consolidated balance sheets. As the Company’s operating leases do not provide an implicit rate, the Company uses its incremental borrowing rate based on information available at the commencement date in determining the present value of future payments. This rate is an estimate of the collateralized borrowing rate the Company would incur on its future lease payments over a similar term based on the information available at commencement date. The Company’s lease terms may include options to extend or terminate the lease when it is reasonably certain that the Company will exercise that option. As of March 31, 2024 and 2023, the Company did not include any options to extend leases in its lease terms as it was not reasonably certain to exercise them. The Company’s lease agreements do not contain residual value guarantees or covenants.
The Company utilizes certain practical expedients and policy elections available under the lease accounting standard. Leases with a term of one year or less are not recognized on its consolidated balance sheets; the Company recognizes lease expense for these leases on a straight-line basis over the lease term. Additionally, the Company has elected to include non-lease components with lease components for contracts containing real estate leases for the purpose of calculating lease ROU assets and liabilities, to the extent that they are fixed. Non-lease components that are not fixed are expensed as incurred as variable lease payments. The Company’s real estate operating leases typically include non-lease components such as common-area maintenance costs.
Income Taxes—The Company accounts for income taxes under the asset and liability method. Deferred tax assets and liabilities are recognized for the future tax consequences attributable to operating loss carryforwards and temporary differences between financial statement bases of existing assets and liabilities and their respective income tax bases.
Deferred tax assets and liabilities are measured using enacted income tax rates expected to apply to taxable income in the years in which those temporary differences are expected to be recovered or settled. The effect of a change in the income tax rates on deferred tax asset and liability balances is recognized in income in the period that includes the enactment date of such rate change. A valuation allowance is recorded for loss carryforwards and other deferred tax assets when it is determined that it is more likely than not that such loss carryforwards and deferred tax assets will not be realized. The Company recognizes the tax benefits on any uncertain tax positions taken or expected to be taken in the consolidated financial statements when it is more likely than not the position will be realized upon ultimate settlement with the tax authority assuming full knowledge of the position and relevant facts. The tax benefits recognized in the consolidated financial statements from such a position are measured based on the largest benefit that has a greater than 50% likelihood of being realized upon ultimate settlement. The Company recognizes estimated interest and penalties related to uncertain tax positions as a part of the provision for income taxes.
Deferred Financing Costs—Deferred financing fees relate to the external costs incurred to obtain financing for the Company. Deferred financing fees are amortized over the respective term of the financing using the effective interest method. Deferred financing fees are presented on the consolidated balance sheets as a reduction to long-term debt.
Derivative Assets and Liabilities—The Company’s convertible note agreement contains features determined to be embedded derivatives from its host. Embedded derivatives are separated from the host contract and carried at fair value when the embedded derivative possesses economic characteristics that are not clearly and closely related to the economic characteristics of the host contract and a separate, standalone instrument with the same terms would qualify as a derivative instrument. The derivative is measured both initially and in subsequent periods at fair value, with changes in fair value recognized on the statement of operations and comprehensive loss.
Revenue Recognition—The Company recognizes revenue upon the transfer of control of its products and services to its customers. The recognition of revenue is determined through application of the following five-step model:
•Identification of the contract(s) with customers;
•Identification of the performance obligation(s) in the contract;
•Determination of the transaction price;
•Allocation of the transaction price to the performance obligation(s) in the contract; and
•Recognition of revenue when or as the performance obligation(s) are satisfied.
The Company generates revenue through its Direct to Consumer and Commerce segments, each of which participate in the sale of the Company’s Toys & Accessories and Consumables product categories. See below for additional information.
Toys & Accessories (“toys”)—The majority of our revenue in the toys category is derived from Barkbox and Super Chewer, which are subscription products that feature monthly themed boxes of premium-quality BARK toys and treats that are delivered directly to a dog’s home. Customers have the option to subscribe to these products on one, six, or twelve month basis. Subscription revenue is recognized at a point in time as control is transferred to the subscriber upon delivery of each monthly box. Revenue from our subscription products is measured as the amount of consideration the Company expects to be entitled to in exchange for transferring products, which includes an estimate of future returns and chargebacks based on historical rates. The transaction price is inclusive of fixed discounts which represent a reduction to revenue for each performance obligation. The Company records a refund reserve based on our historical refund patterns. The impact of our refund reserve on our operating results may fluctuate based on changes in client refund activity over time.The refund liability related to toy direct to consumer revenue is recorded within accrued and other current liabilities on the consolidated balance sheets and was not material as of March 31, 2024 and 2023. During the life of their subscription, we offer customers incremental products via Add to Box “ATB”, which enables BARK to cross-sell customers into less discretionary products across our full portfolio of products including kibble, treats, toppers, dental, and more. ATB revenue is recognized at a point in time as control is transferred to the customer upon delivery of goods to the subscriber.
The Company also sells toys through our network of retail partners. This distribution channel allows us to reach new customers and introduce them to the BARK brand. Commerce revenue derived from our retail partners is recognized net of estimates for sales returns, discounts, markdowns and allowances, after the goods are shipped, or when the retail customer picks up the goods directly from one of our distribution points and control of the goods is transferred to the customer. Online marketplaces revenue is recognized upon delivery of goods to the end customer. Similar to subscriptions, the customer payment discounts, sales returns and chargebacks are considered to be contingent and represents a component of variable consideration. The estimated consideration reflects potential sales returns and chargebacks as a reduction in the transaction price. The Company has determined that the expected value method will provide the best predictor for a refund liability associated with sales returns and chargebacks. The estimate is recorded in total for sales transactions recorded in each period and, in effect, represents a reduction in the transaction price at the time of sale.The refund liability related to commerce revenue is recorded within accrued and other current liabilities on the consolidated balance sheets and was not material as of March 31, 2024 and 2023.
Our toys category also includes revenue derived from the sale of other products such as beds, leashes, apparel, and other miscellaneous products.
Consumables—The majority of our consumables revenue today is derived from the treats and chews that are included in our BarkBox and Super Chewer boxes. Over the past several years, the Company has expanded into new and larger consumables markets such as kibble, toppers, supplements and dental products. To sell these products, the Company recently launched a new website, www.bark.co, which contains the majority of its consumables portfolio, all of which can be purchased on a recurring, auto-ship basis, or one-off. Revenue related to food.BARK.co is recognized at a point in time, as control is transferred to the customer upon each delivery.
Online Marketplaces—Online marketplaces revenue consists of sales of toys & accessories sold through major online marketplaces. Online marketplaces revenue is recognized at a point in time, as control is transferred, upon delivery of goods to the end customer. Revenue is measured as the amount of consideration the Company expects to be entitled to in exchange for transferring products.
The Company evaluated principal versus agent considerations to determine whether it is appropriate to record seller fees paid to the marketplaces as an expense or as a reduction of revenue. Seller fees charged by third-party marketplaces are recorded as general and administrative expense and are not recorded as a reduction of revenue as the Company owns and controls all the goods before they are transferred to the end customer. The Company can, at
any time, direct the marketplaces and similarly with other third-party logistics providers, to return the Company’s inventory to any location specified by the Company. Any returns made by customers directly to third-party logistics providers are the responsibility of the Company to make customers whole and the Company retains the inventory risk. Further, the Company is subject to credit risk (i.e., credit card chargebacks), establishes the prices of its products, can determine who fulfills the goods to the customer (third-party online marketplaces or the Company) and can limit quantities or stop selling the goods at any time. Based on these considerations, the Company is the principal in these arrangements.
The Company earned revenue from the sale of subscriptions, and the sale of goods through the Company’s online platforms. Deferred revenue represented payment for subscription boxes that the Company was contractually obligated to deliver in future periods. Subscription revenue was recognized as each monthly box was delivered to the customer. Revenue was recognized net of cash discounts given to the customer and net of estimated sales returns and chargebacks. Revenue relating to the sale of goods was recognized upon delivery of goods to the customer, as the risk of loss on these sales transfers to the customer upon delivery.
Sales Tax—As a part of the Company’s normal course of business, sales taxes are collected from customers. Sales taxes collected are remitted to the appropriate governmental tax authority on behalf of the customer. Sales tax collected from customers is not considered revenue and is included in accrued and other current liabilities until remitted. Total sales tax accrued was $6.3 million and $7.8 million, as of March 31, 2024 and 2023, respectively. As of March 31, 2024 and 2023, $2.1 million and $2.7 million of the sales tax accrued had been collected but not remitted, respectively.
On June 21, 2018, the U.S. Supreme Court decided, in South Dakota v. Wayfair, Inc. that state and local jurisdictions may, at least in certain circumstances, enforce a sales and use tax collection obligation on remote vendors that have no physical presence in such jurisdiction. A number of states have positioned themselves to require sales and use tax collection by remote vendors and/or by online marketplaces. The details and effective dates of these collection requirements vary from state to state and accordingly, the Company recorded a liability in those periods in which it created economic nexus based on each state’s requirements. Total sales tax (income)/ expense recorded related to economic nexus was $0.9 million, $(0.4) million and $0.6 million for the fiscal years ended March 31, 2024, 2023, and 2022, respectively.
Inventories—Consist principally of finished goods, and represent products available for sale and are accounted for using the first-in, first-out (“FIFO”) method and valued at the lower of cost or net realizable value. Inventory costs consist of product and inbound shipping and handling costs. The Company assesses the valuation of inventory and periodically writes down the value for estimated excess and obsolete inventory based upon estimates of future demand and market conditions. Inventory valuation requires the Company to make judgments, based on information available at each reporting period. Inventory valuation losses are recorded as cost of revenues.
The Company reviews current business trends and forecasts, and inventory aging to determine adjustments which it estimates will be needed to liquidate existing excess inventories and record inventories at either the lower of cost or net realizable value or the lower of cost or market, as applicable. The Company believes that all inventory write-downs required at March 31, 2024, have been recorded. The Company’s historical estimates of inventory reserves have not differed materially from actual results. If market conditions were to change, including as a result of war in Israel and the Ukraine and rising tensions between the U.S. and China and their broader macroeconomic implications or the COVID-19 pandemic and the supply chain and logistics disruptions globally, it is possible that the required level of inventory reserves would need to be adjusted.
As of March 31, 2024 and 2023, the Company has recorded reserves to reflect inventories at their estimated net realizable value. The reserve balance as of March 31, 2024 and 2023 was $3.5 million and $4.0 million, respectively.
Cost of Revenues—Cost of revenues includes the purchase price of inventory sold, inbound freight costs associated with inventory, shipping supply costs, and inventory shrinkage costs.
General and Administrative—General and administrative expenses include compensation and benefits costs, including stock-based compensation expense, facility costs, insurance, professional service fees, donations of goods
in kind and other general overhead costs including depreciation and amortization and account management support teams, as well as commissions. General and administrative expense also includes processing fees charged by third parties that provide payment processing services for credit cards. For the fiscal years ended March 31, 2024, 2023 and 2022 the Company recorded payment processing fees of $10.6 million, $11.3 million and $10.8 million, respectively, within general and administrative expenses in the consolidated statements of operations and comprehensive loss.
Shipping and Fulfillment Cost—Shipping and fulfillment costs represent those costs incurred in operating and staffing fulfillment, including costs attributable to receiving, inspecting, picking, packaging and preparing customer orders for shipment, outbound freight costs associated with shipping orders to customers, and responding to inquiries from customers. Shipping generally occurs prior to the transfer of control to the customer and is therefore accounted for as a fulfillment expense. In circumstances where shipping and handling activities occur after the customer has obtained control of the product, the Company has elected to account for shipping and handling activities as a fulfillment cost rather than an additional promised service. Shipping and handling fees billed to the customers are recorded as revenue. During the years ended March 31, 2024, 2023, and 2022, the Company expensed $139.8 million, $157.0 million and $158.6 million, respectively, for shipping and fulfillment costs within general and administrative expenses in the consolidated statements of operations and comprehensive loss.
Advertising Costs—Costs associated with the Company’s advertising is expensed as incurred and are included in advertising and marketing expense in the consolidated statements of operations and comprehensive loss. During the fiscal years ended March 31, 2024, 2023, and 2022, the Company expensed $66.3 million, $55.7 million and $63.7 million, respectively, for advertising costs, which is comprised primarily of print and internet advertising, and agency fees.
Stock-Based Compensation—The Company measures and records the expense related to stock-based payment awards based on the fair value of those awards as determined on the date of grant. The Company recognizes stock-based compensation expense over the requisite service period of the individual grant, generally equal to the vesting period and uses the straight-line method to recognize stock-based compensation. For stock options with performance conditions, the Company records compensation expense when it is deemed probable that the performance condition will be met. The Company uses the Black-Scholes option-pricing model to determine the fair value of stock awards.
The Company estimates expected forfeitures of stock-based awards at the grant date and recognizes compensation cost only for those awards expected to vest. The Company estimates future forfeitures at the date of grant based on historical experience and revises the estimates, if necessary, in subsequent periods if actual forfeitures differ from those estimates.
For stock-based awards issued to non-employees, including consultants, the Company records expense related to stock options based on the fair value of the options calculated using the Black-Scholes option-pricing model over the service performance period. The fair value of options granted to non-employees is remeasured over the vesting period and recognized as an expense over the period the services are rendered.
The Company calculates the fair value of options granted by using the Black-Scholes option-pricing model with the following assumptions:
Expected Volatility—The Company estimated volatility for option grants by evaluating the average historical volatility of a peer group of companies for the period immediately preceding the option grant for a term that is approximately equal to the options’ expected life.
Expected Term—The expected term of the Company’s options represents the period that the stock-based awards are expected to be outstanding. The Company has elected to use the simplified method to compute the expected term, which the Company believes is representative of future behavior. The Company will continue to evaluate the appropriateness of utilizing such method.
Risk-Free Interest Rate—The risk-free interest rate is based on the implied yield currently available on U.S. Treasury zero-coupon issues with an equivalent remaining term at the grant date.
Dividend Yield—The Company has not declared or paid dividends to date and does not anticipate declaring dividends. As such, the dividend yield has been estimated to be zero.
Common Stock Valuations— Since the closing of the Merger, the fair value of the common stock was determined using the Company’s closing stock price as reported on the New York Stock Exchange. Prior to the Closing of the Merger the Company had historically granted stock options at exercise prices equal to the fair value as determined by the Board of Directors (the “Board”) on the date of grant. In the absence of a public trading market, the Board, with input from management, exercised significant judgment and considered numerous objective and subjective factors to determine the fair value of the Company’s common stock as of the date of each stock option grant.
In addition, the Board considered the independent valuations completed by a third-party valuation consultant. The valuations of the Company’s common stock were determined in accordance with the guidelines outlined in the American Institute of Certified Public Accountants Practice Aid, Valuation of Privately-Held-Company Equity Securities Issued as Compensation.
Net Loss Per Share—Basic net loss per share attributable to common stockholders is computed by dividing the loss attributable to common stockholders by the weighted-average number of shares of common stock outstanding during the period, without consideration for potentially dilutive securities. Diluted net loss per share is computed by dividing the loss attributable to common stockholders by the weighted-average number of shares of common stock and potentially dilutive securities outstanding during the period determined using the treasury-stock and if-converted methods. For purposes of the diluted loss per share calculation, stock options, redeemable convertible preferred stock and warrants are considered to be potentially dilutive securities, but were excluded from the calculation of diluted loss per share because their effect would be anti-dilutive and therefore, basic and diluted loss per share were the same for all periods presented.
Related Party Transactions—Parties are considered to be related if one party has the ability, directly or indirectly, to control the other party or exercise significant influence over the other party in making financial and operating decisions. Parties are also considered to be related if they are subject to common control. Related parties may be individuals or corporate entities. A transaction is considered to be a related party transaction when there is a transfer of resources or obligations between related parties. During the fiscal year ended March 31, 2024 the Company completed a repurchase of 300,000 shares of the Company’s common stock for $0.3 million from a former director. Refer to Note 7 “Related Party Transactions” for further information. During the fiscal year ended March 31, 2023 and March 31, 2022 there were no material related party arrangements.
Recently Issued Accounting Pronouncements
ASU 2023-09, Income Taxes (Topic 740): Improvements to Income Tax Disclosures. In December 2023, the FASB issued this ASU to update income tax disclosure requirements, primarily related to the income tax rate reconciliation and income taxes paid information. This update is effective beginning with the Company’s fiscal year ended March 31, 2025 annual reporting period, with early adoption permitted. The Company is currently evaluating the impact that the adoption of this standard will have on its consolidated financial statements.
ASU 2023-07, Segment Reporting (Topic 280): Improvements to Reportable Segment Disclosures. In November 2023, the FASB issued this ASU to update reportable segment disclosure requirements, primarily through enhanced disclosures about significant segment expenses and information used to assess segment performance. This update is effective beginning with the Company’s fiscal year ended March 31, 2025, with early adoption permitted. The Company is currently evaluating the impact that the adoption of this standard will have on its consolidated financial statements.
3. REVENUE FROM CONTRACTS WITH CUSTOMERS
The Company’s standard payment terms vary but do not result in a significant delay between the timing of invoice and payment. The Company occasionally negotiates other payment terms during the contracting process for
its Commerce business. The Company has elected the practical expedient to not adjust the total consideration within a contract to reflect a financing component when the duration of the financing is one year or less.
Disaggregated Revenue
Revenue disaggregated by significant revenue stream for the fiscal years ended March 31, 2024, 2023, and 2022 were as follows (in thousands):
| | | | | | | | | | | | | | | | | | | | |
| | Fiscal Year Ended |
| | March 31, |
| | 2024 | | 2023 | | 2022 |
| Revenue | | | | | | |
| Direct to Consumer: | | | | | | |
| Toys & Accessories (1) | | $ | 284,676 | | | $ | 307,045 | | | $ | 294,253 | |
| Consumables (1) | | 151,770 | | | 164,949 | | | 153,821 | |
| Total Direct to Consumer | | $ | 436,446 | | | $ | 471,994 | | | $ | 448,074 | |
| Commerce | | 53,738 | | | 63,321 | | | 59,332 | |
| Revenue | | $ | 490,184 | | | $ | 535,315 | | | $ | 507,406 | |
(1) The allocation between Toys & Accessories and Consumables includes estimates and was determined utilizing data on stand-alone selling prices that the Company charges for similar offerings, and also reflects historical pricing practices. The fiscal year ended March 31, 2022 disaggregated revenue information for Direct to Consumer revenue has been reclassified to conform with the current presentation to allocate revenue between Toys & Accessories and Consumables.
Contract Liability
The Company’s contract liability represents cash collections from its customers prior to delivery of subscription products, which is recorded as deferred revenue on the consolidated balance sheets. Deferred revenue is recognized as revenue upon the delivery of the box or product.
Deferred revenue was $26.0 million, $27.8 million, and $31.5 million as of March 31, 2024, 2023, and 2022, respectively. During the fiscal years ended March 31, 2024, 2023, and 2022, the Company recognized $27.8 million, $31.5 million, and $26.3 million of revenue included in deferred revenue as of March 31, 2023, 2022, and 2021, respectively.
Performance Obligations
A performance obligation is a promise in a contract to transfer a distinct good or service to the customer and is the unit of account. Performance obligations are satisfied as of a point in time when control of promised goods are transferred to customers. The Company has elected to not disclose information related to remaining performance obligations due to their original expected terms being one year or less.
4. PROPERTY AND EQUIPMENT AND INTANGIBLE ASSETS
Property and equipment consisted of the following as of March 31, 2024 and 2023:
| | | | | | | | | | | |
| March 31, |
| 2024 | | 2023 |
| Computer equipment, software, and domain names | $ | 6,614 | | | $ | 6,799 | |
| Warehouse machinery and equipment | 14,988 | | | 14,488 | |
| Furniture and fixtures | 2,433 | | | 2,417 | |
| Leasehold improvements | 21,834 | | | 21,668 | |
| Construction in process | 766 | | | 7,842 | |
| Total property and equipment | 46,635 | | | 53,214 | |
| Less: accumulated depreciation | (21,095) | | | (13,363) | |
Property and equipment—net | $ | 25,540 | | | $ | 39,851 | |
Intangible assets consisted of the following as of March 31, 2024 and 2023:
| | | | | | | | | | | |
| March 31, |
| 2024 | | 2023 |
| Internally developed software | $ | 20,813 | | | $ | 8,991 | |
| Less: accumulated amortization | (8,892) | | | (4,901) | |
| | | |
Intangible assets—net | $ | 11,921 | | | $ | 4,090 | |
Total depreciation expense for property and equipment during the fiscal years ended March 31, 2024 and 2023 was $7.9 million and $6.9 million, respectively. Total amortization expense for internally developed software during the fiscal years ended March 31, 2024, 2023, and 2022 was $4.7 million, $2.5 million, and $1.5 million, respectively. Amortization expense related to finance leases amounted to $0.2 million, $0.3 million, and $0.6 million for fiscal years ended March 31, 2024, 2023, and 2022, respectively. During the fiscal year ended March 31, 2024 the Company recorded a non-cash impairment of $2.6 million relating to previously capitalized software and a non-cash impairment of $0.5 million relating to prepaid assets due to a strategic shift which led to a termination of a contract for an e-commerce platform. No impairment of internally developed software was recorded during the fiscal years ended March 31, 2023 and 2022. Depreciation, amortization and impairment expense is included in general and administrative expenses on the consolidated statements of operations and comprehensive loss.
As of March 31, 2024 and 2023, equipment that was leased under finance leases and included in property and equipment, net in the consolidated balance sheets was $0.7 million and $0.4 million, respectively.
5. ACCRUED AND OTHER CURRENT LIABILITIES
Accrued expenses and other current liabilities consisted of the following as of March 31, 2024 and 2023:
| | | | | | | | | | | |
| March 31, |
| 2024 | | 2023 |
| Warrant liability | $ | 391 | | | $ | 3,129 | |
| Sales tax payable | 6,310 | | | 7,778 | |
| Accrued compensation costs | 4,866 | | | 5,510 | |
| | | |
| Accrued licensing fees | 136 | | | 215 | |
| | | |
| Accrued professional and legal fees | 1,116 | | | 1,593 | |
| Accrued marketing costs | 5,171 | | | 5,601 | |
| Accrued shipping and fulfillment costs | 4,260 | | | 2,267 | |
| Other accrued expenses | 8,240 | | | 5,882 | |
| Accrued and other current liabilities | $ | 30,490 | | | $ | 31,975 | |
6. DEBT
As of March 31, 2024 and 2023, long-term debt consisted of the following:
| | | | | | | | | | | | | | |
| | March 31, |
| | 2024 | | 2023 |
2025 Convertible Notes | | $ | 40,644 | | | $ | 83,525 | |
| | | | |
| | | | |
| | | | |
| | | | |
| Less: deferred financing fees and debt discount | | (718) | | | (2,304) | |
| Total long-term debt | | $ | 39,926 | | | $ | 81,221 | |
| | | | |
During the fiscal years ended March 31, 2024, 2023, and 2022, the Company incurred interest expense of $4.4 million, $5.4 million, and $5.5 million, respectively, on the Consolidated Statements of Operations. Interest expense for the fiscal years ended March 31, 2024, 2023, and 2022 included deferred financing fees and debt discount amortization of $0.6 million, $0.7 million, and $0.8 million, respectively. Additionally, as of March 31, 2024 and 2023, the Company had accrued interest of $0.7 million and $1.5 million, respectively, within Other long-term liabilities on the Consolidated Balance Sheet.
2025 Convertible Notes
On November 27, 2020, the Company issued $75.0 million aggregate principal amount of 2025 Convertible Notes (the “2025 Convertible Notes”) to Magnetar Capital, LLC (“Magnetar”) under an indenture, dated as of November 27, 2020, between Legacy BARK and U.S. Bank National Association, as trustee and collateral agent (the “Indenture”). The Company received net proceeds of approximately $74.7 million from the sale of the 2025 Convertible Notes, after deducting fees and expenses of approximately $0.3 million. The Company recorded the expenses as a discount to the note and will amortize the expenses over the term of the note. The 2025 Convertible Notes will mature on December 1, 2025, unless earlier converted, redeemed or repurchased.
The 2025 Convertible Notes are governed by the Indenture. The 2025 Convertible Notes bear interest at the annual rate of 5.50%, payable entirely in payment-in-kind annually on December 1st of each year commencing December 1, 2021, compounded annually. As of March 31, 2024, the effective interest rate is 6.60%. The accrued
interest of $2.1 million and $4.4 million was paid-in-kind through an increase of the outstanding principal on the 2025 Convertible Notes on December 1, 2023 and 2022, respectively.
If the 2025 Convertible Notes are not converted into common stock by the maturity date, the Company must repay the outstanding principal amount plus accrued interest.
The 2025 Convertible Notes contain call and put options to be settled in cash contingent upon the occurrence of a change of control and a default interest rate increase of 3.0% applicable upon the occurrence of an event of default that when evaluated under the guidance of ASC 815, Derivatives and Hedging, are embedded derivatives requiring bifurcation at fair value. The fair value calculation includes Level 3 inputs including the estimated fair value of the Company’s common stock and assumptions regarding the probability that the contingent call or put will be exercised or an event of default will occur. Management determined that the probability that the contingent events will occur was near zero at inception and has remained near zero as of March 31, 2024. Therefore, the Company did not record a derivative liability related to these features as of March 31, 2024. The Company will assess the probability of occurrence quarterly during the term of the 2025 Convertible Notes.
On November 2, 2023, the Company repurchased $45.0 million of the $83.5 million of outstanding aggregate principal amount of the 2025 Convertible Notes from entities affiliated with Magnetar Financial, LLC (collectively, the “Holders”), pursuant to the terms and conditions of a negotiated notes purchase agreement (the “Agreement”) among the Company and the Holders.
Pursuant to the Agreement, the Company repurchased $45.0 million in aggregate principal amount of the 2025 Convertible Notes plus $2.2 million of accrued and unpaid interest thereon to, but excluding the repurchase date, from the Holders for a total cash purchase price of $44.4 million. In addition, $1.0 million of unamortized deferred financing fees were derecognized from the Company’s balance sheet on the date of extinguishment. The accelerated deferred financing fees were recognized as a component of gain on extinguishment of debt. The Company recognized a gain on debt extinguishment of $1.8 million in connection with the repurchase. If a Change of Control (as defined in the Indenture) of the Company occurs at any time after the date of the Agreement and prior to the December 1, 2025 maturity date of the Notes, the Holders are also entitled to receive an additional cash “true-up” payment from the Company, totaling, in the aggregate for all Holders, either (i) $11.3 million in the case that the Company elects to redeem all of the Notes outstanding at the time of such Change of Control or (ii) $4.5 million in the case that the Holders elect to require the Company to repurchase all of the 2025 Convertible Notes outstanding at the time of such Change of Control any other case, in each case, in accordance with the terms and conditions specified in the Agreement.
As of March 31, 2024 and 2023, the Company had $40.6 million and $83.5 million, respectively, of outstanding borrowings under the note purchase agreement governing the purchase and sale of the 2025 Convertible Notes agreement respectively.
Western Alliance Bank—Revolving Line of Credit
In October 2017, the Company entered into a loan and security agreement with and issued a warrant to purchase preferred stock (“Initial Western Alliance Warrant”) to Western Alliance Bank (“Western Alliance”), which provide for a revolving line of credit (as amended, the “Credit Facility”) in an aggregate principal amount of up to $35.0 million, subject to borrowing base limitations derived from advance rates derived from the Company’s eligible subscription revenues and eligible accounts receivable. The Credit Facility has been amended several times, most recently in December 2023. After giving effect to this most recent amendment, the maturity date of the Credit Facility is December 13, 2024. Certain of the Company’s obligations to Western Alliance and under the Credit Facility are guaranteed by certain of the Company’s subsidiaries and secured by substantially all of their assets.
The interest rate for borrowings under the Credit Facility is equal to (a)(i) the greater of the prime rate that is published in the Money Rates section of The Wall Street Journal from time to time and (ii) five and one quarter percent (5.25%) per annum, plus (b) half of one percent (0.50%), per annum.
The Credit Facility has a borrowing base subject to an amount equal to eighty percent (80.00%) of the Company’s trailing three months of subscription revenue and an amount equal to (80.00%) of certain of the
Company’s customer accounts receivable when a collateral audit is performed and sixty percent (60.00%) when no such collateral audit is performed. Western Alliance has first perfected security in substantially all of the Company’s assets, including its rights to its intellectual property.
The Credit Facility requires the Company to comply with certain financial and performance covenants, including, among other things, minimum cash deposits with Western Alliance. The Credit Facility also contains affirmative and negative covenants customary for financings of this type, including, among other things, limitations or prohibitions on repurchasing common shares, declaring and paying dividends and other distributions, making payments in respect of subordinated debt or our 2025 Convertible Notes, incurring indebtedness, making loans and investments, incurring liens, or entering into mergers, asset sales and transactions with affiliates.
As of March 31, 2024 and March 31, 2023, there were no outstanding borrowings under the Credit Facility. As of March 31, 2024 and March 31, 2023, the Company was compliant with its financial covenants.
7. RELATED PARTY TRANSACTIONS
During the fiscal year ended March 31, 2024, the Company repurchased, outside of its share repurchase plan, 300,000 shares of the Company’s common stock, held by a former director for total consideration of $0.3 million. The repurchased shares of common stock were recorded as treasury stock and were accounted for under the cost method. None of the repurchased shares of common stock have been retired. There were no related party transactions during the fiscal years and March 31, 2023 and 2022.
8. STOCKHOLDERS’ EQUITY
On August 17, 2023, the Company announced that its Board of Directors has authorized a stock repurchase program, pursuant to which the Company may repurchase, from time to time, up to an aggregate of $7.5 million of the Company’s outstanding shares of common stock, exclusive of any fees, commissions or other expenses related to such repurchases. The Company’s stock repurchase programs may be limited or terminated at any time without prior notice. The timing and actual number of shares repurchased will depend on a variety of factors, including corporate and regulatory requirements, price and other market conditions and management’s determination as to the appropriate use of our cash.
During the fiscal year ended March 31, 2024, the Company purchased 4,343,589 shares of its common stock under the program in open market transactions for $5.9 million at an average price of $1.36. The repurchased shares of common stock were recorded as treasury stock and were accounted for under the cost method. None of the repurchased shares of common stock have been retired. As of March 31, 2024, $1.6 million of the shares authorized for issuance under the stock repurchase program remained available for future share repurchases. Treasury stock activity also includes the Company’s common stock repurchased in conjunction with a related party transaction. See Note 7, “Related Party Transactions,” for additional details.
9. STOCK-BASED COMPENSATION PLANS
Equity Incentive Plans
The Barkbox, Inc. 2011 Stock Incentive Plan (as amended from time to time, the “2011 Plan”) provides for the award of stock options and other equity interests in the Company to directors, officers, employees, advisors or consultants of the Company.
On June 1, 2021, in connection with the Merger, the 2021 Equity Incentive Plan (the “2021 Plan”) became effective and 16,929,505 authorized shares of common stock were reserved for issuance thereunder. In addition, pursuant to the terms of the Merger Agreement, on the Closing Date of the Merger, options to purchase shares of Legacy BARK’s common stock previously issued under the 2011 Plan were converted into options to purchase an aggregate of 29,390,344 shares of BARK common stock.
For each fiscal year beginning on April 1, 2022 and ending on (and including) March 31, 2031, the aggregate number of shares of common stock that may be issued under the 2021 Plan may be increased by a number, determined and approved by the Board on or before May 1st of such fiscal year, not to exceed 5% of the total number of shares of common stock issued and outstanding on the last day of the preceding fiscal year. In April 2023, the Board approved an increase of the aggregate number of common stock that may be issued under the 2021 Plan by 8,876,143 shares. As of March 31, 2024, 20,188,141 shares of common stock were available for the Company to grant under the 2021 Stock Plan; there were no remaining shares available for grant under the 2011 Plan. Periodically, the Company issues new hire, promotion and other awards under the 2021 Stock Plan and awards may be forfeited resulting in the underlying shares returning to the 2021 Stock Plan.
The 2011 and 2021 Plans (together, the “Plans”) are administered by the Company’s Compensation Committee of its Board (the “Compensation Committee”). The exercise prices, vesting and other restrictions are determined by the Board, except that the exercise price per share of a stock option may not be less than 100% of the fair value of the common share on the date of grant. Stock options awarded under the Plans typically expire 10 years after the date of grant and generally have vesting conditions of 25% on the first anniversary of the date of grant and 75% on a monthly basis at a rate of 1/36th, unless otherwise determined by the Compensation Committee. Restricted stock units (“RSUs”) awarded under the plan for the purchase of common stock will vest based on continued service which is generally four years. The grant date fair value of the award will be recognized as compensation expense over the requisite service period. The fair value of the RSUs is estimated on the date of grant based on the fair value of the Company’s common stock. The Plans provide that the Compensation Committee shall determine the vesting conditions of awards granted under the Plans, and the Compensation Committee has, from time to time, approved vesting schedules for certain awards that deviate from the vesting conditions described in this paragraph.
Employee Stock Purchase Plan
In June 2021, the 2021 Employee Stock Purchase Plan (the “2021 ESPP”) became effective. The 2021 ESPP authorizes the issuance of shares of common stock pursuant to purchase rights granted to employees. On the first day of each fiscal year commencing on April 1, 2022 and ending on (and including) March 31, 2041, the aggregate number of shares of common stock that may be issued under the ESPP shall increase by a number, determined by the Board on or before May 1st of such fiscal year, not to exceed the lesser of (i) one percent (1%) of the total number of shares of common stock issued and outstanding on the last day of the preceding fiscal year or (ii) 1,500,000 shares of common stock. If the Board does not determine to increase the aggregate number of shares of common stock in the ESPP by May 1 of the applicable fiscal year, then the increase shall be zero for that year.
In April 2023, the Board approved the authorization of an additional 1,500,000 shares of common stock that may be issued under the 2021 ESPP. A total of 4,885,901 shares of common stock have been reserved for future issuance under the 2021 ESPP.
Employees who elect to participate in the ESPP commence payroll withholdings that accumulate through the end of the respective offering period. In accordance with the guidance in ASC 718-50 - Compensation - Stock Compensation, the ability to purchase shares of the Company’s common stock for eighty-five percent (85%) of the lower of the price on the first day of the offering period or the last day of the offering period (i.e. the purchase date) represents an option and, therefore, the ESPP is a compensatory plan under this guidance. Accordingly, share-based compensation expense is determined based on the option’s grant-date fair value as estimated by applying the Black Scholes option-pricing model and is recognized over the withholding period.
The fair value assumptions used to determine the fair value of ESPP rights were estimated on the grant dates using the Black-Scholes option-pricing model with the following assumptions:
| | | | | | | | | | | |
| Fiscal Year Ended March 31, | Fiscal Year Ended March 31, | Fiscal Year Ended March 31, |
| 2024 | 2023 | 2022 |
| Expected term (years) | 0.5 | 0.5 | N/A |
| Expected volatility | 61.9 - 77.6% | 76.9 - 97.5% | N/A |
| Risk-free interest rate | 5.4 - 5.4% | 2.80 - 4.80% | N/A |
| Expected dividend yield | — | % | —% | N/A |
Expected stock price volatility was estimated using the historical volatility for the Company based on daily price observations over a period equivalent to the expected term. The risk-free interest rate was determined using an interest rate based on U.S. Treasury zero-coupon notes with terms consistent with the expected term. The expected term was determined using the time period between the beginning of the offering period and the end of the offering period. The Company determined the dividend yield by dividing the expected annual dividend on the Company's stock by the share price on the date of grant.
For the fiscal year ended March 31, 2024, employees who elected to participate in the ESPP purchased a total of 545,133 shares of common stock at an average price of $0.90, resulting in cash proceeds to the Company of approximately $0.5 million. ESPP employee payroll contributions accrued as of March 31, 2024 were $0.2 million, and are included within accrued and other current liabilities in the consolidated balance sheet. Cash withheld via employee payroll deductions is presented in financing activities as proceeds from stock purchases under employee stock purchase plan on the consolidated statement of cash flows.
Stock Option Activity
The following is a summary of stock option activity for the fiscal year ended March 31, 2024:
| | | | | | | | | | | | | | | | | | | | | | | |
| Number Options Outstanding | | Weighted- Average Exercise Price | | Weighted-Average Remaining Contractual Life (Years) | | Aggregate Intrinsic Value (in millions) |
| Outstanding as of March 31, 2023 | 16,623,587 | | | 2.79 | | | 4.56 | | $ | 2.7 | |
| Granted | 1,120,000 | | | 1.17 | | | | | |
| Exercised | (126,816) | | | 0.79 | | | | | |
| Cancelled or forfeited | (863,155) | | | 5.63 | | | | | |
| Expired | (4,635,617) | | | 2.61 | | | | |
| Outstanding as of March 31, 2024 | 12,117,999 | | | $ | 2.52 | | | 5.14 | | $ | 1.7 | |
| Vested and expected to vest as of March 31, 2024 | 11,962,962 | | | $ | 2.50 | | | 5.10 | | $ | 1.7 | |
| Exercisable as of March 31, 2024 | 9,235,801 | | | $ | 2.45 | | | 4.52 | | $ | 1.6 | |
The weighted-average grant-date fair value of options granted during the years ended March 31, 2024, 2023 and 2022 was $1.17, $2.75 and $4.10 respectively.
The aggregate intrinsic value of options exercised during the year ended March 31, 2024, 2023 and 2022 was $0.1 million, $1.6 million and $44.7 million respectively.
As of March 31, 2024, there was $2.9 million of unrecognized stock-based compensation expense related to stock options that is expected to be recognized over a weighted average remaining vesting period of 1.88 years.
The Company estimates the fair values of stock options using the Black-Scholes option-pricing model on the date of grant. During the years ended March 31, 2024, 2023, and 2022 the weighted average of the assumptions used in the Black-Scholes option pricing model were as follows:
| | | | | | | | | | | | | | | | | |
| Fiscal Year Ended March 31, |
| 2024 | | 2023 | | 2022 |
| Expected term (years) | 5.26 | | 4.38 | | 5.24 |
| Expected volatility | 73.71 | % | | 70.43 | % | | 62.96 | % |
| Risk-free interest rate | 4.21 | % | | 3.30 | % | | 1.16 | % |
| Expected dividend yield | — | % | | — | % | | — | % |
Restricted Stock Unit (“RSU”) Activity
The following table summarizes the activity related to the Company’s RSUs for Fiscal Year Ended March 31, 2024:
| | | | | | | | | | | |
| Number of RSUs | | Weighted Average Grant Date Fair Value |
| Unvested and outstanding as of March 31, 2023 | 8,151,777 | | | $ | 3.24 | |
| Granted | 10,402,320 | | | $ | 1.16 | |
| Released | (2,793,320) | | | $ | 3.32 | |
| Forfeited | (3,482,788) | | | $ | 2.45 | |
| Unvested and outstanding as of March 31, 2024 | 12,277,989 | | | $ | 1.68 | |
The following table summarizes the weighted average grant-date fair value of RSUs and total fair value of vested RSUs for the periods presented:
| | | | | | | | | | | | | | | | | |
| Fiscal Year Ended March 31, |
| 2024 | | 2023 | | 2022 |
| Weighted average grant-date fair value of RSUs | $ | 1.16 | | | $ | 2.79 | | | $ | 5.34 | |
| Total fair value of released RSUs (in millions) | $ | 3.3 | | | $ | 2.4 | | | $ | 0.1 | |
As of March 31, 2024, total unrecognized compensation expense related to RSUs was $12.3 million and is expected to be recognized over a weighted average period of 2.77 years. The fair value for RSUs is established based on the market price of the Company’s common stock on the date of grant.
Market-based Award
On April 15, 2022, pursuant to the 2021 Plan, the Company granted its Chief Executive Officer a market condition performance option award for the purchase of up to 600,000 shares of the Company’s common stock. The award had a grant date fair value of approximately $0.7 million using a Monte Carlo simulation model. Options under this market-based award will vest based on achievement of stock price targets of the Company's common stock. The right to purchase 200,000 shares of common stock under the options vests when the stock price meets or exceeds $8.00 per share for 30 consecutive days, the right to purchase 200,000 shares of common stock under the options vest when the stock price meets or exceeds $12.00 per share for 30 consecutive days, and the right to purchase 200,000 shares of common stock under the options vests when the stock price meets or exceeds $16.00 per share for 30 consecutive days. These market-based conditions must be met in order for this option award to vest, and it is therefore possible that no awards would ultimately vest. These options expire on April 15, 2025 regardless of
whether any of the options have vested. The Company will recognize compensation expense for this award regardless of whether such conditions are met. The fair value is expensed over the requisite service period.
The fair value of each market-based award is estimated on the date of grant using the Monte Carlo model that uses the assumptions noted in the following table:
| | | | | | | | | | | | | | | | | |
| Fiscal Year Ended March 31, |
| 2024 | | 2023 | | 2022 |
| Expected volatility | N/A | | 70.10 | % | | N/A |
| Risk-free interest rate | N/A | | 2.70 | % | | N/A |
| Expected dividend yield | N/A | | — | % | | N/A |
Stock-Based Compensation
The following table summarizes the total stock-based compensation expense by function and by type of award for the fiscal years ended March 31, 2024, 2023, and 2022 (in thousands):
| | | | | | | | | | | | | | | | | | | | |
| | Fiscal Year ended |
| | March 31, |
| | 2024 | | 2023 | | 2022 |
| General and administrative | | $11,754 | | $13,578 | | $17,063 |
| Advertising and marketing | | 1,177 | | 1,233 | | 797 |
| Total stock-based compensation expense | | $12,931 | | $14,811 | | $17,861 |
| | | | | | |
| Stock-based compensation expense by type of award | | | | | | |
| RSUs | | $ | 8,268 | | | $ | 8,598 | | | $ | 4,188 | |
| Stock options | | 3,803 | | | 5,638 | | | 13,673 | |
| Management Incentive Program | | 284 | | | — | | | — | |
| Market-based award | | 304 | | | 406 | | | — | |
| ESPP | | 272 | | | 169 | | | — | |
| Total stock-based compensation expense | | $ | 12,931 | | | $ | 14,811 | | | $ | 17,861 | |
10. LEASES
The Company has operating leases for its offices and fulfillment centers. Fulfillment and customer service centers and corporate office leases expire at various dates through 2038, excluding renewal options.
The Company also leases certain equipment under operating and finance leases. The terms of equipment leases are generally five years and do not contain renewal options. These finance leases expire at various dates through 2028.
The Company’s finance leases as of March 31, 2024 and March 31, 2023 were not material and were included in property and equipment, net, on the Company’s consolidated balance sheets.
The following schedule represents the components of the Company’s operating lease assets as of March 31, 2024 and 2023 (in thousands):
| | | | | | | | | | | | | | | | | | | | |
| | | | March 31, |
| Leases | | Consolidated Balance Sheets Location | | 2024 | | 2023 |
| | | | | | |
| Assets | | | | | | |
| Operating | | Operating lease right-of-use assets | | $ | 32,793 | | | $ | 36,892 | |
Total operating lease assets | | | | $ | 32,793 | | | $ | 36,892 | |
| Liabilities | | | | | | |
| Operating lease liabilities (current) | | Operating lease liabilities, current | | $ | 5,294 | | | $ | 5,484 | |
| | | | | | |
| Operating lease liabilities (non-current) | | Operating lease liabilities | | $ | 42,599 | | | $ | 47,240 | |
Total operating lease liabilities | | | | $ | 47,893 | | | $ | 52,724 | |
The following schedule represents the components of operating lease expense for the fiscal years ended March 31, 2024 and 2023 (in thousands):
| | | | | | | | | | | | | | | | | |
| | | Fiscal Year Ended |
| Consolidated Statements of Operations and
Comprehensive Loss Location | | March 31, 2024 | | March 31, 2023 |
| Operating lease costs | General and administrative | | $ | 7,606 | | | $ | 9,039 | |
Short-term lease costs | General and administrative | | 56 | | | 289 | |
| Sublease income | Other income | | (801) | | | (708) | |
| Total lease costs | | | $ | 6,861 | | | $ | 8,620 | |
As of March 31, 2024, the Company’s maturity of operating lease liabilities in the years through March 31, 2029, and thereafter are as follows (in thousands):
| | | | | | | | |
| | Operating Leases |
| 2025 | | $ | 8,476 | |
| 2026 | | 8,625 | |
| 2027 | | 7,446 | |
| 2028 | | 6,474 | |
| 2029 | | 6,723 | |
| Thereafter | | 31,917 | |
| Total lease payments | | 69,661 | |
| Less: imputed interest | | (21,768) | |
| Present value of lease liabilities | | $ | 47,893 | |
Other operating leases information:
| | | | | | | | | | | | | | |
| | March 31, 2024 | | March 31, 2023 |
| Cash paid for amounts included in the measurement of lease liabilities | | $ | 8,336 | | | $ | 7,022 | |
| Right-of-use assets obtained in exchange for new lease liabilities | | $ | — | | | $ | 25,628 | |
| Weighted-average remaining term (years) | | 10.2 | | 10.4 |
| Weighted average discount rate | | 7.1 | % | | 6.9 | % |
11. COMMITMENT AND CONTINGENCIES
Litigation
On March 20, 2024, three alleged shareholders filed a putative class action complaint in the lawsuit styled Kenville v. Northern Star Sponsor LLC, et al., Case No. 2024-276, which is pending in the Delaware Court of Chancery. The complaint is brought against (a) certain officers and directors of Northern Star Acquisition Corp. at the time of its proposed acquisition of Legacy BARK, (b) Northern Star Sponsor, LLC, and (c) two of the founders of Legacy BARK. The alleged class consists of Company stockholders who held stock as of the redemption deadline and who elected not to redeem all or some of their stock, and the claims alleged are for breach of fiduciary duty, aiding and abetting breach of fiduciary duty, and unjust enrichment. At this time, the Company is not able to quantify any potential liability in connection with this litigation because the case is in its early stages.
In addition, the Company is from time to time subject to, and are presently involved in, litigation and other legal proceedings in the ordinary course of business. While it is not possible to determine the outcome of any legal proceedings brought against the Company, the Company believes that, except for the matter described above, there are no pending lawsuits or claims that, individually or in the aggregate, may have a material effect on the Company’s business, financial condition or operating results. The Company’s view and estimates related to these matters may change in the future, as new events and circumstances arise and as the matters continue to develop.
12. INCOME TAXES
A reconciliation of the Company’s effective tax rate to the United States federal income tax rate is as follows:
| | | | | | | | | | | | | | | | | |
| March 31, |
| 2024 | | 2023 | | 2022 |
| Federal statutory rate | 21.00 | % | | 21.00 | % | | 21.00 | % |
| Permanent differences | (0.19) | | | (0.23) | | | (1.51) | |
| State taxes, net of federal benefits | (0.27) | | | 3.54 | | | 8.85 | |
| Change in valuation allowance | (14.08) | | | (23.68) | | | (42.85) | |
| Interest expense | (2.06) | | | (1.51) | | | (1.33) | |
| Warrant mark-to-market | 1.56 | | | 1.83 | | | 10.11 | |
| Stock-based compensation | (5.71) | | | (3.84) | | | 5.64 | |
| Other deferred adjustments | (0.25) | | | 2.89 | | | 0.09 | |
| | | | | |
| Total | — | % | | — | % | | — | % |
The components of the Company’s deferred taxes are as follows (in thousands): | | | | | | | | | | | |
| As of March 31, |
| 2024 | | 2023 |
| | | |
| Net operating loss carryforwards | $ | 67,974 | | | $ | 59,170 | |
| Charitable contributions | 1,073 | | | 1,054 | |
| Interest expense | 1,674 | | | 3,577 | |
| Lease liabilities | 8,900 | | | 7,441 | |
| UNICAP | 3,385 | | | 5,076 | |
| Stock compensation | 4,317 | | | 4,387 | |
| Accruals and other | 3,572 | | | 3,507 | |
| Depreciation | 329 | | | 107 | |
| Total deferred tax assets | 91,224 | | | 84,319 | |
| Valuation allowance | (85,620) | | | (80,405) | |
| Net deferred tax assets | 5,604 | | | 3,914 | |
| | | |
| | | |
| Lease right-of-use asset | (5,604) | | | (3,914) | |
| Total deferred tax liabilities | (5,604) | | | (3,914) | |
| Net deferred tax assets | $ | — | | | $ | — | |
As of March 31, 2024, the Company had federal net operating loss carryforwards (“NOLs”) of approximately $281.2 million, of which $60.5 million begin to expire in 2031 and $220.8 million can be carried forward indefinitely. The Company also had state NOLs of approximately $172.1 million, of which $145.2 million begin to expire at various times in 2024 through 2031 and $26.9 can be carried forward indefinitely. In addition, the Company has foreign NOLs of approximately $0.1 million, which begin to expire in 2026.
As of March 31, 2023, the Company had federal NOLs of approximately $243.7 million, of which $60.5 million begin to expire in 2031 and $183.2 million can be carried forward indefinitely. The Company also had state NOLs of approximately $153.7 million which begin to expire in 2031. The Company’s foreign NOLs as of March 31, 2023 were not material.
The utilization of NOLs and tax credit carryforwards to offset future taxable income may be subject to an annual limitation as a result of ownership changes that have occurred previously or may occur in the future. Under
Sections 382 and 383 of the Internal Revenue Code of 1986, as amended (“IRC”), a corporation that undergoes an ownership change may be subject to limitations on its ability to utilize its pre-change NOLs and other tax attributes otherwise available to offset future taxable income and/or tax liability. An ownership change is defined as a cumulative change of 50% or more in the ownership positions of certain stockholders during a rolling three-year period. The Company has completed a formal study through March 31, 2022 to determine if any ownership changes within the meaning of IRC Section 382 and 383 have occurred. As a result of the study, it was determined that BarkBox, Inc. experienced an ownership change on July 8, 2014; however, the limitation from the ownership change will not result in any of the NOLs or tax credits expiring unutilized. The Company has not completed a formal study related to Northern Star Acquisition Corp. and its separate NOLs from periods prior to the Merger. However, any potential ownership change is not expected to result in any of the NOLs expiring unutilized.
The Company has recorded a valuation allowance against its deferred tax assets in each of the fiscal years ended March 31, 2024 and 2023, because the Company’s management believes that it is more likely than not that these assets will not be realized. As a result of generating additional net operating losses, the valuation allowance increased by approximately $5.2 million, from $80.4 million as of March 31, 2023 to $85.6 million as of March 31, 2024.
The Company had no unrecognized tax benefits or related interest and penalties accrued for the years ended March 31, 2024, 2023 and 2022. The Company will recognize interest and penalties related to uncertain tax positions in income tax expense.
The Company is subject to U.S. federal income tax and state income tax. The statute of limitations for assessment by the IRS and state tax authorities is open for the tax years since 2019; currently, no federal or state income tax returns are under examination by the respective taxing authorities. To the extent the Company has tax attributes carryforwards, the tax years in which the attribute was generated may still be adjusted upon examination by the IRS and the state tax authorities to the extent utilized in a future period.
13. OTHER INCOME —NET
Other income—net consisted of the following:
| | | | | | | | | | | | | | | | | | | | |
| | Fiscal Year Ended March 31 |
| | 2024 | | 2023 | | 2022 |
| | | | | | |
| Other income | | $ | 762 | | | $ | 1,334 | | | $ | 275 | |
| Change in fair value of warrants | | 2,738 | | | 5,350 | | | 33,196 | |
| Gain (Loss) on extinguishment of debt | | 1,828 | | | — | | | (2,024) | |
| Loss on warrant exercise | | — | | | — | | | (101) | |
Other income-net | | $ | 5,328 | | | $ | 6,684 | | | $ | 31,346 | |
14. NET LOSS PER SHARE
Basic and diluted net loss per share attributable to common stockholders was calculated as follows:
| | | | | | | | | | | | | | | | | | | | |
| Fiscal Year Ended March 31 |
| | 2024 | | 2023 | | 2022 |
| Numerator: | | | | | | |
| Net loss | | $ | (37,010) | | | $ | (61,519) | | | $ | (68,299) | |
| | | | | | |
| Net loss attributable to common stockholders—basic and diluted | | $ | (37,010) | | | $ | (61,519) | | | $ | (68,299) | |
| Denominator: | | | | | | |
| Weighted average common shares outstanding—basic and diluted | | 177,260,581 | | | 176,717,509 | | | 156,201,601 | |
| | | | | | |
| Net loss per share attributable to common stockholders - basic and diluted | | $ | (0.21) | | | $ | (0.35) | | | $ | (0.44) | |
For the fiscal years ended March 31, 2024, 2023 and 2022, the Company’s potential dilutive securities, which include stock options, RSUs, warrants and convertible notes have been excluded from the computation of diluted net loss per share as the effect would be to reduce the net loss per share. Therefore, the weighted-average number of shares of common stock outstanding used to calculate both basic and diluted net loss per share attributable to common stockholders is the same for each of the fiscal years ended March 31, 2024, 2023 and 2022.
The Company excluded the following potential shares of common stock, presented based on amounts outstanding at March 31, 2024, 2023 and 2022 from the computation of diluted net loss per share attributable to common shareholders for the fiscal years ended March 31, 2024, 2023 and 2022 because including them would have had an anti-dilutive effect.
| | | | | | | | | | | | | | | | | | | | |
| As of | |
| March 31, | |
| 2024 | | 2023 | | 2022 | |
| Redeemable convertible preferred stock as converted to common stock | | | — | | | — | | |
| Stock options to purchase common stock | 12,113,905 | | | 16,019,476 | | 19,331,636 | | |
| Restricted stock units | 12,277,989 | | | 8,188,054 | | | 4,134,053 | | |
| Warrants to purchase common stock | 13,036,333 | | | 13,036,333 | | 13,036,333 | | |
2025 Convertible Notes as converted to common stock | 4,138,926 | | 8,505,620 | | | 8,062,230 | | |
Employee stock purchase plan | 296,335 | | | 278,111 | | | — | | |
The Company also had convertible notes outstanding for the fiscal year ended March 31, 2024, which could have obligated the Company and/or its stockholders to issue shares of common stock upon the occurrence of various future events at prices and in amounts that are not determinable until the occurrence of those future events. Since the necessary conditions for the conversion of these instruments had not been satisfied during the fiscal year ended March 31, 2024, the Company excluded these instruments from the table above and the calculation of diluted net loss per share for the period. See Note 6, “Debt,” for additional details.
15. SEGMENTS
The Company applies ASC 280, Segment Reporting, in determining reportable segments for its financial statement disclosure. The Company has two reportable segments: Direct to Consumer and Commerce. The Direct to Consumer segment derives revenue from the sale of toys & accessories and consumables through BarkBox, Super Chewer, and the Company’s consumables website, bark.co. The Commerce segment today derives revenue primarily from the sale of individual toys through major retailers and online marketplaces. Reporting in this format
provides management with the financial information necessary to evaluate the success of the segments and the overall business. There are no internal revenue transactions between the Company’s segments.
The CODM reviews revenue and gross profit for both of the reportable segments. Gross profit is defined as revenue less cost of revenue incurred by the segment. The Company does not allocate assets at the reportable segment level as these are managed on an entity wide group basis and, accordingly, the Company does not report asset information by segments.
Key financial performance measures of the segments including revenue, cost of revenue, and gross profit are as follows (in thousands):
| | | | | | | | | | | | | | | | | | | | |
| | Fiscal Year Ended March 31 |
| | 2024 | | 2023 | | 2022 |
| Direct to Consumer: | | | | | | |
| Revenue | | $ | 436,446 | | | $ | 471,994 | | | $ | 448,074 | |
| Cost of revenue | | 157,578 | | | 186,666 | | | 187,991 | |
| Gross profit | | 278,868 | | | 285,328 | | | 260,083 | |
| Commerce: | | | | | | |
| Revenue | | 53,738 | | | 63,321 | | | 59,332 | |
| Cost of revenue | | 30,454 | | | 40,534 | | | 37,309 | |
| Gross profit | | 23,284 | | | 22,787 | | | 22,023 | |
| Consolidated: | | | | | | |
| Revenue | | 490,184 | | | 535,315 | | | 507,406 | |
| Cost of revenue | | 188,032 | | | 227,200 | | | 225,300 | |
| Gross profit | | $ | 302,152 | | | $ | 308,115 | | | $ | 282,106 | |
16. 401(k)
The Company sponsors a 401(k) defined contribution plan covering all eligible U.S. employees. Subject to certain Internal Revenue Service (“IRS”) limits, eligible employees may elect to contribute from 1% to 100% of their compensation. Company contributions to the plan are at the sole discretion of the Company’s Board. Effective April 1, 2022, the Company began making matching contributions to the 401(k) plan. The expense related to the matching contributions was $1.6 million and $0.5 million for the fiscal years ended March 31, 2024 and March 31, 2023, respectively.
17. SUBSEQUENT EVENTS
Stock repurchase program
On June 3, 2024 the Board of Directors authorized a stock repurchase program, pursuant to which the Company may repurchase, from time to time, up to an aggregate of $15.0 million of the Company’s outstanding shares of common stock, exclusive of any fees, commissions or other expenses related to such repurchases.
Under the stock repurchase program, the Company may repurchase up to $15.0 million of its outstanding common stock. The stock repurchase program permits the Company to repurchase shares of common stock at any time or from time to time at management’s discretion in open market transactions made in accordance with the provisions of Rule 10b-18 and/or Rule 10b5-1 under the Securities Exchange Act of 1934, as amended, privately negotiated transactions or by other means in accordance with applicable securities laws. The timing, price and volume of common stock repurchases will be based on a number of factors, including market conditions, relevant securities laws, and other considerations. The stock repurchase program is not subject to a termination or expiration
date, and it does not obligate the Company to acquire any specific number of shares of common stock. The stock repurchase program is expected to be funded by cash on hand.
ITEM 9. CHANGES IN AND DISAGREEMENT WITH ACCOUNTANTS ON ACCOUNTING AND FINANCIAL DISCLOSURE
None.
ITEM 9A. CONTROLS AND PROCEDURES
Evaluation of disclosure controls and procedures
Based on the evaluation of our disclosure controls and procedures (as defined in the Rules 13a-15(e) and 15d-15(e) under the Securities Exchange Act of 1934, as amended, or the Exchange Act) required by Exchange Act Rules 13a-15(b) or 15d-15(b), our principal executive officer and our principal financial officer have concluded that our disclosure controls and procedures were effective as of March 31, 2024.
Management’s annual report on internal control over financial reporting
Our management is responsible for establishing and maintaining adequate internal control over financial reporting. Our management, including our principal executive officer and principal financial officer, conducted an evaluation of the effectiveness of our internal control over financial reporting based on the framework in Internal Control - Integrated Framework (2013) issued by the Committee of Sponsoring Organizations of the Treadway Commission. Based on its evaluation under the framework in Internal Control - Integrated Framework, our management concluded that our internal control over financial reporting was effective as of March 31, 2024.
Changes in internal controls
There have been no changes in our internal control over financial reporting during the period to which this report relates that have materially affected, or are reasonably likely to materially affect, our internal control over financial reporting.
The effectiveness of our internal control over financial reporting as of March 31, 2024 has been audited by Deloitte & Touche LLP, an independent registered public accounting firm, as stated in their report which appears in Item 15 of this Annual Report on Form 10-K.
ITEM 9B. OTHER INFORMATION
During the year ended March 31, 2024, none of the Company’s directors or executive officers adopted or terminated any contract, instruction or written plan for the purchase or sale of Company securities that was intended to satisfy the affirmative defense conditions of Rule 10b5-1(c) or any “non-Rule 10b5-1 trading arrangement” as defined in Item 408 of Regulation S-K under the Exchange Act.
ITEM 9C. DISCLOSURES REGARDING FOREIGN JURISDICTIONS THAT PREVENT INSPECTIONS
Not applicable.
PART III
ITEM 10. DIRECTORS, EXECUTIVE OFFICERS AND CORPORATE GOVERNANCE
Incorporated by reference from our Proxy Statement for our 2024 Annual Meeting of Stockholders to be filed with the SEC within 120 days after the end of the fiscal year ended March 31, 2024.
Code of Conduct, Governance Guidelines and Committee Charters
We have adopted a Code of Conduct that applies to all of our employees and directors. The Code of Conduct and is posted on our website at https://investors.bark.co/governance/governance-documents/. We will post any amendments to or waivers from the Code of Conduct at that location.
We have also adopted Corporate Governance Guidelines for the Board of Directors and a written committee charter for each of our Audit Committee, Compensation Committee and Corporate Governance and Nominating Committee. Each of these documents is available on our website at https://investors.bark.co/governance/governance-documents/.
ITEM 11. EXECUTIVE COMPENSATION
Incorporated by reference from our Proxy Statement for our 2024 Annual Meeting of Stockholders to be filed with the SEC within 120 days after the end of the fiscal year ended March 31, 2024.
ITEM 12. SECURITY OWNERSHIP OF CERTAIN BENEFICIAL OWNERS AND MANAGEMENT AND RELATED STOCKHOLDER MATTERS
Incorporated by reference from our Proxy Statement for our 2024 Annual Meeting of Stockholders to be filed with the SEC within 120 days after the end of the fiscal year ended March 31, 2024.
ITEM 13. CERTAIN RELATIONSHIPS AND RELATED TRANSACTIONS, AND DIRECTOR INDEPENDENCE
Incorporated by reference from our Proxy Statement for our 2024 Annual Meeting of Stockholders to be filed with the SEC within 120 days after the end of the fiscal year ended March 31, 2024.
ITEM 14. PRINCIPAL ACCOUNTANT AND FEES AND SERVICES
Incorporated by reference from our Proxy Statement for our 2024 Annual Meeting of Stockholders to be filed with the SEC within 120 days after the end of the fiscal year ended March 31, 2024.
ITEM 15. EXHIBITS AND FINANCIAL STATEMENT SCHEDULES
(a)(1) Financial Statements:
Consolidated Financial Statements filed as part of this report are listed in the accompanying Index to Consolidated Financial Statements included in this Annual Report on Form 10-K in Part II, Item 8 “Financial Statements and Supplementary Data.”
(a)(2) Financial Statement Schedules:
Financial statement schedules are omitted because they are not applicable or are not required or the information is included elsewhere in this Annual Report on Form 10-K
(a)(3) & (b):
The following exhibits are filed as part of, or incorporated by reference into, this Annual Report on Form 10-K.
| | | | | | | | | | | | | | | | | | | | | | | | | | | | | | | | | | | |
| | | | | | | Incorporated by Reference |
No. | |
Description of Exhibit | | Filed or Furnished Herewith | | Form | | File No. | | Date Filed |
| 2.1 | | | | | | 8-K | | 001-39691 | | 12/17/2020 |
| 3.1 | | | | | | 8-K | | 001-39691 | | 11/23/2021 |
| 3.2 | | | | | | 8-K | | 001-39691 | | 11/23/2021 |
| 4.1 | | | | | | 10-K | | 001-39691 | | 6/7/2021 |
| 4.2 | | | | | | S-1 | | 333-249138 | | 10/14//2020 |
| 4.3 | | | | | | S-1 | | 333-249138 | | 10/14//2020 |
| 4.4 | | | | | | S-1 | | 333-249138 | | 10/14//2020 |
| 4.5 | | | | | | S-4 | | 333-252603 | | 2/1/2021 |
| 4.6 | | | | | | S-1 | | 333-257306 | | 6/23/2021 |
| 4.7 | | | | | | S-1 | | 333-257306 | | 6/23/2021 |
| 4.8 | | | | | | S-4 | | 333-252603 | | 2/1/2021 |
| 4.9 | | | | | | S-4 | | 333-252603 | | 2/1/2021 |
| 4.10 | | | | | | S-4 | | 333-252603 | | 2/1/2021 |
| 4.11 | | | | | | S-4 | | 333-252603 | | 2/1/2021 |
| 4.12 | | | | | | S-4 | | 333-252603 | | 2/1/2021 |
| | | | | | | | | | | | | | | | | | | | | | | | | | | | | | | | | | | |
| 4.13 | | | | | | S-4 | | 333-252603 | | 2/1/2021 |
| 4.14 | | | | | | S-4 | | 333-252603 | | 2/1/2021 |
| 4.15 | | | | | | S-4 | | 333-252603 | | 2/1/2021 |
| 4.16 | | | | | | S-4 | | 333-252603 | | 2/1/2021 |
| 4.17 | | | | | | S-4 | | 333-252603 | | 2/1/2021 |
| 10.1 | | | | | | 8-K | | 001-39691 | | 11/13/2020 |
10.2# | | | | | | S-4 | | 333-252603 | | 2/1/2021 |
10.3# | | | | | | S-8 | | 333-258596 | | 8/6/2021 |
10.4# | | | | | | S-8 | | 333-258596 | | 8/6/2021 |
| 10.5# | | | | | | S-4 | | 333-252603 | | 2/1/2021 |
| 10.6 | | | | | | S-4 | | 333-252603 | | 2/1/2021 |
| 10.7 | | | | | | S-4 | | 333-252603 | | 2/1/2021 |
| 10.8 | | | | | | 8-K | | 001-39691 | | 11/4/2021 |
10.9# | | | | | | 10-K | | 001-39691 | | May 31, 2022 |
| 19 | | | | X | | | | | | |
| 21.1 | | | | | | 10-K | | 001-39691 | | 6/7/2021 |
| 23.1 | | | | X | | | | | | |
| 24.1 | | Power of Attorney (included on signature page hereto) | | | | | | | | |
| 31.1 | | | | X | | | | | | |
| 31.2 | | | | X | | | | | | |
| 31.3 | | | | X | | | | | | |
| 32.1* | | | | X | | | | | | |
| | | | | | | | | | | | | | | | | | | | | | | | | | | | | | | | | | | |
| 32.2* | | | | X | | | | | | |
| 32.3* | | | | X | | | | | | |
| 97 | | | | X | | | | | | |
| 101.INS | | XBRL Instance Document | | X | | | | | | |
| 101.SCH | | XBRL Taxonomy Extension Schema Document | | | | | | | | |
| 101.CAL | | XBRL Taxonomy Extension Calculation Linkbase Document | | X | | | | | | |
| 101.DEF | | XBRL Taxonomy Extension Definition Linkbase Document | | X | | | | | | |
| 101.LAB | | XBRL Taxonomy Extension Label Linkbase Document | | X | | | | | | |
| 101.PRE | | XBRL Taxonomy Extension Presentation Linkbase Document | | X | | | | | | |
| 104 | | Cover Page Interactive Data File (formatted as Inline XBRL and contained in Exhibit 101) | | | | | | | | |
# | Indicates management contract or compensatory plan or arrangement. | | | | | | | | |
| * | The certifications attached as Exhibit 32.1 and 32.2 that accompany this Annual Report on Form 10-K are not deemed filed with the Securities and Exchange Commission and are not to be incorporated by reference into any filing of BARK, Inc. under the Securities Act of 1933, as amended, or the Securities Exchange Act of 1934, as amended, whether made before or after the date of this Annual Report on Form 10-K, irrespective of any general incorporation language contained in such filing. | | | | | | | | |
ITEM 16. FORM 10-K SUMMARY
None.
SIGNATURES
Pursuant to the requirements of Section 13 or 15(d) of the Securities Exchange Act of 1934, the registrant has duly caused this report to be signed on its behalf by the undersigned thereunto duly authorized.
| | | | | | | | |
| | BARK, Inc. |
| | |
June 3, 2024 | | /s/ Matt Meeker |
| | Matt Meeker |
| | Chief Executive Officer |
| | (Principal Executive Officer) |
| | |
| | |
| | BARK, Inc. |
| | |
June 3, 2024 | | /s/ Zahir Ibrahim |
| | Zahir Ibrahim |
| | Chief Financial Officer |
| | (Principal Financial Officer) |
| | |
| | |
| | BARK, Inc. |
| | |
June 3, 2024 | | /s/ Brian Dostie |
| | Brian Dostie |
| | Controller |
| | (Principal Accounting Officer) |
KNOW ALL PERSONS BY THESE PRESENTS, that each person whose signature appears below hereby constitutes and appoints Allison Koehler, as his or her true and lawful attorneys-in-fact, proxy, and agent, each with full power of substitution, for him or her in any and all capacities, to sign any and all amendments to this Annual Report on Form 10-K, and to file the same, with all exhibits thereto and other documents in connection therewith, with the Securities and Exchange Commission, granting unto said attorneys-in-fact, proxies, and agents full power and authority to do and perform each and every act and thing requisite and necessary to be done in connection therewith, as fully for all intents and purposes as he might or could do in person, hereby ratifying and confirming all that said attorneys-in-fact, proxy, and agent, or his or her substitute or substitutes, may lawfully do or cause to be done by virtue hereof.
Pursuant to the requirements of the Securities Exchange Act of 1934, as amended, this report has been signed below by the following persons on behalf of the registrant and in the capacities and on the dates indicated.
| | | | | | | | | | | |
| Signature | Title | Date |
| | | |
| | Chief Executive Officer | June 3, 2024 |
| By: | /s/ Matt Meeker | (Principal Executive Officer) | |
| Matt Meeker | | | |
| | | |
| | Chief Financial Officer | June 3, 2024 |
| By: | /s/ Zahir Ibrahim | (Principal Financial Officer) | |
| Zahir Ibrahim | | | |
| | | |
| | Controller | June 3, 2024 |
| By: | /s/ Brian Dostie | (Principal Accounting Officer) | |
| Brian Dostie | | | |
| | | |
| | | |
| | | |
| | | |
| By: | /s/ Paulette Dodson | Director | June 3, 2024 |
| Paulette Dodson | | | |
| | | |
| By: | /s/ Larry Bodner | Director | June 3, 2024 |
Larry Bodner | | | |
| | | |
| By: | /s/ Jim McGinty | Director | June 3, 2024 |
| Jim McGinty | | | |
| | | |
| By: | /s/ Elizabeth McLaughlin | Director | June 3, 2024 |
| Elizabeth McLaughlin | | | |
| | | |
| By: | /s/ Michele Meyer | Director | June 3, 2024 |
| Michele Meyer | | | |
| | | |
| By: | /s/ Henrik Werdelin | Director | June 3, 2024 |
| Henrik Werdelin | | | |