Delaware |
3690 |
98-1567584 | ||
(State or other jurisdiction of incorporation or organization) |
(Primary Standard Industrial Classification Code Number) |
(I.R.S. Employer Identification Number) |
Large accelerated filer | ☐ | Accelerated filer | ☐ | |||
Non-accelerated filer |
☒ | Smaller reporting company | ||||
Emerging growth company |
Page |
||||
ii | ||||
iii | ||||
iv | ||||
vii | ||||
1 | ||||
7 | ||||
39 | ||||
40 | ||||
41 | ||||
57 | ||||
70 | ||||
85 | ||||
92 | ||||
97 | ||||
98 | ||||
101 | ||||
107 | ||||
118 | ||||
127 | ||||
130 | ||||
132 | ||||
132 | ||||
132 | ||||
F-1 |
• | “Amalgamation” means the amalgamation of Amalgamation Sub and SES, with SES continuing as the Amalgamated Company; |
• | “Amalgamated Company” means SES, as the amalgamated company resulting from the Amalgamation; |
• | “Amalgamation Sub” means Wormhole Merger Sub Pte. Ltd., a Singapore private company limited by shares and wholly owned subsidiary of Ivanhoe Capital Acquisition Corp.; |
• | “Ah” means amp-hour; |
• | “AI” means artificial intelligence; |
• | “Board” means the board of directors of the Company; |
• | “Boston” means Boston, Massachusetts, U.S.A; |
• | “Business Combination” means the Domestication, the Amalgamation and other transactions contemplated by the Business Combination Agreement, collectively, including the PIPE Financing; |
• | “Business Combination Agreement” means that certain Business Combination Agreement, dated July 12, 2021 (as amended on September 20, 2021, the “Business Combination Agreement”), by and among Ivanhoe, Amalgamation Sub, and SES; |
• | “Bylaws” means the Bylaws of SES AI Corporation; |
• | “Charter” means the Certificate of Incorporation of SES AI Corporation; |
• | “China” means the People’s Republic of China; |
• | “Class A ordinary shares” means the Class A ordinary shares, par value $0.0001 per-share, of Ivanhoe, which automatically converted into a number of shares of Class A common stock, on a one-for-one basis, in connection with the Domestication and Closing; |
• | “Class B ordinary shares” or “Sponsor Shares” means the 6,900,000 Class B ordinary shares, par value $0.0001 per share, of Ivanhoe, outstanding as of immediately prior to the Domestication that were initially issued to Sponsor (as defined below) in a private placement prior to the Company’s initial public offering, and which, converted on a one-for-one basis, into Class A ordinary shares, and then subsequently converted on a one-for-one basis, into Class A common stock in connection with the Closing; |
• | “Closing” means the closing of the Business Combination; |
• | “Closing Date” means February 3, 2022, the date of the closing of the Business Combination; |
• | “Common Stock” means, collectively, the Class A common stock and Class B common stock; |
• | “Continental” means Continental Stock Transfer & Trust Company; |
• | “DGCL” means the Delaware General Corporation Law), as amended and restated from time to time. |
• | “Domestication” means the transfer by way of continuation and deregistration of Ivanhoe from the Cayman Islands and the continuation and domestication of Ivanhoe as a corporation incorporated in the State of Delaware; |
• | “Effective Time” means the time at which the Amalgamation became effective; |
• | “Equity Incentive Plan” means the SES AI Corporation 2021 Incentive Award Plan; |
• | “Exchange Act” means the Securities Exchange Act of 1934, as amended; |
• | “Expansion I Facility” means SES’s proposed 10 GWh joint venture plant expected to be operational by 2025, which is expected to ramp up to 30 GWh capabilities by 2027; |
• | “Expansion II Facility” means SES’s proposed 30 GWh facility expected to be operational by 2026, which is expected to ramp to 70 GWh capabilities by 2028; |
• | “GAAP” means generally accepted accounting principles, as in effect in the United States; |
• | “GM” means General Motors Company and its subsidiaries; |
• | “GWh” means Gigawatt-hour; |
• | “Honda” means Honda Motor Co. Ltd.; |
• | “Hyundai” means Hyundai Motor Company, including its affiliate Kia Corporation; |
• | “Initial Public Offering” means Ivanhoe’s Initial Public Offering that was consummated on January 6, 2021; |
• | “IPO Letter Agreement Amendment” means the IPO Letter Agreement Amendment, dated as of July 12, 2021, by and between Sponsor and the officers and directors of Ivanhoe; |
• | “Ivanhoe” means Ivanhoe Capital Acquisition Corp., a Delaware corporation; following the Business Combination Ivanhoe’s name was changed to “SES AI Corporation;” |
• | “kWh” means kilowatt-hour; |
• | “Li-ion” means lithium-ion battery technology; |
• | “Li-Metal” means lithium-metal battery cell technology; |
• | “NYSE” means the New York Stock Exchange; |
• | “Old SES” means SES Holdings Pte. Ltd., a Singapore private company limited by shares; |
• | “OEM” means an automotive original equipment manufacturer; |
• | “Pilot Facility” means SES’s proposed 1 GWh pilot facility that is expected to be completed by 2023 and operational by 2024; |
• | “PIPE Financing” means the sale of $274.5 million of shares of Class A common stock in a private placement to PIPE Investors pursuant to the Subscription Agreements, consummated at the Closing Date; |
• | “PIPE Investors” means the certain institutional and accredited investors participating in the PIPE Financing pursuant to the Subscription Agreements; |
• | “PIPE Shares” means the shares of Class A common stock sold to PIPE Investors; |
• | “private placement warrants” means the 5,013,333 private placement warrants outstanding that were issued to Ivanhoe Capital Sponsor LLC as part of the private placement consummated simultaneously with the Initial Public Offering, which are substantially identical to the public warrants, subject to certain limited exceptions; |
• | “pro forma” means giving pro forma effect to the Business Combination, including the Amalgamation and PIPE Financing; |
• |
• | “public shareholders” means holders of public shares, whether acquired in the Company’s Initial Public Offering or acquired in the secondary market; |
• | “public warrants” warrants to purchase our Class A common stock; |
• | “SEC” means the Securities and Exchange Commission; |
• | “Securities Act” means the Securities Act of 1933, as amended; |
• | “SES” means SES AI Corporation; |
• | “SES Group” means SES and each of its subsidiaries; |
• | “Sponsor” means Ivanhoe Capital Sponsor LLC; |
• | “Subscription Agreements” means the subscription agreements, entered into by the Company and each of the PIPE Investors in connection with the PIPE Financing; |
• | “transfer agent” means Continental, Ivanhoe’s transfer agent; |
• | “warrants” means the public warrants and the private placement warrants; |
• | “Warrant Agreement” means the Amended and Restated Warrant Agreement, dated as of February 3, 2022, by and between Ivanhoe Capital Acquisition Corp. (now known as SES AI Corporation) and Continental Stock Transfer & Trust Company; and |
• | “Wh” means watt-hour. |
• | changes in domestic and foreign business, market, financial, political and legal conditions; |
• | risks relating to the uncertainty of the projected financial information with respect to the Company; |
• | risks related to the development and commercialization of the Company’s battery technology and the timing and achievement of expected business milestones; |
• | the effects of competition on the Company’s business; |
• | the ability of the Company to issue equity or equity-linked securities or obtain debt financing in the future; |
• | the ability of the Company to integrate its products into electric vehicles (“EVs”); |
• | the risk that delays in the pre-manufacturing development of the Company’s battery cells could adversely affect the Company’s business and prospects; |
• | potential supply chain difficulties; |
• | risks resulting from the Company’s JDAs and other strategic alliances, if such alliances are unsuccessful; |
• | the quickly evolving battery market; |
• | the Company’s ability to accurately estimate future supply and demand for its batteries; |
• | the Company’s ability to develop new products on an ongoing basis in a timely manner; |
• | product liability and other potential litigation, regulation and legal compliance; |
• | the Company’s ability to effectively manage its growth; |
• | the Company’s ability to attract, train and retain highly skilled employees and key personnel; |
• | the willingness of vehicle operators and consumers to adopt EVs; |
• | developments in alternative technology or other fossil fuel alternatives; |
• | the Company’s ability to meet certain motor vehicle standards; |
• | a potential shortage of metals required for manufacturing batteries; |
• | risks related to the Company’s intellectual property; |
• | risks related to the Company’s business operations outside the United States, including in China; |
• | compliance with certain health and safety laws; and |
• | changes in U.S. and foreign tax laws. |
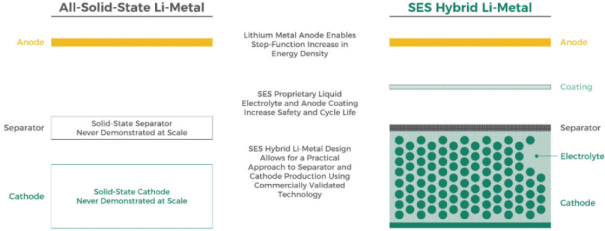
• | deliver a step-change in energy density to deliver a lightweight and compact battery, and substantially eliminate range anxiety of EVs; |
• | provide fast-charge capability to reduce charging times significantly, to a charge of 80% in less than 15 minutes; |
• | incorporate advanced AI-powered safety management software, which will accurately monitor state of health of the battery and apply appropriate self-healing protocols; |
• | use similar manufacturing processes as required for Li-ion, but is expected to be substantially less costly than conventional Li-ion at scale due to Li-Metal’s high energy density; |
• | achieve rapid market adoption due to our strategic partnerships, including with leading global OEMs, such as GM, Hyundai and Honda; and |
• | capitalize on the innovation occurring in Li-ion, including improvements in energy density, manufacturing efficiency and cost reduction, as Li-Metal shares similar cathode and manufacturing process with Li-ion. |
• | We have a history of no revenues and of net losses, and expect to continue to incur losses for the foreseeable future. While we expects to become profitable eventually, our projections are based on internal assumptions that may prove incorrect, and we may never achieve or maintain profitability. |
• | Delays in the pre-manufacturing development of our battery cells could adversely affect its business and prospects. |
• | If we are unable to integrate our products into EVs manufactured by OEM customers, our results of operations could be impaired. |
• | We may not be able to establish new, or maintain existing, supply relationships for necessary raw materials, components or equipment or may be required to pay costs for raw materials, components or equipment that are more expensive than anticipated, which could delay the introduction of our product and negatively impact our business. |
• | We have pursued and may continue to pursue JDAs and other strategic alliances, which could have an adverse impact on our business if they are unsuccessful. |
• | The EV battery market continues to evolve and is highly competitive, and certain other battery manufacturers have significantly greater resources than we do. |
• | We may not be able to estimate accurately the future supply and demand for our batteries, which could result in a variety of inefficiencies in our business and hinder our ability to generate revenue. If we fail to predict accurately our manufacturing requirements, we could incur additional costs or experience delays. |
• | If we cannot develop new products on an ongoing basis in a timely manner and at favorable margins, including those not currently contemplated by our growth plan, we may not be able to compete effectively. |
• | Certain components of our batteries pose safety risks that may cause accidents. We may be subject to financial and reputational risks due to product recalls and product liability claims, and could face substantial liabilities that exceed our resources. |
• | We may incur significant costs based on the warranties we may supply in our products and services. |
• | If we fail to effectively manage eventual growth, then our business, results of operations and financial condition could be adversely affected. |
• | Our business depends substantially on the continuing efforts of our senior executives and other key personnel as well as the ability to attract, train and retain highly skilled employees and key personnel. |
• | Our future growth and success depend on the willingness of vehicle operators and consumers to adopt EVs. |
• | Developments in alternative technology or other fossil fuel alternatives may adversely affect the demand for our battery products. |
• | If the EVs in which our batteries are installed do not meet certain motor vehicle standards, iour business, operating results and prospects could be adversely affected. |
• | The Biden administration has put forth ambitious goals for advancing new battery technology, which may lead to a shortage of the metals required for manufacturing batteries. |
• | Our patent applications may not result in issued patents or our patent rights may be challenged, invalidated or limited in scope, any of which could have a material adverse effect on our ability to prevent others from competing or interfering with the commercialization of our products. |
• | We may need to defend ourself against intellectual property infringement claims, which may be time-consuming and could cause us to incur substantial costs. |
• | International expansion of our business exposes it to business, regulatory, political, operational, financial and economic risks associated with doing business outside of the United States. |
• | Changes in the economic and political policies of the Chinese government could have a significant impact on our operations in China, where we conduct research and development. |
• | We could experience losses associated with our intellectual property in relation to our operations in China. |
• | Implementation of labor laws and regulations in China may adversely affect our business and results of operations. |
• | The unavailability, reduction or elimination of, or uncertainty regarding, government and economic incentives or subsidies available to us, end-users or OEMs could have a material adverse effect on our business, financial condition, operating results and prospects. |
• | Our operations expose us to litigation, environmental and other legal compliance risks. Compliance with laws and regulations can be expensive, and our failure to comply with these laws and regulations may result in monetary damages and fines, adverse publicity and a material adverse effect on our business. |
• | Failure to comply with certain health and production safety laws and regulations governing hazardous materials could materially adversely affect our business and results of operations. |
• | We are subject to U.S. and foreign anti-corruption, anti-bribery, anti-money laundering, financial and economic sanctions and similar laws and regulations. We can face criminal liability and other serious consequences for violations, which can harm our business. |
• | Governmental trade controls, including export and import controls, sanctions, customs requirements and related regimes, could subject us to liability or loss of contracting privileges, limit our ability to transfer technology or compete in certain markets and affect our ability to hire qualified personnel. |
• | Changes in U.S. and foreign tax laws, particularly since the recent change in U.S. presidential administration, could have a material adverse effect on our business, cash flow, results of operations or financial conditions. |
• | The uncertainty in global economic conditions and the risks relating to health epidemics, including the COVID-19 pandemic, could have a material adverse effect on our business and results of operations. Our ability to operate in any respect may be interrupted by the current COVID-19 pandemic. |
Issuance of Class A Common Stock | ||
The following information is as of February 11, 2022 and does not give effect to issuances of our Class A Common Stock or the exercise of warrants after such date. | ||
Shares of our Class A common stock to be issued upon exercise of all public warrants and private placement warrants |
14,213,280 shares | |
Shares of our Class A common stock outstanding prior to exercise of all public warrants and private placement warrants |
303,989,794 shares | |
Use of proceeds |
We will receive up to an aggregate of approximately $163,452,750 from the exercise of all public warrants and private placement warrants assuming the exercise in full of all such warrants for cash. Unless we inform you otherwise in a prospectus supplement or free writing prospectus, we intend to use the net proceeds from the exercise of such warrants for general corporate purposes which may include acquisitions or other strategic investments or repayment of outstanding indebtedness. | |
Resale of Shares of Common Stock and Warrants |
||
Shares of Class A common stock offered by the Selling Securityholders (includes (x) up to 43,881,251 shares of Class A common stock underlying the shares of the Class B common stock and (y) 27,450,000 PIPE Shares) |
320,342,749 shares | |
Warrants offered by the Selling Securityholders |
5,013,333 private placement warrants | |
Exercise Price |
$11.50 per share, subject to adjustment as described herein. | |
Redemption |
The private placement warrants are not redeemable by us. See “ Description of Our Securities—Private Placement Warrants” |
Use of proceeds |
We will not receive any of the proceeds from the sale of the shares of Class A common stock by the Selling Securityholders. With respect to shares of Class A common stock underlying the warrants, we will not receive any proceeds from such shares except with respect to amounts received by us upon exercise of such warrants to the extent such warrants are exercised for cash. | |
Ticker Symbol |
Our shares of Class A common stock and public warrants are listed on the NYSE under the symbol “SES” and “SES WS.” | |
Lock-up restrictions |
Certain of our stockholders, including the Selling Securityholders, are subject to certain restrictions on transfer until the termination of applicable lock-up periods. See “ Securities Act Restrictions on Resale of Common Stock |
• | develop and fund research and technological innovations; |
• | receive and maintain necessary intellectual property protections; |
• | obtain governmental approvals and registrations; |
• | comply with governmental regulations; and |
• | anticipate customer needs and preferences successfully. |
• | perceptions about EV quality, design and performance, especially if adverse events or accidents occur that are linked to the quality or safety of EVs; |
• | volatility in sales of EVs; |
• | the costs of purchasing and maintaining EVs; |
• | perceptions about vehicle safety in general, namely, safety issues that may be attributed to the use of advanced technology, including vehicle electronics; |
• | negative perceptions of EVs, such as that they are more expensive than nonelectric vehicles and are only affordable with government subsidies or that they have failed to meet customer expectations; |
• | the limited range over which EVs may be driven on a single battery charge and the effects of weather on this range; |
• | the decline of an EV’s range resulting from deterioration over time in the battery’s ability to hold a charge; |
• | concerns about electric charging infrastructure availability and reliability, which could derail past and present efforts to promote EVs as a practical solution to vehicles which require gasoline; |
• | concerns about charging station standardizations, convenience and cost influencing consumers’ perceptions regarding the convenience of EV charging stations; |
• | concerns of potential customers about the susceptibility of battery packs to damage from improper charging, as well as the lifespan of battery packs and the cost of their replacement; |
• | concerns regarding comprehensive vehicular insurance coverage related to EVs; |
• | developments in alternative technologies, such as advanced diesel, ethanol, fuel cells or compressed natural gas, or improvements in the fuel economy of the internal combustion engine, which could adversely affect sales of EVs; |
• | the environmental consciousness of consumers; |
• | the availability and volatility in the cost of natural gas, diesel, coal, oil, gasoline and other fuels relative to electricity, such as the sharp reduction in prices for gasoline in 2020; |
• | the availability of tax and other governmental incentives to purchase and operate EVs or future regulation requiring increased use of nonpolluting vehicles; |
• | concerns regarding the value and costs for upkeep of EVs in the used car market; |
• | the availability of enough skilled labor in after-sale maintenance and repair services of EVs; and |
• | macroeconomic factors. |
• | cease selling, incorporating or using products that incorporate the challenged intellectual property; |
• | pay damages; |
• | obtain a license from the holder of the infringed intellectual property right, which license may not be available on reasonable terms or at all; or |
• | redesign our batteries. |
• | general trade tensions between the United States and China have been escalating, and new legislation or regulations in either jurisdiction could impose additional restrictions and costs on our ability to operate in one or both jurisdictions, or even foreclose operations entirely; |
• | non-U.S. countries have enacted and could enact legislation or impose regulations or other restrictions, including unfavorable labor regulations or tax policies (such as Chinese regulations prohibiting our operating company from paying dividends out of accumulated distributable profits unless 10% of such profits (up to half of the company’s registered capital) are set aside annually, under Article 166 of China’s Company Law), which could have an adverse effect on our ability to conduct business in or expatriate profits from those countries; |
• | tax rates in certain non-U.S. countries may exceed those in the United States and non-U.S. earnings may be subject to withholding requirements or the imposition of tariffs, exchange controls, or other restrictions, including restrictions on repatriation; |
• | the regulatory or judicial authorities of non-U.S. countries may not enforce legal rights and recognize business procedures in a manner to which we are accustomed or would reasonably expect; |
• | we may have difficulty complying with a variety of laws and regulations in non-U.S. countries, some of which may conflict with laws in the United States; |
• | changes in political and economic conditions may lead to changes in the business environment in which we operate, as well as changes in currency exchange rates; |
• | in the case of China, the degree of significant government control over China’s economic growth through restrictions and limitations on foreign investment in certain industries, control over the allocation of resources, control over payment of foreign currency-denominated obligations, implementation of monetary policy, data localization and privacy requirements, technology transfer requirements, national security laws, influence over the courts and preferential treatment of particular industries or companies, could materially affect our liquidity, access to capital, intellectual property and ability to operate our business; |
• | in the case of China, data localization requirements and restrictions on the use of foreign technology applications have already been enacted by the Chinese government, and restrictions on the use of Chinese technology and applications that have been or may be adopted in the future by the United |
States, may make it difficult to efficiently coordinate complex manufacturing supply chains in a global setting; |
• | restrictions or denials on visas for our personnel, limiting our ability to train and pass along proprietary information efficiently; |
• | differences in software usage and export controls, making it difficult to share certain engineering documents and resources between global subsidiaries; |
• | the adoption and expansion of trade restrictions, the occurrence or escalation of a “trade war,” or other governmental action related to tariffs or trade agreements or policies among the governments of the United States and other countries, such as China, could adversely impact our raw material prices, our ability to manufacture our products, and demand for our products in China, the U.S. and other global markets; |
• | changes to export controls and/or failure to obtain export licenses in the United States, China or other countries in which we do business could adversely affect our access to raw materials, ability to manufacture and ship our products or increase our costs to conduct research & development; |
• | regulatory changes and economic conditions following “Brexit” (the United Kingdom’s exit from the European Union), including uncertainties as to its effect on trade laws, tariffs, and taxes, could create instability and volatility in the global financial and currency markets, conflicting or redundant regulatory regimes in Europe and political instability; and |
• | natural disasters or international conflict, including terrorist acts, could interrupt our research and development, manufacturing or commercialization or endanger our personnel. |
• | provisions that authorize our Board, without action by SES’s shareholders, to authorize by resolution the issuance of shares of preferred stock and to establish the number of shares to be included in such series, along with the preferential rights determined by SES’s board of directors; provided that, our Board may also, subject to the rights of the holders of preferred stock, authorize shares of preferred stock to be increased or decreased by the approval of the Board and the affirmative vote of the holders of a majority in voting power of the outstanding shares of capital stock of the corporation; |
• | provisions that permit only a majority of our Board, the chief executive officer of SES or the chairman of SES’s board of directors to call special stockholder meetings; provided, that for so long as the SES Founder Group beneficially owns at least 50% of the voting power of the then outstanding shares of our capital stock, special meetings of stockholders may also be called by or at the request of SES stockholders holding a majority of the voting power of the issued and outstanding shares of our capital stock; |
• | provisions that impose advance notice requirements and other requirements and limitations on the ability of stockholders to propose matters for consideration at stockholder meetings; and |
• | a staggered board whereby SES’s directors are divided into three classes, with each class subject to retirement and reelection once every three years on a rotating basis. |
• | a limited availability of market quotations for our securities; |
• | reduced liquidity for our securities; |
• | a determination that the SES common stock is a “penny stock” which will require brokers trading in SES common stock to adhere to more stringent rules and possibly result in a reduced level of trading activity in the secondary trading market for our securities; |
• | a limited amount of news and analyst coverage; and |
• | a decreased ability to issue additional securities or obtain additional financing in the future. |
• | actual or anticipated fluctuations in SES’s quarterly financial results or the quarterly financial results of companies perceived to be similar to it; |
• | changes in the market’s expectations about its operating results; |
• | success of competitors; |
• | our operating results failing to meet market expectations in a particular period; |
• | changes in financial estimates and recommendations by securities analysts concerning SES or the payments industry and market in general; |
• | operating and stock price performance of other companies that investors deem comparable to SES; |
• | our ability to market new and enhanced products on a timely basis; |
• | changes in laws and regulations affecting our business; |
• | commencement of, or involvement in, litigation involving SES; |
• | changes in our capital structure, such as future issuances of securities or the incurrence of additional debt; |
• | the volume of shares of our Class A common stock available for public sale; |
• | any significant change in our board or management; |
• | sales of substantial amounts of our Class A common stock by our directors, executive officers or significant stockholders or the perception that such sales could occur; and |
• | general economic and political conditions such as recessions, interest rates, fuel prices, international currency fluctuations and acts of war or terrorism. |
• | the election of SES’s board of directors and the appointment and removal of our officers; |
• | mergers and other business combination transactions requiring stockholder approval, including proposed transactions that would result in our stockholders receiving a premium price for their shares; and |
• | amendments to SES’s certificate of incorporation or increases or decreases in the size of our board of directors. |
• | the issuance and sale of 27,450,000 shares of our Class A common stock for a purchase price of $10.00 per share and an aggregate purchase price of $274.5 million pursuant to the Subscription Agreements; and |
• | The Business Combination and other events contemplated by the Business Combination Agreement. |
(i) | historical audited financial statements of Ivanhoe as of December 31, 2020 and for the period from July 8, 2020 (inception) through December 31, 2020 and |
(ii) | historical unaudited condensed financial statements of Ivanhoe as of and for the nine months ended September 30, 2021. |
(i) | historical audited consolidated financial statements of Old SES as of and for the year ended December 31, 2020; and |
(ii) | historical unaudited condensed consolidated financial statements of Old SES as of and for the nine months ended September 30, 2021. |
• | Each Old SES common stock, excluding shares held by the SES Founder Group, and each redeemable convertible preferred share that was outstanding immediately prior to the Closing was cancelled and converted into a number of fully paid and nonassessable shares of our Class A common stock equal to the Exchange Ratio, rounded down to the nearest whole number; |
• | Each Old SES common stock held by the SES Founder Group that was outstanding immediately prior to the Closing was cancelled and converted into a number of fully paid and nonassessable shares of our Class B common stock equal to the Exchange Ratio, rounded down to the nearest whole number. The shares of our Class B common stock have the same economic rights as the shares of our Class A common stock, but each share of our Class B common stock is entitled to 10 votes, and each share of our Class A common stock is entitled to 1 vote, in each case, on each matter submitted for a vote of the our stockholders; |
• | Each Old SES restricted share that was issued, outstanding and subject to restrictions (including vesting) immediately prior to the Closing was assumed by the Company and converted into a number of shares of restricted Class A common stock equal to the Exchange Ratio, rounded down to the nearest whole number, and are subject to the same terms and conditions as were applicable prior to the Closing; and |
• | Each Old SES option that was outstanding immediately prior to the Closing, whether vested or unvested, was assumed by the Company and converted into an option to acquire our Class A common stock with the same terms except for the number of shares exercisable and the exercise price, each of which was adjusted using the Exchange Ratio, rounded down to the nearest whole number. |
• | Old SES common stock and redeemable convertible preferred stock shareholders and Old SES option and restricted shareholders received 29,999,947 earn-out shares of our Class A common stock (valued |
at $10.00 per share), including 23,691,182 shares of our Class A common stock (the “Earn-out Shares”) issued for the benefit of the former holders of Old SES common and redeemable convertible preferred stock, 2,308,969 shares of restricted Class A common stock (the “Earn-out Restricted Shares”) issued to Old SES option holders and pre-Closing recipients of Old SES restricted shares and 3,999,796 shares of our Class B common stock issued to the SES Founder Group (“Founder Earn-out Shares”). The Earn-Out Shares and the Founder Earn-Out Shares (collectively, the “Escrowed Earn-Out Shares”) were placed into escrow at the Closing and shall vest on the date that the closing price of shares of our Class A common stock is equal to or greater than $18.00 during the period beginning on the date that is one year following the Closing of the Business Combination and ending on the date that is five years following the Closing. The Earn-Out Restricted Shares are subject to vesting based on the same terms as the Earn-Out Shares and are also subject to forfeiture if such recipient’s service with us terminates prior to the vesting. |
• | 6,900,000 shares of Ivanhoe’s Class B ordinary shares (the “Sponsor Earn-Out Shares”) held by Ivanhoe Capital Sponsor LLC’s (the “Sponsor”) converted, on a one-for-one Earn-out Shares are subject to the certain transfer restrictions and forfeiture terms following the Closing and released as follows: |
• | 20% are subject to transfer restrictions until the date that is 180 days after the Closing (“Tranche 1”); |
• | 20% are subject to transfer restrictions until SES’s closing stock price equals or exceeds $12.00 for 20 out of 30 consecutive trading days following the date that is 150 days after the Closing (“Tranche 2”); |
• | 20% are subject to transfer restrictions until SES’s closing stock price equals or exceeds $14.00 for 20 out of 30 consecutive trading days following the date that is 150 days after the Closing (“Tranche 3”); |
• | 20% are subject to transfer restrictions until SES’s closing stock price equals or exceeds $16.00 for 20 out of 30 consecutive trading days following the date that is 150 days after the Closing (“Tranche 4”); and |
• | 20% are subject to transfer restrictions until SES’s closing stock price equals or exceeds $18.00 for 20 out of 30 consecutive trading days following the date that is 150 days after the Closing (“Tranche 5”). |
Pro Forma Combined |
||||||||
Shares |
% |
|||||||
SES stockholders (other than the SES Founder Group) – Class A common stock (1) |
264,495,644 | 76.0 | % | |||||
SES Founder Group – Class B common stock (2) |
43,881,251 | 12.6 | % | |||||
PIPE Investors – Class A common stock (3) |
27,450,000 | 7.9 | % | |||||
Ivanhoe stockholders - Class A common stock |
5,144,150 | 1.5 | % | |||||
Ivanhoe Capital Sponsor LLC - Class A common stock (4) |
6,900,000 | 2.0 | % | |||||
|
|
|
|
|||||
Total Shares at Closing (excluding shares described below) |
347,871,045 |
100.0 |
% | |||||
|
|
|
|
(1) | Old SES stockholders, option holders and restricted shareholders, after considering 23,691,182 Earn-Out Shares issued for the benefit of the former holders of Old SES common and redeemable convertible preferred stock, 2,273,727 restricted shares issued at Closing to pre-Closing recipients of SES restricted share and 2,308,969 Earn-Out Restricted Shares issued to Old SES option holders and pre-Closing recipients of Old SES restricted share, but excluding their 6,700,000 shares of our Class A common stock purchased in the PIPE Financing (see note 3 below), will own 88.6% of SES’s total common stock issued and outstanding at Closing . |
(2) | Class B common stock issued to the SES Founder Group, which carry 10 votes per share, and allow the SES Founder Group to have approximately 59.1% of the total voting power of the the Company’s capital stock, after considering the 3,999,796 Founder Earn-Out Shares issued and held in escrow at Closing. |
(3) | Includes 6,700,000 shares of our Class A common stock issued to Old SES stockholders that participated in the PIPE Financing. |
(4) | Subject to certain transfer restrictions and/or forfeiture terms as described above. |
September 30, 2021 |
||||||||||||||||||||
Ivanhoe (Historical) |
Old SES (Historical) |
Transaction Accounting Adjustments |
Pro Forma Combined |
|||||||||||||||||
ASSETS |
||||||||||||||||||||
Current assets: |
||||||||||||||||||||
Cash and cash equivalents |
$ | 255 | $ | 30,093 | $ | 276,052 | A |
$ | 317,757 | |||||||||||
(9,660 | ) | B |
||||||||||||||||||
(17,712 | ) | C |
||||||||||||||||||
(10,109 | ) | D |
||||||||||||||||||
274,500 | F |
|||||||||||||||||||
(10 | ) | L |
||||||||||||||||||
(224,608 | ) | O |
||||||||||||||||||
(1,045 | ) | R |
||||||||||||||||||
Short-term investments |
— | 150,000 | — | 150,000 | ||||||||||||||||
Receivable from related party |
— | 1,138 | — | 1,138 | ||||||||||||||||
Prepaid expenses and other current assets |
761 | 953 | — | 1,714 | ||||||||||||||||
|
|
|
|
|
|
|
|
|||||||||||||
Total current assets |
1,016 |
182,184 |
287,409 |
470,609 |
||||||||||||||||
Investments held in Trust Account |
276,052 | — | (276,052 | ) | A |
— | ||||||||||||||
Property and equipment, net |
— | 5,656 | — | 5,656 | ||||||||||||||||
Intangible assets, net |
— | 1,632 | — | 1,632 | ||||||||||||||||
Restricted cash |
— | 475 | — | 475 | ||||||||||||||||
Deferred offering costs |
— | 2,679 | (2,679 | ) | C |
— | ||||||||||||||
Other assets |
— | 5,108 | — | 5,108 | ||||||||||||||||
|
|
|
|
|
|
|
|
|||||||||||||
Total Assets |
$ |
277,068 |
$ |
197,734 |
$ |
8,678 |
$ |
483,480 |
||||||||||||
|
|
|
|
|
|
|
|
|||||||||||||
LIABILITIES, REDEEMABLE CONVERTIBLE PREFERRED STOCK, AND STOCKHOLDERS’ EQUITY (DEFICIT) |
||||||||||||||||||||
Current liabilities: |
||||||||||||||||||||
Accounts payable |
$ | 43 | $ | 3,637 | $ | 10,878 | C |
$ | 26,270 | |||||||||||
11,712 | D |
|||||||||||||||||||
Accrued compensation |
— | 2,009 | — | 2,009 | ||||||||||||||||
Strategic premium liability related to an investor |
— | — | 7,493 | F |
7,493 | |||||||||||||||
Accrued expenses and other current liabilities |
198 | 1,352 | (87 | ) | C |
1,463 | ||||||||||||||
Due to related party |
10 | — | (10 | ) | L |
— | ||||||||||||||
|
|
|
|
|
|
|
|
|||||||||||||
Total current liabilities |
251 |
6,998 |
29,985 |
37,234 |
||||||||||||||||
Accrued liabilities |
4,484 | — | — | 4,484 | ||||||||||||||||
Convertible note - related party |
1,064 | — | (1,064 | ) | R |
— | ||||||||||||||
Deferred underwriting commissions |
9,660 | — | (9,660 | ) | B |
— | ||||||||||||||
Derivative warrant liabilities |
20,760 | — | (20,760 | ) | Q |
— | ||||||||||||||
Other liabilities |
— | 672 | — | 672 | ||||||||||||||||
Strategic premium liability related to an investor, long-term |
— | — | 11,239 | F |
11,239 | |||||||||||||||
Sponsor earn out liability |
— | — | 48,597 | M |
48,597 | |||||||||||||||
|
|
|
|
|
|
|
|
|||||||||||||
Total liabilities |
36,219 |
7,670 |
58,337 |
102,226 |
September 30, 2021 |
||||||||||||||||||||
Ivanhoe |
Old SES |
Transaction Accounting |
Pro Forma |
|||||||||||||||||
(Historical) |
(Historical) |
Adjustments |
Combined |
|||||||||||||||||
Commitments and contingencies |
||||||||||||||||||||
Redeemable convertible preferred stock |
— | 269,941 | (269,941 | ) | H |
— | ||||||||||||||
Class A ordinary shares, subject to possible redemption |
276,000 | — | (276,000 | ) | E |
— | ||||||||||||||
Class A common stock, subject to possible redemption |
— | — | 276,000 | E |
— | |||||||||||||||
(276,000 | ) | G |
||||||||||||||||||
Stockholders’ equity (deficit): |
||||||||||||||||||||
Class A ordinary shares |
— | — | — | E |
— | |||||||||||||||
Class A common stock |
— | — | — | E |
28 | |||||||||||||||
3 | F |
|||||||||||||||||||
3 | G |
|||||||||||||||||||
21 | H |
|||||||||||||||||||
1 | I |
|||||||||||||||||||
6 | J |
|||||||||||||||||||
(2 | ) | O |
||||||||||||||||||
(4 | ) | P |
||||||||||||||||||
Class B ordinary shares |
1 | — | (1 | ) | E |
— | ||||||||||||||
Class B common stock |
— | — | 1 | E |
4 | |||||||||||||||
(1 | ) | I |
||||||||||||||||||
4 | P |
|||||||||||||||||||
SES common stock |
— | — | — | J |
— | |||||||||||||||
Additional paid-in capital |
— | 1,199 | (31,182 | ) | C |
471,598 | ||||||||||||||
(22,074 | ) | D |
||||||||||||||||||
255,766 | F |
|||||||||||||||||||
275,997 | G |
|||||||||||||||||||
269,920 | H |
|||||||||||||||||||
(6 | ) | J |
||||||||||||||||||
(35,152 | ) | K |
||||||||||||||||||
(48,597 | ) | M |
||||||||||||||||||
9,574 | N |
|||||||||||||||||||
(224,606 | ) | O |
||||||||||||||||||
20,760 | Q |
|||||||||||||||||||
Accumulated other comprehensive income (loss) |
— | 181 | — | 181 | ||||||||||||||||
Accumulated deficit |
(35,152 | ) | (81,257 | ) | 253 | D |
(90,558 | ) | ||||||||||||
35,152 | K |
|||||||||||||||||||
(9,574 | ) | N |
||||||||||||||||||
19 | R |
|||||||||||||||||||
|
|
|
|
|
|
|
|
|||||||||||||
Total stockholders’ equity (deficit) |
(35,151 |
) |
(79,877 |
) |
496,281 |
381,253 |
||||||||||||||
|
|
|
|
|
|
|
|
|||||||||||||
Total liabilities, redeemable convertible preferred stock and stockholders’ equity (deficit) |
$ |
277,068 |
$ |
197,734 |
$ |
8,678 |
$ |
483,480 |
||||||||||||
|
|
|
|
|
|
|
|
Nine months ended September 30, 2021 |
||||||||||||||||||||
Ivanhoe |
Old SES |
Transaction Accounting Adjustments |
Pro Forma |
|||||||||||||||||
(Historical) |
(Historical) |
Combined |
||||||||||||||||||
Research and development |
$ | — | $ | 10,175 | $ | 1,841 | AA |
$ | 16,881 | |||||||||||
10,484 | BB |
|||||||||||||||||||
(5,619 | ) | BB |
||||||||||||||||||
General and administrative |
5,919 | 8,879 | 2,097 | AA |
16,642 | |||||||||||||||
(253 | ) | FF |
||||||||||||||||||
General and administrative expenses - related party |
90 | — | (90 | ) | CC |
— | ||||||||||||||
|
|
|
|
|
|
|
|
|||||||||||||
Total operating expenses |
6,009 |
19,054 |
8,460 |
33,523 |
||||||||||||||||
Loss from operations |
(6,009 | ) | (19,054 | ) | (8,460 | ) | (33,523 | ) | ||||||||||||
Other income (expense), net: |
||||||||||||||||||||
Interest income |
— | 163 | — | 163 | ||||||||||||||||
Other (expense) income, net |
— | 694 | — | 694 | ||||||||||||||||
Income from investments held in Trust Account |
52 | — | (52 | ) | DD |
— | ||||||||||||||
Change in fair value of convertible note - related party |
(119 | ) | — | — | (119 | ) | ||||||||||||||
Change in fair value of derivative warrant liabilities |
1,388 | — | (1,388 | ) | GG |
— | ||||||||||||||
Offering costs - derivative warrant liabilities |
(855 | ) | — | 855 | GG |
— | ||||||||||||||
|
|
|
|
|
|
|
|
|||||||||||||
Other income (expense), net |
466 |
857 |
(585 |
) |
738 |
|||||||||||||||
|
|
|
|
|
|
|
|
|||||||||||||
Loss before provision of income taxes |
(5,543 | ) | (18,197 | ) | (9,045 | ) | (32,785 | ) | ||||||||||||
Provision for income taxes |
— | (22 | ) | — | (22 | ) | ||||||||||||||
|
|
|
|
|
|
|
|
|||||||||||||
Net loss |
(5,543 |
) |
(18,219 |
) |
(9,045 |
) |
(32,807 |
) | ||||||||||||
Other comprehensive loss: |
||||||||||||||||||||
Foreign currency translation adjustment |
— | 48 | — | 48 | ||||||||||||||||
|
|
|
|
|
|
|
|
|||||||||||||
Net and comprehensive loss |
$ |
(5,543 |
) |
$ |
(18,171 |
) |
$ |
(9,045 |
) |
$ |
(32,759 |
) | ||||||||
|
|
|
|
|
|
|
|
|||||||||||||
Net loss per share – SES Class A and Class B common stock – basic and diluted |
— | — | — | $ | (0.11 | ) | ||||||||||||||
Weighted-average SES Class A and Class B common stock outstanding – basic and diluted |
— | — | — | 310,077,371 | ||||||||||||||||
Net loss per share of Ivanhoe Class A ordinary shares – basic and diluted |
$ | (0.17 | ) | — | — | — | ||||||||||||||
Weighted average shares of Ivanhoe Class A ordinary shares outstanding, subject to possible redemption – basic and diluted |
26,589,011 | — | — | — | ||||||||||||||||
Net loss per share of Ivanhoe Class B ordinary shares – basic and diluted |
$ | (0.17 | ) | — | — | — | ||||||||||||||
Weighted average shares of Ivanhoe Class B ordinary shares outstanding – basic and diluted |
6,867,033 | — | — | — | ||||||||||||||||
Net loss per Old SES common stock – basic and diluted |
— | $ | (1.78 | ) | — | — | ||||||||||||||
Weighted average shares of Old SES common stock outstanding – basic and diluted |
— | 10,249,586 | — | — |
For the period from July 8, 2020 (inception) through December 31, 2020 |
Twelve months ended December 31, 2020 |
|||||||||||||||||||
Ivanhoe (Historical) |
Old SES (Historical) |
Transaction Accounting Adjustments |
Pro Forma Combined |
|||||||||||||||||
Research and development |
$ | — | $ | 9,443 | $ | 8,005 | AA |
$ | 23,934 | |||||||||||
13,979 | BB |
|||||||||||||||||||
(7,493 | ) | BB |
||||||||||||||||||
General and administrative |
33 | 4,460 | 9,116 | AA |
13,609 | |||||||||||||||
|
|
|
|
|
|
|
|
|||||||||||||
Total operating expenses |
33 |
13,903 |
23,607 |
37,543 |
||||||||||||||||
Loss from operations |
(33 | ) | (13,903 | ) | (23,607 | ) | (37,543 | ) | ||||||||||||
Other income (expense), net: |
||||||||||||||||||||
Interest (expense) income |
— | 76 | — | 76 | ||||||||||||||||
Other (expense) income, net |
— | (55 | ) | (9,574 | ) | EE |
(9,629 | ) | ||||||||||||
|
|
|
|
|
|
|
|
|||||||||||||
Other income (expense), net |
— |
21 |
(9,574 |
) |
(9,553 |
) | ||||||||||||||
|
|
|
|
|
|
|
|
|||||||||||||
Loss before provision of income taxes |
(33 | ) | (13,882 | ) | (33,181 | ) | (47,096 | ) | ||||||||||||
Provision for income taxes |
— | (7 | ) | — | (7 | ) | ||||||||||||||
|
|
|
|
|
|
|
|
|||||||||||||
Net loss |
(33 |
) |
(13,889 |
) |
(33,181 |
) |
(47,103 |
) | ||||||||||||
Other comprehensive loss: |
||||||||||||||||||||
Foreign currency translation adjustment |
— | 188 | — | 188 | ||||||||||||||||
|
|
|
|
|
|
|
|
|||||||||||||
Net and comprehensive loss |
$ |
(33 |
) |
$ |
(13,701 |
) |
$ |
(33,181 |
) |
$ |
(46,915 |
) | ||||||||
|
|
|
|
|
|
|
|
|||||||||||||
Net loss per share – SES Class A and Class B common stock – basic and diluted |
— | — | — | (0.15 | ) | |||||||||||||||
Weighted-average SES Class A and Class B common stock outstanding – basic and diluted |
— | — | — | 310,077,371 | ||||||||||||||||
Net loss per share of Ivanhoe Class B ordinary shares – basic and diluted |
$ | (0.01 | ) | — | — | — | ||||||||||||||
Weighted average shares of Ivanhoe Class B ordinary shares outstanding – basic and diluted |
6,000,000 | — | — | — | ||||||||||||||||
Net loss per Old SES common stock – basic and diluted |
— | $ | (1.36 | ) | — | — | ||||||||||||||
Weighted average shares of Old SES common stock outstanding – basic and diluted |
— | 10,245,074 | — | — |
1. |
Basis of Presentation |
(i) | historical audited financial statements of Ivanhoe as of December 31, 2020 and for the period from July 8, 2020 (inception) through December 31, 2020; and |
(ii) | historical unaudited condensed financial statements of Ivanhoe as of and for the nine months ended September 30, 2021. |
(i) | historical audited consolidated financial statements of SES as of and for the year ended December 31, 2020; and |
(ii) | historical unaudited condensed consolidated financial statements of SES as of and for the nine months ended September 30, 2021. |
2. |
Adjustments to Unaudited Pro Forma Condensed Combined Financial Information |
(A) | Reflects the liquidation and reclassification of $276.0 million of investments held in the Trust Account to cash and cash equivalents that becomes available at the Closing prior to redemption. See Note (O) below for actual redemptions in connection with the Closing. |
(B) | Reflects the repayment and settlement of deferred underwriter commission liability of $9.7 million. |
(C) | Represents estimated direct and incremental transaction costs of $31.2 million for financial advisory, legal, accounting and other professional services incurred by Old SES prior to, or concurrent with the Closing. Such costs are reflected in the unaudited pro forma condensed combined balance sheet as a direct reduction to SES’s additional paid-in-capital |
(D) | Represents estimated direct and incremental transaction costs of $22.1 million for financial advisory, legal, accounting and other professional services incurred by Ivanhoe prior to, or concurrent with the Closing. Such costs are reflected in the unaudited pro forma condensed combined balance sheet as a direct reduction to SES’s APIC. Of $22.1 million, $10.1 million was paid and $11.7 million remained unpaid at the time of Closing. During the nine months ended September 30, 2021, Ivanhoe paid and expensed $0.3 million as General and administrative costs and has been reflected in the historical financial statements. This amount was adjusted as a pro forma adjustment in the above pro forma financial statements. See Note (FF) below. Included within the $22.1 million is approximately $6.2 million of expenses to be incurred for the PIPE Financing. |
(E) | Reflects conversion of Ivanhoe’s Class A ordinary shares and Class B ordinary shares into Ivanhoe’s Class A common stock and Class B common stock upon Domestication. |
(F) | Reflects the proceeds of $274.5 million from the issuance and sale of 27.45 million shares of Class A common stock at $10.00 per share pursuant to the Subscription Agreements entered into in connection with the PIPE Financing. In relation to a PIPE Financing by a strategic investor, SES will provide certain benefits to such strategic investor pursuant to a development agreement entered between such strategic investor and SES which is over and above the value that would be expected to be realized from the equity investment itself. We believe that SES is providing additional benefits in the form of funded research and development activities (“R&D Activities”) to the strategic investor which is over and above the value that would be expected to be realized from the equity investment itself. Thus, the sale of the shares of Class A common stock to such strategic investor reflects a higher price (the “strategic premium”) than a market participant who did not receive these strategic benefits would be willing to pay. As a result, SES has allocated on a relative fair value basis the relevant proceeds between the shares of Class A common stock and the strategic premium, resulting in an estimated $18.7 million of strategic premium which is recorded as a liability in the unaudited pro forma condensed combined balance sheet. Of the total $18.7 million, $7.5 million was classified as short-term liability and $11.2 million was classified as long-term liability. Based on the nature of the strategic premium it has been treated for accounting purposes as a payment for research and development |
efforts. SES will amortize the strategic premium liability over the estimated period of the development agreement with the investor which is 2.5 years. Such amortization would be recorded as an offset to research and development expense. See Note (BB) below. |
(i) | the R&D Activities do not amount to a Collaboration Agreement under the scope of ASC 808, Collaboration Agreements |
(ii) | the strategic investor would not be considered our customer under ASC 606, Revenue from Contracts with Customer |
(G) | Reflects the reclassification of Ivanhoe’s Class A common stock subject to possible redemption to permanent equity immediately prior to the Closing. |
(H) | Reflects the conversion of Old SES redeemable convertible preferred stock into Class A common stock pursuant to the conversion rate effective immediately prior to the Effective Time. |
(I) | Reflects the conversion of Ivanhoe’s 6,900,000 shares of Class B common stock into shares of Class A common stock concurrent with the Closing. |
(J) | Reflects the recapitalization of common shares between Old SES’s common stock, the Company’s Class A common stock and APIC. |
(K) | Reflects the elimination of Ivanhoe’s historical retained earnings. |
(L) | Reflects the repayment and settlement of Ivanhoe’s related party liability. |
(M) | Reflects the fair value of the Sponsor Earn-Out Shares contingently issuable to the Sponsor as of the Closing. The fair value was determined based on information available as of the date of these unaudited pro forma condensed combined financial information. Refer to Note 5 below for more information. |
(N) | Reflects the transaction costs allocated to Sponsor Earn-out Shares derivative liability and the strategic premium liability and expensed immediately as other expense at Closing. See Note (EE) below. |
(O) | Reflects the redemptions of 22,455,850 public shares of Ivanhoe Class A common stock for $224.6 million allocated to common stock and APIC, using a par value of $0.0001 per share at a redemption price of approximately $10.00 per share (based on the fair value of marketable securities held in the trust account as of the date of closing of $276.1 million). |
(P) | Reflects the conversion of SES Founder Group shares of Class A common stock into shares of Class B common stock concurrent with the Closing. |
(Q) | Reflects the reclassification of Ivanhoe IPO Warrants (as defined elsewhere in this prospectus) from liability to equity upon amendment of the Warrant Agreement dated January 6, 2021concurrently with the Closing on February 3, 2022, as they meet the equity classification criteria under ASC Subtopic 815-40. See Note (GG) below. |
(R) | Reflects the repayment and settlement of convertible note - related party upon closing. |
(AA) | Represents the stock-based compensation charge related to the restricted shares granted to Old SES option holders at Closing which will be subject to vesting based on the same terms as the Earn-Out Shares and will also be subject to forfeiture if such option holder’s service with SES terminates prior to the vesting. The grant date fair values of these equity awards were determined using Monte Carlo simulation valuation model. See Note 4 below for further information. |
(BB) | Represents estimated incremental research and development expense related to the development agreement with the strategic investor and amortization of strategic premium liability over the estimated period of the development agreement with the strategic investor. See Note (F) above. |
(CC) | Reflects elimination of Ivanhoe’s historical general and administrative expenses - related party charge related to fee paid to Ivanhoe’s Sponsor for office space, utilities, secretarial and administrative support services, that will cease upon consummation of the Business Combination. |
(DD) | Reflects elimination of income earned by Ivanhoe investments held in Trust Account. |
(EE) | Reflects the transaction costs allocated to Sponsor shares derivative liability and the strategic premium and expensed immediately as other expense at Closing. See Note (N) above. |
(FF) | Reflects elimination of direct and incremental transaction costs which was paid and expensed by Ivanhoe during the nine months ending September 30, 2022. See Note (D) above. |
(GG) | Reflects elimination of fair value changes and offering costs related to Ivanhoe IPO warrants upon change in their classification from liability to equity. See Note (Q) above. |
3. |
Loss per share |
Twelve Months Ended |
Nine Months Ended |
|||||||
December 31, 2020 |
September 30, 2021 |
|||||||
(in thousands, except share and per share amounts) |
||||||||
SES Pro Forma net loss |
$ | (47,103 | ) | $ | (32,807 | ) | ||
SES Weighted average shares outstanding – basic and diluted |
310,077,371 | 310,077,371 | ||||||
SES net loss per share – basic and diluted (1) |
$ | (0.15 | ) | $ | (0.11 | ) | ||
SES weighted average shares outstanding – basic and diluted |
||||||||
Old SES stockholders (other than SES Founder Group) - Class A common stock |
236,221,766 | 236,221,766 | ||||||
SES Founder Group - Class B common stock |
39,881,455 | 39,881,455 | ||||||
PIPE Investors - Class A common stock |
27,450,000 | 27,450,000 | ||||||
Ivanhoe stockholders - Class A common stock |
5,144,150 | 5,144,150 | ||||||
Ivanhoe Capital Sponsor LLC - Class A common stock |
1,380,000 | 1,380,000 | ||||||
|
|
|
|
|||||
Total |
310,077,371 | 310,077,371 | ||||||
|
|
|
|
(1) | The following outstanding shares of common stock equivalents were excluded from the computation of diluted net loss per share for the periods presented because including them would have had an anti-dilutive effect: |
Twelve Months Ended |
Nine Months Ended |
|||||||
December 31, 2020 |
September 30, 2021 |
|||||||
Options and restricted shares to purchase Class A common stock by Old SES stockholders |
23,022,703 | 23,022,703 | ||||||
Ivanhoe public warrants to purchase Class A common stock |
9,200,000 | 9,200,000 | ||||||
Ivanhoe Capital Sponsor LLC private placement warrants to purchase Class A common stock |
5,013,333 | 5,013,333 | ||||||
|
|
|
|
|||||
Total |
37,236,036 | 37,236,036 | ||||||
|
|
|
|
4. |
SES Earn-Out Shares |
Restricted Earn-Out Shares |
||||
Expected stock price |
$ | 9.84 | ||
Expected volatility |
80.0 | % | ||
Risk-free rate |
0.72 | % | ||
Expected term (in years) |
5.0 |
5. |
Sponsor Earn-Out Shares |
• | deliver a step-change in energy density to deliver a lightweight and compact battery, and substantially eliminate range anxiety of EVs; |
• | provide fast-charge capability to reduce charging times significantly, to a charge of 80% in less than 15 minutes; |
• | incorporate advanced AI-powered safety management software, which will accurately monitor state of health of the battery and apply appropriate self-healing protocols; |
• | use similar manufacturing processes as required for Li-ion, but is expected to be substantially less costly than conventional Li-ion at scale due to Li-Metal’s high energy density; |
• | achieve rapid market adoption due to our strategic partnerships, including with leading global OEMs, such as GM, Hyundai and Honda; |
• | capitalize on the innovation occurring in Li-ion, including improvements in energy density, manufacturing efficiency and cost reduction, as Li-Metal shares similar cathode and manufacturing process with Li-ion. |
• | Canada: All new light-duty cars and passenger trucks sold to be zero-emission by 2035. |
• | United States: $174 billion proposed to boost the EV market and halve greenhouse gas emissions by 2030. |
• | Denmark: Denmark has urged the European Union to ban the sale of all petrol and diesel cars by 2040. |
• | Finland: 30% market share for EVs by 2030, including personal vehicles, trucks and buses. |
• | France: Ban on gasoline and diesel vehicle sales by 2040. |
• | Germany: 10 million EVs and one million electric car charge points by 2030. |
• | Iceland: Reduce carbon emissions by 40% by 2030 and become carbon-neutral by 2040. |
• | Ireland: Ban on sales of new petrol and diesel cars by 2030 and become carbon neutral by 2050. |
• | Israel: Eliminate imports of gas and diesel vehicles and coal-fired electricity generation by 2030. |
• | Netherlands: All new petrol and diesel cars to be emission free by 2030. |
• | Norway: EVs to account for 100% of all car sales by 2025 (already accounting for 58% of all car sales in March 2019). |
• | United Kingdom: Ban on selling new petrol, diesel or hybrid cars by 2035. |
• | Australia: A$1.9 billion investment package already approved, including A$1.6 billion for renewable energy. |
• | China: 20% of new cars sold by 2025 to be electrified. |
• | India: Various regulatory programs to increase EV sales to 30% of total new cars by 2030. |
• | Japan: All new passenger cars sold to be electric or hybrid by the mid-2030s. |
• | Singapore: Phase out petrol and diesel vehicles by 2040. |
• | South Korea: 33% of new vehicle sold to be electric or hydrogen-fueled by 2030. |
• | GM: Launch more than 30 new EV models by 2025 and sell only zero-emission light-duty vehicles by 2035. |
• | Hyundai: Fully electrify lineup in major global markets by 2040. |
• | Toyota: 70% of vehicle sales to be from EVs in 2030. |
• | Ford: Invest $29 billion in EVs and autonomous vehicles by 2025 and become carbon neutral by 2050. |
• | light and compact |
• | durable and safe |
• | capable of fast charge |
• | capable of high power discharge |
• | low-cost Li-ion manufacturing scale and best-practices to enable cost-reduction; |
• | capitalizing on the innovation occurring in Li-ion, Li-ion; and |
• | smarter AI-powered health monitoring software that can predict safety incidents in real time and make appropriate safety recommendations. |
• | Scale-up cell-size manufactured at GWh scale (five to seven cells-per-minute) |
• | Module and pack design Li-Metal cells must be integrated into modules and packs as part of their integration into vehicles. Our active development efforts are focused on the integration of our Li-Metal cells into modules to enable our Li-Metal cells perform as intended once they are integrated into modules and vehicles. |
• | Advanced AI software and battery management systems (“BMS”) |
• | Advanced materials and coatings: |
• | Cathode materials and design Li-Metal cells for a variety of different cathode materials, cathode design and cathode processing methods that can provide ultra-high energy density and/or significant cost-reduction. |
• | Lithium metal recycling Li-Metal foil will also need to be recycled in the future. We continue to explore methods of recycling that are productive and cost-effective. |
• | Cell design, |
• | Materials state-of-the |
• | Battery management |
• | Environmental low-impact production of cell materials and recyclability of spent materials. |
• | $8.0 million for the three months ended September 30, 2021; |
• | $3.3 million for the three months ended September 30, 2020; |
• | $18.2 million for the nine months ended September 30, 2021; |
• | $10.0 million for the nine months ended September 30, 2020; |
• | $13.9 million for the year ended December 31, 2020; and |
• | $14.7 million for the year ended December 31, 2019. |
• | Scale-up cell-size manufactured at GWh scale (five to seven cells-per-minute) |
• | Module and pack design Li-Metal cells must be integrated into modules and packs as part of their integration into vehicles. We have active development in integration of our Li-Metal cells in modules to ensure that our Li-Metal cells perform as intended once they are integrated into modules and vehicles. |
• | Advanced AI software and battery management systems |
• | Advanced materials and coatings: |
• | Cathode materials and design Li-Metal cells for a variety of different cathode materials, cathode design and cathode processing methods that can provide ultra-high energy density and/or significant cost-reduction. |
• | Lithium metal recycling Li-Metal foil will also need to be recycled in the future. We continue to explore methods of recycling that are productive and cost-effective. |
Three Months Ended September 30 |
$ |
% |
||||||||||||||
2021 |
2020 |
Change |
Change |
|||||||||||||
Operating expenses: |
||||||||||||||||
Research and development |
$ | 3,684 | $ | 2,219 | $ | 1,465 | 66 | % | ||||||||
General and administrative |
4,374 | 1,046 | 3,328 | 318 | % | |||||||||||
|
|
|
|
|
|
|
|
|||||||||
Total operating expenses |
8,058 | 3,265 | 4,793 | 147 | % | |||||||||||
|
|
|
|
|
|
|
|
|||||||||
Loss from operations |
(8,058 | ) | (3,265 | ) | (4,793 | ) | (147 | )% | ||||||||
Other income: |
||||||||||||||||
Interest income |
160 | — | 160 | nm | (1) % | |||||||||||
Other (expense) income, net |
(94 | ) | (47 | ) | (47 | ) | (100 | )% | ||||||||
|
|
|
|
|
|
|
|
|||||||||
Total other income, net |
66 | (47 | ) | 113 | 240 | % | ||||||||||
Loss before income taxes |
(7,992 | ) | (3,312 | ) | (4,680 | ) | (141 | )% | ||||||||
Provision for income taxes |
(3 | ) | — | (3 | ) | nm | (1) % | |||||||||
|
|
|
|
|
|
|
|
|||||||||
Net loss |
(7,995 | ) | (3,312 | ) | (4,683 | ) | (141 | )% | ||||||||
|
|
|
|
|
|
|
|
|||||||||
Other comprehensive loss: |
||||||||||||||||
Foreign currency translation adjustment |
(23 | ) | 121 | (144 | ) | (119 | )% | |||||||||
|
|
|
|
|
|
|
|
|||||||||
Total comprehensive loss |
$ | (8,018 | ) | $ | (3,191 | ) | $ | (4,827 | ) | (151 | )% | |||||
|
|
|
|
|
|
|
|
|||||||||
Nine months Ended September 30 |
$ |
% |
||||||||||||||
2021 |
2020 |
Change |
Change |
|||||||||||||
Operating expenses: |
||||||||||||||||
Research and development |
$ | 10,175 | $ | 7,254 | $ | 2,921 | 40 | % | ||||||||
General and administrative |
8,879 | 2,828 | 6,051 | 214 | % | |||||||||||
|
|
|
|
|
|
|
|
|||||||||
Total operating expenses |
19,054 | 10,082 | 8,972 | 89 | % | |||||||||||
|
|
|
|
|
|
|
|
|||||||||
Loss from operations |
(19,054 | ) | (10,082 | ) | (8,972 | ) | (89 | )% | ||||||||
Other income: |
||||||||||||||||
Interest income |
163 | 71 | 92 | 130 | % | |||||||||||
Other income, net |
694 | (32 | ) | 726 | nm | (1) % | ||||||||||
|
|
|
|
|
|
|
|
|||||||||
Total other income, net |
857 | 39 | 818 | nm | (1) % | |||||||||||
Loss before income taxes |
(18,197 | ) | (10,043 | ) | (8,154 | ) | (81 | )% | ||||||||
Provision for income taxes |
(22 | ) | — | (22 | ) | nm | (1) % | |||||||||
|
|
|
|
|
|
|
|
|||||||||
Net loss |
(18,219 | ) | (10,043 | ) | (8,176 | ) | (81 | )% | ||||||||
|
|
|
|
|
|
|
|
|||||||||
Other comprehensive loss: |
||||||||||||||||
Foreign currency translation adjustment |
48 | 61 | (13 | ) | (21 | )% | ||||||||||
|
|
|
|
|
|
|
|
|||||||||
Total comprehensive loss |
$ | (18,171 | ) | $ | (9,982 | ) | $ | (8,189 | ) | (82 | )% | |||||
|
|
|
|
|
|
|
|
(1) | “nm” means not meaningful. |
Year Ended December 31 |
$ |
% |
||||||||||||||
2020 |
2019 |
Change |
Change |
|||||||||||||
Operating expenses: |
||||||||||||||||
Research and development |
$ | 9,443 | $ | 10,514 | $ | (1,071 | ) | (10 | )% | |||||||
General and administrative |
4,460 | 4,776 | (316 | ) | (7 | )% | ||||||||||
|
|
|
|
|
|
|
|
|||||||||
Total operating expenses |
13,903 | 15,290 | (1,387 | ) | (9 | )% | ||||||||||
|
|
|
|
|
|
|
|
|||||||||
Loss from operations |
(13,903 | ) | (15,290 | ) | (1,387 | ) | (9 | )% | ||||||||
Other income (expense): |
||||||||||||||||
Interest income |
76 | 684 | (608 | ) | (89 | )% | ||||||||||
Other (expense) income, net |
(55 | ) | 12 | (67 | ) | (558 | )% | |||||||||
|
|
|
|
|
|
|
|
|||||||||
Total other income, net |
21 | 696 | (675 | ) | (97 | )% | ||||||||||
Loss before income taxes |
(13,882 | ) | (14,594 | ) | (712 | ) | (5 | )% | ||||||||
Provision for income taxes |
(7 | ) | (108 | ) | (101 | ) | (94 | )% | ||||||||
|
|
|
|
|
|
|
|
|||||||||
Net loss |
(13,889 | ) | (14,702 | ) | (813 | ) | (6 | )% | ||||||||
|
|
|
|
|
|
|
|
|||||||||
Other comprehensive income (loss): |
||||||||||||||||
Foreign currency translation adjustment |
188 | (62 | ) | (250 | ) | (403 | )% | |||||||||
|
|
|
|
|
|
|
|
|||||||||
Total comprehensive loss |
$ | (13,701 | ) | $ | (14,764 | ) | $ | (1,063 | ) | (7 | )% | |||||
|
|
|
|
|
|
|
|
Nine months Ended September 30, |
||||||||
2021 |
2020 |
|||||||
Net cash used in operating activities |
$ | (17,804 | ) | $ | (8,603 | ) | ||
Net cash used in investing activities |
(141,673 | ) | (13,383 | ) | ||||
Net cash provided by financing activities |
187,341 | 840 |
Year Ended December 31, |
||||||||
2020 |
2019 |
|||||||
Net cash used in operating activities |
$ | (11,009 | ) | $ | (14,271 | ) | ||
Net cash used in investing activities |
(13,273 | ) | (4,609 | ) | ||||
Net cash provided by financing activities |
840 | 1,142 |
Payments Due by Period |
||||||||||||||||
Less than |
1-5 |
More than |
||||||||||||||
Total |
1 Year |
Years |
5 Years |
|||||||||||||
(in thousands) |
||||||||||||||||
Contractual Obligations |
||||||||||||||||
Operating Lease Obligations |
$ | 11,343 | $ | 2,704 | $ | 8,639 | $ | — | ||||||||
|
|
|
|
|
|
|
|
|||||||||
Purchase Obligations |
7,227 | 7,160 | 67 | — | ||||||||||||
|
|
|
|
|
|
|
|
|||||||||
Total |
$ |
18,570 |
$ |
9,864 |
$ |
8,706 |
$ | — | ||||||||
|
|
|
|
|
|
|
|
• | Expected Term |
• | Expected Volatility |
• | Expected Dividend Yield |
• | Risk-Free Interest Rate zero-coupon issues with an equivalent remaining term equal to the expected term of the award. |
Name |
Age |
Position | ||||
Dr. Qichao Hu |
35 | Chief Executive Officer; Chairman, Director | ||||
Rohit Makharia |
43 | President and Chief Operating Officer | ||||
Jing Nealis |
42 | Chief Financial Officer | ||||
Joanne Ban |
41 | Chief Legal and Corporate Officer | ||||
Yongkyu Son |
46 | Chief Technology Officer | ||||
Dr. Hong Gan |
61 | Chief Science Officer | ||||
Dr. Jang Wook Choi |
46 | Director | ||||
Robert Friedland |
70 | Director | ||||
Kent Helfrich |
56 | Director | ||||
Eric Luo |
55 | Director | ||||
Dr. Jiong Ma |
57 | Director | ||||
Michael Noonen |
58 | Director |
• | Dr. Qichao Hu, SES’s Founder and Chief Executive Officer and a director of SES; |
• | Mr. Rohit Makharia, SES’s President and Chief Operating Officer, who joined SES in this role in March 2021; and |
• | Ms. Jing Nealis, SES’s Chief Financial Officer, who joined SES in this role in March 2021. |
Name and Principal Position |
Year |
Salary ($) (1) |
Bonus ($) (2) |
Stock Awards ($) (3) |
Option Awards ($) (3) |
All Other Compensation ($) (4) |
Total ($) |
|||||||||||||||||||||
Dr. Qichao Hu Founder, Chief Executive Officer and Director |
2021 | 328,333 | 35,417 | — | — | 184,446 | 548,196 | |||||||||||||||||||||
2020 | 241,667 | 125,000 | — | 6,277 | 54,903 | 427,847 | ||||||||||||||||||||||
Rohit Makharia President and Chief Operating Officer |
2021 | 275,000 | 150,000 | — | 674,170 | 156,448 | 1,255,618 | |||||||||||||||||||||
Jing Nealis Chief Financial Officer |
2021 | 289,423 | 150,000 | 7,480,000 | 112,809 | 100,000 | 8,132,232 |
(1) | Amounts reflect the named executive officer’s base salary earned during fiscal year 2021. |
(2) | Amounts reflect (i) in the case of Dr. Hu, a bonus of $35,417 for performance from January 1, 2021 to March 31, 2021, and (ii) in the case of Mr. Makharia and Ms. Nealis, sign-on bonuses of $150,000 each in connection with their joining SES in March 2021. Additionally, each of the named executive officers was granted annual performance bonuses in 2021 for performance from April 1, 2021 to March 31, 2022. Actual bonus amounts to be paid in 2022 in respect of 2021 performance are expected to be determined by the Company in the second quarter of 2022, and will be disclosed in a Current Report on Form 8-K once determined. For more information, see “Narrative Disclosure to Summary Compensation Table - Bonuses.” |
(3) | Amount represents the aggregate grant date fair value of restricted share or stock option awards made to the named executive officer computed in accordance with Financial Accounting Standards Codification Topic 718, Compensation - Stock Compensation (“Topic 718”). The fair value of options was calculated using the Black-Scholes value on the grant date. As required by SEC rules, awards are reported in the year of grant. |
(4) | Amounts shown in this column represent (i) for all named executive officers, the aggregate amount of a monthly allowance for subsidized childcare benefits and other related benefits and (ii) for Dr. Hu and Mr. Makharia, certain other personal benefits. This allowance is also provided to certain other key employees of the Company. See “Narrative Disclosure to Summary Compensation Table - Other Benefits.” |
Option Awards |
Stock Awards |
|||||||||||||||||||||||||||
Name |
Grant Date |
Number of Securities Underlying Unexercised Options Exercisable (#) |
Number of Securities Underlying Unexercised Options Unexercisable (#) |
Option Exercise Price ($) |
Option Expiration Date |
Number of Shares of Stock That Have Not Vested (#) |
Market Value of Shares of Stock That Have Not Vested ($) |
|||||||||||||||||||||
Dr. Qichao Hu |
4/1/2020 | (1) |
91,554 | — | 0.14 | 3/31/2030 | — | — | ||||||||||||||||||||
Rohit Makharia |
3/1/2021 | (2) |
— | 7,091,082 | 0.16 | 2/28/2031 | — | — | ||||||||||||||||||||
Jing Nealis |
2/10/2021 | (2) |
— | 1,186,555 | 0.16 | 2/9/2031 | — | — | ||||||||||||||||||||
8/16/2021 | (3) |
— | — | — | — | 1,483,194 | 7,480,000 |
(1) | Reflects stock options that were granted under the 2018 Plan to compensate grantees, including Dr. Hu, for COVID-19-related |
(2) | Reflects time-based stock options that were granted under the 2018 Plan and vest 25% on the first anniversary of the grant date and in equal monthly installments over the following 36 months. For more information, see “Potential Payments Upon Termination or Change in Control - Equity Awards.” |
(3) | Reflects a restricted share award that was granted under the 2021 Plan and vests 25% on the first anniversary of the grant date and in equal monthly installments over the following 36 months. For more information, see “Potential Payments Upon Termination or Change in Control - Equity Awards.” |
• | each of our current directors; |
• | each of our named executive officers (as defined in “Executive and Director Compensation”); |
• | all of our current directors and executive officers as a group; and |
• | each person or “group” (as such term is used in Section 13(d)(3) of the Exchange Act) who is a beneficial owner of more than 5% of the outstanding Class A common stock or Class B common stock. |
Name and Address of Beneficial Owner |
Number of shares of SES Class A common stock |
% of New SES Class A common stock |
Number of Shares of SES Class B common stock |
% of New SES Class B common stock |
% of Total Voting Power** |
|||||||||||||||
Directors & executive officers (1) |
||||||||||||||||||||
Dr. Qichao Hu (2) |
100,736 | * | 43,881,251 | 100 | % | 56.5 | % | |||||||||||||
Jing Nealis (3) |
589,113 | * | — | — | * | |||||||||||||||
Rohit Makharia (4) |
2,631,681 | * | — | — | * | |||||||||||||||
Dr. Jang Wook Choi |
— | * | — | — | * | |||||||||||||||
Robert Friedland (5) |
319,166 | * | — | — | * | |||||||||||||||
Kent Helfrich |
— | * | — | — | * | |||||||||||||||
Eric Luo |
— | * | — | — | * | |||||||||||||||
Dr. Jiong Ma |
— | * | — | — | * | |||||||||||||||
Michael Noonen |
— | * | — | — | * | |||||||||||||||
All current directors and executive officers as a group (12 individuals) (6) |
7,893,444 | 2.6 | % | 43,881,251 | 100 | % | 59.1 | % | ||||||||||||
Greater-than-5% beneficial owners |
||||||||||||||||||||
Dr. Qichao Hu (2) |
100,736 | * | 43,881,251 | 100 | % | 56.5 | % | |||||||||||||
Long Siang Pte. Ltd. (7) |
27,280,647 | 9.0 | % | — | — | 3.7 | % | |||||||||||||
Vertex Legacy Continuation Fund Pte. Ltd. (8) |
32,256,315 | 10.6 | % | — | — | 4.3 | % | |||||||||||||
General Motors Ventures LLC and General Motors Holdings LLC (9) |
33,056,337 | 10.9 | % | — | — | 4.5 | % | |||||||||||||
Tianqi Lithium HK Co., Ltd. (10) |
30,522,386 | 10.0 | % | — | — | 4.1 | % | |||||||||||||
Affiliates of Temasek Holdings (Private) Limited (11) |
34,675,757 | 11.4 | % | — | — | 4.7 | % | |||||||||||||
SK Inc. (12) |
42,007,759 | 13.8 | % | — | — | 5.7 | % |
* | Indicates beneficial ownership of less than 1%. |
** | Percentage of total voting power represents the combined voting power with respect to all shares of Class A common stock and Class B common stock, voting as a single class. As described elsewhere in this prospectus, subject to certain conditions, each share of Class B common stock is entitled to 10 votes per share and each share of Class A common stock is entitled to one vote per share. |
(1) | The business address of each of these stockholders is c/o SES AI Corporation, 35 Cabot Road, Woburn, MA 01801. |
(2) | Includes (i) 100,736 shares of Class A common stock, 9,182 of which are Earn-Out Shares held directly by Dr. Qichao Hu; (ii) 30,716,882 shares of our Class B common stock, 2,799,859 of which are Founder Earn-Out Shares, held directly by Dr. Hu and (iii) an aggregate of 13,164,369 shares of Class B common stock, 1,199,937 of which are Founder Earn-Out Shares, held by various trusts affiliated with Dr. Hu. These trusts consist of: (i) Qichao Hu 2021 Irrevocable Trust U/A/D March 31, 2021; (ii) Qichao Hu Family Delaware Trust U/A/D March 31, 2021; and (iii) Qichao Hu 2021 Annuity Trust March 31, 2021 (collectively, the “Trusts”), each owning 4,388,123 shares of Class B common stock and 399,979 Founder Earn-Out Shares. |
(3) | Consists of 321,358 shares Class A common stock underlying SES options and 267,755 Earn-Out Shares. |
(4) | Consists of 1,920,501 shares of Class A common stock underlying SES options and 711,180 Earn-Out Shares. |
(5) | Consists of (i) 240,000 Class A ordinary shares of Ivanhoe (purchased in the open market) that were automatically converted on a one-for-one basis |
(6) | Includes shares beneficially owned by all directors, named executive officers and other executive officers (namely, Joanne Ban, Hong Gan and Yongkyu Son). |
(7) | Consists of (i) 24,703,118 shares of Class A common stock issued at Closing and (ii) 2,477,529 Earn-Out Shares. Long Siang Pte. Ltd. (“Long Siang”) is the record holder of the shares of Class A common stock. As a shareholder of Long Siang, Xie Huefeng may be deemed to have beneficial ownership over the shares of Class A common stock directly owned by Long Siang. The principal business address of all persons named in this footnote is 238 Orchard Boulevard, #24-05, Singapore 237973. |
(8) | Consists of (i) 29,361,711 shares of Class A common stock issued at Closing and (ii) 2,894,604 Earn-Out Shares. Vertex Legacy Continuation Fund Pte. Ltd. (“VLCF”) is the record holder of the shares of Class A common stock. Vertex Legacy Fund (SG) LP (“VLFSG”) is the 100% shareholder of VLCF. VLC GP Pte. Ltd. (“VLCGP”) is the general partner of VLFSG and has appointed Vertex Ventures SEA Management Pte. Ltd. (“VVSEAMPL”) to serve as the fund manager of VLCF. VVSEAMPL is deemed to have dispositive and voting power over the shares of Class A common stock directly owned by VLCF pursuant to a management agreement between VLFSG and VVSEAMPL, whereby dispositive and voting decisions require the majority approval of the members of an investment committee established by VVSEAMPL. The principal business address of all persons named in this footnote is 250 North Bridge Road, #11-01 Raffles City Tower, Singapore 179101. |
(9) | Consists of (i) 30,134,387 shares of Class A common stock issued at Closing and (ii) 2,921,950 Earn-Out Shares. GM Ventures is the record holder of 21,090,498 shares of Class A common stock and 2,085,124 Earn-Out Shares. GM Holdings is the record holder of 9,043,889 shares of Class A common stock and 836,826 Earn-Out Shares. GM Ventures is a wholly owned subsidiary of GM Holdings. GM Holdings is a wholly owned subsidiary of General Motors Company (“GM”). GM may be deemed to share beneficial ownership over the shares of Class A common stock directly owned by GM Ventures and GM Holdings, and GM Holdings may be deemed to share beneficial ownership over the shares of Class A common stock directly owned by GM Ventures. The principal office of each of all persons named in this footnote is 300 Renaissance Center, Detroit, MI, 48265. |
(10) | Consists of (i) 27,740,256 shares of Class A common stock issued at Closing and (ii) 2,782,130 Earn-Out Shares. Tianqi Lithium HK Co., Limited (“Tianqi HK”) is the record holder of such shares of Class A common stock. Tianqi HK is wholly owned by Tianqi Lithium Co., Limited (“Tianqi Limited”), and Tianqi Lithium is wholly owned by Tianqi Lithium Corporation (“Tianqi Lithium”). Tianqi Lithium and Tianqi Lithium may thus be deemed to share beneficial ownership over the shares of Class A common stock owned by Tianqi HK. The principal business address of all persons named in this footnote is No.10 East Gaopeng Road, Chengdu, Sichuan 610041, China. |
(11) | Anderson Investments Pte. Ltd. (“Anderson”) is the record holder of 25,882,916 shares of Class A common stock and 2,595,854 Earn-Out Shares. Aranda Investments Pte. Ltd. (“Aranda”) is the record holder of 5,632,129 shares of Class A common stock and 564,858 Earn-Out Shares. Anderson is a direct wholly-owned subsidiary of Thomson Capital Pte. Ltd. (“Thomson”), which in turn is a direct wholly-owned subsidiary of Tembusu Capital Pte. Ltd. (“Tembusu”). Aranda is a direct wholly-owned subsidiary of Seletar Investments Pte. Ltd. (“Seletar”), which in turn is a direct wholly-owned subsidiary of Temasek Capital (Private) Limited (“Temasek Capital”). Each of Tembusu and Temasek Capital is a direct wholly-owned subsidiary of Temasek Holdings (Private) Limited (“Temasek Holdings”). In such capacities, each of Thomson, Tembusu, and Temasek Holdings may be deemed to have beneficial ownership over the shares of Class A common stock directly owned by Anderson, and each of Seletar, Temasek Capital and Temasek Holdings may be deemed to have beneficial ownership over the shares of Class A common stock directly owned by Aranda. The principal business address of all persons named in this footnote is 60B Orchard Road, #06-18 Tower 2, The Atrium@Orchard, Singapore 238891. |
(12) | Consists of (i) 38,178,731 shares of Class A common stock issued at Closing and (ii) 3,829,028 Earn-Out Shares. SK, Inc. is the record holder and ultimate beneficial owner of such shares of Class A common stock. The principal business address of SK, Inc. is 26, Jong-ro, Jongno-gu, Seoul, |
Beneficially Owned Before the Offering |
Beneficially Owned After the Offering |
|||||||||||||||||||||||||||||||||||||||||||||||
Selling Securityholder |
Shares of Class A Common Stock |
% of Class A Common Stock |
Number of Shares of Class B Common Stock |
% of Class B Common Stock |
Number of Private Placement Warrants |
Number of Shares of Class A Common Stock Being Offered |
Number of Private Placement Warrants Being Offered |
Number of Shares of Class A Common Stock |
% of Class A Common Stock |
Number of Shares of Class B Common Stock |
% of Class B Common Stock |
Number of Private Placement Warrants |
||||||||||||||||||||||||||||||||||||
Dr. Qichao Hu (1) |
30,817,618 | 8.9 | % | 30,716,882 | 70 | % | — | 30,716,882 | — | 100,736 | * | — | — | — | ||||||||||||||||||||||||||||||||||
Qichao Hu, As the Trustee of The Qichao Hu 2021 Annuity Trust March 31, 2021 (1) |
4,388,123 | 1.3 | % | 4,388,123 | 10 | % | — | 4,388,123 | — | — | — | — | — | — | ||||||||||||||||||||||||||||||||||
First State Trust Company, As Trustee of the Qichao Hu 2021 Irrevocable Trust U/A/D March 31, 2021 (1) |
4,388,123 | 1.3 | % | 4,388,123 | 10 | % | — | 4,388,123 | — | — | — | — | — | — | ||||||||||||||||||||||||||||||||||
First State Trust Company, As Trustee of the Qichao Hu Family Delaware Trust U/A/D March 31, 2021 (1) |
4,388,123 | 1.3 | % | 4,388,123 | 10 | % | — | 4,388,123 | — | — | — | — | — | — | ||||||||||||||||||||||||||||||||||
Alyeska Master Fund, L.P. (2) |
700,000 | * | — | — | — | 300,000 | — | 400,000 | * | — | — | — | ||||||||||||||||||||||||||||||||||||
Anderson Investments Pte. Ltd. (3) |
28,478,770 | 8.2 | % | — | — | — | 28,478,770 | — | — | — | — | — | — | |||||||||||||||||||||||||||||||||||
Applied Ventures, LLC (4) |
7,451,210 | 2.1 | % | — | — | — | 7,451,210 | — | — | — | — | — | — | |||||||||||||||||||||||||||||||||||
Aranda Investments Pte. Ltd. (3) |
6,196,987 | 1.8 | % | — | — | — | 6,196,987 | — | — | — | — | — | — | |||||||||||||||||||||||||||||||||||
Bopu Global Private Equity Investment Portfolio LP (5) |
150,000 | * | — | — | — | 150,000 | — | — | — | — | — | — | ||||||||||||||||||||||||||||||||||||
Eric Victor Friedland (6) |
200,000 | * | — | — | — | 150,000 | — | 50,000 | * | — | — | — | ||||||||||||||||||||||||||||||||||||
Fidelity True North Fund, by its manager Fidelity Investments Canada ULC (7) |
715,607 | * | — | — | — | 400,000 | — | 315,607 | * | — | — | — | ||||||||||||||||||||||||||||||||||||
Franklin Strategic Series – Franklin Natural Resources Fund (8) |
150,000 | * | — | — | — | 150,000 | — | — | — | — | — | — |
Beneficially Owned Before the Offering |
Beneficially Owned After the Offering |
|||||||||||||||||||||||||||||||||||||||||||||||
Selling Securityholder |
Shares of Class A Common Stock |
% of Class A Common Stock |
Number of Shares of Class B Common Stock |
% of Class B Common Stock |
Number of Private Placement Warrants |
Number of Shares of Class A Common Stock Being Offered |
Number of Private Placement Warrants Being Offered |
Number of Shares of Class A Common Stock |
% of Class A Common Stock |
Number of Shares of Class B Common Stock |
% of Class B Common Stock |
Number of Private Placement Warrants |
||||||||||||||||||||||||||||||||||||
Franklin Templeton Investment Funds – Franklin Natural Resources Fund (9) |
250,000 | * | — | — | — | 250,000 | — | — | — | — | — | — | ||||||||||||||||||||||||||||||||||||
GCF Spower Ltd. (10) |
2,000,000 | * | — | — | — | 2,000,000 | — | — | — | — | — | — | ||||||||||||||||||||||||||||||||||||
General Motors Holdings LLC (11) |
23,175,622 | 6.7 | % | — | — | — | 23,175,622 | — | — | — | — | — | — | |||||||||||||||||||||||||||||||||||
General Motors Ventures LLC (11) |
9,880,715 | 2.8 | % | — | — | — | 9,880,715 | — | — | — | — | — | — | |||||||||||||||||||||||||||||||||||
Hel Ved Master Fund (12) |
500,000 | * | — | — | — | 500,000 | — | — | — | — | — | — | ||||||||||||||||||||||||||||||||||||
Honda Motor Co., Ltd. (13) |
7,500,000 | 2.2 | % | — | — | — | 7,500,000 | — | — | — | — | — | — | |||||||||||||||||||||||||||||||||||
Hyundai Motor Company (14) |
9,650,858 | 2.8 | % | — | — | 9,650,858 | — | — | — | — | — | — | ||||||||||||||||||||||||||||||||||||
Icreate Investments Limited (15) |
500,000 | * | — | — | — | 500,000 | — | — | — | — | — | — | ||||||||||||||||||||||||||||||||||||
Ivanhoe Capital Sponsor LLC (16) |
11,913,333 | 3.4 | % | — | — | 5,013,333 | 11,913,333 | 5,013,333 | — | — | — | — | — | |||||||||||||||||||||||||||||||||||
Kia Corporation (14) |
6,433,903 | 1.8 | % | — | — | — | 6,433,903 | — | — | — | — | — | — | |||||||||||||||||||||||||||||||||||
LG Energy Solution Fund I LLC (17) |
1,000,000 | * | — | — | — | 1,000,000 | — | — | — | — | — | — | ||||||||||||||||||||||||||||||||||||
Long Siang Pte., Ltd. (18) |
27,280,647 | 7.8 | % | — | — | — | 27,280,647 | — | — | — | — | — | — | |||||||||||||||||||||||||||||||||||
Luxor Capital Partners Long Offshore master Fund, LP (19) |
6,880 | * | — | — | — | 6,880 | — | — | — | — | — | — | ||||||||||||||||||||||||||||||||||||
Luxor Capital Partners Long, LP (19) |
21,055 | * | — | — | — | 21,055 | — | — | — | — | — | — | ||||||||||||||||||||||||||||||||||||
Luxor Capital Partners Offshore Master Fund, LP (19) |
342,206 | * | — | — | — | 342,206 | — | — | — | — | — | — | ||||||||||||||||||||||||||||||||||||
Luxor Capital Partners, LP (19) |
543,004 | * | — | — | — | 543,004 | — | — | — | — | — | — | ||||||||||||||||||||||||||||||||||||
Luxor Gibraltar, LP – Series I (19) |
38,926 | * | — | — | — | 38,926 | — | — | — | — | — | — | ||||||||||||||||||||||||||||||||||||
Luxor Wavefront, LP (19) |
247,929 | * | — | — | — | 247,929 | — | — | — | — | — | — | ||||||||||||||||||||||||||||||||||||
Peck Hong Hoon Alan (20) |
50,000 | * | — | — | — | 50,000 | — | — | — | — | — | — | ||||||||||||||||||||||||||||||||||||
SAIC Technologies Fund I, LLC (21) |
7,871,653 | * | — | — | — | 7,871,653 | — | — | — | — | — | — |
Beneficially Owned Before the Offering |
Beneficially Owned After the Offering |
|||||||||||||||||||||||||||||||||||||||||||||||
Selling Securityholder |
Shares of Class A Common Stock |
% of Class A Common Stock |
Number of Shares of Class B Common Stock |
% of Class B Common Stock |
Number of Private Placement Warrants |
Number of Shares of Class A Common Stock Being Offered |
Number of Private Placement Warrants Being Offered |
Number of Shares of Class A Common Stock |
% of Class A Common Stock |
Number of Shares of Class B Common Stock |
% of Class B Common Stock |
Number of Private Placement Warrants |
||||||||||||||||||||||||||||||||||||
SAIC Technology Fund II, LLC (21) |
788,550 | * | — | — | — | 788,550 | — | — | — | — | — | — | ||||||||||||||||||||||||||||||||||||
Shanghai Achiever Ltd. (22) |
10,368,304 | 3.0 | % | — | — | — | 10,368,304 | — | — | — | — | — | — | |||||||||||||||||||||||||||||||||||
Shangqi Partners LLC (21) |
286,895 | * | — | — | — | 286,895 | — | — | — | — | — | — | ||||||||||||||||||||||||||||||||||||
SK Inc. (23) |
42,007,759 | 12.1 | % | — | — | — | 42,007,759 | — | — | — | — | — | — | |||||||||||||||||||||||||||||||||||
Spring Creek Capital, LLC (24) |
5,000,000 | 1.4 | % | — | — | — | 5,000,000 | — | — | — | — | — | — | |||||||||||||||||||||||||||||||||||
Tianqi Lithium HK Co., Ltd. (25) |
30,522,386 | 8.8 | % | — | — | — | 30,522,386 | — | — | — | — | — | — | |||||||||||||||||||||||||||||||||||
Vance C. Brown (26) |
10,000 | * | — | — | — | 10,000 | — | — | — | — | — | — | ||||||||||||||||||||||||||||||||||||
Vertex Legacy Continuation Fund Pte. Ltd. (27) |
32,256,315 | 9.3 | % | — | — | — | 32,256,315 | — | — | — | — | — | — | |||||||||||||||||||||||||||||||||||
Vertex Ventures China IV, L.P. (28) |
1,147,591 | * | — | — | — | 1,147,591 | — | — | — | — | — | — | ||||||||||||||||||||||||||||||||||||
Walleye Opportunities Master Fund Ltd (29) |
1,000,000 | * | — | — | — | 1,000,000 | — | — | — | — | — | — | ||||||||||||||||||||||||||||||||||||
WJA Value Equity Fund LLC (30) |
90,000 | * | — | — | — | 90,000 | — | — | — | — | — | — | ||||||||||||||||||||||||||||||||||||
WJ-IBKS Global Fund No. 1(31) |
500,000 | * | — | — | — | 500,000 | — | — | — | — | — | — |
(1) | The address of each of these securityholders is c/o SES AI Corporation, 35 Cabot Road, Woburn, MA 01801. Dr. Qichao Hu is the Chief Executive Officer of the Company. The shares held directly by Mr. Hu include (i) 100,736 shares of New SES Class A common stock, 9,182 of which are Earn-Out Shares; and (ii) 30,716,882 shares of New SES Class B common stock, 2,799,859 of which are Founder Earn-Out Shares, and the shares of Class A common stock underlying such shares. An aggregate of 13,164,369 shares of New SES Class B common stock, 1,199,937 of which are Founder Earn-Out Shares, are held by various trusts affiliated with Dr. Hu. These trusts consist of: (i) Qichao Hu 2021 Irrevocable Trust U/A/D March 31, 2021; (ii) Qichao Hu Family Delaware Trust U/A/D March 31, 2021; and (iii) Qichao Hu 2021 Annuity Trust March 31, 2021 (collectively, the “Trusts”), each owning 4,388,123 shares of New SES Class B common stock and 399,979 Founder Earn-Out Shares, and the shares of Class A common stock underlying such shares. |
(2) | Alyeska Investment Group, L.P., the investment manager of Alyeska Master Fund, L.P. (the “Selling Securityholder”), has voting and investment control of the shares held by the Selling Securityholder. Anand Parekh is the Chief Executive Officer of Alyeska Investment Group, L.P. and may be deemed to be the beneficial owner of such shares. Mr. Parekh, however, disclaims any beneficial ownership of the shares held by the Selling Securityholder. The registered address of Alyeska Master Fund, L.P. is at c/o Maples Corporate Services Limited, P.O. Box 309, Ugland House, South Church Street George Town, Grand Cayman, KY1-1104, Cayman Islands. Alyeska Investment Group, L.P. is located at 77 W. Wacker, Suite 700, Chicago IL 60601 |
(3) | The address of each of these securityholders is 60B Orchard Road, #06-18 Tower 2, The Atrium@Orchard, Singapore 238891. |
(4) | The address of Applied Ventures, LLC is 3050 Bowers Avenue, Santa Clara, CA 95054. |
(5) | The address of Bopu Global Private Equity Investment Portfolio LP is Rm 2501, Hengbang Land Building, Qiaoxiang Rd, Shenzhen, PR China. |
(6) | The address of Eric Victor Friedland is 6151 St . Georges Cres., West Vancouver BC V7W 1Y9, Canada. |
(7) | Fidelity Investments Canada ULC is the manager of Fidelity True North Fund. The address of Fidelity True North Fund is 483 Bay Street, Suite 300, Toronto, Ontario, M5G 2N7. |
(8) | The address of Franklin Strategic Series – Franklin Natural Resources Fund is One Franklin Parkway, San Mateo, CA 94403. |
(9) | The address of Franklin Templeton Investment Funds – Franklin Natural Resources Fund is 8A, Rue Albert Borschette, Luxembourg, Luxembourg. |
(10) | The address of GCF Spower Ltd. is Craigmuir Chambers, Road Town Tortola, VG 110, British Virgin Island. |
(11) | The address of each of these securityholders is 300 Renaissance Center, Detroit, MI, 48265. |
(12) | The address of Hel Ved Master Fund is Suite 4120, 41/F, Jardine House, 1 Connaught Place, Central Hong Kong. |
(13) | The address of Honda Motor Co., Ltd. is 1-1, 2-Chome, Minami-Aoyama, Minato-Ku, Tokyo, Japan. |
(14) | The address each of these securityholders is 12, Heolleung-Ro, Seocho-Gu, Seoul, South Korea |
(15) | The address of Icreate Investments Limited is Floor 4, Willow House PO BOX 2804, Cricket Square, Grand Cayman KY1-1112. |
(16) | The address of Ivanhoe Capital Sponsor LLC is 1177 Avenue of the Americas, 5 th Floor, New York, NY 10036. |
(17) | The address of LG Energy Solution Fund I LLC is 2952 Bunker Hill Lane, Suite 110, Santa Clara, CA 95054. |
(18) | The address of Long Siang Pte., Ltd. is 6 Shenton Way #32-01, Singapore, 06809. |
(19) | The address of each of these securityholders is 1114 Avenue of the Americas, Floor 28, New York, NY 10036. |
(20) | The address of Peck Hong Hoon Alan is One Newton Road #28-03 Singapore 307943. |
(21) | The address of each of these securityholders is 2680 Zanker Road, STE 100, San Jose, CA 95134. |
(22) | The address of Shanghai Achiever Ltd.is Room 605, Block A, 818 East Longhua Road, Shanghai, China. |
(23) | The address of SK Inc. is 26, Jong-ro, Jongno-gu, Seoul, South Korea 03188. |
(24) | The principal business addresss of the entity is 4111 E 37 th Street, North Wichita, KS, USA 67220. |
(25) | The address of Tianqi Lithium HK Co., Ltd. is No.10 East Gaopeng Road, Chengdu, Sichuan 610041, China. |
(26) | The address of Vance C. Brown is 224 Vail Lane, North Salem, NY 10560. |
(27) | The address of Vertex Legacy Continuation Fund Pte. Ltd. is 250 North Bridge Road, #11-01 Raffles City Tower, Singapore 179101. |
(28) | The address of Vertex Ventures China IV, L.P. is 250 North Bridge Road, #11-01 Raffles City Tower, Singapore 179101. |
(29) | The address of Walleye Opportunities Master Fund Ltd is 2800 Niagara Lane, N, Plymouth, MN 55447. |
(30) | The address of WJA Value Equity Fund LLC is 717 Fifth Avenue, Floor 11, New York, NY 10022. |
(31) | The address of WJ-IBKS Global Fund No. 1 is 11 Gukjegeumyung-ro, 6-Gil, Yeongdeungpo-Gu, Seoul, South Korea. |
• | The audit committee or disinterested members of the board shall review the material facts of all related person transactions. |
• | In reviewing any related person transaction, the committee will take into account, among other factors that it deems appropriate: the importance and fairness of the transaction to us and the related person; the business rationale for engaging in the transaction; whether the value and terms of the transaction are substantially similar as compared to those of similar transactions previously entered into by us with non-related persons; the extent of the related person’s interest in the transaction; whether the transaction would likely impair the judgment of a director or executive officer to act in the best interests of us and our stockholders; and the impact on a director’s or a director nominee’s independence in the event the related person is a director or director nominee or an immediate family member of the director or director nominee. |
• | In connection with its review of any related person transaction, we shall provide the committee or disinterested members of the board with all material information regarding such related person transaction, the interest of the related person and any potential disclosure obligations of ours in connection with such related person transaction. |
• | If a related person transaction will be ongoing, the committee may establish guidelines for our management to follow in its ongoing dealings with the related person. |
• | banks, financial institutions or financial services entities; |
• | broker-dealers; |
• | governments or agencies or instrumentalities thereof; |
• | regulated investment companies; |
• | real estate investment trusts; |
• | expatriates or former long-term residents of the United States; |
• | except as specifically provided below, persons that actually or constructively own five percent or more (by vote or value) of our shares; |
• | persons that acquired our securities pursuant to an exercise of employee share options, in connection with employee share incentive plans or otherwise as compensation; |
• | insurance companies; |
• | dealers or traders subject to a mark-to-market |
• | persons holding our securities as part of a “straddle,” constructive sale, hedge, wash sale, conversion or other integrated or similar transaction; |
• | U.S. holders (as defined below) whose functional currency is not the U.S. dollar; |
• | partnerships (or entities or arrangements classified as partnerships or other pass-through entities for U.S. federal income tax purposes) and any beneficial owners of such partnerships; |
• | tax-exempt entities; |
• | controlled foreign corporations; and |
• | passive foreign investment companies. |
• | an individual who is a citizen or resident of the United States; |
• | a corporation (or other entity taxable as a corporation) organized in or under the laws of the United States, any state thereof or the District of Columbia; |
• | an estate the income of which is includible in gross income for U.S. federal income tax purposes regardless of its source; or |
• | a trust, if (i) a court within the United States is able to exercise primary supervision over the administration of the trust and one or more United States persons (as defined in the Code) have authority to control all substantial decisions of the trust or (ii) it has a valid election in effect under Treasury Regulations to be treated as a United States person. |
• | a non-resident alien individual (other than certain former citizens and residents of the United States subject to U.S. tax as expatriates); |
• | a foreign corporation; or |
• | an estate or trust that is not a U.S. holder; |
• | the gain is effectively connected with the conduct by the Non-U.S. holder of a trade or business within the United States (and, under certain income tax treaties, is attributable to a United States permanent establishment or fixed base maintained by the Non-U.S. holder); or |
• | we are or have been a “United States real property holding corporation” (as defined below) for U.S. federal income tax purposes at any time during the shorter of the five-year period ending on the date of disposition or the Non-U.S. holder’s holding period for the applicable security, except, in the case where shares of our Class A common stock are “regularly traded on an established securities market” (within the meaning of applicable Treasury Regulations, referred to herein as “regularly traded”), (i) the Non-U.S. holder is disposing of Class A common stock and has owned, directly or constructively, 5% or less of our Class A common stock at all times within the shorter of the five-year period preceding such disposition of Class A common stock or such Non-U.S. holder’s holding period for such Class A common stock or (ii) the Non-U.S. holder is disposing of warrants and has owned, directly or constructively, 5% or less of the total fair market value of our warrants (provided our warrants are considered to be regularly traded) at all times within the shorter of the five-year period preceding such disposition of warrants or such Non-U.S. holder’s holding period for such warrants. It is unclear how the rules for determining the 5% threshold for this purpose would be applied with respect to our Class A common stock and warrants, including how a Non-U.S. holder’s ownership of warrants impacts the 5% threshold determination with respect to its Class A common stock and whether the 5% threshold determination with respect to our warrants must be made with or without reference to the private placement warrants. In addition, special rules may apply in the case of a disposition of warrants if our Class A common stock is considered to be regularly traded, but the warrants are not considered to be regularly traded. We can provide no assurance as to our future status as a United States real property holding corporation or as to whether our Class A common stock or warrants will be considered to be regularly traded. Non-U.S. holders should consult their own tax advisors regarding the application of the foregoing rules in light of their particular facts and circumstances. |
• | in whole and not in part; |
• | at a price of $0.01 per warrant; |
• | upon a minimum of 30 days’ prior written notice of redemption (the “30-day redemption period”) to each warrant holder; and |
• | if, and only if, the closing price of the Class A common stock equals or exceeds $18.00 per share for any 20 trading days within a 30-trading day period ending on the third trading day prior to the date on which we send the notice of redemption to the warrant holders. |
(1) | prior to such time the board of directors of the corporation approved either the business combination or the transaction which resulted in the stockholder becoming an interested stockholder; |
(2) | upon consummation of the transaction which resulted in the stockholder becoming an interested stockholder, the interested stockholder owned at least 85% of the voting stock of the corporation outstanding at the time the transaction commenced, excluding for purposes of determining the voting stock outstanding (but not the outstanding voting stock owned by the interested stockholder) those shares owned (i) by persons who are directors and also officers and (ii) employee stock plans in which employee participants do not have the right to determine confidentially whether shares held subject to the plan will be tendered in a tender or exchange offer; or |
(3) | at or subsequent to such time the business combination is approved by the board of directors and authorized at an annual or special meeting of stockholders, and not by written consent, by the affirmative vote of at least 662/3% of the outstanding voting stock which is not owned by the interested stockholder. |
• | of the shares of SES common stock then outstanding as shown by the most recent report or statement published by SES; |
• | the average weekly reported volume of trading in SES common stock on all national securities exchanges and/or reported through the automated quotation system of a registered securities association during the four calendar weeks preceding the filing of the notice required to be filed by the seller under Rule 144 or if no such notice is required, the date of receipt of the order to execute the transaction by the broker or the date of execution of the transaction directly with a market maker; or |
• | the average weekly volume of trading in such securities reported pursuant to an effective transaction report plan or an effective national market system plan, as defined in Regulation NMS under the Exchange Act, during the four week period described in the preceding bullet. |
• | the issuer of the securities that was formerly a shell company has ceased to be a shell company; |
• | the issuer of the securities is subject to the reporting requirements of Section 13 or 15(d) of the Exchange Act; |
• | the issuer of the securities has filed all Exchange Act reports and material required to be filed, as applicable, during the preceding twelve months (or such shorter period that the issuer was required to file such reports and materials), other than Form 8-K reports; and |
• | at least one year has elapsed from the time that the issuer filed current Form 10 type information with the SEC reflecting its status as an entity that is not a shell company. |
• | purchases by a broker-dealer as principal and resale by such broker-dealer for its own account pursuant to this prospectus; |
• | ordinary brokerage transactions and transactions in which the broker solicits purchasers; |
• | block trades in which the broker-dealer so engaged will attempt to sell the securities as agent but may position and resell a portion of the block as principal to facilitate the transaction; |
• | an over-the-counter |
• | settlement of short sales entered into after the date of this prospectus; |
• | agreements with broker-dealers to sell a specified number of the securities at a stipulated price per share; |
• | in “at the market” offerings, as defined in Rule 415 under the Securities Act, at negotiated prices, at prices prevailing at the time of sale or at prices related to such prevailing market prices, including sales made directly on a national securities exchange or sales made through a market maker other than on an exchange or other similar offerings through sales agents; |
• | directly to purchasers, including through a specific bidding, auction or other process or in privately negotiated transactions; |
• | through the writing or settlement of options or other hedging transactions, whether through an options exchange or otherwise; |
• | through a combination of any of the above methods of sale; or |
• | any other method permitted pursuant to applicable law. |
Page |
||||
Audited Financial Statements of Ivanhoe Capital Acquisition Corp. as of December 31, 2020, for the year ended December 31, 2020 and the period from July 8, 2020 (inception) through December 31, 2020 |
||||
F-2 |
||||
F-3 |
||||
F-4 |
||||
F-5 |
||||
F-6 |
||||
F-7 |
||||
Condensed Consolidated Financial Statements of Ivanhoe Capital Acquisition Corp. as of and for the three and nine months ended September 30, 2021 |
||||
F-17 |
||||
F-18 |
||||
F-19 |
||||
F-20 |
||||
F-21 |
||||
F-45 |
||||
F-46 |
||||
F-47 |
||||
SES HOLDINGS PTE. LTD. AND SUBSIDIARIES |
||||
Audited Consolidated Financial Statements of SES Holdings Pte. Ltd. and Subsidiaries as of December 31, 2020 and 2019 and for the years ended December 31, 2020 and 2019 |
||||
F-64 |
||||
F-65 |
||||
F-66 |
||||
F-67 |
||||
F-68 |
||||
F-69 |
||||
Unaudited Condensed Consolidated Financial Statements of SES Holdings Pte. Ltd. and Subsidiaries as of September 30, 2021 and for the three and nine months ended September 30, 2021 and 2020 |
||||
F-91 |
||||
F-92 |
||||
F-93 |
||||
F-95 |
||||
F-96 |
Assets |
||||
Current assets |
||||
Cash |
$ | |||
|
|
|||
Total current assets |
||||
Deferred offering costs associated with Initial Public Offering |
||||
|
|
|||
Total Assets |
$ | |||
|
|
|||
Liabilities and Shareholder’s Deficit |
||||
Current liabilities: |
||||
Accounts payable |
||||
Accrued expenses |
||||
Note payable – related party |
||||
|
|
|||
Total current liabilities |
||||
Commitments and Contingencies (Note 6) |
||||
Shareholder’s Deficit |
||||
Preference shares, $ |
||||
Additional paid-in capital |
||||
Accumulated deficit |
( |
) | ||
|
|
|||
Total shareholders’ deficit |
( |
) | ||
|
|
|||
Total Liabilities and Shareholder’s Deficit |
$ |
|||
|
|
(1) | This number includes up to |
(2) | Shares and the associated amounts have been retroactively restated to reflect: (i) the surrender of |
General and administrative expenses |
$ | |||
|
|
|||
Net loss |
$ | ( |
) | |
|
|
|||
Weighted average shares outstanding, basic and diluted(1)(2) |
||||
|
|
|||
Basic and diluted net loss per share |
$ | ( |
) | |
|
|
(1) | This number excludes an aggregate of up to |
(2) | Shares and the associated amounts have been retroactively restated to reflect: (i) the surrender of |
Ordinary Shares |
Additional Paid-in Capital |
Accumulated Deficit |
Total Shareholder’s Deficit |
|||||||||||||||||||||||||
Class A |
Class B |
|||||||||||||||||||||||||||
Shares |
Amount |
Shares |
Amount |
|||||||||||||||||||||||||
Balance |
$ | $ | $ | $ | $ | |||||||||||||||||||||||
July 8, 2020 (inception) |
||||||||||||||||||||||||||||
Issuance of Class B ordinary shares to Sponsor(1)(2) |
||||||||||||||||||||||||||||
Net loss |
( |
) | ( |
) | ||||||||||||||||||||||||
|
|
|
|
|
|
|
|
|
|
|
|
|
|
|||||||||||||||
Balance – December 31, 2020 |
$ |
$ |
$ |
$ |
( |
) |
$ |
( |
) | |||||||||||||||||||
|
|
|
|
|
|
|
|
|
|
|
|
|
|
(1) | This number includes up to |
(2) | Shares and the associated amounts have been retroactively restated to reflect: (i) the surrender of |
Cash Flows from Operating Activities: |
||||
Net loss |
$ | ( |
) | |
Adjustments to reconcile net loss to net cash used in operating activities: |
||||
General and administrative expenses paid by Sponsor in exchange for issuance of Class B ordinary shares |
||||
Changes in operating liabilities |
||||
Accrued expenses |
||||
|
|
|
||
Net cash used in operating activities |
( |
) | ||
|
|
|
||
Cash Flows from Financing Activities: |
||||
Proceeds received from note payable to related party |
||||
Offering costs paid |
( |
) | ||
|
|
|
||
Net cash provided by financing activities |
||||
|
|
|
||
Net increase in cash |
||||
Cash – beginning of the period |
||||
|
|
|
||
Cash – end of the period |
$ |
|||
|
|
|
||
Supplemental disclosure of noncash investing and financing activities: |
||||
Offering costs included in accounts payable |
$ | |||
Offering costs included in accrued expenses |
$ | |||
Offering costs paid by Sponsor under promissory note |
$ |
• | in whole and not in party’ |
• | at a price of $ |
• | upon a minimum of |
• | if, and only if, the last reported sale price (the “closing price”) of Class A ordinary shares equals or exceeds $18.00 per share (as adjusted) for any |
• | in whole and not in part; |
• | at $ |
• | if, and only if, the closing price of Class A ordinary shares equals or exceeds $10.00 per share (as adjusted) for any |
September 30, 2021 |
December 31, 2020 |
|||||||
(Unaudited) |
||||||||
Assets |
||||||||
Current assets: |
||||||||
Cash |
$ | $ | ||||||
Prepaid expenses |
— | |||||||
|
|
|
|
|
||||
Total current assets |
||||||||
Investments held in Trust Account |
— | |||||||
Deferred offering costs associated with the I nitial P ublic O ffering |
— | |||||||
|
|
|
|
|
||||
Total Assets |
$ |
$ |
||||||
|
|
|
|
|
||||
Liabilities, Class A Ordinary Shares Subject to Redemption and Shareholders’ Deficit |
||||||||
Current liabilities: |
||||||||
Accounts payable |
$ | $ | ||||||
Due to related party |
— | |||||||
Accrued expenses |
||||||||
Note payable – related party |
— | |||||||
|
|
|
|
|
||||
|
||||||||
Accrued liabilities |
— | |||||||
Convertible note – related party |
— | |||||||
Deferred underwriting commissions |
— | |||||||
Derivative warrant liabilities |
— | |||||||
|
|
|
|
|
||||
Total liabilities |
||||||||
|
|
|
|
|||||
Commitments and Contingencies |
||||||||
Class A ordinary shares subject to possible redemption, $ - |
— | |||||||
Shareholders’ Deficit: |
||||||||
Preference shares, $ |
— | |||||||
Class A ordinary shares, $ |
— | |||||||
Class B ordinary shares, $ |
||||||||
Additional paid-in capital |
— | |||||||
Accumulated deficit |
( |
) | ( |
) | ||||
|
|
|
|
|||||
Total shareholders’ deficit |
( |
) | ( |
) | ||||
|
|
|
|
|||||
Total Liabilities, Class A Ordinary Shares Subject to Possible Redemption and Shareholders’ Deficit |
$ |
$ |
||||||
|
|
|
|
For the Three Months Ended September 30, 2021 |
For the Nine Months Ended September 30, 2021 |
For the Period From July 8, 2020 (Inception) Through September 30, 2020 |
||||||||||
General and administrative expenses |
$ | $ | $ | |||||||||
General and administrative expenses – related party |
— | |||||||||||
|
|
|
|
|
|
|
||||||
Total operating expenses |
( |
) | ( |
) | ( |
) | ||||||
Other income (expenses): |
||||||||||||
Income from investments held in Trust Account |
— | |||||||||||
Change in fair value of derivative warrant liabilities |
— | |||||||||||
Change in fair value of convertible note – related party |
( |
) | — | |||||||||
Offering costs – derivative warrant liabilities |
— | ( |
) | — | ||||||||
|
|
|
|
|
|
|||||||
Net income (loss) |
$ | $ | ( |
) | $ | ( |
) | |||||
|
|
|
|
|
|
|||||||
Basic and diluted weighted average shares outstanding, Class A ordinary shares |
— | |||||||||||
|
|
|
|
|
|
|||||||
Basic and diluted net income (loss) per ordinary share, Class A ordinary shares |
$ | $ | ( |
) | $ | — | ||||||
|
|
|
|
|
|
|||||||
Basic and diluted weighted average ordinary shares outstanding, Class B ordinary shares |
||||||||||||
|
|
|
|
|
|
|||||||
Basic and diluted net income (loss) per ordinary share, Class B ordinary shares |
$ | $ | ( |
) | $ | ( |
) | |||||
|
|
|
|
|
|
For the Three And Nine Months Ended September 30, 2021 |
||||||||||||||||||||||||||||
Ordinary Shares |
Additional Paid-in Capital |
Accumulated Deficit |
Total Shareholders’ Deficit |
|||||||||||||||||||||||||
Class A |
Class B |
|||||||||||||||||||||||||||
Shares |
Amount |
Shares |
Amount |
|||||||||||||||||||||||||
Balance – December 31, 2020 |
$ |
$ |
$ |
$ |
( |
) |
$ |
( |
) | |||||||||||||||||||
Accretion of Class A ordinary shares subject to redemption |
— | — | — | — | ( |
) | ( |
) | ( |
) | ||||||||||||||||||
Net income |
— | — | — | — | — | |||||||||||||||||||||||
|
|
|
|
|
|
|
|
|
|
|
|
|
|
|||||||||||||||
Balance – March 31, 2021 (unaudited), as restated |
— |
( |
) |
( |
) | |||||||||||||||||||||||
Net loss |
— | — | — | — | — | ( |
) | ( |
) | |||||||||||||||||||
|
|
|
|
|
|
|
|
|
|
|
|
|
|
|||||||||||||||
Balance – June 30, 2021 (unaudited), as restated |
— |
( |
) |
( |
) | |||||||||||||||||||||||
Net income |
— | — | — | — | — | |||||||||||||||||||||||
|
|
|
|
|
|
|
|
|
|
|
|
|
|
|||||||||||||||
Balance – September 30, 2021 (unaudited) |
$ |
$ |
$ |
— |
$ |
( |
) |
$ |
( |
) | ||||||||||||||||||
|
|
|
|
|
|
|
|
|
|
|
|
|
|
For the Period From July 8, 2020 (Inception) Through September 30, 2020 |
||||||||||||||||||||||||||||
Ordinary Shares |
Additional Paid-in Capital |
Accumulated Deficit |
Total Shareholder’s Equity |
|||||||||||||||||||||||||
Class A |
Class B |
|||||||||||||||||||||||||||
Shares |
Amount |
Shares |
Amount |
|||||||||||||||||||||||||
Balance – July 8, 2020 (inception) |
$ |
$ |
$ |
$ |
$ |
|||||||||||||||||||||||
Issuance of Class B ordinary shares to Sponsor |
— | — | — | |||||||||||||||||||||||||
Net loss |
— | — | — | — | — | ( |
) | ( |
) | |||||||||||||||||||
|
|
|
|
|
|
|
|
|
|
|
|
|
|
|
|
|
|
|
|
|
|
|
|
|
|
|
|
|
Balance – September 30, 2020 (unaudited) |
$ |
$ |
$ |
$ |
( |
) |
$ |
|||||||||||||||||||||
|
|
|
|
|
|
|
|
|
|
|
|
|
|
|
|
|
|
|
|
|
|
|
|
|
|
|
|
|
Nine months ended Ended September 30, 2021 |
For the Period From July 8, 2020 (Inception) Through September 30, 2020 |
|||||||
Cash Flows from Operating Activities: |
||||||||
Net loss |
$ | ( |
) | $ | ( |
) | ||
Adjustments to reconcile net loss to net cash used in operating activities: |
||||||||
Income from investments held in Trust Account |
( |
) | — | |||||
Change in fair value of derivative warrant liabilities |
( |
) | — | |||||
Change in fair value of convertible note – related party |
— | |||||||
Offering costs – derivative warrant liabilities |
— | |||||||
Changes in operating assets and liabilities: |
||||||||
Prepaid expenses |
( |
) | ||||||
Accounts payable |
— | |||||||
Due to related party |
— | |||||||
Accrued expenses |
— | |||||||
Accrued liabilities |
— | |||||||
|
|
|
|
|
||||
Net cash used in operating activities |
( |
) | — | |||||
|
|
|
|
|
||||
Cash Flows from Investing Activities: |
||||||||
Cash deposited in Trust Account |
( |
) | — | |||||
|
|
|
|
|
||||
Net cash used in investing activities |
( |
) | — | |||||
|
|
|
|
|
||||
Cash Flows from Financing Activities: |
||||||||
Payment of note payable to related party |
( |
) | — | |||||
Proceeds received from I nitial P ublic O ffering, gross |
— | |||||||
Proceeds received from private placement |
— | |||||||
Offering costs paid |
( |
) | — | |||||
Proceeds from convertible note to related party |
— | |||||||
|
|
|
|
|
||||
Net cash provided by financing activities |
— | |||||||
|
|
|
|
|
||||
Net change in cash |
— | |||||||
Cash – beginning of the period |
— | |||||||
|
|
|
|
|
||||
Cash – end of the period |
$ |
$ |
— |
|||||
|
|
|
|
|
||||
Supplemental disclosure of noncash financing activities: |
||||||||
Prepaid expenses paid by Sponsor in exchange for issuance of Class B ordinary shares |
$ | — | $ | |||||
Deferred offering costs included in accounts payable |
$ | — | $ | |||||
Offering costs included in accrued expenses |
$ | $ | ||||||
Deferred offering costs paid by Sponsor under promissory note |
$ | — | $ | |||||
Deferred underwriting commissions |
$ | $ | — |
As of March 31, 2021 |
As Previously Reported |
Adjustment |
As Restated |
|||||||||
Total assets |
$ |
$ |
— |
$ |
||||||||
Total liabilities |
$ |
$ |
— |
$ |
||||||||
Class A ordinary shares subject to possible redemption |
||||||||||||
Preference shares |
||||||||||||
Class A ordinary shares |
( |
) | — | |||||||||
Class B ordinary shares |
— | |||||||||||
Additional paid-in capital |
$ | ( |
) | — | ||||||||
Retained earnings (accumulated deficit) |
$ | ( |
) | $ | ( |
) | ||||||
Total shareholders’ equity (deficit) |
$ |
$ |
( |
) |
$ |
( |
) | |||||
Total Liabilities, Class A Ordinary Shares Subject to Possible Redemption and Shareholders’ Equity (Deficit) |
$ |
$ |
— |
$ |
Supplemental Disclosure of Noncash Financing |
As Reported |
Adjustment |
As Restated |
|||||||||
Initial |
$ | $ | ( |
) | $ | — | ||||||
Change |
$ | ( |
) | $ | $ | — |
As of June 30, 2021 |
As Previously Reported |
Adjustment |
As Restated |
|||||||||
Total assets |
$ |
$ |
— |
$ |
||||||||
Total liabilities |
$ |
$ |
— |
$ |
||||||||
Class A ordinary shares subject to possible redemption |
||||||||||||
Preference shares |
||||||||||||
Class A ordinary shares |
( |
) | — | |||||||||
Class B ordinary shares |
— | |||||||||||
Additional paid-in capital |
$ | ( |
) | — | ||||||||
Accumulated deficit |
$ | ( |
) | ( |
) | $ | ( |
) | ||||
Total shareholders’ equity (deficit) |
$ |
$ |
( |
) |
$ |
( |
) | |||||
Total Liabilities, Class A Ordinary Shares Subject to Possible Redemption and Shareholders’ Equity (Deficit) |
$ |
$ |
— |
$ |
Supplemental Disclosure of Noncash Financing Activities: |
As Reported |
Adjustment |
As Restated |
|||||||||
Initial value of Class A ordinary shares subject to possible redemption |
$ | $ | ( |
) | $ | — | ||||||
Change in value of Class A ordinary shares subject to possible redemption |
$ | ( |
) | $ | $ | — |
|
Earnings Per Share for Class A ordinary shares |
|||||||||||
|
As Reported |
Adjustment |
As Restated |
|||||||||
For the three months ended March 31, 2021 |
||||||||||||
Net income |
$ | $ | — | $ | ||||||||
Weighted average shares outstanding |
( |
) | ||||||||||
Basic and diluted earnings per ordinary share |
$ | — | $ | $ | ||||||||
For three months ended June 30, 2021 |
||||||||||||
Net loss |
$ | ( |
) | $ | — | $ | ( |
) | ||||
Weighted average shares outstanding |
— | |||||||||||
Basic and diluted earnings per ordinary share |
$ | — | $ | ( |
) | $ | ( |
) | ||||
For the six months ended June 30, 2021 |
||||||||||||
Net loss |
$ | ( |
) | $ | — | $ | ( |
) | ||||
Weighted average shares outstanding |
( |
) | ||||||||||
Basic and diluted earnings per ordinary share |
$ | — | $ | ( |
) | $ | ( |
) |
Earnings Per Share for Class B ordinary shares |
||||||||||||
As Reported |
Adjustment |
As Restated |
||||||||||
For the three months ended March 31, 2021 |
||||||||||||
Net income |
$ | $ | — | $ | ||||||||
Weighted average shares outstanding |
— | |||||||||||
Basic and diluted earnings per ordinary share |
$ | $ | ( |
) | $ | |||||||
For three months ended June 30, 2021 |
||||||||||||
Net loss |
$ | ( |
) | $ | — | $ | ( |
) | ||||
Weighted average shares outstanding |
— | |||||||||||
Basic and diluted earnings per ordinary share |
$ | ( |
) | $ | $ | ( |
) | |||||
For the six months ended June 30, 2021 |
||||||||||||
Net loss |
$ | ( |
) | $ | — | $ | ( |
) | ||||
Weighted average shares outstanding |
— | |||||||||||
Basic and diluted earnings per ordinary share |
$ | ( |
) | $ | $ | ( |
) |
• |
Level 1, defined as observable inputs such as quoted prices (unadjusted) for identical instruments in active markets; |
• |
Level 2, defined as inputs other than quoted prices in active markets that are either directly or indirectly observable such as quoted prices for similar instruments in active markets or quoted prices for identical or similar instruments in markets that are not active; and |
• |
Level 3, defined as unobservable inputs in which little or no market data exists, therefore requiring an entity to develop its own assumptions, such as valuations derived from valuation techniques in which one or more significant inputs or significant value drivers are unobservable. |
For the Three Months Ended September 30, 2021 |
For the Nine Months Ended September 30, 2021 |
For the Period From July 8, 2020 (Inception) Through September 30, 2020 |
||||||||||||||||||||||
Class A |
Class B |
Class A |
Class B |
Class A |
Class B |
|||||||||||||||||||
Basic and diluted net income (loss) per ordinary share: |
||||||||||||||||||||||||
Numerator: |
||||||||||||||||||||||||
Allocation of net income (loss) |
$ | $ | $ | ( |
) | $ | ( |
) | $ | — | $ | ( |
) | |||||||||||
Denominator: |
||||||||||||||||||||||||
Basic and diluted weighted average ordinary shares outstanding |
— | |||||||||||||||||||||||
|
|
|
|
|
|
|
|
|
|
|
|
|||||||||||||
Basic and diluted net income (loss) per ordinary share |
$ | $ | $ | ( |
) | $ | ( |
) | $ | — | $ | ( |
) | |||||||||||
|
|
|
|
|
|
|
|
|
|
|
|
• | in whole and not in part; |
• | at a price of $ |
• | upon a minimum of |
• | if, and only if, the last reported sale price (the “closing price”) of Class A ordinary shares equals or exceeds $ |
• | in whole and not in part; |
• | at $ |
• | if, and only if, the closing price of Class A ordinary shares equals or exceeds $ |
Gross proceeds from Initial Public Offering |
$ | |||
Less: |
||||
Fair value of Public Warrants at issuance |
( |
) | ||
Offering costs allocated to Class A ordinary shares subject to possible redemption |
( |
) | ||
Plus: |
||||
Accretion on Class A ordinary shares subject to possible redemption amount |
||||
|
|
|||
Class A ordinary shares subject to possible redemption |
$ | |||
|
|
Description |
Quoted Prices in Active Markets (Level 1) |
Significant Other Observable Inputs (Level 2) |
Significant Other Unobservable Inputs (Level 3) |
|||||||||
Assets: |
||||||||||||
Investments held in Trust Account |
$ | $ | — | $ | — | |||||||
Liabilities: |
||||||||||||
Derivative warrant liabilities – Public Warrants |
$ | $ | — | $ | — | |||||||
Derivative warrant liabilities – Private Placement Warrants |
$ | — | $ | — | $ | |||||||
Convertible note – related party |
$ | — | $ | — | $ |
As of September 30, 2021 |
||||
Option term (in years) |
||||
Stock price |
$ | |||
Volatility |
% | |||
Risk-free interest rate |
% | |||
Expected dividends |
— | % |
As of September 30, 2021 |
As of April 15, 2021 (Draw Down Date) |
|||||||
Option term (in years) |
||||||||
Stock price |
$ | $ | ||||||
Volatility |
% | % | ||||||
Risk-free interest rate |
% | % | ||||||
Expected dividends |
— | % | — | % |
Derivative warrant liabilities at January 1, 2021 |
$ | |||
Issuance of Public and Private Warrants |
||||
Transfer of Public Warrants to Level 1 measurement |
( |
) | ||
Change in fair value of derivative warrant liabilities |
( |
) | ||
|
|
|
||
Derivative warrant liabilities at March 31, 2021 |
||||
Change in fair value of derivative warrant liabilities |
||||
Derivative warrant liabilities at June 30, 2021 |
||||
Change in fair value of derivative warrant liabilities |
( |
) | ||
|
|
|
||
Derivative warrant liabilities at September 30, 2021 |
$ | |||
|
|
|
Fair Value at January 1, 2021 |
$ | |||
Initial fair value of convertible note – related party – second quarter |
||||
Change in fair value of convertible note – related party |
||||
|
|
|
||
Fair Value of convertible note – related party, June 30, 2021 |
||||
Initial fair value of convertible note – related party – third quarter |
||||
Change in fair value of convertible note – related party |
( |
) | ||
|
|
|
||
Fair Value of convertible note – related party, September 30, 2021 |
$ | |||
|
|
|
Assets |
||||
Current assets: |
||||
Cash |
$ | |||
Prepaid expenses |
||||
|
|
|
||
Total current assets |
||||
Cash held in Trust Account |
||||
|
|
|
||
Total Assets |
$ |
|||
|
|
|
||
|
||||
Liabilities, Class A Ordinary Shares Subject to Redemption and Shareholders’ Deficit |
||||
Current liabilities: |
||||
Accounts payable |
$ | |||
Accrued expenses |
||||
Note payable – related party |
||||
|
|
|
||
Total current liabilities |
||||
Deferred underwriting commissions |
||||
Derivative warrant liabilities |
||||
|
|
|||
Total liabilities |
||||
Commitments and Contingencies |
||||
Class A ordinary shares subject to possible redemption, $ |
||||
Shareholders’ Deficit: |
||||
Preference shares, $ |
||||
Class A ordinary shares, $ non-redeemable shares issued or outstanding |
||||
Class B ordinary shares, $ |
||||
Additional paid-in capital |
||||
Accumulated deficit |
( |
) | ||
|
|
|||
Total shareholders’ deficit |
( |
) | ||
|
|
|||
Total Liabilities, Class A Ordinary Shares Subject to Redemption and Shareholders’ Deficit |
$ |
|||
|
|
As of January 11, 2021 |
8-K OriginallyFiled |
Adjustment |
As Restated |
|||||||||
Total assets |
$ |
$ |
— |
$ |
||||||||
Total current liabilities |
$ |
$ |
— |
$ |
||||||||
Deferred underwriting commissions |
— | |||||||||||
Derivative warrant liabilities |
||||||||||||
Total liabilities |
$ |
$ |
$ |
|||||||||
Class A ordinary shares subject to possible redemption |
||||||||||||
Preference shares |
||||||||||||
Class A ordinary shares |
( |
) | ||||||||||
Class B ordinary shares |
— | |||||||||||
Additional paid-in capital |
( |
) | — | |||||||||
Accumulated deficit |
( |
) | ( |
) | ( |
) | ||||||
Total shareholders’ equity (deficit) |
$ |
$ |
( |
) |
$ |
( |
) | |||||
Total liabilities, Class A ordinary shares subject to possible redemption and shareholders’ equity (deficit) |
$ |
$ |
$ |
• | Level 1, defined as observable inputs such as quoted prices (unadjusted) for identical instruments in active markets; |
• | Level 2, defined as inputs other than quoted prices in active markets that are either directly or indirectly observable such as quoted prices for similar instruments in active markets or quoted prices for identical or similar instruments in markets that are not active; and |
• | Level 3, defined as unobservable inputs in which little or no market data exists, therefore requiring an entity to develop its own assumptions, such as valuations derived from valuation techniques in which one or more significant inputs or significant value drivers are unobservable. |
Gross proceeds from Initial Public Offering |
$ | |||
Less: | ||||
Fair value of Public Warrants at issuance |
( |
) | ||
Offering costs allocated to Class A ordinary shares subject to possible redemption |
( |
) | ||
Plus: | ||||
Accretion on Class A ordinary shares subject to possible redemption amount |
||||
|
|
|||
Class A ordinary shares subject to possible redemption |
$ | |||
|
|
• | in whole and not in part; |
• | at a price of $ |
• | upon a minimum of |
• | if, and only if, the last reported sale price (the “Closing Price”) of Class A ordinary shares equals or exceeds $ |
• |
in whole and not in part; |
• | at $ |
• | if, and only if, the Closing Price of Class A ordinary shares equals or exceeds $ |
Description |
Quoted Prices in Active Markets(Level 1) |
Significant Other Observable Inputs (Level 2) |
Significant Other Unobservable Inputs (Level 3) |
|||||||||
Liabilities: |
||||||||||||
Derivative warrant liabilities – Public Warrants |
$ | — | $ | — | $ | |||||||
Derivative warrant liabilities – Private Placement Warrants |
$ | — | $ | — | $ |
As of January 11, 2021 |
||||
Option term (in years) |
||||
Stock price |
$ | |||
Volatility |
% | |||
Risk-free interest rate |
% | |||
Expected dividends |
% |
Audited Consolidated Financial Statements of SES Holdings Pte. Ltd. and Subsidiaries as of December 31, 2020 and 2019 and for the years ended December 31, 2020 and 2019 |
||||
F-64 |
||||
F-65 |
||||
F-66 |
||||
F-67 |
||||
F-68 |
||||
F-69 |
||||
Unaudited Condensed Consolidated Financial Statements of SES Holdings Pte. Ltd. and Subsidiaries as of September 30, 2021 and for the three and nine months ended September 30, 2021 and 2020 |
||||
F-91 |
||||
F-92 |
||||
F-93 |
||||
F-95 |
||||
F-96 |
December 31, |
||||||||
2020 |
2019 |
|||||||
Assets |
||||||||
Current assets: |
||||||||
Cash and cash equivalents |
$ | $ | ||||||
Short-term investments |
||||||||
Prepaid expenses and other current assets |
||||||||
|
|
|
|
|||||
Total current assets |
||||||||
Property and equipment, net |
||||||||
Intangible assets, net |
||||||||
Restricted cash |
||||||||
Other assets |
||||||||
|
|
|
|
|||||
Total assets |
$ | $ | ||||||
|
|
|
|
|||||
Liabilities, redeemable convertible preferred stock and stockholders’ deficit |
||||||||
Current liabilities: |
||||||||
Accounts payable |
$ | $ | ||||||
Accrued compensation |
||||||||
Note payable |
||||||||
Accrued expenses and other current liabilities |
||||||||
|
|
|
|
|||||
Total current liabilities |
||||||||
Other liabilities |
||||||||
|
|
|
|
|||||
Total liabilities |
||||||||
|
|
|
|
|||||
Commitments and contingencies (Note 8) |
||||||||
Redeemable Convertible Preferred Stock, $ - |
||||||||
|
|
|
|
|||||
Stockholders’ deficit: |
||||||||
Common stock, $ - |
||||||||
Additional paid-in capital |
||||||||
Accumulated other comprehensive income (loss) |
( |
) | ||||||
Accumulated deficit |
( |
) | ( |
) | ||||
|
|
|
|
|||||
Total stockholder’s deficit |
( |
) | ( |
) | ||||
|
|
|
|
|||||
Total liabilities, redeemable convertible preferred stock, and stockholders’ deficit |
$ | $ | ||||||
|
|
|
|
Year Ended December 31, |
||||||||
2020 |
2019 |
|||||||
Operating expenses: |
||||||||
Research and development |
$ | $ | ||||||
General and administrative |
||||||||
Total operating expenses |
||||||||
Loss from operations |
( |
) | ( |
) | ||||
Other income (expense): |
||||||||
Interest income |
||||||||
Other (expense) income, net |
( |
) | ||||||
|
|
|
|
|||||
Total other income, net |
||||||||
Loss before income taxes |
( |
) | ( |
) | ||||
Provision for income taxes |
( |
) | ( |
) | ||||
|
|
|
|
|||||
Net loss |
( |
) | ( |
) | ||||
|
|
|
|
|||||
Other comprehensive income (loss): |
||||||||
Foreign currency translation adjustment |
( |
) | ||||||
|
|
|
|
|||||
Total comprehensive loss |
( |
) | ( |
) | ||||
|
|
|
|
|||||
Net loss per share, basic and diluted |
$ | ( |
) | $ | ( |
) | ||
|
|
|
|
|||||
Weighted-average shares outstanding, basic and diluted |
||||||||
|
|
|
|
|
|
Accumulated |
||||||||||||||||||||||||||||||||
Redeemable Convertible |
|
|
Other |
Total |
||||||||||||||||||||||||||||||
Preferred Stock |
|
|
Common Stock |
Additional |
Accumulated |
Comprehensive |
Stockholders’ |
|||||||||||||||||||||||||||
Shares |
Amount |
|
|
Shares |
Amount |
Paid-in- Capital |
Deficit |
Income/(Loss) |
Deficit |
|||||||||||||||||||||||||
Balance - January 1, 2019 |
$ |
|
|
$ |
— |
$ |
$ |
( |
) |
$ |
$ |
( |
) | |||||||||||||||||||||
Issuance of Series C plus preference shares net of issuance costs of $ |
|
|
— |
— |
— |
— |
— |
|||||||||||||||||||||||||||
Issuance of common stock upon exercise of stock options |
— |
— |
|
|
— |
— |
— |
|||||||||||||||||||||||||||
Stock-based compensation |
— |
— |
|
|
— |
— |
— |
— |
||||||||||||||||||||||||||
Foreign currency translation adjustments |
— |
— |
|
|
— |
— |
— |
— |
( |
) |
( |
) | ||||||||||||||||||||||
Net loss |
— |
— |
|
|
— |
— |
— |
( |
) |
— |
( |
) | ||||||||||||||||||||||
|
|
|
|
|
|
|
|
|
|
|
|
|
|
|
|
|
|
|||||||||||||||||
Balance - December 31, 2019 |
$ |
|
|
$ |
— |
$ |
$ |
( |
) |
$ |
( |
) |
$ |
( |
) | |||||||||||||||||||
|
|
|
|
|
|
|
|
|
|
|
|
|
|
|
|
|
|
|||||||||||||||||
Stock-based compensation |
— |
— |
|
|
— |
— |
— |
— |
||||||||||||||||||||||||||
Foreign currency translation adjustments |
— |
— |
|
|
— |
— |
— |
— |
||||||||||||||||||||||||||
Net loss |
— |
— |
|
|
— |
— |
— |
( |
) |
— |
( |
) | ||||||||||||||||||||||
|
|
|
|
|
|
|
|
|
|
|
|
|
|
|
|
|
|
|||||||||||||||||
Balance - December 31, 2020 |
$ |
|
|
$ |
— |
$ |
$ |
( |
) |
$ |
$ |
( |
) | |||||||||||||||||||||
|
|
|
|
|
|
|
|
|
|
|
|
|
|
|
|
|
|
For The Years Ended |
||||||||
|
|
December 31, |
| |||||
2020 |
2019 |
|||||||
CASH FLOWS FROM OPERATING ACTIVITIES |
||||||||
Net loss |
$ | ( |
) | $ | ( |
) | ||
Adjustments to reconcile net loss to net cash used in operating activities: |
||||||||
Depreciation and amortization |
||||||||
Stock-based compensation |
||||||||
Changes in operating assets and liabilities that provide (use) cash: |
||||||||
Prepaid expenses and other current assets |
( |
) | ( |
) | ||||
Other assets |
||||||||
Accounts payable |
( |
) | ||||||
Accrued compensation |
||||||||
Accrued expenses and other liabilities |
( |
) | ||||||
|
|
|
|
|||||
Net cash used in operating activities |
( |
) | ( |
) | ||||
|
|
|
|
|||||
CASH FLOWS FROM INVESTING ACTIVITIES |
||||||||
Purchases of property and equipment |
( |
) | ( |
) | ||||
Purchase of short-term investments |
( |
) | ||||||
Maturities of short-term investments |
||||||||
Purchases of intangible assets |
( |
) | ||||||
|
|
|
|
|||||
Net cash used in investing activities |
( |
) | ( |
) | ||||
|
|
|
|
|||||
CASH FLOWS FROM FINANCING ACTIVITIES |
||||||||
Proceeds from issuance of Series C plus redeemable convertible preferred stock, net of issuance costs of $ |
||||||||
Proceeds from note payable |
||||||||
Proceeds from exercise of stock options |
||||||||
|
|
|
|
|||||
Net cash provided by financing activities |
||||||||
|
|
|
|
|||||
Effect of exchange rates on cash and cash equivalents |
( |
) | ||||||
|
|
|
|
|||||
Net decrease in cash, cash equivalents and restricted cash |
( |
) | ( |
) | ||||
Cash, cash equivalents and restricted cash at beginning of period |
||||||||
|
|
|
|
|||||
Cash, cash equivalents and restricted cash at end of period |
$ | $ | ||||||
|
|
|
|
|||||
SUPPLEMENTAL DISCLOSURES OF NON-CASH INVESTING AND FINANCING INFORMATION: |
||||||||
Accounts payable and accrued expenses related to purchases of property and equipment |
$ | $ | ||||||
|
|
|
|
|||||
Recognition of asset retirement obligation included in property and equipment, net |
$ | $ | ||||||
|
|
|
|
Level 1 |
Observable inputs such as quoted prices in active markets for identical assets or liabilities that the Company has the ability to access at the measurement date. |
Level 2 |
Inputs other than the quoted prices in active markets that are observable either directly or indirectly. |
Level 3 |
Unobservable inputs in which there are little or no market data and which require the Company to develop its own assumptions. |
Estimated Useful Life |
||||
(in years) |
||||
Laboratory machinery and equipment |
- |
|||
Office and computer equipment |
- |
|||
Furniture and fixtures |
||||
Leasehold improvements |
December 31, |
||||||||
2020 |
2019 |
|||||||
Cash |
$ | $ | ||||||
Cash equivalents: |
||||||||
Money market funds |
||||||||
Restricted cash: |
||||||||
Certificates of deposit |
||||||||
|
|
|
|
|||||
Total cash, cash equivalents, and restricted cash |
$ | $ | ||||||
|
|
|
|
December 31, 2020 |
||||||||||||||||
Level 1 |
Level 2 |
Level 3 |
Total |
|||||||||||||
Assets |
||||||||||||||||
Cash equivalents in money market funds |
$ | $ | $ | $ | ||||||||||||
Restricted cash |
||||||||||||||||
Short-term investments: |
||||||||||||||||
Corporate bonds |
||||||||||||||||
Mutual funds |
||||||||||||||||
|
|
|
|
|
|
|
|
|||||||||
$ | $ | $ | $ | |||||||||||||
|
|
|
|
|
|
|
|
December 31, 2019 |
||||||||||||||||
Level 1 |
Level 2 |
Level 3 |
Total |
|||||||||||||
Assets |
||||||||||||||||
Cash equivalents in money market funds |
$ | $ | $ | $ | ||||||||||||
Restricted cash |
||||||||||||||||
|
|
|
|
|
|
|
|
|
|
|
|
|
|
|
|
|
$ | $ | $ | $ | |||||||||||||
|
|
|
|
|
|
|
|
|
|
|
|
|
|
|
|
|
December 31, |
||||||||
2020 |
2019 |
|||||||
Laboratory machinery and equipment |
$ | $ | ||||||
Office and computer equipment |
||||||||
Leasehold improvements |
||||||||
|
|
|
|
|||||
Less: Accumulated depreciation |
( |
) | ( |
) | ||||
|
|
|
|
|||||
Property and equipment, net |
$ | $ | ||||||
|
|
|
|
December 31, |
||||||||
2020 |
2019 |
|||||||
Intangible assets - Patents |
$ | $ | ||||||
Less: Accumulated amortization |
( |
) | ( |
) | ||||
|
|
|
|
|||||
Intangible assets, net |
$ | $ | ||||||
|
|
|
|
Year Ending 2021 |
$ | |||
2022 |
||||
2023 |
||||
2024 |
||||
2025 |
||||
Thereafter |
||||
|
|
|||
Total |
$ | |||
|
|
December 31, |
||||||||
2020 |
2019 |
|||||||
Accrued bonus |
$ | $ | ||||||
Other |
||||||||
|
|
|
|
|||||
Accrued compensation |
$ | $ | ||||||
|
|
|
|
December 31, |
||||||||
2020 |
2019 |
|||||||
Deferred rent liabilities |
$ | $ | ||||||
Accrual related to purchase of property and equipment |
||||||||
Income taxes payable |
||||||||
Other |
||||||||
|
|
|
|
|||||
Accrued expenses and other current liabilities |
$ | $ | ||||||
|
|
|
|
December 31, |
||||||||
2020 |
2019 |
|||||||
Deferred rent included in accrued expenses and other current liabilities |
$ | $ | ||||||
Deferred rent included in other liabilities |
||||||||
|
|
|
|
|||||
Total deferred rent |
$ | $ | ||||||
|
|
|
|
Year Ending 2021 |
$ | |||
2022 |
||||
2023 |
||||
2024 |
||||
2025 |
||||
Thereafter |
||||
|
|
|||
Total future minimum lease payments |
$ | |||
|
|
December 31, 2020 and 2019 |
||||||||||||||||||||
Issue Price |
Shares |
Shares Issued |
Liquidation |
Carrying |
||||||||||||||||
Series |
per share |
Authorized |
and Outstanding |
Amount |
Amount |
|||||||||||||||
Series A |
$ | $ | $ | |||||||||||||||||
Series B |
$ | $ | ||||||||||||||||||
Series C |
$ | $ | ||||||||||||||||||
Series C plus |
$ | $ | ||||||||||||||||||
|
|
|
|
|
|
|
|
|||||||||||||
$ | $ | |||||||||||||||||||
|
|
|
|
|
|
|
|
Weighted- |
Weighted- |
|||||||||||||||||||
Number of |
Number of |
Average |
Average |
|||||||||||||||||
Shares |
Shares Underlying |
Exercise |
Remaining |
Aggregate |
||||||||||||||||
Available for |
Outstanding |
Price per |
Contractual |
Intrinsic |
||||||||||||||||
Grant |
Options |
Share |
Term (in years) |
Value |
||||||||||||||||
Outstanding - January 1, 2019 |
$ | $ | ||||||||||||||||||
Options granted |
( |
) | ||||||||||||||||||
Options exercised |
( |
) | — | |||||||||||||||||
Options cancelled and forfeited |
( |
) | ||||||||||||||||||
|
|
|
|
|||||||||||||||||
Outstanding - December 31, 2019 |
$ | $ | ||||||||||||||||||
Options granted |
( |
) | ||||||||||||||||||
Options exercised |
— | — | — | |||||||||||||||||
Options cancelled and forfeited |
( |
) | ||||||||||||||||||
|
|
|
|
|||||||||||||||||
Outstanding - December 31, 2020 |
$ | $ | ||||||||||||||||||
|
|
|
|
|||||||||||||||||
Vested and expected to vest - December 31, 2019 |
$ | $ | ||||||||||||||||||
|
|
|||||||||||||||||||
Exercisable - December 31, 2019 |
$ | $ | ||||||||||||||||||
|
|
|||||||||||||||||||
Vested and expected to vest - December 31, 2020 |
$ | $ | ||||||||||||||||||
|
|
|||||||||||||||||||
Exercisable - December 31, 2020 |
$ | $ | ||||||||||||||||||
|
|
Year Ended December 31, | ||||
2020 |
2019 | |||
Expected term (in years) |
- |
- | ||
Risk-free interest rate |
||||
Expected volatility |
||||
Expected dividend rate |
Year Ended December 31, |
||||||||
2020 |
2019 |
|||||||
Research and development |
$ | $ | ||||||
General and administrative |
||||||||
|
|
|
|
|||||
Total stock-based compensation |
$ | $ | ||||||
|
|
|
|
December 31, |
||||||||
2020 |
2019 |
|||||||
Redeemable convertible preferred stock |
||||||||
Common stock options outstanding |
||||||||
Shares reserved for issuance under the 2018 Plan |
||||||||
|
|
|
|
|||||
|
|
|
|
December 31, |
||||||||
2020 |
2019 |
|||||||
US |
$ | ( |
) | $ | ( |
) | ||
Foreign |
( |
) | ( |
) | ||||
|
|
|
|
|||||
$ | ( |
) | $ | ( |
) | |||
|
|
|
|
December 31, |
||||||||
2020 |
2019 |
|||||||
Current: |
||||||||
Federal |
$ | $ | ||||||
State |
||||||||
Foreign |
||||||||
|
|
|
|
|||||
|
|
|
|
|||||
Deferred: |
||||||||
Federal |
||||||||
State |
||||||||
Foreign |
||||||||
|
|
|
|
|||||
$ | $ | |||||||
|
|
|
|
December 31, |
||||||||
2020 |
2019 |
|||||||
Federal statutory income tax rate |
% | % | ||||||
Foreign Tax |
( |
)% | ( |
)% | ||||
Foreign income taxed at non-US rates |
( |
)% | ( |
)% | ||||
Other permanent items |
( |
)% | ( |
)% | ||||
Research and development tax credits |
% | % | ||||||
Unrecognized tax benefits |
( |
)% | ( |
)% | ||||
Increase in Valuation Allowance |
( |
)% | ( |
)% | ||||
Others |
% | ( |
)% | |||||
|
|
|
|
|
|
|
|
|
( |
)% | ( |
)% | |||||
|
|
|
|
|
|
|
|
|
December 31, |
||||||||
2020 |
2019 |
|||||||
Deferred tax assets: |
||||||||
Net operating losses |
$ | $ | ||||||
Research and development tax credits |
||||||||
Accruals and Reserves |
||||||||
Stock-based compensation |
||||||||
Other |
||||||||
|
|
|
|
|||||
Gross deferred tax assets |
||||||||
Valuation Allowance |
( |
) | ( |
) | ||||
|
|
|
|
|||||
Total deferred tax assets |
||||||||
Deferred tax liabilities: |
||||||||
Fixed Assets |
( |
) | ( |
) | ||||
|
|
|
|
|||||
Total deferred tax liabilities |
( |
) | ( |
) | ||||
|
|
|
|
|||||
Total net deferred tax assets |
$ | $ | ||||||
|
|
|
|
December 31, |
||||||||
2020 |
2019 |
|||||||
Beginning of the year |
$ | $ | ||||||
Increase - current year positions |
||||||||
Increase - prior year positions |
||||||||
|
|
|
|
|||||
End of the year |
$ | $ | ||||||
|
|
|
|
Year Ended December 31, |
||||||||
2020 |
2019 |
|||||||
Numerator: |
||||||||
Net loss |
$ | ( |
) | $ | ( |
) | ||
|
|
|
|
|||||
Denominator: |
||||||||
Weighted-average shares of common stock outstanding |
||||||||
|
|
|
|
|||||
Net loss per common share - basic and diluted |
$ | ( |
) | $ | ( |
) | ||
|
|
|
|
Year Ended December 31, |
||||||||
2020 |
2019 |
|||||||
Redeemable convertible preferred stock |
||||||||
Options to purchase common stock |
||||||||
|
|
|
|
|||||
Total |
||||||||
|
|
|
|
December 31, |
||||||||
2020 |
2019 |
|||||||
Property and equipment, net: |
||||||||
United States |
$ | $ | ||||||
China |
||||||||
|
|
|
|
|||||
Total property and equipment, net |
||||||||
|
|
|
|
|||||
Intangible assets, net: |
||||||||
Singapore |
||||||||
|
|
|
|
|||||
Total intangible assets, net |
||||||||
|
|
|
|
|||||
Total long-lived assets |
$ | $ | ||||||
|
|
|
|
Name |
Role |
Voting Interest in 2020 and 2019 on a fully diluted basis |
||||
Dr. Qichao Hu |
|
% | ||||
Long Siang Pte. Ltd. |
|
% | ||||
Vertex Legacy Continuation Fund Pte. Ltd. |
|
% | ||||
General Motors Ventures LLC |
|
% | ||||
Tianqi Lithium HK Co., Ltd. |
|
% | ||||
Anderson Investments Pte. Ltd. |
|
% | ||||
SK Holdings |
|
% |
• |
the Company’s outstanding ordinary shares, excluding shares held by Dr. Qichao Hu (the Company’s founder and Chief Executive Officer) and certain entities affiliated with Dr. Hu (collectively, the “SES Founder Group”), and redeemable convertible preferred shares were cancelled and converted into the right to receive shares of Class A common stock of New SES; |
• |
the Company’s outstanding ordinary shares held by the SES Founder Group were cancelled and converted into the right to receive shares of our Class B common stock; |
• |
the Company’s outstanding and unexercised options, whether vested or unvested, were assumed by the Company and converted into an option to acquire our Class A common stock at an adjusted exercise price per-share with the same terms; and |
• |
the Company’s restricted shares that were issued, outstanding and subject to restrictions (including vesting) immediately prior to the Effective Time, were assumed by the Company and converted into shares of restricted Class A common stock. |
September 30, |
December 31, |
|||||||
2021 |
2020 |
|||||||
(Unaudited) |
||||||||
Assets |
||||||||
Current assets: |
||||||||
Cash and cash equivalents |
$ | $ | ||||||
Short-term investments |
||||||||
Receivable from related party |
||||||||
Prepaid expenses and other current assets |
||||||||
|
|
|
|
|||||
Total current assets |
||||||||
Property and equipment, net |
||||||||
Intangible assets, net |
||||||||
Restricted cash |
||||||||
Deferred offering costs |
||||||||
Other assets |
||||||||
|
|
|
|
|||||
Total assets |
$ | $ | ||||||
|
|
|
|
|||||
Liabilities, redeemable convertible preferred stock and stockholders’ deficit |
||||||||
Current liabilities: |
||||||||
Accounts payable |
$ | $ | ||||||
Accrued compensation |
||||||||
Note payable |
||||||||
Accrued expenses and other current liabilities |
||||||||
|
|
|
|
|||||
Total current liabilities |
||||||||
Other liabilities |
||||||||
|
|
|
|
|||||
Total liabilities |
||||||||
|
|
|
|
|||||
Commitments and contingencies (Note 6) |
||||||||
Redeemable Convertible Preferred Stock, $ - |
||||||||
|
|
|
|
|
|
|
|
|
Stockholders’ deficit: |
||||||||
Common stock, $ |
|
|
|
|
|
|
|
|
September 30, 2021 and December 31, 2020; |
||||||||
Additional paid-in capital |
||||||||
Accumulated other comprehensive income |
||||||||
Accumulated deficit |
( |
) | ( |
) | ||||
|
|
|
|
|||||
Total stockholders’ deficit |
( |
) | ( |
) | ||||
|
|
|
|
|||||
Total liabilities, redeemable convertible preferred stock, and stockholders’ deficit |
$ | $ | ||||||
|
|
|
|
Three months ended |
Nine months ended |
|||||||||||||||
2021 |
2020 |
2021 |
2020 |
|||||||||||||
Operating expenses: |
||||||||||||||||
Research and development |
$ | $ | $ | $ | ||||||||||||
General and administrative |
||||||||||||||||
|
|
|
|
|
|
|
|
|||||||||
Total operating expenses |
||||||||||||||||
|
|
|
|
|
|
|
|
|||||||||
Loss from operations |
( |
) | ( |
) | ( |
) | ( |
) | ||||||||
Other income (expense): |
||||||||||||||||
Interest income |
||||||||||||||||
Other (expense) income, net |
( |
) | ( |
) | ( |
) | ||||||||||
|
|
|
|
|
|
|
|
|||||||||
Total other (expense) income, net |
( |
) | ||||||||||||||
Loss before income taxes |
( |
) | ( |
) | ( |
) | ( |
) | ||||||||
Provision for income taxes |
( |
) | ( |
) | ||||||||||||
|
|
|
|
|
|
|
|
|||||||||
Net loss |
( |
) | ( |
) | ( |
) | ( |
) | ||||||||
|
|
|
|
|
|
|
|
|||||||||
Other comprehensive loss: |
||||||||||||||||
Foreign currency translation adjustment |
( |
) | ||||||||||||||
|
|
|
|
|
|
|
|
|||||||||
Total comprehensive loss |
( |
) | ( |
) | ( |
) | ( |
) | ||||||||
|
|
|
|
|
|
|
|
|||||||||
Net loss per share, basic and diluted |
$ | ( |
) | $ | ( |
) | $ | ( |
) | $ | ( |
) | ||||
|
|
|
|
|
|
|
|
|||||||||
Weighted-average shares outstanding, basic and diluted |
Nine months ended September 30, 2021 and 2020 |
|||||||||||||||||||||||||||||||||||
Redeemable |
|
|
|
Accumulated Other Comprehensive Income/(Loss) |
Total Shareholders’ Deficit |
||||||||||||||||||||||||||||||
Convertible |
|
|
|
Additional Paid-in Capital |
|||||||||||||||||||||||||||||||
Preferred Stock |
|
|
|
Common Stock |
|||||||||||||||||||||||||||||||
Shares |
Amount |
|
|
|
Shares |
Amount |
Deficit |
||||||||||||||||||||||||||||
Balance - December 31, 2019. |
$ |
|
|
|
$ |
— |
$ |
$ |
( |
) |
$ |
( |
) |
$ |
( |
) | |||||||||||||||||||
Stock-based compensation. |
— |
— |
|
|
|
— |
— |
— |
— |
||||||||||||||||||||||||||
Foreign currency translation adjustments. |
— |
— |
|
|
|
— |
— |
— |
— |
( |
) |
( |
) | ||||||||||||||||||||||
Net loss. |
— |
— |
|
|
|
— |
— |
— |
( |
) |
— |
( |
) | ||||||||||||||||||||||
|
|
|
|
|
|
|
|
|
|
|
|
|
|
|
|
|
|
|
|||||||||||||||||
Balance - March 31, 2020 |
|
|
|
— |
$ |
( |
) |
( |
) |
$ |
( |
) | |||||||||||||||||||||||
Stock-based compensation |
— |
— |
|
|
|
— |
— |
— |
— |
||||||||||||||||||||||||||
Foreign currency translation adjustments. |
— |
— |
|
|
|
— |
— |
— |
— |
||||||||||||||||||||||||||
Net loss |
— |
— |
|
|
|
— |
— |
— |
( |
) |
— |
( |
) | ||||||||||||||||||||||
|
|
|
|
|
|
|
|
|
|
|
|
|
|
|
|
|
|
|
|||||||||||||||||
Balance - June 30, 2020. |
$ |
|
|
|
— |
$ |
( |
) |
( |
) |
$ |
( |
) | ||||||||||||||||||||||
|
|
|
|
|
|
|
|
|
|
|
|
|
|
|
|
|
|
|
|||||||||||||||||
Stock-based compensation. |
— |
— |
|
|
|
— |
— |
( |
) |
— |
— |
( |
) | ||||||||||||||||||||||
Foreign currency translation adjustments. |
— |
— |
|
|
|
— |
— |
— |
— |
||||||||||||||||||||||||||
Net loss |
— |
— |
|
|
|
— |
— |
— |
( |
) |
— |
( |
) | ||||||||||||||||||||||
|
|
|
|
|
|
|
|
|
|
|
|
|
|
|
|
|
|
|
|||||||||||||||||
Balance - September 30, 2020 |
$ |
|
|
|
$ |
— |
$ |
$ |
( |
) |
$ |
$ |
( |
) | |||||||||||||||||||||
|
|
|
|
|
|
|
|
|
|
|
|
|
|
|
|
|
|
|
|||||||||||||||||
Balance - December 31, 2020 |
$ |
|
|
|
$ |
— |
$ |
( |
) |
$ |
$ |
( |
) | ||||||||||||||||||||||
Stock-based compensation |
— |
— |
|
|
|
— |
— |
— |
— |
||||||||||||||||||||||||||
Foreign currency translation adjustments. |
— |
— |
|
|
|
— |
— |
— |
( |
) |
( |
) | |||||||||||||||||||||||
Net loss |
— |
— |
|
|
|
— |
— |
— |
( |
) |
— |
( |
) | ||||||||||||||||||||||
|
|
|
|
|
|
|
|
|
|
|
|
|
|
|
|
|
|
|
|||||||||||||||||
Balance - March 31, 2021 |
|
|
|
— |
( |
) |
( |
) |
Nine months ended September 30, 2021 and 2020 |
|||||||||||||||||||||||||||||||||||
Redeemable |
|
|
|
Accumulated Other Comprehensive Income/(Loss) |
Total Shareholders’ Deficit |
||||||||||||||||||||||||||||||
Convertible |
|
|
|
Additional Paid-in Capital |
|||||||||||||||||||||||||||||||
Preferred Stock |
|
|
|
Common Stock |
|||||||||||||||||||||||||||||||
Shares |
Amount |
|
|
|
Shares |
Amount |
Deficit |
||||||||||||||||||||||||||||
Issuance of Series D and Series D plus redeemable convertible preferred stock, net of issuance costs of $ |
|
|
|
— |
— |
— |
— |
— |
— |
||||||||||||||||||||||||||
Stock-based compensation . |
— |
— |
|
|
|
— |
— |
— |
— |
||||||||||||||||||||||||||
Foreign currency translation adjustments . |
— |
— |
|
|
|
— |
— |
— |
— |
||||||||||||||||||||||||||
Net loss . |
— |
— |
|
|
|
— |
— |
— |
( |
) |
— |
( |
) | ||||||||||||||||||||||
|
|
|
|
|
|
|
|
|
|
|
|
|
|
|
|
|
|
|
|||||||||||||||||
Balance - June 30, 2021 |
$ |
|
|
|
— |
( |
) |
( |
) | ||||||||||||||||||||||||||
|
|
|
|
|
|
|
|
|
|
|
|
|
|
|
|
|
|
|
|||||||||||||||||
Stock-based compensation |
— |
— |
|
|
|
— |
— |
— |
— |
||||||||||||||||||||||||||
Foreign currency translation adjustments |
— |
— |
|
|
|
— |
— |
— |
— |
( |
) |
( |
) | ||||||||||||||||||||||
Option exercises . |
— |
— |
|
|
|
— |
— |
— |
|||||||||||||||||||||||||||
Net loss |
— |
— |
|
|
|
— |
— |
— |
( |
) |
— |
( |
) | ||||||||||||||||||||||
|
|
|
|
|
|
|
|
|
|
|
|
|
|
|
|
|
|
|
|||||||||||||||||
Balance - September 30, 2021 |
$ |
|
|
|
$ |
— |
$ |
$ |
( |
) |
$ |
$ |
( |
) | |||||||||||||||||||||
|
|
|
|
|
|
|
|
|
|
|
|
|
|
|
|
|
|
|
Nine months ended September 30, |
||||||||
2021 |
2020 |
|||||||
CASH FLOWS FROM OPERATING ACTIVITIES |
||||||||
Net loss |
$ | ( |
) | $ | ( |
) | ||
Adjustments to reconcile net loss to net cash used in operating activities: |
||||||||
Depreciation and amortization |
||||||||
Stock-based compensation |
||||||||
Note payable forgiveness |
( |
) | ||||||
Changes in operating assets and liabilities that provide (use) cash: |
||||||||
Receivable from related party |
( |
) | ||||||
Prepaid expenses and other current assets |
( |
) | ( |
) | ||||
Other assets |
( |
) | ( |
) | ||||
Accounts payable |
( |
) | ||||||
Accrued compensation |
||||||||
Accrued expenses and other liabilities |
||||||||
|
|
|
|
|||||
Net cash used in operating activities |
( |
) | ( |
) | ||||
|
|
|
|
|||||
CASH FLOWS FROM INVESTING ACTIVITIES |
||||||||
Purchases of property and equipment |
( |
) | ( |
) | ||||
Purchase of short-term investments |
( |
) | ( |
) | ||||
Maturities of short-term investments |
||||||||
|
|
|
|
|||||
Net cash used in investing activities |
( |
) | ( |
) | ||||
|
|
|
|
|||||
CASH FLOWS FROM FINANCING ACTIVITIES |
||||||||
Proceeds from issuance of Series D and Series D plus redeemable convertible preferred stock, net of issuance costs |
||||||||
Proceeds from stock option exercises. |
||||||||
Payment of deferred offering costs |
( |
) | ||||||
Proceeds from note payable |
||||||||
|
|
|
|
|||||
Net cash provided by financing activities |
||||||||
Effect of exchange rates on cash and cash equivalents |
( |
) | ||||||
|
|
|
|
|||||
Net increase (decrease) in cash, cash equivalents and restricted cash |
( |
) | ||||||
Cash, cash equivalents and restricted cash at beginning of period |
||||||||
|
|
|
|
|||||
Cash, cash equivalents and restricted cash at end of period |
$ | $ | ||||||
|
|
|
|
|||||
SUPPLEMENTAL DISCLOSURES OF NON-CASH INVESTING AND FINANCING INFORMATION: |
||||||||
Accounts payable and accrued expenses related to purchases of property and equipment |
$ | ( |
) | $ | ||||
|
|
|
|
|||||
Deferred offering costs included in accounts payable and accrued expenses and other liabilities |
$ | $ | ||||||
|
|
|
|
September 30, |
December 31, |
|||||||
2021 |
2020 |
|||||||
(Unaudited) |
||||||||
Cash |
$ | $ | ||||||
Cash equivalents: |
||||||||
Money market funds . |
||||||||
Restricted cash: |
||||||||
Certificates of deposit . |
||||||||
|
|
|
|
|||||
Total cash, cash equivalents, and restricted cash |
$ | $ |
September 30, 2021 (Unaudited) |
||||||||||||||||
Level 1 |
Level 2 |
Level 3 |
Total |
|||||||||||||
Assets |
||||||||||||||||
Cash equivalents in money market funds |
$ | $ | $ | $ | ||||||||||||
Restricted cash: |
||||||||||||||||
Short-term investments: |
||||||||||||||||
Time deposit |
||||||||||||||||
|
|
|
|
|
|
|
|
|||||||||
$ | $ | $ | $ | |||||||||||||
|
|
|
|
|
|
|
|
December 31, 2020 |
||||||||||||||||
Level 1 |
Level 2 |
Level 3 |
Total |
|||||||||||||
Assets |
||||||||||||||||
Cash equivalents in money market funds |
$ | $ | $ | $ | ||||||||||||
Restricted cash |
||||||||||||||||
Short-term investments: |
||||||||||||||||
Corporate bonds |
||||||||||||||||
Mutual funds |
||||||||||||||||
|
|
|
|
|
|
|
|
|||||||||
$ | $ | $ | $ | |||||||||||||
|
|
|
|
|
|
|
|
September 30, |
December 31, |
|||||||
2021 |
2020 |
|||||||
(Unaudited) |
||||||||
Accrued bonus |
$ | $ | ||||||
Other |
||||||||
|
|
|
|
|||||
Accrued compensation |
$ | $ | ||||||
|
|
|
|
September 30, |
December 31, |
|||||||
2021 |
2020 |
|||||||
(Unaudited) |
||||||||
Deferred rent liabilities |
$ | $ | ||||||
Payments received under joint development agreements |
||||||||
Accrued professional services |
— | |||||||
Income taxes payable |
||||||||
Other |
||||||||
|
|
|
|
|||||
Accrued expenses and other current liabilities |
$ | $ | ||||||
|
|
|
|
September 30, |
December 31, |
|||||||
2021 |
2020 |
|||||||
(Unaudited) |
||||||||
Deferred rent included in accrued expenses and other current liabilities |
$ | $ | ||||||
Deferred rent included in other liabilities |
||||||||
|
|
|
|
|||||
Total deferred rent |
$ | $ | ||||||
|
|
|
|
Year Ending |
||||
Remainder of 2021 |
$ | |||
2022 |
||||
2023 |
||||
2024 |
||||
2025 |
||||
Thereafter |
||||
|
|
|||
Total future minimum lease payments |
$ | |||
|
|
September 30, 2021 |
||||||||||||||||||||
Series |
Issue Price per share |
Shares Authorized |
Shares Issued and Outstanding |
Liquidation Amount |
Carrying Amount |
|||||||||||||||
Series A |
$ | $ | $ | |||||||||||||||||
Series B |
$ | |||||||||||||||||||
Series C |
$ | |||||||||||||||||||
Series C plus |
$ | |||||||||||||||||||
Series D |
$ | |||||||||||||||||||
Series D plus |
$ | |||||||||||||||||||
|
|
|
|
|
|
|
|
|||||||||||||
$ | $ | |||||||||||||||||||
|
|
|
|
|
|
|
|
December 31, 2020 |
||||||||||||||||||||
Series |
Issue Price per share |
Shares Authorized |
Shares Issued and Outstanding |
Liquidation Amount |
Carrying Amount |
|||||||||||||||
Series A |
$ | $ | $ | |||||||||||||||||
Series B |
$ | |||||||||||||||||||
Series C |
$ | |||||||||||||||||||
Series C plus |
$ | |||||||||||||||||||
|
|
|
|
|
|
|
|
|||||||||||||
$ | $ | |||||||||||||||||||
|
|
|
|
|
|
|
|
Number of |
Weighted- |
|||||||||||||||||||
Number of |
Shares |
Average |
||||||||||||||||||
Shares |
Underlying |
Weighted- |
Remaining |
Aggregate |
||||||||||||||||
Available |
Outstanding |
Average Exercise |
Contractual |
Intrinsic |
||||||||||||||||
for Grant |
Options |
Price per Share |
Term (in years) |
Value |
||||||||||||||||
Outstanding - January 1, 2021 |
$ | $ | ||||||||||||||||||
Additional shares authorized |
— | |||||||||||||||||||
Options granted |
( |
) | ||||||||||||||||||
Options exercised |
— | ( |
) | — | — | |||||||||||||||
Options cancelled and forfeited |
( |
) | ||||||||||||||||||
|
|
|
|
|||||||||||||||||
Outstanding - September 30, 2021 |
$ | $ | ||||||||||||||||||
|
|
|
|
|||||||||||||||||
Vested and expected to vest - September 30, 2021 |
$ | $ | ||||||||||||||||||
|
|
|||||||||||||||||||
Exercisable - September 30, 2021 |
$ | $ | ||||||||||||||||||
|
|
Number of |
Weighted- |
|||||||||||||||||||
Number of |
Shares |
Average |
||||||||||||||||||
Shares |
Underlying |
Weighted- |
Remaining |
Aggregate |
||||||||||||||||
Available |
Outstanding |
Average Exercise |
Contractual |
Intrinsic |
||||||||||||||||
for Grant |
Options |
Price per Share |
Term (in years) |
Value |
||||||||||||||||
Outstanding - January 1, 2020 |
$ | $ | ||||||||||||||||||
Options granted |
( |
) | ||||||||||||||||||
Options exercised |
— | — | ||||||||||||||||||
Options cancelled and forfeited |
( |
) | ||||||||||||||||||
|
|
|
|
|||||||||||||||||
Outstanding - September 30, 2020 |
$ | $ | ||||||||||||||||||
|
|
|
|
|||||||||||||||||
Vested and expected to vest - September 30, 2020 |
$ | $ | ||||||||||||||||||
|
|
|||||||||||||||||||
Exercisable - September 30, 2020 |
$ | $ | ||||||||||||||||||
|
|
Three Months Ended September 30, |
Nine months Ended September 30, | |||||||
2021 |
2020 |
2021 |
2020 | |||||
(Unaudited) |
(Unaudited) |
(Unaudited) |
(Unaudited) | |||||
Expected term (in years) |
||||||||
Risk-free interest rate |
||||||||
Expected volatility |
||||||||
Expected dividend rate |
Three Months Ended September 30 |
Nine months Ended September 30, |
|||||||||||||||
2021 |
2020 |
2021 |
2020 |
|||||||||||||
(Unaudited) |
(Unaudited) |
(Unaudited) |
(Unaudited) |
|||||||||||||
Research and development |
$ | $ | $ | $ | ||||||||||||
General and administrative |
||||||||||||||||
|
|
|
|
|
|
|
|
|||||||||
Total stock-based compensation |
$ | $ | $ | $ | ||||||||||||
|
|
|
|
|
|
|
|
September 30, |
December 31, |
|||||||
2021 |
2020 |
|||||||
(Unaudited) |
||||||||
Redeemable convertible preferred stock |
||||||||
Common stock options outstanding |
||||||||
Shares reserved for issuance under the Share Incentive Plan |
||||||||
|
|
|
|
|||||
Three Months Ended September 30, |
Nine Months Ended September 30, |
|||||||||||||||
2021 |
2020 |
2021 |
2020 |
|||||||||||||
(Unaudited) |
(Unaudited) |
(Unaudited) |
(Unaudited) |
|||||||||||||
Numerator: |
||||||||||||||||
Net loss |
$ | ( |
) | $ | ( |
) | $ | ( |
) | $ | ( |
) | ||||
|
|
|
|
|
|
|
|
|||||||||
Denominator: |
||||||||||||||||
Weighted-average shares of common stock outstanding |
||||||||||||||||
|
|
|
|
|
|
|
|
|||||||||
Net loss per common share - basic and diluted |
$ | ( |
) | $ | ( |
) | $ | ( |
) | $ | ( |
) | ||||
|
|
|
|
|
|
|
|
As of September 30, |
||||||||
2021 |
2020 |
|||||||
(Unaudited) |
(Unaudited) |
|||||||
Redeemable convertible preferred stock |
||||||||
Options to purchase common stock |
||||||||
|
|
|
|
|||||
Total |
||||||||
|
|
|
|
Voting Interest |
Voting Interest |
|||||||||
in 2021 on a |
in 2020 on a |
|||||||||
fully diluted |
fully diluted |
|||||||||
Name |
Role |
basis |
basis |
|||||||
Dr. Qichao Hu |
% | % | ||||||||
Long Siang Pte. Ltd |
% | % | ||||||||
Vertex Legacy Continuation Fund Pte. Ltd |
% | % | ||||||||
General Motors Ventures LLC |
% | % | ||||||||
Tianqi Lithium HK Co., Ltd. |
% | % | ||||||||
Anderson Investments Pte. Ltd. |
% | % | ||||||||
SK Holdings |
% | % |
• |
the Company’s outstanding ordinary shares, excluding shares held by Dr. Qichao Hu (the Company’s founder and Chief Executive Officer) and certain entities affiliated with Dr. Hu (collectively, the “SES Founder Group”), and redeemable convertible preference shares will be cancelled and convert into the right to receive shares of Class A common stock of New SES; |
• |
the Company’s outstanding ordinary shares held by the SES Founder Group will be cancelled and convert into the right to receive shares of Class B common stock of New SES; |
• |
the Company’s outstanding and unexercised options, whether vested or unvested, will be assumed by New SES and converted into an option to acquire Class A common stock of New SES at an adjusted exercise price per-share with the same terms; and |
• |
the Company’s restricted shares that are issued, outstanding and subject to restrictions (including vesting) immediately prior to the Effective Time, if any, will be assumed by New SES and converted into shares of restricted New Class A common stock. |
Securities and Exchange Commission registration fee |
169,300 | |||
Accounting fees and expenses |
* | |||
Legal fees and expenses |
* | |||
Advisory fees |
* | |||
Financial printing and miscellaneous expenses |
* | |||
|
|
|||
Total |
$ | * | ||
|
|
* | Estimates not presently known. |
• | On July 22, 2020, the Sponsor paid an aggregate of $25,000 for certain expenses on behalf of the Company in exchange for the issuance of 8,625,000 Class B ordinary shares (the “Founder Shares”). On December 16, 2020, the Sponsor surrendered 2,875,000 Founder Shares to the Company for cancellation for no consideration. On January 6, 2021, the Company effected a share capitalization of 1,150,000 shares, resulting in an aggregate of 6,900,000 Founder Shares outstanding. |
• | On January 11, 2021, we issued 5,013,333 private placement warrants to the Sponsor concurrently with the closing of the Ivanhoe IPO; and |
• | On February 3, 2022, in connection with the Business Combination, we issued 27,450,000 shares of Class A common stock to certain qualified institutional buyers and accredited investors that agreed to purchase such shares in connection with the Business Combination for aggregate consideration of $274,500,000. |
Incorporated By Reference |
||||||||
Exhibit Number |
Description |
Form |
Exhibit |
Filing Date | ||||
101.CAL* | Inline XBRL Taxonomy Extension Calculation Linkbase Document | |||||||
101.DEF* | Inline XBRL Taxonomy Extension Definition Linkbase Document | |||||||
101.LAB+* | Inline XBRL Taxonomy Extension Label Linkbase Document | |||||||
101.PRE+* | Inline XBRL Taxonomy Extension Presentation Linkbase Document | |||||||
104* | Cover Page Interactive Data File (formatted as Inline XBRL and contained in Exhibit 101). | |||||||
107* | Filing Fee Table |
* | Filed herewith. |
† | Certain of the exhibits and schedules to this Exhibit have been omitted in accordance with Regulation S-K Item 601(a)(5). |
# | Management contract or compensatory plan or arrangement. |
(a) | any preliminary prospectus or prospectus of the undersigned registrant relating to the offering required to be filed pursuant to Rule 424; |
(b) | any free writing prospectus relating to the offering prepared by or on behalf of the undersigned registrant or used or referred to by the undersigned registrant; |
(c) | the portion of any other free writing prospectus relating to the offering containing material information about the undersigned registrant or its securities provided by or on behalf of an undersigned registrant; and |
(d) | any other communication that is an offer in the offering made by the undersigned registrant to the purchaser. |
SES AI CORPORATION | ||
By: | /s/ Qichao Hu | |
Name: | Qichao Hu | |
Title: | Chief Executive Officer |
Signature |
Title | |
/s/ Qichao Hu |
Chief Executive Officer and Director (Principal Executive Officer) | |
Qichao Hu | ||
/s/ Jing Nealis |
Chief Financial Officer (Principal Financial Officer and Principal Accounting Officer) | |
Jing Nealis | ||
/s/ Jang Wook Choi |
Director | |
Jang Wook Choi | ||
/s/ Robert Friedland |
Director | |
Robert Friedland | ||
/s/ Kent Helfrich |
Director | |
Kent Helfrich | ||
/s/ Eric Luo |
Director | |
Eric Luo | ||
/s/ Jiong Ma |
Director | |
Jiong Ma | ||
/s/ Michael Noonen |
Director | |
Michael Noonen |