UNITED STATES
SECURITIES AND EXCHANGE COMMISSION
Washington, D.C. 20549
FORM N-CSR
CERTIFIED SHAREHOLDER REPORT OF REGISTERED
MANAGEMENT INVESTMENT COMPANIES
Investment Company Act file number 811-23580
DIMENSIONAL ETF TRUST
(Exact name of registrant as specified in charter)
6300 Bee Cave Road, Building One, Austin, TX 78746
(Address of principal executive offices) (Zip code)
Catherine L. Newell, Esquire, President and General Counsel
Dimensional ETF Trust,
6300 Bee Cave Road, Building One, Austin, TX 78746
(Name and address of agent for service)
Registrant’s telephone number, including area code: 512-306-7400
Date of fiscal year end: October 31
Date of reporting period: October 31, 2021
| ITEM 1. | REPORTS TO STOCKHOLDERS. |

Annual Report
Period Ended: October 31, 2021
DIMENSIONAL ETF TRUST
Dimensional U.S. Equity ETF
Dimensional US Core Equity Market ETF
Dimensional U.S. Core Equity 2 ETF
Dimensional U.S. Small Cap ETF
Dimensional U.S. Targeted Value ETF
Dimensional International Core Equity Market ETF
Dimensional International Value ETF
Dimensional Emerging Core Equity Market ETF
Dimensional World ex U.S. Core Equity 2 ETF
December 2021
Dear Shareholder,
As we near the end of a year that saw us mark four decades since our founding, we want to thank you for entrusting us with your investments. We built Dimensional to implement the great ideas in finance, with the goal of transforming the investor experience for the better.
We are proud of the role Dimensional has played over the past 40 years in helping drive down costs, providing solutions that can improve diversification, and contributing to investor education. We’re committed to continuing to enhance our research-driven strategies, our efficient implementation, and the services we provide.
Just this past year, we launched an expanded offering for separately managed accounts, broadened our suite of fixed income solutions, and became one of the first asset managers to convert mutual funds into exchange-traded funds, offering greater choice in how investors access Dimensional’s strategies.
We have always focused on empowering financial professionals so they can meet their clients’ evolving needs. The solutions we have recently developed will help further that mission, offering more ability to customize and tailor investments to investors’ specific situations. It’s all part of our enduring tradition of innovation to enable the best possible experience for investors.
For 40 years, we have trusted markets. And for 40 years, we have built trust with financial professionals and investors around the world. The advances made in the industry have been profound for investors, and we believe this is just the beginning. We look forward to many more years of innovating on behalf of our clients and investors.
Sincerely,

|

| |
| David P. Butler | Gerard O’Reilly | |
| CO-CHIEF EXECUTIVE OFFICER | CO-CHIEF EXECUTIVE OFFICER and CHIEF INVESTMENT OFFICER | |
DIMENSIONAL ETF TRUST
ANNUAL REPORT
| Letter to Shareholders |
||||
| 3 | ||||
| 4 | ||||
| 9 | ||||
| 14 | ||||
| 16 | ||||
| 18 | ||||
| 50 | ||||
| 53 | ||||
| 56 | ||||
| 61 | ||||
| 66 | ||||
| 84 | ||||
| 85 | ||||
| 94 |
This report is submitted for the information of each Fund’s shareholders. It is not authorized for distribution to prospective investors unless preceded or accompanied by an effective prospectus.
i
DEFINITIONS OF ABBREVIATIONS AND FOOTNOTES
(Unaudited)
| Summary Schedules of Portfolio Holdings | ||
| Investment Abbreviations | ||
| PLC | Public Limited Company | |
| SA | Special Assessment | |
| ADR | American Depositary Receipt | |
| GDR | Global Depositary Receipt | |
| Investment Footnotes | ||
| † | See Note B to Financial Statements | |
| ‡ | Calculated as a percentage of total net assets. Percentages shown parenthetically next to the category headings have been calculated as a percentage of total investments. “Other Securities” are those securities that are not among the top 50 holdings in unaffiliated issuers of the Fund or do not represent more than 1.0% of the net assets of the Fund. Some of the individual securities within this category may include Total or Partial Securities on Loan and/or Non-Income Producing Securities | |
| * | Non-Income Producing Security | |
| @ | Security purchased with cash collateral received from Securities on Loan | |
| § | Affiliated Fund | |
| # | Total or Partial Securities on Loan | |
| Financial Highlights | ||
| (a) | Computed using average shares outstanding | |
| (b) | Net asset value (“NAV”) total return is calculated assuming an initial investment made at the net asset value at the beginning of the period, reinvestment of all dividends and distributions at net asset value during the period, if any, and redemption on the last day of the period at net asset value. This percentage is not an indication of the performance of a shareholder’s investment in the Fund based on market value due to differences between the market price of the shares and the net asset value per share of the Fund | |
| (c) | Not annualized for periods less than one year | |
| (d) | Market value total return is calculated assuming an initial investment made at the market value at the beginning of the period, reinvestment of all dividends and distributions at net asset value during the period, if any, and redemption on the last day of the period at market value. Market value is determined by the composite closing price. Composite closing security price is defined as the last reported sale price from any primary listing market (e.g., NYSE Arca) or participating regional exchanges or markets. The composite closing price is the last reported sale price from any of the eligible sources, regardless of volume and not an average price and may have occurred on a date prior to the close of the reporting period. Market value may be greater or less than net asset value, depending on the Fund’s closing price on the listing market | |
| (e) | Annualized for periods less than one year | |
| (f) | Excludes impact of in-kind transactions | |
| All Statements, Schedules and Notes to Financial Statements | ||
| — | Amounts designated as — are either zero or rounded to zero | |
| SEC | Securities and Exchange Commission | |
3
DIMENSIONAL ETF TRUST
(Unaudited)
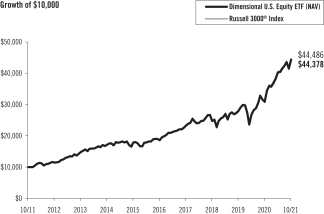
Dimensional U.S. Equity ETF vs.
Russell 3000® Index
October 31, 2011-October 31, 2021
|
|
Past performance is not predictive of future performance.
The returns shown do not reflect the deduction of taxes that a shareholder would pay on fund distributions or the redemption or sale of fund shares. The price used to calculate market return (“Fund Market Price”) is the market closing price as determined by the fund’s listing exchange.
Frank Russell Company is the source and owner of the trademarks, service marks, and copyrights related to the Russell Indexes. | |||||||||||
| Average Annual Total Return |
One Year |
Five Years |
Ten Years |
|||||||||
| Fund Net Asset Value | 43.83% | 18.95% | 16.07% | |||||||||
| Fund Market Price | 43.80% | 18.94% | 16.07% | |||||||||
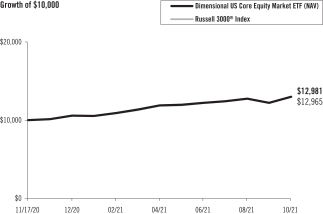
Dimensional US Core Equity Market ETF vs.
Russell 3000® Index
November 17, 2020-October 31, 2021
|
|
Past performance is not predictive of future performance.
The returns shown do not reflect the deduction of taxes that a shareholder would pay on fund distributions or the redemption or sale of fund shares. The price used to calculate market return (“Fund Market Price”) is the market closing price as determined by the fund’s listing exchange.
The inception date is the date the fund commenced operations. Shares of the fund began trading in the secondary market on November 18, 2020.
Frank Russell Company is the source and owner of the trademarks, service marks, and copyrights related to the Russell Indexes. | |||||||||||
| Average Annual Total Return |
Since Inception |
|||||||||||
| Fund Net Asset Value | 29.81% | |||||||||||
| Fund Market Price | 29.88% | |||||||||||
4
DIMENSIONAL ETF TRUST
PERFORMANCE CHARTS
(Unaudited)
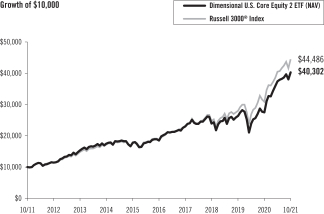
Dimensional U.S. Core Equity 2 ETF vs.
Russell 3000® Index
October 31, 2011-October 31, 2021
|
|
Past performance is not predictive of future performance.
The returns shown do not reflect the deduction of taxes that a shareholder would pay on fund distributions or the redemption or sale of fund shares. The price used to calculate market return (“Fund Market Price”) is the market closing price as determined by the fund’s listing exchange.
Frank Russell Company is the source and owner of the trademarks, service marks, and copyrights related to the Russell Indexes. | |||||||||||
| Average Annual Total Return |
One Year |
Five Years |
Ten Years |
|||||||||
| Fund Net Asset Value | 46.47% | 16.88% | 14.96% | |||||||||
| Fund Market Price | 46.57% | 16.90% | 14.96% | |||||||||
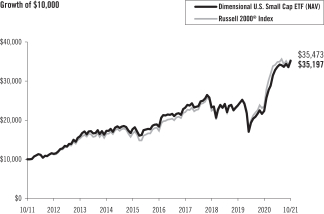
Dimensional U.S. Small Cap ETF vs.
Russell 2000® Index
October 31, 2011-October 31, 2021
|
|
Past performance is not predictive of future performance.
The returns shown do not reflect the deduction of taxes that a shareholder would pay on fund distributions or the redemption or sale of fund shares. The price used to calculate market return (“Fund Market Price”) is the market closing price as determined by the fund’s listing exchange.
Frank Russell Company is the source and owner of the trademarks, service marks, and copyrights related to the Russell Indexes. | |||||||||||
| Average Annual Total Return |
One Year |
Five Years |
Ten Years |
|||||||||
| Fund Net Asset Value | 57.38% | 13.94% | 13.41% | |||||||||
| Fund Market Price | 57.51% | 13.96% | 13.42% | |||||||||
5
DIMENSIONAL ETF TRUST
PERFORMANCE CHARTS
(Unaudited)
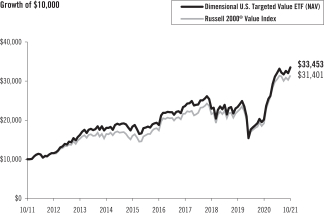
Dimensional U.S. Targeted Value ETF vs.
Russell 2000® Value Index
October 31, 2011-October 31, 2021
|
|
Past performance is not predictive of future performance.
The returns shown do not reflect the deduction of taxes that a shareholder would pay on fund distributions or the redemption or sale of fund shares. The price used to calculate market return (“Fund Market Price”) is the market closing price as determined by the fund’s listing exchange.
Frank Russell Company is the source and owner of the trademarks, service marks, and copyrights related to the Russell Indexes. | |||||||||||
| Average Annual Total Return |
One Year |
Five Years |
Ten Years |
|||||||||
| Fund Net Asset Value | 65.98% | 12.25% | 12.83% | |||||||||
| Fund Market Price | 66.13% | 12.27% | 12.84% | |||||||||
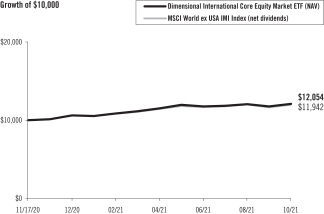
Dimensional International Core Equity Market ETF vs.
MSCI World ex USA IMI Index (net dividends)
November 17, 2020-October 31, 2021
|
|
Past performance is not predictive of future performance.
The returns shown do not reflect the deduction of taxes that a shareholder would pay on fund distributions or the redemption or sale of fund shares. The price used to calculate market return (“Fund Market Price”) is the market closing price as determined by the fund’s listing exchange.
The inception date is the date the fund commenced operations. Shares of the fund began trading in the secondary market on November 18, 2020
MSCI data © MSCI 2021, all rights reserved. | |||||||||||
| Average Annual Total Return |
Since Inception |
|||||||||||
| Fund Net Asset Value | 20.54% | |||||||||||
| Fund Market Price | 21.08% | |||||||||||
6
DIMENSIONAL ETF TRUST
PERFORMANCE CHARTS
(Unaudited)
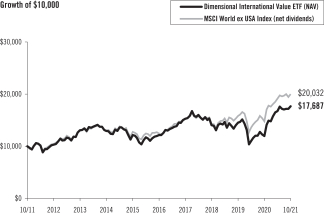
Dimensional International Value ETF vs.
MSCI World ex USA Index (net dividends)
October 31, 2011-October 31, 2021
|
|
Past performance is not predictive of future performance.
The returns shown do not reflect the deduction of taxes that a shareholder would pay on fund distributions or the redemption or sale of fund shares. The price used to calculate market return (“Fund Market Price”) is the market closing price as determined by the fund’s listing exchange.
MSCI data © MSCI 2021, all rights reserved. | |||||||||||
| Average Annual Total Return |
One Year |
Five Years |
Ten Years |
|||||||||
| Fund Net Asset Value | 48.18% | 7.85% | 5.87% | |||||||||
| Fund Market Price | 48.68% | 7.92% | 5.90% | |||||||||
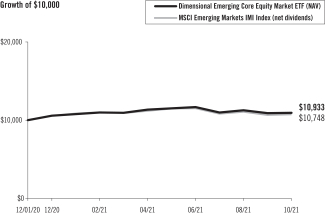
Dimensional Emerging Core Equity Market ETF vs.
MSCI Emerging Markets IMI Index (net dividends)
December 1, 2020-October 31, 2021
|
|
Past performance is not predictive of future performance.
The returns shown do not reflect the deduction of taxes that a shareholder would pay on fund distributions or the redemption or sale of fund shares. The price used to calculate market return (“Fund Market Price”) is the market closing price as determined by the fund’s listing exchange.
The inception date is the date the fund commenced operations. Shares of the fund began trading in the secondary market on December 2, 2020.
MSCI data © MSCI 2021, all rights reserved. | |||||||||||
| Average Annual Total Return |
Since Inception |
|||||||||||
| Fund Net Asset Value | 9.33% | |||||||||||
| Fund Market Price | 9.57% | |||||||||||
7
DIMENSIONAL ETF TRUST
PERFORMANCE CHARTS
(Unaudited)
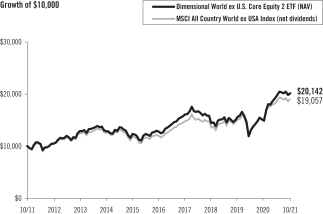
Dimensional World ex U.S. Core Equity 2 ETF vs.
MSCI All Country World ex USA Index (net dividends)
October 31, 2011-October 31, 2021
|
|
Past performance is not predictive of future performance.
The returns shown do not reflect the deduction of taxes that a shareholder would pay on fund distributions or the redemption or sale of fund shares. The price used to calculate market return (“Fund Market Price”) is the market closing price as determined by the fund’s listing exchange.
MSCI data © MSCI 2021, all rights reserved. | |||||||||||
| Average Annual Total Return |
One Year |
Five Years |
Ten Years |
|||||||||
| Fund Net Asset Value | 35.23% | 9.57% | 7.25% | |||||||||
| Fund Market Price | 35.23% | 9.57% | 7.25% | |||||||||
8
MANAGEMENT’S DISCUSSION AND ANALYSIS
| U.S. Equity Market Review | 12 Months Ended October 31, 2021 |
U.S. equities had positive returns for the period. The broad U.S. equity market, as measured by the Russell 3000® Index, gained approximately 43.90%. As measured by Russell indices, small-cap stocks outperformed large-cap stocks, and mid-cap stocks, a subset of the large-cap universe, outperformed large-cap stocks but underperformed small-cap stocks. Value stocks outperformed growth stocks as measured by the Russell indices.
| Total Return for 12 Months Ended October 31, 2021 |
||||
| Russell 3000® Index |
43.90% | |||
| Russell 1000® Index (large-cap stocks) |
43.51% | |||
| Russell Midcap® Index (mid-cap stocks) |
45.40% | |||
| Russell 2000® Index (small-cap stocks) |
50.80% | |||
| Russell Microcap® Index (micro-cap stocks) |
62.54% | |||
| Dow Jones U.S. Select REIT Index SM |
56.10% | |||
| Total Return for 12 Months Ended October 31, 2021 |
||||
| Russell 1000® Value Index (large-cap value stocks) |
43.76% | |||
| Russell 1000® Growth Index (large-cap growth stocks) |
43.21% | |||
| Russell 2000® Value Index (small-cap value stocks) |
64.30% | |||
| Russell 2000® Growth Index (small-cap growth stocks) |
38.45% | |||
Source: Frank Russell Company is the source and owner of the trademarks, service marks, and copyrights related to the Russell Indexes.
U.S. Equity ETF
The U.S. Equity ETF invests in a broadly diversified group of U.S. securities while considering the federal tax implications of investment decisions. The ETF generally excludes stocks with the lowest profitability and highest relative price. The ETF also generally excludes certain companies that have high asset growth. The investment strategy is process driven, emphasizing broad diversification. As of October 31, 2021, the ETF held approximately 2,200 securities. Average cash exposure throughout the year was less than 1% of the ETF’s assets.
For the 12 months ended October 31, 2021, total returns were 43.83% on a net asset value basis for the ETF and 43.90% for the Russell 3000® Index, the ETF’s benchmark. The ETF’s exclusion of stocks with high asset growth contributed positively to performance relative to the benchmark, as those stocks underperformed. The ETF’s exclusion of stocks with the lowest profitability and highest relative price also contributed positively to relative performance, as those stocks underperformed. Conversely, the ETF’s exclusion of real estate investment trusts (REITs) detracted from performance relative to the benchmark, as REITs generally outperformed.
U.S. Targeted Value ETF
The U.S. Targeted Value ETF invests in a broadly diversified group of U.S. small- and mid-cap value stocks with higher profitability, while considering the federal tax implications of investment decisions. Additionally, the ETF generally excludes certain companies with high asset growth. The investment strategy is process driven, emphasizing broad diversification. As of October 31, 2021, the ETF held approximately 1,610 securities. Average cash exposure throughout the year was less than 1% of the ETF’s assets.
For the 12 months ended October 31, 2021, total returns were 65.98% on a net asset value basis for the ETF and 64.30% for the Russell 2000® Value Index, the ETF’s benchmark. With low relative price (value) stocks outperforming high relative price (growth) stocks, the ETF’s greater emphasis on value stocks contributed positively to performance relative to the benchmark. The ETF’s exclusion of highly regulated utilities also contributed
9
positively to relative performance, as utilities generally underperformed. Conversely, the ETF’s lesser allocation to micro-cap stocks detracted from relative performance, as these stocks outperformed.
U.S. Small Cap ETF
The U.S. Small Cap ETF invests in a broadly diversified group of U.S. small-cap stocks while considering the federal tax implications of investment decisions. The ETF generally excludes stocks with the lowest profitability and highest relative price. Additionally, the ETF generally excludes certain companies with high asset growth. The investment strategy is process driven, emphasizing broad diversification. As of October 31, 2021, the ETF held approximately 2,000 securities. Average cash exposure throughout the year was less than 1% of the ETF’s assets.
For the 12 months ended October 31, 2021, total returns were 57.38% on a net asset value basis for the ETF and 50.80% for the Russell 2000® Index, the ETF’s benchmark. The ETF’s exclusion of stocks with the lowest profitability and highest relative price contributed positively to performance relative to the benchmark, as those stocks underperformed. The ETF’s exclusion of stocks with high asset growth also contributed positively to relative performance, as those securities underperformed.
U.S. Core Equity 2 ETF
The U.S. Core Equity 2 ETF invests in a broadly diversified group of U.S. securities with increased exposure to smaller market capitalization stocks, lower relative price (value) stocks, and higher-profitability stocks relative to the market while considering federal tax implications of investment decisions. The investment strategy is process driven, emphasizing broad diversification. As of October 31, 2021, the ETF held approximately 2,580 securities. Average cash exposure throughout the year was less than 1% of the ETF’s assets.
For the 12 months ended October 31, 2021, total returns were 46.47% on a net asset value basis for the ETF and 43.90% for the Russell 3000® Index, the ETF’s benchmark. The ETF’s emphasis on small-cap stocks contributed positively to performance relative to the benchmark, as small-caps outperformed large-caps for the period. With low relative price (value) stocks outperforming high relative price (growth) stocks, the ETF’s emphasis on value stocks also contributed positively to relative performance.
U.S. Core Equity Market ETF
The U.S. Core Equity Market ETF invests in a broadly diversified group of U.S. securities with increased exposure to smaller market capitalization stocks, lower relative price (value) stocks, and higher-profitability stocks relative to the market. The investment strategy is process driven, emphasizing broad diversification. As of October 31, 2021, the ETF held approximately 2,500 securities. Average cash exposure throughout the year was less than 1% of the ETF’s assets.
From its inception on November 17, 2020, through October 31, 2021, total returns were 29.81% on a net asset value basis for the ETF and 29.65% for the Russell 3000® Index, the ETF’s benchmark. The ETF’s emphasis on small-cap stocks contributed positively to performance relative to the benchmark, as small-caps outperformed large-caps for the period. With low relative price (value) stocks outperforming high relative price (growth) stocks, the ETF’s emphasis on value stocks also contributed positively to relative performance.
| International Equity Market Review | 12 Months Ended October 31, 2021 |
Performance of non-U.S. developed markets was positive for the period. As measured by the MSCI World ex USA indices, small-cap stocks outperformed large-cap stocks, and mid-cap stocks, a subset of the large-cap universe, underperformed large-cap stocks and small-cap stocks. Value stocks outperformed growth stocks as measured by the MSCI World ex USA indices.
10
| 12 Months Ended October 31, 2021 |
||||
| Return in U.S. Dollars | ||||
| MSCI World ex USA Index |
35.59% | |||
| MSCI World ex USA Mid Cap Index |
31.20% | |||
| MSCI World ex USA Small Cap Index |
37.19% | |||
| MSCI World ex USA Value Index |
40.88% | |||
| MSCI World ex USA Growth Index |
30.25% | |||
For the 12 Months Ended October 31, 2021, the U.S. dollar appreciated against some non-U.S. developed markets currencies and depreciated against others. Overall, currency movements did not have a material overall impact on the U.S. dollar-denominated returns of developed markets.
| 12 Months Ended October 31, 2021 |
||||||||
| Ten Largest Foreign Developed Markets by Market Cap | Local Return | Return in U.S. Dollars | ||||||
| Japan |
30.75% | 19.88% | ||||||
| United Kingdom |
35.57% | 43.72% | ||||||
| Canada |
38.56% | 49.05% | ||||||
| France |
48.30% | 47.33% | ||||||
| Switzerland |
28.36% | 28.75% | ||||||
| Germany |
33.47% | 32.60% | ||||||
| Australia |
27.93% | 36.82% | ||||||
| Netherlands |
60.71% | 59.67% | ||||||
| Sweden |
40.26% | 45.36% | ||||||
| Hong Kong |
18.26% | 17.91% | ||||||
Source: Returns are of MSCI standard indices net of foreign withholding taxes on dividends. Copyright MSCI 2021, all rights reserved.
Emerging markets had positive performance for the period but underperformed both U.S. and non-U.S. developed markets. As measured by the MSCI Emerging Markets indices, small-cap stocks outperformed large-cap stocks, and mid-cap stocks, a subset of the large-cap universe, outperformed large-cap stocks but underperformed small-cap stocks. Value stocks outperformed growth stocks as measured by the MSCI Emerging Markets indices.
| 12 Months Ended October 31, 2021 |
||||
| Return in U.S. Dollars | ||||
| MSCI Emerging Markets Index |
16.96% | |||
| MSCI Emerging Markets Mid Cap Index |
31.20% | |||
| MSCI Emerging Markets Small Cap Index |
44.29% | |||
| MSCI Emerging Markets Value Index |
28.31% | |||
| MSCI Emerging Markets Growth Index |
7.38% | |||
11
For the 12 Months Ended October 31, 2021, the U.S. dollar depreciated against some emerging markets currencies and appreciated against others. Overall, currency movements had a positive impact on the U.S. dollar denominated returns of emerging markets.
| 12 Months Ended October 31, 2021 |
||||||||
| Ten Largest Emerging Markets by Market Cap | Local Return | Return in U.S. | ||||||
| Dollars |
||||||||
| China |
-9.52% | -9.21% | ||||||
| Taiwan |
38.36% | 42.32% | ||||||
| Korea |
27.78% | 24.08% | ||||||
| India |
51.78% | 50.21% | ||||||
| Russia |
64.53% | 81.80% | ||||||
| Brazil |
10.38% | 12.91% | ||||||
| Saudi Arabia |
56.07% | 56.04% | ||||||
| South Africa |
18.16% | 26.32% | ||||||
| Mexico |
42.35% | 47.44% | ||||||
| Thailand |
34.75% | 26.57% | ||||||
Source: Returns are of MSCI standard indices net of foreign withholding taxes on dividends. Copyright MSCI 2021, all rights reserved.
For Portfolios investing in non-U.S. equities traded outside of the U.S. market time zone, differences in the valuation timing and methodology between a Portfolio and its benchmark index may impact relative performance over the referenced period. The Portfolios price foreign exchange rates at the closing of the U.S. market, while their benchmark indices use rates at 4 p.m. London time. The Portfolios also may use fair value pricing to price certain portfolio securities at the closing of the U.S. market, while benchmark indices may use local market closing prices. For the one-year period ended October 31, 2021, these differences generally detracted from the Portfolios’ relative performance.
International Value ETF
The International Value ETF invests in a broadly diversified group of developed ex U.S. large company value stocks while considering the federal tax implications of investment decisions. The investment strategy is process driven, emphasizing broad diversification, with increased exposure to stocks with smaller total market capitalizations, lower relative price (value), and higher-profitability within the large-cap value segment of developed ex U.S. markets. As of October 31, 2021, the ETF held approximately 520 securities in 22 eligible developed markets. Average cash exposure throughout the year was less than 1% of the ETF’s assets.
For the 12 months ended October 31, 2021, total returns were 48.18% on a net asset value basis for the ETF and 35.59% for the MSCI World ex USA Index (net dividends), the ETF’s benchmark. With low relative price (value) stocks outperforming high relative price (growth) stocks for the period, the ETF’s focus on value stocks contributed positively to performance relative to the style-neutral benchmark.
World ex U.S. Core 2 Equity ETF
The World ex U.S. Core 2 Equity ETF invests in a broadly diversified group of stocks in developed ex U.S. and emerging markets, with increased exposure to stocks with smaller market capitalization, lower relative price, and higher profitability, while considering potential federal tax implications of investment decisions. The investment strategy is process driven, emphasizing broad diversification. As of October 31, 2021, the ETF held approximately 9,390 securities in 46 eligible developed and emerging markets. Average cash exposure throughout the year was less than 1% of the ETF’s assets.
For the 12 months ended October 31, 2021, total returns were 35.23% on a net asset value basis for the ETF and 29.66% for the MSCI All Country World ex USA Index (net dividends), the ETF’s benchmark. The ETF’s greater emphasis on low relative price (value) stocks contributed positively to relative performance, as value stocks outperformed high relative price (growth) stocks in developed ex U.S. and emerging markets.
12
International Core Equity Market ETF
The International Core Equity Market ETF invests in a broadly diversified group of stocks in developed ex U.S. markets, with increased exposure to stocks with smaller market capitalization, lower relative price (value), and higher profitability. The investment strategy is process driven, emphasizing broad diversification. As of October 31, 2021, the ETF held approximately 3,090 securities in 22 eligible developed markets. Average cash exposure throughout the year was less than 1% of the ETF’s assets.
From its inception on November 17, 2020 through October 31, 2021, total returns were 20.54% on a net asset value basis for the ETF and 19.42% for the MSCI World ex USA IMI Index (net dividends), the ETF’s benchmark. The ETF’s emphasis on low relative price (value) stocks contributed positively to performance relative to the benchmark, as value stocks outperformed high relative price (growth) stocks in developed ex US markets.
Emerging Core Equity Market ETF
The Emerging Core Equity Market ETF invests in a broadly diversified group of stocks in emerging markets, with increased exposure to stocks with smaller market capitalization, lower relative price (value), and higher profitability. The investment strategy is process driven, emphasizing broad diversification. As of October 31, 2021, the ETF held approximately 4,140 securities in 24 eligible emerging markets. Average cash exposure throughout the year was less than 1% of the ETF’s assets.
From its inception on December 1, 2020 through October 31, 2021, total returns were 9.33% on a net asset value basis for the ETF and 7.48% for the MSCI Emerging Markets IMI Index (net dividends), the ETF’s benchmark. The ETF’s emphasis on low relative price (value) stocks contributed positively to performance relative to the benchmark, as value stocks outperformed high relative price (growth) stocks in emerging markets. The ETF’s emphasis on small-cap stocks contributed positively to performance relative to the benchmark, as small-caps outperformed large-caps for the period.
13
DISCLOSURE OF FUND EXPENSES
The following Expense Tables are shown so that you can understand the impact of fees on your investment. All mutual funds have operating expenses. As a shareholder of the fund, you incur ongoing costs, which include costs for portfolio management, administrative services, and shareholder reports, among others. Operating expenses and legal and audit services, which are deducted from a fund’s gross income, directly reduce the investment return of the fund. A fund’s expenses are expressed as a percentage of its average net assets. This figure is known as the expense ratio. The following examples are intended to help you understand the ongoing costs, in dollars, of investing in the fund and to compare these costs with those of other mutual funds. The examples are based on an investment of $1,000 made at the beginning of the period shown and held for the entire period.
The Expense Tables below illustrate your fund’s costs in two ways.
Actual Fund Return
This section helps you to estimate the actual expenses after fee waivers that you paid over the period. The “Ending Account Value” shown is derived from the fund’s actual return and “Expenses Paid During Period” reflects the dollar amount that would have been paid by an investor who started with $1,000 in the fund. You may use the information here, together with the amount you invested, to estimate the expenses that you paid over the period.
To do so, simply divide your account value by $1,000 (for example, a $7,500 account value divided by $1,000 = 7.5), then multiply the result by the number given for your fund under the heading “Expenses Paid During Period.”
Hypothetical Example for Comparison Purposes
This section is intended to help you compare your fund’s costs with those of other mutual funds. The hypothetical “Ending Account Value” and “Expenses Paid During Period” are derived from the fund’s actual expense ratio and an assumed 5% annual return before expenses. In this case, because the return used is not the fund’s actual return, the results do not apply to your investment. The example is useful in making comparisons because the SEC requires all mutual funds to calculate expenses based on a 5% annual return. You can assess your fund’s costs by comparing this hypothetical example with the hypothetical examples that appear in shareholder reports of other funds.
Please note that the expenses shown in the tables are meant to highlight and help you compare ongoing costs only and do not reflect any transactional costs, such as brokerage commissions if applicable. The “Annualized Expense Ratio” represents the actual expenses for the six-month period indicated.
| For the period ended October 31, 2021 | ||||||||||||||||
| Expense Tables |
||||||||||||||||
| Beginning Account Value 5/1/2021 |
Ending Account Value 10/31/2021 |
Annualized Expense Ratio(a) |
Expenses Paid During Period(a) |
|||||||||||||
| Dimensional U.S. Equity ETF |
||||||||||||||||
| Actual Fund Return |
$ | 1,000.00 | $ | 1,102.20 | 0.17 | % | $ | 0.90 | ||||||||
| Hypothetical 5% Annual Return |
$ | 1,000.00 | $ | 1,024.35 | 0.17 | % | $ | 0.87 | ||||||||
| Dimensional US Core Equity Market ETF |
||||||||||||||||
| Actual Fund Return |
$ | 1,000.00 | $ | 1,092.90 | 0.12 | % | $ | 0.63 | ||||||||
| Hypothetical 5% Annual Return |
$ | 1,000.00 | $ | 1,024.60 | 0.12 | % | $ | 0.61 | ||||||||
14
DISCLOSURE OF FUND EXPENSES
CONTINUED
| Beginning Account Value 5/1/2021 |
Ending Account Value 10/31/2021 |
Annualized Expense Ratio(a) |
Expenses Paid During Period(a) |
|||||||||||||
| Dimensional U.S. Core Equity 2 ETF |
||||||||||||||||
| Actual Fund Return |
$ | 1,000.00 | $ | 1,076.00 | 0.21 | % | $ | 1.10 | ||||||||
| Hypothetical 5% Annual Return |
$ | 1,000.00 | $ | 1,024.15 | 0.21 | % | $ | 1.07 | ||||||||
| Dimensional U.S. Small Cap ETF |
||||||||||||||||
| Actual Fund Return |
$ | 1,000.00 | $ | 1,047.30 | 0.39 | % | $ | 2.01 | ||||||||
| Hypothetical 5% Annual Return |
$ | 1,000.00 | $ | 1,023.24 | 0.39 | % | $ | 1.99 | ||||||||
| Dimensional U.S. Targeted Value ETF |
||||||||||||||||
| Actual Fund Return |
$ | 1,000.00 | $ | 1,042.40 | 0.38 | % | $ | 1.96 | ||||||||
| Hypothetical 5% Annual Return |
$ | 1,000.00 | $ | 1,023.29 | 0.38 | % | $ | 1.94 | ||||||||
| Dimensional International Core Equity Market ETF |
||||||||||||||||
| Actual Fund Return |
$ | 1,000.00 | $ | 1,049.40 | 0.18 | % | $ | 0.93 | ||||||||
| Hypothetical 5% Annual Return |
$ | 1,000.00 | $ | 1,024.30 | 0.18 | % | $ | 0.92 | ||||||||
| Dimensional International Value ETF |
||||||||||||||||
| Actual Fund Return |
$ | 1,000.00 | $ | 1,054.50 | 0.48 | % | $ | 2.49 | ||||||||
| Hypothetical 5% Annual Return |
$ | 1,000.00 | $ | 1,022.79 | 0.48 | % | $ | 2.45 | ||||||||
| Dimensional Emerging Core Equity Market ETF |
||||||||||||||||
| Actual Fund Return |
$ | 1,000.00 | $ | 961.80 | 0.35 | % | $ | 1.73 | ||||||||
| Hypothetical 5% Annual Return |
$ | 1,000.00 | $ | 1,023.44 | 0.35 | % | $ | 1.79 | ||||||||
| Dimensional World ex U.S. Core Equity 2 ETF |
||||||||||||||||
| Actual Fund Return |
$ | 1,000.00 | $ | 1,018.40 | 0.36 | % | $ | 1.83 | ||||||||
| Hypothetical 5% Annual Return |
$ | 1,000.00 | $ | 1,023.39 | 0.36 | % | $ | 1.84 | ||||||||
| (a) | Expenses are equal to the Fund’s annualized expense ratio for the six-month period, multiplied by the average account value over the period, multiplied by the number of days in the most recent six-month period (184), then divided by the number of days in the year (365) (to reflect the six-month period). |
15
DISCLOSURE OF PORTFOLIO HOLDINGS
(Unaudited)
The SEC requires that all funds file a complete Schedule of Investments with the SEC for their first and third fiscal quarters as an exhibit to their reports on Form N-PORT. For Dimensional ETF Trust, this would be for the fiscal quarters ending January 31 and July 31. Such Form N-PORT filing must be made within 60 days of the end of the quarter. Dimensional ETF Trust filed its most recent Form N-PORT with the SEC on September 29, 2021. They are available upon request, without charge, by calling collect: (512) 306-7400; by mailing a request to Dimensional Fund Advisors LP, 6300 Bee Cave Road, Building One, Austin, TX 78746; or by visiting the SEC’s website at http://www.sec.gov.
SEC regulations permit a fund to include in its reports to shareholders a “Summary Schedule of Portfolio Holdings” in lieu of a full Schedule of Investments. The Summary Schedule of Portfolio Holdings reports the fund’s 50 largest holdings in unaffiliated issuers and any investments that exceed one percent of the fund’s net assets at the end of the reporting period. The regulations also require that the Summary Schedule of Portfolio Holdings identify each category of investments that are held.
A fund is required to file a complete Schedule of Investments with the SEC on Form N-CSR within ten days after mailing the annual and semi-annual reports to shareholders. It will be available upon request, without charge, by calling collect: (512) 306-7400; by mailing a request to Dimensional Fund Advisors LP, 6300 Bee Cave Road, Building One, Austin, TX 78746; or by visiting the SEC’s website at http://www.sec.gov.
PORTFOLIO HOLDINGS
The SEC requires that all funds present their categories of portfolio holdings in a table, chart, or graph format in their annual and semi-annual shareholder reports, whether or not a Schedule of Investments is used. The following table, which presents portfolio holdings as a percentage of total investments before short-term investments and collateral for loaned securities, is provided in compliance with this requirement. The categories shown below represent broad industry sectors. Each industry sector consists of one or more specific industry classifications.
| Dimensional U.S. Equity ETF |
| |||
| Communication Services |
10.4 | % | ||
| Consumer Discretionary |
13.0 | % | ||
| Consumer Staples |
5.4 | % | ||
| Energy |
2.5 | % | ||
| Financials |
12.2 | % | ||
| Health Care |
13.2 | % | ||
| Industrials |
9.1 | % | ||
| Information Technology |
29.1 | % | ||
| Materials |
2.7 | % | ||
| Real Estate |
0.1 | % | ||
| Utilities |
2.3 | % | ||
|
|
|
|||
| 100.0 | % | |||
| Dimensional US Core Equity Market ETF |
| |||
| Communication Services |
9.3 | % | ||
| Consumer Discretionary |
13.0 | % | ||
| Consumer Staples |
5.8 | % | ||
| Energy |
3.3 | % | ||
| Financials |
12.9 | % | ||
| Health Care |
12.7 | % | ||
| Industrials |
10.4 | % | ||
| Information Technology |
26.6 | % | ||
| Materials |
3.2 | % | ||
| Real Estate |
0.2 | % | ||
| Utilities |
2.6 | % | ||
|
|
|
|||
| 100.0 | % | |||
| Dimensional U.S. Core Equity 2 ETF |
| |||
| Communication Services |
7.0 | % | ||
| Consumer Discretionary |
13.2 | % | ||
| Consumer Staples |
5.1 | % | ||
| Energy |
3.0 | % | ||
| Financials |
15.4 | % | ||
| Health Care |
11.7 | % | ||
| Industrials |
13.9 | % | ||
| Information Technology |
24.4 | % | ||
| Materials |
4.3 | % | ||
| Real Estate |
0.4 | % | ||
| Utilities |
1.6 | % | ||
|
|
|
|||
| 100.0 | % | |||
| Dimensional U.S. Small Cap ETF |
| |||
| Communication Services |
2.3 | % | ||
| Consumer Discretionary |
14.6 | % | ||
| Consumer Staples |
4.1 | % | ||
| Energy |
3.3 | % | ||
| Financials |
20.7 | % | ||
| Health Care |
11.8 | % | ||
| Industrials |
20.8 | % | ||
| Information Technology |
13.7 | % | ||
| Materials |
5.8 | % | ||
| Real Estate |
0.5 | % | ||
| Utilities |
2.4 | % | ||
|
|
|
|||
| 100.0 | % | |||
| Dimensional U.S. Targeted Value ETF |
| |||
| Communication Services |
2.8 | % | ||
| Consumer Discretionary |
14.8 | % | ||
| Consumer Staples |
5.0 | % | ||
| Energy |
5.1 | % | ||
| Financials |
29.0 | % | ||
| Health Care |
4.1 | % | ||
| Industrials |
22.0 | % | ||
| Information Technology |
8.4 | % | ||
| Materials |
8.0 | % | ||
| Real Estate |
0.6 | % | ||
| Utilities |
0.2 | % | ||
|
|
|
|||
| 100.0 | % | |||
| Dimensional International Core Equity Market ETF |
| |||
| Communication Services |
4.8 | % | ||
| Consumer Discretionary |
12.7 | % | ||
| Consumer Staples |
8.8 | % | ||
| Energy |
5.0 | % | ||
| Financials |
17.6 | % | ||
| Health Care |
10.5 | % | ||
| Industrials |
17.4 | % | ||
| Information Technology |
9.2 | % | ||
| Materials |
9.1 | % | ||
| Real Estate |
1.4 | % | ||
| Utilities |
3.5 | % | ||
|
|
|
|||
| 100.0 | % | |||
16
DISCLOSURE OF PORTFOLIO HOLDINGS
CONTINUED
| Dimensional International Value ETF |
| |||
| Communication Services |
4.9 | % | ||
| Consumer Discretionary |
14.3 | % | ||
| Consumer Staples |
4.8 | % | ||
| Energy |
12.6 | % | ||
| Financials |
29.0 | % | ||
| Health Care |
5.5 | % | ||
| Industrials |
11.2 | % | ||
| Information Technology |
1.2 | % | ||
| Materials |
12.9 | % | ||
| Real Estate |
2.1 | % | ||
| Utilities |
1.5 | % | ||
|
|
|
|||
| 100.0 | % | |||
| Dimensional Emerging Core Equity Market ETF |
| |||
| Communication Services |
9.3 | % | ||
| Consumer Discretionary |
13.2 | % | ||
| Consumer Staples |
6.0 | % | ||
| Energy |
5.1 | % | ||
| Financials |
17.1 | % | ||
| Health Care |
4.2 | % | ||
| Industrials |
7.8 | % | ||
| Information Technology |
21.1 | % | ||
| Materials |
11.0 | % | ||
| Real Estate |
2.5 | % | ||
| Utilities |
2.7 | % | ||
|
|
|
|||
| 100.0 | % | |||
| Dimensional World ex U.S. Core Equity 2 ETF |
| |||
| Communication Services |
5.8 | % | ||
| Consumer Discretionary |
13.6 | % | ||
| Consumer Staples |
7.7 | % | ||
| Energy |
5.1 | % | ||
| Financials |
15.0 | % | ||
| Health Care |
6.3 | % | ||
| Industrials |
16.9 | % | ||
| Information Technology |
11.7 | % | ||
| Materials |
12.1 | % | ||
| Real Estate |
2.8 | % | ||
| Utilities |
3.0 | % | ||
|
|
|
|||
| 100.0 | % | |||
17
SUMMARY SCHEDULE OF PORTFOLIO HOLDINGS
October 31, 2021
| Shares |
Value† |
Percentage |
||||||||||||
| COMMON STOCKS — (99.1%) |
| |||||||||||||
| COMMUNICATION SERVICES — (10.3%) |
| |||||||||||||
| * |
Alphabet, Inc., Class A |
41,882 | $ | 124,009,251 | 2.1% | |||||||||
| * |
Alphabet, Inc., Class C |
41,863 | 124,140,959 | 2.1% | ||||||||||
| Comcast Corp., Class A |
633,966 | 32,604,871 | 0.6% | |||||||||||
| * |
Facebook, Inc., Class A |
336,080 | 108,745,406 | 1.8% | ||||||||||
| * |
Netflix, Inc. |
61,692 | 42,586,605 | 0.7% | ||||||||||
| Verizon Communications, Inc. |
577,823 | 30,618,841 | 0.5% | |||||||||||
| * |
Walt Disney Co. (The) |
252,754 | 42,733,119 | 0.7% | ||||||||||
| Other Securities |
120,108,481 | 1.9% | ||||||||||||
|
|
|
|
|
|||||||||||
| TOTAL COMMUNICATION SERVICES |
625,547,533 | 10.4% | ||||||||||||
|
|
|
|
|
|||||||||||
| CONSUMER DISCRETIONARY — (12.8%) |
| |||||||||||||
| * |
Amazon.com, Inc. |
61,739 | 208,210,456 | 3.5% | ||||||||||
| Home Depot, Inc. (The) |
150,712 | 56,025,679 | 0.9% | |||||||||||
| Lowe’s Cos., Inc. |
105,669 | 24,707,526 | 0.4% | |||||||||||
| McDonald’s Corp. |
104,363 | 25,626,335 | 0.4% | |||||||||||
| NIKE, Inc., Class B |
174,778 | 29,238,612 | 0.5% | |||||||||||
| * |
Tesla, Inc. |
108,041 | 120,357,674 | 2.0% | ||||||||||
| Other Securities |
318,178,523 | 5.3% | ||||||||||||
|
|
|
|
|
|||||||||||
| TOTAL CONSUMER DISCRETIONARY |
782,344,805 | 13.0% | ||||||||||||
|
|
|
|
|
|||||||||||
| CONSUMER STAPLES — (5.4%) |
| |||||||||||||
| Coca-Cola Co. (The) |
570,909 | 32,182,140 | 0.5% | |||||||||||
| Costco Wholesale Corp. |
63,220 | 31,075,159 | 0.5% | |||||||||||
| * |
PepsiCo., Inc. |
200,142 | 32,342,947 | 0.5% | ||||||||||
| Procter & Gamble Co. (The) |
347,476 | 49,685,593 | 0.8% | |||||||||||
| Walmart, Inc. |
198,534 | 29,664,950 | 0.5% | |||||||||||
| Other Securities |
152,790,715 | 2.6% | ||||||||||||
|
|
|
|
|
|||||||||||
| TOTAL CONSUMER STAPLES |
327,741,504 | 5.4% | ||||||||||||
|
|
|
|
|
|||||||||||
| ENERGY — (2.5%) |
| |||||||||||||
| Chevron Corp. |
237,748 | 27,219,769 | 0.5% | |||||||||||
| Exxon Mobil Corp. |
517,515 | 33,364,192 | 0.6% | |||||||||||
| Other Securities |
92,417,867 | 1.4% | ||||||||||||
|
|
|
|
|
|||||||||||
| TOTAL ENERGY |
153,001,828 | 2.5% | ||||||||||||
|
|
|
|
|
|||||||||||
| FINANCIALS — (12.1%) |
| |||||||||||||
| Bank of America Corp. |
1,086,017 | 51,889,892 | 0.9% | |||||||||||
| * |
Berkshire Hathaway, Inc., Class B |
270,863 | 77,740,390 | 1.3% | ||||||||||
| JPMorgan Chase & Co. |
425,131 | 72,225,506 | 1.2% | |||||||||||
| Wells Fargo & Co. |
481,144 | 24,615,327 | 0.4% | |||||||||||
| Other Securities |
508,168,125 | 8.4% | ||||||||||||
|
|
|
|
|
|||||||||||
| TOTAL FINANCIALS |
734,639,240 | 12.2% | ||||||||||||
|
|
|
|
|
|||||||||||
| HEALTH CARE — (13.1%) |
| |||||||||||||
| Abbott Laboratories |
245,051 | 31,584,623 | 0.5% | |||||||||||
| AbbVie, Inc. |
246,043 | 28,213,751 | 0.5% | |||||||||||
| Danaher Corp. |
82,522 | 25,727,884 | 0.4% | |||||||||||
| Eli Lilly & Co. |
124,654 | 31,756,853 | 0.5% | |||||||||||
| Johnson & Johnson |
367,378 | 59,838,529 | 1.0% | |||||||||||
| Merck & Co., Inc. |
352,752 | 31,059,814 | 0.5% | |||||||||||
| Pfizer, Inc. |
777,093 | 33,990,048 | 0.6% | |||||||||||
| Thermo Fisher Scientific, Inc. |
55,402 | 35,073,344 | 0.6% | |||||||||||
| UnitedHealth Group, Inc. |
132,814 | 61,156,863 | 1.0% | |||||||||||
18
DIMENSIONAL U.S. EQUITY ETF
CONTINUED
| Shares |
Value† |
Percentage |
||||||||||||
| HEALTH CARE — (Continued) |
||||||||||||||
| Other Securities |
$ | 456,277,856 | 7.6% | |||||||||||
|
|
|
|
|
|||||||||||
| TOTAL HEALTH CARE |
794,679,565 | 13.2% | ||||||||||||
|
|
|
|
|
|||||||||||
| INDUSTRIALS — (9.0%) |
| |||||||||||||
| Union Pacific Corp. |
95,269 | 1,962,031 | 0.3% | |||||||||||
| Other Securities |
544,975,801 | 8.8% | ||||||||||||
|
|
|
|
|
|||||||||||
| INFORMATION TECHNOLOGY — (28.8%) |
| |||||||||||||
| Accenture PLC, Class A |
88,303 | 31,682,233 | 0.5% | |||||||||||
| * |
Adobe, Inc. |
67,867 | 44,137,982 | 0.7% | ||||||||||
| Apple, Inc. |
2,426,513 | 363,491,647 | 6.0% | |||||||||||
| Broadcom, Inc. |
56,543 | 30,062,217 | 0.5% | |||||||||||
| Cisco Systems, Inc. |
590,015 | 33,023,140 | 0.6% | |||||||||||
| Intel Corp. |
594,424 | 29,126,776 | 0.5% | |||||||||||
| Mastercard, Inc., Class A |
124,413 | 41,743,050 | 0.7% | |||||||||||
| Microsoft Corp. |
1,007,984 | 334,267,654 | 5.5% | |||||||||||
| NVIDIA Corp. |
337,735 | 86,348,707 | 1.4% | |||||||||||
| Oracle Corp. |
298,001 | 28,590,216 | 0.5% | |||||||||||
| * |
PayPal Holdings, Inc. |
161,088 | 37,467,458 | 0.6% | ||||||||||
| * |
salesforce.com, Inc. |
122,379 | 36,675,763 | 0.6% | ||||||||||
| Texas Instruments, Inc. |
128,211 | 24,036,998 | 0.4% | |||||||||||
| Visa, Inc., Class A |
234,741 | 49,711,102 | 0.8% | |||||||||||
| Other Securities |
583,675,055 | 9.7% | ||||||||||||
|
|
|
|
|
|||||||||||
| TOTAL INFORMATION TECHNOLOGY |
1,754,039,998 | 29.0% | ||||||||||||
|
|
|
|
|
|||||||||||
| MATERIALS — (2.7%) |
| |||||||||||||
| Linde PLC |
73,618 | 23,498,866 | 0.4% | |||||||||||
| Other Securities |
141,668,949 | 2.3% | ||||||||||||
|
|
|
|
|
|||||||||||
| TOTAL MATERIALS |
165,167,815 | 2.7% | ||||||||||||
|
|
|
|
|
|||||||||||
| REAL ESTATE — (0.1%) |
| |||||||||||||
| Other Securities |
8,092,288 | 0.1% | ||||||||||||
|
|
|
|
|
|||||||||||
| UTILITIES — (2.3%) |
| |||||||||||||
| NextEra Energy, Inc. |
274,601 | 23,431,703 | 0.4% | |||||||||||
| Other Securities |
117,237,466 | 1.9% | ||||||||||||
|
|
|
|
|
|||||||||||
| TOTAL UTILITIES |
140,669,169 | 2.3% | ||||||||||||
|
|
|
|
|
|||||||||||
| TOTAL COMMON STOCKS |
6,032,861,577 | 99.9% | ||||||||||||
|
|
|
|
|
|||||||||||
| PREFERRED STOCKS — (0.0%) |
| |||||||||||||
| INDUSTRIALS — (0.0%) |
| |||||||||||||
| Other Securities |
97,183 | 0.0% | ||||||||||||
|
|
|
|
|
|||||||||||
| TOTAL PREFERRED STOCKS |
97,183 | 0.0% | ||||||||||||
|
|
|
|
|
|||||||||||
| RIGHTS/WARRANTS — (0.0%) |
| |||||||||||||
| COMMUNICATION SERVICES — (0.0%) |
| |||||||||||||
| Other Securities |
213 | 0.0% | ||||||||||||
|
|
|
|
|
|||||||||||
| CONSUMER DISCRETIONARY — (0.0%) |
| |||||||||||||
| Other Securities |
15 | 0.0% | ||||||||||||
|
|
|
|
|
|||||||||||
| FINANCIALS — (0.0%) |
| |||||||||||||
| Other Securities |
390 | 0.0% | ||||||||||||
|
|
|
|
|
|||||||||||
19
DIMENSIONAL U.S. EQUITY ETF
CONTINUED
| Shares |
Value† |
Percentage |
||||||||||||
| HEALTH CARE — (0.0%) |
| |||||||||||||
| Other Securities |
$ | 2,610 | 0.0% | |||||||||||
|
|
|
|
|
|||||||||||
| TOTAL RIGHTS/WARRANTS |
3,228 | 0.0% | ||||||||||||
|
|
|
|
|
|||||||||||
| TOTAL INVESTMENT SECURITIES — (99.1%) |
|
|||||||||||||
| (Cost $1,776,076,906) |
6,032,961,988 | |||||||||||||
|
|
|
|||||||||||||
| SECURITIES LENDING COLLATERAL — (0.9%) |
|
|||||||||||||
| @§ |
The DFA Short Term Investment Fund |
4,863,828 | 56,272,062 | 0.9% | ||||||||||
|
|
|
|
|
|||||||||||
| TOTAL INVESTMENTS — 100.0% |
||||||||||||||
| (Cost $1,832,348,968) |
$ | 6,089,234,050 | 100.8% | |||||||||||
|
|
|
|
|
|||||||||||
Summary of the Fund’s investments as of October 31, 2021, based on their valuation inputs, is as follows (see Security Valuation Note):
| Investment in Securities (Market Value) | ||||||||||||||||
| Level 1 | Level 2 | Level 3 | Total | |||||||||||||
| Common Stocks |
||||||||||||||||
| Communication Services |
$625,546,774 | $759 | $— | $625,547,533 | ||||||||||||
| Consumer Discretionary |
782,344,805 | — | — | 782,344,805 | ||||||||||||
| Consumer Staples |
327,741,504 | — | — | 327,741,504 | ||||||||||||
| Energy |
153,001,828 | — | — | 153,001,828 | ||||||||||||
| Financials |
734,639,240 | — | — | 734,639,240 | ||||||||||||
| Healthcare |
794,641,710 | — | 37,855 | 794,679,565 | ||||||||||||
| Industrials |
546,937,832 | — | — | 546,937,832 | ||||||||||||
| Information Technology |
1,754,039,998 | — | — | 1,754,039,998 | ||||||||||||
| Materials |
165,167,815 | — | — | 165,167,815 | ||||||||||||
| Real Estate |
8,092,288 | — | — | 8,092,288 | ||||||||||||
| Utilities |
140,669,169 | — | — | 140,669,169 | ||||||||||||
| Preferred Stocks |
||||||||||||||||
| Industrials |
97,183 | — | — | 97,183 | ||||||||||||
| Rights/Warrants |
||||||||||||||||
| Communication Services |
— | — | 213 | 213 | ||||||||||||
| Consumer Discretionary |
— | — | 15 | 15 | ||||||||||||
| Financials |
— | — | 390 | 390 | ||||||||||||
| Healthcare |
— | — | 2,610 | 2,610 | ||||||||||||
| Collateral for Securities on Loan |
56,272,062 | — | — | 56,272,062 | ||||||||||||
|
|
|
|
|
|
|
|
|
|||||||||
| Total Investments |
$6,089,192,208 | $759 | $41,083 | $6,089,234,050 | ||||||||||||
|
|
|
|
|
|
|
|
|
|||||||||
A reconciliation of Level 3 investments is presented when the Fund had a significant amount of Level 3 investments at the beginning and/or end of the reporting period in relation to net assets.
See accompanying Notes to Financial Statements.
20
DIMENSIONAL US CORE EQUITY MARKET ETF
SUMMARY SCHEDULE OF PORTFOLIO HOLDINGS
October 31, 2021
| Shares |
Value† |
Percentage |
||||||||||||
| COMMON STOCKS — (98.8%) |
| |||||||||||||
| COMMUNICATION SERVICES — (9.2%) |
| |||||||||||||
| * |
Alphabet, Inc., Class A |
7,874 | $ | 23,314,284 | 1.8% | |||||||||
| * |
Alphabet, Inc., Class C |
7,889 | 23,394,119 | 1.8% | ||||||||||
| AT&T, Inc. |
222,296 | 5,615,197 | 0.4% | |||||||||||
| Comcast Corp., Class A |
131,270 | 6,751,216 | 0.5% | |||||||||||
| * |
Facebook, Inc., Class A |
60,082 | 19,440,733 | 1.5% | ||||||||||
| * |
Netflix, Inc. |
9,564 | 6,602,125 | 0.5% | ||||||||||
| Verizon Communications, Inc. |
157,735 | 8,358,378 | 0.6% | |||||||||||
| * |
Walt Disney Co. (The) |
38,734 | 6,548,757 | 0.5% | ||||||||||
| Other Securities |
22,824,591 | 1.6% | ||||||||||||
|
|
|
|
|
|||||||||||
| TOTAL COMMUNICATION SERVICES |
122,849,400 | 9.2% | ||||||||||||
|
|
|
|
|
|||||||||||
| CONSUMER DISCRETIONARY — (12.8%) |
| |||||||||||||
| * |
Amazon.com, Inc. |
11,958 | 40,327,518 | 3.0% | ||||||||||
| Home Depot, Inc. (The) |
27,432 | 10,197,572 | 0.8% | |||||||||||
| Lowe’s Cos., Inc. |
20,030 | 4,683,415 | 0.4% | |||||||||||
| McDonald’s Corp. |
18,480 | 4,537,764 | 0.4% | |||||||||||
| NIKE, Inc., Class B |
37,267 | 6,234,396 | 0.5% | |||||||||||
| * |
Tesla, Inc. |
19,427 | 21,641,678 | 1.6% | ||||||||||
| Other Securities |
84,504,127 | 6.3% | ||||||||||||
|
|
|
|
|
|||||||||||
| TOTAL CONSUMER DISCRETIONARY |
172,126,470 | 13.0% | ||||||||||||
|
|
|
|
|
|||||||||||
| CONSUMER STAPLES — (5.7%) |
| |||||||||||||
| Coca-Cola Co. (The) |
110,156 | 6,209,494 | 0.5% | |||||||||||
| Costco Wholesale Corp. |
11,584 | 5,693,999 | 0.4% | |||||||||||
| PepsiCo., Inc. |
42,177 | 6,815,803 | 0.5% | |||||||||||
| Procter & Gamble Co. (The) |
75,108 | 10,739,693 | 0.8% | |||||||||||
| Walmart, Inc. |
46,009 | 6,874,665 | 0.5% | |||||||||||
| Other Securities |
40,541,062 | 3.1% | ||||||||||||
|
|
|
|
|
|||||||||||
| TOTAL CONSUMER STAPLES |
76,874,716 | 5.8% | ||||||||||||
|
|
|
|
|
|||||||||||
| ENERGY — (3.3%) |
| |||||||||||||
| Chevron Corp. |
50,928 | 5,830,747 | 0.4% | |||||||||||
| Exxon Mobil Corp. |
101,611 | 6,550,861 | 0.5% | |||||||||||
| Other Securities |
31,635,286 | 2.4% | ||||||||||||
|
|
|
|
|
|||||||||||
| TOTAL ENERGY |
44,016,894 | 3.3% | ||||||||||||
|
|
|
|
|
|||||||||||
| FINANCIALS — (12.7%) |
| |||||||||||||
| Bank of America Corp. |
186,214 | 8,897,305 | 0.7% | |||||||||||
| * |
Berkshire Hathaway, Inc., Class B |
41,322 | 11,859,827 | 0.9% | ||||||||||
| JPMorgan Chase & Co. |
84,147 | 14,295,734 | 1.1% | |||||||||||
| Wells Fargo & Co. |
94,881 | 4,854,112 | 0.4% | |||||||||||
| Other Securities |
131,177,299 | 9.8% | ||||||||||||
|
|
|
|
|
|||||||||||
| TOTAL FINANCIALS |
171,084,277 | 12.9% | ||||||||||||
|
|
|
|
|
|||||||||||
| HEALTH CARE — (12.6%) |
| |||||||||||||
| Abbott Laboratories |
41,732 | 5,378,837 | 0.4% | |||||||||||
| AbbVie, Inc. |
53,510 | 6,135,992 | 0.5% | |||||||||||
| Danaher Corp. |
14,916 | 4,650,361 | 0.4% | |||||||||||
| Eli Lilly & Co. |
23,624 | 6,018,450 | 0.5% | |||||||||||
| Johnson & Johnson |
80,812 | 13,162,659 | 1.0% | |||||||||||
| Merck & Co., Inc. |
65,010 | 5,724,131 | 0.4% | |||||||||||
21
DIMENSIONAL US CORE EQUITY MARKET ETF
CONTINUED
| Shares |
Value† |
Percentage |
||||||||||||
| HEALTH CARE — (Continued) |
| |||||||||||||
| Pfizer, Inc. |
138,358 | $ | 6,051,779 | 0.5% | ||||||||||
| Thermo Fisher Scientific, Inc. |
9,970 | 6,311,708 | 0.5% | |||||||||||
| UnitedHealth Group, Inc. |
26,312 | 12,115,887 | 0.9% | |||||||||||
| Other Securities |
103,240,587 | 7.6% | ||||||||||||
|
|
|
|
|
|||||||||||
| TOTAL HEALTH CARE |
168,790,391 | 12.7% | ||||||||||||
|
|
|
|
|
|||||||||||
| INDUSTRIALS — (10.3%) |
||||||||||||||
| Union Pacific Corp. |
20,423 | 4,930,112 | 0.4% | |||||||||||
| Other Securities |
133,579,269 | 10.0% | ||||||||||||
|
|
|
|
|
|||||||||||
| TOTAL INDUSTRIALS |
138,509,381 | 10.4% | ||||||||||||
|
|
|
|
|
|||||||||||
| INFORMATION TECHNOLOGY — (26.3%) |
| |||||||||||||
| Accenture PLC, Class A |
19,075 | 6,843,919 | 0.5% | |||||||||||
| * |
Adobe, Inc. |
11,857 | 7,711,319 | 0.6% | ||||||||||
| Apple, Inc. |
483,503 | 72,428,749 | 5.5% | |||||||||||
| Broadcom, Inc. |
13,278 | 7,059,514 | 0.5% | |||||||||||
| Cisco Systems, Inc. |
120,142 | 6,724,348 | 0.5% | |||||||||||
| Intel Corp. |
145,823 | 7,145,327 | 0.6% | |||||||||||
| Mastercard, Inc., Class A |
25,251 | 8,472,216 | 0.7% | |||||||||||
| Microsoft Corp. |
200,479 | 66,482,846 | 5.0% | |||||||||||
| NVIDIA Corp. |
58,272 | 14,898,402 | 1.1% | |||||||||||
| Oracle Corp. |
55,871 | 5,360,264 | 0.4% | |||||||||||
| * |
PayPal Holdings, Inc. |
21,698 | 5,046,738 | 0.4% | ||||||||||
| QUALCOMM, Inc. |
35,543 | 4,728,641 | 0.4% | |||||||||||
| * |
Salesforce.com, Inc. |
18,400 | 5,514,296 | 0.4% | ||||||||||
| Texas Instruments, Inc. |
29,308 | 5,494,664 | 0.4% | |||||||||||
| Visa, Inc., Class A |
42,538 | 9,008,272 | 0.7% | |||||||||||
| Other Securities |
120,314,815 | 8.9% | ||||||||||||
|
|
|
|
|
|||||||||||
| TOTAL INFORMATION TECHNOLOGY |
353,234,330 | 26.6% | ||||||||||||
|
|
|
|
|
|||||||||||
| MATERIALS — (3.2%) |
| |||||||||||||
| Other Securities |
42,619,965 | 3.2% | ||||||||||||
|
|
|
|
|
|||||||||||
| REAL ESTATE — (0.2%) |
| |||||||||||||
| Other Securities |
2,862,338 | 0.2% | ||||||||||||
|
|
|
|
|
|||||||||||
| UTILITIES — (2.5%) |
| |||||||||||||
| Other Securities |
34,109,146 | 2.6% | ||||||||||||
|
|
|
|
|
|||||||||||
| TOTAL COMMON STOCKS |
1,327,077,308 | 99.9% | ||||||||||||
|
|
|
|
|
|||||||||||
| RIGHTS/WARRANTS — (0.0%) |
| |||||||||||||
| HEALTH CARE — (0.0%) |
| |||||||||||||
| Other Securities |
92 | 0.0% | ||||||||||||
|
|
|
|
|
|||||||||||
| TOTAL RIGHTS/WARRANTS |
92 | 0.0% | ||||||||||||
|
|
|
|
|
|||||||||||
| TOTAL INVESTMENT SECURITIES — (98.8%) |
||||||||||||||
| (Cost $1,178,651,884) |
1,327,077,400 | |||||||||||||
|
|
|
|||||||||||||
| SECURITIES LENDING COLLATERAL — (1.2%) |
||||||||||||||
| @§ |
The DFA Short Term Investment Fund |
1,353,948 | 15,664,505 | 1.2% | ||||||||||
|
|
|
|
|
|||||||||||
| TOTAL INVESTMENTS — 100.0% |
||||||||||||||
| (Cost $1,194,316,389) |
$ | 1,342,741,905 | 101.1% | |||||||||||
|
|
|
|
|
|||||||||||
22
DIMENSIONAL US CORE EQUITY MARKET ETF
CONTINUED
Summary of the Fund’s investments as of October 31, 2021, based on their valuation inputs, is as follows (see Security Valuation Note):
| Investment in Securities (Market Value) | ||||||||||||||||
| Level 1 | Level 2 | Level 3 | Total | |||||||||||||
| Common Stocks |
||||||||||||||||
| Communication Services |
$122,849,400 | $— | — | $122,849,400 | ||||||||||||
| Consumer Discretionary |
172,126,470 | — | — | 172,126,470 | ||||||||||||
| Consumer Staples |
76,874,716 | — | — | 76,874,716 | ||||||||||||
| Energy |
44,016,894 | — | — | 44,016,894 | ||||||||||||
| Financials |
171,084,277 | — | — | 171,084,277 | ||||||||||||
| Healthcare |
168,790,391 | — | — | 168,790,391 | ||||||||||||
| Industrials |
138,509,381 | — | — | 138,509,381 | ||||||||||||
| Information Technology |
353,234,330 | — | — | 353,234,330 | ||||||||||||
| Materials |
42,619,965 | — | — | 42,619,965 | ||||||||||||
| Real Estate |
2,862,338 | — | — | 2,862,338 | ||||||||||||
| Utilities |
34,109,146 | — | — | 34,109,146 | ||||||||||||
| Rights/Warrants |
||||||||||||||||
| Healthcare |
— | 92 | — | 92 | ||||||||||||
| Collateral for Securities on Loan |
15,664,505 | — | — | 15,664,505 | ||||||||||||
|
|
|
|
|
|
|
|
|
|||||||||
| Total Investments |
$1,342,741,813 | $92 | — | $1,342,741,905 | ||||||||||||
|
|
|
|
|
|
|
|
|
|||||||||
See accompanying Notes to Financial Statements.
23
DIMENSIONAL U.S. CORE EQUITY 2 ETF
SUMMARY SCHEDULE OF PORTFOLIO HOLDINGS
October 31, 2021
| Shares |
Value† |
Percentage |
||||||||||||
| COMMON STOCKS — (98.7%) |
| |||||||||||||
| COMMUNICATION SERVICES — (7.0%) |
| |||||||||||||
| * |
Alphabet, Inc., Class A |
46,097 | $ | 136,489,529 | 1.0% | |||||||||
| * |
Alphabet, Inc., Class C |
43,937 | 130,291,219 | 0.9% | ||||||||||
| AT&T, Inc. |
1,861,421 | 47,019,494 | 0.3% | |||||||||||
| #* |
Charter Communications, Inc., Class A |
59,151 | 39,920,418 | 0.3% | ||||||||||
| Comcast Corp., Class A |
1,670,985 | 85,938,759 | 0.6% | |||||||||||
| * |
Facebook, Inc., Class A |
409,273 | 132,428,465 | 0.9% | ||||||||||
| Verizon Communications, Inc. |
1,494,331 | 79,184,600 | 0.6% | |||||||||||
| * |
Walt Disney Co. (The) |
287,831 | 48,663,587 | 0.3% | ||||||||||
| Other Securities |
316,864,066 | 2.1% | ||||||||||||
|
|
|
|
|
|||||||||||
| TOTAL COMMUNICATION SERVICES |
1,016,800,137 | 7.0% | ||||||||||||
|
|
|
|
|
|||||||||||
| CONSUMER DISCRETIONARY — (13.0%) |
| |||||||||||||
| * |
Amazon.com, Inc. |
110,142 | 371,446,185 | 2.6% | ||||||||||
| * |
Home Depot, Inc. (The) |
174,264 | 64,780,899 | 0.5% | ||||||||||
| * |
Lowe’s Cos., Inc. |
222,608 | 52,050,203 | 0.4% | ||||||||||
| * |
NIKE, Inc., Class B |
239,422 | 40,052,906 | 0.3% | ||||||||||
| Target Corp. |
212,860 | 55,262,713 | 0.4% | |||||||||||
| * |
Tesla, Inc. |
36,850 | 41,050,900 | 0.3% | ||||||||||
| Other Securities |
1,284,347,315 | 8.7% | ||||||||||||
|
|
|
|
|
|||||||||||
| TOTAL CONSUMER DISCRETIONARY |
1,908,991,121 | 13.2% | ||||||||||||
|
|
|
|
|
|||||||||||
| CONSUMER STAPLES — (5.0%) |
| |||||||||||||
| * |
Coca-Cola Co. (The) |
943,734 | 53,198,286 | 0.4% | ||||||||||
| Costco Wholesale Corp. |
85,007 | 41,784,341 | 0.3% | |||||||||||
| * |
PepsiCo., Inc. |
371,657 | 60,059,771 | 0.4% | ||||||||||
| Procter & Gamble Co. (The) |
541,034 | 77,362,452 | 0.5% | |||||||||||
| * |
Walmart, Inc. |
380,368 | 56,834,587 | 0.4% | ||||||||||
| Other Securities |
447,090,562 | 3.1% | ||||||||||||
|
|
|
|
|
|||||||||||
| TOTAL CONSUMER STAPLES |
736,329,999 | 5.1% | ||||||||||||
|
|
|
|
|
|||||||||||
| ENERGY — (2.9%) |
| |||||||||||||
| * |
Chevron Corp. |
400,964 | 45,906,368 | 0.3% | ||||||||||
| ConocoPhillips |
529,860 | 39,469,271 | 0.3% | |||||||||||
| Exxon Mobil Corp. |
725,975 | 46,803,608 | 0.3% | |||||||||||
| Other Securities |
293,606,826 | 2.0% | ||||||||||||
|
|
|
|
|
|||||||||||
| TOTAL ENERGY |
425,786,073 | 2.9% | ||||||||||||
|
|
|
|
|
|||||||||||
| FINANCIALS — (15.2%) |
| |||||||||||||
| American Express Co. |
282,115 | 49,025,945 | 0.4% | |||||||||||
| * |
Bank of America Corp. |
1,783,289 | 85,205,548 | 0.6% | ||||||||||
| * |
Berkshire Hathaway, Inc., Class B |
373,165 | 107,102,087 | 0.8% | ||||||||||
| JPMorgan Chase & Co. |
911,109 | 154,788,308 | 1.1% | |||||||||||
| Morgan Stanley |
469,909 | 48,297,247 | 0.3% | |||||||||||
| Other Securities |
1,776,466,884 | 12.2% | ||||||||||||
|
|
|
|
|
|||||||||||
| TOTAL FINANCIALS |
2,220,886,019 | 15.4% | ||||||||||||
|
|
|
|
|
|||||||||||
| HEALTH CARE — (11.6%) |
| |||||||||||||
| AbbVie, Inc. |
383,467 | 43,972,161 | 0.3% | |||||||||||
| * |
Eli Lilly & Co. |
191,095 | 48,683,362 | 0.3% | ||||||||||
| * |
Johnson & Johnson |
844,412 | 137,537,827 | 1.0% | ||||||||||
| Merck & Co., Inc. |
632,612 | 55,701,487 | 0.4% | |||||||||||
24
DIMENSIONAL U.S. CORE EQUITY 2 ETF
CONTINUED
| Shares |
Value† |
Percentage |
||||||||||||
| HEALTH CARE — (Continued) |
| |||||||||||||
| * |
Pfizer, Inc. |
1,223,377 | $ | 53,510,510 | 0.4% | |||||||||
| * |
Thermo Fisher Scientific, Inc. |
69,685 | 44,115,483 | 0.3% | ||||||||||
| UnitedHealth Group, Inc. |
239,504 | 110,284,407 | 0.8% | |||||||||||
| Other Securities |
1,195,876,721 | 8.2% | ||||||||||||
|
|
|
|
|
|||||||||||
| TOTAL HEALTH CARE |
1,689,681,958 | 11.7% | ||||||||||||
|
|
|
|
|
|||||||||||
| INDUSTRIALS — (13.8%) |
| |||||||||||||
| * |
Generac Holdings, Inc. |
83,981 | 41,869,567 | 0.3% | ||||||||||
| Union Pacific Corp. |
246,644 | 59,539,862 | 0.4% | |||||||||||
| Other Securities |
1,911,713,845 | 13.2% | ||||||||||||
|
|
|
|
|
|||||||||||
| TOTAL INDUSTRIALS |
2,013,123,274 | 13.9% | ||||||||||||
|
|
|
|
|
|||||||||||
| INFORMATION TECHNOLOGY — (24.1%) |
| |||||||||||||
| Accenture PLC, Class A |
155,759 | 55,884,772 | 0.4% | |||||||||||
| * |
Adobe, Inc. |
69,394 | 45,131,082 | 0.3% | ||||||||||
| * |
Apple, Inc. |
4,465,082 | 668,869,284 | 4.6% | ||||||||||
| * |
Applied Materials, Inc. |
295,382 | 40,363,950 | 0.3% | ||||||||||
| Broadcom, Inc. |
86,838 | 46,169,159 | 0.3% | |||||||||||
| Cisco Systems, Inc. |
1,250,244 | 69,976,157 | 0.5% | |||||||||||
| * |
Intel Corp. |
1,809,759 | 88,678,191 | 0.6% | ||||||||||
| Mastercard, Inc., Class A |
224,959 | 75,478,244 | 0.5% | |||||||||||
| * |
Microsoft Corp. |
1,856,730 | 615,728,803 | 4.3% | ||||||||||
| NVIDIA Corp. |
294,561 | 75,310,411 | 0.5% | |||||||||||
| Oracle Corp. |
622,608 | 59,733,012 | 0.4% | |||||||||||
| * |
QUALCOMM, Inc. |
419,413 | 55,798,706 | 0.4% | ||||||||||
| Texas Instruments, Inc. |
268,223 | 50,286,448 | 0.4% | |||||||||||
| Visa, Inc., Class A |
415,024 | 87,889,632 | 0.6% | |||||||||||
| Other Securities |
1,494,275,370 | 10.3% | ||||||||||||
|
|
|
|
|
|||||||||||
| TOTAL INFORMATION TECHNOLOGY |
3,529,573,221 | 24.4% | ||||||||||||
|
|
|
|
|
|||||||||||
| MATERIALS — (4.2%) |
| |||||||||||||
| Other Securities |
619,418,291 | 4.3% | ||||||||||||
|
|
|
|
|
|||||||||||
| REAL ESTATE — (0.3%) |
| |||||||||||||
| Other Securities |
50,215,840 | 0.4% | ||||||||||||
|
|
|
|
|
|||||||||||
| UTILITIES — (1.6%) |
| |||||||||||||
| Other Securities |
226,559,886 | 1.6% | ||||||||||||
|
|
|
|
|
|||||||||||
| TOTAL COMMON STOCKS |
14,437,365,819 | 99.9% | ||||||||||||
|
|
|
|
|
|||||||||||
| PREFERRED STOCKS — (0.0%) |
| |||||||||||||
| COMMUNICATION SERVICES — (0.0%) |
| |||||||||||||
| Other Securities |
268,380 | 0.0% | ||||||||||||
|
|
|
|
|
|||||||||||
| CONSUMER DISCRETIONARY — (0.0%) |
| |||||||||||||
| Other Securities |
776,597 | 0.0% | ||||||||||||
|
|
|
|
|
|||||||||||
| INDUSTRIALS — (0.0%) |
| |||||||||||||
| Other Securities |
819,854 | 0.0% | ||||||||||||
|
|
|
|
|
|||||||||||
| TOTAL PREFERRED STOCKS |
1,864,831 | 0.0% | ||||||||||||
|
|
|
|
|
|||||||||||
| RIGHTS/WARRANTS — (0.0%) |
| |||||||||||||
| COMMUNICATION SERVICES — (0.0%) |
| |||||||||||||
| Other Securities |
2,181 | 0.0% | ||||||||||||
|
|
|
|
|
|||||||||||
25
DIMENSIONAL U.S. CORE EQUITY 2 ETF
CONTINUED
| Shares |
Value† |
Percentage |
||||||||||||
| CONSUMER DISCRETIONARY — (0.0%) |
| |||||||||||||
| Other Securities |
$ | 2,568 | 0.0% | |||||||||||
|
|
|
|
|
|||||||||||
| ENERGY — (0.0%) |
| |||||||||||||
| Other Securities |
23,297 | 0.0% | ||||||||||||
|
|
|
|
|
|||||||||||
| FINANCIALS — (0.0%) |
||||||||||||||
| Other Securities |
4,345 | 0.0% | ||||||||||||
|
|
|
|
|
|||||||||||
| HEALTH CARE — (0.0%) |
| |||||||||||||
| Other Securities |
288,457 | 0.0% | ||||||||||||
|
|
|
|
|
|||||||||||
| TOTAL RIGHTS/WARRANTS |
320,848 | 0.0% | ||||||||||||
|
|
|
|
|
|||||||||||
| TOTAL INVESTMENT SECURITIES — (98.7%) |
||||||||||||||
| (Cost $5,783,599,229) |
14,439,551,498 | |||||||||||||
|
|
|
|||||||||||||
| SECURITIES LENDING COLLATERAL — (1.3%) |
| |||||||||||||
| @§ |
The DFA Short Term Investment Fund |
16,805,717 | 194,433,748 | 1.3% | ||||||||||
|
|
|
|
|
|||||||||||
| TOTAL INVESTMENTS — 100.0% |
||||||||||||||
| (Cost $5,978,032,977) |
$ | 14,633,985,246 | 101.2% | |||||||||||
|
|
|
|
|
|||||||||||
Summary of the Fund’s investments as of October 31, 2021, based on their valuation inputs, is as follows (see Security Valuation Note):
| Investment in Securities (Market Value) | ||||||||||||||||
| Level 1 | Level 2 | Level 3 | Total | |||||||||||||
| Common Stocks |
||||||||||||||||
| Communication Services |
$1,016,774,472 | $25,665 | — | $1,016,800,137 | ||||||||||||
| Consumer Discretionary |
1,908,991,121 | — | — | 1,908,991,121 | ||||||||||||
| Consumer Staples |
736,315,481 | 14,518 | — | 736,329,999 | ||||||||||||
| Energy |
425,786,073 | — | — | 425,786,073 | ||||||||||||
| Financials |
2,220,879,869 | 6,150 | — | 2,220,886,019 | ||||||||||||
| Healthcare |
1,689,299,695 | — | $382,263 | 1,689,681,958 | ||||||||||||
| Industrials |
2,012,616,798 | 506,476 | — | 2,013,123,274 | ||||||||||||
| Information Technology |
3,529,573,221 | — | — | 3,529,573,221 | ||||||||||||
| Materials |
619,418,291 | — | — | 619,418,291 | ||||||||||||
| Real Estate |
50,215,840 | — | — | 50,215,840 | ||||||||||||
| Utilities |
226,559,886 | — | — | 226,559,886 | ||||||||||||
| Preferred Stocks |
||||||||||||||||
| Communication Services |
268,380 | — | — | 268,380 | ||||||||||||
| Consumer Discretionary |
776,597 | — | — | 776,597 | ||||||||||||
| Industrials |
819,854 | — | — | 819,854 | ||||||||||||
| Rights/Warrants |
||||||||||||||||
| Communication Services |
— | — | 2,181 | 2,181 | ||||||||||||
| Consumer Discretionary |
— | — | 2,568 | 2,568 | ||||||||||||
| Energy |
23,297 | — | — | 23,297 | ||||||||||||
| Financials |
— | — | 4,345 | 4,345 | ||||||||||||
| Healthcare |
— | 10,255 | 278,202 | 288,457 | ||||||||||||
| Collateral for Securities on Loan |
194,433,748 | — | — | 194,433,748 | ||||||||||||
|
|
|
|
|
|
|
|
|
|||||||||
| Total Investments |
$14,632,752,623 | $563,064 | $669,559 | $14,633,985,246 | ||||||||||||
|
|
|
|
|
|
|
|
|
|||||||||
A reconciliation of Level 3 investments is presented when the Fund had a significant amount of Level 3 investments at the beginning and/or end of the reporting period in relation to net assets.
See accompanying Notes to Financial Statements.
26
DIMENSIONAL U.S. SMALL CAP ETF
SUMMARY SCHEDULE OF PORTFOLIO HOLDINGS
October 31, 2021
| Shares |
Value† |
Percentage |
||||||||||||
| COMMON STOCKS — (97.3%) |
| |||||||||||||
| COMMUNICATION SERVICES — (2.2%) |
| |||||||||||||
| Nexstar Media Group, Inc., Class A |
70,281 | $ | 10,537,230 | 0.3% | ||||||||||
| Other Securities |
87,725,440 | 2.0% | ||||||||||||
|
|
|
|
|
|||||||||||
| TOTAL COMMUNICATION SERVICES |
98,262,670 | 2.3% | ||||||||||||
|
|
|
|
|
|||||||||||
| CONSUMER DISCRETIONARY — (14.2%) |
| |||||||||||||
| * |
Crocs, Inc. |
125,337 | 20,235,659 | 0.5% | ||||||||||
| # |
Dick’s Sporting Goods, Inc. |
83,687 | 10,394,762 | 0.2% | ||||||||||
| * |
Fox Factory Holding Corp. |
72,260 | 11,630,247 | 0.3% | ||||||||||
| * |
Helen of Troy, Ltd. |
52,142 | 11,729,343 | 0.3% | ||||||||||
| * |
Lithia Motors, Inc., Class A |
47,402 | 15,131,666 | 0.4% | ||||||||||
| Marriott Vacations Worldwide Corp. |
61,634 | 9,690,097 | 0.2% | |||||||||||
| * |
Murphy USA, Inc. |
59,830 | 9,749,299 | 0.2% | ||||||||||
| Penske Automotive Group, Inc. |
103,793 | 11,007,248 | 0.3% | |||||||||||
| * |
RH |
15,878 | 10,473,605 | 0.2% | ||||||||||
| * |
TopBuild Corp. |
51,917 | 13,341,111 | 0.3% | ||||||||||
| Other Securities |
499,967,931 | 11.6% | ||||||||||||
|
|
|
|
|
|||||||||||
| TOTAL CONSUMER DISCRETIONARY |
623,350,968 | 14.5% | ||||||||||||
|
|
|
|
|
|||||||||||
| CONSUMER STAPLES — (4.0%) |
| |||||||||||||
| * |
Darling Ingredients, Inc. |
288,631 | 24,395,092 | 0.6% | ||||||||||
| Other Securities |
150,250,685 | 3.5% | ||||||||||||
|
|
|
|
|
|||||||||||
| TOTAL CONSUMER STAPLES |
174,645,777 | 4.1% | ||||||||||||
|
|
|
|
|
|||||||||||
| ENERGY — (3.2%) |
| |||||||||||||
| * |
Range Resources Corp. |
481,008 | 11,217,107 | 0.3% | ||||||||||
| Other Securities |
131,787,711 | 3.0% | ||||||||||||
|
|
|
|
|
|||||||||||
| TOTAL ENERGY |
143,004,818 | 3.3% | ||||||||||||
|
|
|
|
|
|||||||||||
| FINANCIALS — (20.1%) |
| |||||||||||||
| * |
Cadence Bank |
334,563 | 9,709,021 | 0.2% | ||||||||||
| Evercore, Inc. |
66,805 | 10,143,671 | 0.2% | |||||||||||
| * |
Huntington Bancshares, Inc. |
624,454 | 9,828,906 | 0.2% | ||||||||||
| Primerica, Inc. |
59,904 | 10,078,249 | 0.2% | |||||||||||
| #* |
Stifel Financial Corp. |
141,416 | 10,304,984 | 0.2% | ||||||||||
| * |
UMB Financial Corp. |
98,861 | 9,769,444 | 0.2% | ||||||||||
| Walker & Dunlop, Inc. |
75,459 | 9,814,952 | 0.2% | |||||||||||
| Other Securities |
817,168,411 | 19.3% | ||||||||||||
|
|
|
|
|
|||||||||||
| TOTAL FINANCIALS |
886,817,638 | 20.7% | ||||||||||||
|
|
|
|
|
|||||||||||
| HEALTH CARE — (11.5%) |
| |||||||||||||
| * |
Intellia Therapeutics, Inc. |
82,732 | 11,001,701 | 0.3% | ||||||||||
| * |
Medpace Holdings, Inc. |
47,538 | 10,769,734 | 0.3% | ||||||||||
| * |
Omnicell, Inc. |
86,451 | 15,401,246 | 0.4% | ||||||||||
| * |
Tenet Healthcare Corp. |
179,446 | 12,859,100 | 0.3% | ||||||||||
| Other Securities |
456,027,100 | 10.5% | ||||||||||||
|
|
|
|
|
|||||||||||
| TOTAL HEALTH CARE |
506,058,881 | 11.8% | ||||||||||||
|
|
|
|
|
|||||||||||
| INDUSTRIALS — (20.2%) |
| |||||||||||||
| * |
ASGN, Inc. |
105,213 | 12,589,788 | 0.3% | ||||||||||
| * |
Avis Budget Group, Inc. |
85,979 | 14,901,020 | 0.4% | ||||||||||
| * |
Builders FirstSource, Inc. |
315,867 | 18,405,570 | 0.4% | ||||||||||
27
DIMENSIONAL U.S. SMALL CAP ETF
CONTINUED
| Shares |
Value† |
Percentage |
||||||||||||
| INDUSTRIALS — (Continued) |
| |||||||||||||
| * |
Chart Industries, Inc. |
58,714 | $ | 10,422,909 | 0.3% | |||||||||
| EMCOR Group, Inc. |
86,972 | 10,566,228 | 0.3% | |||||||||||
| Exponent, Inc. |
86,244 | 9,900,811 | 0.2% | |||||||||||
| * |
FTI Consulting, Inc. |
73,465 | 10,573,083 | 0.3% | ||||||||||
| * |
Generac Holdings, Inc. |
27,660 | 13,790,170 | 0.3% | ||||||||||
| # |
KBR, Inc. |
229,643 | 9,746,049 | 0.2% | ||||||||||
| * |
MasTec, Inc. |
131,255 | 11,698,758 | 0.3% | ||||||||||
| * |
Regal Rexnord Corp. |
122,112 | 18,601,321 | 0.4% | ||||||||||
| * |
Saia, Inc. |
61,117 | 19,107,619 | 0.5% | ||||||||||
| # |
Tetra Tech, Inc. |
64,747 | 11,373,458 | 0.3% | ||||||||||
| UFP Industries, Inc. |
121,049 | 9,905,440 | 0.2% | |||||||||||
| Other Securities |
707,009,077 | 16.3% | ||||||||||||
|
|
|
|
|
|||||||||||
| TOTAL INDUSTRIALS |
888,591,301 | 20.7% | ||||||||||||
|
|
|
|
|
|||||||||||
| INFORMATION TECHNOLOGY — (13.3%) |
| |||||||||||||
| * |
Amkor Technology, Inc. |
460,154 | 10,086,576 | 0.2% | ||||||||||
| * |
Brooks Automation, Inc. |
108,343 | 12,616,542 | 0.3% | ||||||||||
| * |
Calix, Inc. |
162,383 | 10,163,552 | 0.2% | ||||||||||
| * |
Cirrus Logic, Inc. |
122,804 | 9,923,791 | 0.2% | ||||||||||
| * |
Lattice Semiconductor Corp. |
243,698 | 16,922,389 | 0.4% | ||||||||||
| * |
Novanta, Inc. |
68,725 | 11,859,186 | 0.3% | ||||||||||
| * |
Onto Innovation, Inc. |
127,461 | 10,096,186 | 0.2% | ||||||||||
| * |
Power Integrations, Inc. |
109,590 | 11,310,784 | 0.3% | ||||||||||
| * |
Silicon Laboratories, Inc. |
57,733 | 10,897,681 | 0.3% | ||||||||||
| * |
Synaptics, Inc. |
66,325 | 12,904,855 | 0.3% | ||||||||||
| Other Securities |
468,161,138 | 10.9% | ||||||||||||
|
|
|
|
|
|||||||||||
| TOTAL INFORMATION TECHNOLOGY |
584,942,680 | 13.6% | ||||||||||||
|
|
|
|
|
|||||||||||
| MATERIALS — (5.7%) |
| |||||||||||||
| * |
Louisiana-Pacific Corp. |
216,002 | 12,728,998 | 0.3% | ||||||||||
| * |
Olin Corp. |
215,263 | 12,265,686 | 0.3% | ||||||||||
| Other Securities |
225,560,717 | 5.3% | ||||||||||||
|
|
|
|
|
|||||||||||
| TOTAL MATERIALS |
250,555,401 | 5.9% | ||||||||||||
|
|
|
|
|
|||||||||||
| REAL ESTATE — (0.5%) |
| |||||||||||||
| Other Securities |
22,823,904 | 0.5% | ||||||||||||
|
|
|
|
|
|||||||||||
| UTILITIES — (2.4%) |
| |||||||||||||
| Other Securities |
104,622,189 | 2.5% | ||||||||||||
|
|
|
|
|
|||||||||||
| TOTAL COMMON STOCKS |
4,283,676,227 | 99.9% | ||||||||||||
|
|
|
|
|
|||||||||||
| PREFERRED STOCKS — (0.0%) |
| |||||||||||||
| COMMUNICATION SERVICES — (0.0%) |
| |||||||||||||
| Other Securities |
252,874 | 0.0% | ||||||||||||
|
|
|
|
|
|||||||||||
| CONSUMER DISCRETIONARY — (0.0%) |
| |||||||||||||
| Other Securities |
588,044 | 0.0% | ||||||||||||
|
|
|
|
|
|||||||||||
| INDUSTRIALS — (0.0%) |
| |||||||||||||
| Other Securities |
1,271,417 | 0.1% | ||||||||||||
|
|
|
|
|
|||||||||||
| TOTAL PREFERRED STOCKS |
2,112,335 | 0.1% | ||||||||||||
|
|
|
|
|
|||||||||||
| RIGHTS/WARRANTS — (0.0%) |
| |||||||||||||
| COMMUNICATION SERVICES — (0.0%) |
| |||||||||||||
| Other Securities |
3,650 | 0.0% | ||||||||||||
|
|
|
|
|
|||||||||||
28
DIMENSIONAL U.S. SMALL CAP ETF
CONTINUED
| Shares |
Value† |
Percentage |
||||||||||||
| CONSUMER DISCRETIONARY — (0.0%) |
| |||||||||||||
| Other Securities |
$ | 4,777 | 0.0% | |||||||||||
|
|
|
|
|
|||||||||||
| ENERGY — (0.0%) |
||||||||||||||
| Other Securities |
14,341 | 0.0% | ||||||||||||
|
|
|
|
|
|||||||||||
| FINANCIALS — (0.0%) |
| |||||||||||||
| Other Securities |
11,470 | 0.0% | ||||||||||||
|
|
|
|
|
|||||||||||
| HEALTH CARE — (0.0%) |
| |||||||||||||
| Other Securities |
548,651 | 0.0% | ||||||||||||
|
|
|
|
|
|||||||||||
| TOTAL RIGHTS/WARRANTS |
582,889 | 0.0% | ||||||||||||
|
|
|
|
|
|||||||||||
| TOTAL INVESTMENT SECURITIES — (97.3%) |
||||||||||||||
| (Cost $1,871,104,529) |
4,286,371,451 | |||||||||||||
|
|
|
|||||||||||||
| SECURITIES LENDING COLLATERAL — (2.7%) |
| |||||||||||||
| @§ |
The DFA Short Term Investment Fund |
10,161,013 | 117,557,837 | 2.7% | ||||||||||
|
|
|
|
|
|||||||||||
| TOTAL INVESTMENTS — 100.0% |
||||||||||||||
| (Cost $1,988,662,366) |
$ | 4,403,929,288 | 102.7% | |||||||||||
|
|
|
|
|
|||||||||||
Summary of the Fund’s investments as of October 31, 2021, based on their valuation inputs, is as follows (see Security Valuation Note):
| Investment in Securities (Market Value) | ||||||||||||||||
| Level 1 | Level 2 | Level 3 | Total | |||||||||||||
| Common Stocks |
||||||||||||||||
| Communication Services |
$ | 98,196,097 | $ | 66,573 | — | $ | 98,262,670 | |||||||||
| Consumer Discretionary |
623,350,968 | — | — | 623,350,968 | ||||||||||||
| Consumer Staples |
174,571,751 | 74,026 | — | 174,645,777 | ||||||||||||
| Energy |
143,004,818 | — | — | 143,004,818 | ||||||||||||
| Financials |
886,768,909 | 48,729 | — | 886,817,638 | ||||||||||||
| Healthcare |
505,053,785 | 175,403 | $ | 829,693 | 506,058,881 | |||||||||||
| Industrials |
888,591,301 | — | — | 888,591,301 | ||||||||||||
| Information Technology |
584,942,680 | — | — | 584,942,680 | ||||||||||||
| Materials |
250,555,401 | — | — | 250,555,401 | ||||||||||||
| Real Estate |
22,823,904 | — | — | 22,823,904 | ||||||||||||
| Utilities |
104,622,189 | — | — | 104,622,189 | ||||||||||||
| Preferred Stocks |
||||||||||||||||
| Communication Services |
252,874 | — | — | 252,874 | ||||||||||||
| Consumer Discretionary |
588,044 | — | — | 588,044 | ||||||||||||
| Industrials |
1,271,417 | — | — | 1,271,417 | ||||||||||||
| Rights/Warrants |
||||||||||||||||
| Communication Services |
— | — | 3,650 | 3,650 | ||||||||||||
| Consumer Discretionary |
— | — | 4,777 | 4,777 | ||||||||||||
| Energy |
14,341 | — | — | 14,341 | ||||||||||||
| Financials |
— | — | 11,470 | 11,470 | ||||||||||||
| Healthcare |
— | 29,072 | 519,579 | 548,651 | ||||||||||||
| Collateral for Securities on Loan |
117,557,837 | — | — | 117,557,837 | ||||||||||||
|
|
|
|
|
|
|
|
|
|||||||||
| Total Investments |
$ | 4,402,166,316 | $ | 393,803 | $ | 1,369,169 | $ | 4,403,929,288 | ||||||||
|
|
|
|
|
|
|
|
|
|||||||||
A reconciliation of Level 3 investments is presented when the Fund had a significant amount of Level 3 investments at the beginning and/or end of the reporting period in relation to net assets.
See accompanying Notes to Financial Statements.
29
DIMENSIONAL U.S. TARGETED VALUE ETF
SUMMARY SCHEDULE OF PORTFOLIO HOLDINGS
October 31, 2021
| Shares |
Value† |
Percentage |
||||||||||||
| COMMON STOCKS — (97.8%) |
| |||||||||||||
| COMMUNICATION SERVICES — (2.7%) |
| |||||||||||||
| News Corp., Class A |
1,305,422 | $ | 29,894,164 | 0.5% | ||||||||||
| Other Securities |
146,409,641 | 2.3% | ||||||||||||
|
|
|
|
|
|||||||||||
| TOTAL COMMUNICATION SERVICES |
176,303,805 | 2.8% | ||||||||||||
|
|
|
|
|
|||||||||||
| CONSUMER DISCRETIONARY — (14.5%) |
| |||||||||||||
| * |
AutoNation, Inc. |
340,002 | 41,181,042 | 0.6% | ||||||||||
| * |
BorgWarner, Inc., Class A |
561,041 | 25,286,118 | 0.4% | ||||||||||
| # |
Dick’s Sporting Goods, Inc. |
236,805 | 29,413,549 | 0.5% | ||||||||||
| #* |
Dillard’s, Inc., Class A |
150,871 | 34,872,323 | 0.5% | ||||||||||
| * |
Kohl’s Corp. |
490,688 | 23,813,089 | 0.4% | ||||||||||
| * |
Lithia Motors, Inc., Class A |
83,546 | 26,669,554 | 0.4% | ||||||||||
| Penske Automotive Group, Inc. |
306,413 | 32,495,099 | 0.5% | |||||||||||
| PulteGroup, Inc. |
708,193 | 34,049,919 | 0.5% | |||||||||||
| * |
PVH Corp. |
226,849 | 24,801,401 | 0.4% | ||||||||||
| Toll Brothers, Inc. |
597,653 | 35,960,781 | 0.6% | |||||||||||
| Other Securities |
641,009,454 | 9.9% | ||||||||||||
|
|
|
|
|
|||||||||||
| TOTAL CONSUMER DISCRETIONARY |
949,552,329 | 14.7% | ||||||||||||
|
|
|
|
|
|||||||||||
| CONSUMER STAPLES — (4.9%) |
| |||||||||||||
| Bunge, Ltd. |
493,858 | 45,751,005 | 0.7% | |||||||||||
| * |
Darling Ingredients, Inc. |
699,905 | 59,155,971 | 0.9% | ||||||||||
| * |
Post Holdings, Inc. |
255,797 | 25,958,280 | 0.4% | ||||||||||
| Other Securities |
189,102,860 | 3.0% | ||||||||||||
|
|
|
|
|
|||||||||||
| TOTAL CONSUMER STAPLES |
319,968,116 | 5.0% | ||||||||||||
|
|
|
|
|
|||||||||||
| ENERGY — (5.0%) |
| |||||||||||||
| Devon Energy Corp. |
912,879 | 36,588,190 | 0.6% | |||||||||||
| Other Securities |
291,932,034 | 4.5% | ||||||||||||
|
|
|
|
|
|||||||||||
| TOTAL ENERGY |
328,520,224 | 5.1% | ||||||||||||
|
|
|
|
|
|||||||||||
| FINANCIALS — (28.4%) |
| |||||||||||||
| Assured Guaranty, Ltd. |
459,563 | 25,542,512 | 0.4% | |||||||||||
| * |
Athene Holding, Ltd., Class A |
653,882 | 56,894,273 | 0.9% | ||||||||||
| CNO Financial Group, Inc. |
1,142,791 | 27,586,975 | 0.4% | |||||||||||
| * |
First Horizon Corp. |
1,751,204 | 29,717,932 | 0.5% | ||||||||||
| Invesco, Ltd. |
1,323,799 | 33,637,733 | 0.5% | |||||||||||
| Janus Henderson Group PLC |
474,958 | 22,085,547 | 0.3% | |||||||||||
| Old Republic International Corp. |
853,193 | 22,037,975 | 0.3% | |||||||||||
| People’s United Financial, Inc. |
1,723,032 | 29,532,768 | 0.5% | |||||||||||
| Pinnacle Financial Partners, Inc. |
246,783 | 23,831,834 | 0.4% | |||||||||||
| * |
Popular, Inc. |
379,807 | 30,931,482 | 0.5% | ||||||||||
| * |
Reinsurance Group of America, Inc. |
186,199 | 21,986,378 | 0.3% | ||||||||||
| Santander Consumer USA Holdings, Inc. |
713,312 | 29,745,110 | 0.5% | |||||||||||
| * |
Voya Financial, Inc. |
468,022 | 32,653,895 | 0.5% | ||||||||||
| * |
Zions BanCorp NA |
546,831 | 34,444,885 | 0.5% | ||||||||||
| Other Securities |
1,438,700,800 | 22.3% | ||||||||||||
|
|
|
|
|
|||||||||||
| TOTAL FINANCIALS |
1,859,330,099 | 28.8% | ||||||||||||
|
|
|
|
|
|||||||||||
| HEALTH CARE — (4.0%) |
| |||||||||||||
| * |
Acadia Healthcare Co., Inc. |
355,206 | 22,022,772 | 0.4% | ||||||||||
| Other Securities |
241,445,632 | 3.7% | ||||||||||||
|
|
|
|
|
|||||||||||
| TOTAL HEALTH CARE |
263,468,404 | 4.1% | ||||||||||||
|
|
|
|
|
|||||||||||
30
DIMENSIONAL U.S. TARGETED VALUE ETF
CONTINUED
| Shares |
Value† |
Percentage |
||||||||||||
| INDUSTRIALS — (21.5%) |
| |||||||||||||
| # |
AGCO Corp. |
291,053 | $ | 35,569,587 | 0.6% | |||||||||
| AMERCO |
45,826 | 33,773,304 | 0.5% | |||||||||||
| * |
Chart Industries, Inc. |
163,089 | 28,951,559 | 0.5% | ||||||||||
| * |
Colfax Corp. |
532,332 | 27,478,978 | 0.4% | ||||||||||
| * |
Knight-Swift Transportation Holdings, Inc. |
708,692 | 40,175,749 | 0.6% | ||||||||||
| Owens Corning |
254,024 | 23,728,382 | 0.4% | |||||||||||
| Quanta Services, Inc. |
590,769 | 71,648,464 | 1.1% | |||||||||||
| * |
Regal Rexnord Corp. |
169,170 | 25,769,666 | 0.4% | ||||||||||
| Triton International, Ltd. |
365,065 | 22,703,392 | 0.4% | |||||||||||
| UFP Industries, Inc. |
278,960 | 22,827,297 | 0.4% | |||||||||||
| * |
WESCO International, Inc. |
173,722 | 22,507,422 | 0.4% | ||||||||||
| Other Securities |
1,056,101,390 | 16.2% | ||||||||||||
|
|
|
|
|
|||||||||||
| TOTAL INDUSTRIALS |
1,411,235,190 | 21.9% | ||||||||||||
|
|
|
|
|
|||||||||||
| INFORMATION TECHNOLOGY — (8.2%) |
| |||||||||||||
| * |
Arrow Electronics, Inc. |
390,791 | 45,234,058 | 0.7% | ||||||||||
| Concentrix Corp. |
211,396 | 37,560,841 | 0.6% | |||||||||||
| * |
Jabil, Inc. |
378,632 | 22,702,775 | 0.4% | ||||||||||
| SYNNEX Corp. |
210,629 | 22,116,045 | 0.4% | |||||||||||
| Other Securities |
409,696,779 | 6.2% | ||||||||||||
|
|
|
|
|
|||||||||||
| TOTAL INFORMATION TECHNOLOGY |
537,310,498 | 8.3% | ||||||||||||
|
|
|
|
|
|||||||||||
| MATERIALS — (7.8%) |
| |||||||||||||
| * |
Huntsman Corp. |
793,071 | 25,838,253 | 0.4% | ||||||||||
| * |
Olin Corp. |
480,822 | 27,397,238 | 0.4% | ||||||||||
| * |
Reliance Steel & Aluminum Co. |
305,575 | 44,662,842 | 0.7% | ||||||||||
| * |
Steel Dynamics, Inc. |
533,554 | 35,257,248 | 0.6% | ||||||||||
| * |
Westlake Chemical Corp. |
260,362 | 25,343,637 | 0.4% | ||||||||||
| Other Securities |
352,093,657 | 5.4% | ||||||||||||
|
|
|
|
|
|||||||||||
| TOTAL MATERIALS |
510,592,875 | 7.9% | ||||||||||||
|
|
|
|
|
|||||||||||
| REAL ESTATE — (0.6%) |
| |||||||||||||
| Other Securities |
38,471,815 | 0.6% | ||||||||||||
|
|
|
|
|
|||||||||||
| UTILITIES — (0.2%) |
| |||||||||||||
| Other Securities |
13,915,954 | 0.2% | ||||||||||||
|
|
|
|
|
|||||||||||
| TOTAL COMMON STOCKS |
6,408,669,309 | 99.4% | ||||||||||||
|
|
|
|
|
|||||||||||
| PREFERRED STOCKS — (0.1%) |
| |||||||||||||
| COMMUNICATION SERVICES — (0.0%) |
| |||||||||||||
| Other Securities |
389,421 | 0.0% | ||||||||||||
|
|
|
|
|
|||||||||||
| CONSUMER DISCRETIONARY — (0.0%) |
| |||||||||||||
| Other Securities |
1,327,411 | 0.0% | ||||||||||||
|
|
|
|
|
|||||||||||
| INDUSTRIALS — (0.1%) |
| |||||||||||||
| Other Securities |
2,076,984 | 0.1% | ||||||||||||
|
|
|
|
|
|||||||||||
| TOTAL PREFERRED STOCKS |
3,793,816 | 0.1% | ||||||||||||
|
|
|
|
|
|||||||||||
| RIGHTS/WARRANTS — (0.0%) |
| |||||||||||||
| COMMUNICATION SERVICES — (0.0%) |
| |||||||||||||
| Other Securities |
6,168 | 0.0% | ||||||||||||
|
|
|
|
|
|||||||||||
| CONSUMER DISCRETIONARY — (0.0%) |
| |||||||||||||
| Other Securities |
8,487 | 0.0% | ||||||||||||
|
|
|
|
|
|||||||||||
31
DIMENSIONAL U.S. TARGETED VALUE ETF
CONTINUED
| Shares |
Value† |
Percentage |
||||||||||||
| ENERGY — (0.0%) |
| |||||||||||||
| Other Securities |
$ | 25,597 | 0.0% | |||||||||||
|
|
|
|
|
|||||||||||
| FINANCIALS — (0.0%) |
||||||||||||||
| Other Securities |
16,226 | 0.0% | ||||||||||||
|
|
|
|
|
|||||||||||
| HEALTH CARE — (0.0%) |
| |||||||||||||
| Other Securities |
146,004 | 0.0% | ||||||||||||
|
|
|
|
|
|||||||||||
| TOTAL RIGHTS/WARRANTS |
202,482 | 0.0% | ||||||||||||
|
|
|
|
|
|||||||||||
| TOTAL INVESTMENT SECURITIES — (97.9%) |
||||||||||||||
| (Cost 3,105,479,309) |
6,412,665,606 | |||||||||||||
|
|
|
|||||||||||||
| SECURITIES LENDING COLLATERAL — (2.1%) |
| |||||||||||||
| @§ |
The DFA Short Term Investment Fund |
11,803,654 | 136,562,377 | 2.1% | ||||||||||
|
|
|
|
|
|||||||||||
| TOTAL INVESTMENTS — 100.0% |
||||||||||||||
| (Cost $3,242,041,687) |
$ | 6,549,227,985 | 101.6% | |||||||||||
|
|
|
|
|
|||||||||||
Summary of the Fund’s investments as of October 31, 2021, based on their valuation inputs, is as follows (see Security Valuation Note):
| Investment in Securities (Market Value) | ||||||||||||||||
| Level 1 | Level 2 | Level 3 | Total | |||||||||||||
| Common Stocks |
||||||||||||||||
| Communication Services |
$ | 176,126,334 | $ | 177,471 | — | $ | 176,303,805 | |||||||||
| Consumer Discretionary |
949,552,329 | — | — | 949,552,329 | ||||||||||||
| Consumer Staples |
319,876,494 | 91,622 | — | 319,968,116 | ||||||||||||
| Energy |
328,520,224 | — | — | 328,520,224 | ||||||||||||
| Financials |
1,859,116,719 | 213,380 | — | 1,859,330,099 | ||||||||||||
| Healthcare |
262,250,873 | 17,278 | $ | 1,200,253 | 263,468,404 | |||||||||||
| Industrials |
1,411,235,190 | — | — | 1,411,235,190 | ||||||||||||
| Information Technology |
537,310,498 | — | — | 537,310,498 | ||||||||||||
| Materials |
510,592,875 | — | — | 510,592,875 | ||||||||||||
| Real Estate |
38,471,815 | — | — | 38,471,815 | ||||||||||||
| Utilities |
13,915,954 | — | — | 13,915,954 | ||||||||||||
| Preferred Stocks |
||||||||||||||||
| Communication Services |
389,421 | — | — | 389,421 | ||||||||||||
| Consumer Discretionary |
1,327,411 | — | — | 1,327,411 | ||||||||||||
| Industrials |
2,076,984 | — | — | 2,076,984 | ||||||||||||
| Rights/Warrants |
||||||||||||||||
| Communication Services |
— | — | 6,168 | 6,168 | ||||||||||||
| Consumer Discretionary |
— | — | 8,487 | 8,487 | ||||||||||||
| Energy |
25,597 | — | — | 25,597 | ||||||||||||
| Financials |
— | — | 16,226 | 16,226 | ||||||||||||
| Healthcare |
— | 2,461 | 143,543 | 146,004 | ||||||||||||
| Collateral for Securities on Loan |
136,562,378 | — | — | 136,562,378 | ||||||||||||
|
|
|
|
|
|
|
|
|
|||||||||
| Total Investments |
$ | 6,547,351,096 | $ | 502,212 | $ | 1,374,677 | $ | 6,549,227,985 | ||||||||
|
|
|
|
|
|
|
|
|
|||||||||
A reconciliation of Level 3 investments is presented when the Fund had a significant amount of Level 3 investments at the beginning and/or end of the reporting period in relation to net assets.
See accompanying Notes to Financial Statements.
32
DIMENSIONAL INTERNATIONAL CORE EQUITY MARKET ETF
SUMMARY SCHEDULE OF PORTFOLIO HOLDINGS
October 31, 2021
| Shares |
Value† |
Percentage |
||||||||||||
| COMMON STOCKS — (98.5%) |
| |||||||||||||
| AUSTRALIA — (6.4%) |
| |||||||||||||
| # |
BHP Group, Ltd. |
89,728 | $ | 2,465,299 | 0.3% | |||||||||
| Commonwealth Bank of Australia |
53,249 | 4,186,712 | 0.5% | |||||||||||
| CSL, Ltd. |
14,963 | 3,377,121 | 0.5% | |||||||||||
| * |
National Australia Bank, Ltd. |
113,499 | 2,447,503 | 0.3% | ||||||||||
| Other Securities |
37,028,582 | 4.8% | ||||||||||||
|
|
|
|
|
|||||||||||
| TOTAL AUSTRALIA |
49,505,217 | 6.4% | ||||||||||||
|
|
|
|
|
|||||||||||
| AUSTRIA — (0.4%) |
| |||||||||||||
| Other Securities |
2,845,092 | 0.4% | ||||||||||||
|
|
|
|
|
|||||||||||
| BELGIUM — (0.9%) |
| |||||||||||||
| Other Securities |
6,951,048 | 0.9% | ||||||||||||
|
|
|
|
|
|||||||||||
| CANADA — (10.4%) |
| |||||||||||||
| Bank of Nova Scotia (The) |
36,952 | 2,418,850 | 0.3% | |||||||||||
| Canadian National Railway Co. |
18,178 | 2,412,099 | 0.3% | |||||||||||
| Royal Bank of Canada |
39,637 | 4,119,268 | 0.5% | |||||||||||
| * |
Shopify, Inc., Class A |
1,816 | 2,647,371 | 0.3% | ||||||||||
| Toronto-Dominion Bank (The) |
49,520 | 3,589,106 | 0.5% | |||||||||||
| Other Securities |
65,077,733 | 8.6% | ||||||||||||
|
|
|
|
|
|||||||||||
| TOTAL CANADA |
80,264,427 | 10.5% | ||||||||||||
|
|
|
|
|
|||||||||||
| CHINA — (0.0%) |
| |||||||||||||
| Other Securities |
39,664 | 0.0% | ||||||||||||
|
|
|
|
|
|||||||||||
| DENMARK — (2.5%) |
| |||||||||||||
| Novo Nordisk A/S, Class B |
55,898 | 6,124,272 | 0.8% | |||||||||||
| Other Securities |
13,073,594 | 1.7% | ||||||||||||
|
|
|
|
|
|||||||||||
| TOTAL DENMARK |
19,197,866 | 2.5% | ||||||||||||
|
|
|
|
|
|||||||||||
| FINLAND — (1.4%) |
| |||||||||||||
| Other Securities |
11,043,964 | 1.4% | ||||||||||||
|
|
|
|
|
|||||||||||
| FRANCE — (8.8%) |
| |||||||||||||
| Air Liquide SA |
14,568 | 2,431,709 | 0.3% | |||||||||||
| * |
Airbus SE |
19,991 | 2,558,678 | 0.3% | ||||||||||
| # |
BNP Paribas SA |
33,449 | 2,241,236 | 0.3% | ||||||||||
| L’Oreal SA |
6,183 | 2,825,968 | 0.4% | |||||||||||
| LVMH Moet Hennessy Louis Vuitton SE |
9,329 | 7,311,020 | 1.0% | |||||||||||
| Sanofi |
31,335 | 3,134,153 | 0.4% | |||||||||||
| Schneider Electric SE |
14,241 | 2,453,924 | 0.3% | |||||||||||
| TotalEnergies SE |
86,535 | 4,343,173 | 0.6% | |||||||||||
| Other Securities |
40,943,403 | 5.3% | ||||||||||||
|
|
|
|
|
|||||||||||
| TOTAL FRANCE |
68,243,264 | 8.9% | ||||||||||||
|
|
|
|
|
|||||||||||
| GERMANY — (7.7%) |
| |||||||||||||
| Allianz SE, Registered |
12,324 | 2,868,783 | 0.4% | |||||||||||
| Daimler AG |
32,691 | 3,243,677 | 0.4% | |||||||||||
| Deutsche Post AG, Registered |
38,069 | 2,357,836 | 0.3% | |||||||||||
| Deutsche Telekom AG |
142,107 | 2,644,073 | 0.4% | |||||||||||
| SAP SE |
30,587 | 4,435,915 | 0.6% | |||||||||||
33
DIMENSIONAL INTERNATIONAL CORE EQUITY MARKET ETF
CONTINUED
| Shares |
Value† |
Percentage |
||||||||||||
| GERMANY — (Continued) |
| |||||||||||||
| Siemens AG, Registered |
16,121 | $ | 2,617,060 | 0.4% | ||||||||||
| Other Securities |
41,374,389 | 5.3% | ||||||||||||
|
|
|
|
|
|||||||||||
| TOTAL GERMANY |
59,541,733 | 7.8% | ||||||||||||
|
|
|
|
|
|||||||||||
| HONG KONG — (2.2%) |
| |||||||||||||
| AIA Group, Ltd. |
369,400 | 4,171,691 | 0.5% | |||||||||||
| Hong Kong Exchanges & Clearing, Ltd. |
48,600 | 2,941,346 | 0.4% | |||||||||||
| Other Securities |
10,292,212 | 1.4% | ||||||||||||
|
|
|
|
|
|||||||||||
| TOTAL HONG KONG |
17,405,249 | 2.3% | ||||||||||||
|
|
|
|
|
|||||||||||
| IRELAND — (0.6%) |
| |||||||||||||
| Other Securities |
5,069,687 | 0.7% | ||||||||||||
|
|
|
|
|
|||||||||||
| ISRAEL — (0.6%) |
| |||||||||||||
| Other Securities |
4,840,932 | 0.6% | ||||||||||||
|
|
|
|
|
|||||||||||
| ITALY — (2.5%) |
| |||||||||||||
| Other Securities |
19,220,299 | 2.5% | ||||||||||||
|
|
|
|
|
|||||||||||
| JAPAN — (21.6%) |
| |||||||||||||
| Astellas Pharma, Inc. |
171,400 | 2,881,594 | 0.4% | |||||||||||
| KDDI Corp. |
69,700 | 2,156,559 | 0.3% | |||||||||||
| Recruit Holdings Co., Ltd. |
69,600 | 4,621,892 | 0.6% | |||||||||||
| SoftBank Corp. |
227,900 | 3,106,955 | 0.4% | |||||||||||
| * |
SoftBank Group Corp. |
49,900 | 2,697,510 | 0.4% | ||||||||||
| Sony Corp. |
51,300 | 5,911,704 | 0.8% | |||||||||||
| * |
Toyota Motor Corp. |
384,300 | 6,762,534 | 0.9% | ||||||||||
| Other Securities |
139,545,172 | 18.0% | ||||||||||||
|
|
|
|
|
|||||||||||
| TOTAL JAPAN |
167,683,920 | 21.8% | ||||||||||||
|
|
|
|
|
|||||||||||
| NETHERLANDS — (4.1%) |
| |||||||||||||
| ASML Holding NV, Sponsored NYS |
2,965 | 2,410,189 | 0.3% | |||||||||||
| ASML Holding NV |
10,045 | 8,142,992 | 1.1% | |||||||||||
| Koninklijke Ahold Delhaize NV |
76,923 | 2,504,101 | 0.3% | |||||||||||
| Other Securities |
18,403,995 | 2.4% | ||||||||||||
|
|
|
|
|
|||||||||||
| TOTAL NETHERLANDS |
31,461,277 | 4.1% | ||||||||||||
|
|
|
|
|
|||||||||||
| NEW ZEALAND — (0.3%) |
| |||||||||||||
| Other Securities |
2,646,240 | 0.3% | ||||||||||||
|
|
|
|
|
|||||||||||
| NORWAY — (0.9%) |
| |||||||||||||
| Other Securities |
6,592,246 | 0.9% | ||||||||||||
|
|
|
|
|
|||||||||||
| PORTUGAL — (0.2%) |
| |||||||||||||
| Other Securities |
1,687,942 | 0.2% | ||||||||||||
|
|
|
|
|
|||||||||||
| SINGAPORE — (0.9%) |
| |||||||||||||
| Other Securities |
6,708,167 | 0.9% | ||||||||||||
|
|
|
|
|
|||||||||||
| SPAIN — (2.2%) |
| |||||||||||||
| Iberdrola SA |
187,685 | 2,218,676 | 0.3% | |||||||||||
| Other Securities |
14,607,276 | 1.9% | ||||||||||||
|
|
|
|
|
|||||||||||
| TOTAL SPAIN |
16,825,952 | 2.2% | ||||||||||||
|
|
|
|
|
|||||||||||
34
DIMENSIONAL INTERNATIONAL CORE EQUITY MARKET ETF
CONTINUED
| Shares |
Value† |
Percentage |
||||||||||||
| SWEDEN — (3.5%) |
| |||||||||||||
| Other Securities |
$ | 27,262,746 | 3.5% | |||||||||||
|
|
|
|
|
|||||||||||
| SWITZERLAND — (8.1%) |
| |||||||||||||
| Nestle SA, Registered |
91,635 | 12,116,379 | 1.6% | |||||||||||
| Novartis AG, Registered |
54,625 | 4,521,844 | 0.6% | |||||||||||
| Roche Holding AG |
24,735 | 9,584,051 | 1.2% | |||||||||||
| Other Securities |
36,779,954 | 4.8% | ||||||||||||
|
|
|
|
|
|||||||||||
| TOTAL SWITZERLAND |
63,002,228 | 8.2% | ||||||||||||
|
|
|
|
|
|||||||||||
| UNITED KINGDOM — (12.3%) |
| |||||||||||||
| AstraZeneca PLC |
44,338 | 5,526,980 | 0.7% | |||||||||||
| BHP Group PLC |
78,463 | 2,081,147 | 0.3% | |||||||||||
| * |
BP PLC |
719,408 | 3,453,411 | 0.5% | ||||||||||
| * |
British American Tobacco PLC |
67,339 | 2,350,538 | 0.3% | ||||||||||
| Diageo PLC |
72,717 | 3,620,251 | 0.5% | |||||||||||
| GlaxoSmithKline PLC |
159,120 | 3,290,453 | 0.4% | |||||||||||
| * |
HSBC Holdings PLC |
596,727 | 3,611,297 | 0.5% | ||||||||||
| Rio Tinto PLC |
42,658 | 2,666,673 | 0.4% | |||||||||||
| Royal Dutch Shell PLC, Class B |
277,423 | 6,407,656 | 0.8% | |||||||||||
| Unilever PLC |
47,776 | 2,561,920 | 0.3% | |||||||||||
| Other Securities |
60,047,709 | 7.8% | ||||||||||||
|
|
|
|
|
|||||||||||
| TOTAL UNITED KINGDOM |
95,618,035 | 12.5% | ||||||||||||
|
|
|
|
|
|||||||||||
| UNITED STATES — (0.0%) |
| |||||||||||||
| Other Securities |
123,859 | 0.0% | ||||||||||||
|
|
|
|
|
|||||||||||
| TOTAL COMMON STOCKS |
763,781,054 | 99.5% | ||||||||||||
|
|
|
|
|
|||||||||||
| RIGHTS/WARRANTS — (0.0%) |
| |||||||||||||
| AUSTRALIA — (0.0%) |
| |||||||||||||
| Other Securities |
3,297 | 0.0% | ||||||||||||
|
|
|
|
|
|||||||||||
| AUSTRIA — (0.0%) |
| |||||||||||||
| Other Securities |
1 | 0.0% | ||||||||||||
|
|
|
|
|
|||||||||||
| NEW ZEALAND — (0.0%) |
| |||||||||||||
| Other Securities |
52 | 0.0% | ||||||||||||
|
|
|
|
|
|||||||||||
| TOTAL RIGHTS/WARRANTS |
3,350 | 0.0% | ||||||||||||
|
|
|
|
|
|||||||||||
| TOTAL INVESTMENT SECURITIES — (98.5%) |
||||||||||||||
| (Cost $732,352,051) |
763,784,404 | |||||||||||||
|
|
|
|||||||||||||
| SECURITIES LENDING COLLATERAL — (1.5%) |
||||||||||||||
| @§ |
The DFA Short Term Investment Fund |
1,022,520 | 11,830,043 | 1.5% | ||||||||||
|
|
|
|
|
|||||||||||
| TOTAL INVESTMENTS — 100.0% |
||||||||||||||
| (Cost $744,182,094) |
$ | 775,614,447 | 101.1% | |||||||||||
|
|
|
|
|
|||||||||||
35
DIMENSIONAL INTERNATIONAL CORE EQUITY MARKET ETF
CONTINUED
Summary of the Fund’s investments as of October 31, 2021, based on their valuation inputs, is as follows (see Security Valuation Note):
| Investment in Securities (Market Value) | ||||||||||||||||
| Level 1 | Level 2 | Level 3 | Total | |||||||||||||
| Common Stocks |
||||||||||||||||
| Australia |
$ | 47,851,531 | $ | 1,653,686 | — | $ | 49,505,217 | |||||||||
| Austria |
2,845,092 | — | — | 2,845,092 | ||||||||||||
| Belgium |
6,951,048 | — | — | 6,951,048 | ||||||||||||
| Canada |
80,264,427 | — | — | 80,264,427 | ||||||||||||
| China |
39,664 | — | — | 39,664 | ||||||||||||
| Denmark |
19,197,866 | — | — | 19,197,866 | ||||||||||||
| Finland |
11,043,964 | — | — | 11,043,964 | ||||||||||||
| France |
68,243,264 | — | — | 68,243,264 | ||||||||||||
| Germany |
59,541,733 | — | — | 59,541,733 | ||||||||||||
| Hong Kong |
17,405,249 | — | — | 17,405,249 | ||||||||||||
| Ireland |
5,069,687 | — | — | 5,069,687 | ||||||||||||
| Israel |
4,840,932 | — | — | 4,840,932 | ||||||||||||
| Italy |
19,220,299 | — | — | 19,220,299 | ||||||||||||
| Japan |
167,683,920 | — | — | 167,683,920 | ||||||||||||
| Netherlands |
31,461,277 | — | — | 31,461,277 | ||||||||||||
| New Zealand |
2,646,240 | — | — | 2,646,240 | ||||||||||||
| Norway |
6,592,246 | — | — | 6,592,246 | ||||||||||||
| Portugal |
1,687,942 | — | — | 1,687,942 | ||||||||||||
| Singapore |
6,708,167 | — | — | 6,708,167 | ||||||||||||
| Spain |
16,825,952 | — | — | 16,825,952 | ||||||||||||
| Sweden |
27,262,586 | 160 | — | 27,262,746 | ||||||||||||
| Switzerland |
63,002,228 | — | — | 63,002,228 | ||||||||||||
| United Kingdom |
95,618,035 | — | — | 95,618,035 | ||||||||||||
| United States |
123,859 | — | — | 123,859 | ||||||||||||
| Rights/Warrants |
||||||||||||||||
| Australia |
3,297 | — | — | 3,297 | ||||||||||||
| Austria |
— | 1 | — | 1 | ||||||||||||
| New Zealand |
— | 52 | — | 52 | ||||||||||||
| Collateral for Securities on Loan |
11,830,043 | — | — | 11,830,043 | ||||||||||||
|
|
|
|
|
|
|
|
|
|||||||||
| Total Investments |
$ | 773,960,548 | $ | 1,653,899 | — | $ | 775,614,447 | |||||||||
|
|
|
|
|
|
|
|
|
|||||||||
See accompanying Notes to Financial Statements.
36
DIMENSIONAL INTERNATIONAL VALUE ETF
SUMMARY SCHEDULE OF PORTFOLIO HOLDINGS
October 31, 2021
| Shares |
Value† |
Percentage of |
||||||||||||
| COMMON STOCKS — (97.7%) |
| |||||||||||||
| AUSTRALIA — (6.2%) |
| |||||||||||||
| * |
Australia & New Zealand Banking Group, Ltd. |
1,965,334 | $ | 41,539,229 | 1.2% | |||||||||
| * |
National Australia Bank, Ltd. |
1,750,279 | 37,743,177 | 1.1% | ||||||||||
| * |
Westpac Banking Corp. |
2,224,681 | 42,893,511 | 1.2% | ||||||||||
| Other Securities |
103,621,907 | 2.7% | ||||||||||||
|
|
|
|
|
|||||||||||
| TOTAL AUSTRALIA |
225,797,824 | 6.2% | ||||||||||||
|
|
|
|
|
|||||||||||
| AUSTRIA — (0.1%) |
| |||||||||||||
| Other Securities |
5,212,102 | 0.1% | ||||||||||||
|
|
|
|
|
|||||||||||
| BELGIUM — (0.7%) |
| |||||||||||||
| Other Securities |
26,030,353 | 0.7% | ||||||||||||
|
|
|
|
|
|||||||||||
| CANADA — (10.0%) |
| |||||||||||||
| * |
Bank of Montreal |
429,987 | 46,657,889 | 1.3% | ||||||||||
| #* |
Bank of Nova Scotia (The) |
381,366 | 25,002,355 | 0.7% | ||||||||||
| Canadian Imperial Bank of Commerce |
245,571 | 29,750,633 | 0.8% | |||||||||||
| * |
Canadian Natural Resources, Ltd. |
1,119,548 | 47,591,985 | 1.3% | ||||||||||
| # |
Manulife Financial Corp. |
885,769 | 17,263,642 | 0.5% | ||||||||||
| Nutrien, Ltd. |
325,659 | 22,766,821 | 0.6% | |||||||||||
| Suncor Energy, Inc. |
612,698 | 16,113,958 | 0.4% | |||||||||||
| Other Securities |
163,251,048 | 4.6% | ||||||||||||
|
|
|
|
|
|||||||||||
| TOTAL CANADA |
368,398,331 | 10.2% | ||||||||||||
|
|
|
|
|
|||||||||||
| DENMARK — (2.4%) |
| |||||||||||||
| DSV A/S |
96,512 | 22,452,682 | 0.6% | |||||||||||
| # |
Vestas Wind Systems A/S |
615,322 | 26,638,891 | 0.7% | ||||||||||
| Other Securities |
40,166,383 | 1.2% | ||||||||||||
|
|
|
|
|
|||||||||||
| TOTAL DENMARK |
89,257,956 | 2.5% | ||||||||||||
|
|
|
|
|
|||||||||||
| FINLAND — (1.2%) |
| |||||||||||||
| Other Securities |
43,908,557 | 1.2% | ||||||||||||
|
|
|
|
|
|||||||||||
| FRANCE — (9.7%) |
| |||||||||||||
| BNP Paribas SA |
491,862 | 32,957,009 | 0.9% | |||||||||||
| Cie de Saint-Gobain |
508,021 | 35,015,658 | 1.0% | |||||||||||
| Cie Generale des Etablissements Michelin SCA |
184,266 | 28,936,834 | 0.8% | |||||||||||
| * |
Orange SA |
1,647,340 | 17,986,684 | 0.5% | ||||||||||
| TotalEnergies SE |
1,666,369 | 83,634,709 | 2.3% | |||||||||||
| Other Securities |
157,300,172 | 4.3% | ||||||||||||
|
|
|
|
|
|||||||||||
| TOTAL FRANCE |
355,831,066 | 9.8% | ||||||||||||
|
|
|
|
|
|||||||||||
| GERMANY — (7.7%) |
| |||||||||||||
| Allianz SE, Registered |
161,874 | 37,681,056 | 1.0% | |||||||||||
| Bayer AG, Registered |
344,537 | 19,405,425 | 0.5% | |||||||||||
| Bayerische Motoren Werke AG |
252,486 | 25,490,532 | 0.7% | |||||||||||
| Daimler AG |
704,740 | 69,925,944 | 1.9% | |||||||||||
| Volkswagen AG, Preference |
152,780 | 34,268,180 | 1.0% | |||||||||||
| Other Securities |
95,965,303 | 2.7% | ||||||||||||
|
|
|
|
|
|||||||||||
| TOTAL GERMANY |
282,736,440 | 7.8% | ||||||||||||
|
|
|
|
|
|||||||||||
| HONG KONG — (1.8%) |
| |||||||||||||
| Other Securities |
67,202,125 | 3.1% | ||||||||||||
|
|
|
|
|
|||||||||||
37
DIMENSIONAL INTERNATIONAL VALUE ETF
CONTINUED
| Shares |
Value† |
Percentage of |
||||||||||||
| IRELAND — (0.4%) |
| |||||||||||||
| Other Securities |
$ | 14,847,826 | 0.4% | |||||||||||
|
|
|
|
|
|||||||||||
| ISRAEL — (0.5%) |
| |||||||||||||
| Other Securities |
19,186,638 | 0.5% | ||||||||||||
|
|
|
|
|
|||||||||||
| ITALY — (2.6%) |
| |||||||||||||
| * |
Intesa Sanpaolo SpA |
6,226,117 | 17,706,835 | 0.5% | ||||||||||
| Stellantis NV |
1,107,861 | 22,100,296 | 0.6% | |||||||||||
| Other Securities |
54,260,365 | 1.5% | ||||||||||||
|
|
|
|
|
|||||||||||
| TOTAL ITALY |
94,067,496 | 2.6% | ||||||||||||
|
|
|
|
|
|||||||||||
| JAPAN — (20.2%) |
| |||||||||||||
| * |
Honda Motor Co., Ltd. |
958,588 | 28,154,451 | 0.8% | ||||||||||
| * |
Mitsubishi Corp. |
513,200 | 16,256,772 | 0.5% | ||||||||||
| * |
SoftBank Group Corp. |
528,200 | 28,553,605 | 0.8% | ||||||||||
| * |
Takeda Pharmaceutical Co., Ltd. |
771,894 | 21,682,757 | 0.6% | ||||||||||
| * |
Toyota Motor Corp. |
5,079,240 | 89,379,480 | 2.5% | ||||||||||
| Other Securities |
556,978,366 | 15.2% | ||||||||||||
|
|
|
|
|
|||||||||||
| TOTAL JAPAN |
741,005,431 | 20.4% | ||||||||||||
|
|
|
|
|
|||||||||||
| NETHERLANDS — (4.9%) |
| |||||||||||||
| ING Groep NV |
1,211,638 | 18,396,392 | 0.5% | |||||||||||
| Koninklijke Ahold Delhaize NV |
1,237,587 | 40,287,601 | 1.1% | |||||||||||
| Koninklijke DSM NV |
165,155 | 36,132,195 | 1.0% | |||||||||||
| Other Securities |
84,894,262 | 2.4% | ||||||||||||
|
|
|
|
|
|||||||||||
| TOTAL NETHERLANDS |
179,710,450 | 5.0% | ||||||||||||
|
|
|
|
|
|||||||||||
| NEW ZEALAND — (0.3%) |
| |||||||||||||
| Other Securities |
11,700,904 | 0.3% | ||||||||||||
|
|
|
|
|
|||||||||||
| NORWAY — (1.0%) |
| |||||||||||||
| Other Securities |
35,090,897 | 1.0% | ||||||||||||
|
|
|
|
|
|||||||||||
| PORTUGAL — (0.2%) |
| |||||||||||||
| Other Securities |
5,545,779 | 0.2% | ||||||||||||
|
|
|
|
|
|||||||||||
| SINGAPORE — (0.9%) |
| |||||||||||||
| Other Securities |
32,564,264 | 0.9% | ||||||||||||
|
|
|
|
|
|||||||||||
| SPAIN — (2.3%) |
| |||||||||||||
| Banco Bilbao Vizcaya Argentaria SA |
2,399,101 | 16,830,244 | 0.4% | |||||||||||
| Banco Santander SA |
9,301,027 | 35,266,878 | 1.0% | |||||||||||
| Other Securities |
31,572,412 | 0.9% | ||||||||||||
|
|
|
|
|
|||||||||||
| TOTAL SPAIN |
83,669,534 | 2.3% | ||||||||||||
|
|
|
|
|
|||||||||||
| SWEDEN — (2.9%) |
| |||||||||||||
| Other Securities |
108,216,664 | 3.0% | ||||||||||||
|
|
|
|
|
|||||||||||
| SWITZERLAND — (8.3%) |
| |||||||||||||
| ABB, Ltd., Registered |
512,841 | 17,000,223 | 0.5% | |||||||||||
| Cie Financiere Richemont SA, Registered |
224,987 | 27,847,911 | 0.8% | |||||||||||
| Novartis AG, Sponsored ADR |
369,814 | 30,605,807 | 0.8% | |||||||||||
| Novartis AG, Registered |
354,588 | 29,352,708 | 0.8% | |||||||||||
| UBS Group AG |
1,374,597 | 25,039,855 | 0.7% | |||||||||||
| Zurich Insurance Group AG |
101,073 | 44,897,981 | 1.2% | |||||||||||
| Other Securities |
129,777,401 | 3.6% | ||||||||||||
|
|
|
|
|
|||||||||||
| TOTAL SWITZERLAND |
304,521,886 | 8.4% | ||||||||||||
|
|
|
|
|
|||||||||||
38
DIMENSIONAL INTERNATIONAL VALUE ETF
CONTINUED
| Shares |
Value† |
Percentage of |
||||||||||||
| UNITED KINGDOM — (13.4%) |
| |||||||||||||
| Anglo American PLC |
535,369 | $ | 20,419,506 | 0.6% | ||||||||||
| Aviva PLC |
3,902,148 | 21,111,919 | 0.6% | |||||||||||
| #* |
Barclays PLC, Sponsored ADR |
1,894,942 | 21,204,401 | 0.6% | ||||||||||
| * |
BP PLC, Sponsored ADR |
1,972,347 | 56,783,869 | 1.5% | ||||||||||
| * |
British American Tobacco PLC |
1,006,113 | 35,119,416 | 1.0% | ||||||||||
| Glencore PLC |
6,855,056 | 34,320,853 | 0.9% | |||||||||||
| * |
HSBC Holdings PLC, Sponsored ADR |
972,926 | 29,255,885 | 0.8% | ||||||||||
| Lloyds Banking Group PLC |
40,936,381 | 28,180,130 | 0.8% | |||||||||||
| * |
Royal Dutch Shell PLC, Sponsored ADR |
2,428,295 | 111,313,042 | 3.1% | ||||||||||
| Vodafone Group PLC |
17,598,295 | 26,062,257 | 0.7% | |||||||||||
| Other Securities |
107,577,376 | 2.9% | ||||||||||||
|
|
|
|
|
|||||||||||
| TOTAL UNITED KINGDOM |
491,348,654 | 13.5% | ||||||||||||
|
|
|
|
|
|||||||||||
| TOTAL COMMON STOCKS |
3,585,851,177 | 98.9% | ||||||||||||
|
|
|
|
|
|||||||||||
| TOTAL INVESTMENT SECURITIES — (97.7%) |
||||||||||||||
| (Cost $2,890,228,822) |
3,585,851,177 | |||||||||||||
|
|
|
|||||||||||||
| SECURITIES LENDING COLLATERAL — (2.3%) |
| |||||||||||||
| @§ |
The DFA Short Term Investment Fund |
7,151,846 | 82,743,279 | 2.3% | ||||||||||
|
|
|
|
|
|||||||||||
| TOTAL INVESTMENTS — 100.0% |
||||||||||||||
| (Cost $2,972,972,101) |
$ | 3,668,594,456 | 101.2% | |||||||||||
|
|
|
|
|
|||||||||||
Summary of the Fund’s investments as of October 31, 2021, based on their valuation inputs, is as follows (see Security Valuation Note):
| Level 1 | Level 2 | Level 3 | Total | |||||||||||||
| Common Stocks |
||||||||||||||||
| Australia |
$ | 225,797,824 | — | — | $ | 225,797,824 | ||||||||||
| Austria |
5,212,102 | — | — | 5,212,102 | ||||||||||||
| Belgium |
26,030,353 | — | — | 26,030,353 | ||||||||||||
| Canada |
368,398,331 | — | — | 368,398,331 | ||||||||||||
| Denmark |
89,257,956 | — | — | 89,257,956 | ||||||||||||
| Finland |
43,908,557 | — | — | 43,908,557 | ||||||||||||
| France |
355,831,066 | — | — | 355,831,066 | ||||||||||||
| Germany |
282,736,440 | — | — | 282,736,440 | ||||||||||||
| Hong Kong |
67,202,125 | — | — | 67,202,125 | ||||||||||||
| Ireland |
14,847,826 | — | — | 14,847,826 | ||||||||||||
| Israel |
19,186,638 | — | — | 19,186,638 | ||||||||||||
| Italy |
94,067,496 | — | — | 94,067,496 | ||||||||||||
| Japan |
741,005,431 | — | — | 741,005,431 | ||||||||||||
| Netherlands |
179,710,450 | — | — | 179,710,450 | ||||||||||||
| New Zealand |
11,700,904 | — | — | 11,700,904 | ||||||||||||
| Norway |
35,090,897 | — | — | 35,090,897 | ||||||||||||
| Portugal |
5,545,779 | — | — | 5,545,779 | ||||||||||||
| Singapore |
32,564,264 | — | — | 32,564,264 | ||||||||||||
| Spain |
83,669,534 | — | — | 83,669,534 | ||||||||||||
| Sweden |
108,216,664 | — | — | 108,216,664 | ||||||||||||
| Switzerland |
304,521,886 | — | — | 304,521,886 | ||||||||||||
| United Kingdom |
491,348,654 | — | — | 491,348,654 | ||||||||||||
| Collateral for Securities on Loan |
82,743,279 | — | — | 82,743,279 | ||||||||||||
|
|
|
|
|
|
|
|
|
|||||||||
| Total Investments |
$ | 3,668,594,456 | — | — | $ | 3,668,594,456 | ||||||||||
|
|
|
|
|
|
|
|
|
|||||||||
See accompanying Notes to Financial Statements.
39
DIMENSIONAL EMERGING CORE EQUITY MARKET ETF
SUMMARY SCHEDULE OF PORTFOLIO HOLDINGS
October 31, 2021
| Shares |
Value† |
Percentage |
||||||||||||
| COMMON STOCKS — (99.6%) |
| |||||||||||||
| BRAZIL — (4.4%) |
| |||||||||||||
| Petroleo Brasileiro SA, Preference |
247,300 | $ | 1,195,481 | 0.3% | ||||||||||
| Vale SA |
140,900 | 1,789,932 | 0.5% | |||||||||||
| Other Securities |
14,331,733 | 3.6% | ||||||||||||
|
|
|
|
|
|||||||||||
| TOTAL BRAZIL |
17,317,146 | 4.4% | ||||||||||||
|
|
|
|
|
|||||||||||
| CHILE — (0.4%) |
| |||||||||||||
| Other Securities |
1,476,208 | 0.4% | ||||||||||||
|
|
|
|
|
|||||||||||
| CHINA — (30.5%) |
| |||||||||||||
| * |
Alibaba Group Holding, Ltd. |
261,200 | 5,473,111 | 1.4% | ||||||||||
| * |
Alibaba Group Holding, Ltd., Sponsored ADR |
47,990 | 7,915,471 | 2.0% | ||||||||||
| Bank of China, Ltd., Class H |
3,920,000 | 1,385,773 | 0.4% | |||||||||||
| China Construction Bank Corp., Class H |
5,352,000 | 3,639,529 | 0.9% | |||||||||||
| China Merchants Bank Co., Ltd., Class H |
144,000 | 1,213,413 | 0.3% | |||||||||||
| China Resources Land, Ltd. |
284,000 | 1,106,202 | 0.3% | |||||||||||
| Geely Automobile Holdings, Ltd. |
435,000 | 1,512,621 | 0.4% | |||||||||||
| Industrial & Commercial Bank of China, Ltd., Class H |
3,178,000 | 1,740,351 | 0.4% | |||||||||||
| * |
JD.com, Inc., Sponsored ADR |
18,042 | 1,412,328 | 0.4% | ||||||||||
| * |
Meituan, Class B |
143,000 | 4,955,978 | 1.3% | ||||||||||
| NetEase, Inc., Sponsored ADR |
12,192 | 1,189,817 | 0.3% | |||||||||||
| * |
NIO, Inc., Sponsored ADR |
34,442 | 1,357,359 | 0.4% | ||||||||||
| Ping An Insurance Group Co. of China, Ltd. |
285,000 | 2,048,001 | 0.5% | |||||||||||
| Sunny Optical Technology Group Co., Ltd. |
44,900 | 1,213,256 | 0.3% | |||||||||||
| Tencent Holdings, Ltd. |
255,800 | 15,816,816 | 4.0% | |||||||||||
| * |
Wuxi Biologics Cayman, Inc. |
72,000 | 1,095,866 | 0.3% | ||||||||||
| Other Securities |
68,119,631 | 17.0% | ||||||||||||
|
|
|
|
|
|||||||||||
| TOTAL CHINA |
121,195,523 | 30.6% | ||||||||||||
|
|
|
|
|
|||||||||||
| COLOMBIA — (0.2%) |
| |||||||||||||
| Other Securities |
706,538 | 0.2% | ||||||||||||
|
|
|
|
|
|||||||||||
| CZECH REPUBLIC — (0.1%) |
| |||||||||||||
| Other Securities |
430,846 | 0.1% | ||||||||||||
|
|
|
|
|
|||||||||||
| EGYPT — (0.1%) |
| |||||||||||||
| Other Securities |
180,243 | 0.0% | ||||||||||||
|
|
|
|
|
|||||||||||
| GREECE — (0.2%) |
| |||||||||||||
| Other Securities |
943,652 | 0.2% | ||||||||||||
|
|
|
|
|
|||||||||||
| HUNGARY — (0.2%) |
| |||||||||||||
| Other Securities |
930,547 | 0.2% | ||||||||||||
|
|
|
|
|
|||||||||||
| INDIA — (13.5%) |
| |||||||||||||
| * |
Axis Bank, Ltd. |
120,377 | 1,192,818 | 0.3% | ||||||||||
| ICICI Bank, Ltd. |
184,319 | 1,974,233 | 0.5% | |||||||||||
| Infosys, Ltd. |
169,856 | 3,783,021 | 1.0% | |||||||||||
| ITC, Ltd. |
415,717 | 1,239,136 | 0.3% | |||||||||||
| Reliance Industries, Ltd. |
119,074 | 4,033,071 | 1.0% | |||||||||||
| Tata Consultancy Services, Ltd. |
38,400 | 1,742,407 | 0.5% | |||||||||||
| Other Securities |
39,364,540 | 9.9% | ||||||||||||
|
|
|
|
|
|||||||||||
| TOTAL INDIA |
53,329,226 | 13.5% | ||||||||||||
|
|
|
|
|
|||||||||||
40
DIMENSIONAL EMERGING CORE EQUITY MARKET ETF
CONTINUED
| Shares |
Value† |
Percentage |
||||||||||||
| INDONESIA — (1.7%) |
| |||||||||||||
| Other Securities |
$ | 6,818,334 | 1.7% | |||||||||||
|
|
|
|
|
|||||||||||
| KOREA, REPUBLIC OF — (13.5%) |
| |||||||||||||
| KB Financial Group, Inc. |
22,322 | 1,081,191 | 0.3% | |||||||||||
| Kia Corp. |
16,541 | 1,204,603 | 0.3% | |||||||||||
| NAVER Corp. |
3,442 | 1,198,831 | 0.3% | |||||||||||
| POSCO |
4,797 | 1,215,106 | 0.3% | |||||||||||
| Samsung Electronics Co., Ltd. |
227,731 | 13,602,862 | 3.5% | |||||||||||
| SK Hynix, Inc. |
30,943 | 2,727,422 | 0.7% | |||||||||||
| Other Securities |
32,712,538 | 8.2% | ||||||||||||
|
|
|
|
|
|||||||||||
| TOTAL KOREA, REPUBLIC OF |
53,742,553 | 13.6% | ||||||||||||
|
|
|
|
|
|||||||||||
| MALAYSIA — (1.6%) |
| |||||||||||||
| Other Securities |
6,512,767 | 1.6% | ||||||||||||
|
|
|
|
|
|||||||||||
| MEXICO — (1.9%) |
| |||||||||||||
| Other Securities |
7,561,748 | 1.9% | ||||||||||||
|
|
|
|
|
|||||||||||
| PERU — (0.1%) |
| |||||||||||||
| Other Securities |
389,029 | 0.1% | ||||||||||||
|
|
|
|
|
|||||||||||
| PHILIPPINES — (0.8%) |
| |||||||||||||
| Other Securities |
3,164,593 | 0.8% | ||||||||||||
|
|
|
|
|
|||||||||||
| POLAND — (1.1%) |
| |||||||||||||
| Other Securities |
4,195,699 | 1.1% | ||||||||||||
|
|
|
|
|
|||||||||||
| QATAR — (0.6%) |
| |||||||||||||
| Other Securities |
2,417,164 | 0.6% | ||||||||||||
|
|
|
|
|
|||||||||||
| RUSSIAN FEDERATION — (1.2%) |
| |||||||||||||
| Gazprom PJSC, ADR |
110,061 | 1,079,258 | 0.3% | |||||||||||
| Sberbank of Russia PJSC, ADR |
56,735 | 1,135,835 | 0.3% | |||||||||||
| Other Securities |
2,718,670 | 0.6% | ||||||||||||
|
|
|
|
|
|||||||||||
| TOTAL RUSSIAN FEDERATION |
4,933,763 | 1.2% | ||||||||||||
|
|
|
|
|
|||||||||||
| SAUDI ARABIA — (2.8%) |
| |||||||||||||
| Al Rajhi Bank |
41,394 | 1,529,555 | 0.4% | |||||||||||
| National Commercial Bank |
87,570 | 1,538,528 | 0.4% | |||||||||||
| Other Securities |
7,997,430 | 2.0% | ||||||||||||
|
|
|
|
|
|||||||||||
| TOTAL SAUDI ARABIA |
11,065,513 | 2.8% | ||||||||||||
|
|
|
|
|
|||||||||||
| SOUTH AFRICA — (3.9%) |
| |||||||||||||
| * |
MTN Group |
134,688 | 1,213,787 | 0.3% | ||||||||||
| Other Securities |
14,159,199 | 3.6% | ||||||||||||
|
|
|
|
|
|||||||||||
| TOTAL SOUTH AFRICA |
15,372,986 | 3.9% | ||||||||||||
|
|
|
|
|
|||||||||||
| TAIWAN — (17.8%) |
| |||||||||||||
| Cathay Financial Holding Co., Ltd. |
805,000 | 1,681,878 | 0.4% | |||||||||||
| China Development Financial Holding Corp. |
3,627,000 | 1,852,074 | 0.5% | |||||||||||
| China Steel Corp. |
1,334,000 | 1,611,824 | 0.4% | |||||||||||
| Chung Hung Steel Corp. |
855,000 | 1,079,184 | 0.3% | |||||||||||
| CTBC Financial Holding Co., Ltd. |
1,332,000 | 1,111,257 | 0.3% | |||||||||||
| Delta Electronics, Inc. |
132,000 | 1,162,954 | 0.3% | |||||||||||
| Formosa Plastics Corp. |
301,000 | 1,163,583 | 0.3% | |||||||||||
| Fubon Financial Holding Co., Ltd. |
516,999 | 1,368,327 | 0.4% | |||||||||||
41
DIMENSIONAL EMERGING CORE EQUITY MARKET ETF
CONTINUED
| Shares |
Value† |
Percentage |
||||||||||||
| TAIWAN — (Continued) |
||||||||||||||
| Hon Hai Precision Industry Co., Ltd. |
467,000 | $ | 1,796,897 | 0.5% | ||||||||||
| Mega Financial Holding Co., Ltd. |
1,338,000 | 1,607,034 | 0.4% | |||||||||||
| Taiwan Semiconductor Manufacturing Co., Ltd. |
1,014,000 | 21,513,566 | 5.4% | |||||||||||
| United Microelectronics Corp. |
588,000 | 1,226,388 | 0.3% | |||||||||||
| # |
Vanguard International Semiconductor Corp. |
272,000 | 1,413,381 | 0.4% | ||||||||||
| Wistron Corp. |
1,095,000 | 1,149,792 | 0.3% | |||||||||||
| * |
Yang Ming Marine Transport Corp. |
331,000 | 1,148,624 | 0.3% | ||||||||||
| Other Securities |
29,876,154 | 7.4% | ||||||||||||
|
|
|
|
|
|||||||||||
| TOTAL TAIWAN |
70,762,917 | 17.9% | ||||||||||||
|
|
|
|
|
|||||||||||
| THAILAND — (2.1%) |
| |||||||||||||
| Other Securities |
8,103,697 | 2.1% | ||||||||||||
|
|
|
|
|
|||||||||||
| TURKEY — (0.5%) |
| |||||||||||||
| Other Securities |
1,866,808 | 0.5% | ||||||||||||
|
|
|
|
|
|||||||||||
| UNITED ARAB EMIRATES — (0.4%) |
| |||||||||||||
| Other Securities |
1,698,671 | 0.4% | ||||||||||||
|
|
|
|
|
|||||||||||
| TOTAL COMMON STOCKS |
395,116,171 | 99.8% | ||||||||||||
|
|
|
|
|
|||||||||||
| PREFERRED STOCK — (0.0%) |
| |||||||||||||
| PHILIPPINES — (0.0%) |
| |||||||||||||
| Other Securities |
6,341 | 0.0% | ||||||||||||
|
|
|
|
|
|||||||||||
| TOTAL PREFERRED STOCK |
6,341 | 0.0% | ||||||||||||
|
|
|
|
|
|||||||||||
| RIGHTS/WARRANTS — (0.0%) |
| |||||||||||||
| KOREA, REPUBLIC OF — (0.0%) |
| |||||||||||||
| Other Securities |
1,269 | 0.0% | ||||||||||||
|
|
|
|
|
|||||||||||
| TAIWAN — (0.0%) |
| |||||||||||||
| Other Securities |
3,390 | 0.0% | ||||||||||||
|
|
|
|
|
|||||||||||
| THAILAND — (0.0%) |
| |||||||||||||
| Other Securities |
1,186 | 0.0% | ||||||||||||
|
|
|
|
|
|||||||||||
| TOTAL RIGHTS/WARRANTS |
5,845 | 0.0% | ||||||||||||
|
|
|
|
|
|||||||||||
| TOTAL INVESTMENT SECURITIES — (99.6%) |
||||||||||||||
| (Cost $402,363,482) |
395,128,357 | |||||||||||||
|
|
|
|||||||||||||
| SECURITIES LENDING COLLATERAL — (0.4%) |
||||||||||||||
| @§ |
The DFA Short Term Investment Fund |
150,819 | 1,744,896 | 0.4% | ||||||||||
|
|
|
|
|
|||||||||||
| TOTAL INVESTMENTS — 100.0% |
||||||||||||||
| (Cost $404,108,378) |
$ | 396,873,253 | 100.3% | |||||||||||
|
|
|
|
|
|||||||||||
42
DIMENSIONAL EMERGING CORE EQUITY MARKET ETF
CONTINUED
Summary of the Fund’s investments as of October 31, 2021, based on their valuation inputs, is as follows (see Security Valuation Note):
| Investment in Securities (Market Value) | ||||||||||||||||
| Level 1 | Level 2 | Level 3 | Total | |||||||||||||
| Common Stocks |
||||||||||||||||
| Brazil |
$ | 17,317,146 | — | — | $ | 17,317,146 | ||||||||||
| Chile |
1,476,208 | — | — | 1,476,208 | ||||||||||||
| China |
120,718,531 | $ | 146,576 | $ | 330,416 | 121,195,523 | ||||||||||
| Columbia |
706,538 | — | — | 706,538 | ||||||||||||
| Czech Republic |
430,846 | — | — | 430,846 | ||||||||||||
| Egypt |
180,243 | — | — | 180,243 | ||||||||||||
| Greece |
943,652 | — | — | 943,652 | ||||||||||||
| Hungary |
930,547 | — | — | 930,547 | ||||||||||||
| India |
53,284,387 | 44,839 | — | 53,329,226 | ||||||||||||
| Indonesia |
6,818,162 | 172 | — | 6,818,334 | ||||||||||||
| Korea, Republic of |
53,179,299 | 563,254 | — | 53,742,553 | ||||||||||||
| Malaysia |
6,511,550 | 1,217 | — | 6,512,767 | ||||||||||||
| Mexico |
7,561,748 | — | — | 7,561,748 | ||||||||||||
| Peru |
389,029 | — | — | 389,029 | ||||||||||||
| Philippines |
3,164,592 | 1 | — | 3,164,593 | ||||||||||||
| Poland |
4,195,699 | — | — | 4,195,699 | ||||||||||||
| Qatar |
2,413,192 | 3,972 | — | 2,417,164 | ||||||||||||
| Russian Federation |
4,933,763 | — | — | 4,933,763 | ||||||||||||
| Saudi Arabia |
11,065,513 | — | — | 11,065,513 | ||||||||||||
| South Africa |
15,372,986 | — | — | 15,372,986 | ||||||||||||
| Taiwan |
70,762,917 | — | — | 70,762,917 | ||||||||||||
| Thailand |
8,103,697 | — | — | 8,103,697 | ||||||||||||
| Turkey |
1,866,808 | — | — | 1,866,808 | ||||||||||||
| United Arab Emirates |
1,698,671 | — | — | 1,698,671 | ||||||||||||
| Preferred Stock |
— | |||||||||||||||
| Philippines |
6,341 | — | — | 6,341 | ||||||||||||
| Rights/Warrants |
— | |||||||||||||||
| Korea, Republic of |
— | 1,269 | — | 1,269 | ||||||||||||
| Taiwan |
— | 3,390 | — | 3,390 | ||||||||||||
| Thailand |
— | 1,186 | — | 1,186 | ||||||||||||
| Collateral for Securities on Loan |
1,744,896 | — | — | 1,744,896 | ||||||||||||
|
|
|
|
|
|
|
|
|
|||||||||
| Total Investments |
$ | 395,776,961 | $ | 765,876 | $ | 330,416 | $ | 396,873,253 | ||||||||
|
|
|
|
|
|
|
|
|
|||||||||
A reconciliation of Level 3 investments is presented when the Fund had a significant amount of Level 3 investments at the beginning and/or end of the reporting period in relation to net assets.
See accompanying Notes to Financial Statements.
43
DIMENSIONAL WORLD EX U.S. CORE EQUITY 2 ETF
SUMMARY SCHEDULE OF PORTFOLIO HOLDINGS
October 31, 2021
| Shares |
Value† |
Percentage |
||||||||||||
| COMMON STOCKS — (98.0%) |
| |||||||||||||
| AUSTRALIA — (4.2%) |
| |||||||||||||
| # |
BHP Group, Ltd. |
329,587 | $ | 9,055,486 | 0.2% | |||||||||
| Other Securities |
190,170,118 | 4.1% | ||||||||||||
|
|
|
|
|
|||||||||||
| TOTAL AUSTRALIA |
199,225,604 | 4.3% | ||||||||||||
|
|
|
|
|
|||||||||||
| AUSTRIA — (0.4%) |
| |||||||||||||
| Other Securities |
19,315,856 | 0.4% | ||||||||||||
|
|
|
|
|
|||||||||||
| BELGIUM — (0.8%) |
| |||||||||||||
| Other Securities |
37,438,581 | 0.8% | ||||||||||||
|
|
|
|
|
|||||||||||
| BRAZIL — (1.3%) |
| |||||||||||||
| Vale SA |
622,419 | 7,906,941 | 0.2% | |||||||||||
| Other Securities |
53,936,335 | 1.1% | ||||||||||||
|
|
|
|
|
|||||||||||
| TOTAL BRAZIL |
61,843,276 | 1.3% | ||||||||||||
|
|
|
|
|
|||||||||||
| CANADA — (7.2%) |
| |||||||||||||
| Canadian Imperial Bank of Commerce |
57,763 | 6,997,918 | 0.2% | |||||||||||
| * |
Canadian Natural Resources, Ltd. |
270,796 | 11,511,538 | 0.3% | ||||||||||
| National Bank of Canada |
86,593 | 7,157,693 | 0.2% | |||||||||||
| * |
Royal Bank of Canada |
139,164 | 14,474,448 | 0.3% | ||||||||||
| Royal Bank of Canada |
73,553 | 7,643,982 | 0.2% | |||||||||||
| Other Securities |
294,063,645 | 6.1% | ||||||||||||
|
|
|
|
|
|||||||||||
| TOTAL CANADA |
341,849,224 | 7.3% | ||||||||||||
|
|
|
|
|
|||||||||||
| CHILE — (0.1%) |
| |||||||||||||
| Other Securities |
5,484,991 | 0.1% | ||||||||||||
|
|
|
|
|
|||||||||||
| CHINA — (9.2%) |
| |||||||||||||
| * |
Alibaba Group Holding, Ltd., Sponsored ADR |
43,175 | 7,121,284 | 0.2% | ||||||||||
| BYD Co., Ltd., Class H |
189,500 | 7,225,265 | 0.2% | |||||||||||
| China Construction Bank Corp., Class H |
16,236,200 | 11,041,129 | 0.3% | |||||||||||
| China Merchants Bank Co., Ltd., Class H |
823,701 | 6,940,899 | 0.2% | |||||||||||
| Geely Automobile Holdings, Ltd. |
2,073,000 | 7,208,419 | 0.2% | |||||||||||
| Ping An Insurance Group Co. of China, Ltd. |
1,219,000 | 8,759,694 | 0.2% | |||||||||||
| Tencent Holdings, Ltd. |
442,300 | 27,348,622 | 0.6% | |||||||||||
| Other Securities |
360,698,429 | 7.5% | ||||||||||||
|
|
|
|
|
|||||||||||
| TOTAL CHINA |
436,343,741 | 9.4% | ||||||||||||
|
|
|
|
|
|||||||||||
| COLOMBIA — (0.1%) |
| |||||||||||||
| Other Securities |
2,581,331 | 0.1% | ||||||||||||
|
|
|
|
|
|||||||||||
| CZECH REPUBLIC — (0.0%) |
| |||||||||||||
| Other Securities |
1,376,989 | 0.0% | ||||||||||||
|
|
|
|
|
|||||||||||
| DENMARK — (1.7%) |
| |||||||||||||
| Novo Nordisk A/S, Class B |
134,410 | 14,726,168 | 0.3% | |||||||||||
| Other Securities |
63,801,481 | 1.4% | ||||||||||||
|
|
|
|
|
|||||||||||
| TOTAL DENMARK |
78,527,649 | 1.7% | ||||||||||||
|
|
|
|
|
|||||||||||
| EGYPT — (0.0%) |
| |||||||||||||
| Other Securities |
405,217 | 0.0% | ||||||||||||
|
|
|
|
|
|||||||||||
44
DIMENSIONAL WORLD EX U.S. CORE EQUITY 2 ETF
CONTINUED
| Shares |
Value† |
Percentage |
||||||||||||
| FINLAND — (1.1%) |
| |||||||||||||
| Other Securities |
$ | 53,401,287 | 1.1% | |||||||||||
|
|
|
|
|
|||||||||||
| FRANCE — (5.3%) |
| |||||||||||||
| Air Liquide SA |
59,288 | 9,896,428 | 0.2% | |||||||||||
| Cie Generale des Etablissements Michelin SCA |
52,105 | 8,182,484 | 0.2% | |||||||||||
| LVMH Moet Hennessy Louis Vuitton SE |
20,433 | 16,013,086 | 0.4% | |||||||||||
| TotalEnergies SE |
202,299 | 10,153,344 | 0.3% | |||||||||||
| Other Securities |
208,340,593 | 4.3% | ||||||||||||
|
|
|
|
|
|||||||||||
| TOTAL FRANCE |
252,585,935 | 5.4% | ||||||||||||
|
|
|
|
|
|||||||||||
| GERMANY — (5.0%) |
| |||||||||||||
| Daimler AG |
175,177 | 17,381,470 | 0.4% | |||||||||||
| Deutsche Post AG, Registered |
115,583 | 7,158,731 | 0.2% | |||||||||||
| Deutsche Telekom AG |
490,159 | 9,120,002 | 0.2% | |||||||||||
| Volkswagen AG, Preference |
35,805 | 8,030,974 | 0.2% | |||||||||||
| Other Securities |
197,485,819 | 4.1% | ||||||||||||
|
|
|
|
|
|||||||||||
| TOTAL GERMANY |
239,176,996 | 5.1% | ||||||||||||
|
|
|
|
|
|||||||||||
| GREECE — (0.1%) |
| |||||||||||||
| Other Securities |
3,995,958 | 0.1% | ||||||||||||
|
|
|
|
|
|||||||||||
| HONG KONG — (1.7%) |
| |||||||||||||
| AIA Group, Ltd. |
1,012,200 | 11,430,929 | 0.3% | |||||||||||
| Other Securities |
67,240,012 | 1.4% | ||||||||||||
|
|
|
|
|
|||||||||||
| TOTAL HONG KONG |
78,670,941 | 1.7% | ||||||||||||
|
|
|
|
|
|||||||||||
| HUNGARY — (0.1%) |
| |||||||||||||
| Other Securities |
3,516,769 | 0.1% | ||||||||||||
|
|
|
|
|
|||||||||||
| INDIA — (3.6%) |
| |||||||||||||
| Infosys, Ltd. |
379,317 | 8,448,122 | 0.2% | |||||||||||
| Other Securities |
160,654,351 | 3.4% | ||||||||||||
|
|
|
|
|
|||||||||||
| TOTAL INDIA |
169,102,473 | 3.6% | ||||||||||||
|
|
|
|
|
|||||||||||
| INDONESIA — (0.6%) |
| |||||||||||||
| Other Securities |
26,738,553 | 0.6% | ||||||||||||
|
|
|
|
|
|||||||||||
| IRELAND — (0.6%) |
| |||||||||||||
| CRH PLC, Sponsored ADR |
190,588 | 9,136,789 | 0.2% | |||||||||||
| Other Securities |
18,642,960 | 0.4% | ||||||||||||
|
|
|
|
|
|||||||||||
| TOTAL IRELAND |
27,779,749 | 0.6% | ||||||||||||
|
|
|
|
|
|||||||||||
| ISRAEL — (0.7%) |
| |||||||||||||
| Other Securities |
32,708,494 | 0.7% | ||||||||||||
|
|
|
|
|
|||||||||||
| ITALY — (1.9%) |
| |||||||||||||
| Stellantis NV |
394,373 | 7,867,197 | 0.2% | |||||||||||
| Other Securities |
81,677,371 | 1.7% | ||||||||||||
|
|
|
|
|
|||||||||||
| TOTAL ITALY |
89,544,568 | 1.9% | ||||||||||||
|
|
|
|
|
|||||||||||
| JAPAN — (14.7%) |
| |||||||||||||
| * |
Hitachi, Ltd. |
131,700 | 7,569,935 | 0.2% | ||||||||||
| KDDI Corp. |
255,900 | 7,917,695 | 0.2% | |||||||||||
| Recruit Holdings Co., Ltd. |
107,400 | 7,132,057 | 0.2% | |||||||||||
| * |
SoftBank Group Corp. |
311,092 | 16,817,111 | 0.4% | ||||||||||
45
DIMENSIONAL WORLD EX U.S. CORE EQUITY 2 ETF
CONTINUED
| Shares |
Value† |
Percentage |
||||||||||||
| JAPAN — (Continued) |
| |||||||||||||
| Sony Corp. |
92,700 | $ | 10,682,552 | 0.3% | ||||||||||
| * |
Toyota Motor Corp. |
1,059,400 | 18,642,281 | 0.4% | ||||||||||
| Other Securities |
627,567,899 | 13.2% | ||||||||||||
|
|
|
|
|
|||||||||||
| TOTAL JAPAN |
696,329,530 | 14.9% | ||||||||||||
|
|
|
|
|
|||||||||||
| KOREA, REPUBLIC OF — (4.6%) |
| |||||||||||||
| Samsung Electronics Co., Ltd. |
524,115 | 31,306,514 | 0.7% | |||||||||||
| Samsung Electronics Co., Ltd., Sponsored GDR |
10,022 | 14,962,846 | 0.3% | |||||||||||
| SK Hynix, Inc. |
92,845 | 8,183,676 | 0.2% | |||||||||||
| Other Securities |
161,576,483 | 3.4% | ||||||||||||
|
|
|
|
|
|||||||||||
| TOTAL KOREA, REPUBLIC OF |
216,029,519 | 4.6% | ||||||||||||
|
|
|
|
|
|||||||||||
| MALAYSIA — (0.5%) |
| |||||||||||||
| Other Securities |
25,787,856 | 0.6% | ||||||||||||
|
|
|
|
|
|||||||||||
| MEXICO — (0.6%) |
| |||||||||||||
| Other Securities |
30,981,103 | 0.7% | ||||||||||||
|
|
|
|
|
|||||||||||
| NETHERLANDS — (2.5%) |
| |||||||||||||
| ASML Holding NV, Sponsored NYS |
21,482 | 17,462,288 | 0.4% | |||||||||||
| Koninklijke Ahold Delhaize NV |
292,367 | 9,517,525 | 0.2% | |||||||||||
| Other Securities |
91,677,547 | 1.9% | ||||||||||||
|
|
|
|
|
|||||||||||
| TOTAL NETHERLANDS |
118,657,360 | 2.5% | ||||||||||||
|
|
|
|
|
|||||||||||
| NEW ZEALAND — (0.3%) |
| |||||||||||||
| Other Securities |
15,872,924 | 0.3% | ||||||||||||
|
|
|
|
|
|||||||||||
| NORWAY — (0.7%) |
| |||||||||||||
| Other Securities |
32,533,306 | 0.7% | ||||||||||||
|
|
|
|
|
|||||||||||
| PERU — (0.0%) |
| |||||||||||||
| Other Securities |
562,421 | 0.0 | ||||||||||||
|
|
|
|
|
|||||||||||
| PHILIPPINES — (0.2%) |
| |||||||||||||
| Other Securities |
11,234,181 | 0.2% | ||||||||||||
|
|
|
|
|
|||||||||||
| POLAND — (0.3%) |
| |||||||||||||
| Other Securities |
15,082,236 | 0.3% | ||||||||||||
|
|
|
|
|
|||||||||||
| PORTUGAL — (0.2%) |
| |||||||||||||
| Other Securities |
7,807,339 | 0.2% | ||||||||||||
|
|
|
|
|
|||||||||||
| QATAR — (0.2%) |
| |||||||||||||
| Other Securities |
8,875,675 | 0.2% | ||||||||||||
|
|
|
|
|
|||||||||||
| RUSSIAN FEDERATION — (0.3%) |
| |||||||||||||
| Other Securities |
16,588,442 | 0.4% | ||||||||||||
|
|
|
|
|
|||||||||||
| SAUDI ARABIA — (0.8%) |
| |||||||||||||
| Other Securities |
39,388,319 | 0.8% | ||||||||||||
|
|
|
|
|
|||||||||||
| SINGAPORE — (0.6%) |
| |||||||||||||
| Other Securities |
27,505,389 | 0.6% | ||||||||||||
|
|
|
|
|
|||||||||||
| SOUTH AFRICA — (1.6%) |
| |||||||||||||
| Other Securities |
76,159,982 | 1.6% | ||||||||||||
|
|
|
|
|
|||||||||||
46
DIMENSIONAL WORLD EX U.S. CORE EQUITY 2 ETF
CONTINUED
| Shares |
Value† |
Percentage |
||||||||||||
| SPAIN — (1.4%) |
||||||||||||||
| Iberdrola SA |
682,474 | $ | 8,067,713 | 0.2% | ||||||||||
| Other Securities |
59,452,152 | 1.3% | ||||||||||||
|
|
|
|
|
|||||||||||
| TOTAL SPAIN |
67,519,865 | 1.5% | ||||||||||||
|
|
|
|
|
|||||||||||
| SWEDEN — (2.5%) |
||||||||||||||
| Other Securities |
119,468,450 | 2.6% | ||||||||||||
|
|
|
|
|
|||||||||||
| SWITZERLAND — (4.9%) |
||||||||||||||
| Nestle SA, Registered |
299,395 | 39,587,309 | 0.9% | |||||||||||
| Julius Baer Group, Ltd. |
87,631 | 6,346,834 | 0.1% | |||||||||||
| Novartis AG, Sponsored ADR |
91,358 | 7,560,788 | 0.2% | |||||||||||
| Roche Holding AG |
53,301 | 20,652,497 | 0.4% | |||||||||||
| Other Securities |
155,926,030 | 3.3% | ||||||||||||
|
|
|
|
|
|||||||||||
| TOTAL SWITZERLAND |
230,073,458 | 4.9% | ||||||||||||
|
|
|
|
|
|||||||||||
| TAIWAN — (5.6%) |
| |||||||||||||
| Taiwan Semiconductor - SP, Sponsored ADR |
296,894 | 33,756,848 | 0.7% | |||||||||||
| Taiwan Semiconductor Manufacturing Co., Ltd. |
436,465 | 9,260,275 | 0.2% | |||||||||||
| Other Securities |
220,295,076 | 4.7% | ||||||||||||
|
|
|
|
|
|||||||||||
| TOTAL TAIWAN |
263,312,199 | 5.6% | ||||||||||||
|
|
|
|
|
|||||||||||
| THAILAND — (0.7%) |
| |||||||||||||
| Other Securities |
32,098,655 | 0.7% | ||||||||||||
|
|
|
|
|
|||||||||||
| TURKEY — (0.2%) |
| |||||||||||||
| Other Securities |
7,917,339 | 0.2% | ||||||||||||
|
|
|
|
|
|||||||||||
| UNITED ARAB EMIRATES — (0.2%) |
| |||||||||||||
| Other Securities |
8,008,432 | 0.2% | ||||||||||||
|
|
|
|
|
|||||||||||
| UNITED KINGDOM — (8.7%) |
| |||||||||||||
| AstraZeneca PLC, Sponsored ADR |
178,391 | 11,128,031 | 0.3% | |||||||||||
| * |
BP PLC, Sponsored ADR |
500,724 | 14,415,844 | 0.3% | ||||||||||
| # |
Rio Tinto PLC, Sponsored ADR |
112,739 | 7,132,997 | 0.2% | ||||||||||
| * |
Royal Dutch Shell PLC, Sponsored ADR |
299,298 | 13,719,820 | 0.3% | ||||||||||
| Unilever PLC, Sponsored ADR |
177,876 | 9,530,596 | 0.2% | |||||||||||
| Other Securities |
355,895,924 | 7.5% | ||||||||||||
|
|
|
|
|
|||||||||||
| TOTAL UNITED KINGDOM |
411,823,212 | 8.8% | ||||||||||||
|
|
|
|
|
|||||||||||
| UNITED STATES — (0.0%) |
| |||||||||||||
| Other Securities |
2,393,727 | 0.1% | ||||||||||||
|
|
|
|
|
|||||||||||
| TOTAL COMMON STOCKS |
4,643,625,101 | 99.5% | ||||||||||||
|
|
|
|
|
|||||||||||
| PREFERRED STOCK — (0.0%) |
| |||||||||||||
| PHILIPPINES — (0.0%) |
| |||||||||||||
| Other Securities |
52,045 | 0.0% | ||||||||||||
|
|
|
|
|
|||||||||||
| TOTAL PREFERRED STOCK |
52,045 | 0.0% | ||||||||||||
|
|
|
|
|
|||||||||||
| RIGHTS/WARRANTS — (0.0%) |
| |||||||||||||
| AUSTRALIA — (0.0%) |
| |||||||||||||
| Other Securities |
14,420 | 0.0% | ||||||||||||
|
|
|
|
|
|||||||||||
| AUSTRIA — (0.0%) |
| |||||||||||||
| Other Securities |
404 | 0.0% | ||||||||||||
|
|
|
|
|
|||||||||||
47
DIMENSIONAL WORLD EX U.S. CORE EQUITY 2 ETF
CONTINUED
| Shares |
Value† |
Percentage |
||||||||||||
| CANADA — (0.0%) |
| |||||||||||||
| Other Securities |
$ | 71,677 | 0.0% | |||||||||||
|
|
|
|
|
|||||||||||
| INDIA — (0.0%) |
| |||||||||||||
| Other Securities |
1,503 | 0.0% | ||||||||||||
|
|
|
|
|
|||||||||||
| INDONESIA — (0.0%) |
| |||||||||||||
| Other Securities |
5,110 | 0.0% | ||||||||||||
|
|
|
|
|
|||||||||||
| KOREA, REPUBLIC OF — (0.0%) |
| |||||||||||||
| Other Securities |
57,146 | 0.0% | ||||||||||||
|
|
|
|
|
|||||||||||
| MALAYSIA — (0.0%) |
| |||||||||||||
| Other Securities |
2,699 | 0.0% | ||||||||||||
|
|
|
|
|
|||||||||||
| NEW ZEALAND — (0.0%) |
| |||||||||||||
| Other Securities |
2,998 | 0.0% | ||||||||||||
|
|
|
|
|
|||||||||||
| TAIWAN — (0.0%) |
| |||||||||||||
| Other Securities |
1,386 | 0.0% | ||||||||||||
|
|
|
|
|
|||||||||||
| THAILAND — (0.0%) |
| |||||||||||||
| Other Securities |
14,459 | 0.0% | ||||||||||||
|
|
|
|
|
|||||||||||
| UNITED KINGDOM — (0.0%) |
| |||||||||||||
| Other Securities |
5,892 | 0.0% | ||||||||||||
|
|
|
|
|
|||||||||||
| TOTAL RIGHTS/WARRANTS |
177,694 | 0.0% | ||||||||||||
|
|
|
|
|
|||||||||||
| TOTAL INVESTMENT SECURITIES — (98.0%) |
||||||||||||||
| (Cost $3,430,274,173) |
4,643,854,840 | |||||||||||||
|
|
|
|||||||||||||
| SECURITIES LENDING COLLATERAL — (2.0%) |
| |||||||||||||
| @§ |
The DFA Short Term Investment Fund |
8,003,357 | 92,594,840 | 2.0% | ||||||||||
|
|
|
|
|
|||||||||||
| TOTAL INVESTMENTS — 100.0% |
||||||||||||||
| (Cost $3,522,869,013) |
$ | 4,736,449,680 | 101.5% | |||||||||||
|
|
|
|
|
|||||||||||
Summary of the Fund’s investments as of October 31, 2021, based on their valuation inputs, is as follows (see Security Valuation Note):
| Investment in Securities (Market Value) | ||||||||||||||||
| Level 1 | Level 2 | Level 3 | Total | |||||||||||||
| Common Stocks |
||||||||||||||||
| Australia |
$ | 193,590,391 | $ | 5,635,213 | — | $ | 199,225,604 | |||||||||
| Austria |
19,315,856 | — | — | 19,315,856 | ||||||||||||
| Belgium |
37,438,581 | — | — | 37,438,581 | ||||||||||||
| Brazil |
61,843,276 | — | — | 61,843,276 | ||||||||||||
| Canada |
341,849,224 | — | — | 341,849,224 | ||||||||||||
| Chile |
5,484,991 | — | — | 5,484,991 | ||||||||||||
| China |
433,425,672 | 1,605,447 | $ | 1,312,622 | 436,343,741 | |||||||||||
| Colombia |
2,581,331 | — | — | 2,581,331 | ||||||||||||
| Czech Republic |
1,376,989 | — | — | 1,376,989 | ||||||||||||
| Denmark |
78,527,649 | — | — | 78,527,649 | ||||||||||||
| Egypt |
405,217 | — | — | 405,217 | ||||||||||||
| Finland |
53,401,287 | — | — | 53,401,287 | ||||||||||||
| France |
252,584,129 | 1,806 | — | 252,585,935 | ||||||||||||
48
DIMENSIONAL WORLD EX U.S. CORE EQUITY 2 ETF
CONTINUED
| Investment in Securities (Market Value) | ||||||||||||||||
| Level 1 | Level 2 | Level 3 | Total | |||||||||||||
| Germany |
$ | 239,176,996 | — | — | $ | 239,176,996 | ||||||||||
| Greece |
3,991,840 | $ | 4,118 | — | 3,995,958 | |||||||||||
| Hong Kong |
78,469,055 | 17,374 | $ | 184,512 | 78,670,941 | |||||||||||
| Hungary |
3,516,769 | — | — | 3,516,769 | ||||||||||||
| India |
169,066,676 | 35,797 | — | 169,102,473 | ||||||||||||
| Indonesia |
26,668,188 | 70,365 | — | 26,738,553 | ||||||||||||
| Ireland |
27,779,749 | — | — | 27,779,749 | ||||||||||||
| Israel |
32,708,494 | — | — | 32,708,494 | ||||||||||||
| Italy |
89,544,568 | — | — | 89,544,568 | ||||||||||||
| Japan |
696,329,530 | — | — | 696,329,530 | ||||||||||||
| Korea, Republic of |
215,328,011 | 701,508 | — | 216,029,519 | ||||||||||||
| Malaysia |
25,753,653 | 34,203 | — | 25,787,856 | ||||||||||||
| Mexico |
30,980,554 | 549 | — | 30,981,103 | ||||||||||||
| Netherlands |
118,657,360 | — | — | 118,657,360 | ||||||||||||
| New Zealand |
15,872,924 | — | — | 15,872,924 | ||||||||||||
| Norway |
32,533,306 | — | — | 32,533,306 | ||||||||||||
| Peru |
562,421 | — | — | 562,421 | ||||||||||||
| Philippines |
11,234,025 | 156 | — | 11,234,181 | ||||||||||||
| Poland |
15,082,236 | — | — | 15,082,236 | ||||||||||||
| Portugal |
7,807,339 | — | — | 7,807,339 | ||||||||||||
| Qatar |
8,687,591 | 188,084 | — | 8,875,675 | ||||||||||||
| Russian Federation |
16,588,442 | — | — | 16,588,442 | ||||||||||||
| Saudi Arabia |
39,388,319 | — | — | 39,388,319 | ||||||||||||
| Singapore |
27,438,000 | 67,389 | — | 27,505,389 | ||||||||||||
| South Africa |
76,159,982 | — | — | 76,159,982 | ||||||||||||
| Spain |
67,519,865 | — | — | 67,519,865 | ||||||||||||
| Sweden |
119,468,450 | — | — | 119,468,450 | ||||||||||||
| Switzerland |
230,073,458 | — | — | 230,073,458 | ||||||||||||
| Taiwan |
263,296,165 | 16,034 | — | 263,312,199 | ||||||||||||
| Thailand |
32,098,655 | — | — | 32,098,655 | ||||||||||||
| Turkey |
7,917,339 | — | — | 7,917,339 | ||||||||||||
| United Arab Emirates |
8,005,047 | 3,385 | — | 8,008,432 | ||||||||||||
| United Kingdom |
411,823,212 | — | — | 411,823,212 | ||||||||||||
| United States |
2,393,727 | — | — | 2,393,727 | ||||||||||||
| Preferred Stock |
||||||||||||||||
| Philippines |
52,045 | — | — | 52,045 | ||||||||||||
| Rights/Warrants |
||||||||||||||||
| Australia |
14,420 | — | — | 14,420 | ||||||||||||
| Austria |
— | 404 | — | 404 | ||||||||||||
| Canada |
71,677 | — | — | 71,677 | ||||||||||||
| India |
— | 1,503 | — | 1,503 | ||||||||||||
| Indonesia |
5,110 | — | — | 5,110 | ||||||||||||
| Korea, Republic of |
— | 57,146 | — | 57,146 | ||||||||||||
| Malaysia |
2,699 | — | — | 2,699 | ||||||||||||
| New Zealand |
— | 2,998 | — | 2,998 | ||||||||||||
| Taiwan |
— | 1,386 | — | 1,386 | ||||||||||||
| Thailand |
8,933 | 5,526 | — | 14,459 | ||||||||||||
| United Kingdom |
— | 5,892 | — | 5,892 | ||||||||||||
| Collateral for Securities on Loan |
92,594,840 | — | — | 92,594,840 | ||||||||||||
|
|
|
|
|
|
|
|
|
|||||||||
| Total Investments |
$ | 4,726,496,263 | $ | 8,456,283 | $ | 1,497,134 | $ | 4,736,449,680 | ||||||||
|
|
|
|
|
|
|
|
|
|||||||||
A reconciliation of Level 3 investments is presented when the Fund had a significant amount of Level 3 investments at the beginning and/or end of the reporting period in relation to net assets.
See accompanying Notes to Financial Statements.
49
STATEMENTS OF ASSETS AND LIABILITIES
OCTOBER 31, 2021
(Amounts in thousands, except per share amounts)
| Dimensional U.S. Equity ETF |
Dimensional US Core Equity Market ETF |
Dimensional U.S. Core Equity 2 ETF |
||||||||||
| ASSETS: |
||||||||||||
| Investment Securities at Value (Including $55,153, $15,300, and $189,640 of securities on loan, respectively) |
$ | 6,032,962 | $ | 1,327,077 | $ | 14,439,551 | ||||||
| Collateral from Securities on Loan Invested in Affiliate at Value (Cost of $56,272, $15,665, and $194,434, respectively) (a) |
56,272 | 15,665 | 194,434 | |||||||||
| Cash |
4,784 | 1,882 | 11,566 | |||||||||
| Receivables: |
||||||||||||
| Dividends and Interest |
4,191 | 970 | 9,465 | |||||||||
| Receivable for Capital Shares Issued |
— | — | 4 | |||||||||
| Prepaid Expenses and Other Assets |
144 | 2 | 290 | |||||||||
|
|
|
|
|
|
|
|||||||
| Total Assets |
6,098,353 | 1,345,596 | 14,655,310 | |||||||||
|
|
|
|
|
|
|
|||||||
| LIABILITIES: |
||||||||||||
| Payables: |
||||||||||||
| Investment Securities Purchased |
— | 1,454 | — | |||||||||
| Upon Return of Securities Loaned |
56,272 | 15,665 | 194,434 | |||||||||
| Accrued Expenses and Other Liabilities: |
||||||||||||
| Advisory Fee |
403 | 129 | 1,908 | |||||||||
| Administration and Accounting |
241 | — | 577 | |||||||||
| Custodian |
53 | — | 110 | |||||||||
| Transfer Agent |
18 | — | 32 | |||||||||
| Trustee |
8 | — | 19 | |||||||||
| Service Fee (b) |
— | 8 | — | |||||||||
| Other Expenses |
118 | — | 292 | |||||||||
|
|
|
|
|
|
|
|||||||
| Total Liabilities |
57,113 | 17,256 | 197,372 | |||||||||
|
|
|
|
|
|
|
|||||||
| NET ASSETS |
$ | 6,041,240 | $ | 1,328,340 | $ | 14,457,938 | ||||||
|
|
|
|
|
|
|
|||||||
| SHARES OUTSTANDING, $0.01 PAR VALUE |
120,005 | 41,404 | 513,989 | |||||||||
|
|
|
|
|
|
|
|||||||
| Net Asset Value, Offering and Redemption price per share |
$ | 50.34 | $ | 32.08 | $ | 28.13 | ||||||
|
|
|
|
|
|
|
|||||||
| Investment Securities at Cost |
$ | 1,776,077 | $ | 1,178,652 | $ | 5,783,599 | ||||||
|
|
|
|
|
|
|
|||||||
| Foreign Currencies at Cost |
$ | 4,784 | $ | 1,882 | $ | 11,566 | ||||||
|
|
|
|
|
|
|
|||||||
| NET ASSETS CONSIST OF: |
||||||||||||
| Paid-In Capital |
$ | 1,801,768 | $ | 1,179,030 | $ | 5,792,695 | ||||||
| Total Distributable Earnings (Loss) |
4,239,472 | 149,310 | 8,665,243 | |||||||||
|
|
|
|
|
|
|
|||||||
| NET ASSETS |
$ | 6,041,240 | $ | 1,328,340 | $ | 14,457,938 | ||||||
|
|
|
|
|
|
|
|||||||
| (a) | See Note F in the Notes to Financial Statements for additional information about securities lending collateral |
| (b) | See Note D in the Notes to Financial Statements for additional information about fees and expenses |
See accompanying Notes to Financial Statements.
50
DIMENSIONAL ETF TRUST
STATEMENTS OF ASSETS AND LIABILITIES
OCTOBER 31, 2021
(Amounts in thousands, except per share amounts)
| Dimensional U.S. Small Cap ETF |
Dimensional U.S. Targeted Value ETF |
Dimensional International Core Equity Market ETF |
||||||||||
| ASSETS: |
||||||||||||
| Investment Securities at Value including $114,320, $134,420, and $14,063 of securities on loan, respectively) |
$ | 4,286,371 | $ | 6,412,666 | $ | 763,784 | ||||||
| Collateral from Securities on Loan Invested in Affiliate at Value (Cost of $117,558, $136,562, and $11,830, respectively) (a) |
117,558 | 136,562 | 11,830 | |||||||||
| Foreign Currencies at Value |
— | — | 949 | |||||||||
| Cash |
3,852 | 30,671 | 1,118 | |||||||||
| Receivables: |
||||||||||||
| Investment Securities Sold |
682 | 8,819 | 72 | |||||||||
| Dividends and Interest |
942 | 1,952 | 1,485 | |||||||||
| Receivable for Tax Reclaims |
— | — | 298 | |||||||||
| Prepaid Expenses and Other Assets |
114 | 178 | 5 | |||||||||
|
|
|
|
|
|
|
|||||||
| Total Assets |
4,409,519 | 6,590,848 | 779,541 | |||||||||
|
|
|
|
|
|
|
|||||||
| LIABILITIES: |
||||||||||||
| Payables: |
||||||||||||
| Investment Securities Purchased |
272 | 2,944 | 152 | |||||||||
| Upon Return of Securities Loaned |
117,558 | 136,562 | 11,830 | |||||||||
| Accrued Expenses and Other Liabilities: |
||||||||||||
| Advisory Fee |
1,068 | 1,609 | 107 | |||||||||
| Administration and Accounting |
183 | 266 | — | |||||||||
| Custodian |
47 | 57 | — | |||||||||
| Transfer Agent |
15 | 18 | — | |||||||||
| Trustee |
6 | 8 | — | |||||||||
| Service Fee (b) |
— | — | 7 | |||||||||
| Other Expenses |
132 | 180 | 5 | |||||||||
|
|
|
|
|
|
|
|||||||
| Total Liabilities |
119,281 | 141,644 | 12,101 | |||||||||
|
|
|
|
|
|
|
|||||||
| NET ASSETS |
$ | 4,290,238 | $ | 6,449,204 | $ | 767,440 | ||||||
|
|
|
|
|
|
|
|||||||
| SHARES OUTSTANDING, $0.01 PAR VALUE |
71,246 | 138,729 | 25,800 | |||||||||
|
|
|
|
|
|
|
|||||||
| Net Asset Value, Offering and Redemption price per share |
$ | 60.22 | $ | 46.49 | $ | 29.75 | ||||||
|
|
|
|
|
|
|
|||||||
| Investment Securities at Cost |
$ | 1,871,105 | $ | 3,105,479 | $ | 732,352 | ||||||
|
|
|
|
|
|
|
|||||||
| Foreign Currencies at Cost |
$ | — | $ | — | $ | 2,065 | ||||||
|
|
|
|
|
|
|
|||||||
| NET ASSETS CONSIST OF: |
||||||||||||
| Paid-In Capital |
$ | 1,778,269 | $ | 3,134,078 | $ | 734,081 | ||||||
| Total Distributable Earnings (Loss) |
2,511,969 | 3,315,126 | 33,359 | |||||||||
|
|
|
|
|
|
|
|||||||
| NET ASSETS |
$ | 4,290,238 | $ | 6,449,204 | $ | 767,440 | ||||||
|
|
|
|
|
|
|
|||||||
| (a) | See Note F in the Notes to Financial Statements for additional information about securities lending collateral |
| (b) | See Note D in the Notes to Financial Statements for additional information about fees and expenses |
See accompanying Notes to Financial Statements.
51
DIMENSIONAL ETF TRUST
STATEMENTS OF ASSETS AND LIABILITIES
OCTOBER 31, 2021
(Amounts in thousands, except per share amounts)
| Dimensional International Value ETF |
Dimensional Emerging Core Equity Market ETF |
Dimensional World ex U.S. Core Equity 2 ETF |
||||||||||
| ASSETS: |
||||||||||||
| Investment Securities at Value including $82,935, $11,056, and $144,209 of securities on loan, respectively) |
$ | 3,585,851 | $ | 395,128 | $ | 4,643,855 | ||||||
| Collateral from Securities on Loan Invested in Affiliate at Value (Cost of $82,743, $1,745, and $92,595, respectively) (a) |
82,743 | 1,745 | 92,595 | |||||||||
| Foreign Currencies at Value |
9,521 | 804 | 9,911 | |||||||||
| Cash |
4,326 | 532 | 2,531 | |||||||||
| Receivables: |
||||||||||||
| Investment Securities Sold |
167 | — | 133 | |||||||||
| Dividends and Interest |
11,703 | 271 | 8,786 | |||||||||
| Receivable for Capital Shares Issued |
8,440 | — | — | |||||||||
| Receivable for Tax Reclaims |
7,711 | 2 | 4,227 | |||||||||
| Prepaid Expenses and Other Assets |
152 | 6 | 190 | |||||||||
|
|
|
|
|
|
|
|||||||
| Total Assets |
3,710,614 | 398,488 | 4,762,228 | |||||||||
|
|
|
|
|
|
|
|||||||
| LIABILITIES: |
||||||||||||
| Payables: |
||||||||||||
| Investment Securities Purchased |
9,234 | — | 2,688 | |||||||||
| Upon Return of Securities Loaned |
82,743 | 1,745 | 92,595 | |||||||||
| Accrued Foreign Capital Gains Tax |
— | 894 | 8 | |||||||||
| Accrued Expenses and Other Liabilities: |
||||||||||||
| Advisory Fee |
940 | 112 | 1,007 | |||||||||
| Administration and Accounting |
218 | — | 254 | |||||||||
| Custodian |
95 | — | 497 | |||||||||
| Transfer Agent |
6 | — | 7 | |||||||||
| Trustee |
3 | — | 3 | |||||||||
| Service Fee (b) |
— | 8 | — | |||||||||
| Other Expenses |
— | — | 190 | |||||||||
| Organization |
406 | — | 575 | |||||||||
|
|
|
|
|
|
|
|||||||
| Total Liabilities |
93,645 | 2,759 | 97,824 | |||||||||
|
|
|
|
|
|
|
|||||||
| NET ASSETS |
$ | 3,616,969 | $ | 395,729 | $ | 4,664,404 | ||||||
|
|
|
|
|
|
|
|||||||
| SHARES OUTSTANDING, $0.01 PAR VALUE |
107,145 | 14,400 | 177,218 | |||||||||
|
|
|
|
|
|
|
|||||||
| Net Asset Value, Offering and Redemption price per share |
$ | 33.76 | $ | 27.48 | $ | 26.32 | ||||||
|
|
|
|
|
|
|
|||||||
| Investment Securities at Cost |
$ | 2,882,073 | $ | 402,363 | $ | 3,430,274 | ||||||
|
|
|
|
|
|
|
|||||||
| Foreign Currencies at Cost |
$ | 13,891 | $ | 1,342 | $ | 9,947 | ||||||
|
|
|
|
|
|
|
|||||||
| NET ASSETS CONSIST OF: |
||||||||||||
| Paid-In Capital |
$ | 3,314,323 | $ | 403,170 | $ | 3,516,090 | ||||||
| Total Distributable Earnings (Loss) |
302,646 | (7,441 | ) | 1,148,314 | ||||||||
|
|
|
|
|
|
|
|||||||
| NET ASSETS |
$ | 3,616,969 | $ | 395,729 | $ | 4,664,404 | ||||||
|
|
|
|
|
|
|
|||||||
| (a) | See Note F in the Notes to Financial Statements for additional information about securities lending collateral |
| (b) | See Note D in the Notes to Financial Statements for additional information about fees and expenses |
See accompanying Notes to Financial Statements.
52
STATEMENTS OF OPERATIONS
FOR THE YEAR ENDED OCTOBER 31, 2021
(Amounts in thousands)
| Dimensional U.S. Equity ETF (a)(c) |
Dimensional US Core Equity Market ETF (a)(b) |
Dimensional U.S. Core Equity 2 ETF (a)(c) |
||||||||||
| INVESTMENT INCOME: |
||||||||||||
| Interest |
$ | 3 | $ | — | $ | 9 | ||||||
| Dividends (Net of Foreign Taxes Withheld of ($9), ($2) and ($42), respectively) |
72,846 | 9,779 | 182,506 | |||||||||
| Income from Securities Lending |
151 | 9 | 639 | |||||||||
|
|
|
|
|
|
|
|||||||
| Total Investment Income |
73,000 | 9,788 | 183,154 | |||||||||
|
|
|
|
|
|
|
|||||||
| EXPENSES: |
||||||||||||
| Investment Management Fees |
7,319 | 839 | (d) | 23,067 | ||||||||
| Administration and Accounting |
216 | — | 496 | |||||||||
| Custodian |
51 | — | 102 | |||||||||
| Filing Fees |
6 | — | 35 | |||||||||
| Transfer Agency |
548 | — | 1,236 | |||||||||
| Directors’/Trustees’ Fees & Expenses |
51 | — | 119 | |||||||||
| Other Expenses |
459 | 35 | 997 | |||||||||
|
|
|
|
|
|
|
|||||||
| Previously Waived Fees Recovered by Advisor |
177 | — | — | |||||||||
|
|
|
|
|
|
|
|||||||
| Total Expenses |
8,827 | 874 | 26,052 | |||||||||
|
|
|
|
|
|
|
|||||||
| Fees Paid Indirectly (d) |
(2 | ) | — | (5 | ) | |||||||
|
|
|
|
|
|
|
|||||||
| Net Expenses |
8,825 | 874 | 26,047 | |||||||||
|
|
|
|
|
|
|
|||||||
| Net Investment Income (Loss) |
64,175 | 8,914 | 157,107 | |||||||||
|
|
|
|
|
|
|
|||||||
| Realized/Unrealized Gain (Loss): |
||||||||||||
| Net Realized Gain (Loss) from: |
||||||||||||
| Investment Transactions |
3,197 | (1,290 | ) | 19,178 | ||||||||
| In-Kind Transactions |
1,631 | 7,978 | 48,871 | |||||||||
| Futures Contracts |
5 | — | — | |||||||||
| Change in Unrealized Appreciation (Depreciation) on Investments |
1,759,540 | 148,424 | 4,211,180 | |||||||||
|
|
|
|
|
|
|
|||||||
| Net Realized and Unrealized Gain (Loss) |
1,764,373 | 155,112 | 4,279,228 | |||||||||
|
|
|
|
|
|
|
|||||||
| Net Increase (Decrease) in Net Assets Resulting from Operations |
$ | 1,828,548 | $ | 164,026 | $ | 4,436,336 | ||||||
|
|
|
|
|
|
|
|||||||
| (a) | Portion of income is from investment in affiliated fund |
| (b) | For the period from the commencement of operations on November 17, 2020 through October 31, 2021 |
| (c) | During the fiscal year the Fund converted from a Mutual Fund to an ETF pursuant to an Agreement and Plan of Reorganization. See Note A in the Notes to Financial Statements for additional information about the Reorganization |
| (d) | See Note D in the Notes to Financial Statements for additional information about fees and expenses |
See accompanying Notes to Financial Statements.
53
DIMENSIONAL ETF TRUST
STATEMENTS OF OPERATIONS
FOR THE YEAR ENDED OCTOBER 31, 2021
(Amounts in thousands)
| Dimensional U.S. Small Cap ETF (a)(c) |
Dimensional U.S. Targeted Value ETF (a)(c) |
Dimensional International Core Equity Market ETF (a)(b) |
||||||||||
| INVESTMENT INCOME: |
||||||||||||
| Interest |
$ | 2 | $ | 2 | $ | — | ||||||
| Dividends (Net of Foreign Taxes Withheld of ($41), ($101) and ($1,199), respectively) |
51,828 | 106,621 | 10,033 | |||||||||
| Income from Securities Lending |
579 | 820 | 44 | |||||||||
|
|
|
|
|
|
|
|||||||
| Total Investment Income |
52,409 | 107,443 | 10,077 | |||||||||
|
|
|
|
|
|
|
|||||||
| EXPENSES: |
||||||||||||
| Investment Management Fees |
13,528 | 20,020 | 608 | (d) | ||||||||
| Administration and Accounting |
80 | 228 | — | |||||||||
| Custodian |
41 | 46 | — | |||||||||
| Filing Fees |
21 | 32 | — | |||||||||
| Transfer Agency |
387 | 551 | — | |||||||||
| Directors’/Trustees’ Fees & Expenses |
36 | 51 | — | |||||||||
| Other Expenses |
480 | 574 | 20 | |||||||||
|
|
|
|
|
|
|
|||||||
| Total Expenses |
14,573 | 21,502 | 628 | |||||||||
|
|
|
|
|
|
|
|||||||
| Fees Paid Indirectly (d) |
(3 | ) | (3 | ) | — | |||||||
|
|
|
|
|
|
|
|||||||
| Net Expenses |
14,570 | 21,499 | 628 | |||||||||
|
|
|
|
|
|
|
|||||||
| Net Investment Income (Loss) |
37,839 | 85,944 | 9,449 | |||||||||
|
|
|
|
|
|
|
|||||||
| Realized/Unrealized Gain (Loss): |
||||||||||||
| Net Realized Gain (Loss) from: |
||||||||||||
| Investment Transactions |
172,215 | 109,276 | (740 | ) | ||||||||
| In-Kind Transactions |
7,852 | 16,117 | — | |||||||||
| Forward Currency Transactions |
— | — | (13 | ) | ||||||||
| Futures Contracts |
(207 | ) | 201 | — | ||||||||
| Change in Unrealized Appreciation (Depreciation) on: |
||||||||||||
| Investments |
1,319,390 | 2,294,406 | 31,433 | |||||||||
| Translation of Foreign Currency-Denominated Amounts |
— | — | (22 | ) | ||||||||
|
|
|
|
|
|
|
|||||||
| Net Realized and Unrealized Gain (Loss) |
1,499,250 | 2,420,000 | 30,658 | |||||||||
|
|
|
|
|
|
|
|||||||
| Net Increase (Decrease) in Net Assets Resulting from Operations |
$ | 1,537,089 | $ | 2,505,944 | $ | 40,107 | ||||||
|
|
|
|
|
|
|
|||||||
| (a) | Portion of income is from investment in affiliated fund |
| (b) | For the period from the commencement of operations on November 17, 2020 through October 31, 2021 |
| (c) | During the fiscal year the Fund converted from a Mutual Fund to an ETF pursuant to an Agreement and Plan of Reorganization. See Note A in the Notes to Financial Statements for additional information about the Reorganization |
| (d) | See Note D in the Notes to Financial Statements for additional information about fees and expenses |
See accompanying Notes to Financial Statements.
54
DIMENSIONAL ETF TRUST
STATEMENTS OF OPERATIONS
FOR THE YEAR ENDED OCTOBER 31, 2021
(Amounts in thousands)
| Dimensional International Value ETF (a)(c) |
Dimensional Emerging Core Equity Market ETF (a)(b) |
Dimensional World ex U.S. Core Equity 2 ETF (a)(c) |
||||||||||
| INVESTMENT INCOME: |
||||||||||||
| Interest |
$ | — | $ | — | $ | — | ||||||
| Dividends (Net of Foreign Taxes Withheld of (9,576), (716) and (11,937), respectively) |
125,611 | 5,415 | 115,373 | |||||||||
| Income from Securities Lending |
577 | 99 | 2,229 | |||||||||
|
|
|
|
|
|
|
|||||||
| Total Investment Income |
126,188 | 5,514 | 117,602 | |||||||||
|
|
|
|
|
|
|
|||||||
| EXPENSES: |
||||||||||||
| Investment Management Fees |
14,066 | 697 | (d) | 12,442 | ||||||||
| Administration and Accounting |
51 | — | 187 | |||||||||
| Custodian |
193 | — | 802 | |||||||||
| Filing Fees |
18 | — | 49 | |||||||||
| Organization Fees |
537 | — | 687 | |||||||||
| Transfer Agency |
518 | — | 616 | |||||||||
| Directors’/Trustees’ Fees & Expenses |
28 | — | 37 | |||||||||
| Other Expenses |
613 | 13 | 654 | |||||||||
|
|
|
|
|
|
|
|||||||
| Total Expenses |
16,024 | 710 | 15,474 | |||||||||
|
|
|
|
|
|
|
|||||||
| Fees Paid Indirectly (d) |
(13 | ) | — | (6 | ) | |||||||
| Fees Waived, Expenses Reimbursed by Advisor |
— | — | (99 | ) | ||||||||
|
|
|
|
|
|
|
|||||||
| Net Expenses |
16,011 | 710 | 15,369 | |||||||||
|
|
|
|
|
|
|
|||||||
| Net Investment Income (Loss) |
110,177 | 4,804 | 102,233 | |||||||||
|
|
|
|
|
|
|
|||||||
| Realized/Unrealized Gain (Loss): |
||||||||||||
| Net Realized Gain (Loss) from: |
||||||||||||
| Investment Transactions |
145,641 | (491 | ) | 84,963 | ||||||||
| Forward Currency Transactions |
— | (92 | ) | — | ||||||||
| Futures Contracts |
8,790 | — | 1,587 | |||||||||
| Change in Unrealized Appreciation (Depreciation) on: |
||||||||||||
| Investments |
885,919 | (7,235 | ) | 943,502 | ||||||||
| Futures |
656 | — | — | |||||||||
| Translation of Foreign Currency-Denominated Amounts |
(241 | ) | (7 | ) | (20 | ) | ||||||
| Change in Accrued Foreign Capital Gains Tax |
— | (894 | ) | — | ||||||||
|
|
|
|
|
|
|
|||||||
| Net Realized and Unrealized Gain (Loss) |
1,040,765 | (8,719 | ) | 1,030,032 | ||||||||
|
|
|
|
|
|
|
|||||||
| Net Increase (Decrease) in Net Assets Resulting from Operations |
$ | 1,150,942 | $ | (3,915 | ) | $ | 1,132,265 | |||||
|
|
|
|
|
|
|
|||||||
| (a) | Portion of income is from investment in affiliated fund |
| (b) | For the period from the commencement of operations on December 1, 2020 through October 31, 2021 |
| (c) | During the fiscal year the Fund converted from a Mutual Fund to an ETF pursuant to an Agreement and Plan of Reorganization. See Note A in the Notes to Financial Statements for additional information about the Reorganization |
| (d) | See Note D in the Notes to Financial Statements for additional information about fees and expenses |
See accompanying Notes to Financial Statements.
55
STATEMENTS OF CHANGES IN NET ASSETS
(Amounts in thousands)
| Dimensional U.S. Equity ETF (a) | Dimensional US Core Equity Market ETF |
|||||||||||
| For the year ended October 31, 2021 |
For the year ended October 31, 2020 |
For the period Nov. 17, 2020 through October 31, 2021 |
||||||||||
| Increase (Decrease) in Net Assets: |
||||||||||||
| Operations: |
||||||||||||
| Net Investment Income (Loss) |
$ | 64,175 | $ | 64,390 | $ | 8,914 | ||||||
| Net Realized Gain (Loss) from Investment, In-Kind, Forward Currency, and Futures Contracts Transactions |
4,833 | (18,953 | ) | 6,688 | ||||||||
| Change in Unrealized Appreciation (Depreciation) on Investments |
1,759,540 | 371,413 | 148,424 | |||||||||
|
|
|
|
|
|
|
|||||||
| Change in Net Assets Resulting from Operations |
1,828,548 | 416,850 | 164,026 | |||||||||
|
|
|
|
|
|
|
|||||||
| Distributions: |
||||||||||||
| Total Distributions |
(63,460 | ) | (64,573 | ) | (6,738 | ) | ||||||
|
|
|
|
|
|
|
|||||||
| Change in Net Assets Resulting from Distributions |
(63,460 | ) | (64,573 | ) | (6,738 | ) | ||||||
|
|
|
|
|
|
|
|||||||
| Capital Share Transactions: |
||||||||||||
| Shares Issued |
387,665 | 696,783 | 1,209,437 | |||||||||
| Dividends Reinvested |
34,001 | 63,297 | ||||||||||
| Cost of Shares Redeemed |
(343,507 | ) | (924,561 | ) | (38,385 | ) | ||||||
|
|
|
|
|
|
|
|||||||
| Change in Net Assets Resulting from Capital Share Transactions |
78,159 | (164,481 | ) | 1,171,052 | ||||||||
|
|
|
|
|
|
|
|||||||
| Change in Net Assets |
1,843,247 | 187,796 | 1,328,340 | |||||||||
| Net Assets: |
||||||||||||
| Beginning of Period |
4,197,993 | 4,010,197 | — | |||||||||
|
|
|
|
|
|
|
|||||||
| End of Period |
$ | 6,041,240 | $ | 4,197,993 | $ | 1,328,340 | ||||||
|
|
|
|
|
|
|
|||||||
| Share Transactions: |
||||||||||||
| Issued |
8,862 | 23,055 | 42,654 | |||||||||
| Issued in Lieu of Cash Distributions |
817 | 1,956 | — | |||||||||
| Redeemed |
(8,153 | ) | (29,560 | ) | (1,250 | ) | ||||||
|
|
|
|
|
|
|
|||||||
| Change in Shares |
1,526 | (4,549 | ) | 41,404 | ||||||||
|
|
|
|
|
|
|
|||||||
| (a) | During fiscal year 2021, the Fund converted from a Mutual Fund to an ETF pursuant to an Agreement and Plan of Reorganization. See Note A in the Notes to Financial Statements for additional information about the Reorganization. |
See accompanying Notes to Financial Statements.
56
DIMENSIONAL ETF TRUST
STATEMENTS OF CHANGES IN NET ASSETS
(Amounts in thousands)
| Dimensional U.S. Core Equity 2 ETF (a) | Dimensional U.S. Small Cap ETF (a) | |||||||||||||||
| For the year ended October 31, 2021 |
For the year ended October 31, 2020 |
For the year ended October 31, 2021 |
For the year ended October 31, 2020 |
|||||||||||||
| Increase (Decrease) in Net Assets: |
||||||||||||||||
| Operations: |
||||||||||||||||
| Net Investment Income (Loss) |
$ | 157,107 | $ | 151,835 | $ | 37,839 | $ | 28,964 | ||||||||
| Net Realized Gain (Loss) from Investment, In-Kind, Forward Currency, and Futures Contracts Transactions |
68,049 | (35,259 | ) | 179,860 | (77,571 | ) | ||||||||||
| Change in Unrealized Appreciation (Depreciation) on Investments |
4,211,180 | 182,258 | 1,319,390 | (160,663 | ) | |||||||||||
|
|
|
|
|
|
|
|
|
|||||||||
| Change in Net Assets Resulting from Operations |
4,436,336 | 298,834 | 1,537,089 | (209,270 | ) | |||||||||||
|
|
|
|
|
|
|
|
|
|||||||||
| Distributions: |
||||||||||||||||
| Total Distributions |
(138,569 | ) | (322,527 | ) | (31,370 | ) | (80,426 | ) | ||||||||
|
|
|
|
|
|
|
|
|
|||||||||
| Change in Net Assets Resulting from Distributions |
(138,569 | ) | (322,527 | ) | (31,370 | ) | (80,426 | ) | ||||||||
|
|
|
|
|
|
|
|
|
|||||||||
| Capital Share Transactions: |
||||||||||||||||
| Shares Issued |
1,511,919 | 2,449,875 | 393,443 | 994,142 | ||||||||||||
| Dividends Reinvested |
67,133 | 316,553 | 16,598 | 79,488 | ||||||||||||
| Cost of Shares Redeemed |
(948,003 | ) | (3,335,406 | ) | (342,665 | ) | (1,182,641 | ) | ||||||||
|
|
|
|
|
|
|
|
|
|||||||||
| Change in Net Assets Resulting from Capital Share Transactions |
631,049 | (568,978 | ) | 67,376 | (109,011 | ) | ||||||||||
|
|
|
|
|
|
|
|
|
|||||||||
| Change in Net Assets |
4,928,816 | (592,671 | ) | 1,573,095 | (398,707 | ) | ||||||||||
| Net Assets: |
||||||||||||||||
| Beginning of Period |
9,529,122 | 10,121,793 | 2,717,143 | 3,115,850 | ||||||||||||
|
|
|
|
|
|
|
|
|
|||||||||
| End of Period |
$ | 14,457,938 | $ | 9,529,122 | $ | 4,290,238 | $ | 2,717,143 | ||||||||
|
|
|
|
|
|
|
|
|
|||||||||
| Share Transactions: |
||||||||||||||||
| Issued |
59,797 | 146,175 | 7,126 | 30,535 | ||||||||||||
| Issued in Lieu of Cash Distributions |
2,821 | 16,717 | 328 | 1,961 | ||||||||||||
| Redeemed |
(39,217 | ) | (198,285 | ) | (6,614 | ) | (36,228 | ) | ||||||||
|
|
|
|
|
|
|
|
|
|||||||||
| Change in Shares |
23,401 | (35,393 | ) | 840 | (3,732 | ) | ||||||||||
|
|
|
|
|
|
|
|
|
|||||||||
| (a) | During fiscal year 2021, the Fund converted from a Mutual Fund to an ETF pursuant to an Agreement and Plan of Reorganization. See Note A in the Notes to Financial Statements for additional information about the Reorganization. |
See accompanying Notes to Financial Statements.
57
DIMENSIONAL ETF TRUST
STATEMENTS OF CHANGES IN NET ASSETS
(Amounts in thousands)
| Dimensional U.S. Targeted Value ETF (a) | Dimensional International Core Equity Market ETF |
|||||||||||
| For the year ended October 31, 2021 |
For the year ended October 31, 2020 |
For the period Nov. 17, 2020 through October 31, 2021 |
||||||||||
| Increase (Decrease) in Net Assets: |
||||||||||||
| Operations: |
||||||||||||
| Net Investment Income (Loss) |
$ | 85,944 | $ | 62,972 | $ | 9,449 | ||||||
| Net Realized Gain (Loss) from Investment, In-Kind, Forward Currency, and Futures Contracts Transactions |
125,594 | (115,056 | ) | (753 | ) | |||||||
| Change in Unrealized Appreciation (Depreciation) on: |
||||||||||||
| Investments |
2,294,406 | (603,686 | ) | 31,433 | ||||||||
| Translation of Foreign Currency-Denominated Amounts |
— | — | (22 | ) | ||||||||
|
|
|
|
|
|
|
|||||||
| Change in Net Assets Resulting from Operations |
2,505,944 | (655,770 | ) | 40,107 | ||||||||
|
|
|
|
|
|
|
|||||||
| Distributions: |
||||||||||||
| Total Distributions |
(69,616 | ) | (149,807 | ) | (6,749 | ) | ||||||
|
|
|
|
|
|
|
|||||||
| Change in Net Assets Resulting from Distributions |
(69,616 | ) | (149,807 | ) | (6,749 | ) | ||||||
|
|
|
|
|
|
|
|||||||
| Capital Share Transactions: |
||||||||||||
| Shares Issued |
689,104 | 2,043,053 | 734,082 | |||||||||
| Dividends Reinvested |
38,245 | 147,931 | ||||||||||
| Cost of Shares Redeemed |
(582,963 | ) | (2,260,203 | ) | — | |||||||
|
|
|
|
|
|
|
|||||||
| Change in Net Assets Resulting from Capital Share Transactions |
144,386 | (69,219 | ) | 734,082 | ||||||||
|
|
|
|
|
|
|
|||||||
| Change in Net Assets |
2,580,714 | (874,796 | ) | 767,440 | ||||||||
| Net Assets: |
||||||||||||
| Beginning of Period |
3,868,490 | 4,743,286 | — | |||||||||
|
|
|
|
|
|
|
|||||||
| End of Period |
$ | 6,449,204 | $ | 3,868,490 | $ | 767,440 | ||||||
|
|
|
|
|
|
|
|||||||
| Share Transactions: |
||||||||||||
| Issued |
16,164 | 83,973 | 25,800 | |||||||||
| Issued in Lieu of Cash Distributions |
996 | 4,724 | — | |||||||||
| Redeemed |
(14,771 | ) | (91,767 | ) | — | |||||||
|
|
|
|
|
|
|
|||||||
| Change in Shares |
2,389 | (3,070 | ) | 25,800 | ||||||||
|
|
|
|
|
|
|
|||||||
| (a) | During fiscal year 2021, the Fund converted from a Mutual Fund to an ETF pursuant to an Agreement and Plan of Reorganization. See Note A in the Notes to Financial Statements for additional information about the Reorganization. |
See accompanying Notes to Financial Statements.
58
DIMENSIONAL ETF TRUST
STATEMENTS OF CHANGES IN NET ASSETS
(Amounts in thousands)
| Dimensional International Value ETF (a) | Dimensional Emerging Core Equity Market ETF |
|||||||||||
| For the year ended October 31, 2021 |
For the year ended October 31, 2020 |
For the period Dec. 1, 2020 through October 31, 2021 |
||||||||||
| Increase (Decrease) in Net Assets: |
||||||||||||
| Operations: |
||||||||||||
| Net Investment Income (Loss) |
$ | 110,177 | $ | 69,097 | $ | 4,804 | ||||||
| Net Realized Gain (Loss) from Investment, In-Kind, Forward Currency, and Futures Contracts Transactions |
154,431 | (451,747 | ) | (583 | ) | |||||||
| Change in Unrealized Appreciation (Depreciation) on: |
||||||||||||
| Investments |
885,919 | (380,214 | ) | (7,235 | ) | |||||||
| Futures |
656 | (910 | ) | — | ||||||||
| Translation of Foreign Currency-Denominated Amounts |
(241 | ) | 135 | (7 | ) | |||||||
| Change in Accrued Foreign Capital Gains Tax |
— | — | (894 | ) | ||||||||
|
|
|
|
|
|
|
|||||||
| Change in Net Assets Resulting from Operations |
1,150,942 | (763,639 | ) | (3,915 | ) | |||||||
|
|
|
|
|
|
|
|||||||
| Distributions: |
||||||||||||
| Total Distributions |
(81,899 | ) | (80,394 | ) | (3,526 | ) | ||||||
|
|
|
|
|
|
|
|||||||
| Change in Net Assets Resulting from Distributions |
(81,899 | ) | (80,394 | ) | (3,526 | ) | ||||||
|
|
|
|
|
|
|
|||||||
| Capital Share Transactions: |
||||||||||||
| Shares Issued |
476,851 | 1,504,513 | 403,170 | |||||||||
| Dividends Reinvested |
62,669 | 79,822 | — | |||||||||
| Cost of Shares Redeemed |
(384,302 | ) | (2,168,736 | ) | — | |||||||
|
|
|
|
|
|
|
|||||||
| Change in Net Assets Resulting from Capital Share Transactions |
155,218 | (584,401 | ) | 403,170 | ||||||||
|
|
|
|
|
|
|
|||||||
| Change in Net Assets |
1,224,261 | (1,428,434 | ) | 395,729 | ||||||||
| Net Assets: |
||||||||||||
| Beginning of Period |
2,392,708 | 3,821,142 | — | |||||||||
|
|
|
|
|
|
|
|||||||
| End of Period |
$ | 3,616,969 | $ | 2,392,708 | $ | 395,729 | ||||||
|
|
|
|
|
|
|
|||||||
| Share Transactions: |
||||||||||||
| Issued |
21,950 | 133,624 | 14,400 | |||||||||
| Issued in Lieu of Cash Distributions |
2,212 | 6,368 | — | |||||||||
| Redeemed |
(122,094 | ) | (196,484 | ) | — | |||||||
|
|
|
|
|
|
|
|||||||
| Change in Shares |
(97,932 | ) | (56,492 | ) | 14,400 | |||||||
|
|
|
|
|
|
|
|||||||
| (a) | During fiscal year 2021, the Fund converted from a Mutual Fund to an ETF pursuant to an Agreement and Plan of Reorganization. See Note A in the Notes to Financial Statements for additional information about the Reorganization. |
See accompanying Notes to Financial Statements.
59
DIMENSIONAL ETF TRUST
STATEMENTS OF CHANGES IN NET ASSETS
(Amounts in thousands)
| Dimensional World ex U.S. Core Equity 2 ETF (a) |
||||||||
| For the year ended October 31, 2021 |
For the year ended October 31, 2020 |
|||||||
| Increase (Decrease) in Net Assets: |
||||||||
| Operations: |
||||||||
| Net Investment Income (Loss) |
$ | 102,233 | $ | 74,974 | ||||
| Net Realized Gain (Loss) from Investment, In-Kind, Forward Currency, and Futures Contracts Transactions |
86,550 | (110,855 | ) | |||||
| Change in Unrealized Appreciation (Depreciation) on: |
||||||||
| Investments |
943,502 | (262,103 | ) | |||||
| Translation of Foreign Currency-Denominated Amounts |
(20 | ) | 147 | |||||
|
|
|
|
|
|||||
| Change in Net Assets Resulting from Operations |
1,132,265 | (297,837 | ) | |||||
|
|
|
|
|
|||||
| Distributions: |
||||||||
| Total Distributions |
(79,477 | ) | (75,881 | ) | ||||
|
|
|
|
|
|||||
| Change in Net Assets Resulting from Distributions |
(79,477 | ) | (75,881 | ) | ||||
|
|
|
|
|
|||||
| Capital Share Transactions: |
||||||||
| Shares Issued |
712,699 | 1,451,506 | ||||||
| Dividends Reinvested |
57,429 | 74,189 | ||||||
| Cost of Shares Redeemed |
(352,850 | ) | (1,914,972 | ) | ||||
|
|
|
|
|
|||||
| Change in Net Assets Resulting from Capital Share Transactions |
417,278 | (389,277 | ) | |||||
|
|
|
|
|
|||||
| Change in Net Assets |
1,470,066 | (762,995 | ) | |||||
| Net Assets: |
||||||||
| Beginning of Period |
3,194,338 | 3,957,333 | ||||||
|
|
|
|
|
|||||
| End of Period |
$ | 4,664,404 | $ | 3,194,338 | ||||
|
|
|
|
|
|||||
| Share Transactions: |
||||||||
| Issued |
37,328 | 165,286 | ||||||
| Issued in Lieu of Cash Distributions |
2,568 | 7,611 | ||||||
| Redeemed |
(185,130 | ) | (222,302 | ) | ||||
|
|
|
|
|
|||||
| Change in Shares |
(145,234 | ) | (49,405 | ) | ||||
|
|
|
|
|
|||||
| (a) | During fiscal year 2021, the Fund converted from a Mutual Fund to an ETF pursuant to an Agreement and Plan of Reorganization. See Note A in the Notes to Financial Statements for additional information about the Reorganization. |
See accompanying Notes to Financial Statements.
60
FINANCIAL HIGHLIGHTS
(for a share outstanding throughout each period)
| Dimensional U.S. Equity ETF | Dimensional US Core Equity Market ETF |
|||||||||||||||||||||||
| Year ended October 31, 2021 |
Year ended October 31, 2020 |
Year ended October 31, 2019 |
Year ended October 31, 2018 |
Year ended October 31, 2017 |
Period November 17, 2020 through October 31, 2021 |
|||||||||||||||||||
| Net Asset Value, Beginning of Period |
$ | 35.43 | $ | 32.60 | $ | 29.44 | $ | 28.01 | $ | 22.93 | $ | 24.92 | ||||||||||||
|
|
|
|
|
|
|
|
|
|
|
|
|
|||||||||||||
| Income from Investment Operations (a) |
||||||||||||||||||||||||
| Net Investment Income (Loss) |
0.54 | 0.53 | 0.52 | 0.47 | 0.44 | 0.36 | ||||||||||||||||||
| Net Gains (Losses) on Securities (Realized and Unrealized) |
14.91 | 2.83 | 3.25 | 1.40 | 5.09 | 7.04 | ||||||||||||||||||
|
|
|
|
|
|
|
|
|
|
|
|
|
|||||||||||||
| Total from Investment Operations |
15.45 | 3.36 | 3.77 | 1.87 | 5.53 | 7.40 | ||||||||||||||||||
| Less Distributions: |
||||||||||||||||||||||||
| Net Investment Income |
(0.54 | ) | (0.53 | ) | (0.56 | ) | (0.44 | ) | (0.45 | ) | (0.24 | ) | ||||||||||||
| Net Realized Gains |
— | — | (0.05 | ) | — | — | — | |||||||||||||||||
|
|
|
|
|
|
|
|
|
|
|
|
|
|||||||||||||
| Total Distributions |
(0.54 | ) | (0.53 | ) | (0.61 | ) | (0.44 | ) | (0.45 | ) | (0.24 | ) | ||||||||||||
| Net Asset Value, End of Period |
$ | 50.34 | $ | 35.43 | $ | 32.60 | $ | 29.44 | $ | 28.01 | $ | 32.08 | ||||||||||||
| Total Return at NAV (b)(c) |
43.83 | % | 10.47 | % | 13.03 | % | 6.68 | % | 24.27 | % | 29.81 | % | ||||||||||||
| Total Return at Market (c)(d) |
43.80 | % | — | — | — | — | 29.88 | % | ||||||||||||||||
| Net Assets, End of Year (thousands) |
$ | 6,041,240 | $ | 4,197,993 | $ | 4,010,197 | $ | 3,562,284 | $ | 3,310,640 | $ | 1,328,340 | ||||||||||||
| Ratio of Expenses to Average Net Assets (e) |
0.17 | % | 0.22 | % | 0.22 | % | 0.21 | % | 0.22 | % | 0.12 | % | ||||||||||||
| Ratio of Expense to Average Net Assets (Excluding Fees (Waived), (Expenses Reimbursed), (Previously Waived Fees Recovered by Advisor) and/or (Fees Paid Indirectly) (e) |
0.17 | % | 0.22 | % | 0.23 | % | 0.21 | % | 0.22 | % | 0.12 | % | ||||||||||||
| Ratio of Net Investment Income to Average Net Assets (e) |
1.21 | % | 1.57 | % | 1.71 | % | 1.58 | % | 1.70 | % | 1.27 | % | ||||||||||||
| Portfolio Turnover Rate (c)(f) |
1.00 | % | 2.00 | % | 2.00 | % | 1.00 | % | 8.00 | % | 3.00 | % | ||||||||||||
See page 3 for the Definitions of Abbreviations and Footnotes
See accompanying Notes to Financial Statements.
61
DIMENSIONAL ETF TRUST
FINANCIAL HIGHLIGHTS
(for a share outstanding throughout each period)
| Dimensional U.S. Core Equity 2 ETF | Dimensional U.S. Small Cap ETF | |||||||||||||||||||||||||||||||||||||||
| Year ended October 31, 2021 |
Year ended October 31, 2020 |
Year ended October 31, 2019 |
Year ended October 31, 2018 |
Year ended October 31, 2017 |
Year ended October 31, 2021 |
Year ended October 31, 2020 |
Year ended October 31, 2019 |
Year ended October 31, 2018 |
Year ended October 31, 2017 |
|||||||||||||||||||||||||||||||
| Net Asset Value, Beginning of Period |
$ | 19.42 | $ | 19.24 | $ | 17.87 | $ | 17.56 | $ | 14.33 | $ | 38.59 | $ | 42.03 | $ | 42.82 | $ | 44.35 | $ | 36.10 | ||||||||||||||||||||
|
|
|
|
|
|
|
|
|
|
|
|
|
|
|
|
|
|
|
|
|
|||||||||||||||||||||
| Income from Investment Operations (a) |
||||||||||||||||||||||||||||||||||||||||
| Net Investment Income (Loss) |
0.32 | 0.30 | 0.30 | 0.28 | 0.25 | 0.55 | 0.40 | 0.41 | 0.39 | 0.36 | ||||||||||||||||||||||||||||||
| Net Gains (Losses) on Securities (Realized and Unrealized) |
8.67 | 0.51 | 1.48 | 0.44 | 3.24 | 21.53 | (2.74 | ) | 0.35 | (0.30 | ) | 9.10 | ||||||||||||||||||||||||||||
|
|
|
|
|
|
|
|
|
|
|
|
|
|
|
|
|
|
|
|
|
|||||||||||||||||||||
| Total from Investment Operations |
8.99 | 0.81 | 1.78 | 0.72 | 3.49 | 22.08 | (2.34 | ) | 0.76 | 0.09 | 9.46 | |||||||||||||||||||||||||||||
| Less Distributions: |
||||||||||||||||||||||||||||||||||||||||
| Net Investment Income |
(0.28 | ) | (0.28 | ) | (0.31 | ) | (0.27 | ) | (0.26 | ) | (0.45 | ) | (0.39 | ) | (0.38 | ) | (0.38 | ) | (0.36 | ) | ||||||||||||||||||||
| Net Realized Gains |
— | (0.35 | ) | (0.10 | ) | (0.14 | ) | — | — | (0.71 | ) | (1.17 | ) | (1.24 | ) | (0.85 | ) | |||||||||||||||||||||||
|
|
|
|
|
|
|
|
|
|
|
|
|
|
|
|
|
|
|
|
|
|||||||||||||||||||||
| Total Distributions |
(0.28 | ) | (0.63 | ) | (0.41 | ) | (0.41 | ) | (0.26 | ) | (0.45 | ) | (1.10 | ) | (1.55 | ) | (1.62 | ) | (1.21 | ) | ||||||||||||||||||||
| Net Asset Value, End of Period |
$ | 28.13 | $ | 19.42 | $ | 19.24 | $ | 17.87 | $ | 17.56 | $ | 60.22 | $ | 38.59 | $ | 42.03 | $ | 42.82 | $ | 44.35 | ||||||||||||||||||||
| Total Return at NAV (b)(c) |
46.47 | % | 4.31 | % | 10.25 | % | 4.05 | % | 24.47 | % | 57.38 | % | (5.68 | )% | 2.18 | % | 0.12 | % | 26.46 | % | ||||||||||||||||||||
| Total Return at Market (c)(d) |
46.57 | % | — | — | — | — | 57.51 | % | — | — | — | — | ||||||||||||||||||||||||||||
| Net Assets, End of Year (thousands) |
$ | 14,457,938 | $ | 9,529,122 | $ | 10,121,793 | $ | 9,113,032 | $ | 8,230,938 | $ | 4,290,238 | $ | 2,717,143 | $ | 3,115,850 | $ | 2,985,680 | $ | 2,933,705 | ||||||||||||||||||||
| Ratio of Expenses to Average Net Assets (e) |
0.21 | % | 0.24 | % | 0.25 | % | 0.23 | % | 0.24 | % | 0.39 | % | 0.46 | % | 0.50 | % | 0.52 | % | 0.52 | % | ||||||||||||||||||||
| Ratio of Net Investment Income to Average Net Assets (e) |
1.25 | % | 1.59 | % | 1.64 | % | 1.49 | % | 1.56 | % | 1.00 | % | 1.04 | % | 0.99 | % | 0.86 | % | 0.87 | % | ||||||||||||||||||||
| Portfolio Turnover Rate (c)(f) |
2.00 | % | 3.00 | % | 6.00 | % | 1.00 | % | 2.00 | % | 11.00 | % | 12.00 | % | 11.00 | % | 12.00 | % | 11.00 | % | ||||||||||||||||||||
See page 3 for the Definitions of Abbreviations and Footnotes
See accompanying Notes to Financial Statements.
62
DIMENSIONAL ETF TRUST
FINANCIAL HIGHLIGHTS
(for a share outstanding throughout each period)
| Dimensional U.S. Targeted Value ETF | Dimensional International Core Equity Market ETF |
|||||||||||||||||||||||
| Year ended October 31, 2021 |
Year ended October 31, 2020 |
Year ended October 31, 2019 |
Year ended October 31, 2018 |
Year ended October 31, 2017 |
Period November 17, 2020 through October 31, 2021 |
|||||||||||||||||||
| Net Asset Value, Beginning of Period |
$ | 28.37 | $ | 34.02 | $ | 35.17 | $ | 37.94 | $ | 31.47 | $ | 25.07 | ||||||||||||
|
|
|
|
|
|
|
|
|
|
|
|
|
|||||||||||||
| Income from Investment Operations (a) |
||||||||||||||||||||||||
| Net Investment Income (Loss) |
0.64 | 0.45 | 0.45 | 0.41 | 0.37 | 0.77 | ||||||||||||||||||
| Net Gains (Losses) on Securities (Realized and Unrealized) |
18.00 | (5.03 | ) | 0.05 | (1.33 | ) | 7.53 | 4.36 | ||||||||||||||||
|
|
|
|
|
|
|
|
|
|
|
|
|
|||||||||||||
| Total from Investment Operations |
18.64 | (4.58 | ) | 0.50 | (0.92 | ) | 7.90 | 5.13 | ||||||||||||||||
| Less Distributions: |
||||||||||||||||||||||||
| Net Investment Income |
(0.52 | ) | (0.43 | ) | (0.43 | ) | (0.40 | ) | (0.36 | ) | (0.45 | ) | ||||||||||||
| Net Realized Gains |
— | (0.64 | ) | (1.22 | ) | (1.45 | ) | (1.07 | ) | — | ||||||||||||||
|
|
|
|
|
|
|
|
|
|
|
|
|
|||||||||||||
| Total Distributions |
(0.52 | ) | (1.07 | ) | (1.65 | ) | (1.85 | ) | (1.43 | ) | (0.45 | ) | ||||||||||||
| Net Asset Value, End of Period |
$ | 46.49 | $ | 28.37 | $ | 34.02 | $ | 35.17 | $ | 37.94 | $ | 29.75 | ||||||||||||
| Total Return at NAV (b)(c) |
65.98 | % | (13.70 | )% | 1.93 | % | (2.66 | )% | 25.40 | % | 20.54 | % | ||||||||||||
| Total Return at Market (c)(d) |
66.13 | % | — | — | — | — | 21.08 | % | ||||||||||||||||
| Net Assets, End of Year (thousands) |
$ | 6,449,204 | $ | 3,868,490 | $ | 4,743,286 | $ | 4,603,040 | $ | 4,733,681 | $ | 767,440 | ||||||||||||
| Ratio of Expenses to Average Net Assets (e) |
0.38 | % | 0.45 | % | 0.45 | % | 0.44 | % | 0.44 | % | 0.18 | % | ||||||||||||
| Ratio of Net Investment Income to Average Net Assets (e) |
1.53 | % | 1.55 | % | 1.36 | % | 1.07 | % | 1.04 | % | 2.78 | % | ||||||||||||
| Portfolio Turnover Rate (c)(f) |
6.00 | % | 14.00 | % | 24.00 | % | 14.00 | % | 14.00 | % | 4.00 | % | ||||||||||||
See page 3 for the Definitions of Abbreviations and Footnotes
See accompanying Notes to Financial Statements.
63
DIMENSIONAL ETF TRUST
FINANCIAL HIGHLIGHTS
(for a share outstanding throughout each period)
| Dimensional International Value ETF | Dimensional Emerging Core Equity Market ETF |
|||||||||||||||||||||||
| Year ended October 31, 2021 |
Year ended October 31, 2020 |
Year ended October 31, 2019 |
Year ended October 31, 2018 |
Year ended October 31, 2017 |
Period December 1, 2020 through October 31, 2021 |
|||||||||||||||||||
| Net Asset Value, Beginning of Period |
$ | 11.67 | $ | 14.61 | $ | 14.61 | $ | 16.39 | $ | 13.37 | $ | 25.41 | ||||||||||||
|
|
|
|
|
|
|
|
|
|
|
|
|
|||||||||||||
| Income from Investment Operations (a) |
||||||||||||||||||||||||
| Net Investment Income (Loss) |
0.78 | 0.30 | 0.51 | 0.47 | 0.45 | 0.62 | ||||||||||||||||||
| Net Gains (Losses) on Securities (Realized and Unrealized) |
22.06 | (2.88 | ) | (0.01 | ) | (1.79 | ) | 3.00 | 1.75 | * | ||||||||||||||
|
|
|
|
|
|
|
|
|
|
|
|
|
|||||||||||||
| Total from Investment Operations |
22.84 | (2.58 | ) | 0.50 | (1.32 | ) | 3.45 | 2.37 | ||||||||||||||||
| Less Distributions: |
||||||||||||||||||||||||
| Net Investment Income |
(0.75 | ) | (0.36 | ) | (0.50 | ) | (0.46 | ) | (0.43 | ) | (0.30 | ) | ||||||||||||
|
|
|
|
|
|
|
|
|
|
|
|
|
|||||||||||||
| Total Distributions |
(0.75 | ) | (0.36 | ) | (0.50 | ) | (0.46 | ) | (0.43 | ) | (0.30 | ) | ||||||||||||
| Net Asset Value, End of Period |
$ | 33.76 | $ | 11.67 | $ | 14.61 | $ | 14.61 | $ | 16.39 | $ | 27.48 | ||||||||||||
| Total Return at NAV (b)(c) |
48.18 | % | (17.77 | )% | 3.52 | % | (8.27 | )% | 26.13 | % | 9.33 | % | ||||||||||||
| Total Return at Market (c)(d) |
48.68 | % | — | — | — | — | 9.57 | % | ||||||||||||||||
| Net Assets, End of Year (thousands) |
$ | 3,616,969 | $ | 2,392,708 | $ | 3,821,142 | $ | 3,668,647 | $ | 3,918,069 | $ | 395,729 | ||||||||||||
| Ratio of Expenses to Average Net Assets (e) |
0.48 | % | 0.52 | % | 0.54 | % | 0.53 | % | 0.53 | % | 0.35 | % | ||||||||||||
| Ratio of Expenses to Average Net Assets (Excluding Fees (Waived), (Expenses Reimbursed), (Previously Waived Fees Recovered by Advisor) and/or (Fees Paid Indirectly) (e) |
0.48 | % | 0.52 | % | 0.55 | % | 0.53 | % | 0.53 | % | 0.35 | % | ||||||||||||
| Ratio of Net Investment Income to Average Net Assets (e) |
3.34 | % | 2.34 | % | 3.58 | % | 2.89 | % | 3.01 | % | 2.40 | % | ||||||||||||
| Portfolio Turnover Rate (c)(f) |
14.00 | % | 16.00 | % | 17.00 | % | 21.00 | % | 16.00 | % | 4.00 | % | ||||||||||||
See page 3 for the Definitions of Abbreviations and Footnotes
| * | Realized and unrealized gains per share are balancing amounts necessary to reconcile the change in net asset value per share for the period, and may not accord with the aggregate gains and losses in the Statements of Operations due to share transactions for the period. |
See accompanying Notes to Financial Statements.
64
DIMENSIONAL ETF TRUST
FINANCIAL HIGHLIGHTS
(for a share outstanding throughout each period)
| Dimensional World ex U.S. Core Equity 2 ETF | ||||||||||||||||||||
| Year ended October 31, 2021 |
Year ended October 31, 2020 |
Year ended October 31, 2019 |
Year ended October 31, 2018 |
Year ended October 31, 2017 |
||||||||||||||||
| Net Asset Value, Beginning of Period |
$ | 9.91 | $ | 10.64 | $ | 10.11 | $ | 11.53 | $ | 9.38 | ||||||||||
|
|
|
|
|
|
|
|
|
|
|
|||||||||||
| Income from Investment Operations (a) |
||||||||||||||||||||
| Net Investment Income (Loss) |
0.45 | 0.22 | 0.30 | 0.29 | 0.25 | |||||||||||||||
| Net Gains (Losses) on Securities (Realized and Unrealized) |
16.41 | (0.72 | ) | 0.53 | (1.44 | ) | 2.15 | |||||||||||||
|
|
|
|
|
|
|
|
|
|
|
|||||||||||
| Total from Investment Operations |
16.86 | (0.50 | ) | 0.83 | (1.15 | ) | 2.40 | |||||||||||||
| Less Distributions: |
||||||||||||||||||||
| Net Investment Income |
(0.45 | ) | (0.23 | ) | (0.30 | ) | (0.27 | ) | (0.25 | ) | ||||||||||
|
|
|
|
|
|
|
|
|
|
|
|||||||||||
| Total Distributions |
(0.45 | ) | (0.23 | ) | (0.30 | ) | (0.27 | ) | (0.25 | ) | ||||||||||
| Net Asset Value, End of Period |
$ | 26.32 | $ | 9.91 | $ | 10.64 | $ | 10.11 | $ | 11.53 | ||||||||||
| Total Return at NAV (b)(c) |
35.23 | % | (4.69 | )% | 8.40 | % | (10.19 | )% | 25.86 | % | ||||||||||
| Total Return at Market (c)(d) |
35.23 | % | — | — | — | — | ||||||||||||||
| Net Assets, End of Year (thousands) |
$ | 4,664,404 | $ | 3,194,338 | $ | 3,957,333 | $ | 3,348,703 | $ | 3,368,999 | ||||||||||
| Ratio of Expenses to Average Net Assets (e) |
0.36 | % | 0.36 | % | 0.37 | % | 0.36 | % | 0.39 | % | ||||||||||
| Ratio of Expenses to Average Net Assets (Excluding Fees (Waived), (Expenses Reimbursed), (Previously Waived Fees Recovered by Advisor) and/or (Fees Paid Indirectly) (e) |
0.39 | % | 0.36 | % | 0.38 | % | 0.36 | % | 0.39 | % | ||||||||||
| Ratio of Net Investment Income to Average Net Assets (e) |
2.39 | % | 2.17 | % | 2.95 | % | 2.47 | % | 2.42 | % | ||||||||||
| Portfolio Turnover Rate (c)(f) |
10.00 | % | 8.00 | % | 8.00 | % | 6.00 | % | 4.00 | % | ||||||||||
See page 3 for the Definitions of Abbreviations and Footnotes
See accompanying Notes to Financial Statements.
65
NOTES TO FINANCIAL STATEMENTS
A. ORGANIZATION
The Dimensional ETF Trust (the “Trust”) was organized on June 16, 2020 as a Delaware statutory trust. The Trust is an open-end management investment company, registered under the Investment Company Act of 1940 (the “1940 Act”). As of October 31, 2021, the Trust is comprised of nine operational exchange-traded funds (“ETFs”) and is authorized to issue an unlimited number of shares of beneficial interest (“Shares”) for each fund representing interests in separate portfolios of securities. The accompanying financial statements are those of Dimensional U.S. Equity ETF (“US Equity ETF”), Dimensional US Core Equity Market ETF (“US Core Equity ETF”), Dimensional U.S. Core Equity 2 ETF (“US Core Equity 2 ETF”), Dimensional U.S. Small Cap ETF (“US Small Cap ETF”), Dimensional U.S. Targeted Value ETF (“US Targeted Value ETF”), Dimensional International Core Equity Market ETF (“International Core ETF”), Dimensional International Value ETF (“International Value ETF”), Dimensional Emerging Core Equity Market ETF (“Emerging Markets Core ETF”), and Dimensional World ex U.S. Core Equity 2 ETF (“World ex US Core Equity 2 ETF”) (individually referred to as a “Fund” or collectively as the “Funds”). The assets of each Fund are segregated and a shareholder’s interest is limited to the Fund in which Shares are held. The Funds are an investment company and, accordingly, follow the accounting and reporting guidance under Financial Accounting Standards Board (“FASB”) Accounting Standards Certification (“ASC”) Topic 946, “Financial Services — Investment Companies”.
The Funds identified below as “Acquiring Funds” became series of the Trust as of the date indicated following a reorganization (“Reorganization”), pursuant to Agreements and Plans of Reorganization dated as shown below (each, a “Plan” and collectively, the “Plans”), which resulted in the conversion of corresponding “Target Funds” organized as mutual funds to ETFs. The Acquiring Funds were established as “shell” funds, organized solely in connection with the Reorganization for the purpose of acquiring the assets and liabilities of the corresponding Target Funds and continuing the operations of the Target Funds as ETFs. The Acquiring Funds had no performance history prior to the Reorganization.
| Acquiring Fund |
Target Fund |
Date | ||
| Dimensional U.S. Equity ETF |
Tax-Managed U.S. Equity Portfolio |
June 11, 2021 | ||
| Dimensional U.S. Small Cap ETF |
Tax-Managed U.S. Small Cap Portfolio |
June 11, 2021 | ||
| Dimensional U.S. Targeted Value ETF |
Tax-Managed U.S. Targeted Value Portfolio |
June 11, 2021 | ||
| Dimensional U.S. Core Equity 2 ETF |
TA U.S. Core Equity 2 Portfolio |
June 11, 2021 | ||
| Dimensional International Value ETF |
Tax-Managed DFA International Value Portfolio |
September 10, 2021 | ||
| Dimensional Word ex U.S. Core Equity 2 ETF |
TA World ex U.S. Core Equity Portfolio |
September 10, 2021 |
Each Reorganization was accomplished by a tax-free exchange of shares (with an exception for fractional mutual fund shares) of the Acquiring Fund for shares of the Target Fund of equivalent aggregate net asset value.
Fees and expenses incurred to effect the Reorganizations were borne by the Target Funds. The management fee of each Acquiring Fund is lower than the management fee of its corresponding Target Fund and, therefore, each Acquiring Fund is expected to experience lower overall expenses as compared to its corresponding Target Fund. The Reorganizations did not result in a material change to the Target Funds’ investment portfolios as compared to those of the Acquiring Funds. There are no material differences in accounting policies of the Target Funds as compared to those of the Acquiring Funds.
The Acquiring Funds did not purchase or sell securities following the Reorganizations for purposes of realigning its investment portfolio. Accordingly, the acquisition of the Target Funds did not affect the Acquiring Funds’ portfolio turnover ratios for the period ended October 31, 2021.
The investment objective of US Core Equity ETF, International Core ETF, and Emerging Markets Core ETF is to achieve long-term capital appreciation. The investment objective of US Equity ETF, US Small Cap ETF, US
66
Targeted Value ETF and International Value ETF is to achieve long-term capital appreciation while minimizing federal income taxes on returns. World ex US Core Equity 2 ETF’s and US Core Equity 2 ETF’s investment objective is to achieve long-term capital appreciation while considering federal tax implications of investment decisions. The investment objective is non-fundamental for US Core Equity ETF, International Core ETF, and Emerging Markets Core ETF, which means it may be changed by the Board of Trustees (the “Board”) without shareholder approval. The Funds are diversified exchange-traded funds. Each Fund’s prospectus provides a description of the Fund’s investment objectives, policies, and strategies.
The Board is responsible for establishing the Trust’s policies and for overseeing the management of the Trust. Under the Trust’s organizational documents, its officers and trustees are indemnified against certain liabilities arising out of the performance of their duties to the Trust. In the normal course of business, the Trust enters into contracts that contain a variety of representations and warranties that provide general indemnification. The Trust’s maximum exposure under these arrangements is unknown as this would involve future claims that may be made against the Trust and/or its affiliates that have not yet occurred. However, based on prior experience, the Trust expects the risk of loss to be remote.
B. SIGNIFICANT ACCOUNTING POLICIES
Shares of the Funds are listed and traded on the NYSE Arca, Inc. Market prices for the Shares may be different from their net asset value (“NAV”). The Funds issue and redeem Shares on a continuous basis at NAV only in large blocks of Shares called (“Creation Units”). Currently a Creation Unit is 30,000 Shares for US Small Cap ETF, 40,000 Shares for US Equity ETF, 50,000 Shares for US Targeted Value ETF, International Value ETF, and US Core Equity ETF, and 100,000 Shares for US Core Equity 2 ETF, International Core ETF, and Emerging Markets ETF, and 200,000 Shares for World ex U.S. Core Equity 2 ETF. Creation Units are issued and redeemed principally in-kind. Once created, Shares generally trade in the secondary market at market prices that change throughout the day in amounts less than a Creation Unit. Shares of each Fund may only be purchased or redeemed by certain financial institutions (“Authorized Participants”). An Authorized Participant is either (i) a broker-dealer or other participant in the clearing process through the Continuous Net Settlement System of the National Securities Clearing Corporation or (ii) a DTC participant and, in each case, must have executed a Participant Agreement with the funds’ distributor (the “Distributor”). Most retail investors do not qualify as Authorized Participants nor have the resources to buy and sell whole Creation Units. Therefore, they are unable to purchase or redeem the Shares directly from a Fund.
The following is a summary of significant accounting policies consistently followed by each Fund in the preparation of its financial statements. These policies are in conformity with generally accepted accounting principles in the United States of America (“U.S. GAAP”). The preparation of financial statements in conformity with GAAP requires management to make estimates and assumptions that affect the amounts of assets and liabilities and disclosure of contingent assets and liabilities at the date of the financial statements and the reported amounts of income and expenses for the period. Actual results could differ from those estimates.
1. SECURITY VALUATION
The Funds hold investments at fair value. Fair value is defined as the price that would be expected to be received to sell an asset or paid to transfer a liability in an orderly transaction between market participants at the measurement date. The valuation techniques used to determine fair value are further described below.
Security values are ordinarily obtained through the use of independent pricing services in accordance with procedures adopted by the Board. Pursuant to these procedures, the Funds may use a pricing service, bank, or broker-dealer experienced in such matters to value the Funds’ securities. When reliable market quotations are not readily available for any security, the fair value of that security will be determined by a committee established by the Advisor, with input from certain third-party pricing services and others, in accordance with procedures adopted by the Board. The fair valuation process is designed to value the subject security at the price the Funds would reasonably expect to receive upon its current sale. Additional consideration is given to securities that have experienced a decrease in the volume or level of activity or to circumstances that indicate that a transaction is not orderly.
67
The Trust has a three-tier fair value hierarchy that is dependent upon the various “inputs” used to determine the value of the Funds’ investments. The valuation techniques described below maximize the use of observable inputs and minimize the use of unobservable inputs in determining fair value. These inputs are summarized in the three broad levels listed below:
| • | Level 1 – Inputs are quoted prices in active markets for identical assets. |
| • | Level 2 – Other observable pricing inputs at the measurement date (including quoted prices for similar securities, interest rates, prepayment speeds, credit risk, etc.). |
| • | Level 3 – Significant unobservable pricing inputs at the measurement date (including the Fund’s own assumptions in determining the fair value of investments). |
The inputs or methodology used for valuing investments are not necessarily an indication of the risk associated with investing in those investments.
Rights and warrants are valued at the last sales price on a national securities exchange. If these instruments are not scheduled to trade for a certain period they are generally valued intrinsically based on the terms of the issuance and the price of the underlying security. These instruments are typically categorized as Level 1 in the fair value hierarchy unless intrinsic value is used then would be categorized as Level 2 in the fair value hierarchy.
Equity securities traded on a securities exchange are valued at the last reported sales price on the principal exchange. Equity securities quoted by NASDAQ are valued at the NASDAQ official closing price. If there is no reported sale on the principal exchange or official closing price of the day, and in the case of over-the-counter securities, the Funds value the securities at the mean between the most recent quoted bid and asked prices. In each of these situations, securities are typically categorized as Level 1 and Level 2, respectively in the fair value hierarchy.
With respect to the World ex U.S. Core Equity 2 ETF, International Core ETF, International Value ETF and Emerging Markets ETF (the “International Funds”), the prices of securities traded in foreign currencies will be expressed in U.S. dollars by using the mid-rate prices for the U.S. dollar as quoted by generally recognized reliable sources at 4 p.m. London time. Because the International Funds own securities that are primarily listed on foreign exchanges which may trade on days when the International Funds do not price their shares, the NAVs of the International Funds may change on days when shareholders will not be able to purchase or redeem shares.
Derivative Instruments: Forward currency contracts are valued using the sum of the spot rate, the available forward point quotation nearest and prior to settlement date, and the linear interpolation of the available forward point quotations nearest to, before and after the settlement date. Futures contracts are valued using the settlement price established each day on the exchange on which they are traded. The value of such futures contracts held by the Fund is determined each day as of such exchange close. Swap agreements will be valued at the price provided by an independent third-party pricing service or source. If a price is not available from an independent third-party pricing service or source, the swap agreement will be valued in good faith at fair value in accordance with procedures adopted by the Board.
Securities for which no market quotations are readily available (including restricted securities), or for which market quotations have become unreliable, are valued in good faith at fair value in accordance with procedures adopted by the Board. Fair value pricing may also be used if events that have a significant effect on the value of an investment (as determined in the discretion of the Advisor) occur before the NAV is calculated. When fair value pricing is used, the prices of securities used by the Funds may differ from the quoted or published prices for the same securities on their primary markets or exchanges. These securities are typically categorized as Level 2 or Level 3 in the fair value hierarchy.
2. SECURITY TRANSACTIONS AND RELATED INCOME
Investment transactions are accounted for no later than the first calculation of the NAV on the business day following the trade date. For financial reporting purposes, however, security transactions are accounted for on the trade date on the last business day of the reporting period. Securities gains and losses are calculated on the identified cost basis. Interest income and expenses are accrued daily. Dividends, less foreign tax withholding, if
68
any, are recorded on the ex-dividend date. Investment income from non-U.S. sources received by a Fund is generally subject to non-U.S. withholding taxes at rates ranging up to 30%. Such withholding taxes may be reduced or eliminated under the terms of applicable U.S. income tax treaties. Emerging Markets Core ETF is subject to tax on short-term and long-term capital gains for investments in India, the Cayman Islands, and Thailand. International Value ETF is subject to tax on short-term and long-term capital gains for investments in the Cayman Islands. World ex U.S. Core Equity 2 ETF is subject to tax on short-term and long-term capital gains for investments in India, the Cayman Islands, and Great Britain. Such taxes are accrued on a daily basis and due upon sale of individual securities.
3. FOREIGN CURRENCY TRANSLATIONS
The accounting records of the Funds are maintained in U.S. dollars. Investment securities and other assets and liabilities of a Fund denominated in a foreign currency are translated into U.S. dollars at current exchange rates. Purchases and sales of securities, income receipts and expense payments are translated into U.S. dollars at the exchange rates on the date of the transactions. The Funds do not isolate the portion of the results of operations resulting from changes in foreign exchange rates on investments from fluctuations arising from changes in market prices of securities held. Such fluctuations are disclosed as net change in unrealized appreciation/depreciation on investments and foreign currency translations on the Statements of Operations. Any realized gains or losses from these fluctuations are disclosed as net realized gains or losses from investment transactions and foreign currency translations on the Statements of Operations.
4. RESTRICTED SECURITIES
A restricted security is a security that cannot be offered for public sale without prior registration under the Securities Act of 1933 (the “1933 Act”) (absent an exemption). Whether a restricted security is illiquid is determined pursuant to the applicable provisions of the Funds’ liquidity risk management program. Not all restricted securities are considered illiquid.
5. DIVIDENDS AND DISTRIBUTIONS TO SHAREHOLDERS
Distributions are recorded on the ex-dividend date. The Funds intend to distribute to its shareholders net investment income, if any, at least quarterly and net realized capital gains, if any, at least annually. The amount of dividends from net investment income and net realized gains is determined in accordance with federal income tax regulations, which may differ from GAAP.
C. DERIVATIVE INSTRUMENTS
All open derivative positions at period end are reflected on each Fund’s Summary Schedule of Portfolio Holdings. The following is a description of the derivative instruments utilized by the Funds, including the primary underlying risk exposure related to each instrument type.
1. FORWARD CURRENCY CONTRACTS:
The Dimensional International Value ETF and Dimensional World ex U.S. Core Equity 2 ETF may each acquire and sell forward currency contracts to hedge against adverse changes in the relationship of the U.S. dollar to foreign currencies (foreign exchange rate risk). The decision to hedge a Portfolio’s currency exposure with respect to a foreign market will be based primarily on the Portfolio’s existing exposure to a given foreign currency. Each contract is valued daily and the change in value is recorded by a Portfolio as an unrealized gain or loss, which is presented in the Portfolio’s Statement of Operations as the change in unrealized appreciation or depreciation of forward currency contracts. When the contract is closed or offset with the same counterparty, a Portfolio records a realized gain or loss equal to the change in the value of the contract when it was opened and the value at the time it was closed or offset. This is presented in the Statements of Operations as a net realized gain or loss on forward currency contracts. Risks may arise upon entering into these contracts from the potential inability of counterparties to meet the terms of their contracts and from unanticipated movements in the value of foreign currency relative to the U.S. dollar. As of October 31, 2021, there were no forward currency contracts outstanding. During the year ended October 31, 2021, the Funds had limited activity in forward currency contracts.
69
2. FUTURES CONTRACTS:
Each Fund may enter into futures and options on futures contracts for equity securities and indices to adjust market exposure based on actual or expected cash inflows to or outflows from the Fund. Upon entering into futures contracts, the Funds are required to pledge to the broker an amount of cash and/or other assets equal to a certain percentage of the contract amount (initial margin deposit). Subsequent payments, known as “variation margin”, are made or received each day, depending on the daily fluctuations in the fair value of the underlying security. The Funds recognize an unrealized gain or loss equal to the daily variation margin. Should market conditions move unexpectedly, the Funds may not achieve the anticipated benefits of the futures contracts and may realize a loss. Futures contracts involve, to varying degrees, elements of market risk (generally equity price risk related to stock futures, interest rate risk related to bond futures, and foreign currency risk related to currency futures) and exposure to loss in excess of the amounts reflected on the Statements of Assets and Liabilities as variation margin. The primary risks associated with the use of futures contracts are the imperfect correlation between the change in market value of the securities held by the Funds and the prices of futures contracts, the possibility of an illiquid market, and the possibility that the Fund could lose more than the initial margin requirements. The Funds entering into stock index futures are subject to equity price risk from those futures contracts. Counterparty credit risk related to exchange-traded futures is minimal because the exchange’s clearinghouse, as counterparty to all exchange-traded futures, guarantees the futures against default. The gross notional amount of futures contracts outstanding as of October 31, 2021, and the monthly average notional amount for these contracts for the period ended October 31, 2021 were as follows:
| Outstanding Notional Amount |
Monthly Average Notional Amount |
|||||||||||||||
| Futures Contracts: | Long | Short | Long | Short | ||||||||||||
| Dimensional International Value ETF |
— | — | $ | 27,178 | (a) | — | ||||||||||
| Dimensional World ex U.S. Core Equity 2 ETF |
— | — | 41,550 | (a) | — | |||||||||||
| (a) | For the period of November 2020 through August 2021 |
As of October 31, 2021, there were no futures contracts outstanding.
Summary of Derivative Instruments:
The following is a summary of the effect of derivative instruments on the Statement of Operations, categorized by risk exposure, as of October 31, 2021 (amounts in thousands):
| Fund |
Net Realized Gains/(Losses) from: Futures Contracts |
|||
| Equity Rate Risk Exposure: |
||||
| Dimensional U.S. Equity ETF |
$ | 5 | ||
| Dimensional U.S. Small Cap ETF |
(207 | ) | ||
| Dimensional U.S. Targeted Value ETF |
201 | |||
| Dimensional International Value ETF |
8,790 | |||
| Dimensional World ex U.S. Core Equity 2 ETF |
1,587 | |||
Currency Rate Risk Exposure:
The Funds had limited activity in forward foreign currency contracts during the year ended October 31, 2021, and no such contracts were outstanding as of October 31, 2021. Net realized and changes in unrealized gain or loss on such contracts were minimal during the year ended October 31, 2021, and are included in Net Realized Gain/Loss from Forward Currency Transactions and Change in Unrealized Appreciation (Depreciation) on Translation of Foreign Currency-Denominated Amounts, respectively, on the accompanying Statements of Operations.
70
D. INVESTMENT ADVISORY AND OTHER CONTRACTUAL SERVICES:
1. INVESTMENT ADVISORY FEES
Dimensional Fund Advisors LP (the “Advisor”), serves as the investment advisor to the Funds pursuant to an investment management agreement. Subject at all times to the oversight and approval of the Board, the Advisor is responsible for the overall management of the Funds. Dimensional Fund Advisors Ltd. and DFA Australia Limited serve as Sub-Advisors for International Core ETF, Emerging Markets Core ETF, International Value ETF, and World ex US Core Equity 2 ETF.
For the period ended October 31, 2021, the Funds’ investment management fee was accrued daily and paid monthly to the Advisor based on the following effective annual rate of average daily net assets:
| Fund |
Management Fee | |||
| US Equity ETF* |
0.14 | % | ||
| US Core Equity ETF |
0.12 | % | ||
| US Core Equity 2 ETF* |
0.18 | % | ||
| US Small Cap ETF* |
0.36 | % | ||
| US Targeted Value ETF* |
0.36 | % | ||
| International Core ETF |
0.18 | % | ||
| International Value ETF* |
0.43 | % | ||
| Emerging Markets Core ETF |
0.35 | % | ||
| World ex US Core Equity 2 ETF* |
0.29 | % | ||
|
|
|
|||
| * | The Management Fees listed above are a blended rate of the Pre-Reorganization and Current rates listed below: |
| Fund |
Pre-Reorganization | Current | ||||||
| US Equity ETF |
0.18 | % | 0.08 | % | ||||
| US Core Equity 2 ETF |
0.20 | % | 0.16 | % | ||||
| US Small Cap ETF |
0.40 | % | 0.30 | % | ||||
| US Targeted Value ETF |
0.40 | % | 0.30 | % | ||||
| International Value ETF |
0.45 | % | 0.30 | % | ||||
| World ex US Core Equity 2 ETF |
0.30 | % | 0.25 | % | ||||
Pursuant to a Fee Waiver and Expense Assumption Agreement (the “Fee Waiver Agreement”), the Advisor has contractually agreed to waive certain fees, and in certain instances, assume certain expenses of the US Equity ETF, US Core Equity 2 ETF and World ex US Core Equity 2 ETF, as described in the notes below. The Fee Waiver Agreement will remain in effect through February 28, 2022, may only be terminated by the Fund’s Board of Trustees prior to that date and shall continue in effect from year to year thereafter unless terminated by the Trust or the Advisor. During the year ended October 31, 2021, the Funds had expense limits based on a percentage of average net assets on an annualized basis, as listed below. The net amount of waived fees/expenses assumed during the year ended October 31, 2021 are also reflected below (amounts in thousands). At any time that the ETF Fund Expenses (defined below) of a Fund are less than the applicable Expense Limitation Amount listed below, the Advisor retains the right to recover fees previously waived and/or expenses previously assumed to the extent that the expense ratio following such recovery would be less than the Expense Limitation Amount that was in place when such prior year fees were waived and/or expenses assumed, and less than the current Expense Limitation Amount in place for the Fund. The Trust, on behalf of a Fund, is also not obligated to reimburse the Advisor for fees previously waived or expenses previously assumed by the Advisor more than thirty-six months before the date of recovery.
71
| Expense Limitation Amount |
Waived Fees/ Expense Assumed |
Recovery of Previously Waived Fees/Expenses Assumed |
Previously Waived Fees/ Expenses Assumed Subject to Future Recovery |
|||||||||||||
| US Equity ETF (1) |
0.22 | % | $ | 0 | $ | 177 | $ | 0 | ||||||||
| US Core Equity 2 ETF (2) |
0.30 | % | 0 | 0 | 0 | |||||||||||
| World ex US Core Equity 2 ETF (3) |
0.39 | % | 99 | 0 | 0 | |||||||||||
| (1) | The Advisor has contractually agreed to waive its management fee and assume the ordinary operating expenses of the Fund (excluding the expenses that the Fund incurs indirectly through its investment in other investment companies) (“ETF Fund Expenses”) to the extent necessary to limit the ETF Fund Expenses of the Fund, on an annualized basis, to the rate listed above as percentage of average net assets (the “Expense Limitation Amount”). |
| (2) | The Advisor has contractually agreed to waive all or a portion of its management fee and assume the ordinary operating expenses of the Fund (excluding the expenses that the Fund incurs indirectly through its investment in other investment companies) (“ETF Fund Expenses”) to the extent necessary to limit the ETF Fund Expenses of the Fund, on an annualized basis, to the rate listed above as percentage of average net assets (the “Expense Limitation Amount”). |
| (3) | The Advisor has contractually agreed to waive all or a portion of its management fee and to assume the expenses of the Fund (including the expenses that the Fund bears as a shareholder of other funds managed by the Advisor but excluding the expenses that the Fund incurs indirectly through investment of its securities lending cash collateral in The DFA Short Term Investment Fund and its investment in unaffiliated investment companies) (“ETF Fund Expenses”) to the extent necessary to limit the ETF Fund Expenses of the Fund, on an annualized basis, to the rate listed above as percentage of average net assets (the “Expense Limitation Amount”). |
US Core Equity ETF, International Core ETF, and Emerging Markets Core ETF (each, a “Unitary Fee Fund” and together, the “Unitary Fee Funds”) pay the Advisor a unitary management fee for managing the Funds’ assets. Pursuant to the investment management agreement with the Trust, on behalf of each Unitary Fee Fund, the Advisor is responsible for substantially all ordinary fund operating expenses, except for (i) the fee paid under the investment management agreement; (ii) payments under the Fund’s 12b-1 plan (if any); (iii) brokerage expenses (including any costs incidental to transactions in portfolio securities, instruments and other investments); (iv) taxes; (v) interest expenses (including borrowing costs and dividend expenses on securities sold short and overdraft charges); (vi) litigation expenses (including litigation to which the Trust or Fund may be a party and indemnification of the Trustees and officers with respect thereto); (vii) Trustees’ fees and expenses; (viii) legal expenses of counsel to the Independent Trustees; (ix) Chief Compliance Officer (“CCO”) compensation; (x) acquired fund fees and expenses (if any); and (xi) other non-routine or extraordinary expenses.
For the Unitary Fee Funds, pursuant to a separate contractual arrangement, the Advisor arranges for the provision of CCO services with respect to each Fund, and is liable and responsible for, and administers, payments to the CCO, the Independent Trustees and counsel to the Independent Trustees. The Advisor receives a fee of up to 0.0044% of each Fund’s average daily net assets for providing such services and paying such expenses. The Advisor provides CCO services to the Trust.
2. EARNED INCOME CREDIT
Additionally, certain Portfolios have entered into arrangements with their custodian whereby net interest earned on uninvested cash balances was used to reduce a portion of each Portfolios custody expenses. Custody expense in the accompanying financial statements is presented before reduction for credits. The impact of such credits is generally less than one basis point of each Portfolio’s net assets. During the year ended October 31, 2021, expenses reduced were as follows (amounts in thousands):
| Fees Paid Indirectly |
||||
| US Equity ETF |
$ | 2 | ||
| US Core Equity 2 ETF |
5 | |||
| US Small Cap ETF |
3 | |||
| US Targeted Value ETF |
3 | |||
| International Value ETF |
13 | |||
| World ex US Core Equity 2 ETF |
6 | |||
72
3. ADMINISTRATION, ACCOUNTING, TRANSFER AGENT, AND CUSTODIAN FEES
Citi Fund Services Ohio, Inc. serves as the Funds’ Administrator and Fund Accountant pursuant to a Services Agreement with the Trust. Citibank, N.A. serves as the Funds’ Custodian and Transfer Agent pursuant to a Global Custodial and Agency Services Agreement with the Trust. American Stock Transfer & Trust Company, LLC serves as stock transfer agent for the Acquiring Funds listed above. Prior to the Reorganizations, State Street Bank and Trust Company provided accounting and administration services, dividend disbursing, and transfer agent services for the Target Funds.
4. DISTRIBUTION AND SHAREHOLDER SERVICES FEES
DFA Securities, LLC, a wholly-owned subsidiary of the Advisor, is the principal underwriter and distributor for the Funds’ Shares. The Distributor does not maintain any secondary market in the Funds’ shares. With respect to the Unitary Fee Funds, the Trust has adopted a Rule 12b-1 Distribution and Service Plan (the “Distribution and Service Plan”) pursuant to which payments of up to 0.25% of average daily net assets may be made to compensate or reimburse financial intermediaries for activities principally intended to result in the sale of Fund shares. In accordance with the Distribution and Service Plan, the Distributor may enter into agreements with financial intermediaries and dealers relating to distribution and/or marketing services with respect to the Funds.
No payments from the Funds are currently planned under the Distribution and Service Plan. The Advisor and its affiliates may, out of their own resources, pay amounts to third parties for distribution or marketing services on behalf of the Funds.
5. FEES PAID TO OFFICERS AND DIRECTORS/TRUSTEES
Certain Officers and Trustees of the Advisor are also Officers and Trustees of the Trust; however, such Officers and Trustees (with the exception of the CCO, with respect to the Funds, except the Unitary Fee Funds) receive no compensation from the Trust. For the year ended October 31, 2021, the total related amounts paid by the Trust to the CCO was $187,472 (in thousands). The total related amounts paid by each of the Funds are included in Other Expenses on the Statements of Operations.
E. FEDERAL INCOME TAXES
Each Fund has qualified and intends to continue to qualify as a regulated investment company under Subchapter M of the Internal Revenue Code for federal income tax purposes and to distribute substantially all of its taxable income and net capital gains to its shareholders. Accordingly, no provision has been made for federal income taxes.
Distributions from net investment income and net realized capital gains are determined in accordance with U.S. federal income tax regulations, which may differ from those amounts determined under accounting principles generally accepted in the United States of America. These book/tax differences are either temporary or permanent in nature. To the extent that these differences are permanent, they are charged or credited to paid-in capital or distributable earnings, undistributed net investment income or accumulated net realized gains or losses, as appropriate, in the period that the differences arise. Accordingly, the permanent differences as of October 31, 2021 can occur as a result of realized gains on securities considered to be “passive foreign investment companies,” non-deductible expenses, net foreign currency gains/losses, the use of accumulated earnings and profits distributed to shareholders on redemptions of shares as part of the dividends paid deduction for income tax purposes, and were reclassified to the accounts mentioned above. These reclassifications had no effect on net assets or net asset value per share.
73
The tax character of dividends and distributions declared and paid during the year ended October 31, 2020 and October 31, 2021, were as follows (amounts in thousands):
| Net Investment Income and Short-Term Capital Gains |
Long-Term Capital Gains |
Tax Exempt Income |
Total | |||||||||||||
| US Equity ETF |
||||||||||||||||
| 2020 |
$ | 64,573 | — | — | $ | 64,573 | ||||||||||
| 2021 |
$ | 63,460 | — | — | $ | 63,460 | ||||||||||
| US Core Equity ETF |
||||||||||||||||
| 2021 |
$ | 6,738 | — | — | $ | 6,738 | ||||||||||
| US Core Equity 2 ETF |
||||||||||||||||
| 2020 |
$ | 142,077 | $ | 180,449 | — | $ | 322,526 | |||||||||
| 2021 |
$ | 138,569 | — | — | $ | 138,569 | ||||||||||
| US Small Cap ETF |
||||||||||||||||
| 2020 |
$ | 27,794 | $ | 52,632 | — | $ | 80,426 | |||||||||
| 2021 |
$ | 31,370 | — | — | $ | 31,370 | ||||||||||
| US Targeted Value ETF |
||||||||||||||||
| 2020 |
$ | 59,992 | $ | 89,816 | — | $ | 149,808 | |||||||||
| 2021 |
$ | 69,616 | — | — | $ | 69,616 | ||||||||||
| International Core ETF |
||||||||||||||||
| 2021 |
$ | 6,749 | — | — | $ | 6,749 | ||||||||||
| International Value ETF |
||||||||||||||||
| 2020 |
$ | 80,394 | — | — | $ | 80,394 | ||||||||||
| 2021 |
$ | 81,899 | — | — | $ | 81,899 | ||||||||||
| Emerging Markets Core ETF |
||||||||||||||||
| 2021 |
$ | 3,526 | — | — | $ | 3,526 | ||||||||||
| World ex US Core Equity 2 ETF |
||||||||||||||||
| 2020 |
$ | 9,362 | $ | 4,663 | — | $ | 14,025 | |||||||||
| 2021 |
$ | 79,477 | — | — | $ | 79,477 | ||||||||||
As of October 31, 2021, the following net investment income and short-term capital gains and long-term capital gains distributions designated for federal income tax purposes are due to the use of accumulated earnings and profits distributed to shareholders upon redemption of shares (amounts in thousands):
| Net Investment Income and Short-Term Capital Gains |
Long-Term Capital Gains |
Total | ||||||||||
| US Equity ETF |
$ | (301 | ) | — | $ | (301 | ) | |||||
| US Core Equity ETF |
— | — | — | |||||||||
| US Core Equity 2 ETF |
$ | (859 | ) | — | $ | (859 | ) | |||||
| US Small Cap ETF |
$ | (3,770 | ) | $ | (430 | ) | $ | (4,200 | ) | |||
| US Targeted Value ETF |
$ | (685 | ) | — | $ | (685 | ) | |||||
| International Core ETF |
— | — | — | |||||||||
| International Value ETF |
$ | (2,039 | ) | — | $ | (2,039 | ) | |||||
| Emerging Markets Core ETF |
— | — | — | |||||||||
| World ex US Core Equity 2 ETF |
$ | (1,834 | ) | — | $ | (1,834 | ) | |||||
74
As of October 31, 2021, the components of distributable earnings (accumulated losses) were as follows (amounts in thousands):
| Undistributed Net Investment Income and Short- Term Capital Gains |
Undistributed Long-Term Capital Gains |
Capital Loss Carryforwards |
Unrealized Appreciation (Depreciation) |
Total Net Distributable Earnings (Accumulated Losses) |
||||||||||||||||
| US Equity ETF |
$ | 8,781 | — | $ | (23,136 | ) | $ | 4,253,827 | $ | 4,239,472 | ||||||||||
| US Core Equity ETF |
$ | 1,980 | — | $ | (1,271 | ) | $ | 148,602 | $ | 149,311 | ||||||||||
| US Core Equity 2 ETF |
$ | 20,629 | — | $ | (16,671 | ) | $ | 8,661,285 | $ | 8,665,243 | ||||||||||
| US Small Cap ETF |
$ | 2,564 | $ | 94,306 | — | $ | 2,415,098 | $ | 2,511,968 | |||||||||||
| US Targeted Value ETF |
$ | 11,286 | $ | 4,625 | — | $ | 3,299,215 | $ | 3,315,126 | |||||||||||
| International Core ETF |
$ | 3,096 | — | $ | (797 | ) | $ | 31,060 | $ | 33,359 | ||||||||||
| International Value ETF |
$ | 35,559 | — | $ | (420,549 | ) | $ | 687,636 | $ | 302,646 | ||||||||||
| Emerging Markets Core ETF |
$ | 1,448 | — | $ | (627 | ) | $ | (8,260 | ) | $ | (7,439 | ) | ||||||||
| World ex US Core Equity 2 ETF |
$ | 27,100 | — | $ | (77,255 | ) | $ | 1,198,469 | $ | 1,148,314 | ||||||||||
For federal income tax purposes, the Fund measures its capital loss carryforwards annually at October 31, its fiscal year end. Capital loss carryforwards may be carried forward and applied against future capital gains. As of October 31, 2021, the Funds had the following capital loss carryforwards available to offset future realized capital gains with no expiration date (amounts in thousands):
| Unlimited | Total | |||||||
| US Equity ETF |
$ | 23,136 | $ | 23,136 | ||||
| US Core Equity ETF |
$ | 1,271 | $ | 1,271 | ||||
| US Core Equity 2 ETF |
$ | 16,671 | $ | 16,671 | ||||
| US Small Cap ETF |
— | — | ||||||
| US Targeted Value ETF |
— | — | ||||||
| International Core ETF |
$ | 797 | $ | 797 | ||||
| International Value ETF |
$ | 420,549 | $ | 420,549 | ||||
| Emerging Markets Core ETF |
$ | 627 | $ | 627 | ||||
| World ex US Core Equity 2 ETF |
$ | 77,255 | $ | 77,255 | ||||
During the year ended October 31, 2021, the following Funds used the following capital loss carryforwards to offset realized capital gains for federal income tax purposes (amounts in thousands):
| US Equity ETF |
$ | 3,320 | ||
| US Core Equity 2 ETF |
18,666 | |||
| US Small Cap ETF |
77,310 | |||
| US Targeted Value ETF |
115,716 | |||
| International Value ETF |
147,125 | |||
| World ex US Core Equity 2 ETF |
92,101 |
As of October 31, 2021, the total cost and aggregate gross unrealized appreciation (depreciation) of securities for federal income tax purposes were different from amounts reported for financial reporting purposes, as follows (amounts in thousands):
| Tax Cost of Securities |
Unrealized Appreciation |
Unrealized Depreciation |
Net Unrealized Appreciation/ (Depreciation) |
|||||||||||||
| US Equity ETF |
$ | 1,835,407 | $ | 4,277,625 | $ | (23,798 | ) | $ | 4,253,827 | |||||||
| US Core Equity ETF |
$ | 1,194,139 | $ | 178,649 | $ | (30,046 | ) | $ | 148,603 | |||||||
| US Core Equity 2 ETF |
$ | 5,972,700 | $ | 8,838,225 | $ | (176,940 | ) | $ | 8,661,285 | |||||||
75
| Tax Cost of Securities |
Unrealized Appreciation |
Unrealized Depreciation |
Net Unrealized Appreciation/ (Depreciation) |
|||||||||||||
| US Small Cap ETF |
$ | 1,988,830 | $ | 2,440,540 | $ | (25,440 | ) | $ | 2,415,100 | |||||||
| US Targeted Value ETF |
$ | 3,250,013 | $ | 3,317,134 | $ | (17,919 | ) | $ | 3,299,215 | |||||||
| International Core ETF |
$ | 744,532 | $ | 59,944 | $ | (28,861 | ) | $ | 31,083 | |||||||
| International Value ETF |
$ | 2,979,742 | $ | 852,375 | $ | (164,602 | ) | $ | 687,773 | |||||||
| Emerging Markets Core ETF |
$ | 404,233 | $ | 31,786 | $ | (39,146 | ) | $ | (7,360 | ) | ||||||
| World ex US Core Equity 2 ETF |
$ | 3,537,848 | $ | 1,517,218 | $ | (318,602 | ) | $ | 1,198,616 | |||||||
The difference between GAAP-basis and tax-basis unrealized gains (losses) can occur as a result of wash sales, net mark to market gains (losses) on regulated futures contracts, net mark-to-market gain/loss on foreign currency contracts, and differences in the tax treatment of passive foreign investment company investments.
ASC 740 Accounting for Uncertainty in Income Taxes sets forth a minimum threshold for financial statement recognition of the benefit of a tax position taken or expected to be taken in a tax return. Management has analyzed the Portfolios’ tax positions and has concluded that no additional provision for income tax is required in the Funds’ financial statements. The Funds are not aware of any tax positions for which it is more likely than not that the total amounts of unrecognized tax benefits will significantly change in the next twelve months. The Funds’ federal tax returns for the prior three fiscal years remain subject to examination by the Internal Revenue Service.
F. SECURITIES LENDING:
As of October 31, 2021, the Funds had securities on loan to brokers/dealers, for which the Funds received cash collateral. Additionally, the Funds received non-cash collateral consisting of short- and/or long-term U.S. Treasuries and U.S. government agency securities as follows (amounts in thousands):
| Non-Cash Collateral Market Value |
||||
| US Equity ETF |
— | |||
| US Core Equity ETF |
— | |||
| US Core Equity 2 ETF |
— | |||
| US Small Cap ETF |
— | |||
| US Targeted Value ETF |
— | |||
| International Core ETF |
3,635 | |||
| International Value ETF |
5,712 | |||
| Emerging Markets Core ETF |
10,079 | |||
| World ex US Core Equity 2 ETF |
64,421 | |||
Each Fund with securities on loan invests the cash collateral, as described below, and records a liability for the return of the collateral, during the period the securities are on loan. Loans of securities are expected at all times to be secured by collateral in an amount (i) equal to at least 100% of the current market value of the loaned securities with respect to securities of the U.S. government or its agencies, (ii) generally equal to 102% of the current market value of the loaned securities with respect to U.S. securities, and (iii) generally equal to 105% of the current market value of the loaned securities with respect to foreign securities. However, daily market fluctuations could cause the Funds’ collateral to be lower or higher than the expected thresholds. If this were to occur, the collateral would be adjusted the next business day to ensure adequate collateralization. In the event of default or bankruptcy by the other party to the agreement, realization and/or retention of the collateral may be subject to legal proceedings. If the borrower fails to return loaned securities, cash collateral being maintained by the borrower is insufficient to cover the value of loaned securities, and such collateral insufficiency is not the result of investment losses, the lending agent has agreed to pay the amount of the shortfall to the Fund or, at the option of the lending agent, to replace the securities. In the event of the bankruptcy of the borrower, the Fund could experience delay in recovering the loaned securities or only recover cash or a security of equivalent value.
76
Subject to its stated investment policies, a Fund with securities on loan will generally invest the cash collateral received for the loaned securities in The DFA Short Term Investment Fund (the “Money Market Series”), an affiliated registered money market fund advised by the Advisor for which the Advisor receives a management fee of 0.05% of the average daily net assets of the Money Market Series. Income received from the Money Market Series is netted with fees for securities lending and collateral investment expenses and with other payments to and from borrowers of securities. The Funds also may invest the cash collateral received for the loaned securities in securities of the U.S. government or its agencies, repurchase agreements collateralized by securities of the U.S. government or its agencies, and affiliated or unaffiliated money market funds that are registered or unregistered. For purposes of this paragraph, agencies include both agency debentures and agency mortgage-backed securities. Additionally, a Fund will be able to terminate the loan at any time and will receive reasonable interest on the loan, as well as amounts equal to any dividends, interest or, other distributions on the loaned securities. However, dividend income received from loaned securities may not be eligible for taxation at qualified dividend income rates.
The following table reflects a breakdown of transactions accounted for as secured borrowings, the gross obligation by the type of collateral pledged, and the remaining contractual maturity of those transactions as of October 31, 2021 (amounts in thousands):
| Remaining Contractual Maturity of the Agreements | ||||||||||||||||||||
| Overnight and Continuous |
< 30 days | Between 30 & 90 days |
> 90 days | Total | ||||||||||||||||
| US Equity ETF |
||||||||||||||||||||
| Common Stocks |
$ | 56,272 | — | — | — | $ | 56,272 | |||||||||||||
| US Core Equity ETF |
||||||||||||||||||||
| Common Stocks |
15,665 | — | — | — | 15,665 | |||||||||||||||
| US Core Equity 2 ETF |
||||||||||||||||||||
| Common Stocks |
194,434 | — | — | — | 194,434 | |||||||||||||||
| US Small Cap ETF |
||||||||||||||||||||
| Common Stocks |
117,558 | — | — | — | 117,558 | |||||||||||||||
| US Targeted Value ETF |
||||||||||||||||||||
| Common Stocks |
136,562 | — | — | — | 136,562 | |||||||||||||||
| International Core ETF |
||||||||||||||||||||
| Common Stocks, Investment Company |
11,830 | — | — | — | 11,830 | |||||||||||||||
| International Value ETF |
||||||||||||||||||||
| Common Stocks |
82,743 | — | — | — | 82,743 | |||||||||||||||
| Emerging Markets Core ETF |
||||||||||||||||||||
| Common Stocks |
1,745 | — | — | — | 1,745 | |||||||||||||||
| World ex US Core Equity 2 ETF |
||||||||||||||||||||
| Common Stocks |
92,595 | — | — | — | 92,595 | |||||||||||||||
G. AFFILIATED TRADES
Cross trades for the period ended October 31, 2021, if any, were executed by the Funds pursuant to procedures adopted by the Board to ensure compliance with Rule 17a-7 under the 1940 Act. Cross trading is the buying or selling of portfolio securities between series of investment companies, or between a series of an investment company and another entity, that are or could be considered affiliates by virtue of a common investment advisor (or affiliated investment advisors), common Trustees and/or common Officers. At its regularly scheduled meetings, the CCO certifies to the Board that the 17a-7 transactions entered into by the Funds complied with the Rule 17a-7 Procedures adopted by the Board of Trustees of the Trust.
77
For the year ended October 31, 2021, cross trades by the Portfolios under Rule 17a-7 were as follows (amounts in thousands):
| Purchases | Sales | Realized Gain (Loss) | ||||||||||
| US Equity ETF |
$ | 356 | $ | 5,930 | $ | (2,619 | ) | |||||
| US Core Equity 2 ETF |
6,496 | 1,313 | 853 | |||||||||
| US Small Cap ETF |
38,412 | 15,645 | 2,467 | |||||||||
| US Targeted Value ETF |
12,380 | 9,740 | 2,859 | |||||||||
| US International Value ETF |
80,569 | 52,640 | 13,295 | |||||||||
| World ex US Core Equity 2 ETF |
35,554 | 18,824 | (1,965 | ) | ||||||||
H. INVESTMENT TRANSACTIONS:
Purchases and sales of investments, excluding in-kind transactions and short-term investments, for the period ended October 31, 2021 were as follows (amounts in thousands):
| Purchases | Sales | |||||||
| US Equity ETF |
$ | 69,492 | $ | 63,386 | ||||
| US Core Equity ETF |
23,878 | 20,817 | ||||||
| US Core Equity 2 ETF |
357,665 | 221,764 | ||||||
| US Small Cap ETF |
426,324 | 564,479 | ||||||
| US Targeted Value ETF |
328,489 | 535,269 | ||||||
| International Core ETF |
39,853 | 15,863 | ||||||
| International Value ETF |
583,663 | 444,824 | ||||||
| Emerging Markets Core ETF |
332,928 | 9,325 | ||||||
| World ex US Core Equity 2 ETF |
794,665 | 440,576 | ||||||
In-kind transactions for the period ended October 31, 2021 were as follows (amounts in thousands):
| Purchases | Sales | |||||||
| US Equity ETF |
$ | 85,043 | $ | 1,918 | ||||
| US Core Equity ETF |
1,237,370 | 38,341 | ||||||
| US Core Equity 2 ETF |
595,697 | 56,573 | ||||||
| US Small Cap ETF |
208,634 | 10,541 | ||||||
| US Targeted Value ETF |
373,743 | 22,771 | ||||||
| International Core ETF |
710,851 | — | ||||||
| International Value ETF |
46,703 | — | ||||||
| Emerging Markets Core ETF |
81,228 | — | ||||||
| World ex US Core Equity 2 ETF |
84,842 | — | ||||||
There were no purchases or sales of U.S. government securities during the period ended October 31, 2021.
I. CAPITAL SHARES TRANSACTIONS:
Shares are issued and redeemed by each Fund only in aggregations of a specified number of shares or multiples thereof at net asset value. Except when aggregated in Creation Units, shares of each Fund are not redeemable. Transactions in shares for each Fund are disclosed in detail on the Statement of Changes in Net Assets.
The consideration for the purchase of Creation Units of a Fund generally consists of the in-kind deposit of a designated basket of securities, which constitutes an optimized representation of the securities of that Fund’s specified universe, and an amount of cash. Investors purchasing and redeeming Creation Units may be charged a transaction fee to cover the transfer and other transactional costs it incurs to issue or redeem Creation Units. The Advisor may increase, decrease or otherwise modify the creation transaction fee to an amount that, in its judgment, is necessary or appropriate to recoup for the Fund the costs it may incur as a result of such purchases, or to otherwise eliminate or reduce so far as practicable any dilution of the value of the Shares.
78
Such transactions fees are treated as increases in capital and are disclosed in the Funds’ Statements of Changes in Net Assets.
From time to time, settlement of securities related to subscriptions-in-kind or redemptions-in-kind may be delayed. In such cases, securities related to in-kind contributions are reflected as “Due from custodian” and securities related to in-kind redemptions are reflected as “Securities payable related to in-kind transactions” on the Statements of Assets and Liabilities.
J. FINANCIAL INSTRUMENTS:
In accordance with the Funds’ investment objectives and policies, the Funds may invest in certain financial instruments that have off-balance sheet risk in excess of the amounts recognized in the financial statements and concentrations of credit and market risk. These instruments and their significant corresponding risks are described below:
Foreign Market Risks: Investments in foreign markets may involve certain considerations and risks not typically associated with investments in the United States of America, including the possibility of future political and economic developments and the level of foreign governmental supervision and regulation of foreign securities markets. These markets are generally smaller, less liquid and more volatile than the major securities markets in the United States of America. Consequently, acquisition and disposition of international securities held by the Funds may be inhibited.
K. LINE OF CREDIT AND INTERFUND LENDING PROGRAM
The Trust, together with other Dimensional-advised portfolios, has entered into a $700 million unsecured line of credit with its custodian bank effective January 2, 2021. A line of credit with similar terms was in effect through January 2, 2021. Each portfolio is permitted to borrow, subject to its investment limitations, up to a maximum of $500 million, as long as total borrowings under the line of credit do not exceed $700 million in the aggregate. Each portfolio is individually, and not jointly, liable for its particular advances under the line of credit. Borrowings under the line of credit are charged interest at rates agreed upon by the parties at the time of borrowing. There is no commitment fee on the unused portion of the line of credit. The line of credit agreement expires on January 1, 2022.
For the year ended October 31, 2021, borrowings by the Funds under the lines of credit were as follows (amounts in thousands, except percentages and days):
| Weighted Average Interest Rate |
Weighted Average Loan Balance |
Number of Days Outstanding |
Interest Expense Incurred |
Maximum Amount Borrowed During the Period |
Outstanding Borrowings as of 10/31/2021 |
|||||||||||||||||||
| US Small Cap ETF |
0.83 | % | $ | 1,063 | 34 | $ | 1 | $ | 1,985 | — | ||||||||||||||
| US Targeted Value ETF |
0.83 | % | 893 | 28 | 1 | 4,912 | — | |||||||||||||||||
| International Value ETF |
0.83 | % | 19 | 3 | — | 27 | — | |||||||||||||||||
| World ex US Core Equity 2 ETF |
0.83 | % | 30 | 3 | — | 47 | — | |||||||||||||||||
Pursuant to an exemptive order issued by the SEC (the “Order”), the Funds may participate in an interfund lending program among certain portfolios managed by the Advisor (portfolios that operate as feeder funds do not participate in the program). The program allows the participating portfolios to borrow money from and loan money to each other for temporary or emergency purposes, subject to the conditions in the Order. A loan can only be made through the program if the interfund loan rate on that day is more favorable to both the borrowing and lending portfolios as compared to rates available through short-term bank loans or investments in overnight repurchase agreements and money market funds, respectively, as detailed in the Order. Further, a portfolio may participate in the program only if and to the extent that such participation is consistent with its investment objectives and limitations. Interfund loans have a maximum duration of seven days and may be called on one business day’s notice.
79
The Funds did not use the interfund lending program during the year ended October 31, 2021.
L. RECENTLY ISSUED ACCOUNTING STANDARDS AND REGULATIONS:
In March 2020, the Financial Accounting Standards Board (FASB) issued Accounting Standards Update (ASU) No. 2020-04, Reference Rate Reform (Topic 848) — Facilitation of the Effects of Reference Rate Reform on Financial Reporting. In January 2021, the FASB issued ASU No. 2021-01, with further amendments to Topic 848. The amendments in the ASUs provide optional temporary accounting recognition and financial reporting relief from the effect of certain types of contract modifications due to the planned discontinuation of the LIBOR and other interbank-offered based reference rates as of the end of 2021 and 2023. The ASUs are effective for certain reference rate-related contract modifications that occur during the period March 12, 2020 through December 31, 2022. Management has reviewed the requirements and believes the adoption of these ASUs will not have a material impact on the Funds’ financial statements.
In October 2020, the SEC adopted new regulations governing the use of derivatives by registered investment companies. Rule 18f-4 (the “Derivatives Rule”) imposes limits on the amount of derivatives contracts the Funds could enter, eliminate the asset segregation framework currently used by the Funds to comply with Section 18 of the 1940 Act, and require funds whose use of derivatives is more than a limited specified exposure to establish and maintain a derivatives risk management program and appoint a derivatives risk manager. The Derivatives Rule became effective February 19, 2021 and the Funds are required to comply on August 19, 2022. Management is currently evaluating the effect, if any, the Derivatives Rule will have on the Funds.
On December 3, 2020, the SEC adopted new Rule 2a-5 (the “Valuation Rule”) under the Investment Company Act of 1940, establishing an updated regulatory framework for fund valuation. The Valuation Rule, in part, provides a framework for good faith fair value determination and permits a Board to designate fair value determinations to a fund’s investment adviser. Further, the SEC is rescinding previously issued guidance on related issues. The Valuation Rule became effective on March 8, 2021, with a compliance date of September 8, 2022. Management is currently evaluating the Valuation Rule and its effect on the Funds.
M. CORONAVIRUS (COVID-19) PANDEMIC:
The ongoing outbreak of the novel coronavirus, COVID-19, has resulted, at times, in market closures, market volatility, liquidity constraints and increased trading costs. Efforts to contain the spread of COVID-19 have resulted in global travel restrictions and disruptions of healthcare systems, business operations and supply chains, layoffs, reduced consumer demand, defaults and credit rating downgrades, and other significant economic impacts. The effects of COVID-19 have impacted global economic activity and may heighten pre-existing political, social and economic risks, domestically or globally. The full impact of the COVID-19 pandemic is unpredictable and may adversely affect a Fund’s performance.
N. OTHER:
The Funds are subject to claims and suits that arise from time to time in the ordinary course of business (for example, ongoing claw back litigation against former shareholders of portfolio companies that filed for bankruptcy, such as The Tribune Company and Nine West)). Although management currently believes that resolving claims against the Funds, individually or in aggregate, will not have a material adverse impact on the Funds’ financial position, results of operations, or cash flows, these matters are subject to inherent uncertainties and management’s view of these matters may change in the future.
On June 3, 2021, President Biden issued an Executive Order titled ”Addressing the Threat from Securities Investments that Finance Certain Companies of the People’s Republic of China” (the “Order”). Effective on August 2, 2021, the Order restricts investment in certain companies identified as “Chinese Military Industrial Complex Companies” (CMICs) by the Office of Foreign Asset Control, an agency of the Department of Treasury and the Department of Defense. As of July 27, 2021, the Funds have divested of all publicly traded securities identified as CMIC’s listed in the Order.
80
As of October 31, 2021, the following number of shareholders held the following approximate percentages of the Funds’ outstanding shares. The following shareholders are omnibus accounts, which typically hold shares for the benefit of several other underlying investors.
| Number of Shareholders |
Approximate Percentage of Outstanding Shares |
|||||||
| US Equity ETF |
2 | 100 | % | |||||
| US Core Equity ETF |
2 | 100 | % | |||||
| US Core Equity 2 ETF |
1 | 100 | % | |||||
| US Small Cap ETF |
1 | 100 | % | |||||
| US Targeted Value ETF |
2 | 100 | % | |||||
| International Core ETF |
1 | 100 | % | |||||
| International Value ETF |
2 | 100 | % | |||||
| Emerging Markets Core ETF |
1 | 100 | % | |||||
| World ex US Core Equity 2 ETF |
1 | 100 | % | |||||
O. SUBSEQUENT EVENTS:
Management has evaluated the impact of all subsequent events on the Funds through the date on which the financial statements were issued and has determined that there are no subsequent events requiring recognition or disclosure in the financial statements.
81
TAX NOTICE TO SHAREHOLDERS
(Unaudited)
The following information is solely for informational purposes. Each Fund is designating the U.S. federal income tax character of the following items with respect to distributions paid or expected to be paid to shareholders related to the fiscal year ended October 31, 2021. All designations are based on financial information available as of the date of this annual report and, accordingly are subject to change. For each classification below and including “Section 163(j) interest dividends” as defined in Treasury Regulation §1.163(j)-1(b)(35) and “Section 199A dividends” as defined in Treasury Regulation §1.199A -3(d), it is the intent of the Fund to designate the maximum amount permitted under the Internal Revenue Code and the regulations thereunder.
For U.S. federal income tax purposes, shareholders generally must report distributions received from a Fund on a calendar-year basis, which therefore may include distributions with respect to portions of two fiscal years of the Fund. Annual statements needed by shareholders concerning the tax status of distributions received for the calendar year 2021 (e.g., IRS Form 1099-DIV) will be provided in early 2022. Shareholders should refer to these statements in preparing their calendar year 2021 tax returns. Please consult your tax advisor for the proper treatment of this information. Unless otherwise noted, the amounts in the table are expressed as a percentage of the distributions paid with respect to the fiscal year ended October 31, 2021.
| Dimensional ETF |
Net Investment Income Distributions |
Short-Term Capital Gain Distributions |
Long-Term Capital Gain Distributions |
Return of Capital |
Tax-Exempt Interest |
Total Distributions |
Qualified Dividends (for Corporate Dividends Received Deduction) (1) |
Qualified Dividend Income (2) |
U.S. Government Interest (3) |
Foreign Tax Credit (4) |
Foreign Source Income (5) |
Qualified Net Interest Income (6) |
Qualified Short- Term Capital Gain (7) |
|||||||||||||||||||||||||||||||||||||||
| US Equity ETF |
100 | % | — | — | — | — | 100 | % | 100 | % | 100 | % | — | — | — | — | — | |||||||||||||||||||||||||||||||||||
| US Core Equity ETF |
100 | % | — | — | — | — | 100 | % | 100 | % | 100 | % | — | — | — | — | — | |||||||||||||||||||||||||||||||||||
| US Core Equity 2 ETF |
100 | % | — | — | — | — | 100 | % | 100 | % | 100 | % | — | — | — | — | — | |||||||||||||||||||||||||||||||||||
| US Small Cap ETF |
100 | % | — | — | — | — | 100 | % | 100 | % | 100 | % | — | — | — | — | — | |||||||||||||||||||||||||||||||||||
| US Targeted Value ETF |
100 | % | — | — | — | — | 100 | % | 100 | % | 100 | % | — | — | — | — | — | |||||||||||||||||||||||||||||||||||
| International Core ETF |
100 | % | — | — | — | — | 100 | % | — | 100 | % | — | 12 | % | 100 | % | — | — | ||||||||||||||||||||||||||||||||||
| International Value ETF |
100 | % | — | — | — | — | 100 | % | — | 100 | % | — | 9 | % | 100 | % | — | — | ||||||||||||||||||||||||||||||||||
| Emerging Markets Core ETF |
100 | % | — | — | — | — | 100 | % | — | 68 | % | — | 7 | % | 100 | % | — | — | ||||||||||||||||||||||||||||||||||
| World ex US Core Equity 2 ETF |
100 | % | — | — | — | — | 100 | % | — | 100 | % | — | 9 | % | 100 | % | — | — | ||||||||||||||||||||||||||||||||||
| (1) | Qualified Dividends represents the amount that qualifies for the corporate dividends-received deduction under Section 243 of the Internal Revenue Code and is reflected as a percentage of estimated ordinary income distributions (the total of short-term capital gain and net investment income distributions) for the calendar year 2021. |
| (2) | Qualified Dividend Income represents the amount that qualifies for the reduced capital gain tax rate under Section 1(h)(11) of the Internal Revenue Code and is reflected as a percentage of estimated ordinary income distributions (the total of short-term capital gain and net investment income distributions) for the calendar year 2021. |
| (3) | U.S. Government Interest represents the amount of interest that was derived from direct U.S. Government obligations and distributed during the fiscal year. This amount is reflected as a percentage of total estimated ordinary income distributions (the total of short-term capital gain and net investment income distributions) for the calendar year 2021. Generally, interest from direct U.S. Government obligations is exempt from state income tax. Please consult your tax advisor for the availability of a state tax exemption based on your individual circumstances. |
82
| (4) | Foreign Tax Credit represents the amount of dividends that qualify for the foreign tax credit pass through under Section 853 of the Internal Revenue Code and is reflected as a percentage of “investment company taxable income” (as defined in Section 852(b)(2) of the Internal Revenue Code). |
| (5) | Foreign Source Income represents the amount of dividends derived from foreign sources and is reflected as a percentage of “investment company taxable income” (as defined in Section 852(b)(2) of the Internal Revenue Code). |
| (6) | Qualified Net Interest Income represents the amount of interest income available as interest-related dividends generally exempt from withholding taxes for non-U.S. shareholders under Section 871(k)(1) of the Internal Revenue Code. The information is reflected as a percentage estimated ordinary income distributions (the total of short-term capital gain and net investment income distributions) for the calendar year 2021. |
| (7) | Qualified Short-Term Capital Gain represents the amount available as short-term capital gain dividends generally exempt from withholding taxes for non-U.S. shareholders under Section 871(k)(2) of the Internal Revenue Code. The information is reflected as a percentage of estimated ordinary income distributions (the total of short-term capital gain and net investment income distributions) for the calendar year 2021. |
83
REPORT OF INDEPENDENT REGISTERED PUBLIC ACCOUNTING FIRM
To the Board of Trustees of The Dimensional ETF Trust and Shareholders of each of the nine funds listed in the table below
Opinions on the Financial Statements
We have audited the accompanying statements of assets and liabilities, including the summary schedules of portfolio holdings, of each of the funds indicated in the table below (constituting The Dimensional ETF Trust, hereafter collectively referred to as the “Funds”) as of October 31, 2021, the related statements of operations and of changes in net assets for each of the periods indicated in the table below, including the related notes, and the financial highlights for each of the periods indicated in the table below (collectively referred to as the “financial statements”). In our opinion, the financial statements present fairly, in all material respects, the financial position of each of the Funds as of October 31, 2021, the results of each of their operations, the changes in each of their net assets, and each of the financial highlights for each of the periods indicated in the table below, in conformity with accounting principles generally accepted in the United States of America.
| Fund | Statement of operations |
Statement of changes in net assets |
Financial highlights | |||
|
Dimensional U.S. Equity ETF Dimensional U.S. Core Equity 2 ETF Dimensional U.S. Small Cap ETF Dimensional U.S. Targeted Value ETF Dimensional International Value ETF Dimensional World ex U.S. Core Equity 2 ETF |
For the year ended October 31, 2021 | For the years ended October 31, 2021 and 2020 | For the years ended October 31, 2021, 2020, 2019, 2018, and 2017 | |||
|
Dimensional US Core Equity Market ETF Dimensional International Core Equity Market ETF |
For the period November 17, 2020 (commencement of operations) through October 31, 2021 | |||||
|
Dimensional Emerging Core Equity Market ETF |
For the period December 1, 2020 (commencement of operations) through October 31, 2021 | |||||
Basis for Opinions
These financial statements are the responsibility of the Funds’ management. Our responsibility is to express an opinion on the Funds’ financial statements based on our audits. We are a public accounting firm registered with the Public Company Accounting Oversight Board (United States) (PCAOB) and are required to be independent with respect to the Funds in accordance with the U.S. federal securities laws and the applicable rules and regulations of the Securities and Exchange Commission and the PCAOB.
We conducted our audits of these financial statements in accordance with the standards of the PCAOB. Those standards require that we plan and perform the audit to obtain reasonable assurance about whether the financial statements are free of material misstatement, whether due to error or fraud.
Our audits included performing procedures to assess the risks of material misstatement of the financial statements, whether due to error or fraud, and performing procedures that respond to those risks. Such procedures included examining, on a test basis, evidence regarding the amounts and disclosures in the financial statements. Our audits also included evaluating the accounting principles used and significant estimates made by management, as well as evaluating the overall presentation of the financial statements. Our procedures included confirmation of securities owned as of October 31, 2021 by correspondence with the custodian, brokers and transfer agent of the investee fund; when replies were not received from brokers, we performed other auditing procedures. We believe that our audits provide a reasonable basis for our opinions.
/s/PricewaterhouseCoopers LLP
Philadelphia, Pennsylvania
December 22, 2021
We have served as the auditor of one or more investment companies in Dimensional Fund Advisors L.P. investment company group since 1981.
84
(Unaudited)
Trustees/ Directors
Each Board of Trustees/Directors (each, the “Board” and collectively, the “Boards”) of The DFA Investment Trust Company (“DFAITC”), DFA Investment Dimensions Group Inc. (“DFAIDG”), Dimensional Investment Group Inc. (“DIG”), Dimensional ETF Trust (“ETF Trust”), and Dimensional Emerging Markets Value Fund (“DEM”) (each, the “Fund” and collectively, the “Funds”) is responsible for establishing the Funds’ policies and for overseeing the management of the Funds. The Trustees/ Directors of the Funds, including all of the disinterested Trustees/Directors, have adopted written procedures to monitor potential conflicts of interest that might develop between portfolios of the Funds (the “Feeder Portfolios”) that invest in certain series of DFAITC or DEM (the “Master Funds”).
Each Board has three standing committees, an Audit Committee, a Nominating Committee, and an Investment Strategy Committee (the “Strategy Committee”). The Audit Committee is composed of George M. Constantinides, Roger G. Ibbotson, Abbie J. Smith and Ingrid M. Werner. Each member of the Audit Committee is a disinterested Trustee/Director. The Audit Committee oversees the Fund’s accounting and financial reporting policies and practices, the Fund’s internal controls, the Fund’s financial statements and the independent audits thereof and performs other oversight functions as requested by the Board. The Audit Committee recommends the appointment of each Fund’s independent registered certified public accounting firm and acts as a liaison between the Fund’s independent registered certified public accounting firm and the full Board. There were two Audit Committee meetings held during the fiscal year ended October 31, 2021.
Each Board’s Nominating Committee is composed of George M. Constantinides, Roger G. Ibbotson, Myron S. Scholes, Abbie J. Smith, Douglas W. Diamond, Darrell Duffie and Ingrid M. Werner. Each member of the Nominating Committee is a disinterested Trustee/Director. The Nominating Committee for each Board makes recommendations for nominations of disinterested and interested members on the Board to the disinterested Board members and to the full Board. The Nominating Committee evaluates a candidate’s qualification for Board membership and the independence of such candidate from the Advisor and other principal service providers. There were four Nominating Committee meetings held during the fiscal year ended October 31, 2021.
Each Board’s Strategy Committee is composed of Gerard K. O’Reilly, Douglas W. Diamond, Myron S. Scholes and Darrell Duffie. The Strategy Committee assists the Board in carrying out its fiduciary duties with respect to the oversight of the Fund and its performance. At the request of the Board or the Advisor, the Strategy Committee (i) reviews the design of possible new series of the Fund, (ii) reviews performance of existing portfolios of the Funds and discusses and recommends possible enhancements to the portfolios’ investment strategies, (iii) reviews proposals by the Advisor to modify or enhance the investment strategies or policies of each portfolio, and (iv) considers issues relating to investment services for each portfolio of the Fund. There were three Strategy Committee meetings held during the fiscal year ended October 31, 2021.
Certain biographical information for each disinterested Trustee/Director and interested Trustee/Director of the Funds is set forth in the tables below, including a description of each Trustee/Director’s experience as a Trustee/ Director of the Funds and as a Director or Trustee of other funds, as well as other recent professional experience.
The statements of additional information (together, “SAI”) of the Funds include additional information about each Trustee/Director. You may obtain copies of the SAI and prospectus of each Fund advised by Dimensional Fund Advisors LP by calling collect (512) 306-7400 or by mailing a request to Dimensional Fund Advisors LP, 6300 Bee Cave Road, Building One, Austin, TX 78746. Prospectuses are also available at http://us.dimensional.com.
85
Disinterested Directors/Trustees
| Name, Address and Year of Birth |
Position | Term of Office1 and Length of Service |
Principal Occupation During Past 5 Years |
Portfolios within the DFA Fund Complex2 Overseen |
Other Directorships of Public Companies Held During Past 5 Years | |||||
| George M. Constantinides University of Chicago Booth School of Business 5807 S. Woodlawn Avenue Chicago, IL 60637 1947 |
Director/ Trustee | DFAIDG — Since 1983; DIG & DEM — Since 1993; DFAITC — Since 1992; ETF Trust - Since 2020 | Leo Melamed Professor of Finance, University of Chicago Booth School of Business (since 1978). | 137 portfolios in 5 investment companies | None | |||||
| Douglas W. Diamond c/o Dimensional 1953 |
Director/ Trustee | DFAIDG, DIG, DEM & DFAITC — Since 2017; ETF Trust - Since 2020 | Merton H. Miller Distinguished Service Professor of Finance, University of Chicago Booth School of Business (since 1988). Formerly, Visiting Scholar, Federal Reserve Bank of Richmond (1990-2019). Formerly, Fischer Black Visiting Professor of Financial Economics, Alfred P. Sloan School of Management, Massachusetts Institute of Technology (2015-2016). | 137 portfolios in 5 investment companies | None | |||||
| Darrell Duffie c/o Dimensional 1954 |
Director/ Trustee | DFAIDG, DIG, DEM & DFAITC — Since 2019; ETF Trust - Since 2020 | Dean Witter Distinguished Professor of Finance, Graduate School of Business, Stanford University (since 1984). Director, TNB Inc. (bank) (since 2020). | 137 portfolios in 5 investment companies | Formerly, Director, Moody’s Corporation (financial information and information technology) (2008-2018). | |||||
| Roger G. Ibbotson Yale School of Management 1943 |
Director/ Trustee | DFAIDG – Since 1981; DIG & DEM — Since 1993; DFAITC — Since 1992; ETF Trust - Since 2020 | Professor in Practice Emeritus of Finance, Yale School of Management (since 1984). Chairman and Partner, Zebra Capital Management, LLC (hedge fund and asset manager) (since 2001). Formerly, Consultant to Morningstar, Inc. (2006-2016). | 137 portfolios in 5 investment companies | None | |||||
| Myron S. Scholes c/o Dimensional 1941 |
Director/ Trustee | DFAIDG — Since 1981; DIG & DEM — Since 1993; DFAITC – Since 1992; ETF Trust - Since 2020 | Chief Investment Strategist, Janus Henderson Investors (since 2014). Frank E. Buck Professor of Finance, Emeritus, Graduate School of Business, Stanford University (since 1981). | 137 portfolios in 5 investment companies | None | |||||
86
| Name, Address and Year of Birth |
Position | Term of Office1 and Length of Service |
Principal Occupation During Past 5 Years |
Portfolios within the DFA Fund Complex2 Overseen |
Other Directorships of Public Companies Held During Past 5 Years | |||||
| Abbie J. Smith University of Chicago Booth School of Business 5807 S. Woodlawn Avenue Chicago, IL 60637 1953 |
Director/ Trustee | DFAIDG, DIG, DEM & DFAITC — Since 2000; ETF Trust - Since 2020 | Boris and Irene Stern Distinguished Service Professor of Accounting and James S. Ely, III Faculty Fellow, University of Chicago Booth School of Business (since 1980). | 137 portfolios in 5 investment companies | Director, (since 2000) and formerly, Lead Director (2014- 2017), HNI Corporation (office furniture); Director, Ryder System Inc. (transportation, logistics and supply-chain management) (since 2003); and Trustee, UBS Funds (3 investment companies within the fund complex) (14 portfolios) (since 2009). | |||||
| Ingrid M. Werner c/o Dimensional 1961 |
Director/ Trustee | DFAIDG, DIG, DEM & DFAITC — Since 2019; ETF Trust — Since 2020 | Martin and Andrew Murrer Professor of Finance, Fisher College of Business, The Ohio State University (since 1998). Adjunct Member, the Prize Committee for the Swedish Riksbank Prize in Economic Sciences in Memory of Alfred Nobel (annual award for significant scientific research contribution) (since 2018). Director, American Finance Association (global association of academic researchers and practitioners in finance) (since January 2019). Member, Scientific Board, Leibniz Institute for Financial Research (institute supporting academic research in finance) (since 2020). Chair, Economic Advisory Committee, FINRA (since 2017). Chairman, Scientific Advisory Board, Swedish House of Finance (institute supporting academic research in finance) (since 2014). Member, Scientific Board, Danish Finance Institute (institute supporting academic research in finance) (since 2017). Member, Academic Board, Mistra Financial Systems (organization funding academic research on environment, governance and climate/sustainability in finance) (since 2016). Fellow, Center for Analytical Finance (academic research) (since 2015). Associate Editor, Journal of Finance (since 2016). Formerly, President, Western Finance Association (global association of academic researchers and practitioners in finance) (2018- 2019). | 137 portfolios in 5 investment companies | Director, Fourth Swedish AP Fund (pension fund asset management) (since 2017). | |||||
87
Interested Director/Trustee
The following interested Director/Trustee is described as such because he is deemed to be an “interested person,” as that term is defined under the 1940 Act, due to his position with the Advisor.
| Name, Address and Year of Birth |
Position | Term of Office1 and Length of Service |
Principal Occupation During Past 5 Years |
Portfolios within the DFA Fund Complex2 Overseen |
Other Directorships of Public Companies Held During Past 5 Years | |||||
| David G. Booth 6300 Bee Cave Road, 1946 |
Chairman and Director/ Trustee | DFAIDG — Since 1981; DIG & DFAITC — Since 1992; DEM — Since 1993; ETF Trust — Since 2020 | Chairman, Director/Trustee, and formerly, President and Co-Chief Executive Officer (each until March 2017) of Dimensional Emerging Markets Value Fund (“DEM”), DFA Investment Dimensions Group Inc. (“DFAIDG”), Dimensional Investment Group Inc. (“DIG”), The DFA Investment Trust Company (“DFAITC”). Executive Chairman, and formerly, President and Co-Chief Executive Officer (each until February 2017) of Dimensional Holdings Inc., Dimensional Fund Advisors LP, Dimensional Investment LLC and DFA Securities LLC (collectively with DEM, DFAIDG, DIG and DFAITC, the “DFA Entities”). Chairman and Trustee of the ETF Trust (since June 2020). Formerly, Chairman and Director (2009-2018) and Co-Chief Executive Officer (2010 June 2017) of Dimensional Fund Advisors Canada ULC. Trustee, University of Chicago (since 2002). Trustee, University of Kansas Endowment Association (since 2005). Member of the Hoover Institution Board (since September 2019). Formerly, Director of Dimensional Fund Advisors Ltd. (2002-July 2017), DFA Australia Limited (1994-July 2017), Dimensional Advisors Ltd. (2012-July 2017), Dimensional Funds plc (2006-July 2017) and Dimensional Funds II plc (2006-July 2017). Formerly, Director and President of Dimensional Japan Ltd. (2012-April 2017). Formerly, President, Dimensional SmartNest (US) LLC (2009-2014); and Limited Partner, VSC Investors, LLC (2007-2015). Formerly, Chairman, Director, President and Co-Chief Executive Officer of Dimensional Cayman Commodity Fund I Ltd. (2010-September 2017). | 137 portfolios in 5 investment companies | None | |||||
| 1 | Each Director/Trustee holds office for an indefinite term until his or her successor is elected and qualified. |
| 2 | Each Director/Trustee is a director or trustee of each of the five registered investment companies within the DFA Fund Complex, which include: DFAIDG, DIG; DFAITC; DEM; and ETF Trust. Each disinterested Director/Trustee also serves on the Independent Review Committee of the Dimensional Funds, mutual funds registered in the provinces of Canada and managed by the Advisor’s affiliate, Dimensional Fund Advisors Canada ULC. |
88
Officers
Below is the name, year of birth, information regarding positions with the Funds and the principal occupation for each officer of the Funds. The address of each officer is 6300 Bee Cave Road, Building One, Austin, TX 78746. Each of the officers listed below holds the same office (except as otherwise noted) in the DFA Entities.
| Name and Year of Birth |
Position | Term of Office1 and Length of Service |
Principal Occupation During Past 5 Years | |||
| Valerie A. Brown 1967 |
Vice President and Assistant Secretary | Since 2001 | Vice President and Assistant Secretary of • all the DFA Entities (since 2001) • DFA Australia Limited (since 2002) • Dimensional Fund Advisors Ltd. (since 2002) • Dimensional Cayman Commodity Fund I Ltd. (since 2010) • Dimensional Fund Advisors Pte. Ltd. (since 2012) • Dimensional Hong Kong Limited (since 2012) • ETF Trust (since 2020) Director, Vice President and Assistant Secretary (since 2003) of • Dimensional Fund Advisors Canada ULC | |||
| Ryan P. Buechner 1982 | Vice President and Assistant Secretary | Since September 2019 | Vice President and Assistant Secretary of • DFAIDG, DIG, DFAITC and DEM (since 2019) • ETF Trust (since 2020) Vice President (since January 2018) of • Dimensional Holdings Inc. • Dimensional Fund Advisors LP • Dimensional Investment LLC • DFA Securities LLC | |||
| David P. Butler 1964 |
Co-Chief Executive Officer | Since 2017 | Co-Chief Executive Officer of • all the DFA Entities (since 2017) • ETF Trust (since 2020) Director (since 2017) of • Dimensional Holdings Inc. • Dimensional Fund Advisors Canada ULC • Dimensional Japan Ltd. • Dimensional Advisors Ltd. • Dimensional Fund Advisors Ltd. • DFA Australia Limited Director and Co-Chief Executive Officer (since 2017) of • Dimensional Cayman Commodity Fund I Ltd. Head of Global Financial Advisor Services (since 2007) for • Dimensional Fund Advisors LP Formerly, Vice President (2007-2017) of • all the DFA Entities | |||
| Stephen A. Clark 1972 |
Executive Vice President | Since 2017 | Executive Vice President of • all the DFA Entities (since 2017) • ETF Trust (since 2020) Director and Vice President (since 2016) of • Dimensional Japan Ltd. President and Director (since 2016) of • Dimensional Fund Advisors Canada ULC Vice President (since 2008) and Director (since 2016) of • DFA Australia Limited Director (since 2016) of • Dimensional Advisors Ltd. • Dimensional Fund Advisors Pte. Ltd. • Dimensional Hong Kong Limited Vice President (since 2019) of • Dimensional Fund Advisors Pte. Ltd. Formerly, Vice President (2004-2017) of • all the DFA Entities Formerly, Vice President (2010-2016) of • Dimensional Fund Advisors Canada ULC Formerly, Vice President (2016-2019) of • Dimensional Fund Advisors Pte. Ltd. Formerly, Interim Chief Executive Officer (2019) of • Dimensional Fund Advisors Pte. Ltd. Formerly, Head of Institutional, North America (2012-2013) and Head of Global Institutional Services (2014-2018) for • Dimensional Fund Advisors LP | |||
89
| Name and Year of Birth |
Position | Term of Office1 and Length of Service |
Principal Occupation During Past 5 Years | |||
| Lisa M. Dallmer 1972 |
Chief Operating Officer | Since June 2021 | Chief Operating Officer (since June 2021) of • the DFA Fund Complex • ETF Trust Executive Vice President (since January 2020) • Dimensional Holdings Inc. • Dimensional Fund Advisors LP • Dimensional Investment LLC • DFA Securities LLC Chief Operating Officer (since December 2019) • Dimensional Holdings Inc. • Dimensional Fund Advisors LP • Dimensional Investment LLC • DFA Securities LLC Formerly, Vice President, Chief Financial Officer, and Treasurer (June 2020-June 2021) of • the DFA Fund Complex • ETF Trust Formerly, Senior Vice President, Business Operations (March 2019-October 2019) at • Delphix Inc. Formerly, Chief Operating Officer Global Technology & Operations, Managing Director (2014-2018) of • BlackRock Inc. | |||
| Bernard J. Grzelak 1971 | Vice President | Since June 2021 | Vice President (since June 2021) of • the DFA Fund Complex • ETF Trust Vice President, Chief Financial Officer and Treasurer (since September 2020) of • DFA Australia Limited • Dimensional Fund Advisors Canada ULC • DFA Securities LLC • Dimensional Advisors Ltd. • Dimensional Fund Advisors LP • Dimensional Fund Advisors Ltd. • Dimensional Fund Advisors Pte. Ltd. • Dimensional Holdings Inc. • Dimensional Hong Kong Limited • Dimensional Investment LLC Vice President (since March 2021) of | |||
|
• Dimensional Ireland Limited Formerly, Partner (2008-2020), Chief Operating Officer, Global Funds and Risk (2018-2020), Chief Operations Officer (2016-2018), and Director of Fund Administration (2003- 2016) of Lord Abbett & Co. LLC Formerly, Chief Financial Officer (2017-2020), and Treaurer (2003-2017) of Lord Abbett Family of Funds | ||||||
| Eric Hall 1978 |
Vice President and Assistant Treasurer | Since June 2021 | Vice President and Assistant Treasurer (since June 2021) of • the DFA Fund Complex • ETF Trust Formerly, Data Integrity Team Lead (December 2019-April 2021) of • Clearwater Analytics Formerly, Assistant Vice President and Assistant Treasurer (March 2015-November 2019) at • INVESCO, U.S. (formerly, OppenheimerFunds, Inc.) | |||
| Jeff J. Jeon 1973 |
Vice President | Since 2004 | Vice President (since 2004) and Assistant Secretary (2017-2019) of • all the DFA Entities Vice President (since 2020) of • ETF Trust Vice President and Assistant Secretary (since 2010) of • Dimensional Cayman Commodity Fund I Ltd. | |||
90
| Name and Year of Birth |
Position | Term of Office1 and Length of Service |
Principal Occupation During Past 5 Years | |||
| Joy Lopez 1971 |
Vice President and Assistant Treasurer | Vice President since 2015 and Assistant Treasurer since 2017 | Vice President (since 2015) of • all the DFA Entities Assistant Treasurer (since 2017) of • the DFA Fund Complex Vice President and Assistant Treasurer (since 2020) of • ETF Trust Formerly, Senior Tax Manager (2013-2015) for • Dimensional Fund Advisors LP | |||
| Kenneth M. Manell 1972 |
Vice President | Since 2010 | Vice President of • all the DFA Entities (since 2010) • Dimensional Cayman Commodity Fund I Ltd. (since 2010) • ETF Trust (since 2020) | |||
| Jan Miller 1963 |
Vice President, Chief Financial Officer, and Treasurer | Since June 2021 | Vice President, Chief Financial Officer, and Treasurer (since June 2021) of • the DFA Fund Complex • ETF Trust Formerly, Director (May 2019-January 2021) at • INVESCO, U.S. (formerly, OppenheimerFunds, Inc.) Formerly, Vice President and Assistant Treasurer (September 2012-May 2019) at • OppenheimerFunds, Inc. | |||
| Catherine L. Newell 1964 |
President and General Counsel | President since 2017 and General Counsel sincec 2001 | President of • the DFA Fund Complex (since 2017) • ETF Trust (since 2020) General Counsel (since 2001) of • all the DFA Entities Executive Vice President (since 2017) and Secretary (since 2000) of • Dimensional Fund Advisors LP • Dimensional Holdings Inc. • DFA Securities LLC | |||
| • Dimensional Investment LLC Director (since 2002), Vice President (since 1997) and Secretary (since 2002) of • DFA Australia Limited • Dimensional Fund Advisors Ltd. Vice President and Secretary of • Dimensional Fund Advisors Canada ULC (since 2003) | ||||||
|
• Dimensional Cayman Commodity Fund I Ltd. (since 2010) • Dimensional Japan Ltd. (since 2012) • Dimensional Advisors Ltd (since 2012) • Dimensional Fund Advisors Pte. Ltd. (since 2012) Director of • Dimensional Funds plc (since 2002) • Dimensional Funds II plc (since 2006) • Director of Dimensional Japan Ltd. (since 2012) • Dimensional Advisors Ltd. (since 2012) • Dimensional Fund Advisors Pte. Ltd. (since 2012) • Dimensional Hong Kong Limited (since 2012) • Dimensional Ireland Limited (since 2019) Formerly, Vice President and Secretary (2010-2014) of • Dimensional SmartNest (US) LLC Formerly, Vice President (1997-2017) and Secretary (2000-2017) of • the DFA Fund Complex Formerly, Vice President of • Dimensional Fund Advisors LP (1997-2017) • Dimensional Holdings Inc. (2006-2017) • DFA Securities LLC (1997-2017) • Dimensional Investment LLC (2009-2017) | ||||||
91
| Name and Year of Birth |
Position | Term of Office1 and Length of Service |
Principal Occupation During Past 5 Years | |||
| Selwyn J. Notelovitz 1961 |
Vice President | Since September 2021 | Vice President (since September 2021) of • the DFA Fund Complex • ETF Trust Vice President (since December 2012) and Chief Compliance Officer (since July 2020) of: • DFA Securities LLC • Dimensional Fund Advisors LP • Dimensional Holdings Inc. • Dimensional Investment LLC Chief Compliance Officer (since July 2020) of: • DFA Australia Limited • Dimensional Fund Advisors Ltd. • Dimensional Fund Advisors Canada ULC Formerly, Deputy Chief Compliance Officer (2013-2020) of: • DFA Fund Complex • DFA Securities LLC • Dimensional Fund Advisors LP • Dimensional Holdings Inc. • Dimensional Investment LLC Formerly, Vice President (2013-2020) of: • DFA Fund Complex Formerly, Director (2019-2021) of: • Dimensional Ireland Limited | |||
| Carolyn L. O 1974 |
Vice President and Secretary | Vice President since 2010 and Secretary since 2017 | Vice President (since 2010) and Secretary (since 2017) of • the DFA Fund Complex Vice President and Secretary (since 2020) of • ETF Trust Vice President (since 2010) and Assistant Secretary (since 2016) of • Dimensional Fund Advisors LP • Dimensional Holdings Inc. • Dimensional Investment LLC Vice President of • DFA Securities LLC (since 2010) | |||
|
• Dimensional Cayman Commodity Fund I Ltd. (since 2010) • Dimensional Fund Advisors Canada ULC (since 2016) | ||||||
| Randy C. Olson 1980 |
Chief Compliance Officer | Since August 2020 | Chief Compliance Officer (since 2020) • all the DFA Funds • ETF Trust Vice President (since 2016) of • DFA Securities LLC • Dimensional Fund Advisors LP • Dimensional Holdings Inc. • Dimensional Investment LLC Formerly, Vice President-Senior Compliance Officer • Dimensional Investment Advisors LP (January 2020-August 2020 and July 2014-March 2017) Formerly, Vice President-Head of Compliance & Operations Asia Ex-Japan • Dimensional Investment Advisors LP (April 2017-January 2020) | |||
92
| Name and Year of Birth |
Position | Term of Office1 and Length of Service |
Principal Occupation During Past 5 Years | |||
| Gerard K. O’Reilly 1976 |
Co-Chief Executive Officer and Chief Investment Officer | Co-Chief Executive Officer and Chief Investment Officer since 2017 | Co-Chief Executive Officer and Chief Investment Officer of • all the DFA Entities (since 2017) • Dimensional Fund Advisors Canada ULC (since 2017) • ETF Trust (since 2020) Director, Chief Investment Officer and Vice President (since 2017) of • DFA Australia Limited Chief Investment Officer (since 2017) and Vice President (since 2016) of • Dimensional Japan Ltd. Director, Co-Chief Executive Officer and Chief Investment Officer (since 2017) of • Dimensional Cayman Commodity Fund I Ltd. Director of • Dimensional Funds plc (since 2014) • Dimensional Funds II plc (since 2014) • Dimensional Holdings Inc. (since 2017) • Dimensional Ireland Limited (since 2019) Formerly, Co-Chief Investment Officer of • Dimensional Japan Ltd. (2016-2017) • DFA Australia Limited (2014-2017) Formerly, Executive Vice President (2017) and Co-Chief Investment Officer (2014-2017) of • all the DFA Entities Formerly, Vice President (2007-2017) of • all the DFA Entities Formerly, Vice President and Co-Chief Investment Officer (2014-2017) of • Dimensional Fund Advisors Canada ULC Formerly, Director (2017-2018) of Dimensional Fund Advisors Pte. Ltd. | |||
| James J. Taylor 1983 |
Vice President and Assistant Treasurer | Since March 2020 | Vice President and Assistant Treasurer (since 2020) of • the DFA Fund Complex • ETF Trust Vice President (since 2016) • Dimensional Holdings Inc. • Dimensional Fund Advisors LP • Dimensional Investment LLC • DFA Securities LLC Formerly, Accounting Manager (2015-2016) • Dimensional Fund Advisors LP | |||
| 1 | Each officer holds office for an indefinite term at the pleasure of the Board of Directors/Trustees and until his or her successor is elected and qualified. |
93
VOTING PROXIES ON FUND PORTFOLIO SECURITIES
A description of the policies and procedures that the Fund and the Trust use in voting proxies relating to securities held in the portfolios is available (1) without charge, upon request, by calling collect: (512) 306-7400 (2) from the Advisor’s website at http://us.dimensional.com; and (3) on the SEC’s website at http://www.sec.gov. Information regarding how the Advisor votes these proxies is available from the EDGAR database on the SEC’s website at http://www.sec.gov and from the Advisor’s website at http://us.dimensional.com and reflects the twelve-month period beginning July 1st and ending June 30th.
94

|
DFA103121-073A |
| ITEM 2. | CODE OF ETHICS. |
The Registrant has adopted, as of the end of the period covered by this Form N-CSR (the “Report”), a code of ethics that applies to the Registrant’s Co-Principal Executive Officers and Principal Financial Officer (the “Code of Business Ethics”). The Registrant has not made any substantive amendments to the Code of Business Ethics during the period covered by this Report. The Registrant also has not granted any waiver from any provisions of the Code of Business Ethics during the period covered by this Report. A copy of the Code of Business Ethics is filed as an exhibit to this Report.
| ITEM 3. | AUDIT COMMITTEE FINANCIAL EXPERT. |
The Registrant’s Board of Trustees has determined that Abbie J. Smith possesses the technical attributes to qualify as an “audit committee financial expert” serving on the Registrant’s Audit Committee and has designated Ms. Smith as the “audit committee financial expert.” Ms. Smith
earned a Ph.D. in Accounting, and has taught Accounting at the graduate level since 1980. Ms. Smith’s education and career have provided her with an understanding of generally accepted accounting principles and financial statements; the ability to assess the general application of such principles in connection with the accounting for estimates, accruals and reserves; and experience preparing, analyzing and evaluating financial statements that present a breadth and level of complexity of issues that can reasonably be expected to be raised by the Registrant’s financial statements. In addition, Ms. Smith has served on the boards of directors and audit committees of entities other than the Registrant. Ms. Smith is independent under the standards set forth in Item 3 of Form N-CSR.
| ITEM 4. | PRINCIPAL ACCOUNTANT FEES AND SERVICES. |
| (a) | Audit Fees |
Fiscal Year Ended October 31, 2021: $166,589
| (b) | Audit-Related Fees |
Fees for Registrant Fiscal Year Ended October 31, 2021: $13,517
For fiscal year ended October 31, 2021, Audit-Related Fees included fees for services related to limited procedures performed in connection with the production of the Registrant’s semi-annual financial statements.
Audit-Related Fees required to be approved pursuant to paragraph (c)(7)(ii) of Rule 2-01 of Regulation S-X
Fiscal Year Ended October 31, 2021: $220,000
For the fiscal year ended October 31, 2021, Audit-Related Fees required to be approved pursuant to paragraph (c)(7)(ii) of Rule 2-01 of Regulation S-X included fees for services rendered in connection with the issuance of a Type II SSAE 16 over controls at the Registrant’s investment adviser.
| (c) | Tax Fees |
Fees for Registrant Fiscal Year Ended October 31, 2021: $0
There were no Tax Fees required to be approved pursuant to paragraph (c)(7)(ii) of Rule 2-01 of Regulation S-X during the fiscal years indicated above.
| (d) | All Other Fees |
Fees for Registrant Fiscal Year Ended October 31, 2021: $0
There were no “All Other Fees” required to be approved pursuant to paragraph (c)(7)(ii) of Rule 2-01 of Regulation S-X during the fiscal years indicated above.
| (e) (1) | Audit Committee’s Pre-Approval Policies and Procedures |
Pre-Approval Policies and Procedures
as adopted by the
Audit Committee
of
Dimensional ETF Trust
(the “Fund”)
The Sarbanes-Oxley Act of 2002 (the “Act”) and the rules (the “Rules”) adopted by the U.S. Securities and Exchange Commission (the “SEC”) require that the Fund’s Audit Committee (the “Committee”) pre-approve all audit services and non-audit services provided to the Fund by its independent registered public accounting firm (the “Auditor”). The Act and the Rules also require that the Committee pre-approve all non-audit services provided by the Auditor to Dimensional Fund Advisors LP (“Dimensional”), the Fund’s investment advisor, and to affiliates of Dimensional that provide ongoing services to the Fund (with Dimensional, together the “Service Affiliates”) if the services directly impact the Fund’s operations and financial reporting.
The following policies and procedures govern the ways in which the Committee will pre-approve audit and various types of non-audit services that the Auditor provides to the Fund and to Service Affiliates. These policies and procedures do not apply in the case of audit services that the Auditor provides to Service Affiliates, nor do they apply to services that an audit firm other than the Auditor provides to such entities.
These policies and procedures comply with the requirements for pre-approval, but also provide mechanisms by which management of the Fund may request and secure pre-approval of audit and non-audit services in an orderly manner with minimal disruption to normal business operations. Pre-approval of non-audit services may be achieved through a combination of the procedures described in Sections C and D below.
| A. | General |
| 1. | The Committee must pre-approve all audit services and non-audit services that the Auditor provides to the Fund. |
| 2. | The Committee must pre-approve any engagement of the Auditor to provide non-audit services to any Service Affiliate during the period of the Auditor’s engagement to provide audit services to the Fund, if the non-audit services to the Service Affiliate directly impact the Fund’s operations and financial reporting. |
| B. | Pre-Approval of Audit Services to the Fund |
| 1. | The Committee shall approve the engagement of an independent registered public accounting firm to certify the Fund’s financial statements for each fiscal year (the “Engagement”). The approval of the Engagement shall not be delegated to a Designated Member (as that term is defined in Section D below). In approving the Engagement, the Committee shall obtain, review and consider sufficient information concerning the proposed Auditor to enable the Committee to make a reasonable evaluation of the Auditor’s qualifications and independence. The Committee also shall consider the Auditor’s proposed fees for the Engagement, in light of the scope and nature of the audit services that the Fund will receive. |
| 2. | The Committee shall report to the Board of Trustees of the Fund (the “Board”) regarding its approval of the Engagement and of the proposed fees for the Engagement, and the basis for such approval. |
| 3. | Unless otherwise required in accordance with applicable law, the Engagement, in any event, shall require that the Auditor be selected by the vote, cast in person, of a majority of the members of the Board who are not “interested persons” of the Fund (as that term is defined in Section 2(a)(19) of the Investment Company Act of 1940) (the “Independent Directors”). |
| C. | Pre-Approval of Non-Audit Services to the Fund and to Service Affiliates—by Types of Services |
| 1. | The Committee may pre-approve types of non-audit services (including tax services) to the Fund and its Service Affiliates pursuant to this Section C. |
| 2. | Annually, at such time as the Committee considers the Engagement of the Auditor, management of the Fund, in consultation with the Auditor, shall provide to the Committee, for its consideration and action, the following: (a) a list of those types of non-audit services, if any, that the Fund may request from the Auditor during the fiscal year; and (b) a list of those types of non-audit services directly impacting the Fund’s operations and financial reporting that Service Affiliates may request from the Auditor during the fiscal year. |
| 3. | The lists submitted to the Committee shall describe the types of non-audit services in reasonable detail (which may include a range of tax services) and shall include an estimated budget (or budgeted range) of fees, where possible, and such other information as the Committee may request. If management and the Auditor desire the Committee to preapprove the furnishing of a range of tax services, the Auditor shall provide an estimated range of fees for such tax services for the consideration and approval by the Committee. |
| 4. | The Committee’s pre-approval of the types of non-audit services submitted pursuant to this Section C shall constitute authorization for management of the Fund to utilize the Auditor for the types of non-audit services so pre-approved, if needed or desired during the fiscal year. |
| 5. | A list of the types of non-audit services pre-approved by the Committee pursuant to this Section C will be distributed to management of the Service Affiliates and the appropriate partners of the Auditor. Periodically, the Auditor will discuss with the Committee those non-audit services that have been or are being provided pursuant to this Section C. |
| D. | Pre-Approval of Non-Audit Services to the Fund and to Service Affiliates—Project-by-Project Basis |
| 1. | The Committee also may pre-approve non-audit services on a project-by-project basis pursuant to this Section D. |
| 2. | Management of the Fund, in consultation with the Auditor, may submit either to the Committee or to the Designated Member, as provided in this Section D, for their consideration and action, a pre-approval request identifying one or more non-audit service projects. The request so submitted shall describe the project(s) in reasonable detail and shall include an estimated budget (or budgeted range) of fees and such other information as the Committee or the Designated Member, as appropriate, shall request. |
| 3. | The Committee, from time to time, shall designate one or more of its members who are Independent Directors (each a “Designated Member”) to consider, on the Committee’s behalf, any non-audit services, whether to the Fund or to any Service Affiliate, that have not been pre-approved by the Committee. The Designated Member also shall review, on the Committee’s behalf, any proposed material change in the nature or extent of any non-audit services previously approved. The Fund’s management, in consultation with the Auditor, shall explain why such non-audit services or material change in non-audit services are necessary and appropriate and the anticipated costs thereof. |
| 4. | The Designated Member will review the requested non-audit services or proposed material change in such services and will either: |
| (a) | pre-approve, pre-approve subject to conditions, or disapprove any such requested services, or any proposed material change in services, whether to the Fund or to a Service Affiliate; or |
| (b) | refer such matter to the full Committee for its consideration and action. |
In considering any requested non-audit services or proposed material change in such services, the Designated Member’s authority shall be limited to approving non-audit services or proposed material changes that do not exceed $10,000 in value in any fiscal year.
| 5. | The Designated Member’s pre-approval (or pre-approval subject to conditions) of the requested non-audit services or proposed material change in services pursuant to this Section D shall constitute authorization for the management of the Fund or the Service Affiliate, as the case may be, to utilize the Auditor for the non-audit services so pre-approved. Any action by the Designated Member in approving a requested non-audit service shall be presented for ratification by the Committee not later than at its next scheduled meeting. If the Designated Member does not approve the Auditor providing the requested non-audit service, the matter may be presented to the full Committee for its consideration and action. |
| E. | Amendment; Annual Review |
| 1. | The Committee may amend these procedures from time to time. |
| 2. | These procedures shall be reviewed annually by the Committee. |
| F. | Recordkeeping |
| 1. | The Fund shall maintain a written record of all decisions made by the Committee or by a Designated Member pursuant to these procedures, together with appropriate supporting materials. |
| 2. | In connection with the approval of any non-audit service pursuant to the de minimis exception provided in the Rules, a record shall be made indicating that each of the conditions for this exception, as set forth in the Rules, has been satisfied. |
| 3. | A copy of these Procedures (and of any amendments to these Procedures) shall be maintained and preserved permanently in an easily accessible place. The written records referred to in paragraphs 1 and 2 of this Section F shall be maintained and preserved for six years from the end of the fiscal year in which the actions recorded were taken, for at least the first two years in an easily accessible location. |
| (e)(2) | The fees disclosed in Items 4(b), 4(c) or 4(d) were approved by the Registrant’s Audit Committee but not pursuant to paragraph (c)(7)(i)(C) of Rule 2-01 of Regulation S-X. |
| (f) | The percentage of hours expended on the principal accountant’s engagement to audit the Registrant’s financial statements for the fiscal year ended October 31, 2021 that were attributed to work performed by persons other than the principal accountant’s full time, permanent employees was not greater than 50%. |
| (g) | Aggregate Non-Audit Fees |
| Fiscal Year Ended October 31, 2021: $1,312,643 |
| (h) | The Registrant’s Audit Committee has considered whether the provision of non-audit services that were rendered to the Registrant’s investment adviser, and any entity controlling, controlled by, or under common control with the investment adviser that provides ongoing services to the Registrant, that were not pre-approved pursuant to paragraph (c)(7)(ii) of Rule 2-01 of Regulation S-X is compatible with maintaining the principal accountant’s independence. |
| ITEM 5. | AUDIT COMMITTEE OF LISTED REGISTRANTS. |
This item is not applicable to the Registrant because it is not a listed issuer.
| ITEM 6. | INVESTMENTS. |
(a) Please see the schedules of investments contained in the reports to stockholders included under Item 1 of this Report except as discussed below. Provided below is a complete schedule of investments for each series of the Registrant that provided a summary schedule of portfolio holdings in a report to stockholders included under Item 1 in lieu of a complete schedule of investments. The schedules of investments for the following series are provided below:
| Name of Entity for which Schedule of Investments is Provided |
| Dimensional U.S. Equity ETF |
| Dimensional US Core Equity Market ETF |
| Dimensional U.S. Core Equity 2 ETF |
| Dimensional U.S. Small Cap ETF |
| Dimensional U.S. Targeted Value ETF |
| Dimensional International Core Equity Market ETF |
| Dimensional International Value ETF |
| Dimensional Emerging Core Equity Market ETF |
| Dimensional World ex U.S. Core Equity 2 ETF |
Dimensional U.S. Equity ETF
SCHEDULE OF INVESTMENTS
October 31, 2021
| Security Description |
Shares | Fair Value | ||||||
| COMMON STOCKS (99.1%) |
| |||||||
| COMMUNICATION SERVICES (10.3%) |
| |||||||
| Activision Blizzard, Inc. |
107,919 | $ | 8,438,187 | |||||
| *Alphabet, Inc., Class A |
41,882 | 124,009,251 | ||||||
| *Alphabet, Inc., Class C |
41,863 | 124,140,959 | ||||||
| *Altice USA, Inc., Class A |
21,475 | 350,042 | ||||||
| *AMC Networks, Inc., Class A |
5,279 | 210,051 | ||||||
| #*Angi, Inc., Class A |
7,228 | 90,567 | ||||||
| *Anterix, Inc. |
18 | 1,154 | ||||||
| #AT&T, Inc. |
880,464 | 22,240,521 | ||||||
| ATN International, Inc. |
1,149 | 46,856 | ||||||
| *Bandwidth, Inc., Class A |
1,196 | 101,995 | ||||||
| *Boston Omaha Corp., Class A |
499 | 17,690 | ||||||
| Cable One, Inc. |
700 | 1,197,847 | ||||||
| *Cargurus, Inc. |
3,783 | 126,882 | ||||||
| *Cars.com, Inc. |
7,636 | 99,421 | ||||||
| *Charter Communications, Inc., Class A |
20,021 | 13,511,973 | ||||||
| #*Cinemark Holdings, Inc. |
5,528 | 103,926 | ||||||
| Cogent Communications Holdings, Inc. |
7,110 | 544,555 | ||||||
| Comcast Corp., Class A |
633,966 | 32,604,871 | ||||||
| *comScore, Inc. |
3,105 | 12,141 | ||||||
| *Consolidated Communications Holdings, Inc. |
1,537 | 11,374 | ||||||
| #*Discovery, Inc. |
22,018 | 516,102 | ||||||
| #*Discovery, Inc., Class C |
35,613 | 803,429 | ||||||
| *DISH Network Corp., Class A |
28,529 | 1,171,686 | ||||||
| Electronic Arts, Inc. |
40,540 | 5,685,735 | ||||||
| *Entercom Communications Corp. |
15,728 | 50,801 | ||||||
| Entravision Communications Corp., Class A |
171 | 1,363 | ||||||
| *Everquote, Inc., Class A |
1,200 | 16,548 | ||||||
| EW Scripps Co. (The), Class A |
5,927 | 110,242 | ||||||
| *Facebook, Inc., Class A |
336,080 | 108,745,406 | ||||||
| Fox Corp., Class A |
47,349 | 1,881,649 | ||||||
| Fox Corp., Class B |
23,429 | 865,936 | ||||||
| *Gannett Co., Inc. |
12,726 | 73,811 | ||||||
| *Globalstar, Inc. |
117 | 193 | ||||||
| *Gray Television, Inc. |
5,301 | 124,255 | ||||||
| *IAC/InterActiveCorp. |
4,771 | 726,957 | ||||||
| *IDT Corp., Class B |
1,800 | 87,066 | ||||||
| *iHeartMedia, Inc., Class A |
846 | 16,395 | ||||||
| *IMAX Corp. |
5,135 | 96,795 | ||||||
| Interpublic Group of Cos., Inc. (The) |
50,726 | 1,855,050 | ||||||
| *Iridium Communications, Inc. |
11,087 | 449,578 | ||||||
| John Wiley & Sons, Inc., Class A |
5,256 | 284,718 | ||||||
| *Liberty Broadband Corp., Class A |
3,994 | 642,115 | ||||||
| *Liberty Broadband Corp., Class C |
23,355 | 3,794,020 | ||||||
| *Liberty Latin America, Ltd., Class A |
2,900 | 34,858 | ||||||
| *Liberty Latin America, Ltd., Class C |
20,007 | 240,684 | ||||||
| #*Liberty Media Corp.-Liberty Braves, Class A |
1,077 | 32,924 | ||||||
| *Liberty Media Corp.-Liberty Braves, Class B |
20 | 758 | ||||||
| *Liberty Media Corp.-Liberty Braves, Class C |
2,325 | 69,099 | ||||||
| *Liberty Media Corp.-Liberty Formula One, Class A |
2,694 | 140,492 | ||||||
| *Liberty Media Corp.-Liberty Formula One, Class C |
26,950 | 1,503,810 | ||||||
| *Liberty Media Corp.-Liberty Siriusxm, Class B |
200 | 10,150 | ||||||
| *Liberty Media Corp.-Liberty SiriusXM, Class A |
11,862 | 590,490 | ||||||
| *Liberty Media Corp.-Liberty SiriusXM, Class C |
25,318 | 1,248,684 | ||||||
| *Lions Gate Entertainment Corp., Class A |
7,250 | 93,887 | ||||||
| *Lions Gate Entertainment Corp., Class B |
12,771 | 144,568 | ||||||
| *Live Nation Entertainment, Inc. |
21,924 | 2,217,613 | ||||||
Dimensional U.S. Equity ETF
SCHEDULE OF INVESTMENTS
October 31, 2021
| Security Description |
Shares | Fair Value | ||||||
| COMMUNICATION SERVICES (Continued) |
| |||||||
| #Lumen Technologies, Inc. |
111,474 | $ | 1,322,082 | |||||
| *Madison Square Garden Entertainment Corp. |
3,290 | 231,846 | ||||||
| *Magnite, Inc. |
162 | 4,379 | ||||||
| #*Marcus Corp. (The) |
2,400 | 44,568 | ||||||
| *Match Group, Inc. |
32,179 | 4,851,950 | ||||||
| *Meredith Corp. |
4,576 | 266,506 | ||||||
| National CineMedia, Inc. |
6,419 | 20,412 | ||||||
| *Netflix, Inc. |
61,692 | 42,586,605 | ||||||
| New York Times Co. (The), Class A |
18,939 | 1,033,880 | ||||||
| News Corp., Class A |
53,137 | 1,216,837 | ||||||
| News Corp., Class B |
16,856 | 380,271 | ||||||
| Nexstar Media Group, Inc., Class A |
4,418 | 662,391 | ||||||
| Omnicom Group, Inc. |
27,693 | 1,885,339 | ||||||
| *Ooma, Inc. |
68 | 1,571 | ||||||
| *Pinterest, Inc., Class A |
31,967 | 1,427,007 | ||||||
| *QuinStreet, Inc. |
1,261 | 17,654 | ||||||
| *ROBLOX Corp., Class A |
87 | 7,310 | ||||||
| *Roku, Inc. |
10,239 | 3,121,871 | ||||||
| Saga Communications, Inc. |
558 | 12,365 | ||||||
| Scholastic Corp. |
2,600 | 94,094 | ||||||
| Shenandoah Telecommunications Co. |
7,796 | 215,481 | ||||||
| #Sirius XM Holdings, Inc. |
159,411 | 970,813 | ||||||
| *Snap, Inc., Class A |
87,827 | 4,617,944 | ||||||
| Spok Holdings, Inc. |
2,839 | 29,213 | ||||||
| *Spotify Technology SA |
5,495 | 1,590,253 | ||||||
| *Take-Two Interactive Software, Inc. |
16,162 | 2,925,322 | ||||||
| *TechTarget, Inc. |
3,560 | 335,744 | ||||||
| TEGNA, Inc. |
24,452 | 480,726 | ||||||
| #Telephone and Data Systems, Inc. |
11,065 | 207,358 | ||||||
| *T-Mobile US, Inc. |
61,931 | 7,123,923 | ||||||
| *TripAdvisor, Inc. |
11,203 | 369,363 | ||||||
| *TrueCar, Inc. |
4,430 | 18,562 | ||||||
| *Twitter, Inc. |
93,648 | 5,013,914 | ||||||
| *United States Cellular Corp. |
1,000 | 30,570 | ||||||
| Verizon Communications, Inc. |
577,823 | 30,618,841 | ||||||
| ViacomCBS, Inc., Class A |
5,128 | 199,633 | ||||||
| ViacomCBS, Inc., Class B |
67,495 | 2,444,669 | ||||||
| *Vimeo, Inc. |
7,805 | 263,263 | ||||||
| *Walt Disney Co. (The) |
252,754 | 42,733,119 | ||||||
| *Warner Music Group Corp., Class A |
537 | 26,576 | ||||||
| *WideOpenWest, Inc. |
299 | 5,696 | ||||||
| World Wrestling Entertainment, Inc., Class A |
5,297 | 323,594 | ||||||
| *Yelp, Inc. |
916 | 35,385 | ||||||
| #*Zedge, Inc., Class B |
68 | 784 | ||||||
| *Zillow Group, Inc., Class A |
7,369 | 779,051 | ||||||
| #*Zillow Group, Inc., Class C |
18,661 | 1,933,839 | ||||||
| *ZipRecruiter, Inc. |
19 | 528 | ||||||
| *Zynga, Inc., Class A |
118,740 | 876,301 | ||||||
|
|
|
|||||||
| TOTAL COMMUNICATION SERVICES |
625,547,533 | |||||||
|
|
|
|||||||
| CONSUMER DISCRETIONARY (12.8%) |
| |||||||
|
#*1-800-Flowers.com, Inc., Class A |
3,914 | 125,718 | ||||||
| #*2U, Inc. |
7,392 | 218,360 | ||||||
| Aaron’s Co., Inc. (The) |
4,533 | 106,027 | ||||||
| *Abercrombie & Fitch Co. |
7,151 | 282,751 | ||||||
| Acushnet Holdings Corp. |
2,786 | 141,919 | ||||||
| *Adient PLC |
11,481 | 477,839 | ||||||
Dimensional U.S. Equity ETF
SCHEDULE OF INVESTMENTS
October 31, 2021
| Security Description |
Shares | Fair Value | ||||||
| CONSUMER DISCRETIONARY (Continued) |
| |||||||
| #*Adtalem Global Education, Inc. |
7,146 | $ | 263,902 | |||||
| Advance Auto Parts, Inc. |
9,080 | 2,047,722 | ||||||
| *Amazon.com, Inc. |
61,739 | 208,210,456 | ||||||
| *American Axle & Manufacturing Holdings, Inc. |
12,936 | 117,459 | ||||||
| American Eagle Outfitters, Inc. |
21,588 | 512,499 | ||||||
| *American Outdoor Brands, Inc. |
1,366 | 31,117 | ||||||
| *American Public Education, Inc. |
170 | 4,248 | ||||||
| *America’s Car-Mart, Inc. |
1,100 | 131,439 | ||||||
| *Aptiv PLC |
35,949 | 6,215,223 | ||||||
| #Aramark |
27,683 | 1,009,876 | ||||||
| *Arko Corp. |
80 | 767 | ||||||
| *Asbury Automotive Group, Inc. |
2,900 | 567,559 | ||||||
| *Autoliv, Inc. |
10,232 | 990,969 | ||||||
| *AutoNation, Inc. |
6,910 | 836,939 | ||||||
| *AutoZone, Inc. |
3,340 | 5,961,366 | ||||||
| *Bassett Furniture Industries, Inc. |
306 | 5,168 | ||||||
| *Bath & Body Works, Inc. |
18,185 | 1,256,402 | ||||||
| *Bbq Holdings, Inc. |
574 | 7,577 | ||||||
| *Beazer Homes USA, Inc. |
1,033 | 18,708 | ||||||
| #*Bed Bath & Beyond, Inc., Class B |
13,869 | 194,721 | ||||||
| Best Buy Co., Inc. |
32,587 | 3,983,435 | ||||||
| Big Lots, Inc., Class B |
5,096 | 225,498 | ||||||
| *Biglari Holdings, Inc., Class B |
7 | 1,164 | ||||||
| *BJ’s Restaurants, Inc. |
2,198 | 73,237 | ||||||
| *Bloomin’ Brands, Inc. |
8,216 | 177,630 | ||||||
| *Booking Holdings, Inc. |
5,289 | 12,803,505 | ||||||
| *Boot Barn Holdings, Inc. |
3,902 | 407,720 | ||||||
| *BorgWarner, Inc., Class A |
25,737 | 1,159,967 | ||||||
| *Boyd Gaming Corp. |
6,138 | 391,482 | ||||||
| #*Bright Horizons Family Solutions, Inc. |
8,339 | 1,384,274 | ||||||
| *Brinker International, Inc. |
6,229 | 261,369 | ||||||
| #Brunswick Corp. |
10,931 | 1,017,567 | ||||||
| Buckle, Inc. (The) |
3,112 | 129,521 | ||||||
| *Burlington Stores, Inc. |
9,694 | 2,678,355 | ||||||
| *Caesars Entertainment, Inc. |
7,947 | 869,879 | ||||||
| Caleres, Inc. |
5,187 | 119,612 | ||||||
| *Callaway Golf Co. |
13,370 | 361,658 | ||||||
| #Camping World Holdings, Inc., Class A |
2,784 | 103,704 | ||||||
| *Capri Holdings, Ltd. |
16,100 | 857,164 | ||||||
| *CarMax, Inc. |
23,796 | 3,258,148 | ||||||
| #*Carnival Corp. |
62,044 | 1,374,895 | ||||||
| *CarParts.com, Inc. |
6,964 | 106,062 | ||||||
| *Carriage Services, Inc. |
2,167 | 111,492 | ||||||
| Carrols Restaurant Group, Inc. |
4,167 | 15,293 | ||||||
| *Carter’s, Inc. |
5,639 | 555,554 | ||||||
| *Carvana Co. |
6,813 | 2,065,565 | ||||||
| Cato Corp. (The), Class A |
2,418 | 42,629 | ||||||
| *Cavco Industries, Inc. |
1,157 | 278,120 | ||||||
| *Century Communities, Inc. |
1,893 | 126,945 | ||||||
| *Cheesecake Factory, Inc. (The) |
5,361 | 217,871 | ||||||
| *Chegg, Inc. |
15,276 | 908,005 | ||||||
| #*Chewy, Inc., Class A |
2,942 | 223,004 | ||||||
| #*Chico’s FAS, Inc. |
2,168 | 11,837 | ||||||
| #*Children’s Place, Inc. (The) |
1,918 | 158,983 | ||||||
| *Chipotle Mexican Grill, Inc. |
3,825 | 6,804,790 | ||||||
| Choice Hotels International, Inc. |
5,483 | 771,019 | ||||||
Dimensional U.S. Equity ETF
SCHEDULE OF INVESTMENTS
October 31, 2021
| Security Description |
Shares | Fair Value | ||||||
| CONSUMER DISCRETIONARY (Continued) |
||||||||
| Churchill Downs, Inc. |
5,189 | $ | 1,193,470 | |||||
| *Chuy’s Holdings, Inc. |
2,100 | 61,236 | ||||||
| *Citi Trends, Inc. |
1,200 | 92,832 | ||||||
| Clarus Corp. |
351 | 9,681 | ||||||
| Columbia Sportswear Co. |
4,094 | 425,121 | ||||||
| *Conn’s, Inc. |
2,501 | 55,697 | ||||||
| Cracker Barrel Old Country Store, Inc. |
2,483 | 330,661 | ||||||
| *Crocs, Inc. |
9,700 | 1,566,065 | ||||||
| Culp, Inc. |
1,492 | 19,739 | ||||||
| *Dana, Inc. |
16,798 | 372,748 | ||||||
| Darden Restaurants, Inc. |
15,648 | 2,255,503 | ||||||
| *Dave & Buster’s Entertainment, Inc. |
20 | 743 | ||||||
| *Deckers Outdoor Corp. |
4,310 | 1,703,786 | ||||||
| *Denny’s Corp. |
8,748 | 139,093 | ||||||
| #*Designer Brands, Inc., Class A |
3,948 | 53,416 | ||||||
| #Dick’s Sporting Goods, Inc. |
7,918 | 983,495 | ||||||
| Dillard’s, Inc., Class A |
1,953 | 451,416 | ||||||
| *Dine Brands Global, Inc. |
197 | 16,648 | ||||||
| Dollar General Corp. |
34,570 | 7,657,946 | ||||||
| *Dollar Tree, Inc. |
31,584 | 3,403,492 | ||||||
| Domino’s Pizza, Inc. |
5,699 | 2,786,640 | ||||||
| *Dorman Products, Inc. |
3,820 | 398,732 | ||||||
| DR Horton, Inc. |
48,419 | 4,322,364 | ||||||
| #eBay, Inc. |
110,262 | 8,459,301 | ||||||
| *»ESC Diamond Resorts, Inc. |
6,168 | — | ||||||
| Ethan Allen Interiors, Inc. |
2,900 | 67,309 | ||||||
| *Etsy, Inc. |
17,721 | 4,442,477 | ||||||
| *Everi Holdings, Inc. |
11,576 | 277,824 | ||||||
| *Expedia Group, Inc. |
17,658 | 2,903,152 | ||||||
| #*Fiesta Restaurant Group, Inc. |
2,072 | 21,839 | ||||||
| #*Fisker, Inc. |
205 | 3,290 | ||||||
| *Five Below, Inc. |
7,784 | 1,535,783 | ||||||
| Flexsteel Industries, Inc. |
300 | 8,400 | ||||||
| *Floor & Decor Holdings, Inc., Class A |
4,045 | 549,796 | ||||||
| Foot Locker, Inc. |
15,542 | 740,887 | ||||||
| *Ford Motor Co. |
453,358 | 7,743,355 | ||||||
| #*Fossil Group, Inc. |
1,187 | 14,030 | ||||||
| *Fox Factory Holding Corp. |
6,507 | 1,047,302 | ||||||
| Franchise Group, Inc. |
487 | 17,922 | ||||||
| *frontdoor, Inc. |
12,222 | 455,636 | ||||||
| *Gap, Inc. (The) |
27,680 | 628,059 | ||||||
| Garmin, Ltd. |
17,563 | 2,522,047 | ||||||
| *General Motors Co. |
165,867 | 9,028,141 | ||||||
| *Genesco, Inc. |
1,500 | 90,885 | ||||||
| Gentex Corp. |
37,590 | 1,330,310 | ||||||
| *Gentherm, Inc. |
4,552 | 335,164 | ||||||
| Genuine Parts Co. |
19,314 | 2,532,259 | ||||||
| *G-III Apparel Group, Ltd. |
5,881 | 168,549 | ||||||
| *Goodyear Tire & Rubber Co. (The) |
33,015 | 631,247 | ||||||
| *GoPro, Inc., Class A |
10,170 | 87,564 | ||||||
| Graham Holdings Co., Class B |
463 | 271,249 | ||||||
| *Grand Canyon Education, Inc. |
6,327 | 504,262 | ||||||
| *Green Brick Partners, Inc. |
4,401 | 114,646 | ||||||
| Group 1 Automotive, Inc. |
2,777 | 499,305 | ||||||
| Guess?, Inc. |
5,581 | 115,582 | ||||||
| H&R Block, Inc. |
21,739 | 501,519 | ||||||
| Hamilton Beach Brands Holding Co., Class A |
574 | 8,610 | ||||||
Dimensional U.S. Equity ETF
SCHEDULE OF INVESTMENTS
October 31, 2021
| Security Description |
Shares | Fair Value | ||||||
| CONSUMER DISCRETIONARY (Continued) |
| |||||||
| Hanesbrands, Inc. |
43,298 | $ | 737,798 | |||||
| Harley-Davidson, Inc. |
20,166 | 735,857 | ||||||
| Hasbro, Inc. |
16,457 | 1,575,922 | ||||||
| Haverty Furniture Cos., Inc. |
1,700 | 48,790 | ||||||
| *Helen of Troy, Ltd. |
3,396 | 763,930 | ||||||
| Hibbett, Inc. |
2,888 | 223,647 | ||||||
| *Hilton Grand Vacations, Inc. |
9,156 | 460,364 | ||||||
| *Hilton Worldwide Holdings, Inc. |
38,361 | 5,522,066 | ||||||
| Home Depot, Inc. (The) |
150,712 | 56,025,679 | ||||||
| Hooker Furnishings Corp. |
1,300 | 32,773 | ||||||
| *Houghton Mifflin Harcourt Co. |
1,383 | 19,625 | ||||||
| *Hovnanian Enterprises, Inc., Class A |
8 | 674 | ||||||
| *Hyatt Hotels Corp., Class A |
4,900 | 417,480 | ||||||
| Installed Building Products, Inc. |
3,123 | 396,777 | ||||||
| *International Game Technology PLC |
7,805 | 230,169 | ||||||
| #*iRobot Corp. |
3,683 | 307,236 | ||||||
| Jack in the Box, Inc. |
3,400 | 336,430 | ||||||
| Johnson Outdoors, Inc., Class A |
1,187 | 126,036 | ||||||
| #*Just Eat Takeaway.com NV, ADR |
36,760 | 525,300 | ||||||
| #KB Home |
9,625 | 386,444 | ||||||
| *Kohl’s Corp. |
5,458 | 264,877 | ||||||
| Kontoor Brands, Inc. |
6,161 | 326,533 | ||||||
| #*Lakeland Industries, Inc. |
1,000 | 20,910 | ||||||
| *Lands’ End, Inc. |
1,303 | 34,243 | ||||||
| *Las Vegas Sands Corp. |
45,888 | 1,780,913 | ||||||
| #*Laureate Education, Inc., Class A |
11,172 | 193,499 | ||||||
| La-Z-Boy, Inc. |
6,010 | 199,772 | ||||||
| LCI Industries |
3,459 | 483,015 | ||||||
| Lear Corp. |
8,394 | 1,442,509 | ||||||
| Leggett & Platt, Inc. |
15,677 | 734,467 | ||||||
| Lennar Corp., Class A |
38,303 | 3,827,619 | ||||||
| Lennar Corp., Class B |
1,957 | 160,631 | ||||||
| Levi Strauss & Co., Class A |
4,089 | 107,050 | ||||||
| *LGI Homes, Inc. |
2,763 | 412,516 | ||||||
| Lifetime Brands, Inc. |
300 | 5,088 | ||||||
| *Liquidity Services, Inc., Class A |
4,136 | 91,323 | ||||||
| Lithia Motors, Inc., Class A |
3,214 | 1,025,973 | ||||||
| *LKQ Corp. |
40,343 | 2,222,092 | ||||||
| *Lovesac Co. (The) |
1,326 | 103,441 | ||||||
| Lowe’s Cos., Inc. |
105,669 | 24,707,526 | ||||||
| *Lululemon Athletica, Inc. |
15,191 | 7,079,158 | ||||||
| *Lumber Liquidators Holdings, Inc. |
583 | 10,541 | ||||||
| *M/I Homes, Inc. |
2,750 | 157,465 | ||||||
| #Macy’s, Inc. |
36,089 | 955,276 | ||||||
| *Malibu Boats, Inc., Class A |
3,494 | 246,711 | ||||||
| Marine Products Corp. |
1,049 | 13,291 | ||||||
| *MarineMax, Inc. |
2,151 | 111,400 | ||||||
| *Marriott International, Inc., Class A |
39,041 | 6,247,341 | ||||||
| Marriott Vacations Worldwide Corp. |
4,789 | 752,927 | ||||||
| *Mastercraft Boat Holdings, Inc. |
4,144 | 110,976 | ||||||
| *Mattel, Inc. |
26,620 | 580,582 | ||||||
| McDonald’s Corp. |
104,363 | 25,626,335 | ||||||
| *MDC Holdings, Inc. |
9,940 | 486,861 | ||||||
| *Meritage Homes Corp. |
3,700 | 402,227 | ||||||
| MGM Resorts International |
54,546 | 2,572,389 | ||||||
| *Modine Manufacturing Co. |
4,337 | 47,707 | ||||||
Dimensional U.S. Equity ETF
SCHEDULE OF INVESTMENTS
October 31, 2021
| Security Description |
Shares | Fair Value | ||||||
| CONSUMER DISCRETIONARY (Continued) |
| |||||||
| *Mohawk Industries, Inc. |
6,904 | $ | 1,223,458 | |||||
| *Monarch Casino & Resort, Inc. |
1,845 | 133,246 | ||||||
| Monro, Inc. |
3,804 | 234,935 | ||||||
| *Motorcar Parts of America, Inc. |
2,528 | 47,830 | ||||||
| Movado Group, Inc. |
2,287 | 76,157 | ||||||
| #Murphy USA, Inc. |
4,449 | 724,965 | ||||||
| Nathan’s Famous, Inc. |
509 | 31,812 | ||||||
| *National Vision Holdings, Inc. |
8,117 | 500,332 | ||||||
| *Nautilus, Inc. |
4,149 | 42,444 | ||||||
| Newell Brands, Inc. |
44,031 | 1,007,870 | ||||||
| NIKE, Inc., Class B |
174,778 | 29,238,612 | ||||||
| #*Nordstrom, Inc. |
7,784 | 223,634 | ||||||
| #*Norwegian Cruise Line Holdings, Ltd. |
29,731 | 764,681 | ||||||
| *NVR, Inc. |
490 | 2,398,452 | ||||||
| *ODP Corp. (The) |
6,232 | 269,846 | ||||||
| #*Ollie’s Bargain Outlet Holdings, Inc. |
7,467 | 505,217 | ||||||
| *OneSpaWorld Holdings, Ltd. |
978 | 10,562 | ||||||
| *O’Reilly Automotive, Inc. |
10,391 | 6,466,527 | ||||||
| Oxford Industries, Inc. |
1,278 | 118,496 | ||||||
| Papa John’s International, Inc. |
3,902 | 484,160 | ||||||
| #*Party City Holdco, Inc. |
582 | 4,231 | ||||||
| Patrick Industries, Inc. |
2,586 | 201,475 | ||||||
| *Peloton Interactive, Inc., Class A |
28,076 | 2,567,269 | ||||||
| #*Penn National Gaming, Inc. |
11,306 | 809,510 | ||||||
| Penske Automotive Group, Inc. |
4,700 | 498,435 | ||||||
| *Perdoceo Education Corp. |
6,800 | 72,216 | ||||||
| #PetMed Express, Inc. |
2,200 | 62,546 | ||||||
| *Planet Fitness, Inc., Class A |
13,004 | 1,034,468 | ||||||
| *Playa Hotels & Resorts NV |
3,606 | 30,687 | ||||||
| *PlayAGS, Inc. |
2,854 | 25,172 | ||||||
| Polaris, Inc. |
7,285 | 837,411 | ||||||
| Pool Corp. |
5,850 | 3,013,686 | ||||||
| PulteGroup, Inc. |
36,670 | 1,763,094 | ||||||
| #*Purple Innovation, Inc. |
560 | 10,808 | ||||||
| *PVH Corp. |
8,161 | 892,242 | ||||||
| #*QuantumScape Corp. |
242 | 7,003 | ||||||
| *Quotient Technology, Inc. |
8,507 | 54,785 | ||||||
| Qurate Retail, Inc., Class A |
61,479 | 641,841 | ||||||
| Ralph Lauren Corp. |
6,100 | 775,737 | ||||||
| RCI Hospitality Holdings, Inc. |
1,000 | 67,800 | ||||||
| *Red Robin Gourmet Burgers, Inc. |
1,197 | 23,784 | ||||||
| *Red Rock Resorts, Inc., Class A |
8,652 | 470,755 | ||||||
| #*Regis Corp. |
2,300 | 6,210 | ||||||
| Rent-A-Center, Inc. |
6,223 | 331,437 | ||||||
| *Revolve Group, Inc. |
3,157 | 236,901 | ||||||
| *RH |
2,471 | 1,629,946 | ||||||
| *Rocky Brands, Inc. |
231 | 12,601 | ||||||
| *Ross Stores, Inc. |
50,104 | 5,671,773 | ||||||
| #*Royal Caribbean Cruises, Ltd. |
22,289 | 1,881,860 | ||||||
| *RumbleON, Inc., Class B |
84 | 3,277 | ||||||
| *Ruth’s Hospitality Group, Inc. |
4,284 | 82,853 | ||||||
| *Sally Beauty Holdings, Inc. |
10,905 | 166,410 | ||||||
| *Scientific Games Corp. |
5,171 | 413,939 | ||||||
| *SeaWorld Entertainment, Inc. |
360 | 22,860 | ||||||
| *Service Corp. |
23,240 | 1,591,708 | ||||||
| *Shake Shack, Inc., Class A |
3,741 | 258,765 | ||||||
| Shoe Carnival, Inc. |
1,542 | 52,228 | ||||||
Dimensional U.S. Equity ETF
SCHEDULE OF INVESTMENTS
October 31, 2021
| Security Description |
Shares | Fair Value | ||||||
| CONSUMER DISCRETIONARY (Continued) |
| |||||||
| *Shutterstock, Inc. |
2,418 | $ | 292,941 | |||||
| Signet Jewelers, Ltd. |
649 | 57,878 | ||||||
| *Skechers USA, Inc., Class A |
18,759 | 866,853 | ||||||
| *Skyline Champion Corp. |
3,659 | 231,688 | ||||||
| *Sleep Number Corp. |
5,587 | 493,556 | ||||||
| Smith & Wesson Brands, Inc. |
5,455 | 117,282 | ||||||
| Sonic Automotive, Inc., Class A |
4,001 | 197,769 | ||||||
| *Sonos, Inc. |
1,074 | 35,034 | ||||||
| *Standard Motor Products, Inc. |
2,307 | 110,505 | ||||||
| Starbucks Corp. |
163,670 | 17,360,477 | ||||||
| *Steven Madden, Ltd. |
10,374 | 467,867 | ||||||
| *Stitch Fix, Inc., Class A |
436 | 15,086 | ||||||
| *Stoneridge, Inc. |
3,400 | 64,532 | ||||||
| Strategic Education, Inc. |
3,690 | 251,695 | ||||||
| #*Stride, Inc. |
3,695 | 131,172 | ||||||
| *Superior Group of Cos., Inc. |
324 | 8,421 | ||||||
| *Tapestry, Inc. |
34,675 | 1,351,631 | ||||||
| Target Corp. |
70,129 | 18,206,891 | ||||||
| *Taylor Morrison Home Corp. |
15,608 | 476,512 | ||||||
| Tempur Sealy International, Inc. |
26,287 | 1,168,983 | ||||||
| *Tenneco, Inc., Class A |
6,339 | 84,118 | ||||||
| *Terminix Global Holdings, Inc. |
18,832 | 762,319 | ||||||
| *Tesla, Inc. |
108,041 | 120,357,674 | ||||||
| *Texas Roadhouse, Inc. |
7,913 | 702,753 | ||||||
| Thor Industries, Inc. |
4,171 | 425,275 | ||||||
| *TJX Cos, Inc. (The) |
168,904 | 11,061,523 | ||||||
| Toll Brothers, Inc. |
18,494 | 1,112,784 | ||||||
| *TopBuild Corp. |
4,853 | 1,247,075 | ||||||
| *Tractor Supply Co. |
17,210 | 3,737,496 | ||||||
| *Travel + Leisure Co. |
13,585 | 738,209 | ||||||
| *TravelCenters of America, Inc. |
212 | 11,429 | ||||||
| *Tri Pointe Homes, Inc. |
15,179 | 367,180 | ||||||
| #*Tupperware Brands Corp. |
5,616 | 124,900 | ||||||
| *Ulta Beauty, Inc. |
7,286 | 2,676,585 | ||||||
| *Under Armour, Inc., Class A |
25,722 | 564,855 | ||||||
| *Under Armour, Inc., Class C |
15,658 | 295,623 | ||||||
| *Unifi, Inc. |
1,766 | 42,419 | ||||||
| *Universal Electronics, Inc. |
1,700 | 70,006 | ||||||
| *Urban Outfitters, Inc. |
8,745 | 279,228 | ||||||
| Vail Resorts, Inc. |
5,589 | 1,926,584 | ||||||
| #*Veoneer, Inc. |
11,014 | 387,693 | ||||||
| #*Vera Bradley, Inc. |
2,206 | 21,641 | ||||||
| *VF Corp. |
46,104 | 3,360,059 | ||||||
| *Victoria’s Secret & Co. |
5,928 | 299,186 | ||||||
| *Vista Outdoor, Inc. |
7,415 | 310,244 | ||||||
| *Visteon Corp. |
4,605 | 521,194 | ||||||
| #*Wayfair, Inc., Class A |
7,996 | 1,991,804 | ||||||
| Wendy’s Co. (The) |
26,971 | 601,453 | ||||||
| *Whirlpool Corp. |
8,688 | 1,831,691 | ||||||
| Williams-Sonoma, Inc. |
11,314 | 2,101,349 | ||||||
| *Wingstop, Inc. |
4,405 | 759,730 | ||||||
| *Winmark Corp. |
300 | 69,846 | ||||||
| Winnebago Industries, Inc. |
5,624 | 380,689 | ||||||
| *Wolverine World Wide, Inc. |
11,174 | 370,642 | ||||||
| *WW International, Inc. |
5,094 | 88,432 | ||||||
| Wyndham Hotels & Resorts, Inc. |
13,672 | 1,154,874 | ||||||
Dimensional U.S. Equity ETF
SCHEDULE OF INVESTMENTS
October 31, 2021
| Security Description |
Shares | Fair Value | ||||||
| CONSUMER DISCRETIONARY (Continued) |
||||||||
| #*Wynn Resorts, Ltd. |
11,293 | $ | 1,014,111 | |||||
| *XPEL, Inc. |
104 | 7,894 | ||||||
| #*YETI Holdings, Inc. |
2,280 | 224,192 | ||||||
| *Yum! Brands, Inc. |
43,017 | 5,374,544 | ||||||
| *Zumiez, Inc. |
2,400 | 97,680 | ||||||
|
|
|
|||||||
| TOTAL CONSUMER DISCRETIONARY |
782,344,805 | |||||||
|
|
|
|||||||
| CONSUMER STAPLES (5.4%) |
| |||||||
| Albertsons Cos., Inc., Class A |
17 | 526 | ||||||
| Alico, Inc. |
496 | 17,658 | ||||||
| Altria Group, Inc. |
215,944 | 9,525,290 | ||||||
| Andersons, Inc. (The), Class A |
3,578 | 121,867 | ||||||
| *Archer-Daniels-Midland Co. |
76,888 | 4,939,285 | ||||||
| #B&G Foods, Inc. |
7,358 | 216,620 | ||||||
| *Bellring Brands, Inc., Class A |
389 | 10,433 | ||||||
| #*Beyond Meat, Inc. |
3,169 | 313,668 | ||||||
| #*BJ’s Wholesale Club Holdings, Inc. |
15,820 | 924,521 | ||||||
| *Boston Beer Co., Inc. (The), Class A |
1,385 | 682,085 | ||||||
| *Brown-Forman Corp., Class A |
8,944 | 572,684 | ||||||
| *Brown-Forman Corp., Class B |
46,117 | 3,130,883 | ||||||
| Bunge, Ltd. |
17,759 | 1,645,194 | ||||||
| *Calavo Growers, Inc. |
2,560 | 102,912 | ||||||
| Cal-Maine Foods, Inc. |
4,200 | 151,452 | ||||||
| Campbell Soup Co. |
21,060 | 841,347 | ||||||
| Casey’s General Stores, Inc. |
5,266 | 1,008,650 | ||||||
| *Celsius Holdings, Inc. |
2,060 | 198,831 | ||||||
| *Central Garden & Pet Co. |
1,175 | 60,607 | ||||||
| *Central Garden & Pet Co., Class A |
5,927 | 273,827 | ||||||
| *Chefs’ Warehouse, Inc. (The) |
2,307 | 80,445 | ||||||
| #Church & Dwight Co., Inc. |
35,423 | 3,094,553 | ||||||
| Clorox Co. (The) |
17,682 | 2,882,343 | ||||||
| *Coca-Cola Co. (The) |
570,909 | 32,182,140 | ||||||
| Coca-Cola Consolidated, Inc. |
781 | 313,493 | ||||||
| Colgate-Palmolive Co. |
115,460 | 8,796,897 | ||||||
| Conagra Brands, Inc. |
62,350 | 2,007,670 | ||||||
| Constellation Brands, Inc., Class A |
21,868 | 4,741,201 | ||||||
| Costco Wholesale Corp. |
63,220 | 31,075,159 | ||||||
| *Coty, Inc., Class A |
10,668 | 90,465 | ||||||
| *Darling Ingredients, Inc. |
22,944 | 1,939,227 | ||||||
| Edgewell Personal Care Co. |
5,960 | 208,540 | ||||||
| *elf Beauty, Inc. |
3,252 | 105,072 | ||||||
| Energizer Holdings, Inc. |
7,088 | 258,499 | ||||||
| *Estee Lauder Cos, Inc. (The) |
31,962 | 10,366,236 | ||||||
| *Farmer Bros Co. |
1,300 | 9,815 | ||||||
| *Flowers Foods, Inc. |
27,552 | 681,912 | ||||||
| Fresh Del Monte Produce, Inc. |
3,516 | 117,751 | ||||||
| *Freshpet, Inc. |
5,275 | 822,425 | ||||||
| General Mills, Inc. |
82,013 | 5,068,403 | ||||||
| *Grocery Outlet Holding Corp. |
417 | 9,253 | ||||||
| *Hain Celestial Group, Inc. (The) |
9,513 | 426,848 | ||||||
| *Herbalife Nutrition, Ltd. |
14,922 | 692,381 | ||||||
| Hershey Co. (The) |
20,976 | 3,678,142 | ||||||
| #Hormel Foods Corp. |
38,917 | 1,646,967 | ||||||
| #*Hostess Brands, Inc. |
13,566 | 256,533 | ||||||
| Ingles Markets, Inc., Class A |
1,110 | 76,801 | ||||||
| Ingredion, Inc. |
8,117 | 772,982 | ||||||
| *Inter Parfums, Inc. |
3,030 | 279,911 | ||||||
Dimensional U.S. Equity ETF
SCHEDULE OF INVESTMENTS
October 31, 2021
| Security Description |
Shares | Fair Value | ||||||
| CONSUMER STAPLES (Continued) |
| |||||||
| *J & J Snack Foods Corp. |
1,999 | $ | 294,952 | |||||
| #J M Smucker Co. (The) |
13,253 | 1,628,264 | ||||||
| John B Sanfilippo & Son, Inc. |
1,301 | 109,935 | ||||||
| Kellogg Co. |
29,893 | 1,832,441 | ||||||
| Keurig Dr Pepper, Inc. |
37,470 | 1,352,292 | ||||||
| Kimberly-Clark Corp. |
47,686 | 6,174,860 | ||||||
| *Kraft Heinz Co. (The) |
76,468 | 2,744,437 | ||||||
| Kroger Co. (The) |
103,233 | 4,131,385 | ||||||
| #*Lamb Weston Holdings, Inc. |
20,641 | 1,165,184 | ||||||
| *Lancaster Colony Corp. |
3,102 | 527,340 | ||||||
| *Landec Corp. |
3,292 | 31,998 | ||||||
| *Lifeway Foods, Inc. |
315 | 1,714 | ||||||
| McCormick & Co., Inc. |
1,214 | 98,625 | ||||||
| McCormick & Co., Inc. |
35,034 | 2,810,778 | ||||||
| Medifast, Inc. |
2,099 | 411,971 | ||||||
| #MGP Ingredients, Inc. |
1,480 | 95,031 | ||||||
| Molson Coors Beverage Co., Class B |
21,211 | 935,193 | ||||||
| Mondelez International, Inc., Class A |
200,249 | 12,163,124 | ||||||
| *Monster Beverage Corp. |
55,817 | 4,744,445 | ||||||
| National Beverage Corp. |
2,098 | 118,327 | ||||||
| #*Natura & Co. Holding SA, ADR |
3,426 | 47,176 | ||||||
| *Natural Alternatives International, Inc. |
709 | 8,933 | ||||||
| Nu Skin Enterprises, Inc., Class A |
6,264 | 251,500 | ||||||
| *Oil-Dri Corp. of America |
641 | 22,320 | ||||||
| PepsiCo., Inc. |
200,142 | 32,342,947 | ||||||
| *Performance Food Group Co. |
18,275 | 826,578 | ||||||
| Philip Morris International, Inc. |
191,624 | 18,116,133 | ||||||
| *Pilgrim’s Pride Corp. |
8,443 | 237,755 | ||||||
| #*Post Holdings, Inc. |
9,276 | 941,329 | ||||||
| PriceSmart, Inc. |
2,276 | 163,758 | ||||||
| Procter & Gamble Co. (The) |
347,476 | 49,685,593 | ||||||
| #Reynolds Consumer Products, Inc. |
333 | 8,984 | ||||||
| #*Rite Aid Corp. |
3,774 | 51,289 | ||||||
| Rocky Mountain Chocolate Factory, Inc. |
466 | 4,059 | ||||||
| Sanderson Farms, Inc. |
2,302 | 436,114 | ||||||
| *Seneca Foods Corp., Class A |
500 | 25,815 | ||||||
| *Simply Good Foods Co. (The) |
8,680 | 344,162 | ||||||
| *SpartanNash Co. |
4,096 | 94,781 | ||||||
| Spectrum Brands Holdings, Inc. |
3,392 | 318,000 | ||||||
| *Sprouts Farmers Market, Inc. |
13,996 | 309,871 | ||||||
| *Sysco Corp. |
67,461 | 5,187,751 | ||||||
| #*Tattooed Chef, Inc. |
295 | 5,301 | ||||||
| #Tootsie Roll Industries, Inc. |
2,517 | 79,663 | ||||||
| *TreeHouse Foods, Inc. |
6,479 | 234,151 | ||||||
| Turning Point Brands, Inc. |
215 | 8,207 | ||||||
| *Tyson Foods, Inc., Class A |
37,864 | 3,027,984 | ||||||
| *United Natural Foods, Inc. |
6,164 | 267,456 | ||||||
| *United-Guardian, Inc. |
600 | 8,406 | ||||||
| *Universal Corp. |
2,600 | 122,200 | ||||||
| *US Foods Holding Corp. |
28,103 | 974,331 | ||||||
| *USANA Health Sciences, Inc. |
1,600 | 155,296 | ||||||
| Vector Group, Ltd. |
13,895 | 184,248 | ||||||
| *Walgreens Boots Alliance, Inc. |
90,594 | 4,259,730 | ||||||
| Walmart, Inc. |
198,534 | 29,664,950 | ||||||
| #WD-40 Co. |
1,865 | 423,355 | ||||||
| *Weis Markets, Inc. |
1,930 | 108,678 | ||||||
|
|
|
|||||||
| TOTAL CONSUMER STAPLES |
327,741,504 | |||||||
|
|
|
|||||||
Dimensional U.S. Equity ETF
SCHEDULE OF INVESTMENTS
October 31, 2021
| Security Description |
Shares | Fair Value | ||||||
| ENERGY (2.5%) |
| |||||||
| *Adams Resources & Energy, Inc. |
300 | $ | 8,805 | |||||
| Antero Midstream Corp. |
17,726 | 188,605 | ||||||
| *Antero Resources Corp. |
23,670 | 470,323 | ||||||
| Apa Corp. |
50,816 | 1,331,887 | ||||||
| *Arch Resources, Inc. |
2,200 | 200,376 | ||||||
| Archrock, Inc. |
14,846 | 121,589 | ||||||
| *Aspen Aerogels, Inc. |
250 | 13,615 | ||||||
| #Baker Hughes Co. |
80,050 | 2,007,654 | ||||||
| Brigham Minerals, Inc. |
1,002 | 23,226 | ||||||
| *Bristow Group, Inc. |
117 | 4,048 | ||||||
| *Cactus, Inc., Class A |
5,306 | 230,811 | ||||||
| *California Resources Corp. |
97 | 4,475 | ||||||
| *Callon Petroleum Co. |
2,283 | 118,100 | ||||||
| *Centennial Resource Development, Inc., Class A |
17,861 | 128,599 | ||||||
| *ChampionX Corp. |
33,237 | 871,806 | ||||||
| *Cheniere Energy, Inc. |
27,627 | 2,856,632 | ||||||
| #*Chesapeake Energy Corp. |
1,690 | 107,721 | ||||||
| *Chevron Corp. |
237,748 | 27,219,769 | ||||||
| #*Clean Energy Fuels Corp. |
795 | 7,330 | ||||||
| #*CNX Resources Corp. |
26,507 | 387,267 | ||||||
| *Comstock Resources, Inc. |
772 | 7,620 | ||||||
| ConocoPhillips |
169,999 | 12,663,225 | ||||||
| *CONSOL Energy, Inc. |
3,000 | 82,530 | ||||||
| *Contango Oil & Gas Co. |
1,040 | 4,295 | ||||||
| #*Continental Resources, Inc. |
7,953 | 388,186 | ||||||
| Core Laboratories NV |
4,584 | 119,230 | ||||||
| *Coterra Energy, Inc. |
92,904 | 1,980,713 | ||||||
| CVR Energy, Inc. |
3,445 | 66,041 | ||||||
| #*Delek US Holdings, Inc. |
8,768 | 170,538 | ||||||
| *Denbury, Inc. |
3,405 | 288,267 | ||||||
| Devon Energy Corp. |
71,862 | 2,880,229 | ||||||
| DHT Holdings, Inc. |
8,565 | 55,758 | ||||||
| Diamondback Energy, Inc. |
11,680 | 1,251,979 | ||||||
| *DMC Global, Inc. |
1,705 | 71,235 | ||||||
| Dorian LPG, Ltd. |
262 | 3,175 | ||||||
| *Dril-Quip, Inc. |
4,008 | 94,428 | ||||||
| DT Midstream, Inc. |
13,243 | 635,134 | ||||||
| EnLink Midstream LLC |
10,678 | 83,822 | ||||||
| EOG Resources, Inc. |
67,611 | 6,251,313 | ||||||
| *EQT Corp. |
37,425 | 745,132 | ||||||
| *Equitrans Midstream Corp. |
36,077 | 371,954 | ||||||
| *Expro Group Holdings NV |
913 | 15,658 | ||||||
| Exxon Mobil Corp. |
517,515 | 33,364,192 | ||||||
| *Geospace Technologies Corp. |
1,000 | 9,510 | ||||||
| *Green Plains, Inc. |
3,668 | 139,201 | ||||||
| *Gulf Island Fabrication, Inc. |
1,100 | 4,334 | ||||||
| *Gulfport Energy Operating Corp. |
115 | 9,435 | ||||||
| *Halliburton Co. |
102,904 | 2,571,571 | ||||||
| *Helix Energy Solutions Group, Inc. |
16,292 | 61,584 | ||||||
| *Helmerich & Payne, Inc. |
12,288 | 381,420 | ||||||
| Hess Corp. |
33,821 | 2,792,600 | ||||||
| HollyFrontier Corp. |
17,302 | 584,808 | ||||||
| International Seaways, Inc. |
2,198 | 38,575 | ||||||
Dimensional U.S. Equity ETF
SCHEDULE OF INVESTMENTS
October 31, 2021
| Security Description |
Shares | Fair Value | ||||||
| ENERGY (Continued) |
| |||||||
| Kinder Morgan, Inc. |
230,288 | $ | 3,857,324 | |||||
| *Kosmos Energy, Ltd. |
4,212 | 15,163 | ||||||
| #*Laredo Petroleum, Inc. |
229 | 17,267 | ||||||
| *Liberty Oilfield Services, Inc., Class A |
11,300 | 145,996 | ||||||
| Magnolia Oil & Gas Corp., Class A |
18,700 | 390,456 | ||||||
| *Marathon Oil Corp. |
91,664 | 1,495,956 | ||||||
| Marathon Petroleum Corp. |
83,507 | 5,505,616 | ||||||
| *Matador Resources Co. |
12,856 | 538,024 | ||||||
| #*Meta Materials, Inc. |
825 | 3,877 | ||||||
| *Murphy Oil Corp. |
13,748 | 382,607 | ||||||
| *Nabors Industries, Ltd. |
112 | 11,480 | ||||||
| *NACCO Industries, Inc., Class A |
287 | 8,908 | ||||||
| #*National Energy Services Reunited Corp. |
26 | 304 | ||||||
| *Natural Gas Services Group, Inc. |
1,600 | 18,192 | ||||||
| *New Fortress Energy, Inc. |
159 | 4,770 | ||||||
| *NexTier Oilfield Solutions, Inc. |
11,007 | 49,091 | ||||||
| #Nordic American Tankers, Ltd. |
970 | 2,279 | ||||||
| *NOV, Inc. |
44,551 | 624,605 | ||||||
| *Oasis Petroleum, Inc. |
166 | 20,020 | ||||||
| *Occidental Petroleum Corp. |
107,769 | 3,613,495 | ||||||
| *Oceaneering International, Inc. |
11,555 | 157,148 | ||||||
| *Oil States International, Inc. |
6,970 | 42,238 | ||||||
| #ONEOK, Inc. |
51,544 | 3,279,229 | ||||||
| Ovintiv, Inc. |
9,003 | 337,793 | ||||||
| *Par Pacific Holdings, Inc. |
559 | 8,642 | ||||||
| *Patterson-UTI Energy, Inc. |
21,985 | 188,192 | ||||||
| *PBF Energy, Inc., Class A |
11,647 | 170,163 | ||||||
| PDC Energy, Inc. |
12,654 | 661,931 | ||||||
| *Peabody Energy Corp. |
2,184 | 25,968 | ||||||
| *Phillips 66 |
56,227 | 4,204,655 | ||||||
| *Pioneer Natural Resources Co. |
25,090 | 4,691,328 | ||||||
| *ProPetro Holding Corp. |
9,796 | 93,944 | ||||||
| *Range Resources Corp. |
22,350 | 521,202 | ||||||
| *Ranger Oil Corp. |
1,500 | 49,560 | ||||||
| *Renewable Energy Group, Inc. |
5,800 | 371,200 | ||||||
| *REX American Resources Corp. |
400 | 35,180 | ||||||
| #*RPC, Inc. |
7,405 | 39,913 | ||||||
| *Schlumberger NV |
162,055 | 5,227,894 | ||||||
| Scorpio Tankers, Inc. |
5,037 | 80,693 | ||||||
| *SEACOR Marine Holdings, Inc. |
2,211 | 9,861 | ||||||
| SFL Corp., Ltd. |
7,246 | 57,316 | ||||||
| #SM Energy Co. |
7,766 | 266,529 | ||||||
| *Southwestern Energy Co. |
70,224 | 342,693 | ||||||
| *Talos Energy, Inc. |
1,493 | 19,364 | ||||||
| Targa Resources Corp. |
26,589 | 1,453,621 | ||||||
| *Technip Energies NV, ADR |
6,566 | 100,591 | ||||||
| TechnipFMC PLC |
48,764 | 359,391 | ||||||
| #*Tellurian, Inc. |
1,387 | 5,437 | ||||||
| *TETRA Technologies, Inc. |
30 | 97 | ||||||
| Texas Pacific Land Corp. |
34 | 43,305 | ||||||
| *Tidewater, Inc. |
2,855 | 34,631 | ||||||
| #*Transocean, Ltd. |
36,412 | 128,534 | ||||||
| *Uranium Energy Corp. |
714 | 2,656 | ||||||
| *US Silica Holdings, Inc. |
1,309 | 12,671 | ||||||
| Valero Energy Corp. |
56,390 | 4,360,639 | ||||||
| *Weatherford International PLC |
1,475 | 42,863 | ||||||
Dimensional U.S. Equity ETF
SCHEDULE OF INVESTMENTS
October 31, 2021
| Security Description |
Shares | Fair Value | ||||||
| ENERGY (Continued) |
||||||||
| *Whiting Petroleum Corp. |
2,370 | $ | 154,358 | |||||
| *Williams Cos, Inc. (The) |
140,793 | 3,954,875 | ||||||
| World Fuel Services Corp. |
8,836 | 269,763 | ||||||
| TOTAL ENERGY |
153,001,828 | |||||||
| FINANCIALS (12.1%) |
| |||||||
| *1st Source Corp. |
2,189 | 105,685 | ||||||
| *Affiliated Managers Group, Inc. |
6,243 | 1,048,075 | ||||||
| *Aflac, Inc. |
92,551 | 4,967,212 | ||||||
| Alerus Financial Corp. |
120 | 3,768 | ||||||
| *Alleghany Corp. |
1,912 | 1,245,439 | ||||||
| Allegiance Bancshares, Inc. |
585 | 22,914 | ||||||
| *Allstate Corp. (The) |
44,131 | 5,457,681 | ||||||
| Ally Financial, Inc. |
51,536 | 2,460,329 | ||||||
| A-Mark Precious Metals, Inc. |
126 | 9,449 | ||||||
| *AMBAC Financial Group, Inc. |
5,231 | 88,456 | ||||||
| *Amerant BanCorp, Inc. |
480 | 12,744 | ||||||
| *American Equity Investment Life Holding Co. |
11,056 | 352,355 | ||||||
| American Express Co. |
94,501 | 16,422,384 | ||||||
| *American Financial Group, Inc. |
9,040 | 1,229,802 | ||||||
| *American International Group, Inc. |
112,267 | 6,633,857 | ||||||
| American National Group, Inc. |
921 | 174,723 | ||||||
| Ameriprise Financial, Inc. |
17,298 | 5,226,245 | ||||||
| Ameris BanCorp |
6,188 | 324,189 | ||||||
| AMERISAFE, Inc. |
2,573 | 152,553 | ||||||
| Ameriserv Financial, Inc. |
100 | 399 | ||||||
| Aon PLC, Class A |
37,460 | 11,984,203 | ||||||
| #Apollo Global Management, Inc. |
1,182 | 90,955 | ||||||
| *Arch Capital Group, Ltd. |
52,391 | 2,190,992 | ||||||
| Ares Management Corp., Class A |
16,733 | 1,417,954 | ||||||
| Argo Group International Holdings, Ltd. |
4,563 | 251,421 | ||||||
| *Arrow Financial Corp. |
1,123 | 40,260 | ||||||
| Arthur J Gallagher & Co. |
24,894 | 4,173,977 | ||||||
| Artisan Partners Asset Management, Inc., Class A |
5,911 | 292,831 | ||||||
| *Associated Banc-Corp. |
17,590 | 391,905 | ||||||
| Assurant, Inc. |
8,617 | 1,390,008 | ||||||
| Assured Guaranty, Ltd. |
15,273 | 848,873 | ||||||
| *Athene Holding, Ltd., Class A |
10,474 | 911,343 | ||||||
| *Atlantic Capital Bancshares, Inc. |
348 | 9,573 | ||||||
| Atlantic Union Bankshares Corp. |
8,715 | 312,607 | ||||||
| *Atlanticus Holdings Corp. |
879 | 68,114 | ||||||
| Axis Capital Holdings, Ltd. |
12,040 | 626,923 | ||||||
| #*Axos Financial, Inc. |
7,386 | 391,458 | ||||||
| B Riley Financial, Inc. |
197 | 14,117 | ||||||
| Banc of California, Inc. |
5,827 | 118,463 | ||||||
| BancFirst Corp. |
1,856 | 120,659 | ||||||
| *BanCorp, Inc. (The) |
7,159 | 218,707 | ||||||
| *Bank of America Corp. |
1,086,017 | 51,889,892 | ||||||
| *Bank of Hawaii Corp. |
5,506 | 465,257 | ||||||
| *Bank of Marin BanCorp |
398 | 15,168 | ||||||
| Bank of New York Mellon Corp. (The) |
111,625 | 6,608,200 | ||||||
| Bank of NT Butterfield & Son, Ltd. (The) |
6,307 | 226,421 | ||||||
| Bank OZK |
13,990 | 624,933 | ||||||
| BankUnited, Inc. |
7,762 | 314,827 | ||||||
| Banner Corp. |
3,457 | 199,676 | ||||||
| *Berkshire Hathaway, Inc., Class B |
270,863 | 77,740,390 | ||||||
| *Berkshire Hills BanCorp, Inc. |
5,968 | 162,031 | ||||||
Dimensional U.S. Equity ETF
SCHEDULE OF INVESTMENTS
October 31, 2021
| Security Description |
Shares | Fair Value | ||||||
| FINANCIALS (Continued) |
||||||||
| BGC Partners, Inc., Class A |
32,590 | $ | 175,008 | |||||
| BlackRock, Inc. |
18,085 | 17,062,474 | ||||||
| Blackstone, Inc., Class A |
82,495 | 11,418,958 | ||||||
| *Blucora, Inc. |
5,747 | 94,940 | ||||||
| BOK Financial Corp. |
3,544 | 358,546 | ||||||
| *Brighthouse Financial, Inc. |
2,561 | 128,639 | ||||||
| Brightsphere Investment Group, Inc. |
4,501 | 134,940 | ||||||
| Brookline BanCorp, Inc. |
9,168 | 147,146 | ||||||
| Brown & Brown, Inc. |
34,624 | 2,185,121 | ||||||
| *BRP Group, Inc., Class A |
20 | 730 | ||||||
| Bryn Mawr Bank Corp. |
2,279 | 105,609 | ||||||
| *Byline BanCorp, Inc. |
744 | 19,165 | ||||||
| *C, Inc.innati Financial Corp. |
21,018 | 2,552,426 | ||||||
| *Cadence Bank |
23,905 | 693,709 | ||||||
| *Cambridge BanCorp |
153 | 14,047 | ||||||
| Camden National Corp. |
980 | 46,648 | ||||||
| *Cannae Holdings, Inc. |
8,602 | 293,328 | ||||||
| *Capital City Bank Group, Inc. |
1,069 | 28,724 | ||||||
| Capital One Financial Corp. |
62,928 | 9,504,016 | ||||||
| Capitol Federal Financial, Inc. |
16,583 | 201,152 | ||||||
| *Cathay General BanCorp |
10,048 | 423,925 | ||||||
| Cboe Global Markets, Inc. |
14,145 | 1,866,291 | ||||||
| CBTX, Inc. |
84 | 2,285 | ||||||
| *Central Pacific Financial Corp. |
4,331 | 119,059 | ||||||
| *Charles Schwab Corp. (The) |
189,202 | 15,520,240 | ||||||
| Chubb, Ltd. |
58,065 | 11,344,740 | ||||||
| #CIT Group, Inc. |
13,624 | 674,797 | ||||||
| Citigroup, Inc. |
272,521 | 18,847,552 | ||||||
| Citizens Community BanCorp, Inc. |
600 | 8,160 | ||||||
| Citizens Financial Group, Inc. |
54,404 | 2,577,661 | ||||||
| *Citizens, Inc. |
4,015 | 25,857 | ||||||
| *City Holding Co. |
2,057 | 163,696 | ||||||
| CME Group, Inc. |
46,770 | 10,315,123 | ||||||
| *CNA Financial Corp. |
4,268 | 191,462 | ||||||
| *CNB Financial Corp. |
280 | 7,188 | ||||||
| CNO Financial Group, Inc. |
21,156 | 510,706 | ||||||
| #Cohen & Steers, Inc. |
3,356 | 318,451 | ||||||
| Columbia Banking System, Inc. |
9,081 | 309,934 | ||||||
| *Columbia Financial, Inc. |
4,380 | 81,556 | ||||||
| *Comerica, Inc. |
19,122 | 1,627,091 | ||||||
| *Commerce Bancshares, Inc. |
16,312 | 1,150,159 | ||||||
| #*Community Bank System, Inc. |
7,087 | 507,925 | ||||||
| *Community Trust BanCorp, Inc. |
1,749 | 76,396 | ||||||
| ConnectOne BanCorp, Inc. |
3,305 | 111,478 | ||||||
| *Consumer Portfolio Services, Inc. |
1,025 | 6,693 | ||||||
| *Cowen, Inc., Class A |
4,014 | 151,448 | ||||||
| *Crawford & Co., Class A |
3,717 | 32,115 | ||||||
| *Crawford & Co., Class B |
1,800 | 14,868 | ||||||
| #*Credit Acceptance Corp. |
1,078 | 644,870 | ||||||
| *CrossFirst Bankshares, Inc. |
1,414 | 20,121 | ||||||
| *Cullen/Frost Bankers, Inc. |
7,481 | 968,789 | ||||||
| Customers BanCorp, Inc. |
3,069 | 163,547 | ||||||
| CVB Financial Corp. |
13,683 | 273,934 | ||||||
| Diamond Hill Investment Group, Inc. |
388 | 84,142 | ||||||
| Dime Community Bancshares, Inc. |
1,017 | 36,287 | ||||||
| *Discover Financial Services |
44,360 | 5,026,875 | ||||||
Dimensional U.S. Equity ETF
SCHEDULE OF INVESTMENTS
October 31, 2021
| Security Description |
Shares | Fair Value | ||||||
| FINANCIALS (Continued) |
| |||||||
| Donegal Group, Inc., Class A |
1,374 | $ | 19,579 | |||||
| *Donnelley Financial Solutions, Inc. |
3,430 | 131,438 | ||||||
| *Eagle BanCorp, Inc. |
3,534 | 199,989 | ||||||
| East West BanCorp, Inc. |
19,266 | 1,531,262 | ||||||
| *eHealth, Inc. |
2,800 | 124,180 | ||||||
| *Employers Holdings, Inc. |
3,900 | 150,540 | ||||||
| *Encore Capital Group, Inc. |
3,141 | 169,677 | ||||||
| *Enova International, Inc. |
4,073 | 132,128 | ||||||
| *Enstar Group, Ltd. |
1,386 | 319,861 | ||||||
| *Enterprise Financial Services Corp. |
3,506 | 164,852 | ||||||
| Equitable Holdings, Inc. |
16,931 | 567,188 | ||||||
| #Erie Indemnity Co., Class A |
3,717 | 764,996 | ||||||
| Essa BanCorp, Inc. |
707 | 11,489 | ||||||
| Essent Group, Ltd. |
11,696 | 561,408 | ||||||
| Evercore, Inc. |
5,612 | 852,126 | ||||||
| Everest Re Group, Ltd. |
5,624 | 1,470,676 | ||||||
| *FactSet Research Systems, Inc. |
5,431 | 2,410,767 | ||||||
| Farmers National Banc Corp. |
332 | 5,916 | ||||||
| FB Financial Corp. |
2,295 | 104,032 | ||||||
| *Federal Agricultural Mortgage Corp. |
1,266 | 159,630 | ||||||
| *Federated Hermes, Inc. |
11,287 | 375,970 | ||||||
| Fednat Holding Co. |
1,029 | 2,614 | ||||||
| Fidelity National Financial, Inc. |
34,954 | 1,674,646 | ||||||
| Fifth Third BanCorp |
97,955 | 4,263,981 | ||||||
| #*Financial Institutions, Inc. |
1,243 | 39,677 | ||||||
| First American Financial Corp. |
15,828 | 1,157,660 | ||||||
| *First BanCorp |
29,967 | 409,050 | ||||||
| First BanCorp/Southern Pines Nc |
2,719 | 131,654 | ||||||
| *First Bancshares, Inc. (The) |
643 | 25,881 | ||||||
| First Busey Corp. |
5,191 | 132,319 | ||||||
| #First Citizens Bancshares, Inc., Class A |
716 | 582,752 | ||||||
| *First Commonwealth Financial Corp. |
13,481 | 206,259 | ||||||
| #First Community Bankshares, Inc. |
1,700 | 55,114 | ||||||
| *First Financial BanCorp |
10,146 | 241,272 | ||||||
| First Financial Bankshares, Inc. |
18,335 | 929,951 | ||||||
| *First Financial Corp. |
1,135 | 48,635 | ||||||
| First Foundation, Inc. |
1,183 | 31,480 | ||||||
| First Hawaiian, Inc. |
10,300 | 284,177 | ||||||
| *First Horizon Corp. |
68,261 | 1,158,389 | ||||||
| First Interstate BancSystem, Inc., Class A |
3,739 | 155,430 | ||||||
| *First Merchants Corp. |
6,618 | 275,176 | ||||||
| *First Mid Bancshares, Inc. |
403 | 17,361 | ||||||
| *First Midwest BanCorp, Inc. |
13,054 | 251,289 | ||||||
| First of Long Island Corp. (The) |
194 | 3,905 | ||||||
| First Republic Bank |
23,367 | 5,054,983 | ||||||
| FirstCash, Inc. |
5,865 | 518,877 | ||||||
| *Flagstar BanCorp, Inc. |
3,908 | 184,418 | ||||||
| Flushing Financial Corp. |
3,151 | 75,687 | ||||||
| *FNB Corp. |
17,842 | 207,859 | ||||||
| Franklin Resources, Inc. |
42,424 | 1,335,932 | ||||||
| *Fulton Financial Corp. |
19,492 | 313,821 | ||||||
| *GAMCO Investors, Inc., Class A |
467 | 12,352 | ||||||
| *Genworth Financial, Inc., Class A |
15,939 | 65,509 | ||||||
| #*German American BanCorp, Inc. |
2,097 | 82,664 | ||||||
| #Glacier BanCorp, Inc. |
12,326 | 681,505 | ||||||
| Global Indemnity Group LLC, Class A |
1,192 | 29,311 | ||||||
| Globe Life, Inc. |
14,825 | 1,319,721 | ||||||
Dimensional U.S. Equity ETF
SCHEDULE OF INVESTMENTS
October 31, 2021
| Security Description |
Shares | Fair Value | ||||||
| FINANCIALS (Continued) |
| |||||||
| Goldman Sachs Group, Inc. (The) |
45,143 | $ | 18,659,859 | |||||
| #Goosehead Insurance, Inc., Class A |
114 | 16,450 | ||||||
| Great Southern BanCorp, Inc. |
1,100 | 62,073 | ||||||
| *Great Western BanCorp, Inc. |
6,451 | 219,657 | ||||||
| *Green Dot Corp., Class A |
6,227 | 263,776 | ||||||
| *Greenlight Capital Re, Ltd., Class A |
2,682 | 19,927 | ||||||
| *Hallmark Financial Services, Inc. |
1,034 | 3,443 | ||||||
| *Hamilton Lane, Inc., Class A |
3,058 | 319,592 | ||||||
| *Hancock Whitney Corp. |
9,868 | 488,269 | ||||||
| *Hanmi Financial Corp. |
3,508 | 77,842 | ||||||
| Hanover Insurance Group, Inc. (The) |
5,148 | 648,648 | ||||||
| HarborOne BanCorp, Inc. |
1,551 | 22,288 | ||||||
| *Hartford Financial Services Group, Inc. (The) |
46,474 | 3,389,349 | ||||||
| HCI Group, Inc. |
1,104 | 147,947 | ||||||
| Heartland Financial USA, Inc. |
4,337 | 217,370 | ||||||
| *Heritage Commerce Corp. |
6,041 | 72,432 | ||||||
| Heritage Financial Corp. |
2,982 | 74,073 | ||||||
| *Hilltop Holdings, Inc. |
10,005 | 354,577 | ||||||
| *Home Bancshares, Inc. |
17,844 | 423,973 | ||||||
| HomeStreet, Inc. |
2,186 | 103,092 | ||||||
| *Hometrust Bancshares, Inc. |
1,062 | 32,285 | ||||||
| Hope BanCorp, Inc. |
14,900 | 217,391 | ||||||
| Horace Mann Educators Corp. |
5,072 | 198,721 | ||||||
| Horizon BanCorp, Inc. |
2,741 | 52,271 | ||||||
| *Houlihan Lokey, Inc. |
6,022 | 674,946 | ||||||
| *Huntington Bancshares, Inc. |
135,362 | 2,130,598 | ||||||
| Independence Holding Co. |
2,640 | 129,492 | ||||||
| *Independent Bank Corp. |
128 | 2,884 | ||||||
| Independent Bank Corp. |
4,532 | 382,954 | ||||||
| Independent Bank Group, Inc. |
3,987 | 288,220 | ||||||
| Interactive Brokers Group, Inc. |
9,327 | 660,818 | ||||||
| Intercontinental Exchange, Inc. |
75,991 | 10,521,714 | ||||||
| International Bancshares Corp. |
7,443 | 315,583 | ||||||
| Invesco, Ltd. |
44,420 | 1,128,712 | ||||||
| Investors BanCorp, Inc. |
32,700 | 500,310 | ||||||
| James River Group Holdings, Ltd. |
4,238 | 135,404 | ||||||
| Janus Henderson Group PLC |
11,028 | 512,802 | ||||||
| Jefferies Financial Group, Inc. |
15,725 | 676,175 | ||||||
| JPMorgan Chase & Co. |
425,131 | 72,225,506 | ||||||
| Kearny Financial Corp. |
9,199 | 123,451 | ||||||
| *Kemper Corp. |
7,095 | 450,391 | ||||||
| *KeyCorp. |
124,147 | 2,888,901 | ||||||
| Kinsale Capital Group, Inc. |
3,211 | 600,939 | ||||||
| KKR & Co., Inc. |
54,792 | 4,365,279 | ||||||
| *Lakeland BanCorp, Inc. |
3,852 | 69,259 | ||||||
| #Lakeland Financial Corp. |
3,269 | 234,943 | ||||||
| Lazard, Ltd., Class A |
9,689 | 474,664 | ||||||
| *LendingClub Corp. |
8,347 | 383,628 | ||||||
| *LendingTree, Inc. |
1,129 | 182,209 | ||||||
| *Lincoln National Corp. |
26,839 | 1,936,434 | ||||||
| #Live Oak Bancshares, Inc. |
2,928 | 261,119 | ||||||
| *Loews Corp. |
31,990 | 1,793,679 | ||||||
| LPL Financial Holdings, Inc. |
11,831 | 1,940,521 | ||||||
| M&T Bank Corp. |
16,737 | 2,462,347 | ||||||
| *Macatawa Bank Corp. |
886 | 7,442 | ||||||
| *Markel Corp. |
1,772 | 2,326,866 | ||||||
Dimensional U.S. Equity ETF
SCHEDULE OF INVESTMENTS
October 31, 2021
| Security Description |
Shares | Fair Value | ||||||
| FINANCIALS (Continued) |
| |||||||
| MarketAxess Holdings, Inc. |
5,139 | $ | 2,100,155 | |||||
| *Marlin Business Services Corp. |
1,200 | 27,504 | ||||||
| Marsh & McLennan Cos., Inc. |
70,925 | 11,830,290 | ||||||
| #*MBIA, Inc. |
14,600 | 226,884 | ||||||
| *Mercantile Bank Corp. |
340 | 11,686 | ||||||
| *Mercury General Corp. |
3,146 | 171,426 | ||||||
| Meridian BanCorp, Inc. |
4,269 | 99,041 | ||||||
| Meta Financial Group, Inc. |
3,525 | 195,426 | ||||||
| MetLife, Inc. |
98,846 | 6,207,529 | ||||||
| #*Metropolitan Bank Holding Corp. |
173 | 15,719 | ||||||
| *MGIC Investment Corp. |
22,524 | 363,988 | ||||||
| *Midland States BanCorp, Inc. |
401 | 10,290 | ||||||
| Moelis & Co., Class A |
6,101 | 443,787 | ||||||
| *Moody’s Corp. |
23,993 | 9,696,771 | ||||||
| Morgan Stanley |
203,464 | 20,912,030 | ||||||
| Morningstar, Inc. |
3,213 | 1,017,718 | ||||||
| *Mr Cooper Group, Inc. |
5,941 | 260,453 | ||||||
| MSCI, Inc. |
11,785 | 7,835,611 | ||||||
| *MVB Financial Corp. |
16 | 683 | ||||||
| *Nasdaq, Inc. |
15,459 | 3,244,380 | ||||||
| *National Bank Holdings Corp., Class A |
4,119 | 178,641 | ||||||
| *National Western Life Group, Inc., Class A |
278 | 59,773 | ||||||
| Navient Corp. |
24,123 | 475,223 | ||||||
| *NBT BanCorp, Inc. |
5,324 | 195,338 | ||||||
| Nelnet, Inc., Class A |
3,140 | 259,458 | ||||||
| *New York Community BanCorp, Inc. |
52,702 | 655,086 | ||||||
| *Nicolet Bankshares, Inc. |
220 | 15,816 | ||||||
| *NMI Holdings, Inc., Class A |
9,277 | 225,246 | ||||||
| #*Northern Trust Corp. |
27,407 | 3,372,157 | ||||||
| Northfield BanCorp, Inc. |
5,064 | 88,873 | ||||||
| Northrim BanCorp, Inc. |
600 | 26,652 | ||||||
| *Northwest Bancshares, Inc. |
15,031 | 207,428 | ||||||
| *OceanFirst Financial Corp. |
5,910 | 131,025 | ||||||
| OFG BanCorp |
7,064 | 182,958 | ||||||
| *Old National BanCorp |
19,095 | 326,143 | ||||||
| Old Republic International Corp. |
32,967 | 851,538 | ||||||
| OneMain Holdings, Inc. |
9,392 | 495,991 | ||||||
| *Open Lending Corp., Class A |
411 | 12,955 | ||||||
| *Oppenheimer Holdings, Inc., Class A |
765 | 39,818 | ||||||
| Origin BanCorp, Inc. |
684 | 30,506 | ||||||
| Pacific Premier BanCorp, Inc. |
7,195 | 302,118 | ||||||
| *PacWest BanCorp |
13,977 | 663,488 | ||||||
| *Palomar Holdings, Inc. |
1,717 | 157,020 | ||||||
| *Park National Corp. |
1,429 | 183,755 | ||||||
| *Patriot National BanCorp, Inc. |
20 | 192 | ||||||
| *Peapack-Gladstone Financial Corp. |
1,562 | 52,405 | ||||||
| PennyMac Financial Services, Inc. |
184 | 11,419 | ||||||
| *Peoples BanCorp, Inc. |
1,433 | 45,799 | ||||||
| People’s United Financial, Inc. |
49,988 | 856,794 | ||||||
| Pinnacle Financial Partners, Inc. |
10,246 | 989,456 | ||||||
| *Piper Sandler Cos. |
1,784 | 293,807 | ||||||
| PJT Partners, Inc., Class A |
2,713 | 221,896 | ||||||
| PNC Financial Services Group, Inc. (The) |
59,555 | 12,567,892 | ||||||
| *Popular, Inc. |
11,636 | 947,636 | ||||||
| Pr, Inc.ipal Financial Group, Inc. |
34,334 | 2,303,468 | ||||||
| *PRA Group, Inc. |
5,710 | 244,845 | ||||||
| Preferred Bank |
1,290 | 88,455 | ||||||
Dimensional U.S. Equity ETF
SCHEDULE OF INVESTMENTS
October 31, 2021
| Security Description |
Shares | Fair Value | ||||||
| FINANCIALS (Continued) |
| |||||||
| Premier Financial Corp. |
3,504 | $ | 111,707 | |||||
| Primerica, Inc. |
6,193 | 1,041,910 | ||||||
| ProAssurance Corp. |
6,155 | 141,011 | ||||||
| #*Prog Holdings, Inc. |
9,248 | 374,082 | ||||||
| Progressive Corp. (The) |
81,939 | 7,774,372 | ||||||
| #*Prosperity Bancshares, Inc. |
11,850 | 892,423 | ||||||
| Provident Financial Services, Inc. |
8,272 | 204,815 | ||||||
| *Prudential Financial, Inc. |
50,840 | 5,594,942 | ||||||
| Pzena Investment Management, Inc., Class A |
566 | 6,158 | ||||||
| QCR Holdings, Inc. |
479 | 26,412 | ||||||
| #*Radian Group, Inc. |
18,341 | 437,800 | ||||||
| Raymond James Financial, Inc. |
23,590 | 2,325,738 | ||||||
| Regional Management Corp. |
133 | 6,794 | ||||||
| Regions Financial Corp. |
138,795 | 3,286,666 | ||||||
| *Reinsurance Group of America, Inc. |
7,890 | 931,651 | ||||||
| Reliant BanCorp, Inc. |
136 | 4,608 | ||||||
| RenaissanceRe Holdings, Ltd. |
5,405 | 766,429 | ||||||
| Renasant Corp. |
4,049 | 151,473 | ||||||
| *Republic BanCorp, Inc., Class A |
805 | 43,486 | ||||||
| *Republic First BanCorp, Inc. |
500 | 1,550 | ||||||
| Riverview BanCorp, Inc. |
1,205 | 8,905 | ||||||
| *RLI Corp. |
6,072 | 657,658 | ||||||
| S&P Global, Inc. |
33,980 | 16,111,957 | ||||||
| *S&T BanCorp, Inc. |
4,265 | 130,338 | ||||||
| *Safeguard Scientifics, Inc. |
1,767 | 14,825 | ||||||
| Safety Insurance Group, Inc. |
1,800 | 141,138 | ||||||
| *Sandy Spring BanCorp, Inc. |
5,273 | 250,257 | ||||||
| Santander Consumer USA Holdings, Inc. |
8,747 | 364,750 | ||||||
| *Seacoast Banking Corp. of Florida |
3,865 | 140,802 | ||||||
| #SEI Investments Co. |
18,553 | 1,169,581 | ||||||
| #*Selective Insurance Group, Inc. |
8,091 | 634,092 | ||||||
| *Selectquote, Inc. |
199 | 2,645 | ||||||
| ServisFirst Bancshares, Inc. |
5,260 | 422,431 | ||||||
| #Sierra BanCorp |
240 | 5,990 | ||||||
| Signature Bank |
6,826 | 2,032,919 | ||||||
| *Simmons First National Corp., Class A |
11,644 | 348,039 | ||||||
| *SiriusPoint, Ltd. |
3,922 | 36,867 | ||||||
| SLM Corp. |
53,316 | 978,349 | ||||||
| Southside Bancshares, Inc. |
3,294 | 136,108 | ||||||
| *SouthState Corp. |
4,690 | 366,242 | ||||||
| *State Auto Financial Corp. |
1,800 | 92,358 | ||||||
| State Street Corp. |
50,116 | 4,938,932 | ||||||
| StepStone Group, Inc., Class A |
147 | 6,906 | ||||||
| Sterling BanCorp |
15,708 | 399,769 | ||||||
| Stewart Information Services Corp. |
2,748 | 195,575 | ||||||
| *Stifel Financial Corp. |
13,183 | 960,645 | ||||||
| #*Stock Yards BanCorp, Inc. |
2,725 | 166,906 | ||||||
| *StoneX Group, Inc. |
2,923 | 202,008 | ||||||
| *SVB Financial Group |
7,070 | 5,072,018 | ||||||
| Synchrony Financial |
59,854 | 2,780,218 | ||||||
| Synovus Financial Corp. |
19,151 | 892,245 | ||||||
| T Rowe Price Group, Inc. |
31,131 | 6,751,691 | ||||||
| Territorial BanCorp, Inc. |
840 | 21,076 | ||||||
| *Texas Capital Bancshares, Inc. |
5,760 | 349,056 | ||||||
| TFS Financial Corp. |
9,949 | 193,608 | ||||||
| #*Tompkins Financial Corp. |
1,280 | 105,101 | ||||||
Dimensional U.S. Equity ETF
SCHEDULE OF INVESTMENTS
October 31, 2021
| Security Description |
Shares | Fair Value | ||||||
| FINANCIALS (Continued) |
| |||||||
| Towne Bank |
7,933 | $ | 250,048 | |||||
| Tradeweb Markets, Inc., Class A |
4,880 | 434,808 | ||||||
| Travelers Cos, Inc. (The) |
35,985 | 5,789,267 | ||||||
| TriCo Bancshares |
2,199 | 96,382 | ||||||
| *TriState Capital Holdings, Inc. |
809 | 24,310 | ||||||
| *Triumph BanCorp, Inc. |
3,157 | 370,316 | ||||||
| Truist Financial Corp. |
180,022 | 11,425,996 | ||||||
| #*Trupanion, Inc. |
1,503 | 153,907 | ||||||
| *TrustCo Bank Corp. NY |
1,460 | 48,998 | ||||||
| *Trustmark Corp. |
8,290 | 263,705 | ||||||
| *UMB Financial Corp. |
4,822 | 476,510 | ||||||
| *Umpqua Holdings Corp. |
24,584 | 502,743 | ||||||
| *United Bankshares, Inc. |
14,099 | 521,522 | ||||||
| United Community Banks, Inc. |
10,515 | 366,343 | ||||||
| *United Fire Group, Inc. |
2,420 | 49,441 | ||||||
| United Security Bancshares/Fresno CA |
1,875 | 14,831 | ||||||
| Universal Insurance Holdings, Inc. |
3,400 | 50,218 | ||||||
| *Univest Financial Corp. |
2,249 | 64,546 | ||||||
| Unum Group |
25,765 | 656,235 | ||||||
| US BanCorp |
189,085 | 11,415,061 | ||||||
| Valley National BanCorp |
45,042 | 597,257 | ||||||
| Value Line, Inc. |
135 | 4,651 | ||||||
| *Veritex Holdings, Inc. |
3,395 | 139,025 | ||||||
| *Virtu Financial, Inc., Class A |
6,674 | 166,049 | ||||||
| Virtus Investment Partners, Inc. |
757 | 242,240 | ||||||
| *Voya Financial, Inc. |
19,581 | 1,366,166 | ||||||
| *W R Berkley Corp. |
20,563 | 1,636,815 | ||||||
| Walker & Dunlop, Inc. |
4,148 | 539,530 | ||||||
| *Washington Federal, Inc. |
11,377 | 402,291 | ||||||
| Washington Trust BanCorp, Inc. |
1,700 | 92,922 | ||||||
| Waterstone Financial, Inc. |
1,767 | 36,524 | ||||||
| *Webster Financial Corp. |
10,302 | 576,500 | ||||||
| *Wells Fargo & Co. |
481,144 | 24,615,327 | ||||||
| *WesBanco, Inc. |
5,561 | 193,356 | ||||||
| West BanCorp, Inc. |
2,033 | 64,446 | ||||||
| *Westamerica BanCorp |
3,207 | 178,822 | ||||||
| *Western Alliance BanCorp |
12,000 | 1,393,080 | ||||||
| *Westwood Holdings Group, Inc. |
700 | 12,180 | ||||||
| White Mountains Insurance Group, Ltd. |
483 | 509,560 | ||||||
| Willis Towers Watson PLC |
17,225 | 4,173,273 | ||||||
| Wintrust Financial Corp. |
6,474 | 572,949 | ||||||
| #WisdomTree Investments, Inc. |
6,819 | 43,573 | ||||||
| #*World Acceptance Corp. |
128 | 23,730 | ||||||
| *WSFS Financial Corp. |
7,001 | 362,722 | ||||||
| *Zions BanCorp NA |
25,384 | 1,598,938 | ||||||
|
|
|
|||||||
| TOTAL FINANCIALS |
734,639,240 | |||||||
|
|
|
|||||||
| HEALTH CARE (13.1%) |
| |||||||
| *10X Genomics, Inc., Class A |
3,291 | 530,740 | ||||||
| *1Life Healthcare, Inc. |
256 | 5,545 | ||||||
| Abbott Laboratories |
245,051 | 31,584,623 | ||||||
| AbbVie, Inc. |
246,043 | 28,213,751 | ||||||
| *ABIOMED, Inc. |
6,368 | 2,114,431 | ||||||
| *Acadia Healthcare Co., Inc. |
9,229 | 572,198 | ||||||
| *ACADIA Pharmaceuticals, Inc. |
15,855 | 284,597 | ||||||
| *Acceleron Pharma, Inc. |
6,187 | 1,077,652 | ||||||
| #*Accuray, Inc. |
125 | 624 | ||||||
Dimensional U.S. Equity ETF
SCHEDULE OF INVESTMENTS
October 31, 2021
| Security Description |
Shares | Fair Value | ||||||
| HEALTH CARE (Continued) |
| |||||||
| #*Adaptive Biotechnologies Corp. |
76 | $ | 2,539 | |||||
| *Addus HomeCare Corp. |
1,997 | 186,719 | ||||||
| Agilent Technologies, Inc. |
44,189 | 6,959,326 | ||||||
| #*Agios Pharmaceuticals, Inc. |
793 | 37,271 | ||||||
| *Akebia Therapeutics, Inc. |
9,700 | 27,839 | ||||||
| *Align Technology, Inc., Class A |
10,342 | 6,457,235 | ||||||
| *Alkermes PLC |
18,339 | 555,488 | ||||||
| *Allogene Therapeutics, Inc. |
512 | 8,827 | ||||||
| #*Allscripts Healthcare Solutions, Inc. |
18,020 | 248,316 | ||||||
| *Alnylam Pharmaceuticals, Inc. |
16,237 | 2,590,776 | ||||||
| *Alphatec Holdings, Inc. |
514 | 6,029 | ||||||
| *Amedisys, Inc., Class B |
4,894 | 828,750 | ||||||
| AmerisourceBergen Corp. |
22,377 | 2,730,442 | ||||||
| *Amgen, Inc. |
81,810 | 16,932,216 | ||||||
| *Amicus Therapeutics, Inc. |
22,289 | 234,034 | ||||||
| *AMN Healthcare Services, Inc. |
6,500 | 641,550 | ||||||
| *Amneal Pharmaceuticals, Inc. |
1,220 | 6,698 | ||||||
| *Amphastar Pharmaceuticals, Inc. |
2,755 | 51,463 | ||||||
| *AnaptysBio, Inc. |
2,444 | 80,408 | ||||||
| *AngioDynamics, Inc. |
4,511 | 129,015 | ||||||
| *ANI Pharmaceuticals, Inc. |
786 | 29,381 | ||||||
| #*Anika Therapeutics, Inc. |
1,888 | 78,635 | ||||||
| *Antares Pharma, Inc. |
3,908 | 14,616 | ||||||
| *Anthem, Inc. |
35,318 | 15,367,921 | ||||||
| #*Apollo Medical Holdings, Inc. |
237 | 16,265 | ||||||
| #*Arcus Biosciences, Inc. |
210 | 7,022 | ||||||
| *Arcutis Biotherapeutics, Inc. |
441 | 9,340 | ||||||
| #*Ardelyx, Inc. |
1,511 | 1,828 | ||||||
| *Arena Pharmaceuticals, Inc., Class A |
8,044 | 461,645 | ||||||
| *Arrowhead Pharmaceuticals, Inc. |
10,653 | 679,874 | ||||||
| *Arvinas, Inc. |
2,116 | 183,203 | ||||||
| #*Asensus Surgical, Inc. |
1,142 | 1,930 | ||||||
| AstraZeneca PLC, Sponsored ADR |
59,803 | 3,730,511 | ||||||
| *Atara Biotherapeutics, Inc., Class A |
1,850 | 28,638 | ||||||
| *AtriCure, Inc. |
4,507 | 338,295 | ||||||
| *Atrion Corp. |
200 | 145,600 | ||||||
| *Avanos Medical, Inc. |
5,426 | 171,136 | ||||||
| *Avantor, Inc. |
25,074 | 1,012,488 | ||||||
| *Avid Bioservices, Inc. |
4,347 | 133,366 | ||||||
| *Avidity Biosciences, Inc. |
424 | 9,540 | ||||||
| *Axogen, Inc. |
124 | 1,884 | ||||||
| *Axonics, Inc. |
2,384 | 174,866 | ||||||
| *Baxter International, Inc. |
69,681 | 5,502,012 | ||||||
| *Becton Dickinson and Co. |
37,487 | 8,981,510 | ||||||
| *BioDelivery Sciences International, Inc. |
4,425 | 18,054 | ||||||
| *Biogen, Inc. |
21,805 | 5,814,957 | ||||||
| *Biohaven Pharmaceutical Holding Co., Ltd. |
421 | 59,917 | ||||||
| *Biolife Solutions, Inc. |
163 | 8,663 | ||||||
| *BioMarin Pharmaceutical, Inc. |
21,096 | 1,671,436 | ||||||
| *Bio-Rad Laboratories, Inc., Class A |
3,154 | 2,506,421 | ||||||
| Bio-Techne Corp. |
5,551 | 2,906,781 | ||||||
| #*Bluebird Bio, Inc. |
6,989 | 163,612 | ||||||
| *Blueprint Medicines Corp. |
439 | 49,383 | ||||||
| *Boston Scientific Corp. |
193,119 | 8,329,222 | ||||||
| #*Bridgebio Pharma, Inc. |
2,087 | 103,056 | ||||||
| Bristol-Myers Squibb Co. |
282,878 | 16,520,075 | ||||||
Dimensional U.S. Equity ETF
SCHEDULE OF INVESTMENTS
October 31, 2021
| Security Description |
Shares | Fair Value | ||||||
| HEALTH CARE (Continued) |
| |||||||
| *Brookdale Senior Living, Inc. |
20,225 | $ | 131,463 | |||||
| *Bruker Corp. |
15,269 | 1,226,101 | ||||||
| *Cara Therapeutics, Inc. |
317 | 5,335 | ||||||
| Cardinal Health, Inc. |
35,123 | 1,679,231 | ||||||
| *Cardiovascular Systems, Inc. |
5,512 | 193,361 | ||||||
| *CareDx, Inc. |
2,892 | 147,492 | ||||||
| *Castle Biosciences, Inc. |
307 | 19,141 | ||||||
| *Catalent, Inc. |
21,596 | 2,977,225 | ||||||
| *Catalyst Pharmaceuticals, Inc. |
1,859 | 10,968 | ||||||
| *Celldex Therapeutics, Inc. |
128 | 5,445 | ||||||
| *Centene Corp. |
73,814 | 5,258,509 | ||||||
| Cerner Corp. |
39,620 | 2,943,370 | ||||||
| *Change Healthcare, Inc. |
43,190 | 929,881 | ||||||
| *Charles River Laboratories International, Inc. |
7,199 | 3,230,047 | ||||||
| Chemed Corp. |
2,338 | 1,127,500 | ||||||
| *Cigna Corp. |
48,148 | 10,284,894 | ||||||
| *Codexis, Inc. |
5,486 | 190,748 | ||||||
| *Collegium Pharmaceutical, Inc. |
5,046 | 99,053 | ||||||
| *Community Health Systems, Inc. |
12,349 | 161,772 | ||||||
| *Computer Programs and Systems, Inc. |
1,145 | 41,334 | ||||||
| *Concert Pharmaceuticals, Inc. |
2,800 | 7,672 | ||||||
| CONMED Corp. |
3,632 | 531,289 | ||||||
| Cooper Cos, Inc. (The) |
6,853 | 2,857,153 | ||||||
| *Corcept Therapeutics, Inc. |
14,638 | 263,484 | ||||||
| *CorVel Corp. |
1,799 | 329,613 | ||||||
| *Covetrus, Inc. |
8,433 | 170,262 | ||||||
| *Crinetics Pharmaceuticals, Inc. |
22 | 548 | ||||||
| *Cross Country Healthcare, Inc. |
4,075 | 84,475 | ||||||
| *CryoLife, Inc. |
4,361 | 90,011 | ||||||
| *Cutera, Inc. |
1,500 | 64,500 | ||||||
| CVS Health Corp. |
181,928 | 16,242,532 | ||||||
| Danaher Corp. |
82,522 | 25,727,884 | ||||||
| *DaVita, Inc. |
12,448 | 1,285,132 | ||||||
| *Deciphera Pharmaceuticals, Inc. |
2,337 | 78,032 | ||||||
| *Denali Therapeutics, Inc. |
8,820 | 426,447 | ||||||
| DENTSPLY SIRONA, Inc. |
28,802 | 1,647,762 | ||||||
| *DexCom, Inc. |
13,248 | 8,256,286 | ||||||
| *Eagle Pharmaceuticals, Inc. |
130 | 6,808 | ||||||
| #*Editas Medicine, Inc. |
1,032 | 37,895 | ||||||
| *Edwards Lifesciences Corp. |
87,872 | 10,528,823 | ||||||
| *Elanco Animal Health, Inc. |
59,794 | 1,966,027 | ||||||
| Eli Lilly & Co. |
124,654 | 31,756,853 | ||||||
| *Emergent BioSolutions, Inc. |
6,954 | 331,497 | ||||||
| *Enanta Pharmaceuticals, Inc. |
1,869 | 160,454 | ||||||
| Encompass Health Corp. |
14,435 | 917,489 | ||||||
| *Endo International PLC |
13,361 | 56,784 | ||||||
| Ensign Group, Inc. (The) |
7,060 | 550,751 | ||||||
| *Envista Holdings Corp. |
23,202 | 907,198 | ||||||
| *Enzo Biochem, Inc. |
3,718 | 12,790 | ||||||
| *Evolent Health, Inc., Class A |
7,938 | 232,345 | ||||||
| *Exact Sciences Corp. |
19,076 | 1,816,417 | ||||||
| *Exelixis, Inc. |
39,826 | 856,657 | ||||||
| *Fate Therapeutics, Inc. |
3,436 | 184,857 | ||||||
| #*FibroGen, Inc. |
7,231 | 80,409 | ||||||
| #*Fluidigm Corp. |
5,000 | 25,750 | ||||||
| #*G1 Therapeutics, Inc. |
1,524 | 22,083 | ||||||
| *Generation Bio Co. |
515 | 10,794 | ||||||
Dimensional U.S. Equity ETF
SCHEDULE OF INVESTMENTS
October 31, 2021
| Security Description |
Shares | Fair Value | ||||||
| HEALTH CARE (Continued) |
| |||||||
| Gilead Sciences, Inc. |
145,392 | $ | 9,433,033 | |||||
| *Glaukos Corp. |
3,180 | 145,358 | ||||||
| *Global Blood Therapeutics, Inc. |
6,235 | 227,702 | ||||||
| *Globus Medical, Inc. |
11,357 | 876,420 | ||||||
| #*Guardant Health, Inc. |
5,844 | 682,521 | ||||||
| *Haemonetics Corp. |
7,015 | 482,001 | ||||||
| *Halozyme Therapeutics, Inc. |
5,829 | 221,910 | ||||||
| #*Hanger, Inc. |
3,139 | 58,637 | ||||||
| *Harvard Bioscience, Inc. |
4,139 | 31,167 | ||||||
| HCA Healthcare, Inc. |
37,959 | 9,507,211 | ||||||
| *HealthEquity, Inc. |
4,406 | 291,589 | ||||||
| *HealthStream, Inc. |
2,809 | 74,747 | ||||||
| *Henry Schein, Inc. |
19,924 | 1,521,197 | ||||||
| #*Heron Therapeutics, Inc. |
1,208 | 13,300 | ||||||
| *Heska Corp. |
1,267 | 283,213 | ||||||
| *Hill-Rom Holdings, Inc. |
9,257 | 1,433,909 | ||||||
| *Hologic, Inc. |
37,349 | 2,738,055 | ||||||
| *Horizon Therapeutics PLC |
23,092 | 2,768,962 | ||||||
| Humana, Inc. |
18,650 | 8,637,934 | ||||||
| *Icon PLC |
3,278 | 940,032 | ||||||
| *ICU Medical, Inc. |
2,440 | 571,277 | ||||||
| *IDEXX Laboratories, Inc., Class B |
12,450 | 8,293,443 | ||||||
| *Illumina, Inc. |
20,435 | 8,481,751 | ||||||
| *ImmunoGen, Inc. |
18,787 | 113,286 | ||||||
| #*Inari Medical, Inc. |
46 | 4,164 | ||||||
| *Incyte Corp. |
21,678 | 1,451,992 | ||||||
| *Innoviva, Inc. |
7,526 | 131,329 | ||||||
| *Inogen, Inc., Class A |
2,432 | 96,429 | ||||||
| *Inovalon Holdings, Inc., Class A |
8,468 | 345,410 | ||||||
| #*Inovio Pharmaceuticals, Inc. |
2,541 | 18,143 | ||||||
| *Insmed, Inc. |
204 | 6,151 | ||||||
| *Inspire Medical Systems, Inc. |
34 | 9,166 | ||||||
| *Insulet Corp. |
9,488 | 2,941,470 | ||||||
| *Integer Holdings Corp. |
5,038 | 453,521 | ||||||
| *Integra LifeSciences Holdings Corp. |
9,872 | 656,093 | ||||||
| *Intellia Therapeutics, Inc. |
4,054 | 539,101 | ||||||
| *Intra-Cellular Therapies, Inc. |
7,505 | 323,240 | ||||||
| *IntriCon Corp. |
800 | 13,600 | ||||||
| *Intuitive Surgical, Inc. |
49,353 | 17,822,849 | ||||||
| #*Invitae Corp. |
82 | 2,173 | ||||||
| *Ionis Pharmaceuticals, Inc. |
16,896 | 538,476 | ||||||
| *Iovance Biotherapeutics, Inc. |
467 | 11,353 | ||||||
| *IQVIA Holdings, Inc. |
22,269 | 5,821,562 | ||||||
| *iRhythm Technologies, Inc. |
44 | 3,086 | ||||||
| *Ironwood Pharmaceuticals, Inc. |
17,565 | 224,305 | ||||||
| *IVERIC bio, Inc. |
11,520 | 203,904 | ||||||
| *Jazz Pharmaceuticals PLC |
6,516 | 866,889 | ||||||
| Johnson & Johnson |
367,378 | 59,838,529 | ||||||
| *Joint Corp. (The) |
1,311 | 114,686 | ||||||
| *Karuna Therapeutics, Inc. |
591 | 82,965 | ||||||
| *Kodiak Sciences, Inc. |
38 | 4,449 | ||||||
| *Krystal Biotech, Inc. |
1,109 | 55,550 | ||||||
| *Kura Oncology, Inc. |
837 | 13,744 | ||||||
| *Laboratory Corp. of America Holdings |
13,637 | 3,914,092 | ||||||
| *Lantheus Holdings, Inc. |
5,004 | 117,044 | ||||||
| *LeMaitre Vascular, Inc. |
2,283 | 118,739 | ||||||
Dimensional U.S. Equity ETF
SCHEDULE OF INVESTMENTS
October 31, 2021
| Security Description |
Shares | Fair Value | ||||||
| #*Lensar, Inc. |
1,109 | $ | 7,929 | |||||
| *LHC Group, Inc. |
4,667 | 628,132 | ||||||
| *Ligand Pharmaceuticals, Inc. |
1,893 | 276,264 | ||||||
| *LivaNova PLC |
5,574 | 427,637 | ||||||
| *MacroGenics, Inc. |
2,975 | 58,102 | ||||||
| *Madrigal Pharmaceuticals, Inc. |
502 | 39,030 | ||||||
| *Magellan Health, Inc. |
2,600 | 246,558 | ||||||
| *Masimo Corp. |
7,491 | 2,123,998 | ||||||
| McKesson Corp. |
21,043 | 4,374,419 | ||||||
| *»Medcath Corp. |
1,565 | — | ||||||
| *MEDNAX, Inc. |
13,090 | 356,441 | ||||||
| *Medpace Holdings, Inc. |
3,728 | 844,578 | ||||||
| Medtronic PLC |
188,030 | 22,537,276 | ||||||
| Merck & Co., Inc. |
352,752 | 31,059,814 | ||||||
| *Meridian Bioscience, Inc. |
2,780 | 52,292 | ||||||
| *Merit Medical Systems, Inc. |
7,199 | 484,205 | ||||||
| *Mersana Therapeutics, Inc. |
91 | 779 | ||||||
| Mesa Laboratories, Inc. |
139 | 42,492 | ||||||
| *Mettler-Toledo International, Inc. |
3,441 | 5,095,708 | ||||||
| *Mirati Therapeutics, Inc. |
751 | 141,954 | ||||||
| *Moderna, Inc. |
43,310 | 14,951,045 | ||||||
| *ModivCare, Inc. |
1,606 | 261,409 | ||||||
| *Molina Healthcare, Inc. |
8,159 | 2,412,779 | ||||||
| *Morphic Holding, Inc. |
141 | 8,108 | ||||||
| *Myriad Genetics, Inc. |
8,646 | 266,037 | ||||||
| *Natera, Inc. |
7,984 | 914,727 | ||||||
| *National HealthCare Corp. |
1,000 | 69,940 | ||||||
| *National Research Corp. |
804 | 34,813 | ||||||
| *Natus Medical, Inc. |
3,868 | 96,893 | ||||||
| *Nektar Therapeutics |
18,779 | 284,690 | ||||||
| *Neogen Corp. |
12,218 | 516,944 | ||||||
| *NeoGenomics, Inc. |
11,937 | 549,102 | ||||||
| *Neurocrine Biosciences, Inc. |
11,631 | 1,226,024 | ||||||
| *Nevro Corp. |
949 | 107,939 | ||||||
| *NextGen Healthcare, Inc. |
6,093 | 100,291 | ||||||
| *NGM Biopharmaceuticals, Inc. |
81 | 1,496 | ||||||
| #*Novavax, Inc. |
4,798 | 714,086 | ||||||
| *Novocure, Ltd. |
11,800 | 1,210,326 | ||||||
| #*NuVasive, Inc. |
7,106 | 379,176 | ||||||
| *Omnicell, Inc. |
5,501 | 980,003 | ||||||
| #*OPKO Health, Inc. |
3,131 | 11,866 | ||||||
| *OptimizeRx Corp. |
236 | 22,821 | ||||||
| *Option Care Health, Inc. |
1,086 | 29,680 | ||||||
| *OraSure Technologies, Inc. |
4,876 | 52,027 | ||||||
| Organon & Co. |
35,310 | 1,297,642 | ||||||
| *Orthofix Medical, Inc. |
2,510 | 90,310 | ||||||
| *OrthoPediatrics Corp. |
369 | 26,262 | ||||||
| *Owens & Minor, Inc. |
7,083 | 254,138 | ||||||
| #*Pacific Biosciences of California, Inc. |
324 | 8,580 | ||||||
| *Pacira BioSciences, Inc. |
6,533 | 341,545 | ||||||
| Patterson Cos., Inc. |
10,102 | 315,789 | ||||||
| *»PDL BioPharma, Inc. |
14,616 | 37,855 | ||||||
| *Pennant Group, Inc. (The) |
3,134 | 80,136 | ||||||
| #*Penumbra, Inc. |
4,793 | 1,325,504 | ||||||
| *PerkinElmer, Inc. |
16,360 | 2,893,920 | ||||||
| Perrigo Co. PLC |
16,024 | 723,484 | ||||||
| *Personalis, Inc. |
54 | 1,059 | ||||||
Dimensional U.S. Equity ETF
SCHEDULE OF INVESTMENTS
October 31, 2021
| Security Description |
Shares | Fair Value | ||||||
| HEALTH CARE (Continued) |
| |||||||
| #*PetIQ, Inc. |
3,789 | $ | 94,914 | |||||
| Pfizer, Inc. |
777,093 | 33,990,048 | ||||||
| Phibro Animal Health Corp., Class A |
86 | 1,887 | ||||||
| #*Precision BioSciences, Inc. |
7 | 66 | ||||||
| #Premier, Inc., Class A |
10,388 | 404,613 | ||||||
| *Prestige Consumer Healthcare, Inc. |
5,899 | 353,881 | ||||||
| *Progyny, Inc. |
4,047 | 248,607 | ||||||
| #*Protagonist Therapeutics, Inc. |
2,901 | 90,395 | ||||||
| Quest Diagnostics, Inc. |
17,753 | 2,605,785 | ||||||
| *Quidel Corp. |
5,565 | 738,865 | ||||||
| *R1 RCM, Inc. |
12,772 | 277,152 | ||||||
| *RadNet, Inc. |
2,435 | 75,704 | ||||||
| *RAPT Therapeutics, Inc. |
6 | 189 | ||||||
| *Regeneron Pharmaceuticals, Inc. |
11,548 | 7,390,027 | ||||||
| *REGENXBIO, Inc. |
3,356 | 118,937 | ||||||
| *Repligen Corp. |
5,969 | 1,733,995 | ||||||
| *Replimune Group, Inc. |
217 | 6,404 | ||||||
| *ResMed, Inc. |
20,299 | 5,336,810 | ||||||
| *REVOLUTION Medicines, Inc. |
390 | 11,478 | ||||||
| *Rigel Pharmaceuticals, Inc. |
1,418 | 4,764 | ||||||
| *Rocket Pharmaceuticals, Inc. |
1,011 | 30,037 | ||||||
| *Sangamo Therapeutics, Inc. |
14,032 | 113,940 | ||||||
| *Sarepta Therapeutics, Inc. |
8,528 | 674,821 | ||||||
| #*Scholar Rock Holding Corp. |
144 | 3,787 | ||||||
| *Seagen, Inc. |
17,316 | 3,053,330 | ||||||
| *SeaSpine Holdings Corp. |
919 | 13,748 | ||||||
| Select Medical Holdings Corp. |
14,898 | 494,912 | ||||||
| *Shockwave Medical, Inc. |
2,200 | 470,140 | ||||||
| *SI-BONE, Inc. |
72 | 1,624 | ||||||
| *Spectrum Pharmaceuticals, Inc. |
190 | 348 | ||||||
| *STAAR Surgical Co. |
2,865 | 339,388 | ||||||
| STERIS PLC |
12,408 | 2,900,246 | ||||||
| Stryker Corp. |
47,315 | 12,589,102 | ||||||
| *Supernus Pharmaceuticals, Inc. |
6,256 | 186,742 | ||||||
| *Surgalign Holdings, Inc. |
5,843 | 5,617 | ||||||
| #*Surgery Partners, Inc. |
4,008 | 164,889 | ||||||
| *Surmodics, Inc. |
1,400 | 77,924 | ||||||
| *Sutro Biopharma, Inc. |
355 | 7,157 | ||||||
| *Syndax Pharmaceuticals, Inc. |
314 | 6,107 | ||||||
| *Syneos Health, Inc. |
10,078 | 940,681 | ||||||
| *Tactile Systems Technology, Inc. |
1,413 | 48,734 | ||||||
| *Tandem Diabetes Care, Inc. |
485 | 66,120 | ||||||
| *Taro Pharmaceutical Industries, Ltd. |
923 | 51,291 | ||||||
| #*Teladoc Health, Inc. |
10,340 | 1,546,761 | ||||||
| *Teleflex, Inc. |
6,469 | 2,309,045 | ||||||
| *Tenet Healthcare Corp. |
13,280 | 951,645 | ||||||
| *Thermo Fisher Scientific, Inc. |
55,402 | 35,073,344 | ||||||
| *Tivity Health, Inc. |
411 | 10,283 | ||||||
| *Travere Therapeutics, Inc. |
2,287 | 65,888 | ||||||
| *Triple-S Management Corp., Class B |
2,641 | 93,201 | ||||||
| *Turning Point Therapeutics, Inc. |
351 | 14,595 | ||||||
| #*Twist Bioscience Corp. |
736 | 87,437 | ||||||
| *Ultragenyx Pharmaceutical, Inc. |
462 | 38,771 | ||||||
| *United Therapeutics Corp. |
5,583 | 1,065,013 | ||||||
| UnitedHealth Group, Inc. |
132,814 | 61,156,863 | ||||||
| *Universal Health Services, Inc., Class B |
10,409 | 1,291,757 | ||||||
Dimensional U.S. Equity ETF
SCHEDULE OF INVESTMENTS
October 31, 2021
| Security Description |
Shares | Fair Value | ||||||
| HEALTH CARE (Continued) |
| |||||||
| US Physical Therapy, Inc. |
1,603 | $ | 172,900 | |||||
| *Utah Medical Products, Inc. |
276 | 26,725 | ||||||
| *Vanda Pharmaceuticals, Inc. |
1,737 | 29,737 | ||||||
| *Varex Imaging Corp. |
4,622 | 124,101 | ||||||
| *VBI Vaccines, Inc. |
858 | 2,488 | ||||||
| *Veeva Systems, Inc., Class A |
19,295 | 6,116,708 | ||||||
| #*Vericel Corp. |
4,081 | 187,808 | ||||||
| *Vertex Pharmaceuticals, Inc. |
34,915 | 6,456,831 | ||||||
| Viatris, Inc. |
153,455 | 2,048,624 | ||||||
| *ViewRay, Inc. |
269 | 1,966 | ||||||
| #*Viking Therapeutics, Inc. |
171 | 995 | ||||||
| *Vocera Communications, Inc. |
2,535 | 143,430 | ||||||
| *Waters Corp. |
8,691 | 3,194,377 | ||||||
| West Pharmaceutical Services, Inc. |
10,226 | 4,395,953 | ||||||
| *Xencor, Inc. |
5,879 | 232,573 | ||||||
| *Xenon Pharmaceuticals, Inc. |
445 | 13,862 | ||||||
| *y-Mabs Therapeutics, Inc. |
389 | 9,554 | ||||||
| Zimmer Biomet Holdings, Inc. |
28,319 | 4,053,015 | ||||||
| Zoetis, Inc. |
67,060 | 14,498,372 | ||||||
| *Zogenix, Inc. |
3,262 | 50,006 | ||||||
|
|
|
|||||||
| TOTAL HEALTH CARE |
794,679,565 | |||||||
|
|
|
|||||||
| INDUSTRIALS (9.0%) 3M Co. |
73,962 | 13,215,530 | ||||||
| A O Smith Corp. |
17,264 | 1,261,480 | ||||||
| *AAON, Inc. |
7,351 | 526,699 | ||||||
| *AAR Corp. |
3,583 | 126,731 | ||||||
| ABM Industries, Inc. |
6,207 | 273,170 | ||||||
| ACCO Brands Corp. |
8,820 | 72,941 | ||||||
| Acme United Corp. |
400 | 14,800 | ||||||
| Acuity Brands, Inc. |
4,607 | 946,416 | ||||||
| ADT, Inc. |
5,359 | 44,748 | ||||||
| Advanced Drainage Systems, Inc. |
7,202 | 812,386 | ||||||
| *AECOM |
22,319 | 1,525,950 | ||||||
| Aerojet Rocketdyne Holdings, Inc. |
11,246 | 494,936 | ||||||
| *AeroVironment, Inc. |
2,752 | 245,231 | ||||||
| *AGCO Corp. |
8,730 | 1,066,893 | ||||||
| Air Lease Corp. |
11,973 | 479,519 | ||||||
| *Air Transport Services Group, Inc. |
8,728 | 217,240 | ||||||
| Alamo Group, Inc. |
1,990 | 300,888 | ||||||
| *Alaska Air Group, Inc. |
14,055 | 742,104 | ||||||
| Albany International Corp. |
4,033 | 325,261 | ||||||
| *Allegiant Travel Co. |
1,647 | 288,670 | ||||||
| Allegion PLC |
12,951 | 1,661,613 | ||||||
| Allison Transmission Holdings, Inc. |
17,479 | 583,099 | ||||||
| Altra Industrial Motion Corp. |
5,270 | 274,831 | ||||||
| AMERCO |
1,101 | 811,426 | ||||||
| *Ameresco, Inc., Class A |
1,721 | 141,346 | ||||||
| #*American Airlines Group, Inc. |
10,162 | 195,110 | ||||||
| *American Woodmark Corp. |
1,591 | 109,365 | ||||||
| *AMETEK, Inc. |
32,148 | 4,256,395 | ||||||
| *API Group Corp. |
4,204 | 91,563 | ||||||
| Apogee Enterprises, Inc. |
3,000 | 125,790 | ||||||
| Applied Industrial Technologies, Inc. |
4,882 | 475,897 | ||||||
| ArcBest Corp. |
3,060 | 274,941 | ||||||
| Arcosa, Inc. |
6,333 | 327,606 | ||||||
| Argan, Inc. |
1,347 | 55,577 | ||||||
Dimensional U.S. Equity ETF
SCHEDULE OF INVESTMENTS
October 31, 2021
| Security Description |
Shares | Fair Value | ||||||
| INDUSTRIALS (Continued) |
| |||||||
| *Armstrong Flooring, Inc. |
2,092 | $ | 5,941 | |||||
| Armstrong World Industries, Inc. |
7,140 | 754,341 | ||||||
| *ASGN, Inc. |
6,140 | 734,712 | ||||||
| *Astec Industries, Inc. |
2,360 | 125,977 | ||||||
| *Astronics Corp. |
1,186 | 15,299 | ||||||
| *Astronics Corp., Class B |
2,338 | 29,798 | ||||||
| *Atkore, Inc. |
6,493 | 613,783 | ||||||
| *Atlas Air Worldwide Holdings, Inc., Class A |
3,208 | 260,233 | ||||||
| #*Avis Budget Group, Inc. |
10,677 | 1,850,431 | ||||||
| *Axon Enterprise, Inc. |
8,160 | 1,468,474 | ||||||
| *Azek Co., Inc. (The) |
1,328 | 48,724 | ||||||
| AZZ, Inc. |
2,800 | 148,764 | ||||||
| *Barnes Group, Inc. |
6,294 | 263,970 | ||||||
| *Barrett Business Services, Inc. |
825 | 67,650 | ||||||
| *Beacon Roofing Supply, Inc. |
6,846 | 361,948 | ||||||
| *BlueLinx Holdings, Inc. |
87 | 4,144 | ||||||
| *Boeing Co. (The) |
75,601 | 15,651,675 | ||||||
| Boise Cascade Co. |
6,147 | 348,043 | ||||||
| *Booz Allen Hamilton Holding Corp. |
20,332 | 1,766,038 | ||||||
| *Brady Corp., Class A |
6,719 | 349,993 | ||||||
| *BrightView Holdings, Inc. |
1,305 | 20,697 | ||||||
| *Brink’s Co. (The) |
7,064 | 486,568 | ||||||
| *Builders FirstSource, Inc. |
26,283 | 1,531,510 | ||||||
| #BWX Technologies, Inc. |
13,126 | 744,769 | ||||||
| *CACI International, Inc., Class A |
3,815 | 1,097,347 | ||||||
| CAI International, Inc. |
1,400 | 78,302 | ||||||
| *Carlisle Cos., Inc. |
8,390 | 1,870,299 | ||||||
| #Carrier Global Corp. |
116,549 | 6,087,354 | ||||||
| *Casella Waste Systems, Inc. |
7,934 | 688,036 | ||||||
| Caterpillar, Inc. |
76,474 | 15,601,461 | ||||||
| *CBIZ, Inc. |
5,697 | 209,137 | ||||||
| *CECO Environmental Corp. |
1,246 | 8,572 | ||||||
| CH Robinson Worldwide, Inc. |
18,446 | 1,789,078 | ||||||
| *Chart Industries, Inc. |
3,869 | 686,825 | ||||||
| *Cimpress PLC |
3,502 | 312,799 | ||||||
| *Cintas Corp. |
12,070 | 5,227,517 | ||||||
| *CIRCOR International, Inc. |
1,580 | 45,093 | ||||||
| *Clarivate PLC |
1,989 | 46,642 | ||||||
| *Clean Harbors, Inc. |
7,346 | 826,719 | ||||||
| *Colfax Corp. |
8,105 | 418,380 | ||||||
| *Columbus McKinnon Corp. |
2,320 | 109,666 | ||||||
| *Comfort Systems USA, Inc. |
4,932 | 451,130 | ||||||
| *Commercial Vehicle Group, Inc. |
1,374 | 13,795 | ||||||
| *Construction Partners, Inc., Class A |
713 | 25,390 | ||||||
| #*Copa Holdings SA, Class A |
3,579 | 264,703 | ||||||
| *Copart, Inc. |
29,664 | 4,606,523 | ||||||
| *Cornerstone Building Brands, Inc. |
729 | 10,432 | ||||||
| Costamare, Inc. |
165 | 2,213 | ||||||
| *CoStar Group, Inc. |
53,110 | 4,570,116 | ||||||
| Covanta Holding Corp. |
6,730 | 135,811 | ||||||
| *Covenant Logistics Group, Inc. |
779 | 22,124 | ||||||
| *CPI Aerostructures, Inc. |
541 | 1,623 | ||||||
| CRA International, Inc. |
1,072 | 117,727 | ||||||
| *Crane Co. |
5,866 | 605,840 | ||||||
| CSW Industrials, Inc. |
1,519 | 210,564 | ||||||
| #*CSX Corp. |
318,280 | 11,512,188 | ||||||
Dimensional U.S. Equity ETF
SCHEDULE OF INVESTMENTS
October 31, 2021
| Security Description |
Shares | Fair Value | ||||||
| INDUSTRIALS (Continued) |
| |||||||
| *Cummins, Inc. |
19,730 | $ | 4,732,043 | |||||
| *Curtiss-Wright Corp. |
5,745 | 733,522 | ||||||
| Deere & Co. |
41,902 | 14,343,474 | ||||||
| *Delta Air Lines, Inc. |
84,499 | 3,306,446 | ||||||
| *Deluxe Corp. |
5,176 | 184,628 | ||||||
| *Donaldson Co., Inc. |
17,602 | 1,056,296 | ||||||
| Douglas Dynamics, Inc. |
3,141 | 132,864 | ||||||
| *Dover Corp. |
20,136 | 3,404,595 | ||||||
| *Ducommun, Inc. |
1,100 | 53,229 | ||||||
| *Dxp Enterprises, Inc. |
1,275 | 42,024 | ||||||
| *Dycom Industries, Inc. |
3,886 | 308,626 | ||||||
| *Eastern Co. (The) |
600 | 14,418 | ||||||
| Eaton Corp PLC |
54,973 | 9,057,351 | ||||||
| *Echo Global Logistics, Inc. |
2,925 | 141,073 | ||||||
| EMCOR Group, Inc. |
8,359 | 1,015,535 | ||||||
| *Emerson Electric Co. |
84,343 | 8,182,114 | ||||||
| *Encore Wire Corp. |
3,195 | 428,322 | ||||||
| *Energy Recovery, Inc. |
3,111 | 63,216 | ||||||
| Enerpac Tool Group Corp. |
6,875 | 143,619 | ||||||
| EnerSys |
5,842 | 467,594 | ||||||
| #Ennis, Inc. |
2,716 | 51,441 | ||||||
| EnPro Industries, Inc. |
3,009 | 269,787 | ||||||
| *Equifax, Inc. |
17,670 | 4,902,188 | ||||||
| *ESCO Technologies, Inc. |
4,368 | 369,358 | ||||||
| *Evoqua Water Technologies Corp. |
9,072 | 379,482 | ||||||
| Expeditors International of Washington, Inc. |
23,742 | 2,926,439 | ||||||
| Exponent, Inc. |
7,408 | 850,438 | ||||||
| Fastenal Co. |
80,430 | 4,590,944 | ||||||
| *Federal Signal Corp. |
8,821 | 377,627 | ||||||
| FedEx Corp. |
34,691 | 8,170,771 | ||||||
| Flowserve Corp. |
14,300 | 480,766 | ||||||
| *Fluor Corp. |
15,628 | 303,808 | ||||||
| *Forrester Research, Inc. |
1,137 | 60,545 | ||||||
| Fortive Corp. |
41,801 | 3,164,754 | ||||||
| Fortune Brands Home & Security, Inc. |
19,602 | 1,987,643 | ||||||
| *Forward Air Corp. |
4,083 | 410,586 | ||||||
| *Franklin Covey Co. |
1,500 | 63,375 | ||||||
| *Franklin Electric Co., Inc. |
5,400 | 466,452 | ||||||
| *FTI Consulting, Inc. |
5,764 | 829,555 | ||||||
| #*Fuelcell Energy, Inc. |
510 | 4,075 | ||||||
| *GATX Corp. |
4,700 | 445,795 | ||||||
| Genco Shipping & Trading, Ltd. |
519 | 8,911 | ||||||
| *Gencor Industries, Inc. |
600 | 6,696 | ||||||
| *Generac Holdings, Inc. |
8,724 | 4,349,437 | ||||||
| General Dynamics Corp. |
31,796 | 6,446,639 | ||||||
| General Electric Co. |
127,434 | 13,364,004 | ||||||
| *Gibraltar Industries, Inc. |
4,240 | 276,278 | ||||||
| Global Industrial Co. |
373 | 15,136 | ||||||
| #*GMS, Inc. |
4,411 | 218,477 | ||||||
| *Gorman-Rupp Co. (The) |
2,441 | 103,791 | ||||||
| Graco, Inc. |
24,692 | 1,856,345 | ||||||
| *GrafTech International, Ltd. |
14,670 | 156,969 | ||||||
| *Graham Corp. |
1,500 | 19,065 | ||||||
| Granite Construction, Inc. |
5,361 | 199,000 | ||||||
| *Great Lakes Dredge & Dock Corp. |
6,665 | 101,441 | ||||||
| *Greenbrier Cos., Inc. (The) |
3,749 | 153,784 | ||||||
| *Griffon Corp. |
5,073 | 134,384 | ||||||
Dimensional U.S. Equity ETF
SCHEDULE OF INVESTMENTS
October 31, 2021
| Security Description |
Shares | Fair Value | ||||||
| INDUSTRIALS (Continued) |
| |||||||
| *GXO Logistics, Inc. |
13,017 | $ | 1,155,910 | |||||
| *H&E Equipment Services, Inc. |
3,851 | 173,603 | ||||||
| *Harsco Corp. |
2,475 | 42,323 | ||||||
| *Hawaiian Holdings, Inc. |
5,254 | 101,665 | ||||||
| #*Healthcare Services Group, Inc. |
8,532 | 163,729 | ||||||
| Heartland Express, Inc. |
5,162 | 84,295 | ||||||
| HEICO Corp. |
6,163 | 859,061 | ||||||
| HEICO Corp., Class A |
11,031 | 1,386,376 | ||||||
| *Heidrick & Struggles International, Inc. |
1,861 | 87,244 | ||||||
| Helios Technologies, Inc. |
3,497 | 318,402 | ||||||
| Herc Holdings, Inc. |
1,683 | 306,373 | ||||||
| *Heritage-Crystal Clean, Inc. |
192 | 6,657 | ||||||
| *Herman Miller, Inc. |
9,680 | 376,746 | ||||||
| *Hexcel Corp. |
10,956 | 621,643 | ||||||
| Hillenbrand, Inc. |
843 | 38,323 | ||||||
| *HNI Corp. |
5,067 | 189,506 | ||||||
| #Honeywell International, Inc. |
97,977 | 21,419,732 | ||||||
| *Howmet Aerospace, Inc. |
50,912 | 1,511,577 | ||||||
| *Hub Group, Inc., Class A |
4,334 | 340,522 | ||||||
| *Hubbell, Inc. |
7,530 | 1,501,256 | ||||||
| *Hudson Global, Inc. |
314 | 5,244 | ||||||
| *Huntington Ingalls Industries, Inc. |
5,833 | 1,182,524 | ||||||
| *Hurco Cos., Inc. |
883 | 28,653 | ||||||
| *Huron Consulting Group, Inc., Class A |
2,384 | 119,581 | ||||||
| *Hyster-Yale Materials Handling, Inc. |
1,066 | 51,211 | ||||||
| *IAA, Inc. |
20,090 | 1,198,369 | ||||||
| ICF International, Inc. |
2,077 | 208,718 | ||||||
| IDEX Corp. |
10,819 | 2,407,985 | ||||||
| *IES Holdings, Inc., Class A |
858 | 42,771 | ||||||
| *Illinois Tool Works, Inc. |
44,645 | 10,173,256 | ||||||
| *Ingersoll Rand, Inc. |
44,706 | 2,403,395 | ||||||
| Innovative Solutions and Support, Inc. |
1,906 | 12,885 | ||||||
| Insperity, Inc. |
5,673 | 709,125 | ||||||
| Insteel Industries, Inc. |
2,000 | 81,340 | ||||||
| *Interface, Inc. |
6,700 | 96,212 | ||||||
| ITT, Inc. |
12,990 | 1,221,969 | ||||||
| Jacobs Engineering Group, Inc. |
19,073 | 2,678,231 | ||||||
| *JB Hunt Transport Services, Inc. |
12,053 | 2,376,731 | ||||||
| *JELD-WEN Holding, Inc. |
8,372 | 229,477 | ||||||
| *JetBlue Airways Corp. |
27,280 | 382,738 | ||||||
| John Bean Technologies Corp., Class A |
4,192 | 619,368 | ||||||
| Johnson Controls International PLC |
103,442 | 7,589,540 | ||||||
| Kadant, Inc. |
1,315 | 292,088 | ||||||
| *Kaman Corp. |
3,743 | 133,962 | ||||||
| *Kansas City Southern |
13,029 | 4,042,247 | ||||||
| *KAR Auction Services, Inc. |
16,984 | 249,155 | ||||||
| #KBR, Inc. |
19,625 | 832,885 | ||||||
| *Kelly Services, Inc., Class A |
2,829 | 51,007 | ||||||
| *Kennametal, Inc. |
9,699 | 385,535 | ||||||
| *Kforce, Inc. |
3,285 | 212,737 | ||||||
| *Kimball International, Inc., Class B |
4,201 | 45,665 | ||||||
| *Kirby Corp. |
6,589 | 345,329 | ||||||
| *Knight-Swift Transportation Holdings, Inc. |
16,523 | 936,689 | ||||||
| Korn Ferry |
6,571 | 507,347 | ||||||
| *Kratos Defense & Security Solutions, Inc. |
12,152 | 259,931 | ||||||
| *L B Foster Co., Class A |
581 | 9,255 | ||||||
Dimensional U.S. Equity ETF
SCHEDULE OF INVESTMENTS
October 31, 2021
| Security Description |
Shares | Fair Value | ||||||
| INDUSTRIALS (Continued) |
| |||||||
| *L3Harris Technologies, Inc. |
30,233 | $ | 6,969,916 | |||||
| *Landstar System, Inc. |
5,264 | 925,464 | ||||||
| *Lawson Products, Inc. |
649 | 32,904 | ||||||
| *Leidos Holdings, Inc. |
18,906 | 1,890,222 | ||||||
| Lennox International, Inc. |
4,771 | 1,427,865 | ||||||
| *Lincoln Electric Holdings, Inc. |
8,460 | 1,204,704 | ||||||
| *Lindsay Corp. |
1,349 | 196,509 | ||||||
| Lockheed Martin Corp. |
34,895 | 11,596,306 | ||||||
| #LSI Industries, Inc. |
2,400 | 17,856 | ||||||
| Luxfer Holdings PLC |
345 | 6,938 | ||||||
| *Lyft, Inc., Class A |
29,904 | 1,371,696 | ||||||
| Macquarie Infrastructure Holdings LLC |
8,465 | 31,236 | ||||||
| *Manitowoc Co., Inc. (The) |
2,711 | 58,097 | ||||||
| ManpowerGroup, Inc. |
8,089 | 781,802 | ||||||
| *ManTech International Corp., Class A |
4,027 | 347,208 | ||||||
| Marten Transport, Ltd. |
8,380 | 139,359 | ||||||
| *Masco Corp. |
36,812 | 2,413,027 | ||||||
| *Masonite International Corp. |
1,341 | 160,933 | ||||||
| *MasTec, Inc. |
8,146 | 726,053 | ||||||
| *Matrix Service Co. |
3,023 | 30,925 | ||||||
| Matson, Inc. |
5,571 | 463,953 | ||||||
| *Matthews International Corp., Class A |
3,280 | 112,734 | ||||||
| Maxar Technologies, Inc. |
1,605 | 42,613 | ||||||
| McGrath RentCorp. |
2,804 | 202,281 | ||||||
| #*Mercury Systems, Inc. |
6,361 | 327,846 | ||||||
| *Meritor, Inc. |
9,605 | 233,786 | ||||||
| *Middleby Corp. (The) |
7,157 | 1,305,723 | ||||||
| *Miller Industries, Inc. |
1,421 | 51,355 | ||||||
| *Mistras Group, Inc. |
1,002 | 9,840 | ||||||
| *Moog, Inc., Class A |
3,947 | 298,117 | ||||||
| *MRC Global, Inc. |
9,392 | 77,954 | ||||||
| *MSA Safety, Inc. |
5,248 | 803,101 | ||||||
| *MSC Industrial Direct Co., Inc. |
5,873 | 493,743 | ||||||
| *Mueller Industries, Inc. |
5,863 | 308,628 | ||||||
| *Mueller Water Products, Inc., Class A |
20,756 | 340,606 | ||||||
| *MYR Group, Inc. |
2,505 | 255,886 | ||||||
| National Presto Industries, Inc. |
737 | 61,282 | ||||||
| Nielsen Holdings PLC |
38,855 | 786,814 | ||||||
| Nordson Corp. |
7,405 | 1,882,425 | ||||||
| *Norfolk Southern Corp. |
35,777 | 10,484,450 | ||||||
| Northrop Grumman Corp. |
22,256 | 7,950,288 | ||||||
| *NOW, Inc. |
15,137 | 109,289 | ||||||
| *NV5 Global, Inc. |
1,435 | 149,427 | ||||||
| nVent Electric PLC |
22,165 | 785,749 | ||||||
| Old Dominion Freight Line, Inc. |
13,267 | 4,528,690 | ||||||
| Omega Flex, Inc. |
302 | 43,718 | ||||||
| Oshkosh Corp. |
9,200 | 984,400 | ||||||
| Otis Worldwide Corp. |
54,456 | 4,373,361 | ||||||
| Owens Corning |
14,078 | 1,315,026 | ||||||
| *PACCAR, Inc. |
45,399 | 4,068,658 | ||||||
| *PAM Transportation Services, Inc. |
470 | 29,055 | ||||||
| Park Aerospace Corp. |
2,087 | 27,319 | ||||||
| *Parker-Hannifin Corp. |
18,160 | 5,386,074 | ||||||
| *Park-Ohio Holdings Corp. |
500 | 11,660 | ||||||
| Pentair PLC |
23,133 | 1,711,148 | ||||||
| *Perma-Pipe International Holdings, Inc. |
996 | 8,516 | ||||||
| *PGT Innovations, Inc. |
7,509 | 160,317 | ||||||
Dimensional U.S. Equity ETF
SCHEDULE OF INVESTMENTS
October 31, 2021
| Security Description |
Shares | Fair Value | ||||||
| INDUSTRIALS (Continued) |
| |||||||
| *Pitney Bowes, Inc. |
17,174 | $ | 119,188 | |||||
| #*Plug Power, Inc. |
32,261 | 1,234,628 | ||||||
| *Powell Industries, Inc. |
700 | 18,102 | ||||||
| Primoris Services Corp. |
4,523 | 121,895 | ||||||
| *Proto Labs, Inc. |
4,108 | 245,699 | ||||||
| Quanex Building Products Corp. |
3,800 | 78,736 | ||||||
| Quanta Services, Inc. |
19,527 | 2,368,235 | ||||||
| *Raven Industries, Inc. |
3,878 | 224,226 | ||||||
| Raytheon Technologies Corp. |
196,864 | 17,493,335 | ||||||
| *RBC Bearings, Inc. |
3,946 | 923,088 | ||||||
| *Regal Rexnord Corp. |
8,756 | 1,333,801 | ||||||
| Republic Services, Inc. |
31,446 | 4,232,632 | ||||||
| *Resideo Technologies, Inc. |
14,997 | 369,826 | ||||||
| Resources Connection, Inc. |
3,527 | 61,405 | ||||||
| REV Group, Inc. |
228 | 3,445 | ||||||
| *Robert Half International, Inc. |
16,136 | 1,824,498 | ||||||
| *Rockwell Automation, Inc. |
16,257 | 5,192,486 | ||||||
| Rollins, Inc. |
32,774 | 1,154,628 | ||||||
| *Roper Technologies, Inc. |
14,327 | 6,989,713 | ||||||
| *Rush Enterprises, Inc., Class A |
4,472 | 232,902 | ||||||
| *Ryder System, Inc. |
6,287 | 534,081 | ||||||
| *Saia, Inc. |
4,195 | 1,311,525 | ||||||
| Schneider National, Inc., Class B |
5,924 | 147,745 | ||||||
| Science Applications International Corp. |
8,142 | 730,989 | ||||||
| *Sensata Technologies Holding PLC |
16,771 | 924,082 | ||||||
| *Shyft Group, Inc. (The) |
3,375 | 139,084 | ||||||
| *Sifco Industries, Inc. |
100 | 767 | ||||||
| *Simpson Manufacturing Co., Inc. |
6,128 | 650,120 | ||||||
| *SiteOne Landscape Supply, Inc. |
4,944 | 1,161,642 | ||||||
| *SkyWest, Inc. |
5,801 | 249,617 | ||||||
| *Snap-on, Inc. |
6,917 | 1,405,742 | ||||||
| *Southwest Airlines Co. |
70,066 | 3,312,720 | ||||||
| *SP Plus Corp. |
2,343 | 75,562 | ||||||
| *Spirit AeroSystems Holdings, Inc., Class A |
11,641 | 480,657 | ||||||
| *Spirit Airlines, Inc. |
8,997 | 196,584 | ||||||
| *SPX Corp. |
7,508 | 436,140 | ||||||
| SPX FLOW, Inc. |
5,735 | 428,462 | ||||||
| *Standex International Corp. |
1,817 | 202,178 | ||||||
| *Stanley Black & Decker, Inc. |
20,758 | 3,730,835 | ||||||
| Steelcase, Inc., Class A |
8,272 | 98,437 | ||||||
| *Stericycle, Inc. |
10,421 | 697,373 | ||||||
| *Sterling Construction Co., Inc. |
825 | 19,833 | ||||||
| *Sunrun, Inc. |
12,592 | 726,307 | ||||||
| *Team, Inc. |
2,701 | 6,536 | ||||||
| Tecnoglass, Inc. |
116 | 3,350 | ||||||
| *Tennant Co. |
2,054 | 163,211 | ||||||
| *Terex Corp. |
7,557 | 338,554 | ||||||
| Tetra Tech, Inc. |
8,557 | 1,503,123 | ||||||
| *Textainer Group Holdings, Ltd. |
2,755 | 108,244 | ||||||
| *Textron, Inc. |
31,652 | 2,337,500 | ||||||
| *Thermon Group Holdings, Inc. |
2,619 | 45,256 | ||||||
| *Timken Co. (The) |
8,547 | 606,410 | ||||||
| *Titan Machinery, Inc. |
1,496 | 42,516 | ||||||
| Toro Co. (The) |
14,867 | 1,419,352 | ||||||
| *TPI Composites, Inc. |
2,852 | 95,913 | ||||||
| Trane Technologies PLC |
33,838 | 6,122,309 | ||||||
Dimensional U.S. Equity ETF
SCHEDULE OF INVESTMENTS
October 31, 2021
| Security Description |
Shares | Fair Value | ||||||
| INDUSTRIALS (Continued) |
| |||||||
| *TransDigm Group, Inc. |
6,799 | $ | 4,241,352 | |||||
| TransUnion |
26,980 | 3,110,524 | ||||||
| *Trex Co., Inc. |
18,994 | 2,020,962 | ||||||
| *TriMas Corp. |
6,793 | 226,547 | ||||||
| *TriNet Group, Inc. |
5,779 | 585,124 | ||||||
| Trinity Industries, Inc. |
13,710 | 384,566 | ||||||
| Triton International, Ltd. |
6,236 | 387,817 | ||||||
| *TrueBlue, Inc. |
4,498 | 125,269 | ||||||
| *Tutor Perini Corp. |
1,842 | 25,088 | ||||||
| *Twin Disc, Inc. |
668 | 9,071 | ||||||
| *Uber Technologies, Inc. |
79,115 | 3,466,819 | ||||||
| UFP Industries, Inc. |
8,439 | 690,563 | ||||||
| *UniFirst Corp. |
1,640 | 324,654 | ||||||
| Union Pacific Corp. |
95,269 | 22,997,937 | ||||||
| *United Airlines Holdings, Inc. |
31,421 | 1,449,765 | ||||||
| United Parcel Service, Inc., Class B |
99,531 | 21,246,883 | ||||||
| *United Rentals, Inc. |
7,594 | 2,878,961 | ||||||
| #*Univar Solutions, Inc. |
13,111 | 335,379 | ||||||
| Universal Logistics Holdings, Inc. |
741 | 15,620 | ||||||
| *Upwork, Inc. |
208 | 9,801 | ||||||
| *US Ecology, Inc. |
3,770 | 121,356 | ||||||
| *USA Truck, Inc. |
951 | 18,326 | ||||||
| *Valmont Industries, Inc. |
2,900 | 692,984 | ||||||
| *Vectrus, Inc. |
1,092 | 52,886 | ||||||
| Verisk Analytics, Inc. |
22,027 | 4,631,617 | ||||||
| *Veritiv Corp. |
916 | 98,259 | ||||||
| *Viad Corp. |
2,806 | 124,502 | ||||||
| *Vicor Corp. |
1,314 | 199,189 | ||||||
| *Virco MFG. Corp. |
1,620 | 5,378 | ||||||
| #*Virgin Galactic Holdings, Inc. |
12,273 | 230,119 | ||||||
| *VSE Corp. |
152 | 8,444 | ||||||
| *Wabash National Corp. |
6,947 | 107,887 | ||||||
| Waste Management, Inc. |
59,454 | 9,526,314 | ||||||
| Watsco, Inc. |
4,386 | 1,270,098 | ||||||
| *Watts Water Technologies, Inc., Class A |
3,354 | 637,327 | ||||||
| *Welbilt, Inc. |
15,430 | 365,074 | ||||||
| *Werner Enterprises, Inc. |
8,190 | 371,171 | ||||||
| *WESCO International, Inc. |
3,699 | 479,242 | ||||||
| *Westinghouse Air Brake Technologies Corp. |
21,826 | 1,980,273 | ||||||
| *Willdan Group, Inc. |
20 | 669 | ||||||
| *Willis Lease Finance Corp. |
400 | 16,204 | ||||||
| *WillScot Mobile Mini Holdings Corp. |
23,851 | 828,822 | ||||||
| *Woodward, Inc. |
6,731 | 760,266 | ||||||
| *WW Grainger, Inc. |
6,480 | 3,000,953 | ||||||
| *XPO Logistics, Inc. |
13,210 | 1,133,418 | ||||||
| Xylem, Inc. |
24,466 | 3,195,015 | ||||||
| Zurn Water Solutions Corp. |
15,186 | 550,948 | ||||||
|
|
|
|||||||
| TOTAL INDUSTRIALS |
546,937,832 | |||||||
|
|
|
|||||||
| INFORMATION TECHNOLOGY (28.8%) |
| |||||||
| *3D Systems Corp. |
15,000 | 422,400 | ||||||
| *A10 Networks, Inc. |
1,449 | 27,082 | ||||||
| Accenture PLC, Class A |
88,303 | 31,682,233 | ||||||
| *ACI Worldwide, Inc. |
15,500 | 475,540 | ||||||
| *ACM Research, Inc., Class A |
885 | 93,960 | ||||||
| *ADDvantage Technologies Group, Inc. |
400 | 892 | ||||||
| *Adobe, Inc. |
67,867 | 44,137,982 | ||||||
Dimensional U.S. Equity ETF
SCHEDULE OF INVESTMENTS
October 31, 2021
| Security Description |
Shares | Fair Value | ||||||
| INFORMATION TECHNOLOGY (Continued) |
| |||||||
| ADTRAN, Inc. |
5,562 | $ | 102,786 | |||||
| #*Advanced Energy Industries, Inc. |
5,308 | 487,381 | ||||||
| *Advanced Micro Devices, Inc. |
185,005 | 22,243,151 | ||||||
| *Agilysys, Inc. |
2,004 | 95,631 | ||||||
| *Akamai Technologies, Inc. |
22,279 | 2,349,543 | ||||||
| *Alarm.com Holdings, Inc. |
5,216 | 439,500 | ||||||
| *Alithya Group, Inc., Class A |
1,191 | 3,287 | ||||||
| *Alliance Data Systems Corp. |
4,714 | 401,869 | ||||||
| *Alpha & Omega Semiconductor, Ltd. |
1,918 | 66,459 | ||||||
| *Altair Engineering, Inc., Class A |
4,005 | 311,549 | ||||||
| #*Alteryx, Inc., Class A |
6,164 | 451,143 | ||||||
| *Ambarella, Inc. |
4,616 | 857,791 | ||||||
| Amdocs, Ltd. |
17,959 | 1,397,929 | ||||||
| *American Software, Inc., Class A |
2,676 | 77,417 | ||||||
| *Amkor Technology, Inc. |
20,862 | 457,295 | ||||||
| *Amphenol Corp., Class A |
84,452 | 6,483,380 | ||||||
| Analog Devices, Inc. |
75,255 | 13,055,990 | ||||||
| *Anaplan, Inc. |
13,533 | 882,487 | ||||||
| *ANSYS, Inc. |
12,027 | 4,565,209 | ||||||
| #*Appfolio, Inc., Class A |
2,372 | 312,369 | ||||||
| #*Appian Corp. |
2,000 | 198,820 | ||||||
| *Apple, Inc. |
2,426,513 | 363,491,647 | ||||||
| *Applied Materials, Inc. |
128,085 | 17,502,815 | ||||||
| *Arista Networks, Inc. |
7,386 | 3,025,970 | ||||||
| *Arlo Technologies, Inc. |
7,824 | 53,986 | ||||||
| *Arrow Electronics, Inc. |
10,995 | 1,272,671 | ||||||
| *Asana, Inc., Class A |
513 | 69,665 | ||||||
| *Aspen Technology, Inc. |
9,467 | 1,483,384 | ||||||
| *Atlassian Corp. PLC, Class A |
17,008 | 7,791,875 | ||||||
| *Autodesk, Inc. |
30,615 | 9,723,630 | ||||||
| *Automatic Data Processing, Inc. |
60,561 | 13,595,339 | ||||||
| *Avalara, Inc. |
10,300 | 1,850,292 | ||||||
| *Avaya Holdings Corp. |
10,977 | 204,392 | ||||||
| *Avid Technology, Inc. |
3,837 | 109,892 | ||||||
| *Avnet, Inc. |
13,904 | 529,881 | ||||||
| *Aware, Inc. |
1,934 | 6,808 | ||||||
| *Axcelis Technologies, Inc. |
6,765 | 371,601 | ||||||
| *AXT, Inc. |
3,074 | 25,115 | ||||||
| *Badger Meter, Inc. |
4,796 | 490,391 | ||||||
| *Bel Fuse, Inc., Class B |
1,175 | 16,356 | ||||||
| *Belden, Inc. |
5,268 | 317,186 | ||||||
| Benchmark Electronics, Inc. |
4,988 | 116,270 | ||||||
| *Bill.com Holdings, Inc. |
1,958 | 576,259 | ||||||
| *Black Knight, Inc. |
22,750 | 1,595,002 | ||||||
| *Blackbaud, Inc. |
6,126 | 435,007 | ||||||
| *Blackline, Inc. |
1,512 | 191,827 | ||||||
| *BM Technologies, Inc. |
453 | 4,050 | ||||||
| *Bottomline Technologies DE, Inc. |
5,152 | 238,538 | ||||||
| *Box, Inc., Class A |
15,678 | 404,963 | ||||||
| Broadcom, Inc. |
56,543 | 30,062,217 | ||||||
| Broadridge Financial Solutions, Inc. |
16,505 | 2,944,657 | ||||||
| *Brooks Automation, Inc. |
8,820 | 1,027,089 | ||||||
| *Cadence Design Systems, Inc. |
40,601 | 7,028,439 | ||||||
| *CalAmp Corp. |
2,813 | 27,061 | ||||||
| *Calix, Inc. |
7,769 | 486,262 | ||||||
| *Cantaloupe, Inc. |
465 | 5,813 | ||||||
Dimensional U.S. Equity ETF
SCHEDULE OF INVESTMENTS
October 31, 2021
| Security Description |
Shares | Fair Value | ||||||
| INFORMATION TECHNOLOGY (Continued) |
| |||||||
| Cass Information Systems, Inc. |
1,475 | $ | 60,460 | |||||
| CDK Global, Inc. |
16,908 | 735,836 | ||||||
| CDW Corp. |
19,923 | 3,718,628 | ||||||
| *Cerence, Inc. |
5,094 | 535,532 | ||||||
| *Ceridian HCM Holding, Inc. |
12,123 | 1,518,406 | ||||||
| *CEVA, Inc. |
3,028 | 138,107 | ||||||
| *ChannelAdvisor Corp. |
32 | 816 | ||||||
| *Ciena Corp. |
22,298 | 1,210,558 | ||||||
| *Cirrus Logic, Inc. |
8,158 | 659,248 | ||||||
| Cisco Systems, Inc. |
590,015 | 33,023,140 | ||||||
| Citrix Systems, Inc. |
16,869 | 1,598,000 | ||||||
| *Clearfield, Inc. |
574 | 32,425 | ||||||
| *Cloudflare, Inc., Class A |
10,702 | 2,083,893 | ||||||
| CMC Materials, Inc. |
4,297 | 551,606 | ||||||
| *Cognex Corp. |
24,288 | 2,127,386 | ||||||
| Cognizant Technology Solutions Corp., Class A |
70,215 | 5,483,089 | ||||||
| *Cognyte Software, Ltd. |
8,843 | 176,064 | ||||||
| *Coherent, Inc. |
3,248 | 826,291 | ||||||
| *Cohu, Inc. |
4,733 | 151,645 | ||||||
| *CommScope Holding Co., Inc. |
21,726 | 232,685 | ||||||
| #Communications Systems, Inc. |
901 | 3,424 | ||||||
| *CommVault Systems, Inc. |
5,082 | 312,543 | ||||||
| Comtech Telecommunications Corp. |
3,063 | 66,069 | ||||||
| Concentrix Corp. |
4,934 | 876,673 | ||||||
| *Conduent, Inc. |
19,121 | 129,067 | ||||||
| *Consensus Cloud Solutions, Inc. |
2,093 | 132,550 | ||||||
| *Corning, Inc. |
109,699 | 3,901,993 | ||||||
| *Coupa Software, Inc. |
9,494 | 2,161,784 | ||||||
| *Crowdstrike Holdings, Inc., Class A |
24,075 | 6,784,335 | ||||||
| *CSG Systems International, Inc. |
4,892 | 244,845 | ||||||
| *CTS Corp. |
5,562 | 198,118 | ||||||
| *Cyberoptics Corp. |
1,199 | 50,070 | ||||||
| *Daktronics, Inc. |
4,150 | 23,033 | ||||||
| *Datadog, Inc., Class A |
3,459 | 577,826 | ||||||
| *Dell Technologies, Inc. |
24,278 | 2,670,337 | ||||||
| *Digi International, Inc. |
2,272 | 48,962 | ||||||
| *Digital Turbine, Inc. |
8,470 | 728,928 | ||||||
| *Diodes, Inc. |
6,555 | 629,870 | ||||||
| *DocuSign, Inc. |
15,836 | 4,407,000 | ||||||
| Dolby Laboratories, Inc., Class A |
8,303 | 733,570 | ||||||
| *Dropbox, Inc., Class A |
29,858 | 910,370 | ||||||
| *DSP Group, Inc. |
2,560 | 56,243 | ||||||
| *DXC Technology Co. |
29,773 | 969,707 | ||||||
| *Dynatrace, Inc. |
6,282 | 471,150 | ||||||
| #Ebix, Inc. |
2,616 | 85,831 | ||||||
| *EchoStar Corp., Class A |
5,475 | 128,444 | ||||||
| *Elastic NV |
3,493 | 606,070 | ||||||
| *EMCORE Corp. |
827 | 6,186 | ||||||
| *Enphase Energy, Inc. |
13,966 | 3,234,945 | ||||||
| Entegris, Inc. |
20,305 | 2,858,538 | ||||||
| *Envestnet, Inc. |
7,035 | 587,423 | ||||||
| *EPAM Systems, Inc. |
7,836 | 5,275,509 | ||||||
| *ePlus, Inc. |
1,399 | 154,687 | ||||||
| *Euronet Worldwide, Inc. |
7,097 | 796,212 | ||||||
| *Everbridge, Inc. |
177 | 28,198 | ||||||
| EVERTEC, Inc. |
10,799 | 488,223 | ||||||
| *Evo Payments, Inc., Class A |
5,258 | 113,993 | ||||||
Dimensional U.S. Equity ETF
SCHEDULE OF INVESTMENTS
October 31, 2021
| Security Description |
Shares | Fair Value | ||||||
| INFORMATION TECHNOLOGY (Continued) |
| |||||||
| *ExlService Holdings, Inc. |
4,216 | $ | 517,008 | |||||
| *Extreme Networks, Inc. |
10,656 | 104,748 | ||||||
| *F5 Networks, Inc. |
8,774 | 1,852,630 | ||||||
| *Fabrinet |
5,460 | 524,160 | ||||||
| *Fair Isaac Corp. |
4,247 | 1,691,155 | ||||||
| *FARO Technologies, Inc. |
2,100 | 154,497 | ||||||
| Fidelity National Information Services, Inc. |
87,244 | 9,661,401 | ||||||
| #*First Solar, Inc. |
11,224 | 1,342,278 | ||||||
| *Fiserv, Inc. |
79,338 | 7,814,000 | ||||||
| *Five9, Inc. |
4,812 | 760,344 | ||||||
| *FleetCor Technologies, Inc. |
12,055 | 2,982,528 | ||||||
| *Flex, Ltd. |
68,096 | 1,150,822 | ||||||
| *FormFactor, Inc. |
12,880 | 512,366 | ||||||
| *Fortinet, Inc. |
19,751 | 6,643,051 | ||||||
| *Frequency Electronics, Inc. |
798 | 7,972 | ||||||
| #*fuboTV, Inc. |
77 | 2,295 | ||||||
| *Gartner, Inc. |
11,669 | 3,873,058 | ||||||
| Genpact, Ltd. |
23,128 | 1,141,367 | ||||||
| Global Payments, Inc. |
42,127 | 6,023,740 | ||||||
| *Globant SA |
4,990 | 1,592,758 | ||||||
| *GoDaddy, Inc., Class A |
23,055 | 1,594,714 | ||||||
| *GreenSky, Inc., Class A |
28 | 343 | ||||||
| *Grid Dynamics Holdings, Inc. |
2,525 | 72,594 | ||||||
| *GSI Technology, Inc. |
2,032 | 10,546 | ||||||
| *Guidewire Software, Inc. |
11,821 | 1,486,254 | ||||||
| *Hackett Group, Inc. (The) |
5,500 | 116,270 | ||||||
| *Harmonic, Inc. |
10,205 | 92,559 | ||||||
| Hewlett Packard Enterprise Co. |
182,922 | 2,679,807 | ||||||
| HP, Inc., Class A |
203,672 | 6,177,372 | ||||||
| *HubSpot, Inc. |
6,213 | 5,033,959 | ||||||
| *I3 Verticals, Inc., Class A |
89 | 1,993 | ||||||
| *Ichor Holdings, Ltd. |
2,073 | 90,632 | ||||||
| *II-VI, Inc. |
5,848 | 353,862 | ||||||
| *Impinj, Inc. |
2,300 | 160,356 | ||||||
| *Infinera Corp. |
23,036 | 174,843 | ||||||
| *Insight Enterprises, Inc. |
4,131 | 391,206 | ||||||
| Intel Corp. |
594,424 | 29,126,776 | ||||||
| InterDigital, Inc. |
4,500 | 301,275 | ||||||
| International Business Machines Corp. |
105,655 | 13,217,440 | ||||||
| *International Money Express, Inc. |
173 | 2,896 | ||||||
| *Intevac, Inc. |
2,384 | 11,133 | ||||||
| Intuit, Inc. |
36,171 | 22,642,684 | ||||||
| *IPG Photonics Corp. |
4,920 | 782,329 | ||||||
| *Iteris, Inc. |
600 | 3,216 | ||||||
| *Itron, Inc. |
5,497 | 427,502 | ||||||
| *Jabil, Inc. |
21,595 | 1,294,836 | ||||||
| Jack Henry & Associates, Inc. |
11,317 | 1,884,054 | ||||||
| #*Jamf Holding Corp. |
8 | 381 | ||||||
| Juniper Networks, Inc. |
42,637 | 1,258,644 | ||||||
| *Key Tronic Corp. |
749 | 4,831 | ||||||
| *Keysight Technologies, Inc. |
26,303 | 4,735,066 | ||||||
| *Kimball Electronics, Inc., Class B |
1,875 | 53,906 | ||||||
| *KLA Corp. |
22,352 | 8,331,932 | ||||||
| #*Knowles Corp. |
11,998 | 250,038 | ||||||
| #*Kopin Corp. |
33 | 173 | ||||||
| *Kulicke & Soffa Industries, Inc. |
8,562 | 488,034 | ||||||
Dimensional U.S. Equity ETF
SCHEDULE OF INVESTMENTS
October 31, 2021
| Security Description |
Shares | Fair Value | ||||||
| INFORMATION TECHNOLOGY (Continued) |
| |||||||
| *KVH Industries, Inc. |
2,000 | $ | 20,520 | |||||
| *Lam Research Corp. |
19,722 | 11,114,728 | ||||||
| *Lattice Semiconductor Corp. |
18,314 | 1,271,724 | ||||||
| #*Limelight Networks, Inc. |
14,044 | 41,851 | ||||||
| *Littelfuse, Inc. |
3,069 | 903,974 | ||||||
| *LiveRamp Holdings, Inc. |
9,833 | 526,164 | ||||||
| *Lumentum Holdings, Inc. |
9,298 | 767,829 | ||||||
| *MACOM Technology Solutions Holdings, Inc. |
3,344 | 233,478 | ||||||
| *MagnaChip Semiconductor Corp. |
2,100 | 39,816 | ||||||
| *Mandiant, Inc. |
24,038 | 419,223 | ||||||
| *Manhattan Associates, Inc. |
10,041 | 1,822,843 | ||||||
| Marvell Technology, Inc. |
108,882 | 7,458,417 | ||||||
| Mastercard, Inc., Class A |
124,413 | 41,743,050 | ||||||
| *Maximus, Inc. |
8,666 | 732,884 | ||||||
| *MaxLinear, Inc. |
8,910 | 561,330 | ||||||
| Methode Electronics, Inc. |
5,669 | 238,495 | ||||||
| *Microchip Technology, Inc. |
69,178 | 5,125,398 | ||||||
| Micron Technology, Inc. |
157,345 | 10,872,539 | ||||||
| Microsoft Corp. |
1,007,984 | 334,267,654 | ||||||
| #*MicroStrategy, Inc. |
455 | 325,352 | ||||||
| *Mimecast, Ltd. |
5,953 | 449,094 | ||||||
| *Mitek Systems, Inc. |
5,049 | 95,073 | ||||||
| MKS Instruments, Inc. |
7,486 | 1,123,274 | ||||||
| *Model N, Inc. |
3,298 | 106,888 | ||||||
| *Momentive Global, Inc. |
4,064 | 93,147 | ||||||
| *MoneyGram International, Inc. |
106 | 633 | ||||||
| *MongoDB, Inc. |
6,764 | 3,526,006 | ||||||
| Monolithic Power Systems, Inc. |
6,067 | 3,187,966 | ||||||
| Motorola Solutions, Inc. |
23,720 | 5,896,555 | ||||||
| *N-Able, Inc. |
1,250 | 16,625 | ||||||
| *Napco Security Technologies, Inc. |
133 | 6,379 | ||||||
| *National Instruments Corp. |
15,500 | 658,285 | ||||||
| *NCR Corp. |
16,829 | 665,419 | ||||||
| *NeoPhotonics Corp. |
86 | 870 | ||||||
| #NetApp, Inc. |
33,410 | 2,983,513 | ||||||
| *NETGEAR, Inc. |
3,951 | 113,907 | ||||||
| *NetScout Systems, Inc. |
5,288 | 143,093 | ||||||
| *nLight, Inc. |
1,180 | 33,182 | ||||||
| NortonLifeLock, Inc. |
78,669 | 2,002,126 | ||||||
| *Novanta, Inc. |
4,569 | 788,427 | ||||||
| *Nuance Communications, Inc. |
40,739 | 2,242,682 | ||||||
| *Nutanix, Inc., Class A |
22,151 | 760,001 | ||||||
| NVIDIA Corp. |
337,735 | 86,348,707 | ||||||
| Nxp Semiconductors NV |
36,718 | 7,375,177 | ||||||
| *Okta, Inc. |
16,250 | 4,016,675 | ||||||
| *ON Semiconductor Corp. |
52,647 | 2,530,741 | ||||||
| *OneSpan, Inc. |
841 | 17,173 | ||||||
| *Onto Innovation, Inc. |
11,371 | 900,697 | ||||||
| *Optical Cable Corp. |
668 | 2,578 | ||||||
| Oracle Corp. |
298,001 | 28,590,216 | ||||||
| *OSI Systems, Inc. |
2,134 | 198,697 | ||||||
| *Palantir Technologies, Inc., Class A |
7,284 | 188,510 | ||||||
| *Palo Alto Networks, Inc. |
13,497 | 6,871,188 | ||||||
| *Par Technology Corp. |
1,836 | 115,338 | ||||||
| Paychex, Inc. |
44,961 | 5,542,792 | ||||||
| *Paycom Software, Inc. |
7,264 | 3,979,582 | ||||||
| *Paylocity Holding Corp. |
4,838 | 1,476,267 | ||||||
Dimensional U.S. Equity ETF
SCHEDULE OF INVESTMENTS
October 31, 2021
| Security Description |
Shares | Fair Value | ||||||
| INFORMATION TECHNOLOGY (Continued) |
| |||||||
| *PayPal Holdings, Inc. |
161,088 | $ | 37,467,458 | |||||
| PC Connection, Inc. |
1,900 | 87,495 | ||||||
| *PDF Solutions, Inc. |
3,109 | 73,155 | ||||||
| Pegasystems, Inc. |
4,961 | 588,970 | ||||||
| #*Perficient, Inc. |
2,748 | 339,653 | ||||||
| #*Photronics, Inc. |
5,488 | 71,289 | ||||||
| *Ping Identity Holding Corp. |
513 | 14,533 | ||||||
| *Plantronics, Inc. |
1,023 | 27,375 | ||||||
| *Plexus Corp. |
3,889 | 339,587 | ||||||
| *Power Integrations, Inc. |
8,727 | 900,714 | ||||||
| *Progress Software Corp. |
6,745 | 346,760 | ||||||
| *PTC, Inc. |
14,896 | 1,897,006 | ||||||
| #*Pure Storage, Inc., Class A |
32,597 | 875,555 | ||||||
| *Q2 Holdings, Inc. |
2,469 | 193,718 | ||||||
| Qad, Inc. |
184 | 16,083 | ||||||
| QAD, Inc., Class A |
739 | 64,766 | ||||||
| *Qorvo, Inc. |
16,040 | 2,698,409 | ||||||
| *QUALCOMM, Inc. |
158,188 | 21,045,332 | ||||||
| *Qualys, Inc. |
4,949 | 616,052 | ||||||
| *Rambus, Inc. |
13,895 | 323,337 | ||||||
| #*Ribbon Communications, Inc. |
7,000 | 38,290 | ||||||
| *RingCentral, Inc., Class A |
10,820 | 2,637,700 | ||||||
| *Rogers Corp. |
2,468 | 496,364 | ||||||
| #*Sailpoint Technologies Holdings, Inc. |
5,842 | 280,299 | ||||||
| *salesforce.com, Inc. |
122,379 | 36,675,763 | ||||||
| *Sanmina Corp. |
8,125 | 306,719 | ||||||
| Sapiens International Corp. NV |
654 | 22,844 | ||||||
| *ScanSource, Inc. |
2,184 | 78,144 | ||||||
| Seagate Technology Holdings PLC |
34,183 | 3,044,680 | ||||||
| *Semtech Corp. |
9,964 | 847,239 | ||||||
| *ServiceNow, Inc. |
26,453 | 18,457,845 | ||||||
| *Silicon Laboratories, Inc. |
5,979 | 1,128,596 | ||||||
| *SiTime Corp. |
15 | 3,973 | ||||||
| Skyworks Solutions, Inc. |
23,586 | 3,941,928 | ||||||
| *SMART Global Holdings, Inc. |
522 | 27,906 | ||||||
| *Smartsheet, Inc., Class A |
6,706 | 462,781 | ||||||
| *SolarEdge Technologies, Inc. |
6,401 | 2,270,307 | ||||||
| #SolarWinds Corp. |
1,267 | 20,399 | ||||||
| *Splunk, Inc. |
22,071 | 3,637,742 | ||||||
| *Sprout Social, Inc., Class A |
72 | 9,193 | ||||||
| *SPS Commerce, Inc. |
5,239 | 800,152 | ||||||
| *Square, Inc., Class A |
49,548 | 12,609,966 | ||||||
| SS&C Technologies Holdings, Inc. |
30,807 | 2,448,232 | ||||||
| #*Stratasys, Ltd. |
585 | 18,451 | ||||||
| *Super Micro Computer, Inc. |
3,048 | 107,869 | ||||||
| Switch, Inc., Class A |
692 | 17,494 | ||||||
| *Synaptics, Inc. |
4,704 | 915,257 | ||||||
| SYNNEX Corp. |
5,136 | 539,280 | ||||||
| *Synopsys, Inc. |
21,065 | 7,018,437 | ||||||
| TE Connectivity, Ltd. |
46,560 | 6,797,760 | ||||||
| *Teledyne Technologies, Inc. |
6,158 | 2,766,297 | ||||||
| *Teradata Corp. |
14,630 | 827,473 | ||||||
| *Teradyne, Inc. |
24,286 | 3,357,297 | ||||||
| Texas Instruments, Inc. |
128,211 | 24,036,998 | ||||||
| *Trade Desk, Inc. (The), Class A |
54,190 | 4,059,373 | ||||||
| *TransAct Technologies, Inc. |
600 | 8,472 | ||||||
Dimensional U.S. Equity ETF
SCHEDULE OF INVESTMENTS
October 31, 2021
| Security Description |
Shares | Fair Value | ||||||
| INFORMATION TECHNOLOGY (Continued) |
| |||||||
| *Trimble, Inc. |
34,036 | $ | 2,973,725 | |||||
| TTEC Holdings, Inc. |
2,404 | 226,914 | ||||||
| *TTM Technologies, Inc. |
11,007 | 145,733 | ||||||
| #*Tucows, Inc., Class A |
92 | 7,572 | ||||||
| *Turtle Beach Corp. |
102 | 2,934 | ||||||
| *Twilio, Inc., Class A |
12,431 | 3,621,896 | ||||||
| *Tyler Technologies, Inc. |
5,622 | 3,053,983 | ||||||
| Ubiquiti, Inc. |
940 | 287,198 | ||||||
| *Ultra Clean Holdings, Inc. |
5,256 | 260,540 | ||||||
| *Unisys Corp. |
8,652 | 221,232 | ||||||
| Universal Display Corp. |
5,597 | 1,025,370 | ||||||
| *Upland Software, Inc. |
2,329 | 77,719 | ||||||
| #*Varonis Systems, Inc. |
480 | 31,075 | ||||||
| *Veeco Instruments, Inc. |
5,634 | 136,850 | ||||||
| *Verint Systems, Inc. |
8,873 | 413,482 | ||||||
| *VeriSign, Inc. |
14,870 | 3,311,103 | ||||||
| *Verra Mobility Corp. |
4,295 | 63,910 | ||||||
| #*Viasat, Inc. |
5,606 | 334,622 | ||||||
| #*Viavi Solutions, Inc. |
31,614 | 486,856 | ||||||
| Visa, Inc., Class A |
234,741 | 49,711,102 | ||||||
| #*Vishay Intertechnology, Inc. |
17,135 | 329,335 | ||||||
| *Vishay Precision Group, Inc. |
1,973 | 67,260 | ||||||
| #*VMware, Inc., Class A |
10,797 | 1,637,905 | ||||||
| *Vonage Holdings Corp. |
25,192 | 406,095 | ||||||
| *Vontier Corp. |
17,153 | 580,286 | ||||||
| *Wayside Technology Group, Inc. |
152 | 4,042 | ||||||
| *Western Digital Corp. |
35,421 | 1,852,164 | ||||||
| Western Union Co. (The) |
58,654 | 1,068,676 | ||||||
| *WEX, Inc. |
5,640 | 844,308 | ||||||
| #*Wolfspeed, Inc. |
15,466 | 1,857,621 | ||||||
| *Workday, Inc., Class A |
23,737 | 6,883,255 | ||||||
| *Workiva, Inc. |
194 | 29,013 | ||||||
| Xerox Holdings Corp. |
19,613 | 349,111 | ||||||
| *Xilinx, Inc. |
33,769 | 6,078,420 | ||||||
| Xperi Holding Corp. |
12,766 | 228,767 | ||||||
| *Yext, Inc. |
51 | 642 | ||||||
| *Zebra Technologies Corp. |
7,424 | 3,964,045 | ||||||
| *Zendesk, Inc. |
15,650 | 1,593,170 | ||||||
| #*Ziff Davis, Inc. |
6,296 | 807,588 | ||||||
| *Zix Corp. |
49 | 415 | ||||||
| *Zoom Video Communications, Inc., Class A |
31,929 | 8,769,300 | ||||||
| *Zscaler, Inc. |
9,329 | 2,974,645 | ||||||
|
|
|
|||||||
| TOTAL INFORMATION TECHNOLOGY |
1,754,039,998 | |||||||
|
|
|
|||||||
| MATERIALS (2.7%) |
| |||||||
| *AdvanSix, Inc. |
3,590 | 174,474 | ||||||
| *Air Products and Chemicals, Inc. |
31,068 | 9,314,497 | ||||||
| *Albemarle Corp. |
15,314 | 3,835,698 | ||||||
| Alcoa Corp. |
21,826 | 1,002,905 | ||||||
| *Allegheny Technologies, Inc. |
14,686 | 236,445 | ||||||
| *Alpha Metallurgical Resources, Inc. |
109 | 6,735 | ||||||
| Amcor PLC |
107,977 | 1,303,282 | ||||||
| American Vanguard Corp. |
2,950 | 45,961 | ||||||
| AptarGroup, Inc. |
8,000 | 966,240 | ||||||
| *Arconic Corp. |
14,750 | 433,945 | ||||||
| *Ashland Global Holdings, Inc. |
7,879 | 756,463 | ||||||
| *Avery Dennison Corp. |
11,753 | 2,558,863 | ||||||
Dimensional U.S. Equity ETF
SCHEDULE OF INVESTMENTS
October 31, 2021
| Security Description |
Shares | Fair Value | ||||||
| MATERIALS (Continued) |
| |||||||
| Avient Corp. |
3,599 | $ | 193,914 | |||||
| *Axalta Coating Systems, Ltd. |
17,368 | 541,708 | ||||||
| Balchem Corp. |
4,444 | 680,332 | ||||||
| *Ball Corp. |
45,362 | 4,149,716 | ||||||
| *Berry Global Group, Inc. |
17,048 | 1,117,326 | ||||||
| #*Cabot Corp. |
7,834 | 417,944 | ||||||
| #Carpenter Technology Corp. |
5,725 | 176,788 | ||||||
| Celanese Corp. |
17,337 | 2,800,099 | ||||||
| #*Century Aluminum Co. |
6,132 | 81,004 | ||||||
| *CF Industries Holdings, Inc. |
28,552 | 1,621,754 | ||||||
| Chase Corp. |
1,300 | 124,800 | ||||||
| #*Chemours Co. (The) |
19,620 | 549,752 | ||||||
| #*Clearwater Paper Corp. |
2,101 | 87,885 | ||||||
| #*Cleveland-Cliffs, Inc. |
4,702 | 113,365 | ||||||
| *Coeur Mining, Inc. |
34,390 | 217,689 | ||||||
| #Commercial Metals Co. |
14,172 | 456,055 | ||||||
| Compass Minerals International, Inc. |
3,942 | 258,595 | ||||||
| *Core Molding Technologies, Inc. |
389 | 4,279 | ||||||
| Corteva, Inc. |
93,917 | 4,052,519 | ||||||
| *Crown Holdings, Inc. |
19,629 | 2,041,220 | ||||||
| *Domtar Corp. |
6,303 | 344,081 | ||||||
| *Dow, Inc. |
96,759 | 5,415,601 | ||||||
| DuPont de Nemours, Inc. |
43,422 | 3,022,171 | ||||||
| Eagle Materials, Inc. |
4,819 | 714,947 | ||||||
| Eastman Chemical Co. |
19,032 | 1,979,899 | ||||||
| Ecolab, Inc. |
35,124 | 7,805,255 | ||||||
| Ecovyst, Inc. |
187 | 2,184 | ||||||
| Element Solutions, Inc. |
23,743 | 539,204 | ||||||
| *Ferro Corp. |
9,200 | 193,384 | ||||||
| *Ferroglobe PLC |
459 | 3,043 | ||||||
| FMC Corp. |
18,390 | 1,673,674 | ||||||
| Freeport-McMoRan, Inc. |
188,777 | 7,120,668 | ||||||
| Friedman Industries, Inc. |
599 | 8,242 | ||||||
| FutureFuel Corp. |
1,256 | 8,867 | ||||||
| *GCP Applied Technologies, Inc. |
5,424 | 122,637 | ||||||
| Glatfelter Corp. |
4,200 | 69,006 | ||||||
| *Graphic Packaging Holding Co. |
37,326 | 743,907 | ||||||
| Greif, Inc., Class A |
3,459 | 223,728 | ||||||
| *Hawkins, Inc. |
1,776 | 65,126 | ||||||
| *Haynes International, Inc. |
1,733 | 69,545 | ||||||
| HB Fuller Co. |
6,500 | 458,315 | ||||||
| *Hecla Mining Co. |
49,363 | 285,318 | ||||||
| *Huntsman Corp. |
27,004 | 879,790 | ||||||
| *Ingevity Corp. |
5,163 | 402,249 | ||||||
| Innospec, Inc. |
3,971 | 359,812 | ||||||
| International Flavors & Fragrances, Inc. |
43,153 | 6,362,910 | ||||||
| *International Paper Co. |
48,566 | 2,412,273 | ||||||
| *Intrepid Potash, Inc. |
16 | 779 | ||||||
| Kaiser Aluminum Corp. |
1,800 | 174,852 | ||||||
| *Koppers Holdings, Inc. |
1,900 | 66,671 | ||||||
| *Kraton Corp. |
3,620 | 165,253 | ||||||
| Kronos Worldwide, Inc. |
2,426 | 31,611 | ||||||
| Linde PLC |
73,618 | 23,498,866 | ||||||
| #*Livent Corp. |
17,181 | 484,848 | ||||||
| *Louisiana-Pacific Corp. |
17,032 | 1,003,696 | ||||||
| *LSB Industries, Inc. |
111 | 991 | ||||||
Dimensional U.S. Equity ETF
SCHEDULE OF INVESTMENTS
October 31, 2021
| Security Description |
Shares | Fair Value | ||||||
| MATERIALS (Continued) |
| |||||||
| LyondellBasell Industries NV, Class A |
34,700 | $ | 3,220,854 | |||||
| *Martin Marietta Materials, Inc. |
8,526 | 3,349,354 | ||||||
| *Materion Corp. |
4,323 | 312,034 | ||||||
| *Mercer International, Inc. |
3,588 | 38,643 | ||||||
| *Minerals Technologies, Inc. |
4,297 | 304,829 | ||||||
| Mosaic Co. (The) |
40,601 | 1,687,784 | ||||||
| *Myers Industries, Inc. |
3,889 | 80,036 | ||||||
| *Neenah, Inc. |
1,500 | 75,810 | ||||||
| *NewMarket Corp. |
1,212 | 412,092 | ||||||
| Newmont Corp. |
107,245 | 5,791,230 | ||||||
| *Northern Technologies International Corp. |
600 | 9,150 | ||||||
| Nucor Corp. |
39,163 | 4,372,549 | ||||||
| *O-I Glass, Inc. |
17,572 | 229,315 | ||||||
| *Olin Corp. |
21,720 | 1,237,606 | ||||||
| *Orion Engineered Carbons SA |
873 | 16,412 | ||||||
| Packaging Corp. of America |
13,024 | 1,789,107 | ||||||
| *PPG Industries, Inc. |
33,109 | 5,316,312 | ||||||
| #*Quaker Chemical Corp. |
106 | 26,059 | ||||||
| *Ranpak Holdings Corp. |
332 | 11,441 | ||||||
| *Rayonier Advanced Materials, Inc. |
4,767 | 34,227 | ||||||
| *Reliance Steel & Aluminum Co. |
9,177 | 1,341,310 | ||||||
| Resolute Forest Products, Inc. |
1,023 | 12,030 | ||||||
| *Royal Gold, Inc. |
9,190 | 909,994 | ||||||
| RPM International, Inc. |
18,747 | 1,634,738 | ||||||
| *Schnitzer Steel Industries, Inc. |
1,864 | 100,283 | ||||||
| *Schweitzer-Mauduit International, Inc. |
3,186 | 111,000 | ||||||
| *Scotts Miracle-Gro Co. (The) |
5,929 | 880,219 | ||||||
| Sealed Air Corp. |
21,343 | 1,266,067 | ||||||
| Sensient Technologies Corp. |
5,521 | 527,808 | ||||||
| *Sherwin-Williams Co. (The) |
34,505 | 10,924,628 | ||||||
| *Silgan Holdings, Inc. |
11,347 | 456,149 | ||||||
| *Sonoco Products Co. |
11,964 | 693,314 | ||||||
| Southern Copper Corp. |
10,711 | 642,553 | ||||||
| *Steel Dynamics, Inc. |
24,681 | 1,630,920 | ||||||
| *Stepan Co. |
2,863 | 343,617 | ||||||
| *Summit Materials, Inc., Class A |
11,741 | 418,567 | ||||||
| SunCoke Energy, Inc. |
6,923 | 49,984 | ||||||
| *Sylvamo Corp. |
4,400 | 123,904 | ||||||
| *Synalloy Corp. |
737 | 8,328 | ||||||
| *TimkenSteel Corp. |
4,280 | 59,706 | ||||||
| *Trecora Resources |
613 | 4,769 | ||||||
| *Tredegar Corp. |
2,230 | 26,894 | ||||||
| Trinseo PLC |
3,678 | 206,189 | ||||||
| Tronox Holdings PLC, Class A |
10,897 | 254,118 | ||||||
| *United States Lime & Minerals, Inc. |
353 | 43,588 | ||||||
| *United States Steel Corp. |
21,712 | 572,980 | ||||||
| *Universal Stainless & Alloy Products, Inc. |
545 | 5,167 | ||||||
| Valvoline, Inc. |
20,788 | 705,960 | ||||||
| Verso Corp., Class A |
3,081 | 68,028 | ||||||
| *Vulcan Materials Co. |
17,916 | 3,406,190 | ||||||
| Warrior Met Coal, Inc. |
4,492 | 107,673 | ||||||
| *Westlake Chemical Corp. |
5,140 | 500,328 | ||||||
| Westrock Co. |
30,666 | 1,475,035 | ||||||
| *Worthington Industries, Inc. |
5,620 | 305,278 | ||||||
|
|
|
|||||||
| TOTAL MATERIALS |
165,167,815 | |||||||
|
|
|
|||||||
Dimensional U.S. Equity ETF
SCHEDULE OF INVESTMENTS
October 31, 2021
| Security Description |
Shares | Fair Value | ||||||
| REAL ESTATE (0.1%) |
| |||||||
| *CBRE Group, Inc., Class A |
43,762 | $ | 4,554,749 | |||||
| *Cushman & Wakefield PLC |
914 | 16,808 | ||||||
| #eXp World Holdings, Inc. |
212 | 10,939 | ||||||
| *Five Point Holdings LLC, Class A |
358 | 2,635 | ||||||
| *Forestar Group, Inc. |
384 | 7,515 | ||||||
| *Howard Hughes Corp. (The) |
4,815 | 419,531 | ||||||
| *Jones Lang LaSalle, Inc. |
6,316 | 1,630,981 | ||||||
| *Kennedy-Wilson Holdings, Inc. |
14,870 | 332,642 | ||||||
| *Marcus & Millichap, Inc. |
2,977 | 140,217 | ||||||
| Newmark Group, Inc., Class A |
17,702 | 263,406 | ||||||
| #*Rafael Holdings, Inc., Class B |
922 | 6,970 | ||||||
| Re/Max Holdings, Inc. |
2,120 | 67,437 | ||||||
| *Realogy Holdings Corp. |
883 | 15,294 | ||||||
| #*Redfin Corp. |
7,272 | 373,344 | ||||||
| RMR Group, Inc. (The), Class A |
73 | 2,540 | ||||||
| *St Joe Co. (The) |
4,493 | 211,261 | ||||||
| *Tejon Ranch Co. |
1,978 | 36,019 | ||||||
|
|
|
|||||||
| TOTAL REAL ESTATE |
8,092,288 | |||||||
|
|
|
|||||||
| UTILITIES (2.3%) |
| |||||||
| AES Corp. (The) |
93,813 | 2,357,521 | ||||||
| *ALLETE, Inc. |
6,045 | 372,009 | ||||||
| Alliant Energy Corp. |
34,058 | 1,926,661 | ||||||
| *Ameren Corp., Class A |
34,847 | 2,937,254 | ||||||
| *American Electric Power Co., Inc. |
70,322 | 5,956,977 | ||||||
| *American States Water Co. |
6,335 | 575,471 | ||||||
| *American Water Works Co., Inc. |
25,969 | 4,523,280 | ||||||
| *Artesian Resources Corp., Class A |
471 | 18,944 | ||||||
| #Atlantica Sustainable Infrastructure PLC |
9,596 | 377,603 | ||||||
| *Atmos Energy Corp. |
17,117 | 1,576,818 | ||||||
| #Avangrid, Inc. |
10,625 | 559,937 | ||||||
| Avista Corp. |
8,322 | 331,299 | ||||||
| *Black Hills Corp. |
7,335 | 486,897 | ||||||
| Brookfield Renewable Corp., Class A |
2,053 | 85,015 | ||||||
| *California Water Service Group |
6,573 | 400,164 | ||||||
| CenterPoint Energy, Inc. |
63,377 | 1,650,337 | ||||||
| *Chesapeake Utilities Corp. |
2,334 | 305,917 | ||||||
| Clearway Energy, Inc., Class A |
4,523 | 149,214 | ||||||
| Clearway Energy, Inc., Class C |
10,697 | 379,530 | ||||||
| CMS Energy Corp. |
39,879 | 2,406,698 | ||||||
| Consolidated Edison, Inc. |
39,750 | 2,997,150 | ||||||
| Consolidated Water Co., Ltd. |
777 | 8,632 | ||||||
| Dominion Energy, Inc. |
98,163 | 7,453,517 | ||||||
| *DTE Energy Co. |
26,785 | 3,036,080 | ||||||
| Duke Energy Corp. |
97,488 | 9,944,751 | ||||||
| Edison International |
43,911 | 2,763,319 | ||||||
| Entergy Corp. |
26,024 | 2,680,992 | ||||||
| Essential Utilities, Inc. |
30,735 | 1,446,696 | ||||||
| Evergy, Inc. |
32,487 | 2,071,046 | ||||||
| Eversource Energy |
46,833 | 3,976,122 | ||||||
| Exelon Corp. |
117,336 | 6,241,102 | ||||||
| *FirstEnergy Corp. |
63,161 | 2,433,593 | ||||||
| *Genie Energy, Ltd., Class B |
1,407 | 6,965 | ||||||
| *Hawaiian Electric Industries, Inc. |
15,331 | 621,825 | ||||||
| *IDACORP, Inc. |
6,993 | 729,510 | ||||||
| *MDU Resources Group, Inc. |
26,237 | 806,263 | ||||||
| MGE Energy, Inc. |
4,689 | 355,848 | ||||||
Dimensional U.S. Equity ETF
SCHEDULE OF INVESTMENTS
October 31, 2021
| Security Description |
Shares | Fair Value | ||||||
| UTILITIES (Continued) |
| |||||||
| *Middlesex Water Co. |
1,661 | $ | 182,909 | |||||
| National Fuel Gas Co. |
10,273 | 589,978 | ||||||
| *New Jersey Resources Corp. |
11,183 | 422,829 | ||||||
| NextEra Energy, Inc. |
274,601 | 23,431,703 | ||||||
| NiSource, Inc. |
43,986 | 1,085,135 | ||||||
| Northwest Natural Holding Co. |
3,579 | 161,377 | ||||||
| *NorthWestern Corp. |
5,844 | 332,290 | ||||||
| NRG Energy, Inc. |
36,120 | 1,440,827 | ||||||
| OGE Energy Corp. |
24,908 | 848,616 | ||||||
| ONE Gas, Inc. |
6,150 | 413,895 | ||||||
| #*Ormat Technologies, Inc. |
5,302 | 383,494 | ||||||
| *Otter Tail Corp. |
5,036 | 312,282 | ||||||
| *PG&E Corp. |
36,705 | 425,778 | ||||||
| *Pinnacle West Capital Corp. |
13,915 | 897,378 | ||||||
| PNM Resources, Inc. |
10,338 | 514,316 | ||||||
| *Portland General Electric Co. |
10,650 | 525,152 | ||||||
| #PPL Corp. |
89,215 | 2,569,392 | ||||||
| *Public Service Enterprise Group, Inc. |
68,171 | 4,349,310 | ||||||
| Rgc Resources, Inc. |
300 | 6,636 | ||||||
| *Sempra Energy |
41,099 | 5,245,465 | ||||||
| *SJW Group |
3,581 | 236,060 | ||||||
| South Jersey Industries, Inc. |
12,334 | 280,722 | ||||||
| *Southern Co. (The) |
145,451 | 9,064,506 | ||||||
| *Southwest Gas Holdings, Inc. |
6,621 | 458,504 | ||||||
| Spire, Inc. |
5,900 | 370,284 | ||||||
| *Sunnova Energy International, Inc. |
4,469 | 199,139 | ||||||
| *UGI Corp. |
24,169 | 1,049,176 | ||||||
| *Unitil Corp. |
1,600 | 66,800 | ||||||
| Vistra Corp. |
49,637 | 972,389 | ||||||
| WEC Energy Group, Inc. |
44,893 | 4,043,064 | ||||||
| Xcel Energy, Inc. |
74,248 | 4,795,678 | ||||||
| York Water Co. (The) |
900 | 43,128 | ||||||
|
|
|
|||||||
| TOTAL UTILITIES |
140,669,169 | |||||||
|
|
|
|||||||
| TOTAL COMMON STOCKS (Cost $1,775,998,700) |
6,032,861,577 | |||||||
|
|
|
|||||||
| PREFERRED STOCK (0.0%) |
| |||||||
| INDUSTRIALS (0.0%) |
| |||||||
| WESCO International, Inc., Series A |
3,095 | 97,183 | ||||||
|
|
|
|||||||
| TOTAL PREFERRED STOCK (Cost $77,363) |
97,183 | |||||||
|
|
|
|||||||
| RIGHTS (0.0%) |
| |||||||
| COMMUNICATION SERVICES (0.0%) |
| |||||||
| *»Media General, Inc. |
3,778 | 213 | ||||||
|
|
|
|||||||
| CONSUMER DISCRETIONARY (0.0%) |
| |||||||
| *»Zagg, Inc. |
171 | 15 | ||||||
|
|
|
|||||||
| FINANCIALS (0.0%) |
| |||||||
| *»Newstar Financial, Inc. |
3,834 | 390 | ||||||
|
|
|
|||||||
Dimensional U.S. Equity ETF
SCHEDULE OF INVESTMENTS
October 31, 2021
| Security Description | Shares | Fair Value | ||||||
| HEALTH CARE (0.0%) |
| |||||||
| *»Achillion Pharmaceuticals |
1,800 | $ | 2,610 | |||||
|
|
|
|||||||
| TOTAL RIGHTS (Cost $843) |
3,228 | |||||||
|
|
|
|||||||
| TOTAL INVESTMENT SECURITIES (Cost $1,776,076,906) |
6,032,961,988 | |||||||
|
|
|
|||||||
| SECURITIES LENDING COLLATERAL (0.9%) |
| |||||||
| @§The DFA Short Term Investment Fund |
4,863,828 | 56,272,062 | ||||||
|
|
|
|||||||
| TOTAL INVESTMENTS (Cost $1,832,348,968) — 100.0% |
$ | 6,089,234,050 | ||||||
|
|
|
|||||||
| * | Non-Income Producing Securities |
| # | Total or Partial Securities on Loan |
| » | Securities that have generally been fair value factored |
| @ | Security purchased with cash collateral received from Securities on Loan |
| § | Affiliated Fund |
| ADR | American Depositary Receipt |
| PLC | Public Limited Company |
| SA | Special Assessment |
Dimensional US Core Equity Market ETF
SCHEDULE OF INVESTMENTS
October 31, 2021
| Security Description |
Shares | Fair Value | ||||||
| COMMON STOCKS (98.8%) |
| |||||||
| COMMUNICATION SERVICES (9.2%) |
| |||||||
| Activision Blizzard, Inc. |
9,321 | $ | 728,809 | |||||
| *Alphabet, Inc., Class A |
7,874 | 23,314,284 | ||||||
| *Alphabet, Inc., Class C |
7,889 | 23,394,119 | ||||||
| *Altice USA, Inc., Class A |
12,449 | 202,919 | ||||||
| *AMC Networks, Inc., Class A |
519 | 20,651 | ||||||
| #*Angi, Inc., Class A |
418 | 5,238 | ||||||
| *Anterix, Inc. |
240 | 15,384 | ||||||
| AT&T, Inc. |
222,296 | 5,615,197 | ||||||
| ATN International, Inc. |
8 | 326 | ||||||
| *Bandwidth, Inc., Class A |
192 | 16,374 | ||||||
| *Boston Omaha Corp., Class A |
483 | 17,122 | ||||||
| #Cable One, Inc. |
23 | 39,358 | ||||||
| *Cargurus, Inc. |
2,890 | 96,931 | ||||||
| *Cars.com, Inc. |
2,575 | 33,526 | ||||||
| *Charter Communications, Inc., Class A |
4,140 | 2,794,045 | ||||||
| #*Cinemark Holdings, Inc. |
17,835 | 335,298 | ||||||
| Cogent Communications Holdings, Inc. |
3,343 | 256,040 | ||||||
| Comcast Corp., Class A |
131,270 | 6,751,216 | ||||||
| *comScore, Inc. |
16 | 63 | ||||||
| *Consolidated Communications Holdings, Inc. |
2,381 | 17,619 | ||||||
| *Cumulus Media, Inc. |
62 | 770 | ||||||
| *Daily Journal Corp. |
5 | 1,716 | ||||||
| *DHI Group, Inc. |
598 | 2,811 | ||||||
| #*Discovery, Inc. |
120 | 2,813 | ||||||
| *Discovery, Inc., Class C |
14,241 | 321,277 | ||||||
| *DISH Network Corp., Class A |
11,448 | 470,169 | ||||||
| Electronic Arts, Inc. |
9,962 | 1,397,170 | ||||||
| *Entercom Communications Corp. |
4,410 | 14,244 | ||||||
| Entravision Communications Corp., Class A |
121 | 964 | ||||||
| *Eros STX Global Corp. |
56 | 46 | ||||||
| *Eventbrite, Inc., Class A |
24 | 486 | ||||||
| *Everquote, Inc., Class A |
16 | 221 | ||||||
| EW Scripps Co. (The), Class A |
4,548 | 84,593 | ||||||
| *Facebook, Inc., Class A |
60,082 | 19,440,733 | ||||||
| *Fluent, Inc. |
24 | 57 | ||||||
| Fox Corp., Class A |
14,161 | 562,758 | ||||||
| Fox Corp., Class B |
9,120 | 337,075 | ||||||
| *Gaia, Inc. |
8 | 78 | ||||||
| *Gannett Co., Inc. |
2,793 | 16,199 | ||||||
| *Globalstar, Inc. |
1,332 | 2,198 | ||||||
| *Gray Television, Inc. |
8,374 | 196,287 | ||||||
| *Hemisphere Media Group, Inc. |
8 | 88 | ||||||
| *IDT Corp., Class B |
619 | 29,941 | ||||||
| *iHeartMedia, Inc., Class A |
2,657 | 51,493 | ||||||
| *IMAX Corp. |
1,697 | 31,988 | ||||||
| *Interpublic Group of Cos., Inc. (The) |
13,948 | 510,078 | ||||||
| *Iridium Communications, Inc. |
4,406 | 178,663 | ||||||
| John Wiley & Sons, Inc., Class A |
5,007 | 271,229 | ||||||
| *Liberty Broadband Corp., Class A |
15 | 2,412 | ||||||
| *Liberty Broadband Corp., Class C |
7,295 | 1,185,073 | ||||||
| *Liberty Latin America, Ltd., Class A |
16 | 192 | ||||||
| *Liberty Latin America, Ltd., Class C |
5,367 | 64,565 | ||||||
| #*Liberty Media Corp.-Liberty Braves, Class A |
81 | 2,476 | ||||||
| *Liberty Media Corp.-Liberty Braves, Class C |
613 | 18,218 | ||||||
| *Liberty Media Corp.-Liberty Formula One, Class A |
8 | 417 | ||||||
| *Liberty Media Corp.-Liberty Formula One, Class C |
7,306 | 407,675 | ||||||
Dimensional US Core Equity Market ETF
SCHEDULE OF INVESTMENTS
October 31, 2021
| Security Description |
Shares | Fair Value | ||||||
| COMMUNICATION SERVICES (Continued) |
| |||||||
| *Liberty Media Corp.-Liberty SiriusXM, Class A |
2,861 | $ | 142,421 | |||||
| *Liberty Media Corp.-Liberty SiriusXM, Class C |
9,179 | 452,708 | ||||||
| *Liberty TripAdvisor Holdings, Inc., Class A |
16 | 49 | ||||||
| *Lions Gate Entertainment Corp., Class A |
32 | 414 | ||||||
| *Lions Gate Entertainment Corp., Class B |
3,287 | 37,209 | ||||||
| *Live Nation Entertainment, Inc. |
5,646 | 571,093 | ||||||
| *Loral Space & Communications, Inc. |
16 | 797 | ||||||
| *Lumen Technologies, Inc. |
51,995 | 616,661 | ||||||
| *Madison Square Garden Entertainment Corp. |
167 | 11,768 | ||||||
| #*Magnite, Inc. |
384 | 10,380 | ||||||
| #*Marcus Corp. (The) |
8 | 149 | ||||||
| *Meredith Corp. |
16 | 932 | ||||||
| *National CineMedia, Inc. |
16 | 51 | ||||||
| *Netflix, Inc. |
9,564 | 6,602,125 | ||||||
| New York Times Co. (The), Class A |
5,943 | 324,428 | ||||||
| News Corp., Class A |
15,909 | 364,316 | ||||||
| News Corp., Class B |
120 | 2,707 | ||||||
| Nexstar Media Group, Inc., Class A |
2,506 | 375,725 | ||||||
| Omnicom Group, Inc. |
10,097 | 687,404 | ||||||
| *Ooma, Inc. |
8 | 185 | ||||||
| *Pinterest, Inc., Class A |
10,037 | 448,052 | ||||||
| *QuinStreet, Inc. |
1,416 | 19,824 | ||||||
| *ROBLOX Corp., Class A |
38 | 3,193 | ||||||
| *Roku, Inc. |
1,647 | 502,170 | ||||||
| *Salem Media Group, Inc. |
206 | 775 | ||||||
| Scholastic Corp. |
731 | 26,455 | ||||||
| *Sciplay Corp., Class A |
343 | 6,932 | ||||||
| Shenandoah Telecommunications Co. |
2,039 | 56,358 | ||||||
| #Sirius XM Holdings, Inc. |
54,925 | 334,493 | ||||||
| *Snap, Inc., Class A |
9,434 | 496,040 | ||||||
| *Spotify Technology SA |
1,547 | 447,702 | ||||||
| *Take-Two Interactive Software, Inc. |
4,052 | 733,412 | ||||||
| *TechTarget, Inc. |
1,453 | 137,032 | ||||||
| TEGNA, Inc. |
11,000 | 216,260 | ||||||
| #Telephone and Data Systems, Inc. |
7,109 | 133,223 | ||||||
| *Thryv Holdings, Inc. |
371 | 11,750 | ||||||
| *T-Mobile US, Inc. |
17,531 | 2,016,591 | ||||||
| *Townsquare Media, Inc., Class A |
1 | 13 | ||||||
| *Travelzoo |
19 | 195 | ||||||
| *TripAdvisor, Inc. |
5,163 | 170,224 | ||||||
| *TrueCar, Inc. |
503 | 2,108 | ||||||
| *Twitter, Inc. |
14,239 | 762,356 | ||||||
| *United States Cellular Corp. |
103 | 3,149 | ||||||
| Verizon Communications, Inc. |
157,735 | 8,358,378 | ||||||
| ViacomCBS, Inc., Class A |
8 | 311 | ||||||
| ViacomCBS, Inc., Class B |
21,588 | 781,917 | ||||||
| *Vimeo, Inc. |
408 | 13,762 | ||||||
| *Walt Disney Co. (The) |
38,734 | 6,548,757 | ||||||
| *Warner Music Group Corp., Class A |
1,010 | 49,985 | ||||||
| *WideOpenWest, Inc. |
921 | 17,545 | ||||||
| #World Wrestling Entertainment, Inc., Class A |
1,191 | 72,758 | ||||||
| *Yelp, Inc. |
2,034 | 78,573 | ||||||
| *Zedge, Inc., Class B |
445 | 5,131 | ||||||
| *Zillow Group, Inc., Class A |
1,176 | 124,327 | ||||||
| #*Zillow Group, Inc., Class C |
4,921 | 509,963 | ||||||
| *ZipRecruiter, Inc. |
28 | 778 | ||||||
| *Zynga, Inc., Class A |
40,067 | 295,694 | ||||||
|
|
|
|||||||
| TOTAL COMMUNICATION SERVICES |
122,849,400 | |||||||
|
|
|
|||||||
Dimensional US Core Equity Market ETF
SCHEDULE OF INVESTMENTS
October 31, 2021
| Security Description |
Shares | Fair Value | ||||||
| CONSUMER DISCRETIONARY (12.8%) |
| |||||||
|
#*1-800-Flowers.com, Inc., Class A |
332 | $ | 10,664 | |||||
| *2U, Inc. |
1,340 | 39,584 | ||||||
| *Abercrombie & Fitch Co. |
962 | 38,037 | ||||||
| *Acushnet Holdings Corp. |
640 | 32,602 | ||||||
| *Adient PLC |
1,705 | 70,962 | ||||||
| *Adtalem Global Education, Inc. |
4,906 | 181,179 | ||||||
| Advance Auto Parts, Inc. |
2,608 | 588,156 | ||||||
| *Amazon.com, Inc. |
11,958 | 40,327,518 | ||||||
| *American Axle & Manufacturing Holdings, Inc. |
8,956 | 81,320 | ||||||
| #American Eagle Outfitters, Inc. |
17,462 | 414,548 | ||||||
| *American Outdoor Brands, Inc. |
206 | 4,693 | ||||||
| *American Public Education, Inc. |
8 | 200 | ||||||
| *America’s Car-Mart, Inc. |
53 | 6,333 | ||||||
| *Aptiv PLC |
8,772 | 1,516,591 | ||||||
| Aramark |
12,849 | 468,732 | ||||||
| *Ark Restaurants Corp. |
63 | 1,008 | ||||||
| *Arko Corp. |
2,928 | 28,080 | ||||||
| *Asbury Automotive Group, Inc. |
91 | 17,810 | ||||||
| *Aspen Group, Inc. |
93 | 442 | ||||||
| #*Autoliv, Inc. |
4,168 | 403,671 | ||||||
| *AutoNation, Inc. |
4,072 | 493,201 | ||||||
| *AutoZone, Inc. |
828 | 1,477,848 | ||||||
| *Bally’s Corp. |
18 | 825 | ||||||
| *Barnes & Noble Education, Inc. |
452 | 4,692 | ||||||
| *Bassett Furniture Industries, Inc. |
158 | 2,669 | ||||||
| *Bath & Body Works, Inc. |
7,013 | 484,528 | ||||||
| *Beazer Homes USA, Inc. |
16 | 290 | ||||||
| *Bed Bath & Beyond, Inc., Class B |
2,055 | 28,852 | ||||||
| Best Buy Co., Inc. |
10,554 | 1,290,121 | ||||||
| #Big Lots, Inc., Class B |
2,917 | 129,077 | ||||||
| *Biglari Holdings, Inc., Class B |
10 | 1,662 | ||||||
| *BJ’s Restaurants, Inc. |
237 | 7,897 | ||||||
| *Bloomin’ Brands, Inc. |
1,708 | 36,927 | ||||||
| *Bluegreen Vacations Holding Corp. |
8 | 205 | ||||||
| *Booking Holdings, Inc. |
834 | 2,018,931 | ||||||
| *Boot Barn Holdings, Inc. |
534 | 55,798 | ||||||
| *BorgWarner, Inc., Class A |
10,848 | 488,919 | ||||||
| *Boyd Gaming Corp. |
2,032 | 129,601 | ||||||
| *Bright Horizons Family Solutions, Inc. |
954 | 158,364 | ||||||
| *Brinker International, Inc. |
788 | 33,064 | ||||||
| *Brunswick Corp. |
3,426 | 318,926 | ||||||
| Buckle, Inc. (The) |
1,264 | 52,608 | ||||||
| *Build-A-Bear Workshop, Inc. |
288 | 4,516 | ||||||
| *Burlington Stores, Inc. |
1,345 | 371,610 | ||||||
| *Caesars Entertainment, Inc. |
6,288 | 688,284 | ||||||
| Caleres, Inc. |
1,288 | 29,701 | ||||||
| *Callaway Golf Co. |
12,490 | 337,854 | ||||||
| #Camping World Holdings, Inc., Class A |
586 | 21,828 | ||||||
| *Capri Holdings, Ltd. |
5,468 | 291,116 | ||||||
| *CarMax, Inc. |
6,619 | 906,273 | ||||||
| *Carnival Corp. |
39,503 | 875,386 | ||||||
| *CarParts.com, Inc. |
442 | 6,732 | ||||||
| *Carriage Services, Inc. |
327 | 16,824 | ||||||
Dimensional US Core Equity Market ETF
SCHEDULE OF INVESTMENTS
October 31, 2021
| Security Description |
Shares | Fair Value | ||||||
| CONSUMER DISCRETIONARY (Continued) |
| |||||||
| Carrols Restaurant Group, Inc. |
16 | $ | 59 | |||||
| *Carter’s, Inc. |
970 | 95,564 | ||||||
| *Carvana Co. |
1,253 | 379,885 | ||||||
| *Cato Corp. (The), Class A |
95 | 1,675 | ||||||
| *Cavco Industries, Inc. |
118 | 28,365 | ||||||
| *Century Casinos, Inc. |
347 | 5,136 | ||||||
| *Century Communities, Inc. |
3,677 | 246,580 | ||||||
| *Charles & Colvard, Ltd. |
535 | 1,616 | ||||||
| *Cheesecake Factory, Inc. (The) |
1,103 | 44,826 | ||||||
| *Chegg, Inc. |
4,671 | 277,644 | ||||||
| #*Chewy, Inc., Class A |
2,955 | 223,989 | ||||||
| *Children’s Place, Inc. (The) |
426 | 35,311 | ||||||
| *Chipotle Mexican Grill, Inc. |
812 | 1,444,572 | ||||||
| Choice Hotels International, Inc. |
3,417 | 480,499 | ||||||
| *Churchill Downs, Inc. |
1,114 | 256,220 | ||||||
| *Chuy’s Holdings, Inc. |
8 | 233 | ||||||
| *Citi Trends, Inc. |
56 | 4,332 | ||||||
| Clarus Corp. |
16 | 441 | ||||||
| *Columbia Sportswear Co. |
3,486 | 361,986 | ||||||
| *Comstock Holding Cos., Inc. |
14 | 62 | ||||||
| *Conn’s, Inc. |
108 | 2,405 | ||||||
| *Container Store Group, Inc. (The) |
309 | 3,418 | ||||||
| #*Cooper-Standard Holdings, Inc. |
199 | 5,162 | ||||||
| Cracker Barrel Old Country Store, Inc. |
1,146 | 152,613 | ||||||
| *Crocs, Inc. |
1,064 | 171,783 | ||||||
| *Crown Crafts, Inc. |
181 | 1,339 | ||||||
| Culp, Inc. |
8 | 106 | ||||||
| *Dana, Inc. |
529 | 11,739 | ||||||
| Darden Restaurants, Inc. |
5,377 | 775,041 | ||||||
| *Dave & Buster’s Entertainment, Inc. |
267 | 9,914 | ||||||
| *Deckers Outdoor Corp. |
787 | 311,109 | ||||||
| *Del Taco Restaurants, Inc. |
16 | 133 | ||||||
| *Delta Apparel, Inc. |
78 | 2,094 | ||||||
| *Denny’s Corp. |
1,176 | 18,698 | ||||||
| *Designer Brands, Inc., Class A |
1,993 | 26,965 | ||||||
| #Dick’s Sporting Goods, Inc. |
1,308 | 162,467 | ||||||
| *Dillard’s, Inc., Class A |
42 | 9,708 | ||||||
| *Dine Brands Global, Inc. |
1,720 | 145,357 | ||||||
| Dollar General Corp. |
7,619 | 1,687,761 | ||||||
| *Dollar Tree, Inc. |
9,560 | 1,030,186 | ||||||
| Domino’s Pizza, Inc. |
1,626 | 795,065 | ||||||
| *Dorman Products, Inc. |
222 | 23,172 | ||||||
| DR Horton, Inc. |
14,918 | 1,331,730 | ||||||
| *Duluth Holdings, Inc., Class B |
16 | 229 | ||||||
| eBay, Inc. |
22,880 | 1,755,354 | ||||||
| *Educational Development Corp. |
444 | 4,338 | ||||||
| *El Pollo Loco Holdings, Inc. |
16 | 235 | ||||||
| *Envela Corp. |
30 | 131 | ||||||
| *Escalade, Inc. |
341 | 6,380 | ||||||
| Ethan Allen Interiors, Inc. |
306 | 7,102 | ||||||
| *Etsy, Inc. |
3,332 | 835,299 | ||||||
| *Everi Holdings, Inc. |
140 | 3,360 | ||||||
| *Expedia Group, Inc. |
3,195 | 525,290 | ||||||
| *Fiesta Restaurant Group, Inc. |
8 | 84 | ||||||
| #*Fisker, Inc. |
228 | 3,659 | ||||||
| *Five Below, Inc. |
2,335 | 460,695 | ||||||
Dimensional US Core Equity Market ETF
SCHEDULE OF INVESTMENTS
October 31, 2021
| Security Description |
Shares | Fair Value | ||||||
| CONSUMER DISCRETIONARY (Continued) |
| |||||||
| Flexsteel Industries, Inc. |
36 | $ | 1,008 | |||||
| *Floor & Decor Holdings, Inc., Class A |
4,967 | 675,115 | ||||||
| *Foot Locker, Inc. |
4,666 | 222,428 | ||||||
| *Ford Motor Co. |
113,753 | 1,942,901 | ||||||
| *Fossil Group, Inc. |
24 | 284 | ||||||
| *Fox Factory Holding Corp. |
223 | 35,892 | ||||||
| Franchise Group, Inc. |
685 | 25,208 | ||||||
| *frontdoor, Inc. |
600 | 22,368 | ||||||
| *Full House Resorts, Inc. |
447 | 4,448 | ||||||
| *Funko, Inc., Class A |
8 | 131 | ||||||
| *Gap, Inc. (The) |
15,026 | 340,940 | ||||||
| Garmin, Ltd. |
6,440 | 924,784 | ||||||
| *Garrett Motion, Inc. |
537 | 3,619 | ||||||
| *General Motors Co. |
41,020 | 2,232,719 | ||||||
| *Genesco, Inc. |
311 | 18,843 | ||||||
| Gentex Corp. |
8,742 | 309,379 | ||||||
| *Gentherm, Inc. |
371 | 27,317 | ||||||
| *Genuine Parts Co. |
4,963 | 650,699 | ||||||
| *G-III Apparel Group, Ltd. |
4,139 | 118,624 | ||||||
| *Goodyear Tire & Rubber Co. (The) |
2,373 | 45,372 | ||||||
| *GoPro, Inc., Class A |
8,889 | 76,534 | ||||||
| Graham Holdings Co., Class B |
16 | 9,374 | ||||||
| *Grand Canyon Education, Inc. |
1,165 | 92,850 | ||||||
| *Green Brick Partners, Inc. |
1,112 | 28,968 | ||||||
| *Group 1 Automotive, Inc. |
416 | 74,797 | ||||||
| Guess?, Inc. |
3,688 | 76,378 | ||||||
| *H&R Block, Inc. |
4,475 | 103,238 | ||||||
| Hanesbrands, Inc. |
11,995 | 204,395 | ||||||
| Harley-Davidson, Inc. |
6,415 | 234,083 | ||||||
| Hasbro, Inc. |
4,953 | 474,299 | ||||||
| *Haverty Furniture Cos., Inc. |
734 | 21,066 | ||||||
| *Helen of Troy, Ltd. |
506 | 113,825 | ||||||
| Hibbett, Inc. |
520 | 40,269 | ||||||
| *Hilton Grand Vacations, Inc. |
9,093 | 457,196 | ||||||
| *Hilton Worldwide Holdings, Inc. |
8,554 | 1,231,348 | ||||||
| Home Depot, Inc. (The) |
27,432 | 10,197,572 | ||||||
| Hooker Furnishings Corp. |
8 | 202 | ||||||
| *Houghton Mifflin Harcourt Co. |
2,473 | 35,092 | ||||||
| *Hovnanian Enterprises, Inc., Class A |
287 | 24,183 | ||||||
| *Hyatt Hotels Corp., Class A |
1,096 | 93,379 | ||||||
| *iMedia Brands, Inc. |
16 | 97 | ||||||
| *Inspired Entertainment, Inc. |
1,871 | 25,726 | ||||||
| Installed Building Products, Inc. |
766 | 97,320 | ||||||
| *International Game Technology PLC |
14,667 | 432,530 | ||||||
| *iRobot Corp. |
271 | 22,607 | ||||||
| Jack in the Box, Inc. |
366 | 36,216 | ||||||
| Johnson Outdoors, Inc., Class A |
363 | 38,543 | ||||||
| KB Home |
1,894 | 76,044 | ||||||
| #*Kirkland’s, Inc. |
8 | 180 | ||||||
| *Kohl’s Corp. |
7,399 | 359,073 | ||||||
| Kontoor Brands, Inc. |
450 | 23,850 | ||||||
| *Lakeland Industries, Inc. |
7 | 146 | ||||||
| *Lands’ End, Inc. |
590 | 15,505 | ||||||
| *Las Vegas Sands Corp. |
11,090 | 430,403 | ||||||
| *Laureate Education, Inc., Class A |
3,600 | 62,352 | ||||||
| *La-Z-Boy, Inc. |
2,645 | 87,920 | ||||||
| #*Lazydays Holdings, Inc. |
243 | 5,125 | ||||||
Dimensional US Core Equity Market ETF
SCHEDULE OF INVESTMENTS
October 31, 2021
| Security Description |
Shares | Fair Value | ||||||
| CONSUMER DISCRETIONARY (Continued) |
| |||||||
| LCI Industries |
58 | $ | 8,099 | |||||
| *Lear Corp. |
2,618 | 449,903 | ||||||
| *Legacy Housing Corp. |
8 | 142 | ||||||
| *Leggett & Platt, Inc. |
4,215 | 197,473 | ||||||
| #Lennar Corp., Class A |
10,831 | 1,082,342 | ||||||
| Lennar Corp., Class B |
8 | 657 | ||||||
| Levi Strauss & Co., Class A |
119 | 3,115 | ||||||
| *LGI Homes, Inc. |
247 | 36,877 | ||||||
| Lifetime Brands, Inc. |
8 | 136 | ||||||
| *Lincoln Educational Services Corp. |
8 | 58 | ||||||
| *Lindblad Expeditions Holdings, Inc. |
22 | 329 | ||||||
| *Liquidity Services, Inc., Class A |
38 | 839 | ||||||
| *Lithia Motors, Inc., Class A |
744 | 237,500 | ||||||
| *LKQ Corp. |
11,632 | 640,691 | ||||||
| *Lovesac Co. (The) |
217 | 16,928 | ||||||
| *Lowe’s Cos., Inc. |
20,030 | 4,683,415 | ||||||
| *Lululemon Athletica, Inc. |
4,080 | 1,901,321 | ||||||
| *Lumber Liquidators Holdings, Inc. |
612 | 11,065 | ||||||
| Macy’s, Inc. |
36,010 | 953,185 | ||||||
| *Malibu Boats, Inc., Class A |
1,272 | 89,816 | ||||||
| *Marine Products Corp. |
22 | 279 | ||||||
| #*MarineMax, Inc. |
906 | 46,922 | ||||||
| *Marriott International, Inc., Class A |
9,157 | 1,465,303 | ||||||
| Marriott Vacations Worldwide Corp. |
1,166 | 183,319 | ||||||
| *Mastercraft Boat Holdings, Inc. |
14 | 375 | ||||||
| *Mattel, Inc. |
13,519 | 294,849 | ||||||
| McDonald’s Corp. |
18,480 | 4,537,764 | ||||||
| *MDC Holdings, Inc. |
779 | 38,155 | ||||||
| *MGM Resorts International |
258 | 12,167 | ||||||
| *Modine Manufacturing Co. |
673 | 7,403 | ||||||
| *Mohawk Industries, Inc. |
3,956 | 701,043 | ||||||
| *Monarch Casino & Resort, Inc. |
408 | 29,466 | ||||||
| Monro, Inc. |
2,378 | 146,865 | ||||||
| *Motorcar Parts of America, Inc. |
183 | 3,462 | ||||||
| Movado Group, Inc. |
146 | 4,862 | ||||||
| *Murphy USA, Inc. |
1,695 | 276,200 | ||||||
| *Nathan’s Famous, Inc. |
7 | 437 | ||||||
| *National Vision Holdings, Inc. |
1,636 | 100,843 | ||||||
| #*Nautilus, Inc. |
391 | 4,000 | ||||||
| *Newell Brands, Inc. |
17,290 | 395,768 | ||||||
| NIKE, Inc., Class B |
37,267 | 6,234,396 | ||||||
| #*Noodles & Co. |
1,977 | 24,021 | ||||||
| #*Nordstrom, Inc. |
3,239 | 93,056 | ||||||
| #*Norwegian Cruise Line Holdings, Ltd. |
17,987 | 462,626 | ||||||
| *NVR, Inc. |
12 | 58,738 | ||||||
| *ODP Corp. (The) |
8,388 | 363,200 | ||||||
| #*Ollie’s Bargain Outlet Holdings, Inc. |
4,529 | 306,432 | ||||||
| *ONE Group Hospitality, Inc. (The) |
22 | 291 | ||||||
| *OneSpaWorld Holdings, Ltd. |
876 | 9,461 | ||||||
| *O’Reilly Automotive, Inc. |
2,465 | 1,534,019 | ||||||
| Oxford Industries, Inc. |
684 | 63,420 | ||||||
| *Papa John’s International, Inc. |
452 | 56,084 | ||||||
| *Party City Holdco, Inc. |
358 | 2,603 | ||||||
| *Patrick Industries, Inc. |
576 | 44,876 | ||||||
| *Peloton Interactive, Inc., Class A |
2,316 | 211,775 | ||||||
| #*Penn National Gaming, Inc. |
5,050 | 361,580 | ||||||
Dimensional US Core Equity Market ETF
SCHEDULE OF INVESTMENTS
October 31, 2021
| Security Description |
Shares | Fair Value | ||||||
| CONSUMER DISCRETIONARY (Continued) |
| |||||||
| Penske Automotive Group, Inc. |
2,957 | $ | 313,590 | |||||
| *Perdoceo Education Corp. |
1,348 | 14,316 | ||||||
| *PetMed Express, Inc. |
8 | 227 | ||||||
| *Planet Fitness, Inc., Class A |
6,787 | 539,906 | ||||||
| *Playa Hotels & Resorts NV |
10,430 | 88,759 | ||||||
| *PlayAGS, Inc. |
16 | 141 | ||||||
| *Polaris, Inc. |
2,700 | 310,365 | ||||||
| Pool Corp. |
1,099 | 566,161 | ||||||
| *Potbelly Corp. |
16 | 96 | ||||||
| PulteGroup, Inc. |
10,805 | 519,504 | ||||||
| #*Purple Innovation, Inc. |
5,549 | 107,096 | ||||||
| *PVH Corp. |
2,087 | 228,172 | ||||||
| #*QuantumScape Corp. |
741 | 21,445 | ||||||
| *Quotient Technology, Inc. |
1,451 | 9,344 | ||||||
| Qurate Retail, Inc., Class A |
11,042 | 115,278 | ||||||
| Ralph Lauren Corp. |
493 | 62,695 | ||||||
| RCI Hospitality Holdings, Inc. |
45 | 3,051 | ||||||
| *RealReal, Inc. (The) |
247 | 3,218 | ||||||
| *Red Robin Gourmet Burgers, Inc. |
8 | 159 | ||||||
| *Red Rock Resorts, Inc., Class A |
62 | 3,373 | ||||||
| *Regis Corp. |
8 | 22 | ||||||
| Rent-A-Center, Inc. |
2,822 | 150,300 | ||||||
| *Revolve Group, Inc. |
453 | 33,993 | ||||||
| *RH |
820 | 540,897 | ||||||
| *Rocky Brands, Inc. |
38 | 2,073 | ||||||
| *Ross Stores, Inc. |
10,616 | 1,201,731 | ||||||
| *Royal Caribbean Cruises, Ltd. |
8,855 | 747,628 | ||||||
| *Ruth’s Hospitality Group, Inc. |
24 | 464 | ||||||
| *Sally Beauty Holdings, Inc. |
1,944 | 29,665 | ||||||
| *Scientific Games Corp. |
130 | 10,407 | ||||||
| #*SeaWorld Entertainment, Inc. |
1,175 | 74,612 | ||||||
| *Service Corp. |
8,274 | 566,686 | ||||||
| #*Shake Shack, Inc., Class A |
644 | 44,545 | ||||||
| Shoe Carnival, Inc. |
1,276 | 43,218 | ||||||
| *Shutterstock, Inc. |
1,397 | 169,247 | ||||||
| Signet Jewelers, Ltd. |
10,694 | 953,691 | ||||||
| *Skechers USA, Inc., Class A |
3,421 | 158,084 | ||||||
| *Skyline Champion Corp. |
4,814 | 304,822 | ||||||
| *Sleep Number Corp. |
395 | 34,894 | ||||||
| Smith & Wesson Brands, Inc. |
1,934 | 41,581 | ||||||
| Sonic Automotive, Inc., Class A |
452 | 22,342 | ||||||
| *Sonos, Inc. |
6,684 | 218,032 | ||||||
| #*Sportsman’s Warehouse Holdings, Inc. |
24 | 414 | ||||||
| *Standard Motor Products, Inc. |
1,075 | 51,493 | ||||||
| Starbucks Corp. |
27,942 | 2,963,808 | ||||||
| *Steven Madden, Ltd. |
1,241 | 55,969 | ||||||
| *Stitch Fix, Inc., Class A |
2,511 | 86,881 | ||||||
| *Stoneridge, Inc. |
8 | 152 | ||||||
| Strategic Education, Inc. |
588 | 40,107 | ||||||
| *Strattec Security Corp. |
43 | 1,491 | ||||||
| *Stride, Inc. |
3,550 | 126,025 | ||||||
| *Superior Group of Cos., Inc. |
465 | 12,085 | ||||||
| *Superior Industries International, Inc. |
49 | 286 | ||||||
| *Sypris Solutions, Inc. |
619 | 2,371 | ||||||
| *Tapestry, Inc. |
10,029 | 390,930 | ||||||
| Target Corp. |
16,330 | 4,239,595 | ||||||
| *Taylor Morrison Home Corp. |
7,252 | 221,404 | ||||||
Dimensional US Core Equity Market ETF
SCHEDULE OF INVESTMENTS
October 31, 2021
| Security Description |
Shares | Fair Value | ||||||
| CONSUMER DISCRETIONARY (Continued) |
| |||||||
| Tempur Sealy International, Inc. |
5,769 | $ | 256,547 | |||||
| *Tenneco, Inc., Class A |
8,849 | 117,426 | ||||||
| *Terminix Global Holdings, Inc. |
3,821 | 154,674 | ||||||
| *Tesla, Inc. |
19,427 | 21,641,678 | ||||||
| *Texas Roadhouse, Inc. |
1,717 | 152,487 | ||||||
| Thor Industries, Inc. |
2,344 | 238,994 | ||||||
| *Tilly’s, Inc., Class A |
545 | 7,565 | ||||||
| *TJX Cos, Inc. (The) |
35,430 | 2,320,311 | ||||||
| Toll Brothers, Inc. |
4,618 | 277,865 | ||||||
| *TopBuild Corp. |
1,695 | 435,564 | ||||||
| *Tractor Supply Co. |
4,857 | 1,054,795 | ||||||
| *Travel + Leisure Co. |
1,496 | 81,293 | ||||||
| *Tri Pointe Homes, Inc. |
2,319 | 56,097 | ||||||
| #*Tupperware Brands Corp. |
2,468 | 54,888 | ||||||
| *Ulta Beauty, Inc. |
3,038 | 1,116,040 | ||||||
| *Under Armour, Inc., Class A |
133 | 2,921 | ||||||
| *Under Armour, Inc., Class C |
223 | 4,210 | ||||||
| *Unifi, Inc. |
197 | 4,732 | ||||||
| *Universal Electronics, Inc. |
8 | 329 | ||||||
| *Universal Technical Institute, Inc. |
8 | 56 | ||||||
| *Urban Outfitters, Inc. |
2,056 | 65,648 | ||||||
| Vail Resorts, Inc. |
1,536 | 529,475 | ||||||
| #*Veoneer, Inc. |
304 | 10,701 | ||||||
| #*Vera Bradley, Inc. |
8 | 78 | ||||||
| *VF Corp. |
11,319 | 824,929 | ||||||
| *Victoria’s Secret & Co. |
2,307 | 116,434 | ||||||
| *Vista Outdoor, Inc. |
2,481 | 103,805 | ||||||
| *Visteon Corp. |
604 | 68,361 | ||||||
| *VOXX International Corp. |
219 | 2,477 | ||||||
| #*Wayfair, Inc., Class A |
2,435 | 606,558 | ||||||
| Wendy’s Co. (The) |
10,531 | 234,841 | ||||||
| *Whirlpool Corp. |
2,958 | 623,635 | ||||||
| Williams-Sonoma, Inc. |
3,874 | 719,518 | ||||||
| *Wingstop, Inc. |
505 | 87,097 | ||||||
| *Winmark Corp. |
95 | 22,118 | ||||||
| Winnebago Industries, Inc. |
6,323 | 428,004 | ||||||
| *Wolverine World Wide, Inc. |
1,256 | 41,662 | ||||||
| *WW International, Inc. |
10,806 | 187,592 | ||||||
| Wyndham Hotels & Resorts, Inc. |
6,459 | 545,592 | ||||||
| *Wynn Resorts, Ltd. |
2,720 | 244,256 | ||||||
| *XPEL, Inc. |
216 | 16,394 | ||||||
| *YETI Holdings, Inc. |
5,788 | 569,134 | ||||||
| *Yum! Brands, Inc. |
9,335 | 1,166,315 | ||||||
| *Zumiez, Inc. |
576 | 23,443 | ||||||
|
|
|
|||||||
| TOTAL CONSUMER DISCRETIONARY |
172,126,470 | |||||||
|
|
|
|||||||
| CONSUMER STAPLES (5.7%) |
| |||||||
| Albertsons Cos., Inc., Class A |
62 | 1,919 | ||||||
| Alico, Inc. |
39 | 1,388 | ||||||
| Altria Group, Inc. |
53,601 | 2,364,340 | ||||||
| Andersons, Inc. (The), Class A |
1,144 | 38,965 | ||||||
| *Archer-Daniels-Midland Co. |
18,861 | 1,211,631 | ||||||
| #B&G Foods, Inc. |
5,621 | 165,482 | ||||||
| *Bellring Brands, Inc., Class A |
246 | 6,598 | ||||||
| #*Beyond Meat, Inc. |
1,283 | 126,991 | ||||||
| *BJ’s Wholesale Club Holdings, Inc. |
2,671 | 156,093 | ||||||
Dimensional US Core Equity Market ETF
SCHEDULE OF INVESTMENTS
October 31, 2021
| Security Description |
Shares | Fair Value | ||||||
| CONSUMER STAPLES (Continued) |
| |||||||
| *Boston Beer Co., Inc. (The), Class A |
160 | $ | 78,797 | |||||
| *Brown-Forman Corp., Class A |
1,540 | 98,606 | ||||||
| *Brown-Forman Corp., Class B |
12,626 | 857,179 | ||||||
| Bunge, Ltd. |
5,816 | 538,794 | ||||||
| *Calavo Growers, Inc. |
611 | 24,562 | ||||||
| Cal-Maine Foods, Inc. |
1,591 | 57,371 | ||||||
| Campbell Soup Co. |
10,949 | 437,413 | ||||||
| Casey’s General Stores, Inc. |
1,703 | 326,193 | ||||||
| *Celsius Holdings, Inc. |
1,851 | 178,659 | ||||||
| *Central Garden & Pet Co. |
8 | 413 | ||||||
| *Central Garden & Pet Co., Class A |
3,482 | 160,868 | ||||||
| *Chefs’ Warehouse, Inc. (The) |
1,184 | 41,286 | ||||||
| Church & Dwight Co., Inc. |
9,523 | 831,929 | ||||||
| Clorox Co. (The) |
4,140 | 674,861 | ||||||
| *Coca-Cola Co. (The) |
110,156 | 6,209,494 | ||||||
| Coca-Cola Consolidated, Inc. |
121 | 48,569 | ||||||
| Colgate-Palmolive Co. |
20,464 | 1,559,152 | ||||||
| Conagra Brands, Inc. |
17,437 | 561,471 | ||||||
| Constellation Brands, Inc., Class A |
5,312 | 1,151,695 | ||||||
| Costco Wholesale Corp. |
11,584 | 5,693,999 | ||||||
| *Coty, Inc., Class A |
23,948 | 203,079 | ||||||
| *Darling Ingredients, Inc. |
5,897 | 498,414 | ||||||
| Edgewell Personal Care Co. |
982 | 34,360 | ||||||
| *elf Beauty, Inc. |
2,138 | 69,079 | ||||||
| Energizer Holdings, Inc. |
5,204 | 189,790 | ||||||
| *Estee Lauder Cos, Inc. (The) |
6,177 | 2,003,386 | ||||||
| *Flowers Foods, Inc. |
8,345 | 206,539 | ||||||
| Fresh Del Monte Produce, Inc. |
2,159 | 72,305 | ||||||
| *Freshpet, Inc. |
518 | 80,761 | ||||||
| General Mills, Inc. |
23,077 | 1,426,159 | ||||||
| *Grocery Outlet Holding Corp. |
4,364 | 96,837 | ||||||
| *Hain Celestial Group, Inc. (The) |
5,766 | 258,720 | ||||||
| *Herbalife Nutrition, Ltd. |
4,735 | 219,704 | ||||||
| Hershey Co. (The) |
6,342 | 1,112,070 | ||||||
| Hormel Foods Corp. |
15,725 | 665,482 | ||||||
| *Hostess Brands, Inc. |
17,111 | 323,569 | ||||||
| Ingles Markets, Inc., Class A |
350 | 24,217 | ||||||
| Ingredion, Inc. |
4,256 | 405,299 | ||||||
| *Inter Parfums, Inc. |
671 | 61,987 | ||||||
| *J & J Snack Foods Corp. |
753 | 111,105 | ||||||
| J M Smucker Co. (The) |
4,248 | 521,909 | ||||||
| John B Sanfilippo & Son, Inc. |
73 | 6,169 | ||||||
| Kellogg Co. |
13,266 | 813,206 | ||||||
| Keurig Dr Pepper, Inc. |
8,262 | 298,176 | ||||||
| Kimberly-Clark Corp. |
9,735 | 1,260,585 | ||||||
| *Kraft Heinz Co. (The) |
30,080 | 1,079,571 | ||||||
| Kroger Co. (The) |
34,991 | 1,400,340 | ||||||
| *Lamb Weston Holdings, Inc. |
6,423 | 362,578 | ||||||
| *Lancaster Colony Corp. |
755 | 128,350 | ||||||
| *Landec Corp. |
8 | 78 | ||||||
| *Lifevantage Corp. |
8 | 55 | ||||||
| *Lifeway Foods, Inc. |
8 | 44 | ||||||
| Limoneira Co. |
8 | 129 | ||||||
| McCormick & Co., Inc. |
8,531 | 684,442 | ||||||
| Medifast, Inc. |
787 | 154,465 | ||||||
| MGP Ingredients, Inc. |
1,088 | 69,860 | ||||||
| Molson Coors Beverage Co., Class B |
8,909 | 392,798 | ||||||
Dimensional US Core Equity Market ETF
SCHEDULE OF INVESTMENTS
October 31, 2021
| Security Description |
Shares | Fair Value | ||||||
| CONSUMER STAPLES (Continued) |
| |||||||
| Mondelez International, Inc., Class A |
35,907 | $ | 2,180,991 | |||||
| *Monster Beverage Corp. |
13,200 | 1,122,000 | ||||||
| National Beverage Corp. |
3,619 | 204,112 | ||||||
| Natural Grocers by Vitamin Cottage, Inc. |
8 | 97 | ||||||
| Nature’s Sunshine Products, Inc. |
8 | 126 | ||||||
| *NewAge, Inc. |
40 | 59 | ||||||
| Nu Skin Enterprises, Inc., Class A |
1,605 | 64,441 | ||||||
| *Oil-Dri Corp. of America |
31 | 1,079 | ||||||
| PepsiCo., Inc. |
42,177 | 6,815,803 | ||||||
| *Performance Food Group Co. |
7,200 | 325,656 | ||||||
| Philip Morris International, Inc. |
38,964 | 3,683,657 | ||||||
| *Pilgrim’s Pride Corp. |
903 | 25,428 | ||||||
| *Post Holdings, Inc. |
3,273 | 332,144 | ||||||
| PriceSmart, Inc. |
835 | 60,078 | ||||||
| Procter & Gamble Co. (The) |
75,108 | 10,739,693 | ||||||
| #Reynolds Consumer Products, Inc. |
1,802 | 48,618 | ||||||
| #*Rite Aid Corp. |
1,741 | 23,660 | ||||||
| *S&W Seed Co. |
8 | 34 | ||||||
| Sanderson Farms, Inc. |
2,363 | 447,670 | ||||||
| *Seaboard Corp. |
4 | 15,400 | ||||||
| *Seneca Foods Corp., Class A |
42 | 2,168 | ||||||
| *Simply Good Foods Co. (The) |
1,846 | 73,194 | ||||||
| *SpartanNash Co. |
8 | 185 | ||||||
| Spectrum Brands Holdings, Inc. |
294 | 27,563 | ||||||
| *Sprouts Farmers Market, Inc. |
9,371 | 207,474 | ||||||
| *Sysco Corp. |
18,513 | 1,423,650 | ||||||
| #*Tattooed Chef, Inc. |
1,508 | 27,099 | ||||||
| #Tootsie Roll Industries, Inc. |
369 | 11,679 | ||||||
| *TreeHouse Foods, Inc. |
948 | 34,261 | ||||||
| Turning Point Brands, Inc. |
210 | 8,016 | ||||||
| *Tyson Foods, Inc., Class A |
11,550 | 923,654 | ||||||
| *United Natural Foods, Inc. |
1,304 | 56,581 | ||||||
| *Universal Corp. |
468 | 21,996 | ||||||
| *US Foods Holding Corp. |
6,637 | 230,105 | ||||||
| *USANA Health Sciences, Inc. |
667 | 64,739 | ||||||
| Vector Group, Ltd. |
6,152 | 81,576 | ||||||
| *Veru, Inc. |
32 | 261 | ||||||
| Village Super Market, Inc., Class A |
44 | 980 | ||||||
| *Walgreens Boots Alliance, Inc. |
32,071 | 1,507,978 | ||||||
| Walmart, Inc. |
46,009 | 6,874,665 | ||||||
| WD-40 Co. |
780 | 177,060 | ||||||
| *Weis Markets, Inc. |
3,352 | 188,751 | ||||||
|
|
|
|||||||
| TOTAL CONSUMER STAPLES |
76,874,716 | |||||||
|
|
|
|||||||
| ENERGY (3.3%) |
| |||||||
| *Adams Resources & Energy, Inc. |
52 | 1,526 | ||||||
| #*Alto Ingredients, Inc. |
24 | 128 | ||||||
| Antero Midstream Corp. |
18,716 | 199,138 | ||||||
| *Antero Resources Corp. |
6,108 | 121,366 | ||||||
| Apa Corp. |
5,678 | 148,820 | ||||||
| *Arch Resources, Inc. |
658 | 59,931 | ||||||
| Archrock, Inc. |
7,502 | 61,441 | ||||||
| *Ardmore Shipping Corp. |
8 | 32 | ||||||
| *Aspen Aerogels, Inc. |
1,650 | 89,859 | ||||||
| Baker Hughes Co. |
24,368 | 611,150 | ||||||
| *Battalion Oil Corp. |
8 | 77 | ||||||
Dimensional US Core Equity Market ETF
SCHEDULE OF INVESTMENTS
October 31, 2021
| Security Description |
Shares | Fair Value | ||||||
| ENERGY (Continued) |
| |||||||
| Berry Corp. |
32 | $ | 308 | |||||
| Brigham Minerals, Inc. |
202 | 4,682 | ||||||
| *Bristow Group, Inc. |
267 | 9,238 | ||||||
| *Cactus, Inc., Class A |
1,810 | 78,735 | ||||||
| *California Resources Corp. |
272 | 12,547 | ||||||
| *Callon Petroleum Co. |
157 | 8,122 | ||||||
| *Centennial Resource Development, Inc., Class A |
10,887 | 78,386 | ||||||
| *Centrus Energy Corp. |
14 | 793 | ||||||
| *ChampionX Corp. |
5,571 | 146,127 | ||||||
| *Cheniere Energy, Inc. |
10,177 | 1,052,302 | ||||||
| *Chesapeake Energy Corp. |
1,836 | 117,027 | ||||||
| *Chevron Corp. |
50,928 | 5,830,747 | ||||||
| *Clean Energy Fuels Corp. |
2,969 | 27,374 | ||||||
| *CNX Resources Corp. |
4,819 | 70,406 | ||||||
| *Comstock Resources, Inc. |
8,203 | 80,964 | ||||||
| ConocoPhillips |
44,131 | 3,287,318 | ||||||
| *CONSOL Energy, Inc. |
896 | 24,649 | ||||||
| *Contango Oil & Gas Co. |
1,073 | 4,432 | ||||||
| #*Continental Resources, Inc. |
8,925 | 435,629 | ||||||
| Core Laboratories NV |
6,248 | 162,511 | ||||||
| *Coterra Energy, Inc. |
19,616 | 418,213 | ||||||
| CVR Energy, Inc. |
1,420 | 27,221 | ||||||
| *Delek US Holdings, Inc. |
18,116 | 352,356 | ||||||
| *Denbury, Inc. |
1,550 | 131,223 | ||||||
| Devon Energy Corp. |
19,412 | 778,033 | ||||||
| DHT Holdings, Inc. |
8,920 | 58,069 | ||||||
| Diamondback Energy, Inc. |
8,622 | 924,192 | ||||||
| *DMC Global, Inc. |
619 | 25,862 | ||||||
| Dorian LPG, Ltd. |
510 | 6,181 | ||||||
| *Dril-Quip, Inc. |
8,118 | 191,260 | ||||||
| DT Midstream, Inc. |
2,420 | 116,063 | ||||||
| *Earthstone Energy, Inc., Class A |
8 | 81 | ||||||
| EnLink Midstream LLC |
77,577 | 608,980 | ||||||
| EOG Resources, Inc. |
19,381 | 1,791,967 | ||||||
| *Epsilon Energy, Ltd. |
8 | 43 | ||||||
| *EQT Corp. |
6,814 | 135,667 | ||||||
| *Equitrans Midstream Corp. |
19,207 | 198,024 | ||||||
| Evolution Petroleum Corp. |
8 | 48 | ||||||
| *Expro Group Holdings NV |
245 | 4,202 | ||||||
| *Exterran Corp. |
16 | 69 | ||||||
| Exxon Mobil Corp. |
101,611 | 6,550,861 | ||||||
| *Forum Energy Technologies, Inc. |
100 | 2,251 | ||||||
| *Geospace Technologies Corp. |
8 | 76 | ||||||
| *Goodrich Petroleum Corp. |
8 | 163 | ||||||
| *Green Plains, Inc. |
1,431 | 54,307 | ||||||
| *Gulf Island Fabrication, Inc. |
200 | 788 | ||||||
| *Gulfport Energy Operating Corp. |
347 | 28,468 | ||||||
| *Halliburton Co. |
34,747 | 868,328 | ||||||
| *Helix Energy Solutions Group, Inc. |
911 | 3,444 | ||||||
| *Helmerich & Payne, Inc. |
2,017 | 62,608 | ||||||
| Hess Corp. |
12,147 | 1,002,978 | ||||||
| HollyFrontier Corp. |
3,113 | 105,219 | ||||||
| International Seaways, Inc. |
8 | 140 | ||||||
| Kinder Morgan, Inc. |
74,176 | 1,242,448 | ||||||
| *Kosmos Energy, Ltd. |
14,662 | 52,783 | ||||||
| #*Laredo Petroleum, Inc. |
8 | 603 | ||||||
| *Liberty Oilfield Services, Inc., Class A |
6,211 | 80,246 | ||||||
Dimensional US Core Equity Market ETF
SCHEDULE OF INVESTMENTS
October 31, 2021
| Security Description |
Shares | Fair Value | ||||||
| ENERGY (Continued) |
| |||||||
| Magnolia Oil & Gas Corp., Class A |
6,457 | $ | 134,822 | |||||
| *Marathon Oil Corp. |
42,063 | 686,468 | ||||||
| Marathon Petroleum Corp. |
20,692 | 1,364,224 | ||||||
| *Matador Resources Co. |
17,262 | 722,415 | ||||||
| #*Meta Materials, Inc. |
2,809 | 13,202 | ||||||
| *Murphy Oil Corp. |
600 | 16,698 | ||||||
| *NACCO Industries, Inc., Class A |
68 | 2,111 | ||||||
| #*National Energy Services Reunited Corp. |
1,849 | 21,633 | ||||||
| *Natural Gas Services Group, Inc. |
8 | 91 | ||||||
| *New Fortress Energy, Inc. |
1,208 | 36,240 | ||||||
| *Newpark Resources, Inc. |
1,641 | 5,579 | ||||||
| *NextDecade Corp. |
16 | 59 | ||||||
| *NexTier Oilfield Solutions, Inc. |
4,851 | 21,636 | ||||||
| Nordic American Tankers, Ltd. |
140 | 329 | ||||||
| *NOV, Inc. |
44,743 | 627,297 | ||||||
| *Oasis Petroleum, Inc. |
524 | 63,194 | ||||||
| *Occidental Petroleum Corp. |
43,043 | 1,443,232 | ||||||
| *Oceaneering International, Inc. |
6,317 | 85,911 | ||||||
| *Oil States International, Inc. |
24 | 145 | ||||||
| ONEOK, Inc. |
17,728 | 1,127,855 | ||||||
| *Overseas Shipholding Group, Inc., Class A |
66 | 131 | ||||||
| Ovintiv, Inc. |
6,828 | 256,187 | ||||||
| *Par Pacific Holdings, Inc. |
648 | 10,018 | ||||||
| *Patterson-UTI Energy, Inc. |
7,187 | 61,521 | ||||||
| *PBF Energy, Inc., Class A |
3,682 | 53,794 | ||||||
| PDC Energy, Inc. |
1,944 | 101,691 | ||||||
| *Peabody Energy Corp. |
3,179 | 37,798 | ||||||
| *Phillips 66 |
14,891 | 1,113,549 | ||||||
| PHX Minerals, Inc. |
310 | 942 | ||||||
| *Pioneer Natural Resources Co. |
6,705 | 1,253,701 | ||||||
| *ProPetro Holding Corp. |
1,746 | 16,744 | ||||||
| #*Range Resources Corp. |
30,586 | 713,266 | ||||||
| *Ranger Oil Corp. |
8 | 264 | ||||||
| *Renewable Energy Group, Inc. |
1,332 | 85,248 | ||||||
| *REX American Resources Corp. |
31 | 2,727 | ||||||
| *RPC, Inc. |
3,587 | 19,334 | ||||||
| *SandRidge Energy, Inc. |
8 | 102 | ||||||
| *Schlumberger NV |
52,940 | 1,707,844 | ||||||
| Scorpio Tankers, Inc. |
1,160 | 18,583 | ||||||
| *SEACOR Marine Holdings, Inc. |
423 | 1,887 | ||||||
| *Select Energy Services, Inc., Class A |
32 | 192 | ||||||
| SFL Corp., Ltd. |
2,830 | 22,385 | ||||||
| #SM Energy Co. |
2,147 | 73,685 | ||||||
| Solaris Oilfield Infrastructure, Inc., Class A |
8 | 61 | ||||||
| *Southwestern Energy Co. |
20,307 | 99,098 | ||||||
| *Talos Energy, Inc. |
2,804 | 36,368 | ||||||
| Targa Resources Corp. |
10,677 | 583,712 | ||||||
| TechnipFMC PLC |
8,851 | 65,232 | ||||||
| #*Teekay Tankers, Ltd., Class A |
16 | 222 | ||||||
| #*Tellurian, Inc. |
21,564 | 84,531 | ||||||
| *TETRA Technologies, Inc. |
70 | 226 | ||||||
| Texas Pacific Land Corp. |
1 | 1,274 | ||||||
| *Tidewater, Inc. |
16 | 194 | ||||||
| #*Transocean, Ltd. |
8,985 | 31,717 | ||||||
| *Uranium Energy Corp. |
1,562 | 5,811 | ||||||
| *US Silica Holdings, Inc. |
630 | 6,098 | ||||||
Dimensional US Core Equity Market ETF
SCHEDULE OF INVESTMENTS
October 31, 2021
| Security Description |
Shares | Fair Value | ||||||
| ENERGY (Continued) |
| |||||||
| *VAALCO Energy, Inc. |
838 | $ | 2,623 | |||||
| Valero Energy Corp. |
15,047 | 1,163,585 | ||||||
| *Vertex Energy, Inc. |
25 | 122 | ||||||
| *W&T Offshore, Inc. |
4,858 | 19,966 | ||||||
| *Weatherford International PLC |
1,605 | 46,641 | ||||||
| *Whiting Petroleum Corp. |
1,118 | 72,815 | ||||||
| *Williams Cos, Inc. (The) |
44,701 | 1,255,651 | ||||||
| World Fuel Services Corp. |
2,194 | 66,983 | ||||||
|
|
|
|||||||
| TOTAL ENERGY |
44,016,894 | |||||||
|
|
|
|||||||
| FINANCIALS (12.7%) |
| |||||||
| *1st Source Corp. |
510 | 24,623 | ||||||
| *ACNB Corp. |
43 | 1,193 | ||||||
| *Affiliated Managers Group, Inc. |
464 | 77,896 | ||||||
| *Aflac, Inc. |
24,155 | 1,296,399 | ||||||
| Alerus Financial Corp. |
8 | 251 | ||||||
| *Alleghany Corp. |
610 | 397,342 | ||||||
| Allegiance Bancshares, Inc. |
90 | 3,525 | ||||||
| *Allstate Corp. (The) |
12,929 | 1,598,929 | ||||||
| Ally Financial, Inc. |
14,205 | 678,147 | ||||||
| A-Mark Precious Metals, Inc. |
37 | 2,775 | ||||||
| *Amerant BanCorp, Inc. |
8 | 212 | ||||||
| *Amerant BanCorp, Inc., Class B |
8 | 199 | ||||||
| *American Equity Investment Life Holding Co. |
2,864 | 91,276 | ||||||
| American Express Co. |
20,474 | 3,557,972 | ||||||
| *American Financial Group, Inc. |
2,931 | 398,733 | ||||||
| *American International Group, Inc. |
29,626 | 1,750,600 | ||||||
| *American National Bankshares, Inc. |
44 | 1,632 | ||||||
| American National Group, Inc. |
22 | 4,174 | ||||||
| Ameriprise Financial, Inc. |
4,910 | 1,483,458 | ||||||
| Ameris BanCorp |
59 | 3,091 | ||||||
| AMERISAFE, Inc. |
398 | 23,597 | ||||||
| *Ames National Corp. |
47 | 1,162 | ||||||
| Aon PLC, Class A |
6,033 | 1,930,077 | ||||||
| #Apollo Global Management, Inc. |
7,152 | 550,346 | ||||||
| *Arch Capital Group, Ltd. |
14,235 | 595,308 | ||||||
| Ares Management Corp., Class A |
3,669 | 310,911 | ||||||
| Argo Group International Holdings, Ltd. |
130 | 7,163 | ||||||
| *Arrow Financial Corp. |
88 | 3,155 | ||||||
| Arthur J Gallagher & Co. |
7,402 | 1,241,093 | ||||||
| Artisan Partners Asset Management, Inc., Class A |
1,808 | 89,568 | ||||||
| *AssetMark Financial Holdings, Inc. |
349 | 8,948 | ||||||
| *Associated Banc-Corp. |
2,493 | 55,544 | ||||||
| Assurant, Inc. |
2,673 | 431,182 | ||||||
| Assured Guaranty, Ltd. |
131 | 7,281 | ||||||
| *Athene Holding, Ltd., Class A |
7,429 | 646,397 | ||||||
| *Atlantic Capital Bancshares, Inc. |
8 | 220 | ||||||
| Atlantic Union Bankshares Corp. |
1,453 | 52,119 | ||||||
| *Atlanticus Holdings Corp. |
420 | 32,546 | ||||||
| Axis Capital Holdings, Ltd. |
3,384 | 176,205 | ||||||
| *Axos Financial, Inc. |
1,563 | 82,839 | ||||||
| B Riley Financial, Inc. |
196 | 14,045 | ||||||
| Banc of California, Inc. |
594 | 12,076 | ||||||
| BancFirst Corp. |
494 | 32,115 | ||||||
| *BanCorp, Inc. (The) |
2,970 | 90,734 | ||||||
| *Bank of America Corp. |
186,214 | 8,897,305 | ||||||
| *Bank of Hawaii Corp. |
5,075 | 428,838 | ||||||
Dimensional US Core Equity Market ETF
SCHEDULE OF INVESTMENTS
October 31, 2021
| Security Description |
Shares | Fair Value | ||||||
| FINANCIALS (Continued) |
| |||||||
| *Bank of Marin BanCorp |
74 | $ | 2,820 | |||||
| Bank of New York Mellon Corp. (The) |
30,016 | 1,776,947 | ||||||
| Bank of NT Butterfield & Son, Ltd. (The) |
5,937 | 213,138 | ||||||
| *Bank of Princeton (The) |
84 | 2,544 | ||||||
| Bank of South Carolina Corp. |
56 | 1,121 | ||||||
| Bank OZK |
3,397 | 151,744 | ||||||
| Bank7 Corp. |
130 | 3,523 | ||||||
| BankFinancial Corp. |
91 | 1,036 | ||||||
| BankUnited, Inc. |
223 | 9,045 | ||||||
| Bankwell Financial Group, Inc. |
88 | 2,614 | ||||||
| Banner Corp. |
6,054 | 349,679 | ||||||
| *Bar Harbor Bankshares |
8 | 238 | ||||||
| *BayCom Corp. |
8 | 151 | ||||||
| BCB BanCorp, Inc. |
8 | 121 | ||||||
| *Berkshire Hathaway, Inc., Class B |
41,322 | 11,859,827 | ||||||
| *Berkshire Hills BanCorp, Inc. |
3,000 | 81,450 | ||||||
| BGC Partners, Inc., Class A |
2,929 | 15,729 | ||||||
| BlackRock, Inc. |
3,311 | 3,123,796 | ||||||
| Blackstone, Inc., Class A |
13,425 | 1,858,289 | ||||||
| BOK Financial Corp. |
5,243 | 530,434 | ||||||
| *Bridgewater Bancshares, Inc. |
97 | 1,755 | ||||||
| *Brighthouse Financial, Inc. |
730 | 36,668 | ||||||
| Brightsphere Investment Group, Inc. |
7,956 | 238,521 | ||||||
| Brookline BanCorp, Inc. |
2,901 | 46,561 | ||||||
| Brown & Brown, Inc. |
9,836 | 620,750 | ||||||
| *BRP Group, Inc., Class A |
38 | 1,387 | ||||||
| Bryn Mawr Bank Corp. |
8 | 371 | ||||||
| Business First Bancshares, Inc. |
8 | 213 | ||||||
| *Byline BanCorp, Inc. |
416 | 10,716 | ||||||
| *C, Inc.innati Financial Corp. |
4,939 | 599,792 | ||||||
| *Cadence Bank |
23,669 | 686,863 | ||||||
| *California BanCorp |
101 | 1,798 | ||||||
| *Cambridge BanCorp |
34 | 3,122 | ||||||
| Camden National Corp. |
8 | 381 | ||||||
| *Cannae Holdings, Inc. |
1,648 | 56,197 | ||||||
| *Capital City Bank Group, Inc. |
8 | 215 | ||||||
| Capital One Financial Corp. |
14,881 | 2,247,477 | ||||||
| Capitol Federal Financial, Inc. |
34,664 | 420,474 | ||||||
| Capstar Financial Holdings, Inc. |
8 | 176 | ||||||
| *Cathay General BanCorp |
1,323 | 55,817 | ||||||
| Cboe Global Markets, Inc. |
4,517 | 595,973 | ||||||
| CBTX, Inc. |
97 | 2,638 | ||||||
| *Central Valley Community BanCorp |
82 | 1,749 | ||||||
| *Century BanCorp, Inc., Class A |
14 | 1,612 | ||||||
| *Charles Schwab Corp. (The) |
39,502 | 3,240,349 | ||||||
| Chubb, Ltd. |
10,730 | 2,096,427 | ||||||
| Citigroup, Inc. |
52,610 | 3,638,508 | ||||||
| Citizens & Northern Corp. |
8 | 204 | ||||||
| Citizens Community BanCorp, Inc. |
138 | 1,877 | ||||||
| Citizens Financial Group, Inc. |
15,140 | 717,333 | ||||||
| *Citizens, Inc. |
16 | 103 | ||||||
| *City Holding Co. |
394 | 31,355 | ||||||
| Civista Bancshares, Inc. |
8 | 192 | ||||||
| CME Group, Inc. |
8,713 | 1,921,652 | ||||||
| *CNA Financial Corp. |
37 | 1,660 | ||||||
| *CNB Financial Corp. |
48 | 1,232 | ||||||
Dimensional US Core Equity Market ETF
SCHEDULE OF INVESTMENTS
October 31, 2021
| Security Description |
Shares | Fair Value | ||||||
| FINANCIALS (Continued) |
| |||||||
| *Coastal Financial Corp. |
8 | $ | 304 | |||||
| Codorus Valley BanCorp, Inc. |
32 | 700 | ||||||
| #Cohen & Steers, Inc. |
1,718 | 163,021 | ||||||
| Columbia Banking System, Inc. |
1,541 | 52,594 | ||||||
| *Columbia Financial, Inc. |
1,306 | 24,318 | ||||||
| *Comerica, Inc. |
4,856 | 413,197 | ||||||
| *Commerce Bancshares, Inc. |
3,689 | 260,111 | ||||||
| *Community Bank System, Inc. |
319 | 22,863 | ||||||
| *Community Bankers Trust Corp. |
251 | 2,927 | ||||||
| Community Financial Corp. (The) |
73 | 2,783 | ||||||
| *Community Trust BanCorp, Inc. |
8 | 349 | ||||||
| ConnectOne BanCorp, Inc. |
876 | 29,547 | ||||||
| *Consumer Portfolio Services, Inc. |
280 | 1,828 | ||||||
| *County BanCorp, Inc. |
77 | 2,726 | ||||||
| *Cowen, Inc., Class A |
1,222 | 46,106 | ||||||
| *Crawford & Co., Class A |
16 | 138 | ||||||
| *Crawford & Co., Class B |
8 | 66 | ||||||
| #*Credit Acceptance Corp. |
1,441 | 862,021 | ||||||
| *CrossFirst Bankshares, Inc. |
24 | 342 | ||||||
| *Cullen/Frost Bankers, Inc. |
3,076 | 398,342 | ||||||
| Curo Group Holdings Corp. |
236 | 4,054 | ||||||
| Customers BanCorp, Inc. |
712 | 37,942 | ||||||
| CVB Financial Corp. |
2,667 | 53,393 | ||||||
| Diamond Hill Investment Group, Inc. |
18 | 3,903 | ||||||
| Dime Community Bancshares, Inc. |
935 | 33,361 | ||||||
| *Discover Financial Services |
9,836 | 1,114,616 | ||||||
| Donegal Group, Inc., Class A |
8 | 114 | ||||||
| *Donnelley Financial Solutions, Inc. |
1,673 | 64,109 | ||||||
| Eagle BanCorp Montana, Inc. |
22 | 495 | ||||||
| *Eagle BanCorp, Inc. |
234 | 13,242 | ||||||
| East West BanCorp, Inc. |
6,978 | 554,611 | ||||||
| *eHealth, Inc. |
694 | 30,779 | ||||||
| *Elevate Credit, Inc. |
709 | 2,432 | ||||||
| *Employers Holdings, Inc. |
880 | 33,968 | ||||||
| *Encore Capital Group, Inc. |
10,884 | 587,954 | ||||||
| *Enova International, Inc. |
845 | 27,412 | ||||||
| *Enstar Group, Ltd. |
1,371 | 316,399 | ||||||
| *Enterprise BanCorp, Inc. |
8 | 297 | ||||||
| *Enterprise Financial Services Corp. |
1,584 | 74,480 | ||||||
| Equitable Holdings, Inc. |
16,961 | 568,194 | ||||||
| Equity Bancshares, Inc., Class A |
8 | 268 | ||||||
| Erie Indemnity Co., Class A |
1,538 | 316,536 | ||||||
| *Esquire Financial Holdings, Inc. |
27 | 863 | ||||||
| Essent Group, Ltd. |
5,622 | 269,856 | ||||||
| Evercore, Inc. |
1,027 | 155,940 | ||||||
| Everest Re Group, Ltd. |
1,821 | 476,192 | ||||||
| *EZCorp., Inc., Class A |
16 | 119 | ||||||
| *FactSet Research Systems, Inc. |
1,540 | 683,591 | ||||||
| Farmers & Merchants BanCorp, Inc. |
8 | 203 | ||||||
| Farmers National Banc Corp. |
8 | 143 | ||||||
| FB Financial Corp. |
1,591 | 72,120 | ||||||
| *Federal Agricultural Mortgage Corp. |
43 | 5,422 | ||||||
| *Federated Hermes, Inc. |
4,345 | 144,732 | ||||||
| Fidelity National Financial, Inc. |
12,123 | 580,813 | ||||||
| Fifth Third BanCorp |
25,945 | 1,129,386 | ||||||
| #*Financial Institutions, Inc. |
8 | 255 | ||||||
| First American Financial Corp. |
5,108 | 373,599 | ||||||
Dimensional US Core Equity Market ETF
SCHEDULE OF INVESTMENTS
October 31, 2021
| Security Description |
Shares | Fair Value | ||||||
| FINANCIALS (Continued) |
| |||||||
| *First BanCorp |
3,958 | $ | 54,027 | |||||
| First BanCorp, Inc. (The) |
8 | 237 | ||||||
| First BanCorp/Southern Pines Nc |
641 | 31,037 | ||||||
| *First Bancshares, Inc. (The) |
1,309 | 52,687 | ||||||
| First Busey Corp. |
3,151 | 80,319 | ||||||
| *First Business Financial Services, Inc. |
58 | 1,694 | ||||||
| First Citizens Bancshares, Inc., Class A |
170 | 138,363 | ||||||
| *First Commonwealth Financial Corp. |
6,490 | 99,297 | ||||||
| First Community Bankshares, Inc. |
8 | 259 | ||||||
| *First Community Corp. |
84 | 1,690 | ||||||
| *First Financial BanCorp |
20,756 | 493,578 | ||||||
| #First Financial Bankshares, Inc. |
4,747 | 240,768 | ||||||
| *First Financial Corp. |
8 | 343 | ||||||
| First Foundation, Inc. |
1,172 | 31,187 | ||||||
| First Hawaiian, Inc. |
104 | 2,869 | ||||||
| *First Horizon Corp. |
29,546 | 501,396 | ||||||
| First Internet BanCorp, Class A |
49 | 1,668 | ||||||
| First Interstate BancSystem, Inc., Class A |
37 | 1,538 | ||||||
| *First Merchants Corp. |
9,786 | 406,902 | ||||||
| *First Mid Bancshares, Inc. |
364 | 15,681 | ||||||
| *First Midwest BanCorp, Inc. |
20,339 | 391,526 | ||||||
| *First Northwest BanCorp |
115 | 2,076 | ||||||
| First of Long Island Corp. (The) |
92 | 1,852 | ||||||
| First Republic Bank |
6,448 | 1,394,896 | ||||||
| *First Western Financial, Inc. |
54 | 1,567 | ||||||
| FirstCash, Inc. |
322 | 28,487 | ||||||
| *Flagstar BanCorp, Inc. |
10,340 | 487,945 | ||||||
| *Flexshopper, Inc. |
21 | 54 | ||||||
| Flushing Financial Corp. |
16 | 384 | ||||||
| *FNB Corp. |
45,769 | 533,209 | ||||||
| *Franklin Financial Services Corp. |
49 | 1,593 | ||||||
| Franklin Resources, Inc. |
14,468 | 455,597 | ||||||
| FS BanCorp, Inc. |
40 | 1,378 | ||||||
| *Fulton Financial Corp. |
3,069 | 49,411 | ||||||
| *FVCBankCorp., Inc. |
8 | 164 | ||||||
| *GAMCO Investors, Inc., Class A |
15 | 397 | ||||||
| *Genworth Financial, Inc., Class A |
3,890 | 15,988 | ||||||
| *German American BanCorp, Inc. |
888 | 35,005 | ||||||
| Glacier BanCorp, Inc. |
1,962 | 108,479 | ||||||
| Globe Life, Inc. |
4,580 | 407,712 | ||||||
| Goldman Sachs Group, Inc. (The) |
9,716 | 4,016,109 | ||||||
| #Goosehead Insurance, Inc., Class A |
264 | 38,095 | ||||||
| Great Southern BanCorp, Inc. |
130 | 7,336 | ||||||
| *Great Western BanCorp, Inc. |
3,236 | 110,186 | ||||||
| *Green Dot Corp., Class A |
1,005 | 42,572 | ||||||
| *Greene County BanCorp, Inc. |
45 | 1,532 | ||||||
| *Greenhill & Co., Inc. |
8 | 126 | ||||||
| *Greenlight Capital Re, Ltd., Class A |
145 | 1,077 | ||||||
| Guaranty Bancshares, Inc. |
60 | 2,252 | ||||||
| *Hamilton Lane, Inc., Class A |
1,379 | 144,119 | ||||||
| *Hancock Whitney Corp. |
461 | 22,810 | ||||||
| *Hanmi Financial Corp. |
58 | 1,287 | ||||||
| Hanover Insurance Group, Inc. (The) |
1,701 | 214,326 | ||||||
| HarborOne BanCorp, Inc. |
2,553 | 36,687 | ||||||
| *Hartford Financial Services Group, Inc. (The) |
13,695 | 998,776 | ||||||
| *Hawthorn Bancshares, Inc. |
52 | 1,246 | ||||||
Dimensional US Core Equity Market ETF
SCHEDULE OF INVESTMENTS
October 31, 2021
| Security Description |
Shares | Fair Value | ||||||
| FINANCIALS (Continued) |
| |||||||
| *HBT Financial, Inc. |
97 | $ | 1,749 | |||||
| HCI Group, Inc. |
49 | 6,566 | ||||||
| Heartland Financial USA, Inc. |
37 | 1,854 | ||||||
| *Heritage Commerce Corp. |
112 | 1,343 | ||||||
| Heritage Financial Corp. |
1,590 | 39,496 | ||||||
| Heritage Insurance Holdings, Inc. |
8 | 52 | ||||||
| Hingham Institution For Savings The |
11 | 3,974 | ||||||
| Home BanCorp, Inc. |
43 | 1,795 | ||||||
| *Home Bancshares, Inc. |
14,798 | 351,600 | ||||||
| HomeStreet, Inc. |
301 | 14,195 | ||||||
| Hope BanCorp, Inc. |
7,956 | 116,078 | ||||||
| Horace Mann Educators Corp. |
2,657 | 104,101 | ||||||
| Horizon BanCorp, Inc. |
439 | 8,372 | ||||||
| *Houlihan Lokey, Inc. |
1,097 | 122,952 | ||||||
| *Howard BanCorp, Inc. |
8 | 166 | ||||||
| *Huntington Bancshares, Inc. |
43,364 | 682,549 | ||||||
| Independence Holding Co. |
8 | 392 | ||||||
| Independent Bank Corp. |
543 | 45,883 | ||||||
| *Independent Bank Corp. |
85 | 1,915 | ||||||
| Independent Bank Group, Inc. |
791 | 57,181 | ||||||
| Interactive Brokers Group, Inc. |
1,719 | 121,791 | ||||||
| Intercontinental Exchange, Inc. |
13,700 | 1,896,902 | ||||||
| International Bancshares Corp. |
1,231 | 52,194 | ||||||
| Invesco, Ltd. |
18,741 | 476,209 | ||||||
| Investar Holding Corp. |
131 | 2,450 | ||||||
| Investors BanCorp, Inc. |
216 | 3,305 | ||||||
| *Investors Title Co. |
8 | 1,550 | ||||||
| James River Group Holdings, Ltd. |
9,854 | 314,835 | ||||||
| Janus Henderson Group PLC |
6,950 | 323,175 | ||||||
| Jefferies Financial Group, Inc. |
13,531 | 581,833 | ||||||
| JPMorgan Chase & Co. |
84,147 | 14,295,734 | ||||||
| Kearny Financial Corp. |
2,999 | 40,247 | ||||||
| *Kemper Corp. |
1,716 | 108,932 | ||||||
| *KeyCorp. |
33,808 | 786,712 | ||||||
| Kinsale Capital Group, Inc. |
718 | 134,374 | ||||||
| KKR & Co., Inc. |
16,478 | 1,312,802 | ||||||
| *Lakeland BanCorp, Inc. |
240 | 4,315 | ||||||
| Lakeland Financial Corp. |
8,388 | 602,846 | ||||||
| Lazard, Ltd., Class A |
3,658 | 179,205 | ||||||
| LCNB Corp. |
8 | 136 | ||||||
| *LendingClub Corp. |
5,681 | 261,099 | ||||||
| *LendingTree, Inc. |
534 | 86,182 | ||||||
| Level One BanCorp, Inc. |
96 | 3,015 | ||||||
| *Limestone BanCorp, Inc. |
45 | 821 | ||||||
| *Lincoln National Corp. |
7,384 | 532,756 | ||||||
| Live Oak Bancshares, Inc. |
2,150 | 191,737 | ||||||
| *Loews Corp. |
8,862 | 496,892 | ||||||
| LPL Financial Holdings, Inc. |
3,319 | 544,382 | ||||||
| *Luther Burbank Corp. |
16 | 232 | ||||||
| M&T Bank Corp. |
4,815 | 708,383 | ||||||
| *Macatawa Bank Corp. |
8 | 67 | ||||||
| *Maiden Holdings, Ltd. |
2,602 | 8,483 | ||||||
| *MainStreet Bancshares, Inc., Class A |
84 | 2,100 | ||||||
| Manning & Napier, Inc. |
100 | 965 | ||||||
| *Markel Corp. |
679 | 891,615 | ||||||
| MarketAxess Holdings, Inc. |
1,043 | 426,243 | ||||||
| *Marlin Business Services Corp. |
8 | 183 | ||||||
Dimensional US Core Equity Market ETF
SCHEDULE OF INVESTMENTS
October 31, 2021
| Security Description |
Shares | Fair Value | ||||||
| FINANCIALS (Continued) |
| |||||||
| Marsh & McLennan Cos., Inc. |
11,605 | $ | 1,935,714 | |||||
| *Mercantile Bank Corp. |
87 | 2,990 | ||||||
| Merchants BanCorp |
1,696 | 75,353 | ||||||
| *Mercury General Corp. |
7,932 | 432,215 | ||||||
| Meridian BanCorp, Inc. |
1,031 | 23,919 | ||||||
| Meridian Corp. |
21 | 634 | ||||||
| Meta Financial Group, Inc. |
2,015 | 111,712 | ||||||
| MetLife, Inc. |
26,691 | 1,676,195 | ||||||
| #*Metropolitan Bank Holding Corp. |
30 | 2,726 | ||||||
| *MGIC Investment Corp. |
22,029 | 355,989 | ||||||
| Mid Penn BanCorp, Inc. |
104 | 2,914 | ||||||
| *Middlefield Banc Corp. |
71 | 1,775 | ||||||
| *Midland States BanCorp, Inc. |
43 | 1,103 | ||||||
| *MidWestOne Financial Group, Inc. |
8 | 251 | ||||||
| Moelis & Co., Class A |
1,995 | 145,116 | ||||||
| *Moody’s Corp. |
4,888 | 1,975,485 | ||||||
| Morgan Stanley |
33,909 | 3,485,167 | ||||||
| Morningstar, Inc. |
1,691 | 535,624 | ||||||
| *Mr Cooper Group, Inc. |
486 | 21,306 | ||||||
| MSCI, Inc. |
2,589 | 1,721,374 | ||||||
| *MVB Financial Corp. |
37 | 1,580 | ||||||
| *Nasdaq, Inc. |
5,747 | 1,206,123 | ||||||
| *National Bank Holdings Corp., Class A |
716 | 31,053 | ||||||
| *National Bankshares, Inc. |
32 | 1,192 | ||||||
| *National Western Life Group, Inc., Class A |
13 | 2,795 | ||||||
| Navient Corp. |
420 | 8,274 | ||||||
| *NBT BanCorp, Inc. |
2,588 | 94,954 | ||||||
| Nelnet, Inc., Class A |
80 | 6,610 | ||||||
| *New York Community BanCorp, Inc. |
20,851 | 259,178 | ||||||
| *NI Holdings, Inc. |
16 | 318 | ||||||
| *Nicolet Bankshares, Inc. |
43 | 3,091 | ||||||
| *NMI Holdings, Inc., Class A |
1,248 | 30,301 | ||||||
| Northeast Bank |
71 | 2,350 | ||||||
| *Northern Trust Corp. |
8,249 | 1,014,957 | ||||||
| Northfield BanCorp, Inc. |
242 | 4,247 | ||||||
| *Northwest Bancshares, Inc. |
33,171 | 457,760 | ||||||
| *OceanFirst Financial Corp. |
3,529 | 78,238 | ||||||
| *Ocwen Financial Corp. |
43 | 1,351 | ||||||
| OFG BanCorp |
2,801 | 72,546 | ||||||
| Ohio Valley Banc Corp. |
59 | 1,644 | ||||||
| *Old National BanCorp |
3,137 | 53,580 | ||||||
| Old Republic International Corp. |
16,644 | 429,915 | ||||||
| Old Second BanCorp, Inc. |
8 | 108 | ||||||
| OneMain Holdings, Inc. |
5,343 | 282,164 | ||||||
| *Open Lending Corp., Class A |
701 | 22,096 | ||||||
| *Oppenheimer Holdings, Inc., Class A |
65 | 3,383 | ||||||
| Origin BanCorp, Inc. |
141 | 6,289 | ||||||
| Orrstown Financial Services, Inc. |
59 | 1,399 | ||||||
| Pacific Premier BanCorp, Inc. |
634 | 26,622 | ||||||
| *PacWest BanCorp |
2,369 | 112,456 | ||||||
| *Palomar Holdings, Inc. |
375 | 34,294 | ||||||
| *Park National Corp. |
22 | 2,829 | ||||||
| PCB BanCorp |
8 | 170 | ||||||
| PCSB Financial Corp. |
8 | 153 | ||||||
| *PDL Community BanCorp |
8 | 124 | ||||||
| *Peapack-Gladstone Financial Corp. |
8 | 268 | ||||||
Dimensional US Core Equity Market ETF
SCHEDULE OF INVESTMENTS
October 31, 2021
| Security Description |
Shares | Fair Value | ||||||
| FINANCIALS (Continued) |
| |||||||
| Penns Woods BanCorp, Inc. |
87 | $ | 2,071 | |||||
| PennyMac Financial Services, Inc. |
428 | 26,562 | ||||||
| *Peoples BanCorp, Inc. |
39 | 1,246 | ||||||
| *Peoples Financial Services Corp. |
36 | 1,648 | ||||||
| People’s United Financial, Inc. |
9,415 | 161,373 | ||||||
| Pinnacle Financial Partners, Inc. |
1,408 | 135,971 | ||||||
| *Piper Sandler Cos. |
259 | 42,655 | ||||||
| PJT Partners, Inc., Class A |
876 | 71,648 | ||||||
| PNC Financial Services Group, Inc. (The) |
9,980 | 2,106,079 | ||||||
| *Popular, Inc. |
5,553 | 452,236 | ||||||
| Pr, Inc.ipal Financial Group, Inc. |
9,218 | 618,436 | ||||||
| *PRA Group, Inc. |
12,789 | 548,392 | ||||||
| Preferred Bank |
610 | 41,828 | ||||||
| Premier Financial Corp. |
1,203 | 38,352 | ||||||
| Primerica, Inc. |
1,294 | 217,703 | ||||||
| Primis Financial Corp. |
8 | 121 | ||||||
| ProAssurance Corp. |
1,080 | 24,743 | ||||||
| *Prog Holdings, Inc. |
739 | 29,893 | ||||||
| Progressive Corp. (The) |
16,980 | 1,611,062 | ||||||
| *Prosperity Bancshares, Inc. |
3,418 | 257,410 | ||||||
| *Provident Financial Holdings, Inc. |
56 | 955 | ||||||
| Provident Financial Services, Inc. |
3,765 | 93,221 | ||||||
| Prudential BanCorp, Inc. |
91 | 1,364 | ||||||
| *Prudential Financial, Inc. |
12,951 | 1,425,258 | ||||||
| Pzena Investment Management, Inc., Class A |
64 | 696 | ||||||
| QCR Holdings, Inc. |
723 | 39,866 | ||||||
| #*Radian Group, Inc. |
7,519 | 179,479 | ||||||
| Raymond James Financial, Inc. |
8,400 | 828,156 | ||||||
| RBB BanCorp |
8 | 205 | ||||||
| Red River Bancshares, Inc. |
29 | 1,519 | ||||||
| Regional Management Corp. |
8 | 409 | ||||||
| Regions Financial Corp. |
22,244 | 526,738 | ||||||
| *Reinsurance Group of America, Inc. |
2,083 | 245,961 | ||||||
| Reliant BanCorp, Inc. |
8 | 271 | ||||||
| RenaissanceRe Holdings, Ltd. |
1,128 | 159,950 | ||||||
| Renasant Corp. |
9,728 | 363,924 | ||||||
| *Republic BanCorp, Inc., Class A |
720 | 38,894 | ||||||
| *Republic First BanCorp, Inc. |
16 | 50 | ||||||
| *Rhinebeck BanCorp, Inc. |
138 | 1,490 | ||||||
| Richmond Mutual BanCorp, Inc. |
8 | 127 | ||||||
| *RLI Corp. |
2,047 | 221,711 | ||||||
| S&P Global, Inc. |
6,648 | 3,152,216 | ||||||
| *S&T BanCorp, Inc. |
752 | 22,981 | ||||||
| Safety Insurance Group, Inc. |
357 | 27,992 | ||||||
| *Salisbury BanCorp, Inc. |
25 | 1,308 | ||||||
| *Sandy Spring BanCorp, Inc. |
682 | 32,368 | ||||||
| Santander Consumer USA Holdings, Inc. |
7,414 | 309,164 | ||||||
| SB Financial Group, Inc. |
85 | 1,590 | ||||||
| *Sculptor Capital Management, Inc. |
402 | 10,653 | ||||||
| *Seacoast Banking Corp. of Florida |
1,550 | 56,467 | ||||||
| *Security National Financial Corp., Class A |
17 | 150 | ||||||
| SEI Investments Co. |
6,034 | 380,383 | ||||||
| *Selective Insurance Group, Inc. |
1,166 | 91,379 | ||||||
| *Selectquote, Inc. |
1,577 | 20,958 | ||||||
| ServisFirst Bancshares, Inc. |
961 | 77,178 | ||||||
| *Shore Bancshares, Inc. |
8 | 148 | ||||||
| Sierra BanCorp |
8 | 200 | ||||||
Dimensional US Core Equity Market ETF
SCHEDULE OF INVESTMENTS
October 31, 2021
| Security Description |
Shares | Fair Value | ||||||
| FINANCIALS (Continued) |
| |||||||
| Signature Bank |
2,228 | $ | 663,543 | |||||
| *Silvercrest Asset Management Group, Inc., Class A |
237 | 3,792 | ||||||
| *Simmons First National Corp., Class A |
2,006 | 59,959 | ||||||
| *SiriusPoint, Ltd. |
40 | 376 | ||||||
| SLM Corp. |
18,082 | 331,805 | ||||||
| SmartFinancial, Inc. |
8 | 208 | ||||||
| South Plains Financial, Inc. |
8 | 208 | ||||||
| *Southern First Bancshares, Inc. |
33 | 1,778 | ||||||
| *Southern Missouri BanCorp, Inc. |
48 | 2,611 | ||||||
| Southside Bancshares, Inc. |
635 | 26,238 | ||||||
| *SouthState Corp. |
1,300 | 101,517 | ||||||
| Spirit of Texas Bancshares, Inc. |
8 | 195 | ||||||
| *State Auto Financial Corp. |
16 | 821 | ||||||
| State Street Corp. |
12,580 | 1,239,759 | ||||||
| StepStone Group, Inc., Class A |
209 | 9,819 | ||||||
| Sterling BanCorp |
40,615 | 1,033,652 | ||||||
| *Sterling BanCorp, Inc. |
16 | 87 | ||||||
| Stewart Information Services Corp. |
910 | 64,765 | ||||||
| *Stifel Financial Corp. |
4,059 | 295,779 | ||||||
| #*Stock Yards BanCorp, Inc. |
1,145 | 70,131 | ||||||
| *StoneX Group, Inc. |
802 | 55,426 | ||||||
| Summit Financial Group, Inc. |
8 | 201 | ||||||
| *SVB Financial Group |
1,765 | 1,266,211 | ||||||
| *SWK Holdings Corp. |
158 | 2,999 | ||||||
| Synchrony Financial |
22,250 | 1,033,512 | ||||||
| Synovus Financial Corp. |
8,700 | 405,333 | ||||||
| T Rowe Price Group, Inc. |
7,792 | 1,689,929 | ||||||
| Territorial BanCorp, Inc. |
47 | 1,179 | ||||||
| *Texas Capital Bancshares, Inc. |
805 | 48,783 | ||||||
| TFS Financial Corp. |
2,015 | 39,212 | ||||||
| *Timberland BanCorp, Inc. |
44 | 1,221 | ||||||
| Tiptree, Inc. |
8 | 125 | ||||||
| *Tompkins Financial Corp. |
308 | 25,290 | ||||||
| Towne Bank |
10,620 | 334,742 | ||||||
| Tradeweb Markets, Inc., Class A |
2,497 | 222,483 | ||||||
| Travelers Cos, Inc. (The) |
10,709 | 1,722,864 | ||||||
| TriCo Bancshares |
743 | 32,566 | ||||||
| *TriState Capital Holdings, Inc. |
320 | 9,616 | ||||||
| *Triumph BanCorp, Inc. |
179 | 20,997 | ||||||
| Truist Financial Corp. |
31,600 | 2,005,652 | ||||||
| #*Trupanion, Inc. |
491 | 50,278 | ||||||
| *TrustCo Bank Corp. NY |
166 | 5,571 | ||||||
| *Trustmark Corp. |
956 | 30,410 | ||||||
| *UMB Financial Corp. |
947 | 93,583 | ||||||
| *Umpqua Holdings Corp. |
30,148 | 616,527 | ||||||
| *United Bankshares, Inc. |
2,466 | 91,217 | ||||||
| United Community Banks, Inc. |
1,725 | 60,099 | ||||||
| *United Fire Group, Inc. |
138 | 2,819 | ||||||
| *United Insurance Holdings Corp. |
8 | 31 | ||||||
| *Unity BanCorp, Inc. |
56 | 1,420 | ||||||
| Universal Insurance Holdings, Inc. |
16 | 236 | ||||||
| *Univest Financial Corp. |
209 | 5,998 | ||||||
| Unum Group |
4,013 | 102,211 | ||||||
| US BanCorp |
36,805 | 2,221,918 | ||||||
| Valley National BanCorp |
12,730 | 168,800 | ||||||
| *Veritex Holdings, Inc. |
2,658 | 108,845 | ||||||
Dimensional US Core Equity Market ETF
SCHEDULE OF INVESTMENTS
October 31, 2021
| Security Description |
Shares | Fair Value | ||||||
| FINANCIALS (Continued) |
| |||||||
| Victory Capital Holdings, Inc., Class A |
142 | $ | 5,382 | |||||
| *Virtu Financial, Inc., Class A |
5,057 | 125,818 | ||||||
| Virtus Investment Partners, Inc. |
83 | 26,560 | ||||||
| *Voya Financial, Inc. |
3,964 | 276,568 | ||||||
| *W R Berkley Corp. |
6,830 | 543,668 | ||||||
| Walker & Dunlop, Inc. |
2,925 | 380,455 | ||||||
| *Washington Federal, Inc. |
1,015 | 35,890 | ||||||
| Washington Trust BanCorp, Inc. |
292 | 15,961 | ||||||
| Waterstone Financial, Inc. |
117 | 2,418 | ||||||
| *Webster Financial Corp. |
1,708 | 95,580 | ||||||
| *Wells Fargo & Co. |
94,881 | 4,854,112 | ||||||
| *WesBanco, Inc. |
938 | 32,614 | ||||||
| West BanCorp, Inc. |
8 | 254 | ||||||
| *Westamerica BanCorp |
8,918 | 497,268 | ||||||
| *Western Alliance BanCorp |
5,517 | 640,469 | ||||||
| *Western New England BanCorp, Inc. |
316 | 3,075 | ||||||
| White Mountains Insurance Group, Ltd. |
12 | 12,660 | ||||||
| Willis Towers Watson PLC |
4,811 | 1,165,609 | ||||||
| Wintrust Financial Corp. |
8,692 | 769,242 | ||||||
| WisdomTree Investments, Inc. |
2,160 | 13,802 | ||||||
| #*World Acceptance Corp. |
350 | 64,887 | ||||||
| *WSFS Financial Corp. |
720 | 37,303 | ||||||
| *Zions BanCorp NA |
9,338 | 588,201 | ||||||
|
|
|
|||||||
| TOTAL FINANCIALS |
171,084,277 | |||||||
|
|
|
|||||||
| HEALTH CARE (12.6%) |
| |||||||
| *10X Genomics, Inc., Class A |
913 | 147,240 | ||||||
| *Aadi Bioscience, Inc. |
28 | 756 | ||||||
| Abbott Laboratories |
41,732 | 5,378,837 | ||||||
| AbbVie, Inc. |
53,510 | 6,135,992 | ||||||
| *ABIOMED, Inc. |
936 | 310,789 | ||||||
| *Acadia Healthcare Co., Inc. |
5,092 | 315,704 | ||||||
| *ACADIA Pharmaceuticals, Inc. |
1,845 | 33,118 | ||||||
| *Acceleron Pharma, Inc. |
1,232 | 214,590 | ||||||
| *Accuray, Inc. |
1,295 | 6,462 | ||||||
| *Aclaris Therapeutics, Inc. |
8 | 139 | ||||||
| *Acorda Therapeutics, Inc. |
171 | 696 | ||||||
| #*Adaptive Biotechnologies Corp. |
4,181 | 139,687 | ||||||
| *Addus HomeCare Corp. |
2,197 | 205,419 | ||||||
| *Adverum Biotechnologies, Inc. |
24 | 54 | ||||||
| *Aeglea BioTherapeutics, Inc. |
8 | 59 | ||||||
| Agilent Technologies, Inc. |
8,259 | 1,300,710 | ||||||
| #*Agios Pharmaceuticals, Inc. |
1,226 | 57,622 | ||||||
| *Akebia Therapeutics, Inc. |
1,894 | 5,436 | ||||||
| *Akero Therapeutics, Inc. |
117 | 2,514 | ||||||
| *Albireo Pharma, Inc. |
8 | 234 | ||||||
| *Aldeyra Therapeutics, Inc. |
175 | 1,592 | ||||||
| *Align Technology, Inc., Class A |
1,608 | 1,003,987 | ||||||
| *Alkermes PLC |
2,725 | 82,540 | ||||||
| *Allakos, Inc. |
547 | 55,017 | ||||||
| *Allogene Therapeutics, Inc. |
301 | 5,189 | ||||||
| *Allscripts Healthcare Solutions, Inc. |
3,165 | 43,614 | ||||||
| *Alnylam Pharmaceuticals, Inc. |
2,801 | 446,928 | ||||||
| *Alphatec Holdings, Inc. |
2,203 | 25,841 | ||||||
| *Amedisys, Inc., Class B |
770 | 130,392 | ||||||
| AmerisourceBergen Corp. |
6,451 | 787,151 | ||||||
| *Amgen, Inc. |
17,190 | 3,557,814 | ||||||
Dimensional US Core Equity Market ETF
SCHEDULE OF INVESTMENTS
October 31, 2021
| Security Description |
Shares | Fair Value | ||||||
| HEALTH CARE (Continued) |
| |||||||
| *AMN Healthcare Services, Inc. |
2,253 | $ | 222,371 | |||||
| *Amneal Pharmaceuticals, Inc. |
3,243 | 17,804 | ||||||
| *Amphastar Pharmaceuticals, Inc. |
780 | 14,570 | ||||||
| *AnaptysBio, Inc. |
390 | 12,831 | ||||||
| *AngioDynamics, Inc. |
709 | 20,277 | ||||||
| *ANI Pharmaceuticals, Inc. |
165 | 6,168 | ||||||
| #*Anika Therapeutics, Inc. |
8 | 333 | ||||||
| *Antares Pharma, Inc. |
40 | 150 | ||||||
| *Anthem, Inc. |
7,670 | 3,337,447 | ||||||
| #*Apollo Medical Holdings, Inc. |
677 | 46,463 | ||||||
| *Applied Genetic Technologies Corp. |
8 | 21 | ||||||
| *Aptinyx, Inc. |
16 | 36 | ||||||
| *Apyx Medical Corp. |
154 | 2,202 | ||||||
| *Aravive, Inc. |
8 | 28 | ||||||
| *Arcus Biosciences, Inc. |
202 | 6,755 | ||||||
| *Arcutis Biotherapeutics, Inc. |
965 | 20,439 | ||||||
| *Ardelyx, Inc. |
181 | 219 | ||||||
| *Arena Pharmaceuticals, Inc., Class A |
534 | 30,646 | ||||||
| *Arrowhead Pharmaceuticals, Inc. |
2,252 | 143,723 | ||||||
| *Arvinas, Inc. |
320 | 27,706 | ||||||
| *Assembly Biosciences, Inc. |
16 | 50 | ||||||
| *Atara Biotherapeutics, Inc., Class A |
2,078 | 32,167 | ||||||
| *Athenex, Inc. |
569 | 1,445 | ||||||
| *Atreca, Inc., Class A |
264 | 1,368 | ||||||
| *AtriCure, Inc. |
5,900 | 442,854 | ||||||
| *Atrion Corp. |
66 | 48,048 | ||||||
| *Avanos Medical, Inc. |
2,787 | 87,902 | ||||||
| *Avantor, Inc. |
8,606 | 347,510 | ||||||
| *Avid Bioservices, Inc. |
2,225 | 68,263 | ||||||
| #*Avidity Biosciences, Inc. |
444 | 9,990 | ||||||
| *Axcella Health, Inc. |
16 | 51 | ||||||
| *Axogen, Inc. |
16 | 243 | ||||||
| *Axonics, Inc. |
777 | 56,993 | ||||||
| *Baxter International, Inc. |
18,969 | 1,497,792 | ||||||
| *Becton Dickinson and Co. |
6,319 | 1,513,969 | ||||||
| *BioDelivery Sciences International, Inc. |
653 | 2,664 | ||||||
| *Biogen, Inc. |
6,406 | 1,708,352 | ||||||
| *Biohaven Pharmaceutical Holding Co., Ltd. |
1,030 | 146,590 | ||||||
| *Biolife Solutions, Inc. |
389 | 20,675 | ||||||
| *BioMarin Pharmaceutical, Inc. |
6,417 | 508,419 | ||||||
| *Bio-Rad Laboratories, Inc., Class A |
828 | 657,995 | ||||||
| Bio-Techne Corp. |
1,335 | 699,073 | ||||||
| *Bluebird Bio, Inc. |
3,291 | 77,042 | ||||||
| *Blueprint Medicines Corp. |
1,686 | 189,658 | ||||||
| *Boston Scientific Corp. |
28,191 | 1,215,878 | ||||||
| *Bridgebio Pharma, Inc. |
252 | 12,444 | ||||||
| Bristol-Myers Squibb Co. |
57,688 | 3,368,979 | ||||||
| *Brookdale Senior Living, Inc. |
4,453 | 28,944 | ||||||
| *Bruker Corp. |
6,789 | 545,157 | ||||||
| *Calithera Biosciences, Inc. |
16 | 31 | ||||||
| *Calyxt, Inc. |
8 | 26 | ||||||
| *Cara Therapeutics, Inc. |
1,878 | 31,607 | ||||||
| Cardinal Health, Inc. |
11,578 | 553,544 | ||||||
| *Cardiovascular Systems, Inc. |
11,819 | 414,611 | ||||||
| *CareDx, Inc. |
71 | 3,621 | ||||||
| *CASI Pharmaceuticals, Inc. |
208 | 225 | ||||||
Dimensional US Core Equity Market ETF
SCHEDULE OF INVESTMENTS
October 31, 2021
| Security Description |
Shares | Fair Value | ||||||
| HEALTH CARE (Continued) |
| |||||||
| *Castle Biosciences, Inc. |
325 | $ | 20,264 | |||||
| *Catalent, Inc. |
5,244 | 722,938 | ||||||
| *Catalyst Biosciences, Inc. |
298 | 980 | ||||||
| *Catalyst Pharmaceuticals, Inc. |
45 | 265 | ||||||
| *cbdMD, Inc. |
8 | 14 | ||||||
| *Celldex Therapeutics, Inc. |
136 | 5,785 | ||||||
| *Centene Corp. |
19,744 | 1,406,563 | ||||||
| Cerner Corp. |
10,855 | 806,418 | ||||||
| *Champions Oncology, Inc. |
101 | 987 | ||||||
| *Charles River Laboratories International, Inc. |
1,847 | 828,712 | ||||||
| Chemed Corp. |
828 | 399,303 | ||||||
| #*ChemoCentryx, Inc. |
190 | 6,614 | ||||||
| *Chimerix, Inc. |
16 | 84 | ||||||
| *Chinook Therapeutics, Inc. |
70 | 752 | ||||||
| *Cigna Corp. |
9,841 | 2,102,136 | ||||||
| *Codexis, Inc. |
1,782 | 61,960 | ||||||
| *Collegium Pharmaceutical, Inc. |
1,240 | 24,341 | ||||||
| *Community Health Systems, Inc. |
13,284 | 174,020 | ||||||
| *Computer Programs and Systems, Inc. |
8 | 289 | ||||||
| *Concert Pharmaceuticals, Inc. |
8 | 22 | ||||||
| CONMED Corp. |
464 | 67,874 | ||||||
| Cooper Cos, Inc. (The) |
1,607 | 669,990 | ||||||
| *Corcept Therapeutics, Inc. |
978 | 17,604 | ||||||
| *Cortexyme, Inc. |
220 | 2,904 | ||||||
| *CorVel Corp. |
1,528 | 279,960 | ||||||
| *Covetrus, Inc. |
2,966 | 59,884 | ||||||
| *Crinetics Pharmaceuticals, Inc. |
50 | 1,246 | ||||||
| *Cross Country Healthcare, Inc. |
2,397 | 49,690 | ||||||
| *CryoLife, Inc. |
1,042 | 21,507 | ||||||
| *Cutera, Inc. |
1,170 | 50,310 | ||||||
| CVS Health Corp. |
39,940 | 3,565,843 | ||||||
| *Cyclerion Therapeutics, Inc. |
8 | 20 | ||||||
| *Cymabay Therapeutics, Inc. |
16 | 62 | ||||||
| Danaher Corp. |
14,916 | 4,650,361 | ||||||
| *DaVita, Inc. |
5,344 | 551,715 | ||||||
| *Deciphera Pharmaceuticals, Inc. |
283 | 9,449 | ||||||
| *Denali Therapeutics, Inc. |
2,324 | 112,365 | ||||||
| DENTSPLY SIRONA, Inc. |
8,533 | 488,173 | ||||||
| *DexCom, Inc. |
1,604 | 999,629 | ||||||
| *Eagle Pharmaceuticals, Inc. |
8 | 419 | ||||||
| #*Editas Medicine, Inc. |
8,151 | 299,305 | ||||||
| *Edwards Lifesciences Corp. |
11,934 | 1,429,932 | ||||||
| *Elanco Animal Health, Inc. |
16,112 | 529,763 | ||||||
| Eli Lilly & Co. |
23,624 | 6,018,450 | ||||||
| *Emergent BioSolutions, Inc. |
807 | 38,470 | ||||||
| *Enanta Pharmaceuticals, Inc. |
369 | 31,679 | ||||||
| Encompass Health Corp. |
4,519 | 287,228 | ||||||
| *Endo International PLC |
3,279 | 13,936 | ||||||
| *Enochian Biosciences, Inc. |
8 | 75 | ||||||
| Ensign Group, Inc. (The) |
2,596 | 202,514 | ||||||
| *Envista Holdings Corp. |
4,077 | 159,411 | ||||||
| *Enzo Biochem, Inc. |
200 | 688 | ||||||
| *Evelo Biosciences, Inc. |
8 | 71 | ||||||
| *Evolent Health, Inc., Class A |
14,548 | 425,820 | ||||||
| *Exact Sciences Corp. |
4,463 | 424,967 | ||||||
| *Exelixis, Inc. |
11,554 | 248,527 | ||||||
| *Fate Therapeutics, Inc. |
2,444 | 131,487 | ||||||
Dimensional US Core Equity Market ETF
SCHEDULE OF INVESTMENTS
October 31, 2021
| Security Description |
Shares | Fair Value | ||||||
| HEALTH CARE (Continued) |
||||||||
| *FibroGen, Inc. |
280 | $ | 3,114 | |||||
| *Five Star Senior Living, Inc. |
16 | 66 | ||||||
| #*Fluidigm Corp. |
16 | 82 | ||||||
| *Forma Therapeutics Holdings, Inc. |
632 | 11,730 | ||||||
| #*G1 Therapeutics, Inc. |
1,950 | 28,255 | ||||||
| *Generation Bio Co. |
962 | 20,164 | ||||||
| Gilead Sciences, Inc. |
35,352 | 2,293,638 | ||||||
| *Glaukos Corp. |
65 | 2,971 | ||||||
| *Global Blood Therapeutics, Inc. |
321 | 11,723 | ||||||
| *Globus Medical, Inc. |
989 | 76,321 | ||||||
| *GlycoMimetics, Inc. |
8 | 15 | ||||||
| *Gritstone Oncology, Inc. |
8 | 88 | ||||||
| #*Guardant Health, Inc. |
3,285 | 383,655 | ||||||
| *Haemonetics Corp. |
1,214 | 83,414 | ||||||
| *Halozyme Therapeutics, Inc. |
2,417 | 92,015 | ||||||
| *Hanger, Inc. |
2,680 | 50,062 | ||||||
| *Harmony Biosciences Holdings, Inc. |
188 | 7,796 | ||||||
| *Harvard Bioscience, Inc. |
8 | 60 | ||||||
| HCA Healthcare, Inc. |
6,541 | 1,638,259 | ||||||
| *Health Catalyst, Inc. |
192 | 10,107 | ||||||
| *HealthEquity, Inc. |
2,803 | 185,503 | ||||||
| *HealthStream, Inc. |
376 | 10,005 | ||||||
| *Henry Schein, Inc. |
4,853 | 370,527 | ||||||
| #*Heron Therapeutics, Inc. |
1,334 | 14,687 | ||||||
| *Heska Corp. |
150 | 33,529 | ||||||
| *Hill-Rom Holdings, Inc. |
2,090 | 323,741 | ||||||
| *Hologic, Inc. |
9,945 | 729,068 | ||||||
| *Homology Medicines, Inc. |
16 | 92 | ||||||
| *Hookipa Pharma, Inc. |
98 | 477 | ||||||
| *Horizon Therapeutics PLC |
7,752 | 929,542 | ||||||
| Humana, Inc. |
3,373 | 1,562,239 | ||||||
| *ICU Medical, Inc. |
355 | 83,116 | ||||||
| *Ideaya Biosciences, Inc. |
197 | 4,224 | ||||||
| *IDEXX Laboratories, Inc., Class B |
2,463 | 1,640,703 | ||||||
| *IGM Biosciences, Inc. |
84 | 3,941 | ||||||
| *Illumina, Inc. |
2,459 | 1,020,633 | ||||||
| *ImmuCell Corp. |
117 | 1,030 | ||||||
| *Immunovant, Inc. |
140 | 1,126 | ||||||
| #*Inari Medical, Inc. |
195 | 17,651 | ||||||
| *Incyte Corp. |
6,671 | 446,824 | ||||||
| *InfuSystem Holdings, Inc. |
15 | 249 | ||||||
| *Innoviva, Inc. |
5,682 | 99,151 | ||||||
| *Inogen, Inc., Class A |
1,131 | 44,844 | ||||||
| *Inovalon Holdings, Inc., Class A |
417 | 17,009 | ||||||
| #*Inovio Pharmaceuticals, Inc. |
2,645 | 18,885 | ||||||
| *Insmed, Inc. |
315 | 9,497 | ||||||
| *Insulet Corp. |
542 | 168,031 | ||||||
| *Integer Holdings Corp. |
706 | 63,554 | ||||||
| *Integra LifeSciences Holdings Corp. |
3,362 | 223,439 | ||||||
| *Intellia Therapeutics, Inc. |
929 | 123,538 | ||||||
| *Intra-Cellular Therapies, Inc. |
1,095 | 47,162 | ||||||
| *IntriCon Corp. |
100 | 1,700 | ||||||
| *Intuitive Surgical, Inc. |
7,482 | 2,701,975 | ||||||
| *Invacare Corp. |
443 | 2,188 | ||||||
| *Ionis Pharmaceuticals, Inc. |
4,285 | 136,563 | ||||||
| *Iovance Biotherapeutics, Inc. |
2,140 | 52,023 | ||||||
Dimensional US Core Equity Market ETF
SCHEDULE OF INVESTMENTS
October 31, 2021
| Security Description |
Shares | Fair Value | ||||||
| HEALTH CARE (Continued) |
| |||||||
| *IQVIA Holdings, Inc. |
6,636 | $ | 1,734,783 | |||||
| *iRadimed Corp. |
55 | 2,053 | ||||||
| *iRhythm Technologies, Inc. |
484 | 33,948 | ||||||
| *Ironwood Pharmaceuticals, Inc. |
10,549 | 134,711 | ||||||
| *IVERIC bio, Inc. |
3,717 | 65,791 | ||||||
| *Jazz Pharmaceuticals PLC |
1,800 | 239,472 | ||||||
| Johnson & Johnson |
80,812 | 13,162,659 | ||||||
| *Joint Corp. (The) |
734 | 64,210 | ||||||
| *Jounce Therapeutics, Inc. |
16 | 140 | ||||||
| #*Kala Pharmaceuticals, Inc. |
8 | 14 | ||||||
| *KalVista Pharmaceuticals, Inc. |
8 | 144 | ||||||
| *Karuna Therapeutics, Inc. |
14 | 1,965 | ||||||
| *Kodiak Sciences, Inc. |
921 | 107,840 | ||||||
| *Krystal Biotech, Inc. |
670 | 33,560 | ||||||
| *Kura Oncology, Inc. |
4,245 | 69,703 | ||||||
| *Laboratory Corp. of America Holdings |
3,632 | 1,042,457 | ||||||
| *Lannett Co., Inc. |
505 | 1,379 | ||||||
| *Lantheus Holdings, Inc. |
2,561 | 59,902 | ||||||
| *Larimar Therapeutics, Inc. |
180 | 2,151 | ||||||
| *LeMaitre Vascular, Inc. |
590 | 30,686 | ||||||
| *LHC Group, Inc. |
1,686 | 226,919 | ||||||
| *Ligand Pharmaceuticals, Inc. |
1,541 | 224,894 | ||||||
| *LivaNova PLC |
799 | 61,299 | ||||||
| *MacroGenics, Inc. |
2,467 | 48,181 | ||||||
| *Madrigal Pharmaceuticals, Inc. |
347 | 26,979 | ||||||
| *Magellan Health, Inc. |
194 | 18,397 | ||||||
| *Magenta Therapeutics, Inc. |
16 | 102 | ||||||
| *Masimo Corp. |
2,235 | 633,712 | ||||||
| McKesson Corp. |
6,149 | 1,278,254 | ||||||
| *MediciNova, Inc. |
8 | 27 | ||||||
| #*MEDNAX, Inc. |
11,597 | 315,786 | ||||||
| *Medpace Holdings, Inc. |
1,447 | 327,818 | ||||||
| Medtronic PLC |
28,285 | 3,390,240 | ||||||
| *MeiraGTx Holdings PLC |
16 | 344 | ||||||
| Merck & Co., Inc. |
65,010 | 5,724,131 | ||||||
| *Meridian Bioscience, Inc. |
1,650 | 31,037 | ||||||
| *Merit Medical Systems, Inc. |
861 | 57,911 | ||||||
| *Mersana Therapeutics, Inc. |
99 | 847 | ||||||
| Mesa Laboratories, Inc. |
214 | 65,420 | ||||||
| *Mettler-Toledo International, Inc. |
828 | 1,226,169 | ||||||
| *Minerva Neurosciences, Inc. |
348 | 487 | ||||||
| *Mirati Therapeutics, Inc. |
1,248 | 235,897 | ||||||
| *Moderna, Inc. |
9,012 | 3,111,033 | ||||||
| *ModivCare, Inc. |
882 | 143,563 | ||||||
| *Molina Healthcare, Inc. |
2,499 | 739,004 | ||||||
| *Morphic Holding, Inc. |
200 | 11,500 | ||||||
| *Mustang Bio, Inc. |
345 | 773 | ||||||
| *Myriad Genetics, Inc. |
17,665 | 543,552 | ||||||
| *Natera, Inc. |
1,085 | 124,308 | ||||||
| *National HealthCare Corp. |
2,662 | 186,180 | ||||||
| *National Research Corp. |
720 | 31,176 | ||||||
| *Natus Medical, Inc. |
520 | 13,026 | ||||||
| #*Nektar Therapeutics |
30,459 | 461,758 | ||||||
| *Neogen Corp. |
1,824 | 77,173 | ||||||
| *NeoGenomics, Inc. |
4,135 | 190,210 | ||||||
| *Neurocrine Biosciences, Inc. |
3,574 | 376,735 | ||||||
| *Nevro Corp. |
536 | 60,965 | ||||||
Dimensional US Core Equity Market ETF
SCHEDULE OF INVESTMENTS
October 31, 2021
| Security Description |
Shares | Fair Value | ||||||
| HEALTH CARE (Continued) |
| |||||||
| *NextCure, Inc. |
185 | $ | 1,521 | |||||
| *NextGen Healthcare, Inc. |
2,420 | 39,833 | ||||||
| *NGM Biopharmaceuticals, Inc. |
2,898 | 53,526 | ||||||
| #*Novavax, Inc. |
847 | 126,059 | ||||||
| *Novocure, Ltd. |
2,391 | 245,245 | ||||||
| *NuVasive, Inc. |
485 | 25,880 | ||||||
| *Odonate Therapeutics, Inc. |
65 | 200 | ||||||
| *Omnicell, Inc. |
2,950 | 525,543 | ||||||
| #*OPKO Health, Inc. |
4,755 | 18,021 | ||||||
| *OptimizeRx Corp. |
68 | 6,576 | ||||||
| *Option Care Health, Inc. |
3,023 | 82,619 | ||||||
| *OraSure Technologies, Inc. |
2,100 | 22,407 | ||||||
| #*Organogenesis Holdings, Inc. |
551 | 6,050 | ||||||
| Organon & Co. |
10,276 | 377,643 | ||||||
| *Orgenesis, Inc. |
8 | 38 | ||||||
| *Orthofix Medical, Inc. |
300 | 10,794 | ||||||
| *OrthoPediatrics Corp. |
326 | 23,201 | ||||||
| *Osmotica Pharmaceuticals PLC |
8 | 14 | ||||||
| *Otonomy, Inc. |
111 | 233 | ||||||
| *Owens & Minor, Inc. |
4,726 | 169,569 | ||||||
| *Pacira BioSciences, Inc. |
616 | 32,204 | ||||||
| Patterson Cos., Inc. |
11,159 | 348,830 | ||||||
| *PDS Biotechnology Corp. |
8 | 96 | ||||||
| *Pennant Group, Inc. (The) |
744 | 19,024 | ||||||
| #*Penumbra, Inc. |
566 | 156,527 | ||||||
| *PerkinElmer, Inc. |
3,477 | 615,047 | ||||||
| Perrigo Co. PLC |
4,021 | 181,548 | ||||||
| *Personalis, Inc. |
122 | 2,394 | ||||||
| #*PetIQ, Inc. |
1,237 | 30,987 | ||||||
| Pfizer, Inc. |
138,358 | 6,051,779 | ||||||
| #*Phathom Pharmaceuticals, Inc. |
37 | 871 | ||||||
| Phibro Animal Health Corp., Class A |
29 | 636 | ||||||
| *Pieris Pharmaceuticals, Inc. |
8 | 37 | ||||||
| #*Pliant Therapeutics, Inc. |
370 | 5,894 | ||||||
| #*Precigen, Inc. |
886 | 4,279 | ||||||
| *Precipio, Inc. |
8 | 19 | ||||||
| Premier, Inc., Class A |
3,471 | 135,195 | ||||||
| *Prestige Consumer Healthcare, Inc. |
829 | 49,732 | ||||||
| *Pro-Dex, Inc. |
50 | 1,213 | ||||||
| *Progyny, Inc. |
466 | 28,626 | ||||||
| *Protagonist Therapeutics, Inc. |
510 | 15,892 | ||||||
| *Prothena Corp. PLC |
317 | 17,546 | ||||||
| *Puma Biotechnology, Inc. |
37 | 189 | ||||||
| *Quanterix Corp. |
316 | 15,993 | ||||||
| Quest Diagnostics, Inc. |
5,257 | 771,622 | ||||||
| *Quidel Corp. |
1,346 | 178,708 | ||||||
| *R1 RCM, Inc. |
6,690 | 145,173 | ||||||
| *RadNet, Inc. |
2,306 | 71,694 | ||||||
| *RAPT Therapeutics, Inc. |
231 | 7,295 | ||||||
| *Regeneron Pharmaceuticals, Inc. |
2,938 | 1,880,144 | ||||||
| *REGENXBIO, Inc. |
2,382 | 84,418 | ||||||
| *Repligen Corp. |
2,311 | 671,345 | ||||||
| *Replimune Group, Inc. |
2,220 | 65,512 | ||||||
| *ResMed, Inc. |
4,921 | 1,293,780 | ||||||
| *Rhythm Pharmaceuticals, Inc. |
61 | 702 | ||||||
| *Rocket Pharmaceuticals, Inc. |
781 | 23,204 | ||||||
Dimensional US Core Equity Market ETF
SCHEDULE OF INVESTMENTS
October 31, 2021
| Security Description |
Shares | Fair Value | ||||||
| HEALTH CARE (Continued) |
| |||||||
| #*Rubius Therapeutics, Inc. |
32 | $ | 455 | |||||
| *Sage Therapeutics, Inc. |
108 | 4,359 | ||||||
| *Sangamo Therapeutics, Inc. |
4,688 | 38,067 | ||||||
| *Sarepta Therapeutics, Inc. |
850 | 67,260 | ||||||
| *Scholar Rock Holding Corp. |
268 | 7,048 | ||||||
| *scPharmaceuticals, Inc. |
8 | 47 | ||||||
| *Seagen, Inc. |
4,554 | 803,007 | ||||||
| *SeaSpine Holdings Corp. |
15 | 224 | ||||||
| Select Medical Holdings Corp. |
2,896 | 96,205 | ||||||
| *Shockwave Medical, Inc. |
128 | 27,354 | ||||||
| *SI-BONE, Inc. |
894 | 20,160 | ||||||
| *Sierra Oncology, Inc. |
100 | 2,027 | ||||||
| *SIGA Technologies, Inc. |
16 | 115 | ||||||
| Simulations Plus, Inc. |
89 | 4,494 | ||||||
| *Sio Gene Therapies, Inc. |
8 | 15 | ||||||
| *Spectrum Pharmaceuticals, Inc. |
40 | 73 | ||||||
| *Spero Therapeutics, Inc. |
113 | 1,984 | ||||||
| *Springworks Therapeutics, Inc. |
372 | 24,946 | ||||||
| *STAAR Surgical Co. |
215 | 25,469 | ||||||
| *Stereotaxis, Inc. |
773 | 4,561 | ||||||
| STERIS PLC |
2,897 | 677,145 | ||||||
| *Stoke Therapeutics, Inc. |
458 | 10,456 | ||||||
| Stryker Corp. |
8,299 | 2,208,115 | ||||||
| #*Supernus Pharmaceuticals, Inc. |
6,336 | 189,130 | ||||||
| *Surface Oncology, Inc. |
8 | 59 | ||||||
| *Surgery Partners, Inc. |
1,149 | 47,270 | ||||||
| *Surmodics, Inc. |
558 | 31,058 | ||||||
| *Sutro Biopharma, Inc. |
1,055 | 21,269 | ||||||
| *Syndax Pharmaceuticals, Inc. |
26 | 506 | ||||||
| *Syneos Health, Inc. |
4,682 | 437,018 | ||||||
| *Synlogic, Inc. |
8 | 20 | ||||||
| *Tactile Systems Technology, Inc. |
1,177 | 40,595 | ||||||
| *Tandem Diabetes Care, Inc. |
264 | 35,991 | ||||||
| *Taro Pharmaceutical Industries, Ltd. |
29 | 1,612 | ||||||
| *TCR2 Therapeutics, Inc. |
256 | 1,613 | ||||||
| #*Teladoc Health, Inc. |
4,273 | 639,198 | ||||||
| *Teleflex, Inc. |
1,656 | 591,093 | ||||||
| *Tenet Healthcare Corp. |
3,589 | 257,188 | ||||||
| *Thermo Fisher Scientific, Inc. |
9,970 | 6,311,708 | ||||||
| #*Tivity Health, Inc. |
3,223 | 80,639 | ||||||
| *TransMedics Group, Inc. |
8 | 219 | ||||||
| *Travere Therapeutics, Inc. |
1,392 | 40,104 | ||||||
| #*Tricida, Inc. |
16 | 73 | ||||||
| *Triple-S Management Corp., Class B |
8 | 282 | ||||||
| *Turning Point Therapeutics, Inc. |
39 | 1,622 | ||||||
| *Twist Bioscience Corp. |
733 | 87,080 | ||||||
| *Ultragenyx Pharmaceutical, Inc. |
1,390 | 116,649 | ||||||
| *United Therapeutics Corp. |
1,674 | 319,332 | ||||||
| UnitedHealth Group, Inc. |
26,312 | 12,115,887 | ||||||
| *Unity Biotechnology, Inc. |
860 | 2,055 | ||||||
| *Universal Health Services, Inc., Class B |
3,317 | 411,640 | ||||||
| US Physical Therapy, Inc. |
2,454 | 264,688 | ||||||
| *Utah Medical Products, Inc. |
17 | 1,646 | ||||||
| *Vanda Pharmaceuticals, Inc. |
920 | 15,750 | ||||||
| *Varex Imaging Corp. |
774 | 20,782 | ||||||
| *VBI Vaccines, Inc. |
603 | 1,749 | ||||||
| *Veeva Systems, Inc., Class A |
2,998 | 950,396 | ||||||
Dimensional US Core Equity Market ETF
SCHEDULE OF INVESTMENTS
October 31, 2021
| Security Description |
Shares | Fair Value | ||||||
| HEALTH CARE (Continued) |
| |||||||
| *Venus Concept, Inc. |
8 | $ | 15 | |||||
| #*Vericel Corp. |
551 | 25,357 | ||||||
| *Vertex Pharmaceuticals, Inc. |
7,160 | 1,324,099 | ||||||
| Viatris, Inc. |
18,223 | 243,277 | ||||||
| *ViewRay, Inc. |
5,650 | 41,301 | ||||||
| *Viking Therapeutics, Inc. |
24 | 140 | ||||||
| *Vir Biotechnology, Inc. |
912 | 34,410 | ||||||
| *Vocera Communications, Inc. |
616 | 34,853 | ||||||
| #*Voyager Therapeutics, Inc. |
8 | 29 | ||||||
| *Waters Corp. |
2,210 | 812,286 | ||||||
| *WaVe Life Sciences, Ltd. |
94 | 431 | ||||||
| West Pharmaceutical Services, Inc. |
2,549 | 1,095,764 | ||||||
| *Windtree Therapeutics, Inc. |
8 | 14 | ||||||
| *X4 Pharmaceuticals, Inc. |
129 | 624 | ||||||
| *Xencor, Inc. |
51 | 2,018 | ||||||
| *Xenon Pharmaceuticals, Inc. |
71 | 2,212 | ||||||
| *Xeris Biopharma Holdings, Inc. |
514 | 956 | ||||||
| *y-Mabs Therapeutics, Inc. |
742 | 18,224 | ||||||
| Zimmer Biomet Holdings, Inc. |
7,396 | 1,058,516 | ||||||
| #*ZIOPHARM Oncology, Inc. |
956 | 1,434 | ||||||
| Zoetis, Inc. |
12,990 | 2,808,438 | ||||||
| *Zogenix, Inc. |
1,547 | 23,716 | ||||||
|
|
|
|||||||
| TOTAL HEALTH CARE |
168,790,391 | |||||||
|
|
|
|||||||
| INDUSTRIALS (10.3%) |
||||||||
| 3M Co. |
18,878 | 3,373,121 | ||||||
| A O Smith Corp. |
5,216 | 381,133 | ||||||
| *AAON, Inc. |
756 | 54,167 | ||||||
| *AAR Corp. |
8,919 | 315,465 | ||||||
| ABM Industries, Inc. |
5,162 | 227,180 | ||||||
| *Acacia Research Corp. |
8 | 46 | ||||||
| ACCO Brands Corp. |
4,031 | 33,336 | ||||||
| Acuity Brands, Inc. |
2,070 | 425,240 | ||||||
| ADT, Inc. |
20,082 | 167,685 | ||||||
| #Advanced Drainage Systems, Inc. |
1,308 | 147,542 | ||||||
| *AECOM |
5,542 | 378,907 | ||||||
| Aerojet Rocketdyne Holdings, Inc. |
2,807 | 123,536 | ||||||
| *AeroVironment, Inc. |
309 | 27,535 | ||||||
| AGCO Corp. |
2,759 | 337,177 | ||||||
| Air Lease Corp. |
2,797 | 112,020 | ||||||
| *Air Transport Services Group, Inc. |
1,885 | 46,918 | ||||||
| *Akerna Corp. |
8 | 21 | ||||||
| Alamo Group, Inc. |
403 | 60,934 | ||||||
| *Alaska Air Group, Inc. |
6,801 | 359,093 | ||||||
| Albany International Corp. |
639 | 51,535 | ||||||
| *Allegiant Travel Co. |
2,107 | 369,294 | ||||||
| Allegion PLC |
3,337 | 428,137 | ||||||
| #*Allied Motion Technologies, Inc. |
60 | 2,109 | ||||||
| Allison Transmission Holdings, Inc. |
7,183 | 239,625 | ||||||
| Altra Industrial Motion Corp. |
919 | 47,926 | ||||||
| AMERCO |
861 | 634,548 | ||||||
| *Ameresco, Inc., Class A |
23 | 1,889 | ||||||
| #*American Airlines Group, Inc. |
18,826 | 361,459 | ||||||
| *American Superconductor Corp. |
8 | 147 | ||||||
| #*American Woodmark Corp. |
3,086 | 212,132 | ||||||
| *AMETEK, Inc. |
8,332 | 1,103,157 | ||||||
Dimensional US Core Equity Market ETF
SCHEDULE OF INVESTMENTS
October 31, 2021
| Security Description |
Shares | Fair Value | ||||||
| INDUSTRIALS (Continued) |
| |||||||
| *API Group Corp. |
4,270 | $ | 93,001 | |||||
| Apogee Enterprises, Inc. |
907 | 38,031 | ||||||
| Applied Industrial Technologies, Inc. |
22 | 2,145 | ||||||
| ArcBest Corp. |
842 | 75,654 | ||||||
| Arcosa, Inc. |
889 | 45,988 | ||||||
| Argan, Inc. |
8 | 330 | ||||||
| *Armstrong Flooring, Inc. |
263 | 747 | ||||||
| Armstrong World Industries, Inc. |
987 | 104,277 | ||||||
| *ASGN, Inc. |
951 | 113,797 | ||||||
| *Astec Industries, Inc. |
3,299 | 176,101 | ||||||
| *Astronics Corp. |
8 | 103 | ||||||
| *Atkore, Inc. |
439 | 41,499 | ||||||
| *Atlas Air Worldwide Holdings, Inc., Class A |
2,344 | 190,145 | ||||||
| #*Avis Budget Group, Inc. |
6,381 | 1,105,891 | ||||||
| *Axon Enterprise, Inc. |
1,688 | 303,772 | ||||||
| *Azek Co., Inc. (The) |
2,623 | 96,238 | ||||||
| AZZ, Inc. |
985 | 52,333 | ||||||
| *Barnes Group, Inc. |
287 | 12,037 | ||||||
| *Barrett Business Services, Inc. |
39 | 3,198 | ||||||
| *Beacon Roofing Supply, Inc. |
1,454 | 76,873 | ||||||
| BGSF, Inc. |
114 | 1,371 | ||||||
| *Blue Bird Corp. |
1,130 | 22,159 | ||||||
| *BlueLinx Holdings, Inc. |
52 | 2,477 | ||||||
| *Boeing Co. (The) |
8,525 | 1,764,931 | ||||||
| Boise Cascade Co. |
4,293 | 243,070 | ||||||
| *Booz Allen Hamilton Holding Corp. |
5,112 | 444,028 | ||||||
| *Brady Corp., Class A |
728 | 37,922 | ||||||
| *BrightView Holdings, Inc. |
17,366 | 275,425 | ||||||
| *Brink’s Co. (The) |
3,090 | 212,839 | ||||||
| *Builders FirstSource, Inc. |
8,777 | 511,436 | ||||||
| BWX Technologies, Inc. |
3,665 | 207,952 | ||||||
| *CACI International, Inc., Class A |
724 | 208,251 | ||||||
| CAI International, Inc. |
8 | 447 | ||||||
| *Carlisle Cos., Inc. |
1,982 | 441,827 | ||||||
| Carrier Global Corp. |
26,086 | 1,362,472 | ||||||
| *Casella Waste Systems, Inc. |
895 | 77,614 | ||||||
| Caterpillar, Inc. |
17,573 | 3,585,068 | ||||||
| *CBIZ, Inc. |
4,492 | 164,901 | ||||||
| *CECO Environmental Corp. |
16 | 110 | ||||||
| CH Robinson Worldwide, Inc. |
5,360 | 519,866 | ||||||
| *Chart Industries, Inc. |
605 | 107,400 | ||||||
| *Cimpress PLC |
227 | 20,276 | ||||||
| *Cintas Corp. |
3,575 | 1,548,333 | ||||||
| *CIRCOR International, Inc. |
8 | 228 | ||||||
| *Civeo Corp. |
69 | 1,557 | ||||||
| *Clarivate PLC |
6,262 | 146,844 | ||||||
| *Clean Harbors, Inc. |
3,326 | 374,308 | ||||||
| *Colfax Corp. |
3,115 | 160,796 | ||||||
| *Columbus McKinnon Corp. |
535 | 25,289 | ||||||
| *Comfort Systems USA, Inc. |
708 | 64,761 | ||||||
| *Commercial Vehicle Group, Inc. |
16 | 161 | ||||||
| *Concrete Pumping Holdings, Inc. |
16 | 138 | ||||||
| *Construction Partners, Inc., Class A |
776 | 27,633 | ||||||
| *Copa Holdings SA, Class A |
30 | 2,219 | ||||||
| *Copart, Inc. |
7,718 | 1,198,528 | ||||||
| *Cornerstone Building Brands, Inc. |
1,515 | 21,680 | ||||||
| Costamare, Inc. |
2,592 | 34,759 | ||||||
Dimensional US Core Equity Market ETF
SCHEDULE OF INVESTMENTS
October 31, 2021
| Security Description |
Shares | Fair Value | ||||||
| INDUSTRIALS (Continued) |
| |||||||
| *CoStar Group, Inc. |
8,611 | $ | 740,977 | |||||
| Covanta Holding Corp. |
16,319 | 329,317 | ||||||
| *Covenant Logistics Group, Inc. |
8 | 227 | ||||||
| CRA International, Inc. |
40 | 4,393 | ||||||
| *Crane Co. |
1,190 | 122,903 | ||||||
| CSW Industrials, Inc. |
699 | 96,895 | ||||||
| *CSX Corp. |
67,332 | 2,435,398 | ||||||
| *Cummins, Inc. |
5,798 | 1,390,592 | ||||||
| *Curtiss-Wright Corp. |
1,766 | 225,483 | ||||||
| *Daseke, Inc. |
32 | 302 | ||||||
| Deere & Co. |
8,981 | 3,074,286 | ||||||
| *Delta Air Lines, Inc. |
16,382 | 641,028 | ||||||
| *Deluxe Corp. |
6,083 | 216,981 | ||||||
| *Donaldson Co., Inc. |
6,447 | 386,884 | ||||||
| Douglas Dynamics, Inc. |
474 | 20,050 | ||||||
| *Dover Corp. |
5,658 | 956,655 | ||||||
| *Ducommun, Inc. |
8 | 387 | ||||||
| *Dxp Enterprises, Inc. |
8 | 264 | ||||||
| *Dycom Industries, Inc. |
273 | 21,682 | ||||||
| Eaton Corp PLC |
11,306 | 1,862,777 | ||||||
| *Echo Global Logistics, Inc. |
1,151 | 55,513 | ||||||
| EMCOR Group, Inc. |
3,394 | 412,337 | ||||||
| *Emerson Electric Co. |
18,106 | 1,756,463 | ||||||
| *Encore Wire Corp. |
532 | 71,320 | ||||||
| *Energy Recovery, Inc. |
869 | 17,658 | ||||||
| Enerpac Tool Group Corp. |
12,808 | 267,559 | ||||||
| EnerSys |
37 | 2,961 | ||||||
| Eneti, Inc. |
8 | 113 | ||||||
| #Ennis, Inc. |
110 | 2,083 | ||||||
| EnPro Industries, Inc. |
604 | 54,155 | ||||||
| #*Equifax, Inc. |
4,333 | 1,202,104 | ||||||
| *ESCO Technologies, Inc. |
71 | 6,004 | ||||||
| *Evoqua Water Technologies Corp. |
2,428 | 101,563 | ||||||
| *ExOne Co. (The) |
8 | 184 | ||||||
| Expeditors International of Washington, Inc. |
5,371 | 662,029 | ||||||
| Exponent, Inc. |
530 | 60,844 | ||||||
| Fastenal Co. |
21,913 | 1,250,794 | ||||||
| *Federal Signal Corp. |
528 | 22,604 | ||||||
| FedEx Corp. |
6,442 | 1,517,284 | ||||||
| Flowserve Corp. |
2,363 | 79,444 | ||||||
| *Fluor Corp. |
1,845 | 35,867 | ||||||
| *Forrester Research, Inc. |
419 | 22,312 | ||||||
| Fortive Corp. |
10,917 | 826,526 | ||||||
| Fortune Brands Home & Security, Inc. |
4,904 | 497,266 | ||||||
| *Forward Air Corp. |
86 | 8,648 | ||||||
| *Franklin Covey Co. |
88 | 3,718 | ||||||
| *Franklin Electric Co., Inc. |
1,717 | 148,314 | ||||||
| *FTI Consulting, Inc. |
4,707 | 677,431 | ||||||
| *Fuel Tech, Inc. |
278 | 573 | ||||||
| #*Fuelcell Energy, Inc. |
1,296 | 10,355 | ||||||
| *Gates Industrial Corp. PLC |
142 | 2,334 | ||||||
| *GATX Corp. |
4,338 | 411,459 | ||||||
| Genco Shipping & Trading, Ltd. |
2,562 | 43,990 | ||||||
| *Gencor Industries, Inc. |
8 | 89 | ||||||
| *Generac Holdings, Inc. |
1,798 | 896,411 | ||||||
| General Dynamics Corp. |
9,030 | 1,830,833 | ||||||
Dimensional US Core Equity Market ETF
SCHEDULE OF INVESTMENTS
October 31, 2021
| Security Description |
Shares | Fair Value | ||||||
| INDUSTRIALS (Continued) |
| |||||||
| General Electric Co. |
23,699 | $ | 2,485,314 | |||||
| *Gibraltar Industries, Inc. |
238 | 15,508 | ||||||
| Global Industrial Co. |
1,979 | 80,308 | ||||||
| #*GMS, Inc. |
213 | 10,550 | ||||||
| *Gorman-Rupp Co. (The) |
517 | 21,983 | ||||||
| Graco, Inc. |
8,083 | 607,680 | ||||||
| *GrafTech International, Ltd. |
5,284 | 56,539 | ||||||
| *Graham Corp. |
121 | 1,538 | ||||||
| Granite Construction, Inc. |
570 | 21,158 | ||||||
| *Great Lakes Dredge & Dock Corp. |
7,115 | 108,290 | ||||||
| *Greenbrier Cos., Inc. (The) |
762 | 31,257 | ||||||
| *Griffon Corp. |
3,437 | 91,046 | ||||||
| *GXO Logistics, Inc. |
3,063 | 271,994 | ||||||
| *H&E Equipment Services, Inc. |
2,382 | 107,381 | ||||||
| *Harsco Corp. |
4,222 | 72,196 | ||||||
| *Hawaiian Holdings, Inc. |
1,900 | 36,765 | ||||||
| *Healthcare Services Group, Inc. |
3,789 | 72,711 | ||||||
| Heartland Express, Inc. |
2,735 | 44,663 | ||||||
| HEICO Corp. |
1,157 | 161,274 | ||||||
| HEICO Corp., Class A |
2,331 | 292,960 | ||||||
| *Heidrick & Struggles International, Inc. |
847 | 39,707 | ||||||
| Helios Technologies, Inc. |
590 | 53,720 | ||||||
| Herc Holdings, Inc. |
2,909 | 529,554 | ||||||
| *Heritage-Crystal Clean, Inc. |
8 | 277 | ||||||
| *Herman Miller, Inc. |
1,323 | 51,491 | ||||||
| *Hexcel Corp. |
1,424 | 80,798 | ||||||
| Hillenbrand, Inc. |
789 | 35,868 | ||||||
| *Hirequest, Inc. |
7 | 126 | ||||||
| *HNI Corp. |
2,643 | 98,848 | ||||||
| Honeywell International, Inc. |
17,275 | 3,776,661 | ||||||
| *Howmet Aerospace, Inc. |
14,974 | 444,578 | ||||||
| *Hub Group, Inc., Class A |
10,287 | 808,250 | ||||||
| *Hubbell, Inc. |
2,487 | 495,833 | ||||||
| *Huntington Ingalls Industries, Inc. |
2,056 | 416,813 | ||||||
| *Huron Consulting Group, Inc., Class A |
390 | 19,562 | ||||||
| *Hyster-Yale Materials Handling, Inc. |
8 | 384 | ||||||
| *IAA, Inc. |
2,971 | 177,220 | ||||||
| ICF International, Inc. |
1,028 | 103,304 | ||||||
| IDEX Corp. |
2,539 | 565,105 | ||||||
| *IES Holdings, Inc., Class A |
614 | 30,608 | ||||||
| IHS Markit, Ltd. |
5,653 | 738,960 | ||||||
| *Illinois Tool Works, Inc. |
9,125 | 2,079,314 | ||||||
| *Infrastructure and Energy Alternatives, Inc. |
388 | 4,295 | ||||||
| *Ingersoll Rand, Inc. |
12,822 | 689,311 | ||||||
| *INNOVATE Corp. |
8 | 32 | ||||||
| Innovative Solutions and Support, Inc. |
172 | 1,163 | ||||||
| Insperity, Inc. |
1,439 | 179,875 | ||||||
| Insteel Industries, Inc. |
406 | 16,512 | ||||||
| *Interface, Inc. |
464 | 6,663 | ||||||
| ITT, Inc. |
5,575 | 524,440 | ||||||
| Jacobs Engineering Group, Inc. |
4,901 | 688,198 | ||||||
| *JB Hunt Transport Services, Inc. |
4,596 | 906,285 | ||||||
| *JELD-WEN Holding, Inc. |
8,316 | 227,942 | ||||||
| *JetBlue Airways Corp. |
7,665 | 107,540 | ||||||
| John Bean Technologies Corp., Class A |
1,201 | 177,448 | ||||||
| Johnson Controls International PLC |
21,409 | 1,570,778 | ||||||
| Kadant, Inc. |
3,274 | 727,221 | ||||||
Dimensional US Core Equity Market ETF
SCHEDULE OF INVESTMENTS
October 31, 2021
| Security Description |
Shares | Fair Value | ||||||
| INDUSTRIALS (Continued) |
| |||||||
| *Kaman Corp. |
1,072 | $ | 38,367 | |||||
| *Kansas City Southern |
1,933 | 599,713 | ||||||
| *KAR Auction Services, Inc. |
3,313 | 48,602 | ||||||
| KBR, Inc. |
4,175 | 177,187 | ||||||
| *Kelly Services, Inc., Class A |
1,446 | 26,071 | ||||||
| *Kennametal, Inc. |
15,347 | 610,043 | ||||||
| *Kforce, Inc. |
1,491 | 96,557 | ||||||
| *Kimball International, Inc., Class B |
16 | 174 | ||||||
| *Kirby Corp. |
1,767 | 92,608 | ||||||
| *Knight-Swift Transportation Holdings, Inc. |
7,062 | 400,345 | ||||||
| Korn Ferry |
851 | 65,706 | ||||||
| *Kratos Defense & Security Solutions, Inc. |
1,822 | 38,973 | ||||||
| *L3Harris Technologies, Inc. |
6,106 | 1,407,677 | ||||||
| *Landstar System, Inc. |
1,333 | 234,355 | ||||||
| *Lawson Products, Inc. |
37 | 1,876 | ||||||
| *Leidos Holdings, Inc. |
5,551 | 554,989 | ||||||
| Lennox International, Inc. |
1,620 | 484,834 | ||||||
| *Lincoln Electric Holdings, Inc. |
2,210 | 314,704 | ||||||
| *Lindsay Corp. |
1,897 | 276,336 | ||||||
| Lockheed Martin Corp. |
7,452 | 2,476,449 | ||||||
| #LSI Industries, Inc. |
137 | 1,019 | ||||||
| *Lyft, Inc., Class A |
9,058 | 415,490 | ||||||
| Macquarie Infrastructure Holdings LLC |
5,793 | 21,376 | ||||||
| *Manitex International, Inc. |
8 | 52 | ||||||
| *Manitowoc Co., Inc. (The) |
228 | 4,886 | ||||||
| ManpowerGroup, Inc. |
2,668 | 257,862 | ||||||
| *ManTech International Corp., Class A |
22 | 1,897 | ||||||
| Marten Transport, Ltd. |
2,225 | 37,002 | ||||||
| *Masco Corp. |
8,447 | 553,701 | ||||||
| *Masonite International Corp. |
413 | 49,564 | ||||||
| *MasTec, Inc. |
4,846 | 431,924 | ||||||
| *Matrix Service Co. |
8 | 82 | ||||||
| Matson, Inc. |
962 | 80,115 | ||||||
| *Matthews International Corp., Class A |
743 | 25,537 | ||||||
| Maxar Technologies, Inc. |
711 | 18,877 | ||||||
| *Mayville Engineering Co., Inc. |
98 | 1,740 | ||||||
| McGrath RentCorp. |
1,167 | 84,187 | ||||||
| *Mercury Systems, Inc. |
1,043 | 53,756 | ||||||
| *Meritor, Inc. |
8,209 | 199,807 | ||||||
| *Mesa Air Group, Inc. |
16 | 121 | ||||||
| *Middleby Corp. (The) |
1,629 | 297,195 | ||||||
| *Miller Industries, Inc. |
8 | 289 | ||||||
| *Mistras Group, Inc. |
8 | 79 | ||||||
| *Moog, Inc., Class A |
203 | 15,333 | ||||||
| *MRC Global, Inc. |
32 | 266 | ||||||
| *MSA Safety, Inc. |
1,786 | 273,312 | ||||||
| *MSC Industrial Direct Co., Inc. |
275 | 23,119 | ||||||
| *Mueller Industries, Inc. |
1,444 | 76,012 | ||||||
| *Mueller Water Products, Inc., Class A |
7,071 | 116,035 | ||||||
| *MYR Group, Inc. |
586 | 59,860 | ||||||
| National Presto Industries, Inc. |
29 | 2,411 | ||||||
| Nielsen Holdings PLC |
16,003 | 324,061 | ||||||
| *NL Industries, Inc. |
8 | 46 | ||||||
| *NN, Inc. |
8 | 40 | ||||||
| Nordson Corp. |
2,248 | 571,464 | ||||||
| *Norfolk Southern Corp. |
6,724 | 1,970,468 | ||||||
Dimensional US Core Equity Market ETF
SCHEDULE OF INVESTMENTS
October 31, 2021
| Security Description |
Shares | Fair Value | ||||||
| INDUSTRIALS (Continued) |
| |||||||
| Northrop Grumman Corp. |
4,968 | $ | 1,774,669 | |||||
| *Northwest Pipe Co. |
51 | 1,212 | ||||||
| *NOW, Inc. |
1,436 | 10,368 | ||||||
| *NV5 Global, Inc. |
4,280 | 445,676 | ||||||
| nVent Electric PLC |
7,623 | 270,235 | ||||||
| Old Dominion Freight Line, Inc. |
4,233 | 1,444,935 | ||||||
| Omega Flex, Inc. |
350 | 50,666 | ||||||
| #*Orbital Energy Group, Inc. |
56 | 150 | ||||||
| *Orion Energy Systems, Inc. |
16 | 65 | ||||||
| *Orion Group Holdings, Inc. |
8 | 36 | ||||||
| *Oshkosh Corp. |
1,333 | 142,631 | ||||||
| Otis Worldwide Corp. |
14,487 | 1,163,451 | ||||||
| Owens Corning |
4,232 | 395,311 | ||||||
| *PACCAR, Inc. |
12,677 | 1,136,113 | ||||||
| *PAM Transportation Services, Inc. |
96 | 5,935 | ||||||
| Pangaea Logistics Solutions, Ltd. |
8 | 36 | ||||||
| Park Aerospace Corp. |
8 | 105 | ||||||
| *Parker-Hannifin Corp. |
5,025 | 1,490,365 | ||||||
| *Park-Ohio Holdings Corp. |
8 | 187 | ||||||
| *Parsons Corp. |
59 | 2,044 | ||||||
| Pentair PLC |
7,140 | 528,146 | ||||||
| *Perma-Fix Environmental Services, Inc. |
8 | 58 | ||||||
| *PGT Innovations, Inc. |
2,115 | 45,155 | ||||||
| *Pitney Bowes, Inc. |
18,852 | 130,833 | ||||||
| #*Plug Power, Inc. |
8,619 | 329,849 | ||||||
| *Powell Industries, Inc. |
8 | 207 | ||||||
| Preformed Line Products Co. |
20 | 1,388 | ||||||
| Primoris Services Corp. |
2,748 | 74,059 | ||||||
| *Proto Labs, Inc. |
47 | 2,811 | ||||||
| #*Quad/Graphics, Inc. |
16 | 63 | ||||||
| Quanex Building Products Corp. |
1,504 | 31,163 | ||||||
| Quanta Services, Inc. |
5,038 | 611,009 | ||||||
| *Quest Resource Holding Corp. |
8 | 47 | ||||||
| *Radiant Logistics, Inc. |
16 | 108 | ||||||
| *Raven Industries, Inc. |
135 | 7,806 | ||||||
| Raytheon Technologies Corp. |
39,832 | 3,539,472 | ||||||
| *RBC Bearings, Inc. |
411 | 96,145 | ||||||
| *Regal Rexnord Corp. |
3,963 | 603,684 | ||||||
| Republic Services, Inc. |
11,508 | 1,548,977 | ||||||
| *Resideo Technologies, Inc. |
2,400 | 59,184 | ||||||
| Resources Connection, Inc. |
8 | 139 | ||||||
| REV Group, Inc. |
1,267 | 19,144 | ||||||
| *Robert Half International, Inc. |
5,547 | 627,199 | ||||||
| *Rockwell Automation, Inc. |
4,262 | 1,361,283 | ||||||
| Rollins, Inc. |
13,005 | 458,166 | ||||||
| *Roper Technologies, Inc. |
3,349 | 1,633,877 | ||||||
| *RR Donnelley & Sons Co. |
5,610 | 35,904 | ||||||
| *Rush Enterprises, Inc., Class A |
160 | 8,333 | ||||||
| *Rush Enterprises, Inc., Class B |
58 | 2,999 | ||||||
| *Ryder System, Inc. |
2,484 | 211,016 | ||||||
| *Saia, Inc. |
619 | 193,524 | ||||||
| Schneider National, Inc., Class B |
73 | 1,821 | ||||||
| Science Applications International Corp. |
2,527 | 226,874 | ||||||
| *Sensata Technologies Holding PLC |
3,247 | 178,910 | ||||||
| *Shyft Group, Inc. (The) |
1,391 | 57,323 | ||||||
| *Sifco Industries, Inc. |
150 | 1,151 | ||||||
| *Simpson Manufacturing Co., Inc. |
850 | 90,177 | ||||||
Dimensional US Core Equity Market ETF
SCHEDULE OF INVESTMENTS
October 31, 2021
| Security Description |
Shares | Fair Value | ||||||
| INDUSTRIALS (Continued) |
| |||||||
| *SiteOne Landscape Supply, Inc. |
2,143 | $ | 503,519 | |||||
| *SkyWest, Inc. |
5,029 | 216,398 | ||||||
| *Snap-on, Inc. |
2,606 | 529,617 | ||||||
| *Southwest Airlines Co. |
18,450 | 872,316 | ||||||
| *SP Plus Corp. |
8 | 258 | ||||||
| *Spirit AeroSystems Holdings, Inc., Class A |
2,065 | 85,264 | ||||||
| *Spirit Airlines, Inc. |
1,981 | 43,285 | ||||||
| *SPX Corp. |
972 | 56,463 | ||||||
| SPX FLOW, Inc. |
134 | 10,011 | ||||||
| *Standex International Corp. |
433 | 48,180 | ||||||
| *Stanley Black & Decker, Inc. |
6,357 | 1,142,544 | ||||||
| Steelcase, Inc., Class A |
3,847 | 45,779 | ||||||
| *Stericycle, Inc. |
3,359 | 224,784 | ||||||
| *Sterling Construction Co., Inc. |
212 | 5,096 | ||||||
| *Sunrun, Inc. |
6,788 | 391,532 | ||||||
| *Team, Inc. |
8 | 19 | ||||||
| Tecnoglass, Inc. |
1,116 | 32,230 | ||||||
| *Tennant Co. |
1,063 | 84,466 | ||||||
| *Terex Corp. |
783 | 35,078 | ||||||
| Tetra Tech, Inc. |
2,198 | 386,101 | ||||||
| *Textainer Group Holdings, Ltd. |
2,017 | 79,248 | ||||||
| *Textron, Inc. |
8,644 | 638,359 | ||||||
| *Thermon Group Holdings, Inc. |
16 | 276 | ||||||
| Timken Co. (The) |
4,574 | 324,525 | ||||||
| *Titan International, Inc. |
24 | 173 | ||||||
| *Titan Machinery, Inc. |
8 | 227 | ||||||
| Toro Co. (The) |
5,099 | 486,802 | ||||||
| *TPI Composites, Inc. |
1,537 | 51,689 | ||||||
| Trane Technologies PLC |
7,422 | 1,342,862 | ||||||
| *Transcat, Inc. |
172 | 12,879 | ||||||
| *TransDigm Group, Inc. |
1,708 | 1,065,485 | ||||||
| TransUnion |
7,142 | 823,401 | ||||||
| *Trex Co., Inc. |
3,758 | 399,851 | ||||||
| *TriMas Corp. |
11,369 | 379,156 | ||||||
| *TriNet Group, Inc. |
2,554 | 258,593 | ||||||
| Trinity Industries, Inc. |
1,954 | 54,810 | ||||||
| Triton International, Ltd. |
4,528 | 281,596 | ||||||
| *TrueBlue, Inc. |
1,089 | 30,329 | ||||||
| *Tutor Perini Corp. |
68 | 926 | ||||||
| *Twin Disc, Inc. |
8 | 109 | ||||||
| *Uber Technologies, Inc. |
16,553 | 725,352 | ||||||
| UFP Industries, Inc. |
1,313 | 107,443 | ||||||
| *Ultralife Corp. |
8 | 50 | ||||||
| *UniFirst Corp. |
15 | 2,969 | ||||||
| Union Pacific Corp. |
20,423 | 4,930,112 | ||||||
| *United Airlines Holdings, Inc. |
10,287 | 474,642 | ||||||
| United Parcel Service, Inc., Class B |
21,190 | 4,523,429 | ||||||
| *United Rentals, Inc. |
3,312 | 1,255,612 | ||||||
| *Univar Solutions, Inc. |
2,270 | 58,067 | ||||||
| Universal Logistics Holdings, Inc. |
43 | 906 | ||||||
| *Upwork, Inc. |
534 | 25,162 | ||||||
| *US Ecology, Inc. |
198 | 6,374 | ||||||
| *US Xpress Enterprises, Inc., Class A |
16 | 121 | ||||||
| *Valmont Industries, Inc. |
370 | 88,415 | ||||||
| *Vectrus, Inc. |
8 | 387 | ||||||
| Verisk Analytics, Inc. |
5,738 | 1,206,529 | ||||||
Dimensional US Core Equity Market ETF
SCHEDULE OF INVESTMENTS
October 31, 2021
| Security Description |
Shares | Fair Value | ||||||
| INDUSTRIALS (Continued) |
| |||||||
| *Veritiv Corp. |
81 | $ | 8,689 | |||||
| *Viad Corp. |
8 | 355 | ||||||
| *Vicor Corp. |
809 | 122,636 | ||||||
| #*Virgin Galactic Holdings, Inc. |
4,877 | 91,444 | ||||||
| *VSE Corp. |
44 | 2,444 | ||||||
| *Wabash National Corp. |
3,355 | 52,103 | ||||||
| Waste Management, Inc. |
12,913 | 2,069,050 | ||||||
| Watsco, Inc. |
807 | 233,691 | ||||||
| *Watts Water Technologies, Inc., Class A |
421 | 79,998 | ||||||
| *Welbilt, Inc. |
1,468 | 34,733 | ||||||
| *Werner Enterprises, Inc. |
3,065 | 138,906 | ||||||
| *WESCO International, Inc. |
1,141 | 147,828 | ||||||
| *Westinghouse Air Brake Technologies Corp. |
6,631 | 601,631 | ||||||
| *Willdan Group, Inc. |
43 | 1,437 | ||||||
| *WillScot Mobile Mini Holdings Corp. |
4,332 | 150,537 | ||||||
| *Woodward, Inc. |
5,127 | 579,095 | ||||||
| *WW Grainger, Inc. |
1,721 | 797,012 | ||||||
| *XPO Logistics, Inc. |
3,227 | 276,877 | ||||||
| Xylem, Inc. |
5,636 | 736,005 | ||||||
| *Yellow Corp. |
32 | 280 | ||||||
| Zurn Water Solutions Corp. |
6,654 | 241,407 | ||||||
|
|
|
|||||||
| TOTAL INDUSTRIALS |
138,509,381 | |||||||
|
|
|
|||||||
| INFORMATION TECHNOLOGY (26.3%) |
| |||||||
| *3D Systems Corp. |
234 | 6,589 | ||||||
| *A10 Networks, Inc. |
1,336 | 24,970 | ||||||
| Accenture PLC, Class A |
19,075 | 6,843,919 | ||||||
| *ACI Worldwide, Inc. |
1,892 | 58,047 | ||||||
| #*ACM Research, Inc., Class A |
694 | 73,682 | ||||||
| *ADDvantage Technologies Group, Inc. |
8 | 18 | ||||||
| *Adobe, Inc. |
11,857 | 7,711,319 | ||||||
| ADTRAN, Inc. |
1,639 | 30,289 | ||||||
| *Advanced Energy Industries, Inc. |
336 | 30,852 | ||||||
| *Advanced Micro Devices, Inc. |
28,026 | 3,369,566 | ||||||
| *Agilysys, Inc. |
32 | 1,527 | ||||||
| *Akamai Technologies, Inc. |
5,962 | 628,753 | ||||||
| *Alarm.com Holdings, Inc. |
757 | 63,785 | ||||||
| *Alithya Group, Inc., Class A |
841 | 2,321 | ||||||
| *Alliance Data Systems Corp. |
2,481 | 211,505 | ||||||
| *Alpha & Omega Semiconductor, Ltd. |
1,444 | 50,035 | ||||||
| *Altair Engineering, Inc., Class A |
526 | 40,918 | ||||||
| *Alteryx, Inc., Class A |
1,378 | 100,856 | ||||||
| *Ambarella, Inc. |
450 | 83,624 | ||||||
| Amdocs, Ltd. |
5,606 | 436,371 | ||||||
| *American Software, Inc., Class A |
8 | 231 | ||||||
| *Amkor Technology, Inc. |
10,811 | 236,977 | ||||||
| *Amphenol Corp., Class A |
21,465 | 1,647,868 | ||||||
| *Amtech Systems, Inc. |
8 | 120 | ||||||
| Analog Devices, Inc. |
8,879 | 1,540,418 | ||||||
| *Anaplan, Inc. |
1,349 | 87,968 | ||||||
| *ANSYS, Inc. |
2,289 | 868,859 | ||||||
| *Appfolio, Inc., Class A |
934 | 122,998 | ||||||
| *Appian Corp. |
8 | 795 | ||||||
| *Apple, Inc. |
483,503 | 72,428,749 | ||||||
| *Applied Materials, Inc. |
27,566 | 3,766,894 | ||||||
| *Applied Optoelectronics, Inc. |
8 | 61 | ||||||
| *Arista Networks, Inc. |
2,484 | 1,017,670 | ||||||
Dimensional US Core Equity Market ETF
SCHEDULE OF INVESTMENTS
October 31, 2021
| Security Description |
Shares | Fair Value | ||||||
| INFORMATION TECHNOLOGY (Continued) |
| |||||||
| *Arlo Technologies, Inc. |
24 | $ | 166 | |||||
| *Arrow Electronics, Inc. |
3,102 | 359,056 | ||||||
| *Asana, Inc., Class A |
656 | 89,085 | ||||||
| *Aspen Technology, Inc. |
2,526 | 395,799 | ||||||
| *Asure Software, Inc. |
8 | 77 | ||||||
| *Atlassian Corp. PLC, Class A |
2,282 | 1,045,453 | ||||||
| *Autodesk, Inc. |
6,032 | 1,915,824 | ||||||
| *Automatic Data Processing, Inc. |
13,265 | 2,977,860 | ||||||
| *Avalara, Inc. |
1,504 | 270,179 | ||||||
| *Avaya Holdings Corp. |
3,683 | 68,577 | ||||||
| *Aviat Networks, Inc. |
58 | 1,659 | ||||||
| *Avid Technology, Inc. |
4,367 | 125,071 | ||||||
| *Avnet, Inc. |
6,297 | 239,979 | ||||||
| *Aware, Inc. |
16 | 56 | ||||||
| *Axcelis Technologies, Inc. |
2,101 | 115,408 | ||||||
| *AXT, Inc. |
16 | 131 | ||||||
| *Badger Meter, Inc. |
500 | 51,125 | ||||||
| *Bel Fuse, Inc., Class B |
129 | 1,796 | ||||||
| *Belden, Inc. |
836 | 50,336 | ||||||
| Benchmark Electronics, Inc. |
1,183 | 27,576 | ||||||
| #*Bill.com Holdings, Inc. |
802 | 236,037 | ||||||
| BK Technologies Corp. |
8 | 24 | ||||||
| *Black Knight, Inc. |
6,377 | 447,091 | ||||||
| *Blackbaud, Inc. |
1,970 | 139,890 | ||||||
| *Blackline, Inc. |
1,067 | 135,370 | ||||||
| *BM Technologies, Inc. |
2 | 18 | ||||||
| *Bottomline Technologies DE, Inc. |
696 | 32,225 | ||||||
| *Box, Inc., Class A |
2,325 | 60,055 | ||||||
| *Brightcove, Inc. |
15 | 149 | ||||||
| Broadcom, Inc. |
13,278 | 7,059,514 | ||||||
| Broadridge Financial Solutions, Inc. |
4,188 | 747,181 | ||||||
| *Brooks Automation, Inc. |
3,098 | 360,762 | ||||||
| *Cadence Design Systems, Inc. |
8,755 | 1,515,578 | ||||||
| *CalAmp Corp. |
16 | 154 | ||||||
| *Calix, Inc. |
4,760 | 297,928 | ||||||
| *Cambium Networks Corp. |
524 | 14,787 | ||||||
| *Casa Systems, Inc. |
154 | 975 | ||||||
| Cass Information Systems, Inc. |
8 | 328 | ||||||
| CDK Global, Inc. |
4,676 | 203,500 | ||||||
| CDW Corp. |
5,530 | 1,032,175 | ||||||
| #*Cerence, Inc. |
2,238 | 235,281 | ||||||
| *Ceridian HCM Holding, Inc. |
5,610 | 702,652 | ||||||
| *CEVA, Inc. |
776 | 35,393 | ||||||
| *ChannelAdvisor Corp. |
726 | 18,520 | ||||||
| *Ciena Corp. |
5,867 | 318,519 | ||||||
| *Cirrus Logic, Inc. |
2,424 | 195,883 | ||||||
| Cisco Systems, Inc. |
120,142 | 6,724,348 | ||||||
| Citrix Systems, Inc. |
4,370 | 413,970 | ||||||
| *Clearfield, Inc. |
8 | 452 | ||||||
| *Cloudflare, Inc., Class A |
2,730 | 531,586 | ||||||
| CMC Materials, Inc. |
400 | 51,348 | ||||||
| *Cognex Corp. |
5,039 | 441,366 | ||||||
| Cognizant Technology Solutions Corp., Class A |
20,076 | 1,567,735 | ||||||
| *Cognyte Software, Ltd. |
24 | 478 | ||||||
| *Coherent, Inc. |
8 | 2,035 | ||||||
| *Cohu, Inc. |
1,749 | 56,038 | ||||||
Dimensional US Core Equity Market ETF
SCHEDULE OF INVESTMENTS
October 31, 2021
| Security Description |
Shares | Fair Value | ||||||
| INFORMATION TECHNOLOGY (Continued) |
| |||||||
| *CommScope Holding Co., Inc. |
2,433 | $ | 26,057 | |||||
| *CommVault Systems, Inc. |
39 | 2,398 | ||||||
| Comtech Telecommunications Corp. |
8 | 173 | ||||||
| Concentrix Corp. |
1,105 | 196,336 | ||||||
| *Conduent, Inc. |
14,343 | 96,815 | ||||||
| *Consensus Cloud Solutions, Inc. |
485 | 30,715 | ||||||
| *Corning, Inc. |
26,290 | 935,135 | ||||||
| *Coupa Software, Inc. |
1,121 | 255,252 | ||||||
| *Cps Technologies Corp. |
2 | 10 | ||||||
| *Crowdstrike Holdings, Inc., Class A |
892 | 251,366 | ||||||
| *CSG Systems International, Inc. |
3,143 | 157,307 | ||||||
| *CTS Corp. |
828 | 29,493 | ||||||
| *Daktronics, Inc. |
16 | 89 | ||||||
| *Datadog, Inc., Class A |
2,214 | 369,849 | ||||||
| *Dell Technologies, Inc. |
6,762 | 743,752 | ||||||
| *Digi International, Inc. |
1,693 | 36,484 | ||||||
| *Digital Turbine, Inc. |
2,803 | 241,226 | ||||||
| *Diodes, Inc. |
473 | 45,451 | ||||||
| *DocuSign, Inc. |
3,376 | 939,507 | ||||||
| Dolby Laboratories, Inc., Class A |
1,716 | 151,609 | ||||||
| *Dropbox, Inc., Class A |
11,708 | 356,977 | ||||||
| *DSP Group, Inc. |
8 | 176 | ||||||
| *Duck Creek Technologies, Inc. |
322 | 10,143 | ||||||
| #*DXC Technology Co. |
9,756 | 317,753 | ||||||
| *Dynatrace, Inc. |
10,593 | 794,475 | ||||||
| *DZS, Inc. |
8 | 87 | ||||||
| *Ebix, Inc. |
34 | 1,116 | ||||||
| *EchoStar Corp., Class A |
62 | 1,455 | ||||||
| *eGain Corp. |
16 | 165 | ||||||
| *Elastic NV |
1,467 | 254,539 | ||||||
| *EMCORE Corp. |
8 | 60 | ||||||
| *Enphase Energy, Inc. |
3,546 | 821,360 | ||||||
| Entegris, Inc. |
5,373 | 756,411 | ||||||
| *Envestnet, Inc. |
869 | 72,562 | ||||||
| *EPAM Systems, Inc. |
1,707 | 1,149,221 | ||||||
| *ePlus, Inc. |
445 | 49,204 | ||||||
| *Euronet Worldwide, Inc. |
2,209 | 247,828 | ||||||
| *Everbridge, Inc. |
492 | 78,381 | ||||||
| EVERTEC, Inc. |
3,831 | 173,200 | ||||||
| *Evo Payments, Inc., Class A |
2,584 | 56,021 | ||||||
| *ExlService Holdings, Inc. |
425 | 52,118 | ||||||
| *Extreme Networks, Inc. |
11,371 | 111,777 | ||||||
| *F5 Networks, Inc. |
2,715 | 573,272 | ||||||
| *Fabrinet |
297 | 28,512 | ||||||
| *Fair Isaac Corp. |
740 | 294,668 | ||||||
| *FARO Technologies, Inc. |
4,132 | 303,991 | ||||||
| Fidelity National Information Services, Inc. |
15,687 | 1,737,178 | ||||||
| *First Solar, Inc. |
4,146 | 495,820 | ||||||
| *Fiserv, Inc. |
5,560 | 547,604 | ||||||
| *Five9, Inc. |
798 | 126,092 | ||||||
| *FleetCor Technologies, Inc. |
3,312 | 819,422 | ||||||
| *Flex, Ltd. |
18,706 | 316,131 | ||||||
| *FormFactor, Inc. |
1,616 | 64,284 | ||||||
| *Fortinet, Inc. |
5,355 | 1,801,101 | ||||||
| #*fuboTV, Inc. |
116 | 3,458 | ||||||
| *Gartner, Inc. |
3,441 | 1,142,102 | ||||||
| *Genasys, Inc. |
335 | 1,702 | ||||||
Dimensional US Core Equity Market ETF
SCHEDULE OF INVESTMENTS
October 31, 2021
| Security Description |
Shares | Fair Value | ||||||
| INFORMATION TECHNOLOGY (Continued) |
| |||||||
| Genpact, Ltd. |
7,558 | $ | 372,987 | |||||
| Global Payments, Inc. |
7,470 | 1,068,135 | ||||||
| *Globant SA |
2,284 | 729,030 | ||||||
| *GoDaddy, Inc., Class A |
5,691 | 393,646 | ||||||
| *GreenSky, Inc., Class A |
41 | 502 | ||||||
| *Grid Dynamics Holdings, Inc. |
1,257 | 36,139 | ||||||
| *GSI Technology, Inc. |
8 | 42 | ||||||
| *GTY Technology Holdings, Inc. |
24 | 182 | ||||||
| *Guidewire Software, Inc. |
2,563 | 322,246 | ||||||
| *Hackett Group, Inc. (The) |
8 | 169 | ||||||
| *Harmonic, Inc. |
3,592 | 32,579 | ||||||
| Hewlett Packard Enterprise Co. |
47,905 | 701,808 | ||||||
| HP, Inc., Class A |
44,518 | 1,350,231 | ||||||
| #*HubSpot, Inc. |
848 | 687,075 | ||||||
| *I3 Verticals, Inc., Class A |
8 | 179 | ||||||
| *Ichor Holdings, Ltd. |
593 | 25,926 | ||||||
| *Identiv, Inc. |
8 | 153 | ||||||
| *II-VI, Inc. |
4,396 | 266,002 | ||||||
| *Immersion Corp. |
8 | 64 | ||||||
| *Infinera Corp. |
11,657 | 88,477 | ||||||
| Information Services Group, Inc. |
8 | 65 | ||||||
| *Insight Enterprises, Inc. |
4,803 | 454,844 | ||||||
| Intel Corp. |
145,823 | 7,145,327 | ||||||
| *Intellicheck, Inc. |
8 | 71 | ||||||
| InterDigital, Inc. |
386 | 25,843 | ||||||
| International Business Machines Corp. |
34,342 | 4,296,184 | ||||||
| *International Money Express, Inc. |
10 | 167 | ||||||
| *Intevac, Inc. |
8 | 37 | ||||||
| Intuit, Inc. |
6,327 | 3,960,639 | ||||||
| *IPG Photonics Corp. |
1,600 | 254,416 | ||||||
| *Iteris, Inc. |
16 | 86 | ||||||
| *Itron, Inc. |
2,252 | 175,138 | ||||||
| *Jabil, Inc. |
7,509 | 450,240 | ||||||
| #Jack Henry & Associates, Inc. |
2,865 | 476,965 | ||||||
| #*Jamf Holding Corp. |
1,354 | 64,518 | ||||||
| Juniper Networks, Inc. |
12,439 | 367,199 | ||||||
| *Key Tronic Corp. |
161 | 1,038 | ||||||
| *Keysight Technologies, Inc. |
7,181 | 1,292,724 | ||||||
| *Kimball Electronics, Inc., Class B |
139 | 3,996 | ||||||
| *KLA Corp. |
5,406 | 2,015,141 | ||||||
| *Knowles Corp. |
1,829 | 38,116 | ||||||
| #*Kopin Corp. |
86 | 451 | ||||||
| *Kulicke & Soffa Industries, Inc. |
8,435 | 480,795 | ||||||
| *KVH Industries, Inc. |
8 | 82 | ||||||
| *Lam Research Corp. |
4,377 | 2,466,746 | ||||||
| *Lantronix, Inc. |
294 | 2,852 | ||||||
| *Lattice Semiconductor Corp. |
1,730 | 120,131 | ||||||
| *Limelight Networks, Inc. |
32 | 95 | ||||||
| *Littelfuse, Inc. |
1,015 | 298,968 | ||||||
| *LiveRamp Holdings, Inc. |
40 | 2,140 | ||||||
| *Lumentum Holdings, Inc. |
2,517 | 207,854 | ||||||
| *Luna Innovations, Inc. |
8 | 78 | ||||||
| *MACOM Technology Solutions Holdings, Inc. |
2,287 | 159,678 | ||||||
| *MagnaChip Semiconductor Corp. |
16 | 303 | ||||||
| *Mandiant, Inc. |
3,538 | 61,703 | ||||||
| *Manhattan Associates, Inc. |
2,486 | 451,308 | ||||||
Dimensional US Core Equity Market ETF
SCHEDULE OF INVESTMENTS
October 31, 2021
| Security Description |
Shares | Fair Value | ||||||
| INFORMATION TECHNOLOGY (Continued) |
| |||||||
| Marvell Technology, Inc. |
17,050 | $ | 1,167,925 | |||||
| Mastercard, Inc., Class A |
25,251 | 8,472,216 | ||||||
| *Maximus, Inc. |
3,580 | 302,761 | ||||||
| *MaxLinear, Inc. |
224 | 14,112 | ||||||
| Methode Electronics, Inc. |
1,214 | 51,073 | ||||||
| *Microchip Technology, Inc. |
18,185 | 1,347,327 | ||||||
| Micron Technology, Inc. |
31,586 | 2,182,593 | ||||||
| Microsoft Corp. |
200,479 | 66,482,846 | ||||||
| *Mimecast, Ltd. |
1,542 | 116,328 | ||||||
| *Mitek Systems, Inc. |
1,846 | 34,760 | ||||||
| MKS Instruments, Inc. |
1,191 | 178,710 | ||||||
| *Model N, Inc. |
792 | 25,669 | ||||||
| *Momentive Global, Inc. |
4,257 | 97,570 | ||||||
| *MoneyGram International, Inc. |
3,355 | 20,029 | ||||||
| *MongoDB, Inc. |
1,756 | 915,385 | ||||||
| Monolithic Power Systems, Inc. |
887 | 466,083 | ||||||
| Motorola Solutions, Inc. |
5,701 | 1,417,212 | ||||||
| *N-Able, Inc. |
2,544 | 33,835 | ||||||
| *Napco Security Technologies, Inc. |
588 | 28,200 | ||||||
| *National Instruments Corp. |
5,661 | 240,423 | ||||||
| *NCR Corp. |
6,825 | 269,860 | ||||||
| *NeoPhotonics Corp. |
24 | 243 | ||||||
| NetApp, Inc. |
8,193 | 731,635 | ||||||
| *NETGEAR, Inc. |
1,026 | 29,580 | ||||||
| *NetScout Systems, Inc. |
10,269 | 277,879 | ||||||
| *NetSol Technologies, Inc. |
16 | 72 | ||||||
| Network-1 Technologies, Inc. |
16 | 45 | ||||||
| *New Relic, Inc. |
16 | 1,299 | ||||||
| *nLight, Inc. |
1,170 | 32,900 | ||||||
| NortonLifeLock, Inc. |
18,636 | 474,286 | ||||||
| *Novanta, Inc. |
766 | 132,181 | ||||||
| *Nuance Communications, Inc. |
5,516 | 303,656 | ||||||
| *Nutanix, Inc., Class A |
3,629 | 124,511 | ||||||
| NVIDIA Corp. |
58,272 | 14,898,402 | ||||||
| Nxp Semiconductors NV |
2,204 | 442,695 | ||||||
| *Okta, Inc. |
2,689 | 664,667 | ||||||
| *ON Semiconductor Corp. |
13,831 | 664,856 | ||||||
| *One Stop Systems, Inc. |
16 | 80 | ||||||
| *OneSpan, Inc. |
280 | 5,718 | ||||||
| *Onto Innovation, Inc. |
776 | 61,467 | ||||||
| Oracle Corp. |
55,871 | 5,360,264 | ||||||
| *OSI Systems, Inc. |
727 | 67,691 | ||||||
| *Pagerduty, Inc. |
42 | 1,753 | ||||||
| *Palantir Technologies, Inc., Class A |
6,592 | 170,601 | ||||||
| *Palo Alto Networks, Inc. |
1,644 | 836,944 | ||||||
| *Par Technology Corp. |
575 | 36,121 | ||||||
| *Park City Group, Inc. |
8 | 45 | ||||||
| Paychex, Inc. |
13,527 | 1,667,609 | ||||||
| *Paycom Software, Inc. |
1,668 | 913,814 | ||||||
| *Paylocity Holding Corp. |
1,453 | 443,368 | ||||||
| *PayPal Holdings, Inc. |
21,698 | 5,046,738 | ||||||
| *Paysign, Inc. |
29 | 73 | ||||||
| PC Connection, Inc. |
521 | 23,992 | ||||||
| PCTEL, Inc. |
8 | 46 | ||||||
| *PDF Solutions, Inc. |
16 | 376 | ||||||
| Pegasystems, Inc. |
1,356 | 160,984 | ||||||
| *Perficient, Inc. |
3,098 | 382,913 | ||||||
Dimensional US Core Equity Market ETF
SCHEDULE OF INVESTMENTS
October 31, 2021
| Security Description |
Shares | Fair Value | ||||||
| INFORMATION TECHNOLOGY (Continued) |
| |||||||
| *Ping Identity Holding Corp. |
801 | $ | 22,692 | |||||
| *Pixelworks, Inc. |
24 | 98 | ||||||
| *Plantronics, Inc. |
3,569 | 95,506 | ||||||
| *Plexus Corp. |
649 | 56,671 | ||||||
| *Power Integrations, Inc. |
2,769 | 285,788 | ||||||
| *Progress Software Corp. |
3,126 | 160,708 | ||||||
| *PTC, Inc. |
4,177 | 531,941 | ||||||
| *Pure Storage, Inc., Class A |
955 | 25,651 | ||||||
| *Q2 Holdings, Inc. |
5,924 | 464,797 | ||||||
| *Qorvo, Inc. |
4,161 | 700,005 | ||||||
| *QUALCOMM, Inc. |
35,543 | 4,728,641 | ||||||
| *Qualys, Inc. |
1,360 | 169,293 | ||||||
| *QuickLogic Corp. |
16 | 95 | ||||||
| *Rambus, Inc. |
14,079 | 327,618 | ||||||
| *RealNetworks, Inc. |
171 | 275 | ||||||
| *Ribbon Communications, Inc. |
2,631 | 14,392 | ||||||
| *Richardson Electronics, Ltd. |
8 | 87 | ||||||
| *Rimini Street, Inc. |
8 | 83 | ||||||
| *RingCentral, Inc., Class A |
1,459 | 355,675 | ||||||
| *Rogers Corp. |
15 | 3,017 | ||||||
| *Sailpoint Technologies Holdings, Inc. |
969 | 46,493 | ||||||
| *salesforce.com, Inc. |
18,400 | 5,514,296 | ||||||
| *Sanmina Corp. |
1,921 | 72,518 | ||||||
| Sapiens International Corp. NV |
5,498 | 192,045 | ||||||
| *ScanSource, Inc. |
136 | 4,866 | ||||||
| Seagate Technology Holdings PLC |
7,335 | 653,328 | ||||||
| *SecureWorks Corp., Class A |
8 | 147 | ||||||
| *Semtech Corp. |
6,052 | 514,602 | ||||||
| *ServiceNow, Inc. |
3,140 | 2,190,966 | ||||||
| *ShotSpotter, Inc. |
702 | 27,315 | ||||||
| *Silicon Laboratories, Inc. |
1,830 | 345,431 | ||||||
| *SiTime Corp. |
36 | 9,536 | ||||||
| #Skyworks Solutions, Inc. |
6,440 | 1,076,317 | ||||||
| *SMART Global Holdings, Inc. |
441 | 23,576 | ||||||
| *Smartsheet, Inc., Class A |
1,408 | 97,166 | ||||||
| *Smith Micro Software, Inc. |
24 | 137 | ||||||
| *SolarEdge Technologies, Inc. |
1,239 | 439,449 | ||||||
| SolarWinds Corp. |
2,774 | 44,661 | ||||||
| *Splunk, Inc. |
3,308 | 545,225 | ||||||
| *SPS Commerce, Inc. |
697 | 106,453 | ||||||
| *Square, Inc., Class A |
4,055 | 1,031,998 | ||||||
| SS&C Technologies Holdings, Inc. |
8,498 | 675,336 | ||||||
| *StarTek, Inc. |
16 | 88 | ||||||
| #*Stratasys, Ltd. |
2,470 | 77,904 | ||||||
| #*SunPower Corp. |
5,195 | 174,864 | ||||||
| *Super Micro Computer, Inc. |
1,393 | 49,298 | ||||||
| #Switch, Inc., Class A |
2,978 | 75,284 | ||||||
| *Synaptics, Inc. |
4,638 | 902,416 | ||||||
| *Synchronoss Technologies, Inc. |
8 | 21 | ||||||
| SYNNEX Corp. |
2,445 | 256,725 | ||||||
| *Synopsys, Inc. |
4,272 | 1,423,345 | ||||||
| TE Connectivity, Ltd. |
10,143 | 1,480,878 | ||||||
| *Teledyne Technologies, Inc. |
1,701 | 764,123 | ||||||
| *Teradata Corp. |
10,365 | 586,244 | ||||||
| *Teradyne, Inc. |
6,487 | 896,763 | ||||||
| *Tessco Technologies, Inc. |
189 | 990 | ||||||
Dimensional US Core Equity Market ETF
SCHEDULE OF INVESTMENTS
October 31, 2021
| Security Description |
Shares | Fair Value | ||||||
| INFORMATION TECHNOLOGY (Continued) |
| |||||||
| Texas Instruments, Inc. |
29,308 | $ | 5,494,664 | |||||
| *Trade Desk, Inc. (The), Class A |
8,435 | 631,866 | ||||||
| *TransAct Technologies, Inc. |
102 | 1,440 | ||||||
| *Trimble, Inc. |
8,908 | 778,292 | ||||||
| TTEC Holdings, Inc. |
1,037 | 97,882 | ||||||
| *TTM Technologies, Inc. |
7,717 | 102,173 | ||||||
| #*Tucows, Inc., Class A |
1,135 | 93,411 | ||||||
| *Turtle Beach Corp. |
169 | 4,860 | ||||||
| *Twilio, Inc., Class A |
3,335 | 971,686 | ||||||
| *Tyler Technologies, Inc. |
895 | 486,182 | ||||||
| Ubiquiti, Inc. |
522 | 159,487 | ||||||
| *Ultra Clean Holdings, Inc. |
916 | 45,406 | ||||||
| *Unisys Corp. |
8,948 | 228,800 | ||||||
| Universal Display Corp. |
1,132 | 207,382 | ||||||
| *Upland Software, Inc. |
511 | 17,052 | ||||||
| *Veeco Instruments, Inc. |
984 | 23,901 | ||||||
| *Verint Systems, Inc. |
1,251 | 58,297 | ||||||
| *VeriSign, Inc. |
4,157 | 925,639 | ||||||
| *Verra Mobility Corp. |
2,495 | 37,126 | ||||||
| *Viasat, Inc. |
1,486 | 88,699 | ||||||
| *Viavi Solutions, Inc. |
7,321 | 112,743 | ||||||
| Visa, Inc., Class A |
42,538 | 9,008,272 | ||||||
| *Vishay Intertechnology, Inc. |
1,382 | 26,562 | ||||||
| *Vishay Precision Group, Inc. |
8 | 273 | ||||||
| *VMware, Inc., Class A |
1,753 | 265,930 | ||||||
| *Vonage Holdings Corp. |
1,207 | 19,457 | ||||||
| *Vontier Corp. |
3,214 | 108,730 | ||||||
| *Western Digital Corp. |
12,802 | 669,417 | ||||||
| Western Union Co. (The) |
13,625 | 248,247 | ||||||
| *WEX, Inc. |
1,543 | 230,987 | ||||||
| #*Wolfspeed, Inc. |
4,807 | 577,369 | ||||||
| *Workday, Inc., Class A |
2,303 | 667,824 | ||||||
| Xerox Holdings Corp. |
6,111 | 108,776 | ||||||
| *Yext, Inc. |
567 | 7,139 | ||||||
| *Zebra Technologies Corp. |
1,656 | 884,221 | ||||||
| *Zendesk, Inc. |
1,624 | 165,323 | ||||||
| *Ziff Davis, Inc. |
1,416 | 181,630 | ||||||
| *Zix Corp. |
399 | 3,380 | ||||||
| *Zoom Video Communications, Inc., Class A |
2,667 | 732,492 | ||||||
| #*Zscaler, Inc. |
1,471 | 469,043 | ||||||
|
|
|
|||||||
| TOTAL INFORMATION TECHNOLOGY |
353,234,330 | |||||||
|
|
|
|||||||
| MATERIALS (3.2%) |
| |||||||
| *Advanced Emissions Solutions, Inc. |
8 | 54 | ||||||
| *AdvanSix, Inc. |
858 | 41,699 | ||||||
| *AgroFresh Solutions, Inc. |
8 | 16 | ||||||
| *Air Products and Chemicals, Inc. |
2,459 | 737,233 | ||||||
| *Albemarle Corp. |
4,033 | 1,010,146 | ||||||
| Alcoa Corp. |
3,674 | 168,820 | ||||||
| *Allegheny Technologies, Inc. |
17,871 | 287,723 | ||||||
| *Alpha Metallurgical Resources, Inc. |
859 | 53,078 | ||||||
| Amcor PLC |
60,990 | 736,149 | ||||||
| American Vanguard Corp. |
8 | 125 | ||||||
| *Ampco-Pittsburgh Corp. |
80 | 450 | ||||||
| AptarGroup, Inc. |
2,525 | 304,969 | ||||||
| *Arconic Corp. |
42 | 1,236 | ||||||
| *Ardagh Metal Packaging SA |
532 | 5,240 | ||||||
Dimensional US Core Equity Market ETF
SCHEDULE OF INVESTMENTS
October 31, 2021
| Security Description |
Shares | Fair Value | ||||||
| MATERIALS (Continued) |
| |||||||
| *Ashland Global Holdings, Inc. |
4,155 | $ | 398,922 | |||||
| *Avery Dennison Corp. |
3,312 | 721,089 | ||||||
| Avient Corp. |
2,416 | 130,174 | ||||||
| *Axalta Coating Systems, Ltd. |
10,428 | 325,249 | ||||||
| Balchem Corp. |
661 | 101,192 | ||||||
| *Ball Corp. |
10,482 | 958,893 | ||||||
| *Berry Global Group, Inc. |
6,183 | 405,234 | ||||||
| *Cabot Corp. |
3,978 | 212,226 | ||||||
| Caledonia Mining Corp. PLC |
670 | 8,301 | ||||||
| Carpenter Technology Corp. |
2,217 | 68,461 | ||||||
| Celanese Corp. |
4,058 | 655,408 | ||||||
| #*Century Aluminum Co. |
2,222 | 29,353 | ||||||
| *CF Industries Holdings, Inc. |
9,234 | 524,491 | ||||||
| Chase Corp. |
356 | 34,176 | ||||||
| *Chemours Co. (The) |
7,264 | 203,537 | ||||||
| #*Clearwater Paper Corp. |
8 | 335 | ||||||
| #*Cleveland-Cliffs, Inc. |
9,395 | 226,513 | ||||||
| *Coeur Mining, Inc. |
12,251 | 77,549 | ||||||
| #Commercial Metals Co. |
6,738 | 216,829 | ||||||
| Compass Minerals International, Inc. |
2,508 | 164,525 | ||||||
| Corteva, Inc. |
24,602 | 1,061,576 | ||||||
| *Crown Holdings, Inc. |
5,320 | 553,227 | ||||||
| *Domtar Corp. |
5,853 | 319,515 | ||||||
| *Dow, Inc. |
27,138 | 1,518,914 | ||||||
| DuPont de Nemours, Inc. |
12,567 | 874,663 | ||||||
| Eagle Materials, Inc. |
2,323 | 344,640 | ||||||
| Eastman Chemical Co. |
5,096 | 530,137 | ||||||
| Ecolab, Inc. |
6,462 | 1,435,986 | ||||||
| Ecovyst, Inc. |
9,124 | 106,568 | ||||||
| Element Solutions, Inc. |
33,201 | 753,995 | ||||||
| *Ferro Corp. |
32 | 673 | ||||||
| *Ferroglobe PLC |
9,312 | 61,739 | ||||||
| *Flotek Industries, Inc. |
16 | 19 | ||||||
| FMC Corp. |
5,593 | 509,019 | ||||||
| *Forterra, Inc. |
627 | 14,935 | ||||||
| Fortitude Gold Corp. |
4 | 27 | ||||||
| Freeport-McMoRan, Inc. |
42,929 | 1,619,282 | ||||||
| FutureFuel Corp. |
8 | 56 | ||||||
| *GCP Applied Technologies, Inc. |
7,598 | 171,791 | ||||||
| Glatfelter Corp. |
665 | 10,926 | ||||||
| Gold Resource Corp. |
16 | 29 | ||||||
| *Graphic Packaging Holding Co. |
11,968 | 238,522 | ||||||
| Greif, Inc., Class A |
1,775 | 114,807 | ||||||
| Greif, Inc., Class B |
8 | 522 | ||||||
| *Hawkins, Inc. |
916 | 33,590 | ||||||
| *Haynes International, Inc. |
8 | 321 | ||||||
| HB Fuller Co. |
37 | 2,609 | ||||||
| *Hecla Mining Co. |
7,760 | 44,853 | ||||||
| *Huntsman Corp. |
10,053 | 327,527 | ||||||
| *Ingevity Corp. |
1,188 | 92,557 | ||||||
| Innospec, Inc. |
405 | 36,697 | ||||||
| International Flavors & Fragrances, Inc. |
8,860 | 1,306,407 | ||||||
| *International Paper Co. |
14,928 | 741,474 | ||||||
| *Intrepid Potash, Inc. |
38 | 1,851 | ||||||
| *Koppers Holdings, Inc. |
227 | 7,965 | ||||||
| *Kraton Corp. |
1,825 | 83,311 | ||||||
Dimensional US Core Equity Market ETF
SCHEDULE OF INVESTMENTS
October 31, 2021
| Security Description |
Shares | Fair Value | ||||||
| MATERIALS (Continued) |
| |||||||
| Kronos Worldwide, Inc. |
1,833 | $ | 23,884 | |||||
| Linde PLC |
12,389 | 3,954,569 | ||||||
| #*Livent Corp. |
7,427 | 209,590 | ||||||
| *Louisiana-Pacific Corp. |
2,424 | 142,846 | ||||||
| *LSB Industries, Inc. |
270 | 2,411 | ||||||
| LyondellBasell Industries NV, Class A |
14,175 | 1,315,723 | ||||||
| *Martin Marietta Materials, Inc. |
2,470 | 970,315 | ||||||
| *Materion Corp. |
1,190 | 85,894 | ||||||
| *Mercer International, Inc. |
778 | 8,379 | ||||||
| *Minerals Technologies, Inc. |
621 | 44,054 | ||||||
| Mosaic Co. (The) |
13,331 | 554,170 | ||||||
| *Myers Industries, Inc. |
1,533 | 31,549 | ||||||
| *Neenah, Inc. |
163 | 8,238 | ||||||
| *NewMarket Corp. |
596 | 202,646 | ||||||
| Newmont Corp. |
22,345 | 1,206,630 | ||||||
| Nexa Resources SA |
200 | 1,690 | ||||||
| Nucor Corp. |
11,473 | 1,280,960 | ||||||
| *O-I Glass, Inc. |
4,965 | 64,793 | ||||||
| *Olin Corp. |
3,272 | 186,439 | ||||||
| Olympic Steel, Inc. |
137 | 3,695 | ||||||
| *Orion Engineered Carbons SA |
3,934 | 73,959 | ||||||
| Packaging Corp. of America |
3,472 | 476,949 | ||||||
| *PPG Industries, Inc. |
8,652 | 1,389,252 | ||||||
| *Quaker Chemical Corp. |
720 | 177,005 | ||||||
| *Ramaco Resources, Inc. |
8 | 149 | ||||||
| *Ranpak Holdings Corp. |
1,021 | 35,184 | ||||||
| *Rayonier Advanced Materials, Inc. |
361 | 2,592 | ||||||
| *Reliance Steel & Aluminum Co. |
2,647 | 386,886 | ||||||
| Resolute Forest Products, Inc. |
6,249 | 73,488 | ||||||
| *Royal Gold, Inc. |
1,831 | 181,306 | ||||||
| RPM International, Inc. |
5,972 | 520,758 | ||||||
| *Ryerson Holding Corp. |
37 | 975 | ||||||
| *Schnitzer Steel Industries, Inc. |
1,666 | 89,631 | ||||||
| *Schweitzer-Mauduit International, Inc. |
626 | 21,810 | ||||||
| *Scotts Miracle-Gro Co. (The) |
2,316 | 343,833 | ||||||
| Sealed Air Corp. |
5,042 | 299,091 | ||||||
| Sensient Technologies Corp. |
1,357 | 129,729 | ||||||
| *Sherwin-Williams Co. (The) |
7,138 | 2,259,962 | ||||||
| *Silgan Holdings, Inc. |
5,687 | 228,617 | ||||||
| *Sonoco Products Co. |
2,868 | 166,201 | ||||||
| Southern Copper Corp. |
4,763 | 285,732 | ||||||
| *Steel Dynamics, Inc. |
8,388 | 554,279 | ||||||
| *Stepan Co. |
428 | 51,369 | ||||||
| *Summit Materials, Inc., Class A |
118 | 4,207 | ||||||
| SunCoke Energy, Inc. |
2,692 | 19,436 | ||||||
| *Sylvamo Corp. |
1,357 | 38,213 | ||||||
| *TimkenSteel Corp. |
107 | 1,493 | ||||||
| *Trecora Resources |
8 | 62 | ||||||
| *Tredegar Corp. |
16 | 193 | ||||||
| Trinseo PLC |
2,780 | 155,847 | ||||||
| Tronox Holdings PLC, Class A |
4,704 | 109,697 | ||||||
| *UFP Technologies, Inc. |
61 | 3,775 | ||||||
| *United States Lime & Minerals, Inc. |
26 | 3,210 | ||||||
| #*United States Steel Corp. |
24,816 | 654,894 | ||||||
| Valvoline, Inc. |
6,401 | 217,378 | ||||||
| *Venator Materials PLC |
754 | 2,270 | ||||||
| Verso Corp., Class A |
16 | 353 | ||||||
Dimensional US Core Equity Market ETF
SCHEDULE OF INVESTMENTS
October 31, 2021
| Security Description |
Shares | Fair Value | ||||||
| MATERIALS (Continued) |
| |||||||
| *Vulcan Materials Co. |
4,220 | $ | 802,306 | |||||
| Warrior Met Coal, Inc. |
1,004 | 24,066 | ||||||
| *Westlake Chemical Corp. |
2,917 | 283,941 | ||||||
| Westrock Co. |
10,408 | 500,625 | ||||||
| *Worthington Industries, Inc. |
380 | 20,642 | ||||||
|
|
|
|||||||
| TOTAL MATERIALS |
42,619,965 | |||||||
|
|
|
|||||||
| REAL ESTATE (0.2%) |
| |||||||
| *CBRE Group, Inc., Class A |
12,149 | 1,264,468 | ||||||
| *Cushman & Wakefield PLC |
8,408 | 154,623 | ||||||
| eXp World Holdings, Inc. |
1,663 | 85,811 | ||||||
| *Five Point Holdings LLC, Class A |
43 | 316 | ||||||
| *Forestar Group, Inc. |
873 | 17,085 | ||||||
| *FRP Holdings, Inc. |
484 | 27,685 | ||||||
| *Howard Hughes Corp. (The) |
1,839 | 160,232 | ||||||
| *Jones Lang LaSalle, Inc. |
1,696 | 437,958 | ||||||
| *Kennedy-Wilson Holdings, Inc. |
4,526 | 101,247 | ||||||
| *Marcus & Millichap, Inc. |
2,871 | 135,224 | ||||||
| *Maui Land & Pineapple Co., Inc. |
8 | 84 | ||||||
| Newmark Group, Inc., Class A |
7,966 | 118,534 | ||||||
| *Rafael Holdings, Inc., Class B |
15 | 113 | ||||||
| Re/Max Holdings, Inc. |
22 | 700 | ||||||
| *Realogy Holdings Corp. |
9,402 | 162,843 | ||||||
| #*Redfin Corp. |
1,687 | 86,611 | ||||||
| RMR Group, Inc. (The), Class A |
80 | 2,783 | ||||||
| *St Joe Co. (The) |
2,222 | 104,478 | ||||||
| *Stratus Properties, Inc. |
41 | 1,397 | ||||||
| *Tejon Ranch Co. |
8 | 146 | ||||||
|
|
|
|||||||
| TOTAL REAL ESTATE |
2,862,338 | |||||||
|
|
|
|||||||
| UTILITIES (2.5%) |
| |||||||
| AES Corp. (The) |
22,404 | 563,012 | ||||||
| *ALLETE, Inc. |
2,636 | 162,219 | ||||||
| Alliant Energy Corp. |
8,295 | 469,248 | ||||||
| *Ameren Corp., Class A |
8,541 | 719,921 | ||||||
| *American Electric Power Co., Inc. |
13,942 | 1,181,027 | ||||||
| *American States Water Co. |
137 | 12,445 | ||||||
| *American Water Works Co., Inc. |
6,011 | 1,046,996 | ||||||
| *Artesian Resources Corp., Class A |
10 | 402 | ||||||
| Atlantica Sustainable Infrastructure PLC |
3,342 | 131,508 | ||||||
| *Atmos Energy Corp. |
4,806 | 442,729 | ||||||
| #Avangrid, Inc. |
537 | 28,300 | ||||||
| Avista Corp. |
14,064 | 559,888 | ||||||
| *Black Hills Corp. |
1,099 | 72,952 | ||||||
| *California Water Service Group |
306 | 18,629 | ||||||
| CenterPoint Energy, Inc. |
18,542 | 482,834 | ||||||
| *Chesapeake Utilities Corp. |
570 | 74,710 | ||||||
| Clearway Energy, Inc., Class A |
8 | 264 | ||||||
| Clearway Energy, Inc., Class C |
66 | 2,342 | ||||||
| CMS Energy Corp. |
9,389 | 566,626 | ||||||
| Consolidated Edison, Inc. |
11,248 | 848,099 | ||||||
| Consolidated Water Co., Ltd. |
7 | 78 | ||||||
| Dominion Energy, Inc. |
20,157 | 1,530,521 | ||||||
| *DTE Energy Co. |
5,864 | 664,684 | ||||||
| Duke Energy Corp. |
19,852 | 2,025,102 | ||||||
| Edison International |
12,443 | 783,038 | ||||||
Dimensional US Core Equity Market ETF
SCHEDULE OF INVESTMENTS
October 31, 2021
| Security Description |
Shares | Fair Value | ||||||
| UTILITIES (Continued) |
||||||||
| Entergy Corp. |
6,807 | $ | 701,257 | |||||
| Essential Utilities, Inc. |
8,807 | 414,545 | ||||||
| Evergy, Inc. |
7,652 | 487,815 | ||||||
| Eversource Energy |
11,799 | 1,001,735 | ||||||
| Exelon Corp. |
32,506 | 1,728,994 | ||||||
| *FirstEnergy Corp. |
17,198 | 662,639 | ||||||
| *Genie Energy, Ltd., Class B |
8 | 40 | ||||||
| *Global Water Resources, Inc. |
159 | 3,008 | ||||||
| *Hawaiian Electric Industries, Inc. |
2,167 | 87,894 | ||||||
| *IDACORP, Inc. |
2,007 | 209,370 | ||||||
| *MDU Resources Group, Inc. |
8,389 | 257,794 | ||||||
| MGE Energy, Inc. |
176 | 13,357 | ||||||
| *Middlesex Water Co. |
2,063 | 227,178 | ||||||
| #National Fuel Gas Co. |
3,491 | 200,488 | ||||||
| *New Jersey Resources Corp. |
3,627 | 137,137 | ||||||
| NextEra Energy, Inc. |
47,490 | 4,052,322 | ||||||
| NiSource, Inc. |
14,147 | 349,006 | ||||||
| Northwest Natural Holding Co. |
2,563 | 115,566 | ||||||
| *NorthWestern Corp. |
1,284 | 73,008 | ||||||
| NRG Energy, Inc. |
10,196 | 406,718 | ||||||
| OGE Energy Corp. |
20,069 | 683,751 | ||||||
| ONE Gas, Inc. |
801 | 53,907 | ||||||
| #*Ormat Technologies, Inc. |
1,449 | 104,806 | ||||||
| *Otter Tail Corp. |
31 | 1,922 | ||||||
| *PG&E Corp. |
75,167 | 871,937 | ||||||
| *Pinnacle West Capital Corp. |
4,246 | 273,825 | ||||||
| *Portland General Electric Co. |
8,351 | 411,788 | ||||||
| PPL Corp. |
21,208 | 610,790 | ||||||
| *Public Service Enterprise Group, Inc. |
18,381 | 1,172,708 | ||||||
| *Pure Cycle Corp. |
1,668 | 26,171 | ||||||
| *Sempra Energy |
11,632 | 1,484,592 | ||||||
| *SJW Group |
366 | 24,127 | ||||||
| South Jersey Industries, Inc. |
1,121 | 25,514 | ||||||
| Southern Co. (The) |
28,027 | 1,746,643 | ||||||
| *Southwest Gas Holdings, Inc. |
831 | 57,547 | ||||||
| Spire, Inc. |
904 | 56,735 | ||||||
| *Sunnova Energy International, Inc. |
3,168 | 141,166 | ||||||
| *UGI Corp. |
8,147 | 353,661 | ||||||
| *Unitil Corp. |
529 | 22,086 | ||||||
| Via Renewables, Inc. |
36 | 401 | ||||||
| Vistra Corp. |
19,324 | 378,557 | ||||||
| WEC Energy Group, Inc. |
10,296 | 927,258 | ||||||
| Xcel Energy, Inc. |
17,707 | 1,143,695 | ||||||
| York Water Co. (The) |
378 | 18,114 | ||||||
|
|
|
|||||||
| TOTAL UTILITIES |
34,109,146 | |||||||
|
|
|
|||||||
| TOTAL COMMON STOCKS (Cost $1,178,651,884) |
1,327,077,308 | |||||||
|
|
|
|||||||
| RIGHT (0.0%) |
| |||||||
| HEALTH CARE (0.0%) |
| |||||||
| *»Xeris Biopharma Holdings, Inc. |
656 | 92 | ||||||
|
|
|
|||||||
| TOTAL RIGHT (Cost $–) |
92 | |||||||
| TOTAL INVESTMENT SECURITIES — (98.8%) |
1,327,077,400 | |||||||
|
|
|
|||||||
Dimensional US Core Equity Market ETF
SCHEDULE OF INVESTMENTS
October 31, 2021
| Security Description |
Shares | Fair Value | ||||||
| SECURITIES LENDING COLLATERAL (1.2%) |
| |||||||
| @§The DFA Short Term Investment Fund |
1,353,948 | $ | 15,664,505 | |||||
| TOTAL INVESTMENTS (Cost $1,194,316,389) — (100.0%) |
|
$ | 1,342,741,905 | |||||
|
|
|
|||||||
| * | Non-Income Producing Securities |
| # | Total or Partial Securities on Loan |
| » | Securities that have generally been fair value factored |
| @ | Security purchased with cash collateral received from Securities on Loan |
| § | Affiliated Fund |
| PLC | Public Limited Company |
| SA | Special Assessment |
Dimensional U.S. Core Equity 2 ETF
SCHEDULE OF INVESTMENTS
October 31, 2021
| Security Description |
Shares | Fair Value | ||||||
| COMMON STOCKS (98.7%) |
| |||||||
| COMMUNICATION SERVICES (7.0%) |
| |||||||
| Activision Blizzard, Inc. |
167,589 | $ | 13,103,784 | |||||
| *Alphabet, Inc., Class A |
46,097 | 136,489,529 | ||||||
| *Alphabet, Inc., Class C |
43,937 | 130,291,219 | ||||||
| *Altice USA, Inc., Class A |
214,617 | 3,498,257 | ||||||
| *AMC Networks, Inc., Class A |
33,221 | 1,321,864 | ||||||
| #*Angi, Inc., Class A |
25,877 | 324,239 | ||||||
| *Anterix, Inc. |
15,084 | 966,884 | ||||||
| AT&T, Inc. |
1,861,421 | 47,019,494 | ||||||
| ATN International, Inc. |
21,161 | 862,946 | ||||||
| *Ballantyne Strong, Inc. |
2,943 | 8,858 | ||||||
| *Bandwidth, Inc., Class A |
3,144 | 268,120 | ||||||
| *Boston Omaha Corp., Class A |
9,123 | 323,410 | ||||||
| #Cable One, Inc. |
5,193 | 8,886,314 | ||||||
| *Cargurus, Inc. |
50,473 | 1,692,864 | ||||||
| *Cars.com, Inc. |
47,551 | 619,114 | ||||||
| #*Charter Communications, Inc., Class A |
59,151 | 39,920,418 | ||||||
| #*Cinemark Holdings, Inc. |
70,123 | 1,318,312 | ||||||
| Cogent Communications Holdings, Inc. |
36,833 | 2,821,039 | ||||||
| Comcast Corp., Class A |
1,670,985 | 85,938,759 | ||||||
| *comScore, Inc. |
42,115 | 164,670 | ||||||
| *Consolidated Communications Holdings, Inc. |
59,604 | 441,070 | ||||||
| *Cumulus Media, Inc. |
11,924 | 148,096 | ||||||
| *Daily Journal Corp. |
200 | 68,644 | ||||||
| *DHI Group, Inc. |
38,113 | 179,131 | ||||||
| #*Discovery, Inc. |
93,472 | 2,190,984 | ||||||
| *Discovery, Inc., Class C |
171,400 | 3,866,784 | ||||||
| *DISH Network Corp., Class A |
125,579 | 5,157,530 | ||||||
| Electronic Arts, Inc. |
57,232 | 8,026,788 | ||||||
| *Emerald Holding, Inc. |
33,424 | 135,367 | ||||||
| *Entercom Communications Corp. |
73,736 | 238,167 | ||||||
| Entravision Communications Corp., Class A |
50,372 | 401,465 | ||||||
| EW Scripps Co. (The), Class A |
84,172 | 1,565,599 | ||||||
| *Facebook, Inc., Class A |
409,273 | 132,428,465 | ||||||
| *Fluent, Inc. |
15,919 | 37,887 | ||||||
| Fox Corp., Class A |
159,003 | 6,318,779 | ||||||
| Fox Corp., Class B |
106,087 | 3,920,975 | ||||||
| *Gaia, Inc. |
6,465 | 62,710 | ||||||
| *Gannett Co., Inc. |
75,253 | 436,467 | ||||||
| *Globalstar, Inc. |
3,052 | 5,036 | ||||||
| *Gray Television, Inc. |
104,999 | 2,461,177 | ||||||
| *Gray Television, Inc. |
2,241 | 50,176 | ||||||
| *Hemisphere Media Group, Inc. |
17,209 | 190,159 | ||||||
| *IAC/InterActiveCorp. |
11,521 | 1,755,455 | ||||||
| *IDT Corp., Class B |
25,205 | 1,219,166 | ||||||
| *iHeartMedia, Inc., Class A |
9,264 | 179,536 | ||||||
| *IMAX Corp. |
52,468 | 989,022 | ||||||
| *Interpublic Group of Cos., Inc. (The) |
296,195 | 10,831,851 | ||||||
| *Iridium Communications, Inc. |
66,309 | 2,688,830 | ||||||
| John Wiley & Sons, Inc. |
2,517 | 136,195 | ||||||
| John Wiley & Sons, Inc., Class A |
44,634 | 2,417,824 | ||||||
| *Lee Enterprises, Inc. |
50 | 1,047 | ||||||
| *Liberty Broadband Corp. |
145 | 23,465 | ||||||
| *Liberty Broadband Corp., Class A |
12,570 | 2,020,879 | ||||||
| *Liberty Broadband Corp., Class C |
105,059 | 17,066,835 | ||||||
| *Liberty Latin America, Ltd., Class C |
125,369 | 1,508,189 | ||||||
| *Liberty Media Corp.-Liberty Braves, Class A |
6,772 | 207,020 | ||||||
Dimensional U.S. Core Equity 2 ETF
SCHEDULE OF INVESTMENTS
October 31, 2021
| Security Description |
Shares | Fair Value | ||||||
| COMMUNICATION SERVICES (Continued) |
| |||||||
| *Liberty Media Corp.-Liberty Braves, Class B |
58 | $ | 2,200 | |||||
| *Liberty Media Corp.-Liberty Braves, Class C |
37,200 | 1,105,584 | ||||||
| *Liberty Media Corp.-Liberty Formula One |
145 | 7,540 | ||||||
| *Liberty Media Corp.-Liberty Formula One, Class A |
12,931 | 674,352 | ||||||
| *Liberty Media Corp.-Liberty Formula One, Class C |
110,889 | 6,187,606 | ||||||
| *Liberty Media Corp.-Liberty Siriusxm, Class B |
481 | 24,411 | ||||||
| *Liberty Media Corp.-Liberty SiriusXM, Class A |
47,725 | 2,375,750 | ||||||
| *Liberty Media Corp.-Liberty SiriusXM, Class C |
111,396 | 5,494,051 | ||||||
| *Liberty TripAdvisor Holdings, Inc., Class A |
56,588 | 174,857 | ||||||
| *Lions Gate Entertainment Corp., Class A |
52,664 | 681,999 | ||||||
| *Lions Gate Entertainment Corp., Class B |
70,026 | 792,694 | ||||||
| *Live Nation Entertainment, Inc. |
94,990 | 9,608,238 | ||||||
| *Loral Space & Communications, Inc. |
13,810 | 688,014 | ||||||
| #*Lumen Technologies, Inc. |
527,227 | 6,252,912 | ||||||
| #*Madison Square Garden Entertainment Corp. |
22,107 | 1,557,880 | ||||||
| #*Magnite, Inc. |
69,808 | 1,886,910 | ||||||
| #*Marcus Corp. (The) |
12,447 | 231,141 | ||||||
| *Match Group, Inc. |
74,229 | 11,192,249 | ||||||
| *Mediaco Holding, Inc. |
312 | 2,615 | ||||||
| *Meredith Corp. |
37,978 | 2,211,839 | ||||||
| *National CineMedia, Inc. |
46,124 | 146,674 | ||||||
| *Netflix, Inc. |
48,534 | 33,503,506 | ||||||
| New York Times Co. (The), Class A |
135,051 | 7,372,434 | ||||||
| News Corp., Class A |
247,535 | 5,668,551 | ||||||
| News Corp., Class B |
113,813 | 2,567,621 | ||||||
| Nexstar Media Group, Inc., Class A |
42,208 | 6,328,245 | ||||||
| Omnicom Group, Inc. |
142,310 | 9,688,465 | ||||||
| *Pinterest, Inc., Class A |
2,665 | 118,966 | ||||||
| *QuinStreet, Inc. |
42,903 | 600,642 | ||||||
| *Reading International, Inc. |
12,881 | 61,700 | ||||||
| *Roku, Inc. |
1,004 | 306,120 | ||||||
| Saga Communications, Inc. |
1,505 | 33,351 | ||||||
| Scholastic Corp. |
31,256 | 1,131,155 | ||||||
| #*Sciplay Corp., Class A |
10,576 | 213,741 | ||||||
| Shenandoah Telecommunications Co. |
82,626 | 2,283,783 | ||||||
| #Sirius XM Holdings, Inc. |
224,186 | 1,365,293 | ||||||
| *Snap, Inc., Class A |
82,438 | 4,334,590 | ||||||
| Spok Holdings, Inc. |
19,425 | 199,883 | ||||||
| *Spotify Technology SA |
5,153 | 1,491,278 | ||||||
| *Take-Two Interactive Software, Inc. |
44,457 | 8,046,717 | ||||||
| *TechTarget, Inc. |
23,708 | 2,235,901 | ||||||
| TEGNA, Inc. |
281,829 | 5,540,758 | ||||||
| Telephone and Data Systems, Inc. |
115,982 | 2,173,503 | ||||||
| *Thryv Holdings, Inc. |
1,279 | 40,506 | ||||||
| *T-Mobile US, Inc. |
159,918 | 18,395,368 | ||||||
| *Townsquare Media, Inc., Class A |
6,660 | 88,711 | ||||||
| *Travelzoo |
6,559 | 67,295 | ||||||
| *TripAdvisor, Inc. |
59,569 | 1,963,990 | ||||||
| *TrueCar, Inc. |
49,477 | 207,309 | ||||||
| *Twitter, Inc. |
139,931 | 7,491,906 | ||||||
| *United States Cellular Corp. |
22,896 | 699,931 | ||||||
| Verizon Communications, Inc. |
1,494,331 | 79,184,600 | ||||||
| ViacomCBS, Inc., Class A |
5,950 | 231,633 | ||||||
| ViacomCBS, Inc., Class B |
206,503 | 7,479,539 | ||||||
| *Vimeo, Inc. |
18,957 | 639,420 | ||||||
| *Walt Disney Co. (The) |
287,831 | 48,663,587 | ||||||
| *Warner Music Group Corp., Class A |
2,249 | 111,303 | ||||||
Dimensional U.S. Core Equity 2 ETF
SCHEDULE OF INVESTMENTS
October 31, 2021
| Security Description |
Shares | Fair Value | ||||||
| COMMUNICATION SERVICES (Continued) |
| |||||||
| *WideOpenWest, Inc. |
2,854 | $ | 54,369 | |||||
| World Wrestling Entertainment, Inc., Class A |
33,937 | 2,073,211 | ||||||
| *Yelp, Inc. |
33,605 | 1,298,161 | ||||||
| *Zedge, Inc., Class B |
1,151 | 13,271 | ||||||
| *Zillow Group, Inc., Class A |
33,266 | 3,516,881 | ||||||
| #*Zillow Group, Inc., Class C |
70,546 | 7,310,682 | ||||||
| *ZipRecruiter, Inc. |
75 | 2,083 | ||||||
| *Zynga, Inc., Class A |
743,062 | 5,483,798 | ||||||
|
|
|
|||||||
| TOTAL COMMUNICATION SERVICES |
1,016,800,137 | |||||||
|
|
|
|||||||
| CONSUMER DISCRETIONARY (13.0%) |
||||||||
|
#*1-800-Flowers.com, Inc., Class A |
40,428 | 1,298,547 | ||||||
| #*2U, Inc. |
23,903 | 706,095 | ||||||
| Aaron’s Co., Inc. (The) |
36,499 | 853,712 | ||||||
| *Abercrombie & Fitch Co. |
72,838 | 2,880,015 | ||||||
| *Acushnet Holdings Corp. |
70,854 | 3,609,303 | ||||||
| *Adient PLC |
90,846 | 3,781,011 | ||||||
| *Adtalem Global Education, Inc. |
59,724 | 2,205,607 | ||||||
| Advance Auto Parts, Inc. |
28,298 | 6,381,765 | ||||||
| *Amazon.com, Inc. |
110,142 | 371,446,185 | ||||||
| AMCON Distributing Co. |
116 | 15,394 | ||||||
| *American Axle & Manufacturing Holdings, Inc. |
104,453 | 948,433 | ||||||
| #American Eagle Outfitters, Inc. |
204,578 | 4,856,682 | ||||||
| *American Outdoor Brands, Inc. |
15,450 | 351,951 | ||||||
| *American Public Education, Inc. |
17,018 | 425,280 | ||||||
| *America’s Car-Mart, Inc. |
9,376 | 1,120,338 | ||||||
| *Aptiv PLC |
143,624 | 24,831,153 | ||||||
| Aramark |
184,478 | 6,729,757 | ||||||
| *Ark Restaurants Corp. |
2,015 | 32,240 | ||||||
| *Arko Corp. |
3,666 | 35,157 | ||||||
| *Asbury Automotive Group, Inc. |
23,474 | 4,594,097 | ||||||
| *Autoliv, Inc. |
78,038 | 7,557,980 | ||||||
| #*AutoNation, Inc. |
100,994 | 12,232,393 | ||||||
| *AutoZone, Inc. |
4,723 | 8,429,799 | ||||||
| *Bally’s Corp. |
7,120 | 326,167 | ||||||
| *Barnes & Noble Education, Inc. |
36,311 | 376,908 | ||||||
| *Bassett Furniture Industries, Inc. |
6,115 | 103,282 | ||||||
| *Bath & Body Works, Inc. |
43,142 | 2,980,681 | ||||||
| *Bbq Holdings, Inc. |
5,581 | 73,669 | ||||||
| *Beazer Homes USA, Inc. |
35,211 | 637,671 | ||||||
| #*Bed Bath & Beyond, Inc., Class B |
142,760 | 2,004,350 | ||||||
| #Best Buy Co., Inc. |
263,641 | 32,227,476 | ||||||
| #Big 5 Sporting Goods Corp. |
9,804 | 237,061 | ||||||
| #Big Lots, Inc., Class B |
47,979 | 2,123,071 | ||||||
| *Biglari Holdings, Inc. |
117 | 97,052 | ||||||
| *Biglari Holdings, Inc., Class B |
1,644 | 273,282 | ||||||
| *BJ’s Restaurants, Inc. |
23,536 | 784,220 | ||||||
| *Bloomin’ Brands, Inc. |
101,006 | 2,183,750 | ||||||
| *Bluegreen Vacations Holding Corp. |
5,541 | 141,905 | ||||||
| *Booking Holdings, Inc. |
10,304 | 24,943,717 | ||||||
| *Boot Barn Holdings, Inc. |
33,430 | 3,493,101 | ||||||
| *BorgWarner, Inc., Class A |
180,661 | 8,142,391 | ||||||
| *Boyd Gaming Corp. |
27,325 | 1,742,789 | ||||||
| #*Bright Horizons Family Solutions, Inc. |
35,811 | 5,944,626 | ||||||
| #*Brinker International, Inc. |
27,220 | 1,142,151 | ||||||
| *Brunswick Corp. |
91,808 | 8,546,407 | ||||||
Dimensional U.S. Core Equity 2 ETF
SCHEDULE OF INVESTMENTS
October 31, 2021
| Security Description |
Shares | Fair Value | ||||||
| CONSUMER DISCRETIONARY (Continued) |
| |||||||
| Buckle, Inc. (The) |
55,891 | $ | 2,326,183 | |||||
| *Build-A-Bear Workshop, Inc. |
11,684 | 183,205 | ||||||
| *Burlington Stores, Inc. |
28,381 | 7,841,386 | ||||||
| *Caesars Entertainment, Inc. |
9,934 | 1,087,376 | ||||||
| Caleres, Inc. |
35,648 | 822,043 | ||||||
| *Callaway Golf Co. |
109,703 | 2,967,466 | ||||||
| #Camping World Holdings, Inc., Class A |
80 | 2,980 | ||||||
| *Canterbury Park Holding Corp. |
200 | 3,160 | ||||||
| *Capri Holdings, Ltd. |
137,066 | 7,297,394 | ||||||
| *CarMax, Inc. |
91,678 | 12,552,552 | ||||||
| #*Carnival Corp. |
171,508 | 3,800,617 | ||||||
| *CarParts.com, Inc. |
11,700 | 178,191 | ||||||
| *Carriage Services, Inc. |
20,348 | 1,046,905 | ||||||
| Carrols Restaurant Group, Inc. |
26,273 | 96,422 | ||||||
| *Carter’s, Inc. |
39,475 | 3,889,077 | ||||||
| *Carvana Co. |
3,636 | 1,102,362 | ||||||
| *Cato Corp. (The), Class A |
18,015 | 317,604 | ||||||
| *Cavco Industries, Inc. |
8,609 | 2,069,431 | ||||||
| *Century Communities, Inc. |
35,404 | 2,374,192 | ||||||
| *Cheesecake Factory, Inc. (The) |
53,955 | 2,192,731 | ||||||
| *Chegg, Inc. |
23,352 | 1,388,043 | ||||||
| #*Chewy, Inc., Class A |
1,277 | 96,797 | ||||||
| #*Chico’s FAS, Inc. |
39,479 | 215,555 | ||||||
| #*Children’s Place, Inc. (The) |
17,810 | 1,476,271 | ||||||
| *Chipotle Mexican Grill, Inc. |
7,794 | 13,865,760 | ||||||
| Choice Hotels International, Inc. |
26,042 | 3,662,026 | ||||||
| *Churchill Downs, Inc. |
17,203 | 3,956,690 | ||||||
| *Chuy’s Holdings, Inc. |
19,205 | 560,018 | ||||||
| *Citi Trends, Inc. |
13,513 | 1,045,366 | ||||||
| Clarus Corp. |
29,630 | 817,195 | ||||||
| *Columbia Sportswear Co. |
53,515 | 5,556,998 | ||||||
| *Conn’s, Inc. |
27,391 | 609,998 | ||||||
| *Container Store Group, Inc. (The) |
47,455 | 524,852 | ||||||
| *Cooper-Standard Holdings, Inc. |
8,705 | 225,808 | ||||||
| Cracker Barrel Old Country Store, Inc. |
27,031 | 3,599,718 | ||||||
| *Crocs, Inc. |
64,082 | 10,346,039 | ||||||
| Culp, Inc. |
8,793 | 116,331 | ||||||
| *Dana, Inc. |
162,169 | 3,598,530 | ||||||
| #Darden Restaurants, Inc. |
77,646 | 11,191,894 | ||||||
| *Dave & Buster’s Entertainment, Inc. |
34,858 | 1,294,278 | ||||||
| *Deckers Outdoor Corp. |
33,936 | 13,415,240 | ||||||
| *Del Taco Restaurants, Inc. |
37,268 | 310,815 | ||||||
| *Delta Apparel, Inc. |
6,871 | 184,486 | ||||||
| *Denny’s Corp. |
40,942 | 650,978 | ||||||
| #*Designer Brands, Inc., Class A |
55,033 | 744,596 | ||||||
| #Dick’s Sporting Goods, Inc. |
75,371 | 9,361,832 | ||||||
| #*Dillard’s, Inc., Class A |
40,084 | 9,265,016 | ||||||
| *Dine Brands Global, Inc. |
1,413 | 119,413 | ||||||
| Dollar General Corp. |
71,290 | 15,792,161 | ||||||
| *Dollar Tree, Inc. |
123,603 | 13,319,459 | ||||||
| Domino’s Pizza, Inc. |
19,944 | 9,752,018 | ||||||
| *Dorman Products, Inc. |
30,708 | 3,205,301 | ||||||
| DR Horton, Inc. |
201,914 | 18,024,863 | ||||||
| *Duluth Holdings, Inc., Class B |
5,714 | 81,882 | ||||||
| #eBay, Inc. |
250,950 | 19,252,884 | ||||||
| *Educational Development Corp. |
2,000 | 19,540 | ||||||
| *El Pollo Loco Holdings, Inc. |
39,367 | 578,695 | ||||||
Dimensional U.S. Core Equity 2 ETF
SCHEDULE OF INVESTMENTS
October 31, 2021
| Security Description |
Shares | Fair Value | ||||||
| CONSUMER DISCRETIONARY (Continued) |
| |||||||
| *»ESC Diamond Resorts, Inc. |
43,101 | $ | — | |||||
| *Escalade, Inc. |
11,525 | 215,633 | ||||||
| Ethan Allen Interiors, Inc. |
23,646 | 548,824 | ||||||
| *Etsy, Inc. |
35,300 | 8,849,357 | ||||||
| *Everi Holdings, Inc. |
19,281 | 462,744 | ||||||
| *Expedia Group, Inc. |
42,194 | 6,937,116 | ||||||
| *Fiesta Restaurant Group, Inc. |
24,246 | 255,553 | ||||||
| #*Fisker, Inc. |
842 | 13,514 | ||||||
| *Five Below, Inc. |
39,269 | 7,747,774 | ||||||
| Flexsteel Industries, Inc. |
5,929 | 166,012 | ||||||
| *Floor & Decor Holdings, Inc., Class A |
26,513 | 3,603,647 | ||||||
| *Foot Locker, Inc. |
105,181 | 5,013,978 | ||||||
| *Ford Motor Co. |
1,714,853 | 29,289,689 | ||||||
| *Fossil Group, Inc. |
32,824 | 387,980 | ||||||
| *Fox Factory Holding Corp. |
47,688 | 7,675,384 | ||||||
| Franchise Group, Inc. |
3,199 | 117,723 | ||||||
| *frontdoor, Inc. |
51,201 | 1,908,773 | ||||||
| *Full House Resorts, Inc. |
6,121 | 60,904 | ||||||
| *Funko, Inc., Class A |
26,688 | 437,416 | ||||||
| *Gap, Inc. (The) |
270,371 | 6,134,718 | ||||||
| Garmin, Ltd. |
63,196 | 9,074,946 | ||||||
| *General Motors Co. |
540,280 | 29,407,440 | ||||||
| *Genesco, Inc. |
14,755 | 894,005 | ||||||
| Gentex Corp. |
322,905 | 11,427,608 | ||||||
| *Gentherm, Inc. |
39,268 | 2,891,303 | ||||||
| *Genuine Parts Co. |
75,934 | 9,955,707 | ||||||
| *G-III Apparel Group, Ltd. |
48,044 | 1,376,941 | ||||||
| *Goodyear Tire & Rubber Co. (The) |
175,699 | 3,359,365 | ||||||
| *GoPro, Inc., Class A |
34,392 | 296,115 | ||||||
| Graham Holdings Co., Class B |
4,700 | 2,753,495 | ||||||
| *Grand Canyon Education, Inc. |
49,481 | 3,943,636 | ||||||
| *Green Brick Partners, Inc. |
18,525 | 482,576 | ||||||
| *Group 1 Automotive, Inc. |
21,606 | 3,884,759 | ||||||
| Guess?, Inc. |
84,628 | 1,752,646 | ||||||
| *H&R Block, Inc. |
94,782 | 2,186,621 | ||||||
| Hamilton Beach Brands Holding Co., Class A |
12,308 | 184,620 | ||||||
| *Hanesbrands, Inc. |
294,548 | 5,019,098 | ||||||
| Harley-Davidson, Inc. |
159,693 | 5,827,198 | ||||||
| Hasbro, Inc. |
62,265 | 5,962,496 | ||||||
| *Haverty Furniture Cos., Inc. |
717 | 20,277 | ||||||
| #*Haverty Furniture Cos., Inc. |
19,634 | 563,496 | ||||||
| *Helen of Troy, Ltd. |
30,953 | 6,962,877 | ||||||
| Hibbett, Inc. |
21,292 | 1,648,852 | ||||||
| *Hilton Grand Vacations, Inc. |
72,664 | 3,653,546 | ||||||
| *Hilton Worldwide Holdings, Inc. |
79,083 | 11,383,998 | ||||||
| Home Depot, Inc. (The) |
174,264 | 64,780,899 | ||||||
| Hooker Furnishings Corp. |
13,297 | 335,217 | ||||||
| *Horizon Global Corp. |
8,128 | 60,310 | ||||||
| *Houghton Mifflin Harcourt Co. |
120,417 | 1,708,717 | ||||||
| #*Hyatt Hotels Corp., Class A |
26,807 | 2,283,956 | ||||||
| Installed Building Products, Inc. |
27,223 | 3,458,682 | ||||||
| *International Game Technology PLC |
58,091 | 1,713,104 | ||||||
| #*iRobot Corp. |
23,796 | 1,985,062 | ||||||
| Jack in the Box, Inc. |
24,784 | 2,452,377 | ||||||
| Johnson Outdoors, Inc., Class A |
9,035 | 959,336 | ||||||
| #*Just Eat Takeaway.com NV, ADR |
157,641 | 2,252,690 | ||||||
Dimensional U.S. Core Equity 2 ETF
SCHEDULE OF INVESTMENTS
October 31, 2021
| Security Description |
Shares | Fair Value | ||||||
| CONSUMER DISCRETIONARY (Continued) |
| |||||||
| KB Home |
49,212 | $ | 1,975,862 | |||||
| *Kohl’s Corp. |
155,076 | 7,525,838 | ||||||
| Kontoor Brands, Inc. |
24,829 | 1,315,937 | ||||||
| *Lakeland Industries, Inc. |
3,363 | 70,320 | ||||||
| *Lands’ End, Inc. |
32,511 | 854,389 | ||||||
| *Las Vegas Sands Corp. |
73,513 | 2,853,040 | ||||||
| *Laureate Education, Inc., Class A |
23,760 | 411,523 | ||||||
| *La-Z-Boy, Inc. |
59,949 | 1,992,705 | ||||||
| LCI Industries |
29,123 | 4,066,736 | ||||||
| *Lear Corp. |
58,335 | 10,024,870 | ||||||
| *Leggett & Platt, Inc. |
105,940 | 4,963,289 | ||||||
| Lennar Corp., Class A |
135,423 | 13,532,820 | ||||||
| Lennar Corp., Class B |
14,378 | 1,180,146 | ||||||
| Levi Strauss & Co., Class A |
31,075 | 813,543 | ||||||
| *LGI Homes, Inc. |
27,435 | 4,096,046 | ||||||
| Lifetime Brands, Inc. |
16,644 | 282,282 | ||||||
| *Lindblad Expeditions Holdings, Inc. |
4,692 | 70,145 | ||||||
| *Liquidity Services, Inc., Class A |
28,294 | 624,732 | ||||||
| *Lithia Motors, Inc., Class A |
27,001 | 8,619,259 | ||||||
| *LKQ Corp. |
170,395 | 9,385,357 | ||||||
| *Lovesac Co. (The) |
1,704 | 132,929 | ||||||
| *Lowe’s Cos., Inc. |
222,608 | 52,050,203 | ||||||
| *Lululemon Athletica, Inc. |
34,677 | 16,159,829 | ||||||
| *Lumber Liquidators Holdings, Inc. |
26,295 | 475,414 | ||||||
| *M/I Homes, Inc. |
25,749 | 1,474,388 | ||||||
| #Macy’s, Inc. |
282,850 | 7,487,039 | ||||||
| *Malibu Boats, Inc., Class A |
24,724 | 1,745,762 | ||||||
| *Marine Products Corp. |
10,739 | 136,063 | ||||||
| #*MarineMax, Inc. |
30,114 | 1,559,604 | ||||||
| *Marriott International, Inc., Class A |
88,342 | 14,136,487 | ||||||
| Marriott Vacations Worldwide Corp. |
42,047 | 6,610,629 | ||||||
| *Mastercraft Boat Holdings, Inc. |
23,269 | 623,144 | ||||||
| *Mattel, Inc. |
170,908 | 3,727,503 | ||||||
| McDonald’s Corp. |
103,634 | 25,447,329 | ||||||
| *MDC Holdings, Inc. |
76,744 | 3,758,921 | ||||||
| *Meritage Homes Corp. |
41,798 | 4,543,861 | ||||||
| *MGM Resorts International |
191,357 | 9,024,396 | ||||||
| *Modine Manufacturing Co. |
48,205 | 530,255 | ||||||
| *Mohawk Industries, Inc. |
38,470 | 6,817,269 | ||||||
| *Monarch Casino & Resort, Inc. |
1,457 | 105,225 | ||||||
| Monro, Inc. |
32,253 | 1,991,945 | ||||||
| *Motorcar Parts of America, Inc. |
21,278 | 402,580 | ||||||
| Movado Group, Inc. |
15,583 | 518,914 | ||||||
| *Murphy USA, Inc. |
51,503 | 8,392,414 | ||||||
| *Nathan’s Famous, Inc. |
4,373 | 273,313 | ||||||
| *National Vision Holdings, Inc. |
77,096 | 4,752,197 | ||||||
| *Nautilus, Inc. |
30,375 | 310,736 | ||||||
| *Newell Brands, Inc. |
297,599 | 6,812,041 | ||||||
| NIKE, Inc., Class B |
239,422 | 40,052,906 | ||||||
| Nobility Homes, Inc. |
1,152 | 35,712 | ||||||
| #*Noodles & Co. |
1,930 | 23,450 | ||||||
| #*Nordstrom, Inc. |
10,796 | 310,169 | ||||||
| #*Norwegian Cruise Line Holdings, Ltd. |
110,444 | 2,840,620 | ||||||
| *NVR, Inc. |
2,379 | 11,644,729 | ||||||
| *ODP Corp. (The) |
37,834 | 1,638,212 | ||||||
| #*Ollie’s Bargain Outlet Holdings, Inc. |
34,873 | 2,359,507 | ||||||
| *OneSpaWorld Holdings, Ltd. |
11,212 | 121,090 | ||||||
Dimensional U.S. Core Equity 2 ETF
SCHEDULE OF INVESTMENTS
October 31, 2021
| Security Description |
Shares | Fair Value | ||||||
| CONSUMER DISCRETIONARY (Continued) |
| |||||||
| *O’Reilly Automotive, Inc. |
28,526 | $ | 17,752,300 | |||||
| Oxford Industries, Inc. |
21,499 | 1,993,387 | ||||||
| *Papa John’s International, Inc. |
28,424 | 3,526,850 | ||||||
| #*Party City Holdco, Inc. |
43 | 313 | ||||||
| *Patrick Industries, Inc. |
39,189 | 3,053,215 | ||||||
| *Peloton Interactive, Inc., Class A |
3,042 | 278,160 | ||||||
| #*Penn National Gaming, Inc. |
61,157 | 4,378,841 | ||||||
| Penske Automotive Group, Inc. |
94,910 | 10,065,206 | ||||||
| *Perdoceo Education Corp. |
95,503 | 1,014,242 | ||||||
| #*PetMed Express, Inc. |
22,786 | 647,806 | ||||||
| *Planet Fitness, Inc., Class A |
65,075 | 5,176,716 | ||||||
| *Playa Hotels & Resorts NV |
81,704 | 695,301 | ||||||
| *PlayAGS, Inc. |
9,406 | 82,961 | ||||||
| *Polaris, Inc. |
50,799 | 5,839,345 | ||||||
| Pool Corp. |
27,455 | 14,143,718 | ||||||
| *Potbelly Corp. |
22,742 | 136,907 | ||||||
| PulteGroup, Inc. |
230,063 | 11,061,429 | ||||||
| #*Purple Innovation, Inc. |
17,777 | 343,096 | ||||||
| *PVH Corp. |
52,793 | 5,771,859 | ||||||
| *QuantumScape Corp. |
1,572 | 45,494 | ||||||
| *Quotient Technology, Inc. |
48,649 | 313,300 | ||||||
| Qurate Retail, Inc., Class A |
308,087 | 3,216,428 | ||||||
| Ralph Lauren Corp. |
23,371 | 2,972,090 | ||||||
| RCI Hospitality Holdings, Inc. |
12,873 | 872,789 | ||||||
| *RealReal, Inc. (The) |
236 | 3,075 | ||||||
| #*Red Robin Gourmet Burgers, Inc. |
9,412 | 187,016 | ||||||
| *Red Rock Resorts, Inc., Class A |
57,795 | 3,144,626 | ||||||
| Rent-A-Center, Inc. |
62,327 | 3,319,536 | ||||||
| *Revolve Group, Inc. |
13,373 | 1,003,510 | ||||||
| *RH |
13,538 | 8,930,071 | ||||||
| *Rocky Brands, Inc. |
6,987 | 381,141 | ||||||
| *Ross Stores, Inc. |
110,056 | 12,458,339 | ||||||
| *Royal Caribbean Cruises, Ltd. |
98,305 | 8,299,891 | ||||||
| *Ruth’s Hospitality Group, Inc. |
33,162 | 641,353 | ||||||
| *Sally Beauty Holdings, Inc. |
70,009 | 1,068,337 | ||||||
| *Scientific Games Corp. |
41,282 | 3,304,624 | ||||||
| *SeaWorld Entertainment, Inc. |
90,958 | 5,775,833 | ||||||
| *Service Corp. |
153,826 | 10,535,543 | ||||||
| *Shake Shack, Inc., Class A |
18,399 | 1,272,659 | ||||||
| Shoe Carnival, Inc. |
32,624 | 1,104,975 | ||||||
| *Shutterstock, Inc. |
25,465 | 3,085,085 | ||||||
| Signet Jewelers, Ltd. |
59,157 | 5,275,621 | ||||||
| *Skechers USA, Inc., Class A |
110,545 | 5,108,284 | ||||||
| *Skyline Champion Corp. |
55,096 | 3,488,679 | ||||||
| *Sleep Number Corp. |
36,881 | 3,258,068 | ||||||
| Smith & Wesson Brands, Inc. |
63,486 | 1,364,949 | ||||||
| Sonic Automotive, Inc., Class A |
35,204 | 1,740,134 | ||||||
| *Sonos, Inc. |
54,317 | 1,771,821 | ||||||
| *Sportsman’s Warehouse Holdings, Inc. |
50,943 | 879,276 | ||||||
| *Standard Motor Products, Inc. |
22,606 | 1,082,827 | ||||||
| Starbucks Corp. |
162,534 | 17,239,981 | ||||||
| *Steven Madden, Ltd. |
90,854 | 4,097,515 | ||||||
| *Stitch Fix, Inc., Class A |
3,519 | 121,757 | ||||||
| *Stoneridge, Inc. |
49,465 | 938,846 | ||||||
| Strategic Education, Inc. |
23,103 | 1,575,856 | ||||||
| *Strattec Security Corp. |
3,604 | 124,951 | ||||||
Dimensional U.S. Core Equity 2 ETF
SCHEDULE OF INVESTMENTS
October 31, 2021
| Security Description |
Shares | Fair Value | ||||||
| CONSUMER DISCRETIONARY (Continued) |
| |||||||
| #*Stride, Inc. |
49,969 | $ | 1,773,899 | |||||
| *Superior Group of Cos., Inc. |
13,632 | 354,296 | ||||||
| *Superior Industries International, Inc. |
9,663 | 56,335 | ||||||
| *Tapestry, Inc. |
160,283 | 6,247,831 | ||||||
| Target Corp. |
212,860 | 55,262,713 | ||||||
| *Taylor Morrison Home Corp. |
145,216 | 4,433,444 | ||||||
| Tempur Sealy International, Inc. |
201,931 | 8,979,872 | ||||||
| *Tenneco, Inc., Class A |
26,863 | 356,472 | ||||||
| *Terminix Global Holdings, Inc. |
105,017 | 4,251,088 | ||||||
| *Tesla, Inc. |
36,850 | 41,050,900 | ||||||
| #*Texas Roadhouse, Inc. |
65,062 | 5,778,156 | ||||||
| Thor Industries, Inc. |
39,198 | 3,996,628 | ||||||
| *Tilly’s, Inc., Class A |
20,768 | 288,260 | ||||||
| *TJX Cos, Inc. (The) |
314,628 | 20,604,988 | ||||||
| Toll Brothers, Inc. |
120,744 | 7,265,166 | ||||||
| *TopBuild Corp. |
40,162 | 10,320,429 | ||||||
| *Tractor Supply Co. |
68,898 | 14,962,579 | ||||||
| *Travel + Leisure Co. |
50,834 | 2,762,320 | ||||||
| #*TravelCenters of America, Inc. |
5,428 | 292,623 | ||||||
| *Tri Pointe Homes, Inc. |
154,532 | 3,738,129 | ||||||
| #*Tupperware Brands Corp. |
2,435 | 54,154 | ||||||
| *Ulta Beauty, Inc. |
34,118 | 12,533,588 | ||||||
| *Under Armour, Inc., Class A |
74,788 | 1,642,344 | ||||||
| *Under Armour, Inc., Class C |
104,748 | 1,977,642 | ||||||
| *Unifi, Inc. |
17,345 | 416,627 | ||||||
| *Unique Fabricating, Inc. |
1,260 | 3,717 | ||||||
| *Universal Electronics, Inc. |
13,600 | 560,048 | ||||||
| *Universal Technical Institute, Inc. |
16,819 | 118,406 | ||||||
| *Urban Outfitters, Inc. |
113,073 | 3,610,421 | ||||||
| Vail Resorts, Inc. |
27,477 | 9,471,597 | ||||||
| #*Veoneer, Inc. |
39,013 | 1,373,258 | ||||||
| *Vera Bradley, Inc. |
31,254 | 306,602 | ||||||
| *VF Corp. |
112,714 | 8,214,596 | ||||||
| *Victoria’s Secret & Co. |
14,380 | 725,759 | ||||||
| *Vince Holding Corp. |
1,616 | 15,594 | ||||||
| *Vista Outdoor, Inc. |
61,407 | 2,569,269 | ||||||
| *Visteon Corp. |
31,972 | 3,618,591 | ||||||
| *VOXX International Corp. |
14,866 | 168,134 | ||||||
| #*Wayfair, Inc., Class A |
15,729 | 3,918,094 | ||||||
| Wendy’s Co. (The) |
277,402 | 6,186,065 | ||||||
| *Weyco Group, Inc. |
8,909 | 203,303 | ||||||
| *Whirlpool Corp. |
51,604 | 10,879,671 | ||||||
| Williams-Sonoma, Inc. |
89,433 | 16,610,391 | ||||||
| *Wingstop, Inc. |
22,230 | 3,834,008 | ||||||
| *Winmark Corp. |
2,730 | 635,599 | ||||||
| Winnebago Industries, Inc. |
39,141 | 2,649,454 | ||||||
| *Wolverine World Wide, Inc. |
93,701 | 3,108,062 | ||||||
| *WW International, Inc. |
22,064 | 383,031 | ||||||
| Wyndham Hotels & Resorts, Inc. |
75,521 | 6,379,259 | ||||||
| *Wynn Resorts, Ltd. |
46,741 | 4,197,342 | ||||||
| *XPEL, Inc. |
879 | 66,716 | ||||||
| #*YETI Holdings, Inc. |
31,394 | 3,086,972 | ||||||
| *Yum! Brands, Inc. |
38,370 | 4,793,948 | ||||||
| *Zovio, Inc. |
17,711 | 30,463 | ||||||
| *Zumiez, Inc. |
31,026 | 1,262,758 | ||||||
|
|
|
|||||||
| TOTAL CONSUMER DISCRETIONARY |
1,908,991,121 | |||||||
|
|
|
|||||||
Dimensional U.S. Core Equity 2 ETF
SCHEDULE OF INVESTMENTS
October 31, 2021
| Security Description |
Shares | Fair Value | ||||||
| CONSUMER STAPLES (5.0%) |
| |||||||
| Albertsons Cos., Inc., Class A |
141 | $ | 4,364 | |||||
| Alico, Inc. |
7,482 | 266,359 | ||||||
| Altria Group, Inc. |
472,316 | 20,833,859 | ||||||
| Andersons, Inc. (The), Class A |
31,147 | 1,060,867 | ||||||
| *Archer-Daniels-Midland Co. |
222,248 | 14,277,211 | ||||||
| #B&G Foods, Inc. |
72,922 | 2,146,824 | ||||||
| *Bellring Brands, Inc., Class A |
278 | 7,456 | ||||||
| #*Beyond Meat, Inc. |
309 | 30,585 | ||||||
| *BJ’s Wholesale Club Holdings, Inc. |
76,612 | 4,477,205 | ||||||
| *Boston Beer Co., Inc. (The), Class A |
8,899 | 4,382,579 | ||||||
| *Bridgford Foods Corp. |
2,509 | 29,355 | ||||||
| *Brown-Forman Corp., Class A |
13,786 | 882,718 | ||||||
| *Brown-Forman Corp., Class B |
113,984 | 7,738,374 | ||||||
| Bunge, Ltd. |
104,947 | 9,722,290 | ||||||
| *Calavo Growers, Inc. |
15,709 | 631,502 | ||||||
| Cal-Maine Foods, Inc. |
43,247 | 1,559,487 | ||||||
| Campbell Soup Co. |
138,567 | 5,535,752 | ||||||
| Casey’s General Stores, Inc. |
48,303 | 9,251,957 | ||||||
| *Celsius Holdings, Inc. |
7,829 | 755,655 | ||||||
| *Central Garden & Pet Co. |
13,355 | 688,851 | ||||||
| *Central Garden & Pet Co., Class A |
50,312 | 2,324,414 | ||||||
| *Chefs’ Warehouse, Inc. (The) |
28,528 | 994,771 | ||||||
| Church & Dwight Co., Inc. |
77,599 | 6,779,049 | ||||||
| Clorox Co. (The) |
49,764 | 8,112,030 | ||||||
| *Coca-Cola Co. (The) |
943,734 | 53,198,286 | ||||||
| Coca-Cola Consolidated, Inc. |
9,927 | 3,984,698 | ||||||
| Colgate-Palmolive Co. |
106,116 | 8,084,978 | ||||||
| #Conagra Brands, Inc. |
195,015 | 6,279,483 | ||||||
| Constellation Brands, Inc., Class A |
48,933 | 10,609,164 | ||||||
| Costco Wholesale Corp. |
85,007 | 41,784,341 | ||||||
| *Coty, Inc., Class A |
351,538 | 2,981,042 | ||||||
| *Darling Ingredients, Inc. |
166,019 | 14,031,926 | ||||||
| Edgewell Personal Care Co. |
56,494 | 1,976,725 | ||||||
| *elf Beauty, Inc. |
47,303 | 1,528,360 | ||||||
| Energizer Holdings, Inc. |
23,937 | 872,982 | ||||||
| *Estee Lauder Cos, Inc. (The) |
55,105 | 17,872,205 | ||||||
| *Farmer Bros Co. |
9,219 | 69,603 | ||||||
| *Flowers Foods, Inc. |
249,165 | 6,166,834 | ||||||
| Fresh Del Monte Produce, Inc. |
60,784 | 2,035,656 | ||||||
| *Freshpet, Inc. |
5,467 | 852,360 | ||||||
| General Mills, Inc. |
183,107 | 11,316,013 | ||||||
| *Grocery Outlet Holding Corp. |
10,671 | 236,789 | ||||||
| *Hain Celestial Group, Inc. (The) |
106,503 | 4,778,790 | ||||||
| *Herbalife Nutrition, Ltd. |
73,948 | 3,431,187 | ||||||
| Hershey Co. (The) |
51,863 | 9,094,177 | ||||||
| Hormel Foods Corp. |
162,072 | 6,858,887 | ||||||
| #*Hostess Brands, Inc. |
147,158 | 2,782,758 | ||||||
| Ingles Markets, Inc., Class A |
17,329 | 1,198,993 | ||||||
| Ingredion, Inc. |
66,839 | 6,365,078 | ||||||
| *Inter Parfums, Inc. |
30,018 | 2,773,063 | ||||||
| *J & J Snack Foods Corp. |
19,554 | 2,885,193 | ||||||
| #J M Smucker Co. (The) |
51,569 | 6,335,767 | ||||||
| John B Sanfilippo & Son, Inc. |
10,482 | 885,729 | ||||||
| #Kellogg Co. |
145,271 | 8,905,112 | ||||||
| Keurig Dr Pepper, Inc. |
79,976 | 2,886,334 | ||||||
| Kimberly-Clark Corp. |
40,933 | 5,300,414 | ||||||
| *Kraft Heinz Co. (The) |
215,998 | 7,752,168 | ||||||
Dimensional U.S. Core Equity 2 ETF
SCHEDULE OF INVESTMENTS
October 31, 2021
| Security Description |
Shares | Fair Value | ||||||
| CONSUMER STAPLES (Continued) |
| |||||||
| Kroger Co. (The) |
518,467 | $ | 20,749,049 | |||||
| *Lamb Weston Holdings, Inc. |
85,667 | 4,835,902 | ||||||
| *Lancaster Colony Corp. |
21,527 | 3,659,590 | ||||||
| *Landec Corp. |
29,740 | 289,073 | ||||||
| *Lifeway Foods, Inc. |
2,867 | 15,596 | ||||||
| Limoneira Co. |
17,931 | 289,227 | ||||||
| McCormick & Co., Inc. |
112,087 | 8,992,740 | ||||||
| McCormick & Co., Inc. |
3,018 | 245,182 | ||||||
| Medifast, Inc. |
20,774 | 4,077,313 | ||||||
| #MGP Ingredients, Inc. |
19,758 | 1,268,661 | ||||||
| Molson Coors Beverage Co. |
266 | 15,456 | ||||||
| Molson Coors Beverage Co., Class B |
76,757 | 3,384,216 | ||||||
| Mondelez International, Inc., Class A |
225,444 | 13,693,469 | ||||||
| *Monster Beverage Corp. |
102,163 | 8,683,855 | ||||||
| National Beverage Corp. |
52,728 | 2,973,859 | ||||||
| #*Natura & Co. Holding SA, ADR |
12,223 | 168,311 | ||||||
| *Natural Alternatives International, Inc. |
5,470 | 68,922 | ||||||
| Natural Grocers by Vitamin Cottage, Inc. |
18,003 | 219,277 | ||||||
| Nature’s Sunshine Products, Inc. |
13,753 | 217,160 | ||||||
| Nu Skin Enterprises, Inc., Class A |
63,736 | 2,559,000 | ||||||
| *Oil-Dri Corp. of America |
5,619 | 195,654 | ||||||
| PepsiCo., Inc. |
371,657 | 60,059,771 | ||||||
| *Performance Food Group Co. |
75,950 | 3,435,218 | ||||||
| Philip Morris International, Inc. |
128,730 | 12,170,134 | ||||||
| *Pilgrim’s Pride Corp. |
105,236 | 2,963,446 | ||||||
| *Post Holdings, Inc. |
84,919 | 8,617,580 | ||||||
| PriceSmart, Inc. |
30,205 | 2,173,250 | ||||||
| Procter & Gamble Co. (The) |
541,034 | 77,362,452 | ||||||
| Reynolds Consumer Products, Inc. |
5,680 | 153,246 | ||||||
| #*Rite Aid Corp. |
19,784 | 268,865 | ||||||
| Rocky Mountain Chocolate Factory, Inc. |
4,490 | 39,108 | ||||||
| *S&W Seed Co. |
5,318 | 22,814 | ||||||
| Sanderson Farms, Inc. |
26,575 | 5,034,634 | ||||||
| *Seaboard Corp. |
360 | 1,386,007 | ||||||
| *Seneca Foods Corp. |
283 | 14,518 | ||||||
| *Seneca Foods Corp., Class A |
8,682 | 448,252 | ||||||
| *Simply Good Foods Co. (The) |
80,220 | 3,180,723 | ||||||
| *SpartanNash Co. |
36,743 | 850,233 | ||||||
| Spectrum Brands Holdings, Inc. |
52,190 | 4,892,812 | ||||||
| *Sprouts Farmers Market, Inc. |
126,227 | 2,794,666 | ||||||
| *Sysco Corp. |
143,229 | 11,014,310 | ||||||
| #*Tattooed Chef, Inc. |
3,060 | 54,988 | ||||||
| #Tootsie Roll Industries, Inc. |
33,975 | 1,075,309 | ||||||
| *TreeHouse Foods, Inc. |
57,083 | 2,062,980 | ||||||
| Turning Point Brands, Inc. |
10,301 | 393,189 | ||||||
| *Tyson Foods, Inc., Class A |
148,764 | 11,896,657 | ||||||
| #*United Natural Foods, Inc. |
37,188 | 1,613,587 | ||||||
| *United-Guardian, Inc. |
1,431 | 20,048 | ||||||
| *Universal Corp. |
27,678 | 1,300,866 | ||||||
| *US Foods Holding Corp. |
183,946 | 6,377,408 | ||||||
| *USANA Health Sciences, Inc. |
25,258 | 2,451,541 | ||||||
| Vector Group, Ltd. |
101,998 | 1,352,493 | ||||||
| Village Super Market, Inc., Class A |
9,492 | 211,387 | ||||||
| *Walgreens Boots Alliance, Inc. |
288,334 | 13,557,465 | ||||||
| Walmart, Inc. |
380,368 | 56,834,587 | ||||||
| #WD-40 Co. |
13,843 | 3,142,361 | ||||||
| *Weis Markets, Inc. |
33,617 | 1,892,973 | ||||||
|
|
|
|||||||
| TOTAL CONSUMER STAPLES |
736,329,999 | |||||||
|
|
|
|||||||
Dimensional U.S. Core Equity 2 ETF
SCHEDULE OF INVESTMENTS
October 31, 2021
| Security Description |
Shares | Fair Value | ||||||
| ENERGY (2.9%) |
| |||||||
| *Adams Resources & Energy, Inc. |
3,385 | $ | 99,350 | |||||
| Antero Midstream Corp. |
249,665 | 2,656,436 | ||||||
| *Antero Resources Corp. |
161,892 | 3,216,794 | ||||||
| Apa Corp. |
35,907 | 941,122 | ||||||
| #*Arch Resources, Inc. |
15,615 | 1,422,214 | ||||||
| Archrock, Inc. |
144,757 | 1,185,560 | ||||||
| *Ardmore Shipping Corp. |
17,763 | 70,519 | ||||||
| *Aspen Aerogels, Inc. |
14,926 | 812,870 | ||||||
| Baker Hughes Co. |
180,350 | 4,523,178 | ||||||
| Berry Corp. |
43,378 | 416,863 | ||||||
| #Bonanza Creek Energy, Inc. |
24,474 | 1,373,970 | ||||||
| #Brigham Minerals, Inc. |
5,893 | 136,600 | ||||||
| *Bristow Group, Inc. |
6,242 | 215,973 | ||||||
| *Cactus, Inc., Class A |
26,574 | 1,155,969 | ||||||
| *California Resources Corp. |
6,232 | 287,482 | ||||||
| #*Callon Petroleum Co. |
345 | 17,847 | ||||||
| *Centennial Resource Development, Inc., Class A |
46,586 | 335,419 | ||||||
| *ChampionX Corp. |
118,146 | 3,098,970 | ||||||
| *Cheniere Energy, Inc. |
74,946 | 7,749,416 | ||||||
| #*Chesapeake Energy Corp. |
14,154 | 902,176 | ||||||
| *Chevron Corp. |
400,964 | 45,906,368 | ||||||
| #*Clean Energy Fuels Corp. |
173,127 | 1,596,231 | ||||||
| *CNX Resources Corp. |
210,144 | 3,070,204 | ||||||
| *Comstock Resources, Inc. |
23,895 | 235,844 | ||||||
| ConocoPhillips |
529,860 | 39,469,271 | ||||||
| *CONSOL Energy, Inc. |
24,953 | 686,457 | ||||||
| *Contango Oil & Gas Co. |
7,725 | 31,904 | ||||||
| #*Continental Resources, Inc. |
105,366 | 5,142,914 | ||||||
| Core Laboratories NV |
25,157 | 654,334 | ||||||
| *Coterra Energy, Inc. |
626,731 | 13,361,905 | ||||||
| CVR Energy, Inc. |
28,589 | 548,051 | ||||||
| *Dawson Geophysical Co. |
9,220 | 21,390 | ||||||
| *Delek US Holdings, Inc. |
84,155 | 1,636,815 | ||||||
| *Denbury, Inc. |
5,731 | 485,186 | ||||||
| Devon Energy Corp. |
287,742 | 11,532,699 | ||||||
| DHT Holdings, Inc. |
160,498 | 1,044,842 | ||||||
| Diamondback Energy, Inc. |
31,178 | 3,341,970 | ||||||
| *DMC Global, Inc. |
15,191 | 634,680 | ||||||
| Dorian LPG, Ltd. |
31,418 | 380,786 | ||||||
| *Dril-Quip, Inc. |
19,779 | 465,993 | ||||||
| DT Midstream, Inc. |
22,931 | 1,099,771 | ||||||
| *Earthstone Energy, Inc., Class A |
22,715 | 230,557 | ||||||
| EnLink Midstream LLC |
148,091 | 1,162,514 | ||||||
| EOG Resources, Inc. |
153,532 | 14,195,569 | ||||||
| *Epsilon Energy, Ltd. |
1,800 | 9,774 | ||||||
| *EQT Corp. |
130,848 | 2,605,184 | ||||||
| *Equitrans Midstream Corp. |
166,990 | 1,721,667 | ||||||
| Evolution Petroleum Corp. |
28,091 | 166,860 | ||||||
| *Expro Group Holdings NV |
22,725 | 389,734 | ||||||
| *Exterran Corp. |
16,546 | 70,817 | ||||||
| Exxon Mobil Corp. |
725,975 | 46,803,608 | ||||||
| *Forum Energy Technologies, Inc. |
2,883 | 64,896 | ||||||
| *Geospace Technologies Corp. |
6,824 | 64,896 | ||||||
Dimensional U.S. Core Equity 2 ETF
SCHEDULE OF INVESTMENTS
October 31, 2021
| Security Description |
Shares | Fair Value | ||||||
| ENERGY (Continued) |
| |||||||
| *Goodrich Petroleum Corp. |
6,434 | $ | 131,382 | |||||
| *Green Plains, Inc. |
42,299 | 1,605,247 | ||||||
| *Gulf Island Fabrication, Inc. |
8,644 | 34,057 | ||||||
| *Gulfport Energy Operating Corp. |
1,206 | 98,940 | ||||||
| *Halliburton Co. |
312,197 | 7,801,803 | ||||||
| *Helix Energy Solutions Group, Inc. |
78,050 | 295,029 | ||||||
| *Helmerich & Payne, Inc. |
55,775 | 1,731,256 | ||||||
| Hess Corp. |
116,523 | 9,621,304 | ||||||
| HollyFrontier Corp. |
134,714 | 4,553,333 | ||||||
| *Independence Contract Drilling, Inc. |
1,854 | 7,305 | ||||||
| International Seaways, Inc. |
30,986 | 543,804 | ||||||
| Kinder Morgan, Inc. |
452,969 | 7,587,231 | ||||||
| *Kosmos Energy, Ltd. |
34,626 | 124,654 | ||||||
| #*Laredo Petroleum, Inc. |
1,172 | 88,369 | ||||||
| *Liberty Oilfield Services, Inc., Class A |
93,767 | 1,211,470 | ||||||
| Magnolia Oil & Gas Corp., Class A |
61,076 | 1,275,267 | ||||||
| *Marathon Oil Corp. |
498,009 | 8,127,507 | ||||||
| Marathon Petroleum Corp. |
279,034 | 18,396,712 | ||||||
| *Matador Resources Co. |
114,380 | 4,786,803 | ||||||
| #*Meta Materials, Inc. |
7,299 | 34,305 | ||||||
| *Mind Technology, Inc. |
11,658 | 19,819 | ||||||
| *Murphy Oil Corp. |
144,425 | 4,019,348 | ||||||
| *Nabors Industries, Ltd. |
4,457 | 456,842 | ||||||
| *NACCO Industries, Inc., Class A |
7,344 | 227,958 | ||||||
| #*National Energy Services Reunited Corp. |
27,079 | 316,824 | ||||||
| *Natural Gas Services Group, Inc. |
7,035 | 79,988 | ||||||
| #*New Fortress Energy, Inc. |
4,558 | 136,740 | ||||||
| *Newpark Resources, Inc. |
48,469 | 164,795 | ||||||
| *NexTier Oilfield Solutions, Inc. |
69,071 | 308,057 | ||||||
| #Nordic American Tankers, Ltd. |
50,055 | 117,629 | ||||||
| *NOV, Inc. |
203,904 | 2,858,734 | ||||||
| *Oasis Petroleum, Inc. |
241 | 29,065 | ||||||
| *Occidental Petroleum Corp. |
376,345 | 12,618,848 | ||||||
| *Oceaneering International, Inc. |
99,051 | 1,347,094 | ||||||
| *Oil States International, Inc. |
31,448 | 190,575 | ||||||
| #ONEOK, Inc. |
181,791 | 11,565,543 | ||||||
| *Overseas Shipholding Group, Inc., Class A |
57,379 | 114,184 | ||||||
| Ovintiv, Inc. |
12,752 | 478,455 | ||||||
| *Par Pacific Holdings, Inc. |
50,810 | 785,523 | ||||||
| *Patterson-UTI Energy, Inc. |
95,835 | 820,348 | ||||||
| *PBF Energy, Inc., Class A |
68,776 | 1,004,817 | ||||||
| PDC Energy, Inc. |
94,113 | 4,923,051 | ||||||
| *Peabody Energy Corp. |
60,351 | 717,573 | ||||||
| *Phillips 66 |
109,561 | 8,192,972 | ||||||
| *Pioneer Natural Resources Co. |
82,764 | 15,475,213 | ||||||
| *Primeenergy Resources Corp. |
892 | 61,441 | ||||||
| *ProPetro Holding Corp. |
63,484 | 608,811 | ||||||
| *Range Resources Corp. |
189,271 | 4,413,800 | ||||||
| *Ranger Oil Corp. |
14,323 | 473,232 | ||||||
| *Renewable Energy Group, Inc. |
59,942 | 3,836,288 | ||||||
| *REX American Resources Corp. |
6,572 | 578,007 | ||||||
| #*RPC, Inc. |
81,549 | 439,549 | ||||||
| *Schlumberger NV |
275,597 | 8,890,759 | ||||||
| Scorpio Tankers, Inc. |
30,172 | 483,355 | ||||||
| *SEACOR Marine Holdings, Inc. |
12,602 | 56,205 | ||||||
| *Select Energy Services, Inc., Class A |
47,900 | 287,879 | ||||||
Dimensional U.S. Core Equity 2 ETF
SCHEDULE OF INVESTMENTS
October 31, 2021
| Security Description |
Shares | Fair Value | ||||||
| ENERGY (Continued) |
| |||||||
| SFL Corp., Ltd. |
71,547 | $ | 565,937 | |||||
| *SilverBow Resources, Inc. |
5,746 | 158,590 | ||||||
| SM Energy Co. |
17,946 | 615,907 | ||||||
| Solaris Oilfield Infrastructure, Inc., Class A |
27,622 | 209,651 | ||||||
| *Southwestern Energy Co. |
436,827 | 2,131,716 | ||||||
| *Talos Energy, Inc. |
42,934 | 556,854 | ||||||
| Targa Resources Corp. |
142,360 | 7,782,821 | ||||||
| *Technip Energies NV, ADR |
23,088 | 353,708 | ||||||
| TechnipFMC PLC |
198,419 | 1,462,348 | ||||||
| #*Teekay Tankers, Ltd., Class A |
17,542 | 243,483 | ||||||
| #*Tellurian, Inc. |
9,118 | 35,743 | ||||||
| *TETRA Technologies, Inc. |
559 | 1,806 | ||||||
| Texas Pacific Land Corp. |
310 | 394,838 | ||||||
| *Tidewater, Inc. |
28,376 | 344,201 | ||||||
| #*Transocean, Ltd. |
30,280 | 106,888 | ||||||
| *Uranium Energy Corp. |
3,630 | 13,504 | ||||||
| *US Silica Holdings, Inc. |
38,304 | 370,783 | ||||||
| Valero Energy Corp. |
176,307 | 13,633,820 | ||||||
| *W&T Offshore, Inc. |
2,171 | 8,923 | ||||||
| *Weatherford International PLC |
9,168 | 266,422 | ||||||
| *Whiting Petroleum Corp. |
2,376 | 154,749 | ||||||
| *Williams Cos, Inc. (The) |
339,109 | 9,525,572 | ||||||
| World Fuel Services Corp. |
73,380 | 2,240,291 | ||||||
|
|
|
|||||||
| TOTAL ENERGY |
425,786,073 | |||||||
|
|
|
|||||||
| FINANCIALS (15.2%) |
||||||||
| 1st Constitution BanCorp |
7,433 | 176,757 | ||||||
| *1st Source Corp. |
30,702 | 1,482,293 | ||||||
| *ACNB Corp. |
7,164 | 198,801 | ||||||
| *Affiliated Managers Group, Inc. |
22,270 | 3,738,688 | ||||||
| *Affinity Bancshares, Inc. |
840 | 12,180 | ||||||
| *Aflac, Inc. |
194,582 | 10,443,216 | ||||||
| *Alleghany Corp. |
7,688 | 5,007,809 | ||||||
| Allegiance Bancshares, Inc. |
21,261 | 832,793 | ||||||
| *Allstate Corp. (The) |
147,922 | 18,293,514 | ||||||
| Ally Financial, Inc. |
296,780 | 14,168,277 | ||||||
| A-Mark Precious Metals, Inc. |
7,393 | 554,401 | ||||||
| *AMBAC Financial Group, Inc. |
25,077 | 424,052 | ||||||
| *American Equity Investment Life Holding Co. |
111,375 | 3,549,521 | ||||||
| American Express Co. |
282,115 | 49,025,945 | ||||||
| *American Financial Group, Inc. |
69,943 | 9,515,046 | ||||||
| *American International Group, Inc. |
178,850 | 10,568,246 | ||||||
| *American National Bankshares, Inc. |
10,541 | 391,071 | ||||||
| American National Group, Inc. |
17,036 | 3,231,900 | ||||||
| Ameriprise Financial, Inc. |
86,306 | 26,075,632 | ||||||
| Ameris BanCorp |
77,737 | 4,072,641 | ||||||
| AMERISAFE, Inc. |
26,199 | 1,553,339 | ||||||
| Ameriserv Financial, Inc. |
3,367 | 13,434 | ||||||
| *Ames National Corp. |
8,700 | 215,064 | ||||||
| Aon PLC, Class A |
71,445 | 22,856,684 | ||||||
| #Apollo Global Management, Inc. |
1,753 | 134,893 | ||||||
| *Arch Capital Group, Ltd. |
179,086 | 7,489,377 | ||||||
| Ares Management Corp., Class A |
34,138 | 2,892,854 | ||||||
| Argo Group International Holdings, Ltd. |
38,705 | 2,132,646 | ||||||
| *Arrow Financial Corp. |
17,296 | 620,062 | ||||||
| Arthur J Gallagher & Co. |
59,404 | 9,960,269 | ||||||
| Artisan Partners Asset Management, Inc., Class A |
47,331 | 2,344,778 | ||||||
Dimensional U.S. Core Equity 2 ETF
SCHEDULE OF INVESTMENTS
October 31, 2021
| Security Description |
Shares | Fair Value | ||||||
| FINANCIALS (Continued) |
| |||||||
| *AssetMark Financial Holdings, Inc. |
308 | $ | 7,897 | |||||
| *Associated Banc-Corp. |
154,837 | 3,449,768 | ||||||
| *Associated Capital Group, Inc. |
2,487 | 90,402 | ||||||
| Assurant, Inc. |
60,849 | 9,815,552 | ||||||
| Assured Guaranty, Ltd. |
112,902 | 6,275,093 | ||||||
| *Athene Holding, Ltd., Class A |
103,830 | 9,034,248 | ||||||
| *Atlantic Capital Bancshares, Inc. |
25,662 | 705,962 | ||||||
| Atlantic Union Bankshares Corp. |
101,716 | 3,648,553 | ||||||
| *Atlanticus Holdings Corp. |
11,544 | 894,545 | ||||||
| *Auburn National BanCorp, Inc. |
2,087 | 70,582 | ||||||
| Axis Capital Holdings, Ltd. |
62,829 | 3,271,506 | ||||||
| *Axos Financial, Inc. |
77,341 | 4,099,073 | ||||||
| B Riley Financial, Inc. |
840 | 60,194 | ||||||
| Banc of California, Inc. |
56,419 | 1,146,998 | ||||||
| BancFirst Corp. |
32,722 | 2,127,257 | ||||||
| *BanCorp, Inc. (The) |
82,148 | 2,509,621 | ||||||
| *Bank of America Corp. |
1,783,289 | 85,205,548 | ||||||
| *Bank of Hawaii Corp. |
37,188 | 3,142,386 | ||||||
| *Bank of Marin BanCorp |
14,423 | 549,661 | ||||||
| Bank of New York Mellon Corp. (The) |
298,780 | 17,687,776 | ||||||
| Bank of NT Butterfield & Son, Ltd. (The) |
61,828 | 2,219,625 | ||||||
| *Bank of Princeton (The) |
4,409 | 133,505 | ||||||
| Bank of South Carolina Corp. |
800 | 16,008 | ||||||
| Bank OZK |
99,619 | 4,449,981 | ||||||
| BankFinancial Corp. |
20,625 | 234,919 | ||||||
| BankUnited, Inc. |
101,514 | 4,117,408 | ||||||
| Bankwell Financial Group, Inc. |
5,396 | 160,261 | ||||||
| Banner Corp. |
38,940 | 2,249,174 | ||||||
| *Bar Harbor Bankshares |
13,636 | 404,989 | ||||||
| *BayCom Corp. |
5,183 | 97,907 | ||||||
| BCB BanCorp, Inc. |
12,179 | 184,146 | ||||||
| *Berkshire Hathaway, Inc., Class B |
373,165 | 107,102,087 | ||||||
| *Berkshire Hills BanCorp, Inc. |
52,489 | 1,425,076 | ||||||
| BGC Partners, Inc., Class A |
297,145 | 1,595,669 | ||||||
| BlackRock, Inc. |
19,990 | 18,859,765 | ||||||
| Blackstone, Inc., Class A |
37,964 | 5,254,977 | ||||||
| *Blucora, Inc. |
52,528 | 867,763 | ||||||
| BOK Financial Corp. |
53,067 | 5,368,788 | ||||||
| *Bridgewater Bancshares, Inc. |
17,270 | 312,414 | ||||||
| *Brighthouse Financial, Inc. |
43,363 | 2,178,123 | ||||||
| Brightsphere Investment Group, Inc. |
80,719 | 2,419,956 | ||||||
| Brookline BanCorp, Inc. |
89,594 | 1,437,984 | ||||||
| Brown & Brown, Inc. |
157,527 | 9,941,529 | ||||||
| *BRP Group, Inc., Class A |
59 | 2,153 | ||||||
| Bryn Mawr Bank Corp. |
24,048 | 1,114,384 | ||||||
| Business First Bancshares, Inc. |
1,176 | 31,376 | ||||||
| *Byline BanCorp, Inc. |
11,289 | 290,805 | ||||||
| C&F Financial Corp. |
2,604 | 133,247 | ||||||
| *C, Inc.innati Financial Corp. |
76,019 | 9,231,747 | ||||||
| *Cadence Bank |
215,112 | 6,242,559 | ||||||
| *Cambridge BanCorp |
1,974 | 181,233 | ||||||
| Camden National Corp. |
17,615 | 838,474 | ||||||
| *Cannae Holdings, Inc. |
103,030 | 3,513,323 | ||||||
| *Capital City Bank Group, Inc. |
16,503 | 443,436 | ||||||
| Capital One Financial Corp. |
130,504 | 19,710,019 | ||||||
| Capitol Federal Financial, Inc. |
208,219 | 2,525,696 | ||||||
Dimensional U.S. Core Equity 2 ETF
SCHEDULE OF INVESTMENTS
October 31, 2021
| Security Description |
Shares | Fair Value | ||||||
| FINANCIALS (Continued) |
| |||||||
| Capstar Financial Holdings, Inc. |
15,450 | $ | 339,437 | |||||
| *Cathay General BanCorp |
87,660 | 3,698,375 | ||||||
| Cboe Global Markets, Inc. |
24,596 | 3,245,196 | ||||||
| CBTX, Inc. |
15,979 | 434,629 | ||||||
| *CCUR Holdings, Inc. |
1 | 6,150 | ||||||
| *Central Pacific Financial Corp. |
41,240 | 1,133,688 | ||||||
| *Central Valley Community BanCorp |
9,445 | 201,462 | ||||||
| *Century BanCorp, Inc., Class A |
4,330 | 498,599 | ||||||
| *Charles Schwab Corp. (The) |
408,407 | 33,501,626 | ||||||
| *Chemung Financial Corp. |
3,869 | 178,941 | ||||||
| Chubb, Ltd. |
91,351 | 17,848,158 | ||||||
| CIT Group, Inc. |
74,984 | 3,713,958 | ||||||
| Citigroup, Inc. |
447,476 | 30,947,440 | ||||||
| Citizens & Northern Corp. |
9,655 | 246,299 | ||||||
| Citizens Community BanCorp, Inc. |
5,226 | 71,074 | ||||||
| Citizens Financial Group, Inc. |
178,685 | 8,466,095 | ||||||
| Citizens Holding Co. |
2,051 | 36,939 | ||||||
| *Citizens, Inc. |
28,479 | 183,405 | ||||||
| *City Holding Co. |
18,587 | 1,479,153 | ||||||
| Civista Bancshares, Inc. |
14,290 | 343,817 | ||||||
| CME Group, Inc. |
56,033 | 12,358,078 | ||||||
| *CNA Financial Corp. |
29,562 | 1,326,151 | ||||||
| *CNB Financial Corp. |
15,464 | 396,961 | ||||||
| CNO Financial Group, Inc. |
150,105 | 3,623,535 | ||||||
| *Coastal Financial Corp. |
4,886 | 185,912 | ||||||
| Codorus Valley BanCorp, Inc. |
7,482 | 163,781 | ||||||
| Cohen & Steers, Inc. |
54,659 | 5,186,593 | ||||||
| Colony Bankcorp, Inc. |
5,329 | 100,185 | ||||||
| Columbia Banking System, Inc. |
90,321 | 3,082,656 | ||||||
| *Columbia Financial, Inc. |
28,462 | 529,962 | ||||||
| *Comerica, Inc. |
86,967 | 7,400,022 | ||||||
| *Commerce Bancshares, Inc. |
122,055 | 8,606,098 | ||||||
| *Community Bank System, Inc. |
60,736 | 4,352,949 | ||||||
| *Community Bankers Trust Corp. |
19,082 | 222,496 | ||||||
| Community Financial Corp. (The) |
4,091 | 155,949 | ||||||
| *Community Trust BanCorp, Inc. |
20,692 | 903,827 | ||||||
| *Community West Bancshares |
4,200 | 55,020 | ||||||
| ConnectOne BanCorp, Inc. |
39,780 | 1,341,779 | ||||||
| *Consumer Portfolio Services, Inc. |
22,519 | 147,049 | ||||||
| *County BanCorp, Inc. |
4,577 | 162,026 | ||||||
| *Cowen, Inc., Class A |
23,758 | 896,389 | ||||||
| *Crawford & Co., Class A |
32,830 | 283,651 | ||||||
| *Crawford & Co., Class B |
20,524 | 169,528 | ||||||
| #*Credit Acceptance Corp. |
20,283 | 12,133,493 | ||||||
| *Cullen/Frost Bankers, Inc. |
46,574 | 6,031,333 | ||||||
| Curo Group Holdings Corp. |
1,410 | 24,224 | ||||||
| Customers BanCorp, Inc. |
30,072 | 1,602,537 | ||||||
| CVB Financial Corp. |
144,537 | 2,893,631 | ||||||
| Diamond Hill Investment Group, Inc. |
3,687 | 799,563 | ||||||
| Dime Community Bancshares, Inc. |
54,673 | 1,950,733 | ||||||
| *Discover Financial Services |
157,659 | 17,865,918 | ||||||
| Donegal Group, Inc. |
1,947 | 28,212 | ||||||
| Donegal Group, Inc., Class A |
26,556 | 378,423 | ||||||
| *Donnelley Financial Solutions, Inc. |
33,629 | 1,288,663 | ||||||
| Eagle BanCorp Montana, Inc. |
4,900 | 110,250 | ||||||
| *Eagle BanCorp, Inc. |
31,813 | 1,800,298 | ||||||
| East West BanCorp, Inc. |
124,586 | 9,902,095 | ||||||
Dimensional U.S. Core Equity 2 ETF
SCHEDULE OF INVESTMENTS
October 31, 2021
| Security Description |
Shares | Fair Value | ||||||
| FINANCIALS (Continued) |
| |||||||
| *eHealth, Inc. |
21,951 | $ | 973,527 | |||||
| *Emclaire Financial Corp. |
300 | 8,124 | ||||||
| *Employers Holdings, Inc. |
45,224 | 1,745,646 | ||||||
| *Encore Capital Group, Inc. |
39,016 | 2,107,644 | ||||||
| *Enova International, Inc. |
47,456 | 1,539,473 | ||||||
| *Enstar Group, Ltd. |
13,183 | 3,042,373 | ||||||
| *Enterprise BanCorp, Inc. |
7,524 | 279,517 | ||||||
| *Enterprise Financial Services Corp. |
37,877 | 1,780,977 | ||||||
| Equitable Holdings, Inc. |
89,309 | 2,991,851 | ||||||
| Equity Bancshares, Inc., Class A |
14,310 | 478,813 | ||||||
| #Erie Indemnity Co., Class A |
26,119 | 5,375,551 | ||||||
| *Esquire Financial Holdings, Inc. |
4,767 | 152,449 | ||||||
| Essa BanCorp, Inc. |
7,776 | 126,360 | ||||||
| Essent Group, Ltd. |
62,643 | 3,006,864 | ||||||
| Evans BanCorp, Inc. |
4,016 | 160,439 | ||||||
| Evercore, Inc. |
47,712 | 7,244,590 | ||||||
| Everest Re Group, Ltd. |
21,244 | 5,555,306 | ||||||
| *EZCorp., Inc., Class A |
61,225 | 456,738 | ||||||
| *FactSet Research Systems, Inc. |
23,973 | 10,641,375 | ||||||
| Farmers & Merchants BanCorp, Inc. |
4,427 | 112,357 | ||||||
| Farmers National Banc Corp. |
24,436 | 435,450 | ||||||
| FB Financial Corp. |
52,108 | 2,362,056 | ||||||
| *Federal Agricultural Mortgage Corp. |
635 | 75,214 | ||||||
| *Federal Agricultural Mortgage Corp. |
10,300 | 1,298,727 | ||||||
| *Federated Hermes, Inc. |
114,974 | 3,829,784 | ||||||
| Fednat Holding Co. |
9,016 | 22,901 | ||||||
| Fidelity D&D BanCorp, Inc. |
1,602 | 81,045 | ||||||
| Fidelity National Financial, Inc. |
152,138 | 7,288,932 | ||||||
| Fifth Third BanCorp |
265,174 | 11,543,024 | ||||||
| #*Financial Institutions, Inc. |
18,608 | 593,967 | ||||||
| First American Financial Corp. |
123,242 | 9,013,920 | ||||||
| *First BanCorp |
254,196 | 3,469,775 | ||||||
| First BanCorp, Inc. (The) |
9,663 | 286,701 | ||||||
| First BanCorp/Southern Pines Nc |
42,208 | 2,043,711 | ||||||
| *First Bancshares, Inc. (The) |
11,881 | 478,210 | ||||||
| First Bank |
13,632 | 205,025 | ||||||
| First Busey Corp. |
65,701 | 1,674,718 | ||||||
| *First Business Financial Services, Inc. |
6,819 | 199,115 | ||||||
| First Capital, Inc. |
2,028 | 81,688 | ||||||
| #First Citizens Bancshares, Inc., Class A |
8,825 | 7,182,667 | ||||||
| *First Commonwealth Financial Corp. |
131,506 | 2,012,042 | ||||||
| First Community Bankshares, Inc. |
19,210 | 622,788 | ||||||
| *First Community Corp. |
5,860 | 117,903 | ||||||
| *First Financial BanCorp |
109,734 | 2,609,475 | ||||||
| First Financial Bankshares, Inc. |
94,956 | 4,816,168 | ||||||
| *First Financial Corp. |
8,447 | 361,954 | ||||||
| First Financial Northwest, Inc. |
13,447 | 221,875 | ||||||
| First Foundation, Inc. |
51,567 | 1,372,198 | ||||||
| First Guaranty Bancshares, Inc. |
2,062 | 42,704 | ||||||
| First Hawaiian, Inc. |
38,291 | 1,056,449 | ||||||
| *First Horizon Corp. |
515,179 | 8,742,588 | ||||||
| First Internet BanCorp, Class A |
8,289 | 282,158 | ||||||
| First Interstate BancSystem, Inc., Class A |
42,696 | 1,774,873 | ||||||
| *First Merchants Corp. |
61,879 | 2,572,929 | ||||||
| *First Mid Bancshares, Inc. |
13,169 | 567,321 | ||||||
| *First Midwest BanCorp, Inc. |
124,581 | 2,398,184 | ||||||
Dimensional U.S. Core Equity 2 ETF
SCHEDULE OF INVESTMENTS
October 31, 2021
| Security Description |
Shares | Fair Value | ||||||
| FINANCIALS (Continued) |
| |||||||
| First National Corp. |
699 | $ | 15,902 | |||||
| *First Northwest BanCorp |
7,811 | 140,989 | ||||||
| First of Long Island Corp. (The) |
25,402 | 511,342 | ||||||
| First Republic Bank |
49,526 | 10,713,960 | ||||||
| First Savings Financial Group, Inc. |
3,174 | 88,174 | ||||||
| First United Corp. |
5,001 | 94,419 | ||||||
| *First Western Financial, Inc. |
1,300 | 37,726 | ||||||
| FirstCash, Inc. |
55,962 | 4,950,958 | ||||||
| *Flagstar BanCorp, Inc. |
67,802 | 3,199,576 | ||||||
| *Flexshopper, Inc. |
51 | 132 | ||||||
| Flushing Financial Corp. |
33,828 | 812,549 | ||||||
| *FNB Corp. |
259,622 | 3,024,596 | ||||||
| *Franklin Financial Services Corp. |
1,100 | 35,750 | ||||||
| Franklin Resources, Inc. |
133,156 | 4,193,082 | ||||||
| FS BanCorp, Inc. |
8,768 | 302,145 | ||||||
| *Fulton Financial Corp. |
186,205 | 2,997,901 | ||||||
| *FVCBankCorp., Inc. |
2,121 | 43,480 | ||||||
| *GAMCO Investors, Inc., Class A |
8,055 | 213,055 | ||||||
| *Genworth Financial, Inc., Class A |
275,340 | 1,131,647 | ||||||
| *German American BanCorp, Inc. |
28,257 | 1,113,891 | ||||||
| Glacier BanCorp, Inc. |
106,912 | 5,911,164 | ||||||
| Global Indemnity Group LLC, Class A |
12,412 | 305,211 | ||||||
| Globe Life, Inc. |
64,620 | 5,752,472 | ||||||
| Goldman Sachs Group, Inc. (The) |
75,550 | 31,228,592 | ||||||
| #Goosehead Insurance, Inc., Class A |
728 | 105,050 | ||||||
| Great Southern BanCorp, Inc. |
16,952 | 956,601 | ||||||
| *Great Western BanCorp, Inc. |
55,782 | 1,899,377 | ||||||
| *Green Dot Corp., Class A |
63,748 | 2,700,365 | ||||||
| *Greene County BanCorp, Inc. |
358 | 12,186 | ||||||
| *Greenhill & Co., Inc. |
8,266 | 129,942 | ||||||
| *Greenlight Capital Re, Ltd., Class A |
15,972 | 118,672 | ||||||
| Guaranty Bancshares, Inc. |
8,599 | 322,806 | ||||||
| Guaranty Federal Bancshares, Inc. |
1,800 | 42,930 | ||||||
| *Hallmark Financial Services, Inc. |
9,393 | 31,279 | ||||||
| *Hamilton Lane, Inc., Class A |
20,748 | 2,168,373 | ||||||
| *Hancock Whitney Corp. |
81,503 | 4,032,768 | ||||||
| *Hanmi Financial Corp. |
28,821 | 639,538 | ||||||
| Hanover Insurance Group, Inc. (The) |
33,841 | 4,263,966 | ||||||
| HarborOne BanCorp, Inc. |
34,764 | 499,559 | ||||||
| *Hartford Financial Services Group, Inc. (The) |
202,035 | 14,734,413 | ||||||
| *Hawthorn Bancshares, Inc. |
3,719 | 89,144 | ||||||
| HCI Group, Inc. |
14,060 | 1,884,181 | ||||||
| Heartland Financial USA, Inc. |
41,249 | 2,067,400 | ||||||
| *Hennessy Advisors, Inc. |
4,698 | 54,215 | ||||||
| *Heritage Commerce Corp. |
56,300 | 675,037 | ||||||
| Heritage Financial Corp. |
36,481 | 906,188 | ||||||
| Heritage Insurance Holdings, Inc. |
15,805 | 103,365 | ||||||
| *Hilltop Holdings, Inc. |
118,134 | 4,186,669 | ||||||
| Hingham Institution For Savings The |
2,003 | 723,564 | ||||||
| *HMN Financial, Inc. |
3,012 | 70,210 | ||||||
| Home BanCorp, Inc. |
8,231 | 343,644 | ||||||
| *Home Bancshares, Inc. |
150,350 | 3,572,316 | ||||||
| HomeStreet, Inc. |
30,554 | 1,440,927 | ||||||
| *Hometrust Bancshares, Inc. |
6,636 | 201,734 | ||||||
| Hope BanCorp, Inc. |
160,763 | 2,345,532 | ||||||
| Horace Mann Educators Corp. |
54,573 | 2,138,170 | ||||||
| Horizon BanCorp, Inc. |
47,538 | 906,550 | ||||||
Dimensional U.S. Core Equity 2 ETF
SCHEDULE OF INVESTMENTS
October 31, 2021
| Security Description |
Shares | Fair Value | ||||||
| FINANCIALS (Continued) |
| |||||||
| *Houlihan Lokey, Inc. |
35,668 | $ | 3,997,669 | |||||
| *Howard BanCorp, Inc. |
16,911 | 350,227 | ||||||
| *Huntington Bancshares, Inc. |
950,754 | 14,964,868 | ||||||
| IF BanCorp, Inc. |
723 | 16,289 | ||||||
| Independence Holding Co. |
12,783 | 627,006 | ||||||
| *Independent Bank Corp. |
25,505 | 574,628 | ||||||
| Independent Bank Corp. |
36,378 | 3,073,941 | ||||||
| Independent Bank Group, Inc. |
49,313 | 3,564,837 | ||||||
| Interactive Brokers Group, Inc. |
84,363 | 5,977,119 | ||||||
| Intercontinental Exchange, Inc. |
134,294 | 18,594,347 | ||||||
| International Bancshares Corp. |
76,621 | 3,248,730 | ||||||
| Invesco, Ltd. |
234,383 | 5,955,672 | ||||||
| Investar Holding Corp. |
7,734 | 144,626 | ||||||
| Investors BanCorp, Inc. |
272,898 | 4,175,339 | ||||||
| *Investors Title Co. |
1,811 | 350,972 | ||||||
| James River Group Holdings, Ltd. |
37,161 | 1,187,294 | ||||||
| Janus Henderson Group PLC |
115,510 | 5,371,215 | ||||||
| Jefferies Financial Group, Inc. |
180,429 | 7,758,447 | ||||||
| JPMorgan Chase & Co. |
911,109 | 154,788,308 | ||||||
| Kearny Financial Corp. |
96,417 | 1,293,916 | ||||||
| *Kemper Corp. |
60,631 | 3,848,856 | ||||||
| Kentucky First Federal BanCorp |
1,549 | 10,951 | ||||||
| *KeyCorp. |
417,426 | 9,713,503 | ||||||
| *Kingstone Cos., Inc. |
5,413 | 31,125 | ||||||
| Kinsale Capital Group, Inc. |
9,763 | 1,827,145 | ||||||
| KKR & Co., Inc. |
75,571 | 6,020,742 | ||||||
| *Lake Shore BanCorp, Inc. |
1,022 | 15,269 | ||||||
| *Lakeland BanCorp, Inc. |
56,672 | 1,018,963 | ||||||
| Lakeland Financial Corp. |
30,125 | 2,165,084 | ||||||
| Landmark BanCorp, Inc. |
2,715 | 77,758 | ||||||
| Lazard, Ltd., Class A |
120,904 | 5,923,087 | ||||||
| LCNB Corp. |
13,150 | 224,207 | ||||||
| *LendingClub Corp. |
71,228 | 3,273,639 | ||||||
| *LendingTree, Inc. |
5,657 | 912,983 | ||||||
| Level One BanCorp, Inc. |
5,109 | 160,474 | ||||||
| *Limestone BanCorp, Inc. |
1,427 | 26,043 | ||||||
| *Lincoln National Corp. |
94,770 | 6,837,655 | ||||||
| Live Oak Bancshares, Inc. |
44,679 | 3,984,473 | ||||||
| *Loews Corp. |
113,043 | 6,338,321 | ||||||
| LPL Financial Holdings, Inc. |
120,821 | 19,817,060 | ||||||
| *Luther Burbank Corp. |
3,141 | 45,576 | ||||||
| M&T Bank Corp. |
46,522 | 6,844,317 | ||||||
| *Macatawa Bank Corp. |
31,316 | 263,054 | ||||||
| *Maiden Holdings, Ltd. |
69,360 | 226,114 | ||||||
| *MainStreet Bancshares, Inc., Class A |
1,520 | 38,000 | ||||||
| *Malvern BanCorp, Inc. |
5,035 | 84,638 | ||||||
| *Markel Corp. |
6,268 | 8,230,699 | ||||||
| MarketAxess Holdings, Inc. |
18,428 | 7,530,971 | ||||||
| *Marlin Business Services Corp. |
11,271 | 258,331 | ||||||
| Marsh & McLennan Cos., Inc. |
104,192 | 17,379,226 | ||||||
| *MBIA, Inc. |
166,799 | 2,592,056 | ||||||
| *Mercantile Bank Corp. |
16,848 | 579,066 | ||||||
| Merchants BanCorp |
3,732 | 165,813 | ||||||
| *Mercury General Corp. |
66,010 | 3,596,885 | ||||||
| Meridian BanCorp, Inc. |
61,364 | 1,423,645 | ||||||
| Meridian Corp. |
2,163 | 65,323 | ||||||
Dimensional U.S. Core Equity 2 ETF
SCHEDULE OF INVESTMENTS
October 31, 2021
| Security Description |
Shares | Fair Value | ||||||
| FINANCIALS (Continued) |
| |||||||
| Meta Financial Group, Inc. |
48,458 | $ | 2,686,512 | |||||
| MetLife, Inc. |
220,839 | 13,868,689 | ||||||
| *Metropolitan Bank Holding Corp. |
3,843 | 349,175 | ||||||
| *MGIC Investment Corp. |
178,397 | 2,882,896 | ||||||
| Mid Penn BanCorp, Inc. |
2,532 | 70,947 | ||||||
| *Middlefield Banc Corp. |
4,154 | 103,850 | ||||||
| *Midland States BanCorp, Inc. |
19,359 | 496,752 | ||||||
| *MidWestOne Financial Group, Inc. |
10,788 | 338,204 | ||||||
| Moelis & Co., Class A |
42,319 | 3,078,284 | ||||||
| *Moody’s Corp. |
42,829 | 17,309,340 | ||||||
| Morgan Stanley |
469,909 | 48,297,247 | ||||||
| Morningstar, Inc. |
40,631 | 12,869,869 | ||||||
| *Mr Cooper Group, Inc. |
20,109 | 881,579 | ||||||
| MSCI, Inc. |
53,714 | 35,713,364 | ||||||
| *MVB Financial Corp. |
9,643 | 411,660 | ||||||
| *Nasdaq, Inc. |
88,257 | 18,522,497 | ||||||
| *National Bank Holdings Corp., Class A |
36,788 | 1,595,496 | ||||||
| *National Bankshares, Inc. |
3,544 | 132,014 | ||||||
| *National Western Life Group, Inc., Class A |
3,855 | 828,864 | ||||||
| Navient Corp. |
215,590 | 4,247,123 | ||||||
| *NBT BanCorp, Inc. |
66,342 | 2,434,088 | ||||||
| Nelnet, Inc., Class A |
31,488 | 2,601,853 | ||||||
| *New York Community BanCorp, Inc. |
310,177 | 3,855,500 | ||||||
| *NI Holdings, Inc. |
9,028 | 179,477 | ||||||
| *Nicolet Bankshares, Inc. |
10,260 | 737,591 | ||||||
| *NMI Holdings, Inc., Class A |
76,782 | 1,864,267 | ||||||
| Northeast Bank |
6,219 | 205,849 | ||||||
| *Northern Trust Corp. |
105,520 | 12,983,181 | ||||||
| Northfield BanCorp, Inc. |
58,568 | 1,027,868 | ||||||
| Northrim BanCorp, Inc. |
6,426 | 285,443 | ||||||
| *Northwest Bancshares, Inc. |
167,299 | 2,308,726 | ||||||
| Norwood Financial Corp. |
4,164 | 108,972 | ||||||
| Oak Valley BanCorp |
4,855 | 83,749 | ||||||
| *OceanFirst Financial Corp. |
62,325 | 1,381,745 | ||||||
| *Oconee Federal Financial Corp. |
400 | 9,800 | ||||||
| OFG BanCorp |
62,356 | 1,615,020 | ||||||
| Ohio Valley Banc Corp. |
4,777 | 133,087 | ||||||
| *Old National BanCorp |
212,695 | 3,632,831 | ||||||
| *Old Point Financial Corp. |
2,663 | 56,216 | ||||||
| Old Republic International Corp. |
238,476 | 6,159,835 | ||||||
| Old Second BanCorp, Inc. |
9,603 | 130,025 | ||||||
| OneMain Holdings, Inc. |
62,774 | 3,315,095 | ||||||
| *Open Lending Corp., Class A |
2,735 | 86,207 | ||||||
| *Oppenheimer Holdings, Inc., Class A |
10,148 | 528,203 | ||||||
| Origin BanCorp, Inc. |
11,731 | 523,203 | ||||||
| Orrstown Financial Services, Inc. |
8,572 | 203,242 | ||||||
| Pacific Premier BanCorp, Inc. |
105,254 | 4,419,615 | ||||||
| *PacWest BanCorp |
100,446 | 4,768,172 | ||||||
| *Palomar Holdings, Inc. |
3,715 | 339,737 | ||||||
| #*Park National Corp. |
18,531 | 2,382,901 | ||||||
| Parke BanCorp, Inc. |
9,531 | 211,302 | ||||||
| PCB BanCorp |
7,184 | 153,019 | ||||||
| PCSB Financial Corp. |
15,491 | 296,033 | ||||||
| *PDL Community BanCorp |
14,479 | 224,569 | ||||||
| *Peapack-Gladstone Financial Corp. |
17,776 | 596,385 | ||||||
| Penns Woods BanCorp, Inc. |
5,436 | 129,377 | ||||||
| PennyMac Financial Services, Inc. |
1,718 | 106,619 | ||||||
Dimensional U.S. Core Equity 2 ETF
SCHEDULE OF INVESTMENTS
October 31, 2021
| Security Description |
Shares | Fair Value | ||||||
| FINANCIALS (Continued) |
| |||||||
| *Peoples BanCorp of North Carolina, Inc. |
3,810 | $ | 107,061 | |||||
| *Peoples BanCorp, Inc. |
26,888 | 859,340 | ||||||
| *Peoples Financial Services Corp. |
3,385 | 154,965 | ||||||
| People’s United Financial, Inc. |
288,458 | 4,944,170 | ||||||
| Pinnacle Financial Partners, Inc. |
51,803 | 5,002,616 | ||||||
| *Piper Sandler Cos. |
19,326 | 3,182,799 | ||||||
| PJT Partners, Inc., Class A |
7,964 | 651,376 | ||||||
| Plumas BanCorp |
3,091 | 114,182 | ||||||
| PNC Financial Services Group, Inc. (The) |
108,420 | 22,879,873 | ||||||
| *Popular, Inc. |
70,900 | 5,774,096 | ||||||
| Pr, Inc.ipal Financial Group, Inc. |
118,134 | 7,925,610 | ||||||
| *PRA Group, Inc. |
51,538 | 2,209,949 | ||||||
| Preferred Bank |
16,917 | 1,159,999 | ||||||
| Premier Financial Corp. |
26,845 | 855,819 | ||||||
| Primerica, Inc. |
60,363 | 10,155,471 | ||||||
| Primis Financial Corp. |
21,058 | 319,029 | ||||||
| ProAssurance Corp. |
40,371 | 924,900 | ||||||
| *Prog Holdings, Inc. |
75,445 | 3,051,750 | ||||||
| Progressive Corp. (The) |
148,676 | 14,106,379 | ||||||
| *Prosperity Bancshares, Inc. |
70,320 | 5,295,799 | ||||||
| Provident BanCorp, Inc. |
12,142 | 218,799 | ||||||
| *Provident Financial Holdings, Inc. |
6,656 | 113,485 | ||||||
| Provident Financial Services, Inc. |
93,301 | 2,310,133 | ||||||
| Prudential BanCorp, Inc. |
6,497 | 97,390 | ||||||
| *Prudential Financial, Inc. |
100,898 | 11,103,825 | ||||||
| Pzena Investment Management, Inc., Class A |
8,763 | 95,341 | ||||||
| QCR Holdings, Inc. |
16,621 | 916,482 | ||||||
| *Radian Group, Inc. |
96,219 | 2,296,748 | ||||||
| *Randolph BanCorp, Inc. |
1,654 | 38,869 | ||||||
| Raymond James Financial, Inc. |
109,708 | 10,816,112 | ||||||
| RBB BanCorp |
9,560 | 245,405 | ||||||
| Regional Management Corp. |
13,416 | 685,289 | ||||||
| Regions Financial Corp. |
516,572 | 12,232,425 | ||||||
| *Reinsurance Group of America, Inc. |
29,330 | 3,463,286 | ||||||
| RenaissanceRe Holdings, Ltd. |
41,850 | 5,934,330 | ||||||
| Renasant Corp. |
63,458 | 2,373,964 | ||||||
| *Republic BanCorp, Inc., Class A |
17,987 | 971,658 | ||||||
| *Republic First BanCorp, Inc. |
30,439 | 94,361 | ||||||
| Riverview BanCorp, Inc. |
17,979 | 132,865 | ||||||
| *RLI Corp. |
33,615 | 3,640,841 | ||||||
| S&P Global, Inc. |
61,588 | 29,202,566 | ||||||
| *S&T BanCorp, Inc. |
41,078 | 1,255,344 | ||||||
| *Safeguard Scientifics, Inc. |
16,272 | 136,522 | ||||||
| Safety Insurance Group, Inc. |
22,742 | 1,783,200 | ||||||
| *Salisbury BanCorp, Inc. |
1,410 | 73,743 | ||||||
| *Sandy Spring BanCorp, Inc. |
38,295 | 1,817,481 | ||||||
| Santander Consumer USA Holdings, Inc. |
217,590 | 9,073,503 | ||||||
| SB Financial Group, Inc. |
3,331 | 62,290 | ||||||
| *Sculptor Capital Management, Inc. |
1,844 | 48,866 | ||||||
| *Seacoast Banking Corp. of Florida |
37,303 | 1,358,948 | ||||||
| *Security National Financial Corp., Class A |
4,019 | 35,488 | ||||||
| SEI Investments Co. |
87,467 | 5,513,920 | ||||||
| *Selective Insurance Group, Inc. |
80,103 | 6,277,672 | ||||||
| *Selectquote, Inc. |
3,851 | 51,180 | ||||||
| ServisFirst Bancshares, Inc. |
50,568 | 4,061,116 | ||||||
| Severn BanCorp, Inc. |
4,355 | 59,359 | ||||||
Dimensional U.S. Core Equity 2 ETF
SCHEDULE OF INVESTMENTS
October 31, 2021
| Security Description |
Shares | Fair Value | ||||||
| FINANCIALS (Continued) |
| |||||||
| *Shore Bancshares, Inc. |
9,404 | $ | 173,786 | |||||
| Sierra BanCorp |
16,572 | 413,637 | ||||||
| Signature Bank |
31,782 | 9,465,315 | ||||||
| *Silvercrest Asset Management Group, Inc., Class A |
3,719 | 59,504 | ||||||
| *Silvergate Capital Corp. |
619 | 96,948 | ||||||
| *Simmons First National Corp., Class A |
120,208 | 3,593,017 | ||||||
| *SiriusPoint, Ltd. |
94,729 | 890,453 | ||||||
| SLM Corp. |
449,123 | 8,241,407 | ||||||
| SmartFinancial, Inc. |
8,592 | 223,306 | ||||||
| Sound Financial BanCorp, Inc. |
771 | 33,246 | ||||||
| *Southern First Bancshares, Inc. |
6,964 | 375,151 | ||||||
| *Southern Missouri BanCorp, Inc. |
8,056 | 438,246 | ||||||
| Southside Bancshares, Inc. |
42,427 | 1,753,084 | ||||||
| *SouthState Corp. |
75,945 | 5,930,545 | ||||||
| Spirit of Texas Bancshares, Inc. |
11,186 | 272,155 | ||||||
| *State Auto Financial Corp. |
41,220 | 2,114,998 | ||||||
| State Street Corp. |
110,595 | 10,899,137 | ||||||
| StepStone Group, Inc., Class A |
1,403 | 65,913 | ||||||
| Sterling BanCorp |
216,291 | 5,504,606 | ||||||
| *Sterling BanCorp, Inc. |
8,152 | 44,102 | ||||||
| Stewart Information Services Corp. |
31,961 | 2,274,664 | ||||||
| *Stifel Financial Corp. |
82,795 | 6,033,272 | ||||||
| *Stock Yards BanCorp, Inc. |
27,958 | 1,712,427 | ||||||
| *StoneX Group, Inc. |
24,822 | 1,715,448 | ||||||
| Summit Financial Group, Inc. |
7,291 | 183,223 | ||||||
| *Summit State Bank |
3,136 | 54,725 | ||||||
| *SVB Financial Group |
36,530 | 26,206,622 | ||||||
| Synchrony Financial |
387,650 | 18,006,343 | ||||||
| Synovus Financial Corp. |
161,486 | 7,523,633 | ||||||
| T Rowe Price Group, Inc. |
119,955 | 26,015,840 | ||||||
| Territorial BanCorp, Inc. |
11,411 | 286,302 | ||||||
| *Texas Capital Bancshares, Inc. |
58,072 | 3,519,163 | ||||||
| TFS Financial Corp. |
132,314 | 2,574,830 | ||||||
| *Timberland BanCorp, Inc. |
8,097 | 224,692 | ||||||
| Tiptree, Inc. |
47,142 | 735,887 | ||||||
| #*Tompkins Financial Corp. |
17,476 | 1,434,954 | ||||||
| Towne Bank |
81,570 | 2,571,086 | ||||||
| Tradeweb Markets, Inc., Class A |
1,067 | 95,070 | ||||||
| Travelers Cos, Inc. (The) |
112,743 | 18,138,094 | ||||||
| TriCo Bancshares |
35,374 | 1,550,442 | ||||||
| *TriState Capital Holdings, Inc. |
33,302 | 1,000,725 | ||||||
| *Triumph BanCorp, Inc. |
29,436 | 3,452,843 | ||||||
| Truist Financial Corp. |
272,008 | 17,264,348 | ||||||
| #*Trupanion, Inc. |
1,473 | 150,835 | ||||||
| *TrustCo Bank Corp. NY |
22,513 | 755,536 | ||||||
| *Trustmark Corp. |
71,572 | 2,276,705 | ||||||
| *UMB Financial Corp. |
44,717 | 4,418,934 | ||||||
| *Umpqua Holdings Corp. |
183,754 | 3,757,769 | ||||||
| Union Bankshares, Inc./Morrisville Vt |
619 | 19,808 | ||||||
| *United Bancshares, Inc. |
606 | 17,707 | ||||||
| *United Bankshares, Inc. |
118,227 | 4,373,217 | ||||||
| United Community Banks, Inc. |
94,747 | 3,300,985 | ||||||
| *United Fire Group, Inc. |
20,449 | 417,773 | ||||||
| *United Insurance Holdings Corp. |
22,139 | 84,571 | ||||||
| United Security Bancshares/Fresno CA |
11,687 | 92,444 | ||||||
| *Unity BanCorp, Inc. |
9,514 | 241,180 | ||||||
| Universal Insurance Holdings, Inc. |
55,725 | 823,058 | ||||||
Dimensional U.S. Core Equity 2 ETF
SCHEDULE OF INVESTMENTS
October 31, 2021
| Security Description |
Shares | Fair Value | ||||||
| FINANCIALS (Continued) |
| |||||||
| Univest Financial Corp. |
33,251 | $ | 954,304 | |||||
| Unum Group |
145,994 | 3,718,467 | ||||||
| US BanCorp |
406,378 | 24,533,040 | ||||||
| Valley National BanCorp |
334,094 | 4,430,086 | ||||||
| Value Line, Inc. |
1,300 | 44,785 | ||||||
| *Veritex Holdings, Inc. |
37,628 | 1,540,867 | ||||||
| #Victory Capital Holdings, Inc., Class A |
4,669 | 176,955 | ||||||
| *Virtu Financial, Inc., Class A |
48,333 | 1,202,525 | ||||||
| Virtus Investment Partners, Inc. |
9,215 | 2,948,800 | ||||||
| *Voya Financial, Inc. |
94,031 | 6,560,543 | ||||||
| *W R Berkley Corp. |
96,921 | 7,714,912 | ||||||
| Walker & Dunlop, Inc. |
43,568 | 5,666,890 | ||||||
| *Washington Federal, Inc. |
110,512 | 3,907,704 | ||||||
| Washington Trust BanCorp, Inc. |
18,309 | 1,000,770 | ||||||
| Waterstone Financial, Inc. |
33,695 | 696,476 | ||||||
| *Webster Financial Corp. |
97,146 | 5,436,290 | ||||||
| *Wells Fargo & Co. |
743,637 | 38,044,469 | ||||||
| *WesBanco, Inc. |
68,250 | 2,373,052 | ||||||
| West BanCorp, Inc. |
18,898 | 599,067 | ||||||
| *Westamerica BanCorp |
32,927 | 1,836,010 | ||||||
| *Western Alliance BanCorp |
91,418 | 10,612,716 | ||||||
| *Western New England BanCorp, Inc. |
25,674 | 249,808 | ||||||
| *Westwood Holdings Group, Inc. |
6,796 | 118,250 | ||||||
| White Mountains Insurance Group, Ltd. |
4,319 | 4,556,502 | ||||||
| Willis Towers Watson PLC |
48,764 | 11,814,542 | ||||||
| Wintrust Financial Corp. |
49,862 | 4,412,787 | ||||||
| #WisdomTree Investments, Inc. |
102,808 | 656,943 | ||||||
| #*World Acceptance Corp. |
9,471 | 1,755,829 | ||||||
| *WSFS Financial Corp. |
59,073 | 3,060,572 | ||||||
| *WVS Financial Corp. |
757 | 11,786 | ||||||
| *Zions BanCorp NA |
142,270 | 8,961,587 | ||||||
|
|
|
|||||||
| TOTAL FINANCIALS |
2,220,886,019 | |||||||
|
|
|
|||||||
| HEALTH CARE (11.6%) |
| |||||||
| *10X Genomics, Inc., Class A |
3,897 | 628,469 | ||||||
| Abbott Laboratories |
240,959 | 31,057,206 | ||||||
| AbbVie, Inc. |
383,467 | 43,972,161 | ||||||
| *ABIOMED, Inc. |
13,184 | 4,377,615 | ||||||
| *Acadia Healthcare Co., Inc. |
97,157 | 6,023,734 | ||||||
| *ACADIA Pharmaceuticals, Inc. |
37,306 | 669,643 | ||||||
| *Acceleron Pharma, Inc. |
5,468 | 952,416 | ||||||
| *Accuray, Inc. |
43,335 | 216,242 | ||||||
| #*Adaptive Biotechnologies Corp. |
2,867 | 95,786 | ||||||
| *Addus HomeCare Corp. |
16,637 | 1,555,560 | ||||||
| *Adverum Biotechnologies, Inc. |
50,280 | 114,136 | ||||||
| *Aeglea BioTherapeutics, Inc. |
17,876 | 130,852 | ||||||
| Agilent Technologies, Inc. |
77,087 | 12,140,432 | ||||||
| #*Agios Pharmaceuticals, Inc. |
8,361 | 392,967 | ||||||
| *Akebia Therapeutics, Inc. |
74,529 | 213,898 | ||||||
| *Akero Therapeutics, Inc. |
1,094 | 23,510 | ||||||
| *Albireo Pharma, Inc. |
9,695 | 283,288 | ||||||
| *Aldeyra Therapeutics, Inc. |
14,742 | 134,152 | ||||||
| *Align Technology, Inc., Class A |
35,042 | 21,879,174 | ||||||
| *Alkermes PLC |
66,993 | 2,029,218 | ||||||
| #*Allakos, Inc. |
3,883 | 390,552 | ||||||
| *Allogene Therapeutics, Inc. |
1,406 | 24,239 | ||||||
Dimensional U.S. Core Equity 2 ETF
SCHEDULE OF INVESTMENTS
October 31, 2021
| Security Description |
Shares | Fair Value | ||||||
| HEALTH CARE (Continued) |
| |||||||
| *Allscripts Healthcare Solutions, Inc. |
181,317 | $ | 2,498,548 | |||||
| *Alnylam Pharmaceuticals, Inc. |
20,307 | 3,240,185 | ||||||
| *Alphatec Holdings, Inc. |
8,967 | 105,183 | ||||||
| *Alpine Immune Sciences, Inc. |
1,694 | 21,429 | ||||||
| *Amedisys, Inc., Class B |
27,580 | 4,670,397 | ||||||
| AmerisourceBergen Corp. |
96,066 | 11,721,973 | ||||||
| *Amgen, Inc. |
163,581 | 33,856,360 | ||||||
| *AMN Healthcare Services, Inc. |
83,720 | 8,263,164 | ||||||
| *Amneal Pharmaceuticals, Inc. |
15,093 | 82,861 | ||||||
| *Amphastar Pharmaceuticals, Inc. |
46,118 | 861,484 | ||||||
| *Amryt Pharma PLC, ADR |
1,705 | 18,056 | ||||||
| *AnaptysBio, Inc. |
14,057 | 462,475 | ||||||
| *AngioDynamics, Inc. |
53,996 | 1,544,286 | ||||||
| *ANI Pharmaceuticals, Inc. |
11,570 | 432,487 | ||||||
| #*Anika Therapeutics, Inc. |
15,896 | 662,068 | ||||||
| *Antares Pharma, Inc. |
13,254 | 49,570 | ||||||
| *Anthem, Inc. |
84,721 | 36,864,649 | ||||||
| #*Apollo Medical Holdings, Inc. |
2,491 | 170,957 | ||||||
| *Applied Genetic Technologies Corp. |
9,627 | 24,934 | ||||||
| *Apyx Medical Corp. |
21,789 | 311,583 | ||||||
| *Aravive, Inc. |
6,843 | 24,293 | ||||||
| #*Arcus Biosciences, Inc. |
2,911 | 97,344 | ||||||
| *Arcutis Biotherapeutics, Inc. |
9,287 | 196,699 | ||||||
| *Arena Pharmaceuticals, Inc., Class A |
37,945 | 2,177,664 | ||||||
| *Arrowhead Pharmaceuticals, Inc. |
18,133 | 1,157,248 | ||||||
| *Arvinas, Inc. |
1,840 | 159,307 | ||||||
| *Assembly Biosciences, Inc. |
23,043 | 72,585 | ||||||
| AstraZeneca PLC, Sponsored ADR |
144,390 | 9,007,048 | ||||||
| *Atara Biotherapeutics, Inc., Class A |
36,531 | 565,500 | ||||||
| *AtriCure, Inc. |
2,284 | 171,437 | ||||||
| *Atrion Corp. |
1,573 | 1,145,144 | ||||||
| *Avanos Medical, Inc. |
63,004 | 1,987,146 | ||||||
| #*Avantor, Inc. |
68,481 | 2,765,263 | ||||||
| #*Avid Bioservices, Inc. |
6,929 | 212,582 | ||||||
| *Avidity Biosciences, Inc. |
48 | 1,080 | ||||||
| *Avrobio, Inc. |
4,201 | 23,610 | ||||||
| *Axogen, Inc. |
4,593 | 69,768 | ||||||
| #*Axonics, Inc. |
6,257 | 458,951 | ||||||
| *Baxter International, Inc. |
109,059 | 8,611,299 | ||||||
| *Becton Dickinson and Co. |
40,014 | 9,586,954 | ||||||
| *Biogen, Inc. |
46,796 | 12,479,557 | ||||||
| *Biohaven Pharmaceutical Holding Co., Ltd. |
7,876 | 1,120,912 | ||||||
| *Biolife Solutions, Inc. |
5,042 | 267,982 | ||||||
| *BioMarin Pharmaceutical, Inc. |
28,373 | 2,247,993 | ||||||
| *Bio-Rad Laboratories, Inc., Class A |
11,806 | 9,381,992 | ||||||
| Bio-Techne Corp. |
18,112 | 9,484,349 | ||||||
| #*Bluebird Bio, Inc. |
23,394 | 547,654 | ||||||
| *Blueprint Medicines Corp. |
4,751 | 534,440 | ||||||
| *Boston Scientific Corp. |
172,202 | 7,427,072 | ||||||
| #*Bridgebio Pharma, Inc. |
3,376 | 166,707 | ||||||
| Bristol-Myers Squibb Co. |
387,364 | 22,622,058 | ||||||
| *Brookdale Senior Living, Inc. |
146,210 | 950,365 | ||||||
| *Bruker Corp. |
96,980 | 7,787,494 | ||||||
| *Calithera Biosciences, Inc. |
37,977 | 73,296 | ||||||
| *Cara Therapeutics, Inc. |
5,424 | 91,286 | ||||||
| Cardinal Health, Inc. |
182,691 | 8,734,457 | ||||||
| *Cardiovascular Systems, Inc. |
12,940 | 453,935 | ||||||
Dimensional U.S. Core Equity 2 ETF
SCHEDULE OF INVESTMENTS
October 31, 2021
| Security Description |
Shares | Fair Value | ||||||
| HEALTH CARE (Continued) |
| |||||||
| *Castle Biosciences, Inc. |
1,769 | $ | 110,297 | |||||
| *Catalent, Inc. |
140,204 | 19,328,523 | ||||||
| *Catalyst Biosciences, Inc. |
4,256 | 14,002 | ||||||
| *Celldex Therapeutics, Inc. |
252 | 10,720 | ||||||
| *Centene Corp. |
291,387 | 20,758,410 | ||||||
| Cerner Corp. |
162,005 | 12,035,351 | ||||||
| *Change Healthcare, Inc. |
121,895 | 2,624,399 | ||||||
| *Charles River Laboratories International, Inc. |
54,737 | 24,559,397 | ||||||
| *Chembio Diagnostics, Inc. |
2,903 | 6,590 | ||||||
| Chemed Corp. |
15,112 | 7,287,762 | ||||||
| #*ChemoCentryx, Inc. |
9,103 | 316,875 | ||||||
| *Chimerix, Inc. |
43,891 | 229,989 | ||||||
| *Chinook Therapeutics, Inc. |
2,896 | 31,103 | ||||||
| *Cigna Corp. |
135,563 | 28,957,612 | ||||||
| *Codexis, Inc. |
10,577 | 367,762 | ||||||
| *Collegium Pharmaceutical, Inc. |
9,005 | 176,768 | ||||||
| *Community Health Systems, Inc. |
49,693 | 650,978 | ||||||
| *Computer Programs and Systems, Inc. |
12,920 | 466,412 | ||||||
| *Concert Pharmaceuticals, Inc. |
16,486 | 45,172 | ||||||
| CONMED Corp. |
26,744 | 3,912,112 | ||||||
| Cooper Cos, Inc. (The) |
20,231 | 8,434,709 | ||||||
| *Corcept Therapeutics, Inc. |
109,337 | 1,968,066 | ||||||
| *CorVel Corp. |
20,243 | 3,708,922 | ||||||
| *Corvus Pharmaceuticals, Inc. |
8,438 | 38,224 | ||||||
| *Covetrus, Inc. |
54,517 | 1,100,698 | ||||||
| *Crinetics Pharmaceuticals, Inc. |
63 | 1,571 | ||||||
| *Cross Country Healthcare, Inc. |
34,737 | 720,098 | ||||||
| *CryoLife, Inc. |
34,272 | 707,374 | ||||||
| *Cumberland Pharmaceuticals, Inc. |
7,698 | 20,708 | ||||||
| #*Cutera, Inc. |
6,895 | 296,485 | ||||||
| CVS Health Corp. |
346,609 | 30,945,252 | ||||||
| *Cymabay Therapeutics, Inc. |
23,457 | 91,482 | ||||||
| *CytomX Therapeutics, Inc. |
18,940 | 112,314 | ||||||
| #Danaher Corp. |
103,047 | 32,126,963 | ||||||
| *DaVita, Inc. |
120,597 | 12,450,434 | ||||||
| *Deciphera Pharmaceuticals, Inc. |
48,074 | 1,605,191 | ||||||
| *Denali Therapeutics, Inc. |
25,598 | 1,237,663 | ||||||
| DENTSPLY SIRONA, Inc. |
89,771 | 5,135,799 | ||||||
| *DexCom, Inc. |
8,963 | 5,585,831 | ||||||
| *Dyadic International, Inc. |
2,750 | 12,210 | ||||||
| *Eagle Pharmaceuticals, Inc. |
6,909 | 361,824 | ||||||
| #*Editas Medicine, Inc. |
8,046 | 295,449 | ||||||
| *Edwards Lifesciences Corp. |
64,715 | 7,754,151 | ||||||
| *Eiger Biopharmaceuticals, Inc. |
2,291 | 15,441 | ||||||
| *Elanco Animal Health, Inc. |
85,870 | 2,823,406 | ||||||
| Eli Lilly & Co. |
191,095 | 48,683,362 | ||||||
| *Emergent BioSolutions, Inc. |
50,942 | 2,428,405 | ||||||
| *Enanta Pharmaceuticals, Inc. |
19,416 | 1,666,864 | ||||||
| Encompass Health Corp. |
132,057 | 8,393,543 | ||||||
| *Endo International PLC |
86,515 | 367,689 | ||||||
| #*Enochian Biosciences, Inc. |
13,353 | 124,450 | ||||||
| Ensign Group, Inc. (The) |
60,445 | 4,715,314 | ||||||
| *Envista Holdings Corp. |
90,264 | 3,529,322 | ||||||
| *Enzo Biochem, Inc. |
45,031 | 154,907 | ||||||
| *Epizyme, Inc. |
45,760 | 192,192 | ||||||
| *Evelo Biosciences, Inc. |
2,447 | 21,656 | ||||||
Dimensional U.S. Core Equity 2 ETF
SCHEDULE OF INVESTMENTS
October 31, 2021
| Security Description |
Shares | Fair Value | ||||||
| HEALTH CARE (Continued) |
| |||||||
| *Evolent Health, Inc., Class A |
89,537 | $ | 2,620,748 | |||||
| *Exact Sciences Corp. |
21,193 | 2,017,997 | ||||||
| *Exelixis, Inc. |
157,284 | 3,383,179 | ||||||
| *Fate Therapeutics, Inc. |
4,283 | 230,425 | ||||||
| #*FibroGen, Inc. |
17,067 | 189,785 | ||||||
| *FONAR Corp. |
3,629 | 58,064 | ||||||
| #*Forma Therapeutics Holdings, Inc. |
5,590 | 103,750 | ||||||
| #*Fulgent Genetics, Inc. |
2,085 | 172,888 | ||||||
| #*G1 Therapeutics, Inc. |
21,891 | 317,201 | ||||||
| *Generation Bio Co. |
6,130 | 128,485 | ||||||
| Gilead Sciences, Inc. |
374,857 | 24,320,722 | ||||||
| *Glaukos Corp. |
2,159 | 98,688 | ||||||
| *Global Blood Therapeutics, Inc. |
22,641 | 826,849 | ||||||
| *Globus Medical, Inc. |
53,164 | 4,102,666 | ||||||
| *GlycoMimetics, Inc. |
26,409 | 50,441 | ||||||
| *Great Elm Group, Inc. |
8,182 | 16,364 | ||||||
| #*Guardant Health, Inc. |
10,744 | 1,254,792 | ||||||
| *Haemonetics Corp. |
39,988 | 2,747,575 | ||||||
| *Halozyme Therapeutics, Inc. |
37,857 | 1,441,216 | ||||||
| *Hanger, Inc. |
17,177 | 320,866 | ||||||
| #*Harmony Biosciences Holdings, Inc. |
1,025 | 42,507 | ||||||
| *Harvard Bioscience, Inc. |
31,221 | 235,094 | ||||||
| HCA Healthcare, Inc. |
31,347 | 7,851,170 | ||||||
| *HealthEquity, Inc. |
36,819 | 2,436,681 | ||||||
| *HealthStream, Inc. |
31,438 | 836,565 | ||||||
| *Henry Schein, Inc. |
59,982 | 4,579,626 | ||||||
| #*Heron Therapeutics, Inc. |
11,387 | 125,371 | ||||||
| *Heska Corp. |
4,303 | 961,850 | ||||||
| *Hill-Rom Holdings, Inc. |
79,437 | 12,304,791 | ||||||
| *Hologic, Inc. |
139,468 | 10,224,399 | ||||||
| *Horizon Therapeutics PLC |
187,678 | 22,504,469 | ||||||
| Humana, Inc. |
54,861 | 25,409,421 | ||||||
| *Icon PLC |
21,411 | 6,140,032 | ||||||
| *ICU Medical, Inc. |
12,663 | 2,964,788 | ||||||
| *IDEXX Laboratories, Inc., Class B |
32,691 | 21,776,783 | ||||||
| #*IGM Biosciences, Inc. |
557 | 26,134 | ||||||
| *Illumina, Inc. |
8,761 | 3,636,341 | ||||||
| *ImmunoGen, Inc. |
834 | 5,029 | ||||||
| #*Immunovant, Inc. |
356 | 2,862 | ||||||
| *Inari Medical, Inc. |
454 | 41,096 | ||||||
| *Incyte Corp. |
29,869 | 2,000,626 | ||||||
| *InfuSystem Holdings, Inc. |
3,825 | 63,610 | ||||||
| *Innoviva, Inc. |
76,696 | 1,338,345 | ||||||
| *Inogen, Inc., Class A |
20,786 | 824,165 | ||||||
| *Inovalon Holdings, Inc., Class A |
22,309 | 909,984 | ||||||
| #*Inovio Pharmaceuticals, Inc. |
7,769 | 55,471 | ||||||
| *Insmed, Inc. |
2,352 | 70,913 | ||||||
| *Inspire Medical Systems, Inc. |
697 | 187,897 | ||||||
| *Insulet Corp. |
6,315 | 1,957,776 | ||||||
| *Integer Holdings Corp. |
26,919 | 2,423,248 | ||||||
| *Integra LifeSciences Holdings Corp. |
60,648 | 4,030,666 | ||||||
| *Intellia Therapeutics, Inc. |
41,799 | 5,558,431 | ||||||
| *Intra-Cellular Therapies, Inc. |
43,977 | 1,894,089 | ||||||
| *IntriCon Corp. |
6,136 | 104,312 | ||||||
| *Intuitive Surgical, Inc. |
28,428 | 10,266,204 | ||||||
| *Invacare Corp. |
17,936 | 88,604 | ||||||
| #*Invitae Corp. |
175 | 4,638 | ||||||
Dimensional U.S. Core Equity 2 ETF
SCHEDULE OF INVESTMENTS
October 31, 2021
| Security Description |
Shares | Fair Value | ||||||
| HEALTH CARE (Continued) |
| |||||||
| *Ionis Pharmaceuticals, Inc. |
24,721 | $ | 787,858 | |||||
| *Iovance Biotherapeutics, Inc. |
15,415 | 374,739 | ||||||
| *IQVIA Holdings, Inc. |
66,021 | 17,259,210 | ||||||
| *iRhythm Technologies, Inc. |
100 | 7,014 | ||||||
| *Ironwood Pharmaceuticals, Inc. |
23,334 | 297,975 | ||||||
| *IVERIC bio, Inc. |
19,988 | 353,788 | ||||||
| *Jazz Pharmaceuticals PLC |
35,981 | 4,786,912 | ||||||
| Johnson & Johnson |
844,412 | 137,537,827 | ||||||
| *Joint Corp. (The) |
518 | 45,315 | ||||||
| *Jounce Therapeutics, Inc. |
28,486 | 250,107 | ||||||
| #*Kala Pharmaceuticals, Inc. |
17,388 | 30,255 | ||||||
| #*KalVista Pharmaceuticals, Inc. |
14,753 | 265,259 | ||||||
| *Karuna Therapeutics, Inc. |
126 | 17,688 | ||||||
| #*Karyopharm Therapeutics, Inc. |
14,212 | 77,598 | ||||||
| *Kewaunee Scientific Corp. |
1,276 | 16,333 | ||||||
| *Kodiak Sciences, Inc. |
2,339 | 273,874 | ||||||
| *Krystal Biotech, Inc. |
3,899 | 195,301 | ||||||
| *Kura Oncology, Inc. |
36,475 | 598,920 | ||||||
| *Laboratory Corp. of America Holdings |
47,954 | 13,763,757 | ||||||
| #*Lannett Co., Inc. |
21,662 | 59,137 | ||||||
| *Lantheus Holdings, Inc. |
59,463 | 1,390,840 | ||||||
| *LeMaitre Vascular, Inc. |
19,396 | 1,008,786 | ||||||
| *Lensar, Inc. |
11,199 | 80,073 | ||||||
| #*Lexicon Pharmaceuticals, Inc. |
3,361 | 17,780 | ||||||
| *LHC Group, Inc. |
37,456 | 5,041,203 | ||||||
| #*Ligand Pharmaceuticals, Inc. |
18,334 | 2,675,664 | ||||||
| *LivaNova PLC |
33,811 | 2,593,980 | ||||||
| *MacroGenics, Inc. |
41,633 | 813,092 | ||||||
| *Madrigal Pharmaceuticals, Inc. |
14,463 | 1,124,498 | ||||||
| *Magellan Health, Inc. |
27,709 | 2,627,644 | ||||||
| *Masimo Corp. |
20,137 | 5,709,645 | ||||||
| McKesson Corp. |
63,190 | 13,135,937 | ||||||
| *»Medcath Corp. |
9,997 | — | ||||||
| *MEDNAX, Inc. |
83,452 | 2,272,398 | ||||||
| *Medpace Holdings, Inc. |
34,976 | 7,923,813 | ||||||
| Medtronic PLC |
188,788 | 22,628,130 | ||||||
| Merck & Co., Inc. |
632,612 | 55,701,487 | ||||||
| *Meridian Bioscience, Inc. |
48,794 | 917,815 | ||||||
| *Merit Medical Systems, Inc. |
44,657 | 3,003,630 | ||||||
| *Merrimack Pharmaceuticals, Inc. |
5,776 | 24,837 | ||||||
| *Mersana Therapeutics, Inc. |
42,229 | 361,480 | ||||||
| #Mesa Laboratories, Inc. |
1,215 | 371,426 | ||||||
| *Mettler-Toledo International, Inc. |
9,541 | 14,129,076 | ||||||
| *Mirati Therapeutics, Inc. |
1,724 | 325,870 | ||||||
| *Moderna, Inc. |
20,180 | 6,966,338 | ||||||
| *ModivCare, Inc. |
15,050 | 2,449,689 | ||||||
| #*Molecular Templates, Inc. |
22,407 | 116,965 | ||||||
| *Molina Healthcare, Inc. |
67,694 | 20,018,470 | ||||||
| *Morphic Holding, Inc. |
2,821 | 162,208 | ||||||
| *Myriad Genetics, Inc. |
71,032 | 2,185,655 | ||||||
| *Natera, Inc. |
1,006 | 115,257 | ||||||
| *National HealthCare Corp. |
18,137 | 1,268,502 | ||||||
| *National Research Corp. |
12,563 | 543,978 | ||||||
| *Natus Medical, Inc. |
31,255 | 782,938 | ||||||
| *Nektar Therapeutics |
49,115 | 744,583 | ||||||
| *Neogen Corp. |
55,988 | 2,368,852 | ||||||
Dimensional U.S. Core Equity 2 ETF
SCHEDULE OF INVESTMENTS
October 31, 2021
| Security Description |
Shares | Fair Value | ||||||
| HEALTH CARE (Continued) |
| |||||||
| *NeoGenomics, Inc. |
36,131 | $ | 1,662,026 | |||||
| *Neurocrine Biosciences, Inc. |
10,069 | 1,061,373 | ||||||
| *Nevro Corp. |
1,113 | 126,593 | ||||||
| *NextGen Healthcare, Inc. |
63,237 | 1,040,881 | ||||||
| *NGM Biopharmaceuticals, Inc. |
13,162 | 243,102 | ||||||
| #*Novavax, Inc. |
972 | 144,663 | ||||||
| *Novocure, Ltd. |
7,388 | 757,787 | ||||||
| *NuVasive, Inc. |
49,421 | 2,637,105 | ||||||
| *Omnicell, Inc. |
26,675 | 4,752,151 | ||||||
| *OPKO Health, Inc. |
114,043 | 432,223 | ||||||
| *OptimizeRx Corp. |
175 | 16,923 | ||||||
| *Option Care Health, Inc. |
40,578 | 1,108,997 | ||||||
| *OraSure Technologies, Inc. |
59,723 | 637,244 | ||||||
| *Organogenesis Holdings, Inc. |
2,397 | 26,319 | ||||||
| Organon & Co. |
76,617 | 2,815,675 | ||||||
| *Orthofix Medical, Inc. |
18,242 | 656,347 | ||||||
| *OrthoPediatrics Corp. |
3,041 | 216,428 | ||||||
| *Otonomy, Inc. |
19,196 | 40,312 | ||||||
| *Owens & Minor, Inc. |
70,651 | 2,534,958 | ||||||
| #*Pacific Biosciences of California, Inc. |
2,829 | 74,912 | ||||||
| *Pacira BioSciences, Inc. |
19,730 | 1,031,484 | ||||||
| Patterson Cos., Inc. |
111,315 | 3,479,707 | ||||||
| *»PDL BioPharma, Inc. |
147,592 | 382,263 | ||||||
| *Pennant Group, Inc. (The) |
32,081 | 820,311 | ||||||
| #*Penumbra, Inc. |
3,157 | 873,068 | ||||||
| *PerkinElmer, Inc. |
64,881 | 11,476,800 | ||||||
| Perrigo Co. PLC |
57,003 | 2,573,685 | ||||||
| *Personalis, Inc. |
3,057 | 59,978 | ||||||
| #*PetIQ, Inc. |
20,575 | 515,404 | ||||||
| Pfizer, Inc. |
1,223,377 | 53,510,510 | ||||||
| *Phathom Pharmaceuticals, Inc. |
44 | 1,035 | ||||||
| Phibro Animal Health Corp., Class A |
15,244 | 334,453 | ||||||
| *Pieris Pharmaceuticals, Inc. |
18,423 | 84,377 | ||||||
| #*Precigen, Inc. |
3,669 | 17,721 | ||||||
| Premier, Inc., Class A |
65,577 | 2,554,224 | ||||||
| *Prestige Consumer Healthcare, Inc. |
48,820 | 2,928,712 | ||||||
| *Progyny, Inc. |
1,120 | 68,802 | ||||||
| *Protagonist Therapeutics, Inc. |
20,607 | 642,114 | ||||||
| *Prothena Corp. PLC |
41,969 | 2,322,984 | ||||||
| *Psychemedics Corp. |
478 | 3,972 | ||||||
| *PTC Therapeutics, Inc. |
1,107 | 41,989 | ||||||
| *Pulse Biosciences, Inc. |
2,860 | 60,317 | ||||||
| *Quanterix Corp. |
6,488 | 328,358 | ||||||
| Quest Diagnostics, Inc. |
70,410 | 10,334,780 | ||||||
| *Quidel Corp. |
32,665 | 4,336,932 | ||||||
| *R1 RCM, Inc. |
68,050 | 1,476,685 | ||||||
| *RadNet, Inc. |
41,812 | 1,299,935 | ||||||
| *RAPT Therapeutics, Inc. |
132 | 4,169 | ||||||
| *Regeneron Pharmaceuticals, Inc. |
14,919 | 9,547,265 | ||||||
| *REGENXBIO, Inc. |
27,120 | 961,133 | ||||||
| *Repligen Corp. |
30,207 | 8,775,134 | ||||||
| *Replimune Group, Inc. |
11,319 | 334,024 | ||||||
| *ResMed, Inc. |
48,231 | 12,680,412 | ||||||
| *REVOLUTION Medicines, Inc. |
655 | 19,277 | ||||||
| *Rhythm Pharmaceuticals, Inc. |
16,829 | 193,702 | ||||||
| *Rigel Pharmaceuticals, Inc. |
39,043 | 131,184 | ||||||
| *Rocket Pharmaceuticals, Inc. |
21,773 | 646,876 | ||||||
Dimensional U.S. Core Equity 2 ETF
SCHEDULE OF INVESTMENTS
October 31, 2021
| Security Description |
Shares | Fair Value | ||||||
| HEALTH CARE (Continued) |
| |||||||
| *Rubius Therapeutics, Inc. |
70 | $ | 995 | |||||
| *Sage Therapeutics, Inc. |
3,386 | 136,659 | ||||||
| *Sangamo Therapeutics, Inc. |
106,765 | 866,932 | ||||||
| *Sarepta Therapeutics, Inc. |
12,131 | 959,926 | ||||||
| #*Scholar Rock Holding Corp. |
1,034 | 27,194 | ||||||
| *scPharmaceuticals, Inc. |
3,700 | 21,756 | ||||||
| *Seagen, Inc. |
20,488 | 3,612,649 | ||||||
| *SeaSpine Holdings Corp. |
24,428 | 365,443 | ||||||
| Select Medical Holdings Corp. |
156,422 | 5,196,339 | ||||||
| *Shockwave Medical, Inc. |
5,607 | 1,198,216 | ||||||
| *SIGA Technologies, Inc. |
10,024 | 72,273 | ||||||
| #Simulations Plus, Inc. |
4,471 | 225,786 | ||||||
| *Spectrum Pharmaceuticals, Inc. |
70,060 | 128,210 | ||||||
| #*Spero Therapeutics, Inc. |
14,666 | 257,535 | ||||||
| #*Springworks Therapeutics, Inc. |
4,505 | 302,105 | ||||||
| *STAAR Surgical Co. |
6,051 | 716,801 | ||||||
| *Star Equity Holdings, Inc. |
862 | 2,276 | ||||||
| STERIS PLC |
40,236 | 9,404,763 | ||||||
| Stryker Corp. |
34,315 | 9,130,192 | ||||||
| *Supernus Pharmaceuticals, Inc. |
56,043 | 1,672,884 | ||||||
| *Surgalign Holdings, Inc. |
73,026 | 70,200 | ||||||
| *Surgery Partners, Inc. |
47,617 | 1,958,963 | ||||||
| *Surmodics, Inc. |
10,887 | 605,970 | ||||||
| *Sutro Biopharma, Inc. |
4,877 | 98,320 | ||||||
| *Syndax Pharmaceuticals, Inc. |
14,267 | 277,493 | ||||||
| *Syneos Health, Inc. |
76,271 | 7,119,135 | ||||||
| #*Syros Pharmaceuticals, Inc. |
25,586 | 105,670 | ||||||
| *Tactile Systems Technology, Inc. |
247 | 8,519 | ||||||
| *Tandem Diabetes Care, Inc. |
132 | 17,996 | ||||||
| *Taro Pharmaceutical Industries, Ltd. |
21,551 | 1,197,589 | ||||||
| *TCR2 Therapeutics, Inc. |
499 | 3,144 | ||||||
| #*Teladoc Health, Inc. |
11,260 | 1,684,383 | ||||||
| *Teleflex, Inc. |
17,780 | 6,346,393 | ||||||
| *Tenet Healthcare Corp. |
73,547 | 5,270,378 | ||||||
| *Thermo Fisher Scientific, Inc. |
69,685 | 44,115,483 | ||||||
| *Tivity Health, Inc. |
2,604 | 65,152 | ||||||
| *Travere Therapeutics, Inc. |
38,496 | 1,109,070 | ||||||
| *Triple-S Management Corp., Class B |
26,289 | 927,739 | ||||||
| *Turning Point Therapeutics, Inc. |
2,005 | 83,368 | ||||||
| *Twist Bioscience Corp. |
2,794 | 331,927 | ||||||
| *Ultragenyx Pharmaceutical, Inc. |
3,619 | 303,706 | ||||||
| *United Therapeutics Corp. |
34,445 | 6,570,728 | ||||||
| UnitedHealth Group, Inc. |
239,504 | 110,284,407 | ||||||
| *Universal Health Services, Inc., Class B |
56,292 | 6,985,837 | ||||||
| US Physical Therapy, Inc. |
14,619 | 1,576,805 | ||||||
| *Utah Medical Products, Inc. |
3,708 | 359,046 | ||||||
| *Vanda Pharmaceuticals, Inc. |
54,389 | 931,140 | ||||||
| *Varex Imaging Corp. |
40,648 | 1,091,399 | ||||||
| *VBI Vaccines, Inc. |
6,250 | 18,125 | ||||||
| *Veeva Systems, Inc., Class A |
23,541 | 7,462,732 | ||||||
| *Veracyte, Inc. |
10,561 | 505,661 | ||||||
| #*Vericel Corp. |
8,619 | 396,646 | ||||||
| *Vertex Pharmaceuticals, Inc. |
17,946 | 3,318,754 | ||||||
| Viatris, Inc. |
388,412 | 5,185,300 | ||||||
| *ViewRay, Inc. |
7,940 | 58,041 | ||||||
| *Vocera Communications, Inc. |
6,375 | 360,697 | ||||||
Dimensional U.S. Core Equity 2 ETF
SCHEDULE OF INVESTMENTS
October 31, 2021
| Security Description |
Shares | Fair Value | ||||||
| HEALTH CARE (Continued) |
| |||||||
| *Waters Corp. |
17,544 | $ | 6,448,297 | |||||
| West Pharmaceutical Services, Inc. |
45,832 | 19,702,260 | ||||||
| *Xencor, Inc. |
52,870 | 2,091,537 | ||||||
| *Xenon Pharmaceuticals, Inc. |
3,287 | 102,390 | ||||||
| *y-Mabs Therapeutics, Inc. |
6,032 | 148,146 | ||||||
| Zimmer Biomet Holdings, Inc. |
41,479 | 5,936,474 | ||||||
| Zoetis, Inc. |
117,952 | 25,501,222 | ||||||
| #*Zogenix, Inc. |
10,080 | 154,526 | ||||||
| *Zynerba Pharmaceuticals, Inc. |
3,973 | 15,217 | ||||||
| *Zynex, Inc. |
46 | 576 | ||||||
|
|
|
|||||||
| TOTAL HEALTH CARE |
1,689,681,958 | |||||||
|
|
|
|||||||
| INDUSTRIALS (13.8%) |
||||||||
| 3M Co. |
164,563 | 29,404,117 | ||||||
| A O Smith Corp. |
91,160 | 6,661,061 | ||||||
| *AAON, Inc. |
74,880 | 5,365,152 | ||||||
| *AAR Corp. |
37,349 | 1,321,034 | ||||||
| ABM Industries, Inc. |
75,291 | 3,313,557 | ||||||
| *Acacia Research Corp. |
23,858 | 136,706 | ||||||
| ACCO Brands Corp. |
111,365 | 920,989 | ||||||
| Acme United Corp. |
1,355 | 50,135 | ||||||
| Acuity Brands, Inc. |
30,609 | 6,288,007 | ||||||
| #ADT, Inc. |
57,681 | 481,636 | ||||||
| Advanced Drainage Systems, Inc. |
58,510 | 6,599,928 | ||||||
| *AECOM |
139,269 | 9,521,822 | ||||||
| Aerojet Rocketdyne Holdings, Inc. |
107,767 | 4,742,826 | ||||||
| *AeroVironment, Inc. |
26,792 | 2,387,435 | ||||||
| *AGCO Corp. |
64,071 | 7,830,117 | ||||||
| Air Lease Corp. |
127,840 | 5,119,992 | ||||||
| *Air T, Inc. |
720 | 19,217 | ||||||
| *Air Transport Services Group, Inc. |
68,033 | 1,693,341 | ||||||
| Alamo Group, Inc. |
12,193 | 1,843,582 | ||||||
| *Alaska Air Group, Inc. |
106,648 | 5,631,014 | ||||||
| Albany International Corp. |
34,443 | 2,777,828 | ||||||
| *Allegiant Travel Co. |
18,352 | 3,216,555 | ||||||
| Allegion PLC |
56,652 | 7,268,452 | ||||||
| *Allied Motion Technologies, Inc. |
16,723 | 587,813 | ||||||
| Allison Transmission Holdings, Inc. |
151,738 | 5,061,980 | ||||||
| Altra Industrial Motion Corp. |
46,134 | 2,405,888 | ||||||
| AMERCO |
15,759 | 11,614,225 | ||||||
| *Ameresco, Inc., Class A |
23,292 | 1,912,972 | ||||||
| #*American Airlines Group, Inc. |
124,820 | 2,396,544 | ||||||
| *American Superconductor Corp. |
10,409 | 191,317 | ||||||
| *American Woodmark Corp. |
19,682 | 1,352,941 | ||||||
| *AMETEK, Inc. |
91,945 | 12,173,518 | ||||||
| *API Group Corp. |
51,897 | 1,130,317 | ||||||
| Apogee Enterprises, Inc. |
24,876 | 1,043,051 | ||||||
| Applied Industrial Technologies, Inc. |
35,912 | 3,500,702 | ||||||
| ARC Document Solutions, Inc. |
22,382 | 67,817 | ||||||
| ArcBest Corp. |
18,796 | 1,688,821 | ||||||
| Arcosa, Inc. |
60,820 | 3,146,219 | ||||||
| Argan, Inc. |
18,143 | 748,580 | ||||||
| *Armstrong Flooring, Inc. |
17,150 | 48,706 | ||||||
| Armstrong World Industries, Inc. |
51,993 | 5,493,060 | ||||||
| *ASGN, Inc. |
63,927 | 7,649,505 | ||||||
| *Astec Industries, Inc. |
28,571 | 1,525,120 | ||||||
| *Astronics Corp. |
12,136 | 156,554 | ||||||
Dimensional U.S. Core Equity 2 ETF
SCHEDULE OF INVESTMENTS
October 31, 2021
| Security Description |
Shares | Fair Value | ||||||
| INDUSTRIALS (Continued) |
| |||||||
| *Astronics Corp., Class B |
13,053 | $ | 166,360 | |||||
| *Atkore, Inc. |
53,241 | 5,032,872 | ||||||
| *Atlas Air Worldwide Holdings, Inc., Class A |
29,345 | 2,380,466 | ||||||
| #*Avis Budget Group, Inc. |
79,607 | 13,796,689 | ||||||
| *Axon Enterprise, Inc. |
24,137 | 4,343,695 | ||||||
| *Azek Co., Inc. (The) |
15,539 | 570,126 | ||||||
| AZZ, Inc. |
30,598 | 1,625,672 | ||||||
| *Barnes Group, Inc. |
69,715 | 2,923,847 | ||||||
| *Barrett Business Services, Inc. |
8,880 | 728,160 | ||||||
| *Beacon Roofing Supply, Inc. |
83,596 | 4,419,721 | ||||||
| BGSF, Inc. |
5,624 | 67,657 | ||||||
| *Blue Bird Corp. |
10,281 | 201,610 | ||||||
| *BlueLinx Holdings, Inc. |
159 | 7,573 | ||||||
| *Boeing Co. (The) |
52,060 | 10,777,982 | ||||||
| Boise Cascade Co. |
45,089 | 2,552,939 | ||||||
| *Booz Allen Hamilton Holding Corp. |
102,622 | 8,913,747 | ||||||
| *Brady Corp., Class A |
53,686 | 2,796,504 | ||||||
| *BrightView Holdings, Inc. |
20,488 | 324,940 | ||||||
| *Brink’s Co. (The) |
65,094 | 4,483,675 | ||||||
| *Builders FirstSource, Inc. |
237,819 | 13,857,713 | ||||||
| BWX Technologies, Inc. |
96,588 | 5,480,403 | ||||||
| *CACI International, Inc., Class A |
25,465 | 7,324,753 | ||||||
| CAI International, Inc. |
21,839 | 1,221,455 | ||||||
| *Carlisle Cos., Inc. |
48,066 | 10,714,873 | ||||||
| Carrier Global Corp. |
279,096 | 14,577,184 | ||||||
| *Casella Waste Systems, Inc. |
42,610 | 3,695,139 | ||||||
| Caterpillar, Inc. |
176,331 | 35,973,287 | ||||||
| *CBIZ, Inc. |
80,301 | 2,947,850 | ||||||
| *CECO Environmental Corp. |
31,961 | 219,892 | ||||||
| CH Robinson Worldwide, Inc. |
69,910 | 6,780,571 | ||||||
| *Chart Industries, Inc. |
41,330 | 7,336,902 | ||||||
| *Cimpress PLC |
9,313 | 831,837 | ||||||
| *Cintas Corp. |
45,847 | 19,856,336 | ||||||
| *CIRCOR International, Inc. |
18,707 | 533,898 | ||||||
| *Clarivate PLC |
11,842 | 277,695 | ||||||
| *Clean Harbors, Inc. |
66,715 | 7,508,106 | ||||||
| *Colfax Corp. |
99,071 | 5,114,045 | ||||||
| *Columbus McKinnon Corp. |
25,404 | 1,200,847 | ||||||
| *Comfort Systems USA, Inc. |
45,891 | 4,197,650 | ||||||
| *Commercial Vehicle Group, Inc. |
27,123 | 272,315 | ||||||
| CompX International, Inc. |
294 | 6,350 | ||||||
| *Construction Partners, Inc., Class A |
36,408 | 1,296,489 | ||||||
| #*Copa Holdings SA, Class A |
24,894 | 1,841,160 | ||||||
| *Copart, Inc. |
140,660 | 21,843,091 | ||||||
| *Cornerstone Building Brands, Inc. |
95,831 | 1,371,342 | ||||||
| Costamare, Inc. |
130,079 | 1,744,359 | ||||||
| *CoStar Group, Inc. |
66,909 | 5,757,519 | ||||||
| Covanta Holding Corp. |
148,081 | 2,988,275 | ||||||
| *Covenant Logistics Group, Inc. |
18,137 | 515,091 | ||||||
| *CPI Aerostructures, Inc. |
7,107 | 21,321 | ||||||
| CRA International, Inc. |
8,810 | 967,514 | ||||||
| *Crane Co. |
56,346 | 5,819,415 | ||||||
| CSW Industrials, Inc. |
17,355 | 2,405,750 | ||||||
| *CSX Corp. |
968,576 | 35,033,394 | ||||||
| *Cummins, Inc. |
74,027 | 17,754,636 | ||||||
| *Curtiss-Wright Corp. |
49,535 | 6,324,629 | ||||||
Dimensional U.S. Core Equity 2 ETF
SCHEDULE OF INVESTMENTS
October 31, 2021
| Security Description |
Shares | Fair Value | ||||||
| INDUSTRIALS (Continued) |
| |||||||
| *Daseke, Inc. |
17,245 | $ | 162,965 | |||||
| Deere & Co. |
80,290 | 27,484,070 | ||||||
| *Delta Air Lines, Inc. |
282,236 | 11,043,895 | ||||||
| #*Deluxe Corp. |
40,096 | 1,430,224 | ||||||
| *Donaldson Co., Inc. |
92,161 | 5,530,582 | ||||||
| Douglas Dynamics, Inc. |
36,008 | 1,523,138 | ||||||
| *Dover Corp. |
78,163 | 13,215,800 | ||||||
| *Ducommun, Inc. |
13,021 | 630,086 | ||||||
| *Dxp Enterprises, Inc. |
19,774 | 651,751 | ||||||
| *Dycom Industries, Inc. |
35,607 | 2,827,908 | ||||||
| #*Eagle Bulk Shipping, Inc. |
9,827 | 423,052 | ||||||
| *Eastern Co. (The) |
4,389 | 105,468 | ||||||
| Eaton Corp PLC |
123,263 | 20,308,812 | ||||||
| *Echo Global Logistics, Inc. |
31,920 | 1,539,502 | ||||||
| EMCOR Group, Inc. |
65,362 | 7,940,829 | ||||||
| *Emerson Electric Co. |
177,114 | 17,181,829 | ||||||
| *Encore Wire Corp. |
24,083 | 3,228,567 | ||||||
| *Energy Recovery, Inc. |
8,939 | 181,640 | ||||||
| Enerpac Tool Group Corp. |
67,942 | 1,419,308 | ||||||
| EnerSys |
47,440 | 3,797,098 | ||||||
| Eneti, Inc. |
6,156 | 87,231 | ||||||
| #Ennis, Inc. |
34,455 | 652,578 | ||||||
| EnPro Industries, Inc. |
24,942 | 2,236,300 | ||||||
| *Equifax, Inc. |
27,025 | 7,497,546 | ||||||
| *ESCO Technologies, Inc. |
25,975 | 2,196,446 | ||||||
| *Espey Mfg. & Electronics Corp. |
1,611 | 24,374 | ||||||
| *Evoqua Water Technologies Corp. |
62,407 | 2,610,485 | ||||||
| *ExOne Co. (The) |
9,959 | 229,256 | ||||||
| Expeditors International of Washington, Inc. |
69,880 | 8,613,409 | ||||||
| Exponent, Inc. |
51,211 | 5,879,023 | ||||||
| Fastenal Co. |
201,754 | 11,516,118 | ||||||
| *Federal Signal Corp. |
71,826 | 3,074,871 | ||||||
| FedEx Corp. |
86,110 | 20,281,488 | ||||||
| Flowserve Corp. |
67,660 | 2,274,729 | ||||||
| *Fluor Corp. |
44,006 | 855,477 | ||||||
| *Forrester Research, Inc. |
17,918 | 954,133 | ||||||
| Fortive Corp. |
73,192 | 5,541,366 | ||||||
| Fortune Brands Home & Security, Inc. |
93,062 | 9,436,487 | ||||||
| *Forward Air Corp. |
31,524 | 3,170,053 | ||||||
| *Franklin Covey Co. |
12,028 | 508,183 | ||||||
| *Franklin Electric Co., Inc. |
47,903 | 4,137,861 | ||||||
| *FTI Consulting, Inc. |
52,247 | 7,519,388 | ||||||
| #*Fuelcell Energy, Inc. |
2,532 | 20,231 | ||||||
| *Gates Industrial Corp. PLC |
840 | 13,810 | ||||||
| *GATX Corp. |
35,809 | 3,396,484 | ||||||
| Genco Shipping & Trading, Ltd. |
39,454 | 677,425 | ||||||
| *Gencor Industries, Inc. |
11,809 | 131,788 | ||||||
| *Generac Holdings, Inc. |
83,981 | 41,869,567 | ||||||
| General Dynamics Corp. |
68,990 | 13,987,722 | ||||||
| General Electric Co. |
103,936 | 10,899,768 | ||||||
| *Gibraltar Industries, Inc. |
36,954 | 2,407,923 | ||||||
| Global Industrial Co. |
28,569 | 1,159,330 | ||||||
| *GMS, Inc. |
47,349 | 2,345,196 | ||||||
| *Gorman-Rupp Co. (The) |
35,268 | 1,499,595 | ||||||
| Graco, Inc. |
116,598 | 8,765,838 | ||||||
| *GrafTech International, Ltd. |
116,310 | 1,244,517 | ||||||
| *Graham Corp. |
6,768 | 86,021 | ||||||
Dimensional U.S. Core Equity 2 ETF
SCHEDULE OF INVESTMENTS
October 31, 2021
| Security Description |
Shares | Fair Value | ||||||
| INDUSTRIALS (Continued) |
| |||||||
| Granite Construction, Inc. |
44,868 | $ | 1,665,500 | |||||
| *Great Lakes Dredge & Dock Corp. |
74,754 | 1,137,756 | ||||||
| #*Greenbrier Cos., Inc. (The) |
35,977 | 1,475,777 | ||||||
| *Griffon Corp. |
57,956 | 1,535,254 | ||||||
| *GXO Logistics, Inc. |
136,487 | 12,120,046 | ||||||
| *H&E Equipment Services, Inc. |
44,791 | 2,019,178 | ||||||
| *Harsco Corp. |
102,883 | 1,759,299 | ||||||
| *Hawaiian Holdings, Inc. |
52,320 | 1,012,392 | ||||||
| *Healthcare Services Group, Inc. |
36,431 | 699,111 | ||||||
| Heartland Express, Inc. |
92,480 | 1,510,198 | ||||||
| HEICO Corp. |
29,600 | 4,125,944 | ||||||
| HEICO Corp., Class A |
43,717 | 5,494,353 | ||||||
| *Heidrick & Struggles International, Inc. |
21,359 | 1,001,310 | ||||||
| Helios Technologies, Inc. |
31,373 | 2,856,512 | ||||||
| Herc Holdings, Inc. |
34,552 | 6,289,846 | ||||||
| *Heritage-Crystal Clean, Inc. |
20,432 | 708,377 | ||||||
| *Herman Miller, Inc. |
85,008 | 3,308,511 | ||||||
| *Hexcel Corp. |
83,484 | 4,736,882 | ||||||
| Hillenbrand, Inc. |
101,441 | 4,611,508 | ||||||
| *HNI Corp. |
53,092 | 1,985,641 | ||||||
| Honeywell International, Inc. |
134,593 | 29,424,722 | ||||||
| *Howmet Aerospace, Inc. |
226,904 | 6,736,780 | ||||||
| *Hub Group, Inc., Class A |
39,007 | 3,064,780 | ||||||
| *Hubbell, Inc. |
45,574 | 9,086,088 | ||||||
| *Hudson Global, Inc. |
1,869 | 31,212 | ||||||
| *Huntington Ingalls Industries, Inc. |
42,603 | 8,636,906 | ||||||
| *Hurco Cos., Inc. |
7,633 | 247,691 | ||||||
| *Huron Consulting Group, Inc., Class A |
21,724 | 1,089,676 | ||||||
| *Hyster-Yale Materials Handling, Inc. |
14,371 | 690,383 | ||||||
| *IAA, Inc. |
111,215 | 6,633,975 | ||||||
| ICF International, Inc. |
23,152 | 2,326,544 | ||||||
| IDEX Corp. |
33,824 | 7,528,208 | ||||||
| *IES Holdings, Inc., Class A |
14,183 | 707,023 | ||||||
| IHS Markit, Ltd. |
12,192 | 1,593,738 | ||||||
| *Illinois Tool Works, Inc. |
76,157 | 17,353,896 | ||||||
| *Infrastructure and Energy Alternatives, Inc. |
1,451 | 16,063 | ||||||
| *Ingersoll Rand, Inc. |
175,862 | 9,454,341 | ||||||
| *INNOVATE Corp. |
24,247 | 95,776 | ||||||
| Innovative Solutions and Support, Inc. |
12,137 | 82,046 | ||||||
| Insperity, Inc. |
50,948 | 6,368,500 | ||||||
| Insteel Industries, Inc. |
24,636 | 1,001,946 | ||||||
| *Interface, Inc. |
55,051 | 790,532 | ||||||
| ITT, Inc. |
94,739 | 8,912,098 | ||||||
| Jacobs Engineering Group, Inc. |
55,786 | 7,833,470 | ||||||
| *JB Hunt Transport Services, Inc. |
57,787 | 11,395,019 | ||||||
| *JELD-WEN Holding, Inc. |
113,689 | 3,116,215 | ||||||
| *JetBlue Airways Corp. |
281,575 | 3,950,497 | ||||||
| John Bean Technologies Corp., Class A |
27,240 | 4,024,710 | ||||||
| Johnson Controls International PLC |
258,139 | 18,939,658 | ||||||
| Kadant, Inc. |
11,315 | 2,513,288 | ||||||
| *Kaman Corp. |
35,198 | 1,259,736 | ||||||
| *Kansas City Southern |
50,340 | 15,617,985 | ||||||
| *KAR Auction Services, Inc. |
143,574 | 2,106,231 | ||||||
| #KBR, Inc. |
173,211 | 7,351,075 | ||||||
| *Kelly Services, Inc., Class A |
40,041 | 721,939 | ||||||
| *Kennametal, Inc. |
98,616 | 3,919,986 | ||||||
Dimensional U.S. Core Equity 2 ETF
SCHEDULE OF INVESTMENTS
October 31, 2021
| Security Description |
Shares | Fair Value | ||||||
| INDUSTRIALS (Continued) |
| |||||||
| *Kforce, Inc. |
48,873 | $ | 3,165,015 | |||||
| *Kimball International, Inc., Class B |
47,205 | 513,118 | ||||||
| *Kirby Corp. |
49,142 | 2,575,532 | ||||||
| *Knight-Swift Transportation Holdings, Inc. |
164,272 | 9,312,580 | ||||||
| Korn Ferry |
61,699 | 4,763,780 | ||||||
| *Kratos Defense & Security Solutions, Inc. |
104,150 | 2,227,768 | ||||||
| *L B Foster Co., Class A |
7,453 | 118,726 | ||||||
| *L3Harris Technologies, Inc. |
52,039 | 11,997,071 | ||||||
| *Landstar System, Inc. |
28,650 | 5,036,957 | ||||||
| *Lawson Products, Inc. |
6,706 | 339,994 | ||||||
| *Leidos Holdings, Inc. |
87,482 | 8,746,450 | ||||||
| Lennox International, Inc. |
17,745 | 5,310,724 | ||||||
| *Limbach Holdings, Inc. |
2,344 | 16,478 | ||||||
| *Lincoln Electric Holdings, Inc. |
62,022 | 8,831,933 | ||||||
| *Lindsay Corp. |
11,344 | 1,652,480 | ||||||
| Lockheed Martin Corp. |
60,748 | 20,187,775 | ||||||
| *LS Starrett Co. (The), Class A |
2,592 | 26,179 | ||||||
| LSI Industries, Inc. |
23,361 | 173,806 | ||||||
| *Lyft, Inc., Class A |
2,679 | 122,886 | ||||||
| Macquarie Infrastructure Holdings LLC |
53,850 | 198,707 | ||||||
| *Manitex International, Inc. |
10,732 | 69,436 | ||||||
| *Manitowoc Co., Inc. (The) |
32,460 | 695,618 | ||||||
| ManpowerGroup, Inc. |
46,384 | 4,483,014 | ||||||
| *ManTech International Corp., Class A |
33,094 | 2,853,365 | ||||||
| Marten Transport, Ltd. |
92,356 | 1,535,880 | ||||||
| *Masco Corp. |
78,913 | 5,172,747 | ||||||
| *Masonite International Corp. |
30,133 | 3,616,261 | ||||||
| *MasTec, Inc. |
87,482 | 7,797,271 | ||||||
| *Mastech Digital, Inc. |
2,364 | 43,829 | ||||||
| *Matrix Service Co. |
25,320 | 259,024 | ||||||
| Matson, Inc. |
51,350 | 4,276,428 | ||||||
| *Matthews International Corp., Class A |
29,398 | 1,010,409 | ||||||
| Maxar Technologies, Inc. |
17,137 | 454,987 | ||||||
| McGrath RentCorp. |
34,131 | 2,462,210 | ||||||
| *Mercury Systems, Inc. |
40,702 | 2,097,781 | ||||||
| *Meritor, Inc. |
91,152 | 2,218,640 | ||||||
| *Mesa Air Group, Inc. |
27,580 | 207,953 | ||||||
| *Middleby Corp. (The) |
44,395 | 8,099,424 | ||||||
| *Miller Industries, Inc. |
10,037 | 362,737 | ||||||
| *Mistras Group, Inc. |
21,634 | 212,446 | ||||||
| *Moog, Inc., Class A |
35,237 | 2,661,451 | ||||||
| *MRC Global, Inc. |
67,852 | 563,172 | ||||||
| *MSA Safety, Inc. |
37,579 | 5,750,714 | ||||||
| *MSC Industrial Direct Co., Inc. |
44,483 | 3,739,686 | ||||||
| *Mueller Industries, Inc. |
68,239 | 3,592,101 | ||||||
| *Mueller Water Products, Inc., Class A |
178,158 | 2,923,573 | ||||||
| *MYR Group, Inc. |
23,070 | 2,356,601 | ||||||
| National Presto Industries, Inc. |
7,205 | 599,096 | ||||||
| Nielsen Holdings PLC |
159,097 | 3,221,714 | ||||||
| *NL Industries, Inc. |
26,449 | 152,611 | ||||||
| *NN, Inc. |
22,245 | 111,003 | ||||||
| Nordson Corp. |
38,303 | 9,737,006 | ||||||
| *Norfolk Southern Corp. |
99,305 | 29,101,330 | ||||||
| Northrop Grumman Corp. |
42,947 | 15,341,527 | ||||||
| *Northwest Pipe Co. |
11,077 | 263,190 | ||||||
| *NOW, Inc. |
101,609 | 733,617 | ||||||
| *NV5 Global, Inc. |
13,707 | 1,427,310 | ||||||
Dimensional U.S. Core Equity 2 ETF
SCHEDULE OF INVESTMENTS
October 31, 2021
| Security Description |
Shares | Fair Value | ||||||
| INDUSTRIALS (Continued) |
| |||||||
| nVent Electric PLC |
88,839 | $ | 3,149,343 | |||||
| Old Dominion Freight Line, Inc. |
106,407 | 36,322,029 | ||||||
| Omega Flex, Inc. |
3,089 | 447,164 | ||||||
| *Orion Group Holdings, Inc. |
16,782 | 74,680 | ||||||
| *Oshkosh Corp. |
80,886 | 8,654,802 | ||||||
| Otis Worldwide Corp. |
105,111 | 8,441,464 | ||||||
| Owens Corning |
99,842 | 9,326,241 | ||||||
| *PACCAR, Inc. |
170,425 | 15,273,488 | ||||||
| *PAM Transportation Services, Inc. |
11,086 | 685,337 | ||||||
| Pangaea Logistics Solutions, Ltd. |
14,834 | 67,050 | ||||||
| Park Aerospace Corp. |
19,413 | 254,116 | ||||||
| *Parker-Hannifin Corp. |
66,921 | 19,848,099 | ||||||
| *Park-Ohio Holdings Corp. |
10,377 | 241,992 | ||||||
| *Parsons Corp. |
13,451 | 465,943 | ||||||
| Patriot Transportation Holding, Inc. |
1,695 | 25,984 | ||||||
| Pentair PLC |
137,758 | 10,189,959 | ||||||
| *Perma-Fix Environmental Services, Inc. |
1,601 | 11,527 | ||||||
| *Perma-Pipe International Holdings, Inc. |
2,769 | 23,675 | ||||||
| *PGT Innovations, Inc. |
68,419 | 1,460,746 | ||||||
| *Pitney Bowes, Inc. |
121,715 | 844,702 | ||||||
| #*Plug Power, Inc. |
5,727 | 219,172 | ||||||
| *Powell Industries, Inc. |
11,854 | 306,544 | ||||||
| Preformed Line Products Co. |
4,777 | 331,524 | ||||||
| Primoris Services Corp. |
60,165 | 1,621,447 | ||||||
| *Proto Labs, Inc. |
16,397 | 980,705 | ||||||
| #*Quad/Graphics, Inc. |
21,228 | 83,638 | ||||||
| Quanex Building Products Corp. |
37,564 | 778,326 | ||||||
| Quanta Services, Inc. |
129,132 | 15,661,129 | ||||||
| *Radiant Logistics, Inc. |
48,514 | 326,499 | ||||||
| *Raven Industries, Inc. |
33,674 | 1,947,031 | ||||||
| Raytheon Technologies Corp. |
338,957 | 30,119,719 | ||||||
| *RBC Bearings, Inc. |
18,466 | 4,319,751 | ||||||
| *Red Violet, Inc. |
746 | 23,760 | ||||||
| *Regal Rexnord Corp. |
74,567 | 11,358,791 | ||||||
| Republic Services, Inc. |
144,929 | 19,507,443 | ||||||
| *Resideo Technologies, Inc. |
66,050 | 1,628,793 | ||||||
| Resources Connection, Inc. |
35,814 | 623,522 | ||||||
| REV Group, Inc. |
54,492 | 823,374 | ||||||
| *Robert Half International, Inc. |
74,877 | 8,466,342 | ||||||
| *Rockwell Automation, Inc. |
46,019 | 14,698,469 | ||||||
| Rollins, Inc. |
129,183 | 4,551,117 | ||||||
| *Roper Technologies, Inc. |
19,996 | 9,755,449 | ||||||
| *RR Donnelley & Sons Co. |
3,772 | 24,141 | ||||||
| *Rush Enterprises, Inc., Class A |
46,014 | 2,396,409 | ||||||
| *Rush Enterprises, Inc., Class B |
1,962 | 101,455 | ||||||
| *Ryder System, Inc. |
60,494 | 5,138,965 | ||||||
| *Saia, Inc. |
34,867 | 10,900,819 | ||||||
| Schneider National, Inc., Class B |
12,934 | 322,574 | ||||||
| Science Applications International Corp. |
56,485 | 5,071,223 | ||||||
| *Sensata Technologies Holding PLC |
144,157 | 7,943,051 | ||||||
| *Shyft Group, Inc. (The) |
34,791 | 1,433,737 | ||||||
| *Sifco Industries, Inc. |
1,400 | 10,738 | ||||||
| *Simpson Manufacturing Co., Inc. |
49,442 | 5,245,302 | ||||||
| *SiteOne Landscape Supply, Inc. |
31,140 | 7,316,654 | ||||||
| *SkyWest, Inc. |
56,700 | 2,439,801 | ||||||
| *Snap-on, Inc. |
36,861 | 7,491,261 | ||||||
Dimensional U.S. Core Equity 2 ETF
SCHEDULE OF INVESTMENTS
October 31, 2021
| Security Description |
Shares | Fair Value | ||||||
| INDUSTRIALS (Continued) |
| |||||||
| *Southwest Airlines Co. |
295,164 | $ | 13,955,354 | |||||
| *SP Plus Corp. |
19,607 | 632,326 | ||||||
| *Spirit AeroSystems Holdings, Inc., Class A |
78,129 | 3,225,946 | ||||||
| #*Spirit Airlines, Inc. |
58,969 | 1,288,473 | ||||||
| *SPX Corp. |
54,000 | 3,136,860 | ||||||
| SPX FLOW, Inc. |
49,991 | 3,734,828 | ||||||
| #*Standex International Corp. |
12,499 | 1,390,764 | ||||||
| *Stanley Black & Decker, Inc. |
60,105 | 10,802,672 | ||||||
| Steelcase, Inc., Class A |
101,401 | 1,206,672 | ||||||
| *Stericycle, Inc. |
36,108 | 2,416,347 | ||||||
| *Sterling Construction Co., Inc. |
18,672 | 448,875 | ||||||
| #*Sunrun, Inc. |
140,591 | 8,109,289 | ||||||
| *Team, Inc. |
15,873 | 38,413 | ||||||
| Tecnoglass, Inc. |
21,584 | 623,346 | ||||||
| *Tennant Co. |
21,875 | 1,738,188 | ||||||
| *Terex Corp. |
81,714 | 3,660,787 | ||||||
| Tetra Tech, Inc. |
53,685 | 9,430,307 | ||||||
| *Textainer Group Holdings, Ltd. |
64,261 | 2,524,815 | ||||||
| *Textron, Inc. |
150,506 | 11,114,868 | ||||||
| *Thermon Group Holdings, Inc. |
31,739 | 548,450 | ||||||
| *Timken Co. (The) |
75,272 | 5,340,548 | ||||||
| *Titan International, Inc. |
47,047 | 339,679 | ||||||
| *Titan Machinery, Inc. |
26,746 | 760,121 | ||||||
| Toro Co. (The) |
84,822 | 8,097,956 | ||||||
| *TPI Composites, Inc. |
33,950 | 1,141,739 | ||||||
| Trane Technologies PLC |
87,451 | 15,822,509 | ||||||
| *Transcat, Inc. |
5,991 | 448,606 | ||||||
| *TransDigm Group, Inc. |
10,166 | 6,341,754 | ||||||
| TransUnion |
47,148 | 5,435,693 | ||||||
| *Trex Co., Inc. |
119,685 | 12,734,484 | ||||||
| *TriMas Corp. |
54,758 | 1,826,179 | ||||||
| *TriNet Group, Inc. |
57,144 | 5,785,830 | ||||||
| Trinity Industries, Inc. |
143,454 | 4,023,885 | ||||||
| Triton International, Ltd. |
85,033 | 5,288,202 | ||||||
| *TrueBlue, Inc. |
43,318 | 1,206,406 | ||||||
| *Tutor Perini Corp. |
42,245 | 575,377 | ||||||
| *Twin Disc, Inc. |
9,373 | 127,285 | ||||||
| *Uber Technologies, Inc. |
6,322 | 277,030 | ||||||
| UFP Industries, Inc. |
78,447 | 6,419,318 | ||||||
| *Ultralife Corp. |
10,343 | 64,747 | ||||||
| *UniFirst Corp. |
15,110 | 2,991,176 | ||||||
| Union Pacific Corp. |
246,644 | 59,539,862 | ||||||
| #*United Airlines Holdings, Inc. |
200,599 | 9,255,638 | ||||||
| United Parcel Service, Inc., Class B |
167,104 | 35,671,691 | ||||||
| *United Rentals, Inc. |
62,326 | 23,628,410 | ||||||
| *Univar Solutions, Inc. |
88,747 | 2,270,148 | ||||||
| Universal Logistics Holdings, Inc. |
25,883 | 545,614 | ||||||
| *Upwork, Inc. |
2,617 | 123,313 | ||||||
| *US Ecology, Inc. |
28,025 | 902,125 | ||||||
| *US Xpress Enterprises, Inc., Class A |
15,607 | 118,145 | ||||||
| *USA Truck, Inc. |
7,165 | 138,070 | ||||||
| *Valmont Industries, Inc. |
20,135 | 4,811,460 | ||||||
| *Vectrus, Inc. |
12,323 | 596,803 | ||||||
| Verisk Analytics, Inc. |
42,576 | 8,952,456 | ||||||
| *Veritiv Corp. |
14,945 | 1,603,150 | ||||||
| *Viad Corp. |
19,731 | 875,464 | ||||||
| #*Vicor Corp. |
15,207 | 2,305,229 | ||||||
Dimensional U.S. Core Equity 2 ETF
SCHEDULE OF INVESTMENTS
October 31, 2021
| Security Description |
Shares | Fair Value | ||||||
| INDUSTRIALS (Continued) |
| |||||||
| *Vidler Water Resources, Inc. |
10,795 | $ | 133,426 | |||||
| *Virco MFG. Corp. |
2,861 | 9,499 | ||||||
| *Virgin Galactic Holdings, Inc. |
785 | 14,719 | ||||||
| *VSE Corp. |
12,191 | 677,210 | ||||||
| *Wabash National Corp. |
61,829 | 960,204 | ||||||
| Waste Management, Inc. |
113,653 | 18,210,620 | ||||||
| Watsco, Inc. |
1,750 | 506,476 | ||||||
| Watsco, Inc. |
25,302 | 7,326,953 | ||||||
| *Watts Water Technologies, Inc., Class A |
28,568 | 5,428,491 | ||||||
| *Welbilt, Inc. |
92,803 | 2,195,719 | ||||||
| *Werner Enterprises, Inc. |
93,991 | 4,259,672 | ||||||
| *WESCO International, Inc. |
60,611 | 7,852,761 | ||||||
| *Westinghouse Air Brake Technologies Corp. |
76,591 | 6,949,101 | ||||||
| *Willdan Group, Inc. |
2,228 | 74,482 | ||||||
| *Willis Lease Finance Corp. |
4,690 | 189,992 | ||||||
| *WillScot Mobile Mini Holdings Corp. |
225,500 | 7,836,125 | ||||||
| *Woodward, Inc. |
59,611 | 6,733,062 | ||||||
| *WW Grainger, Inc. |
25,359 | 11,744,006 | ||||||
| *XPO Logistics, Inc. |
136,195 | 11,685,531 | ||||||
| Xylem, Inc. |
95,424 | 12,461,420 | ||||||
| *Yellow Corp. |
466 | 4,077 | ||||||
| Zurn Water Solutions Corp. |
133,235 | 4,833,766 | ||||||
|
|
|
|||||||
| TOTAL INDUSTRIALS |
2,013,123,274 | |||||||
|
|
|
|||||||
| INFORMATION TECHNOLOGY (24.1%) |
| |||||||
| *3D Systems Corp. |
110,703 | 3,117,396 | ||||||
| *A10 Networks, Inc. |
26,600 | 497,154 | ||||||
| Accenture PLC, Class A |
155,759 | 55,884,772 | ||||||
| *ACI Worldwide, Inc. |
141,869 | 4,352,541 | ||||||
| #*ACM Research, Inc., Class A |
1,031 | 109,461 | ||||||
| *Adobe, Inc. |
69,394 | 45,131,082 | ||||||
| ADTRAN, Inc. |
46,191 | 853,610 | ||||||
| *Advanced Energy Industries, Inc. |
36,486 | 3,350,145 | ||||||
| *Advanced Micro Devices, Inc. |
97,435 | 11,714,610 | ||||||
| *Agilysys, Inc. |
15,692 | 748,822 | ||||||
| *Airgain, Inc. |
3,707 | 41,630 | ||||||
| *Akamai Technologies, Inc. |
81,748 | 8,621,144 | ||||||
| *Alarm.com Holdings, Inc. |
15,309 | 1,289,936 | ||||||
| *Alithya Group, Inc., Class A |
12,595 | 34,762 | ||||||
| *Alliance Data Systems Corp. |
26,164 | 2,230,481 | ||||||
| *Alpha & Omega Semiconductor, Ltd. |
27,852 | 965,072 | ||||||
| *Altair Engineering, Inc., Class A |
7,687 | 597,972 | ||||||
| #*Alteryx, Inc., Class A |
5,552 | 406,351 | ||||||
| *Ambarella, Inc. |
30,025 | 5,579,546 | ||||||
| Amdocs, Ltd. |
65,619 | 5,107,783 | ||||||
| *American Software, Inc., Class A |
22,587 | 653,442 | ||||||
| *Amkor Technology, Inc. |
281,898 | 6,179,204 | ||||||
| *Amphenol Corp., Class A |
134,952 | 10,360,265 | ||||||
| *Amtech Systems, Inc. |
13,210 | 198,414 | ||||||
| Analog Devices, Inc. |
164,731 | 28,579,181 | ||||||
| *Anaplan, Inc. |
15,173 | 989,431 | ||||||
| *ANSYS, Inc. |
30,112 | 11,429,913 | ||||||
| *Appfolio, Inc., Class A |
6,461 | 850,849 | ||||||
| #*Appian Corp. |
2 | 199 | ||||||
| *Apple, Inc. |
4,465,082 | 668,869,284 | ||||||
| *Applied Materials, Inc. |
295,382 | 40,363,950 | ||||||
Dimensional U.S. Core Equity 2 ETF
SCHEDULE OF INVESTMENTS
October 31, 2021
| Security Description |
Shares | Fair Value | ||||||
| INFORMATION TECHNOLOGY (Continued) |
| |||||||
| #*Applied Optoelectronics, Inc. |
9,865 | $ | 75,467 | |||||
| *Arista Networks, Inc. |
29,726 | 12,178,445 | ||||||
| *Arlo Technologies, Inc. |
50,947 | 351,534 | ||||||
| *Arrow Electronics, Inc. |
74,490 | 8,622,217 | ||||||
| *Asana, Inc., Class A |
12,573 | 1,707,413 | ||||||
| *Aspen Technology, Inc. |
48,739 | 7,636,914 | ||||||
| *AstroNova, Inc. |
3,998 | 65,967 | ||||||
| *Asure Software, Inc. |
5,929 | 57,274 | ||||||
| *Atlassian Corp. PLC, Class A |
5,755 | 2,636,538 | ||||||
| *Autodesk, Inc. |
34,302 | 10,894,658 | ||||||
| *Automatic Data Processing, Inc. |
101,796 | 22,852,184 | ||||||
| *Avalara, Inc. |
5,124 | 920,475 | ||||||
| *Avaya Holdings Corp. |
110,516 | 2,057,808 | ||||||
| *Aviat Networks, Inc. |
5,980 | 171,028 | ||||||
| *Avid Technology, Inc. |
37,445 | 1,072,425 | ||||||
| *Avnet, Inc. |
115,885 | 4,416,377 | ||||||
| *Aware, Inc. |
6,547 | 23,045 | ||||||
| *Axcelis Technologies, Inc. |
41,875 | 2,300,194 | ||||||
| *AXT, Inc. |
45,804 | 374,219 | ||||||
| *Badger Meter, Inc. |
38,174 | 3,903,291 | ||||||
| *Bel Fuse, Inc. |
1,600 | 23,864 | ||||||
| *Bel Fuse, Inc., Class B |
6,388 | 88,921 | ||||||
| *Belden, Inc. |
42,836 | 2,579,156 | ||||||
| Benchmark Electronics, Inc. |
42,938 | 1,000,885 | ||||||
| *Bill.com Holdings, Inc. |
936 | 275,474 | ||||||
| BK Technologies Corp. |
766 | 2,260 | ||||||
| *Black Knight, Inc. |
73,593 | 5,159,605 | ||||||
| #*Blackbaud, Inc. |
27,523 | 1,954,408 | ||||||
| *Blackline, Inc. |
9,798 | 1,243,072 | ||||||
| *BM Technologies, Inc. |
4,560 | 40,766 | ||||||
| *Bottomline Technologies DE, Inc. |
18,740 | 867,662 | ||||||
| *Box, Inc., Class A |
12,473 | 322,178 | ||||||
| *Brightcove, Inc. |
10,100 | 100,192 | ||||||
| Broadcom, Inc. |
86,838 | 46,169,159 | ||||||
| Broadridge Financial Solutions, Inc. |
60,980 | 10,879,442 | ||||||
| *Brooks Automation, Inc. |
65,535 | 7,631,551 | ||||||
| *Cadence Design Systems, Inc. |
99,655 | 17,251,277 | ||||||
| *CalAmp Corp. |
27,538 | 264,916 | ||||||
| #*Calix, Inc. |
56,074 | 3,509,672 | ||||||
| *Cambium Networks Corp. |
4,134 | 116,661 | ||||||
| *Casa Systems, Inc. |
4,922 | 31,156 | ||||||
| Cass Information Systems, Inc. |
13,663 | 560,046 | ||||||
| CDK Global, Inc. |
59,261 | 2,579,039 | ||||||
| CDW Corp. |
78,273 | 14,609,655 | ||||||
| #*Cerence, Inc. |
28,413 | 2,987,059 | ||||||
| *Ceridian HCM Holding, Inc. |
3,428 | 429,357 | ||||||
| *CEVA, Inc. |
19,824 | 904,173 | ||||||
| *ChannelAdvisor Corp. |
18,912 | 482,445 | ||||||
| *Ciena Corp. |
154,842 | 8,406,372 | ||||||
| *Cirrus Logic, Inc. |
73,120 | 5,908,827 | ||||||
| Cisco Systems, Inc. |
1,250,244 | 69,976,157 | ||||||
| Citrix Systems, Inc. |
40,498 | 3,836,376 | ||||||
| *Clearfield, Inc. |
7,734 | 436,894 | ||||||
| *Cloudflare, Inc., Class A |
2,615 | 509,193 | ||||||
| CMC Materials, Inc. |
26,914 | 3,454,950 | ||||||
| *Cognex Corp. |
63,553 | 5,566,607 | ||||||
| Cognizant Technology Solutions Corp., Class A |
172,515 | 13,471,696 | ||||||
Dimensional U.S. Core Equity 2 ETF
SCHEDULE OF INVESTMENTS
October 31, 2021
| Security Description |
Shares | Fair Value | ||||||
| INFORMATION TECHNOLOGY (Continued) |
| |||||||
| *Cognyte Software, Ltd. |
52,741 | $ | 1,050,073 | |||||
| *Coherent, Inc. |
21,682 | 5,515,901 | ||||||
| *Cohu, Inc. |
53,479 | 1,713,467 | ||||||
| *CommScope Holding Co., Inc. |
105,627 | 1,131,265 | ||||||
| #Communications Systems, Inc. |
6,432 | 24,442 | ||||||
| *CommVault Systems, Inc. |
12,368 | 760,632 | ||||||
| *Computer Task Group, Inc. |
11,157 | 86,578 | ||||||
| Comtech Telecommunications Corp. |
23,666 | 510,476 | ||||||
| Concentrix Corp. |
54,113 | 9,614,798 | ||||||
| *Conduent, Inc. |
137,316 | 926,883 | ||||||
| *Consensus Cloud Solutions, Inc. |
16,488 | 1,044,185 | ||||||
| *Corning, Inc. |
343,628 | 12,222,848 | ||||||
| *Coupa Software, Inc. |
4,016 | 914,443 | ||||||
| *Crowdstrike Holdings, Inc., Class A |
3,084 | 869,071 | ||||||
| *CSG Systems International, Inc. |
41,581 | 2,081,129 | ||||||
| *CTS Corp. |
33,147 | 1,180,696 | ||||||
| *Cyberoptics Corp. |
4,601 | 192,138 | ||||||
| *Daktronics, Inc. |
34,451 | 191,203 | ||||||
| *Data I/O Corp. |
4,103 | 22,238 | ||||||
| *Datadog, Inc., Class A |
958 | 160,034 | ||||||
| *Dell Technologies, Inc. |
48,609 | 5,346,504 | ||||||
| *Digi International, Inc. |
31,463 | 678,028 | ||||||
| *Digital Turbine, Inc. |
29,049 | 2,499,957 | ||||||
| *Diodes, Inc. |
62,266 | 5,983,140 | ||||||
| *DocuSign, Inc. |
9,517 | 2,648,486 | ||||||
| Dolby Laboratories, Inc., Class A |
46,615 | 4,118,435 | ||||||
| *Dropbox, Inc., Class A |
162,561 | 4,956,485 | ||||||
| *DSP Group, Inc. |
20,898 | 459,129 | ||||||
| *Duck Creek Technologies, Inc. |
1,750 | 55,125 | ||||||
| *DXC Technology Co. |
145,191 | 4,728,871 | ||||||
| *Dynatrace, Inc. |
548 | 41,100 | ||||||
| *DZS, Inc. |
15,810 | 172,329 | ||||||
| *Ebix, Inc. |
25,628 | 840,855 | ||||||
| *EchoStar Corp., Class A |
37,483 | 879,351 | ||||||
| *eGain Corp. |
3,704 | 38,225 | ||||||
| *Elastic NV |
541 | 93,869 | ||||||
| *EMCORE Corp. |
21,229 | 158,793 | ||||||
| *Enphase Energy, Inc. |
57,397 | 13,294,867 | ||||||
| Entegris, Inc. |
138,984 | 19,566,168 | ||||||
| *Envestnet, Inc. |
24,148 | 2,016,358 | ||||||
| *EPAM Systems, Inc. |
20,842 | 14,031,668 | ||||||
| *ePlus, Inc. |
16,735 | 1,850,389 | ||||||
| *Euronet Worldwide, Inc. |
45,642 | 5,120,576 | ||||||
| *Everbridge, Inc. |
711 | 113,269 | ||||||
| EVERTEC, Inc. |
68,666 | 3,104,390 | ||||||
| *Evo Payments, Inc., Class A |
8,578 | 185,971 | ||||||
| *ExlService Holdings, Inc. |
32,654 | 4,004,360 | ||||||
| *Extreme Networks, Inc. |
6,056 | 59,530 | ||||||
| *F5 Networks, Inc. |
29,057 | 6,135,386 | ||||||
| *Fabrinet |
50,592 | 4,856,832 | ||||||
| *Fair Isaac Corp. |
25,115 | 10,000,793 | ||||||
| *FARO Technologies, Inc. |
20,339 | 1,496,340 | ||||||
| Fidelity National Information Services, Inc. |
106,148 | 11,754,830 | ||||||
| *First Solar, Inc. |
81,888 | 9,792,986 | ||||||
| *Fiserv, Inc. |
100,975 | 9,945,028 | ||||||
| *Five9, Inc. |
341 | 53,881 | ||||||
Dimensional U.S. Core Equity 2 ETF
SCHEDULE OF INVESTMENTS
October 31, 2021
| Security Description |
Shares | Fair Value | ||||||
| INFORMATION TECHNOLOGY (Continued) |
| |||||||
| *FleetCor Technologies, Inc. |
44,581 | $ | 11,029,785 | |||||
| *Flex, Ltd. |
379,482 | 6,413,246 | ||||||
| *FormFactor, Inc. |
101,750 | 4,047,615 | ||||||
| *Fortinet, Inc. |
49,450 | 16,632,013 | ||||||
| *Frequency Electronics, Inc. |
4,145 | 41,409 | ||||||
| #*fuboTV, Inc. |
1,299 | 38,723 | ||||||
| *Gartner, Inc. |
37,961 | 12,599,636 | ||||||
| *Genasys, Inc. |
6,445 | 32,741 | ||||||
| Genpact, Ltd. |
176,499 | 8,710,226 | ||||||
| Global Payments, Inc. |
85,689 | 12,252,670 | ||||||
| *Globant SA |
16,827 | 5,371,010 | ||||||
| *GoDaddy, Inc., Class A |
36,501 | 2,524,774 | ||||||
| *Grid Dynamics Holdings, Inc. |
2,463 | 70,811 | ||||||
| *GSI Technology, Inc. |
13,940 | 72,349 | ||||||
| *Guidewire Software, Inc. |
22,488 | 2,827,416 | ||||||
| *Hackett Group, Inc. (The) |
31,360 | 662,950 | ||||||
| *Harmonic, Inc. |
87,598 | 794,514 | ||||||
| Hewlett Packard Enterprise Co. |
641,677 | 9,400,568 | ||||||
| HP, Inc., Class A |
258,935 | 7,853,499 | ||||||
| *HubSpot, Inc. |
5,598 | 4,535,668 | ||||||
| *Ichor Holdings, Ltd. |
22,228 | 971,808 | ||||||
| *Identiv, Inc. |
1,600 | 30,656 | ||||||
| *II-VI, Inc. |
56,596 | 3,424,624 | ||||||
| *Immersion Corp. |
27,982 | 223,576 | ||||||
| *Infinera Corp. |
177,824 | 1,349,684 | ||||||
| Information Services Group, Inc. |
22,709 | 185,078 | ||||||
| *Insight Enterprises, Inc. |
42,497 | 4,024,466 | ||||||
| Intel Corp. |
1,809,759 | 88,678,191 | ||||||
| InterDigital, Inc. |
29,385 | 1,967,326 | ||||||
| International Business Machines Corp. |
266,482 | 33,336,898 | ||||||
| *International Money Express, Inc. |
4,866 | 81,457 | ||||||
| *inTEST Corp. |
2,800 | 30,996 | ||||||
| *Intevac, Inc. |
13,969 | 65,235 | ||||||
| Intuit, Inc. |
40,550 | 25,383,894 | ||||||
| *IPG Photonics Corp. |
40,079 | 6,372,962 | ||||||
| *Iteris, Inc. |
21,217 | 113,723 | ||||||
| *Itron, Inc. |
38,719 | 3,011,177 | ||||||
| *Jabil, Inc. |
249,973 | 14,988,381 | ||||||
| Jack Henry & Associates, Inc. |
42,095 | 7,007,976 | ||||||
| #*Jamf Holding Corp. |
9,100 | 433,615 | ||||||
| Juniper Networks, Inc. |
165,196 | 4,876,586 | ||||||
| *Key Tronic Corp. |
5,745 | 37,055 | ||||||
| *Keysight Technologies, Inc. |
102,740 | 18,495,255 | ||||||
| *Kimball Electronics, Inc., Class B |
17,079 | 491,021 | ||||||
| *KLA Corp. |
61,741 | 23,014,575 | ||||||
| *Knowles Corp. |
109,259 | 2,276,958 | ||||||
| *Kulicke & Soffa Industries, Inc. |
80,808 | 4,606,056 | ||||||
| *KVH Industries, Inc. |
13,737 | 140,942 | ||||||
| *Lam Research Corp. |
69,147 | 38,969,175 | ||||||
| *Lattice Semiconductor Corp. |
107,332 | 7,453,134 | ||||||
| #*Limelight Networks, Inc. |
71,556 | 213,237 | ||||||
| *Littelfuse, Inc. |
19,043 | 5,609,116 | ||||||
| *LiveRamp Holdings, Inc. |
75,270 | 4,027,698 | ||||||
| *Lumentum Holdings, Inc. |
37,652 | 3,109,302 | ||||||
| *Luna Innovations, Inc. |
21,473 | 209,147 | ||||||
| *MACOM Technology Solutions Holdings, Inc. |
50,120 | 3,499,378 | ||||||
| *MagnaChip Semiconductor Corp. |
16,223 | 307,588 | ||||||
Dimensional U.S. Core Equity 2 ETF
SCHEDULE OF INVESTMENTS
October 31, 2021
| Security Description |
Shares | Fair Value | ||||||
| INFORMATION TECHNOLOGY (Continued) |
| |||||||
| *Mandiant, Inc. |
66,659 | $ | 1,162,533 | |||||
| *Manhattan Associates, Inc. |
68,630 | 12,459,090 | ||||||
| Marvell Technology, Inc. |
316,808 | 21,701,348 | ||||||
| Mastercard, Inc., Class A |
224,959 | 75,478,244 | ||||||
| *Maximus, Inc. |
68,990 | 5,834,484 | ||||||
| *MaxLinear, Inc. |
66,532 | 4,191,516 | ||||||
| Methode Electronics, Inc. |
44,060 | 1,853,604 | ||||||
| *Microchip Technology, Inc. |
183,617 | 13,604,184 | ||||||
| Micron Technology, Inc. |
453,294 | 31,322,615 | ||||||
| Microsoft Corp. |
1,856,730 | 615,728,803 | ||||||
| #*MicroStrategy, Inc. |
7,530 | 5,384,402 | ||||||
| *Mimecast, Ltd. |
14,832 | 1,118,926 | ||||||
| *Mitek Systems, Inc. |
23,421 | 441,017 | ||||||
| MKS Instruments, Inc. |
57,292 | 8,596,665 | ||||||
| *Model N, Inc. |
4,127 | 133,756 | ||||||
| *Momentive Global, Inc. |
8,330 | 190,924 | ||||||
| *MoneyGram International, Inc. |
36,366 | 217,105 | ||||||
| *MongoDB, Inc. |
3,513 | 1,831,292 | ||||||
| Monolithic Power Systems, Inc. |
16,536 | 8,689,007 | ||||||
| Motorola Solutions, Inc. |
37,339 | 9,282,102 | ||||||
| *N-Able, Inc. |
7,130 | 94,829 | ||||||
| *Napco Security Technologies, Inc. |
7,089 | 339,988 | ||||||
| *National Instruments Corp. |
76,303 | 3,240,588 | ||||||
| *NCR Corp. |
100,678 | 3,980,808 | ||||||
| *NeoPhotonics Corp. |
41,502 | 420,000 | ||||||
| NetApp, Inc. |
126,442 | 11,291,271 | ||||||
| *NETGEAR, Inc. |
33,512 | 966,151 | ||||||
| *NetScout Systems, Inc. |
83,189 | 2,251,094 | ||||||
| *NetSol Technologies, Inc. |
3,510 | 15,865 | ||||||
| Network-1 Technologies, Inc. |
8,087 | 22,724 | ||||||
| *nLight, Inc. |
10,909 | 306,761 | ||||||
| NortonLifeLock, Inc. |
162,297 | 4,130,459 | ||||||
| *Novanta, Inc. |
29,884 | 5,156,783 | ||||||
| *Nuance Communications, Inc. |
148,149 | 8,155,602 | ||||||
| *Nutanix, Inc., Class A |
11,364 | 389,899 | ||||||
| NVE Corp. |
3,642 | 247,547 | ||||||
| NVIDIA Corp. |
294,561 | 75,310,411 | ||||||
| Nxp Semiconductors NV |
1,940 | 389,668 | ||||||
| *Okta, Inc. |
9,515 | 2,351,918 | ||||||
| *ON Semiconductor Corp. |
448,915 | 21,579,344 | ||||||
| *OneSpan, Inc. |
37,651 | 768,833 | ||||||
| *Onto Innovation, Inc. |
61,172 | 4,845,434 | ||||||
| Oracle Corp. |
622,608 | 59,733,012 | ||||||
| *OSI Systems, Inc. |
21,578 | 2,009,128 | ||||||
| *Pagerduty, Inc. |
20,440 | 853,370 | ||||||
| *Palantir Technologies, Inc., Class A |
40,515 | 1,048,528 | ||||||
| *Palo Alto Networks, Inc. |
5,073 | 2,582,614 | ||||||
| #*Par Technology Corp. |
8,949 | 562,176 | ||||||
| Paychex, Inc. |
124,479 | 15,345,771 | ||||||
| *Paycom Software, Inc. |
37,699 | 20,653,397 | ||||||
| *Paylocity Holding Corp. |
22,590 | 6,893,113 | ||||||
| *PayPal Holdings, Inc. |
106,766 | 24,832,704 | ||||||
| PC Connection, Inc. |
34,874 | 1,605,948 | ||||||
| PCTEL, Inc. |
14,847 | 85,519 | ||||||
| *PDF Solutions, Inc. |
32,204 | 757,760 | ||||||
| Pegasystems, Inc. |
23,316 | 2,768,076 | ||||||
Dimensional U.S. Core Equity 2 ETF
SCHEDULE OF INVESTMENTS
October 31, 2021
| Security Description |
Shares | Fair Value | ||||||
| INFORMATION TECHNOLOGY (Continued) |
| |||||||
| *Perficient, Inc. |
48,090 | $ | 5,943,924 | |||||
| *PFSweb, Inc. |
15,487 | 201,331 | ||||||
| *Photronics, Inc. |
80,157 | 1,041,239 | ||||||
| *Ping Identity Holding Corp. |
20,332 | 576,006 | ||||||
| *Pixelworks, Inc. |
15,908 | 65,064 | ||||||
| *Plantronics, Inc. |
7,213 | 193,020 | ||||||
| *Plexus Corp. |
39,753 | 3,471,232 | ||||||
| *Power Integrations, Inc. |
47,010 | 4,851,902 | ||||||
| *Progress Software Corp. |
60,456 | 3,108,043 | ||||||
| *PTC, Inc. |
21,547 | 2,744,010 | ||||||
| *Pure Storage, Inc., Class A |
58,264 | 1,564,971 | ||||||
| *Q2 Holdings, Inc. |
12,414 | 974,002 | ||||||
| Qad, Inc. |
1,920 | 167,827 | ||||||
| QAD, Inc., Class A |
8,282 | 725,834 | ||||||
| *Qorvo, Inc. |
81,568 | 13,722,185 | ||||||
| *QUALCOMM, Inc. |
419,413 | 55,798,706 | ||||||
| *Qualys, Inc. |
22,898 | 2,850,343 | ||||||
| *Rambus, Inc. |
130,757 | 3,042,715 | ||||||
| *Ribbon Communications, Inc. |
119,121 | 651,592 | ||||||
| *Richardson Electronics, Ltd. |
8,608 | 93,913 | ||||||
| *Rimini Street, Inc. |
2,875 | 29,929 | ||||||
| *RingCentral, Inc., Class A |
6,923 | 1,687,689 | ||||||
| *Rogers Corp. |
18,659 | 3,752,698 | ||||||
| *Sailpoint Technologies Holdings, Inc. |
18,672 | 895,883 | ||||||
| *salesforce.com, Inc. |
46,787 | 14,021,596 | ||||||
| *Sanmina Corp. |
80,296 | 3,031,174 | ||||||
| Sapiens International Corp. NV |
23,741 | 829,273 | ||||||
| *ScanSource, Inc. |
24,269 | 868,345 | ||||||
| Seagate Technology Holdings PLC |
131,759 | 11,735,774 | ||||||
| *SecureWorks Corp., Class A |
4,100 | 75,522 | ||||||
| *Semtech Corp. |
53,948 | 4,587,198 | ||||||
| *ServiceNow, Inc. |
6,885 | 4,804,078 | ||||||
| *ShotSpotter, Inc. |
4 | 156 | ||||||
| #*Silicon Laboratories, Inc. |
21,264 | 4,013,793 | ||||||
| *SiTime Corp. |
24 | 6,357 | ||||||
| Skyworks Solutions, Inc. |
106,352 | 17,774,610 | ||||||
| *SMART Global Holdings, Inc. |
27,030 | 1,445,024 | ||||||
| *Smartsheet, Inc., Class A |
2,373 | 163,761 | ||||||
| *SolarEdge Technologies, Inc. |
53,165 | 18,856,562 | ||||||
| #SolarWinds Corp. |
8,028 | 129,251 | ||||||
| *Splunk, Inc. |
8,690 | 1,432,286 | ||||||
| *Sprout Social, Inc., Class A |
9 | 1,149 | ||||||
| *SPS Commerce, Inc. |
18,758 | 2,864,909 | ||||||
| *Square, Inc., Class A |
10,506 | 2,673,777 | ||||||
| SS&C Technologies Holdings, Inc. |
102,077 | 8,112,059 | ||||||
| *StarTek, Inc. |
26,365 | 145,008 | ||||||
| #*Stratasys, Ltd. |
59,162 | 1,865,969 | ||||||
| #*SunPower Corp. |
3,639 | 122,489 | ||||||
| *Super Micro Computer, Inc. |
14,840 | 525,188 | ||||||
| Switch, Inc., Class A |
25,224 | 637,663 | ||||||
| *Synaptics, Inc. |
38,581 | 7,506,705 | ||||||
| *Synchronoss Technologies, Inc. |
21,920 | 57,869 | ||||||
| SYNNEX Corp. |
53,191 | 5,585,055 | ||||||
| *Synopsys, Inc. |
45,184 | 15,054,405 | ||||||
| TE Connectivity, Ltd. |
141,994 | 20,731,124 | ||||||
| *Teledyne Technologies, Inc. |
28,702 | 12,893,512 | ||||||
| *Teradata Corp. |
105,540 | 5,969,342 | ||||||
Dimensional U.S. Core Equity 2 ETF
SCHEDULE OF INVESTMENTS
October 31, 2021
| Security Description |
Shares | Fair Value | ||||||
| INFORMATION TECHNOLOGY (Continued) |
| |||||||
| *Teradyne, Inc. |
133,062 | $ | 18,394,491 | |||||
| *Tessco Technologies, Inc. |
4,950 | 25,938 | ||||||
| Texas Instruments, Inc. |
268,223 | 50,286,448 | ||||||
| *Trade Desk, Inc. (The), Class A |
85,487 | 6,403,831 | ||||||
| *TransAct Technologies, Inc. |
6,652 | 93,926 | ||||||
| *Trimble, Inc. |
78,921 | 6,895,328 | ||||||
| TTEC Holdings, Inc. |
55,722 | 5,259,600 | ||||||
| *TTM Technologies, Inc. |
137,177 | 1,816,223 | ||||||
| #*Tucows, Inc., Class A |
133 | 10,946 | ||||||
| *Turtle Beach Corp. |
73 | 2,099 | ||||||
| *Twilio, Inc., Class A |
22,363 | 6,515,684 | ||||||
| *Tyler Technologies, Inc. |
6,993 | 3,798,737 | ||||||
| Ubiquiti, Inc. |
26,389 | 8,062,631 | ||||||
| *Ultra Clean Holdings, Inc. |
45,751 | 2,267,877 | ||||||
| *Unisys Corp. |
22,452 | 574,098 | ||||||
| Universal Display Corp. |
12,820 | 2,348,624 | ||||||
| *Upland Software, Inc. |
8,766 | 292,521 | ||||||
| *Varonis Systems, Inc. |
868 | 56,194 | ||||||
| *Veeco Instruments, Inc. |
49,806 | 1,209,788 | ||||||
| *Verint Systems, Inc. |
54,759 | 2,551,769 | ||||||
| *VeriSign, Inc. |
26,854 | 5,979,580 | ||||||
| #*Verra Mobility Corp. |
29,051 | 432,279 | ||||||
| #*Viasat, Inc. |
40,944 | 2,443,947 | ||||||
| *Viavi Solutions, Inc. |
203,831 | 3,138,997 | ||||||
| Visa, Inc., Class A |
415,024 | 87,889,632 | ||||||
| *Vishay Intertechnology, Inc. |
158,246 | 3,041,488 | ||||||
| *Vishay Precision Group, Inc. |
10,529 | 358,934 | ||||||
| #*VMware, Inc., Class A |
13,324 | 2,021,251 | ||||||
| *Vonage Holdings Corp. |
203,547 | 3,281,178 | ||||||
| *Vontier Corp. |
53,921 | 1,824,147 | ||||||
| *Wayside Technology Group, Inc. |
3,335 | 88,678 | ||||||
| *Western Digital Corp. |
122,665 | 6,414,153 | ||||||
| Western Union Co. (The) |
167,417 | 3,050,338 | ||||||
| *WEX, Inc. |
24,209 | 3,624,087 | ||||||
| #*Wolfspeed, Inc. |
85,991 | 10,328,379 | ||||||
| *Workday, Inc., Class A |
4,175 | 1,210,666 | ||||||
| *Workiva, Inc. |
35 | 5,234 | ||||||
| Xerox Holdings Corp. |
137,193 | 2,442,035 | ||||||
| *Xilinx, Inc. |
95,665 | 17,219,700 | ||||||
| Xperi Holding Corp. |
106,145 | 1,902,118 | ||||||
| #*Yext, Inc. |
1,674 | 21,076 | ||||||
| *Zebra Technologies Corp. |
40,064 | 21,392,173 | ||||||
| *Zendesk, Inc. |
6,932 | 705,678 | ||||||
| *Ziff Davis, Inc. |
49,628 | 6,365,784 | ||||||
| *Zix Corp. |
11,217 | 95,008 | ||||||
| *Zoom Video Communications, Inc., Class A |
9,887 | 2,715,465 | ||||||
| *Zscaler, Inc. |
4,859 | 1,549,341 | ||||||
|
|
|
|||||||
| TOTAL INFORMATION TECHNOLOG |
3,529,573,221 | |||||||
|
|
|
|||||||
| MATERIALS (4.2%) |
| |||||||
| *Advanced Emissions Solutions, Inc. |
1,692 | 11,489 | ||||||
| *AdvanSix, Inc. |
29,808 | 1,448,669 | ||||||
| *AgroFresh Solutions, Inc. |
19,213 | 39,002 | ||||||
| *Air Products and Chemicals, Inc. |
40,866 | 12,252,035 | ||||||
| *Albemarle Corp. |
65,613 | 16,434,088 | ||||||
| Alcoa Corp. |
132,138 | 6,071,741 | ||||||
Dimensional U.S. Core Equity 2 ETF
SCHEDULE OF INVESTMENTS
October 31, 2021
| Security Description |
Shares | Fair Value | ||||||
| MATERIALS (Continued) |
| |||||||
| *Allegheny Technologies, Inc. |
82,330 | $ | 1,325,513 | |||||
| *Alpha Metallurgical Resources, Inc. |
522 | 32,254 | ||||||
| Amcor PLC |
582,052 | 7,025,368 | ||||||
| American Vanguard Corp. |
35,319 | 550,270 | ||||||
| *Ampco-Pittsburgh Corp. |
3,640 | 20,457 | ||||||
| AptarGroup, Inc. |
75,569 | 9,127,224 | ||||||
| *Arconic Corp. |
53,377 | 1,570,351 | ||||||
| *Ardagh Metal Packaging SA |
1,452 | 14,302 | ||||||
| *Ashland Global Holdings, Inc. |
42,770 | 4,106,348 | ||||||
| *Avery Dennison Corp. |
75,830 | 16,509,708 | ||||||
| Avient Corp. |
85,385 | 4,600,544 | ||||||
| *Axalta Coating Systems, Ltd. |
220,943 | 6,891,212 | ||||||
| Balchem Corp. |
32,237 | 4,935,162 | ||||||
| *Ball Corp. |
185,823 | 16,999,088 | ||||||
| *Berry Global Group, Inc. |
114,535 | 7,506,624 | ||||||
| *Cabot Corp. |
59,880 | 3,194,598 | ||||||
| Carpenter Technology Corp. |
48,030 | 1,483,166 | ||||||
| Celanese Corp. |
78,165 | 12,624,429 | ||||||
| *Century Aluminum Co. |
97,314 | 1,285,518 | ||||||
| *CF Industries Holdings, Inc. |
121,692 | 6,912,106 | ||||||
| Chase Corp. |
9,338 | 896,448 | ||||||
| *Chemours Co. (The) |
114,270 | 3,201,845 | ||||||
| *Clearwater Paper Corp. |
18,306 | 765,740 | ||||||
| #*Cleveland-Cliffs, Inc. |
408,731 | 9,854,504 | ||||||
| *Coeur Mining, Inc. |
296,600 | 1,877,478 | ||||||
| Commercial Metals Co. |
135,093 | 4,347,293 | ||||||
| Compass Minerals International, Inc. |
34,552 | 2,266,611 | ||||||
| *Contango Ore, Inc. |
780 | 15,795 | ||||||
| *Core Molding Technologies, Inc. |
6,699 | 73,689 | ||||||
| Corteva, Inc. |
223,297 | 9,635,266 | ||||||
| *Crown Holdings, Inc. |
99,121 | 10,307,593 | ||||||
| *Domtar Corp. |
63,134 | 3,446,485 | ||||||
| *Dow, Inc. |
266,963 | 14,941,919 | ||||||
| DuPont de Nemours, Inc. |
84,168 | 5,858,093 | ||||||
| Eagle Materials, Inc. |
35,950 | 5,333,542 | ||||||
| Eastman Chemical Co. |
72,797 | 7,573,072 | ||||||
| Ecolab, Inc. |
33,509 | 7,446,370 | ||||||
| Ecovyst, Inc. |
8,136 | 95,028 | ||||||
| Element Solutions, Inc. |
311,531 | 7,074,869 | ||||||
| *Ferro Corp. |
95,231 | 2,001,756 | ||||||
| *Ferroglobe PLC |
10,589 | 70,205 | ||||||
| *Flotek Industries, Inc. |
21,184 | 24,785 | ||||||
| FMC Corp. |
59,437 | 5,409,361 | ||||||
| *Forterra, Inc. |
3,194 | 76,081 | ||||||
| Fortitude Gold Corp. |
18,826 | 127,829 | ||||||
| Freeport-McMoRan, Inc. |
564,406 | 21,289,394 | ||||||
| Friedman Industries, Inc. |
5,121 | 70,465 | ||||||
| FutureFuel Corp. |
35,402 | 249,938 | ||||||
| *GCP Applied Technologies, Inc. |
79,521 | 1,797,970 | ||||||
| Glatfelter Corp. |
48,771 | 801,308 | ||||||
| Gold Resource Corp. |
65,892 | 121,241 | ||||||
| *Graphic Packaging Holding Co. |
346,501 | 6,905,765 | ||||||
| Greif, Inc., Class A |
31,237 | 2,020,409 | ||||||
| Greif, Inc., Class B |
12,847 | 838,395 | ||||||
| *Hawkins, Inc. |
23,885 | 875,863 | ||||||
| *Haynes International, Inc. |
11,807 | 473,815 | ||||||
| HB Fuller Co. |
57,657 | 4,065,395 | ||||||
Dimensional U.S. Core Equity 2 ETF
SCHEDULE OF INVESTMENTS
October 31, 2021
| Security Description |
Shares | Fair Value | ||||||
| MATERIALS (Continued) |
| |||||||
| *Hecla Mining Co. |
280,569 | $ | 1,621,689 | |||||
| *Huntsman Corp. |
250,076 | 8,147,476 | ||||||
| *Ingevity Corp. |
34,911 | 2,719,916 | ||||||
| Innospec, Inc. |
26,520 | 2,402,977 | ||||||
| International Flavors & Fragrances, Inc. |
87,956 | 12,969,112 | ||||||
| *International Paper Co. |
199,740 | 9,921,086 | ||||||
| *Intrepid Potash, Inc. |
11,849 | 577,165 | ||||||
| Kaiser Aluminum Corp. |
12,541 | 1,218,233 | ||||||
| *Koppers Holdings, Inc. |
21,522 | 755,207 | ||||||
| *Kraton Corp. |
32,140 | 1,467,191 | ||||||
| Kronos Worldwide, Inc. |
71,189 | 927,593 | ||||||
| Linde PLC |
62,425 | 19,926,060 | ||||||
| #*Livent Corp. |
140,082 | 3,953,114 | ||||||
| *Louisiana-Pacific Corp. |
113,266 | 6,674,765 | ||||||
| *LSB Industries, Inc. |
28,105 | 250,978 | ||||||
| LyondellBasell Industries NV, Class A |
156,417 | 14,518,626 | ||||||
| *Martin Marietta Materials, Inc. |
27,398 | 10,763,030 | ||||||
| *Materion Corp. |
25,789 | 1,861,450 | ||||||
| *Mercer International, Inc. |
77,374 | 833,318 | ||||||
| *Minerals Technologies, Inc. |
38,935 | 2,762,049 | ||||||
| Mosaic Co. (The) |
164,715 | 6,847,203 | ||||||
| *Myers Industries, Inc. |
42,390 | 872,386 | ||||||
| *Neenah, Inc. |
17,665 | 892,789 | ||||||
| *NewMarket Corp. |
7,928 | 2,695,599 | ||||||
| Newmont Corp. |
184,121 | 9,942,534 | ||||||
| #Nexa Resources SA |
3,500 | 29,575 | ||||||
| *Northern Technologies International Corp. |
5,456 | 83,204 | ||||||
| Nucor Corp. |
160,841 | 17,957,898 | ||||||
| *O-I Glass, Inc. |
118,127 | 1,541,557 | ||||||
| *Olin Corp. |
181,602 | 10,347,682 | ||||||
| Olympic Steel, Inc. |
13,520 | 364,634 | ||||||
| *Orion Engineered Carbons SA |
4,570 | 85,916 | ||||||
| Packaging Corp. of America |
66,536 | 9,140,050 | ||||||
| *PPG Industries, Inc. |
121,599 | 19,525,151 | ||||||
| *Quaker Chemical Corp. |
1,476 | 362,860 | ||||||
| *Ramaco Resources, Inc. |
6,117 | 113,715 | ||||||
| *Ranpak Holdings Corp. |
5,927 | 204,244 | ||||||
| *Rayonier Advanced Materials, Inc. |
41,237 | 296,082 | ||||||
| *Reliance Steel & Aluminum Co. |
73,533 | 10,747,583 | ||||||
| Resolute Forest Products, Inc. |
85,558 | 1,006,162 | ||||||
| *Royal Gold, Inc. |
48,417 | 4,794,251 | ||||||
| RPM International, Inc. |
104,470 | 9,109,784 | ||||||
| *Ryerson Holding Corp. |
35,565 | 937,493 | ||||||
| *Schnitzer Steel Industries, Inc. |
32,659 | 1,757,054 | ||||||
| *Schweitzer-Mauduit International, Inc. |
37,376 | 1,302,180 | ||||||
| *Scotts Miracle-Gro Co. (The) |
50,484 | 7,494,855 | ||||||
| Sealed Air Corp. |
78,693 | 4,668,069 | ||||||
| Sensient Technologies Corp. |
39,299 | 3,756,984 | ||||||
| *Sherwin-Williams Co. (The) |
68,594 | 21,717,546 | ||||||
| *Silgan Holdings, Inc. |
134,271 | 5,397,694 | ||||||
| *Sonoco Products Co. |
107,442 | 6,226,264 | ||||||
| Southern Copper Corp. |
23,689 | 1,421,103 | ||||||
| *Steel Dynamics, Inc. |
203,069 | 13,418,800 | ||||||
| *Stepan Co. |
30,589 | 3,671,292 | ||||||
| *Summit Materials, Inc., Class A |
127,123 | 4,531,935 | ||||||
| SunCoke Energy, Inc. |
77,821 | 561,868 | ||||||
Dimensional U.S. Core Equity 2 ETF
SCHEDULE OF INVESTMENTS
October 31, 2021
| Security Description |
Shares | Fair Value | ||||||
| MATERIALS (Continued) |
| |||||||
| *Sylvamo Corp. |
18,158 | $ | 511,329 | |||||
| *Synalloy Corp. |
5,922 | 66,919 | ||||||
| *TimkenSteel Corp. |
43,254 | 603,393 | ||||||
| *Trecora Resources |
19,142 | 148,925 | ||||||
| *Tredegar Corp. |
34,968 | 421,714 | ||||||
| Trinseo PLC |
37,543 | 2,104,661 | ||||||
| Tronox Holdings PLC, Class A |
137,759 | 3,212,540 | ||||||
| *UFP Technologies, Inc. |
5,584 | 345,594 | ||||||
| *United States Lime & Minerals, Inc. |
5,417 | 668,891 | ||||||
| *United States Steel Corp. |
200,079 | 5,280,085 | ||||||
| *Universal Stainless & Alloy Products, Inc. |
4,818 | 45,675 | ||||||
| Valvoline, Inc. |
125,636 | 4,266,599 | ||||||
| *Venator Materials PLC |
46,253 | 139,222 | ||||||
| Verso Corp., Class A |
31,659 | 699,031 | ||||||
| *Vulcan Materials Co. |
46,773 | 8,892,483 | ||||||
| Warrior Met Coal, Inc. |
52,123 | 1,249,388 | ||||||
| *Westlake Chemical Corp. |
81,463 | 7,929,608 | ||||||
| Westrock Co. |
136,146 | 6,548,623 | ||||||
| *Worthington Industries, Inc. |
54,965 | 2,985,699 | ||||||
|
|
|
|||||||
| TOTAL MATERIALS |
619,418,291 | |||||||
|
|
|
|||||||
| REAL ESTATE (0.3%) |
| |||||||
| *Altisource Portfolio Solutions SA |
3,696 | 48,048 | ||||||
| *AMREP Corp. |
2,552 | 35,779 | ||||||
| *CBRE Group, Inc., Class A |
180,173 | 18,752,406 | ||||||
| *CKX Lands, Inc. |
39 | 458 | ||||||
| *Cushman & Wakefield PLC |
16,873 | 310,294 | ||||||
| eXp World Holdings, Inc. |
35,739 | 1,844,132 | ||||||
| *Five Point Holdings LLC, Class A |
3,182 | 23,420 | ||||||
| *Forestar Group, Inc. |
13,809 | 270,242 | ||||||
| *FRP Holdings, Inc. |
10,189 | 582,811 | ||||||
| *Howard Hughes Corp. (The) |
35,176 | 3,064,885 | ||||||
| Indus Realty Trust, Inc. |
3,110 | 216,767 | ||||||
| *Jones Lang LaSalle, Inc. |
43,868 | 11,328,034 | ||||||
| *Kennedy-Wilson Holdings, Inc. |
157,325 | 3,519,360 | ||||||
| *Marcus & Millichap, Inc. |
38,273 | 1,802,658 | ||||||
| Newmark Group, Inc., Class A |
174,047 | 2,589,819 | ||||||
| #*Rafael Holdings, Inc., Class B |
16,227 | 122,676 | ||||||
| Re/Max Holdings, Inc. |
15,209 | 483,798 | ||||||
| *Realogy Holdings Corp. |
7,924 | 137,244 | ||||||
| #*Redfin Corp. |
22,255 | 1,142,572 | ||||||
| RMR Group, Inc. (The), Class A |
6,635 | 230,832 | ||||||
| *St Joe Co. (The) |
62,255 | 2,927,230 | ||||||
| *Stratus Properties, Inc. |
7,315 | 249,295 | ||||||
| *Tejon Ranch Co. |
29,274 | 533,080 | ||||||
|
|
|
|||||||
| TOTAL REAL ESTATE |
50,215,840 | |||||||
|
|
|
|||||||
| UTILITIES (1.6%) |
| |||||||
| AES Corp. (The) |
201,400 | 5,061,182 | ||||||
| *ALLETE, Inc. |
25,794 | 1,587,363 | ||||||
| Alliant Energy Corp. |
46,351 | 2,622,076 | ||||||
| *Ameren Corp., Class A |
54,941 | 4,630,977 | ||||||
| *American Electric Power Co., Inc. |
41,664 | 3,529,357 | ||||||
| *American States Water Co. |
26,292 | 2,388,365 | ||||||
| *American Water Works Co., Inc. |
41,868 | 7,292,568 | ||||||
| *Artesian Resources Corp., Class A |
6,405 | 257,609 | ||||||
| Atlantica Sustainable Infrastructure PLC |
100,569 | 3,957,390 | ||||||
Dimensional U.S. Core Equity 2 ETF
SCHEDULE OF INVESTMENTS
October 31, 2021
| Security Description |
Shares | Fair Value | ||||||
| UTILITIES (Continued) |
| |||||||
| *Atmos Energy Corp. |
43,332 | $ | 3,991,744 | |||||
| #Avangrid, Inc. |
24,630 | 1,298,001 | ||||||
| Avista Corp. |
42,540 | 1,693,517 | ||||||
| *Black Hills Corp. |
40,311 | 2,675,844 | ||||||
| Brookfield Renewable Corp., Class A |
29,437 | 1,218,986 | ||||||
| *California Water Service Group |
45,761 | 2,785,930 | ||||||
| CenterPoint Energy, Inc. |
130,053 | 3,386,580 | ||||||
| *Chesapeake Utilities Corp. |
14,778 | 1,936,952 | ||||||
| Clearway Energy, Inc., Class A |
17,052 | 562,545 | ||||||
| Clearway Energy, Inc., Class C |
47,356 | 1,680,191 | ||||||
| #CMS Energy Corp. |
57,732 | 3,484,126 | ||||||
| Consolidated Edison, Inc. |
50,905 | 3,838,237 | ||||||
| Consolidated Water Co., Ltd. |
8,025 | 89,158 | ||||||
| Dominion Energy, Inc. |
64,645 | 4,908,495 | ||||||
| *DTE Energy Co. |
41,865 | 4,745,398 | ||||||
| Duke Energy Corp. |
62,272 | 6,352,367 | ||||||
| Edison International |
79,101 | 4,977,826 | ||||||
| Entergy Corp. |
46,914 | 4,833,080 | ||||||
| Essential Utilities, Inc. |
75,543 | 3,555,809 | ||||||
| #Evergy, Inc. |
77,020 | 4,910,025 | ||||||
| Eversource Energy |
58,025 | 4,926,322 | ||||||
| Exelon Corp. |
161,666 | 8,599,015 | ||||||
| *FirstEnergy Corp. |
111,774 | 4,306,652 | ||||||
| *Genie Energy, Ltd., Class B |
14,776 | 73,141 | ||||||
| *Global Water Resources, Inc. |
1,118 | 21,153 | ||||||
| *Hawaiian Electric Industries, Inc. |
49,353 | 2,001,758 | ||||||
| *IDACORP, Inc. |
33,525 | 3,497,328 | ||||||
| *MDU Resources Group, Inc. |
137,720 | 4,232,136 | ||||||
| MGE Energy, Inc. |
29,151 | 2,212,269 | ||||||
| *Middlesex Water Co. |
14,897 | 1,640,458 | ||||||
| National Fuel Gas Co. |
42,251 | 2,426,475 | ||||||
| *New Jersey Resources Corp. |
69,590 | 2,631,198 | ||||||
| NextEra Energy, Inc. |
159,184 | 13,583,171 | ||||||
| NiSource, Inc. |
108,413 | 2,674,549 | ||||||
| Northwest Natural Holding Co. |
24,717 | 1,114,490 | ||||||
| *NorthWestern Corp. |
40,870 | 2,323,868 | ||||||
| NRG Energy, Inc. |
185,592 | 7,403,265 | ||||||
| OGE Energy Corp. |
77,354 | 2,635,451 | ||||||
| ONE Gas, Inc. |
29,343 | 1,974,784 | ||||||
| #*Ormat Technologies, Inc. |
54,709 | 3,957,102 | ||||||
| *Otter Tail Corp. |
35,257 | 2,186,287 | ||||||
| *PG&E Corp. |
217,150 | 2,518,940 | ||||||
| *Pinnacle West Capital Corp. |
23,981 | 1,546,535 | ||||||
| PNM Resources, Inc. |
53,779 | 2,675,505 | ||||||
| *Portland General Electric Co. |
57,889 | 2,854,507 | ||||||
| PPL Corp. |
157,984 | 4,549,939 | ||||||
| *Public Service Enterprise Group, Inc. |
72,267 | 4,610,635 | ||||||
| *Pure Cycle Corp. |
13,871 | 217,636 | ||||||
| Rgc Resources, Inc. |
4,261 | 94,253 | ||||||
| *Sempra Energy |
42,902 | 5,475,582 | ||||||
| *SJW Group |
22,672 | 1,494,538 | ||||||
| South Jersey Industries, Inc. |
65,089 | 1,481,426 | ||||||
| *Southern Co. (The) |
89,090 | 5,552,089 | ||||||
| *Southwest Gas Holdings, Inc. |
25,612 | 1,773,631 | ||||||
| Spire, Inc. |
23,955 | 1,503,416 | ||||||
| *Sunnova Energy International, Inc. |
36,713 | 1,635,931 | ||||||
Dimensional U.S. Core Equity 2 ETF
SCHEDULE OF INVESTMENTS
October 31, 2021
| Security Description |
Shares | Fair Value | ||||||
| UTILITIES (Continued) |
| |||||||
| *UGI Corp. |
96,089 | $ | 4,171,223 | |||||
| *Unitil Corp. |
13,200 | 551,100 | ||||||
| #Via Renewables, Inc. |
6,166 | 68,751 | ||||||
| Vistra Corp. |
312,143 | 6,114,881 | ||||||
| WEC Energy Group, Inc. |
46,690 | 4,204,901 | ||||||
| Xcel Energy, Inc. |
66,573 | 4,299,950 | ||||||
| York Water Co. (The) |
10,266 | 491,947 | ||||||
|
|
|
|||||||
| TOTAL UTILITIES |
226,559,886 | |||||||
|
|
|
|||||||
| TOTAL COMMON STOCKS (Cost $5,782,184,598) |
14,437,365,819 | |||||||
|
|
|
|||||||
| PREFERRED STOCKS (0.0%) |
| |||||||
| COMMUNICATION SERVICES (0.0%) |
| |||||||
| *Liberty Broadband Corp. |
9,450 | 268,380 | ||||||
|
|
|
|||||||
| CONSUMER DISCRETIONARY (0.0%) |
| |||||||
| Qurate Retail, Inc. |
7,113 | 776,597 | ||||||
|
|
|
|||||||
| INDUSTRIALS (0.0%) |
| |||||||
| WESCO International, Inc., Series A |
26,110 | 819,854 | ||||||
|
|
|
|||||||
| TOTAL PREFERRED STOCKS (Cost $1,320,623) |
1,864,831 | |||||||
|
|
|
|||||||
| RIGHTS (0.0%) |
| |||||||
| COMMUNICATION SERVICES (0.0%) |
| |||||||
| *»Media General, Inc. |
38,671 | 2,181 | ||||||
|
|
|
|||||||
| CONSUMER DISCRETIONARY (0.0%) |
| |||||||
| *»Zagg, Inc. |
28,536 | 2,568 | ||||||
|
|
|
|||||||
| FINANCIALS (0.0%) |
| |||||||
| *»Newstar Financial, Inc. |
42,768 | 4,345 | ||||||
|
|
|
|||||||
| HEALTH CARE (0.0%) |
| |||||||
| *»Achillion Pharmaceuticals |
174,484 | 253,002 | ||||||
| *»Chinook Therapeutics, Inc. |
5,844 | 10,461 | ||||||
| »Elanco Animal Health, Inc. |
36,632 | — | ||||||
| *»Pfenex, Inc. |
13,673 | 10,255 | ||||||
| »Progenics Pharmaceuticals |
42,113 | 14,739 | ||||||
|
|
|
|||||||
| TOTAL HEALTH CARE (Cost $91,440) |
288,457 | |||||||
|
|
|
|||||||
| TOTAL RIGHTS (Cost $94,008) |
297,551 | |||||||
|
|
|
|||||||
| WARRANTS (0.0%) |
| |||||||
| ENERGY (0.0%) |
| |||||||
| *Nabors Industries, Ltd. 6/11/2026 |
3,148 | 23,295 | ||||||
| Parker Drilling Co. 9/16/2024 |
1,207 | 2 | ||||||
|
|
|
|||||||
| TOTAL ENERGY (Cost $–) |
23,297 | |||||||
|
|
|
|||||||
| TOTAL WARRANTS (Cost $–) |
23,297 | |||||||
|
|
|
|||||||
Dimensional U.S. Core Equity 2 ETF
SCHEDULE OF INVESTMENTS
October 31, 2021
| Security Description |
Shares | Fair Value | ||||||
| TOTAL INVESTMENT SECURITIES (Cost $5,783,599,229) |
$ | 14,439,551,498 | ||||||
|
|
|
|||||||
| SECURITIES LENDING COLLATERAL (1.3%) |
| |||||||
| @§The DFA Short Term Investment Fund |
16,805,717 | 194,433,748 | ||||||
|
|
|
|||||||
| TOTAL INVESTMENTS (Cost $5,978,032,977) — 100.0% |
|
$ | 14,633,985,246 | |||||
|
|
|
|||||||
| * | Non-Income Producing Securities |
| # | Total or Partial Securities on Loan |
| » | Securities that have generally been fair value factored |
| @ | Security purchased with cash collateral received from Securities on Loan |
| § | Affiliated Fund |
| ADR | American Depositary Receipt |
| PLC | Public Limited Company |
| SA | Special Assessment |
Dimensional U.S. Small Cap ETF
SCHEDULE OF INVESTMENTS
October 31, 2021
| Security Description |
Shares | Fair Value | ||||||
| COMMON STOCKS (97.3%) |
| |||||||
| COMMUNICATION SERVICES (2.2%) |
| |||||||
| *»Actua Corp. |
15,285 | $ | — | |||||
| *AMC Networks, Inc., Class A |
42,214 | 1,679,695 | ||||||
| #*Angi, Inc., Class A |
33,690 | 422,136 | ||||||
| *Anterix, Inc. |
21,271 | 1,363,471 | ||||||
| ATN International, Inc. |
30,983 | 1,263,487 | ||||||
| *Autoweb, Inc. |
7,894 | 24,866 | ||||||
| *Bandwidth, Inc., Class A |
2,792 | 238,102 | ||||||
| *Boston Omaha Corp., Class A |
13,923 | 493,570 | ||||||
| *Cargurus, Inc. |
43,823 | 1,469,823 | ||||||
| *Cars.com, Inc. |
146,450 | 1,906,779 | ||||||
| #*Cinemark Holdings, Inc. |
57,602 | 1,082,918 | ||||||
| Cogent Communications Holdings, Inc. |
92,768 | 7,105,101 | ||||||
| *comScore, Inc. |
15,929 | 62,282 | ||||||
| *Consolidated Communications Holdings, Inc. |
128,375 | 949,975 | ||||||
| *Cumulus Media, Inc. |
135 | 1,677 | ||||||
| *Daily Journal Corp. |
249 | 85,462 | ||||||
| *DHI Group, Inc. |
70,760 | 332,572 | ||||||
| *Dolphin Entertainment, Inc. |
5,565 | 62,662 | ||||||
| *Entercom Communications Corp. |
116,394 | 375,953 | ||||||
| Entravision Communications Corp., Class A |
120,096 | 957,165 | ||||||
| *Eventbrite, Inc., Class A |
991 | 20,058 | ||||||
| EW Scripps Co. (The), Class A |
142,458 | 2,649,719 | ||||||
| *Gaia, Inc. |
19,681 | 190,906 | ||||||
| *Gannett Co., Inc. |
31,302 | 181,552 | ||||||
| *Gray Television, Inc. |
912 | 20,420 | ||||||
| *Gray Television, Inc. |
162,433 | 3,807,429 | ||||||
| *Hemisphere Media Group, Inc. |
26,456 | 292,339 | ||||||
| *IDT Corp., Class B |
62,422 | 3,019,352 | ||||||
| *iHeartMedia, Inc., Class A |
71,606 | 1,387,724 | ||||||
| *IMAX Corp. |
53,405 | 1,006,684 | ||||||
| *Iridium Communications, Inc. |
137,213 | 5,563,987 | ||||||
| John Wiley & Sons, Inc., Class A |
85,061 | 4,607,754 | ||||||
| *Lee Enterprises, Inc. |
33 | 691 | ||||||
| *Liberty Latin America, Ltd., Class A |
22,400 | 269,248 | ||||||
| *Liberty Latin America, Ltd., Class C |
127,930 | 1,538,998 | ||||||
| #*Liberty Media Corp.-Liberty Braves, Class A |
12,435 | 380,138 | ||||||
| *Liberty Media Corp.-Liberty Braves, Class C |
34,505 | 1,025,489 | ||||||
| *Liberty TripAdvisor Holdings, Inc., Class A |
36,565 | 112,986 | ||||||
| *Lions Gate Entertainment Corp., Class A |
101,622 | 1,316,005 | ||||||
| *Lions Gate Entertainment Corp., Class B |
108,956 | 1,233,382 | ||||||
| *Loral Space & Communications, Inc. |
7,058 | 351,629 | ||||||
| *Madison Square Garden Entertainment Corp. |
237 | 16,701 | ||||||
| #*Magnite, Inc. |
221,237 | 5,980,036 | ||||||
| #*Marcus Corp. (The) |
42,441 | 788,129 | ||||||
| *Meredith Corp. |
55,206 | 3,215,197 | ||||||
| *National CineMedia, Inc. |
2,679 | 8,519 | ||||||
| Nexstar Media Group, Inc., Class A |
70,281 | 10,537,230 | ||||||
| *Ooma, Inc. |
9,398 | 217,094 | ||||||
| *QuinStreet, Inc. |
101,145 | 1,416,030 | ||||||
| *Reading International, Inc. |
13,690 | 65,575 | ||||||
| *Reading International, Inc. |
2,340 | 66,573 | ||||||
| Saga Communications, Inc. |
7,360 | 163,098 | ||||||
| Scholastic Corp. |
35,724 | 1,292,852 | ||||||
| #*Sciplay Corp., Class A |
16,929 | 342,135 | ||||||
| Shenandoah Telecommunications Co. |
104,879 | 2,898,856 | ||||||
| Spok Holdings, Inc. |
49,803 | 512,473 | ||||||
Dimensional U.S. Small Cap ETF
SCHEDULE OF INVESTMENTS
October 31, 2021
| Security Description |
Shares | Fair Value | ||||||
| COMMUNICATION SERVICES (Continued) |
| |||||||
| *Super League Gaming, Inc. |
4,966 | $ | 15,593 | |||||
| *TechTarget, Inc. |
68,197 | 6,431,659 | ||||||
| TEGNA, Inc. |
211,430 | 4,156,714 | ||||||
| Telephone and Data Systems, Inc. |
143,635 | 2,691,720 | ||||||
| *Townsquare Media, Inc., Class A |
30,109 | 401,052 | ||||||
| *Travelzoo |
17,435 | 178,883 | ||||||
| *TripAdvisor, Inc. |
45,760 | 1,508,707 | ||||||
| #*TrueCar, Inc. |
112,022 | 469,372 | ||||||
| *United States Cellular Corp. |
29,920 | 914,654 | ||||||
| *Urban One, Inc. |
4,654 | 32,904 | ||||||
| *Urban One, Inc. |
1,466 | 13,927 | ||||||
| *WideOpenWest, Inc. |
2,232 | 42,520 | ||||||
| World Wrestling Entertainment, Inc., Class A |
13,229 | 808,160 | ||||||
| *Yelp, Inc. |
104,118 | 4,022,078 | ||||||
| #*Zedge, Inc., Class B |
17,051 | 196,598 | ||||||
| *ZipRecruiter, Inc. |
124 | 3,445 | ||||||
|
|
|
|||||||
| TOTAL COMMUNICATION SERVICES |
98,262,670 | |||||||
|
|
|
|||||||
| CONSUMER DISCRETIONARY (14.2%) |
| |||||||
|
#*1-800-Flowers.com, Inc., Class A |
92,369 | 2,966,892 | ||||||
| #*2U, Inc. |
1,694 | 50,041 | ||||||
| Aaron’s Co., Inc. (The) |
60,271 | 1,409,739 | ||||||
| *Abercrombie & Fitch Co. |
124,967 | 4,941,195 | ||||||
| *Acushnet Holdings Corp. |
39,181 | 1,995,880 | ||||||
| *Adient PLC |
122,734 | 5,108,189 | ||||||
| #*Adtalem Global Education, Inc. |
84,222 | 3,110,318 | ||||||
| AMCON Distributing Co. |
300 | 39,813 | ||||||
| *American Axle & Manufacturing Holdings, Inc. |
302,506 | 2,746,754 | ||||||
| #American Eagle Outfitters, Inc. |
355,591 | 8,441,730 | ||||||
| *American Outdoor Brands, Inc. |
30,011 | 683,651 | ||||||
| *American Public Education, Inc. |
26,196 | 654,638 | ||||||
| *America’s Car-Mart, Inc. |
18,780 | 2,244,022 | ||||||
| *Ark Restaurants Corp. |
3,459 | 55,344 | ||||||
| *Arko Corp. |
276 | 2,647 | ||||||
| *Asbury Automotive Group, Inc. |
48,187 | 9,430,678 | ||||||
| *Aspen Group, Inc. |
331 | 1,572 | ||||||
| *AutoNation, Inc. |
69,758 | 8,449,089 | ||||||
| *Bally’s Corp. |
6,187 | 283,426 | ||||||
| *Barnes & Noble Education, Inc. |
103,115 | 1,070,334 | ||||||
| *Bassett Furniture Industries, Inc. |
17,681 | 298,632 | ||||||
| *Bath & Body Works, Inc. |
11,215 | 774,844 | ||||||
| *Bbq Holdings, Inc. |
440 | 5,808 | ||||||
| *Beazer Homes USA, Inc. |
13,898 | 251,693 | ||||||
| #*Bed Bath & Beyond, Inc., Class B |
18,196 | 255,472 | ||||||
| Big Lots, Inc., Class B |
48,296 | 2,137,098 | ||||||
| *Biglari Holdings, Inc. |
46 | 38,157 | ||||||
| *Biglari Holdings, Inc., Class B |
2,903 | 482,566 | ||||||
| *BJ’s Restaurants, Inc. |
52,180 | 1,738,638 | ||||||
| *Bloomin’ Brands, Inc. |
132,023 | 2,854,337 | ||||||
| *Bluegreen Vacations Holding Corp. |
5,390 | 138,038 | ||||||
| *Boot Barn Holdings, Inc. |
74,566 | 7,791,401 | ||||||
| *Boyd Gaming Corp. |
3,615 | 230,565 | ||||||
| #*Brinker International, Inc. |
13,010 | 545,900 | ||||||
| *Brunswick Corp. |
21,398 | 1,991,940 | ||||||
| Buckle, Inc. (The) |
70,164 | 2,920,226 | ||||||
| #*Build-A-Bear Workshop, Inc. |
33,754 | 529,263 | ||||||
| Caleres, Inc. |
80,621 | 1,859,120 | ||||||
Dimensional U.S. Small Cap ETF
SCHEDULE OF INVESTMENTS
October 31, 2021
| Security Description |
Shares | Fair Value | ||||||
| CONSUMER DISCRETIONARY (Continued) |
| |||||||
| *Callaway Golf Co. |
210,329 | $ | 5,689,399 | |||||
| #Camping World Holdings, Inc., Class A |
3,598 | 134,026 | ||||||
| *Canterbury Park Holding Corp. |
6,569 | 103,790 | ||||||
| *Capri Holdings, Ltd. |
4,451 | 236,971 | ||||||
| *CarParts.com, Inc. |
5,076 | 77,307 | ||||||
| *Carriage Services, Inc. |
47,667 | 2,452,467 | ||||||
| Carrols Restaurant Group, Inc. |
70,426 | 258,463 | ||||||
| *Carter’s, Inc. |
31,903 | 3,143,084 | ||||||
| *Cato Corp. (The), Class A |
42,203 | 744,039 | ||||||
| *Cavco Industries, Inc. |
20,502 | 4,928,271 | ||||||
| *Century Casinos, Inc. |
9,514 | 140,807 | ||||||
| *Century Communities, Inc. |
86,727 | 5,815,913 | ||||||
| *Cheesecake Factory, Inc. (The) |
68,677 | 2,791,033 | ||||||
| #*Chico’s FAS, Inc. |
13,000 | 70,980 | ||||||
| #*Children’s Place, Inc. (The) |
28,743 | 2,382,507 | ||||||
| Choice Hotels International, Inc. |
54,446 | 7,656,197 | ||||||
| *Churchill Downs, Inc. |
1,672 | 384,560 | ||||||
| *Chuy’s Holdings, Inc. |
37,553 | 1,095,045 | ||||||
| *Citi Trends, Inc. |
15,762 | 1,219,348 | ||||||
| Clarus Corp. |
18,156 | 500,742 | ||||||
| *Columbia Sportswear Co. |
6,618 | 687,213 | ||||||
| *Conn’s, Inc. |
73,700 | 1,641,299 | ||||||
| *Container Store Group, Inc. (The) |
34,809 | 384,988 | ||||||
| *Cooper-Standard Holdings, Inc. |
15,612 | 404,975 | ||||||
| Cracker Barrel Old Country Store, Inc. |
29,082 | 3,872,850 | ||||||
| *Crocs, Inc. |
125,337 | 20,235,659 | ||||||
| Culp, Inc. |
32,366 | 428,202 | ||||||
| *Dana, Inc. |
281,395 | 6,244,155 | ||||||
| *Dave & Buster’s Entertainment, Inc. |
27,333 | 1,014,874 | ||||||
| *Deckers Outdoor Corp. |
11,464 | 4,531,834 | ||||||
| *Del Taco Restaurants, Inc. |
63,560 | 530,090 | ||||||
| *Delta Apparel, Inc. |
9,884 | 265,385 | ||||||
| *Denny’s Corp. |
84,381 | 1,341,658 | ||||||
| #*Designer Brands, Inc., Class A |
89,583 | 1,212,058 | ||||||
| #Dick’s Sporting Goods, Inc. |
83,687 | 10,394,762 | ||||||
| #*Dillard’s, Inc., Class A |
19,720 | 4,558,081 | ||||||
| *Dixie Group, Inc. (The) |
7,497 | 34,411 | ||||||
| *Dorman Products, Inc. |
66,345 | 6,925,091 | ||||||
| *Educational Development Corp. |
5,452 | 53,266 | ||||||
| *El Pollo Loco Holdings, Inc. |
76,763 | 1,128,416 | ||||||
| *Escalade, Inc. |
17,256 | 322,860 | ||||||
| Ethan Allen Interiors, Inc. |
55,310 | 1,283,745 | ||||||
| *Everi Holdings, Inc. |
46,082 | 1,105,968 | ||||||
| #*Fiesta Restaurant Group, Inc. |
58,955 | 621,386 | ||||||
| *Flanigan’s Enterprises, Inc. |
1,877 | 54,902 | ||||||
| Flexsteel Industries, Inc. |
16,686 | 467,208 | ||||||
| *Floor & Decor Holdings, Inc., Class A |
18,902 | 2,569,160 | ||||||
| *Foot Locker, Inc. |
15,773 | 751,899 | ||||||
| *Fossil Group, Inc. |
101,802 | 1,203,300 | ||||||
| *Fox Factory Holding Corp. |
72,260 | 11,630,247 | ||||||
| Franchise Group, Inc. |
3,888 | 143,078 | ||||||
| *frontdoor, Inc. |
26,627 | 992,655 | ||||||
| *Full House Resorts, Inc. |
2,767 | 27,532 | ||||||
| *Funko, Inc., Class A |
4,030 | 66,052 | ||||||
| *Gap, Inc. (The) |
52,154 | 1,183,374 | ||||||
| *Genesco, Inc. |
45,388 | 2,750,059 | ||||||
Dimensional U.S. Small Cap ETF
SCHEDULE OF INVESTMENTS
October 31, 2021
| Security Description |
Shares | Fair Value | ||||||
| CONSUMER DISCRETIONARY (Continued) |
| |||||||
| *Gentherm, Inc. |
73,648 | $ | 5,422,702 | |||||
| *G-III Apparel Group, Ltd. |
74,551 | 2,136,632 | ||||||
| *Goodyear Tire & Rubber Co. (The) |
254,837 | 4,872,483 | ||||||
| *GoPro, Inc., Class A |
97,060 | 835,687 | ||||||
| Graham Holdings Co., Class B |
7,320 | 4,288,422 | ||||||
| *Grand Canyon Education, Inc. |
22,772 | 1,814,928 | ||||||
| *Green Brick Partners, Inc. |
26,301 | 685,141 | ||||||
| *Group 1 Automotive, Inc. |
38,935 | 7,000,513 | ||||||
| Guess?, Inc. |
122,705 | 2,541,221 | ||||||
| *H&R Block, Inc. |
24,141 | 556,933 | ||||||
| Hamilton Beach Brands Holding Co., Class A |
21,382 | 320,730 | ||||||
| *Hanesbrands, Inc. |
176,944 | 3,015,126 | ||||||
| Harley-Davidson, Inc. |
91,202 | 3,327,961 | ||||||
| *Haverty Furniture Cos., Inc. |
457 | 12,924 | ||||||
| #*Haverty Furniture Cos., Inc. |
43,948 | 1,261,308 | ||||||
| *Helen of Troy, Ltd. |
52,142 | 11,729,343 | ||||||
| Hibbett, Inc. |
43,002 | 3,330,075 | ||||||
| *Hilton Grand Vacations, Inc. |
98,663 | 4,960,776 | ||||||
| Hooker Furnishings Corp. |
26,595 | 670,460 | ||||||
| *Horizon Global Corp. |
16,767 | 124,411 | ||||||
| *Houghton Mifflin Harcourt Co. |
175,254 | 2,486,854 | ||||||
| *Hovnanian Enterprises, Inc., Class A |
266 | 22,413 | ||||||
| *Inspired Entertainment, Inc. |
3,367 | 46,296 | ||||||
| Installed Building Products, Inc. |
55,518 | 7,053,562 | ||||||
| *International Game Technology PLC |
1,324 | 39,045 | ||||||
| #*iRobot Corp. |
43,885 | 3,660,887 | ||||||
| Jack in the Box, Inc. |
46,422 | 4,593,457 | ||||||
| *JAKKS Pacific, Inc. |
1,753 | 18,389 | ||||||
| Johnson Outdoors, Inc., Class A |
21,033 | 2,233,284 | ||||||
| KB Home |
133,760 | 5,370,464 | ||||||
| *Kohl’s Corp. |
732 | 35,524 | ||||||
| Kontoor Brands, Inc. |
9,676 | 512,828 | ||||||
| #*Lakeland Industries, Inc. |
16,356 | 342,004 | ||||||
| *Lands’ End, Inc. |
29,041 | 763,197 | ||||||
| *Laureate Education, Inc., Class A |
108,054 | 1,871,495 | ||||||
| *La-Z-Boy, Inc. |
111,401 | 3,702,969 | ||||||
| #*Lazydays Holdings, Inc. |
4,626 | 97,562 | ||||||
| LCI Industries |
47,608 | 6,647,981 | ||||||
| *Legacy Housing Corp. |
400 | 7,100 | ||||||
| *Leggett & Platt, Inc. |
65,147 | 3,052,137 | ||||||
| *LGI Homes, Inc. |
21,814 | 3,256,830 | ||||||
| Lifetime Brands, Inc. |
30,621 | 519,332 | ||||||
| *Lincoln Educational Services Corp. |
7,876 | 56,707 | ||||||
| *Lindblad Expeditions Holdings, Inc. |
58,820 | 879,359 | ||||||
| *Liquidity Services, Inc., Class A |
84,212 | 1,859,401 | ||||||
| *Lithia Motors, Inc., Class A |
47,402 | 15,131,666 | ||||||
| *Lovesac Co. (The) |
3,825 | 298,388 | ||||||
| *Lumber Liquidators Holdings, Inc. |
21,978 | 397,362 | ||||||
| *M/I Homes, Inc. |
42,762 | 2,448,552 | ||||||
| #Macy’s, Inc. |
6,403 | 169,487 | ||||||
| *Malibu Boats, Inc., Class A |
43,271 | 3,055,365 | ||||||
| *Marine Products Corp. |
33,805 | 428,309 | ||||||
| #*MarineMax, Inc. |
62,323 | 3,227,708 | ||||||
| Marriott Vacations Worldwide Corp. |
61,634 | 9,690,097 | ||||||
| *Mastercraft Boat Holdings, Inc. |
59,268 | 1,587,197 | ||||||
| *Mattel, Inc. |
71,223 | 1,553,374 | ||||||
| *MDC Holdings, Inc. |
121,490 | 5,950,580 | ||||||
Dimensional U.S. Small Cap ETF
SCHEDULE OF INVESTMENTS
October 31, 2021
| Security Description |
Shares | Fair Value | ||||||
| CONSUMER DISCRETIONARY (Continued) |
| |||||||
| *Meritage Homes Corp. |
43,894 | $ | 4,771,717 | |||||
| *Modine Manufacturing Co. |
92,625 | 1,018,875 | ||||||
| *Monarch Casino & Resort, Inc. |
36,264 | 2,618,986 | ||||||
| Monro, Inc. |
54,952 | 3,393,836 | ||||||
| *Motorcar Parts of America, Inc. |
38,494 | 728,306 | ||||||
| Movado Group, Inc. |
34,044 | 1,133,665 | ||||||
| *Murphy USA, Inc. |
59,830 | 9,749,299 | ||||||
| *Nathan’s Famous, Inc. |
13,929 | 870,563 | ||||||
| *National Vision Holdings, Inc. |
43,676 | 2,692,189 | ||||||
| #*Nautilus, Inc. |
91,439 | 935,421 | ||||||
| #*Noodles & Co. |
65,373 | 794,282 | ||||||
| #*Nordstrom, Inc. |
4,986 | 143,248 | ||||||
| *ODP Corp. (The) |
78,828 | 3,413,252 | ||||||
| #*Ollie’s Bargain Outlet Holdings, Inc. |
29,148 | 1,972,154 | ||||||
| *ONE Group Hospitality, Inc. (The) |
1,653 | 21,853 | ||||||
| *OneSpaWorld Holdings, Ltd. |
18,044 | 194,875 | ||||||
| OneWater Marine, Inc. |
133 | 5,897 | ||||||
| Oxford Industries, Inc. |
31,513 | 2,921,885 | ||||||
| *Papa John’s International, Inc. |
60,664 | 7,527,189 | ||||||
| #*Party City Holdco, Inc. |
12,762 | 92,780 | ||||||
| *Patrick Industries, Inc. |
52,205 | 4,067,292 | ||||||
| #*Penn National Gaming, Inc. |
50,921 | 3,645,944 | ||||||
| Penske Automotive Group, Inc. |
103,793 | 11,007,248 | ||||||
| *Perdoceo Education Corp. |
182,481 | 1,937,948 | ||||||
| #*PetMed Express, Inc. |
54,171 | 1,540,082 | ||||||
| *Planet Fitness, Inc., Class A |
3,432 | 273,016 | ||||||
| *Playa Hotels & Resorts NV |
30,068 | 255,879 | ||||||
| *PlayAGS, Inc. |
28,830 | 254,281 | ||||||
| *Polaris, Inc. |
27,344 | 3,143,193 | ||||||
| *Potbelly Corp. |
33,023 | 198,798 | ||||||
| #*Purple Innovation, Inc. |
1,755 | 33,872 | ||||||
| *PVH Corp. |
12,112 | 1,324,205 | ||||||
| Qurate Retail, Inc., Class A |
201,057 | 2,099,035 | ||||||
| RCI Hospitality Holdings, Inc. |
22,308 | 1,512,482 | ||||||
| *Red Robin Gourmet Burgers, Inc. |
22,225 | 441,611 | ||||||
| *Red Rock Resorts, Inc., Class A |
16,620 | 904,294 | ||||||
| Rent-A-Center, Inc. |
41,654 | 2,218,492 | ||||||
| *Revolve Group, Inc. |
8,169 | 613,002 | ||||||
| *RH |
15,878 | 10,473,605 | ||||||
| *Rocky Brands, Inc. |
13,973 | 762,227 | ||||||
| *RumbleON, Inc., Class B |
1,300 | 50,713 | ||||||
| *Ruth’s Hospitality Group, Inc. |
85,751 | 1,658,424 | ||||||
| *Sally Beauty Holdings, Inc. |
161,175 | 2,459,531 | ||||||
| *Scientific Games Corp. |
64,853 | 5,191,483 | ||||||
| *SeaWorld Entertainment, Inc. |
80,769 | 5,128,832 | ||||||
| *Shake Shack, Inc., Class A |
38,271 | 2,647,205 | ||||||
| #Shoe Carnival, Inc. |
74,277 | 2,515,762 | ||||||
| *Shutterstock, Inc. |
56,614 | 6,858,786 | ||||||
| Signet Jewelers, Ltd. |
90,902 | 8,106,640 | ||||||
| *Six Flags Entertainment Corp. |
1,859 | 76,461 | ||||||
| *Skechers USA, Inc., Class A |
72,421 | 3,346,574 | ||||||
| *Skyline Champion Corp. |
51,665 | 3,271,428 | ||||||
| *Sleep Number Corp. |
72,525 | 6,406,859 | ||||||
| Smith & Wesson Brands, Inc. |
124,376 | 2,674,084 | ||||||
| Sonic Automotive, Inc., Class A |
75,363 | 3,725,193 | ||||||
| *Sonos, Inc. |
32,188 | 1,049,973 | ||||||
Dimensional U.S. Small Cap ETF
SCHEDULE OF INVESTMENTS
October 31, 2021
| Security Description |
Shares | Fair Value | ||||||
| CONSUMER DISCRETIONARY (Continued) |
| |||||||
| #*Sportsman’s Warehouse Holdings, Inc. |
128,949 | $ | 2,225,660 | |||||
| *Standard Motor Products, Inc. |
61,667 | 2,953,849 | ||||||
| *Steven Madden, Ltd. |
162,391 | 7,323,834 | ||||||
| *Stitch Fix, Inc., Class A |
11,930 | 412,778 | ||||||
| *Stoneridge, Inc. |
69,872 | 1,326,171 | ||||||
| Strategic Education, Inc. |
22,709 | 1,548,981 | ||||||
| *Strattec Security Corp. |
8,408 | 291,505 | ||||||
| *Stride, Inc. |
95,201 | 3,379,636 | ||||||
| *Superior Group of Cos., Inc. |
31,413 | 816,424 | ||||||
| *Superior Industries International, Inc. |
4,833 | 28,176 | ||||||
| *Sypris Solutions, Inc. |
779 | 2,984 | ||||||
| *Tandy Leather Factory, Inc. |
11,426 | 55,987 | ||||||
| *Tapestry, Inc. |
6,377 | 248,575 | ||||||
| *Taylor Morrison Home Corp. |
176,403 | 5,385,584 | ||||||
| Tempur Sealy International, Inc. |
147,761 | 6,570,932 | ||||||
| *Tenneco, Inc., Class A |
35,331 | 468,842 | ||||||
| *Terminix Global Holdings, Inc. |
30,151 | 1,220,512 | ||||||
| *Texas Roadhouse, Inc. |
93,061 | 8,264,747 | ||||||
| Thor Industries, Inc. |
2,472 | 252,045 | ||||||
| *Tilly’s, Inc., Class A |
44,987 | 624,420 | ||||||
| Toll Brothers, Inc. |
3,216 | 193,507 | ||||||
| *TopBuild Corp. |
51,917 | 13,341,111 | ||||||
| *Travel + Leisure Co. |
18,301 | 994,476 | ||||||
| *TravelCenters of America, Inc. |
15,642 | 843,260 | ||||||
| *Tri Pointe Homes, Inc. |
263,331 | 6,369,977 | ||||||
| *Tuesday Morning Corp. |
4,063 | 9,223 | ||||||
| #*Tupperware Brands Corp. |
19,434 | 432,212 | ||||||
| *Unifi, Inc. |
38,168 | 916,795 | ||||||
| *Universal Electronics, Inc. |
34,164 | 1,406,874 | ||||||
| *Universal Technical Institute, Inc. |
32,881 | 231,482 | ||||||
| *Urban Outfitters, Inc. |
138,019 | 4,406,947 | ||||||
| #*Veoneer, Inc. |
6,349 | 223,485 | ||||||
| #*Vera Bradley, Inc. |
48,405 | 474,853 | ||||||
| *Victoria’s Secret & Co. |
3,738 | 188,657 | ||||||
| *Vista Outdoor, Inc. |
122,977 | 5,145,358 | ||||||
| *Visteon Corp. |
42,700 | 4,832,786 | ||||||
| *VOXX International Corp. |
50,324 | 569,164 | ||||||
| Wendy’s Co. (The) |
237,724 | 5,301,245 | ||||||
| *Weyco Group, Inc. |
11,874 | 270,965 | ||||||
| #*Wingstop, Inc. |
30,419 | 5,246,365 | ||||||
| *Winmark Corp. |
9,881 | 2,300,494 | ||||||
| Winnebago Industries, Inc. |
66,003 | 4,467,743 | ||||||
| *Wolverine World Wide, Inc. |
165,602 | 5,493,018 | ||||||
| Wyndham Hotels & Resorts, Inc. |
43,174 | 3,646,908 | ||||||
| *XPEL, Inc. |
756 | 57,380 | ||||||
| #*YETI Holdings, Inc. |
20,642 | 2,029,728 | ||||||
| *Zumiez, Inc. |
56,225 | 2,288,358 | ||||||
|
|
|
|||||||
| TOTAL CONSUMER DISCRETIONARY |
623,350,968 | |||||||
|
|
|
|||||||
| CONSUMER STAPLES (4.0%) |
| |||||||
| Alico, Inc. |
11,239 | 400,108 | ||||||
| Andersons, Inc. (The), Class A |
59,284 | 2,019,213 | ||||||
| #B&G Foods, Inc. |
66,860 | 1,968,358 | ||||||
| *Bellring Brands, Inc., Class A |
4,245 | 113,851 | ||||||
| *BJ’s Wholesale Club Holdings, Inc. |
48,694 | 2,845,677 | ||||||
| *Boston Beer Co., Inc. (The), Class A |
967 | 476,228 | ||||||
| *Bridgford Foods Corp. |
6,015 | 70,376 | ||||||
Dimensional U.S. Small Cap ETF
SCHEDULE OF INVESTMENTS
October 31, 2021
| Security Description |
Shares | Fair Value | ||||||
| CONSUMER STAPLES (Continued) |
| |||||||
| *Calavo Growers, Inc. |
27,085 | $ | 1,088,817 | |||||
| Cal-Maine Foods, Inc. |
58,866 | 2,122,708 | ||||||
| *Celsius Holdings, Inc. |
12,373 | 1,194,242 | ||||||
| *Central Garden & Pet Co. |
25,378 | 1,308,997 | ||||||
| *Central Garden & Pet Co., Class A |
82,612 | 3,816,674 | ||||||
| *Chefs’ Warehouse, Inc. (The) |
75,078 | 2,617,970 | ||||||
| Coca-Cola Consolidated, Inc. |
14,915 | 5,986,881 | ||||||
| *Coty, Inc., Class A |
91,409 | 775,148 | ||||||
| *Darling Ingredients, Inc. |
288,631 | 24,395,092 | ||||||
| Edgewell Personal Care Co. |
81,921 | 2,866,416 | ||||||
| *elf Beauty, Inc. |
61,051 | 1,972,558 | ||||||
| Energizer Holdings, Inc. |
9,061 | 330,455 | ||||||
| *Farmer Bros Co. |
20,952 | 158,188 | ||||||
| *Flowers Foods, Inc. |
99,962 | 2,474,059 | ||||||
| Fresh Del Monte Produce, Inc. |
89,667 | 3,002,948 | ||||||
| *Freshpet, Inc. |
6,969 | 1,086,537 | ||||||
| *Hain Celestial Group, Inc. (The) |
61,154 | 2,743,980 | ||||||
| *Herbalife Nutrition, Ltd. |
2,496 | 115,814 | ||||||
| #*Hostess Brands, Inc. |
180,011 | 3,404,008 | ||||||
| Ingles Markets, Inc., Class A |
35,416 | 2,450,433 | ||||||
| Ingredion, Inc. |
7,041 | 670,514 | ||||||
| *Inter Parfums, Inc. |
66,106 | 6,106,872 | ||||||
| *J & J Snack Foods Corp. |
31,825 | 4,695,779 | ||||||
| John B Sanfilippo & Son, Inc. |
22,053 | 1,863,479 | ||||||
| *Lancaster Colony Corp. |
39,479 | 6,711,430 | ||||||
| *Landec Corp. |
66,039 | 641,899 | ||||||
| Limoneira Co. |
27,270 | 439,865 | ||||||
| Medifast, Inc. |
22,706 | 4,456,507 | ||||||
| #MGP Ingredients, Inc. |
40,899 | 2,626,125 | ||||||
| National Beverage Corp. |
137,605 | 7,760,922 | ||||||
| *Natural Alternatives International, Inc. |
16,917 | 213,154 | ||||||
| Natural Grocers by Vitamin Cottage, Inc. |
41,432 | 504,642 | ||||||
| Nature’s Sunshine Products, Inc. |
5,543 | 87,524 | ||||||
| Nu Skin Enterprises, Inc., Class A |
80,053 | 3,214,128 | ||||||
| Ocean Bio-Chem, Inc. |
2,148 | 21,931 | ||||||
| *Oil-Dri Corp. of America |
13,411 | 466,971 | ||||||
| *Performance Food Group Co. |
148,847 | 6,732,350 | ||||||
| *Pilgrim’s Pride Corp. |
25,408 | 715,489 | ||||||
| *Post Holdings, Inc. |
1,690 | 171,501 | ||||||
| PriceSmart, Inc. |
57,719 | 4,152,882 | ||||||
| #Reynolds Consumer Products, Inc. |
7,058 | 190,425 | ||||||
| #*Rite Aid Corp. |
1,200 | 16,308 | ||||||
| Rocky Mountain Chocolate Factory, Inc. |
4,995 | 43,506 | ||||||
| Sanderson Farms, Inc. |
46,367 | 8,784,228 | ||||||
| *Seaboard Corp. |
351 | 1,351,357 | ||||||
| *Seneca Foods Corp. |
1,443 | 74,026 | ||||||
| *Seneca Foods Corp., Class A |
19,290 | 995,943 | ||||||
| *Simply Good Foods Co. (The) |
97,480 | 3,865,082 | ||||||
| *SpartanNash Co. |
81,811 | 1,893,107 | ||||||
| Spectrum Brands Holdings, Inc. |
30,982 | 2,904,562 | ||||||
| *Sprouts Farmers Market, Inc. |
178,020 | 3,941,363 | ||||||
| #Tootsie Roll Industries, Inc. |
46,502 | 1,471,788 | ||||||
| *TreeHouse Foods, Inc. |
36,614 | 1,323,230 | ||||||
| Turning Point Brands, Inc. |
21,762 | 830,656 | ||||||
| *United Natural Foods, Inc. |
113,913 | 4,942,685 | ||||||
| *United-Guardian, Inc. |
10,372 | 145,312 | ||||||
Dimensional U.S. Small Cap ETF
SCHEDULE OF INVESTMENTS
October 31, 2021
| Security Description |
Shares | Fair Value | ||||||
| CONSUMER STAPLES (Continued) |
| |||||||
| *Universal Corp. |
47,608 | $ | 2,237,576 | |||||
| *USANA Health Sciences, Inc. |
45,055 | 4,373,038 | ||||||
| Vector Group, Ltd. |
296,028 | 3,925,331 | ||||||
| Village Super Market, Inc., Class A |
19,939 | 444,042 | ||||||
| *Vital Farms, Inc. |
216 | 3,547 | ||||||
| #WD-40 Co. |
20,299 | 4,607,873 | ||||||
| *Weis Markets, Inc. |
39,444 | 2,221,092 | ||||||
|
|
|
|||||||
| TOTAL CONSUMER STAPLES |
174,645,777 | |||||||
|
|
|
|||||||
| ENERGY (3.2%) |
| |||||||
| *Adams Resources & Energy, Inc. |
7,069 | 207,475 | ||||||
| #*Alto Ingredients, Inc. |
89,549 | 476,401 | ||||||
| Antero Midstream Corp. |
201,106 | 2,139,768 | ||||||
| *Antero Resources Corp. |
239,340 | 4,755,686 | ||||||
| Apa Corp. |
7,169 | 187,899 | ||||||
| #*Arch Resources, Inc. |
14,487 | 1,319,476 | ||||||
| Archrock, Inc. |
133,634 | 1,094,462 | ||||||
| #*Ardmore Shipping Corp. |
51,635 | 204,991 | ||||||
| *Aspen Aerogels, Inc. |
9,160 | 498,854 | ||||||
| Berry Corp. |
13,757 | 132,205 | ||||||
| #Bonanza Creek Energy, Inc. |
28,053 | 1,574,895 | ||||||
| #Brigham Minerals, Inc. |
2,276 | 52,758 | ||||||
| *Bristow Group, Inc. |
10,431 | 360,913 | ||||||
| *Cactus, Inc., Class A |
59,370 | 2,582,595 | ||||||
| *California Resources Corp. |
18,657 | 860,647 | ||||||
| *Callon Petroleum Co. |
72 | 3,725 | ||||||
| *Centennial Resource Development, Inc., Class A |
157,619 | 1,134,857 | ||||||
| *Centrus Energy Corp. |
747 | 42,333 | ||||||
| *ChampionX Corp. |
103,587 | 2,717,087 | ||||||
| #*Chesapeake Energy Corp. |
37,541 | 2,392,863 | ||||||
| #*Clean Energy Fuels Corp. |
331,369 | 3,055,222 | ||||||
| *CNX Resources Corp. |
363,294 | 5,307,725 | ||||||
| *Comstock Resources, Inc. |
61,325 | 605,278 | ||||||
| *CONSOL Energy, Inc. |
51,490 | 1,416,490 | ||||||
| #*Contango Oil & Gas Co. |
11,698 | 48,313 | ||||||
| Core Laboratories NV |
960 | 24,970 | ||||||
| *Coterra Energy, Inc. |
214,689 | 4,577,169 | ||||||
| CVR Energy, Inc. |
8,317 | 159,437 | ||||||
| *Dawson Geophysical Co. |
30,257 | 70,196 | ||||||
| #*Delek US Holdings, Inc. |
90,900 | 1,768,005 | ||||||
| *Denbury, Inc. |
19,641 | 1,662,807 | ||||||
| Devon Energy Corp. |
86,639 | 3,472,491 | ||||||
| DHT Holdings, Inc. |
383,098 | 2,493,968 | ||||||
| Diamondback Energy, Inc. |
8,641 | 926,229 | ||||||
| *DMC Global, Inc. |
41,559 | 1,736,335 | ||||||
| Dorian LPG, Ltd. |
63,647 | 771,402 | ||||||
| *Dril-Quip, Inc. |
10,921 | 257,299 | ||||||
| DT Midstream, Inc. |
12,990 | 623,000 | ||||||
| *Earthstone Energy, Inc., Class A |
40,144 | 407,462 | ||||||
| #*ENGlobal Corp. |
8,803 | 19,719 | ||||||
| EnLink Midstream LLC |
150,212 | 1,179,164 | ||||||
| *EQT Corp. |
222,266 | 4,425,316 | ||||||
| *Equitrans Midstream Corp. |
155,957 | 1,607,917 | ||||||
| Evolution Petroleum Corp. |
50,891 | 302,293 | ||||||
| *Expro Group Holdings NV |
20,998 | 360,116 | ||||||
| *Exterran Corp. |
47,608 | 203,762 | ||||||
| *Forum Energy Technologies, Inc. |
7,807 | 175,736 | ||||||
Dimensional U.S. Small Cap ETF
SCHEDULE OF INVESTMENTS
October 31, 2021
| Security Description |
Shares | Fair Value | ||||||
| ENERGY (Continued) |
| |||||||
| *Geospace Technologies Corp. |
19,805 | $ | 188,346 | |||||
| #*Gevo, Inc. |
34,646 | 250,491 | ||||||
| *Goodrich Petroleum Corp. |
9,227 | 188,415 | ||||||
| *Green Plains, Inc. |
90,853 | 3,447,871 | ||||||
| *Gulf Island Fabrication, Inc. |
3,186 | 12,553 | ||||||
| *Gulfport Energy Operating Corp. |
1,750 | 143,570 | ||||||
| *Hallador Energy Co. |
11,113 | 35,895 | ||||||
| *Helix Energy Solutions Group, Inc. |
151,516 | 572,730 | ||||||
| *Helmerich & Payne, Inc. |
91,788 | 2,849,100 | ||||||
| HollyFrontier Corp. |
85,063 | 2,875,129 | ||||||
| International Seaways, Inc. |
50,671 | 889,276 | ||||||
| *Kosmos Energy, Ltd. |
306,594 | 1,103,738 | ||||||
| #*Laredo Petroleum, Inc. |
28,539 | 2,151,841 | ||||||
| *Liberty Oilfield Services, Inc., Class A |
15,991 | 206,604 | ||||||
| Magnolia Oil & Gas Corp., Class A |
76,699 | 1,601,475 | ||||||
| *Matador Resources Co. |
181,924 | 7,613,519 | ||||||
| #*Meta Materials, Inc. |
3,406 | 16,008 | ||||||
| *Mexco Energy Corp. |
1,439 | 17,225 | ||||||
| *Murphy Oil Corp. |
83,965 | 2,336,746 | ||||||
| *NACCO Industries, Inc., Class A |
13,890 | 431,146 | ||||||
| *Natural Gas Services Group, Inc. |
18,203 | 206,968 | ||||||
| *NCS Multistage Holdings, Inc. |
1,332 | 39,893 | ||||||
| *Newpark Resources, Inc. |
47,383 | 161,102 | ||||||
| *NexTier Oilfield Solutions, Inc. |
82,798 | 369,279 | ||||||
| *NOV, Inc. |
105,398 | 1,477,680 | ||||||
| *Oasis Petroleum, Inc. |
4,887 | 589,372 | ||||||
| *Oceaneering International, Inc. |
139,824 | 1,901,606 | ||||||
| *Oil States International, Inc. |
24,202 | 146,664 | ||||||
| *Overseas Shipholding Group, Inc., Class A |
105,883 | 210,707 | ||||||
| Ovintiv, Inc. |
4,334 | 162,612 | ||||||
| *Par Pacific Holdings, Inc. |
64,622 | 999,056 | ||||||
| *Patterson-UTI Energy, Inc. |
267,522 | 2,289,988 | ||||||
| *PBF Energy, Inc., Class A |
28,882 | 421,966 | ||||||
| PDC Energy, Inc. |
141,952 | 7,425,509 | ||||||
| *Peabody Energy Corp. |
28,948 | 344,192 | ||||||
| PHX Minerals, Inc. |
22,619 | 68,762 | ||||||
| *Pioneer Natural Resources Co. |
2,609 | 487,831 | ||||||
| *ProPetro Holding Corp. |
94,852 | 909,631 | ||||||
| *Range Resources Corp. |
481,008 | 11,217,107 | ||||||
| *Renewable Energy Group, Inc. |
94,113 | 6,023,232 | ||||||
| *REX American Resources Corp. |
15,143 | 1,331,827 | ||||||
| #*Ring Energy, Inc. |
25,732 | 96,752 | ||||||
| #*RPC, Inc. |
154,570 | 833,132 | ||||||
| *SandRidge Energy, Inc. |
37,331 | 477,837 | ||||||
| Scorpio Tankers, Inc. |
40,539 | 649,435 | ||||||
| *SEACOR Marine Holdings, Inc. |
26,514 | 118,252 | ||||||
| *Select Energy Services, Inc., Class A |
30,969 | 186,124 | ||||||
| SFL Corp., Ltd. |
16,602 | 131,322 | ||||||
| *SilverBow Resources, Inc. |
14,822 | 409,087 | ||||||
| #SM Energy Co. |
108,809 | 3,734,325 | ||||||
| Solaris Oilfield Infrastructure, Inc., Class A |
2,521 | 19,134 | ||||||
| *Southwestern Energy Co. |
1,267,677 | 6,186,264 | ||||||
| *Talos Energy, Inc. |
6,932 | 89,908 | ||||||
| TechnipFMC PLC |
105,900 | 780,483 | ||||||
| #*Teekay Tankers, Ltd., Class A |
1,781 | 24,720 | ||||||
| *TETRA Technologies, Inc. |
76,176 | 246,048 | ||||||
Dimensional U.S. Small Cap ETF
SCHEDULE OF INVESTMENTS
October 31, 2021
| Security Description |
Shares | Fair Value | ||||||
| ENERGY (Continued) |
| |||||||
| *Tidewater, Inc. |
15,541 | $ | 188,512 | |||||
| #*Transocean, Ltd. |
21,933 | 77,423 | ||||||
| *US Silica Holdings, Inc. |
116,960 | 1,132,173 | ||||||
| *VAALCO Energy, Inc. |
24,148 | 75,583 | ||||||
| *Vertex Energy, Inc. |
283 | 1,384 | ||||||
| *W&T Offshore, Inc. |
77,994 | 320,555 | ||||||
| *Weatherford International PLC |
1,200 | 34,872 | ||||||
| *Whiting Petroleum Corp. |
7,374 | 480,269 | ||||||
| World Fuel Services Corp. |
85,059 | 2,596,851 | ||||||
|
|
|
|||||||
| TOTAL ENERGY |
143,004,818 | |||||||
|
|
|
|||||||
| FINANCIALS (20.1%) |
||||||||
| 1st Constitution BanCorp |
2,564 | 60,972 | ||||||
| *1st Source Corp. |
55,343 | 2,671,960 | ||||||
| *ACNB Corp. |
3,852 | 106,893 | ||||||
| *Affiliated Managers Group, Inc. |
50,490 | 8,476,261 | ||||||
| Alerus Financial Corp. |
1,545 | 48,513 | ||||||
| Allegiance Bancshares, Inc. |
19,375 | 758,919 | ||||||
| A-Mark Precious Metals, Inc. |
17,334 | 1,299,877 | ||||||
| *AMBAC Financial Group, Inc. |
7,225 | 122,175 | ||||||
| *Amerant BanCorp, Inc. |
1,365 | 36,241 | ||||||
| *American Equity Investment Life Holding Co. |
170,538 | 5,435,046 | ||||||
| *American National Bankshares, Inc. |
10,039 | 372,447 | ||||||
| American National Group, Inc. |
17,802 | 3,377,217 | ||||||
| Ameris BanCorp |
142,813 | 7,481,973 | ||||||
| AMERISAFE, Inc. |
48,475 | 2,874,083 | ||||||
| Ameriserv Financial, Inc. |
40,106 | 160,023 | ||||||
| *Ames National Corp. |
5,066 | 125,232 | ||||||
| Argo Group International Holdings, Ltd. |
63,297 | 3,487,665 | ||||||
| *Arrow Financial Corp. |
39,581 | 1,418,979 | ||||||
| Artisan Partners Asset Management, Inc., Class A |
98,985 | 4,903,717 | ||||||
| *AssetMark Financial Holdings, Inc. |
1,307 | 33,511 | ||||||
| *Associated Banc-Corp. |
262,761 | 5,854,315 | ||||||
| *Associated Capital Group, Inc. |
1,064 | 38,676 | ||||||
| Assured Guaranty, Ltd. |
99,108 | 5,508,423 | ||||||
| Atlantic American Corp. |
4,900 | 19,992 | ||||||
| *Atlantic Capital Bancshares, Inc. |
47,412 | 1,304,304 | ||||||
| Atlantic Union Bankshares Corp. |
133,753 | 4,797,720 | ||||||
| *Atlanticus Holdings Corp. |
22,624 | 1,753,134 | ||||||
| *Auburn National BanCorp, Inc. |
300 | 10,146 | ||||||
| Axis Capital Holdings, Ltd. |
51,584 | 2,685,979 | ||||||
| *Axos Financial, Inc. |
123,945 | 6,569,085 | ||||||
| B Riley Financial, Inc. |
869 | 62,273 | ||||||
| Banc of California, Inc. |
137,032 | 2,785,861 | ||||||
| BancFirst Corp. |
50,875 | 3,307,384 | ||||||
| *BanCorp, Inc. (The) |
153,885 | 4,701,187 | ||||||
| #Bank First Corp. |
161 | 11,429 | ||||||
| *Bank of Hawaii Corp. |
72,796 | 6,151,262 | ||||||
| *Bank of Marin BanCorp |
22,822 | 869,746 | ||||||
| Bank of NT Butterfield & Son, Ltd. (The) |
44,681 | 1,604,048 | ||||||
| *Bank of Princeton (The) |
166 | 5,026 | ||||||
| #Bank OZK |
128,499 | 5,740,050 | ||||||
| BankFinancial Corp. |
23,459 | 267,198 | ||||||
| BankUnited, Inc. |
115,652 | 4,690,845 | ||||||
| Bankwell Financial Group, Inc. |
4,094 | 121,592 | ||||||
| Banner Corp. |
65,735 | 3,796,854 | ||||||
| *Bar Harbor Bankshares |
20,676 | 614,077 | ||||||
Dimensional U.S. Small Cap ETF
SCHEDULE OF INVESTMENTS
October 31, 2021
| Security Description |
Shares | Fair Value | ||||||
| FINANCIALS (Continued) |
| |||||||
| *BayCom Corp. |
3,575 | $ | 67,532 | |||||
| BCB BanCorp, Inc. |
19,322 | 292,149 | ||||||
| *Berkshire Hills BanCorp, Inc. |
75,352 | 2,045,807 | ||||||
| BGC Partners, Inc., Class A |
126,662 | 680,175 | ||||||
| *Blucora, Inc. |
92,763 | 1,532,445 | ||||||
| BOK Financial Corp. |
28,287 | 2,861,796 | ||||||
| *Bridgewater Bancshares, Inc. |
11,520 | 208,397 | ||||||
| *Brighthouse Financial, Inc. |
89,891 | 4,515,225 | ||||||
| Brightsphere Investment Group, Inc. |
82,064 | 2,460,279 | ||||||
| *Broadway Financial Corp. |
6,315 | 18,819 | ||||||
| Brookline BanCorp, Inc. |
155,619 | 2,497,685 | ||||||
| *BRP Group, Inc., Class A |
88 | 3,212 | ||||||
| Bryn Mawr Bank Corp. |
43,107 | 1,997,578 | ||||||
| Business First Bancshares, Inc. |
3,999 | 106,693 | ||||||
| *Byline BanCorp, Inc. |
18,374 | 473,314 | ||||||
| C&F Financial Corp. |
4,656 | 238,248 | ||||||
| *Cadence Bank |
334,563 | 9,709,021 | ||||||
| *California First Leasing Corp. |
1,651 | 30,279 | ||||||
| *Cambridge BanCorp |
3,045 | 279,561 | ||||||
| Camden National Corp. |
32,769 | 1,559,804 | ||||||
| *Cannae Holdings, Inc. |
31,621 | 1,078,276 | ||||||
| *Capital BanCorp, Inc. |
995 | 25,323 | ||||||
| *Capital City Bank Group, Inc. |
24,568 | 660,142 | ||||||
| Capitol Federal Financial, Inc. |
277,000 | 3,360,010 | ||||||
| Capstar Financial Holdings, Inc. |
18,622 | 409,125 | ||||||
| *Carter Bankshares, Inc. |
1,649 | 24,702 | ||||||
| *Carver BanCorp, Inc. |
3,610 | 53,284 | ||||||
| *Cathay General BanCorp |
205,612 | 8,674,770 | ||||||
| CBTX, Inc. |
4,859 | 132,165 | ||||||
| *CCUR Holdings, Inc. |
3 | 18,450 | ||||||
| *Central Pacific Financial Corp. |
20,028 | 550,570 | ||||||
| *Central Valley Community BanCorp |
12,038 | 256,771 | ||||||
| *Century BanCorp, Inc., Class A |
6,627 | 763,099 | ||||||
| *Chemung Financial Corp. |
909 | 42,041 | ||||||
| Citizens & Northern Corp. |
14,799 | 377,522 | ||||||
| Citizens Community BanCorp, Inc. |
17,222 | 234,219 | ||||||
| Citizens Holding Co. |
592 | 10,662 | ||||||
| *Citizens, Inc. |
77,494 | 499,061 | ||||||
| *City Holding Co. |
33,048 | 2,629,960 | ||||||
| Civista Bancshares, Inc. |
14,980 | 360,419 | ||||||
| *CNB Financial Corp. |
21,455 | 550,750 | ||||||
| CNO Financial Group, Inc. |
335,819 | 8,106,671 | ||||||
| *Coastal Financial Corp. |
1,794 | 68,262 | ||||||
| Codorus Valley BanCorp, Inc. |
4,253 | 93,098 | ||||||
| #Cohen & Steers, Inc. |
62,332 | 5,914,683 | ||||||
| Colony Bankcorp, Inc. |
1,629 | 30,625 | ||||||
| Columbia Banking System, Inc. |
170,090 | 5,805,172 | ||||||
| *Columbia Financial, Inc. |
24,193 | 450,474 | ||||||
| *Community Bank System, Inc. |
98,493 | 7,058,993 | ||||||
| *Community Bankers Trust Corp. |
35,657 | 415,761 | ||||||
| Community Financial Corp. (The) |
1,681 | 64,080 | ||||||
| *Community Trust BanCorp, Inc. |
41,677 | 1,820,451 | ||||||
| *Community West Bancshares |
1,200 | 15,720 | ||||||
| ConnectOne BanCorp, Inc. |
71,437 | 2,409,570 | ||||||
| *County BanCorp, Inc. |
1,012 | 35,825 | ||||||
| *Cowen, Inc., Class A |
38,810 | 1,464,301 | ||||||
Dimensional U.S. Small Cap ETF
SCHEDULE OF INVESTMENTS
October 31, 2021
| Security Description |
Shares | Fair Value | ||||||
| FINANCIALS (Continued) |
| |||||||
| *Crawford & Co., Class A |
73,049 | $ | 631,143 | |||||
| *Crawford & Co., Class B |
53,100 | 438,606 | ||||||
| *CrossFirst Bankshares, Inc. |
5,221 | 74,295 | ||||||
| *Cullen/Frost Bankers, Inc. |
24,593 | 3,184,793 | ||||||
| Curo Group Holdings Corp. |
30,816 | 529,419 | ||||||
| Customers BanCorp, Inc. |
59,915 | 3,192,870 | ||||||
| CVB Financial Corp. |
232,590 | 4,656,452 | ||||||
| Diamond Hill Investment Group, Inc. |
8,075 | 1,751,144 | ||||||
| Dime Community Bancshares, Inc. |
88,792 | 3,168,099 | ||||||
| Donegal Group, Inc. |
870 | 12,606 | ||||||
| Donegal Group, Inc., Class A |
42,484 | 605,397 | ||||||
| *Donnelley Financial Solutions, Inc. |
75,356 | 2,887,642 | ||||||
| Eagle BanCorp Montana, Inc. |
498 | 11,205 | ||||||
| *Eagle BanCorp, Inc. |
59,385 | 3,360,597 | ||||||
| East West BanCorp, Inc. |
11,889 | 944,938 | ||||||
| *eHealth, Inc. |
50,477 | 2,238,655 | ||||||
| *Elevate Credit, Inc. |
24,141 | 82,804 | ||||||
| *Employers Holdings, Inc. |
56,184 | 2,168,702 | ||||||
| *Encore Capital Group, Inc. |
59,731 | 3,226,669 | ||||||
| *Enova International, Inc. |
92,239 | 2,992,233 | ||||||
| *Enstar Group, Ltd. |
20,225 | 4,667,525 | ||||||
| *Enterprise BanCorp, Inc. |
7,463 | 277,250 | ||||||
| *Enterprise Financial Services Corp. |
59,468 | 2,796,185 | ||||||
| Equity Bancshares, Inc., Class A |
18,145 | 607,132 | ||||||
| *Esquire Financial Holdings, Inc. |
3,514 | 112,378 | ||||||
| Essa BanCorp, Inc. |
14,300 | 232,375 | ||||||
| Essent Group, Ltd. |
71,713 | 3,442,224 | ||||||
| Evans BanCorp, Inc. |
4,948 | 197,673 | ||||||
| Evercore, Inc. |
66,805 | 10,143,671 | ||||||
| *EZCorp., Inc., Class A |
87,775 | 654,801 | ||||||
| Farmers & Merchants BanCorp, Inc. |
689 | 17,487 | ||||||
| Farmers National Banc Corp. |
36,333 | 647,454 | ||||||
| FB Financial Corp. |
51,708 | 2,343,924 | ||||||
| *Federal Agricultural Mortgage Corp. |
1,115 | 132,068 | ||||||
| *Federal Agricultural Mortgage Corp. |
24,677 | 3,111,523 | ||||||
| *Federated Hermes, Inc. |
198,157 | 6,600,610 | ||||||
| Fednat Holding Co. |
19,701 | 50,041 | ||||||
| #*Financial Institutions, Inc. |
34,811 | 1,111,167 | ||||||
| *First BanCorp |
380,448 | 5,193,115 | ||||||
| First BanCorp, Inc. (The) |
18,147 | 538,421 | ||||||
| First BanCorp/Southern Pines Nc |
52,808 | 2,556,960 | ||||||
| *First Bancshares, Inc. (The) |
15,062 | 606,245 | ||||||
| First Bank |
13,121 | 197,340 | ||||||
| First Busey Corp. |
84,442 | 2,152,427 | ||||||
| *First Business Financial Services, Inc. |
12,183 | 355,744 | ||||||
| #First Citizens Bancshares, Inc., Class A |
6,087 | 4,954,209 | ||||||
| *First Commonwealth Financial Corp. |
182,772 | 2,796,412 | ||||||
| #First Community Bankshares, Inc. |
40,256 | 1,305,100 | ||||||
| *First Community Corp. |
400 | 8,048 | ||||||
| *First Financial BanCorp |
192,050 | 4,566,949 | ||||||
| First Financial Bankshares, Inc. |
177,759 | 9,015,936 | ||||||
| *First Financial Corp. |
26,421 | 1,132,140 | ||||||
| First Financial Northwest, Inc. |
23,602 | 389,433 | ||||||
| First Foundation, Inc. |
81,098 | 2,158,018 | ||||||
| First Hawaiian, Inc. |
92,712 | 2,557,924 | ||||||
| *First Horizon Corp. |
24,137 | 409,605 | ||||||
| First Internet BanCorp, Class A |
19,603 | 667,286 | ||||||
Dimensional U.S. Small Cap ETF
SCHEDULE OF INVESTMENTS
October 31, 2021
| Security Description |
Shares | Fair Value | ||||||
| FINANCIALS (Continued) |
| |||||||
| First Interstate BancSystem, Inc., Class A |
84,852 | $ | 3,527,298 | |||||
| *First Merchants Corp. |
95,810 | 3,983,780 | ||||||
| *First Mid Bancshares, Inc. |
11,271 | 485,555 | ||||||
| *First Midwest BanCorp, Inc. |
201,524 | 3,879,337 | ||||||
| *First Northwest BanCorp |
12,745 | 230,047 | ||||||
| First of Long Island Corp. (The) |
45,175 | 909,373 | ||||||
| First Savings Financial Group, Inc. |
432 | 12,001 | ||||||
| First United Corp. |
1,912 | 36,099 | ||||||
| *First Western Financial, Inc. |
762 | 22,113 | ||||||
| FirstCash, Inc. |
87,800 | 7,767,666 | ||||||
| *Flagstar BanCorp, Inc. |
101,266 | 4,778,743 | ||||||
| Flushing Financial Corp. |
75,439 | 1,812,045 | ||||||
| *FNB Corp. |
278,648 | 3,246,249 | ||||||
| FS BanCorp, Inc. |
10,528 | 362,795 | ||||||
| *Fulton Financial Corp. |
349,831 | 5,632,279 | ||||||
| *GAMCO Investors, Inc., Class A |
16,163 | 427,511 | ||||||
| *Genworth Financial, Inc., Class A |
19,454 | 79,956 | ||||||
| #*German American BanCorp, Inc. |
52,736 | 2,078,853 | ||||||
| Glacier BanCorp, Inc. |
175,219 | 9,687,859 | ||||||
| Global Indemnity Group LLC, Class A |
25,088 | 616,914 | ||||||
| #Goosehead Insurance, Inc., Class A |
8,149 | 1,175,901 | ||||||
| Great Southern BanCorp, Inc. |
32,028 | 1,807,340 | ||||||
| *Great Western BanCorp, Inc. |
65,218 | 2,220,673 | ||||||
| *Green Dot Corp., Class A |
114,138 | 4,834,886 | ||||||
| *Greenhill & Co., Inc. |
25,451 | 400,090 | ||||||
| *Greenlight Capital Re, Ltd., Class A |
27,428 | 203,790 | ||||||
| Guaranty Bancshares, Inc. |
6,793 | 255,009 | ||||||
| Guaranty Federal Bancshares, Inc. |
2,022 | 48,225 | ||||||
| *Hallmark Financial Services, Inc. |
21,825 | 72,677 | ||||||
| *Hamilton Lane, Inc., Class A |
19,239 | 2,010,668 | ||||||
| #*Hancock Whitney Corp. |
122,135 | 6,043,240 | ||||||
| *Hanmi Financial Corp. |
71,912 | 1,595,727 | ||||||
| Hanover Insurance Group, Inc. (The) |
53,393 | 6,727,518 | ||||||
| HarborOne BanCorp, Inc. |
52,279 | 751,249 | ||||||
| *Hawthorn Bancshares, Inc. |
2,376 | 56,953 | ||||||
| *HBT Financial, Inc. |
1,070 | 19,292 | ||||||
| #HCI Group, Inc. |
28,804 | 3,860,024 | ||||||
| Heartland Financial USA, Inc. |
49,418 | 2,476,830 | ||||||
| *Heritage Commerce Corp. |
107,891 | 1,293,613 | ||||||
| Heritage Financial Corp. |
67,403 | 1,674,291 | ||||||
| Heritage Insurance Holdings, Inc. |
37,630 | 246,100 | ||||||
| *Hilltop Holdings, Inc. |
165,009 | 5,847,919 | ||||||
| Hingham Institution For Savings The |
2,256 | 814,957 | ||||||
| *HMN Financial, Inc. |
3,408 | 79,440 | ||||||
| Home BanCorp, Inc. |
4,681 | 195,432 | ||||||
| *Home Bancshares, Inc. |
251,271 | 5,970,199 | ||||||
| HomeStreet, Inc. |
60,304 | 2,843,937 | ||||||
| *Hometrust Bancshares, Inc. |
11,678 | 355,011 | ||||||
| Hope BanCorp, Inc. |
273,672 | 3,992,874 | ||||||
| Horace Mann Educators Corp. |
81,686 | 3,200,457 | ||||||
| Horizon BanCorp, Inc. |
81,702 | 1,558,057 | ||||||
| *Houlihan Lokey, Inc. |
45,896 | 5,144,024 | ||||||
| *Howard BanCorp, Inc. |
14,380 | 297,810 | ||||||
| *Huntington Bancshares, Inc. |
624,454 | 9,828,906 | ||||||
| Independence Holding Co. |
6,095 | 298,960 | ||||||
| Independent Bank Corp. |
56,172 | 4,746,534 | ||||||
Dimensional U.S. Small Cap ETF
SCHEDULE OF INVESTMENTS
October 31, 2021
| Security Description |
Shares | Fair Value | ||||||
| FINANCIALS (Continued) |
| |||||||
| *Independent Bank Corp. |
26,093 | $ | 587,875 | |||||
| Independent Bank Group, Inc. |
60,991 | 4,409,039 | ||||||
| Interactive Brokers Group, Inc. |
8,296 | 587,772 | ||||||
| International Bancshares Corp. |
135,964 | 5,764,874 | ||||||
| Investar Holding Corp. |
4,804 | 89,835 | ||||||
| Investors BanCorp, Inc. |
269,719 | 4,126,701 | ||||||
| Investors Title Co. |
3,664 | 710,083 | ||||||
| James River Group Holdings, Ltd. |
22,353 | 714,178 | ||||||
| Janus Henderson Group PLC |
137,128 | 6,376,452 | ||||||
| Jefferies Financial Group, Inc. |
172,874 | 7,433,582 | ||||||
| Kearny Financial Corp. |
150,636 | 2,021,535 | ||||||
| *Kemper Corp. |
88,963 | 5,647,371 | ||||||
| Kentucky First Federal BanCorp |
3,402 | 24,052 | ||||||
| *Kingstone Cos., Inc. |
10,135 | 58,276 | ||||||
| Kinsale Capital Group, Inc. |
19,140 | 3,582,051 | ||||||
| *Lake Shore BanCorp, Inc. |
338 | 5,050 | ||||||
| *Lakeland BanCorp, Inc. |
114,703 | 2,062,360 | ||||||
| Lakeland Financial Corp. |
62,197 | 4,470,098 | ||||||
| Landmark BanCorp, Inc. |
3,458 | 99,037 | ||||||
| Lazard, Ltd., Class A |
65,278 | 3,197,969 | ||||||
| LCNB Corp. |
5,984 | 102,027 | ||||||
| *LendingClub Corp. |
114,828 | 5,277,495 | ||||||
| *LendingTree, Inc. |
16,568 | 2,673,910 | ||||||
| Level One BanCorp, Inc. |
87 | 2,733 | ||||||
| *Limestone BanCorp, Inc. |
857 | 15,640 | ||||||
| Live Oak Bancshares, Inc. |
50,257 | 4,481,919 | ||||||
| LPL Financial Holdings, Inc. |
5,796 | 950,660 | ||||||
| *Luther Burbank Corp. |
13,113 | 190,270 | ||||||
| *Macatawa Bank Corp. |
56,938 | 478,279 | ||||||
| *Magyar BanCorp, Inc. |
1,254 | 14,183 | ||||||
| *Maiden Holdings, Ltd. |
153,677 | 500,987 | ||||||
| *Malvern BanCorp, Inc. |
1,300 | 21,853 | ||||||
| Manning & Napier, Inc. |
365 | 3,522 | ||||||
| *Marlin Business Services Corp. |
25,132 | 576,025 | ||||||
| *MBIA, Inc. |
159,089 | 2,472,243 | ||||||
| *Mercantile Bank Corp. |
23,120 | 794,634 | ||||||
| Merchants BanCorp |
8,781 | 390,140 | ||||||
| *Mercury General Corp. |
102,985 | 5,611,653 | ||||||
| Meridian BanCorp, Inc. |
117,839 | 2,733,865 | ||||||
| Meridian Corp. |
332 | 10,026 | ||||||
| Meta Financial Group, Inc. |
61,855 | 3,429,241 | ||||||
| Metrocity Bankshares, Inc. |
1,441 | 33,863 | ||||||
| #*Metropolitan Bank Holding Corp. |
4,571 | 415,321 | ||||||
| *MGIC Investment Corp. |
251,648 | 4,066,632 | ||||||
| #Mid Penn BanCorp, Inc. |
3,147 | 88,179 | ||||||
| *Middlefield Banc Corp. |
614 | 15,350 | ||||||
| *Midland States BanCorp, Inc. |
21,810 | 559,645 | ||||||
| *MidWestOne Financial Group, Inc. |
11,634 | 364,726 | ||||||
| Moelis & Co., Class A |
63,780 | 4,639,357 | ||||||
| Morgan Stanley |
10,697 | 1,099,438 | ||||||
| *Mr Cooper Group, Inc. |
103,253 | 4,526,612 | ||||||
| *MVB Financial Corp. |
2,770 | 118,251 | ||||||
| *National Bank Holdings Corp., Class A |
64,452 | 2,795,283 | ||||||
| *National Bankshares, Inc. |
2,991 | 111,415 | ||||||
| *National Security Group, Inc. (The) |
1,000 | 10,130 | ||||||
| *National Western Life Group, Inc., Class A |
4,293 | 923,038 | ||||||
| Navient Corp. |
312,442 | 6,155,107 | ||||||
Dimensional U.S. Small Cap ETF
SCHEDULE OF INVESTMENTS
October 31, 2021
| Security Description |
Shares | Fair Value | ||||||
| FINANCIALS (Continued) |
| |||||||
| *NBT BanCorp, Inc. |
89,759 | $ | 3,293,258 | |||||
| Nelnet, Inc., Class A |
62,087 | 5,130,249 | ||||||
| #*New York Community BanCorp, Inc. |
222,239 | 2,762,431 | ||||||
| *NI Holdings, Inc. |
5,418 | 107,710 | ||||||
| *Nicholas Financial, Inc. |
8,598 | 102,316 | ||||||
| *Nicolet Bankshares, Inc. |
12,111 | 870,660 | ||||||
| *NMI Holdings, Inc., Class A |
103,962 | 2,524,197 | ||||||
| Northeast Bank |
12,481 | 413,121 | ||||||
| Northfield BanCorp, Inc. |
118,085 | 2,072,392 | ||||||
| Northrim BanCorp, Inc. |
8,823 | 391,918 | ||||||
| *Northwest Bancshares, Inc. |
214,486 | 2,959,907 | ||||||
| Norwood Financial Corp. |
949 | 24,835 | ||||||
| *OceanFirst Financial Corp. |
80,907 | 1,793,708 | ||||||
| *Ocwen Financial Corp. |
12,782 | 401,483 | ||||||
| OFG BanCorp |
81,697 | 2,115,952 | ||||||
| Ohio Valley Banc Corp. |
834 | 23,235 | ||||||
| *Old National BanCorp |
265,322 | 4,531,700 | ||||||
| Old Republic International Corp. |
53,533 | 1,382,757 | ||||||
| #Old Second BanCorp, Inc. |
20,952 | 283,690 | ||||||
| OneMain Holdings, Inc. |
65,746 | 3,472,046 | ||||||
| OP BanCorp |
1,353 | 14,991 | ||||||
| *Open Lending Corp., Class A |
1,778 | 56,043 | ||||||
| *Oportun Financial Corp. |
1,263 | 29,339 | ||||||
| *Oppenheimer Holdings, Inc., Class A |
10,824 | 563,389 | ||||||
| Origin BanCorp, Inc. |
9,453 | 421,604 | ||||||
| Orrstown Financial Services, Inc. |
8,084 | 191,672 | ||||||
| *Oxbridge Re Holdings, Ltd. |
5,300 | 17,490 | ||||||
| Pacific Premier BanCorp, Inc. |
146,819 | 6,164,930 | ||||||
| *PacWest BanCorp |
12,097 | 574,245 | ||||||
| *Palomar Holdings, Inc. |
1,562 | 142,845 | ||||||
| #*Park National Corp. |
20,581 | 2,646,511 | ||||||
| Parke BanCorp, Inc. |
8,155 | 180,796 | ||||||
| PCB BanCorp |
116 | 2,471 | ||||||
| PCSB Financial Corp. |
8,024 | 153,339 | ||||||
| *Peapack-Gladstone Financial Corp. |
36,205 | 1,214,678 | ||||||
| Penns Woods BanCorp, Inc. |
4,979 | 118,500 | ||||||
| PennyMac Financial Services, Inc. |
15,482 | 960,813 | ||||||
| *Peoples BanCorp of North Carolina, Inc. |
1,084 | 30,460 | ||||||
| *Peoples BanCorp, Inc. |
56,885 | 1,818,045 | ||||||
| *Peoples Financial Services Corp. |
981 | 44,910 | ||||||
| People’s United Financial, Inc. |
22,676 | 388,667 | ||||||
| Pinnacle Financial Partners, Inc. |
67,435 | 6,512,198 | ||||||
| *Piper Sandler Cos. |
22,263 | 3,666,493 | ||||||
| PJT Partners, Inc., Class A |
37,030 | 3,028,684 | ||||||
| *Popular, Inc. |
81,344 | 6,624,655 | ||||||
| *PRA Group, Inc. |
115,929 | 4,971,036 | ||||||
| Preferred Bank |
34,823 | 2,387,813 | ||||||
| Premier Financial Corp. |
63,874 | 2,036,303 | ||||||
| Primerica, Inc. |
59,904 | 10,078,249 | ||||||
| Primis Financial Corp. |
18,469 | 279,805 | ||||||
| ProAssurance Corp. |
19,108 | 437,764 | ||||||
| *Professional Holding Corp., Class A |
42 | 787 | ||||||
| *Prog Holdings, Inc. |
127,483 | 5,156,687 | ||||||
| *Prosperity Bancshares, Inc. |
7,772 | 585,309 | ||||||
| *Provident Financial Holdings, Inc. |
13,724 | 233,994 | ||||||
| Provident Financial Services, Inc. |
142,436 | 3,526,715 | ||||||
Dimensional U.S. Small Cap ETF
SCHEDULE OF INVESTMENTS
October 31, 2021
| Security Description |
Shares | Fair Value | ||||||
| FINANCIALS (Continued) |
| |||||||
| Prudential BanCorp, Inc. |
3,645 | $ | 54,639 | |||||
| Pzena Investment Management, Inc., Class A |
25,304 | 275,308 | ||||||
| QCR Holdings, Inc. |
31,575 | 1,741,045 | ||||||
| *Radian Group, Inc. |
341,563 | 8,153,109 | ||||||
| RBB BanCorp |
13,037 | 334,660 | ||||||
| Red River Bancshares, Inc. |
1,016 | 53,218 | ||||||
| #Regional Management Corp. |
26,949 | 1,376,555 | ||||||
| Reliant BanCorp, Inc. |
4,795 | 162,455 | ||||||
| RenaissanceRe Holdings, Ltd. |
829 | 117,552 | ||||||
| Renasant Corp. |
99,038 | 3,705,012 | ||||||
| *Republic BanCorp, Inc., Class A |
37,669 | 2,034,879 | ||||||
| *Republic First BanCorp, Inc. |
46,819 | 145,139 | ||||||
| Richmond Mutual BanCorp, Inc. |
1,956 | 31,100 | ||||||
| Riverview BanCorp, Inc. |
33,814 | 249,885 | ||||||
| *RLI Corp. |
76,410 | 8,275,967 | ||||||
| *S&T BanCorp, Inc. |
68,457 | 2,092,046 | ||||||
| *Safeguard Scientifics, Inc. |
23,311 | 195,579 | ||||||
| Safety Insurance Group, Inc. |
37,550 | 2,944,295 | ||||||
| *Salisbury BanCorp, Inc. |
551 | 28,817 | ||||||
| *Sandy Spring BanCorp, Inc. |
74,328 | 3,527,607 | ||||||
| *Seacoast Banking Corp. of Florida |
85,974 | 3,132,033 | ||||||
| *Security National Financial Corp., Class A |
4,139 | 36,547 | ||||||
| #*Selective Insurance Group, Inc. |
99,721 | 7,815,135 | ||||||
| ServisFirst Bancshares, Inc. |
90,986 | 7,307,086 | ||||||
| *Shore Bancshares, Inc. |
16,901 | 312,330 | ||||||
| #Sierra BanCorp |
31,564 | 787,837 | ||||||
| *Silvercrest Asset Management Group, Inc., Class A |
8,797 | 140,752 | ||||||
| *Simmons First National Corp., Class A |
168,432 | 5,034,432 | ||||||
| *SiriusPoint, Ltd. |
61,908 | 581,935 | ||||||
| SLM Corp. |
106,211 | 1,948,972 | ||||||
| SmartFinancial, Inc. |
8,732 | 226,945 | ||||||
| South Plains Financial, Inc. |
553 | 14,411 | ||||||
| *Southern First Bancshares, Inc. |
15,648 | 842,958 | ||||||
| #*Southern Missouri BanCorp, Inc. |
9,533 | 518,595 | ||||||
| Southside Bancshares, Inc. |
63,313 | 2,616,093 | ||||||
| *SouthState Corp. |
67,377 | 5,261,470 | ||||||
| Spirit of Texas Bancshares, Inc. |
5,459 | 132,817 | ||||||
| *State Auto Financial Corp. |
58,828 | 3,018,465 | ||||||
| StepStone Group, Inc., Class A |
656 | 30,819 | ||||||
| Sterling BanCorp |
307,307 | 7,820,963 | ||||||
| *Sterling BanCorp, Inc. |
6,080 | 32,893 | ||||||
| Stewart Information Services Corp. |
61,897 | 4,405,209 | ||||||
| #*Stifel Financial Corp. |
141,416 | 10,304,984 | ||||||
| *Stock Yards BanCorp, Inc. |
48,866 | 2,993,042 | ||||||
| *StoneX Group, Inc. |
38,892 | 2,687,826 | ||||||
| Summit Financial Group, Inc. |
7,598 | 190,938 | ||||||
| *Summit State Bank |
1,100 | 19,195 | ||||||
| *SVB Financial Group |
3,390 | 2,431,986 | ||||||
| *SWK Holdings Corp. |
357 | 6,776 | ||||||
| Synovus Financial Corp. |
37,129 | 1,729,840 | ||||||
| Territorial BanCorp, Inc. |
20,639 | 517,833 | ||||||
| *Texas Capital Bancshares, Inc. |
65,007 | 3,939,424 | ||||||
| TFS Financial Corp. |
29,682 | 577,612 | ||||||
| *Timberland BanCorp, Inc. |
16,031 | 444,860 | ||||||
| Tiptree, Inc. |
66,662 | 1,040,594 | ||||||
| #*Tompkins Financial Corp. |
26,920 | 2,210,401 | ||||||
| Towne Bank |
117,245 | 3,695,562 | ||||||
Dimensional U.S. Small Cap ETF
SCHEDULE OF INVESTMENTS
October 31, 2021
| Security Description |
Shares | Fair Value | ||||||
| FINANCIALS (Continued) |
| |||||||
| TriCo Bancshares |
53,216 | $ | 2,332,457 | |||||
| *TriState Capital Holdings, Inc. |
64,921 | 1,950,876 | ||||||
| *Triumph BanCorp, Inc. |
33,779 | 3,962,277 | ||||||
| #*Trupanion, Inc. |
925 | 94,720 | ||||||
| *TrustCo Bank Corp. NY |
46,709 | 1,567,554 | ||||||
| *Trustmark Corp. |
149,883 | 4,767,778 | ||||||
| *UMB Financial Corp. |
98,861 | 9,769,444 | ||||||
| *Umpqua Holdings Corp. |
203,411 | 4,159,755 | ||||||
| *Unico American Corp. |
4,300 | 14,362 | ||||||
| *United Bancshares, Inc. |
110 | 3,214 | ||||||
| *United Bankshares, Inc. |
179,360 | 6,634,526 | ||||||
| United Community Banks, Inc. |
132,640 | 4,621,178 | ||||||
| *United Fire Group, Inc. |
42,558 | 869,460 | ||||||
| *United Insurance Holdings Corp. |
25,747 | 98,354 | ||||||
| United Security Bancshares/Fresno CA |
12,425 | 98,282 | ||||||
| *Unity BanCorp, Inc. |
13,231 | 335,406 | ||||||
| Universal Insurance Holdings, Inc. |
80,511 | 1,189,147 | ||||||
| *Univest Financial Corp. |
60,790 | 1,744,673 | ||||||
| Unum Group |
19,506 | 496,818 | ||||||
| *US Global Investors, Inc. |
5,500 | 33,715 | ||||||
| Valley National BanCorp |
610,912 | 8,100,693 | ||||||
| Value Line, Inc. |
3,333 | 114,822 | ||||||
| *Veritex Holdings, Inc. |
29,944 | 1,226,207 | ||||||
| #Victory Capital Holdings, Inc., Class A |
4,153 | 157,399 | ||||||
| *Virtu Financial, Inc., Class A |
34,638 | 861,793 | ||||||
| Virtus Investment Partners, Inc. |
20,087 | 6,427,840 | ||||||
| *Voya Financial, Inc. |
186 | 12,977 | ||||||
| Walker & Dunlop, Inc. |
75,459 | 9,814,952 | ||||||
| *Washington Federal, Inc. |
182,052 | 6,437,359 | ||||||
| Washington Trust BanCorp, Inc. |
40,997 | 2,240,896 | ||||||
| Waterstone Financial, Inc. |
64,082 | 1,324,575 | ||||||
| *Webster Financial Corp. |
39,981 | 2,237,337 | ||||||
| *WesBanco, Inc. |
110,944 | 3,857,523 | ||||||
| West BanCorp, Inc. |
34,476 | 1,092,889 | ||||||
| *Westamerica BanCorp |
37,378 | 2,084,197 | ||||||
| *Western Alliance BanCorp |
60,798 | 7,058,040 | ||||||
| *Western New England BanCorp, Inc. |
33,283 | 323,844 | ||||||
| *Westwood Holdings Group, Inc. |
11,474 | 199,648 | ||||||
| White Mountains Insurance Group, Ltd. |
4,056 | 4,279,039 | ||||||
| Wintrust Financial Corp. |
67,024 | 5,931,624 | ||||||
| #WisdomTree Investments, Inc. |
244,393 | 1,561,671 | ||||||
| #*World Acceptance Corp. |
18,194 | 3,372,986 | ||||||
| *WSFS Financial Corp. |
87,606 | 4,538,867 | ||||||
| *WVS Financial Corp. |
700 | 10,899 | ||||||
|
|
|
|||||||
| TOTAL Financials |
886,817,638 | |||||||
|
|
|
|||||||
| HEALTH CARE (11.5%) |
| |||||||
| *Acadia Healthcare Co., Inc. |
139,332 | 8,638,584 | ||||||
| *ACADIA Pharmaceuticals, Inc. |
2,358 | 42,326 | ||||||
| #*Accuray, Inc. |
108,317 | 540,502 | ||||||
| *Acutus Medical, Inc. |
2,600 | 20,384 | ||||||
| #*Adaptive Biotechnologies Corp. |
36,765 | 1,228,319 | ||||||
| #*Addus HomeCare Corp. |
39,408 | 3,684,648 | ||||||
| *Adial Pharmaceuticals, Inc. |
1,100 | 3,531 | ||||||
| *Aeglea BioTherapeutics, Inc. |
47,215 | 345,614 | ||||||
| *Aethlon Medical, Inc. |
16,114 | 57,849 | ||||||
Dimensional U.S. Small Cap ETF
SCHEDULE OF INVESTMENTS
October 31, 2021
| Security Description |
Shares | Fair Value | ||||||
| HEALTH CARE (Continued) |
| |||||||
| *Agios Pharmaceuticals, Inc. |
65,677 | $ | 3,086,819 | |||||
| *AIM ImmunoTech, Inc. |
45,524 | 81,488 | ||||||
| *Akebia Therapeutics, Inc. |
55,730 | 159,945 | ||||||
| #*Akero Therapeutics, Inc. |
26,494 | 569,356 | ||||||
| *Albireo Pharma, Inc. |
28,832 | 842,471 | ||||||
| *Aldeyra Therapeutics, Inc. |
19,311 | 175,730 | ||||||
| *Alkermes PLC |
216,824 | 6,567,599 | ||||||
| *Allied Healthcare Products, Inc. |
5,468 | 28,871 | ||||||
| *Allogene Therapeutics, Inc. |
12,767 | 220,103 | ||||||
| *Allscripts Healthcare Solutions, Inc. |
232,050 | 3,197,649 | ||||||
| *Alpine Immune Sciences, Inc. |
3,685 | 46,615 | ||||||
| *Amedisys, Inc., Class B |
33,278 | 5,635,297 | ||||||
| *AMN Healthcare Services, Inc. |
91,738 | 9,054,541 | ||||||
| *Amneal Pharmaceuticals, Inc. |
117,310 | 644,032 | ||||||
| *Amphastar Pharmaceuticals, Inc. |
91,999 | 1,718,541 | ||||||
| *Amryt Pharma PLC, ADR |
9,823 | 104,026 | ||||||
| *AnaptysBio, Inc. |
33,572 | 1,104,519 | ||||||
| *AngioDynamics, Inc. |
92,343 | 2,641,010 | ||||||
| *ANI Pharmaceuticals, Inc. |
9,604 | 358,998 | ||||||
| *Anika Therapeutics, Inc. |
36,234 | 1,509,146 | ||||||
| *Antares Pharma, Inc. |
29,451 | 110,147 | ||||||
| #*Apollo Medical Holdings, Inc. |
18,675 | 1,281,665 | ||||||
| *Applied Genetic Technologies Corp. |
15,685 | 40,624 | ||||||
| *Applied Therapeutics, Inc. |
9,329 | 136,856 | ||||||
| *Aptevo Therapeutics, Inc. |
3,186 | 48,555 | ||||||
| *Apyx Medical Corp. |
44,777 | 640,311 | ||||||
| #*Arcus Biosciences, Inc. |
63,218 | 2,114,010 | ||||||
| *Arcutis Biotherapeutics, Inc. |
8,904 | 188,587 | ||||||
| *Arena Pharmaceuticals, Inc., Class A |
50,142 | 2,877,649 | ||||||
| *Arrowhead Pharmaceuticals, Inc. |
39,306 | 2,508,509 | ||||||
| *Arvinas, Inc. |
8,889 | 769,610 | ||||||
| *Assembly Biosciences, Inc. |
3,283 | 10,341 | ||||||
| *Atara Biotherapeutics, Inc., Class A |
81,235 | 1,257,518 | ||||||
| #*Athenex, Inc. |
43,976 | 111,699 | ||||||
| *AtriCure, Inc. |
12,024 | 902,521 | ||||||
| *Atrion Corp. |
3,664 | 2,667,392 | ||||||
| *aTyr Pharma, Inc. |
16,117 | 138,445 | ||||||
| *Avanos Medical, Inc. |
65,415 | 2,063,189 | ||||||
| #*Avid Bioservices, Inc. |
63,962 | 1,962,354 | ||||||
| #*Avidity Biosciences, Inc. |
11,608 | 261,180 | ||||||
| *Axogen, Inc. |
54,239 | 823,890 | ||||||
| #*Axonics, Inc. |
52,092 | 3,820,948 | ||||||
| *BioDelivery Sciences International, Inc. |
135,868 | 554,341 | ||||||
| *Biolife Solutions, Inc. |
12,365 | 657,200 | ||||||
| *Biomerica, Inc. |
391 | 1,795 | ||||||
| *Bluebird Bio, Inc. |
5,140 | 120,327 | ||||||
| *Blueprint Medicines Corp. |
36,820 | 4,141,882 | ||||||
| #*Bridgebio Pharma, Inc. |
1,845 | 91,106 | ||||||
| *Brookdale Senior Living, Inc. |
298,196 | 1,938,274 | ||||||
| *Cabaletta Bio, Inc. |
330 | 4,511 | ||||||
| *Calithera Biosciences, Inc. |
7,115 | 13,732 | ||||||
| *Capital Senior Living Corp. |
2,200 | 62,084 | ||||||
| *Capricor Therapeutics, Inc. |
6,316 | 23,496 | ||||||
| *Cara Therapeutics, Inc. |
16,488 | 277,493 | ||||||
| *Cardiovascular Systems, Inc. |
7,954 | 279,026 | ||||||
| *CareCloud, Inc. |
20,906 | 161,603 | ||||||
| *CareDx, Inc. |
25,895 | 1,320,645 | ||||||
Dimensional U.S. Small Cap ETF
SCHEDULE OF INVESTMENTS
October 31, 2021
| Security Description |
Shares | Fair Value | ||||||
| HEALTH CARE (Continued) |
| |||||||
| #*Cassava Sciences, Inc. |
3,856 | $ | 166,309 | |||||
| *Castle Biosciences, Inc. |
9,033 | 563,208 | ||||||
| *Catalyst Biosciences, Inc. |
16,551 | 54,453 | ||||||
| *Catalyst Pharmaceuticals, Inc. |
134,970 | 796,323 | ||||||
| *Change Healthcare, Inc. |
8,202 | 176,589 | ||||||
| *Checkpoint Therapeutics, Inc. |
2,541 | 8,919 | ||||||
| Chemed Corp. |
3,201 | 1,543,682 | ||||||
| #*ChemoCentryx, Inc. |
1,644 | 57,228 | ||||||
| *Chimerix, Inc. |
49,981 | 261,900 | ||||||
| *Chinook Therapeutics, Inc. |
16,994 | 182,516 | ||||||
| *Codexis, Inc. |
85,612 | 2,976,729 | ||||||
| *Collegium Pharmaceutical, Inc. |
49,925 | 980,028 | ||||||
| *Community Health Systems, Inc. |
188,754 | 2,472,677 | ||||||
| #*Computer Programs and Systems, Inc. |
31,727 | 1,145,345 | ||||||
| CONMED Corp. |
50,001 | 7,314,146 | ||||||
| #*ContraFect Corp. |
17,037 | 64,230 | ||||||
| *Corcept Therapeutics, Inc. |
140,804 | 2,534,472 | ||||||
| *CorVel Corp. |
38,261 | 7,010,180 | ||||||
| *Corvus Pharmaceuticals, Inc. |
3,068 | 13,898 | ||||||
| *Covetrus, Inc. |
14,862 | 300,064 | ||||||
| *Crinetics Pharmaceuticals, Inc. |
29,594 | 737,778 | ||||||
| *Cross Country Healthcare, Inc. |
96,749 | 2,005,607 | ||||||
| *CryoLife, Inc. |
82,607 | 1,705,009 | ||||||
| *Cue Biopharma, Inc. |
37,733 | 460,720 | ||||||
| #*Cutera, Inc. |
26,215 | 1,127,245 | ||||||
| *Cyclacel Pharmaceuticals, Inc. |
12,283 | 60,310 | ||||||
| *Cymabay Therapeutics, Inc. |
55,407 | 216,087 | ||||||
| *CytomX Therapeutics, Inc. |
12,865 | 76,289 | ||||||
| *CytoSorbents Corp. |
45,735 | 269,379 | ||||||
| *Deciphera Pharmaceuticals, Inc. |
21,943 | 732,677 | ||||||
| *Denali Therapeutics, Inc. |
53,300 | 2,577,055 | ||||||
| *Eagle Pharmaceuticals, Inc. |
17,598 | 921,607 | ||||||
| #*Edesa Biotech, Inc. |
16,977 | 139,551 | ||||||
| #*Editas Medicine, Inc. |
18,859 | 692,502 | ||||||
| #*Eiger Biopharmaceuticals, Inc. |
27,858 | 187,763 | ||||||
| *Electromed, Inc. |
12,695 | 139,391 | ||||||
| *Emergent BioSolutions, Inc. |
72,887 | 3,474,523 | ||||||
| *Enanta Pharmaceuticals, Inc. |
48,693 | 4,180,294 | ||||||
| Encompass Health Corp. |
11,053 | 702,529 | ||||||
| *Endo International PLC |
52,596 | 223,533 | ||||||
| Ensign Group, Inc. (The) |
90,511 | 7,060,763 | ||||||
| *Entasis Therapeutics Holdings, Inc. |
4,637 | 13,215 | ||||||
| *Envista Holdings Corp. |
156,380 | 6,114,458 | ||||||
| *Enzo Biochem, Inc. |
103,916 | 357,471 | ||||||
| *Equillium, Inc. |
2,384 | 15,043 | ||||||
| *Eton Pharmaceuticals, Inc. |
8,846 | 50,953 | ||||||
| *Evolent Health, Inc., Class A |
166,707 | 4,879,514 | ||||||
| #*Evolus, Inc. |
13,453 | 105,202 | ||||||
| *Exagen, Inc. |
7,644 | 88,823 | ||||||
| *Exelixis, Inc. |
247,012 | 5,313,228 | ||||||
| *EyePoint Pharmaceuticals, Inc. |
559 | 6,412 | ||||||
| *Fate Therapeutics, Inc. |
20,968 | 1,128,078 | ||||||
| *Five Star Senior Living, Inc. |
24,715 | 101,579 | ||||||
| #*Fluidigm Corp. |
100,835 | 519,300 | ||||||
| *FONAR Corp. |
8,259 | 132,144 | ||||||
| #*Forma Therapeutics Holdings, Inc. |
24,396 | 452,790 | ||||||
Dimensional U.S. Small Cap ETF
SCHEDULE OF INVESTMENTS
October 31, 2021
| Security Description |
Shares | Fair Value | ||||||
| HEALTH CARE (Continued) |
| |||||||
| *Fulcrum Therapeutics, Inc. |
2,112 | $ | 46,760 | |||||
| #*Fulgent Genetics, Inc. |
3,090 | 256,223 | ||||||
| #*G1 Therapeutics, Inc. |
13,861 | 200,846 | ||||||
| *Generation Bio Co. |
13,404 | 280,948 | ||||||
| *Global Blood Therapeutics, Inc. |
16,827 | 614,522 | ||||||
| *Globus Medical, Inc. |
8,494 | 655,482 | ||||||
| *GlycoMimetics, Inc. |
30,607 | 58,459 | ||||||
| #*Gritstone Oncology, Inc. |
32,639 | 358,703 | ||||||
| *Haemonetics Corp. |
11,224 | 771,201 | ||||||
| *Halozyme Therapeutics, Inc. |
55,554 | 2,114,941 | ||||||
| *Hanger, Inc. |
24,668 | 460,798 | ||||||
| #*Harmony Biosciences Holdings, Inc. |
44,616 | 1,850,226 | ||||||
| *Harrow Health, Inc. |
10,766 | 108,629 | ||||||
| *Harvard Bioscience, Inc. |
93,884 | 706,947 | ||||||
| #*Health Catalyst, Inc. |
8,466 | 445,650 | ||||||
| *HealthEquity, Inc. |
4,541 | 300,523 | ||||||
| *HealthStream, Inc. |
63,851 | 1,699,075 | ||||||
| #*Heat Biologics, Inc. |
11,891 | 63,498 | ||||||
| #*Heron Therapeutics, Inc. |
2,400 | 26,424 | ||||||
| *Heska Corp. |
19,896 | 4,447,353 | ||||||
| *Homology Medicines, Inc. |
46,536 | 266,651 | ||||||
| *iCAD, Inc. |
3,194 | 33,697 | ||||||
| *ICU Medical, Inc. |
27,355 | 6,404,626 | ||||||
| *Ideaya Biosciences, Inc. |
21,882 | 469,150 | ||||||
| #*IGM Biosciences, Inc. |
7,459 | 349,976 | ||||||
| #*Inari Medical, Inc. |
47,800 | 4,326,856 | ||||||
| #*Infinity Pharmaceuticals, Inc. |
15,237 | 38,702 | ||||||
| *InfuSystem Holdings, Inc. |
7,422 | 123,428 | ||||||
| *Innoviva, Inc. |
99,338 | 1,733,448 | ||||||
| *Inogen, Inc., Class A |
12,717 | 504,229 | ||||||
| #*Inotiv, Inc. |
9,024 | 436,671 | ||||||
| *Inovalon Holdings, Inc., Class A |
62,006 | 2,529,225 | ||||||
| *Insmed, Inc. |
101,731 | 3,067,190 | ||||||
| *Integer Holdings Corp. |
65,487 | 5,895,140 | ||||||
| *Integra LifeSciences Holdings Corp. |
101,591 | 6,751,738 | ||||||
| *Intellia Therapeutics, Inc. |
82,732 | 11,001,701 | ||||||
| *Intersect ENT, Inc. |
36,832 | 993,359 | ||||||
| *Intra-Cellular Therapies, Inc. |
38,086 | 1,640,364 | ||||||
| *IntriCon Corp. |
22,808 | 387,736 | ||||||
| *Invacare Corp. |
88,513 | 437,254 | ||||||
| *Iovance Biotherapeutics, Inc. |
137,204 | 3,335,429 | ||||||
| *iRadimed Corp. |
5,863 | 218,807 | ||||||
| *iRhythm Technologies, Inc. |
10,314 | 723,424 | ||||||
| *IRIDEX Corp. |
21,508 | 164,966 | ||||||
| #*Ironwood Pharmaceuticals, Inc. |
186,293 | 2,378,962 | ||||||
| *iTeos Therapeutics, Inc. |
20,364 | 544,737 | ||||||
| *IVERIC bio, Inc. |
71,048 | 1,257,550 | ||||||
| *Joint Corp. (The) |
28,476 | 2,491,080 | ||||||
| *Jounce Therapeutics, Inc. |
66,027 | 579,717 | ||||||
| #*Kaleido Biosciences, Inc. |
5,332 | 22,928 | ||||||
| *KalVista Pharmaceuticals, Inc. |
10,207 | 183,522 | ||||||
| *Karuna Therapeutics, Inc. |
24,646 | 3,459,805 | ||||||
| #*Karyopharm Therapeutics, Inc. |
9,358 | 51,095 | ||||||
| *Kewaunee Scientific Corp. |
1,692 | 21,658 | ||||||
| *Kezar Life Sciences, Inc. |
42,730 | 341,840 | ||||||
| #*Kodiak Sciences, Inc. |
27,394 | 3,207,563 | ||||||
| *Krystal Biotech, Inc. |
2,719 | 136,195 | ||||||
Dimensional U.S. Small Cap ETF
SCHEDULE OF INVESTMENTS
October 31, 2021
| Security Description |
Shares | Fair Value | ||||||
| HEALTH CARE (Continued) |
| |||||||
| #*Kura Oncology, Inc. |
44,474 | $ | 730,263 | |||||
| *Lannett Co., Inc. |
7,706 | 21,037 | ||||||
| *Lantheus Holdings, Inc. |
112,328 | 2,627,352 | ||||||
| *Larimar Therapeutics, Inc. |
1,927 | 23,028 | ||||||
| *Leap Therapeutics, Inc. |
684 | 1,908 | ||||||
| *LeMaitre Vascular, Inc. |
51,477 | 2,677,319 | ||||||
| *Lensar, Inc. |
25,622 | 183,197 | ||||||
| #*Lexicon Pharmaceuticals, Inc. |
57,105 | 302,085 | ||||||
| *LHC Group, Inc. |
41,337 | 5,563,547 | ||||||
| *Ligand Pharmaceuticals, Inc. |
22,512 | 3,285,401 | ||||||
| *LivaNova PLC |
70,187 | 5,384,747 | ||||||
| *MacroGenics, Inc. |
119,628 | 2,336,335 | ||||||
| *Madrigal Pharmaceuticals, Inc. |
1,443 | 112,193 | ||||||
| *Magellan Health, Inc. |
46,795 | 4,437,570 | ||||||
| *Marinus Pharmaceuticals, Inc. |
10,382 | 119,393 | ||||||
| *»Medcath Corp. |
41,900 | — | ||||||
| #*MediciNova, Inc. |
2,512 | 8,440 | ||||||
| *MEDNAX, Inc. |
119,399 | 3,251,235 | ||||||
| *Medpace Holdings, Inc. |
47,538 | 10,769,734 | ||||||
| #*MeiraGTx Holdings PLC |
14,690 | 315,835 | ||||||
| *Meridian Bioscience, Inc. |
103,735 | 1,951,255 | ||||||
| *Merit Medical Systems, Inc. |
111,589 | 7,505,476 | ||||||
| *Merrimack Pharmaceuticals, Inc. |
13,521 | 58,140 | ||||||
| *Mersana Therapeutics, Inc. |
5,128 | 43,896 | ||||||
| #Mesa Laboratories, Inc. |
4,976 | 1,521,163 | ||||||
| *Microbot Medical, Inc. |
5,288 | 38,232 | ||||||
| *Minerva Neurosciences, Inc. |
486 | 680 | ||||||
| *Mirati Therapeutics, Inc. |
312 | 58,974 | ||||||
| *»Misonix, Inc. |
6,609 | 175,403 | ||||||
| *ModivCare, Inc. |
38,232 | 6,223,023 | ||||||
| #*Molecular Templates, Inc. |
21,525 | 112,361 | ||||||
| *Morphic Holding, Inc. |
26,691 | 1,534,733 | ||||||
| *Mustang Bio, Inc. |
93,601 | 209,666 | ||||||
| *Myriad Genetics, Inc. |
139,910 | 4,305,031 | ||||||
| *NanoViricides, Inc. |
3,320 | 15,737 | ||||||
| *National HealthCare Corp. |
22,898 | 1,601,486 | ||||||
| *National Research Corp. |
42,322 | 1,832,543 | ||||||
| *Natus Medical, Inc. |
76,967 | 1,928,023 | ||||||
| #*Nektar Therapeutics |
117,800 | 1,785,848 | ||||||
| *Neogen Corp. |
144,392 | 6,109,226 | ||||||
| *NeoGenomics, Inc. |
134,571 | 6,190,266 | ||||||
| *Neoleukin Therapeutics, Inc. |
8,321 | 60,993 | ||||||
| *NeuBase Therapeutics, Inc. |
252 | 932 | ||||||
| *NeuroMetrix, Inc. |
7,803 | 63,360 | ||||||
| *Nevro Corp. |
3,679 | 418,449 | ||||||
| #*NextCure, Inc. |
21,107 | 173,500 | ||||||
| *NextGen Healthcare, Inc. |
73,571 | 1,210,979 | ||||||
| *NGM Biopharmaceuticals, Inc. |
46,405 | 857,100 | ||||||
| #*NuVasive, Inc. |
75,783 | 4,043,781 | ||||||
| *ObsEva SA |
5,795 | 15,067 | ||||||
| *Omnicell, Inc. |
86,451 | 15,401,246 | ||||||
| *Opiant Pharmaceuticals, Inc. |
6,418 | 151,272 | ||||||
| #*OPKO Health, Inc. |
103,093 | 390,722 | ||||||
| *OptimizeRx Corp. |
22,788 | 2,203,600 | ||||||
| *Option Care Health, Inc. |
234,378 | 6,405,551 | ||||||
| *OraSure Technologies, Inc. |
158,182 | 1,687,802 | ||||||
Dimensional U.S. Small Cap ETF
SCHEDULE OF INVESTMENTS
October 31, 2021
| Security Description |
Shares | Fair Value | ||||||
| HEALTH CARE (Continued) |
| |||||||
| #*Organogenesis Holdings, Inc. |
42,571 | $ | 467,430 | |||||
| *Orthofix Medical, Inc. |
11,390 | 409,812 | ||||||
| *OrthoPediatrics Corp. |
21,419 | 1,524,390 | ||||||
| *Osmotica Pharmaceuticals PLC |
2,087 | 3,715 | ||||||
| *Otonomy, Inc. |
17,742 | 37,258 | ||||||
| *Owens & Minor, Inc. |
189,536 | 6,800,552 | ||||||
| *Pacira BioSciences, Inc. |
56,405 | 2,948,853 | ||||||
| Patterson Cos., Inc. |
146,428 | 4,577,339 | ||||||
| #*»PDL BioPharma, Inc. |
320,345 | 829,694 | ||||||
| *Pennant Group, Inc. (The) |
38,902 | 994,724 | ||||||
| Perrigo Co. PLC |
165,740 | 7,483,161 | ||||||
| #*PetIQ, Inc. |
17,483 | 437,949 | ||||||
| #*Phathom Pharmaceuticals, Inc. |
945 | 22,236 | ||||||
| Phibro Animal Health Corp., Class A |
15,741 | 345,358 | ||||||
| *Precigen, Inc. |
5,565 | 26,879 | ||||||
| *Precipio, Inc. |
25,496 | 60,171 | ||||||
| #*Precision BioSciences, Inc. |
41,433 | 393,199 | ||||||
| Premier, Inc., Class A |
91,389 | 3,559,602 | ||||||
| *Prestige Consumer Healthcare, Inc. |
114,718 | 6,881,933 | ||||||
| *Pro-Dex, Inc. |
6,434 | 156,153 | ||||||
| *Progyny, Inc. |
93,937 | 5,770,550 | ||||||
| #*Protagonist Therapeutics, Inc. |
68,078 | 2,121,311 | ||||||
| *Prothena Corp. PLC |
98,007 | 5,424,687 | ||||||
| *Psychemedics Corp. |
63 | 524 | ||||||
| *Pulse Biosciences, Inc. |
471 | 9,933 | ||||||
| *Quanterix Corp. |
2,280 | 115,391 | ||||||
| *Quidel Corp.marcus |
1,339 | 177,779 | ||||||
| *R1 RCM, Inc. |
123,910 | 2,688,847 | ||||||
| *RadNet, Inc. |
108,284 | 3,366,550 | ||||||
| *RAPT Therapeutics, Inc. |
30,520 | 963,822 | ||||||
| *REGENXBIO, Inc. |
2,070 | 73,361 | ||||||
| #*Relmada Therapeutics, Inc. |
15,498 | 363,738 | ||||||
| *Replimune Group, Inc. |
2,265 | 66,840 | ||||||
| *Rigel Pharmaceuticals, Inc. |
211,606 | 710,996 | ||||||
| *Rocket Pharmaceuticals, Inc. |
12,422 | 369,058 | ||||||
| *Rubius Therapeutics, Inc. |
3,849 | 54,694 | ||||||
| *Sangamo Therapeutics, Inc. |
50,396 | 409,216 | ||||||
| *Satsuma Pharmaceuticals, Inc. |
7,059 | 40,942 | ||||||
| *Scholar Rock Holding Corp. |
8,532 | 224,392 | ||||||
| *Schrodinger, Inc. |
1,379 | 75,266 | ||||||
| *scPharmaceuticals, Inc. |
1,064 | 6,256 | ||||||
| *SeaSpine Holdings Corp. |
46,733 | 699,126 | ||||||
| Select Medical Holdings Corp. |
266,063 | 8,838,613 | ||||||
| *SELLAS Life Sciences Group, Inc. |
3,696 | 32,118 | ||||||
| *Semler Scientific, Inc. |
290 | 43,497 | ||||||
| #*Sharps Compliance Corp. |
15,204 | 125,433 | ||||||
| *Shockwave Medical, Inc. |
3,160 | 675,292 | ||||||
| *SI-BONE, Inc. |
27,238 | 614,217 | ||||||
| *Sierra Oncology, Inc. |
3,613 | 73,236 | ||||||
| *SIGA Technologies, Inc. |
87,292 | 629,375 | ||||||
| #Simulations Plus, Inc. |
1,567 | 79,134 | ||||||
| *Sio Gene Therapies, Inc. |
70,113 | 133,916 | ||||||
| *Spectrum Pharmaceuticals, Inc. |
96,925 | 177,373 | ||||||
| #*Spero Therapeutics, Inc. |
25,050 | 439,878 | ||||||
| #*Springworks Therapeutics, Inc. |
4,243 | 284,536 | ||||||
| *STAAR Surgical Co. |
41,347 | 4,897,966 | ||||||
| *Stereotaxis, Inc. |
5,314 | 31,353 | ||||||
Dimensional U.S. Small Cap ETF
SCHEDULE OF INVESTMENTS
October 31, 2021
| Security Description |
Shares | Fair Value | ||||||
| HEALTH CARE (Continued) |
| |||||||
| STERIS PLC |
28,086 | $ | 6,564,822 | |||||
| *Stoke Therapeutics, Inc. |
2,565 | 58,559 | ||||||
| *SunLink Health Systems, Inc. |
5,803 | 13,927 | ||||||
| *Supernus Pharmaceuticals, Inc. |
86,081 | 2,569,518 | ||||||
| #*Surface Oncology, Inc. |
1,412 | 10,477 | ||||||
| #*Surgery Partners, Inc. |
101,389 | 4,171,143 | ||||||
| *Surmodics, Inc. |
31,105 | 1,731,304 | ||||||
| *Sutro Biopharma, Inc. |
29,455 | 593,813 | ||||||
| *Syndax Pharmaceuticals, Inc. |
66,184 | 1,287,279 | ||||||
| *Synlogic, Inc. |
10,740 | 27,494 | ||||||
| #*Syros Pharmaceuticals, Inc. |
12,346 | 50,989 | ||||||
| *Tactile Systems Technology, Inc. |
3,766 | 129,889 | ||||||
| *Tandem Diabetes Care, Inc. |
10,933 | 1,490,496 | ||||||
| *Taro Pharmaceutical Industries, Ltd. |
3,148 | 174,934 | ||||||
| *Tempest Therapeutics, Inc. |
800 | 9,376 | ||||||
| *Tenet Healthcare Corp. |
179,446 | 12,859,100 | ||||||
| #*Tivity Health, Inc. |
39,391 | 985,563 | ||||||
| *TransMedics Group, Inc. |
28,957 | 794,291 | ||||||
| *Travere Therapeutics, Inc. |
68,158 | 1,963,632 | ||||||
| #*Tricida, Inc. |
5,306 | 24,248 | ||||||
| *Triple-S Management Corp., Class B |
47,785 | 1,686,333 | ||||||
| *Turning Point Therapeutics, Inc. |
170 | 7,069 | ||||||
| #*Twist Bioscience Corp. |
6,900 | 819,720 | ||||||
| *Ultragenyx Pharmaceutical, Inc. |
20,794 | 1,745,032 | ||||||
| *United Therapeutics Corp. |
18,640 | 3,555,766 | ||||||
| US Physical Therapy, Inc. |
30,258 | 3,263,628 | ||||||
| *Utah Medical Products, Inc. |
9,480 | 917,948 | ||||||
| *Vanda Pharmaceuticals, Inc. |
111,326 | 1,905,901 | ||||||
| *Vapotherm, Inc. |
2,300 | 52,601 | ||||||
| *Varex Imaging Corp. |
54,958 | 1,475,622 | ||||||
| *VBI Vaccines, Inc. |
3,607 | 10,460 | ||||||
| *Venus Concept, Inc. |
15,228 | 28,933 | ||||||
| *Verastem, Inc. |
237,350 | 617,110 | ||||||
| #*Vericel Corp. |
41,459 | 1,907,943 | ||||||
| *ViewRay, Inc. |
112,854 | 824,963 | ||||||
| #*Viking Therapeutics, Inc. |
103,887 | 604,622 | ||||||
| *Vir Biotechnology, Inc. |
36,081 | 1,361,336 | ||||||
| *Viveve Medical, Inc. |
10,154 | 21,628 | ||||||
| *Vocera Communications, Inc. |
46,081 | 2,607,263 | ||||||
| *Xencor, Inc. |
48,029 | 1,900,027 | ||||||
| *Xenon Pharmaceuticals, Inc. |
68,943 | 2,147,574 | ||||||
| *Xeris Biopharma Holdings, Inc. |
39,114 | 72,752 | ||||||
| *XOMA Corp. |
1,200 | 30,000 | ||||||
| *Yield10 Bioscience, Inc. |
1,700 | 10,149 | ||||||
| *y-Mabs Therapeutics, Inc. |
22,185 | 544,864 | ||||||
| #*Zogenix, Inc. |
62,428 | 957,021 | ||||||
| *Zynerba Pharmaceuticals, Inc. |
1,209 | 4,630 | ||||||
|
|
|
|||||||
| TOTAL HEALTH CARE |
506,058,881 | |||||||
|
|
|
|||||||
| INDUSTRIALS (20.2%) |
| |||||||
| *AAON, Inc. |
101,888 | 7,300,275 | ||||||
| *AAR Corp. |
58,274 | 2,061,151 | ||||||
| ABM Industries, Inc. |
123,147 | 5,419,699 | ||||||
| *Acacia Research Corp. |
41,499 | 237,789 | ||||||
| ACCO Brands Corp. |
183,970 | 1,521,432 | ||||||
| Acme United Corp. |
8,337 | 308,469 | ||||||
Dimensional U.S. Small Cap ETF
SCHEDULE OF INVESTMENTS
October 31, 2021
| Security Description |
Shares | Fair Value | ||||||
| INDUSTRIALS (Continued) |
| |||||||
| #Acuity Brands, Inc. |
5,539 | $ | 1,137,877 | |||||
| ADT, Inc. |
11,308 | 94,422 | ||||||
| Advanced Drainage Systems, Inc. |
56,426 | 6,364,853 | ||||||
| Aerojet Rocketdyne Holdings, Inc. |
116,931 | 5,146,133 | ||||||
| *AeroVironment, Inc. |
57,266 | 5,102,973 | ||||||
| *AGCO Corp. |
8,119 | 992,223 | ||||||
| Air Lease Corp. |
81,226 | 3,253,101 | ||||||
| *Air T, Inc. |
600 | 16,014 | ||||||
| #*Air Transport Services Group, Inc. |
137,863 | 3,431,410 | ||||||
| Alamo Group, Inc. |
28,092 | 4,247,510 | ||||||
| *Alaska Air Group, Inc. |
5,224 | 275,827 | ||||||
| Albany International Corp. |
59,291 | 4,781,819 | ||||||
| *Allegiant Travel Co. |
28,428 | 4,982,576 | ||||||
| *Allied Motion Technologies, Inc. |
37,131 | 1,305,155 | ||||||
| Allison Transmission Holdings, Inc. |
18,599 | 620,463 | ||||||
| Altra Industrial Motion Corp. |
30,148 | 1,572,218 | ||||||
| *Ameresco, Inc., Class A |
45,289 | 3,719,586 | ||||||
| #*American Superconductor Corp. |
7,900 | 145,202 | ||||||
| *American Woodmark Corp. |
33,931 | 2,332,417 | ||||||
| *API Group Corp. |
9,638 | 209,916 | ||||||
| Apogee Enterprises, Inc. |
61,695 | 2,586,871 | ||||||
| Applied Industrial Technologies, Inc. |
74,344 | 7,247,053 | ||||||
| ARC Document Solutions, Inc. |
422 | 1,279 | ||||||
| ArcBest Corp. |
61,163 | 5,495,496 | ||||||
| Arcosa, Inc. |
19,971 | 1,033,100 | ||||||
| Argan, Inc. |
39,771 | 1,640,951 | ||||||
| *Armstrong Flooring, Inc. |
28,886 | 82,036 | ||||||
| Armstrong World Industries, Inc. |
68,209 | 7,206,281 | ||||||
| *ASGN, Inc. |
105,213 | 12,589,788 | ||||||
| *Astec Industries, Inc. |
59,416 | 3,171,626 | ||||||
| *Astronics Corp. |
24,522 | 316,334 | ||||||
| *Astronics Corp., Class B |
8,090 | 103,107 | ||||||
| *Atkore, Inc. |
53,784 | 5,084,202 | ||||||
| *Atlas Air Worldwide Holdings, Inc., Class A |
43,194 | 3,503,897 | ||||||
| *Avis Budget Group, Inc. |
85,979 | 14,901,020 | ||||||
| *Axon Enterprise, Inc. |
3,929 | 707,063 | ||||||
| *Azek Co., Inc. (The) |
2,824 | 103,613 | ||||||
| AZZ, Inc. |
49,429 | 2,626,163 | ||||||
| *Barnes Group, Inc. |
96,795 | 4,059,582 | ||||||
| *Barrett Business Services, Inc. |
19,716 | 1,616,712 | ||||||
| *Beacon Roofing Supply, Inc. |
96,683 | 5,111,630 | ||||||
| BGSF, Inc. |
7,037 | 84,655 | ||||||
| *Blue Bird Corp. |
37,626 | 737,846 | ||||||
| *BlueLinx Holdings, Inc. |
1,021 | 48,630 | ||||||
| Boise Cascade Co. |
86,560 | 4,901,027 | ||||||
| *Brady Corp., Class A |
92,354 | 4,810,720 | ||||||
| *BrightView Holdings, Inc. |
13,663 | 216,695 | ||||||
| *Brink’s Co. (The) |
61,736 | 4,252,376 | ||||||
| *Builders FirstSource, Inc. |
315,867 | 18,405,570 | ||||||
| BWX Technologies, Inc. |
4,702 | 266,791 | ||||||
| *CACI International, Inc., Class A |
20,147 | 5,795,083 | ||||||
| CAI International, Inc. |
32,981 | 1,844,627 | ||||||
| *Casella Waste Systems, Inc. |
104,820 | 9,089,990 | ||||||
| *CBIZ, Inc. |
128,957 | 4,734,011 | ||||||
| *CECO Environmental Corp. |
76,193 | 524,208 | ||||||
| *Chart Industries, Inc. |
58,714 | 10,422,909 | ||||||
| *Chicago Rivet & Machine Co. |
498 | 13,396 | ||||||
Dimensional U.S. Small Cap ETF
SCHEDULE OF INVESTMENTS
October 31, 2021
| Security Description |
Shares | Fair Value | ||||||
| INDUSTRIALS (Continued) |
| |||||||
| *Cimpress PLC |
36,838 | $ | 3,290,370 | |||||
| *CIRCOR International, Inc. |
27,414 | 782,396 | ||||||
| *Civeo Corp. |
5,545 | 125,151 | ||||||
| *Clean Harbors, Inc. |
83,777 | 9,428,264 | ||||||
| *Colfax Corp. |
135,695 | 7,004,576 | ||||||
| *Columbus McKinnon Corp. |
46,326 | 2,189,830 | ||||||
| *Comfort Systems USA, Inc. |
84,812 | 7,757,754 | ||||||
| *Commercial Vehicle Group, Inc. |
22,184 | 222,727 | ||||||
| CompX International, Inc. |
2,107 | 45,511 | ||||||
| *Construction Partners, Inc., Class A |
12,386 | 441,065 | ||||||
| #*Copa Holdings SA, Class A |
28,773 | 2,128,051 | ||||||
| *Cornerstone Building Brands, Inc. |
65,508 | 937,419 | ||||||
| Costamare, Inc. |
95,116 | 1,275,506 | ||||||
| Covanta Holding Corp. |
166,810 | 3,366,226 | ||||||
| *Covenant Logistics Group, Inc. |
27,793 | 789,321 | ||||||
| CRA International, Inc. |
20,088 | 2,206,064 | ||||||
| *Crane Co. |
14,754 | 1,523,793 | ||||||
| CSW Industrials, Inc. |
28,494 | 3,949,838 | ||||||
| *Curtiss-Wright Corp. |
28,341 | 3,618,579 | ||||||
| *Daseke, Inc. |
6,820 | 64,449 | ||||||
| *Deluxe Corp. |
33,010 | 1,177,467 | ||||||
| Douglas Dynamics, Inc. |
64,147 | 2,713,418 | ||||||
| *Ducommun, Inc. |
24,516 | 1,186,329 | ||||||
| *Dxp Enterprises, Inc. |
32,352 | 1,066,322 | ||||||
| *Dycom Industries, Inc. |
72,801 | 5,781,855 | ||||||
| *Eastern Co. (The) |
9,151 | 219,899 | ||||||
| *Echo Global Logistics, Inc. |
72,397 | 3,491,707 | ||||||
| EMCOR Group, Inc. |
86,972 | 10,566,228 | ||||||
| *Encore Wire Corp. |
42,594 | 5,710,152 | ||||||
| *Energy Recovery, Inc. |
11,705 | 237,846 | ||||||
| Enerpac Tool Group Corp. |
111,853 | 2,336,609 | ||||||
| EnerSys |
75,581 | 6,049,503 | ||||||
| #Eneti, Inc. |
9,326 | 132,149 | ||||||
| #Ennis, Inc. |
58,519 | 1,108,350 | ||||||
| EnPro Industries, Inc. |
43,440 | 3,894,830 | ||||||
| *ESCO Technologies, Inc. |
42,846 | 3,623,058 | ||||||
| *Espey Mfg. & Electronics Corp. |
2,550 | 38,582 | ||||||
| *EVI Industries, Inc. |
837 | 26,366 | ||||||
| *Evoqua Water Technologies Corp. |
20,536 | 859,021 | ||||||
| *ExOne Co. (The) |
1,980 | 45,580 | ||||||
| Exponent, Inc. |
86,244 | 9,900,811 | ||||||
| *Federal Signal Corp. |
150,258 | 6,432,545 | ||||||
| Flowserve Corp. |
23,390 | 786,372 | ||||||
| *Fluor Corp. |
7,217 | 140,298 | ||||||
| *Forrester Research, Inc. |
45,846 | 2,441,300 | ||||||
| *Forward Air Corp. |
57,976 | 5,830,067 | ||||||
| *Franklin Covey Co. |
37,956 | 1,603,641 | ||||||
| *Franklin Electric Co., Inc. |
92,766 | 8,013,127 | ||||||
| #*FreightCar America, Inc. |
15,012 | 62,900 | ||||||
| *FTI Consulting, Inc. |
73,465 | 10,573,083 | ||||||
| #*Fuelcell Energy, Inc. |
2,936 | 23,459 | ||||||
| *Gates Industrial Corp. PLC |
13,793 | 226,757 | ||||||
| *GATX Corp. |
68,141 | 6,463,174 | ||||||
| Genco Shipping & Trading, Ltd. |
64,131 | 1,101,129 | ||||||
| *Gencor Industries, Inc. |
30,515 | 340,547 | ||||||
| *Generac Holdings, Inc. |
27,660 | 13,790,170 | ||||||
Dimensional U.S. Small Cap ETF
SCHEDULE OF INVESTMENTS
October 31, 2021
| Security Description |
Shares | Fair Value | ||||||
| INDUSTRIALS (Continued) |
| |||||||
| *Gibraltar Industries, Inc. |
66,751 | $ | 4,349,495 | |||||
| Global Industrial Co. |
67,876 | 2,754,408 | ||||||
| *GMS, Inc. |
48,759 | 2,415,033 | ||||||
| *Gorman-Rupp Co. (The) |
65,351 | 2,778,725 | ||||||
| *GrafTech International, Ltd. |
77,673 | 831,101 | ||||||
| *Graham Corp. |
18,580 | 236,152 | ||||||
| Granite Construction, Inc. |
61,997 | 2,301,329 | ||||||
| *Great Lakes Dredge & Dock Corp. |
148,759 | 2,264,112 | ||||||
| *Greenbrier Cos., Inc. (The) |
64,062 | 2,627,823 | ||||||
| *Griffon Corp. |
91,318 | 2,419,014 | ||||||
| *H&E Equipment Services, Inc. |
90,065 | 4,060,130 | ||||||
| *Harsco Corp. |
52,649 | 900,298 | ||||||
| *Hawaiian Holdings, Inc. |
130,515 | 2,525,465 | ||||||
| #*Healthcare Services Group, Inc. |
71,060 | 1,363,641 | ||||||
| Heartland Express, Inc. |
50,244 | 820,485 | ||||||
| *Heidrick & Struggles International, Inc. |
55,731 | 2,612,669 | ||||||
| Helios Technologies, Inc. |
51,944 | 4,729,501 | ||||||
| Herc Holdings, Inc. |
46,665 | 8,494,897 | ||||||
| *Heritage-Crystal Clean, Inc. |
33,430 | 1,159,018 | ||||||
| *Herman Miller, Inc. |
112,487 | 4,377,994 | ||||||
| *Hexcel Corp. |
14,640 | 830,674 | ||||||
| *Hill International, Inc. |
1,172 | 2,391 | ||||||
| Hillenbrand, Inc. |
42,861 | 1,948,461 | ||||||
| *HNI Corp. |
64,001 | 2,393,637 | ||||||
| *Hub Group, Inc., Class A |
62,554 | 4,914,868 | ||||||
| *Hudson Technologies, Inc. |
3,891 | 13,774 | ||||||
| *Hurco Cos., Inc. |
18,614 | 604,024 | ||||||
| *Huron Consulting Group, Inc., Class A |
44,554 | 2,234,829 | ||||||
| *Huttig Building Products, Inc. |
680 | 4,862 | ||||||
| *Hyster-Yale Materials Handling, Inc. |
17,600 | 845,504 | ||||||
| *IAA, Inc. |
702 | 41,874 | ||||||
| ICF International, Inc. |
46,480 | 4,670,775 | ||||||
| *IES Holdings, Inc., Class A |
36,062 | 1,797,691 | ||||||
| Innovative Solutions and Support, Inc. |
19,757 | 133,557 | ||||||
| Insperity, Inc. |
60,901 | 7,612,625 | ||||||
| Insteel Industries, Inc. |
39,789 | 1,618,219 | ||||||
| *Interface, Inc. |
120,672 | 1,732,850 | ||||||
| ITT, Inc. |
6,200 | 583,234 | ||||||
| *JELD-WEN Holding, Inc. |
79,277 | 2,172,983 | ||||||
| *JetBlue Airways Corp. |
68,083 | 955,204 | ||||||
| John Bean Technologies Corp., Class A |
62,100 | 9,175,275 | ||||||
| Kadant, Inc. |
23,649 | 5,252,916 | ||||||
| *Kaman Corp. |
41,570 | 1,487,790 | ||||||
| *KAR Auction Services, Inc. |
31,083 | 455,988 | ||||||
| #KBR, Inc. |
229,643 | 9,746,049 | ||||||
| *Kelly Services, Inc., Class A |
46,277 | 834,374 | ||||||
| *Kennametal, Inc. |
139,925 | 5,562,019 | ||||||
| *Kforce, Inc. |
58,229 | 3,770,910 | ||||||
| *Kimball International, Inc., Class B |
77,230 | 839,490 | ||||||
| *Kirby Corp. |
66,864 | 3,504,342 | ||||||
| Korn Ferry |
115,839 | 8,943,929 | ||||||
| *Kratos Defense & Security Solutions, Inc. |
234,300 | 5,011,677 | ||||||
| *L B Foster Co., Class A |
21,876 | 348,485 | ||||||
| *Landstar System, Inc. |
46,767 | 8,222,106 | ||||||
| *Lawson Products, Inc. |
22,868 | 1,159,408 | ||||||
| *Lindsay Corp. |
17,791 | 2,591,615 | ||||||
| *LiqTech International, Inc. |
2,400 | 12,696 | ||||||
Dimensional U.S. Small Cap ETF
SCHEDULE OF INVESTMENTS
October 31, 2021
| Security Description |
Shares | Fair Value | ||||||
| INDUSTRIALS (Continued) |
| |||||||
| LSI Industries, Inc. |
86,912 | $ | 646,625 | |||||
| Macquarie Infrastructure Holdings LLC |
46,728 | 172,426 | ||||||
| *Manitex International, Inc. |
12,718 | 82,285 | ||||||
| *Manitowoc Co., Inc. (The) |
79,042 | 1,693,870 | ||||||
| ManpowerGroup, Inc. |
7,952 | 768,561 | ||||||
| *ManTech International Corp., Class A |
47,911 | 4,130,886 | ||||||
| Marten Transport, Ltd. |
192,048 | 3,193,758 | ||||||
| *Masonite International Corp. |
22,634 | 2,716,306 | ||||||
| *MasTec, Inc. |
131,255 | 11,698,758 | ||||||
| *Mastech Digital, Inc. |
1,100 | 20,394 | ||||||
| *Matrix Service Co. |
53,980 | 552,215 | ||||||
| Matson, Inc. |
81,330 | 6,773,162 | ||||||
| *Matthews International Corp., Class A |
35,650 | 1,225,291 | ||||||
| Maxar Technologies, Inc. |
10,147 | 269,403 | ||||||
| McGrath RentCorp. |
42,617 | 3,074,390 | ||||||
| *Mercury Systems, Inc. |
68,149 | 3,512,399 | ||||||
| *Meritor, Inc. |
189,646 | 4,615,984 | ||||||
| *Mesa Air Group, Inc. |
18,331 | 138,216 | ||||||
| *Middleby Corp. (The) |
11,400 | 2,079,816 | ||||||
| *Miller Industries, Inc. |
25,962 | 938,267 | ||||||
| *Mistras Group, Inc. |
25,870 | 254,043 | ||||||
| *Moog, Inc., Class A |
42,799 | 3,232,608 | ||||||
| *MRC Global, Inc. |
82,739 | 686,734 | ||||||
| *MSA Safety, Inc. |
45,473 | 6,958,733 | ||||||
| *MSC Industrial Direct Co., Inc. |
6,123 | 514,761 | ||||||
| *Mueller Industries, Inc. |
116,969 | 6,157,248 | ||||||
| *Mueller Water Products, Inc., Class A |
370,942 | 6,087,158 | ||||||
| *MYR Group, Inc. |
42,474 | 4,338,719 | ||||||
| National Presto Industries, Inc. |
11,954 | 993,975 | ||||||
| Nielsen Holdings PLC |
692 | 14,013 | ||||||
| *NN, Inc. |
45,717 | 228,128 | ||||||
| *Northwest Pipe Co. |
25,726 | 611,250 | ||||||
| *NOW, Inc. |
146,454 | 1,057,398 | ||||||
| *NV5 Global, Inc. |
31,642 | 3,294,881 | ||||||
| nVent Electric PLC |
65,465 | 2,320,734 | ||||||
| Omega Flex, Inc. |
19,850 | 2,873,486 | ||||||
| *Orion Energy Systems, Inc. |
3,292 | 13,464 | ||||||
| *Orion Group Holdings, Inc. |
58,599 | 260,766 | ||||||
| *Oshkosh Corp. |
4,708 | 503,756 | ||||||
| *PAM Transportation Services, Inc. |
23,973 | 1,482,011 | ||||||
| Pangaea Logistics Solutions, Ltd. |
1,518 | 6,861 | ||||||
| Park Aerospace Corp. |
28,805 | 377,057 | ||||||
| *Park-Ohio Holdings Corp. |
31,873 | 743,278 | ||||||
| *Parsons Corp. |
3,630 | 125,743 | ||||||
| Patriot Transportation Holding, Inc. |
5,218 | 79,992 | ||||||
| *Performant Financial Corp. |
3,065 | 9,226 | ||||||
| *Perma-Pipe International Holdings, Inc. |
1,287 | 11,004 | ||||||
| *PGT Innovations, Inc. |
143,145 | 3,056,146 | ||||||
| *Pitney Bowes, Inc. |
173,195 | 1,201,973 | ||||||
| #*Polar Power, Inc. |
13,887 | 70,546 | ||||||
| *Powell Industries, Inc. |
23,104 | 597,469 | ||||||
| Preformed Line Products Co. |
7,374 | 511,756 | ||||||
| Primoris Services Corp. |
78,714 | 2,121,342 | ||||||
| #*Quad/Graphics, Inc. |
49,056 | 193,281 | ||||||
| Quanex Building Products Corp. |
67,441 | 1,397,378 | ||||||
| *Quest Resource Holding Corp. |
673 | 3,917 | ||||||
Dimensional U.S. Small Cap ETF
SCHEDULE OF INVESTMENTS
October 31, 2021
| Security Description |
Shares | Fair Value | ||||||
| INDUSTRIALS (Continued) |
| |||||||
| *Radiant Logistics, Inc. |
101,613 | $ | 683,855 | |||||
| *Raven Industries, Inc. |
52,211 | 3,018,840 | ||||||
| *RBC Bearings, Inc. |
39,899 | 9,333,573 | ||||||
| *RCM Technologies, Inc. |
16,100 | 96,117 | ||||||
| *Red Violet, Inc. |
1,608 | 51,215 | ||||||
| *Regal Rexnord Corp. |
122,112 | 18,601,321 | ||||||
| *Resideo Technologies, Inc. |
72,017 | 1,775,939 | ||||||
| Resources Connection, Inc. |
66,960 | 1,165,774 | ||||||
| REV Group, Inc. |
34,626 | 523,199 | ||||||
| *Rush Enterprises, Inc., Class A |
73,304 | 3,817,672 | ||||||
| *Rush Enterprises, Inc., Class B |
26,695 | 1,380,398 | ||||||
| *Ryder System, Inc. |
3,894 | 330,795 | ||||||
| *Saia, Inc. |
61,117 | 19,107,619 | ||||||
| Schneider National, Inc., Class B |
12,548 | 312,947 | ||||||
| Science Applications International Corp. |
29,620 | 2,659,284 | ||||||
| *Servotronics, Inc. |
941 | 10,643 | ||||||
| *Shyft Group, Inc. (The) |
93,349 | 3,846,912 | ||||||
| *Sifco Industries, Inc. |
4,994 | 38,304 | ||||||
| *Simpson Manufacturing Co., Inc. |
86,351 | 9,160,978 | ||||||
| *SiteOne Landscape Supply, Inc. |
8,492 | 1,995,280 | ||||||
| *SkyWest, Inc. |
63,196 | 2,719,324 | ||||||
| *SP Plus Corp. |
51,459 | 1,659,553 | ||||||
| *Spirit AeroSystems Holdings, Inc., Class A |
2,232 | 92,159 | ||||||
| *Spirit Airlines, Inc. |
1,690 | 36,926 | ||||||
| *SPX Corp. |
59,502 | 3,456,471 | ||||||
| SPX FLOW, Inc. |
78,376 | 5,855,471 | ||||||
| *Standex International Corp. |
31,352 | 3,488,537 | ||||||
| Steelcase, Inc., Class A |
90,013 | 1,071,155 | ||||||
| *Stericycle, Inc. |
22,348 | 1,495,528 | ||||||
| *Sterling Construction Co., Inc. |
73,974 | 1,778,335 | ||||||
| *Sunrun, Inc. |
102,982 | 5,940,002 | ||||||
| *Team, Inc. |
25,687 | 62,163 | ||||||
| Tecnoglass, Inc. |
8,551 | 246,953 | ||||||
| Tennant Co. |
37,867 | 3,008,912 | ||||||
| *Terex Corp. |
122,060 | 5,468,288 | ||||||
| #Tetra Tech, Inc. |
64,747 | 11,373,458 | ||||||
| *Textainer Group Holdings, Ltd. |
65,534 | 2,574,831 | ||||||
| *Thermon Group Holdings, Inc. |
51,138 | 883,665 | ||||||
| *Timken Co. (The) |
125,688 | 8,917,564 | ||||||
| *Titan International, Inc. |
34,244 | 247,242 | ||||||
| *Titan Machinery, Inc. |
45,462 | 1,292,030 | ||||||
| *TPI Composites, Inc. |
44,376 | 1,492,365 | ||||||
| *Transcat, Inc. |
10,598 | 793,578 | ||||||
| *Trex Co., Inc. |
56,057 | 5,964,465 | ||||||
| *TriMas Corp. |
81,346 | 2,712,889 | ||||||
| *TriNet Group, Inc. |
69,342 | 7,020,878 | ||||||
| Trinity Industries, Inc. |
80,196 | 2,249,498 | ||||||
| Triton International, Ltd. |
131,238 | 8,161,691 | ||||||
| *TrueBlue, Inc. |
77,762 | 2,165,672 | ||||||
| *Tutor Perini Corp. |
35,272 | 480,405 | ||||||
| *Twin Disc, Inc. |
20,090 | 272,822 | ||||||
| UFP Industries, Inc. |
121,049 | 9,905,440 | ||||||
| *Ultralife Corp. |
33,700 | 210,962 | ||||||
| *UniFirst Corp. |
28,167 | 5,575,939 | ||||||
| *Univar Solutions, Inc. |
26,723 | 683,574 | ||||||
| Universal Logistics Holdings, Inc. |
31,071 | 654,977 | ||||||
| *Upwork, Inc. |
11,894 | 560,445 | ||||||
Dimensional U.S. Small Cap ETF
SCHEDULE OF INVESTMENTS
October 31, 2021
| Security Description |
Shares | Fair Value | ||||||
| INDUSTRIALS (Continued) |
| |||||||
| *US Ecology, Inc. |
44,514 | $ | 1,432,906 | |||||
| *US Xpress Enterprises, Inc., Class A |
3,486 | 26,389 | ||||||
| *USA Truck, Inc. |
21,291 | 410,278 | ||||||
| *Valmont Industries, Inc. |
32,422 | 7,747,561 | ||||||
| *Vectrus, Inc. |
29,127 | 1,410,621 | ||||||
| *Veritiv Corp. |
32,709 | 3,508,694 | ||||||
| *Viad Corp. |
39,842 | 1,767,790 | ||||||
| *Vicor Corp. |
26,713 | 4,049,424 | ||||||
| *Vidler Water Resources, Inc. |
22,219 | 274,627 | ||||||
| *Virco MFG. Corp. |
1,169 | 3,881 | ||||||
| *VSE Corp. |
17,884 | 993,456 | ||||||
| *Wabash National Corp. |
111,489 | 1,731,424 | ||||||
| *Watts Water Technologies, Inc., Class A |
49,997 | 9,500,430 | ||||||
| *Welbilt, Inc. |
171,798 | 4,064,741 | ||||||
| #*Werner Enterprises, Inc. |
141,721 | 6,422,796 | ||||||
| *WESCO International, Inc. |
34,495 | 4,469,172 | ||||||
| *Willdan Group, Inc. |
9,014 | 301,338 | ||||||
| *Willis Lease Finance Corp. |
11,646 | 471,779 | ||||||
| *WillScot Mobile Mini Holdings Corp. |
223,394 | 7,762,942 | ||||||
| Zurn Water Solutions Corp. |
164,046 | 5,951,589 | ||||||
|
|
|
|||||||
| TOTAL INDUSTRIALS |
888,591,301 | |||||||
|
|
|
|||||||
| INFORMATION TECHNOLOGY (13.3%) |
| |||||||
| *3D Systems Corp. |
41,324 | 1,163,684 | ||||||
| *A10 Networks, Inc. |
42,348 | 791,484 | ||||||
| *ACI Worldwide, Inc. |
187,695 | 5,758,483 | ||||||
| *ACM Research, Inc., Class A |
4,631 | 491,673 | ||||||
| ADTRAN, Inc. |
115,374 | 2,132,112 | ||||||
| *Advanced Energy Industries, Inc. |
81,399 | 7,474,056 | ||||||
| *Aehr Test Systems |
13,183 | 298,199 | ||||||
| *Agilysys, Inc. |
55,194 | 2,633,858 | ||||||
| *Airgain, Inc. |
16,753 | 188,136 | ||||||
| *Alarm.com Holdings, Inc. |
74,450 | 6,273,157 | ||||||
| *Alithya Group, Inc., Class A |
14,711 | 40,602 | ||||||
| *Alliance Data Systems Corp. |
9,026 | 769,467 | ||||||
| *Alpha & Omega Semiconductor, Ltd. |
55,469 | 1,922,001 | ||||||
| *Altair Engineering, Inc., Class A |
23,393 | 1,819,741 | ||||||
| #*Alteryx, Inc., Class A |
2,067 | 151,284 | ||||||
| *Ambarella, Inc. |
35,953 | 6,681,146 | ||||||
| *American Software, Inc., Class A |
76,699 | 2,218,902 | ||||||
| *Amkor Technology, Inc. |
460,154 | 10,086,576 | ||||||
| *Amtech Systems, Inc. |
34,855 | 523,522 | ||||||
| #*Appfolio, Inc., Class A |
11,606 | 1,528,394 | ||||||
| #*Applied Optoelectronics, Inc. |
1,520 | 11,628 | ||||||
| *Arlo Technologies, Inc. |
93,991 | 648,538 | ||||||
| *Arrow Electronics, Inc. |
4,100 | 474,575 | ||||||
| *AstroNova, Inc. |
8,147 | 134,426 | ||||||
| *Asure Software, Inc. |
11,981 | 115,736 | ||||||
| *Autoscope Technologies Corp. |
700 | 4,788 | ||||||
| *Avaya Holdings Corp. |
37,982 | 707,225 | ||||||
| *Aviat Networks, Inc. |
10,002 | 286,057 | ||||||
| *Avid Technology, Inc. |
115,254 | 3,300,875 | ||||||
| *Avnet, Inc. |
28,646 | 1,091,699 | ||||||
| *Aware, Inc. |
34,012 | 119,722 | ||||||
| *Axcelis Technologies, Inc. |
88,880 | 4,882,178 | ||||||
| *AXT, Inc. |
104,435 | 853,234 | ||||||
Dimensional U.S. Small Cap ETF
SCHEDULE OF INVESTMENTS
October 31, 2021
| Security Description |
Shares | Fair Value | ||||||
| INFORMATION TECHNOLOGY (Continued) |
| |||||||
| *Badger Meter, Inc. |
58,594 | $ | 5,991,236 | |||||
| *Bel Fuse, Inc. |
890 | 13,274 | ||||||
| *Bel Fuse, Inc., Class B |
16,178 | 225,198 | ||||||
| *Belden, Inc. |
64,440 | 3,879,932 | ||||||
| Benchmark Electronics, Inc. |
76,070 | 1,773,192 | ||||||
| *Benefitfocus, Inc. |
9,461 | 103,693 | ||||||
| BK Technologies Corp. |
15,768 | 46,516 | ||||||
| #*Blackbaud, Inc. |
57,946 | 4,114,745 | ||||||
| *BM Technologies, Inc. |
9,175 | 82,024 | ||||||
| *Bottomline Technologies DE, Inc. |
38,415 | 1,778,615 | ||||||
| *Box, Inc., Class A |
64,736 | 1,672,131 | ||||||
| *Bridgeline Digital, Inc. |
4,407 | 14,984 | ||||||
| *Brightcove, Inc. |
18,799 | 186,486 | ||||||
| *Brooks Automation, Inc. |
108,343 | 12,616,542 | ||||||
| *CalAmp Corp. |
84,427 | 812,188 | ||||||
| *Calix, Inc. |
162,383 | 10,163,552 | ||||||
| *Cambium Networks Corp. |
1,215 | 34,287 | ||||||
| *Cantaloupe, Inc. |
2,501 | 31,263 | ||||||
| *Casa Systems, Inc. |
11,868 | 75,124 | ||||||
| Cass Information Systems, Inc. |
34,099 | 1,397,718 | ||||||
| CDK Global, Inc. |
4,265 | 185,613 | ||||||
| #*Cerence, Inc. |
1,062 | 111,648 | ||||||
| *CEVA, Inc. |
54,275 | 2,475,483 | ||||||
| *ChannelAdvisor Corp. |
37,556 | 958,054 | ||||||
| *Cirrus Logic, Inc. |
122,804 | 9,923,791 | ||||||
| *Clearfield, Inc. |
37,963 | 2,144,530 | ||||||
| CMC Materials, Inc. |
46,501 | 5,969,333 | ||||||
| *Cognyte Software, Ltd. |
55,164 | 1,098,315 | ||||||
| *Coherent, Inc. |
17,967 | 4,570,805 | ||||||
| *Cohu, Inc. |
89,257 | 2,859,794 | ||||||
| *CommScope Holding Co., Inc. |
64,653 | 692,434 | ||||||
| *CommVault Systems, Inc. |
57,749 | 3,551,563 | ||||||
| *Computer Task Group, Inc. |
34,141 | 264,934 | ||||||
| Comtech Telecommunications Corp. |
61,240 | 1,320,947 | ||||||
| Concentrix Corp. |
40,677 | 7,227,489 | ||||||
| *Conduent, Inc. |
165,191 | 1,115,039 | ||||||
| *Consensus Cloud Solutions, Inc. |
19,109 | 1,210,173 | ||||||
| CSG Systems International, Inc. |
69,813 | 3,494,141 | ||||||
| *CSP, Inc. |
2,788 | 23,754 | ||||||
| *CTS Corp. |
70,239 | 2,501,913 | ||||||
| *Cyberoptics Corp. |
19,213 | 802,335 | ||||||
| *Daktronics, Inc. |
64,129 | 355,916 | ||||||
| *Digi International, Inc. |
65,704 | 1,415,921 | ||||||
| #*Digimarc Corp. |
253 | 12,784 | ||||||
| *Digital Turbine, Inc. |
44,302 | 3,812,630 | ||||||
| *Diodes, Inc. |
94,358 | 9,066,860 | ||||||
| *DSP Group, Inc. |
59,772 | 1,313,191 | ||||||
| *Duck Creek Technologies, Inc. |
4,528 | 142,632 | ||||||
| *DXC Technology Co. |
9,473 | 308,536 | ||||||
| #*DZS, Inc. |
3,568 | 38,891 | ||||||
| #*Ebix, Inc. |
49,249 | 1,615,860 | ||||||
| *EchoStar Corp., Class A |
14,789 | 346,950 | ||||||
| *eGain Corp. |
59,222 | 611,171 | ||||||
| *EMCORE Corp. |
61,611 | 460,850 | ||||||
| *Enphase Energy, Inc. |
24,780 | 5,739,791 | ||||||
| Entegris, Inc. |
3,677 | 517,648 | ||||||
| *Envestnet, Inc. |
49,262 | 4,113,377 | ||||||
Dimensional U.S. Small Cap ETF
SCHEDULE OF INVESTMENTS
October 31, 2021
| Security Description |
Shares | Fair Value | ||||||
| INFORMATION TECHNOLOGY (Continued) |
| |||||||
| *ePlus, Inc. |
34,951 | $ | 3,864,532 | |||||
| *Euronet Worldwide, Inc. |
1,681 | 188,591 | ||||||
| *Everbridge, Inc. |
1,346 | 214,431 | ||||||
| EVERTEC, Inc. |
95,557 | 4,320,132 | ||||||
| *Evo Payments, Inc., Class A |
848 | 18,385 | ||||||
| *ExlService Holdings, Inc. |
68,717 | 8,426,766 | ||||||
| *Extreme Networks, Inc. |
15,075 | 148,187 | ||||||
| *Fabrinet |
76,436 | 7,337,856 | ||||||
| *FARO Technologies, Inc. |
40,939 | 3,011,882 | ||||||
| #*First Solar, Inc. |
17,952 | 2,146,880 | ||||||
| *Flex, Ltd. |
12,349 | 208,698 | ||||||
| *FormFactor, Inc. |
162,869 | 6,478,929 | ||||||
| *Frequency Electronics, Inc. |
13,949 | 139,351 | ||||||
| #*fuboTV, Inc. |
60,261 | 1,796,380 | ||||||
| #*Genasys, Inc. |
9,541 | 48,468 | ||||||
| #*Globant SA |
14,348 | 4,579,738 | ||||||
| *GreenSky, Inc., Class A |
8,700 | 106,488 | ||||||
| *Grid Dynamics Holdings, Inc. |
24,859 | 714,696 | ||||||
| *GSI Technology, Inc. |
44,714 | 232,066 | ||||||
| *GTY Technology Holdings, Inc. |
12,625 | 95,950 | ||||||
| #*Hackett Group, Inc. (The) |
76,769 | 1,622,897 | ||||||
| *Harmonic, Inc. |
275,669 | 2,500,318 | ||||||
| *I3 Verticals, Inc., Class A |
9,104 | 203,839 | ||||||
| *Ichor Holdings, Ltd. |
56,037 | 2,449,938 | ||||||
| *Identiv, Inc. |
2,200 | 42,152 | ||||||
| *II-VI, Inc. |
44,242 | 2,677,083 | ||||||
| *Immersion Corp. |
30,607 | 244,550 | ||||||
| #*Impinj, Inc. |
9,200 | 641,424 | ||||||
| *Infinera Corp. |
178,481 | 1,354,671 | ||||||
| Information Services Group, Inc. |
24,776 | 201,924 | ||||||
| *Innodata, Inc. |
7,543 | 80,107 | ||||||
| *Insight Enterprises, Inc. |
67,172 | 6,361,188 | ||||||
| InterDigital, Inc. |
68,598 | 4,592,636 | ||||||
| *International Money Express, Inc. |
5,733 | 95,970 | ||||||
| *inTEST Corp. |
21,713 | 240,363 | ||||||
| *Intevac, Inc. |
60,418 | 282,152 | ||||||
| *Issuer Direct Corp. |
1,772 | 45,133 | ||||||
| *Iteris, Inc. |
37,350 | 200,196 | ||||||
| *Itron, Inc. |
62,463 | 4,857,748 | ||||||
| *Jabil, Inc. |
23,277 | 1,395,689 | ||||||
| #*Jamf Holding Corp. |
11,754 | 560,078 | ||||||
| *Key Tronic Corp. |
24,700 | 159,315 | ||||||
| *Kimball Electronics, Inc., Class B |
52,089 | 1,497,559 | ||||||
| #*Knowles Corp. |
197,715 | 4,120,381 | ||||||
| *Kopin Corp. |
1,269 | 6,650 | ||||||
| *Kulicke & Soffa Industries, Inc. |
115,947 | 6,608,979 | ||||||
| *KVH Industries, Inc. |
43,383 | 445,110 | ||||||
| *Lantronix, Inc. |
47,350 | 459,295 | ||||||
| *Lattice Semiconductor Corp. |
243,698 | 16,922,389 | ||||||
| #*Limelight Networks, Inc. |
168,244 | 501,367 | ||||||
| *Littelfuse, Inc. |
23,147 | 6,817,949 | ||||||
| *LiveRamp Holdings, Inc. |
138,368 | 7,404,072 | ||||||
| *Lumentum Holdings, Inc. |
39,865 | 3,292,052 | ||||||
| #*Luna Innovations, Inc. |
36,993 | 360,312 | ||||||
| *MACOM Technology Solutions Holdings, Inc. |
23,413 | 1,634,696 | ||||||
| *MagnaChip Semiconductor Corp. |
30,435 | 577,048 | ||||||
Dimensional U.S. Small Cap ETF
SCHEDULE OF INVESTMENTS
October 31, 2021
| Security Description |
Shares | Fair Value | ||||||
| INFORMATION TECHNOLOGY (Continued) |
| |||||||
| *Mandiant, Inc. |
86,897 | $ | 1,515,484 | |||||
| *Manhattan Associates, Inc. |
36,742 | 6,670,143 | ||||||
| #*Marin Software, Inc. |
30,799 | 194,034 | ||||||
| Marvell Technology, Inc. |
35,528 | 2,433,668 | ||||||
| *Maximus, Inc. |
18,308 | 1,548,308 | ||||||
| *MaxLinear, Inc. |
107,392 | 6,765,696 | ||||||
| Methode Electronics, Inc. |
84,520 | 3,555,756 | ||||||
| *Mimecast, Ltd. |
51,213 | 3,863,509 | ||||||
| *Mitek Systems, Inc. |
63,771 | 1,200,808 | ||||||
| *Model N, Inc. |
8,929 | 289,389 | ||||||
| *Momentive Global, Inc. |
16,525 | 378,753 | ||||||
| *MoneyGram International, Inc. |
5,943 | 35,480 | ||||||
| *N-Able, Inc. |
1,007 | 13,393 | ||||||
| *Napco Security Technologies, Inc. |
46,030 | 2,207,599 | ||||||
| *National Instruments Corp. |
47,358 | 2,011,294 | ||||||
| *NCR Corp. |
74,712 | 2,954,112 | ||||||
| *NeoPhotonics Corp. |
130,276 | 1,318,393 | ||||||
| *NETGEAR, Inc. |
68,449 | 1,973,385 | ||||||
| *NetScout Systems, Inc. |
139,200 | 3,766,752 | ||||||
| *NetSol Technologies, Inc. |
2,874 | 12,990 | ||||||
| Network-1 Technologies, Inc. |
10,978 | 30,848 | ||||||
| *New Relic, Inc. |
12,918 | 1,048,425 | ||||||
| *nLight, Inc. |
1,119 | 31,466 | ||||||
| *Novanta, Inc. |
68,725 | 11,859,186 | ||||||
| NVE Corp. |
8,348 | 567,414 | ||||||
| #*One Stop Systems, Inc. |
6,129 | 30,706 | ||||||
| *OneSpan, Inc. |
94,324 | 1,926,096 | ||||||
| *Onto Innovation, Inc. |
127,461 | 10,096,186 | ||||||
| *Optical Cable Corp. |
3,533 | 13,637 | ||||||
| *OSI Systems, Inc. |
37,675 | 3,507,919 | ||||||
| *Pagerduty, Inc. |
13,542 | 565,379 | ||||||
| #*Par Technology Corp. |
21,837 | 1,371,800 | ||||||
| PC Connection, Inc. |
59,229 | 2,727,495 | ||||||
| PCTEL, Inc. |
20,526 | 118,230 | ||||||
| *PDF Solutions, Inc. |
67,628 | 1,591,287 | ||||||
| *Perficient, Inc. |
76,133 | 9,410,039 | ||||||
| *PFSweb, Inc. |
40,298 | 523,874 | ||||||
| #*Photronics, Inc. |
158,936 | 2,064,579 | ||||||
| *Pixelworks, Inc. |
81,383 | 332,856 | ||||||
| *Plantronics, Inc. |
5,147 | 137,734 | ||||||
| *Plexus Corp. |
75,362 | 6,580,610 | ||||||
| *Power Integrations, Inc. |
109,590 | 11,310,784 | ||||||
| *Powerfleet, Inc. |
12,160 | 84,147 | ||||||
| *Progress Software Corp. |
103,825 | 5,337,643 | ||||||
| *Pure Storage, Inc., Class A |
20,650 | 554,659 | ||||||
| *Q2 Holdings, Inc. |
788 | 61,826 | ||||||
| Qad, Inc. |
4,173 | 364,762 | ||||||
| QAD, Inc., Class A |
24,107 | 2,112,737 | ||||||
| *Qualys, Inc. |
33,701 | 4,195,100 | ||||||
| *Rambus, Inc. |
241,632 | 5,622,777 | ||||||
| *RF Industries, Ltd. |
18,031 | 137,216 | ||||||
| *Ribbon Communications, Inc. |
157,206 | 859,917 | ||||||
| *Richardson Electronics, Ltd. |
23,057 | 251,552 | ||||||
| *Rimini Street, Inc. |
16,752 | 174,388 | ||||||
| *Rogers Corp. |
37,593 | 7,560,704 | ||||||
| *Sailpoint Technologies Holdings, Inc. |
56,670 | 2,719,027 | ||||||
| *Sanmina Corp. |
155,473 | 5,869,106 | ||||||
Dimensional U.S. Small Cap ETF
SCHEDULE OF INVESTMENTS
October 31, 2021
| Security Description |
Shares | Fair Value | ||||||
| INFORMATION TECHNOLOGY (Continued) | ||||||||
| Sapiens International Corp. NV |
13,263 | $ | 463,277 | |||||
| *ScanSource, Inc. |
49,134 | 1,758,015 | ||||||
| *SecureWorks Corp., Class A |
3,900 | 71,838 | ||||||
| *Semtech Corp. |
85,141 | 7,239,539 | ||||||
| *ShotSpotter, Inc. |
7,519 | 292,564 | ||||||
| *SigmaTron International, Inc. |
2,576 | 22,669 | ||||||
| *Silicon Laboratories, Inc. |
57,733 | 10,897,681 | ||||||
| *SiTime Corp. |
244 | 64,633 | ||||||
| *SMART Global Holdings, Inc. |
50,793 | 2,715,394 | ||||||
| *Smith Micro Software, Inc. |
19,158 | 109,201 | ||||||
| *Socket Mobile, Inc. |
11,259 | 69,918 | ||||||
| *SolarEdge Technologies, Inc. |
18,142 | 6,434,605 | ||||||
| #SolarWinds Corp. |
2,336 | 37,610 | ||||||
| *SPS Commerce, Inc. |
30,407 | 4,644,061 | ||||||
| *Squarespace, Inc., Class A |
116 | 4,517 | ||||||
| *StarTek, Inc. |
37,813 | 207,972 | ||||||
| #*Stratasys, Ltd. |
3,513 | 110,800 | ||||||
| #*SunPower Corp. |
2,670 | 89,872 | ||||||
| *Super Micro Computer, Inc. |
31,332 | 1,108,839 | ||||||
| #Switch, Inc., Class A |
48,941 | 1,237,228 | ||||||
| *Synaptics, Inc. |
66,325 | 12,904,855 | ||||||
| *Synchronoss Technologies, Inc. |
5,625 | 14,850 | ||||||
| SYNNEX Corp. |
40,889 | 4,293,345 | ||||||
| *Teledyne Technologies, Inc. |
471 | 211,583 | ||||||
| *Teradata Corp. |
96,068 | 5,433,606 | ||||||
| *Tessco Technologies, Inc. |
13,243 | 69,393 | ||||||
| *TransAct Technologies, Inc. |
19,887 | 280,804 | ||||||
| *TSR, Inc. |
27 | 285 | ||||||
| TTEC Holdings, Inc. |
84,893 | 8,013,050 | ||||||
| *TTM Technologies, Inc. |
193,096 | 2,556,591 | ||||||
| #*Tucows, Inc., Class A |
83 | 6,831 | ||||||
| #*Turtle Beach Corp. |
25,475 | 732,661 | ||||||
| *Ultra Clean Holdings, Inc. |
104,864 | 5,198,108 | ||||||
| *Unisys Corp. |
124,248 | 3,177,021 | ||||||
| *Upland Software, Inc. |
26,559 | 886,274 | ||||||
| *Usio, Inc. |
2,695 | 17,113 | ||||||
| #*Varonis Systems, Inc. |
19,146 | 1,239,512 | ||||||
| *Veeco Instruments, Inc. |
126,670 | 3,076,814 | ||||||
| *Verint Systems, Inc. |
90,937 | 4,237,664 | ||||||
| #*Verra Mobility Corp. |
25,068 | 373,012 | ||||||
| *Viasat, Inc. |
39,559 | 2,361,277 | ||||||
| *Viavi Solutions, Inc. |
188,433 | 2,901,868 | ||||||
| *Vishay Intertechnology, Inc. |
244,793 | 4,704,921 | ||||||
| *Vishay Precision Group, Inc. |
23,970 | 817,137 | ||||||
| *Vonage Holdings Corp. |
467,823 | 7,541,307 | ||||||
| *Vontier Corp. |
18,056 | 610,834 | ||||||
| *Wayside Technology Group, Inc. |
8,842 | 235,109 | ||||||
| #*Wolfspeed, Inc. |
7,301 | 876,923 | ||||||
| Xerox Holdings Corp. |
52,782 | 939,520 | ||||||
| Xperi Holding Corp. |
155,908 | 2,793,871 | ||||||
| *Ziff Davis, Inc. |
57,848 | 7,420,163 | ||||||
| *Zix Corp. |
56,021 | 474,498 | ||||||
|
|
|
|||||||
| TOTAL INFORMATION TECHNOLOGY |
|
584,942,680 | ||||||
|
|
|
|||||||
Dimensional U.S. Small Cap ETF
SCHEDULE OF INVESTMENTS
October 31, 2021
| Security Description |
Shares | Fair Value | ||||||
| MATERIALS (5.7%) |
| |||||||
| *Advanced Emissions Solutions, Inc. |
14,444 | $ | 98,075 | |||||
| *AdvanSix, Inc. |
40,577 | 1,972,042 | ||||||
| *AgroFresh Solutions, Inc. |
9,500 | 19,285 | ||||||
| Alcoa Corp. |
122,665 | 5,636,457 | ||||||
| *Allegheny Technologies, Inc. |
146,558 | 2,359,584 | ||||||
| *Alpha Metallurgical Resources, Inc. |
10,459 | 646,262 | ||||||
| American Vanguard Corp. |
60,394 | 940,938 | ||||||
| *Arconic Corp. |
3,221 | 94,762 | ||||||
| *Ardagh Metal Packaging SA |
26,537 | 261,389 | ||||||
| *Ashland Global Holdings, Inc. |
48,139 | 4,621,825 | ||||||
| Avient Corp. |
143,059 | 7,708,019 | ||||||
| *Axalta Coating Systems, Ltd. |
8,878 | 276,905 | ||||||
| Balchem Corp. |
52,026 | 7,964,660 | ||||||
| *Cabot Corp. |
91,365 | 4,874,323 | ||||||
| Caledonia Mining Corp. PLC |
592 | 7,335 | ||||||
| #Carpenter Technology Corp. |
75,708 | 2,337,863 | ||||||
| *Century Aluminum Co. |
189,543 | 2,503,863 | ||||||
| Chase Corp. |
20,234 | 1,942,464 | ||||||
| *Chemours Co. (The) |
66,194 | 1,854,756 | ||||||
| #*Clearwater Paper Corp. |
33,661 | 1,408,040 | ||||||
| *Coeur Mining, Inc. |
405,783 | 2,568,606 | ||||||
| #Commercial Metals Co. |
237,532 | 7,643,780 | ||||||
| Compass Minerals International, Inc. |
68,081 | 4,466,114 | ||||||
| *Core Molding Technologies, Inc. |
24,525 | 269,775 | ||||||
| *Domtar Corp. |
98,438 | 5,373,730 | ||||||
| Eagle Materials, Inc. |
24,433 | 3,624,880 | ||||||
| Ecovyst, Inc. |
26,641 | 311,167 | ||||||
| Element Solutions, Inc. |
419,949 | 9,537,042 | ||||||
| *Ferro Corp. |
148,485 | 3,121,155 | ||||||
| #*Ferroglobe PLC |
46,676 | 309,462 | ||||||
| *Forterra, Inc. |
33,623 | 800,900 | ||||||
| Fortitude Gold Corp. |
39,179 | 266,025 | ||||||
| Friedman Industries, Inc. |
8,235 | 113,314 | ||||||
| FutureFuel Corp. |
52,574 | 371,172 | ||||||
| *GCP Applied Technologies, Inc. |
58,834 | 1,330,237 | ||||||
| Glatfelter Corp. |
73,236 | 1,203,267 | ||||||
| Gold Resource Corp. |
100,579 | 185,065 | ||||||
| *Graphic Packaging Holding Co. |
260,783 | 5,197,405 | ||||||
| Greif, Inc., Class A |
51,176 | 3,310,064 | ||||||
| Greif, Inc., Class B |
4,594 | 299,804 | ||||||
| *Hawkins, Inc. |
53,981 | 1,979,483 | ||||||
| *Haynes International, Inc. |
26,958 | 1,081,825 | ||||||
| HB Fuller Co. |
103,795 | 7,318,585 | ||||||
| *Hecla Mining Co. |
806,961 | 4,664,235 | ||||||
| *Huntsman Corp. |
70,836 | 2,307,837 | ||||||
| #*Ikonics Corp. |
416 | 11,041 | ||||||
| *Ingevity Corp. |
58,371 | 4,547,685 | ||||||
| Innospec, Inc. |
51,232 | 4,642,132 | ||||||
| *Intrepid Potash, Inc. |
21,188 | 1,032,067 | ||||||
| Kaiser Aluminum Corp. |
33,977 | 3,300,526 | ||||||
| *Koppers Holdings, Inc. |
40,470 | 1,420,092 | ||||||
| *Kraton Corp. |
62,153 | 2,837,284 | ||||||
| Kronos Worldwide, Inc. |
101,166 | 1,318,193 | ||||||
| #*Livent Corp. |
118,469 | 3,343,195 | ||||||
| *Louisiana-Pacific Corp. |
216,002 | 12,728,998 | ||||||
| *LSB Industries, Inc. |
996 | 8,894 | ||||||
| *Materion Corp. |
43,567 | 3,144,666 | ||||||
| *Mercer International, Inc. |
127,730 | 1,375,652 | ||||||
Dimensional U.S. Small Cap ETF
SCHEDULE OF INVESTMENTS
October 31, 2021
| Security Description |
Shares | Fair Value | ||||||
| MATERIALS (Continued) | ||||||||
| *Minerals Technologies, Inc. |
70,257 | $ | 4,984,032 | |||||
| Mosaic Co. (The) |
20,757 | 862,868 | ||||||
| *Myers Industries, Inc. |
96,349 | 1,982,862 | ||||||
| *Neenah, Inc. |
42,546 | 2,150,275 | ||||||
| *NewMarket Corp. |
2,226 | 756,862 | ||||||
| #Nexa Resources SA |
960 | 8,112 | ||||||
| *Northern Technologies International Corp. |
17,386 | 265,136 | ||||||
| *O-I Glass, Inc. |
238,347 | 3,110,428 | ||||||
| *Olin Corp. |
215,263 | 12,265,686 | ||||||
| Olympic Steel, Inc. |
20,403 | 550,269 | ||||||
| *Orion Engineered Carbons SA |
12,316 | 231,541 | ||||||
| #*Quaker Chemical Corp. |
3,250 | 798,980 | ||||||
| *Ramaco Resources, Inc. |
3,731 | 69,359 | ||||||
| *Ranpak Holdings Corp. |
20,003 | 689,303 | ||||||
| *Rayonier Advanced Materials, Inc. |
132,771 | 953,296 | ||||||
| Resolute Forest Products, Inc. |
148,522 | 1,746,619 | ||||||
| *Royal Gold, Inc. |
8,293 | 821,173 | ||||||
| *Ryerson Holding Corp. |
68,965 | 1,817,917 | ||||||
| *Schnitzer Steel Industries, Inc. |
53,432 | 2,874,642 | ||||||
| *Schweitzer-Mauduit International, Inc. |
66,244 | 2,307,941 | ||||||
| Sensient Technologies Corp. |
81,347 | 7,776,773 | ||||||
| *Silgan Holdings, Inc. |
125,374 | 5,040,035 | ||||||
| *Sonoco Products Co. |
9,972 | 577,877 | ||||||
| *Stepan Co. |
45,838 | 5,501,477 | ||||||
| *Summit Materials, Inc., Class A |
168,729 | 6,015,189 | ||||||
| SunCoke Energy, Inc. |
129,085 | 931,994 | ||||||
| *Synalloy Corp. |
11,195 | 126,503 | ||||||
| *TimkenSteel Corp. |
79,134 | 1,103,919 | ||||||
| *Trecora Resources |
45,581 | 354,620 | ||||||
| *Tredegar Corp. |
44,670 | 538,720 | ||||||
| Trinseo PLC |
69,569 | 3,900,038 | ||||||
| Tronox Holdings PLC, Class A |
222,715 | 5,193,714 | ||||||
| *UFP Technologies, Inc. |
11,729 | 725,908 | ||||||
| *United States Lime & Minerals, Inc. |
14,128 | 1,744,525 | ||||||
| #*United States Steel Corp. |
149,704 | 3,950,689 | ||||||
| *Universal Stainless & Alloy Products, Inc. |
12,612 | 119,562 | ||||||
| Valvoline, Inc. |
106,152 | 3,604,922 | ||||||
| *Venator Materials PLC |
21,071 | 63,424 | ||||||
| #Verso Corp., Class A |
48,000 | 1,059,840 | ||||||
| Warrior Met Coal, Inc. |
61,005 | 1,462,290 | ||||||
| *Worthington Industries, Inc. |
121,905 | 6,621,880 | ||||||
|
|
|
|||||||
| TOTAL MATERIALS |
250,555,401 | |||||||
|
|
|
|||||||
| REAL ESTATE (0.5%) |
| |||||||
| *AMREP Corp. |
2,776 | 38,919 | ||||||
| *CKX Lands, Inc. |
702 | 8,238 | ||||||
| *Cushman & Wakefield PLC |
98,403 | 1,809,631 | ||||||
| eXp World Holdings, Inc. |
2,133 | 110,063 | ||||||
| *Five Point Holdings LLC, Class A |
25,625 | 188,600 | ||||||
| *Forestar Group, Inc. |
23,303 | 456,040 | ||||||
| *FRP Holdings, Inc. |
20,841 | 1,192,105 | ||||||
| *Howard Hughes Corp. (The) |
2,698 | 235,077 | ||||||
| Indus Realty Trust, Inc. |
3,961 | 276,082 | ||||||
| *Kennedy-Wilson Holdings, Inc. |
198,600 | 4,442,682 | ||||||
| *Marcus & Millichap, Inc. |
63,115 | 2,972,716 | ||||||
| *Maui Land & Pineapple Co., Inc. |
29,915 | 315,005 | ||||||
Dimensional U.S. Small Cap ETF
SCHEDULE OF INVESTMENTS
October 31, 2021
| Security Description |
Shares | Fair Value | ||||||
| REAL ESTATE (Continued) | ||||||||
| Newmark Group, Inc., Class A |
72,716 | $ | 1,082,014 | |||||
| #*Rafael Holdings, Inc., Class B |
40,549 | 306,550 | ||||||
| Re/Max Holdings, Inc. |
28,944 | 920,709 | ||||||
| *Realogy Holdings Corp. |
203,474 | 3,524,170 | ||||||
| #*Redfin Corp. |
10,932 | 561,249 | ||||||
| RMR Group, Inc. (The), Class A |
2,707 | 94,177 | ||||||
| *St Joe Co. (The) |
67,344 | 3,166,515 | ||||||
| *Stratus Properties, Inc. |
12,519 | 426,647 | ||||||
| *Tejon Ranch Co. |
38,260 | 696,715 | ||||||
|
|
|
|||||||
| TOTAL REAL ESTATE |
22,823,904 | |||||||
|
|
|
|||||||
| UTILITIES (2.4%) |
| |||||||
| *ALLETE, Inc. |
66,060 | 4,065,332 | ||||||
| *American States Water Co. |
67,366 | 6,119,527 | ||||||
| *Artesian Resources Corp., Class A |
20,232 | 813,731 | ||||||
| Atlantica Sustainable Infrastructure PLC |
61,124 | 2,405,229 | ||||||
| Avista Corp. |
113,876 | 4,533,404 | ||||||
| *Black Hills Corp. |
70,295 | 4,666,182 | ||||||
| Brookfield Renewable Corp., Class A |
17,234 | 713,660 | ||||||
| *California Water Service Group |
88,523 | 5,389,280 | ||||||
| *Chesapeake Utilities Corp. |
33,046 | 4,331,339 | ||||||
| Clearway Energy, Inc., Class A |
28,281 | 932,990 | ||||||
| Clearway Energy, Inc., Class C |
41,540 | 1,473,839 | ||||||
| Consolidated Water Co., Ltd. |
27,556 | 306,147 | ||||||
| *Genie Energy, Ltd., Class B |
49,603 | 245,535 | ||||||
| *Global Water Resources, Inc. |
1,127 | 21,323 | ||||||
| *Hawaiian Electric Industries, Inc. |
59,404 | 2,409,426 | ||||||
| *IDACORP, Inc. |
16,325 | 1,703,024 | ||||||
| *MDU Resources Group, Inc. |
39,463 | 1,212,698 | ||||||
| MGE Energy, Inc. |
53,973 | 4,096,011 | ||||||
| *Middlesex Water Co. |
36,314 | 3,998,898 | ||||||
| National Fuel Gas Co. |
33,667 | 1,933,496 | ||||||
| *New Jersey Resources Corp. |
152,364 | 5,760,883 | ||||||
| Northwest Natural Holding Co. |
47,196 | 2,128,068 | ||||||
| *NorthWestern Corp. |
82,290 | 4,679,009 | ||||||
| OGE Energy Corp. |
4,133 | 140,811 | ||||||
| ONE Gas, Inc. |
50,195 | 3,378,124 | ||||||
| #*Ormat Technologies, Inc. |
78,273 | 5,661,486 | ||||||
| *Otter Tail Corp. |
63,375 | 3,929,884 | ||||||
| PNM Resources, Inc. |
135,526 | 6,742,419 | ||||||
| *Portland General Electric Co. |
58,048 | 2,862,347 | ||||||
| *Pure Cycle Corp. |
4,192 | 65,772 | ||||||
| Rgc Resources, Inc. |
20,361 | 450,385 | ||||||
| *SJW Group |
40,902 | 2,696,260 | ||||||
| South Jersey Industries, Inc. |
99,213 | 2,258,088 | ||||||
| #*Southwest Gas Holdings, Inc. |
64,899 | 4,494,256 | ||||||
| Spire, Inc. |
76,209 | 4,782,877 | ||||||
| *Sunnova Energy International, Inc. |
1,781 | 79,361 | ||||||
| *Unitil Corp. |
31,538 | 1,316,712 | ||||||
| Via Renewables, Inc. |
21,692 | 241,866 | ||||||
| York Water Co. (The) |
33,024 | 1,582,510 | ||||||
|
|
|
|||||||
| TOTAL UTILITIES |
104,622,189 | |||||||
|
|
|
|||||||
| TOTAL COMMON STOCKS (Cost $1,869,355,490) |
4,283,676,227 | |||||||
|
|
|
|||||||
Dimensional U.S. Small Cap ETF
SCHEDULE OF INVESTMENTS
October 31, 2021
| Security Description |
Shares | Fair Value | ||||||
| PREFERRED STOCKS (0.0%) |
| |||||||
| COMMUNICATION SERVICES (0.0%) |
| |||||||
| *Liberty Broadband Corp. |
8,904 | 252,874 | ||||||
|
|
|
|||||||
| CONSUMER DISCRETIONARY (0.0%) |
| |||||||
| Qurate Retail, Inc. |
5,386 | 588,044 | ||||||
|
|
|
|||||||
| INDUSTRIALS (0.1%) |
| |||||||
| WESCO International, Inc., Series A |
40,491 | 1,271,417 | ||||||
|
|
|
|||||||
| TOTAL PREFERRED STOCKS (Cost $1,570,729) |
2,112,335 | |||||||
|
|
|
|||||||
| RIGHTS (0.0%) |
| |||||||
| COMMUNICATION SERVICES (0.0%) |
| |||||||
| *»Media General, Inc. |
64,715 | 3,650 | ||||||
|
|
|
|||||||
| CONSUMER DISCRETIONARY (0.0%) |
| |||||||
| *»Zagg, Inc. |
53,073 | 4,777 | ||||||
|
|
|
|||||||
| FINANCIALS (0.0%) |
| |||||||
| *»Newstar Financial, Inc. |
112,900 | 11,470 | ||||||
|
|
|
|||||||
| HEALTH CARE (0.0%) |
| |||||||
| *»Achillion Pharmaceuticals |
327,308 | 474,596 | ||||||
| »Chinook Therapeutics, Inc. |
13,304 | 23,814 | ||||||
| »Elanco Animal Health, Inc. |
105,700 | — | ||||||
| *»Pfenex, Inc. |
29,449 | 22,087 | ||||||
| »Progenics Pharmaceuticals |
60,482 | 21,169 | ||||||
| *»Xeris Biopharma Holdings, Inc. |
49,892 | 6,985 | ||||||
|
|
|
|||||||
| TOTAL HEALTH CARE (Cost $173,533) |
548,651 | |||||||
|
|
|
|||||||
| TOTAL RIGHTS (Cost $178,310) |
568,548 | |||||||
|
|
|
|||||||
| WARRANT (0.0%) |
| |||||||
| ENERGY (0.0%) |
| |||||||
| *Nabors Industries, Ltd. 6/11/2026 |
1,938 | 14,341 | ||||||
|
|
|
|||||||
| TOTAL WARRANT (Cost $–) |
14,341 | |||||||
|
|
|
|||||||
| TOTAL INVESTMENT SECURITIES (Cost $1,871,104,529) |
4,286,371,451 | |||||||
|
|
|
|||||||
| SECURITIES LENDING COLLATERAL (2.7%) |
| |||||||
| @§The DFA Short Term Investment Fund |
10,161,013 | 117,557,837 | ||||||
|
|
|
|||||||
| TOTAL INVESTMENTS (Cost $1,988,662,366) — 100.0% |
|
4,403,929,288 | ||||||
|
|
|
|||||||
| * | Non-Income Producing Securities |
| » | Securities that have generally been fair value factored |
| # | Total or Partial Securities on Loan |
| @ | Security purchased with cash collateral received from Securities on Loan |
| § | Affiliated Fund |
Dimensional U.S. Small Cap ETF
SCHEDULE OF INVESTMENTS
October 31, 2021
| ADR | American Depositary Receipt |
| PLC | Public Limited Company |
| SA | Special Assessment |
Dimensional U.S. Targeted Value ETF
SCHEDULE OF INVESTMENTS
October 31, 2021
| Security Description |
Shares | Fair Value | ||||||
| COMMON STOCKS (97.8%) |
||||||||
| COMMUNICATION SERVICES (2.7%) |
||||||||
| *»Actua Corp. |
11,098 | $ | — | |||||
| *AMC Networks, Inc., Class A |
69,735 | 2,774,756 | ||||||
| ATN International, Inc. |
45,555 | 1,857,733 | ||||||
| *Ballantyne Strong, Inc. |
31,115 | 93,656 | ||||||
| *Beasley Broadcast Group, Inc. |
1,884 | 4,427 | ||||||
| *Boston Omaha Corp., Class A |
14,433 | 511,650 | ||||||
| *Cars.com, Inc. |
238,846 | 3,109,775 | ||||||
| #*Cinemark Holdings, Inc. |
47,479 | 892,605 | ||||||
| *comScore, Inc. |
50,746 | 198,417 | ||||||
| *Consolidated Communications Holdings, Inc. |
322,586 | 2,387,136 | ||||||
| *Cumulus Media, Inc. |
11,682 | 145,090 | ||||||
| *Dallasnews Corp. |
4,658 | 32,327 | ||||||
| *DHI Group, Inc. |
152,023 | 714,508 | ||||||
| *Emerald Holding, Inc. |
11,460 | 46,413 | ||||||
| *Entercom Communications Corp. |
8,933 | 28,854 | ||||||
| Entravision Communications Corp., Class A |
144,365 | 1,150,589 | ||||||
| EW Scripps Co. (The), Class A |
307,657 | 5,722,420 | ||||||
| *Fluent, Inc. |
15,761 | 37,511 | ||||||
| *Gaia, Inc. |
1,626 | 15,772 | ||||||
| *Gannett Co., Inc. |
136,353 | 790,847 | ||||||
| *Gray Television, Inc. |
347,153 | 8,137,266 | ||||||
| *Gray Television, Inc. |
2,809 | 62,894 | ||||||
| *Hemisphere Media Group, Inc. |
51,832 | 572,744 | ||||||
| *IDT Corp., Class B |
32,125 | 1,553,886 | ||||||
| *iHeartMedia, Inc., Class A |
514 | 9,961 | ||||||
| *IMAX Corp. |
21,513 | 405,520 | ||||||
| *Interpublic Group of Cos., Inc. (The) |
183,962 | 6,727,490 | ||||||
| *Iridium Communications, Inc. |
232,722 | 9,436,877 | ||||||
| John Wiley & Sons, Inc., Class A |
136,632 | 7,401,355 | ||||||
| *Liberty Latin America, Ltd., Class A |
77,920 | 936,599 | ||||||
| *Liberty Latin America, Ltd., Class C |
227,134 | 2,732,422 | ||||||
| *Liberty Media Corp.-Liberty Braves, Class A |
8,976 | 274,396 | ||||||
| *Liberty Media Corp.-Liberty Braves, Class C |
21,234 | 631,075 | ||||||
| *Liberty Media Corp.-Liberty Formula One, Class A |
24,743 | 1,290,347 | ||||||
| *Liberty Media Corp.-Liberty Formula One, Class C |
127,046 | 7,089,167 | ||||||
| *Liberty TripAdvisor Holdings, Inc., Class A |
9,307 | 28,759 | ||||||
| #*Lions Gate Entertainment Corp., Class A |
306,985 | 3,975,456 | ||||||
| *Lions Gate Entertainment Corp., Class B |
375,297 | 4,248,362 | ||||||
| #Lumen Technologies, Inc. |
142,515 | 1,690,228 | ||||||
| *Madison Square Garden Entertainment Corp. |
11,726 | 826,331 | ||||||
| #*Magnite, Inc. |
64,660 | 1,747,760 | ||||||
| #*Marcus Corp. (The) |
111,734 | 2,074,900 | ||||||
| *Meredith Corp. |
49,184 | 2,864,476 | ||||||
| News Corp., Class A |
1,305,422 | 29,894,164 | ||||||
| News Corp., Class B |
632,908 | 14,278,404 | ||||||
| Nexstar Media Group, Inc., Class A |
109,975 | 16,488,552 | ||||||
| *QuinStreet, Inc. |
95,601 | 1,338,414 | ||||||
| *Reading International, Inc. |
6,238 | 177,471 | ||||||
| *Reading International, Inc. |
26,879 | 128,750 | ||||||
| Saga Communications, Inc. |
31,184 | 691,037 | ||||||
| *Salem Media Group, Inc. |
3,877 | 14,578 | ||||||
| Scholastic Corp. |
146,880 | 5,315,587 | ||||||
| Shenandoah Telecommunications Co. |
20,723 | 572,784 | ||||||
| Spok Holdings, Inc. |
50,399 | 518,606 | ||||||
| *TechTarget, Inc. |
1,541 | 145,332 | ||||||
Dimensional U.S. Targeted Value ETF
SCHEDULE OF INVESTMENTS
October 31, 2021
| Security Description |
Shares | Fair Value | ||||||
| COMMUNICATION SERVICES (Continued) |
||||||||
| TEGNA, Inc. |
503,132 | $ | 9,891,575 | |||||
| Telephone and Data Systems, Inc. |
77,267 | 1,447,984 | ||||||
| *Thryv Holdings, Inc. |
1,146 | 36,294 | ||||||
| *Townsquare Media, Inc., Class A |
41,734 | 555,897 | ||||||
| *TripAdvisor, Inc. |
14,964 | 493,363 | ||||||
| #*TrueCar, Inc. |
145,340 | 608,975 | ||||||
| *United States Cellular Corp. |
74,782 | 2,286,086 | ||||||
| *Urban One, Inc. |
35,302 | 249,585 | ||||||
| *Urban One, Inc. |
2,239 | 21,271 | ||||||
| *Yelp, Inc. |
153,154 | 5,916,339 | ||||||
|
|
|
|||||||
| Total Communication Services |
176,303,805 | |||||||
|
|
|
|||||||
| CONSUMER DISCRETIONARY (14.5%) |
| |||||||
|
#*1-800-Flowers.com, Inc., Class A |
101,115 | 3,247,814 | ||||||
| #*2U, Inc. |
4,192 | 123,832 | ||||||
| Aaron’s Co., Inc. (The) |
93,382 | 2,184,205 | ||||||
| *Abercrombie & Fitch Co. |
311,482 | 12,315,998 | ||||||
| *Acushnet Holdings Corp. |
71,394 | 3,636,810 | ||||||
| *Adient PLC |
297,182 | 12,368,715 | ||||||
| *Adtalem Global Education, Inc. |
234,249 | 8,650,816 | ||||||
| Advance Auto Parts, Inc. |
2,340 | 527,717 | ||||||
| AMCON Distributing Co. |
459 | 60,914 | ||||||
| *American Axle & Manufacturing Holdings, Inc. |
390,489 | 3,545,640 | ||||||
| #American Eagle Outfitters, Inc. |
440,444 | 10,456,141 | ||||||
| *American Outdoor Brands, Inc. |
58,908 | 1,341,924 | ||||||
| *American Public Education, Inc. |
50,331 | 1,257,772 | ||||||
| *America’s Car-Mart, Inc. |
23,819 | 2,846,132 | ||||||
| Aramark |
258,382 | 9,425,775 | ||||||
| *Ark Restaurants Corp. |
11,519 | 184,304 | ||||||
| *Asbury Automotive Group, Inc. |
33,329 | 6,522,819 | ||||||
| *Autoliv, Inc. |
25,557 | 2,475,195 | ||||||
| *AutoNation, Inc. |
340,002 | 41,181,042 | ||||||
| *Bally’s Corp. |
24,256 | 1,111,167 | ||||||
| *Barnes & Noble Education, Inc. |
131,150 | 1,361,337 | ||||||
| *Bassett Furniture Industries, Inc. |
44,279 | 747,872 | ||||||
| *Beazer Homes USA, Inc. |
69,915 | 1,266,161 | ||||||
| #*Bed Bath & Beyond, Inc., Class B |
105,154 | 1,476,362 | ||||||
| #Big Lots, Inc., Class B |
76,160 | 3,370,080 | ||||||
| *Biglari Holdings, Inc. |
166 | 137,697 | ||||||
| *Biglari Holdings, Inc., Class B |
7,239 | 1,203,339 | ||||||
| *BJ’s Restaurants, Inc. |
60,317 | 2,009,762 | ||||||
| *Bluegreen Vacations Holding Corp. |
284 | 7,273 | ||||||
| *Boot Barn Holdings, Inc. |
72,876 | 7,614,813 | ||||||
| *BorgWarner, Inc., Class A |
561,041 | 25,286,118 | ||||||
| *Boyd Gaming Corp. |
156,752 | 9,997,643 | ||||||
| *Brunswick Corp. |
52,361 | 4,874,285 | ||||||
| Buckle, Inc. (The) |
31,588 | 1,314,693 | ||||||
| *Build-A-Bear Workshop, Inc. |
74,129 | 1,162,343 | ||||||
| Caleres, Inc. |
133,028 | 3,067,626 | ||||||
| *Callaway Golf Co. |
304,840 | 8,245,922 | ||||||
| *Canterbury Park Holding Corp. |
7,625 | 120,475 | ||||||
| *Capri Holdings, Ltd. |
131,503 | 7,001,220 | ||||||
| #*Carnival Corp. |
61,499 | 1,362,818 | ||||||
| *Carriage Services, Inc. |
117,625 | 6,051,806 | ||||||
| Carrols Restaurant Group, Inc. |
21,528 | 79,008 | ||||||
| *Carter’s, Inc. |
93 | 9,162 | ||||||
| *Cato Corp. (The), Class A |
61,700 | 1,087,771 | ||||||
Dimensional U.S. Targeted Value ETF
SCHEDULE OF INVESTMENTS
October 31, 2021
| Security Description |
Shares | Fair Value | ||||||
| CONSUMER DISCRETIONARY (Continued) | ||||||||
| *Cavco Industries, Inc. |
30,546 | 7,342,647 | ||||||
| *Century Casinos, Inc. |
7,371 | 109,091 | ||||||
| *Century Communities, Inc. |
142,254 | 9,539,553 | ||||||
| *Charles & Colvard, Ltd. |
15,596 | 47,100 | ||||||
| *Cheesecake Factory, Inc. (The) |
13,573 | 551,607 | ||||||
| *Chuy’s Holdings, Inc. |
84,457 | 2,462,766 | ||||||
| #*Citi Trends, Inc. |
20,887 | 1,615,818 | ||||||
| Clarus Corp. |
383 | 10,563 | ||||||
| *Columbia Sportswear Co. |
11,474 | 1,191,460 | ||||||
| *Conn’s, Inc. |
110,107 | 2,452,083 | ||||||
| *Container Store Group, Inc. (The) |
57,908 | 640,462 | ||||||
| *Cooper-Standard Holdings, Inc. |
12,616 | 327,259 | ||||||
| *Crown Crafts, Inc. |
93 | 688 | ||||||
| Culp, Inc. |
43,190 | 571,404 | ||||||
| *Dana, Inc. |
482,829 | 10,713,976 | ||||||
| *Deckers Outdoor Corp. |
2,910 | 1,150,352 | ||||||
| *Del Taco Restaurants, Inc. |
147,244 | 1,228,015 | ||||||
| *Delta Apparel, Inc. |
21,057 | 565,380 | ||||||
| #*Designer Brands, Inc., Class A |
38,225 | 517,184 | ||||||
| #Dick’s Sporting Goods, Inc. |
236,805 | 29,413,549 | ||||||
| #*Dillard’s, Inc., Class A |
150,871 | 34,872,323 | ||||||
| *Dixie Group, Inc. (The) |
5,643 | 25,901 | ||||||
| *Dogness International Corp. |
2,724 | 10,569 | ||||||
| *Dorman Products, Inc. |
34,856 | 3,638,269 | ||||||
| *Dover Motorsports, Inc. |
38,497 | 87,003 | ||||||
| *Duluth Holdings, Inc., Class B |
2,310 | 33,102 | ||||||
| *Educational Development Corp. |
4,570 | 44,649 | ||||||
| *El Pollo Loco Holdings, Inc. |
148,689 | 2,185,728 | ||||||
| *Escalade, Inc. |
37,711 | 705,573 | ||||||
| #Ethan Allen Interiors, Inc. |
88,032 | 2,043,223 | ||||||
| #*Fiesta Restaurant Group, Inc. |
82,501 | 869,561 | ||||||
| *Flanigan’s Enterprises, Inc. |
5,529 | 161,723 | ||||||
| #Flexsteel Industries, Inc. |
41,502 | 1,162,056 | ||||||
| *Foot Locker, Inc. |
104,414 | 4,977,415 | ||||||
| #*Fossil Group, Inc. |
197,948 | 2,339,745 | ||||||
| Franchise Group, Inc. |
1,025 | 37,720 | ||||||
| *Full House Resorts, Inc. |
2,530 | 25,174 | ||||||
| *Funko, Inc., Class A |
23,884 | 391,459 | ||||||
| *Gap, Inc. (The) |
284,924 | 6,464,926 | ||||||
| *Genesco, Inc. |
80,163 | 4,857,076 | ||||||
| Gentex Corp. |
2,766 | 97,889 | ||||||
| *Gentherm, Inc. |
37,710 | 2,776,587 | ||||||
| *G-III Apparel Group, Ltd. |
148,587 | 4,258,503 | ||||||
| *Good Times Restaurants, Inc. |
1,651 | 7,958 | ||||||
| *Goodyear Tire & Rubber Co. (The) |
82,592 | 1,579,159 | ||||||
| Graham Holdings Co., Class B |
17,464 | 10,231,284 | ||||||
| *Grand Canyon Education, Inc. |
4,214 | 335,856 | ||||||
| *Green Brick Partners, Inc. |
69,301 | 1,805,291 | ||||||
| *Group 1 Automotive, Inc. |
121,799 | 21,899,460 | ||||||
| Guess?, Inc. |
251,047 | 5,199,183 | ||||||
| Hamilton Beach Brands Holding Co., Class A |
39,652 | 594,780 | ||||||
| Harley-Davidson, Inc. |
211,929 | 7,733,289 | ||||||
| *Haverty Furniture Cos., Inc. |
700 | 19,796 | ||||||
| #*Haverty Furniture Cos., Inc. |
114,185 | 3,277,110 | ||||||
| Hibbett, Inc. |
55,177 | 4,272,907 | ||||||
| Hooker Furnishings Corp. |
56,084 | 1,413,878 | ||||||
| *Horizon Global Corp. |
39,368 | 292,111 | ||||||
Dimensional U.S. Targeted Value ETF
SCHEDULE OF INVESTMENTS
October 31, 2021
| Security Description |
Shares | Fair Value | ||||||
| CONSUMER DISCRETIONARY (Continued) | ||||||||
| *iMedia Brands, Inc. |
2,814 | $ | 17,109 | |||||
| #*iRobot Corp. |
2,019 | 168,425 | ||||||
| Jerash Holdings US, Inc. |
2,232 | 14,620 | ||||||
| Johnson Outdoors, Inc., Class A |
50,348 | 5,345,951 | ||||||
| KB Home |
95,791 | 3,846,009 | ||||||
| *Kirkland’s, Inc. |
1,481 | 33,293 | ||||||
| *Kohl’s Corp. |
490,688 | 23,813,089 | ||||||
| *Lakeland Industries, Inc. |
29,156 | 609,652 | ||||||
| *Lands’ End, Inc. |
56,343 | 1,480,694 | ||||||
| *Laureate Education, Inc., Class A |
247,358 | 4,284,241 | ||||||
| *La-Z-Boy, Inc. |
219,054 | 7,281,355 | ||||||
| #*Lazydays Holdings, Inc. |
2,957 | 62,363 | ||||||
| LCI Industries |
11,862 | 1,656,410 | ||||||
| *Lear Corp. |
80,861 | 13,895,963 | ||||||
| *Legacy Housing Corp. |
3,342 | 59,321 | ||||||
| *LGI Homes, Inc. |
38,185 | 5,701,021 | ||||||
| Lifetime Brands, Inc. |
69,701 | 1,182,129 | ||||||
| *Lincoln Educational Services Corp. |
12,206 | 87,883 | ||||||
| *Liquidity Services, Inc., Class A |
73,515 | 1,623,211 | ||||||
| *Lithia Motors, Inc., Class A |
83,546 | 26,669,554 | ||||||
| *Live Ventures, Inc. |
155 | 4,940 | ||||||
| *Lumber Liquidators Holdings, Inc. |
33,686 | 609,043 | ||||||
| *M/I Homes, Inc. |
94,672 | 5,420,919 | ||||||
| Macy’s, Inc. |
106,032 | 2,806,667 | ||||||
| *Malibu Boats, Inc., Class A |
11,122 | 785,324 | ||||||
| #*MarineMax, Inc. |
131,296 | 6,799,820 | ||||||
| Marriott Vacations Worldwide Corp. |
117,155 | 18,419,109 | ||||||
| *Mastercraft Boat Holdings, Inc. |
11,651 | 312,014 | ||||||
| *MDC Holdings, Inc. |
269,507 | 13,200,453 | ||||||
| *Meritage Homes Corp. |
93,172 | 10,128,728 | ||||||
| *Modine Manufacturing Co. |
224,419 | 2,468,609 | ||||||
| *Mohawk Industries, Inc. |
111,046 | 19,678,462 | ||||||
| *Monarch Casino & Resort, Inc. |
8,637 | 623,764 | ||||||
| Monro, Inc. |
43,607 | 2,693,168 | ||||||
| *Motorcar Parts of America, Inc. |
97,290 | 1,840,727 | ||||||
| Movado Group, Inc. |
78,078 | 2,599,997 | ||||||
| *Nathan’s Famous, Inc. |
8,570 | 535,625 | ||||||
| #*Nautilus, Inc. |
68,258 | 698,279 | ||||||
| *Newell Brands, Inc. |
742,011 | 16,984,632 | ||||||
| #*Norwegian Cruise Line Holdings, Ltd. |
15,607 | 401,412 | ||||||
| *ODP Corp. (The) |
125,997 | 5,455,670 | ||||||
| #*Ollie’s Bargain Outlet Holdings, Inc. |
2,203 | 149,055 | ||||||
| *OneSpaWorld Holdings, Ltd. |
1,651 | 17,831 | ||||||
| OneWater Marine, Inc. |
1,484 | 65,801 | ||||||
| Oxford Industries, Inc. |
38,820 | 3,599,390 | ||||||
| *P&F Industries, Inc., Class A |
764 | 4,997 | ||||||
| *Patrick Industries, Inc. |
49,784 | 3,878,671 | ||||||
| Penske Automotive Group, Inc. |
306,413 | 32,495,099 | ||||||
| #*Perdoceo Education Corp. |
223,454 | 2,373,081 | ||||||
| #*PetMed Express, Inc. |
5,310 | 150,963 | ||||||
| *Playa Hotels & Resorts NV |
96,117 | 817,956 | ||||||
| *Potbelly Corp. |
83,401 | 502,074 | ||||||
| PulteGroup, Inc. |
708,193 | 34,049,919 | ||||||
| *PVH Corp. |
226,849 | 24,801,401 | ||||||
| Qurate Retail, Inc., Class A |
445,830 | 4,654,465 | ||||||
| Ralph Lauren Corp. |
35,088 | 4,462,141 | ||||||
| RCI Hospitality Holdings, Inc. |
43,256 | 2,932,757 | ||||||
Dimensional U.S. Targeted Value ETF
SCHEDULE OF INVESTMENTS
October 31, 2021
| Security Description |
Shares | Fair Value | ||||||
| CONSUMER DISCRETIONARY (Continued) | ||||||||
| #*Red Robin Gourmet Burgers, Inc. |
49,565 | $ | 984,857 | |||||
| #*Regis Corp. |
45,544 | 122,969 | ||||||
| Rent-A-Center, Inc. |
37,698 | 2,007,795 | ||||||
| *Rocky Brands, Inc. |
24,660 | 1,345,203 | ||||||
| *Royal Caribbean Cruises, Ltd. |
68,753 | 5,804,816 | ||||||
| Shoe Carnival, Inc. |
191,627 | 6,490,406 | ||||||
| Signet Jewelers, Ltd. |
182,583 | 16,282,752 | ||||||
| *Skechers USA, Inc., Class A |
92,900 | 4,292,909 | ||||||
| *Skyline Champion Corp. |
59,559 | 3,771,276 | ||||||
| Smith & Wesson Brands, Inc. |
189,956 | 4,084,054 | ||||||
| Sonic Automotive, Inc., Class A |
137,171 | 6,780,363 | ||||||
| *Sportsman’s Warehouse Holdings, Inc. |
25,198 | 434,917 | ||||||
| *Standard Motor Products, Inc. |
131,300 | 6,289,270 | ||||||
| *Steven Madden, Ltd. |
9,434 | 425,473 | ||||||
| *Stoneridge, Inc. |
85,273 | 1,618,482 | ||||||
| Strategic Education, Inc. |
2,346 | 160,021 | ||||||
| *Strattec Security Corp. |
8,708 | 301,906 | ||||||
| #*Stride, Inc. |
186,764 | 6,630,122 | ||||||
| *Superior Group of Cos., Inc. |
80,395 | 2,089,466 | ||||||
| *Tandy Leather Factory, Inc. |
11,937 | 58,491 | ||||||
| *Tapestry, Inc. |
15,862 | 618,301 | ||||||
| *Taylor Morrison Home Corp. |
393,654 | 12,018,257 | ||||||
| *Tenneco, Inc., Class A |
20,970 | 278,272 | ||||||
| *Terminix Global Holdings, Inc. |
6,594 | 266,925 | ||||||
| Thor Industries, Inc. |
5,647 | 575,768 | ||||||
| *Tile Shop Holdings, Inc. |
516 | 4,303 | ||||||
| *Tilly’s, Inc., Class A |
89,110 | 1,236,847 | ||||||
| Toll Brothers, Inc. |
597,653 | 35,960,781 | ||||||
| *TopBuild Corp. |
67,029 | 17,224,442 | ||||||
| #*TravelCenters of America, Inc. |
24,223 | 1,305,862 | ||||||
| *Tri Pointe Homes, Inc. |
577,279 | 13,964,379 | ||||||
| *Unifi, Inc. |
95,831 | 2,301,861 | ||||||
| *Universal Electronics, Inc. |
67,180 | 2,766,472 | ||||||
| *Universal Technical Institute, Inc. |
80,307 | 565,361 | ||||||
| *Urban Outfitters, Inc. |
323,239 | 10,321,021 | ||||||
| #*Veoneer, Inc. |
238 | 8,378 | ||||||
| *Vera Bradley, Inc. |
111,920 | 1,097,935 | ||||||
| *Vista Outdoor, Inc. |
279,117 | 11,678,255 | ||||||
| *VOXX International Corp. |
110,677 | 1,251,757 | ||||||
| *Weyco Group, Inc. |
27,340 | 623,899 | ||||||
| *Whirlpool Corp. |
57,250 | 12,070,018 | ||||||
| Winnebago Industries, Inc. |
135,775 | 9,190,610 | ||||||
| *Wolverine World Wide, Inc. |
66,597 | 2,209,022 | ||||||
| *Zovio, Inc. |
295 | 507 | ||||||
| *Zumiez, Inc. |
80,658 | 3,282,781 | ||||||
|
|
|
|||||||
| TOTAL CONSUMER DISCRETIONARY |
949,552,329 | |||||||
|
|
|
|||||||
| CONSUMER STAPLES (4.9%) |
| |||||||
| Alico, Inc. |
27,066 | 963,550 | ||||||
| Andersons, Inc. (The), Class A |
131,244 | 4,470,171 | ||||||
| *Arcadia Biosciences, Inc. |
4,475 | 8,726 | ||||||
| #B&G Foods, Inc. |
2,143 | 63,090 | ||||||
| *Bridgford Foods Corp. |
2,376 | 27,799 | ||||||
| Bunge, Ltd. |
493,858 | 45,751,005 | ||||||
| Cal-Maine Foods, Inc. |
48,804 | 1,759,872 | ||||||
| Campbell Soup Co. |
1,720 | 68,714 | ||||||
Dimensional U.S. Targeted Value ETF
SCHEDULE OF INVESTMENTS
October 31, 2021
| Security Description |
Shares | Fair Value | ||||||
| CONSUMER STAPLES (Continued) | ||||||||
| #Casey’s General Stores, Inc. |
6,299 | $ | 1,206,510 | |||||
| *Central Garden & Pet Co. |
64,148 | 3,308,754 | ||||||
| *Central Garden & Pet Co., Class A |
186,950 | 8,637,090 | ||||||
| *Chefs’ Warehouse, Inc. (The) |
69,071 | 2,408,506 | ||||||
| *Coffee Holding Co., Inc. |
2,777 | 12,330 | ||||||
| *Coty, Inc., Class A |
1,290,741 | 10,945,484 | ||||||
| *Cyanotech Corp. |
1,408 | 4,323 | ||||||
| *Darling Ingredients, Inc. |
699,905 | 59,155,971 | ||||||
| Edgewell Personal Care Co. |
177,076 | 6,195,889 | ||||||
| *elf Beauty, Inc. |
30,031 | 970,302 | ||||||
| *Farmer Bros Co. |
21,041 | 158,860 | ||||||
| *Flowers Foods, Inc. |
22,702 | 561,874 | ||||||
| Fresh Del Monte Produce, Inc. |
242,697 | 8,127,922 | ||||||
| *Grocery Outlet Holding Corp. |
893 | 19,816 | ||||||
| *Hain Celestial Group, Inc. (The) |
119,727 | 5,372,150 | ||||||
| *HF Foods Group, Inc. |
1,645 | 11,614 | ||||||
| #*Hostess Brands, Inc. |
518,735 | 9,809,279 | ||||||
| Ingles Markets, Inc., Class A |
71,921 | 4,976,214 | ||||||
| Ingredion, Inc. |
160,551 | 15,289,272 | ||||||
| *Inter Parfums, Inc. |
9,943 | 918,534 | ||||||
| *J & J Snack Foods Corp. |
4,010 | 591,675 | ||||||
| #J M Smucker Co. (The) |
15,079 | 1,852,606 | ||||||
| John B Sanfilippo & Son, Inc. |
6,726 | 568,347 | ||||||
| *Landec Corp. |
126,076 | 1,225,459 | ||||||
| *Lifevantage Corp. |
7,577 | 51,902 | ||||||
| *Lifeway Foods, Inc. |
1,057 | 5,750 | ||||||
| Limoneira Co. |
5,584 | 90,070 | ||||||
| *Mannatech, Inc. |
414 | 16,841 | ||||||
| #MGP Ingredients, Inc. |
12,863 | 825,933 | ||||||
| Molson Coors Beverage Co., Class B |
37,493 | 1,653,066 | ||||||
| *Natural Alternatives International, Inc. |
24,242 | 305,449 | ||||||
| Natural Grocers by Vitamin Cottage, Inc. |
87,740 | 1,068,673 | ||||||
| Natural Health Trends Corp. |
390 | 2,925 | ||||||
| Nature’s Sunshine Products, Inc. |
1,369 | 21,616 | ||||||
| Nu Skin Enterprises, Inc., Class A |
105,818 | 4,248,593 | ||||||
| Ocean Bio-Chem, Inc. |
7,839 | 80,036 | ||||||
| *Oil-Dri Corp. of America |
28,766 | 1,001,632 | ||||||
| *Performance Food Group Co. |
91,787 | 4,151,526 | ||||||
| *Pilgrim’s Pride Corp. |
157,665 | 4,439,846 | ||||||
| *Post Holdings, Inc. |
255,797 | 25,958,280 | ||||||
| PriceSmart, Inc. |
56,026 | 4,031,071 | ||||||
| #Reynolds Consumer Products, Inc. |
7,619 | 205,561 | ||||||
| #*Rite Aid Corp. |
4,684 | 63,656 | ||||||
| Rocky Mountain Chocolate Factory, Inc. |
338 | 2,944 | ||||||
| *S&W Seed Co. |
508 | 2,179 | ||||||
| Sanderson Farms, Inc. |
32,322 | 6,123,403 | ||||||
| *Seaboard Corp. |
2,589 | 9,967,702 | ||||||
| *Seneca Foods Corp. |
1,786 | 91,622 | ||||||
| *Seneca Foods Corp., Class A |
29,351 | 1,515,392 | ||||||
| *Simply Good Foods Co. (The) |
197,707 | 7,839,083 | ||||||
| *SpartanNash Co. |
181,443 | 4,198,591 | ||||||
| Spectrum Brands Holdings, Inc. |
48,567 | 4,553,156 | ||||||
| *Sprouts Farmers Market, Inc. |
9,012 | 199,526 | ||||||
| #Tootsie Roll Industries, Inc. |
5,880 | 186,102 | ||||||
| *TreeHouse Foods, Inc. |
108,552 | 3,923,069 | ||||||
| *United Natural Foods, Inc. |
292,708 | 12,700,600 | ||||||
| *Universal Corp. |
115,375 | 5,422,625 | ||||||
Dimensional U.S. Targeted Value ETF
SCHEDULE OF INVESTMENTS
October 31, 2021
| Security Description |
Shares | Fair Value | ||||||
| CONSUMER STAPLES (Continued) | ||||||||
| *US Foods Holding Corp. |
341,014 | $ | 11,822,955 | |||||
| Village Super Market, Inc., Class A |
34,643 | 771,500 | ||||||
| *Weis Markets, Inc. |
123,586 | 6,959,128 | ||||||
| *Willamette Valley Vineyards, Inc. |
1,627 | 24,405 | ||||||
|
|
|
|||||||
| TOTAL CONSUMER STAPLES |
319,968,116 | |||||||
|
|
|
|||||||
| ENERGY (5.0%) |
| |||||||
| *Adams Resources & Energy, Inc. |
23,548 | 691,134 | ||||||
| #*Alto Ingredients, Inc. |
88,111 | 468,751 | ||||||
| Antero Midstream Corp. |
118,808 | 1,264,117 | ||||||
| *Antero Resources Corp. |
201,114 | 3,996,135 | ||||||
| *Arch Resources, Inc. |
10,057 | 915,992 | ||||||
| Archrock, Inc. |
311,486 | 2,551,070 | ||||||
| *Ardmore Shipping Corp. |
37,858 | 150,297 | ||||||
| Berry Corp. |
123,026 | 1,182,280 | ||||||
| #Bonanza Creek Energy, Inc. |
105,072 | 5,898,742 | ||||||
| Brigham Minerals, Inc. |
7,030 | 162,955 | ||||||
| *Bristow Group, Inc. |
31,725 | 1,097,685 | ||||||
| *Callon Petroleum Co. |
279 | 14,433 | ||||||
| *Centennial Resource Development, Inc., Class A |
408,874 | 2,943,893 | ||||||
| *ChampionX Corp. |
42,310 | 1,109,791 | ||||||
| #*Chesapeake Energy Corp. |
15,946 | 1,016,398 | ||||||
| *Chevron Corp. |
18,568 | 2,125,850 | ||||||
| #*Clean Energy Fuels Corp. |
738,436 | 6,808,380 | ||||||
| #*CNX Resources Corp. |
842,351 | 12,306,748 | ||||||
| *Comstock Resources, Inc. |
100,053 | 987,523 | ||||||
| *CONSOL Energy, Inc. |
113,897 | 3,133,306 | ||||||
| #*Continental Resources, Inc. |
147,897 | 7,218,853 | ||||||
| *Coterra Energy, Inc. |
254,443 | 5,424,725 | ||||||
| *Dawson Geophysical Co. |
13,283 | 30,817 | ||||||
| *Delek US Holdings, Inc. |
247,310 | 4,810,179 | ||||||
| *Denbury, Inc. |
13,461 | 1,139,608 | ||||||
| Devon Energy Corp. |
912,879 | 36,588,190 | ||||||
| DHT Holdings, Inc. |
772,092 | 5,026,319 | ||||||
| Diamondback Energy, Inc. |
30,820 | 3,303,596 | ||||||
| #*DMC Global, Inc. |
20,935 | 874,664 | ||||||
| Dorian LPG, Ltd. |
133,587 | 1,619,074 | ||||||
| *Dril-Quip, Inc. |
117,626 | 2,771,269 | ||||||
| DT Midstream, Inc. |
3,104 | 148,868 | ||||||
| *Earthstone Energy, Inc., Class A |
68,821 | 698,533 | ||||||
| EnLink Midstream LLC |
814,865 | 6,396,690 | ||||||
| *Epsilon Energy, Ltd. |
1,901 | 10,322 | ||||||
| *EQT Corp. |
827,303 | 16,471,603 | ||||||
| *Equitrans Midstream Corp. |
181,570 | 1,871,987 | ||||||
| Evolution Petroleum Corp. |
15,481 | 91,957 | ||||||
| *Expro Group Holdings NV |
54,904 | 941,604 | ||||||
| *Exterran Corp. |
31,310 | 134,007 | ||||||
| Falcon Minerals Corp. |
4,361 | 25,643 | ||||||
| *Forum Energy Technologies, Inc. |
5,347 | 120,361 | ||||||
| *FTS International, Inc., Class A |
3,733 | 98,924 | ||||||
| *Geospace Technologies Corp. |
39,175 | 372,554 | ||||||
| *Goodrich Petroleum Corp. |
316 | 6,453 | ||||||
| *Green Plains, Inc. |
197,385 | 7,490,761 | ||||||
| *Gulf Island Fabrication, Inc. |
42,599 | 167,840 | ||||||
| *Hallador Energy Co. |
12,991 | 41,961 | ||||||
| *Halliburton Co. |
374,536 | 9,359,655 | ||||||
Dimensional U.S. Targeted Value ETF
SCHEDULE OF INVESTMENTS
October 31, 2021
| Security Description |
Shares | Fair Value | ||||||
| ENERGY (Continued) |
| |||||||
| *Helix Energy Solutions Group, Inc. |
133,244 | $ | 503,662 | |||||
| *Helmerich & Payne, Inc. |
183,170 | 5,685,597 | ||||||
| HollyFrontier Corp. |
463,230 | 15,657,174 | ||||||
| *Houston American Energy Corp. |
204 | 369 | ||||||
| *Independence Contract Drilling, Inc. |
3,853 | 15,181 | ||||||
| International Seaways, Inc. |
60,116 | 1,055,036 | ||||||
| *Kosmos Energy, Ltd. |
27,214 | 97,970 | ||||||
| *Liberty Oilfield Services, Inc., Class A |
115,977 | 1,498,423 | ||||||
| *Marathon Oil Corp. |
1,042,756 | 17,017,778 | ||||||
| *Matador Resources Co. |
119,190 | 4,988,101 | ||||||
| *Mexco Energy Corp. |
3,464 | 41,464 | ||||||
| *Murphy Oil Corp. |
171,514 | 4,773,235 | ||||||
| *Nabors Industries, Ltd. |
16,182 | 1,658,655 | ||||||
| *NACCO Industries, Inc., Class A |
26,168 | 812,255 | ||||||
| #*National Energy Services Reunited Corp. |
36,750 | 429,975 | ||||||
| *Natural Gas Services Group, Inc. |
65,826 | 748,442 | ||||||
| *NCS Multistage Holdings, Inc. |
2 | 60 | ||||||
| *Newpark Resources, Inc. |
139,941 | 475,799 | ||||||
| *NexTier Oilfield Solutions, Inc. |
177,544 | 791,846 | ||||||
| Nordic American Tankers, Ltd. |
— | — | ||||||
| *NOV, Inc. |
208,731 | 2,926,409 | ||||||
| *Oasis Petroleum, Inc. |
1,182 | 142,549 | ||||||
| *Oceaneering International, Inc. |
121,681 | 1,654,860 | ||||||
| *Oil States International, Inc. |
124,214 | 752,737 | ||||||
| *Overseas Shipholding Group, Inc., Class A |
81,060 | 161,310 | ||||||
| Ovintiv, Inc. |
20,309 | 761,994 | ||||||
| *Par Pacific Holdings, Inc. |
47,339 | 731,861 | ||||||
| *Patterson-UTI Energy, Inc. |
254,511 | 2,178,614 | ||||||
| *PBF Energy, Inc., Class A |
354,791 | 5,183,497 | ||||||
| PDC Energy, Inc. |
150,057 | 7,849,482 | ||||||
| *Peabody Energy Corp. |
287,397 | 3,417,150 | ||||||
| PHX Minerals, Inc. |
23,658 | 71,920 | ||||||
| *Pioneer Natural Resources Co. |
82,103 | 15,351,619 | ||||||
| *Primeenergy Resources Corp. |
191 | 13,156 | ||||||
| *ProPetro Holding Corp. |
98,852 | 947,991 | ||||||
| *Range Resources Corp. |
354,073 | 8,256,982 | ||||||
| *Ranger Energy Services, Inc. |
242 | 2,408 | ||||||
| *Renewable Energy Group, Inc. |
183,767 | 11,761,088 | ||||||
| *REX American Resources Corp. |
40,735 | 3,582,643 | ||||||
| *Ring Energy, Inc. |
1,011 | 3,801 | ||||||
| #*RPC, Inc. |
299,427 | 1,613,912 | ||||||
| *SandRidge Energy, Inc. |
121,235 | 1,551,808 | ||||||
| Scorpio Tankers, Inc. |
199,345 | 3,193,507 | ||||||
| *SEACOR Marine Holdings, Inc. |
64,139 | 286,060 | ||||||
| *Select Energy Services, Inc., Class A |
136,595 | 820,936 | ||||||
| SFL Corp., Ltd. |
117,595 | 930,176 | ||||||
| *SilverBow Resources, Inc. |
4,402 | 121,495 | ||||||
| SM Energy Co. |
127,838 | 4,387,400 | ||||||
| *Smart Sand, Inc. |
3,307 | 7,540 | ||||||
| Solaris Oilfield Infrastructure, Inc., Class A |
39,700 | 301,323 | ||||||
| *Southwestern Energy Co. |
1,355,051 | 6,612,649 | ||||||
| *Talos Energy, Inc. |
121,876 | 1,580,732 | ||||||
| Targa Resources Corp. |
26,706 | 1,460,017 | ||||||
| *Technip Energies NV, ADR |
52,129 | 798,616 | ||||||
| TechnipFMC PLC |
1,030,616 | 7,595,640 | ||||||
| #*Teekay Tankers, Ltd., Class A |
15,265 | 211,878 | ||||||
| *TETRA Technologies, Inc. |
28,508 | 92,081 | ||||||
Dimensional U.S. Targeted Value ETF
SCHEDULE OF INVESTMENTS
October 31, 2021
| Security Description |
Shares | Fair Value | ||||||
| ENERGY (Continued) | ||||||||
| *Tidewater, Inc. |
15,500 | $ | 188,015 | |||||
| #*Transocean, Ltd. |
18,217 | 64,306 | ||||||
| *US Silica Holdings, Inc. |
142,762 | 1,381,936 | ||||||
| *VAALCO Energy, Inc. |
13,875 | 43,429 | ||||||
| *Weatherford International PLC |
7,056 | 205,047 | ||||||
| *Whiting Petroleum Corp. |
60,948 | 3,969,543 | ||||||
| World Fuel Services Corp. |
229,826 | 7,016,588 | ||||||
|
|
|
|||||||
| TOTAL ENERGY |
328,520,224 | |||||||
|
|
|
|||||||
| FINANCIALS (28.4%) |
||||||||
| 1st Constitution BanCorp |
6,810 | 161,942 | ||||||
| *1st Source Corp. |
126,847 | 6,124,173 | ||||||
| *ACNB Corp. |
3,179 | 88,217 | ||||||
| *Affinity Bancshares, Inc. |
188 | 2,726 | ||||||
| Alerus Financial Corp. |
2,023 | 63,522 | ||||||
| *Alleghany Corp. |
7,705 | 5,018,883 | ||||||
| Allegiance Bancshares, Inc. |
57,280 | 2,243,658 | ||||||
| Ally Financial, Inc. |
47,514 | 2,268,318 | ||||||
| *Amalgamated Financial Corp. |
1,672 | 30,698 | ||||||
| #A-Mark Precious Metals, Inc. |
3,667 | 274,988 | ||||||
| *AMBAC Financial Group, Inc. |
18,465 | 312,243 | ||||||
| *Amerant BanCorp, Inc. |
4,721 | 125,343 | ||||||
| *Amerant BanCorp, Inc., Class B |
9 | 224 | ||||||
| *American Equity Investment Life Holding Co. |
358,690 | 11,431,450 | ||||||
| *American Financial Group, Inc. |
138,490 | 18,840,180 | ||||||
| *American National Bankshares, Inc. |
30,247 | 1,122,164 | ||||||
| American National Group, Inc. |
51,021 | 9,679,194 | ||||||
| Ameris BanCorp |
250,462 | 13,121,704 | ||||||
| Ameriserv Financial, Inc. |
63,446 | 253,150 | ||||||
| *Ames National Corp. |
4,315 | 106,667 | ||||||
| Argo Group International Holdings, Ltd. |
148,160 | 8,163,616 | ||||||
| *Arrow Financial Corp. |
22,295 | 799,276 | ||||||
| *AssetMark Financial Holdings, Inc. |
1,673 | 42,896 | ||||||
| *Associated Banc-Corp. |
665,628 | 14,830,192 | ||||||
| *Associated Capital Group, Inc. |
1,802 | 65,503 | ||||||
| Assurant, Inc. |
118,440 | 19,105,556 | ||||||
| Assured Guaranty, Ltd. |
459,563 | 25,542,512 | ||||||
| *Athene Holding, Ltd., Class A |
653,882 | 56,894,273 | ||||||
| Atlantic American Corp. |
9,607 | 39,197 | ||||||
| *Atlantic Capital Bancshares, Inc. |
80,191 | 2,206,054 | ||||||
| Atlantic Union Bankshares Corp. |
286,674 | 10,282,996 | ||||||
| *Atlanticus Holdings Corp. |
50,492 | 3,912,625 | ||||||
| *Auburn National BanCorp, Inc. |
624 | 21,104 | ||||||
| Axis Capital Holdings, Ltd. |
287,551 | 14,972,781 | ||||||
| *Axos Financial, Inc. |
215,272 | 11,409,416 | ||||||
| Banc of California, Inc. |
268,228 | 5,453,075 | ||||||
| BancFirst Corp. |
23,291 | 1,514,148 | ||||||
| *BanCorp, Inc. (The) |
248,407 | 7,588,834 | ||||||
| *Bank of Marin BanCorp |
23,283 | 887,315 | ||||||
| Bank of NT Butterfield & Son, Ltd. (The) |
22,862 | 820,746 | ||||||
| *Bank of Princeton (The) |
1,967 | 59,561 | ||||||
| *Bank of the James Financial Group, Inc. |
224 | 3,494 | ||||||
| Bank OZK |
449,983 | 20,100,741 | ||||||
| Bank7 Corp. |
26 | 705 | ||||||
| BankFinancial Corp. |
39,687 | 452,035 | ||||||
| BankUnited, Inc. |
303,671 | 12,316,896 | ||||||
Dimensional U.S. Targeted Value ETF
SCHEDULE OF INVESTMENTS
October 31, 2021
| Security Description |
Shares | Fair Value | ||||||
| FINANCIALS (Continued) |
||||||||
| Bankwell Financial Group, Inc. |
15,486 | $ | 459,934 | |||||
| Banner Corp. |
135,906 | 7,849,931 | ||||||
| *Bar Harbor Bankshares |
42,718 | 1,268,725 | ||||||
| *BayCom Corp. |
14,149 | 267,275 | ||||||
| BCB BanCorp, Inc. |
40,760 | 616,291 | ||||||
| *Berkshire Hills BanCorp, Inc. |
190,873 | 5,182,202 | ||||||
| *Blucora, Inc. |
155,377 | 2,566,828 | ||||||
| #Blue Ridge Bankshares, Inc. |
319 | 5,854 | ||||||
| #BOK Financial Corp. |
138,389 | 14,000,815 | ||||||
| *Bridgewater Bancshares, Inc. |
20,818 | 376,598 | ||||||
| *Brighthouse Financial, Inc. |
87,436 | 4,391,910 | ||||||
| *Broadway Financial Corp. |
6,393 | 19,051 | ||||||
| Brookline BanCorp, Inc. |
319,432 | 5,126,884 | ||||||
| Bryn Mawr Bank Corp. |
61,991 | 2,872,663 | ||||||
| Business First Bancshares, Inc. |
5,001 | 133,427 | ||||||
| *Byline BanCorp, Inc. |
50,919 | 1,311,673 | ||||||
| C&F Financial Corp. |
8,647 | 442,467 | ||||||
| *Cadence Bank |
570,195 | 16,547,053 | ||||||
| *California BanCorp |
540 | 9,612 | ||||||
| *California First Leasing Corp. |
7,946 | 145,730 | ||||||
| *Cambridge BanCorp |
2,652 | 243,480 | ||||||
| Camden National Corp. |
59,572 | 2,835,627 | ||||||
| *Cannae Holdings, Inc. |
23,421 | 798,656 | ||||||
| *Capital BanCorp, Inc. |
3,787 | 96,379 | ||||||
| *Capital City Bank Group, Inc. |
93,240 | 2,505,359 | ||||||
| Capitol Federal Financial, Inc. |
461,644 | 5,599,742 | ||||||
| Capstar Financial Holdings, Inc. |
26,156 | 574,647 | ||||||
| *Carter Bankshares, Inc. |
4,306 | 64,504 | ||||||
| *Carver BanCorp, Inc. |
2,519 | 37,180 | ||||||
| *Cathay General BanCorp |
301,561 | 12,722,859 | ||||||
| CB Financial Services, Inc. |
724 | 17,376 | ||||||
| CBTX, Inc. |
8,389 | 228,181 | ||||||
| *CCUR Holdings, Inc. |
11 | 67,650 | ||||||
| *Central Pacific Financial Corp. |
50,459 | 1,387,118 | ||||||
| *Central Valley Community BanCorp |
27,042 | 576,806 | ||||||
| *Century BanCorp, Inc., Class A |
9,984 | 1,149,658 | ||||||
| CF Bankshares, Inc. |
102 | 2,050 | ||||||
| *Chemung Financial Corp. |
4,227 | 195,499 | ||||||
| Choiceone Financial Services, Inc. |
546 | 13,792 | ||||||
| CIT Group, Inc. |
95,112 | 4,710,897 | ||||||
| Citizens & Northern Corp. |
28,616 | 729,994 | ||||||
| Citizens Community BanCorp, Inc. |
34,757 | 472,695 | ||||||
| Citizens Holding Co. |
1,446 | 26,042 | ||||||
| *Citizens, Inc. |
93,657 | 603,151 | ||||||
| *City Holding Co. |
11,436 | 910,077 | ||||||
| Civista Bancshares, Inc. |
35,001 | 842,124 | ||||||
| *CNA Financial Corp. |
25,087 | 1,125,403 | ||||||
| *CNB Financial Corp. |
13,271 | 340,666 | ||||||
| CNO Financial Group, Inc. |
1,142,791 | 27,586,975 | ||||||
| Codorus Valley BanCorp, Inc. |
16,759 | 366,855 | ||||||
| Cohen & Co., Inc. |
38 | 799 | ||||||
| Colony Bankcorp, Inc. |
6,585 | 123,798 | ||||||
| Columbia Banking System, Inc. |
247,146 | 8,435,093 | ||||||
| *Columbia Financial, Inc. |
5,251 | 97,774 | ||||||
| *Comerica, Inc. |
117,725 | 10,017,220 | ||||||
| *Community Bank System, Inc. |
56,498 | 4,049,212 | ||||||
| *Community Bankers Trust Corp. |
15,381 | 179,342 | ||||||
Dimensional U.S. Targeted Value ETF
SCHEDULE OF INVESTMENTS
October 31, 2021
| Security Description |
Shares | Fair Value | ||||||
| FINANCIALS (Continued) |
||||||||
| Community Financial Corp. (The) |
3,798 | $ | 144,780 | |||||
| *Community Trust BanCorp, Inc. |
62,037 | 2,709,776 | ||||||
| *Community West Bancshares |
17,592 | 230,455 | ||||||
| *Conifer Holdings, Inc. |
1,978 | 5,360 | ||||||
| ConnectOne BanCorp, Inc. |
156,719 | 5,286,132 | ||||||
| *Consumer Portfolio Services, Inc. |
107,633 | 702,843 | ||||||
| *County BanCorp, Inc. |
620 | 21,948 | ||||||
| *Cowen, Inc., Class A |
67,576 | 2,549,642 | ||||||
| *CrossFirst Bankshares, Inc. |
14,339 | 204,044 | ||||||
| Customers BanCorp, Inc. |
108,077 | 5,759,423 | ||||||
| CVB Financial Corp. |
49,987 | 1,000,740 | ||||||
| Dime Community Bancshares, Inc. |
139,546 | 4,979,001 | ||||||
| Donegal Group, Inc. |
6,421 | 93,040 | ||||||
| Donegal Group, Inc., Class A |
92,549 | 1,318,823 | ||||||
| *Donnelley Financial Solutions, Inc. |
59,818 | 2,292,226 | ||||||
| Eagle BanCorp Montana, Inc. |
778 | 17,505 | ||||||
| *Eagle BanCorp, Inc. |
88,926 | 5,032,322 | ||||||
| East West BanCorp, Inc. |
850 | 67,558 | ||||||
| *eHealth, Inc. |
1,113 | 49,362 | ||||||
| *Elevate Credit, Inc. |
31,746 | 108,889 | ||||||
| *Elmira Savings Bank |
4 | 91 | ||||||
| *Employers Holdings, Inc. |
139,205 | 5,373,313 | ||||||
| *Encore Capital Group, Inc. |
129,940 | 7,019,359 | ||||||
| *Enova International, Inc. |
128,922 | 4,182,230 | ||||||
| *Enstar Group, Ltd. |
33,669 | 7,770,132 | ||||||
| *Enterprise BanCorp, Inc. |
20,058 | 745,155 | ||||||
| *Enterprise Financial Services Corp. |
49,554 | 2,330,029 | ||||||
| Equitable Holdings, Inc. |
85,745 | 2,872,457 | ||||||
| Equity Bancshares, Inc., Class A |
55,929 | 1,871,384 | ||||||
| *Esquire Financial Holdings, Inc. |
3,699 | 118,294 | ||||||
| Essa BanCorp, Inc. |
24,400 | 396,500 | ||||||
| Essent Group, Ltd. |
10,715 | 514,320 | ||||||
| Evans BanCorp, Inc. |
10,532 | 420,753 | ||||||
| Everest Re Group, Ltd. |
31,277 | 8,178,936 | ||||||
| *EZCorp., Inc., Class A |
175,693 | 1,310,670 | ||||||
| Farmers & Merchants BanCorp, Inc. |
1,079 | 27,385 | ||||||
| Farmers National Banc Corp. |
70,143 | 1,249,948 | ||||||
| FB Financial Corp. |
61,148 | 2,771,839 | ||||||
| *Federal Agricultural Mortgage Corp. |
2,759 | 326,795 | ||||||
| *Federal Agricultural Mortgage Corp. |
42,481 | 5,356,429 | ||||||
| Fednat Holding Co. |
45,533 | 115,654 | ||||||
| *FFBW, Inc. |
176 | 2,112 | ||||||
| Fidelity National Financial, Inc. |
25,049 | 1,200,098 | ||||||
| #*Financial Institutions, Inc. |
63,249 | 2,018,908 | ||||||
| First American Financial Corp. |
296,597 | 21,693,105 | ||||||
| *First BanCorp |
823,343 | 11,238,632 | ||||||
| First BanCorp, Inc. (The) |
31,229 | 926,564 | ||||||
| #First BanCorp/Southern Pines Nc |
106,262 | 5,145,206 | ||||||
| *First Bancshares, Inc. (The) |
37,191 | 1,496,938 | ||||||
| First Bank |
30,808 | 463,352 | ||||||
| First Busey Corp. |
139,860 | 3,565,031 | ||||||
| *First Business Financial Services, Inc. |
26,220 | 765,624 | ||||||
| First Capital, Inc. |
67 | 2,699 | ||||||
| #First Citizens Bancshares, Inc., Class A |
20,492 | 16,678,439 | ||||||
| *First Commonwealth Financial Corp. |
371,907 | 5,690,177 | ||||||
| First Community Bankshares, Inc. |
66,323 | 2,150,192 | ||||||
Dimensional U.S. Targeted Value ETF
SCHEDULE OF INVESTMENTS
October 31, 2021
| Security Description |
Shares | Fair Value | ||||||
| FINANCIALS (Continued) |
||||||||
| *First Community Corp. |
2,820 | $ | 56,738 | |||||
| *First Financial BanCorp |
360,068 | 8,562,417 | ||||||
| *First Financial Corp. |
46,672 | 1,999,895 | ||||||
| First Financial Northwest, Inc. |
74,588 | 1,230,702 | ||||||
| First Foundation, Inc. |
148,841 | 3,960,659 | ||||||
| First Guaranty Bancshares, Inc. |
29 | 601 | ||||||
| First Hawaiian, Inc. |
87,608 | 2,417,105 | ||||||
| *First Horizon Corp. |
1,751,204 | 29,717,932 | ||||||
| First Internet BanCorp, Class A |
22,477 | 765,117 | ||||||
| First Interstate BancSystem, Inc., Class A |
141,295 | 5,873,633 | ||||||
| *First Merchants Corp. |
187,665 | 7,803,111 | ||||||
| *First Mid Bancshares, Inc. |
27,457 | 1,182,848 | ||||||
| *First Midwest BanCorp, Inc. |
389,085 | 7,489,886 | ||||||
| First National Corp. |
10 | 227 | ||||||
| *First Northwest BanCorp |
9,100 | 164,255 | ||||||
| First of Long Island Corp. (The) |
61,667 | 1,241,357 | ||||||
| First Savings Financial Group, Inc. |
2,557 | 71,033 | ||||||
| First United Corp. |
7,758 | 146,471 | ||||||
| First US Bancshares, Inc. |
73 | 814 | ||||||
| *First Western Financial, Inc. |
1,679 | 48,725 | ||||||
| Flagstar BanCorp, Inc. |
248,327 | 11,718,551 | ||||||
| Flushing Financial Corp. |
148,225 | 3,560,364 | ||||||
| *FNB Corp. |
1,060,935 | 12,359,893 | ||||||
| *FNCB BanCorp, Inc. |
990 | 8,484 | ||||||
| *Franklin Financial Services Corp. |
115 | 3,737 | ||||||
| FS BanCorp, Inc. |
19,489 | 671,591 | ||||||
| *Fulton Financial Corp. |
685,786 | 11,041,155 | ||||||
| *FVCBankCorp., Inc. |
3,019 | 61,889 | ||||||
| *Genworth Financial, Inc., Class A |
465,399 | 1,912,790 | ||||||
| *German American BanCorp, Inc. |
79,850 | 3,147,687 | ||||||
| Glacier BanCorp, Inc. |
12,639 | 698,810 | ||||||
| Global Indemnity Group LLC, Class A |
50,518 | 1,242,238 | ||||||
| Globe Life, Inc. |
47,037 | 4,187,234 | ||||||
| Great Southern BanCorp, Inc. |
56,591 | 3,193,430 | ||||||
| *Great Western BanCorp, Inc. |
146,075 | 4,973,854 | ||||||
| *Greenlight Capital Re, Ltd., Class A |
68,464 | 508,688 | ||||||
| Guaranty Bancshares, Inc. |
15,717 | 590,016 | ||||||
| Guaranty Federal Bancshares, Inc. |
13,715 | 327,103 | ||||||
| *Hallmark Financial Services, Inc. |
40,904 | 136,210 | ||||||
| *Hancock Whitney Corp. |
296,424 | 14,667,060 | ||||||
| *Hanmi Financial Corp. |
122,018 | 2,707,579 | ||||||
| Hanover Insurance Group, Inc. (The) |
47,435 | 5,976,810 | ||||||
| HarborOne BanCorp, Inc. |
127,296 | 1,829,244 | ||||||
| *Hawthorn Bancshares, Inc. |
16,313 | 391,023 | ||||||
| *HBT Financial, Inc. |
1,051 | 18,950 | ||||||
| HCI Group, Inc. |
14,894 | 1,995,945 | ||||||
| Heartland Financial USA, Inc. |
120,253 | 6,027,080 | ||||||
| *Hennessy Advisors, Inc. |
372 | 4,293 | ||||||
| *Heritage Commerce Corp. |
199,655 | 2,393,863 | ||||||
| Heritage Financial Corp. |
88,097 | 2,188,329 | ||||||
| Heritage Insurance Holdings, Inc. |
43,315 | 283,280 | ||||||
| *Hilltop Holdings, Inc. |
246,560 | 8,738,086 | ||||||
| Hingham Institution For Savings (The) |
1,243 | 449,021 | ||||||
| *HMN Financial, Inc. |
17,337 | 404,125 | ||||||
| Home BanCorp, Inc. |
19,221 | 802,477 | ||||||
| *Home Bancshares, Inc. |
102,693 | 2,439,986 | ||||||
| HomeStreet, Inc. |
87,536 | 4,128,198 | ||||||
Dimensional U.S. Targeted Value ETF
SCHEDULE OF INVESTMENTS
October 31, 2021
| Security Description |
Shares | Fair Value | ||||||
| FINANCIALS (Continued) |
||||||||
| *Hometrust Bancshares, Inc. |
21,623 | $ | 657,339 | |||||
| Hope BanCorp, Inc. |
417,667 | 6,093,762 | ||||||
| Horace Mann Educators Corp. |
180,122 | 7,057,180 | ||||||
| Horizon BanCorp, Inc. |
98,991 | 1,887,758 | ||||||
| *Howard BanCorp, Inc. |
33,640 | 696,684 | ||||||
| *Huntington Bancshares, Inc. |
1,379,004 | 21,705,523 | ||||||
| IF BanCorp, Inc. |
37 | 834 | ||||||
| Independence Holding Co. |
8,996 | 441,254 | ||||||
| *Independent Bank Corp. |
58,992 | 1,329,090 | ||||||
| Independent Bank Corp. |
71,495 | 6,041,327 | ||||||
| Independent Bank Group, Inc. |
160,809 | 11,624,883 | ||||||
| International Bancshares Corp. |
293,114 | 12,428,034 | ||||||
| Invesco, Ltd. |
1,323,799 | 33,637,733 | ||||||
| Investar Holding Corp. |
5,034 | 94,136 | ||||||
| Investors BanCorp, Inc. |
899,600 | 13,763,880 | ||||||
| *Investors Title Co. |
7,699 | 1,492,066 | ||||||
| James River Group Holdings, Ltd. |
9,921 | 316,976 | ||||||
| Janus Henderson Group PLC |
474,958 | 22,085,547 | ||||||
| Jefferies Financial Group, Inc. |
169,099 | 7,271,257 | ||||||
| Kearny Financial Corp. |
300,354 | 4,030,751 | ||||||
| *Kemper Corp. |
191,008 | 12,125,188 | ||||||
| Kentucky First Federal BanCorp |
161 | 1,138 | ||||||
| *Kingstone Cos., Inc. |
2,029 | 11,667 | ||||||
| *Lake Shore BanCorp, Inc. |
1,070 | 15,986 | ||||||
| *Lakeland BanCorp, Inc. |
185,388 | 3,333,276 | ||||||
| Lakeland Financial Corp. |
22,637 | 1,626,921 | ||||||
| Landmark BanCorp, Inc. |
3,905 | 111,839 | ||||||
| LCNB Corp. |
8,997 | 153,399 | ||||||
| *LendingClub Corp. |
87,105 | 4,003,346 | ||||||
| Level One BanCorp, Inc. |
1,712 | 53,774 | ||||||
| *Limestone BanCorp, Inc. |
93 | 1,697 | ||||||
| *Lincoln National Corp. |
157,081 | 11,333,394 | ||||||
| Live Oak Bancshares, Inc. |
74,301 | 6,626,163 | ||||||
| *Luther Burbank Corp. |
24,011 | 348,400 | ||||||
| *Macatawa Bank Corp. |
92,257 | 774,959 | ||||||
| *Magyar BanCorp, Inc. |
9,045 | 102,299 | ||||||
| *Maiden Holdings, Ltd. |
15,002 | 48,907 | ||||||
| *MainStreet Bancshares, Inc., Class A |
538 | 13,450 | ||||||
| *Malvern BanCorp, Inc. |
3,308 | 55,607 | ||||||
| *Marlin Business Services Corp. |
52,803 | 1,210,245 | ||||||
| #*MBIA, Inc. |
382,403 | 5,942,543 | ||||||
| *Mercantile Bank Corp. |
58,696 | 2,017,382 | ||||||
| Merchants BanCorp |
15,731 | 698,928 | ||||||
| *Mercury General Corp. |
47,180 | 2,570,838 | ||||||
| Meridian BanCorp, Inc. |
181,663 | 4,214,582 | ||||||
| Meridian Corp. |
1,194 | 36,059 | ||||||
| Meta Financial Group, Inc. |
98,948 | 5,485,677 | ||||||
| #*Metropolitan Bank Holding Corp. |
12,705 | 1,154,376 | ||||||
| *MGIC Investment Corp. |
448,049 | 7,240,472 | ||||||
| #Mid Penn BanCorp, Inc. |
3,353 | 93,951 | ||||||
| *Middlefield Banc Corp. |
2,530 | 63,250 | ||||||
| *Midland States BanCorp, Inc. |
58,126 | 1,491,513 | ||||||
| #*MidWestOne Financial Group, Inc. |
25,967 | 814,065 | ||||||
| Morgan Stanley |
39,720 | 4,082,422 | ||||||
| *Mr Cooper Group, Inc. |
213,899 | 9,377,332 | ||||||
| *MVB Financial Corp. |
2,380 | 101,602 | ||||||
Dimensional U.S. Targeted Value ETF
SCHEDULE OF INVESTMENTS
October 31, 2021
| Security Description |
Shares | Fair Value | ||||||
| FINANCIALS (Continued) |
||||||||
| *National Bank Holdings Corp., Class A |
91,435 | $ | 3,965,536 | |||||
| *National Bankshares, Inc. |
2,324 | 86,569 | ||||||
| *National Security Group, Inc. (The) |
193 | 1,955 | ||||||
| *National Western Life Group, Inc., Class A |
9,545 | 2,052,270 | ||||||
| Navient Corp. |
868,959 | 17,118,492 | ||||||
| *NBT BanCorp, Inc. |
125,977 | 4,622,096 | ||||||
| Nelnet, Inc., Class A |
133,574 | 11,037,220 | ||||||
| *New York Community BanCorp, Inc. |
1,663,422 | 20,676,335 | ||||||
| *NI Holdings, Inc. |
6,855 | 136,277 | ||||||
| *Nicholas Financial, Inc. |
22,714 | 270,297 | ||||||
| *Nicolet Bankshares, Inc. |
18,913 | 1,359,656 | ||||||
| *NMI Holdings, Inc., Class A |
129,151 | 3,135,786 | ||||||
| Northeast Bank |
18,924 | 626,384 | ||||||
| Northfield BanCorp, Inc. |
212,567 | 3,730,551 | ||||||
| Northrim BanCorp, Inc. |
27,590 | 1,225,548 | ||||||
| *Northwest Bancshares, Inc. |
448,348 | 6,187,202 | ||||||
| Norwood Financial Corp. |
5,359 | 140,245 | ||||||
| Oak Valley BanCorp |
41 | 707 | ||||||
| *OceanFirst Financial Corp. |
90,186 | 1,999,424 | ||||||
| *Ocwen Financial Corp. |
8,602 | 270,189 | ||||||
| OFG BanCorp |
197,918 | 5,126,076 | ||||||
| Ohio Valley Banc Corp. |
3,740 | 104,196 | ||||||
| *Old National BanCorp |
656,326 | 11,210,048 | ||||||
| Old Republic International Corp. |
853,193 | 22,037,975 | ||||||
| Old Second BanCorp, Inc. |
48,083 | 651,044 | ||||||
| OneMain Holdings, Inc. |
241,879 | 12,773,630 | ||||||
| OP BanCorp |
4,181 | 46,325 | ||||||
| *Oportun Financial Corp. |
9,278 | 215,528 | ||||||
| *Oppenheimer Holdings, Inc., Class A |
16,677 | 868,038 | ||||||
| *Optimumbank Holdings, Inc. |
983 | 5,161 | ||||||
| Origin BanCorp, Inc. |
9,740 | 434,404 | ||||||
| Orrstown Financial Services, Inc. |
14,449 | 342,586 | ||||||
| Pacific Premier BanCorp, Inc. |
339,600 | 14,259,804 | ||||||
| *PacWest BanCorp |
347,403 | 16,491,220 | ||||||
| *Park National Corp. |
10,687 | 1,374,241 | ||||||
| Parke BanCorp, Inc. |
13,443 | 298,031 | ||||||
| *Patriot National BanCorp, Inc. |
140 | 1,341 | ||||||
| PCB BanCorp |
2,008 | 42,770 | ||||||
| PCSB Financial Corp. |
17,194 | 328,577 | ||||||
| *PDL Community BanCorp |
59 | 915 | ||||||
| *Peapack-Gladstone Financial Corp. |
75,310 | 2,526,650 | ||||||
| Penns Woods BanCorp, Inc. |
9,028 | 214,867 | ||||||
| PennyMac Financial Services, Inc. |
4,366 | 270,954 | ||||||
| *Peoples BanCorp of North Carolina, Inc. |
5,573 | 156,601 | ||||||
| *Peoples BanCorp, Inc. |
105,297 | 3,365,292 | ||||||
| *Peoples Financial Services Corp. |
3,686 | 168,745 | ||||||
| People’s United Financial, Inc. |
1,723,032 | 29,532,768 | ||||||
| Pinnacle Financial Partners, Inc. |
246,783 | 23,831,834 | ||||||
| *Piper Sandler Cos. |
34,879 | 5,744,223 | ||||||
| Plumas BanCorp |
916 | 33,837 | ||||||
| *Popular, Inc. |
379,807 | 30,931,482 | ||||||
| *PRA Group, Inc. |
122,031 | 5,232,689 | ||||||
| Preferred Bank |
35,954 | 2,465,366 | ||||||
| Premier Financial Corp. |
132,895 | 4,236,693 | ||||||
| Primis Financial Corp. |
31,560 | 478,134 | ||||||
| ProAssurance Corp. |
98,564 | 2,258,101 | ||||||
| *Professional Holding Corp., Class A |
2,077 | 38,944 | ||||||
Dimensional U.S. Targeted Value ETF
SCHEDULE OF INVESTMENTS
October 31, 2021
| Security Description |
Shares | Fair Value | ||||||
| FINANCIALS (Continued) |
||||||||
| #*Prog Holdings, Inc. |
186,845 | $ | 7,557,880 | |||||
| *Prosperity Bancshares, Inc. |
259,279 | 19,526,301 | ||||||
| *Provident Financial Holdings, Inc. |
26,733 | 455,798 | ||||||
| Provident Financial Services, Inc. |
290,538 | 7,193,721 | ||||||
| Prudential BanCorp, Inc. |
1,902 | 28,511 | ||||||
| QCR Holdings, Inc. |
55,658 | 3,068,982 | ||||||
| *Radian Group, Inc. |
474,329 | 11,322,233 | ||||||
| *Randolph BanCorp, Inc. |
145 | 3,407 | ||||||
| RBB BanCorp |
25,252 | 648,219 | ||||||
| Red River Bancshares, Inc. |
636 | 33,314 | ||||||
| #Regional Management Corp. |
29,664 | 1,515,237 | ||||||
| *Reinsurance Group of America, Inc. |
186,199 | 21,986,378 | ||||||
| Reliant BanCorp, Inc. |
2,468 | 83,616 | ||||||
| RenaissanceRe Holdings, Ltd. |
27,026 | 3,832,287 | ||||||
| #Renasant Corp. |
210,935 | 7,891,078 | ||||||
| *Republic BanCorp, Inc., Class A |
33,602 | 1,815,180 | ||||||
| *Republic First BanCorp, Inc. |
40,020 | 124,062 | ||||||
| Richmond Mutual BanCorp, Inc. |
1,805 | 28,699 | ||||||
| Riverview BanCorp, Inc. |
69,571 | 514,130 | ||||||
| *S&T BanCorp, Inc. |
105,738 | 3,231,353 | ||||||
| Safety Insurance Group, Inc. |
48,653 | 3,814,882 | ||||||
| *Salisbury BanCorp, Inc. |
576 | 30,125 | ||||||
| *Sandy Spring BanCorp, Inc. |
155,261 | 7,368,687 | ||||||
| Santander Consumer USA Holdings, Inc. |
713,312 | 29,745,110 | ||||||
| SB Financial Group, Inc. |
1,949 | 36,446 | ||||||
| *Seacoast Banking Corp. of Florida |
99,693 | 3,631,816 | ||||||
| *Security National Financial Corp., Class A |
16,079 | 141,978 | ||||||
| *Selective Insurance Group, Inc. |
89,892 | 7,044,836 | ||||||
| Severn BanCorp, Inc. |
42 | 572 | ||||||
| *Shore Bancshares, Inc. |
24,694 | 456,345 | ||||||
| Sierra BanCorp |
36,710 | 916,282 | ||||||
| Signature Bank |
31,175 | 9,284,538 | ||||||
| *Simmons First National Corp., Class A |
376,545 | 11,254,930 | ||||||
| *SiriusPoint, Ltd. |
240,027 | 2,256,253 | ||||||
| SmartFinancial, Inc. |
23,268 | 604,735 | ||||||
| South Plains Financial, Inc. |
834 | 21,734 | ||||||
| *Southern First Bancshares, Inc. |
19,030 | 1,025,146 | ||||||
| *Southern Missouri BanCorp, Inc. |
16,618 | 904,019 | ||||||
| Southside Bancshares, Inc. |
55,343 | 2,286,773 | ||||||
| *SouthState Corp. |
166,669 | 13,015,182 | ||||||
| Spirit of Texas Bancshares, Inc. |
12,405 | 301,814 | ||||||
| *State Auto Financial Corp. |
132,055 | 6,775,742 | ||||||
| Sterling BanCorp |
682,451 | 17,368,378 | ||||||
| *Sterling BanCorp, Inc. |
12,450 | 67,354 | ||||||
| Stewart Information Services Corp. |
116,458 | 8,288,316 | ||||||
| *Stifel Financial Corp. |
265,542 | 19,350,046 | ||||||
| *StoneX Group, Inc. |
61,158 | 4,226,629 | ||||||
| Summit Financial Group, Inc. |
23,559 | 592,038 | ||||||
| *Summit State Bank |
829 | 14,473 | ||||||
| *SVB Financial Group |
8,490 | 6,090,726 | ||||||
| *SWK Holdings Corp. |
1,255 | 23,820 | ||||||
| Synovus Financial Corp. |
369,013 | 17,192,316 | ||||||
| Territorial BanCorp, Inc. |
25,086 | 629,408 | ||||||
| *Texas Capital Bancshares, Inc. |
173,865 | 10,536,219 | ||||||
| *Timberland BanCorp, Inc. |
48,857 | 1,355,782 | ||||||
| Tiptree, Inc. |
157,672 | 2,461,260 | ||||||
Dimensional U.S. Targeted Value ETF
SCHEDULE OF INVESTMENTS
October 31, 2021
| Security Description |
Shares | Fair Value | ||||||
| FINANCIALS (Continued) |
||||||||
| #*Tompkins Financial Corp. |
6,558 | $ | 538,477 | |||||
| Towne Bank |
224,801 | 7,085,728 | ||||||
| TriCo Bancshares |
79,020 | 3,463,447 | ||||||
| *TriState Capital Holdings, Inc. |
77,973 | 2,343,089 | ||||||
| *Triumph BanCorp, Inc. |
62,412 | 7,320,928 | ||||||
| *TrustCo Bank Corp. NY |
64,693 | 2,171,097 | ||||||
| *Trustmark Corp. |
320,878 | 10,207,129 | ||||||
| *UMB Financial Corp. |
18,712 | 1,849,120 | ||||||
| *Umpqua Holdings Corp. |
806,558 | 16,494,111 | ||||||
| *Unico American Corp. |
26,066 | 87,060 | ||||||
| *United BanCorp, Inc. |
192 | 2,882 | ||||||
| *United Bancshares, Inc. |
3,560 | 104,023 | ||||||
| *United Bankshares, Inc. |
403,750 | 14,934,712 | ||||||
| United Community Banks, Inc. |
296,337 | 10,324,381 | ||||||
| #*United Fire Group, Inc. |
53,449 | 1,091,963 | ||||||
| *United Insurance Holdings Corp. |
89,766 | 342,906 | ||||||
| United Security Bancshares/Fresno CA |
54,205 | 428,762 | ||||||
| *Unity BanCorp, Inc. |
31,829 | 806,865 | ||||||
| Universal Insurance Holdings, Inc. |
61,901 | 914,278 | ||||||
| *Univest Financial Corp. |
112,313 | 3,223,383 | ||||||
| Unum Group |
137,596 | 3,504,570 | ||||||
| Valley National BanCorp |
1,552,634 | 20,587,927 | ||||||
| *Veritex Holdings, Inc. |
59,705 | 2,444,920 | ||||||
| Virtus Investment Partners, Inc. |
19,018 | 6,085,760 | ||||||
| *Voya Financial, Inc. |
468,022 | 32,653,895 | ||||||
| Walker & Dunlop, Inc. |
56,134 | 7,301,349 | ||||||
| *Washington Federal, Inc. |
339,072 | 11,989,586 | ||||||
| Washington Trust BanCorp, Inc. |
34,312 | 1,875,494 | ||||||
| Waterstone Financial, Inc. |
123,923 | 2,561,488 | ||||||
| *Webster Financial Corp. |
228,925 | 12,810,643 | ||||||
| *WesBanco, Inc. |
248,548 | 8,642,014 | ||||||
| West BanCorp, Inc. |
68,174 | 2,161,116 | ||||||
| *Westamerica BanCorp |
2,464 | 137,393 | ||||||
| *Western Alliance BanCorp |
32,169 | 3,734,499 | ||||||
| *Western New England BanCorp, Inc. |
74,033 | 720,341 | ||||||
| *Westwood Holdings Group, Inc. |
10,449 | 181,813 | ||||||
| White Mountains Insurance Group, Ltd. |
9,334 | 9,847,277 | ||||||
| Wintrust Financial Corp. |
204,575 | 18,104,887 | ||||||
| #*World Acceptance Corp. |
2,095 | 388,392 | ||||||
| *WSFS Financial Corp. |
183,706 | 9,517,808 | ||||||
| *WVS Financial Corp. |
1,304 | 20,303 | ||||||
| *Zions BanCorp NA |
546,831 | 34,444,885 | ||||||
|
|
|
|||||||
| TOTAL FINANCIALS |
1,859,330,099 | |||||||
|
|
|
|||||||
| HEALTH CARE (4.0%) |
| |||||||
| *Acadia Healthcare Co., Inc. |
355,206 | 22,022,772 | ||||||
| #*Acorda Therapeutics, Inc. |
577 | 2,348 | ||||||
| *Actinium Pharmaceuticals, Inc. |
1,150 | 9,027 | ||||||
| *Addus HomeCare Corp. |
6,384 | 596,904 | ||||||
| *Aethlon Medical, Inc. |
1,430 | 5,134 | ||||||
| *Agios Pharmaceuticals, Inc. |
12,741 | 598,827 | ||||||
| *Akebia Therapeutics, Inc. |
7,932 | 22,765 | ||||||
| *Alkermes PLC |
6,793 | 205,760 | ||||||
| *Allied Healthcare Products, Inc. |
106 | 560 | ||||||
| *Allscripts Healthcare Solutions, Inc. |
802,756 | 11,061,978 | ||||||
| *AMN Healthcare Services, Inc. |
14,829 | 1,463,622 | ||||||
| *Amphastar Pharmaceuticals, Inc. |
92,918 | 1,735,708 | ||||||
Dimensional U.S. Targeted Value ETF
SCHEDULE OF INVESTMENTS
October 31, 2021
| Security Description |
Shares | Fair Value | ||||||
| HEALTH CARE (Continued) |
||||||||
| *AnaptysBio, Inc. |
56,733 | $ | 1,866,516 | |||||
| #*AngioDynamics, Inc. |
131,373 | 3,757,268 | ||||||
| *ANI Pharmaceuticals, Inc. |
5,290 | 197,740 | ||||||
| #*Anika Therapeutics, Inc. |
65,230 | 2,716,830 | ||||||
| *Applied Genetic Technologies Corp. |
3,449 | 8,933 | ||||||
| *Assembly Biosciences, Inc. |
12,786 | 40,276 | ||||||
| *aTyr Pharma, Inc. |
4,474 | 38,432 | ||||||
| *Avanos Medical, Inc. |
175,174 | 5,524,988 | ||||||
| *Bellerophon Therapeutics, Inc. |
198 | 701 | ||||||
| *BioDelivery Sciences International, Inc. |
19,143 | 78,103 | ||||||
| #*Bluebird Bio, Inc. |
4,674 | 109,418 | ||||||
| *Brookdale Senior Living, Inc. |
642,337 | 4,175,190 | ||||||
| *Cabaletta Bio, Inc. |
22 | 301 | ||||||
| *Calithera Biosciences, Inc. |
5,567 | 10,744 | ||||||
| *Cara Therapeutics, Inc. |
780 | 13,127 | ||||||
| *CareCloud, Inc. |
9,918 | 76,666 | ||||||
| *Catalyst Biosciences, Inc. |
15,672 | 51,561 | ||||||
| *Catalyst Pharmaceuticals, Inc. |
43,436 | 256,272 | ||||||
| *Chinook Therapeutics, Inc. |
11,937 | 128,203 | ||||||
| *Collegium Pharmaceutical, Inc. |
12,805 | 251,362 | ||||||
| *Computer Programs and Systems, Inc. |
25,392 | 916,651 | ||||||
| *Concert Pharmaceuticals, Inc. |
792 | 2,170 | ||||||
| CONMED Corp. |
60,167 | 8,801,229 | ||||||
| *Corvus Pharmaceuticals, Inc. |
5,669 | 25,681 | ||||||
| *Covetrus, Inc. |
143,699 | 2,901,283 | ||||||
| *Cross Country Healthcare, Inc. |
34,824 | 721,902 | ||||||
| *CryoLife, Inc. |
2,718 | 56,100 | ||||||
| *Cumberland Pharmaceuticals, Inc. |
40,033 | 107,689 | ||||||
| *Cyclacel Pharmaceuticals, Inc. |
1,439 | 7,065 | ||||||
| *Cyclerion Therapeutics, Inc. |
11,200 | 28,672 | ||||||
| *Cymabay Therapeutics, Inc. |
5,148 | 20,077 | ||||||
| *Eagle Pharmaceuticals, Inc. |
4,337 | 227,129 | ||||||
| *Eiger Biopharmaceuticals, Inc. |
6,785 | 45,731 | ||||||
| *Ekso Bionics Holdings, Inc. |
1,054 | 4,237 | ||||||
| *Electromed, Inc. |
24,662 | 270,789 | ||||||
| *Emergent BioSolutions, Inc. |
29,143 | 1,389,247 | ||||||
| *Enanta Pharmaceuticals, Inc. |
26,826 | 2,303,012 | ||||||
| Encompass Health Corp. |
2,729 | 173,455 | ||||||
| Ensign Group, Inc. (The) |
13,118 | 1,023,335 | ||||||
| *Envista Holdings Corp. |
171,902 | 6,721,368 | ||||||
| *Enzo Biochem, Inc. |
211,746 | 728,406 | ||||||
| *Evolent Health, Inc., Class A |
222,704 | 6,518,546 | ||||||
| *Exagen, Inc. |
1,745 | 20,277 | ||||||
| *EyePoint Pharmaceuticals, Inc. |
945 | 10,839 | ||||||
| *Five Star Senior Living, Inc. |
47,180 | 193,910 | ||||||
| #*Fluidigm Corp. |
3,533 | 18,195 | ||||||
| *FONAR Corp. |
13,689 | 219,024 | ||||||
| #*Forma Therapeutics Holdings, Inc. |
7,303 | 135,544 | ||||||
| *GlycoMimetics, Inc. |
17,532 | 33,487 | ||||||
| *Harvard Bioscience, Inc. |
150,853 | 1,135,923 | ||||||
| *HealthStream, Inc. |
88,708 | 2,360,520 | ||||||
| #*Heat Biologics, Inc. |
1,838 | 9,815 | ||||||
| *Homology Medicines, Inc. |
2,924 | 16,755 | ||||||
| *Horizon Therapeutics PLC |
3,680 | 441,269 | ||||||
| *ICU Medical, Inc. |
189 | 44,251 | ||||||
| *ImmuCell Corp. |
6 | 53 | ||||||
Dimensional U.S. Targeted Value ETF
SCHEDULE OF INVESTMENTS
October 31, 2021
| Security Description |
Shares | Fair Value | ||||||
| HEALTH CARE (Continued) |
| |||||||
| *Innoviva, Inc. |
17,197 | $ | 300,088 | |||||
| *Inogen, Inc., Class A |
2,039 | 80,846 | ||||||
| *Integer Holdings Corp. |
133,410 | 12,009,568 | ||||||
| *IntriCon Corp. |
16,901 | 287,317 | ||||||
| *Invacare Corp. |
37,310 | 184,311 | ||||||
| *IRIDEX Corp. |
26,323 | 201,897 | ||||||
| *Ironwood Pharmaceuticals, Inc. |
336 | 4,291 | ||||||
| *Jazz Pharmaceuticals PLC |
58,218 | 7,745,323 | ||||||
| *Jounce Therapeutics, Inc. |
65,260 | 572,983 | ||||||
| *Kewaunee Scientific Corp. |
9,980 | 127,744 | ||||||
| *Kezar Life Sciences, Inc. |
5,360 | 42,880 | ||||||
| *Lannett Co., Inc. |
14,739 | 40,237 | ||||||
| *Lantheus Holdings, Inc. |
7,781 | 181,998 | ||||||
| *LeMaitre Vascular, Inc. |
15,327 | 797,157 | ||||||
| *Lensar, Inc. |
49,116 | 351,179 | ||||||
| *LHC Group, Inc. |
16,984 | 2,285,877 | ||||||
| #*Ligand Pharmaceuticals, Inc. |
9,946 | 1,451,519 | ||||||
| *Lyra Therapeutics, Inc. |
1,980 | 14,454 | ||||||
| *Magellan Health, Inc. |
101,770 | 9,650,849 | ||||||
| *»Medcath Corp. |
116,120 | — | ||||||
| #*MediciNova, Inc. |
4,227 | 14,203 | ||||||
| *MEDNAX, Inc. |
252,481 | 6,875,058 | ||||||
| *Meridian Bioscience, Inc. |
138,215 | 2,599,824 | ||||||
| *Merit Medical Systems, Inc. |
112,656 | 7,577,243 | ||||||
| *Merrimack Pharmaceuticals, Inc. |
84,806 | 364,666 | ||||||
| Mesa Laboratories, Inc. |
385 | 117,694 | ||||||
| *Metacrine, Inc. |
3,360 | 4,771 | ||||||
| *Minerva Neurosciences, Inc. |
4,774 | 6,684 | ||||||
| *»Misonix, Inc. |
651 | 17,278 | ||||||
| *ModivCare, Inc. |
23,334 | 3,798,075 | ||||||
| *Mustang Bio, Inc. |
59,701 | 133,730 | ||||||
| *Myriad Genetics, Inc. |
229,405 | 7,058,792 | ||||||
| #*NanoViricides, Inc. |
5,722 | 27,122 | ||||||
| *National HealthCare Corp. |
34,148 | 2,388,311 | ||||||
| #*Natus Medical, Inc. |
42,063 | 1,053,678 | ||||||
| *Neoleukin Therapeutics, Inc. |
59 | 432 | ||||||
| *NeuBase Therapeutics, Inc. |
702 | 2,597 | ||||||
| *NextCure, Inc. |
5,372 | 44,158 | ||||||
| *NextGen Healthcare, Inc. |
95,398 | 1,570,251 | ||||||
| #*NuVasive, Inc. |
12,331 | 657,982 | ||||||
| *Opiant Pharmaceuticals, Inc. |
2,727 | 64,275 | ||||||
| #*OPKO Health, Inc. |
38,704 | 146,688 | ||||||
| *Option Care Health, Inc. |
32,651 | 892,352 | ||||||
| *OraSure Technologies, Inc. |
212,800 | 2,270,576 | ||||||
| Organon & Co. |
36,970 | 1,358,648 | ||||||
| *Organovo Holdings, Inc. |
1,021 | 6,340 | ||||||
| *Orgenesis, Inc. |
200 | 962 | ||||||
| *Orthofix Medical, Inc. |
9,006 | 324,036 | ||||||
| *Otonomy, Inc. |
32,870 | 69,027 | ||||||
| #*Owens & Minor, Inc. |
346,486 | 12,431,918 | ||||||
| *Pacira BioSciences, Inc. |
5,343 | 279,332 | ||||||
| Patterson Cos., Inc. |
353,422 | 11,047,972 | ||||||
| #*»PDL BioPharma, Inc. |
463,418 | 1,200,253 | ||||||
| *Pennant Group, Inc. (The) |
3,614 | 92,410 | ||||||
| Perrigo Co. PLC |
213,004 | 9,617,131 | ||||||
| #*PetIQ, Inc. |
1,957 | 49,023 | ||||||
| Phibro Animal Health Corp., Class A |
13,679 | 300,117 | ||||||
Dimensional U.S. Targeted Value ETF
SCHEDULE OF INVESTMENTS
October 31, 2021
| Security Description |
Shares | Fair Value | ||||||
| HEALTH CARE (Continued) |
| |||||||
| Premier, Inc., Class A |
118,658 | $ | 4,621,729 | |||||
| *Prestige Consumer Healthcare, Inc. |
181,994 | 10,917,820 | ||||||
| *Protagonist Therapeutics, Inc. |
16,999 | 529,689 | ||||||
| *Prothena Corp. PLC |
56,014 | 3,100,375 | ||||||
| *Psychemedics Corp. |
758 | 6,299 | ||||||
| *Quidel Corp. |
1,685 | 223,717 | ||||||
| *Sage Therapeutics, Inc. |
201 | 8,112 | ||||||
| *Satsuma Pharmaceuticals, Inc. |
6,227 | 36,117 | ||||||
| *scPharmaceuticals, Inc. |
547 | 3,216 | ||||||
| Select Medical Holdings Corp. |
364,303 | 12,102,146 | ||||||
| *SIGA Technologies, Inc. |
3,715 | 26,785 | ||||||
| *Sio Gene Therapies, Inc. |
27,613 | 52,741 | ||||||
| *Star Equity Holdings, Inc. |
408 | 1,077 | ||||||
| STERIS PLC |
1,039 | 242,856 | ||||||
| *SunLink Health Systems, Inc. |
135 | 324 | ||||||
| *Supernus Pharmaceuticals, Inc. |
150,338 | 4,487,589 | ||||||
| *Surgalign Holdings, Inc. |
134,148 | 128,956 | ||||||
| *Surgery Partners, Inc. |
104,246 | 4,288,680 | ||||||
| *Syneos Health, Inc. |
73,457 | 6,856,476 | ||||||
| *Synlogic, Inc. |
71,863 | 183,969 | ||||||
| *Taro Pharmaceutical Industries, Ltd. |
9,922 | 551,366 | ||||||
| *Tempest Therapeutics, Inc. |
533 | 6,247 | ||||||
| *Triple-S Management Corp., Class B |
80,799 | 2,851,397 | ||||||
| *United Therapeutics Corp. |
399 | 76,113 | ||||||
| *Universal Health Services, Inc., Class B |
7,487 | 929,137 | ||||||
| *Utah Medical Products, Inc. |
1,192 | 115,421 | ||||||
| *Vanda Pharmaceuticals, Inc. |
112,191 | 1,920,710 | ||||||
| *Varex Imaging Corp. |
100,810 | 2,706,748 | ||||||
| Viatris, Inc. |
71,664 | 956,714 | ||||||
| *Viking Therapeutics, Inc. |
995 | 5,791 | ||||||
| *Viveve Medical, Inc. |
693 | 1,476 | ||||||
| *Windtree Therapeutics, Inc. |
3,509 | 6,246 | ||||||
| *Xenetic Biosciences, Inc. |
26,294 | 43,911 | ||||||
| *Xeris Biopharma Holdings, Inc. |
280 | 521 | ||||||
| *Zynerba Pharmaceuticals, Inc. |
5,779 | 22,134 | ||||||
|
|
|
|||||||
| TOTAL HEALTH CARE |
263,468,404 | |||||||
|
|
|
|||||||
| INDUSTRIALS (21.5%) |
| |||||||
| *AAR Corp. |
161,551 | 5,714,059 | ||||||
| ABM Industries, Inc. |
304,626 | 13,406,590 | ||||||
| *Acacia Research Corp. |
94,080 | 539,078 | ||||||
| ACCO Brands Corp. |
287,702 | 2,379,296 | ||||||
| Acme United Corp. |
8,819 | 326,303 | ||||||
| Acuity Brands, Inc. |
370 | 76,009 | ||||||
| #ADT, Inc. |
246,283 | 2,056,463 | ||||||
| *AECOM |
122,362 | 8,365,890 | ||||||
| *AeroVironment, Inc. |
14,318 | 1,275,877 | ||||||
| #*AGCO Corp. |
291,053 | 35,569,587 | ||||||
| Air Lease Corp. |
425,692 | 17,048,965 | ||||||
| *Air Transport Services Group, Inc. |
130,206 | 3,240,827 | ||||||
| Alamo Group, Inc. |
64,075 | 9,688,140 | ||||||
| *Alaska Air Group, Inc. |
82,738 | 4,368,566 | ||||||
| Albany International Corp. |
78,093 | 6,298,200 | ||||||
| *Allegiant Travel Co. |
2,390 | 418,895 | ||||||
| #*Allied Motion Technologies, Inc. |
18,884 | 663,773 | ||||||
| Altra Industrial Motion Corp. |
41,436 | 2,160,887 | ||||||
Dimensional U.S. Targeted Value ETF
SCHEDULE OF INVESTMENTS
October 31, 2021
| Security Description |
Shares | Fair Value | ||||||
| INDUSTRIALS (Continued) |
||||||||
| AMERCO |
45,826 | $ | 33,773,304 | |||||
| *Ameresco, Inc., Class A |
57,943 | 4,758,859 | ||||||
| *American Woodmark Corp. |
21,965 | 1,509,874 | ||||||
| *API Group Corp. |
1,140 | 24,829 | ||||||
| Apogee Enterprises, Inc. |
114,529 | 4,802,201 | ||||||
| Applied Industrial Technologies, Inc. |
100,271 | 9,774,417 | ||||||
| ARC Document Solutions, Inc. |
74,000 | 224,220 | ||||||
| ArcBest Corp. |
91,415 | 8,213,638 | ||||||
| Arcosa, Inc. |
229,140 | 11,853,412 | ||||||
| Argan, Inc. |
32,061 | 1,322,837 | ||||||
| *Armstrong Flooring, Inc. |
49,319 | 140,066 | ||||||
| *Art’s-Way Manufacturing Co., Inc. |
223 | 827 | ||||||
| *ASGN, Inc. |
151,262 | 18,100,011 | ||||||
| *Astec Industries, Inc. |
72,148 | 3,851,260 | ||||||
| *Atlas Air Worldwide Holdings, Inc., Class A |
137,316 | 11,139,074 | ||||||
| *Avalon Holdings Corp., Class A |
225 | 862 | ||||||
| AZZ, Inc. |
23,240 | 1,234,741 | ||||||
| *Barnes Group, Inc. |
141,106 | 5,917,986 | ||||||
| *Barrett Business Services, Inc. |
11,005 | 902,410 | ||||||
| *Beacon Roofing Supply, Inc. |
304,136 | 16,079,670 | ||||||
| BGSF, Inc. |
3,700 | 44,511 | ||||||
| *BlueLinx Holdings, Inc. |
94 | 4,477 | ||||||
| Boise Cascade Co. |
135,720 | 7,684,466 | ||||||
| *Brady Corp., Class A |
85,272 | 4,441,818 | ||||||
| *BrightView Holdings, Inc. |
36,680 | 581,745 | ||||||
| *Broadwind, Inc. |
17,523 | 50,992 | ||||||
| *Builders FirstSource, Inc. |
322,588 | 18,797,203 | ||||||
| *CACI International, Inc., Class A |
72,907 | 20,970,970 | ||||||
| CAI International, Inc. |
78,665 | 4,399,733 | ||||||
| *CBIZ, Inc. |
192,682 | 7,073,356 | ||||||
| *CECO Environmental Corp. |
147,082 | 1,011,924 | ||||||
| *Chart Industries, Inc. |
163,089 | 28,951,559 | ||||||
| *Chicago Rivet & Machine Co. |
1,984 | 53,370 | ||||||
| *CIRCOR International, Inc. |
67,222 | 1,918,516 | ||||||
| *Clarivate PLC |
928 | 21,762 | ||||||
| *Clean Harbors, Inc. |
118,395 | 13,324,173 | ||||||
| *Colfax Corp. |
532,332 | 27,478,978 | ||||||
| *Columbus McKinnon Corp. |
77,121 | 3,645,510 | ||||||
| *Comfort Systems USA, Inc. |
51,396 | 4,701,192 | ||||||
| *Commercial Vehicle Group, Inc. |
30,985 | 311,089 | ||||||
| CompX International, Inc. |
5,758 | 124,373 | ||||||
| *Construction Partners, Inc., Class A |
9,337 | 332,491 | ||||||
| #*Copa Holdings SA, Class A |
34,418 | 2,545,555 | ||||||
| *Cornerstone Building Brands, Inc. |
11,973 | 171,334 | ||||||
| Costamare, Inc. |
289,372 | 3,880,479 | ||||||
| *Covenant Logistics Group, Inc. |
63,461 | 1,802,292 | ||||||
| CRA International, Inc. |
29,700 | 3,261,654 | ||||||
| *Crane Co. |
6,678 | 689,704 | ||||||
| CSW Industrials, Inc. |
16,301 | 2,259,645 | ||||||
| #*Deluxe Corp. |
3,523 | 125,665 | ||||||
| *DLH Holdings Corp. |
504 | 7,671 | ||||||
| Douglas Dynamics, Inc. |
63,793 | 2,698,444 | ||||||
| *Ducommun, Inc. |
47,190 | 2,283,524 | ||||||
| *Dxp Enterprises, Inc. |
59,106 | 1,948,134 | ||||||
| *Dycom Industries, Inc. |
31,416 | 2,495,059 | ||||||
| *Eastern Co. (The) |
32,938 | 791,500 | ||||||
| *Echo Global Logistics, Inc. |
122,731 | 5,919,316 | ||||||
Dimensional U.S. Targeted Value ETF
SCHEDULE OF INVESTMENTS
October 31, 2021
| Security Description |
Shares | Fair Value | ||||||
| INDUSTRIALS (Continued) |
| |||||||
| EMCOR Group, Inc. |
23,560 | $ | 2,862,304 | |||||
| *Encore Wire Corp. |
97,598 | 13,083,988 | ||||||
| Enerpac Tool Group Corp. |
74,127 | 1,548,513 | ||||||
| EnerSys |
88,339 | 7,070,654 | ||||||
| #Eneti, Inc. |
1,849 | 26,200 | ||||||
| #Ennis, Inc. |
101,081 | 1,914,474 | ||||||
| EnPro Industries, Inc. |
73,786 | 6,615,653 | ||||||
| *ESCO Technologies, Inc. |
84,062 | 7,108,283 | ||||||
| *Espey Mfg. & Electronics Corp. |
12,828 | 194,088 | ||||||
| *EVI Industries, Inc. |
22 | 693 | ||||||
| *Federal Signal Corp. |
225,366 | 9,647,918 | ||||||
| *Fluor Corp. |
16,655 | 323,773 | ||||||
| *Forward Air Corp. |
19,421 | 1,952,976 | ||||||
| *Franklin Covey Co. |
44,255 | 1,869,774 | ||||||
| *Franklin Electric Co., Inc. |
33,104 | 2,859,524 | ||||||
| *FTI Consulting, Inc. |
57,928 | 8,336,998 | ||||||
| *Gates Industrial Corp. PLC |
74,791 | 1,229,564 | ||||||
| #*GATX Corp. |
201,832 | 19,143,765 | ||||||
| Genco Shipping & Trading, Ltd. |
135,659 | 2,329,265 | ||||||
| *Gencor Industries, Inc. |
59,013 | 658,585 | ||||||
| *Gibraltar Industries, Inc. |
138,302 | 9,011,758 | ||||||
| Global Industrial Co. |
74,533 | 3,024,549 | ||||||
| *GMS, Inc. |
128,379 | 6,358,612 | ||||||
| *Gorman-Rupp Co. (The) |
113,530 | 4,827,296 | ||||||
| *Graham Corp. |
4,080 | 51,857 | ||||||
| Granite Construction, Inc. |
180,216 | 6,689,618 | ||||||
| *Great Lakes Dredge & Dock Corp. |
235,537 | 3,584,873 | ||||||
| #*Greenbrier Cos., Inc. (The) |
138,122 | 5,665,764 | ||||||
| *Griffon Corp. |
265,611 | 7,036,035 | ||||||
| *GXO Logistics, Inc. |
133,945 | 11,894,316 | ||||||
| *H&E Equipment Services, Inc. |
64,525 | 2,908,787 | ||||||
| *Harsco Corp. |
11,015 | 188,357 | ||||||
| *Hawaiian Holdings, Inc. |
131,395 | 2,542,493 | ||||||
| *Healthcare Services Group, Inc. |
3,653 | 70,101 | ||||||
| Heartland Express, Inc. |
10,043 | 164,002 | ||||||
| *Heidrick & Struggles International, Inc. |
77,377 | 3,627,434 | ||||||
| Helios Technologies, Inc. |
25,541 | 2,325,508 | ||||||
| Herc Holdings, Inc. |
45,532 | 8,288,645 | ||||||
| *Heritage-Crystal Clean, Inc. |
45,271 | 1,569,546 | ||||||
| *Herman Miller, Inc. |
19,744 | 768,436 | ||||||
| *Hill International, Inc. |
13,692 | 27,932 | ||||||
| Hillenbrand, Inc. |
37,804 | 1,718,570 | ||||||
| *HNI Corp. |
5,485 | 205,139 | ||||||
| *Howmet Aerospace, Inc. |
58,927 | 1,749,543 | ||||||
| *Hub Group, Inc., Class A |
128,934 | 10,130,344 | ||||||
| *Hudson Global, Inc. |
422 | 7,047 | ||||||
| *Hudson Technologies, Inc. |
23,213 | 82,174 | ||||||
| *Hurco Cos., Inc. |
33,909 | 1,100,347 | ||||||
| *Huron Consulting Group, Inc., Class A |
83,980 | 4,212,437 | ||||||
| *Huttig Building Products, Inc. |
3,773 | 26,977 | ||||||
| *Hyster-Yale Materials Handling, Inc. |
43,766 | 2,102,519 | ||||||
| ICF International, Inc. |
66,111 | 6,643,494 | ||||||
| *IES Holdings, Inc., Class A |
5,101 | 254,285 | ||||||
| Innovative Solutions and Support, Inc. |
5,621 | 37,998 | ||||||
| Insteel Industries, Inc. |
79,646 | 3,239,203 | ||||||
| *Interface, Inc. |
104,373 | 1,498,796 | ||||||
Dimensional U.S. Targeted Value ETF
SCHEDULE OF INVESTMENTS
October 31, 2021
| Security Description |
Shares | Fair Value | ||||||
| INDUSTRIALS (Continued) |
| |||||||
| #*iSun, Inc. |
434 | $ | 3,528 | |||||
| ITT, Inc. |
85,743 | 8,065,844 | ||||||
| Jacobs Engineering Group, Inc. |
4,867 | 683,424 | ||||||
| *JELD-WEN Holding, Inc. |
135,552 | 3,715,480 | ||||||
| *JetBlue Airways Corp. |
1,120,014 | 15,713,796 | ||||||
| Kadant, Inc. |
53,911 | 11,974,711 | ||||||
| *Kaman Corp. |
80,597 | 2,884,567 | ||||||
| *KAR Auction Services, Inc. |
187,078 | 2,744,434 | ||||||
| #KBR, Inc. |
349,561 | 14,835,369 | ||||||
| *Kelly Services, Inc., Class A |
137,475 | 2,478,674 | ||||||
| *Kennametal, Inc. |
188,413 | 7,489,417 | ||||||
| *Kforce, Inc. |
507 | 32,833 | ||||||
| *Kimball International, Inc., Class B |
145,667 | 1,583,400 | ||||||
| *Kirby Corp. |
104,289 | 5,465,787 | ||||||
| *Knight-Swift Transportation Holdings, Inc. |
708,692 | 40,175,749 | ||||||
| Korn Ferry |
206,406 | 15,936,607 | ||||||
| *Kratos Defense & Security Solutions, Inc. |
9,228 | 197,387 | ||||||
| *L B Foster Co., Class A |
32,768 | 521,994 | ||||||
| *Lawson Products, Inc. |
26,450 | 1,341,015 | ||||||
| *Leidos Holdings, Inc. |
2,591 | 259,048 | ||||||
| *Limbach Holdings, Inc. |
942 | 6,622 | ||||||
| *LS Starrett Co. (The), Class A |
801 | 8,090 | ||||||
| #LSI Industries, Inc. |
60,157 | 447,568 | ||||||
| Macquarie Infrastructure Holdings LLC |
32,371 | 119,449 | ||||||
| *Manitex International, Inc. |
6,385 | 41,311 | ||||||
| *Manitowoc Co., Inc. (The) |
108,678 | 2,328,970 | ||||||
| ManpowerGroup, Inc. |
104,486 | 10,098,572 | ||||||
| *ManTech International Corp., Class A |
72,554 | 6,255,606 | ||||||
| Marten Transport, Ltd. |
481,854 | 8,013,232 | ||||||
| *Masonite International Corp. |
53,228 | 6,387,892 | ||||||
| *MasTec, Inc. |
233,014 | 20,768,538 | ||||||
| *Mastech Digital, Inc. |
3,529 | 65,428 | ||||||
| *Matrix Service Co. |
55,962 | 572,491 | ||||||
| Matson, Inc. |
186,591 | 15,539,299 | ||||||
| *Matthews International Corp., Class A |
81,984 | 2,817,790 | ||||||
| Maxar Technologies, Inc. |
24,156 | 641,342 | ||||||
| McGrath RentCorp. |
75,744 | 5,464,172 | ||||||
| *Mercury Systems, Inc. |
2,726 | 140,498 | ||||||
| *Meritor, Inc. |
8,279 | 201,511 | ||||||
| *Mesa Air Group, Inc. |
20,842 | 157,149 | ||||||
| *Middleby Corp. (The) |
1,226 | 223,671 | ||||||
| *Miller Industries, Inc. |
61,687 | 2,229,368 | ||||||
| *Mistras Group, Inc. |
28,522 | 280,086 | ||||||
| *Moog, Inc., Class A |
77,021 | 5,817,396 | ||||||
| *MRC Global, Inc. |
77,538 | 643,565 | ||||||
| *MSC Industrial Direct Co., Inc. |
61,366 | 5,159,040 | ||||||
| *Mueller Industries, Inc. |
145,411 | 7,654,435 | ||||||
| *Mueller Water Products, Inc., Class A |
312,259 | 5,124,170 | ||||||
| *MYR Group, Inc. |
75,884 | 7,751,551 | ||||||
| National Presto Industries, Inc. |
11,383 | 946,496 | ||||||
| Navios Maritime Partners, LP |
65 | 1,945 | ||||||
| Nielsen Holdings PLC |
187,515 | 3,797,179 | ||||||
| *NL Industries, Inc. |
4,420 | 25,503 | ||||||
| *NN, Inc. |
40,436 | 201,775 | ||||||
| *Northwest Pipe Co. |
53,846 | 1,279,381 | ||||||
| *NOW, Inc. |
427,324 | 3,085,279 | ||||||
| *NV5 Global, Inc. |
35,751 | 3,722,752 | ||||||
Dimensional U.S. Targeted Value ETF
SCHEDULE OF INVESTMENTS
October 31, 2021
| Security Description |
Shares | Fair Value | ||||||
| INDUSTRIALS (Continued) |
||||||||
| nVent Electric PLC |
168,534 | $ | 5,974,530 | |||||
| *Orion Energy Systems, Inc. |
3,225 | 13,190 | ||||||
| *Orion Group Holdings, Inc. |
87,764 | 390,550 | ||||||
| *Oshkosh Corp. |
176,293 | 18,863,351 | ||||||
| Owens Corning |
254,024 | 23,728,382 | ||||||
| *PAM Transportation Services, Inc. |
52,430 | 3,241,223 | ||||||
| Pangaea Logistics Solutions, Ltd. |
13,222 | 59,763 | ||||||
| Park Aerospace Corp. |
20,050 | 262,455 | ||||||
| *Park-Ohio Holdings Corp. |
31,696 | 739,151 | ||||||
| *Parsons Corp. |
6,468 | 224,052 | ||||||
| Patriot Transportation Holding, Inc. |
8,998 | 137,939 | ||||||
| *Perma-Fix Environmental Services, Inc. |
88 | 634 | ||||||
| *Perma-Pipe International Holdings, Inc. |
44,465 | 380,176 | ||||||
| *PGT Innovations, Inc. |
87,543 | 1,869,043 | ||||||
| *Powell Industries, Inc. |
34,230 | 885,188 | ||||||
| Preformed Line Products Co. |
18,288 | 1,269,187 | ||||||
| Primoris Services Corp. |
114,070 | 3,074,187 | ||||||
| *Proto Labs, Inc. |
705 | 42,166 | ||||||
| #*Quad/Graphics, Inc. |
40,912 | 161,193 | ||||||
| Quanex Building Products Corp. |
85,122 | 1,763,728 | ||||||
| Quanta Services, Inc. |
590,769 | 71,648,464 | ||||||
| *Quest Resource Holding Corp. |
7,056 | 41,066 | ||||||
| *Radiant Logistics, Inc. |
172,714 | 1,162,365 | ||||||
| *Raven Industries, Inc. |
40,179 | 2,323,150 | ||||||
| *RBC Bearings, Inc. |
312 | 72,986 | ||||||
| *RCM Technologies, Inc. |
61,355 | 366,289 | ||||||
| *Regal Rexnord Corp. |
169,170 | 25,769,666 | ||||||
| *Resideo Technologies, Inc. |
158,721 | 3,914,060 | ||||||
| Resources Connection, Inc. |
149,903 | 2,609,811 | ||||||
| REV Group, Inc. |
54,417 | 822,241 | ||||||
| *Rush Enterprises, Inc., Class A |
276,290 | 14,389,183 | ||||||
| *Rush Enterprises, Inc., Class B |
77,968 | 4,031,725 | ||||||
| *Ryder System, Inc. |
243,899 | 20,719,220 | ||||||
| *Saia, Inc. |
62,801 | 19,634,105 | ||||||
| Schneider National, Inc., Class B |
78,852 | 1,966,569 | ||||||
| Science Applications International Corp. |
6,453 | 579,350 | ||||||
| *Sensata Technologies Holding PLC |
171,604 | 9,455,380 | ||||||
| *Servotronics, Inc. |
6,331 | 71,604 | ||||||
| *SG Blocks, Inc. |
277 | 839 | ||||||
| *Shyft Group, Inc. (The) |
116,299 | 4,792,682 | ||||||
| *Sifco Industries, Inc. |
8,510 | 65,272 | ||||||
| *Simpson Manufacturing Co., Inc. |
50,466 | 5,353,938 | ||||||
| *SkyWest, Inc. |
257,278 | 11,070,672 | ||||||
| *Snap-on, Inc. |
61,658 | 12,530,755 | ||||||
| *SP Plus Corp. |
29,312 | 945,312 | ||||||
| *Spirit Airlines, Inc. |
58,828 | 1,285,392 | ||||||
| *SPX Corp. |
53,342 | 3,098,637 | ||||||
| SPX FLOW, Inc. |
78,557 | 5,868,993 | ||||||
| *Standex International Corp. |
57,794 | 6,430,738 | ||||||
| Steelcase, Inc., Class A |
215,525 | 2,564,748 | ||||||
| *Sterling Construction Co., Inc. |
105,845 | 2,544,514 | ||||||
| *Sunrun, Inc. |
1,264 | 72,908 | ||||||
| *Taylor Devices, Inc. |
7 | 84 | ||||||
| *Tennant Co. |
2,364 | 187,843 | ||||||
| *Terex Corp. |
268,366 | 12,022,797 | ||||||
| *Textainer Group Holdings, Ltd. |
102,909 | 4,043,295 | ||||||
Dimensional U.S. Targeted Value ETF
SCHEDULE OF INVESTMENTS
October 31, 2021
| Security Description |
Shares | Fair Value | ||||||
| INDUSTRIALS (Continued) |
| |||||||
| *Textron, Inc. |
32,241 | $ | 2,380,998 | |||||
| *Thermon Group Holdings, Inc. |
127,763 | 2,207,745 | ||||||
| *Timken Co. (The) |
131,407 | 9,323,327 | ||||||
| *Titan International, Inc. |
— | — | ||||||
| *Titan Machinery, Inc. |
106,679 | 3,031,817 | ||||||
| *Transcat, Inc. |
8,060 | 603,533 | ||||||
| *TriMas Corp. |
150,623 | 5,023,277 | ||||||
| Trinity Industries, Inc. |
631,459 | 17,712,425 | ||||||
| Triton International, Ltd. |
365,065 | 22,703,392 | ||||||
| *TrueBlue, Inc. |
149,606 | 4,166,527 | ||||||
| *Tutor Perini Corp. |
91,359 | 1,244,310 | ||||||
| *Twin Disc, Inc. |
45,044 | 611,698 | ||||||
| UFP Industries, Inc. |
278,960 | 22,827,297 | ||||||
| *Ultralife Corp. |
56,788 | 355,493 | ||||||
| *UniFirst Corp. |
56,206 | 11,126,540 | ||||||
| *United Airlines Holdings, Inc. |
1,047 | 48,309 | ||||||
| *Univar Solutions, Inc. |
108,955 | 2,787,069 | ||||||
| Universal Logistics Holdings, Inc. |
12,580 | 265,186 | ||||||
| *US Ecology, Inc. |
3,716 | 119,618 | ||||||
| *US Xpress Enterprises, Inc., Class A |
10,338 | 78,259 | ||||||
| *USA Truck, Inc. |
14,812 | 285,427 | ||||||
| *Valmont Industries, Inc. |
12,275 | 2,933,234 | ||||||
| *Vectrus, Inc. |
47,055 | 2,278,874 | ||||||
| *Veritiv Corp. |
38,418 | 4,121,099 | ||||||
| *Viad Corp. |
84,251 | 3,738,217 | ||||||
| *Vidler Water Resources, Inc. |
50,122 | 619,508 | ||||||
| *Virco MFG. Corp. |
12,780 | 42,430 | ||||||
| *VSE Corp. |
26,188 | 1,454,743 | ||||||
| *Wabash National Corp. |
189,318 | 2,940,109 | ||||||
| *Watts Water Technologies, Inc., Class A |
65,622 | 12,469,492 | ||||||
| *Werner Enterprises, Inc. |
204,618 | 9,273,288 | ||||||
| *WESCO International, Inc. |
173,722 | 22,507,422 | ||||||
| *Wilhelmina International, Inc. |
1,048 | 5,754 | ||||||
| #*Willdan Group, Inc. |
14,488 | 484,334 | ||||||
| *Willis Lease Finance Corp. |
36,626 | 1,483,719 | ||||||
| *WillScot Mobile Mini Holdings Corp. |
509,908 | 17,719,303 | ||||||
| *XPO Logistics, Inc. |
133,945 | 11,492,481 | ||||||
| Zurn Water Solutions Corp. |
128,780 | 4,672,138 | ||||||
|
|
|
|||||||
| TOTAL INDSUTRIALS |
1,411,235,190 | |||||||
|
|
|
|||||||
| INFORMATION TECHNOLOGY (8.2%) |
| |||||||
| *ACI Worldwide, Inc. |
10,297 | 315,912 | ||||||
| ADTRAN, Inc. |
107,636 | 1,989,113 | ||||||
| *Advanced Energy Industries, Inc. |
2,827 | 259,575 | ||||||
| *Alithya Group, Inc., Class A |
89,683 | 247,525 | ||||||
| *Alliance Data Systems Corp. |
6,494 | 553,613 | ||||||
| *Alpha & Omega Semiconductor, Ltd. |
96,702 | 3,350,724 | ||||||
| *Amkor Technology, Inc. |
654,133 | 14,338,595 | ||||||
| *Amtech Systems, Inc. |
43,046 | 646,551 | ||||||
| #*Applied Optoelectronics, Inc. |
1,509 | 11,544 | ||||||
| *Arlo Technologies, Inc. |
8,234 | 56,815 | ||||||
| *Arrow Electronics, Inc. |
390,791 | 45,234,058 | ||||||
| *AstroNova, Inc. |
28,177 | 464,921 | ||||||
| *Asure Software, Inc. |
11,304 | 109,197 | ||||||
| *Autoscope Technologies Corp. |
181 | 1,238 | ||||||
| *Avaya Holdings Corp. |
11,316 | 210,704 | ||||||
| *Aviat Networks, Inc. |
16,326 | 466,924 | ||||||
Dimensional U.S. Targeted Value ETF
SCHEDULE OF INVESTMENTS
October 31, 2021
| Security Description |
Shares | Fair Value | ||||||
| INFORMATION TECHNOLOGY (Continued) |
| |||||||
| *Avnet, Inc. |
394,340 | $ | 15,028,297 | |||||
| *Aware, Inc. |
72,391 | 254,816 | ||||||
| *Axcelis Technologies, Inc. |
125,801 | 6,910,249 | ||||||
| *AXT, Inc. |
171,300 | 1,399,521 | ||||||
| *Bel Fuse, Inc. |
7,823 | 116,680 | ||||||
| *Bel Fuse, Inc., Class B |
7,503 | 104,442 | ||||||
| *Belden, Inc. |
85,889 | 5,171,377 | ||||||
| Benchmark Electronics, Inc. |
209,080 | 4,873,655 | ||||||
| BK Technologies Corp. |
507 | 1,496 | ||||||
| #*BM Technologies, Inc. |
8,473 | 75,749 | ||||||
| *Bottomline Technologies DE, Inc. |
459 | 21,252 | ||||||
| *Brooks Automation, Inc. |
149,662 | 17,428,140 | ||||||
| #*BSQUARE Corp. |
33,602 | 74,932 | ||||||
| Cass Information Systems, Inc. |
5,098 | 208,967 | ||||||
| *Cerence, Inc. |
1,261 | 132,569 | ||||||
| *CEVA, Inc. |
5,396 | 246,112 | ||||||
| *Cirrus Logic, Inc. |
86,254 | 6,970,186 | ||||||
| *Clearfield, Inc. |
15,018 | 848,367 | ||||||
| *ClearOne, Inc. |
83 | 131 | ||||||
| CMC Materials, Inc. |
2,192 | 281,387 | ||||||
| *Coda Octopus Group, Inc. |
66 | 557 | ||||||
| *Coherent, Inc. |
24,310 | 6,184,464 | ||||||
| *Cohu, Inc. |
66,355 | 2,126,014 | ||||||
| *Computer Task Group, Inc. |
59,710 | 463,350 | ||||||
| Comtech Telecommunications Corp. |
124,202 | 2,679,037 | ||||||
| Concentrix Corp. |
211,396 | 37,560,841 | ||||||
| *Conduent, Inc. |
151,657 | 1,023,685 | ||||||
| *CSG Systems International, Inc. |
25,361 | 1,269,318 | ||||||
| *CSP, Inc. |
5,491 | 46,783 | ||||||
| *CTS Corp. |
98,519 | 3,509,247 | ||||||
| *Cyberoptics Corp. |
28,832 | 1,204,024 | ||||||
| *Daktronics, Inc. |
104,594 | 580,497 | ||||||
| *Data I/O Corp. |
18,111 | 98,162 | ||||||
| *Digi International, Inc. |
126,389 | 2,723,683 | ||||||
| *Diodes, Inc. |
227,675 | 21,877,291 | ||||||
| *DSP Group, Inc. |
68,852 | 1,512,678 | ||||||
| *DXC Technology Co. |
126,090 | 4,106,751 | ||||||
| *Ebix, Inc. |
10,046 | 329,609 | ||||||
| *EchoStar Corp., Class A |
150,916 | 3,540,489 | ||||||
| *Electro-Sensors, Inc. |
248 | 1,277 | ||||||
| *EMCORE Corp. |
45,704 | 341,866 | ||||||
| *ePlus, Inc. |
66,917 | 7,399,013 | ||||||
| *Evolving Systems, Inc. |
69 | 188 | ||||||
| *ExlService Holdings, Inc. |
4,788 | 587,152 | ||||||
| *Fabrinet |
122,455 | 11,755,680 | ||||||
| *FARO Technologies, Inc. |
2,631 | 193,563 | ||||||
| *First Solar, Inc. |
19,136 | 2,288,474 | ||||||
| *Flex, Ltd. |
880,760 | 14,884,844 | ||||||
| *FormFactor, Inc. |
244,897 | 9,742,003 | ||||||
| *Frequency Electronics, Inc. |
36,804 | 367,672 | ||||||
| *Genasys, Inc. |
98 | 498 | ||||||
| *GSI Technology, Inc. |
69,671 | 361,592 | ||||||
| *GTY Technology Holdings, Inc. |
9,458 | 71,881 | ||||||
| #*Hackett Group, Inc. (The) |
90,393 | 1,910,908 | ||||||
| *Harmonic, Inc. |
327,361 | 2,969,164 | ||||||
| *I3 Verticals, Inc., Class A |
815 | 18,248 | ||||||
Dimensional U.S. Targeted Value ETF
SCHEDULE OF INVESTMENTS
October 31, 2021
| Security Description |
Shares | Fair Value | ||||||
| INFORMATION TECHNOLOGY (Continued) |
| |||||||
| *Ichor Holdings, Ltd. |
73,378 | $ | 3,208,086 | |||||
| *II-VI, Inc. |
107,002 | 6,474,691 | ||||||
| *Immersion Corp. |
1,474 | 11,777 | ||||||
| Information Services Group, Inc. |
6,612 | 53,888 | ||||||
| *Insight Enterprises, Inc. |
146,740 | 13,896,278 | ||||||
| InterDigital, Inc. |
48,617 | 3,254,908 | ||||||
| *inTEST Corp. |
51,079 | 565,445 | ||||||
| *Intevac, Inc. |
46,019 | 214,909 | ||||||
| *Issuer Direct Corp. |
250 | 6,367 | ||||||
| *Iteris, Inc. |
5,783 | 30,997 | ||||||
| *Itron, Inc. |
4,854 | 377,496 | ||||||
| *Jabil, Inc. |
378,632 | 22,702,775 | ||||||
| Juniper Networks, Inc. |
187,220 | 5,526,734 | ||||||
| *Key Tronic Corp. |
55,546 | 358,272 | ||||||
| *Kimball Electronics, Inc., Class B |
110,386 | 3,173,598 | ||||||
| *Knowles Corp. |
425,349 | 8,864,273 | ||||||
| *Kulicke & Soffa Industries, Inc. |
175,477 | 10,002,189 | ||||||
| *KVH Industries, Inc. |
49,047 | 503,222 | ||||||
| *Lantronix, Inc. |
9,015 | 87,445 | ||||||
| *LGL Group, Inc. (The) |
10,224 | 129,436 | ||||||
| *Lightpath Technologies, Inc. |
617 | 1,203 | ||||||
| *Littelfuse, Inc. |
594 | 174,963 | ||||||
| *Luna Innovations, Inc. |
35,024 | 341,134 | ||||||
| *MACOM Technology Solutions Holdings, Inc. |
146 | 10,194 | ||||||
| *MagnaChip Semiconductor Corp. |
2,960 | 56,122 | ||||||
| *Maximus, Inc. |
3,258 | 275,529 | ||||||
| Methode Electronics, Inc. |
165,396 | 6,958,210 | ||||||
| MKS Instruments, Inc. |
86,518 | 12,982,026 | ||||||
| *N-Able, Inc. |
2,965 | 39,434 | ||||||
| *Napco Security Technologies, Inc. |
18,706 | 897,140 | ||||||
| *NeoPhotonics Corp. |
35,153 | 355,748 | ||||||
| *NETGEAR, Inc. |
108,517 | 3,128,545 | ||||||
| *NetScout Systems, Inc. |
297,829 | 8,059,253 | ||||||
| *NetSol Technologies, Inc. |
498 | 2,251 | ||||||
| Network-1 Technologies, Inc. |
5,396 | 15,163 | ||||||
| *nLight, Inc. |
787 | 22,130 | ||||||
| *Nortech Systems, Inc. |
244 | 2,501 | ||||||
| NVE Corp. |
492 | 33,441 | ||||||
| *ON Semiconductor Corp. |
147,893 | 7,109,217 | ||||||
| *OneSpan, Inc. |
57,280 | 1,169,658 | ||||||
| *Onto Innovation, Inc. |
127,467 | 10,096,661 | ||||||
| *Optical Cable Corp. |
8,416 | 32,486 | ||||||
| *OSI Systems, Inc. |
61,739 | 5,748,518 | ||||||
| *Park City Group, Inc. |
321 | 1,820 | ||||||
| PC Connection, Inc. |
162,245 | 7,471,382 | ||||||
| PCTEL, Inc. |
67,965 | 391,478 | ||||||
| *PDF Solutions, Inc. |
829 | 19,506 | ||||||
| *Perficient, Inc. |
96,250 | 11,896,500 | ||||||
| *PFSweb, Inc. |
915 | 11,895 | ||||||
| #*Photronics, Inc. |
209,028 | 2,715,274 | ||||||
| *Ping Identity Holding Corp. |
12,880 | 364,890 | ||||||
| *Plexus Corp. |
108,854 | 9,505,131 | ||||||
| *Powerfleet, Inc. |
5,717 | 39,562 | ||||||
| Qad, Inc. |
465 | 40,646 | ||||||
| *Rambus, Inc. |
232,304 | 5,405,714 | ||||||
| *RF Industries, Ltd. |
23,468 | 178,591 | ||||||
| *Ribbon Communications, Inc. |
28,126 | 153,849 | ||||||
Dimensional U.S. Targeted Value ETF
SCHEDULE OF INVESTMENTS
October 31, 2021
| Security Description |
Shares | Fair Value | ||||||
| INFORMATION TECHNOLOGY (Continued) |
| |||||||
| *Richardson Electronics, Ltd. |
49,836 | $ | 543,711 | |||||
| *Rogers Corp. |
42,130 | 8,473,186 | ||||||
| *Rubicon Technology, Inc. |
4 | 40 | ||||||
| *Sanmina Corp. |
308,784 | 11,656,596 | ||||||
| Sapiens International Corp. NV |
3,848 | 134,411 | ||||||
| *ScanSource, Inc. |
94,897 | 3,395,415 | ||||||
| *SigmaTron International, Inc. |
1,284 | 11,299 | ||||||
| *SMART Global Holdings, Inc. |
14,606 | 780,837 | ||||||
| *Smith Micro Software, Inc. |
10,272 | 58,550 | ||||||
| *StarTek, Inc. |
4,876 | 26,818 | ||||||
| #*Stratasys, Ltd. |
92,049 | 2,903,225 | ||||||
| *Super Micro Computer, Inc. |
66,711 | 2,360,902 | ||||||
| *Synaptics, Inc. |
23,882 | 4,646,721 | ||||||
| *Synchronoss Technologies, Inc. |
16,678 | 44,030 | ||||||
| SYNNEX Corp. |
210,629 | 22,116,045 | ||||||
| *Taitron Components, Inc. |
978 | 3,961 | ||||||
| *Tessco Technologies, Inc. |
33,244 | 174,199 | ||||||
| *Trio-Tech International |
1,041 | 4,684 | ||||||
| *TSR, Inc. |
9 | 95 | ||||||
| *TTM Technologies, Inc. |
429,357 | 5,684,687 | ||||||
| *Turtle Beach Corp. |
1,158 | 33,304 | ||||||
| *Ultra Clean Holdings, Inc. |
140,095 | 6,944,509 | ||||||
| *Upland Software, Inc. |
6,644 | 221,710 | ||||||
| *Veeco Instruments, Inc. |
89,405 | 2,171,647 | ||||||
| *VerifyMe, Inc. |
239 | 803 | ||||||
| *Verint Systems, Inc. |
34,464 | 1,606,022 | ||||||
| *Viasat, Inc. |
43,274 | 2,583,025 | ||||||
| *Vishay Intertechnology, Inc. |
493,895 | 9,492,662 | ||||||
| *Vishay Precision Group, Inc. |
61,324 | 2,090,535 | ||||||
| *Wayside Technology Group, Inc. |
4,869 | 129,467 | ||||||
| *WidePoint Corp. |
80 | 406 | ||||||
| Xerox Holdings Corp. |
14,168 | 252,190 | ||||||
| Xperi Holding Corp. |
82,501 | 1,478,418 | ||||||
|
|
|
|||||||
| TOTAL INFORMATION TECHNOLOGY |
537,310,498 | |||||||
|
|
|
|||||||
| MATERIALS (7.8%) |
| |||||||
| *Advanced Emissions Solutions, Inc. |
8,374 | 56,859 | ||||||
| *AdvanSix, Inc. |
88,766 | 4,314,028 | ||||||
| *AgroFresh Solutions, Inc. |
7,956 | 16,151 | ||||||
| *Albemarle Corp. |
1,324 | 331,622 | ||||||
| Alcoa Corp. |
83,384 | 3,831,495 | ||||||
| #*Allegheny Technologies, Inc. |
268,988 | 4,314,607 | ||||||
| *Alpha Metallurgical Resources, Inc. |
3,131 | 193,464 | ||||||
| American Vanguard Corp. |
123,363 | 1,921,996 | ||||||
| *Ampco-Pittsburgh Corp. |
3,149 | 17,697 | ||||||
| *Arconic Corp. |
19,701 | 579,603 | ||||||
| *Ashland Global Holdings, Inc. |
191,277 | 18,364,505 | ||||||
| Avient Corp. |
47,159 | 2,540,927 | ||||||
| *Berry Global Group, Inc. |
16,563 | 1,085,539 | ||||||
| *Cabot Corp. |
109,209 | 5,826,300 | ||||||
| Caledonia Mining Corp. PLC |
1,282 | 15,884 | ||||||
| Carpenter Technology Corp. |
149,365 | 4,612,391 | ||||||
| #*Century Aluminum Co. |
377,341 | 4,984,675 | ||||||
| *CF Industries Holdings, Inc. |
208,543 | 11,845,242 | ||||||
| Chase Corp. |
16,507 | 1,584,672 | ||||||
| *Chemours Co. (The) |
16,823 | 471,380 | ||||||
Dimensional U.S. Targeted Value ETF
SCHEDULE OF INVESTMENTS
October 31, 2021
| Security Description |
Shares | Fair Value | ||||||
| MATERIALS (Continued) |
| |||||||
| *Clearwater Paper Corp. |
83,468 | $ | 3,491,466 | |||||
| #*Cleveland-Cliffs, Inc. |
18,060 | 435,427 | ||||||
| *Coeur Mining, Inc. |
414,186 | 2,621,798 | ||||||
| #Commercial Metals Co. |
550,745 | 17,722,974 | ||||||
| *Core Molding Technologies, Inc. |
22,812 | 250,932 | ||||||
| *Domtar Corp. |
213,899 | 11,676,746 | ||||||
| Eastman Chemical Co. |
22,589 | 2,349,934 | ||||||
| Ecovyst, Inc. |
13,780 | 160,951 | ||||||
| Element Solutions, Inc. |
914,545 | 20,769,317 | ||||||
| *Ferro Corp. |
83,666 | 1,758,659 | ||||||
| *Ferroglobe PLC |
12,960 | 85,925 | ||||||
| *Flexible Solutions International, Inc. |
1,181 | 4,322 | ||||||
| FMC Corp. |
887 | 80,726 | ||||||
| Fortitude Gold Corp. |
29,616 | 201,093 | ||||||
| Friedman Industries, Inc. |
18,630 | 256,349 | ||||||
| FutureFuel Corp. |
65,144 | 459,916 | ||||||
| *GCP Applied Technologies, Inc. |
20,147 | 455,524 | ||||||
| Glatfelter Corp. |
235,527 | 3,869,709 | ||||||
| #Gold Resource Corp. |
108,335 | 199,336 | ||||||
| *Graphic Packaging Holding Co. |
516,837 | 10,300,561 | ||||||
| Greif, Inc., Class A |
91,627 | 5,926,434 | ||||||
| Greif, Inc., Class B |
15,964 | 1,041,811 | ||||||
| *Hawkins, Inc. |
78,881 | 2,892,566 | ||||||
| *Haynes International, Inc. |
64,151 | 2,574,380 | ||||||
| HB Fuller Co. |
215,093 | 15,166,207 | ||||||
| *Hecla Mining Co. |
2,128,997 | 12,305,603 | ||||||
| *Huntsman Corp. |
793,071 | 25,838,253 | ||||||
| #*Ikonics Corp. |
36 | 955 | ||||||
| Innospec, Inc. |
89,657 | 8,123,821 | ||||||
| *Intrepid Potash, Inc. |
18,072 | 880,287 | ||||||
| Kaiser Aluminum Corp. |
70,396 | 6,838,267 | ||||||
| *Koppers Holdings, Inc. |
24,029 | 843,178 | ||||||
| *Kraton Corp. |
111,919 | 5,109,102 | ||||||
| Kronos Worldwide, Inc. |
76,763 | 1,000,222 | ||||||
| #*Livent Corp. |
125,269 | 3,535,091 | ||||||
| *Louisiana-Pacific Corp. |
185,693 | 10,942,888 | ||||||
| *Materion Corp. |
85,277 | 6,155,294 | ||||||
| *Mercer International, Inc. |
228,909 | 2,465,350 | ||||||
| *Minerals Technologies, Inc. |
145,020 | 10,287,719 | ||||||
| Mosaic Co. (The) |
239,505 | 9,956,223 | ||||||
| *Myers Industries, Inc. |
92,136 | 1,896,159 | ||||||
| *Neenah, Inc. |
47,467 | 2,398,982 | ||||||
| #Nexa Resources SA |
6,064 | 51,241 | ||||||
| *Northern Technologies International Corp. |
44,842 | 683,840 | ||||||
| *Olin Corp. |
480,822 | 27,397,238 | ||||||
| Olympic Steel, Inc. |
52,325 | 1,411,205 | ||||||
| *Orion Engineered Carbons SA |
3,447 | 64,804 | ||||||
| Packaging Corp. of America |
6,086 | 836,034 | ||||||
| Pactiv Evergreen, Inc. |
2,854 | 39,699 | ||||||
| #*Quaker Chemical Corp. |
529 | 130,049 | ||||||
| *Ramaco Resources, Inc. |
162 | 3,012 | ||||||
| *Ranpak Holdings Corp. |
18,510 | 637,855 | ||||||
| #*Rayonier Advanced Materials, Inc. |
214,283 | 1,538,552 | ||||||
| *Reliance Steel & Aluminum Co. |
305,575 | 44,662,842 | ||||||
| Resolute Forest Products, Inc. |
80,393 | 945,422 | ||||||
| *Ryerson Holding Corp. |
17,335 | 456,951 | ||||||
| *Schnitzer Steel Industries, Inc. |
151,640 | 8,158,232 | ||||||
Dimensional U.S. Targeted Value ETF
SCHEDULE OF INVESTMENTS
October 31, 2021
| Security Description |
Shares | Fair Value | ||||||
| MATERIALS (Continued) |
| |||||||
| *Schweitzer-Mauduit International, Inc. |
109,950 | $ | 3,830,658 | |||||
| Sensient Technologies Corp. |
20,799 | 1,988,384 | ||||||
| *Silgan Holdings, Inc. |
13,551 | 544,750 | ||||||
| *Smith-Midland Corp. |
120 | 2,400 | ||||||
| *Sonoco Products Co. |
57,956 | 3,358,550 | ||||||
| *Steel Dynamics, Inc. |
533,554 | 35,257,248 | ||||||
| *Stepan Co. |
69,040 | 8,286,181 | ||||||
| *Summit Materials, Inc., Class A |
380,527 | 13,565,788 | ||||||
| SunCoke Energy, Inc. |
342,226 | 2,470,872 | ||||||
| *Synalloy Corp. |
24,561 | 277,539 | ||||||
| *TimkenSteel Corp. |
234,634 | 3,273,144 | ||||||
| *Trecora Resources |
49,579 | 385,725 | ||||||
| *Tredegar Corp. |
90,692 | 1,093,745 | ||||||
| Trinseo PLC |
54,943 | 3,080,105 | ||||||
| Tronox Holdings PLC, Class A |
387,832 | 9,044,242 | ||||||
| *UFP Technologies, Inc. |
15,338 | 949,269 | ||||||
| *United States Lime & Minerals, Inc. |
12,201 | 1,506,579 | ||||||
| #*United States Steel Corp. |
409,864 | 10,816,311 | ||||||
| *Universal Stainless & Alloy Products, Inc. |
17,097 | 162,080 | ||||||
| Valvoline, Inc. |
105,622 | 3,586,923 | ||||||
| *Venator Materials PLC |
27,797 | 83,669 | ||||||
| #Verso Corp., Class A |
119,284 | 2,633,791 | ||||||
| Warrior Met Coal, Inc. |
62,298 | 1,493,283 | ||||||
| *Westlake Chemical Corp. |
260,362 | 25,343,637 | ||||||
| Westrock Co. |
82,473 | 3,966,951 | ||||||
| *Worthington Industries, Inc. |
116,616 | 6,334,581 | ||||||
|
|
|
|||||||
| TOTAL MATERIALS |
510,592,875 | |||||||
|
|
|
|||||||
| REAL ESTATE (0.6%) |
| |||||||
| *Altisource Portfolio Solutions SA |
2,866 | 37,258 | ||||||
| *AMREP Corp. |
10,126 | 141,966 | ||||||
| *Cushman & Wakefield PLC |
175,541 | 3,228,199 | ||||||
| *Five Point Holdings LLC, Class A |
8,804 | 64,797 | ||||||
| *Forestar Group, Inc. |
42,102 | 823,936 | ||||||
| *FRP Holdings, Inc. |
27,162 | 1,553,666 | ||||||
| *Howard Hughes Corp. (The) |
26,993 | 2,351,900 | ||||||
| Indus Realty Trust, Inc. |
10,561 | 736,102 | ||||||
| *Jones Lang LaSalle, Inc. |
53,520 | 13,820,470 | ||||||
| *Kennedy-Wilson Holdings, Inc. |
79,578 | 1,780,160 | ||||||
| *Marcus & Millichap, Inc. |
41,310 | 1,945,701 | ||||||
| Newmark Group, Inc., Class A |
2,633 | 39,179 | ||||||
| #*Rafael Holdings, Inc., Class B |
43,798 | 331,113 | ||||||
| Re/Max Holdings, Inc. |
37,289 | 1,186,163 | ||||||
| *Realogy Holdings Corp. |
388,338 | 6,726,014 | ||||||
| RMR Group, Inc. (The), Class A |
8,075 | 280,929 | ||||||
| *St Joe Co. (The) |
9,476 | 445,562 | ||||||
| #*Stratus Properties, Inc. |
26,919 | 917,400 | ||||||
| *Tejon Ranch Co. |
113,186 | 2,061,117 | ||||||
| *Trinity Place Holdings, Inc. |
91 | 183 | ||||||
|
|
|
|||||||
| TOTAL REAL ESTATE |
38,471,815 | |||||||
|
|
|
|||||||
| UTILITIES (0.2%) |
| |||||||
| *Genie Energy, Ltd., Class B |
84,494 | 418,245 | ||||||
| *MDU Resources Group, Inc. |
54,701 | 1,680,962 | ||||||
| *New Jersey Resources Corp. |
42,852 | 1,620,234 | ||||||
| NRG Energy, Inc. |
6 | 239 | ||||||
Dimensional U.S. Targeted Value ETF
SCHEDULE OF INVESTMENTS
October 31, 2021
| Security Description |
Shares | Fair Value | ||||||
| UTILITIES (Continued) |
| |||||||
| #*Ormat Technologies, Inc. |
80,841 | $ | 5,847,230 | |||||
| *Sunnova Energy International, Inc. |
3,056 | 136,175 | ||||||
| Vistra Corp. |
215,052 | 4,212,869 | ||||||
|
|
|
|||||||
| TOTAL UTILITIES |
13,915,954 | |||||||
|
|
|
|||||||
| TOTAL COMMON STOCKS (Cost $3,102,654,605) |
6,408,669,308 | |||||||
|
|
|
|||||||
| PREFERRED STOCKS (0.1%) |
| |||||||
| COMMUNICATION SERVICES (0.0%) |
| |||||||
| *Liberty Broadband Corp. |
13,712 | 389,421 | ||||||
|
|
|
|||||||
| CONSUMER DISCRETIONARY (0.0%) |
| |||||||
| Qurate Retail, Inc. |
12,158 | 1,327,411 | ||||||
|
|
|
|||||||
| INDUSTRIALS (0.1%) |
| |||||||
| WESCO International, Inc., Series A |
66,146 | 2,076,984 | ||||||
|
|
|
|||||||
| TOTAL PREFERRED STOCKS (Cost $2,768,268) |
3,793,816 | |||||||
|
|
|
|||||||
| RIGHTS (0.0%) |
| |||||||
| COMMUNICATION SERVICES (0.0%) |
| |||||||
| *»Media General, Inc. |
109,358 | 6,167 | ||||||
|
|
|
|||||||
| CONSUMER DISCRETIONARY (0.0%) |
| |||||||
| *»Zagg, Inc. |
94,298 | 8,487 | ||||||
|
|
|
|||||||
| FINANCIALS (0.0%) |
| |||||||
| *»Newstar Financial, Inc. |
159,703 | 16,226 | ||||||
|
|
|
|||||||
| HEALTH CARE (0.0%) |
| |||||||
| *»Achillion Pharmaceuticals |
98,996 | 143,544 | ||||||
| *»Pfenex, Inc. |
3,214 | 2,411 | ||||||
| *»Xeris Biopharma Holdings, Inc. |
358 | 50 | ||||||
|
|
|
|||||||
| TOTAL HEALTH CARE |
146,005 | |||||||
|
|
|
|||||||
| TOTAL RIGHTS (Cost $56,436) |
176,885 | |||||||
|
|
|
|||||||
| WARRANT (0.0%) |
| |||||||
| ENERGY (0.0%) |
| |||||||
| *Nabors Industries, Ltd. 6/11/2026 |
3,459 | 25,597 | ||||||
|
|
|
|||||||
| TOTAL WARRANT (Cost $–) |
25,597 | |||||||
|
|
|
|||||||
| TOTAL INVESTMENT SECURITIES (Cost $3,105,479,309) |
6,412,665,606 | |||||||
|
|
|
|||||||
| SECURITIES LENDING COLLATERAL (2.1%) |
| |||||||
| @§The DFA Short Term Investment Fund |
11,803,654 | 136,562,377 | ||||||
|
|
|
|||||||
| TOTAL INVESTMENTS (Cost $3,242,041,687) — 100.0% |
|
6,549,227,985 | ||||||
|
|
|
|||||||
Dimensional U.S. Targeted Value ETF
SCHEDULE OF INVESTMENTS
October 31, 2021
| * | Non-Income Producing Securities |
| » | Securities that have generally been fair value factored |
| # | Total or Partial Securities on Loan. |
| @ | Security purchased with cash collateral received from Securities on Loan |
| § | Affiliated Fund |
| ADR | American Depositary Receipt |
| PLC | Public Limited Company |
| SA | Special Assessment |
Dimensional International Core Equity Market ETF
SCHEDULE OF INVESTMENTS
October 31, 2021
| Security Description |
Shares | Fair Value | ||||||
| COMMON STOCKS (98.5%) |
| |||||||
| AUSTRALIA (6.4%) |
| |||||||
| *5G Networks, Ltd. |
40 | $ | 28 | |||||
| *A2B Australia, Ltd. |
92 | 92 | ||||||
| Accent Group, Ltd. |
272 | 507 | ||||||
| Adairs, Ltd. |
6,335 | 17,558 | ||||||
| Adbri, Ltd. |
288 | 645 | ||||||
| *Advance NanoTek, Ltd. |
16 | 42 | ||||||
| *Aeris Resources, Ltd. |
1,048 | 126 | ||||||
| *Afterpay, Ltd. |
2,248 | 208,172 | ||||||
| AGL Energy, Ltd. |
42,153 | 181,101 | ||||||
| #*Alkane Resources, Ltd. |
276 | 186 | ||||||
| *Alliance Aviation Services, Ltd. |
368 | 1,034 | ||||||
| ALS, Ltd. |
25,799 | 255,979 | ||||||
| Altium, Ltd. |
4,637 | 127,890 | ||||||
| Alumina, Ltd. |
7,878 | 11,775 | ||||||
| #*AMA Group, Ltd. |
1,351 | 492 | ||||||
| *AMP, Ltd. |
6,736 | 5,464 | ||||||
| Ampol, Ltd. |
8,187 | 187,860 | ||||||
| Ansell, Ltd. |
6,189 | 146,476 | ||||||
| APA Group |
60,468 | 372,424 | ||||||
| Appen, Ltd. |
6,694 | 54,050 | ||||||
| ARB Corp., Ltd. |
40 | 1,460 | ||||||
| *Ardent Leisure Group, Ltd. |
420 | 472 | ||||||
| *»Aristocrat Leisure, Ltd. |
929 | 32,572 | ||||||
| #*Aristocrat Leisure, Ltd. |
19,988 | 700,807 | ||||||
| *Artemis Resources, Ltd. |
496 | 37 | ||||||
| ASX, Ltd. |
6,706 | 418,162 | ||||||
| Atlas Arteria, Ltd. |
52,083 | 242,541 | ||||||
| AUB Group, Ltd. |
109 | 1,777 | ||||||
| *Aurelia Metals, Ltd. |
8,745 | 2,496 | ||||||
| Aurizon Holdings, Ltd. |
96,592 | 244,495 | ||||||
| AusNet Services, Ltd. |
1,196 | 2,219 | ||||||
| Austal, Ltd. |
13,585 | 19,183 | ||||||
| *Austin Engineering, Ltd. |
401 | 71 | ||||||
| *Australia & New Zealand Banking Group, Ltd. |
81,992 | 1,732,980 | ||||||
| *Australian Agricultural Co., Ltd. |
990 | 1,175 | ||||||
| Australian Ethical Investment, Ltd. |
56 | 576 | ||||||
| *Australian Pharmaceutical Industries, Ltd. |
1,902 | 2,157 | ||||||
| *Australian Vintage, Ltd. |
122 | 76 | ||||||
| Auswide Bank, Ltd. |
46 | 237 | ||||||
| #Ava Risk Group, Ltd. |
68 | 23 | ||||||
| AVJennings, Ltd. |
108 | 50 | ||||||
| Baby Bunting Group, Ltd. |
1,268 | 5,619 | ||||||
| Bank of Queensland, Ltd. |
1,247 | 8,242 | ||||||
| Bapcor, Ltd. |
12,517 | 74,742 | ||||||
| Base Resources, Ltd. |
260 | 60 | ||||||
| Beach Energy, Ltd. |
88,193 | 92,407 | ||||||
| Beacon Lighting Group, Ltd. |
72 | 118 | ||||||
| Bega Cheese, Ltd. |
217 | 883 | ||||||
| Bell Financial Group, Ltd. |
108 | 148 | ||||||
| Bendigo & Adelaide Bank, Ltd. |
60,037 | 417,118 | ||||||
| #BHP Group, Ltd., Sponsored ADR |
12,060 | 661,370 | ||||||
| #BHP Group, Ltd. |
89,728 | 2,465,299 | ||||||
| Blackmores, Ltd. |
8 | 566 | ||||||
| BlueScope Steel, Ltd. |
1,912 | 29,612 | ||||||
| Brambles, Ltd. |
69,585 | 524,744 | ||||||
Dimensional International Core Equity Market ETF
SCHEDULE OF INVESTMENTS
October 31, 2021
| Security Description |
Shares | Fair Value | ||||||
| AUSTRALIA (Continued) |
| |||||||
| Bravura Solutions, Ltd. |
9,549 | $ | 19,939 | |||||
| Breville Group, Ltd. |
7,549 | 166,189 | ||||||
| *Brickworks, Ltd. |
52 | 927 | ||||||
| BSA, Ltd. |
228 | 51 | ||||||
| *Bubs Australia, Ltd. |
224 | 87 | ||||||
| BWX, Ltd. |
273 | 955 | ||||||
| *»BWX, Ltd. |
34 | 119 | ||||||
| *Byron Energy, Ltd. |
392 | 41 | ||||||
| Capitol Health, Ltd. |
664 | 170 | ||||||
| Capral, Ltd. |
12 | 72 | ||||||
| carsales.com, Ltd. |
13,089 | 242,436 | ||||||
| *Catapult Group International, Ltd. |
60 | 80 | ||||||
| Cedar Woods Properties, Ltd. |
403 | 1,804 | ||||||
| *Central Petroleum, Ltd. |
400 | 36 | ||||||
| Challenger, Ltd. |
396 | 2,064 | ||||||
| *Champion Iron, Ltd. |
228 | 754 | ||||||
| CIMIC Group, Ltd. |
1,783 | 26,677 | ||||||
| *City Chic Collective, Ltd. |
8,853 | 41,160 | ||||||
| Class, Ltd. |
68 | 149 | ||||||
| Cleanaway Waste Management, Ltd. |
139,955 | 281,722 | ||||||
| ClearView Wealth, Ltd. |
180 | 107 | ||||||
| Clinuvel Pharmaceuticals, Ltd. |
20 | 580 | ||||||
| Clover Corp., Ltd. |
100 | 121 | ||||||
| Cochlear, Ltd. |
2,415 | 399,858 | ||||||
| Codan, Ltd. |
92 | 694 | ||||||
| Coles Group, Ltd. |
44,476 | 572,578 | ||||||
| Collins Foods, Ltd. |
25,405 | 244,246 | ||||||
| Commonwealth Bank of Australia |
53,249 | 4,186,712 | ||||||
| Computershare, Ltd. |
23,434 | 330,200 | ||||||
| #*Cooper Energy, Ltd. |
1,128 | 246 | ||||||
| *Corporate Travel Management, Ltd. |
3,729 | 68,593 | ||||||
| Costa Group Holdings, Ltd. |
8,068 | 17,695 | ||||||
| *»Costa Group Holdings, Ltd. |
1,235 | 2,709 | ||||||
| *Crown Resorts, Ltd. |
5,665 | 42,380 | ||||||
| CSL, Ltd. |
14,963 | 3,377,121 | ||||||
| *CSR, Ltd. |
1,548 | 6,895 | ||||||
| *Dacian Gold, Ltd. |
316 | 55 | ||||||
| Data#3, Ltd. |
3,677 | 15,659 | ||||||
| Dicker Data, Ltd. |
452 | 5,089 | ||||||
| Domain Holdings Australia, Ltd. |
132 | 567 | ||||||
| Domino’s Pizza Enterprises, Ltd. |
2,509 | 255,276 | ||||||
| Downer EDI, Ltd. |
37,721 | 178,493 | ||||||
| Eagers Automotive, Ltd. |
3,719 | 41,397 | ||||||
| *Eclipx Group, Ltd. |
312 | 586 | ||||||
| *Elders, Ltd. |
24,624 | 222,496 | ||||||
| #*Electro Optic Systems Holdings, Ltd. |
6,697 | 16,046 | ||||||
| *Elmo Software, Ltd. |
24 | 96 | ||||||
| Emeco Holdings, Ltd. |
3,967 | 3,278 | ||||||
| Endeavour Group, Ltd. |
26,123 | 133,423 | ||||||
| Enero Group, Ltd. |
40 | 119 | ||||||
| EQT Holdings, Ltd. |
8 | 169 | ||||||
| Estia Health, Ltd. |
1,588 | 2,505 | ||||||
| *EVENT Hospitality and Entertainment, Ltd. |
560 | 6,907 | ||||||
| *»Evolution Mining, Ltd. |
533 | 1,453 | ||||||
| Evolution Mining, Ltd. |
11,092 | 30,242 | ||||||
| *Experience Co., Ltd. |
228 | 62 | ||||||
Dimensional International Core Equity Market ETF
SCHEDULE OF INVESTMENTS
October 31, 2021
| Security Description |
Shares | Fair Value | ||||||
| AUSTRALIA (Continued) |
| |||||||
| Fiducian Group, Ltd. |
12 | $ | 79 | |||||
| Finbar Group, Ltd. |
100 | 62 | ||||||
| Fleetwood, Ltd. |
56 | 100 | ||||||
| #*Flight Centre Travel Group, Ltd. |
297 | 4,459 | ||||||
| Fortescue Metals Group, Ltd. |
62,729 | 656,323 | ||||||
| *G8 Education, Ltd. |
71,810 | 59,330 | ||||||
| Genworth Mortgage Insurance Australia, Ltd. |
64,928 | 112,165 | ||||||
| Gold Road Resources, Ltd. |
76,534 | 79,616 | ||||||
| *GrainCorp, Ltd., Class A |
70,008 | 330,221 | ||||||
| *GTN, Ltd. |
136 | 53 | ||||||
| GUD Holdings, Ltd. |
24,809 | 227,335 | ||||||
| GWA Group, Ltd. |
142 | 290 | ||||||
| Hansen Technologies, Ltd. |
112 | 532 | ||||||
| Harvey Norman Holdings, Ltd. |
17,473 | 65,095 | ||||||
| Healius, Ltd. |
485 | 1,756 | ||||||
| *Helloworld Travel, Ltd. |
40 | 82 | ||||||
| HT&E, Ltd. |
956 | 1,386 | ||||||
| HUB24, Ltd. |
32 | 761 | ||||||
| *Huon Aquaculture Group, Ltd. |
28 | 81 | ||||||
| IDP Education, Ltd. |
5,136 | 144,469 | ||||||
| IGO, Ltd. |
49,959 | 361,734 | ||||||
| Iluka Resources, Ltd. |
36,906 | 260,569 | ||||||
| Image Resources NL |
357 | 52 | ||||||
| Imdex, Ltd. |
11,642 | 25,096 | ||||||
| *Incitec Pivot, Ltd. |
119,726 | 268,879 | ||||||
| Infomedia, Ltd. |
10,563 | 10,949 | ||||||
| Inghams Group, Ltd. |
126,554 | 352,653 | ||||||
| Insurance Australia Group, Ltd. |
65,448 | 235,958 | ||||||
| Integral Diagnostics, Ltd. |
2,912 | 10,280 | ||||||
| *Integrated Research, Ltd. |
72 | 82 | ||||||
| InvoCare, Ltd. |
9,883 | 84,104 | ||||||
| IOOF Holdings, Ltd. |
29,029 | 88,959 | ||||||
| IPH, Ltd. |
28,017 | 180,133 | ||||||
| IRESS, Ltd. |
20,578 | 185,474 | ||||||
| IVE Group, Ltd. |
96 | 129 | ||||||
| James Hardie Industries PLC |
15,307 | 593,825 | ||||||
| *»Japara Healthcare, Ltd. |
168 | 177 | ||||||
| JB Hi-Fi, Ltd. |
6,533 | 247,751 | ||||||
| Johns Lyng Group, Ltd. |
8,891 | 43,340 | ||||||
| Jumbo Interactive, Ltd. |
32 | 402 | ||||||
| Jupiter Mines, Ltd. |
876 | 155 | ||||||
| Kogan.com, Ltd. |
2,779 | 20,748 | ||||||
| Lendlease Corp., Ltd. |
27,937 | 219,487 | ||||||
| Lifestyle Communities, Ltd. |
282 | 4,607 | ||||||
| *»LI-S Energy, Ltd. |
3 | – | ||||||
| #*Livetiles, Ltd. |
288 | 27 | ||||||
| Lovisa Holdings, Ltd. |
639 | 10,425 | ||||||
| *Lynas Rare Earths, Ltd. |
15,592 | 85,843 | ||||||
| MA Financial Group, Ltd. |
40 | 246 | ||||||
| MACA, Ltd. |
250 | 144 | ||||||
| *Macmahon Holdings, Ltd. |
1,120 | 172 | ||||||
| Macquarie Group, Ltd. |
8,666 | 1,287,683 | ||||||
| Magellan Financial Group, Ltd. |
4,547 | 118,407 | ||||||
| #*Mayne Pharma Group, Ltd. |
10,100 | 2,579 | ||||||
| McMillan Shakespeare, Ltd. |
2,745 | 28,226 | ||||||
Dimensional International Core Equity Market ETF
SCHEDULE OF INVESTMENTS
October 31, 2021
| Security Description |
Shares | Fair Value | ||||||
| AUSTRALIA (Continued) |
| |||||||
| McPherson’s, Ltd. |
80 | $ | 58 | |||||
| Medibank Pvt, Ltd. |
121,394 | 302,715 | ||||||
| *Medusa Mining, Ltd. |
192 | 111 | ||||||
| #*Mesoblast, Ltd. |
31,908 | 38,106 | ||||||
| Metcash, Ltd. |
47,228 | 144,375 | ||||||
| *Mincor Resources NL |
792 | 818 | ||||||
| *»Mincor Resources Placement |
86 | 89 | ||||||
| Mineral Resources, Ltd. |
2,455 | 71,158 | ||||||
| MNF Group, Ltd. |
36 | 193 | ||||||
| Monadelphous Group, Ltd. |
2,104 | 15,882 | ||||||
| Monash IVF Group, Ltd. |
1,890 | 1,334 | ||||||
| MotorCycle Holdings, Ltd. |
32 | 75 | ||||||
| Mount Gibson Iron, Ltd. |
378 | 119 | ||||||
| *Myer Holdings, Ltd. |
796 | 323 | ||||||
| #MyState, Ltd. |
416 | 1,628 | ||||||
| *Nanosonics, Ltd. |
92 | 409 | ||||||
| *National Australia Bank, Ltd. |
113,499 | 2,447,503 | ||||||
| Navigator Global Investments, Ltd. |
827 | 1,168 | ||||||
| #*Nearmap, Ltd. |
8,265 | 13,719 | ||||||
| Netwealth Group, Ltd. |
79 | 1,027 | ||||||
| New Hope Corp., Ltd. |
3,323 | 5,017 | ||||||
| Newcrest Mining, Ltd. |
26,261 | 490,946 | ||||||
| *NEXTDC, Ltd. |
16,832 | 148,423 | ||||||
| nib holdings, Ltd. |
4,513 | 22,440 | ||||||
| Nick Scali, Ltd. |
683 | 7,423 | ||||||
| Nine Entertainment Co. Holdings, Ltd. |
65,045 | 134,841 | ||||||
| Northern Star Resources, Ltd. |
81,967 | 568,865 | ||||||
| NRW Holdings, Ltd. |
60,967 | 83,571 | ||||||
| *Nufarm, Ltd. |
63,573 | 207,711 | ||||||
| Objective Corp., Ltd. |
12 | 188 | ||||||
| OFX Group, Ltd. |
160 | 192 | ||||||
| Oil Search, Ltd. |
83,278 | 268,340 | ||||||
| *OM Holdings, Ltd. |
260 | 211 | ||||||
| *Omni Bridgeway, Ltd. |
1,885 | 4,389 | ||||||
| *oOh!media, Ltd. |
75,395 | 102,782 | ||||||
| *Orica, Ltd. |
15,953 | 181,292 | ||||||
| Origin Energy, Ltd. |
71,320 | 270,521 | ||||||
| *Orocobre, Ltd. |
7,552 | 50,484 | ||||||
| Orora, Ltd. |
4,902 | 12,150 | ||||||
| OZ Minerals, Ltd. |
29,637 | 559,403 | ||||||
| Pacific Smiles Group, Ltd. |
36 | 78 | ||||||
| Pact Group Holdings, Ltd. |
5,892 | 13,719 | ||||||
| *Panoramic Resources, Ltd. |
736 | 133 | ||||||
| #*Pantoro, Ltd. |
480 | 79 | ||||||
| Peet, Ltd. |
280 | 227 | ||||||
| Pendal Group, Ltd. |
148 | 739 | ||||||
| People Infrastructure, Ltd. |
40 | 133 | ||||||
| Perenti Global, Ltd. |
520 | 398 | ||||||
| Perpetual, Ltd. |
5,994 | 169,549 | ||||||
| *Perseus Mining, Ltd. |
912 | 1,082 | ||||||
| *Pilbara Minerals, Ltd. |
965 | 1,595 | ||||||
| Platinum Asset Management, Ltd. |
639 | 1,459 | ||||||
| *PPK Group, Ltd. |
8 | 78 | ||||||
| #*Praemium, Ltd. |
256 | 230 | ||||||
| *Premier Investments, Ltd. |
8,861 | 203,525 | ||||||
| #Pro Medicus, Ltd. |
5,851 | 234,149 | ||||||
Dimensional International Core Equity Market ETF
SCHEDULE OF INVESTMENTS
October 31, 2021
| Security Description |
Shares | Fair Value | ||||||
| AUSTRALIA (Continued) |
| |||||||
| Probiotec, Ltd. |
32 | $ | 53 | |||||
| *»Propel Funeral Partners, Ltd. |
5 | 16 | ||||||
| Propel Funeral Partners, Ltd. |
44 | 139 | ||||||
| PWR Holdings, Ltd. |
48 | 340 | ||||||
| *Qantas Airways, Ltd. |
28,135 | 113,057 | ||||||
| QANTM Intellectual Property, Ltd. |
68 | 63 | ||||||
| QBE Insurance Group, Ltd. |
61,102 | 542,923 | ||||||
| Qube Holdings, Ltd. |
77,320 | 184,679 | ||||||
| Ramelius Resources, Ltd. |
72,136 | 86,148 | ||||||
| Ramsay Health Care, Ltd. |
4,548 | 240,555 | ||||||
| #REA Group, Ltd. |
217 | 26,101 | ||||||
| *Red 5, Ltd. |
1,236 | 241 | ||||||
| *Red River Resources, Ltd. |
236 | 40 | ||||||
| *Redbubble, Ltd. |
8,562 | 26,688 | ||||||
| Reece, Ltd. |
10,270 | 153,428 | ||||||
| Regis Healthcare, Ltd. |
104 | 154 | ||||||
| Regis Resources, Ltd. |
462 | 694 | ||||||
| *»Regis Resources, Ltd. |
217 | 326 | ||||||
| *Reject Shop, Ltd. (The) |
28 | 146 | ||||||
| Reliance Worldwide Corp., Ltd. |
10,685 | 46,307 | ||||||
| *Resolute Mining, Ltd. |
3,060 | 965 | ||||||
| *Retail Food Group, Ltd. |
1,588 | 95 | ||||||
| Ridley Corp., Ltd. |
132 | 131 | ||||||
| Rio Tinto, Ltd. |
11,088 | 751,953 | ||||||
| *RPMGlobal Holdings, Ltd. |
84 | 123 | ||||||
| Sandfire Resources, Ltd. |
45,740 | 191,016 | ||||||
| *»Sandfire Resources, Ltd. |
57,710 | 241,004 | ||||||
| Santos, Ltd. |
97,794 | 512,703 | ||||||
| SEEK, Ltd. |
22,105 | 542,920 | ||||||
| *Select Harvests, Ltd. |
5,702 | 31,650 | ||||||
| Senex Energy, Ltd. |
8,501 | 28,350 | ||||||
| ServCorp., Ltd. |
36 | 110 | ||||||
| Service Stream, Ltd. |
2,762 | 1,815 | ||||||
| *»Service Stream, Ltd. |
1,384 | 910 | ||||||
| Seven Group Holdings, Ltd. |
2,509 | 40,574 | ||||||
| SG Fleet Group, Ltd. |
84 | 160 | ||||||
| Sigma Healthcare, Ltd. |
8,845 | 3,787 | ||||||
| *Silver Lake Resources, Ltd. |
247,669 | 315,311 | ||||||
| *Silver Mines, Ltd. |
448 | 74 | ||||||
| Sims, Ltd. |
262 | 2,812 | ||||||
| SmartGroup Corp., Ltd. |
4,352 | 26,216 | ||||||
| Sonic Healthcare, Ltd. |
24,287 | 730,226 | ||||||
| South32, Ltd. |
320,108 | 858,347 | ||||||
| Southern Cross Media Group, Ltd. |
14,170 | 24,692 | ||||||
| Spark Infrastructure Group |
36,655 | 77,364 | ||||||
| SRG Global, Ltd. |
300 | 116 | ||||||
| St Barbara, Ltd. |
73,773 | 81,177 | ||||||
| *Star Entertainment Grp, Ltd. (The) |
55,419 | 152,348 | ||||||
| Steadfast Group, Ltd. |
44,507 | 155,446 | ||||||
| SunCorp. Group, Ltd. |
51,237 | 451,034 | ||||||
| Super Retail Group, Ltd. |
9,582 | 93,058 | ||||||
| *»Superloop, Ltd. |
114 | 110 | ||||||
| *Superloop, Ltd. |
388 | 376 | ||||||
| *Sydney Airport |
32,243 | 198,343 | ||||||
| *Syrah Resources, Ltd. |
22,487 | 21,197 | ||||||
Dimensional International Core Equity Market ETF
SCHEDULE OF INVESTMENTS
October 31, 2021
| Security Description |
Shares | Fair Value | ||||||
| AUSTRALIA (Continued) |
| |||||||
| #TabCorp. Holdings, Ltd. |
96,419 | $ | 359,205 | |||||
| Tassal Group, Ltd. |
9,400 | 25,064 | ||||||
| Technology One, Ltd. |
23,567 | 216,131 | ||||||
| Telstra Corp., Ltd. |
153,671 | 440,913 | ||||||
| *Temple & Webster Group, Ltd. |
32 | 305 | ||||||
| TPG Telecom, Ltd. |
235 | 1,191 | ||||||
| *»Transurban Group |
8,560 | 86,411 | ||||||
| Transurban Group |
113,192 | 1,142,649 | ||||||
| Treasury Wine Estates, Ltd. |
31,375 | 271,478 | ||||||
| United Malt Grp, Ltd. |
26,330 | 79,897 | ||||||
| »Virtus Health, Ltd. |
26 | 108 | ||||||
| Virtus Health, Ltd. |
403 | 1,680 | ||||||
| Vita Group, Ltd. |
106 | 66 | ||||||
| Viva Energy Group, Ltd. |
10,788 | 18,799 | ||||||
| *Wagners Holding Co., Ltd. |
44 | 59 | ||||||
| *Webjet, Ltd. |
65,681 | 311,785 | ||||||
| *Wesfarmers, Ltd. |
33,430 | 1,437,507 | ||||||
| *West African Resources, Ltd. |
24,376 | 23,802 | ||||||
| *Western Areas, Ltd. |
29,044 | 68,935 | ||||||
| Westgold Resources, Ltd. |
3,547 | 5,195 | ||||||
| *Westpac Banking Corp. |
106,525 | 2,053,881 | ||||||
| *Whitehaven Coal, Ltd. |
119,815 | 234,882 | ||||||
| WiseTech Global, Ltd. |
2,739 | 105,085 | ||||||
| Woodside Petroleum, Ltd. |
46,166 | 806,547 | ||||||
| Woolworths Group, Ltd. |
33,854 | 968,289 | ||||||
| Worley, Ltd. |
343 | 2,787 | ||||||
| *Xero, Ltd. |
4,246 | 476,813 | ||||||
|
|
|
|||||||
| TOTAL AUSTRALIA |
49,505,217 | |||||||
|
|
|
|||||||
| AUSTRIA (0.4%) |
| |||||||
| Agrana Beteiligungs AG |
12 | 253 | ||||||
| ANDRITZ AG |
5,104 | 289,305 | ||||||
| AT&S Austria Technologie & Systemtechnik AG |
2,264 | 86,853 | ||||||
| Atrium European Real Estate, Ltd. |
3,110 | 12,777 | ||||||
| BAWAG Group AG |
3,980 | 250,788 | ||||||
| *DO & CO AG |
4 | 362 | ||||||
| *Erste Group Bank AG |
11,260 | 483,435 | ||||||
| EVN AG |
33 | 932 | ||||||
| *Flughafen Wien AG |
4 | 132 | ||||||
| *Kapsch TrafficCom AG |
4 | 71 | ||||||
| *Lenzing AG |
2,063 | 248,289 | ||||||
| Mayr Melnhof Karton AG |
4 | 788 | ||||||
| Oesterreichische Post AG |
328 | 13,855 | ||||||
| OMV AG |
7,050 | 427,510 | ||||||
| Palfinger AG |
388 | 17,152 | ||||||
| POLYTEC Holding AG |
12 | 118 | ||||||
| *Porr AG |
8 | 115 | ||||||
| Raiffeisen Bank International AG |
10,683 | 312,781 | ||||||
| Rosenbauer International AG |
4 | 218 | ||||||
| S IMMO AG |
28 | 664 | ||||||
| *Schoeller-Bleckmann Oilfield Equipment AG |
8 | 327 | ||||||
| Semperit AG Holding |
4 | 135 | ||||||
| Strabag SE |
8 | 343 | ||||||
| Telekom Austria AG |
1,222 | 10,578 | ||||||
| UNIQA Insurance Group AG |
866 | 8,067 | ||||||
Dimensional International Core Equity Market ETF
SCHEDULE OF INVESTMENTS
October 31, 2021
| Security Description |
Shares | Fair Value | ||||||
| AUSTRIA (Continued) |
| |||||||
| Verbund AG |
2,055 | $ | 214,270 | |||||
| Vienna Insurance Group AG Wiener Versicherung Gruppe |
40 | 1,169 | ||||||
| voestalpine AG |
4,252 | 161,593 | ||||||
| Wienerberger AG |
8,524 | 302,047 | ||||||
| Zumtobel Group AG |
16 | 165 | ||||||
|
|
|
|||||||
| TOTAL AUSTRIA |
2,845,092 | |||||||
|
|
|
|||||||
| BELGIUM (0.9%) |
| |||||||
| Ackermans & van Haaren NV |
1,297 | 223,191 | ||||||
| Ageas SA |
7,030 | 342,502 | ||||||
| *AGFA-Gevaert NV |
5,749 | 25,015 | ||||||
| #Anheuser-Busch InBev SA/NV |
27,926 | 1,705,382 | ||||||
| *Argenx SE, Sponsored ADR |
165 | 49,824 | ||||||
| *Argenx SE |
699 | 209,428 | ||||||
| Barco NV |
5,312 | 119,626 | ||||||
| Bekaert SA |
2,883 | 126,381 | ||||||
| #*Biocartis Group NV |
28 | 128 | ||||||
| *bpost SA |
12,132 | 103,894 | ||||||
| Cie d’Entreprises CFE |
60 | 6,145 | ||||||
| D’ieteren Group |
423 | 72,889 | ||||||
| Econocom Group SA |
5,961 | 25,214 | ||||||
| #Elia Group SA |
1,859 | 217,068 | ||||||
| Etablissements Franz Colruyt NV |
3,770 | 185,158 | ||||||
| #Euronav NV |
12,003 | 126,632 | ||||||
| Euronav NV |
47,561 | 505,816 | ||||||
| EVS Broadcast Equipment SA |
8 | 188 | ||||||
| Exmar NV |
28 | 149 | ||||||
| Fagron |
3,474 | 60,224 | ||||||
| *Galapagos NV |
690 | 36,575 | ||||||
| Gimv NV |
1,041 | 67,343 | ||||||
| #Immobel SA |
4 | 352 | ||||||
| Ion Beam Applications |
766 | 15,070 | ||||||
| Jensen-Group NV |
8 | 244 | ||||||
| *KBC Group NV |
10,110 | 942,533 | ||||||
| *Kinepolis Group NV |
8 | 504 | ||||||
| Melexis NV |
1,234 | 142,233 | ||||||
| *Ontex Group NV |
2,728 | 25,698 | ||||||
| Orange Belgium SA |
32 | 727 | ||||||
| Proximus SADP |
8,252 | 155,515 | ||||||
| Recticel SA |
20 | 370 | ||||||
| *Solvay SA, Class A |
4,124 | 490,611 | ||||||
| Telenet Group Holding NV |
26 | 935 | ||||||
| *Tessenderlo Group SA |
1,460 | 53,306 | ||||||
| UCB SA |
3,701 | 441,574 | ||||||
| #Umicore SA |
8,150 | 467,617 | ||||||
| Van de Velde NV |
4 | 139 | ||||||
| VGP NV |
18 | 4,666 | ||||||
| Viohalco SA |
36 | 182 | ||||||
|
|
|
|||||||
| TOTAL BELGIUM |
6,951,048 | |||||||
|
|
|
|||||||
| CANADA (10.4%) |
| |||||||
| *5N Plus, Inc. |
76 | 189 | ||||||
| *Absolute Software Corp. |
3,655 | 40,986 | ||||||
Dimensional International Core Equity Market ETF
SCHEDULE OF INVESTMENTS
October 31, 2021
| Security Description |
Shares | Fair Value | ||||||
| CANADA (Continued) |
| |||||||
| Absolute Software Corp. |
1,850 | $ | 20,794 | |||||
| Acadian Timber Corp. |
8 | 119 | ||||||
| *AcuityAds Holdings, Inc. |
18 | 114 | ||||||
| *Advantage Energy, Ltd. |
8,336 | 47,142 | ||||||
| Aecon Group, Inc. |
6,175 | 91,961 | ||||||
| Ag Growth International, Inc. |
12 | 263 | ||||||
| AGF Management, Ltd., Class B |
48 | 306 | ||||||
| *Agnico Eagle Mines, Ltd. |
2,204 | 116,922 | ||||||
| *Agnico Eagle Mines, Ltd. |
8,033 | 425,709 | ||||||
| *Air Canada |
1,501 | 26,870 | ||||||
| *AirBoss of America Corp. |
8 | 208 | ||||||
| Alamos Gold, Inc. |
37,014 | 274,122 | ||||||
| Alamos Gold, Inc. |
14,447 | 107,486 | ||||||
| *Alcanna, Inc. |
20 | 130 | ||||||
| *Algoma Central Corp. |
16 | 222 | ||||||
| #Algonquin Power & Utilities Corp. |
19,366 | 278,722 | ||||||
| *Algonquin Power & Utilities Corp. |
5,138 | 74,141 | ||||||
| Alimentation Couche-Tard, Inc., Class B |
31,725 | 1,188,072 | ||||||
| AltaGas, Ltd. |
12,915 | 266,938 | ||||||
| #*Altius Minerals Corp. |
1,840 | 23,469 | ||||||
| Altus Group, Ltd. |
1,954 | 102,323 | ||||||
| *Andrew Peller, Ltd., Class A |
12 | 82 | ||||||
| ARC Resources, Ltd. |
66,366 | 635,525 | ||||||
| *Argonaut Gold, Inc. |
7,130 | 18,062 | ||||||
| *Aritzia, Inc. |
114 | 4,483 | ||||||
| Atco, Ltd., Class I |
1,247 | 42,252 | ||||||
| *ATS Automation Tooling Systems, Inc. |
5,133 | 174,378 | ||||||
| #*Aurora Cannabis, Inc. |
812 | 5,378 | ||||||
| B2Gold Corp. |
14,554 | 60,254 | ||||||
| B2Gold Corp. |
39,460 | 162,672 | ||||||
| Badger Infrastructure Solutions, Ltd. |
3,570 | 98,355 | ||||||
| *Ballard Power Systems, Inc. |
110 | 1,993 | ||||||
| Bank of Montreal |
4,874 | 528,878 | ||||||
| Bank of Montreal |
17,674 | 1,915,901 | ||||||
| Bank of Nova Scotia (The) |
36,952 | 2,418,850 | ||||||
| #Bank of Nova Scotia (The) |
4,667 | 305,969 | ||||||
| *Barrick Gold Corp. |
38,133 | 698,641 | ||||||
| *Barrick Gold Corp. |
10,699 | 196,541 | ||||||
| *Bausch Health Cos., Inc. |
2,820 | 79,186 | ||||||
| *Bausch Health Cos., Inc. |
10,701 | 299,478 | ||||||
| BCE, Inc. |
1,092 | 56,205 | ||||||
| BCE, Inc. |
4,307 | 221,370 | ||||||
| #Birchcliff Energy, Ltd. |
22,144 | 118,799 | ||||||
| Bird Construction, Inc. |
8 | 65 | ||||||
| *Black Diamond Group, Ltd. |
68 | 249 | ||||||
| #*BlackBerry, Ltd. |
4,769 | 51,439 | ||||||
| #*BlackBerry, Ltd. |
1,844 | 19,915 | ||||||
| BMTC Group, Inc. |
4 | 43 | ||||||
| *Bombardier, Inc. |
9,772 | 15,688 | ||||||
| *Bombardier, Inc., Class A |
12 | 20 | ||||||
| #*Boralex, Inc., Class A |
3,521 | 108,793 | ||||||
| Brookfield Asset Management Reinsurance Partners, Ltd., Class A |
122 | 7,504 | ||||||
| *Brookfield Asset Management, Inc., Class A |
23,914 | 1,441,535 | ||||||
| #*Brookfield Asset Management, Inc., Class A |
6,291 | 379,914 | ||||||
| Brookfield Infrastructure Corp., Class A |
395 | 23,906 | ||||||
| Brookfield Infrastructure Corp., Class A |
671 | 40,689 | ||||||
Dimensional International Core Equity Market ETF
SCHEDULE OF INVESTMENTS
October 31, 2021
| Security Description |
Shares | Fair Value | ||||||
| CANADA (Continued) |
||||||||
| BRP, Inc. |
823 | $ | 72,547 | |||||
| BRP, Inc. |
1,544 | 135,548 | ||||||
| *CAE, Inc. |
9,085 | 275,068 | ||||||
| *CAE, Inc. |
2,662 | 80,845 | ||||||
| Calian Group, Ltd. |
8 | 398 | ||||||
| Cameco Corp. |
3,606 | 87,626 | ||||||
| *Cameco Corp. |
14,109 | 342,267 | ||||||
| Canaccord Genuity Group, Inc. |
8,172 | 94,408 | ||||||
| #Canacol Energy, Ltd. |
130 | 407 | ||||||
| *Canada Goose Holdings, Inc. |
1,209 | 44,854 | ||||||
| #*Canada Goose Holdings, Inc. |
3,972 | 147,081 | ||||||
| Canadian Imperial Bank of Commerce |
248 | 30,072 | ||||||
| Canadian Imperial Bank of Commerce |
16,238 | 1,967,214 | ||||||
| *Canadian National Railway Co. |
4,974 | 661,094 | ||||||
| *Canadian National Railway Co. |
18,178 | 2,412,099 | ||||||
| *Canadian Natural Resources, Ltd. |
12,657 | 538,049 | ||||||
| *Canadian Natural Resources, Ltd. |
48,511 | 2,058,552 | ||||||
| *Canadian Pacific Railway, Ltd. |
16,013 | 1,237,453 | ||||||
| Canadian Pacific Railway, Ltd. |
4,334 | 335,452 | ||||||
| *Canadian Tire Corp., Ltd., Class A |
1,951 | 276,670 | ||||||
| *Canadian Utilities, Ltd., Class A |
3,512 | 101,573 | ||||||
| *Canadian Utilities, Ltd., Class B |
4 | 116 | ||||||
| Canadian Western Bank |
766 | 24,465 | ||||||
| *Canfor Corp. |
109 | 2,255 | ||||||
| *Canfor Pulp Products, Inc. |
28 | 152 | ||||||
| #*Canopy Growth Corp. |
4,418 | 55,780 | ||||||
| Capital Power Corp. |
9,229 | 302,657 | ||||||
| *Capstone Mining Corp. |
4,344 | 18,188 | ||||||
| *Cascades, Inc. |
5,956 | 68,903 | ||||||
| *CCL Industries, Inc. |
6,913 | 377,286 | ||||||
| *Celestica, Inc. |
4,762 | 46,869 | ||||||
| *Celestica, Inc. |
1,666 | 16,360 | ||||||
| Cenovus Energy, Inc. |
39,892 | 476,303 | ||||||
| Cenovus Energy, Inc. |
13,271 | 158,987 | ||||||
| Centerra Gold, Inc. |
1,495 | 11,192 | ||||||
| CES Energy Solutions Corp. |
212 | 330 | ||||||
| *CGI, Inc. |
7,487 | 667,793 | ||||||
| *CGI, Inc. |
2,035 | 181,909 | ||||||
| China Gold International Resources Corp., Ltd. |
184 | 530 | ||||||
| CI Financial Corp. |
10,224 | 232,763 | ||||||
| Cogeco Communications, Inc. |
793 | 67,999 | ||||||
| *Cogeco, Inc. |
200 | 13,292 | ||||||
| *Colabor Group, Inc. |
68 | 50 | ||||||
| Colliers International Group, Inc. |
220 | 31,981 | ||||||
| Colliers International Group, Inc. |
756 | 109,501 | ||||||
| *Computer Modelling Group, Ltd. |
28 | 122 | ||||||
| Constellation Software, Inc. |
771 | 1,352,844 | ||||||
| *Copper Mountain Mining Corp. |
104 | 319 | ||||||
| Corby Spirit and Wine, Ltd. |
8 | 115 | ||||||
| *Corus Entertainment, Inc., Class B |
15,751 | 71,286 | ||||||
| Crescent Point Energy Corp. |
5,245 | 26,319 | ||||||
| Crescent Point Energy Corp. |
2,958 | 14,879 | ||||||
| *Cronos Group, Inc. |
7,165 | 37,110 | ||||||
| *Cronos Group, Inc. |
155 | 804 | ||||||
| *Denison Mines Corp. |
1,422 | 2,403 | ||||||
Dimensional International Core Equity Market ETF
SCHEDULE OF INVESTMENTS
October 31, 2021
| Security Description |
Shares | Fair Value | ||||||
| CANADA (Continued) |
||||||||
| *Denison Mines Corp. |
14,056 | $ | 23,813 | |||||
| *Descartes Systems Group, Inc. (The) |
165 | 13,454 | ||||||
| *Descartes Systems Group, Inc. (The) |
165 | 13,492 | ||||||
| Dexterra Group, Inc. |
48 | 347 | ||||||
| #Dollarama, Inc. |
11,938 | 538,753 | ||||||
| Doman Building Materials Group, Ltd. |
48 | 263 | ||||||
| *Dorel Industries, Inc., Class B |
20 | 360 | ||||||
| DREAM Unlimited Corp. |
1,188 | 29,615 | ||||||
| Dundee Precious Metals, Inc. |
13,721 | 90,104 | ||||||
| Dynacor Gold Mines, Inc. |
40 | 90 | ||||||
| ECN Capital Corp. |
9,798 | 85,052 | ||||||
| *Eldorado Gold Corp. |
7,490 | 66,891 | ||||||
| Emera, Inc. |
11,508 | 534,574 | ||||||
| Empire Co., Ltd., Class A |
7,957 | 237,513 | ||||||
| *Enbridge, Inc. |
46,221 | 1,933,038 | ||||||
| Enbridge, Inc. |
12,479 | 522,371 | ||||||
| Endeavour Mining PLC |
2,992 | 75,889 | ||||||
| Enerflex, Ltd. |
9,142 | 77,809 | ||||||
| Enerplus Corp. |
174 | 1,645 | ||||||
| *Enghouse Systems, Ltd. |
2,171 | 94,000 | ||||||
| *Equinox Gold Corp. |
25 | 185 | ||||||
| #Equitable Group, Inc. |
3,664 | 228,462 | ||||||
| *ERO Copper Corp. |
207 | 3,856 | ||||||
| Evertz Technologies, Ltd. |
8 | 91 | ||||||
| *Excellon Resources, Inc. |
24 | 34 | ||||||
| Exchange Income Corp. |
1,672 | 57,462 | ||||||
| Exco Technologies, Ltd. |
16 | 126 | ||||||
| Extendicare, Inc. |
2,585 | 15,098 | ||||||
| Fairfax Financial Holdings, Ltd. |
1,293 | 522,864 | ||||||
| Fiera Capital Corp. |
2,479 | 21,239 | ||||||
| *Finning International, Inc. |
694 | 20,514 | ||||||
| *First Majestic Silver Corp. |
92 | 1,164 | ||||||
| First Majestic Silver Corp. |
715 | 9,059 | ||||||
| *First Quantum Minerals, Ltd. |
24,580 | 581,012 | ||||||
| FirstService Corp., Class WI |
385 | 76,969 | ||||||
| FirstService Corp. |
1,397 | 278,194 | ||||||
| *Fortis, Inc. |
14,479 | 643,498 | ||||||
| *Fortis, Inc. |
3,905 | 173,812 | ||||||
| #*Fortuna Silver Mines, Inc. |
21,010 | 101,698 | ||||||
| *Franco-Nevada Corp. |
777 | 110,979 | ||||||
| Franco-Nevada Corp. |
2,247 | 320,114 | ||||||
| *Frontera Energy Corp. |
52 | 370 | ||||||
| *Gamehost, Inc. |
20 | 132 | ||||||
| *GDI Integrated Facility services, Inc. |
508 | 21,397 | ||||||
| George Weston, Ltd. |
3,561 | 384,153 | ||||||
| #Gibson Energy, Inc. |
1,879 | 37,806 | ||||||
| *Gildan Activewear, Inc. |
721 | 26,442 | ||||||
| *Gildan Activewear, Inc. |
484 | 17,772 | ||||||
| *GoGold Resources, Inc. |
132 | 366 | ||||||
| *Golden Star Resources, Ltd. |
8 | 25 | ||||||
| *GoldMoney, Inc. |
52 | 100 | ||||||
| *Great-West Lifeco, Inc. |
11,204 | 329,101 | ||||||
| Hardwoods Distribution, Inc. |
12 | 401 | ||||||
| *Heroux-Devtek, Inc. |
8 | 119 | ||||||
| *HEXO Corp. |
12 | 17 | ||||||
| *High Liner Foods, Inc. |
8 | 85 | ||||||
Dimensional International Core Equity Market ETF
SCHEDULE OF INVESTMENTS
October 31, 2021
| Security Description |
Shares | Fair Value | ||||||
| CANADA (Continued) |
||||||||
| HLS Therapeutics, Inc. |
12 | $ | 184 | |||||
| *Home Capital Group, Inc. |
3,910 | 126,680 | ||||||
| Hudbay Minerals, Inc. |
566 | 3,941 | ||||||
| Hudbay Minerals, Inc. |
744 | 5,178 | ||||||
| Hydro One, Ltd. |
19,916 | 475,105 | ||||||
| *i-80 Gold Corp. |
53 | 128 | ||||||
| iA Financial Corp., Inc. |
7,206 | 425,599 | ||||||
| #*IAMGOLD Corp. |
65,331 | 179,725 | ||||||
| *IAMGOLD Corp. |
26,478 | 73,344 | ||||||
| *IBI Group, Inc. |
35 | 339 | ||||||
| *IGM Financial, Inc. |
5,862 | 232,390 | ||||||
| *Imperial Metals Corp. |
66 | 213 | ||||||
| *Imperial Oil, Ltd. |
1,083 | 36,608 | ||||||
| Information Services Corp. |
12 | 267 | ||||||
| #Innergex Renewable Energy, Inc. |
1,994 | 33,138 | ||||||
| Intact Financial Corp. |
3,776 | 505,406 | ||||||
| Inter Pipeline, Ltd. |
9,878 | 150,136 | ||||||
| Interfor Corp. |
3,177 | 72,636 | ||||||
| *Intertape Polymer Group, Inc. |
3,364 | 76,315 | ||||||
| Jamieson Wellness, Inc. |
2,029 | 62,382 | ||||||
| *Karora Resources, Inc. |
92 | 328 | ||||||
| K-Bro Linen, Inc. |
8 | 239 | ||||||
| *Kelt Exploration, Ltd. |
120 | 484 | ||||||
| Keyera Corp. |
10,515 | 269,078 | ||||||
| *Kinaxis, Inc. |
472 | 73,141 | ||||||
| Kinross Gold Corp. |
54,300 | 325,918 | ||||||
| *Kinross Gold Corp. |
16,408 | 98,612 | ||||||
| Kirkland Lake Gold, Ltd. |
9,672 | 407,074 | ||||||
| Kirkland Lake Gold, Ltd. |
2,572 | 108,461 | ||||||
| KP Tissue, Inc. |
4 | 35 | ||||||
| #*Largo Resources, Ltd. |
8 | 100 | ||||||
| *Lassonde Industries, Inc., Class A |
4 | 568 | ||||||
| Laurentian Bank of Canada |
6,115 | 205,568 | ||||||
| *Leon’s Furniture, Ltd. |
1,223 | 24,864 | ||||||
| LifeWorks, Inc. |
1,428 | 36,853 | ||||||
| *Lightspeed Commerce, Inc. |
121 | 11,775 | ||||||
| *Lightspeed Commerce, Inc. |
165 | 16,119 | ||||||
| *Linamar Corp. |
3,547 | 194,784 | ||||||
| *Loblaw Cos., Ltd. |
7,811 | 586,542 | ||||||
| Logistec Corp., Class B |
8 | 292 | ||||||
| *Lucara Diamond Corp. |
280 | 136 | ||||||
| *Lundin Mining Corp. |
40,819 | 354,661 | ||||||
| #*MAG Silver Corp. |
40 | 795 | ||||||
| *Magellan Aerospace Corp. |
4 | 34 | ||||||
| *Magna International, Inc. |
2,815 | 228,860 | ||||||
| *Magna International, Inc. |
10,219 | 829,936 | ||||||
| *Major Drilling Group International, Inc. |
3,429 | 24,648 | ||||||
| *Mandalay Resources Corp. |
64 | 119 | ||||||
| Manulife Financial Corp. |
12,681 | 247,153 | ||||||
| *Manulife Financial Corp. |
45,608 | 887,103 | ||||||
| *Maple Leaf Foods, Inc. |
6,221 | 135,406 | ||||||
| *Martinrea International, Inc. |
6,252 | 57,953 | ||||||
| *Mav Beauty Brands, Inc. |
16 | 29 | ||||||
| *MDF Commerce, Inc. |
8 | 37 | ||||||
| Medical Facilities Corp. |
8 | 60 | ||||||
Dimensional International Core Equity Market ETF
SCHEDULE OF INVESTMENTS
October 31, 2021
| Security Description |
Shares | Fair Value | ||||||
| CANADA (Continued) |
||||||||
| *MEG Energy Corp. |
12,604 | $ | 112,765 | |||||
| *Melcor Developments, Ltd. |
12 | 140 | ||||||
| Methanex Corp. |
1,722 | 77,111 | ||||||
| #*Methanex Corp. |
6,690 | 299,216 | ||||||
| Metro, Inc. |
10,451 | 525,016 | ||||||
| *Morguard Corp. |
4 | 441 | ||||||
| *MTY Food Group, Inc. |
2,576 | 125,730 | ||||||
| Mullen Group, Ltd. |
4,038 | 41,698 | ||||||
| National Bank of Canada |
15,552 | 1,285,513 | ||||||
| Neo Performance Materials, Inc. |
16 | 246 | ||||||
| *New Gold, Inc. |
116,075 | 162,939 | ||||||
| *New Gold, Inc. |
60,449 | 84,024 | ||||||
| NFI Group, Inc. |
2,897 | 58,615 | ||||||
| North American Construction Group, Ltd. |
8 | 138 | ||||||
| North West Co., Inc. (The) |
3,023 | 82,016 | ||||||
| Northland Power, Inc. |
5,548 | 178,093 | ||||||
| Nutrien, Ltd. |
20,445 | 1,426,721 | ||||||
| Nutrien, Ltd. |
5,212 | 364,371 | ||||||
| *NuVista Energy, Ltd. |
7,278 | 35,992 | ||||||
| *OceanaGold Corp. |
35,873 | 66,852 | ||||||
| *Open Text Corp. |
8,737 | 439,405 | ||||||
| *Open Text Corp. |
2,352 | 118,423 | ||||||
| *Organigram Holdings, Inc. |
8,616 | 18,976 | ||||||
| Osisko Gold Royalties, Ltd. |
2,822 | 35,584 | ||||||
| *Pan American Silver Corp. |
6,170 | 157,641 | ||||||
| *Pan American Silver Corp. |
1,739 | 44,536 | ||||||
| Paramount Resources, Ltd., Class A |
122 | 2,036 | ||||||
| Parex Resources, Inc. |
23,295 | 451,598 | ||||||
| Park Lawn Corp. |
1,107 | 32,972 | ||||||
| Parkland Corp. |
10,667 | 309,886 | ||||||
| *Pason Systems, Inc. |
100 | 742 | ||||||
| *Patriot One Technologies, Inc. |
84 | 32 | ||||||
| Pembina Pipeline Corp. |
19,841 | 655,791 | ||||||
| *Pembina Pipeline Corp. |
5,277 | 174,616 | ||||||
| Peyto Exploration & Development Corp. |
11,312 | 89,069 | ||||||
| PHX Energy Services Corp. |
40 | 161 | ||||||
| Pizza Pizza Royalty Corp. |
8 | 76 | ||||||
| *Points International, Ltd. |
8 | 140 | ||||||
| Polaris Infrastructure, Inc. |
12 | 178 | ||||||
| Pollard Banknote, Ltd. |
4 | 151 | ||||||
| *Precision Drilling Corp. |
12 | 530 | ||||||
| #Premium Brands Holdings Corp. |
1,771 | 191,095 | ||||||
| #*Pretium Resources, Inc. |
2,854 | 34,476 | ||||||
| *Pretium Resources, Inc. |
9,260 | 111,833 | ||||||
| Primo Water Corp. |
515 | 8,188 | ||||||
| Primo Water Corp. |
5,432 | 86,330 | ||||||
| #*Quebecor, Inc., Class B |
7,053 | 179,462 | ||||||
| *Real Matters, Inc. |
6,697 | 48,895 | ||||||
| *Recipe Unlimited Corp. |
8 | 125 | ||||||
| Restaurant Brands International, Inc. |
2,079 | 117,755 | ||||||
| Restaurant Brands International, Inc. |
7,918 | 447,593 | ||||||
| Richelieu Hardware, Ltd. |
7,551 | 266,148 | ||||||
| *Ritchie Bros Auctioneers, Inc. |
3,432 | 234,208 | ||||||
| *Ritchie Bros Auctioneers, Inc. |
932 | 63,702 | ||||||
| *Rogers Communications, Inc., Class B |
17,810 | 827,029 | ||||||
| *Rogers Communications, Inc., Class B |
4,610 | 214,734 | ||||||
Dimensional International Core Equity Market ETF
SCHEDULE OF INVESTMENTS
October 31, 2021
| Security Description |
Shares | Fair Value | ||||||
| CANADA (Continued) |
||||||||
| Rogers Sugar, Inc. |
5,044 | $ | 22,950 | |||||
| Royal Bank of Canada |
10,814 | 1,124,764 | ||||||
| Royal Bank of Canada |
39,637 | 4,119,268 | ||||||
| *Russel Metals, Inc. |
7,795 | 205,196 | ||||||
| *Sandstorm Gold, Ltd. |
6,596 | 41,666 | ||||||
| *Sandstorm Gold, Ltd. |
3,254 | 20,598 | ||||||
| *Saputo, Inc. |
10,283 | 245,222 | ||||||
| Savaria Corp. |
20 | 315 | ||||||
| Secure Energy Services, Inc. |
28 | 129 | ||||||
| *Shaw Communications, Inc., Class B |
7,249 | 208,426 | ||||||
| *ShawCor, Ltd. |
52 | 224 | ||||||
| *Shopify, Inc., Class A |
1,816 | 2,647,371 | ||||||
| *Shopify, Inc., Class A |
452 | 662,962 | ||||||
| Sienna Senior Living, Inc. |
3,973 | 45,482 | ||||||
| *Sierra Metals, Inc. |
60 | 121 | ||||||
| *Sierra Wireless, Inc. |
1,675 | 28,026 | ||||||
| *Sierra Wireless, Inc. |
916 | 15,334 | ||||||
| Sleep Country Canada Holdings, Inc. |
2,814 | 78,843 | ||||||
| *SNC-Lavalin Group, Inc. |
8,455 | 227,072 | ||||||
| *Spin Master Corp. |
139 | 4,804 | ||||||
| Sprott, Inc. |
717 | 29,124 | ||||||
| *Sprott, Inc. |
405 | 16,447 | ||||||
| Stantec, Inc. |
1,265 | 69,955 | ||||||
| *Stantec, Inc. |
4,854 | 267,850 | ||||||
| Stelco Holdings, Inc. |
34 | 1,179 | ||||||
| *Stella-Jones, Inc. |
346 | 12,402 | ||||||
| *Storm Resources, Ltd. |
80 | 356 | ||||||
| *Sun Life Financial, Inc. |
3,370 | 191,989 | ||||||
| #*Sun Life Financial, Inc. |
12,997 | 739,525 | ||||||
| Suncor Energy, Inc. |
55,614 | 1,460,398 | ||||||
| *Suncor Energy, Inc. |
14,762 | 388,241 | ||||||
| *SunOpta, Inc. |
485 | 3,756 | ||||||
| Superior Plus Corp. |
7,298 | 81,073 | ||||||
| *Tamarack Valley Energy, Ltd. |
168 | 488 | ||||||
| *Taseko Mines, Ltd. |
5,399 | 11,368 | ||||||
| TC Energy Corp. |
27,192 | 1,468,682 | ||||||
| TC Energy Corp. |
6,178 | 334,230 | ||||||
| *Teck Resources, Ltd., Class B |
15,789 | 439,960 | ||||||
| *Teck Resources, Ltd., Class B |
4,243 | 118,380 | ||||||
| *TeraGo, Inc. |
16 | 73 | ||||||
| TerraVest Industries, Inc. |
12 | 251 | ||||||
| TFI International, Inc. |
1,525 | 169,016 | ||||||
| TFI International, Inc. |
6,058 | 670,678 | ||||||
| *Thomson Reuters Corp. |
964 | 115,998 | ||||||
| Thomson Reuters Corp. |
3,592 | 431,399 | ||||||
| Tidewater Midstream and Infrastructure, Ltd. |
220 | 264 | ||||||
| #*Tilray, Inc. |
4,293 | 44,054 | ||||||
| #*Tilray, Inc., Class 2 |
1,068 | 11,000 | ||||||
| TMX Group, Ltd. |
2,330 | 251,863 | ||||||
| *Torex Gold Resources, Inc. |
2,406 | 27,931 | ||||||
| *Toromont Industries, Ltd. |
3,888 | 345,374 | ||||||
| Toronto-Dominion Bank (The) |
49,520 | 3,589,106 | ||||||
| Toronto-Dominion Bank (The) |
6,312 | 457,683 | ||||||
| *Total Energy Services, Inc. |
40 | 162 | ||||||
| Tourmaline Oil Corp. |
5,902 | 212,978 | ||||||
Dimensional International Core Equity Market ETF
SCHEDULE OF INVESTMENTS
October 31, 2021
| Security Description |
Shares | Fair Value | ||||||
| CANADA (Continued) |
||||||||
| TransAlta Corp. |
3,675 | $ | 41,234 | |||||
| *TransAlta Corp. |
14,589 | 163,362 | ||||||
| TransAlta Renewables, Inc. |
6,803 | 100,545 | ||||||
| Transcontinental, Inc., Class A |
12,587 | 199,028 | ||||||
| *Trican Well Service, Ltd. |
160 | 448 | ||||||
| *Trisura Group, Ltd. |
1,595 | 53,825 | ||||||
| *Turquoise Hill Resources, Ltd. |
88 | 1,113 | ||||||
| *Uni-Select, Inc. |
1,576 | 22,644 | ||||||
| Vecima Networks, Inc. |
4 | 52 | ||||||
| *Vermilion Energy, Inc. |
3,651 | 39,577 | ||||||
| *Vermilion Energy, Inc. |
10,682 | 115,649 | ||||||
| VersaBank |
16 | 191 | ||||||
| *Victoria Gold Corp. |
1,400 | 21,426 | ||||||
| Wajax Corp. |
1,112 | 22,167 | ||||||
| Waste Connections, Inc. |
5,039 | 684,577 | ||||||
| Waste Connections, Inc. |
1,393 | 189,462 | ||||||
| Waterloo Brewing, Ltd. |
27 | 127 | ||||||
| *Wesdome Gold Mines, Ltd. |
26,738 | 240,082 | ||||||
| West Fraser Timber Co., Ltd. |
4,183 | 334,390 | ||||||
| Western Forest Products, Inc. |
10,962 | 18,925 | ||||||
| Westshore Terminals Investment Corp. |
3,815 | 82,391 | ||||||
| Wheaton Precious Metals Corp. |
10,203 | 411,231 | ||||||
| #*Wheaton Precious Metals Corp. |
2,750 | 111,127 | ||||||
| Whitecap Resources, Inc. |
29,122 | 174,561 | ||||||
| #Winpak, Ltd. |
2,361 | 73,770 | ||||||
| WSP Global, Inc. |
4,850 | 656,475 | ||||||
| Yamana Gold, Inc. |
8,195 | 32,370 | ||||||
| *Yamana Gold, Inc. |
29,857 | 117,063 | ||||||
| Yellow Pages, Ltd. |
20 | 229 | ||||||
|
|
|
|||||||
| TOTAL CANADA |
80,264,427 | |||||||
|
|
|
|||||||
| CHINA (0.0%) |
| |||||||
| *FIH Mobile, Ltd. |
255,000 | 39,664 | ||||||
|
|
|
|||||||
| TOTAL CHINA |
39,664 | |||||||
|
|
|
|||||||
| DENMARK (2.5%) |
| |||||||
| *ALK-Abello A/S |
257 | 111,462 | ||||||
| #Alm Brand A/S |
25 | 193 | ||||||
| Ambu A/S, Class B |
2,616 | 74,594 | ||||||
| AP Moller—Maersk A/S, Class B |
54 | 156,203 | ||||||
| #AP Moller—Maersk A/S, Class A |
16 | 43,856 | ||||||
| #*Bang & Olufsen A/S |
375 | 1,847 | ||||||
| BankNordik P/F |
4 | 90 | ||||||
| *Bavarian Nordic A/S |
3,263 | 156,339 | ||||||
| *Brodrene Hartmann A/S |
4 | 239 | ||||||
| #Carlsberg AS, Class B |
4,812 | 794,596 | ||||||
| Cbrain A/S |
6 | 325 | ||||||
| Chemometec A/S |
798 | 120,662 | ||||||
| #Chr Hansen Holding A/S |
4,099 | 326,474 | ||||||
| Coloplast A/S, Class B |
4,453 | 726,656 | ||||||
| Columbus A/S |
114 | 168 | ||||||
| D/S Norden A/S |
3,588 | 86,681 | ||||||
| Danske Bank A/S |
25,820 | 437,406 | ||||||
| *Demant A/S |
4,575 | 221,834 | ||||||
Dimensional International Core Equity Market ETF
SCHEDULE OF INVESTMENTS
October 31, 2021
| Security Description |
Shares | Fair Value | ||||||
| DENMARK (Continued) |
||||||||
| *Dfds A/S |
78 | $ | 4,041 | |||||
| *Drilling Co. of 1972 A/S (The) |
530 | 19,012 | ||||||
| DSV A/S |
8,289 | 1,928,364 | ||||||
| #FLSmidth & Co. A/S |
8,611 | 327,650 | ||||||
| *Genmab A/S, Class S , ADR |
2,860 | 127,670 | ||||||
| *Genmab A/S |
2,410 | 1,081,217 | ||||||
| GN Store Nord AS |
4,860 | 295,228 | ||||||
| #H Lundbeck A/S, Class B |
2,037 | 56,689 | ||||||
| *H+H International A/S, Class B |
46 | 1,818 | ||||||
| #*ISS A/S |
8,932 | 177,991 | ||||||
| *Jyske Bank A/S, Registered |
129 | 6,301 | ||||||
| Matas A/S |
2,617 | 51,254 | ||||||
| #Netcompany Group A/S |
1,413 | 160,680 | ||||||
| *Nilfisk Holding A/S |
1,710 | 59,453 | ||||||
| *NKT A/S |
1,286 | 62,056 | ||||||
| #NNIT A/S |
8 | 151 | ||||||
| Novo Nordisk A/S , Sponsored ADR |
2,680 | 295,148 | ||||||
| Novo Nordisk A/S, Class B |
55,898 | 6,124,272 | ||||||
| Novozymes A/S, B Shares |
10,042 | 739,206 | ||||||
| *NTG Nordic Transport Group A/S |
709 | 57,793 | ||||||
| Orsted AS |
3,924 | 554,262 | ||||||
| Pandora A/S |
4,146 | 579,557 | ||||||
| Per Aarsleff Holding A/S |
572 | 24,692 | ||||||
| Ringkjoebing Landbobank A/S |
355 | 45,118 | ||||||
| ROCKWOOL International A/S, Class B |
609 | 278,526 | ||||||
| Royal Unibrew A/S |
2,424 | 301,060 | ||||||
| #RTX A/S |
4 | 95 | ||||||
| Scandinavian Tobacco Group A/S |
10,174 | 228,855 | ||||||
| Schouw & Co. A/S |
237 | 23,079 | ||||||
| Simcorp A/S |
1,582 | 191,316 | ||||||
| Solar A/S, B Shares |
204 | 23,801 | ||||||
| SP Group A/S |
217 | 13,435 | ||||||
| Spar Nord Bank A/S |
2,068 | 26,669 | ||||||
| Sydbank AS |
10,940 | 376,106 | ||||||
| Topdanmark AS |
5,320 | 282,869 | ||||||
| *TORM PLC |
26 | 212 | ||||||
| Tryg A/S |
9,558 | 226,819 | ||||||
| Vestas Wind Systems A/S |
26,506 | 1,147,514 | ||||||
| *Zealand Pharma A/S |
1,194 | 38,262 | ||||||
|
|
|
|||||||
| TOTAL DENMARK |
19,197,866 | |||||||
|
|
|
|||||||
| FINLAND (1.4%) |
| |||||||
| Aktia Bank OYJ |
1,287 | 18,439 | ||||||
| Alandsbanken Abp, Class B |
4 | 147 | ||||||
| Alma Media OYJ |
24 | 311 | ||||||
| Altia OYJ |
68 | 844 | ||||||
| Apetit OYJ |
8 | 114 | ||||||
| *BasWare OYJ |
291 | 10,759 | ||||||
| #Bittium OYJ |
16 | 96 | ||||||
| Cargotec OYJ, Class B |
1,970 | 102,225 | ||||||
| Caverion OYJ |
4,136 | 32,715 | ||||||
| #Citycon OYJ |
40 | 329 | ||||||
| Digia OYJ |
8 | 64 | ||||||
| Elisa OYJ |
6,013 | 363,096 | ||||||
Dimensional International Core Equity Market ETF
SCHEDULE OF INVESTMENTS
October 31, 2021
| Security Description |
Shares | Fair Value | ||||||
| FINLAND (Continued) |
| |||||||
| Enento Group OYJ |
17 | $ | 720 | |||||
| #*Finnair OYJ |
836 | 640 | ||||||
| Fiskars OYJ Abp |
1,561 | 38,387 | ||||||
| Fortum OYJ |
23,005 | 684,197 | ||||||
| F-Secure OYJ |
4,900 | 27,644 | ||||||
| Harvia OYJ |
841 | 51,777 | ||||||
| Hkscan OYJ |
16 | 37 | ||||||
| Huhtamaki OYJ |
4,657 | 202,961 | ||||||
| Kamux Corp. |
1,555 | 24,150 | ||||||
| Kemira OYJ |
8,566 | 131,545 | ||||||
| Kesko OYJ, Class B |
17,983 | 584,574 | ||||||
| Kesko OYJ, Class A |
72 | 2,200 | ||||||
| Kojamo OYJ |
7,085 | 158,488 | ||||||
| Kone OYJ, Class B |
12,115 | 826,622 | ||||||
| Konecranes OYJ |
2,311 | 96,225 | ||||||
| Lassila & Tikanoja OYJ |
1,407 | 22,144 | ||||||
| *Lehto Group OYJ |
32 | 38 | ||||||
| *Marimekko OYJ |
276 | 26,350 | ||||||
| Metsa Board OYJ |
9 | 102 | ||||||
| Metsa Board OYJ |
1,058 | 9,795 | ||||||
| Metso Outotec OYJ |
2,726 | 27,382 | ||||||
| Musti Group OYJ |
2,142 | 84,230 | ||||||
| Neles OYJ |
2,912 | 43,674 | ||||||
| Neste OYJ |
9,646 | 537,935 | ||||||
| *Nokia OYJ , Sponsored ADR |
54,128 | 307,447 | ||||||
| *Nokia OYJ |
200,356 | 1,152,351 | ||||||
| Nokian Renkaat OYJ |
5,666 | 212,445 | ||||||
| Nordea Bank Abp |
96,411 | 1,179,755 | ||||||
| Olvi OYJ |
586 | 35,467 | ||||||
| Oriola OYJ, Class A |
40 | 91 | ||||||
| Oriola OYJ, Class A |
92 | 211 | ||||||
| Orion OYJ, Class B |
5,058 | 219,091 | ||||||
| Orion OYJ, Class A |
24 | 1,036 | ||||||
| *Outokumpu OYJ |
45,147 | 282,130 | ||||||
| Ponsse OYJ |
328 | 16,967 | ||||||
| *QT Group OYJ |
807 | 130,372 | ||||||
| Raisio OYJ |
4,893 | 19,818 | ||||||
| *Rapala VMC OYJ |
32 | 327 | ||||||
| Revenio Group OYJ |
1,298 | 85,845 | ||||||
| Rovio Entertainment OYJ |
8 | 65 | ||||||
| #Sampo OYJ, A Shares |
12,017 | 639,705 | ||||||
| Sanoma OYJ |
1,245 | 19,393 | ||||||
| Stora Enso OYJ, Registered |
23,748 | 395,195 | ||||||
| Taaleri OYJ |
8 | 101 | ||||||
| Talenom OYJ |
641 | 10,311 | ||||||
| #*Tecnotree OYJ |
168 | 296 | ||||||
| Teleste OYJ |
16 | 98 | ||||||
| Terveystalo OYJ |
4,479 | 58,364 | ||||||
| TietoEVRY OYJ |
4,534 | 139,044 | ||||||
| Tokmanni Group Corp. |
11,041 | 251,455 | ||||||
| UPM-Kymmene OYJ |
24,491 | 865,002 | ||||||
| Uponor OYJ |
9,970 | 242,754 | ||||||
| Vaisala OYJ, A Shares |
345 | 18,366 | ||||||
| Valmet OYJ |
2,915 | 118,406 | ||||||
| Wartsila OYJ Abp |
35,169 | 488,187 | ||||||
| YIT OYJ |
7,271 | 42,913 | ||||||
|
|
|
|||||||
| TOTAL FINLAND |
11,043,964 | |||||||
|
|
|
Dimensional International Core Equity Market ETF
SCHEDULE OF INVESTMENTS
October 31, 2021
| Security Description |
Shares | Fair Value | ||||||
| FRANCE (8.8%) |
| |||||||
| ABC arbitrage |
45 | $ | 371 | |||||
| *Accor SA |
5,728 | 204,893 | ||||||
| *Aeroports de Paris |
1,841 | 244,793 | ||||||
| Air Liquide SA |
14,568 | 2,431,709 | ||||||
| *Airbus SE |
19,991 | 2,558,678 | ||||||
| *Akka Technologies |
104 | 5,748 | ||||||
| AKWEL |
8 | 204 | ||||||
| Albioma SA |
3,286 | 129,292 | ||||||
| ALD SA |
7,431 | 110,590 | ||||||
| #Alstom SA |
6,048 | 215,430 | ||||||
| Alten SA |
1,051 | 169,304 | ||||||
| Amundi SA |
48 | 4,280 | ||||||
| Arkema SA |
3,677 | 502,964 | ||||||
| Atos SE |
2,548 | 132,631 | ||||||
| *Aubay |
237 | 14,701 | ||||||
| AXA SA |
56,548 | 1,646,470 | ||||||
| Axway Software SA |
4 | 126 | ||||||
| Bastide le Confort Medical |
8 | 406 | ||||||
| *Beneteau SA |
3,684 | 56,190 | ||||||
| #Bigben Interactive |
12 | 228 | ||||||
| BioMerieux |
1,451 | 184,792 | ||||||
| #BNP Paribas SA |
33,449 | 2,241,236 | ||||||
| Boiron SA |
4 | 194 | ||||||
| Bollore SA |
42,371 | 245,659 | ||||||
| *Bonduelle SCA |
222 | 5,691 | ||||||
| Bouygues SA |
11,547 | 467,695 | ||||||
| Bureau Veritas SA |
11,577 | 367,894 | ||||||
| Capgemini SE |
6,807 | 1,585,716 | ||||||
| Carrefour SA |
33,096 | 599,590 | ||||||
| #*Casino Guichard Perrachon SA |
2,187 | 54,490 | ||||||
| *Cegedim SA |
8 | 240 | ||||||
| *CGG SA |
27,129 | 19,678 | ||||||
| Chargeurs SA |
16 | 475 | ||||||
| Cie de Saint-Gobain |
17,078 | 1,177,112 | ||||||
| *Cie des Alpes |
16 | 283 | ||||||
| Cie Generale des Etablissements Michelin SCA |
7,818 | 1,227,726 | ||||||
| Cie Plastic Omnium SA |
257 | 7,126 | ||||||
| CNP Assurances |
5,468 | 137,061 | ||||||
| Coface SA |
12,703 | 181,551 | ||||||
| Credit Agricole SA |
52,359 | 790,123 | ||||||
| Danone SA |
22,271 | 1,452,311 | ||||||
| Dassault Aviation SA |
112 | 11,697 | ||||||
| Dassault Systemes SE |
12,959 | 755,537 | ||||||
| *DBV Technologies SA |
32 | 213 | ||||||
| *Derichebourg SA |
9,895 | 112,563 | ||||||
| Edenred |
10,525 | 569,660 | ||||||
| Eiffage SA |
4,676 | 481,388 | ||||||
| Electricite de France SA |
26,190 | 385,825 | ||||||
| *Elior Group SA |
14,802 | 116,824 | ||||||
| *Elis SA |
12,475 | 236,617 | ||||||
| Engie SA |
55,763 | 793,480 | ||||||
Dimensional International Core Equity Market ETF
SCHEDULE OF INVESTMENTS
October 31, 2021
| Security Description |
Shares | Fair Value | ||||||
| FRANCE (Continued) |
| |||||||
| *Eramet SA |
890 | $ | 74,465 | |||||
| EssilorLuxottica SA |
7,957 | 1,647,349 | ||||||
| *Etablissements Maurel et Prom SA |
52 | 150 | ||||||
| Eurazeo SE |
193 | 18,103 | ||||||
| Eurofins Scientific SE |
4,356 | 513,876 | ||||||
| Euronext NV |
3,295 | 371,399 | ||||||
| Eutelsat Communications SA |
7,831 | 111,286 | ||||||
| Faurecia SE |
263 | 13,580 | ||||||
| Faurecia SE |
7,521 | 392,100 | ||||||
| Fnac Darty SA |
3,383 | 219,434 | ||||||
| Gaztransport Et Technigaz SA |
822 | 67,920 | ||||||
| Getlink SE |
14,741 | 226,628 | ||||||
| *GL Events |
16 | 338 | ||||||
| Groupe Gorge SA |
14 | 255 | ||||||
| Guerbet |
4 | 177 | ||||||
| *Haulotte Group SA |
16 | 93 | ||||||
| Hermes International |
1,020 | 1,617,727 | ||||||
| HEXAOM |
4 | 203 | ||||||
| *Id Logistics Group |
116 | 42,621 | ||||||
| Imerys SA |
2,199 | 95,379 | ||||||
| *Innate Pharma SA |
40 | 224 | ||||||
| Ipsen SA |
1,901 | 196,673 | ||||||
| IPSOS |
6,353 | 297,388 | ||||||
| Jacquet Metals SACA |
16 | 391 | ||||||
| *JCDecaux SA |
8,528 | 222,645 | ||||||
| Kaufman & Broad SA |
304 | 12,172 | ||||||
| Kering SA |
2,323 | 1,742,546 | ||||||
| Korian SA |
4,049 | 134,948 | ||||||
| La Francaise des Jeux SAEM |
60 | 3,118 | ||||||
| *Lagardere SA |
139 | 3,674 | ||||||
| Lectra |
22 | 922 | ||||||
| Legrand SA |
11,825 | 1,289,622 | ||||||
| LISI |
528 | 14,695 | ||||||
| LNA Sante SA |
4 | 230 | ||||||
| L’Oreal SA |
6,183 | 2,825,968 | ||||||
| *LVMH Moet Hennessy Louis Vuitton SE |
9,329 | 7,311,020 | ||||||
| Maisons du Monde SA |
1,371 | 31,065 | ||||||
| Manitou BF SA |
8 | 273 | ||||||
| Mersen SA |
1,752 | 65,792 | ||||||
| Metropole Television SA |
75 | 1,654 | ||||||
| *Neoen SA |
6 | 276 | ||||||
| Nexity SA |
5,953 | 271,981 | ||||||
| *Nicox |
28 | 106 | ||||||
| NRJ Group |
12 | 80 | ||||||
| Oeneo SA |
40 | 624 | ||||||
| *Onxeo SA |
44 | 26 | ||||||
| #*Orange SA |
96,996 | 1,059,063 | ||||||
| Orpea SA |
2,529 | 263,986 | ||||||
| *Pernod Ricard SA |
4,093 | 941,165 | ||||||
| Pharmagest Interactive |
224 | 24,574 | ||||||
| Publicis Groupe SA |
12,216 | 819,093 | ||||||
| Quadient SA |
2,488 | 59,485 | ||||||
| Remy Cointreau SA |
1,037 | 209,531 | ||||||
| *Renault SA |
9,583 | 344,452 | ||||||
| Rexel SA |
11,334 | 225,075 | ||||||
Dimensional International Core Equity Market ETF
SCHEDULE OF INVESTMENTS
October 31, 2021
| Security Description |
Shares | Fair Value | ||||||
| FRANCE (Continued) |
| |||||||
| Rothschild & Co. |
1,153 | $ | 50,770 | |||||
| Rubis SCA |
3,089 | 98,985 | ||||||
| Safran SA |
10,416 | 1,398,732 | ||||||
| Sanofi |
31,335 | 3,134,153 | ||||||
| Sartorius Stedim Biotech |
774 | 426,537 | ||||||
| Schneider Electric SE |
14,241 | 2,453,924 | ||||||
| SCOR SE |
9,821 | 330,731 | ||||||
| SEB SA |
599 | 93,789 | ||||||
| SES SA |
19,844 | 178,388 | ||||||
| Societe BIC SA |
677 | 39,369 | ||||||
| Societe Generale SA |
43,055 | 1,436,711 | ||||||
| Societe pour l’Informatique Industrielle |
445 | 20,290 | ||||||
| *Sodexo SA |
5,217 | 507,138 | ||||||
| *SOITEC |
756 | 201,047 | ||||||
| #*Solocal Group |
114 | 172 | ||||||
| Somfy SA |
10 | 1,967 | ||||||
| Sopra Steria Group SACA |
705 | 138,778 | ||||||
| SPIE SA |
9,308 | 226,205 | ||||||
| *SRP Groupe SA |
52 | 127 | ||||||
| Stef SA |
4 | 501 | ||||||
| #STMicroelectronics NV , Sponsored NYS |
4,486 | 213,713 | ||||||
| *STMicroelectronics NV |
15,815 | 748,820 | ||||||
| Suez SA |
6,656 | 151,626 | ||||||
| Sword Group |
211 | 10,316 | ||||||
| Synergie SE |
4 | 185 | ||||||
| *Technip Energies NV |
138 | 2,128 | ||||||
| Teleperformance |
2,078 | 868,358 | ||||||
| Television Francaise 1 |
95 | 1,018 | ||||||
| *Thales SA |
5,146 | 474,391 | ||||||
| Thermador Groupe |
228 | 25,963 | ||||||
| TotalEnergies SE |
86,535 | 4,343,173 | ||||||
| Trigano SA |
199 | 37,284 | ||||||
| *Ubisoft Entertainment SA |
2,268 | 118,712 | ||||||
| Valeo |
11,676 | 342,259 | ||||||
| *Vallourec SA |
4 | 32 | ||||||
| Veolia Environnement SA |
22,084 | 721,464 | ||||||
| Verallia SA |
232 | 8,586 | ||||||
| Vetoquinol SA |
4 | 683 | ||||||
| Vicat SA |
1,619 | 69,042 | ||||||
| VIEL & Cie SA |
16 | 109 | ||||||
| Vilmorin & Cie SA |
101 | 6,429 | ||||||
| Vinci SA |
18,954 | 2,026,085 | ||||||
| Virbac SA |
532 | 269,349 | ||||||
| Vivendi SE |
16,658 | 214,654 | ||||||
| Wavestone |
282 | 15,534 | ||||||
| *Worldline SA |
6,579 | 383,569 | ||||||
| *X-Fab Silicon Foundries SE |
2,451 | 24,393 | ||||||
|
|
|
|||||||
| TOTAL FRANCE |
68,243,264 | |||||||
|
|
|
|||||||
| GERMANY (7.7%) |
||||||||
| 1&1 AG |
2,519 | 73,402 | ||||||
| 3U Holding AG |
24 | 116 | ||||||
| 7C Solarparken AG |
12 | 58 | ||||||
| *Aareal Bank AG |
2,488 | 79,582 | ||||||
| Adesso SE |
116 | 25,855 | ||||||
Dimensional International Core Equity Market ETF
SCHEDULE OF INVESTMENTS
October 31, 2021
| Security Description |
Shares | Fair Value | ||||||
| GERMANY (Continued) |
| |||||||
| adidas AG |
6,180 | $ | 2,026,101 | |||||
| *ADVA Optical Networking se |
3,403 | 45,131 | ||||||
| AIXTRON SE |
3,656 | 86,945 | ||||||
| Allgeier SE |
4 | 131 | ||||||
| Allianz SE, Registered |
12,324 | 2,868,783 | ||||||
| Amadeus Fire AG |
418 | 96,649 | ||||||
| Atoss Software AG |
142 | 32,143 | ||||||
| *Aumann AG |
8 | 150 | ||||||
| Aurubis AG |
1,542 | 133,193 | ||||||
| BASF SE |
27,551 | 1,985,692 | ||||||
| Basler AG |
4 | 740 | ||||||
| *Bauer AG |
11 | 143 | ||||||
| Bayer AG, Registered |
34,960 | 1,969,059 | ||||||
| Bayerische Motoren Werke AG |
14,913 | 1,505,590 | ||||||
| Bayerische Motoren Werke AG, Preference |
246 | 20,953 | ||||||
| BayWa AG |
429 | 18,170 | ||||||
| Bechtle AG |
5,242 | 393,095 | ||||||
| Befesa SA |
1,791 | 133,270 | ||||||
| Beiersdorf AG |
3,735 | 397,221 | ||||||
| Bertrandt AG |
4 | 262 | ||||||
| bet-at-home.com AG |
8 | 163 | ||||||
| *Bijou Brigitte AG |
4 | 114 | ||||||
| *Bilfinger SE |
3,221 | 113,167 | ||||||
| *Borussia Dortmund GmbH & Co. KGaA |
48 | 265 | ||||||
| Brenntag SE |
6,258 | 595,586 | ||||||
| CANCOM SE |
2,736 | 189,214 | ||||||
| Carl Zeiss Meditec AG |
1,154 | 232,304 | ||||||
| *CECONOMY AG |
8,611 | 41,973 | ||||||
| CENIT AG |
8 | 134 | ||||||
| Cewe Stiftung & Co. KGaA |
201 | 28,099 | ||||||
| *Commerzbank AG |
61,944 | 452,759 | ||||||
| CompuGroup Medical SE & Co. KGaA |
748 | 62,584 | ||||||
| *Continental AG |
3,928 | 461,476 | ||||||
| *Corestate Capital Holding SA |
16 | 188 | ||||||
| Covestro AG |
8,180 | 524,432 | ||||||
| CropEnergies AG |
27 | 388 | ||||||
| *CTS Eventim AG & Co. KGaA |
182 | 13,240 | ||||||
| Daimler AG |
32,691 | 3,243,677 | ||||||
| *Delivery Hero SE |
2,692 | 335,051 | ||||||
| Dermapharm Holding SE |
78 | 7,853 | ||||||
| *Deutsche Bank AG, Registered |
67,871 | 875,446 | ||||||
| *Deutsche Bank AG, Registered |
18,936 | 242,759 | ||||||
| Deutsche Boerse AG |
7,912 | 1,314,821 | ||||||
| #*Deutsche Lufthansa AG, Registered |
13,278 | 87,770 | ||||||
| Deutsche Post AG, Registered |
38,069 | 2,357,836 | ||||||
| *Deutsche Telekom AG |
142,107 | 2,644,073 | ||||||
| *Deutz AG |
42,996 | 361,236 | ||||||
| DIC Asset AG |
208 | 3,656 | ||||||
| Draegerwerk AG & Co. KGaA, Preference |
1,143 | 90,078 | ||||||
| Duerr AG |
11,715 | 530,084 | ||||||
| E.ON SE |
94,457 | 1,198,694 | ||||||
| Eckert & Ziegler Strahlen- und Medizintechnik AG |
809 | 121,240 | ||||||
| *EDAG Engineering Group AG |
4 | 54 | ||||||
| #*ElringKlinger AG |
1,562 | 22,071 | ||||||
| #Encavis AG |
5,160 | 108,082 | ||||||
Dimensional International Core Equity Market ETF
SCHEDULE OF INVESTMENTS
October 31, 2021
| Security Description |
Shares | Fair Value | ||||||
| GERMANY (Continued) |
| |||||||
| Energiekontor AG |
8 | $ | 721 | |||||
| Evonik Industries AG |
12,048 | 390,669 | ||||||
| *Evotec SE |
2,977 | 144,178 | ||||||
| Fielmann AG |
1,719 | 113,390 | ||||||
| *flatexDEGIRO AG |
960 | 21,841 | ||||||
| Fraport AG Frankfurt Airport Services Worldwide |
1,556 | 111,102 | ||||||
| Freenet AG |
1,709 | 44,064 | ||||||
| Fresenius Medical Care AG & Co. KGaA |
10,152 | 675,061 | ||||||
| Fresenius SE & Co. KGaA |
19,600 | 890,610 | ||||||
| FUCHS PETROLUB SE |
86 | 3,167 | ||||||
| FUCHS PETROLUB SE, Preference |
4,148 | 198,923 | ||||||
| *Gateway Real Estate AG |
28 | 86 | ||||||
| GEA Group AG |
6,153 | 303,264 | ||||||
| #Gerresheimer AG |
2,011 | 184,549 | ||||||
| GFT Technologies SE |
638 | 30,124 | ||||||
| *Global Fashion Group SA |
3 | 27 | ||||||
| Grand City Properties SA |
6,277 | 160,971 | ||||||
| Hamburger Hafen und Logistik AG |
3,812 | 85,537 | ||||||
| Hannover Rueck SE |
2,267 | 414,510 | ||||||
| #Hapag-Lloyd AG |
827 | 177,914 | ||||||
| HeidelbergCement AG |
6,815 | 513,735 | ||||||
| *Heidelberger Druckmaschinen AG |
10,580 | 27,303 | ||||||
| Hella GmbH & Co. KGaA |
778 | 54,020 | ||||||
| *Hellofresh SE |
806 | 65,292 | ||||||
| Henkel AG & Co. KGaA |
1,970 | 164,372 | ||||||
| Henkel AG & Co. KGaA, Preference |
6,253 | 559,942 | ||||||
| *Highlight Communications AG |
12 | 55 | ||||||
| HOCHTIEF AG |
459 | 35,429 | ||||||
| *HolidayCheck Group AG |
24 | 75 | ||||||
| Hornbach Baumarkt AG |
8 | 360 | ||||||
| Hornbach Holding AG & Co. KGaA |
984 | 124,463 | ||||||
| HUGO BOSS AG |
5,283 | 330,508 | ||||||
| *Hypoport SE |
277 | 170,376 | ||||||
| Indus Holding AG |
506 | 19,909 | ||||||
| *Infineon Technologies AG |
38,217 | 1,786,529 | ||||||
| Instone Real Estate Group SE |
3,072 | 81,056 | ||||||
| IVU Traffic Technologies AG |
8 | 187 | ||||||
| Jenoptik AG |
4,290 | 164,229 | ||||||
| JOST Werke AG |
386 | 22,380 | ||||||
| Jungheinrich AG, Preference |
1,089 | 55,224 | ||||||
| K+S AG, Registered |
13,321 | 229,617 | ||||||
| KION Group AG |
3,351 | 366,077 | ||||||
| *Kloeckner & Co. SE |
4,370 | 58,865 | ||||||
| Knorr-Bremse AG |
2,765 | 291,629 | ||||||
| *Koenig & Bauer AG |
8 | 282 | ||||||
| Krones AG |
10 | 1,033 | ||||||
| *KWS Saat SE & Co.KGaA |
47 | 4,014 | ||||||
| LANXESS AG |
2,631 | 177,385 | ||||||
| LEG Immobilien SE |
3,143 | 467,929 | ||||||
| *Leoni AG |
16 | 248 | ||||||
| LPKF Laser & Electronics AG |
12 | 266 | ||||||
| #*Manz AG |
4 | 209 | ||||||
| *MAX Automation SE |
8 | 41 | ||||||
| *Medigene AG |
8 | 33 | ||||||
| Merck KGaA |
3,530 | 834,174 | ||||||
| Metro AG |
468 | 5,919 | ||||||
Dimensional International Core Equity Market ETF
SCHEDULE OF INVESTMENTS
October 31, 2021
| Security Description |
Shares | Fair Value | ||||||
| GERMANY (Continued) |
| |||||||
| MLP SE |
2,308 | $ | 22,249 | |||||
| MTU Aero Engines AG |
2,338 | 520,430 | ||||||
| Muenchener Rueckversicherungs-Gesellschaft AG in Muenchen, Registered |
4,076 | 1,208,479 | ||||||
| *Nagarro SE |
550 | 110,748 | ||||||
| Nemetschek SE |
470 | 53,955 | ||||||
| New Work SE |
43 | 10,500 | ||||||
| Nexus AG |
474 | 41,360 | ||||||
| #*Nordex SE |
1,523 | 28,024 | ||||||
| Norma Group SE |
1,451 | 62,465 | ||||||
| OHB SE |
4 | 175 | ||||||
| PATRIZIA AG |
1,343 | 37,145 | ||||||
| Pfeiffer Vacuum Technology AG |
98 | 24,497 | ||||||
| Porsche Automobil Holding SE, Preference |
6,066 | 630,524 | ||||||
| ProSiebenSat.1 Media SE |
11,559 | 193,760 | ||||||
| PSI Software AG |
8 | 386 | ||||||
| Puma SE |
3,425 | 425,291 | ||||||
| *PVA TePla AG |
665 | 30,244 | ||||||
| *q.beyond AG |
48 | 110 | ||||||
| *QIAGEN NV |
6,002 | 330,550 | ||||||
| *QIAGEN NV |
1,721 | 95,963 | ||||||
| Rational AG |
273 | 271,572 | ||||||
| Rheinmetall AG |
4,031 | 391,102 | ||||||
| RTL Group SA |
248 | 14,316 | ||||||
| RWE AG |
24,892 | 958,382 | ||||||
| #S&T AG |
3,882 | 93,353 | ||||||
| *SAF-Holland SE |
3,692 | 51,271 | ||||||
| *Salzgitter AG |
2,205 | 81,196 | ||||||
| SAP SE |
30,587 | 4,435,915 | ||||||
| Sartorius AG, Preference |
1,330 | 862,533 | ||||||
| Scout24 SE |
3,949 | 275,112 | ||||||
| *SGL Carbon SE |
48 | 459 | ||||||
| *Siemens AG, Registered |
16,121 | 2,617,060 | ||||||
| *Siemens Energy AG |
506 | 14,534 | ||||||
| Siemens Healthineers AG |
8,590 | 571,196 | ||||||
| Siltronic AG |
80 | 12,656 | ||||||
| *Sixt SE |
87 | 14,991 | ||||||
| Sixt SE, Preference |
26 | 2,576 | ||||||
| #SMA Solar Technology AG |
571 | 30,172 | ||||||
| #*SNP Schneider-Neureither & Partner SE |
4 | 207 | ||||||
| Software AG |
785 | 32,304 | ||||||
| Stabilus SA |
3,974 | 298,928 | ||||||
| STO SE & Co.KGaA, Preference |
4 | 901 | ||||||
| STRATEC SE |
1,629 | 260,151 | ||||||
| Stroeer SE & Co.KGaA |
999 | 84,741 | ||||||
| Suedzucker AG |
4,889 | 77,625 | ||||||
| *SUESS MicroTec SE |
817 | 21,462 | ||||||
| Surteco Group SE |
4 | 170 | ||||||
| Symrise AG |
4,561 | 631,009 | ||||||
| *TAG Immobilien AG |
7,336 | 223,106 | ||||||
| Takkt AG |
765 | 12,500 | ||||||
| Talanx AG |
832 | 40,054 | ||||||
| *Teamviewer AG |
78 | 1,164 | ||||||
| Technotrans SE |
4 | 118 | ||||||
| Telefonica Deutschland Holding AG |
64,941 | 169,319 | ||||||
| *thyssenkrupp AG |
11,542 | 120,106 | ||||||
Dimensional International Core Equity Market ETF
SCHEDULE OF INVESTMENTS
October 31, 2021
| Security Description |
Shares | Fair Value | ||||||
| GERMANY (Continued) |
| |||||||
| Traffic Systems SE |
4 | $ | 209 | |||||
| United Internet AG |
9,181 | 338,715 | ||||||
| *va-Q-tec AG |
4 | 127 | ||||||
| #Varta AG |
59 | 9,081 | ||||||
| VERBIO Vereinigte BioEnergie AG |
300 | 23,816 | ||||||
| *Vitesco Technologies Group AG |
785 | 45,059 | ||||||
| Volkswagen AG, Preference |
8,043 | 1,804,025 | ||||||
| Volkswagen AG |
805 | 261,589 | ||||||
| Vonovia SE, Class R |
11,607 | 704,651 | ||||||
| Vossloh AG |
391 | 20,927 | ||||||
| Wacker Chemie AG |
1,078 | 194,549 | ||||||
| Wacker Neuson SE |
1,088 | 35,708 | ||||||
| Washtec AG |
224 | 14,568 | ||||||
| Wuestenrot & Wuerttembergische AG |
520 | 10,844 | ||||||
| *Zalando SE |
5,280 | 498,475 | ||||||
| Zeal Network SE |
496 | 21,812 | ||||||
| *zooplus AG |
617 | 341,588 | ||||||
|
|
|
|||||||
| TOTAL GERMANY |
59,541,733 | |||||||
|
|
|
|||||||
| HONG KONG (2.2%) |
| |||||||
| AIA Group, Ltd. |
369,400 | 4,171,691 | ||||||
| *Apollo Future Mobility Group, Ltd. |
1,328,000 | 92,186 | ||||||
| ASM Pacific Technology, Ltd. |
25,500 | 275,519 | ||||||
| Bank of East Asia, Ltd. (The) |
143,600 | 236,286 | ||||||
| BOC Aviation, Ltd. |
200 | 1,755 | ||||||
| BOC Hong Kong Holdings, Ltd. |
199,000 | 631,864 | ||||||
| BOCOM International Holdings Co., Ltd. |
1,000 | 225 | ||||||
| Budweiser Brewing Co. Apac, Ltd. |
10,400 | 28,677 | ||||||
| Cafe de Coral Holdings, Ltd. |
12,000 | 21,905 | ||||||
| *Cathay Pacific Airways, Ltd. |
343,000 | 316,145 | ||||||
| *China Energy Development Holdings, Ltd. |
8,000 | 176 | ||||||
| Chow Sang Sang Holdings International, Ltd. |
7,000 | 9,952 | ||||||
| Chow Tai Fook Jewellery Group, Ltd. |
278,400 | 569,752 | ||||||
| CITIC Telecom International Holdings, Ltd. |
2,000 | 710 | ||||||
| CK Asset Holdings, Ltd. |
80,127 | 494,932 | ||||||
| CK Hutchison Holdings, Ltd. |
98,500 | 662,867 | ||||||
| CK Infrastructure Holdings, Ltd. |
500 | 3,014 | ||||||
| CK Life Sciences Int’l Holdings, Inc. |
2,000 | 188 | ||||||
| *CLP Holdings, Ltd. |
132,500 | 1,297,057 | ||||||
| Dah Sing Banking Group, Ltd. |
400 | 383 | ||||||
| Dah Sing Financial Holdings, Ltd. |
5,600 | 17,457 | ||||||
| *Digital Domain Holdings, Ltd. |
4,000 | 334 | ||||||
| Far East Consortium International, Ltd. |
1,014 | 335 | ||||||
| First Pacific Co., Ltd. |
206,000 | 82,357 | ||||||
| *FIT Hon Teng, Ltd. |
490,000 | 98,264 | ||||||
| *Galaxy Entertainment Group, Ltd. |
1,000 | 5,412 | ||||||
| *Genting Hong Kong, Ltd. |
353,000 | 31,311 | ||||||
| Giordano International, Ltd. |
2,000 | 391 | ||||||
| Guotai Junan International Holdings, Ltd. |
525,000 | 76,262 | ||||||
| Haitong International Securities Group, Ltd. |
595,000 | 136,913 | ||||||
| Hang Lung Group, Ltd. |
1,000 | 2,342 | ||||||
| Hang Lung Properties, Ltd. |
10,000 | 23,216 | ||||||
| Hang Seng Bank, Ltd. |
25,800 | 490,857 | ||||||
| #Henderson Land Development Co., Ltd. |
1,000 | 4,191 | ||||||
| HK Electric Investments & HK Electric Investments, Ltd. |
250,500 | 249,565 | ||||||
Dimensional International Core Equity Market ETF
SCHEDULE OF INVESTMENTS
October 31, 2021
| Security Description |
Shares | Fair Value | ||||||
| HONG KONG (Continued) |
| |||||||
| HKBN, Ltd. |
103,500 | $ | 124,268 | |||||
| HKT Trust & HKT, Ltd. |
256,000 | 347,518 | ||||||
| Hong Kong & China Gas Co., Ltd. |
757,000 | 1,177,483 | ||||||
| Hong Kong Exchanges & Clearing, Ltd. |
48,600 | 2,941,346 | ||||||
| Hong Kong Technology Venture Co., Ltd. |
17,000 | 25,569 | ||||||
| *Hongkong & Shanghai Hotels, Ltd. (The) |
1,000 | 911 | ||||||
| IGG, Inc. |
282,000 | 262,459 | ||||||
| Johnson Electric Holdings, Ltd. |
509 | 1,130 | ||||||
| K Wah International Holdings, Ltd. |
47,000 | 18,790 | ||||||
| Karrie International Holdings, Ltd. |
2,000 | 406 | ||||||
| Kerry Logistics Network, Ltd. |
500 | 1,215 | ||||||
| *Landing International Development, Ltd. |
2,400 | 74 | ||||||
| #*Lifestyle International Holdings, Ltd. |
500 | 262 | ||||||
| Luk Fook Holdings International, Ltd. |
14,000 | 38,244 | ||||||
| Man Wah Holdings, Ltd. |
101,600 | 158,035 | ||||||
| MTR Corp., Ltd. |
500 | 2,725 | ||||||
| NagaCorp., Ltd. |
2,000 | 1,838 | ||||||
| New World Development Co., Ltd. |
4,000 | 17,354 | ||||||
| Pacific Basin Shipping, Ltd. |
670,000 | 310,064 | ||||||
| Pacific Textiles Holdings, Ltd. |
85,000 | 42,396 | ||||||
| PCCW, Ltd. |
394,000 | 203,102 | ||||||
| Power Assets Holdings, Ltd. |
1,000 | 6,100 | ||||||
| PRADA SpA |
15,700 | 98,490 | ||||||
| *Samsonite International SA |
3,300 | 7,110 | ||||||
| *Sands China, Ltd. |
2,400 | 5,485 | ||||||
| Sino Land Co., Ltd. |
2,000 | 2,628 | ||||||
| #SITC International Holdings Co., Ltd. |
255,000 | 863,762 | ||||||
| *SJM Holdings, Ltd. |
1,000 | 747 | ||||||
| *SmarTone Telecommunications Holdings, Ltd. |
500 | 291 | ||||||
| Stella International Holdings, Ltd. |
9,500 | 11,321 | ||||||
| *Sun Hung Kai Properties, Ltd. |
500 | 6,653 | ||||||
| Swire Pacific, Ltd., Class A |
500 | 3,146 | ||||||
| Swire Properties, Ltd. |
15,600 | 41,812 | ||||||
| Techtronic Industries Co., Ltd. |
500 | 10,291 | ||||||
| *Television Broadcasts, Ltd. |
21,500 | 16,666 | ||||||
| United Laboratories International Holdings, Ltd. (The) |
28,000 | 17,745 | ||||||
| Value Partners Group, Ltd. |
144,000 | 74,045 | ||||||
| VPower Group International Holdings, Ltd. |
1,004 | 196 | ||||||
| VSTECS Holdings, Ltd. |
26,000 | 24,633 | ||||||
| Wang On Group, Ltd. |
20,000 | 188 | ||||||
| WH Group, Ltd. |
577,760 | 405,521 | ||||||
| Wharf Real Estate Investment Co., Ltd. |
1,000 | 5,644 | ||||||
| #*Wynn Macau, Ltd. |
96,000 | 86,386 | ||||||
| Xinyi Glass Holdings, Ltd. |
2,000 | 5,643 | ||||||
| *Yue Yuen Industrial Holdings, Ltd. |
500 | 1,066 | ||||||
|
|
|
|||||||
| TOTAL HONG KONG |
17,405,249 | |||||||
|
|
|
|||||||
| IRELAND (0.6%) |
| |||||||
| *AIB Group PLC |
868 | 2,354 | ||||||
| *Bank of Ireland Group PLC |
61,897 | 369,755 | ||||||
| Cairn Homes PLC |
39,457 | 51,232 | ||||||
| CRH PLC |
25,471 | 1,222,674 | ||||||
| CRH PLC , Sponsored ADR |
7,873 | 377,432 | ||||||
| *Dalata Hotel Group PLC |
4,785 | 20,489 | ||||||
Dimensional International Core Equity Market ETF
SCHEDULE OF INVESTMENTS
October 31, 2021
| Security Description |
Shares | Fair Value | ||||||
| IRELAND (Continued) |
| |||||||
| *FBD Holdings PLC |
114 | $ | 1,090 | |||||
| *Flutter Entertainment PLC |
3,072 | 581,608 | ||||||
| Glanbia PLC |
8,614 | 140,855 | ||||||
| *Glenveagh Properties PLC |
34,097 | 43,010 | ||||||
| *Irish Continental Group PLC |
10,393 | 51,116 | ||||||
| Kerry Group PLC, Class A |
5,734 | 770,399 | ||||||
| Kingspan Group PLC |
7,744 | 892,946 | ||||||
| *Permanent TSB Group Holdings PLC |
92 | 170 | ||||||
| Smurfit Kappa Group PLC |
10,390 | 544,557 | ||||||
|
|
|
|||||||
| TOTAL IRELAND |
5,069,687 | |||||||
|
|
|
|||||||
| ISRAEL (0.6%) |
| |||||||
| *AFI Properties, Ltd. |
16 | 831 | ||||||
| Africa Israel Residences, Ltd. |
4 | 219 | ||||||
| *Airport City, Ltd. |
44 | 840 | ||||||
| *Allot, Ltd. |
16 | 236 | ||||||
| *Alrov Properties and Lodgings, Ltd. |
4 | 221 | ||||||
| Amot Investments, Ltd. |
116 | 886 | ||||||
| Arad, Ltd. |
8 | 119 | ||||||
| Ashtrom Group, Ltd. |
24 | 562 | ||||||
| Azrieli Group, Ltd. |
24 | 2,246 | ||||||
| *Bank Hapoalim BM |
16,407 | 161,635 | ||||||
| *Bank Leumi Le-Israel BM |
110,508 | 1,056,124 | ||||||
| *Bezeq The Israeli Telecommunication Corp., Ltd. |
527,939 | 662,422 | ||||||
| Big Shopping Centers, Ltd. |
4 | 600 | ||||||
| Blue Square Real Estate, Ltd. |
4 | 309 | ||||||
| *Camtek, Ltd./Israel |
16 | 639 | ||||||
| *Cellcom Israel, Ltd. |
6,112 | 23,117 | ||||||
| *Clal Insurance Enterprises Holdings, Ltd. |
536 | 13,264 | ||||||
| *Danel Adir Yeoshua, Ltd. |
4 | 846 | ||||||
| Delek Automotive Systems, Ltd. |
32 | 419 | ||||||
| *Delek Group, Ltd. |
8 | 665 | ||||||
| *Delta Galil Industries, Ltd. |
8 | 410 | ||||||
| Elbit Systems, Ltd. |
308 | 48,588 | ||||||
| Elbit Systems, Ltd. |
10 | 1,588 | ||||||
| Electra Consumer Products 1970, Ltd. |
4 | 188 | ||||||
| Electra Real Estate, Ltd. |
36 | 562 | ||||||
| Energix-Renewable Energies, Ltd. |
104 | 489 | ||||||
| *Enlight Renewable Energy, Ltd. |
4,196 | 10,368 | ||||||
| *Equital, Ltd. |
28 | 862 | ||||||
| First International Bank Of Israel, Ltd. (The) |
40 | 1,604 | ||||||
| Formula Systems 1985, Ltd. |
8 | 860 | ||||||
| Fox Wizel, Ltd. |
916 | 126,366 | ||||||
| Gav-Yam Lands Corp., Ltd. |
232 | 2,765 | ||||||
| Gilat Satellite Networks, Ltd. |
2,217 | 18,365 | ||||||
| Harel Insurance Investments & Financial Services, Ltd. |
1,728 | 19,317 | ||||||
| Hilan, Ltd. |
12 | 665 | ||||||
| *ICL Group, Ltd. |
500 | 4,284 | ||||||
| Inrom Construction Industries, Ltd. |
5,403 | 27,795 | ||||||
| Isracard, Ltd. |
4,817 | 19,364 | ||||||
| Israel Canada T.R, Ltd. |
60 | 290 | ||||||
| *Israel Discount Bank, Ltd., Class A |
98,233 | 593,720 | ||||||
| *Kamada, Ltd. |
20 | 115 | ||||||
| Kenon Holdings, Ltd. |
12 | 481 | ||||||
| Magic Software Enterprises, Ltd. |
20 | 426 | ||||||
Dimensional International Core Equity Market ETF
SCHEDULE OF INVESTMENTS
October 31, 2021
| Security Description |
Shares | Fair Value | ||||||
| ISRAEL (Continued) |
| |||||||
| *Malam—Team, Ltd. |
636 | $ | 21,456 | |||||
| *Matrix IT, Ltd. |
28 | 761 | ||||||
| Maytronics, Ltd. |
24 | 568 | ||||||
| Mediterranean Towers, Ltd. |
48 | 150 | ||||||
| Mega Or Holdings, Ltd. |
16 | 634 | ||||||
| Menora Mivtachim Holdings, Ltd. |
20 | 462 | ||||||
| Migdal Insurance & Financial Holdings, Ltd. |
252 | 429 | ||||||
| Mivne Real Estate KD, Ltd. |
384 | 1,401 | ||||||
| *Mizrahi Tefahot Bank, Ltd. |
16,830 | 612,562 | ||||||
| *Nice, Ltd. |
1,416 | 399,298 | ||||||
| #*Nice, Ltd., Sponsored ADR |
460 | 130,189 | ||||||
| *Nova, Ltd. |
1,929 | 204,703 | ||||||
| Novolog, Ltd. |
180 | 166 | ||||||
| *Oil Refineries, Ltd. |
1,220 | 331 | ||||||
| *OPC Energy, Ltd. |
1,165 | 12,170 | ||||||
| *Partner Communications Co., Ltd. |
112 | 566 | ||||||
| *Paz Oil Co., Ltd. |
4 | 510 | ||||||
| *Perion Network, Ltd. |
889 | 24,948 | ||||||
| Phoenix Holdings, Ltd. (The) |
112 | 1,415 | ||||||
| Plasson Industries, Ltd. |
4 | 300 | ||||||
| Rami Levy Chain Stores Hashikma Marketing, Ltd. |
12 | 905 | ||||||
| Shapir Engineering and Industry, Ltd. |
60 | 492 | ||||||
| *Shikun & Binui, Ltd. |
138 | 824 | ||||||
| Shufersal, Ltd. |
49,282 | 408,387 | ||||||
| Strauss Group, Ltd. |
40 | 1,177 | ||||||
| Tadiran Group, Ltd. |
4 | 522 | ||||||
| Telsys |
4 | 176 | ||||||
| *Tera Light, Ltd. |
20 | 50 | ||||||
| *Teva Pharmaceutical Industries, Ltd. |
18,061 | 159,622 | ||||||
| *Teva Pharmaceutical Industries, Ltd., Sponsored ADR |
4,905 | 42,870 | ||||||
| *Tower Semiconductor, Ltd. |
213 | 6,929 | ||||||
| YH Dimri Construction & Development, Ltd. |
4 | 287 | ||||||
|
|
|
|||||||
| TOTAL ISRAEL |
4,840,932 | |||||||
|
|
|
|||||||
| ITALY (2.5%) |
| |||||||
| A2A SpA |
5,687 | 11,965 | ||||||
| ACEA SpA |
3,062 | 66,476 | ||||||
| #Alerion Cleanpower SpA |
4 | 111 | ||||||
| Amplifon SpA |
109 | 5,544 | ||||||
| Anima Holding SpA |
53,591 | 284,663 | ||||||
| *Aquafil SpA |
12 | 108 | ||||||
| *Arnoldo Mondadori Editore SpA |
156 | 361 | ||||||
| Ascopiave SpA |
64 | 261 | ||||||
| Assicurazioni Generali SpA |
43,240 | 943,242 | ||||||
| *Atlantia SpA |
19,331 | 373,703 | ||||||
| Avio SpA |
12 | 160 | ||||||
| Azimut Holding SpA |
10,024 | 288,730 | ||||||
| *Banca Generali SpA |
95 | 4,470 | ||||||
| Banca IFIS SpA |
16 | 296 | ||||||
| Banca Mediolanum SpA |
5,790 | 58,334 | ||||||
| Banca Popolare di Sondrio SCPA |
55,449 | 241,016 | ||||||
| *Banca Sistema SpA |
32 | 84 | ||||||
| Banco BPM SpA |
2,509 | 7,799 | ||||||
| Banco di Desio e della Brianza SpA |
40 | 148 | ||||||
Dimensional International Core Equity Market ETF
SCHEDULE OF INVESTMENTS
October 31, 2021
| Security Description |
Shares | Fair Value | ||||||
| ITALY (Continued) |
| |||||||
| Be Shaping The Future SpA |
68 | $ | 183 | |||||
| BFF Bank SpA |
5,660 | 50,697 | ||||||
| BPER Banca |
47,555 | 104,260 | ||||||
| Brembo SpA |
6,061 | 79,610 | ||||||
| *Brunello Cucinelli SpA |
3,106 | 188,347 | ||||||
| Buzzi Unicem SpA |
6,933 | 161,828 | ||||||
| Cairo Communication SpA |
44 | 92 | ||||||
| Carel Industries SpA |
1,042 | 30,146 | ||||||
| Cementir Holding NV |
40 | 421 | ||||||
| CNH Industrial NV |
54,029 | 933,496 | ||||||
| Credito Emiliano SpA |
4,650 | 35,301 | ||||||
| *Danieli & C Officine Meccaniche SpA |
1,209 | 26,135 | ||||||
| *Danieli & C Officine Meccaniche SpA |
8 | 269 | ||||||
| Davide Campari-Milano NV |
16,987 | 241,402 | ||||||
| DiaSorin SpA |
20 | 4,521 | ||||||
| Digital Bros SpA |
4 | 194 | ||||||
| doValue SpA |
2,394 | 22,967 | ||||||
| *Elica SpA |
12 | 50 | ||||||
| Emak SpA |
40 | 93 | ||||||
| *Enav SpA |
14,683 | 64,399 | ||||||
| *Enel SpA |
158,249 | 1,325,151 | ||||||
| Eni SpA |
96,199 | 1,380,887 | ||||||
| ERG SpA |
705 | 25,471 | ||||||
| Esprinet SpA |
1,359 | 17,646 | ||||||
| #*Eurotech SpA |
20 | 116 | ||||||
| Ferrari NV |
2,264 | 536,953 | ||||||
| Ferrari NV |
4,088 | 969,819 | ||||||
| *FinecoBank Banca Fineco SpA, Class B |
22,582 | 431,585 | ||||||
| FNM SpA |
100 | 78 | ||||||
| *Geox SpA |
64 | 81 | ||||||
| Gruppo MutuiOnline SpA |
1,621 | 79,257 | ||||||
| Hera SpA |
80,188 | 328,224 | ||||||
| *Illimity Bank SpA |
1,399 | 22,083 | ||||||
| Infrastrutture Wireless Italiane SpA |
15,946 | 176,341 | ||||||
| *Intek Group SpA |
148 | 58 | ||||||
| Interpump Group SpA |
456 | 33,641 | ||||||
| *Intesa Sanpaolo SpA |
495,563 | 1,409,348 | ||||||
| Iren SpA |
26,474 | 82,291 | ||||||
| Italgas SpA |
19,617 | 124,632 | ||||||
| #*Juventus Football Club SpA |
17,781 | 14,383 | ||||||
| *Leonardo SpA |
21,154 | 155,157 | ||||||
| LU-VE SpA |
4 | 109 | ||||||
| Maire Tecnimont SpA |
7,941 | 34,241 | ||||||
| *Mediobanca Banca di Credito Finanziario SpA |
56,634 | 676,040 | ||||||
| Moncler SpA |
8,152 | 586,032 | ||||||
| #*Nexi SpA |
1,255 | 21,821 | ||||||
| Openjobmetis Spa agenzia per il lavoro |
8 | 107 | ||||||
| *OVS SpA |
313 | 898 | ||||||
| Piaggio & C SpA |
18,652 | 62,596 | ||||||
| Piovan SpA |
12 | 125 | ||||||
| Pirelli & C SpA |
3,532 | 21,712 | ||||||
| Poste Italiane SpA |
17,564 | 250,821 | ||||||
| Prysmian SpA |
10,373 | 392,535 | ||||||
| RAI Way SpA |
4,244 | 25,735 | ||||||
| Recordati Industria Chimica e Farmaceutica SpA |
12,375 | 775,049 | ||||||
| Reno de Medici SpA |
160 | 269 | ||||||
Dimensional International Core Equity Market ETF
SCHEDULE OF INVESTMENTS
October 31, 2021
| Security Description |
Shares | Fair Value | ||||||
| ITALY (Continued) |
| |||||||
| Reply SpA |
856 | $ | 166,124 | |||||
| Rizzoli Corriere Della Sera Mediagroup SpA |
108 | 89 | ||||||
| *Safilo Group SpA |
96 | 173 | ||||||
| *Saipem SpA |
22,796 | 50,031 | ||||||
| *Saras SpA |
392 | 292 | ||||||
| Sesa SpA |
1,492 | 292,833 | ||||||
| *Snam SpA |
96,571 | 547,272 | ||||||
| *Sogefi SpA |
48 | 76 | ||||||
| SOL SpA |
1,262 | 29,004 | ||||||
| Stellantis NV |
13,994 | 279,161 | ||||||
| Stellantis NV |
18,663 | 372,140 | ||||||
| Stellantis NV |
50,875 | 1,015,593 | ||||||
| Technogym SpA |
8,432 | 88,602 | ||||||
| Telecom Italia SpA |
3,808 | 1,448 | ||||||
| Telecom Italia SpA, Class A |
464,532 | 165,628 | ||||||
| *Tenaris SA |
16,917 | 188,528 | ||||||
| #Tenaris SA , Sponsored ADR |
1,401 | 31,214 | ||||||
| Terna Rete Elettrica Nazionale SpA |
59,237 | 441,611 | ||||||
| Tinexta SpA |
1,677 | 74,329 | ||||||
| #*Tiscali SpA |
2,080 | 42 | ||||||
| *Tod’s SpA |
412 | 22,733 | ||||||
| UniCredit SpA |
88,985 | 1,176,416 | ||||||
| Unieuro SpA |
706 | 16,586 | ||||||
| Unipol Gruppo SpA |
1,063 | 6,114 | ||||||
| UnipolSai Assicurazioni SpA |
17,319 | 50,186 | ||||||
| Webuild SpA |
188 | 466 | ||||||
| Zignago Vetro SpA |
517 | 10,434 | ||||||
|
|
|
|||||||
| TOTAL ITALY |
19,220,299 | |||||||
|
|
|
|||||||
| JAPAN (21.6%) |
| |||||||
| A&D Co., Ltd. |
200 | 1,773 | ||||||
| ADEKA Corp. |
1,000 | 22,188 | ||||||
| Adtec Plasma Technology Co., Ltd. |
100 | 2,026 | ||||||
| *Advanced Media, Inc. |
300 | 2,031 | ||||||
| Advantest Corp. |
24,000 | 1,963,780 | ||||||
| Aeon Co., Ltd. |
300 | 6,888 | ||||||
| Aeon Fantasy Co., Ltd. |
100 | 1,653 | ||||||
| Aeon Mall Co., Ltd. |
27,800 | 405,206 | ||||||
| AGC, Inc. |
23,200 | 1,153,642 | ||||||
| Agro-Kanesho Co., Ltd. |
200 | 2,378 | ||||||
| Aichi Bank, Ltd. (The) |
100 | 3,017 | ||||||
| Aichi Steel Corp. |
100 | 2,325 | ||||||
| Aida Engineering, Ltd. |
2,600 | 23,509 | ||||||
| Air Water, Inc. |
25,400 | 388,045 | ||||||
| Aisan Industry Co., Ltd. |
100 | 733 | ||||||
| Aisin Corp. |
100 | 3,653 | ||||||
| Ajinomoto Co., Inc. |
29,300 | 875,210 | ||||||
| *Akebono Brake Industry Co., Ltd. |
142,500 | 287,437 | ||||||
| Alconix Corp. |
100 | 1,503 | ||||||
| Alfresa Holdings Corp. |
100 | 1,403 | ||||||
| *Allied Telesis Holdings KK |
200 | 163 | ||||||
| Alps Alpine Co., Ltd. |
20,900 | 203,455 | ||||||
| Altech Corp. |
200 | 3,589 | ||||||
| Amada Co., Ltd. |
20,600 | 202,703 | ||||||
Dimensional International Core Equity Market ETF
SCHEDULE OF INVESTMENTS
October 31, 2021
| Security Description |
Shares | Fair Value | ||||||
| JAPAN (Continued) |
| |||||||
| Amano Corp. |
100 | $ | 2,464 | |||||
| Anicom Holdings, Inc. |
200 | 1,552 | ||||||
| Anritsu Corp. |
23,400 | 386,836 | ||||||
| AOKI Holdings, Inc. |
100 | 609 | ||||||
| Aomori Bank, Ltd. (The) |
200 | 3,443 | ||||||
| Aoyama Trading Co., Ltd. |
61,200 | 419,182 | ||||||
| Aoyama Zaisan Networks Co., Ltd. |
200 | 2,064 | ||||||
| Aozora Bank, Ltd. |
51,100 | 1,167,872 | ||||||
| Arata Corp. |
400 | 14,120 | ||||||
| Arcland Service Holdings Co., Ltd. |
200 | 3,955 | ||||||
| Ardepro Co., Ltd. |
66,900 | 31,683 | ||||||
| Arealink Co., Ltd. |
200 | 2,715 | ||||||
| Argo Graphics, Inc. |
100 | 2,771 | ||||||
| Asahi Co., Ltd. |
100 | 1,159 | ||||||
| Asahi Group Holdings, Ltd. |
25,600 | 1,157,809 | ||||||
| Asahi Intecc Co., Ltd. |
24,600 | 647,011 | ||||||
| Asahi Kasei Corp. |
56,900 | 597,069 | ||||||
| Asics Corp. |
25,500 | 633,335 | ||||||
| ASKA Pharmaceutical Holdings Co., Ltd. |
200 | 1,728 | ||||||
| Astellas Pharma, Inc. |
171,400 | 2,881,594 | ||||||
| Avant Corp. |
200 | 2,785 | ||||||
| Avantia Co., Ltd. |
200 | 1,507 | ||||||
| Avex, Inc. |
100 | 1,365 | ||||||
| Awa Bank, Ltd. (The) |
1,200 | 22,321 | ||||||
| Azbil Corp. |
24,000 | 1,020,829 | ||||||
| Bandai Namco Holdings, Inc. |
4,800 | 365,688 | ||||||
| Bando Chemical Industries, Ltd. |
300 | 2,315 | ||||||
| Bank of Iwate, Ltd. (The) |
100 | 1,432 | ||||||
| Bank of Nagoya, Ltd. (The) |
100 | 2,121 | ||||||
| Bank of The Ryukyus, Ltd. |
400 | 2,663 | ||||||
| Baroque Japan, Ltd. |
300 | 2,273 | ||||||
| BeNext-Yumeshin Group Co. |
17,485 | 227,409 | ||||||
| Bic Camera, Inc. |
45,700 | 393,174 | ||||||
| *BrainPad, Inc. |
100 | 4,788 | ||||||
| Bridgestone Corp. |
25,300 | 1,113,622 | ||||||
| Broadleaf Co., Ltd. |
26,700 | 127,851 | ||||||
| *Broadmedia Corp. |
4,600 | 40,745 | ||||||
| Broccoli Co., Ltd. |
100 | 1,149 | ||||||
| Brother Industries, Ltd. |
25,500 | 491,550 | ||||||
| Bunka Shutter Co., Ltd. |
2,400 | 23,321 | ||||||
| C Uyemura & Co., Ltd. |
500 | 20,609 | ||||||
| Calbee, Inc. |
100 | 2,574 | ||||||
| *Can Do Co., Ltd. |
100 | 2,240 | ||||||
| Canon Electronics, Inc. |
200 | 2,745 | ||||||
| Canon, Inc. |
17,800 | 399,320 | ||||||
| Canon, Inc., Sponsored ADR |
2,500 | 55,925 | ||||||
| Capcom Co., Ltd. |
200 | 5,367 | ||||||
| Careerlink Co., Ltd. |
100 | 1,356 | ||||||
| Carta Holdings, Inc. |
200 | 4,283 | ||||||
| Cawachi, Ltd. |
300 | 5,838 | ||||||
| Central Japan Railway Co. |
100 | 14,821 | ||||||
| Central Security Patrols Co., Ltd. |
100 | 2,393 | ||||||
| Charm Care Corp. KK |
100 | 1,497 | ||||||
| Chiba Bank, Ltd. (The) |
400 | 2,477 | ||||||
| Chiyoda Co., Ltd. |
400 | 2,680 | ||||||
| Chubu Electric Power Co., Inc. |
29,600 | 306,059 | ||||||
Dimensional International Core Equity Market ETF
SCHEDULE OF INVESTMENTS
October 31, 2021
| Security Description |
Shares | Fair Value | ||||||
| JAPAN (Continued) |
| |||||||
| Chubu Shiryo Co., Ltd. |
100 | $ | 954 | |||||
| Chugai Pharmaceutical Co., Ltd. |
30,100 | 1,121,111 | ||||||
| Chugoku Bank, Ltd. (The) |
200 | 1,449 | ||||||
| Chugoku Electric Power Co., Inc. (The) |
200 | 1,658 | ||||||
| Chugoku Marine Paints, Ltd. |
500 | 3,854 | ||||||
| Chukyo Bank, Ltd. (The) |
100 | 1,156 | ||||||
| CI Takiron Corp. |
500 | 2,657 | ||||||
| Citizen Watch Co., Ltd. |
200 | 868 | ||||||
| CMK Corp. |
300 | 1,123 | ||||||
| Coca-Cola Bottlers Japan Holdings, Inc. |
100 | 1,372 | ||||||
| Computer Engineering & Consulting, Ltd. |
500 | 5,933 | ||||||
| COMSYS Holdings Corp. |
13,300 | 328,928 | ||||||
| Comture Corp. |
300 | 8,104 | ||||||
| Concordia Financial Group, Ltd. |
25,300 | 100,512 | ||||||
| CONEXIO Corp. |
100 | 1,277 | ||||||
| Cosel Co., Ltd. |
500 | 4,060 | ||||||
| Cosmo Energy Holdings Co., Ltd. |
100 | 2,046 | ||||||
| Create Restaurants Holdings, Inc. |
45,500 | 312,445 | ||||||
| Creek & River Co., Ltd. |
100 | 1,727 | ||||||
| Cresco, Ltd. |
100 | 1,825 | ||||||
| CTI Engineering Co., Ltd. |
200 | 4,790 | ||||||
| CyberAgent, Inc. |
68,000 | 1,133,085 | ||||||
| Dai Nippon Printing Co., Ltd. |
23,500 | 579,127 | ||||||
| Daiho Corp. |
600 | 20,180 | ||||||
| Dai-ichi Life Holdings, Inc. |
400 | 8,424 | ||||||
| Daiichi Sankyo Co., Ltd. |
58,800 | 1,478,444 | ||||||
| Daiken Corp. |
100 | 2,179 | ||||||
| Daiki Aluminium Industry Co., Ltd. |
300 | 4,354 | ||||||
| Daikin Industries, Ltd. |
3,500 | 763,999 | ||||||
| Daikyonishikawa Corp. |
200 | 1,196 | ||||||
| Daio Paper Corp. |
200 | 3,506 | ||||||
| Daito Pharmaceutical Co., Ltd. |
100 | 2,806 | ||||||
| Daito Trust Construction Co., Ltd. |
500 | 61,916 | ||||||
| Daitron Co., Ltd. |
200 | 3,971 | ||||||
| Daiwa House Industry Co., Ltd. |
3,200 | 105,268 | ||||||
| Daiwa Securities Group, Inc. |
66,700 | 373,614 | ||||||
| DCM Holdings Co., Ltd. |
25,400 | 247,039 | ||||||
| Dear Life Co., Ltd. |
100 | 502 | ||||||
| Denka Co., Ltd. |
100 | 3,271 | ||||||
| Densan System Holdings Co., Ltd. |
100 | 2,252 | ||||||
| Denso Corp. |
24,200 | 1,745,201 | ||||||
| Dentsu Group, Inc. |
100 | 3,657 | ||||||
| Denyo Co., Ltd. |
100 | 1,731 | ||||||
| Dexerials Corp. |
200 | 4,031 | ||||||
| DIC Corp. |
100 | 2,644 | ||||||
| Digital Information Technologies Corp. |
100 | 1,508 | ||||||
| Disco Corp. |
300 | 80,509 | ||||||
| DKS Co., Ltd. |
100 | 3,026 | ||||||
| DMG Mori Co., Ltd. |
25,200 | 432,063 | ||||||
| Doutor Nichires Holdings Co., Ltd. |
400 | 5,725 | ||||||
| *Dream Incubator, Inc. |
100 | 699 | ||||||
| Eagle Industry Co., Ltd. |
200 | 2,129 | ||||||
| East Japan Railway Co. |
24,800 | 1,541,613 | ||||||
| Ebara Corp. |
800 | 43,499 | ||||||
| Ebara Jitsugyo Co., Ltd. |
200 | 5,034 | ||||||
Dimensional International Core Equity Market ETF
SCHEDULE OF INVESTMENTS
October 31, 2021
| Security Description |
Shares | Fair Value | ||||||
| JAPAN (Continued) |
| |||||||
| EDION Corp. |
100 | $ | 947 | |||||
| E-Guardian, Inc. |
100 | 2,736 | ||||||
| Eisai Co., Ltd. |
1,600 | 112,635 | ||||||
| Elan Corp. |
400 | 4,315 | ||||||
| Electric Power Development Co., Ltd. |
300 | 3,952 | ||||||
| ENEOS Holdings, Inc. |
265,300 | 1,069,343 | ||||||
| Enigmo, Inc. |
300 | 2,836 | ||||||
| ES-Con Japan, Ltd. |
100 | 717 | ||||||
| ESPEC Corp. |
200 | 4,041 | ||||||
| Exedy Corp. |
300 | 4,454 | ||||||
| EXEO Group, Inc. |
100 | 2,305 | ||||||
| FANUC Corp. |
100 | 19,566 | ||||||
| Fast Retailing Co., Ltd. |
200 | 132,445 | ||||||
| FCC Co., Ltd. |
1,600 | 22,100 | ||||||
| *FDK Corp. |
100 | 901 | ||||||
| Ferrotec Holdings Corp. |
500 | 16,663 | ||||||
| FIDEA Holdings Co., Ltd. |
150 | 1,550 | ||||||
| FINDEX, Inc. |
100 | 819 | ||||||
| First Juken Co., Ltd. |
100 | 1,071 | ||||||
| FJ Next Holdings Co., Ltd. |
100 | 888 | ||||||
| France Bed Holdings Co., Ltd. |
100 | 789 | ||||||
| Freund Corp. |
200 | 1,466 | ||||||
| Fronteo, Inc. |
100 | 2,282 | ||||||
| Fudo Tetra Corp. |
100 | 1,588 | ||||||
| Fuji Co., Ltd. |
400 | 7,034 | ||||||
| Fuji Corp. |
200 | 4,639 | ||||||
| Fuji Electric Co., Ltd. |
25,300 | 1,231,440 | ||||||
| Fuji Oil Co., Ltd. |
1,000 | 2,368 | ||||||
| Fuji Pharma Co., Ltd. |
100 | 963 | ||||||
| Fuji Seal International, Inc. |
100 | 2,190 | ||||||
| Fujibo Holdings, Inc. |
100 | 3,609 | ||||||
| Fujicco Co., Ltd. |
200 | 3,352 | ||||||
| FUJIFILM Holdings Corp. |
25,500 | 1,968,213 | ||||||
| *Fujikura, Ltd. |
66,600 | 357,458 | ||||||
| Fujimori Kogyo Co., Ltd. |
400 | 16,365 | ||||||
| Fujisash Co., Ltd. |
300 | 203 | ||||||
| Fujitec Co., Ltd. |
200 | 4,524 | ||||||
| Fujitsu, Ltd. |
1,900 | 327,012 | ||||||
| Fukuda Corp. |
100 | 4,056 | ||||||
| Fukui Bank, Ltd. (The) |
100 | 1,291 | ||||||
| Fukui Computer Holdings, Inc. |
100 | 3,596 | ||||||
| Fukuoka Financial Group, Inc. |
18,600 | 333,911 | ||||||
| FULLCAST Holdings Co., Ltd. |
200 | 4,650 | ||||||
| Funai Soken Holdings, Inc. |
100 | 2,767 | ||||||
| Furukawa Co., Ltd. |
300 | 3,310 | ||||||
| Furukawa Electric Co., Ltd. |
100 | 2,181 | ||||||
| Furuno Electric Co., Ltd. |
600 | 6,388 | ||||||
| Furyu Corp. |
100 | 1,447 | ||||||
| Fuso Pharmaceutical Industries, Ltd. |
100 | 2,224 | ||||||
| Futaba Industrial Co., Ltd. |
200 | 781 | ||||||
| Future Corp. |
200 | 5,832 | ||||||
| G-7 Holdings, Inc. |
200 | 3,648 | ||||||
| Gakken Holdings Co., Ltd. |
100 | 977 | ||||||
| Genky DrugStores Co., Ltd. |
100 | 4,806 | ||||||
| Geo Holdings Corp. |
400 | 4,241 | ||||||
| GLOBERIDE, Inc. |
800 | 28,871 | ||||||
Dimensional International Core Equity Market ETF
SCHEDULE OF INVESTMENTS
October 31, 2021
| Security Description |
Shares | Fair Value | ||||||
| JAPAN (Continued) |
| |||||||
| GMO Financial Holdings, Inc. |
100 | $ | 763 | |||||
| GMO GlobalSign Holdings KK |
100 | 4,109 | ||||||
| Godo Steel, Ltd. |
100 | 1,319 | ||||||
| Golf Digest Online, Inc. |
100 | 1,139 | ||||||
| Good Com Asset Co., Ltd. |
100 | 1,194 | ||||||
| GS Yuasa Corp. |
100 | 2,170 | ||||||
| G-Tekt Corp. |
200 | 2,484 | ||||||
| Gunma Bank, Ltd. (The) |
400 | 1,235 | ||||||
| Gunze, Ltd. |
600 | 23,074 | ||||||
| H2O Retailing Corp. |
200 | 1,591 | ||||||
| Hachijuni Bank, Ltd. (The) |
700 | 2,339 | ||||||
| Hagihara Industries, Inc. |
300 | 3,947 | ||||||
| Hagiwara Electric Holdings Co., Ltd. |
100 | 1,886 | ||||||
| Hakuhodo DY Holdings, Inc. |
200 | 3,259 | ||||||
| Hamakyorex Co., Ltd. |
200 | 5,525 | ||||||
| Hamamatsu Photonics KK |
100 | 5,911 | ||||||
| Hankyu Hanshin Holdings, Inc. |
200 | 6,183 | ||||||
| Haseko Corp. |
48,900 | 635,132 | ||||||
| Hazama Ando Corp. |
400 | 2,701 | ||||||
| Hino Motors, Ltd. |
100 | 944 | ||||||
| Hioki EE Corp. |
100 | 6,955 | ||||||
| Hirata Corp. |
100 | 6,060 | ||||||
| Hiroshima Gas Co., Ltd. |
100 | 328 | ||||||
| Hitachi Construction Machinery Co., Ltd. |
100 | 3,179 | ||||||
| Hitachi Metals, Ltd. |
100 | 1,892 | ||||||
| Hitachi Zosen Corp. |
17,700 | 138,154 | ||||||
| Hitachi, Ltd. |
18,900 | 1,086,346 | ||||||
| Hito Communications Holdings, Inc. |
100 | 1,925 | ||||||
| Hodogaya Chemical Co., Ltd. |
100 | 4,245 | ||||||
| Hokkaido Electric Power Co., Inc. |
60,000 | 248,893 | ||||||
| Hokkoku Financial Holdings, Inc. |
300 | 5,223 | ||||||
| Hokuetsu Corp. |
300 | 1,973 | ||||||
| Hokuhoku Financial Group, Inc. |
100 | 716 | ||||||
| Hokuriku Electric Power Co. |
200 | 951 | ||||||
| Hokuto Corp. |
100 | 1,725 | ||||||
| Honda Motor Co., Ltd. |
40,300 | 1,183,641 | ||||||
| Honda Motor Co., Ltd., Sponsored ADR |
11,000 | 325,380 | ||||||
| H-One Co., Ltd. |
100 | 659 | ||||||
| Hosokawa Micron Corp. |
200 | 5,508 | ||||||
| Hotland Co., Ltd. |
100 | 1,194 | ||||||
| Hoya Corp. |
1,100 | 161,346 | ||||||
| Hulic Co., Ltd. |
34,800 | 333,579 | ||||||
| Hyakugo Bank, Ltd. (The) |
11,600 | 33,572 | ||||||
| Hyakujushi Bank, Ltd. (The) |
200 | 2,584 | ||||||
| IBJ, Inc. |
200 | 1,914 | ||||||
| Ichigo, Inc. |
63,600 | 189,643 | ||||||
| Ichikoh Industries, Ltd. |
200 | 989 | ||||||
| Ichinen Holdings Co., Ltd. |
200 | 2,447 | ||||||
| Ichiyoshi Securities Co., Ltd. |
200 | 1,140 | ||||||
| IDEA Consultants, Inc. |
100 | 1,780 | ||||||
| Idec Corp. |
1,400 | 29,529 | ||||||
| Idemitsu Kosan Co., Ltd. |
1,100 | 30,051 | ||||||
| IDOM, Inc. |
24,500 | 167,165 | ||||||
| IHI Corp. |
24,500 | 570,252 | ||||||
| Iida Group Holdings Co., Ltd. |
100 | 2,458 | ||||||
Dimensional International Core Equity Market ETF
SCHEDULE OF INVESTMENTS
October 31, 2021
| Security Description |
Shares | Fair Value | ||||||
| JAPAN (Continued) |
| |||||||
| Iino Kaiun Kaisha, Ltd. |
300 | $ | 1,439 | |||||
| Inaba Denki Sangyo Co., Ltd. |
100 | 2,391 | ||||||
| Inaba Seisakusho Co., Ltd. |
200 | 2,343 | ||||||
| Ines Corp. |
200 | 2,913 | ||||||
| I-Net Corp. |
100 | 1,159 | ||||||
| Infomart Corp. |
53,900 | 524,701 | ||||||
| INFRONEER Holdings, Inc. |
200 | 1,656 | ||||||
| Inpex Corp. |
61,800 | 515,971 | ||||||
| Intage Holdings, Inc. |
1,800 | 30,309 | ||||||
| Inter Action Corp. |
100 | 2,149 | ||||||
| I-PEX, Inc. |
200 | 3,596 | ||||||
| IPS, Inc. |
100 | 1,580 | ||||||
| Iseki & Co., Ltd. |
400 | 5,760 | ||||||
| Isetan Mitsukoshi Holdings, Ltd. |
69,400 | 505,170 | ||||||
| Ishihara Sangyo Kaisha, Ltd. |
100 | 1,099 | ||||||
| Isuzu Motors, Ltd. |
6,800 | 91,184 | ||||||
| Itfor, Inc. |
200 | 1,556 | ||||||
| ITOCHU Corp. |
51,300 | 1,458,580 | ||||||
| Itochu Enex Co., Ltd. |
100 | 880 | ||||||
| Itochu-Shokuhin Co., Ltd. |
100 | 4,613 | ||||||
| Itoham Yonekyu Holdings, Inc. |
26,000 | 158,018 | ||||||
| Itoki Corp. |
900 | 2,857 | ||||||
| IwaiCosmo Holdings, Inc. |
200 | 2,343 | ||||||
| Iyo Bank, Ltd. (The) |
200 | 977 | ||||||
| J Front Retailing Co., Ltd. |
13,200 | 121,668 | ||||||
| JAC Recruitment Co., Ltd. |
200 | 3,915 | ||||||
| JANOME Corp. |
200 | 1,298 | ||||||
| *Japan Airlines Co., Ltd. |
100 | 2,150 | ||||||
| Japan Exchange Group, Inc. |
34,200 | 807,873 | ||||||
| Japan Lifeline Co., Ltd. |
100 | 1,074 | ||||||
| Japan Material Co., Ltd. |
200 | 2,775 | ||||||
| Japan Post Holdings Co., Ltd. |
13,300 | 102,061 | ||||||
| Japan Post Insurance Co., Ltd. |
200 | 3,245 | ||||||
| Japan Property Management Center Co., Ltd. |
100 | 1,011 | ||||||
| Japan Pulp & Paper Co., Ltd. |
100 | 3,368 | ||||||
| Japan Steel Works, Ltd. (The) |
16,500 | 482,592 | ||||||
| Japan Tobacco, Inc. |
30,100 | 590,121 | ||||||
| Japan Transcity Corp. |
100 | 530 | ||||||
| *Japan Wool Textile Co., Ltd. (The) |
1,100 | 8,759 | ||||||
| JCR Pharmaceuticals Co., Ltd. |
100 | 2,455 | ||||||
| JDC Corp. |
100 | 524 | ||||||
| JFE Holdings, Inc. |
6,200 | 94,774 | ||||||
| JGC Holdings Corp. |
100 | 935 | ||||||
| JM Holdings Co., Ltd. |
200 | 3,276 | ||||||
| J-Oil Mills, Inc. |
200 | 3,217 | ||||||
| Joshin Denki Co., Ltd. |
200 | 4,150 | ||||||
| JP-Holdings, Inc. |
100 | 222 | ||||||
| JSB Co., Ltd. |
100 | 2,515 | ||||||
| JSP Corp. |
100 | 1,344 | ||||||
| JSR Corp. |
24,500 | 883,096 | ||||||
| JTEKT Corp. |
20,900 | 183,843 | ||||||
| Juki Corp. |
600 | 4,462 | ||||||
| Juroku Financial Group, Inc. |
400 | 7,258 | ||||||
| JVCKenwood Corp. |
241,400 | 414,948 | ||||||
| Kaga Electronics Co., Ltd. |
200 | 5,481 | ||||||
| Kagome Co., Ltd. |
100 | 2,535 | ||||||
Dimensional International Core Equity Market ETF
SCHEDULE OF INVESTMENTS
October 31, 2021
| Security Description |
Shares | Fair Value | ||||||
| JAPAN (Continued) |
| |||||||
| Kajima Corp. |
2,000 | $ | 24,556 | |||||
| Kaken Pharmaceutical Co., Ltd. |
100 | 3,938 | ||||||
| Kamigumi Co., Ltd. |
100 | 2,006 | ||||||
| Kanamic Network Co., Ltd. |
200 | 1,061 | ||||||
| Kandenko Co., Ltd. |
100 | 773 | ||||||
| Kanematsu Corp. |
100 | 1,158 | ||||||
| Kansai Electric Power Co., Inc. (The) |
20,000 | 183,819 | ||||||
| Kansai Paint Co., Ltd. |
24,400 | 563,431 | ||||||
| Kansai Super Market, Ltd. |
100 | 1,621 | ||||||
| Kanto Denka Kogyo Co., Ltd. |
500 | 4,591 | ||||||
| Kao Corp. |
25,600 | 1,443,838 | ||||||
| Kawasaki Heavy Industries, Ltd. |
20,800 | 420,652 | ||||||
| KDDI Corp. |
69,700 | 2,156,559 | ||||||
| KeePer Technical Laboratory Co., Ltd. |
200 | 5,736 | ||||||
| Keihan Holdings Co., Ltd. |
100 | 2,620 | ||||||
| Keikyu Corp. |
100 | 1,124 | ||||||
| Keio Corp. |
100 | 5,034 | ||||||
| Keisei Electric Railway Co., Ltd. |
25,400 | 814,181 | ||||||
| Keiyo Bank, Ltd. (The) |
1,000 | 3,885 | ||||||
| Keiyo Co., Ltd. |
900 | 6,543 | ||||||
| *Kewpie Corp. |
100 | 2,188 | ||||||
| Keyence Corp. |
3,400 | 2,042,833 | ||||||
| KFC Holdings Japan, Ltd. |
100 | 2,534 | ||||||
| Kikkoman Corp. |
1,800 | 147,126 | ||||||
| *Kintetsu Group Holdings Co., Ltd. |
100 | 3,135 | ||||||
| Kirin Holdings Co., Ltd. |
46,100 | 800,913 | ||||||
| Ki-Star Real Estate Co., Ltd. |
100 | 5,560 | ||||||
| Kitanotatsujin Corp. |
45,100 | 163,748 | ||||||
| Kitz Corp. |
1,200 | 7,998 | ||||||
| *KLab, Inc. |
200 | 1,112 | ||||||
| Koa Corp. |
300 | 4,036 | ||||||
| Kobe Bussan Co., Ltd. |
100 | 3,433 | ||||||
| Kobe Steel, Ltd. |
400 | 2,350 | ||||||
| Koito Manufacturing Co., Ltd. |
100 | 5,648 | ||||||
| #Kojima Co., Ltd. |
700 | 3,591 | ||||||
| Komatsu, Ltd. |
400 | 10,406 | ||||||
| KOMEDA Holdings Co., Ltd. |
100 | 1,809 | ||||||
| Konami Holdings Corp. |
100 | 5,490 | ||||||
| Konica Minolta, Inc. |
5,300 | 26,122 | ||||||
| Konishi Co., Ltd. |
200 | 3,096 | ||||||
| Konoike Transport Co., Ltd. |
100 | 1,088 | ||||||
| Krosaki Harima Corp. |
100 | 4,122 | ||||||
| *KRS Corp. |
100 | 1,743 | ||||||
| K’s Holdings Corp. |
48,100 | 495,237 | ||||||
| Kubota Corp. |
400 | 8,498 | ||||||
| Kuraray Co., Ltd. |
100 | 903 | ||||||
| Kurita Water Industries, Ltd. |
100 | 4,911 | ||||||
| Kuriyama Holdings Corp. |
300 | 2,613 | ||||||
| KYB Corp. |
400 | 10,664 | ||||||
| Kyoei Steel, Ltd. |
200 | 2,463 | ||||||
| Kyokuto Kaihatsu Kogyo Co., Ltd. |
200 | 2,726 | ||||||
| Kyokuto Securities Co., Ltd. |
200 | 1,335 | ||||||
| Kyosan Electric Manufacturing Co., Ltd. |
100 | 420 | ||||||
| Kyowa Electronic Instruments Co., Ltd. |
400 | 1,428 | ||||||
| Kyowa Kirin Co., Ltd. |
500 | 16,400 | ||||||
Dimensional International Core Equity Market ETF
SCHEDULE OF INVESTMENTS
October 31, 2021
| Security Description |
Shares | Fair Value | ||||||
| JAPAN (Continued) |
| |||||||
| Kyushu Electric Power Co., Inc. |
100 | $ | 704 | |||||
| Kyushu Financial Group, Inc. |
300 | 1,008 | ||||||
| Kyushu Railway Co |
100 | 2,233 | ||||||
| Lacto Japan Co., Ltd. |
100 | 2,346 | ||||||
| LEC, Inc. |
200 | 1,824 | ||||||
| LIFULL Co., Ltd. |
31,900 | 99,875 | ||||||
| LIKE, Inc. |
100 | 1,558 | ||||||
| Lion Corp. |
31,600 | 525,166 | ||||||
| Lixil Corp. |
900 | 23,079 | ||||||
| Look Holdings, Inc. |
100 | 1,209 | ||||||
| M3, Inc. |
20,500 | 1,205,999 | ||||||
| Macromill, Inc. |
800 | 5,641 | ||||||
| *Maezawa Industries, Inc. |
300 | 1,747 | ||||||
| Makita Corp. |
200 | 9,231 | ||||||
| *Management Solutions Co., Ltd. |
100 | 2,982 | ||||||
| Mandom Corp. |
100 | 1,451 | ||||||
| MarkLines Co., Ltd. |
100 | 2,824 | ||||||
| Marubeni Corp. |
80,400 | 677,750 | ||||||
| Marudai Food Co., Ltd. |
200 | 2,970 | ||||||
| Marui Group Co., Ltd. |
26,400 | 516,076 | ||||||
| Marusan Securities Co., Ltd. |
500 | 2,627 | ||||||
| Maruzen CHI Holdings Co., Ltd. |
500 | 1,640 | ||||||
| Maruzen Showa Unyu Co., Ltd. |
800 | 24,346 | ||||||
| Matsui Securities Co., Ltd. |
17,800 | 127,539 | ||||||
| Max Co., Ltd. |
200 | 3,175 | ||||||
| Maxell, Ltd. |
600 | 7,193 | ||||||
| Mazda Motor Corp. |
500 | 4,468 | ||||||
| MCJ Co., Ltd. |
24,300 | 272,995 | ||||||
| Mebuki Financial Group, Inc. |
13,300 | 27,177 | ||||||
| MEC Co., Ltd. |
800 | 21,890 | ||||||
| Medical Data Vision Co., Ltd. |
300 | 3,849 | ||||||
| Medipal Holdings Corp. |
21,900 | 394,690 | ||||||
| *MedPeer, Inc. |
700 | 20,873 | ||||||
| Megachips Corp. |
500 | 15,742 | ||||||
| MEIJI Holdings Co., Ltd. |
1,600 | 100,890 | ||||||
| Meiko Electronics Co., Ltd. |
1,200 | 33,098 | ||||||
| Meisei Industrial Co., Ltd. |
100 | 594 | ||||||
| Mercuria Holdings Co., Ltd. |
200 | 1,293 | ||||||
| Michinoku Bank, Ltd. (The) |
100 | 768 | ||||||
| Micronics Japan Co., Ltd. |
300 | 3,954 | ||||||
| Mie Kotsu Group Holdings, Inc. |
100 | 436 | ||||||
| MIMAKI ENGINEERING Co., Ltd. |
300 | 2,442 | ||||||
| *Mimasu Semiconductor Industry Co., Ltd. |
200 | 4,366 | ||||||
| MINEBEA MITSUMI, Inc. |
43,600 | 1,099,320 | ||||||
| Mirai Industry Co., Ltd. |
100 | 1,482 | ||||||
| Mirait Holdings Corp. |
100 | 1,914 | ||||||
| Miroku Jyoho Service Co., Ltd. |
100 | 1,573 | ||||||
| MISUMI Group, Inc. |
25,600 | 1,068,678 | ||||||
| Mitsubishi Chemical Holdings Corp. |
100,100 | 827,575 | ||||||
| Mitsubishi Corp. |
51,200 | 1,621,876 | ||||||
| Mitsubishi Electric Corp. |
20,700 | 276,847 | ||||||
| Mitsubishi Estate Co., Ltd. |
900 | 13,639 | ||||||
| Mitsubishi Gas Chemical Co., Inc. |
100 | 2,011 | ||||||
| Mitsubishi Heavy Industries, Ltd. |
1,600 | 40,819 | ||||||
| Mitsubishi Materials Corp. |
100 | 1,935 | ||||||
| Mitsubishi Motors Corp. |
700 | 2,228 | ||||||
Dimensional International Core Equity Market ETF
SCHEDULE OF INVESTMENTS
October 31, 2021
| Security Description |
Shares | Fair Value | ||||||
| JAPAN (Continued) |
| |||||||
| Mitsubishi Research Institute, Inc. |
100 | $ | 3,719 | |||||
| Mitsubishi UFJ Financial Group, Inc. |
380,800 | 2,078,913 | ||||||
| Mitsui Chemicals, Inc. |
100 | 2,964 | ||||||
| Mitsui DM Sugar Holdings Co., Ltd. |
100 | 1,774 | ||||||
| *Mitsui E&S Holdings Co., Ltd. |
180,900 | 916,994 | ||||||
| Mitsui Fudosan Co., Ltd. |
25,700 | 585,674 | ||||||
| Mitsui OSK Lines, Ltd. |
25,400 | 1,594,948 | ||||||
| Mitsui-Soko Holdings Co., Ltd. |
1,100 | 22,005 | ||||||
| Miura Co., Ltd. |
100 | 3,828 | ||||||
| Miyazaki Bank, Ltd. (The) |
100 | 1,800 | ||||||
| Miyoshi Oil & Fat Co., Ltd. |
100 | 1,169 | ||||||
| Mizuho Financial Group, Inc. |
47,600 | 628,266 | ||||||
| Mizuno Corp. |
1,000 | 23,170 | ||||||
| Monex Group, Inc. |
69,900 | 452,411 | ||||||
| Monogatari Corp. (The) |
200 | 12,436 | ||||||
| MonotaRO Co., Ltd. |
46,600 | 1,054,400 | ||||||
| MORESCO Corp. |
100 | 1,051 | ||||||
| Morinaga & Co., Ltd. |
100 | 3,526 | ||||||
| Morita Holdings Corp. |
1,800 | 22,574 | ||||||
| MRK Holdings, Inc. |
100 | 118 | ||||||
| MS&AD Insurance Group Holdings, Inc. |
22,800 | 737,038 | ||||||
| m-up Holdings, Inc. |
100 | 3,407 | ||||||
| Murata Manufacturing Co., Ltd. |
24,800 | 1,881,994 | ||||||
| Musashi Seimitsu Industry Co., Ltd. |
100 | 1,872 | ||||||
| Musashino Bank, Ltd. (The) |
300 | 4,699 | ||||||
| Nabtesco Corp. |
21,000 | 679,588 | ||||||
| Nafco Co., Ltd. |
100 | 1,510 | ||||||
| Nagase & Co., Ltd. |
200 | 3,371 | ||||||
| Nagoya Railroad Co., Ltd. |
100 | 1,647 | ||||||
| Naigai Trans Line, Ltd. |
100 | 1,926 | ||||||
| Nankai Electric Railway Co., Ltd. |
100 | 1,978 | ||||||
| Nanto Bank, Ltd. (The) |
300 | 5,159 | ||||||
| Natori Co., Ltd. |
100 | 1,697 | ||||||
| NEC Corp. |
1,900 | 96,979 | ||||||
| NEC Networks & System Integration Corp. |
24,700 | 396,196 | ||||||
| NET One Systems Co., Ltd. |
18,600 | 607,630 | ||||||
| Neturen Co., Ltd. |
100 | 533 | ||||||
| Nexon Co., Ltd. |
200 | 3,387 | ||||||
| NGK Insulators, Ltd. |
100 | 1,659 | ||||||
| NGK Spark Plug Co., Ltd. |
100 | 1,589 | ||||||
| NH Foods, Ltd. |
100 | 3,512 | ||||||
| NHK Spring Co., Ltd. |
400 | 3,006 | ||||||
| Nichias Corp. |
100 | 2,441 | ||||||
| Nichiban Co., Ltd. |
100 | 1,622 | ||||||
| Nichicon Corp. |
500 | 4,714 | ||||||
| Nichi-iko Pharmaceutical Co., Ltd. |
300 | 2,271 | ||||||
| Nichirei Corp. |
200 | 4,876 | ||||||
| Nichirin Co., Ltd. |
200 | 3,192 | ||||||
| Nidec Corp. |
5,700 | 628,362 | ||||||
| Nifco, Inc. |
100 | 3,179 | ||||||
| Nihon House Holdings Co., Ltd. |
900 | 3,015 | ||||||
| Nihon M&A Center Holdings, Inc. |
400 | 12,225 | ||||||
| Nihon Nohyaku Co., Ltd. |
100 | 470 | ||||||
| Nihon Parkerizing Co., Ltd. |
100 | 993 | ||||||
| Nihon Unisys, Ltd. |
100 | 2,798 | ||||||
Dimensional International Core Equity Market ETF
SCHEDULE OF INVESTMENTS
October 31, 2021
| Security Description |
Shares | Fair Value | ||||||
| JAPAN (Continued) |
| |||||||
| Nikkiso Co., Ltd. |
2,800 | $ | 24,728 | |||||
| Nikko Co., Ltd. |
200 | 1,159 | ||||||
| Nikon Corp. |
500 | 5,477 | ||||||
| Nintendo Co., Ltd. |
1,800 | 792,458 | ||||||
| Nippon Chemical Industrial Co., Ltd. |
100 | 2,561 | ||||||
| *Nippon Chemi-Con Corp. |
500 | 9,349 | ||||||
| Nippon Coke & Engineering Co., Ltd. |
104,000 | 138,636 | ||||||
| Nippon Concrete Industries Co., Ltd. |
100 | 262 | ||||||
| Nippon Denko Co., Ltd. |
200,300 | 644,684 | ||||||
| Nippon Electric Glass Co., Ltd. |
26,000 | 661,715 | ||||||
| Nippon Express Co., Ltd. |
100 | 6,244 | ||||||
| Nippon Kayaku Co., Ltd. |
25,000 | 262,881 | ||||||
| Nippon Koei Co., Ltd. |
300 | 9,077 | ||||||
| Nippon Paper Industries Co., Ltd. |
25,600 | 261,557 | ||||||
| Nippon Parking Development Co., Ltd. |
600 | 758 | ||||||
| Nippon Pillar Packing Co., Ltd. |
200 | 4,859 | ||||||
| Nippon Road Co., Ltd. (The) |
100 | 7,218 | ||||||
| Nippon Sanso Holdings Corp. |
28,200 | 664,039 | ||||||
| Nippon Sheet Glass Co., Ltd. |
12,700 | 70,726 | ||||||
| Nippon Signal Co., Ltd. |
400 | 3,448 | ||||||
| Nippon Steel Corp. |
28,600 | 501,393 | ||||||
| Nippon Suisan Kaisha, Ltd. |
59,900 | 339,884 | ||||||
| Nippon Telegraph & Telephone Corp. |
39,500 | 1,104,372 | ||||||
| Nippon Thompson Co., Ltd. |
400 | 2,052 | ||||||
| Nippon Yakin Kogyo Co., Ltd. |
200 | 4,811 | ||||||
| Nippon Yusen KK |
2,700 | 193,694 | ||||||
| Nipro Corp. |
26,300 | 266,633 | ||||||
| Nishi-Nippon Financial Holdings, Inc. |
200 | 1,166 | ||||||
| Nishio Rent All Co., Ltd. |
1,200 | 29,562 | ||||||
| Nissan Chemical Corp. |
100 | 5,551 | ||||||
| *Nissan Motor Co., Ltd. |
5,700 | 28,864 | ||||||
| Nissei ASB Machine Co., Ltd. |
100 | 3,249 | ||||||
| Nissha Co., Ltd. |
500 | 8,143 | ||||||
| Nisshin Seifun Group, Inc. |
21,300 | 336,055 | ||||||
| Nisshinbo Holdings, Inc. |
1,100 | 8,470 | ||||||
| Nisso Corp. |
100 | 630 | ||||||
| Nitori Holdings Co., Ltd. |
100 | 18,290 | ||||||
| Nitto Denko Corp. |
1,200 | 93,453 | ||||||
| Nitto Kogyo Corp. |
1,100 | 16,303 | ||||||
| Nitto Seiko Co., Ltd. |
600 | 3,447 | ||||||
| NOK Corp. |
100 | 1,152 | ||||||
| *Nomura Holdings, Inc., Sponsored ADR |
6,000 | 27,660 | ||||||
| Nomura Holdings, Inc. |
66,800 | 322,210 | ||||||
| Nomura Micro Science Co., Ltd. |
100 | 4,275 | ||||||
| Nomura Real Estate Holdings, Inc. |
100 | 2,428 | ||||||
| Nomura Research Institute, Ltd. |
52,200 | 2,078,386 | ||||||
| Noritake Co., Ltd. |
100 | 4,354 | ||||||
| Noritz Corp. |
300 | 4,799 | ||||||
| North Pacific Bank, Ltd. |
300 | 621 | ||||||
| NSD Co., Ltd. |
200 | 3,797 | ||||||
| NSK, Ltd. |
700 | 4,696 | ||||||
| NTN Corp. |
276,200 | 595,880 | ||||||
| NTT Data Corp. |
101,300 | 2,028,221 | ||||||
| Obara Group, Inc. |
100 | 3,197 | ||||||
| Obayashi Corp. |
13,300 | 111,742 | ||||||
| Odakyu Electric Railway Co., Ltd. |
25,500 | 550,813 | ||||||
Dimensional International Core Equity Market ETF
SCHEDULE OF INVESTMENTS
October 31, 2021
| Security Description |
Shares | Fair Value | ||||||
| JAPAN (Continued) |
| |||||||
| Oenon Holdings, Inc. |
100 | $ | 331 | |||||
| Ohara, Inc. |
100 | 1,215 | ||||||
| Oiles Corp. |
100 | 1,481 | ||||||
| Oita Bank, Ltd. (The) |
100 | 1,590 | ||||||
| Oji Holdings Corp. |
2,000 | 9,893 | ||||||
| Okabe Co., Ltd. |
800 | 4,792 | ||||||
| Okamoto Industries, Inc. |
100 | 3,499 | ||||||
| Okasan Securities Group, Inc. |
1,000 | 3,412 | ||||||
| Oki Electric Industry Co., Ltd. |
35,300 | 289,458 | ||||||
| Okinawa Financial Group, Inc. |
300 | 6,580 | ||||||
| Okura Industrial Co., Ltd. |
200 | 3,687 | ||||||
| Okuwa Co., Ltd. |
600 | 5,746 | ||||||
| Olympus Corp. |
85,800 | 1,851,444 | ||||||
| Omron Corp. |
2,000 | 190,660 | ||||||
| Ono Pharmaceutical Co., Ltd. |
33,800 | 707,125 | ||||||
| Onward Holdings Co., Ltd. |
2,000 | 5,911 | ||||||
| Optex Group Co., Ltd. |
700 | 8,877 | ||||||
| Oriental Shiraishi Corp. |
47,600 | 112,295 | ||||||
| Osaka Gas Co., Ltd. |
25,600 | 412,204 | ||||||
| *Osaka Organic Chemical Industry, Ltd. |
700 | 20,903 | ||||||
| Osaka Soda Co., Ltd. |
100 | 2,533 | ||||||
| Osaki Electric Co., Ltd. |
300 | 1,476 | ||||||
| Otsuka Corp. |
600 | 29,467 | ||||||
| Otsuka Holdings Co., Ltd. |
23,900 | 941,957 | ||||||
| Outsourcing, Inc. |
25,200 | 480,905 | ||||||
| Pacific Industrial Co., Ltd. |
2,100 | 21,308 | ||||||
| Pan Pacific International Holdings Corp. |
7,100 | 148,569 | ||||||
| Panasonic Corp. |
74,400 | 908,590 | ||||||
| Park24 Co., Ltd. |
400 | 6,107 | ||||||
| Pasona Group, Inc. |
300 | 8,353 | ||||||
| Penta-Ocean Construction Co., Ltd. |
90,500 | 621,456 | ||||||
| *PeptiDream, Inc. |
900 | 21,729 | ||||||
| Persol Holdings Co., Ltd. |
25,500 | 682,087 | ||||||
| Pigeon Corp. |
19,700 | 455,592 | ||||||
| Pola Orbis Holdings, Inc. |
25,300 | 539,171 | ||||||
| Poletowin Pitcrew Holdings, Inc. |
400 | 3,596 | ||||||
| *PR Times, Inc. |
100 | 3,201 | ||||||
| Press Kogyo Co., Ltd. |
800 | 2,322 | ||||||
| Prestige International, Inc. |
200 | 1,365 | ||||||
| Pronexus, Inc. |
100 | 930 | ||||||
| Proto Corp. |
200 | 2,468 | ||||||
| PS Mitsubishi Construction Co., Ltd. |
100 | 581 | ||||||
| *QB Net Holdings Co., Ltd. |
100 | 1,675 | ||||||
| Qol Holdings Co., Ltd. |
200 | 2,957 | ||||||
| Raiznext Corp. |
100 | 1,079 | ||||||
| Rakuten, Inc. |
67,000 | 734,488 | ||||||
| Recruit Holdings Co., Ltd. |
69,600 | 4,621,892 | ||||||
| Relia, Inc. |
1,100 | 11,248 | ||||||
| Relo Group, Inc. |
1,200 | 24,805 | ||||||
| *Renesas Electronics Corp. |
88,200 | 1,084,467 | ||||||
| Rengo Co., Ltd. |
200 | 1,514 | ||||||
| *RENOVA, Inc. |
200 | 8,770 | ||||||
| Resona Holdings, Inc. |
138,600 | 520,244 | ||||||
| Resorttrust, Inc. |
26,800 | 473,598 | ||||||
| Restar Holdings Corp. |
100 | 1,666 | ||||||
Dimensional International Core Equity Market ETF
SCHEDULE OF INVESTMENTS
October 31, 2021
| Security Description |
Shares | Fair Value | ||||||
| JAPAN (Continued) |
||||||||
| Retail Partners Co., Ltd. |
200 | $ | 2,087 | |||||
| Rheon Automatic Machinery Co., Ltd. |
100 | 1,186 | ||||||
| Right On Co., Ltd. |
200 | 1,251 | ||||||
| Riken Technos Corp. |
200 | 959 | ||||||
| Riso Kagaku Corp. |
100 | 2,103 | ||||||
| *Riso Kyoiku Co., Ltd. |
65,200 | 272,179 | ||||||
| Rohm Co., Ltd. |
100 | 9,103 | ||||||
| Rohto Pharmaceutical Co., Ltd. |
100 | 3,048 | ||||||
| Rokko Butter Co., Ltd. |
300 | 4,383 | ||||||
| Roland DG Corp. |
300 | 7,856 | ||||||
| RS Technologies Co., Ltd. |
100 | 5,411 | ||||||
| Ryobi, Ltd. |
500 | 5,227 | ||||||
| Ryohin Keikaku Co., Ltd. |
36,800 | 722,284 | ||||||
| Ryosan Co., Ltd. |
200 | 4,108 | ||||||
| Sakata INX Corp. |
1,000 | 9,629 | ||||||
| *Sala Corp. |
200 | 1,089 | ||||||
| SAMTY Co., Ltd. |
400 | 8,865 | ||||||
| San ju San Financial Group, Inc. |
200 | 2,445 | ||||||
| San-Ai Oil Co., Ltd. |
400 | 5,185 | ||||||
| Sanei Architecture Planning Co., Ltd. |
200 | 3,117 | ||||||
| San-In Godo Bank, Ltd. (The) |
6,900 | 33,706 | ||||||
| *Sanix, Inc. |
78,700 | 232,597 | ||||||
| Sanki Engineering Co., Ltd. |
500 | 6,288 | ||||||
| Sankyo Tateyama, Inc. |
500 | 3,254 | ||||||
| Sanoh Industrial Co., Ltd. |
200 | 1,765 | ||||||
| Santen Pharmaceutical Co., Ltd. |
46,500 | 652,896 | ||||||
| Sanwa Holdings Corp. |
26,400 | 306,543 | ||||||
| Sanyo Denki Co., Ltd. |
100 | 5,718 | ||||||
| Sapporo Holdings, Ltd. |
200 | 4,332 | ||||||
| *Satori Electric Co., Ltd. |
200 | 1,766 | ||||||
| SBI Holdings, Inc. |
27,400 | 706,957 | ||||||
| Scala, Inc. |
300 | 1,818 | ||||||
| SCREEN Holdings Co., Ltd. |
100 | 9,270 | ||||||
| Secom Co., Ltd. |
100 | 6,787 | ||||||
| Sega Sammy Holdings, Inc. |
200 | 2,831 | ||||||
| Seibu Holdings, Inc. |
25,900 | 282,112 | ||||||
| Seiko Epson Corp. |
200 | 3,554 | ||||||
| Seiko PMC Corp. |
200 | 1,365 | ||||||
| Seino Holdings Co., Ltd. |
100 | 1,208 | ||||||
| Sekisui Chemical Co., Ltd. |
25,600 | 418,715 | ||||||
| Sekisui House, Ltd. |
25,300 | 523,972 | ||||||
| Senko Group Holdings Co., Ltd. |
100 | 886 | ||||||
| Senshu Electric Co., Ltd. |
100 | 4,179 | ||||||
| Senshu Ikeda Holdings, Inc. |
152,500 | 213,988 | ||||||
| Septeni Holdings Co., Ltd. |
124,500 | 525,187 | ||||||
| Seven & i Holdings Co., Ltd. |
18,900 | 792,631 | ||||||
| Seven Bank, Ltd. |
51,300 | 108,426 | ||||||
| SG Holdings Co., Ltd. |
25,100 | 627,362 | ||||||
| Shibaura Electronics Co., Ltd. |
100 | 5,762 | ||||||
| Shibaura Machine Co., Ltd. |
300 | 6,983 | ||||||
| Shibuya Corp. |
800 | 21,048 | ||||||
| Shikoku Bank, Ltd. (The) |
200 | 1,315 | ||||||
| Shikoku Electric Power Co, Inc. |
200 | 1,301 | ||||||
| Shima Seiki Manufacturing, Ltd. |
1,400 | 26,803 | ||||||
| Shimadzu Corp. |
25,500 | 1,032,076 | ||||||
| Shimano, Inc. |
300 | 83,087 | ||||||
Dimensional International Core Equity Market ETF
SCHEDULE OF INVESTMENTS
October 31, 2021
| Security Description |
Shares | Fair Value | ||||||
| JAPAN (Continued) |
||||||||
| Shimizu Corp. |
300 | $ | 2,192 | |||||
| Shin Nippon Air Technologies Co., Ltd. |
100 | 2,142 | ||||||
| Shinagawa Refractories Co., Ltd. |
100 | 3,407 | ||||||
| Shindengen Electric Manufacturing Co., Ltd. |
100 | 3,543 | ||||||
| Shin-Etsu Chemical Co., Ltd. |
5,200 | 923,710 | ||||||
| Shin-Etsu Polymer Co., Ltd. |
100 | 901 | ||||||
| Shinko Shoji Co., Ltd. |
200 | 1,600 | ||||||
| Shinmaywa Industries, Ltd. |
3,300 | 26,915 | ||||||
| Shinoken Group Co., Ltd. |
100 | 988 | ||||||
| Shinsei Bank, Ltd. |
100 | 1,653 | ||||||
| Shinwa Co., Ltd. |
200 | 3,885 | ||||||
| Shionogi & Co., Ltd. |
2,800 | 181,886 | ||||||
| Shiseido Co., Ltd. |
22,300 | 1,481,451 | ||||||
| Shizuoka Bank, Ltd. (The) |
300 | 2,413 | ||||||
| Shizuoka Gas Co., Ltd. |
700 | 7,367 | ||||||
| Shoei Foods Corp. |
200 | 6,876 | ||||||
| Showa Denko KK |
9,100 | 228,328 | ||||||
| Siix Corp. |
600 | 6,625 | ||||||
| SKY Perfect JSAT Holdings, Inc. |
39,500 | 147,919 | ||||||
| Skylark Holdings Co., Ltd. |
25,800 | 349,129 | ||||||
| SMC Corp. |
100 | 59,583 | ||||||
| SMS Co., Ltd. |
700 | 27,134 | ||||||
| Sodick Co., Ltd. |
900 | 6,906 | ||||||
| SoftBank Corp. |
227,900 | 3,106,955 | ||||||
| SoftBank Group Corp. |
49,900 | 2,697,510 | ||||||
| Sohgo Security Services Co., Ltd. |
100 | 4,262 | ||||||
| Sojitz Corp. |
16,720 | 274,940 | ||||||
| Solasto Corp. |
100 | 1,207 | ||||||
| Soliton Systems KK |
100 | 1,245 | ||||||
| Sompo Holdings, Inc. |
25,500 | 1,106,547 | ||||||
| Sony Group Corp. |
51,300 | 5,911,704 | ||||||
| Space Co., Ltd. |
300 | 2,486 | ||||||
| Space Value Holdings Co., Ltd. |
200 | 1,419 | ||||||
| Sparx Group Co., Ltd. |
600 | 1,552 | ||||||
| S-Pool, Inc. |
3,400 | 37,929 | ||||||
| Square Enix Holdings Co., Ltd. |
100 | 5,464 | ||||||
| SRA Holdings |
100 | 2,546 | ||||||
| Stanley Electric Co., Ltd. |
100 | 2,513 | ||||||
| Star Mica Holdings Co., Ltd. |
300 | 3,962 | ||||||
| Star Micronics Co., Ltd. |
1,600 | 20,922 | ||||||
| Starzen Co., Ltd. |
200 | 3,759 | ||||||
| Strike Co., Ltd. |
100 | 3,771 | ||||||
| Subaru Corp. |
25,700 | 502,167 | ||||||
| SUMCO Corp. |
31,800 | 603,510 | ||||||
| Sumida Corp. |
100 | 1,151 | ||||||
| Sumitomo Bakelite Co., Ltd. |
300 | 13,444 | ||||||
| Sumitomo Chemical Co., Ltd. |
15,200 | 74,650 | ||||||
| Sumitomo Corp. |
31,200 | 442,450 | ||||||
| Sumitomo Dainippon Pharma Co., Ltd. |
200 | 2,819 | ||||||
| Sumitomo Electric Industries, Ltd. |
49,600 | 655,316 | ||||||
| Sumitomo Forestry Co., Ltd. |
100 | 1,903 | ||||||
| Sumitomo Heavy Industries, Ltd. |
100 | 2,570 | ||||||
| Sumitomo Metal Mining Co., Ltd. |
18,200 | 705,973 | ||||||
| Sumitomo Mitsui Construction Co., Ltd. |
39,100 | 165,624 | ||||||
| *Sumitomo Mitsui Financial Group, Inc., Sponsored ADR |
30,000 | 194,400 | ||||||
Dimensional International Core Equity Market ETF
SCHEDULE OF INVESTMENTS
October 31, 2021
| Security Description |
Shares | Fair Value | ||||||
| JAPAN (Continued) |
||||||||
| Sumitomo Mitsui Financial Group, Inc. |
40,500 | $ | 1,321,644 | |||||
| Sumitomo Mitsui Trust Holdings, Inc. |
21,400 | 704,544 | ||||||
| Sumitomo Realty & Development Co., Ltd. |
25,500 | 919,141 | ||||||
| Sumitomo Riko Co., Ltd. |
300 | 1,947 | ||||||
| Sumitomo Rubber Industries, Ltd. |
100 | 1,229 | ||||||
| Sumitomo Seika Chemicals Co., Ltd. |
100 | 2,846 | ||||||
| Sun Frontier Fudousan Co., Ltd. |
100 | 933 | ||||||
| Suntory Beverage & Food, Ltd. |
100 | 3,872 | ||||||
| Suruga Bank, Ltd. |
119,000 | 436,238 | ||||||
| Sushiro Global Holdings, Ltd. |
22,900 | 989,103 | ||||||
| Suzuki Motor Corp. |
10,800 | 480,684 | ||||||
| SWCC Showa Holdings Co., Ltd. |
300 | 5,828 | ||||||
| Sysmex Corp. |
100 | 12,339 | ||||||
| Systena Corp. |
200 | 3,676 | ||||||
| T&D Holdings, Inc. |
25,400 | 325,672 | ||||||
| Tadano, Ltd. |
1,000 | 10,884 | ||||||
| Taihei Dengyo Kaisha, Ltd. |
100 | 2,356 | ||||||
| Taiheiyo Cement Corp. |
100 | 2,114 | ||||||
| Taiko Pharmaceutical Co., Ltd. |
300 | 2,126 | ||||||
| Taisei Corp. |
18,100 | 566,692 | ||||||
| Taisei Lamick Co., Ltd. |
100 | 2,402 | ||||||
| Taiyo Yuden Co., Ltd. |
600 | 30,257 | ||||||
| Takamatsu Construction Group Co., Ltd. |
100 | 1,751 | ||||||
| *Takara & Co., Ltd. |
200 | 3,120 | ||||||
| Takara Holdings, Inc. |
25,600 | 349,565 | ||||||
| Takara Leben Co., Ltd. |
34,500 | 93,795 | ||||||
| Takashimaya Co., Ltd. |
70,300 | 649,208 | ||||||
| *Takasho Co., Ltd. |
200 | 1,451 | ||||||
| Takeda Pharmaceutical Co., Ltd. |
49,900 | 1,401,708 | ||||||
| Takihyo Co., Ltd. |
100 | 1,562 | ||||||
| Tama Home Co., Ltd. |
200 | 4,113 | ||||||
| Tamura Corp. |
600 | 4,120 | ||||||
| Tatsuta Electric Wire and Cable Co., Ltd. |
100 | 449 | ||||||
| Tayca Corp. |
100 | 1,151 | ||||||
| Tazmo Co., Ltd. |
100 | 1,468 | ||||||
| TDK Corp. |
8,600 | 311,493 | ||||||
| TechMatrix Corp. |
1,400 | 22,100 | ||||||
| TechnoPro Holdings, Inc. |
1,200 | 38,150 | ||||||
| Teijin, Ltd. |
26,900 | 360,711 | ||||||
| Terumo Corp. |
31,100 | 1,368,645 | ||||||
| THK Co., Ltd. |
100 | 2,143 | ||||||
| TIS, Inc. |
900 | 24,429 | ||||||
| Tobu Railway Co., Ltd. |
100 | 2,483 | ||||||
| Tocalo Co., Ltd. |
2,600 | 31,740 | ||||||
| Tochigi Bank, Ltd. (The) |
300 | 466 | ||||||
| Toda Corp. |
1,000 | 6,288 | ||||||
| Toho Bank, Ltd. (The) |
1,600 | 2,863 | ||||||
| Toho Co., Ltd. |
100 | 4,692 | ||||||
| *Toho Co., Ltd. |
100 | 1,341 | ||||||
| Toho Holdings Co., Ltd. |
100 | 1,611 | ||||||
| Toho Titanium Co., Ltd. |
100 | 1,048 | ||||||
| Tohoku Electric Power Co., Inc. |
100 | 648 | ||||||
| Tokai Carbon Co., Ltd. |
100 | 1,305 | ||||||
| Tokai Corp. |
200 | 3,839 | ||||||
| TOKAI Holdings Corp. |
300 | 2,273 | ||||||
| Tokai Tokyo Financial Holdings, Inc. |
142,400 | 492,046 | ||||||
Dimensional International Core Equity Market ETF
SCHEDULE OF INVESTMENTS
October 31, 2021
| Security Description |
Shares | Fair Value | ||||||
| JAPAN (Continued) |
||||||||
| Tokio Marine Holdings, Inc. |
23,500 | $ | 1,236,159 | |||||
| Tokuyama Corp. |
26,600 | 454,667 | ||||||
| *Tokyo Base Co., Ltd. |
200 | 1,237 | ||||||
| *Tokyo Electric Power Co. Holdings, Inc. |
107,700 | 297,527 | ||||||
| Tokyo Electron Device, Ltd. |
100 | 6,043 | ||||||
| Tokyo Electron, Ltd. |
700 | 324,446 | ||||||
| Tokyo Gas Co., Ltd. |
25,500 | 442,574 | ||||||
| Tokyo Kiraboshi Financial Group, Inc. |
300 | 3,875 | ||||||
| Tokyo Seimitsu Co., Ltd. |
100 | 4,056 | ||||||
| Tokyo Steel Manufacturing Co., Ltd. |
34,200 | 379,717 | ||||||
| Tokyo Tatemono Co., Ltd. |
25,500 | 373,471 | ||||||
| Tokyo Tekko Co., Ltd. |
100 | 1,307 | ||||||
| Tokyu Construction Co., Ltd. |
36,800 | 259,803 | ||||||
| Tokyu Corp. |
51,000 | 716,527 | ||||||
| Tokyu Fudosan Holdings Corp. |
400 | 2,312 | ||||||
| Toli Corp. |
100 | 203 | ||||||
| Tomoe Engineering Co., Ltd. |
100 | 1,994 | ||||||
| TOMONY Holdings, Inc. |
900 | 2,399 | ||||||
| Tomy Co., Ltd. |
22,700 | 215,005 | ||||||
| Topcon Corp. |
24,800 | 441,517 | ||||||
| Topre Corp. |
400 | 4,603 | ||||||
| Toray Industries, Inc. |
51,300 | 318,935 | ||||||
| Toridoll Holdings Corp. |
100 | 2,404 | ||||||
| *Tosei Corp. |
700 | 6,704 | ||||||
| Toshiba Corp. |
21,400 | 921,500 | ||||||
| Tosho Co., Ltd. |
100 | 1,708 | ||||||
| Tosoh Corp. |
25,500 | 429,156 | ||||||
| TOTO, Ltd. |
1,000 | 48,235 | ||||||
| Tow Co., Ltd. |
800 | 2,428 | ||||||
| Towa Bank, Ltd. (The) |
200 | 887 | ||||||
| Towa Corp. |
1,200 | 25,994 | ||||||
| Toyo Construction Co., Ltd. |
2,600 | 12,997 | ||||||
| Toyo Denki Seizo KK |
100 | 941 | ||||||
| *Toyo Engineering Corp. |
700 | 5,243 | ||||||
| Toyo Machinery & Metal Co., Ltd. |
300 | 1,415 | ||||||
| Toyo Seikan Group Holdings, Ltd. |
22,200 | 262,448 | ||||||
| Toyo Suisan Kaisha, Ltd. |
100 | 4,306 | ||||||
| Toyo Tanso Co., Ltd. |
200 | 5,429 | ||||||
| Toyo Tire Corp. |
100 | 1,656 | ||||||
| Toyobo Co., Ltd. |
200 | 2,399 | ||||||
| Toyota Boshoku Corp. |
100 | 1,914 | ||||||
| Toyota Motor Corp. |
384,300 | 6,762,534 | ||||||
| Toyota Tsusho Corp. |
26,200 | 1,132,787 | ||||||
| TPR Co., Ltd. |
300 | 3,804 | ||||||
| Trancom Co., Ltd. |
100 | 6,981 | ||||||
| Trans Genic, Inc. |
400 | 1,905 | ||||||
| Transaction Co., Ltd. |
100 | 1,009 | ||||||
| TRE Holdings Corp. |
124 | 1,949 | ||||||
| Trend Micro, Inc. |
24,100 | 1,359,027 | ||||||
| Tsubaki Nakashima Co., Ltd. |
800 | 11,169 | ||||||
| Tsugami Corp. |
1,600 | 21,890 | ||||||
| Tsukishima Kikai Co., Ltd. |
100 | 1,019 | ||||||
| Tsukuba Bank, Ltd. |
200 | 300 | ||||||
| Tsurumi Manufacturing Co., Ltd. |
100 | 1,537 | ||||||
| Ube Industries, Ltd. |
24,800 | 461,092 | ||||||
Dimensional International Core Equity Market ETF
SCHEDULE OF INVESTMENTS
October 31, 2021
| Security Description |
Shares | Fair Value | ||||||
| JAPAN (Continued) |
||||||||
| Ubicom Holdings, Inc. |
100 | $ | 2,530 | |||||
| Uchida Yoko Co., Ltd. |
100 | 4,210 | ||||||
| Unicharm Corp. |
20,100 | 809,465 | ||||||
| Union Tool Co. |
100 | 3,368 | ||||||
| Unipres Corp. |
800 | 6,504 | ||||||
| Ushio, Inc. |
61,100 | 1,089,378 | ||||||
| USS Co., Ltd. |
300 | 4,815 | ||||||
| V Technology Co., Ltd. |
100 | 3,758 | ||||||
| Valqua, Ltd. |
100 | 2,014 | ||||||
| Vector, Inc. |
100 | 1,132 | ||||||
| Vertex Corp. |
100 | 2,657 | ||||||
| Vital KSK Holdings, Inc. |
100 | 665 | ||||||
| VT Holdings Co., Ltd. |
19,700 | 87,767 | ||||||
| Wacom Co., Ltd. |
60,300 | 388,162 | ||||||
| Wakita & Co., Ltd. |
800 | 7,226 | ||||||
| Warabeya Nichiyo Holdings Co., Ltd. |
300 | 5,864 | ||||||
| Watahan & Co., Ltd. |
100 | 1,080 | ||||||
| *Weathernews, Inc. |
100 | 7,288 | ||||||
| Welcia Holdings Co., Ltd. |
100 | 3,732 | ||||||
| Wellnet Corp. |
400 | 1,754 | ||||||
| West Japan Railway Co. |
100 | 4,703 | ||||||
| World Holdings Co., Ltd. |
100 | 2,493 | ||||||
| Wowow, Inc. |
100 | 2,033 | ||||||
| Yakult Honsha Co., Ltd. |
100 | 5,034 | ||||||
| YAKUODO Holdings Co., Ltd. |
200 | 4,218 | ||||||
| YAMABIKO Corp. |
200 | 2,173 | ||||||
| Yamada Holdings Co., Ltd. |
102,000 | 389,125 | ||||||
| Yamagata Bank, Ltd. (The) |
100 | 712 | ||||||
| Yamaguchi Financial Group, Inc. |
300 | 1,673 | ||||||
| Yamaha Corp. |
100 | 6,297 | ||||||
| Yamaha Motor Co., Ltd. |
25,500 | 707,805 | ||||||
| Yamaichi Electronics Co., Ltd. |
200 | 3,059 | ||||||
| YA-MAN, Ltd. |
400 | 4,234 | ||||||
| Yamanashi Chuo Bank, Ltd. (The) |
100 | 719 | ||||||
| Yamato Holdings Co., Ltd. |
23,200 | 569,089 | ||||||
| Yamazaki Baking Co., Ltd. |
22,600 | 342,890 | ||||||
| Yaskawa Electric Corp. |
100 | 4,315 | ||||||
| Yellow Hat, Ltd. |
100 | 1,627 | ||||||
| Yokogawa Electric Corp. |
200 | 3,985 | ||||||
| Yokohama Reito Co., Ltd. |
500 | 3,815 | ||||||
| Yokohama Rubber Co., Ltd. (The) |
100 | 1,686 | ||||||
| Yokowo Co., Ltd. |
200 | 4,425 | ||||||
| Yondoshi Holdings, Inc. |
300 | 4,541 | ||||||
| Yotai Refractories Co., Ltd. |
100 | 1,122 | ||||||
| Yuasa Trading Co., Ltd. |
200 | 5,323 | ||||||
| Yurtec Corp. |
300 | 1,752 | ||||||
| Z Holdings Corp. |
141,300 | 874,877 | ||||||
| Zenrin Co., Ltd. |
100 | 919 | ||||||
| Zensho Holdings Co., Ltd. |
100 | 2,305 | ||||||
| Zeon Corp. |
23,200 | 274,677 | ||||||
|
|
|
|||||||
| TOTAL JAPAN |
167,683,920 | |||||||
|
|
|
|||||||
| NETHERLANDS (4.1%) |
||||||||
| Aalberts NV |
291 | 16,114 | ||||||
| ABN AMRO Bank NV |
10,066 | 148,243 | ||||||
Dimensional International Core Equity Market ETF
SCHEDULE OF INVESTMENTS
October 31, 2021
| Security Description |
Shares | Fair Value | ||||||
| NETHERLANDS (Continued) |
||||||||
| *Accell Group NV |
1,670 | $ | 68,897 | |||||
| *Adyen NV |
397 | 1,199,334 | ||||||
| Aegon NV, Registered, Sponsored NYS |
37,891 | 191,350 | ||||||
| Aegon NV |
112,685 | 571,823 | ||||||
| Akzo Nobel NV |
7,410 | 852,546 | ||||||
| AMG Advanced Metallurgical Group NV |
1,858 | 54,915 | ||||||
| *Amsterdam Commodities NV |
148 | 4,162 | ||||||
| APERAM SA |
3,001 | 179,132 | ||||||
| Arcadis NV |
9,562 | 466,968 | ||||||
| #ArcelorMittal SA, Sponsored NYS |
7,092 | 242,334 | ||||||
| ArcelorMittal SA |
25,933 | 880,069 | ||||||
| ASM International NV |
1,791 | 811,227 | ||||||
| ASML Holding NV, Sponsored NYS |
2,965 | 2,410,189 | ||||||
| ASML Holding NV |
10,045 | 8,142,992 | ||||||
| ASR Nederland NV |
2,789 | 130,587 | ||||||
| #*Basic-Fit NV |
3,011 | 146,348 | ||||||
| BE Semiconductor Industries NV |
3,374 | 308,304 | ||||||
| #*Beter Bed Holding NV |
22 | 133 | ||||||
| Boskalis Westminster |
4,847 | 144,717 | ||||||
| Brunel International NV |
17 | 234 | ||||||
| Coca-Cola Europacific Partners PLC |
3,415 | 180,923 | ||||||
| Corbion NV |
3,064 | 145,733 | ||||||
| ForFarmers NV |
20 | 96 | ||||||
| *Fugro NV |
3,122 | 26,483 | ||||||
| Heijmans NV |
27 | 376 | ||||||
| Heineken NV |
9,534 | 1,057,200 | ||||||
| *Hunter Douglas NV |
4 | 477 | ||||||
| IMCD NV |
2,277 | 506,062 | ||||||
| ING Groep NV |
131,334 | 1,994,054 | ||||||
| *Intertrust NV |
7,320 | 110,801 | ||||||
| Kendrion NV |
20 | 463 | ||||||
| Koninklijke Ahold Delhaize NV |
76,923 | 2,504,101 | ||||||
| *Koninklijke BAM Groep NV |
3,332 | 9,678 | ||||||
| Koninklijke DSM NV |
6,835 | 1,495,344 | ||||||
| Koninklijke KPN NV |
193,113 | 577,694 | ||||||
| Koninklijke Philips NV |
20,654 | 973,400 | ||||||
| Koninklijke Philips NV , Sponsored NYS |
1,032 | 48,762 | ||||||
| Koninklijke Vopak NV |
5,984 | 238,219 | ||||||
| *Lucas Bols NV |
4 | 47 | ||||||
| NN Group NV |
12,371 | 663,131 | ||||||
| *OCI NV |
60 | 1,701 | ||||||
| Ordina NV |
102 | 425 | ||||||
| PostNL NV |
23,600 | 102,498 | ||||||
| Prosus NV |
7,178 | 633,055 | ||||||
| Randstad NV |
5,975 | 430,085 | ||||||
| SBM Offshore NV |
868 | 13,721 | ||||||
| SIF Holding NV |
14 | 228 | ||||||
| Signify NV |
10,865 | 526,200 | ||||||
| *Sligro Food Group NV |
2,077 | 55,643 | ||||||
| TKH Group NV |
2,658 | 151,522 | ||||||
| *TomTom NV |
17,303 | 149,077 | ||||||
| Universal Music Group NV |
16,658 | 484,152 | ||||||
| Van Lanschot Kempen NV |
1,687 | 46,855 | ||||||
| Wolters Kluwer NV |
12,989 | 1,362,453 | ||||||
|
|
|
|||||||
| TOTAL NETHERLANDS |
31,461,277 | |||||||
|
|
|
Dimensional International Core Equity Market ETF
SCHEDULE OF INVESTMENTS
October 31, 2021
| Security Description |
Shares | Fair Value | ||||||
| NEW ZEALAND (0.3%) |
| |||||||
| #*a2 Milk Co., Ltd. (The) |
14,674 | $ | 68,995 | |||||
| *Air New Zealand, Ltd. |
1,287 | 1,538 | ||||||
| Arvida Group, Ltd. |
3,165 | 4,530 | ||||||
| *Auckland International Airport, Ltd. |
36,645 | 209,538 | ||||||
| Chorus, Ltd. |
3,073 | 14,009 | ||||||
| Contact Energy, Ltd. |
64,156 | 375,571 | ||||||
| Delegat Group, Ltd. |
36 | 376 | ||||||
| EBOS Group, Ltd. |
13,900 | 360,598 | ||||||
| #*Eroad, Ltd. |
24 | 91 | ||||||
| *Evolve Education Group, Ltd. |
65 | 41 | ||||||
| Fisher & Paykel Healthcare Corp., Ltd. |
15,148 | 338,338 | ||||||
| Fletcher Building, Ltd. |
67,108 | 344,346 | ||||||
| Fonterra Co-operative Group, Ltd. |
76 | 217 | ||||||
| Freightways, Ltd. |
571 | 5,292 | ||||||
| Genesis Energy, Ltd. |
955 | 2,228 | ||||||
| *Gentrack Group, Ltd. |
60 | 83 | ||||||
| Hallenstein Glasson Holdings, Ltd. |
44 | 220 | ||||||
| Heartland Group Holdings, Ltd. |
499 | 839 | ||||||
| *Infratil, Ltd. |
3,341 | 19,797 | ||||||
| Kathmandu Holdings, Ltd. |
24,212 | 27,550 | ||||||
| *Mainfreight, Ltd. |
1,408 | 90,587 | ||||||
| Mercury NZ, Ltd. |
1,039 | 4,562 | ||||||
| Meridian Energy, Ltd. |
21,560 | 76,993 | ||||||
| *New Zealand Refining Co., Ltd. (The) |
136 | 83 | ||||||
| NZME, Ltd. |
136 | 111 | ||||||
| NZX, Ltd. |
185 | 229 | ||||||
| Oceania Healthcare, Ltd. |
4,128 | 4,136 | ||||||
| *Pacific Edge, Ltd. |
272 | 286 | ||||||
| *Plexure Group, Ltd. |
64 | 26 | ||||||
| Port of Tauranga, Ltd. |
184 | 909 | ||||||
| *Restaurant Brands New Zealand, Ltd. |
20 | 223 | ||||||
| #*Ryman Healthcare, Ltd. |
14,458 | 149,512 | ||||||
| *Sanford, Ltd. |
52 | 188 | ||||||
| Scales Corp., Ltd. |
80 | 307 | ||||||
| *Serko, Ltd. |
40 | 223 | ||||||
| Skellerup Holdings, Ltd. |
120 | 535 | ||||||
| *SKY Network Television, Ltd. |
111 | 151 | ||||||
| SKYCITY Entertainment Group, Ltd. |
34,094 | 78,078 | ||||||
| Spark New Zealand, Ltd. |
107,279 | 350,474 | ||||||
| Summerset Group Holdings, Ltd. |
2,019 | 20,966 | ||||||
| *Synlait Milk, Ltd. |
52 | 134 | ||||||
| *Tourism Holdings, Ltd. |
80 | 157 | ||||||
| Trustpower, Ltd. |
40 | 213 | ||||||
| *Turners Automotive Group, Ltd. |
40 | 125 | ||||||
| Vector, Ltd. |
144 | 421 | ||||||
| #*Vista Group International, Ltd. |
136 | 246 | ||||||
| *Warehouse Group, Ltd. (The) |
56 | 162 | ||||||
| Z Energy, Ltd. |
35,712 | 92,006 | ||||||
|
|
|
|||||||
| TOTAL NEW ZEALAND |
2,646,240 | |||||||
|
|
|
|||||||
Dimensional International Core Equity Market ETF
SCHEDULE OF INVESTMENTS
October 31, 2021
| Security Description |
Shares | Fair Value | ||||||
| NORWAY (0.9%) |
| |||||||
| ABG Sundal Collier Holding ASA |
252 | $ | 278 | |||||
| *Adevinta ASA |
1,191 | 19,577 | ||||||
| *AF Gruppen ASA |
28 | 652 | ||||||
| *Akastor ASA |
92 | 64 | ||||||
| Aker ASA, A Shares |
1,386 | 127,306 | ||||||
| Aker BP ASA |
5,261 | 201,440 | ||||||
| *Aker Solutions ASA |
920 | 2,603 | ||||||
| AKVA Group ASA |
8 | 85 | ||||||
| American Shipping Co. ASA |
56 | 206 | ||||||
| *ArcticZymes Technologies ASA |
28 | 293 | ||||||
| Atea ASA |
647 | 12,084 | ||||||
| Austevoll Seafood ASA |
156 | 2,104 | ||||||
| Bakkafrost P/F |
1,902 | 175,421 | ||||||
| Bank Norwegian ASA |
1,602 | 19,809 | ||||||
| Bonheur ASA |
24 | 946 | ||||||
| *Borr Drilling, Ltd. |
124 | 125 | ||||||
| Borregaard ASA |
1,159 | 28,087 | ||||||
| Bouvet ASA |
1,647 | 13,162 | ||||||
| *BW Energy, Ltd. |
56 | 182 | ||||||
| BW LPG, Ltd. |
3,771 | 20,060 | ||||||
| BW Offshore, Ltd. |
296 | 960 | ||||||
| *Crayon Group Holding ASA |
128 | 2,982 | ||||||
| DNB Bank ASA |
16,387 | 388,981 | ||||||
| *DNO ASA |
8,584 | 12,481 | ||||||
| Elkem ASA |
271 | 1,072 | ||||||
| Entra ASA |
677 | 16,871 | ||||||
| *Equinor ASA |
35,425 | 895,121 | ||||||
| Europris ASA |
60,291 | 444,737 | ||||||
| Fjordkraft Holding ASA |
2,564 | 15,231 | ||||||
| FLEX LNG, Ltd. |
44 | 887 | ||||||
| *Frontline, Ltd. |
304 | 2,699 | ||||||
| Gjensidige Forsikring ASA |
5,310 | 131,882 | ||||||
| Golden Ocean Group, Ltd. |
611 | 5,504 | ||||||
| #*Grieg Seafood ASA |
68 | 755 | ||||||
| *Hexagon Composites ASA |
52 | 209 | ||||||
| Kid ASA |
1,927 | 25,741 | ||||||
| #*Kongsberg Automotive ASA |
703 | 249 | ||||||
| Kongsberg Gruppen ASA |
4,021 | 131,668 | ||||||
| Leroy Seafood Group ASA |
11,375 | 103,271 | ||||||
| Mowi ASA |
11,579 | 334,806 | ||||||
| #*NEL ASA |
24,288 | 51,193 | ||||||
| *Nordic Semiconductor ASA |
14,907 | 440,551 | ||||||
| Norsk Hydro ASA |
70,016 | 512,169 | ||||||
| Norway Royal Salmon ASA |
9 | 189 | ||||||
| *Odfjell Drilling, Ltd. |
88 | 222 | ||||||
| *Odfjell SE, A Shares |
20 | 75 | ||||||
| Olav Thon Eiendomsselskap ASA |
16 | 350 | ||||||
| #Orkla ASA |
29,014 | 281,795 | ||||||
| *Otello Corp. ASA |
56 | 190 | ||||||
| #*PGS ASA |
1,838 | 747 | ||||||
| Protector Forsikring ASA |
144 | 1,667 | ||||||
| *REC Silicon ASA |
156 | 282 | ||||||
| Salmar ASA |
3,456 | 262,694 | ||||||
| Scatec ASA |
2,425 | 47,615 | ||||||
| Schibsted ASA, Class B |
2,980 | 134,358 | ||||||
| Schibsted ASA, Class A |
3,104 | 159,873 | ||||||
Dimensional International Core Equity Market ETF
SCHEDULE OF INVESTMENTS
October 31, 2021
| Security Description |
Shares | Fair Value | ||||||
| NORWAY (Continued) |
||||||||
| Selvaag Bolig ASA |
44 | $ | 270 | |||||
| *Solon Eiendom ASA |
20 | 91 | ||||||
| Sparebank 1 Oestlandet |
68 | 1,119 | ||||||
| SpareBank 1 SR-Bank ASA |
368 | 5,629 | ||||||
| Stolt-Nielsen, Ltd. |
48 | 738 | ||||||
| Storebrand ASA |
23,697 | 253,629 | ||||||
| Subsea 7 SA |
16,029 | 143,553 | ||||||
| Telenor ASA |
23,050 | 363,354 | ||||||
| TGS ASA |
22,496 | 206,683 | ||||||
| TOMRA Systems ASA |
4,295 | 276,812 | ||||||
| Veidekke ASA |
1,581 | 22,726 | ||||||
| *Wallenius Wilhelmsen ASA |
172 | 783 | ||||||
| XXL ASA |
80 | 132 | ||||||
| Yara International ASA |
5,415 | 282,166 | ||||||
|
|
|
|||||||
| TOTAL NORWAY |
6,592,246 | |||||||
|
|
|
|||||||
| PORTUGAL (0.2%) |
| |||||||
| Altri SGPS SA |
60 | 389 | ||||||
| #*Banco Comercial Portugues SA, Registered |
1,402,704 | 253,393 | ||||||
| *Corticeira Amorim SGPS SA |
995 | 13,886 | ||||||
| CTT-Correios de Portugal SA |
4,908 | 27,036 | ||||||
| #EDP—Energias de Portugal SA |
88,836 | 502,100 | ||||||
| #EDP Renovaveis SA |
5,168 | 144,134 | ||||||
| Galp Energia SGPS SA |
19,738 | 205,393 | ||||||
| *Greenvolt-Energias Renovaveis SA |
1 | 8 | ||||||
| Jeronimo Martins SGPS SA |
11,221 | 254,515 | ||||||
| #*Mota-Engil SGPS SA |
48 | 75 | ||||||
| Navigator Co. SA (The) |
14,145 | 55,328 | ||||||
| NOS SGPS SA |
32,924 | 128,553 | ||||||
| REN—Redes Energeticas Nacionais SGPS SA |
20,560 | 62,695 | ||||||
| Sonae SGPS SA |
36,723 | 40,437 | ||||||
|
|
|
|||||||
| TOTAL PORTUGAL |
1,687,942 | |||||||
|
|
|
|||||||
| SINGAPORE (0.9%) |
| |||||||
| AEM Holdings, Ltd. |
14,400 | 44,743 | ||||||
| *Avarga, Ltd. |
800 | 175 | ||||||
| *Banyan Tree Holdings, Ltd. |
300 | 76 | ||||||
| Bukit Sembawang Estates, Ltd. |
6,500 | 25,210 | ||||||
| CapitaLand Integrated Commercial Trust |
43 | 69 | ||||||
| *Capitaland Investment, Ltd. |
34,000 | 86,733 | ||||||
| *Centurion Corp., Ltd. |
500 | 122 | ||||||
| China Aviation Oil Singapore Corp., Ltd. |
400 | 297 | ||||||
| China Sunsine Chemical Holdings, Ltd. |
500 | 189 | ||||||
| Chip Eng Seng Corp., Ltd. |
700 | 223 | ||||||
| City Developments, Ltd. |
11,600 | 62,968 | ||||||
| ComfortDelGro Corp., Ltd. |
106,900 | 123,666 | ||||||
| *COSCO Shipping International Singapore Co., Ltd. |
1,000 | 204 | ||||||
| CSE Global, Ltd. |
300 | 115 | ||||||
| Dairy Farm International Holdings, Ltd. |
300 | 1,071 | ||||||
| *DBS Group Holdings, Ltd. |
51,539 | 1,205,061 | ||||||
| Far East Orchard, Ltd. |
200 | 165 | ||||||
| First Resources, Ltd. |
400 | 528 | ||||||
| Frencken Group, Ltd. |
11,100 | 18,768 | ||||||
Dimensional International Core Equity Market ETF
SCHEDULE OF INVESTMENTS
October 31, 2021
| Security Description |
Shares | Fair Value | ||||||
| SINGAPORE (Continued) |
||||||||
| *Fu Yu Corp., Ltd. |
700 | $ | 151 | |||||
| Genting Singapore, Ltd. |
247,700 | 143,275 | ||||||
| *Golden Agri-Resources, Ltd. |
8,500 | 1,670 | ||||||
| *GuocoLand, Ltd. |
400 | 504 | ||||||
| *Halcyon Agri Corp., Ltd. |
500 | 98 | ||||||
| Hongkong Land Holdings, Ltd. |
66,100 | 364,211 | ||||||
| Hour Glass, Ltd. (The) |
200 | 291 | ||||||
| Hutchison Port Holdings Trust, Class U |
546,800 | 117,562 | ||||||
| iFAST Corp., Ltd. |
3,800 | 24,375 | ||||||
| ISDN Holdings, Ltd. |
505 | 232 | ||||||
| Japfa, Ltd. |
340,000 | 172,710 | ||||||
| Jardine Cycle & Carriage, Ltd. |
100 | 1,668 | ||||||
| Keppel Corp., Ltd. |
13,300 | 53,062 | ||||||
| Keppel Infrastructure Trust |
85,500 | 33,604 | ||||||
| Low Keng Huat Singapore, Ltd. |
200 | 71 | ||||||
| *Mandarin Oriental International, Ltd. |
200 | 464 | ||||||
| NetLink NBN Trust |
97,900 | 74,051 | ||||||
| *Oceanus Group, Ltd. |
21,700 | 644 | ||||||
| Olam International, Ltd. |
690 | 870 | ||||||
| OUE, Ltd. |
500 | 512 | ||||||
| Oversea-Chinese Banking Corp., Ltd. |
52,836 | 462,340 | ||||||
| Oxley Holdings, Ltd. |
963 | 143 | ||||||
| *Raffles Education Corp., Ltd. |
900 | 51 | ||||||
| Raffles Medical Group, Ltd. |
54,900 | 55,775 | ||||||
| Riverstone Holdings, Ltd. |
500 | 319 | ||||||
| *Roxy-Pacific Holdings, Ltd. |
200 | 70 | ||||||
| *SATS, Ltd. |
300 | 932 | ||||||
| Sembcorp Industries, Ltd. |
57,300 | 85,408 | ||||||
| *Sembcorp Marine, Ltd. |
5,092,600 | 298,343 | ||||||
| Sheng Siong Group, Ltd. |
96,000 | 101,090 | ||||||
| *SIA Engineering Co., Ltd. |
100 | 161 | ||||||
| Sing Holdings, Ltd. |
200 | 56 | ||||||
| *Singapore Airlines, Ltd. |
136,600 | 526,748 | ||||||
| *Singapore Exchange, Ltd. |
25,800 | 185,201 | ||||||
| Singapore Technologies Engineering, Ltd. |
77,500 | 220,115 | ||||||
| Singapore Telecommunications, Ltd. |
280,800 | 520,578 | ||||||
| StarHub, Ltd. |
400 | 368 | ||||||
| *UMS Holdings, Ltd. |
24,600 | 24,080 | ||||||
| United Overseas Bank, Ltd. |
51,200 | 1,015,647 | ||||||
| UOB-Kay Hian Holdings, Ltd. |
639 | 749 | ||||||
| UOL Group, Ltd. |
300 | 1,608 | ||||||
| Valuetronics Holdings, Ltd. |
500 | 215 | ||||||
| Venture Corp., Ltd. |
25,500 | 355,695 | ||||||
| Vicom, Ltd. |
100 | 153 | ||||||
| Wilmar International, Ltd. |
84,700 | 271,342 | ||||||
| *Wing Tai Holdings, Ltd. |
14,300 | 20,572 | ||||||
|
|
|
|||||||
| TOTAL SINGAPORE |
6,708,167 | |||||||
|
|
|
|||||||
| SPAIN (2.2%) |
| |||||||
| Acciona SA |
1,712 | 328,484 | ||||||
| Acerinox SA |
7,985 | 111,211 | ||||||
| ACS Actividades de Construccion y Servicios SA |
10,820 | 283,359 | ||||||
| Aedas Homes SA |
385 | 11,072 | ||||||
| *Aena SME SA |
3,194 | 523,573 | ||||||
| *Alantra Partners SA |
12 | 225 | ||||||
Dimensional International Core Equity Market ETF
SCHEDULE OF INVESTMENTS
October 31, 2021
| Security Description |
Shares | Fair Value | ||||||
| SPAIN (Continued) |
||||||||
| Almirall SA |
9,936 | $ | 147,755 | |||||
| *Amadeus IT Group SA |
14,503 | 970,760 | ||||||
| *Amper SA |
720 | 161 | ||||||
| Applus Services SA |
19,902 | 180,337 | ||||||
| *Atresmedia Corp. de Medios de Comunicacion SA |
168 | 687 | ||||||
| Banco Bilbao Vizcaya Argentaria SA |
252,915 | 1,774,257 | ||||||
| Banco Bilbao Vizcaya Argentaria SA , Sponsored ADR |
28,118 | 195,982 | ||||||
| *Banco de Sabadell SA |
237,886 | 191,714 | ||||||
| Banco Santander SA , Sponsored ADR |
12,402 | 47,004 | ||||||
| Banco Santander SA |
515,365 | 1,954,119 | ||||||
| Bankinter SA |
52,384 | 288,678 | ||||||
| CaixaBank SA |
141,623 | 407,274 | ||||||
| Cellnex Telecom SA |
6,280 | 386,486 | ||||||
| Cia de Distribucion Integral Logista Holdings SA |
14,517 | 309,787 | ||||||
| CIE Automotive SA |
3,629 | 98,776 | ||||||
| Construcciones y Auxiliar de Ferrocarriles SA |
847 | 37,198 | ||||||
| *Distribuidora Internacional de Alimentacion SA |
8,816 | 161 | ||||||
| Ebro Foods SA |
3,108 | 61,720 | ||||||
| *eDreams ODIGEO SA |
40 | 351 | ||||||
| Elecnor SA |
1,219 | 14,812 | ||||||
| Enagas SA |
10,896 | 244,685 | ||||||
| *Ence Energia y Celulosa SA |
7,762 | 19,977 | ||||||
| Endesa SA |
14,988 | 345,942 | ||||||
| *Ercros SA |
9,213 | 37,316 | ||||||
| Faes Farma SA |
19,598 | 80,014 | ||||||
| Ferrovial SA |
17,546 | 553,516 | ||||||
| Fluidra SA |
248 | 9,485 | ||||||
| Fomento de Construcciones y Contratas SA |
83 | 1,057 | ||||||
| *Gestamp Automocion SA |
6,851 | 30,619 | ||||||
| Global Dominion Access SA |
4,652 | 24,953 | ||||||
| Grifols SA |
10,766 | 246,624 | ||||||
| Grupo Catalana Occidente SA |
24 | 854 | ||||||
| Grupo Empresarial San Jose SA |
12 | 60 | ||||||
| *Grupo Ezentis SA |
192 | 59 | ||||||
| Iberdrola SA |
187,685 | 2,218,676 | ||||||
| Iberpapel Gestion SA |
4 | 91 | ||||||
| *Indra Sistemas SA |
21,467 | 259,605 | ||||||
| Industria de Diseno Textil SA |
39,949 | 1,444,252 | ||||||
| Laboratorios Farmaceuticos Rovi SA |
13 | 912 | ||||||
| Linea Directa Aseguradora SA Cia de Seguros y Reaseguros |
21,705 | 43,705 | ||||||
| Mapfre SA |
1,860 | 3,940 | ||||||
| *Mediaset Espana Comunicacion SA |
16,413 | 85,472 | ||||||
| *Melia Hotels International SA |
6,042 | 44,484 | ||||||
| Metrovacesa SA |
32 | 280 | ||||||
| Miquel y Costas & Miquel SA |
12 | 166 | ||||||
| Neinor Homes SA |
32 | 412 | ||||||
| *Obrascon Huarte Lain SA |
166 | 135 | ||||||
| Pharma Mar SA |
832 | 64,644 | ||||||
| Prim SA |
4 | 65 | ||||||
| *Promotora de Informaciones SA, Class A |
132 | 92 | ||||||
| Prosegur Cia de Seguridad SA |
13,029 | 36,941 | ||||||
| *Realia Business SA |
136 | 115 | ||||||
| Red Electrica Corp. SA |
18,715 | 390,058 | ||||||
| Renta 4 Banco SA |
8 | 88 | ||||||
| *Repsol SA |
60,089 | 768,810 | ||||||
Dimensional International Core Equity Market ETF
SCHEDULE OF INVESTMENTS
October 31, 2021
| Security Description |
Shares | Fair Value | ||||||
| SPAIN (Continued) |
||||||||
| Sacyr SA |
36,793 | $ | 104,743 | |||||
| *Siemens Gamesa Renewable Energy SA |
3,672 | 99,564 | ||||||
| *Solaria Energia y Medio Ambiente SA |
4,106 | 82,061 | ||||||
| *Talgo SA |
48 | 264 | ||||||
| *Tecnicas Reunidas SA |
28 | 253 | ||||||
| *Telefonica SA |
227,941 | 993,015 | ||||||
| *Tubacex SA |
84 | 168 | ||||||
| Unicaja Banco SA |
13,946 | 14,929 | ||||||
| Vidrala SA |
360 | 38,203 | ||||||
| *Viscofan SA |
2,112 | 144,569 | ||||||
| *Vocento SA |
52 | 62 | ||||||
| Zardoya Otis SA |
7,978 | 64,074 | ||||||
|
|
|
|||||||
| TOTAL SPAIN |
16,825,952 | |||||||
|
|
|
|||||||
| SWEDEN (3.5%) |
| |||||||
| AAK AB |
6,610 | 144,460 | ||||||
| AcadeMedia AB |
3,511 | 25,141 | ||||||
| AddLife AB, Class B |
242 | 9,896 | ||||||
| AddNode Group AB |
309 | 12,790 | ||||||
| AddTech AB, B Shares |
11,325 | 253,176 | ||||||
| AFRY AB |
4,722 | 140,640 | ||||||
| Alfa Laval AB |
630 | 26,972 | ||||||
| Alimak Group AB |
1,050 | 14,255 | ||||||
| Ambea AB |
2,695 | 18,733 | ||||||
| *Annehem Fastigheter AB, Class B |
28 | 120 | ||||||
| *AQ Group AB |
26 | 863 | ||||||
| *Arise AB |
16 | 80 | ||||||
| Arjo AB, Class B |
5,825 | 79,353 | ||||||
| Assa Abloy AB, Class B |
28,186 | 825,380 | ||||||
| Atlas Copco AB, Class B |
13,357 | 722,399 | ||||||
| Atlas Copco AB, Class A |
25,184 | 1,618,039 | ||||||
| Atrium Ljungberg AB, B Shares |
28 | 643 | ||||||
| *Attendo AB |
3,287 | 14,122 | ||||||
| Avanza Bank Holding AB |
6,025 | 239,148 | ||||||
| Axfood AB |
4,639 | 113,700 | ||||||
| *Balco Group AB |
16 | 237 | ||||||
| Beijer Alma AB, Class B |
1,156 | 29,006 | ||||||
| Beijer Ref AB |
4,280 | 87,907 | ||||||
| Bergman & Beving AB |
28 | 505 | ||||||
| Besqab AB |
4 | 82 | ||||||
| Betsson AB |
27,694 | 192,828 | ||||||
| *»Betsson AB |
200 | 86 | ||||||
| Bilia AB, A Shares |
19,036 | 338,009 | ||||||
| BillerudKorsnas AB |
15,790 | 330,012 | ||||||
| BioGaia AB, B Shares |
2,001 | 123,017 | ||||||
| Biotage AB |
28 | 905 | ||||||
| Boliden AB |
13,312 | 469,489 | ||||||
| Bonava AB, B Shares |
10,677 | 105,359 | ||||||
| *Boozt AB |
1,277 | 21,515 | ||||||
| Bravida Holding AB |
314 | 4,720 | ||||||
| Bufab AB |
1,273 | 54,249 | ||||||
| Bulten AB |
8 | 72 | ||||||
| Byggmax Group AB |
3,670 | 31,408 | ||||||
| Castellum AB |
29,492 | 784,302 | ||||||
| Catella AB |
28 | 125 | ||||||
Dimensional International Core Equity Market ETF
SCHEDULE OF INVESTMENTS
October 31, 2021
| Security Description |
Shares | Fair Value | ||||||
| SWEDEN (Continued) |
||||||||
| Catena AB |
16 | $ | 974 | |||||
| #*Catena Media PLC |
44 | 293 | ||||||
| Cellavision AB |
341 | 15,508 | ||||||
| Clas Ohlson AB, B Shares |
2,229 | 23,981 | ||||||
| Cloetta AB, B Shares |
11,950 | 37,929 | ||||||
| Concentric AB |
880 | 25,872 | ||||||
| Coor Service Management Holding AB |
12,522 | 121,451 | ||||||
| Corem Property Group AB, Class B |
285 | 946 | ||||||
| Dios Fastigheter AB |
28,491 | 331,568 | ||||||
| Dometic Group AB |
14,603 | 212,282 | ||||||
| *Duni AB, Class A |
94 | 1,311 | ||||||
| #Dustin Group AB |
2,793 | 34,179 | ||||||
| Elanders AB, Class B |
4 | 69 | ||||||
| Electrolux AB, Class B |
12,143 | 275,563 | ||||||
| *Electrolux Professional AB |
1,015 | 7,824 | ||||||
| Elekta AB, Class B |
20,081 | 233,158 | ||||||
| *Enea AB |
12 | 330 | ||||||
| Eolus Vind AB |
38 | 697 | ||||||
| Epiroc AB |
160 | 3,400 | ||||||
| Epiroc AB |
19,079 | 474,726 | ||||||
| *»Epiroc AB, Class A |
212 | 74 | ||||||
| Essity AB, Class A |
16 | 518 | ||||||
| Essity AB, Class B |
22,851 | 739,129 | ||||||
| Evolution AB |
477 | 77,155 | ||||||
| Fabege AB |
16,285 | 275,320 | ||||||
| Fagerhult AB |
231 | 1,853 | ||||||
| *Fastighets AB Balder, B Shares |
360 | 26,081 | ||||||
| FastPartner AB, Class A |
24 | 342 | ||||||
| Ferronordic AB |
8 | 274 | ||||||
| *Fingerprint Cards AB, Class B |
244 | 584 | ||||||
| GARO AB |
1,331 | 33,475 | ||||||
| Getinge AB, Class B |
11,024 | 493,279 | ||||||
| GHP Specialty Care AB |
20 | 60 | ||||||
| Granges AB |
4,768 | 51,880 | ||||||
| H & M Hennes & Mauritz AB, Class B |
28,720 | 538,452 | ||||||
| *Haldex AB |
40 | 239 | ||||||
| Hexagon AB |
38,306 | 615,501 | ||||||
| Hexatronic Group AB |
1,330 | 58,149 | ||||||
| Hexpol AB |
12,353 | 144,263 | ||||||
| HMS Networks AB |
12 | 685 | ||||||
| Holmen AB, Class B |
84 | 3,724 | ||||||
| Hufvudstaden AB, Class A |
72 | 1,150 | ||||||
| *Humana AB |
36 | 301 | ||||||
| Husqvarna AB, A Shares |
8 | 114 | ||||||
| Husqvarna AB, Class B |
19,342 | 275,092 | ||||||
| *IAR Systems Group AB |
8 | 90 | ||||||
| ICA Gruppen AB |
4,662 | 241,012 | ||||||
| #Industrivarden AB, Class A |
698 | 23,025 | ||||||
| Indutrade AB |
21,086 | 613,540 | ||||||
| *International Petroleum Corp. |
88 | 492 | ||||||
| Intrum AB |
4,618 | 130,768 | ||||||
| INVISIO AB |
697 | 12,595 | ||||||
| Inwido AB |
9,839 | 180,432 | ||||||
| JM AB |
3,458 | 139,914 | ||||||
| Karnov Group AB |
2,214 | 14,178 | ||||||
Dimensional International Core Equity Market ETF
SCHEDULE OF INVESTMENTS
October 31, 2021
| Security Description |
Shares | Fair Value | ||||||
| SWEDEN (Continued) |
||||||||
| *Karo Pharma AB |
150 | $ | 989 | |||||
| Kindred Group PLC |
11,108 | 155,203 | ||||||
| KNOW IT AB |
697 | 27,999 | ||||||
| Kungsleden AB |
120 | 1,649 | ||||||
| Lagercrantz Group AB, B Shares |
7,072 | 94,694 | ||||||
| LeoVegas AB |
72 | 272 | ||||||
| Lifco AB |
577 | 16,803 | ||||||
| Lindab International AB |
17,515 | 573,875 | ||||||
| Loomis AB |
6,720 | 181,448 | ||||||
| *Lundin Energy AB |
7,912 | 312,482 | ||||||
| Medicover AB, Class B |
28 | 844 | ||||||
| *Mekonomen AB |
3,143 | 64,774 | ||||||
| *Millicom International Cellular SA |
6,517 | 227,945 | ||||||
| MIPS AB |
5,480 | 661,671 | ||||||
| *Modern Times Group MTG AB, Class B |
17,573 | 201,133 | ||||||
| Munters Group AB |
3,603 | 26,597 | ||||||
| Mycronic AB |
5,732 | 132,947 | ||||||
| *NCC AB, Class B |
60 | 1,039 | ||||||
| Nederman Holding AB |
519 | 11,421 | ||||||
| *Net Insight AB, Class B |
232 | 88 | ||||||
| *New Wave Group AB, Class B |
1,482 | 25,124 | ||||||
| Nibe Industrier AB |
9,912 | 147,552 | ||||||
| Nobia AB |
16,694 | 102,728 | ||||||
| Nobina AB |
13,549 | 129,677 | ||||||
| Nolato AB |
21,624 | 285,517 | ||||||
| *Nordic Entertainment Group AB, Class B |
3,237 | 187,244 | ||||||
| Nordic Waterproofing Holding AB |
697 | 20,695 | ||||||
| Oem International AB |
1,338 | 30,067 | ||||||
| *Orexo AB |
20 | 74 | ||||||
| Peab AB, Class B |
466 | 5,844 | ||||||
| Platzer Fastigheter Holding AB, Class B |
52 | 848 | ||||||
| *Pricer AB, Class B |
80 | 240 | ||||||
| Proact It Group AB |
24 | 242 | ||||||
| Ratos AB, B Shares |
31,354 | 180,271 | ||||||
| *RaySearch Laboratories AB |
20 | 142 | ||||||
| Rejlers AB |
4 | 68 | ||||||
| Resurs Holding AB |
5,112 | 27,499 | ||||||
| Rottneros AB |
48 | 56 | ||||||
| Saab AB, Class B |
56 | 1,557 | ||||||
| Sagax AB, Class B |
44 | 1,721 | ||||||
| Samhallsbyggnadsbolaget i Norden AB |
524 | 3,514 | ||||||
| Samhallsbyggnadsbolaget i Norden AB, Class D |
112 | 407 | ||||||
| Sandvik AB |
36,812 | 932,248 | ||||||
| Scandi Standard AB |
36 | 179 | ||||||
| #*Scandic Hotels Group AB |
7,277 | 35,078 | ||||||
| Sectra AB, Class B |
120 | 2,929 | ||||||
| Securitas AB, Class B |
5,511 | 91,117 | ||||||
| Semcon AB |
16 | 229 | ||||||
| *Sensys Gatso Group AB |
488 | 55 | ||||||
| *Sinch AB |
8,101 | 153,606 | ||||||
| *SinterCast AB |
4 | 70 | ||||||
| *Skandinaviska Enskilda Banken AB, Class C |
8 | 128 | ||||||
| *Skandinaviska Enskilda Banken AB, Class A |
51,185 | 800,092 | ||||||
| Skanska AB, Class B |
23,258 | 590,353 | ||||||
| SKF AB, Class B |
26,467 | 613,254 | ||||||
| SKF AB, Class A |
38 | 894 | ||||||
Dimensional International Core Equity Market ETF
SCHEDULE OF INVESTMENTS
October 31, 2021
| Security Description |
Shares | Fair Value | ||||||
| SWEDEN (Continued) |
||||||||
| *SkiStar AB |
28 | $ | 584 | |||||
| *SSAB AB, Class B |
7,894 | 39,357 | ||||||
| *SSAB AB, Class A |
156 | 888 | ||||||
| *Stendorren Fastigheter AB |
8 | 234 | ||||||
| Svenska Cellulosa AB SCA, Class A |
8 | 126 | ||||||
| #Svenska Cellulosa AB SCA, Class B |
37,879 | 590,557 | ||||||
| Svenska Handelsbanken AB, Class B |
16 | 202 | ||||||
| #Svenska Handelsbanken AB, Class A |
47,561 | 544,583 | ||||||
| Sweco AB, Class B |
5,986 | 95,277 | ||||||
| Swedbank AB, Class A |
25,610 | 555,348 | ||||||
| Swedish Match AB |
62,839 | 552,992 | ||||||
| *Swedish Orphan Biovitrum AB, Class A |
8,440 | 228,971 | ||||||
| Systemair AB |
384 | 3,702 | ||||||
| Tele2 AB, Class B |
24,580 | 346,727 | ||||||
| Telefonaktiebolaget LM Ericsson, Class B |
100,734 | 1,102,520 | ||||||
| Telefonaktiebolaget LM Ericsson, Class A |
28 | 306 | ||||||
| Telia Co. AB |
89,115 | 350,660 | ||||||
| Tethys Oil AB |
28 | 203 | ||||||
| Thule Group AB |
4,573 | 263,459 | ||||||
| Trelleborg AB, Class B |
15,666 | 357,791 | ||||||
| Troax Group AB |
346 | 14,181 | ||||||
| VBG Group AB, Class B |
12 | 231 | ||||||
| Vitrolife AB |
10 | 651 | ||||||
| Volvo AB, Class A |
156 | 3,684 | ||||||
| Volvo AB, Class B |
62,149 | 1,446,682 | ||||||
| Wallenstam AB, B Shares |
104 | 1,821 | ||||||
| Wihlborgs Fastigheter AB |
15,481 | 366,273 | ||||||
|
|
|
|||||||
| TOTAL SWEDEN |
27,262,746 | |||||||
|
|
|
|||||||
| SWITZERLAND (8.1%) |
| |||||||
| ABB, Ltd., Registered |
49,764 | 1,649,632 | ||||||
| Adecco Group AG |
5,733 | 289,050 | ||||||
| Alcon, Inc. |
15,567 | 1,288,973 | ||||||
| Alcon, Inc. |
4,222 | 351,946 | ||||||
| Allreal Holding AG, Registered |
8 | 1,695 | ||||||
| ALSO Holding AG, Registered |
15 | 4,449 | ||||||
| *ams AG |
3,112 | 61,610 | ||||||
| Arbonia AG |
2,510 | 54,609 | ||||||
| *Aryzta AG |
126,722 | 166,004 | ||||||
| *Ascom Holding AG, Registered |
1,347 | 20,962 | ||||||
| *Autoneum Holding AG |
133 | 20,843 | ||||||
| Bachem Holding AG, Registered B |
549 | 442,204 | ||||||
| Baloise Holding AG, Registered |
3,813 | 609,245 | ||||||
| Banque Cantonale Vaudoise, Registered |
24 | 1,936 | ||||||
| Belimo Holding AG |
10 | 5,822 | ||||||
| Bell Food Group AG |
36 | 11,583 | ||||||
| Bellevue Group AG |
16 | 720 | ||||||
| Berner Kantonalbank AG, Registered |
110 | 25,341 | ||||||
| BKW AG |
736 | 97,623 | ||||||
| *Bobst Group SA, Registered |
1,112 | 90,785 | ||||||
| Bossard Holding AG, Registered A |
339 | 124,656 | ||||||
| Bucher Industries AG, Registered |
29 | 14,650 | ||||||
| Burckhardt Compression Holding AG |
177 | 74,577 | ||||||
| Bystronic AG |
39 | 53,693 | ||||||
Dimensional International Core Equity Market ETF
SCHEDULE OF INVESTMENTS
October 31, 2021
| Security Description |
Shares | Fair Value | ||||||
| SWITZERLAND (Continued) |
| |||||||
| Cembra Money Bank AG |
1,802 | $ | 120,396 | |||||
| Cie Financiere Richemont SA, Registered |
15,407 | 1,907,012 | ||||||
| Clariant AG, Registered |
8,065 | 169,994 | ||||||
| Coltene Holding AG, Registered |
106 | 13,410 | ||||||
| Comet Holding AG |
452 | 168,186 | ||||||
| *COSMO Pharmaceuticals NV |
191 | 14,569 | ||||||
| Credit Suisse Group AG, Registered |
53,808 | 561,311 | ||||||
| Credit Suisse Group AG, Sponsored ADR |
9,982 | 102,914 | ||||||
| DKSH Holding AG |
40 | 3,209 | ||||||
| dormakaba Holding AG |
266 | 197,517 | ||||||
| *Dufry AG, Registered |
1,724 | 91,280 | ||||||
| EFG International AG |
383 | 2,695 | ||||||
| EMS-Chemie Holding AG |
226 | 224,454 | ||||||
| #*Evolva Holding SA |
564 | 86 | ||||||
| *Flughafen Zurich AG, Registered |
3,366 | 607,814 | ||||||
| Galenica AG |
311 | 22,804 | ||||||
| *GAM Holding AG |
25,355 | 40,929 | ||||||
| Geberit AG, Registered |
1,602 | 1,253,198 | ||||||
| Georg Fischer AG, Registered |
318 | 482,003 | ||||||
| Givaudan SA, Registered |
257 | 1,211,943 | ||||||
| Helvetia Holding AG, Registered |
1,736 | 207,085 | ||||||
| Holcim, Ltd. |
20,259 | 1,013,449 | ||||||
| Huber + Suhner AG, Registered |
1,866 | 166,230 | ||||||
| *Implenia AG, Registered |
3,743 | 76,519 | ||||||
| Inficon Holding AG |
30 | 38,479 | ||||||
| Interroll Holding AG |
5 | 24,323 | ||||||
| Intershop Holding AG |
42 | 26,338 | ||||||
| Julius Baer Group, Ltd. |
11,701 | 847,466 | ||||||
| *Jungfraubahn Holding AG, Registered |
176 | 27,659 | ||||||
| Kardex Holding AG, Registered |
450 | 138,878 | ||||||
| *Komax Holding AG, Registered |
530 | 135,262 | ||||||
| Kudelski SA |
32 | 128 | ||||||
| Kuehne + Nagel International AG, Registered |
1,929 | 608,625 | ||||||
| Landis+Gyr Group AG |
4,423 | 304,951 | ||||||
| *Lastminute.com NV |
8 | 385 | ||||||
| LEM Holding SA |
13 | 31,584 | ||||||
| Liechtensteinische Landesbank AG |
390 | 23,048 | ||||||
| Logitech International SA, Class R |
1,535 | 127,451 | ||||||
| Logitech International SA, Registered |
5,848 | 487,808 | ||||||
| Lonza Group AG, Registered |
1,395 | 1,145,923 | ||||||
| *Medacta Group SA |
4 | 672 | ||||||
| *Medartis Holding AG |
122 | 16,102 | ||||||
| *Medmix AG |
20 | 958 | ||||||
| Mobilezone Holding AG, Registered |
1,732 | 23,315 | ||||||
| Mobimo Holding AG, Registered |
721 | 243,424 | ||||||
| Nestle SA, Registered |
91,635 | 12,116,379 | ||||||
| Novartis AG , Sponsored ADR |
14,699 | 1,216,489 | ||||||
| Novartis AG, Registered |
54,625 | 4,521,844 | ||||||
| OC Oerlikon Corp. AG |
13,955 | 141,955 | ||||||
| *Orascom Development Holding AG |
12 | 142 | ||||||
| Orior AG |
368 | 37,857 | ||||||
| Partners Group Holding AG |
525 | 917,852 | ||||||
| PSP Swiss Property AG, Registered |
1,816 | 227,360 | ||||||
| *Rieter Holding AG, Registered |
16 | 3,327 | ||||||
| Roche Holding AG |
24,735 | 9,584,051 | ||||||
| Roche Holding AG |
67 | 28,817 | ||||||
Dimensional International Core Equity Market ETF
SCHEDULE OF INVESTMENTS
October 31, 2021
| Security Description |
Shares | Fair Value | ||||||
| SWITZERLAND (Continued) |
| |||||||
| Romande Energie Holding SA |
10 | $ | 14,884 | |||||
| Schindler Holding AG, Registered |
1,204 | 309,384 | ||||||
| Schweiter Technologies AG |
46 | 66,149 | ||||||
| *Sensirion Holding AG |
191 | 27,550 | ||||||
| SFS Group AG |
8 | 1,079 | ||||||
| SGS SA, Registered |
258 | 764,612 | ||||||
| Siegfried Holding AG, Registered |
830 | 798,889 | ||||||
| SIG Combibloc Group AG |
13,697 | 358,558 | ||||||
| Sika AG, Registered |
4,541 | 1,540,585 | ||||||
| Softwareone Holding AG |
42 | 974 | ||||||
| Sonova Holding AG |
2,030 | 840,437 | ||||||
| St Galler Kantonalbank AG, Registered |
31 | 14,317 | ||||||
| Straumann Holding AG, Registered |
257 | 534,954 | ||||||
| Sulzer AG, Registered |
20 | 1,971 | ||||||
| Swatch Group AG (The) |
2,216 | 609,203 | ||||||
| Swatch Group AG (The) |
36 | 1,916 | ||||||
| Swiss Life Holding AG |
1,679 | 923,519 | ||||||
| Swiss Prime Site AG, Registered |
5,469 | 556,626 | ||||||
| Swiss Re AG |
12,470 | 1,209,675 | ||||||
| *Swiss Steel Holding AG |
284 | 109 | ||||||
| Swisscom AG, Registered |
1,791 | 976,891 | ||||||
| Swissquote Group Holding SA, Registered |
3,213 | 651,918 | ||||||
| Tecan Group AG, Class R |
15 | 9,193 | ||||||
| Temenos AG, Registered |
3,073 | 470,324 | ||||||
| *u-blox Holding AG |
4 | 293 | ||||||
| UBS Group AG |
24,168 | 438,649 | ||||||
| UBS Group AG |
89,405 | 1,628,614 | ||||||
| Valiant Holding AG |
2,447 | 242,625 | ||||||
| *Valora Holding AG, Registered |
162 | 30,884 | ||||||
| VAT Group AG |
777 | 371,769 | ||||||
| Vetropack Holding AG |
877 | 54,036 | ||||||
| Vifor Pharma AG |
2,100 | 271,420 | ||||||
| Vontobel Holding AG, Registered |
218 | 20,208 | ||||||
| VP Bank AG |
4 | 451 | ||||||
| VZ Holding AG |
28 | 2,853 | ||||||
| Ypsomed Holding AG, Registered |
4 | 666 | ||||||
| Zehnder Group AG, Registered |
2,069 | 223,033 | ||||||
| Zug Estates Holding AG |
9 | 19,502 | ||||||
| Zurich Insurance Group AG |
4,149 | 1,843,041 | ||||||
|
|
|
|||||||
| TOTAL SWITZERLAND |
63,002,228 | |||||||
|
|
|
|||||||
| UNITED KINGDOM (12.3%) |
||||||||
| abrdn PLC |
105,828 | 368,461 | ||||||
| Admiral Group PLC |
8,995 | 353,867 | ||||||
| AJ Bell PLC |
10,537 | 59,219 | ||||||
| Anglo American PLC |
33,490 | 1,277,342 | ||||||
| Antofagasta PLC |
15,933 | 311,330 | ||||||
| Ashmore Group PLC |
15,676 | 72,500 | ||||||
| Ashtead Group PLC |
20,824 | 1,748,059 | ||||||
| *ASOS PLC |
2,827 | 96,180 | ||||||
| Associated British Foods PLC |
14,649 | 359,031 | ||||||
| AstraZeneca PLC |
44,338 | 5,526,980 | ||||||
| Auto Trader Group PLC |
40,178 | 333,527 | ||||||
| AVEVA Group PLC |
3,090 | 150,703 | ||||||
Dimensional International Core Equity Market ETF
SCHEDULE OF INVESTMENTS
October 31, 2021
| Security Description |
Shares | Fair Value | ||||||
| UNITED KINGDOM (Continued) |
| |||||||
| Aviva PLC |
160,058 | $ | 865,967 | |||||
| B&M European Value Retail SA |
41,977 | 364,342 | ||||||
| BAE Systems PLC |
132,799 | 1,004,462 | ||||||
| Balfour Beatty PLC |
26,300 | 91,568 | ||||||
| Barclays PLC |
591,889 | 1,640,913 | ||||||
| Barratt Developments PLC |
38,893 | 353,461 | ||||||
| *Beazley PLC |
23,204 | 124,046 | ||||||
| Bellway PLC |
5,397 | 245,093 | ||||||
| Berkeley Group Holdings PLC |
4,488 | 267,916 | ||||||
| BHP Group PLC |
78,463 | 2,081,147 | ||||||
| *boohoo Group PLC |
36,301 | 90,438 | ||||||
| BP PLC |
719,408 | 3,453,411 | ||||||
| British American Tobacco PLC |
67,339 | 2,350,538 | ||||||
| Britvic PLC |
11,308 | 137,644 | ||||||
| *BT Group PLC |
477,029 | 908,247 | ||||||
| Bunzl PLC |
13,878 | 514,007 | ||||||
| *Burberry Group PLC |
17,221 | 455,352 | ||||||
| *Carnival PLC |
6,425 | 129,463 | ||||||
| *Centrica PLC |
315,249 | 260,658 | ||||||
| Close Brothers Group PLC |
5,654 | 111,603 | ||||||
| Coca-Cola HBC AG |
8,224 | 285,545 | ||||||
| *Compass Group PLC |
72,415 | 1,538,569 | ||||||
| Computacenter PLC |
3,084 | 113,716 | ||||||
| ConvaTec Group PLC |
58,515 | 171,487 | ||||||
| *Countryside Properties PLC |
22,172 | 142,965 | ||||||
| Cranswick PLC |
2,074 | 98,365 | ||||||
| Croda International PLC |
5,397 | 699,695 | ||||||
| Daily Mail & General Trust PLC |
5,911 | 84,266 | ||||||
| DCC PLC |
4,112 | 344,165 | ||||||
| Dechra Pharmaceuticals PLC |
302 | 21,195 | ||||||
| Diageo PLC |
72,717 | 3,620,251 | ||||||
| Diploma PLC |
3,598 | 148,155 | ||||||
| Direct Line Insurance Group PLC |
59,110 | 236,916 | ||||||
| Domino’s Pizza Group PLC |
17,732 | 94,064 | ||||||
| DS Smith PLC |
59,889 | 314,743 | ||||||
| Dunelm Group PLC |
4,112 | 72,091 | ||||||
| easyJet PLC |
14,155 | 120,880 | ||||||
| Electrocomponents PLC |
19,274 | 297,222 | ||||||
| *Entain PLC |
25,569 | 717,795 | ||||||
| Evraz PLC |
23,730 | 202,193 | ||||||
| Experian PLC |
30,149 | 1,383,202 | ||||||
| Ferguson PLC |
9,252 | 1,394,401 | ||||||
| Fevertree Drinks PLC |
3,084 | 95,919 | ||||||
| *Frasers Group PLC |
9,509 | 83,877 | ||||||
| Fresnillo PLC |
7,710 | 91,227 | ||||||
| Games Workshop Group PLC |
1,285 | 169,888 | ||||||
| GlaxoSmithKline PLC |
159,120 | 3,290,453 | ||||||
| Glencore PLC |
346,963 | 1,737,122 | ||||||
| Grafton Group PLC |
8,738 | 160,619 | ||||||
| Grainger PLC |
25,783 | 109,136 | ||||||
| Greggs PLC |
4,369 | 182,957 | ||||||
| Halma PLC |
13,364 | 542,598 | ||||||
| Hargreaves Lansdown PLC |
13,621 | 286,972 | ||||||
| Hays PLC |
72,227 | 164,348 | ||||||
| Hikma Pharmaceuticals PLC |
7,453 | 245,903 | ||||||
| Hiscox, Ltd. |
13,107 | 149,660 | ||||||
Dimensional International Core Equity Market ETF
SCHEDULE OF INVESTMENTS
October 31, 2021
| Security Description |
Shares | Fair Value | ||||||
| UNITED KINGDOM (Continued) |
| |||||||
| HomeServe PLC |
12,850 | $ | 150,600 | |||||
| Howden Joinery Group PLC |
25,312 | 319,137 | ||||||
| HSBC Holdings PLC |
596,727 | 3,611,297 | ||||||
| IMI PLC |
11,565 | 259,033 | ||||||
| Imperial Brands PLC |
44,290 | 936,153 | ||||||
| Inchcape PLC |
18,760 | 212,407 | ||||||
| *Informa PLC |
53,716 | 382,439 | ||||||
| IntegraFin Holdings PLC |
11,051 | 86,571 | ||||||
| *InterContinental Hotels Group PLC |
6,682 | 468,774 | ||||||
| Intertek Group PLC |
6,425 | 431,105 | ||||||
| Investec PLC |
28,396 | 129,149 | ||||||
| *ITV PLC |
153,920 | 227,126 | ||||||
| *IWG PLC |
35,287 | 149,703 | ||||||
| J Sainsbury PLC |
86,233 | 353,901 | ||||||
| JD Sports Fashion PLC |
20,559 | 306,611 | ||||||
| *JET2 PLC |
5,397 | 90,218 | ||||||
| *John Wood Group PLC |
30,154 | 88,247 | ||||||
| Johnson Matthey PLC |
8,224 | 308,091 | ||||||
| *Just Eat Takeaway.com NV |
4,369 | 313,812 | ||||||
| Kingfisher PLC |
102,208 | 469,339 | ||||||
| Lancashire Holdings, Ltd. |
9,252 | 64,172 | ||||||
| Legal & General Group PLC |
211,824 | 838,841 | ||||||
| Lloyds Banking Group PLC |
2,405,168 | 1,655,690 | ||||||
| London Stock Exchange Group PLC |
7,967 | 775,372 | ||||||
| Man Group PLC |
62,993 | 200,930 | ||||||
| *Marks & Spencer Group PLC |
94,945 | 238,947 | ||||||
| Marshalls PLC |
7,453 | 72,382 | ||||||
| *Mediclinic International PLC |
18,246 | 83,536 | ||||||
| *Meggitt PLC |
33,745 | 346,919 | ||||||
| Melrose Industries PLC |
167,460 | 362,222 | ||||||
| Mondi PLC |
22,686 | 567,515 | ||||||
| National Grid PLC |
105,038 | 1,346,792 | ||||||
| NatWest Group PLC |
197,929 | 599,867 | ||||||
| Next PLC |
5,397 | 589,318 | ||||||
| *Ocado Group PLC |
9,509 | 235,011 | ||||||
| Pearson PLC |
28,910 | 238,721 | ||||||
| Pennon Group PLC |
11,308 | 180,735 | ||||||
| Persimmon PLC |
13,107 | 488,865 | ||||||
| Pets at Home Group PLC |
21,140 | 139,788 | ||||||
| Phoenix Group Holdings PLC |
29,635 | 266,724 | ||||||
| Plus500, Ltd. |
4,369 | 78,842 | ||||||
| Prudential PLC |
63,669 | 1,304,310 | ||||||
| QinetiQ Group PLC |
24,798 | 91,574 | ||||||
| Reckitt Benckiser Group PLC |
21,915 | 1,779,863 | ||||||
| Redrow PLC |
10,794 | 95,463 | ||||||
| RELX PLC |
63,996 | 1,986,031 | ||||||
| Renishaw PLC |
1,028 | 70,809 | ||||||
| Rentokil Initial PLC |
65,802 | 530,724 | ||||||
| Rightmove PLC |
36,579 | 346,671 | ||||||
| Rio Tinto PLC |
42,658 | 2,666,673 | ||||||
| *Rolls-Royce Holdings PLC |
328,135 | 593,003 | ||||||
| Rotork PLC |
32,516 | 157,871 | ||||||
| Royal Dutch Shell PLC, Class B |
277,423 | 6,407,656 | ||||||
| Royal Mail PLC |
39,920 | 230,098 | ||||||
| RWS Holdings PLC |
10,023 | 85,456 | ||||||
Dimensional International Core Equity Market ETF
SCHEDULE OF INVESTMENTS
October 31, 2021
| Security Description |
Shares | Fair Value | ||||||
| UNITED KINGDOM (Continued) |
| |||||||
| Sage Group PLC (The) |
40,692 | $ | 396,473 | |||||
| Schroders PLC |
5,140 | 255,052 | ||||||
| Schroders PLC |
2,056 | 69,611 | ||||||
| Severn Trent PLC |
9,509 | 356,882 | ||||||
| Smith & Nephew PLC |
28,348 | 487,667 | ||||||
| Smiths Group PLC |
15,162 | 281,717 | ||||||
| Softcat PLC |
4,883 | 130,052 | ||||||
| Spectris PLC |
4,369 | 225,418 | ||||||
| Spirax-Sarco Engineering PLC |
2,570 | 549,735 | ||||||
| Spirent Communications PLC |
26,083 | 102,969 | ||||||
| SSE PLC |
44,094 | 993,359 | ||||||
| *SSP Group PLC |
36,365 | 128,356 | ||||||
| St James’s Place PLC |
19,796 | 428,602 | ||||||
| Standard Chartered PLC |
109,446 | 742,462 | ||||||
| Synthomer PLC |
14,649 | 101,705 | ||||||
| Tate & Lyle PLC |
22,429 | 199,286 | ||||||
| Taylor Wimpey PLC |
139,474 | 295,474 | ||||||
| Tesco PLC |
355,567 | 1,315,471 | ||||||
| Travis Perkins PLC |
9,707 | 205,309 | ||||||
| #*TUI AG |
37,242 | 125,224 | ||||||
| Ultra Electronics Holdings PLC |
2,570 | 114,210 | ||||||
| Unilever PLC |
28,805 | 1,543,720 | ||||||
| Unilever PLC |
47,776 | 2,561,920 | ||||||
| United Utilities Group PLC |
27,564 | 392,379 | ||||||
| Victrex PLC |
3,084 | 96,722 | ||||||
| *Virgin Money UK PLC |
57,353 | 159,827 | ||||||
| Vodafone Group PLC |
896,444 | 1,327,592 | ||||||
| Weir Group PLC (The) |
11,308 | 268,932 | ||||||
| *WH Smith PLC |
6,168 | 132,063 | ||||||
| *Whitbread PLC |
7,453 | 334,069 | ||||||
| Wickes Group PLC |
10,794 | 31,722 | ||||||
| WPP PLC |
50,633 | 732,916 | ||||||
|
|
|
|||||||
| TOTAL UNITED KINGDOM |
95,618,035 | |||||||
|
|
|
|||||||
| UNITED STATES (0.0%) |
| |||||||
| *Jackson Financial, Inc., Class A |
1,202 | 32,538 | ||||||
| Ovintiv, Inc. |
2,438 | 91,321 | ||||||
|
|
|
|||||||
| TOTAL UNITED STATES |
123,859 | |||||||
|
|
|
|||||||
| TOTAL COMMON STOCKS (Cost $732,352,051) |
763,781,054 | |||||||
|
|
|
|||||||
| RIGHTS (0.0%) |
| |||||||
| AUSTRALIA (0.0%) |
| |||||||
| *Aristocrat Leisure, Ltd. 11/9/2021 |
928 | 3,297 | ||||||
|
|
|
|||||||
| TOTAL AUSTRALIA |
3,297 | |||||||
|
|
|
|||||||
| AUSTRIA (0.0%) |
| |||||||
| *Porr AG 11/4/2021 |
8 | 1 | ||||||
|
|
|
|||||||
| TOTAL AUSTRIA |
1 | |||||||
|
|
|
|||||||
Dimensional International Core Equity Market ETF
SCHEDULE OF INVESTMENTS
October 31, 2021
| Security Description |
Shares | Fair Value | ||||||
| NEW ZEALAND (0.0%) |
| |||||||
| *Arvida Group, Ltd. 11/9/2021 |
481 | $ | 52 | |||||
|
|
|
|||||||
| TOTAL NEW ZEALAND |
52 | |||||||
|
|
|
|||||||
| TOTAL RIGHTS (Cost $–) |
3,350 | |||||||
|
|
|
|||||||
| WARRANT (0.0%) |
| |||||||
| ITALY (0.0%) |
| |||||||
| *»Webuild SpA 8/2/2030 |
17 | – | ||||||
|
|
|
|||||||
| TOTAL ITALY |
– | |||||||
|
|
|
|||||||
| TOTAL WARRANT (Cost $–) |
– | |||||||
|
|
|
|||||||
| TOTAL INVESTMENT SECURITIES (Cost $732,352,051) |
763,784,404 | |||||||
|
|
|
|||||||
| SECURITIES LENDING COLLATERAL (1.5%) |
| |||||||
| @§The DFA Short Term Investment Fund |
1,022,520 | 11,830,043 | ||||||
| TOTAL INVESTMENTS (Cost $744,182,094) — 100.0% |
|
$ | 775,614,447 | |||||
|
|
|
|||||||
| * | Non-Income Producing Securities |
| # | Total or Partial Securities on Loan |
| » | Securities that have generally been fair value factored |
| @ | Security purchased with cash collateral received from Securities on Loan |
| § | Affiliated Fund |
| ADR | American Depositary Receipt | |
| PLC | Public Limited Company | |
| SA | Special Assessment |
Dimensional International Value ETF
SCHEDULE OF INVESTMENTS
October 31, 2021
| Security Description |
Shares | Fair Value | ||||||
| COMMON STOCKS (97.7%) |
| |||||||
| AUSTRALIA (6.2%) |
| |||||||
| *AMP, Ltd. |
314,905 | $ | 255,447 | |||||
| Ampol, Ltd. |
1,532 | 35,153 | ||||||
| Ansell, Ltd. |
9,723 | 230,116 | ||||||
| Aurizon Holdings, Ltd. |
1,464,468 | 3,706,873 | ||||||
| *Australia & New Zealand Banking Group, Ltd. |
1,965,334 | 41,539,229 | ||||||
| Bank of Queensland, Ltd. |
160,193 | 1,058,825 | ||||||
| Bendigo & Adelaide Bank, Ltd. |
206,577 | 1,435,230 | ||||||
| BlueScope Steel, Ltd. |
918,753 | 14,229,360 | ||||||
| Challenger, Ltd. |
98,334 | 512,580 | ||||||
| Cleanaway Waste Management, Ltd. |
1,586,061 | 3,192,660 | ||||||
| *Crown Resorts, Ltd. |
78,771 | 589,283 | ||||||
| Downer EDI, Ltd. |
354,730 | 1,678,558 | ||||||
| Fortescue Metals Group, Ltd. |
76,691 | 802,405 | ||||||
| Harvey Norman Holdings, Ltd. |
955,425 | 3,559,396 | ||||||
| #IGO, Ltd. |
287,092 | 2,078,720 | ||||||
| *Incitec Pivot, Ltd. |
492,859 | 1,106,858 | ||||||
| Lendlease Corp., Ltd. |
249,473 | 1,959,987 | ||||||
| *National Australia Bank, Ltd. |
1,750,279 | 37,743,177 | ||||||
| Newcrest Mining, Ltd. |
315,862 | 5,905,005 | ||||||
| Nine Entertainment Co. Holdings, Ltd. |
103,421 | 214,395 | ||||||
| Oil Search, Ltd. |
1,809,793 | 5,831,552 | ||||||
| #Orica, Ltd. |
147,629 | 1,677,678 | ||||||
| Origin Energy, Ltd. |
914,033 | 3,466,979 | ||||||
| #OZ Minerals, Ltd. |
159,234 | 3,005,566 | ||||||
| QBE Insurance Group, Ltd. |
103,183 | 916,834 | ||||||
| Qube Holdings, Ltd. |
906,815 | 2,165,927 | ||||||
| Rio Tinto, Ltd. |
46 | 3,120 | ||||||
| Santos, Ltd. |
2,386,238 | 12,510,284 | ||||||
| #Seven Group Holdings, Ltd. |
86,063 | 1,391,741 | ||||||
| South32, Ltd. |
2,535,588 | 6,798,998 | ||||||
| *Star Entertainment Grp, Ltd. (The) |
109,327 | 300,543 | ||||||
| SunCorp. Group, Ltd. |
774,547 | 6,818,257 | ||||||
| TabCorp. Holdings, Ltd. |
1,245,224 | 4,639,029 | ||||||
| #TPG Telecom, Ltd. |
113,705 | 576,477 | ||||||
| Treasury Wine Estates, Ltd. |
188,983 | 1,635,209 | ||||||
| *Westpac Banking Corp. |
2,224,681 | 42,893,511 | ||||||
| Woodside Petroleum, Ltd. |
470,841 | 8,225,872 | ||||||
| Worley, Ltd. |
136,213 | 1,106,990 | ||||||
|
|
|
|||||||
| TOTAL AUSTRALIA |
225,797,824 | |||||||
|
|
|
|||||||
| AUSTRIA (0.1%) |
| |||||||
| *Erste Group Bank AG |
75,304 | 3,233,091 | ||||||
| Raiffeisen Bank International AG |
67,593 | 1,979,011 | ||||||
|
|
|
|||||||
| TOTAL AUSTRIA |
5,212,102 | |||||||
|
|
|
|||||||
| BELGIUM (0.7%) |
| |||||||
| Ageas SA |
114,653 | 5,585,904 | ||||||
| Anheuser-Busch InBev SA/NV |
694 | 42,381 | ||||||
| *KBC Group NV |
164,367 | 15,323,573 | ||||||
| *Solvay SA, Class A |
42,689 | 5,078,495 | ||||||
|
|
|
|||||||
| TOTAL BELGIUM |
26,030,353 | |||||||
|
|
|
|||||||
Dimensional International Value ETF
SCHEDULE OF INVESTMENTS
October 31, 2021
| Security Description |
Shares | Fair Value | ||||||
| CANADA (10.0%) |
| |||||||
| AltaGas, Ltd. |
162,933 | $ | 3,367,628 | |||||
| #ARC Resources, Ltd. |
143,362 | 1,372,843 | ||||||
| #Bank of Montreal |
67,198 | 7,284,414 | ||||||
| Bank of Montreal |
429,987 | 46,657,889 | ||||||
| Bank of Nova Scotia (The) |
241,847 | 15,831,120 | ||||||
| #Bank of Nova Scotia (The) |
381,366 | 25,002,355 | ||||||
| *Barrick Gold Corp. |
80,162 | 1,468,661 | ||||||
| *Barrick Gold Corp. |
629,003 | 11,554,784 | ||||||
| Cameco Corp. |
109,765 | 2,667,290 | ||||||
| Canadian Imperial Bank of Commerce |
245,571 | 29,750,633 | ||||||
| Canadian Imperial Bank of Commerce |
91,891 | 11,142,703 | ||||||
| *Canadian Natural Resources, Ltd. |
1,119,548 | 47,591,985 | ||||||
| Cenovus Energy, Inc. |
397,261 | 4,759,187 | ||||||
| Endeavour Mining PLC |
149,446 | 3,790,555 | ||||||
| Fairfax Financial Holdings, Ltd. |
25,872 | 10,462,135 | ||||||
| *First Quantum Minerals, Ltd. |
471,856 | 11,153,549 | ||||||
| #*Great-West Lifeco, Inc. |
129,285 | 3,797,561 | ||||||
| iA Financial Corp., Inc. |
30,804 | 1,819,338 | ||||||
| #*Imperial Oil, Ltd. |
120,535 | 4,083,726 | ||||||
| *Kinross Gold Corp. |
37,296 | 224,149 | ||||||
| Kinross Gold Corp. |
1,333,085 | 8,001,414 | ||||||
| Lundin Mining Corp. |
732,455 | 6,364,035 | ||||||
| *Magna International, Inc. |
17,641 | 1,434,213 | ||||||
| #Manulife Financial Corp. |
885,769 | 17,263,642 | ||||||
| *Manulife Financial Corp. |
62,135 | 1,208,563 | ||||||
| Nutrien, Ltd. |
325,659 | 22,766,821 | ||||||
| Nutrien, Ltd. |
9,402 | 656,103 | ||||||
| *Pembina Pipeline Corp. |
224,681 | 7,434,694 | ||||||
| *Sun Life Financial, Inc. |
52,370 | 2,983,519 | ||||||
| Suncor Energy, Inc. |
346,524 | 9,099,557 | ||||||
| Suncor Energy, Inc. |
612,698 | 16,113,958 | ||||||
| *Teck Resources, Ltd., Class B |
351,988 | 9,820,466 | ||||||
| *Teck Resources, Ltd., Class B |
8,888 | 247,664 | ||||||
| #*Tilray, Inc., Class 2 |
89,746 | 924,384 | ||||||
| Toronto-Dominion Bank (The) |
35,156 | 2,548,034 | ||||||
| #Toronto-Dominion Bank (The) |
16,223 | 1,176,330 | ||||||
| #Tourmaline Oil Corp. |
272,552 | 9,835,223 | ||||||
| West Fraser Timber Co., Ltd. |
70,505 | 5,636,191 | ||||||
| Yamana Gold, Inc. |
278,738 | 1,101,015 | ||||||
|
|
|
|||||||
| TOTAL CANADA |
368,398,331 | |||||||
|
|
|
|||||||
| DENMARK (2.4%) |
| |||||||
| AP Moller—Maersk A/S, Class B |
1,762 | 5,096,859 | ||||||
| #AP Moller—Maersk A/S, Class A |
1,260 | 3,453,639 | ||||||
| Carlsberg AS, Class B |
85,402 | 14,102,253 | ||||||
| #Chr Hansen Holding A/S |
15,721 | 1,252,133 | ||||||
| Danske Bank A/S |
158,379 | 2,683,033 | ||||||
| *Demant A/S |
24,093 | 1,168,229 | ||||||
| DSV A/S |
96,512 | 22,452,682 | ||||||
| *Genmab A/S |
16,470 | 7,389,063 | ||||||
| *Genmab A/S, Class S , ADR |
120 | 5,357 | ||||||
| H Lundbeck A/S, Class B |
59,359 | 1,651,952 | ||||||
| #ROCKWOOL International A/S, Class B |
2,465 | 1,127,366 | ||||||
| ROCKWOOL International A/S, Class A |
64 | 25,736 | ||||||
| Tryg A/S |
93,160 | 2,210,763 | ||||||
Dimensional International Value ETF
SCHEDULE OF INVESTMENTS
October 31, 2021
| Security Description |
Shares | Fair Value | ||||||
| DENMARK (Continued) |
| |||||||
| #Vestas Wind Systems A/S |
615,322 | $ | 26,638,891 | |||||
|
|
|
|||||||
| TOTAL DENMARK |
89,257,956 | |||||||
|
|
|
|||||||
| FINLAND (1.2%) |
| |||||||
| Fortum OYJ |
212,623 | 6,323,672 | ||||||
| *Nokia OYJ |
1,247,735 | 7,176,368 | ||||||
| Nordea Bank Abp |
874,513 | 10,697,600 | ||||||
| Nordea Bank Abp |
540,974 | 6,619,750 | ||||||
| Stora Enso OYJ, Registered |
392,830 | 6,537,165 | ||||||
| UPM-Kymmene OYJ |
185,565 | 6,554,002 | ||||||
|
|
|
|||||||
| TOTAL FINLAND |
43,908,557 | |||||||
|
|
|
|||||||
| FRANCE (9.7%) |
| |||||||
| Amundi SA |
26,619 | 2,373,506 | ||||||
| Arkema SA |
85,619 | 11,711,528 | ||||||
| AXA SA |
467,572 | 13,613,979 | ||||||
| BNP Paribas SA |
491,862 | 32,957,009 | ||||||
| Bollore SA |
479,357 | 2,779,219 | ||||||
| Bouygues SA |
304,379 | 12,328,455 | ||||||
| Carrefour SA |
735,322 | 13,321,605 | ||||||
| Cie de Saint-Gobain |
508,021 | 35,015,658 | ||||||
| Cie Generale des Etablissements Michelin SCA |
184,266 | 28,936,834 | ||||||
| CNP Assurances |
106,025 | 2,657,619 | ||||||
| Credit Agricole SA |
230,464 | 3,477,816 | ||||||
| Danone SA |
138,451 | 9,028,508 | ||||||
| Dassault Aviation SA |
5,679 | 593,123 | ||||||
| Eiffage SA |
47,208 | 4,860,001 | ||||||
| Electricite de France SA |
446,630 | 6,579,642 | ||||||
| Engie SA |
831,885 | 11,837,312 | ||||||
| EssilorLuxottica SA |
36,379 | 7,531,596 | ||||||
| Eurazeo SE |
14 | 1,313 | ||||||
| Faurecia SE |
32,373 | 1,687,733 | ||||||
| Faurecia SE |
13,847 | 715,009 | ||||||
| *Orange SA |
1,647,340 | 17,986,684 | ||||||
| Orpea SA |
11,335 | 1,183,189 | ||||||
| Publicis Groupe SA |
170,166 | 11,409,779 | ||||||
| *Renault SA |
107,646 | 3,869,237 | ||||||
| Sanofi |
157,023 | 15,705,571 | ||||||
| Societe Generale SA |
369,482 | 12,329,321 | ||||||
| TotalEnergies SE |
1,666,369 | 83,634,709 | ||||||
| Valeo |
20,298 | 594,996 | ||||||
| Vinci SA |
44,354 | 4,741,215 | ||||||
| #Vivendi SE |
183,836 | 2,368,900 | ||||||
|
|
|
|||||||
| TOTAL FRANCE |
355,831,066 | |||||||
|
|
|
|||||||
| GERMANY (7.7%) |
| |||||||
| Allianz SE, Registered |
161,874 | 37,681,056 | ||||||
| BASF SE |
38,287 | 2,759,472 | ||||||
| Bayer AG, Registered |
344,537 | 19,405,425 | ||||||
| Bayerische Motoren Werke AG |
252,486 | 25,490,532 | ||||||
| Bayerische Motoren Werke AG, Preference |
37,738 | 3,214,272 | ||||||
| *Commerzbank AG |
241,814 | 1,767,459 | ||||||
Dimensional International Value ETF
SCHEDULE OF INVESTMENTS
October 31, 2021
| Security Description |
Shares | Fair Value | ||||||
| GERMANY (Continued) |
| |||||||
| *Continental AG |
40,160 | $ | 4,718,145 | |||||
| Covestro AG |
65,780 | 4,217,252 | ||||||
| Daimler AG |
704,740 | 69,925,944 | ||||||
| *Deutsche Bank AG, Registered |
402,940 | 5,165,691 | ||||||
| *Deutsche Bank AG, Registered |
331,426 | 4,274,955 | ||||||
| Evonik Industries AG |
113,952 | 3,695,013 | ||||||
| Fresenius Medical Care AG & Co. KGaA |
8,340 | 554,572 | ||||||
| Fresenius SE & Co. KGaA |
245,612 | 11,160,435 | ||||||
| HeidelbergCement AG |
103,822 | 7,826,419 | ||||||
| Muenchener Rueckversicherungs-Gesellschaft AG in Muenchen, Registered |
30,958 | 9,178,632 | ||||||
| Porsche Automobil Holding SE, Preference |
78,506 | 8,160,220 | ||||||
| RWE AG |
347,611 | 13,383,578 | ||||||
| *Siemens Energy AG |
9,951 | 285,821 | ||||||
| Talanx AG |
52,495 | 2,527,186 | ||||||
| Telefonica Deutschland Holding AG |
837,757 | 2,184,265 | ||||||
| *thyssenkrupp AG |
84,918 | 883,653 | ||||||
| United Internet AG |
22,876 | 843,965 | ||||||
| *Vitesco Technologies Group AG |
8,032 | 461,032 | ||||||
| Volkswagen AG, Preference |
152,780 | 34,268,180 | ||||||
| Volkswagen AG |
26,783 | 8,703,266 | ||||||
|
|
|
|||||||
| TOTAL GERMANY |
282,736,440 | |||||||
|
|
|
|||||||
| HONG KONG (1.8%) |
| |||||||
| BOC Aviation, Ltd. |
325,400 | 2,854,918 | ||||||
| BOC Hong Kong Holdings, Ltd. |
1,370,500 | 4,351,605 | ||||||
| *Cathay Pacific Airways, Ltd. |
1,400,727 | 1,291,059 | ||||||
| CK Asset Holdings, Ltd. |
1,401,462 | 8,656,616 | ||||||
| CK Hutchison Holdings, Ltd. |
1,593,348 | 10,722,616 | ||||||
| CK Infrastructure Holdings, Ltd. |
188,500 | 1,136,469 | ||||||
| Hang Lung Properties, Ltd. |
1,174,000 | 2,725,582 | ||||||
| #Hang Seng Bank, Ltd. |
42,600 | 810,485 | ||||||
| Henderson Land Development Co., Ltd. |
599,730 | 2,513,315 | ||||||
| HKT Trust & HKT, Ltd. |
2,746,000 | 3,727,674 | ||||||
| MTR Corp., Ltd. |
521,211 | 2,840,880 | ||||||
| New World Development Co., Ltd. |
1,252,199 | 5,432,761 | ||||||
| Orient Overseas International, Ltd. |
87,500 | 1,616,361 | ||||||
| #Sino Land Co., Ltd. |
1,251,486 | 1,644,184 | ||||||
| *Sun Hung Kai Properties, Ltd. |
811,934 | 10,802,755 | ||||||
| Swire Pacific, Ltd., Class A |
131,500 | 827,469 | ||||||
| Swire Pacific, Ltd., Class B |
705,000 | 741,337 | ||||||
| Tsim Sha Tsui Properties, Ltd. |
11,125 | 33,193 | ||||||
| WH Group, Ltd. |
6,372,620 | 4,472,848 | ||||||
|
|
|
|||||||
| TOTAL HONG KONG |
67,202,125 | |||||||
|
|
|
|||||||
| IRELAND (0.4%) |
| |||||||
| *AIB Group PLC |
306,780 | 832,167 | ||||||
| CRH PLC |
51,239 | 2,459,605 | ||||||
| CRH PLC , Sponsored ADR |
241,009 | 11,553,971 | ||||||
| *Flutter Entertainment PLC |
11 | 2,083 | ||||||
|
|
|
|||||||
| TOTAL IRELAND |
14,847,826 | |||||||
|
|
|
|||||||
| ISRAEL (0.5%) |
| |||||||
| *Bank Hapoalim BM |
585,554 | 5,768,640 | ||||||
Dimensional International Value ETF
SCHEDULE OF INVESTMENTS
October 31, 2021
| Security Description |
Shares | Fair Value | ||||||
| ISRAEL (Continued) |
| |||||||
| *Bank Leumi Le-Israel BM |
435,210 | $ | 4,159,299 | |||||
| Isracard, Ltd. |
1 | 4 | ||||||
| *Israel Discount Bank, Ltd., Class A |
814,593 | 4,923,400 | ||||||
| Phoenix Holdings, Ltd. (The) |
115,843 | 1,463,060 | ||||||
| #*Teva Pharmaceutical Industries, Ltd. , Sponsored ADR |
328,631 | 2,872,235 | ||||||
|
|
|
|||||||
| TOTAL ISRAEL |
19,186,638 | |||||||
|
|
|
|||||||
| ITALY (2.6%) |
| |||||||
| Assicurazioni Generali SpA |
70,162 | 1,530,521 | ||||||
| Eni SpA |
1,074,402 | 15,422,490 | ||||||
| *Intesa Sanpaolo SpA |
6,226,177 | 17,706,835 | ||||||
| *Mediobanca Banca di Credito Finanziario SpA |
285,481 | 3,407,787 | ||||||
| Stellantis NV |
516,830 | 10,317,221 | ||||||
| #Stellantis NV |
150,889 | 3,008,727 | ||||||
| Stellantis NV |
1,107,861 | 22,100,296 | ||||||
| Telecom Italia SpA, Class A |
14,013,853 | 4,996,607 | ||||||
| Telecom Italia SpA |
2,799,124 | 1,064,103 | ||||||
| Tenaris SA , Sponsored ADR |
40,268 | 897,171 | ||||||
| UniCredit SpA |
973,986 | 12,876,471 | ||||||
| UnipolSai Assicurazioni SpA |
255,118 | 739,267 | ||||||
|
|
|
|||||||
| TOTAL ITALY |
94,067,496 | |||||||
|
|
|
|||||||
| JAPAN (20.2%) |
| |||||||
| AGC, Inc. |
252,600 | 12,560,771 | ||||||
| Aisin Corp. |
147,400 | 5,384,092 | ||||||
| Alfresa Holdings Corp. |
82,600 | 1,159,044 | ||||||
| Alps Alpine Co., Ltd. |
95,800 | 932,585 | ||||||
| Amada Co., Ltd. |
252,292 | 2,482,540 | ||||||
| Aozora Bank, Ltd. |
79,500 | 1,816,944 | ||||||
| Asahi Kasei Corp. |
568,900 | 5,969,645 | ||||||
| Bank of Kyoto, Ltd. (The) |
26,200 | 1,176,444 | ||||||
| Bridgestone Corp. |
193,800 | 8,530,429 | ||||||
| Brother Industries, Ltd. |
130,400 | 2,513,652 | ||||||
| Canon Marketing Japan, Inc. |
56,300 | 1,111,928 | ||||||
| Canon, Inc. |
302,500 | 6,786,124 | ||||||
| Chiba Bank, Ltd. (The) |
213,300 | 1,320,673 | ||||||
| Coca-Cola Bottlers Japan Holdings, Inc. |
50,075 | 686,843 | ||||||
| Concordia Financial Group, Ltd. |
428,213 | 1,701,211 | ||||||
| Dai Nippon Printing Co., Ltd. |
140,200 | 3,455,049 | ||||||
| Daicel Corp. |
199,000 | 1,490,428 | ||||||
| Dai-ichi Life Holdings, Inc. |
261,900 | 5,515,921 | ||||||
| Daio Paper Corp. |
56,900 | 997,528 | ||||||
| Daiwa House Industry Co., Ltd. |
157,200 | 5,171,297 | ||||||
| Daiwa Securities Group, Inc. |
594,700 | 3,331,154 | ||||||
| Denka Co., Ltd. |
84,400 | 2,760,903 | ||||||
| Dentsu Group, Inc. |
83,800 | 3,064,644 | ||||||
| DIC Corp. |
90,892 | 2,403,327 | ||||||
| Dowa Holdings Co., Ltd. |
43,800 | 1,822,679 | ||||||
| Ebara Corp. |
88,400 | 4,806,665 | ||||||
| ENEOS Holdings, Inc. |
1,880,386 | 7,579,262 | ||||||
| FUJIFILM Holdings Corp. |
46,000 | 3,550,502 | ||||||
Dimensional International Value ETF
SCHEDULE OF INVESTMENTS
October 31, 2021
| Security Description |
Shares | Fair Value | ||||||
| JAPAN (Continued) |
| |||||||
| Fukuoka Financial Group, Inc. |
66,618 | $ | 1,195,940 | |||||
| Fukuyama Transporting Co., Ltd. |
24,700 | 981,285 | ||||||
| Hankyu Hanshin Holdings, Inc. |
195,300 | 6,037,557 | ||||||
| Haseko Corp. |
159,500 | 2,071,647 | ||||||
| Hino Motors, Ltd. |
111,200 | 1,049,342 | ||||||
| Hitachi Construction Machinery Co., Ltd. |
10,500 | 333,808 | ||||||
| Hitachi Metals, Ltd. |
66,500 | 1,257,974 | ||||||
| Hitachi, Ltd. |
164,400 | 9,449,486 | ||||||
| Honda Motor Co., Ltd. |
958,588 | 28,154,451 | ||||||
| House Foods Group, Inc. |
8,500 | 243,390 | ||||||
| Idemitsu Kosan Co., Ltd. |
123,900 | 3,384,771 | ||||||
| IHI Corp. |
38,600 | 898,438 | ||||||
| Iida Group Holdings Co., Ltd. |
144,400 | 3,549,688 | ||||||
| Inpex Corp. |
888,900 | 7,421,467 | ||||||
| Isetan Mitsukoshi Holdings, Ltd. |
50,500 | 367,595 | ||||||
| Isuzu Motors, Ltd. |
504,400 | 6,763,671 | ||||||
| ITOCHU Corp. |
230,000 | 6,539,443 | ||||||
| J Front Retailing Co., Ltd. |
221,500 | 2,041,627 | ||||||
| Japan Post Holdings Co., Ltd. |
305,884 | 2,347,279 | ||||||
| Japan Post Insurance Co., Ltd. |
40,200 | 652,225 | ||||||
| JFE Holdings, Inc. |
241,092 | 3,685,361 | ||||||
| JGC Holdings Corp. |
90,200 | 843,264 | ||||||
| JTEKT Corp. |
237,800 | 2,091,764 | ||||||
| Kajima Corp. |
253,100 | 3,107,564 | ||||||
| Kamigumi Co., Ltd. |
93,500 | 1,875,330 | ||||||
| Kaneka Corp. |
44,400 | 1,699,680 | ||||||
| Kawasaki Heavy Industries, Ltd. |
167,300 | 3,383,414 | ||||||
| Komatsu, Ltd. |
163,400 | 4,251,051 | ||||||
| Konica Minolta, Inc. |
147,500 | 726,990 | ||||||
| K’s Holdings Corp. |
193,800 | 1,995,362 | ||||||
| Kuraray Co., Ltd. |
384,332 | 3,471,712 | ||||||
| Lixil Corp. |
214,340 | 5,496,428 | ||||||
| Mabuchi Motor Co., Ltd. |
31,900 | 1,096,672 | ||||||
| Marubeni Corp. |
951,500 | 8,020,889 | ||||||
| Mazda Motor Corp. |
223,594 | 1,998,179 | ||||||
| Mebuki Financial Group, Inc. |
284,317 | 580,977 | ||||||
| Medipal Holdings Corp. |
97,000 | 1,748,169 | ||||||
| Mitsubishi Chemical Holdings Corp. |
1,151,700 | 9,521,663 | ||||||
| Mitsubishi Corp. |
513,200 | 16,256,772 | ||||||
| Mitsubishi Electric Corp. |
594,300 | 7,948,323 | ||||||
| Mitsubishi Estate Co., Ltd. |
167,600 | 2,539,906 | ||||||
| Mitsubishi Gas Chemical Co., Inc. |
209,900 | 4,221,011 | ||||||
| Mitsubishi Heavy Industries, Ltd. |
205,900 | 5,252,911 | ||||||
| Mitsubishi Logistics Corp. |
23,400 | 652,594 | ||||||
| Mitsubishi Materials Corp. |
88,900 | 1,719,915 | ||||||
| Mitsubishi Motors Corp. |
262,053 | 834,249 | ||||||
| Mitsubishi UFJ Financial Group, Inc. |
2,807,834 | 15,328,889 | ||||||
| #*Mitsubishi UFJ Financial Group, Inc. , Sponsored ADR |
558,326 | 3,076,376 | ||||||
| Mitsui Chemicals, Inc. |
230,200 | 6,823,731 | ||||||
| Mitsui Fudosan Co., Ltd. |
277,900 | 6,333,024 | ||||||
| Mitsui OSK Lines, Ltd. |
89,100 | 5,594,878 | ||||||
| Mizuho Financial Group, Inc. |
478,500 | 6,315,654 | ||||||
| Morinaga Milk Industry Co., Ltd. |
8,500 | 497,961 | ||||||
| MS&AD Insurance Group Holdings, Inc. |
133,463 | 4,314,357 | ||||||
| Nagase & Co., Ltd. |
7,800 | 131,476 | ||||||
| NEC Corp. |
166,900 | 8,518,815 | ||||||
Dimensional International Value ETF
SCHEDULE OF INVESTMENTS
October 31, 2021
| Security Description |
Shares | Fair Value | ||||||
| JAPAN (Continued) |
| |||||||
| NGK Insulators, Ltd. |
92,500 | $ | 1,534,839 | |||||
| NGK Spark Plug Co., Ltd. |
113,800 | 1,808,424 | ||||||
| NH Foods, Ltd. |
66,500 | 2,335,738 | ||||||
| Nikon Corp. |
140,113 | 1,534,761 | ||||||
| Nippo Corp. |
66,000 | 2,329,752 | ||||||
| Nippon Express Co., Ltd. |
87,300 | 5,451,226 | ||||||
| Nippon Shokubai Co., Ltd. |
33,800 | 1,760,772 | ||||||
| Nippon Steel Corp. |
267,600 | 4,691,361 | ||||||
| Nippon Yusen KK |
49,100 | 3,522,368 | ||||||
| *Nissan Motor Co., Ltd. |
1,151,600 | 5,831,474 | ||||||
| Nisshin Seifun Group, Inc. |
20,200 | 318,700 | ||||||
| Nitto Denko Corp. |
17,600 | 1,370,647 | ||||||
| NOK Corp. |
38,500 | 443,666 | ||||||
| Nomura Holdings, Inc. |
1,052,400 | 5,076,256 | ||||||
| Nomura Real Estate Holdings, Inc. |
146,900 | 3,567,341 | ||||||
| NSK, Ltd. |
316,200 | 2,121,403 | ||||||
| Obayashi Corp. |
847,000 | 7,116,212 | ||||||
| Oji Holdings Corp. |
1,166,000 | 5,767,367 | ||||||
| Otsuka Holdings Co., Ltd. |
89,600 | 3,531,352 | ||||||
| Panasonic Corp. |
628,400 | 7,674,168 | ||||||
| Rengo Co., Ltd. |
223,900 | 1,694,591 | ||||||
| Resona Holdings, Inc. |
1,054,620 | 3,958,582 | ||||||
| Rohm Co., Ltd. |
19,500 | 1,775,137 | ||||||
| SBI Holdings, Inc. |
67,500 | 1,741,592 | ||||||
| Seibu Holdings, Inc. |
30,700 | 334,395 | ||||||
| Seiko Epson Corp. |
220,300 | 3,914,298 | ||||||
| Seino Holdings Co., Ltd. |
119,400 | 1,441,910 | ||||||
| Sekisui Chemical Co., Ltd. |
1,600 | 26,170 | ||||||
| Sekisui House, Ltd. |
363,400 | 7,526,149 | ||||||
| Seven & i Holdings Co., Ltd. |
319,700 | 13,407,633 | ||||||
| Shimizu Corp. |
469,800 | 3,432,084 | ||||||
| Shinsei Bank, Ltd. |
62,600 | 1,034,870 | ||||||
| Shizuoka Bank, Ltd. (The) |
168,900 | 1,358,310 | ||||||
| Showa Denko KK |
128,300 | 3,219,174 | ||||||
| SoftBank Group Corp. |
528,200 | 28,553,605 | ||||||
| Sojitz Corp. |
115,260 | 1,895,308 | ||||||
| Sompo Holdings, Inc. |
206,560 | 8,963,464 | ||||||
| Stanley Electric Co., Ltd. |
22,800 | 573,074 | ||||||
| Subaru Corp. |
266,900 | 5,215,113 | ||||||
| Sumitomo Chemical Co., Ltd. |
1,977,800 | 9,713,379 | ||||||
| Sumitomo Corp. |
333,717 | 4,732,475 | ||||||
| Sumitomo Dainippon Pharma Co., Ltd. |
83,700 | 1,179,618 | ||||||
| Sumitomo Electric Industries, Ltd. |
806,500 | 10,655,490 | ||||||
| Sumitomo Forestry Co., Ltd. |
170,100 | 3,237,159 | ||||||
| Sumitomo Heavy Industries, Ltd. |
133,900 | 3,440,710 | ||||||
| Sumitomo Metal Mining Co., Ltd. |
104,400 | 4,049,650 | ||||||
| Sumitomo Mitsui Financial Group, Inc. |
392,927 | 12,822,463 | ||||||
| #*Sumitomo Mitsui Financial Group, Inc. , Sponsored ADR |
10,000 | 64,800 | ||||||
| Sumitomo Mitsui Trust Holdings, Inc. |
164,800 | 5,425,646 | ||||||
| Sumitomo Realty & Development Co., Ltd. |
140,100 | 5,049,866 | ||||||
| Sumitomo Rubber Industries, Ltd. |
202,900 | 2,492,988 | ||||||
| Suzuken Co., Ltd. |
32,200 | 892,366 | ||||||
| Suzuki Motor Corp. |
86,100 | 3,832,120 | ||||||
| T&D Holdings, Inc. |
212,100 | 2,719,493 | ||||||
| Taiheiyo Cement Corp. |
150,500 | 3,182,245 | ||||||
Dimensional International Value ETF
SCHEDULE OF INVESTMENTS
October 31, 2021
| Security Description |
Shares | Fair Value | ||||||
| JAPAN (Continued) |
| |||||||
| Taisei Corp. |
65,499 | $ | 2,050,703 | |||||
| Takeda Pharmaceutical Co., Ltd. |
771,894 | 21,682,757 | ||||||
| TDK Corp. |
72,300 | 2,618,715 | ||||||
| Teijin, Ltd. |
243,400 | 3,263,833 | ||||||
| Toda Corp. |
178,100 | 1,119,910 | ||||||
| Tokai Carbon Co., Ltd. |
34,700 | 452,827 | ||||||
| Tokio Marine Holdings, Inc. |
128,000 | 6,733,120 | ||||||
| Tokyo Tatemono Co., Ltd. |
240,500 | 3,522,342 | ||||||
| Tokyu Fudosan Holdings Corp. |
719,900 | 4,160,615 | ||||||
| Toray Industries, Inc. |
883,800 | 5,494,635 | ||||||
| Tosoh Corp. |
359,500 | 6,050,257 | ||||||
| Toyo Seikan Group Holdings, Ltd. |
57,700 | 682,128 | ||||||
| Toyoda Gosei Co., Ltd. |
80,300 | 1,634,521 | ||||||
| Toyota Boshoku Corp. |
7,500 | 143,521 | ||||||
| Toyota Motor Corp. |
5,079,240 | 89,379,480 | ||||||
| Toyota Tsusho Corp. |
192,800 | 8,335,926 | ||||||
| Tsumura & Co. |
8,500 | 263,889 | ||||||
| Ube Industries, Ltd. |
110,100 | 2,047,025 | ||||||
| Yamada Holdings Co., Ltd. |
403,300 | 1,538,570 | ||||||
| Yamaha Motor Co., Ltd. |
251,500 | 6,980,903 | ||||||
| Yamazaki Baking Co., Ltd. |
20,800 | 315,580 | ||||||
| Yokohama Rubber Co., Ltd. (The) |
137,900 | 2,324,436 | ||||||
| Zeon Corp. |
176,300 | 2,087,305 | ||||||
|
|
|
|||||||
| TOTAL JAPAN |
741,005,431 | |||||||
|
|
|
|||||||
| NETHERLANDS (4.9%) |
| |||||||
| ABN AMRO Bank NV |
159,505 | 2,349,049 | ||||||
| Aegon NV, Registered , Sponsored NYS |
412,718 | 2,084,226 | ||||||
| Akzo Nobel NV |
90,916 | 10,460,200 | ||||||
| #ArcelorMittal SA , Sponsored NYS |
230,126 | 7,863,405 | ||||||
| ArcelorMittal SA |
121,802 | 4,133,504 | ||||||
| ASM International NV |
7,737 | 3,504,446 | ||||||
| Coca-Cola Europacific Partners PLC |
63,943 | 3,387,620 | ||||||
| Heineken NV |
88,214 | 9,781,819 | ||||||
| ING Groep NV |
1,211,638 | 18,396,392 | ||||||
| Koninklijke Ahold Delhaize NV |
1,237,587 | 40,287,601 | ||||||
| Koninklijke DSM NV |
165,155 | 36,132,195 | ||||||
| Koninklijke KPN NV |
1,360,581 | 4,070,155 | ||||||
| Koninklijke Philips NV , Sponsored NYS |
50,874 | 2,403,796 | ||||||
| Koninklijke Philips NV |
267,403 | 12,602,402 | ||||||
| NN Group NV |
186,071 | 9,974,088 | ||||||
| Randstad NV |
96,366 | 6,936,497 | ||||||
| Universal Music Group NV |
183,836 | 5,343,055 | ||||||
|
|
|
|||||||
| TOTAL NETHERLANDS |
179,710,450 | |||||||
|
|
|
|||||||
| NEW ZEALAND (0.3%) |
| |||||||
| *Auckland International Airport, Ltd. |
641,572 | 3,668,539 | ||||||
| Chorus, Ltd. |
198,269 | 903,848 | ||||||
| #EBOS Group, Ltd. |
97,605 | 2,532,102 | ||||||
| Fletcher Building, Ltd. |
368,497 | 1,890,838 | ||||||
| #Fonterra Co-operative Group, Ltd. |
64,089 | 183,461 | ||||||
| *Mainfreight, Ltd. |
13,612 | 875,755 | ||||||
| *Ryman Healthcare, Ltd. |
66,136 | 683,922 | ||||||
Dimensional International Value ETF
SCHEDULE OF INVESTMENTS
October 31, 2021
| Security Description |
Shares | Fair Value | ||||||
| NEW ZEALAND (Continued) |
| |||||||
| Summerset Group Holdings, Ltd. |
92,684 | $ | 962,439 | |||||
|
|
|
|||||||
| TOTAL NEW ZEALAND |
11,700,904 | |||||||
|
|
|
|||||||
| NORWAY (1.0%) |
| |||||||
| Austevoll Seafood ASA |
63,051 | 850,439 | ||||||
| #DNB Bank ASA |
466,001 | 11,061,553 | ||||||
| Elkem ASA |
93,409 | 369,471 | ||||||
| *Equinor ASA |
308,427 | 7,793,348 | ||||||
| Equinor ASA , Sponsored ADR |
42,297 | 1,075,613 | ||||||
| Golden Ocean Group, Ltd. |
10,546 | 94,997 | ||||||
| Norsk Hydro ASA |
643,899 | 4,710,138 | ||||||
| Orkla ASA |
8,056 | 78,243 | ||||||
| Schibsted ASA, Class B |
11,938 | 538,242 | ||||||
| Schibsted ASA, Class A |
9,961 | 513,046 | ||||||
| SpareBank 1 SR-Bank ASA |
81,034 | 1,239,559 | ||||||
| Storebrand ASA |
239,955 | 2,568,242 | ||||||
| Subsea 7 SA |
61,419 | 550,058 | ||||||
| Yara International ASA |
70,007 | 3,647,948 | ||||||
|
|
|
|||||||
| TOTAL NORWAY |
35,090,897 | |||||||
|
|
|
|||||||
| PORTUGAL (0.2%) |
| |||||||
| *»Banco Espirito Santo SA, Registered |
865,680 | 0 | ||||||
| EDP Renovaveis SA |
168,020 | 4,686,018 | ||||||
| Galp Energia SGPS SA |
82,622 | 859,761 | ||||||
|
|
|
|||||||
| TOTAL PORTUGAL |
5,545,779 | |||||||
|
|
|
|||||||
| SINGAPORE (0.9%) |
| |||||||
| CapitaLand Integrated Commercial Trust |
503 | 802 | ||||||
| *Capitaland Investment, Ltd. |
856,200 | 2,184,151 | ||||||
| City Developments, Ltd. |
471,200 | 2,557,793 | ||||||
| Frasers Property, Ltd. |
245,200 | 212,743 | ||||||
| Hongkong Land Holdings, Ltd. |
478,800 | 2,638,188 | ||||||
| Jardine Cycle & Carriage, Ltd. |
91,700 | 1,530,033 | ||||||
| Keppel Corp., Ltd. |
1,945,900 | 7,763,398 | ||||||
| Olam International, Ltd. |
450,570 | 568,015 | ||||||
| Oversea-Chinese Banking Corp., Ltd. |
315,437 | 2,760,221 | ||||||
| *Singapore Airlines, Ltd. |
2,016,700 | 7,776,669 | ||||||
| Singapore Land Group, Ltd. |
304,501 | 611,938 | ||||||
| United Overseas Bank, Ltd. |
88,300 | 1,751,595 | ||||||
| UOL Group, Ltd. |
409,807 | 2,197,185 | ||||||
| Wilmar International, Ltd. |
3,600 | 11,533 | ||||||
|
|
|
|||||||
| TOTAL SINGAPORE |
32,564,264 | |||||||
|
|
|
|||||||
| SPAIN (2.3%) |
| |||||||
| Banco Bilbao Vizcaya Argentaria SA |
2,399,101 | 16,830,244 | ||||||
| Banco Bilbao Vizcaya Argentaria SA , Sponsored ADR |
521,115 | 3,632,172 | ||||||
| Banco Santander SA |
9,301,027 | 35,266,878 | ||||||
| Banco Santander SA , Sponsored ADR |
2,987,846 | 11,323,936 | ||||||
| CaixaBank SA |
902,400 | 2,595,084 | ||||||
| Iberdrola SA |
184,638 | 2,182,657 | ||||||
Dimensional International Value ETF
SCHEDULE OF INVESTMENTS
October 31, 2021
| Security Description |
Shares | Fair Value | ||||||
| SPAIN (Continued) |
| |||||||
| *Repsol SA |
925,284 | $ | 11,838,563 | |||||
|
|
|
|||||||
| TOTAL SPAIN |
83,669,534 | |||||||
|
|
|
|||||||
| SWEDEN (2.9%) |
| |||||||
| AFRY AB |
16,750 | 498,883 | ||||||
| BillerudKorsnas AB |
140,802 | 2,942,768 | ||||||
| Boliden AB |
340,936 | 12,024,162 | ||||||
| Dometic Group AB |
122,236 | 1,776,931 | ||||||
| Electrolux AB, Class B |
26,757 | 607,200 | ||||||
| Essity AB, Class B |
9,945 | 321,677 | ||||||
| Getinge AB, Class B |
158,510 | 7,092,670 | ||||||
| Holmen AB, Class B |
79,986 | 3,546,448 | ||||||
| Husqvarna AB, Class B |
206,024 | 2,930,178 | ||||||
| ICA Gruppen AB |
62,161 | 3,213,539 | ||||||
| #Industrivarden AB, Class A |
5,876 | 193,771 | ||||||
| Intrum AB |
26,045 | 737,515 | ||||||
| *Millicom International Cellular SA |
57,578 | 2,013,905 | ||||||
| Peab AB, Class B |
144,006 | 1,805,839 | ||||||
| Saab AB, Class B |
29,229 | 812,701 | ||||||
| Securitas AB, Class B |
54,703 | 904,445 | ||||||
| *Skandinaviska Enskilda Banken AB, Class A |
704,738 | 11,016,017 | ||||||
| Skanska AB, Class B |
154,659 | 3,925,675 | ||||||
| SKF AB, Class B |
370,312 | 8,580,321 | ||||||
| *SSAB AB, Class A |
88,048 | 501,315 | ||||||
| *SSAB AB, Class B |
152,994 | 762,788 | ||||||
| Svenska Cellulosa AB SCA, Class A |
4,705 | 74,066 | ||||||
| Svenska Cellulosa AB SCA, Class B |
292,479 | 4,559,928 | ||||||
| #Svenska Handelsbanken AB, Class A |
372,611 | 4,266,469 | ||||||
| #Svenska Handelsbanken AB, Class B |
10,738 | 135,655 | ||||||
| #Swedbank AB, Class A |
235,679 | 5,110,655 | ||||||
| Tele2 AB, Class B |
272,841 | 3,848,715 | ||||||
| #Telia Co. AB |
1,288,192 | 5,068,924 | ||||||
| Trelleborg AB, Class B |
103,441 | 2,362,456 | ||||||
| Volvo AB, Class B |
605,168 | 14,086,881 | ||||||
| Volvo AB, Class A |
105,627 | 2,494,167 | ||||||
|
|
|
|||||||
| TOTAL SWEDEN |
108,216,664 | |||||||
|
|
|
|||||||
| SWITZERLAND (8.3%) |
| |||||||
| ABB, Ltd., Registered |
512,841 | 17,000,223 | ||||||
| Adecco Group AG |
111,022 | 5,597,574 | ||||||
| Alcon, Inc. |
66,018 | 5,503,260 | ||||||
| Alcon, Inc. |
98,795 | 8,180,388 | ||||||
| Baloise Holding AG, Registered |
34,223 | 5,468,189 | ||||||
| Banque Cantonale Vaudoise, Registered |
6,260 | 504,911 | ||||||
| Chocoladefabriken Lindt & Spruengli AG |
3 | 360,821 | ||||||
| Cie Financiere Richemont SA, Registered |
224,987 | 27,847,911 | ||||||
| Clariant AG, Registered |
2,184 | 46,034 | ||||||
| #Credit Suisse Group AG , Sponsored ADR |
489,589 | 5,047,662 | ||||||
| Credit Suisse Group AG, Registered |
287,522 | 2,999,354 | ||||||
| Holcim, Ltd. |
319,814 | 15,998,575 | ||||||
| Holcim, Ltd. |
116,138 | 5,818,190 | ||||||
| Julius Baer Group, Ltd. |
209,998 | 15,209,486 | ||||||
| Novartis AG , Sponsored ADR |
369,814 | 30,605,807 | ||||||
| Novartis AG, Registered |
354,588 | 29,352,708 | ||||||
Dimensional International Value ETF
SCHEDULE OF INVESTMENTS
October 31, 2021
| Security Description |
Shares | Fair Value | ||||||
| SWITZERLAND (Continued) |
| |||||||
| SIG Combibloc Group AG |
140,428 | $ | 3,676,102 | |||||
| Swatch Group AG (The) |
27,478 | 1,462,687 | ||||||
| Swatch Group AG (The) |
8,349 | 2,295,233 | ||||||
| Swiss Life Holding AG |
18,305 | 10,068,501 | ||||||
| Swiss Prime Site AG, Registered |
10,349 | 1,053,304 | ||||||
| Swiss Re AG |
159,159 | 15,439,511 | ||||||
| Swisscom AG, Registered |
22,992 | 12,540,862 | ||||||
| #UBS Group AG |
540,311 | 9,806,645 | ||||||
| UBS Group AG |
1,374,597 | 25,039,855 | ||||||
| Vifor Pharma AG |
20,891 | 2,700,112 | ||||||
| Zurich Insurance Group AG |
101,073 | 44,897,981 | ||||||
|
|
|
|||||||
| TOTAL SWITZERLAND |
304,521,886 | |||||||
|
|
|
|||||||
| UNITED KINGDOM (13.4%) |
||||||||
| abrdn PLC |
576,464 | 2,007,071 | ||||||
| Anglo American PLC |
535,369 | 20,419,506 | ||||||
| Aviva PLC |
3,902,148 | 21,111,919 | ||||||
| Barclays PLC |
56,699 | 157,188 | ||||||
| #Barclays PLC , Sponsored ADR |
1,894,942 | 21,204,401 | ||||||
| Barratt Developments PLC |
259,079 | 2,354,521 | ||||||
| Bellway PLC |
27,716 | 1,258,661 | ||||||
| BP PLC |
1,356,881 | 6,513,505 | ||||||
| *BP PLC , Sponsored ADR |
1,972,347 | 56,783,869 | ||||||
| British American Tobacco PLC |
1,006,113 | 35,119,416 | ||||||
| *British American Tobacco PLC , Sponsored ADR |
36,089 | 1,260,227 | ||||||
| *BT Group PLC |
6,851,414 | 13,044,856 | ||||||
| *Carnival PLC |
65,438 | 1,318,573 | ||||||
| *Centrica PLC |
1,293,152 | 1,069,222 | ||||||
| DS Smith PLC |
781,458 | 4,106,904 | ||||||
| Glencore PLC |
6,855,056 | 34,320,853 | ||||||
| HSBC Holdings PLC |
396,638 | 2,400,390 | ||||||
| HSBC Holdings PLC , Sponsored ADR |
972,926 | 29,255,885 | ||||||
| J Sainsbury PLC |
1,767,365 | 7,253,287 | ||||||
| Kingfisher PLC |
1,735,857 | 7,971,052 | ||||||
| Lloyds Banking Group PLC |
40,936,381 | 28,180,130 | ||||||
| Lloyds Banking Group PLC , Sponsored ADR |
610,956 | 1,661,800 | ||||||
| *Marks & Spencer Group PLC |
287,194 | 722,778 | ||||||
| Melrose Industries PLC |
1,860,382 | 4,024,075 | ||||||
| NatWest Group PLC |
536,459 | 1,625,856 | ||||||
| NatWest Group PLC , ADR |
627,550 | 3,796,677 | ||||||
| Pearson PLC |
301,002 | 2,485,485 | ||||||
| Phoenix Group Holdings PLC |
129,618 | 1,166,603 | ||||||
| *Royal Dutch Shell PLC , Sponsored ADR |
2,428,295 | 111,313,042 | ||||||
| Royal Dutch Shell PLC, Class B |
277,216 | 6,402,876 | ||||||
| Royal Mail PLC |
557,416 | 3,212,937 | ||||||
| Standard Chartered PLC |
873,882 | 5,928,258 | ||||||
| Tesco PLC |
2,445,941 | 9,049,107 | ||||||
| Vodafone Group PLC |
17,598,295 | 26,062,257 | ||||||
| #Vodafone Group PLC , Sponsored ADR |
370,811 | 5,543,624 | ||||||
| #WPP PLC , Sponsored ADR |
31,432 | 2,274,420 | ||||||
Dimensional International Value ETF
SCHEDULE OF INVESTMENTS
October 31, 2021
| Security Description |
Shares | Fair Value | ||||||
| UNITED KINGDOM (Continued) |
| |||||||
| WPP PLC |
619,508 | $ | 8,967,423 | |||||
|
|
|
|||||||
| TOTAL UNITED KINGDOM |
491,348,654 | |||||||
|
|
|
|||||||
| TOTAL COMMON STOCKS (Cost $2,890,228,822) |
3,585,851,177 | |||||||
|
|
|
|||||||
| TOTAL INVESTMENT SECURITIES (Cost $2,890,228,822) |
3,585,851,177 | |||||||
|
|
|
|||||||
| SECURITIES LENDING COLLATERAL (2.3%) |
| |||||||
| @§The DFA Short Term Investment Fund |
7,151,846 | 82,743,279 | ||||||
| TOTAL INVESTMENTS (Cost $2,972,972,101) — 100.0% |
|
$ | 3,668,594,456 | |||||
|
|
|
|||||||
| * | Non-Income Producing Securities |
| # | Total or Partial Securities on Loan |
| » | Securities that have generally been fair value factored |
| @ | Security purchased with cash collateral received from Securities on Loan |
| § | Affiliated Fund |
| ADR | American Depositary Receipt |
| PLC | Public Limited Company |
| SA | Special Assessment |
Dimensional Emerging Core Equity Market ETF
SCHEDULE OF INVESTMENTS
October 31, 2021
| Security Description |
Shares | Fair Value | ||||||
| COMMON STOCKS (99.6%) |
| |||||||
| BRAZIL (4.4%) |
||||||||
| Aliansce Sonae Shopping Centers SA |
8,300 | $ | 28,241 | |||||
| *Alliar Medicos A Frente SA |
100 | 263 | ||||||
| *Alpargatas SA, Preference |
14,200 | 97,312 | ||||||
| Alupar Investimento SA |
9,800 | 41,272 | ||||||
| Ambev SA, Sponsored ADR |
25,700 | 76,072 | ||||||
| Ambev SA |
121,000 | 364,696 | ||||||
| *Americanas SA |
8,139 | 42,882 | ||||||
| *Anima Holding SA |
6,900 | 8,079 | ||||||
| Atacadao SA |
2,400 | 7,085 | ||||||
| B3 SA—Brasil Bolsa Balcao |
158,000 | 333,827 | ||||||
| Banco ABC Brasil SA, Preference |
100 | 269 | ||||||
| Banco Bradesco SA, Preference |
223,000 | 787,245 | ||||||
| Banco Bradesco SA |
33,090 | 99,792 | ||||||
| Banco BTG Pactual SA |
60,716 | 242,886 | ||||||
| *Banco do Brasil SA |
42,600 | 215,381 | ||||||
| Banco do Estado do Rio Grande do Sul SA, Preference |
65,700 | 126,924 | ||||||
| Banco Inter SA |
337 | 692 | ||||||
| Banco Inter SA, Class P |
1,374 | 2,981 | ||||||
| Banco Santander Brasil SA |
400 | 2,441 | ||||||
| BB Seguridade Participacoes SA |
30,100 | 117,954 | ||||||
| *BK Brasil Operacao e Assessoria a Restaurantes SA |
9,200 | 11,212 | ||||||
| *BR Malls Participacoes SA |
70,300 | 89,418 | ||||||
| BR Properties SA |
12,400 | 15,860 | ||||||
| BrasilAgro—Co. Brasileira de Propriedades Agricolas |
3,433 | 15,384 | ||||||
| *Braskem SA, Preference A |
300 | 2,898 | ||||||
| *BRF SA |
46,400 | 191,214 | ||||||
| Camil Alimentos SA |
200 | 343 | ||||||
| CCR SA |
84,500 | 171,338 | ||||||
| Centrais Eletricas Brasileiras SA |
13,700 | 82,219 | ||||||
| Centrais Eletricas Brasileiras SA, Class B |
16,800 | 100,854 | ||||||
| Cia Brasileira de Distribuicao |
16,200 | 73,370 | ||||||
| Cia de Locacao das Americas |
2,300 | 8,050 | ||||||
| Cia de Saneamento Basico do Estado de Sao Paulo |
35,600 | 222,303 | ||||||
| Cia de Saneamento Basico Do Estado de Sao Paulo, Sponsored ADR |
2,400 | 15,072 | ||||||
| Cia de Saneamento de Minas Gerais-COPASA |
15,300 | 36,940 | ||||||
| Cia de Saneamento do Parana |
400 | 254 | ||||||
| Cia de Saneamento do Parana, Preference |
60,100 | 39,662 | ||||||
| Cia de Saneamento do Parana |
56,500 | 182,921 | ||||||
| *Cia de Transmissao de Energia Eletrica Paulista |
100 | 431 | ||||||
| Cia Energetica de Minas Gerais |
223 | 657 | ||||||
| Cia Energetica de Minas Gerais, Preference |
167,479 | 382,674 | ||||||
| Cia Energetica de Sao Paulo, Preference B |
13,600 | 61,522 | ||||||
| Cia Ferro Ligas da Bahia—FERBASA, Preference |
2,300 | 19,340 | ||||||
| Cia Paranaense de Energia, Preference B |
5,100 | 5,356 | ||||||
| Cia Siderurgica Nacional SA |
1,400 | 5,658 | ||||||
| Cielo SA |
65,600 | 25,486 | ||||||
| *Cogna Educacao |
190,100 | 83,635 | ||||||
| Construtora Tenda SA |
100 | 303 | ||||||
| Cosan SA, ADR |
825 | 11,542 | ||||||
| Cosan SA |
4,200 | 14,745 | ||||||
| CPFL Energia SA |
400 | 1,867 | ||||||
| CSU Cardsystem SA |
100 | 300 | ||||||
| *Cyrela Brazil Realty SA Empreendimentos e Participacoes |
19,500 | 48,741 | ||||||
| Dexco SA |
31,100 | 85,571 | ||||||
| Direcional Engenharia SA |
200 | 338 | ||||||
Dimensional Emerging Core Equity Market ETF
SCHEDULE OF INVESTMENTS
October 31, 2021
| Security Description |
Shares | Fair Value | ||||||
| BRAZIL (Continued) |
||||||||
| *EcoRodovias Infraestrutura e Logistica SA |
18,312 | $ | 26,606 | |||||
| EDP—Energias do Brasil SA |
59,500 | 206,883 | ||||||
| *Embraer SA |
117,100 | 455,562 | ||||||
| *Embraer SA, Sponsored ADR |
2,950 | 45,814 | ||||||
| Enauta Participacoes SA |
9,300 | 21,085 | ||||||
| Energisa SA |
400 | 2,811 | ||||||
| *Eneva SA |
1,800 | 4,598 | ||||||
| Engie Brasil Energia SA |
300 | 2,071 | ||||||
| Equatorial Energia SA |
70,700 | 286,964 | ||||||
| Eucatex SA Industria e Comercio, Preference |
100 | 141 | ||||||
| Even Construtora e Incorporadora SA |
200 | 221 | ||||||
| Ez Tec Empreendimentos e Participacoes SA |
7,800 | 25,253 | ||||||
| Fleury SA |
28,500 | 95,202 | ||||||
| Fras-Le SA |
200 | 504 | ||||||
| *Gafisa SA |
2,100 | 749 | ||||||
| *Gerdau SA, Preference |
62,200 | 296,821 | ||||||
| *Gerdau SA, Sponsored ADR |
12,500 | 59,125 | ||||||
| *Getnet Adquirencia e Servicos para Meios de Pagamento SA |
100 | 77 | ||||||
| *Gol Linhas Aereas Inteligentes SA, Preference |
50 | 135 | ||||||
| Grendene SA |
82,900 | 126,181 | ||||||
| *Grupo de Moda Soma SA |
325 | 756 | ||||||
| Guararapes Confeccoes SA |
200 | 389 | ||||||
| Hapvida Participacoes e Investimentos SA |
5,701 | 11,671 | ||||||
| Helbor Empreendimentos SA |
100 | 85 | ||||||
| Hypera SA |
16,800 | 83,627 | ||||||
| Iguatemi Empresa de Shopping Centers SA |
3,000 | 15,934 | ||||||
| Industrias Romi SA |
100 | 290 | ||||||
| Instituto Hermes Pardini SA |
100 | 390 | ||||||
| *International Meal Co. Alimentacao SA |
2,100 | 1,047 | ||||||
| *Iochpe Maxion SA |
4,800 | 14,288 | ||||||
| *IRB Brasil Resseguros SA |
81,300 | 67,642 | ||||||
| Itau Unibanco Holding SA, Preference |
175,700 | 726,551 | ||||||
| Itau Unibanco Holding SA |
500 | 1,865 | ||||||
| JBS SA |
88,600 | 613,771 | ||||||
| JHSF Participacoes SA |
36,100 | 31,957 | ||||||
| *Klabin SA |
72,300 | 294,228 | ||||||
| Light SA |
19,600 | 33,658 | ||||||
| Localiza Rent a Car SA |
30,700 | 246,711 | ||||||
| LOG Commercial Properties e Participacoes SA |
100 | 416 | ||||||
| *Log-in Logistica Intermodal SA |
200 | 752 | ||||||
| Lojas Americanas SA, Preference |
42,698 | 36,585 | ||||||
| Lojas Americanas SA |
300 | 262 | ||||||
| Lojas Renner SA |
47,623 | 272,288 | ||||||
| M Dias Branco SA |
100 | 549 | ||||||
| Magazine Luiza SA |
63,660 | 122,080 | ||||||
| Mahle-Metal Leve SA |
100 | 605 | ||||||
| Marcopolo SA |
200 | 83 | ||||||
| Marcopolo SA, Preference |
7,600 | 3,492 | ||||||
| Marfrig Global Foods SA |
34,300 | 161,247 | ||||||
| *Marisa Lojas SA |
200 | 146 | ||||||
| Mills Estruturas e Servicos de Engenharia SA |
200 | 178 | ||||||
| Minerva SA |
37,200 | 64,277 | ||||||
| Movida Participacoes SA |
200 | 527 | ||||||
| MRV Engenharia e Participacoes SA |
30,100 | 54,198 | ||||||
| *Natura & Co. Holding SA |
25,200 | 173,901 | ||||||
| *Natura & Co. Holding SA, ADR |
3,400 | 46,818 | ||||||
Dimensional Emerging Core Equity Market ETF
SCHEDULE OF INVESTMENTS
October 31, 2021
| Security Description |
Shares | Fair Value | ||||||
| BRAZIL (Continued) |
||||||||
| Notre Dame Intermedica Participacoes SA |
29,700 | $ | 338,149 | |||||
| Odontoprev SA |
18,400 | 43,772 | ||||||
| *Omega Geracao SA |
9,000 | 52,257 | ||||||
| *Petro Rio SA |
72,200 | 300,609 | ||||||
| *Petroleo Brasileiro SA |
205,100 | 1,006,762 | ||||||
| Petroleo Brasileiro SA, Sponsored ADR |
25,350 | 243,613 | ||||||
| Petroleo Brasileiro SA, Sponsored ADR |
20,350 | 199,837 | ||||||
| *Petroleo Brasileiro SA, Preference |
247,300 | 1,195,481 | ||||||
| Porto Seguro SA |
33,000 | 136,637 | ||||||
| Positivo Tecnologia SA |
100 | 150 | ||||||
| Qualicorp Consultoria e Corretora de Seguros SA |
18,000 | 54,635 | ||||||
| Raia Drogasil SA |
73,100 | 301,503 | ||||||
| Randon SA Implementos e Participacoes, Preference |
19,400 | 34,966 | ||||||
| *Rumo SA |
76,800 | 217,852 | ||||||
| Sao Martinho SA |
13,000 | 88,327 | ||||||
| Schulz SA, Preference |
200 | 293 | ||||||
| Sendas Distribuidora SA |
800 | 2,170 | ||||||
| Ser Educacional SA |
100 | 185 | ||||||
| SLC Agricola SA |
2,700 | 20,874 | ||||||
| Sul America SA |
17,168 | 79,094 | ||||||
| *Suzano SA |
39,700 | 346,715 | ||||||
| Syn Prop E Tech SA |
100 | 225 | ||||||
| *Taurus Armas SA |
100 | 361 | ||||||
| *Tecnisa SA |
100 | 65 | ||||||
| TIM SA |
1,300 | 2,588 | ||||||
| Tim SA/Brazil, ADR |
220 | 2,169 | ||||||
| TOTVS SA |
14,500 | 84,268 | ||||||
| Transmissora Alianca de Energia Eletrica SA |
9,300 | 60,482 | ||||||
| Trisul SA |
100 | 104 | ||||||
| *Tupy SA |
4,900 | 18,159 | ||||||
| Ultrapar Participacoes SA, Sponsored ADR |
1,600 | 3,728 | ||||||
| Ultrapar Participacoes SA |
45,000 | 104,178 | ||||||
| *Unipar Carbocloro SA |
1,600 | 22,920 | ||||||
| *Unipar Carbocloro SA |
2,300 | 30,467 | ||||||
| Usinas Siderurgicas de Minas Gerais SA Usiminas, Preference A |
31,900 | 74,982 | ||||||
| Usinas Siderurgicas de Minas Gerais SA Usiminas |
100 | 228 | ||||||
| Vale SA, Sponsored ADR |
28,900 | 367,897 | ||||||
| Vale SA |
140,900 | 1,789,932 | ||||||
| *Valid Solucoes e Servicos de Seguranca em Meios de Pagamento e Identificacao SA |
100 | 127 | ||||||
| *Via SA |
57,800 | 63,060 | ||||||
| Vibra Energia SA |
32,800 | 122,076 | ||||||
| *Vulcabras Azaleia SA |
200 | 310 | ||||||
| WEG SA |
56,800 | 372,822 | ||||||
| *XP, Inc. |
4,068 | 133,510 | ||||||
| YDUQS Participacoes SA |
14,800 | 54,768 | ||||||
|
|
|
|||||||
| TOTAL BRAZIL |
17,317,146 | |||||||
|
|
|
|||||||
| CHILE (0.4%) |
||||||||
| *AES Andes SA |
4,837 | 498 | ||||||
| *Aguas Andinas SA, Class A |
66,871 | 12,776 | ||||||
| Banco de Chile, Sponsored ADR |
1,578 | 27,268 | ||||||
| Banco de Chile |
1,268,330 | 110,369 | ||||||
| Banco de Credito e Inversiones SA |
1,713 | 57,845 | ||||||
| Banco Santander Chile |
111,268 | 4,882 | ||||||
Dimensional Emerging Core Equity Market ETF
SCHEDULE OF INVESTMENTS
October 31, 2021
| Security Description |
Shares | Fair Value | ||||||
| CHILE (Continued) |
||||||||
| *Besalco SA |
31,632 | $ | 8,379 | |||||
| *Camanchaca SA |
2,668 | 112 | ||||||
| CAP SA |
228 | 2,263 | ||||||
| Cencosud SA |
180,240 | 264,368 | ||||||
| *Cia Cervecerias Unidas SA |
237 | 1,991 | ||||||
| Cia Sud Americana de Vapores SA |
24,233 | 1,579 | ||||||
| Colbun SA |
22,519 | 1,557 | ||||||
| Embotelladora Andina SA, Preference B |
548 | 1,135 | ||||||
| Empresa Nacional de Telecomunicaciones SA |
304 | 1,045 | ||||||
| Empresas CMPC SA |
70,379 | 130,207 | ||||||
| *Empresas COPEC SA |
21,879 | 172,591 | ||||||
| Empresas Lipigas SA |
64 | 220 | ||||||
| *Enel Americas SA |
1,160,308 | 132,289 | ||||||
| ENEL Americas SA, Sponsored ADR |
5,323 | 30,128 | ||||||
| Enel Chile SA |
2,960,328 | 121,615 | ||||||
| Engie Energia Chile SA |
1,472 | 858 | ||||||
| Falabella SA |
833 | 2,310 | ||||||
| Forus SA |
116 | 155 | ||||||
| Grupo Security SA |
2,084 | 316 | ||||||
| Hortifrut SA |
16,259 | 17,281 | ||||||
| Instituto de Diagnostico SA |
124 | 234 | ||||||
| Inversiones Aguas Metropolitanas SA |
908 | 428 | ||||||
| Inversiones La Construccion SA |
52 | 188 | ||||||
| *Itau CorpBanca Chile SA |
245,116 | 545 | ||||||
| *Multiexport Foods SA |
580 | 183 | ||||||
| *Parque Arauco SA |
40,381 | 39,967 | ||||||
| PAZ Corp. SA |
400 | 139 | ||||||
| Plaza SA |
400 | 400 | ||||||
| *Ripley Corp. SA |
1,516 | 257 | ||||||
| SalfaCorp. SA |
1,805 | 613 | ||||||
| Sigdo Koppers SA |
4,830 | 4,573 | ||||||
| SMU SA |
114,934 | 11,473 | ||||||
| Sociedad Matriz SAAM SA |
172,028 | 10,769 | ||||||
| Sociedad Quimica y Minera de Chile SA, Class B |
4,114 | 224,027 | ||||||
| Sociedad Quimica y Minera de Chile SA, Sponsored ADR |
980 | 53,792 | ||||||
| Socovesa SA |
972 | 126 | ||||||
| SONDA SA |
20,607 | 6,980 | ||||||
| *Vina Concha y Toro SA |
11,986 | 17,477 | ||||||
|
|
|
|||||||
| TOTAL CHILE |
1,476,208 | |||||||
|
|
|
|||||||
| CHINA (30.5%) |
||||||||
| *36Kr Holdings, Inc., ADR |
24 | 40 | ||||||
| *3SBio, Inc. |
52,500 | 48,052 | ||||||
| 5I5J Holding Group Co., Ltd., Class A |
300 | 140 | ||||||
| AAC Technologies Holdings, Inc. |
70,500 | 307,682 | ||||||
| AAG Energy Holdings, Ltd. |
1,000 | 225 | ||||||
| Accelink Technologies Co., Ltd., Class A |
100 | 339 | ||||||
| Addsino Co., Ltd., Class A |
100 | 240 | ||||||
| Advanced Technology & Materials Co., Ltd., Class A |
100 | 133 | ||||||
| AECC Aero-Engine Control Co., Ltd., Class A |
100 | 417 | ||||||
| AECC Aviation Power Co., Ltd., Class A |
100 | 924 | ||||||
| *Aerospace Hi-Tech Holdings Group, Ltd., Class A |
100 | 131 | ||||||
| *Aesthetic Medical International Holdings Group, Ltd., ADR |
14 | 58 | ||||||
| #Agile Group Holdings, Ltd. |
2,000 | 1,573 | ||||||
| Agricultural Bank of China, Ltd., Class H |
1,070,000 | 364,505 | ||||||
Dimensional Emerging Core Equity Market ETF
SCHEDULE OF INVESTMENTS
October 31, 2021
| Security Description |
Shares | Fair Value | ||||||
| CHINA (Continued) |
||||||||
| Aier Eye Hospital Group Co., Ltd., Class A |
518 | $ | 3,926 | |||||
| *Air China, Ltd., Class H |
4,000 | 2,823 | ||||||
| Aisino Corp., Class A |
100 | 179 | ||||||
| AK Medical Holdings, Ltd. |
20,000 | 20,799 | ||||||
| *Alibaba Group Holding, Ltd. |
261,200 | 5,473,111 | ||||||
| *Alibaba Group Holding, Ltd., Sponsored ADR |
47,990 | 7,915,471 | ||||||
| *Alibaba Health Information Technology, Ltd. |
262,000 | 331,076 | ||||||
| #*Alibaba Pictures Group, Ltd. |
1,910,000 | 203,791 | ||||||
| A-Living Smart City Services Co., Ltd. |
77,500 | 260,025 | ||||||
| *Alpha Group, Class A |
100 | 79 | ||||||
| *Aluminum Corp., Ltd., Class H |
358,000 | 213,998 | ||||||
| An Hui Wenergy Co., Ltd., Class A |
100 | 69 | ||||||
| Angang Steel Co., Ltd., Class H |
2,000 | 1,077 | ||||||
| Angel Yeast Co., Ltd., Class A |
100 | 869 | ||||||
| Anhui Conch Cement Co., Ltd., Class H |
72,000 | 358,193 | ||||||
| Anhui Construction Engineering Group Co., Ltd., Class A |
100 | 60 | ||||||
| Anhui Guangxin Agrochemical Co., Ltd., Class A |
100 | 552 | ||||||
| Anhui Gujing Distillery Co., Ltd., Class A |
100 | 3,556 | ||||||
| Anhui Hengyuan Coal Industry and Electricity Power Co., Ltd., Class A |
200 | 218 | ||||||
| Anhui Jiangnan Chemical Industry Co., Ltd., Class A |
140 | 114 | ||||||
| Anhui Jinhe Industrial Co., Ltd., Class A |
100 | 751 | ||||||
| Anhui Korrun Co., Ltd., Class A |
100 | 347 | ||||||
| Anhui Transport Consulting & Design Institute Co., Ltd., Class A |
100 | 132 | ||||||
| Anhui Truchum Advanced Materials & Technology Co., Ltd., Class A |
100 | 162 | ||||||
| Anhui Zhongding Sealing Parts Co., Ltd., Class A |
200 | 537 | ||||||
| ANTA Sports Products, Ltd. |
1,000 | 15,632 | ||||||
| *Anton Oilfield Services Group |
4,000 | 273 | ||||||
| Apeloa Pharmaceutical Co., Ltd., Class A |
5,700 | 30,909 | ||||||
| Asia Cement China Holdings Corp. |
21,500 | 16,390 | ||||||
| Asiainfo Technologies, Ltd. |
14,400 | 23,768 | ||||||
| Ausnutria Dairy Corp., Ltd. |
47,000 | 58,908 | ||||||
| Avary Holding Shenzhen Co., Ltd., Class A |
200 | 1,093 | ||||||
| *BAIC BluePark New Energy Technology Co., Ltd., Class A |
1,500 | 3,303 | ||||||
| BAIC Motor Corp., Ltd., Class H |
372,500 | 123,543 | ||||||
| *Baidu, Inc., Sponsored ADR |
5,519 | 895,403 | ||||||
| *Baidu, Inc. |
27,000 | 562,279 | ||||||
| Bank of Beijing Co., Ltd., Class A |
1,400 | 969 | ||||||
| Bank of Changsha Co., Ltd., Class A |
400 | 503 | ||||||
| Bank of Chengdu Co., Ltd., Class A |
400 | 797 | ||||||
| Bank of China, Ltd., Class H |
3,920,000 | 1,385,773 | ||||||
| Bank of Chongqing Co., Ltd., Class H |
1,000 | 563 | ||||||
| Bank of Communications Co., Ltd., Class H |
491,000 | 292,237 | ||||||
| Bank of Hangzhou Co., Ltd., Class A |
500 | 1,115 | ||||||
| Bank of Jiangsu Co., Ltd., Class A |
24,860 | 24,422 | ||||||
| Bank of Nanjing Co., Ltd., Class A |
1,100 | 1,666 | ||||||
| Bank of Ningbo Co., Ltd., Class A |
1,600 | 9,546 | ||||||
| Bank of Shanghai Co., Ltd., Class A |
1,400 | 1,594 | ||||||
| Baoshan Iron & Steel Co., Ltd., Class A |
71,500 | 79,622 | ||||||
| *Baozun, Inc., Sponsored ADR |
1,741 | 30,119 | ||||||
| *Baozun, Inc. |
3,700 | 21,404 | ||||||
| BBMG Corp., Class H |
4,000 | 674 | ||||||
| Befar Group Co., Ltd., Class A |
200 | 262 | ||||||
| Beibuwan Port Co., Ltd., Class A |
100 | 116 | ||||||
| #*BeiGene, Ltd., Sponsored ADR |
1,117 | 399,573 | ||||||
| *BeiGene, Ltd. |
10,500 | 293,982 | ||||||
Dimensional Emerging Core Equity Market ETF
SCHEDULE OF INVESTMENTS
October 31, 2021
| Security Description |
Shares | Fair Value | ||||||
| CHINA (Continued) |
||||||||
| Beijing Aosaikang Pharmaceutical Co., Ltd., Class A |
100 | $ | 182 | |||||
| Beijing Capital Development Co., Ltd., Class A |
600 | 460 | ||||||
| Beijing Capital Eco-Environment Protection Group Co., Ltd., Class A |
10,000 | 5,248 | ||||||
| *Beijing Capital International Airport Co., Ltd., Class H |
202,000 | 131,134 | ||||||
| Beijing Dabeinong Technology Group Co., Ltd., Class A |
400 | 536 | ||||||
| *Beijing Energy International Holding Co., Ltd. |
4,000 | 152 | ||||||
| Beijing Enlight Media Co., Ltd., Class A |
200 | 292 | ||||||
| *Beijing Enterprises Clean Energy Group, Ltd. |
2,000,000 | 26,996 | ||||||
| Beijing Enterprises Holdings, Ltd. |
500 | 1,922 | ||||||
| Beijing Enterprises Water Group, Ltd. |
8,000 | 3,054 | ||||||
| *Beijing Forever Technology Co., Ltd., Class A |
100 | 179 | ||||||
| *»Beijing Gas Blue Sky Holdings, Ltd. |
8,000 | 45 | ||||||
| *Beijing Jetsen Technology Co., Ltd., Class A |
500 | 321 | ||||||
| Beijing Jingneng Clean Energy Co., Ltd., Class H |
200,000 | 60,419 | ||||||
| *Beijing Jingxi Culture & Tourism Co., Ltd., Class A |
100 | 73 | ||||||
| Beijing Kunlun Tech Co., Ltd., Class A |
100 | 292 | ||||||
| Beijing New Building Materials PLC, Class A |
200 | 882 | ||||||
| Beijing North Star Co., Ltd., Class H |
2,000 | 321 | ||||||
| *Beijing Orient Landscape & Environment Co., Ltd., Class A |
500 | 222 | ||||||
| *Beijing Orient National Communication Science & Technology Co., Ltd., Class A |
200 | 275 | ||||||
| Beijing Oriental Yuhong Waterproof Technology Co., Ltd., Class A |
7,300 | 47,601 | ||||||
| Beijing Originwater Technology Co., Ltd., Class A |
200 | 218 | ||||||
| *Beijing Sanju Environmental Protection and New Material Co., Ltd., Class A |
300 | 285 | ||||||
| Beijing Shiji Information Technology Co., Ltd., Class A |
140 | 518 | ||||||
| *Beijing Shougang Co., Ltd., Class A |
400 | 360 | ||||||
| Beijing Shunxin Agriculture Co., Ltd., Class A |
100 | 509 | ||||||
| Beijing Sinnet Technology Co., Ltd., Class A |
200 | 413 | ||||||
| Beijing SL Pharmaceutical Co., Ltd., Class A |
100 | 145 | ||||||
| Beijing SPC Environment Protection Tech Co., Ltd., Class A |
100 | 94 | ||||||
| Beijing Thunisoft Corp., Ltd., Class A |
100 | 167 | ||||||
| Beijing Tiantan Biological Products Corp., Ltd., Class A |
100 | 451 | ||||||
| Beijing Tong Ren Tang Chinese Medicine Co., Ltd. |
9,000 | 11,489 | ||||||
| Beijing Tongrentang Co., Ltd., Class A |
100 | 501 | ||||||
| *Beijing UniStrong Science & Technology Co., Ltd., Class A |
100 | 94 | ||||||
| Beijing Yanjing Brewery Co., Ltd., Class A |
300 | 311 | ||||||
| Beijing Zhong Ke San Huan High-Tech Co., Ltd., Class A |
200 | 350 | ||||||
| #*BEST, Inc., ADR |
11,368 | 18,302 | ||||||
| Bestsun Energy Co., Ltd., Class A |
200 | 153 | ||||||
| Better Life Commercial Chain Share Co., Ltd., Class A |
100 | 105 | ||||||
| Blue Sail Medical Co., Ltd., Class A |
100 | 226 | ||||||
| *Bluedon Information Security Technology Co., Ltd., Class A |
100 | 52 | ||||||
| Bluefocus Intelligent Communications Group Co., Ltd., Class A |
200 | 157 | ||||||
| BOE Technology Group Co., Ltd., Class A |
131,700 | 100,996 | ||||||
| #Bosideng International Holdings, Ltd. |
1,144,000 | 888,252 | ||||||
| Bright Dairy & Food Co., Ltd., Class A |
100 | 218 | ||||||
| Bright Real Estate Group Co., Ltd., Class A |
200 | 68 | ||||||
| *»Brilliance China Automotive Holdings, Ltd. |
224,000 | 157,654 | ||||||
| B-Soft Co., Ltd., Class A |
158,880 | 198,516 | ||||||
| *BTG Hotels Group Co., Ltd., Class A |
100 | 383 | ||||||
| BYD Co., Ltd., Class H |
500 | 19,064 | ||||||
| BYD Electronic International Co., Ltd. |
70,000 | 208,316 | ||||||
| By-health Co., Ltd., Class A |
100 | 398 | ||||||
| C&S Paper Co., Ltd., Class A |
200 | 532 | ||||||
| #*»CA Cultural Technology Group, Ltd. |
1,000 | 78 | ||||||
| Caitong Securities Co., Ltd., Class A |
300 | 481 | ||||||
| Camel Group Co., Ltd., Class A |
100 | 205 | ||||||
Dimensional Emerging Core Equity Market ETF
SCHEDULE OF INVESTMENTS
October 31, 2021
| Security Description |
Shares | Fair Value | ||||||
| CHINA (Continued) |
||||||||
| Canny Elevator Co., Ltd., Class A |
100 | $ | 114 | |||||
| *Capital Environment Holdings, Ltd. |
8,000 | 188 | ||||||
| CCS Supply Chain Management Co., Ltd., Class A |
200 | 170 | ||||||
| CECEP Solar Energy Co., Ltd., Class A |
200 | 348 | ||||||
| CECEP Wind-Power Corp., Class A |
75,500 | 86,670 | ||||||
| Central China Management Co., Ltd. |
2,000 | 311 | ||||||
| #Central China Real Estate, Ltd. |
2,000 | 301 | ||||||
| #CGN New Energy Holdings Co., Ltd. |
64,000 | 59,894 | ||||||
| CGN Nuclear Technology Development Co., Ltd., Class A |
100 | 139 | ||||||
| Cgn Power Co., Ltd., Class H |
19,000 | 5,129 | ||||||
| Chacha Food Co., Ltd., Class A |
100 | 889 | ||||||
| Changchun High & New Technology Industry Group, Inc., Class A |
100 | 4,260 | ||||||
| Changjiang Securities Co., Ltd., Class A |
400 | 452 | ||||||
| Changzhou Tronly New Electronic Materials Co., Ltd., Class A |
100 | 185 | ||||||
| Chaozhou Three-Circle Group Co., Ltd., Class A |
200 | 1,249 | ||||||
| Chengdu Kanghong Pharmaceutical Group Co., Ltd., Class A |
18,700 | 53,331 | ||||||
| Chengdu Xingrong Environment Co., Ltd., Class A |
100 | 92 | ||||||
| China Aerospace International Holdings, Ltd. |
4,000 | 298 | ||||||
| *China Agri-Products Exchange, Ltd. |
5,000 | 68 | ||||||
| China Aoyuan Group, Ltd. |
130,000 | 51,304 | ||||||
| China Baoan Group Co., Ltd., Class A |
61,500 | 200,847 | ||||||
| *China CAMC Engineering Co., Ltd., Class A |
200 | 202 | ||||||
| China Cinda Asset Management Co., Ltd., Class H |
1,659,000 | 277,245 | ||||||
| China CITIC Bank Corp., Ltd., Class H |
780,000 | 342,921 | ||||||
| China Coal Energy Co., Ltd., Class H |
3,000 | 1,828 | ||||||
| China Conch Venture Holdings, Ltd. |
155,000 | 757,162 | ||||||
| China Construction Bank Corp., Class H |
5,352,000 | 3,639,529 | ||||||
| *China CYTS Tours Holding Co., Ltd., Class A |
100 | 156 | ||||||
| China Datang Corp. Renewable Power Co., Ltd., Class H |
141,000 | 59,996 | ||||||
| *China Dili Group |
76,000 | 18,660 | ||||||
| *China Eastern Airlines Corp., Ltd., Sponsored ADR |
422 | 8,157 | ||||||
| China Education Group Holdings, Ltd. |
1,000 | 1,717 | ||||||
| #China Energy Engineering Corp., Ltd., Class H |
4,216 | 623 | ||||||
| China Everbright Bank Co., Ltd., Class H |
5,000 | 1,761 | ||||||
| China Everbright Environment Group, Ltd. |
283,000 | 194,632 | ||||||
| #China Everbright Greentech, Ltd. |
1,000 | 352 | ||||||
| China Express Airlines Co., Ltd., Class A |
100 | 172 | ||||||
| *China Film Co., Ltd., Class A |
100 | 183 | ||||||
| China Foods, Ltd. |
38,000 | 14,557 | ||||||
| *China Fortune Land Development Co., Ltd., Class A |
400 | 230 | ||||||
| China Galaxy Securities Co., Ltd., Class H |
23,500 | 13,111 | ||||||
| China Gas Holdings, Ltd. |
155,000 | 387,747 | ||||||
| China Glass Holdings, Ltd. |
2,000 | 589 | ||||||
| #China Grand Pharmaceutical and Healthcare Holdings, Ltd. |
77,500 | 62,267 | ||||||
| China Great Wall Securities Co., Ltd., Class A |
200 | 356 | ||||||
| China Greatwall Technology Group Co., Ltd., Class A |
200 | 420 | ||||||
| *China Green Agriculture, Inc. |
53 | 577 | ||||||
| China Hanking Holdings, Ltd. |
153,000 | 27,929 | ||||||
| China Harmony Auto Holding, Ltd. |
36,500 | 18,675 | ||||||
| *China High Speed Railway Technology Co., Ltd., Class A |
200 | 68 | ||||||
| #*China High Speed Transmission Equipment Group Co., Ltd. |
1,000 | 776 | ||||||
| China Hongqiao Group, Ltd. |
53,500 | 59,490 | ||||||
| China International Capital Corp., Ltd., Class H |
70,800 | 176,203 | ||||||
| China International Marine Containers Group Co., Ltd., Class H |
14,000 | 27,679 | ||||||
| China Jushi Co., Ltd., Class A |
457 | 1,366 | ||||||
Dimensional Emerging Core Equity Market ETF
SCHEDULE OF INVESTMENTS
October 31, 2021
| Security Description |
Shares | Fair Value | ||||||
| CHINA (Continued) |
||||||||
| China Lesso Group Holdings, Ltd. |
143,000 | $ | 222,063 | |||||
| #China Life Insurance Co., Ltd., Sponsored ADR |
21,798 | 187,899 | ||||||
| China Life Insurance Co., Ltd. |
67,000 | 116,791 | ||||||
| China Lilang, Ltd. |
10,000 | 5,695 | ||||||
| #*China Logistics Property Holdings Co., Ltd. |
1,000 | 537 | ||||||
| China Longyuan Power Group Corp., Ltd., Class H |
301,000 | 703,451 | ||||||
| *China Maple Leaf Educational Systems, Ltd. |
4,000 | 643 | ||||||
| *China Medical & HealthCare Group, Ltd. |
20,000 | 257 | ||||||
| China Medical System Holdings, Ltd. |
280,000 | 477,282 | ||||||
| China Meheco Co., Ltd., Class A |
100 | 174 | ||||||
| China Meidong Auto Holdings, Ltd. |
2,000 | 10,387 | ||||||
| China Mengniu Dairy Co., Ltd. |
150,000 | 955,451 | ||||||
| China Merchants Bank Co., Ltd., Class H |
144,000 | 1,213,413 | ||||||
| China Merchants Energy Shipping Co., Ltd. |
4,300 | 3,076 | ||||||
| China Merchants Land, Ltd. |
2,000 | 224 | ||||||
| China Merchants Port Holdings Co., Ltd. |
238,000 | 397,735 | ||||||
| China Merchants Securities Co., Ltd., Class H |
600 | 949 | ||||||
| China Merchants Shekou Industrial Zone Holdings Co., Ltd., Class A |
7,400 | 12,055 | ||||||
| #China Minsheng Banking Corp., Ltd., Class H |
399,000 | 158,491 | ||||||
| China Modern Dairy Holdings, Ltd. |
604,000 | 114,137 | ||||||
| China Molybdenum Co., Ltd., Class H |
441,000 | 273,816 | ||||||
| China National Building Material Co., Ltd., Class H |
258,000 | 324,364 | ||||||
| China National Medicines Corp., Ltd., Class A |
100 | 476 | ||||||
| China National Nuclear Power Co., Ltd., Class A |
900 | 963 | ||||||
| China New Higher Education Group, Ltd. |
1,000 | 505 | ||||||
| *China Nonferrous Metal Industry’s Foreign Engineering and Construction Co., Ltd., Class A |
200 | 161 | ||||||
| China Northern Rare Earth Group High-Tech Co., Ltd., Class A |
300 | 2,371 | ||||||
| China Oilfield Services, Ltd., Class H |
50,000 | 48,142 | ||||||
| China Overseas Grand Oceans Group, Ltd. |
181,000 | 86,788 | ||||||
| China Overseas Land & Investment, Ltd. |
31,000 | 68,384 | ||||||
| China Overseas Property Holdings, Ltd. |
60,000 | 53,991 | ||||||
| China Pacific Insurance Group Co., Ltd., Class H |
205,200 | 633,085 | ||||||
| China Petroleum & Chemical Corp. |
472,000 | 231,782 | ||||||
| China Petroleum & Chemical Corp., Sponsored ADR |
6,528 | 317,783 | ||||||
| China Power International Development, Ltd. |
1,039,000 | 522,235 | ||||||
| China Publishing & Media Co., Ltd., Class A |
100 | 85 | ||||||
| #China Railway Signal & Communication Corp., Ltd., Class H |
217,000 | 76,155 | ||||||
| China Railway Tielong Container Logistics Co., Ltd., Class A |
100 | 74 | ||||||
| China Reinsurance Group Corp., Class H |
65,000 | 6,768 | ||||||
| China Renaissance Holdings, Ltd. |
14,600 | 35,134 | ||||||
| China Resources Beer Holdings Co., Ltd. |
2,000 | 16,583 | ||||||
| China Resources Cement Holdings, Ltd. |
282,000 | 237,808 | ||||||
| China Resources Double Crane Pharmaceutical Co., Ltd., Class A |
100 | 178 | ||||||
| #China Resources Gas Group, Ltd. |
2,000 | 10,747 | ||||||
| China Resources Land, Ltd. |
284,000 | 1,106,202 | ||||||
| China Resources Medical Holdings Co., Ltd. |
83,000 | 58,150 | ||||||
| China Resources Pharmaceutical Group, Ltd. |
298,000 | 143,655 | ||||||
| China Resources Power Holdings Co., Ltd. |
2,000 | 5,168 | ||||||
| China Resources Sanjiu Medical & Pharmaceutical Co., Ltd., Class A |
200 | 754 | ||||||
| China Risun Group, Ltd. |
115,000 | 69,777 | ||||||
| *China Ruifeng Renewable Energy Holdings, Ltd. |
4,000 | 102 | ||||||
| China Sanjiang Fine Chemicals Co., Ltd. |
47,000 | 14,138 | ||||||
| China SCE Group Holdings, Ltd. |
588,000 | 183,678 | ||||||
| China Science Publishing & Media, Ltd., Class A |
100 | 129 | ||||||
| #*China Shanshui Cement Group, Ltd. |
2,000 | 514 | ||||||
Dimensional Emerging Core Equity Market ETF
SCHEDULE OF INVESTMENTS
October 31, 2021
| Security Description |
Shares | Fair Value | ||||||
| CHINA (Continued) |
||||||||
| *China Shengmu Organic Milk, Ltd. |
160,000 | $ | 10,901 | |||||
| China Shenhua Energy Co., Ltd., Class H |
240,500 | 518,158 | ||||||
| China Shuifa Singyes Energy Holdings, Ltd. |
1,000 | 278 | ||||||
| #China South City Holdings, Ltd. |
274,000 | 20,429 | ||||||
| China South Publishing & Media Group Co., Ltd., Class A |
200 | 256 | ||||||
| *China Southern Airlines Co., Ltd., Sponsored ADR |
1,036 | 31,329 | ||||||
| *China Southern Airlines Co., Ltd. |
12,000 | 7,312 | ||||||
| China State Construction Engineering Corp., Ltd., Class A |
2,000 | 1,456 | ||||||
| *China Sunshine Paper Holdings Co., Ltd. |
1,000 | 228 | ||||||
| China Suntien Green Energy Corp., Ltd., Class H |
284,000 | 226,352 | ||||||
| China Taiping Insurance Holdings Co., Ltd. |
203,400 | 311,151 | ||||||
| *China Tianrui Group Cement Co., Ltd. |
2,000 | 1,723 | ||||||
| *China Tianying, Inc., Class A |
600 | 444 | ||||||
| China Tourism Group Duty Free Corp., Ltd., Class A |
14,100 | 591,202 | ||||||
| China Tower Corp., Ltd., Class H |
3,564,000 | 462,735 | ||||||
| China Traditional Chinese Medicine Holdings Co., Ltd. |
380,000 | 180,742 | ||||||
| China TransInfo Technology Co., Ltd., Class A |
44,800 | 93,620 | ||||||
| China Vanke Co., Ltd., Class H |
143,319 | 335,680 | ||||||
| #China Vast Industrial Urban Development Co., Ltd. |
1,000 | 289 | ||||||
| China Water Affairs Group, Ltd. |
36,000 | 37,115 | ||||||
| China World Trade Center Co., Ltd., Class A |
200 | 424 | ||||||
| China Xinhua Education Group, Ltd. |
1,000 | 213 | ||||||
| China XLX Fertiliser, Ltd. |
44,000 | 30,883 | ||||||
| China Yongda Automobiles Services Holdings, Ltd. |
206,500 | 330,228 | ||||||
| #China Yuhua Education Corp., Ltd. |
46,000 | 20,933 | ||||||
| China Zhenhua Group Science & Technology Co., Ltd., Class A |
4,400 | 71,195 | ||||||
| China Zheshang Bank Co., Ltd., Class H |
3,000 | 1,211 | ||||||
| China Zhonghua Geotechnical Engineering Group Co., Ltd., Class A |
100 | 42 | ||||||
| *»China Zhongwang Holdings, Ltd. |
250,000 | 53,991 | ||||||
| Chinasoft International, Ltd. |
4,000 | 6,695 | ||||||
| Chongqing Changan Automobile Co., Ltd., Class A |
1,400 | 4,264 | ||||||
| Chongqing Dima Industry Co., Ltd., Class A |
400 | 144 | ||||||
| Chongqing Fuling Electric Power Industrial Co., Ltd., Class A |
62,320 | 164,008 | ||||||
| Chongqing Machinery & Electric Co., Ltd., Class H |
2,000 | 183 | ||||||
| #Chongqing Rural Commercial Bank Co., Ltd., Class H |
109,000 | 39,234 | ||||||
| Chongqing Zhifei Biological Products Co., Ltd., Class A |
14,100 | 330,770 | ||||||
| Chongqing Zongshen Power Machinery Co., Ltd., Class A |
200 | 205 | ||||||
| Chow Tai Seng Jewellery Co., Ltd., Class A |
300 | 886 | ||||||
| CIFI Holdings Group Co., Ltd. |
724,000 | 402,065 | ||||||
| CIMC Enric Holdings, Ltd. |
52,000 | 67,247 | ||||||
| *Cinda Real Estate Co., Ltd., Class A |
200 | 100 | ||||||
| Cisen Pharmaceutical Co., Ltd., Class A |
100 | 188 | ||||||
| *CITIC Guoan Information Industry Co., Ltd., Class A |
900 | 316 | ||||||
| *CITIC Resources Holdings, Ltd. |
4,000 | 283 | ||||||
| CITIC Securities Co., Ltd., Class H |
334,000 | 850,988 | ||||||
| CITIC, Ltd. |
369,000 | 369,994 | ||||||
| *Citychamp Watch & Jewellery Group, Ltd. |
2,000 | 337 | ||||||
| CMST Development Co., Ltd., Class A |
300 | 287 | ||||||
| CNHTC Jinan Truck Co., Ltd., Class A |
140 | 290 | ||||||
| CNOOC Energy Technology & Services, Ltd., Class A |
700 | 316 | ||||||
| COFCO Biotechnology Co., Ltd., Class A |
200 | 332 | ||||||
| #COFCO Joycome Foods, Ltd. |
141,000 | 54,739 | ||||||
| *Cogobuy Group |
1,000 | 369 | ||||||
| Colour Life Services Group Co., Ltd. |
1,000 | 176 | ||||||
| #*Comba Telecom Systems Holdings, Ltd. |
2,000 | 558 | ||||||
Dimensional Emerging Core Equity Market ETF
SCHEDULE OF INVESTMENTS
October 31, 2021
| Security Description |
Shares | Fair Value | ||||||
| CHINA (Continued) |
||||||||
| Concord New Energy Group, Ltd. |
700,000 | $ | 73,788 | |||||
| Consun Pharmaceutical Group, Ltd. |
1,000 | 432 | ||||||
| Contemporary Amperex Technology Co., Ltd., Class A |
100 | 9,984 | ||||||
| *Coolpad Group, Ltd. |
6,000 | 316 | ||||||
| COSCO SHIPPING Development Co., Ltd., Class H |
73,000 | 14,170 | ||||||
| COSCO SHIPPING Energy Transportation Co., Ltd., Class H |
2,000 | 884 | ||||||
| #*COSCO SHIPPING Holdings Co., Ltd., Class H |
493,399 | 766,194 | ||||||
| *Cosmo Lady China Holdings Co., Ltd. |
1,000 | 72 | ||||||
| Country Garden Holdings Co., Ltd. |
555,000 | 521,535 | ||||||
| Country Garden Services Holdings Co., Ltd. |
133,000 | 1,034,381 | ||||||
| CP Pokphand Co., Ltd. |
678,000 | 95,873 | ||||||
| CPMC Holdings, Ltd. |
38,000 | 18,563 | ||||||
| CSC Financial Co., Ltd., Class H |
1,000 | 1,061 | ||||||
| CSG Holding Co., Ltd., Class A |
200 | 282 | ||||||
| CSPC Pharmaceutical Group, Ltd. |
572,000 | 598,541 | ||||||
| CSSC Science & Technology Co., Ltd., Class A |
4,600 | 9,196 | ||||||
| CTS International Logistics Corp., Ltd., Class A |
200 | 386 | ||||||
| *Cybernaut International Holdings Co., Ltd. |
4,000 | 98 | ||||||
| Daan Gene Co., Ltd., Class A |
160 | 481 | ||||||
| Dali Foods Group Co., Ltd. |
8,500 | 4,731 | ||||||
| Dalian Huarui Heavy Industry Group Co., Ltd., Class A |
100 | 60 | ||||||
| Daqin Railway Co., Ltd., Class A |
17,900 | 17,753 | ||||||
| Dare Power Dekor Home Co., Ltd., Class A |
100 | 182 | ||||||
| DaShenLin Pharmaceutical Group Co., Ltd., Class A |
22,260 | 122,969 | ||||||
| Datang International Power Generation Co., Ltd., Class H |
16,000 | 2,900 | ||||||
| Deppon Logistics Co., Ltd., Class A |
200 | 341 | ||||||
| #Dexin China Holdings Co., Ltd. |
23,000 | 7,717 | ||||||
| DHC Software Co., Ltd., Class A |
43,100 | 46,717 | ||||||
| Dian Diagnostics Group Co., Ltd., Class A |
100 | 503 | ||||||
| Digital China Group Co., Ltd., Class A |
100 | 233 | ||||||
| Digital China Information Service Co., Ltd., Class A |
100 | 174 | ||||||
| Dong-E-E-Jiao Co., Ltd., Class A |
100 | 635 | ||||||
| *Dongfang Electronics Co., Ltd., Class A |
200 | 192 | ||||||
| Dongfeng Motor Group Co., Ltd., Class H |
4,000 | 3,738 | ||||||
| Dongjiang Environmental Co., Ltd., Class H |
400 | 183 | ||||||
| Dongxing Securities Co., Ltd., Class A |
300 | 514 | ||||||
| Dongyue Group, Ltd. |
430,000 | 1,001,613 | ||||||
| *DouYu International Holdings, Ltd., Sponsored ADR |
5,248 | 16,531 | ||||||
| #Dynagreen Environmental Protection Group Co., Ltd., Class H |
52,000 | 26,605 | ||||||
| East Money Information Co., Ltd., Class A |
67,780 | 348,285 | ||||||
| E-House China Enterprise Holdings, Ltd. |
27,900 | 5,272 | ||||||
| Elion Energy Co., Ltd., Class A |
390 | 302 | ||||||
| *ENN Energy Holdings, Ltd. |
32,800 | 567,956 | ||||||
| Essex Bio-technology, Ltd. |
1,000 | 681 | ||||||
| Eternal Asia Supply Chain Management, Ltd., Class A |
300 | 269 | ||||||
| *Ev Dynamics Holdings, Ltd. |
10,000 | 132 | ||||||
| EVA Precision Industrial Holdings, Ltd. |
2,000 | 350 | ||||||
| Eve Energy Co., Ltd., Class A |
100 | 1,772 | ||||||
| *Everbright Jiabao Co., Ltd., Class A |
200 | 81 | ||||||
| #Everbright Securities Co., Ltd., Class H |
400 | 313 | ||||||
| Fangda Carbon New Material Co., Ltd., Class A |
300 | 503 | ||||||
| Fangda Special Steel Technology Co., Ltd., Class A |
2,300 | 2,655 | ||||||
| *Fangdd Network Group, Ltd., ADR |
33 | 35 | ||||||
| Fanhua, Inc., ADR |
3,300 | 43,758 | ||||||
| #»Fantasia Holdings Group Co., Ltd. |
3,000 | 216 | ||||||
| FAW Jiefang Group Co., Ltd., Class A |
200 | 325 | ||||||
Dimensional Emerging Core Equity Market ETF
SCHEDULE OF INVESTMENTS
October 31, 2021
| Security Description |
Shares | Fair Value | ||||||
| CHINA (Continued) |
||||||||
| Fiberhome Telecommunication Technologies Co., Ltd., Class A |
100 | $ | 269 | |||||
| *FIH Mobile, Ltd. |
339,000 | 52,730 | ||||||
| Financial Street Holdings Co., Ltd., Class A |
300 | 274 | ||||||
| First Capital Securities Co., Ltd., Class A |
1,500 | 1,600 | ||||||
| Focus Media Information Technology Co., Ltd., Class A |
27,800 | 31,957 | ||||||
| Foshan Haitian Flavouring & Food Co., Ltd., Class A |
53,590 | 979,446 | ||||||
| Foshan Nationstar Optoelectronics Co., Ltd., Class A |
100 | 159 | ||||||
| #Fosun International, Ltd. |
173,000 | 203,489 | ||||||
| Founder Securities Co., Ltd., Class A |
700 | 892 | ||||||
| Fu Shou Yuan International Group, Ltd. |
152,000 | 130,720 | ||||||
| Fuan Pharmaceutical Group Co., Ltd., Class A |
100 | 62 | ||||||
| Fufeng Group, Ltd. |
145,000 | 50,141 | ||||||
| Fujian Longking Co., Ltd., Class A |
100 | 127 | ||||||
| Fujian Sunner Development Co., Ltd., Class A |
200 | 701 | ||||||
| #*Futu Holdings, Ltd., ADR |
249 | 13,326 | ||||||
| Fuyao Glass Industry Group Co., Ltd., Class H |
56,400 | 325,536 | ||||||
| Gansu Qilianshan Cement Group Co., Ltd., Class A |
100 | 151 | ||||||
| Gansu Shangfeng Cement Co., Ltd., Class A |
100 | 272 | ||||||
| #*GCL New Energy Holdings, Ltd. |
26,000 | 1,220 | ||||||
| *GCL-Poly Energy Holdings, Ltd. |
905,000 | 172,762 | ||||||
| GD Power Development Co., Ltd., Class A |
1,800 | 784 | ||||||
| *GDS Holdings, Ltd. |
11,200 | 85,954 | ||||||
| *GDS Holdings, Ltd., Sponsored ADR |
1,634 | 97,060 | ||||||
| Geely Automobile Holdings, Ltd. |
435,000 | 1,512,621 | ||||||
| GEM Co., Ltd., Class A |
400 | 681 | ||||||
| Gemdale Corp., Class A |
34,400 | 54,533 | ||||||
| Gemdale Properties & Investment Corp., Ltd. |
584,000 | 57,056 | ||||||
| *Genimous Technology Co., Ltd., Class A |
100 | 94 | ||||||
| GF Securities Co., Ltd., Class H |
2,600 | 4,419 | ||||||
| Giant Network Group Co., Ltd., Class A |
100 | 155 | ||||||
| *Global Top E-Commerce Co., Ltd., Class A |
200 | 71 | ||||||
| *Glorious Property Holdings, Ltd. |
3,000 | 94 | ||||||
| *Glory Sun Financial Group, Ltd. |
280,000 | 9,718 | ||||||
| GoerTek, Inc., Class A |
300 | 2,040 | ||||||
| Golden Eagle Retail Group, Ltd. |
1,000 | 870 | ||||||
| *GOME Retail Holdings, Ltd. |
540,000 | 54,840 | ||||||
| *Gosuncn Technology Group Co., Ltd., Class A |
300 | 208 | ||||||
| *Gotion High-tech Co., Ltd., Class A |
100 | 920 | ||||||
| *Grand Baoxin Auto Group, Ltd. |
500 | 57 | ||||||
| Grandblue Environment Co., Ltd., Class A |
100 | 345 | ||||||
| *Grandjoy Holdings Group Co., Ltd., Class A |
300 | 154 | ||||||
| Great Wall Motor Co., Ltd., Class H |
89,500 | 403,835 | ||||||
| Greattown Holdings, Ltd., Class A |
300 | 166 | ||||||
| Greatview Aseptic Packaging Co., Ltd. |
55,000 | 22,625 | ||||||
| Gree Electric Appliances, Inc. of Zhuhai, Class A |
200 | 1,145 | ||||||
| *Gree Real Estate Co., Ltd., Class A |
100,200 | 105,009 | ||||||
| Greenland Holdings Corp., Ltd., Class A |
18,100 | 11,619 | ||||||
| #Greenland Hong Kong Holdings, Ltd. |
2,000 | 427 | ||||||
| Greentown China Holdings, Ltd. |
1,500 | 2,075 | ||||||
| GRG Banking Equipment Co., Ltd., Class A |
200 | 324 | ||||||
| Guangdong Baolihua New Energy Stock Co., Ltd., Class A |
200 | 179 | ||||||
| *Guangdong Dongfang Precision Science & Technology Co., Ltd., Class A |
100 | 85 | ||||||
| Guangdong Ellington Electronics Technology Co., Ltd., Class A |
200 | 208 | ||||||
| Guangdong Haid Group Co., Ltd., Class A |
200 | 2,051 | ||||||
| *Guangdong HEC Technology Holding Co., Ltd., Class A |
100 | 166 | ||||||
Dimensional Emerging Core Equity Market ETF
SCHEDULE OF INVESTMENTS
October 31, 2021
| Security Description |
Shares | Fair Value | ||||||
| CHINA (Continued) |
||||||||
| Guangdong Hongda Blasting Co., Ltd., Class A |
100 | $ | 430 | |||||
| Guangdong Huatie Tongda High-speed Railway Equipment Corp., Class A |
200 | 141 | ||||||
| Guangdong Investment, Ltd. |
282,000 | 355,262 | ||||||
| *Guangdong Shenglu Telecommunication Tech Co., Ltd., Class A |
100 | 82 | ||||||
| Guangdong Shirongzhaoye Co., Ltd., Class A |
100 | 76 | ||||||
| Guangdong Tapai Group Co., Ltd., Class A |
200 | 315 | ||||||
| Guangdong Xinbao Electrical Appliances Holdings Co., Ltd., Class A |
100 | 350 | ||||||
| Guangdong Zhongsheng Pharmaceutical Co., Ltd., Class A |
100 | 132 | ||||||
| *Guanghui Energy Co., Ltd., Class A |
114,800 | 118,517 | ||||||
| *Guangshen Railway Co., Ltd., Class H |
2,000 | 352 | ||||||
| Guangxi Guidong Electric Power Co., Ltd., Class A |
100 | 91 | ||||||
| Guangxi Liugong Machinery Co., Ltd., Class A |
200 | 232 | ||||||
| Guangxi Wuzhou Zhongheng Group Co., Ltd., Class A |
300 | 143 | ||||||
| Guangzhou Automobile Group Co., Ltd., Class H |
288,000 | 272,486 | ||||||
| Guangzhou Baiyun International Airport Co., Ltd., Class A |
200 | 370 | ||||||
| Guangzhou Haige Communications Group, Inc. Co., Class A |
200 | 295 | ||||||
| Guangzhou Kingmed Diagnostics Group Co., Ltd., Class A |
100 | 1,788 | ||||||
| #Guangzhou R&F Properties Co., Ltd., Class H |
74,800 | 46,924 | ||||||
| Guangzhou Shiyuan Electronic Technology Co., Ltd., Class A |
15,900 | 188,733 | ||||||
| Guangzhou Tinci Materials Technology Co., Ltd., Class A |
170 | 4,379 | ||||||
| *Guizhou Bailing Group Pharmaceutical Co., Ltd., Class A |
100 | 92 | ||||||
| *Guizhou Broadcasting & TV Information Network Co., Ltd., Class A |
100 | 68 | ||||||
| Guizhou Panjiang Refined Coal Co., Ltd., Class A |
100 | 120 | ||||||
| *Guizhou Xinbang Pharmaceutical Co., Ltd., Class A |
200 | 213 | ||||||
| Guomai Technologies, Inc., Class A |
100 | 89 | ||||||
| *Guorui Properties, Ltd. |
2,000 | 89 | ||||||
| Guosen Securities Co., Ltd., Class A |
25,100 | 44,691 | ||||||
| *Guosheng Financial Holding, Inc., Class A |
1,000 | 1,457 | ||||||
| Guotai Junan Securities Co., Ltd., Class H |
1,000 | 1,368 | ||||||
| Guoyuan Securities Co., Ltd., Class A |
300 | 348 | ||||||
| *Haichang Ocean Park Holdings, Ltd. |
1,000 | 253 | ||||||
| Haier Smart Home Co., Ltd. |
36,400 | 136,166 | ||||||
| Haier Smart Home Co., Ltd., Class A |
24,500 | 104,081 | ||||||
| *Hailiang Education Group, Inc., Sponsored ADR |
319 | 9,730 | ||||||
| *Hainan Meilan International Airport Co., Ltd. |
12,000 | 48,669 | ||||||
| Hainan Ruize New Building Material Co., Ltd., Class A |
100 | 55 | ||||||
| Hainan Strait Shipping Co., Ltd., Class A |
150 | 132 | ||||||
| Haisco Pharmaceutical Group Co., Ltd., Class A |
100 | 263 | ||||||
| Haitian International Holdings, Ltd. |
1,000 | 2,931 | ||||||
| Haitong Securities Co., Ltd., Class H |
6,400 | 5,701 | ||||||
| Hand Enterprise Solutions Co., Ltd., Class A |
100 | 103 | ||||||
| *Hang Zhou Great Star Industrial Co., Ltd., Class A |
100 | 500 | ||||||
| Hangxiao Steel Structure Co., Ltd., Class A |
376,500 | 209,928 | ||||||
| Hangzhou Binjiang Real Estate Group Co., Ltd., Class A |
2,300 | 1,466 | ||||||
| Hangzhou Century Co., Ltd., Class A |
100 | 96 | ||||||
| Hangzhou Oxygen Plant Group Co., Ltd., Class A |
200 | 809 | ||||||
| Hangzhou Robam Appliances Co., Ltd., Class A |
100 | 489 | ||||||
| Hangzhou Silan Microelectronics Co., Ltd., Class A |
100 | 963 | ||||||
| Han’s Laser Technology Industry Group Co., Ltd., Class A |
24,800 | 166,012 | ||||||
| *Harbin Bank Co., Ltd., Class H |
5,000 | 514 | ||||||
| *Harbin Gloria Pharmaceuticals Co., Ltd., Class A |
300 | 112 | ||||||
| *HC Group, Inc. |
1,000 | 103 | ||||||
| Health & Happiness H&H International Holdings, Ltd. |
10,500 | 24,647 | ||||||
| Hebei Chengde Lolo Co., Class A |
100 | 162 | ||||||
| Hefei Meiya Optoelectronic Technology, Inc., Class A |
100 | 631 | ||||||
| Heilongjiang Agriculture Co., Ltd., Class A |
100 | 215 | ||||||
Dimensional Emerging Core Equity Market ETF
SCHEDULE OF INVESTMENTS
October 31, 2021
| Security Description |
Shares | Fair Value | ||||||
| CHINA (Continued) |
||||||||
| Hello Group, Inc., ADR |
16,643 | $ | 207,205 | |||||
| Henan Lingrui Pharmaceutical Co., Class A |
100 | 168 | ||||||
| Henan Pinggao Electric Co., Ltd., Class A |
200 | 276 | ||||||
| *Henan Rebecca Hair Products Co., Ltd., Class A |
200 | 83 | ||||||
| *Henan Senyuan Electric Co., Ltd., Class A |
100 | 41 | ||||||
| Henan Shenhuo Coal & Power Co., Ltd., Class A |
200 | 296 | ||||||
| Henan Shuanghui Investment & Development Co., Ltd., Class A |
400 | 1,843 | ||||||
| Henan Yuguang Gold & Lead Co., Ltd., Class A |
100 | 84 | ||||||
| Henan Zhongyuan Expressway Co., Ltd., Class A |
200 | 98 | ||||||
| Hengan International Group Co., Ltd. |
70,500 | 368,403 | ||||||
| Hengdian Group DMEGC Magnetics Co., Ltd., Class A |
400 | 883 | ||||||
| Hengli Petrochemical Co., Ltd., Class A |
20,000 | 68,846 | ||||||
| Hengtong Optic-electric Co., Ltd., Class A |
200 | 475 | ||||||
| Hengyi Petrochemical Co., Ltd., Class A |
37,900 | 64,817 | ||||||
| Hesteel Co., Ltd., Class A |
1,700 | 653 | ||||||
| Hexing Electrical Co., Ltd., Class A |
100 | 184 | ||||||
| Hisense Home Appliances Group Co., Ltd., Class H |
1,000 | 1,076 | ||||||
| *Holitech Technology Co., Ltd., Class A |
600 | 305 | ||||||
| Hongda Xingye Co., Ltd., Class A |
200 | 169 | ||||||
| Hongfa Technology Co., Ltd., Class A |
100 | 1,161 | ||||||
| *Honghua Group, Ltd. |
32,000 | 1,090 | ||||||
| *»Honworld Group, Ltd. |
500 | 148 | ||||||
| Hope Education Group Co., Ltd. |
124,000 | 22,316 | ||||||
| Hopson Development Holdings, Ltd. |
2,200 | 6,010 | ||||||
| Huaan Securities Co., Ltd., Class A |
520 | 415 | ||||||
| #Huadian Power International Corp., Ltd., Class H |
572,000 | 212,504 | ||||||
| Huadong Medicine Co., Ltd., Class A |
200 | 1,145 | ||||||
| Huafa Industrial Co., Ltd. Zhuhai, Class A |
300 | 246 | ||||||
| Huafon Chemical Co., Ltd., Class A |
11,000 | 20,427 | ||||||
| *Huafon Microfibre Shanghai Technology Co., Ltd., Class A |
100 | 71 | ||||||
| *Huafu Fashion Co., Ltd., Class A |
300 | 207 | ||||||
| Huagong Tech Co., Ltd., Class A |
100 | 450 | ||||||
| Hualan Biological Engineering, Inc., Class A |
22,000 | 102,051 | ||||||
| Huaneng Power International, Inc., Sponsored ADR |
1,108 | 22,725 | ||||||
| #Huaneng Power International, Inc., Class H |
40,000 | 20,722 | ||||||
| Huapont Life Sciences Co., Ltd., Class A |
200 | 194 | ||||||
| Huatai Securities Co., Ltd., Class H |
2,000 | 2,982 | ||||||
| *Huawen Media Group, Class A |
100 | 36 | ||||||
| Huaxi Securities Co., Ltd., Class A |
300 | 424 | ||||||
| Huaxia Bank Co., Ltd., Class A |
1,100 | 967 | ||||||
| Huaxin Cement Co., Ltd., Class A |
100 | 261 | ||||||
| Huayu Automotive Systems Co., Ltd., Class A |
3,200 | 13,364 | ||||||
| *Huazhu Group, Ltd., Sponsored ADR |
6,740 | 312,466 | ||||||
| *Huazhu Group, Ltd. |
13,200 | 61,851 | ||||||
| Hubei Biocause Pharmaceutical Co., Ltd., Class A |
400 | 203 | ||||||
| Hubei Energy Group Co., Ltd., Class A |
500 | 387 | ||||||
| Hubei Jumpcan Pharmaceutical Co., Ltd., Class A |
200 | 503 | ||||||
| *Hubei Kaile Science & Technology Co., Ltd., Class A |
200 | 80 | ||||||
| Hubei Xingfa Chemicals Group Co., Ltd., Class A |
100 | 775 | ||||||
| *Hunan Gold Corp., Ltd., Class A |
100 | 169 | ||||||
| Hunan New Wellful Co., Ltd., Class A |
200 | 217 | ||||||
| Hunan Valin Steel Co., Ltd., Class A |
2,100 | 1,751 | ||||||
| Hundsun Technologies, Inc., Class A |
140 | 1,378 | ||||||
| Huolinhe Opencut Coal Industry Corp., Ltd., Class A |
195,600 | 387,369 | ||||||
| *HUYA, Inc., Sponsored ADR |
91 | 748 | ||||||
Dimensional Emerging Core Equity Market ETF
SCHEDULE OF INVESTMENTS
October 31, 2021
| Security Description |
Shares | Fair Value | ||||||
| CHINA (Continued) |
||||||||
| HY Energy Group Co., Ltd., Class A |
100 | $ | 75 | |||||
| Hytera Communications Corp., Ltd., Class A |
300 | 264 | ||||||
| *HyUnion Holding Co., Ltd., Class A |
100 | 87 | ||||||
| #*iDreamSky Technology Holdings, Ltd. |
32,000 | 22,831 | ||||||
| Iflytek Co., Ltd., Class A |
28,600 | 252,021 | ||||||
| IMAX China Holding, Inc. |
100 | 147 | ||||||
| Industrial & Commercial Bank of China, Ltd., Class H |
3,178,000 | 1,740,351 | ||||||
| Industrial Bank Co., Ltd., Class A |
5,700 | 16,585 | ||||||
| Industrial Securities Co., Ltd., Class A |
600 | 856 | ||||||
| Infore Environment Technology Group Co., Ltd., Class A |
300 | 293 | ||||||
| *Inner Mongolia BaoTou Steel Union Co., Ltd., Class A |
293,700 | 128,898 | ||||||
| Inner Mongolia Eerduosi Resources Co., Ltd., Class A |
100 | 462 | ||||||
| Inner Mongolia Junzheng Energy & Chemical Industry Group Co., Ltd., Class A |
14,300 | 11,458 | ||||||
| Inner Mongolia MengDian HuaNeng Thermal Power Corp., Ltd., Class A |
16,100 | 9,002 | ||||||
| Inner Mongolia Yili Industrial Group Co., Ltd., Class A |
38,500 | 258,563 | ||||||
| Inner Mongolia Yitai Coal Co., Ltd., Class H |
200 | 152 | ||||||
| *Inner Mongolia Yuan Xing Energy Co., Ltd., Class A |
4,000 | 4,735 | ||||||
| *Innuovo Technology Co., Ltd., Class A |
100 | 83 | ||||||
| Inspur Electronic Information Industry Co., Ltd., Class A |
100 | 485 | ||||||
| *Iqiyi, Inc., Sponsored ADR |
913 | 7,560 | ||||||
| Jafron Biomedical Co., Ltd., Class A |
20,400 | 164,661 | ||||||
| Jason Furniture Hangzhou Co., Ltd., Class A |
100 | 972 | ||||||
| *JD.com, Inc. |
24,800 | 989,571 | ||||||
| *JD.com, Inc., Sponsored ADR |
18,042 | 1,412,328 | ||||||
| Jiajiayue Group Co., Ltd., Class A |
100 | 230 | ||||||
| *Jiangnan Group, Ltd. |
4,000 | 154 | ||||||
| Jiangsu Changshu Rural Commercial Bank Co., Ltd., Class A |
400 | 454 | ||||||
| Jiangsu Eastern Shenghong Co., Ltd., Class A |
12,600 | 53,626 | ||||||
| *Jiangsu Etern Co., Ltd., Class A |
200 | 121 | ||||||
| Jiangsu Expressway Co., Ltd., Class H |
2,000 | 1,892 | ||||||
| Jiangsu Hengli Hydraulic Co., Ltd., Class A |
19,600 | 251,325 | ||||||
| Jiangsu Hengrui Medicine Co., Ltd., Class A |
16,780 | 129,047 | ||||||
| Jiangsu Hengshun Vinegar Industry Co., Ltd., Class A |
100 | 252 | ||||||
| Jiangsu Jiangyin Rural Commercial Bank Co., Ltd., Class A |
300 | 179 | ||||||
| *Jiangsu Kanion Pharmaceutical Co., Ltd., Class A |
100 | 146 | ||||||
| *Jiangsu Leike Defense Technology Co., Ltd., Class A |
300 | 269 | ||||||
| Jiangsu Nhwa Pharmaceutical Co., Ltd., Class A |
200 | 459 | ||||||
| Jiangsu Provincial Agricultural Reclamation and Development Corp. |
100 | 174 | ||||||
| Jiangsu Shagang Co., Ltd., Class A |
700 | 679 | ||||||
| Jiangsu Yanghe Brewery Joint-Stock Co., Ltd., Class A |
14,700 | 427,452 | ||||||
| Jiangsu Yuyue Medical Equipment & Supply Co., Ltd., Class A |
200 | 1,100 | ||||||
| Jiangsu Zhangjiagang Rural Commercial Bank Co., Ltd., Class A |
300 | 290 | ||||||
| Jiangsu Zhongnan Construction Group Co., Ltd., Class A |
400 | 239 | ||||||
| Jiangsu Zhongtian Technology Co., Ltd., Class A |
400 | 632 | ||||||
| Jiangsu Zijin Rural Commercial Bank Co., Ltd., Class A |
700 | 351 | ||||||
| Jiangxi Bank Co., Ltd., Class H |
2,500 | 1,099 | ||||||
| Jiangxi Copper Co., Ltd., Class H |
141,000 | 246,871 | ||||||
| Jiangxi Huangshanghuang Group Food Co., Ltd., Class A |
100 | 216 | ||||||
| Jiangxi Wannianqing Cement Co., Ltd., Class A |
200 | 359 | ||||||
| Jiangxi Zhengbang Technology Co., Ltd., Class A |
9,800 | 15,337 | ||||||
| Jiangzhong Pharmaceutical Co., Ltd., Class A |
100 | 180 | ||||||
| *Jiayin Group, Inc., ADR |
330 | 1,254 | ||||||
| Jiayuan International Group, Ltd. |
92,000 | 35,598 | ||||||
| *Jilin Electric Power Co., Ltd., Class A |
200 | 236 | ||||||
| *Jinchuan Group International Resources Co., Ltd. |
365,000 | 58,651 | ||||||
| Jinduicheng Molybdenum Co., Ltd., Class A |
200 | 227 | ||||||
Dimensional Emerging Core Equity Market ETF
SCHEDULE OF INVESTMENTS
October 31, 2021
| Security Description |
Shares | Fair Value | ||||||
| CHINA (Continued) |
||||||||
| #Jingrui Holdings, Ltd. |
1,000 | $ | 280 | |||||
| Jinke Properties Group Co., Ltd., Class A |
600 | 416 | ||||||
| #*JinkoSolar Holding Co., Ltd., Sponsored ADR |
3,210 | 192,022 | ||||||
| *Jinneng Holding Shanxi Coal Industry Co., Ltd., Class A |
200 | 335 | ||||||
| Jinneng Science&Technology Co., Ltd., Class A |
100 | 221 | ||||||
| Jinyu Bio-Technology Co., Ltd., Class A |
100 | 249 | ||||||
| JiuGui Liquor Co., Ltd., Class A |
100 | 3,357 | ||||||
| Jiuzhitang Co., Ltd., Class A |
100 | 133 | ||||||
| Jizhong Energy Resources Co., Ltd., Class A |
200 | 196 | ||||||
| Jnby Design, Ltd. |
11,500 | 19,307 | ||||||
| Joincare Pharmaceutical Group Industry Co., Ltd., Class A |
200 | 360 | ||||||
| Jointo Energy Investment Co., Ltd. Hebei, Class A |
300 | 240 | ||||||
| Jointown Pharmaceutical Group Co., Ltd., Class A |
300 | 637 | ||||||
| Jonjee Hi-Tech Industrial And Commercial Holding Co., Ltd., Class A |
400 | 2,271 | ||||||
| Joy City Property, Ltd. |
6,000 | 312 | ||||||
| Joyoung Co., Ltd., Class A |
8,600 | 31,363 | ||||||
| JSTI Group, Class A |
100 | 88 | ||||||
| Ju Teng International Holdings, Ltd. |
2,000 | 342 | ||||||
| Juewei Food Co., Ltd., Class A |
400 | 4,114 | ||||||
| Juneyao Airlines Co., Ltd., Class A |
200 | 497 | ||||||
| #Kaisa Group Holdings, Ltd. |
151,428 | 23,359 | ||||||
| Kaishan Group Co., Ltd., Class A |
100 | 283 | ||||||
| *Kangda International Environmental Co., Ltd. |
1,000 | 105 | ||||||
| *Kasen International Holdings, Ltd. |
1,000 | 93 | ||||||
| Kinetic Mines and Energy, Ltd. |
2,000 | 167 | ||||||
| *Kingboard Holdings, Ltd. |
70,500 | 308,588 | ||||||
| Kingboard Laminates Holdings, Ltd. |
146,000 | 228,974 | ||||||
| *Kingdee International Software Group Co., Ltd. |
141,000 | 465,828 | ||||||
| Kingsoft Corp., Ltd. |
3,800 | 16,340 | ||||||
| Konka Group Co., Ltd., Class A |
300 | 263 | ||||||
| KPC Pharmaceuticals, Inc., Class A |
100 | 130 | ||||||
| *Kuang-Chi Technologies Co., Ltd., Class A |
100 | 320 | ||||||
| Kunlun Energy Co., Ltd. |
246,000 | 225,159 | ||||||
| Kweichow Moutai Co., Ltd., Class A |
300 | 85,561 | ||||||
| KWG Group Holdings, Ltd. |
73,500 | 64,249 | ||||||
| *Launch Tech Co., Ltd., Class H |
500 | 193 | ||||||
| LB Group Co., Ltd., Class A |
200 | 887 | ||||||
| Lee & Man Paper Manufacturing, Ltd. |
2,000 | 1,501 | ||||||
| Lee’s Pharmaceutical Holdings, Ltd. |
500 | 235 | ||||||
| Legend Holdings Corp., Class H |
5,100 | 8,969 | ||||||
| *Lenovo Group, Ltd. |
552,000 | 600,320 | ||||||
| Lens Technology Co., Ltd., Class A |
300 | 997 | ||||||
| Leo Group Co., Ltd., Class A |
10,700 | 3,810 | ||||||
| Lepu Medical Technology Beijing Co., Ltd., Class A |
200 | 666 | ||||||
| Leyard Optoelectronic Co., Ltd., Class A |
300 | 441 | ||||||
| *LI Auto, Inc., ADR |
51 | 1,664 | ||||||
| Li Ning Co., Ltd. |
72,000 | 800,612 | ||||||
| *Lianhua Supermarket Holdings Co., Ltd., Class H |
1,000 | 123 | ||||||
| Liaoning Port Co., Ltd. |
2,000 | 185 | ||||||
| *Lifetech Scientific Corp. |
218,000 | 101,447 | ||||||
| *LingNan Eco&Culture-Tourism Co., Ltd., Class A |
200 | 83 | ||||||
| *Lingyi iTech Guangdong Co, Class A |
67,900 | 70,629 | ||||||
| Lionco Pharmaceutical Group Co., Ltd., Class A |
100 | 127 | ||||||
| Livzon Pharmaceutical Group, Inc., Class H |
400 | 1,321 | ||||||
| LK Technology Holdings, Ltd. |
11,000 | 27,687 | ||||||
Dimensional Emerging Core Equity Market ETF
SCHEDULE OF INVESTMENTS
October 31, 2021
| Security Description |
Shares | Fair Value | ||||||
| CHINA (Continued) |
||||||||
| Logan Group Co., Ltd. |
3,000 | $ | 3,012 | |||||
| Loncin Motor Co., Ltd., Class A |
100 | 68 | ||||||
| Long Yuan Construction Group Co., Ltd., Class A |
200 | 225 | ||||||
| Longfor Group Holdings, Ltd. |
183,500 | 891,664 | ||||||
| LONGi Green Energy Technology Co., Ltd., Class A |
40,920 | 624,342 | ||||||
| Lonking Holdings, Ltd. |
208,000 | 60,964 | ||||||
| Luenmei Quantum Co., Ltd., Class A |
126,600 | 163,324 | ||||||
| *Luoniushan Co., Ltd., Class A |
100 | 107 | ||||||
| *Luoyang Glass Co., Ltd., Class H |
16,000 | 23,324 | ||||||
| Luxi Chemical Group Co., Ltd., Class A |
200 | 512 | ||||||
| Luxshare Precision Industry Co., Ltd., Class A |
37,900 | 228,725 | ||||||
| *Luye Pharma Group, Ltd. |
214,000 | 102,061 | ||||||
| Luzhou Laojiao Co., Ltd., Class A |
200 | 7,152 | ||||||
| *LVGEM China Real Estate Investment Co., Ltd. |
2,000 | 455 | ||||||
| Maanshan Iron & Steel Co., Ltd., Class H |
226,000 | 96,454 | ||||||
| Maccura Biotechnology Co., Ltd., Class A |
100 | 435 | ||||||
| *Macrolink Culturaltainment Development Co., Ltd., Class A |
100 | 28 | ||||||
| Mango Excellent Media Co., Ltd., Class A |
400 | 2,455 | ||||||
| *Maoyan Entertainment |
13,000 | 15,742 | ||||||
| Maoye Commercial Co., Ltd., Class A |
200 | 106 | ||||||
| *Markor International Home Furnishings Co., Ltd., Class A |
100 | 53 | ||||||
| *Meinian Onehealth Healthcare Holdings Co., Ltd., Class A |
200 | 226 | ||||||
| *Meitu, Inc. |
314,000 | 68,620 | ||||||
| *Meituan, Class B |
143,000 | 4,955,978 | ||||||
| Metallurgical Corp. of China, Ltd., Class H |
4,000 | 1,111 | ||||||
| Midea Real Estate Holding, Ltd. |
15,800 | 27,257 | ||||||
| Ming Yang Smart Energy Group, Ltd., Class A |
200 | 968 | ||||||
| Minmetals Land, Ltd. |
2,000 | 206 | ||||||
| Minsheng Education Group Co., Ltd. |
2,000 | 291 | ||||||
| Minth Group, Ltd. |
2,000 | 7,996 | ||||||
| *Misho Ecology & Landscape Co., Ltd., Class A |
100 | 40 | ||||||
| MLS Co., Ltd., Class A |
100 | 218 | ||||||
| *MMG, Ltd. |
4,000 | 1,851 | ||||||
| »Modern Land China Co., Ltd. |
2,000 | 98 | ||||||
| #*MOGU, Inc., ADR |
14 | 14 | ||||||
| Muyuan Foods Co., Ltd., Class A |
17,180 | 153,240 | ||||||
| *Myhome Real Estate Development Group Co., Ltd., Class A |
300 | 74 | ||||||
| MYS Group Co., Ltd., Class A |
200 | 102 | ||||||
| NanJi E-Commerce Co., Ltd., Class A |
100 | 112 | ||||||
| Nanjing Iron & Steel Co., Ltd., Class A |
700 | 386 | ||||||
| Nanjing King-Friend Biochemical Pharmaceutical Co., Ltd., Class A |
130 | 753 | ||||||
| *Nanjing Sample Technology Co., Ltd., Class H |
500 | 336 | ||||||
| Nanjing Securities Co., Ltd., Class A |
300 | 455 | ||||||
| Nanjing Xinjiekou Department Store Co., Ltd., Class A |
200 | 305 | ||||||
| NARI Technology Co., Ltd., Class A |
360 | 2,189 | ||||||
| *NavInfo Co., Ltd., Class A |
45,300 | 82,779 | ||||||
| NetDragon Websoft Holdings, Ltd. |
22,500 | 49,460 | ||||||
| NetEase, Inc. |
43,700 | 863,433 | ||||||
| NetEase, Inc., Sponsored ADR |
12,192 | 1,189,817 | ||||||
| *New Century Healthcare Holding Co., Ltd. |
500 | 67 | ||||||
| New China Life Insurance Co., Ltd., Class H |
47,100 | 136,534 | ||||||
| *New Hope Liuhe Co., Ltd., Class A |
36,400 | 81,809 | ||||||
| *New Oriental Education & Technology Group, Inc., Sponsored ADR |
35,332 | 72,431 | ||||||
| *New Oriental Education & Technology Group, Inc. |
23,400 | 48,370 | ||||||
| *New Sparkle Roll International Group, Ltd. |
8,000 | 185 | ||||||
| *New World Department Store China, Ltd. |
1,000 | 172 | ||||||
Dimensional Emerging Core Equity Market ETF
SCHEDULE OF INVESTMENTS
October 31, 2021
| Security Description |
Shares | Fair Value | ||||||
| CHINA (Continued) |
||||||||
| Newland Digital Technology Co., Ltd., Class A |
100 | $ | 236 | |||||
| Nexteer Automotive Group, Ltd. |
99,000 | 122,174 | ||||||
| Nine Dragons Paper Holdings, Ltd. |
281,000 | 353,280 | ||||||
| Ninestar Corp., Class A |
44,700 | 256,428 | ||||||
| Ningbo Construction Co., Ltd., Class A |
300 | 163 | ||||||
| Ningbo Huaxiang Electronic Co., Ltd., Class A |
100 | 370 | ||||||
| Ningbo Joyson Electronic Corp., Class A |
100 | 277 | ||||||
| Ningbo Orient Wires & Cables Co., Ltd., Class A |
200 | 1,409 | ||||||
| Ningbo Sanxing Medical Electric Co., Ltd., Class A |
200 | 380 | ||||||
| Ningbo Tuopu Group Co., Ltd., Class A |
100 | 811 | ||||||
| Ningbo Zhoushan Port Co., Ltd., Class A |
200 | 117 | ||||||
| Ningxia Jiaze New Energy Co., Ltd., Class A |
300 | 255 | ||||||
| *NIO, Inc., Sponsored ADR |
34,442 | 1,357,359 | ||||||
| #*Niu Technologies, ADR |
3,157 | 82,650 | ||||||
| North Huajin Chemical Industries Co., Ltd., Class A |
200 | 184 | ||||||
| Northeast Pharmaceutical Group Co., Ltd., Class A |
100 | 82 | ||||||
| Northeast Securities Co., Ltd., Class A |
300 | 404 | ||||||
| NSFOCUS Technologies Group Co., Ltd., Class A |
100 | 236 | ||||||
| *Oceanwide Holdings Co., Ltd., Class A |
93,300 | 25,938 | ||||||
| Offshore Oil Engineering Co., Ltd., Class A |
500 | 363 | ||||||
| OFILM Group Co., Ltd., Class A |
400 | 467 | ||||||
| Opple Lighting Co., Ltd., Class A |
100 | 303 | ||||||
| ORG Technology Co., Ltd., Class A |
100 | 104 | ||||||
| *Orient Group, Inc., Class A |
800 | 365 | ||||||
| Orient Securities Co., Ltd., Class H |
49,600 | 40,743 | ||||||
| *Ourpalm Co., Ltd., Class A |
32,200 | 19,563 | ||||||
| Ovctek China, Inc., Class A |
35,320 | 377,268 | ||||||
| *Pacific Securities Co., Ltd. (The), Class A |
3,600 | 1,754 | ||||||
| *Pangang Group Vanadium Titanium & Resources Co., Ltd., Class A |
11,300 | 7,060 | ||||||
| #PAX Global Technology, Ltd. |
92,000 | 92,000 | ||||||
| PCI Technology Group Co., Ltd., Class A |
300 | 356 | ||||||
| *Pengdu Agriculture & Animal Husbandry Co., Ltd., Class A |
97,200 | 52,678 | ||||||
| People’s Insurance Co. Group of China, Ltd. (The), Class H |
11,000 | 3,436 | ||||||
| Perfect World Co., Ltd., Class A |
34,700 | 94,192 | ||||||
| PetroChina Co., Ltd. |
326,000 | 157,572 | ||||||
| PetroChina Co., Ltd., Sponsored ADR |
4,394 | 212,054 | ||||||
| PhiChem Corp., Class A |
100 | 277 | ||||||
| PICC Property & Casualty Co., Ltd., Class H |
852,000 | 797,342 | ||||||
| *Pinduoduo, Inc., Sponsored ADR |
10,317 | 917,388 | ||||||
| Ping An Bank Co., Ltd., Class A |
4,200 | 12,791 | ||||||
| *Ping An Healthcare and Technology Co., Ltd. |
13,600 | 66,173 | ||||||
| Ping An Insurance Group Co. of China, Ltd. |
285,000 | 2,048,001 | ||||||
| Pingdingshan Tianan Coal Mining Co., Ltd., Class A |
300 | 398 | ||||||
| *Polaris Bay Group Co., Ltd., Class A |
200 | 288 | ||||||
| Poly Developments and Holdings Group Co., Ltd., Class A |
22,100 | 43,353 | ||||||
| Poly Property Group Co., Ltd. |
164,000 | 40,478 | ||||||
| #Poly Property Services Co., Ltd., Class H |
9,000 | 50,559 | ||||||
| Postal Savings Bank of China Co., Ltd., Class H |
608,000 | 442,378 | ||||||
| *Pou Sheng International Holdings, Ltd. |
170,000 | 28,628 | ||||||
| Power Construction Corp. of China, Ltd., Class A |
2,500 | 3,206 | ||||||
| Powerlong Real Estate Holdings, Ltd. |
75,000 | 51,677 | ||||||
| Prinx Chengshan Holdings, Ltd. |
16,000 | 14,850 | ||||||
| Q Technology Group Co., Ltd. |
36,000 | 52,942 | ||||||
| Qianhe Condiment and Food Co., Ltd., Class A |
120 | 460 | ||||||
| Qingdao East Steel Tower Stock Co., Ltd., Class A |
100 | 122 | ||||||
Dimensional Emerging Core Equity Market ETF
SCHEDULE OF INVESTMENTS
October 31, 2021
| Security Description |
Shares | Fair Value | ||||||
| CHINA (Continued) |
||||||||
| Qingdao Hanhe Cable Co., Ltd., Class A |
41,400 | $ | 27,933 | |||||
| Qingdao TGOOD Electric Co., Ltd., Class A |
100 | 411 | ||||||
| Qingdao Topscomm Communication, Inc., Class A |
100 | 108 | ||||||
| Qinhuangdao Port Co., Ltd., Class H |
1,500 | 241 | ||||||
| Rainbow Digital Commercial Co., Ltd., Class A |
100 | 99 | ||||||
| Rastar Group, Class A |
100 | 48 | ||||||
| Realcan Pharmaceutical Group Co., Ltd., Class A |
100 | 55 | ||||||
| *Red Star Macalline Group Corp., Ltd., Class H |
1,200 | 676 | ||||||
| #Redco Properties Group, Ltd. |
14,000 | 4,301 | ||||||
| Redsun Properties Group, Ltd. |
46,000 | 13,246 | ||||||
| Renhe Pharmacy Co., Ltd., Class A |
100 | 148 | ||||||
| RiseSun Real Estate Development Co., Ltd., Class A |
600 | 402 | ||||||
| Rongan Property Co., Ltd., Class A |
300 | 112 | ||||||
| Rongsheng Petrochemical Co., Ltd., Class A |
14,600 | 39,312 | ||||||
| Ronshine China Holdings, Ltd. |
31,500 | 12,755 | ||||||
| *RYB Education, Inc., ADR |
1,579 | 4,137 | ||||||
| SAIC Motor Corp., Ltd., Class A |
28,400 | 89,955 | ||||||
| Sailun Group Co., Ltd., Class A |
400 | 837 | ||||||
| Sanan Optoelectronics Co., Ltd., Class A |
13,200 | 69,271 | ||||||
| *SanFeng Intelligent Equipment Group Co., Ltd., Class A |
200 | 113 | ||||||
| Sansteel Minguang Co., Ltd. Fujian, Class A |
500 | 535 | ||||||
| Sany Heavy Equipment International Holdings Co., Ltd. |
148,000 | 169,707 | ||||||
| Sany Heavy Industry Co., Ltd., Class A |
33,400 | 119,772 | ||||||
| Satellite Chemical Co., Ltd., Class A |
280 | 1,703 | ||||||
| *Saurer Intelligent Technology Co., Ltd., Class A |
200 | 89 | ||||||
| SDIC Power Holdings Co., Ltd., Class A |
47,400 | 78,103 | ||||||
| Sealand Securities Co., Ltd., Class A |
500 | 301 | ||||||
| Seazen Group, Ltd. |
528,000 | 418,786 | ||||||
| Seazen Holdings Co., Ltd., Class A |
200 | 1,070 | ||||||
| S-Enjoy Service Group Co., Ltd. |
9,000 | 17,516 | ||||||
| SF Holding Co., Ltd., Class A |
300 | 3,028 | ||||||
| SGIS Songshan Co., Ltd., Class A |
281,800 | 194,976 | ||||||
| Shaan Xi Provincial Natural Gas Co., Ltd., Class A |
200 | 226 | ||||||
| Shaanxi Coal Industry Co., Ltd., Class A |
32,900 | 64,282 | ||||||
| Shan Xi Hua Yang Group New Energy Co., Ltd., Class A |
12,500 | 20,538 | ||||||
| Shandong Buchang Pharmaceuticals Co., Ltd., Class A |
27,700 | 75,667 | ||||||
| #Shandong Gold Mining Co., Ltd., Class H |
146,250 | 265,839 | ||||||
| Shandong Himile Mechanical Science & Technology Co., Ltd., Class A |
200 | 780 | ||||||
| Shandong Hi-speed Co., Ltd., Class A |
200 | 168 | ||||||
| Shandong Hualu Hengsheng Chemical Co., Ltd., Class A |
390 | 1,893 | ||||||
| Shandong Humon Smelting Co., Ltd., Class A |
14,300 | 25,684 | ||||||
| Shandong Linglong Tyre Co., Ltd., Class A |
200 | 1,102 | ||||||
| Shandong Longda Meat Foodstuff Co., Ltd., Class A |
100 | 157 | ||||||
| Shandong Nanshan Aluminum Co., Ltd., Class A |
5,700 | 3,846 | ||||||
| Shandong New Beiyang Information Technology Co., Ltd., Class A |
100 | 121 | ||||||
| Shandong Sun Paper Industry JSC, Ltd., Class A |
2,700 | 4,841 | ||||||
| Shandong Weigao Group Medical Polymer Co., Ltd., Class H |
4,000 | 6,818 | ||||||
| *Shanghai 2345 Network Holding Group Co., Ltd., Class A |
3,100 | 973 | ||||||
| Shanghai AJ Group Co., Ltd., Class A |
300 | 304 | ||||||
| Shanghai Bairun Investment Holding Group Co., Ltd., Class A |
36,600 | 363,559 | ||||||
| Shanghai Baosight Software Co., Ltd., Class A |
130 | 1,421 | ||||||
| Shanghai Belling Co., Ltd., Class A |
100 | 474 | ||||||
| #Shanghai Electric Group Co., Ltd., Class H |
4,000 | 1,126 | ||||||
| Shanghai Electric Power Co., Ltd., Class A |
200 | 345 | ||||||
| Shanghai Environment Group Co., Ltd., Class A |
100 | 181 | ||||||
| Shanghai Fosun Pharmaceutical Group Co., Ltd., Class H |
500 | 2,359 | ||||||
Dimensional Emerging Core Equity Market ETF
SCHEDULE OF INVESTMENTS
October 31, 2021
| Security Description |
Shares | Fair Value | ||||||
| CHINA (Continued) |
||||||||
| *Shanghai Fudan Microelectronics Group Co., Ltd. |
8,000 | $ | 21,905 | |||||
| #Shanghai Fudan-Zhangjiang Bio-Pharmaceutical Co., Ltd., Class H |
1,000 | 492 | ||||||
| Shanghai Industrial Development Co., Ltd., Class A |
200 | 121 | ||||||
| Shanghai Industrial Holdings, Ltd. |
25,000 | 37,344 | ||||||
| Shanghai Industrial Urban Development Group, Ltd. |
4,000 | 345 | ||||||
| *Shanghai International Airport Co., Ltd., Class A |
100 | 825 | ||||||
| Shanghai International Port Group Co., Ltd., Class A |
36,900 | 32,620 | ||||||
| Shanghai Jahwa United Co., Ltd., Class A |
100 | 749 | ||||||
| Shanghai Jin Jiang Capital Co., Ltd., Class H |
64,000 | 14,562 | ||||||
| Shanghai Jinjiang International Hotels Co., Ltd., Class A |
100 | 843 | ||||||
| Shanghai Lingang Holdings Corp., Ltd., Class A |
120 | 276 | ||||||
| Shanghai Lujiazui Finance & Trade Zone Development Co., Ltd., Class A |
200 | 338 | ||||||
| Shanghai M&G Stationery, Inc., Class A |
14,100 | 139,839 | ||||||
| Shanghai Maling Aquarius Co., Ltd., Class A |
200 | 244 | ||||||
| Shanghai Mechanical and Electrical Industry Co., Ltd., Class A |
100 | 226 | ||||||
| Shanghai Pharmaceuticals Holding Co., Ltd., Class H |
104,900 | 192,295 | ||||||
| Shanghai Pudong Development Bank Co., Ltd., Class A |
6,800 | 9,495 | ||||||
| Shanghai RAAS Blood Products Co., Ltd., Class A |
31,600 | 32,574 | ||||||
| *Shanghai Shenda Co., Ltd., Class A |
100 | 58 | ||||||
| Shanghai Shimao Co., Ltd., Class A |
600 | 296 | ||||||
| Shanghai Shyndec Pharmaceutical Co., Ltd., Class A |
100 | 146 | ||||||
| Shanghai Tongji Science & Technology Industrial Co., Ltd., Class A |
100 | 120 | ||||||
| Shanghai Tunnel Engineering Co., Ltd., Class A |
200 | 160 | ||||||
| Shanghai Waigaoqiao Free Trade Zone Group Co., Ltd., Class A |
100 | 201 | ||||||
| Shanghai Wanye Enterprises Co., Ltd., Class A |
100 | 483 | ||||||
| Shanghai Yuyuan Tourist Mart Group Co., Ltd., Class A |
400 | 614 | ||||||
| Shanghai Zhangjiang High-Tech Park Development Co., Ltd., Class A |
100 | 261 | ||||||
| Shanghai Zijiang Enterprise Group Co., Ltd., Class A |
100 | 151 | ||||||
| Shanxi Blue Flame Holding Co., Ltd., Class A |
100 | 143 | ||||||
| Shanxi Coking Co., Ltd., Class A |
130 | 139 | ||||||
| Shanxi Coking Coal Energy Group Co., Ltd., Class A |
500 | 722 | ||||||
| Shanxi Lu’an Environmental Energy Development Co., Ltd., Class A |
8,200 | 16,572 | ||||||
| *Shanxi Meijin Energy Co., Ltd., Class A |
24,500 | 43,010 | ||||||
| Shanxi Securities Co., Ltd., Class A |
300 | 293 | ||||||
| Shanxi Taigang Stainless Steel Co., Ltd., Class A |
3,200 | 3,848 | ||||||
| Shanxi Xinghuacun Fen Wine Factory Co., Ltd., Class A |
140 | 6,592 | ||||||
| Shanying International Holding Co., Ltd., Class A |
5,700 | 2,884 | ||||||
| Shenergy Co., Ltd., Class A |
17,200 | 16,629 | ||||||
| Sheng Ye Capital, Ltd. |
500 | 552 | ||||||
| *Shengda Resources Co., Ltd., Class A |
79,500 | 142,419 | ||||||
| Shenghe Resources Holding Co., Ltd., Class A |
200 | 632 | ||||||
| Shengyi Technology Co., Ltd., Class A |
200 | 695 | ||||||
| Shenwan Hongyuan Group Co., Ltd., Class H |
1,600 | 405 | ||||||
| Shenzhen Agricultural Products Group Co., Ltd., Class A |
200 | 217 | ||||||
| *Shenzhen Airport Co., Ltd., Class A |
300 | 354 | ||||||
| Shenzhen Aisidi Co., Ltd., Class A |
200 | 335 | ||||||
| Shenzhen Bauing Construction Holding Group Co., Ltd., Class A |
200 | 79 | ||||||
| Shenzhen Capchem Technology Co., Ltd., Class A |
14,600 | 326,902 | ||||||
| Shenzhen Comix Group Co., Ltd., Class A |
100 | 104 | ||||||
| *Shenzhen Danbond Technology Co., Ltd., Class A |
200 | 77 | ||||||
| Shenzhen Das Intellitech Co., Ltd., Class A |
123,600 | 65,635 | ||||||
| Shenzhen Energy Group Co., Ltd., Class A |
400 | 507 | ||||||
| Shenzhen Everwin Precision Technology Co., Ltd., Class A |
120 | 263 | ||||||
| Shenzhen Expressway Co., Ltd. |
22,000 | 20,730 | ||||||
| Shenzhen Gas Corp., Ltd., Class A |
200 | 284 | ||||||
Dimensional Emerging Core Equity Market ETF
SCHEDULE OF INVESTMENTS
October 31, 2021
| Security Description |
Shares | Fair Value | ||||||
| CHINA (Continued) |
||||||||
| Shenzhen Gongjin Electronics Co., Ltd., Class A |
100 | $ | 124 | |||||
| *Shenzhen Grandland Group Co., Ltd., Class A |
100 | 35 | ||||||
| Shenzhen H&T Intelligent Control Co., Ltd., Class A |
66,400 | 240,806 | ||||||
| Shenzhen Hepalink Pharmaceutical Group Co., Ltd., Class A |
100 | 240 | ||||||
| Shenzhen Heungkong Holding Co., Ltd., Class A |
400 | 117 | ||||||
| *Shenzhen Hifuture Information Technology Co., Ltd., Class A |
100 | 54 | ||||||
| Shenzhen Inovance Technology Co., Ltd., Class A |
150 | 1,528 | ||||||
| Shenzhen International Holdings, Ltd. |
107,669 | 129,966 | ||||||
| Shenzhen Investment Holdings Bay Area Development Co., Ltd. |
14,500 | 5,294 | ||||||
| #Shenzhen Investment, Ltd. |
112,000 | 27,500 | ||||||
| Shenzhen Jinjia Group Co., Ltd., Class A |
200 | 338 | ||||||
| Shenzhen Kaifa Technology Co., Ltd., Class A |
100 | 231 | ||||||
| Shenzhen Kinwong Electronic Co., Ltd., Class A |
100 | 404 | ||||||
| Shenzhen Megmeet Electrical Co., Ltd., Class A |
100 | 478 | ||||||
| Shenzhen Mindray Bio-Medical Electronics Co., Ltd., Class A |
100 | 5,874 | ||||||
| *Shenzhen MTC Co., Ltd., Class A |
25,100 | 19,209 | ||||||
| *Shenzhen Neptunus Bioengineering Co., Ltd., Class A |
200 | 97 | ||||||
| Shenzhen Overseas Chinese Town Co., Ltd., Class A |
109,600 | 107,157 | ||||||
| *Shenzhen Salubris Pharmaceuticals Co., Ltd., Class A |
100 | 451 | ||||||
| *Shenzhen SDG Information Co., Ltd., Class A |
100 | 94 | ||||||
| Shenzhen Sunline Tech Co., Ltd., Class A |
50,100 | 98,280 | ||||||
| Shenzhen Sunlord Electronics Co., Ltd., Class A |
100 | 516 | ||||||
| Shenzhen Sunway Communication Co., Ltd., Class A |
100 | 372 | ||||||
| Shenzhen Tagen Group Co., Ltd., Class A |
500 | 394 | ||||||
| *Shenzhen Techand Ecology & Environment Co., Ltd., Class A |
200 | 86 | ||||||
| Shenzhen Woer Heat-Shrinkable Material Co., Ltd., Class A |
100 | 114 | ||||||
| Shenzhen World Union Group, Inc., Class A |
200 | 117 | ||||||
| Shenzhen Yinghe Technology Co., Ltd., Class A |
100 | 488 | ||||||
| Shenzhen Ysstech Info-tech Co., Ltd., Class A |
100 | 153 | ||||||
| Shenzhen YUTO Packaging Technology Co., Ltd., Class A |
200 | 1,023 | ||||||
| Shenzhen Zhenye Group Co., Ltd., Class A |
300 | 195 | ||||||
| Shenzhen Zhongjin Lingnan Nonfemet Co., Ltd., Class A |
400 | 309 | ||||||
| Shenzhou International Group Holdings, Ltd. |
43,500 | 938,328 | ||||||
| *Shijiazhuang Changshan BeiMing Technology Co., Ltd., Class A |
200 | 203 | ||||||
| Shijiazhuang Yiling Pharmaceutical Co., Ltd., Class A |
140 | 351 | ||||||
| Shimao Group Holdings, Ltd. |
78,500 | 123,516 | ||||||
| *Shineco, Inc. |
19 | 196 | ||||||
| Shougang Fushan Resources Group, Ltd. |
150,000 | 39,529 | ||||||
| *Shouhang High-Tech Energy Co., Ltd., Class A |
200 | 102 | ||||||
| Shui On Land, Ltd. |
362,500 | 53,589 | ||||||
| Sichuan Chuantou Energy Co., Ltd., Class A |
400 | 818 | ||||||
| *Sichuan Hebang Biotechnology Co., Ltd., Class A |
45,300 | 25,187 | ||||||
| Sichuan Kelun Pharmaceutical Co., Ltd., Class A |
13,600 | 37,533 | ||||||
| *Sichuan Languang Development Co., Ltd., Class A |
200 | 54 | ||||||
| Sichuan Shuangma Cement Co., Ltd., Class A |
100 | 313 | ||||||
| Sieyuan Electric Co., Ltd., Class A |
100 | 647 | ||||||
| Sino Biopharmaceutical, Ltd. |
1,031,000 | 763,404 | ||||||
| Sinocare, Inc., Class A |
100 | 367 | ||||||
| Sinofert Holdings, Ltd. |
12,000 | 1,882 | ||||||
| Sinolink Securities Co., Ltd., Class A |
9,500 | 15,906 | ||||||
| Sinoma International Engineering Co., Class A |
300 | 487 | ||||||
| Sinoma Science & Technology Co., Ltd., Class A |
300 | 1,766 | ||||||
| Sinomach Automobile Co., Ltd., Class A |
100 | 99 | ||||||
| Sino-Ocean Group Holding, Ltd. |
978,000 | 212,471 | ||||||
| Sinopec Engineering Group Co., Ltd., Class H |
438,500 | 231,114 | ||||||
| Sinopec Kantons Holdings, Ltd. |
34,000 | 12,981 | ||||||
Dimensional Emerging Core Equity Market ETF
SCHEDULE OF INVESTMENTS
October 31, 2021
| Security Description |
Shares | Fair Value | ||||||
| CHINA (Continued) |
||||||||
| *Sinopec Oilfield Service Corp., Class H |
2,000 | $ | 193 | |||||
| Sinopharm Group Co., Ltd., Class H |
116,400 | 277,718 | ||||||
| #Sinosoft Technology Group, Ltd. |
1,000 | 131 | ||||||
| Sinotrans, Ltd., Class H |
3,000 | 983 | ||||||
| Sinotruk Hong Kong, Ltd. |
75,000 | 103,547 | ||||||
| Skshu Paint Co., Ltd., Class A |
140 | 2,437 | ||||||
| Skyfame Realty Holdings, Ltd. |
6,000 | 710 | ||||||
| Skyworth Digital Co., Ltd., Class A |
200 | 226 | ||||||
| *Skyworth Group, Ltd. |
196,000 | 109,350 | ||||||
| *SOHO China, Ltd. |
455,500 | 115,353 | ||||||
| *Solargiga Energy Holdings, Ltd. |
2,000 | 129 | ||||||
| Songcheng Performance Development Co., Ltd., Class A |
200 | 437 | ||||||
| SooChow Securities Co., Ltd., Class A |
300 | 397 | ||||||
| *Sou Yu Te Group Co., Ltd., Class A |
300 | 69 | ||||||
| *South Manganese Investment, Ltd. |
1,000 | 158 | ||||||
| *Spring Airlines Co., Ltd., Class A |
100 | 914 | ||||||
| SSY Group, Ltd. |
106,000 | 50,554 | ||||||
| #Sun Art Retail Group, Ltd. |
4,000 | 2,355 | ||||||
| Sun King Technology Group, Ltd. |
136,000 | 77,099 | ||||||
| Sunac China Holdings, Ltd. |
144,000 | 310,249 | ||||||
| Sunflower Pharmaceutical Group Co., Ltd., Class A |
58,600 | 130,879 | ||||||
| Sunfly Intelligent Technology Co., Ltd., Class A |
100 | 189 | ||||||
| Sungrow Power Supply Co., Ltd., Class A |
100 | 2,563 | ||||||
| *Suning Universal Co., Ltd., Class A |
300 | 225 | ||||||
| *Suning.com Co., Ltd., Class A |
45,300 | 31,626 | ||||||
| Sunny Optical Technology Group Co., Ltd. |
44,900 | 1,213,256 | ||||||
| *Sunshine 100 China Holdings, Ltd. |
2,000 | 107 | ||||||
| Sunward Intelligent Equipment Co., Ltd., Class A |
100 | 126 | ||||||
| *Sunwave Communications Co., Ltd., Class A |
100 | 83 | ||||||
| Sunwoda Electronic Co., Ltd., Class A |
200 | 1,540 | ||||||
| Suofeiya Home Collection Co., Ltd., Class A |
200 | 529 | ||||||
| Suzhou Anjie Technology Co., Ltd., Class A |
100 | 215 | ||||||
| *Suzhou Chunxing Precision Mechanical Co., Ltd., Class A |
100 | 57 | ||||||
| Suzhou Dongshan Precision Manufacturing Co., Ltd., Class A |
200 | 635 | ||||||
| Suzhou Gold Mantis Construction Decoration Co., Ltd., Class A |
300 | 280 | ||||||
| Tangshan Jidong Cement Co., Ltd., Class A |
200 | 364 | ||||||
| TangShan Port Group Co., Ltd., Class A |
39,700 | 16,555 | ||||||
| Tangshan Sanyou Chemical Industries Co., Ltd., Class A |
100 | 144 | ||||||
| TBEA Co., Ltd., Class A |
300 | 1,266 | ||||||
| *TCL Electronics Holdings, Ltd. |
68,000 | 36,976 | ||||||
| TCL Technology Group Corp., Class A |
42,100 | 39,847 | ||||||
| Tencent Holdings, Ltd. |
255,800 | 15,816,816 | ||||||
| *Tencent Music Entertainment Group, ADR |
1,648 | 12,953 | ||||||
| Tian An China Investment Co., Ltd. |
8,000 | 4,628 | ||||||
| Tian Di Science & Technology Co., Ltd., Class A |
900 | 586 | ||||||
| Tian Lun Gas Holdings, Ltd. |
500 | 462 | ||||||
| Tiangong International Co., Ltd. |
86,000 | 51,960 | ||||||
| Tianjin 712 Communication & Broadcasting Co., Ltd., Class A |
100 | 588 | ||||||
| Tianjin Chase Sun Pharmaceutical Co., Ltd., Class A |
300 | 192 | ||||||
| Tianjin Guangyu Development Co., Ltd., Class A |
200 | 523 | ||||||
| Tianjin Port Development Holdings, Ltd. |
4,000 | 334 | ||||||
| Tianjin Zhonghuan Semiconductor Co., Ltd., Class A |
43,100 | 352,463 | ||||||
| Tianjin ZhongXin Pharmaceutical Group Corp., Ltd., Class A |
100 | 419 | ||||||
| Tianli Education International Holdings, Ltd. |
83,000 | 17,392 | ||||||
| #Tianneng Power International, Ltd. |
66,000 | 75,426 | ||||||
Dimensional Emerging Core Equity Market ETF
SCHEDULE OF INVESTMENTS
October 31, 2021
| Security Description |
Shares | Fair Value | ||||||
| CHINA (Continued) |
||||||||
| Tianshui Huatian Technology Co., Ltd., Class A |
300 | $ | 602 | |||||
| Tibet Summit Resources Co., Ltd., Class A |
200 | 953 | ||||||
| Tibet Tianlu Co., Ltd., Class A |
100 | 99 | ||||||
| *Tibet Water Resources, Ltd. |
3,000 | 193 | ||||||
| Times China Holdings, Ltd. |
41,000 | 27,987 | ||||||
| *Tingyi Cayman Islands Holding Corp. |
4,000 | 7,487 | ||||||
| Titan Wind Energy Suzhou Co., Ltd., Class A |
600 | 2,000 | ||||||
| Tong Ren Tang Technologies Co., Ltd., Class H |
29,000 | 20,541 | ||||||
| *Tongcheng-Elong Holdings, Ltd. |
1,200 | 2,687 | ||||||
| *Tongda Group Holdings, Ltd. |
15,000 | 480 | ||||||
| *Tongdao Liepin Group |
6,200 | 8,958 | ||||||
| *Tongding Interconnection Information Co., Ltd., Class A |
100 | 61 | ||||||
| TongFu Microelectronics Co., Ltd., Class A |
100 | 313 | ||||||
| *Tongguan Gold Group, Ltd. |
2,000 | 203 | ||||||
| Tonghua Dongbao Pharmaceutical Co., Ltd., Class A |
200 | 381 | ||||||
| *Tonghua Golden-Horse Pharmaceutical Industry Co., Ltd., Class A |
200 | 119 | ||||||
| Tongkun Group Co., Ltd., Class A |
200 | 623 | ||||||
| Tongling Jingda Special Magnet Wire Co., Ltd., Class A |
200 | 242 | ||||||
| Tongling Nonferrous Metals Group Co., Ltd., Class A |
2,500 | 1,441 | ||||||
| Tongwei Co., Ltd., Class A |
300 | 2,681 | ||||||
| Top Spring International Holdings, Ltd. |
500 | 76 | ||||||
| Topsec Technologies Group, Inc., Class A |
100 | 288 | ||||||
| Towngas China Co., Ltd. |
76,446 | 52,575 | ||||||
| TravelSky Technology, Ltd., Class H |
166,000 | 310,701 | ||||||
| *Trigiant Group, Ltd. |
2,000 | 167 | ||||||
| *Trip.com Group, Ltd., Sponsored ADR |
17,078 | 487,748 | ||||||
| *Trip.com Group, Ltd. |
6,200 | 179,647 | ||||||
| Truly International Holdings, Ltd. |
180,000 | 58,773 | ||||||
| Tsaker Chemical Group, Ltd. |
1,000 | 208 | ||||||
| *TuanChe, Ltd., ADR |
8 | 19 | ||||||
| *Tunghsu Optoelectronic Technology Co., Ltd., Class A |
900 | 278 | ||||||
| *Tus Environmental Science And Technology Development Co., Ltd., Class A |
200 | 121 | ||||||
| Unigroup Guoxin Microelectronics Co., Ltd., Class A |
100 | 3,165 | ||||||
| Unilumin Group Co., Ltd., Class A |
100 | 128 | ||||||
| Uni-President China Holdings, Ltd. |
180,000 | 153,643 | ||||||
| Unisplendour Corp., Ltd., Class A |
700 | 3,031 | ||||||
| United Energy Group, Ltd. |
164,000 | 14,547 | ||||||
| Universal Scientific Industrial Shanghai Co., Ltd., Class A |
100 | 217 | ||||||
| Vatti Corp., Ltd., Class A |
100 | 92 | ||||||
| Victory Giant Technology Huizhou Co., Ltd., Class A |
100 | 411 | ||||||
| Vinda International Holdings, Ltd. |
1,000 | 2,757 | ||||||
| *Viomi Technology Co., Ltd., ADR |
97 | 428 | ||||||
| *Vipshop Holdings, Ltd., Sponsored ADR |
25,659 | 286,354 | ||||||
| *Vnet Group, Inc., Sponsored ADR |
8,433 | 132,229 | ||||||
| Walvax Biotechnology Co., Ltd., Class A |
100 | 859 | ||||||
| *Wanda Film Holding Co., Ltd., Class A |
200 | 438 | ||||||
| *Wanda Hotel Development Co., Ltd. |
1,000 | 41 | ||||||
| Wangsu Science & Technology Co., Ltd., Class A |
2,800 | 2,396 | ||||||
| Wanhua Chemical Group Co., Ltd., Class A |
19,700 | 324,513 | ||||||
| #Want Want China Holdings, Ltd. |
30,000 | 23,255 | ||||||
| Wanxiang Qianchao Co., Ltd., Class A |
200 | 187 | ||||||
| Wasu Media Holding Co., Ltd., Class A |
100 | 114 | ||||||
| *Weibo Corp., Sponsored ADR |
3,718 | 167,236 | ||||||
| Weichai Power Co., Ltd., Class H |
3,000 | 5,391 | ||||||
| Weihai Guangwei Composites Co., Ltd., Class A |
100 | 1,060 | ||||||
| Wellhope Foods Co., Ltd., Class A |
200 | 286 | ||||||
Dimensional Emerging Core Equity Market ETF
SCHEDULE OF INVESTMENTS
October 31, 2021
| Security Description |
Shares | Fair Value | ||||||
| CHINA (Continued) |
||||||||
| Wens Foodstuffs Group Co., Ltd. |
21,400 | $ | 55,082 | |||||
| West China Cement, Ltd. |
312,000 | 54,547 | ||||||
| Western Securities Co., Ltd., Class A |
221,200 | 264,637 | ||||||
| #Wharf Holdings, Ltd. (The) |
131,000 | 454,683 | ||||||
| Wingtech Technology Co., Ltd., Class A |
100 | 1,714 | ||||||
| Winning Health Technology Group Co., Ltd., Class A |
200 | 395 | ||||||
| Wisdom Education International Holdings Co., Ltd. |
2,000 | 345 | ||||||
| *Wison Engineering Services Co., Ltd. |
2,000 | 105 | ||||||
| Wuchan Zhongda Group Co., Ltd., Class A |
49,300 | 48,278 | ||||||
| *Wuhan DDMC Culture & Sports Co., Ltd., Class A |
100 | 95 | ||||||
| Wuhan Department Store Group Co., Ltd., Class A |
100 | 158 | ||||||
| Wuhan Guide Infrared Co., Ltd., Class A |
58,880 | 199,556 | ||||||
| Wuhu Sanqi Interactive Entertainment Network Technology Group Co., Ltd., Class A |
31,500 | 117,091 | ||||||
| Wuhu Token Science Co., Ltd., Class A |
200 | 320 | ||||||
| Wuliangye Yibin Co., Ltd., Class A |
28,100 | 950,213 | ||||||
| WUS Printed Circuit Kunshan Co., Ltd., Class A |
7,450 | 11,915 | ||||||
| *Wuxi Biologics Cayman, Inc. |
72,000 | 1,095,866 | ||||||
| Wuxi Lead Intelligent Equipment Co., Ltd., Class A |
160 | 2,030 | ||||||
| Wuxi Taiji Industry Co., Ltd., Class A |
100 | 125 | ||||||
| XCMG Construction Machinery Co., Ltd., Class A |
26,300 | 25,098 | ||||||
| Xiabuxiabu Catering Management China Holdings Co., Ltd. |
124,500 | 91,226 | ||||||
| Xiamen C & D, Inc., Class A |
300 | 375 | ||||||
| Xiamen Comfort Science & Technology Group Co., Ltd., Class A |
100 | 170 | ||||||
| Xiamen International Port Co., Ltd., Class H |
2,000 | 224 | ||||||
| Xiamen ITG Group Corp., Ltd., Class A |
200 | 216 | ||||||
| Xiamen Meiya Pico Information Co., Ltd., Class A |
100 | 241 | ||||||
| Xiamen Tungsten Co., Ltd., Class A |
100 | 355 | ||||||
| Xiamen Xiangyu Co., Ltd., Class A |
200 | 242 | ||||||
| Xiandai Investment Co., Ltd., Class A |
100 | 63 | ||||||
| *Xiaomi Corp., Class B |
5,400 | 14,821 | ||||||
| Xinfengming Group Co., Ltd., Class A |
100 | 229 | ||||||
| Xingda International Holdings, Ltd. |
1,085 | 247 | ||||||
| Xinhu Zhongbao Co., Ltd., Class A |
1,200 | 540 | ||||||
| #Xinjiang Goldwind Science & Technology Co., Ltd., Class H |
17,400 | 39,009 | ||||||
| Xinjiang Tianshan Cement Co., Ltd., Class A |
100 | 214 | ||||||
| Xinjiang Zhongtai Chemical Co., Ltd., Class A |
100 | 165 | ||||||
| Xinte Energy Co., Ltd. |
1,200 | 3,864 | ||||||
| Xinxing Ductile Iron Pipes Co., Ltd., Class A |
5,500 | 3,187 | ||||||
| Xinyi Solar Holdings, Ltd. |
286,161 | 598,878 | ||||||
| Xinyu Iron & Steel Co., Ltd., Class A |
300 | 277 | ||||||
| Xinyuan Real Estate Co., Ltd., Sponsored ADR |
6,904 | 7,940 | ||||||
| Xtep International Holdings, Ltd. |
430,361 | 566,508 | ||||||
| Xuji Electric Co., Ltd., Class A |
100 | 310 | ||||||
| Yadea Group Holdings, Ltd. |
2,000 | 3,445 | ||||||
| *YaGuang Technology Group Co., Ltd., Class A |
100 | 134 | ||||||
| *Yanchang Petroleum International, Ltd. |
20,000 | 203 | ||||||
| Yango Group Co., Ltd., Class A |
16,100 | 8,097 | ||||||
| Yangtze Optical Fibre and Cable Joint Stock, Ltd. Co., Class H |
500 | 843 | ||||||
| Yantai Dongcheng Pharmaceutical Co., Ltd., Class A |
100 | 217 | ||||||
| Yantai Jereh Oilfield Services Group Co., Ltd., Class A |
100 | 661 | ||||||
| YanTai Shuangta Food Co., Ltd., Class A |
100 | 143 | ||||||
| Yantai Tayho Advanced Materials Co., Ltd., Class A |
100 | 281 | ||||||
| #Yanzhou Coal Mining Co., Ltd., Class H |
2,000 | 2,967 | ||||||
| *Yashili International Holdings, Ltd. |
2,000 | 147 | ||||||
| Yealink Network Technology Corp., Ltd., Class A |
100 | 1,183 | ||||||
Dimensional Emerging Core Equity Market ETF
SCHEDULE OF INVESTMENTS
October 31, 2021
| Security Description |
Shares | Fair Value | ||||||
| CHINA (Continued) |
||||||||
| #*YiChang HEC ChangJiang Pharmaceutical Co., Ltd., Class H |
61,600 | $ | 28,824 | |||||
| Yifan Pharmaceutical Co., Ltd., Class A |
100 | 256 | ||||||
| Yifeng Pharmacy Chain Co., Ltd., Class A |
17,190 | 128,199 | ||||||
| Yihai International Holding, Ltd. |
1,000 | 5,881 | ||||||
| Yintai Gold Co., Ltd., Class A |
10,300 | 14,189 | ||||||
| Yixintang Pharmaceutical Group Co., Ltd., Class A |
15,200 | 75,256 | ||||||
| Yonghui Superstores Co., Ltd., Class A |
64,700 | 39,713 | ||||||
| Yotrio Group Co., Ltd., Class A |
103,300 | 55,823 | ||||||
| Youngor Group Co., Ltd., Class A |
55,100 | 55,335 | ||||||
| *Youzu Interactive Co., Ltd., Class A |
100 | 208 | ||||||
| Yuexiu Property Co., Ltd. |
82,000 | 72,312 | ||||||
| *Yuexiu Transport Infrastructure, Ltd. |
42,000 | 26,888 | ||||||
| Yum China Holdings, Inc. |
3,000 | 175,857 | ||||||
| Yum China Holdings, Inc. |
16,716 | 954,149 | ||||||
| Yunda Holding Co., Ltd., Class A |
31,400 | 91,561 | ||||||
| *Yunji, Inc., ADR |
869 | 782 | ||||||
| *Yunnan Aluminium Co., Ltd., Class A |
300 | 557 | ||||||
| Yunnan Baiyao Group Co., Ltd., Class A |
100 | 1,399 | ||||||
| Yunnan Copper Co., Ltd., Class A |
200 | 414 | ||||||
| Yunnan Energy New Material Co., Ltd., Class A |
100 | 4,557 | ||||||
| *Yunnan Tin Co., Ltd., Class A |
200 | 513 | ||||||
| Yutong Bus Co., Ltd., Class A |
100 | 177 | ||||||
| Yuzhou Group Holdings Co., Ltd. |
128,398 | 14,030 | ||||||
| #*Zepp Health Corp., ADR |
3,130 | 25,697 | ||||||
| #Zhaojin Mining Industry Co., Ltd., Class H |
370,000 | 264,930 | ||||||
| Zhefu Holding Group Co., Ltd., Class A |
300 | 335 | ||||||
| *Zhejiang Century Huatong Group Co., Ltd., Class A |
37,400 | 43,401 | ||||||
| Zhejiang Chint Electrics Co., Ltd., Class A |
200 | 1,882 | ||||||
| Zhejiang Communications Technology Co., Ltd. |
200 | 162 | ||||||
| *Zhejiang Conba Pharmaceutical Co., Ltd., Class A |
100 | 64 | ||||||
| Zhejiang Crystal-Optech Co., Ltd., Class A |
100 | 246 | ||||||
| Zhejiang Dahua Technology Co., Ltd., Class A |
300 | 1,020 | ||||||
| #Zhejiang Expressway Co., Ltd., Class H |
2,000 | 1,777 | ||||||
| Zhejiang Garden Bio-Chemical High-tech Co., Ltd., Class A |
100 | 208 | ||||||
| Zhejiang Hailiang Co., Ltd., Class A |
200 | 329 | ||||||
| Zhejiang Hangmin Co., Ltd., Class A |
200 | 170 | ||||||
| Zhejiang Hisoar Pharmaceutical Co., Ltd., Class A |
18,000 | 21,872 | ||||||
| Zhejiang Huace Film & Television Co., Ltd., Class A |
800 | 705 | ||||||
| Zhejiang Huahai Pharmaceutical Co., Ltd., Class A |
100 | 288 | ||||||
| Zhejiang Huayou Cobalt Co., Ltd., Class A |
100 | 1,734 | ||||||
| Zhejiang Jiahua Energy Chemical Industry Co., Ltd., Class A |
200 | 306 | ||||||
| Zhejiang Jiemei Electronic & Technology Co., Ltd., Class A |
100 | 430 | ||||||
| Zhejiang Jingsheng Mechanical & Electrical Co., Ltd., Class A |
100 | 1,193 | ||||||
| *Zhejiang Jingu Co., Ltd., Class A |
100 | 110 | ||||||
| Zhejiang Jingxin Pharmaceutical Co., Ltd., Class A |
120 | 151 | ||||||
| Zhejiang Juhua Co., Ltd., Class A |
200 | 485 | ||||||
| Zhejiang Longsheng Group Co., Ltd., Class A |
400 | 778 | ||||||
| Zhejiang Medicine Co., Ltd., Class A |
100 | 249 | ||||||
| Zhejiang Meida Industrial Co., Ltd., Class A |
100 | 256 | ||||||
| Zhejiang Narada Power Source Co., Ltd., Class A |
100 | 177 | ||||||
| Zhejiang NHU Co., Ltd., Class A |
44,880 | 190,239 | ||||||
| Zhejiang Runtu Co., Ltd., Class A |
100 | 138 | ||||||
| Zhejiang Sanhua Intelligent Controls Co., Ltd., Class A |
53,100 | 196,719 | ||||||
| Zhejiang Semir Garment Co., Ltd., Class A |
100 | 117 | ||||||
| Zhejiang Supor Co., Ltd., Class A |
100 | 828 | ||||||
| Zhejiang Wanliyang Co., Ltd., Class A |
200 | 421 | ||||||
Dimensional Emerging Core Equity Market ETF
SCHEDULE OF INVESTMENTS
October 31, 2021
| Security Description |
Shares | Fair Value | ||||||
| CHINA (Continued) |
||||||||
| Zhejiang Weiming Environment Protection Co., Ltd., Class A |
100 | $ | 429 | |||||
| Zhejiang Weixing New Building Materials Co., Ltd., Class A |
36,200 | 101,770 | ||||||
| Zhejiang Xianju Pharmaceutical Co., Ltd., Class A |
300 | 517 | ||||||
| Zhejiang Xinan Chemical Industrial Group Co., Ltd., Class A |
100 | 433 | ||||||
| Zhejiang Yankon Group Co., Ltd., Class A |
100 | 57 | ||||||
| Zhejiang Yasha Decoration Co., Ltd., Class A |
200 | 232 | ||||||
| Zhengzhou Coal Mining Machinery Group Co., Ltd., Class H |
400 | 421 | ||||||
| #Zhenro Properties Group, Ltd. |
317,000 | 150,777 | ||||||
| *Zheshang Securities Co., Ltd., Class A |
400 | 771 | ||||||
| *Zhong An Group, Ltd. |
3,000 | 120 | ||||||
| Zhongji Innolight Co., Ltd., Class A |
28,100 | 145,137 | ||||||
| Zhongjin Gold Corp., Ltd., Class A |
500 | 650 | ||||||
| Zhongshan Broad Ocean Motor Co., Ltd., Class A |
300 | 318 | ||||||
| Zhongshan Public Utilities Group Co., Ltd., Class A |
100 | 134 | ||||||
| Zhongsheng Group Holdings, Ltd. |
70,500 | 637,568 | ||||||
| *Zhongtian Financial Group Co., Ltd., Class A |
16,300 | 6,390 | ||||||
| Zhongyu Gas Holdings, Ltd. |
21,000 | 20,139 | ||||||
| Zhongyuan Environment-Protection Co., Ltd., Class A |
100 | 95 | ||||||
| #Zhou Hei Ya International Holdings Co., Ltd. |
177,000 | 159,501 | ||||||
| Zhuguang Holdings Group Co., Ltd. |
88,000 | 19,344 | ||||||
| *Zhuhai Orbita Aerospace Science & Technology Co., Ltd., Class A |
100 | 135 | ||||||
| *Zhuzhou CRRC Times Electric Co., Ltd., Class H |
10,100 | 48,429 | ||||||
| Zhuzhou Kibing Group Co., Ltd., Class A |
7,600 | 18,873 | ||||||
| Zibo Qixiang Tengda Chemical Co., Ltd., Class A |
280 | 490 | ||||||
| Zijin Mining Group Co., Ltd., Class H |
564,000 | 785,926 | ||||||
| *ZJBC Information Technology Co., Ltd., Class A |
100 | 49 | ||||||
| *Zk International Group Co., Ltd. |
4 | 11 | ||||||
| Zoomlion Heavy Industry Science and Technology Co., Ltd., Class H |
220,000 | 158,940 | ||||||
| ZTE Corp., Class H |
12,600 | 37,902 | ||||||
| ZTO Express Cayman, Inc., Sponsored ADR |
13,915 | 408,127 | ||||||
| ZTO Express Cayman, Inc. |
2,000 | 60,213 | ||||||
|
|
|
|||||||
| TOTAL CHINA |
121,195,523 | |||||||
|
|
|
|||||||
| COLOMBIA (0.2%) |
||||||||
| *Banco de Bogota SA |
52 | 1,040 | ||||||
| Bancolombia SA, Sponsored ADR |
2,690 | 96,652 | ||||||
| Bancolombia SA |
650 | 5,769 | ||||||
| Bancolombia SA, Preference |
9,414 | 83,845 | ||||||
| Celsia SA ESP |
19,241 | 21,720 | ||||||
| Cementos Argos SA |
35,766 | 59,846 | ||||||
| Corp. Financiera Colombiana SA |
158 | 1,235 | ||||||
| Ecopetrol SA |
450,040 | 337,620 | ||||||
| Grupo Argos SA |
484 | 1,505 | ||||||
| Grupo Aval Acciones y Valores SA, Sponsored ADR |
764 | 4,607 | ||||||
| Grupo Aval Acciones y Valores SA, Preference |
79,536 | 24,102 | ||||||
| Grupo de Inversiones Suramericana SA, Preference |
140 | 697 | ||||||
| Grupo de Inversiones Suramericana SA |
9,187 | 53,137 | ||||||
| Grupo Energia Bogota SA ESP |
1,688 | 1,210 | ||||||
| Grupo Nutresa SA |
1,555 | 9,019 | ||||||
| *Interconexion Electrica SA ESP |
635 | 3,783 | ||||||
| *Mineros SA |
188 | 199 | ||||||
| *Promigas SA |
284 | 552 | ||||||
|
|
|
|||||||
| TOTAL COLOMBIA |
706,538 | |||||||
|
|
|
|||||||
Dimensional Emerging Core Equity Market ETF
SCHEDULE OF INVESTMENTS
October 31, 2021
| Security Description |
Shares | Fair Value | ||||||
| CZECH REPUBLIC (0.1%) |
||||||||
| CEZ A/S |
7,423 | $ | 245,288 | |||||
| *Komercni Banka A/S |
3,986 | 154,805 | ||||||
| *Moneta Money Bank A/S |
6,073 | 23,764 | ||||||
| O2 Czech Republic A/S |
608 | 6,989 | ||||||
|
|
|
|||||||
| TOTAL CZECH REPUBLIC |
430,846 | |||||||
|
|
|
|||||||
| EGYPT (0.1%) |
||||||||
| *Commercial International Bank Egypt SAE, Registered, GDR |
58,143 | 180,243 | ||||||
|
|
|
|||||||
| TOTAL EGYPT |
180,243 | |||||||
|
|
|
|||||||
| GREECE (0.2%) |
||||||||
| *Aegean Airlines SA |
55 | 328 | ||||||
| *Alpha Bank AE |
157,100 | 199,711 | ||||||
| Athens Water Supply & Sewage Co. SA |
177 | 1,549 | ||||||
| Autohellas Tourist and Trading SA |
1,615 | 14,839 | ||||||
| Bank of Greece |
660 | 12,908 | ||||||
| *Ellaktor SA |
227 | 363 | ||||||
| *Eurobank Ergasias Services and Holdings SA |
155,168 | 162,221 | ||||||
| *Fourlis Holdings SA |
83 | 369 | ||||||
| *GEK Terna Holding Real Estate Construction SA |
282 | 3,156 | ||||||
| Hellenic Exchanges—Athens Stock Exchange SA |
96 | 411 | ||||||
| *Hellenic Petroleum SA |
168 | 1,159 | ||||||
| *Hellenic Telecommunications Organization SA |
14,261 | 252,503 | ||||||
| Holding Co. ADMIE IPTO SA |
424 | 1,251 | ||||||
| *JUMBO SA |
3,884 | 57,713 | ||||||
| *LAMDA Development SA |
92 | 756 | ||||||
| *Motor Oil Hellas Corinth Refineries SA |
3,876 | 65,847 | ||||||
| Mytilineos SA |
539 | 9,837 | ||||||
| *National Bank of Greece SA |
34,477 | 108,524 | ||||||
| Opap SA |
1,859 | 28,935 | ||||||
| *Piraeus Financial Holdings SA |
25 | 43 | ||||||
| Piraeus Port Authority SA |
21 | 442 | ||||||
| Plastika Kritis SA |
17 | 348 | ||||||
| *Public Power Corp. SA |
144 | 1,562 | ||||||
| Quest Holdings SA |
18 | 360 | ||||||
| Sarantis SA |
1,358 | 13,719 | ||||||
| Terna Energy SA |
139 | 1,882 | ||||||
| Titan Cement International SA |
168 | 2,916 | ||||||
|
|
|
|||||||
| TOTAL GREECE |
943,652 | |||||||
|
|
|
|||||||
| HUNGARY (0.2%) |
||||||||
| Magyar Telekom Telecommunications PLC |
22,173 | 30,588 | ||||||
| MOL Hungarian Oil & Gas PLC |
30,669 | 262,328 | ||||||
| *Opus Global Nyrt |
328 | 249 | ||||||
| *OTP Bank Nyrt |
8,776 | 527,577 | ||||||
| Richter Gedeon Nyrt |
3,916 | 109,805 | ||||||
|
|
|
|||||||
| TOTAL HUNGARY |
930,547 | |||||||
|
|
|
|||||||
| INDIA (13.5%) |
||||||||
| *3M India, Ltd. |
4 | 1,357 | ||||||
| Aarti Drugs, Ltd. |
5,687 | 44,471 | ||||||
Dimensional Emerging Core Equity Market ETF
SCHEDULE OF INVESTMENTS
October 31, 2021
| Security Description |
Shares | Fair Value | ||||||
| INDIA (Continued) |
||||||||
| Aarti Industries, Ltd. |
423 | $ | 5,446 | |||||
| ACC, Ltd. |
5,537 | 172,540 | ||||||
| Adani Enterprises, Ltd. |
348 | 6,616 | ||||||
| *Adani Green Energy, Ltd. |
5,469 | 84,199 | ||||||
| Adani Ports & Special Economic Zone, Ltd. |
24,814 | 229,645 | ||||||
| *Adani Transmission, Ltd. |
15,452 | 364,709 | ||||||
| Advanced Enzyme Technologies, Ltd. |
152 | 765 | ||||||
| Aegis Logistics, Ltd. |
7,255 | 20,608 | ||||||
| Agro Tech Foods, Ltd. |
8 | 105 | ||||||
| *Ahluwalia Contracts India, Ltd. |
40 | 201 | ||||||
| AIA Engineering, Ltd. |
338 | 8,656 | ||||||
| Ajanta Pharma, Ltd. |
5,241 | 148,353 | ||||||
| Akzo Nobel India, Ltd. |
391 | 10,970 | ||||||
| Alembic Pharmaceuticals, Ltd. |
80 | 830 | ||||||
| Alembic, Ltd. |
100 | 139 | ||||||
| Alkem Laboratories, Ltd. |
1 | 48 | ||||||
| Alkyl Amines Chemicals |
105 | 5,054 | ||||||
| Amara Raja Batteries, Ltd. |
6,017 | 54,693 | ||||||
| *Amber Enterprises India, Ltd. |
24 | 1,060 | ||||||
| Ambuja Cements, Ltd. |
4,441 | 24,008 | ||||||
| Amrutanjan Health Care, Ltd. |
12 | 146 | ||||||
| *APL Apollo Tubes, Ltd. |
5,844 | 62,443 | ||||||
| Apollo Hospitals Enterprise, Ltd. |
5,810 | 330,690 | ||||||
| Apollo Tyres, Ltd. |
92,826 | 263,920 | ||||||
| *Arvind Fashions, Ltd. |
52 | 207 | ||||||
| Asahi India Glass, Ltd. |
140 | 802 | ||||||
| Ashok Leyland, Ltd. |
120,276 | 228,726 | ||||||
| *Ashoka Buildcon, Ltd. |
152 | 213 | ||||||
| Asian Paints, Ltd. |
15,920 | 659,091 | ||||||
| Astec Lifesciences, Ltd. |
4 | 67 | ||||||
| *Aster DM Healthcare, Ltd. |
5,936 | 14,887 | ||||||
| *»Astral Poly Techni Inr1 |
516 | 15,054 | ||||||
| Astral, Ltd. |
4,099 | 119,588 | ||||||
| AstraZeneca Pharma India, Ltd. |
8 | 321 | ||||||
| Atul, Ltd. |
2,395 | 291,962 | ||||||
| *AU Small Finance Bank, Ltd. |
3,995 | 64,894 | ||||||
| *Aurobindo Pharma, Ltd. |
31,386 | 288,937 | ||||||
| Automotive Axles, Ltd. |
8 | 142 | ||||||
| Avanti Feeds, Ltd. |
27,784 | 206,596 | ||||||
| *Avenue Supermarts, Ltd. |
4,422 | 273,740 | ||||||
| *Axis Bank, Ltd. |
120,377 | 1,192,818 | ||||||
| Bajaj Auto, Ltd. |
3,960 | 196,053 | ||||||
| Bajaj Consumer Care, Ltd. |
4,038 | 12,473 | ||||||
| *Bajaj Electricals, Ltd. |
32 | 472 | ||||||
| Bajaj Finserv, Ltd. |
2,261 | 538,100 | ||||||
| Bajaj Holdings & Investment, Ltd. |
1,207 | 77,849 | ||||||
| Balaji Amines, Ltd. |
447 | 20,654 | ||||||
| *Balkrishna Industries, Ltd. |
2,204 | 72,409 | ||||||
| Balmer Lawrie & Co., Ltd. |
88 | 148 | ||||||
| Balrampur Chini Mills, Ltd. |
9,584 | 41,846 | ||||||
| Bandhan Bank, Ltd. |
130 | 506 | ||||||
| *Bank of Baroda |
27,918 | 36,351 | ||||||
| *Bank of Maharashtra |
2,688 | 747 | ||||||
| BASF India, Ltd. |
69 | 2,986 | ||||||
| Bata India, Ltd. |
48 | 1,269 | ||||||
Dimensional Emerging Core Equity Market ETF
SCHEDULE OF INVESTMENTS
October 31, 2021
| Security Description |
Shares | Fair Value | ||||||
| INDIA (Continued) |
||||||||
| *Bayer CropScience, Ltd. |
937 | $ | 62,419 | |||||
| BEML, Ltd. |
676 | 14,493 | ||||||
| Berger Paints India, Ltd. |
6,713 | 66,474 | ||||||
| *BF Utilities, Ltd. |
24 | 130 | ||||||
| Bhansali Engineering Polymers, Ltd. |
84 | 199 | ||||||
| Bharat Dynamics, Ltd. |
80 | 433 | ||||||
| Bharat Electronics, Ltd. |
68,295 | 188,656 | ||||||
| Bharat Forge, Ltd. |
10,058 | 103,043 | ||||||
| *Bharat Heavy Electricals, Ltd. |
175,795 | 160,227 | ||||||
| *Bharat Petroleum Corp., Ltd. |
45,506 | 253,840 | ||||||
| Bharat Rasayan, Ltd. |
4 | 546 | ||||||
| *Bharti Airtel, Ltd. |
62,514 | 572,159 | ||||||
| *Biocon, Ltd. |
10,065 | 47,192 | ||||||
| Birla Corp., Ltd. |
6,991 | 142,684 | ||||||
| Birlasoft, Ltd. |
18,474 | 100,276 | ||||||
| Bliss Gvs Pharma, Ltd. |
56 | 83 | ||||||
| Blue Dart Express, Ltd. |
33 | 2,933 | ||||||
| Blue Star, Ltd. |
3,738 | 47,927 | ||||||
| Bombay Burmah Trading Co. |
1,078 | 15,535 | ||||||
| *Borosil Renewables, Ltd. |
32 | 192 | ||||||
| Bosch, Ltd. |
606 | 137,192 | ||||||
| Brigade Enterprises, Ltd. |
11,828 | 73,316 | ||||||
| Britannia Industries, Ltd. |
93 | 4,565 | ||||||
| Cadila Healthcare, Ltd. |
2,316 | 15,551 | ||||||
| *Camlin Fine Sciences, Ltd. |
56 | 124 | ||||||
| *Canara Bank |
1,170 | 3,352 | ||||||
| *Capacit’e Infraprojects, Ltd. |
44 | 96 | ||||||
| Caplin Point Laboratories, Ltd. |
32 | 351 | ||||||
| Carborundum Universal, Ltd. |
5,252 | 58,867 | ||||||
| Care Ratings, Ltd. |
16 | 147 | ||||||
| Castrol India, Ltd. |
65,768 | 121,337 | ||||||
| CCL Products India, Ltd. |
3,019 | 15,341 | ||||||
| Ceat, Ltd. |
7,374 | 122,819 | ||||||
| Central Depository Services India, Ltd. |
876 | 15,830 | ||||||
| Century Plyboards India, Ltd. |
4,342 | 31,318 | ||||||
| Century Textiles & Industries, Ltd. |
3,512 | 36,655 | ||||||
| Cera Sanitaryware, Ltd. |
8 | 554 | ||||||
| Cesc, Ltd. |
103,907 | 121,001 | ||||||
| Chambal Fertilisers and Chemicals, Ltd. |
39,509 | 195,062 | ||||||
| *Chennai Petroleum Corp., Ltd. |
72 | 118 | ||||||
| Cholamandalam Financial Holdings, Ltd. |
5,573 | 52,131 | ||||||
| Cigniti Technologies, Ltd. |
16 | 128 | ||||||
| Cipla, Ltd. |
1,820 | 21,997 | ||||||
| City Union Bank, Ltd. |
25,683 | 57,673 | ||||||
| Coal India, Ltd. |
70,517 | 154,866 | ||||||
| Cochin Shipyard, Ltd. |
56 | 261 | ||||||
| Coforge, Ltd. |
44 | 2,862 | ||||||
| *Colgate-Palmolive India, Ltd. |
437 | 9,002 | ||||||
| Container Corp. Of India, Ltd. |
17,109 | 149,678 | ||||||
| Coromandel International, Ltd. |
305 | 3,200 | ||||||
| CRISIL, Ltd. |
993 | 37,157 | ||||||
| Crompton Greaves Consumer Electricals, Ltd. |
67,224 | 417,988 | ||||||
| *Csb Bank, Ltd. |
2,515 | 9,879 | ||||||
| Cummins India, Ltd. |
152 | 1,818 | ||||||
| Cyient, Ltd. |
3,379 | 48,205 | ||||||
| *Dabur India, Ltd. |
25,308 | 198,003 | ||||||
Dimensional Emerging Core Equity Market ETF
SCHEDULE OF INVESTMENTS
October 31, 2021
| Security Description |
Shares | Fair Value | ||||||
| INDIA (Continued) |
||||||||
| Dalmia Bharat, Ltd. |
2,977 | $ | 80,000 | |||||
| *DCB Bank, Ltd. |
682 | 827 | ||||||
| DCM Shriram, Ltd. |
448 | 5,909 | ||||||
| Deepak Fertilisers & Petrochemicals Corp., Ltd. |
3,012 | 16,222 | ||||||
| Deepak Nitrite, Ltd. |
21,406 | 637,581 | ||||||
| Delta Corp., Ltd. |
13,034 | 45,030 | ||||||
| Dhampur Sugar Mills, Ltd. |
16 | 63 | ||||||
| Dhanuka Agritech, Ltd. |
20 | 195 | ||||||
| Dilip Buildcon, Ltd. |
469 | 3,761 | ||||||
| *Dish TV India, Ltd. |
151,931 | 34,999 | ||||||
| *Dishman Carbogen Amcis, Ltd. |
76 | 207 | ||||||
| Divi’s Laboratories, Ltd. |
3,341 | 229,786 | ||||||
| Dixon Technologies India, Ltd. |
20 | 1,334 | ||||||
| DLF, Ltd. |
43,683 | 232,529 | ||||||
| Dr Reddy’s Laboratories, Ltd. |
5,084 | 316,333 | ||||||
| Dr. Lal PathLabs, Ltd. |
3,332 | 156,134 | ||||||
| Dr. Reddy’s Laboratories, Ltd., Sponsored ADR |
894 | 54,927 | ||||||
| eClerx Services, Ltd. |
697 | 20,296 | ||||||
| Eicher Motors, Ltd. |
7,152 | 237,326 | ||||||
| *EID Parry India, Ltd. |
4,812 | 29,364 | ||||||
| *EIH, Ltd. |
7,634 | 14,145 | ||||||
| Elgi Equipments, Ltd. |
4,995 | 13,274 | ||||||
| *Emami, Ltd. |
152 | 1,078 | ||||||
| Endurance Technologies, Ltd. |
92 | 2,237 | ||||||
| Engineers India, Ltd. |
1,761 | 1,704 | ||||||
| EPL, Ltd. |
9,431 | 27,053 | ||||||
| Eris Lifesciences, Ltd. |
1,212 | 13,288 | ||||||
| *ESAB India, Ltd. |
8 | 270 | ||||||
| Escorts, Ltd. |
9,702 | 203,340 | ||||||
| *Eveready Industries India, Ltd. |
36 | 172 | ||||||
| Exide Industries, Ltd. |
400 | 924 | ||||||
| *FDC, Ltd. |
60 | 256 | ||||||
| Federal Bank, Ltd. |
287,429 | 374,058 | ||||||
| Fine Organic Industries, Ltd. |
12 | 527 | ||||||
| Finolex Cables, Ltd. |
2,486 | 15,509 | ||||||
| Finolex Industries, Ltd. |
23,497 | 69,065 | ||||||
| Firstsource Solutions, Ltd. |
25,279 | 66,724 | ||||||
| Force Motors, Ltd. |
8 | 151 | ||||||
| *Fortis Healthcare, Ltd. |
55,479 | 181,000 | ||||||
| *Future Lifestyle Fashions, Ltd. |
148 | 109 | ||||||
| Gabriel India, Ltd. |
100 | 206 | ||||||
| GAIL India, Ltd. |
107,433 | 213,557 | ||||||
| Galaxy Surfactants, Ltd. |
668 | 28,103 | ||||||
| Garware Technical Fibres, Ltd. |
740 | 33,641 | ||||||
| Gateway Distriparks, Ltd. |
72 | 268 | ||||||
| GE Power India, Ltd. |
24 | 93 | ||||||
| *GE T&D India, Ltd. |
104 | 178 | ||||||
| *General Insurance Corp. of India |
156 | 278 | ||||||
| GHCL, Ltd. |
2,562 | 14,444 | ||||||
| *Gillette India, Ltd. |
8 | 603 | ||||||
| GlaxoSmithKline Pharmaceuticals, Ltd. |
40 | 803 | ||||||
| Glenmark Pharmaceuticals, Ltd. |
29,796 | 200,507 | ||||||
| GMM Pfaudler, Ltd. |
30 | 1,867 | ||||||
| *GMR Infrastructure, Ltd. |
1,028 | 557 | ||||||
| Godfrey Phillips India, Ltd. |
24 | 415 | ||||||
Dimensional Emerging Core Equity Market ETF
SCHEDULE OF INVESTMENTS
October 31, 2021
| Security Description |
Shares | Fair Value | ||||||
| INDIA (Continued) |
||||||||
| Godrej Agrovet, Ltd. |
28 | $ | 222 | |||||
| *Godrej Consumer Products, Ltd. |
29,066 | 371,334 | ||||||
| *Godrej Industries, Ltd. |
325 | 2,519 | ||||||
| *Godrej Properties, Ltd. |
191 | 5,696 | ||||||
| Granules India, Ltd. |
13,806 | 57,137 | ||||||
| Graphite India, Ltd. |
4,737 | 33,933 | ||||||
| Grasim Industries, Ltd. |
24,871 | 571,645 | ||||||
| Great Eastern Shipping Co., Ltd. (The) |
9,530 | 40,974 | ||||||
| Greaves Cotton, Ltd. |
108 | 192 | ||||||
| Greenply Industries, Ltd. |
80 | 224 | ||||||
| Grindwell Norton, Ltd. |
828 | 17,909 | ||||||
| Gujarat Alkalies & Chemicals, Ltd. |
40 | 401 | ||||||
| Gujarat Ambuja Exports, Ltd. |
136 | 298 | ||||||
| *Gujarat Fluorochemicals, Ltd. |
23 | 558 | ||||||
| Gujarat Gas, Ltd. |
3,816 | 31,713 | ||||||
| Gujarat Narmada Valley Fertilizers & Chemicals, Ltd. |
3,492 | 21,480 | ||||||
| Gujarat Pipavav Port, Ltd. |
19,554 | 29,182 | ||||||
| Gujarat State Fertilizers & Chemicals, Ltd. |
184 | 324 | ||||||
| Gujarat State Petronet, Ltd. |
42,442 | 172,956 | ||||||
| Gulf Oil Lubricants India, Ltd. |
16 | 124 | ||||||
| Hatsun Agro Product, Ltd. |
1,118 | 19,967 | ||||||
| Havells India, Ltd. |
14,396 | 242,803 | ||||||
| HCL Technologies, Ltd. |
69,317 | 1,058,761 | ||||||
| HDFC Asset Management Co., Ltd. |
2,318 | 81,946 | ||||||
| HDFC Bank, Ltd. |
23,490 | 496,535 | ||||||
| HDFC Life Insurance Co., Ltd. |
16,185 | 147,074 | ||||||
| HEG, Ltd. |
661 | 18,166 | ||||||
| HeidelbergCement India, Ltd. |
352 | 1,123 | ||||||
| Hero MotoCorp., Ltd. |
7,031 | 249,489 | ||||||
| Hester Biosciences, Ltd. |
4 | 130 | ||||||
| HFCL, Ltd. |
62,065 | 59,055 | ||||||
| Hikal, Ltd. |
7,975 | 61,313 | ||||||
| HIL, Ltd. |
343 | 20,469 | ||||||
| Himadri Speciality Chemical, Ltd. |
156 | 110 | ||||||
| Himatsingka Seide, Ltd. |
60 | 199 | ||||||
| Hindalco Industries, Ltd. |
78,654 | 482,966 | ||||||
| Hinduja Global Solutions, Ltd. |
1,123 | 40,170 | ||||||
| Hindustan Aeronautics, Ltd. |
8,129 | 141,843 | ||||||
| Hindustan Petroleum Corp., Ltd. |
17,170 | 71,174 | ||||||
| Hindustan Unilever, Ltd. |
28,166 | 900,165 | ||||||
| Honeywell Automation India, Ltd. |
102 | 57,121 | ||||||
| Huhtamaki India, Ltd. |
40 | 127 | ||||||
| I G Petrochemicals, Ltd. |
16 | 179 | ||||||
| ICICI Bank, Ltd., Sponsored ADR |
20,273 | 428,774 | ||||||
| ICICI Bank, Ltd. |
184,319 | 1,974,233 | ||||||
| ICICI Lombard General Insurance Co., Ltd. |
14,911 | 295,019 | ||||||
| ICICI Prudential Life Insurance Co., Ltd. |
13,170 | 108,763 | ||||||
| ICICI Securities, Ltd. |
456 | 4,494 | ||||||
| ICRA, Ltd. |
4 | 185 | ||||||
| *IDFC First Bank, Ltd. |
389,604 | 257,546 | ||||||
| *IDFC, Ltd. |
115,950 | 85,320 | ||||||
| *IFB Industries, Ltd. |
12 | 201 | ||||||
| IIFL Wealth Management, Ltd. |
2,335 | 50,825 | ||||||
| India Cements, Ltd. (The) |
67,294 | 185,217 | ||||||
| *Indiabulls Real Estate, Ltd. |
19,670 | 39,875 | ||||||
| Indian Bank |
303 | 696 | ||||||
Dimensional Emerging Core Equity Market ETF
SCHEDULE OF INVESTMENTS
October 31, 2021
| Security Description |
Shares | Fair Value | ||||||
| INDIA (Continued) |
||||||||
| Indian Energy Exchange, Ltd. |
1,423 | $ | 13,460 | |||||
| Indian Hotels Co., Ltd. (The) |
29,996 | 78,774 | ||||||
| *Indian Oil Corp., Ltd. |
14,881 | 25,427 | ||||||
| *Indian Overseas Bank |
6,330 | 1,796 | ||||||
| Indian Railway Catering & Tourism Corp., Ltd. |
200 | 2,259 | ||||||
| Indo Count Industries, Ltd. |
116 | 374 | ||||||
| Indraprastha Gas, Ltd. |
13,075 | 82,748 | ||||||
| Indus Towers, Ltd. |
24,588 | 89,150 | ||||||
| IndusInd Bank, Ltd. |
8,645 | 131,635 | ||||||
| Infibeam Avenues, Ltd. |
512 | 310 | ||||||
| Info Edge India, Ltd. |
2,693 | 218,491 | ||||||
| Infosys, Ltd. |
169,856 | 3,783,021 | ||||||
| Ingersoll Rand India, Ltd. |
12 | 182 | ||||||
| *Inox Leisure, Ltd. |
2,585 | 14,466 | ||||||
| *Intellect Design Arena, Ltd. |
3,969 | 34,699 | ||||||
| *InterGlobe Aviation, Ltd. |
5,321 | 154,568 | ||||||
| IOL Chemicals and Pharmaceuticals, Ltd. |
32 | 236 | ||||||
| *Ipca Laboratories, Ltd. |
10,298 | 294,632 | ||||||
| *IRB Infrastructure Developers, Ltd. |
4,800 | 14,519 | ||||||
| IRCON International, Ltd. |
152 | 96 | ||||||
| ITC, Ltd. |
415,717 | 1,239,136 | ||||||
| *Jagran Prakashan, Ltd. |
160 | 132 | ||||||
| *Jaiprakash Power Ventures, Ltd. |
3,336 | 196 | ||||||
| *Jammu & Kashmir Bank, Ltd. (The) |
376 | 202 | ||||||
| Jamna Auto Industries, Ltd. |
184 | 239 | ||||||
| JB Chemicals & Pharmaceuticals, Ltd. |
1,430 | 32,047 | ||||||
| Jindal Poly Films, Ltd. |
1,244 | 15,709 | ||||||
| Jindal Saw, Ltd. |
13,910 | 21,548 | ||||||
| *Jindal Stainless Hisar, Ltd. |
8,815 | 39,683 | ||||||
| *Jindal Stainless, Ltd. |
34,086 | 87,285 | ||||||
| *Jindal Steel & Power, Ltd. |
20,486 | 114,165 | ||||||
| JK Cement, Ltd. |
39 | 1,727 | ||||||
| JK Lakshmi Cement, Ltd. |
9,795 | 80,440 | ||||||
| JK Paper, Ltd. |
174 | 524 | ||||||
| JK Tyre & Industries, Ltd. |
136 | 261 | ||||||
| *Johnson Controls-Hitachi Air Conditioning India, Ltd. |
12 | 332 | ||||||
| JSW Energy, Ltd. |
3,769 | 17,549 | ||||||
| JSW Steel, Ltd. |
69,452 | 620,633 | ||||||
| JTEKT India, Ltd. |
88 | 116 | ||||||
| Jubilant Foodworks, Ltd. |
3,500 | 172,440 | ||||||
| Jubilant Ingrevia, Ltd. |
334 | 2,985 | ||||||
| Jubilant Pharmova, Ltd. |
4,152 | 33,058 | ||||||
| *Just Dial, Ltd. |
61 | 650 | ||||||
| Jyothy Labs, Ltd. |
5,440 | 11,373 | ||||||
| Kajaria Ceramics, Ltd. |
5,411 | 88,249 | ||||||
| Kalpataru Power Transmission, Ltd. |
7,808 | 43,820 | ||||||
| Kansai Nerolac Paints, Ltd. |
3,426 | 24,937 | ||||||
| Karnataka Bank, Ltd. (The) |
164 | 149 | ||||||
| Karur Vysya Bank, Ltd. (The) |
2,710 | 1,773 | ||||||
| Kaveri Seed Co., Ltd. |
44 | 306 | ||||||
| KEC International, Ltd. |
6,935 | 44,237 | ||||||
| KEI Industries, Ltd. |
7,311 | 89,145 | ||||||
| Kennametal India, Ltd. |
8 | 148 | ||||||
| *Kiri Industries, Ltd. |
20 | 129 | ||||||
| Kirloskar Oil Engines, Ltd. |
80 | 215 | ||||||
Dimensional Emerging Core Equity Market ETF
SCHEDULE OF INVESTMENTS
October 31, 2021
| Security Description |
Shares | Fair Value | ||||||
| INDIA (Continued) |
||||||||
| KNR Constructions, Ltd. |
13,562 | $ | 50,676 | |||||
| Kotak Mahindra Bank, Ltd. |
24,215 | 656,831 | ||||||
| KPIT Technologies, Ltd. |
14,481 | 59,698 | ||||||
| Kpr Mill, Ltd. |
365 | 2,194 | ||||||
| KRBL, Ltd. |
120 | 453 | ||||||
| KSB, Ltd. |
667 | 11,806 | ||||||
| L&T Technology Services, Ltd. |
107 | 6,752 | ||||||
| LA Opala RG, Ltd. |
40 | 156 | ||||||
| Lakshmi Machine Works, Ltd. |
101 | 11,791 | ||||||
| Larsen & Toubro Infotech, Ltd. |
3,007 | 268,341 | ||||||
| Larsen & Toubro, Ltd. |
33,987 | 801,845 | ||||||
| Laurus Labs, Ltd. |
1,824 | 12,564 | ||||||
| *Lemon Tree Hotels, Ltd. |
368 | 268 | ||||||
| Linde India, Ltd. |
37 | 1,139 | ||||||
| LT Foods, Ltd. |
276 | 256 | ||||||
| Lupin, Ltd. |
10,061 | 124,000 | ||||||
| *LUX Industries, Ltd. |
1,090 | 51,765 | ||||||
| Mahanagar Gas, Ltd. |
6,379 | 85,456 | ||||||
| Maharashtra Seamless, Ltd. |
36 | 236 | ||||||
| Mahindra & Mahindra, Ltd. |
34,628 | 408,912 | ||||||
| *Mahindra CIE Automotive, Ltd. |
11,478 | 40,804 | ||||||
| *Mahindra Holidays & Resorts India, Ltd. |
84 | 256 | ||||||
| *Mahindra Lifespace Developers, Ltd. |
84 | 309 | ||||||
| Mahindra Logistics, Ltd. |
997 | 8,630 | ||||||
| Maithan Alloys, Ltd. |
12 | 169 | ||||||
| *Mangalore Refinery & Petrochemicals, Ltd. |
232 | 152 | ||||||
| Marico, Ltd. |
58,613 | 444,952 | ||||||
| Marksans Pharma, Ltd. |
352 | 310 | ||||||
| Maruti Suzuki India, Ltd. |
3,993 | 398,995 | ||||||
| *Max Financial Services, Ltd. |
52 | 676 | ||||||
| *Max Healthcare Institute, Ltd. |
32 | 142 | ||||||
| Mayur Uniquoters, Ltd. |
28 | 162 | ||||||
| *Meghmani Finechem, Ltd. |
15 | 178 | ||||||
| Meghmani Organics, Ltd. |
164 | 240 | ||||||
| Metropolis Healthcare, Ltd. |
1,988 | 78,643 | ||||||
| Minda Industries, Ltd. |
120 | 1,252 | ||||||
| Mindtree, Ltd. |
406 | 24,357 | ||||||
| Mishra Dhatu Nigam, Ltd. |
76 | 187 | ||||||
| *Morepen Laboratories, Ltd. |
244 | 163 | ||||||
| Motherson Sumi Systems, Ltd. |
13,774 | 41,102 | ||||||
| Motilal Oswal Financial Services, Ltd. |
941 | 11,509 | ||||||
| Mphasis, Ltd. |
14,509 | 626,969 | ||||||
| Multi Commodity Exchange of India, Ltd. |
2,266 | 51,558 | ||||||
| *Narayana Hrudayalaya, Ltd. |
92 | 641 | ||||||
| Natco Pharma, Ltd. |
1,644 | 18,161 | ||||||
| *National Aluminium Co., Ltd. |
46,895 | 60,684 | ||||||
| Navin Fluorine International, Ltd. |
1,968 | 87,739 | ||||||
| Navneet Education, Ltd. |
108 | 152 | ||||||
| NBCC India, Ltd. |
21,327 | 12,717 | ||||||
| NCC, Ltd. |
51,295 | 48,739 | ||||||
| NESCo., Ltd. |
28 | 227 | ||||||
| Nestle India, Ltd. |
1,594 | 404,457 | ||||||
| NHPC, Ltd. |
2,876 | 1,179 | ||||||
| Nilkamal, Ltd. |
8 | 254 | ||||||
| NLC India, Ltd. |
312 | 265 | ||||||
| NMDC, Ltd. |
2,157 | 4,124 | ||||||
Dimensional Emerging Core Equity Market ETF
SCHEDULE OF INVESTMENTS
October 31, 2021
| Security Description |
Shares | Fair Value | ||||||
| INDIA (Continued) |
||||||||
| NOCIL, Ltd. |
7,624 | $ | 27,174 | |||||
| NTPC, Ltd. |
127,156 | 225,253 | ||||||
| NXTDigital, Ltd. |
16 | 82 | ||||||
| *Oberoi Realty, Ltd. |
554 | 6,698 | ||||||
| *Oil & Natural Gas Corp., Ltd. |
208,414 | 414,845 | ||||||
| Oil India, Ltd. |
926 | 2,783 | ||||||
| Oracle Financial Services Software, Ltd. |
39 | 2,304 | ||||||
| Orient Cement, Ltd. |
5,316 | 11,558 | ||||||
| Orient Electric, Ltd. |
17,494 | 80,822 | ||||||
| Orient Refractories, Ltd. |
56 | 258 | ||||||
| Page Industries, Ltd. |
8 | 4,021 | ||||||
| Persistent Systems, Ltd. |
11,939 | 625,591 | ||||||
| Petronet LNG, Ltd. |
33,061 | 101,349 | ||||||
| Phillips Carbon Black, Ltd. |
6,967 | 20,450 | ||||||
| Phoenix Mills, Ltd. (The) |
12,408 | 159,745 | ||||||
| PI Industries, Ltd. |
2,765 | 110,774 | ||||||
| Pidilite Industries, Ltd. |
9,119 | 281,755 | ||||||
| PNC Infratech, Ltd. |
5,602 | 24,269 | ||||||
| Poly Medicure, Ltd. |
516 | 6,365 | ||||||
| *Polyplex Corp., Ltd. |
1,454 | 32,742 | ||||||
| Power Grid Corp. of India, Ltd. |
126,407 | 312,383 | ||||||
| Praj Industries, Ltd. |
2,458 | 10,946 | ||||||
| Prataap Snacks, Ltd. |
12 | 109 | ||||||
| Prestige Estates Projects, Ltd. |
21,189 | 120,573 | ||||||
| *Prism Johnson, Ltd. |
292 | 465 | ||||||
| *Procter & Gamble Health, Ltd. |
266 | 19,267 | ||||||
| *Procter & Gamble Hygiene & Health Care, Ltd. |
16 | 3,040 | ||||||
| *Punjab & Sind Bank |
45,606 | 10,841 | ||||||
| *Punjab National Bank |
21,609 | 12,149 | ||||||
| *PVR, Ltd. |
3,529 | 79,064 | ||||||
| Quess Corp., Ltd. |
10,563 | 122,210 | ||||||
| Radico Khaitan, Ltd. |
4,273 | 63,869 | ||||||
| *Rain Industries, Ltd. |
9,533 | 28,975 | ||||||
| Rajesh Exports, Ltd. |
12,582 | 107,243 | ||||||
| Rallis India, Ltd. |
532 | 1,885 | ||||||
| Ramco Cements, Ltd. (The) |
1,314 | 18,715 | ||||||
| Ramkrishna Forgings, Ltd. |
16 | 233 | ||||||
| *Rashtriya Chemicals & Fertilizers, Ltd. |
196 | 201 | ||||||
| Ratnamani Metals & Tubes, Ltd. |
860 | 24,607 | ||||||
| *Raymond, Ltd. |
36 | 220 | ||||||
| *RBL Bank, Ltd. |
72,414 | 174,601 | ||||||
| *»Redington India, Ltd. |
15,521 | 29,785 | ||||||
| Redington India, Ltd. |
42,287 | 81,150 | ||||||
| Relaxo Footwears, Ltd. |
72 | 1,280 | ||||||
| Reliance Industries, Ltd. |
119,074 | 4,033,071 | ||||||
| *Reliance Power, Ltd. |
173,135 | 32,601 | ||||||
| Sanofi India, Ltd. |
10 | 1,115 | ||||||
| Saregama India, Ltd. |
8 | 434 | ||||||
| SBI Life Insurance Co., Ltd. |
21,344 | 326,525 | ||||||
| Schaeffler India, Ltd. |
45 | 4,448 | ||||||
| Sequent Scientific, Ltd. |
76 | 194 | ||||||
| SH Kelkar & Co., Ltd. |
80 | 170 | ||||||
| Sharda Cropchem, Ltd. |
56 | 230 | ||||||
| *Sheela Foam, Ltd. |
1,041 | 34,350 | ||||||
| Shilpa Medicare, Ltd. |
44 | 343 | ||||||
Dimensional Emerging Core Equity Market ETF
SCHEDULE OF INVESTMENTS
October 31, 2021
| Security Description |
Shares | Fair Value | ||||||
| INDIA (Continued) |
||||||||
| Shipping Corp. of India, Ltd. |
7,737 | $ | 13,241 | |||||
| *Shoppers Stop, Ltd. |
44 | 203 | ||||||
| Shree Cement, Ltd. |
395 | 151,051 | ||||||
| *Shree Renuka Sugars, Ltd. |
54,514 | 19,693 | ||||||
| Siemens, Ltd. |
3,001 | 87,634 | ||||||
| *SIS, Ltd. |
48 | 298 | ||||||
| SKF India, Ltd. |
101 | 4,479 | ||||||
| Sobha, Ltd. |
1,392 | 14,314 | ||||||
| Solar Industries India, Ltd. |
70 | 2,325 | ||||||
| Solara Active Pharma Sciences, Ltd. |
20 | 333 | ||||||
| Somany Ceramics, Ltd. |
24 | 245 | ||||||
| Sonata Software, Ltd. |
5,606 | 62,617 | ||||||
| *South Indian Bank, Ltd. (The) |
976 | 122 | ||||||
| *SpiceJet, Ltd. |
10,720 | 10,136 | ||||||
| SRF, Ltd. |
1,038 | 29,350 | ||||||
| State Bank of India |
66,526 | 446,120 | ||||||
| *Steel Authority of India, Ltd. |
3,714 | 5,709 | ||||||
| Sterlite Technologies, Ltd. |
10,750 | 39,314 | ||||||
| Strides Pharma Science, Ltd. |
10,816 | 77,240 | ||||||
| Subex, Ltd. |
15,381 | 8,720 | ||||||
| Subros, Ltd. |
32 | 154 | ||||||
| Sudarshan Chemical Industries |
1,116 | 8,473 | ||||||
| Sun Pharmaceutical Industries, Ltd. |
45,995 | 488,320 | ||||||
| Sun TV Network, Ltd. |
788 | 5,904 | ||||||
| Sundaram-Clayton, Ltd. |
317 | 16,251 | ||||||
| Sundram Fasteners, Ltd. |
7,686 | 85,758 | ||||||
| Sunteck Realty, Ltd. |
4,166 | 25,617 | ||||||
| Suprajit Engineering, Ltd. |
2,426 | 11,155 | ||||||
| Supreme Industries, Ltd. |
6,513 | 202,567 | ||||||
| *Supreme Petrochem, Ltd. |
1,275 | 10,661 | ||||||
| Surya Roshni, Ltd. |
28 | 228 | ||||||
| *Suvidhaa Infoserve Pvt, Ltd. |
33 | 6 | ||||||
| Swaraj Engines, Ltd. |
4 | 92 | ||||||
| Symphony, Ltd. |
24 | 332 | ||||||
| *Syngene International, Ltd. |
150 | 1,083 | ||||||
| Tanla Platforms, Ltd. |
3,694 | 60,219 | ||||||
| Tata Chemicals, Ltd. |
604 | 7,270 | ||||||
| Tata Communications, Ltd. |
974 | 17,006 | ||||||
| Tata Consultancy Services, Ltd. |
38,400 | 1,742,407 | ||||||
| Tata Consumer Products, Ltd. |
27,113 | 293,104 | ||||||
| Tata Elxsi, Ltd. |
26 | 2,039 | ||||||
| #*Tata Motors, Ltd., Sponsored ADR |
4,637 | 146,436 | ||||||
| *Tata Motors, Ltd. |
104,563 | 675,431 | ||||||
| Tata Power Co., Ltd. (The) |
161,531 | 462,280 | ||||||
| *Tata Steel BSL, Ltd. |
25,232 | 29,113 | ||||||
| Tata Steel Long Products, Ltd. |
16 | 180 | ||||||
| Tata Steel, Ltd. |
47,947 | 842,612 | ||||||
| TCI Express, Ltd. |
20 | 489 | ||||||
| *TCNS Clothing Co., Ltd. |
32 | 320 | ||||||
| Tech Mahindra, Ltd. |
27,213 | 537,074 | ||||||
| Techno Electric & Engineering Co., Ltd. |
60 | 207 | ||||||
| Thermax, Ltd. |
52 | 957 | ||||||
| Thyrocare Technologies, Ltd. |
20 | 304 | ||||||
| *Tide Water Oil Co. India, Ltd. |
20 | 440 | ||||||
| Timken India, Ltd. |
1,221 | 29,317 | ||||||
| Titan Co., Ltd. |
16,730 | 532,534 | ||||||
Dimensional Emerging Core Equity Market ETF
SCHEDULE OF INVESTMENTS
October 31, 2021
| Security Description |
Shares | Fair Value | ||||||
| INDIA (Continued) |
||||||||
| Torrent Pharmaceuticals, Ltd. |
2,835 | $ | 108,295 | |||||
| Torrent Power, Ltd. |
168 | 1,122 | ||||||
| Transport Corp. of India, Ltd. |
36 | 303 | ||||||
| Trent, Ltd. |
19 | 255 | ||||||
| Trident, Ltd. |
81,852 | 41,483 | ||||||
| Triveni Engineering & Industries, Ltd. |
136 | 347 | ||||||
| Triveni Turbine, Ltd. |
168 | 430 | ||||||
| TTK Prestige, Ltd. |
4 | 584 | ||||||
| Tube Investments of India, Ltd. |
3,156 | 58,858 | ||||||
| TV Today Network, Ltd. |
40 | 167 | ||||||
| *TV18 Broadcast, Ltd. |
704 | 391 | ||||||
| TVS Srichakra, Ltd. |
4 | 123 | ||||||
| *UCO Bank |
1,977 | 380 | ||||||
| Uflex, Ltd. |
60 | 453 | ||||||
| UltraTech Cement, Ltd. |
6,327 | 645,199 | ||||||
| United Breweries, Ltd. |
141 | 3,123 | ||||||
| *United Spirits, Ltd. |
5,927 | 74,985 | ||||||
| UPL, Ltd. |
62,104 | 613,897 | ||||||
| *VA Tech Wabag, Ltd. |
32 | 136 | ||||||
| Vaibhav Global, Ltd. |
9,193 | 70,548 | ||||||
| Vakrangee, Ltd. |
3,386 | 1,664 | ||||||
| *Vardhman Textiles, Ltd. |
2,256 | 58,630 | ||||||
| *Varroc Engineering, Ltd. |
40 | 157 | ||||||
| Varun Beverages, Ltd. |
274 | 3,108 | ||||||
| Vedanta, Ltd. |
243 | 987 | ||||||
| Venky’s India, Ltd. |
4 | 146 | ||||||
| Vesuvius India, Ltd. |
12 | 172 | ||||||
| V-Guard Industries, Ltd. |
14,016 | 48,086 | ||||||
| Vinati Organics, Ltd. |
606 | 15,473 | ||||||
| *VIP Industries, Ltd. |
52 | 377 | ||||||
| *V-Mart Retail, Ltd. |
623 | 33,796 | ||||||
| *Vodafone Idea, Ltd. |
528,578 | 67,412 | ||||||
| Voltamp Transformers, Ltd. |
4 | 80 | ||||||
| Voltas, Ltd. |
282 | 4,536 | ||||||
| VRL Logistics, Ltd. |
64 | 320 | ||||||
| VST Industries, Ltd. |
32 | 1,409 | ||||||
| VST Tillers Tractors, Ltd. |
4 | 154 | ||||||
| Welspun Corp., Ltd. |
660 | 1,177 | ||||||
| Welspun Enterprises, Ltd. |
104 | 136 | ||||||
| Welspun India, Ltd. |
28,393 | 52,212 | ||||||
| *Westlife Development, Ltd. |
56 | 434 | ||||||
| Whirlpool of India, Ltd. |
36 | 1,064 | ||||||
| Wipro, Ltd. |
95,850 | 827,857 | ||||||
| *Wockhardt, Ltd. |
52 | 297 | ||||||
| Zee Entertainment Enterprises, Ltd. |
47,916 | 192,576 | ||||||
| Zensar Technologies, Ltd. |
7,457 | 45,973 | ||||||
| Zydus Wellnes, Ltd. |
2,485 | 68,180 | ||||||
|
|
|
|||||||
| TOTAL INDIA |
53,329,226 | |||||||
|
|
|
|||||||
| INDONESIA (1.7%) |
||||||||
| Ace Hardware Indonesia TBK PT |
710,500 | 70,712 | ||||||
| Adaro Energy TBK PT |
1,005,000 | 119,174 | ||||||
| *Adhi Karya Persero TBK PT |
2,500 | 185 | ||||||
| *Adi Sarana Armada TBK PT |
61,600 | 13,827 | ||||||
Dimensional Emerging Core Equity Market ETF
SCHEDULE OF INVESTMENTS
October 31, 2021
| Security Description |
Shares | Fair Value | ||||||
| INDONESIA (Continued) |
||||||||
| AKR Corporindo TBK PT |
2,700 | $ | 814 | |||||
| *Alam Sutera Realty TBK PT |
18,800 | 242 | ||||||
| Aneka Tambang TBK |
10,800 | 1,784 | ||||||
| Arwana Citramulia TBK PT |
7,900 | 482 | ||||||
| Astra Agro Lestari TBK PT |
700 | 530 | ||||||
| Astra International TBK PT |
999,400 | 425,014 | ||||||
| Astra Otoparts TBK PT |
1,100 | 88 | ||||||
| Bank BTPN Syariah TBK PT |
2,700 | 726 | ||||||
| *Bank Bukopin TBK |
5,713,000 | 172,590 | ||||||
| Bank Central Asia TBK PT |
1,803,000 | 951,292 | ||||||
| *Bank China Construction Bank Indonesia TBK PT |
47,100 | 429 | ||||||
| *Bank Ina Perdana PT |
4,300 | 1,205 | ||||||
| *Bank Jago TBK PT |
2,700 | 2,954 | ||||||
| Bank Mandiri Persero TBK PT |
617,100 | 312,525 | ||||||
| *Bank Mayapada International TBK PT |
160,000 | 8,809 | ||||||
| Bank Maybank Indonesia TBK PT |
24,100 | 571 | ||||||
| Bank Negara Indonesia Persero TBK PT |
282,400 | 139,531 | ||||||
| *Bank Pan Indonesia TBK PT |
6,700 | 373 | ||||||
| Bank Pembangunan Daerah Jawa Barat Dan Banten TBK PT |
4,800 | 483 | ||||||
| Bank Pembangunan Daerah Jawa Timur TBK PT |
4,900 | 270 | ||||||
| Bank Rakyat Indonesia Persero TBK PT |
2,069,460 | 620,801 | ||||||
| *Bank Syariah Indonesia Tbk PT |
1,100 | 164 | ||||||
| *Bank Tabungan Negara Persero TBK PT |
66,700 | 8,380 | ||||||
| Barito Pacific TBK PT |
669,500 | 44,184 | ||||||
| *Bekasi Fajar Industrial Estate TBK PT |
8,000 | 73 | ||||||
| *Bintang Oto Global TBK PT |
1,900 | 202 | ||||||
| BISI International TBK PT |
2,200 | 158 | ||||||
| Blue Bird TBK PT |
1,000 | 105 | ||||||
| Bukit Asam TBK PT |
760,400 | 143,841 | ||||||
| *Bumi Serpong Damai TBK PT |
129,600 | 10,154 | ||||||
| *Capital Financial Indonesia TBK PT |
24,800 | 735 | ||||||
| Charoen Pokphand Indonesia TBK PT |
21,300 | 9,321 | ||||||
| Cikarang Listrindo TBK PT |
3,300 | 148 | ||||||
| Ciputra Development TBK PT |
1,087,600 | 82,525 | ||||||
| *Citra Marga Nusaphala Persada TBK PT |
1,700 | 152 | ||||||
| *Delta Dunia Makmur TBK PT |
9,900 | 207 | ||||||
| Dharma Satya Nusantara TBK PT |
4,000 | 164 | ||||||
| *Eagle High Plantations TBK PT |
11,800 | 76 | ||||||
| *Elang Mahkota Teknologi TBK PT |
24,500 | 3,329 | ||||||
| Elnusa TBK PT |
6,500 | 139 | ||||||
| Erajaya Swasembada TBK PT |
652,100 | 29,918 | ||||||
| Gajah Tunggal TBK PT |
2,000 | 103 | ||||||
| Gudang Garam TBK PT |
31,200 | 73,775 | ||||||
| Indah Kiat Pulp & Paper Corp. TBK PT |
157,900 | 94,456 | ||||||
| *Indika Energy TBK PT |
3,200 | 402 | ||||||
| Indo Tambangraya Megah TBK PT |
223,700 | 341,057 | ||||||
| Indocement Tunggal Prakarsa TBK PT |
94,600 | 78,959 | ||||||
| Indofood CBP Sukses Makmur TBK PT |
159,500 | 99,072 | ||||||
| Indofood Sukses Makmur TBK PT |
294,700 | 132,087 | ||||||
| Indomobil Sukses Internasional TBK PT |
2,500 | 176 | ||||||
| *Indosat TBK PT |
1,800 | 880 | ||||||
| Industri Jamu Dan Farmasi Sido Muncul TBK PT |
32,345 | 1,929 | ||||||
| Integra Indocabinet TBK PT |
2,800 | 162 | ||||||
| *Intiland Development TBK PT |
9,300 | 114 | ||||||
| Japfa Comfeed Indonesia TBK PT |
8,400 | 1,023 | ||||||
| *Jasa Marga Persero TBK PT |
2,900 | 860 | ||||||
Dimensional Emerging Core Equity Market ETF
SCHEDULE OF INVESTMENTS
October 31, 2021
| Security Description |
Shares | Fair Value | ||||||
| INDONESIA (Continued) |
||||||||
| Jaya Real Property TBK PT |
4,900 | $ | 172 | |||||
| Kalbe Farma TBK PT |
1,442,800 | 162,942 | ||||||
| *Kapuas Prima Coal TBK PT |
12,400 | 111 | ||||||
| *Kawasan Industri Jababeka TBK PT |
24,700 | 275 | ||||||
| *Krakatau Steel Persero TBK PT |
5,800 | 215 | ||||||
| Link Net TBK PT |
76,000 | 20,867 | ||||||
| *Lippo Karawaci TBK PT |
350,700 | 3,664 | ||||||
| Mayora Indah TBK PT |
5,400 | 896 | ||||||
| *Medco Energi Internasional TBK PT |
803,400 | 32,323 | ||||||
| Media Nusantara Citra TBK PT |
644,000 | 40,911 | ||||||
| *Merdeka Copper Gold TBK PT |
1,027,600 | 229,202 | ||||||
| Metrodata Electronics TBK PT |
1,500 | 391 | ||||||
| *Mitra Adiperkasa TBK PT |
480,800 | 29,864 | ||||||
| Mitra Keluarga Karyasehat TBK PT |
5,800 | 933 | ||||||
| *MNC Land TBK PT |
1,852,500 | 13,337 | ||||||
| *Mnc Vision Networks TBK PT |
1,408,100 | 24,052 | ||||||
| Nippon Indosari Corpindo TBK PT |
1,500 | 142 | ||||||
| Pabrik Kertas Tjiwi Kimia TBK PT |
1,600 | 943 | ||||||
| *Pacific Strategic Financial TBK PT |
6,400 | 438 | ||||||
| *Pakuwon Jati TBK PT |
21,900 | 773 | ||||||
| *Pan Brothers TBK PT |
4,900 | 46 | ||||||
| *Paninvest TBK PT |
2,000 | 97 | ||||||
| *Perusahaan Gas Negara TBK PT |
20,700 | 2,206 | ||||||
| Perusahaan Perkebunan London Sumatra Indonesia TBK PT |
14,700 | 1,447 | ||||||
| *Pollux Properti Indonesia TBK PT |
1,500 | 349 | ||||||
| *PP Persero TBK PT |
4,600 | 391 | ||||||
| Puradelta Lestari TBK PT |
12,100 | 191 | ||||||
| *Ramayana Lestari Sentosa TBK PT |
3,800 | 198 | ||||||
| Salim Ivomas Pratama TBK PT |
5,000 | 170 | ||||||
| Samindo Resources TBK PT |
1,100 | 129 | ||||||
| *Sampoerna Agro TBK PT |
1,100 | 173 | ||||||
| Sarana Menara Nusantara TBK PT |
914,600 | 74,885 | ||||||
| Sariguna Primatirta TBK PT |
3,100 | 100 | ||||||
| Sawit Sumbermas Sarana TBK PT |
4,300 | 346 | ||||||
| *Selamat Sempurna TBK PT |
5,300 | 595 | ||||||
| *Semen Baturaja Persero TBK PT |
1,600 | 86 | ||||||
| Semen Indonesia Persero TBK PT |
225,100 | 144,585 | ||||||
| Siloam International Hospitals TBK PT |
400 | 243 | ||||||
| *»Sri Rejeki Isman TBK PT |
16,700 | 172 | ||||||
| Sumber Alfaria Trijaya TBK PT |
21,600 | 1,822 | ||||||
| *Summarecon Agung TBK PT |
28,149 | 1,818 | ||||||
| *Surya Citra Media TBK PT |
2,033,500 | 60,284 | ||||||
| *Surya Esa Perkasa TBK PT |
6,600 | 156 | ||||||
| *Surya Semesta Internusa TBK PT |
7,000 | 246 | ||||||
| Telkom Indonesia Persero TBK PT |
2,150,800 | 576,887 | ||||||
| Telkom Indonesia Persero TBK PT, Sponsored ADR |
122 | 3,207 | ||||||
| Tempo Scan Pacific TBK PT |
1,300 | 135 | ||||||
| *Timah TBK PT |
220,100 | 24,702 | ||||||
| Tower Bersama Infrastructure TBK PT |
2,234,000 | 463,593 | ||||||
| *Transcoal Pacific TBK PT |
1,700 | 1,038 | ||||||
| Tunas Baru Lampung TBK PT |
4,900 | 299 | ||||||
| Ultrajaya Milk Industry & Trading Co. TBK PT |
7,700 | 886 | ||||||
| *Unilever Indonesia TBK PT |
579,800 | 180,887 | ||||||
| United Tractors TBK PT |
162,300 | 269,784 | ||||||
| Vale Indonesia TBK PT |
3,100 | 1,061 | ||||||
Dimensional Emerging Core Equity Market ETF
SCHEDULE OF INVESTMENTS
October 31, 2021
| Security Description |
Shares | Fair Value | ||||||
| INDONESIA (Continued) |
||||||||
| *Waskita Beton Precast TBK PT |
15,100 | $ | 165 | |||||
| *Waskita Karya Persero TBK PT |
7,100 | 461 | ||||||
| Wijaya Karya Beton TBK PT |
4,500 | 86 | ||||||
| *Wijaya Karya Persero TBK PT |
1,530,600 | 134,505 | ||||||
| XL Axiata TBK PT |
1,393,800 | 303,011 | ||||||
|
|
|
|||||||
| TOTAL INDONESIA |
6,818,334 | |||||||
|
|
|
|||||||
| KOREA, REPUBLIC OF (13.5%) |
||||||||
| *3S Korea Co., Ltd. |
44 | 159 | ||||||
| ABOV Semiconductor Co., Ltd. |
20 | 226 | ||||||
| *Advanced Digital Chips, Inc. |
48 | 36 | ||||||
| Advanced Nano Products Co., Ltd. |
8 | 304 | ||||||
| Advanced Process Systems Corp. |
1,227 | 24,885 | ||||||
| Aekyung Industrial Co., Ltd. |
12 | 228 | ||||||
| Aekyung Petrochemical Co., Ltd. |
16 | 183 | ||||||
| *AeroSpace Technology of Korea, Inc. |
32 | 179 | ||||||
| AfreecaTV Co., Ltd. |
462 | 76,305 | ||||||
| *Agabang&Company |
44 | 200 | ||||||
| Ahn-Gook Pharmaceutical Co., Ltd. |
8 | 71 | ||||||
| Ahnlab, Inc. |
53 | 3,719 | ||||||
| AJ Networks Co., Ltd. |
32 | 153 | ||||||
| *Ajin Industrial Co., Ltd. |
64 | 194 | ||||||
| AK Holdings, Inc. |
8 | 181 | ||||||
| *Alpha Holdings, Inc. |
24 | 72 | ||||||
| *Alteogen, Inc. |
148 | 8,866 | ||||||
| *ALUKO Co., Ltd. |
60 | 205 | ||||||
| *Amicogen, Inc. |
58 | 1,603 | ||||||
| *Aminologics Co., Ltd. |
48 | 104 | ||||||
| Amorepacific Corp. |
1,579 | 245,251 | ||||||
| AMOREPACIFIC Group |
2,309 | 98,007 | ||||||
| *Amotech Co., Ltd. |
380 | 10,081 | ||||||
| *Anam Electronics Co., Ltd. |
64 | 130 | ||||||
| *Ananti, Inc. |
700 | 7,907 | ||||||
| *Apact Co., Ltd. |
20 | 110 | ||||||
| *APS Holdings Corp. |
20 | 306 | ||||||
| Asia Cement Co., Ltd. |
4 | 466 | ||||||
| Asia Paper Manufacturing Co., Ltd. |
8 | 314 | ||||||
| Atec Co., Ltd. |
8 | 166 | ||||||
| Austem Co., Ltd. |
36 | 87 | ||||||
| Autech Corp. |
16 | 149 | ||||||
| Avaco Co., Ltd. |
16 | 141 | ||||||
| Bcworld Pharm Co., Ltd. |
8 | 116 | ||||||
| BGF retail Co., Ltd. |
303 | 41,876 | ||||||
| BH Co., Ltd. |
166 | 2,656 | ||||||
| *Binex Co., Ltd. |
234 | 3,304 | ||||||
| Binggrae Co., Ltd. |
739 | 35,225 | ||||||
| *BioSmart Co., Ltd. |
20 | 92 | ||||||
| *Biotoxtech Co., Ltd. |
8 | 56 | ||||||
| BIT Computer Co., Ltd. |
12 | 88 | ||||||
| BNK Financial Group, Inc. |
37,202 | 280,157 | ||||||
| Boditech Med, Inc. |
2,409 | 33,088 | ||||||
| *Bohae Brewery Co., Ltd. |
136 | 115 | ||||||
| BoKwang Industry Co., Ltd. |
16 | 114 | ||||||
| Bolak Co., Ltd. |
28 | 50 | ||||||
| Bookook Securities Co., Ltd. |
4 | 84 | ||||||
Dimensional Emerging Core Equity Market ETF
SCHEDULE OF INVESTMENTS
October 31, 2021
| Security Description |
Shares | Fair Value | ||||||
| KOREA, REPUBLIC OF (Continued) |
||||||||
| Boryung Pharmaceutical Co., Ltd. |
56 | $ | 688 | |||||
| *Bosung Power Technology Co., Ltd. |
56 | 213 | ||||||
| *Bubang Co., Ltd. |
48 | 104 | ||||||
| Bukwang Pharmaceutical Co., Ltd. |
26 | 290 | ||||||
| BusinessOn Communication Co., Ltd. |
4 | 74 | ||||||
| *BYON Co., Ltd. |
68 | 70 | ||||||
| Byucksan Corp. |
52 | 163 | ||||||
| *Cafe24 Corp. |
102 | 2,514 | ||||||
| *CammSys Corp. |
64 | 103 | ||||||
| Camus Engineering & Construction, Inc. |
40 | 99 | ||||||
| *Capro Corp. |
48 | 170 | ||||||
| Cell Biotech Co., Ltd. |
8 | 122 | ||||||
| *Celltrion Healthcare Co., Ltd. |
2,735 | 189,347 | ||||||
| *Celltrion Pharm, Inc. |
88 | 8,532 | ||||||
| *Celltrion, Inc. |
3,460 | 593,667 | ||||||
| *Chabiotech Co., Ltd. |
3,794 | 63,474 | ||||||
| Changhae Ethanol Co., Ltd. |
12 | 147 | ||||||
| *Cheil Bio Co., Ltd. |
24 | 72 | ||||||
| Cheil Worldwide, Inc. |
4,559 | 93,049 | ||||||
| *Chemon, Inc. |
32 | 88 | ||||||
| Chemtronics Co., Ltd. |
957 | 21,006 | ||||||
| *Chemtros Co., Ltd. |
16 | 196 | ||||||
| *ChinHung International, Inc. |
44 | 79 | ||||||
| Chips&Media, Inc. |
4 | 54 | ||||||
| *Choa Pharmaceutical Co. |
24 | 84 | ||||||
| Chong Kun Dang Pharmaceutical Corp. |
855 | 85,972 | ||||||
| Chongkundang Holdings Corp. |
31 | 2,173 | ||||||
| Choong Ang Vaccine Laboratory |
8 | 107 | ||||||
| Chunbo Co., Ltd. |
4 | 969 | ||||||
| Chungdahm Learning, Inc. |
8 | 236 | ||||||
| CJ CheilJedang Corp. |
568 | 184,708 | ||||||
| CJ Corp. |
1,378 | 112,971 | ||||||
| CJ ENM Co., Ltd. |
24 | 3,623 | ||||||
| *CJ Freshway Corp. |
12 | 338 | ||||||
| *CJ Logistics Corp. |
16 | 1,944 | ||||||
| *CJ Seafood Corp. |
24 | 80 | ||||||
| CKD Bio Corp. |
4 | 144 | ||||||
| Classys, Inc. |
8 | 153 | ||||||
| Clean & Science Co., Ltd. |
8 | 138 | ||||||
| CLIO Cosmetics Co., Ltd. |
8 | 153 | ||||||
| *CMG Pharmaceutical Co., Ltd. |
430 | 1,415 | ||||||
| *CoAsia Corp. |
20 | 149 | ||||||
| *Coreana Cosmetics Co., Ltd. |
32 | 117 | ||||||
| *Corentec Co., Ltd. |
12 | 145 | ||||||
| *CORESTEM, Inc. |
12 | 191 | ||||||
| *COSMAX NBT, Inc. |
12 | 84 | ||||||
| *Cosmax, Inc. |
1,302 | 138,161 | ||||||
| *Cosmecca Korea Co., Ltd. |
8 | 102 | ||||||
| *CosmoAM&T Co., Ltd. |
195 | 7,017 | ||||||
| *Cosmochemical Co., Ltd. |
20 | 265 | ||||||
| Coway Co., Ltd. |
2,854 | 193,922 | ||||||
| COWELL FASHION Co., Ltd. |
40 | 314 | ||||||
| *Creative & Innovative System |
84 | 1,319 | ||||||
| *CrystalGenomics, Inc. |
586 | 3,435 | ||||||
| CS Wind Corp. |
18 | 1,069 | ||||||
Dimensional Emerging Core Equity Market ETF
SCHEDULE OF INVESTMENTS
October 31, 2021
| Security Description |
Shares | Fair Value | ||||||
| KOREA, REPUBLIC OF (Continued) |
||||||||
| *CTC BIO, Inc. |
20 | $ | 148 | |||||
| Cuckoo Holdings Co., Ltd. |
20 | 385 | ||||||
| Cuckoo Homesys Co., Ltd. |
12 | 447 | ||||||
| *Curexo, Inc. |
24 | 150 | ||||||
| *Curo Co., Ltd. |
200 | 86 | ||||||
| Cymechs, Inc. |
8 | 112 | ||||||
| *D&C Media Co., Ltd. |
8 | 287 | ||||||
| D.I Corp. |
32 | 217 | ||||||
| *DA Technology Co., Ltd. |
20 | 142 | ||||||
| Dae Hwa Pharmaceutical Co., Ltd. |
12 | 102 | ||||||
| Dae Won Kang Up Co., Ltd. |
68 | 245 | ||||||
| *Dae Young Packaging Co., Ltd. |
92 | 196 | ||||||
| Dae Yu Co., Ltd. |
12 | 64 | ||||||
| Daea TI Co., Ltd. |
5,411 | 30,469 | ||||||
| Daebongls Co., Ltd. |
12 | 90 | ||||||
| *Daechang Co., Ltd. |
76 | 133 | ||||||
| Daedong Corp. |
24 | 201 | ||||||
| *Daehan New Pharm Co., Ltd. |
16 | 153 | ||||||
| Daejoo Co., Ltd. |
32 | 59 | ||||||
| Daejoo Electronic Materials Co., Ltd. |
91 | 8,130 | ||||||
| Daejung Chemicals & Metals Co., Ltd. |
4 | 75 | ||||||
| Daesang Corp. |
2,687 | 54,841 | ||||||
| Daesang Holdings Co., Ltd. |
28 | 240 | ||||||
| *Daesung Fine Tech Co., Ltd. |
36 | 68 | ||||||
| Daesung Holdings Co., Ltd. |
8 | 303 | ||||||
| *Daewon Media Co., Ltd. |
16 | 469 | ||||||
| Daewon Pharmaceutical Co., Ltd. |
21 | 286 | ||||||
| *Daewoo Electronic Components Co., Ltd. |
24 | 64 | ||||||
| *Daewoo Engineering & Construction Co., Ltd. |
1,422 | 7,606 | ||||||
| Daewoong Co., Ltd. |
2,956 | 79,936 | ||||||
| Daewoong Pharmaceutical Co., Ltd. |
4 | 479 | ||||||
| Daihan Pharmaceutical Co., Ltd. |
8 | 207 | ||||||
| Daishin Information & Communication |
36 | 40 | ||||||
| Daishin Securities Co., Ltd. |
52 | 926 | ||||||
| *Daiyang Metal Co., Ltd. |
24 | 111 | ||||||
| *Danal Co., Ltd. |
4,779 | 33,617 | ||||||
| Danawa Co., Ltd. |
1,569 | 37,595 | ||||||
| *Dasan Networks, Inc. |
23,114 | 140,438 | ||||||
| Dawonsys Co., Ltd. |
6,974 | 196,350 | ||||||
| *Dayou Plus Co., Ltd. |
160 | 195 | ||||||
| DB Financial Investment Co., Ltd. |
48 | 290 | ||||||
| DB HiTek Co., Ltd. |
2,441 | 120,113 | ||||||
| DB Insurance Co., Ltd. |
6,207 | 314,453 | ||||||
| Dentium Co., Ltd. |
60 | 3,548 | ||||||
| Deutsch Motors, Inc. |
40 | 260 | ||||||
| *Dexter Studios Co., Ltd. |
20 | 413 | ||||||
| DGB Financial Group, Inc. |
994 | 8,804 | ||||||
| DI Dong Il Corp. |
4 | 982 | ||||||
| Digital Daesung Co., Ltd. |
20 | 167 | ||||||
| *Digital Optics Co., Ltd. |
10 | 54 | ||||||
| Digital Power Communications Co., Ltd. |
3,088 | 39,242 | ||||||
| *DIO Corp. |
1,953 | 62,925 | ||||||
| *DL E&C Co., Ltd. |
328 | 37,893 | ||||||
| DL Holdings Co., Ltd. |
1,017 | 57,179 | ||||||
| DMS Co., Ltd. |
32 | 176 | ||||||
| DNF Co., Ltd. |
12 | 210 | ||||||
Dimensional Emerging Core Equity Market ETF
SCHEDULE OF INVESTMENTS
October 31, 2021
| Security Description |
Shares | Fair Value | ||||||
| KOREA, REPUBLIC OF (Continued) |
||||||||
| Dohwa Engineering Co., Ltd. |
24 | $ | 163 | |||||
| Dong-A Hwasung Co., Ltd. |
12 | 146 | ||||||
| Dong-A ST Co., Ltd. |
217 | 13,500 | ||||||
| Dong-Ah Geological Engineering Co., Ltd. |
20 | 316 | ||||||
| *Dongbang Transport Logistics Co., Ltd. |
8,173 | 27,837 | ||||||
| Dongjin Semichem Co., Ltd. |
572 | 17,132 | ||||||
| Dongkoo Bio & Pharma Co., Ltd. |
24 | 166 | ||||||
| DongKook Pharmaceutical Co., Ltd. |
4,147 | 79,672 | ||||||
| Dongkuk Steel Mill Co., Ltd. |
467 | 6,814 | ||||||
| Dongkuk Structures & Construction Co., Ltd. |
32 | 160 | ||||||
| Dongsuh Cos., Inc. |
1,051 | 31,119 | ||||||
| Dongsung Chemical Co., Ltd. |
40 | 198 | ||||||
| Dongsung Finetec Co., Ltd. |
4,337 | 46,579 | ||||||
| *Dongsung Pharmaceutical Co., Ltd. |
16 | 122 | ||||||
| *Dongwha Enterprise Co., Ltd. |
8 | 578 | ||||||
| Dongwha Pharm Co., Ltd. |
5,495 | 76,884 | ||||||
| Dongwon F&B Co., Ltd. |
4 | 702 | ||||||
| Dongwon Industries Co., Ltd. |
4 | 779 | ||||||
| Dongwon Systems Corp. |
8 | 357 | ||||||
| *Dongyang Steel Pipe Co., Ltd. |
148 | 183 | ||||||
| *Doosan Bobcat, Inc. |
88 | 2,865 | ||||||
| Doosan Co., Ltd. |
12 | 1,058 | ||||||
| *Doosan Fuel Cell Co., Ltd. |
8 | 357 | ||||||
| *Doosan Heavy Industries & Construction Co., Ltd. |
23,515 | 491,007 | ||||||
| DoubleUGames Co., Ltd. |
1,745 | 95,870 | ||||||
| Douzone Bizon Co., Ltd. |
846 | 58,859 | ||||||
| Dreamtech Co., Ltd. |
28 | 239 | ||||||
| *Dreamus Co. |
20 | 80 | ||||||
| *DSK Co., Ltd. |
24 | 171 | ||||||
| *Duk San Neolux Co., Ltd. |
16 | 741 | ||||||
| DY Corp. |
28 | 131 | ||||||
| DY POWER Corp. |
12 | 130 | ||||||
| DYPNF Co., Ltd. |
8 | 265 | ||||||
| E1 Corp. |
4 | 179 | ||||||
| Eagle Veterinary Technology Co., Ltd. |
8 | 57 | ||||||
| Eagon Industrial, Ltd. |
8 | 97 | ||||||
| Easy Holdings Co., Ltd. |
60 | 230 | ||||||
| eBEST Investment & Securities Co., Ltd. |
32 | 248 | ||||||
| Echo Marketing, Inc. |
20 | 298 | ||||||
| *EcoBio Holdings Co., Ltd. |
12 | 92 | ||||||
| Ecopro BM Co., Ltd. |
433 | 151,886 | ||||||
| Ecopro Co., Ltd. |
1,186 | 101,595 | ||||||
| *Ecopro HN Co., Ltd. |
668 | 62,653 | ||||||
| e-Credible Co., Ltd. |
8 | 137 | ||||||
| Eehwa Construction Co., Ltd. |
12 | 69 | ||||||
| Elentec Co., Ltd. |
28 | 259 | ||||||
| E-MART, Inc. |
1,194 | 171,659 | ||||||
| *EMKOREA Co., Ltd. |
40 | 151 | ||||||
| *EM-Tech Co., Ltd. |
1,355 | 30,496 | ||||||
| ENF Technology Co., Ltd. |
2,355 | 58,243 | ||||||
| *Enplus Co., Ltd. |
32 | 95 | ||||||
| Eo Technics Co., Ltd. |
8 | 735 | ||||||
| Estechpharma Co., Ltd. |
12 | 108 | ||||||
| Eugene Investment & Securities Co., Ltd. |
20,570 | 66,891 | ||||||
| Eugene Technology Co., Ltd. |
20 | 762 | ||||||
Dimensional Emerging Core Equity Market ETF
SCHEDULE OF INVESTMENTS
October 31, 2021
| Security Description |
Shares | Fair Value | ||||||
| KOREA, REPUBLIC OF (Continued) |
||||||||
| *Exax, Inc. |
64 | $ | 108 | |||||
| *Exem Co., Ltd. |
28 | 113 | ||||||
| *F&F Co., Ltd. |
282 | 209,470 | ||||||
| F&F Holdings Co., Ltd. |
404 | 13,483 | ||||||
| Fila Holdings Corp. |
2,428 | 77,086 | ||||||
| Fine Semitech Corp. |
168 | 3,666 | ||||||
| *Fine Technix Co., Ltd. |
36 | 336 | ||||||
| *FINETEK Co., Ltd. |
64 | 87 | ||||||
| Foosung Co., Ltd. |
64 | 1,093 | ||||||
| *»Futurestream Networks Co., Ltd. |
60 | 51 | ||||||
| Gabia, Inc. |
16 | 175 | ||||||
| *Gamevil, Inc. |
8 | 508 | ||||||
| *Gemvaxlink Co., Ltd. |
88 | 121 | ||||||
| *Genexine, Inc. |
12 | 672 | ||||||
| *Genie Music Corp. |
40 | 201 | ||||||
| *GenoFocus, Inc. |
8 | 60 | ||||||
| Genoray Co., Ltd. |
20 | 166 | ||||||
| Global Standard Technology Co., Ltd. |
12 | 296 | ||||||
| GMB Korea Corp. |
12 | 66 | ||||||
| GnCenergy Co., Ltd. |
16 | 66 | ||||||
| *GNCO Co., Ltd. |
100 | 71 | ||||||
| GOLFZON Co., Ltd. |
4 | 484 | ||||||
| *»Good People Co., Ltd. |
80 | 72 | ||||||
| *Grand Korea Leisure Co., Ltd. |
40 | 560 | ||||||
| *»Green Cross Cell Corp. |
4 | 132 | ||||||
| Green Cross Corp. |
134 | 31,477 | ||||||
| Green Cross Holdings Corp. |
1,765 | 44,255 | ||||||
| Green Cross LabCell Corp. |
4 | 332 | ||||||
| *Green Cross Medical Science Corp. |
8 | 56 | ||||||
| GS Engineering & Construction Corp. |
880 | 31,139 | ||||||
| *GS Global Corp. |
72 | 159 | ||||||
| GS Holdings Corp. |
3,397 | 122,822 | ||||||
| GS Retail Co., Ltd. |
1,448 | 39,900 | ||||||
| HAESUNG DS Co., Ltd. |
51 | 1,899 | ||||||
| Haitai Confectionery & Foods Co., Ltd. |
16 | 114 | ||||||
| Halla Corp. |
48 | 232 | ||||||
| Halla Holdings Corp. |
4,745 | 206,684 | ||||||
| Han Kuk Carbon Co., Ltd. |
3,955 | 42,476 | ||||||
| Hana Financial Group, Inc. |
19,864 | 764,948 | ||||||
| *Hana Micron, Inc. |
5,337 | 105,502 | ||||||
| Hana Pharm Co., Ltd. |
8 | 141 | ||||||
| *Hanall Biopharma Co., Ltd. |
11,350 | 198,143 | ||||||
| HanChang Paper Co., Ltd. |
52 | 91 | ||||||
| *Hancom, Inc. |
111 | 1,895 | ||||||
| Handok, Inc. |
12 | 243 | ||||||
| Handsome Co., Ltd. |
20 | 721 | ||||||
| Hanil Holdings Co., Ltd. |
20 | 239 | ||||||
| Hanil Hyundai Cement Co., Ltd. |
4 | 118 | ||||||
| *Hanjin Heavy Industries & Construction Co., Ltd. |
126 | 1,031 | ||||||
| Hanjin Kal Corp. |
8 | 375 | ||||||
| Hanjin Transportation Co., Ltd. |
373 | 11,060 | ||||||
| Hankook Tire & Technology Co., Ltd. |
10,726 | 379,547 | ||||||
| Hanmi Pharm Co., Ltd. |
8 | 1,807 | ||||||
| Hanmi Science Co., Ltd. |
16 | 780 | ||||||
| Hanmi Semiconductor Co., Ltd. |
78 | 2,146 | ||||||
| HanmiGlobal Co., Ltd. |
12 | 109 | ||||||
Dimensional Emerging Core Equity Market ETF
SCHEDULE OF INVESTMENTS
October 31, 2021
| Security Description |
Shares | Fair Value | ||||||
| KOREA, REPUBLIC OF (Continued) |
||||||||
| Hanon Systems |
12,723 | $ | 156,785 | |||||
| *Hans Biomed Corp. |
12 | 144 | ||||||
| Hansae Co., Ltd. |
24 | 477 | ||||||
| Hansae Yes24 Holdings Co., Ltd. |
16 | 109 | ||||||
| Hanshin Construction Co., Ltd. |
16 | 261 | ||||||
| Hansol Chemical Co., Ltd. |
1,419 | 399,513 | ||||||
| Hansol Holdings Co., Ltd. |
36 | 117 | ||||||
| *Hansol HomeDeco Co., Ltd. |
84 | 144 | ||||||
| Hansol Paper Co., Ltd. |
6,577 | 81,048 | ||||||
| *Hansol Technics Co., Ltd. |
2,982 | 17,251 | ||||||
| Hanssem Co., Ltd. |
590 | 51,247 | ||||||
| Hanwha Aerospace Co., Ltd. |
64 | 2,465 | ||||||
| Hanwha Corp. |
72 | 2,064 | ||||||
| *Hanwha General Insurance Co., Ltd. |
15,989 | 61,778 | ||||||
| *Hanwha Investment & Securities Co., Ltd. |
1,523 | 7,220 | ||||||
| Hanwha Life Insurance Co., Ltd. |
5,997 | 17,834 | ||||||
| *Hanwha Solutions Corp. |
6,773 | 236,770 | ||||||
| Hanyang Eng Co., Ltd. |
16 | 210 | ||||||
| Hanyang Securities Co., Ltd. |
12 | 183 | ||||||
| *Harim Co., Ltd. |
68 | 167 | ||||||
| Harim Holdings Co., Ltd. |
29,115 | 240,933 | ||||||
| HB Technology Co., Ltd. |
96 | 208 | ||||||
| HDC Hyundai Engineering Plastics Co., Ltd. |
16 | 80 | ||||||
| *Heungkuk Fire & Marine Insurance Co., Ltd. |
120 | 399 | ||||||
| *HFR, Inc. |
8 | 146 | ||||||
| HIMS Co., Ltd. |
8 | 62 | ||||||
| Hite Jinro Co., Ltd. |
1,748 | 52,056 | ||||||
| Hitejinro Holdings Co., Ltd. |
12 | 153 | ||||||
| *HJ Magnolia Yongpyong Hotel & Resort Corp. |
44 | 237 | ||||||
| *HLB POWER Co., Ltd. |
92 | 132 | ||||||
| *HLB, Inc. |
1,994 | 71,839 | ||||||
| HLscience Co., Ltd. |
4 | 124 | ||||||
| *HMM Co., Ltd. |
4,281 | 97,633 | ||||||
| *Home Center Holdings Co., Ltd. |
92 | 136 | ||||||
| *Homecast Co., Ltd. |
44 | 116 | ||||||
| Hotel Shilla Co., Ltd. |
2,096 | 156,767 | ||||||
| HS Industries Co., Ltd. |
500 | 2,875 | ||||||
| *HSD Engine Co., Ltd. |
84 | 664 | ||||||
| Huchems Fine Chemical Corp. |
24 | 541 | ||||||
| *Hugel, Inc. |
4 | 619 | ||||||
| *Humax Co., Ltd. |
38 | 165 | ||||||
| Humedix Co., Ltd. |
8 | 190 | ||||||
| Huons Co., Ltd. |
30 | 1,296 | ||||||
| Huons Global Co., Ltd. |
12 | 505 | ||||||
| Huvis Corp. |
20 | 167 | ||||||
| Huvitz Co., Ltd. |
16 | 118 | ||||||
| *Hwail Pharm Co., Ltd. |
36 | 87 | ||||||
| Hwaseung Corp. Co., Ltd. |
60 | 144 | ||||||
| Hwaseung Enterprise Co., Ltd. |
32 | 471 | ||||||
| *Hwaseung R&A Co., Ltd. |
23 | 120 | ||||||
| *Hyosung Advanced Materials Corp. |
4 | 2,427 | ||||||
| *Hyosung Chemical Corp. |
4 | 984 | ||||||
| *Hyosung Heavy Industries Corp. |
56 | 3,235 | ||||||
| Hyosung TNC Corp. |
4 | 2,044 | ||||||
| HyosungITX Co., Ltd. |
4 | 65 | ||||||
Dimensional Emerging Core Equity Market ETF
SCHEDULE OF INVESTMENTS
October 31, 2021
| Security Description |
Shares | Fair Value | ||||||
| KOREA, REPUBLIC OF (Continued) |
||||||||
| Hyundai Bioland Co., Ltd. |
3,106 | $ | 53,027 | |||||
| Hyundai BNG Steel Co., Ltd. |
12 | 171 | ||||||
| *Hyundai Construction Equipment Co., Ltd. |
1,355 | 46,672 | ||||||
| Hyundai Department Store Co., Ltd. |
2,307 | 163,467 | ||||||
| *Hyundai Doosan Infracore Co., Ltd. |
7,740 | 69,548 | ||||||
| *Hyundai Electric & Energy System Co., Ltd. |
194 | 3,669 | ||||||
| Hyundai Elevator Co., Ltd. |
574 | 23,701 | ||||||
| Hyundai Engineering & Construction Co., Ltd. |
198 | 8,523 | ||||||
| Hyundai Engineering & Construction Co., Ltd. |
3 | 407 | ||||||
| Hyundai Ezwel Co., Ltd. |
28 | 236 | ||||||
| Hyundai Glovis Co., Ltd. |
1,865 | 267,329 | ||||||
| Hyundai Heavy Industries Holdings Co., Ltd. |
89 | 4,814 | ||||||
| Hyundai Home Shopping Network Corp. |
12 | 720 | ||||||
| Hyundai Livart Furniture Co., Ltd. |
20 | 271 | ||||||
| Hyundai Marine & Fire Insurance Co., Ltd. |
3,356 | 75,388 | ||||||
| Hyundai Motor Co. |
5,060 | 900,672 | ||||||
| Hyundai Motor Securities Co., Ltd. |
28 | 303 | ||||||
| Hyundai Pharmaceutical Co., Ltd. |
20 | 101 | ||||||
| *Hyundai Rotem Co., Ltd. |
2,114 | 40,704 | ||||||
| Hyundai Steel Co. |
5,227 | 198,828 | ||||||
| Hyundai Wia Corp. |
28 | 2,015 | ||||||
| *Hyungji Elite, Inc. |
28 | 94 | ||||||
| HyVision System, Inc. |
16 | 230 | ||||||
| i3system, Inc. |
4 | 58 | ||||||
| *iA, Inc. |
1,113 | 972 | ||||||
| ICD Co., Ltd. |
24 | 257 | ||||||
| *Icure Pharm, Inc. |
4 | 137 | ||||||
| *IHQ, Inc. |
108 | 171 | ||||||
| *Il Dong Pharmaceutical Co., Ltd. |
12 | 144 | ||||||
| Iljin Diamond Co., Ltd. |
4 | 130 | ||||||
| *Iljin Display Co., Ltd. |
12 | 36 | ||||||
| Iljin Holdings Co., Ltd. |
28 | 160 | ||||||
| Iljin Materials Co., Ltd. |
16 | 1,376 | ||||||
| *Ilshin Stone Co., Ltd. |
52 | 123 | ||||||
| ilShinbiobase Co., Ltd. |
32 | 119 | ||||||
| Ilyang Pharmaceutical Co., Ltd. |
132 | 3,366 | ||||||
| iMarketKorea, Inc. |
28 | 262 | ||||||
| InBody Co., Ltd. |
24 | 558 | ||||||
| *INCON Co., Ltd. |
36 | 57 | ||||||
| *Incross Co., Ltd. |
4 | 158 | ||||||
| Industrial Bank of Korea |
456 | 4,312 | ||||||
| *Infinitt Healthcare Co., Ltd. |
12 | 73 | ||||||
| Innocean Worldwide, Inc. |
277 | 13,938 | ||||||
| InnoWireless, Inc. |
4 | 129 | ||||||
| *Insun ENT Co., Ltd. |
3,174 | 32,866 | ||||||
| Intekplus Co., Ltd. |
2,459 | 52,924 | ||||||
| Intellian Technologies, Inc. |
4 | 244 | ||||||
| Intelligent Digital Integrated Security Co., Ltd. |
8 | 174 | ||||||
| *Interflex Co., Ltd. |
16 | 178 | ||||||
| Interojo Co., Ltd. |
12 | 303 | ||||||
| Interpark Corp. |
124 | 711 | ||||||
| *iNtRON Biotechnology, Inc. |
221 | 3,650 | ||||||
| Inzi Controls Co., Ltd. |
12 | 173 | ||||||
| INZI Display Co., Ltd. |
52 | 150 | ||||||
| *Iones Co., Ltd. |
32 | 237 | ||||||
| IS Dongseo Co., Ltd. |
24 | 928 | ||||||
Dimensional Emerging Core Equity Market ETF
SCHEDULE OF INVESTMENTS
October 31, 2021
| Security Description |
Shares | Fair Value | ||||||
| KOREA, REPUBLIC OF (Continued) |
||||||||
| ISC Co., Ltd. |
942 | $ | 21,241 | |||||
| i-SENS, Inc. |
12 | 344 | ||||||
| ISU Chemical Co., Ltd. |
3,066 | 39,881 | ||||||
| *IsuPetasys Co., Ltd. |
28 | 99 | ||||||
| *ITCEN Co., Ltd. |
20 | 82 | ||||||
| *Jaeyoung Solutec Co., Ltd. |
100 | 98 | ||||||
| *Jahwa Electronics Co., Ltd. |
16 | 255 | ||||||
| JASTECH, Ltd. |
12 | 64 | ||||||
| *Jayjun Cosmetic Co., Ltd. |
78 | 77 | ||||||
| JB Financial Group Co., Ltd. |
324 | 2,459 | ||||||
| JC Chemical Co., Ltd. |
20 | 173 | ||||||
| JC Hyun System, Inc. |
12 | 66 | ||||||
| *Jcontentree Corp. |
8 | 479 | ||||||
| *Jeju Semiconductor Corp. |
36 | 147 | ||||||
| Jin Yang Pharmaceutical Co., Ltd. |
8 | 47 | ||||||
| Jinsung T.E.C. |
16 | 163 | ||||||
| *JLS Co., Ltd. |
16 | 104 | ||||||
| *JNK Heaters Co., Ltd. |
32 | 194 | ||||||
| *JoyCity Corp. |
24 | 225 | ||||||
| *Jusung Engineering Co., Ltd. |
187 | 1,800 | ||||||
| JVM Co., Ltd. |
8 | 110 | ||||||
| JW Holdings Corp. |
37 | 124 | ||||||
| JW Life Science Corp. |
16 | 222 | ||||||
| JW Pharmaceutical Corp. |
47 | 939 | ||||||
| *JW Shinyak Corp. |
25 | 83 | ||||||
| JYP Entertainment Corp. |
4,799 | 215,196 | ||||||
| Kakao Corp. |
5,044 | 541,716 | ||||||
| *Kanglim Co., Ltd. |
40 | 84 | ||||||
| Kangnam Jevisco Co., Ltd. |
8 | 171 | ||||||
| *Kangstem Biotech Co., Ltd. |
24 | 72 | ||||||
| *Kangwon Land, Inc. |
5,243 | 124,732 | ||||||
| KAON Media Co., Ltd. |
24 | 337 | ||||||
| KB Financial Group, Inc. |
22,322 | 1,081,191 | ||||||
| KC Green Holdings Co., Ltd. |
24 | 105 | ||||||
| KC Tech Co., Ltd. |
12 | 231 | ||||||
| KCTC |
32 | 178 | ||||||
| KEPCO Engineering & Construction Co, Inc. |
20 | 1,214 | ||||||
| KEPCO Plant Service & Engineering Co., Ltd. |
241 | 8,631 | ||||||
| Kginicis Co., Ltd. |
1,696 | 27,068 | ||||||
| KGMobilians Co., Ltd. |
32 | 252 | ||||||
| *KH FEELUX Co., Ltd. |
3,487 | 9,042 | ||||||
| *KH Vatec Co., Ltd. |
328 | 6,765 | ||||||
| Kia Corp. |
16,541 | 1,204,603 | ||||||
| *KineMaster Corp. |
8 | 117 | ||||||
| KINX, Inc. |
4 | 164 | ||||||
| KISWIRE, Ltd. |
1,113 | 26,145 | ||||||
| KIWOOM Securities Co., Ltd. |
318 | 28,574 | ||||||
| KM Corp. |
12 | 84 | ||||||
| *KMW Co., Ltd. |
1,459 | 51,441 | ||||||
| Koentec Co., Ltd. |
36 | 279 | ||||||
| Koh Young Technology, Inc. |
800 | 12,631 | ||||||
| Kolmar BNH Co., Ltd. |
12 | 365 | ||||||
| Kolmar Korea Co., Ltd. |
1,137 | 43,445 | ||||||
| Kolon Global Corp. |
12 | 267 | ||||||
| Kolon Industries, Inc. |
36 | 2,748 | ||||||
Dimensional Emerging Core Equity Market ETF
SCHEDULE OF INVESTMENTS
October 31, 2021
| Security Description |
Shares | Fair Value | ||||||
| KOREA, REPUBLIC OF (Continued) |
||||||||
| KoMiCo., Ltd. |
78 | $ | 5,447 | |||||
| Kopla Co., Ltd. |
20 | 149 | ||||||
| Korea Aerospace Industries, Ltd. |
535 | 13,987 | ||||||
| Korea Arlico Pharm Co., Ltd. |
18 | 119 | ||||||
| Korea Cast Iron Pipe Industries Co., Ltd. |
16 | 134 | ||||||
| *Korea Circuit Co., Ltd. |
16 | 216 | ||||||
| Korea District Heating Corp. |
4 | 141 | ||||||
| Korea Electric Power Corp., Sponsored ADR |
982 | 9,418 | ||||||
| Korea Electric Power Corp. |
13,951 | 269,815 | ||||||
| Korea Electric Terminal Co., Ltd. |
2,874 | 185,197 | ||||||
| Korea Electronic Certification Authority, Inc. |
12 | 82 | ||||||
| *Korea Gas Corp. |
2,483 | 94,131 | ||||||
| Korea Industrial Co., Ltd. |
20 | 57 | ||||||
| Korea Investment Holdings Co., Ltd. |
5,712 | 425,265 | ||||||
| *Korea Line Corp. |
265 | 640 | ||||||
| Korea Petrochemical Industries Co., Ltd. |
4 | 633 | ||||||
| *Korea Shipbuilding & Offshore Engineering Co., Ltd. |
9,003 | 793,555 | ||||||
| Korea United Pharm, Inc. |
12 | 501 | ||||||
| Korea Zinc Co., Ltd. |
572 | 262,859 | ||||||
| *Korean Air Lines Co., Ltd. |
10,205 | 265,921 | ||||||
| Korean Drug Co., Ltd. |
8 | 63 | ||||||
| Korean Reinsurance Co. |
128 | 1,058 | ||||||
| *KOSES Co., Ltd. |
12 | 127 | ||||||
| *KPM Tech Co., Ltd. |
10,921 | 12,710 | ||||||
| *KRW Dividend |
1 | – | ||||||
| *KSIGN Co., Ltd. |
76 | 150 | ||||||
| KSS LINE, Ltd. |
34 | 346 | ||||||
| *Kt alpha Co., Ltd. |
24 | 189 | ||||||
| KT Submarine Co., Ltd. |
24 | 123 | ||||||
| KT&G Corp. |
6,487 | 450,212 | ||||||
| KTB Investment & Securities Co., Ltd. |
4,232 | 23,830 | ||||||
| *Kuk Young G&M |
32 | 55 | ||||||
| Kukdo Chemical Co., Ltd. |
4 | 229 | ||||||
| Kukdong Corp. |
48 | 104 | ||||||
| *Kukje Pharma Co., Ltd. |
12 | 62 | ||||||
| *Kum Yang Co., Ltd. |
20 | 86 | ||||||
| Kumho Petrochemical Co., Ltd. |
858 | 126,290 | ||||||
| *Kumho Tire Co., Inc. |
148 | 678 | ||||||
| KUMHOE&C Co., Ltd. |
2,753 | 28,389 | ||||||
| Kumkang Kind Co., Ltd. |
20 | 135 | ||||||
| Kwang Dong Pharmaceutical Co., Ltd. |
9,084 | 60,480 | ||||||
| Kyeryong Construction Industrial Co., Ltd. |
779 | 23,799 | ||||||
| Kyobo Securities Co., Ltd. |
28 | 211 | ||||||
| Kyongbo Pharmaceutical Co., Ltd. |
16 | 136 | ||||||
| Kyung Dong Navien Co., Ltd. |
39 | 2,236 | ||||||
| *Kyung Nam Pharm Co., Ltd. |
8 | 41 | ||||||
| Kyung Nong Corp. |
8 | 91 | ||||||
| Kyungbang Co., Ltd. |
16 | 182 | ||||||
| KyungDong City Gas Co., Ltd. |
4 | 81 | ||||||
| Kyung-In Synthetic Corp. |
52 | 312 | ||||||
| L&C Bio Co., Ltd. |
75 | 2,195 | ||||||
| L&F Co., Ltd. |
13 | 2,048 | ||||||
| *Lake Materials Co., Ltd. |
48 | 191 | ||||||
| LB Semicon, Inc. |
3,993 | 43,397 | ||||||
| LEADCorp., Inc. (The) |
24 | 205 | ||||||
| LEENO Industrial, Inc. |
1,492 | 218,587 | ||||||
Dimensional Emerging Core Equity Market ETF
SCHEDULE OF INVESTMENTS
October 31, 2021
| Security Description |
Shares | Fair Value | ||||||
| KOREA, REPUBLIC OF (Continued) |
||||||||
| LG Chem, Ltd. |
1,468 | $ | 1,050,231 | |||||
| LG Corp. |
3,643 | 284,320 | ||||||
| *LG Display Co., Ltd. |
15,384 | 259,351 | ||||||
| LG Electronics, Inc. |
7,743 | 798,452 | ||||||
| LG HelloVision Co., Ltd. |
44 | 260 | ||||||
| LG Household & Health Care, Ltd. |
429 | 429,899 | ||||||
| LG Innotek Co., Ltd. |
1,325 | 237,549 | ||||||
| LG Uplus Corp. |
18,017 | 221,252 | ||||||
| LIG Nex1 Co., Ltd. |
7,441 | 296,736 | ||||||
| Lion Chemtech Co., Ltd. |
12 | 94 | ||||||
| *Lock&Lock Co., Ltd. |
32 | 288 | ||||||
| *LONGTU KOREA, Inc. |
16 | 82 | ||||||
| LOT Vacuum Co., Ltd. |
16 | 199 | ||||||
| Lotte Chemical Corp. |
685 | 131,601 | ||||||
| Lotte Chilsung Beverage Co., Ltd. |
157 | 19,549 | ||||||
| Lotte Confectionery Co., Ltd. |
4 | 440 | ||||||
| Lotte Corp. |
44 | 1,231 | ||||||
| Lotte Data Communication Co. |
1,643 | 53,780 | ||||||
| LOTTE Fine Chemical Co., Ltd. |
4,161 | 303,026 | ||||||
| LOTTE Himart Co., Ltd. |
16 | 379 | ||||||
| *Lotte Non-Life Insurance Co., Ltd. |
92 | 145 | ||||||
| Lotte Shopping Co., Ltd. |
741 | 66,583 | ||||||
| LS Cable & System Asia, Ltd. |
12 | 86 | ||||||
| LS Corp. |
28 | 1,500 | ||||||
| LS Electric Co., Ltd. |
4,828 | 243,352 | ||||||
| *Lumens Co., Ltd. |
60 | 51 | ||||||
| *Lutronic Corp. |
24 | 387 | ||||||
| *LVMC Holdings |
88 | 252 | ||||||
| LX Hausys, Ltd. |
2,504 | 149,141 | ||||||
| *LX Holdings Corp. |
1,201 | 9,065 | ||||||
| LX INTERNATIONAL Corp. |
48 | 1,115 | ||||||
| LX Semicon Co., Ltd. |
16 | 1,501 | ||||||
| Macquarie Korea Infrastructure Fund |
22,534 | 264,187 | ||||||
| Macrogen, Inc. |
953 | 23,243 | ||||||
| Maeil Dairies Co., Ltd. |
1,396 | 84,222 | ||||||
| *Mando Corp. |
2,070 | 110,537 | ||||||
| *»Maniker Co., Ltd. |
160 | 59 | ||||||
| Mcnex Co., Ltd. |
9,058 | 336,027 | ||||||
| ME2ON Co., Ltd. |
40 | 202 | ||||||
| Mediana Co., Ltd. |
22 | 113 | ||||||
| *Medipost Co., Ltd. |
2,951 | 57,325 | ||||||
| Medytox, Inc. |
16 | 2,048 | ||||||
| Meerecompany, Inc. |
4 | 84 | ||||||
| MegaStudyEdu Co., Ltd. |
187 | 12,322 | ||||||
| *Mercury Corp. |
8 | 56 | ||||||
| Meritz Financial Group, Inc. |
76 | 2,163 | ||||||
| Meritz Fire & Marine Insurance Co., Ltd. |
2,353 | 55,777 | ||||||
| Meritz Securities Co., Ltd. |
1,842 | 7,346 | ||||||
| *Metalabs Co., Ltd. |
72 | 63 | ||||||
| *Mgame Corp. |
28 | 226 | ||||||
| *MiCo., Ltd. |
1,067 | 12,738 | ||||||
| Mirae Asset Life Insurance Co., Ltd. |
108 | 395 | ||||||
| Mirae Asset Securities Co., Ltd. |
520 | 3,863 | ||||||
| Miwon Commercial Co., Ltd. |
4 | 710 | ||||||
| Miwon Specialty Chemical Co., Ltd. |
4 | 738 | ||||||
Dimensional Emerging Core Equity Market ETF
SCHEDULE OF INVESTMENTS
October 31, 2021
| Security Description |
Shares | Fair Value | ||||||
| KOREA, REPUBLIC OF (Continued) |
||||||||
| *Mobile Appliance, Inc. |
16 | $ | 51 | |||||
| MOM’S TOUCH&Co. |
56 | 234 | ||||||
| Monalisa Co., Ltd. |
20 | 68 | ||||||
| MonAmi Co., Ltd. |
16 | 64 | ||||||
| Moorim P&P Co., Ltd. |
36 | 138 | ||||||
| mPlus Corp. |
8 | 94 | ||||||
| Mr Blue Corp. |
24 | 182 | ||||||
| MS Autotech Co., Ltd. |
4,556 | 23,510 | ||||||
| Multicampus Co., Ltd. |
4 | 129 | ||||||
| *MyungMoon Pharm Co., Ltd. |
28 | 136 | ||||||
| Nam Hwa Construction Co., Ltd. |
8 | 63 | ||||||
| Namhae Chemical Corp. |
3,144 | 36,053 | ||||||
| *Namsun Aluminum Co., Ltd. |
128 | 321 | ||||||
| *Namu Tech Co., Ltd. |
12 | 30 | ||||||
| *Namuga Co., Ltd. |
16 | 115 | ||||||
| *NanoenTek, Inc. |
20 | 123 | ||||||
| Nasmedia Co., Ltd. |
4 | 121 | ||||||
| *Nature & Environment Co., Ltd. |
64 | 103 | ||||||
| NAVER Corp. |
3,442 | 1,198,831 | ||||||
| NCSoft Corp. |
858 | 460,371 | ||||||
| *NDFOS Co., Ltd. |
19 | 147 | ||||||
| NeoPharm Co., Ltd. |
8 | 183 | ||||||
| *Neowiz |
4,160 | 93,271 | ||||||
| Netmarble Corp. |
467 | 49,356 | ||||||
| Nexen Corp. |
36 | 155 | ||||||
| Nexen Tire Corp. |
197 | 1,276 | ||||||
| *Nexon GT Co., Ltd. |
8 | 81 | ||||||
| *Next Entertainment World Co., Ltd. |
24 | 352 | ||||||
| NH Investment & Securities Co., Ltd. |
285 | 3,207 | ||||||
| *NHN KCP Corp. |
25 | 1,224 | ||||||
| NICE Holdings Co., Ltd. |
66 | 955 | ||||||
| Nice Information & Telecommunication, Inc. |
12 | 345 | ||||||
| NICE Information Service Co., Ltd. |
1,678 | 28,432 | ||||||
| NICE Total Cash Management Co., Ltd. |
28 | 133 | ||||||
| *NK Co., Ltd. |
96 | 92 | ||||||
| Nong Shim Holdings Co., Ltd. |
4 | 265 | ||||||
| Nong Woo Bio Co., Ltd. |
8 | 81 | ||||||
| NongShim Co., Ltd. |
4 | 970 | ||||||
| NOROO Paint & Coatings Co., Ltd. |
12 | 107 | ||||||
| NOVAREX Co., Ltd. |
8 | 284 | ||||||
| NS Co., Ltd. |
8 | 77 | ||||||
| *Nuintek Co., Ltd. |
28 | 84 | ||||||
| Oceanbridge Co., Ltd. |
12 | 141 | ||||||
| *OCI Co., Ltd. |
1,413 | 156,590 | ||||||
| Okong Corp. |
20 | 75 | ||||||
| *Omnisystem Co., Ltd. |
52 | 99 | ||||||
| Openbase, Inc. |
28 | 77 | ||||||
| OptoElectronics Solutions Co., Ltd. |
5,067 | 144,394 | ||||||
| *OPTRON-TEC, Inc. |
36 | 260 | ||||||
| *Orbitech Co., Ltd. |
20 | 122 | ||||||
| Orion Corp. |
2 | 202 | ||||||
| Orion Holdings Corp. |
44 | 603 | ||||||
| *OSANGJAIEL Co., Ltd. |
8 | 64 | ||||||
| Osstem Implant Co., Ltd. |
27 | 2,854 | ||||||
| Ottogi Corp. |
4 | 1,647 | ||||||
| Paik Kwang Industrial Co., Ltd. |
44 | 212 | ||||||
Dimensional Emerging Core Equity Market ETF
SCHEDULE OF INVESTMENTS
October 31, 2021
| Security Description |
Shares | Fair Value | ||||||
| KOREA, REPUBLIC OF (Continued) |
||||||||
| Pan Ocean Co., Ltd. |
524 | $ | 2,700 | |||||
| *Paradise Co., Ltd. |
1,191 | 17,734 | ||||||
| Park Systems Corp. |
47 | 4,774 | ||||||
| Partron Co., Ltd. |
15,699 | 125,479 | ||||||
| *Paru Co., Ltd. |
36 | 35 | ||||||
| *Pearl Abyss Corp. |
2,673 | 237,666 | ||||||
| People & Technology, Inc. |
1,301 | 38,856 | ||||||
| PHARMA RESEARCH PRODUCTS Co., Ltd. |
618 | 48,655 | ||||||
| *Pharmicell Co., Ltd. |
12,447 | 132,613 | ||||||
| *Philoptics Co., Ltd. |
12 | 107 | ||||||
| PI Advanced Materials Co., Ltd. |
44 | 1,702 | ||||||
| *PNE Solution Co., Ltd. |
24 | 708 | ||||||
| Point Engineering Co., Ltd. |
36 | 109 | ||||||
| Poongsan Corp. |
32 | 906 | ||||||
| POSCO |
4,797 | 1,215,106 | ||||||
| POSCO Chemical Co., Ltd. |
92 | 11,455 | ||||||
| Posco ICT Co., Ltd. |
72 | 412 | ||||||
| Posco International Corp. |
107 | 1,987 | ||||||
| Posco M-Tech Co., Ltd. |
32 | 220 | ||||||
| *Power Logics Co., Ltd. |
40 | 270 | ||||||
| *Prostemics Co., Ltd. |
24 | 57 | ||||||
| Protec Co., Ltd. |
4 | 92 | ||||||
| PSK, Inc. |
7,540 | 249,387 | ||||||
| Pulmuone Co., Ltd. |
103 | 1,503 | ||||||
| Puloon Technology, Inc. |
5 | 51 | ||||||
| Pungkuk Alcohol Industry Co., Ltd. |
8 | 120 | ||||||
| Pyeong Hwa Automotive Co., Ltd. |
12 | 114 | ||||||
| QSI Co., Ltd. |
8 | 110 | ||||||
| Reyon Pharmaceutical Co., Ltd. |
8 | 380 | ||||||
| RFHIC Corp. |
17 | 455 | ||||||
| *RFTech Co., Ltd. |
1,457 | 7,356 | ||||||
| *Robostar Co., Ltd. |
8 | 139 | ||||||
| *Robotis Co., Ltd. |
4 | 44 | ||||||
| Rsupport Co., Ltd. |
24 | 146 | ||||||
| S Net Systems, Inc. |
12 | 68 | ||||||
| S&S Tech Corp. |
1,609 | 50,533 | ||||||
| S-1 Corp. |
36 | 2,566 | ||||||
| Sajo Industries Co., Ltd. |
4 | 163 | ||||||
| Sajodaerim Corp. |
4 | 95 | ||||||
| *Sam Chun Dang Pharm Co., Ltd. |
4,225 | 170,114 | ||||||
| *SAM KANG M&T Co., Ltd. |
1,062 | 18,858 | ||||||
| Sambo Corrugated Board Co., Ltd. |
12 | 148 | ||||||
| *Sambu Engineering & Construction Co., Ltd. |
1,286 | 2,289 | ||||||
| Samchully Co., Ltd. |
4 | 323 | ||||||
| Samchuly Bicycle Co., Ltd. |
8 | 67 | ||||||
| SAMHWA Paints Industrial Co., Ltd. |
16 | 138 | ||||||
| Samick Musical Instruments Co., Ltd. |
84 | 131 | ||||||
| Samick THK Co., Ltd. |
12 | 123 | ||||||
| Samil Pharmaceutical Co., Ltd. |
8 | 55 | ||||||
| Samji Electronics Co., Ltd. |
16 | 167 | ||||||
| Samjin LND Co., Ltd. |
32 | 115 | ||||||
| Samjin Pharmaceutical Co., Ltd. |
2,408 | 53,062 | ||||||
| *Samkee Corp. |
60 | 268 | ||||||
| SAMPYO Cement Co., Ltd. |
48 | 204 | ||||||
| *Samsung Biologics Co., Ltd. |
324 | 241,499 | ||||||
Dimensional Emerging Core Equity Market ETF
SCHEDULE OF INVESTMENTS
October 31, 2021
| Security Description |
Shares | Fair Value | ||||||
| KOREA, REPUBLIC OF (Continued) |
||||||||
| Samsung Electro-Mechanics Co., Ltd. |
3,524 | $ | 479,497 | |||||
| Samsung Electronics Co., Ltd. |
227,731 | 13,602,862 | ||||||
| *Samsung Engineering Co., Ltd. |
29,254 | 620,854 | ||||||
| Samsung Fire & Marine Insurance Co., Ltd. |
1,490 | 294,545 | ||||||
| *Samsung Heavy Industries Co., Ltd. |
1,304 | 7,120 | ||||||
| Samsung Life Insurance Co., Ltd. |
3,769 | 217,067 | ||||||
| *Samsung Pharmaceutical Co., Ltd. |
56 | 280 | ||||||
| Samsung Publishing Co., Ltd. |
8 | 235 | ||||||
| Samsung SDI Co., Ltd. |
1,468 | 922,093 | ||||||
| Samsung SDS Co., Ltd. |
1,949 | 255,186 | ||||||
| Samsung Securities Co., Ltd. |
111 | 4,498 | ||||||
| SAMT Co., Ltd. |
88 | 395 | ||||||
| Samwha Capacitor Co., Ltd. |
1,575 | 76,422 | ||||||
| Samwha Electric Co., Ltd. |
4 | 99 | ||||||
| Samyang Corp. |
54 | 3,156 | ||||||
| Samyang Foods Co., Ltd. |
4 | 280 | ||||||
| Samyang Packaging Corp. |
8 | 180 | ||||||
| Sang-A Frontec Co., Ltd. |
8 | 431 | ||||||
| *Sangbo Corp. |
44 | 74 | ||||||
| Sangsin Energy Display Precision Co., Ltd. |
16 | 233 | ||||||
| SaraminHR Co., Ltd. |
12 | 471 | ||||||
| Satrec Initiative Co., Ltd. |
610 | 26,205 | ||||||
| SCI Information Service, Inc. |
28 | 80 | ||||||
| *S-Connect Co., Ltd. |
48 | 75 | ||||||
| *SDN Co., Ltd. |
52 | 100 | ||||||
| Seah Besteel Corp. |
20 | 371 | ||||||
| SeAH Steel Corp. |
4 | 353 | ||||||
| SeAH Steel Holdings Corp. |
4 | 430 | ||||||
| Seegene, Inc. |
2,023 | 92,100 | ||||||
| Sejin Heavy Industries Co., Ltd. |
24 | 134 | ||||||
| Sejong Industrial Co., Ltd. |
20 | 187 | ||||||
| *Sekonix Co., Ltd. |
16 | 113 | ||||||
| S-Energy Co., Ltd. |
26 | 105 | ||||||
| *Seojin System Co., Ltd. |
16 | 471 | ||||||
| *Seoul Pharma Co., Ltd. |
4 | 24 | ||||||
| Seoul Semiconductor Co., Ltd. |
7,822 | 99,737 | ||||||
| Seoulin Bioscience Co., Ltd. |
8 | 153 | ||||||
| *Seowon Co., Ltd. |
40 | 73 | ||||||
| Seoyon Co., Ltd. |
16 | 214 | ||||||
| Seoyon E-Hwa Co., Ltd. |
20 | 132 | ||||||
| Sewha P&C, Inc. |
32 | 49 | ||||||
| *Sewon Cellontech Co., Ltd. |
136 | 127 | ||||||
| *Sewoo Global Co., Ltd. |
20 | 48 | ||||||
| SEWOONMEDICAL Co., Ltd. |
32 | 117 | ||||||
| SFA Engineering Corp. |
36 | 1,084 | ||||||
| *SFA Semicon Co., Ltd. |
128 | 693 | ||||||
| *SH Energy & Chemical Co., Ltd. |
124 | 116 | ||||||
| Shin Heung Energy & Electronics Co., Ltd. |
1,043 | 58,641 | ||||||
| Shin Poong Pharmaceutical Co., Ltd. |
3,466 | 153,642 | ||||||
| Shindaeyang Paper Co., Ltd. |
4 | 299 | ||||||
| Shinhan Financial Group Co., Ltd. |
30,007 | 982,215 | ||||||
| Shinil Electronics Co., Ltd. |
64 | 106 | ||||||
| Shinsegae Food Co., Ltd. |
4 | 310 | ||||||
| Shinsegae International, Inc. |
4 | 575 | ||||||
| Shinsegae, Inc. |
12 | 2,547 | ||||||
| Shinsung Delta Tech Co., Ltd. |
28 | 389 | ||||||
Dimensional Emerging Core Equity Market ETF
SCHEDULE OF INVESTMENTS
October 31, 2021
| Security Description |
Shares | Fair Value | ||||||
| KOREA, REPUBLIC OF (Continued) |
||||||||
| *Shinsung E&G Co., Ltd. |
14,818 | $ | 29,926 | |||||
| *Shinsung Tongsang Co., Ltd. |
112 | 345 | ||||||
| Shinwha Intertek Corp. |
40 | 120 | ||||||
| *Shinwon Corp. |
88 | 258 | ||||||
| SHOWBOX Corp. |
52 | 309 | ||||||
| SIMMTECH Co., Ltd. |
362 | 9,495 | ||||||
| *SinSin Pharmaceutical Co., Ltd. |
8 | 49 | ||||||
| SK Chemicals Co., Ltd. |
408 | 62,847 | ||||||
| SK D&D Co., Ltd. |
12 | 324 | ||||||
| SK Discovery Co., Ltd. |
1,224 | 49,963 | ||||||
| SK Gas, Ltd. |
4 | 471 | ||||||
| SK Hynix, Inc. |
30,943 | 2,727,422 | ||||||
| *SK Innovation Co., Ltd. |
3,812 | 791,074 | ||||||
| SK Materials Co., Ltd. |
76 | 24,773 | ||||||
| SK Networks Co., Ltd. |
6,379 | 27,786 | ||||||
| *SK Rent A Car Co., Ltd. |
12 | 124 | ||||||
| SK Securities Co., Ltd. |
6,442 | 5,408 | ||||||
| »SK Telecom Co., Ltd. |
2,156 | 562,772 | ||||||
| SK, Inc. |
2,127 | 442,310 | ||||||
| SKC Co., Ltd. |
1,287 | 196,043 | ||||||
| SL Corp. |
20 | 561 | ||||||
| *SM Culture & Contents Co., Ltd. |
64 | 260 | ||||||
| *SM Entertainment Co., Ltd. |
694 | 46,443 | ||||||
| *SM Life Design Group Co., Ltd. |
36 | 108 | ||||||
| *S-MAC Co., Ltd. |
167,165 | 165,942 | ||||||
| SMCore, Inc. |
16 | 95 | ||||||
| SNT Motiv Co., Ltd. |
16 | 689 | ||||||
| *SNU Precision Co., Ltd. |
28 | 84 | ||||||
| S-Oil Corp. |
908 | 79,646 | ||||||
| *Solid, Inc. |
3,595 | 20,458 | ||||||
| Songwon Industrial Co., Ltd. |
12,060 | 184,737 | ||||||
| Soosan Heavy Industries Co., Ltd. |
32 | 73 | ||||||
| *Soulbrain Holdings Co., Ltd. |
8 | 299 | ||||||
| SPC Samlip Co., Ltd. |
4 | 262 | ||||||
| Speco Co., Ltd. |
20 | 104 | ||||||
| SPG Co., Ltd. |
20 | 169 | ||||||
| Spigen Korea Co., Ltd. |
4 | 156 | ||||||
| *»Ssangyong Motor Co. |
44 | 39 | ||||||
| *ST Pharm Co., Ltd. |
8 | 599 | ||||||
| *Straffic Co., Ltd. |
12 | 63 | ||||||
| *Studio Dragon Corp. |
20 | 1,474 | ||||||
| Suheung Co., Ltd. |
8 | 328 | ||||||
| Sun Kwang Co., Ltd. |
8 | 382 | ||||||
| Sung Kwang Bend Co., Ltd. |
28 | 220 | ||||||
| *Sungchang Enterprise Holdings, Ltd. |
76 | 166 | ||||||
| Sungshin Cement Co., Ltd. |
28 | 266 | ||||||
| Sungwoo Hitech Co., Ltd. |
833 | 4,284 | ||||||
| Sunjin Co., Ltd. |
30 | 332 | ||||||
| *Sunny Electronics Corp. |
40 | 135 | ||||||
| *Suprema, Inc. |
8 | 170 | ||||||
| SV Investment Corp. |
28 | 87 | ||||||
| *SY Co., Ltd. |
28 | 91 | ||||||
| *Synergy Innovation Co., Ltd. |
40 | 140 | ||||||
| *Synopex, Inc. |
1,690 | 4,331 | ||||||
| Systems Technology, Inc. |
16 | 225 | ||||||
Dimensional Emerging Core Equity Market ETF
SCHEDULE OF INVESTMENTS
October 31, 2021
| Security Description |
Shares | Fair Value | ||||||
| KOREA, REPUBLIC OF (Continued) |
||||||||
| Tae Kyung Industrial Co., Ltd. |
12 | $ | 66 | |||||
| TAEKYUNG BK Co., Ltd. |
20 | 97 | ||||||
| *»Taewoong Co., Ltd. |
16 | 128 | ||||||
| Taeyoung Engineering & Construction Co., Ltd. |
38 | 361 | ||||||
| *Taihan Electric Wire Co., Ltd. |
408 | 787 | ||||||
| *Taihan Fiberoptics Co., Ltd. |
64 | 174 | ||||||
| *Taihan Textile Co., Ltd. |
4 | 158 | ||||||
| *Tailim Packaging Co., Ltd. |
28 | 100 | ||||||
| TechWing, Inc. |
2,041 | 37,115 | ||||||
| *Tego Science, Inc. |
4 | 83 | ||||||
| *Telcon RF Pharmaceutical, Inc. |
11,707 | 33,862 | ||||||
| *Telechips, Inc. |
12 | 160 | ||||||
| *TERA SCIENCE Co., Ltd. |
56 | 95 | ||||||
| TES Co., Ltd. |
1,095 | 24,973 | ||||||
| *TK Chemical Corp. |
68 | 403 | ||||||
| TK Corp. |
24 | 240 | ||||||
| *TOBESOFT Co., Ltd. |
28 | 49 | ||||||
| Tokai Carbon Korea Co., Ltd. |
8 | 856 | ||||||
| *Tong Yang Moolsan Co., Ltd. |
120 | 208 | ||||||
| Tongyang Life Insurance Co., Ltd. |
80 | 469 | ||||||
| *Top Engineering Co., Ltd. |
20 | 128 | ||||||
| Toptec Co., Ltd. |
109 | 813 | ||||||
| *Tovis Co., Ltd. |
20 | 145 | ||||||
| TS Corp. |
40 | 113 | ||||||
| TSE Co., Ltd. |
4 | 206 | ||||||
| UBCare Co., Ltd. |
28 | 184 | ||||||
| Ubiquoss Holdings, Inc. |
8 | 113 | ||||||
| Ubiquoss, Inc. |
8 | 144 | ||||||
| Uni-Chem Co., Ltd. |
76 | 90 | ||||||
| *Unick Corp. |
16 | 100 | ||||||
| Unid Co., Ltd. |
43 | 4,287 | ||||||
| Union Materials Corp. |
20 | 61 | ||||||
| Union Semiconductor Equipment & Materials Co., Ltd. |
630 | 7,143 | ||||||
| Uniquest Corp. |
16 | 141 | ||||||
| UniTest, Inc. |
303 | 7,649 | ||||||
| UTI, Inc. |
8 | 81 | ||||||
| Value Added Technology Co., Ltd. |
12 | 416 | ||||||
| *VICTEK Co., Ltd. |
20 | 94 | ||||||
| Vieworks Co., Ltd. |
549 | 18,605 | ||||||
| Vitzro Tech Co., Ltd. |
16 | 129 | ||||||
| Vitzrocell Co., Ltd. |
24 | 335 | ||||||
| *Vivien Corp. |
28 | 73 | ||||||
| *Vivozon Healthcare, Inc. |
84 | 90 | ||||||
| *VT GMP Co., Ltd. |
24 | 163 | ||||||
| *W Holding Co., Ltd. |
58 | 76 | ||||||
| Webcash Corp. |
144 | 3,759 | ||||||
| *Webzen, Inc. |
30 | 693 | ||||||
| Wemade Co., Ltd. |
24 | 3,754 | ||||||
| *WI Co., Ltd. |
48 | 65 | ||||||
| Wiable Corp. |
40 | 105 | ||||||
| *Willbes & Co. (The) |
92 | 149 | ||||||
| Winix, Inc. |
12 | 208 | ||||||
| *Winpac, Inc. |
68 | 135 | ||||||
| Wins Co., Ltd. |
8 | 108 | ||||||
| WiSoL Co., Ltd. |
5,114 | 45,295 | ||||||
| WONIK IPS Co., Ltd. |
40 | 1,385 | ||||||
Dimensional Emerging Core Equity Market ETF
SCHEDULE OF INVESTMENTS
October 31, 2021
| Security Description |
Shares | Fair Value | ||||||
| KOREA, REPUBLIC OF (Continued) |
||||||||
| Wonik Materials Co., Ltd. |
1,855 | $ | 51,671 | |||||
| *Wonik QnC Corp. |
72 | 1,550 | ||||||
| *Wonpung Mulsan Co., Ltd. |
32 | 36 | ||||||
| *WooGene B&G Co., Ltd. |
20 | 38 | ||||||
| Woojin, Inc. |
20 | 165 | ||||||
| Woongjin Thinkbig Co., Ltd. |
64 | 183 | ||||||
| *Wooree Bio Co., Ltd. |
44 | 154 | ||||||
| Woori Financial Group, Inc. |
93,789 | 1,063,458 | ||||||
| Woori Investment Bank Co., Ltd. |
568 | 484 | ||||||
| *Wooridul Huebrain, Ltd. |
40 | 53 | ||||||
| *Wooridul Pharmaceutical, Ltd. |
16 | 162 | ||||||
| Woorison F&G Co., Ltd. |
64 | 127 | ||||||
| Woory Industrial Co., Ltd. |
8 | 169 | ||||||
| *Woosu AMS Co., Ltd. |
20 | 86 | ||||||
| *Woowon Development Co., Ltd. |
24 | 111 | ||||||
| Worldex Industry & Trading Co., Ltd. |
1,176 | 24,455 | ||||||
| Y G-1 Co., Ltd. |
24 | 178 | ||||||
| YAS Co., Ltd. |
8 | 88 | ||||||
| *YBM NET, Inc. |
8 | 42 | ||||||
| *Y-entec Co., Ltd. |
20 | 209 | ||||||
| Yeong Hwa Metal Co., Ltd. |
40 | 68 | ||||||
| *Yest Co., Ltd. |
12 | 149 | ||||||
| *YG Entertainment, Inc. |
12 | 722 | ||||||
| *YG PLUS |
28 | 183 | ||||||
| *YIK Corp. |
20 | 91 | ||||||
| YMC Co., Ltd. |
16 | 122 | ||||||
| *YMT Co., Ltd. |
12 | 214 | ||||||
| Yonwoo Co., Ltd. |
4 | 84 | ||||||
| Youlchon Chemical Co., Ltd. |
12 | 226 | ||||||
| Youngone Corp. |
5,947 | 227,233 | ||||||
| Youngone Holdings Co., Ltd. |
12 | 483 | ||||||
| *YoungWoo DSP Co., Ltd. |
52 | 95 | ||||||
| Yuanta Securities Korea Co., Ltd. |
34,320 | 131,870 | ||||||
| Yuhan Corp. |
2,386 | 122,307 | ||||||
| *Yungjin Pharmaceutical Co., Ltd. |
104 | 417 | ||||||
| Yura Tech Co., Ltd. |
4 | 37 | ||||||
| Yuyu Pharma, Inc. |
16 | 102 | ||||||
| Zeus Co., Ltd. |
8 | 142 | ||||||
|
|
|
|||||||
| TOTAL KOREA, REPUBLIC OF |
53,742,553 | |||||||
|
|
|
|||||||
| MALAYSIA (1.6%) |
||||||||
| #7-Eleven Malaysia Holdings BHD |
600 | 222 | ||||||
| Able Global BHD |
300 | 127 | ||||||
| Aeon Co. M Bhd |
2,200 | 786 | ||||||
| #AFFIN Bank BHD |
409 | 168 | ||||||
| #Alliance Bank Malaysia BHD |
52,000 | 34,533 | ||||||
| Allianz Malaysia BHD |
100 | 318 | ||||||
| *AMMB Holdings BHD |
8,200 | 6,654 | ||||||
| Astro Malaysia Holdings BHD |
6,100 | 1,466 | ||||||
| #Axiata Group BHD |
169,000 | 161,205 | ||||||
| Bank Islam Malaysia BHD |
1,100 | 850 | ||||||
| Batu Kawan BHD |
200 | 1,077 | ||||||
| *Berjaya Corp. BHD |
6,500 | 400 | ||||||
| #*Berjaya Sports Toto BHD |
2,000 | 1,005 | ||||||
Dimensional Emerging Core Equity Market ETF
SCHEDULE OF INVESTMENTS
October 31, 2021
| Security Description |
Shares | Fair Value | ||||||
| MALAYSIA (Continued) |
||||||||
| #Bermaz Auto BHD |
800 | $ | 313 | |||||
| *Boustead Holdings BHD |
800 | 118 | ||||||
| Boustead Plantations BHD |
1,000 | 173 | ||||||
| #*British American Tobacco Malaysia BHD |
32,100 | 117,051 | ||||||
| *Bumi Armada BHD |
12,700 | 1,564 | ||||||
| #Bursa Malaysia BHD |
120,400 | 218,354 | ||||||
| #Cahya Mata Sarawak BHD |
441,700 | 152,531 | ||||||
| #Carlsberg Brewery Malaysia BHD |
200 | 1,071 | ||||||
| CB Industrial Product Holding BHD |
300 | 92 | ||||||
| CIMB Group Holdings BHD |
271,811 | 342,635 | ||||||
| #Comfort Glove BHD |
162,600 | 46,726 | ||||||
| #*Cypark Resources BHD |
500 | 120 | ||||||
| D&O Green Technologies BHD |
1,900 | 2,588 | ||||||
| #*Dayang Enterprise Holdings BHD |
500 | 119 | ||||||
| #Dialog Group BHD |
269,500 | 184,179 | ||||||
| *DiGi.Com BHD |
225,100 | 229,938 | ||||||
| DRB-Hicom BHD |
3,900 | 1,554 | ||||||
| #Dufu Technology Corp. BHD |
300 | 322 | ||||||
| #Duopharma Biotech BHD |
534 | 218 | ||||||
| Eco World Development Group BHD |
1,300 | 320 | ||||||
| *Econpile Holdings BHD |
700 | 68 | ||||||
| #*Ekovest BHD |
4,800 | 481 | ||||||
| FAR East Holdings BHD |
200 | 146 | ||||||
| Formosa Prosonic Industries BHD |
200 | 211 | ||||||
| FoundPac Group BHD |
500 | 94 | ||||||
| *Fraser & Neave Holdings BHD |
200 | 1,307 | ||||||
| #Frontken Corp. BHD |
9,800 | 9,017 | ||||||
| *Gamuda BHD |
21,000 | 16,431 | ||||||
| Gas Malaysia BHD |
200 | 131 | ||||||
| Genting Malaysia BHD |
378,200 | 289,518 | ||||||
| Genting Plantations BHD |
400 | 705 | ||||||
| George Kent Malaysia BHD |
500 | 84 | ||||||
| #Globetronics Technology BHD |
84,400 | 42,598 | ||||||
| #Guan Chong BHD |
500 | 366 | ||||||
| Hai-O Enterprise BHD |
311 | 146 | ||||||
| #HAP Seng Consolidated BHD |
800 | 1,515 | ||||||
| Hartalega Holdings BHD |
2,000 | 2,830 | ||||||
| #Heineken Malaysia BHD |
200 | 1,111 | ||||||
| #Hengyuan Refining Co. BHD |
200 | 210 | ||||||
| HeveaBoard BHD |
600 | 69 | ||||||
| #*Hiap Teck Venture BHD |
3,500 | 478 | ||||||
| Hibiscus Petroleum BHD |
498,800 | 108,409 | ||||||
| #*Hong Leong Bank BHD |
29,000 | 131,799 | ||||||
| *Hong Leong Financial Group BHD |
400 | 1,772 | ||||||
| *Hong Leong Industries BHD |
100 | 220 | ||||||
| Hup Seng Industries BHD |
600 | 133 | ||||||
| *IGB BHD |
400 | 188 | ||||||
| IHH Healthcare BHD |
115,600 | 182,571 | ||||||
| IJM Corp. BHD |
312,600 | 139,655 | ||||||
| Inari Amertron BHD |
317,000 | 296,255 | ||||||
| IOI Corp. BHD |
18,900 | 17,937 | ||||||
| #IOI Properties Group BHD |
4,300 | 1,329 | ||||||
| *Iskandar Waterfront City BHD |
800 | 76 | ||||||
| #*JAKS Resources BHD |
4,800 | 539 | ||||||
| #*Jaya Tiasa Holdings BHD |
600 | 103 | ||||||
| *JCY International BHD |
600 | 46 | ||||||
Dimensional Emerging Core Equity Market ETF
SCHEDULE OF INVESTMENTS
October 31, 2021
| Security Description |
Shares | Fair Value | ||||||
| MALAYSIA (Continued) |
||||||||
| #JHM Consolidation BHD |
600 | $ | 287 | |||||
| Karex BHD |
1,100 | 125 | ||||||
| Kim Loong Resources BHD |
500 | 194 | ||||||
| *KNM Group BHD |
8,500 | 421 | ||||||
| #Kossan Rubber Industries BHD |
51,600 | 29,407 | ||||||
| *KPJ Healthcare BHD |
22,800 | 6,277 | ||||||
| Kretam Holdings BHD |
900 | 119 | ||||||
| #Kuala Lumpur Kepong BHD |
41,000 | 214,059 | ||||||
| Leong Hup International BHD |
7,000 | 1,107 | ||||||
| *Lii Hen Industries BHD |
100 | 74 | ||||||
| Lingkaran Trans Kota Holdings BHD |
200 | 186 | ||||||
| LPI Capital BHD |
300 | 1,022 | ||||||
| *Magni-Tech Industries BHD |
300 | 154 | ||||||
| *Magnum BHD |
1,800 | 939 | ||||||
| #Mah Sing Group BHD |
630,800 | 123,388 | ||||||
| Malakoff Corp. BHD |
5,700 | 1,115 | ||||||
| Malayan Banking BHD |
134,665 | 261,785 | ||||||
| *Malayan Flour Mills BHD |
1,000 | 182 | ||||||
| *Malaysia Airports Holdings BHD |
139,000 | 217,513 | ||||||
| #Malaysia Building Society BHD |
9,100 | 1,406 | ||||||
| Malaysian Pacific Industries BHD |
100 | 1,151 | ||||||
| #Malaysian Resources Corp. BHD |
28,945 | 2,866 | ||||||
| Matrix Concepts Holdings BHD |
5,900 | 3,063 | ||||||
| #Maxis BHD |
3,700 | 4,173 | ||||||
| #Mega First Corp. BHD |
26,000 | 22,603 | ||||||
| *MISC BHD |
73,100 | 124,805 | ||||||
| MKH BHD |
500 | 175 | ||||||
| *MMC Corp. BHD |
600 | 287 | ||||||
| MNRB Holdings BHD |
400 | 128 | ||||||
| *MPHB Capital BHD |
500 | 163 | ||||||
| Muhibbah Engineering M BHD |
400 | 92 | ||||||
| #My EG Services BHD |
980,164 | 246,165 | ||||||
| #*Nestle Malaysia BHD |
100 | 3,248 | ||||||
| *Notion VTEC BHD |
400 | 46 | ||||||
| #Padini Holdings BHD |
600 | 455 | ||||||
| Paramount Corp. BHD |
500 | 94 | ||||||
| #Pentamaster Corp. BHD |
700 | 904 | ||||||
| Perak Transit BHD |
600 | 99 | ||||||
| Petron Malaysia Refining & Marketing BHD |
100 | 109 | ||||||
| Petronas Chemicals Group BHD |
102,900 | 215,938 | ||||||
| Petronas Dagangan BHD |
400 | 1,967 | ||||||
| *Petronas Gas BHD |
800 | 3,234 | ||||||
| #PIE Industrial BHD |
200 | 186 | ||||||
| #*Pos Malaysia BHD |
400 | 71 | ||||||
| Power Root BHD |
400 | 143 | ||||||
| Press Metal Aluminium Holdings BHD |
147,300 | 197,775 | ||||||
| Public Bank BHD |
678,700 | 683,453 | ||||||
| QL Resources BHD |
5,700 | 6,951 | ||||||
| #Ranhill Utilities BHD |
913 | 139 | ||||||
| RHB Bank BHD |
134,388 | 181,088 | ||||||
| Sam Engineering & Equipment M BHD |
100 | 527 | ||||||
| #*Sapura Energy BHD |
523,900 | 12,651 | ||||||
| Sarawak Oil Palms BHD |
300 | 278 | ||||||
| #Scientex BHD |
1,900 | 2,138 | ||||||
| #»Serba Dinamik Holdings BHD |
14,400 | 1,217 | ||||||
Dimensional Emerging Core Equity Market ETF
SCHEDULE OF INVESTMENTS
October 31, 2021
| Security Description |
Shares | Fair Value | ||||||
| MALAYSIA (Continued) |
||||||||
| *Shangri-La Hotels Malaysia BHD |
100 | $ | 84 | |||||
| #Sime Darby BHD |
235,800 | 129,260 | ||||||
| Sime Darby Plantation BHD |
77,242 | 74,799 | ||||||
| #Sime Darby Property BHD |
6,500 | 1,138 | ||||||
| Skp Resources BHD |
800 | 352 | ||||||
| *SP Setia BHD Group |
180,300 | 67,923 | ||||||
| Sunway BHD |
8,100 | 3,482 | ||||||
| #Supermax Corp. BHD |
170,200 | 78,914 | ||||||
| Syarikat Takaful Malaysia Keluarga BHD |
760 | 729 | ||||||
| *Ta Ann Holdings BHD |
200 | 157 | ||||||
| #Taliworks Corp. BHD |
600 | 121 | ||||||
| Telekom Malaysia BHD |
107,800 | 150,727 | ||||||
| #Tenaga Nasional BHD |
130,600 | 304,660 | ||||||
| #*Thong Guan Industries BHD |
300 | 207 | ||||||
| TIME dotCom BHD |
67,900 | 74,114 | ||||||
| Top Glove Corp. BHD |
319,000 | 209,534 | ||||||
| *Tropicana Corp. BHD |
400 | 98 | ||||||
| TSH Resources BHD |
1,600 | 452 | ||||||
| Uchi Technologies BHD |
400 | 304 | ||||||
| *UEM Edgenta BHD |
300 | 133 | ||||||
| #*UEM Sunrise BHD |
4,800 | 458 | ||||||
| UMW Holdings BHD |
500 | 412 | ||||||
| United Malacca BHD |
200 | 249 | ||||||
| #*United Plantations BHD |
200 | 684 | ||||||
| UOA Development BHD |
400 | 169 | ||||||
| #*Velesto Energy BHD |
13,700 | 529 | ||||||
| ViTrox Corp. BHD |
200 | 951 | ||||||
| *VS Industry BHD |
7,300 | 2,785 | ||||||
| #*WCT Holdings BHD |
1,110 | 166 | ||||||
| Wellcall Holdings BHD |
700 | 179 | ||||||
| Westports Holdings BHD |
1,500 | 1,619 | ||||||
| *Yinson Holdings BHD |
48,900 | 69,081 | ||||||
| YNH Property BHD |
500 | 322 | ||||||
| YTL Corp. BHD |
12,100 | 1,841 | ||||||
| YTL Power International BHD |
3,800 | 647 | ||||||
|
|
|
|||||||
| TOTAL MALAYSIA |
6,512,767 | |||||||
|
|
|
|||||||
| MEXICO (1.9%) |
||||||||
| *ALEATICA SAB de CV |
400 | 356 | ||||||
| Alpek SAB de CV |
63,600 | 69,783 | ||||||
| *Alsea SAB de CV |
32,400 | 68,166 | ||||||
| America Movil Sab de CV, Sponsored ADR |
10,950 | 194,691 | ||||||
| *America Movil SAB de CV, Class L |
1,068,900 | 954,793 | ||||||
| Arca Continental SAB de CV |
28,500 | 174,152 | ||||||
| *Axtel SAB de CV |
23,500 | 5,354 | ||||||
| Banco del Bajio SA |
115,500 | 217,304 | ||||||
| Becle SAB de CV |
12,600 | 28,864 | ||||||
| #Bolsa Mexicana de Valores SAB de CV |
30,500 | 58,556 | ||||||
| *Cemex Sab de CV, Sponsored ADR |
12,240 | 78,703 | ||||||
| *Cemex SAB de CV |
639,400 | 412,094 | ||||||
| Cia Minera Autlan SAB de CV, Class B |
500 | 324 | ||||||
| Coca-Cola Femsa Sab de CV, Sponsored ADR |
396 | 21,285 | ||||||
| Coca-Cola Femsa SAB de CV, Class A |
18,960 | 102,400 | ||||||
| Consorcio ARA SAB de CV |
21,100 | 4,489 | ||||||
| *Controladora Vuela Cia de Aviacion SAB de CV, Class A |
50,400 | 91,880 | ||||||
Dimensional Emerging Core Equity Market ETF
SCHEDULE OF INVESTMENTS
October 31, 2021
| Security Description |
Shares | Fair Value | ||||||
| MEXICO (Continued) |
||||||||
| Corp. Actinver SAB de CV |
200 | $ | 107 | |||||
| Corp. Inmobiliaria Vesta SAB de CV |
41,100 | 71,705 | ||||||
| El Puerto de Liverpool SAB de CV |
14,300 | 63,408 | ||||||
| *Elementia Materiales Sab de CV |
350 | 247 | ||||||
| *Fomento Economico Mexicano Sab de CV, Sponsored ADR |
520 | 42,739 | ||||||
| *Fomento Economico Mexicano SAB de CV |
59,900 | 493,534 | ||||||
| *Fortaleza Materiales Sab de CV |
350 | 264 | ||||||
| GCC SAB de CV |
200 | 1,491 | ||||||
| #*Genomma Lab Internacional SAB de CV, Class B |
128,000 | 122,747 | ||||||
| *Gruma SAB de CV, Class B |
11,510 | 135,450 | ||||||
| *Grupo Aeroportuario del Centro Norte Sab de CV, Sponsored ADR |
288 | 13,936 | ||||||
| #*Grupo Aeroportuario del Centro Norte SAB de CV |
7,861 | 47,538 | ||||||
| Grupo Aeroportuario del Pacifico Sab de CV, Sponsored ADR |
500 | 63,140 | ||||||
| #Grupo Aeroportuario del Pacifico SAB de CV, Class B |
21,200 | 267,830 | ||||||
| Grupo Aeroportuario del Sureste SAB de CV, Class B |
5,290 | 106,915 | ||||||
| Grupo Aeroportuario del Sureste SAB de CV, Sponsored ADR |
100 | 20,165 | ||||||
| Grupo Bimbo SAB de CV, Class A |
84,900 | 251,853 | ||||||
| *Grupo Carso SAB de CV, Class A1 |
23,700 | 79,892 | ||||||
| Grupo Comercial Chedraui SA de CV |
38,985 | 77,048 | ||||||
| *Grupo Financiero Banorte SAB de CV, Class O |
100,200 | 635,792 | ||||||
| *Grupo Financiero Inbursa SAB de CV, Class O |
90,000 | 90,556 | ||||||
| *Grupo GICSA SAB de CV |
1,800 | 231 | ||||||
| Grupo Herdez SAB de CV |
5,830 | 10,745 | ||||||
| *Grupo Hotelero Santa Fe SAB de CV |
600 | 139 | ||||||
| #Grupo Industrial Saltillo SAB de CV |
600 | 873 | ||||||
| *Grupo Mexico SAB de CV, Class B |
108,700 | 477,914 | ||||||
| Grupo Rotoplas SAB de CV |
3,900 | 5,397 | ||||||
| *Grupo Simec SAB de CV, Class B |
100 | 828 | ||||||
| Grupo Televisa Sab, Sponsored ADR |
5,680 | 57,482 | ||||||
| Grupo Televisa SAB |
137,900 | 280,593 | ||||||
| *Hoteles City Express SAB de CV |
20,000 | 6,182 | ||||||
| Industrias Bachoco Sab de CV, ADR |
136 | 5,773 | ||||||
| Industrias Bachoco SAB de CV, Class B |
8,400 | 29,858 | ||||||
| #*Industrias Penoles SAB de CV |
12,700 | 163,203 | ||||||
| *Kimberly-Clark de Mexico SAB de CV, Class A |
49,800 | 78,956 | ||||||
| La Comer SAB de CV |
33,187 | 59,999 | ||||||
| Medica Sur SAB de CV, Class B |
100 | 214 | ||||||
| Megacable Holdings SAB de CV |
50,700 | 149,708 | ||||||
| *Minera Frisco SAB de CV |
600 | 111 | ||||||
| *Nemak SAB de CV |
233,084 | 53,894 | ||||||
| Orbia Advance Corp. SAB de CV |
59,900 | 156,026 | ||||||
| Organizacion Cultiba SAB de CV |
200 | 100 | ||||||
| *Organizacion Soriana SAB de CV, Class B |
600 | 723 | ||||||
| Promotora y Operadora de Infraestructura SAB de CV |
25,659 | 189,105 | ||||||
| Promotora y Operadora de Infraestructura SAB de CV |
80 | 379 | ||||||
| Qualitas Controladora SAB de CV |
12,800 | 59,424 | ||||||
| Telesites SAB de CV |
48,100 | 43,972 | ||||||
| #*Unifin Financiera SAB de CV |
10,404 | 16,014 | ||||||
| Vitro SAB de CV, Class A |
100 | 116 | ||||||
| Wal-Mart de Mexico SAB de CV |
184,300 | 644,238 | ||||||
|
|
|
|||||||
| TOTAL MEXICO |
7,561,748 | |||||||
|
|
|
|||||||
| PERU (0.1%) |
||||||||
| *Aenza SAA, Class A, ADR |
1,745 | 3,385 | ||||||
Dimensional Emerging Core Equity Market ETF
SCHEDULE OF INVESTMENTS
October 31, 2021
| Security Description |
Shares | Fair Value | ||||||
| PERU (Continued) |
||||||||
| Cementos Pacasmayo SAA, ADR |
448 | $ | 2,755 | |||||
| *Cia de Minas Buenaventura SAA, Sponsored ADR |
461 | 3,633 | ||||||
| CrediCorp., Ltd. |
2,925 | 379,256 | ||||||
|
|
|
|||||||
| TOTAL PERU |
389,029 | |||||||
|
|
|
|||||||
| PHILIPPINES (0.8%) |
||||||||
| *8990 Holdings, Inc. |
2,200 | 449 | ||||||
| Aboitiz Equity Ventures, Inc. |
20,400 | 19,587 | ||||||
| Aboitiz Power Corp. |
2,600 | 1,658 | ||||||
| Alliance Global Group, Inc. |
16,500 | 3,404 | ||||||
| *Apex Mining Co., Inc. |
4,000 | 115 | ||||||
| Asia United Bank Corp. |
200 | 182 | ||||||
| *Atlas Consolidated Mining & Development Corp. |
20,700 | 2,587 | ||||||
| Ayala Corp. |
12,580 | 215,365 | ||||||
| Ayala Land, Inc. |
256,700 | 178,738 | ||||||
| *AyalaLand Logistics Holdings Corp. |
2,000 | 230 | ||||||
| *Bank of the Philippine Islands |
10,700 | 18,456 | ||||||
| BDO Unibank, Inc. |
165,710 | 407,947 | ||||||
| *Belle Corp. |
5,000 | 139 | ||||||
| *Bloomberry Resorts Corp. |
131,000 | 17,671 | ||||||
| *Cebu Air, Inc. |
24,890 | 21,849 | ||||||
| Cebu Landmasters, Inc. |
49,952 | 2,874 | ||||||
| *CEMEX Holdings Philippines, Inc. |
5,000 | 123 | ||||||
| Century Pacific Food, Inc. |
76,500 | 42,947 | ||||||
| *Chelsea Logistics and Infrastructure Holdings Corp. |
800 | 31 | ||||||
| China Banking Corp. |
1,600 | 766 | ||||||
| COL Financial Group, Inc. |
2,000 | 162 | ||||||
| Cosco Capital, Inc. |
48,900 | 5,063 | ||||||
| D&L Industries, Inc. |
117,800 | 19,723 | ||||||
| DMCI Holdings, Inc. |
681,000 | 107,398 | ||||||
| DoubleDragon Properties Corp. |
67,100 | 13,683 | ||||||
| Eagle Cement Corp. |
900 | 257 | ||||||
| *East West Banking Corp. |
4,900 | 920 | ||||||
| Emperador, Inc. |
5,300 | 1,924 | ||||||
| Filinvest Development Corp. |
800 | 128 | ||||||
| *Filinvest Land, Inc. |
168,000 | 3,833 | ||||||
| First Gen Corp. |
1,200 | 716 | ||||||
| *First Philippine Holdings Corp. |
1,010 | 1,493 | ||||||
| Global Ferronickel Holdings, Inc. |
3,000 | 126 | ||||||
| *Globe Telecom, Inc. |
1,675 | 99,550 | ||||||
| GT Capital Holdings, Inc. |
14,440 | 161,845 | ||||||
| Holcim Philippines, Inc. |
8,600 | 1,000 | ||||||
| *Integrated Micro-Electronics, Inc. |
10,100 | 1,779 | ||||||
| International Container Terminal Services, Inc. |
58,150 | 207,637 | ||||||
| JG Summit Holdings, Inc. |
4,520 | 5,398 | ||||||
| *Jollibee Foods Corp. |
31,790 | 148,324 | ||||||
| LT Group, Inc. |
4,300 | 858 | ||||||
| *MacroAsia Corp. |
600 | 61 | ||||||
| Manila Electric Co. |
8,130 | 46,287 | ||||||
| *Max’s Group, Inc. |
500 | 72 | ||||||
| *Megawide Construction Corp. |
900 | 109 | ||||||
| *Megaworld Corp. |
31,000 | 1,888 | ||||||
| Metro Pacific Investments Corp. |
1,394,000 | 103,700 | ||||||
| Metropolitan Bank & Trust Co. |
187,690 | 177,600 | ||||||
| Nickel Asia Corp. |
504,300 | 54,822 | ||||||
Dimensional Emerging Core Equity Market ETF
SCHEDULE OF INVESTMENTS
October 31, 2021
| Security Description |
Shares | Fair Value | ||||||
| PHILIPPINES (Continued) |
||||||||
| *Petron Corp. |
5,000 | $ | 384 | |||||
| Philex Mining Corp. |
2,000 | 206 | ||||||
| *Philippine National Bank |
500 | 199 | ||||||
| *Philippine Savings Bank |
80 | 92 | ||||||
| *Philippine Seven Corp. |
720 | 1,300 | ||||||
| Philippine Stock Exchange, Inc. (The) |
40 | 175 | ||||||
| *Phoenix Petroleum Philippines, Inc. |
300 | 68 | ||||||
| *Pilipinas Shell Petroleum Corp. |
500 | 214 | ||||||
| #Pldt, Inc., Sponsored ADR |
1,225 | 40,204 | ||||||
| PLDT, Inc. |
5,845 | 190,389 | ||||||
| *»PNB Holdings Corp. |
78 | 0 | ||||||
| Premium Leisure Corp. |
10,000 | 86 | ||||||
| Puregold Price Club, Inc. |
7,000 | 5,867 | ||||||
| *PXP Energy Corp. |
500 | 66 | ||||||
| Rizal Commercial Banking Corp. |
1,000 | 384 | ||||||
| Robinsons Land Corp. |
185,500 | 62,557 | ||||||
| Robinsons Retail Holdings, Inc. |
38,430 | 47,456 | ||||||
| San Miguel Corp. |
700 | 1,623 | ||||||
| San Miguel Food and Beverage, Inc. |
1,320 | 1,990 | ||||||
| *Security Bank Corp. |
2,490 | 5,972 | ||||||
| Semirara Mining & Power Corp. |
235,200 | 121,309 | ||||||
| Shakey’s Pizza Asia Ventures, Inc. |
600 | 95 | ||||||
| SM Investments Corp. |
7,205 | 137,926 | ||||||
| SM Prime Holdings, Inc. |
292,700 | 192,191 | ||||||
| *Top Frontier Investment Holdings, Inc. |
80 | 208 | ||||||
| Union Bank of the Philippines |
880 | 1,581 | ||||||
| Universal Robina Corp. |
61,720 | 168,962 | ||||||
| Vista Land & Lifescapes, Inc. |
115,200 | 8,615 | ||||||
| Vistamalls, Inc. |
2,000 | 152 | ||||||
| Wilcon Depot, Inc. |
117,700 | 72,848 | ||||||
|
|
|
|||||||
| TOTAL PHILIPPINES |
3,164,593 | |||||||
|
|
|
|||||||
| POLAND (1.1%) |
||||||||
| *11 bit studios SA |
4 | 417 | ||||||
| AB SA |
48 | 686 | ||||||
| *Agora SA |
40 | 82 | ||||||
| *Alior Bank SA |
29,913 | 472,407 | ||||||
| Alumetal SA |
32 | 441 | ||||||
| Amica SA |
4 | 123 | ||||||
| *AmRest Holdings SE |
5,138 | 41,216 | ||||||
| Apator SA |
66 | 357 | ||||||
| Asseco Poland SA |
5,832 | 143,728 | ||||||
| Asseco South Eastern Europe SA |
20 | 241 | ||||||
| Auto Partner SA |
3,128 | 10,592 | ||||||
| Bank Handlowy w Warszawie SA |
83 | 1,206 | ||||||
| *Bank Millennium SA |
63,838 | 146,518 | ||||||
| *Bank Ochrony Srodowiska SA |
92 | 278 | ||||||
| Bank Polska Kasa Opieki SA |
9,217 | 304,602 | ||||||
| *Benefit Systems SA |
69 | 14,313 | ||||||
| Budimex SA |
86 | 5,501 | ||||||
| *CCC SA |
2,050 | 61,963 | ||||||
| CD Projekt SA |
1,569 | 68,433 | ||||||
| Celon Pharma SA |
6 | 55 | ||||||
| Ciech SA |
1,471 | 13,099 | ||||||
Dimensional Emerging Core Equity Market ETF
SCHEDULE OF INVESTMENTS
October 31, 2021
| Security Description |
Shares | Fair Value | ||||||
| POLAND (Continued) |
||||||||
| Cognor Holding SA |
9,282 | $ | 10,140 | |||||
| ComArch SA |
4 | 225 | ||||||
| Cyfrowy Polsat SA |
9,409 | 84,209 | ||||||
| Develia SA |
904 | 814 | ||||||
| *Dino Polska SA |
1,853 | 165,655 | ||||||
| Dom Development SA |
24 | 807 | ||||||
| Echo Investment SA |
274 | 317 | ||||||
| *Enea SA |
14,418 | 36,563 | ||||||
| Eurocash SA |
266 | 657 | ||||||
| Fabryki Mebli Forte SA |
42 | 481 | ||||||
| *Famur SA |
724 | 566 | ||||||
| *Globe Trade Centre SA |
320 | 550 | ||||||
| *Grupa Azoty SA |
3,566 | 26,656 | ||||||
| Grupa Kety SA |
108 | 16,959 | ||||||
| *Grupa Lotos SA |
6,275 | 97,557 | ||||||
| *ING Bank Slaski SA |
172 | 11,735 | ||||||
| Inter Cars SA |
38 | 4,356 | ||||||
| *Jastrzebska Spolka Weglowa SA |
22,641 | 294,183 | ||||||
| Kernel Holding SA |
574 | 8,668 | ||||||
| KGHM Polska Miedz SA |
4,654 | 179,078 | ||||||
| LiveChat Software SA |
1,695 | 51,871 | ||||||
| *Lubelski Wegiel Bogdanka SA |
44 | 444 | ||||||
| *mBank SA |
2,082 | 294,806 | ||||||
| Mirbud SA |
158 | 153 | ||||||
| Neuca SA |
59 | 13,793 | ||||||
| NEWAG SA |
56 | 324 | ||||||
| *Orange Polska SA |
32,635 | 63,729 | ||||||
| *PGE Polska Grupa Energetyczna SA |
49,485 | 121,744 | ||||||
| *PKP Cargo SA |
64 | 295 | ||||||
| Polski Holding Nieruchomosci SA |
20 | 76 | ||||||
| Polski Koncern Naftowy ORLEN SA |
16,617 | 358,712 | ||||||
| Polskie Gornictwo Naftowe i Gazownictwo SA |
59,346 | 89,555 | ||||||
| *Powszechna Kasa Oszczednosci Bank Polski SA |
27,994 | 342,671 | ||||||
| Powszechny Zaklad Ubezpieczen SA |
20,936 | 209,536 | ||||||
| Santander Bank Polska SA |
2,618 | 243,304 | ||||||
| *Tauron Polska Energia SA |
142,341 | 117,325 | ||||||
| Ten Square Games SA |
165 | 14,618 | ||||||
| *TIM SA |
84 | 891 | ||||||
| *VRG SA |
394 | 375 | ||||||
| Warsaw Stock Exchange |
1,871 | 20,659 | ||||||
| Wirtualna Polska Holding SA |
663 | 24,281 | ||||||
| *Zespol Elektrocieplowni Wroclawskich Kogeneracja SA |
12 | 103 | ||||||
|
|
|
|||||||
| TOTAL POLAND |
4,195,699 | |||||||
|
|
|
|||||||
| QATAR (0.6%) |
||||||||
| Aamal Co. |
37,156 | 11,134 | ||||||
| »Al Khalij Commercial Bank PQSC |
6,456 | 3,972 | ||||||
| Al Meera Consumer Goods Co. QSC |
2,203 | 11,853 | ||||||
| Barwa Real Estate Co. |
36,394 | 31,486 | ||||||
| Commercial Bank PSQC (The) |
43,079 | 72,291 | ||||||
| Doha Bank QPSC |
2,356 | 1,866 | ||||||
| *Gulf International Services QSC |
217,693 | 110,013 | ||||||
| Gulf Warehousing Co. |
18,206 | 24,491 | ||||||
| Industries Qatar QSC |
35,045 | 152,654 | ||||||
| Masraf Al Rayan QSC |
118,021 | 154,779 | ||||||
Dimensional Emerging Core Equity Market ETF
SCHEDULE OF INVESTMENTS
October 31, 2021
| Security Description |
Shares | Fair Value | ||||||
| QATAR (Continued) |
||||||||
| Mazaya Real Estate Development QPSC |
8,225 | $ | 2,354 | |||||
| Medicare Group |
144 | 335 | ||||||
| Mesaieed Petrochemical Holding Co. |
6,160 | 4,060 | ||||||
| Ooredoo QPSC |
1,672 | 3,178 | ||||||
| Qatar Electricity & Water Co. QSC |
3,636 | 16,777 | ||||||
| *Qatar First Bank |
428 | 215 | ||||||
| Qatar Fuel QSC |
31,863 | 160,934 | ||||||
| Qatar Gas Transport Co., Ltd. |
216,678 | 193,409 | ||||||
| Qatar Industrial Manufacturing Co. QSC |
12,733 | 11,156 | ||||||
| *Qatar Insurance Co. SAQ |
2,484 | 1,672 | ||||||
| Qatar International Islamic Bank QSC |
6,004 | 16,144 | ||||||
| Qatar Islamic Bank SAQ |
84,695 | 428,476 | ||||||
| Qatar Islamic Insurance Group |
108 | 234 | ||||||
| Qatar National Bank QPSC |
164,082 | 923,834 | ||||||
| Qatar National Cement Co. QSC |
252 | 351 | ||||||
| *Salam International Investment, Ltd. QSC |
99,438 | 26,054 | ||||||
| United Development Co. QSC |
121,590 | 51,862 | ||||||
| Vodafone Qatar QSC |
3,240 | 1,441 | ||||||
| Widam Food Co. |
124 | 139 | ||||||
|
|
|
|||||||
| TOTAL QATAR |
2,417,164 | |||||||
|
|
|
|||||||
| RUSSIAN FEDERATION (1.2%) |
||||||||
| Etalon Group PLC, Registered, GDR |
5,953 | 9,358 | ||||||
| Gazprom PJSC, ADR |
110,061 | 1,079,258 | ||||||
| *Global Ports Investments PLC, Registered, GDR |
687 | 2,720 | ||||||
| Globaltrans Investment PLC, GDR |
4,770 | 42,024 | ||||||
| *Lenta PLC, Sponsored GDR |
130 | 394 | ||||||
| LUKOIL PJSC, ADR |
9,827 | 1,002,354 | ||||||
| Magnitogorsk Iron & Steel Works PJSC, GDR |
3,462 | 42,237 | ||||||
| *Mail.Ru Group, Ltd., GDR |
2,255 | 46,137 | ||||||
| MMC Norilsk Nickel PJSC, ADR |
66 | 2,065 | ||||||
| MMC Norilsk Nickel PJSC, Sponsored ADR |
193 | 6,026 | ||||||
| Mobile TeleSystems PJSC, Sponsored ADR |
12,900 | 118,551 | ||||||
| Novatek PJSC, GDR |
635 | 160,973 | ||||||
| Novolipetsk Steel PJSC, GDR |
1,202 | 37,959 | ||||||
| PhosAgro PJSC, GDR |
3,917 | 93,695 | ||||||
| Polyus PJSC, Class G, GDR |
1,794 | 177,785 | ||||||
| Ros Agro PLC, Registered, GDR |
2,962 | 49,228 | ||||||
| Rosneft Oil Co. PJSC, GDR |
26,817 | 238,939 | ||||||
| Rostelecom PJSC, ADR |
1,736 | 13,645 | ||||||
| RusHydro PJSC, ADR |
15,140 | 16,563 | ||||||
| Sberbank of Russia PJSC, ADR |
56,735 | 1,135,835 | ||||||
| Severstal PAO, GDR |
6,603 | 150,945 | ||||||
| Tatneft PJSC, ADR |
6,248 | 285,846 | ||||||
| *VEON, Ltd., Sponsored ADR |
15,200 | 32,072 | ||||||
| VTB Bank PJSC, GDR |
52,856 | 76,958 | ||||||
| X5 Retail Group NV, GDR |
3,296 | 112,196 | ||||||
|
|
|
|||||||
| TOTAL RUSSIAN FEDERATION |
4,933,763 | |||||||
|
|
|
|||||||
Dimensional Emerging Core Equity Market ETF
SCHEDULE OF INVESTMENTS
October 31, 2021
| Security Description |
Shares | Fair Value | ||||||
| SAUDI ARABIA (2.8%) |
||||||||
| Abdullah Al Othaim Markets Co. |
64 | $ | 1,976 | |||||
| Advanced Petrochemical Co. |
164 | 3,253 | ||||||
| Al Babtain Power & Telecommunication Co. |
36 | 355 | ||||||
| Al Hammadi Co. for Development and Investment |
422 | 4,759 | ||||||
| *Al Hassan Ghazi Ibrahim Shaker Co. |
80 | 513 | ||||||
| *Al Jouf Cement Co. |
3,105 | 9,934 | ||||||
| Al Khaleej Training and Education Co. |
36 | 266 | ||||||
| Al Moammar Information Systems Co. |
416 | 16,658 | ||||||
| Al Rajhi Bank |
41,394 | 1,529,555 | ||||||
| *Al Rajhi Co. for Co-operative Insurance |
667 | 16,591 | ||||||
| Al Yamamah Steel Industries Co. |
820 | 9,903 | ||||||
| *AlAbdullatif Industrial Investment Co. |
2,345 | 21,538 | ||||||
| Alandalus Property Co. |
5,553 | 29,727 | ||||||
| Aldrees Petroleum and Transport Services Co. |
6,589 | 129,992 | ||||||
| *Al-Etihad Cooperative Insurance Co. |
28 | 165 | ||||||
| Alinma Bank |
133,879 | 897,666 | ||||||
| *Allianz Saudi Fransi Cooperative Insurance Co. |
1,501 | 10,084 | ||||||
| Almarai Co. JSC |
1,062 | 14,978 | ||||||
| Arab National Bank |
1,008 | 6,186 | ||||||
| Arabian Cement Co. |
21,488 | 223,422 | ||||||
| Arabian Centres Co., Ltd. |
136 | 925 | ||||||
| Arriyadh Development Co. |
786 | 5,574 | ||||||
| *Aseer Trading Tourism & Manufacturing Co. |
2,001 | 12,152 | ||||||
| Astra Industrial Group |
72 | 828 | ||||||
| *AXA Cooperative Insurance Co. |
696 | 6,726 | ||||||
| *Bank AlBilad |
17,291 | 194,535 | ||||||
| Bank Al-Jazira |
119,800 | 613,229 | ||||||
| Banque Saudi Fransi |
1,266 | 14,260 | ||||||
| Bawan Co. |
897 | 9,482 | ||||||
| Bupa Arabia for Cooperative Insurance Co. |
88 | 3,393 | ||||||
| City Cement Co. |
29,524 | 190,640 | ||||||
| Co. For Cooperative Insurance (The) |
857 | 19,649 | ||||||
| Dallah Healthcare Co. |
44 | 851 | ||||||
| *Dar Al Arkan Real Estate Development Co. |
844 | 2,225 | ||||||
| *Dur Hospitality Co. |
2,862 | 27,278 | ||||||
| Eastern Province Cement Co. |
504 | 6,450 | ||||||
| *Emaar Economic City |
612 | 2,072 | ||||||
| Etihad Etisalat Co. |
51,655 | 416,584 | ||||||
| Fitaihi Holding Group |
20 | 261 | ||||||
| Hail Cement Co. |
2,385 | 9,385 | ||||||
| Halwani Brothers Co. |
902 | 22,509 | ||||||
| Herfy Food Services Co. |
995 | 17,402 | ||||||
| Jarir Marketing Co. |
8,480 | 458,488 | ||||||
| Leejam Sports Co. JSC |
624 | 18,898 | ||||||
| Maharah Human Resources Co. |
4,034 | 92,491 | ||||||
| *Methanol Chemicals Co. |
53 | 502 | ||||||
| *Middle East Healthcare Co. |
190 | 1,879 | ||||||
| *Middle East Paper Co. |
48 | 592 | ||||||
| *Mobile Telecommunications Co. |
640 | 2,317 | ||||||
| Mouwasat Medical Services Co. |
72 | 3,451 | ||||||
| Najran Cement Co. |
5,085 | 25,622 | ||||||
| *National Agriculture Development Co. (The) |
15,583 | 147,484 | ||||||
| *National Co for Glass Manufacturing (The) |
40 | 394 | ||||||
| National Gas & Industrialization Co. |
158 | 2,490 | ||||||
| National Gypsum |
24 | 295 | ||||||
| *National Industrialization Co. |
524 | 3,479 | ||||||
Dimensional Emerging Core Equity Market ETF
SCHEDULE OF INVESTMENTS
October 31, 2021
| Security Description |
Shares | Fair Value | ||||||
| SAUDI ARABIA (Continued) |
||||||||
| National Medical Care Co. |
812 | $ | 13,162 | |||||
| National Petrochemical Co. |
188 | 2,411 | ||||||
| Northern Region Cement Co. |
4,879 | 19,355 | ||||||
| Qassim Cement Co. (The) |
64 | 1,392 | ||||||
| *Rabigh Refining & Petrochemical Co. |
296 | 2,249 | ||||||
| Riyad Bank |
3,968 | 31,260 | ||||||
| SABIC Agri-Nutrients Co. |
836 | 36,552 | ||||||
| Sahara International Petrochemical Co. |
1,286 | 15,051 | ||||||
| *Saudi Arabian Mining Co. |
32,540 | 707,901 | ||||||
| Saudi Automotive Services Co. |
1,130 | 10,183 | ||||||
| Saudi Basic Industries Corp. |
24,557 | 844,558 | ||||||
| Saudi British Bank (The) |
46,363 | 409,751 | ||||||
| Saudi Cement Co. |
120 | 1,894 | ||||||
| Saudi Ceramic Co. |
220 | 3,185 | ||||||
| Saudi Chemical Co. Holding |
8,707 | 88,094 | ||||||
| Saudi Co. For Hardware CJSC |
2,634 | 40,308 | ||||||
| Saudi Electricity Co. |
33,221 | 252,419 | ||||||
| Saudi Industrial Investment Group |
304 | 3,068 | ||||||
| Saudi Industrial Services Co. |
3,233 | 30,340 | ||||||
| Saudi Investment Bank (The) |
648 | 3,113 | ||||||
| *Saudi Kayan Petrochemical Co. |
2,520 | 13,679 | ||||||
| *Saudi Marketing Co. |
813 | 7,012 | ||||||
| Saudi National Bank (The) |
87,570 | 1,538,528 | ||||||
| *Saudi Printing & Packaging Co. |
28 | 203 | ||||||
| *Saudi Public Transport Co. |
3,153 | 20,342 | ||||||
| *Saudi Re for Cooperative Reinsurance Co. |
70 | 357 | ||||||
| *Saudi Real Estate Co. |
140 | 834 | ||||||
| *Saudi Research & Marketing Group |
52 | 2,343 | ||||||
| Saudi Telecom Co. |
24,355 | 759,693 | ||||||
| Saudia Dairy & Foodstuff Co. |
24 | 1,049 | ||||||
| Savola Group (The) |
36,063 | 351,890 | ||||||
| *Seera Group Holding |
236 | 1,460 | ||||||
| Southern Province Cement Co. |
7,721 | 147,384 | ||||||
| *Tabuk Cement Co. |
3,443 | 17,440 | ||||||
| *Takween Advanced Industries Co. |
56 | 302 | ||||||
| Umm Al-Qura Cement Co. |
1,036 | 7,333 | ||||||
| United Electronics Co. |
44 | 1,652 | ||||||
| United International Transportation Co. |
17,631 | 235,964 | ||||||
| United Wire Factories Co. |
598 | 5,460 | ||||||
| *Yamama Cement Co. |
172 | 1,270 | ||||||
| Yanbu Cement Co. |
120 | 1,225 | ||||||
| Yanbu National Petrochemical Co. |
7,385 | 149,830 | ||||||
| *Zamil Industrial Investment Co. |
2,303 | 21,704 | ||||||
|
|
|
|||||||
| TOTAL SAUDI ARABIA |
11,065,513 | |||||||
|
|
|
|||||||
| SOUTH AFRICA (3.9%) |
||||||||
| Absa Group, Ltd. |
50,180 | 462,184 | ||||||
| Adcock Ingram Holdings, Ltd. |
6,010 | 19,370 | ||||||
| Advtech, Ltd. |
31,150 | 39,347 | ||||||
| AECI, Ltd. |
8,113 | 59,993 | ||||||
| African Rainbow Minerals, Ltd. |
3,258 | 43,625 | ||||||
| Afrimat, Ltd. |
156 | 517 | ||||||
| Alexander Forbes Group Holdings, Ltd. |
3,803 | 1,098 | ||||||
| Altron, Ltd., Class A |
77 | 55 | ||||||
Dimensional Emerging Core Equity Market ETF
SCHEDULE OF INVESTMENTS
October 31, 2021
| Security Description |
Shares | Fair Value | ||||||
| SOUTH AFRICA (Continued) |
||||||||
| Alviva Holdings, Ltd. |
287 | $ | 282 | |||||
| Anglo American Platinum, Ltd. |
2,193 | 222,676 | ||||||
| AngloGold Ashanti, Ltd. |
19,768 | 371,014 | ||||||
| Aspen Pharmacare Holdings, Ltd. |
27,606 | 441,787 | ||||||
| *Astral Foods, Ltd. |
8,384 | 97,630 | ||||||
| *Aveng, Ltd. |
332,970 | 1,314 | ||||||
| AVI, Ltd. |
20,793 | 108,206 | ||||||
| Balwin Properties, Ltd. |
516 | 119 | ||||||
| *Barloworld, Ltd. |
26,871 | 226,795 | ||||||
| Bid Corp., Ltd. |
18,962 | 408,980 | ||||||
| Bidvest Group, Ltd. (The) |
19,535 | 245,974 | ||||||
| *Blue Label Telecoms, Ltd. |
2,673 | 974 | ||||||
| Capitec Bank Holdings, Ltd. |
4,137 | 464,536 | ||||||
| Cashbuild, Ltd. |
99 | 1,732 | ||||||
| *City Lodge Hotels, Ltd. |
929 | 330 | ||||||
| *Clicks Group, Ltd. |
14,769 | 270,933 | ||||||
| Coronation Fund Managers, Ltd. |
17,910 | 59,633 | ||||||
| *Curro Holdings, Ltd. |
250 | 202 | ||||||
| *DataTec, Ltd. |
10,990 | 30,078 | ||||||
| Dis-Chem Pharmacies, Ltd. |
1,833 | 3,853 | ||||||
| *Discovery, Ltd. |
19,987 | 183,999 | ||||||
| *Distell Group Holdings, Ltd. |
3,553 | 42,723 | ||||||
| Drdgold, Ltd., ADR |
368 | 3,319 | ||||||
| DRDGOLD, Ltd. |
32,219 | 29,082 | ||||||
| Exxaro Resources, Ltd. |
19,864 | 218,569 | ||||||
| *Famous Brands, Ltd. |
135 | 654 | ||||||
| FirstRand, Ltd. |
171,294 | 653,735 | ||||||
| *Foschini Group, Ltd. (The) |
19,385 | 165,410 | ||||||
| Gold Fields, Ltd., Sponsored ADR |
21,986 | 204,030 | ||||||
| Gold Fields, Ltd. |
57,057 | 537,950 | ||||||
| *Grindrod Shipping Holdings, Ltd. |
2 | 29 | ||||||
| *Grindrod, Ltd. |
1,401 | 473 | ||||||
| Harmony Gold Mining Co., Ltd. |
26,381 | 96,308 | ||||||
| Hudaco Industries, Ltd. |
154 | 1,387 | ||||||
| Impala Platinum Holdings, Ltd. |
45,431 | 591,769 | ||||||
| Imperial Logistics, Ltd. |
9,218 | 38,024 | ||||||
| Investec, Ltd. |
3,048 | 14,037 | ||||||
| Invicta Holdings, Ltd. |
101 | 196 | ||||||
| Italtile, Ltd. |
12,989 | 15,091 | ||||||
| JSE, Ltd. |
8,741 | 61,365 | ||||||
| KAP Industrial Holdings, Ltd. |
238,172 | 73,959 | ||||||
| Kumba Iron Ore, Ltd. |
548 | 16,736 | ||||||
| Lewis Group, Ltd. |
132 | 375 | ||||||
| *Liberty Holdings, Ltd. |
9,324 | 55,349 | ||||||
| Libstar Holdings, Ltd. |
638 | 279 | ||||||
| *Life Healthcare Group Holdings, Ltd. |
141,328 | 226,125 | ||||||
| *Long4Life, Ltd. |
1,474 | 580 | ||||||
| *Massmart Holdings, Ltd. |
7,239 | 29,832 | ||||||
| Merafe Resources, Ltd. |
1,779 | 133 | ||||||
| Metair Investments, Ltd. |
8,529 | 16,267 | ||||||
| MiX Telematics, Ltd. |
701 | 352 | ||||||
| Momentum Metropolitan Holdings |
150,651 | 194,855 | ||||||
| Motus Holdings, Ltd. |
28,033 | 187,987 | ||||||
| *Mpact, Ltd. |
812 | 1,816 | ||||||
| Mr Price Group, Ltd. |
22,764 | 299,467 | ||||||
| *MTN Group, Ltd. |
134,688 | 1,213,787 | ||||||
Dimensional Emerging Core Equity Market ETF
SCHEDULE OF INVESTMENTS
October 31, 2021
| Security Description |
Shares | Fair Value | ||||||
| SOUTH AFRICA (Continued) |
||||||||
| MultiChoice Group |
19,615 | $ | 156,752 | |||||
| *Murray & Roberts Holdings, Ltd. |
734 | 674 | ||||||
| *Nampak, Ltd. |
1,284 | 329 | ||||||
| Nedbank Group, Ltd. |
26,150 | 299,194 | ||||||
| NEPI Rockcastle PLC |
23,238 | 156,551 | ||||||
| *Netcare, Ltd. |
123,685 | 137,600 | ||||||
| *Northam Platinum Holdings, Ltd. |
18,261 | 274,816 | ||||||
| Oceana Group, Ltd. |
4,186 | 16,871 | ||||||
| Old Mutual, Ltd. |
389,831 | 399,833 | ||||||
| Omnia Holdings, Ltd. |
17,217 | 71,745 | ||||||
| *Pepkor Holdings, Ltd. |
63,713 | 100,725 | ||||||
| *Pick n Pay Stores, Ltd. |
10,250 | 40,258 | ||||||
| *PPC, Ltd. |
143,470 | 50,403 | ||||||
| *PSG Group, Ltd. |
28,594 | 143,873 | ||||||
| PSG Konsult, Ltd. |
1,455 | 1,330 | ||||||
| Raubex Group, Ltd. |
11,761 | 25,263 | ||||||
| RCL Foods, Ltd. |
364 | 308 | ||||||
| Reunert, Ltd. |
10,234 | 34,142 | ||||||
| RFG Holdings, Ltd. |
432 | 353 | ||||||
| Royal Bafokeng Platinum, Ltd. |
26,793 | 193,086 | ||||||
| Sanlam, Ltd. |
148,161 | 611,652 | ||||||
| Santam, Ltd. |
3,042 | 50,833 | ||||||
| *Sappi, Ltd. |
54,054 | 165,825 | ||||||
| *Sasol, Ltd. |
42,860 | 723,573 | ||||||
| Shoprite Holdings, Ltd. |
30,811 | 367,887 | ||||||
| Sibanye Stillwater, Ltd. |
186,160 | 653,275 | ||||||
| SPAR Group, Ltd. (The) |
28,574 | 366,537 | ||||||
| *Spur Corp., Ltd. |
152 | 192 | ||||||
| *Stadio Holdings, Ltd. |
60 | 13 | ||||||
| Standard Bank Group, Ltd. |
74,771 | 666,200 | ||||||
| *Steinhoff International Holdings NV |
2,605 | 413 | ||||||
| *Sun International, Ltd. |
823 | 1,746 | ||||||
| Super Group, Ltd. |
30,316 | 63,664 | ||||||
| *Telkom SA SOC, Ltd. |
33,783 | 112,751 | ||||||
| Tiger Brands, Ltd. |
11,852 | 150,232 | ||||||
| Truworths International, Ltd. |
30,753 | 109,092 | ||||||
| *Tsogo Sun Gaming, Ltd. |
3,937 | 3,178 | ||||||
| *Tsogo Sun Hotels, Ltd. |
2,852 | 657 | ||||||
| Vodacom Group, Ltd. |
32,507 | 289,954 | ||||||
| Wilson Bayly Holmes-Ovcon, Ltd. |
3,565 | 25,065 | ||||||
| Woolworths Holdings, Ltd. |
41,406 | 146,855 | ||||||
|
|
|
|||||||
| TOTAL SOUTH AFRICA |
15,372,986 | |||||||
|
|
|
|||||||
| TAIWAN (17.8%) |
||||||||
| #AcBel Polytech, Inc. |
332,000 | 413,082 | ||||||
| Accton Technology Corp. |
1,000 | 8,756 | ||||||
| Acer, Inc. |
4,000 | 3,740 | ||||||
| Acter Group Corp., Ltd. |
1,000 | 6,671 | ||||||
| #ADATA Technology Co., Ltd. |
225,000 | 671,557 | ||||||
| Addcn Technology Co., Ltd. |
2,000 | 18,196 | ||||||
| Advanced International Multitech Co., Ltd. |
9,000 | 25,568 | ||||||
| Advantech Co., Ltd. |
3,000 | 39,161 | ||||||
| Aerospace Industrial Development Corp. |
3,000 | 3,042 | ||||||
| Airtac International Group |
1,046 | 31,220 | ||||||
Dimensional Emerging Core Equity Market ETF
SCHEDULE OF INVESTMENTS
October 31, 2021
| Security Description |
Shares | Fair Value | ||||||
| TAIWAN (Continued) |
||||||||
| All Ring Tech Co., Ltd. |
5,000 | $ | 19,598 | |||||
| Allis Electric Co., Ltd. |
1,050 | 895 | ||||||
| Alltop Technology Co., Ltd. |
4,000 | 22,727 | ||||||
| Amazing Microelectronic Corp. |
4,000 | 29,344 | ||||||
| Anpec Electronics Corp. |
4,000 | 26,251 | ||||||
| Apex International Co., Ltd. |
11,000 | 30,854 | ||||||
| Ardentec Corp. |
1,000 | 2,136 | ||||||
| ASE Technology Holding Co., Ltd. |
144,000 | 516,792 | ||||||
| Asia Cement Corp. |
371,000 | 591,017 | ||||||
| *Asia Pacific Telecom Co., Ltd. |
4,000 | 1,184 | ||||||
| Asia Vital Components Co., Ltd. |
1,000 | 2,981 | ||||||
| Asustek Computer, Inc. |
1,000 | 12,694 | ||||||
| *Aten International Co., Ltd. |
4,000 | 12,140 | ||||||
| #AU Optronics Corp. |
1,324,000 | 914,138 | ||||||
| AURAS Technology Co., Ltd. |
2,000 | 11,471 | ||||||
| Bank of Kaohsiung Co., Ltd. |
3,229 | 1,306 | ||||||
| BenQ Materials Corp. |
17,000 | 24,056 | ||||||
| BES Engineering Corp. |
76,000 | 23,996 | ||||||
| Brighton-Best International Taiwan, Inc. |
3,000 | 3,749 | ||||||
| C Sun Manufacturing, Ltd. |
13,000 | 21,200 | ||||||
| Capital Securities Corp. |
636,000 | 346,491 | ||||||
| Career Technology MFG. Co., Ltd. |
25,000 | 22,475 | ||||||
| Cathay Financial Holding Co., Ltd. |
805,000 | 1,681,878 | ||||||
| Cathay Real Estate Development Co., Ltd. |
1,000 | 701 | ||||||
| Chailease Holding Co., Ltd. |
2,100 | 20,087 | ||||||
| Chang Hwa Commercial Bank, Ltd. |
26,150 | 15,422 | ||||||
| *Chang Wah Electromaterials, Inc. |
2,000 | 2,431 | ||||||
| Channel Well Technology Co., Ltd. |
14,000 | 20,415 | ||||||
| Chenbro Micom Co., Ltd. |
2,000 | 5,408 | ||||||
| Cheng Loong Corp. |
1,000 | 1,223 | ||||||
| *Cheng Mei Materials Technology Corp. |
2,000 | 856 | ||||||
| Cheng Shin Rubber Industry Co., Ltd. |
424,000 | 519,927 | ||||||
| Cheng Uei Precision Industry Co., Ltd. |
1,000 | 1,388 | ||||||
| Chicony Electronics Co., Ltd. |
9,000 | 25,697 | ||||||
| *China Airlines, Ltd. |
917,000 | 567,179 | ||||||
| China Bills Finance Corp. |
2,000 | 1,197 | ||||||
| China Chemical & Pharmaceutical Co., Ltd. |
1,000 | 795 | ||||||
| China Development Financial Holding Corp. |
3,627,000 | 1,852,074 | ||||||
| China General Plastics Corp. |
2,100 | 2,805 | ||||||
| China Life Insurance Co., Ltd. |
1,040 | 1,085 | ||||||
| China Metal Products |
14,000 | 16,110 | ||||||
| China Steel Chemical Corp. |
1,000 | 4,441 | ||||||
| China Steel Corp. |
1,334,000 | 1,611,824 | ||||||
| Chin-Poon Industrial Co., Ltd. |
21,000 | 22,579 | ||||||
| Chipbond Technology Corp. |
238,000 | 550,314 | ||||||
| ChipMOS Technologies, Inc. |
1,000 | 1,660 | ||||||
| Chlitina Holding, Ltd. |
1,000 | 8,577 | ||||||
| Chroma ATE, Inc. |
2,000 | 13,018 | ||||||
| Chun Yuan Steel Industry Co., Ltd. |
1,000 | 816 | ||||||
| Chung Hung Steel Corp. |
855,000 | 1,079,184 | ||||||
| *Chung Hwa Pulp Corp. |
2,000 | 1,597 | ||||||
| #Chung-Hsin Electric & Machinery Manufacturing Corp. |
300,000 | 443,929 | ||||||
| Chunghwa Telecom Co., Ltd. |
170,000 | 675,513 | ||||||
| Chunghwa Telecom Co., Ltd., Sponsored ADR |
500 | 19,750 | ||||||
| Compal Electronics, Inc. |
22,000 | 19,343 | ||||||
| Compeq Manufacturing Co., Ltd. |
2,000 | 2,902 | ||||||
Dimensional Emerging Core Equity Market ETF
SCHEDULE OF INVESTMENTS
October 31, 2021
| Security Description |
Shares | Fair Value | ||||||
| TAIWAN (Continued) |
||||||||
| Concord Securities Co., Ltd. |
2,000 | $ | 849 | |||||
| Concraft Holding Co., Ltd. |
3,000 | 6,106 | ||||||
| Continental Holdings Corp. |
1,000 | 906 | ||||||
| CTBC Financial Holding Co., Ltd. |
1,332,000 | 1,111,257 | ||||||
| CTCI Corp. |
2,000 | 2,621 | ||||||
| DA CIN Construction Co., Ltd. |
10,000 | 10,914 | ||||||
| *Da-Li Development Co., Ltd. |
1,020 | 1,119 | ||||||
| Darfon Electronics Corp. |
15,000 | 22,520 | ||||||
| *Darwin Precisions Corp. |
2,000 | 802 | ||||||
| Daxin Materials Corp. |
2,000 | 6,609 | ||||||
| De Licacy Industrial Co., Ltd. |
2,000 | 1,104 | ||||||
| Delta Electronics, Inc. |
132,000 | 1,162,954 | ||||||
| Dimerco Express Corp. |
4,320 | 13,375 | ||||||
| *D-Link Corp. |
219,000 | 161,443 | ||||||
| Dyaco International, Inc. |
1,000 | 2,330 | ||||||
| Dynapack International Technology Corp. |
8,000 | 27,617 | ||||||
| #E Ink Holdings, Inc. |
313,000 | 1,034,385 | ||||||
| E.Sun Financial Holding Co., Ltd. |
1,016,522 | 970,518 | ||||||
| Eastern Media International Corp. |
1,900 | 2,169 | ||||||
| Eclat Textile Co., Ltd. |
1,000 | 21,828 | ||||||
| Ecove Environment Corp. |
3,000 | 25,136 | ||||||
| E-LIFE MALL Corp. |
1,000 | 2,999 | ||||||
| Elite Advanced Laser Corp. |
12,000 | 24,079 | ||||||
| Elite Material Co., Ltd. |
2,000 | 17,297 | ||||||
| Elite Semiconductor Microelectronics Technology, Inc. |
1,000 | 5,124 | ||||||
| *ENNOSTAR, Inc. |
13,000 | 34,126 | ||||||
| EnTie Commercial Bank Co., Ltd. |
2,000 | 1,201 | ||||||
| Eternal Materials Co., Ltd. |
360,000 | 476,401 | ||||||
| *Eva Airways Corp. |
901,000 | 610,743 | ||||||
| Evergreen International Storage & Transport Corp. |
322,000 | 313,217 | ||||||
| Evergreen Marine Corp. Taiwan, Ltd. |
2,000 | 7,156 | ||||||
| Everlight Chemical Industrial Corp. |
54,000 | 49,614 | ||||||
| Everlight Electronics Co., Ltd. |
28,000 | 49,841 | ||||||
| Far Eastern Department Stores, Ltd. |
1,000 | 795 | ||||||
| Far Eastern International Bank |
4,076 | 1,532 | ||||||
| Far Eastern New Century Corp. |
596,000 | 623,680 | ||||||
| Far EasTone Telecommunications Co., Ltd. |
212,000 | 466,562 | ||||||
| *Federal Corp. |
1,000 | 967 | ||||||
| Feng Hsin Steel Co., Ltd. |
1,000 | 2,816 | ||||||
| Feng TAY Enterprise Co., Ltd. |
11,000 | 85,442 | ||||||
| First Financial Holding Co., Ltd. |
15,150 | 12,476 | ||||||
| *First Steamship Co., Ltd. |
497,000 | 228,765 | ||||||
| Fittech Co., Ltd. |
1,000 | 7,552 | ||||||
| FLEXium Interconnect, Inc. |
149,000 | 514,911 | ||||||
| Flytech Technology Co., Ltd. |
7,000 | 18,351 | ||||||
| Formosa Advanced Technologies Co., Ltd. |
6,000 | 8,167 | ||||||
| Formosa Chemicals & Fibre Corp. |
5,000 | 14,474 | ||||||
| Formosa Petrochemical Corp. |
202,000 | 726,397 | ||||||
| Formosa Plastics Corp. |
301,000 | 1,163,583 | ||||||
| Foxsemicon Integrated Technology, Inc. |
1,000 | 7,354 | ||||||
| Fubon Financial Holding Co., Ltd. |
516,999 | 1,368,327 | ||||||
| Fulgent Sun International Holding Co., Ltd. |
8,000 | 29,631 | ||||||
| Gamania Digital Entertainment Co., Ltd. |
1,000 | 2,075 | ||||||
| GEM Services, Inc. |
2,000 | 7,163 | ||||||
| Gemtek Technology Corp. |
19,000 | 18,721 | ||||||
Dimensional Emerging Core Equity Market ETF
SCHEDULE OF INVESTMENTS
October 31, 2021
| Security Description |
Shares | Fair Value | ||||||
| TAIWAN (Continued) |
||||||||
| #Genesys Logic, Inc. |
9,000 | $ | 46,604 | |||||
| Getac Holdings Corp. |
2,000 | 3,761 | ||||||
| Giant Manufacturing Co., Ltd. |
1,000 | 11,597 | ||||||
| Gigabyte Technology Co., Ltd. |
3,000 | 12,137 | ||||||
| Globalwafers Co., Ltd. |
1,000 | 27,330 | ||||||
| Gloria Material Technology Corp. |
25,000 | 19,059 | ||||||
| Gold Circuit Electronics, Ltd. |
1,000 | 2,388 | ||||||
| Goldsun Building Materials Co., Ltd. |
1,000 | 924 | ||||||
| Grand Plastic Technology Corp. |
2,000 | 26,107 | ||||||
| Great Taipei Gas Co., Ltd. |
2,000 | 2,384 | ||||||
| Great Tree Pharmacy Co., Ltd. |
5,188 | 38,152 | ||||||
| Great Wall Enterprise Co., Ltd. |
1,030 | 1,989 | ||||||
| Greatek Electronics, Inc. |
1,000 | 2,859 | ||||||
| HannsTouch Solution, Inc. |
3,000 | 1,284 | ||||||
| Hey Song Corp. |
11,000 | 13,845 | ||||||
| Highwealth Construction Corp. |
1,000 | 1,616 | ||||||
| Hiwin Technologies Corp. |
1,030 | 11,445 | ||||||
| Holtek Semiconductor, Inc. |
11,000 | 40,743 | ||||||
| Hon Hai Precision Industry Co., Ltd. |
467,000 | 1,796,897 | ||||||
| Hua Nan Financial Holdings Co., Ltd. |
13,343 | 9,764 | ||||||
| Huaku Development Co., Ltd. |
1,000 | 3,272 | ||||||
| Hung Sheng Construction, Ltd. |
18,600 | 16,153 | ||||||
| IBF Financial Holdings Co., Ltd. |
213,600 | 122,130 | ||||||
| *I-Chiun Precision Industry Co., Ltd. |
13,000 | 27,441 | ||||||
| Innolux Corp. |
24,000 | 14,413 | ||||||
| Inventec Corp. |
5,000 | 4,774 | ||||||
| ITE Technology, Inc. |
4,000 | 14,959 | ||||||
| ITEQ Corp. |
1,000 | 4,621 | ||||||
| KEE TAI Properties Co., Ltd. |
2,000 | 942 | ||||||
| Kenda Rubber Industrial Co., Ltd. |
1,000 | 1,100 | ||||||
| King Yuan Electronics Co., Ltd. |
138,000 | 197,260 | ||||||
| King’s Town Bank Co., Ltd. |
1,000 | 1,492 | ||||||
| Kinik Co. |
10,000 | 27,186 | ||||||
| Kinpo Electronics |
833,000 | 389,413 | ||||||
| KS Terminals, Inc. |
7,000 | 24,392 | ||||||
| Kung Long Batteries Industrial Co., Ltd. |
2,000 | 10,141 | ||||||
| Kung Sing Engineering Corp. |
108,900 | 33,600 | ||||||
| *Kuo Yang Construction Co., Ltd. |
6,545 | 5,649 | ||||||
| *Lealea Enterprise Co., Ltd. |
2,000 | 831 | ||||||
| Lelon Electronics Corp. |
9,000 | 20,681 | ||||||
| *Li Peng Enterprise Co., Ltd. |
2,000 | 744 | ||||||
| *Lingsen Precision Industries, Ltd. |
24,000 | 21,749 | ||||||
| Lite-On Technology Corp. |
81,000 | 178,553 | ||||||
| Longchen Paper & Packaging Co., Ltd. |
210,000 | 181,240 | ||||||
| Longwell Co. |
12,000 | 24,252 | ||||||
| Machvision, Inc. |
7,000 | 58,903 | ||||||
| Macronix International Co., Ltd. |
32,000 | 45,109 | ||||||
| Makalot Industrial Co., Ltd. |
13,975 | 121,867 | ||||||
| Materials Analysis Technology, Inc. |
5,000 | 25,712 | ||||||
| MediaTek, Inc. |
21,000 | 689,465 | ||||||
| Mega Financial Holding Co., Ltd. |
1,338,000 | 1,607,034 | ||||||
| Mercuries & Associates Holding, Ltd. |
1,000 | 832 | ||||||
| *Mercuries Life Insurance Co., Ltd. |
2,106 | 695 | ||||||
| Merida Industry Co., Ltd. |
1,000 | 10,393 | ||||||
| Micro-Star International Co., Ltd. |
149,000 | 750,130 | ||||||
| Mirle Automation Corp. |
1,000 | 1,503 | ||||||
Dimensional Emerging Core Equity Market ETF
SCHEDULE OF INVESTMENTS
October 31, 2021
| Security Description |
Shares | Fair Value | ||||||
| TAIWAN (Continued) |
||||||||
| MOSA Industrial Corp. |
1,000 | $ | 1,582 | |||||
| MPI Corp. |
4,000 | 18,412 | ||||||
| Namchow Holdings Co., Ltd. |
5,000 | 8,702 | ||||||
| Nan Ya Plastics Corp. |
348,000 | 1,064,955 | ||||||
| Nantex Industry Co., Ltd. |
1,000 | 2,931 | ||||||
| Nanya Technology Corp. |
269,000 | 643,275 | ||||||
| Nichidenbo Corp. |
13,000 | 23,561 | ||||||
| Nien Made Enterprise Co., Ltd. |
1,000 | 13,737 | ||||||
| Novatek Microelectronics Corp. |
1,000 | 14,941 | ||||||
| O-Bank Co., Ltd. |
2,000 | 561 | ||||||
| OptoTech Corp. |
681,000 | 1,050,574 | ||||||
| *Orient Semiconductor Electronics, Ltd. |
26,000 | 23,187 | ||||||
| *Oriental Union Chemical Corp. |
2,000 | 1,715 | ||||||
| O-TA Precision Industry Co., Ltd. |
11,000 | 68,828 | ||||||
| Pchome Online, Inc. |
6,000 | 31,285 | ||||||
| Pegatron Corp. |
144,000 | 352,123 | ||||||
| Polytronics Technology Corp. |
5,000 | 22,205 | ||||||
| Power Wind Health Industry, Inc. |
1,050 | 5,475 | ||||||
| Powertech Technology, Inc. |
1,000 | 3,503 | ||||||
| President Chain Store Corp. |
1,000 | 10,105 | ||||||
| President Securities Corp. |
2,080 | 1,694 | ||||||
| Primax Electronics, Ltd. |
2,000 | 3,704 | ||||||
| Prince Housing & Development Corp. |
4,000 | 1,906 | ||||||
| Promate Electronic Co., Ltd. |
16,000 | 22,324 | ||||||
| Qisda Corp. |
3,000 | 3,344 | ||||||
| Quanta Computer, Inc. |
141,000 | 395,491 | ||||||
| Radiant Opto-Electronics Corp. |
1,000 | 3,499 | ||||||
| Radium Life Tech Co., Ltd. |
51,000 | 19,257 | ||||||
| Realtek Semiconductor Corp. |
1,000 | 17,944 | ||||||
| Rechi Precision Co., Ltd. |
1,000 | 671 | ||||||
| Rexon Industrial Corp., Ltd. |
10,000 | 24,093 | ||||||
| Rich Development Co., Ltd. |
2,000 | 659 | ||||||
| *Ritek Corp. |
3,000 | 1,055 | ||||||
| *Roo Hsing Co., Ltd. |
2,000 | 607 | ||||||
| Ruentex Development Co., Ltd. |
1,400 | 3,569 | ||||||
| Sampo Corp. |
75,000 | 79,832 | ||||||
| San Far Property, Ltd. |
1,050 | 574 | ||||||
| Sanyang Motor Co., Ltd. |
175,000 | 170,227 | ||||||
| #SDI Corp. |
158,000 | 943,165 | ||||||
| Shin Kong Financial Holding Co., Ltd. |
162,547 | 57,342 | ||||||
| *Shining Building Business Co., Ltd. |
2,000 | 798 | ||||||
| Shinkong Insurance Co., Ltd. |
1,000 | 1,658 | ||||||
| Sigurd Microelectronics Corp. |
377,000 | 794,441 | ||||||
| Silicon Optronics, Inc. |
4,000 | 20,353 | ||||||
| Simplo Technology Co., Ltd. |
3,000 | 32,256 | ||||||
| Sinbon Electronics Co., Ltd. |
1,000 | 8,271 | ||||||
| Sincere Navigation Corp. |
1,000 | 996 | ||||||
| Sino-American Silicon Products, Inc., Class A |
136,000 | 926,767 | ||||||
| Sinon Corp. |
29,000 | 25,393 | ||||||
| SinoPac Financial Holdings Co., Ltd. |
247,000 | 125,683 | ||||||
| Solar Applied Materials Technology Co. |
1,140 | 2,050 | ||||||
| Sonix Technology Co., Ltd. |
1,000 | 3,085 | ||||||
| Standard Foods Corp. |
1,000 | 1,863 | ||||||
| Stark Technology, Inc. |
5,000 | 12,712 | ||||||
| Sunjuice Holdings Co., Ltd. |
2,000 | 26,718 | ||||||
Dimensional Emerging Core Equity Market ETF
SCHEDULE OF INVESTMENTS
October 31, 2021
| Security Description |
Shares | Fair Value | ||||||
| TAIWAN (Continued) |
||||||||
| Sunonwealth Electric Machine Industry Co., Ltd. |
6,000 | $ | 8,307 | |||||
| Supreme Electronics Co., Ltd. |
2,211 | 3,566 | ||||||
| Symtek Automation Asia Co., Ltd. |
6,000 | 21,792 | ||||||
| Syncmold Enterprise Corp. |
3,000 | 7,616 | ||||||
| Synmosa Biopharma Corp. |
1,120 | 926 | ||||||
| Synnex Technology International Corp. |
2,000 | 3,869 | ||||||
| TA Chen Stainless Pipe |
2,316 | 3,677 | ||||||
| #Ta Ya Electric Wire & Cable |
753,275 | 670,427 | ||||||
| Taichung Commercial Bank Co., Ltd. |
241,435 | 103,751 | ||||||
| TaiDoc Technology Corp. |
2,000 | 12,550 | ||||||
| Taiflex Scientific Co., Ltd. |
1,000 | 1,713 | ||||||
| Tainan Spinning Co., Ltd. |
2,000 | 1,633 | ||||||
| Taishin Financial Holding Co., Ltd. |
32,408 | 21,269 | ||||||
| Taisun Enterprise Co., Ltd. |
1,000 | 982 | ||||||
| Taita Chemical Co., Ltd. |
6,600 | 8,212 | ||||||
| Taiwan Business Bank |
25,476 | 8,667 | ||||||
| Taiwan Cement Corp. |
422,000 | 732,204 | ||||||
| Taiwan Cogeneration Corp. |
1,000 | 1,376 | ||||||
| Taiwan Cooperative Financial Holding Co., Ltd. |
14,280 | 11,605 | ||||||
| Taiwan Fertilizer Co., Ltd. |
28,000 | 68,368 | ||||||
| Taiwan FU Hsing Industrial Co., Ltd. |
1,000 | 1,455 | ||||||
| Taiwan Glass Industry Corp. |
2,000 | 1,963 | ||||||
| Taiwan High Speed Rail Corp. |
179,000 | 186,991 | ||||||
| Taiwan Hon Chuan Enterprise Co., Ltd. |
8,000 | 18,728 | ||||||
| Taiwan Hopax Chemicals Manufacturing Co., Ltd. |
1,000 | 2,880 | ||||||
| *Taiwan Land Development Corp. |
51,000 | 6,236 | ||||||
| Taiwan Mobile Co., Ltd. |
163,000 | 575,015 | ||||||
| Taiwan Paiho, Ltd. |
1,000 | 3,107 | ||||||
| Taiwan Pcb Techvest Co., Ltd. |
15,000 | 25,298 | ||||||
| Taiwan Sakura Corp. |
10,000 | 25,172 | ||||||
| Taiwan Secom Co., Ltd. |
1,000 | 3,614 | ||||||
| Taiwan Semiconductor Co., Ltd. |
1,000 | 2,920 | ||||||
| *Taiwan Semiconductor Manufacturing Co., Ltd. |
1,014,000 | 21,513,566 | ||||||
| Taiwan Shin Kong Security Co., Ltd. |
20,000 | 27,761 | ||||||
| Taiwan Styrene Monomer |
45,000 | 29,371 | ||||||
| *Taiwan TEA Corp. |
51,000 | 38,330 | ||||||
| #*Tatung Co., Ltd. |
817,000 | 1,010,655 | ||||||
| Tehmag Foods Corp. |
1,100 | 11,827 | ||||||
| Test Research, Inc. |
7,000 | 14,071 | ||||||
| Test Rite International Co., Ltd. |
1,000 | 868 | ||||||
| The Shanghai Commercial & Savings Bank, Ltd. |
60,000 | 94,935 | ||||||
| Ton Yi Industrial Corp. |
2,000 | 935 | ||||||
| Tong Yang Industry Co., Ltd. |
1,000 | 1,215 | ||||||
| Topkey Corp. |
2,000 | 9,314 | ||||||
| TPK Holding Co., Ltd. |
1,000 | 1,528 | ||||||
| Tripod Technology Corp. |
7,000 | 29,577 | ||||||
| TSC Auto Id Technology Co., Ltd. |
2,000 | 14,888 | ||||||
| TSRC Corp. |
1,000 | 1,153 | ||||||
| TTY Biopharm Co., Ltd. |
1,000 | 2,467 | ||||||
| *Tung Ho Steel Enterprise Corp. |
1,000 | 1,453 | ||||||
| TYC Brother Industrial Co., Ltd. |
1,000 | 717 | ||||||
| *Tycoons Group Enterprise |
3,000 | 1,516 | ||||||
| U-Ming Marine Transport Corp. |
1,000 | 1,891 | ||||||
| Unimicron Technology Corp. |
48,000 | 327,957 | ||||||
| *Union Bank Of Taiwan |
4,252 | 1,804 | ||||||
| Uni-President Enterprises Corp. |
306,000 | 732,855 | ||||||
Dimensional Emerging Core Equity Market ETF
SCHEDULE OF INVESTMENTS
October 31, 2021
| Security Description |
Shares | Fair Value | ||||||
| TAIWAN (Continued) |
||||||||
| *Unitech Printed Circuit Board Corp. |
411,000 | $ | 267,512 | |||||
| United Microelectronics Corp., Sponsored ADR |
800 | 8,216 | ||||||
| United Microelectronics Corp. |
588,000 | 1,226,388 | ||||||
| *United Renewable Energy Co., Ltd. |
2,407 | 2,069 | ||||||
| Universal Cement Corp. |
31,000 | 22,964 | ||||||
| UPC Technology Corp. |
2,000 | 1,665 | ||||||
| USI Corp. |
1,000 | 1,237 | ||||||
| #Vanguard International Semiconductor Corp. |
272,000 | 1,413,381 | ||||||
| Ventec International Group Co., Ltd. |
2,000 | 9,098 | ||||||
| Visual Photonics Epitaxy Co., Ltd. |
1,000 | 5,052 | ||||||
| Wafer Works Corp. |
3,137 | 7,242 | ||||||
| Walsin Lihwa Corp. |
4,000 | 3,733 | ||||||
| Walsin Technology Corp. |
5,000 | 27,150 | ||||||
| Wan Hai Lines, Ltd. |
1,100 | 6,329 | ||||||
| Wei Chuan Foods Corp. |
2,000 | 1,643 | ||||||
| Weikeng Industrial Co., Ltd. |
23,000 | 23,076 | ||||||
| Win Semiconductors Corp. |
1,000 | 12,856 | ||||||
| Winbond Electronics Corp. |
3,000 | 2,837 | ||||||
| Wisdom Marine Lines Co., Ltd. |
2,000 | 4,696 | ||||||
| Wistron Corp. |
1,095,000 | 1,149,792 | ||||||
| Wowprime Corp. |
2,000 | 10,357 | ||||||
| WPG Holdings, Ltd. |
3,000 | 5,599 | ||||||
| WT Microelectronics Co., Ltd. |
1,000 | 2,258 | ||||||
| XinTec, Inc. |
1,000 | 4,855 | ||||||
| Yageo Corp. |
1,000 | 15,607 | ||||||
| *Yang Ming Marine Transport Corp. |
331,000 | 1,148,624 | ||||||
| YC INOX Co., Ltd. |
19,000 | 21,556 | ||||||
| Yem Chio Co., Ltd. |
1,059 | 579 | ||||||
| #YFY, Inc. |
448,000 | 515,526 | ||||||
| *Yieh Phui Enterprise Co., Ltd. |
4,000 | 3,567 | ||||||
| Youngtek Electronics Corp. |
7,000 | 21,245 | ||||||
| Yuanta Financial Holding Co., Ltd. |
15,000 | 13,323 | ||||||
| Yulon Motor Co., Ltd. |
1,000 | 1,478 | ||||||
| YungShin Global Holding Corp. |
1,000 | 1,564 | ||||||
| Zeng Hsing Industrial Co., Ltd. |
4,000 | 21,936 | ||||||
| Zhen Ding Technology Holding, Ltd. |
1,000 | 3,452 | ||||||
| Zig Sheng Industrial Co., Ltd. |
2,000 | 1,230 | ||||||
| ZillTek Technology Corp. |
1,000 | 11,399 | ||||||
| ZongTai Real Estate Development Co., Ltd. |
1,000 | 1,395 | ||||||
|
|
|
|||||||
| TOTAL TAIWAN |
70,762,917 | |||||||
|
|
|
|||||||
| THAILAND (2.1%) |
||||||||
| Aapico Hitech PCL—NVDR |
440 | 281 | ||||||
| Advanced INFO Service PCL—NVDR |
57,100 | 325,229 | ||||||
| Advanced Information Technology PCL—NVDR |
300 | 398 | ||||||
| After You PCL—NVDR |
300 | 93 | ||||||
| Airports of Thailand PCL—NVDR |
162,100 | 315,089 | ||||||
| Aj Plast PCL—NVDR |
200 | 115 | ||||||
| Allianz Ayudhya Capital PCL—NVDR, Class R |
200 | 230 | ||||||
| Amata Corp. PCL—NVDR |
215,400 | 132,424 | ||||||
| *Ananda Development PCL—NVDR |
2,300 | 110 | ||||||
| AP Thailand PCL—NVDR |
646,800 | 172,506 | ||||||
| Asia Plus Group Holdings PCL—NVDR |
225,700 | 24,758 | ||||||
| Asian Insulators PCL—NVDR |
550 | 128 | ||||||
Dimensional Emerging Core Equity Market ETF
SCHEDULE OF INVESTMENTS
October 31, 2021
| Security Description |
Shares | Fair Value | ||||||
| THAILAND (Continued) |
||||||||
| Asian Sea Corp. PCL—NVDR |
300 | $ | 143 | |||||
| B Grimm Power PCL—NVDR, Class R |
19,300 | 24,719 | ||||||
| Bangchak Corp. PCL—NVDR |
73,600 | 60,996 | ||||||
| Bangkok Bank PCL—NVDR |
30,200 | 111,489 | ||||||
| Bangkok Chain Hospital PCL—NVDR |
1,700 | 1,040 | ||||||
| Bangkok Dusit Medical Services PCL—NVDR |
370,300 | 262,248 | ||||||
| Bangkok Expressway & Metro PCL—NVDR, Class R |
336,700 | 91,322 | ||||||
| *Bangkok Insurance PCL—NVDR |
1,600 | 13,453 | ||||||
| Bangkok Land PCL—NVDR |
670,300 | 22,220 | ||||||
| Bangkok Life Assurance PCL—NVDR |
900 | 807 | ||||||
| Banpu PCL—NVDR |
416,100 | 142,953 | ||||||
| Banpu Power PCL—NVDR |
1,100 | 580 | ||||||
| *Bec World PCL—NVDR |
1,100 | 405 | ||||||
| Berli Jucker PCL—NVDR |
62,900 | 63,976 | ||||||
| *Better World Green PCL—NVDR |
6,000 | 148 | ||||||
| BG Container Glass PCL—NVDR, Class R |
400 | 136 | ||||||
| Bts Group Holdings PCL—NVDR |
473,300 | 136,217 | ||||||
| Bumrungrad Hospital PCL—NVDR |
32,400 | 142,069 | ||||||
| Cal-Co. Electronics Thailand PCL—NVDR |
129,041 | 10,189 | ||||||
| Carabao Group PCL—NVDR |
700 | 2,616 | ||||||
| Central Pattana PCL—NVDR |
100,800 | 179,986 | ||||||
| Central Retail Corp. PCL—NVDR, Class R |
87,200 | 91,319 | ||||||
| CH Karnchang PCL—NVDR |
129,000 | 84,750 | ||||||
| Charoen Pokphand Foods PCL—NVDR |
236,300 | 179,811 | ||||||
| Chularat Hospital PCL—NVDR |
6,900 | 790 | ||||||
| Ck Power PCL—NVDR |
3,300 | 502 | ||||||
| Com7 PCL—NVDR |
800 | 1,730 | ||||||
| *Country Group Development PCL—NVDR |
5,500 | 86 | ||||||
| CP ALL PCL—NVDR |
198,900 | 383,624 | ||||||
| Delta Electronics Thailand PCL—NVDR |
13,600 | 170,499 | ||||||
| Diamond Building Products PCL—NVDR |
700 | 156 | ||||||
| *Dynasty Ceramic PCL—NVDR |
812,500 | 72,478 | ||||||
| Eastern Polymer Group PCL—NVDR |
5,500 | 1,840 | ||||||
| Eastern Power Group PCL—NVDR |
600 | 110 | ||||||
| Eastern Water Resources Development And Management—NVDR |
1,000 | 304 | ||||||
| Ekachai Medical Care PCL—NVDR |
700 | 171 | ||||||
| Electricity Generating PCL—NVDR |
28,200 | 151,697 | ||||||
| Energy Absolute PCL—NVDR |
72,900 | 143,900 | ||||||
| Forth Corp. PCL—NVDR |
700 | 422 | ||||||
| Forth Smart Service PCL—NVDR |
500 | 169 | ||||||
| *Frasers Property Thailand PCL—NVDR, Class R |
900 | 331 | ||||||
| Gfpt PCL—NVDR |
800 | 280 | ||||||
| Global Green Chemicals PCL—NVDR |
400 | 152 | ||||||
| Global Power Synergy PCL—NVDR |
47,000 | 110,480 | ||||||
| Gulf Energy Development PCL, Class R |
1,200 | 1,564 | ||||||
| Gunkul Engineering PCL—NVDR |
1,395,900 | 227,164 | ||||||
| Haad Thip PCL—NVDR |
100 | 114 | ||||||
| Hana Microelectronics PCL—NVDR |
41,400 | 99,812 | ||||||
| Home Product Center PCL—NVDR |
341,800 | 150,389 | ||||||
| Humanica PCL—NVDR |
400 | 129 | ||||||
| Ichitan Group PCL—NVDR |
800 | 263 | ||||||
| Indorama Ventures PCL—NVDR |
85,600 | 108,346 | ||||||
| IRPC PCL—NVDR |
49,300 | 6,389 | ||||||
| *Italian-Thai Development PCL—NVDR |
481,600 | 33,962 | ||||||
| Jkn Global Media PCL—NVDR, Class R |
500 | 133 | ||||||
| Jmt Network Services PCL—NVDR |
500 | 735 | ||||||
Dimensional Emerging Core Equity Market ETF
SCHEDULE OF INVESTMENTS
October 31, 2021
| Security Description |
Shares | Fair Value | ||||||
| THAILAND (Continued) |
||||||||
| Jubilee Enterprise PCL—NVDR |
100 | $ | 75 | |||||
| JWD Infologistics PCL—NVDR |
31,300 | 13,866 | ||||||
| Karmarts PCL—NVDR |
900 | 103 | ||||||
| *Kaset Thai International Sugar Corp. PCL—NVDR |
2,200 | 348 | ||||||
| Kasikornbank PCL—NVDR |
50,700 | 215,436 | ||||||
| KCE Electronics PCL—NVDR |
187,400 | 491,337 | ||||||
| KGI Securities Thailand PCL |
327,200 | 65,080 | ||||||
| *Khon Kaen Sugar Industry PCL—NVDR |
2,300 | 267 | ||||||
| Kiatnakin Phatra Bank PCL—NVDR |
300 | 542 | ||||||
| Krung Thai Bank PCL—NVDR |
7,700 | 2,669 | ||||||
| Lalin Property PCL—NVDR |
700 | 196 | ||||||
| Land & Houses PCL |
642,500 | 163,614 | ||||||
| Lh Financial Group PCL—NVDR, Class R |
5,300 | 235 | ||||||
| *Loxley PCL—NVDR |
2,300 | 190 | ||||||
| LPN Development PCL |
2,000 | 300 | ||||||
| *Mbk PCL—NVDR |
89,400 | 37,719 | ||||||
| Mcs Steel PCL—NVDR |
46,200 | 20,188 | ||||||
| Mega Lifesciences PCL—NVDR |
600 | 841 | ||||||
| *Minor International PCL—NVDR |
154,200 | 152,190 | ||||||
| MK Restaurants Group PCL—NVDR |
400 | 660 | ||||||
| Modernform Group PCL—NVDR |
1,400 | 165 | ||||||
| *Mono Next PCL—NVDR |
1,200 | 55 | ||||||
| Namyong Terminal PCL—NVDR |
800 | 98 | ||||||
| Netbay PCL—NVDR |
100 | 75 | ||||||
| Noble Development PCL—NVDR |
900 | 178 | ||||||
| Northeast Rubber PCL, Class R |
140,700 | 32,437 | ||||||
| Origin Property PCL—NVDR |
1,400 | 477 | ||||||
| Osotspa PCL—NVDR |
900 | 888 | ||||||
| Plan B Media PCL—NVDR |
46,600 | 8,988 | ||||||
| *Platinum Group PCL (The)—NVDR |
1,500 | 147 | ||||||
| Polyplex Thailand PCL—NVDR |
2,500 | 1,838 | ||||||
| *Power Solution Technologies PCL—NVDR |
3,600 | 284 | ||||||
| Premier Marketing PCL—NVDR |
500 | 154 | ||||||
| Prima Marine PCL—NVDR, Class R |
157,900 | 30,930 | ||||||
| *Principal Capital PCL—NVDR |
900 | 119 | ||||||
| Property Perfect PCL—NVDR |
10,500 | 146 | ||||||
| Pruksa Holding PCL—NVDR |
1,200 | 499 | ||||||
| PTG Energy PCL—NVDR |
1,500 | 705 | ||||||
| PTT Exploration & Production PCL—NVDR |
85,800 | 303,820 | ||||||
| PTT Global Chemical PCL—NVDR |
113,900 | 215,391 | ||||||
| PTT PCL—NVDR |
435,300 | 498,498 | ||||||
| Quality Houses PCL—NVDR |
551,700 | 38,240 | ||||||
| Rajthanee Hospital PCL—NVDR |
200 | 200 | ||||||
| Ratch Group PCL—NVDR |
1,200 | 1,646 | ||||||
| *Regional Container Lines PCL—NVDR |
1,900 | 2,505 | ||||||
| Rojana Industrial Park PCL—NVDR |
1,000 | 208 | ||||||
| *Rs PCL—NVDR |
38,100 | 20,093 | ||||||
| Sabina PCL—NVDR |
300 | 175 | ||||||
| Sahakol Equipment PCL—NVDR |
2,200 | 162 | ||||||
| Sahamitr Pressure Container PCL—NVDR |
500 | 173 | ||||||
| *Samart Corp. PCL—NVDR |
1,100 | 209 | ||||||
| *Sansiri PCL—NVDR |
1,105,000 | 41,959 | ||||||
| Sappe PCL—NVDR |
100 | 77 | ||||||
| SC Asset Corp. PCL—NVDR |
3,300 | 356 | ||||||
| Seafco PCL—NVDR |
800 | 110 | ||||||
Dimensional Emerging Core Equity Market ETF
SCHEDULE OF INVESTMENTS
October 31, 2021
| Security Description |
Shares | Fair Value | ||||||
| THAILAND (Continued) |
||||||||
| Sena Development PCL—NVDR |
1,000 | $ | 124 | |||||
| Sermsang Power Corp. Co., Ltd.—NVDR, Class R |
770 | 320 | ||||||
| Siam Cement PCL (The)—NVDR |
28,600 | 340,451 | ||||||
| Siam City Cement PCL—NVDR |
200 | 1,022 | ||||||
| Siam Commercial Bank PCL (The)—NVDR |
21,100 | 80,121 | ||||||
| Siam Global House PCL—NVDR |
2,595 | 1,595 | ||||||
| Siamgas & Petrochemicals PCL—NVDR |
7,000 | 3,038 | ||||||
| Sikarin PCL—NVDR |
1,100 | 408 | ||||||
| *Singha Estate PCL—NVDR |
5,400 | 329 | ||||||
| Sino-Thai Engineering & Construction PCL—NVDR |
323,200 | 134,413 | ||||||
| Sis Distribution Thailand PCL—NVDR |
200 | 220 | ||||||
| Sisb PCL—NVDR, Class A |
300 | 89 | ||||||
| Snc Former PCL—NVDR |
300 | 128 | ||||||
| Somboon Advance Technology PCL—NVDR |
500 | 309 | ||||||
| Spcg PCL—NVDR |
38,500 | 20,653 | ||||||
| Sri Trang Agro-Industry PCL—NVDR |
155,100 | 151,910 | ||||||
| Srivichai Vejvivat PCL—NVDR |
500 | 178 | ||||||
| *Star Petroleum Refining PCL—NVDR |
3,500 | 1,107 | ||||||
| *Stars Microelectronics Thailand PCL—NVDR |
900 | 159 | ||||||
| Supalai PCL |
174,000 | 122,703 | ||||||
| Super Energy Corp. PCL—NVDR, Class A |
134,200 | 3,923 | ||||||
| Susco PCL—NVDR |
1,000 | 99 | ||||||
| Svi PCL—NVDR |
500 | 84 | ||||||
| Syn MUN Kong Insurance PCL—NVDR |
200 | 175 | ||||||
| Syntec Construction PCL—NVDR |
1,800 | 105 | ||||||
| Tac Consumer PCL—NVDR |
500 | 122 | ||||||
| Taokaenoi Food & Marketing PCL—NVDR |
600 | 119 | ||||||
| Thai Nakarin Hospital PCL—NVDR |
100 | 98 | ||||||
| Thai Oil PCL—NVDR |
112,500 | 189,012 | ||||||
| Thai President Foods PCL—NVDR |
100 | 586 | ||||||
| Thai Reinsurance PCL—NVDR |
3,000 | 117 | ||||||
| *Thai Rubber Latex Group PCL—NVDR |
1,800 | 138 | ||||||
| Thai Solar Energy PCL—NVDR |
1,200 | 98 | ||||||
| Thai Stanley Electric PCL—NVDR |
100 | 532 | ||||||
| Thai Union Group PCL—NVDR |
252,700 | 159,163 | ||||||
| Thai Vegetable Oil PCL—NVDR |
9,500 | 8,947 | ||||||
| Thai Wah PCL—NVDR |
900 | 150 | ||||||
| Thaifoods Group PCL—NVDR |
1,600 | 211 | ||||||
| Thaire Life Assurance PCL—NVDR |
800 | 73 | ||||||
| Thaitheparos PCL—NVDR |
100 | 92 | ||||||
| Thanachart Capital PCL—NVDR |
500 | 531 | ||||||
| Thoresen Thai Agencies PCL—NVDR |
70,100 | 24,506 | ||||||
| Tipco Asphalt PCL—NVDR |
1,100 | 607 | ||||||
| Tisco Financial Group PCL—NVDR |
300 | 834 | ||||||
| Tks Technologies PCL—NVDR |
400 | 148 | ||||||
| TMB Bank PCL—NVDR |
49,200 | 1,720 | ||||||
| Tmt Steel PCL—NVDR, Class R |
400 | 130 | ||||||
| Toa Paint Thailand PCL—NVDR |
700 | 696 | ||||||
| Total Access Communication PCL—NVDR |
1,200 | 1,383 | ||||||
| TPC Power Holdings Co., Ltd.—NVDR |
300 | 99 | ||||||
| TPI Polene PCL—NVDR |
10,300 | 531 | ||||||
| TPI Polene Power PCL—NVDR |
4,600 | 588 | ||||||
| TQM Corp. PCL—NVDR, Class R |
200 | 633 | ||||||
| True Corp. PCL—NVDR |
938,900 | 114,878 | ||||||
| *TTCL PCL—NVDR |
600 | 80 | ||||||
| TTW PCL—NVDR |
2,000 | 705 | ||||||
Dimensional Emerging Core Equity Market ETF
SCHEDULE OF INVESTMENTS
October 31, 2021
| Security Description |
Shares | Fair Value | ||||||
| THAILAND (Continued) |
||||||||
| *U City PCL—NVDR |
5,600 | $ | 302 | |||||
| Union Auction PCL—NVDR |
400 | 111 | ||||||
| *Unique Engineering & Construction PCL—NVDR |
1,200 | 242 | ||||||
| United Paper PCL—NVDR, Class R |
500 | 249 | ||||||
| Univanich Palm Oil PCL—NVDR |
900 | 228 | ||||||
| Univentures PCL—NVDR |
1,300 | 160 | ||||||
| Vanachai Group PCL—NVDR |
800 | 227 | ||||||
| Vinythai PCL—NVDR |
300 | 344 | ||||||
| Wha Corp. PCL—NVDR |
968,300 | 98,632 | ||||||
| Wha Utilities And Power PCL—NVDR |
1,600 | 204 | ||||||
| Workpoint Entertainment PCL—NVDR |
400 | 273 | ||||||
|
|
|
|||||||
| TOTAL THAILAND |
8,103,697 | |||||||
|
|
|
|||||||
| TURKEY (0.5%) |
||||||||
| *Afyon Cimento Sanayi T A/S |
408 | 149 | ||||||
| Agesa Hayat ve Emeklilik A/S |
433 | 886 | ||||||
| Akbank T.A.S. |
542,419 | 330,580 | ||||||
| Akcansa Cimento A/S |
36 | 59 | ||||||
| *Akenerji Elektrik Uretim A/S |
224 | 45 | ||||||
| Aksa Akrilik Kimya Sanayii A/S |
11,669 | 28,447 | ||||||
| *Aksa Enerji Uretim A/S |
464 | 363 | ||||||
| Aksigorta A/S |
1,017 | 745 | ||||||
| Alarko Holding A/S |
208 | 204 | ||||||
| *Albaraka Turk Katilim Bankasi A/S |
1,060 | 195 | ||||||
| Alkim Alkali Kimya A/S |
793 | 1,410 | ||||||
| Anadolu Anonim Turk Sigorta Sirketi |
324 | 200 | ||||||
| Anadolu Efes Biracilik Ve Malt Sanayii A/S |
25,943 | 59,899 | ||||||
| Anadolu Hayat Emeklilik A/S |
761 | 738 | ||||||
| *Anadolu Isuzu Otomotiv Sanayi VE Ticaret A/S, Class C |
44 | 91 | ||||||
| Arcelik A/S |
13,839 | 48,475 | ||||||
| Aselsan Elektronik Sanayi Ve Ticaret A/S |
31,215 | 53,339 | ||||||
| Aygaz A/S |
88 | 168 | ||||||
| *Bagfas Bandirma Gubre Fabrikalari A/S |
44 | 96 | ||||||
| *Bera Holding A/S |
12,146 | 12,152 | ||||||
| BIM Birlesik Magazalar A/S |
21,485 | 138,874 | ||||||
| Bizim Toptan Satis Magazalari A/S |
44 | 57 | ||||||
| *Borusan Mannesmann Boru Sanayi VE Ticaret A/S |
48 | 120 | ||||||
| Brisa Bridgestone Sabanci Sanayi VE Ticaret A/S |
196 | 476 | ||||||
| *Bursa Cimento Fabrikasi A/S |
222 | 87 | ||||||
| Cemtas Celik Makina Sanayi Ve Ticaret A/S |
517 | 796 | ||||||
| *Cimsa Cimento Sanayi VE Ticaret A/S |
80 | 259 | ||||||
| Coca-Cola Icecek A/S |
11,437 | 101,224 | ||||||
| Deva Holding A/S |
56 | 137 | ||||||
| Dogus Otomotiv Servis Ve Ticaret A/S |
52 | 196 | ||||||
| EGE Endustri VE Ticaret A/S |
17 | 2,284 | ||||||
| Enerjisa Enerji A/S |
364 | 445 | ||||||
| Erbosan Erciyas Boru Sanayii Ve Ticaret A/S |
16 | 195 | ||||||
| Eregli Demir ve Celik Fabrikalari TAS |
55,518 | 113,690 | ||||||
| *Fenerbahce Futbol A/S |
48 | 153 | ||||||
| Ford Otomotiv Sanayi A/S |
3,300 | 63,700 | ||||||
| Gentas Genel Metal Sanayi VE Ticaret A/S |
140 | 47 | ||||||
| *Global Yatirim Holding A/S |
263 | 51 | ||||||
| Goltas Goller Bolgesi Cimento Sanayi ve Ticaret A/S |
119 | 475 | ||||||
| Goodyear Lastikleri TAS |
1,014 | 844 | ||||||
Dimensional Emerging Core Equity Market ETF
SCHEDULE OF INVESTMENTS
October 31, 2021
| Security Description |
Shares | Fair Value | ||||||
| TURKEY (Continued) |
||||||||
| *Gubre Fabrikalari TAS |
56 | $ | 400 | |||||
| *Hektas Ticaret TAS |
544 | 502 | ||||||
| *IhlA/S Holding A/S |
1,533 | 89 | ||||||
| Is Yatirim Menkul Degerler A/S |
216 | 359 | ||||||
| *Isiklar Enerji VE Yapi Holding A/S |
648 | 62 | ||||||
| *Ittifak Holding A.S |
424 | 54 | ||||||
| *Kardemir Karabuk Demir Celik Sanayi VE Ticaret A/S, Class D |
2,936 | 2,278 | ||||||
| *Kardemir Karabuk Demir Celik Sanayi VE Ticaret A/S, Class A |
224 | 151 | ||||||
| Kartonsan Karton Sanayi ve Ticaret A/S |
156 | 851 | ||||||
| *Kerevitas Gida Sanayi VE Ticaret A/S |
156 | 69 | ||||||
| KOC Holding A/S |
29,067 | 71,283 | ||||||
| *Kordsa Teknik Tekstil A/S |
92 | 264 | ||||||
| *Koza Altin Isletmeleri A/S |
68 | 759 | ||||||
| *Kutahya Porselen Sanayi A/S |
12 | 88 | ||||||
| Logo Yazilim Sanayi Ve Ticaret AS |
1,036 | 4,579 | ||||||
| Mavi Giyim Sanayi Ve Ticaret AS, Class B |
627 | 4,695 | ||||||
| *Metro Ticari VE Mali Yatirimlar Holding A/S |
312 | 42 | ||||||
| *Migros Ticaret A/S |
124 | 454 | ||||||
| *Mlp Saglik Hizmetleri A/S |
1,330 | 3,751 | ||||||
| *Netas Telekomunikasyon A/S |
40 | 72 | ||||||
| Nuh Cimento Sanayi A/S |
92 | 417 | ||||||
| *Odas Elektrik Uretim VE Sanayi Ticaret A/S |
1,139 | 166 | ||||||
| Otokar Otomotiv Ve Savunma Sanayi A/S |
16 | 561 | ||||||
| *Peasus Hava Tasimaciligi A/S |
72 | 596 | ||||||
| *Petkim Petrokimya Holding A/S |
273,008 | 185,410 | ||||||
| Polisan Holding A/S |
156 | 45 | ||||||
| *Reysas Tasimacilik VE Lojistik Ticaret A/S |
235 | 125 | ||||||
| Sarkuysan Elektrolitik Bakir Sanayi ve Ticaret AS |
36,821 | 70,769 | ||||||
| *Sasa Polyester Sanayi A/S |
243 | 784 | ||||||
| *Sekerbank Turk A/S |
820 | 86 | ||||||
| Selcuk Ecza Deposu Ticaret ve Sanayi A/S |
164 | 152 | ||||||
| Tat Gida Sanayi A/S |
116 | 115 | ||||||
| *Tav Havalimanlari Holding A/S |
559 | 1,545 | ||||||
| Tekfen Holding A/S |
272 | 428 | ||||||
| *Teknosa Ic VE DIS Ticaret A/S |
132 | 85 | ||||||
| Tofas Turk Otomobil Fabrikasi A/S |
1,712 | 10,470 | ||||||
| *Turcas Petrol A/S |
136 | 50 | ||||||
| *Turk Hava Yollari AO |
67,899 | 105,713 | ||||||
| Turk Telekomunikasyon A/S |
950 | 744 | ||||||
| Turk Traktor VE Ziraat Makineleri A/S |
28 | 480 | ||||||
| Turkcell Iletisim Hizmetleri A/S |
83,924 | 133,456 | ||||||
| Turkiye Garanti Bankasi A/S |
93,936 | 96,230 | ||||||
| *Turkiye Halk Bankasi A/S |
1,040 | 479 | ||||||
| Turkiye Is Bankasi A/S |
3,564 | 2,087 | ||||||
| *Turkiye Petrol Rafinerileri A/S |
6,623 | 96,296 | ||||||
| Turkiye Sise VE CAM Fabrikalari A/S |
77,103 | 69,444 | ||||||
| *Turkiye Vakiflar Bankasi TAO |
1,580 | 565 | ||||||
| Ulker Biskuvi Sanayi A/S |
14,874 | 31,217 | ||||||
| Vestel Elektronik Sanayi VE Ticaret A/S |
128 | 337 | ||||||
| Yapi VE Kredi Bankasi A/S |
5,264 | 1,495 | ||||||
| Yatas Yatak VE Yorgan Sanayi VE Ticaret A/S |
2,258 | 3,137 | ||||||
| *Zorlu Enerji Elektrik Uretim A/S |
1,005 | 171 | ||||||
|
|
|
|||||||
| TOTAL TURKEY |
1,866,808 | |||||||
|
|
|
|||||||
Dimensional Emerging Core Equity Market ETF
SCHEDULE OF INVESTMENTS
October 31, 2021
| Security Description |
Shares | Fair Value | ||||||
| UNITED ARAB EMIRATES (0.4%) |
||||||||
| Abu Dhabi Commercial Bank PJSC |
37,603 | $ | 84,969 | |||||
| Abu Dhabi Islamic Bank PJSC |
8,882 | 14,122 | ||||||
| Agthia Group Pjsc |
12,856 | 20,790 | ||||||
| Aldar Properties PJSC |
40,844 | 44,923 | ||||||
| Aramex PJSC |
29,977 | 35,664 | ||||||
| Dana Gas PJSC |
203,571 | 57,084 | ||||||
| Dubai Islamic Bank PJSC |
3,728 | 5,186 | ||||||
| *Emaar Malls PJSC |
4,840 | 2,635 | ||||||
| Emaar Properties PJSC |
64,675 | 70,606 | ||||||
| Emirates NBD Bank PJSC |
90,606 | 344,106 | ||||||
| Emirates Telecommunications Group Co. PJSC |
70,249 | 489,600 | ||||||
| First Abu Dhabi Bank PJSC |
99,870 | 484,512 | ||||||
| *Manazel Real Estate PJSC |
12,090 | 1,807 | ||||||
| *Rak Properties Pjsc |
128,322 | 25,538 | ||||||
| RAS Al Khaimah Ceramics |
22,962 | 17,129 | ||||||
|
|
|
|||||||
| TOTAL UNITED ARAB EMIRATES |
1,698,671 | |||||||
|
|
|
|||||||
| TOTAL COMMON STOCKS (Cost $402,357,802) |
395,116,171 | |||||||
|
|
|
|||||||
| PREFERRED STOCK (0.0%) |
||||||||
| PHILIPPINES (0.0%) |
||||||||
| *Cebu Air, Inc. |
7,265 | 6,341 | ||||||
|
|
|
|||||||
| TOTAL PHILIPPINES |
6,341 | |||||||
|
|
|
|||||||
| TOTAL PREFERRED STOCK (Cost $5,680) |
6,341 | |||||||
|
|
|
|||||||
| RIGHTS (0.0%) |
||||||||
| BRAZIL (0.0%) |
||||||||
| *»Ultrapar Participacoes SA 11/4/2021 |
2,824 | — | ||||||
|
|
|
|||||||
| TOTAL BRAZIL |
— | |||||||
|
|
|
|||||||
| CHILE (0.0%) |
||||||||
| *Itau Corpbanca 11/3/2021 |
220,579 | — | ||||||
|
|
|
|||||||
| TOTAL CHILE |
— | |||||||
|
|
|
|||||||
| KOREA, REPUBLIC OF (0.0%) |
||||||||
| *Dongbang Transport Logistics Co., Ltd. 12/8/2021 |
1,314 | 855 | ||||||
| *IsuPetasys Co., Ltd. 11/1/2021 |
11 | 8 | ||||||
| *Samsung Heavy Industries Co., Ltd. 11/1/2021 |
380 | 406 | ||||||
|
|
|
|||||||
| TOTAL KOREA, REPUBLIC OF |
1,269 | |||||||
|
|
|
|||||||
| TAIWAN (0.0%) |
||||||||
| *Ta Ya Electric Wire & Cable 11/11/2021 |
25,137 | 3,390 | ||||||
|
|
|
|||||||
| TOTAL TAIWAN |
3,390 | |||||||
|
|
|
|||||||
| TOTAL RIGHTS (Cost $–) |
4,659 | |||||||
Dimensional Emerging Core Equity Market ETF
SCHEDULE OF INVESTMENTS
October 31, 2021
| Security Description |
Shares | Fair Value | ||||||
| WARRANTS (0.0%) |
||||||||
| THAILAND (0.0%) |
||||||||
| BTS Group Holdings PCL 12/31/2024 |
32,280 | $ | — | |||||
| BTS Group Holdings PCL 12/31/2026 |
64,560 | — | ||||||
| MBK PCL 12/31/2024 |
3,576 | 1,186 | ||||||
| TOTAL THAILAND |
1,186 | |||||||
|
|
|
|||||||
| TOTAL WARRANTS (Cost $–) |
1,186 | |||||||
|
|
|
|||||||
| TOTAL INVESTMENT SECURITIES |
395,128,357 | |||||||
|
|
|
|||||||
| SECURITIES LENDING COLLATERAL (0.4%) @§ The DFA Short Term Investment Fund |
150,819 | 1,744,896 | ||||||
|
|
|
|||||||
| TOTAL INVESTMENTS — 100.0% |
$ | 396,873,253 | ||||||
|
|
|
|||||||
| * |
Non-Income Producing Securities | |
| # |
Total or Partial Securities on Loan. | |
| » |
Securities that have generally been fair value factored. | |
| @ |
Security purchased with cash collateral received from Securities on Loan | |
| § |
Affiliated Fund |
| ADR |
American Depositary Receipt | |
| GDR |
Global Depositary Receipt | |
| PLC |
Public Limited Company | |
| SA |
Special Assessment |
Dimensional World ex U.S. Core Equity 2 ETF
SCHEDULE OF INVESTMENTS
October 31, 2021
| Security Description |
Shares | Fair Value | ||||||
| COMMON STOCKS (98.0%) |
||||||||
| AUSTRALIA (4.2%) |
||||||||
| *A2B Australia, Ltd. |
73,897 | $ | 73,820 | |||||
| Accent Group, Ltd. |
151,390 | 281,999 | ||||||
| Adairs, Ltd. |
48,504 | 134,432 | ||||||
| Adbri, Ltd. |
210,042 | 470,133 | ||||||
| *»Aet D Holdings No. 1 Pty, Ltd. |
4 | — | ||||||
| *Afterpay, Ltd. |
4,982 | 461,349 | ||||||
| AGL Energy, Ltd. |
63,261 | 271,788 | ||||||
| *Ainsworth Game Technology, Ltd. |
23,526 | 23,855 | ||||||
| *Alkane Resources, Ltd. |
99,703 | 67,024 | ||||||
| *Alliance Aviation Services, Ltd. |
32,754 | 92,010 | ||||||
| ALS, Ltd. |
169,458 | 1,681,368 | ||||||
| Altium, Ltd. |
36,467 | 1,005,775 | ||||||
| #Alumina, Ltd. |
423,317 | 632,728 | ||||||
| #*AMA Group, Ltd. |
260,064 | 94,737 | ||||||
| *»AMA Group, Ltd. |
68,438 | 24,931 | ||||||
| #*AMP, Ltd. |
1,192,870 | 967,642 | ||||||
| Ampol, Ltd. |
109,243 | 2,506,702 | ||||||
| Ansell, Ltd. |
44,839 | 1,061,212 | ||||||
| APA Group |
109,312 | 673,255 | ||||||
| Appen, Ltd. |
7,243 | 58,482 | ||||||
| ARB Corp., Ltd. |
24,910 | 909,115 | ||||||
| *Ardent Leisure Group, Ltd. |
24,294 | 27,280 | ||||||
| *Aristocrat Leisure, Ltd. |
83,587 | 2,930,674 | ||||||
| *»Aristocrat Leisure, Ltd. |
4,062 | 142,419 | ||||||
| ASX, Ltd. |
4,088 | 254,913 | ||||||
| Atlas Arteria, Ltd. |
153,269 | 713,747 | ||||||
| AUB Group, Ltd. |
14,076 | 229,529 | ||||||
| #*Aurelia Metals, Ltd. |
428,130 | 122,196 | ||||||
| Aurizon Holdings, Ltd. |
512,016 | 1,296,019 | ||||||
| AusNet Services, Ltd. |
334,951 | 621,407 | ||||||
| Austal, Ltd. |
87,461 | 123,501 | ||||||
| *Australia & New Zealand Banking Group, Ltd. |
233,308 | 4,931,189 | ||||||
| *Australian Agricultural Co., Ltd. |
172,205 | 204,362 | ||||||
| *Australian Pharmaceutical Industries, Ltd. |
201,372 | 228,388 | ||||||
| *Australian Strategic Materials, Ltd. |
13,490 | 107,504 | ||||||
| Auswide Bank, Ltd. |
4,027 | 20,779 | ||||||
| AVJennings, Ltd. |
44,901 | 20,572 | ||||||
| Baby Bunting Group, Ltd. |
33,144 | 146,877 | ||||||
| Bank of Queensland, Ltd. |
255,864 | 1,691,180 | ||||||
| Bapcor, Ltd. |
148,076 | 884,199 | ||||||
| #Beach Energy, Ltd. |
1,053,223 | 1,103,551 | ||||||
| Bega Cheese, Ltd. |
108,475 | 441,598 | ||||||
| Bell Financial Group, Ltd. |
38,273 | 52,319 | ||||||
| Bendigo & Adelaide Bank, Ltd. |
196,531 | 1,365,434 | ||||||
| #BHP Group, Ltd. , Sponsored ADR |
49,113 | 2,693,357 | ||||||
| #BHP Group, Ltd. |
329,587 | 9,055,486 | ||||||
| #*Bigtincan Holdings, Ltd. |
32,791 | 28,816 | ||||||
| Blackmores, Ltd. |
5,307 | 375,370 | ||||||
| BlueScope Steel, Ltd. |
157,192 | 2,434,541 | ||||||
| Brambles, Ltd. |
159,186 | 1,200,429 | ||||||
| Bravura Solutions, Ltd. |
60,506 | 126,340 | ||||||
| Breville Group, Ltd. |
35,129 | 773,356 | ||||||
| *Brickworks, Ltd. |
35,999 | 641,903 | ||||||
| BWX, Ltd. |
24,890 | 87,118 | ||||||
| Capitol Health, Ltd. |
161,487 | 41,240 | ||||||
Dimensional World ex U.S. Core Equity 2 ETF
SCHEDULE OF INVESTMENTS
October 31, 2021
| Security Description |
Shares | Fair Value | ||||||
| AUSTRALIA (Continued) |
||||||||
| Cardno, Ltd. |
99,590 | $ | 113,325 | |||||
| carsales.com, Ltd. |
97,425 | 1,804,519 | ||||||
| Cedar Woods Properties, Ltd. |
25,600 | 114,600 | ||||||
| Challenger, Ltd. |
222,938 | 1,162,095 | ||||||
| *Champion Iron, Ltd. |
81,531 | 269,447 | ||||||
| #CIMIC Group, Ltd. |
6,127 | 91,672 | ||||||
| *City Chic Collective, Ltd. |
38,998 | 181,314 | ||||||
| Class, Ltd. |
24,575 | 53,898 | ||||||
| *Clean Seas Seafood, Ltd. |
27,163 | 12,751 | ||||||
| *»Clean Seas Seafood, Ltd. Private Placement |
4,119 | 1,934 | ||||||
| Cleanaway Waste Management, Ltd. |
584,575 | 1,176,720 | ||||||
| Clinuvel Pharmaceuticals, Ltd. |
10,982 | 318,478 | ||||||
| #Clover Corp., Ltd. |
13,880 | 16,733 | ||||||
| Cochlear, Ltd. |
7,776 | 1,287,492 | ||||||
| Codan, Ltd. |
57,506 | 434,087 | ||||||
| Coles Group, Ltd. |
130,615 | 1,681,519 | ||||||
| Collins Foods, Ltd. |
67,476 | 648,720 | ||||||
| Commonwealth Bank of Australia |
80,104 | 6,298,192 | ||||||
| Computershare, Ltd. |
109,620 | 1,544,616 | ||||||
| #*Cooper Energy, Ltd. |
472,395 | 102,897 | ||||||
| *Corporate Travel Management, Ltd. |
11,769 | 216,484 | ||||||
| Costa Group Holdings, Ltd. |
111,363 | 244,243 | ||||||
| *Crown Resorts, Ltd. |
89,300 | 668,050 | ||||||
| CSL, Ltd. |
29,983 | 6,767,108 | ||||||
| *CSR, Ltd. |
309,364 | 1,377,915 | ||||||
| Data#3, Ltd. |
41,113 | 175,090 | ||||||
| *Decmil Group, Ltd. |
41,293 | 9,770 | ||||||
| *»Decmil Group, Ltd. Plt T2 |
881 | 208 | ||||||
| #Dicker Data, Ltd. |
13,951 | 157,074 | ||||||
| Domain Holdings Australia, Ltd. |
71,915 | 308,968 | ||||||
| Domino’s Pizza Enterprises, Ltd. |
23,328 | 2,373,485 | ||||||
| Downer EDI, Ltd. |
334,379 | 1,582,259 | ||||||
| Eagers Automotive, Ltd. |
57,396 | 638,893 | ||||||
| *Eclipx Group, Ltd. |
172,174 | 323,300 | ||||||
| *Elders, Ltd. |
76,649 | 692,580 | ||||||
| #Emeco Holdings, Ltd. |
133,359 | 110,183 | ||||||
| *EML Payments, Ltd. |
20,681 | 45,824 | ||||||
| Endeavour Group, Ltd. |
81,815 | 417,869 | ||||||
| *Energy World Corp., Ltd. |
283,308 | 18,726 | ||||||
| Enero Group, Ltd. |
8,518 | 25,335 | ||||||
| EQT Holdings, Ltd. |
3,626 | 76,530 | ||||||
| Estia Health, Ltd. |
119,732 | 188,855 | ||||||
| *EVENT Hospitality and Entertainment, Ltd. |
28,051 | 345,955 | ||||||
| Evolution Mining, Ltd. |
258,273 | 704,180 | ||||||
| Fleetwood, Ltd. |
30,302 | 54,396 | ||||||
| #*Flight Centre Travel Group, Ltd. |
41,492 | 622,982 | ||||||
| Fortescue Metals Group, Ltd. |
294,037 | 3,076,459 | ||||||
| *G8 Education, Ltd. |
424,519 | 350,742 | ||||||
| Genworth Mortgage Insurance Australia, Ltd. |
154,990 | 267,750 | ||||||
| Gold Road Resources, Ltd. |
434,536 | 452,036 | ||||||
| *GrainCorp, Ltd., Class A |
111,970 | 528,153 | ||||||
| GUD Holdings, Ltd. |
41,148 | 377,057 | ||||||
| GWA Group, Ltd. |
79,001 | 161,399 | ||||||
| Hansen Technologies, Ltd. |
32,444 | 154,010 | ||||||
| Harvey Norman Holdings, Ltd. |
270,592 | 1,008,079 | ||||||
| Healius, Ltd. |
667,523 | 2,416,636 | ||||||
Dimensional World ex U.S. Core Equity 2 ETF
SCHEDULE OF INVESTMENTS
October 31, 2021
| Security Description |
Shares | Fair Value | ||||||
| AUSTRALIA (Continued) |
||||||||
| #*Helloworld Travel, Ltd. |
11,322 | $ | 23,131 | |||||
| Horizon Oil, Ltd. |
135,680 | 9,376 | ||||||
| HT&E, Ltd. |
100,192 | 145,241 | ||||||
| #HUB24, Ltd. |
3,682 | 87,613 | ||||||
| *Huon Aquaculture Group, Ltd. |
8,232 | 23,805 | ||||||
| IDP Education, Ltd. |
42,002 | 1,181,462 | ||||||
| IGO, Ltd. |
234,193 | 1,695,700 | ||||||
| Iluka Resources, Ltd. |
188,196 | 1,328,728 | ||||||
| Imdex, Ltd. |
191,481 | 412,768 | ||||||
| *Incitec Pivot, Ltd. |
580,320 | 1,303,277 | ||||||
| Infomedia, Ltd. |
115,467 | 119,684 | ||||||
| Inghams Group, Ltd. |
114,624 | 319,409 | ||||||
| Insurance Australia Group, Ltd. |
209,145 | 754,027 | ||||||
| Integral Diagnostics, Ltd. |
47,669 | 168,280 | ||||||
| *Integrated Research, Ltd. |
39,117 | 44,512 | ||||||
| InvoCare, Ltd. |
52,540 | 447,114 | ||||||
| IOOF Holdings, Ltd. |
271,909 | 833,262 | ||||||
| IPH, Ltd. |
57,052 | 366,811 | ||||||
| IRESS, Ltd. |
36,722 | 330,983 | ||||||
| IVE Group, Ltd. |
53,827 | 72,167 | ||||||
| James Hardie Industries PLC, Sponsored ADR |
6,180 | 243,059 | ||||||
| James Hardie Industries PLC |
34,920 | 1,354,698 | ||||||
| *»Japara Healthcare, Ltd. |
123,069 | 129,412 | ||||||
| JB Hi-Fi, Ltd. |
43,462 | 1,648,212 | ||||||
| Johns Lyng Group, Ltd. |
21,961 | 107,052 | ||||||
| Jumbo Interactive, Ltd. |
8,083 | 101,570 | ||||||
| Jupiter Mines, Ltd. |
60,549 | 10,687 | ||||||
| Lendlease Corp., Ltd. |
52,415 | 411,799 | ||||||
| Lifestyle Communities, Ltd. |
10,258 | 167,579 | ||||||
| Link Administration Holdings, Ltd. |
197,197 | 644,299 | ||||||
| Lovisa Holdings, Ltd. |
14,591 | 238,036 | ||||||
| *Lynas Rare Earths, Ltd. |
105,063 | 578,431 | ||||||
| MA Financial Group, Ltd. |
2,657 | 16,325 | ||||||
| MACA, Ltd. |
186,333 | 107,065 | ||||||
| *Macmahon Holdings, Ltd. |
265,071 | 40,814 | ||||||
| Macquarie Group, Ltd. |
30,484 | 4,529,623 | ||||||
| Magellan Financial Group, Ltd. |
28,629 | 745,518 | ||||||
| *Mayne Pharma Group, Ltd. |
689,464 | 176,071 | ||||||
| McMillan Shakespeare, Ltd. |
49,386 | 507,815 | ||||||
| McPherson’s, Ltd. |
58,842 | 42,649 | ||||||
| Medibank Pvt, Ltd. |
567,546 | 1,415,263 | ||||||
| *Medusa Mining, Ltd. |
96,557 | 55,843 | ||||||
| #*Mesoblast, Ltd. |
120,549 | 143,966 | ||||||
| #*Metals X, Ltd. |
234,043 | 63,284 | ||||||
| Metcash, Ltd. |
434,753 | 1,329,031 | ||||||
| Michael Hill International, Ltd. |
12,057 | 8,920 | ||||||
| *»Millennium Minerals, Ltd. |
74,492 | — | ||||||
| Mineral Resources, Ltd. |
109,119 | 3,162,810 | ||||||
| *MMA Offshore, Ltd. |
104,190 | 34,042 | ||||||
| MNF Group, Ltd. |
11,041 | 59,211 | ||||||
| #Monadelphous Group, Ltd. |
19,320 | 145,838 | ||||||
| Monash IVF Group, Ltd. |
183,046 | 129,237 | ||||||
| Mount Gibson Iron, Ltd. |
289,236 | 91,243 | ||||||
| #*Myer Holdings, Ltd. |
1,669,270 | 677,046 | ||||||
| #MyState, Ltd. |
46,088 | 180,353 | ||||||
Dimensional World ex U.S. Core Equity 2 ETF
SCHEDULE OF INVESTMENTS
October 31, 2021
| Security Description |
Shares | Fair Value | ||||||
| AUSTRALIA (Continued) |
||||||||
| *National Australia Bank, Ltd. |
271,807 | $ | 5,861,271 | |||||
| Navigator Global Investments, Ltd. |
60,321 | 85,177 | ||||||
| *Nearmap, Ltd. |
6,709 | 11,137 | ||||||
| Netwealth Group, Ltd. |
23,536 | 305,828 | ||||||
| New Hope Corp., Ltd. |
187,339 | 282,828 | ||||||
| Newcrest Mining, Ltd. |
92,436 | 1,728,081 | ||||||
| *NEXTDC, Ltd. |
38,144 | 336,351 | ||||||
| nib holdings, Ltd. |
174,740 | 868,857 | ||||||
| Nick Scali, Ltd. |
20,458 | 222,346 | ||||||
| Nine Entertainment Co. Holdings, Ltd. |
657,990 | 1,364,038 | ||||||
| Northern Star Resources, Ltd. |
330,708 | 2,295,169 | ||||||
| NRW Holdings, Ltd. |
247,909 | 339,823 | ||||||
| *Nufarm, Ltd. |
125,857 | 411,211 | ||||||
| OFX Group, Ltd. |
88,684 | 106,244 | ||||||
| Oil Search, Ltd. |
393,660 | 1,268,459 | ||||||
| #*Omni Bridgeway, Ltd. |
88,285 | 205,564 | ||||||
| *oOh!media, Ltd. |
295,667 | 403,067 | ||||||
| *Orica, Ltd. |
24,461 | 277,978 | ||||||
| Origin Energy, Ltd. |
346,686 | 1,315,000 | ||||||
| *Orocobre, Ltd. |
21,431 | 143,262 | ||||||
| Orora, Ltd. |
353,648 | 876,563 | ||||||
| #Over the Wire Holdings, Ltd. |
3,418 | 13,889 | ||||||
| OZ Minerals, Ltd. |
129,173 | 2,438,160 | ||||||
| Pact Group Holdings, Ltd. |
92,135 | 214,528 | ||||||
| Peet, Ltd. |
105,911 | 85,914 | ||||||
| Pendal Group, Ltd. |
109,245 | 545,659 | ||||||
| Perenti Global, Ltd. |
318,890 | 244,309 | ||||||
| Perpetual, Ltd. |
25,640 | 725,264 | ||||||
| *Perseus Mining, Ltd. |
550,940 | 653,822 | ||||||
| #*Pilbara Minerals, Ltd. |
41,813 | 69,093 | ||||||
| Platinum Asset Management, Ltd. |
107,684 | 245,880 | ||||||
| #*Praemium, Ltd. |
68,361 | 61,358 | ||||||
| *Premier Investments, Ltd. |
35,432 | 813,825 | ||||||
| #Pro Medicus, Ltd. |
15,866 | 634,935 | ||||||
| Propel Funeral Partners, Ltd. |
4,796 | 15,130 | ||||||
| *»Propel Funeral Partners, Ltd. |
572 | 1,804 | ||||||
| PWR Holdings, Ltd. |
19,114 | 135,526 | ||||||
| *Qantas Airways, Ltd. |
373,856 | 1,502,298 | ||||||
| QBE Insurance Group, Ltd. |
246,728 | 2,192,306 | ||||||
| Qube Holdings, Ltd. |
297,553 | 710,705 | ||||||
| Ramelius Resources, Ltd. |
433,680 | 517,922 | ||||||
| Ramsay Health Care, Ltd. |
17,580 | 929,850 | ||||||
| REA Group, Ltd. |
6,832 | 821,761 | ||||||
| *ReadyTech Holdings, Ltd. |
8,760 | 24,871 | ||||||
| #Reckon, Ltd. |
23,466 | 18,154 | ||||||
| *Red 5, Ltd. |
186,476 | 36,416 | ||||||
| Reece, Ltd. |
14,352 | 214,410 | ||||||
| Regis Healthcare, Ltd. |
53,468 | 78,914 | ||||||
| Regis Resources, Ltd. |
368,916 | 554,186 | ||||||
| *Reject Shop, Ltd. (The) |
13,159 | 68,494 | ||||||
| Reliance Worldwide Corp., Ltd. |
216,677 | 939,045 | ||||||
| #*Resolute Mining, Ltd. |
392,450 | 123,803 | ||||||
| *Retail Food Group, Ltd. |
299,647 | 18,005 | ||||||
| »Rhipe, Ltd. |
8,549 | 16,053 | ||||||
| Ridley Corp., Ltd. |
105,502 | 104,996 | ||||||
| Rio Tinto, Ltd. |
45,196 | 3,065,050 | ||||||
Dimensional World ex U.S. Core Equity 2 ETF
SCHEDULE OF INVESTMENTS
October 31, 2021
| Security Description |
Shares | Fair Value | ||||||
| AUSTRALIA (Continued) |
||||||||
| *RPMGlobal Holdings, Ltd. |
5,840 | $ | 8,554 | |||||
| *»Salmat, Ltd. |
11,000 | — | ||||||
| *»Sandfire Resources, Ltd. |
163,454 | 682,603 | ||||||
| Sandfire Resources, Ltd. |
126,593 | 528,667 | ||||||
| Santos, Ltd. |
524,791 | 2,751,311 | ||||||
| Sealink Travel Group, Ltd. |
18,360 | 101,220 | ||||||
| SEEK, Ltd. |
11,980 | 294,240 | ||||||
| *Select Harvests, Ltd. |
41,713 | 231,534 | ||||||
| #Senex Energy, Ltd. |
89,304 | 297,819 | ||||||
| ServCorp., Ltd. |
17,667 | 53,742 | ||||||
| Service Stream, Ltd. |
197,800 | 129,997 | ||||||
| #Seven Group Holdings, Ltd. |
38,215 | 617,982 | ||||||
| *Seven West Media, Ltd. |
292,031 | 99,802 | ||||||
| SG Fleet Group, Ltd. |
39,400 | 75,167 | ||||||
| Shaver Shop Group, Ltd. |
23,118 | 17,798 | ||||||
| Sigma Healthcare, Ltd. |
456,334 | 195,369 | ||||||
| *Silver Lake Resources, Ltd. |
434,885 | 553,659 | ||||||
| Sims, Ltd. |
79,539 | 853,710 | ||||||
| SmartGroup Corp., Ltd. |
37,437 | 225,514 | ||||||
| Sonic Healthcare, Ltd. |
51,904 | 1,560,574 | ||||||
| South32, Ltd. , Sponsored ADR |
41,219 | 556,456 | ||||||
| South32, Ltd. |
530,751 | 1,423,171 | ||||||
| Southern Cross Media Group, Ltd. |
86,085 | 150,008 | ||||||
| Spark Infrastructure Group |
440,458 | 929,627 | ||||||
| *»SpeedCast International, Ltd. |
148,941 | — | ||||||
| #St Barbara, Ltd. |
228,683 | 251,634 | ||||||
| *Star Entertainment Grp, Ltd. (The) |
388,978 | 1,069,311 | ||||||
| Steadfast Group, Ltd. |
286,193 | 999,562 | ||||||
| SunCorp. Group, Ltd. |
166,242 | 1,463,411 | ||||||
| Sunland Group, Ltd. |
21,844 | 44,135 | ||||||
| Super Retail Group, Ltd. |
107,780 | 1,046,730 | ||||||
| *Superloop, Ltd. |
71,466 | 69,245 | ||||||
| *Sydney Airport |
102,061 | 627,829 | ||||||
| *Syrah Resources, Ltd. |
164,969 | 155,505 | ||||||
| TabCorp. Holdings, Ltd. |
375,522 | 1,398,991 | ||||||
| Tassal Group, Ltd. |
85,052 | 226,783 | ||||||
| Technology One, Ltd. |
103,167 | 946,138 | ||||||
| Telstra Corp., Ltd. , ADR |
600 | 8,670 | ||||||
| Telstra Corp., Ltd. |
583,559 | 1,674,349 | ||||||
| *»Tiger Resources, Ltd. |
202,588 | 30 | ||||||
| #TPG Telecom, Ltd. |
174,420 | 884,297 | ||||||
| *»Transurban Group |
10,520 | 106,197 | ||||||
| Transurban Group |
102,655 | 1,036,281 | ||||||
| Treasury Wine Estates, Ltd. |
102,774 | 889,270 | ||||||
| #*Tuas, Ltd. |
100,097 | 105,256 | ||||||
| United Malt Grp, Ltd. |
157,383 | 477,570 | ||||||
| *»Virgin Australia Int Holdings Common Stock |
312,963 | — | ||||||
| Virtus Health, Ltd. |
21,675 | 90,354 | ||||||
| Vita Group, Ltd. |
95,974 | 59,831 | ||||||
| Viva Energy Group, Ltd. |
48,648 | 84,772 | ||||||
| *Wagners Holding Co., Ltd. |
3,074 | 4,110 | ||||||
| *Webjet, Ltd. |
63,055 | 299,319 | ||||||
| *Wesfarmers, Ltd. |
99,536 | 4,280,097 | ||||||
| *West African Resources, Ltd. |
16,967 | 16,567 | ||||||
| *Western Areas, Ltd. |
123,037 | 292,026 | ||||||
Dimensional World ex U.S. Core Equity 2 ETF
SCHEDULE OF INVESTMENTS
October 31, 2021
| Security Description |
Shares | Fair Value | ||||||
| AUSTRALIA (Continued) |
||||||||
| Westgold Resources, Ltd. |
93,997 | $ | 137,672 | |||||
| *Westpac Banking Corp. |
224,986 | 4,337,898 | ||||||
| *Whitehaven Coal, Ltd. |
409,666 | 803,098 | ||||||
| WiseTech Global, Ltd. |
3,510 | 134,665 | ||||||
| Woodside Petroleum, Ltd. |
100,031 | 1,747,601 | ||||||
| Woolworths Group, Ltd. |
81,815 | 2,340,065 | ||||||
| Worley, Ltd. |
94,920 | 771,406 | ||||||
| *Xero, Ltd. |
4,566 | 512,748 | ||||||
| #*Zip Co., Ltd. |
24,861 | 121,375 | ||||||
|
|
|
|||||||
| TOTAL AUSTRALIA |
199,225,604 | |||||||
|
|
|
|||||||
| AUSTRIA (0.4%) |
||||||||
| *Addiko Bank AG |
727 | 12,367 | ||||||
| Agrana Beteiligungs AG |
5,922 | 125,003 | ||||||
| ANDRITZ AG |
29,718 | 1,684,474 | ||||||
| AT&S Austria Technologie & Systemtechnik AG |
20,351 | 780,720 | ||||||
| Atrium European Real Estate, Ltd. |
37,422 | 153,738 | ||||||
| BAWAG Group AG |
14,447 | 910,336 | ||||||
| *»CA Immobilien Anla |
10,074 | — | ||||||
| *DO & CO AG |
2,338 | 211,581 | ||||||
| *Erste Group Bank AG |
54,616 | 2,344,875 | ||||||
| EVN AG |
18,463 | 521,336 | ||||||
| *Flughafen Wien AG |
2,358 | 77,770 | ||||||
| #*Kapsch TrafficCom AG |
1,571 | 27,961 | ||||||
| *Lenzing AG |
4,086 | 491,765 | ||||||
| Mayr Melnhof Karton AG |
2,813 | 554,058 | ||||||
| Oesterreichische Post AG |
12,355 | 521,869 | ||||||
| OMV AG |
47,668 | 2,890,575 | ||||||
| Palfinger AG |
4,858 | 214,757 | ||||||
| POLYTEC Holding AG |
5,223 | 51,135 | ||||||
| #*Porr AG |
2,474 | 35,501 | ||||||
| Raiffeisen Bank International AG |
64,726 | 1,895,070 | ||||||
| Rosenbauer International AG |
731 | 39,929 | ||||||
| S IMMO AG |
18,580 | 440,784 | ||||||
| *Schoeller-Bleckmann Oilfield Equipment AG |
1,853 | 75,589 | ||||||
| Semperit AG Holding |
2,415 | 81,467 | ||||||
| Strabag SE |
7,454 | 320,029 | ||||||
| Telekom Austria AG |
60,508 | 523,770 | ||||||
| Ubm Development AG |
887 | 43,830 | ||||||
| UNIQA Insurance Group AG |
59,842 | 557,478 | ||||||
| Verbund AG |
2,686 | 280,064 | ||||||
| Vienna Insurance Group AG Wiener Versicherung Gruppe |
18,578 | 542,858 | ||||||
| voestalpine AG |
54,140 | 2,057,536 | ||||||
| #*Warimpex Finanz- Und Beteiligungs AG |
10,740 | 15,349 | ||||||
| Wienerberger AG |
20,890 | 740,235 | ||||||
| Zumtobel Group AG |
8,937 | 92,047 | ||||||
|
|
|
|||||||
| TOTAL AUSTRIA |
19,315,856 | |||||||
|
|
|
|||||||
| BELGIUM (0.8%) |
||||||||
| Ackermans & van Haaren NV |
10,404 | 1,790,347 | ||||||
| Ageas SA |
55,338 | 2,696,072 | ||||||
| *AGFA-Gevaert NV |
76,713 | 333,797 | ||||||
| #Anheuser-Busch InBev SA/NV, Sponsored ADR |
8,449 | 517,248 | ||||||
| Anheuser-Busch InBev SA/NV |
79,380 | 4,847,570 | ||||||
Dimensional World ex U.S. Core Equity 2 ETF
SCHEDULE OF INVESTMENTS
October 31, 2021
| Security Description |
Shares | Fair Value | ||||||
| BELGIUM (Continued) |
||||||||
| *Argenx SE |
949 | $ | 284,331 | |||||
| *Argenx SE, Sponsored ADR |
300 | 90,588 | ||||||
| Atenor |
1,729 | 114,850 | ||||||
| Banque Nationale de Belgique |
37 | 73,219 | ||||||
| Barco NV |
13,500 | 304,020 | ||||||
| Bekaert SA |
22,791 | 999,078 | ||||||
| #*Biocartis Group NV |
2,296 | 10,495 | ||||||
| *bpost SA |
35,967 | 308,008 | ||||||
| #*Celyad Oncology SA |
572 | 2,515 | ||||||
| Cie d’Entreprises CFE |
5,218 | 534,408 | ||||||
| Deceuninck NV |
30,852 | 131,746 | ||||||
| D’ieteren Group |
16,137 | 2,780,631 | ||||||
| Econocom Group SA |
64,162 | 271,389 | ||||||
| #Elia Group SA |
7,252 | 846,789 | ||||||
| Etablissements Franz Colruyt NV |
11,205 | 550,317 | ||||||
| #Euronav NV |
87,737 | 925,625 | ||||||
| Euronav NV |
24,745 | 263,166 | ||||||
| EVS Broadcast Equipment SA |
6,891 | 161,884 | ||||||
| Exmar NV |
16,028 | 85,322 | ||||||
| Fagron |
18,432 | 319,529 | ||||||
| *Galapagos NV |
1,892 | 100,291 | ||||||
| Gimv NV |
8,243 | 533,240 | ||||||
| *Greenyard NV |
2,603 | 25,303 | ||||||
| Immobel SA |
1,348 | 118,714 | ||||||
| Ion Beam Applications |
2,087 | 41,058 | ||||||
| Jensen-Group NV |
589 | 17,995 | ||||||
| *KBC Group NV |
35,456 | 3,305,485 | ||||||
| *Kinepolis Group NV |
7,850 | 494,645 | ||||||
| Lotus Bakeries NV |
97 | 644,332 | ||||||
| *MDxHealth SA |
5,908 | 7,965 | ||||||
| Melexis NV |
7,930 | 914,026 | ||||||
| *Ontex Group NV |
30,443 | 286,773 | ||||||
| Orange Belgium SA |
19,136 | 434,929 | ||||||
| *Picanol |
532 | 42,357 | ||||||
| Proximus SADP |
73,770 | 1,390,252 | ||||||
| Recticel SA |
23,561 | 436,254 | ||||||
| Resilux |
571 | 118,942 | ||||||
| Roularta Media Group NV |
1,508 | 28,445 | ||||||
| Shurgard Self Storage SA |
6,970 | 427,499 | ||||||
| Sipef NV |
2,502 | 168,514 | ||||||
| *Solvay SA, Class A |
32,108 | 3,819,727 | ||||||
| Telenet Group Holding NV |
11,557 | 415,406 | ||||||
| Ter Beke SA |
301 | 41,800 | ||||||
| *Tessenderlo Group SA |
16,074 | 586,880 | ||||||
| UCB SA |
12,741 | 1,520,156 | ||||||
| Umicore SA |
35,408 | 2,031,580 | ||||||
| Van de Velde NV |
2,567 | 89,120 | ||||||
| VGP NV |
185 | 47,956 | ||||||
| Viohalco SA |
20,959 | 105,993 | ||||||
|
|
|
|||||||
| TOTAL BELGIUM |
37,438,581 | |||||||
|
|
|
|||||||
| BRAZIL (1.3%) |
||||||||
| AES Brasil Energia SA |
0 | 0 | ||||||
| Aliansce Sonae Shopping Centers SA |
22,914 | 77,965 | ||||||
Dimensional World ex U.S. Core Equity 2 ETF
SCHEDULE OF INVESTMENTS
October 31, 2021
| Security Description |
Shares | Fair Value | ||||||
| BRAZIL (Continued) |
||||||||
| *Alliar Medicos A Frente SA |
17,249 | $ | 45,287 | |||||
| *Alpargatas SA, Preference |
7,443 | 51,006 | ||||||
| Alupar Investimento SA |
37,148 | 156,447 | ||||||
| #Ambev SA, Sponsored ADR |
94,170 | 278,743 | ||||||
| *Americanas SA |
15,594 | 82,161 | ||||||
| *Anima Holding SA |
46,437 | 54,370 | ||||||
| Atacadao SA |
175,810 | 518,978 | ||||||
| #*Azul SA, Sponsored ADR |
3,972 | 52,550 | ||||||
| B3 SA—Brasil Bolsa Balcao |
105,914 | 223,778 | ||||||
| Banco ABC Brasil SA, Preference |
40,326 | 108,666 | ||||||
| Banco Bradesco SA, Preference |
86,995 | 307,114 | ||||||
| Banco Bradesco SA |
126,184 | 380,544 | ||||||
| *Banco Bradesco SA, Sponsored ADR |
225,479 | 789,177 | ||||||
| Banco BTG Pactual SA |
77,304 | 309,243 | ||||||
| *Banco do Brasil SA |
95,984 | 485,284 | ||||||
| Banco do Estado do Rio Grande do Sul SA, Preference |
94,839 | 183,217 | ||||||
| Banco Pan SA |
32,678 | 77,043 | ||||||
| Banco Santander Brasil SA |
32,328 | 197,283 | ||||||
| BB Seguridade Participacoes SA |
87,750 | 343,870 | ||||||
| *BK Brasil Operacao e Assessoria a Restaurantes SA |
76,700 | 93,477 | ||||||
| *BR Malls Participacoes SA |
178,576 | 227,140 | ||||||
| BR Properties SA |
32,617 | 41,719 | ||||||
| BrasilAgro—Co. Brasileira de Propriedades Agricolas |
23,306 | 104,437 | ||||||
| *Braskem SA, Sponsored ADR |
23,706 | 459,185 | ||||||
| *Braskem SA, Preference A |
15,400 | 148,782 | ||||||
| *BRF SA |
276,739 | 1,140,438 | ||||||
| *C&A Modas, Ltda. |
27,471 | 29,532 | ||||||
| Camil Alimentos SA |
33,561 | 57,632 | ||||||
| CCR SA |
312,750 | 634,155 | ||||||
| Centrais Eletricas Brasileiras SA, Class B |
24,904 | 149,504 | ||||||
| Centrais Eletricas Brasileiras SA |
15,116 | 90,718 | ||||||
| Centrais Eletricas Santa Catarina |
4,700 | 56,697 | ||||||
| Cia Brasileira de Distribuicao |
80,861 | 366,220 | ||||||
| Cia de Locacao das Americas |
145,964 | 510,887 | ||||||
| Cia de Saneamento Basico do Estado de Sao Paulo |
33,000 | 206,067 | ||||||
| #Cia de Saneamento Basico Do Estado de Sao Paulo , Sponsored ADR |
25,800 | 162,024 | ||||||
| Cia de Saneamento de Minas Gerais-COPASA |
31,755 | 76,670 | ||||||
| Cia de Saneamento do Parana |
102,902 | 333,149 | ||||||
| Cia de Saneamento do Parana |
41,100 | 26,102 | ||||||
| Cia de Saneamento do Parana, Preference |
334,905 | 221,012 | ||||||
| *Cia de Transmissao de Energia Eletrica Paulista |
52,600 | 226,935 | ||||||
| Cia Energetica de Minas Gerais, Preference |
165,988 | 379,266 | ||||||
| Cia Energetica de Minas Gerais |
31,618 | 93,223 | ||||||
| Cia Energetica de Sao Paulo, Preference B |
36,222 | 163,857 | ||||||
| *Cia Energetica Do Ceara |
3,232 | 30,210 | ||||||
| Cia Ferro Ligas da Bahia—FERBASA, Preference |
15,600 | 131,176 | ||||||
| Cia Paranaense de Energia, Preference B |
220,050 | 231,097 | ||||||
| Cia Paranaense de Energia |
23,000 | 21,951 | ||||||
| #Cia Siderurgica Nacional SA, Sponsored ADR |
208,061 | 848,889 | ||||||
| Cia Siderurgica Nacional SA |
226,966 | 917,205 | ||||||
| Cielo SA |
362,143 | 140,694 | ||||||
| *Cogna Educacao |
604,518 | 265,958 | ||||||
| Construtora Tenda SA |
31,344 | 94,860 | ||||||
| Cosan SA |
155,380 | 545,498 | ||||||
| #Cosan SA, ADR |
650 | 9,094 | ||||||
| CSU Cardsystem SA |
18,186 | 54,652 | ||||||
Dimensional World ex U.S. Core Equity 2 ETF
SCHEDULE OF INVESTMENTS
October 31, 2021
| Security Description |
Shares | Fair Value | ||||||
| BRAZIL (Continued) |
||||||||
| *Cyrela Brazil Realty SA Empreendimentos e Participacoes |
105,210 | $ | 262,978 | |||||
| Dexco SA |
104,937 | 288,730 | ||||||
| Direcional Engenharia SA |
31,936 | 54,048 | ||||||
| *EcoRodovias Infraestrutura e Logistica SA |
70,960 | 103,098 | ||||||
| EDP—Energias do Brasil SA |
50,882 | 176,918 | ||||||
| *Embraer SA, Sponsored ADR |
77,176 | 1,198,543 | ||||||
| Enauta Participacoes SA |
41,800 | 94,767 | ||||||
| Energisa SA |
68,145 | 478,961 | ||||||
| *Eneva SA |
82,444 | 210,607 | ||||||
| Engie Brasil Energia SA |
24,375 | 168,251 | ||||||
| Equatorial Energia SA |
241,960 | 982,091 | ||||||
| Eucatex SA Industria e Comercio, Preference |
16,900 | 23,864 | ||||||
| Even Construtora e Incorporadora SA |
48,516 | 53,534 | ||||||
| Ez Tec Empreendimentos e Participacoes SA |
32,267 | 104,466 | ||||||
| Fleury SA |
75,200 | 251,200 | ||||||
| Fras-Le SA |
9,200 | 23,192 | ||||||
| *Gafisa SA |
81,757 | 29,152 | ||||||
| #*Gerdau SA, Sponsored ADR |
131,435 | 621,688 | ||||||
| *Gerdau SA, Preference |
198,623 | 947,837 | ||||||
| *Getnet Adquirencia e Servicos para Meios de Pagamento SA |
8,082 | 6,251 | ||||||
| *Gol Linhas Aereas Inteligentes SA, Preference |
1 | 2 | ||||||
| #*GOL Linhas Aereas Inteligentes SA, ADR |
10,588 | 57,916 | ||||||
| Grazziotin SA |
3,100 | 24,835 | ||||||
| Grendene SA |
28,300 | 43,075 | ||||||
| *Grupo de Moda Soma SA |
12,608 | 29,344 | ||||||
| Guararapes Confeccoes SA |
49,064 | 95,308 | ||||||
| Hapvida Participacoes e Investimentos SA |
12,655 | 25,907 | ||||||
| Helbor Empreendimentos SA |
31,530 | 26,737 | ||||||
| Hypera SA |
60,074 | 299,038 | ||||||
| Iguatemi Empresa de Shopping Centers SA |
15,600 | 82,857 | ||||||
| Industrias Romi SA |
700 | 2,028 | ||||||
| Instituto Hermes Pardini SA |
24,400 | 95,055 | ||||||
| *International Meal Co. Alimentacao SA |
93,106 | 46,413 | ||||||
| *Iochpe Maxion SA |
65,310 | 194,412 | ||||||
| *IRB Brasil Resseguros SA |
188,032 | 156,443 | ||||||
| Itau Unibanco Holding SA, Preference |
196,079 | 810,822 | ||||||
| Itau Unibanco Holding SA |
15,703 | 58,583 | ||||||
| JBS SA |
484,960 | 3,359,533 | ||||||
| JHSF Participacoes SA |
115,664 | 102,388 | ||||||
| Jsl SA |
7,925 | 10,151 | ||||||
| Kepler Weber SA |
6,200 | 38,859 | ||||||
| *Klabin SA |
224,274 | 912,692 | ||||||
| Light SA |
61,500 | 105,609 | ||||||
| Localiza Rent a Car SA |
134,249 | 1,078,850 | ||||||
| LOG Commercial Properties e Participacoes SA |
12,060 | 50,127 | ||||||
| *Log-in Logistica Intermodal SA |
12,719 | 47,835 | ||||||
| Lojas Americanas SA, Preference |
35,397 | 30,330 | ||||||
| Lojas Americanas SA |
9,573 | 8,372 | ||||||
| Lojas Renner SA |
200,723 | 1,147,650 | ||||||
| *Lps Brasil Consultoria de Imoveis SA |
13,200 | 5,714 | ||||||
| M Dias Branco SA |
17,710 | 97,237 | ||||||
| Magazine Luiza SA |
100,667 | 193,048 | ||||||
| Mahle-Metal Leve SA |
24,438 | 147,746 | ||||||
| Marcopolo SA, Preference |
212,533 | 97,651 | ||||||
| Marcopolo SA |
54,800 | 22,651 | ||||||
Dimensional World ex U.S. Core Equity 2 ETF
SCHEDULE OF INVESTMENTS
October 31, 2021
| Security Description |
Shares | Fair Value | ||||||
| BRAZIL (Continued) |
||||||||
| Marfrig Global Foods SA |
102,662 | $ | 482,622 | |||||
| *Marisa Lojas SA |
42,258 | 30,811 | ||||||
| Mills Estruturas e Servicos de Engenharia SA |
70,257 | 62,692 | ||||||
| Minerva SA |
46,069 | 79,601 | ||||||
| Movida Participacoes SA |
7,500 | 19,758 | ||||||
| MRV Engenharia e Participacoes SA |
117,737 | 211,998 | ||||||
| Multiplan Empreendimentos Imobiliarios SA |
61,400 | 201,726 | ||||||
| #*Natura & Co. Holding SA, ADR |
1,650 | 22,720 | ||||||
| *Natura & Co. Holding SA |
151,982 | 1,048,802 | ||||||
| Neoenergia SA |
14,900 | 40,970 | ||||||
| Notre Dame Intermedica Participacoes SA |
31,816 | 362,241 | ||||||
| Odontoprev SA |
128,363 | 305,366 | ||||||
| *Omega Geracao SA |
20,913 | 121,427 | ||||||
| *Petro Rio SA |
224,585 | 935,074 | ||||||
| Petroleo Brasileiro SA, Sponsored ADR |
55,024 | 528,781 | ||||||
| Petroleo Brasileiro SA, Sponsored ADR |
19,287 | 189,398 | ||||||
| *Petroleo Brasileiro SA |
644,147 | 3,161,885 | ||||||
| *Petroleo Brasileiro SA, Preference |
812,708 | 3,928,737 | ||||||
| Porto Seguro SA |
143,884 | 595,752 | ||||||
| *Portobello SA |
22,113 | 37,502 | ||||||
| Positivo Tecnologia SA |
50,624 | 75,707 | ||||||
| Qualicorp Consultoria e Corretora de Seguros SA |
143,803 | 436,486 | ||||||
| Raia Drogasil SA |
155,750 | 642,396 | ||||||
| Randon SA Implementos e Participacoes, Preference |
91,000 | 164,016 | ||||||
| *Rumo SA |
200,177 | 567,825 | ||||||
| Sao Carlos Empreendimentos E Participacoes SA |
3,800 | 24,942 | ||||||
| Sao Martinho SA |
135,629 | 921,517 | ||||||
| Schulz SA, Preference |
32,600 | 47,712 | ||||||
| Sendas Distribuidora SA |
316,050 | 857,265 | ||||||
| #Sendas Distribuidora SA, ADR |
1,840 | 24,822 | ||||||
| Ser Educacional SA |
31,107 | 57,612 | ||||||
| Simpar SA |
90,400 | 164,378 | ||||||
| SLC Agricola SA |
54,137 | 418,537 | ||||||
| Sul America SA |
111,055 | 511,637 | ||||||
| *Suzano SA |
129,026 | 1,126,832 | ||||||
| #*Suzano SA, Sponsored ADR |
10,562 | 92,629 | ||||||
| Syn Prop E Tech SA |
300 | 676 | ||||||
| *Taurus Armas SA |
5,200 | 18,791 | ||||||
| *Tecnisa SA |
16,366 | 10,597 | ||||||
| Tegma Gestao Logistica SA |
19,812 | 53,809 | ||||||
| Telefonica Brasil SA, ADR |
12,260 | 98,448 | ||||||
| Telefonica Brasil SA |
27,800 | 224,491 | ||||||
| *Terra Santa Propriedades Agricolas SA |
5,318 | 20,538 | ||||||
| TIM SA |
244,773 | 487,201 | ||||||
| Tim SA/Brazil , ADR |
6,220 | 61,329 | ||||||
| TOTVS SA |
31,800 | 184,809 | ||||||
| Transmissora Alianca de Energia Eletrica SA |
97,278 | 632,644 | ||||||
| Trisul SA |
43,531 | 45,176 | ||||||
| *Tupy SA |
65,500 | 242,735 | ||||||
| #Ultrapar Participacoes SA, Sponsored ADR |
136,784 | 318,707 | ||||||
| Ultrapar Participacoes SA |
38,900 | 90,056 | ||||||
| *Unipar Carbocloro SA |
47,836 | 633,655 | ||||||
| *Unipar Carbocloro SA |
7,938 | 113,712 | ||||||
| Usinas Siderurgicas de Minas Gerais SA Usiminas, Preference A |
196,146 | 461,049 | ||||||
| Usinas Siderurgicas de Minas Gerais SA Usiminas |
27,360 | 62,515 | ||||||
| Vale SA, Sponsored ADR |
18,200 | 231,686 | ||||||
Dimensional World ex U.S. Core Equity 2 ETF
SCHEDULE OF INVESTMENTS
October 31, 2021
| Security Description |
Shares | Fair Value | ||||||
| BRAZIL (Continued) |
||||||||
| Vale SA |
622,419 | $ | 7,906,941 | |||||
| *Valid Solucoes e Servicos de Seguranca em Meios de Pagamento e Identificacao SA |
33,833 | 42,854 | ||||||
| *Via SA |
28,204 | 30,771 | ||||||
| Vibra Energia SA |
179,933 | 669,681 | ||||||
| *Vulcabras Azaleia SA |
41,656 | 64,512 | ||||||
| WEG SA |
37,400 | 245,485 | ||||||
| Wiz Solucoes E Corretagem de Seguros SA |
29,400 | 50,330 | ||||||
| *XP, Inc. |
4,890 | 160,471 | ||||||
| YDUQS Participacoes SA |
156,517 | 579,199 | ||||||
|
|
|
|||||||
| TOTAL BRAZIL |
61,843,276 | |||||||
|
|
|
|||||||
| CANADA (7.2%) |
||||||||
| *5N Plus, Inc. |
24,500 | $ | 60,877 | |||||
| *Absolute Software Corp. |
14,380 | 161,254 | ||||||
| Acadian Timber Corp. |
4,453 | 66,173 | ||||||
| *AcuityAds Holdings, Inc. |
3,739 | 23,799 | ||||||
| *Advantage Energy, Ltd. |
106,611 | 602,915 | ||||||
| Aecon Group, Inc. |
35,659 | 531,052 | ||||||
| Ag Growth International, Inc. |
11,375 | 249,607 | ||||||
| AGF Management, Ltd., Class B |
23,660 | 150,601 | ||||||
| *Agnico Eagle Mines, Ltd. |
14,797 | 784,981 | ||||||
| *Agnico Eagle Mines, Ltd. |
6,007 | 318,341 | ||||||
| *Aimia, Inc. |
7,300 | 28,563 | ||||||
| #*Air Canada |
46,467 | 831,836 | ||||||
| #*AirBoss of America Corp. |
7,393 | 192,049 | ||||||
| #Alamos Gold, Inc. |
185,019 | 1,370,235 | ||||||
| Alamos Gold, Inc. |
51,779 | 385,236 | ||||||
| *Alcanna, Inc. |
5,691 | 36,959 | ||||||
| *Alexco Resource Corp. |
16,413 | 27,012 | ||||||
| *Algoma Central Corp. |
4,700 | 65,293 | ||||||
| #Algonquin Power & Utilities Corp. |
62,598 | 900,930 | ||||||
| *Algonquin Power & Utilities Corp. |
14,677 | 211,789 | ||||||
| Alimentation Couche-Tard, Inc., Class B |
79,905 | 2,992,368 | ||||||
| AltaGas, Ltd. |
96,980 | 2,004,459 | ||||||
| *Altius Minerals Corp. |
7,200 | 91,833 | ||||||
| #Altus Group, Ltd. |
7,961 | 416,884 | ||||||
| #*Americas Gold & Silver Corp. |
11,652 | 10,904 | ||||||
| *Amerigo Resources, Ltd. |
33,200 | 34,819 | ||||||
| #Andlauer Healthcare Group, Inc. |
21 | 817 | ||||||
| *Andrew Peller, Ltd., Class A |
11,100 | 76,027 | ||||||
| ARC Resources, Ltd. |
303,773 | 2,908,947 | ||||||
| *Argonaut Gold, Inc. |
113,166 | 286,670 | ||||||
| *Aritzia, Inc. |
35,452 | 1,393,998 | ||||||
| *Atco, Ltd., Class I |
14,974 | 507,368 | ||||||
| *ATS Automation Tooling Systems, Inc. |
7,473 | 253,873 | ||||||
| #*Aurora Cannabis, Inc. |
48,717 | 322,994 | ||||||
| #*Aurora Cannabis, Inc. |
5,853 | 38,767 | ||||||
| *AutoCanada, Inc. |
14,210 | 511,172 | ||||||
| B2Gold Corp. |
20,132 | 83,346 | ||||||
| B2Gold Corp. |
343,746 | 1,417,080 | ||||||
| Badger Infrastructure Solutions, Ltd. |
13,691 | 377,191 | ||||||
| *Ballard Power Systems, Inc. |
36 | 651 | ||||||
| Bank of Montreal |
30,462 | 3,302,149 | ||||||
| Bank of Montreal |
21,087 | 2,288,150 | ||||||
Dimensional World ex U.S. Core Equity 2 ETF
SCHEDULE OF INVESTMENTS
October 31, 2021
| Security Description |
Shares | Fair Value | ||||||
| CANADA (Continued) |
||||||||
| #Bank of Nova Scotia (The) |
73,087 | $ | 4,791,584 | |||||
| Bank of Nova Scotia (The) |
70,372 | 4,606,498 | ||||||
| Barrick Gold Corp. |
36,529 | 677,474 | ||||||
| *Barrick Gold Corp. |
197,635 | 3,630,555 | ||||||
| *Barrick Gold Corp. |
2,500 | 45,803 | ||||||
| *Bausch Health Cos., Inc. |
52,891 | 1,485,179 | ||||||
| *Bausch Health Cos., Inc. |
34,276 | 959,247 | ||||||
| BCE, Inc. |
345 | 17,757 | ||||||
| #BCE, Inc. |
18,344 | 942,839 | ||||||
| #Birchcliff Energy, Ltd. |
131,174 | 703,729 | ||||||
| Bird Construction, Inc. |
14,424 | 117,296 | ||||||
| *Black Diamond Group, Ltd. |
26,016 | 95,077 | ||||||
| *BlackBerry, Ltd. |
1,428 | 15,422 | ||||||
| #*BlackBerry, Ltd. |
55,808 | 601,955 | ||||||
| *Bombardier, Inc. |
224,342 | 360,163 | ||||||
| *Bonterra Energy Corp. |
13,150 | 72,563 | ||||||
| #*Boralex, Inc., Class A |
36,080 | 1,114,811 | ||||||
| Brookfield Asset Management Reinsurance Partners, Ltd. |
115 | 7,090 | ||||||
| Brookfield Asset Management Reinsurance Partners, Ltd., Class A |
65 | 3,998 | ||||||
| *Brookfield Asset Management, Inc., Class A |
9,384 | 565,667 | ||||||
| #*Brookfield Asset Management, Inc., Class A |
17,392 | 1,050,303 | ||||||
| #Brookfield Infrastructure Corp., Class A |
5,180 | 313,504 | ||||||
| Brookfield Infrastructure Corp., Class A |
610 | 36,990 | ||||||
| BRP, Inc. |
9,248 | 811,881 | ||||||
| BRP, Inc. |
511 | 45,045 | ||||||
| *CAE, Inc. |
26,952 | 816,029 | ||||||
| *CAE, Inc. |
22,935 | 696,536 | ||||||
| Calian Group, Ltd. |
4,200 | 208,721 | ||||||
| #*Calibre Mining Corp. |
8,694 | 10,380 | ||||||
| *Cameco Corp. |
102,984 | 2,498,269 | ||||||
| Cameco Corp. |
38,092 | 925,636 | ||||||
| Canaccord Genuity Group, Inc. |
54,257 | 626,808 | ||||||
| #Canacol Energy, Ltd. |
54,005 | 169,045 | ||||||
| #*Canada Goose Holdings, Inc. |
13,776 | 511,090 | ||||||
| #*Canada Goose Holdings, Inc. |
500 | 18,515 | ||||||
| Canadian Imperial Bank of Commerce |
57,763 | 6,997,918 | ||||||
| Canadian Imperial Bank of Commerce |
25,552 | 3,098,435 | ||||||
| *Canadian National Railway Co. |
13,000 | 1,725,013 | ||||||
| *Canadian National Railway Co. |
48,451 | 6,439,622 | ||||||
| *Canadian Natural Resources, Ltd. |
270,796 | 11,511,538 | ||||||
| *Canadian Natural Resources, Ltd. |
28,391 | 1,204,765 | ||||||
| Canadian Pacific Railway, Ltd. |
10,149 | 785,533 | ||||||
| *Canadian Pacific Railway, Ltd. |
45,360 | 3,505,332 | ||||||
| *Canadian Tire Corp., Ltd., Class A |
12,570 | 1,782,546 | ||||||
| *Canadian Utilities, Ltd., Class B |
600 | 17,397 | ||||||
| *Canadian Utilities, Ltd., Class A |
22,549 | 652,157 | ||||||
| #Canadian Western Bank |
50,247 | 1,604,839 | ||||||
| *Canfor Corp. |
30,104 | 622,699 | ||||||
| *Canfor Pulp Products, Inc. |
15,063 | 81,661 | ||||||
| #*Canopy Growth Corp. |
14,574 | 184,070 | ||||||
| Capital Power Corp. |
31,398 | 1,029,671 | ||||||
| *Capstone Mining Corp. |
148,077 | 619,999 | ||||||
| *Cardinal Energy, Ltd. |
3,982 | 15,002 | ||||||
| *Cascades, Inc. |
49,084 | 567,839 | ||||||
| *CCL Industries, Inc. |
28,675 | 1,564,974 | ||||||
| *Celestica, Inc. |
5,600 | 55,117 | ||||||
Dimensional World ex U.S. Core Equity 2 ETF
SCHEDULE OF INVESTMENTS
October 31, 2021
| Security Description |
Shares | Fair Value | ||||||
| CANADA (Continued) |
||||||||
| *Celestica, Inc. |
52,952 | $ | 519,989 | |||||
| Cenovus Energy, Inc. |
124,733 | 1,494,301 | ||||||
| Cenovus Energy, Inc. |
130,052 | 1,552,797 | ||||||
| Centerra Gold, Inc. |
73,651 | 551,395 | ||||||
| CES Energy Solutions Corp. |
119,725 | 186,414 | ||||||
| *CGI, Inc. |
27,460 | 2,449,258 | ||||||
| *CGI, Inc. |
886 | 79,199 | ||||||
| China Gold International Resources Corp., Ltd. |
120,535 | 347,150 | ||||||
| CI Financial Corp. |
82,137 | 1,869,958 | ||||||
| Cogeco Communications, Inc. |
6,627 | 568,258 | ||||||
| *Cogeco, Inc. |
27,978 | 1,859,407 | ||||||
| *Colabor Group, Inc. |
23,800 | 17,472 | ||||||
| Colliers International Group, Inc. |
11,873 | 1,725,978 | ||||||
| Colliers International Group, Inc. |
2,800 | 405,560 | ||||||
| *Computer Modelling Group, Ltd. |
35,217 | 153,988 | ||||||
| *Conifex Timber, Inc. |
12,884 | 18,398 | ||||||
| Constellation Software, Inc. |
1,742 | 3,056,619 | ||||||
| #*Copper Mountain Mining Corp. |
97,704 | 299,524 | ||||||
| Corby Spirit and Wine, Ltd. |
5,700 | 82,036 | ||||||
| *Corus Entertainment, Inc., Class B |
252,575 | 1,143,113 | ||||||
| Crescent Point Energy Corp. |
160,991 | 809,785 | ||||||
| Crescent Point Energy Corp. |
53,200 | 266,955 | ||||||
| *Crew Energy, Inc. |
145,698 | 358,500 | ||||||
| #*Cronos Group, Inc. |
30,175 | 156,608 | ||||||
| *Denison Mines Corp. |
134,958 | 228,641 | ||||||
| *Descartes Systems Group, Inc. (The) |
3,518 | 286,849 | ||||||
| *Descartes Systems Group, Inc. (The) |
2,071 | 169,346 | ||||||
| Dexterra Group, Inc. |
16,103 | 116,269 | ||||||
| #*Dirtt Environmental Solutions |
10,600 | 34,206 | ||||||
| Dollarama, Inc. |
40,498 | 1,827,646 | ||||||
| Doman Building Materials Group, Ltd. |
34,600 | 189,253 | ||||||
| *Dorel Industries, Inc., Class B |
16,650 | 299,540 | ||||||
| DREAM Unlimited Corp. |
16,182 | 403,392 | ||||||
| Dundee Precious Metals, Inc. |
49,593 | 325,672 | ||||||
| Dynacor Gold Mines, Inc. |
10,800 | 24,222 | ||||||
| ECN Capital Corp. |
57,559 | 499,645 | ||||||
| *E-L Financial Corp., Ltd. |
284 | 207,347 | ||||||
| #*Eldorado Gold Corp. |
82,338 | 735,333 | ||||||
| *Eldorado Gold Corp. |
646 | 5,788 | ||||||
| Emera, Inc. |
33,375 | 1,550,347 | ||||||
| Empire Co., Ltd., Class A |
35,910 | 1,071,897 | ||||||
| Enbridge, Inc. |
36,711 | 1,536,723 | ||||||
| *Enbridge, Inc. |
54,246 | 2,268,656 | ||||||
| #Endeavour Mining PLC |
74,765 | 1,896,343 | ||||||
| Enerflex, Ltd. |
48,213 | 410,348 | ||||||
| #*Enerplus Corp. |
17,636 | 167,013 | ||||||
| Enerplus Corp. |
82,000 | 775,314 | ||||||
| *Enghouse Systems, Ltd. |
17,808 | 771,050 | ||||||
| *Ensign Energy Services, Inc. |
81,720 | 134,491 | ||||||
| #*Equinox Gold Corp. |
9,628 | 71,304 | ||||||
| Equitable Group, Inc. |
17,266 | 1,076,592 | ||||||
| *ERO Copper Corp. |
13,024 | 242,608 | ||||||
| Evertz Technologies, Ltd. |
8,165 | 93,339 | ||||||
| Exchange Income Corp. |
9,378 | 322,297 | ||||||
| Exco Technologies, Ltd. |
37,240 | 293,221 | ||||||
Dimensional World ex U.S. Core Equity 2 ETF
SCHEDULE OF INVESTMENTS
October 31, 2021
| Security Description |
Shares | Fair Value | ||||||
| CANADA (Continued) |
||||||||
| Extendicare, Inc. |
45,471 | $ | 265,588 | |||||
| Fairfax Financial Holdings, Ltd. |
5,286 | 2,137,556 | ||||||
| Fiera Capital Corp. |
16,900 | 144,793 | ||||||
| *Finning International, Inc. |
82,752 | 2,446,076 | ||||||
| First Majestic Silver Corp. |
528 | 6,690 | ||||||
| *First Majestic Silver Corp. |
258 | 3,264 | ||||||
| *First Quantum Minerals, Ltd. |
139,723 | 3,302,718 | ||||||
| FirstService Corp., Class WI |
7,871 | 1,573,570 | ||||||
| FirstService Corp. |
2,400 | 477,928 | ||||||
| *Fortis, Inc. |
20,830 | 925,759 | ||||||
| *Fortis, Inc. |
8,774 | 390,531 | ||||||
| #*Fortuna Silver Mines, Inc. |
68,299 | 330,599 | ||||||
| #*Franco-Nevada Corp. |
3,892 | 555,894 | ||||||
| *Frontera Energy Corp. |
8,419 | 59,837 | ||||||
| #*Galiano Gold, Inc. |
70,680 | 53,599 | ||||||
| *Gamehost, Inc. |
9,498 | 62,832 | ||||||
| *GDI Integrated Facility services, Inc. |
300 | 12,636 | ||||||
| #*Gear Energy, Ltd. |
54,000 | 38,337 | ||||||
| George Weston, Ltd. |
20,810 | 2,244,938 | ||||||
| #Gibson Energy, Inc. |
57,549 | 1,157,898 | ||||||
| *Gildan Activewear, Inc. |
846 | 31,065 | ||||||
| *Gildan Activewear, Inc. |
14,296 | 524,300 | ||||||
| #*GoGold Resources, Inc. |
16,500 | 45,791 | ||||||
| *Golden Star Resources, Ltd. |
19,013 | 59,361 | ||||||
| #*GoldMoney, Inc. |
16,200 | 31,105 | ||||||
| #*Gran Tierra Energy, Inc. |
182,088 | 165,995 | ||||||
| *Great-West Lifeco, Inc. |
28,477 | 836,471 | ||||||
| *Headwater Exploration, Inc. |
6,928 | 27,387 | ||||||
| *Heroux-Devtek, Inc. |
13,891 | 206,760 | ||||||
| *High Liner Foods, Inc. |
12,787 | 135,653 | ||||||
| *Home Capital Group, Inc. |
35,123 | 1,137,945 | ||||||
| Hudbay Minerals, Inc. |
3,627 | 25,244 | ||||||
| #Hudbay Minerals, Inc. |
127,861 | 890,194 | ||||||
| #Hydro One, Ltd. |
25,757 | 614,444 | ||||||
| #*i-80 Gold Corp. |
19,580 | 47,230 | ||||||
| iA Financial Corp., Inc. |
40,144 | 2,370,975 | ||||||
| *IAMGOLD Corp. |
155,174 | 426,883 | ||||||
| *IAMGOLD Corp. |
43,882 | 121,553 | ||||||
| *IBI Group, Inc. |
7,300 | 70,789 | ||||||
| *IGM Financial, Inc. |
13,669 | 541,886 | ||||||
| *Imperial Metals Corp. |
12,540 | 40,466 | ||||||
| *Imperial Oil, Ltd. |
24,351 | 825,012 | ||||||
| #*Imperial Oil, Ltd. |
9,800 | 331,265 | ||||||
| Information Services Corp. |
5,400 | 120,019 | ||||||
| #Innergex Renewable Energy, Inc. |
11,908 | 197,898 | ||||||
| Intact Financial Corp. |
15,046 | 2,013,861 | ||||||
| Inter Pipeline, Ltd. |
67,922 | 1,032,351 | ||||||
| #Interfor Corp. |
33,168 | 758,324 | ||||||
| *International Petroleum Corp. |
33,561 | 189,255 | ||||||
| *Intertape Polymer Group, Inc. |
43,583 | 988,709 | ||||||
| #Jamieson Wellness, Inc. |
23,663 | 727,520 | ||||||
| K-Bro Linen, Inc. |
1,229 | 36,725 | ||||||
| #*Kelt Exploration, Ltd. |
63,747 | 257,138 | ||||||
| Keyera Corp. |
63,515 | 1,625,345 | ||||||
| #*Kinaxis, Inc. |
4,982 | 772,008 | ||||||
| *Kinross Gold Corp. |
75,968 | 456,568 | ||||||
Dimensional World ex U.S. Core Equity 2 ETF
SCHEDULE OF INVESTMENTS
October 31, 2021
| Security Description |
Shares | Fair Value | ||||||
| CANADA (Continued) |
||||||||
| Kinross Gold Corp. |
261,711 | $ | 1,570,836 | |||||
| Kirkland Lake Gold, Ltd. |
3,329 | 140,384 | ||||||
| Kirkland Lake Gold, Ltd. |
80,828 | 3,401,877 | ||||||
| KP Tissue, Inc. |
5,700 | 49,203 | ||||||
| *Lassonde Industries, Inc., Class A |
2,100 | 298,156 | ||||||
| Laurentian Bank of Canada |
18,571 | 624,302 | ||||||
| *Leon’s Furniture, Ltd. |
14,887 | 302,652 | ||||||
| LifeWorks, Inc. |
20,579 | 531,098 | ||||||
| *Lightspeed Commerce, Inc. |
22 | 2,141 | ||||||
| *»Lightstream Resources, Ltd. |
52,634 | — | ||||||
| *Linamar Corp. |
29,830 | 1,638,117 | ||||||
| #*Loblaw Cos., Ltd. |
27,842 | 2,090,705 | ||||||
| *Lucara Diamond Corp. |
184,114 | 89,120 | ||||||
| *Lundin Mining Corp. |
363,103 | 3,154,870 | ||||||
| #*MAG Silver Corp. |
44 | 875 | ||||||
| *Magellan Aerospace Corp. |
8,300 | 70,977 | ||||||
| *Magna International, Inc. |
80,312 | 6,522,536 | ||||||
| *Magna International, Inc. |
32,010 | 2,602,413 | ||||||
| *Mainstreet Equity Corp. |
2,696 | 240,314 | ||||||
| *Major Drilling Group International, Inc. |
42,738 | 307,205 | ||||||
| *Mandalay Resources Corp. |
23,408 | 43,434 | ||||||
| Manulife Financial Corp. |
146,220 | 2,849,828 | ||||||
| *Manulife Financial Corp. |
17,741 | 345,073 | ||||||
| #*Maple Leaf Foods, Inc. |
29,549 | 643,162 | ||||||
| *Martinrea International, Inc. |
58,054 | 538,131 | ||||||
| *Mav Beauty Brands, Inc. |
2,500 | 4,498 | ||||||
| *MDF Commerce, Inc. |
3,302 | 15,344 | ||||||
| Medical Facilities Corp. |
18,216 | 135,788 | ||||||
| *MEG Energy Corp. |
125,325 | 1,121,257 | ||||||
| *Melcor Developments, Ltd. |
2,500 | 29,245 | ||||||
| *»Mercator Minerals, Ltd. |
15,420 | — | ||||||
| Methanex Corp. |
6,165 | 276,069 | ||||||
| #*Methanex Corp. |
19,726 | 882,263 | ||||||
| Metro, Inc. |
29,631 | 1,488,542 | ||||||
| *Morguard Corp. |
900 | 99,145 | ||||||
| *MTY Food Group, Inc. |
7,100 | 346,537 | ||||||
| Mullen Group, Ltd. |
44,276 | 457,208 | ||||||
| National Bank of Canada |
86,593 | 7,157,693 | ||||||
| Neo Performance Materials, Inc. |
1,300 | 20,010 | ||||||
| *New Gold, Inc. |
513,322 | 720,568 | ||||||
| *New Gold, Inc. |
42,951 | 59,702 | ||||||
| #NFI Group, Inc. |
28,542 | 577,494 | ||||||
| North American Construction Group, Ltd. |
19,538 | 335,734 | ||||||
| *North American Construction Group, Ltd. |
1,751 | 30,135 | ||||||
| North West Co., Inc. (The) |
23,014 | 624,389 | ||||||
| Northland Power, Inc. |
45,108 | 1,447,983 | ||||||
| Nutrien, Ltd. |
53,668 | 3,751,930 | ||||||
| *NuVista Energy, Ltd. |
76,496 | 378,299 | ||||||
| *OceanaGold Corp. |
286,042 | 533,062 | ||||||
| *Open Text Corp. |
18,400 | 925,381 | ||||||
| *Open Text Corp. |
17,828 | 897,640 | ||||||
| Osisko Gold Royalties, Ltd. |
3,504 | 44,256 | ||||||
| #Osisko Gold Royalties, Ltd. |
26,572 | 335,057 | ||||||
| *Pan American Silver Corp. |
46,840 | 1,199,572 | ||||||
| Paramount Resources, Ltd., Class A |
31,458 | 525,083 | ||||||
Dimensional World ex U.S. Core Equity 2 ETF
SCHEDULE OF INVESTMENTS
October 31, 2021
| Security Description |
Shares | Fair Value | ||||||
| CANADA (Continued) |
||||||||
| #Parex Resources, Inc. |
108,249 | $ | 2,098,522 | |||||
| Park Lawn Corp. |
7,381 | 219,843 | ||||||
| Parkland Corp. |
43,841 | 1,273,619 | ||||||
| *Pason Systems, Inc. |
25,000 | 185,551 | ||||||
| Pembina Pipeline Corp. |
2,245 | 74,202 | ||||||
| *Pembina Pipeline Corp. |
81,326 | 2,691,077 | ||||||
| Peyto Exploration & Development Corp. |
93,979 | 739,974 | ||||||
| PHX Energy Services Corp. |
18,919 | 76,314 | ||||||
| Pizza Pizza Royalty Corp. |
10,074 | 95,413 | ||||||
| Polaris Infrastructure, Inc. |
11,721 | 174,177 | ||||||
| Pollard Banknote, Ltd. |
3,300 | 124,594 | ||||||
| *Precision Drilling Corp. |
5,364 | 237,097 | ||||||
| #*Precision Drilling Corp. |
1,204 | 53,289 | ||||||
| #Premium Brands Holdings Corp. |
14,672 | 1,583,139 | ||||||
| *Pretium Resources, Inc. |
11,151 | 134,704 | ||||||
| *Pretium Resources, Inc. |
44,718 | 540,058 | ||||||
| Primo Water Corp. |
23,099 | 367,109 | ||||||
| Primo Water Corp. |
25,743 | 409,314 | ||||||
| Quarterhill, Inc. |
76,668 | 157,103 | ||||||
| #*Quebecor, Inc., Class B |
40,608 | 1,033,259 | ||||||
| #*Questerre Energy Corp. |
32,700 | 4,221 | ||||||
| *Recipe Unlimited Corp. |
14,874 | 232,311 | ||||||
| Restaurant Brands International, Inc. |
9,100 | 514,410 | ||||||
| Restaurant Brands International, Inc. |
9,336 | 528,791 | ||||||
| #*RF Capital Group, Inc. |
20,071 | 34,327 | ||||||
| Richelieu Hardware, Ltd. |
29,721 | 1,047,566 | ||||||
| *Ritchie Bros Auctioneers, Inc. |
7,600 | 518,643 | ||||||
| *Ritchie Bros Auctioneers, Inc. |
20,133 | 1,376,091 | ||||||
| *Rogers Communications, Inc., Class B |
10,300 | 478,293 | ||||||
| *Rogers Communications, Inc., Class B |
25,874 | 1,205,211 | ||||||
| #Rogers Sugar, Inc. |
44,731 | 203,528 | ||||||
| *Roots Corp. |
4,000 | 9,390 | ||||||
| Royal Bank of Canada |
139,164 | 14,474,448 | ||||||
| Royal Bank of Canada |
73,553 | 7,643,982 | ||||||
| *Russel Metals, Inc. |
43,470 | 1,144,307 | ||||||
| *Sandstorm Gold, Ltd. |
45,625 | 288,204 | ||||||
| *Sandstorm Gold, Ltd. |
7,058 | 44,677 | ||||||
| *Saputo, Inc. |
18,411 | 439,054 | ||||||
| Secure Energy Services, Inc. |
78,191 | 361,449 | ||||||
| Shaw Communications, Inc. |
67,901 | 1,958,265 | ||||||
| *Shaw Communications, Inc., Class B |
10,960 | 315,126 | ||||||
| *ShawCor, Ltd. |
35,032 | 150,636 | ||||||
| *Shopify, Inc., Class A |
823 | 1,207,119 | ||||||
| Sienna Senior Living, Inc. |
15,938 | 182,453 | ||||||
| *Sierra Wireless, Inc. |
12,659 | 211,912 | ||||||
| *Sierra Wireless, Inc. |
7,200 | 120,469 | ||||||
| #Sleep Country Canada Holdings, Inc. |
21,318 | 597,293 | ||||||
| *SNC-Lavalin Group, Inc. |
29,590 | 794,684 | ||||||
| *Spin Master Corp. |
5,653 | 195,373 | ||||||
| Sprott, Inc. |
3,770 | 153,136 | ||||||
| SSR Mining, Inc. |
82,541 | 1,299,827 | ||||||
| *SSR Mining, Inc. |
3,034 | 47,877 | ||||||
| Stantec, Inc. |
8,999 | 497,645 | ||||||
| *Stantec, Inc. |
21,142 | 1,166,643 | ||||||
| Stelco Holdings, Inc. |
8,622 | 298,889 | ||||||
| *Stella-Jones, Inc. |
26,841 | 962,079 | ||||||
Dimensional World ex U.S. Core Equity 2 ETF
SCHEDULE OF INVESTMENTS
October 31, 2021
| Security Description |
Shares | Fair Value | ||||||
| CANADA (Continued) |
||||||||
| *Storm Resources, Ltd. |
14,900 | 66,353 | ||||||
| *Sun Life Financial, Inc. |
809 | 46,032 | ||||||
| *Sun Life Financial, Inc. |
49,096 | 2,796,999 | ||||||
| Suncor Energy, Inc. |
111,613 | 2,930,905 | ||||||
| *Suncor Energy, Inc. |
212,594 | 5,591,222 | ||||||
| *SunOpta, Inc. |
7,675 | 59,558 | ||||||
| *SunOpta, Inc. |
4,800 | 37,175 | ||||||
| Superior Plus Corp. |
96,193 | 1,068,596 | ||||||
| Taiga Building Products, Ltd. |
12,900 | 27,370 | ||||||
| *Tamarack Valley Energy, Ltd. |
113,214 | 328,805 | ||||||
| #*Taseko Mines, Ltd. |
134,013 | 282,178 | ||||||
| *Taseko Mines, Ltd. |
4,961 | 10,468 | ||||||
| TC Energy Corp. |
65,802 | 3,559,888 | ||||||
| TC Energy Corp. |
5,442 | 293,931 | ||||||
| *Teck Resources, Ltd., Class B |
42,725 | 1,190,530 | ||||||
| *Teck Resources, Ltd., Class B |
102,551 | 2,861,173 | ||||||
| TECSYS, Inc. |
298 | 13,461 | ||||||
| *TELUS Corp. |
49,328 | 1,129,782 | ||||||
| *TeraGo, Inc. |
3,300 | 15,015 | ||||||
| TerraVest Industries, Inc. |
100 | 2,094 | ||||||
| TFI International, Inc. |
818 | 90,659 | ||||||
| TFI International, Inc. |
48,463 | 5,365,316 | ||||||
| Thomson Reuters Corp. |
4,681 | 562,188 | ||||||
| *Thomson Reuters Corp. |
3,276 | 394,201 | ||||||
| Tidewater Midstream and Infrastructure, Ltd. |
109,000 | 131,023 | ||||||
| #*Tilray, Inc., Class 2 |
53,270 | 548,681 | ||||||
| TMX Group, Ltd. |
10,531 | 1,138,356 | ||||||
| *Topicus.com, Inc. |
361 | 40,222 | ||||||
| *Torex Gold Resources, Inc. |
39,274 | 455,934 | ||||||
| *Toromont Industries, Ltd. |
21,492 | 1,909,148 | ||||||
| #Toronto-Dominion Bank (The) |
11,181 | 810,734 | ||||||
| Toronto-Dominion Bank (The) |
92,257 | 6,686,595 | ||||||
| *Total Energy Services, Inc. |
18,600 | 75,327 | ||||||
| #Tourmaline Oil Corp. |
121,168 | 4,372,429 | ||||||
| TransAlta Corp. |
36,662 | 411,348 | ||||||
| *TransAlta Corp. |
133,581 | 1,495,788 | ||||||
| TransAlta Renewables, Inc. |
40,996 | 605,903 | ||||||
| Transcontinental, Inc., Class A |
53,982 | 853,574 | ||||||
| *Trican Well Service, Ltd. |
109,914 | 307,694 | ||||||
| *Trisura Group, Ltd. |
8,821 | 297,674 | ||||||
| *Turquoise Hill Resources, Ltd. |
26,254 | 332,107 | ||||||
| *Uni-Select, Inc. |
18,930 | 271,988 | ||||||
| *Vermilion Energy, Inc. |
65,619 | 711,310 | ||||||
| *Vermilion Energy, Inc. |
13,654 | 147,825 | ||||||
| VersaBank |
4,000 | 47,695 | ||||||
| Wajax Corp. |
12,234 | 243,881 | ||||||
| Waste Connections, Inc. |
5,748 | 780,899 | ||||||
| Waste Connections, Inc. |
284 | 38,627 | ||||||
| *Wesdome Gold Mines, Ltd. |
130,571 | 1,172,406 | ||||||
| #West Fraser Timber Co., Ltd. |
2,369 | 189,615 | ||||||
| West Fraser Timber Co., Ltd. |
32,743 | 2,617,485 | ||||||
| Western Forest Products, Inc. |
210,094 | 362,713 | ||||||
| #Westshore Terminals Investment Corp. |
26,233 | 566,542 | ||||||
| #*Wheaton Precious Metals Corp. |
18,164 | 734,007 | ||||||
| Whitecap Resources, Inc. |
319,373 | 1,914,357 | ||||||
Dimensional World ex U.S. Core Equity 2 ETF
SCHEDULE OF INVESTMENTS
October 31, 2021
| Security Description |
Shares | Fair Value | ||||||
| CANADA (Continued) |
||||||||
| #*WildBrain, Ltd. |
65,806 | $ | 207,046 | |||||
| #Winpak, Ltd. |
7,738 | 241,775 | ||||||
| #WSP Global, Inc. |
17,233 | 2,332,583 | ||||||
| Yamana Gold, Inc. |
11,022 | 43,537 | ||||||
| #*Yamana Gold, Inc. |
398,609 | 1,562,857 | ||||||
| #*Yangarra Resources, Ltd. |
48,609 | 76,469 | ||||||
| Yellow Pages, Ltd. |
9,936 | 113,744 | ||||||
|
|
|
|||||||
| TOTAL CANADA |
341,849,224 | |||||||
|
|
|
|||||||
| CHILE (0.1%) |
||||||||
| *AES Andes SA |
297,414 | 30,646 | ||||||
| *Aguas Andinas SA, Class A |
422,238 | 80,668 | ||||||
| #Banco de Chile , Sponsored ADR |
8,263 | 142,785 | ||||||
| Banco de Credito e Inversiones SA |
6,066 | 204,808 | ||||||
| Banco Santander Chile , Sponsored ADR |
6,102 | 108,127 | ||||||
| *Besalco SA |
159,422 | 42,228 | ||||||
| CAP SA |
33,285 | 330,341 | ||||||
| Cencosud SA |
292,663 | 429,265 | ||||||
| *Cia Cervecerias Unidas SA |
2,971 | 24,959 | ||||||
| Cia Sud Americana de Vapores SA |
10,984,223 | 715,525 | ||||||
| *Coca-Cola Embonor SA |
10,803 | 12,054 | ||||||
| Colbun SA |
714,528 | 49,408 | ||||||
| *Cristalerias de Chile SA |
2,000 | 6,632 | ||||||
| Embotelladora Andina SA, Sponsored ADR |
4,903 | 60,160 | ||||||
| Embotelladora Andina SA, Preference B |
60,988 | 126,288 | ||||||
| Empresa Nacional de Telecomunicaciones SA |
75,858 | 260,772 | ||||||
| Empresas CMPC SA |
150,589 | 278,602 | ||||||
| *Empresas COPEC SA |
17,140 | 135,208 | ||||||
| *Empresas Hites SA |
40,531 | 7,230 | ||||||
| *Enel Americas SA |
2,271,184 | 258,943 | ||||||
| ENEL Americas SA, Sponsored ADR |
49,388 | 279,536 | ||||||
| Enel Chile SA |
844,942 | 34,711 | ||||||
| ENEL Chile SA, Sponsored ADR |
60,103 | 130,424 | ||||||
| Engie Energia Chile SA |
97,172 | 56,646 | ||||||
| Falabella SA |
25,508 | 70,728 | ||||||
| Forus SA |
24,881 | 33,277 | ||||||
| Grupo Security SA |
496,836 | 75,311 | ||||||
| Hortifrut SA |
47,782 | 50,784 | ||||||
| Inversiones Aguas Metropolitanas SA |
210,439 | 99,171 | ||||||
| Inversiones La Construccion SA |
14,743 | 53,338 | ||||||
| *Itau CorpBanca Chile SA |
31,981,234 | 71,151 | ||||||
| *Itau CorpBanca Chile SA, Sponsored ADR |
9,675 | 33,379 | ||||||
| Molibdenos y Metales SA |
1,797 | 7,973 | ||||||
| *Multiexport Foods SA |
175,108 | 55,240 | ||||||
| *Parque Arauco SA |
110,688 | 109,553 | ||||||
| PAZ Corp. SA |
30,769 | 10,687 | ||||||
| Plaza SA |
7,638 | 7,643 | ||||||
| *Ripley Corp. SA |
362,922 | 61,552 | ||||||
| SalfaCorp. SA |
188,280 | 63,974 | ||||||
| Sigdo Koppers SA |
85,947 | 81,373 | ||||||
| SMU SA |
190,409 | 19,008 | ||||||
| Sociedad Matriz SAAM SA |
1,873,505 | 117,285 | ||||||
| Sociedad Quimica y Minera de Chile SA, Sponsored ADR |
7,702 | 422,763 | ||||||
| Socovesa SA |
126,028 | 16,311 | ||||||
| SONDA SA |
182,389 | 61,777 | ||||||
Dimensional World ex U.S. Core Equity 2 ETF
SCHEDULE OF INVESTMENTS
October 31, 2021
| Security Description |
Shares | Fair Value | ||||||
| CHILE (Continued) |
||||||||
| *Vina Concha y Toro SA |
107,499 | $ | 156,747 | |||||
|
|
|
|||||||
| TOTAL CHILE |
5,484,991 | |||||||
|
|
|
|||||||
| CHINA (9.2%) |
||||||||
| *360 DigiTech Inc , ADR |
40,592 | 828,483 | ||||||
| *360 Security Technology, Inc. |
63,800 | 119,973 | ||||||
| *3SBio, Inc. |
582,000 | 532,692 | ||||||
| *51job, Inc. , Sponsored ADR |
5,450 | 324,602 | ||||||
| 5I5J Holding Group Co., Ltd., Class A |
39,500 | 18,384 | ||||||
| AAC Technologies Holdings, Inc. |
364,000 | 1,588,600 | ||||||
| AAG Energy Holdings, Ltd. |
472,000 | 106,183 | ||||||
| Accelink Technologies Co., Ltd., Class A |
10,200 | 34,554 | ||||||
| Addsino Co., Ltd., Class A |
12,800 | 30,687 | ||||||
| Advanced Technology & Materials Co., Ltd., Class A |
24,800 | 32,885 | ||||||
| AECC Aero-Engine Control Co., Ltd., Class A |
14,400 | 60,005 | ||||||
| AECC Aviation Power Co., Ltd., Class A |
7,130 | 65,880 | ||||||
| *Aerospace Hi-Tech Holdings Group, Ltd., Class A |
18,300 | 23,980 | ||||||
| *Aesthetic Medical International Holdings Group, Ltd. , ADR |
87 | 358 | ||||||
| Agile Group Holdings, Ltd. |
1,144,749 | 900,607 | ||||||
| Agricultural Bank of China, Ltd., Class H |
5,361,000 | 1,826,271 | ||||||
| Aier Eye Hospital Group Co., Ltd., Class A |
27,300 | 206,923 | ||||||
| *Air China, Ltd., Class H |
682,000 | 481,316 | ||||||
| AK Medical Holdings, Ltd. |
186,000 | 193,435 | ||||||
| AKM Industrial Co., Ltd. |
50,000 | 7,070 | ||||||
| *Alibaba Group Holding, Ltd. , Sponsored ADR |
43,175 | 7,121,284 | ||||||
| *Alibaba Group Holding, Ltd. |
286,500 | 6,003,239 | ||||||
| *Alibaba Health Information Technology, Ltd. |
62,000 | 78,346 | ||||||
| *Alibaba Pictures Group, Ltd. |
5,570,000 | 594,301 | ||||||
| A-Living Smart City Services Co., Ltd. |
244,500 | 820,338 | ||||||
| *Aluminum Corp., Ltd., Class H |
2,396,000 | 1,432,231 | ||||||
| Amoy Diagnostics Co., Ltd. |
4,200 | 53,016 | ||||||
| Angang Steel Co., Ltd., Class H |
827,400 | 445,659 | ||||||
| Angel Yeast Co., Ltd., Class A |
17,600 | 152,918 | ||||||
| Anhui Anke Biotechnology Group Co., Ltd. |
17,200 | 32,908 | ||||||
| Anhui Conch Cement Co., Ltd., Class H |
410,000 | 2,039,709 | ||||||
| Anhui Construction Engineering Group Co., Ltd., Class A |
41,600 | 25,144 | ||||||
| Anhui Expressway Co., Ltd. |
118,000 | 70,081 | ||||||
| Anhui Guangxin Agrochemical Co., Ltd., Class A |
9,500 | 52,465 | ||||||
| Anhui Gujing Distillery Co., Ltd., Class A |
4,600 | 163,554 | ||||||
| Anhui Hengyuan Coal Industry and Electricity Power Co., Ltd., Class A |
38,800 | 42,359 | ||||||
| Anhui Jinhe Industrial Co., Ltd., Class A |
11,500 | 86,357 | ||||||
| Anhui Korrun Co., Ltd., Class A |
7,200 | 24,998 | ||||||
| Anhui Kouzi Distillery Co., Ltd. |
16,400 | 155,299 | ||||||
| *Anhui Tatfook Technology Co., Ltd. |
15,600 | 21,490 | ||||||
| Anhui Truchum Advanced Materials & Technology Co., Ltd., Class A |
17,700 | 28,750 | ||||||
| Anhui Yingjia Distillery Co., Ltd. |
16,900 | 160,588 | ||||||
| Anhui Zhongding Sealing Parts Co., Ltd., Class A |
28,000 | 75,175 | ||||||
| ANTA Sports Products, Ltd. |
235,000 | 3,673,456 | ||||||
| *Anton Oilfield Services Group |
1,118,000 | 76,171 | ||||||
| Aoshikang Technology Co., Ltd. |
2,900 | 32,208 | ||||||
| *»Aowei Holdings, Ltd. |
59,000 | 6,030 | ||||||
| Apeloa Pharmaceutical Co., Ltd., Class A |
29,500 | 159,970 | ||||||
| APT Satellite Holdings, Ltd. |
186,250 | 55,307 | ||||||
| Asia Cement China Holdings Corp. |
341,500 | 260,327 | ||||||
Dimensional World ex U.S. Core Equity 2 ETF
SCHEDULE OF INVESTMENTS
October 31, 2021
| Security Description |
Shares | Fair Value | ||||||
| CHINA (Continued) |
||||||||
| #Asiainfo Technologies, Ltd. |
111,200 | 183,545 | ||||||
| Asymchem Laboratories Tianjin Co., Ltd. |
500 | 31,097 | ||||||
| Ausnutria Dairy Corp., Ltd. |
334,000 | 418,624 | ||||||
| Autobio Diagnostics Co., Ltd. |
14,200 | 121,270 | ||||||
| Avary Holding Shenzhen Co., Ltd., Class A |
12,262 | 67,010 | ||||||
| AVIC Electromechanical Systems Co., Ltd. |
21,700 | 51,516 | ||||||
| AviChina Industry & Technology Co., Ltd. |
1,154,000 | 735,802 | ||||||
| Avicopter PLC |
4,600 | 45,133 | ||||||
| BAIC Motor Corp., Ltd., Class H |
1,257,000 | 416,897 | ||||||
| *Baidu, Inc. |
9,400 | 195,756 | ||||||
| *Baidu, Inc. , Sponsored ADR |
33,222 | 5,389,937 | ||||||
| Bank of Beijing Co., Ltd., Class A |
203,000 | 140,455 | ||||||
| Bank of Changsha Co., Ltd., Class A |
61,800 | 77,700 | ||||||
| Bank of Chengdu Co., Ltd., Class A |
83,200 | 165,810 | ||||||
| Bank of China, Ltd., Class H |
8,447,800 | 2,986,412 | ||||||
| Bank of Chongqing Co., Ltd., Class H |
341,500 | 192,282 | ||||||
| Bank of Communications Co., Ltd., Class H |
1,214,695 | 722,972 | ||||||
| Bank of Guiyang Co., Ltd. |
45,300 | 47,757 | ||||||
| Bank of Hangzhou Co., Ltd., Class A |
57,000 | 127,128 | ||||||
| Bank of Jiangsu Co., Ltd., Class A |
170,100 | 167,106 | ||||||
| Bank of Nanjing Co., Ltd., Class A |
115,300 | 174,678 | ||||||
| Bank of Ningbo Co., Ltd., Class A |
44,400 | 264,901 | ||||||
| Bank of Shanghai Co., Ltd., Class A |
163,621 | 186,296 | ||||||
| Bank of Suzhou Co., Ltd. |
47,000 | 50,577 | ||||||
| *Bank of Zhengzhou Co., Ltd. |
83,600 | 19,882 | ||||||
| Baoshan Iron & Steel Co., Ltd., Class A |
231,084 | 257,333 | ||||||
| *Baoye Group Co., Ltd. |
87,040 | 42,630 | ||||||
| *Baozun, Inc. |
14,600 | 84,458 | ||||||
| *Baozun, Inc. , Sponsored ADR |
4,280 | 74,044 | ||||||
| BBMG Corp., Class H |
1,443,000 | 243,003 | ||||||
| Bear Electric Appliance Co., Ltd. |
3,300 | 29,456 | ||||||
| *BeiGene, Ltd. |
3,600 | 100,794 | ||||||
| Beijing Capital Development Co., Ltd., Class A |
36,385 | 27,902 | ||||||
| Beijing Capital Eco-Environment Protection Group Co., Ltd., Class A |
187,400 | 98,344 | ||||||
| *Beijing Capital International Airport Co., Ltd., Class H |
1,086,000 | 705,009 | ||||||
| *Beijing Career International Co., Ltd. |
4,800 | 43,122 | ||||||
| Beijing Certificate Authority Co., Ltd. |
3,300 | 19,153 | ||||||
| *Beijing Chunlizhengda Medical Instruments Co., Ltd. |
34,250 | 80,484 | ||||||
| Beijing Cisri-Gaona Materials & Technology Co., Ltd. |
4,700 | 30,640 | ||||||
| Beijing Ctrowell Technology Corp., Ltd. |
11,700 | 17,378 | ||||||
| Beijing Dabeinong Technology Group Co., Ltd., Class A |
98,200 | 131,594 | ||||||
| Beijing Easpring Material Technology Co., Ltd. |
9,500 | 131,668 | ||||||
| *Beijing Energy International Holding Co., Ltd. |
1,408,000 | 53,395 | ||||||
| *Beijing Enterprises Clean Energy Group, Ltd. |
10,500,000 | 141,727 | ||||||
| Beijing Enterprises Holdings, Ltd. |
233,500 | 897,494 | ||||||
| Beijing Enterprises Water Group, Ltd. |
2,059,000 | 786,115 | ||||||
| *»Beijing Gas Blue Sky Holdings, Ltd. |
2,080,000 | 11,631 | ||||||
| Beijing GeoEnviron Engineering & Technology, Inc. |
17,300 | 43,907 | ||||||
| *Beijing Jetsen Technology Co., Ltd., Class A |
52,400 | 33,636 | ||||||
| Beijing Jingneng Clean Energy Co., Ltd., Class H |
400,000 | 120,837 | ||||||
| Beijing New Building Materials PLC, Class A |
30,000 | 132,319 | ||||||
| Beijing North Star Co., Ltd., Class H |
300,000 | 48,206 | ||||||
| *Beijing Orient Landscape & Environment Co., Ltd., Class A |
53,288 | 23,637 | ||||||
| *Beijing Orient National Communication Science & Technology Co., Ltd., Class A |
23,600 | 32,510 | ||||||
| Beijing Originwater Technology Co., Ltd., Class A |
66,500 | 72,496 | ||||||
| *Beijing Sanju Environmental Protection and New Material Co., Ltd., Class A |
56,754 | 53,894 | ||||||
Dimensional World ex U.S. Core Equity 2 ETF
SCHEDULE OF INVESTMENTS
October 31, 2021
| Security Description |
Shares | Fair Value | ||||||
| CHINA (Continued) |
||||||||
| Beijing Shunxin Agriculture Co., Ltd., Class A |
15,400 | $ | 78,363 | |||||
| Beijing Sinnet Technology Co., Ltd., Class A |
46,076 | 95,064 | ||||||
| Beijing SL Pharmaceutical Co., Ltd., Class A |
25,900 | 37,539 | ||||||
| Beijing SuperMap Software Co., Ltd. |
7,300 | 26,383 | ||||||
| Beijing Thunisoft Corp., Ltd., Class A |
23,000 | 38,509 | ||||||
| Beijing Tiantan Biological Products Corp., Ltd., Class A |
6,500 | 29,309 | ||||||
| Beijing Tong Ren Tang Chinese Medicine Co., Ltd. |
123,000 | 157,010 | ||||||
| Beijing Tongtech Co., Ltd. |
6,800 | 30,619 | ||||||
| Beijing Urban Construction Design & Development Group Co., Ltd. |
80,000 | 21,391 | ||||||
| Beijing Yanjing Brewery Co., Ltd., Class A |
70,955 | 73,474 | ||||||
| Beijing Yuanliu Hongyuan Electronic Technology Co., Ltd. |
5,100 | 129,039 | ||||||
| Beijing Zhong Ke San Huan High-Tech Co., Ltd., Class A |
12,700 | 22,216 | ||||||
| *Berry Genomics Co., Ltd. |
7,400 | 22,433 | ||||||
| Best Pacific International Holdings, Ltd. |
186,000 | 56,428 | ||||||
| #*BEST, Inc. , ADR |
58 | 93 | ||||||
| Betta Pharmaceuticals Co., Ltd. |
2,500 | 30,924 | ||||||
| Better Life Commercial Chain Share Co., Ltd., Class A |
21,800 | 22,880 | ||||||
| BGI Genomics Co., Ltd. |
12,000 | 167,030 | ||||||
| Binhai Investment Co., Ltd. |
152,000 | 32,631 | ||||||
| Blue Sail Medical Co., Ltd., Class A |
25,321 | 57,265 | ||||||
| Bluefocus Intelligent Communications Group Co., Ltd., Class A |
50,700 | 39,672 | ||||||
| BOC International China Co., Ltd. |
21,200 | 43,971 | ||||||
| BOE Technology Group Co., Ltd., Class A |
545,600 | 418,401 | ||||||
| #Bosideng International Holdings, Ltd. |
1,362,000 | 1,057,517 | ||||||
| Bright Dairy & Food Co., Ltd., Class A |
45,200 | 98,480 | ||||||
| *»Brilliance China Automotive Holdings, Ltd. |
1,194,000 | 840,353 | ||||||
| B-Soft Co., Ltd., Class A |
37,200 | 46,480 | ||||||
| BYD Co., Ltd., Class H |
189,500 | 7,225,265 | ||||||
| BYD Electronic International Co., Ltd. |
550,500 | 1,638,256 | ||||||
| By-health Co., Ltd., Class A |
42,216 | 168,002 | ||||||
| C&S Paper Co., Ltd., Class A |
48,371 | 128,733 | ||||||
| #*»CA Cultural Technology Group, Ltd. |
315,000 | 24,701 | ||||||
| Cabbeen Fashion, Ltd. |
155,000 | 63,761 | ||||||
| Caitong Securities Co., Ltd., Class A |
68,900 | 110,409 | ||||||
| Camel Group Co., Ltd., Class A |
28,400 | 58,107 | ||||||
| Canny Elevator Co., Ltd., Class A |
19,300 | 21,975 | ||||||
| *CanSino Biologics, Inc. |
2,200 | 56,675 | ||||||
| Canvest Environmental Protection Group Co., Ltd. |
218,000 | 125,267 | ||||||
| *Capital Environment Holdings, Ltd. |
2,440,000 | 57,400 | ||||||
| Carrianna Group Holdings Co., Ltd. |
238,000 | 21,111 | ||||||
| CECEP Solar Energy Co., Ltd., Class A |
77,100 | 134,146 | ||||||
| Central China Management Co., Ltd. |
370,696 | 57,660 | ||||||
| Central China Real Estate, Ltd. |
370,696 | 55,754 | ||||||
| Central China Securities Co., Ltd. |
361,000 | 66,362 | ||||||
| CETC Digital Technology Co., Ltd. |
6,300 | 32,894 | ||||||
| #CGN New Energy Holdings Co., Ltd. |
904,000 | 846,006 | ||||||
| CGN Nuclear Technology Development Co., Ltd., Class A |
22,900 | 31,832 | ||||||
| Cgn Power Co., Ltd., Class H |
1,104,000 | 298,031 | ||||||
| Changchun Faway Automobile Components Co., Ltd. |
15,400 | 25,231 | ||||||
| Changchun High & New Technology Industry Group, Inc., Class A |
5,300 | 225,784 | ||||||
| Changjiang Securities Co., Ltd., Class A |
107,500 | 121,558 | ||||||
| Changzhou Tronly New Electronic Materials Co., Ltd., Class A |
10,800 | 19,955 | ||||||
| Chaowei Power Holdings, Ltd. |
330,000 | 97,570 | ||||||
| Chaozhou Three-Circle Group Co., Ltd., Class A |
17,700 | 110,578 | ||||||
| Chengdu Fusen Noble-House Industrial Co., Ltd. |
11,470 | 22,447 | ||||||
Dimensional World ex U.S. Core Equity 2 ETF
SCHEDULE OF INVESTMENTS
October 31, 2021
| Security Description |
Shares | Fair Value | ||||||
| CHINA (Continued) |
||||||||
| Chengdu Hongqi Chain Co., Ltd. |
33,500 | $ | 26,579 | |||||
| Chengdu Kanghong Pharmaceutical Group Co., Ltd., Class A |
15,900 | 45,346 | ||||||
| Chengdu Xingrong Environment Co., Ltd., Class A |
25,200 | 23,261 | ||||||
| Chengtun Mining Group Co., Ltd. |
34,500 | 55,177 | ||||||
| *Chifeng Jilong Gold Mining Co., Ltd. |
37,400 | 95,388 | ||||||
| China Aerospace International Holdings, Ltd. |
848,000 | 63,226 | ||||||
| China Aoyuan Group, Ltd. |
779,000 | 307,432 | ||||||
| *China Boton Group Co., Ltd. |
146,000 | 52,364 | ||||||
| *China CAMC Engineering Co., Ltd., Class A |
29,900 | 30,168 | ||||||
| China Cinda Asset Management Co., Ltd., Class H |
3,992,000 | 667,125 | ||||||
| China CITIC Bank Corp., Ltd., Class H |
1,751,000 | 769,814 | ||||||
| China Coal Energy Co., Ltd., Class H |
1,031,000 | 628,218 | ||||||
| China Communications Services Corp., Ltd. |
1,062,000 | 587,038 | ||||||
| China Conch Venture Holdings, Ltd. |
527,500 | 2,576,793 | ||||||
| China Construction Bank Corp., Class H |
16,236,200 | 11,041,129 | ||||||
| China CSSC Holdings, Ltd. |
24,800 | 87,344 | ||||||
| China Datang Corp. Renewable Power Co., Ltd., Class H |
1,037,000 | 441,245 | ||||||
| *China Daye Non-Ferrous Metals Mining, Ltd. |
3,026,163 | 38,901 | ||||||
| #*China Dili Group |
715,600 | 175,702 | ||||||
| China East Education Holdings, Ltd. |
74,000 | 70,489 | ||||||
| *China Eastern Airlines Corp., Ltd. |
674,000 | 265,128 | ||||||
| *China Eastern Airlines Corp., Ltd. , Sponsored ADR |
2,373 | 45,870 | ||||||
| China Education Group Holdings, Ltd. |
156,000 | 267,920 | ||||||
| *China Electronics Huada Technology Co., Ltd. |
256,000 | 25,998 | ||||||
| China Electronics Optics Valley Union Holding Co., Ltd. |
664,000 | 37,131 | ||||||
| #China Energy Engineering Corp., Ltd., Class H |
1,332,709 | 197,018 | ||||||
| China Everbright Bank Co., Ltd., Class H |
919,000 | 323,698 | ||||||
| China Everbright Environment Group, Ltd. |
1,060,074 | 729,060 | ||||||
| #China Everbright Greentech, Ltd. |
447,000 | 157,446 | ||||||
| China Everbright Water, Ltd. |
129,348 | 30,694 | ||||||
| China Express Airlines Co., Ltd., Class A |
37,700 | 64,770 | ||||||
| China Feihe, Ltd. |
42,000 | 69,973 | ||||||
| *»China Financial Services Holdings, Ltd. |
17,700 | 2,901 | ||||||
| China Foods, Ltd. |
604,000 | 231,380 | ||||||
| *China Fordoo Holdings, Ltd. |
131,000 | 10,946 | ||||||
| China Galaxy Securities Co., Ltd., Class H |
1,050,500 | 586,083 | ||||||
| China Gas Holdings, Ltd. |
1,132,800 | 2,833,802 | ||||||
| China Glass Holdings, Ltd. |
262,000 | 77,128 | ||||||
| #China Grand Pharmaceutical and Healthcare Holdings, Ltd. |
771,500 | 619,854 | ||||||
| China Greatwall Technology Group Co., Ltd., Class A |
32,300 | 67,852 | ||||||
| *China Green Agriculture, Inc. |
17 | 185 | ||||||
| *China Greenland Broad Greenstate Group Co., Ltd. |
356,000 | 11,212 | ||||||
| China Hanking Holdings, Ltd. |
433,000 | 79,041 | ||||||
| China Harmony Auto Holding, Ltd. |
380,000 | 194,420 | ||||||
| *»China High Precision Automation Group, Ltd. |
127,000 | 3,735 | ||||||
| *China High Speed Railway Technology Co., Ltd., Class A |
67,200 | 22,880 | ||||||
| #*China High Speed Transmission Equipment Group Co., Ltd. |
195,000 | 151,407 | ||||||
| China Hongqiao Group, Ltd. |
1,341,500 | 1,491,696 | ||||||
| *China Index Holdings, Ltd. , ADR |
2,946 | 4,507 | ||||||
| China International Capital Corp., Ltd., Class H |
374,400 | 931,783 | ||||||
| China International Marine Containers Group Co., Ltd., Class H |
291,820 | 576,959 | ||||||
| China Isotope & Radiation Corp. |
3,200 | 9,132 | ||||||
| China Jinmao Holdings Group, Ltd. |
1,880,000 | 551,018 | ||||||
| China Jushi Co., Ltd., Class A |
57,831 | 172,878 | ||||||
| China Kepei Education Group, Ltd. |
202,000 | 111,399 | ||||||
| China Kings Resources Group Co., Ltd. |
8,500 | 56,342 | ||||||
Dimensional World ex U.S. Core Equity 2 ETF
SCHEDULE OF INVESTMENTS
October 31, 2021
| Security Description |
Shares | Fair Value | ||||||
| CHINA (Continued) |
||||||||
| China Lesso Group Holdings, Ltd. |
767,000 | $ | 1,191,066 | |||||
| #China Life Insurance Co., Ltd. , Sponsored ADR |
3,332 | 28,722 | ||||||
| China Life Insurance Co., Ltd. |
532,000 | 927,352 | ||||||
| China Lilang, Ltd. |
323,000 | 183,941 | ||||||
| #*China Literature, Ltd. |
12,800 | 89,101 | ||||||
| #*China Logistics Property Holdings Co., Ltd. |
193,000 | 103,707 | ||||||
| China Longyuan Power Group Corp., Ltd., Class H |
776,000 | 1,813,548 | ||||||
| *»China Lumena New Materials Corp. |
18,800 | — | ||||||
| *China Maple Leaf Educational Systems, Ltd. |
542,000 | 87,093 | ||||||
| China Medical System Holdings, Ltd. |
853,000 | 1,454,005 | ||||||
| China Meheco Co., Ltd., Class A |
21,200 | 36,853 | ||||||
| China Meidong Auto Holdings, Ltd. |
250,000 | 1,298,359 | ||||||
| China Mengniu Dairy Co., Ltd. |
630,000 | 4,012,894 | ||||||
| China Merchants Bank Co., Ltd., Class H |
823,701 | 6,940,899 | ||||||
| China Merchants Energy Shipping Co., Ltd. |
187,160 | 133,880 | ||||||
| China Merchants Land, Ltd. |
614,000 | 68,669 | ||||||
| China Merchants Port Holdings Co., Ltd. |
424,000 | 708,570 | ||||||
| China Merchants Securities Co., Ltd., Class H |
17,160 | 27,133 | ||||||
| China Merchants Shekou Industrial Zone Holdings Co., Ltd., Class A |
76,100 | 123,967 | ||||||
| *»China Metal Recycling Holdings, Ltd. |
89,400 | — | ||||||
| China Minmetals Rare Earth Co., Ltd. |
3,200 | 18,907 | ||||||
| #China Minsheng Banking Corp., Ltd., Class H |
1,231,120 | 489,026 | ||||||
| China Modern Dairy Holdings, Ltd. |
1,940,000 | 366,600 | ||||||
| China Molybdenum Co., Ltd., Class H |
1,188,000 | 737,627 | ||||||
| China National Accord Medicines Corp., Ltd. |
9,400 | 49,212 | ||||||
| China National Building Material Co., Ltd., Class H |
2,227,400 | 2,800,338 | ||||||
| China National Chemical Engineering Co., Ltd. |
77,000 | 126,395 | ||||||
| China National Medicines Corp., Ltd., Class A |
18,600 | 88,603 | ||||||
| China National Nuclear Power Co., Ltd., Class A |
203,101 | 217,290 | ||||||
| China New Higher Education Group, Ltd. |
461,000 | 232,899 | ||||||
| *China Nonferrous Metal Industry’s Foreign Engineering and Construction Co., Ltd., Class A |
26,200 | 21,033 | ||||||
| China Northern Rare Earth Group High-Tech Co., Ltd., Class A |
3,900 | 30,821 | ||||||
| *China Oceanwide Holdings, Ltd. |
964,000 | 15,986 | ||||||
| *China Oil & Gas Group, Ltd. |
1,984,000 | 123,696 | ||||||
| China Oilfield Services, Ltd., Class H |
1,164,000 | 1,120,749 | ||||||
| China Overseas Grand Oceans Group, Ltd. |
1,191,375 | 571,256 | ||||||
| China Overseas Land & Investment, Ltd. |
1,438,827 | 3,173,944 | ||||||
| China Overseas Property Holdings, Ltd. |
749,275 | 674,237 | ||||||
| China Pacific Insurance Group Co., Ltd., Class H |
867,800 | 2,677,345 | ||||||
| China Petroleum & Chemical Corp. , Sponsored ADR |
11,057 | 538,255 | ||||||
| China Petroleum & Chemical Corp. |
4,659,400 | 2,288,057 | ||||||
| China Pioneer Pharma Holdings, Ltd. |
106,000 | 15,807 | ||||||
| China Power International Development, Ltd. |
882,333 | 443,489 | ||||||
| *»China Properties Group, Ltd. |
173,000 | 6,922 | ||||||
| China Publishing & Media Co., Ltd., Class A |
45,400 | 38,503 | ||||||
| China Railway Group, Ltd. |
1,671,000 | 818,417 | ||||||
| China Railway Signal & Communication Corp., Ltd., Class H |
566,000 | 198,634 | ||||||
| China Reinsurance Group Corp., Class H |
2,564,000 | 266,979 | ||||||
| China Renaissance Holdings, Ltd. |
106,100 | 255,326 | ||||||
| China Resources Beer Holdings Co., Ltd. |
178,962 | 1,483,864 | ||||||
| China Resources Cement Holdings, Ltd. |
1,630,610 | 1,375,078 | ||||||
| China Resources Double Crane Pharmaceutical Co., Ltd., Class A |
26,300 | 46,909 | ||||||
| China Resources Gas Group, Ltd. |
486,000 | 2,611,476 | ||||||
| China Resources Land, Ltd. |
1,056,444 | 4,114,931 | ||||||
Dimensional World ex U.S. Core Equity 2 ETF
SCHEDULE OF INVESTMENTS
October 31, 2021
| Security Description |
Shares | Fair Value | ||||||
| CHINA (Continued) |
||||||||
| China Resources Medical Holdings Co., Ltd. |
432,000 | $ | 302,659 | |||||
| China Resources Pharmaceutical Group, Ltd. |
703,000 | 338,891 | ||||||
| China Resources Power Holdings Co., Ltd. |
482,678 | 1,247,174 | ||||||
| China Resources Sanjiu Medical & Pharmaceutical Co., Ltd., Class A |
25,427 | 95,827 | ||||||
| China Risun Group, Ltd. |
56,000 | 33,978 | ||||||
| China Sanjiang Fine Chemicals Co., Ltd. |
500,000 | 150,404 | ||||||
| China SCE Group Holdings, Ltd. |
1,318,600 | 411,901 | ||||||
| China Science Publishing & Media, Ltd., Class A |
15,400 | 19,795 | ||||||
| *China Shanshui Cement Group, Ltd. |
234,000 | 60,162 | ||||||
| *China Shengmu Organic Milk, Ltd. |
1,157,000 | 78,828 | ||||||
| China Shenhua Energy Co., Ltd., Class H |
1,051,616 | 2,265,712 | ||||||
| China Shuifa Singyes Energy Holdings, Ltd. |
126,000 | 34,986 | ||||||
| #China South City Holdings, Ltd. |
2,254,000 | 168,057 | ||||||
| China South Publishing & Media Group Co., Ltd., Class A |
36,500 | 46,746 | ||||||
| *China Southern Airlines Co., Ltd. |
860,000 | 524,023 | ||||||
| #*China Southern Airlines Co., Ltd. , Sponsored ADR |
3,231 | 97,705 | ||||||
| China State Construction Engineering Corp., Ltd., Class A |
287,100 | 208,957 | ||||||
| *China Sunshine Paper Holdings Co., Ltd. |
359,000 | 81,685 | ||||||
| China Suntien Green Energy Corp., Ltd., Class H |
617,000 | 491,757 | ||||||
| China Taiping Insurance Holdings Co., Ltd. |
1,064,306 | 1,628,122 | ||||||
| #*China Tianrui Group Cement Co., Ltd. |
53,000 | 45,648 | ||||||
| *China Tianying, Inc., Class A |
61,000 | 45,159 | ||||||
| China Tourism Group Duty Free Corp., Ltd., Class A |
700 | 29,350 | ||||||
| China Tower Corp., Ltd., Class H |
7,034,000 | 913,266 | ||||||
| China Traditional Chinese Medicine Holdings Co., Ltd. |
1,366,000 | 649,719 | ||||||
| China TransInfo Technology Co., Ltd., Class A |
32,200 | 67,290 | ||||||
| *China Tungsten And Hightech Materials Co., Ltd. |
17,600 | 36,505 | ||||||
| China Vanke Co., Ltd., Class H |
608,310 | 1,424,777 | ||||||
| China Vast Industrial Urban Development Co., Ltd. |
218,000 | 63,054 | ||||||
| China Water Affairs Group, Ltd. |
310,000 | 319,602 | ||||||
| China West Construction Group Co., Ltd. |
30,500 | 34,250 | ||||||
| *»China Wood Optimization Holding, Ltd. |
88,000 | 7,636 | ||||||
| China World Trade Center Co., Ltd., Class A |
7,900 | 16,756 | ||||||
| China Xinhua Education Group, Ltd. |
65,000 | 13,871 | ||||||
| China XLX Fertiliser, Ltd. |
247,000 | 173,366 | ||||||
| China Yangtze Power Co., Ltd. |
76,400 | 253,565 | ||||||
| China Yongda Automobiles Services Holdings, Ltd. |
602,000 | 962,699 | ||||||
| #China Yuhua Education Corp., Ltd. |
798,000 | 363,145 | ||||||
| *China ZhengTong Auto Services Holdings, Ltd. |
456,000 | 55,688 | ||||||
| China Zhenhua Group Science & Technology Co., Ltd., Class A |
2,100 | 33,979 | ||||||
| #*»China Zhongwang Holdings, Ltd. |
878,400 | 189,703 | ||||||
| Chinasoft International, Ltd. |
1,192,000 | 1,995,082 | ||||||
| *Chongqing Brewery Co., Ltd. |
3,200 | 75,193 | ||||||
| Chongqing Changan Automobile Co., Ltd., Class A |
24,600 | 74,921 | ||||||
| Chongqing Department Store Co., Ltd. |
9,400 | 33,782 | ||||||
| Chongqing Dima Industry Co., Ltd., Class A |
54,500 | 19,663 | ||||||
| Chongqing Fuling Electric Power Industrial Co., Ltd., Class A |
27,700 | 72,898 | ||||||
| Chongqing Machinery & Electric Co., Ltd., Class H |
633,925 | 57,859 | ||||||
| Chongqing Rural Commercial Bank Co., Ltd., Class H |
1,221,000 | 439,488 | ||||||
| Chongqing Zhifei Biological Products Co., Ltd., Class A |
8,500 | 199,400 | ||||||
| Chongqing Zongshen Power Machinery Co., Ltd., Class A |
26,200 | 26,803 | ||||||
| Chow Tai Seng Jewellery Co., Ltd., Class A |
9,300 | 27,452 | ||||||
| CIFI Holdings Group Co., Ltd. |
1,589,085 | 882,479 | ||||||
| CIMC Enric Holdings, Ltd. |
458,000 | 592,293 | ||||||
| *Cinda Real Estate Co., Ltd., Class A |
39,600 | 19,853 | ||||||
| Cisen Pharmaceutical Co., Ltd., Class A |
11,500 | 21,571 | ||||||
Dimensional World ex U.S. Core Equity 2 ETF
SCHEDULE OF INVESTMENTS
October 31, 2021
| Security Description |
Shares | Fair Value | ||||||
| CHINA (Continued) |
||||||||
| *CITIC Guoan Information Industry Co., Ltd., Class A |
79,700 | $ | 28,008 | |||||
| *CITIC Resources Holdings, Ltd. |
1,040,000 | 73,531 | ||||||
| CITIC Securities Co., Ltd., Class H |
205,500 | 523,587 | ||||||
| CITIC, Ltd. |
1,440,000 | 1,443,878 | ||||||
| *Citychamp Watch & Jewellery Group, Ltd. |
438,000 | 73,760 | ||||||
| CNHTC Jinan Truck Co., Ltd., Class A |
11,060 | 22,871 | ||||||
| CNNC Hua Yuan Titanium Dioxide Co., Ltd. |
20,500 | 44,217 | ||||||
| COFCO Biotechnology Co., Ltd., Class A |
45,100 | 74,947 | ||||||
| #COFCO Joycome Foods, Ltd. |
1,044,000 | 405,304 | ||||||
| #*Cogobuy Group |
246,000 | 90,759 | ||||||
| Colour Life Services Group Co., Ltd. |
260,247 | 45,833 | ||||||
| *Comba Telecom Systems Holdings, Ltd. |
408,000 | 113,813 | ||||||
| Concord New Energy Group, Ltd. |
3,850,000 | 405,834 | ||||||
| Consun Pharmaceutical Group, Ltd. |
296,000 | 127,851 | ||||||
| Contemporary Amperex Technology Co., Ltd., Class A |
2,600 | 259,574 | ||||||
| *Continental Aerospace Technologies Holding, Ltd. |
1,307,948 | 20,513 | ||||||
| *Coolpad Group, Ltd. |
1,295,400 | 68,275 | ||||||
| COSCO SHIPPING Development Co., Ltd., Class H |
2,101,000 | 407,827 | ||||||
| COSCO SHIPPING Energy Transportation Co., Ltd., Class H |
565,752 | 250,183 | ||||||
| #*COSCO SHIPPING Holdings Co., Ltd., Class H |
1,239,900 | 1,925,427 | ||||||
| *Cosmo Lady China Holdings Co., Ltd. |
295,000 | 21,237 | ||||||
| Country Garden Holdings Co., Ltd. |
2,675,875 | 2,514,529 | ||||||
| Country Garden Services Holdings Co., Ltd. |
316,550 | 2,461,904 | ||||||
| CP Pokphand Co., Ltd. |
4,330,000 | 612,286 | ||||||
| CPMC Holdings, Ltd. |
265,000 | 129,450 | ||||||
| CQ Pharmaceutical Holding Co., Ltd. |
36,600 | 27,324 | ||||||
| #CSC Financial Co., Ltd., Class H |
84,500 | 89,616 | ||||||
| CSG Holding Co., Ltd., Class A |
27,400 | 38,686 | ||||||
| CSPC Innovation Pharmaceutical Co., Ltd. |
11,419 | 21,794 | ||||||
| CSPC Pharmaceutical Group, Ltd. |
3,054,080 | 3,195,790 | ||||||
| CSSC Science & Technology Co., Ltd., Class A |
10,100 | 20,191 | ||||||
| *»CT Environmental Group, Ltd. |
1,368,000 | 11,220 | ||||||
| CTS International Logistics Corp., Ltd., Class A |
26,730 | 51,559 | ||||||
| Da Ming International Holdings, Ltd. |
8,000 | 3,723 | ||||||
| Daan Gene Co., Ltd., Class A |
35,160 | 105,710 | ||||||
| DaFa Properties Group, Ltd. |
64,000 | 41,465 | ||||||
| Dali Foods Group Co., Ltd. |
1,003,000 | 558,293 | ||||||
| Dare Power Dekor Home Co., Ltd., Class A |
13,300 | 24,242 | ||||||
| Dashang Co., Ltd. |
7,000 | 21,308 | ||||||
| DaShenLin Pharmaceutical Group Co., Ltd., Class A |
17,888 | 98,817 | ||||||
| Datang International Power Generation Co., Ltd., Class H |
718,000 | 130,142 | ||||||
| Dawning Information Industry Co., Ltd. |
13,300 | 57,062 | ||||||
| Dawnrays Pharmaceutical Holdings, Ltd. |
450,000 | 98,341 | ||||||
| Dazzle Fashion Co., Ltd. |
6,000 | 17,561 | ||||||
| Dexin China Holdings Co., Ltd. |
84,000 | 28,183 | ||||||
| DHC Software Co., Ltd., Class A |
63,300 | 68,612 | ||||||
| Dian Diagnostics Group Co., Ltd., Class A |
4,800 | 24,155 | ||||||
| Digital China Group Co., Ltd., Class A |
13,500 | 31,416 | ||||||
| Digital China Information Service Co., Ltd., Class A |
19,900 | 34,655 | ||||||
| Do-Fluoride New Materials Co., Ltd. |
4,800 | 46,495 | ||||||
| Dong-E-E-Jiao Co., Ltd., Class A |
16,500 | 104,705 | ||||||
| Dongfeng Motor Group Co., Ltd., Class H |
1,268,000 | 1,185,024 | ||||||
| Dongjiang Environmental Co., Ltd., Class H |
100,200 | 45,727 | ||||||
| Dongxing Securities Co., Ltd., Class A |
53,000 | 90,724 | ||||||
| Dongyue Group, Ltd. |
986,000 | 2,296,723 | ||||||
Dimensional World ex U.S. Core Equity 2 ETF
SCHEDULE OF INVESTMENTS
October 31, 2021
| Security Description |
Shares | Fair Value | ||||||
| CHINA (Continued) |
||||||||
| *DouYu International Holdings, Ltd. , Sponsored ADR |
6,264 | $ | 19,732 | |||||
| *Duiba Group, Ltd. |
83,200 | 19,466 | ||||||
| Dynagreen Environmental Protection Group Co., Ltd., Class H |
280,000 | 143,257 | ||||||
| East Group Co., Ltd. |
30,700 | 49,627 | ||||||
| East Money Information Co., Ltd., Class A |
17,300 | 88,895 | ||||||
| *E-Commodities Holdings, Ltd. |
828,000 | 87,281 | ||||||
| Edifier Technology Co., Ltd. |
23,500 | 41,475 | ||||||
| *ENN Energy Holdings, Ltd. |
126,300 | 2,186,978 | ||||||
| *ESR Cayman, Ltd. |
7,800 | 25,318 | ||||||
| Essex Bio-technology, Ltd. |
154,000 | 104,923 | ||||||
| Eternal Asia Supply Chain Management, Ltd., Class A |
34,500 | 30,929 | ||||||
| *Ev Dynamics Holdings, Ltd. |
590,000 | 7,812 | ||||||
| EVA Precision Industrial Holdings, Ltd. |
396,000 | 69,232 | ||||||
| Eve Energy Co., Ltd., Class A |
1,500 | 26,579 | ||||||
| #Everbright Securities Co., Ltd., Class H |
123,800 | 96,760 | ||||||
| Fangda Carbon New Material Co., Ltd., Class A |
29,771 | 49,938 | ||||||
| Fangda Special Steel Technology Co., Ltd., Class A |
52,100 | 60,134 | ||||||
| #Fanhua, Inc. , ADR |
3,078 | 40,814 | ||||||
| #»Fantasia Holdings Group Co., Ltd. |
810,000 | 58,310 | ||||||
| FAWER Automotive Parts Co., Ltd. |
33,662 | 29,757 | ||||||
| Fiberhome Telecommunication Technologies Co., Ltd., Class A |
23,000 | 61,894 | ||||||
| Fibocom Wireless, Inc. |
10,000 | 72,095 | ||||||
| *FIH Mobile, Ltd. |
1,550,000 | 241,096 | ||||||
| Financial Street Holdings Co., Ltd., Class A |
42,100 | 38,400 | ||||||
| First Capital Securities Co., Ltd., Class A |
80,700 | 86,086 | ||||||
| Flat Glass Group Co., Ltd., Class H |
66,000 | 356,342 | ||||||
| Focus Media Information Technology Co., Ltd., Class A |
205,088 | 235,752 | ||||||
| Foshan Haitian Flavouring & Food Co., Ltd., Class A |
22,300 | 407,570 | ||||||
| Fosun International, Ltd. |
716,392 | 842,646 | ||||||
| Founder Securities Co., Ltd., Class A |
79,000 | 100,683 | ||||||
| FriendTimes, Inc. |
278,000 | 41,098 | ||||||
| Fu Jian Anjoy Foods Co., Ltd. |
5,000 | 158,246 | ||||||
| Fu Shou Yuan International Group, Ltd. |
696,000 | 598,561 | ||||||
| Fufeng Group, Ltd. |
944,600 | 326,643 | ||||||
| Fujian Funeng Co., Ltd. |
31,800 | 88,456 | ||||||
| Fujian Green Pine Co., Ltd. |
10,300 | 15,942 | ||||||
| Fujian Longking Co., Ltd., Class A |
25,900 | 32,887 | ||||||
| Fujian Longma Environmental Sanitation Equipment Co., Ltd. |
10,200 | 19,945 | ||||||
| Fujian Star-net Communication Co., Ltd. |
8,600 | 29,429 | ||||||
| Fujian Sunner Development Co., Ltd., Class A |
39,600 | 138,789 | ||||||
| #*Futu Holdings, Ltd. , ADR |
3,568 | 190,959 | ||||||
| Fuyao Glass Industry Group Co., Ltd., Class H |
280,800 | 1,620,753 | ||||||
| Gansu Qilianshan Cement Group Co., Ltd., Class A |
18,800 | 28,394 | ||||||
| G-bits Network Technology Xiamen Co., Ltd. |
1,600 | 85,574 | ||||||
| #*GCL New Energy Holdings, Ltd. |
2,012,000 | 94,405 | ||||||
| *GCL System Integration Technology Co., Ltd., Class A |
35,600 | 22,407 | ||||||
| *GCL-Poly Energy Holdings, Ltd. |
6,857,000 | 1,308,983 | ||||||
| *GDS Holdings, Ltd. |
7,000 | 53,721 | ||||||
| #*GDS Holdings, Ltd. , Sponsored ADR |
1,566 | 93,020 | ||||||
| Geely Automobile Holdings, Ltd. |
2,073,000 | 7,208,419 | ||||||
| GEM Co., Ltd., Class A |
20,000 | 34,048 | ||||||
| Gemdale Corp., Class A |
43,400 | 68,801 | ||||||
| Gemdale Properties & Investment Corp., Ltd. |
4,256,000 | 415,804 | ||||||
| Getein Biotech, Inc. |
13,400 | 36,604 | ||||||
| GF Securities Co., Ltd., Class H |
341,800 | 580,867 | ||||||
| Giant Network Group Co., Ltd., Class A |
30,500 | 47,350 | ||||||
Dimensional World ex U.S. Core Equity 2 ETF
SCHEDULE OF INVESTMENTS
October 31, 2021
| Security Description |
Shares | Fair Value | ||||||
| CHINA (Continued) |
||||||||
| Gigadevice Semiconductor Beijing, Inc. |
2,000 | $ | 52,950 | |||||
| *Glorious Property Holdings, Ltd. |
1,665,000 | 52,225 | ||||||
| *Glory Sun Land Group, Ltd. |
227,000 | 6,099 | ||||||
| GoerTek, Inc., Class A |
20,300 | 138,045 | ||||||
| Golden Eagle Retail Group, Ltd. |
273,000 | 237,588 | ||||||
| Goldenmax International Technology, Ltd., Class A |
10,700 | 22,210 | ||||||
| Goldlion Holdings, Ltd. |
162,000 | 34,986 | ||||||
| #*GOME Retail Holdings, Ltd. |
3,285,060 | 333,614 | ||||||
| *Gotion High-tech Co., Ltd., Class A |
3,900 | 35,877 | ||||||
| *Grand Baoxin Auto Group, Ltd. |
439,881 | 49,761 | ||||||
| Grandblue Environment Co., Ltd., Class A |
5,800 | 20,020 | ||||||
| *Grandjoy Holdings Group Co., Ltd., Class A |
39,100 | 20,091 | ||||||
| Great Wall Motor Co., Ltd., Class H |
629,000 | 2,838,123 | ||||||
| Greattown Holdings, Ltd., Class A |
39,100 | 21,618 | ||||||
| Greatview Aseptic Packaging Co., Ltd. |
543,000 | 223,369 | ||||||
| Gree Electric Appliances, Inc. of Zhuhai, Class A |
28,800 | 164,855 | ||||||
| *Gree Real Estate Co., Ltd., Class A |
18,100 | 18,969 | ||||||
| Greenland Holdings Corp., Ltd., Class A |
98,100 | 62,972 | ||||||
| Greenland Hong Kong Holdings, Ltd. |
589,000 | 125,689 | ||||||
| Greentown China Holdings, Ltd. |
512,000 | 708,200 | ||||||
| Greentown Service Group Co., Ltd. |
592,000 | 588,267 | ||||||
| GRG Banking Equipment Co., Ltd., Class A |
22,600 | 36,568 | ||||||
| Guangdong Baolihua New Energy Stock Co., Ltd., Class A |
22,100 | 19,778 | ||||||
| *Guangdong Dongfang Precision Science & Technology Co., Ltd., Class A |
30,500 | 25,819 | ||||||
| Guangdong Great River Smarter Logistics Co., Ltd. |
9,020 | 32,219 | ||||||
| Guangdong Haid Group Co., Ltd., Class A |
22,200 | 227,627 | ||||||
| *Guangdong HEC Technology Holding Co., Ltd., Class A |
23,600 | 39,218 | ||||||
| Guangdong Hongda Blasting Co., Ltd., Class A |
14,100 | 60,626 | ||||||
| Guangdong Huatie Tongda High-speed Railway Equipment Corp., Class A |
38,582 | 27,237 | ||||||
| Guangdong Investment, Ltd. |
580,000 | 730,680 | ||||||
| Guangdong South New Media Co., Ltd. |
4,300 | 31,867 | ||||||
| Guangdong Xinbao Electrical Appliances Holdings Co., Ltd., Class A |
20,900 | 73,217 | ||||||
| Guangdong Zhongsheng Pharmaceutical Co., Ltd., Class A |
20,500 | 26,959 | ||||||
| *Guanghui Energy Co., Ltd., Class A |
136,800 | 141,229 | ||||||
| #*»Guangshen Railway Co., Ltd. , Sponsored ADR |
6,099 | 1,568 | ||||||
| *Guangshen Railway Co., Ltd., Class H |
442,000 | 77,842 | ||||||
| Guangxi Liugong Machinery Co., Ltd., Class A |
35,700 | 41,428 | ||||||
| Guangxi Liuzhou Pharmaceutical Co., Ltd. |
9,000 | 21,408 | ||||||
| Guangxi Wuzhou Zhongheng Group Co., Ltd., Class A |
87,500 | 41,682 | ||||||
| Guangzhou Automobile Group Co., Ltd., Class H |
826,000 | 781,504 | ||||||
| Guangzhou Baiyunshan Pharmaceutical Holdings Co. LT |
48,000 | 121,557 | ||||||
| Guangzhou Haige Communications Group, Inc. Co., Class A |
21,000 | 30,962 | ||||||
| Guangzhou Kingmed Diagnostics Group Co., Ltd., Class A |
5,200 | 92,984 | ||||||
| #Guangzhou R&F Properties Co., Ltd., Class H |
1,124,400 | 705,365 | ||||||
| Guangzhou Shangpin Home Collection Co., Ltd. |
3,300 | 22,487 | ||||||
| Guangzhou Tinci Materials Technology Co., Ltd., Class A |
2,400 | 61,823 | ||||||
| Guangzhou Wondfo Biotech Co., Ltd. |
14,007 | 75,847 | ||||||
| Guangzhou Zhujiang Brewery Co., Ltd. |
26,900 | 41,635 | ||||||
| *Guizhou Bailing Group Pharmaceutical Co., Ltd., Class A |
34,700 | 32,084 | ||||||
| Guizhou Gas Group Corp., Ltd. |
23,300 | 36,100 | ||||||
| Guizhou Panjiang Refined Coal Co., Ltd., Class A |
50,700 | 60,973 | ||||||
| Guolian Securities Co., Ltd. |
107,500 | 52,651 | ||||||
| Guomai Technologies, Inc., Class A |
23,600 | 21,120 | ||||||
| Guosen Securities Co., Ltd., Class A |
47,400 | 84,396 | ||||||
| *Guosheng Financial Holding, Inc., Class A |
39,000 | 56,831 | ||||||
Dimensional World ex U.S. Core Equity 2 ETF
SCHEDULE OF INVESTMENTS
October 31, 2021
| Security Description |
Shares | Fair Value | ||||||
| CHINA (Continued) |
||||||||
| Guotai Junan Securities Co., Ltd., Class H |
51,400 | $ | 70,304 | |||||
| Guoyuan Securities Co., Ltd., Class A |
83,800 | 97,115 | ||||||
| *Haichang Ocean Park Holdings, Ltd. |
498,000 | 126,116 | ||||||
| Haier Smart Home Co., Ltd. |
657,600 | 2,459,961 | ||||||
| *Hailiang Education Group, Inc. , Sponsored ADR |
1,838 | 56,059 | ||||||
| Hailir Pesticides and Chemicals Group Co., Ltd. |
1,400 | 3,929 | ||||||
| *Hainan Meilan International Airport Co., Ltd. |
50,000 | 202,788 | ||||||
| Hainan Poly Pharm Co., Ltd. |
7,500 | 57,620 | ||||||
| Haitian International Holdings, Ltd. |
433,000 | 1,269,101 | ||||||
| Haitong Securities Co., Ltd., Class H |
571,200 | 508,856 | ||||||
| Hand Enterprise Solutions Co., Ltd., Class A |
18,000 | 18,555 | ||||||
| Hangcha Group Co., Ltd. |
20,100 | 51,924 | ||||||
| Hangjin Technology Co., Ltd. |
16,600 | 87,865 | ||||||
| Hangxiao Steel Structure Co., Ltd., Class A |
52,100 | 29,050 | ||||||
| Hangzhou Binjiang Real Estate Group Co., Ltd., Class A |
43,800 | 27,911 | ||||||
| Hangzhou First Applied Material Co., Ltd. |
2,800 | 62,667 | ||||||
| Hangzhou Oxygen Plant Group Co., Ltd., Class A |
13,500 | 54,610 | ||||||
| Han’s Laser Technology Industry Group Co., Ltd., Class A |
27,300 | 182,748 | ||||||
| *Harbin Bank Co., Ltd., Class H |
231,000 | 23,756 | ||||||
| Harbin Boshi Automation Co., Ltd. |
16,665 | 31,728 | ||||||
| *Harbin Electric Co., Ltd. |
354,236 | 150,273 | ||||||
| *»Harmonicare |
74,000 | 3,639 | ||||||
| *HC Group, Inc. |
211,500 | 21,751 | ||||||
| Health & Happiness H&H International Holdings, Ltd. |
124,500 | 292,243 | ||||||
| Hebei Chengde Lolo Co., Class A |
21,700 | 35,078 | ||||||
| Hebei Hengshui Laobaigan Liquor Co., Ltd. |
9,400 | 31,609 | ||||||
| Hefei Meiya Optoelectronic Technology, Inc., Class A |
10,200 | 64,408 | ||||||
| Heilongjiang Agriculture Co., Ltd., Class A |
39,700 | 85,319 | ||||||
| Hello Group, Inc. , ADR |
77,584 | 965,921 | ||||||
| Henan Shenhuo Coal & Power Co., Ltd., Class A |
18,900 | 28,013 | ||||||
| Henan Shuanghui Investment & Development Co., Ltd., Class A |
74,800 | 344,636 | ||||||
| Henan Thinker Automatic Equipment Co., Ltd. |
6,560 | 20,911 | ||||||
| Henan Yuguang Gold & Lead Co., Ltd., Class A |
26,400 | 22,224 | ||||||
| Henan Zhongyuan Expressway Co., Ltd., Class A |
54,300 | 26,715 | ||||||
| Hengan International Group Co., Ltd. |
317,500 | 1,659,120 | ||||||
| Hengdian Group DMEGC Magnetics Co., Ltd., Class A |
26,400 | 58,262 | ||||||
| Hengli Petrochemical Co., Ltd., Class A |
95,400 | 328,395 | ||||||
| Hengyi Petrochemical Co., Ltd., Class A |
34,082 | 58,288 | ||||||
| Hesteel Co., Ltd., Class A |
267,700 | 102,854 | ||||||
| Hexing Electrical Co., Ltd., Class A |
10,600 | 19,469 | ||||||
| Hisense Home Appliances Group Co., Ltd., Class H |
125,000 | 134,496 | ||||||
| *Holitech Technology Co., Ltd., Class A |
63,400 | 32,182 | ||||||
| Hongda Xingye Co., Ltd., Class A |
72,700 | 61,542 | ||||||
| Hongfa Technology Co., Ltd., Class A |
15,800 | 183,449 | ||||||
| *Honghua Group, Ltd. |
1,656,000 | 56,413 | ||||||
| *Hongli Zhihui Group Co., Ltd. |
10,600 | 18,658 | ||||||
| *»Honworld Group, Ltd. |
59,000 | 17,463 | ||||||
| Hope Education Group Co., Ltd. |
696,000 | 125,259 | ||||||
| Hopson Development Holdings, Ltd. |
343,860 | 939,321 | ||||||
| *Hua Hong Semiconductor, Ltd. |
152,000 | 765,955 | ||||||
| Huaan Securities Co., Ltd., Class A |
90,190 | 71,981 | ||||||
| Huabao International Holdings, Ltd. |
11,000 | 20,673 | ||||||
| #Huadian Power International Corp., Ltd., Class H |
476,000 | 176,839 | ||||||
| Huadong Medicine Co., Ltd., Class A |
30,400 | 173,967 | ||||||
| Huafa Industrial Co., Ltd. Zhuhai, Class A |
29,900 | 24,564 | ||||||
| Huafon Chemical Co., Ltd., Class A |
72,200 | 134,078 | ||||||
Dimensional World ex U.S. Core Equity 2 ETF
SCHEDULE OF INVESTMENTS
October 31, 2021
| Security Description |
Shares | Fair Value | ||||||
| CHINA (Continued) |
||||||||
| *Huafon Microfibre Shanghai Technology Co., Ltd., Class A |
42,600 | $ | 30,074 | |||||
| *Huafu Fashion Co., Ltd., Class A |
34,800 | 24,024 | ||||||
| Huagong Tech Co., Ltd., Class A |
9,200 | 41,383 | ||||||
| Hualan Biological Engineering, Inc., Class A |
17,100 | 79,321 | ||||||
| #Huaneng Power International, Inc., Class H |
644,000 | 333,629 | ||||||
| Huaneng Power International, Inc. , Sponsored ADR |
3,000 | 61,530 | ||||||
| *Huanxi Media Group, Ltd. |
20,000 | 3,805 | ||||||
| Huatai Securities Co., Ltd., Class H |
379,800 | 566,352 | ||||||
| Huaxi Holdings Co., Ltd. |
78,000 | 21,458 | ||||||
| Huaxi Securities Co., Ltd., Class A |
50,400 | 71,239 | ||||||
| Huaxia Bank Co., Ltd., Class A |
123,100 | 108,244 | ||||||
| Huaxin Cement Co., Ltd., Class A |
43,000 | 112,424 | ||||||
| Huazhong In-Vehicle Holdings Co., Ltd. |
344,000 | 168,483 | ||||||
| #*Huazhu Group, Ltd. , Sponsored ADR |
29,612 | 1,372,812 | ||||||
| *Huazhu Group, Ltd. |
8,600 | 40,297 | ||||||
| Hubei Biocause Pharmaceutical Co., Ltd., Class A |
69,600 | 35,329 | ||||||
| Hubei Jumpcan Pharmaceutical Co., Ltd., Class A |
21,900 | 55,103 | ||||||
| Hubei Xingfa Chemicals Group Co., Ltd., Class A |
15,520 | 120,205 | ||||||
| *Huishang Bank Corp., Ltd. |
186,200 | 63,431 | ||||||
| Humanwell Healthcare Group Co., Ltd. |
38,700 | 127,414 | ||||||
| Hunan Aihua Group Co., Ltd. |
7,300 | 40,646 | ||||||
| *Hunan Gold Corp., Ltd., Class A |
16,000 | 27,089 | ||||||
| Hunan Valin Steel Co., Ltd., Class A |
184,700 | 154,044 | ||||||
| #*HUYA, Inc. , Sponsored ADR |
10,006 | 82,249 | ||||||
| *iDreamSky Technology Holdings, Ltd. |
212,400 | 151,538 | ||||||
| Iflytek Co., Ltd., Class A |
13,700 | 120,723 | ||||||
| IKD Co., Ltd. |
16,700 | 35,629 | ||||||
| IMAX China Holding, Inc. |
106,100 | 155,487 | ||||||
| Industrial & Commercial Bank of China, Ltd., Class H |
11,950,460 | 6,544,367 | ||||||
| Industrial Bank Co., Ltd., Class A |
148,000 | 430,637 | ||||||
| Industrial Securities Co., Ltd., Class A |
77,200 | 110,084 | ||||||
| Infore Environment Technology Group Co., Ltd., Class A |
52,300 | 51,134 | ||||||
| Inner Mongolia Eerduosi Resources Co., Ltd., Class A |
9,400 | 43,471 | ||||||
| Inner Mongolia Junzheng Energy & Chemical Industry Group Co., Ltd., Class A |
82,400 | 66,021 | ||||||
| Inner Mongolia Yili Industrial Group Co., Ltd., Class A |
44,600 | 299,530 | ||||||
| Inner Mongolia Yitai Coal Co., Ltd., Class H |
21,900 | 16,610 | ||||||
| *Innovent Biologics, Inc. |
33,000 | 296,103 | ||||||
| *Innuovo Technology Co., Ltd., Class A |
22,600 | 18,672 | ||||||
| Inspur Electronic Information Industry Co., Ltd., Class A |
21,300 | 103,395 | ||||||
| *Inspur International, Ltd. |
174,000 | 74,932 | ||||||
| #*Iqiyi, Inc. , Sponsored ADR |
90,359 | 748,172 | ||||||
| IReader Technology Co., Ltd. |
8,000 | 23,753 | ||||||
| Jafron Biomedical Co., Ltd., Class A |
11,400 | 92,016 | ||||||
| *JC Finance & Tax Interconnect Holdings, Ltd., Class A |
20,500 | 18,602 | ||||||
| *JD.com, Inc. |
14,450 | 576,585 | ||||||
| *JD.com, Inc. , Sponsored ADR |
23,730 | 1,857,584 | ||||||
| Jiajiayue Group Co., Ltd., Class A |
19,400 | 44,632 | ||||||
| Jiangling Motors Corp., Ltd. |
9,844 | 23,985 | ||||||
| *Jiangnan Group, Ltd. |
1,143,000 | 44,080 | ||||||
| Jiangsu Changshu Rural Commercial Bank Co., Ltd., Class A |
22,000 | 24,946 | ||||||
| Jiangsu Eastern Shenghong Co., Ltd., Class A |
4,300 | 18,301 | ||||||
| Jiangsu Expressway Co., Ltd., Class H |
200,000 | 189,226 | ||||||
| Jiangsu Hengli Hydraulic Co., Ltd., Class A |
5,200 | 66,678 | ||||||
| Jiangsu Hengrui Medicine Co., Ltd., Class A |
39,500 | 303,775 | ||||||
| Jiangsu Hengshun Vinegar Industry Co., Ltd., Class A |
14,400 | 36,322 | ||||||
Dimensional World ex U.S. Core Equity 2 ETF
SCHEDULE OF INVESTMENTS
October 31, 2021
| Security Description |
Shares | Fair Value | ||||||
| CHINA (Continued) |
||||||||
| Jiangsu Jiangyin Rural Commercial Bank Co., Ltd., Class A |
35,900 | $ | 21,419 | |||||
| Jiangsu King’s Luck Brewery JSC, Ltd. |
14,000 | 107,842 | ||||||
| *Jiangsu Leike Defense Technology Co., Ltd., Class A |
32,400 | 29,097 | ||||||
| Jiangsu Linyang Energy Co., Ltd. |
45,100 | 79,526 | ||||||
| Jiangsu Shuangxing Color Plastic New Materials Co., Ltd. |
16,200 | 59,965 | ||||||
| Jiangsu Yanghe Brewery Joint-Stock Co., Ltd., Class A |
9,900 | 287,876 | ||||||
| Jiangsu Yuyue Medical Equipment & Supply Co., Ltd., Class A |
24,900 | 137,009 | ||||||
| Jiangsu Zhangjiagang Rural Commercial Bank Co., Ltd., Class A |
25,500 | 24,653 | ||||||
| Jiangsu Zhongtian Technology Co., Ltd., Class A |
28,500 | 45,002 | ||||||
| Jiangxi Bank Co., Ltd., Class H |
24,500 | 10,771 | ||||||
| Jiangxi Copper Co., Ltd., Class H |
478,000 | 836,909 | ||||||
| Jiangxi Huangshanghuang Group Food Co., Ltd., Class A |
13,100 | 28,317 | ||||||
| Jiangxi Wannianqing Cement Co., Ltd., Class A |
19,300 | 34,665 | ||||||
| Jiangxi Zhengbang Technology Co., Ltd., Class A |
95,900 | 150,080 | ||||||
| Jiangzhong Pharmaceutical Co., Ltd., Class A |
15,900 | 28,633 | ||||||
| Jiaozuo Wanfang Aluminum Manufacturing Co., Ltd. |
28,800 | 31,397 | ||||||
| *Jiayin Group, Inc. , ADR |
146 | 555 | ||||||
| Jiayou International Logistics Co., Ltd. |
7,900 | 20,223 | ||||||
| #Jiayuan International Group, Ltd. |
542,406 | 209,877 | ||||||
| *Jilin Electric Power Co., Ltd., Class A |
18,800 | 22,198 | ||||||
| *Jinchuan Group International Resources Co., Ltd. |
737,000 | 118,427 | ||||||
| Jinduicheng Molybdenum Co., Ltd., Class A |
56,500 | 64,065 | ||||||
| #Jingrui Holdings, Ltd. |
257,000 | 72,022 | ||||||
| Jinke Properties Group Co., Ltd., Class A |
60,100 | 41,677 | ||||||
| #*JinkoSolar Holding Co., Ltd. , Sponsored ADR |
17,990 | 1,076,162 | ||||||
| Jinneng Science&Technology Co., Ltd., Class A |
27,500 | 60,689 | ||||||
| JiuGui Liquor Co., Ltd., Class A |
1,600 | 53,705 | ||||||
| Jiuzhitang Co., Ltd., Class A |
21,859 | 28,985 | ||||||
| JL Mag Rare-Earth Co., Ltd. |
10,669 | 65,253 | ||||||
| Jnby Design, Ltd. |
173,000 | 290,444 | ||||||
| Joincare Pharmaceutical Group Industry Co., Ltd., Class A |
49,344 | 88,859 | ||||||
| Jointown Pharmaceutical Group Co., Ltd., Class A |
57,400 | 121,834 | ||||||
| Jonjee Hi-Tech Industrial And Commercial Holding Co., Ltd., Class A |
18,100 | 102,759 | ||||||
| Joy City Property, Ltd. |
1,920,000 | 99,961 | ||||||
| Joyoung Co., Ltd., Class A |
19,400 | 70,750 | ||||||
| JSTI Group, Class A |
23,500 | 20,774 | ||||||
| Ju Teng International Holdings, Ltd. |
502,000 | 85,828 | ||||||
| Juewei Food Co., Ltd., Class A |
14,400 | 148,100 | ||||||
| Jutal Offshore Oil Services, Ltd. |
34,000 | 4,589 | ||||||
| #Kaisa Group Holdings, Ltd. |
1,742,000 | 268,722 | ||||||
| Kaisa Prosperity Holdings, Ltd. |
28,000 | 59,390 | ||||||
| Kaiser China Cultural Co., Ltd. |
28,600 | 31,581 | ||||||
| Kaishan Group Co., Ltd., Class A |
13,200 | 37,316 | ||||||
| *Kangda International Environmental Co., Ltd. |
285,000 | 30,042 | ||||||
| *Kasen International Holdings, Ltd. |
194,000 | 17,956 | ||||||
| Kehua Data Co., Ltd. |
3,400 | 20,753 | ||||||
| Kinetic Mines and Energy, Ltd. |
812,000 | 67,849 | ||||||
| *Kingboard Holdings, Ltd. |
439,000 | 1,921,565 | ||||||
| Kingboard Laminates Holdings, Ltd. |
742,000 | 1,163,690 | ||||||
| *Kingdee International Software Group Co., Ltd. |
141,000 | 465,828 | ||||||
| Kingfa Sci & Tech Co., Ltd. |
89,200 | 163,418 | ||||||
| Kingsoft Corp., Ltd. |
321,200 | 1,381,164 | ||||||
| Konfoong Materials International Co., Ltd. |
3,400 | 21,278 | ||||||
| KPC Pharmaceuticals, Inc., Class A |
19,100 | 24,820 | ||||||
| Kunlun Energy Co., Ltd. |
2,276,000 | 2,083,175 | ||||||
| *Kunshan Kersen Science & Technology Co., Ltd. |
12,100 | 19,314 | ||||||
Dimensional World ex U.S. Core Equity 2 ETF
SCHEDULE OF INVESTMENTS
October 31, 2021
| Security Description |
Shares | Fair Value | ||||||
| CHINA (Continued) |
||||||||
| Kweichow Moutai Co., Ltd., Class A |
7,446 | $ | 2,123,634 | |||||
| KWG Group Holdings, Ltd. |
825,400 | 721,517 | ||||||
| KWG Living Group Holdings, Ltd. |
359,200 | 244,267 | ||||||
| *Lanzhou Lishang Guochao Industrial Group Co., Ltd. |
24,300 | 23,682 | ||||||
| Lao Feng Xiang Co., Ltd. |
7,300 | 54,738 | ||||||
| Laobaixing Pharmacy Chain JSC |
15,100 | 103,179 | ||||||
| *Launch Tech Co., Ltd., Class H |
19,000 | 7,327 | ||||||
| LB Group Co., Ltd., Class A |
40,900 | 181,353 | ||||||
| Lee & Man Chemical Co., Ltd. |
126,300 | 156,677 | ||||||
| Lee & Man Paper Manufacturing, Ltd. |
792,600 | 595,032 | ||||||
| Lee’s Pharmaceutical Holdings, Ltd. |
122,000 | 57,400 | ||||||
| Legend Holdings Corp., Class H |
338,100 | 594,572 | ||||||
| *Lenovo Group, Ltd. |
4,052,000 | 4,406,698 | ||||||
| Lens Technology Co., Ltd., Class A |
75,400 | 250,482 | ||||||
| Leo Group Co., Ltd., Class A |
137,256 | 48,877 | ||||||
| Lepu Medical Technology Beijing Co., Ltd., Class A |
31,300 | 104,224 | ||||||
| Leyard Optoelectronic Co., Ltd., Class A |
23,200 | 34,097 | ||||||
| *LI Auto, Inc. , ADR |
22 | 718 | ||||||
| Li Ning Co., Ltd. |
343,000 | 3,814,026 | ||||||
| Lier Chemical Co., Ltd. |
10,800 | 38,121 | ||||||
| *Lifestyle China Group, Ltd. |
229,500 | 30,977 | ||||||
| *Lifetech Scientific Corp. |
772,000 | 359,252 | ||||||
| *Lingyi iTech Guangdong Co, Class A |
103,800 | 107,971 | ||||||
| Livzon Pharmaceutical Group, Inc., Class H |
80,656 | 266,467 | ||||||
| Lizhong Sitong Light Alloys Group Co., Ltd. |
10,200 | 24,709 | ||||||
| LK Technology Holdings, Ltd. |
68,750 | 173,045 | ||||||
| Logan Group Co., Ltd. |
760,000 | 763,024 | ||||||
| Loncin Motor Co., Ltd., Class A |
47,000 | 32,005 | ||||||
| Long Yuan Construction Group Co., Ltd., Class A |
37,000 | 41,607 | ||||||
| Longfor Group Holdings, Ltd. |
550,500 | 2,674,992 | ||||||
| LONGi Green Energy Technology Co., Ltd., Class A |
37,340 | 569,720 | ||||||
| Longshine Technology Group Co., Ltd. |
12,500 | 63,216 | ||||||
| Lonking Holdings, Ltd. |
1,265,000 | 370,765 | ||||||
| Luenmei Quantum Co., Ltd., Class A |
49,800 | 64,246 | ||||||
| Luolai Lifestyle Technology Co., Ltd. |
19,000 | 38,726 | ||||||
| *Luoniushan Co., Ltd., Class A |
28,300 | 30,233 | ||||||
| *Luoyang Glass Co., Ltd., Class H |
68,000 | 99,128 | ||||||
| Luxi Chemical Group Co., Ltd., Class A |
29,200 | 74,793 | ||||||
| Luxshare Precision Industry Co., Ltd., Class A |
44,400 | 267,952 | ||||||
| #*Luye Pharma Group, Ltd. |
1,223,000 | 583,276 | ||||||
| Luzhou Laojiao Co., Ltd., Class A |
12,400 | 443,404 | ||||||
| *LVGEM China Real Estate Investment Co., Ltd. |
162,000 | 36,861 | ||||||
| Maanshan Iron & Steel Co., Ltd., Class H |
572,000 | 244,122 | ||||||
| Maccura Biotechnology Co., Ltd., Class A |
17,700 | 76,935 | ||||||
| Mango Excellent Media Co., Ltd., Class A |
25,000 | 153,412 | ||||||
| *Maoyan Entertainment |
48,800 | 59,094 | ||||||
| *Maoye International Holdings, Ltd. |
445,000 | 16,303 | ||||||
| *Markor International Home Furnishings Co., Ltd., Class A |
82,100 | 43,469 | ||||||
| *Meinian Onehealth Healthcare Holdings Co., Ltd., Class A |
58,700 | 66,193 | ||||||
| *Meitu, Inc. |
732,500 | 160,077 | ||||||
| *Meituan, Class B |
32,500 | 1,126,359 | ||||||
| Metallurgical Corp. of China, Ltd., Class H |
878,000 | 243,793 | ||||||
| Microport Scientific Corp. |
15,541 | 73,319 | ||||||
| Midea Group Co., Ltd. |
82,300 | 883,966 | ||||||
| Ming Yang Smart Energy Group, Ltd., Class A |
24,500 | 118,584 | ||||||
Dimensional World ex U.S. Core Equity 2 ETF
SCHEDULE OF INVESTMENTS
October 31, 2021
| Security Description |
Shares | Fair Value | ||||||
| CHINA (Continued) |
||||||||
| *Mingfa Group International Co., Ltd. |
589,000 | $ | 33,694 | |||||
| Minmetals Land, Ltd. |
764,000 | 78,570 | ||||||
| Minsheng Education Group Co., Ltd. |
70,000 | 10,168 | ||||||
| Minth Group, Ltd. |
408,000 | 1,631,150 | ||||||
| MLS Co., Ltd., Class A |
46,078 | 100,249 | ||||||
| *MMG, Ltd. |
1,700,000 | 786,728 | ||||||
| »Modern Land China Co., Ltd. |
444,400 | 21,709 | ||||||
| Montage Technology Co., Ltd. |
2,439 | 24,799 | ||||||
| *Montnets Rongxin Technology Group Co., Ltd. |
9,600 | 30,137 | ||||||
| Muyuan Foods Co., Ltd., Class A |
87,200 | 777,796 | ||||||
| *Nan Hai Corp., Ltd. |
8,450,000 | 45,622 | ||||||
| NanJi E-Commerce Co., Ltd., Class A |
30,000 | 33,595 | ||||||
| Nanjing Hanrui Cobalt Co., Ltd. |
3,012 | 37,201 | ||||||
| Nanjing Iron & Steel Co., Ltd., Class A |
181,200 | 99,901 | ||||||
| Nanjing King-Friend Biochemical Pharmaceutical Co., Ltd., Class A |
28,465 | 164,938 | ||||||
| *Nanjing Sample Technology Co., Ltd., Class H |
18,000 | 12,102 | ||||||
| Nanjing Securities Co., Ltd., Class A |
43,100 | 65,363 | ||||||
| Nanjing Xinjiekou Department Store Co., Ltd., Class A |
30,800 | 46,998 | ||||||
| NARI Technology Co., Ltd., Class A |
12,000 | 72,963 | ||||||
| *NavInfo Co., Ltd., Class A |
41,300 | 75,470 | ||||||
| NetDragon Websoft Holdings, Ltd. |
170,500 | 374,795 | ||||||
| NetEase, Inc. |
7,800 | 154,114 | ||||||
| NetEase, Inc. , Sponsored ADR |
52,369 | 5,110,691 | ||||||
| New China Life Insurance Co., Ltd., Class H |
513,800 | 1,489,409 | ||||||
| *New Hope Liuhe Co., Ltd., Class A |
49,000 | 110,127 | ||||||
| *New Oriental Education & Technology Group, Inc. , Sponsored ADR |
40,280 | 82,574 | ||||||
| *New Oriental Education & Technology Group, Inc. |
20,300 | 41,962 | ||||||
| *New Sparkle Roll International Group, Ltd. |
944,000 | 21,843 | ||||||
| *New World Department Store China, Ltd. |
223,000 | 38,413 | ||||||
| Newland Digital Technology Co., Ltd., Class A |
15,100 | 35,564 | ||||||
| Nexteer Automotive Group, Ltd. |
582,000 | 718,237 | ||||||
| Nine Dragons Paper Holdings, Ltd. |
1,328,000 | 1,669,592 | ||||||
| Ninestar Corp., Class A |
9,800 | 56,219 | ||||||
| Ningbo Huaxiang Electronic Co., Ltd., Class A |
14,400 | 53,302 | ||||||
| Ningbo Jifeng Auto Parts Co., Ltd. |
16,700 | 26,474 | ||||||
| Ningbo Orient Wires & Cables Co., Ltd., Class A |
13,400 | 94,430 | ||||||
| Ningbo Sanxing Medical Electric Co., Ltd., Class A |
33,500 | 63,571 | ||||||
| Ningbo Zhoushan Port Co., Ltd., Class A |
58,300 | 34,146 | ||||||
| Ningxia Baofeng Energy Group Co., Ltd. |
71,600 | 163,269 | ||||||
| *NIO, Inc. , Sponsored ADR |
3,475 | 136,950 | ||||||
| *Niu Technologies , ADR |
2,110 | 55,240 | ||||||
| North Huajin Chemical Industries Co., Ltd., Class A |
38,700 | 35,662 | ||||||
| Northeast Securities Co., Ltd., Class A |
33,000 | 44,428 | ||||||
| NSFOCUS Technologies Group Co., Ltd., Class A |
9,500 | 22,390 | ||||||
| *Oceanwide Holdings Co., Ltd., Class A |
60,500 | 16,819 | ||||||
| Offshore Oil Engineering Co., Ltd., Class A |
142,700 | 103,637 | ||||||
| OFILM Group Co., Ltd., Class A |
21,400 | 25,001 | ||||||
| Opple Lighting Co., Ltd., Class A |
18,600 | 56,328 | ||||||
| ORG Technology Co., Ltd., Class A |
58,600 | 61,230 | ||||||
| *Orient Group, Inc., Class A |
89,800 | 40,954 | ||||||
| #Orient Securities Co., Ltd., Class H |
207,600 | 170,530 | ||||||
| *Ourpalm Co., Ltd., Class A |
76,200 | 46,296 | ||||||
| Ovctek China, Inc., Class A |
4,200 | 44,862 | ||||||
| Pacific Online, Ltd. |
210,000 | 38,874 | ||||||
| *Pacific Securities Co., Ltd. (The), Class A |
137,700 | 67,100 | ||||||
| *Pangang Group Vanadium Titanium & Resources Co., Ltd., Class A |
67,100 | 41,920 | ||||||
Dimensional World ex U.S. Core Equity 2 ETF
SCHEDULE OF INVESTMENTS
October 31, 2021
| Security Description |
Shares | Fair Value | ||||||
| CHINA (Continued) |
||||||||
| PAX Global Technology, Ltd. |
371,000 | $ | 371,000 | |||||
| PCI Technology Group Co., Ltd., Class A |
20,600 | 24,452 | ||||||
| People’s Insurance Co. Group of China, Ltd. (The), Class H |
1,078,000 | 336,743 | ||||||
| #Perennial Energy Holdings, Ltd. |
155,000 | 31,881 | ||||||
| Perfect World Co., Ltd., Class A |
22,900 | 62,162 | ||||||
| PetroChina Co., Ltd. , Sponsored ADR |
6,046 | 291,780 | ||||||
| PetroChina Co., Ltd. |
3,134,000 | 1,514,817 | ||||||
| PharmaBlock Sciences Nanjing, Inc. |
800 | 18,953 | ||||||
| PhiChem Corp., Class A |
8,500 | 23,511 | ||||||
| PICC Property & Casualty Co., Ltd., Class H |
2,257,753 | 2,112,911 | ||||||
| *Pinduoduo, Inc. , Sponsored ADR |
482 | 42,859 | ||||||
| Ping An Bank Co., Ltd., Class A |
143,400 | 436,738 | ||||||
| #*Ping An Healthcare and Technology Co., Ltd. |
30,300 | 147,429 | ||||||
| Ping An Insurance Group Co. of China, Ltd. |
1,219,000 | 8,759,694 | ||||||
| Pingdingshan Tianan Coal Mining Co., Ltd., Class A |
75,740 | 100,431 | ||||||
| Poly Developments and Holdings Group Co., Ltd., Class A |
34,400 | 67,482 | ||||||
| Poly Property Group Co., Ltd. |
1,323,000 | 326,539 | ||||||
| #Poly Property Services Co., Ltd., Class H |
5,200 | 29,212 | ||||||
| Postal Savings Bank of China Co., Ltd., Class H |
1,262,000 | 918,225 | ||||||
| *Pou Sheng International Holdings, Ltd. |
1,268,000 | 213,532 | ||||||
| Power Construction Corp. of China, Ltd., Class A |
67,300 | 86,297 | ||||||
| Powerlong Real Estate Holdings, Ltd. |
1,055,000 | 726,927 | ||||||
| Prinx Chengshan Holdings, Ltd. |
101,500 | 94,206 | ||||||
| Proya Cosmetics Co., Ltd. |
1,600 | 50,229 | ||||||
| #Q Technology Group Co., Ltd. |
240,000 | 352,948 | ||||||
| Qianhe Condiment and Food Co., Ltd., Class A |
8,400 | 32,208 | ||||||
| Qingdao East Steel Tower Stock Co., Ltd., Class A |
25,100 | 30,578 | ||||||
| Qingdao Eastsoft Communication Technology Co., Ltd. |
7,000 | 19,461 | ||||||
| Qingdao Gon Technology Co., Ltd. |
6,600 | 24,193 | ||||||
| Qingdao Hanhe Cable Co., Ltd., Class A |
44,200 | 29,822 | ||||||
| Qingdao Port International Co., Ltd. |
269,000 | 135,208 | ||||||
| Qingdao Rural Commercial Bank Corp. |
78,200 | 46,656 | ||||||
| Qingdao TGOOD Electric Co., Ltd., Class A |
6,500 | 26,730 | ||||||
| Qingdao Topscomm Communication, Inc., Class A |
18,200 | 19,585 | ||||||
| Qinhuangdao Port Co., Ltd., Class H |
280,000 | 44,993 | ||||||
| *»Qunxing Paper Holdings Co., Ltd. |
147,174 | — | ||||||
| Red Avenue New Materials Group Co., Ltd. |
2,600 | 22,273 | ||||||
| *Red Star Macalline Group Corp., Ltd., Class H |
183,739 | 103,454 | ||||||
| #Redco Properties Group, Ltd. |
730,000 | 224,282 | ||||||
| #Redsun Properties Group, Ltd. |
156,000 | 44,921 | ||||||
| Rianlon Corp. |
4,200 | 25,662 | ||||||
| RiseSun Real Estate Development Co., Ltd., Class A |
30,100 | 20,168 | ||||||
| Riyue Heavy Industry Co., Ltd. |
7,000 | 42,540 | ||||||
| Road King Infrastructure, Ltd. |
96,000 | 97,122 | ||||||
| Rongan Property Co., Ltd., Class A |
53,900 | 20,036 | ||||||
| Rongsheng Petrochemical Co., Ltd., Class A |
87,500 | 235,604 | ||||||
| #Ronshine China Holdings, Ltd. |
221,500 | 89,693 | ||||||
| SAIC Motor Corp., Ltd., Class A |
30,200 | 95,656 | ||||||
| Sanan Optoelectronics Co., Ltd., Class A |
4,400 | 23,090 | ||||||
| Sanquan Food Co., Ltd. |
27,970 | 84,879 | ||||||
| Sansteel Minguang Co., Ltd. Fujian, Class A |
59,300 | 63,443 | ||||||
| Sany Heavy Equipment International Holdings Co., Ltd. |
451,000 | 517,148 | ||||||
| Sany Heavy Industry Co., Ltd., Class A |
138,800 | 497,735 | ||||||
| Satellite Chemical Co., Ltd., Class A |
21,600 | 131,401 | ||||||
| Sealand Securities Co., Ltd., Class A |
76,700 | 46,240 | ||||||
Dimensional World ex U.S. Core Equity 2 ETF
SCHEDULE OF INVESTMENTS
October 31, 2021
| Security Description |
Shares | Fair Value | ||||||
| CHINA (Continued) |
||||||||
| Seazen Group, Ltd. |
1,464,000 | $ | 1,161,180 | |||||
| Seazen Holdings Co., Ltd., Class A |
59,000 | 315,517 | ||||||
| S-Enjoy Service Group Co., Ltd. |
75,000 | 145,969 | ||||||
| SF Holding Co., Ltd., Class A |
16,579 | 167,351 | ||||||
| SGIS Songshan Co., Ltd., Class A |
58,500 | 40,476 | ||||||
| Shaanxi Coal Industry Co., Ltd., Class A |
12,600 | 24,619 | ||||||
| Shan Xi Hua Yang Group New Energy Co., Ltd., Class A |
66,400 | 109,099 | ||||||
| Shandong Buchang Pharmaceuticals Co., Ltd., Class A |
28,011 | 76,517 | ||||||
| #Shandong Chenming Paper Holdings, Ltd. |
148,750 | 71,707 | ||||||
| #Shandong Gold Mining Co., Ltd., Class H |
302,750 | 550,310 | ||||||
| Shandong Himile Mechanical Science & Technology Co., Ltd., Class A |
23,200 | 90,478 | ||||||
| Shandong Hi-speed Co., Ltd., Class A |
24,201 | 20,298 | ||||||
| Shandong Hualu Hengsheng Chemical Co., Ltd., Class A |
20,700 | 100,482 | ||||||
| Shandong Humon Smelting Co., Ltd., Class A |
27,791 | 49,916 | ||||||
| Shandong Linglong Tyre Co., Ltd., Class A |
26,200 | 144,367 | ||||||
| *Shandong Molong Petroleum Machinery Co., Ltd. |
59,600 | 30,417 | ||||||
| Shandong Nanshan Aluminum Co., Ltd., Class A |
125,600 | 84,744 | ||||||
| Shandong Publishing & Media Co., Ltd. |
28,300 | 27,095 | ||||||
| Shandong Sun Paper Industry JSC, Ltd., Class A |
29,100 | 52,176 | ||||||
| Shandong Weigao Group Medical Polymer Co., Ltd., Class H |
1,108,000 | 1,888,673 | ||||||
| Shandong Xiantan Co., Ltd. |
21,700 | 23,996 | ||||||
| Shandong Xinhua Pharmaceutical Co., Ltd. |
109,200 | 53,624 | ||||||
| *Shanghai 2345 Network Holding Group Co., Ltd., Class A |
116,347 | 36,525 | ||||||
| Shanghai AJ Group Co., Ltd., Class A |
22,900 | 23,176 | ||||||
| Shanghai Bailian Group Co., Ltd. |
40,400 | 86,886 | ||||||
| Shanghai Bairun Investment Holding Group Co., Ltd., Class A |
3,700 | 36,753 | ||||||
| Shanghai Belling Co., Ltd., Class A |
10,700 | 50,753 | ||||||
| Shanghai Construction Group Co., Ltd. |
50,300 | 25,689 | ||||||
| Shanghai Daimay Automotive Interior Co., Ltd. |
8,000 | 23,253 | ||||||
| Shanghai Electric Group Co., Ltd., Class H |
678,000 | 190,874 | ||||||
| Shanghai Electric Power Co., Ltd., Class A |
15,500 | 26,775 | ||||||
| Shanghai Environment Group Co., Ltd., Class A |
27,151 | 49,233 | ||||||
| Shanghai Fosun Pharmaceutical Group Co., Ltd., Class H |
93,000 | 438,755 | ||||||
| *Shanghai Fudan Microelectronics Group Co., Ltd. |
58,000 | 158,811 | ||||||
| #Shanghai Fudan-Zhangjiang Bio-Pharmaceutical Co., Ltd., Class H |
111,000 | 54,651 | ||||||
| Shanghai Ganglian E-Commerce Holdings Co., Ltd. |
2,900 | 17,302 | ||||||
| Shanghai Hanbell Precise Machinery Co., Ltd. |
13,000 | 48,080 | ||||||
| Shanghai Industrial Development Co., Ltd., Class A |
33,400 | 20,240 | ||||||
| Shanghai Industrial Holdings, Ltd. |
271,000 | 404,808 | ||||||
| Shanghai Industrial Urban Development Group, Ltd. |
941,200 | 81,064 | ||||||
| *Shanghai International Airport Co., Ltd., Class A |
7,400 | 61,024 | ||||||
| Shanghai International Port Group Co., Ltd., Class A |
41,000 | 36,244 | ||||||
| Shanghai Jahwa United Co., Ltd., Class A |
9,500 | 71,116 | ||||||
| Shanghai Jin Jiang Capital Co., Ltd., Class H |
818,000 | 186,123 | ||||||
| Shanghai Jinqiao Export Processing Zone Development Co., Ltd. |
11,500 | 20,278 | ||||||
| Shanghai Lingang Holdings Corp., Ltd., Class A |
18,700 | 42,963 | ||||||
| Shanghai Lujiazui Finance & Trade Zone Development Co., Ltd., Class A |
32,300 | 54,635 | ||||||
| Shanghai M&G Stationery, Inc., Class A |
11,100 | 110,086 | ||||||
| Shanghai Maling Aquarius Co., Ltd., Class A |
23,600 | 28,824 | ||||||
| *»Shanghai MicroPort MedBot Group Co., Ltd. |
14 | 78 | ||||||
| Shanghai Moons’ Electric Co., Ltd. |
7,400 | 19,463 | ||||||
| Shanghai Pharmaceuticals Holding Co., Ltd., Class H |
401,500 | 736,001 | ||||||
| Shanghai Pudong Development Bank Co., Ltd., Class A |
139,354 | 194,578 | ||||||
| Shanghai Putailai New Energy Technology Co., Ltd. |
2,900 | 80,527 | ||||||
| Shanghai RAAS Blood Products Co., Ltd., Class A |
73,000 | 75,250 | ||||||
| Shanghai Shyndec Pharmaceutical Co., Ltd., Class A |
25,900 | 37,782 | ||||||
Dimensional World ex U.S. Core Equity 2 ETF
SCHEDULE OF INVESTMENTS
October 31, 2021
| Security Description |
Shares | Fair Value | ||||||
| CHINA (Continued) |
||||||||
| Shanghai Sinyang Semiconductor Materials Co., Ltd. |
3,800 | $ | 23,509 | |||||
| Shanghai Tongji Science & Technology Industrial Co., Ltd., Class A |
16,100 | 19,337 | ||||||
| Shanghai Tunnel Engineering Co., Ltd., Class A |
76,000 | 60,774 | ||||||
| Shanghai Waigaoqiao Free Trade Zone Group Co., Ltd., Class A |
22,600 | 45,534 | ||||||
| Shanghai Wanye Enterprises Co., Ltd., Class A |
8,900 | 42,980 | ||||||
| *Shanghai Zendai Property, Ltd. |
2,745,000 | 12,703 | ||||||
| Shanghai Zhangjiang High-Tech Park Development Co., Ltd., Class A |
29,800 | 77,680 | ||||||
| Shanghai Zijiang Enterprise Group Co., Ltd., Class A |
24,710 | 37,397 | ||||||
| Shanxi Coking Co., Ltd., Class A |
53,900 | 57,666 | ||||||
| Shanxi Coking Coal Energy Group Co., Ltd., Class A |
107,100 | 154,560 | ||||||
| *Shanxi Meijin Energy Co., Ltd., Class A |
42,100 | 73,907 | ||||||
| Shanxi Securities Co., Ltd., Class A |
50,550 | 49,423 | ||||||
| Shanxi Taigang Stainless Steel Co., Ltd., Class A |
71,100 | 85,506 | ||||||
| Shanxi Xinghuacun Fen Wine Factory Co., Ltd., Class A |
6,100 | 287,246 | ||||||
| Shanying International Holding Co., Ltd., Class A |
111,500 | 56,423 | ||||||
| *Shengda Resources Co., Ltd., Class A |
14,100 | 25,259 | ||||||
| Shenghe Resources Holding Co., Ltd., Class A |
16,400 | 51,792 | ||||||
| *Shengjing Bank Co., Ltd. |
144,500 | 130,029 | ||||||
| Shengyi Technology Co., Ltd., Class A |
26,200 | 91,048 | ||||||
| Shennan Circuits Co., Ltd. |
9,768 | 135,520 | ||||||
| Shenwan Hongyuan Group Co., Ltd., Class H |
632,000 | 160,050 | ||||||
| Shenzhen Agricultural Products Group Co., Ltd., Class A |
42,800 | 46,392 | ||||||
| *Shenzhen Airport Co., Ltd., Class A |
49,600 | 58,565 | ||||||
| Shenzhen Aisidi Co., Ltd., Class A |
22,700 | 37,971 | ||||||
| Shenzhen Anche Technologies Co., Ltd. |
6,900 | 20,540 | ||||||
| Shenzhen Capchem Technology Co., Ltd., Class A |
1,800 | 40,303 | ||||||
| Shenzhen Center Power Tech Co., Ltd. |
7,100 | 18,386 | ||||||
| Shenzhen Cereals Holdings Co., Ltd. |
23,100 | 23,451 | ||||||
| Shenzhen Changhong Technology Co., Ltd. |
5,300 | 29,452 | ||||||
| Shenzhen Das Intellitech Co., Ltd., Class A |
39,100 | 20,763 | ||||||
| Shenzhen Desay Battery Technology Co. |
8,700 | 57,396 | ||||||
| Shenzhen Everwin Precision Technology Co., Ltd., Class A |
14,700 | 32,189 | ||||||
| Shenzhen Expressway Co., Ltd. |
210,000 | 197,878 | ||||||
| Shenzhen Fastprint Circuit Tech Co., Ltd. |
22,300 | 44,059 | ||||||
| Shenzhen Gongjin Electronics Co., Ltd., Class A |
15,800 | 19,594 | ||||||
| Shenzhen Goodix Technology Co., Ltd. |
1,900 | 30,384 | ||||||
| Shenzhen H&T Intelligent Control Co., Ltd., Class A |
22,100 | 80,148 | ||||||
| Shenzhen Inovance Technology Co., Ltd., Class A |
6,600 | 67,240 | ||||||
| Shenzhen International Holdings, Ltd. |
847,433 | 1,022,926 | ||||||
| Shenzhen Investment, Ltd. |
1,439,142 | 353,354 | ||||||
| *Shenzhen Jieshun Science And Technology Industry Co., Ltd. |
14,100 | 19,137 | ||||||
| Shenzhen Jinjia Group Co., Ltd., Class A |
35,400 | 59,878 | ||||||
| Shenzhen Jufei Optoelectronics Co., Ltd. |
22,200 | 20,249 | ||||||
| Shenzhen Kaifa Technology Co., Ltd., Class A |
15,300 | 35,366 | ||||||
| Shenzhen Kangtai Biological Products Co., Ltd. |
2,000 | 35,688 | ||||||
| Shenzhen Kinwong Electronic Co., Ltd., Class A |
13,000 | 52,486 | ||||||
| Shenzhen Kstar Science And Technology Co., Ltd. |
8,800 | 43,748 | ||||||
| Shenzhen Laibao Hi-tech Co., Ltd. |
14,400 | 23,210 | ||||||
| Shenzhen Megmeet Electrical Co., Ltd., Class A |
8,200 | 39,228 | ||||||
| Shenzhen Mindray Bio-Medical Electronics Co., Ltd., Class A |
6,100 | 358,310 | ||||||
| *Shenzhen Neptunus Bioengineering Co., Ltd., Class A |
69,300 | 33,553 | ||||||
| Shenzhen Overseas Chinese Town Co., Ltd., Class A |
20,700 | 20,239 | ||||||
| *Shenzhen Salubris Pharmaceuticals Co., Ltd., Class A |
16,500 | 74,476 | ||||||
| *Shenzhen SDG Information Co., Ltd., Class A |
18,400 | 17,214 | ||||||
| Shenzhen Sinovatio Technology Co., Ltd. |
3,999 | 18,613 | ||||||
Dimensional World ex U.S. Core Equity 2 ETF
SCHEDULE OF INVESTMENTS
October 31, 2021
| Security Description |
Shares | Fair Value | ||||||
| CHINA (Continued) |
||||||||
| Shenzhen Sunline Tech Co., Ltd., Class A |
17,266 | $ | 33,870 | |||||
| Shenzhen Sunlord Electronics Co., Ltd., Class A |
16,500 | 85,171 | ||||||
| Shenzhen Suntak Circuit Technology Co., Ltd. |
12,900 | 27,784 | ||||||
| Shenzhen Sunway Communication Co., Ltd., Class A |
21,500 | 79,886 | ||||||
| Shenzhen Tagen Group Co., Ltd., Class A |
45,200 | 35,580 | ||||||
| Shenzhen Woer Heat-Shrinkable Material Co., Ltd., Class A |
25,700 | 29,422 | ||||||
| Shenzhen World Union Group, Inc., Class A |
41,080 | 24,060 | ||||||
| Shenzhen Yan Tian Port Holding Co., Ltd. |
54,400 | 44,011 | ||||||
| Shenzhen Yinghe Technology Co., Ltd., Class A |
8,600 | 41,974 | ||||||
| Shenzhen Ysstech Info-tech Co., Ltd., Class A |
11,700 | 17,908 | ||||||
| Shenzhen YUTO Packaging Technology Co., Ltd., Class A |
10,700 | 54,731 | ||||||
| Shenzhen Zhenye Group Co., Ltd., Class A |
29,700 | 19,343 | ||||||
| Shenzhen Zhongjin Lingnan Nonfemet Co., Ltd., Class A |
86,300 | 66,720 | ||||||
| Shenzhou International Group Holdings, Ltd. |
122,400 | 2,640,261 | ||||||
| *Shijiazhuang Changshan BeiMing Technology Co., Ltd., Class A |
36,595 | 37,094 | ||||||
| Shijiazhuang Yiling Pharmaceutical Co., Ltd., Class A |
41,301 | 103,531 | ||||||
| Shimao Group Holdings, Ltd. |
854,000 | 1,343,732 | ||||||
| *Shineco, Inc. |
102 | 1,053 | ||||||
| Shougang Fushan Resources Group, Ltd. |
953,839 | 251,364 | ||||||
| Shui On Land, Ltd. |
1,429,656 | 211,350 | ||||||
| *Sichuan Development Lomon Co., Ltd. |
25,800 | 72,774 | ||||||
| Sichuan Expressway Co., Ltd. |
266,000 | 61,550 | ||||||
| *Sichuan Haite High-tech Co., Ltd. |
10,100 | 18,630 | ||||||
| *Sichuan Hebang Biotechnology Co., Ltd., Class A |
110,800 | 61,607 | ||||||
| Sichuan Kelun Pharmaceutical Co., Ltd., Class A |
37,100 | 102,388 | ||||||
| Sichuan Road & Bridge Co., Ltd. |
140,900 | 264,516 | ||||||
| Sichuan Shuangma Cement Co., Ltd., Class A |
12,500 | 39,105 | ||||||
| Sichuan Swellfun Co., Ltd. |
3,200 | 63,303 | ||||||
| Sichuan Yahua Industrial Group Co., Ltd. |
7,200 | 36,884 | ||||||
| Sieyuan Electric Co., Ltd., Class A |
9,600 | 62,119 | ||||||
| Sihuan Pharmaceutical Holdings Group, Ltd. |
1,587,000 | 334,576 | ||||||
| Sino Biopharmaceutical, Ltd. |
3,187,745 | 2,360,367 | ||||||
| Sinocare, Inc., Class A |
5,900 | 21,627 | ||||||
| Sinofert Holdings, Ltd. |
1,054,000 | 165,300 | ||||||
| Sinolink Securities Co., Ltd., Class A |
58,056 | 97,203 | ||||||
| Sinoma International Engineering Co., Class A |
42,000 | 68,156 | ||||||
| Sinoma Science & Technology Co., Ltd., Class A |
21,100 | 124,174 | ||||||
| Sino-Ocean Group Holding, Ltd. |
2,107,332 | 457,818 | ||||||
| Sinopec Engineering Group Co., Ltd., Class H |
691,500 | 364,460 | ||||||
| Sinopec Kantons Holdings, Ltd. |
470,000 | 179,443 | ||||||
| *Sinopec Oilfield Service Corp., Class H |
1,364,000 | 131,507 | ||||||
| Sinopharm Group Co., Ltd., Class H |
750,400 | 1,790,376 | ||||||
| Sino-Platinum Metals Co., Ltd. |
9,300 | 33,117 | ||||||
| Sinosoft Technology Group, Ltd. |
374,000 | 49,039 | ||||||
| Sinotrans, Ltd., Class H |
927,000 | 303,874 | ||||||
| Sinotruk Hong Kong, Ltd. |
439,500 | 606,787 | ||||||
| Skshu Paint Co., Ltd., Class A |
2,500 | 43,521 | ||||||
| Skyfame Realty Holdings, Ltd. |
1,856,000 | 219,502 | ||||||
| Skyworth Digital Co., Ltd., Class A |
21,700 | 24,538 | ||||||
| *Skyworth Group, Ltd. |
644,324 | 359,474 | ||||||
| *SOHO China, Ltd. |
1,213,500 | 307,312 | ||||||
| *Solargiga Energy Holdings, Ltd. |
518,000 | 33,295 | ||||||
| SooChow Securities Co., Ltd., Class A |
74,471 | 98,516 | ||||||
| *Sou Yu Te Group Co., Ltd., Class A |
79,000 | 18,138 | ||||||
| *South Manganese Investment, Ltd. |
361,000 | 57,080 | ||||||
| Southwest Securities Co., Ltd. |
127,600 | 95,859 | ||||||
Dimensional World ex U.S. Core Equity 2 ETF
SCHEDULE OF INVESTMENTS
October 31, 2021
| Security Description |
Shares | Fair Value | ||||||
| CHINA (Continued) |
||||||||
| SSY Group, Ltd. |
1,073,042 | $ | 511,757 | |||||
| »Suchuang Gas Corp., Ltd. |
98,000 | 30,487 | ||||||
| Sun Art Retail Group, Ltd. |
109,500 | 64,469 | ||||||
| Sun King Technology Group, Ltd. |
272,000 | 154,199 | ||||||
| Sunac China Holdings, Ltd. |
1,370,000 | 2,951,671 | ||||||
| Sunac Services Holdings, Ltd. |
27,059 | 54,890 | ||||||
| Sunfly Intelligent Technology Co., Ltd., Class A |
12,100 | 22,905 | ||||||
| Sungrow Power Supply Co., Ltd., Class A |
3,700 | 94,830 | ||||||
| *Suning Universal Co., Ltd., Class A |
42,800 | 32,086 | ||||||
| *Suning.com Co., Ltd., Class A |
84,600 | 59,063 | ||||||
| Sunny Optical Technology Group Co., Ltd. |
144,000 | 3,891,066 | ||||||
| Sunresin New Materials Co., Ltd. |
5,400 | 66,131 | ||||||
| *Sunshine 100 China Holdings, Ltd. |
217,000 | 11,577 | ||||||
| Sunward Intelligent Equipment Co., Ltd., Class A |
26,250 | 33,086 | ||||||
| Suofeiya Home Collection Co., Ltd., Class A |
11,600 | 30,655 | ||||||
| Suzhou Anjie Technology Co., Ltd., Class A |
13,700 | 29,507 | ||||||
| Suzhou Dongshan Precision Manufacturing Co., Ltd., Class A |
27,800 | 88,228 | ||||||
| Suzhou Gold Mantis Construction Decoration Co., Ltd., Class A |
53,000 | 49,418 | ||||||
| Suzhou Maxwell Technologies Co., Ltd. |
660 | 78,857 | ||||||
| Suzhou Secote Precision Electronic Co., Ltd. |
5,800 | 23,489 | ||||||
| Suzhou TFC Optical Communication Co., Ltd. |
5,900 | 23,636 | ||||||
| Symphony Holdings, Ltd./Hong Kong |
450,000 | 53,798 | ||||||
| Taiji Computer Corp., Ltd. |
8,500 | 36,986 | ||||||
| Tang Palace China Holdings, Ltd. |
88,000 | 8,145 | ||||||
| Tangrenshen Group Co., Ltd. |
29,700 | 29,131 | ||||||
| Tangshan Jidong Cement Co., Ltd., Class A |
34,200 | 62,175 | ||||||
| TangShan Port Group Co., Ltd., Class A |
143,148 | 59,694 | ||||||
| Tangshan Sanyou Chemical Industries Co., Ltd., Class A |
31,700 | 45,698 | ||||||
| *TCL Electronics Holdings, Ltd. |
420,000 | 228,383 | ||||||
| TCL Technology Group Corp., Class A |
268,600 | 254,223 | ||||||
| Ten Pao Group Holdings, Ltd. |
196,000 | 48,376 | ||||||
| Tencent Holdings, Ltd. |
442,300 | 27,348,622 | ||||||
| *Tencent Music Entertainment Group , ADR |
3,212 | 25,246 | ||||||
| Three Squirrels, Inc. |
6,400 | 42,402 | ||||||
| Thunder Software Technology Co., Ltd. |
1,800 | 38,234 | ||||||
| Tian An China Investment Co., Ltd. |
141,000 | 81,565 | ||||||
| Tian Di Science & Technology Co., Ltd., Class A |
100,000 | 65,129 | ||||||
| Tian Lun Gas Holdings, Ltd. |
106,000 | 97,837 | ||||||
| *Tian Shan Development Holding, Ltd. |
66,000 | 14,339 | ||||||
| #Tiangong International Co., Ltd. |
728,000 | 439,848 | ||||||
| Tianjin 712 Communication & Broadcasting Co., Ltd., Class A |
15,800 | 92,983 | ||||||
| Tianjin Capital Environmental Protection Group Co., Ltd. |
146,000 | 72,446 | ||||||
| Tianjin Chase Sun Pharmaceutical Co., Ltd., Class A |
75,700 | 48,357 | ||||||
| Tianjin Port Development Holdings, Ltd. |
1,134,000 | 94,755 | ||||||
| Tianjin Teda Co., Ltd. |
35,700 | 22,024 | ||||||
| Tianjin Zhonghuan Semiconductor Co., Ltd., Class A |
5,900 | 48,249 | ||||||
| Tianli Education International Holdings, Ltd. |
704,000 | 147,514 | ||||||
| Tianma Microelectronics Co., Ltd. |
76,300 | 146,696 | ||||||
| #Tianneng Power International, Ltd. |
528,000 | 603,405 | ||||||
| Tianshui Huatian Technology Co., Ltd., Class A |
44,500 | 89,310 | ||||||
| *Tianyun International Holdings, Ltd. |
266,000 | 48,898 | ||||||
| Tibet Summit Resources Co., Ltd., Class A |
13,800 | 65,781 | ||||||
| Tibet Tianlu Co., Ltd., Class A |
22,200 | 22,052 | ||||||
| *Tibet Water Resources, Ltd. |
583,000 | 37,472 | ||||||
| Times China Holdings, Ltd. |
407,000 | 277,819 | ||||||
Dimensional World ex U.S. Core Equity 2 ETF
SCHEDULE OF INVESTMENTS
October 31, 2021
| Security Description |
Shares | Fair Value | ||||||
| CHINA (Continued) |
||||||||
| *Tingyi Cayman Islands Holding Corp. |
952,000 | $ | 1,781,853 | |||||
| TK Group Holdings, Ltd. |
176,000 | 66,743 | ||||||
| Toly Bread Co., Ltd. |
18,800 | 92,492 | ||||||
| Tomson Group, Ltd. |
304,503 | 74,374 | ||||||
| Tong Ren Tang Technologies Co., Ltd., Class H |
378,000 | 267,742 | ||||||
| *Tongcheng-Elong Holdings, Ltd. |
244,400 | 547,297 | ||||||
| *Tongda Group Holdings, Ltd. |
3,960,000 | 126,756 | ||||||
| TongFu Microelectronics Co., Ltd., Class A |
7,000 | 21,888 | ||||||
| Tonghua Dongbao Pharmaceutical Co., Ltd., Class A |
13,000 | 24,751 | ||||||
| Tongkun Group Co., Ltd., Class A |
28,900 | 90,004 | ||||||
| Tongling Jingda Special Magnet Wire Co., Ltd., Class A |
32,200 | 38,925 | ||||||
| Tongling Nonferrous Metals Group Co., Ltd., Class A |
83,000 | 47,835 | ||||||
| Tongwei Co., Ltd., Class A |
29,500 | 263,683 | ||||||
| Tongyu Heavy Industry Co., Ltd. |
94,200 | 46,345 | ||||||
| Top Spring International Holdings, Ltd. |
107,600 | 16,322 | ||||||
| *Topchoice Medical Corp. |
2,100 | 78,212 | ||||||
| Topsec Technologies Group, Inc., Class A |
23,500 | 67,754 | ||||||
| Topsports International Holdings, Ltd. |
30,000 | 36,483 | ||||||
| Towngas China Co., Ltd. |
222,122 | 152,763 | ||||||
| TravelSky Technology, Ltd., Class H |
384,471 | 719,612 | ||||||
| *Trigiant Group, Ltd. |
360,000 | 30,081 | ||||||
| *Trip.com Group, Ltd. , Sponsored ADR |
97,388 | 2,781,401 | ||||||
| *Trip.com Group, Ltd. |
3,600 | 104,311 | ||||||
| TRS Information Technology Corp., Ltd. |
12,900 | 17,508 | ||||||
| Truly International Holdings, Ltd. |
908,000 | 296,478 | ||||||
| Tsaker Chemical Group, Ltd. |
17,500 | 3,644 | ||||||
| Tsingtao Brewery Co., Ltd. |
160,000 | 1,391,430 | ||||||
| Unilumin Group Co., Ltd., Class A |
22,300 | 28,455 | ||||||
| Uni-President China Holdings, Ltd. |
881,400 | 752,341 | ||||||
| Unisplendour Corp., Ltd., Class A |
14,000 | 60,612 | ||||||
| United Energy Group, Ltd. |
5,188,000 | 460,174 | ||||||
| Valiant Co., Ltd. |
14,900 | 47,823 | ||||||
| Vatti Corp., Ltd., Class A |
19,900 | 18,338 | ||||||
| Victory Giant Technology Huizhou Co., Ltd., Class A |
18,600 | 76,460 | ||||||
| #Vinda International Holdings, Ltd. |
197,000 | 543,209 | ||||||
| #*Viomi Technology Co., Ltd. , ADR |
5,909 | 26,059 | ||||||
| *Vipshop Holdings, Ltd. , Sponsored ADR |
167,041 | 1,864,178 | ||||||
| Virscend Education Co., Ltd. |
169,000 | 11,297 | ||||||
| *Vnet Group, Inc. , Sponsored ADR |
13,904 | 218,015 | ||||||
| Walvax Biotechnology Co., Ltd., Class A |
2,100 | 18,039 | ||||||
| Wangfujing Group Co., Ltd., Class A |
17,800 | 85,626 | ||||||
| Wangneng Environment Co., Ltd. |
10,200 | 25,744 | ||||||
| Wangsu Science & Technology Co., Ltd., Class A |
49,800 | 42,623 | ||||||
| Wanguo International Mining Group, Ltd. |
56,000 | 14,758 | ||||||
| Wanhua Chemical Group Co., Ltd., Class A |
23,400 | 385,462 | ||||||
| Want Want China Holdings, Ltd. |
2,276,000 | 1,764,262 | ||||||
| Wanxiang Qianchao Co., Ltd., Class A |
75,600 | 70,609 | ||||||
| Wasion Holdings, Ltd. |
250,000 | 85,807 | ||||||
| Wasu Media Holding Co., Ltd., Class A |
31,400 | 35,899 | ||||||
| #*Weibo Corp. , Sponsored ADR |
18,723 | 842,160 | ||||||
| Weichai Power Co., Ltd., Class H |
994,880 | 1,787,933 | ||||||
| Weihai Guangwei Composites Co., Ltd., Class A |
10,900 | 115,576 | ||||||
| Wellhope Foods Co., Ltd., Class A |
22,700 | 32,440 | ||||||
| Wens Foodstuffs Group Co., Ltd. |
57,000 | 146,713 | ||||||
| *Wenzhou Kangning Hospital Co., Ltd. |
7,200 | 27,582 | ||||||
| West China Cement, Ltd. |
1,542,000 | 269,586 | ||||||
Dimensional World ex U.S. Core Equity 2 ETF
SCHEDULE OF INVESTMENTS
October 31, 2021
| Security Description |
Shares | Fair Value | ||||||
| CHINA (Continued) |
||||||||
| Western Region Gold Co., Ltd., Class A |
11,800 | $ | 21,378 | |||||
| Western Securities Co., Ltd., Class A |
85,800 | 102,649 | ||||||
| Western Superconducting Technologies Co., Ltd. |
5,894 | 71,499 | ||||||
| Westone Information Industry, Inc., Class A |
5,200 | 42,460 | ||||||
| Wharf Holdings, Ltd. (The) |
463,000 | 1,607,009 | ||||||
| Will Semiconductor, Ltd. |
4,004 | 166,346 | ||||||
| Wingtech Technology Co., Ltd., Class A |
3,400 | 58,285 | ||||||
| Winning Health Technology Group Co., Ltd., Class A |
12,600 | 24,894 | ||||||
| Wisdom Education International Holdings Co., Ltd. |
576,000 | 99,220 | ||||||
| *Wison Engineering Services Co., Ltd. |
88,000 | 4,638 | ||||||
| Wolong Electric Group Co., Ltd. |
21,500 | 49,731 | ||||||
| Wuchan Zhongda Group Co., Ltd., Class A |
38,400 | 37,604 | ||||||
| Wuhan Department Store Group Co., Ltd., Class A |
17,508 | 27,673 | ||||||
| Wuhan Fingu Electronic Technology Co., Ltd. |
10,800 | 17,087 | ||||||
| Wuhan Guide Infrared Co., Ltd., Class A |
9,600 | 32,536 | ||||||
| Wuhan Raycus Fiber Laser Technologies Co., Ltd. |
8,800 | 83,688 | ||||||
| Wuhu Sanqi Interactive Entertainment Network Technology Group Co., Ltd., Class A |
17,200 | 63,935 | ||||||
| Wuhu Token Science Co., Ltd., Class A |
44,900 | 71,950 | ||||||
| Wuliangye Yibin Co., Ltd., Class A |
33,500 | 1,132,817 | ||||||
| WUS Printed Circuit Kunshan Co., Ltd., Class A |
23,200 | 37,104 | ||||||
| #WuXi AppTec Co., Ltd. |
8,280 | 177,009 | ||||||
| *Wuxi Biologics Cayman, Inc. |
35,500 | 540,323 | ||||||
| Wuxi Taiji Industry Co., Ltd., Class A |
38,500 | 48,105 | ||||||
| XCMG Construction Machinery Co., Ltd., Class A |
98,800 | 94,283 | ||||||
| Xiabuxiabu Catering Management China Holdings Co., Ltd. |
310,000 | 227,149 | ||||||
| Xiamen C & D, Inc., Class A |
69,200 | 86,572 | ||||||
| Xiamen Comfort Science & Technology Group Co., Ltd., Class A |
14,500 | 24,640 | ||||||
| Xiamen International Port Co., Ltd., Class H |
500,000 | 55,919 | ||||||
| Xiamen ITG Group Corp., Ltd., Class A |
47,400 | 51,304 | ||||||
| Xiamen Kingdomway Group Co. |
12,700 | 60,319 | ||||||
| Xiamen Meiya Pico Information Co., Ltd., Class A |
11,800 | 28,382 | ||||||
| Xiamen Tungsten Co., Ltd., Class A |
30,000 | 106,361 | ||||||
| Xiamen Xiangyu Co., Ltd., Class A |
52,200 | 63,184 | ||||||
| *Xi’an Tian He Defense Technology Co., Ltd. |
8,900 | 19,725 | ||||||
| Xi’an Triangle Defense Co., Ltd. |
7,500 | 58,276 | ||||||
| *Xiaomi Corp., Class B |
14,600 | 40,070 | ||||||
| Xinfengming Group Co., Ltd., Class A |
48,174 | 110,377 | ||||||
| Xingda International Holdings, Ltd. |
565,612 | 128,696 | ||||||
| Xingfa Aluminium Holdings, Ltd. |
60,000 | 75,433 | ||||||
| Xinjiang Goldwind Science & Technology Co., Ltd., Class H |
279,353 | 626,287 | ||||||
| Xinjiang Tianshan Cement Co., Ltd., Class A |
25,400 | 54,270 | ||||||
| Xinjiang Xintai Natural Gas Co., Ltd. |
4,300 | 18,623 | ||||||
| *Xinjiang Xinxin Mining Industry Co., Ltd. |
304,000 | 61,745 | ||||||
| Xinjiang Zhongtai Chemical Co., Ltd., Class A |
75,800 | 124,899 | ||||||
| Xinte Energy Co., Ltd. |
400 | 1,288 | ||||||
| Xinxing Ductile Iron Pipes Co., Ltd., Class A |
96,400 | 55,858 | ||||||
| Xinyangfeng Agricultural Technology Co., Ltd. |
18,200 | 51,621 | ||||||
| #Xinyi Energy Holdings, Ltd. |
552,000 | 324,996 | ||||||
| Xinyi Solar Holdings, Ltd. |
2,258,943 | 4,727,517 | ||||||
| Xinyu Iron & Steel Co., Ltd., Class A |
93,800 | 86,582 | ||||||
| Xinyuan Real Estate Co., Ltd. , Sponsored ADR |
23,755 | 27,318 | ||||||
| *Xiwang Foodstuffs Co., Ltd. |
27,200 | 19,669 | ||||||
| #Xtep International Holdings, Ltd. |
699,836 | 921,233 | ||||||
| Xuji Electric Co., Ltd., Class A |
24,400 | 75,532 | ||||||
| Yadea Group Holdings, Ltd. |
608,000 | 1,047,326 | ||||||
Dimensional World ex U.S. Core Equity 2 ETF
SCHEDULE OF INVESTMENTS
October 31, 2021
| Security Description |
Shares | Fair Value | ||||||
| CHINA (Continued) |
||||||||
| *YaGuang Technology Group Co., Ltd., Class A |
24,400 | $ | 32,583 | |||||
| Yangtze Optical Fibre and Cable Joint Stock, Ltd. Co., Class H |
12,000 | 20,239 | ||||||
| Yangzhou Yangjie Electronic Technology Co., Ltd. |
7,700 | 61,297 | ||||||
| Yantai Changyu Pioneer Wine Co., Ltd. |
7,600 | 37,426 | ||||||
| Yantai Dongcheng Pharmaceutical Co., Ltd., Class A |
19,300 | 41,839 | ||||||
| Yantai Eddie Precision Machinery Co., Ltd. |
15,600 | 87,031 | ||||||
| Yantai Jereh Oilfield Services Group Co., Ltd., Class A |
27,677 | 182,807 | ||||||
| Yantai Tayho Advanced Materials Co., Ltd., Class A |
6,400 | 17,982 | ||||||
| #Yanzhou Coal Mining Co., Ltd., Class H |
1,364,000 | 2,023,455 | ||||||
| *Yashili International Holdings, Ltd. |
466,000 | 34,146 | ||||||
| Yeebo International Holdings, Ltd. |
106,000 | 32,158 | ||||||
| YGSOFT, Inc., Class A |
19,000 | 20,149 | ||||||
| #*YiChang HEC ChangJiang Pharmaceutical Co., Ltd., Class H |
142,200 | 66,539 | ||||||
| *Yida China Holdings, Ltd. |
110,000 | 15,555 | ||||||
| Yifan Pharmaceutical Co., Ltd., Class A |
29,600 | 75,772 | ||||||
| Yifeng Pharmacy Chain Co., Ltd., Class A |
10,700 | 79,798 | ||||||
| Yihai International Holding, Ltd. |
204,000 | 1,199,761 | ||||||
| Yijiahe Technology Co., Ltd. |
2,600 | 22,659 | ||||||
| Yintai Gold Co., Ltd., Class A |
67,600 | 93,122 | ||||||
| Yipinhong Pharmaceutical Co., Ltd. |
4,185 | 20,785 | ||||||
| Yip’s Chemical Holdings, Ltd. |
96,000 | 56,891 | ||||||
| *Yiren Digital, Ltd. , Sponsored ADR |
8,553 | 26,856 | ||||||
| Yixintang Pharmaceutical Group Co., Ltd., Class A |
22,000 | 108,923 | ||||||
| Yonghui Superstores Co., Ltd., Class A |
142,700 | 87,590 | ||||||
| Youngor Group Co., Ltd., Class A |
88,900 | 89,279 | ||||||
| *Youzu Interactive Co., Ltd., Class A |
10,900 | 22,625 | ||||||
| *Yuan Longping High-tech Agriculture Co., Ltd., Class A |
9,200 | 30,160 | ||||||
| Yuexiu Property Co., Ltd. |
843,344 | 743,708 | ||||||
| *Yuexiu Transport Infrastructure, Ltd. |
172,639 | 110,520 | ||||||
| Yum China Holdings, Inc. |
62,870 | 3,588,620 | ||||||
| Yum China Holdings, Inc. |
2,600 | 152,409 | ||||||
| Yunda Holding Co., Ltd., Class A |
16,200 | 47,239 | ||||||
| *Yunji, Inc. , ADR |
889 | 800 | ||||||
| *Yunnan Aluminium Co., Ltd., Class A |
52,900 | 98,237 | ||||||
| Yunnan Baiyao Group Co., Ltd., Class A |
4,700 | 65,772 | ||||||
| Yunnan Energy New Material Co., Ltd., Class A |
1,500 | 68,348 | ||||||
| *Yunnan Tin Co., Ltd., Class A |
21,000 | 53,888 | ||||||
| Yusys Technologies Co., Ltd. |
7,600 | 21,853 | ||||||
| Yutong Bus Co., Ltd., Class A |
17,500 | 30,995 | ||||||
| Yuzhou Group Holdings Co., Ltd. |
1,440,783 | 157,431 | ||||||
| *Zai Lab, Ltd. |
100 | 10,445 | ||||||
| ZBOM Home Collection Co., Ltd. |
11,677 | 35,946 | ||||||
| *Zepp Health Corp. , ADR |
178 | 1,461 | ||||||
| Zhangzhou Pientzehuang Pharmaceutical Co., Ltd. |
1,900 | 122,534 | ||||||
| #Zhaojin Mining Industry Co., Ltd., Class H |
454,500 | 325,434 | ||||||
| Zhefu Holding Group Co., Ltd., Class A |
74,900 | 83,759 | ||||||
| Zhejiang China Commodities City Group Co., Ltd. |
105,400 | 80,334 | ||||||
| Zhejiang Chint Electrics Co., Ltd., Class A |
20,100 | 189,111 | ||||||
| Zhejiang Communications Technology Co., Ltd. |
33,300 | 26,993 | ||||||
| Zhejiang Crystal-Optech Co., Ltd., Class A |
16,600 | 40,834 | ||||||
| Zhejiang Dahua Technology Co., Ltd., Class A |
19,500 | 66,333 | ||||||
| Zhejiang Dingli Machinery Co., Ltd. |
10,300 | 109,890 | ||||||
| Zhejiang Expressway Co., Ltd., Class H |
416,000 | 369,526 | ||||||
| Zhejiang Hailiang Co., Ltd., Class A |
47,500 | 78,119 | ||||||
| Zhejiang Hangke Technology, Inc. Co. |
2,076 | 33,510 | ||||||
| Zhejiang Hisoar Pharmaceutical Co., Ltd., Class A |
40,800 | 49,577 | ||||||
Dimensional World ex U.S. Core Equity 2 ETF
SCHEDULE OF INVESTMENTS
October 31, 2021
| Security Description |
Shares | Fair Value | ||||||
| CHINA (Continued) |
||||||||
| Zhejiang Huace Film & Television Co., Ltd., Class A |
38,700 | $ | 34,090 | |||||
| Zhejiang Huahai Pharmaceutical Co., Ltd., Class A |
39,910 | 114,880 | ||||||
| Zhejiang Huayou Cobalt Co., Ltd., Class A |
2,700 | 46,829 | ||||||
| Zhejiang Jiahua Energy Chemical Industry Co., Ltd., Class A |
34,600 | 52,905 | ||||||
| Zhejiang Jiemei Electronic & Technology Co., Ltd., Class A |
10,000 | 43,044 | ||||||
| *Zhejiang Jingu Co., Ltd., Class A |
22,500 | 24,845 | ||||||
| Zhejiang Jingxin Pharmaceutical Co., Ltd., Class A |
21,060 | 26,544 | ||||||
| Zhejiang JIULI Hi-tech Metals Co., Ltd. |
20,000 | 39,452 | ||||||
| Zhejiang Juhua Co., Ltd., Class A |
21,100 | 51,212 | ||||||
| Zhejiang Longsheng Group Co., Ltd., Class A |
41,000 | 79,724 | ||||||
| Zhejiang Medicine Co., Ltd., Class A |
24,300 | 60,459 | ||||||
| Zhejiang Narada Power Source Co., Ltd., Class A |
20,800 | 36,710 | ||||||
| Zhejiang NHU Co., Ltd., Class A |
44,700 | 189,476 | ||||||
| Zhejiang Runtu Co., Ltd., Class A |
27,800 | 38,426 | ||||||
| Zhejiang Sanhua Intelligent Controls Co., Ltd., Class A |
35,800 | 132,628 | ||||||
| Zhejiang Semir Garment Co., Ltd., Class A |
51,400 | 60,209 | ||||||
| *Zhejiang Shibao Co., Ltd. |
46,000 | 8,811 | ||||||
| Zhejiang Supor Co., Ltd., Class A |
12,500 | 103,472 | ||||||
| Zhejiang Wanfeng Auto Wheel Co., Ltd. |
50,100 | 41,159 | ||||||
| Zhejiang Wanliyang Co., Ltd., Class A |
32,400 | 68,264 | ||||||
| Zhejiang Weiming Environment Protection Co., Ltd., Class A |
23,465 | 100,564 | ||||||
| Zhejiang Weixing New Building Materials Co., Ltd., Class A |
35,700 | 100,364 | ||||||
| Zhejiang Wolwo Bio-Pharmaceutical Co., Ltd. |
2,700 | 22,624 | ||||||
| Zhejiang Xianju Pharmaceutical Co., Ltd., Class A |
24,900 | 42,896 | ||||||
| Zhejiang Xinan Chemical Industrial Group Co., Ltd., Class A |
11,400 | 49,409 | ||||||
| Zhejiang Yasha Decoration Co., Ltd., Class A |
30,700 | 35,674 | ||||||
| Zhejiang Yinlun Machinery Co., Ltd. |
18,200 | 33,116 | ||||||
| #Zhengzhou Coal Mining Machinery Group Co., Ltd., Class H |
158,000 | 166,144 | ||||||
| #Zhenro Properties Group, Ltd. |
76,000 | 36,148 | ||||||
| *Zheshang Securities Co., Ltd., Class A |
37,300 | 71,889 | ||||||
| *Zhong An Group, Ltd. |
1,718,000 | 68,463 | ||||||
| #*ZhongAn Online P&C Insurance Co., Ltd. |
89,500 | 328,475 | ||||||
| Zhongjin Gold Corp., Ltd., Class A |
122,175 | 158,761 | ||||||
| Zhongshan Broad Ocean Motor Co., Ltd., Class A |
57,200 | 60,660 | ||||||
| Zhongshan Public Utilities Group Co., Ltd., Class A |
15,300 | 20,551 | ||||||
| Zhongsheng Group Holdings, Ltd. |
366,000 | 3,309,929 | ||||||
| *Zhongtian Financial Group Co., Ltd., Class A |
98,518 | 38,621 | ||||||
| Zhongyu Gas Holdings, Ltd. |
190,666 | 182,846 | ||||||
| Zhongyuan Environment-Protection Co., Ltd., Class A |
21,900 | 20,830 | ||||||
| #Zhou Hei Ya International Holdings Co., Ltd. |
516,000 | 464,987 | ||||||
| Zhuguang Holdings Group Co., Ltd. |
972,000 | 213,666 | ||||||
| *Zhuhai Orbita Aerospace Science & Technology Co., Ltd., Class A |
14,300 | 19,319 | ||||||
| *Zhuzhou CRRC Times Electric Co., Ltd., Class H |
220,400 | 1,056,803 | ||||||
| Zhuzhou Kibing Group Co., Ltd., Class A |
34,400 | 85,426 | ||||||
| Zijin Mining Group Co., Ltd., Class H |
3,153,000 | 4,393,662 | ||||||
| Zoomlion Heavy Industry Science and Technology Co., Ltd., Class H |
825,200 | 596,168 | ||||||
| ZTE Corp., Class H |
169,800 | 510,772 | ||||||
| ZTO Express Cayman, Inc. |
2,100 | 63,224 | ||||||
| #ZTO Express Cayman, Inc. , Sponsored ADR |
76,912 | 2,255,829 | ||||||
|
|
|
|||||||
| TOTAL CHINA |
436,343,741 | |||||||
|
|
|
|||||||
| COLOMBIA (0.1%) |
||||||||
| *Banco Davivienda SA |
9,863 | 88,131 | ||||||
| *Banco de Bogota SA |
4,740 | 94,800 | ||||||
Dimensional World ex U.S. Core Equity 2 ETF
SCHEDULE OF INVESTMENTS
October 31, 2021
| Security Description |
Shares | Fair Value | ||||||
| COLOMBIA (Continued) |
||||||||
| Bancolombia SA, Sponsored ADR |
5,747 | $ | 206,490 | |||||
| Bancolombia SA |
12,320 | 109,338 | ||||||
| Celsia SA ESP |
103,896 | 117,284 | ||||||
| Cementos Argos SA |
144,715 | 242,146 | ||||||
| *Cemex Latam Holdings SA |
37,434 | 34,524 | ||||||
| Corp. Financiera Colombiana SA |
18,970 | 148,311 | ||||||
| Ecopetrol SA |
356,765 | 267,645 | ||||||
| Grupo Argos SA |
73,551 | 228,697 | ||||||
| Grupo Argos SA/Colombia |
4,347 | 9,851 | ||||||
| #Grupo Aval Acciones y Valores SA, Sponsored ADR |
5,281 | 31,845 | ||||||
| Grupo Aval Acciones y Valores SA, Preference |
357,618 | 108,369 | ||||||
| Grupo de Inversiones Suramericana SA, Preference |
13,796 | 68,671 | ||||||
| Grupo de Inversiones Suramericana SA |
34,155 | 197,551 | ||||||
| Grupo Energia Bogota SA ESP |
47,042 | 33,716 | ||||||
| Grupo Nutresa SA |
28,000 | 162,393 | ||||||
| *Interconexion Electrica SA ESP |
72,437 | 431,569 | ||||||
|
|
|
|||||||
| TOTAL COLOMBIA |
2,581,331 | |||||||
|
|
|
|||||||
| CZECH REPUBLIC (0.0%) |
||||||||
| CEZ A/S |
19,352 | 639,473 | ||||||
| *Komercni Banka A/S |
9,552 | 370,973 | ||||||
| *Moneta Money Bank A/S |
43,189 | 168,999 | ||||||
| O2 Czech Republic A/S |
10,996 | 126,406 | ||||||
| #Philip Morris Cr As |
100 | 71,138 | ||||||
|
|
|
|||||||
| TOTAL CZECH REPUBLIC |
1,376,989 | |||||||
|
|
|
|||||||
| DENMARK (1.7%) |
||||||||
| *ALK-Abello A/S |
2,698 | 1,170,133 | ||||||
| #Alm Brand A/S |
31,154 | 240,379 | ||||||
| Ambu A/S, Class B |
9,445 | 269,318 | ||||||
| #AP Moller—Maersk A/S, Class A |
237 | 649,613 | ||||||
| AP Moller—Maersk A/S, Class B |
274 | 792,588 | ||||||
| #*Bang & Olufsen A/S |
42,342 | 208,537 | ||||||
| BankNordik P/F |
590 | 13,308 | ||||||
| *Bavarian Nordic A/S |
28,817 | 1,380,702 | ||||||
| *Brodrene Hartmann A/S |
1,220 | 73,067 | ||||||
| Carlsberg AS, Class B |
15,352 | 2,535,044 | ||||||
| Chemometec A/S |
3,075 | 464,956 | ||||||
| #Chr Hansen Holding A/S |
19,776 | 1,575,103 | ||||||
| Coloplast A/S, Class B |
6,991 | 1,140,815 | ||||||
| Columbus A/S |
35,018 | 51,424 | ||||||
| D/S Norden A/S |
13,349 | 322,493 | ||||||
| Danske Bank A/S |
94,894 | 1,607,560 | ||||||
| *Demant A/S |
34,141 | 1,655,440 | ||||||
| *Dfds A/S |
16,046 | 831,211 | ||||||
| *Drilling Co. of 1972 A/S (The) |
4,458 | 159,919 | ||||||
| DSV A/S |
28,224 | 6,566,069 | ||||||
| FLSmidth & Co. A/S |
15,703 | 597,502 | ||||||
| *Genmab A/S |
6,434 | 2,886,535 | ||||||
| *Genmab A/S, Class S , ADR |
1,640 | 73,210 | ||||||
| #GN Store Nord AS |
43,714 | 2,655,474 | ||||||
| H Lundbeck A/S, Class B |
23,136 | 643,871 | ||||||
| *H+H International A/S, Class B |
8,326 | 328,981 | ||||||
| #*ISS A/S |
60,255 | 1,200,723 | ||||||
Dimensional World ex U.S. Core Equity 2 ETF
SCHEDULE OF INVESTMENTS
October 31, 2021
| Security Description |
Shares | Fair Value | ||||||
| DENMARK (Continued) |
||||||||
| Jeudan A/S |
2,050 | $ | 87,379 | |||||
| *Jyske Bank A/S, Registered |
27,603 | 1,348,300 | ||||||
| Matas A/S |
17,910 | 350,769 | ||||||
| Netcompany Group A/S |
4,459 | 507,055 | ||||||
| *Nilfisk Holding A/S |
15,278 | 531,183 | ||||||
| *NKT A/S |
15,790 | 761,946 | ||||||
| #NNIT A/S |
5,934 | 111,695 | ||||||
| North Media A/S |
1,296 | 24,394 | ||||||
| Novo Nordisk A/S, Class B |
134,410 | 14,726,168 | ||||||
| Novo Nordisk A/S , Sponsored ADR |
23,058 | 2,539,378 | ||||||
| #Novozymes A/S, B Shares |
34,159 | 2,514,493 | ||||||
| *NTG Nordic Transport Group A/S |
1,260 | 102,708 | ||||||
| Orsted AS |
6,883 | 972,219 | ||||||
| Pandora A/S |
48,254 | 6,745,284 | ||||||
| *Parken Sport & Entertainment A/S |
2,697 | 36,081 | ||||||
| Per Aarsleff Holding A/S |
9,319 | 402,284 | ||||||
| Ringkjoebing Landbobank A/S |
12,703 | 1,614,466 | ||||||
| ROCKWOOL International A/S, Class B |
2,787 | 1,274,632 | ||||||
| ROCKWOOL International A/S, Class A |
396 | 159,242 | ||||||
| Royal Unibrew A/S |
25,994 | 3,228,450 | ||||||
| #RTX A/S |
2,195 | 52,243 | ||||||
| Scandinavian Tobacco Group A/S |
30,929 | 695,720 | ||||||
| Schouw & Co. A/S |
5,888 | 573,380 | ||||||
| Simcorp A/S |
12,916 | 1,561,971 | ||||||
| Solar A/S, B Shares |
3,709 | 432,732 | ||||||
| SP Group A/S |
789 | 48,849 | ||||||
| Spar Nord Bank A/S |
40,494 | 522,211 | ||||||
| Sydbank AS |
29,568 | 1,016,517 | ||||||
| Tivoli A/S |
202 | 27,087 | ||||||
| Topdanmark AS |
24,047 | 1,278,596 | ||||||
| #*TORM PLC |
11,612 | 94,563 | ||||||
| Tryg A/S |
54,210 | 1,286,447 | ||||||
| #Vestas Wind Systems A/S |
57,013 | 2,468,241 | ||||||
| *Zealand Pharma A/S |
10,516 | 336,991 | ||||||
|
|
|
|||||||
| TOTAL DENMARK |
78,527,649 | |||||||
|
|
|
|||||||
| EGYPT (0.0%) |
||||||||
| *Commercial International Bank Egypt Sae , Sponsored GDR |
76,998 | 238,694 | ||||||
| *Commercial International Bank Egypt SAE, Registered , GDR |
53,717 | 166,523 | ||||||
|
|
|
|||||||
| TOTAL EGYPT |
405,217 | |||||||
|
|
|
|||||||
| FINLAND (1.1%) |
||||||||
| Aktia Bank OYJ |
19,456 | 278,741 | ||||||
| Alma Media OYJ |
10,852 | 140,654 | ||||||
| Aspo OYJ |
8,325 | 117,150 | ||||||
| Atria OYJ |
7,160 | 92,471 | ||||||
| *BasWare OYJ |
1,070 | 39,562 | ||||||
| Cargotec OYJ, Class B |
17,668 | 916,809 | ||||||
| Caverion OYJ |
20,229 | 160,007 | ||||||
| Citycon OYJ |
17,305 | 142,286 | ||||||
| Digia OYJ |
1,095 | 8,744 | ||||||
| Elisa OYJ |
38,392 | 2,318,306 | ||||||
| #*Finnair OYJ |
361,889 | 276,907 | ||||||
Dimensional World ex U.S. Core Equity 2 ETF
SCHEDULE OF INVESTMENTS
October 31, 2021
| Security Description |
Shares | Fair Value | ||||||
| FINLAND (Continued) |
||||||||
| Fiskars OYJ Abp |
13,847 | $ | 340,518 | |||||
| Fortum OYJ |
79,839 | 2,374,511 | ||||||
| F-Secure OYJ |
28,944 | 163,290 | ||||||
| Harvia OYJ |
873 | 53,747 | ||||||
| Hkscan OYJ |
20,409 | 46,528 | ||||||
| Huhtamaki OYJ |
36,724 | 1,600,502 | ||||||
| Kemira OYJ |
59,833 | 918,835 | ||||||
| Kesko OYJ, Class A |
32,432 | 990,840 | ||||||
| Kesko OYJ, Class B |
102,751 | 3,340,133 | ||||||
| Kojamo OYJ |
441 | 9,865 | ||||||
| Kone OYJ, Class B |
22,631 | 1,544,142 | ||||||
| Konecranes OYJ |
28,946 | 1,205,246 | ||||||
| Lassila & Tikanoja OYJ |
16,264 | 255,972 | ||||||
| Metsa Board OYJ |
78,209 | 724,057 | ||||||
| Metsa Board OYJ |
4,065 | 46,007 | ||||||
| Metso Outotec OYJ |
255,527 | 2,566,743 | ||||||
| Musti Group OYJ |
1,674 | 65,827 | ||||||
| Neles OYJ |
50,698 | 760,364 | ||||||
| Neste OYJ |
36,507 | 2,035,912 | ||||||
| *Nokia OYJ |
394,854 | 2,271,009 | ||||||
| *Nokia OYJ , Sponsored ADR |
207,885 | 1,180,787 | ||||||
| *Nokia OYJ |
150,663 | 867,587 | ||||||
| Nokian Renkaat OYJ |
64,831 | 2,430,825 | ||||||
| Nordea Bank Abp |
70,935 | 868,012 | ||||||
| Nordea Bank Abp |
291,852 | 3,570,119 | ||||||
| Olvi OYJ |
6,636 | 401,637 | ||||||
| Oriola OYJ, Class A |
72,809 | 166,831 | ||||||
| Orion OYJ, Class B |
26,552 | 1,150,119 | ||||||
| Orion OYJ, Class A |
9,151 | 395,006 | ||||||
| *Outokumpu OYJ |
144,361 | 902,131 | ||||||
| Pihlajalinna OYJ |
749 | 10,176 | ||||||
| Ponsse OYJ |
3,963 | 205,002 | ||||||
| *QT Group OYJ |
68 | 10,985 | ||||||
| Raisio OYJ |
14,141 | 57,276 | ||||||
| *Rapala VMC OYJ |
2,901 | 29,610 | ||||||
| Revenio Group OYJ |
8,707 | 575,852 | ||||||
| #Rovio Entertainment OYJ |
4,014 | 32,958 | ||||||
| Sampo OYJ, A Shares |
31,801 | 1,692,874 | ||||||
| Sanoma OYJ |
48,649 | 757,783 | ||||||
| Stora Enso OYJ, Registered |
126,558 | 2,106,078 | ||||||
| Taaleri OYJ |
3,924 | 49,497 | ||||||
| Teleste OYJ |
1,219 | 7,448 | ||||||
| Terveystalo OYJ |
9,342 | 121,732 | ||||||
| TietoEVRY OYJ |
35,665 | 1,093,740 | ||||||
| Tokmanni Group Corp. |
26,269 | 598,266 | ||||||
| UPM-Kymmene OYJ |
67,405 | 2,380,689 | ||||||
| Uponor OYJ |
26,494 | 645,088 | ||||||
| Vaisala OYJ, A Shares |
5,625 | 299,438 | ||||||
| Valmet OYJ |
68,713 | 2,791,078 | ||||||
| Verkkokauppa.com OYJ |
1,444 | 11,848 | ||||||
| Wartsila OYJ Abp |
124,244 | 1,724,653 | ||||||
| YIT OYJ |
78,021 | 460,477 | ||||||
|
|
|
|||||||
| TOTAL FINLAND |
53,401,287 | |||||||
|
|
|
|||||||
Dimensional World ex U.S. Core Equity 2 ETF
SCHEDULE OF INVESTMENTS
October 31, 2021
| Security Description |
Shares | Fair Value | ||||||
| FRANCE (5.3%) |
||||||||
| ABC arbitrage |
6,524 | $ | 53,755 | |||||
| *Accor SA |
52,846 | 1,890,328 | ||||||
| *Aeroports de Paris |
5,395 | 717,360 | ||||||
| Air Liquide SA |
59,288 | 9,896,428 | ||||||
| *Airbus SE |
46,389 | 5,937,397 | ||||||
| *Akka Technologies |
5,836 | 322,556 | ||||||
| AKWEL |
7,357 | 187,731 | ||||||
| Albioma SA |
15,718 | 618,447 | ||||||
| ALD SA |
5,047 | 75,110 | ||||||
| Alstom SA |
23,567 | 839,458 | ||||||
| Alten SA |
16,114 | 2,595,784 | ||||||
| Amundi SA |
9,443 | 841,993 | ||||||
| Arkema SA |
33,928 | 4,640,894 | ||||||
| Assystem SA |
2,834 | 101,669 | ||||||
| Atos SE |
26,073 | 1,357,177 | ||||||
| *Aubay |
3,005 | 186,395 | ||||||
| AXA SA |
128,655 | 3,745,961 | ||||||
| Axway Software SA |
1,805 | 56,816 | ||||||
| Bastide le Confort Medical |
2,315 | 117,609 | ||||||
| *Beneteau SA |
24,757 | 377,606 | ||||||
| Bigben Interactive |
8,107 | 153,862 | ||||||
| BioMerieux |
4,579 | 583,159 | ||||||
| BNP Paribas SA |
76,793 | 5,145,483 | ||||||
| Boiron SA |
3,504 | 169,701 | ||||||
| Bollore SA |
240,760 | 1,395,880 | ||||||
| *Bonduelle SCA |
10,757 | 275,734 | ||||||
| *»Bourbon Corp. |
12,106 | — | ||||||
| Bouygues SA |
101,347 | 4,104,922 | ||||||
| Bureau Veritas SA |
59,044 | 1,876,300 | ||||||
| Burelle SA |
26 | 19,919 | ||||||
| Capgemini SE |
25,881 | 6,029,076 | ||||||
| Carrefour SA |
204,488 | 3,704,647 | ||||||
| *Casino Guichard Perrachon SA |
11,721 | 292,035 | ||||||
| *Catering International Services |
977 | 15,716 | ||||||
| CBO Territoria |
5,020 | 21,495 | ||||||
| *Cegedim SA |
4,490 | 134,577 | ||||||
| *CGG SA |
323,049 | 234,327 | ||||||
| Chargeurs SA |
13,271 | 394,082 | ||||||
| Cie de Saint-Gobain |
86,234 | 5,943,731 | ||||||
| *Cie des Alpes |
12,244 | 216,791 | ||||||
| Cie Generale des Etablissements Michelin SCA |
52,105 | 8,182,484 | ||||||
| Cie Plastic Omnium SA |
34,382 | 953,331 | ||||||
| *Claranova SE |
1,863 | 11,621 | ||||||
| CNP Assurances |
54,655 | 1,369,980 | ||||||
| Coface SA |
45,691 | 653,016 | ||||||
| Credit Agricole SA |
76,761 | 1,158,362 | ||||||
| Danone SA |
83,698 | 5,458,018 | ||||||
| Danone SA, Sponsored ADR |
600 | 7,806 | ||||||
| Dassault Aviation SA |
1,586 | 165,644 | ||||||
| Dassault Systemes SE, ADR |
5,700 | 332,140 | ||||||
| Dassault Systemes SE |
6,270 | 365,554 | ||||||
| *DBV Technologies SA |
693 | 4,616 | ||||||
| Delta Plus Group |
763 | 83,530 | ||||||
| *Derichebourg SA |
62,189 | 707,446 | ||||||
| *Devoteam SA |
193 | 37,634 | ||||||
| Edenred |
44,915 | 2,430,999 | ||||||
Dimensional World ex U.S. Core Equity 2 ETF
SCHEDULE OF INVESTMENTS
October 31, 2021
| Security Description |
Shares | Fair Value | ||||||
| FRANCE (Continued) |
||||||||
| Eiffage SA |
45,569 | $ | 4,691,268 | |||||
| Electricite de France SA |
129,397 | 1,906,244 | ||||||
| *Elior Group SA |
40,941 | 323,124 | ||||||
| *Elis SA |
97,985 | 1,858,508 | ||||||
| Engie SA |
173,483 | 2,468,577 | ||||||
| *Eramet SA |
4,749 | 397,344 | ||||||
| EssilorLuxottica SA |
10,604 | 2,195,361 | ||||||
| *Esso SA Francaise |
1,602 | 25,306 | ||||||
| *Etablissements Maurel et Prom SA |
25,342 | 73,024 | ||||||
| Eurazeo SE |
146 | 13,694 | ||||||
| Eurofins Scientific SE |
15,971 | 1,884,094 | ||||||
| Euronext NV |
26,291 | 2,963,412 | ||||||
| Eutelsat Communications SA |
79,539 | 1,130,328 | ||||||
| *Exel Industries |
538 | 43,831 | ||||||
| Faurecia SE |
69,698 | 3,633,633 | ||||||
| Faurecia SE |
2,213 | 114,271 | ||||||
| Fnac Darty SA |
14,932 | 968,544 | ||||||
| Gaztransport Et Technigaz SA |
8,501 | 702,416 | ||||||
| Getlink SE |
41,328 | 635,378 | ||||||
| *GL Events |
7,370 | 155,738 | ||||||
| Groupe Crit |
2,025 | 159,353 | ||||||
| Groupe Gorge SA |
981 | 17,892 | ||||||
| Guerbet |
3,868 | 170,992 | ||||||
| *Haulotte Group SA |
3,630 | 21,004 | ||||||
| Hermes International |
2,669 | 4,233,052 | ||||||
| HEXAOM |
1,444 | 73,193 | ||||||
| *Id Logistics Group |
1,018 | 374,040 | ||||||
| Imerys SA |
15,316 | 664,310 | ||||||
| Infotel SA |
1,233 | 71,273 | ||||||
| Interparfums SA |
17 | 1,373 | ||||||
| Ipsen SA |
17,461 | 1,806,478 | ||||||
| IPSOS |
19,658 | 920,203 | ||||||
| Jacquet Metals SACA |
7,553 | 184,428 | ||||||
| *JCDecaux SA |
34,064 | 889,325 | ||||||
| Kaufman & Broad SA |
11,366 | 455,103 | ||||||
| Kering SA |
5,501 | 4,126,450 | ||||||
| Korian SA |
37,031 | 1,234,195 | ||||||
| La Francaise des Jeux SAEM |
112 | 5,820 | ||||||
| *Lagardere SA |
72,034 | 1,903,968 | ||||||
| Laurent-Perrier |
664 | 74,075 | ||||||
| Lectra |
9,871 | 413,519 | ||||||
| Legrand SA |
33,115 | 3,611,486 | ||||||
| Linedata Services |
2,241 | 98,808 | ||||||
| LISI |
11,769 | 327,552 | ||||||
| LNA Sante SA |
2,542 | 146,351 | ||||||
| L’Oreal SA |
4,124 | 1,884,893 | ||||||
| *LVMH Moet Hennessy Louis Vuitton SE |
20,433 | 16,013,086 | ||||||
| Maisons du Monde SA |
20,058 | 454,492 | ||||||
| Manitou BF SA |
3,963 | 135,063 | ||||||
| Manutan International |
734 | 60,818 | ||||||
| Mersen SA |
7,318 | 274,810 | ||||||
| Metropole Television SA |
18,143 | 400,182 | ||||||
| Nexans SA |
16,434 | 1,647,926 | ||||||
| Nexity SA |
25,367 | 1,158,970 | ||||||
| *Nicox |
4,347 | 16,400 | ||||||
Dimensional World ex U.S. Core Equity 2 ETF
SCHEDULE OF INVESTMENTS
October 31, 2021
| Security Description |
Shares | Fair Value | ||||||
| FRANCE (Continued) |
||||||||
| NRJ Group |
8,607 | $ | 57,372 | |||||
| Oeneo SA |
11,406 | 177,930 | ||||||
| *Ol Groupe SA |
2,387 | 6,132 | ||||||
| *Onxeo SA |
18,755 | 10,852 | ||||||
| *Orange SA |
628,276 | 6,859,909 | ||||||
| Orange SA, Sponsored ADR |
6,981 | 76,163 | ||||||
| Orpea SA |
14,090 | 1,470,766 | ||||||
| *Pernod Ricard SA |
6,627 | 1,523,845 | ||||||
| Plastiques Du Val De Loire |
6,808 | 46,798 | ||||||
| Publicis Groupe SA |
79,567 | 5,335,037 | ||||||
| Publicis Groupe SA, ADR |
1,600 | 27,008 | ||||||
| Quadient SA |
16,966 | 405,635 | ||||||
| *Rallye SA |
4,002 | 25,796 | ||||||
| *»Recylex SA |
4,505 | 1,806 | ||||||
| Remy Cointreau SA |
2,421 | 489,176 | ||||||
| *Renault SA |
62,315 | 2,239,855 | ||||||
| Rexel SA |
141,838 | 2,816,669 | ||||||
| Robertet SA |
77 | 84,653 | ||||||
| Rothschild & Co. |
8,078 | 355,700 | ||||||
| Rubis SCA |
25,147 | 805,814 | ||||||
| Safran SA |
21,193 | 2,845,942 | ||||||
| Sanofi , Sponsored ADR |
11,372 | 573,490 | ||||||
| Sanofi |
40,576 | 4,058,445 | ||||||
| Sartorius Stedim Biotech |
4,020 | 2,215,345 | ||||||
| Savencia SA |
2,171 | 160,793 | ||||||
| Schneider Electric SE |
15,242 | 2,626,411 | ||||||
| SCOR SE |
66,836 | 2,250,761 | ||||||
| SEB SA |
11,638 | 1,822,225 | ||||||
| Seche Environnement SA |
1,874 | 148,338 | ||||||
| SES SA |
162,986 | 1,465,161 | ||||||
| Societe BIC SA |
14,721 | 856,050 | ||||||
| Societe Generale SA |
113,393 | 3,783,835 | ||||||
| Societe LDC SA |
223 | 25,187 | ||||||
| Societe pour l’Informatique Industrielle |
1,767 | 80,567 | ||||||
| *Sodexo SA |
19,351 | 1,881,086 | ||||||
| *SOITEC |
6,525 | 1,735,228 | ||||||
| *Solocal Group |
30,984 | 46,792 | ||||||
| Somfy SA |
3,186 | 626,788 | ||||||
| Sopra Steria Group SACA |
7,986 | 1,572,025 | ||||||
| SPIE SA |
57,142 | 1,388,675 | ||||||
| Stef SA |
2,220 | 277,975 | ||||||
| *STMicroelectronics NV |
44,824 | 2,122,360 | ||||||
| #STMicroelectronics NV, Sponsored NYS |
42,980 | 2,047,567 | ||||||
| Suez SA |
61,973 | 1,411,770 | ||||||
| Sword Group |
3,594 | 175,724 | ||||||
| Synergie SE |
6,848 | 316,597 | ||||||
| *Technip Energies NV |
21,320 | 328,761 | ||||||
| Teleperformance |
9,500 | 3,969,877 | ||||||
| Television Francaise 1 |
38,901 | 416,867 | ||||||
| *Thales SA |
22,511 | 2,075,205 | ||||||
| Thermador Groupe |
2,409 | 274,320 | ||||||
| Total Gabon |
289 | 45,150 | ||||||
| Total SA, Sponsored ADR |
9,550 | 478,550 | ||||||
| TotalEnergies SE |
202,299 | 10,153,344 | ||||||
| *Touax SCA-SGTR-CITE-SGT-CMTE-TAF-SLM Touage Investissments Reunies |
698 | 6,446 | ||||||
| Trigano SA |
3,845 | 720,392 | ||||||
Dimensional World ex U.S. Core Equity 2 ETF
SCHEDULE OF INVESTMENTS
October 31, 2021
| Security Description |
Shares | Fair Value | ||||||
| FRANCE (Continued) |
||||||||
| *Ubisoft Entertainment SA |
15,867 | $ | 830,515 | |||||
| *Union Financiere de France Bqe SA |
1,915 | 40,333 | ||||||
| Valeo |
87,319 | 2,559,587 | ||||||
| *Vallourec SA |
20,803 | 166,112 | ||||||
| Veolia Environnement SA |
40,078 | 1,309,311 | ||||||
| Veolia Environnement SA, ADR |
13,366 | 438,004 | ||||||
| Verallia SA |
10,676 | 395,105 | ||||||
| Vetoquinol SA |
832 | 142,114 | ||||||
| Vicat SA |
9,164 | 390,795 | ||||||
| VIEL & Cie SA |
11,323 | 77,311 | ||||||
| Vilmorin & Cie SA |
4,324 | 275,216 | ||||||
| Vinci SA |
62,705 | 6,702,843 | ||||||
| Virbac SA |
1,455 | 736,660 | ||||||
| Vivendi SE |
30,730 | 395,985 | ||||||
| *Vranken-Pommery Monopole SA |
954 | 19,431 | ||||||
| Wavestone |
930 | 51,229 | ||||||
| *Worldline SA |
47,392 | 2,763,053 | ||||||
| *X-Fab Silicon Foundries SE |
6,155 | 61,257 | ||||||
| *Xilam Animation SA |
450 | 21,039 | ||||||
|
|
|
|||||||
| TOTAL FRANCE |
252,585,935 | |||||||
|
|
|
|||||||
| GERMANY (5.0%) |
||||||||
| 1&1 AG |
20,313 | 591,910 | ||||||
| 7C Solarparken AG |
10,291 | 49,781 | ||||||
| *Aareal Bank AG |
29,049 | 929,170 | ||||||
| Adesso SE |
259 | 57,727 | ||||||
| adidas AG |
13,923 | 4,564,627 | ||||||
| Adler Group SA |
11,871 | 161,143 | ||||||
| *ADVA Optical Networking SE |
28,965 | 384,135 | ||||||
| AIXTRON SE |
7,882 | 187,445 | ||||||
| All For One Group SE |
460 | 36,305 | ||||||
| Allgeier SE |
1,637 | 53,707 | ||||||
| Allianz SE, ADR |
35,377 | 821,454 | ||||||
| Allianz SE, Registered |
23,224 | 5,406,087 | ||||||
| Amadeus Fire AG |
1,257 | 290,641 | ||||||
| Atoss Software AG |
1,330 | 301,055 | ||||||
| Aurubis AG |
21,709 | 1,875,156 | ||||||
| BASF SE |
37,631 | 2,712,191 | ||||||
| Basler AG |
1,425 | 263,522 | ||||||
| *Bauer AG |
7,803 | 101,497 | ||||||
| Bayer AG, Registered |
117,961 | 6,643,941 | ||||||
| Bayerische Motoren Werke AG |
62,742 | 6,334,319 | ||||||
| Bayerische Motoren Werke AG, Preference |
12,142 | 1,034,175 | ||||||
| BayWa AG |
8,892 | 376,623 | ||||||
| Bechtle AG |
34,980 | 2,623,136 | ||||||
| Befesa SA |
6,741 | 501,604 | ||||||
| Beiersdorf AG |
2,138 | 227,378 | ||||||
| Bertrandt AG |
2,768 | 180,984 | ||||||
| bet-at-home.com AG |
1,125 | 22,966 | ||||||
| *Bijou Brigitte AG |
1,389 | 39,703 | ||||||
| *Bilfinger SE |
13,345 | 468,863 | ||||||
| Biotest AG |
4,837 | 234,540 | ||||||
| *Borussia Dortmund GmbH & Co. KGaA |
74,878 | 413,332 | ||||||
| Brenntag SE |
48,824 | 4,646,676 | ||||||
Dimensional World ex U.S. Core Equity 2 ETF
SCHEDULE OF INVESTMENTS
October 31, 2021
| Security Description |
Shares | Fair Value | ||||||
| GERMANY (Continued) |
||||||||
| CANCOM SE |
6,898 | 477,045 | ||||||
| Carl Zeiss Meditec AG |
1,130 | 227,472 | ||||||
| *CECONOMY AG |
72,877 | 355,226 | ||||||
| CENIT AG |
4,236 | 71,080 | ||||||
| Cewe Stiftung & Co. KGaA |
4,034 | 563,935 | ||||||
| *Commerzbank AG |
380,818 | 2,783,464 | ||||||
| CompuGroup Medical SE & Co. KGaA |
9,352 | 782,472 | ||||||
| *Continental AG |
21,086 | 2,477,261 | ||||||
| #*Corestate Capital Holding SA |
3,101 | 36,496 | ||||||
| Covestro AG |
73,622 | 4,720,014 | ||||||
| CropEnergies AG |
13,802 | 198,057 | ||||||
| *CTS Eventim AG & Co. KGaA |
20,387 | 1,483,043 | ||||||
| Daimler AG |
175,177 | 17,381,470 | ||||||
| Data Modul AG Produktion Und Vertrieb Von Elektronischen Systemen |
208 | 15,646 | ||||||
| *Delivery Hero SE |
1,671 | 207,976 | ||||||
| *Delticom AG |
1,778 | 17,325 | ||||||
| Dermapharm Holding SE |
3,992 | 401,916 | ||||||
| *Deutsche Bank AG, Registered |
288,224 | 3,695,032 | ||||||
| Deutsche Boerse AG |
13,580 | 2,256,733 | ||||||
| #*Deutsche Lufthansa AG, Registered |
209,960 | 1,387,876 | ||||||
| Deutsche Post AG, Registered |
115,583 | 7,158,731 | ||||||
| *Deutsche Telekom AG |
490,159 | 9,120,002 | ||||||
| *Deutz AG |
89,519 | 752,104 | ||||||
| DIC Asset AG |
17,469 | 307,080 | ||||||
| Dmg Mori AG |
6,958 | 338,189 | ||||||
| Dr Hoenle AG |
1,093 | 52,808 | ||||||
| Draegerwerk AG & Co. KGaA |
1,968 | 146,896 | ||||||
| Draegerwerk AG & Co. KGaA, Preference |
5,957 | 469,462 | ||||||
| Duerr AG |
29,536 | 1,336,455 | ||||||
| E.ON SE |
95,384 | 1,210,458 | ||||||
| Eckert & Ziegler Strahlen- und Medizintechnik AG |
4,623 | 692,819 | ||||||
| *EDAG Engineering Group AG |
5,318 | 71,697 | ||||||
| *ElringKlinger AG |
14,246 | 201,296 | ||||||
| #Encavis AG |
8,556 | 179,215 | ||||||
| Energiekontor AG |
3,966 | 357,533 | ||||||
| Evonik Industries AG |
44,035 | 1,427,881 | ||||||
| *Evotec SE |
3,969 | 192,222 | ||||||
| Fabasoft AG |
224 | 8,697 | ||||||
| Fielmann AG |
9,265 | 611,148 | ||||||
| First Sensor AG |
1,547 | 78,771 | ||||||
| #*flatexDEGIRO AG |
13,752 | 312,878 | ||||||
| *Francotyp-Postalia Holding AG |
6,658 | 22,576 | ||||||
| Fraport AG Frankfurt Airport Services Worldwide |
15,034 | 1,073,460 | ||||||
| Freenet AG |
75,162 | 1,937,936 | ||||||
| Fresenius Medical Care AG & Co. KGaA |
26,607 | 1,769,243 | ||||||
| Fresenius SE & Co. KGaA |
90,601 | 4,116,845 | ||||||
| FUCHS PETROLUB SE |
6,582 | 242,373 | ||||||
| FUCHS PETROLUB SE, Preference |
17,615 | 844,750 | ||||||
| GEA Group AG |
14,864 | 732,604 | ||||||
| Gerresheimer AG |
20,016 | 1,836,862 | ||||||
| *Gesco AG |
3,607 | 98,511 | ||||||
| GFT Technologies SE |
11,952 | 564,322 | ||||||
| *Global Fashion Group SA |
14 | 126 | ||||||
| *Grammer AG |
776 | 17,781 | ||||||
| Grand City Properties SA |
24,631 | 631,652 | ||||||
| *H&R GmbH & Co. KGaA |
7,950 | 82,065 | ||||||
Dimensional World ex U.S. Core Equity 2 ETF
SCHEDULE OF INVESTMENTS
October 31, 2021
| Security Description |
Shares | Fair Value | ||||||
| GERMANY (Continued) |
||||||||
| Hamburger Hafen und Logistik AG |
21,872 | $ | 490,786 | |||||
| Hannover Rueck SE |
5,109 | 934,155 | ||||||
| #Hapag-Lloyd AG |
9,144 | 1,967,169 | ||||||
| Hawesko Holding AG |
668 | 45,300 | ||||||
| HeidelbergCement AG |
23,301 | 1,756,501 | ||||||
| *Heidelberger Druckmaschinen AG |
210,383 | 542,927 | ||||||
| #Hella GmbH & Co. KGaA |
21,998 | 1,527,427 | ||||||
| *Hellofresh SE |
18,656 | 1,511,272 | ||||||
| Henkel AG & Co. KGaA |
4,534 | 378,306 | ||||||
| Henkel AG & Co. KGaA, Preference |
7,465 | 668,474 | ||||||
| *Highlight Communications AG |
2,399 | 11,050 | ||||||
| HOCHTIEF AG |
3,362 | 259,507 | ||||||
| *HolidayCheck Group AG |
20,142 | 63,168 | ||||||
| Hornbach Baumarkt AG |
5,038 | 226,504 | ||||||
| Hornbach Holding AG & Co. KGaA |
5,990 | 757,657 | ||||||
| HUGO BOSS AG |
21,045 | 1,316,591 | ||||||
| *Hypoport SE |
273 | 167,916 | ||||||
| Indus Holding AG |
10,309 | 405,622 | ||||||
| Infineon Technologies AG , Sponsored ADR |
36,257 | 1,703,354 | ||||||
| *Infineon Technologies AG |
100,088 | 4,678,812 | ||||||
| Instone Real Estate Group SE |
8,493 | 224,090 | ||||||
| IVU Traffic Technologies AG |
1,229 | 28,730 | ||||||
| Jenoptik AG |
12,491 | 478,177 | ||||||
| JOST Werke AG |
5,193 | 301,080 | ||||||
| Jungheinrich AG, Preference |
34,530 | 1,751,035 | ||||||
| #K+S AG, Registered |
83,087 | 1,432,186 | ||||||
| KION Group AG |
38,358 | 4,190,385 | ||||||
| *Kloeckner & Co. SE |
26,935 | 362,824 | ||||||
| Knorr-Bremse AG |
4,554 | 480,317 | ||||||
| *Koenig & Bauer AG |
6,651 | 234,754 | ||||||
| Krones AG |
4,409 | 455,380 | ||||||
| KSB SE & Co. KGaA |
38 | 19,525 | ||||||
| *KWS Saat SE & Co.KGaA |
3,677 | 314,034 | ||||||
| LANXESS AG |
40,940 | 2,760,224 | ||||||
| LEG Immobilien SE |
9,763 | 1,453,513 | ||||||
| Leifheit AG |
2,484 | 99,749 | ||||||
| *Leoni AG |
13,093 | 203,034 | ||||||
| *Manz AG |
1,394 | 72,917 | ||||||
| *Medigene AG |
1,703 | 7,085 | ||||||
| Merck KGaA |
7,778 | 1,838,017 | ||||||
| Metro AG |
102,262 | 1,293,482 | ||||||
| MLP SE |
26,112 | 251,716 | ||||||
| MTU Aero Engines AG |
10,767 | 2,396,695 | ||||||
| Muenchener Rueckversicherungs-Gesellschaft AG in Muenchen, Registered |
8,264 | 2,450,165 | ||||||
| #*Nagarro SE |
2,049 | 412,589 | ||||||
| Nemetschek SE |
18,927 | 2,172,798 | ||||||
| New Work SE |
1,082 | 264,202 | ||||||
| Nexus AG |
2,243 | 195,716 | ||||||
| #*Nordex SE |
32,039 | 589,525 | ||||||
| Norma Group SE |
25,023 | 1,077,230 | ||||||
| OHB SE |
3,082 | 135,175 | ||||||
| PATRIZIA AG |
13,603 | 376,234 | ||||||
| Pfeiffer Vacuum Technology AG |
1,904 | 475,934 | ||||||
| Pne AG |
35,221 | 340,341 | ||||||
| Porsche Automobil Holding SE, Preference |
19,927 | 2,071,290 | ||||||
Dimensional World ex U.S. Core Equity 2 ETF
SCHEDULE OF INVESTMENTS
October 31, 2021
| Security Description |
Shares | Fair Value | ||||||
| GERMANY (Continued) |
||||||||
| *Progress-Werk Oberkirch AG |
1,010 | $ | 31,324 | |||||
| ProSiebenSat.1 Media SE |
94,645 | 1,586,508 | ||||||
| PSI Software AG |
1,178 | 56,847 | ||||||
| Puma SE |
16,841 | 2,091,190 | ||||||
| *PVA TePla AG |
1,898 | 86,321 | ||||||
| *q.beyond AG |
69,244 | 159,463 | ||||||
| *QIAGEN NV |
747 | 41,653 | ||||||
| *QIAGEN NV |
11,520 | 634,445 | ||||||
| *R Stahl AG |
845 | 21,904 | ||||||
| Rational AG |
882 | 877,387 | ||||||
| Rheinmetall AG |
27,074 | 2,626,816 | ||||||
| RTL Group SA |
16,604 | 958,440 | ||||||
| RWE AG |
90,771 | 3,494,828 | ||||||
| #S&T AG |
17,396 | 418,332 | ||||||
| *SAF-Holland SE |
26,825 | 372,518 | ||||||
| *Salzgitter AG |
18,271 | 672,804 | ||||||
| SAP SE, Sponsored ADR |
9,200 | 1,331,976 | ||||||
| SAP SE |
32,117 | 4,657,805 | ||||||
| Sartorius AG, Preference |
7,155 | 4,640,168 | ||||||
| Schaeffler AG |
35,561 | 282,308 | ||||||
| *Schloss Wachenheim AG |
321 | 7,355 | ||||||
| Scout24 SE |
6,606 | 460,215 | ||||||
| Secunet Security Networks AG |
479 | 251,662 | ||||||
| *SGL Carbon SE |
3,688 | 35,253 | ||||||
| *Siemens AG, Registered |
35,963 | 5,838,182 | ||||||
| *Siemens Energy AG |
36,239 | 1,040,888 | ||||||
| Siemens Healthineers AG |
7,463 | 496,255 | ||||||
| #Siltronic AG |
12,404 | 1,934,985 | ||||||
| *Sixt SE |
8,449 | 1,455,881 | ||||||
| Sixt SE, Preference |
10,712 | 1,061,134 | ||||||
| #SMA Solar Technology AG |
2,407 | 127,186 | ||||||
| Software AG |
15,712 | 646,575 | ||||||
| Stabilus SA |
7,392 | 556,034 | ||||||
| STO SE & Co.KGaA, Preference |
1,263 | 284,428 | ||||||
| STRATEC SE |
1,513 | 241,626 | ||||||
| Stroeer SE & Co.KGaA |
10,262 | 870,486 | ||||||
| Suedzucker AG |
30,905 | 490,692 | ||||||
| *SUESS MicroTec SE |
5,804 | 152,468 | ||||||
| Surteco Group SE |
3,313 | 141,090 | ||||||
| Symrise AG |
18,488 | 2,557,793 | ||||||
| *TAG Immobilien AG |
24,279 | 738,384 | ||||||
| Takkt AG |
16,965 | 277,214 | ||||||
| Talanx AG |
15,166 | 730,113 | ||||||
| Technotrans SE |
1,931 | 57,095 | ||||||
| Telefonica Deutschland Holding AG |
600,776 | 1,566,389 | ||||||
| *thyssenkrupp AG |
122,651 | 1,276,302 | ||||||
| Traffic Systems SE |
1,480 | 77,244 | ||||||
| United Internet AG |
52,869 | 1,950,497 | ||||||
| #Varta AG |
1,307 | 201,165 | ||||||
| VERBIO Vereinigte BioEnergie AG |
12,186 | 967,411 | ||||||
| Villeroy & Boch AG |
6,080 | 168,865 | ||||||
| *Vitesco Technologies Group AG |
4,217 | 242,053 | ||||||
| Volkswagen AG |
6,818 | 2,215,542 | ||||||
| Volkswagen AG, Preference |
35,805 | 8,030,974 | ||||||
| Vonovia SE, Class R |
15,745 | 955,866 | ||||||
| Vossloh AG |
2,803 | 150,024 | ||||||
Dimensional World ex U.S. Core Equity 2 ETF
SCHEDULE OF INVESTMENTS
October 31, 2021
| Security Description |
Shares | Fair Value | ||||||
| GERMANY (Continued) |
||||||||
| Wacker Chemie AG |
9,010 | $ | 1,626,058 | |||||
| Wacker Neuson SE |
14,206 | 466,234 | ||||||
| Washtec AG |
4,642 | 301,903 | ||||||
| *Westwing Group AG |
2,736 | 85,678 | ||||||
| Wuestenrot & Wuerttembergische AG |
11,676 | 243,486 | ||||||
| *Zalando SE |
6,653 | 628,098 | ||||||
| Zeal Network SE |
269 | 11,829 | ||||||
| *zooplus AG |
1,481 | 819,921 | ||||||
|
|
|
|||||||
| TOTAL GERMANY |
239,176,996 | |||||||
|
|
|
|||||||
| GREECE (0.1%) |
||||||||
| *Aegean Airlines SA |
8,926 | 53,197 | ||||||
| *Alpha Bank AE |
218,111 | 277,270 | ||||||
| Athens Water Supply & Sewage Co. SA |
6,973 | 61,005 | ||||||
| Autohellas Tourist and Trading SA |
6,534 | 60,038 | ||||||
| Bank of Greece |
4,806 | 93,993 | ||||||
| *Ellaktor SA |
36,391 | 58,201 | ||||||
| *Eurobank Ergasias Services and Holdings SA |
175,715 | 183,702 | ||||||
| *»Ff Group |
3,954 | 4,118 | ||||||
| *Fourlis Holdings SA |
16,859 | 74,918 | ||||||
| *GEK Terna Holding Real Estate Construction SA |
22,240 | 248,879 | ||||||
| Hellenic Exchanges—Athens Stock Exchange SA |
14,293 | 61,200 | ||||||
| *Hellenic Petroleum SA |
16,443 | 113,410 | ||||||
| *Hellenic Telecommunications Organization SA |
25,956 | 459,574 | ||||||
| Holding Co. ADMIE IPTO SA |
18,711 | 55,216 | ||||||
| *Intracom Holdings SA |
14,015 | 32,340 | ||||||
| *JUMBO SA |
10,239 | 152,142 | ||||||
| *LAMDA Development SA |
21,537 | 176,958 | ||||||
| *Motor Oil Hellas Corinth Refineries SA |
17,068 | 289,958 | ||||||
| Mytilineos SA |
18,428 | 336,307 | ||||||
| *National Bank of Greece SA |
37,402 | 117,731 | ||||||
| Opap SA |
22,183 | 345,278 | ||||||
| *Piraeus Financial Holdings SA |
4,666 | 7,938 | ||||||
| Piraeus Port Authority SA |
2,736 | 57,625 | ||||||
| *Public Power Corp. SA |
13,423 | 145,629 | ||||||
| Quest Holdings SA |
650 | 12,998 | ||||||
| Sarantis SA |
4,694 | 47,422 | ||||||
| Terna Energy SA |
9,556 | 129,386 | ||||||
| Titan Cement International SA |
10,067 | 174,750 | ||||||
| Titan Cement International SA |
9,442 | 164,775 | ||||||
|
|
|
|||||||
| TOTAL GREECE |
3,995,958 | |||||||
|
|
|
|||||||
| HONG KONG (1.7%) |
||||||||
| AIA Group, Ltd. |
1,012,200 | 11,430,929 | ||||||
| Asia Financial Holdings, Ltd. |
72,000 | 32,210 | ||||||
| ASM Pacific Technology, Ltd. |
58,500 | 632,073 | ||||||
| Associated International Hotels, Ltd. |
38,000 | 63,015 | ||||||
| Atlas Corp. |
42,872 | 600,208 | ||||||
| Bank of East Asia, Ltd. (The) |
318,879 | 524,698 | ||||||
| BOC Aviation, Ltd. |
108,000 | 947,545 | ||||||
| BOC Hong Kong Holdings, Ltd. |
444,500 | 1,411,374 | ||||||
| BOCOM International Holdings Co., Ltd. |
265,000 | 59,615 | ||||||
| Build King Holdings, Ltd. |
300,000 | 38,179 | ||||||
Dimensional World ex U.S. Core Equity 2 ETF
SCHEDULE OF INVESTMENTS
October 31, 2021
| Security Description |
Shares | Fair Value | ||||||
| HONG KONG (Continued) |
||||||||
| *»Burwill Holdings, Ltd. |
1,710,000 | $ | 2,924 | |||||
| Cafe de Coral Holdings, Ltd. |
176,000 | 321,273 | ||||||
| *Cathay Pacific Airways, Ltd. |
563,271 | 519,170 | ||||||
| *Century City International Holdings, Ltd. |
596,000 | 33,328 | ||||||
| *Cheuk Nang Holdings, Ltd. |
24,781 | 8,219 | ||||||
| Chevalier International Holdings, Ltd. |
34,349 | 42,964 | ||||||
| *China Baoli Technologies Holdings, Ltd. |
26,625 | 1,301 | ||||||
| *»China Com Rich Rene Ene Invest |
710,000 | 85,566 | ||||||
| *China Display Optoelectronics Technology Holdings, Ltd. |
360,000 | 27,767 | ||||||
| *China Energy Development Holdings, Ltd. |
3,368,000 | 74,036 | ||||||
| Chow Sang Sang Holdings International, Ltd. |
158,000 | 224,639 | ||||||
| Chow Tai Fook Jewellery Group, Ltd. |
246,600 | 504,672 | ||||||
| Chuang’s China Investments, Ltd. |
360,000 | 17,817 | ||||||
| Chuang’s Consortium International, Ltd. |
484,000 | 54,130 | ||||||
| CITIC Telecom International Holdings, Ltd. |
1,112,000 | 394,537 | ||||||
| CK Asset Holdings, Ltd. |
28,843 | 178,159 | ||||||
| CK Hutchison Holdings, Ltd. |
382,760 | 2,575,827 | ||||||
| CK Infrastructure Holdings, Ltd. |
64,000 | 385,857 | ||||||
| CK Life Sciences Int’l Holdings, Inc. |
746,000 | 70,006 | ||||||
| *CLP Holdings, Ltd. |
102,000 | 998,490 | ||||||
| *CNQC International Holdings, Ltd. |
222,500 | 19,736 | ||||||
| Convenience Retail Asia, Ltd. |
40,000 | 3,959 | ||||||
| Crystal International Group, Ltd. |
25,000 | 8,034 | ||||||
| CSI Properties, Ltd. |
2,240,000 | 63,638 | ||||||
| Dah Sing Banking Group, Ltd. |
209,596 | 201,000 | ||||||
| Dah Sing Financial Holdings, Ltd. |
65,100 | 202,939 | ||||||
| *Digital Domain Holdings, Ltd. |
181,000 | 15,124 | ||||||
| *Eagle Nice International Holdings, Ltd. |
118,000 | 69,929 | ||||||
| Ec Healthcare |
35,000 | 50,662 | ||||||
| Emperor International Holdings, Ltd. |
603,333 | 83,763 | ||||||
| *»Energy International Investments Holdings, Ltd. |
400,000 | 3,651 | ||||||
| *Esprit Holdings, Ltd. |
130,000 | 11,364 | ||||||
| Fairwood Holdings, Ltd. |
26,000 | 55,282 | ||||||
| Far East Consortium International, Ltd. |
824,213 | 272,299 | ||||||
| First Pacific Co., Ltd. |
1,092,400 | 436,732 | ||||||
| *First Shanghai Investments, Ltd. |
1,168,000 | 38,287 | ||||||
| *Fosun Tourism Group |
7,200 | 8,987 | ||||||
| Fountain SET Holdings, Ltd. |
858,000 | 154,415 | ||||||
| FSE Lifestyle Services, Ltd. |
23,000 | 19,691 | ||||||
| *Galaxy Entertainment Group, Ltd. |
76,000 | 411,310 | ||||||
| Get Nice Financial Group, Ltd. |
80,525 | 7,867 | ||||||
| Giordano International, Ltd. |
616,000 | 120,364 | ||||||
| *Gold Peak Industries Holdings, Ltd. |
262,000 | 21,555 | ||||||
| *Goodbaby International Holdings, Ltd. |
433,000 | 62,898 | ||||||
| Great Eagle Holdings, Ltd. |
40,711 | 112,257 | ||||||
| Guotai Junan International Holdings, Ltd. |
1,580,000 | 229,514 | ||||||
| Haitong International Securities Group, Ltd. |
1,200,724 | 276,293 | ||||||
| Hang Lung Group, Ltd. |
275,000 | 644,102 | ||||||
| Hang Lung Properties, Ltd. |
571,000 | 1,325,645 | ||||||
| Hang Seng Bank, Ltd. |
83,200 | 1,582,918 | ||||||
| *Hanison Construction Holdings, Ltd. |
215,208 | 36,795 | ||||||
| *Harbour Centre Development, Ltd. |
21,000 | 18,870 | ||||||
| Henderson Land Development Co., Ltd. |
177,486 | 743,798 | ||||||
| HK Electric Investments & HK Electric Investments, Ltd. |
440,000 | 438,357 | ||||||
| HKBN, Ltd. |
410,000 | 492,271 | ||||||
| *HKR International, Ltd. |
378,960 | 151,992 | ||||||
Dimensional World ex U.S. Core Equity 2 ETF
SCHEDULE OF INVESTMENTS
October 31, 2021
| Security Description |
Shares | Fair Value | ||||||
| HONG KONG (Continued) |
||||||||
| HKT Trust & HKT, Ltd. |
1,523,000 | $ | 2,067,461 | |||||
| Hon Kwok Land Investment Co., Ltd. |
20,000 | 7,790 | ||||||
| Hong Kong & China Gas Co., Ltd. |
410,765 | 638,928 | ||||||
| Hong Kong Exchanges & Clearing, Ltd. |
99,590 | 6,027,339 | ||||||
| Hong Kong Technology Venture Co., Ltd. |
113,000 | 169,957 | ||||||
| *Hongkong & Shanghai Hotels, Ltd. (The) |
209,962 | 191,364 | ||||||
| Honma Golf, Ltd. |
12,500 | 5,512 | ||||||
| *Huafa Property Services Group Co., Ltd. |
1,180,000 | 27,304 | ||||||
| Hysan Development Co., Ltd. |
111,000 | 385,979 | ||||||
| IGG, Inc. |
460,000 | 428,124 | ||||||
| International Housewares Retail Co., Ltd. |
153,000 | 53,301 | ||||||
| *IRC, Ltd. |
2,236,000 | 71,285 | ||||||
| *ITC Properties Group, Ltd. |
197,218 | 26,366 | ||||||
| Jacobson Pharma Corp., Ltd. |
140,000 | 10,438 | ||||||
| Johnson Electric Holdings, Ltd. |
210,905 | 468,494 | ||||||
| JS Global Lifestyle Co., Ltd. |
184,500 | 342,007 | ||||||
| K Wah International Holdings, Ltd. |
583,931 | 233,451 | ||||||
| *»Karce International Holdings Open Off10 |
44,000 | — | ||||||
| Karrie International Holdings, Ltd. |
232,000 | 47,121 | ||||||
| Kerry Logistics Network, Ltd. |
245,250 | 595,860 | ||||||
| Kerry Properties, Ltd. |
201,000 | 567,158 | ||||||
| *Kingston Financial Group, Ltd. |
1,205,000 | 96,040 | ||||||
| *Kowloon Development Co., Ltd. |
172,000 | 203,860 | ||||||
| *KuangChi Science, Ltd. |
152,000 | 4,475 | ||||||
| *Lai Sun Development Co., Ltd. |
139,920 | 73,746 | ||||||
| *Landing International Development, Ltd. |
568,800 | 17,549 | ||||||
| *Lifestyle International Holdings, Ltd. |
202,000 | 105,946 | ||||||
| Liu Chong Hing Investment, Ltd. |
88,000 | 91,631 | ||||||
| L’occitane International SA |
255,000 | 909,655 | ||||||
| Luk Fook Holdings International, Ltd. |
167,000 | 456,193 | ||||||
| Lung Kee Bermuda Holdings |
54,000 | 25,337 | ||||||
| *Magnificent Hotel Investment, Ltd. |
500,000 | 7,456 | ||||||
| Man Wah Holdings, Ltd. |
782,800 | 1,217,614 | ||||||
| *Meilleure Health International Industry Group, Ltd. |
210,000 | 12,148 | ||||||
| *Melco International Development, Ltd. |
388,000 | 506,756 | ||||||
| *Melco Resorts & Entertainment, Ltd. , Sponsored ADR |
11,953 | 129,451 | ||||||
| *»MH Development, Ltd. |
34,000 | 951 | ||||||
| *Midland Holdings, Ltd. |
218,100 | 31,682 | ||||||
| Ming Fai International Holdings, Ltd. |
107,000 | 6,809 | ||||||
| Miramar Hotel & Investment |
54,000 | 90,520 | ||||||
| Modern Dental Group, Ltd. |
41,000 | 34,944 | ||||||
| MTR Corp., Ltd. |
93,585 | 510,089 | ||||||
| NagaCorp., Ltd. |
674,000 | 619,497 | ||||||
| Nameson Holdings, Ltd. |
764,000 | 53,035 | ||||||
| National Electronics Holdings |
30,800 | 4,237 | ||||||
| New World Development Co., Ltd. |
339,602 | 1,473,389 | ||||||
| #*NewOcean Energy Holdings, Ltd. |
346,000 | 11,787 | ||||||
| #Nissin Foods Co., Ltd. |
64,000 | 47,718 | ||||||
| Orient Overseas International, Ltd. |
31,000 | 572,653 | ||||||
| Pacific Basin Shipping, Ltd. |
2,177,000 | 1,007,475 | ||||||
| *Pacific Century Premium Developments, Ltd. |
211,842 | 17,429 | ||||||
| *Pacific Century Premium Developments, Ltd. |
1 | 0 | ||||||
| Pacific Textiles Holdings, Ltd. |
549,000 | 273,828 | ||||||
| *Paliburg Holdings, Ltd. |
156,000 | 40,709 | ||||||
| *Paradise Entertainment, Ltd. |
132,000 | 14,932 | ||||||
Dimensional World ex U.S. Core Equity 2 ETF
SCHEDULE OF INVESTMENTS
October 31, 2021
| Security Description |
Shares | Fair Value | ||||||
| HONG KONG (Continued) |
||||||||
| PC Partner Group, Ltd. |
110,000 | $ | 139,709 | |||||
| PCCW, Ltd. |
1,853,954 | 955,689 | ||||||
| Pentamaster International, Ltd. |
156,000 | 22,460 | ||||||
| #Perfect Medical Health Management, Ltd. |
180,000 | 136,983 | ||||||
| Pico Far East Holdings, Ltd. |
396,000 | 65,669 | ||||||
| Power Assets Holdings, Ltd. |
174,500 | 1,064,401 | ||||||
| PRADA SpA |
132,100 | 828,698 | ||||||
| Public Financial Holdings, Ltd. |
174,000 | 55,025 | ||||||
| *Regal Hotels International Holdings, Ltd. |
188,000 | 77,336 | ||||||
| Regina Miracle International Holdings, Ltd. |
170,000 | 80,640 | ||||||
| *Samsonite International SA |
350,100 | 754,292 | ||||||
| *Sands China, Ltd. |
162,000 | 370,271 | ||||||
| SAS Dragon Holdings, Ltd. |
216,000 | 127,172 | ||||||
| *Shangri-La Asia, Ltd. |
437,166 | 356,294 | ||||||
| Shenwan Hongyuan HK, Ltd. |
302,500 | 38,109 | ||||||
| Singamas Container Holdings, Ltd. |
786,000 | 92,957 | ||||||
| Sino Land Co., Ltd. |
894,661 | 1,175,392 | ||||||
| SITC International Holdings Co., Ltd. |
717,000 | 2,428,696 | ||||||
| #*SJM Holdings, Ltd. |
720,301 | 537,977 | ||||||
| *SmarTone Telecommunications Holdings, Ltd. |
216,586 | 126,125 | ||||||
| Solomon Systech International, Ltd. |
184,000 | 17,977 | ||||||
| Soundwill Holdings, Ltd. |
40,500 | 40,297 | ||||||
| *South China Holdings Co., Ltd. |
1,160,000 | 13,421 | ||||||
| Stella International Holdings, Ltd. |
173,500 | 206,753 | ||||||
| *Sun Hung Kai Properties, Ltd. |
102,588 | 1,364,930 | ||||||
| *SUNeVision Holdings, Ltd. |
195,000 | 179,231 | ||||||
| Swire Pacific, Ltd., Class A |
144,000 | 906,126 | ||||||
| Swire Pacific, Ltd., Class B |
217,500 | 228,710 | ||||||
| Swire Properties, Ltd. |
81,200 | 217,638 | ||||||
| Tai Sang Land Development, Ltd. |
20,710 | 11,022 | ||||||
| Tao Heung Holdings, Ltd. |
144,000 | 16,290 | ||||||
| Techtronic Industries Co., Ltd. |
195,000 | 4,013,279 | ||||||
| *Television Broadcasts, Ltd. |
109,900 | 85,190 | ||||||
| Texhong Textile Group, Ltd. |
235,000 | 351,637 | ||||||
| *Texwinca Holdings, Ltd. |
336,000 | 68,677 | ||||||
| *Theme International Holdings, Ltd. |
630,000 | 76,937 | ||||||
| Tradelink Electronic Commerce, Ltd. |
268,000 | 38,586 | ||||||
| *Transport International Holdings, Ltd. |
121,373 | 205,642 | ||||||
| United Laboratories International Holdings, Ltd. (The) |
420,500 | 266,493 | ||||||
| *»Untrade CW Group Hold |
210,000 | 1,169 | ||||||
| *»Untrade Hua Han Health |
1,233,842 | 17,844 | ||||||
| *»Untrade Huiyuan Juice |
306,500 | 13,814 | ||||||
| *»Untrade Smi Holdings |
414,396 | 4,997 | ||||||
| *»Untrade.Anxin China |
816,000 | — | ||||||
| *»Untrade.Brightoil |
1,089,000 | 39,379 | ||||||
| *»Untrade.C Animal Health |
47,000 | 567 | ||||||
| *»Untrade.C Fiber Optic |
521,599 | — | ||||||
| *»Untrade.Dba Telecom |
72,000 | — | ||||||
| *»Untrade.Fuguiniao H Shs |
53,000 | — | ||||||
| *»Untrade.Gold Finance Holding |
62,000 | — | ||||||
| *»Untrade.Hosa International |
178,000 | — | ||||||
| *»Untrade.Hsin Chong GP |
876,000 | 7,387 | ||||||
| *»Untrade.Long Well International |
856,000 | 2,432 | ||||||
| *»Untrade.Master Glory GP |
211,687 | 1,328 | ||||||
| *»Untrade.Pac Andes International Holdings |
1,128,607 | 3,975 | ||||||
| *»Untrade.Realgold Mining |
19,000 | — | ||||||
Dimensional World ex U.S. Core Equity 2 ETF
SCHEDULE OF INVESTMENTS
October 31, 2021
| Security Description |
Shares | Fair Value | ||||||
| HONG KONG (Continued) |
||||||||
| *»Untrade.Rexlot Holdings |
5,031,399 | $ | 2,522 | |||||
| *»Untrade.Superb Summit |
55,000 | 1,936 | ||||||
| *»Untrade.Tech Pro |
2,780,000 | 4,574 | ||||||
| *»Untrade.Tenwow Int L |
286,000 | 5,239 | ||||||
| *»Untrade.Youyuan Holdings |
259,510 | — | ||||||
| *»Up Energy Development Group, Ltd. |
524,000 | 1,630 | ||||||
| Value Partners Group, Ltd. |
832,000 | 427,816 | ||||||
| *Vedan International Holdings, Ltd. |
152,000 | 15,436 | ||||||
| Vitasoy International Holdings, Ltd. |
286,000 | 688,249 | ||||||
| *Vobile Group, Ltd. |
17,000 | 14,926 | ||||||
| VPower Group International Holdings, Ltd. |
189,899 | 37,106 | ||||||
| VSTECS Holdings, Ltd. |
401,600 | 380,482 | ||||||
| *VTech Holdings, Ltd. |
61,000 | 469,318 | ||||||
| Wai Kee Holdings, Ltd. |
26,000 | 12,634 | ||||||
| WH Group, Ltd. |
3,128,708 | 2,195,994 | ||||||
| Wharf Real Estate Investment Co., Ltd. |
209,000 | 1,179,463 | ||||||
| Wing Tai Properties, Ltd. |
102,000 | 55,727 | ||||||
| *Xingye Alloy Materials Group, Ltd. |
89,000 | 12,242 | ||||||
| Xinyi Glass Holdings, Ltd. |
988,000 | 2,787,821 | ||||||
| YGM Trading, Ltd. |
20,000 | 4,705 | ||||||
| YTO Express Holdings, Ltd. |
74,000 | 31,868 | ||||||
| *Yue Yuen Industrial Holdings, Ltd. |
375,000 | 799,262 | ||||||
| #*Yunfeng Financial Group, Ltd. |
4,000 | 1,064 | ||||||
| #Zensun Enterprises, Ltd. |
24,000 | 13,698 | ||||||
|
|
|
|||||||
| TOTAL HONG KONG |
78,670,941 | |||||||
|
|
|
|||||||
| HUNGARY (0.1%) |
||||||||
| 4Ig Nyrt |
4,928 | 14,357 | ||||||
| Magyar Telekom Telecommunications PLC |
155,376 | 214,340 | ||||||
| MOL Hungarian Oil & Gas PLC |
172,036 | 1,471,514 | ||||||
| *Opus Global Nyrt |
46,922 | 35,684 | ||||||
| *OTP Bank Nyrt |
22,989 | 1,382,003 | ||||||
| Richter Gedeon Nyrt |
14,225 | 398,871 | ||||||
|
|
|
|||||||
| TOTAL HUNGARY |
3,516,769 | |||||||
|
|
|
|||||||
| INDIA (3.6%) |
||||||||
| Aarti Industries, Ltd. |
29,772 | 383,316 | ||||||
| ABB India, Ltd. |
6,072 | 171,899 | ||||||
| ACC, Ltd. |
27,574 | 859,243 | ||||||
| Action Construction Equipment, Ltd. |
8,856 | 27,598 | ||||||
| Adani Enterprises, Ltd. |
17,248 | 327,909 | ||||||
| *Adani Green Energy, Ltd. |
4,186 | 64,447 | ||||||
| Adani Ports & Special Economic Zone, Ltd. |
30,446 | 281,767 | ||||||
| *Adani Transmission, Ltd. |
22,505 | 531,179 | ||||||
| ADF Foods, Ltd. |
1,976 | 22,272 | ||||||
| Advanced Enzyme Technologies, Ltd. |
15,554 | 78,267 | ||||||
| Agro Tech Foods, Ltd. |
1,871 | 24,626 | ||||||
| *Ahluwalia Contracts India, Ltd. |
9,358 | 47,114 | ||||||
| AIA Engineering, Ltd. |
7,996 | 204,771 | ||||||
| Ajanta Pharma, Ltd. |
9,970 | 282,212 | ||||||
| Akzo Nobel India, Ltd. |
1,614 | 45,283 | ||||||
| Alkem Laboratories, Ltd. |
8,278 | 399,151 | ||||||
| Alkyl Amines Chemicals |
6,128 | 294,979 | ||||||
Dimensional World ex U.S. Core Equity 2 ETF
SCHEDULE OF INVESTMENTS
October 31, 2021
| Security Description |
Shares | Fair Value | ||||||
| INDIA (Continued) |
||||||||
| Allcargo Logistics, Ltd. |
25,752 | $ | 92,596 | |||||
| Ambuja Cements, Ltd. |
102,153 | 552,228 | ||||||
| Amrutanjan Health Care, Ltd. |
3,932 | 47,899 | ||||||
| *»Amtek Auto, Ltd. |
48,317 | 333 | ||||||
| Anant Raj, Ltd. |
27,866 | 22,775 | ||||||
| Andhra Sugars, Ltd. (The) |
4,653 | 39,567 | ||||||
| Apar Industries, Ltd. |
1,428 | 12,908 | ||||||
| Apcotex Industries, Ltd. |
7,008 | 36,701 | ||||||
| *APL Apollo Tubes, Ltd. |
45,383 | 484,914 | ||||||
| Apollo Hospitals Enterprise, Ltd. |
10,315 | 587,104 | ||||||
| Apollo Tyres, Ltd. |
128,675 | 365,845 | ||||||
| *Arvind Fashions, Ltd. |
13,800 | 55,057 | ||||||
| *Arvind, Ltd. |
60,053 | 105,340 | ||||||
| Asahi India Glass, Ltd. |
17,028 | 97,600 | ||||||
| Ashiana Housing, Ltd. |
15,665 | 37,436 | ||||||
| Ashok Leyland, Ltd. |
220,762 | 419,818 | ||||||
| *Ashoka Buildcon, Ltd. |
48,597 | 67,949 | ||||||
| Asian Paints, Ltd. |
30,039 | 1,243,621 | ||||||
| Astec Lifesciences, Ltd. |
2,084 | 35,143 | ||||||
| *Aster DM Healthcare, Ltd. |
47,048 | 117,995 | ||||||
| Astra Microwave Products, Ltd. |
23,981 | 70,520 | ||||||
| Astral, Ltd. |
14,536 | 424,086 | ||||||
| AstraZeneca Pharma India, Ltd. |
552 | 22,167 | ||||||
| Atul, Ltd. |
4,385 | 534,553 | ||||||
| Automotive Axles, Ltd. |
1,352 | 24,085 | ||||||
| Avanti Feeds, Ltd. |
13,519 | 100,524 | ||||||
| *Avenue Supermarts, Ltd. |
2,849 | 176,365 | ||||||
| *Axis Bank, Ltd. , GDR |
757 | 41,105 | ||||||
| *Axis Bank, Ltd. |
155,020 | 1,536,097 | ||||||
| Bajaj Auto, Ltd. |
9,327 | 461,765 | ||||||
| Bajaj Consumer Care, Ltd. |
35,277 | 108,967 | ||||||
| Bajaj Finserv, Ltd. |
1,395 | 331,999 | ||||||
| *Bajaj Hindusthan Sugar, Ltd. |
400,041 | 71,854 | ||||||
| Bajaj Holdings & Investment, Ltd. |
6,750 | 435,362 | ||||||
| Balaji Amines, Ltd. |
3,857 | 178,213 | ||||||
| *Balkrishna Industries, Ltd. |
30,074 | 988,032 | ||||||
| Balrampur Chini Mills, Ltd. |
56,094 | 244,920 | ||||||
| Banco Products India, Ltd. |
14,122 | 34,710 | ||||||
| Bandhan Bank, Ltd. |
72,024 | 280,329 | ||||||
| *Bank of Baroda |
319,673 | 416,234 | ||||||
| Bannari Amman Sugars, Ltd. |
921 | 27,110 | ||||||
| BASF India, Ltd. |
4,100 | 177,436 | ||||||
| *Bayer CropScience, Ltd. |
3,536 | 235,555 | ||||||
| BEML, Ltd. |
5,338 | 114,443 | ||||||
| Berger Paints India, Ltd. |
34,811 | 344,711 | ||||||
| Bhansali Engineering Polymers, Ltd. |
37,755 | 89,470 | ||||||
| Bharat Bijlee, Ltd. |
1,333 | 26,511 | ||||||
| Bharat Dynamics, Ltd. |
12,181 | 65,955 | ||||||
| Bharat Electronics, Ltd. |
409,149 | 1,130,222 | ||||||
| Bharat Forge, Ltd. |
41,616 | 426,351 | ||||||
| *Bharat Heavy Electricals, Ltd. |
382,092 | 348,255 | ||||||
| *Bharat Petroleum Corp., Ltd. |
75,786 | 422,747 | ||||||
| Bharat Rasayan, Ltd. |
262 | 35,741 | ||||||
| *Bharti Airtel, Ltd. |
287,590 | 2,632,165 | ||||||
| Birla Corp., Ltd. |
8,802 | 179,646 | ||||||
| Birlasoft, Ltd. |
71,359 | 387,331 | ||||||
Dimensional World ex U.S. Core Equity 2 ETF
SCHEDULE OF INVESTMENTS
October 31, 2021
| Security Description |
Shares | Fair Value | ||||||
| INDIA (Continued) |
||||||||
| Bliss Gvs Pharma, Ltd. |
9,575 | $ | 14,168 | |||||
| BLS International Services, Ltd. |
2,658 | 7,673 | ||||||
| Blue Dart Express, Ltd. |
1,757 | 156,145 | ||||||
| Blue Star, Ltd. |
5,691 | 72,968 | ||||||
| Bodal Chemicals, Ltd. |
30,839 | 50,471 | ||||||
| Bombay Burmah Trading Co. |
6,330 | 91,220 | ||||||
| *Borosil Renewables, Ltd. |
5,513 | 33,097 | ||||||
| Bosch, Ltd. |
601 | 136,060 | ||||||
| Brigade Enterprises, Ltd. |
27,627 | 171,245 | ||||||
| Britannia Industries, Ltd. |
15,597 | 765,621 | ||||||
| Cadila Healthcare, Ltd. |
106,901 | 717,801 | ||||||
| *Camlin Fine Sciences, Ltd. |
15,635 | 34,504 | ||||||
| *Canara Bank |
93,455 | 267,705 | ||||||
| Caplin Point Laboratories, Ltd. |
5,845 | 64,085 | ||||||
| Carborundum Universal, Ltd. |
32,710 | 366,627 | ||||||
| Care Ratings, Ltd. |
6,056 | 55,472 | ||||||
| Castrol India, Ltd. |
143,671 | 265,062 | ||||||
| CCL Products India, Ltd. |
32,954 | 167,452 | ||||||
| *Central Bank of India |
276,099 | 80,380 | ||||||
| Central Depository Services India, Ltd. |
10,524 | 190,175 | ||||||
| Century Enka, Ltd. |
3,367 | 19,609 | ||||||
| Century Plyboards India, Ltd. |
10,535 | 75,986 | ||||||
| Century Textiles & Industries, Ltd. |
24,612 | 256,880 | ||||||
| Cera Sanitaryware, Ltd. |
439 | 30,386 | ||||||
| Cesc, Ltd. |
87,553 | 101,956 | ||||||
| Chambal Fertilisers and Chemicals, Ltd. |
77,899 | 384,599 | ||||||
| *Chennai Petroleum Corp., Ltd. |
6,883 | 11,274 | ||||||
| *»Chennai Super Kings Cricket, Ltd. |
65,357 | 368 | ||||||
| Cholamandalam Financial Holdings, Ltd. |
20,319 | 190,067 | ||||||
| Cigniti Technologies, Ltd. |
6,598 | 52,714 | ||||||
| Cipla, Ltd. |
121,661 | 1,470,452 | ||||||
| City Union Bank, Ltd. |
115,666 | 259,734 | ||||||
| Clariant Chemicals India, Ltd. |
2,284 | 16,776 | ||||||
| Coal India, Ltd. |
165,522 | 363,510 | ||||||
| Cochin Shipyard, Ltd. |
11,704 | 54,612 | ||||||
| Coforge, Ltd. |
3,602 | 234,282 | ||||||
| *Colgate-Palmolive India, Ltd. |
29,945 | 616,886 | ||||||
| Container Corp. Of India, Ltd. |
80,867 | 707,466 | ||||||
| Coromandel International, Ltd. |
48,137 | 505,019 | ||||||
| Cosmo Films, Ltd. |
2,845 | 60,090 | ||||||
| CRISIL, Ltd. |
4,292 | 160,603 | ||||||
| Crompton Greaves Consumer Electricals, Ltd. |
68,362 | 425,064 | ||||||
| *Csb Bank, Ltd. |
11,277 | 44,299 | ||||||
| Cummins India, Ltd. |
31,455 | 376,252 | ||||||
| Cyient, Ltd. |
20,025 | 285,675 | ||||||
| *Dabur India, Ltd. |
73,339 | 573,784 | ||||||
| Dalmia Bharat Sugar & Industries, Ltd. |
4,946 | 26,044 | ||||||
| Dalmia Bharat, Ltd. |
28,666 | 770,328 | ||||||
| DB Corp., Ltd. |
17,322 | 22,763 | ||||||
| DCM Shriram, Ltd. |
4,167 | 54,964 | ||||||
| *DCW, Ltd. |
38,645 | 24,437 | ||||||
| Deepak Fertilisers & Petrochemicals Corp., Ltd. |
7,277 | 39,193 | ||||||
| Deepak Nitrite, Ltd. |
20,094 | 598,503 | ||||||
| Delta Corp., Ltd. |
48,145 | 166,331 | ||||||
| Dhampur Sugar Mills, Ltd. |
7,263 | 28,579 | ||||||
Dimensional World ex U.S. Core Equity 2 ETF
SCHEDULE OF INVESTMENTS
October 31, 2021
| Security Description |
Shares | Fair Value | ||||||
| INDIA (Continued) |
||||||||
| Dhanuka Agritech, Ltd. |
1,774 | $ | 17,335 | |||||
| Dilip Buildcon, Ltd. |
10,731 | 86,063 | ||||||
| *Dish TV India, Ltd. |
491,927 | 113,323 | ||||||
| *Dishman Carbogen Amcis, Ltd. |
14,057 | 38,324 | ||||||
| Divi’s Laboratories, Ltd. |
15,362 | 1,056,561 | ||||||
| Dixon Technologies India, Ltd. |
11,175 | 745,219 | ||||||
| DLF, Ltd. |
78,559 | 418,177 | ||||||
| Dollar Industries, Ltd. |
9,222 | 53,794 | ||||||
| Dr. Lal PathLabs, Ltd. |
9,253 | 433,585 | ||||||
| Dr. Reddy’s Laboratories, Ltd. , Sponsored ADR |
31,152 | 1,913,979 | ||||||
| Dwarikesh Sugar Industries, Ltd. |
67,893 | 64,011 | ||||||
| *Dynamatic Technologies, Ltd. |
1,482 | 52,043 | ||||||
| eClerx Services, Ltd. |
4,072 | 118,574 | ||||||
| Eicher Motors, Ltd. |
14,877 | 493,667 | ||||||
| *EID Parry India, Ltd. |
22,225 | 135,624 | ||||||
| *Eih Associated Hotels |
716 | 3,746 | ||||||
| *EIH, Ltd. |
28,725 | 53,225 | ||||||
| Electrosteel Castings, Ltd. |
74,447 | 33,753 | ||||||
| Elgi Equipments, Ltd. |
29,307 | 77,885 | ||||||
| *Emami, Ltd. |
42,617 | 302,349 | ||||||
| Endurance Technologies, Ltd. |
10,540 | 256,282 | ||||||
| EPL, Ltd. |
24,374 | 69,918 | ||||||
| Eris Lifesciences, Ltd. |
6,514 | 71,420 | ||||||
| *ESAB India, Ltd. |
1,533 | 51,830 | ||||||
| Escorts, Ltd. |
34,022 | 713,051 | ||||||
| *Eveready Industries India, Ltd. |
21,974 | 104,997 | ||||||
| Everest Kanto Cylinder, Ltd. |
17,320 | 25,998 | ||||||
| Exide Industries, Ltd. |
156,259 | 360,800 | ||||||
| *FDC, Ltd. |
3,967 | 16,900 | ||||||
| Federal Bank, Ltd. |
664,630 | 864,945 | ||||||
| FIEM Industries, Ltd. |
2,152 | 35,916 | ||||||
| Filatex India, Ltd. |
53,433 | 71,428 | ||||||
| Fine Organic Industries, Ltd. |
2,414 | 105,985 | ||||||
| Finolex Cables, Ltd. |
23,609 | 147,286 | ||||||
| Finolex Industries, Ltd. |
120,488 | 354,153 | ||||||
| Firstsource Solutions, Ltd. |
126,281 | 333,320 | ||||||
| Force Motors, Ltd. |
3,544 | 66,723 | ||||||
| *Fortis Healthcare, Ltd. |
126,639 | 413,160 | ||||||
| *Future Consumer, Ltd. |
552,066 | 51,239 | ||||||
| *Future Lifestyle Fashions, Ltd. |
15,000 | 11,027 | ||||||
| *Future Retail, Ltd. |
95,311 | 61,223 | ||||||
| Gabriel India, Ltd. |
22,641 | 46,548 | ||||||
| GAIL India, Ltd. |
208,993 | 415,439 | ||||||
| Galaxy Surfactants, Ltd. |
3,750 | 157,765 | ||||||
| Garware Technical Fibres, Ltd. |
2,397 | 108,969 | ||||||
| *Gati, Ltd. |
12,829 | 23,720 | ||||||
| *Gayatri Projects, Ltd. |
68,535 | 39,310 | ||||||
| GE Power India, Ltd. |
5,739 | 22,188 | ||||||
| *GE T&D India, Ltd. |
19,360 | 33,081 | ||||||
| Genus Power Infrastructures, Ltd. |
30,127 | 27,057 | ||||||
| Geojit Financial Services, Ltd. |
19,329 | 20,870 | ||||||
| GHCL, Ltd. |
19,700 | 111,061 | ||||||
| *Gillette India, Ltd. |
1,449 | 109,164 | ||||||
| GlaxoSmithKline Pharmaceuticals, Ltd. |
6,427 | 129,083 | ||||||
| Glenmark Pharmaceuticals, Ltd. |
69,351 | 466,685 | ||||||
| Godawari Power and Ispat, Ltd. |
7,498 | 35,096 | ||||||
Dimensional World ex U.S. Core Equity 2 ETF
SCHEDULE OF INVESTMENTS
October 31, 2021
| Security Description |
Shares | Fair Value | ||||||
| INDIA (Continued) |
||||||||
| *»Godawari Power and Ispat, Ltd. |
7,498 | $ | 35,096 | |||||
| Godfrey Phillips India, Ltd. |
4,880 | 84,379 | ||||||
| Godrej Agrovet, Ltd. |
8,262 | 65,495 | ||||||
| *Godrej Consumer Products, Ltd. |
51,976 | 664,023 | ||||||
| *Godrej Industries, Ltd. |
18,952 | 146,921 | ||||||
| *Godrej Properties, Ltd. |
19,580 | 583,965 | ||||||
| Goodyear India, Ltd. |
1,667 | 22,564 | ||||||
| Granules India, Ltd. |
65,571 | 271,369 | ||||||
| Graphite India, Ltd. |
11,251 | 80,595 | ||||||
| Grasim Industries, Ltd. |
49,915 | 1,147,266 | ||||||
| Great Eastern Shipping Co., Ltd. (The) |
24,927 | 107,173 | ||||||
| Greaves Cotton, Ltd. |
10,734 | 19,122 | ||||||
| Greenlam Industries, Ltd. |
1,698 | 32,203 | ||||||
| *Greenpanel Industries, Ltd. |
9,931 | 51,146 | ||||||
| Greenply Industries, Ltd. |
18,110 | 50,801 | ||||||
| Grindwell Norton, Ltd. |
11,947 | 258,401 | ||||||
| *GTL Infrastructure, Ltd. |
500,000 | 9,348 | ||||||
| Gujarat Alkalies & Chemicals, Ltd. |
8,574 | 85,962 | ||||||
| Gujarat Ambuja Exports, Ltd. |
8,234 | 18,072 | ||||||
| *Gujarat Fluorochemicals, Ltd. |
5,435 | 131,837 | ||||||
| Gujarat Gas, Ltd. |
30,636 | 254,600 | ||||||
| Gujarat Narmada Valley Fertilizers & Chemicals, Ltd. |
10,388 | 63,897 | ||||||
| Gujarat Pipavav Port, Ltd. |
70,202 | 104,767 | ||||||
| Gujarat State Fertilizers & Chemicals, Ltd. |
53,802 | 94,806 | ||||||
| Gujarat State Petronet, Ltd. |
115,648 | 471,279 | ||||||
| Hatsun Agro Product, Ltd. |
14,469 | 258,411 | ||||||
| Havells India, Ltd. |
26,966 | 454,810 | ||||||
| HBL Power Systems, Ltd. |
31,466 | 20,990 | ||||||
| HCL Technologies, Ltd. |
176,293 | 2,692,732 | ||||||
| HDFC Asset Management Co., Ltd. |
277 | 9,792 | ||||||
| HDFC Life Insurance Co., Ltd. |
18,594 | 168,965 | ||||||
| *HealthCare Global Enterprises, Ltd. |
16,384 | 49,361 | ||||||
| HEG, Ltd. |
4,185 | 115,013 | ||||||
| HeidelbergCement India, Ltd. |
10,320 | 32,925 | ||||||
| Heritage Foods, Ltd. |
7,415 | 51,804 | ||||||
| Hero MotoCorp., Ltd. |
336 | 11,923 | ||||||
| Hester Biosciences, Ltd. |
1,027 | 33,422 | ||||||
| HFCL, Ltd. |
241,471 | 229,761 | ||||||
| HG Infra Engineering, Ltd. |
10,441 | 102,784 | ||||||
| Hikal, Ltd. |
21,725 | 167,026 | ||||||
| HIL, Ltd. |
1,234 | 73,641 | ||||||
| Himadri Speciality Chemical, Ltd. |
130,379 | 91,671 | ||||||
| Himatsingka Seide, Ltd. |
8,380 | 27,776 | ||||||
| Hindalco Industries, Ltd. |
306,645 | 1,882,920 | ||||||
| Hinduja Global Solutions, Ltd. |
1,818 | 65,031 | ||||||
| Hindustan Aeronautics, Ltd. |
16,980 | 296,283 | ||||||
| *Hindustan Construction Co., Ltd. |
364,820 | 45,797 | ||||||
| *Hindustan Oil Exploration Co., Ltd. |
21,624 | 48,688 | ||||||
| Hindustan Petroleum Corp., Ltd. |
111,800 | 463,437 | ||||||
| Hindustan Unilever, Ltd. |
41,199 | 1,316,690 | ||||||
| Honda India Power Products, Ltd. |
281 | 4,936 | ||||||
| HSIL, Ltd. |
8,018 | 25,484 | ||||||
| Huhtamaki India, Ltd. |
6,706 | 21,238 | ||||||
| I G Petrochemicals, Ltd. |
1,037 | 11,573 | ||||||
| ICICI Bank, Ltd. |
185,319 | 1,984,944 | ||||||
Dimensional World ex U.S. Core Equity 2 ETF
SCHEDULE OF INVESTMENTS
October 31, 2021
| Security Description |
Shares | Fair Value | ||||||
| INDIA (Continued) |
||||||||
| ICICI Bank, Ltd. , Sponsored ADR |
189,488 | $ | 4,007,671 | |||||
| ICICI Lombard General Insurance Co., Ltd. |
10,138 | 200,584 | ||||||
| ICICI Prudential Life Insurance Co., Ltd. |
13,800 | 113,966 | ||||||
| ICRA, Ltd. |
496 | 22,887 | ||||||
| *IDFC, Ltd. |
400,618 | 294,787 | ||||||
| *IFB Industries, Ltd. |
2,327 | 38,887 | ||||||
| Igarashi Motors India, Ltd. |
4,877 | 33,389 | ||||||
| IIFL Securities, Ltd. |
13,143 | 16,876 | ||||||
| IIFL Wealth Management, Ltd. |
8,264 | 179,878 | ||||||
| India Cements, Ltd. (The) |
61,212 | 168,477 | ||||||
| India Glycols, Ltd. |
5,787 | 65,265 | ||||||
| *Indiabulls Real Estate, Ltd. |
103,995 | 210,820 | ||||||
| Indian Energy Exchange, Ltd. |
60,597 | 573,186 | ||||||
| Indian Hotels Co., Ltd. (The) |
191,828 | 503,771 | ||||||
| *Indian Oil Corp., Ltd. |
176,325 | 301,287 | ||||||
| *Indian Overseas Bank |
472,823 | 134,179 | ||||||
| Indian Railway Catering & Tourism Corp., Ltd. |
58,200 | 657,304 | ||||||
| Indo Count Industries, Ltd. |
8,648 | 27,902 | ||||||
| Indoco Remedies, Ltd. |
11,199 | 69,678 | ||||||
| Indraprastha Gas, Ltd. |
52,871 | 334,604 | ||||||
| Indus Towers, Ltd. |
181,019 | 656,328 | ||||||
| Infibeam Avenues, Ltd. |
44,228 | 26,756 | ||||||
| Info Edge India, Ltd. |
1,549 | 125,675 | ||||||
| Infosys, Ltd. |
379,317 | 8,448,122 | ||||||
| Infosys, Ltd. , Sponsored ADR |
15,928 | 354,876 | ||||||
| Ingersoll Rand India, Ltd. |
1,923 | 29,121 | ||||||
| *Inox Leisure, Ltd. |
5,712 | 31,966 | ||||||
| *Inox Wind, Ltd. |
20,269 | 32,157 | ||||||
| Insecticides India, Ltd. |
2,366 | 20,187 | ||||||
| *Intellect Design Arena, Ltd. |
19,644 | 171,738 | ||||||
| *InterGlobe Aviation, Ltd. |
304 | 8,831 | ||||||
| IOL Chemicals and Pharmaceuticals, Ltd. |
10,197 | 75,094 | ||||||
| *Ipca Laboratories, Ltd. |
16,440 | 470,359 | ||||||
| *IRB Infrastructure Developers, Ltd. |
38,034 | 115,045 | ||||||
| IRCON International, Ltd. |
95,859 | 60,487 | ||||||
| ITC, Ltd. |
476,305 | 1,419,732 | ||||||
| ITD Cementation India, Ltd. |
40,223 | 43,563 | ||||||
| *ITI, Ltd. |
11,135 | 17,473 | ||||||
| J Kumar Infraprojects, Ltd. |
7,113 | 14,320 | ||||||
| *Jagran Prakashan, Ltd. |
14,986 | 12,408 | ||||||
| Jai Corp., Ltd. |
33,695 | 53,862 | ||||||
| *Jaiprakash Associates, Ltd. |
518,703 | 58,187 | ||||||
| *Jaiprakash Power Ventures, Ltd. |
768,279 | 45,144 | ||||||
| *Jammu & Kashmir Bank, Ltd. (The) |
153,671 | 82,396 | ||||||
| Jamna Auto Industries, Ltd. |
14,250 | 18,545 | ||||||
| JB Chemicals & Pharmaceuticals, Ltd. |
10,076 | 225,811 | ||||||
| JBM Auto, Ltd. |
4,098 | 32,779 | ||||||
| Jindal Poly Films, Ltd. |
4,911 | 62,016 | ||||||
| Jindal Saw, Ltd. |
66,832 | 103,531 | ||||||
| *Jindal Stainless Hisar, Ltd. |
27,020 | 121,638 | ||||||
| *Jindal Stainless, Ltd. |
94,971 | 243,194 | ||||||
| JK Cement, Ltd. |
12,132 | 537,206 | ||||||
| JK Lakshmi Cement, Ltd. |
28,437 | 233,534 | ||||||
| JK Paper, Ltd. |
44,439 | 133,914 | ||||||
| JK Tyre & Industries, Ltd. |
52,452 | 100,552 | ||||||
| JMC Projects India, Ltd. |
16,862 | 24,331 | ||||||
Dimensional World ex U.S. Core Equity 2 ETF
SCHEDULE OF INVESTMENTS
October 31, 2021
| Security Description |
Shares | Fair Value | ||||||
| INDIA (Continued) |
||||||||
| JSW Energy, Ltd. |
41,350 | $ | 192,527 | |||||
| JSW Steel, Ltd. |
299,144 | 2,673,195 | ||||||
| JTEKT India, Ltd. |
16,206 | 21,307 | ||||||
| Jubilant Foodworks, Ltd. |
20,728 | 1,021,241 | ||||||
| Jyothy Labs, Ltd. |
45,094 | 94,276 | ||||||
| Kajaria Ceramics, Ltd. |
23,313 | 380,215 | ||||||
| Kalpataru Power Transmission, Ltd. |
16,152 | 90,649 | ||||||
| Kalyani Steels, Ltd. |
10,438 | 51,374 | ||||||
| Kansai Nerolac Paints, Ltd. |
6,681 | 48,630 | ||||||
| Karnataka Bank, Ltd. (The) |
115,742 | 105,260 | ||||||
| Kaveri Seed Co., Ltd. |
13,767 | 95,777 | ||||||
| KCP, Ltd. (The) |
19,168 | 33,456 | ||||||
| KEC International, Ltd. |
32,654 | 208,292 | ||||||
| KEI Industries, Ltd. |
31,138 | 379,675 | ||||||
| Kennametal India, Ltd. |
2,206 | 40,901 | ||||||
| *Kiri Industries, Ltd. |
8,039 | 51,843 | ||||||
| Kirloskar Brothers, Ltd. |
8,717 | 45,942 | ||||||
| Kirloskar Ferrous Industries, Ltd. |
5,981 | 18,794 | ||||||
| Kirloskar Oil Engines, Ltd. |
14,031 | 37,794 | ||||||
| KNR Constructions, Ltd. |
54,892 | 205,109 | ||||||
| *Kolte-Patil Developers, Ltd. |
15,009 | 61,965 | ||||||
| Kotak Mahindra Bank, Ltd. |
56,117 | 1,522,171 | ||||||
| KPIT Technologies, Ltd. |
76,353 | 314,767 | ||||||
| Kpr Mill, Ltd. |
41,360 | 248,636 | ||||||
| KRBL, Ltd. |
21,844 | 82,526 | ||||||
| KSB, Ltd. |
5,475 | 96,911 | ||||||
| LA Opala RG, Ltd. |
8,879 | 34,606 | ||||||
| Lakshmi Machine Works, Ltd. |
663 | 77,397 | ||||||
| Larsen & Toubro Infotech, Ltd. |
7,634 | 681,248 | ||||||
| Larsen & Toubro, Ltd. |
114,744 | 2,707,119 | ||||||
| Laurus Labs, Ltd. |
14,333 | 98,729 | ||||||
| *Lemon Tree Hotels, Ltd. |
104,051 | 75,730 | ||||||
| LG Balakrishnan & Bros, Ltd. |
6,297 | 42,311 | ||||||
| Linde India, Ltd. |
1,563 | 48,103 | ||||||
| LT Foods, Ltd. |
21,162 | 19,641 | ||||||
| Lupin, Ltd. |
12,985 | 160,038 | ||||||
| *LUX Industries, Ltd. |
725 | 34,431 | ||||||
| Maharashtra Seamless, Ltd. |
6,087 | 39,970 | ||||||
| Mahindra & Mahindra, Ltd. |
116,938 | 1,380,885 | ||||||
| Mahindra & Mahindra, Ltd. , GDR |
1,564 | 18,768 | ||||||
| *Mahindra CIE Automotive, Ltd. |
13,331 | 47,391 | ||||||
| *Mahindra Holidays & Resorts India, Ltd. |
11,277 | 34,321 | ||||||
| *Mahindra Lifespace Developers, Ltd. |
31,462 | 115,628 | ||||||
| Mahindra Logistics, Ltd. |
11,573 | 100,172 | ||||||
| Maithan Alloys, Ltd. |
3,777 | 53,259 | ||||||
| Man Infraconstruction, Ltd. |
36,343 | 59,794 | ||||||
| Mangalam Cement, Ltd. |
3,718 | 20,787 | ||||||
| Marico, Ltd. |
139,980 | 1,062,638 | ||||||
| Marksans Pharma, Ltd. |
35,648 | 31,444 | ||||||
| Maruti Suzuki India, Ltd. |
4,917 | 491,324 | ||||||
| Mastek, Ltd. |
2,439 | 89,819 | ||||||
| *Max Healthcare Institute, Ltd. |
53,426 | 236,410 | ||||||
| Mayur Uniquoters, Ltd. |
2,490 | 14,417 | ||||||
| Metropolis Healthcare, Ltd. |
11,598 | 458,801 | ||||||
| Minda Corp., Ltd. |
34,411 | 71,550 | ||||||
Dimensional World ex U.S. Core Equity 2 ETF
SCHEDULE OF INVESTMENTS
October 31, 2021
| Security Description |
Shares | Fair Value | ||||||
| INDIA (Continued) |
||||||||
| Minda Industries, Ltd. |
20,798 | $ | 217,073 | |||||
| Mindtree, Ltd. |
14,502 | 870,028 | ||||||
| Mishra Dhatu Nigam, Ltd. |
12,679 | 31,164 | ||||||
| MM Forgings, Ltd. |
1,768 | 20,096 | ||||||
| Monte Carlo Fashions, Ltd. |
4,781 | 24,859 | ||||||
| *Morepen Laboratories, Ltd. |
110,677 | 74,049 | ||||||
| Motherson Sumi Systems, Ltd. |
312,259 | 931,799 | ||||||
| Motilal Oswal Financial Services, Ltd. |
12,063 | 147,539 | ||||||
| Mphasis, Ltd. |
27,086 | 1,170,452 | ||||||
| *MRF, Ltd. |
445 | 459,422 | ||||||
| Mukand, Ltd. |
11,875 | 20,917 | ||||||
| Multi Commodity Exchange of India, Ltd. |
4,997 | 113,695 | ||||||
| Nahar Spinning Mills, Ltd. |
2,750 | 18,768 | ||||||
| Natco Pharma, Ltd. |
20,802 | 229,796 | ||||||
| *National Aluminium Co., Ltd. |
408,054 | 528,042 | ||||||
| *National Fertilizers, Ltd. |
14,661 | 10,729 | ||||||
| Nava Bharat Ventures, Ltd. |
12,549 | 19,247 | ||||||
| Navin Fluorine International, Ltd. |
6,751 | 300,977 | ||||||
| Navneet Education, Ltd. |
23,881 | 33,614 | ||||||
| NBCC India, Ltd. |
183,639 | 109,500 | ||||||
| NCC, Ltd. |
121,944 | 115,868 | ||||||
| NCL Industries, Ltd. |
4,450 | 14,551 | ||||||
| Neogen Chemicals, Ltd. |
2,549 | 40,418 | ||||||
| NESCo., Ltd. |
6,627 | 53,773 | ||||||
| Nestle India, Ltd. |
2,732 | 693,210 | ||||||
| *Network18 Media & Investments, Ltd. |
2,501 | 2,579 | ||||||
| Newgen Software Technologies, Ltd. |
9,261 | 70,081 | ||||||
| NHPC, Ltd. |
430,664 | 176,565 | ||||||
| Nilkamal, Ltd. |
1,403 | 44,481 | ||||||
| NLC India, Ltd. |
76,475 | 65,005 | ||||||
| NMDC, Ltd. |
274,958 | 525,635 | ||||||
| NOCIL, Ltd. |
28,266 | 100,749 | ||||||
| Novartis India, Ltd. |
3,198 | 31,813 | ||||||
| NRB Bearings, Ltd. |
19,273 | 33,138 | ||||||
| NTPC, Ltd. |
417,580 | 739,731 | ||||||
| *Oberoi Realty, Ltd. |
62,395 | 754,344 | ||||||
| *Oil & Natural Gas Corp., Ltd. |
242,394 | 482,481 | ||||||
| OnMobile Global, Ltd. |
31,003 | 46,019 | ||||||
| Oracle Financial Services Software, Ltd. |
6,230 | 368,111 | ||||||
| Orient Cement, Ltd. |
48,494 | 105,431 | ||||||
| Orient Electric, Ltd. |
31,397 | 145,054 | ||||||
| Orient Paper & Industries, Ltd. |
71,537 | 29,281 | ||||||
| Orient Refractories, Ltd. |
3,872 | 17,834 | ||||||
| Oriental Aromatics, Ltd. |
2,651 | 27,214 | ||||||
| *Oriental Carbon & Chemicals, Ltd. |
2,976 | 40,651 | ||||||
| Page Industries, Ltd. |
1,373 | 690,083 | ||||||
| Panama Petrochem, Ltd. |
6,257 | 22,139 | ||||||
| Parag Milk Foods, Ltd. |
22,437 | 40,256 | ||||||
| Persistent Systems, Ltd. |
20,582 | 1,078,475 | ||||||
| Petronet LNG, Ltd. |
195,457 | 599,177 | ||||||
| Pfizer, Ltd. |
3,828 | 258,025 | ||||||
| Phillips Carbon Black, Ltd. |
28,587 | 83,912 | ||||||
| Phoenix Mills, Ltd. (The) |
23,578 | 303,552 | ||||||
| PI Industries, Ltd. |
14,894 | 596,695 | ||||||
| Pidilite Industries, Ltd. |
16,447 | 508,173 | ||||||
| PNC Infratech, Ltd. |
27,660 | 119,828 | ||||||
Dimensional World ex U.S. Core Equity 2 ETF
SCHEDULE OF INVESTMENTS
October 31, 2021
| Security Description |
Shares | Fair Value | ||||||
| INDIA (Continued) |
||||||||
| Poly Medicure, Ltd. |
3,759 | $ | 46,367 | |||||
| *Polyplex Corp., Ltd. |
5,866 | 132,092 | ||||||
| Power Grid Corp. of India, Ltd. |
300,317 | 742,157 | ||||||
| *Power Mech Projects, Ltd. |
3,139 | 41,270 | ||||||
| *Prakash Industries, Ltd. |
38,602 | 33,663 | ||||||
| Prataap Snacks, Ltd. |
2,746 | 25,004 | ||||||
| Prestige Estates Projects, Ltd. |
63,121 | 359,180 | ||||||
| *Pricol, Ltd. |
50,758 | 65,853 | ||||||
| *Prime Focus, Ltd. |
27,584 | 29,727 | ||||||
| *Prince Pipes & Fittings, Ltd. |
1,610 | 15,678 | ||||||
| *Prism Johnson, Ltd. |
34,173 | 54,398 | ||||||
| Privi Speciality Chemicals, Ltd. |
2,038 | 43,866 | ||||||
| *Procter & Gamble Hygiene & Health Care, Ltd. |
1,001 | 190,196 | ||||||
| *Punjab National Bank |
482,128 | 271,064 | ||||||
| *Puravankara, Ltd. |
18,870 | 31,764 | ||||||
| *PVR, Ltd. |
9,908 | 221,980 | ||||||
| Quess Corp., Ltd. |
14,945 | 172,908 | ||||||
| Quick Heal Technologies, Ltd. |
6,605 | 19,564 | ||||||
| Radico Khaitan, Ltd. |
23,128 | 345,694 | ||||||
| *Rain Industries, Ltd. |
98,664 | 299,887 | ||||||
| Rajesh Exports, Ltd. |
18,710 | 159,475 | ||||||
| Rallis India, Ltd. |
22,333 | 79,139 | ||||||
| Ramco Cements, Ltd. (The) |
21,259 | 302,782 | ||||||
| Ramkrishna Forgings, Ltd. |
5,116 | 74,563 | ||||||
| *Rane Holdings, Ltd. |
1,631 | 13,122 | ||||||
| *Rashtriya Chemicals & Fertilizers, Ltd. |
58,815 | 60,204 | ||||||
| Ratnamani Metals & Tubes, Ltd. |
2,516 | 71,989 | ||||||
| *RattanIndia Power, Ltd. |
304,423 | 15,449 | ||||||
| *Raymond, Ltd. |
13,761 | 84,048 | ||||||
| *RBL Bank, Ltd. |
16,766 | 40,425 | ||||||
| Redington India, Ltd. |
168,430 | 323,224 | ||||||
| Relaxo Footwears, Ltd. |
9,269 | 164,755 | ||||||
| Reliance Industrial Infrastructure, Ltd. |
3,572 | 30,885 | ||||||
| Reliance Industries, Ltd. , Sponsored GDR |
20,070 | 1,364,760 | ||||||
| Reliance Industries, Ltd. |
172,840 | 5,854,142 | ||||||
| *Reliance Infrastructure, Ltd. |
55,392 | 62,692 | ||||||
| *Reliance Power, Ltd. |
838,053 | 157,804 | ||||||
| Rico Auto Industries, Ltd. |
37,543 | 21,509 | ||||||
| *RPSG Ventures, Ltd. |
4,881 | 49,885 | ||||||
| Sagar Cements, Ltd. |
6,328 | 23,683 | ||||||
| *Sanghi Industries, Ltd. |
13,643 | 12,007 | ||||||
| Sanofi India, Ltd. |
2,861 | 318,911 | ||||||
| Sarda Energy & Minerals, Ltd. |
4,016 | 44,168 | ||||||
| Saregama India, Ltd. |
1,092 | 59,239 | ||||||
| Sasken Technologies, Ltd. |
1,668 | 27,303 | ||||||
| Savita Oil Technologies, Ltd. |
1,688 | 31,146 | ||||||
| SBI Life Insurance Co., Ltd. |
19,763 | 302,339 | ||||||
| Schaeffler India, Ltd. |
1,435 | 141,845 | ||||||
| *Schneider Electric Infrastructure, Ltd. |
24,200 | 33,724 | ||||||
| SH Kelkar & Co., Ltd. |
20,820 | 44,153 | ||||||
| Shakti Pumps India, Ltd. |
2,226 | 19,297 | ||||||
| *Shankara Building Products, Ltd. |
4,888 | 35,573 | ||||||
| Sharda Motor Industries, Ltd. |
2,825 | 22,328 | ||||||
| *Sheela Foam, Ltd. |
3,690 | 121,761 | ||||||
| Shilpa Medicare, Ltd. |
10,382 | 80,900 | ||||||
Dimensional World ex U.S. Core Equity 2 ETF
SCHEDULE OF INVESTMENTS
October 31, 2021
| Security Description |
Shares | Fair Value | ||||||
| INDIA (Continued) |
||||||||
| Shipping Corp. of India, Ltd. |
27,631 | $ | 47,287 | |||||
| Shree Cement, Ltd. |
1,539 | 588,527 | ||||||
| *Shree Renuka Sugars, Ltd. |
157,625 | 56,940 | ||||||
| Siemens, Ltd. |
5,567 | 162,565 | ||||||
| *SIS, Ltd. |
9,421 | 58,591 | ||||||
| Siyaram Silk Mills, Ltd. |
3,036 | 18,697 | ||||||
| SKF India, Ltd. |
9,200 | 408,010 | ||||||
| Sobha, Ltd. |
18,481 | 190,039 | ||||||
| Solar Industries India, Ltd. |
5,071 | 168,424 | ||||||
| Solara Active Pharma Sciences, Ltd. |
1,513 | 25,158 | ||||||
| Somany Ceramics, Ltd. |
6,122 | 62,535 | ||||||
| Somany Home Innovation, Ltd. |
5,859 | 35,488 | ||||||
| Sonata Software, Ltd. |
29,055 | 324,535 | ||||||
| *South Indian Bank, Ltd. (The) |
959,860 | 119,852 | ||||||
| *SpiceJet, Ltd. |
42,688 | 40,361 | ||||||
| SRF, Ltd. |
48,228 | 1,363,668 | ||||||
| *Star Cement, Ltd. |
63,523 | 84,662 | ||||||
| State Bank of India , GDR |
275 | 18,590 | ||||||
| State Bank of India |
169,116 | 1,134,084 | ||||||
| State Bank of India , Sponsored GDR |
5,596 | 368,273 | ||||||
| *Steel Authority of India, Ltd. |
477,483 | 733,939 | ||||||
| Sterlite Technologies, Ltd. |
38,895 | 142,244 | ||||||
| Subex, Ltd. |
214,576 | 121,643 | ||||||
| Subros, Ltd. |
4,888 | 23,575 | ||||||
| Sudarshan Chemical Industries |
11,800 | 89,586 | ||||||
| Sun Pharmaceutical Industries, Ltd. |
130,375 | 1,384,167 | ||||||
| Sun TV Network, Ltd. |
26,405 | 197,823 | ||||||
| Sundaram-Clayton, Ltd. |
492 | 25,223 | ||||||
| Sundram Fasteners, Ltd. |
31,358 | 349,882 | ||||||
| Sunteck Realty, Ltd. |
24,254 | 149,139 | ||||||
| Suprajit Engineering, Ltd. |
14,119 | 64,918 | ||||||
| Supreme Industries, Ltd. |
7,134 | 221,881 | ||||||
| *Supreme Petrochem, Ltd. |
10,044 | 83,987 | ||||||
| Surya Roshni, Ltd. |
7,228 | 58,809 | ||||||
| Sutlej Textiles and Industries, Ltd. |
44,155 | 40,687 | ||||||
| Suven Pharmaceuticals, Ltd. |
30,025 | 203,932 | ||||||
| Swaraj Engines, Ltd. |
2,143 | 49,250 | ||||||
| *Syngene International, Ltd. |
46,572 | 336,348 | ||||||
| Tamilnadu Petroproducts, Ltd. |
13,899 | 22,710 | ||||||
| Tasty Bite Eatables, Ltd. |
199 | 43,896 | ||||||
| Tata Chemicals, Ltd. |
79,223 | 953,612 | ||||||
| Tata Coffee, Ltd. |
44,920 | 124,716 | ||||||
| Tata Consultancy Services, Ltd. |
75,059 | 3,405,815 | ||||||
| Tata Consumer Products, Ltd. |
36,480 | 394,365 | ||||||
| Tata Elxsi, Ltd. |
4,611 | 361,602 | ||||||
| #*Tata Motors, Ltd. , Sponsored ADR |
4,198 | 132,573 | ||||||
| *Tata Motors, Ltd. |
665,454 | 4,298,541 | ||||||
| Tata Power Co., Ltd. (The) |
290,914 | 832,557 | ||||||
| *Tata Steel BSL, Ltd. |
101,040 | 116,583 | ||||||
| Tata Steel Long Products, Ltd. |
3,239 | 36,501 | ||||||
| Tata Steel, Ltd. |
264,521 | 4,648,646 | ||||||
| TCI Express, Ltd. |
1,371 | 33,528 | ||||||
| *TCNS Clothing Co., Ltd. |
1,173 | 11,731 | ||||||
| TD Power Systems, Ltd. |
7,824 | 35,081 | ||||||
| Tech Mahindra, Ltd. |
175,061 | 3,454,989 | ||||||
| Techno Electric & Engineering Co., Ltd. |
5,787 | 19,947 | ||||||
Dimensional World ex U.S. Core Equity 2 ETF
SCHEDULE OF INVESTMENTS
October 31, 2021
| Security Description |
Shares | Fair Value | ||||||
| INDIA (Continued) |
||||||||
| Texmaco Rail & Engineering, Ltd. |
42,806 | $ | 18,321 | |||||
| Thermax, Ltd. |
6,512 | 119,867 | ||||||
| Thirumalai Chemicals, Ltd. |
29,402 | 103,797 | ||||||
| *Thomas Cook India, Ltd. |
39,127 | 36,681 | ||||||
| *Tide Water Oil Co. India, Ltd. |
792 | 17,423 | ||||||
| Time Technoplast, Ltd. |
35,548 | 32,875 | ||||||
| Timken India, Ltd. |
1,266 | 30,398 | ||||||
| Tinplate Co. of India, Ltd. (The) |
10,651 | 41,512 | ||||||
| *Titagarh Wagons, Ltd. |
20,382 | 25,654 | ||||||
| Titan Co., Ltd. |
14,280 | 454,548 | ||||||
| Torrent Pharmaceuticals, Ltd. |
12,111 | 462,630 | ||||||
| Torrent Power, Ltd. |
42,837 | 286,004 | ||||||
| Transport Corp. of India, Ltd. |
8,216 | 69,058 | ||||||
| Trent, Ltd. |
9,080 | 121,641 | ||||||
| Trident, Ltd. |
490,275 | 248,473 | ||||||
| Triveni Engineering & Industries, Ltd. |
10,166 | 25,964 | ||||||
| Triveni Turbine, Ltd. |
34,864 | 89,300 | ||||||
| TTK Prestige, Ltd. |
639 | 93,331 | ||||||
| TV Today Network, Ltd. |
6,718 | 28,032 | ||||||
| TVS Srichakra, Ltd. |
1,228 | 37,755 | ||||||
| Uflex, Ltd. |
13,650 | 103,075 | ||||||
| UltraTech Cement, Ltd. |
4,036 | 411,573 | ||||||
| United Breweries, Ltd. |
7,765 | 171,988 | ||||||
| *United Spirits, Ltd. |
48,405 | 612,389 | ||||||
| UPL, Ltd. |
228,066 | 2,254,429 | ||||||
| *Usha Martin, Ltd. |
46,778 | 54,942 | ||||||
| *VA Tech Wabag, Ltd. |
9,691 | 41,297 | ||||||
| Vaibhav Global, Ltd. |
5,700 | 43,743 | ||||||
| Valiant Organics, Ltd. |
2,559 | 44,749 | ||||||
| *Vardhman Textiles, Ltd. |
6,902 | 179,372 | ||||||
| Varun Beverages, Ltd. |
48,056 | 545,081 | ||||||
| Vedanta, Ltd. |
271,926 | 1,103,955 | ||||||
| Venky’s India, Ltd. |
2,705 | 98,492 | ||||||
| Vesuvius India, Ltd. |
3,266 | 46,889 | ||||||
| V-Guard Industries, Ltd. |
42,452 | 145,643 | ||||||
| Vinati Organics, Ltd. |
5,579 | 142,445 | ||||||
| Vindhya Telelinks, Ltd. |
1,249 | 18,718 | ||||||
| Visaka Industries, Ltd. |
2,684 | 21,348 | ||||||
| *Vodafone Idea, Ltd. |
1,956,306 | 249,498 | ||||||
| Voltamp Transformers, Ltd. |
1,556 | 31,105 | ||||||
| Voltas, Ltd. |
35,610 | 572,827 | ||||||
| VRL Logistics, Ltd. |
4,457 | 22,267 | ||||||
| VST Industries, Ltd. |
980 | 43,156 | ||||||
| VST Tillers Tractors, Ltd. |
1,548 | 59,786 | ||||||
| Welspun India, Ltd. |
107,333 | 197,376 | ||||||
| West Coast Paper Mills, Ltd. |
14,191 | 47,331 | ||||||
| Wheels India, Ltd. |
3,850 | 36,368 | ||||||
| Wipro, Ltd. |
140,381 | 1,212,472 | ||||||
| *Wockhardt, Ltd. |
4,069 | 23,200 | ||||||
| *Wonderla Holidays, Ltd. |
7,702 | 23,559 | ||||||
| *Yes Bank, Ltd. |
370,586 | 63,347 | ||||||
| Zee Entertainment Enterprises, Ltd. |
199,006 | 799,811 | ||||||
| *Zee Media Corp., Ltd. |
200,098 | 31,799 | ||||||
| Zensar Technologies, Ltd. |
49,125 | 302,860 | ||||||
Dimensional World ex U.S. Core Equity 2 ETF
SCHEDULE OF INVESTMENTS
October 31, 2021
| Security Description |
Shares | Fair Value | ||||||
| INDIA (Continued) |
||||||||
| Zydus Wellnes, Ltd. |
3,868 | $ | 106,125 | |||||
|
|
|
|||||||
| TOTAL INDIA |
169,102,473 | |||||||
|
|
|
|||||||
| INDONESIA (0.6%) |
||||||||
| Ace Hardware Indonesia TBK PT |
2,051,100 | 204,133 | ||||||
| Adaro Energy TBK PT |
10,517,200 | 1,247,143 | ||||||
| *Adhi Karya Persero TBK PT |
461,787 | 34,225 | ||||||
| *Adi Sarana Armada TBK PT |
416,600 | 93,509 | ||||||
| *Agung Semesta Sejahtera TBK PT |
358,500 | 1,265 | ||||||
| AKR Corporindo TBK PT |
640,000 | 192,892 | ||||||
| *Alam Sutera Realty TBK PT |
5,254,900 | 67,506 | ||||||
| Aneka Tambang TBK |
2,901,820 | 479,284 | ||||||
| *»Armidian Karyatama TBK PT |
230,900 | 153 | ||||||
| Arwana Citramulia TBK PT |
394,500 | 24,086 | ||||||
| Astra Agro Lestari TBK PT |
197,888 | 149,804 | ||||||
| Astra International TBK PT |
2,921,800 | 1,242,551 | ||||||
| Astra Otoparts TBK PT |
247,500 | 19,741 | ||||||
| *Asuransi Maximus Graha Persada Tbk PT |
245,400 | 5,369 | ||||||
| Bank BTPN Syariah TBK PT |
186,200 | 50,074 | ||||||
| *Bank Bukopin TBK |
2,664,000 | 80,479 | ||||||
| *Bank Capital Indonesia TBK PT |
322,200 | 6,913 | ||||||
| Bank Central Asia TBK PT |
3,171,200 | 1,673,176 | ||||||
| *Bank China Construction Bank Indonesia TBK PT |
1,768,600 | 16,104 | ||||||
| Bank Danamon Indonesia TBK PT |
367,463 | 69,771 | ||||||
| Bank Mandiri Persero TBK PT |
1,439,218 | 728,879 | ||||||
| Bank Maybank Indonesia TBK PT |
2,867,100 | 67,997 | ||||||
| Bank Negara Indonesia Persero TBK PT |
1,466,520 | 724,591 | ||||||
| *Bank Pan Indonesia TBK PT |
1,433,000 | 79,906 | ||||||
| Bank Pembangunan Daerah Jawa Barat Dan Banten TBK PT |
1,553,400 | 156,244 | ||||||
| Bank Pembangunan Daerah Jawa Timur TBK PT |
1,666,800 | 91,767 | ||||||
| Bank Rakyat Indonesia Persero TBK PT |
8,165,593 | 2,449,534 | ||||||
| *Bank Tabungan Negara Persero TBK PT |
1,811,941 | 227,652 | ||||||
| Barito Pacific TBK PT |
13,954,000 | 920,910 | ||||||
| *Bekasi Fajar Industrial Estate TBK PT |
2,056,600 | 18,871 | ||||||
| BISI International TBK PT |
468,500 | 33,730 | ||||||
| Blue Bird TBK PT |
213,900 | 22,345 | ||||||
| *Buana Lintas Lautan TBK PT |
6,619,900 | 119,618 | ||||||
| Bukit Asam TBK PT |
1,560,500 | 295,193 | ||||||
| *Bumi Serpong Damai TBK PT |
2,211,100 | 173,236 | ||||||
| *Bumi Teknokultura Unggul TBK PT |
2,300,800 | 8,120 | ||||||
| Charoen Pokphand Indonesia TBK PT |
1,071,100 | 468,736 | ||||||
| Cikarang Listrindo TBK PT |
440,700 | 19,752 | ||||||
| Ciputra Development TBK PT |
6,297,672 | 477,854 | ||||||
| *Citra Marga Nusaphala Persada TBK PT |
775,750 | 69,540 | ||||||
| *Delta Dunia Makmur TBK PT |
3,705,200 | 77,412 | ||||||
| Elnusa TBK PT |
1,952,600 | 41,898 | ||||||
| Erajaya Swasembada TBK PT |
4,163,100 | 191,002 | ||||||
| *Fks Food Sejahtera TBK PT |
2,240,600 | 34,793 | ||||||
| Gajah Tunggal TBK PT |
674,600 | 34,760 | ||||||
| Gudang Garam TBK PT |
185,600 | 438,864 | ||||||
| *»Hanson International TBK PT |
19,060,700 | 12,613 | ||||||
| Indah Kiat Pulp & Paper Corp. TBK PT |
1,113,600 | 666,156 | ||||||
| *Indika Energy TBK PT |
1,022,000 | 128,404 | ||||||
| Indo Tambangraya Megah TBK PT |
214,300 | 326,725 | ||||||
| Indocement Tunggal Prakarsa TBK PT |
137,100 | 114,431 | ||||||
Dimensional World ex U.S. Core Equity 2 ETF
SCHEDULE OF INVESTMENTS
October 31, 2021
| Security Description |
Shares | Fair Value | ||||||
| INDONESIA (Continued) |
||||||||
| Indofood CBP Sukses Makmur TBK PT |
279,300 | $ | 173,484 | |||||
| Indofood Sukses Makmur TBK PT |
2,368,500 | 1,061,583 | ||||||
| *Indosat TBK PT |
272,050 | 132,977 | ||||||
| Industri Jamu Dan Farmasi Sido Muncul TBK PT |
2,593,044 | 154,658 | ||||||
| *»Inovisi Infracom TBK PT |
7,778 | — | ||||||
| Integra Indocabinet TBK PT |
911,100 | 52,733 | ||||||
| *»Inti Agri Resources TBK PT |
473,600 | 313 | ||||||
| *Intiland Development TBK PT |
3,125,700 | 38,168 | ||||||
| Japfa Comfeed Indonesia TBK PT |
2,168,300 | 264,007 | ||||||
| *Jasa Marga Persero TBK PT |
367,226 | 108,865 | ||||||
| Jaya Real Property TBK PT |
932,000 | 32,629 | ||||||
| Kalbe Farma TBK PT |
6,553,900 | 740,161 | ||||||
| *Kapuas Prima Coal TBK PT |
1,985,300 | 17,797 | ||||||
| *Kawasan Industri Jababeka TBK PT |
5,953,389 | 66,394 | ||||||
| *Kmi Wire & Cable TBK PT |
964,700 | 20,019 | ||||||
| *Krakatau Steel Persero TBK PT |
2,335,937 | 86,562 | ||||||
| Link Net TBK PT |
522,900 | 143,574 | ||||||
| *Lippo Karawaci TBK PT |
13,784,095 | 143,995 | ||||||
| *Malindo Feedmill TBK PT |
473,600 | 25,239 | ||||||
| *Map Aktif Adiperkasa PT |
270,000 | 61,938 | ||||||
| Mayora Indah TBK PT |
2,753,725 | 456,768 | ||||||
| *Medco Energi Internasional TBK PT |
5,130,532 | 206,416 | ||||||
| Media Nusantara Citra TBK PT |
4,019,200 | 255,322 | ||||||
| *Merdeka Copper Gold TBK PT |
1,005,200 | 224,206 | ||||||
| Metrodata Electronics TBK PT |
520,600 | 135,593 | ||||||
| *Mitra Adiperkasa TBK PT |
4,108,300 | 255,183 | ||||||
| Mitra Keluarga Karyasehat TBK PT |
626,600 | 100,840 | ||||||
| *MNC Land TBK PT |
8,726,100 | 62,824 | ||||||
| *Mnc Vision Networks TBK PT |
8,030,700 | 137,175 | ||||||
| Nippon Indosari Corpindo TBK PT |
323,700 | 30,616 | ||||||
| Pabrik Kertas Tjiwi Kimia TBK PT |
253,000 | 149,112 | ||||||
| *Pacific Strategic Financial TBK PT |
553,200 | 37,876 | ||||||
| *Pakuwon Jati TBK PT |
4,335,300 | 153,002 | ||||||
| *Paninvest TBK PT |
148,100 | 7,213 | ||||||
| *Perusahaan Gas Negara TBK PT |
1,770,400 | 188,693 | ||||||
| Perusahaan Perkebunan London Sumatra Indonesia TBK PT |
1,560,700 | 153,674 | ||||||
| *»Pool Advista Indonesia TBK PT |
91,300 | 60 | ||||||
| *PP Persero TBK PT |
954,454 | 81,180 | ||||||
| Puradelta Lestari TBK PT |
4,546,100 | 71,878 | ||||||
| *Ramayana Lestari Sentosa TBK PT |
1,111,824 | 58,073 | ||||||
| *»Rimo International Lestari TBK PT |
3,756,500 | 2,486 | ||||||
| Salim Ivomas Pratama TBK PT |
1,950,400 | 66,356 | ||||||
| Samudera Indonesia TBK PT |
716,000 | 36,135 | ||||||
| Sarana Menara Nusantara TBK PT |
2,868,600 | 234,874 | ||||||
| Sariguna Primatirta TBK PT |
541,800 | 17,439 | ||||||
| Sawit Sumbermas Sarana TBK PT |
1,534,600 | 123,483 | ||||||
| *»Sekawan Intipratama TBK PT |
1,471,800 | — | ||||||
| *Selamat Sempurna TBK PT |
588,600 | 66,058 | ||||||
| *Semen Baturaja Persero TBK PT |
772,600 | 41,445 | ||||||
| Semen Indonesia Persero TBK PT |
566,300 | 363,743 | ||||||
| Siloam International Hospitals TBK PT |
132,431 | 80,389 | ||||||
| *Smartfren Telecom TBK PT |
17,384,000 | 132,520 | ||||||
| *»Sri Rejeki Isman TBK PT |
4,830,100 | 49,775 | ||||||
| Steel Pipe Industry of Indonesia PT |
504,000 | 12,451 | ||||||
| Sumber Alfaria Trijaya TBK PT |
987,600 | 83,302 | ||||||
Dimensional World ex U.S. Core Equity 2 ETF
SCHEDULE OF INVESTMENTS
October 31, 2021
| Security Description |
Shares | Fair Value | ||||||
| INDONESIA (Continued) |
||||||||
| *Summarecon Agung TBK PT |
4,252,333 | $ | 274,634 | |||||
| *Surya Citra Media TBK PT |
7,898,500 | 234,153 | ||||||
| *Surya Esa Perkasa TBK PT |
1,124,200 | 26,503 | ||||||
| *Surya Semesta Internusa TBK PT |
1,861,600 | 65,437 | ||||||
| Telkom Indonesia Persero TBK PT , Sponsored ADR |
14,021 | 368,612 | ||||||
| Telkom Indonesia Persero TBK PT |
915,700 | 245,609 | ||||||
| Tempo Scan Pacific TBK PT |
559,300 | 58,032 | ||||||
| *Timah TBK PT |
1,442,756 | 161,919 | ||||||
| *»Tiphone Mobile Indonesia TBK PT |
784,500 | 1,256 | ||||||
| Tower Bersama Infrastructure TBK PT |
2,483,000 | 515,265 | ||||||
| *»Trada Alam Minera TBK PT |
5,604,000 | 3,708 | ||||||
| *Transcoal Pacific TBK PT |
91,900 | 56,110 | ||||||
| *»Truba Alam Manunggal Engineering PT |
2,841,000 | — | ||||||
| Tunas Baru Lampung TBK PT |
1,787,300 | 109,124 | ||||||
| Tunas Ridean TBK PT |
537,500 | 47,613 | ||||||
| Ultrajaya Milk Industry & Trading Co. TBK PT |
148,000 | 17,028 | ||||||
| *Unilever Indonesia TBK PT |
578,000 | 180,325 | ||||||
| United Tractors TBK PT |
676,024 | 1,123,725 | ||||||
| Vale Indonesia TBK PT |
786,700 | 269,313 | ||||||
| *Waskita Beton Precast TBK PT |
3,253,600 | 35,596 | ||||||
| *Waskita Karya Persero TBK PT |
1,328,763 | 86,286 | ||||||
| Wijaya Karya Bangunan Gedung TBK PT |
497,000 | 6,841 | ||||||
| Wijaya Karya Beton TBK PT |
1,962,100 | 37,670 | ||||||
| *Wijaya Karya Persero TBK PT |
1,429,459 | 125,617 | ||||||
| XL Axiata TBK PT |
1,873,100 | 407,210 | ||||||
|
|
|
|||||||
| TOTAL INDONESIA |
26,738,553 | |||||||
|
|
|
|||||||
| IRELAND (0.6%) |
||||||||
| *AIB Group PLC |
207,229 | 562,127 | ||||||
| *Bank of Ireland Group PLC |
389,567 | 2,327,159 | ||||||
| Cairn Homes PLC |
188,634 | 244,928 | ||||||
| CRH PLC |
1,971 | 94,613 | ||||||
| CRH PLC, Sponsored ADR |
190,588 | 9,136,789 | ||||||
| *Datalex PLC |
12,482 | 12,856 | ||||||
| *FBD Holdings PLC |
7,442 | 71,137 | ||||||
| *Flutter Entertainment PLC |
30,640 | 5,800,935 | ||||||
| Glanbia PLC |
22,741 | 371,858 | ||||||
| *Glenveagh Properties PLC |
54,776 | 69,095 | ||||||
| *Irish Continental Group PLC |
58,079 | 285,650 | ||||||
| Kerry Group PLC, Class A |
6,877 | 923,969 | ||||||
| Kingspan Group PLC |
30,947 | 3,568,438 | ||||||
| *Permanent TSB Group Holdings PLC |
11,387 | 21,084 | ||||||
| Smurfit Kappa Group PLC |
81,835 | 4,289,111 | ||||||
|
|
|
|||||||
| TOTAL IRELAND |
27,779,749 | |||||||
|
|
|
|||||||
| ISRAEL (0.7%) |
||||||||
| Afcon Holdings, Ltd. |
936 | 56,839 | ||||||
| *AFI Properties, Ltd. |
4,877 | 253,373 | ||||||
| Africa Israel Residences, Ltd. |
419 | 22,895 | ||||||
| *Airport City, Ltd. |
17,649 | 337,011 | ||||||
| *Allot, Ltd. |
3,308 | 48,779 | ||||||
| #*Alrov Properties and Lodgings, Ltd. |
2,753 | 151,842 | ||||||
| Arad, Ltd. |
2,321 | 34,644 | ||||||
| #Ashtrom Group, Ltd. |
7,575 | 177,351 | ||||||
Dimensional World ex U.S. Core Equity 2 ETF
SCHEDULE OF INVESTMENTS
October 31, 2021
| Security Description |
Shares | Fair Value | ||||||
| ISRAEL (Continued) |
||||||||
| AudioCodes, Ltd. |
0 | $ | 14 | |||||
| #AudioCodes, Ltd. |
6,524 | 231,211 | ||||||
| Aura Investments, Ltd. |
36,795 | 54,513 | ||||||
| *Avgol Industries 1953, Ltd. |
26,233 | 25,328 | ||||||
| *Azorim-Investment Development & Construction Co., Ltd. |
21,656 | 96,863 | ||||||
| Azrieli Group, Ltd. |
1,037 | 97,037 | ||||||
| *Bank Hapoalim BM |
105,498 | 1,039,323 | ||||||
| *Bank Leumi Le-Israel BM |
278,618 | 2,662,751 | ||||||
| *Bet Shemesh Engines Holdings 1997, Ltd. |
1,426 | 36,033 | ||||||
| *Bezeq The Israeli Telecommunication Corp., Ltd. |
265,698 | 333,380 | ||||||
| Big Shopping Centers, Ltd. |
1,289 | 193,461 | ||||||
| Blue Square Real Estate, Ltd. |
1,707 | 131,899 | ||||||
| *Brack Capital Properties NV |
718 | 83,634 | ||||||
| #*Camtek, Ltd./Israel |
5,451 | 217,740 | ||||||
| Carasso Motors, Ltd. |
22,350 | 131,331 | ||||||
| *Cellcom Israel, Ltd. |
11,977 | 44,758 | ||||||
| *Cellcom Israel, Ltd. |
27,071 | 102,389 | ||||||
| *Ceragon Networks, Ltd. |
16,269 | 57,104 | ||||||
| *Clal Insurance Enterprises Holdings, Ltd. |
15,227 | 376,810 | ||||||
| *Danel Adir Yeoshua, Ltd. |
1,587 | 335,815 | ||||||
| Delek Automotive Systems, Ltd. |
14,896 | 195,210 | ||||||
| *Delek Group, Ltd. |
4,292 | 356,866 | ||||||
| *Delta Galil Industries, Ltd. |
7,386 | 378,793 | ||||||
| Dor Alon Energy in Israel 1988, Ltd. |
1,648 | 47,647 | ||||||
| Duniec Brothers, Ltd. |
1,112 | 61,890 | ||||||
| #Elbit Systems, Ltd. |
1,800 | 285,858 | ||||||
| Elbit Systems, Ltd. |
2,679 | 422,618 | ||||||
| Electra Consumer Products 1970, Ltd. |
5,785 | 271,580 | ||||||
| Electra Real Estate, Ltd. |
6,214 | 96,945 | ||||||
| Electra, Ltd. |
1,001 | 659,544 | ||||||
| Energix-Renewable Energies, Ltd. |
20,254 | 95,275 | ||||||
| *Enlight Renewable Energy, Ltd. |
62,806 | 155,182 | ||||||
| #*Equital, Ltd. |
10,987 | 338,145 | ||||||
| First International Bank Of Israel, Ltd. (The) |
19,943 | 799,796 | ||||||
| FMS Enterprises Migun, Ltd. |
1,293 | 42,146 | ||||||
| Formula Systems 1985, Ltd. |
5,389 | 579,042 | ||||||
| Fox Wizel, Ltd. |
6,475 | 893,252 | ||||||
| Gav-Yam Lands Corp., Ltd. |
38,100 | 454,036 | ||||||
| Gilat Satellite Networks, Ltd. |
11,636 | 96,388 | ||||||
| *Hadera Paper, Ltd. |
3,184 | 255,176 | ||||||
| Hamat Group, Ltd. |
3,726 | 24,869 | ||||||
| Harel Insurance Investments & Financial Services, Ltd. |
85,240 | 952,886 | ||||||
| Hilan, Ltd. |
5,686 | 315,203 | ||||||
| *ICL Group, Ltd. |
64,027 | 548,626 | ||||||
| IDI Insurance Co., Ltd. |
3,256 | 130,989 | ||||||
| Inrom Construction Industries, Ltd. |
38,208 | 196,556 | ||||||
| Isracard, Ltd. |
18,592 | 74,735 | ||||||
| Israel Canada T.R, Ltd. |
36,509 | 176,482 | ||||||
| *Israel Discount Bank, Ltd., Class A |
357,728 | 2,162,108 | ||||||
| Israel Land Development—Urban Renewal, Ltd. |
3,565 | 49,926 | ||||||
| *Isras Investment Co., Ltd. |
181 | 40,427 | ||||||
| *Issta Lines, Ltd. |
1,332 | 33,911 | ||||||
| *Kamada, Ltd. |
6,921 | 39,682 | ||||||
| Kenon Holdings, Ltd. |
7,066 | 282,922 | ||||||
| Kerur Holdings, Ltd. |
2,125 | 64,103 | ||||||
Dimensional World ex U.S. Core Equity 2 ETF
SCHEDULE OF INVESTMENTS
October 31, 2021
| Security Description |
Shares | Fair Value | ||||||
| ISRAEL (Continued) |
||||||||
| Klil Industries, Ltd. |
429 | $ | 39,736 | |||||
| Magic Software Enterprises, Ltd. |
2,813 | 61,267 | ||||||
| *Malam—Team, Ltd. |
2,313 | 78,032 | ||||||
| *Matrix IT, Ltd. |
14,912 | 405,340 | ||||||
| Maytronics, Ltd. |
19,155 | 453,019 | ||||||
| Mediterranean Towers, Ltd. |
10,551 | 32,988 | ||||||
| Mega Or Holdings, Ltd. |
2,452 | 97,090 | ||||||
| *Mehadrin, Ltd. |
269 | 15,743 | ||||||
| Meitav Dash Investments, Ltd. |
13,800 | 74,664 | ||||||
| *Melisron, Ltd. |
1 | 53 | ||||||
| Menora Mivtachim Holdings, Ltd. |
16,867 | 390,038 | ||||||
| Migdal Insurance & Financial Holdings, Ltd. |
225,564 | 383,770 | ||||||
| Mivne Real Estate KD, Ltd. |
44,370 | 161,915 | ||||||
| *Mizrahi Tefahot Bank, Ltd. |
34,767 | 1,265,403 | ||||||
| *Naphtha Israel Petroleum Corp., Ltd. |
24,518 | 152,148 | ||||||
| Neto ME Holdings, Ltd. |
1,295 | 63,953 | ||||||
| #*Nice, Ltd. , Sponsored ADR |
5,031 | 1,423,874 | ||||||
| *Nova, Ltd. |
5,678 | 602,540 | ||||||
| *Oil Refineries, Ltd. |
977,915 | 265,168 | ||||||
| *One Software Technologies, Ltd. |
11,000 | 188,476 | ||||||
| #*OPC Energy, Ltd. |
12,546 | 131,070 | ||||||
| Palram Industries 1990, Ltd. |
3,542 | 60,846 | ||||||
| *Partner Communications Co., Ltd. |
81,126 | 410,404 | ||||||
| *Paz Oil Co., Ltd. |
5,472 | 697,163 | ||||||
| *Perion Network, Ltd. |
3,394 | 95,245 | ||||||
| Phoenix Holdings, Ltd. (The) |
94,331 | 1,191,370 | ||||||
| Plasson Industries, Ltd. |
1,869 | 140,196 | ||||||
| Prashkovsky Investments and Construction, Ltd. |
1,151 | 36,307 | ||||||
| Rami Levy Chain Stores Hashikma Marketing, Ltd. |
3,585 | 270,279 | ||||||
| Rapac Communication & Infrastructure, Ltd. |
1,408 | 13,554 | ||||||
| Raval Ics, Ltd. |
15,087 | 36,508 | ||||||
| Scope Metals Group, Ltd. |
4,129 | 186,775 | ||||||
| Shapir Engineering and Industry, Ltd. |
30,549 | 250,249 | ||||||
| *Shikun & Binui, Ltd. |
121,036 | 720,805 | ||||||
| Shufersal, Ltd. |
66,104 | 547,787 | ||||||
| Strauss Group, Ltd. |
9,128 | 268,706 | ||||||
| *Suny Cellular Communication, Ltd. |
38,947 | 17,877 | ||||||
| Tadiran Group, Ltd. |
1,501 | 195,895 | ||||||
| Telsys |
1,037 | 45,595 | ||||||
| *Tera Light, Ltd. |
16,867 | 42,562 | ||||||
| *Teva Pharmaceutical Industries, Ltd. , Sponsored ADR |
142,878 | 1,248,754 | ||||||
| *Tower Semiconductor, Ltd. |
22,973 | 732,149 | ||||||
| *Tower Semiconductor, Ltd. |
4,323 | 140,622 | ||||||
| #Vitania, Ltd. |
3,757 | 28,646 | ||||||
| YH Dimri Construction & Development, Ltd. |
1,823 | 130,971 | ||||||
|
|
|
|||||||
| TOTAL ISRAEL |
32,708,494 | |||||||
|
|
|
|||||||
| ITALY (1.9%) |
||||||||
| A2A SpA |
776,001 | 1,632,609 | ||||||
| ACEA SpA |
28,657 | 622,142 | ||||||
| *Aeffe SpA |
11,360 | 32,997 | ||||||
| Amplifon SpA |
48,859 | 2,485,017 | ||||||
| Anima Holding SpA |
107,640 | 571,758 | ||||||
| *Arnoldo Mondadori Editore SpA |
71,829 | 166,248 | ||||||
| Ascopiave SpA |
6,261 | 25,504 | ||||||
Dimensional World ex U.S. Core Equity 2 ETF
SCHEDULE OF INVESTMENTS
October 31, 2021
| Security Description |
Shares | Fair Value | ||||||
| ITALY (Continued) |
||||||||
| Assicurazioni Generali SpA |
141,297 | $ | 3,082,267 | |||||
| *Atlantia SpA |
28,422 | 549,449 | ||||||
| *Autogrill SpA |
42,682 | 334,691 | ||||||
| Autostrade Meridionali SpA |
305 | 9,954 | ||||||
| Azimut Holding SpA |
50,328 | 1,449,641 | ||||||
| *Banca Generali SpA |
17,997 | 846,825 | ||||||
| Banca IFIS SpA |
9,650 | 178,567 | ||||||
| Banca Mediolanum SpA |
26,912 | 271,138 | ||||||
| #*Banca Monte DEI Paschi DI Siena SpA |
3,026 | 3,610 | ||||||
| Banca Popolare di Sondrio SCPA |
223,056 | 969,539 | ||||||
| *Banca Profilo SpA |
61,003 | 14,755 | ||||||
| *Banca Sistema SpA |
22,699 | 59,498 | ||||||
| Banco BPM SpA |
661,016 | 2,054,679 | ||||||
| Banco di Desio e della Brianza SpA |
12,951 | 47,960 | ||||||
| Be Shaping The Future SpA |
49,166 | 132,001 | ||||||
| BFF Bank SpA |
52,093 | 466,602 | ||||||
| *Biesse SpA |
3,608 | 111,649 | ||||||
| BPER Banca |
484,932 | 1,063,167 | ||||||
| Brembo SpA |
39,741 | 521,988 | ||||||
| *Brunello Cucinelli SpA |
11,594 | 703,057 | ||||||
| Buzzi Unicem SpA |
18,595 | 434,038 | ||||||
| Cairo Communication SpA |
36,924 | 77,427 | ||||||
| Carel Industries SpA |
171 | 4,947 | ||||||
| Cementir Holding NV |
22,837 | 240,231 | ||||||
| *Cerved Group SpA |
71,833 | 862,874 | ||||||
| *Cir Spa-Compagnie Industriali |
125,367 | 69,131 | ||||||
| CNH Industrial NV |
192,230 | 3,321,291 | ||||||
| Credito Emiliano SpA |
34,872 | 264,732 | ||||||
| #*D’amico International Shipping SA |
132,518 | 15,796 | ||||||
| *Danieli & C Officine Meccaniche SpA |
12,184 | 263,386 | ||||||
| *Danieli & C Officine Meccaniche SpA |
6,446 | 217,075 | ||||||
| Davide Campari-Milano NV |
10,416 | 148,022 | ||||||
| de’ Longhi SpA |
9,943 | 388,920 | ||||||
| DiaSorin SpA |
8,023 | 1,813,745 | ||||||
| *Elica SpA |
4,280 | 17,781 | ||||||
| Emak SpA |
29,309 | 68,175 | ||||||
| *Enav SpA |
604 | 2,649 | ||||||
| *Enel SpA |
443,812 | 3,716,409 | ||||||
| Eni SpA |
249,724 | 3,584,660 | ||||||
| ERG SpA |
27,501 | 993,590 | ||||||
| Esprinet SpA |
4,419 | 57,378 | ||||||
| *Eurotech SpA |
5,643 | 32,717 | ||||||
| Ferrari NV |
589 | 139,693 | ||||||
| Ferrari NV |
2,484 | 589,293 | ||||||
| Fila SpA |
6,803 | 82,034 | ||||||
| #*Fincantieri SpA |
66,621 | 52,580 | ||||||
| *FinecoBank Banca Fineco SpA, Class B |
151,446 | 2,894,425 | ||||||
| FNM SpA |
64,413 | 50,018 | ||||||
| Gruppo MutuiOnline SpA |
12,931 | 632,244 | ||||||
| Hera SpA |
354,026 | 1,449,093 | ||||||
| *Illimity Bank SpA |
14,964 | 236,204 | ||||||
| *Immsi SpA |
154,940 | 93,059 | ||||||
| Infrastrutture Wireless Italiane SpA |
14,825 | 163,944 | ||||||
| Interpump Group SpA |
22,597 | 1,667,082 | ||||||
| *Intesa Sanpaolo SpA |
1,343,920 | 3,822,019 | ||||||
Dimensional World ex U.S. Core Equity 2 ETF
SCHEDULE OF INVESTMENTS
October 31, 2021
| Security Description |
Shares | Fair Value | ||||||
| ITALY (Continued) |
||||||||
| Iren SpA |
220,316 | $ | 684,822 | |||||
| Italgas SpA |
144,437 | 917,649 | ||||||
| *Ivs Group SA |
3,120 | 22,891 | ||||||
| #*Juventus Football Club SpA |
197,124 | 159,457 | ||||||
| La Doria SpA |
10,807 | 207,355 | ||||||
| *Leonardo SpA |
137,777 | 1,010,543 | ||||||
| LU-VE SpA |
1,368 | 37,361 | ||||||
| Maire Tecnimont SpA |
57,102 | 246,218 | ||||||
| Mediaset NV |
315,144 | 885,490 | ||||||
| *Mediobanca Banca di Credito Finanziario SpA |
198,150 | 2,365,316 | ||||||
| Moncler SpA |
38,312 | 2,754,179 | ||||||
| Orsero SpA |
1,271 | 13,885 | ||||||
| *OVS SpA |
103,113 | 295,932 | ||||||
| Piaggio & C SpA |
130,977 | 439,561 | ||||||
| Pirelli & C SpA |
59,034 | 362,899 | ||||||
| Poste Italiane SpA |
113,376 | 1,619,057 | ||||||
| *Prima Industrie SpA |
2,367 | 52,264 | ||||||
| Prysmian SpA |
29,392 | 1,112,251 | ||||||
| RAI Way SpA |
25,222 | 152,945 | ||||||
| Recordati Industria Chimica e Farmaceutica SpA |
27,985 | 1,752,706 | ||||||
| Reno de Medici SpA |
121,336 | 203,884 | ||||||
| Reply SpA |
5,077 | 985,295 | ||||||
| Rizzoli Corriere Della Sera Mediagroup SpA |
34,455 | 28,350 | ||||||
| Sabaf SpA |
2,590 | 83,324 | ||||||
| *Saipem SpA |
240,569 | 527,981 | ||||||
| *Salvatore Ferragamo SpA |
5 | 107 | ||||||
| #*Saras SpA |
216,134 | 160,677 | ||||||
| *Servizi Italia SpA |
5,016 | 12,074 | ||||||
| Sesa SpA |
1,530 | 300,292 | ||||||
| *Snam SpA |
73,510 | 416,584 | ||||||
| *Sogefi SpA |
33,393 | 52,942 | ||||||
| SOL SpA |
10,344 | 237,735 | ||||||
| Stellantis NV |
394,373 | 7,867,197 | ||||||
| Stellantis NV |
136,782 | 2,730,511 | ||||||
| #Stellantis NV |
224,021 | 4,466,979 | ||||||
| Technogym SpA |
39,175 | 411,643 | ||||||
| Telecom Italia SpA, Class A |
2,896,369 | 1,032,694 | ||||||
| Telecom Italia SpA , Sponsored ADR |
48,868 | 173,481 | ||||||
| Tenaris SA, Sponsored ADR |
31,768 | 707,791 | ||||||
| Terna Rete Elettrica Nazionale SpA |
191,426 | 1,427,078 | ||||||
| Tinexta SpA |
8,957 | 396,997 | ||||||
| UniCredit SpA |
256,870 | 3,395,921 | ||||||
| Unieuro SpA |
4,908 | 115,299 | ||||||
| Unipol Gruppo SpA |
174,961 | 1,006,291 | ||||||
| UnipolSai Assicurazioni SpA |
195,106 | 565,368 | ||||||
| Webuild SpA |
30,099 | 74,540 | ||||||
| Zignago Vetro SpA |
9,750 | 196,778 | ||||||
|
|
|
|||||||
| TOTAL ITALY |
89,544,568 | |||||||
|
|
|
|||||||
| JAPAN (14.7%) |
||||||||
| 77 Bank, Ltd. (The) |
26,100 | 265,978 | ||||||
| A&A Material Corp. |
1,800 | 15,233 | ||||||
| A&D Co., Ltd. |
12,000 | 106,398 | ||||||
| ABC-Mart, Inc. |
1,500 | 71,695 | ||||||
| Abist Co., Ltd. |
500 | 12,585 | ||||||
Dimensional World ex U.S. Core Equity 2 ETF
SCHEDULE OF INVESTMENTS
October 31, 2021
| Security Description |
Shares | Fair Value | ||||||
| JAPAN (Continued) |
||||||||
| Achilles Corp. |
5,500 | $ | 63,236 | |||||
| AD Works Group Co., Ltd. |
8,180 | 11,693 | ||||||
| Adastria Co., Ltd. |
17,480 | 324,229 | ||||||
| ADEKA Corp. |
41,200 | 914,150 | ||||||
| Ad-sol Nissin Corp. |
2,600 | 47,451 | ||||||
| Advan Group Co., Ltd. |
5,700 | 48,489 | ||||||
| Advance Create Co., Ltd. |
2,600 | 24,216 | ||||||
| Advantage Risk Management Co., Ltd. |
2,100 | 16,925 | ||||||
| Advantest Corp. |
27,100 | 2,217,435 | ||||||
| Adventure, Inc. |
600 | 44,253 | ||||||
| Aeon Co., Ltd. |
86,205 | 1,979,256 | ||||||
| Aeon Delight Co., Ltd. |
10,000 | 306,073 | ||||||
| Aeon Fantasy Co., Ltd. |
5,400 | 89,270 | ||||||
| Aeon Hokkaido Corp. |
9,100 | 104,787 | ||||||
| Aeon Mall Co., Ltd. |
22,380 | 326,205 | ||||||
| Aeria, Inc. |
8,800 | 33,494 | ||||||
| AFC-HD AMS Life Science Co., Ltd. |
4,900 | 43,661 | ||||||
| AGC, Inc. |
40,200 | 1,998,983 | ||||||
| Agro-Kanesho Co., Ltd. |
800 | 9,514 | ||||||
| Ahresty Corp. |
14,600 | 54,418 | ||||||
| Ai Holdings Corp. |
7,100 | 133,563 | ||||||
| Aica Kogyo Co., Ltd. |
8,900 | 272,015 | ||||||
| Aichi Bank, Ltd. (The) |
3,700 | 111,625 | ||||||
| Aichi Steel Corp. |
5,000 | 116,246 | ||||||
| Aichi Tokei Denki Co., Ltd. |
1,400 | 59,241 | ||||||
| Aida Engineering, Ltd. |
22,800 | 206,155 | ||||||
| Ain Holdings, Inc. |
15,100 | 888,586 | ||||||
| Ainavo Holdings Co., Ltd. |
1,300 | 11,310 | ||||||
| Air Water, Inc. |
113,400 | 1,732,452 | ||||||
| Airport Facilities Co., Ltd. |
9,700 | 49,425 | ||||||
| Aisan Industry Co., Ltd. |
21,700 | 159,098 | ||||||
| Aisin Corp. |
33,762 | 1,233,227 | ||||||
| AIT Corp. |
1,100 | 10,718 | ||||||
| Ajinomoto Co., Inc. |
87,600 | 2,616,668 | ||||||
| Ajis Co., Ltd. |
1,600 | 41,563 | ||||||
| Akatsuki Corp. |
14,600 | 47,760 | ||||||
| Akatsuki, Inc. |
4,600 | 125,060 | ||||||
| *Akebono Brake Industry Co., Ltd. |
23,100 | 46,595 | ||||||
| Akita Bank, Ltd. (The) |
7,200 | 91,496 | ||||||
| Albis Co., Ltd. |
2,100 | 43,372 | ||||||
| Alconix Corp. |
13,700 | 205,936 | ||||||
| Alfresa Holdings Corp. |
46,900 | 658,101 | ||||||
| Alinco, Inc. |
9,000 | 78,378 | ||||||
| Alleanza Holdings Co., Ltd. |
4,900 | 50,235 | ||||||
| Alpen Co., Ltd. |
9,300 | 226,250 | ||||||
| Alpha Corp. |
2,600 | 28,069 | ||||||
| Alps Alpine Co., Ltd. |
84,600 | 823,556 | ||||||
| Alps Logistics Co., Ltd. |
5,100 | 46,427 | ||||||
| Altech Corp. |
5,610 | 100,663 | ||||||
| Amada Co., Ltd. |
86,800 | 854,107 | ||||||
| Amano Corp. |
18,300 | 450,820 | ||||||
| Amiyaki Tei Co., Ltd. |
2,300 | 61,925 | ||||||
| ANA Holdings, Inc. |
9,800 | 228,015 | ||||||
| Anabuki Kosan, Inc. |
1,900 | 34,442 | ||||||
| Anest Iwata Corp. |
7,400 | 58,798 | ||||||
Dimensional World ex U.S. Core Equity 2 ETF
SCHEDULE OF INVESTMENTS
October 31, 2021
| Security Description |
Shares | Fair Value | ||||||
| JAPAN (Continued) |
||||||||
| Anicom Holdings, Inc. |
11,100 | $ | 86,152 | |||||
| Anritsu Corp. |
54,300 | 897,658 | ||||||
| AOKI Holdings, Inc. |
15,800 | 96,165 | ||||||
| Aomori Bank, Ltd. (The) |
8,500 | 146,332 | ||||||
| Aoyama Trading Co., Ltd. |
20,500 | 140,412 | ||||||
| Aoyama Zaisan Networks Co., Ltd. |
5,800 | 59,869 | ||||||
| Aozora Bank, Ltd. |
36,300 | 829,623 | ||||||
| Apaman Co., Ltd. |
3,400 | 15,804 | ||||||
| Arakawa Chemical Industries, Ltd. |
6,500 | 70,572 | ||||||
| Arata Corp. |
8,200 | 289,454 | ||||||
| Araya Industrial Co., Ltd. |
900 | 13,742 | ||||||
| Arcland Service Holdings Co., Ltd. |
5,000 | 98,882 | ||||||
| Arcs Co., Ltd. |
15,900 | 305,241 | ||||||
| Ardepro Co., Ltd. |
22,200 | 10,514 | ||||||
| Arealink Co., Ltd. |
3,200 | 43,443 | ||||||
| Argo Graphics, Inc. |
2,200 | 60,969 | ||||||
| ARTERIA Networks Corp. |
3,800 | 53,422 | ||||||
| Artnature, Inc. |
5,200 | 33,701 | ||||||
| ArtSpark Holdings, Inc. |
11,600 | 119,637 | ||||||
| As One Corp. |
1,400 | 191,046 | ||||||
| Asahi Co., Ltd. |
11,800 | 136,809 | ||||||
| Asahi Group Holdings, Ltd. |
49,500 | 2,238,733 | ||||||
| Asahi Holdings, Inc. |
39,400 | 702,479 | ||||||
| Asahi Intecc Co., Ltd. |
30,500 | 802,188 | ||||||
| Asahi Kasei Corp. |
279,100 | 2,928,684 | ||||||
| Asahi Kogyosha Co., Ltd. |
1,900 | 56,904 | ||||||
| Asahi Net, Inc. |
8,800 | 55,490 | ||||||
| ASAHI YUKIZAI CORP. |
4,900 | 59,045 | ||||||
| Asanuma Corp. |
3,600 | 143,811 | ||||||
| Ascentech KK |
900 | 10,340 | ||||||
| Ashimori Industry Co., Ltd. |
3,300 | 28,478 | ||||||
| Asia Pile Holdings Corp. |
11,800 | 47,914 | ||||||
| Asics Corp. |
7,600 | 188,759 | ||||||
| ASKA Pharmaceutical Holdings Co., Ltd. |
11,400 | 98,478 | ||||||
| ASKUL Corp. |
15,700 | 212,867 | ||||||
| Astellas Pharma, Inc. |
177,000 | 2,975,742 | ||||||
| *Astena Holdings Co., Ltd. |
19,500 | 96,453 | ||||||
| Asti Corp. |
800 | 12,671 | ||||||
| Atled Corp. |
700 | 15,206 | ||||||
| *Atrae, Inc. |
1,600 | 33,901 | ||||||
| *Aucfan Co., Ltd. |
2,000 | 12,892 | ||||||
| Aucnet, Inc. |
3,600 | 74,415 | ||||||
| Autobacs Seven Co., Ltd. |
23,600 | 304,663 | ||||||
| Avant Corp. |
6,000 | 83,561 | ||||||
| Avantia Co., Ltd. |
4,800 | 36,160 | ||||||
| Avex, Inc. |
8,800 | 120,086 | ||||||
| Awa Bank, Ltd. (The) |
14,800 | 275,297 | ||||||
| Axial Retailing, Inc. |
9,600 | 304,775 | ||||||
| Azbil Corp. |
10,600 | 450,866 | ||||||
| Bandai Namco Holdings, Inc. |
16,100 | 1,226,579 | ||||||
| Bando Chemical Industries, Ltd. |
15,300 | 118,079 | ||||||
| Bank of Iwate, Ltd. (The) |
6,400 | 91,657 | ||||||
| Bank of Kochi, Ltd. (The) |
4,400 | 29,404 | ||||||
| Bank of Kyoto, Ltd. (The) |
16,500 | 740,890 | ||||||
| Bank of Nagoya, Ltd. (The) |
4,800 | 101,830 | ||||||
| Bank of Saga, Ltd. (The) |
5,901 | 74,316 | ||||||
Dimensional World ex U.S. Core Equity 2 ETF
SCHEDULE OF INVESTMENTS
October 31, 2021
| Security Description |
Shares | Fair Value | ||||||
| JAPAN (Continued) |
||||||||
| Bank of The Ryukyus, Ltd. |
19,600 | $ | 130,466 | |||||
| Baroque Japan, Ltd. |
8,400 | 63,649 | ||||||
| Base Co., Ltd. |
800 | 33,642 | ||||||
| BayCurrent Consulting, Inc. |
6,800 | 2,796,930 | ||||||
| Beauty Garage, Inc. |
1,200 | 41,570 | ||||||
| Belc Co., Ltd. |
6,000 | 295,725 | ||||||
| Bell System24 Holdings, Inc. |
16,300 | 208,709 | ||||||
| Belluna Co., Ltd. |
21,200 | 148,367 | ||||||
| Benefit One, Inc. |
20,200 | 1,018,636 | ||||||
| Benesse Holdings, Inc. |
7,300 | 166,455 | ||||||
| BeNext-Yumeshin Group Co. |
19,669 | 255,813 | ||||||
| #*Bengo4.com, Inc. |
1,100 | 65,986 | ||||||
| Bic Camera, Inc. |
31,500 | 271,006 | ||||||
| BML, Inc. |
11,100 | 388,902 | ||||||
| Bookoff Group Holdings, Ltd. |
3,500 | 30,204 | ||||||
| BP Castrol KK |
3,500 | 43,894 | ||||||
| Br Holdings Corp. |
16,900 | 63,732 | ||||||
| *BrainPad, Inc. |
300 | 14,365 | ||||||
| Bridgestone Corp. |
88,500 | 3,895,475 | ||||||
| Broadleaf Co., Ltd. |
50,800 | 243,252 | ||||||
| Brother Industries, Ltd. |
76,200 | 1,468,867 | ||||||
| Bunka Shutter Co., Ltd. |
27,500 | 267,222 | ||||||
| Business Brain Showa-Ota, Inc. |
1,400 | 24,004 | ||||||
| Business Engineering Corp. |
400 | 12,331 | ||||||
| C Uyemura & Co., Ltd. |
2,800 | 115,413 | ||||||
| Calbee, Inc. |
37,300 | 960,101 | ||||||
| *Can Do Co., Ltd. |
1,500 | 33,598 | ||||||
| Canon Electronics, Inc. |
7,900 | 108,428 | ||||||
| Canon Marketing Japan, Inc. |
14,200 | 280,451 | ||||||
| Canon, Inc. , Sponsored ADR |
1,500 | 33,555 | ||||||
| Canon, Inc. |
47,000 | 1,054,383 | ||||||
| Capcom Co., Ltd. |
37,600 | 1,009,042 | ||||||
| Careerlink Co., Ltd. |
700 | 9,491 | ||||||
| Carenet, Inc. |
2,800 | 30,670 | ||||||
| Carlit Holdings Co., Ltd. |
8,000 | 53,251 | ||||||
| Carta Holdings, Inc. |
3,600 | 77,099 | ||||||
| Casa, Inc. |
2,700 | 21,501 | ||||||
| Casio Computer Co., Ltd. |
27,600 | 388,736 | ||||||
| Cawachi, Ltd. |
5,600 | 108,980 | ||||||
| CDS Co., Ltd. |
1,300 | 17,603 | ||||||
| CE Holdings Co., Ltd. |
5,000 | 23,635 | ||||||
| *CellSource Co., Ltd. |
1,800 | 101,662 | ||||||
| Central Glass Co., Ltd. |
17,100 | 317,030 | ||||||
| Central Japan Railway Co. |
6,400 | 948,564 | ||||||
| Central Security Patrols Co., Ltd. |
3,500 | 83,767 | ||||||
| Central Sports Co., Ltd. |
3,500 | 74,497 | ||||||
| Charm Care Corp. KK |
5,000 | 74,852 | ||||||
| Chiba Bank, Ltd. (The) |
81,900 | 507,094 | ||||||
| Chiba Kogyo Bank, Ltd. (The) |
20,700 | 49,016 | ||||||
| Chilled & Frozen Logistics Holdings Co., Ltd. |
9,800 | 144,733 | ||||||
| Chino Corp. |
3,000 | 36,939 | ||||||
| Chiyoda Co., Ltd. |
6,800 | 45,562 | ||||||
| Chori Co., Ltd. |
4,400 | 69,999 | ||||||
| Chubu Electric Power Co., Inc. |
44,500 | 460,123 | ||||||
| Chubu Shiryo Co., Ltd. |
9,500 | 90,647 | ||||||
Dimensional World ex U.S. Core Equity 2 ETF
SCHEDULE OF INVESTMENTS
October 31, 2021
| Security Description |
Shares | Fair Value | ||||||
| JAPAN (Continued) |
||||||||
| Chuetsu Pulp & Paper Co., Ltd. |
11,700 | $ | 120,463 | |||||
| Chugai Pharmaceutical Co., Ltd. |
22,100 | 823,141 | ||||||
| Chugai Ro Co., Ltd. |
2,700 | 41,225 | ||||||
| Chugoku Bank, Ltd. (The) |
56,500 | 409,287 | ||||||
| Chugoku Electric Power Co., Inc. (The) |
55,500 | 459,965 | ||||||
| Chugoku Marine Paints, Ltd. |
19,700 | 151,864 | ||||||
| Chukyo Bank, Ltd. (The) |
4,300 | 49,703 | ||||||
| CI Takiron Corp. |
19,000 | 100,978 | ||||||
| Citizen Watch Co., Ltd. |
119,300 | 517,900 | ||||||
| CK-San-Etsu Co., Ltd. |
2,100 | 62,986 | ||||||
| Cleanup Corp. |
9,900 | 48,187 | ||||||
| CMIC Holdings Co., Ltd. |
7,700 | 99,943 | ||||||
| CMK Corp. |
21,000 | 78,641 | ||||||
| Coca-Cola Bottlers Japan Holdings, Inc. |
37,813 | 518,654 | ||||||
| Computer Engineering & Consulting, Ltd. |
12,800 | 151,882 | ||||||
| COMSYS Holdings Corp. |
18,000 | 445,166 | ||||||
| Comture Corp. |
8,200 | 221,495 | ||||||
| Concordia Financial Group, Ltd. |
364,524 | 1,448,186 | ||||||
| CONEXIO Corp. |
12,800 | 163,445 | ||||||
| Core Corp. |
2,800 | 39,290 | ||||||
| Cosel Co., Ltd. |
7,600 | 61,720 | ||||||
| Cosmo Energy Holdings Co., Ltd. |
32,900 | 673,148 | ||||||
| Cosmos Initia Co., Ltd. |
2,200 | 7,949 | ||||||
| Cosmos Pharmaceutical Corp. |
4,200 | 639,807 | ||||||
| Cota Co., Ltd. |
400 | 5,543 | ||||||
| CRE, Inc. |
4,800 | 75,015 | ||||||
| Create Medic Co., Ltd. |
2,900 | 25,102 | ||||||
| Create Restaurants Holdings, Inc. |
28,000 | 192,274 | ||||||
| Create SD Holdings Co., Ltd. |
13,600 | 417,452 | ||||||
| Creek & River Co., Ltd. |
3,500 | 60,438 | ||||||
| Cresco, Ltd. |
4,000 | 73,002 | ||||||
| CTI Engineering Co., Ltd. |
7,100 | 170,051 | ||||||
| CTS Co., Ltd. |
10,400 | 72,510 | ||||||
| CyberAgent, Inc. |
72,000 | 1,199,737 | ||||||
| Cybernet Systems Co., Ltd. |
6,500 | 36,198 | ||||||
| Cybozu, Inc. |
6,300 | 149,233 | ||||||
| Dai Nippon Printing Co., Ltd. |
31,500 | 776,277 | ||||||
| Dai Nippon Toryo Co., Ltd. |
11,300 | 85,822 | ||||||
| Daibiru Corp. |
10,500 | 145,402 | ||||||
| Daicel Corp. |
125,900 | 942,939 | ||||||
| Dai-Dan Co., Ltd. |
3,400 | 71,414 | ||||||
| Daido Kogyo Co., Ltd. |
3,210 | 28,771 | ||||||
| Daido Metal Co., Ltd. |
20,900 | 111,809 | ||||||
| Daido Steel Co., Ltd. |
9,800 | 375,155 | ||||||
| Daifuku Co., Ltd. |
11,100 | 1,017,277 | ||||||
| Daihatsu Diesel Manufacturing Co., Ltd. |
7,200 | 37,255 | ||||||
| Daihen Corp. |
9,000 | 374,523 | ||||||
| Daiho Corp. |
5,400 | 181,618 | ||||||
| DAI-Ichi Cutter Kogyo KK |
2,900 | 36,039 | ||||||
| Daiichi Jitsugyo Co., Ltd. |
4,000 | 185,573 | ||||||
| Daiichi Kigenso Kagaku-Kogyo Co., Ltd. |
13,200 | 164,153 | ||||||
| Dai-ichi Life Holdings, Inc. |
65,100 | 1,371,082 | ||||||
| Daiichi Sankyo Co., Ltd. |
10,200 | 256,465 | ||||||
| Daiichikosho Co., Ltd. |
13,300 | 481,728 | ||||||
| Daiken Corp. |
6,500 | 141,658 | ||||||
| Daiken Medical Co., Ltd. |
4,400 | 22,227 | ||||||
Dimensional World ex U.S. Core Equity 2 ETF
SCHEDULE OF INVESTMENTS
October 31, 2021
| Security Description |
Shares | Fair Value | ||||||
| JAPAN (Continued) |
||||||||
| Daiki Aluminium Industry Co., Ltd. |
17,800 | $ | 258,356 | |||||
| Daikin Industries, Ltd. |
16,000 | 3,492,567 | ||||||
| Daikoku Denki Co., Ltd. |
2,900 | 30,799 | ||||||
| Daikokutenbussan Co., Ltd. |
3,100 | 176,172 | ||||||
| Daikyonishikawa Corp. |
24,300 | 145,342 | ||||||
| Dainichiseika Color & Chemicals Manufacturing Co., Ltd. |
5,000 | 115,282 | ||||||
| Daio Paper Corp. |
38,300 | 671,447 | ||||||
| Daiohs Corp. |
2,300 | 20,615 | ||||||
| Daiseki Co., Ltd. |
12,260 | 570,933 | ||||||
| Daiseki Eco. Solution Co., Ltd. |
3,240 | 49,925 | ||||||
| Daishi Hokuetsu Financial Group, Inc. |
16,150 | 361,171 | ||||||
| Daishinku Corp. |
11,600 | 102,749 | ||||||
| Daisue Construction Co., Ltd. |
3,600 | 27,783 | ||||||
| Daito Bank, Ltd. (The) |
4,200 | 24,900 | ||||||
| Daito Pharmaceutical Co., Ltd. |
8,180 | 229,564 | ||||||
| Daito Trust Construction Co., Ltd. |
12,300 | 1,523,140 | ||||||
| Daitron Co., Ltd. |
3,600 | 71,479 | ||||||
| Daiwa House Industry Co., Ltd. |
109,000 | 3,585,696 | ||||||
| Daiwa Securities Group, Inc. |
199,100 | 1,115,239 | ||||||
| Daiwabo Holdings Co., Ltd. |
57,600 | 1,009,800 | ||||||
| DATA HORIZON Co., Ltd. |
900 | 17,917 | ||||||
| DCM Holdings Co., Ltd. |
51,200 | 497,968 | ||||||
| Dear Life Co., Ltd. |
11,100 | 55,683 | ||||||
| Denka Co., Ltd. |
42,500 | 1,390,265 | ||||||
| Densan System Holdings Co., Ltd. |
1,100 | 24,774 | ||||||
| Denso Corp. |
19,600 | 1,413,469 | ||||||
| Dentsu Group, Inc. |
28,100 | 1,027,643 | ||||||
| Denyo Co., Ltd. |
5,600 | 96,947 | ||||||
| Dexerials Corp. |
37,800 | 761,801 | ||||||
| DIC Corp. |
40,900 | 1,081,460 | ||||||
| Digital Arts, Inc. |
4,400 | 357,325 | ||||||
| Digital Garage, Inc. |
5,400 | 250,998 | ||||||
| Digital Hearts Holdings Co., Ltd. |
5,100 | 80,911 | ||||||
| Digital Holdings, Inc. |
7,800 | 119,232 | ||||||
| Digital Information Technologies Corp. |
3,200 | 48,242 | ||||||
| Dip Corp. |
12,300 | 441,193 | ||||||
| Disco Corp. |
1,900 | 509,888 | ||||||
| DKK-Toa Corp. |
3,200 | 23,630 | ||||||
| DKS Co., Ltd. |
5,300 | 160,360 | ||||||
| DMG Mori Co., Ltd. |
45,300 | 776,685 | ||||||
| Double Standard, Inc. |
2,000 | 64,284 | ||||||
| Doutor Nichires Holdings Co., Ltd. |
10,200 | 145,989 | ||||||
| Dowa Holdings Co., Ltd. |
33,200 | 1,381,574 | ||||||
| *Dream Incubator, Inc. |
1,200 | 8,388 | ||||||
| #*Drecom Co., Ltd. |
2,400 | 10,840 | ||||||
| DTS Corp. |
18,800 | 415,818 | ||||||
| Duskin Co., Ltd. |
10,400 | 249,728 | ||||||
| Dvx, Inc. |
2,900 | 29,299 | ||||||
| Dynic Corp. |
2,100 | 13,960 | ||||||
| Eagle Industry Co., Ltd. |
14,900 | 158,637 | ||||||
| Earth Corp. |
3,400 | 208,130 | ||||||
| East Japan Railway Co. |
16,000 | 994,589 | ||||||
| Ebara Corp. |
36,400 | 1,979,215 | ||||||
| Ebara Foods Industry, Inc. |
2,400 | 53,294 | ||||||
| Ebara Jitsugyo Co., Ltd. |
4,700 | 118,299 | ||||||
Dimensional World ex U.S. Core Equity 2 ETF
SCHEDULE OF INVESTMENTS
October 31, 2021
| Security Description |
Shares | Fair Value | ||||||
| JAPAN (Continued) |
||||||||
| Ebase Co., Ltd. |
7,200 | $ | 47,863 | |||||
| *ebook Initiative Japan Co., Ltd. |
1,200 | 50,147 | ||||||
| Eco’s Co., Ltd. |
4,300 | 70,934 | ||||||
| EDION Corp. |
49,300 | 466,950 | ||||||
| #EF-ON, INC. |
10,080 | 73,550 | ||||||
| eGuarantee, Inc. |
9,100 | 202,071 | ||||||
| E-Guardian, Inc. |
2,900 | 79,351 | ||||||
| Ehime Bank, Ltd. (The) |
13,100 | 88,233 | ||||||
| Eidai Co., Ltd. |
16,800 | 43,022 | ||||||
| Eiken Chemical Co., Ltd. |
4,300 | 72,028 | ||||||
| Eisai Co., Ltd. |
14,100 | 992,596 | ||||||
| Eizo Corp. |
6,600 | 251,787 | ||||||
| Elan Corp. |
9,800 | 105,714 | ||||||
| Elecom Co., Ltd. |
20,300 | 309,774 | ||||||
| Electric Power Development Co., Ltd. |
29,100 | 383,321 | ||||||
| Elematec Corp. |
8,004 | 79,671 | ||||||
| EM Systems Co., Ltd. |
2,400 | 15,849 | ||||||
| en Japan, Inc. |
13,100 | 518,141 | ||||||
| Endo Lighting Corp. |
8,800 | 81,189 | ||||||
| ENEOS Holdings, Inc. |
333,968 | 1,346,123 | ||||||
| Enigmo, Inc. |
8,600 | 81,305 | ||||||
| Enomoto Co., Ltd. |
2,700 | 41,770 | ||||||
| Enshu, Ltd. |
1,800 | 10,387 | ||||||
| Entrust, Inc. |
2,400 | 16,291 | ||||||
| EPCO Co., Ltd. |
800 | 5,865 | ||||||
| eRex Co., Ltd. |
8,600 | 196,399 | ||||||
| ES-Con Japan, Ltd. |
14,300 | 102,586 | ||||||
| Escrow Agent Japan, Inc. |
6,800 | 12,106 | ||||||
| Eslead Corp. |
3,600 | 53,167 | ||||||
| ESPEC Corp. |
6,300 | 127,298 | ||||||
| Exedy Corp. |
15,500 | 230,138 | ||||||
| EXEO Group, Inc. |
30,074 | 693,133 | ||||||
| Ezaki Glico Co., Ltd. |
10,500 | 380,311 | ||||||
| F&M Co., Ltd. |
1,800 | 31,335 | ||||||
| FALCO HOLDINGS Co., Ltd. |
1,800 | 26,789 | ||||||
| Fancl Corp. |
15,000 | 452,532 | ||||||
| FANUC Corp. |
1,500 | 293,488 | ||||||
| Fast Retailing Co., Ltd. |
4,500 | 2,980,004 | ||||||
| FCC Co., Ltd. |
28,600 | 395,045 | ||||||
| *FDK Corp. |
5,200 | 46,835 | ||||||
| Feed One Co., Ltd. |
15,196 | 99,819 | ||||||
| Ferrotec Holdings Corp. |
18,200 | 606,534 | ||||||
| #*FFRI Security, Inc. |
1,000 | 14,348 | ||||||
| FIDEA Holdings Co., Ltd. |
7,600 | 78,516 | ||||||
| FINDEX, Inc. |
4,200 | 34,403 | ||||||
| First Bank of Toyama, Ltd. (The) |
21,100 | 53,108 | ||||||
| First Brothers Co., Ltd. |
2,700 | 24,460 | ||||||
| First Juken Co., Ltd. |
3,300 | 35,337 | ||||||
| First-corp., Inc. |
1,800 | 12,550 | ||||||
| Fixstars Corp. |
6,000 | 40,833 | ||||||
| FJ Next Holdings Co., Ltd. |
9,100 | 80,765 | ||||||
| Focus Systems Corp. |
1,500 | 13,339 | ||||||
| Forval Corp. |
3,700 | 37,544 | ||||||
| Foster Electric Co., Ltd. |
8,800 | 62,513 | ||||||
| FP Corp. |
19,400 | 657,584 | ||||||
| France Bed Holdings Co., Ltd. |
14,300 | 112,870 | ||||||
Dimensional World ex U.S. Core Equity 2 ETF
SCHEDULE OF INVESTMENTS
October 31, 2021
| Security Description |
Shares | Fair Value | ||||||
| JAPAN (Continued) |
||||||||
| Freebit Co., Ltd. |
5,200 | $ | 60,243 | |||||
| Freund Corp. |
2,400 | 17,596 | ||||||
| F-Tech, Inc. |
9,500 | 52,988 | ||||||
| FTGroup Co., Ltd. |
4,600 | 49,943 | ||||||
| Fudo Tetra Corp. |
10,550 | 167,560 | ||||||
| Fuji Co., Ltd. |
8,900 | 156,496 | ||||||
| Fuji Corp. |
6,800 | 71,504 | ||||||
| Fuji Corp. |
22,200 | 514,966 | ||||||
| Fuji Corp., Ltd. |
11,200 | 67,578 | ||||||
| Fuji Die Co., Ltd. |
3,700 | 20,995 | ||||||
| Fuji Electric Co., Ltd. |
28,100 | 1,367,726 | ||||||
| Fuji Furukawa Engineering & Construction Co., Ltd. |
1,600 | 37,395 | ||||||
| Fuji Kyuko Co., Ltd. |
7,200 | 289,200 | ||||||
| Fuji Oil Co., Ltd. |
21,300 | 50,436 | ||||||
| Fuji Oil Holdings, Inc. |
21,900 | 513,385 | ||||||
| Fuji Pharma Co., Ltd. |
9,700 | 93,406 | ||||||
| Fuji Seal International, Inc. |
21,400 | 468,632 | ||||||
| Fuji Soft, Inc. |
4,800 | 243,315 | ||||||
| Fujibo Holdings, Inc. |
5,100 | 184,052 | ||||||
| Fujicco Co., Ltd. |
6,500 | 108,937 | ||||||
| FUJIFILM Holdings Corp. |
15,800 | 1,219,520 | ||||||
| Fujikura Composites, Inc. |
6,800 | 47,470 | ||||||
| Fujikura Kasei Co., Ltd. |
10,700 | 49,172 | ||||||
| *Fujikura, Ltd. |
164,200 | 881,301 | ||||||
| Fujimak Corp. |
1,400 | 9,614 | ||||||
| Fujimori Kogyo Co., Ltd. |
8,900 | 364,118 | ||||||
| Fujisash Co., Ltd. |
38,500 | 25,999 | ||||||
| Fujitec Co., Ltd. |
5,000 | 113,089 | ||||||
| Fujitsu General, Ltd. |
11,300 | 277,087 | ||||||
| Fujitsu, Ltd. |
21,350 | 3,674,578 | ||||||
| Fujiya Co., Ltd. |
3,700 | 76,417 | ||||||
| Fukoku Co., Ltd. |
6,500 | 56,378 | ||||||
| Fukuda Corp. |
2,900 | 117,628 | ||||||
| Fukuda Denshi Co., Ltd. |
1,900 | 159,632 | ||||||
| Fukui Bank, Ltd. (The) |
8,800 | 113,603 | ||||||
| Fukui Computer Holdings, Inc. |
3,600 | 129,445 | ||||||
| Fukuoka Financial Group, Inc. |
52,880 | 949,312 | ||||||
| Fukushima Galilei Co., Ltd. |
5,100 | 202,166 | ||||||
| Fukuyama Transporting Co., Ltd. |
9,900 | 393,308 | ||||||
| FULLCAST Holdings Co., Ltd. |
6,800 | 158,095 | ||||||
| Funai Soken Holdings, Inc. |
11,560 | 319,858 | ||||||
| Furukawa Battery Co., Ltd. (The) |
7,400 | 102,799 | ||||||
| Furukawa Co., Ltd. |
14,700 | 162,180 | ||||||
| Furukawa Electric Co., Ltd. |
29,700 | 647,787 | ||||||
| Furuno Electric Co., Ltd. |
9,500 | 101,144 | ||||||
| Furyu Corp. |
7,700 | 111,423 | ||||||
| Fuso Chemical Co., Ltd. |
11,800 | 540,197 | ||||||
| Fuso Pharmaceutical Industries, Ltd. |
3,000 | 66,722 | ||||||
| Futaba Industrial Co., Ltd. |
37,100 | 144,788 | ||||||
| Future Corp. |
15,100 | 440,320 | ||||||
| G-7 Holdings, Inc. |
16,100 | 293,690 | ||||||
| Gakken Holdings Co., Ltd. |
11,400 | 111,376 | ||||||
| Gakkyusha Co., Ltd. |
2,400 | 29,446 | ||||||
| Gecoss Corp. |
7,400 | 55,812 | ||||||
| Genki Sushi Co., Ltd. |
1,800 | 42,528 | ||||||
Dimensional World ex U.S. Core Equity 2 ETF
SCHEDULE OF INVESTMENTS
October 31, 2021
| Security Description |
Shares | Fair Value | ||||||
| JAPAN (Continued) |
||||||||
| Genky DrugStores Co., Ltd. |
4,900 | 235,492 | ||||||
| Geo Holdings Corp. |
20,300 | 215,240 | ||||||
| *Geostr Corp. |
6,900 | 21,724 | ||||||
| Giken, Ltd. |
1,400 | 53,287 | ||||||
| GL Sciences, Inc. |
2,400 | 57,356 | ||||||
| GLOBERIDE, Inc. |
12,400 | 447,498 | ||||||
| Glory, Ltd. |
24,400 | 523,415 | ||||||
| Glosel Co., Ltd. |
4,200 | 15,249 | ||||||
| GMO Financial Holdings, Inc. |
15,300 | 116,738 | ||||||
| GMO GlobalSign Holdings KK |
1,300 | 53,414 | ||||||
| GMO Internet, Inc. |
19,000 | 522,385 | ||||||
| GMO Payment Gateway, Inc. |
7,600 | 962,456 | ||||||
| Godo Steel, Ltd. |
4,400 | 58,036 | ||||||
| Goldwin, Inc. |
5,600 | 337,400 | ||||||
| Golf Digest Online, Inc. |
6,700 | 76,328 | ||||||
| Good Com Asset Co., Ltd. |
3,600 | 43,001 | ||||||
| Grace Technology, Inc. |
1,800 | 16,433 | ||||||
| Grandy House Corp. |
7,600 | 32,326 | ||||||
| gremz, Inc. |
1,200 | 27,604 | ||||||
| GS Yuasa Corp. |
42,400 | 919,953 | ||||||
| GSI Creos Corp. |
3,800 | 32,859 | ||||||
| G-Tekt Corp. |
14,900 | 185,033 | ||||||
| #Gumi, Inc. |
12,600 | 100,667 | ||||||
| Gunma Bank, Ltd. (The) |
149,600 | 461,821 | ||||||
| Gunze, Ltd. |
6,400 | 246,121 | ||||||
| H.U. Group Holdings, Inc. |
30,100 | 740,456 | ||||||
| H2O Retailing Corp. |
39,625 | 315,193 | ||||||
| HABA Laboratories, Inc. |
1,500 | 40,254 | ||||||
| Hachijuni Bank, Ltd. (The) |
176,400 | 589,418 | ||||||
| Hagihara Industries, Inc. |
3,600 | 47,358 | ||||||
| Hagiwara Electric Holdings Co., Ltd. |
3,200 | 60,366 | ||||||
| Hakudo Co., Ltd. |
5,000 | 126,507 | ||||||
| Hakuhodo DY Holdings, Inc. |
41,500 | 676,229 | ||||||
| Hakuto Co., Ltd. |
6,600 | 112,349 | ||||||
| Halows Co., Ltd. |
5,200 | 127,418 | ||||||
| Hamakyorex Co., Ltd. |
10,300 | 284,543 | ||||||
| Hamamatsu Photonics KK |
8,600 | 508,345 | ||||||
| Handsman Co., Ltd. |
1,000 | 15,347 | ||||||
| Hankyu Hanshin Holdings, Inc. |
35,300 | 1,091,274 | ||||||
| Hanwa Co., Ltd. |
14,200 | 424,039 | ||||||
| Happinet Corp. |
5,000 | 65,731 | ||||||
| Harada Industry Co., Ltd. |
4,200 | 37,202 | ||||||
| Hard Off Corp. Co., Ltd. |
3,900 | 26,439 | ||||||
| Harima Chemicals Group, Inc. |
6,500 | 49,765 | ||||||
| Haruyama Holdings, Inc. |
4,000 | 20,241 | ||||||
| Haseko Corp. |
147,300 | 1,913,188 | ||||||
| Hayashikane Sangyo Co., Ltd. |
3,600 | 18,312 | ||||||
| Hazama Ando Corp. |
112,220 | 757,811 | ||||||
| Heiwa Corp. |
22,000 | 391,283 | ||||||
| Heiwa Real Estate Co., Ltd. |
10,100 | 317,992 | ||||||
| Heiwado Co., Ltd. |
15,800 | 272,560 | ||||||
| Helios Techno Holding Co., Ltd. |
12,400 | 33,712 | ||||||
| *Hennge KK |
400 | 19,680 | ||||||
| Hikari Tsushin, Inc. |
3,800 | 584,872 | ||||||
| Himaraya Co., Ltd. |
1,300 | 12,017 | ||||||
| Hino Motors, Ltd. |
97,000 | 915,343 | ||||||
Dimensional World ex U.S. Core Equity 2 ETF
SCHEDULE OF INVESTMENTS
October 31, 2021
| Security Description |
Shares | Fair Value | ||||||
| JAPAN (Continued) |
||||||||
| Hinokiya Group Co., Ltd. |
1,400 | $ | 28,178 | |||||
| Hioki EE Corp. |
600 | 41,728 | ||||||
| Hirakawa Hewtech Corp. |
5,200 | 56,458 | ||||||
| Hirata Corp. |
900 | 54,541 | ||||||
| Hirogin Holdings, Inc. |
94,100 | 517,437 | ||||||
| Hirose Electric Co., Ltd. |
735 | 122,409 | ||||||
| Hiroshima Gas Co., Ltd. |
14,400 | 47,232 | ||||||
| Hisamitsu Pharmaceutical Co., Inc. |
5,200 | 176,488 | ||||||
| Hitachi Construction Machinery Co., Ltd. |
27,400 | 871,081 | ||||||
| Hitachi Metals, Ltd. |
19,610 | 370,961 | ||||||
| Hitachi Transport System, Ltd. |
20,000 | 785,793 | ||||||
| Hitachi Zosen Corp. |
105,100 | 820,338 | ||||||
| Hitachi, Ltd. |
131,700 | 7,569,935 | ||||||
| Hito Communications Holdings, Inc. |
3,400 | 65,451 | ||||||
| Hochiki Corp. |
6,300 | 69,119 | ||||||
| Hodogaya Chemical Co., Ltd. |
2,800 | 118,851 | ||||||
| Hogy Medical Co., Ltd. |
7,400 | 202,157 | ||||||
| Hokkaido Electric Power Co., Inc. |
62,900 | 260,923 | ||||||
| Hokkaido Gas Co., Ltd. |
4,400 | 58,885 | ||||||
| Hokkan Holdings, Ltd. |
4,700 | 62,364 | ||||||
| *Hokko Chemical Industry Co., Ltd. |
9,200 | 80,603 | ||||||
| Hokkoku Financial Holdings, Inc. |
10,700 | 186,271 | ||||||
| Hokuetsu Corp. |
66,900 | 440,035 | ||||||
| Hokuetsu Industries Co., Ltd. |
13,700 | 116,304 | ||||||
| Hokuhoku Financial Group, Inc. |
53,600 | 383,579 | ||||||
| Hokuriku Electric Industry Co., Ltd. |
4,100 | 37,180 | ||||||
| Hokuriku Electric Power Co. |
52,300 | 248,600 | ||||||
| Hokuto Corp. |
11,800 | 203,557 | ||||||
| Honda Motor Co., Ltd. , Sponsored ADR |
41,106 | 1,215,915 | ||||||
| Honda Motor Co., Ltd. |
108,300 | 3,180,852 | ||||||
| Honda Tsushin Kogyo Co., Ltd. |
6,500 | 25,937 | ||||||
| H-One Co., Ltd. |
10,200 | 67,180 | ||||||
| *Honeys Holdings Co., Ltd. |
5,900 | 54,330 | ||||||
| Hoosiers Holdings |
16,300 | 100,209 | ||||||
| Horiba, Ltd. |
12,300 | 802,561 | ||||||
| Hoshizaki Corp. |
400 | 33,536 | ||||||
| Hosokawa Micron Corp. |
5,600 | 154,212 | ||||||
| Hotland Co., Ltd. |
2,900 | 34,640 | ||||||
| House Foods Group, Inc. |
6,600 | 188,985 | ||||||
| Howa Machinery, Ltd. |
6,400 | 45,408 | ||||||
| Hoya Corp. |
32,800 | 4,811,050 | ||||||
| *HPC Systems, Inc. |
800 | 27,748 | ||||||
| Hulic Co., Ltd. |
28,796 | 276,027 | ||||||
| Hyakugo Bank, Ltd. (The) |
107,200 | 310,248 | ||||||
| Hyakujushi Bank, Ltd. (The) |
10,300 | 133,058 | ||||||
| Ibiden Co., Ltd. |
14,900 | 889,884 | ||||||
| IBJ, Inc. |
8,000 | 76,545 | ||||||
| Ichibanya Co., Ltd. |
1,800 | 72,695 | ||||||
| Ichigo, Inc. |
129,300 | 385,547 | ||||||
| Ichiken Co., Ltd. |
3,500 | 58,965 | ||||||
| Ichikoh Industries, Ltd. |
24,000 | 118,711 | ||||||
| Ichinen Holdings Co., Ltd. |
13,300 | 162,714 | ||||||
| Ichiyoshi Securities Co., Ltd. |
15,300 | 87,218 | ||||||
| ID Holdings Corp. |
6,700 | 55,175 | ||||||
| Idec Corp. |
13,500 | 284,740 | ||||||
Dimensional World ex U.S. Core Equity 2 ETF
SCHEDULE OF INVESTMENTS
October 31, 2021
| Security Description |
Shares | Fair Value | ||||||
| JAPAN (Continued) |
||||||||
| Idemitsu Kosan Co., Ltd. |
40,341 | $ | 1,102,058 | |||||
| IDOM, Inc. |
47,900 | 326,825 | ||||||
| Ihara Science Corp. |
3,600 | 66,333 | ||||||
| IHI Corp. |
85,100 | 1,980,753 | ||||||
| Iida Group Holdings Co., Ltd. |
20,116 | 494,498 | ||||||
| Iino Kaiun Kaisha, Ltd. |
61,400 | 294,548 | ||||||
| IJTT Co., Ltd. |
10,900 | 56,400 | ||||||
| Ikegami Tsushinki Co., Ltd. |
3,300 | 22,198 | ||||||
| IMAGICA GROUP, Inc. |
6,000 | 30,520 | ||||||
| Imasen Electric Industrial |
2,200 | 13,679 | ||||||
| *Impact HD, Inc. |
800 | 28,099 | ||||||
| Imuraya Group Co., Ltd. |
1,500 | 30,888 | ||||||
| Inaba Denki Sangyo Co., Ltd. |
12,000 | 286,884 | ||||||
| Inaba Seisakusho Co., Ltd. |
4,100 | 48,039 | ||||||
| Inabata & Co., Ltd. |
17,100 | 252,695 | ||||||
| Inageya Co., Ltd. |
11,000 | 132,646 | ||||||
| Ines Corp. |
8,100 | 117,993 | ||||||
| I-Net Corp. |
7,230 | 83,761 | ||||||
| Infocom Corp. |
12,200 | 233,461 | ||||||
| Infomart Corp. |
75,500 | 734,970 | ||||||
| Information Services International-Dentsu, Ltd. |
11,000 | 383,469 | ||||||
| INFRONEER Holdings, Inc. |
104,004 | 861,037 | ||||||
| Innotech Corp. |
5,100 | 63,825 | ||||||
| Inpex Corp. |
245,500 | 2,049,691 | ||||||
| Insource Co., Ltd. |
3,600 | 71,826 | ||||||
| Intage Holdings, Inc. |
18,700 | 314,878 | ||||||
| Intelligent Wave, Inc. |
1,900 | 9,798 | ||||||
| Internet Initiative Japan, Inc. |
28,000 | 973,646 | ||||||
| I-O Data Device, Inc. |
4,000 | 31,818 | ||||||
| I-PEX, Inc. |
5,300 | 95,286 | ||||||
| IPS, Inc. |
900 | 14,223 | ||||||
| IR Japan Holdings, Ltd. |
2,700 | 248,866 | ||||||
| Iriso Electronics Co., Ltd. |
1,000 | 45,604 | ||||||
| I’rom Group Co., Ltd. |
800 | 13,786 | ||||||
| ISB Corp. |
4,000 | 43,499 | ||||||
| Iseki & Co., Ltd. |
8,700 | 125,283 | ||||||
| Isetan Mitsukoshi Holdings, Ltd. |
94,200 | 685,692 | ||||||
| Ishihara Sangyo Kaisha, Ltd. |
16,100 | 176,920 | ||||||
| Ishii Iron Works Co., Ltd. |
500 | 13,155 | ||||||
| Ishizuka Glass Co., Ltd. |
1,100 | 20,760 | ||||||
| Isolite Insulating Products Co., Ltd. |
1,800 | 13,955 | ||||||
| Isuzu Motors, Ltd. |
109,800 | 1,472,346 | ||||||
| Itfor, Inc. |
13,500 | 105,016 | ||||||
| ITmedia, Inc. |
2,600 | 53,197 | ||||||
| Ito En, Ltd. |
9,800 | 651,471 | ||||||
| ITOCHU Corp. |
201,600 | 5,731,964 | ||||||
| Itochu Enex Co., Ltd. |
34,500 | 303,473 | ||||||
| Itochu Techno-Solutions Corp. |
17,700 | 557,273 | ||||||
| Itochu-Shokuhin Co., Ltd. |
2,100 | 96,873 | ||||||
| Itoham Yonekyu Holdings, Inc. |
42,368 | 257,496 | ||||||
| Itoki Corp. |
13,300 | 42,224 | ||||||
| #*Itokuro, Inc. |
1,300 | 10,329 | ||||||
| IwaiCosmo Holdings, Inc. |
6,800 | 79,674 | ||||||
| Iwaki Co., Ltd. |
1,300 | 11,435 | ||||||
| Iwasaki Electric Co., Ltd. |
3,700 | 67,818 | ||||||
| Iwatani Corp. |
22,900 | 1,345,582 | ||||||
Dimensional World ex U.S. Core Equity 2 ETF
SCHEDULE OF INVESTMENTS
October 31, 2021
| Security Description |
Shares | Fair Value | ||||||
| JAPAN (Continued) |
||||||||
| Iyo Bank, Ltd. (The) |
107,943 | $ | 527,290 | |||||
| Izumi Co., Ltd. |
14,200 | 429,020 | ||||||
| J Front Retailing Co., Ltd. |
82,700 | 762,269 | ||||||
| J Trust Co., Ltd. |
23,700 | 123,462 | ||||||
| JAC Recruitment Co., Ltd. |
7,200 | 140,937 | ||||||
| #Jalux, Inc. |
3,000 | 44,832 | ||||||
| Jamco Corp. |
3,400 | 29,281 | ||||||
| JANOME Corp. |
10,500 | 68,143 | ||||||
| *Japan Airlines Co., Ltd. |
40,200 | 864,110 | ||||||
| #*Japan Airport Terminal Co., Ltd. |
3,400 | 167,875 | ||||||
| *Japan Asset Marketing Co., Ltd. |
40,100 | 36,926 | ||||||
| Japan Aviation Electronics Industry, Ltd. |
32,300 | 533,400 | ||||||
| Japan Best Rescue System Co., Ltd. |
5,100 | 51,257 | ||||||
| Japan Cash Machine Co., Ltd. |
9,600 | 71,900 | ||||||
| *Japan Display, Inc. |
578,400 | 172,467 | ||||||
| Japan Electronic Materials Corp. |
3,000 | 50,357 | ||||||
| Japan Elevator Service Holdings Co., Ltd. |
7,500 | 162,201 | ||||||
| Japan Exchange Group, Inc. |
47,900 | 1,131,494 | ||||||
| *Japan Hospice Holdings, Inc. |
700 | 12,217 | ||||||
| Japan Investment Adviser Co., Ltd. |
4,500 | 48,976 | ||||||
| Japan Lifeline Co., Ltd. |
22,600 | 242,798 | ||||||
| Japan Material Co., Ltd. |
22,600 | 313,556 | ||||||
| Japan Medical Dynamic Marketing, Inc. |
10,700 | 204,569 | ||||||
| Japan Oil Transportation Co., Ltd. |
1,600 | 36,960 | ||||||
| Japan Post Holdings Co., Ltd. |
92,300 | 708,288 | ||||||
| Japan Post Insurance Co., Ltd. |
16,000 | 259,592 | ||||||
| Japan Property Management Center Co., Ltd. |
6,000 | 60,671 | ||||||
| Japan Pulp & Paper Co., Ltd. |
6,900 | 232,370 | ||||||
| Japan Steel Works, Ltd. (The) |
42,000 | 1,228,415 | ||||||
| Japan Tobacco, Inc. |
210,500 | 4,126,926 | ||||||
| Japan Transcity Corp. |
13,100 | 69,392 | ||||||
| *Japan Wool Textile Co., Ltd. (The) |
26,700 | 212,617 | ||||||
| JBCC Holdings, Inc. |
4,700 | 71,597 | ||||||
| JCR Pharmaceuticals Co., Ltd. |
11,600 | 284,748 | ||||||
| JCU Corp. |
14,200 | 567,253 | ||||||
| Jeol, Ltd. |
14,500 | 1,093,620 | ||||||
| JFE Holdings, Inc. |
63,132 | 965,043 | ||||||
| JFE Systems, Inc. |
1,700 | 28,774 | ||||||
| JGC Holdings Corp. |
82,100 | 767,539 | ||||||
| *JIG-SAW, Inc. |
900 | 61,565 | ||||||
| Jimoto Holdings, Inc. |
9,350 | 53,300 | ||||||
| JINS Holdings, Inc. |
4,900 | 308,976 | ||||||
| JK Holdings Co., Ltd. |
7,000 | 53,041 | ||||||
| J-Lease Co., Ltd. |
2,100 | 42,451 | ||||||
| JM Holdings Co., Ltd. |
6,300 | 103,209 | ||||||
| JMS Co., Ltd. |
6,200 | 40,454 | ||||||
| *Joban Kosan Co., Ltd. |
2,100 | 26,631 | ||||||
| J-Oil Mills, Inc. |
9,800 | 157,625 | ||||||
| Joshin Denki Co., Ltd. |
11,300 | 234,473 | ||||||
| Joyful Honda Co., Ltd. |
3,100 | 42,493 | ||||||
| JP-Holdings, Inc. |
17,100 | 37,942 | ||||||
| JSB Co., Ltd. |
1,300 | 32,698 | ||||||
| JSP Corp. |
4,400 | 59,117 | ||||||
| JSR Corp. |
16,800 | 605,551 | ||||||
| JTEKT Corp. |
86,100 | 757,363 | ||||||
Dimensional World ex U.S. Core Equity 2 ETF
SCHEDULE OF INVESTMENTS
October 31, 2021
| Security Description |
Shares | Fair Value | ||||||
| JAPAN (Continued) |
||||||||
| Juki Corp. |
19,400 | $ | 144,277 | |||||
| Juroku Financial Group, Inc. |
13,200 | 239,516 | ||||||
| Justsystems Corp. |
6,400 | 328,910 | ||||||
| JVCKenwood Corp. |
123,900 | 212,974 | ||||||
| Kadokawa Corp. |
3,900 | 206,244 | ||||||
| Kaga Electronics Co., Ltd. |
8,400 | 230,213 | ||||||
| Kagome Co., Ltd. |
9,000 | 228,108 | ||||||
| Kajima Corp. |
120,500 | 1,479,500 | ||||||
| Kakaku.com, Inc. |
19,300 | 637,268 | ||||||
| Kaken Pharmaceutical Co., Ltd. |
15,400 | 606,411 | ||||||
| Kakiyasu Honten Co., Ltd. |
2,300 | 53,836 | ||||||
| Kameda Seika Co., Ltd. |
4,300 | 168,003 | ||||||
| Kamei Corp. |
10,900 | 110,506 | ||||||
| Kamigumi Co., Ltd. |
26,800 | 537,528 | ||||||
| Kanaden Corp. |
9,000 | 80,982 | ||||||
| Kanagawa Chuo Kotsu Co., Ltd. |
3,000 | 91,690 | ||||||
| Kanamic Network Co., Ltd. |
7,600 | 40,325 | ||||||
| Kanamoto Co., Ltd. |
19,300 | 411,982 | ||||||
| Kandenko Co., Ltd. |
39,600 | 306,312 | ||||||
| Kaneka Corp. |
17,800 | 681,403 | ||||||
| *Kaneko Seeds Co., Ltd. |
2,800 | 36,883 | ||||||
| Kanematsu Corp. |
49,000 | 567,244 | ||||||
| Kanematsu Electronics, Ltd. |
6,200 | 202,000 | ||||||
| Kansai Electric Power Co., Inc. (The) |
50,700 | 465,982 | ||||||
| Kansai Paint Co., Ltd. |
15,100 | 348,681 | ||||||
| Kansai Super Market, Ltd. |
5,400 | 87,518 | ||||||
| Kanto Denka Kogyo Co., Ltd. |
36,100 | 331,477 | ||||||
| Kao Corp. |
34,100 | 1,923,237 | ||||||
| Kasai Kogyo Co., Ltd. |
15,000 | 44,201 | ||||||
| Katakura & Co-op Agri Corp. |
1,800 | 18,659 | ||||||
| Katitas Co., Ltd. |
12,100 | 439,855 | ||||||
| Kato Sangyo Co., Ltd. |
5,300 | 148,972 | ||||||
| Kato Works Co., Ltd. |
3,200 | 23,518 | ||||||
| KAWADA TECHNOLOGIES, Inc. |
1,900 | 65,569 | ||||||
| Kawai Musical Instruments Manufacturing Co., Ltd. |
2,600 | 80,035 | ||||||
| Kawasaki Heavy Industries, Ltd. |
87,500 | 1,769,568 | ||||||
| Kawasaki Kisen Kaisha, Ltd. |
27,900 | 1,340,864 | ||||||
| Kawata Manufacturing Co., Ltd. |
1,100 | 9,232 | ||||||
| KDDI Corp. |
255,900 | 7,917,695 | ||||||
| KeePer Technical Laboratory Co., Ltd. |
6,600 | 189,274 | ||||||
| Keihan Holdings Co., Ltd. |
17,900 | 469,066 | ||||||
| Keihanshin Building Co., Ltd. |
6,900 | 85,868 | ||||||
| Keihin Co., Ltd./Minato-Ku Tokyo Japan |
2,900 | 35,530 | ||||||
| Keikyu Corp. |
24,300 | 273,208 | ||||||
| Keio Corp. |
6,400 | 322,175 | ||||||
| Keisei Electric Railway Co., Ltd. |
8,000 | 256,435 | ||||||
| Keiyo Bank, Ltd. (The) |
52,800 | 205,134 | ||||||
| Keiyo Co., Ltd. |
16,200 | 117,779 | ||||||
| KEL Corp. |
1,500 | 15,878 | ||||||
| Kenko Mayonnaise Co., Ltd. |
6,200 | 83,029 | ||||||
| *Kewpie Corp. |
41,300 | 903,692 | ||||||
| Keyence Corp. |
2,808 | 1,687,139 | ||||||
| KFC Holdings Japan, Ltd. |
6,000 | 152,019 | ||||||
| KFC, Ltd. |
2,200 | 38,549 | ||||||
| KH Neochem Co., Ltd. |
15,000 | 384,389 | ||||||
| Kikkoman Corp. |
8,600 | 702,934 | ||||||
Dimensional World ex U.S. Core Equity 2 ETF
SCHEDULE OF INVESTMENTS
October 31, 2021
| Security Description |
Shares | Fair Value | ||||||
| JAPAN (Continued) |
||||||||
| Kimura Chemical Plants Co., Ltd. |
2,900 | $ | 19,380 | |||||
| Kimura Unity Co., Ltd. |
2,800 | 33,347 | ||||||
| Kinki Sharyo Co., Ltd. (The) |
2,500 | 23,526 | ||||||
| *Kintetsu Department Store Co., Ltd. |
2,100 | 46,853 | ||||||
| *Kintetsu Group Holdings Co., Ltd. |
10,800 | 338,610 | ||||||
| Kintetsu World Express, Inc. |
22,600 | 539,903 | ||||||
| Kirin Holdings Co., Ltd. |
65,640 | 1,140,389 | ||||||
| Ki-Star Real Estate Co., Ltd. |
5,200 | 289,130 | ||||||
| Kitagawa Corp. |
4,400 | 60,313 | ||||||
| Kita-Nippon Bank, Ltd. (The) |
3,100 | 41,460 | ||||||
| Kitano Construction Corp. |
1,800 | 34,129 | ||||||
| Kitanotatsujin Corp. |
26,100 | 94,763 | ||||||
| Kito Corp. |
13,800 | 190,374 | ||||||
| Kitz Corp. |
37,400 | 249,279 | ||||||
| Kiyo Bank, Ltd. (The) |
27,000 | 353,764 | ||||||
| *KLab, Inc. |
16,200 | 90,075 | ||||||
| Koa Corp. |
12,300 | 165,474 | ||||||
| Koa Shoji Holdings Co., Ltd. |
4,200 | 24,458 | ||||||
| Koatsu Gas Kogyo Co., Ltd. |
13,700 | 92,154 | ||||||
| Kobayashi Pharmaceutical Co., Ltd. |
700 | 55,926 | ||||||
| Kobe Bussan Co., Ltd. |
26,400 | 906,433 | ||||||
| *Kobe Electric Railway Co., Ltd. |
1,500 | 45,187 | ||||||
| Kobe Steel, Ltd. |
128,620 | 755,759 | ||||||
| Kohnan Shoji Co., Ltd. |
16,100 | 501,956 | ||||||
| Kohsoku Corp. |
4,000 | 56,619 | ||||||
| Koito Manufacturing Co., Ltd. |
16,100 | 909,309 | ||||||
| #Kojima Co., Ltd. |
19,400 | 99,531 | ||||||
| Kokusai Co., Ltd. |
3,100 | 18,514 | ||||||
| Kokusai Pulp & Paper Co., Ltd. |
5,800 | 18,820 | ||||||
| KOMAIHALTEC, Inc. |
1,200 | 17,165 | ||||||
| Komatsu Wall Industry Co., Ltd. |
3,200 | 54,444 | ||||||
| Komatsu, Ltd. |
82,800 | 2,154,143 | ||||||
| KOMEDA Holdings Co., Ltd. |
19,100 | 345,567 | ||||||
| Komehyo Holdings Co., Ltd. |
3,600 | 58,629 | ||||||
| Komeri Co., Ltd. |
19,800 | 456,689 | ||||||
| #Konaka Co., Ltd. |
10,000 | 29,116 | ||||||
| Konami Holdings Corp. |
14,600 | 801,544 | ||||||
| Kondotec, Inc. |
4,000 | 34,273 | ||||||
| Konica Minolta, Inc. |
162,700 | 801,907 | ||||||
| Konishi Co., Ltd. |
9,900 | 153,243 | ||||||
| Konoike Transport Co., Ltd. |
12,500 | 136,045 | ||||||
| Konoshima Chemical Co., Ltd. |
4,600 | 117,879 | ||||||
| *Kosaido Holdings Co., Ltd. |
5,600 | 48,523 | ||||||
| Kose Corp. |
3,900 | 451,138 | ||||||
| Krosaki Harima Corp. |
2,900 | 119,535 | ||||||
| *KRS Corp. |
3,200 | 55,763 | ||||||
| K’s Holdings Corp. |
79,220 | 815,648 | ||||||
| KU Holdings Co., Ltd. |
4,600 | 43,005 | ||||||
| Kubota Corp. , ADR |
371 | 39,716 | ||||||
| Kubota Corp. |
41,700 | 885,931 | ||||||
| Kumagai Gumi Co., Ltd. |
22,600 | 558,137 | ||||||
| Kumiai Chemical Industry Co., Ltd. |
19,170 | 142,399 | ||||||
| Kurabo Industries, Ltd. |
7,600 | 126,172 | ||||||
| Kuraray Co., Ltd. |
188,400 | 1,701,837 | ||||||
| Kureha Corp. |
8,900 | 576,032 | ||||||
Dimensional World ex U.S. Core Equity 2 ETF
SCHEDULE OF INVESTMENTS
October 31, 2021
| Security Description |
Shares | Fair Value | ||||||
| JAPAN (Continued) |
||||||||
| Kurimoto, Ltd. |
3,400 | $ | 48,424 | |||||
| Kurita Water Industries, Ltd. |
22,500 | 1,105,021 | ||||||
| Kuriyama Holdings Corp. |
8,400 | 73,152 | ||||||
| Kusuri no Aoki Holdings Co., Ltd. |
6,300 | 418,250 | ||||||
| KYB Corp. |
11,000 | 293,269 | ||||||
| Kyoden Co., Ltd. |
11,300 | 52,524 | ||||||
| Kyodo Printing Co., Ltd. |
2,600 | 59,559 | ||||||
| Kyoei Steel, Ltd. |
9,400 | 115,743 | ||||||
| Kyokuto Boeki Kaisha, Ltd. |
2,700 | 61,708 | ||||||
| Kyokuto Kaihatsu Kogyo Co., Ltd. |
11,300 | 154,003 | ||||||
| Kyokuto Securities Co., Ltd. |
10,000 | 66,740 | ||||||
| Kyokuyo Co., Ltd. |
2,400 | 64,196 | ||||||
| KYORIN Holdings, Inc. |
10,700 | 163,843 | ||||||
| Kyoritsu Printing Co., Ltd. |
13,500 | 20,009 | ||||||
| Kyosan Electric Manufacturing Co., Ltd. |
14,700 | 61,752 | ||||||
| Kyowa Electronic Instruments Co., Ltd. |
7,400 | 26,414 | ||||||
| Kyowa Kirin Co., Ltd. |
1,600 | 52,480 | ||||||
| Kyowa Leather Cloth Co., Ltd. |
5,300 | 31,700 | ||||||
| Kyudenko Corp. |
24,000 | 759,833 | ||||||
| Kyushu Electric Power Co., Inc. |
80,400 | 566,202 | ||||||
| Kyushu Financial Group, Inc. |
176,650 | 593,352 | ||||||
| Kyushu Railway Co |
18,900 | 422,007 | ||||||
| LAC Co., Ltd. |
4,700 | 32,810 | ||||||
| Lacto Japan Co., Ltd. |
2,200 | 51,611 | ||||||
| #*Laox Co., Ltd. |
5,400 | 8,856 | ||||||
| Lasertec Corp. |
13,100 | 2,875,624 | ||||||
| Lawson, Inc. |
20,700 | 1,000,281 | ||||||
| LEC, Inc. |
14,000 | 127,691 | ||||||
| Life Corp. |
9,300 | 304,631 | ||||||
| LIFULL Co., Ltd. |
2,800 | 8,766 | ||||||
| LIKE, Inc. |
2,500 | 38,939 | ||||||
| Linical Co., Ltd. |
5,500 | 38,636 | ||||||
| Link And Motivation, Inc. |
11,500 | 121,127 | ||||||
| Lintec Corp. |
17,700 | 394,592 | ||||||
| Lion Corp. |
38,500 | 639,838 | ||||||
| LITALICO, Inc. |
5,000 | 150,186 | ||||||
| Lixil Corp. |
47,200 | 1,210,373 | ||||||
| Loadstar Capital KK |
1,200 | 9,587 | ||||||
| #Locondo, Inc. |
1,500 | 17,391 | ||||||
| Lonseal Corp. |
400 | 5,269 | ||||||
| Look Holdings, Inc. |
3,000 | 36,282 | ||||||
| *M&A Capital Partners Co., Ltd. |
5,200 | 292,322 | ||||||
| M3, Inc. |
24,000 | 1,411,901 | ||||||
| Mabuchi Motor Co., Ltd. |
6,600 | 226,898 | ||||||
| Macnica Fuji Electronics Holdings, Inc. |
20,050 | 469,665 | ||||||
| Macromill, Inc. |
20,600 | 145,252 | ||||||
| Maeda Kosen Co., Ltd. |
12,000 | 346,766 | ||||||
| *Maezawa Industries, Inc. |
6,000 | 34,940 | ||||||
| Makino Milling Machine Co., Ltd. |
9,400 | 337,584 | ||||||
| Makita Corp. |
3,000 | 138,470 | ||||||
| *Management Solutions Co., Ltd. |
1,400 | 41,745 | ||||||
| Mani, Inc. |
5,100 | 86,770 | ||||||
| MarkLines Co., Ltd. |
3,500 | 98,838 | ||||||
| Marubeni Corp. |
138,600 | 1,168,361 | ||||||
| Marubun Corp. |
8,900 | 62,364 | ||||||
| Marudai Food Co., Ltd. |
8,500 | 126,205 | ||||||
Dimensional World ex U.S. Core Equity 2 ETF
SCHEDULE OF INVESTMENTS
October 31, 2021
| Security Description |
Shares | Fair Value | ||||||
| JAPAN (Continued) |
||||||||
| Marufuji Sheet Piling Co., Ltd. |
300 | $ | 5,280 | |||||
| Maruha Nichiro Corp. |
26,500 | 596,816 | ||||||
| Marui Group Co., Ltd. |
34,300 | 670,508 | ||||||
| MARUKA FURUSATO Corp. |
6,470 | 114,165 | ||||||
| Marusan Securities Co., Ltd. |
23,100 | 121,350 | ||||||
| Maruwa Co., Ltd./Aichi |
4,100 | 457,014 | ||||||
| Maruwa Unyu Kikan Co., Ltd. |
20,800 | 290,406 | ||||||
| Maruyama Manufacturing Co., Inc. |
1,400 | 18,699 | ||||||
| Maruzen CHI Holdings Co., Ltd. |
6,600 | 21,648 | ||||||
| Maruzen Showa Unyu Co., Ltd. |
5,300 | 161,289 | ||||||
| Marvelous, Inc. |
15,500 | 98,145 | ||||||
| Matching Service Japan Co., Ltd. |
1,600 | 14,004 | ||||||
| Matsuda Sangyo Co., Ltd. |
4,800 | 142,706 | ||||||
| Matsui Securities Co., Ltd. |
24,900 | 178,411 | ||||||
| MatsukiyoCocokara & Co |
28,930 | 1,276,193 | ||||||
| Matsuoka Corp. |
700 | 8,404 | ||||||
| Matsuyafoods Holdings Co., Ltd. |
3,600 | 114,922 | ||||||
| Max Co., Ltd. |
2,600 | 41,272 | ||||||
| Maxell, Ltd. |
20,700 | 248,164 | ||||||
| Maxvalu Nishinihon Co., Ltd. |
1,900 | 31,043 | ||||||
| Maxvalu Tokai Co., Ltd. |
4,000 | 91,559 | ||||||
| Mazda Motor Corp. |
96,400 | 861,492 | ||||||
| McDonald’s Holdings Co. Japan, Ltd. |
1,300 | 58,031 | ||||||
| MCJ Co., Ltd. |
40,300 | 452,745 | ||||||
| Mebuki Financial Group, Inc. |
335,490 | 685,544 | ||||||
| MEC Co., Ltd. |
800 | 21,890 | ||||||
| Media Do Co., Ltd. |
2,500 | 93,401 | ||||||
| Medical Data Vision Co., Ltd. |
6,700 | 85,964 | ||||||
| Medical System Network Co., Ltd. |
16,100 | 103,921 | ||||||
| Medipal Holdings Corp. |
43,100 | 776,764 | ||||||
| Medius Holdings Co., Ltd. |
2,100 | 16,410 | ||||||
| #*MedPeer, Inc. |
2,700 | 80,509 | ||||||
| Megachips Corp. |
1,900 | 59,820 | ||||||
| Megmilk Snow Brand Co., Ltd. |
21,600 | 417,698 | ||||||
| Meidensha Corp. |
20,400 | 427,769 | ||||||
| Meiji Electric Industries Co., Ltd. |
2,100 | 24,642 | ||||||
| MEIJI Holdings Co., Ltd. |
26,574 | 1,675,659 | ||||||
| Meiji Shipping Co., Ltd. |
7,600 | 52,655 | ||||||
| Meiko Electronics Co., Ltd. |
18,000 | 496,470 | ||||||
| Meisei Industrial Co., Ltd. |
11,700 | 69,466 | ||||||
| Meitec Corp. |
10,600 | 634,001 | ||||||
| Meiwa Corp. |
10,000 | 72,528 | ||||||
| Meiwa Estate Co., Ltd. |
4,600 | 24,810 | ||||||
| Members Co., Ltd. |
600 | 18,180 | ||||||
| Menicon Co., Ltd. |
26,200 | 983,433 | ||||||
| Mercuria Holdings Co., Ltd. |
3,900 | 25,208 | ||||||
| Mesco, Inc. |
1,800 | 15,786 | ||||||
| METAWATER Co., Ltd. |
9,400 | 158,528 | ||||||
| Michinoku Bank, Ltd. (The) |
8,200 | 62,997 | ||||||
| Micronics Japan Co., Ltd. |
7,400 | 97,542 | ||||||
| Midac Holdings Co., Ltd. |
1,000 | 47,358 | ||||||
| Mie Kotsu Group Holdings, Inc. |
30,000 | 130,761 | ||||||
| Mikuni Corp. |
11,600 | 32,046 | ||||||
| Milbon Co., Ltd. |
6,992 | 416,975 | ||||||
| MIMAKI ENGINEERING Co., Ltd. |
6,200 | 50,459 | ||||||
Dimensional World ex U.S. Core Equity 2 ETF
SCHEDULE OF INVESTMENTS
October 31, 2021
| Security Description |
Shares | Fair Value | ||||||
| JAPAN (Continued) |
||||||||
| *Mimasu Semiconductor Industry Co., Ltd. |
11,500 | $ | 251,028 | |||||
| MINEBEA MITSUMI, Inc. |
85,975 | 2,167,754 | ||||||
| Ministop Co., Ltd. |
9,400 | 114,342 | ||||||
| Minkabu The Infonoid, Inc. |
2,000 | 59,899 | ||||||
| Mirai Industry Co., Ltd. |
1,400 | 20,750 | ||||||
| Mirait Holdings Corp. |
35,190 | 673,710 | ||||||
| Miroku Jyoho Service Co., Ltd. |
6,800 | 106,927 | ||||||
| MISUMI Group, Inc. |
16,800 | 701,320 | ||||||
| Mitani Corp. |
14,800 | 228,701 | ||||||
| Mitani Sangyo Co., Ltd. |
12,500 | 41,767 | ||||||
| Mitani Sekisan Co., Ltd. |
1,200 | 76,089 | ||||||
| Mito Securities Co., Ltd. |
17,500 | 45,275 | ||||||
| Mitsuba Corp. |
26,700 | 148,691 | ||||||
| Mitsubishi Chemical Holdings Corp. |
445,200 | 3,680,684 | ||||||
| Mitsubishi Corp. |
82,300 | 2,607,039 | ||||||
| Mitsubishi Electric Corp. |
106,100 | 1,419,009 | ||||||
| Mitsubishi Estate Co., Ltd. |
41,500 | 628,915 | ||||||
| Mitsubishi Gas Chemical Co., Inc. |
44,400 | 892,867 | ||||||
| Mitsubishi Heavy Industries, Ltd. |
62,050 | 1,583,016 | ||||||
| Mitsubishi Kakoki Kaisha, Ltd. |
2,100 | 43,188 | ||||||
| Mitsubishi Logisnext Co., Ltd. |
17,600 | 161,144 | ||||||
| Mitsubishi Logistics Corp. |
14,000 | 390,441 | ||||||
| Mitsubishi Materials Corp. |
36,700 | 710,022 | ||||||
| Mitsubishi Motors Corp. |
159,700 | 508,407 | ||||||
| Mitsubishi Paper Mills, Ltd. |
14,500 | 45,652 | ||||||
| Mitsubishi Research Institute, Inc. |
1,500 | 55,777 | ||||||
| Mitsubishi Shokuhin Co., Ltd. |
5,100 | 130,827 | ||||||
| Mitsubishi Steel Manufacturing Co., Ltd. |
5,200 | 52,490 | ||||||
| Mitsubishi UFJ Financial Group, Inc. |
692,400 | 3,780,039 | ||||||
| #*Mitsubishi UFJ Financial Group, Inc. , Sponsored ADR |
248,988 | 1,371,924 | ||||||
| Mitsui Chemicals, Inc. |
48,397 | 1,434,614 | ||||||
| Mitsui DM Sugar Holdings Co., Ltd. |
6,700 | 118,870 | ||||||
| *Mitsui E&S Holdings Co., Ltd. |
46,500 | 235,711 | ||||||
| Mitsui Fudosan Co., Ltd. |
48,200 | 1,098,423 | ||||||
| Mitsui High-Tec, Inc. |
3,200 | 246,963 | ||||||
| Mitsui Matsushima Holdings Co., Ltd. |
5,600 | 72,538 | ||||||
| Mitsui Mining & Smelting Co., Ltd. |
37,600 | 1,074,992 | ||||||
| Mitsui OSK Lines, Ltd. |
33,482 | 2,102,443 | ||||||
| Mitsui-Soko Holdings Co., Ltd. |
14,000 | 280,061 | ||||||
| Miura Co., Ltd. |
1,000 | 38,281 | ||||||
| Miyaji Engineering Group, Inc. |
3,600 | 84,329 | ||||||
| Miyazaki Bank, Ltd. (The) |
6,200 | 111,576 | ||||||
| Miyoshi Oil & Fat Co., Ltd. |
3,300 | 38,578 | ||||||
| Mizuho Financial Group, Inc. |
149,635 | 1,975,011 | ||||||
| Mizuho Medy Co., Ltd. |
1,100 | 25,285 | ||||||
| Mizuno Corp. |
6,800 | 157,558 | ||||||
| *Mobile Factory, Inc. |
2,000 | 19,171 | ||||||
| Mochida Pharmaceutical Co., Ltd. |
3,200 | 92,892 | ||||||
| Modec, Inc. |
6,600 | 113,449 | ||||||
| Molitec Steel Co., Ltd. |
2,700 | 10,135 | ||||||
| Monex Group, Inc. |
83,300 | 539,140 | ||||||
| *Money Forward, Inc. |
900 | 60,934 | ||||||
| Monogatari Corp. (The) |
4,800 | 298,461 | ||||||
| MonotaRO Co., Ltd. |
43,200 | 977,470 | ||||||
| MORESCO Corp. |
3,400 | 35,722 | ||||||
| Morinaga & Co., Ltd. |
22,300 | 786,196 | ||||||
Dimensional World ex U.S. Core Equity 2 ETF
SCHEDULE OF INVESTMENTS
October 31, 2021
| Security Description |
Shares | Fair Value | ||||||
| JAPAN (Continued) |
||||||||
| Morinaga Milk Industry Co., Ltd. |
21,700 | $ | 1,271,265 | |||||
| Moriroku Holdings Co., Ltd. |
1,500 | 25,665 | ||||||
| Morita Holdings Corp. |
10,400 | 130,428 | ||||||
| *Morito Co., Ltd. |
7,000 | 41,868 | ||||||
| Morningstar Japan KK |
6,800 | 30,891 | ||||||
| Morozoff, Ltd. |
900 | 42,149 | ||||||
| Mory Industries, Inc. |
2,300 | 54,542 | ||||||
| MrMax Holdings, Ltd. |
14,600 | 76,057 | ||||||
| MS&AD Insurance Group Holdings, Inc. |
29,813 | 963,742 | ||||||
| MTG Co., Ltd. |
5,400 | 72,316 | ||||||
| MTI, Ltd. |
13,100 | 83,523 | ||||||
| Mugen Estate Co., Ltd. |
6,400 | 27,503 | ||||||
| m-up Holdings, Inc. |
800 | 27,257 | ||||||
| Murata Manufacturing Co., Ltd. |
57,639 | 4,374,043 | ||||||
| Musashi Seimitsu Industry Co., Ltd. |
35,700 | 668,132 | ||||||
| Musashino Bank, Ltd. (The) |
11,800 | 184,826 | ||||||
| Nabtesco Corp. |
33,200 | 1,074,396 | ||||||
| NAC Co., Ltd. |
8,800 | 75,633 | ||||||
| *Nachi-Fujikoshi Corp. |
10,700 | 403,977 | ||||||
| Nadex Co., Ltd. |
500 | 3,442 | ||||||
| Nafco Co., Ltd. |
4,300 | 64,938 | ||||||
| Nagano Bank, Ltd. (The) |
3,600 | 34,035 | ||||||
| Nagano Keiki Co., Ltd. |
4,800 | 55,104 | ||||||
| Nagase & Co., Ltd. |
40,400 | 680,980 | ||||||
| Nagatanien Holdings Co., Ltd. |
5,200 | 95,039 | ||||||
| Nagawa Co., Ltd. |
1,600 | 151,265 | ||||||
| Nagoya Railroad Co., Ltd. |
25,700 | 423,281 | ||||||
| Naigai Trans Line, Ltd. |
1,700 | 32,740 | ||||||
| Nakabayashi Co., Ltd. |
9,900 | 49,663 | ||||||
| Nakamoto Packs Co., Ltd. |
3,000 | 45,832 | ||||||
| Nakamuraya Co., Ltd. |
1,191 | 39,065 | ||||||
| Nakanishi, Inc. |
10,100 | 233,843 | ||||||
| Nakayama Steel Works, Ltd. |
9,500 | 35,992 | ||||||
| Nakayamafuku Co., Ltd. |
2,200 | 7,814 | ||||||
| Nankai Electric Railway Co., Ltd. |
16,100 | 318,399 | ||||||
| Nanto Bank, Ltd. (The) |
15,300 | 263,129 | ||||||
| Narasaki Sangyo Co., Ltd. |
1,200 | 21,927 | ||||||
| Natori Co., Ltd. |
3,500 | 59,395 | ||||||
| NEC Corp. |
43,200 | 2,204,990 | ||||||
| NEC Networks & System Integration Corp. |
14,700 | 235,793 | ||||||
| NEOJAPAN, Inc. |
500 | 5,753 | ||||||
| NET One Systems Co., Ltd. |
28,700 | 937,579 | ||||||
| Neturen Co., Ltd. |
14,800 | 78,916 | ||||||
| New Japan Chemical Co., Ltd. |
8,500 | 23,109 | ||||||
| Nexon Co., Ltd. |
14,400 | 243,862 | ||||||
| Nextage Co., Ltd. |
10,700 | 195,091 | ||||||
| NGK Insulators, Ltd. |
43,000 | 713,493 | ||||||
| NGK Spark Plug Co., Ltd. |
94,000 | 1,493,778 | ||||||
| NH Foods, Ltd. |
30,200 | 1,060,741 | ||||||
| NHK Spring Co., Ltd. |
89,700 | 674,176 | ||||||
| Nicca Chemical Co., Ltd. |
1,900 | 15,813 | ||||||
| Nice Corp. |
2,400 | 39,865 | ||||||
| Nichias Corp. |
38,800 | 946,989 | ||||||
| Nichiban Co., Ltd. |
2,500 | 40,539 | ||||||
| Nichicon Corp. |
25,400 | 239,465 | ||||||
Dimensional World ex U.S. Core Equity 2 ETF
SCHEDULE OF INVESTMENTS
October 31, 2021
| Security Description |
Shares | Fair Value | ||||||
| JAPAN (Continued) |
||||||||
| Nichiden Corp. |
5,800 | $ | 116,381 | |||||
| Nichiha Corp. |
13,700 | 392,888 | ||||||
| Nichi-iko Pharmaceutical Co., Ltd. |
23,600 | 178,617 | ||||||
| Nichimo Co., Ltd. |
700 | 11,726 | ||||||
| Nichirei Corp. |
48,100 | 1,172,708 | ||||||
| Nichirin Co., Ltd. |
5,330 | 85,074 | ||||||
| Nidec Corp. |
11,436 | 1,260,693 | ||||||
| Nidec Corp. , Sponsored ADR |
10,124 | 280,536 | ||||||
| Nifco, Inc. |
29,700 | 944,201 | ||||||
| Nihon Chouzai Co., Ltd. |
8,720 | 125,342 | ||||||
| Nihon Denkei Co., Ltd. |
2,400 | 39,234 | ||||||
| Nihon Flush Co., Ltd. |
4,600 | 43,529 | ||||||
| Nihon House Holdings Co., Ltd. |
21,800 | 73,033 | ||||||
| Nihon Kohden Corp. |
22,300 | 708,945 | ||||||
| Nihon M&A Center Holdings, Inc. |
53,400 | 1,632,089 | ||||||
| Nihon Nohyaku Co., Ltd. |
10,800 | 50,768 | ||||||
| Nihon Parkerizing Co., Ltd. |
16,700 | 165,792 | ||||||
| Nihon Plast Co., Ltd. |
7,300 | 40,141 | ||||||
| Nihon Tokushu Toryo Co., Ltd. |
5,200 | 45,467 | ||||||
| Nihon Unisys, Ltd. |
32,500 | 909,230 | ||||||
| *Nihon Yamamura Glass Co., Ltd. |
3,300 | 25,150 | ||||||
| *Niitaka Co., Ltd. |
2,200 | 43,566 | ||||||
| Nikkato Corp. |
3,000 | 20,759 | ||||||
| Nikkiso Co., Ltd. |
37,900 | 334,710 | ||||||
| Nikko Co., Ltd. |
4,700 | 27,246 | ||||||
| Nikkon Holdings Co., Ltd. |
23,900 | 464,690 | ||||||
| Nikon Corp. |
81,300 | 890,539 | ||||||
| Nintendo Co., Ltd. |
1,700 | 748,432 | ||||||
| Nippi, Inc. |
1,200 | 39,360 | ||||||
| Nippn Corp. |
20,800 | 297,521 | ||||||
| Nippo Corp. |
17,000 | 600,088 | ||||||
| Nippon Aqua Co., Ltd. |
4,000 | 20,276 | ||||||
| Nippon Carbide Industries Co., Inc. |
3,200 | 38,728 | ||||||
| Nippon Carbon Co., Ltd. |
5,900 | 227,411 | ||||||
| Nippon Chemical Industrial Co., Ltd. |
3,000 | 76,825 | ||||||
| *Nippon Chemi-Con Corp. |
7,800 | 145,842 | ||||||
| Nippon Chemiphar Co., Ltd. |
1,200 | 22,827 | ||||||
| Nippon Coke & Engineering Co., Ltd. |
81,900 | 109,176 | ||||||
| Nippon Commercial Development Co., Ltd. |
5,300 | 80,319 | ||||||
| Nippon Concept Corp. |
2,900 | 44,330 | ||||||
| Nippon Concrete Industries Co., Ltd. |
17,800 | 46,676 | ||||||
| Nippon Denko Co., Ltd. |
54,700 | 176,057 | ||||||
| Nippon Densetsu Kogyo Co., Ltd. |
14,800 | 227,792 | ||||||
| Nippon Dry-Chemical Co., Ltd. |
2,800 | 50,021 | ||||||
| Nippon Electric Glass Co., Ltd. |
34,400 | 875,499 | ||||||
| Nippon Express Co., Ltd. |
22,800 | 1,423,688 | ||||||
| *Nippon Filcon Co., Ltd./Tokyo |
5,200 | 24,945 | ||||||
| Nippon Gas Co., Ltd. |
66,200 | 818,029 | ||||||
| Nippon Kayaku Co., Ltd. |
37,300 | 392,218 | ||||||
| Nippon Kodoshi Corp. |
3,900 | 112,015 | ||||||
| Nippon Koei Co., Ltd. |
6,300 | 190,616 | ||||||
| Nippon Light Metal Holdings Co., Ltd. |
35,900 | 594,109 | ||||||
| Nippon Paint Holdings Co., Ltd. |
17,500 | 187,086 | ||||||
| Nippon Paper Industries Co., Ltd. |
64,400 | 657,979 | ||||||
| Nippon Parking Development Co., Ltd. |
90,100 | 113,786 | ||||||
| Nippon Pillar Packing Co., Ltd. |
10,000 | 242,929 | ||||||
Dimensional World ex U.S. Core Equity 2 ETF
SCHEDULE OF INVESTMENTS
October 31, 2021
| Security Description |
Shares | Fair Value | ||||||
| JAPAN (Continued) |
||||||||
| Nippon Piston Ring Co., Ltd. |
3,700 | $ | 43,060 | |||||
| Nippon Rietec Co., Ltd. |
700 | 9,724 | ||||||
| Nippon Road Co., Ltd. (The) |
3,100 | 223,749 | ||||||
| Nippon Sanso Holdings Corp. |
30,900 | 727,617 | ||||||
| Nippon Seisen Co., Ltd. |
1,400 | 57,461 | ||||||
| Nippon Sharyo, Ltd. |
4,700 | 86,560 | ||||||
| Nippon Sheet Glass Co., Ltd. |
17,300 | 96,343 | ||||||
| Nippon Shinyaku Co., Ltd. |
3,800 | 303,600 | ||||||
| Nippon Shokubai Co., Ltd. |
8,100 | 421,960 | ||||||
| Nippon Signal Co., Ltd. |
17,100 | 147,418 | ||||||
| Nippon Soda Co., Ltd. |
9,600 | 287,516 | ||||||
| Nippon Steel Corp. |
100,778 | 1,766,764 | ||||||
| Nippon Steel Trading Corp. |
6,152 | 277,319 | ||||||
| Nippon Suisan Kaisha, Ltd. |
210,700 | 1,195,553 | ||||||
| Nippon Systemware Co., Ltd. |
4,200 | 91,717 | ||||||
| Nippon Telegraph & Telephone Corp. |
68,100 | 1,903,993 | ||||||
| Nippon Thompson Co., Ltd. |
24,800 | 127,235 | ||||||
| Nippon Tungsten Co., Ltd. |
800 | 15,877 | ||||||
| Nippon Yakin Kogyo Co., Ltd. |
8,750 | 210,491 | ||||||
| Nippon Yusen KK |
44,900 | 3,221,066 | ||||||
| Nipro Corp. |
85,300 | 864,782 | ||||||
| Nishimatsu Construction Co., Ltd. |
21,100 | 607,880 | ||||||
| Nishi-Nippon Financial Holdings, Inc. |
53,800 | 313,765 | ||||||
| Nishi-Nippon Railroad Co., Ltd. |
14,100 | 345,869 | ||||||
| Nishio Rent All Co., Ltd. |
12,300 | 303,010 | ||||||
| Nissan Chemical Corp. |
20,700 | 1,149,143 | ||||||
| *Nissan Motor Co., Ltd. |
215,700 | 1,092,262 | ||||||
| Nissan Tokyo Sales Holdings Co., Ltd. |
12,100 | 26,423 | ||||||
| Nissei ASB Machine Co., Ltd. |
3,800 | 123,473 | ||||||
| Nissei Plastic Industrial Co., Ltd. |
5,800 | 55,291 | ||||||
| Nissha Co., Ltd. |
26,400 | 429,948 | ||||||
| Nisshin Oillio Group, Ltd. (The) |
8,000 | 211,883 | ||||||
| Nisshin Seifun Group, Inc. |
17,830 | 281,308 | ||||||
| Nisshinbo Holdings, Inc. |
60,055 | 462,427 | ||||||
| Nissin Corp. |
6,100 | 86,505 | ||||||
| Nissin Electric Co., Ltd. |
12,200 | 150,434 | ||||||
| Nissin Foods Holdings Co., Ltd. |
2,900 | 221,522 | ||||||
| Nisso Corp. |
1,400 | 8,816 | ||||||
| Nitori Holdings Co., Ltd. |
4,500 | 823,043 | ||||||
| Nitta Gelatin, Inc. |
6,300 | 34,311 | ||||||
| Nittan Valve Co., Ltd. |
9,600 | 30,562 | ||||||
| Nitto Boseki Co., Ltd. |
1,700 | 54,343 | ||||||
| Nitto Denko Corp. |
24,000 | 1,869,064 | ||||||
| Nitto Fuji Flour Milling Co., Ltd. |
1,400 | 40,763 | ||||||
| Nitto Kogyo Corp. |
14,200 | 210,463 | ||||||
| Nitto Seiko Co., Ltd. |
11,900 | 68,358 | ||||||
| Nittoc Construction Co., Ltd. |
12,900 | 79,193 | ||||||
| Noevir Holdings Co., Ltd. |
5,300 | 258,435 | ||||||
| NOF Corp. |
13,200 | 661,013 | ||||||
| Nohmi Bosai, Ltd. |
6,400 | 116,802 | ||||||
| Nojima Corp. |
19,800 | 432,900 | ||||||
| NOK Corp. |
25,900 | 298,466 | ||||||
| Nomura Co., Ltd. |
27,900 | 274,045 | ||||||
| Nomura Holdings, Inc. |
149,100 | 719,184 | ||||||
| *Nomura Holdings, Inc. , Sponsored ADR |
102,675 | 473,332 | ||||||
Dimensional World ex U.S. Core Equity 2 ETF
SCHEDULE OF INVESTMENTS
October 31, 2021
| Security Description |
Shares | Fair Value | ||||||
| JAPAN (Continued) |
||||||||
| Nomura Micro Science Co., Ltd. |
600 | $ | 25,652 | |||||
| Nomura Real Estate Holdings, Inc. |
45,000 | 1,092,787 | ||||||
| Nomura Research Institute, Ltd. |
15,079 | 600,383 | ||||||
| Noritake Co., Ltd. |
3,800 | 165,464 | ||||||
| Noritsu Koki Co., Ltd. |
7,300 | 151,218 | ||||||
| Noritz Corp. |
14,100 | 225,551 | ||||||
| North Pacific Bank, Ltd. |
113,000 | 233,879 | ||||||
| Nozawa Corp. |
3,700 | 22,585 | ||||||
| NS Solutions Corp. |
11,300 | 378,566 | ||||||
| NS Tool Co., Ltd. |
3,200 | 42,770 | ||||||
| NS United Kaiun Kaisha, Ltd. |
5,700 | 178,711 | ||||||
| NSD Co., Ltd. |
20,260 | 384,678 | ||||||
| NSK, Ltd. |
100,900 | 676,944 | ||||||
| NTN Corp. |
248,100 | 535,256 | ||||||
| NTT Data Corp. |
79,600 | 1,593,745 | ||||||
| Oat Agrio Co., Ltd. |
1,400 | 26,042 | ||||||
| Obara Group, Inc. |
6,000 | 191,800 | ||||||
| Obayashi Corp. |
178,600 | 1,500,538 | ||||||
| OBIC Business Consultants Co., Ltd. |
700 | 34,440 | ||||||
| Obic Co., Ltd. |
300 | 55,225 | ||||||
| Odakyu Electric Railway Co., Ltd. |
30,400 | 656,656 | ||||||
| Oenon Holdings, Inc. |
26,500 | 87,617 | ||||||
| Ogaki Kyoritsu Bank, Ltd. (The) |
15,000 | 248,893 | ||||||
| Ohara, Inc. |
3,000 | 36,439 | ||||||
| *Ohba Co., Ltd. |
4,400 | 31,333 | ||||||
| Ohki Healthcare Holdings Co., Ltd. |
1,000 | 7,946 | ||||||
| Ohsho Food Service Corp. |
3,500 | 183,249 | ||||||
| Oiles Corp. |
9,184 | 136,038 | ||||||
| *Oisix ra daichi, Inc. |
2,600 | 108,538 | ||||||
| Oita Bank, Ltd. (The) |
13,100 | 208,290 | ||||||
| Oji Holdings Corp. |
256,300 | 1,267,733 | ||||||
| Okabe Co., Ltd. |
17,100 | 102,428 | ||||||
| Okada Aiyon Corp. |
1,200 | 13,702 | ||||||
| Okamoto Industries, Inc. |
2,700 | 94,479 | ||||||
| Okamoto Machine Tool Works, Ltd. |
2,400 | 100,294 | ||||||
| Okamura Corp. |
25,300 | 332,378 | ||||||
| Okasan Securities Group, Inc. |
80,400 | 274,287 | ||||||
| Oki Electric Industry Co., Ltd. |
64,800 | 531,357 | ||||||
| Okinawa Cellular Telephone Co. |
5,100 | 229,450 | ||||||
| Okinawa Electric Power Co., Inc. (The) |
13,485 | 165,332 | ||||||
| Okinawa Financial Group, Inc. |
9,280 | 203,546 | ||||||
| OKUMA Corp. |
9,300 | 442,061 | ||||||
| Okumura Corp. |
7,700 | 198,535 | ||||||
| Okura Industrial Co., Ltd. |
4,700 | 86,642 | ||||||
| Okuwa Co., Ltd. |
15,500 | 148,441 | ||||||
| Olba Healthcare Holdings, Inc. |
1,400 | 19,878 | ||||||
| Olympic Group Corp. |
4,500 | 28,296 | ||||||
| Olympus Corp. |
111,400 | 2,403,856 | ||||||
| Omron Corp. |
5,100 | 486,183 | ||||||
| Ono Pharmaceutical Co., Ltd. |
8,000 | 167,367 | ||||||
| ONO Sokki Co., Ltd. |
2,500 | 11,423 | ||||||
| Onoken Co., Ltd. |
7,000 | 103,135 | ||||||
| Onward Holdings Co., Ltd. |
42,600 | 125,904 | ||||||
| Open House Co., Ltd. |
22,200 | 1,405,692 | ||||||
| Optex Group Co., Ltd. |
10,200 | 129,351 | ||||||
| #*Optim Corp. |
1,400 | 21,916 | ||||||
Dimensional World ex U.S. Core Equity 2 ETF
SCHEDULE OF INVESTMENTS
October 31, 2021
| Security Description |
Shares | Fair Value | ||||||
| JAPAN (Continued) |
||||||||
| Optorun Co., Ltd. |
2,900 | $ | 58,521 | |||||
| Oracle Corp. Japan |
3,000 | 282,833 | ||||||
| Organo Corp. |
3,300 | 208,954 | ||||||
| Oricon, Inc. |
1,300 | 11,435 | ||||||
| Oriental Land Co., Ltd./Japan |
4,100 | 645,069 | ||||||
| Oriental Shiraishi Corp. |
35,100 | 82,806 | ||||||
| Origin Co., Ltd. |
2,000 | 22,539 | ||||||
| Oro Co., Ltd. |
1,300 | 42,868 | ||||||
| Osaka Gas Co., Ltd. |
25,600 | 412,204 | ||||||
| *Osaka Organic Chemical Industry, Ltd. |
7,300 | 217,992 | ||||||
| Osaka Soda Co., Ltd. |
7,400 | 187,426 | ||||||
| OSAKA Titanium Technologies Co., Ltd. |
5,100 | 34,977 | ||||||
| Osaki Electric Co., Ltd. |
15,500 | 76,260 | ||||||
| *OSG Corp. |
38,200 | 634,517 | ||||||
| Otsuka Corp. |
10,100 | 496,032 | ||||||
| Otsuka Holdings Co., Ltd. |
15,400 | 606,951 | ||||||
| OUG Holdings, Inc. |
1,000 | 24,442 | ||||||
| Outsourcing, Inc. |
48,800 | 931,276 | ||||||
| Ozu Corp. |
800 | 13,471 | ||||||
| Pacific Industrial Co., Ltd. |
28,700 | 291,216 | ||||||
| Pack Corp. (The) |
4,100 | 108,770 | ||||||
| PAL GROUP Holdings Co., Ltd. |
14,400 | 207,744 | ||||||
| PALTAC Corp. |
7,650 | 338,136 | ||||||
| Pan Pacific International Holdings Corp. |
27,800 | 581,722 | ||||||
| Panasonic Corp. |
421,344 | 5,145,552 | ||||||
| PAPYLESS Co., Ltd. |
2,400 | 28,962 | ||||||
| Paramount Bed Holdings Co., Ltd. |
11,700 | 217,839 | ||||||
| Park24 Co., Ltd. |
31,800 | 485,541 | ||||||
| Pasco Corp. |
2,400 | 31,888 | ||||||
| Pasona Group, Inc. |
11,300 | 314,646 | ||||||
| PC Depot Corp. |
6,220 | 24,984 | ||||||
| PCI Holdings, Inc. |
1,000 | 9,252 | ||||||
| Pegasus Sewing Machine Manufacturing Co., Ltd. |
8,500 | 34,142 | ||||||
| Penta-Ocean Construction Co., Ltd. |
205,800 | 1,413,211 | ||||||
| People Dreams & Technologies Group Co., Ltd. |
3,800 | 65,219 | ||||||
| *PeptiDream, Inc. |
11,000 | 265,582 | ||||||
| Persol Holdings Co., Ltd. |
27,000 | 722,210 | ||||||
| Pickles Corp. |
4,800 | 75,478 | ||||||
| Pigeon Corp. |
21,400 | 494,907 | ||||||
| Pilot Corp. |
13,100 | 479,079 | ||||||
| Plenus Co., Ltd. |
2,400 | 40,770 | ||||||
| Pola Orbis Holdings, Inc. |
8,500 | 181,144 | ||||||
| Poletowin Pitcrew Holdings, Inc. |
19,800 | 177,987 | ||||||
| *Premium Water Holdings, Inc. |
700 | 19,307 | ||||||
| Press Kogyo Co., Ltd. |
46,100 | 133,822 | ||||||
| #Pressance Corp. |
13,500 | 222,820 | ||||||
| Prestige International, Inc. |
33,200 | 226,526 | ||||||
| Prima Meat Packers, Ltd. |
21,800 | 510,849 | ||||||
| Pronexus, Inc. |
6,500 | 60,425 | ||||||
| *Prored Partners Co., Ltd. |
1,200 | 13,818 | ||||||
| Pro-Ship, Inc. |
1,200 | 17,175 | ||||||
| Proto Corp. |
12,200 | 150,541 | ||||||
| PS Mitsubishi Construction Co., Ltd. |
19,300 | 112,051 | ||||||
| Punch Industry Co., Ltd. |
11,100 | 56,559 | ||||||
| *QB Net Holdings Co., Ltd. |
2,800 | 46,902 | ||||||
Dimensional World ex U.S. Core Equity 2 ETF
SCHEDULE OF INVESTMENTS
October 31, 2021
| Security Description |
Shares | Fair Value | ||||||
| JAPAN (Continued) |
||||||||
| Qol Holdings Co., Ltd. |
15,600 | $ | 230,665 | |||||
| Quick Co., Ltd. |
5,300 | 66,700 | ||||||
| Raccoon Holdings, Inc. |
3,200 | 44,622 | ||||||
| Raito Kogyo Co., Ltd. |
20,500 | 363,346 | ||||||
| Raiznext Corp. |
9,100 | 98,163 | ||||||
| Rakus Co., Ltd. |
26,500 | 835,497 | ||||||
| Rakuten, Inc. |
42,800 | 469,195 | ||||||
| RareJob, Inc. |
800 | 8,721 | ||||||
| Rasa Corp. |
2,600 | 21,548 | ||||||
| Rasa Industries, Ltd. |
4,600 | 75,077 | ||||||
| Raysum Co., Ltd. |
4,300 | 27,152 | ||||||
| Recruit Holdings Co., Ltd. |
107,400 | 7,132,057 | ||||||
| Relia, Inc. |
12,300 | 125,778 | ||||||
| Relo Group, Inc. |
27,900 | 576,718 | ||||||
| *Renesas Electronics Corp. |
103,300 | 1,270,130 | ||||||
| Rengo Co., Ltd. |
99,000 | 749,283 | ||||||
| *RENOVA, Inc. |
9,100 | 399,035 | ||||||
| Resona Holdings, Inc. |
325,583 | 1,222,096 | ||||||
| Resorttrust, Inc. |
36,800 | 650,314 | ||||||
| Restar Holdings Corp. |
7,700 | 128,305 | ||||||
| Retail Partners Co., Ltd. |
7,700 | 80,360 | ||||||
| Rheon Automatic Machinery Co., Ltd. |
1,200 | 14,228 | ||||||
| *Riberesute Corp. |
3,100 | 22,647 | ||||||
| Ride On Express Holdings Co., Ltd. |
4,800 | 59,818 | ||||||
| Right On Co., Ltd. |
7,700 | 48,148 | ||||||
| Riken Corp. |
3,400 | 80,032 | ||||||
| Riken Keiki Co., Ltd. |
2,500 | 69,173 | ||||||
| Riken Technos Corp. |
17,100 | 82,032 | ||||||
| Riken Vitamin Co., Ltd. |
4,800 | 78,593 | ||||||
| Rinnai Corp. |
1,400 | 143,162 | ||||||
| Rion Co., Ltd. |
500 | 10,853 | ||||||
| Riso Kagaku Corp. |
7,360 | 154,784 | ||||||
| *Riso Kyoiku Co., Ltd. |
54,700 | 228,346 | ||||||
| Rock Field Co., Ltd. |
2,300 | 33,887 | ||||||
| Rohm Co., Ltd. |
7,900 | 719,158 | ||||||
| Rohto Pharmaceutical Co., Ltd. |
31,000 | 944,749 | ||||||
| Rokko Butter Co., Ltd. |
7,500 | 109,581 | ||||||
| Roland Corp. |
1,000 | 40,868 | ||||||
| Roland DG Corp. |
8,000 | 209,498 | ||||||
| Rorze Corp. |
4,500 | 429,380 | ||||||
| RS Technologies Co., Ltd. |
2,100 | 113,633 | ||||||
| Ryobi, Ltd. |
13,700 | 143,218 | ||||||
| Ryoden Corp. |
6,900 | 108,802 | ||||||
| Ryohin Keikaku Co., Ltd. |
44,600 | 875,376 | ||||||
| Ryosan Co., Ltd. |
8,200 | 168,423 | ||||||
| S Foods, Inc. |
6,500 | 187,547 | ||||||
| S LINE Co., Ltd. |
1,300 | 10,763 | ||||||
| S&B Foods, Inc. |
1,100 | 42,784 | ||||||
| Sac’s Bar Holdings, Inc. |
9,350 | 45,182 | ||||||
| Sagami Rubber Industries Co., Ltd. |
2,000 | 18,487 | ||||||
| Saibu Gas Holdings Co., Ltd. |
10,200 | 207,891 | ||||||
| Saizeriya Co., Ltd. |
7,200 | 193,852 | ||||||
| Sakai Chemical Industry Co., Ltd. |
6,400 | 118,935 | ||||||
| Sakai Heavy Industries, Ltd. |
1,600 | 35,220 | ||||||
| Sakai Moving Service Co., Ltd. |
5,700 | 234,199 | ||||||
| Sakata INX Corp. |
16,700 | 160,812 | ||||||
Dimensional World ex U.S. Core Equity 2 ETF
SCHEDULE OF INVESTMENTS
October 31, 2021
| Security Description |
Shares | Fair Value | ||||||
| JAPAN (Continued) |
||||||||
| Sakura Internet, Inc. |
9,600 | $ | 49,421 | |||||
| *Sala Corp. |
30,200 | 164,475 | ||||||
| SAMTY Co., Ltd. |
11,800 | 261,509 | ||||||
| San Holdings, Inc. |
3,200 | 41,843 | ||||||
| San ju San Financial Group, Inc. |
7,990 | 97,681 | ||||||
| San-A Co., Ltd. |
5,500 | 197,522 | ||||||
| San-Ai Oil Co., Ltd. |
27,500 | 356,457 | ||||||
| Sanei Architecture Planning Co., Ltd. |
6,800 | 105,973 | ||||||
| Sangetsu Corp. |
12,100 | 166,073 | ||||||
| San-In Godo Bank, Ltd. (The) |
74,400 | 363,436 | ||||||
| *Sanix, Inc. |
10,700 | 31,624 | ||||||
| Sanken Electric Co., Ltd. |
17,800 | 931,954 | ||||||
| Sanki Engineering Co., Ltd. |
25,100 | 315,662 | ||||||
| *Sanko Gosei, Ltd. |
14,000 | 50,340 | ||||||
| Sanko Metal Industrial Co., Ltd. |
1,200 | 26,447 | ||||||
| Sankyo Co., Ltd. |
16,700 | 404,081 | ||||||
| Sankyo Frontier Co., Ltd. |
1,500 | 71,958 | ||||||
| Sankyo Tateyama, Inc. |
9,600 | 62,470 | ||||||
| Sankyu, Inc. |
24,900 | 1,120,254 | ||||||
| Sanoh Industrial Co., Ltd. |
12,800 | 112,930 | ||||||
| Sanoyas Holdings Corp. |
8,700 | 10,377 | ||||||
| *Sansan, Inc. |
1,500 | 172,988 | ||||||
| Sansei Technologies, Inc. |
1,000 | 7,060 | ||||||
| Sansha Electric Manufacturing Co., Ltd. |
5,100 | 48,618 | ||||||
| Sanshin Electronics Co., Ltd. |
4,300 | 61,544 | ||||||
| Santen Pharmaceutical Co., Ltd. |
31,300 | 439,476 | ||||||
| Sanwa Holdings Corp. |
84,300 | 978,848 | ||||||
| Sanyo Chemical Industries, Ltd. |
6,400 | 316,001 | ||||||
| Sanyo Denki Co., Ltd. |
1,700 | 97,207 | ||||||
| Sanyo Electric Railway Co., Ltd. |
4,400 | 77,253 | ||||||
| Sanyo Special Steel Co., Ltd. |
10,100 | 165,905 | ||||||
| Sanyo Trading Co., Ltd. |
12,800 | 122,471 | ||||||
| Sapporo Holdings, Ltd. |
36,000 | 779,829 | ||||||
| Sato Holdings Corp. |
14,900 | 342,102 | ||||||
| Sato Shoji Corp. |
4,800 | 50,221 | ||||||
| *Satori Electric Co., Ltd. |
7,500 | 66,235 | ||||||
| Sawada Holdings Co., Ltd. |
8,500 | 77,825 | ||||||
| Sawai Group Holdings Co., Ltd. |
26,900 | 1,184,284 | ||||||
| Saxa Holdings, Inc. |
2,300 | 28,986 | ||||||
| SB Technology Corp. |
5,200 | 142,513 | ||||||
| SBI Holdings, Inc. |
39,030 | 1,007,027 | ||||||
| *SBI Insurance Group Co., Ltd. |
1,600 | 17,821 | ||||||
| SBS Holdings, Inc. |
14,000 | 495,418 | ||||||
| Scala, Inc. |
5,700 | 34,542 | ||||||
| SCREEN Holdings Co., Ltd. |
5,100 | 472,765 | ||||||
| Scroll Corp. |
16,300 | 123,367 | ||||||
| SCSK Corp. |
18,300 | 369,130 | ||||||
| SEC Carbon, Ltd. |
600 | 30,572 | ||||||
| Secom Co., Ltd. |
5,700 | 386,865 | ||||||
| Seed Co., Ltd./Tokyo |
9,000 | 48,700 | ||||||
| Sega Sammy Holdings, Inc. |
30,900 | 437,383 | ||||||
| Segue Group Co., Ltd. |
1,700 | 11,033 | ||||||
| Seibu Holdings, Inc. |
56,500 | 615,418 | ||||||
| Seika Corp. |
4,300 | 61,733 | ||||||
| Seikitokyu Kogyo Co., Ltd. |
20,100 | 143,666 | ||||||
Dimensional World ex U.S. Core Equity 2 ETF
SCHEDULE OF INVESTMENTS
October 31, 2021
| Security Description |
Shares | Fair Value | ||||||
| JAPAN (Continued) |
||||||||
| Seiko Epson Corp. |
80,000 | $ | 1,421,443 | |||||
| Seiko Holdings Corp. |
12,500 | 263,210 | ||||||
| Seiko PMC Corp. |
2,100 | 14,328 | ||||||
| Seino Holdings Co., Ltd. |
39,300 | 474,599 | ||||||
| Seiren Co., Ltd. |
23,100 | 464,735 | ||||||
| Sekisui Chemical Co., Ltd. |
101,500 | 1,660,140 | ||||||
| Sekisui House, Ltd. |
26,700 | 552,967 | ||||||
| Sekisui Jushi Corp. |
5,600 | 103,970 | ||||||
| Sekisui Kasei Co., Ltd. |
11,000 | 54,795 | ||||||
| SEMITEC Corp. |
900 | 92,585 | ||||||
| Senko Group Holdings Co., Ltd. |
64,400 | 570,436 | ||||||
| Senshu Electric Co., Ltd. |
3,900 | 162,977 | ||||||
| Senshu Ikeda Holdings, Inc. |
88,240 | 123,818 | ||||||
| Septeni Holdings Co., Ltd. |
11,400 | 48,089 | ||||||
| #SERAKU Co., Ltd. |
1,300 | 24,033 | ||||||
| Seria Co., Ltd. |
14,500 | 478,141 | ||||||
| Seven & i Holdings Co., Ltd. |
117,900 | 4,944,510 | ||||||
| Seven Bank, Ltd. |
385,300 | 814,359 | ||||||
| SG Holdings Co., Ltd. |
9,000 | 224,951 | ||||||
| Sharp Corp./Japan |
27,500 | 323,416 | ||||||
| Shibaura Electronics Co., Ltd. |
4,300 | 247,761 | ||||||
| Shibaura Machine Co., Ltd. |
11,900 | 276,980 | ||||||
| Shibaura Mechatronics Corp. |
1,700 | 108,985 | ||||||
| Shibusawa Warehouse Co., Ltd. (The) |
3,000 | 58,198 | ||||||
| Shibuya Corp. |
6,800 | 178,908 | ||||||
| *Shidax Corp. |
4,300 | 16,555 | ||||||
| *SHIFT, Inc. |
1,200 | 275,203 | ||||||
| Shiga Bank, Ltd. (The) |
18,000 | 290,305 | ||||||
| Shikibo, Ltd. |
5,500 | 44,762 | ||||||
| Shikoku Bank, Ltd. (The) |
13,300 | 87,481 | ||||||
| Shikoku Electric Power Co, Inc. |
43,200 | 281,117 | ||||||
| Shima Seiki Manufacturing, Ltd. |
13,000 | 248,884 | ||||||
| Shimadzu Corp. |
17,600 | 712,335 | ||||||
| Shimano, Inc. |
1,300 | 360,044 | ||||||
| Shimizu Bank, Ltd. (The) |
13,500 | 182,328 | ||||||
| Shimizu Corp. |
142,700 | 1,042,483 | ||||||
| Shimojima Co., Ltd. |
2,800 | 27,748 | ||||||
| Shin Nippon Air Technologies Co., Ltd. |
6,300 | 134,923 | ||||||
| Shin Nippon Biomedical Laboratories, Ltd. |
1,100 | 13,863 | ||||||
| Shinagawa Refractories Co., Ltd. |
2,700 | 91,993 | ||||||
| Shindengen Electric Manufacturing Co., Ltd. |
3,100 | 109,836 | ||||||
| Shin-Etsu Chemical Co., Ltd. |
19,300 | 3,428,384 | ||||||
| Shin-Etsu Polymer Co., Ltd. |
26,300 | 236,879 | ||||||
| Shinko Electric Industries Co., Ltd. |
17,200 | 687,849 | ||||||
| Shinko Shoji Co., Ltd. |
14,200 | 113,575 | ||||||
| Shinmaywa Industries, Ltd. |
41,000 | 334,400 | ||||||
| Shin-Nihon Tatemono Co., Ltd. |
2,800 | 10,240 | ||||||
| #Shinnihonseiyaku Co., Ltd. |
3,700 | 54,709 | ||||||
| Shinoken Group Co., Ltd. |
20,000 | 197,501 | ||||||
| Shinsei Bank, Ltd. |
40,500 | 669,524 | ||||||
| Shinsho Corp. |
2,400 | 73,142 | ||||||
| Shinwa Co., Ltd. |
500 | 9,713 | ||||||
| Shinwa Co., Ltd./Gifu |
2,000 | 12,769 | ||||||
| Shionogi & Co., Ltd. |
10,200 | 662,586 | ||||||
| Ship Healthcare Holdings, Inc. |
38,100 | 998,068 | ||||||
| Shiseido Co., Ltd. |
30,600 | 2,032,844 | ||||||
Dimensional World ex U.S. Core Equity 2 ETF
SCHEDULE OF INVESTMENTS
October 31, 2021
| Security Description |
Shares | Fair Value | ||||||
| JAPAN (Continued) |
||||||||
| Shizuki Electric Co., Inc. |
4,900 | $ | 27,932 | |||||
| Shizuoka Bank, Ltd. (The) |
135,900 | 1,092,921 | ||||||
| Shizuoka Gas Co., Ltd. |
27,900 | 293,620 | ||||||
| SHO-BOND Holdings Co., Ltd. |
3,600 | 150,283 | ||||||
| Shoei Co., Ltd. |
9,300 | 411,883 | ||||||
| Shoei Foods Corp. |
4,400 | 151,265 | ||||||
| Shofu, Inc. |
3,400 | 70,221 | ||||||
| Showa Denko KK |
53,700 | 1,347,386 | ||||||
| Showa Sangyo Co., Ltd. |
8,200 | 203,733 | ||||||
| Showa Shinku Co., Ltd. |
800 | 10,819 | ||||||
| SIGMAXYZ Holdings, Inc. |
2,500 | 60,075 | ||||||
| Siix Corp. |
19,100 | 210,891 | ||||||
| #*Silver Life Co., Ltd. |
1,400 | 17,717 | ||||||
| Sinanen Holdings Co., Ltd. |
3,600 | 110,186 | ||||||
| Sinfonia Technology Co., Ltd. |
13,400 | 153,949 | ||||||
| Sinko Industries, Ltd. |
8,600 | 155,369 | ||||||
| SK-Electronics Co., Ltd. |
5,300 | 42,670 | ||||||
| SKY Perfect JSAT Holdings, Inc. |
85,500 | 320,180 | ||||||
| Skylark Holdings Co., Ltd. |
73,400 | 993,258 | ||||||
| SMC Corp. |
500 | 297,917 | ||||||
| SMK Corp. |
2,800 | 57,191 | ||||||
| SMS Co., Ltd. |
21,600 | 837,290 | ||||||
| Snow Peak, Inc. |
1,400 | 73,668 | ||||||
| Soda Nikka Co., Ltd. |
9,000 | 50,436 | ||||||
| Sodick Co., Ltd. |
16,700 | 128,152 | ||||||
| SoftBank Corp. |
81,000 | 1,104,271 | ||||||
| SoftBank Group Corp. |
311,092 | 16,817,111 | ||||||
| Softcreate Holdings Corp. |
4,200 | 145,126 | ||||||
| Software Service, Inc. |
600 | 37,834 | ||||||
| Sohgo Security Services Co., Ltd. |
10,100 | 430,485 | ||||||
| Sojitz Corp. |
70,200 | 1,154,352 | ||||||
| Soken Chemical & Engineering Co., Ltd. |
4,100 | 63,644 | ||||||
| Solasto Corp. |
16,300 | 196,701 | ||||||
| Soliton Systems KK |
3,000 | 37,360 | ||||||
| Solxyz Co., Ltd. |
5,400 | 25,194 | ||||||
| Sompo Holdings, Inc. |
25,875 | 1,122,820 | ||||||
| *Sony Group Corp. , ADR |
41,118 | 4,761,053 | ||||||
| Sony Group Corp. |
92,700 | 10,682,552 | ||||||
| *Sotetsu Holdings, Inc. |
15,600 | 300,713 | ||||||
| Space Co., Ltd. |
2,820 | 23,371 | ||||||
| #Space Value Holdings Co., Ltd. |
17,900 | 126,999 | ||||||
| Sparx Group Co., Ltd. |
54,700 | 141,517 | ||||||
| SPK Corp. |
2,400 | 29,657 | ||||||
| S-Pool, Inc. |
10,800 | 120,479 | ||||||
| Square Enix Holdings Co., Ltd. |
7,200 | 393,387 | ||||||
| SRA Holdings |
5,600 | 142,572 | ||||||
| St Marc Holdings Co., Ltd. |
8,000 | 107,345 | ||||||
| Stanley Electric Co., Ltd. |
39,400 | 990,313 | ||||||
| Star Mica Holdings Co., Ltd. |
3,100 | 40,944 | ||||||
| Star Micronics Co., Ltd. |
22,000 | 287,674 | ||||||
| Starts Corp., Inc. |
21,200 | 508,131 | ||||||
| Starzen Co., Ltd. |
5,000 | 93,971 | ||||||
| St-Care Holding Corp. |
6,100 | 48,415 | ||||||
| Stella Chemifa Corp. |
6,300 | 157,963 | ||||||
| Step Co., Ltd. |
1,700 | 26,434 | ||||||
Dimensional World ex U.S. Core Equity 2 ETF
SCHEDULE OF INVESTMENTS
October 31, 2021
| Security Description |
Shares | Fair Value | ||||||
| JAPAN (Continued) |
||||||||
| Strike Co., Ltd. |
3,700 | $ | 139,531 | |||||
| Studio Alice Co., Ltd. |
6,500 | 122,732 | ||||||
| Subaru Corp. |
90,700 | 1,772,239 | ||||||
| Sugi Holdings Co., Ltd. |
10,400 | 744,258 | ||||||
| Sugimoto & Co., Ltd. |
4,100 | 86,189 | ||||||
| SUMCO Corp. |
76,200 | 1,446,146 | ||||||
| Sumida Corp. |
16,700 | 192,154 | ||||||
| *Suminoe Textile Co., Ltd. |
2,900 | 45,042 | ||||||
| Sumitomo Bakelite Co., Ltd. |
10,800 | 483,999 | ||||||
| Sumitomo Chemical Co., Ltd. |
412,855 | 2,027,615 | ||||||
| Sumitomo Corp. |
67,900 | 962,897 | ||||||
| Sumitomo Dainippon Pharma Co., Ltd. |
18,300 | 257,909 | ||||||
| Sumitomo Densetsu Co., Ltd. |
8,200 | 157,132 | ||||||
| Sumitomo Electric Industries, Ltd. |
156,400 | 2,066,359 | ||||||
| Sumitomo Forestry Co., Ltd. |
86,100 | 1,638,562 | ||||||
| Sumitomo Heavy Industries, Ltd. |
44,900 | 1,153,756 | ||||||
| Sumitomo Metal Mining Co., Ltd. |
34,800 | 1,349,883 | ||||||
| Sumitomo Mitsui Construction Co., Ltd. |
150,420 | 637,166 | ||||||
| Sumitomo Mitsui Financial Group, Inc. |
86,283 | 2,815,690 | ||||||
| #*Sumitomo Mitsui Financial Group, Inc. , Sponsored ADR |
5,000 | 32,400 | ||||||
| Sumitomo Mitsui Trust Holdings, Inc. |
47,244 | 1,555,396 | ||||||
| Sumitomo Osaka Cement Co., Ltd. |
16,800 | 470,002 | ||||||
| Sumitomo Precision Products Co., Ltd. |
1,200 | 24,531 | ||||||
| Sumitomo Realty & Development Co., Ltd. |
24,100 | 868,678 | ||||||
| Sumitomo Riko Co., Ltd. |
24,400 | 158,351 | ||||||
| Sumitomo Rubber Industries, Ltd. |
104,333 | 1,281,917 | ||||||
| Sumitomo Seika Chemicals Co., Ltd. |
5,300 | 150,831 | ||||||
| Sun Frontier Fudousan Co., Ltd. |
23,300 | 217,419 | ||||||
| Suncall Corp. |
8,000 | 32,554 | ||||||
| Sundrug Co., Ltd. |
21,400 | 625,907 | ||||||
| Suntory Beverage & Food, Ltd. |
25,400 | 983,477 | ||||||
| Sun-Wa Technos Corp. |
5,200 | 70,093 | ||||||
| *SuRaLa Net Co., Ltd. |
1,300 | 23,646 | ||||||
| Suruga Bank, Ltd. |
52,700 | 193,191 | ||||||
| Sushiro Global Holdings, Ltd. |
11,200 | 483,754 | ||||||
| Suzuken Co., Ltd. |
20,060 | 555,927 | ||||||
| #Suzuki Co., Ltd. |
7,500 | 59,198 | ||||||
| Suzuki Motor Corp. |
28,100 | 1,250,669 | ||||||
| SWCC Showa Holdings Co., Ltd. |
50,700 | 984,876 | ||||||
| Sysmex Corp. |
15,200 | 1,875,589 | ||||||
| System Information Co., Ltd. |
2,300 | 18,920 | ||||||
| System Research Co., Ltd. |
2,400 | 42,307 | ||||||
| System Support, Inc. |
1,000 | 12,059 | ||||||
| Systena Corp. |
32,700 | 601,089 | ||||||
| Syuppin Co., Ltd. |
9,000 | 99,215 | ||||||
| T Hasegawa Co., Ltd. |
8,200 | 199,490 | ||||||
| T RAD Co., Ltd. |
3,900 | 108,937 | ||||||
| T&D Holdings, Inc. |
73,000 | 935,988 | ||||||
| T&K Toka Co., Ltd. |
6,900 | 48,955 | ||||||
| Tachibana Eletech Co., Ltd. |
6,120 | 82,495 | ||||||
| Tachi-S Co., Ltd. |
11,000 | 132,550 | ||||||
| Tadano, Ltd. |
37,100 | 403,781 | ||||||
| Taihei Dengyo Kaisha, Ltd. |
7,300 | 171,961 | ||||||
| Taiheiyo Cement Corp. |
59,722 | 1,262,791 | ||||||
| Taiheiyo Kouhatsu, Inc. |
2,700 | 15,794 | ||||||
| Taiho Kogyo Co., Ltd. |
6,900 | 48,410 | ||||||
Dimensional World ex U.S. Core Equity 2 ETF
SCHEDULE OF INVESTMENTS
October 31, 2021
| Security Description |
Shares | Fair Value | ||||||
| JAPAN (Continued) |
||||||||
| Taikisha, Ltd. |
6,400 | $ | 182,135 | |||||
| Taiko Bank, Ltd. (The) |
1,500 | 17,536 | ||||||
| Taiko Pharmaceutical Co., Ltd. |
1,000 | 7,086 | ||||||
| Taisei Corp. |
54,400 | 1,703,205 | ||||||
| Taisei Lamick Co., Ltd. |
1,700 | 40,836 | ||||||
| Taiyo Holdings Co., Ltd. |
16,000 | 426,573 | ||||||
| Taiyo Yuden Co., Ltd. |
36,800 | 1,855,733 | ||||||
| Takamatsu Construction Group Co., Ltd. |
6,000 | 105,082 | ||||||
| Takamatsu Machinery Co., Ltd. |
600 | 4,162 | ||||||
| Takamiya Co., Ltd. |
11,200 | 43,906 | ||||||
| Takaoka Toko Co., Ltd. |
3,380 | 43,634 | ||||||
| *Takara & Co., Ltd. |
2,000 | 31,204 | ||||||
| Takara Bio, Inc. |
6,000 | 155,861 | ||||||
| Takara Holdings, Inc. |
33,000 | 450,612 | ||||||
| Takara Leben Co., Ltd. |
58,700 | 159,588 | ||||||
| Takara Standard Co., Ltd. |
14,500 | 192,019 | ||||||
| Takasago International Corp. |
5,000 | 129,840 | ||||||
| Takasago Thermal Engineering Co., Ltd. |
12,000 | 218,899 | ||||||
| Takashima & Co., Ltd. |
1,600 | 26,282 | ||||||
| Takashimaya Co., Ltd. |
53,700 | 495,910 | ||||||
| *Take And Give Needs Co., Ltd. |
4,820 | 52,459 | ||||||
| TAKEBISHI Corp. |
3,900 | 51,202 | ||||||
| #*Takeda Pharmaceutical Co., Ltd. , Sponsored ADR |
5,264 | 73,801 | ||||||
| Takeda Pharmaceutical Co., Ltd. |
73,108 | 2,053,628 | ||||||
| Takemoto Yohki Co., Ltd. |
3,400 | 28,029 | ||||||
| Takeuchi Manufacturing Co., Ltd. |
15,900 | 407,871 | ||||||
| Takihyo Co., Ltd. |
2,500 | 39,048 | ||||||
| Takisawa Machine Tool Co., Ltd. |
2,300 | 22,531 | ||||||
| Takuma Co., Ltd. |
1,600 | 20,838 | ||||||
| Tama Home Co., Ltd. |
10,000 | 205,657 | ||||||
| Tamron Co., Ltd. |
7,000 | 164,096 | ||||||
| Tamura Corp. |
28,000 | 192,274 | ||||||
| Tanseisha Co., Ltd. |
10,300 | 84,008 | ||||||
| Tatsuta Electric Wire and Cable Co., Ltd. |
17,800 | 79,926 | ||||||
| Tayca Corp. |
6,500 | 74,791 | ||||||
| TBK Co., Ltd. |
9,700 | 34,793 | ||||||
| TDC Soft, Inc. |
6,500 | 74,449 | ||||||
| TDK Corp. |
65,900 | 2,386,906 | ||||||
| *TDK Corp. , ADR |
21,036 | 769,707 | ||||||
| TechMatrix Corp. |
13,700 | 216,268 | ||||||
| TECHNO HORIZON Co., Ltd. |
1,300 | 14,434 | ||||||
| Techno Medica Co., Ltd. |
800 | 11,064 | ||||||
| TechnoPro Holdings, Inc. |
44,600 | 1,417,891 | ||||||
| Tecnos Japan, Inc. |
4,000 | 21,259 | ||||||
| Teijin, Ltd. |
93,700 | 1,256,455 | ||||||
| Teikoku Electric Manufacturing Co., Ltd. |
4,400 | 55,837 | ||||||
| Tekken Corp. |
4,900 | 78,125 | ||||||
| Temairazu, Inc. |
500 | 24,293 | ||||||
| Terasaki Electric Co., Ltd. |
800 | 9,429 | ||||||
| Terumo Corp. |
54,600 | 2,402,831 | ||||||
| T-Gaia Corp. |
6,700 | 119,163 | ||||||
| THK Co., Ltd. |
22,800 | 488,493 | ||||||
| TIS, Inc. |
46,100 | 1,251,300 | ||||||
| TKC Corp. |
7,100 | 217,312 | ||||||
| Toa Corp./Hyogo |
10,300 | 73,620 | ||||||
Dimensional World ex U.S. Core Equity 2 ETF
SCHEDULE OF INVESTMENTS
October 31, 2021
|
Security Description |
Shares | Fair Value | ||||||
| JAPAN (Continued) |
||||||||
| Toa Corp./Tokyo |
7,700 | $ | 168,485 | |||||
| Toa Oil Co., Ltd. |
2,500 | 62,048 | ||||||
| TOA ROAD Corp. |
2,400 | 106,503 | ||||||
| Tobishima Corp. |
10,210 | 95,631 | ||||||
| Tobu Railway Co., Ltd. |
15,700 | 389,798 | ||||||
| Tocalo Co., Ltd. |
33,200 | 405,301 | ||||||
| Tochigi Bank, Ltd. (The) |
40,300 | 62,557 | ||||||
| Toda Corp. |
65,000 | 408,726 | ||||||
| Toda Kogyo Corp. |
2,100 | 59,855 | ||||||
| Toei Animation Co., Ltd. |
4,900 | 760,623 | ||||||
| Toei Co., Ltd. |
600 | 117,711 | ||||||
| Toell Co., Ltd. |
2,100 | 14,789 | ||||||
| Toenec Corp. |
5,100 | 149,836 | ||||||
| Togami Electric Manufacturing Co., Ltd. |
800 | 12,334 | ||||||
| Toho Bank, Ltd. (The) |
89,100 | 159,407 | ||||||
| *Toho Co., Ltd. |
3,800 | 50,955 | ||||||
| Toho Co., Ltd. |
3,500 | 164,218 | ||||||
| Toho Gas Co., Ltd. |
8,500 | 251,217 | ||||||
| Toho Holdings Co., Ltd. |
21,700 | 349,598 | ||||||
| Toho Titanium Co., Ltd. |
25,200 | 264,100 | ||||||
| Toho Zinc Co., Ltd. |
3,600 | 98,031 | ||||||
| Tohoku Bank, Ltd. (The) |
4,000 | 35,185 | ||||||
| Tohoku Electric Power Co., Inc. |
83,000 | 537,926 | ||||||
| Tokai Carbon Co., Ltd. |
88,800 | 1,158,820 | ||||||
| Tokai Corp. |
6,600 | 126,704 | ||||||
| TOKAI Holdings Corp. |
59,200 | 448,575 | ||||||
| Tokai Lease Co., Ltd. |
200 | 2,815 | ||||||
| Tokai Rika Co., Ltd. |
32,400 | 451,796 | ||||||
| Tokai Tokyo Financial Holdings, Inc. |
93,600 | 323,424 | ||||||
| Tokio Marine Holdings, Inc. |
32,700 | 1,720,102 | ||||||
| Tokushu Tokai Paper Co., Ltd. |
4,200 | 163,175 | ||||||
| Tokuyama Corp. |
45,600 | 779,429 | ||||||
| *Tokyo Base Co., Ltd. |
6,600 | 40,807 | ||||||
| *Tokyo Electric Power Co. Holdings, Inc. |
314,088 | 867,685 | ||||||
| Tokyo Electron Device, Ltd. |
1,000 | 60,425 | ||||||
| Tokyo Electron, Ltd. |
11,200 | 5,191,142 | ||||||
| Tokyo Gas Co., Ltd. |
28,000 | 485,964 | ||||||
| Tokyo Keiki, Inc. |
5,500 | 48,331 | ||||||
| Tokyo Kiraboshi Financial Group, Inc. |
11,412 | 147,423 | ||||||
| Tokyo Ohka Kogyo Co., Ltd. |
6,800 | 429,976 | ||||||
| Tokyo Rakutenchi Co., Ltd. |
1,400 | 49,849 | ||||||
| Tokyo Rope Manufacturing Co., Ltd. |
1,700 | 13,165 | ||||||
| Tokyo Sangyo Co., Ltd. |
9,500 | 59,070 | ||||||
| Tokyo Seimitsu Co., Ltd. |
14,600 | 592,195 | ||||||
| Tokyo Steel Manufacturing Co., Ltd. |
39,200 | 435,231 | ||||||
| Tokyo Tatemono Co., Ltd. |
68,900 | 1,009,103 | ||||||
| Tokyo Tekko Co., Ltd. |
5,700 | 74,484 | ||||||
| Tokyo Theatres Co., Inc. |
3,800 | 41,791 | ||||||
| Tokyotokeiba Co., Ltd. |
5,900 | 232,844 | ||||||
| Tokyu Construction Co., Ltd. |
66,600 | 470,186 | ||||||
| Tokyu Corp. |
31,500 | 442,561 | ||||||
| Tokyu Fudosan Holdings Corp. |
241,925 | 1,398,190 | ||||||
| Toli Corp. |
21,200 | 43,134 | ||||||
| Tomato Bank, Ltd. |
3,500 | 32,107 | ||||||
| Tomen Devices Corp. |
1,600 | 81,526 | ||||||
| Tomoe Corp. |
15,300 | 61,321 | ||||||
Dimensional World ex U.S. Core Equity 2 ETF
SCHEDULE OF INVESTMENTS
October 31, 2021
| Security Description |
Shares | Fair Value | ||||||
| JAPAN (Continued) |
||||||||
| Tomoe Engineering Co., Ltd. |
3,600 | $ | 71,795 | |||||
| *Tomoegawa Co., Ltd. |
1,400 | 10,363 | ||||||
| Tomoku Co., Ltd. |
7,000 | 117,808 | ||||||
| TOMONY Holdings, Inc. |
64,400 | 171,696 | ||||||
| Tomy Co., Ltd. |
61,400 | 581,557 | ||||||
| Tonami Holdings Co., Ltd. |
2,700 | 106,319 | ||||||
| Topcon Corp. |
69,500 | 1,237,316 | ||||||
| Toppan Forms Co., Ltd. |
10,600 | 101,515 | ||||||
| Topre Corp. |
25,400 | 292,259 | ||||||
| Topy Industries, Ltd. |
9,700 | 101,487 | ||||||
| Toray Industries, Inc. |
344,800 | 2,143,641 | ||||||
| Toridoll Holdings Corp. |
29,100 | 699,523 | ||||||
| Torishima Pump Manufacturing Co., Ltd. |
8,300 | 64,056 | ||||||
| *Tosei Corp. |
21,800 | 208,775 | ||||||
| Toshiba Corp. |
11,900 | 512,423 | ||||||
| Toshiba TEC Corp. |
12,900 | 505,705 | ||||||
| Tosho Co., Ltd. |
1,000 | 17,075 | ||||||
| Tosoh Corp. |
81,100 | 1,364,884 | ||||||
| Totech Corp. |
2,900 | 67,576 | ||||||
| Totetsu Kogyo Co., Ltd. |
16,000 | 347,292 | ||||||
| TOTO, Ltd. |
9,900 | 477,527 | ||||||
| Totoku Electric Co., Ltd. |
1,700 | 44,131 | ||||||
| Tottori Bank, Ltd. (The) |
4,000 | 39,079 | ||||||
| Tow Co., Ltd. |
16,200 | 49,158 | ||||||
| Towa Bank, Ltd. (The) |
15,900 | 70,558 | ||||||
| Towa Corp. |
6,600 | 142,969 | ||||||
| Towa Pharmaceutical Co., Ltd. |
17,100 | 438,654 | ||||||
| Toyo Construction Co., Ltd. |
48,800 | 243,946 | ||||||
| #Toyo Denki Seizo KK |
2,600 | 24,467 | ||||||
| *Toyo Engineering Corp. |
13,700 | 102,607 | ||||||
| Toyo Ink SC Holdings Co., Ltd. |
16,100 | 282,959 | ||||||
| Toyo Kanetsu KK |
4,300 | 94,617 | ||||||
| Toyo Logistics Co., Ltd. |
6,800 | 19,859 | ||||||
| Toyo Machinery & Metal Co., Ltd. |
7,600 | 35,859 | ||||||
| Toyo Securities Co., Ltd. |
26,300 | 37,365 | ||||||
| Toyo Seikan Group Holdings, Ltd. |
46,700 | 552,086 | ||||||
| Toyo Suisan Kaisha, Ltd. |
28,000 | 1,205,700 | ||||||
| Toyo Tanso Co., Ltd. |
5,500 | 149,287 | ||||||
| Toyo Tire Corp. |
70,900 | 1,173,946 | ||||||
| Toyo Wharf & Warehouse Co., Ltd. |
2,200 | 27,706 | ||||||
| Toyobo Co., Ltd. |
51,400 | 616,665 | ||||||
| Toyoda Gosei Co., Ltd. |
36,000 | 732,787 | ||||||
| Toyota Boshoku Corp. |
37,500 | 717,606 | ||||||
| Toyota Motor Corp. |
1,059,400 | 18,642,281 | ||||||
| #*Toyota Motor Corp. , Sponsored ADR |
38,395 | 6,779,405 | ||||||
| Toyota Tsusho Corp. |
31,500 | 1,361,938 | ||||||
| TPR Co., Ltd. |
14,100 | 178,808 | ||||||
| Traders Holdings Co., Ltd. |
3,120 | 8,564 | ||||||
| Trancom Co., Ltd. |
4,800 | 335,084 | ||||||
| Transaction Co., Ltd. |
4,200 | 42,359 | ||||||
| Transcosmos, Inc. |
10,900 | 327,406 | ||||||
| TRE Holdings Corp. |
16,244 | 255,288 | ||||||
| Trend Micro, Inc. |
20,800 | 1,172,936 | ||||||
| Tri Chemical Laboratories, Inc. |
8,000 | 238,895 | ||||||
| Trusco Nakayama Corp. |
8,200 | 197,764 | ||||||
Dimensional World ex U.S. Core Equity 2 ETF
SCHEDULE OF INVESTMENTS
October 31, 2021
| Security Description |
Shares | Fair Value | ||||||
| JAPAN (Continued) |
||||||||
| Tsubaki Nakashima Co., Ltd. |
28,500 | $ | 397,913 | |||||
| Tsubakimoto Chain Co. |
12,400 | 364,850 | ||||||
| Tsubakimoto Kogyo Co., Ltd. |
1,500 | 50,778 | ||||||
| *Tsudakoma Corp. |
1,800 | 12,818 | ||||||
| Tsugami Corp. |
29,800 | 407,700 | ||||||
| Tsukada Global Holdings, Inc. |
10,100 | 30,028 | ||||||
| Tsukishima Kikai Co., Ltd. |
9,600 | 97,831 | ||||||
| Tsukuba Bank, Ltd. |
35,900 | 53,838 | ||||||
| Tsumura & Co. |
8,400 | 260,785 | ||||||
| Tsuruha Holdings, Inc. |
5,200 | 640,737 | ||||||
| Tsurumi Manufacturing Co., Ltd. |
6,800 | 104,542 | ||||||
| Tv Tokyo Holdings Corp. |
5,300 | 100,353 | ||||||
| UACJ Corp. |
20,790 | 479,888 | ||||||
| Ube Industries, Ltd. |
65,520 | 1,218,175 | ||||||
| Ubicom Holdings, Inc. |
800 | 20,241 | ||||||
| Uchida Yoko Co., Ltd. |
4,500 | 189,432 | ||||||
| Ulvac, Inc. |
15,400 | 858,970 | ||||||
| Unicharm Corp. |
19,000 | 765,166 | ||||||
| Uniden Holdings Corp. |
2,400 | 67,038 | ||||||
| Union Tool Co. |
2,100 | 70,721 | ||||||
| Unipres Corp. |
24,400 | 198,367 | ||||||
| United Super Markets Holdings, Inc. |
34,500 | 314,365 | ||||||
| UNITED, Inc. |
4,700 | 69,949 | ||||||
| *Unitika, Ltd. |
39,400 | 125,430 | ||||||
| *Universal Entertainment Corp. |
9,000 | 212,953 | ||||||
| UPR Corp. |
700 | 17,686 | ||||||
| Urbanet Corp. Co., Ltd. |
14,900 | 40,509 | ||||||
| Usen-Next Holdings Co., Ltd. |
2,200 | 64,635 | ||||||
| Ushio, Inc. |
20,200 | 360,154 | ||||||
| USS Co., Ltd. |
12,400 | 199,009 | ||||||
| UT Group Co., Ltd. |
9,400 | 299,250 | ||||||
| Utoc Corp. |
7,600 | 36,059 | ||||||
| *UUUM Co., Ltd. |
2,000 | 17,663 | ||||||
| *Uzabase, Inc. |
3,800 | 67,852 | ||||||
| V Technology Co., Ltd. |
4,300 | 161,592 | ||||||
| Valor Holdings Co., Ltd. |
22,100 | 466,906 | ||||||
| Valqua, Ltd. |
8,100 | 163,101 | ||||||
| Value HR Co., Ltd. |
1,000 | 16,137 | ||||||
| ValueCommerce Co., Ltd. |
9,900 | 389,836 | ||||||
| V-Cube, Inc. |
2,300 | 34,694 | ||||||
| Vector, Inc. |
10,100 | 114,353 | ||||||
| Vega Corp. Co., Ltd. |
1,700 | 20,470 | ||||||
| Vertex Corp. |
3,020 | 80,251 | ||||||
| *Village Vanguard Co., Ltd. |
2,800 | 26,496 | ||||||
| VINX Corp. |
2,700 | 24,034 | ||||||
| Vital KSK Holdings, Inc. |
18,700 | 124,311 | ||||||
| VT Holdings Co., Ltd. |
68,800 | 306,515 | ||||||
| Wacoal Holdings Corp. |
17,300 | 345,014 | ||||||
| Wacom Co., Ltd. |
58,500 | 376,575 | ||||||
| Wakachiku Construction Co., Ltd. |
5,800 | 103,258 | ||||||
| Wakita & Co., Ltd. |
15,200 | 137,303 | ||||||
| Warabeya Nichiyo Holdings Co., Ltd. |
8,500 | 166,161 | ||||||
| Waseda Academy Co., Ltd. |
3,100 | 27,731 | ||||||
| Watahan & Co., Ltd. |
8,400 | 90,685 | ||||||
| Watts Co., Ltd. |
4,500 | 29,757 | ||||||
| WDB Holdings Co., Ltd. |
2,900 | 91,305 | ||||||
Dimensional World ex U.S. Core Equity 2 ETF
SCHEDULE OF INVESTMENTS
October 31, 2021
| Security Description |
Shares | Fair Value | ||||||
| JAPAN (Continued) |
||||||||
| *Weathernews, Inc. |
1,400 | $ | 102,030 | |||||
| Welbe, Inc. |
2,900 | 40,871 | ||||||
| Welcia Holdings Co., Ltd. |
17,200 | 641,842 | ||||||
| #West Holdings Corp. |
11,024 | 612,955 | ||||||
| West Japan Railway Co. |
10,300 | 484,446 | ||||||
| Will Group, Inc. |
6,200 | 69,871 | ||||||
| WIN-Partners Co., Ltd. |
5,000 | 42,140 | ||||||
| Wood One Co., Ltd. |
3,700 | 36,667 | ||||||
| Workman Co., Ltd. |
800 | 42,447 | ||||||
| World Co., Ltd. |
8,100 | 99,168 | ||||||
| World Holdings Co., Ltd. |
4,300 | 107,212 | ||||||
| Wowow, Inc. |
4,300 | 87,414 | ||||||
| Xebio Holdings Co., Ltd. |
9,600 | 88,991 | ||||||
| YAC Holdings Co., Ltd. |
4,800 | 39,781 | ||||||
| Yachiyo Industry Co., Ltd. |
5,600 | 43,710 | ||||||
| Yahagi Construction Co., Ltd. |
13,000 | 87,104 | ||||||
| Yakult Honsha Co., Ltd. |
4,600 | 231,563 | ||||||
| YAKUODO Holdings Co., Ltd. |
5,000 | 105,459 | ||||||
| YAMABIKO Corp. |
19,800 | 215,148 | ||||||
| YAMADA Consulting Group Co., Ltd. |
5,200 | 52,855 | ||||||
| Yamada Holdings Co., Ltd. |
213,740 | 815,408 | ||||||
| Yamagata Bank, Ltd. (The) |
12,500 | 89,016 | ||||||
| Yamaguchi Financial Group, Inc. |
83,200 | 464,067 | ||||||
| Yamaha Corp. |
4,400 | 277,062 | ||||||
| Yamaha Motor Co., Ltd. |
77,900 | 2,162,276 | ||||||
| Yamaichi Electronics Co., Ltd. |
11,400 | 174,362 | ||||||
| YA-MAN, Ltd. |
11,000 | 116,439 | ||||||
| Yamanashi Chuo Bank, Ltd. (The) |
11,500 | 82,701 | ||||||
| Yamatane Corp. |
4,600 | 63,176 | ||||||
| Yamato Holdings Co., Ltd. |
28,900 | 708,909 | ||||||
| Yamaura Corp. |
1,900 | 15,463 | ||||||
| Yamaya Corp. |
2,500 | 52,730 | ||||||
| Yamazaki Baking Co., Ltd. |
43,600 | 661,504 | ||||||
| Yamazen Corp. |
14,500 | 133,778 | ||||||
| Yaoko Co., Ltd. |
8,800 | 522,482 | ||||||
| Yashima Denki Co., Ltd. |
7,200 | 60,303 | ||||||
| Yaskawa Electric Corp. |
5,200 | 224,372 | ||||||
| Yasunaga Corp. |
4,700 | 48,432 | ||||||
| YE DIGITAL Corp. |
4,300 | 19,534 | ||||||
| Yellow Hat, Ltd. |
14,400 | 234,264 | ||||||
| Yokogawa Bridge Holdings Corp. |
19,600 | 394,321 | ||||||
| Yokogawa Electric Corp. |
55,000 | 1,095,900 | ||||||
| Yokohama Reito Co., Ltd. |
16,500 | 125,893 | ||||||
| Yokohama Rubber Co., Ltd. (The) |
69,600 | 1,173,174 | ||||||
| Yokowo Co., Ltd. |
11,700 | 258,883 | ||||||
| Yondenko Corp. |
4,000 | 59,566 | ||||||
| Yondoshi Holdings, Inc. |
4,900 | 74,171 | ||||||
| Yorozu Corp. |
8,700 | 90,643 | ||||||
| Yotai Refractories Co., Ltd. |
8,000 | 89,735 | ||||||
| Yuasa Funashoku Co., Ltd. |
400 | 10,664 | ||||||
| Yuasa Trading Co., Ltd. |
6,100 | 162,364 | ||||||
| Yuken Kogyo Co., Ltd. |
1,600 | 24,696 | ||||||
| Yurtec Corp. |
15,400 | 89,949 | ||||||
| Yushin Precision Equipment Co., Ltd. |
2,900 | 19,533 | ||||||
| Yushiro Chemical Industry Co., Ltd. |
3,700 | 38,842 | ||||||
Dimensional World ex U.S. Core Equity 2 ETF
SCHEDULE OF INVESTMENTS
October 31, 2021
| Security Description |
Shares | Fair Value | ||||||
| JAPAN (Continued) |
||||||||
| Z Holdings Corp. |
179,400 | $ | 1,110,777 | |||||
| Zenrin Co., Ltd. |
13,950 | 128,214 | ||||||
| Zensho Holdings Co., Ltd. |
27,437 | 632,356 | ||||||
| Zeon Corp. |
69,900 | 827,582 | ||||||
| ZOZO, Inc. |
27,500 | 879,084 | ||||||
| Zuiko Corp. |
4,800 | 37,044 | ||||||
|
|
|
|||||||
| TOTAL JAPAN |
696,329,530 | |||||||
|
|
|
|||||||
| KOREA, REPUBLIC OF (4.6%) |
||||||||
| *Able C&C Co., Ltd. |
1,546 | 10,161 | ||||||
| ABOV Semiconductor Co., Ltd. |
3,017 | 34,080 | ||||||
| *Abpro Bio Co., Ltd. |
33,350 | 31,822 | ||||||
| ADTechnology Co., Ltd. |
2,279 | 42,614 | ||||||
| Advanced Nano Products Co., Ltd. |
930 | 35,376 | ||||||
| Advanced Process Systems Corp. |
6,587 | 133,595 | ||||||
| Aekyung Industrial Co., Ltd. |
474 | 9,005 | ||||||
| Aekyung Petrochemical Co., Ltd. |
3,303 | 37,876 | ||||||
| *AeroSpace Technology of Korea, Inc. |
7,617 | 42,500 | ||||||
| AfreecaTV Co., Ltd. |
3,510 | 579,718 | ||||||
| *Agabang&Company |
9,906 | 44,929 | ||||||
| Ahn-Gook Pharmaceutical Co., Ltd. |
1,865 | 16,519 | ||||||
| Ahnlab, Inc. |
706 | 49,542 | ||||||
| AJ Networks Co., Ltd. |
9,411 | 45,019 | ||||||
| *Ajin Industrial Co., Ltd. |
19,310 | 58,415 | ||||||
| AK Holdings, Inc. |
2,163 | 49,052 | ||||||
| *Alpha Holdings, Inc. |
3,024 | 9,096 | ||||||
| *Alteogen, Inc. |
1,432 | 85,782 | ||||||
| *ALUKO Co., Ltd. |
14,854 | 50,782 | ||||||
| Amorepacific Corp. |
1,447 | 224,749 | ||||||
| Amorepacific Group |
120 | 3,995 | ||||||
| AMOREPACIFIC Group |
10,695 | 453,957 | ||||||
| *Amotech Co., Ltd. |
529 | 14,034 | ||||||
| *Anam Electronics Co., Ltd. |
26,032 | 52,686 | ||||||
| *Ananti, Inc. |
4,285 | 48,404 | ||||||
| *Apact Co., Ltd. |
5,646 | 30,922 | ||||||
| *APS Holdings Corp. |
6,201 | 94,988 | ||||||
| Asia Cement Co., Ltd. |
960 | 111,728 | ||||||
| Asia Holdings Co., Ltd. |
566 | 60,303 | ||||||
| Asia Paper Manufacturing Co., Ltd. |
2,188 | 85,943 | ||||||
| Aurora World Corp. |
2,222 | 19,585 | ||||||
| Austem Co., Ltd. |
8,124 | 19,710 | ||||||
| Autech Corp. |
5,453 | 50,864 | ||||||
| Avaco Co., Ltd. |
2,268 | 19,991 | ||||||
| Baiksan Co., Ltd. |
6,645 | 45,037 | ||||||
| *»Barun Electronics Co., Ltd. |
326 | 1,093 | ||||||
| Bcworld Pharm Co., Ltd. |
1,008 | 14,621 | ||||||
| BGF retail Co., Ltd. |
2,200 | 304,052 | ||||||
| #BH Co., Ltd. |
8,461 | 135,399 | ||||||
| *BHI Co., Ltd. |
2,415 | 10,395 | ||||||
| *Binex Co., Ltd. |
1,074 | 15,165 | ||||||
| Binggrae Co., Ltd. |
1,922 | 91,614 | ||||||
| *BioSmart Co., Ltd. |
2,999 | 13,859 | ||||||
| BIT Computer Co., Ltd. |
2,385 | 17,450 | ||||||
| BNK Financial Group, Inc. |
89,983 | 677,635 | ||||||
| Boditech Med, Inc. |
4,164 | 57,192 | ||||||
Dimensional World ex U.S. Core Equity 2 ETF
SCHEDULE OF INVESTMENTS
October 31, 2021
| Security Description |
Shares | Fair Value | ||||||
| KOREA, REPUBLIC OF (Continued) |
||||||||
| BoKwang Industry Co., Ltd. |
3,616 | $ | 25,839 | |||||
| Bookook Securities Co., Ltd. |
1,282 | 27,043 | ||||||
| #Boryung Pharmaceutical Co., Ltd. |
9,276 | 113,911 | ||||||
| *Bubang Co., Ltd. |
10,013 | 21,593 | ||||||
| Bukwang Pharmaceutical Co., Ltd. |
1,943 | 21,699 | ||||||
| Busan City Gas Co., Ltd. |
645 | 46,420 | ||||||
| BYC Co., Ltd. |
64 | 23,879 | ||||||
| *BYON Co., Ltd. |
12,725 | 13,176 | ||||||
| Byucksan Corp. |
23,697 | 74,221 | ||||||
| *Cafe24 Corp. |
354 | 8,725 | ||||||
| *CammSys Corp. |
30,945 | 49,785 | ||||||
| *Capro Corp. |
9,878 | 35,039 | ||||||
| Caregen Co., Ltd. |
491 | 28,236 | ||||||
| *Carelabs Co., Ltd. |
2,443 | 17,728 | ||||||
| *Celltrion Healthcare Co., Ltd. |
1,212 | 83,908 | ||||||
| *Celltrion Pharm, Inc. |
591 | 57,302 | ||||||
| *Celltrion, Inc. |
3,728 | 639,651 | ||||||
| *Chabiotech Co., Ltd. |
3,005 | 50,274 | ||||||
| Changhae Ethanol Co., Ltd. |
2,313 | 28,404 | ||||||
| Cheil Worldwide, Inc. |
19,324 | 394,401 | ||||||
| Chemtronics Co., Ltd. |
3,658 | 80,294 | ||||||
| *ChinHung International, Inc. |
4,637 | 8,333 | ||||||
| *Choil Aluminum Co., Ltd. |
18,258 | 37,108 | ||||||
| Chong Kun Dang Pharmaceutical Corp. |
3,440 | 345,899 | ||||||
| Chongkundang Holdings Corp. |
956 | 67,003 | ||||||
| Chunbo Co., Ltd. |
284 | 68,828 | ||||||
| Chungdahm Learning, Inc. |
2,571 | 75,906 | ||||||
| CJ CheilJedang Corp. |
5,132 | 1,668,872 | ||||||
| CJ Corp. |
8,526 | 698,978 | ||||||
| CJ ENM Co., Ltd. |
4,834 | 729,723 | ||||||
| *CJ Freshway Corp. |
1,946 | 54,789 | ||||||
| *CJ Logistics Corp. |
2,606 | 316,676 | ||||||
| CKD Bio Corp. |
418 | 15,060 | ||||||
| Classys, Inc. |
3,148 | 60,075 | ||||||
| Clean & Science Co., Ltd. |
1,813 | 31,185 | ||||||
| *Comtec Systems Co., Ltd. |
24,189 | 19,251 | ||||||
| *Cosmax, Inc. |
3,019 | 320,359 | ||||||
| *Cosmecca Korea Co., Ltd. |
891 | 11,361 | ||||||
| *CosmoAM&T Co., Ltd. |
969 | 34,869 | ||||||
| Coway Co., Ltd. |
15,453 | 1,049,992 | ||||||
| COWELL FASHION Co., Ltd. |
10,296 | 80,884 | ||||||
| Crown Confectionery Co., Ltd. |
1,955 | 17,232 | ||||||
| CROWNHAITAI Holdings Co., Ltd. |
6,389 | 48,496 | ||||||
| *CrystalGenomics, Inc. |
4,872 | 28,559 | ||||||
| CS Wind Corp. |
2,151 | 127,748 | ||||||
| Cuckoo Holdings Co., Ltd. |
1,400 | 26,956 | ||||||
| Cuckoo Homesys Co., Ltd. |
2,925 | 108,885 | ||||||
| Cymechs, Inc. |
1,064 | 14,887 | ||||||
| *D&C Media Co., Ltd. |
524 | 18,834 | ||||||
| D.I Corp. |
6,112 | 41,373 | ||||||
| Dae Hwa Pharmaceutical Co., Ltd. |
1,708 | 14,587 | ||||||
| Dae Won Chemical Co., Ltd. |
6,000 | 30,037 | ||||||
| Dae Won Kang Up Co., Ltd. |
16,250 | 58,545 | ||||||
| Daebongls Co., Ltd. |
2,222 | 16,581 | ||||||
| *Daechang Co., Ltd. |
31,547 | 55,073 | ||||||
Dimensional World ex U.S. Core Equity 2 ETF
SCHEDULE OF INVESTMENTS
October 31, 2021
| Security Description |
Shares | Fair Value | ||||||
| KOREA, REPUBLIC OF (Continued) |
||||||||
| Daedong Corp. |
4,791 | $ | 40,180 | |||||
| *Daehan New Pharm Co., Ltd. |
3,538 | 33,910 | ||||||
| *Dae-Il Corp. |
2,747 | 13,352 | ||||||
| Daejoo Electronic Materials Co., Ltd. |
512 | 45,743 | ||||||
| Daejung Chemicals & Metals Co., Ltd. |
1,255 | 23,520 | ||||||
| Daelim B&Co. Co., Ltd. |
2,393 | 14,335 | ||||||
| Daesang Corp. |
13,274 | 270,921 | ||||||
| Daesang Holdings Co., Ltd. |
7,797 | 66,724 | ||||||
| *Daesung Eltec Co., Ltd. |
21,904 | 18,463 | ||||||
| Daesung Holdings Co., Ltd. |
711 | 26,954 | ||||||
| *Daesung Industrial Co., Ltd. |
2,494 | 11,120 | ||||||
| *Daewon Cable Co., Ltd. |
7,277 | 11,957 | ||||||
| *Daewon Media Co., Ltd. |
2,936 | 86,054 | ||||||
| Daewon Pharmaceutical Co., Ltd. |
4,020 | 54,699 | ||||||
| *Daewoo Engineering & Construction Co., Ltd. |
115,457 | 617,523 | ||||||
| *Daewoo Shipbuilding & Marine Engineering Co., Ltd. |
17,168 | 379,046 | ||||||
| Daewoong Co., Ltd. |
3,522 | 95,242 | ||||||
| Daewoong Pharmaceutical Co., Ltd. |
501 | 60,023 | ||||||
| Daihan Pharmaceutical Co., Ltd. |
2,757 | 71,488 | ||||||
| Daishin Securities Co., Ltd. |
16,973 | 302,117 | ||||||
| *Danal Co., Ltd. |
3,342 | 23,509 | ||||||
| Danawa Co., Ltd. |
2,885 | 69,128 | ||||||
| *Dasan Networks, Inc. |
1,978 | 12,018 | ||||||
| Dawonsys Co., Ltd. |
3,646 | 102,651 | ||||||
| *Dayou Automotive Seat Technology Co., Ltd. |
36,739 | 56,434 | ||||||
| DB Financial Investment Co., Ltd. |
13,364 | 80,741 | ||||||
| #DB HiTek Co., Ltd. |
20,993 | 1,032,987 | ||||||
| DB Insurance Co., Ltd. |
32,383 | 1,640,558 | ||||||
| Dentium Co., Ltd. |
2,282 | 134,942 | ||||||
| Deutsch Motors, Inc. |
10,999 | 71,535 | ||||||
| Device ENG Co., Ltd. |
2,083 | 52,318 | ||||||
| DGB Financial Group, Inc. |
82,605 | 731,643 | ||||||
| DI Dong Il Corp. |
800 | 196,483 | ||||||
| Digital Daesung Co., Ltd. |
3,145 | 26,214 | ||||||
| Digital Power Communications Co., Ltd. |
1,768 | 22,468 | ||||||
| *DIO Corp. |
1,334 | 42,981 | ||||||
| *DL E&C Co., Ltd. |
5,121 | 591,618 | ||||||
| DL Holdings Co., Ltd. |
4,085 | 229,673 | ||||||
| DMS Co., Ltd. |
8,142 | 44,732 | ||||||
| DNF Co., Ltd. |
1,073 | 18,778 | ||||||
| Dohwa Engineering Co., Ltd. |
3,658 | 24,761 | ||||||
| Dong-A Hwasung Co., Ltd. |
1,280 | 15,609 | ||||||
| Dong-A Socio Holdings Co., Ltd. |
701 | 63,288 | ||||||
| Dong-A ST Co., Ltd. |
2,024 | 125,921 | ||||||
| Dong-Ah Geological Engineering Co., Ltd. |
5,490 | 86,681 | ||||||
| *Dongbang Transport Logistics Co., Ltd. |
14,386 | 48,998 | ||||||
| Dongjin Semichem Co., Ltd. |
16,152 | 483,779 | ||||||
| Dongkoo Bio & Pharma Co., Ltd. |
2,349 | 16,282 | ||||||
| DongKook Pharmaceutical Co., Ltd. |
9,102 | 174,866 | ||||||
| Dongkuk Steel Mill Co., Ltd. |
34,404 | 501,980 | ||||||
| Dongkuk Structures & Construction Co., Ltd. |
3,797 | 19,009 | ||||||
| Dongsuh Cos., Inc. |
897 | 26,560 | ||||||
| Dongsung Chemical Co., Ltd. |
12,919 | 64,012 | ||||||
| Dongsung Finetec Co., Ltd. |
8,825 | 94,779 | ||||||
| *Dongwha Enterprise Co., Ltd. |
683 | 49,331 | ||||||
| Dongwha Pharm Co., Ltd. |
8,912 | 124,694 | ||||||
Dimensional World ex U.S. Core Equity 2 ETF
SCHEDULE OF INVESTMENTS
October 31, 2021
| Security Description |
Shares | Fair Value | ||||||
| KOREA, REPUBLIC OF (Continued) |
||||||||
| Dongwon F&B Co., Ltd. |
746 | $ | 130,872 | |||||
| Dongwon Industries Co., Ltd. |
960 | 186,898 | ||||||
| Dongwon Systems Corp. |
2,248 | 100,227 | ||||||
| *Doosan Bobcat, Inc. |
13,624 | 443,621 | ||||||
| Doosan Co., Ltd. |
2,554 | 225,118 | ||||||
| #*Doosan Fuel Cell Co., Ltd. |
9,724 | 434,378 | ||||||
| #*Doosan Heavy Industries & Construction Co., Ltd. |
131,291 | 2,741,432 | ||||||
| #DoubleUGames Co., Ltd. |
5,898 | 324,035 | ||||||
| Douzone Bizon Co., Ltd. |
6,665 | 463,707 | ||||||
| DRB Holding Co., Ltd. |
4,714 | 22,470 | ||||||
| *Dream Security Co., Ltd. |
9,336 | 36,152 | ||||||
| Dreamtech Co., Ltd. |
12,336 | 105,250 | ||||||
| Drgem Corp. |
1,507 | 14,960 | ||||||
| *DSK Co., Ltd. |
4,393 | 31,240 | ||||||
| *Duck Yang Industry Co., Ltd. |
6,472 | 20,714 | ||||||
| *Duk San Neolux Co., Ltd. |
1,716 | 79,445 | ||||||
| *Duksan Hi-Metal Co., Ltd. |
1,846 | 21,563 | ||||||
| DY Corp. |
3,478 | 16,310 | ||||||
| DY POWER Corp. |
5,033 | 54,699 | ||||||
| DYPNF Co., Ltd. |
1,795 | 59,370 | ||||||
| E1 Corp. |
979 | 43,900 | ||||||
| Eagon Industrial, Ltd. |
2,793 | 33,940 | ||||||
| Easy Bio, Inc. |
11,835 | 50,944 | ||||||
| Easy Holdings Co., Ltd. |
19,205 | 73,546 | ||||||
| #eBEST Investment & Securities Co., Ltd. |
10,646 | 82,450 | ||||||
| Echo Marketing, Inc. |
4,236 | 63,075 | ||||||
| *EcoBio Holdings Co., Ltd. |
2,982 | 22,737 | ||||||
| Ecoplastic Corp. |
11,811 | 38,762 | ||||||
| Ecopro BM Co., Ltd. |
3 | 1,052 | ||||||
| #Ecopro Co., Ltd. |
4,442 | 380,509 | ||||||
| *Ecopro HN Co., Ltd. |
3,296 | 309,137 | ||||||
| e-Credible Co., Ltd. |
1,366 | 23,438 | ||||||
| Elentec Co., Ltd. |
9,961 | 92,062 | ||||||
| E-MART, Inc. |
5,798 | 833,566 | ||||||
| *EMKOREA Co., Ltd. |
2,736 | 10,349 | ||||||
| *EM-Tech Co., Ltd. |
2,896 | 65,179 | ||||||
| ENF Technology Co., Ltd. |
7,575 | 187,341 | ||||||
| Eo Technics Co., Ltd. |
860 | 78,968 | ||||||
| Estechpharma Co., Ltd. |
1,289 | 11,582 | ||||||
| Eugene Investment & Securities Co., Ltd. |
30,725 | 99,914 | ||||||
| Eugene Technology Co., Ltd. |
2,909 | 110,903 | ||||||
| *E-World |
9,343 | 19,469 | ||||||
| *F&F Co., Ltd. |
1,034 | 768,056 | ||||||
| F&F Holdings Co., Ltd. |
1,044 | 34,843 | ||||||
| Farmsco |
6,877 | 35,781 | ||||||
| FarmStory Co., Ltd. |
27,766 | 64,630 | ||||||
| Fila Holdings Corp. |
20,003 | 635,070 | ||||||
| Fine Semitech Corp. |
5,871 | 128,116 | ||||||
| *Fine Technix Co., Ltd. |
3,805 | 35,492 | ||||||
| Gabia, Inc. |
4,066 | 44,364 | ||||||
| *Gamevil, Inc. |
1,501 | 95,310 | ||||||
| Gaon Cable Co., Ltd. |
1,340 | 32,510 | ||||||
| *Gemvaxlink Co., Ltd. |
14,336 | 19,690 | ||||||
| *Genexine, Inc. |
470 | 26,304 | ||||||
| Global Standard Technology Co., Ltd. |
881 | 21,751 | ||||||
Dimensional World ex U.S. Core Equity 2 ETF
SCHEDULE OF INVESTMENTS
October 31, 2021
| Security Description |
Shares | Fair Value | ||||||
| KOREA, REPUBLIC OF (Continued) |
||||||||
| GMB Korea Corp. |
5,922 | $ | 32,687 | |||||
| *GNCO Co., Ltd. |
4,594 | 3,279 | ||||||
| GOLFZON Co., Ltd. |
1,145 | 138,648 | ||||||
| *Grand Korea Leisure Co., Ltd. |
1,453 | 20,330 | ||||||
| Green Cross Corp. |
445 | 104,533 | ||||||
| Green Cross Holdings Corp. |
3,869 | 97,011 | ||||||
| Green Cross LabCell Corp. |
1,524 | 126,505 | ||||||
| GS Engineering & Construction Corp. |
30,377 | 1,074,912 | ||||||
| *GS Global Corp. |
10,509 | 23,157 | ||||||
| GS Holdings Corp. |
37,790 | 1,366,332 | ||||||
| GS Retail Co., Ltd. |
20,176 | 555,960 | ||||||
| Gwangju Shinsegae Co., Ltd. |
211 | 34,939 | ||||||
| Hae In Corp. |
3,320 | 17,615 | ||||||
| HAESUNG DS Co., Ltd. |
4,957 | 184,527 | ||||||
| Haitai Confectionery & Foods Co., Ltd. |
4,559 | 32,421 | ||||||
| Halla Corp. |
14,134 | 68,218 | ||||||
| Halla Holdings Corp. |
4,431 | 193,007 | ||||||
| Han Kuk Carbon Co., Ltd. |
11,907 | 127,879 | ||||||
| Hana Financial Group, Inc. |
47,280 | 1,820,718 | ||||||
| *Hana Micron, Inc. |
10,762 | 212,744 | ||||||
| Hana Pharm Co., Ltd. |
1,618 | 28,454 | ||||||
| *Hanall Biopharma Co., Ltd. |
1,459 | 25,471 | ||||||
| HanChang Paper Co., Ltd. |
28,019 | 49,154 | ||||||
| *Hancom, Inc. |
5,157 | 88,043 | ||||||
| Handok, Inc. |
3,605 | 72,961 | ||||||
| Handsome Co., Ltd. |
5,551 | 200,226 | ||||||
| Hanil Holdings Co., Ltd. |
3,885 | 46,379 | ||||||
| Hanil Hyundai Cement Co., Ltd. |
1,484 | 43,623 | ||||||
| *Hanjin Heavy Industries & Construction Co., Ltd. |
6,658 | 54,470 | ||||||
| *Hanjin Heavy Industries & Construction Holdings Co., Ltd. |
4,636 | 18,012 | ||||||
| Hanjin Kal Corp. |
460 | 21,572 | ||||||
| Hanjin Transportation Co., Ltd. |
6,385 | 189,329 | ||||||
| Hankook Shell Oil Co., Ltd. |
303 | 72,344 | ||||||
| Hankook Tire & Technology Co., Ltd. |
30,099 | 1,065,075 | ||||||
| Hanmi Pharm Co., Ltd. |
353 | 79,750 | ||||||
| Hanmi Science Co., Ltd. |
445 | 21,706 | ||||||
| Hanmi Semiconductor Co., Ltd. |
5,901 | 162,353 | ||||||
| HanmiGlobal Co., Ltd. |
2,183 | 19,896 | ||||||
| Hanon Systems |
35,882 | 442,173 | ||||||
| #Hansae Co., Ltd. |
7,974 | 158,313 | ||||||
| Hansae Yes24 Holdings Co., Ltd. |
4,846 | 33,052 | ||||||
| Hanshin Construction Co., Ltd. |
4,668 | 76,099 | ||||||
| Hanshin Machinery Co. |
5,751 | 21,384 | ||||||
| Hansol Chemical Co., Ltd. |
2,852 | 802,968 | ||||||
| Hansol Holdings Co., Ltd. |
18,532 | 60,105 | ||||||
| *Hansol HomeDeco Co., Ltd. |
24,463 | 41,869 | ||||||
| Hansol Logistics Co., Ltd. |
14,713 | 59,680 | ||||||
| Hansol Paper Co., Ltd. |
14,535 | 179,114 | ||||||
| *Hansol Technics Co., Ltd. |
11,263 | 65,156 | ||||||
| Hanssem Co., Ltd. |
1,642 | 142,624 | ||||||
| Hanwha Aerospace Co., Ltd. |
13,618 | 524,419 | ||||||
| Hanwha Corp. |
17,230 | 493,950 | ||||||
| *Hanwha General Insurance Co., Ltd. |
41,493 | 160,319 | ||||||
| *Hanwha Investment & Securities Co., Ltd. |
53,696 | 254,568 | ||||||
| Hanwha Life Insurance Co., Ltd. |
111,893 | 332,744 | ||||||
| *Hanwha Solutions Corp. |
51,009 | 1,783,165 | ||||||
Dimensional World ex U.S. Core Equity 2 ETF
SCHEDULE OF INVESTMENTS
October 31, 2021
| Security Description |
Shares | Fair Value | ||||||
| KOREA, REPUBLIC OF (Continued) |
||||||||
| Hanyang Eng Co., Ltd. |
5,129 | $ | 67,374 | |||||
| Hanyang Securities Co., Ltd. |
5,778 | 88,014 | ||||||
| *Harim Co., Ltd. |
24,641 | 60,625 | ||||||
| Harim Holdings Co., Ltd. |
10,691 | 88,470 | ||||||
| HB Technology Co., Ltd. |
8,492 | 18,422 | ||||||
| HDC Hyundai Engineering Plastics Co., Ltd. |
4,140 | 20,797 | ||||||
| *Helixmith Co., Ltd. |
778 | 15,846 | ||||||
| *Heung-A Shipping Co., Ltd. |
11,732 | 38,101 | ||||||
| *Heungkuk Fire & Marine Insurance Co., Ltd. |
26,951 | 89,602 | ||||||
| High Tech Pharm Co., Ltd. |
1,557 | 21,519 | ||||||
| HIMS Co., Ltd. |
2,899 | 22,601 | ||||||
| #Hite Jinro Co., Ltd. |
10,858 | 323,357 | ||||||
| Hitejinro Holdings Co., Ltd. |
5,272 | 66,997 | ||||||
| *HJ Magnolia Yongpyong Hotel & Resort Corp. |
8,820 | 47,551 | ||||||
| *HLB Life Science Co., Ltd. |
7,215 | 92,306 | ||||||
| *HLB, Inc. |
2,710 | 97,635 | ||||||
| HLscience Co., Ltd. |
474 | 14,704 | ||||||
| #*HMM Co., Ltd. |
39,721 | 905,879 | ||||||
| *Home Center Holdings Co., Ltd. |
19,426 | 28,760 | ||||||
| *Homecast Co., Ltd. |
5,594 | 14,744 | ||||||
| Hotel Shilla Co., Ltd. |
1,154 | 86,312 | ||||||
| HS Industries Co., Ltd. |
30,043 | 172,769 | ||||||
| *HSD Engine Co., Ltd. |
5,280 | 41,705 | ||||||
| #Huchems Fine Chemical Corp. |
10,363 | 233,679 | ||||||
| *Hugel, Inc. |
835 | 129,193 | ||||||
| *Humasis Co., Ltd. |
3,088 | 42,546 | ||||||
| *Humax Co., Ltd. |
6,108 | 26,449 | ||||||
| Humedix Co., Ltd. |
667 | 15,811 | ||||||
| *Huneed Technologies |
2,598 | 15,785 | ||||||
| Huons Co., Ltd. |
2,846 | 122,993 | ||||||
| Huons Global Co., Ltd. |
1,900 | 79,997 | ||||||
| Huvis Corp. |
6,198 | 51,767 | ||||||
| Huvitz Co., Ltd. |
2,888 | 21,378 | ||||||
| Hwa Shin Co., Ltd. |
5,548 | 45,484 | ||||||
| *Hwail Pharm Co., Ltd. |
5,818 | 14,140 | ||||||
| Hwaseung Corp. Co., Ltd. |
16,883 | 40,598 | ||||||
| Hwaseung Enterprise Co., Ltd. |
3,754 | 55,256 | ||||||
| *Hwaseung R&A Co., Ltd. |
6,406 | 33,331 | ||||||
| *Hyosung Advanced Materials Corp. |
1,295 | 785,722 | ||||||
| *Hyosung Chemical Corp. |
922 | 226,841 | ||||||
| *Hyosung Heavy Industries Corp. |
1,213 | 70,068 | ||||||
| Hyosung TNC Corp. |
1,251 | 639,123 | ||||||
| HyosungITX Co., Ltd. |
1,138 | 18,601 | ||||||
| Hyundai Bioland Co., Ltd. |
1,881 | 32,113 | ||||||
| Hyundai BNG Steel Co., Ltd. |
2,646 | 37,815 | ||||||
| *Hyundai Construction Equipment Co., Ltd. |
5,718 | 196,953 | ||||||
| Hyundai Department Store Co., Ltd. |
7,253 | 513,926 | ||||||
| #*Hyundai Doosan Infracore Co., Ltd. |
27,602 | 248,018 | ||||||
| *Hyundai Electric & Energy System Co., Ltd. |
9,398 | 177,738 | ||||||
| Hyundai Elevator Co., Ltd. |
4,241 | 175,113 | ||||||
| Hyundai Engineering & Construction Co., Ltd. |
26,108 | 1,123,814 | ||||||
| Hyundai Engineering & Construction Co., Ltd. |
423 | 57,375 | ||||||
| Hyundai Ezwel Co., Ltd. |
3,258 | 27,463 | ||||||
| Hyundai Glovis Co., Ltd. |
7,505 | 1,075,767 | ||||||
| Hyundai Heavy Industries Holdings Co., Ltd. |
10,945 | 591,951 | ||||||
Dimensional World ex U.S. Core Equity 2 ETF
SCHEDULE OF INVESTMENTS
October 31, 2021
| Security Description |
Shares | Fair Value | ||||||
| KOREA, REPUBLIC OF (Continued) |
||||||||
| Hyundai Home Shopping Network Corp. |
2,761 | $ | 165,629 | |||||
| Hyundai Livart Furniture Co., Ltd. |
5,239 | 71,061 | ||||||
| Hyundai Marine & Fire Insurance Co., Ltd. |
39,665 | 891,024 | ||||||
| Hyundai Motor Co. |
11,862 | 2,111,417 | ||||||
| Hyundai Motor Securities Co., Ltd. |
9,464 | 102,451 | ||||||
| #*Hyundai Rotem Co., Ltd. |
8,840 | 170,211 | ||||||
| Hyundai Steel Co. |
28,126 | 1,069,874 | ||||||
| Hyundai Wia Corp. |
6,778 | 487,810 | ||||||
| HyVision System, Inc. |
3,080 | 44,281 | ||||||
| *iA, Inc. |
22,640 | 19,762 | ||||||
| ICD Co., Ltd. |
7,716 | 82,538 | ||||||
| *Icure Pharm, Inc. |
506 | 17,321 | ||||||
| *IHQ, Inc. |
28,719 | 45,467 | ||||||
| *Il Dong Pharmaceutical Co., Ltd. |
3,283 | 39,473 | ||||||
| Iljin Diamond Co., Ltd. |
527 | 17,070 | ||||||
| Iljin Electric Co., Ltd. |
5,010 | 24,567 | ||||||
| Iljin Holdings Co., Ltd. |
9,856 | 56,342 | ||||||
| Iljin Materials Co., Ltd. |
328 | 28,209 | ||||||
| Iljin Power Co., Ltd. |
1,996 | 29,550 | ||||||
| Ilyang Pharmaceutical Co., Ltd. |
2,041 | 52,049 | ||||||
| iMarketKorea, Inc. |
5,580 | 52,288 | ||||||
| InBody Co., Ltd. |
3,074 | 71,421 | ||||||
| *Incross Co., Ltd. |
799 | 31,589 | ||||||
| Industrial Bank of Korea |
96,665 | 914,080 | ||||||
| INFAC Corp. |
3,820 | 51,814 | ||||||
| *INNO Instrument, Inc. |
8,405 | 15,500 | ||||||
| Innocean Worldwide, Inc. |
2,407 | 121,117 | ||||||
| InnoWireless, Inc. |
392 | 12,664 | ||||||
| #*Innox Advanced Materials Co., Ltd. |
5,836 | 211,755 | ||||||
| *Insun ENT Co., Ltd. |
6,974 | 72,214 | ||||||
| Intekplus Co., Ltd. |
1,440 | 30,992 | ||||||
| Intelligent Digital Integrated Security Co., Ltd. |
515 | 11,194 | ||||||
| *Interflex Co., Ltd. |
3,448 | 38,359 | ||||||
| Interojo Co., Ltd. |
2,116 | 53,418 | ||||||
| Interpark Corp. |
23,187 | 132,945 | ||||||
| *iNtRON Biotechnology, Inc. |
913 | 15,079 | ||||||
| Inzi Controls Co., Ltd. |
1,230 | 17,683 | ||||||
| INZI Display Co., Ltd. |
15,360 | 44,363 | ||||||
| #IS Dongseo Co., Ltd. |
8,079 | 312,499 | ||||||
| ISC Co., Ltd. |
1,275 | 28,750 | ||||||
| i-SENS, Inc. |
2,574 | 73,791 | ||||||
| ISU Chemical Co., Ltd. |
6,469 | 84,146 | ||||||
| *IsuPetasys Co., Ltd. |
10,021 | 35,417 | ||||||
| *Jaeyoung Solutec Co., Ltd. |
18,171 | 17,883 | ||||||
| *Jahwa Electronics Co., Ltd. |
3,600 | 57,456 | ||||||
| JASTECH, Ltd. |
2,126 | 11,316 | ||||||
| *Jayjun Cosmetic Co., Ltd. |
14,235 | 14,009 | ||||||
| JB Financial Group Co., Ltd. |
75,507 | 573,144 | ||||||
| JC Hyun System, Inc. |
3,025 | 16,645 | ||||||
| *Jeju Air Co., Ltd. |
1,135 | 21,271 | ||||||
| *Jeju Semiconductor Corp. |
2,916 | 11,928 | ||||||
| Jinsung T.E.C. |
6,911 | 70,379 | ||||||
| *JLS Co., Ltd. |
5,065 | 32,898 | ||||||
| *JNK Heaters Co., Ltd. |
6,208 | 37,719 | ||||||
| *JNTC Co., Ltd. |
1,489 | 10,500 | ||||||
| *JoyCity Corp. |
3,350 | 31,391 | ||||||
Dimensional World ex U.S. Core Equity 2 ETF
SCHEDULE OF INVESTMENTS
October 31, 2021
| Security Description |
Shares | Fair Value | ||||||
| KOREA, REPUBLIC OF (Continued) |
||||||||
| *Jungdawn Co., Ltd. |
6,535 | $ | 16,218 | |||||
| *Jusung Engineering Co., Ltd. |
5,310 | 51,121 | ||||||
| JW Holdings Corp. |
5,297 | 17,724 | ||||||
| JW Life Science Corp. |
2,832 | 39,261 | ||||||
| JW Pharmaceutical Corp. |
1,301 | 25,997 | ||||||
| JYP Entertainment Corp. |
7,688 | 344,744 | ||||||
| Kangnam Jevisco Co., Ltd. |
787 | 16,837 | ||||||
| *Kangwon Land, Inc. |
9,407 | 223,794 | ||||||
| KAON Media Co., Ltd. |
5,358 | 75,197 | ||||||
| KB Financial Group, Inc. |
50,982 | 2,469,369 | ||||||
| KB Financial Group, Inc. , Sponsored ADR |
12,984 | 624,141 | ||||||
| KC Green Holdings Co., Ltd. |
5,380 | 23,618 | ||||||
| KC Tech Co., Ltd. |
4,198 | 80,651 | ||||||
| KCC Glass Corp. |
2,521 | 129,658 | ||||||
| KCTC |
6,856 | 38,077 | ||||||
| *KEC Corp. |
10,010 | 31,695 | ||||||
| KEPCO Plant Service & Engineering Co., Ltd. |
6,940 | 248,546 | ||||||
| Keyang Electric Machinery Co., Ltd. |
5,070 | 20,132 | ||||||
| *KEYEAST Co., Ltd. |
4,075 | 52,657 | ||||||
| KG Chemical Corp. |
3,158 | 91,750 | ||||||
| Kginicis Co., Ltd. |
8,476 | 135,277 | ||||||
| KGMobilians Co., Ltd. |
11,569 | 90,984 | ||||||
| *KH FEELUX Co., Ltd. |
40,540 | 105,118 | ||||||
| *KH Vatec Co., Ltd. |
1,074 | 22,150 | ||||||
| Kia Corp. |
33,150 | 2,414,159 | ||||||
| *KineMaster Corp. |
1,862 | 27,327 | ||||||
| KINX, Inc. |
1,250 | 51,132 | ||||||
| KISWIRE, Ltd. |
3,796 | 89,170 | ||||||
| KIWOOM Securities Co., Ltd. |
8,850 | 795,216 | ||||||
| KleanNara Co., Ltd. |
13,123 | 50,255 | ||||||
| KM Corp. |
3,247 | 22,868 | ||||||
| KMH Co., Ltd. |
5,729 | 44,075 | ||||||
| *KMW Co., Ltd. |
3,893 | 137,257 | ||||||
| #Koentec Co., Ltd. |
9,065 | 70,128 | ||||||
| Koh Young Technology, Inc. |
3,275 | 51,708 | ||||||
| Kolmar BNH Co., Ltd. |
3,928 | 119,499 | ||||||
| Kolmar Korea Co., Ltd. |
1,851 | 70,726 | ||||||
| Kolon Global Corp. |
4,370 | 97,232 | ||||||
| Kolon Industries, Inc. |
8,088 | 617,389 | ||||||
| *Kolon Plastic, Inc. |
3,939 | 54,776 | ||||||
| KoMiCo., Ltd. |
2,650 | 185,050 | ||||||
| Kopla Co., Ltd. |
2,448 | 18,205 | ||||||
| Korea Aerospace Industries, Ltd. |
11,226 | 293,487 | ||||||
| Korea Arlico Pharm Co., Ltd. |
2,877 | 18,982 | ||||||
| Korea Cast Iron Pipe Industries Co., Ltd. |
2,347 | 19,723 | ||||||
| *Korea Circuit Co., Ltd. |
4,621 | 62,283 | ||||||
| Korea District Heating Corp. |
352 | 12,441 | ||||||
| #Korea Electric Power Corp. , Sponsored ADR |
16,026 | 153,689 | ||||||
| Korea Electric Power Corp. |
8,427 | 162,980 | ||||||
| Korea Electric Terminal Co., Ltd. |
2,571 | 165,672 | ||||||
| Korea Electronic Power Industrial Development Co., Ltd. |
2,574 | 36,786 | ||||||
| Korea Flange Co., Ltd. |
4,442 | 11,024 | ||||||
| Korea Fuel-Tech Corp. |
11,559 | 36,055 | ||||||
| *Korea Gas Corp. |
4,518 | 171,278 | ||||||
| *Korea Information & Communications Co., Ltd. |
4,831 | 38,324 | ||||||
Dimensional World ex U.S. Core Equity 2 ETF
SCHEDULE OF INVESTMENTS
October 31, 2021
| Security Description |
Shares | Fair Value | ||||||
| KOREA, REPUBLIC OF (Continued) |
||||||||
| Korea Investment Holdings Co., Ltd. |
25,274 | $ | 1,881,681 | |||||
| *Korea Line Corp. |
107,559 | 259,566 | ||||||
| Korea Petrochemical Industries Co., Ltd. |
2,135 | 338,004 | ||||||
| Korea Petroleum Industries Co. |
1,250 | 13,746 | ||||||
| *Korea Shipbuilding & Offshore Engineering Co., Ltd. |
12,653 | 1,115,279 | ||||||
| Korea United Pharm, Inc. |
1,409 | 58,781 | ||||||
| Korea Zinc Co., Ltd. |
2,971 | 1,365,305 | ||||||
| *Korean Air Lines Co., Ltd. |
122,141 | 3,182,742 | ||||||
| Korean Drug Co., Ltd. |
2,263 | 17,797 | ||||||
| Korean Reinsurance Co. |
38,045 | 314,505 | ||||||
| *KOSES Co., Ltd. |
2,037 | 21,528 | ||||||
| *KPM Tech Co., Ltd. |
13,178 | 15,337 | ||||||
| KSS LINE, Ltd. |
10,808 | 110,064 | ||||||
| *Kt alpha Co., Ltd. |
1,876 | 14,786 | ||||||
| KT Corp. , Sponsored ADR |
10,532 | 134,915 | ||||||
| KT Submarine Co., Ltd. |
1,746 | 8,965 | ||||||
| KT&G Corp. |
18,009 | 1,249,865 | ||||||
| KTB Investment & Securities Co., Ltd. |
35,583 | 200,365 | ||||||
| KTCS Corp. |
14,078 | 32,167 | ||||||
| Kukdo Chemical Co., Ltd. |
1,651 | 94,520 | ||||||
| Kukdong Corp. |
17,735 | 38,549 | ||||||
| Kukdong Oil & Chemicals Co., Ltd. |
4,465 | 16,507 | ||||||
| Kumho Petrochemical Co., Ltd. |
8,874 | 1,306,173 | ||||||
| *Kumho Tire Co., Inc. |
29,214 | 133,751 | ||||||
| KUMHOE&C Co., Ltd. |
4,803 | 49,528 | ||||||
| Kumkang Kind Co., Ltd. |
7,285 | 49,001 | ||||||
| Kwang Dong Pharmaceutical Co., Ltd. |
12,947 | 86,199 | ||||||
| Kyeryong Construction Industrial Co., Ltd. |
5,587 | 170,687 | ||||||
| Kyobo Securities Co., Ltd. |
10,286 | 77,373 | ||||||
| Kyongbo Pharmaceutical Co., Ltd. |
1,786 | 15,131 | ||||||
| Kyung Dong Navien Co., Ltd. |
2,793 | 160,139 | ||||||
| Kyungbang Co., Ltd. |
6,447 | 73,377 | ||||||
| *Kyungchang Industrial Co., Ltd. |
16,657 | 54,594 | ||||||
| KyungDong City Gas Co., Ltd. |
601 | 12,112 | ||||||
| Kyung-In Synthetic Corp. |
1,883 | 11,312 | ||||||
| L&C Bio Co., Ltd. |
697 | 20,399 | ||||||
| *Lake Materials Co., Ltd. |
7,482 | 29,837 | ||||||
| #LB Semicon, Inc. |
14,679 | 159,534 | ||||||
| LEADCorp., Inc. (The) |
14,653 | 125,395 | ||||||
| Lee Ku Industrial Co., Ltd. |
5,377 | 17,900 | ||||||
| LEENO Industrial, Inc. |
3,241 | 474,827 | ||||||
| *Leenos Corp. |
11,057 | 13,389 | ||||||
| LG Chem, Ltd. |
2,808 | 2,008,890 | ||||||
| LG Corp. |
13,227 | 1,032,307 | ||||||
| #*LG Display Co., Ltd. |
68,481 | 1,154,487 | ||||||
| #*LG Display Co., Ltd. , Sponsored ADR |
144,957 | 1,210,391 | ||||||
| LG Electronics, Inc. |
46,485 | 4,793,498 | ||||||
| LG HelloVision Co., Ltd. |
20,364 | 120,419 | ||||||
| LG Household & Health Care, Ltd. |
760 | 761,593 | ||||||
| #LG Innotek Co., Ltd. |
7,430 | 1,332,065 | ||||||
| LG Uplus Corp. |
142,792 | 1,753,511 | ||||||
| LIG Nex1 Co., Ltd. |
2,920 | 116,445 | ||||||
| Lion Chemtech Co., Ltd. |
1,399 | 10,919 | ||||||
| *Lock&Lock Co., Ltd. |
9,097 | 81,741 | ||||||
| LOT Vacuum Co., Ltd. |
1,372 | 17,083 | ||||||
| Lotte Chemical Corp. |
6,549 | 1,258,184 | ||||||
Dimensional World ex U.S. Core Equity 2 ETF
SCHEDULE OF INVESTMENTS
October 31, 2021
| Security Description |
Shares | Fair Value | ||||||
| KOREA, REPUBLIC OF (Continued) |
||||||||
| Lotte Chilsung Beverage Co., Ltd. |
1,606 | $ | 199,968 | |||||
| Lotte Confectionery Co., Ltd. |
563 | 61,910 | ||||||
| Lotte Corp. |
5,481 | 153,377 | ||||||
| Lotte Data Communication Co. |
860 | 28,150 | ||||||
| LOTTE Fine Chemical Co., Ltd. |
8,194 | 596,730 | ||||||
| Lotte Food Co., Ltd. |
197 | 64,231 | ||||||
| LOTTE Himart Co., Ltd. |
4,318 | 102,172 | ||||||
| *Lotte Non-Life Insurance Co., Ltd. |
41,650 | 65,582 | ||||||
| Lotte Shopping Co., Ltd. |
3,712 | 333,542 | ||||||
| LS Corp. |
6,302 | 337,602 | ||||||
| LS Electric Co., Ltd. |
7,649 | 385,543 | ||||||
| *Lumens Co., Ltd. |
22,437 | 19,066 | ||||||
| *LVMC Holdings |
29,041 | 83,006 | ||||||
| LX Hausys, Ltd. |
4,114 | 245,034 | ||||||
| *LX Holdings Corp. |
6,248 | 47,159 | ||||||
| LX INTERNATIONAL Corp. |
11,715 | 272,185 | ||||||
| LX Semicon Co., Ltd. |
5,681 | 532,829 | ||||||
| Macquarie Korea Infrastructure Fund |
64,371 | 754,681 | ||||||
| Maeil Dairies Co., Ltd. |
2,223 | 134,116 | ||||||
| Maeil Holdings Co., Ltd. |
4,128 | 34,973 | ||||||
| *Mando Corp. |
17,630 | 941,433 | ||||||
| Mcnex Co., Ltd. |
6,556 | 243,210 | ||||||
| ME2ON Co., Ltd. |
8,057 | 40,611 | ||||||
| *Medipost Co., Ltd. |
771 | 14,977 | ||||||
| Medytox, Inc. |
1,281 | 163,996 | ||||||
| Meerecompany, Inc. |
1,150 | 24,259 | ||||||
| MegaStudyEdu Co., Ltd. |
3,356 | 221,139 | ||||||
| Meritz Financial Group, Inc. |
26,181 | 744,956 | ||||||
| Meritz Fire & Marine Insurance Co., Ltd. |
32,093 | 760,752 | ||||||
| Meritz Securities Co., Ltd. |
185,167 | 738,418 | ||||||
| *Mgame Corp. |
3,179 | 25,654 | ||||||
| *MiCo., Ltd. |
22,418 | 267,623 | ||||||
| Mirae Asset Life Insurance Co., Ltd. |
45,023 | 164,711 | ||||||
| Mirae Asset Securities Co., Ltd. |
107,472 | 798,303 | ||||||
| Miwon Commercial Co., Ltd. |
279 | 49,542 | ||||||
| Miwon Holdings Co., Ltd. |
92 | 10,943 | ||||||
| Miwon Specialty Chemical Co., Ltd. |
1,128 | 208,022 | ||||||
| *Mobase Co., Ltd. |
3,216 | 9,577 | ||||||
| *Mobase Electronics Co., Ltd. |
7,749 | 14,523 | ||||||
| *Mobile Appliance, Inc. |
4,921 | 15,708 | ||||||
| MOM’S TOUCH&Co. |
7,857 | 32,845 | ||||||
| Moorim P&P Co., Ltd. |
12,956 | 49,560 | ||||||
| Moorim Paper Co., Ltd. |
3,983 | 9,322 | ||||||
| Mr Blue Corp. |
2,196 | 16,613 | ||||||
| Multicampus Co., Ltd. |
752 | 24,165 | ||||||
| Nam Hwa Construction Co., Ltd. |
1,132 | 8,951 | ||||||
| Namhae Chemical Corp. |
6,809 | 78,080 | ||||||
| *NamKwang Engineering & Construction Co., Ltd. |
1,419 | 18,458 | ||||||
| *Namsun Aluminum Co., Ltd. |
3,792 | 9,508 | ||||||
| *Namuga Co., Ltd. |
2,376 | 17,019 | ||||||
| Nasmedia Co., Ltd. |
1,454 | 43,861 | ||||||
| *Nat Games Co., Ltd. |
2,329 | 30,494 | ||||||
| NAVER Corp. |
2,389 | 832,076 | ||||||
| NCSoft Corp. |
1,344 | 721,140 | ||||||
| *NDFOS Co., Ltd. |
2,063 | 15,942 | ||||||
Dimensional World ex U.S. Core Equity 2 ETF
SCHEDULE OF INVESTMENTS
October 31, 2021
| Security Description |
Shares | Fair Value | ||||||
| KOREA, REPUBLIC OF (Continued) |
||||||||
| NeoPharm Co., Ltd. |
1,311 | $ | 29,955 | |||||
| *Neowiz |
3,484 | 78,115 | ||||||
| *NEPES Corp. |
2,785 | 83,535 | ||||||
| Netmarble Corp. |
661 | 69,859 | ||||||
| Newtree Co., Ltd. |
743 | 18,217 | ||||||
| Nexen Corp. |
11,315 | 48,608 | ||||||
| Nexen Tire Corp. |
19,176 | 124,224 | ||||||
| NH Investment & Securities Co., Ltd. |
57,348 | 645,352 | ||||||
| *NHN KCP Corp. |
4,946 | 242,104 | ||||||
| NI Steel Co., Ltd. |
10,022 | 34,692 | ||||||
| NICE Holdings Co., Ltd. |
8,074 | 116,769 | ||||||
| Nice Information & Telecommunication, Inc. |
4,184 | 120,305 | ||||||
| NICE Information Service Co., Ltd. |
12,936 | 219,189 | ||||||
| NICE Total Cash Management Co., Ltd. |
8,974 | 42,622 | ||||||
| *NK Co., Ltd. |
11,385 | 10,961 | ||||||
| Nong Shim Holdings Co., Ltd. |
919 | 60,871 | ||||||
| Nong Woo Bio Co., Ltd. |
1,832 | 18,578 | ||||||
| NongShim Co., Ltd. |
1,360 | 329,947 | ||||||
| Noroo Holdings Co., Ltd. |
1,230 | 12,842 | ||||||
| NOROO Paint & Coatings Co., Ltd. |
1,839 | 16,367 | ||||||
| NOVAREX Co., Ltd. |
1,890 | 67,122 | ||||||
| Npc |
3,066 | 16,687 | ||||||
| *NuriFlex Co., Ltd. |
2,500 | 17,030 | ||||||
| Oceanbridge Co., Ltd. |
1,265 | 14,885 | ||||||
| #*OCI Co., Ltd. |
6,769 | 750,148 | ||||||
| Okong Corp. |
2,287 | 8,611 | ||||||
| *Omnisystem Co., Ltd. |
9,523 | 18,173 | ||||||
| OptoElectronics Solutions Co., Ltd. |
2,293 | 65,343 | ||||||
| *OPTRON-TEC, Inc. |
11,325 | 81,893 | ||||||
| Orion Corp. |
2,635 | 266,082 | ||||||
| Orion Holdings Corp. |
9,991 | 136,799 | ||||||
| Osstem Implant Co., Ltd. |
5,380 | 568,594 | ||||||
| Ottogi Corp. |
417 | 171,646 | ||||||
| Paik Kwang Industrial Co., Ltd. |
13,521 | 65,028 | ||||||
| Pan Ocean Co., Ltd. |
77,892 | 401,275 | ||||||
| *Pan-Pacific Co., Ltd. |
8,830 | 20,553 | ||||||
| #*Paradise Co., Ltd. |
21,299 | 317,147 | ||||||
| Park Systems Corp. |
1,042 | 105,845 | ||||||
| Partron Co., Ltd. |
28,803 | 230,217 | ||||||
| *Pearl Abyss Corp. |
7,551 | 671,387 | ||||||
| People & Technology, Inc. |
3,673 | 109,698 | ||||||
| PHARMA RESEARCH PRODUCTS Co., Ltd. |
343 | 27,004 | ||||||
| *Pharmicell Co., Ltd. |
4,580 | 48,796 | ||||||
| PI Advanced Materials Co., Ltd. |
4,562 | 176,460 | ||||||
| *PNE Solution Co., Ltd. |
2,025 | 59,699 | ||||||
| Poongsan Corp. |
7,772 | 220,147 | ||||||
| *POSCO , Sponsored ADR |
33,942 | 2,147,171 | ||||||
| POSCO |
2,604 | 659,607 | ||||||
| POSCO Chemical Co., Ltd. |
763 | 95,004 | ||||||
| POSCO Coated & Color Steel Co., Ltd. |
373 | 18,226 | ||||||
| Posco ICT Co., Ltd. |
3,942 | 22,568 | ||||||
| #Posco International Corp. |
22,451 | 416,916 | ||||||
| *Power Logics Co., Ltd. |
18,336 | 123,961 | ||||||
| Protec Co., Ltd. |
1,581 | 36,395 | ||||||
| PSK, Inc. |
5,160 | 170,668 | ||||||
| Pulmuone Co., Ltd. |
8,790 | 128,253 | ||||||
Dimensional World ex U.S. Core Equity 2 ETF
SCHEDULE OF INVESTMENTS
October 31, 2021
| Security Description |
Shares | Fair Value | ||||||
| KOREA, REPUBLIC OF (Continued) |
||||||||
| Pungkuk Alcohol Industry Co., Ltd. |
1,844 | $ | 27,694 | |||||
| Pyeong Hwa Automotive Co., Ltd. |
2,201 | 20,813 | ||||||
| Rayence Co., Ltd. |
875 | 9,847 | ||||||
| *»Redrover Co., Ltd. |
4,271 | 1,254 | ||||||
| Reyon Pharmaceutical Co., Ltd. |
1,119 | 53,147 | ||||||
| RFHIC Corp. |
1,017 | 27,241 | ||||||
| *RFTech Co., Ltd. |
6,617 | 33,409 | ||||||
| Rsupport Co., Ltd. |
3,581 | 21,788 | ||||||
| S Net Systems, Inc. |
1,963 | 11,053 | ||||||
| #S&S Tech Corp. |
4,200 | 131,907 | ||||||
| S-1 Corp. |
5,222 | 372,250 | ||||||
| Sajo Industries Co., Ltd. |
712 | 29,064 | ||||||
| Sajodaerim Corp. |
851 | 20,245 | ||||||
| *Sajodongaone Co., Ltd. |
16,592 | 18,032 | ||||||
| *SAM KANG M&T Co., Ltd. |
1,181 | 20,971 | ||||||
| Sambo Corrugated Board Co., Ltd. |
1,487 | 18,324 | ||||||
| *Sambo Motors Co., Ltd. |
6,699 | 37,148 | ||||||
| *Sambu Engineering & Construction Co., Ltd. |
17,272 | 30,744 | ||||||
| Samchully Co., Ltd. |
408 | 32,960 | ||||||
| SAMHWA Paints Industrial Co., Ltd. |
2,901 | 24,950 | ||||||
| Samick Musical Instruments Co., Ltd. |
15,326 | 23,870 | ||||||
| Samick THK Co., Ltd. |
1,844 | 18,857 | ||||||
| Samji Electronics Co., Ltd. |
5,213 | 54,425 | ||||||
| Samjin LND Co., Ltd. |
3,154 | 11,309 | ||||||
| Samjin Pharmaceutical Co., Ltd. |
3,278 | 72,234 | ||||||
| *Samkee Corp. |
13,569 | 60,614 | ||||||
| SAMPYO Cement Co., Ltd. |
10,906 | 46,291 | ||||||
| *Samsung Biologics Co., Ltd. |
81 | 60,375 | ||||||
| Samsung Electro-Mechanics Co., Ltd. |
10,676 | 1,452,641 | ||||||
| Samsung Electronics Co., Ltd. |
524,115 | 31,306,514 | ||||||
| Samsung Electronics Co., Ltd. , Sponsored GDR |
10,022 | 14,962,846 | ||||||
| *Samsung Engineering Co., Ltd. |
45,873 | 973,557 | ||||||
| Samsung Fire & Marine Insurance Co., Ltd. |
11,559 | 2,284,993 | ||||||
| *Samsung Heavy Industries Co., Ltd. |
148,515 | 810,856 | ||||||
| Samsung Life Insurance Co., Ltd. |
10,369 | 597,179 | ||||||
| *Samsung Pharmaceutical Co., Ltd. |
3,763 | 18,806 | ||||||
| Samsung Publishing Co., Ltd. |
505 | 14,845 | ||||||
| Samsung SDI Co., Ltd. |
911 | 572,225 | ||||||
| Samsung SDS Co., Ltd. |
2,515 | 329,293 | ||||||
| Samsung Securities Co., Ltd. |
27,580 | 1,117,550 | ||||||
| SAMT Co., Ltd. |
30,865 | 138,405 | ||||||
| Samwha Capacitor Co., Ltd. |
3,281 | 159,200 | ||||||
| Samyang Corp. |
1,441 | 84,224 | ||||||
| Samyang Foods Co., Ltd. |
1,538 | 107,662 | ||||||
| Samyang Packaging Corp. |
2,270 | 51,187 | ||||||
| Sang-A Frontec Co., Ltd. |
687 | 37,038 | ||||||
| *Sangbo Corp. |
15,979 | 26,870 | ||||||
| Sangsin Energy Display Precision Co., Ltd. |
5,049 | 73,453 | ||||||
| SaraminHR Co., Ltd. |
2,474 | 97,177 | ||||||
| Satrec Initiative Co., Ltd. |
1,979 | 85,016 | ||||||
| SAVEZONE I&C Corp. |
10,599 | 28,934 | ||||||
| SCI Information Service, Inc. |
4,390 | 12,585 | ||||||
| *S-Connect Co., Ltd. |
28,101 | 43,887 | ||||||
| *SDN Co., Ltd. |
14,962 | 28,745 | ||||||
| Seah Besteel Corp. |
6,008 | 111,312 | ||||||
Dimensional World ex U.S. Core Equity 2 ETF
SCHEDULE OF INVESTMENTS
October 31, 2021
| Security Description |
Shares | Fair Value | ||||||
| KOREA, REPUBLIC OF (Continued) |
||||||||
| SeAH Holdings Corp. |
341 | $ | 32,391 | |||||
| SeAH Steel Corp. |
577 | 50,859 | ||||||
| SeAH Steel Holdings Corp. |
339 | 36,408 | ||||||
| Seegene, Inc. |
7,049 | 320,916 | ||||||
| *Seha Corp. |
17,828 | 28,377 | ||||||
| Sejin Heavy Industries Co., Ltd. |
3,770 | 20,970 | ||||||
| Sejong Industrial Co., Ltd. |
7,293 | 68,340 | ||||||
| Sempio Co. |
129 | 4,857 | ||||||
| Sempio Foods Co. |
863 | 34,083 | ||||||
| S-Energy Co., Ltd. |
3,885 | 15,642 | ||||||
| *Seojin System Co., Ltd. |
1,094 | 32,205 | ||||||
| Seoul Semiconductor Co., Ltd. |
19,036 | 242,725 | ||||||
| #Seoul Viosys Co., Ltd. |
5,001 | 60,129 | ||||||
| *Seowon Co., Ltd. |
9,585 | 17,512 | ||||||
| Seoyon Co., Ltd. |
5,173 | 69,280 | ||||||
| Seoyon E-Hwa Co., Ltd. |
6,437 | 42,471 | ||||||
| *Sewon Cellontech Co., Ltd. |
45,090 | 42,252 | ||||||
| SEWOONMEDICAL Co., Ltd. |
3,469 | 12,646 | ||||||
| SFA Engineering Corp. |
13,002 | 391,657 | ||||||
| *SFA Semicon Co., Ltd. |
43,839 | 237,475 | ||||||
| SGC e Tec E&C Co., Ltd. |
759 | 45,012 | ||||||
| *SH Energy & Chemical Co., Ltd. |
16,904 | 15,840 | ||||||
| Shin Heung Energy & Electronics Co., Ltd. |
1,891 | 106,319 | ||||||
| Shin Poong Pharmaceutical Co., Ltd. |
509 | 22,563 | ||||||
| Shindaeyang Paper Co., Ltd. |
1,347 | 100,862 | ||||||
| Shinhan Financial Group Co., Ltd. |
48,984 | 1,603,387 | ||||||
| Shinhan Financial Group Co., Ltd. , Sponsored ADR |
18,630 | 602,122 | ||||||
| Shinil Electronics Co., Ltd. |
17,933 | 29,772 | ||||||
| Shinsegae Engineering & Construction Co., Ltd. |
1,204 | 39,256 | ||||||
| Shinsegae Food Co., Ltd. |
965 | 74,653 | ||||||
| Shinsegae Information & Communication Co., Ltd. |
103 | 18,246 | ||||||
| Shinsegae International, Inc. |
339 | 48,737 | ||||||
| Shinsegae, Inc. |
2,932 | 622,255 | ||||||
| Shinsung Delta Tech Co., Ltd. |
2,191 | 30,468 | ||||||
| *Shinsung E&G Co., Ltd. |
17,911 | 36,173 | ||||||
| #*Shinsung Tongsang Co., Ltd. |
24,154 | 74,412 | ||||||
| Shinwha Intertek Corp. |
9,715 | 29,056 | ||||||
| *Shinwon Corp. |
10,590 | 31,084 | ||||||
| SHOWBOX Corp. |
5,429 | 32,243 | ||||||
| *Signetics Corp. |
32,920 | 49,300 | ||||||
| SIMMTECH Co., Ltd. |
11,808 | 309,713 | ||||||
| SIMMTECH HOLDINGS Co., Ltd. |
3,734 | 9,235 | ||||||
| SK Chemicals Co., Ltd. |
2,831 | 436,002 | ||||||
| SK D&D Co., Ltd. |
1,668 | 45,035 | ||||||
| SK Discovery Co., Ltd. |
6,508 | 265,655 | ||||||
| SK Gas, Ltd. |
1,109 | 130,493 | ||||||
| SK Hynix, Inc. |
92,845 | 8,183,676 | ||||||
| *SK Innovation Co., Ltd. |
10,446 | 2,167,776 | ||||||
| SK Materials Co., Ltd. |
1,887 | 615,086 | ||||||
| SK Networks Co., Ltd. |
81,031 | 352,957 | ||||||
| *SK Rent A Car Co., Ltd. |
4,007 | 41,491 | ||||||
| SK Securities Co., Ltd. |
177,816 | 149,277 | ||||||
| »SK Telecom Co., Ltd. |
2,483 | 648,128 | ||||||
| SK Telecom Co., Ltd. , Sponsored ADR |
2,392 | 69,368 | ||||||
| SK, Inc. |
5,342 | 1,110,869 | ||||||
| SKC Co., Ltd. |
2,940 | 447,837 | ||||||
Dimensional World ex U.S. Core Equity 2 ETF
SCHEDULE OF INVESTMENTS
October 31, 2021
| Security Description |
Shares | Fair Value | ||||||
| KOREA, REPUBLIC OF (Continued) |
||||||||
| SL Corp. |
6,248 | $ | 175,108 | |||||
| *SM Entertainment Co., Ltd. |
5,257 | 351,801 | ||||||
| *S-MAC Co., Ltd. |
97,175 | 96,464 | ||||||
| SNT Motiv Co., Ltd. |
3,786 | 162,968 | ||||||
| *SNU Precision Co., Ltd. |
5,496 | 16,438 | ||||||
| S-Oil Corp. |
3,936 | 345,249 | ||||||
| Solus Advanced Materials Co., Ltd. |
4,707 | 331,510 | ||||||
| Songwon Industrial Co., Ltd. |
5,192 | 79,532 | ||||||
| Soulbrain Co., Ltd. |
3,063 | 685,705 | ||||||
| *Soulbrain Holdings Co., Ltd. |
3,458 | 129,318 | ||||||
| SPC Samlip Co., Ltd. |
986 | 64,549 | ||||||
| Speco Co., Ltd. |
5,408 | 28,231 | ||||||
| SPG Co., Ltd. |
1,138 | 9,612 | ||||||
| Spigen Korea Co., Ltd. |
2,334 | 91,279 | ||||||
| SSANGYONG C&E Co., Ltd. |
48,615 | 326,582 | ||||||
| *»Ssangyong Motor Co. |
14,162 | 12,589 | ||||||
| *Studio Dragon Corp. |
2,045 | 150,678 | ||||||
| Suheung Co., Ltd. |
2,443 | 100,036 | ||||||
| Sun Kwang Co., Ltd. |
1,194 | 57,015 | ||||||
| Sung Kwang Bend Co., Ltd. |
9,457 | 74,212 | ||||||
| *Sungchang Enterprise Holdings, Ltd. |
14,019 | 30,532 | ||||||
| Sungdo Engineering & Construction Co., Ltd. |
5,870 | 27,628 | ||||||
| Sungshin Cement Co., Ltd. |
5,696 | 54,106 | ||||||
| Sungwoo Hitech Co., Ltd. |
20,748 | 106,710 | ||||||
| Sunjin Co., Ltd. |
8,292 | 91,893 | ||||||
| *Suprema, Inc. |
1,851 | 39,284 | ||||||
| SurplusGLOBAL, Inc. |
4,367 | 16,107 | ||||||
| SV Investment Corp. |
3,837 | 11,919 | ||||||
| *SY Co., Ltd. |
13,264 | 43,247 | ||||||
| *Synopex, Inc. |
20,512 | 52,572 | ||||||
| Systems Technology, Inc. |
2,361 | 33,135 | ||||||
| Tae Kyung Industrial Co., Ltd. |
2,111 | 11,634 | ||||||
| TAEKYUNG BK Co., Ltd. |
5,026 | 24,430 | ||||||
| *»Taewoong Co., Ltd. |
4,708 | 37,771 | ||||||
| Taeyoung Engineering & Construction Co., Ltd. |
14,037 | 133,337 | ||||||
| *Taihan Fiberoptics Co., Ltd. |
12,697 | 34,607 | ||||||
| *Taihan Textile Co., Ltd. |
1,266 | 50,053 | ||||||
| *Tailim Packaging Co., Ltd. |
2,666 | 9,536 | ||||||
| TechWing, Inc. |
5,406 | 98,308 | ||||||
| *Telcon RF Pharmaceutical, Inc. |
4,634 | 13,404 | ||||||
| TES Co., Ltd. |
2,306 | 52,591 | ||||||
| Tesna, Inc. |
3,991 | 155,569 | ||||||
| *Thinkware Systems Corp. |
2,319 | 34,531 | ||||||
| *TK Chemical Corp. |
20,345 | 120,655 | ||||||
| TK Corp. |
8,803 | 88,139 | ||||||
| Tokai Carbon Korea Co., Ltd. |
1,830 | 195,755 | ||||||
| Tongyang Life Insurance Co., Ltd. |
20,755 | 121,665 | ||||||
| *Top Engineering Co., Ltd. |
5,140 | 32,770 | ||||||
| Toptec Co., Ltd. |
7,009 | 52,303 | ||||||
| *Tovis Co., Ltd. |
8,847 | 64,353 | ||||||
| TS Corp. |
15,520 | 43,829 | ||||||
| TSE Co., Ltd. |
1,537 | 79,050 | ||||||
| *Tuksu Construction Co., Ltd. |
2,777 | 27,448 | ||||||
| *TY Holdings Co., Ltd. |
13,297 | 308,941 | ||||||
| Ubiquoss, Inc. |
642 | 11,537 | ||||||
Dimensional World ex U.S. Core Equity 2 ETF
SCHEDULE OF INVESTMENTS
October 31, 2021
| Security Description |
Shares | Fair Value | ||||||
| KOREA, REPUBLIC OF (Continued) |
||||||||
| Uni-Chem Co., Ltd. |
18,028 | $ | 21,367 | |||||
| *Unick Corp. |
4,767 | 29,780 | ||||||
| Unid Co., Ltd. |
3,047 | 303,774 | ||||||
| Union Semiconductor Equipment & Materials Co., Ltd. |
10,057 | 114,035 | ||||||
| Uniquest Corp. |
3,365 | 29,660 | ||||||
| UniTest, Inc. |
2,869 | 72,428 | ||||||
| Value Added Technology Co., Ltd. |
1,180 | 40,947 | ||||||
| Vieworks Co., Ltd. |
772 | 26,162 | ||||||
| Visang Education, Inc. |
1,083 | 7,831 | ||||||
| Vitzro Tech Co., Ltd. |
3,706 | 29,970 | ||||||
| *Vivien Corp. |
3,713 | 9,691 | ||||||
| *W Holding Co., Ltd. |
4,947 | 6,498 | ||||||
| Webcash Corp. |
1,881 | 49,095 | ||||||
| *Webzen, Inc. |
6,531 | 150,902 | ||||||
| *Welcron Co., Ltd. |
9,790 | 35,480 | ||||||
| Wemade Co., Ltd. |
1,236 | 193,351 | ||||||
| Wiable Corp. |
5,674 | 14,931 | ||||||
| *Willbes & Co. (The) |
9,382 | 15,215 | ||||||
| #Winix, Inc. |
4,065 | 70,269 | ||||||
| *Winpac, Inc. |
13,073 | 26,011 | ||||||
| Wins Co., Ltd. |
945 | 12,777 | ||||||
| WiSoL Co., Ltd. |
15,043 | 133,238 | ||||||
| *WONIK CUBE Corp. |
8,997 | 31,336 | ||||||
| WONIK IPS Co., Ltd. |
11,126 | 385,133 | ||||||
| Wonik Materials Co., Ltd. |
4,076 | 113,537 | ||||||
| *Wonik QnC Corp. |
7,136 | 153,584 | ||||||
| Woojin, Inc. |
4,027 | 33,290 | ||||||
| Woongjin Thinkbig Co., Ltd. |
10,864 | 31,098 | ||||||
| *Wooree Bio Co., Ltd. |
11,460 | 40,111 | ||||||
| *Wooree Lighting Co., Ltd. |
9,932 | 25,031 | ||||||
| Woori Financial Group, Inc. |
200,281 | 2,270,954 | ||||||
| Woori Financial Group, Inc. , ADR |
592 | 19,879 | ||||||
| Woori Investment Bank Co., Ltd. |
124,300 | 105,946 | ||||||
| *Wooridul Pharmaceutical, Ltd. |
2,161 | 21,822 | ||||||
| Woorison F&G Co., Ltd. |
32,073 | 63,539 | ||||||
| Woory Industrial Co., Ltd. |
1,316 | 27,817 | ||||||
| WooSung Co., Ltd. |
673 | 17,278 | ||||||
| *Woowon Development Co., Ltd. |
10,114 | 46,651 | ||||||
| Worldex Industry & Trading Co., Ltd. |
3,979 | 82,743 | ||||||
| Y G-1 Co., Ltd. |
8,699 | 64,393 | ||||||
| *»Y2 Solution Co., Ltd. |
1,719 | 673 | ||||||
| YAS Co., Ltd. |
1,235 | 13,581 | ||||||
| *Y-entec Co., Ltd. |
8,016 | 83,689 | ||||||
| Yeong Hwa Metal Co., Ltd. |
11,796 | 19,987 | ||||||
| *YG Entertainment, Inc. |
515 | 30,982 | ||||||
| *YIK Corp. |
2,888 | 13,173 | ||||||
| *YMT Co., Ltd. |
3,328 | 59,238 | ||||||
| Yonwoo Co., Ltd. |
670 | 13,990 | ||||||
| Youlchon Chemical Co., Ltd. |
2,827 | 53,223 | ||||||
| Youngone Corp. |
9,636 | 368,189 | ||||||
| Youngone Holdings Co., Ltd. |
2,822 | 113,503 | ||||||
| *YoungWoo DSP Co., Ltd. |
9,762 | 17,794 | ||||||
| Yuanta Securities Korea Co., Ltd. |
52,438 | 201,486 | ||||||
| Yuhan Corp. |
4,305 | 220,675 | ||||||
| *Yungjin Pharmaceutical Co., Ltd. |
7,605 | 30,523 | ||||||
| Yuyu Pharma, Inc. |
2,573 | 16,338 | ||||||
Dimensional World ex U.S. Core Equity 2 ETF
SCHEDULE OF INVESTMENTS
October 31, 2021
| Security Description |
Shares | Fair Value | ||||||
| KOREA, REPUBLIC OF (Continued) |
||||||||
| Zeus Co., Ltd. |
2,499 | $ | 44,375 | |||||
| Zinus, Inc. |
3,306 | 220,956 | ||||||
|
|
|
|||||||
| TOTAL KOREA, REPUBLIC OF |
216,029,519 | |||||||
|
|
|
|||||||
| MALAYSIA (0.5%) |
||||||||
| 7-Eleven Malaysia Holdings BHD |
145,056 | 53,595 | ||||||
| Able Global BHD |
84,100 | 35,541 | ||||||
| Aeon Co. M Bhd |
243,200 | 86,920 | ||||||
| AFFIN Bank BHD |
138,556 | 56,881 | ||||||
| #Alliance Bank Malaysia BHD |
376,100 | 249,765 | ||||||
| Allianz Malaysia BHD |
22,400 | 71,295 | ||||||
| *AMMB Holdings BHD |
604,200 | 490,247 | ||||||
| Apex Healthcare BHD |
14,400 | 9,633 | ||||||
| Astro Malaysia Holdings BHD |
206,700 | 49,666 | ||||||
| #Ata IMS BHD |
80,800 | 48,975 | ||||||
| Axiata Group BHD |
464,910 | 443,466 | ||||||
| Bank Islam Malaysia BHD |
160,600 | 124,105 | ||||||
| Batu Kawan BHD |
34,800 | 187,404 | ||||||
| *Berjaya Assets BHD |
277,000 | 16,723 | ||||||
| *Berjaya Corp. BHD |
1,209,254 | 74,465 | ||||||
| *Berjaya Sports Toto BHD |
319,825 | 160,646 | ||||||
| #Bermaz Auto BHD |
102,200 | 39,982 | ||||||
| #*Boustead Holdings BHD |
220,899 | 32,540 | ||||||
| Boustead Plantations BHD |
158,480 | 27,364 | ||||||
| *British American Tobacco Malaysia BHD |
45,900 | 167,373 | ||||||
| #*Bumi Armada BHD |
1,616,500 | 199,086 | ||||||
| Bursa Malaysia BHD |
219,300 | 397,716 | ||||||
| #Cahya Mata Sarawak BHD |
294,900 | 101,837 | ||||||
| Carlsberg Brewery Malaysia BHD |
50,200 | 268,881 | ||||||
| CB Industrial Product Holding BHD |
102,800 | 31,528 | ||||||
| CIMB Group Holdings BHD |
452,174 | 569,995 | ||||||
| #Comfort Glove BHD |
85,800 | 24,656 | ||||||
| #*Cypark Resources BHD |
91,500 | 21,985 | ||||||
| #D&O Green Technologies BHD |
248,900 | 338,999 | ||||||
| #Datasonic Group BHD |
427,400 | 48,510 | ||||||
| *Dayang Enterprise Holdings BHD |
309,472 | 73,613 | ||||||
| #Dialog Group BHD |
380,058 | 259,735 | ||||||
| *DiGi.Com BHD |
245,600 | 250,879 | ||||||
| #DRB-Hicom BHD |
497,400 | 198,191 | ||||||
| #Dufu Technology Corp. BHD |
55,700 | 59,722 | ||||||
| #Duopharma Biotech BHD |
134,490 | 54,887 | ||||||
| Dutch Lady Milk Industries BHD |
4,500 | 36,404 | ||||||
| Eco World Development Group BHD |
481,100 | 118,503 | ||||||
| *Ekovest BHD |
326,000 | 32,671 | ||||||
| FGV Holdings BHD |
33,800 | 12,243 | ||||||
| Formosa Prosonic Industries BHD |
31,300 | 32,955 | ||||||
| #*Fraser & Neave Holdings BHD |
32,100 | 209,762 | ||||||
| Frontken Corp. BHD |
483,450 | 444,807 | ||||||
| *Gadang Holdings BHD |
76,950 | 7,712 | ||||||
| *Gamuda BHD |
458,591 | 358,811 | ||||||
| #Gas Malaysia BHD |
80,000 | 52,354 | ||||||
| Gdex BHD |
172,500 | 13,330 | ||||||
| Genting Malaysia BHD |
510,600 | 390,872 | ||||||
| Genting Plantations BHD |
43,000 | 75,803 | ||||||
Dimensional World ex U.S. Core Equity 2 ETF
SCHEDULE OF INVESTMENTS
October 31, 2021
| Security Description |
Shares | Fair Value | ||||||
| MALAYSIA (Continued) |
||||||||
| George Kent Malaysia BHD |
195,300 | $ | 33,014 | |||||
| Globetronics Technology BHD |
190,533 | 96,164 | ||||||
| #Guan Chong BHD |
125,200 | 91,610 | ||||||
| Hai-O Enterprise BHD |
84,219 | 39,659 | ||||||
| HAP Seng Consolidated BHD |
209,180 | 396,033 | ||||||
| Hartalega Holdings BHD |
150,500 | 212,975 | ||||||
| #Heineken Malaysia BHD |
39,900 | 221,613 | ||||||
| #Hengyuan Refining Co. BHD |
58,600 | 61,416 | ||||||
| HeveaBoard BHD |
142,700 | 16,369 | ||||||
| Hextar Global BHD |
54,000 | 18,778 | ||||||
| *Hiap Teck Venture BHD |
425,300 | 58,028 | ||||||
| Hibiscus Petroleum BHD |
486,400 | 105,714 | ||||||
| #*Hong Leong Bank BHD |
22,032 | 100,131 | ||||||
| *Hong Leong Financial Group BHD |
43,353 | 192,005 | ||||||
| *Hong Leong Industries BHD |
36,400 | 80,166 | ||||||
| *IGB BHD |
7,600 | 3,579 | ||||||
| IHH Healthcare BHD |
20,400 | 32,218 | ||||||
| IJM Corp. BHD |
958,320 | 428,131 | ||||||
| #Inari Amertron BHD |
705,088 | 658,945 | ||||||
| IOI Corp. BHD |
104,826 | 99,485 | ||||||
| IOI Properties Group BHD |
412,924 | 127,636 | ||||||
| *Iskandar Waterfront City BHD |
179,900 | 17,160 | ||||||
| #*JAKS Resources BHD |
521,819 | 58,596 | ||||||
| #*Jaya Tiasa Holdings BHD |
170,800 | 29,285 | ||||||
| #JHM Consolidation BHD |
81,400 | 38,921 | ||||||
| Kelington Group BHD |
40,400 | 16,585 | ||||||
| Kenanga Investment Bank BHD |
238,800 | 74,391 | ||||||
| Kerjaya Prospek Group BHD |
151,176 | 49,650 | ||||||
| Kim Loong Resources BHD |
60,500 | 23,522 | ||||||
| #*KNM Group BHD |
414,000 | 20,495 | ||||||
| #Kossan Rubber Industries BHD |
360,200 | 205,282 | ||||||
| #*KPJ Healthcare BHD |
522,800 | 143,925 | ||||||
| #*Ksl Holdings BHD |
222,492 | 35,193 | ||||||
| Kuala Lumpur Kepong BHD |
17,718 | 92,505 | ||||||
| Lbs Bina Group BHD |
304,550 | 40,450 | ||||||
| #Leong Hup International BHD |
311,700 | 49,303 | ||||||
| #*Lii Hen Industries BHD |
52,800 | 39,017 | ||||||
| Lingkaran Trans Kota Holdings BHD |
48,400 | 44,999 | ||||||
| Lotte Chemical Titan Holding BHD |
125,591 | 82,494 | ||||||
| #LPI Capital BHD |
48,784 | 166,108 | ||||||
| Luxchem Corp. BHD |
139,900 | 25,338 | ||||||
| #*Magni-Tech Industries BHD |
170,666 | 87,785 | ||||||
| *Magnum BHD |
254,419 | 132,708 | ||||||
| #Mah Sing Group BHD |
576,440 | 112,755 | ||||||
| Malakoff Corp. BHD |
339,500 | 66,408 | ||||||
| Malayan Banking BHD |
211,952 | 412,029 | ||||||
| *Malayan Flour Mills BHD |
239,200 | 43,612 | ||||||
| #*Malaysia Airports Holdings BHD |
378,492 | 592,279 | ||||||
| Malaysia Building Society BHD |
802,494 | 124,027 | ||||||
| Malaysian Pacific Industries BHD |
44,675 | 514,394 | ||||||
| Malaysian Resources Corp. BHD |
926,897 | 91,772 | ||||||
| Matrix Concepts Holdings BHD |
351,975 | 182,745 | ||||||
| #Maxis BHD |
131,200 | 147,960 | ||||||
| *Media Prima BHD |
274,000 | 33,746 | ||||||
| Mega First Corp. BHD |
251,400 | 218,556 | ||||||
| *MISC BHD |
195,180 | 333,234 | ||||||
Dimensional World ex U.S. Core Equity 2 ETF
SCHEDULE OF INVESTMENTS
October 31, 2021
| Security Description |
Shares | Fair Value | ||||||
| MALAYSIA (Continued) |
||||||||
| MKH BHD |
124,324 | $ | 43,533 | |||||
| *MMC Corp. BHD |
227,500 | 108,778 | ||||||
| MNRB Holdings BHD |
105,800 | 33,981 | ||||||
| *MPHB Capital BHD |
114,100 | 37,198 | ||||||
| Muda Holdings BHD |
18,100 | 12,064 | ||||||
| Muhibbah Engineering M BHD |
122,000 | 28,136 | ||||||
| My EG Services BHD |
629,692 | 158,145 | ||||||
| N2n Connect BHD |
167,800 | 29,378 | ||||||
| *Nestle Malaysia BHD |
3,300 | 107,184 | ||||||
| *Ock Group BHD |
179,400 | 22,311 | ||||||
| #Padini Holdings BHD |
269,400 | 204,278 | ||||||
| Panasonic Manufacturing Malaysia BHD |
4,500 | 32,601 | ||||||
| Pantech Group Holdings BHD |
195,129 | 27,566 | ||||||
| Pentamaster Corp. BHD |
171,225 | 221,215 | ||||||
| Perak Transit BHD |
202,700 | 33,286 | ||||||
| #Petron Malaysia Refining & Marketing BHD |
36,200 | 39,426 | ||||||
| #Petronas Chemicals Group BHD |
234,400 | 491,895 | ||||||
| Petronas Dagangan BHD |
26,000 | 127,834 | ||||||
| *Petronas Gas BHD |
48,500 | 196,061 | ||||||
| #*Pos Malaysia BHD |
150,400 | 26,695 | ||||||
| Press Metal Aluminium Holdings BHD |
616,678 | 827,995 | ||||||
| #Public Bank BHD |
2,094,900 | 2,109,571 | ||||||
| QL Resources BHD |
259,057 | 315,923 | ||||||
| Ranhill Utilities BHD |
144,553 | 21,992 | ||||||
| RHB Bank BHD |
219,526 | 295,811 | ||||||
| *Sapura Energy BHD |
3,166,242 | 76,461 | ||||||
| #Sarawak Oil Palms BHD |
103,357 | 95,844 | ||||||
| Scientex BHD |
373,800 | 420,649 | ||||||
| #»Serba Dinamik Holdings BHD |
404,670 | 34,203 | ||||||
| *Shangri-La Hotels Malaysia BHD |
15,100 | 12,763 | ||||||
| Sime Darby BHD |
514,922 | 282,268 | ||||||
| #Sime Darby Plantation BHD |
96,119 | 93,078 | ||||||
| Sime Darby Property BHD |
543,222 | 95,106 | ||||||
| #Skp Resources BHD |
317,249 | 139,433 | ||||||
| Solarvest Holdings BHD |
43,800 | 14,385 | ||||||
| *SP Setia BHD Group |
587,024 | 221,144 | ||||||
| #Sunway BHD |
476,189 | 204,689 | ||||||
| Sunway Construction Group BHD |
111,780 | 44,269 | ||||||
| #Supermax Corp. BHD |
413,397 | 191,674 | ||||||
| Syarikat Takaful Malaysia Keluarga BHD |
155,628 | 149,201 | ||||||
| *Ta Ann Holdings BHD |
80,256 | 62,794 | ||||||
| Taliworks Corp. BHD |
69,500 | 14,098 | ||||||
| Telekom Malaysia BHD |
212,548 | 297,187 | ||||||
| #Tenaga Nasional BHD |
141,950 | 331,137 | ||||||
| *Thong Guan Industries BHD |
78,900 | 54,493 | ||||||
| TIME dotCom BHD |
267,600 | 292,092 | ||||||
| *Tmc Life Sciences BHD |
72,700 | 10,095 | ||||||
| Top Glove Corp. BHD |
688,000 | 451,910 | ||||||
| *Tropicana Corp. BHD |
220,288 | 53,729 | ||||||
| TSH Resources BHD |
164,100 | 46,365 | ||||||
| *Tune Protect Group BHD |
178,800 | 21,373 | ||||||
| Uchi Technologies BHD |
87,900 | 66,864 | ||||||
| *UEM Edgenta BHD |
78,600 | 34,925 | ||||||
| #*UEM Sunrise BHD |
605,058 | 57,715 | ||||||
| #UMW Holdings BHD |
90,600 | 74,607 | ||||||
Dimensional World ex U.S. Core Equity 2 ETF
SCHEDULE OF INVESTMENTS
October 31, 2021
| Security Description |
Shares | Fair Value | ||||||
| MALAYSIA (Continued) |
||||||||
| #Unisem M BHD |
102,000 | $ | 105,424 | |||||
| *United Plantations BHD |
22,600 | 77,280 | ||||||
| UOA Development BHD |
335,000 | 141,572 | ||||||
| #Uwc BHD |
42,100 | 62,423 | ||||||
| #*Velesto Energy BHD |
1,276,083 | 49,305 | ||||||
| ViTrox Corp. BHD |
25,900 | 123,089 | ||||||
| *VS Industry BHD |
801,100 | 305,660 | ||||||
| #*WCT Holdings BHD |
122,392 | 18,325 | ||||||
| Westports Holdings BHD |
163,100 | 176,058 | ||||||
| *Yinson Holdings BHD |
261,000 | 368,715 | ||||||
| YNH Property BHD |
134,015 | 86,409 | ||||||
| YTL Corp. BHD |
1,300,340 | 197,830 | ||||||
| YTL Power International BHD |
260,953 | 44,427 | ||||||
|
|
|
|||||||
| TOTAL MALAYSIA |
25,787,856 | |||||||
|
|
|
|||||||
| MEXICO (0.6%) |
||||||||
| ALFA Sab de CV |
1,725,090 | 1,252,061 | ||||||
| Alpek SAB de CV |
236,508 | 259,499 | ||||||
| *Alsea SAB de CV |
239,021 | 502,872 | ||||||
| America Movil Sab de CV, Sponsored ADR |
28,302 | 503,210 | ||||||
| *America Movil SAB de CV, Class L |
1,806,998 | 1,614,098 | ||||||
| Arca Continental SAB de CV |
61,482 | 375,692 | ||||||
| *Axtel SAB de CV |
675,377 | 153,861 | ||||||
| Banco del Bajio SA |
162,770 | 306,238 | ||||||
| Becle SAB de CV |
20,571 | 47,124 | ||||||
| Bolsa Mexicana de Valores SAB de CV |
230,541 | 442,610 | ||||||
| *Cemex Sab de CV, Sponsored ADR |
7,570 | 48,675 | ||||||
| *Cemex SAB de CV |
2,989,044 | 1,926,444 | ||||||
| Coca-Cola Femsa Sab de CV, Sponsored ADR |
3,136 | 168,560 | ||||||
| Coca-Cola Femsa SAB de CV, Class A |
13,350 | 72,102 | ||||||
| Consorcio ARA SAB de CV |
305,857 | 65,063 | ||||||
| *Controladora Vuela Cia de Aviacion Sab de CV, Sponsored ADR |
15,370 | 278,197 | ||||||
| *Controladora Vuela Cia de Aviacion SAB de CV, Class A |
25,993 | 47,385 | ||||||
| Corp. Inmobiliaria Vesta SAB de CV |
203,077 | 354,295 | ||||||
| Corp. Moctezuma SAB de CV |
73,800 | 235,414 | ||||||
| El Puerto de Liverpool SAB de CV |
40,077 | 177,706 | ||||||
| *»Empresas ICA Sab de CV |
117,564 | 549 | ||||||
| *Financiera Independencia Sab de CV Sofom Enr |
16,374 | 6,261 | ||||||
| *Fomento Economico Mexicano Sab de CV, Sponsored ADR |
997 | 81,943 | ||||||
| *Fomento Economico Mexicano SAB de CV |
41,878 | 345,046 | ||||||
| GCC SAB de CV |
50,206 | 374,290 | ||||||
| #*Genomma Lab Internacional SAB de CV, Class B |
221,511 | 212,421 | ||||||
| *Gruma SAB de CV, Class B |
77,554 | 912,655 | ||||||
| #*Grupo Aeroportuario del Centro Norte Sab de CV, Sponsored ADR |
512 | 24,776 | ||||||
| *Grupo Aeroportuario del Centro Norte SAB de CV |
74,672 | 451,565 | ||||||
| Grupo Aeroportuario del Pacifico Sab de CV, Sponsored ADR |
9,767 | 1,233,377 | ||||||
| Grupo Aeroportuario del Pacifico SAB de CV, Class B |
33,125 | 418,485 | ||||||
| Grupo Aeroportuario del Sureste SAB de CV, Sponsored ADR |
2,970 | 598,901 | ||||||
| #Grupo Bimbo SAB de CV, Class A |
317,628 | 942,231 | ||||||
| *Grupo Carso SAB de CV, Class A1 |
76,516 | 257,934 | ||||||
| Grupo Comercial Chedraui SA de CV |
204,267 | 403,701 | ||||||
| *Grupo Financiero Banorte SAB de CV, Class O |
489,532 | 3,106,192 | ||||||
| *Grupo Financiero Inbursa SAB de CV, Class O |
441,883 | 444,615 | ||||||
| *Grupo GICSA SAB de CV |
109,089 | 14,019 | ||||||
| Grupo Herdez SAB de CV |
82,896 | 152,774 | ||||||
Dimensional World ex U.S. Core Equity 2 ETF
SCHEDULE OF INVESTMENTS
October 31, 2021
| Security Description |
Shares | Fair Value | ||||||
| MEXICO (Continued) |
||||||||
| #Grupo Industrial Saltillo SAB de CV |
11,906 | $ | 17,329 | |||||
| Grupo Lala SAB de CV |
93,077 | 78,655 | ||||||
| Grupo Lamosa Sab de CV |
35,276 | 132,652 | ||||||
| *Grupo Mexico SAB de CV, Class B |
483,224 | 2,124,558 | ||||||
| #Grupo Rotoplas SAB de CV |
31,616 | 43,754 | ||||||
| *Grupo Sanborns Sab de CV |
53,862 | 62,926 | ||||||
| *Grupo Simec Sab de CV, ADR |
1,049 | 26,031 | ||||||
| *Grupo Simec SAB de CV, Class B |
35,729 | 295,687 | ||||||
| Grupo Televisa Sab , Sponsored ADR |
63,561 | 643,237 | ||||||
| Grupo Televisa SAB |
402,868 | 819,738 | ||||||
| *Grupo Traxion Sab de CV |
33,240 | 57,619 | ||||||
| *Hoteles City Express SAB de CV |
167,851 | 51,884 | ||||||
| Industrias Bachoco Sab de CV, ADR |
266 | 11,292 | ||||||
| Industrias Bachoco SAB de CV, Class B |
63,591 | 226,034 | ||||||
| *Industrias CH SAB de CV, Class B |
83,707 | 727,338 | ||||||
| *Industrias Penoles SAB de CV |
55,136 | 708,531 | ||||||
| *Kimberly-Clark de Mexico SAB de CV, Class A |
336,912 | 534,159 | ||||||
| La Comer SAB de CV |
254,723 | 460,518 | ||||||
| Megacable Holdings SAB de CV |
280,049 | 826,937 | ||||||
| #*Minera Frisco SAB de CV |
210,105 | 38,865 | ||||||
| *Nemak SAB de CV |
990,847 | 229,106 | ||||||
| Orbia Advance Corp. SAB de CV |
492,409 | 1,282,617 | ||||||
| Organizacion Cultiba SAB de CV |
12,061 | 6,047 | ||||||
| *Organizacion Soriana SAB de CV, Class B |
151,399 | 182,551 | ||||||
| Promotora y Operadora de Infraestructura SAB de CV |
4,232 | 20,020 | ||||||
| Promotora y Operadora de Infraestructura SAB de CV |
80,704 | 594,781 | ||||||
| #Qualitas Controladora SAB de CV |
57,781 | 268,246 | ||||||
| Regional Sab de CV |
124,507 | 652,687 | ||||||
| Telesites SAB de CV |
437,806 | 400,234 | ||||||
| #*Unifin Financiera SAB de CV |
74,424 | 114,554 | ||||||
| Vitro SAB de CV, Class A |
16,205 | 18,853 | ||||||
| Wal-Mart de Mexico SAB de CV |
146,133 | 510,822 | ||||||
|
|
|
|||||||
| TOTAL MEXICO |
30,981,103 | |||||||
|
|
|
|||||||
| NETHERLANDS (2.5%) |
||||||||
| Aalberts NV |
58,795 | 3,255,729 | ||||||
| ABN AMRO Bank NV |
89,301 | 1,315,147 | ||||||
| *Accell Group NV |
12,288 | 506,952 | ||||||
| *Adyen NV |
405 | 1,223,502 | ||||||
| Aegon NV |
329,830 | 1,673,731 | ||||||
| Aegon NV, Registered , Sponsored NYS |
251,107 | 1,268,090 | ||||||
| *AFC Ajax NV |
546 | 9,415 | ||||||
| Akzo Nobel NV |
58,572 | 6,738,911 | ||||||
| AMG Advanced Metallurgical Group NV |
7,922 | 234,143 | ||||||
| *Amsterdam Commodities NV |
8,922 | 250,897 | ||||||
| APERAM SA |
22,304 | 1,331,343 | ||||||
| Arcadis NV |
36,817 | 1,797,988 | ||||||
| ArcelorMittal SA |
14,749 | 500,526 | ||||||
| #ArcelorMittal SA, Sponsored NYS |
75,062 | 2,564,869 | ||||||
| ASM International NV |
14,661 | 6,640,646 | ||||||
| ASML Holding NV |
893 | 723,912 | ||||||
| ASML Holding NV, Sponsored NYS |
21,482 | 17,462,288 | ||||||
| ASR Nederland NV |
71,647 | 3,354,670 | ||||||
| B&S Group Sarl |
3,612 | 32,646 | ||||||
Dimensional World ex U.S. Core Equity 2 ETF
SCHEDULE OF INVESTMENTS
October 31, 2021
| Security Description |
Shares | Fair Value | ||||||
| NETHERLANDS (Continued) |
||||||||
| #*Basic-Fit NV |
9,905 | $ | 481,426 | |||||
| BE Semiconductor Industries NV |
45,533 | 4,160,632 | ||||||
| #*Beter Bed Holding NV |
7,640 | 46,329 | ||||||
| Boskalis Westminster |
34,192 | 1,020,869 | ||||||
| Brunel International NV |
6,552 | 90,077 | ||||||
| Coca-Cola Europacific Partners PLC |
39,096 | 2,071,257 | ||||||
| Corbion NV |
30,018 | 1,427,741 | ||||||
| ForFarmers NV |
13,965 | 66,664 | ||||||
| *Fugro NV |
26,659 | 226,138 | ||||||
| Grandvision NV |
24,330 | 799,625 | ||||||
| Heijmans NV |
16,397 | 228,464 | ||||||
| Heineken NV |
36,215 | 4,015,786 | ||||||
| *Hunter Douglas NV |
1,706 | 203,349 | ||||||
| IMCD NV |
13,172 | 2,927,467 | ||||||
| ING Groep NV |
212,573 | 3,227,512 | ||||||
| #ING Groep NV, Sponsored ADR |
92,618 | 1,401,310 | ||||||
| *Intertrust NV |
28,918 | 437,726 | ||||||
| Kendrion NV |
7,095 | 164,213 | ||||||
| Koninklijke Ahold Delhaize NV |
292,367 | 9,517,525 | ||||||
| Koninklijke Ahold Delhaize NV, ADR |
786 | 25,584 | ||||||
| *Koninklijke BAM Groep NV |
102,250 | 297,004 | ||||||
| Koninklijke DSM NV |
22,578 | 4,939,558 | ||||||
| Koninklijke KPN NV |
1,504,644 | 4,501,117 | ||||||
| Koninklijke Philips NV, Sponsored NYS |
39,145 | 1,849,601 | ||||||
| Koninklijke Vopak NV |
33,930 | 1,350,729 | ||||||
| *Lucas Bols NV |
700 | 8,198 | ||||||
| Nedap N.V. |
2,302 | 161,171 | ||||||
| NN Group NV |
62,272 | 3,338,008 | ||||||
| *OCI NV |
26,234 | 743,801 | ||||||
| Ordina NV |
48,363 | 201,485 | ||||||
| PostNL NV |
238,210 | 1,034,581 | ||||||
| Prosus NV |
13,693 | 1,207,637 | ||||||
| Randstad NV |
56,042 | 4,033,945 | ||||||
| SBM Offshore NV |
71,733 | 1,133,955 | ||||||
| Signify NV |
61,607 | 2,983,675 | ||||||
| *Sligro Food Group NV |
10,761 | 288,290 | ||||||
| *»Srh NV |
38,309 | – | ||||||
| TKH Group NV |
27,178 | 1,549,308 | ||||||
| *TomTom NV |
24,677 | 212,610 | ||||||
| Universal Music Group NV |
30,730 | 893,144 | ||||||
| Van Lanschot Kempen NV |
5,938 | 164,922 | ||||||
| Wolters Kluwer NV |
41,371 | 4,339,522 | ||||||
|
|
|
|||||||
| TOTAL NETHERLANDS |
118,657,360 | |||||||
|
|
|
|||||||
| NEW ZEALAND (0.3%) |
||||||||
| #*a2 Milk Co., Ltd. (The) |
89,196 | 419,384 | ||||||
| *Air New Zealand, Ltd. |
375,730 | 449,049 | ||||||
| Arvida Group, Ltd. |
183,467 | 262,597 | ||||||
| *Auckland International Airport, Ltd. |
64,306 | 367,705 | ||||||
| Briscoe Group, Ltd. |
8,520 | 42,194 | ||||||
| Chorus, Ltd. , ADR |
2,187 | 49,959 | ||||||
| Chorus, Ltd. |
206,024 | 939,200 | ||||||
| #Comvita, Ltd. |
5,949 | 15,837 | ||||||
| Contact Energy, Ltd. |
59,220 | 346,675 | ||||||
| EBOS Group, Ltd. |
29,859 | 774,612 | ||||||
Dimensional World ex U.S. Core Equity 2 ETF
SCHEDULE OF INVESTMENTS
October 31, 2021
| Security Description |
Shares | Fair Value | ||||||
| NEW ZEALAND (Continued) |
||||||||
| Fisher & Paykel Healthcare Corp., Ltd. |
40,778 | $ | 910,795 | |||||
| Fletcher Building, Ltd. |
184,065 | 944,477 | ||||||
| Fletcher Building, Ltd. |
12,299 | 62,355 | ||||||
| #Fonterra Co-operative Group, Ltd. |
16,318 | 46,712 | ||||||
| Freightways, Ltd. |
44,079 | 408,510 | ||||||
| Genesis Energy, Ltd. |
104,739 | 244,358 | ||||||
| #*Gentrack Group, Ltd. |
5,110 | 7,058 | ||||||
| Hallenstein Glasson Holdings, Ltd. |
13,766 | 68,961 | ||||||
| Heartland Group Holdings, Ltd. |
201,590 | 339,030 | ||||||
| *Infratil, Ltd. |
178,376 | 1,056,983 | ||||||
| Kathmandu Holdings, Ltd. |
211,207 | 240,329 | ||||||
| *Mainfreight, Ltd. |
19,790 | 1,273,229 | ||||||
| Mercury NZ, Ltd. |
28,664 | 125,850 | ||||||
| Meridian Energy, Ltd. |
66,110 | 236,085 | ||||||
| Napier Port Holdings, Ltd. |
6,780 | 14,847 | ||||||
| *NEW Zealand King Salmon Investments, Ltd. |
4,992 | 5,109 | ||||||
| #*New Zealand Refining Co., Ltd. (The) |
70,771 | 43,050 | ||||||
| NZME, Ltd. |
83,243 | 69,401 | ||||||
| NZX, Ltd. |
73,966 | 91,575 | ||||||
| Oceania Healthcare, Ltd. |
89,670 | 89,841 | ||||||
| *PGG Wrightson, Ltd. |
8,801 | 28,343 | ||||||
| Port of Tauranga, Ltd. |
61,481 | 303,592 | ||||||
| *Pushpay Holdings, Ltd. |
169,077 | 229,900 | ||||||
| *Rakon, Ltd. |
14,370 | 15,734 | ||||||
| *Restaurant Brands New Zealand, Ltd. |
9,039 | 100,783 | ||||||
| #*Ryman Healthcare, Ltd. |
34,578 | 357,576 | ||||||
| #*Sanford, Ltd. |
22,200 | 80,232 | ||||||
| Scales Corp., Ltd. |
45,399 | 174,145 | ||||||
| Skellerup Holdings, Ltd. |
36,263 | 161,679 | ||||||
| *SKY Network Television, Ltd. |
114,461 | 155,637 | ||||||
| SKYCITY Entertainment Group, Ltd. |
327,920 | 750,964 | ||||||
| Spark New Zealand, Ltd. |
378,255 | 1,235,738 | ||||||
| Steel & Tube Holdings, Ltd. |
99,869 | 85,051 | ||||||
| Summerset Group Holdings, Ltd. |
110,119 | 1,143,486 | ||||||
| #*Synlait Milk, Ltd. |
16,752 | 43,159 | ||||||
| *Tourism Holdings, Ltd. |
62,429 | 122,863 | ||||||
| TOWER, Ltd. |
151,190 | 68,707 | ||||||
| #Trustpower, Ltd. |
4,520 | 24,034 | ||||||
| #*Turners Automotive Group, Ltd. |
4,015 | 12,528 | ||||||
| Vector, Ltd. |
54,504 | 159,534 | ||||||
| #*Vista Group International, Ltd. |
37,480 | 67,861 | ||||||
| *Warehouse Group, Ltd. (The) |
49,900 | 143,915 | ||||||
| Z Energy, Ltd. |
179,206 | 461,696 | ||||||
|
|
|
|||||||
| TOTAL NEW ZEALAND |
15,872,924 | |||||||
|
|
|
|||||||
| NORWAY (0.7%) |
||||||||
| ABG Sundal Collier Holding ASA |
241,840 | 266,160 | ||||||
| *Adevinta ASA |
3,745 | 61,559 | ||||||
| *AF Gruppen ASA |
5,034 | 117,232 | ||||||
| *Akastor ASA |
70,814 | 49,222 | ||||||
| Aker ASA, A Shares |
2,562 | 235,324 | ||||||
| Aker BP ASA |
39,650 | 1,518,168 | ||||||
| *Aker Solutions ASA |
87,554 | 247,676 | ||||||
| American Shipping Co. ASA |
28,808 | 106,251 | ||||||
Dimensional World ex U.S. Core Equity 2 ETF
SCHEDULE OF INVESTMENTS
October 31, 2021
| Security Description |
Shares | Fair Value | ||||||
| NORWAY (Continued) |
||||||||
| *Archer, Ltd. |
34,943 | $ | 20,034 | |||||
| *ArcticZymes Technologies ASA |
5,823 | 60,954 | ||||||
| *Asetek A/S |
962 | 4,839 | ||||||
| Atea ASA |
39,793 | 743,240 | ||||||
| Austevoll Seafood ASA |
50,830 | 685,601 | ||||||
| Bakkafrost P/F |
1,985 | 183,076 | ||||||
| Bank Norwegian ASA |
57,578 | 711,957 | ||||||
| Bonheur ASA |
9,038 | 356,315 | ||||||
| Borregaard ASA |
48,634 | 1,178,581 | ||||||
| Bouvet ASA |
1,280 | 10,229 | ||||||
| *BW Energy, Ltd. |
19,283 | 62,800 | ||||||
| BW LPG, Ltd. |
42,167 | 224,311 | ||||||
| BW Offshore, Ltd. |
57,352 | 186,037 | ||||||
| *Crayon Group Holding ASA |
6,861 | 159,860 | ||||||
| #DNB Bank ASA |
76,909 | 1,825,604 | ||||||
| *DNO ASA |
269,933 | 392,488 | ||||||
| Entra ASA |
20,969 | 522,533 | ||||||
| Equinor ASA, Sponsored ADR |
36,145 | 919,167 | ||||||
| *Equinor ASA |
164,928 | 4,167,409 | ||||||
| Europris ASA |
92,211 | 680,194 | ||||||
| FLEX LNG, Ltd. |
12,239 | 246,826 | ||||||
| *Frontline, Ltd. |
60,043 | 533,050 | ||||||
| *Gaming Innovation Group, Inc. |
6,002 | 12,757 | ||||||
| Gjensidige Forsikring ASA |
12,648 | 314,133 | ||||||
| *Golar LNG, Ltd. |
3,007 | 39,181 | ||||||
| Golden Ocean Group, Ltd. |
19,143 | 172,437 | ||||||
| #*Grieg Seafood ASA |
33,933 | 376,463 | ||||||
| *Hafnia, Ltd. |
17,689 | 37,556 | ||||||
| *Hexagon Composites ASA |
8,722 | 35,076 | ||||||
| Kid ASA |
7,434 | 99,304 | ||||||
| Kitron ASA |
54,029 | 114,709 | ||||||
| Komplett Bank ASA |
21,722 | 19,618 | ||||||
| #*Kongsberg Automotive ASA |
150,680 | 53,437 | ||||||
| Kongsberg Gruppen ASA |
14,943 | 489,309 | ||||||
| Leroy Seafood Group ASA |
30,030 | 272,635 | ||||||
| Medistim ASA |
2,583 | 116,031 | ||||||
| Mowi ASA |
42,716 | 1,235,130 | ||||||
| *Nekkar ASA |
15,354 | 17,787 | ||||||
| #*NEL ASA |
159,809 | 336,836 | ||||||
| *Nordic Semiconductor ASA |
13,652 | 403,461 | ||||||
| Norsk Hydro ASA |
193,441 | 1,415,026 | ||||||
| *Norske Skog ASA |
12,104 | 49,722 | ||||||
| Norway Royal Salmon ASA |
1,121 | 23,508 | ||||||
| *Norwegian Energy Co. ASA |
2,343 | 45,368 | ||||||
| *Nrc Group ASA |
16,497 | 32,568 | ||||||
| *Odfjell Drilling, Ltd. |
46,226 | 116,832 | ||||||
| *Odfjell SE, A Shares |
2,716 | 10,178 | ||||||
| Okeanis Eco Tankers Corp. |
5,976 | 64,286 | ||||||
| Orkla ASA |
26,306 | 255,494 | ||||||
| *Otello Corp. ASA |
44,343 | 150,967 | ||||||
| Pareto Bank ASA |
8,257 | 60,127 | ||||||
| #*PGS ASA |
186,253 | 75,740 | ||||||
| Protector Forsikring ASA |
26,165 | 302,809 | ||||||
| *Q-Free ASA |
23,453 | 22,346 | ||||||
| Salmar ASA |
8,154 | 619,794 | ||||||
| Sbanken ASA |
11,283 | 132,046 | ||||||
Dimensional World ex U.S. Core Equity 2 ETF
SCHEDULE OF INVESTMENTS
October 31, 2021
| Security Description |
Shares | Fair Value | ||||||
| NORWAY (Continued) |
||||||||
| Scatec ASA |
21,475 | $ | 421,666 | |||||
| Schibsted ASA, Class B |
3,700 | 166,820 | ||||||
| Schibsted ASA, Class A |
3,700 | 190,570 | ||||||
| Selvaag Bolig ASA |
19,595 | 120,220 | ||||||
| *Shelf Drilling, Ltd. |
87,900 | 63,177 | ||||||
| *Solon Eiendom ASA |
8,436 | 38,494 | ||||||
| Sparebank 1 Oestlandet |
1,103 | 18,150 | ||||||
| SpareBank 1 SR-Bank ASA |
56,107 | 858,256 | ||||||
| Stolt-Nielsen, Ltd. |
14,968 | 230,024 | ||||||
| Storebrand ASA |
143,621 | 1,537,178 | ||||||
| Subsea 7 SA |
69,622 | 623,522 | ||||||
| Telenor ASA |
52,519 | 827,895 | ||||||
| TGS ASA |
47,856 | 439,678 | ||||||
| TOMRA Systems ASA |
11,535 | 743,428 | ||||||
| Veidekke ASA |
38,821 | 558,041 | ||||||
| *Wallenius Wilhelmsen ASA |
22,907 | 104,254 | ||||||
| XXL ASA |
70,048 | 115,763 | ||||||
| Yara International ASA |
28,341 | 1,476,802 | ||||||
|
|
|
|||||||
| TOTAL NORWAY |
32,533,306 | |||||||
|
|
|
|||||||
| PERU (0.0%) |
||||||||
| *Aenza SAA, Class A , ADR |
8,827 | 17,124 | ||||||
| Cementos Pacasmayo SAA , ADR |
4,207 | 25,873 | ||||||
| #*Cia de Minas Buenaventura SAA , Sponsored ADR |
955 | 7,526 | ||||||
| CrediCorp., Ltd. |
3,948 | 511,898 | ||||||
|
|
|
|||||||
| TOTAL PERU |
562,421 | |||||||
|
|
|
|||||||
| PHILIPPINES (0.2%) |
||||||||
| Aboitiz Equity Ventures, Inc. |
252,080 | 242,029 | ||||||
| Aboitiz Power Corp. |
157,100 | 100,194 | ||||||
| AC Energy Corp. |
439,721 | 106,943 | ||||||
| Alliance Global Group, Inc. |
1,124,000 | 231,890 | ||||||
| *Apex Mining Co., Inc. |
379,000 | 10,902 | ||||||
| *Atlas Consolidated Mining & Development Corp. |
277,700 | 34,706 | ||||||
| Ayala Corp. |
15,885 | 271,945 | ||||||
| Ayala Land, Inc. |
479,000 | 333,523 | ||||||
| *Bank of the Philippine Islands |
281,915 | 486,263 | ||||||
| BDO Unibank, Inc. |
397,886 | 979,521 | ||||||
| *Belle Corp. |
909,800 | 25,267 | ||||||
| *Bloomberry Resorts Corp. |
1,472,300 | 198,604 | ||||||
| *Cebu Air, Inc. |
74,220 | 65,150 | ||||||
| Cebu Landmasters, Inc. |
478,033 | 27,501 | ||||||
| Century Pacific Food, Inc. |
283,700 | 159,268 | ||||||
| *Chelsea Logistics and Infrastructure Holdings Corp. |
150,500 | 5,881 | ||||||
| China Banking Corp. |
277,867 | 133,118 | ||||||
| Cosco Capital, Inc. |
592,500 | 61,354 | ||||||
| D&L Industries, Inc. |
813,700 | 136,235 | ||||||
| DMCI Holdings, Inc. |
2,220,150 | 350,133 | ||||||
| DoubleDragon Properties Corp. |
126,160 | 25,728 | ||||||
| Eagle Cement Corp. |
123,800 | 35,364 | ||||||
| *East West Banking Corp. |
261,350 | 49,097 | ||||||
| *EEI Corp. |
113,400 | 14,622 | ||||||
| Emperador, Inc. |
507,900 | 184,380 | ||||||
Dimensional World ex U.S. Core Equity 2 ETF
SCHEDULE OF INVESTMENTS
October 31, 2021
| Security Description |
Shares | Fair Value | ||||||
| PHILIPPINES (Continued) |
||||||||
| *Filinvest Land, Inc. |
2,767,000 | $ | 63,123 | |||||
| First Gen Corp. |
83,700 | 49,977 | ||||||
| Global Ferronickel Holdings, Inc. |
428,820 | 18,034 | ||||||
| *Globe Telecom, Inc. |
5,920 | 351,841 | ||||||
| GT Capital Holdings, Inc. |
17,350 | 194,460 | ||||||
| Holcim Philippines, Inc. |
119,600 | 13,903 | ||||||
| *Integrated Micro-Electronics, Inc. |
310,479 | 54,693 | ||||||
| International Container Terminal Services, Inc. |
168,860 | 602,952 | ||||||
| JG Summit Holdings, Inc. |
306,500 | 366,025 | ||||||
| *Jollibee Foods Corp. |
68,710 | 320,583 | ||||||
| LT Group, Inc. |
367,000 | 73,240 | ||||||
| Manila Electric Co. |
17,040 | 97,014 | ||||||
| *Manila Water Co., Inc. |
313,200 | 164,646 | ||||||
| *Megawide Construction Corp. |
314,600 | 38,069 | ||||||
| *Megaworld Corp. |
2,852,500 | 173,719 | ||||||
| Metro Pacific Investments Corp. |
1,985,800 | 147,724 | ||||||
| Metropolitan Bank & Trust Co. |
461,151 | 436,360 | ||||||
| Nickel Asia Corp. |
1,519,860 | 165,222 | ||||||
| Philex Mining Corp. |
680,300 | 70,311 | ||||||
| *Philippine National Bank |
24,873 | 9,918 | ||||||
| Philippine Stock Exchange, Inc. (The) |
312 | 1,362 | ||||||
| *Phoenix Petroleum Philippines, Inc. |
115,600 | 26,142 | ||||||
| *Pilipinas Shell Petroleum Corp. |
116,030 | 49,717 | ||||||
| Pldt, Inc. , Sponsored ADR |
10,690 | 350,846 | ||||||
| PLDT, Inc. |
15,340 | 499,668 | ||||||
| *»Pnb Holdings Corp. |
24,721 | 156 | ||||||
| Premium Leisure Corp. |
1,877,000 | 16,197 | ||||||
| Puregold Price Club, Inc. |
333,700 | 279,683 | ||||||
| RFM Corp. |
137,000 | 12,230 | ||||||
| Rizal Commercial Banking Corp. |
104,967 | 40,271 | ||||||
| Robinsons Land Corp. |
1,047,378 | 353,212 | ||||||
| Robinsons Retail Holdings, Inc. |
250,430 | 309,250 | ||||||
| San Miguel Corp. |
90,210 | 209,196 | ||||||
| San Miguel Food and Beverage, Inc. |
54,530 | 82,211 | ||||||
| *Security Bank Corp. |
76,964 | 184,585 | ||||||
| Semirara Mining & Power Corp. |
517,340 | 266,829 | ||||||
| SM Investments Corp. |
575 | 11,007 | ||||||
| SM Prime Holdings, Inc. |
358,425 | 235,348 | ||||||
| *Top Frontier Investment Holdings, Inc. |
3,465 | 8,998 | ||||||
| Union Bank of the Philippines |
60,005 | 107,785 | ||||||
| Universal Robina Corp. |
85,940 | 235,265 | ||||||
| Vista Land & Lifescapes, Inc. |
1,668,000 | 124,744 | ||||||
| Wilcon Depot, Inc. |
239,200 | 148,047 | ||||||
|
|
|
|||||||
| TOTAL PHILIPPINES |
11,234,181 | |||||||
|
|
|
|||||||
| POLAND (0.3%) |
||||||||
| *11 bit studios SA |
217 | 22,644 | ||||||
| AB SA |
714 | 10,209 | ||||||
| *Agora SA |
8,317 | 17,065 | ||||||
| *Alior Bank SA |
44,822 | 707,861 | ||||||
| Amica SA |
1,516 | 46,773 | ||||||
| *AmRest Holdings SE |
12,150 | 97,465 | ||||||
| Apator SA |
3,256 | 17,641 | ||||||
| Asseco Poland SA |
6,311 | 155,533 | ||||||
| Auto Partner SA |
3,732 | 12,638 | ||||||
Dimensional World ex U.S. Core Equity 2 ETF
SCHEDULE OF INVESTMENTS
October 31, 2021
| Security Description |
Shares | Fair Value | ||||||
| POLAND (Continued) |
||||||||
| Bank Handlowy w Warszawie SA |
12,222 | $ | 177,506 | |||||
| *Bank Millennium SA |
215,693 | 495,050 | ||||||
| *Bank Ochrony Srodowiska SA |
4,661 | 14,088 | ||||||
| Bank Polska Kasa Opieki SA |
18,982 | 627,313 | ||||||
| *Boryszew SA |
54,851 | 43,890 | ||||||
| Budimex SA |
3,875 | 247,858 | ||||||
| *CCC SA |
4,109 | 124,198 | ||||||
| CD Projekt SA |
869 | 37,902 | ||||||
| Ciech SA |
19,145 | 170,481 | ||||||
| Cognor Holding SA |
24,487 | 26,749 | ||||||
| ComArch SA |
886 | 49,782 | ||||||
| Cyfrowy Polsat SA |
36,563 | 327,234 | ||||||
| Develia SA |
100,816 | 90,785 | ||||||
| *Dino Polska SA |
8,103 | 724,395 | ||||||
| Dom Development SA |
1,479 | 49,712 | ||||||
| Echo Investment SA |
1,495 | 1,729 | ||||||
| *Enea SA |
103,846 | 263,350 | ||||||
| *Erbud SA |
1,560 | 28,644 | ||||||
| #Eurocash SA |
25,664 | 63,409 | ||||||
| Fabryki Mebli Forte SA |
1,825 | 20,920 | ||||||
| *Famur SA |
116,994 | 91,414 | ||||||
| *Globe Trade Centre SA |
18,382 | 31,585 | ||||||
| *Grupa Azoty SA |
22,035 | 164,710 | ||||||
| Grupa Kety SA |
2,908 | 456,626 | ||||||
| *Grupa Lotos SA |
57,892 | 900,040 | ||||||
| *ING Bank Slaski SA |
2,413 | 164,633 | ||||||
| Inter Cars SA |
2,270 | 260,216 | ||||||
| *Jastrzebska Spolka Weglowa SA |
19,759 | 256,736 | ||||||
| Kernel Holding SA |
31,719 | 478,970 | ||||||
| KGHM Polska Miedz SA |
38,511 | 1,481,843 | ||||||
| LiveChat Software SA |
2,273 | 69,559 | ||||||
| Lpp SA |
221 | 794,384 | ||||||
| *Lubelski Wegiel Bogdanka SA |
6,074 | 61,248 | ||||||
| *mBank SA |
4,307 | 609,861 | ||||||
| Mirbud SA |
19,238 | 18,579 | ||||||
| Neuca SA |
532 | 124,371 | ||||||
| NEWAG SA |
1,769 | 10,250 | ||||||
| *Orange Polska SA |
161,071 | 314,534 | ||||||
| *PGE Polska Grupa Energetyczna SA |
309,510 | 761,460 | ||||||
| *PKP Cargo SA |
10,504 | 48,427 | ||||||
| Playway SA |
135 | 15,543 | ||||||
| Polski Koncern Naftowy ORLEN SA |
68,967 | 1,488,794 | ||||||
| Polskie Gornictwo Naftowe i Gazownictwo SA |
101,680 | 153,439 | ||||||
| *Powszechna Kasa Oszczednosci Bank Polski SA |
39,680 | 485,717 | ||||||
| Powszechny Zaklad Ubezpieczen SA |
29,761 | 297,860 | ||||||
| Santander Bank Polska SA |
2,212 | 205,573 | ||||||
| *Tauron Polska Energia SA |
493,823 | 407,034 | ||||||
| Ten Square Games SA |
455 | 40,311 | ||||||
| *TIM SA |
1,094 | 11,608 | ||||||
| *VRG SA |
23,900 | 22,721 | ||||||
| Warsaw Stock Exchange |
11,142 | 123,028 | ||||||
| Wawel SA |
108 | 15,929 | ||||||
| Wirtualna Polska Holding SA |
1,158 | 42,409 | ||||||
|
|
|
|||||||
| TOTAL POLAND |
15,082,236 | |||||||
|
|
|
|||||||
Dimensional World ex U.S. Core Equity 2 ETF
SCHEDULE OF INVESTMENTS
October 31, 2021
| Security Description |
Shares | Fair Value | ||||||
| PORTUGAL (0.2%) |
||||||||
| Altri SGPS SA |
42,109 | $ | 272,891 | |||||
| *Banco Comercial Portugues SA, Registered |
3,684,968 | 665,676 | ||||||
| *»Banco Espirito Santo SA, Registered |
499,965 | — | ||||||
| CTT-Correios de Portugal SA |
45,285 | 249,452 | ||||||
| EDP—Energias de Portugal SA |
178,902 | 1,011,153 | ||||||
| EDP Renovaveis SA |
17,816 | 496,882 | ||||||
| Galp Energia SGPS SA |
220,380 | 2,293,266 | ||||||
| *Greenvolt-Energias Renovaveis SA |
765 | 6,038 | ||||||
| Jeronimo Martins SGPS SA |
50,768 | 1,151,521 | ||||||
| #*Mota-Engil SGPS SA |
52,154 | 81,479 | ||||||
| Navigator Co. SA (The) |
74,103 | 289,853 | ||||||
| NOS SGPS SA |
177,258 | 692,113 | ||||||
| REN—Redes Energeticas Nacionais SGPS SA |
65,309 | 199,149 | ||||||
| Sonae SGPS SA |
361,328 | 397,866 | ||||||
|
|
|
|||||||
| TOTAL PORTUGAL |
7,807,339 | |||||||
|
|
|
|||||||
| QATAR (0.2%) |
||||||||
| Aamal Co. |
775,544 | 232,386 | ||||||
| Al Khaleej Takaful Group Qsc |
64,871 | 79,748 | ||||||
| »Al Khalij Commercial Bank PQSC |
305,721 | 188,084 | ||||||
| Al Meera Consumer Goods Co. QSC |
26,523 | 142,704 | ||||||
| Barwa Real Estate Co. |
491,820 | 425,496 | ||||||
| Doha Bank QPSC |
333,387 | 264,073 | ||||||
| Doha Insurance Co. QSC |
38,447 | 20,485 | ||||||
| *Gulf International Services QSC |
423,578 | 214,058 | ||||||
| Gulf Warehousing Co. |
79,627 | 107,117 | ||||||
| Industries Qatar QSC |
102,035 | 444,459 | ||||||
| *Investment Holding Group |
191,210 | 72,682 | ||||||
| Mannai Corp. QSC |
61,697 | 81,862 | ||||||
| Masraf Al Rayan QSC |
399,005 | 523,276 | ||||||
| Mazaya Real Estate Development QPSC |
280,466 | 80,265 | ||||||
| Medicare Group |
35,621 | 82,855 | ||||||
| Mesaieed Petrochemical Holding Co. |
414,598 | 273,286 | ||||||
| Ooredoo QPSC |
129,518 | 246,159 | ||||||
| Qatar Electricity & Water Co. QSC |
67,810 | 312,883 | ||||||
| *Qatar First Bank |
127,068 | 63,726 | ||||||
| Qatar Fuel QSC |
92,763 | 468,528 | ||||||
| Qatar Gas Transport Co., Ltd. |
489,061 | 436,542 | ||||||
| Qatar Industrial Manufacturing Co. QSC |
84,358 | 73,909 | ||||||
| *Qatar Insurance Co. SAQ |
416,810 | 280,468 | ||||||
| Qatar International Islamic Bank QSC |
159,759 | 429,564 | ||||||
| Qatar Islamic Bank SAQ |
103,797 | 525,114 | ||||||
| Qatar National Bank QPSC |
339,422 | 1,911,055 | ||||||
| Qatar National Cement Co. QSC |
54,520 | 75,903 | ||||||
| *Salam International Investment, Ltd. QSC |
394,015 | 103,238 | ||||||
| United Development Co. QSC |
867,345 | 369,950 | ||||||
| Vodafone Qatar QSC |
730,335 | 324,950 | ||||||
| Widam Food Co. |
18,611 | 20,850 | ||||||
|
|
|
|||||||
| TOTAL QATAR |
8,875,675 | |||||||
|
|
|
|||||||
| RUSSIAN FEDERATION (0.3%) |
||||||||
| Etalon Group PLC, Registered , GDR |
68,399 | 107,523 | ||||||
| Gazprom PJSC, Sponsored ADR |
21,000 | 206,850 | ||||||
| Gazprom PJSC, ADR |
162,969 | 1,598,074 | ||||||
Dimensional World ex U.S. Core Equity 2 ETF
SCHEDULE OF INVESTMENTS
October 31, 2021
| Security Description |
Shares | Fair Value | ||||||
| RUSSIAN FEDERATION (Continued) |
||||||||
| Globaltrans Investment PLC, GDR |
46,684 | $ | 411,286 | |||||
| LUKOIL PJSC, Sponsored ADR |
4,888 | 498,723 | ||||||
| LUKOIL PJSC, ADR |
18,449 | 1,881,798 | ||||||
| Magnitogorsk Iron & Steel Works PJSC, GDR |
39,857 | 486,255 | ||||||
| *Mail.Ru Group, Ltd. , GDR |
11,740 | 240,200 | ||||||
| *Mechel PJSC, ADR |
18,460 | 77,532 | ||||||
| MMC Norilsk Nickel PJSC, ADR |
28,296 | 885,382 | ||||||
| Mobile TeleSystems PJSC, Sponsored ADR |
62,662 | 575,864 | ||||||
| Novatek PJSC, GDR |
516 | 130,806 | ||||||
| Novolipetsk Steel PJSC, GDR |
20,659 | 652,411 | ||||||
| PhosAgro PJSC, GDR |
19,434 | 464,861 | ||||||
| Polyus PJSC, Class G , GDR |
3,186 | 315,733 | ||||||
| Qiwi PLC, Sponsored ADR |
4,768 | 41,720 | ||||||
| Ros Agro PLC, Registered , GDR |
22,112 | 367,501 | ||||||
| Rosneft Oil Co. PJSC, GDR |
184,938 | 1,647,798 | ||||||
| Rostelecom PJSC, Sponsored ADR |
10,240 | 82,841 | ||||||
| Rostelecom PJSC, ADR |
8,231 | 64,696 | ||||||
| RusHydro PJSC, ADR |
224,424 | 245,520 | ||||||
| Sberbank of Russia PJSC, Sponsored ADR |
33,168 | 666,013 | ||||||
| Sberbank of Russia PJSC, ADR |
58,680 | 1,174,774 | ||||||
| Severstal PAO , GDR |
15,581 | 356,182 | ||||||
| Severstal PAO , Sponsored GDR |
4,738 | 107,908 | ||||||
| Tatneft PJSC, Sponsored ADR |
25,235 | 1,151,094 | ||||||
| Tatneft PJSC, ADR |
9,520 | 435,540 | ||||||
| *VEON, Ltd. , Sponsored ADR |
125,134 | 264,033 | ||||||
| VTB Bank PJSC, GDR |
471,930 | 687,130 | ||||||
| X5 Retail Group NV, GDR |
22,397 | 762,394 | ||||||
|
|
|
|||||||
| TOTAL RUSSIAN FEDERATION |
16,588,442 | |||||||
|
|
|
|||||||
| SAUDI ARABIA (0.8%) |
||||||||
| *Abdul Mohsen Al-Hokair Tourism and Development Co. |
15,184 | 89,382 | ||||||
| Abdullah Al Othaim Markets Co. |
13,324 | 411,346 | ||||||
| Advanced Petrochemical Co. |
13,239 | 262,599 | ||||||
| *Al Alamiya For Cooperative Insurance Co. |
5,354 | 37,398 | ||||||
| Al Babtain Power & Telecommunication Co. |
11,865 | 117,040 | ||||||
| Al Hammadi Co. for Development and Investment |
12,672 | 142,906 | ||||||
| *Al Hassan Ghazi Ibrahim Shaker Co. |
14,581 | 93,607 | ||||||
| *Al Jouf Cement Co. |
33,735 | 107,926 | ||||||
| Al Khaleej Training and Education Co. |
4,245 | 31,405 | ||||||
| Al Moammar Information Systems Co. |
2,460 | 98,508 | ||||||
| Al Rajhi Bank |
84,842 | 3,135,008 | ||||||
| *Al Rajhi Co. for Co-operative Insurance |
9,689 | 241,004 | ||||||
| Al Yamamah Steel Industries Co. |
8,808 | 106,375 | ||||||
| *AlAbdullatif Industrial Investment Co. |
8,254 | 75,808 | ||||||
| Alandalus Property Co. |
10,725 | 57,415 | ||||||
| Aldrees Petroleum and Transport Services Co. |
10,248 | 202,179 | ||||||
| *Al-Etihad Cooperative Insurance Co. |
9,148 | 53,802 | ||||||
| Alinma Bank |
159,915 | 1,072,239 | ||||||
| *Aljazira Takaful Ta’awuni Co. |
6,567 | 48,409 | ||||||
| *Allianz Saudi Fransi Cooperative Insurance Co. |
8,030 | 53,949 | ||||||
| Almarai Co. JSC |
26,916 | 379,604 | ||||||
| *Alujain Holding |
2,015 | 34,059 | ||||||
| Arab National Bank |
14,556 | 89,333 | ||||||
| Arabian Cement Co. |
18,008 | 187,238 | ||||||
Dimensional World ex U.S. Core Equity 2 ETF
SCHEDULE OF INVESTMENTS
October 31, 2021
| Security Description |
Shares | Fair Value | ||||||
| SAUDI ARABIA (Continued) |
||||||||
| Arabian Centres Co., Ltd. |
23,473 | $ | 159,578 | |||||
| *Arabian Shield Cooperative Insurance Co. |
7,704 | 50,033 | ||||||
| Arriyadh Development Co. |
31,399 | 222,670 | ||||||
| *Aseer Trading Tourism & Manufacturing Co. |
28,188 | 171,192 | ||||||
| Astra Industrial Group |
23,081 | 265,522 | ||||||
| *AXA Cooperative Insurance Co. |
10,630 | 102,732 | ||||||
| *Bank AlBilad |
90,899 | 1,022,671 | ||||||
| Bank Al-Jazira |
137,065 | 701,604 | ||||||
| Banque Saudi Fransi |
3,321 | 37,408 | ||||||
| *Basic Chemical Industries, Ltd. |
5,420 | 68,276 | ||||||
| *Batic Investments and Logistic Co. |
4,349 | 49,741 | ||||||
| Bawan Co. |
12,761 | 134,894 | ||||||
| Bupa Arabia for Cooperative Insurance Co. |
10,244 | 394,914 | ||||||
| City Cement Co. |
26,119 | 168,653 | ||||||
| Co. For Cooperative Insurance (The) |
19,516 | 447,459 | ||||||
| Dallah Healthcare Co. |
7,412 | 143,264 | ||||||
| *Dar Al Arkan Real Estate Development Co. |
259,402 | 683,965 | ||||||
| *Dur Hospitality Co. |
14,869 | 141,717 | ||||||
| Eastern Province Cement Co. |
15,419 | 197,316 | ||||||
| Electrical Industries Co. |
5,577 | 45,200 | ||||||
| *Emaar Economic City |
145,161 | 491,494 | ||||||
| Etihad Etisalat Co. |
188,919 | 1,523,581 | ||||||
| Fitaihi Holding Group |
3,170 | 41,454 | ||||||
| Hail Cement Co. |
17,472 | 68,753 | ||||||
| Halwani Brothers Co. |
4,216 | 105,206 | ||||||
| Herfy Food Services Co. |
5,236 | 91,573 | ||||||
| Jarir Marketing Co. |
9,188 | 496,768 | ||||||
| *Jazan Energy and Development Co. |
13,313 | 83,337 | ||||||
| Leejam Sports Co. JSC |
3,928 | 118,964 | ||||||
| Maharah Human Resources Co. |
3,533 | 81,004 | ||||||
| *Malath Cooperative Insurance Co. |
10,359 | 79,814 | ||||||
| *Mediterranean & Gulf Insurance & Reinsurance Co.(The) |
8,185 | 50,931 | ||||||
| *Methanol Chemicals Co. |
9,142 | 86,523 | ||||||
| *Middle East Healthcare Co. |
9,974 | 98,652 | ||||||
| *Middle East Paper Co. |
14,592 | 180,119 | ||||||
| *Mobile Telecommunications Co. |
222,627 | 806,013 | ||||||
| Mouwasat Medical Services Co. |
7,901 | 378,736 | ||||||
| Najran Cement Co. |
40,781 | 205,487 | ||||||
| *Nama Chemicals Co. |
2,845 | 31,022 | ||||||
| *National Agriculture Development Co. (The) |
25,821 | 244,380 | ||||||
| *National Co for Glass Manufacturing (The) |
4,939 | 48,588 | ||||||
| National Gas & Industrialization Co. |
8,440 | 132,982 | ||||||
| National Gypsum |
2,553 | 31,377 | ||||||
| *National Industrialization Co. |
112,236 | 745,068 | ||||||
| National Medical Care Co. |
11,148 | 180,703 | ||||||
| National Petrochemical Co. |
33,174 | 425,410 | ||||||
| Northern Region Cement Co. |
37,269 | 147,848 | ||||||
| Qassim Cement Co. (The) |
14,012 | 304,828 | ||||||
| *Rabigh Refining & Petrochemical Co. |
96,245 | 731,286 | ||||||
| Riyad Bank |
115,253 | 907,976 | ||||||
| SABIC Agri-Nutrients Co. |
16,611 | 726,280 | ||||||
| Sahara International Petrochemical Co. |
125,225 | 1,465,616 | ||||||
| *Salama Cooperative Insurance Co. |
7,968 | 46,522 | ||||||
| *Saudi Arabian Mining Co. |
40,373 | 878,306 | ||||||
| Saudi Automotive Services Co. |
11,420 | 102,908 | ||||||
| Saudi Basic Industries Corp. |
31,058 | 1,068,139 | ||||||
Dimensional World ex U.S. Core Equity 2 ETF
SCHEDULE OF INVESTMENTS
October 31, 2021
| Security Description |
Shares | Fair Value | ||||||
| SAUDI ARABIA (Continued) |
||||||||
| Saudi British Bank (The) |
12,690 | $ | 112,153 | |||||
| Saudi Cement Co. |
28,476 | 449,433 | ||||||
| Saudi Ceramic Co. |
18,465 | 267,309 | ||||||
| Saudi Chemical Co. Holding |
19,265 | 194,915 | ||||||
| Saudi Co. For Hardware CJSC |
4,141 | 63,370 | ||||||
| Saudi Electricity Co. |
30,904 | 234,814 | ||||||
| *Saudi Ground Services Co. |
22,744 | 226,173 | ||||||
| Saudi Industrial Investment Group |
62,164 | 627,291 | ||||||
| Saudi Industrial Services Co. |
25,547 | 239,744 | ||||||
| Saudi Investment Bank (The) |
7,557 | 36,305 | ||||||
| *Saudi Kayan Petrochemical Co. |
386,563 | 2,098,276 | ||||||
| *Saudi Marketing Co. |
10,474 | 90,334 | ||||||
| Saudi National Bank (The) |
173,121 | 3,041,583 | ||||||
| *Saudi Paper Manufacturing Co. |
775 | 12,376 | ||||||
| Saudi Pharmaceutical Industries & Medical Appliances Corp. |
6,974 | 79,578 | ||||||
| *Saudi Printing & Packaging Co. |
10,200 | 73,830 | ||||||
| *Saudi Public Transport Co. |
14,061 | 90,718 | ||||||
| *Saudi Re for Cooperative Reinsurance Co. |
16,970 | 86,413 | ||||||
| *Saudi Real Estate Co. |
12,843 | 76,492 | ||||||
| *Saudi Research & Marketing Group |
7,364 | 331,792 | ||||||
| Saudi Telecom Co. |
44,284 | 1,381,329 | ||||||
| Saudia Dairy & Foodstuff Co. |
5,235 | 228,889 | ||||||
| Savola Group (The) |
96,943 | 945,937 | ||||||
| *Seera Group Holding |
79,978 | 494,678 | ||||||
| Southern Province Cement Co. |
20,908 | 399,108 | ||||||
| *Tabuk Cement Co. |
14,840 | 75,171 | ||||||
| *Takween Advanced Industries Co. |
12,357 | 66,613 | ||||||
| Umm Al-Qura Cement Co. |
14,668 | 103,825 | ||||||
| United Electronics Co. |
6,189 | 232,321 | ||||||
| United International Transportation Co. |
20,551 | 275,043 | ||||||
| United Wire Factories Co. |
8,670 | 79,167 | ||||||
| *Walaa Cooperative Insurance Co. |
8,863 | 51,606 | ||||||
| *Yamama Cement Co. |
36,465 | 269,290 | ||||||
| Yanbu Cement Co. |
23,315 | 238,067 | ||||||
| Yanbu National Petrochemical Co. |
20,984 | 425,733 | ||||||
| Zahrat Al Waha For Trading Co. |
2,134 | 43,239 | ||||||
| *Zamil Industrial Investment Co. |
10,654 | 100,408 | ||||||
|
|
|
|||||||
| TOTAL SAUDI ARABIA |
39,388,319 | |||||||
|
|
|
|||||||
| SINGAPORE (0.6%) |
||||||||
| »Accordia Golf Trust |
312,200 | — | ||||||
| AEM Holdings, Ltd. |
59,700 | 185,497 | ||||||
| *Amara Holdings, Ltd. |
25,000 | 6,952 | ||||||
| *Aspial Corp., Ltd. |
58,100 | 5,084 | ||||||
| *Avarga, Ltd. |
188,400 | 41,215 | ||||||
| *Banyan Tree Holdings, Ltd. |
203,300 | 51,258 | ||||||
| *»Best World International, Ltd. |
114,600 | 21,484 | ||||||
| *Bonvests Holdings, Ltd. |
22,000 | 15,336 | ||||||
| Boustead Projects, Ltd. |
15,189 | 11,376 | ||||||
| Bukit Sembawang Estates, Ltd. |
56,100 | 217,577 | ||||||
| Bund Center Investment, Ltd. |
64,750 | 24,728 | ||||||
| CapitaLand Integrated Commercial Trust |
50 | 80 | ||||||
| *Capitaland Investment, Ltd. |
152,500 | 389,025 | ||||||
| *Centurion Corp., Ltd. |
57,200 | 13,998 | ||||||
Dimensional World ex U.S. Core Equity 2 ETF
SCHEDULE OF INVESTMENTS
October 31, 2021
| Security Description |
Shares | Fair Value | ||||||
| SINGAPORE (Continued) |
||||||||
| China Aviation Oil Singapore Corp., Ltd. |
132,800 | $ | 98,480 | |||||
| China Sunsine Chemical Holdings, Ltd. |
230,000 | 86,986 | ||||||
| Chip Eng Seng Corp., Ltd. |
198,400 | 63,264 | ||||||
| City Developments, Ltd. |
74,700 | 405,491 | ||||||
| Civmec, Ltd. |
16,000 | 8,424 | ||||||
| ComfortDelGro Corp., Ltd. |
606,000 | 701,046 | ||||||
| *COSCO Shipping International Singapore Co., Ltd. |
139,800 | 28,509 | ||||||
| CSE Global, Ltd. |
83,500 | 31,889 | ||||||
| Dairy Farm International Holdings, Ltd. |
39,800 | 142,086 | ||||||
| *DBS Group Holdings, Ltd. |
124,974 | 2,922,084 | ||||||
| Del Monte Pacific, Ltd. |
252,659 | 73,072 | ||||||
| Delfi, Ltd. |
21,900 | 12,505 | ||||||
| *»Ezion Holdings, Ltd. |
1,747,154 | 10,494 | ||||||
| #*»Ezra Holdings, Ltd. |
767,465 | 1,172 | ||||||
| Far East Orchard, Ltd. |
55,776 | 45,911 | ||||||
| First Resources, Ltd. |
228,800 | 302,013 | ||||||
| Food Empire Holdings, Ltd. |
131,300 | 79,841 | ||||||
| Frasers Property, Ltd. |
110,100 | 95,526 | ||||||
| Frencken Group, Ltd. |
147,500 | 249,388 | ||||||
| *Fu Yu Corp., Ltd. |
231,600 | 49,806 | ||||||
| *Gallant Venture, Ltd. |
282,900 | 27,063 | ||||||
| Genting Singapore, Ltd. |
490,000 | 283,426 | ||||||
| Geo Energy Resources, Ltd. |
267,800 | 67,521 | ||||||
| *Golden Agri-Resources, Ltd. |
2,679,700 | 526,600 | ||||||
| *Golden Energy & Resources, Ltd. |
117,900 | 31,038 | ||||||
| Great Eastern Holdings, Ltd. |
6,700 | 106,922 | ||||||
| *GuocoLand, Ltd. |
129,766 | 163,591 | ||||||
| *Halcyon Agri Corp., Ltd. |
115,355 | 22,669 | ||||||
| *Hiap Hoe, Ltd. |
39,000 | 19,088 | ||||||
| Ho Bee Land, Ltd. |
79,100 | 165,415 | ||||||
| *Hong Fok Corp., Ltd. |
141,220 | 82,732 | ||||||
| Hong Leong Asia, Ltd. |
146,400 | 91,195 | ||||||
| Hongkong Land Holdings, Ltd. |
147,400 | 812,174 | ||||||
| Hotel Grand Central, Ltd. |
42,775 | 33,465 | ||||||
| Hour Glass, Ltd. (The) |
18,700 | 27,180 | ||||||
| Hutchison Port Holdings Trust, Class U |
2,676,800 | 575,512 | ||||||
| *»Hyflux, Ltd. |
291,500 | 17,942 | ||||||
| iFAST Corp., Ltd. |
61,900 | 397,060 | ||||||
| *Indofood Agri Resources, Ltd. |
175,000 | 42,825 | ||||||
| Japfa, Ltd. |
369,240 | 187,564 | ||||||
| Jardine Cycle & Carriage, Ltd. |
24,355 | 406,368 | ||||||
| Keppel Corp., Ltd. |
200,100 | 798,323 | ||||||
| Keppel Infrastructure Trust |
710,515 | 279,253 | ||||||
| KSH Holdings, Ltd. |
66,000 | 17,620 | ||||||
| Low Keng Huat Singapore, Ltd. |
66,000 | 23,493 | ||||||
| *Mandarin Oriental International, Ltd. |
21,800 | 50,576 | ||||||
| *»Midas Holdings, Ltd. |
550,500 | 14,696 | ||||||
| *mm2 Asia, Ltd. |
270,800 | 11,848 | ||||||
| NetLink NBN Trust |
238,000 | 180,022 | ||||||
| *Oceanus Group, Ltd. |
2,196,800 | 65,163 | ||||||
| Olam International, Ltd. |
180,205 | 227,177 | ||||||
| OUE, Ltd. |
165,800 | 169,673 | ||||||
| Oversea-Chinese Banking Corp., Ltd. |
155,626 | 1,361,799 | ||||||
| Oxley Holdings, Ltd. |
468,652 | 69,507 | ||||||
| *Pan-United Corp., Ltd. |
53,750 | 12,157 | ||||||
| Q&M Dental Group Singapore, Ltd. |
112,920 | 47,312 | ||||||
Dimensional World ex U.S. Core Equity 2 ETF
SCHEDULE OF INVESTMENTS
October 31, 2021
| Security Description |
Shares | Fair Value | ||||||
| SINGAPORE (Continued) |
||||||||
| QAF, Ltd. |
102,907 | $ | 66,773 | |||||
| *Raffles Education Corp., Ltd. |
143,481 | 8,193 | ||||||
| Raffles Medical Group, Ltd. |
84,311 | 85,655 | ||||||
| Riverstone Holdings, Ltd. |
165,200 | 105,356 | ||||||
| *SATS, Ltd. |
142,370 | 442,366 | ||||||
| SBS Transit, Ltd. |
22,300 | 49,776 | ||||||
| Sembcorp Industries, Ltd. |
652,700 | 972,879 | ||||||
| *Sembcorp Marine, Ltd. |
8,508,220 | 498,442 | ||||||
| Sheng Siong Group, Ltd. |
252,300 | 265,677 | ||||||
| *SIA Engineering Co., Ltd. |
16,700 | 26,874 | ||||||
| SIIC Environment Holdings, Ltd. |
499,200 | 83,292 | ||||||
| *Sinarmas Land, Ltd. |
520,200 | 104,156 | ||||||
| Sing Holdings, Ltd. |
16,000 | 4,509 | ||||||
| *Singapore Airlines, Ltd. |
556,850 | 2,147,290 | ||||||
| *Singapore Exchange, Ltd. |
124,600 | 894,422 | ||||||
| Singapore Land Group, Ltd. |
80,613 | 162,003 | ||||||
| Singapore Technologies Engineering, Ltd. |
180,900 | 513,791 | ||||||
| Singapore Telecommunications, Ltd. |
40,000 | 73,563 | ||||||
| Singapore Telecommunications, Ltd. |
589,700 | 1,093,252 | ||||||
| *Stamford Land Corp., Ltd. |
150,000 | 56,174 | ||||||
| StarHub, Ltd. |
209,100 | 192,276 | ||||||
| *»Swiber Holdings, Ltd. |
105,749 | 1,600 | ||||||
| *Tai Sin Electric, Ltd. |
55,856 | 16,568 | ||||||
| Tuan Sing Holdings, Ltd. |
243,540 | 88,494 | ||||||
| *UMS Holdings, Ltd. |
243,750 | 238,598 | ||||||
| United Overseas Bank, Ltd. |
108,392 | 2,150,156 | ||||||
| UOB-Kay Hian Holdings, Ltd. |
121,701 | 142,594 | ||||||
| UOL Group, Ltd. |
137,755 | 738,575 | ||||||
| Valuetronics Holdings, Ltd. |
309,480 | 133,110 | ||||||
| Venture Corp., Ltd. |
93,700 | 1,307,006 | ||||||
| Vicom, Ltd. |
18,400 | 28,108 | ||||||
| Wee Hur Holdings, Ltd. |
112,500 | 16,351 | ||||||
| Wilmar International, Ltd. |
213,900 | 685,241 | ||||||
| *Wing Tai Holdings, Ltd. |
211,800 | 304,703 | ||||||
|
|
|
|||||||
| TOTAL SINGAPORE |
27,505,389 | |||||||
|
|
|
|||||||
| SOUTH AFRICA (1.6%) |
||||||||
| Absa Group, Ltd. |
222,777 | 2,051,893 | ||||||
| Adcock Ingram Holdings, Ltd. |
28,223 | 90,964 | ||||||
| Advtech, Ltd. |
276,567 | 349,348 | ||||||
| AECI, Ltd. |
70,081 | 518,231 | ||||||
| African Rainbow Minerals, Ltd. |
56,458 | 755,980 | ||||||
| Afrimat, Ltd. |
19,640 | 65,122 | ||||||
| Alexander Forbes Group Holdings, Ltd. |
384,692 | 111,105 | ||||||
| Altron, Ltd., Class A |
61,028 | 44,004 | ||||||
| Alviva Holdings, Ltd. |
57,884 | 56,856 | ||||||
| Anglo American Platinum, Ltd. |
10,754 | 1,091,955 | ||||||
| #AngloGold Ashanti, Ltd. , Sponsored ADR |
49,366 | 912,284 | ||||||
| AngloGold Ashanti, Ltd. |
36,658 | 688,013 | ||||||
| Aspen Pharmacare Holdings, Ltd. |
139,860 | 2,238,220 | ||||||
| *Astral Foods, Ltd. |
26,679 | 310,670 | ||||||
| *Aveng, Ltd. |
7,346,707 | 29,000 | ||||||
| AVI, Ltd. |
147,219 | 766,120 | ||||||
| Balwin Properties, Ltd. |
30,346 | 6,987 | ||||||
Dimensional World ex U.S. Core Equity 2 ETF
SCHEDULE OF INVESTMENTS
October 31, 2021
| Security Description |
Shares | Fair Value | ||||||
| SOUTH AFRICA (Continued) |
||||||||
| *Barloworld, Ltd. |
131,044 | $ | 1,106,029 | |||||
| Bid Corp., Ltd. |
64,263 | 1,386,051 | ||||||
| Bidvest Group, Ltd. (The) |
76,133 | 958,625 | ||||||
| *Blue Label Telecoms, Ltd. |
237,264 | 86,476 | ||||||
| Capitec Bank Holdings, Ltd. |
15,477 | 1,737,884 | ||||||
| Cashbuild, Ltd. |
13,762 | 240,735 | ||||||
| *City Lodge Hotels, Ltd. |
256,396 | 91,088 | ||||||
| *Clicks Group, Ltd. |
71,269 | 1,307,411 | ||||||
| Coronation Fund Managers, Ltd. |
81,420 | 271,096 | ||||||
| *Curro Holdings, Ltd. |
41,356 | 33,466 | ||||||
| *DataTec, Ltd. |
119,829 | 327,953 | ||||||
| Dis-Chem Pharmacies, Ltd. |
59,209 | 124,456 | ||||||
| *Discovery, Ltd. |
110,176 | 1,014,272 | ||||||
| *Distell Group Holdings, Ltd. |
16,311 | 196,129 | ||||||
| DRDGOLD, Ltd. |
30,163 | 27,226 | ||||||
| *EOH Holdings, Ltd. |
18,687 | 9,405 | ||||||
| Exxaro Resources, Ltd. |
88,827 | 977,389 | ||||||
| *Famous Brands, Ltd. |
23,111 | 111,997 | ||||||
| FirstRand, Ltd. |
598,714 | 2,284,960 | ||||||
| *Foschini Group, Ltd. (The) |
148,634 | 1,268,278 | ||||||
| Gold Fields, Ltd. , Sponsored ADR |
502,437 | 4,662,615 | ||||||
| *Grindrod Shipping Holdings, Ltd. |
5,985 | 85,763 | ||||||
| *Grindrod, Ltd. |
206,608 | 69,730 | ||||||
| Harmony Gold Mining Co., Ltd. |
14,209 | 51,872 | ||||||
| #Harmony Gold Mining Co., Ltd. , Sponsored ADR |
199,683 | 722,852 | ||||||
| Hudaco Industries, Ltd. |
19,536 | 175,991 | ||||||
| Impala Platinum Holdings, Ltd. |
237,506 | 3,093,672 | ||||||
| Imperial Logistics, Ltd. |
97,154 | 400,760 | ||||||
| Investec, Ltd. |
112,014 | 515,854 | ||||||
| Italtile, Ltd. |
90,429 | 105,064 | ||||||
| JSE, Ltd. |
29,744 | 208,815 | ||||||
| KAP Industrial Holdings, Ltd. |
843,338 | 261,879 | ||||||
| Kumba Iron Ore, Ltd. |
23,306 | 711,753 | ||||||
| Lewis Group, Ltd. |
40,500 | 115,105 | ||||||
| *Liberty Holdings, Ltd. |
87,314 | 518,312 | ||||||
| *Life Healthcare Group Holdings, Ltd. |
850,033 | 1,360,053 | ||||||
| *Long4Life, Ltd. |
163,116 | 64,173 | ||||||
| *Massmart Holdings, Ltd. |
51,006 | 210,198 | ||||||
| Metair Investments, Ltd. |
98,252 | 187,390 | ||||||
| MiX Telematics, Ltd. , Sponsored ADR |
7,590 | 95,103 | ||||||
| Momentum Metropolitan Holdings |
611,704 | 791,191 | ||||||
| Motus Holdings, Ltd. |
96,763 | 648,885 | ||||||
| *Mpact, Ltd. |
81,828 | 183,036 | ||||||
| Mr Price Group, Ltd. |
70,155 | 922,907 | ||||||
| *MTN Group, Ltd. |
550,420 | 4,960,298 | ||||||
| MultiChoice Group |
125,476 | 1,002,735 | ||||||
| *Murray & Roberts Holdings, Ltd. |
118,042 | 108,335 | ||||||
| *Nampak, Ltd. |
49,933 | 12,779 | ||||||
| Nedbank Group, Ltd. |
140,487 | 1,607,375 | ||||||
| NEPI Rockcastle PLC |
64,985 | 437,794 | ||||||
| *Netcare, Ltd. |
569,808 | 633,911 | ||||||
| *Northam Platinum Holdings, Ltd. |
122,047 | 1,836,727 | ||||||
| Oceana Group, Ltd. |
38,491 | 155,129 | ||||||
| Old Mutual, Ltd. |
2,422,438 | 2,484,593 | ||||||
| Omnia Holdings, Ltd. |
88,576 | 369,105 | ||||||
| *Pepkor Holdings, Ltd. |
330,382 | 522,308 | ||||||
Dimensional World ex U.S. Core Equity 2 ETF
SCHEDULE OF INVESTMENTS
October 31, 2021
| Security Description |
Shares | Fair Value | ||||||
| SOUTH AFRICA (Continued) |
||||||||
| *Pick n Pay Stores, Ltd. |
137,682 | $ | 540,764 | |||||
| *PPC, Ltd. |
783,519 | 275,263 | ||||||
| *PSG Group, Ltd. |
88,711 | 446,356 | ||||||
| PSG Konsult, Ltd. |
39,560 | 36,150 | ||||||
| Raubex Group, Ltd. |
82,409 | 177,017 | ||||||
| RCL Foods, Ltd. |
37,465 | 31,747 | ||||||
| Reunert, Ltd. |
101,585 | 338,906 | ||||||
| RFG Holdings, Ltd. |
35,527 | 29,053 | ||||||
| Royal Bafokeng Platinum, Ltd. |
108,736 | 783,615 | ||||||
| Sanlam, Ltd. |
457,156 | 1,887,272 | ||||||
| Santam, Ltd. |
18,866 | 315,261 | ||||||
| *Sappi, Ltd. |
309,588 | 949,743 | ||||||
| #*Sasol, Ltd. , Sponsored ADR |
78,283 | 1,312,023 | ||||||
| *Sasol, Ltd. |
15,328 | 258,771 | ||||||
| Shoprite Holdings, Ltd. |
125,550 | 1,499,084 | ||||||
| Sibanye Stillwater, Ltd. , ADR |
49,830 | 707,586 | ||||||
| Sibanye Stillwater, Ltd. |
822,803 | 2,887,389 | ||||||
| SPAR Group, Ltd. (The) |
77,528 | 994,501 | ||||||
| *Spur Corp., Ltd. |
23,750 | 30,016 | ||||||
| Standard Bank Group, Ltd. |
372,456 | 3,318,534 | ||||||
| *Steinhoff International Holdings NV |
314,204 | 49,818 | ||||||
| *Sun International, Ltd. |
113,238 | 240,184 | ||||||
| Super Group, Ltd. |
250,572 | 526,201 | ||||||
| *Telkom SA SOC, Ltd. |
191,727 | 639,889 | ||||||
| *Thungela Resources, Ltd. |
10,258 | 48,216 | ||||||
| Tiger Brands, Ltd. |
54,404 | 689,606 | ||||||
| Truworths International, Ltd. |
165,523 | 587,171 | ||||||
| *Tsogo Sun Gaming, Ltd. |
157,765 | 127,354 | ||||||
| Vodacom Group, Ltd. |
116,399 | 1,038,248 | ||||||
| Wilson Bayly Holmes-Ovcon, Ltd. |
29,309 | 206,069 | ||||||
| Woolworths Holdings, Ltd. |
351,434 | 1,246,435 | ||||||
|
|
|
|||||||
| TOTAL SOUTH AFRICA |
76,159,982 | |||||||
|
|
|
|||||||
| SPAIN (1.4%) |
||||||||
| Acciona SA |
12,534 | 2,404,917 | ||||||
| Acerinox SA |
92,847 | 1,293,123 | ||||||
| ACS Actividades de Construccion y Servicios SA |
67,092 | 1,757,038 | ||||||
| Aedas Homes SA |
825 | 23,725 | ||||||
| *Aena SME SA |
7,229 | 1,185,007 | ||||||
| *Alantra Partners SA |
614 | 11,511 | ||||||
| Almirall SA |
21,093 | 313,666 | ||||||
| *Amadeus IT Group SA |
39,238 | 2,626,401 | ||||||
| *Amper SA |
310,784 | 69,413 | ||||||
| Applus Services SA |
83,813 | 759,450 | ||||||
| *Atresmedia Corp. de Medios de Comunicacion SA |
37,599 | 153,682 | ||||||
| Azkoyen SA |
4,453 | 29,579 | ||||||
| Banco Bilbao Vizcaya Argentaria SA |
487,011 | 3,416,494 | ||||||
| Banco Bilbao Vizcaya Argentaria SA, Sponsored ADR |
228,912 | 1,595,517 | ||||||
| *Banco de Sabadell SA |
2,523,110 | 2,033,391 | ||||||
| Banco Santander SA |
116,432 | 422,244 | ||||||
| Banco Santander SA |
1,186,958 | 4,500,612 | ||||||
| Bankinter SA |
257,810 | 1,420,742 | ||||||
| CaixaBank SA |
726,721 | 2,089,874 | ||||||
| *»CAJA de Ahorros del Mediterraneo |
4,397 | — | ||||||
Dimensional World ex U.S. Core Equity 2 ETF
SCHEDULE OF INVESTMENTS
October 31, 2021
| Security Description |
Shares | Fair Value | ||||||
| SPAIN (Continued) |
||||||||
| Cellnex Telecom SA |
93,679 | $ | 5,765,228 | |||||
| Cia de Distribucion Integral Logista Holdings SA |
18,856 | 402,380 | ||||||
| CIE Automotive SA |
25,604 | 696,901 | ||||||
| Construcciones y Auxiliar de Ferrocarriles SA |
7,787 | 341,986 | ||||||
| Ebro Foods SA |
30,528 | 606,236 | ||||||
| *eDreams ODIGEO SA |
21,208 | 186,035 | ||||||
| Elecnor SA |
10,299 | 125,144 | ||||||
| Enagas SA |
114,400 | 2,569,009 | ||||||
| *Ence Energia y Celulosa SA |
71,139 | 183,092 | ||||||
| Endesa SA |
33,860 | 781,532 | ||||||
| *Ercros SA |
47,819 | 193,685 | ||||||
| Faes Farma SA |
195,485 | 798,120 | ||||||
| Ferrovial SA |
3,998 | 126,123 | ||||||
| Fluidra SA |
14,942 | 571,487 | ||||||
| Fomento de Construcciones y Contratas SA |
32,184 | 409,693 | ||||||
| *Gestamp Automocion SA |
39,599 | 176,979 | ||||||
| Global Dominion Access SA |
50,319 | 269,903 | ||||||
| Grifols SA |
31,000 | 710,139 | ||||||
| Grupo Catalana Occidente SA |
12,740 | 453,357 | ||||||
| Grupo Empresarial San Jose SA |
7,310 | 36,376 | ||||||
| Iberdrola SA |
682,474 | 8,067,713 | ||||||
| Iberpapel Gestion SA |
351 | 8,002 | ||||||
| *Indra Sistemas SA |
49,833 | 602,642 | ||||||
| Industria de Diseno Textil SA |
67,238 | 2,430,814 | ||||||
| Laboratorios Farmaceuticos Rovi SA |
945 | 66,272 | ||||||
| Linea Directa Aseguradora SA Cia de Seguros y Reaseguros |
210,927 | 424,724 | ||||||
| #Mapfre SA |
363,125 | 769,222 | ||||||
| *Mediaset Espana Comunicacion SA |
113,398 | 590,533 | ||||||
| *Melia Hotels International SA |
56,304 | 414,533 | ||||||
| Metrovacesa SA |
1,751 | 15,319 | ||||||
| Miquel y Costas & Miquel SA |
11,594 | 160,737 | ||||||
| *Obrascon Huarte Lain SA |
69,591 | 56,696 | ||||||
| Pharma Mar SA |
1,259 | 97,821 | ||||||
| Prim SA |
2,407 | 39,136 | ||||||
| *Promotora de Informaciones SA, Class A |
72,018 | 50,256 | ||||||
| Prosegur Cash SA |
33,373 | 22,863 | ||||||
| Prosegur Cia de Seguridad SA |
106,234 | 301,200 | ||||||
| *Realia Business SA |
69,999 | 59,459 | ||||||
| #Red Electrica Corp. SA |
77,204 | 1,609,087 | ||||||
| Repsol SA, Sponsored ADR |
41,900 | 538,834 | ||||||
| *Repsol SA |
218,688 | 2,798,008 | ||||||
| Sacyr SA |
218,383 | 621,699 | ||||||
| *Siemens Gamesa Renewable Energy SA |
6,995 | 189,664 | ||||||
| *Solaria Energia y Medio Ambiente SA |
5,790 | 115,717 | ||||||
| *Solarpack Corp. Tecnologica SA |
493 | 15,090 | ||||||
| *Talgo SA |
4,147 | 22,844 | ||||||
| *Tecnicas Reunidas SA |
3,605 | 32,624 | ||||||
| #*Telefonica SA, Sponsored ADR |
54,763 | 238,219 | ||||||
| *Telefonica SA |
551,029 | 2,400,533 | ||||||
| #*Tubacex SA |
41,556 | 82,908 | ||||||
| Unicaja Banco SA |
489,989 | 524,510 | ||||||
| Vidrala SA |
7,616 | 808,206 | ||||||
| *Viscofan SA |
20,280 | 1,388,189 | ||||||
| *Vocento SA |
6,696 | 7,981 | ||||||
Dimensional World ex U.S. Core Equity 2 ETF
SCHEDULE OF INVESTMENTS
October 31, 2021
| Security Description |
Shares | Fair Value | ||||||
| SPAIN (Continued) |
||||||||
| Zardoya Otis SA |
54,539 | $ | 438,019 | |||||
|
|
|
|||||||
| TOTAL SPAIN |
67,519,865 | |||||||
|
|
|
|||||||
| SWEDEN (2.5%) |
||||||||
| AAK AB |
10,600 | 231,661 | ||||||
| AcadeMedia AB |
37,991 | 272,044 | ||||||
| AddLife AB, Class B |
21,816 | 892,097 | ||||||
| AddNode Group AB |
6,360 | 263,257 | ||||||
| AddTech AB, B Shares |
62,536 | 1,398,022 | ||||||
| AFRY AB |
23,983 | 714,310 | ||||||
| Alfa Laval AB |
49,360 | 2,113,253 | ||||||
| Alimak Group AB |
8,628 | 117,136 | ||||||
| Ambea AB |
23,540 | 163,630 | ||||||
| *Annehem Fastigheter AB, Class B |
21,544 | 92,563 | ||||||
| *AQ Group AB |
828 | 27,476 | ||||||
| *Arise AB |
3,191 | 15,976 | ||||||
| Arjo AB, Class B |
56,597 | 771,013 | ||||||
| Assa Abloy AB, Class B |
33,603 | 984,008 | ||||||
| Atlas Copco AB, Class B |
27,621 | 1,493,853 | ||||||
| Atlas Copco AB, Class A |
50,223 | 3,226,763 | ||||||
| Atrium Ljungberg AB, B Shares |
9,002 | 206,694 | ||||||
| *Attendo AB |
40,806 | 175,321 | ||||||
| Avanza Bank Holding AB |
36,123 | 1,433,816 | ||||||
| Axfood AB |
18,043 | 442,225 | ||||||
| Beijer Alma AB, Class B |
22,051 | 553,297 | ||||||
| *Beijer Electronics Group AB |
9,700 | 85,610 | ||||||
| Beijer Ref AB |
53,013 | 1,088,839 | ||||||
| Bergman & Beving AB |
12,025 | 217,020 | ||||||
| Besqab AB |
1,033 | 21,289 | ||||||
| Betsson AB |
73,663 | 512,901 | ||||||
| #*Better Collective A/S |
1,251 | 26,510 | ||||||
| *Bhg Group AB |
5,703 | 65,639 | ||||||
| Bilia AB, A Shares |
63,056 | 1,119,641 | ||||||
| BillerudKorsnas AB |
63,397 | 1,325,000 | ||||||
| BioGaia AB, B Shares |
6,804 | 418,293 | ||||||
| Biotage AB |
17,611 | 569,228 | ||||||
| Boliden AB |
104,052 | 3,669,715 | ||||||
| Bonava AB, B Shares |
32,578 | 321,475 | ||||||
| Bravida Holding AB |
47,201 | 709,513 | ||||||
| Bufab AB |
16,525 | 704,215 | ||||||
| Bulten AB |
6,216 | 55,802 | ||||||
| Byggmax Group AB |
40,103 | 343,200 | ||||||
| Castellum AB |
18,860 | 501,557 | ||||||
| Catella AB |
15,449 | 69,074 | ||||||
| Catena AB |
4,684 | 285,234 | ||||||
| #*Catena Media PLC |
5,976 | 39,814 | ||||||
| *Cavotec SA |
5,047 | 13,281 | ||||||
| Cellavision AB |
2,324 | 105,694 | ||||||
| Clas Ohlson AB, B Shares |
25,216 | 271,288 | ||||||
| Cloetta AB, B Shares |
96,192 | 305,314 | ||||||
| Concentric AB |
20,211 | 594,199 | ||||||
| Coor Service Management Holding AB |
22,462 | 217,859 | ||||||
| Corem Property Group AB, Class B |
52,370 | 173,784 | ||||||
| Dios Fastigheter AB |
14,899 | 173,390 | ||||||
| Dometic Group AB |
149,141 | 2,168,045 | ||||||
Dimensional World ex U.S. Core Equity 2 ETF
SCHEDULE OF INVESTMENTS
October 31, 2021
| Security Description |
Shares | Fair Value | ||||||
| SWEDEN (Continued) |
||||||||
| *Doro AB |
9,675 | $ | 75,476 | |||||
| *Duni AB, Class A |
11,410 | 159,157 | ||||||
| #Dustin Group AB |
33,833 | 414,024 | ||||||
| Eastnine AB |
8,283 | 144,279 | ||||||
| Elanders AB, Class B |
4,907 | 84,559 | ||||||
| #Electrolux AB, Class B |
49,363 | 1,120,201 | ||||||
| *Electrolux Professional AB |
44,147 | 340,284 | ||||||
| Elekta AB, Class B |
34,624 | 402,015 | ||||||
| *Eltel AB |
18,432 | 37,557 | ||||||
| *Enea AB |
4,344 | 119,620 | ||||||
| Eolus Vind AB |
1,116 | 20,472 | ||||||
| Epiroc AB |
38,078 | 809,133 | ||||||
| Epiroc AB |
40,629 | 1,010,935 | ||||||
| Essity AB, Class B |
80,200 | 2,594,115 | ||||||
| Essity AB, Class A |
3,631 | 117,531 | ||||||
| Evolution AB |
5,053 | 817,329 | ||||||
| Ework Group AB |
3,724 | 47,523 | ||||||
| Fabege AB |
19,571 | 330,874 | ||||||
| Fagerhult AB |
15,646 | 125,518 | ||||||
| *Fastighets AB Balder, B Shares |
5,706 | 413,375 | ||||||
| Fastpartner AB |
322 | 3,014 | ||||||
| FastPartner AB, Class A |
10,334 | 147,276 | ||||||
| Fenix Outdoor International AG |
789 | 116,120 | ||||||
| Ferronordic AB |
4,563 | 156,200 | ||||||
| *Fingerprint Cards AB, Class B |
15,173 | 36,340 | ||||||
| Formpipe Software AB |
4,982 | 18,563 | ||||||
| #G5 Entertainment AB |
2,732 | 149,698 | ||||||
| GARO AB |
2,029 | 51,029 | ||||||
| Getinge AB, Class B |
32,383 | 1,449,006 | ||||||
| GHP Specialty Care AB |
14,434 | 43,108 | ||||||
| Granges AB |
64,322 | 699,877 | ||||||
| H & M Hennes & Mauritz AB, Class B |
73,063 | 1,369,809 | ||||||
| *Haldex AB |
20,108 | 120,107 | ||||||
| Hexagon AB |
70,005 | 1,124,840 | ||||||
| Hexatronic Group AB |
3,990 | 174,448 | ||||||
| Hexpol AB |
65,230 | 761,783 | ||||||
| HMS Networks AB |
3,137 | 178,975 | ||||||
| Holmen AB, Class B |
19,680 | 872,579 | ||||||
| Hufvudstaden AB, Class A |
11,429 | 182,577 | ||||||
| *Humana AB |
23,713 | 197,965 | ||||||
| Husqvarna AB, A Shares |
14,304 | 204,854 | ||||||
| Husqvarna AB, Class B |
133,988 | 1,905,645 | ||||||
| ICA Gruppen AB |
8,788 | 454,314 | ||||||
| #Industrivarden AB, Class A |
1,638 | 54,022 | ||||||
| Indutrade AB |
71,727 | 2,087,044 | ||||||
| Instalco AB |
6,266 | 331,959 | ||||||
| Intrum AB |
28,950 | 819,775 | ||||||
| Inwido AB |
53,211 | 975,809 | ||||||
| *Itab Shop Concept AB |
3,537 | 5,692 | ||||||
| JM AB |
31,451 | 1,272,541 | ||||||
| Kindred Group PLC |
69,240 | 967,433 | ||||||
| KNOW IT AB |
17,201 | 690,964 | ||||||
| Kungsleden AB |
34,306 | 471,341 | ||||||
| Lagercrantz Group AB, B Shares |
61,467 | 823,043 | ||||||
| LeoVegas AB |
39,568 | 149,362 | ||||||
Dimensional World ex U.S. Core Equity 2 ETF
SCHEDULE OF INVESTMENTS
October 31, 2021
| Security Description |
Shares | Fair Value | ||||||
| SWEDEN (Continued) |
||||||||
| Lifco AB |
21,302 | $ | 620,321 | |||||
| Lime Technologies AB |
2,116 | 85,394 | ||||||
| Lindab International AB |
36,456 | 1,194,471 | ||||||
| Loomis AB |
47,020 | 1,269,597 | ||||||
| *Lundin Energy AB |
21,512 | 849,609 | ||||||
| Medicover AB, Class B |
10,261 | 309,437 | ||||||
| *Medivir AB |
8,875 | 10,127 | ||||||
| *Mekonomen AB |
26,242 | 540,820 | ||||||
| *Millicom International Cellular SA |
60,988 | 2,133,178 | ||||||
| MIPS AB |
7,298 | 881,181 | ||||||
| *Modern Times Group MTG AB, Class B |
16,240 | 185,876 | ||||||
| Momentum Group AB |
11,021 | 282,952 | ||||||
| Munters Group AB |
13,973 | 103,148 | ||||||
| Mycronic AB |
30,253 | 701,682 | ||||||
| *NCC AB, Class B |
24,724 | 428,068 | ||||||
| Nederman Holding AB |
1,650 | 36,310 | ||||||
| *Nelly Group AB |
4,321 | 14,943 | ||||||
| *Net Insight AB, Class B |
97,523 | 36,790 | ||||||
| *New Wave Group AB, Class B |
19,517 | 330,870 | ||||||
| Nibe Industrier AB |
19,196 | 285,755 | ||||||
| Nobia AB |
75,510 | 464,657 | ||||||
| Nobina AB |
72,537 | 694,247 | ||||||
| Nolato AB |
154,574 | 2,040,949 | ||||||
| *Nordic Entertainment Group AB, Class B |
15,399 | 890,752 | ||||||
| Nordic Waterproofing Holding AB |
2,268 | 67,339 | ||||||
| Oem International AB |
8,658 | 194,562 | ||||||
| Peab AB, Class B |
114,349 | 1,433,939 | ||||||
| Platzer Fastigheter Holding AB, Class B |
5,668 | 92,393 | ||||||
| *Pricer AB, Class B |
52,318 | 156,677 | ||||||
| Proact It Group AB |
17,259 | 173,826 | ||||||
| *Qliro AB |
4,321 | 13,559 | ||||||
| Ratos AB, B Shares |
103,694 | 596,194 | ||||||
| *RaySearch Laboratories AB |
7,166 | 50,980 | ||||||
| Resurs Holding AB |
29,603 | 159,243 | ||||||
| Rottneros AB |
45,215 | 52,646 | ||||||
| Saab AB, Class B |
18,127 | 504,014 | ||||||
| Sagax AB, Class B |
15,230 | 595,829 | ||||||
| Samhallsbyggnadsbolaget i Norden AB |
231,041 | 1,549,509 | ||||||
| Sandvik AB |
87,884 | 2,225,624 | ||||||
| #*Sas AB |
1,213,090 | 211,092 | ||||||
| Scandi Standard AB |
31,872 | 158,646 | ||||||
| #*Scandic Hotels Group AB |
29,877 | 144,019 | ||||||
| Sectra AB, Class B |
23,500 | 573,511 | ||||||
| Securitas AB, Class B |
94,497 | 1,562,389 | ||||||
| Semcon AB |
7,689 | 110,118 | ||||||
| *Sensys Gatso Group AB |
132,179 | 14,929 | ||||||
| *Sinch AB |
5,100 | 96,703 | ||||||
| *Skandinaviska Enskilda Banken AB, Class C |
1,689 | 27,060 | ||||||
| *Skandinaviska Enskilda Banken AB, Class A |
127,518 | 1,993,281 | ||||||
| Skanska AB, Class B |
73,579 | 1,867,640 | ||||||
| SKF AB, Class B |
94,056 | 2,179,326 | ||||||
| SKF AB, Class A |
3,415 | 80,320 | ||||||
| *SkiStar AB |
14,478 | 301,748 | ||||||
| *SSAB AB |
73,711 | 367,651 | ||||||
| *SSAB AB, Class A |
96,409 | 548,920 | ||||||
| *SSAB AB, Class B |
153,348 | 764,553 | ||||||
Dimensional World ex U.S. Core Equity 2 ETF
SCHEDULE OF INVESTMENTS
October 31, 2021
| Security Description |
Shares | Fair Value | ||||||
| SWEDEN (Continued) |
||||||||
| *SSAB AB |
13,020 | $ | 74,372 | |||||
| *Stendorren Fastigheter AB |
1,814 | 53,014 | ||||||
| Svenska Cellulosa AB SCA, Class A |
5,089 | 80,111 | ||||||
| Svenska Cellulosa AB SCA, Class B |
110,861 | 1,728,391 | ||||||
| #Svenska Handelsbanken AB, Class B |
2,965 | 37,457 | ||||||
| Svenska Handelsbanken AB, Class A |
103,526 | 1,185,393 | ||||||
| Sweco AB, Class B |
59,184 | 942,010 | ||||||
| Swedbank AB, Class A |
61,415 | 1,331,773 | ||||||
| Swedish Match AB |
97,165 | 855,066 | ||||||
| *Swedish Orphan Biovitrum AB, Class A |
8,319 | 225,689 | ||||||
| #Systemair AB |
14,540 | 140,177 | ||||||
| Tele2 AB, Class B |
68,156 | 961,413 | ||||||
| Telefonaktiebolaget LM Ericsson, Class B |
350,175 | 3,832,619 | ||||||
| Telefonaktiebolaget LM Ericsson, Class A |
6,342 | 69,412 | ||||||
| Telia Co. AB |
417,996 | 1,644,778 | ||||||
| Tethys Oil AB |
7,070 | 51,450 | ||||||
| Thule Group AB |
25,516 | 1,470,026 | ||||||
| Trelleborg AB, Class B |
68,870 | 1,572,900 | ||||||
| Troax Group AB |
15,479 | 634,407 | ||||||
| Vitec Software Group AB |
4,869 | 287,429 | ||||||
| Vitrolife AB |
5,537 | 360,387 | ||||||
| Volvo AB, Class A |
42,804 | 1,010,730 | ||||||
| Volvo AB, Class B |
288,367 | 6,712,503 | ||||||
| Wallenstam AB, B Shares |
19,704 | 345,052 | ||||||
| Wihlborgs Fastigheter AB |
24,962 | 590,590 | ||||||
|
|
|
|||||||
| TOTAL SWEDEN |
119,468,450 | |||||||
|
|
|
|||||||
| SWITZERLAND (4.9%) |
||||||||
| #ABB, Ltd. , Sponsored ADR |
2,290 | 75,662 | ||||||
| ABB, Ltd., Registered |
94,500 | 3,132,591 | ||||||
| Adecco Group AG |
61,388 | 3,095,097 | ||||||
| Alcon, Inc. |
2,807 | 232,424 | ||||||
| Alcon, Inc. |
63,502 | 5,293,527 | ||||||
| Allreal Holding AG, Registered |
5,345 | 1,132,467 | ||||||
| ALSO Holding AG, Registered |
2,999 | 889,443 | ||||||
| *ams AG |
41,710 | 825,755 | ||||||
| *Apg Sga SA |
506 | 114,629 | ||||||
| Arbonia AG |
23,513 | 511,561 | ||||||
| *Aryzta AG |
398,122 | 521,534 | ||||||
| *Ascom Holding AG, Registered |
12,384 | 192,723 | ||||||
| *Autoneum Holding AG |
1,999 | 313,277 | ||||||
| Bachem Holding AG, Registered B |
506 | 407,569 | ||||||
| Baloise Holding AG, Registered |
16,863 | 2,694,389 | ||||||
| Banque Cantonale de Geneve |
541 | 99,467 | ||||||
| Banque Cantonale Vaudoise, Registered |
11,000 | 887,223 | ||||||
| *Barry Callebaut AG |
1,117 | 2,589,118 | ||||||
| Belimo Holding AG |
927 | 539,714 | ||||||
| Bell Food Group AG |
1,066 | 342,987 | ||||||
| Bellevue Group AG |
4,979 | 223,953 | ||||||
| Berner Kantonalbank AG, Registered |
1,620 | 373,198 | ||||||
| BKW AG |
5,847 | 775,547 | ||||||
| *Bobst Group SA, Registered |
4,280 | 349,426 | ||||||
| Bossard Holding AG, Registered A |
4,527 | 1,664,648 | ||||||
| Bucher Industries AG, Registered |
4,301 | 2,172,740 | ||||||
Dimensional World ex U.S. Core Equity 2 ETF
SCHEDULE OF INVESTMENTS
October 31, 2021
| Security Description |
Shares | Fair Value | ||||||
| SWITZERLAND (Continued) |
||||||||
| Burckhardt Compression Holding AG |
1,393 | $ | 586,928 | |||||
| Burkhalter Holding AG |
2,071 | 150,041 | ||||||
| Bystronic AG |
561 | 772,354 | ||||||
| Calida Holding AG |
2,049 | 108,757 | ||||||
| Carlo Gavazzi Holding AG |
216 | 59,570 | ||||||
| Cembra Money Bank AG |
11,813 | 789,257 | ||||||
| Chocoladefabriken Lindt & Spruengli AG |
11 | 1,323,010 | ||||||
| Cicor Technologies, Ltd. |
1,054 | 67,594 | ||||||
| Cie Financiere Richemont SA, Registered |
36,994 | 4,578,956 | ||||||
| CIE Financiere Tradition SA |
869 | 106,039 | ||||||
| Clariant AG, Registered |
98,933 | 2,085,307 | ||||||
| Coltene Holding AG, Registered |
1,624 | 205,455 | ||||||
| Comet Holding AG |
4 | 1,488 | ||||||
| *COSMO Pharmaceuticals NV |
461 | 35,165 | ||||||
| Credit Suisse Group AG, Registered |
168,897 | 1,761,889 | ||||||
| Credit Suisse Group AG , Sponsored ADR |
94,326 | 972,501 | ||||||
| Daetwyler Holding AG |
1,724 | 670,733 | ||||||
| DKSH Holding AG |
17,009 | 1,364,443 | ||||||
| dormakaba Holding AG |
1,068 | 793,037 | ||||||
| *Dottikon Es Holding AG |
162 | 59,570 | ||||||
| *Dufry AG, Registered |
22,209 | 1,175,892 | ||||||
| EFG International AG |
44,537 | 313,404 | ||||||
| Emmi AG |
753 | 786,581 | ||||||
| EMS-Chemie Holding AG |
971 | 964,358 | ||||||
| Energiedienst Holding AG |
1,995 | 101,087 | ||||||
| *Evolva Holding SA |
73,727 | 11,296 | ||||||
| *Feintool International Holding AG |
1,240 | 73,416 | ||||||
| *Flughafen Zurich AG, Registered |
10,040 | 1,812,969 | ||||||
| Forbo Holding AG |
738 | 1,436,021 | ||||||
| Galenica AG |
16,108 | 1,181,106 | ||||||
| *GAM Holding AG |
79,101 | 127,687 | ||||||
| Geberit AG, Registered |
4,794 | 3,750,207 | ||||||
| Georg Fischer AG, Registered |
2,558 | 3,877,242 | ||||||
| Givaudan SA, Registered |
328 | 1,546,760 | ||||||
| Gurit Holding AG |
232 | 403,191 | ||||||
| Helvetia Holding AG, Registered |
16,685 | 1,990,331 | ||||||
| *Hochdorf Holding AG |
415 | 18,621 | ||||||
| Holcim, Ltd. |
23,757 | 1,190,159 | ||||||
| Holcim, Ltd. |
64,934 | 3,248,299 | ||||||
| Huber + Suhner AG, Registered |
8,102 | 721,754 | ||||||
| Hypothekarbank Lenzburg AG |
9 | 41,368 | ||||||
| *Implenia AG, Registered |
6,013 | 122,925 | ||||||
| *Ina Invest Holding AG |
1,202 | 24,336 | ||||||
| Inficon Holding AG |
617 | 791,381 | ||||||
| Interroll Holding AG |
272 | 1,323,163 | ||||||
| Intershop Holding AG |
288 | 180,601 | ||||||
| Investis Holding SA |
125 | 13,954 | ||||||
| Julius Baer Group, Ltd. |
87,631 | 6,346,834 | ||||||
| *Jungfraubahn Holding AG, Registered |
462 | 72,605 | ||||||
| Kardex Holding AG, Registered |
3,496 | 1,078,930 | ||||||
| *Komax Holding AG, Registered |
1,956 | 499,195 | ||||||
| Kudelski SA |
18,111 | 72,246 | ||||||
| Kuehne + Nagel International AG, Registered |
6,112 | 1,928,415 | ||||||
| Landis+Gyr Group AG |
7,148 | 492,831 | ||||||
| *Lastminute.com NV |
2,606 | 125,487 | ||||||
| LEM Holding SA |
165 | 400,876 | ||||||
Dimensional World ex U.S. Core Equity 2 ETF
SCHEDULE OF INVESTMENTS
October 31, 2021
| Security Description |
Shares | Fair Value | ||||||
| SWITZERLAND (Continued) |
||||||||
| Liechtensteinische Landesbank AG |
4,977 | $ | 294,126 | |||||
| #Logitech International SA, Class R |
14,660 | 1,217,220 | ||||||
| Lonza Group AG, Registered |
2,886 | 2,370,705 | ||||||
| Luzerner Kantonalbank AG |
1,408 | 651,802 | ||||||
| *Medacta Group SA |
710 | 119,350 | ||||||
| *Medartis Holding AG |
115 | 15,178 | ||||||
| *Medmix AG |
8,776 | 420,431 | ||||||
| *Meier Tobler Group AG |
2,661 | 56,351 | ||||||
| Metall Zug AG |
82 | 185,762 | ||||||
| *Mikron Holding AG |
2,431 | 20,752 | ||||||
| Mobilezone Holding AG, Registered |
19,438 | 261,655 | ||||||
| Mobimo Holding AG, Registered |
3,171 | 1,070,592 | ||||||
| Nestle SA, Registered |
299,395 | 39,587,309 | ||||||
| Novartis AG , Sponsored ADR |
91,358 | 7,560,788 | ||||||
| Novartis AG, Registered |
16,181 | 1,339,459 | ||||||
| OC Oerlikon Corp. AG |
102,434 | 1,041,996 | ||||||
| *Orascom Development Holding AG |
6,054 | 71,555 | ||||||
| Orell Fuessli AG |
152 | 15,570 | ||||||
| Orior AG |
2,835 | 291,644 | ||||||
| Partners Group Holding AG |
2,807 | 4,907,450 | ||||||
| Peach Property Group AG |
285 | 19,338 | ||||||
| Phoenix Mecano AG |
223 | 108,724 | ||||||
| Plazza AG |
244 | 88,921 | ||||||
| PSP Swiss Property AG, Registered |
9,432 | 1,180,871 | ||||||
| *Rieter Holding AG, Registered |
1,653 | 343,715 | ||||||
| Roche Holding AG |
53,301 | 20,652,497 | ||||||
| Roche Holding AG |
2,558 | 1,100,185 | ||||||
| Romande Energie Holding SA |
69 | 102,698 | ||||||
| Schaffner Holding AG |
216 | 67,134 | ||||||
| Schindler Holding AG, Registered |
3,296 | 846,950 | ||||||
| Schweiter Technologies AG |
510 | 733,395 | ||||||
| *Sensirion Holding AG |
802 | 115,681 | ||||||
| SFS Group AG |
8,928 | 1,203,753 | ||||||
| SGS SA, Registered |
650 | 1,926,347 | ||||||
| Siegfried Holding AG, Registered |
1,887 | 1,816,270 | ||||||
| SIG Combibloc Group AG |
60,474 | 1,583,079 | ||||||
| Sika AG, Registered |
15,841 | 5,374,238 | ||||||
| Softwareone Holding AG |
292 | 6,775 | ||||||
| Sonova Holding AG |
6,119 | 2,533,316 | ||||||
| St Galler Kantonalbank AG, Registered |
1,037 | 478,921 | ||||||
| Straumann Holding AG, Registered |
689 | 1,434,176 | ||||||
| Sulzer AG, Registered |
8,776 | 864,874 | ||||||
| Swatch Group AG (The) |
9,512 | 2,614,954 | ||||||
| Swatch Group AG (The) |
12,910 | 687,215 | ||||||
| Swiss Life Holding AG |
9,360 | 5,148,384 | ||||||
| Swiss Prime Site AG, Registered |
28,937 | 2,945,161 | ||||||
| Swiss Re AG |
40,870 | 3,964,670 | ||||||
| *Swiss Steel Holding AG |
261,907 | 100,607 | ||||||
| Swisscom AG, Registered |
7,754 | 4,229,377 | ||||||
| Swissquote Group Holding SA, Registered |
5,322 | 1,079,835 | ||||||
| Tecan Group AG, Class R |
293 | 179,568 | ||||||
| Temenos AG, Registered |
17,807 | 2,725,372 | ||||||
| Thurgauer Kantonalbank |
112 | 12,931 | ||||||
| *Tornos Holding AG |
3,658 | 29,945 | ||||||
| *Tx Group AG |
1,310 | 216,768 | ||||||
Dimensional World ex U.S. Core Equity 2 ETF
SCHEDULE OF INVESTMENTS
October 31, 2021
| Security Description |
Shares | Fair Value | ||||||
| SWITZERLAND (Continued) |
||||||||
| *u-blox Holding AG |
3,189 | $ | 233,831 | |||||
| UBS Group AG |
266,312 | 4,833,563 | ||||||
| Valiant Holding AG |
8,258 | 818,796 | ||||||
| *Valora Holding AG, Registered |
2,643 | 503,869 | ||||||
| VAT Group AG |
3,376 | 1,615,307 | ||||||
| Vaudoise Assurances Holding SA |
445 | 224,509 | ||||||
| Vetropack Holding AG |
5,517 | 339,926 | ||||||
| Vifor Pharma AG |
14,151 | 1,828,983 | ||||||
| *Von Roll Holding AG |
14,867 | 19,850 | ||||||
| Vontobel Holding AG, Registered |
14,565 | 1,350,102 | ||||||
| VP Bank AG |
1,623 | 182,948 | ||||||
| VZ Holding AG |
3,400 | 346,419 | ||||||
| *V-Zug Holding AG |
820 | 115,406 | ||||||
| Warteck Invest AG |
24 | 63,300 | ||||||
| Ypsomed Holding AG, Registered |
521 | 86,667 | ||||||
| Zehnder Group AG, Registered |
5,349 | 576,609 | ||||||
| Zug Estates Holding AG |
68 | 147,349 | ||||||
| Zuger Kantonalbank AG |
34 | 244,093 | ||||||
| Zurich Insurance Group AG |
9,764 | 4,337,300 | ||||||
|
|
|
|||||||
| TOTAL SWITZERLAND |
230,073,458 | |||||||
|
|
|
|||||||
| TAIWAN (5.6%) |
||||||||
| *Ability Opto-Electronics Technology Co., Ltd. |
35,700 | 92,689 | ||||||
| AcBel Polytech, Inc. |
229,540 | 285,599 | ||||||
| Accton Technology Corp. |
121,929 | 1,067,649 | ||||||
| #Acer, Inc. |
1,098,521 | 1,027,080 | ||||||
| ACES Electronic Co., Ltd. |
43,000 | 73,371 | ||||||
| *Acme Electronics Corp. |
19,000 | 32,454 | ||||||
| *Acon Holding, Inc. |
73,000 | 20,030 | ||||||
| #Acter Group Corp., Ltd. |
26,350 | 175,771 | ||||||
| #ADATA Technology Co., Ltd. |
71,503 | 213,415 | ||||||
| Addcn Technology Co., Ltd. |
9,000 | 81,881 | ||||||
| Advanced Ceramic X Corp. |
9,000 | 111,009 | ||||||
| #Advanced International Multitech Co., Ltd. |
64,000 | 181,815 | ||||||
| *Advanced Optoelectronic Technology, Inc. |
31,000 | 27,200 | ||||||
| Advancetek Enterprise Co., Ltd. |
121,532 | 109,695 | ||||||
| Advantech Co., Ltd. |
38,039 | 496,544 | ||||||
| Aerospace Industrial Development Corp. |
227,000 | 230,196 | ||||||
| Airtac International Group |
32,202 | 961,133 | ||||||
| Allied Circuit Co., Ltd. |
10,000 | 51,603 | ||||||
| Allis Electric Co., Ltd. |
67,511 | 57,537 | ||||||
| Alltek Technology Corp. |
34,600 | 37,638 | ||||||
| Alltop Technology Co., Ltd. |
12,001 | 68,186 | ||||||
| Alpha Networks, Inc. |
80,000 | 77,674 | ||||||
| #Amazing Microelectronic Corp. |
21,055 | 154,457 | ||||||
| *Ambassador Hotel (The) |
121,000 | 131,623 | ||||||
| Ampire Co., Ltd. |
34,000 | 29,405 | ||||||
| Ample Electronic Technology Co., Ltd. |
5,000 | 17,980 | ||||||
| AMPOC Far-East Co., Ltd. |
24,000 | 33,055 | ||||||
| Anji Technology Co., Ltd. |
10,000 | 16,254 | ||||||
| #Anpec Electronics Corp. |
31,781 | 208,571 | ||||||
| AP Memory Technology Corp. |
4,000 | 77,386 | ||||||
| Apac Opto Electronics, Inc. |
23,000 | 25,392 | ||||||
| Apacer Technology, Inc. |
40,501 | 63,209 | ||||||
| #APAQ Technology Co., Ltd. |
26,319 | 48,079 | ||||||
Dimensional World ex U.S. Core Equity 2 ETF
SCHEDULE OF INVESTMENTS
October 31, 2021
| Security Description |
Shares | Fair Value | ||||||
| TAIWAN (Continued) |
||||||||
| APCB, Inc. |
62,000 | $ | 47,935 | |||||
| Apex Biotechnology Corp. |
31,226 | 25,770 | ||||||
| Apex International Co., Ltd. |
58,252 | 163,391 | ||||||
| Apex Medical Corp. |
20,000 | 19,095 | ||||||
| Apex Science & Engineering |
75,920 | 29,212 | ||||||
| Apogee Optocom Co., Ltd. |
5,000 | 12,712 | ||||||
| Arcadyan Technology Corp. |
42,566 | 160,722 | ||||||
| Ardentec Corp. |
319,120 | 681,652 | ||||||
| #Argosy Research, Inc. |
28,025 | 92,212 | ||||||
| ASE Technology Holding Co., Ltd. |
462,796 | 1,660,897 | ||||||
| #ASE Technology Holding Co., Ltd. , ADR |
80,708 | 574,641 | ||||||
| Asia Cement Corp. |
439,028 | 699,388 | ||||||
| Asia Electronic Material Co., Ltd. |
33,000 | 24,505 | ||||||
| Asia Optical Co., Inc. |
74,000 | 235,504 | ||||||
| *Asia Pacific Telecom Co., Ltd. |
775,588 | 229,537 | ||||||
| Asia Tech Image, Inc. |
19,000 | 38,125 | ||||||
| Asia Vital Components Co., Ltd. |
133,053 | 396,645 | ||||||
| ASMedia Technology, Inc. |
3,364 | 196,577 | ||||||
| ASPEED Technology, Inc. |
6,000 | 597,659 | ||||||
| #ASROCK, Inc. |
20,000 | 124,782 | ||||||
| Asustek Computer, Inc. |
99,502 | 1,263,074 | ||||||
| *Aten International Co., Ltd. |
24,000 | 72,841 | ||||||
| #AU Optronics Corp. |
3,242,980 | 2,239,071 | ||||||
| AURAS Technology Co., Ltd. |
38,000 | 217,955 | ||||||
| Aurora Corp. |
14,100 | 45,025 | ||||||
| Avalue Technology, Inc. |
16,000 | 28,365 | ||||||
| Axiomtek Co., Ltd. |
25,000 | 47,108 | ||||||
| *Azurewave Technologies, Inc. |
54,000 | 42,235 | ||||||
| Bank of Kaohsiung Co., Ltd. |
307,978 | 124,593 | ||||||
| BenQ Materials Corp. |
41,000 | 58,016 | ||||||
| BES Engineering Corp. |
855,000 | 269,950 | ||||||
| Bin Chuan Enterprise Co., Ltd. |
66,000 | 58,504 | ||||||
| Bionime Corp. |
7,000 | 17,067 | ||||||
| Bioteque Corp. |
22,000 | 86,628 | ||||||
| #Bizlink Holding, Inc. |
49,038 | 452,317 | ||||||
| Bora Pharmaceuticals Co., Ltd. |
4,986 | 39,087 | ||||||
| Brave C&H Supply Co., Ltd. |
15,000 | 41,318 | ||||||
| Brighton-Best International Taiwan, Inc. |
114,423 | 142,985 | ||||||
| Browave Corp. |
13,000 | 18,582 | ||||||
| #C Sun Manufacturing, Ltd. |
80,586 | 131,419 | ||||||
| *Cameo Communications, Inc. |
51,000 | 24,575 | ||||||
| Capital Futures Corp. |
34,509 | 48,025 | ||||||
| Capital Securities Corp. |
934,600 | 509,168 | ||||||
| Career Technology MFG. Co., Ltd. |
235,715 | 211,909 | ||||||
| Caswell, Inc. |
8,000 | 26,524 | ||||||
| Cathay Financial Holding Co., Ltd. |
1,097,254 | 2,292,481 | ||||||
| Cathay Real Estate Development Co., Ltd. |
327,300 | 229,511 | ||||||
| Cayman Engley Industrial Co., Ltd. |
15,327 | 35,826 | ||||||
| Celxpert Energy Corp. |
18,000 | 30,002 | ||||||
| Central Reinsurance Co., Ltd. |
67,788 | 68,377 | ||||||
| Century Iron & Steel Industrial Co., Ltd. |
27,000 | 109,715 | ||||||
| Chailease Holding Co., Ltd. |
356,648 | 3,411,488 | ||||||
| *Chain Chon Industrial Co., Ltd. |
27,000 | 20,535 | ||||||
| ChainQui Construction Development Co., Ltd. |
39,990 | 26,460 | ||||||
| *Champion Building Materials Co., Ltd. |
109,526 | 42,340 | ||||||
Dimensional World ex U.S. Core Equity 2 ETF
SCHEDULE OF INVESTMENTS
October 31, 2021
| Security Description |
Shares | Fair Value | ||||||
| TAIWAN (Continued) |
||||||||
| Champion Microelectronic Corp. |
13,000 | $ | 33,472 | |||||
| Chang Hwa Commercial Bank, Ltd. |
1,465,228 | 864,115 | ||||||
| *Chang Wah Electromaterials, Inc. |
159,130 | 193,415 | ||||||
| #Channel Well Technology Co., Ltd. |
85,000 | 123,946 | ||||||
| Charoen Pokphand Enterprise |
80,920 | 232,792 | ||||||
| Chc Healthcare Group |
50,000 | 66,077 | ||||||
| CHC Resources Corp. |
45,900 | 74,358 | ||||||
| Chen Full International Co., Ltd. |
48,000 | 71,029 | ||||||
| #Chenbro Micom Co., Ltd. |
33,000 | 89,239 | ||||||
| #Cheng Loong Corp. |
339,360 | 414,918 | ||||||
| *Cheng Mei Materials Technology Corp. |
279,100 | 119,434 | ||||||
| Cheng Shin Rubber Industry Co., Ltd. |
654,341 | 802,382 | ||||||
| Cheng Uei Precision Industry Co., Ltd. |
183,050 | 254,085 | ||||||
| #Chenming Electronic Technology Corp. |
38,000 | 18,448 | ||||||
| Chian Hsing Forging Industrial Co., Ltd. |
21,000 | 32,397 | ||||||
| Chicony Electronics Co., Ltd. |
261,400 | 746,360 | ||||||
| #Chicony Power Technology Co., Ltd. |
78,807 | 197,524 | ||||||
| Chief Telecom, Inc. |
5,000 | 51,243 | ||||||
| Chieftek Precision Co., Ltd. |
29,700 | 92,277 | ||||||
| Chilisin Electronics Corp. |
77,024 | 238,480 | ||||||
| *China Airlines, Ltd. |
2,199,019 | 1,360,128 | ||||||
| China Bills Finance Corp. |
384,000 | 229,915 | ||||||
| China Chemical & Pharmaceutical Co., Ltd. |
122,000 | 96,956 | ||||||
| China Development Financial Holding Corp. |
3,562,412 | 1,819,093 | ||||||
| China Ecotek Corp. |
11,000 | 15,585 | ||||||
| #China General Plastics Corp. |
204,108 | 272,672 | ||||||
| China Metal Products |
122,290 | 140,722 | ||||||
| China Steel Chemical Corp. |
31,000 | 137,674 | ||||||
| China Steel Corp. |
1,255,882 | 1,517,437 | ||||||
| China Steel Structure Co., Ltd. |
24,000 | 47,899 | ||||||
| #China Wire & Cable Co., Ltd. |
34,160 | 33,228 | ||||||
| #Chinese Maritime Transport, Ltd. |
31,570 | 63,802 | ||||||
| Ching Feng Home Fashions Co., Ltd. |
78,000 | 56,238 | ||||||
| Chin-Poon Industrial Co., Ltd. |
161,126 | 173,244 | ||||||
| Chipbond Technology Corp. |
361,000 | 834,720 | ||||||
| #ChipMOS Technologies, Inc. |
160,096 | 265,690 | ||||||
| ChipMOS Technologies, Inc. , ADR |
4,641 | 154,406 | ||||||
| Chlitina Holding, Ltd. |
29,000 | 248,719 | ||||||
| #Chong Hong Construction Co., Ltd. |
84,940 | 225,419 | ||||||
| Chroma ATE, Inc. |
47,560 | 309,559 | ||||||
| *Chun YU Works & Co., Ltd. |
18,000 | 18,642 | ||||||
| #Chun Yuan Steel Industry Co., Ltd. |
194,570 | 158,827 | ||||||
| Chung Hung Steel Corp. |
505,212 | 637,681 | ||||||
| Chung Hwa Food Industrial Co., Ltd. |
6,600 | 31,091 | ||||||
| #*Chung Hwa Pulp Corp. |
191,629 | 152,981 | ||||||
| #Chung-Hsin Electric & Machinery Manufacturing Corp. |
222,000 | 328,507 | ||||||
| Chunghwa Precision Test Tech Co., Ltd. |
6,000 | 171,099 | ||||||
| Chunghwa Telecom Co., Ltd. |
112,727 | 447,933 | ||||||
| Cleanaway Co., Ltd. |
40,000 | 307,820 | ||||||
| Co.-Tech Development Corp. |
101,253 | 271,989 | ||||||
| CoAsia Electronics Corp. |
67,722 | 31,415 | ||||||
| Compal Electronics, Inc. |
1,625,747 | 1,429,402 | ||||||
| Compeq Manufacturing Co., Ltd. |
744,000 | 1,079,540 | ||||||
| Compucase Enterprise |
17,000 | 19,012 | ||||||
| #Concord Securities Co., Ltd. |
211,685 | 89,824 | ||||||
| Concraft Holding Co., Ltd. |
31,241 | 63,586 | ||||||
Dimensional World ex U.S. Core Equity 2 ETF
SCHEDULE OF INVESTMENTS
October 31, 2021
| Security Description |
Shares | Fair Value | ||||||
| TAIWAN (Continued) |
||||||||
| #Continental Holdings Corp. |
192,200 | $ | 174,171 | |||||
| #Contrel Technology Co., Ltd. |
72,000 | 51,135 | ||||||
| Coremax Corp. |
18,296 | 112,835 | ||||||
| *Coremax Corp. |
595 | 1,744 | ||||||
| *Crowell Development Corp. |
15,000 | 11,705 | ||||||
| *CSBC Corp. Taiwan |
58,616 | 45,951 | ||||||
| CTBC Financial Holding Co., Ltd. |
2,846,654 | 2,374,899 | ||||||
| CTCI Corp. |
168,444 | 220,788 | ||||||
| Cub Elecparts, Inc. |
16,788 | 103,233 | ||||||
| CviLux Corp. |
26,600 | 45,818 | ||||||
| Cyberlink Corp. |
8,000 | 26,035 | ||||||
| CyberPower Systems, Inc. |
19,000 | 51,585 | ||||||
| CyberTAN Technology, Inc. |
152,424 | 144,978 | ||||||
| Cypress Technology Co., Ltd. |
19,161 | 40,653 | ||||||
| DA CIN Construction Co., Ltd. |
117,000 | 127,693 | ||||||
| Dadi Early-Childhood Education Group, Ltd. |
9,368 | 50,868 | ||||||
| *Da-Li Development Co., Ltd. |
67,832 | 74,397 | ||||||
| #Darfon Electronics Corp. |
127,000 | 190,670 | ||||||
| *Darwin Precisions Corp. |
178,000 | 71,370 | ||||||
| Daxin Materials Corp. |
31,100 | 102,778 | ||||||
| De Licacy Industrial Co., Ltd. |
89,662 | 49,492 | ||||||
| *Delpha Construction Co., Ltd. |
90,244 | 48,353 | ||||||
| Delta Electronics, Inc. |
57,699 | 508,343 | ||||||
| Depo Auto Parts Industries Co., Ltd. |
58,000 | 117,425 | ||||||
| DFI, Inc. |
4,000 | 8,012 | ||||||
| Dimerco Express Corp. |
65,880 | 203,976 | ||||||
| #*D-Link Corp. |
270,976 | 199,759 | ||||||
| DONPON PRECISION, INC. |
17,000 | 9,139 | ||||||
| Dyaco International, Inc. |
39,000 | 90,879 | ||||||
| Dynamic Electronics Co., Ltd. |
144,934 | 109,449 | ||||||
| #Dynapack International Technology Corp. |
65,000 | 224,392 | ||||||
| #E Ink Holdings, Inc. |
171,000 | 565,111 | ||||||
| E&R Engineering Corp. |
11,982 | 26,930 | ||||||
| E.Sun Financial Holding Co., Ltd. |
2,093,063 | 1,998,339 | ||||||
| Eastern Media International Corp. |
119,759 | 136,733 | ||||||
| Eclat Textile Co., Ltd. |
36,143 | 788,924 | ||||||
| Ecove Environment Corp. |
10,000 | 83,787 | ||||||
| Edimax Technology Co., Ltd. |
52,313 | 20,317 | ||||||
| Edom Technology Co., Ltd. |
59,578 | 72,843 | ||||||
| eGalax_eMPIA Technology, Inc. |
24,576 | 67,254 | ||||||
| Egis Technology, Inc. |
39,000 | 185,825 | ||||||
| #Elan Microelectronics Corp. |
113,600 | 682,209 | ||||||
| E-LIFE MALL Corp. |
34,000 | 101,969 | ||||||
| Elite Advanced Laser Corp. |
35,723 | 71,681 | ||||||
| Elite Material Co., Ltd. |
163,162 | 1,411,096 | ||||||
| #Elite Semiconductor Microelectronics Technology, Inc. |
71,000 | 363,828 | ||||||
| Elitegroup Computer Systems Co., Ltd. |
157,087 | 133,879 | ||||||
| eMemory Technology, Inc. |
19,000 | 1,571,462 | ||||||
| Emerging Display Technologies Corp. |
32,000 | 21,173 | ||||||
| Ennoconn Corp. |
20,109 | 133,055 | ||||||
| *ENNOSTAR, Inc. |
328,933 | 863,481 | ||||||
| EnTie Commercial Bank Co., Ltd. |
226,000 | 135,721 | ||||||
| *Epileds Technologies, Inc. |
36,000 | 30,228 | ||||||
| Eson Precision Industries Co., Ltd. |
35,000 | 83,949 | ||||||
| Eternal Materials Co., Ltd. |
294,993 | 390,375 | ||||||
Dimensional World ex U.S. Core Equity 2 ETF
SCHEDULE OF INVESTMENTS
October 31, 2021
| Security Description |
Shares | Fair Value | ||||||
| TAIWAN (Continued) |
||||||||
| #*Etron Technology, Inc. |
65,671 | $ | 140,276 | |||||
| Eurocharm Holdings Co., Ltd. |
17,000 | 95,061 | ||||||
| *Eva Airways Corp. |
1,667,132 | 1,130,066 | ||||||
| *Everest Textile Co., Ltd. |
231,794 | 81,186 | ||||||
| Evergreen International Storage & Transport Corp. |
262,000 | 254,854 | ||||||
| Evergreen Marine Corp. Taiwan, Ltd. |
846,722 | 3,029,607 | ||||||
| #Everlight Chemical Industrial Corp. |
227,155 | 208,706 | ||||||
| #Everlight Electronics Co., Ltd. |
210,225 | 374,207 | ||||||
| #*Everspring Industry Co., Ltd. |
59,000 | 46,464 | ||||||
| Excel Cell Electronic Co., Ltd. |
17,000 | 15,528 | ||||||
| Excelliance Mos Corp. |
5,000 | 34,432 | ||||||
| Excelsior Medical Co., Ltd. |
49,684 | 98,802 | ||||||
| EZconn Corp. |
12,600 | 15,802 | ||||||
| Far Eastern Department Stores, Ltd. |
496,249 | 394,379 | ||||||
| Far Eastern International Bank |
1,233,498 | 463,529 | ||||||
| Far Eastern New Century Corp. |
571,625 | 598,173 | ||||||
| Far EasTone Telecommunications Co., Ltd. |
485,000 | 1,067,371 | ||||||
| Farcent Enterprise Co., Ltd. |
5,000 | 11,417 | ||||||
| Farglory F T Z Investment Holding Co., Ltd. |
41,000 | 74,456 | ||||||
| Farglory Land Development Co., Ltd. |
179,575 | 433,948 | ||||||
| *Federal Corp. |
207,567 | 200,786 | ||||||
| Feedback Technology Corp. |
10,000 | 25,388 | ||||||
| Feng Hsin Steel Co., Ltd. |
239,000 | 672,949 | ||||||
| Feng TAY Enterprise Co., Ltd. |
70,297 | 546,026 | ||||||
| First Financial Holding Co., Ltd. |
1,664,163 | 1,370,420 | ||||||
| First Hi-Tec Enterprise Co., Ltd. |
22,282 | 51,121 | ||||||
| First Insurance Co., Ltd. (The) |
58,000 | 27,740 | ||||||
| *First Steamship Co., Ltd. |
301,553 | 138,802 | ||||||
| FIT Holding Co., Ltd. |
66,000 | 79,033 | ||||||
| Fittech Co., Ltd. |
8,000 | 60,413 | ||||||
| FLEXium Interconnect, Inc. |
129,515 | 447,575 | ||||||
| Flytech Technology Co., Ltd. |
33,312 | 87,327 | ||||||
| FOCI Fiber Optic Communications, Inc. |
26,000 | 31,602 | ||||||
| Forest Water Environment Engineering Co., Ltd. |
12,143 | 14,890 | ||||||
| Formosa Advanced Technologies Co., Ltd. |
69,000 | 93,916 | ||||||
| Formosa Chemicals & Fibre Corp. |
188,821 | 546,599 | ||||||
| *Formosa International Hotels Corp. |
21,246 | 113,456 | ||||||
| *Formosa Laboratories, Inc. |
41,108 | 87,512 | ||||||
| Formosa Optical Technology Co., Ltd. |
11,000 | 22,903 | ||||||
| Formosa Petrochemical Corp. |
19,000 | 68,324 | ||||||
| Formosa Plastics Corp. |
252,000 | 974,163 | ||||||
| Formosa Sumco Technology Corp. |
8,000 | 45,310 | ||||||
| Formosan Union Chemical |
164,304 | 120,532 | ||||||
| Fortune Electric Co., Ltd. |
22,000 | 29,034 | ||||||
| Founding Construction & Development Co., Ltd. |
62,208 | 42,280 | ||||||
| Foxsemicon Integrated Technology, Inc. |
28,845 | 212,122 | ||||||
| Froch Enterprise Co., Ltd. |
89,000 | 91,373 | ||||||
| Fubon Financial Holding Co., Ltd. |
1,118,130 | 2,959,324 | ||||||
| Fulgent Sun International Holding Co., Ltd. |
39,129 | 144,930 | ||||||
| #*Fulltech Fiber Glass Corp. |
165,604 | 104,215 | ||||||
| Fusheng Precision Co., Ltd. |
44,000 | 298,254 | ||||||
| Fwusow Industry Co., Ltd. |
70,321 | 53,357 | ||||||
| Gamania Digital Entertainment Co., Ltd. |
54,000 | 112,045 | ||||||
| *GCS Holdings, Inc. |
24,000 | 42,030 | ||||||
| GEM Services, Inc. |
24,200 | 86,676 | ||||||
| #Gemtek Technology Corp. |
153,348 | 151,095 | ||||||
Dimensional World ex U.S. Core Equity 2 ETF
SCHEDULE OF INVESTMENTS
October 31, 2021
| Security Description |
Shares | Fair Value | ||||||
| TAIWAN (Continued) |
||||||||
| General Interface Solution Holding, Ltd. |
107,000 | $ | 373,616 | |||||
| General Plastic Industrial Co., Ltd. |
19,114 | 18,043 | ||||||
| #GeneReach Biotechnology Corp. |
6,176 | 17,634 | ||||||
| #Genesys Logic, Inc. |
11,000 | 56,961 | ||||||
| #Genius Electronic Optical Co., Ltd. |
49,646 | 763,208 | ||||||
| Genmont Biotech, Inc. |
23,000 | 19,809 | ||||||
| Genovate Biotechnology Co., Ltd. |
18,360 | 14,789 | ||||||
| Getac Holdings Corp. |
167,000 | 314,080 | ||||||
| GFC, Ltd. |
12,000 | 28,308 | ||||||
| Giant Manufacturing Co., Ltd. |
131,760 | 1,528,044 | ||||||
| *Giantplus Technology Co., Ltd. |
147,000 | 62,112 | ||||||
| Gigabyte Technology Co., Ltd. |
64,000 | 258,914 | ||||||
| #*Gigastorage Corp. |
129,744 | 116,641 | ||||||
| Ginko International Co., Ltd. |
18,900 | 136,949 | ||||||
| Global Brands Manufacture, Ltd. |
112,240 | 142,679 | ||||||
| Global Lighting Technologies, Inc. |
8,000 | 23,158 | ||||||
| Global Unichip Corp. |
32,000 | 688,135 | ||||||
| Globalwafers Co., Ltd. |
33,000 | 901,883 | ||||||
| Globe Union Industrial Corp. |
129,075 | 71,480 | ||||||
| #Gloria Material Technology Corp. |
240,636 | 183,450 | ||||||
| *GMI Technology, Inc. |
17,600 | 13,639 | ||||||
| Gold Circuit Electronics, Ltd. |
126,000 | 300,858 | ||||||
| #Goldsun Building Materials Co., Ltd. |
516,788 | 477,604 | ||||||
| Gourmet Master Co., Ltd. |
46,026 | 216,819 | ||||||
| Grand Fortune Securities Co., Ltd. |
60,000 | 34,414 | ||||||
| Grand Ocean Retail Group, Ltd. |
40,000 | 27,689 | ||||||
| Grand Plastic Technology Corp. |
4,000 | 52,214 | ||||||
| *GrandTech CG Systems, Inc. |
26,250 | 47,292 | ||||||
| Grape King Bio, Ltd. |
46,000 | 267,976 | ||||||
| Great China Metal Industry |
57,000 | 52,883 | ||||||
| Great Taipei Gas Co., Ltd. |
54,000 | 64,373 | ||||||
| Great Tree Pharmacy Co., Ltd. |
12,970 | 95,380 | ||||||
| Great Wall Enterprise Co., Ltd. |
268,204 | 517,919 | ||||||
| Greatek Electronics, Inc. |
185,000 | 528,885 | ||||||
| GTM Holdings Corp. |
59,350 | 53,356 | ||||||
| #HannsTouch Solution, Inc. |
289,941 | 124,074 | ||||||
| Harvatek Corp. |
58,239 | 52,357 | ||||||
| Heran Co., Ltd. |
21,000 | 88,354 | ||||||
| Hey Song Corp. |
129,500 | 162,990 | ||||||
| #Highwealth Construction Corp. |
185,824 | 300,368 | ||||||
| HIM International Music, Inc. |
12,800 | 40,552 | ||||||
| Hiroca Holdings, Ltd. |
21,795 | 38,247 | ||||||
| Hitron Technology, Inc. |
44,000 | 33,227 | ||||||
| Hiwin Technologies Corp. |
88,080 | 978,719 | ||||||
| Ho Tung Chemical Corp. |
418,117 | 156,370 | ||||||
| Hocheng Corp. |
93,000 | 47,656 | ||||||
| Holiday Entertainment Co., Ltd. |
21,000 | 46,971 | ||||||
| Holtek Semiconductor, Inc. |
39,000 | 144,452 | ||||||
| Holy Stone Enterprise Co., Ltd. |
64,000 | 271,572 | ||||||
| Hon Hai Precision Industry Co., Ltd. , GDR |
26,821 | 208,131 | ||||||
| Hon Hai Precision Industry Co., Ltd. |
754,177 | 2,901,880 | ||||||
| Hon Hai Precision Industry Co., Ltd. , GDR |
7,429 | 58,169 | ||||||
| Hong Pu Real Estate Development Co., Ltd. |
111,695 | 87,361 | ||||||
| Hong Tai Electric Industrial |
87,000 | 82,750 | ||||||
| Horizon Securities Co., Ltd. |
145,000 | 83,949 | ||||||
Dimensional World ex U.S. Core Equity 2 ETF
SCHEDULE OF INVESTMENTS
October 31, 2021
| Security Description |
Shares | Fair Value | ||||||
| TAIWAN (Continued) |
||||||||
| Hota Industrial Manufacturing Co., Ltd. |
49,439 | $ | 166,583 | |||||
| Hotai Motor Co., Ltd. |
38,000 | 836,291 | ||||||
| Hotron Precision Electronic Industrial Co., Ltd. |
32,092 | 69,127 | ||||||
| Hsing TA Cement Co. |
64,000 | 48,446 | ||||||
| Hu Lane Associate, Inc. |
34,266 | 165,117 | ||||||
| Hua Nan Financial Holdings Co., Ltd. |
1,192,011 | 872,302 | ||||||
| Huaku Development Co., Ltd. |
95,539 | 312,640 | ||||||
| Huang Hsiang Construction Corp. |
58,000 | 76,232 | ||||||
| Hung Ching Development & Construction Co., Ltd. |
60,000 | 64,513 | ||||||
| Hung Sheng Construction, Ltd. |
226,608 | 196,795 | ||||||
| Huxen Corp. |
21,000 | 38,664 | ||||||
| Hwa Fong Rubber Industrial Co., Ltd. |
68,687 | 39,643 | ||||||
| Hycon Technology Corp. |
4,200 | 26,280 | ||||||
| Ibase Technology, Inc. |
66,353 | 93,057 | ||||||
| IBF Financial Holdings Co., Ltd. |
1,223,347 | 699,470 | ||||||
| Ichia Technologies, Inc. |
139,000 | 80,975 | ||||||
| #*I-Chiun Precision Industry Co., Ltd. |
65,832 | 138,963 | ||||||
| Innodisk Corp. |
39,598 | 272,687 | ||||||
| #Innolux Corp. |
3,882,685 | 2,331,691 | ||||||
| Inpaq Technology Co., Ltd. |
33,000 | 69,421 | ||||||
| Insyde Software Corp. |
14,000 | 39,369 | ||||||
| Intai Technology Corp. |
14,400 | 44,067 | ||||||
| *Integrated Service Technology, Inc. |
24,656 | 45,750 | ||||||
| IntelliEPI, Inc. |
5,000 | 13,611 | ||||||
| International Games System Co., Ltd. |
20,000 | 513,512 | ||||||
| Inventec Corp. |
848,944 | 810,524 | ||||||
| Iron Force Industrial Co., Ltd. |
13,000 | 32,817 | ||||||
| I-Sheng Electric Wire & Cable Co., Ltd. |
48,000 | 73,359 | ||||||
| I-Sunny Construction & Development Co., Ltd. |
4,400 | 12,310 | ||||||
| ITE Technology, Inc. |
48,000 | 179,513 | ||||||
| #ITEQ Corp. |
168,019 | 776,397 | ||||||
| Jarllytec Co., Ltd. |
26,000 | 49,460 | ||||||
| Jentech Precision Industrial Co., Ltd. |
12,000 | 159,232 | ||||||
| Jess-Link Products Co., Ltd. |
26,000 | 32,958 | ||||||
| Jia Wei Lifestyle, Inc. |
29,327 | 86,056 | ||||||
| Johnson Health Tech Co., Ltd. |
5,000 | 10,482 | ||||||
| Jourdeness Group, Ltd. |
22,000 | 60,205 | ||||||
| K Laser Technology, Inc. |
37,000 | 26,744 | ||||||
| Kaori Heat Treatment Co., Ltd. |
12,147 | 21,971 | ||||||
| Kaulin Manufacturing Co., Ltd. |
34,000 | 17,912 | ||||||
| Kedge Construction Co., Ltd. |
15,000 | 25,379 | ||||||
| KEE TAI Properties Co., Ltd. |
186,790 | 87,993 | ||||||
| Kenda Rubber Industrial Co., Ltd. |
169,338 | 186,337 | ||||||
| Kenmec Mechanical Engineering Co., Ltd. |
68,000 | 67,979 | ||||||
| #Kerry TJ Logistics Co., Ltd. |
61,000 | 95,091 | ||||||
| #Key Ware Electronics Co., Ltd. |
56,515 | 30,078 | ||||||
| Keystone Microtech Corp. |
8,000 | 95,654 | ||||||
| Kindom Development Co., Ltd. |
178,200 | 246,071 | ||||||
| King Chou Marine Technology Co., Ltd. |
39,220 | 49,151 | ||||||
| King Slide Works Co., Ltd. |
9,000 | 138,195 | ||||||
| King Yuan Electronics Co., Ltd. |
896,545 | 1,281,539 | ||||||
| King’s Town Bank Co., Ltd. |
340,000 | 507,399 | ||||||
| *King’s Town Construction Co., Ltd. |
50,000 | 65,627 | ||||||
| Kinik Co. |
51,000 | 138,648 | ||||||
| *Kinko Optical Co., Ltd. |
38,871 | 41,235 | ||||||
| #Kinpo Electronics |
589,000 | 275,347 | ||||||
Dimensional World ex U.S. Core Equity 2 ETF
SCHEDULE OF INVESTMENTS
October 31, 2021
| Security Description |
Shares | Fair Value | ||||||
| TAIWAN (Continued) |
||||||||
| #Kinsus Interconnect Technology Corp. |
111,000 | $ | 973,947 | |||||
| *KMC Kuei Meng International, Inc. |
21,581 | 156,764 | ||||||
| Ko Ja Cayman Co., Ltd. |
5,000 | 13,197 | ||||||
| KS Terminals, Inc. |
32,162 | 112,070 | ||||||
| Kung Long Batteries Industrial Co., Ltd. |
34,000 | 172,393 | ||||||
| Kung Sing Engineering Corp. |
163,738 | 50,519 | ||||||
| *Kuo Toong International Co., Ltd. |
79,917 | 61,644 | ||||||
| #*Kuo Yang Construction Co., Ltd. |
127,000 | 109,607 | ||||||
| Kwong Fong Industries Corp. |
48,915 | 19,701 | ||||||
| Kwong Lung Enterprise Co., Ltd. |
19,000 | 28,628 | ||||||
| L&K Engineering Co., Ltd. |
74,000 | 77,570 | ||||||
| La Kaffa International Co., Ltd. |
5,000 | 17,728 | ||||||
| LandMark Optoelectronics Corp. |
12,000 | 77,027 | ||||||
| Lanner Electronics, Inc. |
29,793 | 53,247 | ||||||
| #Largan Precision Co., Ltd. |
12,000 | 893,252 | ||||||
| Laser Tek Taiwan Co., Ltd. |
20,000 | 21,504 | ||||||
| Laster Tech Corp., Ltd. |
19,711 | 31,188 | ||||||
| Leader Electronics, Inc. |
36,000 | 21,037 | ||||||
| *Leadtek Research, Inc. |
10,000 | 23,374 | ||||||
| #*Lealea Enterprise Co., Ltd. |
308,933 | 128,312 | ||||||
| Ledlink Optics, Inc. |
18,900 | 19,472 | ||||||
| #LEE CHI Enterprises Co., Ltd. |
96,000 | 86,477 | ||||||
| Lelon Electronics Corp. |
42,634 | 97,967 | ||||||
| Lemtech Holdings Co., Ltd. |
30,349 | 162,066 | ||||||
| Leo Systems, Inc. |
14,000 | 11,353 | ||||||
| *Leofoo Development Co., Ltd. |
40,104 | 26,031 | ||||||
| *Li Cheng Enterprise Co., Ltd. |
64,494 | 45,109 | ||||||
| *Li Peng Enterprise Co., Ltd. |
246,366 | 91,695 | ||||||
| Lian HWA Food Corp. |
48,602 | 116,225 | ||||||
| Lifestyle Global Enterprise, Inc. |
6,000 | 7,595 | ||||||
| Ligitek Electronics Co., Ltd. |
16,000 | 10,385 | ||||||
| *Lingsen Precision Industries, Ltd. |
202,000 | 183,052 | ||||||
| Lite-On Technology Corp. |
832,164 | 1,834,391 | ||||||
| Long Da Construction & Development Corp. |
66,000 | 48,061 | ||||||
| Longchen Paper & Packaging Co., Ltd. |
262,620 | 226,653 | ||||||
| Longwell Co. |
41,000 | 82,860 | ||||||
| Lotes Co., Ltd. |
34,303 | 712,988 | ||||||
| Lotus Pharmaceutical Co., Ltd. |
24,000 | 81,126 | ||||||
| Lu Hai Holding Corp. |
8,001 | 11,509 | ||||||
| Lumax International Corp., Ltd. |
40,034 | 102,358 | ||||||
| Lung Yen Life Service Corp. |
55,000 | 89,002 | ||||||
| *LuxNet Corp. |
28,976 | 18,339 | ||||||
| M31 Technology Corp. |
2,000 | 28,552 | ||||||
| Macauto Industrial Co., Ltd. |
25,000 | 73,089 | ||||||
| Machvision, Inc. |
12,358 | 103,989 | ||||||
| #Macronix International Co., Ltd. |
925,974 | 1,305,291 | ||||||
| Makalot Industrial Co., Ltd. |
49,680 | 433,227 | ||||||
| Marketech International Corp. |
21,000 | 87,977 | ||||||
| Materials Analysis Technology, Inc. |
20,355 | 104,672 | ||||||
| Mayer Steel Pipe Corp. |
51,700 | 56,425 | ||||||
| MediaTek, Inc. |
72,048 | 2,365,458 | ||||||
| Mega Financial Holding Co., Ltd. |
1,293,365 | 1,553,424 | ||||||
| Meiloon Industrial Co. |
29,050 | 29,250 | ||||||
| Mercuries & Associates Holding, Ltd. |
221,915 | 184,740 | ||||||
| *Mercuries Life Insurance Co., Ltd. |
558,177 | 184,263 | ||||||
Dimensional World ex U.S. Core Equity 2 ETF
SCHEDULE OF INVESTMENTS
October 31, 2021
| Security Description |
Shares | Fair Value | ||||||
| TAIWAN (Continued) |
||||||||
| Merida Industry Co., Ltd. |
16,000 | $ | 166,280 | |||||
| Merry Electronics Co., Ltd. |
46,981 | 138,873 | ||||||
| Micro-Star International Co., Ltd. |
238,394 | 1,200,178 | ||||||
| Mildef Crete, Inc. |
8,000 | 16,944 | ||||||
| *MIN AIK Technology Co., Ltd. |
64,000 | 50,862 | ||||||
| Mirle Automation Corp. |
79,805 | 119,958 | ||||||
| MJ International Co., Ltd. |
8,000 | 15,448 | ||||||
| *Mobiletron Electronics Co., Ltd. |
32,600 | 70,807 | ||||||
| momo.com, Inc. |
15,600 | 1,004,153 | ||||||
| Mosel Vitelic, Inc. |
11,000 | 17,978 | ||||||
| #MPI Corp. |
24,000 | 110,470 | ||||||
| Nak Sealing Technologies Corp. |
35,000 | 110,128 | ||||||
| Namchow Holdings Co., Ltd. |
84,000 | 146,200 | ||||||
| *Nan Kang Rubber Tire Co., Ltd. |
101,183 | 145,543 | ||||||
| Nan Liu Enterprise Co., Ltd. |
13,000 | 57,500 | ||||||
| Nan Ya Plastics Corp. |
316,187 | 967,600 | ||||||
| #Nan Ya Printed Circuit Board Corp. |
85,000 | 1,499,272 | ||||||
| Nang Kuang Pharmaceutical Co., Ltd. |
26,000 | 32,350 | ||||||
| #Nantex Industry Co., Ltd. |
88,391 | 259,053 | ||||||
| Nanya Technology Corp. |
295,110 | 705,713 | ||||||
| National Aerospace Fasteners Corp. |
10,000 | 21,073 | ||||||
| National Petroleum Co., Ltd. |
67,000 | 115,889 | ||||||
| New Best Wire Industrial Co., Ltd. |
28,000 | 36,147 | ||||||
| *Newmax Technology Co., Ltd. |
16,000 | 23,619 | ||||||
| Nexcom International Co., Ltd. |
20,000 | 16,757 | ||||||
| Nichidenbo Corp. |
75,424 | 136,698 | ||||||
| Nidec Chaun-Choung Technology Corp. |
8,000 | 48,043 | ||||||
| Nien Hsing Textile Co., Ltd. |
62,654 | 46,976 | ||||||
| Nien Made Enterprise Co., Ltd. |
47,000 | 645,630 | ||||||
| Niko Semiconductor Co., Ltd. |
8,000 | 21,519 | ||||||
| #Novatek Microelectronics Corp. |
113,000 | 1,688,387 | ||||||
| #Nuvoton Technology Corp. |
68,140 | 313,642 | ||||||
| #O-Bank Co., Ltd. |
385,746 | 108,198 | ||||||
| Ocean Plastics Co., Ltd. |
80,000 | 95,079 | ||||||
| *Oneness Biotech Co., Ltd. |
17,000 | 160,167 | ||||||
| OptoTech Corp. |
175,005 | 269,979 | ||||||
| Orient Europharma Co., Ltd. |
9,000 | 13,205 | ||||||
| #*Orient Semiconductor Electronics, Ltd. |
189,605 | 169,092 | ||||||
| *Oriental Union Chemical Corp. |
275,992 | 236,705 | ||||||
| O-TA Precision Industry Co., Ltd. |
22,000 | 137,656 | ||||||
| Pacific Construction Co. |
61,000 | 21,563 | ||||||
| Pacific Hospital Supply Co., Ltd. |
15,396 | 38,533 | ||||||
| Paiho Shih Holdings Corp. |
35,573 | 47,907 | ||||||
| Pan German Universal Motors, Ltd. |
5,000 | 38,567 | ||||||
| #Pan Jit International, Inc. |
76,046 | 307,646 | ||||||
| Parade Technologies, Ltd. |
11,000 | 706,079 | ||||||
| *Paragon Technologies Co., Ltd. |
20,423 | 17,516 | ||||||
| #Pchome Online, Inc. |
29,000 | 151,213 | ||||||
| PCL Technologies, Inc. |
11,610 | 35,195 | ||||||
| P-Duke Technology Co., Ltd. |
26,284 | 67,580 | ||||||
| Pegatron Corp. |
808,261 | 1,976,437 | ||||||
| Pegavision Corp. |
9,000 | 176,061 | ||||||
| *»Pharmally International Holding Co., Ltd. |
18,917 | 7,219 | ||||||
| #*Phihong Technology Co., Ltd. |
148,272 | 196,214 | ||||||
| #*Phison Electronics Corp. |
43,000 | 603,826 | ||||||
| Phoenix Silicon International Corp. |
12,720 | 22,299 | ||||||
Dimensional World ex U.S. Core Equity 2 ETF
SCHEDULE OF INVESTMENTS
October 31, 2021
| Security Description |
Shares | Fair Value | ||||||
| TAIWAN (Continued) |
||||||||
| Phoenix Tours International, Inc. |
8,457 | $ | 13,001 | |||||
| *Phytohealth Corp. |
15,000 | 12,029 | ||||||
| Pixart Imaging, Inc. |
37,000 | 209,558 | ||||||
| Planet Technology Corp. |
10,000 | 24,129 | ||||||
| *Plotech Co., Ltd. |
47,000 | 41,915 | ||||||
| Polytronics Technology Corp. |
10,470 | 46,498 | ||||||
| Posiflex Technology, Inc. |
29,698 | 97,183 | ||||||
| Power Wind Health Industry, Inc. |
12,809 | 66,789 | ||||||
| Powertech Technology, Inc. |
494,900 | 1,733,400 | ||||||
| Poya International Co., Ltd. |
18,989 | 339,376 | ||||||
| President Chain Store Corp. |
97,768 | 987,928 | ||||||
| President Securities Corp. |
483,046 | 393,441 | ||||||
| Primax Electronics, Ltd. |
210,000 | 388,910 | ||||||
| Prince Housing & Development Corp. |
569,000 | 271,113 | ||||||
| Pro Hawk Corp. |
6,000 | 38,837 | ||||||
| Promate Electronic Co., Ltd. |
36,000 | 50,229 | ||||||
| Prosperity Dielectrics Co., Ltd. |
46,000 | 89,656 | ||||||
| Qisda Corp. |
715,875 | 798,034 | ||||||
| QST International Corp. |
13,000 | 27,488 | ||||||
| Qualipoly Chemical Corp. |
43,547 | 64,361 | ||||||
| Quang Viet Enterprise Co., Ltd. |
11,000 | 49,841 | ||||||
| Quanta Computer, Inc. |
380,007 | 1,065,881 | ||||||
| Quanta Storage, Inc. |
86,000 | 119,528 | ||||||
| #Quintain Steel Co., Ltd. |
64,842 | 47,567 | ||||||
| #Radiant Opto-Electronics Corp. |
232,000 | 811,752 | ||||||
| Radium Life Tech Co., Ltd. |
419,251 | 158,302 | ||||||
| #Rafael Microelectronics, Inc. |
9,619 | 117,261 | ||||||
| *RDC Semiconductor Co., Ltd. |
10,000 | 142,403 | ||||||
| Realtek Semiconductor Corp. |
96,098 | 1,724,397 | ||||||
| Rechi Precision Co., Ltd. |
183,185 | 122,855 | ||||||
| Rexon Industrial Corp., Ltd. |
76,000 | 183,109 | ||||||
| Rich Development Co., Ltd. |
264,814 | 87,229 | ||||||
| #RichWave Technology Corp. |
13,300 | 137,742 | ||||||
| *Right WAY Industrial Co., Ltd. |
18,653 | 7,144 | ||||||
| *Ritek Corp. |
313,093 | 110,112 | ||||||
| Rodex Fasteners Corp. |
11,000 | 13,766 | ||||||
| *Roo Hsing Co., Ltd. |
179,000 | 54,327 | ||||||
| Ruentex Development Co., Ltd. |
497,827 | 1,269,250 | ||||||
| Ruentex Engineering & Construction Co. |
17,810 | 79,416 | ||||||
| Sakura Development Co., Ltd. |
11,400 | 12,872 | ||||||
| Sampo Corp. |
166,200 | 176,907 | ||||||
| San Fang Chemical Industry Co., Ltd. |
89,648 | 69,633 | ||||||
| San Far Property, Ltd. |
96,818 | 52,920 | ||||||
| San Shing Fastech Corp. |
35,565 | 75,201 | ||||||
| Sanitar Co., Ltd. |
16,000 | 20,080 | ||||||
| Sanyang Motor Co., Ltd. |
240,900 | 234,329 | ||||||
| Savior Lifetec Corp. |
52,659 | 38,725 | ||||||
| Scan-D Corp. |
14,000 | 26,028 | ||||||
| SCI Pharmtech, Inc. |
29,340 | 82,296 | ||||||
| ScinoPharm Taiwan, Ltd. |
23,000 | 20,512 | ||||||
| #SDI Corp. |
36,000 | 214,898 | ||||||
| Sea Sonic Electronics Co., Ltd. |
15,000 | 42,883 | ||||||
| Senao International Co., Ltd. |
39,000 | 44,668 | ||||||
| Senao Networks, Inc. |
9,000 | 30,131 | ||||||
| Sercomm Corp. |
61,000 | 139,731 | ||||||
Dimensional World ex U.S. Core Equity 2 ETF
SCHEDULE OF INVESTMENTS
October 31, 2021
| Security Description |
Shares | Fair Value | ||||||
| TAIWAN (Continued) |
||||||||
| Sesoda Corp. |
75,565 | $ | 83,422 | |||||
| Shan-Loong Transportation Co., Ltd. |
48,000 | 60,845 | ||||||
| Sharehope Medicine Co., Ltd. |
36,786 | 35,915 | ||||||
| ShenMao Technology, Inc. |
44,922 | 114,209 | ||||||
| Shih Her Technologies, Inc. |
15,000 | 38,837 | ||||||
| Shihlin Electric & Engineering Corp. |
86,000 | 161,433 | ||||||
| Shin Kong Financial Holding Co., Ltd. |
3,502,379 | 1,235,534 | ||||||
| Shin Ruenn Development Co., Ltd. |
11,550 | 11,318 | ||||||
| #Shin Zu Shing Co., Ltd. |
71,758 | 257,269 | ||||||
| Shinih Enterprise Co., Ltd. |
24,000 | 19,160 | ||||||
| *Shining Building Business Co., Ltd. |
229,439 | 91,583 | ||||||
| Shinkong Insurance Co., Ltd. |
96,000 | 159,146 | ||||||
| Shinkong Textile Co., Ltd. |
59,000 | 87,624 | ||||||
| #Shiny Chemical Industrial Co., Ltd. |
37,332 | 178,548 | ||||||
| ShunSin Technology Holding, Ltd. |
10,000 | 32,436 | ||||||
| *Shuttle, Inc. |
115,000 | 48,798 | ||||||
| Sigurd Microelectronics Corp. |
279,770 | 589,551 | ||||||
| Silergy Corp. |
4,000 | 658,791 | ||||||
| Simplo Technology Co., Ltd. |
42,600 | 458,040 | ||||||
| Sinbon Electronics Co., Ltd. |
45,616 | 377,283 | ||||||
| Sincere Navigation Corp. |
162,868 | 162,233 | ||||||
| Single Well Industrial Corp. |
13,500 | 13,399 | ||||||
| Sinher Technology, Inc. |
33,000 | 50,078 | ||||||
| Sinmag Equipment Corp. |
22,196 | 85,404 | ||||||
| Sino-American Silicon Products, Inc., Class A |
292,000 | 1,989,823 | ||||||
| Sinon Corp. |
212,000 | 185,634 | ||||||
| SinoPac Financial Holdings Co., Ltd. |
3,448,307 | 1,754,627 | ||||||
| Sinopower Semiconductor, Inc. |
6,000 | 29,667 | ||||||
| #Sinphar Pharmaceutical Co., Ltd. |
21,937 | 23,035 | ||||||
| Sinyi Realty, Inc. |
115,077 | 137,802 | ||||||
| #Sitronix Technology Corp. |
45,000 | 431,253 | ||||||
| #Siward Crystal Technology Co., Ltd. |
70,000 | 84,453 | ||||||
| Softstar Entertainment, Inc. |
7,280 | 16,990 | ||||||
| Solar Applied Materials Technology Co. |
142,037 | 255,384 | ||||||
| Solteam, Inc. |
31,190 | 77,166 | ||||||
| Southeast Cement Co., Ltd. |
51,000 | 33,470 | ||||||
| Speed Tech Corp. |
27,000 | 82,335 | ||||||
| Spirox Corp. |
21,000 | 21,673 | ||||||
| Sporton International, Inc. |
25,423 | 206,156 | ||||||
| St Shine Optical Co., Ltd. |
18,000 | 190,625 | ||||||
| Standard Chemical & Pharmaceutical Co., Ltd. |
28,330 | 39,273 | ||||||
| Standard Foods Corp. |
143,002 | 266,375 | ||||||
| Stark Technology, Inc. |
32,800 | 83,390 | ||||||
| Sunjuice Holdings Co., Ltd. |
5,000 | 66,796 | ||||||
| SunMax Biotechnology Co., Ltd. |
19,000 | 55,274 | ||||||
| Sunny Friend Environmental Technology Co., Ltd. |
22,000 | 157,829 | ||||||
| #Sunonwealth Electric Machine Industry Co., Ltd. |
70,000 | 96,913 | ||||||
| #Sunrex Technology Corp. |
53,581 | 83,622 | ||||||
| Sunspring Metal Corp. |
41,351 | 41,859 | ||||||
| Superior Plating Technology Co., Ltd. |
9,000 | 19,095 | ||||||
| Supreme Electronics Co., Ltd. |
211,522 | 341,146 | ||||||
| #Swancor Holding Co., Ltd. |
6,000 | 21,296 | ||||||
| Sweeten Real Estate Development Co., Ltd. |
46,099 | 46,251 | ||||||
| Symtek Automation Asia Co., Ltd. |
26,000 | 94,432 | ||||||
| Syncmold Enterprise Corp. |
49,750 | 126,305 | ||||||
| SYNergy ScienTech Corp. |
9,000 | 11,004 | ||||||
Dimensional World ex U.S. Core Equity 2 ETF
SCHEDULE OF INVESTMENTS
October 31, 2021
| Security Description |
Shares | Fair Value | ||||||
| TAIWAN (Continued) |
||||||||
| Synmosa Biopharma Corp. |
89,607 | $ | 74,113 | |||||
| Synnex Technology International Corp. |
350,810 | 678,698 | ||||||
| Sysage Technology Co., Ltd. |
8,000 | 11,004 | ||||||
| Systex Corp. |
64,000 | 198,616 | ||||||
| T3EX Global Holdings Corp. |
23,735 | 110,104 | ||||||
| #TA Chen Stainless Pipe |
601,331 | 954,700 | ||||||
| Ta Liang Technology Co., Ltd. |
23,000 | 66,829 | ||||||
| #Ta Ya Electric Wire & Cable |
283,520 | 252,337 | ||||||
| Ta Yih Industrial Co., Ltd. |
16,000 | 24,798 | ||||||
| TAI Roun Products Co., Ltd. |
18,000 | 10,130 | ||||||
| TA-I Technology Co., Ltd. |
41,064 | 93,769 | ||||||
| *Tai Tung Communication Co., Ltd. |
42,847 | 27,041 | ||||||
| Taichung Commercial Bank Co., Ltd. |
1,359,927 | 584,394 | ||||||
| TaiDoc Technology Corp. |
20,323 | 127,528 | ||||||
| Taiflex Scientific Co., Ltd. |
80,640 | 138,177 | ||||||
| Taimide Tech, Inc. |
25,252 | 37,004 | ||||||
| Tainan Enterprises Co., Ltd. |
37,000 | 24,216 | ||||||
| Tainan Spinning Co., Ltd. |
512,171 | 418,084 | ||||||
| *Tainergy Tech Co., Ltd. |
20,900 | 28,034 | ||||||
| Taishin Financial Holding Co., Ltd. |
2,936,017 | 1,926,832 | ||||||
| TaiSol Electronics Co., Ltd. |
19,000 | 27,466 | ||||||
| Taisun Enterprise Co., Ltd. |
78,601 | 77,164 | ||||||
| #Taita Chemical Co., Ltd. |
124,144 | 154,463 | ||||||
| Taiwan Business Bank |
1,622,219 | 551,853 | ||||||
| Taiwan Cement Corp. |
1,081,451 | 1,876,405 | ||||||
| Taiwan Chinsan Electronic Industrial Co., Ltd. |
46,684 | 78,398 | ||||||
| Taiwan Cogeneration Corp. |
105,993 | 145,791 | ||||||
| Taiwan Cooperative Financial Holding Co., Ltd. |
955,395 | 776,451 | ||||||
| Taiwan FamilyMart Co., Ltd. |
6,000 | 55,882 | ||||||
| Taiwan Fertilizer Co., Ltd. |
233,000 | 568,916 | ||||||
| Taiwan Fire & Marine Insurance Co., Ltd. |
67,040 | 48,095 | ||||||
| Taiwan FU Hsing Industrial Co., Ltd. |
70,000 | 101,821 | ||||||
| Taiwan Glass Industry Corp. |
349,671 | 343,277 | ||||||
| Taiwan High Speed Rail Corp. |
266,000 | 277,875 | ||||||
| Taiwan Hon Chuan Enterprise Co., Ltd. |
169,421 | 396,616 | ||||||
| #Taiwan Hopax Chemicals Manufacturing Co., Ltd. |
85,000 | 244,835 | ||||||
| *Taiwan Land Development Corp. |
371,640 | 45,438 | ||||||
| Taiwan Mobile Co., Ltd. |
157,800 | 556,671 | ||||||
| Taiwan Navigation Co., Ltd. |
73,000 | 92,010 | ||||||
| #Taiwan Paiho, Ltd. |
131,892 | 409,784 | ||||||
| Taiwan Pcb Techvest Co., Ltd. |
163,800 | 276,254 | ||||||
| Taiwan Sakura Corp. |
57,512 | 144,770 | ||||||
| Taiwan Sanyo Electric Co., Ltd. |
12,750 | 15,841 | ||||||
| Taiwan Secom Co., Ltd. |
139,330 | 503,539 | ||||||
| Taiwan Semiconductor Co., Ltd. |
108,000 | 315,357 | ||||||
| *Taiwan Semiconductor Manufacturing Co., Ltd. |
436,465 | 9,260,275 | ||||||
| *Taiwan Semiconductor Manufacturing Co., Ltd. , Sponsored ADR |
296,894 | 33,756,848 | ||||||
| Taiwan Shin Kong Security Co., Ltd. |
71,000 | 98,553 | ||||||
| Taiwan Styrene Monomer |
273,832 | 178,724 | ||||||
| Taiwan Surface Mounting Technology Corp. |
77,867 | 313,613 | ||||||
| Taiwan Taxi Co., Ltd. |
16,800 | 43,860 | ||||||
| *Taiwan TEA Corp. |
352,704 | 265,081 | ||||||
| Taiwan Union Technology Corp. |
75,000 | 257,565 | ||||||
| Taiyen Biotech Co., Ltd. |
48,000 | 56,875 | ||||||
| #*Tatung Co., Ltd. |
633,000 | 783,041 | ||||||
Dimensional World ex U.S. Core Equity 2 ETF
SCHEDULE OF INVESTMENTS
October 31, 2021
| Security Description |
Shares | Fair Value | ||||||
| TAIWAN (Continued) |
||||||||
| TBI Motion Technology Co., Ltd. |
13,000 | $ | 22,463 | |||||
| TCI Co., Ltd. |
35,218 | 285,584 | ||||||
| Tehmag Foods Corp. |
12,650 | 136,014 | ||||||
| TEKOM Technologies, Inc. |
7,350 | 33,831 | ||||||
| Tera Autotech Corp. |
17,296 | 12,813 | ||||||
| Test Research, Inc. |
75,532 | 151,833 | ||||||
| Test Rite International Co., Ltd. |
119,389 | 103,682 | ||||||
| Tex-Ray Industrial Co., Ltd. |
59,000 | 29,491 | ||||||
| The Shanghai Commercial & Savings Bank, Ltd. |
345,000 | 545,876 | ||||||
| #Thermaltake Technology Co., Ltd. |
25,294 | 36,701 | ||||||
| Thinking Electronic Industrial Co., Ltd. |
37,000 | 226,190 | ||||||
| *Thye Ming Industrial Co., Ltd. |
48,850 | 57,706 | ||||||
| Tofu Restaurant Co., Ltd. |
6,000 | 33,875 | ||||||
| Ton Yi Industrial Corp. |
388,200 | 181,477 | ||||||
| Tong Hsing Electronic Industries, Ltd. |
37,098 | 352,190 | ||||||
| Tong Yang Industry Co., Ltd. |
219,040 | 266,233 | ||||||
| *Tong-Tai Machine & Tool Co., Ltd. |
76,159 | 43,819 | ||||||
| Top Bright Holding Co., Ltd. |
5,000 | 20,767 | ||||||
| Top Union Electronics Corp. |
15,000 | 10,437 | ||||||
| Topco Scientific Co., Ltd. |
47,945 | 237,928 | ||||||
| Topco Technologies Corp. |
19,000 | 53,703 | ||||||
| Topkey Corp. |
35,000 | 162,990 | ||||||
| Toung Loong Textile Manufacturing |
40,000 | 50,920 | ||||||
| #TPK Holding Co., Ltd. |
193,000 | 294,964 | ||||||
| Transcend Information, Inc. |
91,483 | 222,058 | ||||||
| Tripod Technology Corp. |
183,970 | 777,333 | ||||||
| *TrueLight Corp. |
41,000 | 39,955 | ||||||
| Tsang Yow Industrial Co., Ltd. |
31,000 | 24,636 | ||||||
| Tsann Kuen Enterprise Co., Ltd. |
29,913 | 45,501 | ||||||
| TSC Auto Id Technology Co., Ltd. |
14,630 | 108,902 | ||||||
| TSRC Corp. |
260,717 | 300,483 | ||||||
| Ttet Union Corp. |
15,000 | 85,226 | ||||||
| TTFB Co., Ltd. |
6,000 | 49,733 | ||||||
| #TTY Biopharm Co., Ltd. |
63,267 | 156,071 | ||||||
| *Tung Ho Steel Enterprise Corp. |
402,254 | 584,392 | ||||||
| Tung Thih Electronic Co., Ltd. |
11,000 | 79,310 | ||||||
| TURVO International Co., Ltd. |
29,135 | 108,437 | ||||||
| TXC Corp. |
84,411 | 311,133 | ||||||
| TYC Brother Industrial Co., Ltd. |
111,000 | 79,632 | ||||||
| *Tycoons Group Enterprise |
174,401 | 88,115 | ||||||
| Tyntek Corp. |
126,167 | 118,869 | ||||||
| #UDE Corp. |
36,000 | 63,175 | ||||||
| Ultra Chip, Inc. |
21,525 | 167,194 | ||||||
| U-Ming Marine Transport Corp. |
191,000 | 361,278 | ||||||
| Unimicron Technology Corp. |
506,356 | 3,459,649 | ||||||
| #*Union Bank Of Taiwan |
710,130 | 301,330 | ||||||
| Uni-President Enterprises Corp. |
1,040,947 | 2,493,017 | ||||||
| Unitech Computer Co., Ltd. |
11,000 | 15,111 | ||||||
| *Unitech Printed Circuit Board Corp. |
433,321 | 282,040 | ||||||
| United Integrated Services Co., Ltd. |
82,000 | 541,094 | ||||||
| #United Microelectronics Corp. |
2,798,453 | 5,836,714 | ||||||
| United Orthopedic Corp. |
26,924 | 28,465 | ||||||
| United Radiant Technology |
28,000 | 15,808 | ||||||
| *United Renewable Energy Co., Ltd. |
602,808 | 518,083 | ||||||
| *»Unity Opto Technology Co., Ltd. |
115,929 | 3,220 | ||||||
| Univacco Technology, Inc. |
20,000 | 17,009 | ||||||
Dimensional World ex U.S. Core Equity 2 ETF
SCHEDULE OF INVESTMENTS
October 31, 2021
| Security Description |
Shares | Fair Value | ||||||
| TAIWAN (Continued) |
||||||||
| #Universal Cement Corp. |
186,340 | $ | 138,037 | |||||
| Universal Microwave Technology, Inc. |
10,229 | 45,796 | ||||||
| Universal Vision Biotechnology Co., Ltd. |
9,000 | 102,918 | ||||||
| Unizyx Holding Corp. |
156,000 | 175,026 | ||||||
| #UPC Technology Corp. |
364,181 | 303,173 | ||||||
| USI Corp. |
557,861 | 690,092 | ||||||
| *Usun Technology Co., Ltd. |
15,400 | 19,244 | ||||||
| Utechzone Co., Ltd. |
22,000 | 50,474 | ||||||
| #Vanguard International Semiconductor Corp. |
298,000 | 1,548,483 | ||||||
| Ve Wong Corp. |
8,000 | 9,378 | ||||||
| Visual Photonics Epitaxy Co., Ltd. |
89,475 | 452,065 | ||||||
| Vivotek, Inc. |
22,242 | 59,107 | ||||||
| Voltronic Power Technology Corp. |
16,543 | 966,696 | ||||||
| Wafer Works Corp. |
126,116 | 291,157 | ||||||
| Waffer Technology Corp. |
16,000 | 11,076 | ||||||
| Wah Hong Industrial Corp. |
8,000 | 8,084 | ||||||
| #Wah Lee Industrial Corp. |
80,580 | 246,302 | ||||||
| Walsin Lihwa Corp. |
901,000 | 840,784 | ||||||
| #Walsin Technology Corp. |
118,000 | 640,739 | ||||||
| Wan Hai Lines, Ltd. |
218,412 | 1,256,663 | ||||||
| We & Win Development Co., Ltd. |
56,000 | 19,634 | ||||||
| *WEI Chih Steel Industrial Co., Ltd. |
46,000 | 59,715 | ||||||
| Wei Chuan Foods Corp. |
129,000 | 105,998 | ||||||
| *»Wei Mon Industry Co., Ltd. |
51,912 | – | ||||||
| Weikeng Industrial Co., Ltd. |
176,076 | 176,655 | ||||||
| Well Shin Technology Co., Ltd. |
44,000 | 76,185 | ||||||
| Wha Yu Industrial Co., Ltd. |
19,000 | 10,966 | ||||||
| Win Semiconductors Corp. |
106,868 | 1,373,872 | ||||||
| #Winbond Electronics Corp. |
1,561,117 | 1,476,433 | ||||||
| *»Wintek Corp./Taiwan |
312,087 | 3,851 | ||||||
| WinWay Technology Co., Ltd. |
9,000 | 107,287 | ||||||
| Wisdom Marine Lines Co., Ltd. |
141,070 | 331,261 | ||||||
| Wistron Corp. |
1,094,506 | 1,149,274 | ||||||
| Wistron NeWeb Corp. |
108,113 | 301,302 | ||||||
| Wiwynn Corp. |
24,000 | 767,247 | ||||||
| #Wowprime Corp. |
45,000 | 233,022 | ||||||
| WPG Holdings, Ltd. |
496,756 | 927,114 | ||||||
| WT Microelectronics Co., Ltd. |
108,836 | 245,785 | ||||||
| XAC Automation Corp. |
13,000 | 11,804 | ||||||
| XinTec, Inc. |
51,000 | 247,586 | ||||||
| X-Legend Entertainment Co., Ltd. |
10,000 | 19,419 | ||||||
| *»XPEC Entertainment, Inc. |
5,612 | – | ||||||
| *Xxentria Technology Materials Corp. |
57,306 | 139,306 | ||||||
| Yageo Corp. |
44,261 | 690,770 | ||||||
| *Yang Ming Marine Transport Corp. |
580,428 | 2,014,179 | ||||||
| #YC INOX Co., Ltd. |
118,400 | 134,330 | ||||||
| YCC Parts Manufacturing Co., Ltd. |
14,000 | 17,167 | ||||||
| Yea Shin International Development Co., Ltd. |
84,533 | 63,836 | ||||||
| #Yem Chio Co., Ltd. |
196,000 | 107,133 | ||||||
| #Yeong Guan Energy Technology Group Co., Ltd. |
26,515 | 61,118 | ||||||
| YFC-Boneagle Electric Co., Ltd. |
45,000 | 38,675 | ||||||
| #YFY, Inc. |
615,000 | 707,697 | ||||||
| Yi Jinn Industrial Co., Ltd. |
114,700 | 71,150 | ||||||
| *Yieh Phui Enterprise Co., Ltd. |
479,787 | 427,881 | ||||||
| Yonyu Plastics Co., Ltd. |
36,400 | 46,206 | ||||||
Dimensional World ex U.S. Core Equity 2 ETF
SCHEDULE OF INVESTMENTS
October 31, 2021
| Security Description |
Shares | Fair Value | ||||||
| TAIWAN (Continued) |
||||||||
| Youngtek Electronics Corp. |
51,120 | $ | 155,151 | |||||
| #Yuan High-Tech Development Co., Ltd. |
6,000 | 25,352 | ||||||
| Yuanta Financial Holding Co., Ltd. |
2,277,589 | 2,022,995 | ||||||
| Yuanta Futures Co., Ltd. |
26,536 | 46,805 | ||||||
| Yuen Chang Stainless Steel Co., Ltd. |
25,000 | 27,959 | ||||||
| Yulon Finance Corp. |
44,889 | 271,996 | ||||||
| Yulon Motor Co., Ltd. |
246,651 | 364,542 | ||||||
| Yung Chi Paint & Varnish Manufacturing Co., Ltd. |
20,000 | 52,142 | ||||||
| Yungshin Construction & Development Co., Ltd. |
31,000 | 66,775 | ||||||
| YungShin Global Holding Corp. |
48,950 | 76,571 | ||||||
| Yungtay Engineering Co., Ltd. |
9,000 | 20,907 | ||||||
| Zeng Hsing Industrial Co., Ltd. |
27,423 | 150,386 | ||||||
| Zenitron Corp. |
87,000 | 90,102 | ||||||
| Zero One Technology Co., Ltd. |
33,000 | 54,706 | ||||||
| Zhen Ding Technology Holding, Ltd. |
308,050 | 1,063,445 | ||||||
| Zhong Yang Technology Co., Ltd. |
6,000 | 10,594 | ||||||
| #Zig Sheng Industrial Co., Ltd. |
200,543 | 123,318 | ||||||
| ZillTek Technology Corp. |
3,000 | 34,198 | ||||||
| *Zinwell Corp. |
136,000 | 96,345 | ||||||
| Zippy Technology Corp. |
20,000 | 28,984 | ||||||
| ZongTai Real Estate Development Co., Ltd. |
107,477 | 149,958 | ||||||
|
|
|
|||||||
| TOTAL TAIWAN |
263,312,199 | |||||||
|
|
|
|||||||
| THAILAND (0.7%) |
||||||||
| 2S Metal PCL |
117,100 | 21,527 | ||||||
| Aapico Hitech PCL |
86,490 | 55,258 | ||||||
| Advanced INFO Service PCL |
75,600 | 430,600 | ||||||
| Advanced Information Technology PCL |
79,300 | 105,152 | ||||||
| After You PCL |
71,400 | 22,163 | ||||||
| Ai Energy PCL |
124,575 | 18,959 | ||||||
| Airports of Thailand PCL |
177,700 | 345,413 | ||||||
| Aj Plast PCL |
93,100 | 53,589 | ||||||
| Allianz Ayudhya Capital PCL |
3,900 | 4,496 | ||||||
| Amanah Leasing PCL |
117,200 | 17,589 | ||||||
| Amata Corp. PCL |
289,800 | 178,164 | ||||||
| *Ananda Development PCL |
738,700 | 35,174 | ||||||
| AP Thailand PCL |
912,904 | 243,478 | ||||||
| Asia Plus Group Holdings PCL |
988,400 | 108,424 | ||||||
| Asia Plus Group Holdings PCL—NVDR |
7,200 | 790 | ||||||
| Asian Insulators PCL |
104,160 | 24,327 | ||||||
| Asian Sea Corp. PCL |
114,300 | 54,424 | ||||||
| B Grimm Power PCL |
100,300 | 128,464 | ||||||
| Bangchak Corp. PCL |
414,300 | 343,351 | ||||||
| Bangchak Corp. PCL—NVDR |
120,400 | 99,782 | ||||||
| Bangkok Bank PCL |
52,600 | 194,184 | ||||||
| Bangkok Bank PCL—NVDR |
3,900 | 14,398 | ||||||
| Bangkok Chain Hospital PCL |
408,175 | 249,709 | ||||||
| Bangkok Dusit Medical Services PCL |
917,300 | 649,636 | ||||||
| Bangkok Expressway & Metro PCL |
1,259,902 | 341,720 | ||||||
| *Bangkok Insurance PCL |
1,300 | 10,930 | ||||||
| Bangkok Land PCL |
5,761,300 | 190,987 | ||||||
| Bangkok Land PCL—NVDR |
232,200 | 7,697 | ||||||
| Bangkok Life Assurance PCL—NVDR |
78,400 | 70,290 | ||||||
| *Bangkok Ranch PCL |
202,500 | 18,674 | ||||||
| Banpu PCL |
1,538,000 | 528,387 | ||||||
Dimensional World ex U.S. Core Equity 2 ETF
SCHEDULE OF INVESTMENTS
October 31, 2021
| Security Description |
Shares | Fair Value | ||||||
| THAILAND (Continued) |
||||||||
| Banpu PCL—NVDR |
273,000 | $ | 93,790 | |||||
| Banpu Power PCL |
139,100 | 73,360 | ||||||
| Bcpg PCL |
22,400 | 8,843 | ||||||
| *Bec World PCL |
370,200 | 136,109 | ||||||
| Berli Jucker PCL |
273,800 | 278,483 | ||||||
| *Better World Green PCL |
1,520,600 | 37,577 | ||||||
| BG Container Glass PCL |
99,700 | 33,952 | ||||||
| Bts Group Holdings PCL |
626,000 | 180,164 | ||||||
| *BTS W8 |
125,200 | — | ||||||
| Bumrungrad Hospital PCL |
91,500 | 401,213 | ||||||
| Cal-Comp Electronics Thailand PCL |
1,380,819 | 109,026 | ||||||
| Carabao Group PCL |
43,600 | 162,929 | ||||||
| Central Pattana PCL |
173,600 | 309,977 | ||||||
| Central Retail Corp. PCL |
111,091 | 116,339 | ||||||
| CH Karnchang PCL |
408,100 | 268,111 | ||||||
| Charoen Pokphand Foods PCL |
982,700 | 747,779 | ||||||
| Charoen Pokphand Foods PCL—NVDR |
109,000 | 82,943 | ||||||
| Chularat Hospital PCL |
1,240,700 | 142,083 | ||||||
| *Cimb Thai Bank PCL |
487,400 | 13,220 | ||||||
| Ck Power PCL |
279,100 | 42,476 | ||||||
| Com7 PCL |
177,600 | 384,022 | ||||||
| Communication & System Solution PCL |
264,000 | 15,832 | ||||||
| *Country Group Development PCL |
2,367,400 | 37,099 | ||||||
| CP All PCL |
334,500 | 645,159 | ||||||
| CP ALL PCL—NVDR |
27,300 | 52,654 | ||||||
| Delta Electronics Thailand PCL |
12,700 | 159,216 | ||||||
| *Dhipaya Group Holdings PCL |
254,700 | 316,624 | ||||||
| Diamond Building Products PCL |
87,500 | 19,513 | ||||||
| *Dod Biotech PCL |
107,100 | 37,763 | ||||||
| Dohome PCL |
27,400 | 19,735 | ||||||
| Dynasty Ceramic PCL |
1,335,900 | 119,167 | ||||||
| Eastern Polymer Group PCL |
155,800 | 52,117 | ||||||
| Eastern Power Group PCL |
214,032 | 39,346 | ||||||
| Eastern Star Real Estate PCL |
1,058,000 | 18,493 | ||||||
| Eastern Water Resources Development and Management PCL |
247,100 | 75,212 | ||||||
| Ekachai Medical Care PCL |
186,500 | 45,525 | ||||||
| Electricity Generating PCL |
30,700 | 165,146 | ||||||
| Energy Absolute PCL |
156,500 | 308,920 | ||||||
| *Erawan Group PCL (The) |
936,000 | 91,957 | ||||||
| *Esso Thailand PCL |
499,400 | 119,648 | ||||||
| Forth Corp. PCL |
142,300 | 85,768 | ||||||
| Forth Smart Service PCL |
124,000 | 41,853 | ||||||
| Gfpt PCL |
231,300 | 80,858 | ||||||
| Global Green Chemicals PCL |
90,900 | 34,516 | ||||||
| Global Power Synergy PCL |
99,928 | 234,894 | ||||||
| Gunkul Engineering PCL |
1,603,840 | 261,003 | ||||||
| Haad Thip PCL |
43,300 | 49,260 | ||||||
| Hana Microelectronics PCL |
251,900 | 607,308 | ||||||
| Home Product Center PCL |
640,957 | 282,015 | ||||||
| Ichitan Group PCL |
150,200 | 49,339 | ||||||
| Indorama Ventures PCL |
389,900 | 493,507 | ||||||
| Interlink Communication PCL |
89,150 | 24,717 | ||||||
| *Interlink Telecom PCL |
59,900 | 8,953 | ||||||
| Irpc PCL |
6,464,500 | 837,711 | ||||||
| IRPC PCL—NVDR |
794,500 | 102,956 | ||||||
Dimensional World ex U.S. Core Equity 2 ETF
SCHEDULE OF INVESTMENTS
October 31, 2021
| Security Description |
Shares | Fair Value | ||||||
| THAILAND (Continued) |
||||||||
| *Italian-Thai Development PCL |
2,567,554 | $ | 181,062 | |||||
| *Italian-Thai Development PCL—NVDR |
440,000 | 31,028 | ||||||
| Jasmine International PCL |
1,777,700 | 153,220 | ||||||
| Jkn Global Media PCL |
134,600 | 35,899 | ||||||
| Jmt Network Services PCL |
39,500 | 58,031 | ||||||
| Jubilee Enterprise PCL |
14,800 | 11,061 | ||||||
| Jwd Infologistics PCL |
211,000 | 93,474 | ||||||
| JWD Infologistics PCL—NVDR |
10,000 | 4,430 | ||||||
| Kang Yong Electric PCL |
100 | 1,136 | ||||||
| Karmarts PCL |
136,400 | 15,620 | ||||||
| *Kaset Thai International Sugar Corp. PCL |
51,200 | 8,101 | ||||||
| Kasikornbank PCL |
34,400 | 146,173 | ||||||
| Kasikornbank PCL—NVDR |
78,700 | 334,414 | ||||||
| Kce Electronics PCL |
200,200 | 524,897 | ||||||
| KCE Electronics PCL—NVDR |
3,000 | 7,866 | ||||||
| Kgi Securities Thailand PCL |
315,500 | 62,753 | ||||||
| *Khon Kaen Sugar Industry PCL |
815,184 | 94,827 | ||||||
| Kiatnakin Phatra Bank PCL |
112,300 | 203,059 | ||||||
| Krung Thai Bank PCL |
537,775 | 186,376 | ||||||
| Ladprao General Hospital PCL |
51,300 | 8,967 | ||||||
| Lalin Property PCL |
260,500 | 73,010 | ||||||
| Lam Soon Thailand PCL |
77,800 | 13,013 | ||||||
| Land & Houses PCL |
1,139,000 | 290,049 | ||||||
| Land & Houses PCL |
280,200 | 71,354 | ||||||
| Lanna Resources PCL |
105,750 | 64,376 | ||||||
| Lh Financial Group PCL |
2,170,700 | 96,163 | ||||||
| *Loxley PCL |
518,575 | 42,821 | ||||||
| Lpn Development PCL |
882,200 | 132,400 | ||||||
| LPN Development PCL |
41,200 | 6,183 | ||||||
| *Mbk PCL |
360,288 | 152,009 | ||||||
| *Mc Group PCL |
159,600 | 45,452 | ||||||
| Mcs Steel PCL |
202,200 | 88,357 | ||||||
| Mega Lifesciences PCL |
173,100 | 242,572 | ||||||
| Millcon Steel PCL |
246,700 | 10,780 | ||||||
| *Minor International PCL |
347,092 | 342,568 | ||||||
| MK Restaurants Group PCL |
80,900 | 133,482 | ||||||
| *Mono Next PCL |
699,300 | 32,244 | ||||||
| Namyong Terminal PCL |
200,300 | 24,628 | ||||||
| Netbay PCL |
32,500 | 24,486 | ||||||
| Noble Development PCL |
329,700 | 65,081 | ||||||
| Northeast Rubber PCL, Class R |
110,300 | 25,429 | ||||||
| Northeast Rubber PCL |
392,200 | 90,419 | ||||||
| *Nusasiri PCL |
773,700 | 8,860 | ||||||
| Origin Property PCL |
411,500 | 140,133 | ||||||
| Osotspa PCL |
18,800 | 18,555 | ||||||
| Plan B Media PCL |
738,300 | 142,398 | ||||||
| *Platinum Group PCL (The) |
287,600 | 28,255 | ||||||
| Polyplex Thailand PCL |
146,200 | 107,505 | ||||||
| *Power Solution Technologies PCL |
146,000 | 11,528 | ||||||
| Premier Marketing PCL |
112,400 | 34,551 | ||||||
| Prima Marine PCL |
516,500 | 101,175 | ||||||
| Prima Marine PCL—NVDR, Class R |
88,100 | 17,258 | ||||||
| *Principal Capital PCL |
136,700 | 18,044 | ||||||
| Property Perfect PCL |
5,370,690 | 74,452 | ||||||
| Pruksa Holding PCL |
390,900 | 162,568 | ||||||
| Ptg Energy PCL |
449,700 | 211,416 | ||||||
Dimensional World ex U.S. Core Equity 2 ETF
SCHEDULE OF INVESTMENTS
October 31, 2021
| Security Description |
Shares | Fair Value | ||||||
| THAILAND (Continued) |
||||||||
| PTT Exploration & Production PCL |
278,385 | $ | 985,768 | |||||
| PTT Exploration & Production PCL—NVDR |
18,500 | 65,509 | ||||||
| PTT Global Chemical PCL |
269,145 | 508,969 | ||||||
| PTT PCL |
881,340 | 1,009,295 | ||||||
| PTT PCL—NVDR |
61,500 | 70,429 | ||||||
| Pylon PCL |
76,800 | 10,369 | ||||||
| Quality Houses PCL |
3,740,209 | 259,248 | ||||||
| *Raimon Land PCL |
859,600 | 25,128 | ||||||
| Rajthanee Hospital PCL |
74,800 | 74,952 | ||||||
| Ratch Group PCL |
96,899 | 132,868 | ||||||
| *Regional Container Lines PCL |
173,100 | 228,226 | ||||||
| Rojana Industrial Park PCL |
383,190 | 79,681 | ||||||
| *Rs PCL |
136,700 | 72,094 | ||||||
| Sabina PCL |
75,100 | 43,907 | ||||||
| Sahakol Equipment PCL |
392,500 | 28,862 | ||||||
| Sahamitr Pressure Container PCL |
29,000 | 10,051 | ||||||
| *Samart Corp. PCL |
115,700 | 21,967 | ||||||
| *Samart Telcoms PCL |
153,700 | 30,108 | ||||||
| Sansiri PCL |
4,896,033 | 185,911 | ||||||
| *Sansiri PCL—NVDR |
938,100 | 35,621 | ||||||
| Sappe PCL |
66,500 | 51,104 | ||||||
| SC Asset Corp. PCL |
876,762 | 94,592 | ||||||
| Scg Ceramics PCL |
264,600 | 20,414 | ||||||
| Seafco PCL |
223,700 | 30,606 | ||||||
| *Sena Development PCL |
203,000 | 25,082 | ||||||
| Sermsang Power Corp. Co., Ltd. |
150,140 | 62,441 | ||||||
| Siam Cement PCL (The) |
16,000 | 190,462 | ||||||
| Siam Cement PCL (The)—NVDR |
11,400 | 135,704 | ||||||
| Siam City Cement PCL |
41,135 | 210,122 | ||||||
| Siam Commercial Bank PCL (The) |
128,300 | 487,178 | ||||||
| Siam Global House PCL |
225,923 | 138,893 | ||||||
| *Siam Wellness Group PCL |
171,850 | 39,360 | ||||||
| Siamgas & Petrochemicals PCL |
488,800 | 212,121 | ||||||
| Sikarin PCL |
188,000 | 69,687 | ||||||
| *Singha Estate PCL |
1,559,564 | 94,939 | ||||||
| Sino-Thai Engineering & Construction PCL |
289,400 | 120,356 | ||||||
| Sino-Thai Engineering & Construction PCL—NVDR |
3,500 | 1,456 | ||||||
| Snc Former PCL |
101,400 | 43,087 | ||||||
| Somboon Advance Technology PCL |
163,550 | 101,041 | ||||||
| Spcg PCL |
257,400 | 138,076 | ||||||
| Sri Trang Agro-Industry PCL |
300,320 | 294,143 | ||||||
| Sri Trang Agro-Industry PCL—NVDR |
92,260 | 90,363 | ||||||
| *Srithai Superware PCL |
333,400 | 14,066 | ||||||
| Srivichai Vejvivat PCL |
109,300 | 38,868 | ||||||
| *Star Petroleum Refining PCL |
596,400 | 188,720 | ||||||
| *Stars Microelectronics Thailand PCL |
119,500 | 21,067 | ||||||
| Supalai PCL |
624,775 | 440,586 | ||||||
| Supalai PCL |
104,200 | 73,481 | ||||||
| Super Energy Corp. PCL |
7,223,400 | 211,156 | ||||||
| Susco PCL |
326,400 | 32,264 | ||||||
| Syntec Construction PCL |
366,400 | 21,421 | ||||||
| Tac Consumer PCL |
175,900 | 42,938 | ||||||
| Taokaenoi Food & Marketing PCL |
221,700 | 44,096 | ||||||
| *Tata Steel Thailand PCL |
754,700 | 37,755 | ||||||
| Thai Oil PCL |
397,500 | 667,841 | ||||||
Dimensional World ex U.S. Core Equity 2 ETF
SCHEDULE OF INVESTMENTS
October 31, 2021
| Security Description |
Shares | Fair Value | ||||||
| THAILAND (Continued) |
||||||||
| Thai Reinsurance PCL |
426,400 | $ | 16,705 | |||||
| Thai Solar Energy PCL |
169,596 | 13,902 | ||||||
| Thai Stanley Electric PCL |
17,642 | 93,839 | ||||||
| Thai Union Group PCL |
1,005,940 | 633,591 | ||||||
| Thai Union Group PCL—NVDR |
159,200 | 100,272 | ||||||
| Thai Vegetable Oil PCL |
211,600 | 199,277 | ||||||
| Thai Wah PCL |
109,900 | 18,382 | ||||||
| Thaifoods Group PCL |
530,300 | 69,998 | ||||||
| *Thaire Life Assurance PCL |
112,800 | 10,266 | ||||||
| Thanachart Capital PCL |
110,000 | 116,854 | ||||||
| Thoresen Thai Agencies PCL |
491,651 | 171,872 | ||||||
| Tipco Asphalt PCL |
307,900 | 169,806 | ||||||
| Tisco Financial Group PCL |
96,900 | 269,390 | ||||||
| Tks Technologies PCL |
43,000 | 15,939 | ||||||
| TMB Bank PCL |
6,352,086 | 222,057 | ||||||
| Tmt Steel PCL |
187,600 | 61,059 | ||||||
| Toa Paint Thailand PCL |
147,100 | 146,291 | ||||||
| Total Access Communication PCL |
235,300 | 271,234 | ||||||
| Total Access Communication PCL—NVDR |
46,900 | 54,062 | ||||||
| TPC Power Holding PCL |
56,000 | 18,564 | ||||||
| Tpi Polene PCL |
2,708,800 | 139,593 | ||||||
| Tpi Polene Power PCL |
821,900 | 105,021 | ||||||
| TQM Corp. PCL |
31,000 | 98,094 | ||||||
| True Corp. PCL |
3,979,941 | 486,960 | ||||||
| True Corp. PCL—NVDR |
1,130,165 | 138,280 | ||||||
| *Ttcl PCL |
135,200 | 18,091 | ||||||
| Ttw PCL |
346,900 | 122,315 | ||||||
| *U City PCL |
1,069,300 | 57,682 | ||||||
| *U City PCL |
3,207,900 | 111,176 | ||||||
| Union Auction PCL |
87,400 | 24,232 | ||||||
| *Unique Engineering & Construction PCL |
326,045 | 65,833 | ||||||
| United Paper PCL |
133,000 | 66,134 | ||||||
| Univanich Palm Oil PCL |
259,100 | 65,590 | ||||||
| Univentures PCL |
288,800 | 35,510 | ||||||
| Vanachai Group PCL |
244,900 | 69,376 | ||||||
| Vinythai PCL |
47,700 | 54,625 | ||||||
| Vinythai PCL—NVDR |
79,400 | 90,927 | ||||||
| WHA Corp. PCL |
1,753,700 | 178,633 | ||||||
| Wha Utilities And Power PCL |
315,800 | 40,162 | ||||||
| Workpoint Entertainment PCL |
92,100 | 62,728 | ||||||
|
|
|
|||||||
| TOTAL THAILAND |
32,098,655 | |||||||
|
|
|
|||||||
| TURKEY (0.2%) |
||||||||
| Agesa Hayat ve Emeklilik A/S |
4,841 | 9,904 | ||||||
| Akbank T.A.S. |
403,344 | 245,820 | ||||||
| *Akenerji Elektrik Uretim A/S |
0 | 0 | ||||||
| Aksa Akrilik Kimya Sanayii A/S |
76,816 | 187,264 | ||||||
| *Aksa Enerji Uretim A/S |
161,556 | 126,353 | ||||||
| Aksigorta A/S |
80,848 | 59,195 | ||||||
| Alarko Holding A/S |
0 | 0 | ||||||
| *Albaraka Turk Katilim Bankasi A/S |
343,811 | 63,290 | ||||||
| Alkim Alkali Kimya A/S |
52,781 | 93,867 | ||||||
| Anadolu Anonim Turk Sigorta Sirketi |
68,078 | 41,915 | ||||||
| Anadolu Efes Biracilik Ve Malt Sanayii A/S |
59,852 | 138,190 | ||||||
| Anadolu Hayat Emeklilik A/S |
18,436 | 17,889 | ||||||
Dimensional World ex U.S. Core Equity 2 ETF
SCHEDULE OF INVESTMENTS
October 31, 2021
| Security Description |
Shares | Fair Value | ||||||
| TURKEY (Continued) |
||||||||
| Arcelik A/S |
55,243 | $ | 193,506 | |||||
| Aselsan Elektronik Sanayi Ve Ticaret A/S |
27,489 | 46,973 | ||||||
| Aygaz A/S |
12,361 | 23,526 | ||||||
| *Banvit Bandirma Vitaminli Yem Sanayii As |
1,340 | 9,100 | ||||||
| *Baticim Bati Anadolu Cimento Sanayii As |
1 | 1 | ||||||
| *Bera Holding A/S |
129,318 | 129,383 | ||||||
| *Besiktas Futbol Yatirimlari Sanayi VE Ticaret As |
44,015 | 28,565 | ||||||
| BIM Birlesik Magazalar A/S |
36,598 | 236,561 | ||||||
| *Borusan Mannesmann Boru Sanayi VE Ticaret A/S |
5,550 | 13,853 | ||||||
| *Bursa Cimento Fabrikasi A/S |
101,129 | 39,757 | ||||||
| Cemtas Celik Makina Sanayi Ve Ticaret A/S |
10,430 | 16,065 | ||||||
| *Cimsa Cimento Sanayi VE Ticaret A/S |
4,048 | 13,110 | ||||||
| Coca-Cola Icecek A/S |
36,806 | 325,756 | ||||||
| Deva Holding A/S |
15,335 | 37,638 | ||||||
| Dogan Sirketler Grubu Holding As |
1 | 0 | ||||||
| Dogus Otomotiv Servis Ve Ticaret A/S |
6,811 | 25,728 | ||||||
| EGE Endustri VE Ticaret A/S |
615 | 82,632 | ||||||
| Enerjisa Enerji A/S |
62,099 | 75,951 | ||||||
| Erbosan Erciyas Boru Sanayii Ve Ticaret A/S |
0 | 0 | ||||||
| Eregli Demir ve Celik Fabrikalari TAS |
136,225 | 278,963 | ||||||
| *Fenerbahce Futbol A/S |
11,698 | 37,227 | ||||||
| Ford Otomotiv Sanayi A/S |
9,472 | 182,837 | ||||||
| #*Global Yatirim Holding A/S |
81,792 | 15,822 | ||||||
| Goodyear Lastikleri TAS |
1 | 0 | ||||||
| #*Hektas Ticaret TAS |
207,798 | 191,478 | ||||||
| *IhlA/S Holding A/S |
192,057 | 11,186 | ||||||
| Indeks Bilgisayar Sistemleri Muhendislik Sanayi Ve Ticaret A/S |
17,144 | 11,821 | ||||||
| *Is Finansal Kiralama A/S |
1 | 0 | ||||||
| Is Yatirim Menkul Degerler A/S |
42,089 | 70,038 | ||||||
| Jantsa Jant Sanayi VE Ticaret As |
2,497 | 16,114 | ||||||
| *Kardemir Karabuk Demir Celik Sanayi VE Ticaret A/S, Class D |
202,304 | 156,960 | ||||||
| *Kardemir Karabuk Demir Celik Sanayi VE Ticaret A/S, Class A |
91,736 | 61,633 | ||||||
| *Kardemir Karabuk Demir Celik Sanayi VE Ticaret As |
19,772 | 13,161 | ||||||
| *Karsan Otomotiv Sanayii VE Ticaret As |
1 | 0 | ||||||
| Kartonsan Karton Sanayi ve Ticaret A/S |
2,119 | 11,559 | ||||||
| *Kerevitas Gida Sanayi VE Ticaret A/S |
46,554 | 20,529 | ||||||
| KOC Holding A/S |
34,623 | 84,908 | ||||||
| *Kordsa Teknik Tekstil A/S |
17,804 | 51,106 | ||||||
| *Koza Altin Isletmeleri A/S |
8,332 | 92,981 | ||||||
| Logo Yazilim Sanayi Ve Ticaret AS |
48,180 | 212,961 | ||||||
| Mavi Giyim Sanayi Ve Ticaret AS, Class B |
9,703 | 72,658 | ||||||
| *Migros Ticaret A/S |
21,932 | 80,291 | ||||||
| *Mlp Saglik Hizmetleri A/S |
17,852 | 50,352 | ||||||
| *Netas Telekomunikasyon A/S |
4,475 | 8,061 | ||||||
| Nuh Cimento Sanayi A/S |
3,431 | 15,551 | ||||||
| Otokar Otomotiv Ve Savunma Sanayi A/S |
902 | 31,614 | ||||||
| *Oyak Cimento Fabrikalari As |
2 | 1 | ||||||
| *Peasus Hava Tasimaciligi A/S |
16,336 | 135,324 | ||||||
| *Petkim Petrokimya Holding A/S |
220,687 | 149,877 | ||||||
| Pinar Sut Mamulleri Sanayii As |
5,950 | 9,944 | ||||||
| Polisan Holding A/S |
0 | 0 | ||||||
| Sarkuysan Elektrolitik Bakir Sanayi ve Ticaret AS |
8,038 | 15,448 | ||||||
| *Sasa Polyester Sanayi A/S |
1 | 3 | ||||||
| *Sekerbank Turk A/S |
316,640 | 33,261 | ||||||
| Selcuk Ecza Deposu Ticaret ve Sanayi A/S |
72,493 | 67,026 | ||||||
Dimensional World ex U.S. Core Equity 2 ETF
SCHEDULE OF INVESTMENTS
October 31, 2021
| Security Description |
Shares | Fair Value | ||||||
| TURKEY (Continued) |
||||||||
| *Tav Havalimanlari Holding A/S |
65,370 | $ | 180,708 | |||||
| Tekfen Holding A/S |
53,328 | 83,915 | ||||||
| *Teknosa Ic VE DIS Ticaret A/S |
20,513 | 13,206 | ||||||
| Tofas Turk Otomobil Fabrikasi A/S |
31,476 | 192,487 | ||||||
| *Tukas Gida Sanayi VE Ticaret As |
52,069 | 36,553 | ||||||
| *Turk Hava Yollari AO |
226,249 | 352,251 | ||||||
| Turk Telekomunikasyon A/S |
66,604 | 52,160 | ||||||
| Turk Traktor VE Ziraat Makineleri A/S |
702 | 12,039 | ||||||
| Turkcell Iletisim Hizmetleri A/S |
311,016 | 494,577 | ||||||
| Turkcell Iletisim Hizmetleri As , Sponsored ADR |
9,157 | 36,353 | ||||||
| Turkiye Garanti Bankasi A/S |
595,461 | 610,005 | ||||||
| #*Turkiye Halk Bankasi A/S |
118,151 | 54,436 | ||||||
| Turkiye Is Bankasi A/S |
232,595 | 136,192 | ||||||
| *Turkiye Petrol Rafinerileri A/S |
5,050 | 73,425 | ||||||
| Turkiye Sinai Kalkinma Bankasi A/S |
1 | 0 | ||||||
| Turkiye Sise VE CAM Fabrikalari A/S |
331,332 | 298,418 | ||||||
| *Turkiye Vakiflar Bankasi TAO |
171,936 | 61,513 | ||||||
| Ulker Biskuvi Sanayi A/S |
135,931 | 285,288 | ||||||
| Vestel Beyaz Esya Sanayi VE Ticaret As |
54,863 | 35,091 | ||||||
| Vestel Elektronik Sanayi VE Ticaret A/S |
37,710 | 99,382 | ||||||
| Yapi VE Kredi Bankasi A/S |
756,386 | 214,759 | ||||||
| Yatas Yatak VE Yorgan Sanayi VE Ticaret A/S |
87,871 | 122,094 | ||||||
| *Zorlu Enerji Elektrik Uretim A/S |
1 | 0 | ||||||
|
|
|
|||||||
| TOTAL TURKEY |
7,917,339 | |||||||
|
|
|
|||||||
| UNITED ARAB EMIRATES (0.2%) |
||||||||
| Abu Dhabi Commercial Bank PJSC |
119,189 | 269,324 | ||||||
| Abu Dhabi Islamic Bank PJSC |
432,942 | 688,342 | ||||||
| Agthia Group PJSC |
46,830 | 75,731 | ||||||
| *Air Arabia PJSC |
651,029 | 246,364 | ||||||
| Aldar Properties PJSC |
769,190 | 846,012 | ||||||
| *Amlak Finance PJSC |
229,184 | 16,659 | ||||||
| *»Arabtec Holding PJSC |
125,089 | 3,385 | ||||||
| Aramex PJSC |
250,272 | 297,752 | ||||||
| *DAMAC Properties Dubai Co. PJSC |
259,066 | 88,162 | ||||||
| Dana Gas PJSC |
1,228,496 | 344,486 | ||||||
| *Deyaar Development PJSC |
646,261 | 52,255 | ||||||
| *Dubai Financial Market PJSC |
590,967 | 164,106 | ||||||
| Dubai Investments PJSC |
408,812 | 189,206 | ||||||
| Dubai Islamic Bank PJSC |
207,498 | 288,666 | ||||||
| *Emaar Development PJSC |
392,633 | 416,881 | ||||||
| *Emaar Malls PJSC |
638,946 | 347,901 | ||||||
| Emaar Properties PJSC |
988,008 | 1,078,614 | ||||||
| Emirates NBD Bank PJSC |
227,850 | 865,336 | ||||||
| jiangsuEmirates Telecommunications Group Co. PJSC |
99,297 | 692,050 | ||||||
| First Abu Dhabi Bank PJSC |
109,450 | 530,988 | ||||||
| *Gulf Navigation Holding PJSC |
157,415 | 11,271 | ||||||
| Islamic Arab Insurance Co. |
172,357 | 35,193 | ||||||
| *Manazel Real Estate PJSC |
522,968 | 78,164 | ||||||
| National Central Cooling Co.PJSC |
41,635 | 31,851 | ||||||
| *Rak Properties PJSC |
403,272 | 80,256 | ||||||
| RAS Al Khaimah Ceramics |
296,539 | 221,204 | ||||||
| *Union Properties PJSC |
674,193 | 48,273 | ||||||
|
|
|
|||||||
| TOTAL UNITED ARAB EMIRATES |
8,008,432 | |||||||
|
|
|
|||||||
Dimensional World ex U.S. Core Equity 2 ETF
SCHEDULE OF INVESTMENTS
October 31, 2021
| Security Description |
Shares | Fair Value | ||||||
| UNITED KINGDOM (8.7%) |
||||||||
| 4Imprint Group PLC |
4,447 | $ | 174,337 | |||||
| 888 Holdings PLC |
123,993 | 650,618 | ||||||
| abrdn PLC |
672,031 | 2,339,806 | ||||||
| Admiral Group PLC |
34,518 | 1,357,952 | ||||||
| Advanced Medical Solutions Group PLC |
6,725 | 29,959 | ||||||
| *»Afren PLC |
357,576 | — | ||||||
| AG Barr PLC |
35,265 | 240,005 | ||||||
| Air Partner PLC |
15,643 | 18,548 | ||||||
| AJ Bell PLC |
1,786 | 10,037 | ||||||
| ALFA Financial Software Holdings PLC |
11,823 | 31,197 | ||||||
| *Alliance Pharma PLC |
49,947 | 70,382 | ||||||
| Anglo American PLC |
102,494 | 3,909,223 | ||||||
| Anglo-Eastern Plantations PLC |
565 | 5,886 | ||||||
| Antofagasta PLC |
86,238 | 1,685,089 | ||||||
| *AO World PLC |
24,049 | 48,228 | ||||||
| Appreciate Group PLC |
31,700 | 11,537 | ||||||
| *Ascential PLC |
12,269 | 67,943 | ||||||
| Ashmore Group PLC |
88,571 | 409,632 | ||||||
| Ashtead Group PLC |
81,641 | 6,853,309 | ||||||
| *ASOS PLC |
8,119 | 276,224 | ||||||
| Associated British Foods PLC |
37,764 | 925,555 | ||||||
| AstraZeneca PLC, Sponsored ADR |
178,391 | 11,128,031 | ||||||
| AstraZeneca PLC |
1,687 | 210,294 | ||||||
| Auto Trader Group PLC |
238,196 | 1,977,321 | ||||||
| AVEVA Group PLC |
2,508 | 122,318 | ||||||
| Aviva PLC |
577,161 | 3,122,633 | ||||||
| Avon Protection PLC |
8,947 | 238,536 | ||||||
| B&M European Value Retail SA |
341,069 | 2,960,329 | ||||||
| *Babcock International Group PLC |
227,500 | 995,720 | ||||||
| BAE Systems PLC |
305,978 | 2,314,348 | ||||||
| Bakkavor Group PLC |
13,050 | 22,611 | ||||||
| Balfour Beatty PLC |
225,633 | 785,585 | ||||||
| Bank of Georgia Group PLC |
18,418 | 383,240 | ||||||
| #Barclays PLC, Sponsored ADR |
254,215 | 2,844,666 | ||||||
| Barclays PLC |
585,814 | 1,624,071 | ||||||
| Barratt Developments PLC |
135,204 | 1,228,740 | ||||||
| *Beazley PLC |
81,504 | 435,713 | ||||||
| Begbies Traynor Group PLC |
12,322 | 24,491 | ||||||
| Bellway PLC |
66,107 | 3,002,104 | ||||||
| Berkeley Group Holdings PLC |
26,078 | 1,556,751 | ||||||
| BHP Group PLC |
137,562 | 3,648,684 | ||||||
| #BHP Group PLC, Sponsored ADR |
78,092 | 4,137,314 | ||||||
| *Biffa PLC |
96,917 | 528,737 | ||||||
| *Bloomsbury Publishing PLC |
22,391 | 111,106 | ||||||
| Bodycote PLC |
120,351 | 1,318,940 | ||||||
| *boohoo Group PLC |
241,888 | 602,623 | ||||||
| *BP PLC, Sponsored ADR |
500,724 | 14,415,844 | ||||||
| BP PLC |
581,149 | 2,789,719 | ||||||
| Brewin Dolphin Holdings PLC |
138,869 | 716,683 | ||||||
| British American Tobacco PLC |
138,418 | 4,831,624 | ||||||
| Britvic PLC |
111,137 | 1,352,784 | ||||||
| *BT Group PLC |
2,503,154 | 4,765,919 | ||||||
| Bunzl PLC |
38,438 | 1,423,649 | ||||||
| *Burberry Group PLC |
62,365 | 1,649,035 | ||||||
| *Bytes Technology Group PLC |
22,885 | 166,564 | ||||||
| *Bytes Technology Group PLC |
54,406 | 398,240 | ||||||
Dimensional World ex U.S. Core Equity 2 ETF
SCHEDULE OF INVESTMENTS
October 31, 2021
| Security Description |
Shares | Fair Value | ||||||
| UNITED KINGDOM (Continued) |
||||||||
| *C&C Group PLC |
105,513 | $ | 374,885 | |||||
| Cairn Energy PLC |
127,452 | 319,534 | ||||||
| *Capita PLC |
473,706 | 307,393 | ||||||
| *Card Factory PLC |
181,277 | 117,657 | ||||||
| Caretech Holdings PLC |
13,040 | 111,537 | ||||||
| #*Carnival PLC, Sponsored ADR |
876 | 17,958 | ||||||
| *Carnival PLC |
12,742 | 256,751 | ||||||
| Carr’s Group PLC |
15,344 | 30,918 | ||||||
| Castings PLC |
2,022 | 9,978 | ||||||
| Centamin PLC |
594,706 | 764,323 | ||||||
| Central Asia Metals PLC |
18,663 | 62,804 | ||||||
| *Centrica PLC |
2,137,473 | 1,767,335 | ||||||
| Chemring Group PLC |
95,546 | 383,085 | ||||||
| Chesnara PLC |
32,227 | 127,224 | ||||||
| #*Cineworld Group PLC |
458,510 | 384,642 | ||||||
| *Circassia Group PLC |
21,446 | 12,641 | ||||||
| Clarkson PLC |
4,590 | 251,669 | ||||||
| Clinigen Group PLC |
22,278 | 187,195 | ||||||
| Clipper Logistics PLC |
29,477 | 289,303 | ||||||
| Close Brothers Group PLC |
45,859 | 905,199 | ||||||
| Cls Holdings PLC |
41,684 | 127,989 | ||||||
| Cmc Markets PLC |
70,849 | 245,218 | ||||||
| Coats Group PLC |
189,492 | 167,276 | ||||||
| Coca-Cola HBC AG |
27,734 | 962,952 | ||||||
| *Compass Group PLC |
138,167 | 2,935,573 | ||||||
| Computacenter PLC |
40,865 | 1,506,817 | ||||||
| ConvaTec Group PLC |
387,350 | 1,135,189 | ||||||
| *Costain Group PLC |
67,109 | 49,214 | ||||||
| *Countryside Properties PLC |
76,435 | 492,852 | ||||||
| Cranswick PLC |
15,363 | 728,633 | ||||||
| Crest Nicholson Holdings PLC |
121,755 | 594,147 | ||||||
| Croda International PLC |
22,654 | 2,936,980 | ||||||
| Currys PLC |
403,139 | 670,858 | ||||||
| *CVS Group PLC |
12,517 | 428,083 | ||||||
| Daily Mail & General Trust PLC |
29,533 | 421,015 | ||||||
| DCC PLC |
26,291 | 2,200,497 | ||||||
| *de La Rue PLC |
99,953 | 229,081 | ||||||
| *»Debenhams PLC |
2,131,609 | 0 | ||||||
| Dechra Pharmaceuticals PLC |
2,571 | 180,438 | ||||||
| Devro PLC |
106,885 | 315,734 | ||||||
| *Dfs Furniture PLC |
44,367 | 166,027 | ||||||
| Diageo PLC |
20,360 | 1,013,632 | ||||||
| Diageo PLC, Sponsored ADR |
21,422 | 4,277,331 | ||||||
| *Dialight PLC |
7,276 | 34,409 | ||||||
| #*Dignity PLC |
14,253 | 138,324 | ||||||
| Diploma PLC |
46,041 | 1,895,839 | ||||||
| Direct Line Insurance Group PLC |
504,783 | 2,023,201 | ||||||
| Discoverie Group PLC |
16,825 | 241,237 | ||||||
| Diversified Energy Co. PLC |
62,587 | 99,003 | ||||||
| Domino’s Pizza Group PLC |
193,196 | 1,024,863 | ||||||
| Dotdigital Group PLC |
57,838 | 190,671 | ||||||
| Drax Group PLC |
174,811 | 1,271,191 | ||||||
| DS Smith PLC |
433,618 | 2,278,853 | ||||||
| Dunelm Group PLC |
40,348 | 707,375 | ||||||
| Dwf Group PLC |
34,360 | 53,222 | ||||||
Dimensional World ex U.S. Core Equity 2 ETF
SCHEDULE OF INVESTMENTS
October 31, 2021
| Security Description |
Shares | Fair Value | ||||||
| UNITED KINGDOM (Continued) |
||||||||
| easyJet PLC |
97,599 | $ | 833,471 | |||||
| Electrocomponents PLC |
242,307 | 3,736,589 | ||||||
| *Elementis PLC |
183,968 | 351,782 | ||||||
| Emis Group PLC |
18,315 | 338,418 | ||||||
| *Enquest PLC |
519,387 | 171,579 | ||||||
| *Entain PLC |
96,728 | 2,715,432 | ||||||
| *Esken, Ltd. |
73,802 | 13,596 | ||||||
| Essentra PLC |
83,668 | 333,167 | ||||||
| Euromoney Institutional Investor PLC |
23,283 | 334,470 | ||||||
| Evraz PLC |
110,077 | 937,917 | ||||||
| Experian PLC |
63,293 | 2,903,810 | ||||||
| Fdm Group Holdings PLC |
12,659 | 208,574 | ||||||
| Ferguson PLC |
35,506 | 5,351,233 | ||||||
| Ferrexpo PLC |
273,985 | 1,171,759 | ||||||
| Fevertree Drinks PLC |
10,945 | 340,414 | ||||||
| *Firstgroup PLC |
734,575 | 1,014,971 | ||||||
| *Flowtech Fluidpower PLC |
6,878 | 12,657 | ||||||
| Forterra PLC |
24,714 | 87,741 | ||||||
| Foxtons Group PLC |
83,030 | 53,663 | ||||||
| *Frasers Group PLC |
158,641 | 1,399,332 | ||||||
| Fresnillo PLC |
20,497 | 242,526 | ||||||
| Future PLC |
7,174 | 346,934 | ||||||
| Galliford Try Holdings PLC |
51,317 | 140,685 | ||||||
| Games Workshop Group PLC |
9,000 | 1,189,876 | ||||||
| Gamma Communications PLC |
11,257 | 279,600 | ||||||
| GB Group PLC |
2,697 | 32,773 | ||||||
| Gem Diamonds, Ltd. |
91,437 | 67,682 | ||||||
| Genel Energy PLC |
46,207 | 95,514 | ||||||
| Genuit Group PLC |
108,202 | 984,828 | ||||||
| Genus PLC |
5,701 | 432,148 | ||||||
| *Georgia Capital PLC |
21,480 | 177,839 | ||||||
| GlaxoSmithKline PLC |
61,533 | 1,272,445 | ||||||
| #GlaxoSmithKline PLC, Sponsored ADR |
116,794 | 4,943,890 | ||||||
| Glencore PLC |
922,275 | 4,617,506 | ||||||
| *Go-Ahead Group PLC (The) |
27,828 | 299,439 | ||||||
| Grafton Group PLC |
64,476 | 1,185,178 | ||||||
| Grainger PLC |
95,632 | 404,797 | ||||||
| *Greencore Group PLC |
128,588 | 227,730 | ||||||
| Greggs PLC |
75,368 | 3,156,131 | ||||||
| Gulf Keystone Petroleum, Ltd. |
95,585 | 260,473 | ||||||
| *Gym Group PLC (The) |
21,280 | 75,403 | ||||||
| H&T Group PLC |
6,022 | 22,453 | ||||||
| Halfords Group PLC |
91,993 | 335,928 | ||||||
| Halma PLC |
54,286 | 2,204,092 | ||||||
| *Harbour Energy PLC |
24,249 | 116,803 | ||||||
| Hargreaves Lansdown PLC |
31,753 | 668,984 | ||||||
| Harworth Group PLC |
927 | 2,154 | ||||||
| Hays PLC |
926,813 | 2,108,905 | ||||||
| Headlam Group PLC |
17,587 | 109,688 | ||||||
| Helical PLC |
90,896 | 573,138 | ||||||
| *Helios Towers PLC |
63,429 | 134,243 | ||||||
| Henry Boot PLC |
9,216 | 35,372 | ||||||
| Hikma Pharmaceuticals PLC |
47,725 | 1,574,631 | ||||||
| Hill & Smith Holdings PLC |
38,131 | 958,593 | ||||||
| Hilton Food Group PLC |
19,252 | 308,230 | ||||||
| Hiscox, Ltd. |
56,787 | 648,412 | ||||||
Dimensional World ex U.S. Core Equity 2 ETF
SCHEDULE OF INVESTMENTS
October 31, 2021
| Security Description |
Shares | Fair Value | ||||||
| UNITED KINGDOM (Continued) |
||||||||
| Hochschild Mining PLC |
174,507 | $ | 341,106 | |||||
| *Hollywood Bowl Group PLC |
16,605 | 54,058 | ||||||
| HomeServe PLC |
140,625 | 1,648,107 | ||||||
| *Hostelworld Group PLC |
2,923 | 2,885 | ||||||
| Howden Joinery Group PLC |
279,526 | 3,524,297 | ||||||
| HSBC Holdings PLC, Sponsored ADR |
190,429 | 5,726,200 | ||||||
| HSBC Holdings PLC |
87,587 | 530,063 | ||||||
| *Hss Hire Group PLC |
27,962 | 6,899 | ||||||
| Hunting PLC |
71,644 | 166,360 | ||||||
| *Hyve Group PLC |
80,031 | 119,027 | ||||||
| Ibstock PLC |
137,503 | 376,209 | ||||||
| IMI PLC |
167,327 | 3,747,787 | ||||||
| Impax Asset Management Group PLC |
8,189 | 123,026 | ||||||
| Imperial Brands PLC |
242,224 | 5,119,864 | ||||||
| Inchcape PLC |
246,305 | 2,788,753 | ||||||
| *Indivior PLC |
161,098 | 537,045 | ||||||
| *Informa PLC |
125,623 | 894,392 | ||||||
| IntegraFin Holdings PLC |
23,311 | 182,614 | ||||||
| *Intercontinental Hotels Group PLC, Sponsored ADR |
10,866 | 770,073 | ||||||
| *InterContinental Hotels Group PLC |
9,891 | 693,901 | ||||||
| *»Interserve PLC |
391,342 | — | ||||||
| Intertek Group PLC |
23,080 | 1,548,622 | ||||||
| Investec PLC |
268,428 | 1,220,846 | ||||||
| Iomart Group PLC |
11,809 | 23,666 | ||||||
| *Iqe PLC |
21,972 | 14,140 | ||||||
| *ITV PLC |
957,299 | 1,412,598 | ||||||
| *IWG PLC |
419,759 | 1,780,810 | ||||||
| *J D Wetherspoon PLC |
58,617 | 821,970 | ||||||
| J Sainsbury PLC |
654,560 | 2,686,322 | ||||||
| *James Fisher & Sons PLC |
23,646 | 132,892 | ||||||
| James Halstead PLC |
1,981 | 15,098 | ||||||
| JD Sports Fashion PLC |
153,200 | 2,284,781 | ||||||
| *JET2 PLC |
17,229 | 288,004 | ||||||
| *John Menzies PLC |
33,395 | 136,413 | ||||||
| *John Wood Group PLC |
312,645 | 914,969 | ||||||
| Johnson Matthey PLC |
52,429 | 1,964,120 | ||||||
| *Johnson Service Group PLC |
42,156 | 76,739 | ||||||
| *Joules Group PLC |
6,592 | 18,072 | ||||||
| Jtc PLC |
4,467 | 47,577 | ||||||
| Jupiter Fund Management PLC |
134,854 | 461,017 | ||||||
| *Just Eat Takeaway.com NV |
2,704 | 194,220 | ||||||
| *Just Group PLC |
416,935 | 525,219 | ||||||
| Kainos Group PLC |
20,959 | 568,843 | ||||||
| Keller Group PLC |
42,386 | 532,781 | ||||||
| Keywords Studios PLC |
319 | 12,401 | ||||||
| *Kier Group PLC |
90,437 | 132,396 | ||||||
| *Kin & Carta PLC |
33,900 | 124,070 | ||||||
| Kingfisher PLC |
639,853 | 2,938,203 | ||||||
| *Lamprell PLC |
165,410 | 93,075 | ||||||
| Lancashire Holdings, Ltd. |
62,727 | 435,073 | ||||||
| Learning Technologies Group PLC |
25,082 | 67,318 | ||||||
| Legal & General Group PLC |
861,508 | 3,411,644 | ||||||
| *Liberty Global PLC |
12,282 | 352,985 | ||||||
| *Liberty Global PLC |
30,120 | 868,661 | ||||||
| Liontrust Asset Management PLC |
1,019 | 30,450 | ||||||
Dimensional World ex U.S. Core Equity 2 ETF
SCHEDULE OF INVESTMENTS
October 31, 2021
| Security Description |
Shares | Fair Value | ||||||
| UNITED KINGDOM (Continued) |
||||||||
| Lloyds Banking Group PLC |
7,242,516 | $ | 4,985,664 | |||||
| Lloyds Banking Group PLC, Sponsored ADR |
77,192 | 209,962 | ||||||
| London Stock Exchange Group PLC |
6,864 | 668,025 | ||||||
| *Lookers PLC |
162,518 | 142,573 | ||||||
| LSL Property Services PLC |
14,223 | 86,173 | ||||||
| Luceco PLC |
28,158 | 146,670 | ||||||
| Macfarlane Group PLC |
20,567 | 37,002 | ||||||
| Man Group PLC |
785,281 | 2,504,830 | ||||||
| *Marks & Spencer Group PLC |
813,931 | 2,048,411 | ||||||
| Marshalls PLC |
134,422 | 1,305,471 | ||||||
| *Marston’s PLC |
415,876 | 453,198 | ||||||
| *Mcbride PLC |
92,036 | 88,310 | ||||||
| Mears Group PLC |
50,085 | 135,935 | ||||||
| *Mediclinic International PLC |
161,514 | 739,458 | ||||||
| *Mediclinic International PLC |
14,240 | 65,326 | ||||||
| Melrose Industries PLC |
882,181 | 1,908,190 | ||||||
| Micro Focus International PLC |
95,905 | 468,923 | ||||||
| Micro Focus International PLC, Sponsored ADR |
10,577 | 51,933 | ||||||
| Midwich Group PLC |
1,881 | 17,069 | ||||||
| *Mitchells & Butlers PLC |
123,858 | 429,877 | ||||||
| *Mitie Group PLC |
551,766 | 494,640 | ||||||
| MJ Gleeson PLC |
1,590 | 16,564 | ||||||
| Mondi PLC |
31,444 | 787,341 | ||||||
| Mondi PLC |
96,349 | 2,410,277 | ||||||
| Moneysupermarket.com Group PLC |
230,543 | 669,953 | ||||||
| Morgan Advanced Materials PLC |
150,212 | 712,422 | ||||||
| Morgan Sindall Group PLC |
5,417 | 168,926 | ||||||
| *Morses Club PLC |
14,477 | 12,224 | ||||||
| Mortgage Advice Bureau Holdings, Ltd. |
1,787 | 32,824 | ||||||
| *Motorpoint Group PLC |
8,764 | 43,007 | ||||||
| *N Brown Group PLC |
103,777 | 61,510 | ||||||
| *Naked Wines PLC |
10,984 | 111,717 | ||||||
| *National Express Group PLC |
250,147 | 783,842 | ||||||
| National Grid PLC |
25,583 | 328,024 | ||||||
| *National Grid PLC, Sponsored ADR |
18,276 | 1,171,126 | ||||||
| NatWest Group PLC |
378,508 | 1,147,151 | ||||||
| NatWest Group PLC, ADR |
68,436 | 414,038 | ||||||
| NCC Group PLC |
39,862 | 135,782 | ||||||
| Next Fifteen Communications Group PLC |
4,841 | 81,952 | ||||||
| Next PLC |
16,963 | 1,852,251 | ||||||
| *»NMC Health PLC |
7,628 | — | ||||||
| Norcros PLC |
9,751 | 44,509 | ||||||
| Numis Corp. PLC |
34,078 | 157,420 | ||||||
| *Ocado Group PLC |
7,998 | 197,667 | ||||||
| *On The Beach Group PLC |
33,890 | 138,667 | ||||||
| Oxford Instruments PLC |
15,082 | 476,526 | ||||||
| Pagegroup PLC |
217,182 | 1,976,736 | ||||||
| Pan African Resources PLC |
418,713 | 99,408 | ||||||
| *Pantheon Resources PLC |
31,437 | 33,439 | ||||||
| Paypoint PLC |
34,748 | 328,652 | ||||||
| Pearson PLC, Sponsored ADR |
67,520 | 559,066 | ||||||
| Pearson PLC |
87,981 | 726,492 | ||||||
| *Pendragon PLC |
669,396 | 168,374 | ||||||
| Pennon Group PLC |
28,769 | 459,812 | ||||||
| Persimmon PLC |
90,229 | 3,365,360 | ||||||
| #*Petrofac, Ltd. |
106,651 | 189,318 | ||||||
Dimensional World ex U.S. Core Equity 2 ETF
SCHEDULE OF INVESTMENTS
October 31, 2021
| Security Description |
Shares | Fair Value | ||||||
| UNITED KINGDOM (Continued) |
||||||||
| #*Petropavlovsk PLC |
1,411,444 | $ | 461,240 | |||||
| Pets at Home Group PLC |
133,874 | 885,239 | ||||||
| *Pharos Energy PLC |
193,267 | 53,116 | ||||||
| Phoenix Group Holdings PLC |
134,935 | 1,214,458 | ||||||
| *Photo-Me International PLC |
151,012 | 137,033 | ||||||
| *Playtech PLC |
133,818 | 1,276,676 | ||||||
| Plus500, Ltd. |
16,017 | 289,041 | ||||||
| Polar Capital Holdings PLC |
16,568 | 188,497 | ||||||
| Porvair PLC |
3,337 | 31,562 | ||||||
| Premier Foods PLC |
818,263 | 1,231,550 | ||||||
| #Prudential PLC, Sponsored ADR |
37,420 | 1,545,446 | ||||||
| *Puretech Health PLC |
2,442 | 11,850 | ||||||
| PZ Cussons PLC |
47,134 | 138,909 | ||||||
| QinetiQ Group PLC |
249,805 | 922,477 | ||||||
| *Rank Group PLC |
81,677 | 183,612 | ||||||
| *Raven Property Group, Ltd. |
51,602 | 24,898 | ||||||
| Reach PLC |
506,182 | 2,196,025 | ||||||
| Reckitt Benckiser Group PLC |
41,460 | 3,367,243 | ||||||
| Record PLC |
17,207 | 19,624 | ||||||
| Redde Northgate PLC |
136,494 | 744,652 | ||||||
| Redrow PLC |
133,259 | 1,178,549 | ||||||
| Relx PLC, Sponsored ADR |
58,899 | 1,837,060 | ||||||
| Relx PLC |
60,337 | 1,873,399 | ||||||
| RELX PLC |
20,102 | 623,839 | ||||||
| Renew Holdings PLC |
13,899 | 145,367 | ||||||
| *Renewi PLC |
41,823 | 406,460 | ||||||
| Renishaw PLC |
9,018 | 621,160 | ||||||
| Rentokil Initial PLC |
352,445 | 2,842,633 | ||||||
| *Restaurant Group PLC (The) |
308,000 | 372,793 | ||||||
| Rhi Magnesita NV |
9,854 | 453,576 | ||||||
| Rhi Magnesita NV |
6,143 | 285,781 | ||||||
| Ricardo PLC |
15,415 | 88,746 | ||||||
| Rightmove PLC |
251,490 | 2,383,455 | ||||||
| #Rio Tinto PLC, Sponsored ADR |
112,739 | 7,132,997 | ||||||
| Rio Tinto PLC |
18,698 | 1,168,865 | ||||||
| RM PLC |
11,027 | 31,440 | ||||||
| Robert Walters PLC |
22,246 | 259,196 | ||||||
| *Rockhopper Exploration PLC |
110,497 | 8,702 | ||||||
| *Rolls-Royce Holdings PLC |
870,545 | 1,573,241 | ||||||
| Rotork PLC |
282,663 | 1,372,380 | ||||||
| Royal Dutch Shell PLC, Class B |
196,112 | 4,529,611 | ||||||
| *Royal Dutch Shell PLC, Sponsored ADR |
299,298 | 13,719,820 | ||||||
| Royal Mail PLC |
367,040 | 2,115,613 | ||||||
| RPS Group PLC |
98,401 | 170,492 | ||||||
| RWS Holdings PLC |
19,559 | 166,761 | ||||||
| *Saga PLC |
43,348 | 185,387 | ||||||
| Sage Group PLC (The) |
122,500 | 1,193,549 | ||||||
| Savills PLC |
103,792 | 2,017,423 | ||||||
| Schroders PLC |
6,823 | 231,009 | ||||||
| Schroders PLC |
13,479 | 668,841 | ||||||
| SCS Group PLC |
4,142 | 14,535 | ||||||
| *Senior PLC |
208,912 | 458,757 | ||||||
| Serco Group PLC |
557,704 | 965,526 | ||||||
| Serica Energy PLC |
8,228 | 23,234 | ||||||
| Severfield PLC |
57,185 | 56,124 | ||||||
Dimensional World ex U.S. Core Equity 2 ETF
SCHEDULE OF INVESTMENTS
October 31, 2021
| Security Description |
Shares | Fair Value | ||||||
| UNITED KINGDOM (Continued) |
||||||||
| Severn Trent PLC |
31,004 | $ | 1,163,611 | |||||
| *Sig PLC |
238,310 | 169,701 | ||||||
| Smart Metering Systems PLC |
7,638 | 85,433 | ||||||
| Smith & Nephew PLC |
63,239 | 1,087,891 | ||||||
| Smiths Group PLC |
52,590 | 977,146 | ||||||
| Softcat PLC |
59,919 | 1,595,858 | ||||||
| Spectris PLC |
34,722 | 1,791,477 | ||||||
| Speedy Hire PLC |
170,420 | 149,038 | ||||||
| Spirax-Sarco Engineering PLC |
13,191 | 2,821,619 | ||||||
| *Spire Healthcare Group PLC |
155,310 | 500,293 | ||||||
| Spirent Communications PLC |
157,934 | 623,483 | ||||||
| SSE PLC |
228,100 | 5,138,683 | ||||||
| *SSP Group PLC |
232,814 | 821,757 | ||||||
| St James’s Place PLC |
56,235 | 1,217,540 | ||||||
| *Stagecoach Group PLC |
220,960 | 241,244 | ||||||
| Standard Chartered PLC |
405,692 | 2,752,141 | ||||||
| SThree PLC |
32,034 | 258,633 | ||||||
| Strix Group PLC |
20,053 | 80,401 | ||||||
| *Studio Retail Group PLC |
17,506 | 61,910 | ||||||
| *Superdry PLC |
29,457 | 116,693 | ||||||
| Synthomer PLC |
140,951 | 978,598 | ||||||
| Tate & Lyle PLC |
229,667 | 2,040,631 | ||||||
| Taylor Wimpey PLC |
1,242,100 | 2,631,373 | ||||||
| TBC Bank Group PLC |
1,370 | 29,483 | ||||||
| TClarke PLC |
21,795 | 48,249 | ||||||
| *Ted Baker PLC |
25,850 | 47,836 | ||||||
| Telecom Plus PLC |
34,552 | 591,078 | ||||||
| Tesco PLC |
895,229 | 3,312,027 | ||||||
| *»Thomas Cook Group PLC |
631,386 | 0 | ||||||
| Ti Fluid Systems PLC |
12,386 | 45,077 | ||||||
| *Topps Tiles PLC |
71,914 | 62,103 | ||||||
| Tp ICAP Group PLC |
494,341 | 1,052,337 | ||||||
| Travis Perkins PLC |
64,967 | 1,374,091 | ||||||
| *Tremor International, Ltd. |
1,032 | 9,619 | ||||||
| Trifast PLC |
13,447 | 24,884 | ||||||
| Tt Electronics PLC |
47,444 | 165,836 | ||||||
| #*TUI AG |
292,192 | 982,478 | ||||||
| *Tullow Oil PLC |
578,106 | 364,283 | ||||||
| Tyman PLC |
18,288 | 93,630 | ||||||
| *U & I Group PLC |
74,393 | 87,698 | ||||||
| *Unilever PLC, Sponsored ADR |
177,876 | 9,530,596 | ||||||
| Unilever PLC |
16,305 | 873,819 | ||||||
| Unilever PLC |
12,449 | 667,560 | ||||||
| United Utilities Group PLC |
84,113 | 1,197,365 | ||||||
| *Vertu Motors PLC |
147,708 | 124,317 | ||||||
| Vesuvius PLC |
63,025 | 407,767 | ||||||
| Victrex PLC |
30,475 | 955,777 | ||||||
| *Virgin Money UK PLC |
426,309 | 1,188,006 | ||||||
| Vistry Group PLC |
109,554 | 1,832,082 | ||||||
| Vitec Group PLC (The) |
9,543 | 188,367 | ||||||
| VIVO Energy PLC |
82,869 | 119,953 | ||||||
| Vodafone Group PLC |
4,340,945 | 6,428,738 | ||||||
| Volex PLC |
1,483 | 9,148 | ||||||
| Volution Group PLC |
345 | 2,336 | ||||||
| Vp PLC |
4,986 | 68,687 | ||||||
| *Watches of Switzerland Group PLC |
20,664 | 320,640 | ||||||
Dimensional World ex U.S. Core Equity 2 ETF
SCHEDULE OF INVESTMENTS
October 31, 2021
| Security Description |
Shares | Fair Value | ||||||
| UNITED KINGDOM (Continued) |
||||||||
| Watkin Jones PLC |
99,988 | $ | 330,995 | |||||
| Weir Group PLC (The) |
71,386 | 1,697,733 | ||||||
| *WH Smith PLC |
44,370 | 950,008 | ||||||
| *Whitbread PLC |
27,211 | 1,219,689 | ||||||
| Wickes Group PLC |
72,801 | 213,953 | ||||||
| Wilmington PLC |
3,449 | 11,346 | ||||||
| *Wincanton PLC |
29,375 | 152,607 | ||||||
| #WPP PLC, Sponsored ADR |
19,457 | 1,407,909 | ||||||
| WPP PLC |
124,993 | 1,809,283 | ||||||
| *Xaar PLC |
27,208 | 64,521 | ||||||
| XP Power, Ltd. |
1,192 | 85,454 | ||||||
| Zotefoams PLC |
1,775 | 8,759 | ||||||
|
|
|
|||||||
| TOTAL UNITED KINGDOM |
411,823,212 | |||||||
|
|
|
|||||||
| UNITED STATES (0.0%) |
||||||||
| *Arko Corp. |
10,265 | 98,426 | ||||||
| #*Energy Fuels, Inc. |
31,800 | 250,388 | ||||||
| *Jackson Financial, Inc., Class A |
1,871 | 50,648 | ||||||
| Ovintiv, Inc. |
50,676 | 1,898,178 | ||||||
| Sempra Energy |
754 | 96,087 | ||||||
|
|
|
|||||||
| TOTAL UNITED STATES |
2,393,727 | |||||||
|
|
|
|||||||
| TOTAL COMMON STOCKS (Cost $3,430,191,862) |
4,643,625,101 | |||||||
|
|
|
|||||||
| PREFERRED STOCK (0.0%) |
||||||||
| PHILIPPINES (0.0%) |
||||||||
| *Cebu Air, Inc. |
59,627 | 52,045 | ||||||
|
|
|
|||||||
| TOTAL PHILIPPINES |
52,045 | |||||||
|
|
|
|||||||
| TOTAL PREFERRED STOCK (Cost $46,651) |
52,045 | |||||||
|
|
|
|||||||
| RIGHTS (0.0%) |
||||||||
| AUSTRALIA (0.0%) |
||||||||
| *Aristocrat Leisure, Ltd. 11/9/2021 |
4,059 | 14,420 | ||||||
|
|
|
|||||||
| TOTAL AUSTRALIA |
14,420 | |||||||
|
|
|
|||||||
| AUSTRIA (0.0%) |
||||||||
| *Porr AG 11/4/2021 |
2,474 | 404 | ||||||
|
|
|
|||||||
| TOTAL AUSTRIA |
404 | |||||||
|
|
|
|||||||
| BRAZIL (0.0%) |
||||||||
| *»Ultrapar Participacoes SA 11/4/2021 |
2,279 | — | ||||||
|
|
|
|||||||
| TOTAL BRAZIL |
— | |||||||
|
|
|
|||||||
Dimensional World ex U.S. Core Equity 2 ETF
SCHEDULE OF INVESTMENTS
October 31, 2021
| Security Description |
Shares or Principal Amount |
Fair Value | ||||||
| CHILE (0.0%) |
||||||||
| *Itau Corpbanca 11/3/2021 |
232 | $ | — | |||||
|
|
|
|||||||
| TOTAL CHILE |
— | |||||||
|
|
|
|||||||
| INDIA (0.0%) |
||||||||
| *Texmaco Rail & Engineering, Ltd. 11/16/2021 |
12,230 | 1,503 | ||||||
|
|
|
|||||||
| TOTAL INDIA |
1,503 | |||||||
|
|
|
|||||||
| KOREA, REPUBLIC OF (0.0%) |
||||||||
| *Dongbang Transport Logistics Co., Ltd. 12/8/2021 |
2,313 | 1,504 | ||||||
| *IsuPetasys Co., Ltd. 11/1/2021 |
4,269 | 3,051 | ||||||
| *Samsung Heavy Industries Co., Ltd. 11/1/2021 |
49,164 | 52,591 | ||||||
|
|
|
|||||||
| TOTAL KOREA, REPUBLIC OF |
57,146 | |||||||
|
|
|
|||||||
| NEW ZEALAND (0.0%) |
||||||||
| *Arvida Group, Ltd. 11/9/2021 |
27,923 | 2,998 | ||||||
|
|
|
|||||||
| TOTAL NEW ZEALAND |
2,998 | |||||||
|
|
|
|||||||
| TAIWAN (0.0%) |
||||||||
| *Ta Ya Electric Wire & Cable 11/11/2021 |
10,281 | 1,386 | ||||||
|
|
|
|||||||
| TOTAL TAIWAN |
1,386 | |||||||
|
|
|
|||||||
| THAILAND (0.0%) |
||||||||
| *Dod Biotech RTS 11/22/2021 |
53,550 | — | ||||||
|
|
|
|||||||
| TOTAL THAILAND |
— | |||||||
|
|
|
|||||||
| UNITED KINGDOM (0.0%) |
||||||||
| *Petrofac, Ltd. 11/12/2021 |
26,632 | 5,892 | ||||||
|
|
|
|||||||
| TOTAL UNITED KINGDOM |
5,892 | |||||||
|
|
|
|||||||
| TOTAL RIGHTS (Cost $–) |
83,749 | |||||||
|
|
|
|||||||
| WARRANTS (0.0%) |
||||||||
| CANADA (0.0%) |
||||||||
| *Cenovus Energy, Inc. 1/1/2026 |
9,574 | 71,677 | ||||||
|
|
|
|||||||
| TOTAL CANADA |
71,677 | |||||||
|
|
|
|||||||
| INDONESIA (0.0%) |
||||||||
| *Citra Marga Nusaphala Persada Tbk PT 11/14/2025 |
181,008 | 5,110 | ||||||
|
|
|
|||||||
| TOTAL INDONESIA |
5,110 | |||||||
|
|
|
|||||||
Dimensional World ex U.S. Core Equity 2 ETF
SCHEDULE OF INVESTMENTS
October 31, 2021
| Security Description |
Shares | Fair Value | ||||||
| ITALY (0.0%) |
||||||||
| *»Webuild SpA 8/2/2030 |
2,724 | $ | — | |||||
|
|
|
|||||||
| TOTAL ITALY |
— | |||||||
|
|
|
|||||||
| MALAYSIA (0.0%) |
||||||||
| *Kelington Group BHD 7/24/2026 |
13,466 | 2,699 | ||||||
|
|
|
|||||||
| TOTAL MALAYSIA |
2,699 | |||||||
|
|
|
|||||||
| SINGAPORE (0.0%) |
||||||||
| *Ezion Holdings, Ltd. 4/16/2023 |
85,767 | — | ||||||
|
|
|
|||||||
| TOTAL SINGAPORE |
— | |||||||
|
|
|
|||||||
| THAILAND (0.0%) |
||||||||
| *BTS Group Holdings PCL 9/5/2022 |
31,300 | 1,349 | ||||||
| *BTS Group Holdings PCL 9/5/2022 |
62,600 | 2,697 | ||||||
| *Interlink Telecom 12/31/2022 |
14,975 | 749 | ||||||
| *MBK PCL 5/15/2024 |
11,947 | 3,961 | ||||||
| *MBK PCL 12/31/2024 |
14,411 | 4,777 | ||||||
| *Samart Telcoms PCL 5/17/2024 |
20,616 | 926 | ||||||
|
|
|
|||||||
| TOTAL THAILAND |
14,459 | |||||||
|
|
|
|||||||
| TOTAL WARRANTS (Cost $35,660) |
93,945 | |||||||
|
|
|
|||||||
| TOTAL INVESTMENT SECURITIES (Cost $3,430,274,173) |
4,643,854,840 | |||||||
|
|
|
|||||||
| SECURITIES LENDING COLLATERAL (2.0%) |
||||||||
| @§The DFA Short Term Investment Fund |
8,003,357 | 92,594,840 | ||||||
|
|
|
|||||||
| TOTAL INVESTMENTS (Cost $3,522,869,013) — 100.0% |
|
$ | 4,736,449,680 | |||||
|
|
|
|||||||
| * |
Non-Income Producing Securities | |
| » |
Securities that have generally been fair value factored | |
| # |
Total or Partial Securities on Loan | |
| @ |
Security purchased with cash collateral received from Securities on Loan | |
| § |
Affiliated Fund |
| ADR |
American Depositary Receipt | |
| GDR |
Global Depositary Receipt | |
| PLC |
Public Limited Company | |
| SA |
Special Assessment |

Report of Independent Registered Public Accounting Firm
To the Board of Trustees of The Dimensional ETF Trust and Shareholders of each of the nine funds listed in the table below
Opinions on the Financial Statements
We have audited the accompanying statements of assets and liabilities, including the summary schedules of portfolio holdings, of each of the funds listed in the table below (constituting The Dimensional ETF Trust, hereafter collectively referred to as the “Funds”) as of October 31, 2021, the related statements of operations and of changes in net assets for each of the periods indicated in the table below, including the related notes, and the financial highlights for each of the periods indicated in the table below (included in Item 1 of this Form N-CSR) and the schedules of investments (included in Item 6 of this Form N-CSR) as of October 31, 2021 (collectively referred to as the “financial statements”). In our opinion, the financial statements present fairly, in all material respects, the financial position of each of the Funds as of October 31, 2021, the results of each of their operations, the changes in each of their net assets, and each of the financial highlights for each of the periods indicated in the table below, in conformity with accounting principles generally accepted in the United States of America.
| Fund | Statement of |
Statement of |
Financial | |||
| Dimensional U.S. Equity ETF Dimensional U.S. Core Equity 2 ETF Dimensional U.S. Small Cap ETF Dimensional U.S. Targeted Value ETF Dimensional International Value ETF Dimensional World ex U.S. Core Equity 2 ETF |
For the year ended October 31, 2021 |
For the years ended October 31, 2021 and 2020 | For the years ended October 31, 2021, 2020, 2019, 2018, and 2017 | |||
| Dimensional US Core Equity Market ETF Dimensional International Core Equity Market ETF
|
For the period November 17, 2020 (commencement of operations) through October 31, 2021 | |||||
| Dimensional Emerging Core Equity Market ETF | For the period December 1, 2020 (commencement of operations) through October 31, 2021 | |||||
Basis for Opinions
These financial statements are the responsibility of the Funds’ management. Our responsibility is to express an opinion on the Funds’ financial statements based on our audits. We are a public accounting firm registered with the Public Company Accounting Oversight Board (United States) (PCAOB) and are required to be independent with respect to the Funds in accordance with the U.S. federal securities laws and the applicable rules and regulations of the Securities and Exchange Commission and the PCAOB.
We conducted our audits of these financial statements in accordance with the standards of the PCAOB. Those standards require that we plan and perform the audit to obtain reasonable assurance about whether the financial statements are free of material misstatement, whether due to error or fraud.
Our audits included performing procedures to assess the risks of material misstatement of the financial statements, whether due to error or fraud, and performing procedures that respond to those risks.
| PricewaterhouseCoopers LLP, Two Commerce
Square, Suite 1800, 2001 Market Street, Philadelphia, PA 19103-7042 |
Such procedures included examining, on a test basis, evidence regarding the amounts and disclosures in the financial statements. Our audits also included evaluating the accounting principles used and significant estimates made by management, as well as evaluating the overall presentation of the financial statements. Our procedures included confirmation of securities owned as of October 31, 2021 by correspondence with the custodian, brokers and transfer agent of the investee fund; when replies were not received from brokers, we performed other auditing procedures. We believe that our audits provide a reasonable basis for our opinions.
Philadelphia, Pennsylvania
December 22, 2021
We have served as the auditor of one or more investment companies in Dimensional Fund Advisors L.P. investment company group
since 1981.
2 of 2
(b) Not applicable.
| ITEM 7. | DISCLOSURE OF PROXY VOTING POLICIES AND PROCEDURES FOR CLOSED-END MANAGEMENT INVESTMENT COMPANIES. |
This item is not applicable to the Registrant, which is an open-end management investment company.
| ITEM 8. | PORTFOLIO MANAGERS OF CLOSED-END MANAGEMENT INVESTMENT COMPANIES. |
This item is not applicable to the Registrant, which is an open-end management investment company.
| ITEM 9. | PURCHASES OF EQUITY SECURITIES BY CLOSED-END MANAGEMENT INVESTMENT COMPANY AND AFFILIATED PURCHASERS. |
This item is not applicable to the Registrant, which is an open-end management investment company.
| ITEM 10. | SUBMISSION OF MATTERS TO A VOTE OF SECURITY HOLDERS. |
None.
| ITEM 11. | CONTROLS AND PROCEDURES. |
| (a) | Based on their evaluation of the Registrant’s disclosure controls and procedures as of a date within 90 days of the filing date of this Form N-CSR (the “Report”), the Registrant’s Co-Principal Executive Officers and Principal Financial Officer believe that the disclosure controls and procedures (as defined in Rule 30a-3(c) under the Investment Company Act of 1940, as amended) are effectively designed to ensure that information required to be disclosed by the Registrant in the Report is recorded, processed, summarized and reported by the filing date, including ensuring that information required to be disclosed in the Report is accumulated and communicated to the Registrant’s officers that are making certifications in the Report, as appropriate, to allow timely decisions regarding required disclosure. The Registrant’s management, including the Co-Principal Executive Officers and the Principal Financial Officer, recognizes that any set of controls and procedures, no matter how well designed and operated, can provide only reasonable assurance of achieving the desired control objectives. |
| (b) | There were no changes in the Registrant’s internal control over financial reporting (as defined in Rule 30a-3(d) under the Investment Company Act of 1940, as amended) that occurred during the period covered by this Report that have materially affected, or are reasonably likely to materially affect, the Registrant’s internal control over financial reporting. |
| ITEM 12. | DISCLOSURE OF SECURITIES LENDING ACTIVITIES FOR CLOSED-END MANAGEMENT INVESTMENT COMPANIES. |
This item is not applicable to the Registrant, which is an open-end management investment company.
| ITEM 13. | EXHIBITS. |
(a)(1) Code of Ethics is filed herewith.
(a)(2) Certifications pursuant to Section 302 of the Sarbanes-Oxley Act of 2002 are filed herewith.
(a)(3) This item is not applicable.
(b) Certifications pursuant to Section 906 of the Sarbanes-Oxley Act of 2002 are filed herewith.
SIGNATURES
Pursuant to the requirements of the Securities Exchange Act of 1934 and the Investment Company Act of 1940, the Registrant has duly caused this Report to be signed on its behalf by the undersigned, thereunto duly authorized.
Dimensional ETF Trust
| By: | /s/ David P. Butler | |
| David P. Butler | ||
| Co-Chief Executive Officer |
Date: January 5, 2022
| By: | /s/ Gerard K. O’Reilly | |
| Gerard K. O’Reilly | ||
| Co-Chief Executive Officer and | ||
| Chief Investment Officer |
Date: January 5, 2022
Pursuant to the requirements of the Securities Exchange Act of 1934 and the Investment Company Act of 1940, this Report has been signed below by the following persons on behalf of the Registrant and in the capacities and on the dates indicated.
| By: | /s/ David P. Butler | |
| David P. Butler | ||
| Co-Principal Executive Officer | ||
| Dimensional ETF Trust |
Date: January 5, 2022
| By: | /s/ Gerard K. O’Reilly | |
| Gerard K. O’Reilly | ||
| Co-Principal Executive Officer | ||
| Dimensional ETF Trust |
Date: January 5, 2022
| By: | /s/ Jan Miller | |
| Jan Miller | ||
| Principal Financial Officer | ||
| Dimensional ETF Trust |
Date: January 5, 2022
