
First Trust
High Yield Opportunities 2027 Term Fund (FTHY)
Annual Report
For the Year Ended
May 31, 2024

UNITED STATES
SECURITIES AND EXCHANGE
COMMISSION
Washington, D.C. 20549
FORM
CERTIFIED SHAREHOLDER REPORT OF REGISTERED MANAGEMENT INVESTMENT COMPANIES
Investment Company Act file number 811-23199
(Exact name of registrant as specified in charter)
120 East Liberty Drive, Suite 400
Wheaton, IL 60187
(Address of principal executive offices) (Zip code)
W. Scott Jardine, Esq.
First Trust Portfolios
L.P.
120 East Liberty Drive, Suite 400
Wheaton, IL 60187
(Name
and address of agent for service)
Registrant’s telephone number, including area code: 630-765-8000
Date of fiscal year end: May 31
Date of reporting period:
Form N-CSR is to be used by management investment companies to file reports with the Commission not later than 10 days after the transmission to stockholders of any report that is required to be transmitted to stockholders under Rule 30e-1 under the Investment Company Act of 1940 (17 CFR 270.30e-1). The Commission may use the information provided on Form N-CSR in its regulatory, disclosure review, inspection, and policymaking roles.
A registrant is required to disclose the information specified by Form N-CSR, and the Commission will make this information public. A registrant is not required to respond to the collection of information contained in Form N-CSR unless the Form displays a currently valid Office of Management and Budget (“OMB”) control number. Please direct comments concerning the accuracy of the information collection burden estimate and any suggestions for reducing the burden to Secretary, Securities and Exchange Commission, 100 F Street, NE, Washington, DC 20549. The OMB has reviewed this collection of information under the clearance requirements of 44 U.S.C. § 3507.
Item 1. Reports to Stockholders.
| (a) | The Report to Shareholders is attached herewith. |
|
1
|
|
|
2
|
|
|
4
|
|
|
8
|
|
|
19
|
|
|
20
|
|
|
21
|
|
|
22
|
|
|
23
|
|
|
24
|
|
|
31
|
|
|
32
|
|
|
34
|
|
|
43
|
|
|
45
|

|
Fund Statistics
|
|
|
Symbol on New York Stock Exchange
|
FTHY
|
|
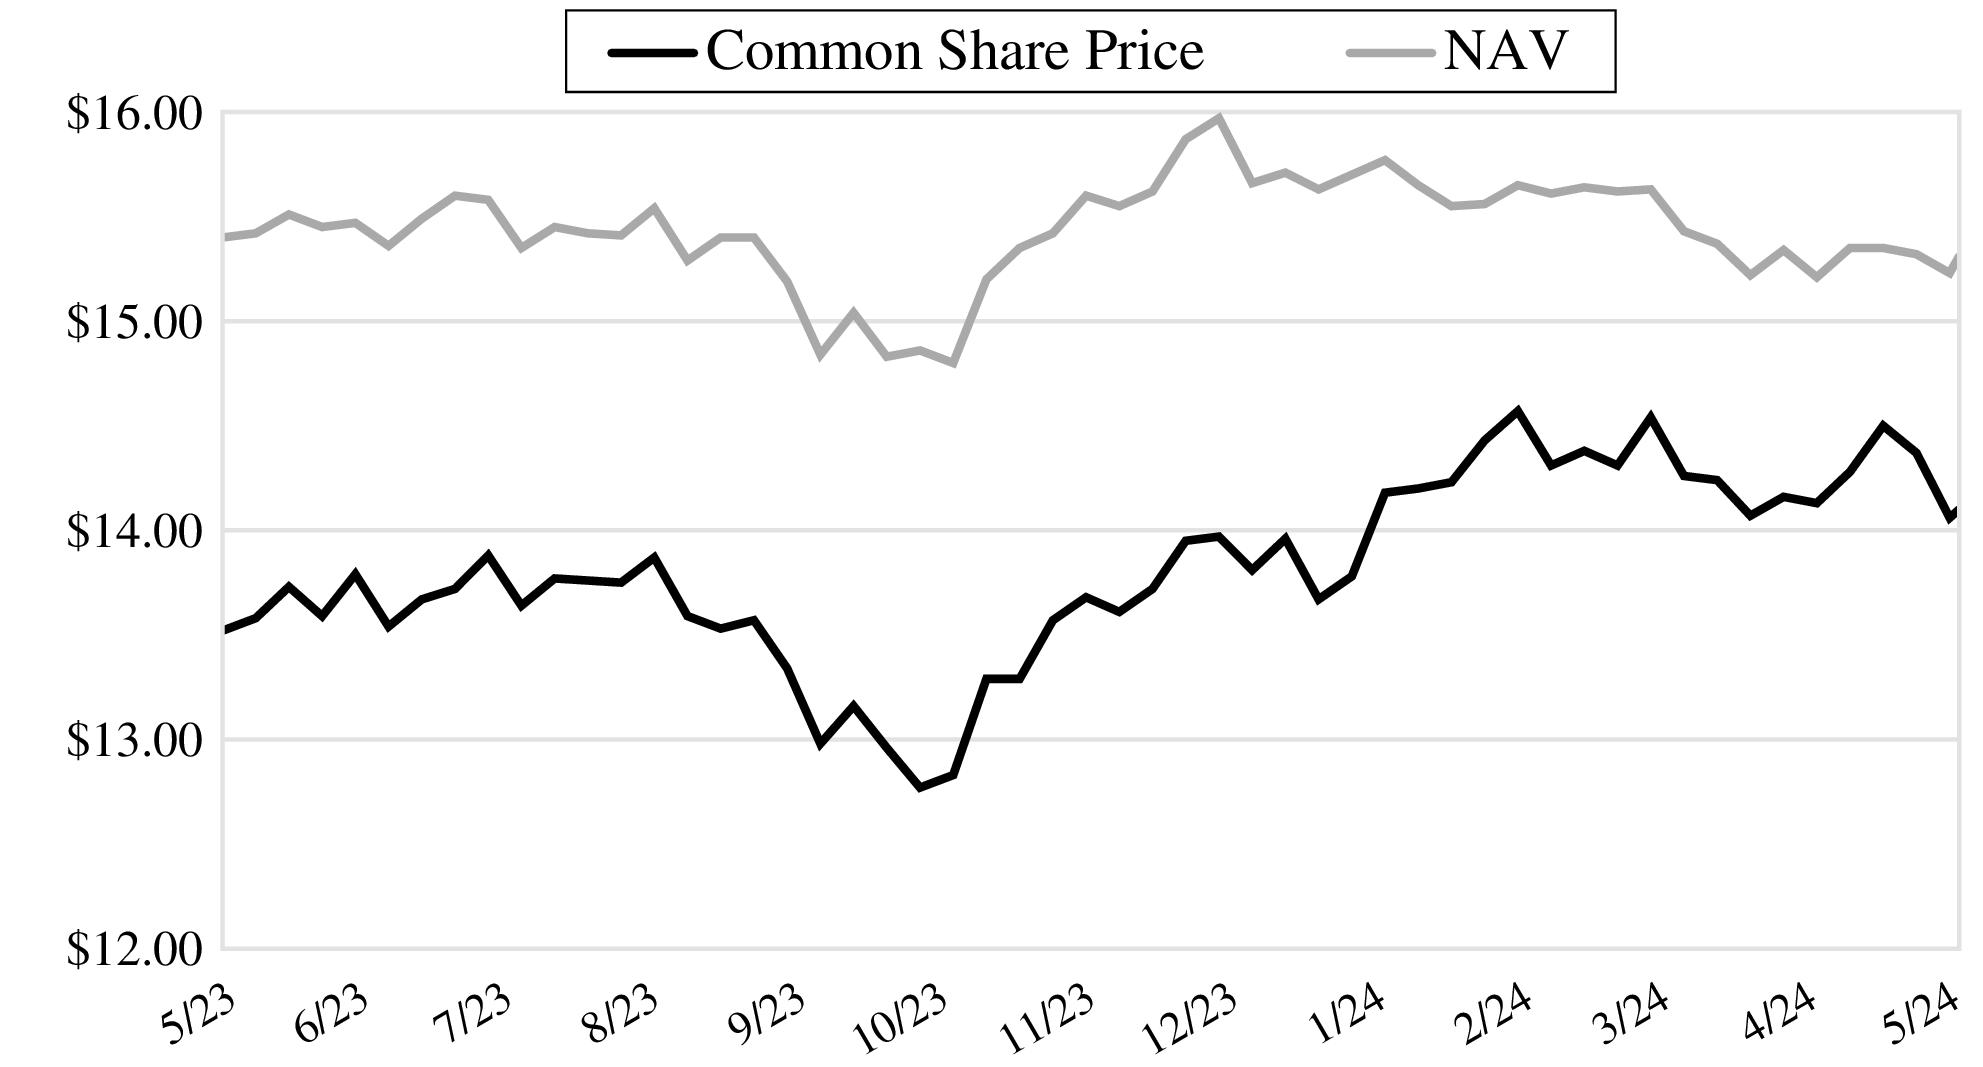
Common Share Price
|
$14.10
|
|
Common Share Net Asset Value (“NAV”)
|
$15.31
|
|
Premium (Discount) to NAV
|
(
)%
|
|
Net Assets Applicable to Common Shares
|
$563,093,133
|
|
Current Distribution per Common Share(1)
|
$0.1300
|
|
Current Annualized Distribution per Common Share
|
$1.5600
|
|
Current Distribution Rate on Common Share Price(2)
|
11.06
%
|
|
Current Distribution Rate on NAV(2)
|
10.19
%
|
|
Performance
|
|
|
|
|
|
|
|
Average Annual
Total Returns
|
|
|
|
1 Year Ended
5/31/24
|
Inception (6/25/20)
to 5/31/24
|
|
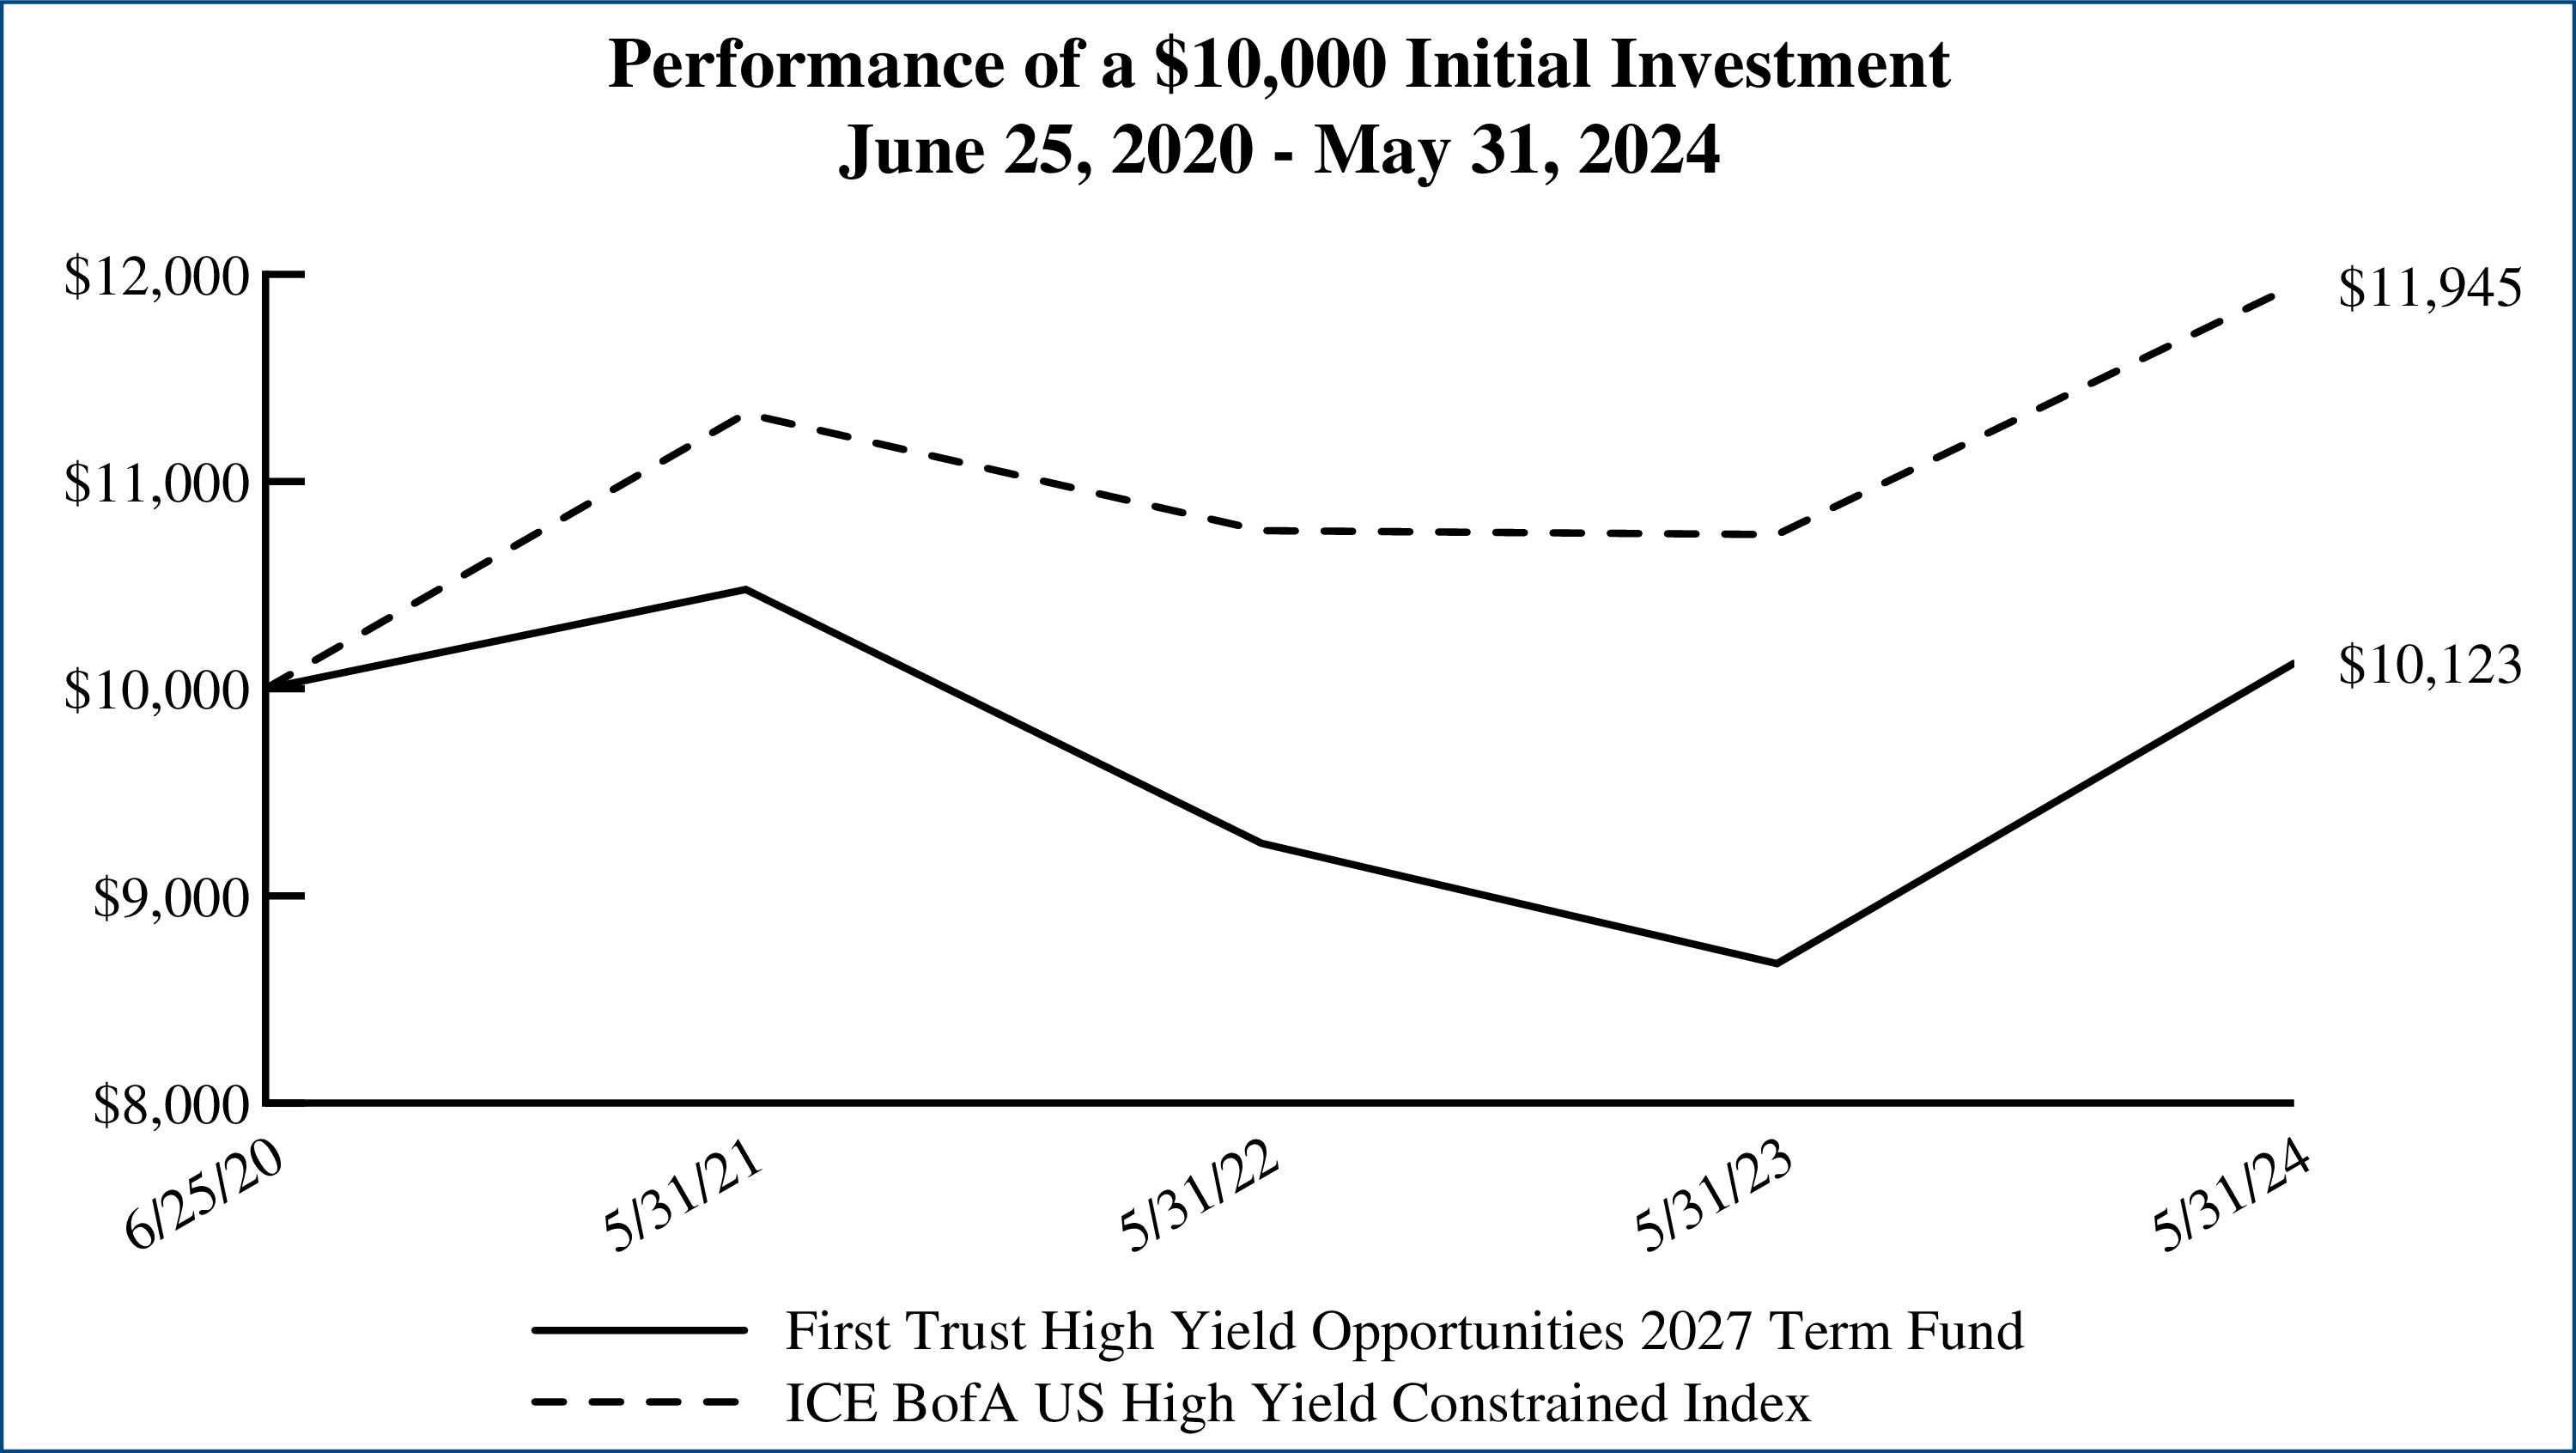
Fund Performance(3)
|
|
|
|
|
NAV
|
|
11.27
%
|
2.43
%
|
|
Market Value
|
|
16.72
%
|
0.31
%
|
|
Index Performance
|
|
|
|
|
ICE BofA US High Yield Constrained Index
|
|
11.18
%
|
4.70
%
|
|
Credit Quality (S&P Global Ratings)(4)
|
% of Total
Fixed-Income
Investments(5)
|
|
BBB
|
0.6%
|
|
BBB-
|
7.1
|
|
BB+
|
8.1
|
|
BB
|
12.1
|
|
BB-
|
11.3
|
|
B+
|
14.6
|
|
B
|
14.5
|
|
B-
|
16.1
|
|
CCC+
|
11.2
|
|
CCC
|
1.6
|
|
CCC-
|
1.3
|
|
Not Rated
|
1.5
|
|
Total
|
100.0%
|
|
Top 10 Issuers
|
% of Total
Long-Term
Investments(5)
|
|
SS&C Technologies Holdings, Inc.
|
3.5%
|
|
Open Text Corp.
|
3.1
|
|
Alliant Holdings I LLC
|
2.9
|
|
Nexstar Media, Inc.
|
2.1
|
|
Sinclair Television Group, Inc.
|
2.1
|
|
AssuredPartners, Inc.
|
2.0
|
|
Medline Borrower LP
|
2.0
|
|
HUB International Ltd.
|
2.0
|
|
Go Daddy Operating Co. LLC / GD Finance Co., Inc.
|
1.8
|
|
1011778 BC ULC / New Red Finance, Inc.
|
1.8
|
|
Total
|
23.3%
|
|
Industry Classification
|
% of Total
Long-Term
Investments(5)
|
|
Software
|
17.1%
|
|
Insurance
|
13.6
|
|
Media
|
9.9
|
|
Containers & Packaging
|
7.7
|
|
Hotels, Restaurants & Leisure
|
5.6
|
|
Commercial Services & Supplies
|
4.9
|
|
Health Care Providers & Services
|
4.6
|
|
Health Care Technology
|
3.7
|
|
IT Services
|
3.3
|
|
Trading Companies & Distributors
|
2.3
|
|
Diversified Telecommunication Services
|
2.3
|
|
Health Care Equipment & Supplies
|
2.0
|
|
Food Products
|
1.9
|
|
Machinery
|
1.7
|
|
Automobile Components
|
1.5
|
|
Professional Services
|
1.4
|
|
Building Products
|
1.4
|
|
Aerospace & Defense
|
1.2
|
|
Interactive Media & Services
|
1.2
|
|
Life Sciences Tools & Services
|
1.1
|
|
Entertainment
|
1.0
|
|
Pharmaceuticals
|
1.0
|
|
Construction & Engineering
|
0.9
|
|
Specialty Retail
|
0.8
|
|
Construction Materials
|
0.8
|
|
Consumer Finance
|
0.7
|
|
Household Products
|
0.7
|
|
Food Staples & Retailing
|
0.7
|
|
Diversified Consumer Services
|
0.7
|
|
Automobiles
|
0.6
|
|
Financial Services
|
0.5
|
|
Independent Power & Renewable Electricity Producers
|
0.5
|
|
Capital Markets
|
0.5
|
|
Electronic Equipment, Instruments & Components
|
0.4
|
|
Electric Utilities
|
0.3
|
|
Industrial Conglomerates
|
0.3
|
|
Leisure Products
|
0.3
|
|
Real Estate Management & Development
|
0.3
|
|
Chemicals
|
0.3
|
|
Personal Care Products
|
0.2
|
|
Ground Transportation
|
0.1
|
|
Electrical Equipment
|
0.0*
|
|
Total
|
100.0%
|
|
*
|
Amount is less than 0.1%.
|
|
Performance
|
|
|
|
|
|
|
|
Average Annual
Total Returns
|
|
|
|
1 Year Ended
5/31/24
|
Inception (6/25/20)
to 5/31/24
|
|
Fund Performance(3)
|
|
|
|
|
NAV
|
|
11.27
%
|
2.43
%
|
|
Market Value
|
|
16.72
%
|
0.31
%
|
|
Index Performance
|
|
|
|
|
ICE BofA US High Yield Constrained Index
|
|
11.18
%
|
4.70
%
|
|
Principal
Value
|
Description
|
Stated
Coupon
|
Stated
Maturity
|
Value
|
|
CORPORATE BONDS AND NOTES – 87.7%
|
||||
|
|
Aerospace & Defense – 1.5%
|
|
|
|
|
$158,000
|
Booz Allen Hamilton, Inc. (a) (b)
|
3.88
%
|
09/01/28
|
$148,331
|
|
4,311,000
|
TransDigm, Inc. (a) (b)
|
6.75
%
|
08/15/28
|
4,365,277
|
|
1,552,000
|
TransDigm, Inc. (a) (b)
|
6.38
%
|
03/01/29
|
1,550,573
|
|
2,281,000
|
TransDigm, Inc. (a) (b)
|
6.63
%
|
03/01/32
|
2,290,612
|
|
|
|
8,354,793
|
||
|
|
Agricultural Products & Services – 0.8%
|
|
|
|
|
623,000
|
Lamb Weston Holdings, Inc. (a) (b)
|
4.88
%
|
05/15/28
|
602,492
|
|
4,297,000
|
Lamb Weston Holdings, Inc. (a) (b)
|
4.38
%
|
01/31/32
|
3,798,342
|
|
|
|
4,400,834
|
||
|
|
Alternative Carriers – 0.9%
|
|
|
|
|
4,662,000
|
Level 3 Financing, Inc. (a) (b)
|
11.00
%
|
11/15/29
|
4,785,188
|
|
|
Apparel Retail – 0.9%
|
|
|
|
|
4,040,000
|
Nordstrom, Inc. (b)
|
4.00
%
|
03/15/27
|
3,863,604
|
|
1,146,000
|
Nordstrom, Inc. (b)
|
4.38
%
|
04/01/30
|
1,042,971
|
|
|
|
4,906,575
|
||
|
|
Application Software – 3.6%
|
|
|
|
|
2,892,000
|
Alteryx, Inc. (a) (b)
|
8.75
%
|
03/15/28
|
2,969,552
|
|
2,445,875
|
GoTo Group, Inc. (a) (b)
|
5.50
%
|
05/01/28
|
2,036,191
|
|
2,445,875
|
GoTo Group, Inc. (a) (b)
|
5.50
%
|
05/01/28
|
1,265,850
|
|
3,000,000
|
McAfee Corp. (a) (b)
|
7.38
%
|
02/15/30
|
2,779,884
|
|
1,513,000
|
Open Text Holdings, Inc. (a) (b)
|
4.13
%
|
12/01/31
|
1,303,059
|
|
3,092,000
|
RingCentral, Inc. (a) (b)
|
8.50
%
|
08/15/30
|
3,238,771
|
|
6,521,000
|
UKG, Inc. (a) (b)
|
6.88
%
|
02/01/31
|
6,566,812
|
|
|
|
20,160,119
|
||
|
|
Automobile Manufacturers – 0.7%
|
|
|
|
|
3,369,000
|
Ford Motor Co (b)
|
9.63
%
|
04/22/30
|
3,904,837
|
|
|
Automotive Parts & Equipment – 0.2%
|
|
|
|
|
1,298,000
|
Wand NewCo 3, Inc. (a) (b)
|
7.63
%
|
01/30/32
|
1,331,156
|
|
|
Automotive Retail – 0.1%
|
|
|
|
|
635,000
|
Mavis Tire Express Services Topco Corp. (a) (b)
|
6.50
%
|
05/15/29
|
585,504
|
|
|
Broadcasting – 9.1%
|
|
|
|
|
13,053,000
|
iHeartCommunications, Inc.
|
8.38
%
|
05/01/27
|
4,729,018
|
|
15,519,000
|
Nexstar Media, Inc. (a) (b)
|
5.63
%
|
07/15/27
|
14,660,222
|
|
611,000
|
Scripps Escrow II, Inc. (a) (b)
|
3.88
%
|
01/15/29
|
393,003
|
|
16,304,000
|
Sinclair Television Group, Inc. (a) (b)
|
5.13
%
|
02/15/27
|
14,618,032
|
|
7,069,000
|
Sirius XM Radio, Inc. (a) (b)
|
3.13
%
|
09/01/26
|
6,619,901
|
|
343,000
|
Sirius XM Radio, Inc. (a) (b)
|
5.50
%
|
07/01/29
|
318,877
|
|
8,987,000
|
TEGNA, Inc. (b)
|
4.63
%
|
03/15/28
|
8,173,770
|
|
2,027,000
|
Univision Communications, Inc. (a) (b)
|
6.63
%
|
06/01/27
|
1,960,049
|
|
|
|
51,472,872
|
||
|
|
Building Products – 1.5%
|
|
|
|
|
3,647,000
|
American Builders & Contractors Supply Co., Inc. (a) (b)
|
4.00
%
|
01/15/28
|
3,399,590
|
|
588,000
|
Beacon Roofing Supply, Inc. (a) (b)
|
6.50
%
|
08/01/30
|
588,987
|
|
2,241,000
|
Builders FirstSource, Inc. (a) (b)
|
6.38
%
|
03/01/34
|
2,199,703
|
|
971,000
|
Miter Brands Acquisition Holdco, Inc. / MIWD Borrower
LLC (a) (b)
|
6.75
%
|
04/01/32
|
965,162
|
|
574,000
|
Standard Industries, Inc. (a) (b)
|
4.75
%
|
01/15/28
|
547,266
|
|
Principal
Value
|
Description
|
Stated
Coupon
|
Stated
Maturity
|
Value
|
|
CORPORATE BONDS AND NOTES (Continued)
|
||||
|
|
Building Products (Continued)
|
|
|
|
|
$858,000
|
Standard Industries, Inc. (a) (b)
|
4.38
%
|
07/15/30
|
$766,319
|
|
|
|
8,467,027
|
||
|
|
Cable & Satellite – 2.9%
|
|
|
|
|
1,567,000
|
CCO Holdings LLC / CCO Holdings Capital Corp. (a) (b)
|
6.38
%
|
09/01/29
|
1,467,988
|
|
1,184,000
|
CCO Holdings LLC / CCO Holdings Capital Corp. (a) (b)
|
4.75
%
|
03/01/30
|
1,009,525
|
|
1,953,000
|
CCO Holdings LLC / CCO Holdings Capital Corp. (a) (b)
|
4.50
%
|
08/15/30
|
1,624,312
|
|
3,219,000
|
CCO Holdings LLC / CCO Holdings Capital Corp. (a) (b)
|
7.38
%
|
03/03/31
|
3,116,498
|
|
1,736,000
|
CSC Holdings LLC (a) (b)
|
7.50
%
|
04/01/28
|
970,867
|
|
667,000
|
CSC Holdings LLC (a) (b)
|
11.25
%
|
05/15/28
|
538,869
|
|
5,113,000
|
CSC Holdings LLC (a)
|
5.75
%
|
01/15/30
|
2,214,448
|
|
250,000
|
CSC Holdings LLC (a) (b)
|
3.38
%
|
02/15/31
|
146,666
|
|
8,320,000
|
CSC Holdings LLC (a) (b)
|
4.50
%
|
11/15/31
|
5,097,546
|
|
|
|
16,186,719
|
||
|
|
Casinos & Gaming – 3.2%
|
|
|
|
|
1,438,000
|
Boyd Gaming Corp. (a) (b)
|
4.75
%
|
06/15/31
|
1,291,114
|
|
1,999,000
|
Caesars Entertainment, Inc. (a) (b)
|
4.63
%
|
10/15/29
|
1,807,258
|
|
77,000
|
Caesars Entertainment, Inc. (a) (b)
|
7.00
%
|
02/15/30
|
77,880
|
|
71,000
|
Churchill Downs, Inc. (a) (b)
|
5.75
%
|
04/01/30
|
68,150
|
|
3,891,000
|
Fertitta Entertainment LLC / Fertitta Entertainment Finance Co,
Inc. (a) (b)
|
6.75
%
|
01/15/30
|
3,441,986
|
|
930,000
|
Light & Wonder International, Inc. (a) (b)
|
7.50
%
|
09/01/31
|
956,744
|
|
582,000
|
MGM Resorts International (b)
|
5.75
%
|
06/15/25
|
580,832
|
|
643,000
|
MGM Resorts International (b)
|
6.50
%
|
04/15/32
|
629,136
|
|
284,000
|
Scientific Games Holdings LP / Scientific Games US FinCo,
Inc. (a) (b)
|
6.63
%
|
03/01/30
|
269,229
|
|
2,694,000
|
Station Casinos LLC (a) (b)
|
4.50
%
|
02/15/28
|
2,510,446
|
|
3,155,000
|
VICI Properties LP (b)
|
5.75
%
|
04/01/34
|
3,105,075
|
|
1,624,000
|
VICI Properties LP / VICI Note Co., Inc. (a) (b)
|
3.50
%
|
02/15/25
|
1,596,962
|
|
60,000
|
VICI Properties LP / VICI Note Co., Inc. (a) (b)
|
3.75
%
|
02/15/27
|
56,845
|
|
2,000,000
|
VICI Properties LP / VICI Note Co., Inc. (a) (b)
|
4.63
%
|
12/01/29
|
1,873,237
|
|
|
|
18,264,894
|
||
|
|
Commercial Printing – 0.9%
|
|
|
|
|
2,000,000
|
LABL, Inc. (a) (b)
|
6.75
%
|
07/15/26
|
1,978,306
|
|
471,000
|
LABL, Inc. (a) (b)
|
10.50
%
|
07/15/27
|
459,018
|
|
2,612,000
|
LABL, Inc. (a) (b)
|
9.50
%
|
11/01/28
|
2,660,111
|
|
|
|
5,097,435
|
||
|
|
Construction & Engineering – 1.1%
|
|
|
|
|
2,445,000
|
Advanced Drainage Systems, Inc. (a) (b)
|
6.38
%
|
06/15/30
|
2,442,529
|
|
3,855,000
|
Pike Corp. (a) (b)
|
5.50
%
|
09/01/28
|
3,672,245
|
|
|
|
6,114,774
|
||
|
|
Construction Materials – 0.9%
|
|
|
|
|
74,000
|
GYP Holdings III Corp. (a) (b)
|
4.63
%
|
05/01/29
|
68,438
|
|
5,167,000
|
Summit Materials LLC / Summit Materials Finance Corp. (a) (b)
|
5.25
%
|
01/15/29
|
4,980,279
|
|
160,000
|
Summit Materials LLC / Summit Materials Finance Corp. (a) (b)
|
7.25
%
|
01/15/31
|
165,091
|
|
|
|
5,213,808
|
||
|
|
Consumer Finance – 0.9%
|
|
|
|
|
3,056,000
|
FirstCash, Inc. (a) (b)
|
4.63
%
|
09/01/28
|
2,868,062
|
|
2,269,000
|
FirstCash, Inc. (a) (b)
|
6.88
%
|
03/01/32
|
2,252,861
|
|
|
|
5,120,923
|
||
|
Principal
Value
|
Description
|
Stated
Coupon
|
Stated
Maturity
|
Value
|
|
CORPORATE BONDS AND NOTES (Continued)
|
||||
|
|
Diversified Support Services – 0.3%
|
|
|
|
|
$901,000
|
Ritchie Bros Holdings, Inc. (a) (b)
|
6.75
%
|
03/15/28
|
$911,130
|
|
625,000
|
Ritchie Bros Holdings, Inc. (a) (b)
|
7.75
%
|
03/15/31
|
653,155
|
|
|
|
1,564,285
|
||
|
|
Electric Utilities – 0.4%
|
|
|
|
|
1,588,000
|
Vistra Operations Co. LLC (a) (b)
|
5.00
%
|
07/31/27
|
1,536,863
|
|
641,000
|
Vistra Operations Co. LLC (a) (b)
|
7.75
%
|
10/15/31
|
666,475
|
|
|
|
2,203,338
|
||
|
|
Electrical Components & Equipment – 0.1%
|
|
|
|
|
333,000
|
Sensata Technologies, Inc. (a) (b)
|
3.75
%
|
02/15/31
|
287,568
|
|
|
Environmental & Facilities Services – 0.9%
|
|
|
|
|
933,000
|
Allied Universal Holdco LLC (a) (b)
|
7.88
%
|
02/15/31
|
931,021
|
|
4,419,000
|
Waste Pro USA, Inc. (a) (b)
|
5.50
%
|
02/15/26
|
4,356,213
|
|
|
|
5,287,234
|
||
|
|
Fertilizers & Agricultural Chemicals – 0.3%
|
|
|
|
|
2,000,000
|
Scotts Miracle-Gro Co. (The) (b)
|
4.50
%
|
10/15/29
|
1,801,169
|
|
|
Financial Exchanges & Data – 0.4%
|
|
|
|
|
2,550,000
|
MSCI, Inc. (a) (b)
|
3.25
%
|
08/15/33
|
2,096,476
|
|
|
Food Distributors – 0.9%
|
|
|
|
|
603,000
|
US Foods, Inc. (a) (b)
|
4.75
%
|
02/15/29
|
566,543
|
|
2,250,000
|
US Foods, Inc. (a) (b)
|
4.63
%
|
06/01/30
|
2,067,649
|
|
2,078,000
|
US Foods, Inc. (a) (b)
|
7.25
%
|
01/15/32
|
2,147,216
|
|
|
|
4,781,408
|
||
|
|
Health Care Facilities – 2.1%
|
|
|
|
|
1,510,000
|
Acadia Healthcare Co., Inc. (a) (b)
|
5.00
%
|
04/15/29
|
1,424,888
|
|
2,218,000
|
HCA, Inc. (b)
|
5.88
%
|
02/15/26
|
2,222,021
|
|
569,000
|
HCA, Inc. (b)
|
5.38
%
|
09/01/26
|
567,157
|
|
7,842,000
|
Select Medical Corp. (a) (b)
|
6.25
%
|
08/15/26
|
7,849,826
|
|
|
|
12,063,892
|
||
|
|
Health Care Supplies – 2.5%
|
|
|
|
|
9,847,000
|
Medline Borrower LP (a) (b)
|
3.88
%
|
04/01/29
|
8,970,930
|
|
4,833,000
|
Medline Borrower LP (a) (b)
|
5.25
%
|
10/01/29
|
4,559,700
|
|
428,000
|
Medline Borrower LP / Medline Co-Issuer, Inc. (a) (b)
|
6.25
%
|
04/01/29
|
428,622
|
|
|
|
13,959,252
|
||
|
|
Health Care Technology – 1.3%
|
|
|
|
|
6,527,000
|
AthenaHealth Group, Inc. (a) (b)
|
6.50
%
|
02/15/30
|
5,928,330
|
|
1,365,000
|
HealthEquity, Inc. (a) (b)
|
4.50
%
|
10/01/29
|
1,252,105
|
|
|
|
7,180,435
|
||
|
|
Hotels, Resorts & Cruise Lines – 0.2%
|
|
|
|
|
937,000
|
Vail Resorts, Inc. (a) (b)
|
6.50
%
|
05/15/32
|
943,717
|
|
289,000
|
Wyndham Hotels & Resorts, Inc. (a) (b)
|
4.38
%
|
08/15/28
|
268,293
|
|
|
|
1,212,010
|
||
|
|
Household Products – 0.9%
|
|
|
|
|
2,733,000
|
Energizer Holdings, Inc. (a) (b)
|
6.50
%
|
12/31/27
|
2,712,548
|
|
1,746,000
|
Energizer Holdings, Inc. (a) (b)
|
4.75
%
|
06/15/28
|
1,612,391
|
|
Principal
Value
|
Description
|
Stated
Coupon
|
Stated
Maturity
|
Value
|
|
CORPORATE BONDS AND NOTES (Continued)
|
||||
|
|
Household Products (Continued)
|
|
|
|
|
$650,000
|
Energizer Holdings, Inc. (a) (b)
|
4.38
%
|
03/31/29
|
$578,437
|
|
|
|
4,903,376
|
||
|
|
Human Resource & Employment Services – 0.5%
|
|
|
|
|
1,913,000
|
TriNet Group, Inc. (a) (b)
|
7.13
%
|
08/15/31
|
1,932,619
|
|
1,153,000
|
ZipRecruiter, Inc. (a) (b)
|
5.00
%
|
01/15/30
|
1,001,040
|
|
|
|
2,933,659
|
||
|
|
Independent Power Producers & Energy Traders – 0.6%
|
|
|
|
|
3,627,000
|
Calpine Corp. (a) (b)
|
5.13
%
|
03/15/28
|
3,458,820
|
|
|
Industrial Conglomerates – 0.4%
|
|
|
|
|
2,116,000
|
Hillenbrand, Inc. (b)
|
6.25
%
|
02/15/29
|
2,107,150
|
|
|
Industrial Machinery & Supplies & Components – 1.3%
|
|
|
|
|
561,000
|
EMRLD Borrower LP / Emerald Co-Issuer, Inc. (a) (b)
|
6.63
%
|
12/15/30
|
562,679
|
|
158,000
|
Gates Corp. (The) (a) (b)
|
6.88
%
|
07/01/29
|
159,715
|
|
6,597,000
|
Gates Global LLC / Gates Corp. (a) (b)
|
6.25
%
|
01/15/26
|
6,618,844
|
|
|
|
7,341,238
|
||
|
|
Insurance Brokers – 11.7%
|
|
|
|
|
11,724,000
|
Alliant Holdings Intermediate LLC / Alliant Holdings
Co-Issuer (a) (b)
|
6.75
%
|
10/15/27
|
11,501,721
|
|
7,588,000
|
Alliant Holdings Intermediate LLC / Alliant Holdings
Co-Issuer (a) (b)
|
6.75
%
|
04/15/28
|
7,607,661
|
|
210,000
|
Alliant Holdings Intermediate LLC / Alliant Holdings
Co-Issuer (a) (b)
|
5.88
%
|
11/01/29
|
195,581
|
|
3,710,000
|
AmWINS Group, Inc. (a) (b)
|
6.38
%
|
02/15/29
|
3,703,230
|
|
7,828,000
|
AmWINS Group, Inc. (a) (b)
|
4.88
%
|
06/30/29
|
7,202,722
|
|
10,162,000
|
AssuredPartners, Inc. (a) (b)
|
5.63
%
|
01/15/29
|
9,465,785
|
|
1,996,000
|
AssuredPartners, Inc. (a) (b)
|
7.50
%
|
02/15/32
|
1,985,874
|
|
1,247,000
|
Baldwin Insurance Group Holdings LLC / Baldwin Insurance
Group Holdings Finance (a) (b)
|
7.13
%
|
05/15/31
|
1,260,216
|
|
2,092,000
|
BroadStreet Partners, Inc. (a) (b)
|
5.88
%
|
04/15/29
|
1,917,314
|
|
675,000
|
Brown & Brown, Inc. (b)
|
2.38
%
|
03/15/31
|
552,758
|
|
2,101,000
|
GTCR AP Finance, Inc. (a) (b)
|
8.00
%
|
05/15/27
|
2,104,841
|
|
4,934,000
|
HUB International Ltd (a) (b)
|
5.63
%
|
12/01/29
|
4,582,964
|
|
925,000
|
HUB International Ltd (a) (b)
|
7.25
%
|
06/15/30
|
940,474
|
|
4,625,000
|
HUB International Ltd (a) (b)
|
7.38
%
|
01/31/32
|
4,644,307
|
|
4,606,000
|
Panther Escrow Issuer LLC (a) (b)
|
7.13
%
|
06/01/31
|
4,648,152
|
|
3,801,000
|
Ryan Specialty LLC (a) (b)
|
4.38
%
|
02/01/30
|
3,511,515
|
|
|
|
65,825,115
|
||
|
|
Integrated Telecommunication Services – 0.7%
|
|
|
|
|
5,814,000
|
Zayo Group Holdings, Inc. (a) (b)
|
6.13
%
|
03/01/28
|
3,961,894
|
|
|
Interactive Media & Services – 1.4%
|
|
|
|
|
8,270,000
|
Cars.com, Inc. (a) (b)
|
6.38
%
|
11/01/28
|
8,131,044
|
|
|
Internet Services & Infrastructure – 2.2%
|
|
|
|
|
6,210,000
|
Go Daddy Operating Co. LLC / GD Finance Co., Inc. (a) (b)
|
5.25
%
|
12/01/27
|
6,047,265
|
|
7,217,000
|
Go Daddy Operating Co. LLC / GD Finance Co., Inc. (a) (b)
|
3.50
%
|
03/01/29
|
6,453,453
|
|
|
|
12,500,718
|
||
|
|
Investment Banking & Brokerage – 0.2%
|
|
|
|
|
1,045,000
|
LPL Holdings, Inc. (a) (b)
|
4.63
%
|
11/15/27
|
1,007,536
|
|
Principal
Value
|
Description
|
Stated
Coupon
|
Stated
Maturity
|
Value
|
|
CORPORATE BONDS AND NOTES (Continued)
|
||||
|
|
IT Consulting & Other Services – 0.4%
|
|
|
|
|
$613,000
|
Central Parent, Inc. / CDK Global, Inc. (a) (b)
|
7.25
%
|
06/15/29
|
$616,836
|
|
2,000,000
|
Gartner, Inc. (a) (b)
|
4.50
%
|
07/01/28
|
1,905,983
|
|
|
|
2,522,819
|
||
|
|
Leisure Facilities – 0.1%
|
|
|
|
|
283,000
|
SeaWorld Parks & Entertainment, Inc. (a) (b)
|
5.25
%
|
08/15/29
|
264,835
|
|
313,000
|
Six Flags Entertainment Corp. / Six Flags Theme Parks,
Inc. (a) (b)
|
6.63
%
|
05/01/32
|
313,424
|
|
|
|
578,259
|
||
|
|
Leisure Products – 0.4%
|
|
|
|
|
1,413,000
|
Acushnet Co. (a) (b)
|
7.38
%
|
10/15/28
|
1,454,457
|
|
611,000
|
Amer Sports Co. (a) (b)
|
6.75
%
|
02/16/31
|
609,177
|
|
|
|
2,063,634
|
||
|
|
Managed Health Care – 2.6%
|
|
|
|
|
6,806,000
|
Centene Corp. (b)
|
4.25
%
|
12/15/27
|
6,482,280
|
|
968,000
|
Molina Healthcare, Inc. (a) (b)
|
4.38
%
|
06/15/28
|
901,467
|
|
4,000,000
|
Molina Healthcare, Inc. (a) (b)
|
3.88
%
|
11/15/30
|
3,491,073
|
|
4,576,000
|
Molina Healthcare, Inc. (a) (b)
|
3.88
%
|
05/15/32
|
3,876,022
|
|
|
|
14,750,842
|
||
|
|
Metal, Glass & Plastic Containers – 2.9%
|
|
|
|
|
903,000
|
Ball Corp. (b)
|
6.88
%
|
03/15/28
|
922,558
|
|
4,227,000
|
Ball Corp. (b)
|
2.88
%
|
08/15/30
|
3,574,987
|
|
5,419,000
|
Berry Global, Inc. (a) (b)
|
5.63
%
|
07/15/27
|
5,352,201
|
|
1,460,000
|
Berry Global, Inc. (a) (b)
|
5.65
%
|
01/15/34
|
1,426,327
|
|
75,000
|
Crown Americas LLC (b)
|
5.25
%
|
04/01/30
|
72,163
|
|
4,321,000
|
Owens-Brockway Glass Container, Inc. (a) (b)
|
7.25
%
|
05/15/31
|
4,311,763
|
|
650,000
|
Owens-Brockway Glass Container, Inc. (a) (b)
|
7.38
%
|
06/01/32
|
650,600
|
|
|
|
16,310,599
|
||
|
|
Movies & Entertainment – 1.3%
|
|
|
|
|
4,380,000
|
Live Nation Entertainment, Inc. (a) (b)
|
5.63
%
|
03/15/26
|
4,320,610
|
|
2,620,000
|
Live Nation Entertainment, Inc. (a) (b)
|
4.75
%
|
10/15/27
|
2,484,355
|
|
394,000
|
WMG Acquisition Corp. (a) (b)
|
3.00
%
|
02/15/31
|
333,741
|
|
|
|
7,138,706
|
||
|
|
Packaged Foods & Meats – 1.5%
|
|
|
|
|
1,198,000
|
Fiesta Purchaser, Inc. (a) (b)
|
7.88
%
|
03/01/31
|
1,232,018
|
|
7,308,000
|
Post Holdings, Inc. (a) (b)
|
6.25
%
|
02/15/32
|
7,273,795
|
|
|
|
8,505,813
|
||
|
|
Paper & Plastic Packaging Products & Materials – 4.6%
|
|
|
|
|
12,810,000
|
Graham Packaging Co., Inc. (a) (b)
|
7.13
%
|
08/15/28
|
12,087,357
|
|
1,060,000
|
Graphic Packaging International LLC (a) (b)
|
3.75
%
|
02/01/30
|
940,407
|
|
936,000
|
Graphic Packaging International LLC (a) (b)
|
6.38
%
|
07/15/32
|
939,026
|
|
6,990,000
|
Pactiv Evergreen Group Issuer, Inc. / Pactiv Evergreen Group
Issuer LLC (a) (b)
|
4.00
%
|
10/15/27
|
6,530,149
|
|
180,000
|
Pactiv LLC (b)
|
7.95
%
|
12/15/25
|
184,991
|
|
566,000
|
Sealed Air Corp. (a) (b)
|
5.00
%
|
04/15/29
|
537,016
|
|
4,070,000
|
Sealed Air Corp. / Sealed Air Corp. US (a) (b)
|
6.13
%
|
02/01/28
|
4,044,345
|
|
774,000
|
Verde Purchaser LLC (a) (b)
|
10.50
%
|
11/30/30
|
816,718
|
|
|
|
26,080,009
|
||
|
Principal
Value
|
Description
|
Stated
Coupon
|
Stated
Maturity
|
Value
|
|
CORPORATE BONDS AND NOTES (Continued)
|
||||
|
|
Personal Care Products – 0.2%
|
|
|
|
|
$1,389,000
|
Prestige Brands, Inc. (a) (b)
|
5.13
%
|
01/15/28
|
$1,339,505
|
|
|
Pharmaceuticals – 1.2%
|
|
|
|
|
3,000,000
|
Charles River Laboratories International, Inc. (a) (b)
|
3.75
%
|
03/15/29
|
2,716,610
|
|
1,483,000
|
Charles River Laboratories International, Inc. (a) (b)
|
4.00
%
|
03/15/31
|
1,304,755
|
|
2,802,000
|
IQVIA, Inc. (a) (b)
|
6.50
%
|
05/15/30
|
2,832,357
|
|
|
|
6,853,722
|
||
|
|
Rail Transportation – 0.2%
|
|
|
|
|
922,000
|
Genesee & Wyoming, Inc. (a) (b)
|
6.25
%
|
04/15/32
|
912,469
|
|
|
Real Estate Services – 0.3%
|
|
|
|
|
2,219,000
|
CoStar Group, Inc. (a) (b)
|
2.80
%
|
07/15/30
|
1,881,761
|
|
|
Research & Consulting Services – 1.4%
|
|
|
|
|
3,973,000
|
Clarivate Science Holdings Corp. (a) (b)
|
3.88
%
|
07/01/28
|
3,641,461
|
|
3,114,000
|
Clarivate Science Holdings Corp. (a) (b)
|
4.88
%
|
07/01/29
|
2,842,506
|
|
342,000
|
CoreLogic, Inc. (a) (b)
|
4.50
%
|
05/01/28
|
309,275
|
|
900,000
|
Dun & Bradstreet Corp. (The) (a) (b)
|
5.00
%
|
12/15/29
|
837,770
|
|
|
|
7,631,012
|
||
|
|
Restaurants – 1.1%
|
|
|
|
|
5,088,000
|
IRB Holding Corp. (a) (b)
|
7.00
%
|
06/15/25
|
5,092,671
|
|
812,000
|
Raising Cane’s Restaurants LLC (a) (b)
|
9.38
%
|
05/01/29
|
875,249
|
|
|
|
5,967,920
|
||
|
|
Security & Alarm Services – 0.3%
|
|
|
|
|
2,000,000
|
Brink’s Co. (The) (a) (b)
|
4.63
%
|
10/15/27
|
1,911,072
|
|
|
Specialized Consumer Services – 0.8%
|
|
|
|
|
4,932,000
|
Aramark Services, Inc. (a) (b)
|
5.00
%
|
02/01/28
|
4,719,510
|
|
|
Specialized Finance – 0.3%
|
|
|
|
|
2,392,000
|
Radiate Holdco LLC / Radiate Finance, Inc. (a) (b)
|
4.50
%
|
09/15/26
|
1,778,500
|
|
|
Specialty Chemicals – 1.4%
|
|
|
|
|
8,153,000
|
Avantor Funding, Inc. (a) (b)
|
4.63
%
|
07/15/28
|
7,679,149
|
|
|
Systems Software – 6.2%
|
|
|
|
|
2,724,000
|
Boxer Parent Co., Inc. (a) (b)
|
9.13
%
|
03/01/26
|
2,736,682
|
|
765,000
|
Crowdstrike Holdings, Inc. (b)
|
3.00
%
|
02/15/29
|
679,911
|
|
3,484,000
|
Gen Digital, Inc. (a) (b)
|
7.13
%
|
09/30/30
|
3,544,806
|
|
1,000,000
|
Oracle Corp. (b)
|
6.15
%
|
11/09/29
|
1,044,342
|
|
1,000,000
|
Oracle Corp. (b)
|
6.25
%
|
11/09/32
|
1,055,380
|
|
1,796,000
|
Oracle Corp. (b)
|
6.50
%
|
04/15/38
|
1,918,336
|
|
22,859,000
|
SS&C Technologies, Inc. (a) (b)
|
5.50
%
|
09/30/27
|
22,403,969
|
|
1,643,000
|
SS&C Technologies, Inc. (a) (b)
|
6.50
%
|
06/01/32
|
1,648,741
|
|
|
|
35,032,167
|
||
|
|
Trading Companies & Distributors – 1.9%
|
|
|
|
|
1,794,000
|
Herc Holdings, Inc. (a) (b)
|
5.50
%
|
07/15/27
|
1,752,864
|
|
8,786,000
|
United Rentals North America, Inc. (a) (b)
|
6.00
%
|
12/15/29
|
8,751,205
|
|
|
|
10,504,069
|
||
|
|
Transaction & Payment Processing Services – 0.1%
|
|
|
|
|
638,000
|
Boost Newco Borrower LLC (a) (b)
|
7.50
%
|
01/15/31
|
661,716
|
|
|
Total Corporate Bonds and Notes
|
493,798,328
|
||
|
|
(Cost $513,337,939)
|
|
|
|
|
Principal
Value
|
Description
|
Rate (c)
|
Stated
Maturity (d)
|
Value
|
|
SENIOR FLOATING-RATE LOAN INTERESTS – 18.7%
|
||||
|
|
Application Software – 7.1%
|
|
|
|
|
$704,012
|
Applied Systems, Inc., 2024 Term Loan, 3 Mo. CME Term SOFR
+ 3.50%, 0.00% Floor (b)
|
8.81
%
|
02/23/31
|
$711,023
|
|
8,565,357
|
Gainwell Acquisition Corp. (f/k/a Milano), Term Loan B, 3 Mo.
CME Term SOFR + CSA + 4.00%, 0.75% Floor (b)
|
9.41
%
|
10/01/27
|
8,347,668
|
|
4,374,990
|
Genesys Cloud Services Holding II LLC (f/k/a Greeneden), Term
Loan B, 1 Mo. CME Term SOFR + 3.50%, 0.75% Floor (b)
|
8.83
%
|
12/01/27
|
4,411,324
|
|
6,365,607
|
Informatica Corp., Initial Term Loan B, 1 Mo. CME Term SOFR +
CSA + 2.75%, 0.00% Floor (b)
|
8.19
%
|
10/29/28
|
6,401,413
|
|
8,877,441
|
Internet Brands, Inc. (Web MD/MH Sub I. LLC), 2nd Lien Term
Loan, 1 Mo. CME Term SOFR + 6.25%, 0.00% Floor (b)
|
11.58
%
|
02/23/29
|
8,881,614
|
|
80,271
|
ION Trading Technologies Ltd., Initial Dollar Term Loan, 1 Mo.
CME Term SOFR + 4.00%, 0.00% Floor (b)
|
9.34
%
|
04/01/28
|
80,443
|
|
2,993,109
|
LogMeIn, Inc. (GoTo Group, Inc.), First Lien First Out TL, 1 Mo.
CME Term SOFR + CSA + 4.75%, 0.00% Floor (b)
|
10.17
%
|
04/30/28
|
2,822,247
|
|
2,457,982
|
LogMeIn, Inc. (GoTo Group, Inc.), First Lien Second Out TL, 1
Mo. CME Term SOFR + CSA + 4.75%, 0.00% Floor (b)
|
10.17
%
|
04/30/28
|
1,523,949
|
|
2,992,327
|
Solera Holdings, Inc. (Polaris Newco), Term Loan B, 3 Mo. CME
Term SOFR + CSA + 4.00%, 0.50% Floor (b)
|
9.59
%
|
06/04/28
|
2,997,669
|
|
3,745,039
|
Ultimate Kronos Group (UKG, Inc.), 2024 Term Loan B, 1 Mo.
CME Term SOFR + 3.50%, 0.00% Floor (b)
|
8.82
%
|
02/10/31
|
3,777,640
|
|
|
|
39,954,990
|
||
|
|
Diversified Support Services – 0.5%
|
|
|
|
|
2,992,327
|
Consilio (Skopima Consilio Parent LLC), Initial Term Loan, 1 Mo.
CME Term SOFR + CSA + 4.00%, 0.50% Floor (b)
|
9.44
%
|
05/17/28
|
2,992,642
|
|
|
Electronic Equipment & Instruments – 0.5%
|
|
|
|
|
2,905,963
|
Verifone Systems, Inc., Term Loan B, 3 Mo. CME Term SOFR +
CSA + 4.00%, 0.00% Floor (b)
|
9.60
%
|
08/20/25
|
2,516,084
|
|
|
Health Care Facilities – 0.8%
|
|
|
|
|
443,128
|
Gentiva Health Services, Inc. (Kindred at Home/Charlotte Buyer),
Initial Term B Loan, 1 Mo. CME Term SOFR + 5.25%, 0.50%
Floor (b)
|
10.57
%
|
02/11/28
|
446,527
|
|
1,718,438
|
IVC Evidensia (IVC Acquisition Midco Ltd.), Facility B9, 3 Mo.
CME Term SOFR + 5.50%, 0.50% Floor (b)
|
10.81
%
|
12/06/28
|
1,725,604
|
|
2,333,040
|
Select Medical Corp., Tranche B-1, 1 Mo. CME Term SOFR +
3.00%, 0.00% Floor (b)
|
8.33
%
|
03/08/27
|
2,345,428
|
|
|
|
4,517,559
|
||
|
|
Health Care Technology – 3.2%
|
|
|
|
|
1,940,698
|
Datavant Group (f/k/a Ciox) (CT Technologies Intermediate
Holdings, Inc.), New Term Loan B, 1 Mo. CME Term SOFR +
CSA + 4.25%, 0.75% Floor (b)
|
9.69
%
|
12/16/25
|
1,944,744
|
|
9,295,770
|
Navicure, Inc. (Waystar Technologies, Inc.), 2024 Refi Term Loan,
1 Mo. CME Term SOFR + 4.00%, 0.00% Floor (b)
|
9.33
%
|
10/22/29
|
9,336,439
|
|
6,800,000
|
Verscend Technologies, Inc. (Cotiviti), Fixed Rate Term Loan, 1
Mo. Fixed + 0.00%, 0.00% Floor (b)
|
7.63
%
|
05/01/31
|
6,773,072
|
|
92,242
|
WS Audiology (Auris Lux III SARL), USD Term Loan B, 6 Mo.
CME Term SOFR + CSA + 4.25%, 0.00% Floor (b)
|
9.99
%
|
02/08/29
|
92,589
|
|
|
|
18,146,844
|
||
|
|
Industrial Machinery & Supplies & Components – 0.8%
|
|
|
|
|
4,302,024
|
Filtration Group Corp., 2021 Incremental Term Loan B, 1 Mo.
CME Term SOFR + 3.50%, 0.50% Floor (b)
|
8.94
%
|
10/21/28
|
4,329,256
|
|
Principal
Value
|
Description
|
Rate (c)
|
Stated
Maturity (d)
|
Value
|
|
SENIOR FLOATING-RATE LOAN INTERESTS (Continued)
|
||||
|
|
Insurance Brokers – 4.8%
|
|
|
|
|
$440,791
|
Alliant Holdings I LLC, Term Loan B-6, 1 Mo. CME Term SOFR
+ 3.50%, 0.50% Floor (b)
|
8.82
%
|
11/06/30
|
$443,066
|
|
6,291,631
|
BroadStreet Partners, Inc., Term Loan B-4, 1 Mo. CME Term
SOFR + 3.25%, 0.00% Floor (b)
|
8.59
%
|
06/14/31
|
6,325,920
|
|
7,988
|
HUB International Ltd., 2024 Refi Term Loan B, 1 Mo. CME
Term SOFR + 3.25%, 0.75% Floor (b)
|
8.58
%
|
06/20/30
|
8,050
|
|
3,186,985
|
HUB International Ltd., 2024 Refi Term Loan B, 3 Mo. CME
Term SOFR + 3.25%, 0.75% Floor
|
8.57
%
|
06/20/30
|
3,211,811
|
|
6,404,650
|
OneDigital Borrower LLC, Term Loan B, 1 Mo. CME Term SOFR
+ CSA + 4.25%, 0.50% Floor (b)
|
9.68
%
|
11/16/27
|
6,448,842
|
|
5,308,425
|
Ryan Specialty Group LLC, 2024 Term Loan, 1 Mo. CME Term
SOFR + 2.75%, 0.75% Floor (b)
|
8.08
%
|
09/01/27
|
5,350,229
|
|
2,101,934
|
Truist Insurance Holdings LLC (McGriff/Panther Escrow), Second
Lien Term Loan, 2 Mo. CME Term SOFR + 4.75%, 0.00%
Floor (b)
|
10.09
%
|
05/06/32
|
2,153,169
|
|
3,258,649
|
USI, Inc., 2030 Term Loan B, 1 Mo. CME Term SOFR + 2.75%,
0.00% Floor (b)
|
8.08
%
|
09/29/30
|
3,270,576
|
|
|
|
27,211,663
|
||
|
|
Integrated Telecommunication Services – 0.1%
|
|
|
|
|
448,562
|
Numericable (Altice France SA or SFR), Term Loan B-13, 3 Mo.
Synthetic USD LIBOR + 4.00%, 0.00% Floor (b)
|
9.58
%
|
08/14/26
|
363,818
|
|
|
Metal, Glass & Plastic Containers – 0.5%
|
|
|
|
|
3,019,147
|
ProAmpac PG Borrower LLC, 2024 Refi Term Loan B, 4 Mo.
CME Term SOFR + 4.00%, 0.75% Floor (b)
|
9.32%-9.33%
|
09/15/28
|
3,042,922
|
|
|
Security & Alarm Services – 0.1%
|
|
|
|
|
725,035
|
Garda World Security Corp., 2024 Refi Term Loan, 3 Mo. CME
Term SOFR + 4.25%, 0.00% Floor (b)
|
9.58
%
|
02/01/29
|
732,920
|
|
|
Specialized Finance – 0.2%
|
|
|
|
|
1,532,974
|
Radiate Holdco LLC (Astound), Amendment No. 6 Term Loan, 1
Mo. CME Term SOFR + CSA + 3.25%, 0.75% Floor (b)
|
8.69
%
|
09/25/26
|
1,214,644
|
|
|
Systems Software – 0.1%
|
|
|
|
|
244,731
|
Idera, Inc., 2nd Lien Term Loan, 3 Mo. CME Term SOFR + CSA
+ 6.75%, 0.75% Floor (b)
|
12.23
%
|
03/02/29
|
238,613
|
|
|
Total Senior Floating-Rate Loan Interests
|
105,261,955
|
||
|
|
(Cost $105,534,746)
|
|
|
|
|
Principal
Value
|
Description
|
Stated
Coupon
|
Stated
Maturity
|
Value
|
|
FOREIGN CORPORATE BONDS AND NOTES – 15.3%
|
||||
|
|
Application Software – 3.9%
|
|
|
|
|
1,721,000
|
ION Trading Technologies Sarl (a) (b)
|
5.75
%
|
05/15/28
|
1,565,190
|
|
11,666,000
|
Open Text Corp. (a) (b)
|
6.90
%
|
12/01/27
|
11,978,264
|
|
6,881,000
|
Open Text Corp. (a) (b)
|
3.88
%
|
02/15/28
|
6,329,531
|
|
2,108,000
|
Open Text Corp. (a) (b)
|
3.88
%
|
12/01/29
|
1,857,956
|
|
|
|
21,730,941
|
||
|
|
Automotive Parts & Equipment – 1.5%
|
|
|
|
|
8,691,000
|
Clarios Global LP / Clarios US Finance Co. (a) (b)
|
8.50
%
|
05/15/27
|
8,762,988
|
|
|
Building Products – 0.2%
|
|
|
|
|
973,000
|
Cemex SAB de CV (a)
|
5.45
%
|
11/19/29
|
950,242
|
|
Principal
Value
|
Description
|
Stated
Coupon
|
Stated
Maturity
|
Value
|
|
FOREIGN CORPORATE BONDS AND NOTES (Continued)
|
||||
|
|
Casinos & Gaming – 0.0%
|
|
|
|
|
$140,000
|
Flutter Treasury Designated Activity Co (a) (b)
|
6.38
%
|
04/29/29
|
$140,805
|
|
|
Environmental & Facilities Services – 1.6%
|
|
|
|
|
473,000
|
GFL Environmental, Inc. (a) (b)
|
3.75
%
|
08/01/25
|
462,117
|
|
3,000,000
|
GFL Environmental, Inc. (a) (b)
|
5.13
%
|
12/15/26
|
2,945,715
|
|
1,300,000
|
GFL Environmental, Inc. (a) (b)
|
4.00
%
|
08/01/28
|
1,189,916
|
|
1,686,000
|
GFL Environmental, Inc. (a) (b)
|
4.75
%
|
06/15/29
|
1,571,001
|
|
2,750,000
|
GFL Environmental, Inc. (a) (b)
|
6.75
%
|
01/15/31
|
2,808,484
|
|
|
|
8,977,233
|
||
|
|
Integrated Telecommunication Services – 1.2%
|
|
|
|
|
2,542,000
|
Altice France Holding SA (a)
|
10.50
%
|
05/15/27
|
942,986
|
|
2,511,000
|
Altice France SA (a) (b)
|
5.50
%
|
01/15/28
|
1,760,761
|
|
1,000,000
|
Altice France SA (a) (b)
|
5.13
%
|
01/15/29
|
676,690
|
|
5,117,000
|
Altice France SA (a) (b)
|
5.13
%
|
07/15/29
|
3,441,449
|
|
|
|
6,821,886
|
||
|
|
IT Consulting & Other Services – 0.5%
|
|
|
|
|
3,464,000
|
Elastic NV (a) (b)
|
4.13
%
|
07/15/29
|
3,100,294
|
|
|
Metal, Glass & Plastic Containers – 1.3%
|
|
|
|
|
7,245,000
|
Trivium Packaging Finance BV (a) (b)
|
5.50
%
|
08/15/26
|
7,148,474
|
|
|
Restaurants – 2.2%
|
|
|
|
|
14,344,000
|
1011778 BC ULC / New Red Finance, Inc. (a) (b)
|
4.00
%
|
10/15/30
|
12,491,516
|
|
|
Security & Alarm Services – 1.1%
|
|
|
|
|
2,000,000
|
Garda World Security Corp. (a) (b)
|
9.50
%
|
11/01/27
|
2,003,222
|
|
4,034,000
|
Garda World Security Corp. (a) (b)
|
7.75
%
|
02/15/28
|
4,099,552
|
|
|
|
6,102,774
|
||
|
|
Trading Companies & Distributors – 1.0%
|
|
|
|
|
2,721,000
|
VistaJet Malta Finance PLC / Vista Management Holding,
Inc. (a) (b)
|
7.88
%
|
05/01/27
|
2,466,009
|
|
3,858,000
|
VistaJet Malta Finance PLC / Vista Management Holding,
Inc. (a) (b)
|
6.38
%
|
02/01/30
|
3,100,841
|
|
|
|
5,566,850
|
||
|
|
Transaction & Payment Processing Services – 0.8%
|
|
|
|
|
4,738,000
|
Paysafe Finance PLC / Paysafe Holdings US Corp. (a) (b)
|
4.00
%
|
06/15/29
|
4,313,916
|
|
|
Total Foreign Corporate Bonds and Notes
|
86,107,919
|
||
|
|
(Cost $89,471,027)
|
|
|
|
|
Shares
|
Description
|
Value
|
|
COMMON STOCKS – 0.0%
|
||
|
|
Pharmaceuticals – 0.0%
|
|
|
220,989
|
Akorn, Inc. (e) (f) (g)
|
16,906
|
|
|
(Cost $2,534,056)
|
|
|
Shares
|
Description
|
Value
|
|
MONEY MARKET FUNDS – 0.2%
|
||
|
1,009,138
|
Morgan Stanley Institutional Liquidity Funds - Treasury Portfolio - Institutional
Class -
5.15% (b) (h)
|
$1,009,138
|
|
|
(Cost $1,009,138)
|
|
|
|
Total Investments – 121.9%
|
686,194,246
|
|
|
(Cost $711,886,906)
|
|
|
|
Outstanding Loan – (23.3)%
|
(131,000,000
)
|
|
|
Net Other Assets and Liabilities – 1.4%
|
7,898,887
|
|
|
Net Assets – 100.0%
|
$563,093,133
|
|
(a)
|
This security, sold within the terms of a private placement memorandum, is exempt
from registration upon resale under
Rule 144A of the Securities Act of 1933, as amended (the “1933 Act”), and may be resold in transactions exempt from
registration, normally to qualified institutional buyers. Pursuant to procedures adopted by the Fund’s Board of Trustees, this
security has been determined to be liquid by First Trust Advisors L.P. (the “Advisor”). Although market instability can result in
periods of increased overall market illiquidity, liquidity for each security is determined
based on security specific factors and
assumptions, which require subjective judgment. At May 31, 2024, securities noted
as such amounted to $530,691,801 or 94.2%
of net assets.
|
|
(b)
|
All or a portion of this security serves as collateral for the outstanding loan. At
May 31, 2024, the segregated value of these
securities amounts to $677,340,646.
|
|
(c)
|
Senior Floating-Rate Loan Interests (“Senior Loans”) in which the Fund invests pay interest at rates which are periodically
predetermined by reference to a base lending rate plus a premium. These base lending
rates are generally (i) the SOFR obtained
from the U.S. Department of the Treasury’s Office of Financial Research or another major financial institution, (ii) the lending
rate offered by one or more major European banks, such as the synthetic LIBOR, (iii)
the prime rate offered by one or more
United States banks or (iv) the certificate of deposit rate. Certain Senior Loans
are subject to a SOFR or synthetic LIBOR floor
that establishes a minimum SOFR or synthetic LIBOR rate. When a range of rates is
disclosed, the Fund holds more than one
contract within the same tranche with identical SOFR or synthetic LIBOR period, spread
and floor, but different SOFR or
synthetic LIBOR reset dates.
|
|
(d)
|
Senior Loans generally are subject to mandatory and/or optional prepayment. As a result,
the actual remaining maturity of Senior
Loans may be substantially less than the stated maturities shown.
|
|
(e)
|
This issuer has filed for protection in bankruptcy court.
|
|
(f)
|
Security received in a transaction exempt from registration under the 1933 Act. The
security may be resold pursuant to an
exemption from registration under the 1933 Act, typically to qualified institutional
buyers (see Note 2E - Restricted Securities in
the Notes to Financial Statements).
|
|
(g)
|
Non-income producing security.
|
|
(h)
|
Rate shown reflects yield as of May 31, 2024.
|
|
Abbreviations throughout the Portfolio of Investments:
|
|
|
CME
|
– Chicago Mercantile Exchange
|
|
CSA
|
– Credit Spread Adjustment
|
|
LIBOR
|
– London Interbank Offered Rate
|
|
SOFR
|
– Secured Overnight Financing Rate
|
|
USD
|
– United States Dollar
|
|
|
Total
Value at
5/31/2024
|
Level 1
Quoted
Prices
|
Level 2
Significant
Observable
Inputs
|
Level 3
Significant
Unobservable
Inputs
|
|
Corporate Bonds and Notes*
|
$493,798,328
|
$—
|
$493,798,328
|
$—
|
|
Senior Floating-Rate Loan Interests*
|
105,261,955
|
—
|
105,261,955
|
—
|
|
Foreign Corporate Bonds and Notes*
|
86,107,919
|
—
|
86,107,919
|
—
|
|
Common Stocks*
|
16,906
|
—
|
16,906
|
—
|
|
Money Market Funds
|
1,009,138
|
1,009,138
|
—
|
—
|
|
Total Investments
|
$686,194,246
|
$1,009,138
|
$685,185,108
|
$—
|
|
*
|
See Portfolio of Investments for industry breakout.
|
|
ASSETS:
|
|
|
Investments, at value
|
$ 686,194,246
|
|
Cash
|
84,228
|
|
Receivables:
|
|
|
Interest
|
9,759,420
|
|
Investment securities sold
|
7,143,923
|
|
Reclaims
|
159
|
|
Prepaid expenses
|
31,254
|
|
Total Assets
|
703,213,230
|
|
LIABILITIES:
|
|
|
Outstanding loan
|
131,000,000
|
|
Payables:
|
|
|
Investment securities purchased
|
7,352,934
|
|
Investment advisory fees
|
793,975
|
|
Interest and fees on loan
|
782,565
|
|
Audit and tax fees
|
73,143
|
|
Administrative fees
|
37,424
|
|
Shareholder reporting fees
|
36,066
|
|
Custodian fees
|
18,821
|
|
Legal fees
|
12,442
|
|
Trustees’ fees and expenses
|
8,616
|
|
Transfer agent fees
|
1,933
|
|
Financial reporting fees
|
771
|
|
Other liabilities
|
1,407
|
|
Total Liabilities
|
140,120,097
|
|
NET ASSETS
|
$563,093,133
|
|
NET ASSETS consist of:
|
|
|
Paid-in capital
|
$ 690,142,097
|
|
Par value
|
367,730
|
|
Accumulated distributable earnings (loss)
|
(127,416,694
)
|
|
NET ASSETS
|
$563,093,133
|
|
NET ASSET VALUE, per Common Share (par value $0.01 per Common Share)
|
$15.31
|
|
Number of
|
|
|
Investments, at cost
|
$711,886,906
|
|
INVESTMENT INCOME:
|
|
|
|
Interest
|
$ 51,206,846
|
|
|
Other
|
78,411
|
|
|
Total investment income
|
51,285,257
|
|
|
EXPENSES:
|
|
|
|
Investment advisory fees
|
9,370,251
|
|
|
Interest and fees on loan
|
8,656,138
|
|
|
Administrative fees
|
354,966
|
|
|
Legal fees
|
197,796
|
|
|
Shareholder reporting fees
|
126,425
|
|
|
Audit and tax fees
|
78,302
|
|
|
Custodian fees
|
47,332
|
|
|
Listing expense
|
36,217
|
|
|
Trustees’ fees and expenses
|
34,645
|
|
|
Transfer agent fees
|
19,985
|
|
|
Financial reporting fees
|
9,250
|
|
|
Licensing fees
|
1,806
|
|
|
Other
|
28,561
|
|
|
Total expenses
|
18,961,674
|
|
|
NET INVESTMENT INCOME (LOSS)
|
32,323,583
|
|
|
NET REALIZED AND UNREALIZED GAIN (LOSS):
|
|
|
|
Net realized gain (loss) on:
|
|
|
|
Investments
|
(27,380,921
)
|
|
|
Swap contracts
|
(147,114
)
|
|
|
Net realized gain (loss)
|
(27,528,035
)
|
|
|
Net change in unrealized appreciation (depreciation) on investments
|
49,264,479
|
|
|
NET REALIZED AND UNREALIZED GAIN (LOSS)
|
21,736,444
|
|
|
NET INCREASE (DECREASE) IN NET ASSETS RESULTING FROM OPERATIONS
|
$ 54,060,027
|
|
|
|
Year
Ended
5/31/2024
|
Year
Ended
5/31/2023
|
|
OPERATIONS:
|
|
|
|
Net investment income (loss)
|
$ 32,323,583
|
$ 33,809,782
|
|
Net realized gain (loss)
|
(27,528,035
)
|
(66,424,648
)
|
|
Net change in unrealized appreciation (depreciation)
|
49,264,479
|
13,008,655
|
|
Net increase (decrease) in net assets resulting from operations
|
54,060,027
|
(19,606,211
)
|
|
DISTRIBUTIONS TO SHAREHOLDERS FROM:
|
|
|
|
Investment operations
|
(33,594,516
)
|
(35,642,807
)
|
|
Return of capital
|
(23,771,347
)
|
(21,134,688
)
|
|
Total distributions to shareholders
|
(57,365,863
)
|
(56,777,495
)
|
|
Total increase (decrease) in net assets
|
(3,305,836
)
|
(76,383,706
)
|
|
NET ASSETS:
|
|
|
|
Beginning of period
|
566,398,969
|
642,782,675
|
|
End of period
|
$ 563,093,133
|
$ 566,398,969
|
|
COMMON SHARES:
|
|
|
|
Common Shares at end of period
|
36,772,989
|
36,772,989
|
|
Cash flows from operating activities:
|
|
|
|
Net increase (decrease) in net assets resulting from operations
|
$54,060,027
|
|
|
Adjustments to reconcile net increase (decrease) in net assets resulting from operations
to net cash
provided by operating activities:
|
|
|
|
Purchases of investments
|
(539,522,650
)
|
|
|
Sales, maturities and paydown of investments
|
559,329,079
|
|
|
Net amortization/accretion of premiums/discounts on investments
|
(3,248,909
)
|
|
|
Net realized gain/loss on investments
|
27,380,921
|
|
|
Net change in unrealized appreciation/depreciation on investments
|
(49,264,479
)
|
|
|
Changes in assets and liabilities:
|
|
|
|
Decrease in interest receivable
|
584,770
|
|
|
Increase in reclaims receivable
|
(159
)
|
|
|
Decrease in prepaid expenses
|
276
|
|
|
Increase in interest and fees payable on loan
|
41,714
|
|
|
Increase in investment advisory fees payable
|
699
|
|
|
Increase in audit and tax fees payable
|
19,182
|
|
|
Decrease in legal fees payable
|
(10,975
)
|
|
|
Increase in shareholder reporting fees payable
|
7,095
|
|
|
Decrease in administrative fees payable
|
(2,276
)
|
|
|
Increase in custodian fees payable
|
11,608
|
|
|
Increase in transfer agent fees payable
|
416
|
|
|
Increase in trustees’ fees and expenses payable
|
869
|
|
|
Decrease in other liabilities payable
|
(3,516
)
|
|
|
Cash provided by operating activities
|
|
$49,383,692
|
|
Cash flows from financing activities:
|
|
|
|
Distributions to Common Shareholders from investment operations
|
(33,594,516
)
|
|
|
Distributions to Common Shareholders from return of capital
|
(23,771,347
)
|
|
|
Repayment of borrowing
|
(198,000,000
)
|
|
|
Proceeds from borrowing
|
206,000,000
|
|
|
Cash used in financing activities
|
|
(49,365,863
)
|
|
Increase in cash
|
|
17,829
|
|
Cash at beginning of period
|
|
66,399
|
|
Cash at end of period
|
|
$84,228
|
|
Supplemental disclosure of cash flow information:
|
|
|
|
Cash paid during the period for interest and fees
|
|
$8,614,424
|
|
|
Year Ended
|
Period
Ended
5/31/2021 (a)
|
||
|
5/31/2024
|
5/31/2023
|
5/31/2022
|
||
|
Net asset value, beginning of period
|
$ 15.40
|
$ 17.48
|
$ 21.13
|
$ 20.00
|
|
Income from investment operations:
|
|
|
|
|
|
Net investment income (loss)
|
0.88
(b)
|
0.92
|
1.16
|
1.08
|
|
Net realized and unrealized gain (loss)
|
0.59
|
(1.46
)
|
(3.14
)
|
1.12
|
|
Total from investment operations
|
1.47
|
(0.54
)
|
(1.98
)
|
2.20
|
|
Distributions paid to shareholders from:
|
|
|
|
|
|
Net investment income
|
(0.91
)
|
(0.97
)
|
(1.29
)
|
(1.07
)
|
|
Net realized gain
|
—
|
—
|
(0.38
)
|
—
|
|
Return of capital
|
(0.65
)
|
(0.57
)
|
—
|
—
|
|
Total distributions paid to Common Shareholders
|
(1.56
)
|
(1.54
)
|
(1.67
)
|
(1.07
)
|
|
Net asset value, end of period
|
$
|
$15.40
|
$17.48
|
$21.13
|
|
Market value, end of period
|
$
|
$13.52
|
$16.07
|
$19.86
|
|
Total return based on net asset value (c)
|
11.27
%
|
(1.86
)%
|
(9.73
)%
|
11.49
%
|
|
Total return based on market value (c)
|
16.72
%
|
(6.27
)%
|
(11.70
)%
|
4.79
%
|
|
Ratios to average net assets/supplemental data:
|
|
|
|
|
|
Net assets, end of period (in 000’s)
|
$ 563,093
|
$ 566,399
|
$ 642,783
|
$ 776,142
|
|
Ratio of total expenses to average net assets
|
3.34
%
|
3.05
%
|
2.41
%
|
2.28
% (d)
|
|
Ratio of total expenses to average net assets excluding
interest expense
|
1.82
%
|
1.86
%
|
2.02
%
|
1.93
% (d)
|
|
Ratio of net investment income (loss) to average net assets
|
5.69
%
|
5.75
%
|
5.81
%
|
5.62
% (d)
|
|
Portfolio turnover rate
|
52
%
|
35
%
|
39
%
|
54
%
|
|
Indebtedness:
|
|
|
|
|
|
Total loan outstanding (in 000’s)
|
$ 131,000
|
$ 123,000
|
$ 278,000
|
$ 309,000
|
|
Asset coverage per $1,000 of indebtedness (e)
|
$ 5,298
|
$ 5,605
|
$ 3,312
|
$ 3,512
|
|
(a)
|
The Fund was seeded on May 21, 2020 and commenced operations on June 25, 2020.
|
|
(b)
|
Based on average shares outstanding.
|
|
(c)
|
Total return is based on the combination of reinvested dividend, capital gain and
return of capital distributions, if any, at prices
obtained by the Dividend Reinvestment Plan, and changes in net asset value per share
for net asset value returns and changes in
Common Share Price for market value returns. Total returns do not reflect sales load
and are not annualized for periods of less
than one year. Past performance is not indicative of future results.
|
|
(d)
|
Annualized.
|
|
(e)
|
Calculated by subtracting the Fund’s total liabilities (not including the loan outstanding) from the Fund’s total assets, and dividing
by the outstanding loan balance in 000’s.
|
|
Security
|
Acquisition
Date
|
Shares
|
Current Price
|
Carrying
Cost
|
Value
|
% of
Net
Assets
|
|
Akorn, Inc.
|
10/15/2020
|
220,989
|
$0.08
|
$2,534,056
|
$16,906
|
0.00
%†
|
|
† Amount is less than 0.01%.
|
|
|
|
|
|
|
|
Distributions paid from:
|
2024
|
2023
|
|
Ordinary income
|
$33,594,516
|
$35,642,807
|
|
Return of capital
|
23,771,347
|
21,134,688
|
|
Undistributed ordinary income
|
$—
|
|
Undistributed capital gains
|
—
|
|
Total undistributed earnings
|
—
|
|
Accumulated capital and other losses
|
(99,241,876
)
|
|
Net unrealized appreciation (depreciation)
|
(28,174,818
)
|
|
Total accumulated earnings (losses)
|
(127,416,694
)
|
|
Other
|
—
|
|
Paid-in capital
|
690,509,827
|
|
Total net assets
|
$563,093,133
|
|
Tax Cost
|
Gross
Unrealized
Appreciation
|
Gross
Unrealized
(Depreciation)
|
Net Unrealized
Appreciation
(Depreciation)
|
|
$714,369,064
|
$5,851,858
|
$(34,026,676)
|
$(28,174,818)
|
|
Statement of Operations Location
|
|
|
Net realized gain (loss) on swap contracts
|
$(147,114
)
|
|
NOT FDIC INSURED
|
NOT BANK GUARANTEED
|
MAY LOSE VALUE
|
|
Assumed Portfolio Total Return (Net of Expenses)
|
-10
%
|
-5
%
|
0
%
|
5
%
|
10
%
|
|
Common Share Total Return
|
-
%
|
%
|
-
%
|
%
|
%
|
|
Name, Year of Birth and
Position with the Fund
|
Term of Office
and Year First
Elected or
Appointed(1)
|
Principal Occupations
During Past 5 Years
|
Number of
Portfolios in
the First Trust
Fund Complex
Overseen by
Trustee
|
Other Trusteeships or
Directorships Held by
Trustee During Past 5 Years
|
|
INDEPENDENT TRUSTEES
|
||||
|
Richard E. Erickson, Trustee
(1951)
|
• Three Year
Term
• Since Fund
Inception
|
Retired; Physician, Edward-Elmhurst
Medical Group (2021 to September
2023); Physician and Officer,
Wheaton Orthopedics (1990 to 2021)
|
271
|
None
|
|
Thomas R. Kadlec, Trustee
(1957)
|
• Three Year
Term
• Since Fund
Inception
|
Retired; President, ADM Investor
Services, Inc. (Futures Commission
Merchant) (2010 to July 2022)
|
271
|
Director, National Futures
Association; Formerly,
Director of ADM Investor
Services, Inc., ADM Investor
Services International,
ADMIS Hong Kong Ltd.,
ADMIS Singapore, Ltd., and
Futures Industry Association
|
|
Denise M. Keefe, Trustee
(1964)
|
• Three Year
Term
• Since 2021
|
Senior Vice President, Advocate
Health, Continuing Health Division
(Integrated Healthcare System) (2023
to present); Executive Vice President,
Advocate Aurora Health (Integrated
Healthcare System) (2018 to 2023)
|
271
|
Director and Board Chair of
Advocate Home Health
Services, Advocate Home
Care Products and Advocate
Hospice; Director and Board
Chair of Aurora At Home
(since 2018); Director of
Advocate Physician Partners
Accountable Care
Organization; Director of
RML Long Term Acute Care
Hospitals; Director of Senior
Helpers (2021 to 2024); and
Director of MobileHelp
(2022 to 2024)
|
|
Robert F. Keith, Trustee
(1956)
|
• Three Year
Term
• Since Fund
Inception
|
President, Hibs Enterprises (Financial
and Management Consulting)
|
271
|
Formerly, Director of Trust
Company of Illinois
|
|
Niel B. Nielson, Trustee
(1954)
|
• Three Year
Term
• Since Fund
Inception
|
Senior Advisor (2018 to Present),
Managing Director and Chief
Operating Officer (2015 to 2018),
Pelita Harapan Educational
Foundation (Educational Products and
Services)
|
271
|
None
|
|
Name, Year of Birth and
Position with the Fund
|
Term of Office
and Year First
Elected or
Appointed(1)
|
Principal Occupations
During Past 5 Years
|
Number of
Portfolios in
the First Trust
Fund Complex
Overseen by
Trustee
|
Other Trusteeships or
Directorships Held by
Trustee During Past 5 Years
|
|
INDEPENDENT TRUSTEES
|
||||
|
Bronwyn Wright, Trustee
(1971)
|
• Three Year
Term
• Since 2023
|
Independent Director to a number of
Irish collective investment funds
(2009 to Present); Various roles at
international affiliates of Citibank
(1994 to 2009), including Managing
Director, Citibank Europe plc and
Head of Securities and Fund Services,
Citi Ireland (2007 to 2009)
|
247
|
None
|
|
INTERESTED TRUSTEE
|
||||
|
James A. Bowen(2), Trustee and
Chairman of the Board
(1955)
|
• Three Year
Term
• Since Fund
Inception
|
Chief Executive Officer, First Trust
Advisors L.P. and First Trust
Portfolios L.P.; Chairman of the
Board of Directors, BondWave LLC
(Software Development Company)
and Stonebridge Advisors LLC
(Investment Advisor)
|
271
|
None
|
|
Name and Year of Birth
|
Position and Offices
with Fund
|
Term of Office
and Length of
Service
|
Principal Occupations
During Past 5 Years
|
|
OFFICERS(3)
|
|||
|
James M. Dykas
(1966)
|
President and Chief
Executive Officer
|
• Indefinite Term
• Since Fund
Inception
|
Managing Director and Chief Financial Officer, First Trust
Advisors L.P. and First Trust Portfolios L.P.; Chief Financial
Officer, BondWave LLC (Software Development Company) and
Stonebridge Advisors LLC (Investment Advisor)
|
|
Derek D. Maltbie
(1972)
|
Treasurer, Chief Financial
Officer and Chief
Accounting Officer
|
• Indefinite Term
• Since 2023
|
Senior Vice President, First Trust Advisors L.P. and First Trust
Portfolios L.P., July 2021 to Present. Previously, Vice President,
First Trust Advisors L.P. and First Trust Portfolios L.P., 2014 to
2021.
|
|
W. Scott Jardine
(1960)
|
Secretary and Chief Legal
Officer
|
• Indefinite Term
• Since Fund
Inception
|
General Counsel, First Trust Advisors L.P. and First Trust
Portfolios L.P.; Secretary and General Counsel, BondWave LLC;
Secretary, Stonebridge Advisors LLC
|
|
Daniel J. Lindquist
(1970)
|
Vice President
|
• Indefinite Term
• Since Fund
Inception
|
Managing Director, First Trust Advisors L.P. and First Trust
Portfolios L.P.
|
|
Kristi A. Maher
(1966)
|
Chief Compliance Officer
and Assistant Secretary
|
• Indefinite Term
• Since Fund
Inception
|
Deputy General Counsel, First Trust Advisors L.P. and First Trust
Portfolios L.P.
|
| (b) | Not applicable to the Registrant. |
Item 2. Code of Ethics.
| (a) | The First Trust High Yield Opportunities 2027 Term Fund (“Registrant”), as of the end of the period covered by this report, has adopted a code of ethics that applies to the Registrant’s principal executive officer, principal financial officer, principal accounting officer or controller, or persons performing similar functions, regardless of whether these individuals are employed by the Registrant or a third party. |
| (c) | There have been no amendments, during the period covered by this report, to a provision of the code of ethics that applies to the Registrant's principal executive officer, principal financial officer, principal accounting officer or controller, or persons performing similar functions, regardless of whether these individuals are employed by the Registrant or a third party, and that relates to any element of the code of ethics description. |
| (d) | The Registrant, during the period covered by this report, has not granted any waivers, including an implicit waiver, from a provision of the code of ethics that applies to the Registrant’s principal executive officer, principal financial officer, principal accounting officer or controller, or persons performing similar functions, regardless of whether these individuals are employed by the Registrant or a third party, that relates to one or more of the items set forth in paragraph (b) of this item’s instructions. |
| (e) | Not applicable to the Registrant. |
| (f) | A copy of the code of ethics that applies to the Registrant’s principal executive officer, principal financial officer, principal accounting officer or controller is filed as an exhibit pursuant to Item 13(a)(1). |
Item 3. Audit Committee Financial Expert.
As of the end of the period covered by the report, the Registrant’s Board of Trustees has determined that Thomas R. Kadlec and Robert F. Keith are qualified to serve as audit committee financial experts serving on its audit committee and that each of them is “independent,” as defined by Item 3 of Form N-CSR.
Item 4. Principal Accountant Fees and Services.
| (a) | Audit Fees (Registrant) -- The aggregate fees billed for professional services rendered by the principal accountant for the audit of the Registrant’s annual financial statements or services that are normally provided by the accountant in connection with statutory and regulatory filings or engagements were $49,000 for the fiscal year ended 2023 and $49,000 for the fiscal year ended 2024. |
| (b) | Audit-Related Fees (Registrant) -- The aggregate fees billed for assurance and related services by the principal accountant that are reasonably related to the performance of the audit of the Registrant’s financial statements and are not reported under paragraph (a) of this Item were $0 for the fiscal year ended 2023 and $0 for the fiscal year ended 2024. |
Audit-Related Fees (Investment Advisor) -- The aggregate fees billed for assurance and related services by the principal accountant that are reasonably related to the performance of the audit of the Registrant’s financial statements and are not reported under paragraph (a) of this Item were $0 for the fiscal year ended 2023 and $0 for the fiscal year ended 2024.
Audit-Related Fees (Distributor) -- The aggregate fees billed for assurance and related services by the principal accountant that are reasonably related to the performance of the audit of the Registrant’s financial statements and are not reported under paragraph (a) of this Item were $0 for the fiscal year ended 2023 and $0 for the fiscal year ended 2024.
| (c) | Tax Fees (Registrant) -- The aggregate fees billed for professional services rendered by the principal accountant for tax return review and debt instrument tax analysis and reporting were $14,023 for the fiscal year ended 2023 and $14,400 for the fiscal year ended 2024. These fees were for tax consultation and/or tax return preparation and professional services rendered for PFIC (Passive Foreign Investment Company) Identification Services. |
Tax Fees (Investment Advisor) -- The aggregate fees billed for professional services rendered by the principal accountant for tax compliance, tax advice, and tax planning to the Registrant’s advisor and distributor $0 for the fiscal year ended 2023 and $0 for the fiscal year ended 2024.
Tax Fees (Distributor) -- The aggregate fees billed for professional services rendered by the principal accountant for tax compliance, tax advice, and tax planning to the Registrant’s distributor were $0 for the fiscal year ended 2023 and $0 for the fiscal year ended 2024.
| (d) | All Other Fees (Registrant) -- The aggregate fees billed for products and services provided by the principal accountant to the Registrant, other than the services reported in paragraphs (a) through (c) of this Item $0 for the fiscal year ended 2023 and $0 for the fiscal year ended 2024. |
All Other Fees (Investment Advisor) -- The aggregate fees billed for products and services provided by the principal accountant to the Registrant’s investment advisor, other than the services reported in paragraphs (a) through (c) of this Item were $0 for the fiscal year ended 2023 and $0 for the fiscal year ended 2024.
All Other Fees (Distributor) -- The aggregate fees billed for products and services provided by the principal accountant to the Registrant’s distributor, other than the services reported in paragraphs (a) through (c) of this Item were $0 for the fiscal year ended 2023 and $0 for the fiscal year ended 2024.
(e)(1) Disclose the audit committee’s pre-approval policies and procedures described in paragraph (c) (7) of Rule 2-01 of Regulation S-X.
Pursuant to its charter and its Audit and Non-Audit Services Pre-Approval Policy, the Audit Committee (the “Committee”) is responsible for the pre-approval of all audit services and permitted non-audit services (including the fees and terms thereof) to be performed for the Registrant by its independent auditors. The Chairman of the Committee is authorized to give such pre-approvals on behalf of the Committee up to $25,000 and report any such pre-approval to the full Committee.
The Committee is also responsible for the pre-approval of the independent auditor’s engagements for non-audit services with the Registrant’s advisor (not including a sub-advisor whose role is primarily portfolio management and is sub-contracted or overseen by another investment advisor) and any entity controlling, controlled by or under common control with the investment advisor that provides ongoing services to the Registrant, if the engagement relates directly to the operations and financial reporting of the Registrant, subject to the de minimis exceptions for non-audit services described in Rule 2-01 of Regulation S-X. If the independent auditor has provided non-audit services to the Registrant’s advisor (other than any sub-advisor whose role is primarily portfolio management and is sub-contracted with or overseen by another investment advisor) and any entity controlling, controlled by or under common control with the investment advisor that provides ongoing services to the Registrant that were not pre-approved pursuant to its policies, the Committee will consider whether the provision of such non-audit services is compatible with the auditor’s independence.
(e)(2) The percentage of services described in each of paragraphs (b) through (d) for the Registrant and the Registrant’s investment advisor and distributor of this Item that were approved by the audit committee pursuant to the pre-approval exceptions included in paragraph (c)(7)(i)(C) or paragraph(C)(7)(ii) of Rule 2-01 of Regulation S-X are as follows:
| Registrant: | Advisor and Distributor: | ||
| (b) 0% | (b) 0% | ||
| (c) 0% | (c) 0% | ||
| (d) 0% | (d) 0% |
| (f) | The percentage of hours expended on the principal accountant’s engagement to audit the Registrant’s financial statements for the most recent fiscal year that were attributed to work performed by persons other than the principal accountant’s full-time, permanent employees was less than fifty percent. |
| (g) | The aggregate non-audit fees billed by the Registrant’s accountant for services rendered to the Registrant, and rendered to the Registrant’s investment advisor (not including any sub-advisor whose role is primarily portfolio management and is subcontracted with or overseen by another investment advisor), and any entity controlling, controlled by, or under common control with the advisor that provides ongoing services to the Registrant for the fiscal year ended 2023 were $14,023 for the Registrant, $31,000 for the Registrant’s investment advisor and $0 for the Registrant’s distributor; and for the fiscal year ended 2024 were $14,400 for the Registrant, $28,600 for the Registrant’s investment advisor and $0 for the Registrant’s distributor. |
| (h) | The Registrant’s audit committee of its Board of Trustees has determined that the provision of non-audit services that were rendered to the Registrant’s investment advisor (not including any sub-advisor whose role is primarily portfolio management and is subcontracted with or overseen by another investment advisor), and any entity controlling, controlled by, or under common control with the investment advisor that provides ongoing services to the Registrant that were not pre-approved pursuant to paragraph (c)(7)(ii) of Rule 2-01 of Regulation S-X is compatible with maintaining the principal accountant’s independence. |
(i) Not applicable to the Registrant.
(j) Not applicable to the Registrant.
Item 5. Audit Committee of Listed Registrants.
| (a) | The Registrant has a separately designated standing audit committee established in accordance with Section 3(a)(58)(A) of the Securities Exchange Act of 1934 consisting of all the independent directors of the Registrant. The audit committee of the Registrant is comprised of: Richard E. Erickson, Thomas R. Kadlec, Denise M. Keefe, Robert F. Keith, Niel B. Nielson and Bronwyn Wright. |
| (b) | Not applicable to the Registrant. |
Item 6. Investments.
| (a) | The Schedule of Investments in securities of unaffiliated issuers as of the close of the reporting period is included in the Registrant’s Annual Report, which is included as Item 1 of this Form N-CSR. |
| (b) | Not applicable to the Registrant. |
Item 7. Financial Statements and Financial Highlights for Open-End Management Investment Companies.
(a) Not applicable to the Registrant.
(b) Not applicable to the Registrant.
Item 8. Changes in and Disagreements with Accountants for Open-End Management Investment Companies.
Not applicable to the Registrant.
Item 9. Proxy Disclosures for Open-End Management Investment Companies.
Not applicable to the Registrant.
Item 10. Remuneration Paid to Directors, Officers, and Others of Open-End Management Investment Companies
Not applicable to the Registrant.
Item 11. Statement Regarding Basis for Approval of Investment Advisory Contract.
There were no approvals of an investment advisory contract during the Registrant’s most recent fiscal half-year.
Item 12. Disclosure of Proxy Voting Policies and Procedures for Closed-End Management Investment Companies.
The Proxy Voting Policies are attached herewith.
Item 13. Portfolio Managers of Closed-End Management Investment Companies.
(a)(1) Identification of Portfolio Manager(s) or Management Team Members and Description of Role of Portfolio Manager(s) or Management Team Members
Information provided as of May 31, 2024
The First Trust Advisors Leveraged Finance Investment team manages a portfolio comprised primarily of U.S. dollar denominated high yield bonds and senior secured floating-rate loans. The Portfolio Managers are responsible for directing the investment activities within the Fund. William Housey is the Senior Portfolio Manager and has primary responsibility for investment decisions. Jeff Scott assists Mr. Housey and there are also Senior Credit Analysts assigned to certain industries. The Portfolio Managers are supported in their portfolio management activities by the First Trust Advisors Leveraged Finance investment team, including a team of credit analysts, designated traders, and operations personnel. Senior Credit Analysts are assigned industries and Associate Credit Analysts support the Senior Credit Analysts. All credit analysts, operations personnel, designated traders, and portfolio managers report to Mr. Housey.
William Housey, CFA
Managing Director of Fixed Income, Senior Portfolio Manager
Mr. Housey joined First Trust Advisors L.P. in June 2010 as the Senior Portfolio Manager for the Leveraged Finance Investment Team and has 27 years of investment experience. Mr. Housey is a Managing Director of Fixed Income and is also a member of the First Trust Strategic Model Investment Committee and the Fixed Income Sub-Committee. Prior to joining First Trust, Mr. Housey was at Morgan Stanley Investment Management and its wholly owned subsidiary, Van Kampen Funds, Inc. for 11 years where he last served as Executive Director and Co-Portfolio Manager. Mr. Housey has extensive experience in the portfolio management of both leveraged and unleveraged credit products, including senior loans, high-yield bonds, credit derivatives and corporate restructurings. Mr. Housey received a B.S. in Finance from Eastern Illinois University and an M.B.A. in Finance as well as Management and Strategy from Northwestern University’s Kellogg School of Business. He also holds the FINRA Series 7, Series 52 and Series 63 licenses. Mr. Housey also holds the Chartered Financial Analyst designation. He is a member of the CFA Institute and the CFA Society of Chicago. Mr. Housey also serves on the Village of Glen Ellyn, IL Police Pension Board.
Jeffrey Scott, CFA
Senior Vice President and Portfolio Manager
Mr. Scott is a Portfolio Manager and a Sector Specialist Credit Analyst for the Leveraged Finance Investment Team at First Trust Advisors L.P. He has 33 years of experience in the investment management industry and has extensive experience in credit analysis, product development, and product management. Prior to joining First Trust, Jeff served as an Assistant Portfolio Manager and as a Senior Credit Analyst for Morgan Stanley/Van Kampen from October 2008 to June 2010. As Assistant Portfolio Manager, Jeff served on a team that managed over $4.0 billion of Senior Loan assets in three separate funds: Van Kampen Senior Loan Fund; Van Kampen Senior Income Trust; and Van Kampen Dynamic Credit Opportunities Fund. His responsibilities included assisting with portfolio construction, buy and sell decision making, and monitoring fund liquidity and leverage. Mr. Scott earned a B.S. in Finance and Economics from Elmhurst College and an M.B.A. with specialization in Analytical Finance and Econometrics and Statistics from the University of Chicago. He also holds the Chartered Financial Analyst designation and is a member of the CFA Institute and the CFA Society of Chicago.
(a)(2) Other Accounts Managed by Portfolio Manager(s) or Management Team Member and Potential Conflicts of Interest
Information provided as of May 31, 2024
| Name
of Portfolio Manager or Team Member |
Type of Accounts | Total # of Accounts Managed* |
Total Assets | # of Accounts Managed for which Advisory Fee is Based on Performance |
Total Assets for which Advisory Fee is Based on Performance |
| 1. William Housey, CFA | Registered Investment Companies | 7 | $5.391B | 0 | 0 |
| 2. Jeffrey Scott CFA | Registered Investment Companies | 7 | $5.391B | 0 | 0 |
Potential Conflicts of Interests
Potential conflicts of interest may arise when a portfolio manager of the Registrant has day-to-day management responsibilities with respect to one or more other funds or other accounts. The First Trust Advisors Leveraged Finance Investment Team adheres to its trade allocation policy utilizing a pro-rata methodology to address this conflict.
First Trust and its affiliate, First Trust Portfolios L.P. (“FTP”), have in place a joint Code of Ethics and Insider Trading Policies and Procedures that are designed to (a) prevent First Trust personnel from trading securities based upon material inside information in the possession of such personnel and (b) ensure that First Trust personnel avoid actual or potential conflicts of interest or abuse of their positions of trust and responsibility that could occur through such activities as front running securities trades for the Registrant. Personnel are required to have duplicate confirmations and account statements delivered to First Trust and FTP compliance personnel who then compare such trades to trading activity to detect any potential conflict situations. In addition to the personal trading restrictions specified in the Code of Ethics and Insider Trading Policies and Procedures, employees in the First Trust Advisors Leveraged Finance Investment Team are prohibited from buying or selling equity securities (including derivative instruments such as options, warrants and futures) and corporate bonds for their personal account and in any accounts over which they exercise control. Employees in the First Trust Advisors Leveraged Finance Investment Team are also prohibited from engaging in any personal transaction while in possession of material non-public information regarding the security or the issuer of the security. First Trust and FTP also maintain a restricted list of all issuers for which the First Trust Advisors Leveraged Finance Investment Team has material non-public information in its possession and all transactions executed for a product advised or supervised by First Trust or FTP are compared daily against the restricted list.
(a)(3) Compensation Structure of Portfolio Manager(s) or Management Team Members
Information provided as of May 31, 2024
The compensation structure for internal portfolio managers is based upon a fixed salary as well as a discretionary bonus determined by the management of FTA. Salaries are determined by management and are based upon an individual’s position and overall value to the firm. Bonuses are also determined by management and are generally based upon an individual’s or team’s overall contribution to the success of the firm, assets under management and the profitability of the firm. Certain internal portfolio managers have an indirect ownership stake in the firm and will therefore receive their allocable share of ownership related distributions.
(a)(4) Disclosure of Securities Ownership as of May 31, 2024
| Name of Portfolio Manager or Team Member |
Dollar ($) Range of Fund Shares Beneficially Owned |
| William Housey | $100,001 - $500,000 |
| Jeffrey Scott | $10,001-$50,000 |
| (b) | Not applicable to the Registrant. |
Item 14. Purchases of Equity Securities by Closed-End Management Investment Company and Affiliated Purchasers.
No reportable purchases for the period covered by this report.
Item 15. Submission of Matters to a Vote of Security Holders.
There have been no material changes to the procedures by which the shareholders may recommend nominees to the Registrant’s board of directors, where those changes were implemented after the Registrant last provided disclosure in response to the requirements of Item 407(c)(2)(iv) of Regulation S-K (17 CFR 229.407) (as required by Item 22(b)(15) of Schedule 14A (17 CFR 240.14a-101)), or this Item.
Item 16. Controls and Procedures.
| (a) | The Registrant’s principal executive and principal financial officers, or persons performing similar functions, have concluded that the Registrant’s disclosure controls and procedures (as defined in Rule 30a-3(c) under the Investment Company Act of 1940, as amended (the “1940 Act”) (17 CFR 270.30a-3(c))) are effective, as of a date within 90 days of the filing date of the report that includes the disclosure required by this paragraph, based on their evaluation of these controls and procedures required by Rule 30a-3(b) under the 1940 Act (17 CFR 270.30a-3(b)) and Rules 13a-15(b) or 15d-15(b) under the Securities Exchange Act of 1934, as amended (17 CFR 240.13a-15(b) or 240.15d-15(b)). |
| (b) | There were no changes in the Registrant’s internal control over financial reporting (as defined in Rule 30a-3(d) under the 1940 Act (17 CFR 270.30a-3(d)) that occurred during the period covered by this report that has materially affected, or is reasonably likely to materially affect, the Registrant’s internal control over financial reporting. |
Item 17. Disclosure of Securities Lending Activities for Closed-End Management Investment Companies.
The Registrant did not engage in any securities lending activity and no services were provided by the securities lending agent to the Registrant during its most recent fiscal year.
Item 18. Recovery of Erroneously Awarded Compensation.
| (a) | Not applicable to the Registrant. |
| (b) | Not applicable to the Registrant. |
Item 19. Exhibits.
| (a)(1) | Code of ethics, or any amendment thereto, that is the subject of disclosure required by Item 2 is attached hereto. |
| (a)(2) | Not applicable to the Registrant. |
| (a)(3) | The certifications required by Rule 30a-2(a) under the 1940 Act and Section 302 of the Sarbanes-Oxley Act of 2022 are attached hereto. |
| (a)(4) | Not applicable to the Registrant. |
| (a)(5) | Not applicable to the Registrant. |
| (b) | Certifications pursuant to Rule 30a-2(b) under the 1940 Act and Section 906 of the Sarbanes-Oxley Act of 2002 are attached hereto. |
| (c) | Disclosure of Proxy Voting Policies and Procedures for Closed-End Management Investment Companies as required by Item 12 is attached hereto. |
SIGNATURES
Pursuant to the requirements of the Securities Exchange Act of 1934 and the Investment Company Act of 1940, the registrant has duly caused this report to be signed on its behalf by the undersigned, thereunto duly authorized.
| (registrant) | First Trust High Yield Opportunities 2027 Term Fund |
| By (Signature and Title)* | /s/ James M. Dykas | |
| James M. Dykas, President and Chief Executive Officer (principal executive officer) |
| Date: | August 9, 2024 |
Pursuant to the requirements of the Securities Exchange Act of 1934 and the Investment Company Act of 1940, this report has been signed below by the following persons on behalf of the registrant and in the capacities and on the dates indicated.
| By (Signature and Title)* | /s/ James M. Dykas | |
| James M. Dykas, President and Chief Executive Officer (principal executive officer) |
| Date: | August 9, 2024 |
| By (Signature and Title)* | /s/ Derek D. Maltbie | |
| Derek D. Maltbie, Treasurer, Chief Financial Officer and Chief Accounting Officer (principal financial officer) |
| Date: | August 9, 2024 |
* Print the name and title of each signing officer under his or her signature.