ANNUAL REPORT PURSUANT TO SECTION 13 OR 15(d) OF THE SECURITIES EXCHANGE ACT OF 1934 |
TRANSITION REPORT PURSUANT TO SECTION 13 OR 15(d) OF THE SECURITIES EXCHANGE ACT OF 1934 |
(State or other jurisdiction of incorporation or organization) |
(I. R. S. Employer Identification No.) |
(Address of principal executive offices) |
(Zip Code) |
Title of each class |
Trading Symbol |
Name of each exchange on which registered | ||
☒ | Accelerated Filer | ☐ | ||||
Non-Accelerated Filer |
☐ | Smaller Reporting Company | ||||
Emerging Growth Company |
Page |
||||
1 | ||||
7 | ||||
41 | ||||
42 | ||||
44 | ||||
45 | ||||
46 | ||||
A-1 |
ITEM 10. |
DIRECTORS, EXECUTIVE OFFICERS AND CORPORATE GOVERNANCE |
|
Kathy T. Betty, Among other qualifications, Ms. Betty brings over thirty years of business management and consultancy experience to our Board of Directors. Ms. Betty currently serves on the board of directors of ScottMadden as well as on the Board of Advisors for Synergy Laboratories, a private for-profit company. In addition, her non-profit leadership positions include serving on the boards of the Chick-fil-A |
|
Douglas C. Curling family-run investment business, and New Kent Consulting LLC, a privacy and mergers and acquisitions consulting business. From 1997 until September 2008, Mr. Curling held various executive positions at ChoicePoint Inc., a provider of identification and credential verification services that was sold to Reed Elsevier in 2008, including serving as President from April 2002 to September 2008, as Chief Operating Officer from 1999 to September 2008 and as Executive Vice President, Chief Financial Officer and Treasurer from 1997 to May 1999. Mr. Curling also served as a director of ChoicePoint Inc. from May 2000 to September 2008. Mr. Curling currently serves on the Board of Directors of CoreLogic, a New York Stock Exchange listed company providing global property information, analytics and data-enabled services to financial services organizations and real estate professionals.Among other qualifications, Mr. Curling brings substantial experience in managing and operating businesses with privacy, data analytics and other data-enabled matters to our Board of Directors. His prior service as a chief financial officer provides him with valuable accounting and financial expertise, and his consulting experience provides him with significant mergers and acquisitions expertise, all of which is utilized by our Board of Directors. These skills and experiences qualify him to serve on our Board of Directors. | |
|
Cynthia N. Day, Among other qualifications, Ms. Day brings significant management and financial experience to our Board of Directors. Her experience in multiple senior executive leadership positions and service on other boards, provide her with accounting and financial expertise, which are utilized by our Board of Directors. In addition, the customer base served by Citizens Bancshares Corporation is similar to that served by the Company, giving her a great understanding of their buying habits, the products they purchase and effective marketing and communication methods. These skills and experiences qualify her to serve on our Board of Directors. | |
|
Curtis L. Doman co-founder of Progressive Leasing. Previously, he served as Chief Technology Officer of Progressive Leasing from 1999 until December 2017 and Chief Product Officer from January 2018 until December 2019. He was also President of IDS, Inc. from September 1993 until October 2015.Among other qualifications, Mr. Doman brings significant experience in technology and data analytics matters to our Board of Directors. Mr. Doman’s intimate knowledge of our Company, including as the creator of the dynamic decision-making engine used by our Progressive Leasing operating segment in evaluating underwriting criteria for our lease products, is utilized by our Board of Directors. These skills and experiences qualify him to serve on our Board of Directors. | |
|
Steven A. Michaels Spin-Off. Mr. Michaels was also named President of the Company as of April 1, 2021. From July 31, 2020 through November 2020, Mr. Michaels served as the Chief Executive Officer of the Company’s Progressive Leasing operating segment. Mr. Michaels previously served as the Company’s Chief Financial Officer and President of Strategic Operations from February 2016 until July 31, 2020, President of the Company from April 2014 until February 2016, Vice President, Strategic Planning & Business Development from 2013 until April 2014, Vice President, Finance from 2012 until April 2014 and Vice President, Finance, Aaron’s Sales & Lease Ownership Division from 2008 until 2011.Among other qualifications, Mr. Michaels brings significant operational and financial experience to our Board of Directors. His considerable experience in senior management, and his leadership and intimate knowledge of our business provide him with strategic and operational expertise generally and for the Company specifically, which are utilized by our Board of Directors. These skills and experiences qualify him to serve on our Board of Directors. |
|
Ray M. Robinson, non-executive Chairman of Citizens Bancshares Corporation and its subsidiary, Citizens Trust Bank, the largest African American-owned bank in the Southeastern United States and the nation’s second largest. As of January 2017, Citizens Bancshares Corporation’s stock is traded only on over-the-counter Among other qualifications, Mr. Robinson brings experience in senior management and board service for numerous public companies to our Board of Directors. His service on the boards of a number of organizations of varying sizes provides him with extensive operational skills and governance expertise, which are utilized by our Board of Directors. These skills and experiences qualify him to serve on our Board of Directors. |
Name (Age) |
Position with the Company and Principal Occupation During the Past Five Years | |
Marvin Fentress (60) | General Counsel and Corporate Secretary since December 2020. Previously, Mr. Fentress served as General Counsel and Chief Compliance Officer of the Company’s Progressive Leasing operating segment from 2012 through November 2020. | |
Debra Fiori (51) | Chief Human Resources Officer since April 2021. Prior to joining the Company, Ms. Fiori served as Corporate Senior Vice President and Chief People Officer of Parsons Corporation, a leading provider of innovative technology-driven solutions in the defense, intelligence and critical infrastructure markets. In this role, Ms. Fiori was responsible for leadership development, succession planning, organizational design, reward systems, talent acquisition, and human resources operations. | |
Brian Garner (41) | Chief Financial Officer since December 2020. Previously, Mr. Garner served in the Company’s Progressive Leasing operating segment as Senior Vice President of Finance and Accounting from January 2019 through November 2020, Vice President of Finance and Accounting from March 2015 through December 2018, and Controller from 2012 to February 2015. | |
Mike Giordano (48) | Chief Commercial Officer since January 2021. Prior to joining the Company, Mr. Giordano served as Vice President, U.S. Sales, of Samsung Electronics America from August 2018 to January 2021, and as Vice President of Regional Sales from March 2014 to August 2018. In these roles at Samsung Electronics America, Mr. Giordano was responsible for managing the development and implementation of marketing and sales strategies for driving in-store and e-commerce home appliance sales to both national and regional retail partners and directly to consumers. | |
Ben Hawksworth (44) | Chief Product and Technology Officer since December 2020. Previously, Mr. Hawksworth served as Chief Product and Technology Officer of the Company’s Progressive Leasing operating segment from January 2018 through November 2020. Prior to joining the Company, Mr. Hawksworth served as Senior Vice President and Chief Information Officer, Global Business Solutions, of First Data Corporation from May 2016 to January 2018. In this role at First Data Corporation, Mr. Hawksworth was responsible for managing all software engineering, application support, project execution and portfolio management for a global merchant-acquiring business segment with more than $4 billion of annual revenue and 1,400 team members, including managing the strategy for transforming core information technology platforms to improve operating leverage, modernize products and facilitate entering new channels. | |
Ryan Ray (46) | Chief Administrative Officer since December 2020. Mr. Ray also continues to serve as President of the Company’s Vive Financial operating segment, a position he was appointed to in May 2016. He served as Chief Operations Officer of the Company’s Progressive Leasing operating segment from January 2015 to April 2016. | |
Matt Sewell (46) | Vice President, Financial Reporting and Principal Accounting Officer since December 2020. Previously, Mr. Sewell served as Director of Financial Reporting of the Company from October 2016 through November 2020. Prior to joining the Company, Mr. Sewell served as Director of Financial Reporting of Novelis Inc. from June 2014 to October 2016. | |
Trevor Thatcher (46) | Chief Operations Officer since December 2020. Previously, Mr. Thatcher served as Vice President of Operations of the Company’s Progressive Leasing operating segment from February 2015 through November 2020. |
Director |
Audit Committee (1) |
Compensation Committee |
Nominating and Corporate Governance Committee | |||
Kathy T. Betty |
Member | Member | (Chair) | |||
Douglas C. Curling |
Member | (Chair) | Member | |||
Cynthia N. Day |
(Chair) | Member | ||||
Ray M. Robinson |
Member | Member | ||||
Number of Meetings in Fiscal Year 2020 |
9 | 10 | 5 |
(1) | All members of the Audit Committee have been designated as an “audit committee financial expert” as defined by regulations of the Securities and Exchange Commission (the “SEC”). |
ITEM 11. |
EXECUTIVE COMPENSATION |
• | Steven A. Michaels, who had previously served as the Company’s Chief Financial Officer (through July 30, 2020) and Chief Executive Officer of the Company’s Progressive Leasing operating segment (through November 30, 2020), was appointed our new Chief Executive Officer effective as of December 1, 2020; |
• | Blake W. Wakefield, who had previously served as President and Chief Revenue Officer of the Company’s Progressive Leasing operating segment (through November 30, 2020), was appointed our new President effective as of December 1, 2020. Mr. Wakefield subsequently resigned as the Company’s President effective as of April 1, 2021 and, in connection therewith, Mr. Michaels was named President and Chief Executive Officer; |
• | Curtis L. Doman, who had previously served as Chief Innovation Officer of the Company’s Progressive Leasing operating segment (through November 30, 2020), was appointed our new Chief Innovation Officer effective as of December 1, 2020; |
• | Brian J. Garner, who had previously served as Senior Vice President of Finance and Accounting of the Company’s Progressive Leasing operating segment (through November 30, 2020), was appointed our new Chief Financial Officer effective as of December 1, 2020; |
• | Marvin A. Fentress, who had previously served as General Counsel and Chief Compliance Officer of the Company’s Progressive Leasing operating segment (through November 30, 2020), was appointed our new General Counsel and Corporate Secretary effective as of December 1, 2020; |
• | John W. Robinson III, our former President and Chief Executive Officer, retired effective as of November 30, 2020 and was appointed Non-Executive Chairman of The Aaron’s Company effective as of December 1, 2020; |
• | Douglas A. Lindsay, who had previously served as Chief Executive Officer of our former Aaron’s Business operating segment, departed the Company on November 30, 2020 to become Chief Executive Officer of The Aaron’s Company effective as of December 1, 2020; |
• | C. Kelly Wall, who had previously served as our Interim Chief Financial Officer, departed the Company on November 30, 2020 to become Chief Financial Officer of The Aaron’s Company effective as of December 1, 2020; and |
• | Ryan K. Woodley, who had had previously served as Chief Executive Officer of the Company’s Progressive Leasing operating segment, retired effective as of July 30, 2020. |
• | consolidated annualized revenues grew from $2.7 billion to more than $4.2 billion; |
• | the Company deepened its talent pool significantly, particularly within its former Aaron’s Business operating segment, where highly relevant experience and capabilities were added to the management team through external hires; |
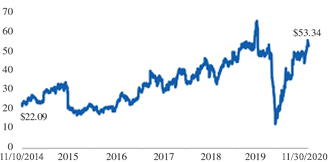
• | the Company’s share price rose from $22.09 to $53.34; and |
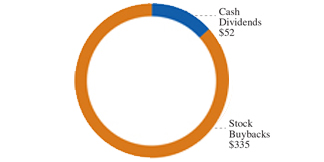
• | over $387 million of capital was returned to shareholders in the form of dividends and share buybacks. |
Revenue Growth (USD in millions) |
Share Price (USD) | |||
|
|
Capital Returned to Shareholders (USD in millions) |
||||
|
• | Temporary Compensation Reductions During the Height of the Pandemic – |
• | Actions Designed to Drive a Successful Spin-Off – |
• | Creating Spin-Off Bonus and Retention Program – - |
• | Modifying 2020 Incentive Compensation Program – Spin-Off was successfully completed on November 30, 2020, which was very late in the 2020 performance cycle, the Compensation Committee determined that it would be appropriate to exercise discretion under the Company’s 2020 Incentive Compensation Program and base its 2020 incentive compensation decisions on ten months of actual performance (i.e., January through October 2020), together with an estimate of November and December 2020 performance based on the Company’s then-latest available outlook. (We note that, based on actual performance at year end, the compensation received by management was in-line with the amounts it would have received had the Compensation Committee based its 2020 incentive compensation decisions on 12 months of actual performance.) |
• | Approving Treatment of Equity Awards Granted Prior to the Spin-Off – two-fold approach to the treatment of outstanding long-term incentive awards in connection with the Spin-Off in order to promote the dual objectives of aligning the management teams of both companies with the performance of their post Spin-Off businesses while also maintaining management focus on the execution of both businesses leading up to the Spin-Off. |
• | Executing Leadership Succession Plans and Establishing New Pay Ranges for Executive Officers – Spin-Off, the go-forward profiles of both PROG Holdings, Inc. and The Aaron’s Company changed dramatically. Accordingly, the Compensation Committee established new pay ranges for the two new executive teams that reflected their new peers, industry norms and size. |
• | attract, motivate, and retain quality executive leadership; |
• | align the incentive goals of our executive officers with the interests of our shareholders; |
• | motivate the individual performance of each executive officer; |
• | improve our overall performance; and |
• | support achievement of our business plans and long-term goals. |
What We Do |
What We Don’t Do | |
✓ Independent Compensation Committee assisted by an independent consultant |
x No repricing or cash buyouts of stock options without shareholder approval x No excise or other tax gross-ups on change-in-control x No hedging or pledging of Company stock x No excessive perquisites or other benefits x No single-trigger severance benefits upon a change-in-control x No payment of dividends on unearned or unvested shares x No guaranteed incentive payments | |
✓ We annually assess the Company’s compensation policies to ensure that the features of our program do not encourage undue risk | ||
✓ As of December 31, 2020, all executives were “at will” employees, with the elimination of employment agreements for all NEOs in connection with the Spin-Off | ||
✓ Pay mix that emphasizes performance-based compensation over fixed compensation (approximately 89% performance-based for CEO and approximately 77% for all other NEOs through the date of the Spin-Off) | ||
✓ Pay mix that emphasizes long-term, equity-based incentives over short-term cash incentives | ||
✓ Incentive plans that utilize multiple measures, including growth, profitability, and returns | ||
✓ Reasonable incentive plan targets and ranges, with capped incentive payouts | ||
✓ Double-trigger equity vesting acceleration upon a change of control | ||
✓ Meaningful stock ownership requirements | ||
✓ Formal claw-back policy to recoup performance-based compensation from our senior executives, including NEOs, under certain prescribed acts of misconduct |
• | Taking Compensation Reductions During the Height of the Pandemic – |
• | Developing and Overseeing Compensation Structures to Drive a Successful Spin-Off – |
• | Creating Spin-Off Bonus and Retention Program –- |
• | Modifying 2020 Incentive Compensation Program – Spin-Off was successfully completed on November 30, 2020, which was very late in the 2020 performance cycle, the Compensation Committee determined that it would be appropriate to exercise discretion under the Company’s 2020 Incentive Compensation Program and base its 2020 incentive compensation decisions on ten months of actual performance (i.e., January through October 2020) and an estimate of November and December 2020 performance based on the Company’s then-latest available outlook. (We note that, based on actual performance at year end, the compensation received by management was in-line with the amounts it would have received had the Compensation Committee based its 2020 incentive compensation decisions on 12 months of actual performance.) |
• | Approving Treatment of Equity Awards Granted Prior to the Spin-Off – two-fold approach to the treatment of outstanding long-term incentive awards in connection with the Spin-Off in order to promote the dual objectives of aligning the management teams of both companies with the performance of their post Spin-Off businesses while also maintaining management focus on the execution of both businesses leading up to the Spin-Off. |
• | Establishing New Pay Ranges for Executive Officers of Both Companies – |
• | providing information on trends and related legislative, regulatory, and governance developments; |
• | reviewing and recommending any changes to the benchmarking peer group for the consideration and approval of the Compensation Committee; |
• | conducting competitive assessments of executive compensation levels and incentive program designs; |
• | consulting on compensation for outside directors; |
• | conducting a review of our compensation programs from a risk assessment perspective; |
• | reviewing compensation tally sheets on our executive officers; |
• | assisting with review and disclosures regarding the executive compensation programs; and |
• | reviewing the Compensation Committee’s annual calendar and related governance matters. |
Peer Group Prior to the Spin-Off |
||||
Ally Financial Inc. |
Encore Capital Group, Inc. | Santander Consumer USA Holdings Inc. | ||
Big Lots, Inc. |
Enova International, Inc. | Sleep Number Corporation | ||
Burlington Stores, Inc. |
FirstCash, Inc. | SLM Corporation | ||
Conn’s, Inc. |
Foot Locker, Inc. | Synchrony Financial | ||
Credit Acceptance Corporation |
Green Dot Corporation | Tractor Supply Company | ||
CURO Group Holdings Corp. |
OneMain Holdings, Inc. | Wayfair Inc. | ||
Designer Brands Inc. |
Rent-A-Center, |
Williams-Sonoma, Inc. | ||
DICK’S Sporting Goods, Inc. |
RH | |||
Discover Financial Services |
Sally Beauty Holdings, Inc. |
Peer Group Following the Spin-Off |
||||
Ally Financial Inc. |
Euronet Worldwide, Inc. | OneMain Holdings, Inc. | ||
Black Knight, Inc. |
FirstCash, Inc. | PRA Group, Inc. | ||
Credit Acceptance Corporation |
Genpact Limited | Santander Consumer USA Holdings Inc. | ||
Discover Financial Services |
Green Dot Corporation | SLM Corporation | ||
Encore Capital Group, Inc. |
Jack Henry & Associates, Inc. | Synchrony Financial | ||
Enova International, Inc. |
LendingTree, Inc. | WEX Inc. | ||
ePlus inc. |
Navient Corporation |
Component |
Terms and Objectives | |
Base Salary | • Fixed amount of compensation for performing day-to-day • Typically reviewed annually for potential adjustment based on factors such as market levels, individual performance and scope of responsibility. However, as the COVID-19 pandemic began to surge across the United States during the first quarter of 2020, the Company focused on aggressively protecting liquidity and tightly managing cash flows and operating expenses. As part of this effort, the senior management team voluntarily reduced their base salaries by 20%, beginning April 2020, which continued through June 2020 until the Company’s operations stabilized. | |
Annual Cash Incentive Award | • Variable performance-based award opportunity based on achievements with respect to challenging financial and operational performance goals. • Motivate executives to improve financial and operational performance year-over-year. • Reward executive officers who deliver targeted financial and operational results. | |
Long-Term Equity Incentive Award | • To balance long-term performance and retention, long-term equity incentive awards for 2020 were allocated as follows: 50% performance shares, 25% stock options, and 25% time-based restricted stock awards. • Aligns executive interests with shareholders. • Motivate executive officers to achieve superior business results over long-term. • Enhance alignment between management and shareholder interests. • Support stock ownership requirements. |
• | Successfully and timely complete the Spin-Off; and |
• | Help ensure that both PROG Holdings, Inc. and The Aaron’s Company would be well positioned for successful operations and equipped with personnel and resources to drive performance following the Spin-Off. |
Named Executive Officer |
1/1/20 Base Salary |
|||
John W. Robinson III |
$ | 800,000 | ||
Steven A. Michaels |
$ | 675,000 | (1) | |
Ryan K. Woodley |
$ | 600,000 | ||
Douglas A. Lindsay |
$ | 650,000 | (2) | |
Curtis L. Doman |
$ | 525,000 | (3) |
(1) | Adjusted from 2019 base salary of $625,000. |
(2) | Adjusted from 2019 base salary of $600,000. |
(3) | Adjusted from 2019 base salary of $475,000. |
Named Executive Officer |
12/1/20 Base Salary |
|||
Steven A. Michaels |
$ | 900,000 | ||
Blake W. Wakefield |
$ | 600,000 | ||
Curtis L. Doman |
$ | 550,000 | ||
Brian J. Garner |
$ | 475,000 | ||
Marvin A. Fentress |
$ | 425,000 |
• | Consolidated Adjusted EBITDA (80% of the award); and |
• | Strategic Initiatives (20% of the award) |
• | Mr. Wakefield – Target Opportunity: 150% of base salary |
• | Mr. Garner – Target Opportunity: 50% of base salary |
• | Mr. Fentress – Target Opportunity: 75% of base salary |
Company: Robinson and Michaels | ||||||||||||||||||||
($ Million) |
Weight |
Plan Performance Range |
Performance and Payout | |||||||||||||||||
Metric |
Threshold |
Target Zone (1) |
Maximum |
Year Ending (2) 12/31/2020 |
% of Target |
Payout Calculation | ||||||||||||||
Consolidated Adjusted EBITDA |
80% | $419 | $451 | - | $460 | $492 | $546 | 120% | 200% | |||||||||||
Strategic Initiatives |
20% | 8 Projects | 10 Projects | 9 Projects | 100% | 112.5% | ||||||||||||||
Payout |
25% | 100% | 200% | 182.5% | ||||||||||||||||
Company: Wall |
||||||||||||||||||||
($ Million) |
Plan Performance Range |
Performance and Payout | ||||||||||||||||||
Metric |
Weight |
Threshold |
Target Zone (1) |
Maximum |
Year Ending (2) 12/31/2020 |
% of Target |
Payout Calculation | |||||||||||||
Consolidated Adjusted EBITDA |
80% | $419 | $451 | - | $460 | $492 | $546 | 120% | 200% | |||||||||||
Strategic Initiatives |
20% | 4 Projects | 5 Projects | 5 Projects | 125% | 125% | ||||||||||||||
Payout |
25% | 100% | 200% | 185% | ||||||||||||||||
Progressive Leasing and Vive: Michaels, Wakefield, Doman, Garner, Fentress and Woodley | ||||||||||||||||||||
($ Million) |
Plan Performance Range |
Performance and Payout | ||||||||||||||||||
Metric |
Weight |
Threshold |
Target Zone (1) |
Maximum |
Year Ending (2) 12/31/2020 |
% of Target |
Payout Calculation | |||||||||||||
Progressive and Vive Adjusted EBITDA |
80% | $297 | $322 | - | $329 | $351 | $355 | 109.1% | 200% | |||||||||||
Strategic Initiatives |
20% | 4 Projects | 5 Projects | 4 Projects | 100% | 100% | ||||||||||||||
Payout |
25% | 100% | 200% | 180% | ||||||||||||||||
Aaron’s Business: Lindsay | ||||||||||||||||||||
($ Million) |
Weight |
Plan Performance Range |
Performance and Payout | |||||||||||||||||
Metric |
Threshold |
Target Zone (1) |
Maximum |
Year Ending (2) 12/31/2020 |
% of Target |
Payout Calculation | ||||||||||||||
Aaron’s Business Adjusted EBITDA |
80% | $116 | $129 | - | $132 | $143 | $191 | 147.1% | 200% | |||||||||||
Strategic Initiatives (3) |
20% | 4 Projects | 5 Projects | 5 Projects | 125% | 125% | ||||||||||||||
Payout |
25% | 100% | 200% | 185% |
(1) | If performance falls anywhere within this range then payout is at 100% of target. |
(2) | Estimated performance as described above. |
(3) | Maximum payout for the Strategic Initiatives metric is 125%. |
Executive Officers at 12/31/20 |
Award Earned under Annual Incentive Plan (1), (2) | |
Steven A. Michaels |
$1,208,400 | |
Blake W. Wakefield |
$1,431,000 | |
Curtis L. Doman |
$928,900 | |
Brian J. Garner |
$283,500 | |
Marvin A. Fentress |
$540,000 |
(1) | Calculated on total annual base salary paid for 2020. |
(2) | Mr. Michaels’ awards were weight-adjusted based on his multiple positions during the year. |
Former Executive Officers |
Award Earned under Annual Incentive Plan (1), (2) | |
John W. Robinson III |
$1,825,000 | |
Ryan K. Woodley |
$626,600 | |
Douglas A. Lindsay |
$1,184,800 | |
C. Kelly Wall |
$382,000 |
(1) | Calculated on total annual base salary paid for 2020. Mr. Woodley’s award was calculated pro rata based on his July 30, 2020 resignation date. |
(2) | Mr. Wall’s awards were weight-adjusted based on his multiple positions during the year. |
• | reward the achievement of business objectives that the Compensation Committee believes will benefit our shareholders; |
• | align the interests of our senior management with those of our shareholders; and |
• | assist with retaining our senior management to ensure continuity of leadership. |
Equity Award |
Objective |
Provisions | ||
Performance Shares | • Focus participants on the fundamentals of growing our business and increasing the level of our earnings over the long term. • One-year performance period ensures greater validity in our forecasts. |
• Number of performance shares earned based on one-year Company performance.• Earned awards are subject to additional time-based vesting, with vesting occurring in three equal increments following the first, second, and third anniversaries of the grant. | ||
Stock Options | • Aligns executives with shareholders, with the value of an award realized only if the stock price appreciates following the date of grant. |
• Pro rata annual three-year vesting, with vesting occurring in three equal increments following the first, second, and third anniversaries of the grant. | ||
Restricted Stock | • Addresses competitive concerns with a focus on retaining our key executives needed to realize our long-term performance objectives. |
• Pro rata annual three-year vesting, with vesting occurring in three equal increments following the first, second, and third anniversaries of the grant. |
• | Mr. Michaels: $1,525,000 |
• | Mr. Woodley: $2,400,000 |
• | Mr. Lindsay: $1,475,000 |
• | Mr. Doman: $1,575,000 |
Named Executive Officer |
Stock Options (25%) |
+ |
Restricted Stock (25%) |
+ |
Performance Shares (50%) |
= |
2020 LTI Value at Target | |||||||
John W. Robinson III |
$1,300,000 | $1,300,000 | $2,600,000 | $5,200,000 | ||||||||||
Steven A. Michaels |
$381,250 | $381,250 | $762,500 | $1,525,000 | ||||||||||
Ryan K. Woodley |
$600,000 | $600,000 | $1,200,000 | $2,400,000 | ||||||||||
Douglas A. Lindsay |
$368,750 | $368,750 | $737,500 | $1,475,000 | ||||||||||
Curtis L. Doman |
$393,750 | $393,750 | $787,500 | $1,575,000 | ||||||||||
LTI Shares (at Target) |
||||||||||||||
Named Executive Officer |
Stock Options (25%) |
+ |
Restricted Stock (25%) |
+ |
Performance Shares (50%) |
= |
2020 LTI Shares at Target | |||||||
John W. Robinson III |
86,010 | 30,450 | 60,900 | 177,360 | ||||||||||
Steven A. Michaels |
25,230 | 8,940 | 17,880 | 52,050 | ||||||||||
Ryan K. Woodley |
39,720 | 14,070 | 28,110 | 81,900 | ||||||||||
Douglas A. Lindsay |
24,420 | 8,640 | 17,280 | 50,340 | ||||||||||
Curtis L. Doman |
26,070 | 9,240 | 18,450 | 53,760 |
(1) | The LTI dollar value of the target awards presented in the table above differ from the aggregate grant date fair values for our NEOs’ LTI awards as reported in the 2020 Summary Compensation Table and the Grants of Plan-Based Awards in Fiscal Year 2020 Table due to different dates used to value the awards (February 25, 2020) versus the date on which the awards were granted (March 6, 2020). |
• | Consolidated Adjusted Revenue (60% of the award); |
• | Consolidated Adjusted Pre-Tax Income (20% of the award); and |
• | Return on Capital (20% of the award). |
• | Mr. Wakefield: $1,590,000 |
• | Mr. Garner: $315,000 |
• | Mr. Fentress: $800,000 |
Company: Robinson, Michaels and Wall | ||||||||||||||||||
($ Millions) |
Weight |
Plan Performance Range |
Performance and Payout | |||||||||||||||
Metric |
Threshold |
Target Zone (1) |
Maximum |
Year Ending 12/31/20 (2) |
% of Target |
Payout Calculation | ||||||||||||
Consolidated Adjusted Revenue (3) |
60% | $4,054 | $4,246 | - | $4,289 | $4,481 | $4,212 | 98.7% | 92.6% | |||||||||
Consolidated Adjusted Pre-Tax Income |
20% | $331 | $356 | - | $363 | $388 | $460 | 128.0% | 200% | |||||||||
Consolidated Return on Capital (4) |
20% | 10.8% | 12.6% | - | 12.8% | 14.6% | 19.3% | 165.2% | 200% | |||||||||
Payout |
25% | 100% | 200% | 135.6% | ||||||||||||||
Progressive Leasing and Vive: Michaels, Wakefield, Doman, Garner, Fentress and Woodley | ||||||||||||||||||
($ Millions) |
Weight |
Plan Performance Range |
Performance and Payout | |||||||||||||||
Metric |
Threshold |
Target Zone (1) |
Maximum |
Year Ending 12/31/20 (2) |
% of Target |
Payout Calculation | ||||||||||||
Progressive Adjusted Revenue (5) |
70% | $2,465 | $2,637 | - | $2,664 | $2,823 | $2,539 | 95.8% | 63.2% | |||||||||
Progressive Adjusted Pre-Tax Income |
30% | $248 | $270 | - | $273 | $293 | $329 | 112.3% | 200% | |||||||||
Payout |
25% | 100% | 200% | 104.2% | ||||||||||||||
Aaron’s Business: Lindsay | ||||||||||||||||||
($ Millions) |
Weight |
Plan Performance Range |
Performance and Payout | |||||||||||||||
Metric |
Threshold |
Target Zone (1) |
Maximum |
Year Ending 12/31/20 (2) |
% of Target |
Payout Calculation | ||||||||||||
Aaron’s Business Revenue |
70% | $1,496 | $1,593 | - | $1,641 | $1,738 | $1,743 | 107.8% | 200% | |||||||||
Aaron’s Business Adjusted Pre-Tax Income (6) |
30% | $54 | $60 | - | $61 | $67 | $127 | 208% | 200% | |||||||||
Payout |
25% | 100% | 200% | 200% |
(1) | If performance falls anywhere within this dollar range, then payout is at 100% of target. |
(2) | Estimated performance as described above. |
(3) | Further adjusted to remove provision for credit losses at Vive, excluding the change in allowance for loan losses. |
(4) | Return on Capital: Adjusted Net Operating Profit after Tax divided by the Sum of Average Net Debt and Average Equity. Net debt is equal to total debt less cash and cash equivalents. |
(5) | Consolidation of Progressive and Vive, further adjusted to remove the effect of provision for credit losses at Vive, excluding the change in allowance for loan losses. The Compensation Committee also approved an upward adjustment of $70 million as discussed in more detail in “ – Compensation Committee’s Use of Discretion During 2020 |
(6) | Further adjusted for intercompany interest income. |
Current Executive Officers |
Award Earned under Long-Term Incentive Plan (1) | |
Steven A. Michaels |
$1,458,378 | |
Blake W. Wakefield |
$1,628,739 | |
Curtis L. Doman |
$1,304,389 | |
Brian J. Garner |
$323,436 | |
Marvin A. Fentress |
$820,762 | |
Former Executive Officers |
Award Earned under Long-Term Incentive Plan (1) | |
John W. Robinson III (2) |
$4,968,208 | |
Ryan K. Woodley (2) |
$1,987,069 | |
Douglas A. Lindsay |
$1,796,813 | |
C. Kelly Wall |
$227,491 |
(1) | Calculated as the grant date fair value of stock options, restricted shares, and performance shares granted on February 23, 2020 and March 6, 2020 for NEOs. The performance shares are based on the number of shares earned based on the payout percentages disclosed in the tables above. |
(2) | See “ Compensation Arrangements with Certain Former Executive Officers |
Outstanding Award Type |
Spin-Off Treatment |
How Treatment Aligned with Objectives | ||
Stock Option Awards | • Replaced with an adjusted option to purchase PRG common stock (or AAN common stock in the case of Former Executive Officers, except for Mr. Woodley who received an adjusted option to purchase PRG common stock). • Adjusted to preserve the ratio of the exercise price to the fair market value of the stock subject to the option by adjusting the number of shares purchasable and the exercise price, by reference to the volume-weighted-average trading price of PRG (or AAN) common stock trading “regular way” on the closing date of the Spin-Off and the simple average of the volume-weighted-average trading price of the PRG (or AAN) common stock on each of the first three trading days following the closing date of the Spin-Off. |
• Promote management focus on stock price performance of the employee’s post-Spin-Off business.• Adjustment aligned the interest of employees with their post Spin-Off company for the full term of the option. | ||
Unvested Restricted Stock and Unearned Performance Share Awards Granted in 2020 | • Replaced with adjusted PRG awards (AAN awards in the case of Former Executive Officers, except for Mr. Woodley who received an adjusted PRG award), each of which will generally preserve the value of the original award immediately prior to the Spin-Off. |
• Helps to align management with the interests and performance of post-Spin-Off business where he would serve.• Promote focus on long-term performance and retention. | ||
Unvested Restricted Stock and Earned Performance Share Awards Granted Prior to 2020 | • Holders had a choice to receive a replacement award denominated in either PRG or both PRG and AAN equity (for Former Executive Officers, except for Mr. Woodley, a choice to receive a replacement award denominated in either AAN or both AAN and PRG equity). Adjusted by reference to the ratio of one share of PRG common stock distributed in the Spin-Off for every two shares of AAN common stock in the Spin-Off. |
• Incentivize management to set up both post-Spin-Off companies for success by providing a choice to receive common stock where he would serve or to receive equity in both companies. |
Feature |
Provision | |
Required levels | 5x base salary: Chief Executive Officer 3x base salary: • President, Progressive Leasing; • Chief Executive Officer, Progressive Leasing; • Chief Innovation Officer, Progressive Leasing 2x base salary: Chief Executive Officer, Aaron’s Business | |
Shares counted toward guidelines | Stock owned outright Shares held in retirement accounts Unvested time-based restricted stock units and restricted stock awards Earned but unvested performance shares “In the money” value of vested but unexercised stock options |
Feature |
Provision | |
Required levels | 5x base salary: Chief Executive Officer 3x base salary: • President • Chief Innovation Officer • Chief Financial Officer 2x base salary • General Counsel | |
Shares counted toward guidelines | Stock owned outright Shares held in retirement accounts Unvested time-based restricted stock units and restricted stock awards Earned but unvested performance shares “In the money” value of vested but unexercised stock options |
Douglas C. Curling (Chair) | ||
Kathy T. Betty | ||
Cynthia N. Day | ||
Ray M. Robinson |
Name and Principal Position |
Year |
Salary ($) |
Bonus ($) |
Stock Awards (1) ($) |
Option Awards (2) ($) |
Non-Equity Incentive Plan Compensation (3) ($) |
All Other Compensation (4) ($) |
Total ($) | ||||||||||
Steven A. Michaels (5) |
2020 | 647,404 | — | 1,453,939 | 304,526 | 1,208,400 | 111,724 | (6),(7),(8) |
3,725,993 | |||||||||
Chief Executive Officer |
2019 | 625,000 | — | 1,056,510 | 354,971 | 604,900 | 26,031 | 2,667,412 | ||||||||||
2018 | 613,462 | — | 1,054,843 | 391,006 | 635,700 | 34,784 | 2,729,795 | |||||||||||
Blake Wakefield (9) President |
2020 | 501,039 | — | 2,727,426 | 401,436 | 1,431,000 | 23,642 | (6),(7) |
5,084,543 | |||||||||
Curtis L. Doman (10) |
2020 | 485,649 | — | 989,725 | 314,665 | 928,900 | 12,210 | (6) |
2,731,149 | |||||||||
Chief Innovation Officer |
2019 | 475,000 | — | 1,071,139 | 359,672 | 463,300 | 12,010 | 2,381,121 | ||||||||||
2018 | 463,462 | — | 1,070,439 | 395,968 | 486,200 | 11,810 | 2,427,879 | |||||||||||
Brian Garner (11) |
2020 | 323,827 | — | 243,603 | 79,834 | 283,500 | 5,900 | (12) |
936,664 | |||||||||
Chief Financial Officer |
||||||||||||||||||
Marvin A. Fentress (13) |
2020 | 400,196 | — | 618,910 | 201,852 | 540,000 | 13,722 | (6) |
1,774,680 | |||||||||
General Counsel, Corporate Secretary |
||||||||||||||||||
John W. Robinson III (14) |
2020 | 701,538 | — | 3,930,067 | 1,038,141 | 1,825,000 | 9,683 | 7,504,429 | ||||||||||
Former Chief Executive Officer |
2019 | 800,000 | — | 3,900,960 | 1,311,159 | 967,900 | 1,171 | 6,981,190 | ||||||||||
2018 | 784,615 | — | 3,900,368 | 1,444,438 | 1,016,300 | 6,317 | 7,152,038 | |||||||||||
Douglas A. Lindsay (14) |
2020 | 560,577 | — | 1,502,064 | 294,749 | 1,083,317 | 25,199 | (6),(7) |
3,465,906 | |||||||||
Former Chief Executive Officer, Aaron’s Business |
2019 2018 |
600,000 584,615 |
— — |
1,014,250 1,015,145 |
340,866 375,127 |
542,800 610,100 |
12,010 25,418 |
2,509,926 2,610,405 | ||||||||||
C. Kelly Wall (14), (15), (16) |
2020 | 354,923 | 229,167 | 307,005 | 48,535 | 350,442 | 22,800 | (6),(7) |
1,312,872 | |||||||||
Former Interim Chief Financial Officer |
||||||||||||||||||
Ryan K. Woodley (17) |
2020 | 410,066 | — | 1,507,649 | 479,420 | 626,600 | 11,894 | (6) |
3,035,629 | |||||||||
Former Chief Executive Officer, Progressive Leasing |
2019 2018 |
600,000 574,616 |
— — |
1,802,569 1,802,024 |
605,331 666,893 |
585,300 602,900 |
11,740 11,540 |
3,604,940 3,657,973 |
(1) | Represents the aggregate grant date fair value of awards of time-based restricted shares and performance shares recognized by the Company as required by Financial Accounting Standards Board Codification Topic 718. See Note 12 to the Company’s consolidated financial statements in the Company’s Annual Report on Form 10-K for the year ended December 31, 2020, for a discussion of the assumptions used in calculating these amounts. For the time-based restricted shares, the fair value is calculated using the closing stock price on the date of grant. For performance shares, the fair value is also the closing stock price on the date of grant, multiplied by the number of shares that were earned on the performance condition achieved in 2020. We caution that the amounts reported above for equity-related awards and, therefore, total compensation, may not represent the amounts that each executive actually realizes from the awards. Whether, and to what extent, an executive realizes value will depend on a number of factors, including stock price and, with respect to the Company’s Long-Term Incentive Award Program, continued employment. |
(2) | Represents the grant date fair value of awards of stock options recognized by the Company as required by the Financial Accounting Standards Board Codification Topic 718. The Company determines the fair value of stock options on the grant date using a Black-Scholes-Merton option pricing model that incorporates expected volatility, expected option life, risk-free interest rates, and expected dividend yields. See Note 12 to the Company’s consolidated financial statements in the Company’s Annual Report on Form 10-K for the year ended December 31, 2020, for a discussion of the assumptions used in calculating these amounts. We caution that the amounts reported above for equity-related awards and, therefore, total compensation, may not represent the amounts that each executive actually realizes from the awards. Whether, and to what extent, an executive realizes value will depend on a number of factors, including stock price and, with respect to Company’s Long-Term Incentive Award Program, continued employment. |
(3) | Reflects the value of the cash bonus earned under the Company’s Annual Cash Incentive Award Program. |
(4) | We provide a limited number of perquisites to our NEOs and value those perquisites based on their aggregate incremental cost to the Company. Prior to the Spin-Off, our NEOs could use the Company’s aircraft from time to time for non-business use. We calculated the incremental cost of Company aircraft use based on the average variable operating costs to the Company. Variable operating costs include fuel costs, maintenance fees, positioning costs, catering costs, landing/ramp fees, and the amount, if any, of disallowed tax deductions associated with the personal use of Company aircraft. The total annual variable operating costs are divided by the annual number of flight hours flown by the aircraft to derive an average variable cost per flight hour. This average variable cost per flight hour is then multiplied by the flight hours flown for personal use to derive the incremental cost to the Company. This method excludes fixed costs that do not change based on usage, such as pilots’ and other employees’ salaries and benefits and hangar expenses. Aggregate incremental cost, if any, of travel by the executive’s family or other guests when accompanying the executive is also included. After the Spin-Off, the Company no longer owned any aircraft and, therefore, this perquisite was discontinued. |
(5) | Mr. Michaels was appointed the Company’s Chief Executive Officer effective as of December 1, 2020 in connection with the Spin-Off. Prior to that, Mr. Michaels served as Chief Executive Officer of the Company’s Progressive Leasing operating segment since July 31, 2020. Prior to that, Mr. Michaels had served as the Company’s Chief Financial Officer and President of Strategic Operations. |
(6) | Includes matching contributions in the amount of $11,400 made by the Company to Messrs. Michaels’, Wakefield’s, Doman’s, Fentress’, Lindsay’s, Wall’s and Woodley’s account, as applicable, in connection with the Company’s 401(k) Plan. |
(7) | Includes matching contributions in the amount of $11,400 made by the Company to Messrs. Michaels’, Wakefield’s, Lindsay’s and Wall’s account, as applicable, in connection with the Company’s Nonqualified Deferred Compensation Plan. These amounts are also included in the Nonqualified Deferred Compensation section below. |
(8) | Includes $85,293 of commuting and relocation expenses reimbursed by the Company. |
(9) | Mr. Wakefield was appointed the Company’s President effective as of December 1, 2020 in connection with the Spin-Off. Mr. Wakefield was not an NEO for the fiscal years ended December 31, 2018 or December 31, 2019. Mr. Wakefield resigned as the Company’s President effective as of April 1, 2021. |
(10) | Mr. Doman was appointed the Company’s Chief Innovation Officer effective as of December 1, 2020 in connection with the Spin-Off. Prior to that, Mr. Doman served as Chief Innovation Officer of the Company’s Progressive Leasing operating segment. |
(11) | Mr. Garner was appointed the Company’s Chief Financial Officer effective as of December 1, 2020 in connection with the Spin-Off. Mr. Garner was not an NEO for the fiscal years ended December 31, 2018 or December 31, 2019. |
(12) | Includes matching contributions in the amount of $5,359 made by the Company to Mr. Garner’s account in the Company’s 401(k) plan. |
(13) | Mr. Fentress was appointed the Company’s General Counsel and Corporate Secretary effective as of December 1, 2020 in connection with the Spin-Off. Mr. Fentress was not an NEO for the fiscal years ended December 31, 2018 or December 31, 2019. |
(14) | Messrs. Robinson, Lindsay and Wall resigned from the Company effective as of November 30, 2020 in connection with the Spin-Off. Salary and non-equity incentive plan compensation amounts in the tables above reflect the cash amounts paid to these NEOs during 2020, prorated for the service with the Company prior to the Spin-Off (January 1, 2020 through November 30, 2020). |
(15) | Mr. Wall was appointed the Company’s Interim Chief Financial Officer effective as of July 31, 2020. Mr. Wall was not an NEO for the fiscal years ended December 31, 2018 or December 31, 2019. |
(16) | Reflects a $250,000 cash bonus paid to Mr. Wall during 2020 in connection with the Company’s Spin-Off Bonus and Retention Program, prorated for the service with the Company prior to the Spin-Off (January 1, 2020 through November 30, 2020). |
(17) | Mr. Woodley resigned as Chief Executive Officer of the Company’s Progressive Leasing operating segment effective as of July 31, 2020. |
Name |
Grant Date |
Potential Payouts Under Non- Equity Incentive Plan Awards (1) |
Estimated Future Payouts Under Equity Incentive Plan Awards (2) |
All Other Stock Awards: Number of Shares of Stock or Units (3) |
All Other Option Awards: Number of Securities Underlying Options (4) |
Exercise or Base Price of Option Awards ($/Sh) |
Grant Date Fair Value of Stock and Option Awards (5) ($) |
|||||||||||||||||||||||||||||||||||||
Threshold ($) |
Target ($) |
Maximum ($) |
Threshold (#) |
Target (#) |
Maximum (#) |
|||||||||||||||||||||||||||||||||||||||
Steven A. Michaels |
167,000 | 666,000 | 1,232,000 | |||||||||||||||||||||||||||||||||||||||||
3/6/2020 | 4,470 | 17,880 | 35,760 | 621,688 | ||||||||||||||||||||||||||||||||||||||||
3/6/2020 | 8,940 | 310,844 | ||||||||||||||||||||||||||||||||||||||||||
3/6/2020 | 25,230 | 34.77 | 304,526 | |||||||||||||||||||||||||||||||||||||||||
7/31/2020 | 5,751 | 300,087 | ||||||||||||||||||||||||||||||||||||||||||
Blake Wakefield |
199,000 | 795,000 | 1,471,000 | |||||||||||||||||||||||||||||||||||||||||
2/25/2020 | 4,658 | 18,630 | 37,260 | 795,501 | ||||||||||||||||||||||||||||||||||||||||
2/25/2020 | 9,330 | 398,391 | ||||||||||||||||||||||||||||||||||||||||||
2/25/2020 | 26,550 | 42.70 | 401,436 | |||||||||||||||||||||||||||||||||||||||||
7/31/2020 | 28,749 | 1,500,123 | ||||||||||||||||||||||||||||||||||||||||||
Curtis L. Doman |
129,000 | 516,000 | 955,000 | |||||||||||||||||||||||||||||||||||||||||
3/6/2020 | 4,613 | 18,450 | 36,900 | 641,507 | ||||||||||||||||||||||||||||||||||||||||
3/6/2020 | 9,240 | 321,275 | ||||||||||||||||||||||||||||||||||||||||||
3/6/2020 | 26,070 | 34.77 | 314,665 | |||||||||||||||||||||||||||||||||||||||||
Brian Garner |
39,000 | 158,000 | 291,000 | |||||||||||||||||||||||||||||||||||||||||
2/25/2020 | 923 | 3,690 | 7,380 | 157,563 | ||||||||||||||||||||||||||||||||||||||||
2/25/2020 | 1,860 | 79,422 | ||||||||||||||||||||||||||||||||||||||||||
2/25/2020 | 5,280 | 42.70 | 79,834 | |||||||||||||||||||||||||||||||||||||||||
Marvin A. Fentress |
75,000 | 300,000 | 555,000 | |||||||||||||||||||||||||||||||||||||||||
2/25/2020 | 2,348 | 9,390 | 18,780 | 400,953 | ||||||||||||||||||||||||||||||||||||||||
2/25/2020 | 4,710 | 201,117 | ||||||||||||||||||||||||||||||||||||||||||
2/25/2020 | 13,350 | 42.70 | 201,852 | |||||||||||||||||||||||||||||||||||||||||
John W. Robinson III |
250,000 | 1,000,000 | 1,850,000 | |||||||||||||||||||||||||||||||||||||||||
3/6/2020 | 15,225 | 60,900 | 121,800 | 2,117,493 | ||||||||||||||||||||||||||||||||||||||||
3/6/2020 | 30,450 | 1,058,747 | ||||||||||||||||||||||||||||||||||||||||||
3/6/2020 | 86,010 | 34.77 | 1,038,141 | |||||||||||||||||||||||||||||||||||||||||
Douglas A. Lindsay |
160,000 | 640,000 | 1,185,000 | |||||||||||||||||||||||||||||||||||||||||
3/6/2020 | 4,320 | 17,280 | 34,560 | 600,826 | ||||||||||||||||||||||||||||||||||||||||
3/6/2020 | 8,640 | 300,413 | ||||||||||||||||||||||||||||||||||||||||||
3/6/2020 | 24,420 | 34.77 | 294,749 | |||||||||||||||||||||||||||||||||||||||||
C. Kelly Wall |
52,000 | 207,000 | 382,000 | |||||||||||||||||||||||||||||||||||||||||
2/25/2020 | 563 | 2,250 | 4,500 | 96,075 | ||||||||||||||||||||||||||||||||||||||||
2/25/2020 | 1,140 | 48,678 | ||||||||||||||||||||||||||||||||||||||||||
2/25/2020 | 3,210 | 42.70 | 48,535 | |||||||||||||||||||||||||||||||||||||||||
7/31/2020 | 2,454 | 128,050 | ||||||||||||||||||||||||||||||||||||||||||
Ryan K. Woodley |
87,000 | 348,000 | 644,000 | |||||||||||||||||||||||||||||||||||||||||
3/6/2020 | 7,028 | 28,110 | 56,220 | 977,385 | ||||||||||||||||||||||||||||||||||||||||
3/6/2020 | 14,070 | 489,214 | ||||||||||||||||||||||||||||||||||||||||||
3/6/2020 | 39,720 | 34.77 | 479,420 |
(1) | Represents the amounts that could be earned under the Company’s Annual Cash Incentive Award Program based on performance against pre-determined goals for Adjusted EBITDA and Strategic Initiatives. The performance goals for Messrs. Michaels and Robinson were measured on a Company-wide basis. The performance goals for Messrs. Wakefield, Doman, Garner, Fentress and Woodley were measured on a Progressive Leasing and Vive operating segments basis. The performance goals for Mr. Lindsay were measured on an Aaron’s Business operating segment basis. The performance goals for Mr. Wall were measured in accordance with the time spent in positions held by Mr. Wall during the year at the Company-wide level and Aaron’s Business operating segment level, as applicable. The amounts actually earned are included in the non-equity incentive plan compensation column of the Summary Compensation Table. |
(2) | Represents performance shares granted under the Company’s Long-Term Incentive Award Program. Performance metrics for Messrs. Michaels, Robinson, and Wall were consolidated Company Adjusted Revenue, Adjusted EBITDA and Return on Capital. Performance metrics for Messrs. Wakefield, Doman, Garner, Fentress and Woodley were Adjusted EBITDA and Adjusted Pre-Tax Income for the Company’s Progressive Leasing and Vive operating segments. Performance metrics for Mr. Lindsay were Adjusted EBITDA and Adjusted Pre-Tax Income for the Aaron’s Business operating segment. The threshold number of shares represents 25% of target, and the maximum number of shares represents 200% of target. Any awards earned vest in three approximately equal increments over a three-year period on March 7, 2021, 2022 and 2023. Based on the Company’s performance for the year, performance shares were earned at 135.6% of target for Mr. Michaels, 104.2% of target for Mr. Wakefield, 104.2% of target for Mr. Doman, 104.2% of target for Mr. Garner, 104.2% of target for Mr. Fentress, 135.6% of target for Mr. Robinson, 200% of target for Mr. Lindsay, 135.6% of target for Mr. Wall and 104.2% of target for Mr. Woodley. |
(3) | Includes time-based restricted stock granted to each of our NEOs under the Company’s Long-Term Incentive Award Program, that are expected to vest in three approximately equal increments over a three-year period on each of March 7, 2021, 2022 and 2023. |
(4) | Includes stock options granted under the Company’s Long-Term Incentive Award Program that are expected to vest in three approximately equal increments over a three-year period on each of March 7, 2021, 2022 and 2023. |
(5) | Represents the aggregate grant date fair value of awards recognized by the Company as required by Financial Accounting Standards Board Codification Topic 718. See Note 12 to the Company’s consolidated financial statements in the Company’s Annual Report on Form 10-K for the year ended December 31, 2020 for a discussion of the assumptions used in calculating these amounts. |
Option Awards |
Stock Awards |
|||||||||||||||||||||||||||||||||||||||||||||||
Name of Executive |
Number of Securities Underlying Unexercised Options Exercisable (#) |
Number of Securities Underlying Unexercised Options Unexercisable (#) |
Option Exercise Price ($) |
Option Expiration Date |
Number of Shares or Units of Stock That Have Not Vested (#) |
Market Value of Shares or Units of Stock That Have Not Vested ($) (1) |
Equity Incentive Plan Awards: Number of Unearned Shares, Units or Other Rights That Have Not Vested (#) |
Equity Incentive Plan Awards: Market or Payout Value of Unearned Shares, Units or Other Rights That Have Not Vested ($) (1) |
||||||||||||||||||||||||||||||||||||||||
Steven A. Michaels |
5,134 | — | 27.46 | 2/18/2024 | ||||||||||||||||||||||||||||||||||||||||||||
8,237 | — | 26.98 | 4/15/2024 | |||||||||||||||||||||||||||||||||||||||||||||
27,324 | — | 25.87 | 3/10/2025 | |||||||||||||||||||||||||||||||||||||||||||||
41,796 | — | 20.88 | 2/26/2026 | |||||||||||||||||||||||||||||||||||||||||||||
33,762 | — | 25.07 | 2/24/2027 | |||||||||||||||||||||||||||||||||||||||||||||
17,088 | (2 | ) | 8,544 | (2 | ) | 43.59 | 3/2/2028 | |||||||||||||||||||||||||||||||||||||||||
6,548 | (3 | ) | 13,096 | (3 | ) | 49.97 | 2/21/2029 | |||||||||||||||||||||||||||||||||||||||||
27,356 | (4 | ) | 32.07 | 3/6/2030 | ||||||||||||||||||||||||||||||||||||||||||||
2,689 | (5 | ) | 144,856 | 5,324 | 286,804 | |||||||||||||||||||||||||||||||||||||||||||
4,705 | (6 | ) | 253,458 | 8,366 | 450,676 | |||||||||||||||||||||||||||||||||||||||||||
9,693 | (7 | ) | 522,162 | 26,289 | (8 | ) | 1,416,188 | |||||||||||||||||||||||||||||||||||||||||
6,235 | (7 | ) | 335,879 | |||||||||||||||||||||||||||||||||||||||||||||
Blake Wakefield |
— | 8,012 | (9 | ) | 43.59 | 3/2/2028 | ||||||||||||||||||||||||||||||||||||||||||
6,148 | (3 | ) | 12,295 | (3 | ) | 49.97 | 2/21/2029 | |||||||||||||||||||||||||||||||||||||||||
28,788 | (4 | ) | 39.39 | 2/25/2030 | ||||||||||||||||||||||||||||||||||||||||||||
2,526 | (5 | ) | 136,076 | 5,047 | 271,882 | |||||||||||||||||||||||||||||||||||||||||||
4,423 | (6 | ) | 238,267 | 7,758 | 417,923 | |||||||||||||||||||||||||||||||||||||||||||
10,116 | (7 | ) | 544,949 | 21,048 | (8 | ) | 1,133,856 | |||||||||||||||||||||||||||||||||||||||||
31,172 | (10 | ) | 1,679,236 | |||||||||||||||||||||||||||||||||||||||||||||
Curtis L. Doman |
17,306 | (2 | ) | 8,652 | (2 | ) | 43.59 | 3/2/2028 | ||||||||||||||||||||||||||||||||||||||||
6,636 | (3 | ) | 13,271 | (3 | ) | 49.97 | 2/21/2029 | |||||||||||||||||||||||||||||||||||||||||
28,267 | (4 | ) | 32.07 | 3/6/2030 | ||||||||||||||||||||||||||||||||||||||||||||
2,732 | (5 | ) | 147,173 | 5,449 | 293,538 | |||||||||||||||||||||||||||||||||||||||||||
4,770 | (6 | ) | 256,960 | 8,368 | 450,784 | |||||||||||||||||||||||||||||||||||||||||||
10,018 | (7 | ) | 539,670 | 20,845 | (8 | ) | 1,122,920 | |||||||||||||||||||||||||||||||||||||||||
Brian Garner |
1,767 | — | 25.07 | 2/24/2027 | ||||||||||||||||||||||||||||||||||||||||||||
1,518 | (11 | ) | 1,518 | (11 | ) | 43.59 | 3/2/2028 | |||||||||||||||||||||||||||||||||||||||||
1,399 | (3 | ) | 2,797 | (3 | ) | 49.97 | 2/21/2029 | |||||||||||||||||||||||||||||||||||||||||
5,725 | (4 | ) | 39.39 | 2/25/2030 | ||||||||||||||||||||||||||||||||||||||||||||
487 | (5 | ) | 26,235 | 964 | 51,931 | |||||||||||||||||||||||||||||||||||||||||||
1,019 | (6 | ) | 54,894 | 1,772 | 95,458 | |||||||||||||||||||||||||||||||||||||||||||
2,016 | (7 | ) | 108,602 | 4,169 | (8 | ) | 224,584 | |||||||||||||||||||||||||||||||||||||||||
Marvin A. Fentress |
13,879 | — | 29.70 | 2/6/2025 | ||||||||||||||||||||||||||||||||||||||||||||
24,717 | — | 20.88 | 2/26/2026 | |||||||||||||||||||||||||||||||||||||||||||||
19,972 | — | 25.07 | 2/24/2027 | |||||||||||||||||||||||||||||||||||||||||||||
8,501 | (2 | ) | 4,250 | (2 | ) | 43.59 | 3/2/2028 | |||||||||||||||||||||||||||||||||||||||||
3,264 | (3 | ) | 6,527 | (3 | ) | 49.97 | 2/21/2029 | |||||||||||||||||||||||||||||||||||||||||
14,475 | (4 | ) | 39.39 | 2/25/2030 | ||||||||||||||||||||||||||||||||||||||||||||
1,344 | (5 | ) | 72,401 | 2,675 | 144,102 | |||||||||||||||||||||||||||||||||||||||||||
2,342 | (6 | ) | 126,164 | 4,117 | 221,783 | |||||||||||||||||||||||||||||||||||||||||||
5,107 | (7 | ) | 275,114 | 10,609 | (8 | ) | 571,507 | |||||||||||||||||||||||||||||||||||||||||
John W. Robinson III |
— | — | — | — | — | — | — | — | — | |||||||||||||||||||||||||||||||||||||||
Douglas A. Lindsay |
— | — | — | — | ||||||||||||||||||||||||||||||||||||||||||||
2,390 | (5 | ) | 128,749 | 4,818 | 259,546 | |||||||||||||||||||||||||||||||||||||||||||
4,160 | (6 | ) | 224,099 | 6,498 | 350,047 | |||||||||||||||||||||||||||||||||||||||||||
C. Kelly Wall |
— | — | — | — | ||||||||||||||||||||||||||||||||||||||||||||
320 | (5 | ) | 17,238 | 634 | 34,154 | |||||||||||||||||||||||||||||||||||||||||||
560 | (6 | ) | 30,167 | 998 | 53,762 | |||||||||||||||||||||||||||||||||||||||||||
Ryan K. Woodley |
29,146 | (2 | ) | 14,572 | (2 | ) | 43.59 | 10/1/2021 | ||||||||||||||||||||||||||||||||||||||||
11,166 | (12 | ) | 11,166 | (12 | ) | 49.97 | 10/1/2021 | |||||||||||||||||||||||||||||||||||||||||
14,356 | (13 | ) | 32.07 | 10/1/2021 | ||||||||||||||||||||||||||||||||||||||||||||
4,597 | (5 | ) | 247,640 | 9,175 | 494,257 | |||||||||||||||||||||||||||||||||||||||||||
4,011 | (5 | ) | 216,073 | 7,043 | 379,406 | |||||||||||||||||||||||||||||||||||||||||||
5,085 | (5 | ) | 273,929 | 6,175 | (14 | ) | 332,656 |
(1) | Reflects award value based on a share price of $53.87, the closing price of our common stock on December 31, 2020. |
(2) | These options vest in three equal increments on each of March 7, 2019, 2020 and 2021. |
(3) | These options vest in three equal increments on each of March 7, 2020, 2021 and 2022. |
(4) | These options vest in three equal increments on each of March 7, 2021, 2022 and 2023. |
(5) | These restricted shares vested on March 7, 2021. |
(6) | One-half of these restricted shares vested on March 7, 2021 and the remaining one-half are scheduled to vest on March 7, 2022. |
(7) | These restricted shares vest in three equal increments on each of March 7, 2021, 2022 and 2023. |
(8) | Amounts shown reflect performance shares that at grant date were subject to meeting specific performance goals and service periods, which, based on the Company’s performance, are reflected at the achieved award level. Performance shares earned vest in three equal increments on each of March 7, 2021, 2022 and 2023. |
(9) | These options vested on March 7, 2021. |
(10) | These restricted shares vest in three equal increments on each of July 31, 2021, 2022 and 2023. |
(11) | These options vest in two equal increments on each of March 7, 2020 and 2021. |
(12) | These options vest in two equal increments on each of March 7, 2020 and 2021. |
(13) | These options vested on March 7, 2021. |
(14) | Amounts shown reflect performance shares that at grant date were subject to meeting specific performance goals and service periods, which, based on the Company’s performance, are reflected at the achieved award level. These performance shares vested on March 7, 2021. |
Prior to the Spin-Off (through 11/30/2020) |
||||||||||||||||
Option Awards |
Stock Awards |
|||||||||||||||
Name |
Number of Shares Acquired on Exercise (#) |
Value Realized on Exercise (1) ($) |
Number of Shares Acquired on Vesting (#) |
Value Realized on Vesting (2) ($) |
||||||||||||
Steven A. Michaels |
— | — | 26,275 | 853,925 | ||||||||||||
Blake Wakefield |
35,300 | 857,305 | 27,493 | 886,842 | ||||||||||||
Curtis L. Doman |
105,990 | 3,427,528 | 29,487 | 951,566 | ||||||||||||
Brian Garner |
— | — | 4,913 | 160,213 | ||||||||||||
Marvin Fentress |
— | — | 15,302 | 492,077 | ||||||||||||
John W. Robinson III (3) |
490,349 | 12,986,370 | 110,307 | 3,553,615 | ||||||||||||
Douglas A. Lindsay |
— | — | 18,593 | 618,379 | ||||||||||||
C. Kelly Wall |
— | — | 3,851 | 124,072 | ||||||||||||
Ryan K. Woodley |
152,910 | 4,464,250 | 45,929 | 1,490,087 | ||||||||||||
Following the Spin-Off |
||||||||||||||||
Option Awards |
Stock Awards |
|||||||||||||||
Name |
Number of Shares Acquired on Exercise (#) |
Value Realized on Exercise (1) ($) |
Number of Shares Acquired on Vesting (#) |
Value Realized on Vesting (2) ($) |
||||||||||||
Steven A. Michaels |
— | — | — | — | ||||||||||||
Blake Wakefield |
— | — | — | — | ||||||||||||
Curtis L. Doman |
— | — | — | — | ||||||||||||
Brian Garner |
— | — | — | — | ||||||||||||
Marvin Fentress |
— | — | — | — | ||||||||||||
John W. Robinson III (3) |
— | — | 71,839 | 3,982,036 | ||||||||||||
Douglas A. Lindsay |
— | — | — | — | ||||||||||||
C. Kelly Wall |
— | — | — | — | ||||||||||||
Ryan K. Woodley |
— | — | — | — |
(1) | Reflects the value of options exercised based on the difference between the closing price of the Company’s common stock on the day of exercise and the applicable exercise price. |
(2) | Reflects the value of shares that vested based on the closing price of the Company’s common stock on the applicable vesting date. |
(3) | As discussed in the CD&A above, in connection with the Spin-Off, the Company entered into a transition agreement with Mr. Robinson, pursuant to which Mr. Robinson retired as the Company’s President and Chief Executive Officer. In connection with his transition, Mr. Robinson agreed to serve as the Non-Executive Chairman of the Board of Directors of The Aaron’s Company. The transition agreement provided that all unvested stock options, restricted stock awards and performance shares granted by the Company to him would fully vest as promptly as practicable following the completion of the Spin-Off. These awards were converted at the time of the Spin-Off as discussed in the CD&A. See “Treatment of Outstanding Long-Term Incentive Awards at the Spin-Off” “Compensation Arrangements with Certain Former Executive Officers.” |
Name of Executive |
Named Executive Officer Contributions in 2020 |
Company Contributions in 2020 (2) |
Aggregate Earnings (Loss) in Last Fiscal Year |
Aggregate Withdrawals / Distributions |
Aggregate Balance at December 31, 2020 |
|||||||||||||||
Steven A. Michaels |
$ | 13,104 | $ | 11,400 | $ | 128,472 | $ | — | $ | 900,315 | ||||||||||
Blake Wakefield |
25,052 | 11,400 | 12,239 | — | 84,648 | |||||||||||||||
Curtis L. Doman (1) |
— | — | — | — | — | |||||||||||||||
Brian Garner (1) |
— | — | — | — | — | |||||||||||||||
Marvin Fentress (1) |
— | — | — | — | — | |||||||||||||||
John W. Robinson III (1) |
— | — | — | — | — | |||||||||||||||
Douglas A. Lindsay |
91,511 | 11,400 | 20,862 | — | 205,140 | |||||||||||||||
C. Kelly Wall |
55,300 | 11,400 | 18,954 | — | 147,792 | |||||||||||||||
Ryan K. Woodley (1) |
— | — | — | — | — |
(1) | Messrs. Robinson, Woodley, Doman, Garner and Fentress did not participate in the Deferred Compensation Plan during 2020. |
(2) | The Company’s discretionary match is calculated and allocated in the first quarter of 2021 based on contributions made in 2020. Also included in the Other Compensation column of the Summary Compensation Table. |
Cash Severance |
Equity Acceleration |
Cash Bonus |
Total Value |
|||||||||||||
Steven A. Michaels |
||||||||||||||||
Voluntary Resignation/Termination for Cause (1) |
$ | — | $ | — | $ | — | $ | — | ||||||||
Termination due to Death/Disability (2) |
$ | — | $ | 4,145,197 | $ | — | $ | 4,145,197 | ||||||||
Termination by Company without Cause (1) |
$ | 4,200,000 | $ | — | $ | — | $ | 4,200,000 | ||||||||
Termination by Executive for Good Reason (3) |
$ | 4,200,000 | $ | — | $ | — | $ | 4,200,000 | ||||||||
Involuntary or Good Reason Termination after Change-in-Control (3), (4) |
$ | 4,235,544 | $ | 4,145,197 | $ | 620,300 | $ | 9,001,041 | ||||||||
|
|
|
|
|
|
|
|
|||||||||
Curtis L. Doman |
||||||||||||||||
Voluntary Resignation/Termination for Cause (1) |
$ | — | $ | — | $ | — | $ | — | ||||||||
Termination due to Death/Disability (2) |
$ | — | $ | 3,568,013 | $ | — | $ | 3,568,013 | ||||||||
Termination by Company without Cause (1) |
$ | 1,119,396 | $ | — | $ | — | $ | 1,119,396 | ||||||||
Termination by Executive for Good Reason (3) |
$ | — | $ | — | $ | — | $ | — | ||||||||
Involuntary or Good Reason Termination after CIC (3), (4) |
$ | 1,679,095 | $ | 3,568,013 | $ | 550,000 | $ | 5,797,108 | ||||||||
|
|
|
|
|
|
|
|
|||||||||
Blake W. Wakefield ( 5 ) |
||||||||||||||||
Voluntary Resignation/Termination for Cause (1) |
$ | — | $ | — | $ | — | $ | — | ||||||||
Termination due to Death/Disability (2) |
$ | — | $ | 6,670,148 | $ | — | $ | 6,670,148 | ||||||||
Termination by Company without Cause (1) |
$ | 1,519,995 | $ | — | $ | — | $ | 1,519,995 | ||||||||
Termination by Executive for Good Reason (3) |
$ | — | $ | — | $ | — | $ | — | ||||||||
Involuntary or Good Reason Termination after CIC (3), (4) |
$ | 2,279,993 | $ | 6,670,149 | $ | 900,000 | $ | 9,850,142 | ||||||||
|
|
|
|
|
|
|
|
|||||||||
Brian J. Garner |
||||||||||||||||
Voluntary Resignation/Termination for Cause (1) |
$ | — | $ | — | $ | — | $ | — | ||||||||
Termination due to Death/Disability (2) |
$ | — | $ | 671,148 | $ | — | $ | 671,148 | ||||||||
Termination by Company without Cause (1) |
$ | 972,061 | $ | — | $ | — | $ | 972,061 | ||||||||
Termination by Executive for Good Reason (3) |
$ | — | $ | — | $ | — | $ | — | ||||||||
Involuntary or Good Reason Termination after CIC (3), (4) |
$ | 1,458,092 | $ | 671,148 | $ | 475,000 | $ | 2,604,240 | ||||||||
|
|
|
|
|
|
|
|
|||||||||
Marvin A. Fentress |
||||||||||||||||
Voluntary Resignation/Termination for Cause (1) |
$ | — | $ | — | $ | — | $ | — | ||||||||
Termination due to Death/Disability (2) |
$ | — | $ | 1,689,922 | $ | — | $ | 1,689,922 | ||||||||
Termination by Company without Cause (1) |
$ | 766,145 | $ | — | $ | — | $ | 766,145 | ||||||||
Termination by Executive for Good Reason (3) |
$ | — | $ | — | $ | — | $ | — | ||||||||
Involuntary or Good Reason Termination after CIC (3), (4) |
$ | 1,149,218 | $ | 1,689,922 | $ | 325,000 | $ | 3,164,140 | ||||||||
|
|
|
|
|
|
|
|
(1) | “Cause” generally means such person’s (i) material fraud, malfeasance, gross negligence, or willful misconduct with respect to business affairs of the Company which is, or is reasonably likely to be if such action were to become known by others, directly or materially harmful to the business or reputation of the Company or any subsidiary of the Company; or (ii) conviction of or failure to contest prosecution for a felony or a crime involving moral turpitude. |
(2) | “Disability” generally means the executive’s inability, due to physical or mental injury or illness, to perform the essential functions of his position with or without reasonable accommodation for a period of 180 days, whether or not consecutive, occurring within any period of 12 consecutive months. |
(3) | “Good Reason” generally means: (i) any material reduction in the executive officer’s base salary; (ii) any material reduction in the executive officer’s authority, duties or responsibilities; (iii) any significant change in the geographic location at which the executive officer must perform his duties; or (iv) any material breach of the executive officer’s employment agreement by the Company. |
(4) | “Change in Control” generally means: (i) the acquisition (other than from the Company) by any person of beneficial ownership, of 35% or more of the combined voting power of then outstanding securities of the Company entitled to vote generally in the election of directors, which we refer to as the Outstanding Company Voting Securities, excluding, however, (1) any acquisition by the Company or (2) any acquisition by an employee benefit plan (or related trust) sponsored or maintained by the Company or any corporation controlled by the Company; (ii) a majority of the members of our Board of Directors is replaced during any 12-month period by directors whose appointment or election is not endorsed by a majority of the members of our Board of Directors before the date of the appointment or election; or (iii) consummation by the Company of a reorganization, merger, or consolidation or sale of all or substantially all of the assets of the Company; excluding, however, a transaction pursuant to which all or substantially all of the individuals or entities who are the beneficial owners, respectively, of the Outstanding Company Voting Securities immediately prior to such transaction will beneficially own, directly or indirectly, more than 50% of the combined voting power of the outstanding securities of such corporation entitled to vote generally in the election of directors of the corporation resulting from such transaction (including, without limitation, a corporation which as a result of such transaction owns the Company or all or substantially all of the Company’s assets either directly or indirectly) in substantially the same proportions relative to each other as their ownership, immediately prior to such transaction, of the Outstanding Company Voting Securities. |
(5) | Mr. Wakefield resigned as the Company’s President effective as of April 1, 2021. |
Name |
Fees Earned or Paid in Cash ($) |
Stock Awards (1) ($) |
Total ($) | |||
Kelly H. Barrett (2), (3), (10) |
65,000 | 125,000 | 190,000 | |||
Kathy T. Betty (2), (4) |
81,250 | 125,000 | 206,250 | |||
Douglas C. Curling (2), (5) |
86,250 | 125,000 | 211,250 | |||
Cynthia N. Day (2), (6) |
91,250 | 125,000 | 216,250 | |||
Walter G. Ehmer (2), (7), (10) |
65,000 | 125,000 | 190,000 | |||
Hubert L. Harris (2), (8), (10) |
65,000 | 125,000 | 190,000 | |||
Ray M. Robinson (2), (9) |
171,250 | 125,000 | 396,250 |
(1) | Represents the grant date fair value of stock awards pursuant to Financial Accounting Standards Board Codification Topic 718. |
(2) | As of December 31, 2020, each of the non-executive directors held 2,881 units of restricted stock subject to vesting, which was the number of units of restricted stock granted to them in June 2020 after taking into account the conversion of their equity awards in connection with the Spin-Off. |
(3) | Includes $12,500 in fees earned for services in the fourth quarter of 2020 which will be paid in 2021. |
(4) | Includes $21,250 in fees earned for services in the fourth quarter of 2020 which will be paid in 2021. |
(5) | Includes $22,500 in fees earned for services in the fourth quarter of 2020 which will be paid in 2021. |
(6) | Includes $23,750 in fees earned for services in the fourth quarter of 2020 which will be paid in 2021. |
(7) | Includes $12,500 in fees earned for services in the fourth quarter of 2020 which will be paid in 2021 that Mr. Ehmer deferred under the Company’s Nonqualified Deferred Compensation Plan and $52,500 in compensation Mr. Ehmer deferred under the Company’s Nonqualified Deferred Compensation Plan. |
(8) | Includes $12,500 in fees earned for services in the fourth quarter of 2020 which will be paid in 2021. |
(9) | Includes $43,750 in fees earned for services in the fourth quarter of 2020 which will be paid in 2021. |
(10) | Departed our Board of Directors on November 30, 2020 in connection with the Spin-Off to join the Board of Directors of The Aaron’s Company. |
• | the annual total compensation of our CEO was $4,960,189 (determined by annualizing Mr. Michaels’ compensation as described below); |
• | the annual total compensation of the employee identified as the median paid employee of our Company (other than the CEO) was $49,943; and |
• | The ratio between the annual total compensation of our CEO to the annual total compensation of the individual identified at median was estimated to be 100 to 1. |
• | Date Used to Determine Employee Population . For purposes of identifying the median employee, we selected December 31, 2020 as the date for determining our employee population. |
• | Identification Date . We identified our median compensated employee using the population of individuals who were actively employed on December 31, 2020 (excluding the CEO). |
• | Pay Data Used . To identify the median employee, we derived compensation information from our payroll records for fiscal year 2020. We used a consistently applied compensation measure, which included total taxable income, or its equivalent. We then annualized compensation for employees hired during 2020. |
ITEM 12. |
SECURITY OWNERSHIP OF CERTAIN BENEFICIAL OWNERS AND MANAGEMENT AND RELATED STOCKHOLDER MATTERS |
Name and Address of Beneficial Owner (1) |
Amount and Nature of Beneficial Ownership |
Percent of Class (2) |
||||||||
BlackRock Inc. 55 East 52nd Street New York, NY 10055 |
7,812,344 | (3) |
11.5 | % | ||||||
The Vanguard Group 100 Vanguard Boulevard Malvern, PA 19355 |
7,101,212 | (4) |
10.5 | % | ||||||
T. Rowe Price Associates, Inc. 100 E. Pratt Street Baltimore, MD 21202 |
5,910,834 | (5) |
8.7 | % | ||||||
Steven A. Michaels |
259,680 | (6) |
* | |||||||
Curtis L. Doman |
216,837 | (7) |
* | |||||||
Brian Garner |
20,600 | (8) |
* | |||||||
Marvin Fentress |
142,090 | (9) |
* | |||||||
Kathy T. Betty |
39,698 | (10) |
* | |||||||
Douglas C. Curling |
16,680 | (10) |
* | |||||||
Cynthia N. Day |
21,568 | (10) |
* | |||||||
Ray M. Robinson |
24,793 | (10) |
* | |||||||
John W. Robinson III |
152,676 | (11) |
* | |||||||
Douglas A. Lindsay |
16,347 | (12) |
* | |||||||
C. Kelly Wall |
1,697 | (13) |
* | |||||||
Ryan K. Woodley |
51,843 | (14) |
* | |||||||
Blake Wakefield |
107,851 | (15) |
* | |||||||
All current executive officers and directors as a group (a total of 14 persons) |
830,593 | (16) |
1.23 | % |
* | Less than 1%. |
(1) | Unless otherwise stated, the address for each beneficial owner is c/o PROG Holdings, Inc., 256 W. Data Drive, Draper, Utah 84020. |
(2) | Percentages for executive officers and directors are based on (i) 67,701,826 shares of common stock outstanding at April 15, 2021 plus (ii) for each named person or group, options exercisable by such person or group within 60 days thereafter, and any restricted stock units, restricted stock awards, and performance share units, that vest for each named person within 60 days thereafter. |
(3) | As of December 31, 2020, based on information provided in a Schedule 13G/A filed with the SEC on January 27, 2021 by BlackRock, Inc. (“BlackRock”), in which BlackRock reported that it has sole voting power with respect to 7,673,869 shares of our common stock and sole power to dispose of, or direct the disposition of, 7,812,344 shares of our common stock. |
(4) | As of December 31, 2020, based on information provided in a Schedule 13G filed with the SEC on February 10, 2021 by The Vanguard Group (“Vanguard”), in which Vanguard reported that it has sole voting power with respect to 0 shares of our common stock, shared voting power with respect to 79,806 shares of our common stock, sole power to dispose of, or direct the disposition of, 6,964,758 shares of our common stock, and shared power to dispose of, or direct the disposition of, 136,454 shares of our common stock. |
(5) | As of December 31, 2020, based on information provided in a Schedule 13G filed with the SEC on February 16, 2021 by T. Rowe Price Associates, Inc. (“T. Rowe Price”), in which T. Rowe Price reported that it has sole voting power with respect to 1,636,115 shares of our common stock and sole power to dispose of, or direct the disposition of, 5,910,834 shares of our common stock. |
(6) | Amounts represent (i) 59,149 shares of common stock held by Mr. Michaels, (ii) 164,100 shares of common stock issuable upon the exercise of options that are currently exercisable and (iii) 36,431 restricted stock awards which are entitled to voting and dividend rights as described in the related award agreement though still subject to vesting. |
(7) | Amounts represent (i) 128,331 shares of common stock held by Mr. Doman, (ii) 22,000 shares of common stock held by an LLC controlled by Mr. Doman, (iii) 48,653 shares of common stock issuable upon the exercise of options that are currently exercisable and (iv) 17,853 restricted stock awards which are entitled to voting and dividend rights as described in the related award agreement though still subject to vesting. |
(8) | Amounts represent (i) 4,438 shares of common stock held by Mr. Garner, (ii) 9,509 shares of common stock issuable upon the exercise of options that are currently exercisable and (iii) 6,653 restricted stock awards which are entitled to voting and dividend rights as described in the related award agreement though still subject to vesting. |
(9) | Amounts represent (i) 50,313 shares of common stock held by Mr. Fentress, (ii) 82,672 shares of common stock issuable upon the exercise of options that are currently exercisable and (iii) 9,105 restricted stock awards which are entitled to voting and dividend rights as described in the related award agreement though still subject to vesting. |
(10) | Amounts include 2,881 restricted stock units vesting on May 8, 2021. |
(11) | Amount represents Mr. Robinson’s ownership as of December 1, 2020, and includes (i) 80,837 shares of common stock held by Mr. Robinson, (ii) 25,170 restricted stock awards that vest within 60 days of December 1, 2020 and (iii) 46,669 performance share units that vest within 60 days of December 1, 2020. |
(12) | Amount represents Mr. Lindsay’s ownership as of December 1, 2020. |
(13) | Amount represents Mr. Wall’s ownership as of December 1, 2020. |
(14) | Amount represents Mr. Woodley’s ownership as of July 30, 2020. |
(15) | Amount represents Mr. Wakefield’s ownership as of March 31, 2021 as a result of Mr. Wakefield’s departure from the Company on April 1, 2021, and includes (i) 18,008 shares of common stock held by Mr. Wakefield, (ii) 1,073 shares of common stock held in a 401(k) plan account, (iii) 827 shares of common stock held by Mr. Wakefield’s spouse, (iv) 29,904 shares of common stock issuable upon the exercise of options that are currently exercisable and (v) 58,039 restricted stock awards which are entitled to voting and dividend rights as described in the related award agreement though still subject to vesting. |
(16) | The group information is as of April 15, 2021. The group excludes Messrs. Robinson, Lindsay and Wall since their ownership information is as of December 1, 2020. The group excludes Mr. Woodley since his ownership information is as of July 30, 2020. The group excludes Mr. Wakefield since his ownership information is as of March 31, 2021. |
Plan Category |
Number of Securities to be Issued Upon Exercise of Outstanding Options, Warrants and Rights (1) |
Weighted-Average Exercise Price of Outstanding Options, Warrants and Rights (1) |
Number of Securities Remaining Available for Future Issuance Under Equity Compensation Plans |
|||||||||
Equity Compensation Plans Approved by Shareholders |
1,479,319 | $ | 37.45 | 3,645,656 | ||||||||
Equity Compensation Plans Not Approved by Shareholders |
N/A | N/A | N/A | |||||||||
Total |
1,479,319 | $ | 37.45 | 3,645,656 |
(1) | Of the 1,479,319 securities to be issued upon exercise of outstanding options, warrants and rights, 722,828 are options with a weighted average exercise price of $37.45 and the remaining 756,491 are restricted shares and performance shares that do not have an exercise price. |
ITEM 13. |
CERTAIN RELATIONSHIPS AND RELATED TRANSACTIONS, AND DIRECTOR INDEPENDENCE |
Director |
Age |
Occupation |
Independent |
Joined Our Board | ||||
Kathy T. Betty |
65 | Former Owner and Chief Executive Officer Atlanta Dream (WNBA team) |
Yes | August 2012 | ||||
Douglas C. Curling |
66 | Managing Principal New Kent Capital LLC and New Kent Consulting LLC |
Yes | January 2016 | ||||
Cynthia N. Day |
56 | President and Chief Executive Officer Citizens Bancshares Corporation and Citizens Trust Bank |
Yes | October 2011 | ||||
Curtis L. Doman |
48 | Chief Innovation Officer PROG Holdings, Inc. |
No | August 2015 | ||||
Steven A. Michaels |
49 | President and Chief Executive Officer PROG Holdings, Inc. |
No | December 2020 | ||||
Ray M. Robinson |
73 | Former President for the Southern Region AT&T |
Yes | November 2002 |
ITEM 14. |
PRINCIPAL ACCOUNTANT FEES AND SERVICES |
Year Ended December 31, |
||||||||
2020 |
2019 |
|||||||
Audit Fees (1) |
$ | 4,838,678 | $ | 2,824,450 | ||||
Audit-Related Fees (2) |
25,000 | 584,410 | ||||||
Tax Fees (3) |
1,963,296 | 972,375 | ||||||
All Other Fees (4) |
7,200 | 7,200 | ||||||
|
|
|
|
|||||
TOTAL |
$ | 6,834,174 | $ | 4,388,435 | ||||
|
|
|
|
(1) | Includes fees associated with the annual audit of the consolidated financial statements, internal control over financial reporting, reviews of the quarterly reports on Form 10-Q, assistance with and review of documents filed with the SEC, accounting and financial reporting consultations and research work necessary to comply with generally accepted auditing standards, debt covenant letters and the audit report in the franchise disclosure document. The audit fees in 2020 also includes services performed by EY associated with the Spin-Off, including the separate carve-out audits and quarterly reviews of The Aaron’s Company and review of the Company’s Form 10 filings. Included in the fees reflected above, the Company reimbursed EY for out of pocket expenses that were incurred while performing these audit services totaling $578 and $67,437 in 2020 and 2019, respectively. |
(2) | Includes fees associated with certain due diligence efforts regarding strategic initiatives in 2020 and 2019. |
(3) | Includes fees for tax compliance, tax due diligence efforts, tax advice and tax planning services, as well as fees for tax services provided in connection with the Spin-Off. |
(4) | Includes fees associated with the Company’s online accounting research subscription. |
ITEM 15. |
EXHIBITS, FINANCIAL STATEMENTS AND SCHEDULES |
Exhibit No. |
Description of Exhibit | |
31.1* |
Certification of the Chief Executive Officer of PROG Holdings, Inc. pursuant to Section 302 of the Sarbanes-Oxley Act of 2002. | |
31.2* |
Certification of the Chief Financial Officer of PROG Holdings, Inc. pursuant to Section 302 of the Sarbanes-Oxley Act of 2002. | |
104 | Cover Page Interactive Data File (formatted as Inline XBRL and embedded within Exhibit 101) |
* | Filed herewith |
PROG Holdings, Inc. | ||
By: | /s/ Brian Garner | |
Brian Garner | ||
Chief Financial Officer |
Year Ended December 31, 2020 |
||||||||||||||||||||
(in Thousands) |
Progressive Leasing 2 |
Aaron’s Business |
Vive |
Consolidated |
Progressive Leasing + Vive 2 |
|||||||||||||||
Net Loss - GAAP |
$ | (40,718 | ) | |||||||||||||||||
Income Taxes |
(61,743 | ) | ||||||||||||||||||
|
|
|||||||||||||||||||
Earnings (Loss) Before Income Taxes |
$ | 299,300 | $ | (387,834 | ) | $ | (13,928 | ) | (102,462 | ) | $ | 285,372 | ||||||||
Interest Expense |
11,902 | (4,950 | ) | 3,860 | 10,812 | 15,762 | ||||||||||||||
Depreciation & Amortization |
31,050 | 70,743 | 1,268 | 103,061 | 32,318 | |||||||||||||||
|
|
|
|
|
|
|
|
|
|
|||||||||||
EBITDA |
342,252 | (322,041 | ) | (8,800 | ) | 11,411 | 333,452 | |||||||||||||
Restructuring Expenses |
— | 33,318 | — | 33,318 | — | |||||||||||||||
Separation related costs |
5,886 | 30,114 | — | 36,000 | 5,886 | |||||||||||||||
Impairment of Goodwill |
— | 446,893 | — | 446,893 | — | |||||||||||||||
Sales & Marketing contract termination fee 3 |
— | 14,663 | — | 14,663 | — | |||||||||||||||
Sales & Marketing contract termination expense savings 3 |
— | (11,417 | ) | — | (11,417 | ) | — | |||||||||||||
Insurance recoveries on legal expenses from the FTC matter |
(835 | ) | — | — | (835 | ) | (835 | ) | ||||||||||||
Vive change in allowance |
— | — | 16,434 | 16,434 | 16,434 | |||||||||||||||
|
|
|
|
|
|
|
|
|
|
|||||||||||
Adjusted EBITDA - used for management incentive purposes |
$ | 347,303 | $ | 191,530 | $ | 7,634 | $ | 546,467 | $ | 354,937 | ||||||||||
|
|
|
|
|
|
|
|
|
|
(1) |
Estimated performance as described above. |
(2) |
The adjusted EBITDA metric used to evaluate Progressive Leasing for incentive purposes includes the consolidation of Progressive Leasing and Vive. |
(3) |
The Aaron’s Business operating segment incurred an early termination fee of $14.7 million related to a sales and marketing contract that was canceled in the first quarter of 2020, which resulted in the elimination of $11.4 million of sales and marketing expenses that were budgeted for the second, third, and fourth quarters of 2020. |
Year Ended December 31, 2020 |
||||||||||||||||||||
(In Thousands) |
Progressive Leasing 2 |
Aaron’s Business |
Vive |
Consolidated |
Progressive Leasing + Vive 2 |
|||||||||||||||
Revenues - GAAP |
$ | 2,443,959 | $ | 1,742,872 | $ | 40,332 | $ | 4,227,163 | $ | 2,484,291 | ||||||||||
Vive provision for credit losses 3 |
— | — | (31,969 | ) | (31,969 | ) | (31,969 | ) | ||||||||||||
Vive change in allowance 3 |
— | — | 16,434 | 16,434 | 16,434 | |||||||||||||||
Discretionary adjustment 4 |
70,000 | — | — | — | 70,000 | |||||||||||||||
|
|
|
|
|
|
|
|
|
|
|||||||||||
Adjusted Revenues - used for management incentive purposes |
$ | 2,513,959 | $ | 1,742,872 | $ | 24,797 | $ | 4,211,628 | $ | 2,538,756 | ||||||||||
|
|
|
|
|
|
|
|
|
|
(1) |
Estimated performance as described above. |
(2) |
The adjusted revenue metric used to evaluate Progressive Leasing for incentive purposes includes the consolidation of Progressive Leasing and Vive. |
(3) |
The adjusted revenue metric used to evaluate Progressive Leasing, Vive, and consolidated revenues is reduced by Vive’s provision of credit losses and adjusts for Vive’s change in loan loss allowance. |
(4) |
The Compensation Committee approved an upward adjustment for Progressive Leasing’s 2020 revenue as described above. This adjustment did not impact the consolidated incentive metrics. |
Year Ended December 31, 2020 |
||||||||||||||||||||
(in Thousands) |
Progressive Leasing 2 |
Aaron’s Business |
Vive |
Consolidated |
Progressive Leasing + Vive 2 |
|||||||||||||||
Net Loss - GAAP |
$ | (40,718 | ) | |||||||||||||||||
Income Taxes |
(61,743 | ) | ||||||||||||||||||
|
|
|||||||||||||||||||
Earnings (Loss) Before Income Taxes |
$ | 299,300 | $ | (387,834 | ) | $ | (13,928 | ) | (102,462 | ) | $ | 285,372 | ||||||||
Intangible amortization 5 |
21,683 | 5,839 | — | 27,522 | 21,683 | |||||||||||||||
Restructuring Expenses |
— | 33,318 | — | 33,318 | — | |||||||||||||||
Separation related costs |
5,886 | 30,114 | — | 36,000 | 5,886 | |||||||||||||||
Impairment of Goodwill |
— | 446,893 | — | 446,893 | — | |||||||||||||||
Sales & Marketing contract termination fee 3 |
— | 14,663 | — | 14,663 | — | |||||||||||||||
Sales & Marketing contract termination expense savings 3 |
— | (11,417 | ) | — | (11,417 | ) | — | |||||||||||||
Insurance recoveries on legal expenses from the FTC matter |
(835 | ) | — | — | (835 | ) | (835 | ) | ||||||||||||
Vive change in allowance |
— | — | 16,434 | 16,434 | 16,434 | |||||||||||||||
Intercompany interest income, net of third-party interest expense 4 |
— | (4,950 | ) | — | — | — | ||||||||||||||
|
|
|
|
|
|
|
|
|
|
|||||||||||
Adjusted Pre-tax income - used for management incentive purposes |
$ | 326,034 | $ | 126,626 | $ | 2,506 | $ | 460,116 | $ | 328,540 | ||||||||||
|
|
|
|
|
|
|
|
|
|
(1) |
Estimated performance as described above. |
(2) |
The adjusted pre-tax income metric used to evaluate Progressive Leasing for incentive purposes includes the consolidation of Progressive Leasing and Vive. |
(3) |
The Aaron’s Business operating segment incurred an early termination fee of $14.7 million related to a sales and marketing contract that was canceled in the first quarter of 2020, which resulted in the elimination of $11.4 million of sales and marketing expenses that were budgeted for the second, third, and fourth quarters of 2020. For purposes of measuring management’s performance compared to the budgeted target, the Compensation Committee determined that both adjustments were appropriate. |
(4) |
Represents Aaron’s Business intercompany interest income, net of third party interest expense. This adjustment did not impact Progressive Leasing and Vive’s intercompany interest expense nor the consolidated incentive metrics. |
(5) |
Represents Progressive Leasing’s amortization expense related to intangible assets from the Company’s acquisition of Progressive Leasing and Aaron’s Business amortization expense for franchisee acquisitions. |
Three Months Ended |
||||||||||||||||
(In Thousands) |
March 31, 2020 |
June 30, 2020 |
September 30, 2020 |
December 31, 2020 |
||||||||||||
Operating (Loss) Profit - GAAP |
$ | (408,895 | ) | $ | 93,442 | $ | 145,815 | $ | 89,917 | |||||||
Restructuring Expense |
22,286 | 6,991 | 4,041 | — | ||||||||||||
Impairment of Goodwill |
446,893 | — | — | — | ||||||||||||
Insurance recoveries on legal expenses for FTC matter |
— | — | (835 | ) | — | |||||||||||
Sales & Marketing contract termination fee |
14,663 | — | — | — | ||||||||||||
Sales & Marketing contract termination expense savings |
— | (3,901 | ) | (3,911 | ) | (3,606 | ) | |||||||||
Separation related costs |
— | 2,522 | 8,274 | — | ||||||||||||
Vive change in Allowance for Loan Losses |
7,220 | (901 | ) | 4,722 | 5,976 | |||||||||||
|
|
|
|
|
|
|
|
|||||||||
Adjusted Operating Profit Before Tax |
82,167 | 98,153 | 158,106 | 92,287 | ||||||||||||
Income Taxes |
(19,876 | ) | (26,150 | ) | (35,927 | ) | (23,675 | ) | ||||||||
|
|
|
|
|
|
|
|
|||||||||
Adjusted Operating Profit After Tax (a) |
$ | 62,291 | $ | 72,003 | $ | 122,179 | $ | 68,612 | ||||||||
|
|
|
|
|
|
|
|
|||||||||
Average Capital 2 (b) |
$ | 1,950,143 | $ | 1,688,575 | $ | 1,481,694 | $ | 1,915,202 | ||||||||
Return on Capital (c) = (a)/(b) |
3.2 | % | 4.3 | % | 8.2 | % | 3.6 | % | ||||||||
Annual Return on Capital [sum (c) 1 |
19.3 | % |
(1) |
Estimated performance as described above. |
(2) |
Average Capital is defined as the sum of the average net debt (debt less cash and cash equivalents) and the average total shareholders’ equity for each three month period. Average Capital for the three months ended December 31, 2020 is estimated as described above. Average total shareholders’ equity has been adjusted by the tax-effected amounts of the adjustments identified in the table above. |