Exhibit 99.1

TDCX reports 19.6% revenue growth for full year 2022
Singapore, March 8th, 2023 – TDCX Inc. (NYSE: TDCX) (“TDCX” or the “Company”), an award-winning digital customer experience (CX) solutions provider for technology and blue-chip companies, today announced its unaudited financial results for the fourth quarter and full year ended December 31, 2022.
Full Year 2022 Financial Highlights
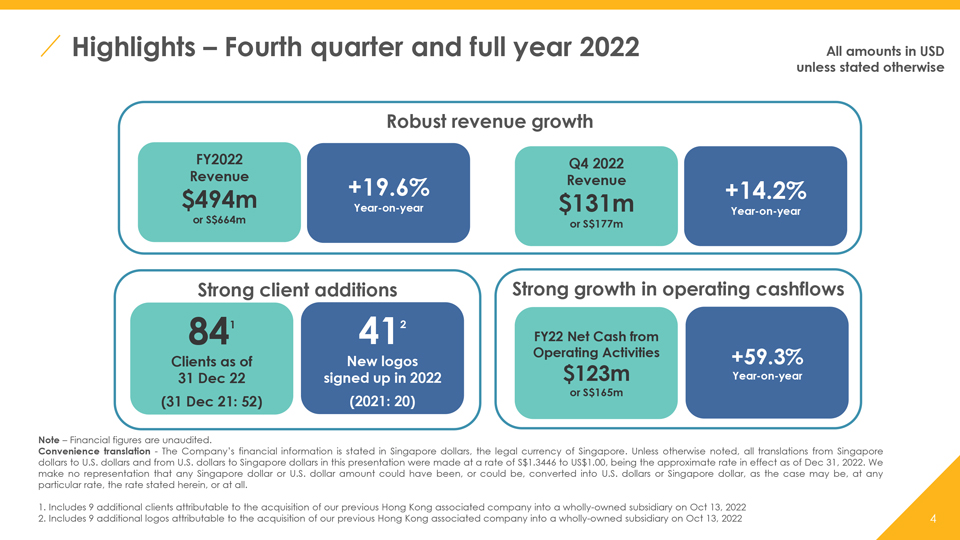
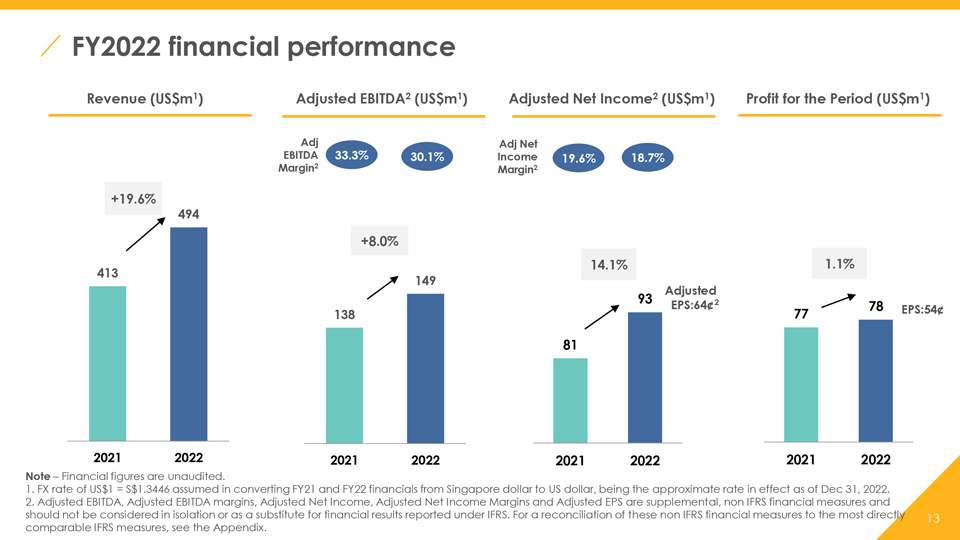
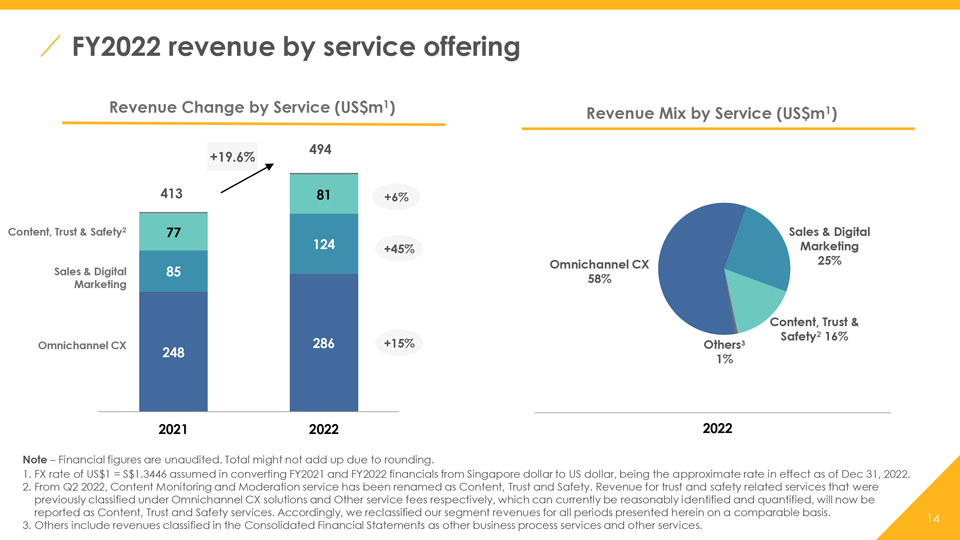
| • | Total revenue of US$493.9 million, up 19.6% year-on-year |
| • | Profit for the period was US$78.0 million, up 1.1% year-on-year |
| • | Adjusted Net Income1,4, which excludes the impact of share-based compensation for a like-for-like comparison with the prior year, was US$92.5 million, up 14.1% year-on-year |
| • | Net Cash from Operating Activities of US$123.0 million, up 59.3% year-on-year |
Fourth Quarter 2022 Financial Highlights
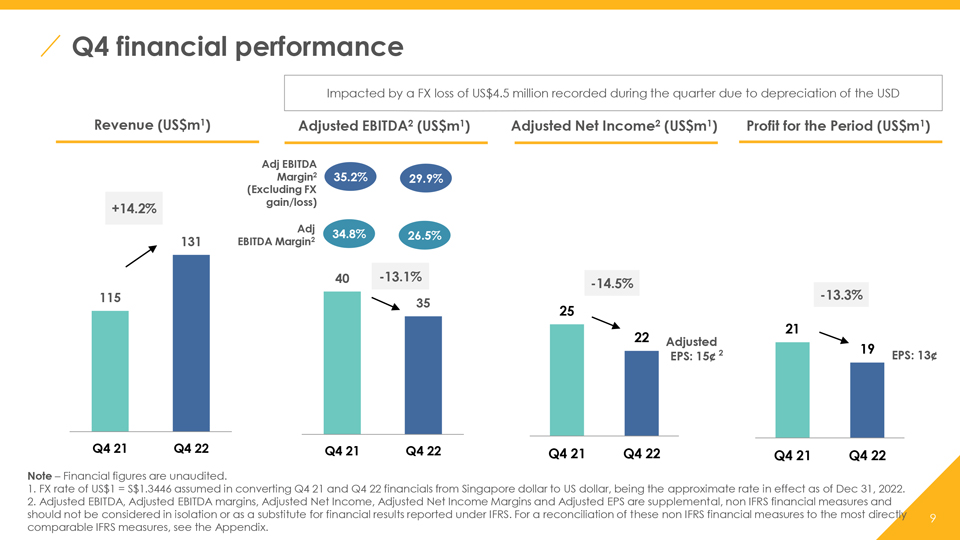
| • | Total revenue of US$131.4 million, up 14.2% year-on-year |
| • | Profit for the period was US$18.6 million, down 13.3% from US$21.5 million in the same period last year, due largely to a foreign exchange loss of US$4.5 million recorded during the quarter with the depreciation of the US dollar |
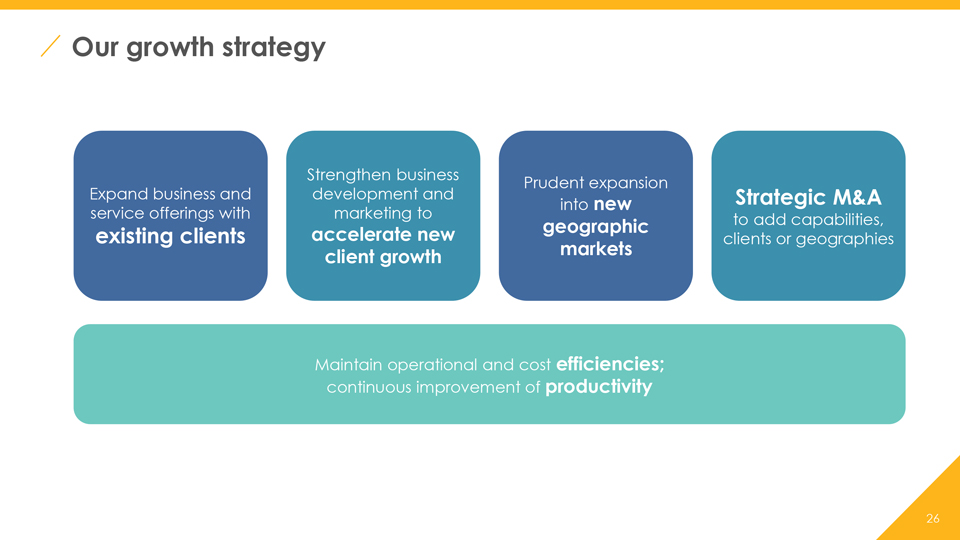
Mr. Laurent Junique, Chief Executive Officer and Founder of TDCX, said, “Despite the challenging year, we remained steadfast in executing our growth strategy and achieved our growth expectations, with an almost 20 per cent increase in revenue year-on-year. We doubled the number of new logos signed up in 2022 and are seeing increased revenue contribution from our newer markets, such as India, Korea and Türkiye.
“While the economic challenges we saw last year are expected to have a spillover effect into 2023, we are focused on strengthening our capabilities through our network expansion strategy and initiatives to deepen our relationship with our clients, such as the launch of our Digital CX Center of Excellence in Singapore. The Center will enable us to provide more dedicated strategic advisory to our clients – an area that we are seeing increased interest in – to help solve their CX challenges. Such client requests demonstrate the strategic role that CX plays in the future economy and our sector’s potential.
“With the COVID-era largely behind us, we are optimistic about the continued recovery of sectors such as travel and hospitality and markets such as China. We are confident that our strategy of pursuing growth while ensuring stability will continue to create value for our clients and other stakeholders.”
| (US$ million, except for %)2 |
FY2021 | FY2022 | % Change | Q4 2021 | Q4 2022 | % Change | ||||||||||||||||||
| Revenue |
412.9 | 493.9 | +19.6 | % | 115.1 | 131.4 | +14.2 | % | ||||||||||||||||
| Profit for the period |
77.2 | 78.0 | +1.1 | % | 21.5 | 18.6 | -13.3 | % | ||||||||||||||||
| Adjusted Net Income1,4 |
81.1 | 92.5 | +14.1 | % | 25.3 | 21.7 | -14.5 | % | ||||||||||||||||
| Adjusted EBITDA1,3 |
137.6 | 148.6 | +8.0 | % | 40.1 | 34.9 | -13.1 | % | ||||||||||||||||
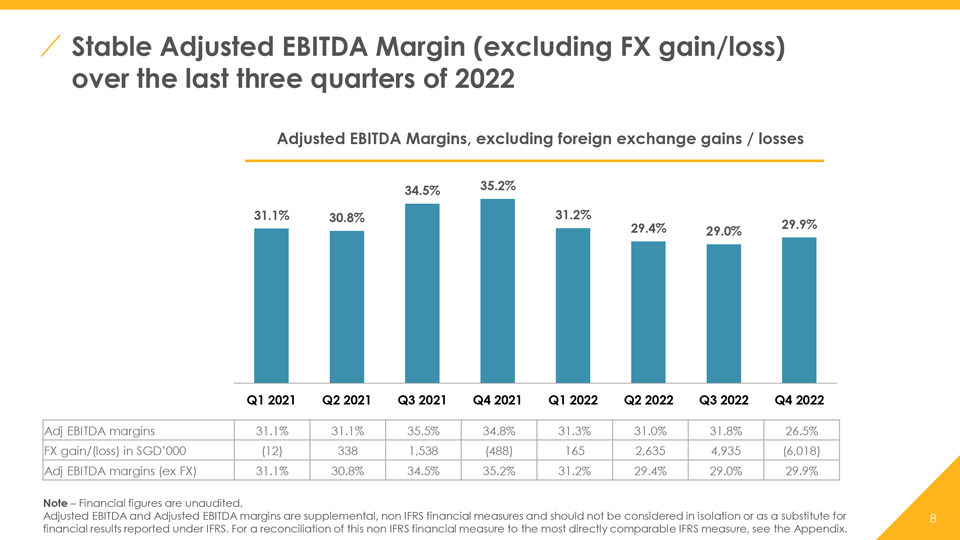
| Adjusted EBITDA Margins1,3 (%) |
33.3 | % | 30.1 | % | 34.8 | % | 26.5 | % | ||||||||||||||||
Business Highlights
Strong Client Additions
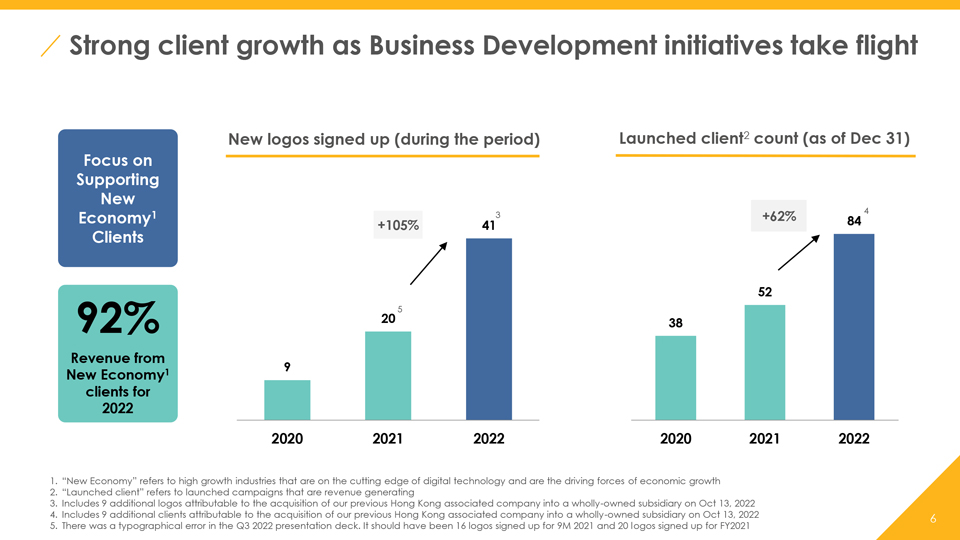
| • | Signed up 415 new logos in 2022, 105% higher than the 20 logos in 2021 |
| • | 846 launched clients7 as of December 31, 2022, a 62% increase as compared with 52 launched clients as of December 31, 2021 |
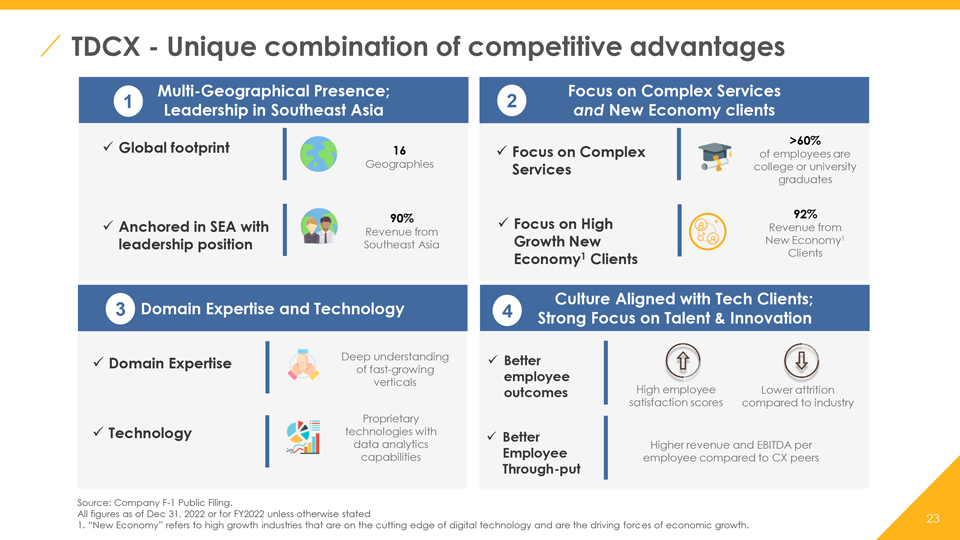
| • | 92% revenue contribution from new economy8 clients for 2022 |
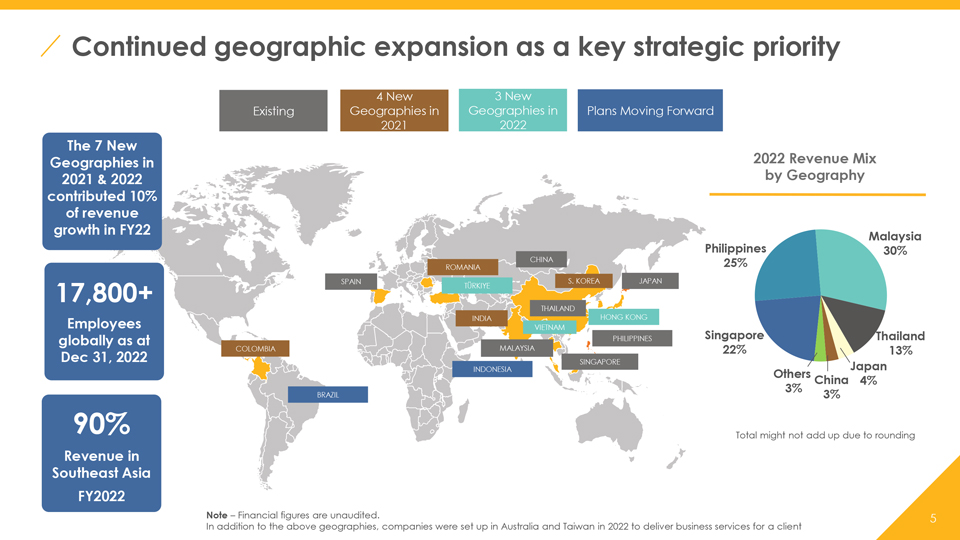
Continued Geographic Expansion as a key strategic priority
| • | Expanded to 16 geographies as of December 31, 2022 |
Full Year 2023 Outlook
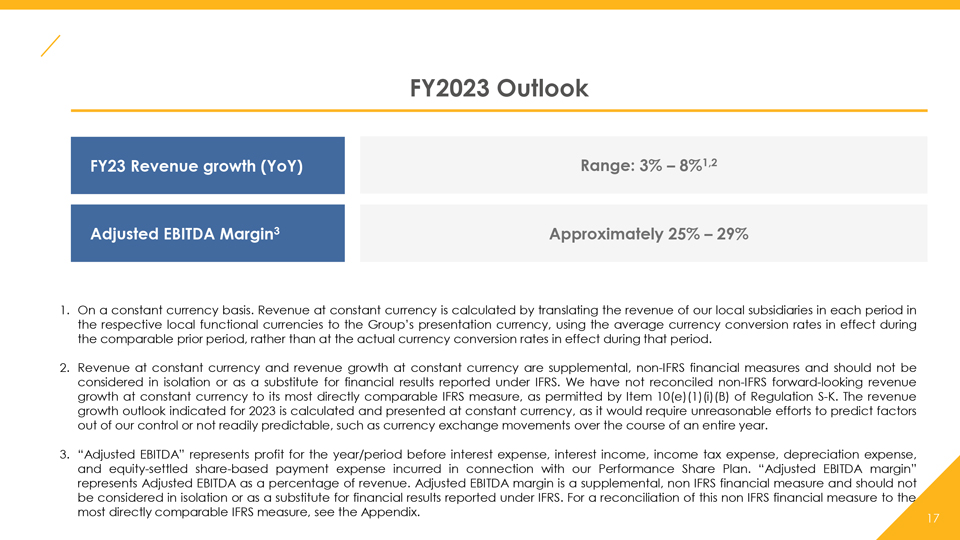
For the full year 2023, TDCX expects its financial results to be:
| 2023 Outlook | ||
| Revenue growth (YoY) | Range: 3% - 8% (On a constant currency basis1,9) | |
| Adjusted EBITDA margin1,3 | Approximately 25% - 29% | |
| 1 | Adjusted EBITDA, Adjusted EBITDA margin, Adjusted Net Income, Adjusted Net Income margin, revenue at constant currency and revenue growth at constant currency are supplemental non-IFRS financial measures and should not be considered in isolation or as a substitute for financial results reported under IFRS (see “Reconciliation of non-IFRS financial measures to the nearest comparable IFRS measures” in the Form 6-K or presentation slides for more details). |
| 2 | FX rate of US$1 = S$1.3446, being the approximate rate in effect as of December 31, 2022, assumed in converting financials from SG dollar to US dollar. |
| 3 | Adjusted EBITDA represents profit for the period before interest expense, interest income, income tax expense, depreciation expense and equity-settled share-based payment expense incurred in connection with our TDCX Performance Share Plan (the “Performance Share Plan”), which was adopted on August 26, 2021 and allows us to offer Class A ordinary shares or ADSs to our employees, officers, executive directors and consultants. “Adjusted EBITDA margin” represents Adjusted EBITDA as a percentage of revenue. |
| 4 | “Adjusted Net Income” represents profit for the period before equity-settled share-based payment expense incurred in connection with our Performance Share Plan, net of any tax impact of such adjustments. “Adjusted Net Income margin” represents Adjusted Net Income as a percentage of revenue. |
| 5 | Includes 9 additional logos attributable to the acquisition of our previous Hong Kong associated company into a wholly-owned subsidiary on October 13, 2022. |
| 6 | Includes 9 additional clients attributable to the acquisition of our previous Hong Kong associated company into a wholly-owned subsidiary on October 13, 2022. |
| 7 | “Launched client” refers to launched campaigns that are revenue generating. |
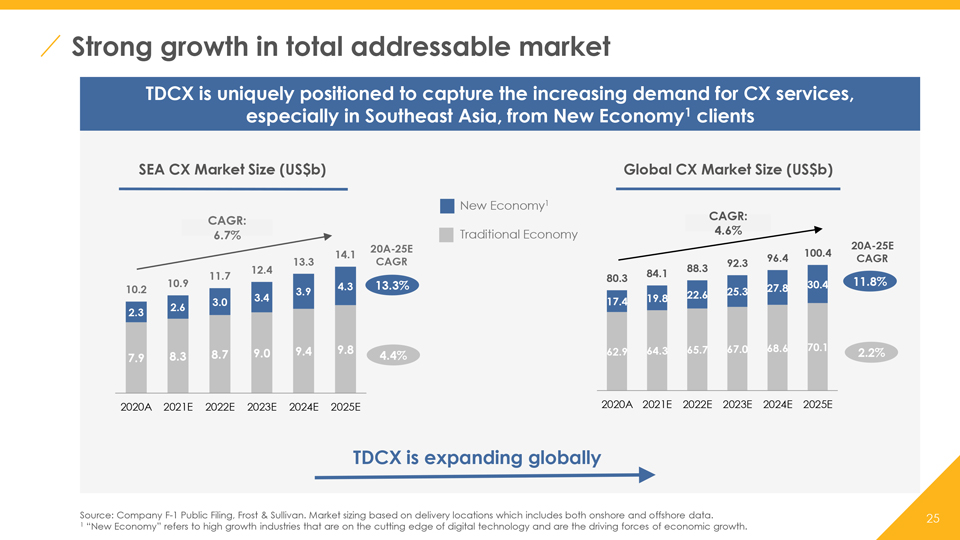
| 8 | “New economy” refers to high growth industries that are on the cutting edge of digital technology and are the driving forces of economic growth. |
| 9 | Revenue at constant currency is calculated by translating the revenue of our local subsidiaries in each period in the respective local functional currencies to the Group’s presentation currency, using the average currency conversion rates in effect during the comparable prior period, rather than at the actual currency conversion rates in effect during that period. We have not reconciled non-IFRS forward-looking revenue growth at constant currency to its most directly comparable IFRS measure, as permitted by Item 10(e)(1)(i)(B) of Regulation S-K. The revenue growth outlook indicated for 2023 is calculated and presented at constant currency, as it would require unreasonable efforts to predict factors out of our control or not readily predictable, such as currency exchange movements over the course of an entire year. |
Webcast and Conference Call Information
TDCX senior management will host a conference call to discuss the fourth quarter 2022 unaudited financial results.
A live webcast of this conference call will be available on TDCX’s website. Access information on the conference call and webcast is as follows:
| Date and time: | March 7, 2023, 7:30 PM (U.S. Eastern Time) | |
| March 8, 2023, 8:30 AM (Singapore / Hong Kong Time) | ||
| Webcast link: | https://events.q4inc.com/earnings/TDCX/Q4-2022 | |
| Dial in numbers: | USA Toll Free: +1 855 9796 654 United States (Local): +1 646 664 1960 | |
| Singapore: +65 3163 4602 Hong Kong: +852 580 33 413 | ||
| UK Toll Free +44 0800 640 6441 All other locations: +44 20 3936 2999 | ||
| Participant Access Code: | 598306 | |
A replay of the conference call will be available at TDCX’s investor relations website (investors.tdcx.com). An archived webcast will be available at the same link above.
For enquiries, please contact:
Investors / Analysts: Jason Lim
lim.jason@tdcx.com
Media: Eunice Seow
eunice.seow@tdcx.com
About TDCX INC.
Singapore-headquartered TDCX provides transformative digital CX solutions, enabling world-leading and disruptive brands to acquire new customers, to build customer loyalty and to protect their online communities.
TDCX helps clients achieve their customer experience aspirations by harnessing technology, human intelligence and its global footprint. It serves clients in fintech, gaming, technology, home sharing and travel, digital advertising and social media, streaming and e-commerce. TDCX’s expertise and strong footprint in Asia has made it a trusted partner for clients, particularly high-growth, new economy companies, looking to tap the region’s growth potential.
TDCX’s commitment to delivering positive outcomes for our clients extends to its role as a responsible corporate citizen. Its Corporate Social Responsibility program focuses on positively transforming the lives of its people, its communities and the environment.
TDCX employs more than 17,800 employees across 28 campuses globally, specifically Singapore, Malaysia, Thailand, Philippines, Mainland China, Hong Kong, South Korea, Japan, India, Romania, Spain, Colombia, Türkiye and Vietnam. For more information, please visit www.tdcx.com.
Convenience Translation
The Company’s financial information is stated in Singapore dollars, the legal currency of Singapore. Unless otherwise noted, all translations from Singapore dollars to U.S. dollars and from U.S. dollars to Singapore dollars in this press release were made at a rate of S$1.3446 to US$1.00, the approximate rate in effect as of December 31, 2022. We make no representation that any Singapore dollar or U.S. dollar amount could have been, or could be, converted into U.S. dollars or Singapore dollar, as the case may be, at any particular rate, the rate stated herein, or at all.
Non-IFRS Financial Measure
To supplement our consolidated financial statements, which are prepared and presented in accordance with IFRS, we use the following non-IFRS financial measure to help evaluate our operating performance:
“EBITDA” represents profit for the year/ period before interest expense, interest income, income tax expense and depreciation expense. “EBITDA margin” represents EBITDA as a percentage of revenue. “Adjusted EBITDA” represents profit for the year/ period before interest expense, interest income, income tax expense, depreciation expense and equity-settled share-based payment expense incurred in connection with our Performance Share Plan. “Adjusted EBITDA margin” represents Adjusted EBITDA as a percentage of revenue.
“Adjusted Net Income” represents profit for the year/ period before equity-settled share-based payment expense incurred in connection with our Performance Share Plan, net of any tax impact of such adjustments. “Adjusted Net Income margin” represents Adjusted Net Income as a percentage of revenue.
Revenue at constant currency is calculated by translating the revenue of our local subsidiaries in each period in the respective local functional currencies to the Group’s presentation currency, using the average currency conversion rates in effect during the comparable prior period, rather than at the actual currency conversion rates in effect during that period.
We believe that EBITDA, EBITDA margin, Adjusted EBITDA, Adjusted EBITDA margin, Adjusted Net Income, Adjusted Net Income margin, revenue at constant currency and revenue growth at constant currency help us to compare our operating performance on a consistent basis by removing the impact of items not directly resulting from our core operations, and thereby help us to identify underlying trends in our operating results, enhancing our understanding of past performance and future prospects.
The above non-IFRS financial measures have limitations as analytical tools and should not be considered in isolation or construed as an alternative to revenue, net income, or any other measure of performance or as an indicator of our operating performance. The non-IFRS financial measures presented here may not be comparable to similarly titled measures presented by other companies because other companies may calculate similarly titled measures differently. For more information on the non-IFRS financial measures, please see the form 6-K section captioned “Non-IFRS Financial Measures” or the presentation slides.
Safe Harbor Statement
This announcement contains forward-looking statements. These statements are made under the “safe harbor” provisions of the U.S. Private Securities Litigation Reform Act of 1995. In some cases, you can identify these forward-looking statements by the use of words such as “outlook,” “believes,” “expects,” “potential,” “continues,” “may,” “will,” “should,” “could,” “seeks,” “predicts,” “intends,” “trends,” “plans,” “estimates,” “anticipates” or the negative version of these words or other comparable words. Among other things, the outlook for the full year, the business outlook and quotations from management in this announcement, as well as the Company’s strategic and operational plans, contain forward-looking statements. The Company may also make written or oral forward-looking statements in its periodic reports to the U.S. Securities and Exchange Commission (the “SEC”), in its annual report to shareholders, in press releases and other written materials and in oral statements made by its officers, directors or employees to third parties. Statements that are not historical facts, including statements about the Company’s beliefs and expectations, are forward-looking statements. Forward-looking statements involve inherent risks and uncertainties. A number of factors could cause actual results to differ materially from those contained in any forward-looking statement, including but not limited to the following: the performance of TDCX’s largest clients; the successful implementation of its business strategy; its ability to compete effectively; its ability to maintain its pricing, control costs or continue to grow its business; the effects of the novel coronavirus (COVID-19) on its business; the continued service of its founder and certain of its key employees and management; its ability to attract and retain enough highly trained employees; its exposure to various risks in Southeast Asia; its contractual relationship with key clients; clients and prospective clients’ spending on omnichannel CX solutions; its spending on employee salaries and benefits expenses; and its involvement in any disputes, legal, regulatory, and other proceedings arising out of its business operations. Further information regarding these and other risks is included in the Company’s filings with the SEC. All information provided in this press release and in the attachments is as of the date of this press release, and the Company undertakes no obligation to update any forward-looking statement, except as required under applicable law.
UNAUDITED CONDENSED INTERIM CONSOLIDATED STATEMENT OF PROFIT OR LOSS AND OTHER COMPREHENSIVE INCOME
| For the three months ended December 31, | ||||||||||||
| 2022 | 2021 | |||||||||||
| US$’000 | S$’000 | S$’000 | ||||||||||
| Revenue |
131,393 | 176,671 | 154,763 | |||||||||
| Employee benefits expense |
(85,386 | ) | (114,810 | ) | (97,674 | ) | ||||||
| Depreciation expense |
(7,937 | ) | (10,672 | ) | (9,605 | ) | ||||||
| Rental and maintenance expense |
(2,001 | ) | (2,690 | ) | (2,092 | ) | ||||||
| Recruitment expense |
(2,532 | ) | (3,404 | ) | (3,340 | ) | ||||||
| Transport and travelling expense |
(495 | ) | (666 | ) | (476 | ) | ||||||
| Telecommunication and technology expense |
(2,433 | ) | (3,271 | ) | (2,493 | ) | ||||||
| Interest expense |
(408 | ) | (549 | ) | (1,964 | ) | ||||||
| Other operating expense |
(7,044 | ) | (9,472 | ) | (2,548 | ) | ||||||
| Share of profit from an associate |
3 | 4 | 23 | |||||||||
| Interest income |
1,061 | 1,426 | 251 | |||||||||
| Other operating income |
294 | 395 | 2,551 | |||||||||
|
|
|
|
|
|
|
|||||||
| Profit before income tax |
24,515 | 32,962 | 37,396 | |||||||||
| Income tax expenses |
(5,914 | ) | (7,952 | ) | (8,550 | ) | ||||||
|
|
|
|
|
|
|
|||||||
| Profit for the period |
18,601 | 25,010 | 28,846 | |||||||||
| Item that will not be reclassified to profit or loss: |
||||||||||||
| Remeasurement of retirement benefit obligation |
687 | 924 | 276 | |||||||||
| Item that may be reclassified subsequently to profit or loss: |
||||||||||||
| Exchange differences on translation of foreign operations |
(12,033 | ) | (16,179 | ) | (2,824 | ) | ||||||
|
|
|
|
|
|
|
|||||||
| Total comprehensive income for the period |
7,255 | 9,755 | 26,298 | |||||||||
|
|
|
|
|
|
|
|||||||
| Profit attributable to: |
||||||||||||
| - Owners of TDCX Inc. |
18,601 | 25,010 | 28,846 | |||||||||
| - Non-controlling interests |
— | — | — | |||||||||
|
|
|
|
|
|
|
|||||||
| 18,601 | 25,010 | 28,846 | ||||||||||
|
|
|
|
|
|
|
|||||||
| Total comprehensive income attributable to: |
||||||||||||
| - Owners of TDCX Inc. |
7,255 | 9,755 | 26,298 | |||||||||
| - Non-controlling interests |
— | — | — | |||||||||
|
|
|
|
|
|
|
|||||||
| 7,255 | 9,755 | 26,298 | ||||||||||
|
|
|
|
|
|
|
|||||||
| Basic earnings per share (in US$ or S$) (1) |
0.13 | 0.17 | 0.20 | |||||||||
| Diluted earnings per share (in US$ or S$) (1) |
0.13 | 0.17 | 0.20 | |||||||||
|
|
|
|
|
|
|
|||||||
| (1) | Basic and diluted earnings per share |
| For the three months ended December 31, |
||||||||
| 2022 | 2021 | |||||||
| Weighted average number of ordinary shares for the purposes of basic earnings per share |
144,921,462 | 144,542,344 | ||||||
| Weighted average number of ordinary shares for the purposes of diluted earnings per share |
144,921,462 | 144,646,728 | ||||||
|
|
|
|
|
|||||
The translation of Singapore Dollar amounts into United States Dollar amounts (“USD”) for the unaudited condensed interim consolidated statement of profit or loss and other comprehensive income above are included solely for the convenience of readers outside of Singapore and have been made at the rate of S$1.3446 to US$1.00, the approximate rate of exchange at December 31, 2022. Such translations should not be construed as representations that the Singapore Dollar amounts could be converted into USD at that or any other rate.
Comparison of the Three Months Ended December 31, 2022 and 2021
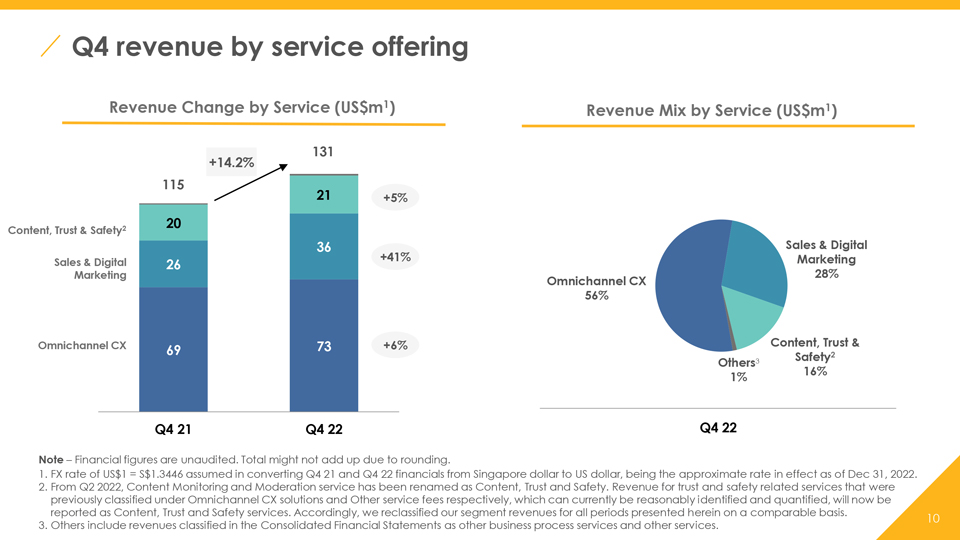
Revenue. Our revenue increased by 14.2% to S$176.7 million (US$131.4 million) for the three months ended December 31, 2022 from S$154.8 million for the three months ended December 31, 2021 primarily driven by a 40.7% increase in revenue from sales and digital marketing services followed by omnichannel CX solutions services rendered.
| • | Our revenue from omnichannel CX solutions increased by 6.6% to S$98.5 million (US$73.2 million) from S$92.3 million for the same period of 2021 primarily due to higher business volumes driven by the expansion of existing campaigns by clients in the travel and hospitality, and technology verticals, partially offset by a decrease in demand from existing clients in the digital advertising and media vertical. |
| • | Our revenue from sales and digital marketing services increased by 40.7% to S$48.9 million (US$36.4 million) from S$34.8 million for the same period of 2021 primarily due to the expansion of existing campaigns by our key digital advertising and media clients and additional contributions from new clients in 2022 continuing to scale up. |
| • | Our revenue from content, trust and safety services increased by 4.6% to S$28.1 million (US$20.9 million) from S$26.8 million for the same period of 2021 primarily due to higher business volumes from existing clients. |
| • | Our revenue from our other service fees increased by 50.9% to S$1.2 million (US$0.9 million) from S$0.8 million for the same period of 2021 primarily due to an expansion of existing campaigns. |
The following table sets forth our service provided by amount for the three months ended December 31, 2022 and 2021.
| For the three months ended December 31, | ||||||||||||
| 2022 | 2021 | |||||||||||
| US$’000 | S$’000 | S$’000 | ||||||||||
| Revenue by service |
||||||||||||
| Omnichannel CX solutions * |
73,220 | 98,452 | 92,340 | |||||||||
| Sales and digital marketing |
36,399 | 48,942 | 34,789 | |||||||||
| Content, trust and safety * |
20,862 | 28,052 | 26,822 | |||||||||
| Other service fees * # |
912 | 1,225 | 812 | |||||||||
|
|
|
|
|
|
|
|||||||
| Total revenue |
131,393 | 176,671 | 154,763 | |||||||||
|
|
|
|
|
|
|
|||||||
| * | In the second quarter of 2022, we renamed our “content monitoring and moderation” services as “content, trust and safety” services which entailed some reclassification of certain of our revenue from our omnichannel CX solutions services and our other service fees into content, trust and safety services. Accordingly, we reclassified our segment revenue for all periods presented herein on a comparable basis except where otherwise noted. See “Segment Reclassification” below. |
| # | Other service fees comprise revenue from other business process services and revenue from other services. |
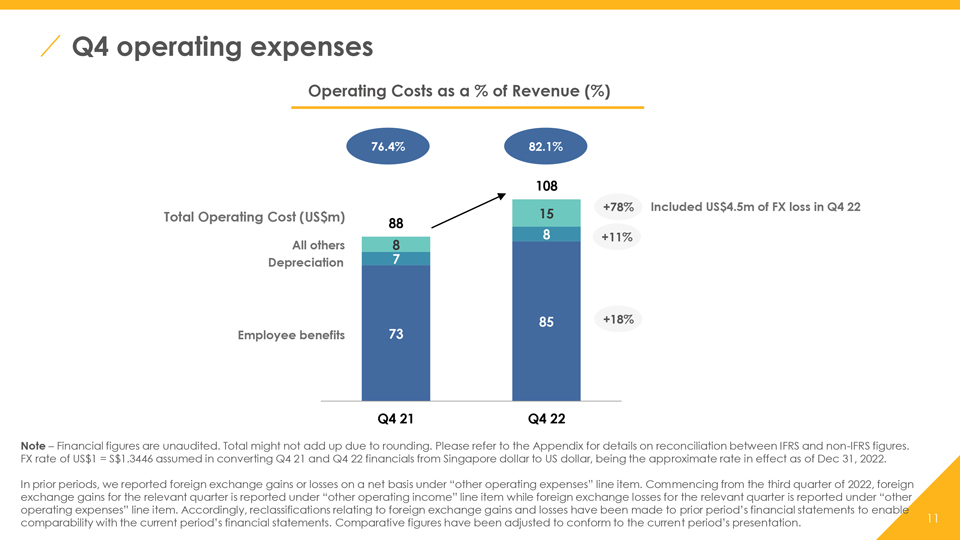
Employee Benefits Expense. Our employee benefits expense increased by 17.5% to S$114.8 million (US$85.4 million) from S$97.7 million for the same period of 2021 due to higher employee headcount, wage adjustments and share-based payment expense arising from the implementation of the TDCX Performance Share Plan (the “Performance Share Plan”) in November 2021. Our average number of employees in the fourth quarter of 2022 increased by 24.0% compared to the same period of 2021 driven by business volumes requirements of current campaigns over the course of 2022, and staff resourcing requirements of new campaign launches in the second half of 2022.
Depreciation Expense. Our depreciation expense increased by 11.1% to S$10.7 million (US$7.9 million) from S$9.6 million for the same period of 2021 primarily due to depreciation expense attributable to our office space expansion to support our business growth in Malaysia, Thailand and Spain and depreciation expense arising from our newly acquired Hong Kong subsidiary.
Rental and Maintenance Expense. Our rental and maintenance expense increased by 28.6% to S$2.7 million (US$2.0 million) from S$2.1 million for the same period of 2021 primarily due to the setting up of new greenfield sites in Türkiye, Korea and Vietnam, and the acquired operation in Hong Kong. In addition, our rental and maintenance expense increased to cope with the growth in our key clients’ campaigns in the Philippines and Thailand as we had to lease additional computer equipment and incur maintenance expense for additional floor space.
Recruitment Expense. The increase in our recruitment expense by 1.9% to S$3.4 million (US$2.5 million) from S$3.3 million for the same period of 2021 is not material in absolute terms.
Transport and Travelling Expense. Our transport and travelling expense increased by 39.9% to S$0.7 million (US$0.5 million) from S$0.5 million for the same period of 2021 mainly due to increased operational and business development travel.
Telecommunication and Technology Expense. Our telecommunication and technology expense increased by 31.2% to S$3.3 million (US$2.4 million) from S$2.5 million for the same period of 2021 primarily due to an increase in software subscription and outsourced IT services.
Interest Expense. Our interest expense decreased by 72.0% to S$0.5 million (US$0.4 million) from S$2.0 million for the same period of 2021 primarily due to reduced bank borrowings.
Other Operating Expense. Our other operating expense increased by 271.7%% to S$9.5 million (US$7.0 million) from S$2.5 million for the same period of 2021 primarily due to foreign exchange losses of S$6.0 million caused by the weakening of the United States Dollar in the fourth quarter of 2022.
Share of Profit from an Associate. Our share of profit from an associate was insignificant for the three months ended December 31, 2022 and 2021.
Interest Income. Our interest income increased by 468.1% to S$1.4 million (US$1.1 million) from S$0.3 million for the same period of 2021 primarily due to higher placements of excess liquid funds in interest earning deposit.
Other Operating Income. Our other operating income decreased by 84.5% to S$0.4 million (US$0.3 million) for the same period of 2021 primarily due to lower government grants received by our Singapore subsidiaries.
Profit Before Income Tax. As a result of the foregoing, our profit before income tax decreased by 11.9% to S$33.0 million (US$24.5 million) from S$37.4 million for the corresponding period of 2021.
Income Tax Expenses. Our income tax expenses decreased by 7.0% to S$8.0 million (US$5.9 million) from S$8.6 million for the same period of 2021 primarily due to the recognition of a previously unrecognized deferred tax asset, and partially offset by higher taxes incurred by our Malaysia subsidiary due to the imposition of a one-off “prosperity tax” enacted by the local government for fiscal 2022 for the Malaysian operations and its higher taxable earnings and the non-availability of the income tax incentive by the Philippines unit as the unit did not meet the work from home threshold requirement imposed by the local fiscal incentive administrative body. The income tax incentive was reinstated to the Philippines unit after it met the work from home threshold requirements during the fourth quarter of 2022.
Profit for the Period. As a result of the foregoing, our profit for the period decreased by 13.3% to S$25.0 million (US$18.6 million) from S$28.8 million for the same period of 2021.
Exchange differences on translation of foreign operations. Exchange differences on translation of foreign operations recognized in other comprehensive income increased by 472.9% to a loss of S$16.2 million (US$12.0 million) from S$2.8 million for the same period of 2021 primarily due to the strengthening of the Singapore Dollar against the functional currencies of the foreign operations.
Total Comprehensive Income for the Period. As a result of the foregoing, our total comprehensive income for the period decreased by 62.9% to S$9.8 million (US$7.3 million) from S$26.3 million for the same period of 2021.
Share Repurchase Program
On March 14, 2022, we announced that the board of directors had approved a US$30.0 million share repurchase program. The share repurchase program commenced on March 14, 2022. The repurchase program has no expiration date and may be suspended, modified or discontinued at any time without prior notice. We expect to fund repurchases under this program with our existing cash balance.
Our proposed repurchases may be made from time to time on the open market at prevailing market prices, in privately negotiated transactions, in block trades, and/or through other legally permissible means, depending on market conditions and in accordance with applicable rules and regulations and its insider trading policy. Our board of directors will review the share repurchase program periodically and may authorize adjustment of its terms and size. We did not make any repurchase of ADSs in the year ended December 31, 2021.
From October 1, 2022 to March 6, 2023, no share repurchases were made.
Service Segment Reclassification
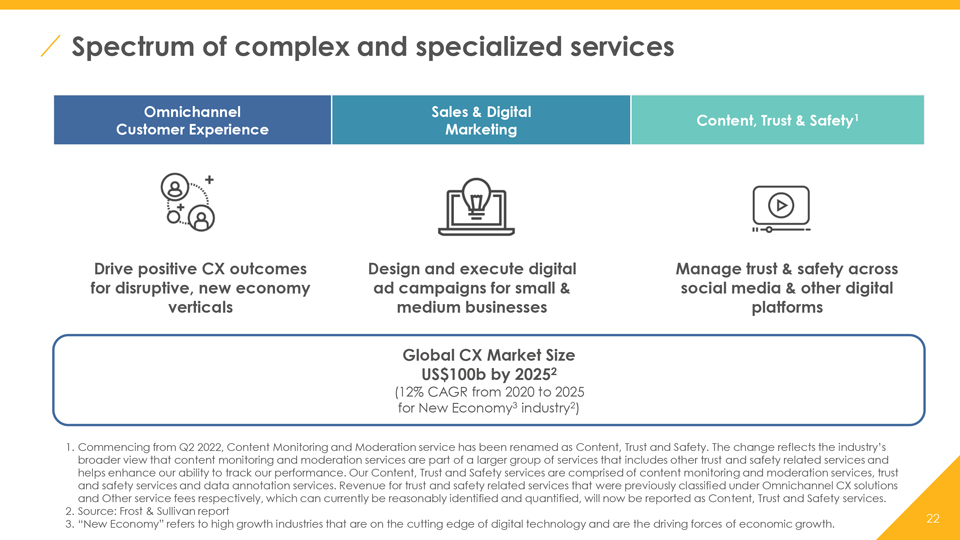
In the second quarter of 2022, we renamed our “content monitoring and moderation” services as “content, trust and safety” services. The change reflects the industry’s broader view that content moderation services are part of a larger group of services that includes other trust and safety related services and helps enhance our ability to track our performance.
Our content, trust and safety services comprise content monitoring and moderation services, trust and safety services and data annotation services. Content monitoring and moderation service involves the review of content submission for violation of terms of use or non-compliant with the specifications and guidelines provided by our clients. Trust and safety services entails our dedicated and trained resources in assisting our clients to verify, detect and prevent incidences of fraudulent use of clients’ tools so as to promote users’ confidence in using our clients’ platforms and tools. Data annotation services provided by us serves to support the development of our clients’ efforts in machine learning and automation initiatives and projects.
Revenue for trust and safety related services that were previously classified under omnichannel CX solutions and other service fees respectively, which can currently be reasonably identified and quantified, will now be reported as content, trust and safety services.
Reclassifications and comparative figures
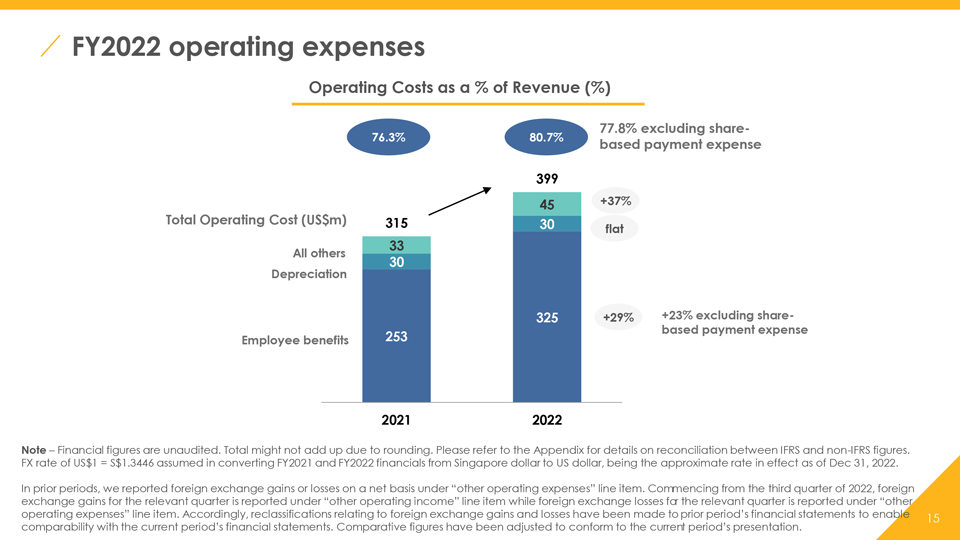
In prior periods, we reported foreign exchange gains or losses on a net basis under “other operating expenses” line item. Commencing from the third quarter of 2022, foreign exchange gains for the relevant quarter is reported under “other operating income” line item while foreign exchange losses for the relevant quarter is reported under “other operating expenses” line item. Accordingly, reclassifications relating to foreign exchange gains and losses have been made to prior period’s financial statements to enable comparability with the current period’s financial statements and therefore, certain line items have been amended in the unaudited condensed interim consolidated statement of profit or loss and other comprehensive income. Comparative figures have been adjusted to conform to the current period’s presentation. The items were reclassified as follows:
| Previously reported |
After reclassification |
|||||||
| S$’000 | S$’000 | |||||||
| For the year ended December 31, 2021: |
||||||||
| Other operating income |
6,315 | 8,191 | ||||||
| Other operating expenses |
11,126 | 13,002 | ||||||
NON-IFRS FINANCIAL MEASURES
EBITDA, EBITDA margin, Adjusted EBITDA, Adjusted EBITDA margin, Adjusted Net Income, Adjusted Net Income margin, Adjusted EPS, revenue at constant currency and revenue growth at constant currency are non-IFRS financial measures. TDCX monitors EBITDA, EBITDA margin, Adjusted EBITDA, Adjusted EBITDA margin, Adjusted Net Income, Adjusted Net Income margin, Adjusted EPS, revenue at constant currency and revenue growth at constant currency because they assist the Company in comparing its operating performance on a consistent basis by removing the impact of items not directly resulting from its core operations.
EBITDA, EBITDA margin, Adjusted EBITDA and Adjusted EBITDA margin
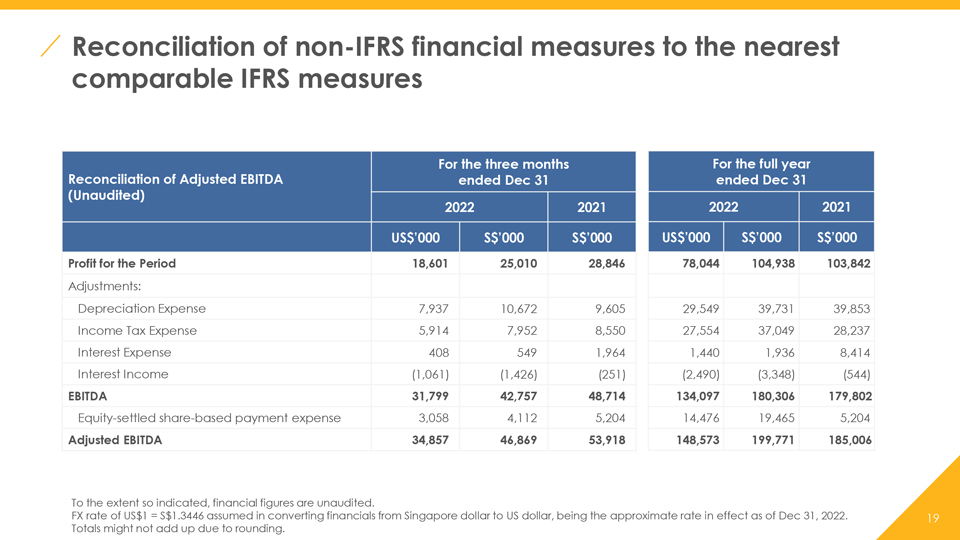
“EBITDA” represents profit for the year/period before interest expense, interest income, income tax expense, and depreciation expense. “EBITDA margin” represents EBITDA as a percentage of revenue. “Adjusted EBITDA” represents profit for the year/period before interest expense, interest income, income tax expense, depreciation expenses, and equity-settled share-based payment expense incurred in connection with our Performance Share Plan. “Adjusted EBITDA margin” represents Adjusted EBITDA as a percentage of revenue.
| For the Three Months ended December 31, | ||||||||||||||||||||
| 2022 | 2021 | |||||||||||||||||||
| US$’000 | S$’000 | Margin | S$’000 | Margin | ||||||||||||||||
| Revenue |
131,393 | 176,671 | — | 154,763 | — | |||||||||||||||
| Profit for the period and net profit margin |
18,601 | 25,010 | 14.2 | % | 28,846 | 18.6 | % | |||||||||||||
| Adjustments for: |
||||||||||||||||||||
| Depreciation expense |
7,937 | 10,672 | 6.0 | % | 9,605 | 6.2 | % | |||||||||||||
| Income tax expenses |
5,914 | 7,952 | 4.5 | % | 8,550 | 5.5 | % | |||||||||||||
| Interest expense |
408 | 549 | 0.3 | % | 1,964 | 1.3 | % | |||||||||||||
| Interest income |
(1,061 | ) | (1,426 | ) | (0.8 | %) | (251 | ) | (0.2 | %) | ||||||||||
|
|
|
|
|
|
|
|
|
|
|
|||||||||||
| EBITDA and EBITDA margin |
31,799 | 42,757 | 24.2 | % | 48,714 | 31.4 | % | |||||||||||||
| Adjustment: |
||||||||||||||||||||
| Equity-settled share-based payment expense |
3,058 | 4,112 | 2.3 | % | 5,204 | 3.4 | % | |||||||||||||
|
|
|
|
|
|
|
|
|
|
|
|||||||||||
| Adjusted EBITDA and Adjusted EBITDA margin |
34,857 | 46,869 | 26.5 | % | 53,918 | 34.8 | % | |||||||||||||
|
|
|
|
|
|
|
|
|
|
|
|||||||||||
| For the Full Year ended December 31, | ||||||||||||||||||||
| 2022 | 2021 | |||||||||||||||||||
| US$’000 | S$’000 | Margin | S$’000 | Margin | ||||||||||||||||
| Revenue |
493,916 | 664,120 | — | 555,198 | — | |||||||||||||||
| Profit for the year and net profit margin |
78,044 | 104,938 | 15.8 | % | 103,842 | 18.7 | % | |||||||||||||
| Adjustments for: |
||||||||||||||||||||
| Depreciation expense |
29,549 | 39,731 | 6.0 | % | 39,853 | 7.2 | % | |||||||||||||
| Income tax expenses |
27,554 | 37,049 | 5.6 | % | 28,237 | 5.1 | % | |||||||||||||
| Interest expense |
1,440 | 1,936 | 0.3 | % | 8,414 | 1.5 | % | |||||||||||||
| Interest income |
(2,490 | ) | (3,348 | ) | (0.5 | %) | (544 | ) | (0.1 | %) | ||||||||||
|
|
|
|
|
|
|
|
|
|
|
|||||||||||
| EBITDA and EBITDA margin |
134,097 | 180,306 | 27.1 | % | 179,802 | 32.4 | % | |||||||||||||
| Adjustment: |
||||||||||||||||||||
| Equity-settled share-based payment expense |
14,476 | 19,465 | 2.9 | % | 5,204 | 0.9 | % | |||||||||||||
|
|
|
|
|
|
|
|
|
|
|
|||||||||||
| Adjusted EBITDA and Adjusted EBITDA margin |
148,573 | 199,771 | 30.1 | % | 185,006 | 33.3 | % | |||||||||||||
|
|
|
|
|
|
|
|
|
|
|
|||||||||||
Adjusted Net Income and Adjusted Net Income margin
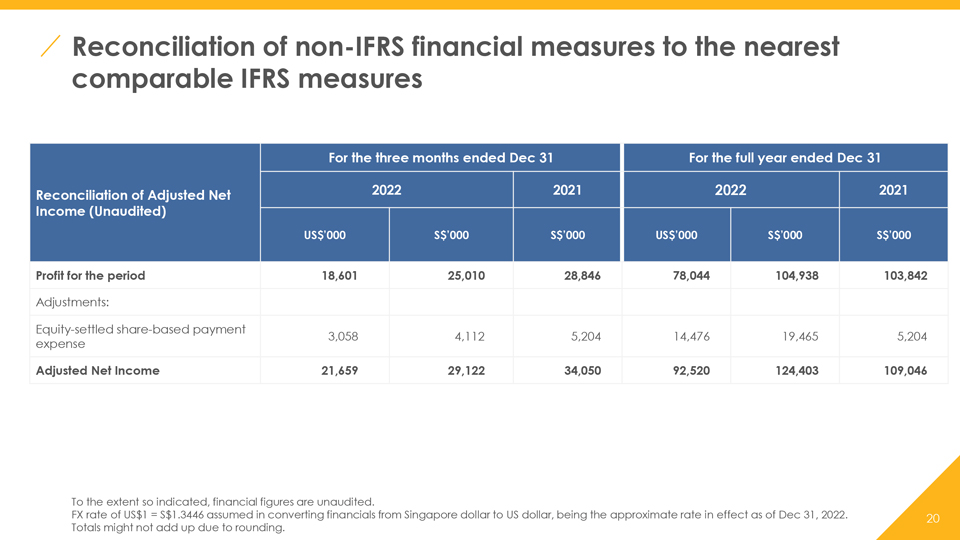
“Adjusted Net Income” represents profit for the year/period before equity-settled share-based payment expense incurred in connection with our Performance Share Plan, net of any tax impact of such adjustments. “Adjusted Net Income margin” represents Adjusted Net Income as a percentage of revenue.
| For the Three Months ended December 31, | ||||||||||||||||||||
| 2022 | 2021 | |||||||||||||||||||
| US$’000 | S$’000 | Margin | S$’000 | Margin | ||||||||||||||||
| Profit for the period and net profit margin |
18,601 | 25,010 | 14.2 | % | 28,846 | 18.6 | % | |||||||||||||
| Adjustment for: |
||||||||||||||||||||
| Equity-settled share-based payment expense |
3,058 | 4,112 | 2.3 | % | 5,204 | 3.4 | % | |||||||||||||
|
|
|
|
|
|
|
|
|
|
|
|||||||||||
| Adjusted Net Income and Adjusted Net Income margin |
21,659 | 29,122 | 16.5 | % | 34,050 | 22.0 | % | |||||||||||||
|
|
|
|
|
|
|
|
|
|
|
|||||||||||
| For the Full Year ended December 31, | ||||||||||||||||||||
| 2022 | 2021 | |||||||||||||||||||
| US$’000 | S$’000 | Margin | S$’000 | Margin | ||||||||||||||||
| Profit for the year and net profit margin |
78,044 | 104,938 | 15.8 | % | 103,842 | 18.7 | % | |||||||||||||
| Adjustment for: |
||||||||||||||||||||
| Equity-settled share-based payment expense |
14,476 | 19,465 | 2.9 | % | 5,204 | 0.9 | % | |||||||||||||
|
|
|
|
|
|
|
|
|
|
|
|||||||||||
| Adjusted Net Income and Adjusted Net Income margin |
92,520 | 124,403 | 18.7 | % | 109,046 | 19.6 | % | |||||||||||||
|
|
|
|
|
|
|
|
|
|
|
|||||||||||
Adjusted EPS
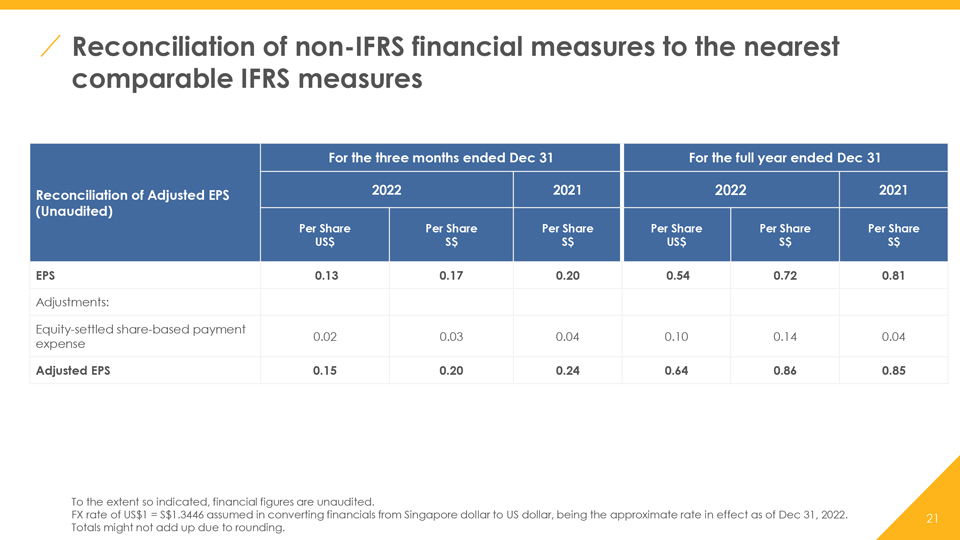
“Adjusted EPS” represents earnings available to shareholders excluding the impact of equity-settled share-based payment expense. Adjusted EPS is calculated as earnings available to shareholders excluding the impact of equity-settled share-based payment expense divided by the diluted weighted-average number of shares outstanding.
| For the Three Months ended December 31, | ||||||||||||||||||||||||
| 2022 | 2021 | |||||||||||||||||||||||
| Amount | Per Share |
Amount | Per Share |
Amount | Per Share |
|||||||||||||||||||
| US$’000 | US$ | S$’000 | S$ | S$’000 | S$ | |||||||||||||||||||
| Earnings available to shareholders and EPS |
18,601 | 0.13 | 25,010 | 0.17 | 28,846 | 0.20 | ||||||||||||||||||
| Adjustments for: |
||||||||||||||||||||||||
| Equity-settled share-based payment expense |
3,058 | 0.02 | 4,112 | 0.03 | 5,204 | 0.04 | ||||||||||||||||||
| Earnings available to shareholders after adjustments and Adjusted EPS |
21,659 | 0.15 | 29,122 | 0.20 | 34,050 | 0.24 | ||||||||||||||||||
| For the Full Year ended December 31, | ||||||||||||||||||||||||
| 2022 | 2021 | |||||||||||||||||||||||
| Amount | Per Share |
Amount | Per Share |
Amount | Per Share |
|||||||||||||||||||
| US$’000 | US$ | S$’000 | S$ | S$’000 | S$ | |||||||||||||||||||
| Earnings available to shareholders and EPS |
78,043 | 0.54 | 104,936 | 0.72 | 103,841 | 0.81 | ||||||||||||||||||
| Adjustments for: |
||||||||||||||||||||||||
| Equity-settled share-based payment expense |
14,476 | 0.10 | 19,465 | 0.14 | 5,204 | 0.04 | ||||||||||||||||||
| Earnings available to shareholders after adjustments and Adjusted EPS |
92,519 | 0.64 | 124,401 | 0.86 | 109,045 | 0.85 | ||||||||||||||||||
Revenue at Constant Currency and Revenue Growth at Constant Currency
Revenue at constant currency, which is revenue adjusted for the translation effect of foreign currencies so that certain financial results can be viewed without the impact of fluctuations in foreign currency exchange rates, thereby facilitating period-to-period comparisons of our business performance. Revenue at constant currency is calculated by translating the revenue of our local subsidiaries in each period in the respective local functional currencies to TDCX Inc.’s and its consolidated subsidiaries’ (together, the “Group”) presentation currency, using the average currency conversion rates in effect during the comparable prior period (rather than at the actual currency conversion rates in effect during that period). Revenue growth at constant currency means the period-over-period change in revenue at constant currency compared against revenue in the prior period.
| For the Full Year Ended December 31, | Revenue growth as reported |
Foreign exchange impact |
Revenue growth at constant currency |
|||||||||||||||||
| 2022 | 2021 | |||||||||||||||||||
| S$’000 | S$’000 | |||||||||||||||||||
| Revenue |
664,120 | 555,198 | 19.6 | % | 3.8 | % | 23.4 | % | ||||||||||||
The Company has not reconciled non-IFRS forward-looking revenue growth at constant currency to its most directly comparable IFRS measure, as permitted by Item 10(e)(1)(i)(B) of Regulation S-K. The revenue growth outlook indicated for 2023 is calculated and presented at constant currency, as it would require unreasonable efforts to predict factors out of the Company’s control or not readily predictable, such as currency exchange movements over the course of an entire year.
The Company uses revenue at constant currency and revenue growth at constant currency, which are supplemental non-IFRS financial measures, to provide better comparability of revenue trends period-over-period (without the impact of fluctuations in foreign currency exchange rates) because it is a global company that transacts business in multiple currencies and reports financial information in the Group’s functional reporting currency. Foreign currency exchange rate fluctuations affect the amounts reported by the Company in the Group’s functional reporting currency with respect to its foreign revenues. Generally, when the Group’s functional reporting currency dollar either strengthens or weakens against other currencies, revenue at constant currency rates and revenue growth at constant currency rates will be higher or lower than revenue and revenue growth reported at actual exchange rates.
The Company believes that non-IFRS financial measures such as EBITDA, EBITDA margin, Adjusted EBITDA, Adjusted EBITDA margin, Adjusted Net Income, Adjusted Net Income margin, Adjusted EPS, revenue at constant currency and revenue growth at constant currency help us to identify underlying trends in our operating results, enhancing our understanding of past performance and future prospects.
While the Company believes that such non-IFRS financial measures provide useful information to investors in understanding and evaluating the Company’s results of operations in the same manner as its management, the Company’s use of such non-IFRS financial measures have limitations as analytical tools and you should not consider these in isolation or as a substitute for analysis of the Company’s results of operations or financial condition as reported under IFRS.
TDCX’s non-IFRS financial measures do not reflect all items of income and expense that affect the Company’s operations and do not represent the residual cash flow available for discretionary expenditures. Further, these non-IFRS measures may differ from the non-IFRS information used by other companies, including peer companies, and therefore their comparability may be limited. The Company compensates for these limitations by reconciling the non-IFRS financial measures to the nearest IFRS performance measure, all of which should be considered when evaluating performance. The Company encourages you to review the company’s financial information in its entirety and not rely on any single financial measure.
The translation of Singapore Dollar amounts into United States Dollar amounts for the unaudited condensed interim consolidated statement of profit or loss and other comprehensive income above are included solely for the convenience of readers outside of Singapore and have been made at the rate of S$1.3446 to US$1.00, the approximate rate of exchange at December 31, 2022. Such translations should not be construed as representations that the Singapore Dollar amounts could be converted into USD at that or any other rate.
UNAUDITED CONDENSED INTERIM CONSOLIDATED STATEMENT OF PROFIT OR LOSS AND OTHER COMPREHENSIVE INCOME
| For the Full Year ended December 31, | ||||||||||||
| 2022 | 2021 | |||||||||||
| US$’000 | S$’000 | S$’000 | ||||||||||
| Revenue |
493,916 | 664,120 | 555,198 | |||||||||
| Employee benefits expense |
(324,520 | ) | (436,350 | ) | (339,683 | ) | ||||||
| Depreciation expense |
(29,549 | ) | (39,731 | ) | (39,853 | ) | ||||||
| Rental and maintenance expense |
(7,422 | ) | (9,980 | ) | (9,832 | ) | ||||||
| Recruitment expense |
(10,562 | ) | (14,201 | ) | (10,884 | ) | ||||||
| Transport and travelling expense |
(1,217 | ) | (1,637 | ) | (1,461 | ) | ||||||
| Telecommunication and technology expense |
(8,792 | ) | (11,822 | ) | (8,826 | ) | ||||||
| Interest expense |
(1,440 | ) | (1,936 | ) | (8,414 | ) | ||||||
| Other operating expense |
(16,684 | ) | (22,434 | ) | (13,002 | ) | ||||||
| Share of profit from an associate |
103 | 139 | 101 | |||||||||
| Interest income |
2,490 | 3,348 | 544 | |||||||||
| Other operating income |
9,275 | 12,471 | 8,191 | |||||||||
|
|
|
|
|
|
|
|||||||
| Profit before income tax |
105,598 | 141,987 | 132,079 | |||||||||
| Income tax expenses |
(27,554 | ) | (37,049 | ) | (28,237 | ) | ||||||
|
|
|
|
|
|
|
|||||||
| Profit for the period |
78,044 | 104,938 | 103,842 | |||||||||
| Item that will not be reclassified to profit or loss: |
||||||||||||
| Remeasurement of retirement benefit obligation |
687 | 924 | 276 | |||||||||
| Item that may be reclassified subsequently to profit or loss: |
||||||||||||
| Exchange differences on translation of foreign operations |
(10,734 | ) | (14,432 | ) | (6,500 | ) | ||||||
|
|
|
|
|
|
|
|||||||
| Total comprehensive income for the period |
67,997 | 91,430 | 97,618 | |||||||||
|
|
|
|
|
|
|
|||||||
| Profit attributable to: |
||||||||||||
| - Owners of the Group |
78,043 | 104,936 | 103,841 | |||||||||
| - Non-controlling interests |
1 | 2 | 1 | |||||||||
|
|
|
|
|
|
|
|||||||
| 78,044 | 104,938 | 103,842 | ||||||||||
|
|
|
|
|
|
|
|||||||
| Total comprehensive income attributable to: |
||||||||||||
| - Owners of the Group |
67,996 | 91,428 | 97,617 | |||||||||
| - Non-controlling interests |
1 | 2 | 1 | |||||||||
|
|
|
|
|
|
|
|||||||
| 67,997 | 91,430 | 97,618 | ||||||||||
|
|
|
|
|
|
|
|||||||
| Basic earnings per share (in US$ or S$) (1) |
0.54 | 0.72 | 0.81 | |||||||||
| Diluted earnings per share (in US$ or S$) (1) |
0.54 | 0.72 | 0.81 | |||||||||
|
|
|
|
|
|
|
|||||||
| (1) | Basic and diluted earnings per share |
| For the Full Year ended December 31, |
||||||||
| 2022 | 2021 | |||||||
| Weighted average number of ordinary shares for the purposes of basic earnings per share |
145,298,557 | 128,803,824 | ||||||
| Weighted average number of ordinary shares for the purposes of diluted earnings per share |
145,298,557 | 128,830,134 | ||||||
|
|
|
|
|
|||||
The translation of Singapore Dollar amounts into United States Dollar amounts (“USD”) for the unaudited condensed interim consolidated statement of profit or loss and other comprehensive income above are included solely for the convenience of readers outside of Singapore and have been made at the rate of S$1.3446 to US$1.00, the approximate rate of exchange at December 31, 2022. Such translations should not be construed as representations that the Singapore Dollar amounts could be converted into USD at that or any other rate.
UNAUDITED CONDENSED INTERIM CONSOLIDATED STATEMENT OF FINANCIAL POSITION
| As of December 31, 2022 | As of December 31, 2021 | |||||||||||
| US$’000 | S$’000 | S$’000 | ||||||||||
| ASSETS |
||||||||||||
| Current assets |
||||||||||||
| Cash and cash equivalents |
289,380 | 389,100 | 313,147 | |||||||||
| Fixed and pledged deposits |
4,872 | 6,551 | 8,860 | |||||||||
| Trade receivables |
66,048 | 88,808 | 92,561 | |||||||||
| Contract assets |
43,736 | 58,808 | 49,365 | |||||||||
| Other receivables |
11,814 | 15,885 | 13,220 | |||||||||
| Financial assets measured at fair value through profit or loss |
22,145 | 29,776 | 23,983 | |||||||||
| Income tax receivable |
263 | 354 | 17 | |||||||||
|
|
|
|
|
|
|
|||||||
| Total current assets |
438,258 | 589,282 | 501,153 | |||||||||
|
|
|
|
|
|
|
|||||||
| Non-current assets |
||||||||||||
| Pledged deposits |
434 | 584 | 456 | |||||||||
| Goodwill and intangible assets1 |
2,175 | 2,924 | — | |||||||||
| Other receivables |
3,733 | 5,019 | 4,771 | |||||||||
| Plant and equipment |
30,710 | 41,292 | 39,709 | |||||||||
| Right-of-use assets |
26,206 | 35,236 | 33,160 | |||||||||
| Deferred tax assets |
2,575 | 3,463 | 1,943 | |||||||||
| Investment in an associate |
— | — | 318 | |||||||||
|
|
|
|
|
|
|
|||||||
| Total non-current assets |
65,833 | 88,518 | 80,357 | |||||||||
|
|
|
|
|
|
|
|||||||
| Total assets |
504,091 | 677,800 | 581,510 | |||||||||
|
|
|
|
|
|
|
|||||||
| LIABILITIES AND EQUITY |
||||||||||||
| Current liabilities |
||||||||||||
| Other payables |
36,980 | 49,723 | 39,096 | |||||||||
| Bank loans |
— | — | 13,847 | |||||||||
| Lease liabilities |
13,252 | 17,818 | 14,550 | |||||||||
| Provision for reinstatement cost |
3,928 | 5,282 | 3,663 | |||||||||
| Income tax payable |
12,316 | 16,560 | 14,715 | |||||||||
|
|
|
|
|
|
|
|||||||
| Total current liabilities |
66,476 | 89,383 | 85,871 | |||||||||
|
|
|
|
|
|
|
|||||||
| Non-current liabilities |
||||||||||||
| Bank loans |
— | — | 2,963 | |||||||||
| Lease liabilities |
15,353 | 20,644 | 21,361 | |||||||||
| Provision for reinstatement cost |
2,657 | 3,572 | 4,384 | |||||||||
| Defined benefit obligation |
1,113 | 1,497 | 1,718 | |||||||||
| Deferred tax liabilities |
634 | 852 | 1,507 | |||||||||
|
|
|
|
|
|
|
|||||||
| Total non-current liabilities |
19,757 | 26,565 | 31,933 | |||||||||
|
|
|
|
|
|
|
|||||||
| Capital, reserves and non-controlling interests |
||||||||||||
| Share capital |
14 | 19 | 19 | |||||||||
| Reserves |
163,313 | 219,590 | 227,181 | |||||||||
| Retained earnings |
254,515 | 342,221 | 236,486 | |||||||||
|
|
|
|
|
|
|
|||||||
| Equity attributable to owners of the Group |
417,842 | 561,830 | 463,686 | |||||||||
| Non-controlling interests |
16 | 22 | 20 | |||||||||
|
|
|
|
|
|
|
|||||||
| Total equity |
417,858 | 561,852 | 463,706 | |||||||||
|
|
|
|
|
|
|
|||||||
| Total liabilities and equity |
504,091 | 677,800 | 581,510 | |||||||||
|
|
|
|
|
|
|
|||||||
The translation of Singapore Dollar amounts into United States Dollar amounts for the unaudited condensed interim consolidated statement of financial position above are included solely for the convenience of readers outside of Singapore and have been made at the rate of S$1.3446 to US$1.00, the approximate rate of exchange at December 31, 2022. Such translations should not be construed as representations that the Singapore Dollar amounts could be converted into USD at that or any other rate.
| 1 | On October 13, 2022, the Group acquired all remaining shares of its associate, Teledirect Hong Kong Limited (subsequently renamed TDCX (HK) Limited), which then became a wholly-owned subsidiary of the Group on that date. Based on preliminary purchase price allocation, a provisional amount of goodwill and intangible assets was recognized by the Group. |
UNAUDITED CONDENSED INTERIM CONSOLIDATED STATEMENT OF CASH FLOWS
| For the Full Year ended December 31, | ||||||||||||
| 2022 | 2021 | |||||||||||
| US$’000 | S$’000 | S$’000 | ||||||||||
| Operating activities |
||||||||||||
| Profit before income tax |
105,598 | 141,987 | 132,079 | |||||||||
| Adjustments for: |
||||||||||||
| Depreciation expense |
29,549 | 39,731 | 39,853 | |||||||||
| Gain on early termination of right-of-use assets |
— | — | (29 | ) | ||||||||
| Reversal of allowance on trade and other receivables |
— | — | (2 | ) | ||||||||
| Equity-settled share-based payment expense |
14,476 | 19,465 | 5,204 | |||||||||
| Provision for office reinstatement cost |
884 | 1,188 | (7 | ) | ||||||||
| Bank loan transaction cost |
37 | 50 | 416 | |||||||||
| Interest income |
(2,490 | ) | (3,348 | ) | (544 | ) | ||||||
| Interest expense |
1,440 | 1,936 | 8,414 | |||||||||
| Retirement benefit service cost |
560 | 753 | 619 | |||||||||
| Fixed assets written off |
13 | 17 | — | |||||||||
| Loss on disposal of plant and equipment |
1 | 1 | 211 | |||||||||
| Share of profit from an associate |
(103 | ) | (139 | ) | (101 | ) | ||||||
| Fair value gain on previously held equity interest |
(103 | ) | (139 | ) | — | |||||||
|
|
|
|
|
|
|
|||||||
| Operating cash flows before movements in working capital |
149,862 | 201,502 | 186,113 | |||||||||
| Trade receivables |
581 | 781 | (57,003 | ) | ||||||||
| Contract assets |
(9,372 | ) | (12,601 | ) | (4,000 | ) | ||||||
| Other receivables |
(4,954 | ) | (6,661 | ) | (672 | ) | ||||||
| Other payables |
12,703 | 17,081 | 4,542 | |||||||||
|
|
|
|
|
|
|
|||||||
| Cash generated from operations |
148,820 | 200,102 | 128,980 | |||||||||
| Interest received |
2,490 | 3,348 | 544 | |||||||||
| Income tax paid |
(28,365 | ) | (38,140 | ) | (25,703 | ) | ||||||
| Income tax refunded |
31 | 42 | 4 | |||||||||
|
|
|
|
|
|
|
|||||||
| Net cash from operating activities |
122,976 | 165,352 | 103,825 | |||||||||
|
|
|
|
|
|
|
|||||||
| Investing activities |
||||||||||||
| Purchase of plant and equipment |
(18,792 | ) | (25,268 | ) | (20,648 | ) | ||||||
| Proceeds from disposal of plant and equipment |
103 | 138 | 126 | |||||||||
| Payment for restoration of office |
— | — | (428 | ) | ||||||||
| Decrease/ (Increase) in fixed deposits |
1,299 | 1,746 | (1,255 | ) | ||||||||
| Increase in pledged deposits |
— | — | 1,888 | |||||||||
| Dividend income from associate |
120 | 161 | 13 | |||||||||
| Acquisition of a subsidiary, net of cash acquired |
(3,134 | ) | (4,214 | ) | — | |||||||
| Investment in financial assets measured at fair value through profit or loss |
(2,255 | ) | (3,032 | ) | (23,835 | ) | ||||||
|
|
|
|
|
|
|
|||||||
| Net cash used in investing activities |
(22,659 | ) | (30,469 | ) | (44,139 | ) | ||||||
|
|
|
|
|
|
|
|||||||
| Financing activities |
||||||||||||
| Dividends paid to non-controlling interests |
(30 | ) | (40 | ) | (176 | ) | ||||||
| Drawdown of bank loan |
— | — | 252,658 | |||||||||
| Distribution to founder |
— | — | (252,033 | ) | ||||||||
| Repayment of lease liabilities |
(14,673 | ) | (19,729 | ) | (19,632 | ) | ||||||
| Interest paid |
(160 | ) | (215 | ) | (6,847 | ) | ||||||
| Repayment of bank loan |
(12,531 | ) | (16,849 | ) | (276,564 | ) | ||||||
| Bank loan transaction cost paid |
— | — | (361 | ) | ||||||||
| Repurchase of American Depositary Shares |
(10,129 | ) | (13,620 | ) | — | |||||||
| Proceeds from issuance of shares |
1 | 1 | 502,406 | |||||||||
| Proceeds from capital call on non-fully paid-up share capital from non-controlling interests |
— | — | 193 | |||||||||
|
|
|
|
|
|
|
|||||||
| Net cash (used in)/ generated from financing activities |
(37,522 | ) | (50,452 | ) | 199,644 | |||||||
|
|
|
|
|
|
|
|||||||
| Net increase in cash and cash equivalents |
62,795 | 84,431 | 259,330 | |||||||||
| Effect of foreign exchange rate changes on cash held in foreign currencies |
(6,307 | ) | (8,478 | ) | (5,990 | ) | ||||||
| Cash and cash equivalents at beginning of period |
232,892 | 313,147 | 59,807 | |||||||||
|
|
|
|
|
|
|
|||||||
| Cash and cash equivalents at end of period |
289,380 | 389,100 | 313,147 | |||||||||
|
|
|
|
|
|
|
|||||||
The translation of Singapore Dollar amounts into United States Dollar amounts for the unaudited condensed interim consolidated statement of cash flows above are included solely for the convenience of readers outside of Singapore and have been made at the rate of S$1.3446 to US$1.00, the approximate rate of exchange at December 31, 2022. Such translations should not be construed as representations that the Singapore Dollar amounts could be converted into USD at that or any other rate.