FALSE00018013682022FYMP Materials Corp. / DEP5DP5D0.02258610.0285714P1Yhttp://fasb.org/us-gaap/2022#OtherLiabilitiesCurrenthttp://fasb.org/us-gaap/2022#OtherLiabilitiesCurrenthttp://fasb.org/us-gaap/2022#AccruedEnvironmentalLossContingenciesNoncurrent00018013682022-01-012022-12-3100018013682022-06-30iso4217:USD00018013682023-02-17xbrli:shares00018013682022-12-3100018013682021-12-31iso4217:USDxbrli:shares0001801368us-gaap:ProductMember2022-01-012022-12-310001801368us-gaap:ProductMember2021-01-012021-12-310001801368us-gaap:ProductMember2020-01-012020-12-310001801368us-gaap:ProductAndServiceOtherMember2022-01-012022-12-310001801368us-gaap:ProductAndServiceOtherMember2021-01-012021-12-310001801368us-gaap:ProductAndServiceOtherMember2020-01-012020-12-3100018013682021-01-012021-12-3100018013682020-01-012020-12-310001801368us-gaap:PreferredStockMember2019-12-310001801368us-gaap:CommonStockMember2019-12-310001801368us-gaap:WarrantMember2019-12-310001801368us-gaap:AdditionalPaidInCapitalMember2019-12-310001801368us-gaap:RetainedEarningsMember2019-12-310001801368us-gaap:AccumulatedOtherComprehensiveIncomeMember2019-12-3100018013682019-12-310001801368us-gaap:WarrantMember2020-01-012020-12-310001801368us-gaap:CommonStockMember2020-01-012020-12-310001801368us-gaap:AdditionalPaidInCapitalMember2020-01-012020-12-310001801368us-gaap:RetainedEarningsMember2020-01-012020-12-310001801368us-gaap:PreferredStockMember2020-12-310001801368us-gaap:CommonStockMember2020-12-310001801368us-gaap:WarrantMember2020-12-310001801368us-gaap:AdditionalPaidInCapitalMember2020-12-310001801368us-gaap:RetainedEarningsMember2020-12-310001801368us-gaap:AccumulatedOtherComprehensiveIncomeMember2020-12-3100018013682020-12-310001801368us-gaap:CommonStockMember2021-01-012021-12-310001801368us-gaap:AdditionalPaidInCapitalMember2021-01-012021-12-310001801368us-gaap:RetainedEarningsMember2021-01-012021-12-310001801368us-gaap:PreferredStockMember2021-12-310001801368us-gaap:CommonStockMember2021-12-310001801368us-gaap:WarrantMember2021-12-310001801368us-gaap:AdditionalPaidInCapitalMember2021-12-310001801368us-gaap:RetainedEarningsMember2021-12-310001801368us-gaap:AccumulatedOtherComprehensiveIncomeMember2021-12-310001801368us-gaap:CommonStockMember2022-01-012022-12-310001801368us-gaap:AdditionalPaidInCapitalMember2022-01-012022-12-310001801368us-gaap:RetainedEarningsMember2022-01-012022-12-310001801368us-gaap:AccumulatedOtherComprehensiveIncomeMember2022-01-012022-12-310001801368us-gaap:PreferredStockMember2022-12-310001801368us-gaap:CommonStockMember2022-12-310001801368us-gaap:WarrantMember2022-12-310001801368us-gaap:AdditionalPaidInCapitalMember2022-12-310001801368us-gaap:RetainedEarningsMember2022-12-310001801368us-gaap:AccumulatedOtherComprehensiveIncomeMember2022-12-31mp:segment0001801368us-gaap:SalesRevenueNetMembermp:ShengheResourcesSingaporeInternationalTradingPteLtdMemberus-gaap:CustomerConcentrationRiskMembersrt:AffiliatedEntityMember2022-01-012022-12-31xbrli:pure0001801368us-gaap:LandImprovementsMember2022-01-012022-12-310001801368us-gaap:BuildingMembersrt:MinimumMember2022-01-012022-12-310001801368us-gaap:BuildingMembersrt:MaximumMember2022-01-012022-12-310001801368us-gaap:MachineryAndEquipmentMembersrt:MinimumMember2022-01-012022-12-310001801368us-gaap:MachineryAndEquipmentMembersrt:MaximumMember2022-01-012022-12-310001801368us-gaap:MiningPropertiesAndMineralRightsMember2022-01-012022-12-310001801368mp:OfftakeAgreementMembersrt:AffiliatedEntityMember2022-03-012022-03-310001801368mp:MPMineOperationsLLCMember2019-12-3100018013682017-05-220001801368mp:OriginalOfftakeAgreementInitialPrepaymentAmountMembersrt:AffiliatedEntityMember2017-05-012017-05-310001801368mp:OriginalOfftakeAgreementFirstAdditionalAdvanceMembersrt:AffiliatedEntityMember2017-06-202017-06-200001801368mp:OriginalOfftakeAgreementInitialPrepaymentAmountMembersrt:AffiliatedEntityMember2017-06-202017-06-200001801368mp:ShengheImpliedDiscountMembermp:ShengheResourcesSingaporeInternationalTradingPteLtdMembersrt:AffiliatedEntityMember2019-01-012020-06-300001801368mp:MPMineOperationsLLCMembermp:ShengheResourcesSingaporeInternationalTradingPteLtdMembermp:ShengheWarrantMembersrt:AffiliatedEntityMembermp:AmendedAndRestatedOfftakeAgreementMember2020-06-020001801368mp:MPMineOperationsLLCMembermp:ShengheResourcesSingaporeInternationalTradingPteLtdMembermp:ShengheWarrantMembersrt:AffiliatedEntityMembermp:AmendedAndRestatedOfftakeAgreementMember2020-06-022020-06-020001801368mp:OriginalOfftakeAgreementSecondAdditionalAdvanceMembermp:ShengheResourcesSingaporeInternationalTradingPteLtdMembersrt:AffiliatedEntityMember2020-06-052020-06-050001801368mp:OriginalOfftakeAgreementInitialPrepaymentAmountMembermp:ShengheResourcesSingaporeInternationalTradingPteLtdMembersrt:AffiliatedEntityMember2020-06-052020-06-050001801368mp:ShengheResourcesSingaporeInternationalTradingPteLtdMembersrt:AffiliatedEntityMember2022-03-012022-03-310001801368mp:ShengheImpliedDiscountMembermp:ShengheResourcesSingaporeInternationalTradingPteLtdMembersrt:AffiliatedEntityMember2017-06-202017-06-200001801368mp:ShengheResourcesSingaporeInternationalTradingPteLtdMembersrt:AffiliatedEntityMember2017-06-202017-06-200001801368mp:ShengeSalesDiscountMembermp:ShengheResourcesSingaporeInternationalTradingPteLtdMembersrt:MinimumMembersrt:AffiliatedEntityMember2019-07-012020-06-050001801368mp:ShengeSalesDiscountMembermp:ShengheResourcesSingaporeInternationalTradingPteLtdMembersrt:MaximumMembersrt:AffiliatedEntityMember2019-07-012020-06-050001801368mp:ShengheResourcesSingaporeInternationalTradingPteLtdMembersrt:AffiliatedEntityMember2020-05-012020-05-310001801368mp:OfftakeAdvancesMembermp:ShengheResourcesSingaporeInternationalTradingPteLtdMembersrt:AffiliatedEntityMember2021-01-012021-12-310001801368mp:OfftakeAdvancesMembermp:ShengheResourcesSingaporeInternationalTradingPteLtdMembersrt:AffiliatedEntityMember2020-01-012020-12-310001801368us-gaap:DemandDepositsMember2022-12-310001801368us-gaap:DemandDepositsMember2021-12-310001801368us-gaap:MoneyMarketFundsMember2022-12-310001801368us-gaap:MoneyMarketFundsMember2021-12-310001801368us-gaap:USGovernmentCorporationsAndAgenciesSecuritiesMember2022-12-310001801368us-gaap:USGovernmentCorporationsAndAgenciesSecuritiesMember2021-12-310001801368us-gaap:USTreasurySecuritiesMember2022-12-310001801368us-gaap:USTreasurySecuritiesMember2021-12-310001801368us-gaap:CashEquivalentsMember2022-12-310001801368us-gaap:CashEquivalentsMember2021-12-310001801368us-gaap:USGovernmentAgenciesDebtSecuritiesMember2022-12-310001801368us-gaap:USGovernmentAgenciesDebtSecuritiesMember2021-12-310001801368us-gaap:USTreasurySecuritiesMember2022-12-310001801368us-gaap:USTreasurySecuritiesMember2021-12-3100018013682021-04-012021-06-300001801368us-gaap:LandAndLandImprovementsMember2022-12-310001801368us-gaap:LandAndLandImprovementsMember2021-12-310001801368us-gaap:BuildingAndBuildingImprovementsMember2022-12-310001801368us-gaap:BuildingAndBuildingImprovementsMember2021-12-310001801368us-gaap:MachineryAndEquipmentMember2022-12-310001801368us-gaap:MachineryAndEquipmentMember2021-12-310001801368us-gaap:ConstructionInProgressMember2022-12-310001801368us-gaap:ConstructionInProgressMember2021-12-310001801368us-gaap:MiningPropertiesAndMineralRightsMember2022-12-310001801368us-gaap:MiningPropertiesAndMineralRightsMember2021-12-3100018013682022-10-012022-12-310001801368us-gaap:MachineryAndEquipmentMember2022-10-012022-12-3100018013682020-11-3000018013682022-02-280001801368us-gaap:BuildingMember2022-01-012022-12-310001801368us-gaap:ConstructionInProgressMember2022-01-012022-12-310001801368us-gaap:BuildingMember2021-01-012021-12-310001801368us-gaap:MachineryAndEquipmentMember2021-01-012021-12-310001801368us-gaap:ConstructionInProgressMember2021-01-012021-12-310001801368us-gaap:MiningPropertiesAndMineralRightsMember2021-10-012021-12-310001801368us-gaap:MiningPropertiesAndMineralRightsMember2020-01-012020-12-310001801368us-gaap:ConvertibleDebtMembermp:ConvertibleNotesDue2026Member2022-12-310001801368us-gaap:ConvertibleDebtMembermp:ConvertibleNotesDue2026Member2021-12-310001801368mp:RelatedPartyDebtMembermp:OfftakeAdvancesMember2022-12-310001801368mp:RelatedPartyDebtMembermp:OfftakeAdvancesMember2021-12-310001801368mp:RelatedPartyDebtMember2022-12-310001801368mp:RelatedPartyDebtMember2021-12-310001801368us-gaap:ConvertibleDebtMembermp:ConvertibleNotesDue2026Member2021-03-260001801368us-gaap:ConvertibleDebtMembermp:ConvertibleNotesDue2026Member2021-01-012021-12-310001801368us-gaap:ConvertibleDebtMembermp:ConvertibleNotesDue2026Member2022-01-012022-12-310001801368us-gaap:DebtInstrumentRedemptionPeriodOneMemberus-gaap:ConvertibleDebtMembermp:ConvertibleNotesDue2026Member2021-03-262021-03-26utr:D0001801368us-gaap:ConvertibleDebtMemberus-gaap:DebtInstrumentRedemptionPeriodTwoMembermp:ConvertibleNotesDue2026Member2021-03-262021-03-260001801368us-gaap:ConvertibleDebtMembermp:ConvertibleNotesDue2026Member2021-03-262021-03-260001801368us-gaap:ConvertibleDebtMembermp:ConvertibleNotesDue2026Member2020-01-012020-12-310001801368mp:OfftakeAdvancesMembermp:RelatedPartyDebtSecondAdditionalOfftakeAdvanceMember2020-06-300001801368mp:RelatedPartyDebtMembermp:OfftakeAdvancesMember2020-06-012020-06-300001801368mp:RelatedPartyDebtMembermp:OfftakeAdvancesMember2022-01-012022-12-310001801368mp:RelatedPartyDebtMembermp:OfftakeAdvancesMember2021-01-012021-12-310001801368mp:RelatedPartyDebtMembermp:OfftakeAdvancesMember2020-01-012020-12-310001801368mp:RelatedPartyDebtMembermp:OfftakeAdvancesMembersrt:MinimumMember2022-12-310001801368mp:RelatedPartyDebtMembermp:OfftakeAdvancesMembersrt:MaximumMember2022-12-310001801368mp:ShengheResourcesSingaporeInternationalTradingPteLtdMember2021-01-012021-01-310001801368mp:ShengheResourcesSingaporeInternationalTradingPteLtdMember2020-08-012020-08-310001801368mp:ShengheResourcesSingaporeInternationalTradingPteLtdMember2020-01-012020-12-310001801368mp:EquipmentNotesMembersrt:MinimumMember2022-01-012022-12-310001801368mp:EquipmentNotesMembersrt:MaximumMember2022-01-012022-12-310001801368mp:EquipmentNotesMembersrt:MinimumMember2022-12-310001801368mp:EquipmentNotesMembersrt:MaximumMember2022-12-310001801368mp:EquipmentNotesMember2022-12-310001801368mp:EquipmentNotesMember2021-12-310001801368us-gaap:NotesPayableToBanksMembermp:PaycheckProtectionProgramLoanMember2020-04-012020-04-300001801368us-gaap:NotesPayableToBanksMembermp:PaycheckProtectionProgramLoanMember2021-01-012021-12-310001801368us-gaap:ConvertibleDebtMembersrt:MaximumMembermp:ConvertibleNotesDue2026Member2021-03-262021-03-260001801368srt:MinimumMember2022-01-012022-12-310001801368srt:MaximumMember2022-01-012022-12-31mp:renewalOption00018013682022-01-012022-09-300001801368us-gaap:StateAndLocalJurisdictionMember2022-12-310001801368us-gaap:StateAndLocalJurisdictionMember2021-12-310001801368us-gaap:CaliforniaFranchiseTaxBoardMember2021-12-310001801368us-gaap:CaliforniaFranchiseTaxBoardMember2022-01-012022-12-310001801368us-gaap:CaliforniaFranchiseTaxBoardMember2021-01-012021-12-3100018013682021-10-012021-10-310001801368mp:MPMineOperationsLLCMember2020-11-162020-11-160001801368mp:MPMineOperationsLLCMember2020-11-1600018013682020-11-1700018013682020-11-172020-11-170001801368mp:ConversionOfCommonAndPreferredUnitsIntoCommonStockMembermp:MPMineOperationsLLCMember2020-11-172020-11-170001801368mp:SecureNaturalResourcesLLCMember2020-11-172020-11-170001801368mp:FortressAcquisitionSponsorLLCMember2020-07-152020-07-150001801368us-gaap:PrivatePlacementMember2020-11-172020-11-170001801368us-gaap:PrivatePlacementMember2020-07-152020-07-150001801368mp:FortressValueAcquisitionCorpPublicStockholdersMember2020-11-170001801368mp:PrivatePlacementWarrantsMember2020-11-170001801368mp:MPMineOperationsLLCUnitholdersMember2020-11-170001801368mp:SecureNaturalResourcesLLCUnitholdersMember2020-11-170001801368mp:PIPEFinancingMember2020-11-170001801368mp:RestrictedStockMPMineOperationsLLCExecutivesMember2020-11-170001801368mp:FortressValueAcquisitionCorpPublicStockholdersMember2020-11-172020-11-170001801368mp:LeshanShengheRareEarthCoLtdMember2020-11-172020-11-170001801368mp:FortressValueAcquisitionCorpMembermp:EarnoutSharesMember2020-11-170001801368mp:FortressValueAcquisitionCorpMembermp:MPMOEarnoutSharesMember2020-11-170001801368mp:SNREarnoutSharesMembermp:FortressValueAcquisitionCorpMember2020-11-170001801368mp:VestingSharesMember2020-12-012020-12-310001801368mp:EarnoutSharesMember2020-12-012020-12-310001801368mp:SecureNaturalResourcesLLCMemberus-gaap:MiningPropertiesAndMineralRightsMember2020-11-172020-11-170001801368mp:SecureNaturalResourcesLLCMembermp:MPMineOperationsLLCMember2020-11-1600018013682020-11-160001801368mp:PublicWarrantMember2020-05-040001801368mp:PublicWarrantMember2021-05-040001801368mp:PublicWarrantMember2021-12-310001801368mp:CashlessExerciseOfPublicWarrantsMember2021-12-310001801368mp:PublicWarrantMember2021-01-012021-12-310001801368mp:A2020IncentivePlanMember2020-11-300001801368mp:A2020IncentivePlanMember2020-11-172020-11-170001801368mp:A2020IncentivePlanMember2022-12-310001801368us-gaap:RestrictedStockMember2020-01-012020-12-310001801368us-gaap:RestrictedStockMember2022-01-012022-12-310001801368us-gaap:RestrictedStockUnitsRSUMember2022-01-012022-12-310001801368us-gaap:RestrictedStockUnitsRSUMember2021-01-012021-12-310001801368us-gaap:RestrictedStockUnitsRSUMember2020-01-012020-12-310001801368mp:NonEmployeeDirectorsMemberus-gaap:RestrictedStockUnitsRSUMember2022-01-012022-12-310001801368mp:NonEmployeeDirectorsMemberus-gaap:RestrictedStockUnitsRSUMember2021-01-012021-12-310001801368mp:NonEmployeeDirectorsMemberus-gaap:RestrictedStockUnitsRSUMember2020-01-012020-12-310001801368us-gaap:CostOfSalesMember2022-01-012022-12-310001801368us-gaap:CostOfSalesMember2021-01-012021-12-310001801368us-gaap:CostOfSalesMember2020-01-012020-12-310001801368us-gaap:SellingGeneralAndAdministrativeExpensesMember2022-01-012022-12-310001801368us-gaap:SellingGeneralAndAdministrativeExpensesMember2021-01-012021-12-310001801368us-gaap:SellingGeneralAndAdministrativeExpensesMember2020-01-012020-12-310001801368us-gaap:OtherOperatingIncomeExpenseMember2022-01-012022-12-310001801368us-gaap:OtherOperatingIncomeExpenseMember2021-01-012021-12-310001801368us-gaap:OtherOperatingIncomeExpenseMember2020-01-012020-12-310001801368us-gaap:CarryingReportedAmountFairValueDisclosureMember2022-12-310001801368us-gaap:EstimateOfFairValueFairValueDisclosureMember2022-12-310001801368us-gaap:FairValueInputsLevel1Member2022-12-310001801368us-gaap:FairValueInputsLevel2Member2022-12-310001801368us-gaap:FairValueInputsLevel3Member2022-12-310001801368us-gaap:ConvertibleDebtMemberus-gaap:CarryingReportedAmountFairValueDisclosureMember2022-12-310001801368us-gaap:ConvertibleDebtMemberus-gaap:EstimateOfFairValueFairValueDisclosureMember2022-12-310001801368us-gaap:FairValueInputsLevel1Memberus-gaap:ConvertibleDebtMember2022-12-310001801368us-gaap:FairValueInputsLevel2Memberus-gaap:ConvertibleDebtMember2022-12-310001801368us-gaap:ConvertibleDebtMemberus-gaap:FairValueInputsLevel3Member2022-12-310001801368mp:EquipmentNotesMemberus-gaap:CarryingReportedAmountFairValueDisclosureMember2022-12-310001801368mp:EquipmentNotesMemberus-gaap:EstimateOfFairValueFairValueDisclosureMember2022-12-310001801368us-gaap:FairValueInputsLevel1Membermp:EquipmentNotesMember2022-12-310001801368us-gaap:FairValueInputsLevel2Membermp:EquipmentNotesMember2022-12-310001801368mp:EquipmentNotesMemberus-gaap:FairValueInputsLevel3Member2022-12-310001801368us-gaap:CarryingReportedAmountFairValueDisclosureMember2021-12-310001801368us-gaap:EstimateOfFairValueFairValueDisclosureMember2021-12-310001801368us-gaap:FairValueInputsLevel1Member2021-12-310001801368us-gaap:FairValueInputsLevel2Member2021-12-310001801368us-gaap:FairValueInputsLevel3Member2021-12-310001801368us-gaap:ConvertibleDebtMemberus-gaap:CarryingReportedAmountFairValueDisclosureMember2021-12-310001801368us-gaap:ConvertibleDebtMemberus-gaap:EstimateOfFairValueFairValueDisclosureMember2021-12-310001801368us-gaap:FairValueInputsLevel1Memberus-gaap:ConvertibleDebtMember2021-12-310001801368us-gaap:FairValueInputsLevel2Memberus-gaap:ConvertibleDebtMember2021-12-310001801368us-gaap:ConvertibleDebtMemberus-gaap:FairValueInputsLevel3Member2021-12-310001801368mp:OfftakeAdvancesMemberus-gaap:CarryingReportedAmountFairValueDisclosureMember2021-12-310001801368mp:OfftakeAdvancesMemberus-gaap:EstimateOfFairValueFairValueDisclosureMember2021-12-310001801368mp:OfftakeAdvancesMemberus-gaap:FairValueInputsLevel1Member2021-12-310001801368us-gaap:FairValueInputsLevel2Membermp:OfftakeAdvancesMember2021-12-310001801368mp:OfftakeAdvancesMemberus-gaap:FairValueInputsLevel3Member2021-12-310001801368mp:EquipmentNotesMemberus-gaap:CarryingReportedAmountFairValueDisclosureMember2021-12-310001801368mp:EquipmentNotesMemberus-gaap:EstimateOfFairValueFairValueDisclosureMember2021-12-310001801368us-gaap:FairValueInputsLevel1Membermp:EquipmentNotesMember2021-12-310001801368us-gaap:FairValueInputsLevel2Membermp:EquipmentNotesMember2021-12-310001801368mp:EquipmentNotesMemberus-gaap:FairValueInputsLevel3Member2021-12-310001801368us-gaap:RestrictedStockMember2021-01-012021-12-310001801368us-gaap:WarrantMember2022-01-012022-12-310001801368us-gaap:WarrantMember2021-01-012021-12-310001801368us-gaap:WarrantMember2020-01-012020-12-310001801368us-gaap:RestrictedStockMember2022-01-012022-12-310001801368us-gaap:RestrictedStockMember2021-01-012021-12-310001801368us-gaap:RestrictedStockMember2020-01-012020-12-310001801368us-gaap:RestrictedStockUnitsRSUMember2022-01-012022-12-310001801368us-gaap:RestrictedStockUnitsRSUMember2021-01-012021-12-310001801368us-gaap:RestrictedStockUnitsRSUMember2020-01-012020-12-310001801368srt:AffiliatedEntityMember2022-01-012022-12-310001801368srt:AffiliatedEntityMember2021-01-012021-12-310001801368srt:AffiliatedEntityMember2020-01-012020-12-310001801368mp:NonConcentrateProductsMembersrt:AffiliatedEntityMember2022-01-012022-12-310001801368mp:ShippingAndFreightRelatedAgreementsWithShengheMembersrt:AffiliatedEntityMember2022-01-012022-12-310001801368mp:ShippingAndFreightRelatedAgreementsWithShengheMembersrt:AffiliatedEntityMember2021-01-012021-12-310001801368mp:ShippingAndFreightRelatedAgreementsWithShengheMembersrt:AffiliatedEntityMember2020-01-012020-12-310001801368srt:AffiliatedEntityMember2022-12-310001801368srt:AffiliatedEntityMember2021-12-31
UNITED STATES
SECURITIES AND EXCHANGE COMMISSION
Washington, D.C. 20549
FORM 10-K
(Mark One)
| | | | | | | | |
☑ | | ANNUAL REPORT PURSUANT TO SECTION 13 OR 15(d) OF THE SECURITIES EXCHANGE ACT OF 1934 |
For the fiscal year ended December 31, 2022
or
| | | | | | | | |
☐ | | TRANSITION REPORT PURSUANT TO SECTION 13 OR 15(d) OF THE SECURITIES EXCHANGE ACT OF 1934 |
For the transition period from __________ to __________
Commission File Number 001-39277
MP MATERIALS CORP.
(Exact name of registrant as specified in its charter)
| | | | | | | | |
| Delaware | | 84-4465489 |
(State or other jurisdiction of incorporation or organization) | | (I.R.S. Employer Identification No.) |
1700 S. Pavilion Center Drive, 8th Floor
Las Vegas, Nevada 89135
(Address of principal executive offices and zip code)
(702) 844-6111
(Registrant’s telephone number, including area code)
Securities registered pursuant to Section 12(b) of the Act:
| | | | | | | | |
| Title of each class | Trading Symbol(s) | Name of each exchange on which registered |
| Common Stock, par value of $0.0001 per share | MP | New York Stock Exchange |
Securities registered pursuant to Section 12(g) of the Act: None
Indicate by check mark if the registrant is a well-known seasoned issuer, as defined in Rule 405 of the Securities Act. Yes ☐ No ☑
Indicate by check mark if the registrant is not required to file reports pursuant to Section 13 or Section 15(d) of the Act. Yes ☐ No ☑
Indicate by check mark whether the registrant (1) has filed all reports required to be filed by Section 13 or 15(d) of the Securities Exchange Act of 1934 during the preceding 12 months (or for such shorter period that the registrant was required to file such reports), and (2) has been subject to such filing requirements for the past 90 days. Yes ☑ No ☐
Indicate by check mark whether the registrant has submitted electronically every Interactive Data File required to be submitted pursuant to Rule 405 of Regulation S-T (§232.405 of this chapter) during the preceding 12 months (or for such shorter period that the registrant was required to submit such files). Yes ☑ No ☐
Indicate by check mark whether the registrant is a large accelerated filer, an accelerated filer, a non-accelerated filer, a smaller reporting company, or an emerging growth company. See the definitions of “large accelerated filer,” “accelerated filer,” “smaller reporting company,” and “emerging growth company” in Rule 12b-2 of the Exchange Act.
| | | | | | | | | | | | | | | | | | | | | | | | | | | | | |
| Large accelerated filer | ☑ | Accelerated filer | ☐ | Non-accelerated filer | ☐ | Smaller reporting company | ☐ | Emerging growth company | ☐ |
If an emerging growth company, indicate by check mark if the registrant has elected not to use the extended transition period for complying with any new or revised financial accounting standards provided pursuant to Section 13(a) of the Exchange Act. ☐
Indicate by check mark whether the registrant has filed a report on and attestation to its management’s assessment of the effectiveness of its internal control over financial reporting under Section 404(b) of the Sarbanes-Oxley Act (15 U.S.C. 7262(b)) by the registered public accounting firm that prepared or issued its audit report. ☑
Indicate by check mark whether the registrant is a shell company (as defined in Rule 12b-2 of the Act). Yes ☐ No ☑
As of June 30, 2022, the aggregate market value of the voting common stock held by non-affiliates of the registrant was approximately $3.4 billion. Such aggregate market value was computed by reference to the closing price of the common stock as reported on the New York Stock Exchange on June 30, 2022. As of February 17, 2023, the number of shares of the registrant’s common stock outstanding was 177,617,795.
DOCUMENTS INCORPORATED BY REFERENCE
Portions of the registrant’s definitive 2023 proxy statement, anticipated to be filed with the Securities and Exchange Commission within 120 days after the end of the registrant’s fiscal year, are incorporated by reference into Part III of this Form 10-K.
MP MATERIALS CORP. AND SUBSIDIARIES
TABLE OF CONTENTS
References herein to the “Company,” “MP Materials,” “we,” “our,” and “us,” refer to MP Materials Corp. and its subsidiaries.
CAUTIONARY NOTE REGARDING FORWARD-LOOKING STATEMENTS
Certain statements included in this Annual Report on Form 10-K for the year ended December 31, 2022 (this “Annual Report”), that are not historical facts are forward-looking statements under Section 27A of the Securities Act of 1933, as amended and Section 21E of the Securities Exchange Act of 1934, as amended. Forward-looking statements may be identified by the use of the words such as “estimate,” “plan,” “shall,” “may,” “project,” “forecast,” “intend,” “expect,” “anticipate,” “believe,” “seek,” “target,” or similar expressions that predict or indicate future events or trends or that are not statements of historical matters. These forward-looking statements include, but are not limited to, statements regarding estimates and forecasts of other financial and performance metrics and projections of market opportunity. These statements are based on various assumptions, whether or not identified in this Annual Report, and on the current expectations of our management and are not predictions of actual performance. These forward-looking statements are provided for illustrative purposes only and are not intended to serve as, and must not be relied on by any investor as, a guarantee, an assurance, a prediction or a definitive statement of fact or probability. Actual events and circumstances are difficult or impossible to predict and will differ from assumptions. Many actual events and circumstances are beyond our control.
These forward-looking statements are subject to a number of risks and uncertainties, including:
•fluctuations and uncertainties related to demand for and pricing of rare earth products;
•uncertainties regarding the growth of existing and emerging uses for rare earth products and ability to compete with substitutions for rare earth minerals;
•the intense competition within the rare earth mining and processing industry and rare earth product manufacturing;
•uncertainties relating to our commercial arrangements with Shenghe Resources (Singapore) International Trading Pte. Ltd., an affiliate of Shenghe Resources Holding Co., Ltd., a global rare earth company listed on the Shanghai Stock Exchange;
•potential changes in China’s political environment and policies;
•unanticipated costs or delays associated with our Stage II optimization project;
•unanticipated costs or delays associated with our Stage III project;
•risks associated with our intellectual property rights, including uncertainties related to our ability to obtain the intellectual property rights or licenses of intellectual property rights to produce rare earth metal, alloy and magnet products;
•uncertainties related to our ability to produce and supply rare earth oxide, metal, alloy and magnet products;
•the ability to convert current commercial discussions with customers for the sale of rare earth oxide products and rare earth metal, alloy and magnet products into contracts;
•uncertainties relating to the COVID-19 pandemic;
•potential power shortages and interruptions at Mountain Pass;
•increasing costs or limited access to raw materials that may adversely affect our profitability;
•fluctuations in transportation costs or disruptions in transportation services;
•inability to meet individual customer specifications;
•diminished access to water;
•uncertainty in our estimates of rare earth oxide reserves;
•risks associated with work stoppages;
•a shortage of skilled technicians and engineers;
•loss of key personnel;
•risks associated with the inherent dangers involved in mining activity and metal and alloy manufacturing;
•risks associated with events outside of our control, such as natural disasters, climate change, wars or health epidemics or pandemics;
•risks related to technology systems and security breaches;
•ability to maintain satisfactory labor relations;
•ability to comply with various government regulations that are applicable to our business;
•ability to maintain our governmental licenses, registrations, permits, and approvals necessary for us to operate our business;
•risks relating to extensive and costly environmental regulatory requirements;
•risks associated with the terms of our convertible notes; and
If any of these risks materialize or our assumptions prove incorrect, actual results could differ materially from the results implied by these forward-looking statements.
These and other factors that could cause actual results to differ from those implied by the forward-looking statements in this Annual Report are more fully described within “Part I, Item 1A. Risk Factors.” The risks described within “Part I, Item 1A. Risk Factors” of this Annual Report are not exhaustive. Other sections of this Annual Report describe additional factors that could adversely affect our business, financial condition or results of operations. New risk factors emerge from time to time, and it is not possible to predict all such risk factors, nor can we assess the impact of all such risk factors on our business or the extent to which any factor or combination of factors may cause actual results to differ materially from those contained in any forward-looking statements. All forward-looking statements attributable to us or persons acting on our behalf are expressly qualified in their entirety by the foregoing cautionary statements. We undertake no obligations to update or revise publicly any forward-looking statements, whether as a result of new information, future events or otherwise, except as required by law. In addition, statements of belief and similar statements reflect our beliefs and opinions on the relevant subject. These statements are based upon information available to us, as applicable, as of the date of this Annual Report, and while we believe such information forms a reasonable basis for such statements, such information may be limited or incomplete, and statements should not be read to indicate that we have conducted an exhaustive inquiry into, or review of, all potentially available relevant information. These statements are inherently uncertain, and you are cautioned not to unduly rely upon these statements.
PART I
ITEM 1. BUSINESS
Overview
MP Materials Corp., including its subsidiaries (the “Company,” “MP Materials,” “we,” “our,” and “us”), is the largest producer of rare earth materials in the Western Hemisphere. The Company owns and operates the Mountain Pass Rare Earth Mine and Processing Facility (“Mountain Pass”), the only active rare earth mining and processing site of scale in North America. The Company currently produces a rare earth concentrate that is principally sold pursuant to the Offtake Agreement (as defined in Note 3 “Relationship and Agreements with Shenghe,” in the notes to the Consolidated Financial Statements) to Shenghe (as defined in the “Customers” section below), that, in turn, typically sells that product to refiners in China. These refiners separate the constituent rare earth elements (“REE”) contained in the Company’s concentrate and sell the separated products to their customers. Upon completing commissioning of the Stage II optimization project (“Stage II”), the Company anticipates producing and selling separated rare earth products, including neodymium-praseodymium (“NdPr”) oxide. In addition, as a part of its Stage III downstream expansion strategy (“Stage III”), the Company is constructing its initial rare earth metal, alloy and magnet manufacturing facility in Fort Worth, Texas (the “Fort Worth Facility”), where it anticipates manufacturing, among other products, neodymium-iron-boron (“NdFeB”) permanent magnets.
Certain REE serve as critical inputs for the rare earth magnets located inside the electric motors and generators powering carbon-reducing technologies such as electric vehicles (“EVs”) and wind turbines, as well as drones, defense systems, robotics and many other high-growth, advanced technologies. As electrification drives significant global growth in demand for REE, the Company believes global economic trends, geopolitical realities and sustainability mandates are coalescing to further its opportunity to create stockholder value. Further, the Company believes businesses are increasingly prioritizing diversification and security of their global supply chains to reduce reliance on a single producer or region for critical materials. As the only scaled source in North America for critical rare earths, with a processing footprint designed to operate with best-in-class sustainability and an industry-leading cost structure, the Company believes it is well-positioned to thrive as the global economy electrifies.
The Company’s mission is to maximize stockholder returns over the long-term by executing a disciplined business strategy to restore the full rare earth supply chain to the United States of America. The Company believes it will generate positive outcomes for U.S. national security and industry, the U.S. workforce, and the environment.
Rare Earth Industry Overview
Rare earth elements are fundamental building blocks of the modern economy, impacting trillions of dollars in global economic activity through the enablement of transportation, clean energy, robotics, national defense, and consumer electronics products, among others. By economic value, NdPr is the largest segment of the REE market. NdPr is most often utilized in NdPr magnets, which are also commonly referred to as “neo,” “NdFeB,” “NIB,” or permanent magnets, and are made predominantly from an alloy of NdPr, iron and boron. NdFeB magnets are the most widely used type of rare earth magnets and are critical for many advanced technologies that are experiencing strong secular growth, including EVs, drones, defense systems, wind turbines, robotics and many others. The rapid growth of these and other advanced motion technologies is expected to drive substantial demand growth for NdPr and NdFeB magnets.
The REE group includes 17 elements, primarily the 15 lanthanide elements. Lanthanum, cerium, praseodymium and neodymium are considered “light” REE (“LREE”); samarium, europium and gadolinium are often referred to as “medium” REE; while terbium, dysprosium, holmium, erbium, thulium, ytterbium and lutetium are considered “heavy” REE (“HREE”). Two additional elements, yttrium and scandium, are often classified as HREE although they are not lanthanides. Depending upon the rare earth-bearing mineral, the mixture of light, medium and heavy REE will differ. The REE in the Mountain Pass ore body are contained primarily within bastnaesite and related minerals in which LREE dominate.
The aggregate global market for rare earth oxides (“REO”) totaled approximately 186,000 metric tons (“MTs”) in 2022 and is expected to grow at a compound annual growth rate (“CAGR”) of approximately 4.1% through 2030, according to research by the CRU Group (“CRU”). Further, CRU estimates that the NdPr segment of the REO market, which makes up the significant majority of the market value, is expected to grow at an 8.6% CAGR through 2030 (excluding the impact of closed loop recycling), well in excess of the overall REO market. This expected growth will be driven by secular growth in demand for NdPr magnets.
Rare earth materials are used in a diverse array of end markets, including:
•Clean-Energy and Transportation Technologies: traction motors in EVs and hybrid electric vehicles, and generators in wind power turbines;
•Consumer and Medical Applications: miniaturization of smart phones and other mobile devices, computing devices, speakers and microphones, as well as fiber optics, lasers, robotics, medical ventilators, precision actuators, and optical sensors;
•Critical Defense Systems: guidance and control systems, communications, global positioning systems, radar and sonar, drones, and railguns; and
•Essential Industrial Infrastructure: power tools, pollution-control systems in traditional internal-combustion automobiles, glass polishing, and LED lighting and phosphors.
Process
The Company has established a three-stage business plan to enable and scale the full rare earth supply chain. Processing of rare earth materials at Mountain Pass includes five primary process steps: (i) mining and crushing; (ii) milling and flotation; (iii) roasting, leaching and impurity removal; (iv) separation and extraction; and (v) product finishing. Having completed Stage I of its optimization plan (“Stage I”) (discussed below), the Company is engaged in the first two of these steps at scale. The rare earth concentrate produced from these steps is marketed to refiners via a distribution arrangement. Beginning in the fourth quarter of 2022, the Company began commissioning the assets required for the latter three steps of production. Upon full commissioning of these process steps, the Company will produce separated rare earth products that will be marketed directly to end users and via distributors, with revenue generated primarily from the magnet supply chain. Lastly, the Company has begun construction of the Fort Worth Facility to convert a portion of the REO produced at Mountain Pass into rare earth metal, alloy, and magnet products to be marketed directly to end users.
Stage I
Following the acquisition of Mountain Pass in July 2017, the Company began implementing Stage I, which was designed to re-establish stable, scaled production of rare earth concentrate leveraging the existing processing facility. Stage I includes mining the primarily bastnaesite ore followed by comminution, which involves crushing and grinding the ore into a milled slurry. Then, the milled bastnaesite slurry is processed by froth flotation, whereby the bastnaesite is carried to the surface while the gangue, or non-desired, elements are suppressed and disposed as tailings.
Since restarting operations from cold-idle status, the Company implemented changes in the milling, flotation and tailings management processes; implemented and continue to advance an improved reagent scheme to improve mineral recovery; and implemented operational best practices. Together, these changes materially increased plant uptime and reliability driving enhanced flotation throughput, REO recovery and production as well as tailings facility reliability and throughput at a significantly lower cost per processed ton. The Company has established its ability to achieve production volumes of REO approximately 3.5x greater than the highest ever production at Mountain Pass prior to the implementation and completion of Stage I. The Company also believes that its Stage I efforts enabled it to achieve world-class production cost levels for rare earth concentrate.
Stage II
Stage II advances the Company’s operations from the production of rare earth concentrate to the separation of individual REE. Significant commissioning activities commenced in the fourth quarter of 2022 beginning with the concentrate drying and roasting circuits, and construction and recommissioning of several Stage II circuits was substantially complete in the fourth quarter of 2022. The Company expects the remaining circuits of the Stage II project to be substantially complete and in commissioning in the first half of 2023. The project incorporated upgrades and enhancements to the prior facility process flow to reliably produce separated REE at a lower cost and with an expected smaller environmental footprint per unit of REO produced. As part of Stage II, the Company has reintroduced an oxidizing roasting circuit, reoriented parts of the plant process flow, increased product finishing capacity, improved wastewater management, and made other improvements to materials handling and storage. The reintroduction of the oxidizing roasting circuit allows subsequent stages of the production process to occur at lower temperatures, and with significantly lower volumes of materials and reagents, which supports lower operating and maintenance costs and higher uptime.
The roasting step that oxidizes the rare earth concentrate in a rotary kiln is crucial to ensuring cost-competitiveness. One of the unique attributes of bastnaesite ore is the ability to convert the trivalent cerium in the mixed rare earth concentrate to
tetravalent cerium that has a low propensity to dissolve, enabling cerium to be separated expediently along with other insoluble gangue elements without selective extraction. Removal of the lower-value cerium early in the Company’s separations process allows for a significant reduction in the mass of material to be separated and finished, thus dramatically reducing the energy, reagents, and wastewater required to produce the higher-value NdPr. Upon reaching run-rate production of REE in Stage II, the Company expects to be a global low-cost, high-volume producer of NdPr oxide, which represents a majority of the value contained in its concentrate.
In February 2022, the Company was awarded a $35.0 million contract by the Department of Defense’s Office of Industrial Base Analysis and Sustainment Program to design and build a facility to process HREE. Successful completion of this project will establish, for the first time in many years, commercial-scale processing and separation of HREE in support of commercial and defense applications in the United States. The HREE processing and separations facility (the “HREE Facility”) will be built at Mountain Pass and will be integrated into the rest of the Company’s Stage I and Stage II facilities. The Company is currently advancing the facilitating works, engineering and procurement for the HREE Facility, which is expected to support the separating of HREE contained in the Mountain Pass ore as well as from third-party feedstocks.
Stage III
The Company’s mission is to restore the full rare earth magnetics supply chain to the U.S. by pursuing opportunities to integrate further downstream into converting NdPr into metal, alloy, and permanent magnet products, as well as advancing magnet recycling capabilities. In February 2022, the Company commenced construction of its initial rare earth metal, alloy and magnet manufacturing facility in Fort Worth, Texas, completing the building shell in September 2022. As currently designed, the Company expects the Fort Worth Facility will produce approximately 1,000 MTs of finished rare earth magnets per year, sufficient to power approximately 500,000 EV motors annually. The rare earth alloy and magnet products produced may also support other key markets, including clean energy, electronic and defense technologies. The Company also expects to supply rare earth alloy flake to other magnet producers to help develop a diverse and resilient U.S. magnet supply chain. The Fort Worth Facility will serve as the business and engineering headquarters for the Company’s growing magnetics division.
In April 2022, the Company entered into a long-term supply agreement with General Motors Company (NYSE: GM) (“GM”) to supply U.S.-sourced and manufactured rare earth materials, alloy and finished magnets for the electric motors in more than a dozen models using GM’s Ultium Platform.
The vertical integration into magnet production would establish MP Materials as the first and only fully-integrated source of supply for rare earth magnets in the Western Hemisphere. By offering magnet customers a complete, end-to-end Western supply chain solution, the Company believes vertical integration represents a material incremental value creation opportunity. The Company believes that the ability to capture significant value from magnet production requires a scaled, steady supply of NdPr, which the Company believes it is uniquely positioned to provide in the Western Hemisphere.
Strategy
Offer the Western Hemisphere a trusted, sustainable source of supply for materials and components that enable the development of critical industries.
More than 60 years of operations at Mountain Pass have demonstrated that the Company’s ore body is one of the world’s largest and highest-grade rare earth resources. The low-volume nature of rare earth mining coupled with the exceptional scale and quality of the ore body results in a resource with significant viability well into the future.
Upon the full commissioning of Stage II, the Company believes Mountain Pass will be one of the largest, most advanced and efficient fully-integrated REO processing facilities in the world, and the only such facility located in the Western Hemisphere. The Company aims to reinvigorate the industrial history of the rare earths supply chain that originated in the United States and provide a domestic alternative to both current and future users of rare earths that helps them avoid the risks associated with the single point-of-failure currently represented by China in the global rare earth supply chain. In addition, the U.S. government is actively seeking to end the country’s reliance on foreign REE sources, and the Company believes that its constructive relationship with key regulatory agencies and the relative stability of U.S. policies provides it with an advantage relative to non-U.S. REE producers.
The global effort to curb carbon emissions and address climate change often focuses on the impact of the transportation system, and the Company believes that its products will play a significant role in advancing those efforts. To date, nearly all U.S. states and the District of Columbia have mandated or offer incentives to support deployment of EVs or alternative fuel vehicles and supporting infrastructure, either through state legislation or private utility incentives within the state, with similar mandates and incentives in other countries globally. Additionally, on August 16, 2022, the U.S. government enacted the
Inflation Reduction Act of 2022 which, among other things, provides several tax incentives to promote clean energy, including tax credits on the purchase of EVs. The NdPr product that the Company intends to produce at Mountain Pass is essential to the permanent magnet motor technology deployed in the significant majority of current EVs. In addition, the Company believes end consumers will demand that the materials used to build these vehicles be extracted sustainably. MP Materials is committed to protecting biodiversity and the Company’s environmental management plans cover biodiversity impacts, waste and noise management, air and water pollution, water extraction and discharge, as well as natural resource and toxic chemical usage. The Company believes that its commitment to environmentally responsible production of REO will be a strong competitive advantage in building relationships with EV manufacturers, who share this commitment to sustainability.
A confluence of geopolitical and economic factors is causing downstream customers, such as automotive original equipment manufacturers (“OEMs”), to be increasingly focused on supply risk, highlighting the need to develop domestic production of REE and related products. To meet the growth in demand for EVs, the Company believes automotive OEMs will redesign their supply chains to ensure a ready and stable supply of rare earth products as they transition their engine, transmission and motor manufacturing facilities to build EV components. MP Materials aims to capitalize on and accelerate this opportunity by seeking to partner with current and future customers in their efforts to re-position the capital and labor in their supply chain and to meet the growth in electrification.
Leverage the Company’s low-cost position to maximize earnings power in all commodity price environments.
The success of the Company’s business reflects its ability to manage its costs. Its production achievements in Stage I have provided economies of scale to lower production costs per unit of REO produced in concentrate. Furthermore, Stage II was designed to enable the Company to continue to manage its cost structure for separating REE through an optimized facility process flow. This process flow will allow the Company to use significantly less energy and raw materials per ton of separated REO.
Optimization of logistics is also central to maintaining a low-cost position relative to other global producers. The location of Mountain Pass, which is immediately adjacent to Interstate 15, within one hour of truck drive-time to a major railhead and four hours to the Ports of Los Angeles and Long Beach, offers significant transportation advantages that create meaningful cost efficiencies in securing incoming supplies and shipping its final products. The Company believes the self-contained nature of its operations, with mining, milling, separations, and finishing all on one site, creates additional cost advantages and operational risk mitigation and upon the full commissioning of Stage II, the Company’s integrated site will incur lower costs of packaging, handling and transportation as compared to competitors who lack co-located processing.
Further the Company’s mission and ability to capture the full rare earth value chain through downstream integration into rare earth magnet production.
Beyond re-establishing a supply chain for REE in the Western Hemisphere, the Company expects to recognize compelling longer-term opportunities to further its mission through the capture of additional value by pairing its attractive access to a large domestic rare earth supply with growing demands for downstream magnetic materials. The Company is currently pursuing vertical integration through further downstream processing of REO into rare earth metals, alloys and finished magnet products, including recycling. The Company intends to accomplish this through a buy, build and/or joint venture strategy to achieve technical and cost leadership. The Company is developing a greenfield metal, alloy and magnet manufacturing facility in Fort Worth, Texas, with GM as a foundational customer. The Company intends to continue exploring future opportunities to invest in, develop, and/or sponsor new downstream opportunities for REO, rare earth metals and alloys and rare earth products that contribute to the electrification of the industrial economy.
MP Materials believes its successes to date at Mountain Pass demonstrate a competency in identifying undervalued assets, creating a disciplined, execution-focused strategy, and assembling the management talent to create value. The Company intends to apply its experience and skill sets across the rare earth value chain, while allocating capital effectively and responsibly, toward opportunities demonstrated to be in the best interest of its stockholders and consistent with its mission.
Human Capital Resources
The people of MP Materials are the Company’s most valuable asset in progressing toward and ultimately fulfilling the Company’s mission. The Company strives to develop and maintain an owner-operator culture that instills an entrepreneurial spirit where its employees feel motivated and empowered to deliver results through an unwavering commitment to doing what is right in a safe environment. In living up to the owner-operator culture, in 2022, the Company issued a time-vested grant to all then-active, non-executive employees to celebrate the five-year anniversary of MP Materials. The Company believes equity ownership reinforces an unwavering commitment to its workforce and enhances its employees’ sense of their contribution to the Company’s success.
Ensuring the Company attracts, develops and retains top talent across all functions with diverse experiences, backgrounds and perspectives is critical to the Company’s success. In each calendar quarter of 2022, the Company’s employee retention rate was approximately 92% or higher, which the Company believes demonstrates that it has prioritized investments and communication to ensure its team is healthy, incentivized, proud to work for MP Materials, and believes in the Company’s mission.
Workforce Composition
Since relaunching production at Mountain Pass in July 2017, the Company has increased its full-time equivalent (“FTE”) employee base from eight contractors in 2017 to 486 employees as of December 31, 2022, of which approximately 80% were field-based employees. This represents a 33% increase of FTE employees in 2022, on top of a 32% increase in 2021. None of the Company’s employees are subject to any collective bargaining agreements. The Company is committed to creating employment opportunities for U.S. workers, and estimates that Stage II, once fully commissioned, will support approximately 200 full-time employees, of which approximately 75 remain to be hired as of December 31, 2022. In addition, the Company plans for at least 150 full-time employees as part of Stage III, the majority of which will support the Fort Worth Facility.
Health, Safety and Well-Being
The health, safety, and well-being of the Company’s employees, suppliers and communities are a priority, with “Safety” being one of the Company’s six core values, along with “Empowerment,” “Entrepreneurship,” “Integrity,” “Results,” and “Unwavering.” MP Materials is committed to maintaining a strong safety culture and continuing to emphasize the importance of its employees’ role in identifying, mitigating and communicating safety risks. To ensure the ongoing safety of employees and any contractors working on-site, the Company has a clear set of health and safety guidelines in place and routinely conducts trainings. The Company believes that the achievement of superior safety performance is both an important short-term and long-term strategic initiative in managing its operations.
All newly-hired employees at Mountain Pass complete a minimum of 24 hours of Federal Mine Safety and Health Administration (“MSHA”) training during the onboarding process and must, at a minimum, complete annual refresher training. Following their initial training, depending on their job classification, new employees complete supervised field training specific to their roles and responsibilities. For example, all mill workers go through specific Lock Out/Tag Out/Try Out training, confined-space work and rescue, forklift classroom, and in-the-field training. In total, the Company’s employees completed over 7,500 hours of new hire and/or annual refresher training and 1,792 hours of emergency medical response training, including first aid and CPR, in 2022, the latter of which represented an increase of over 1,000% when compared to 2021, demonstrating the Company’s prioritization of health and safety in light of Stage II. The Company also conducted four planned emergency response drills and 24 real-world responses that included detailed post-accident review and best practice findings.
The Company utilizes a formalized digital data reporting system to track all incidents reportable to the California Occupational Health and Safety Administration and MSHA. The Company tracks lost time injuries, recordable injuries, recordable injury rates, and near-miss reports. MP Materials strongly encourages the reporting of near-miss incidents so that it can mitigate hazards or change procedures to improve workforce safety in advance of any actual incident. In January 2023, the Company passed the 1,000-day milestone without a lost-time injury.
In addition, through continued commitment to monitor, assess and implement guidance and best practices recommended by the World Health Organization and Centers for Disease Control, the Company has been able to maintain the continuity of the essential services that it provides to its customers, while also managing the continued COVID-19 pandemic and promoting the health, safety, and well-being of its employees, suppliers and communities.
Diversity and Inclusion
MP Materials believes that a diverse and inclusive workforce and Board of Directors produces better overall decision-making for employees, which benefits the organization. In addition to hiring employees with requisite skills, the Company has taken steps to assemble a diverse workforce. As of December 31, 2022, based on employees’ self-reporting, veterans and women represented 4% and 16%, respectively, of the Company’s workforce and 17% of managerial or supervisory positions were occupied by women. As of December 31, 2022, women represented 28% of the Company’s Board of Directors. Additionally, as of December 31, 2022, 44% of the Company’s workforce was composed of underrepresented minorities. As the Company progresses with its Stage II and Stage III projects, it will continue to strive to assemble a diverse and inclusive workforce.
Employee Engagement and Development
Employee engagement efforts are critical in ensuring all employees feel heard, respected, and valued, and that applicable actions are taken when feedback is received. The Company provides opportunities for employees to engage with executive management through events such as virtual town hall sessions, family days and routine stand-up briefings.
Methodical execution is key to ensuring the Company goals are achieved and exceeded. To ensure the Company’s employees receive the feedback they need to grow and thrive in their careers, MP Materials continually reviews and updates its performance-management processes. The Company ensures that new hires receive the feedback and support they need by scheduling periodic performance evaluations three to six months after their introductory periods. Managers hold reviews with all employees no less than annually to give them an opportunity to discuss work performance. This performance management process, rooted in the values of the organization, sets the foundation for applicable goal setting, individual development plans and career pathways going forward.
MP Materials is dedicated to the continual training and development of its employees, especially of those in field operations, to ensure the Company develops future managers and leaders from within its organization. The training starts on an employee’s first day with on-boarding procedures that focus on safety, responsibility, ethical conduct and inclusive teamwork. In addition, the Company has an electrical and instrumentation apprenticeship program in which it pays for its employees to attend trade school to increase their opportunity for future advancement.
Sustainability and Natural Resources
The Company’s business provides a key input to carbon-reducing technologies critical for the transition to a low-carbon economy. Further, MP Materials is solving for the overconcentration of the rare earth supply today while helping to enable a more sustainable future. Sustainability at MP Materials means much more than maintaining environmentally conscious operations; it means caring for the health, safety, and well-being of our employees; encouraging a spirit of joint ownership, entrepreneurship, and continuous growth; supporting the communities that surround us; and operating with integrity. The Company recognizes that it has a responsibility to operate as efficiently as possible to reduce emissions.
The Company believes Mountain Pass is the world’s cleanest and most environmentally sustainable rare earth production facility. Producing rare earth materials requires significant energy and resources, and can lead to environmental challenges if not carefully managed. MP Materials understands that our natural resources, such as water, are precious and limited. As such, the Company is committed to limiting resource consumption, increasing efficiency, and achieving as light of an environmental footprint as possible. The Company does this, in part, by investing in water recycling, reducing reagent usage, implementing energy reduction initiatives, and utilizing a dry stack tailings process.
The Company believes it is unique among scaled rare earth producers in its use of a dry tailings process that allows recycling of the water used in its milling and flotation circuit and eliminates the need for high-risk wet tailings ponds and traditional impoundment dams. The Company’s tailings and concentrate dewatering methods provide a closed-loop water resource for its beneficiation process satisfying approximately 95% of those processes’ water needs at Mountain Pass. The Company also has a variety of initiatives underway at Mountain Pass to limit freshwater withdrawal and maximize recycling. In addition, the Company remains focused on ensuring the most efficient use of energy to minimize hydrocarbon consumption and greenhouse gas (“GHG”) emissions.
The materials that the Company produces are essential to the supply chains for many technologies that help decarbonize the global economy, improve productivity in the workforce, and better the lives of many. Without MP Materials’ conscientiously-mined materials, not only will the future of low-carbon technologies depend on more highly polluting traditional production methods, but the advanced research and development related to these vital applications and their manufacturing will continue to follow that supply overseas. MP Materials is restoring the resource independence of the United States—removing the single point-of-failure in the supply chain for these products and ensuring that American industry can determine its own future in the automotive, aerospace, renewable energy, and information technologies industries.
Customers
Currently, the Company sells the vast majority of its rare earth concentrate to Shenghe Resources (Singapore) International Trading Pte. Ltd. (“Shenghe”), a majority-owned subsidiary of Leshan Shenghe Rare Earth Co., Ltd. whose ultimate parent is Shenghe Resources Holding Co., Ltd., a leading global rare earth company listed on the Shanghai Stock Exchange, under the terms of the Offtake Agreement, which became effective in March 2022.
Under the Offtake Agreement, Shenghe is contractually obligated to purchase the Company’s rare earth concentrate product meeting certain minimum specifications as the exclusive distributor in China on a “take-or-pay” basis (such that they are obliged to pay for product even if they are unable or unwilling to take delivery), with certain exceptions for the Company’s direct sales globally. Shenghe then sells the rare earth concentrate it acquires to customers in China that process the refined products. In addition, at the discretion of the Company, Shenghe may be required to purchase on a “take-or-pay” basis certain non-concentrate rare earth products, although the Company may sell all non-concentrate rare earth products in its sole discretion to customers or end users in any jurisdiction. The Company also regularly enters into short- and long-term sales contracts with other customers for the sale of its rare earth concentrate.
In addition, the Company intends to enter into short- and long-term sales contracts and/or distribution relationships with existing and new customers for separated rare earth products. For certain rare earth products where the market demand is high, the Company may decide not to enter into letters of intent or contracts prior to commencing commercial production.
In April 2022, the Company entered into a long-term supply agreement with GM to supply rare earth alloy flake and finished magnet products, that will be manufactured at the Fort Worth Facility, for the electric motors in GM’s Ultium Platform. The Company is also pursuing sales opportunities to other customers for its future rare earth metal, alloy and magnet products.
Suppliers
The Company uses certain proprietary chemical reagents in its flotation process, which it currently purchases from third-party suppliers. These products are subject to pricing volatility, supply availability and other restrictions and guidelines. In the event of a supply disruption or any other restriction, the Company believes that alternative reagents could be sourced for certain processes. The solvent extraction and finishing processes are highly reliant upon standard commodity reagents.
Patents, Trademarks and Licenses
The Company relies on a combination of trade secret protection, nondisclosure and licensing agreements, patents and trademarks to establish and protect its proprietary intellectual property rights. The Company utilizes trade secret protection and nondisclosure agreements to protect its proprietary rare earth technology.
Competition
The rare earth mining and processing markets are capital intensive and highly competitive. With continued state-sponsored consolidation, there remain two major rare earth groups in China. These groups and their affiliates control (and/or allocate to unaffiliated third parties) substantially all of China’s quota for concentrate production and rare earth refining. Outside of China, there are only two other producers operating at scale, MP Materials and Lynas Rare Earths Ltd., which processes its rare earth materials in Malaysia.
Environmental and Regulatory Matters
The Company is subject to numerous federal, state and local environmental laws, certifications, regulations, permits, and other legal requirements applicable to the mining and mineral processing industry, including, without limitation, those pertaining to employee health and safety, air quality standards and emissions, water usage, wastewater and stormwater discharges, GHG emissions, hazardous and radioactive and other waste management, plant and wildlife protection, remediation of contamination, land use, reclamation and restoration of properties, procurement of certain materials used in the Company’s operations, groundwater quality and the use of explosives. Environmental laws and regulation continue to evolve which may require the Company to meet stricter standards and give rise to greater enforcement, result in increased fines and penalties for non-compliance, and result in a heightened degree of responsibility for companies and their officers, directors and employees. Future laws, regulations, permits or legal requirements, as well as the interpretation or enforcement of existing requirements, may require substantial increases in capital or operating costs to achieve and maintain compliance or otherwise delay, limit or prohibit operations, or other restrictions upon, the Company’s current or future operations or result in the imposition of fines and penalties for failure to comply.
Complying with these regulations is complicated and requires significant attention and resources. The Company expects to continue to incur significant sums for ongoing operating environmental expenditures, including salaries, and the costs for monitoring, compliance, remediation, reporting, pollution control equipment and permitting.
Information About Our Executive Officers
The persons serving as executive officers of MP Materials and their positions with the Company are as follows:
| | | | | | | | | | | | | | |
NAME | | AGE | | POSITION WITH THE COMPANY |
James H. Litinsky | | 45 | | Chairman of the Board and Chief Executive Officer |
Michael Rosenthal | | 44 | | Chief Operating Officer |
Ryan Corbett | | 33 | | Chief Financial Officer |
| Elliot Hoops | | 48 | | General Counsel and Secretary |
James H. Litinsky. Mr. Litinsky is the Founder, Chairman and Chief Executive Officer of MP Materials. Mr. Litinsky is also the Founder, Chief Executive Officer and Chief Investment Officer of JHL Capital Group LLC (“JHL”), an alternative investment management firm. Before founding JHL in 2006, he was a member of the Drawbridge Special Opportunities Fund at Fortress Investment Group. Prior to Fortress, he was a Director of Finance at Omnicom Group, and he worked as a merchant banker at Allen & Company. Mr. Litinsky received a B.A. in Economics from Yale University, cum laude, and a J.D./M.B.A. from the Northwestern University School of Law and the Kellogg School of Management. He was admitted to the Illinois Bar. Mr. Litinsky also serves as a member of the Boards of the Shirley Ryan AbilityLab and the Museum of Contemporary Art Chicago.
Michael Rosenthal. Mr. Rosenthal is a Founder and the Chief Operating Officer of MP Materials. He has managed the Mountain Pass operation since the Company acquired the site in 2017. Before MP Materials, he was a Partner at QVT Financial (“QVT”), an investment management firm. At QVT, Mr. Rosenthal concentrated on investments in the global automotive sector and in China. Prior to joining QVT, he worked as a senior high yield credit analyst for Shenkman Capital Management. Mr. Rosenthal graduated from Duke University with an A.B. degree in Economics and Comparative Area Studies.
Ryan Corbett. Mr. Corbett joined MP Materials as its Chief Financial Officer in 2019. Prior to joining MP Materials, he was a Managing Director at JHL, where he focused on JHL’s investment in MP Materials. Before JHL, Mr. Corbett was a member of alternative asset managers Brahman Capital Corp. and King Street Capital Management LP, both based in New York, where he focused on special situations investments across the capital structure. Mr. Corbett began his career in investment banking and corporate finance at Morgan Stanley & Co. after graduating magna cum laude from the Wharton School of the University of Pennsylvania with a concentration in Finance.
Elliot Hoops. Mr. Hoops joined MP Materials as its General Counsel and Secretary in May 2021. Prior to joining MP Materials, he was Vice President and Deputy General Counsel at Penn National Gaming, Inc. (now known as PENN Entertainment, Inc. (“PENN”)), a regional gaming company, from January 2019 to May 2021, where he was responsible for a variety of legal matters, including commercial transactions, financings, corporate governance, securities law and gaming regulatory compliance. Prior to joining PENN, he was Vice President and Legal Counsel at Pinnacle Entertainment, Inc. (“Pinnacle”), a regional gaming company (which was acquired by PENN), from June 2007 to October 2018. Prior to Pinnacle, he was an associate at Holland and Knight LLP and an attorney advisor with the U.S. Securities and Exchange Commission (the “SEC”). Mr. Hoops received his B.A. in English from the University of Michigan, J.D. from the University of Miami, and LL.M. in Securities and Financial Regulation from Georgetown University Law Center.
Available Information
The Company’s website is located at www.mpmaterials.com. Annual reports on Form 10‑K, quarterly reports on Form 10‑Q, current reports on Form 8‑K, and amendments to those reports, proxy and information statements, earnings releases, and financial statements are made available free of charge on the investor relations section of the Company’s website as soon as reasonably practicable after the Company electronically files such materials with, or furnishes such materials to, the SEC. The Company’s Code of Business Conduct and Ethics is also available on the investor relations section of its website. The information contained on its website, or accessible from its website, is not incorporated into, and should not be considered part of, this Form 10‑K or any other documents the Company files with, or furnishes to, the SEC. The SEC maintains an internet site (http://www.sec.gov) that contains reports, proxy and information statements and other information regarding issuers that file electronically with the SEC. Annual reports, quarterly reports, current reports, amendments to those reports, proxy and information statements, earnings releases, financial statements and the Company’s various corporate governance documents, including its Code of Business Conduct and Ethics, are also available free of charge upon written request.
Investors and others should note that the Company may announce material financial information to its investors using its investor relations website (https://investors.mpmaterials.com/overview), SEC filings, press releases, public conference calls and
webcasts. The Company uses these channels as well as social media to communicate with its stockholders and the public about the Company, its services and other issues. It is possible that the information the Company posts on social media could be deemed to be material information. Therefore, the Company encourages investors, the media, and others interested in MP Materials to review the information the Company posts on the social media channels listed on its investor relations website.
Other
The Company was incorporated on January 24, 2020, as a Delaware corporation under the name “Fortress Value Acquisition Corp.” (“FVAC”) and formed for the purpose of effecting a merger, capital stock exchange, asset acquisition, stock purchase, reorganization or similar business combination with one or more businesses. On November 17, 2020, the Company consummated the transactions contemplated by the Agreement and Plan of Merger, dated as of July 15, 2020, as amended on August 26, 2020 (the “Merger Agreement”), by and among FVAC, certain direct wholly-owned subsidiaries of FVAC, MP Mine Operations LLC, a Delaware limited liability company (“MPMO”), which owns the Mountain Pass mine and processing facilities, and Secure Natural Resources LLC, a Delaware limited liability company (“SNR”), which holds the mineral rights to the Mountain Pass mine and surrounding areas as well as intellectual property rights related to the processing and development of rare earth minerals. Pursuant to the Merger Agreement, among other things, MPMO and SNR each became wholly-owned subsidiaries of FVAC (the “Business Combination”), which was in turn renamed “MP Materials Corp.”
ITEM 1A. RISK FACTORS
Investing in our securities involves a high degree of risk. Investors should carefully consider the risks described below and all of the other information we file with the SEC before deciding to invest in our common stock. If any of the events or developments described below occur, our business, prospects, financial condition, or results of operations could be materially or adversely affected. As a result, the market price of our common stock could decline, and investors could lose all or part of their investment. The risks and uncertainties described below are not the only risks and uncertainties that we face. Additional risks and uncertainties not presently known to us or that we currently deem immaterial may also impair our business operations. The risks discussed below also include forward-looking statements, and our actual results may differ substantially from those discussed in these forward-looking statements. See “Cautionary Note Regarding Forward-Looking Statements” above. Risk Factor Summary
Our business is subject to a number of risks and uncertainties, including those highlighted immediately following this summary. Some of these risks are:
•We may be adversely affected by fluctuations in demand for, and prices of, rare earth minerals and products, alloy flake and magnets.
•The success of our business will depend, in part, on the growth of existing and emerging uses for rare earth products.
•An increase in the global supply of rare earth products, dumping, predatory pricing and other tactics designed to inhibit our further downstream integration by our competitors may materially adversely affect our profitability.
•We operate in a highly competitive industry.
•We currently rely on Shenghe to purchase the vast majority of our rare earth concentrate product on a “take-or-pay” basis and sell that product to end users in China; we cannot assure you that they will continue to honor their contractual obligations to purchase and sell our products, or that they will make optimum efforts to market and sell our products.
•Changes in China’s political environment and policies, including changes in export policy or the interpretation of China’s export policy and policy on rare earths production or the import of rare earth feedstock, may adversely affect our financial condition and results of operations.
•The production of rare earth products is a capital-intensive business and will require the commitment of substantial resources and if we do not have sufficient resources to provide for such production, it could have a material adverse effect on our financial condition or results of operations.
•Our continued growth depends on our ability to successfully complete and commission the Stage II project at Mountain Pass, our only rare earth mining and processing facility.
•The production of alloy flake and magnets in Stage III is dependent upon the successful completion and commissioning of our Stage II project and our ability to complete the construction of our Fort Worth Facility; an unanticipated delay in the completion of Stage II or Stage III could have a material adverse effect on our ability to produce alloy flake and magnets.
•We may not be able to adequately protect our intellectual property rights. If we fail to adequately enforce or defend our intellectual property rights, our business may be harmed. If we infringe, or are accused of infringing, the intellectual property rights of third parties, it may increase our costs or prevent us from being able to commercialize new products.
•If we are unable to perform the obligations under our long-term supply agreement with GM, this may have a material adverse effect on our financial position and results of operations.
•We may not be able to convert current commercial discussions with customers for the sale of rare earth products into contracts, which may have a material adverse effect on our financial position and results of operations.
•The COVID-19 pandemic, or other outbreaks, epidemics or pandemics, could have an adverse effect on our business.
•We are subject to a number of operational risks of our business, including power outages or shortages at the Mountain Pass facility; increasing costs or limited access to raw materials; disruptions in transportation or other services; inability to process REO that meet individual customer specifications; access to water; uncertainty in our estimates of REO reserves; labor matters/labor relations; cybersecurity breaches; and/or environmental, social and governance (“ESG”) matters.
•The conditional conversion feature of our Convertible Notes, if triggered, may adversely affect our financial condition and operating results.
•Conversion of our Convertible Notes may dilute the ownership interest of our stockholders or may otherwise depress the price of our common stock.
•Certain provisions in the indenture governing the Convertible Notes may delay or prevent an otherwise beneficial takeover attempt of us.
•Servicing our debt requires a significant amount of cash, and we may not have sufficient cash flow from our business to pay our debt.
Risks Relating to our Business and Industry
We may be adversely affected by fluctuations in demand for, and prices of, rare earth minerals and products, alloy flake and magnets.
Because our revenue is, and will be for the foreseeable future, from the sale of rare earth products, changes in demand for, and the market price of, and taxes and other tariffs and fees imposed upon rare earth minerals and products could significantly affect our profitability. Our financial results may be significantly adversely affected by declines in the prices of rare earth minerals and products. Rare earth mineral and product prices may fluctuate and are affected by numerous factors beyond our control such as interest rates, exchange rates, taxes, inflation or deflation, fluctuation in the relative value of the U.S. dollar against foreign currencies on the world market, shipping and other transportation and logistics costs, global and regional supply and demand for rare earth minerals and products, potential industry trends, such as competitor consolidation or other integration methodologies, and the political and economic conditions of countries that produce and procure rare earth minerals and products. Furthermore, supply side factors have a significant influence on price volatility for rare earth minerals. Supply of rare earth minerals is dominated by Chinese producers. The Chinese Central Government regulates production via quotas and environmental standards, and, to a lesser extent, regulation of imports, and has and may continue to change such production quotas, environmental standards, and import regulations. Over the past few years, there has been significant restructuring of the Chinese market in line with Chinese Central Government policy; however, periods of over-supply or speculative trading of rare earth minerals can lead to significant fluctuations in the market price of rare earth minerals.
A prolonged or significant economic contraction in the United States or worldwide could put downward pressure on market prices of rare earth minerals and products. Protracted periods of low prices for rare earth minerals and products could significantly reduce revenues and the availability of required development funds in the future. This could cause substantial reductions to, or a suspension of, REO production operations, impair asset values and reduce our proven and probable rare earth ore reserves.
Demand for our products may be impacted by demand for downstream products incorporating rare earths, including hybrid and electric vehicles, wind turbines, robotics, medical equipment, military equipment and other high-growth, advanced motion technologies, as well as demand in the general automotive and electronic industries. Lack of growth in these markets may adversely affect the demand for our products.
In contrast, extended periods of high commodity prices may create economic dislocations that may be destabilizing to rare earth minerals supply and demand and ultimately to the broader markets. Periods of high rare earth mineral market prices generally are beneficial to our financial performance. However, strong rare earth mineral prices also create economic pressure to identify or create alternate technologies that ultimately could depress future long-term demand for rare earth minerals and products, and at the same time may incentivize development of competing mining properties.
The success of our business will depend, in part, on the growth of existing and emerging uses for rare earth products.
Our strategy is to produce rare earth products that are used in critical existing and emerging technologies, such as hybrid and electric vehicles, wind turbines, robotics, medical equipment, military equipment and other high-growth, advanced motion technologies. The success of our business depends on the continued growth of these end markets and the successful commercialization of rare earth products, including NdPr, in such markets. If the market for these critical existing and emerging technologies does not grow as we expect, grows more slowly than we expect, or if the demand for our products in these markets decreases, then our business, prospects, financial condition and operating results could be harmed. In addition, the market for these technologies, particularly in the automotive industry, tends to be cyclical, which exposes us to increased volatility, and it is uncertain as to how such macroeconomic factors will impact our business. Any unexpected costs or delays in the commercialization of separated REE products or rare earth magnets, or less than expected demand for the critical existing and emerging technologies that use rare earth products, could have a material adverse effect on our financial condition or results of operations.
An increase in the global supply of rare earth products, dumping, predatory pricing and other tactics designed to inhibit our further downstream integration by our competitors may materially adversely affect our profitability.
The pricing and demand for rare earth products is affected by a number of factors beyond our control, including the global macroeconomic environment and the global supply and demand for REO products. China accounts for the significant majority of global separated REO production and also dominates the manufacture of metals and NdFeB magnets from rare earths, capabilities that are not currently present in the United States, and the Chinese Central Government regulates production via quotas and environmental standards. Over the past few years, there has been significant restructuring of the Chinese markets in line with China Central Government policy. Assuming that we reach anticipated production rates for REO and other planned downstream products and subsequently become fully operational and integrated, the increased competition may lead our competitors to engage in predatory pricing or other behaviors designed to inhibit our further downstream integration. Any increase in the amount of rare earth products exported from other nations and increased competition may result in price reductions, reduced margins or loss of potential market share, any of which could materially adversely affect our profitability. As a result of these factors, we may not be able to compete effectively against current and future competitors.
We operate in a highly competitive industry.
The rare earth mining and processing and rare earth magnetics markets are capital intensive and competitive. Production of rare earths and related products is dominated by our Chinese competitors. These competitors may have greater financial resources, as well as other strategic advantages to operate, maintain, improve and possibly expand their facilities. Additionally, our Chinese competitors have historically been able to produce at relatively low costs due to domestic economic and regulatory factors, including less stringent environmental and governmental regulations and lower labor and benefit costs. Even upon successful completion of Stage II at Mountain Pass, if we are not able to achieve consistent product quality at our anticipated costs of production, then any strategic advantages that our competitors may have over us, including, without limitation, lower labor, compliance and production costs, could have a material adverse effect on our business.
Industry consolidation may result in increased competition, which could result in a reduction in revenue.
Some of our competitors have made, or may make, acquisitions or enter into partnerships or other strategic relationships to achieve competitive advantages. In addition, new entrants not currently considered competitors may enter our market through acquisitions, partnerships or strategic relationships. We expect these trends to continue as demand for rare earth materials increases. Industry consolidation may result in competitors with more compelling product offerings or greater pricing flexibility than we have, or business practices that make it more difficult for us to compete effectively, including on the basis of price, sales, technology or supply. For example, in December 2021, China merged three state entities to establish the China Rare Earth Group Co. Ltd (“China Rare Earth Group”), that will account for more than half of China’s heavy rare earths supplies. China
Rare Earth Group will have enhanced pricing power of key rare earths, such as dysprosium and terbium, which will likely bring changes to the global rare earth supply chain. These competitive pressures could have a material adverse effect on our business.
Our ability to generate revenue will be diminished if we are unable to compete with substitutions for our rare earth materials.
Technology changes rapidly in the industries and end markets that utilize our materials. If these industries introduce new technologies or products that no longer require the rare earth materials or NdFeB magnets we produce or may produce in the future, or suitable substitutes become available, it could result in a decline in demand for our rare earth materials or NdFeB magnets. If the demand for our rare earth materials or NdFeB magnets decreases, it will have a material adverse effect on our business and the results of our operations and financial condition.
We currently rely on Shenghe to purchase the vast majority of our rare earth concentrate product on a “take-or-pay” basis and sell that product to end users in China. We cannot assure you that they will continue to honor their contractual obligations to purchase and sell our products, or that they will make optimum efforts to market and sell our products.
We currently sell the vast majority of our rare earth concentrate to Shenghe, which typically sells that product to refiners in China. Demand for rare earth concentrate is currently constrained to a relatively limited number of refiners, a significant majority of which are based in China. While Shenghe is obligated under the Offtake Agreement to purchase all of the rare earth concentrate product meeting certain minimum specifications on a “take-or-pay” basis (such that they are obliged to pay for product even if they are unable or unwilling to take delivery), we cannot guarantee that Shenghe will continue to purchase all of the products that it is contractually bound to purchase or that they will purchase products that do not meet these specifications. The initial term of the Offtake Agreement is two years and expires on March 10, 2024, with the option to extend the term at the Company’s discretion for an additional one-year period.
Further, Shenghe sells the rare earth concentrate it acquires under the Offtake Agreement to customers in China who separate and extract the individual rare earth elements. We do not control the amount and timing of resources that Shenghe will dedicate to their sales efforts. Therefore, any decline or delay in Shenghe’s sales efforts could reduce sales prices or sales volumes, which could have an adverse impact on our results of operations.
To the extent we utilize Shenghe, we are also subject to the risks faced by Shenghe where such risks impede their ability to stay in business, make timely payments to us, perform their obligations to us, or sell our products to their end-customers.
Changes in China’s political environment and policies, including changes in export policy or the interpretation of China’s export policy and policy on rare earths production or the import of rare earth feedstock may adversely affect our financial condition and results of operations.
Because the vast majority of our rare earth concentrate product is currently sold to Shenghe under our Offtake Agreement for further processing by third-party customers in China, the possibility of adverse changes in trade or political relations with China, political instability in China, increases in labor or shipping costs, subsidies to related industries, the occurrence of prolonged adverse weather conditions or a natural disaster such as an earthquake or typhoon, or the continuation of COVID-19 or the outbreak of another global pandemic disease could severely interfere with the sale and/or shipment of our products and would have a material adverse effect on our operations.
Our sales may be adversely affected by the current and future political environment in China and the policies of the China Central Government. China’s government has exercised and continues to exercise substantial control over nearly all sectors of the Chinese economy through regulation and state ownership. Our ability to ship products to China may be adversely affected by changes in Chinese laws and regulations, including those relating to taxation, import and export tariffs, raw materials, environmental regulations, land use rights, property and other matters. The United States Government has instituted substantial changes to foreign trade policy with China and has raised tariffs on several Chinese goods. China has retaliated with increased tariffs on United States goods. Any further changes in United States trade policy could trigger retaliatory actions by affected countries, including China, resulting in trade wars. Any changes in United States and China relations, including through changes in policies by the Chinese government could adversely affect our financial condition and results of operations, including changes in laws, regulations or the interpretation thereof, confiscatory taxation, governmental royalties, restrictions on currency conversion, imports or sources of supplies, or the expropriation or nationalization of private enterprises.
In addition, there may be circumstances where we may have to incur premium freight charges to expedite the delivery of our products to customers or as a result of being required to ship to alternative ports due to local Chinese government regulations or delays at the ports that we typically utilize. If we incur a significant amount of freight charges, our gross profit will be negatively affected if we are unable to pass on those charges to customers. In addition, we may be adversely affected by
shipments to such alternative ports, including that these shipments may be delayed for any reason or as they are affected by domestic or international laws and regulations, taxation, import and export tariffs, environmental regulations, customs and other matters.
The production of rare earth products is a capital-intensive business and requires the commitment of substantial resources. Unanticipated costs or delays associated with our ongoing Stage II project could have a material adverse effect on our financial condition or results of operations.
The completion and commissioning of our Stage II project at Mountain Pass will require the commitment of substantial resources and capital expenditures. We expect to achieve anticipated production run rates for separated REO by the end of 2023. Our estimated expenses may increase as consultants, personnel and equipment associated with our efforts are added, and as a result of inflationary pressures in the United States. The progress of Stage II, the amounts and timing of expenditures and the success of this project will depend in part on the following: (a) the successful completion of the Stage II facilities and the operational resumption of a portion of the existing process, plant and equipment, and the further enhancement and development of such existing process, plant and equipment; (b) the ability of the new equipment and Stage II facilities to separate REO as designed and engineered; (c) our ability to timely procure new equipment and materials, certain of which may involve long lead-times, or to repair existing equipment; (d) the failure of service providers or vendors to meet contractually-negotiated delivery or completion deadlines or meet performance specifications or guarantees; (e) maintaining, and procuring, as required, applicable federal, state and local permits; (f) the incorporation of project change orders, due to engineering, process, health and safety, or other considerations; (g) negotiating contracts for equipment, earthwork, construction, equipment installation, labor and completing infrastructure and construction work following commissioning; (h) impact of planned and unplanned shut-downs and delays in our production; (i) impact of stoppages or delays on construction projects; (j) disputes with contractors or other third parties; (k) negotiating sales and offtake contracts for our planned production; (l) the execution of any joint venture agreements or similar arrangements with strategic partners; (m) the impact of COVID-19 or similar pandemics on our business, our strategic partners’ or suppliers’ businesses, logistics or the global economy; and (n) other factors, many of which are beyond our control.
Most of these activities require significant lead times and must be advanced concurrently. Unanticipated costs or delays associated with our Stage II project could have a material adverse effect on our financial condition or results of operations and could require us to seek additional capital, which may not be available on commercially acceptable terms or at all.
Our continued growth depends on our ability to successfully complete and commission the Stage II project at Mountain Pass, our only rare earth mining and processing facility.
Our only rare earth mining and processing facility at this time is Mountain Pass. Our continued growth is based on successfully completing and commissioning the Stage II project and reaching anticipated production rates for the separation of REE in accordance with our expected timeframe. The deterioration or destruction of any part of Mountain Pass, or a failure of any necessary equipment to operate as designed, may significantly hinder our ability to reach or maintain anticipated production rates within the expected time frame or at all. If we are unsuccessful in reaching and maintaining expected production rates for REO at Mountain Pass, including by failing to reach anticipated throughput, recoveries, uptimes, yields, product quality, or any combination thereof, within expected time frames or at all, we may not be able to reach our full revenue potential. In the event that the Stage II project is not completed, the Company may not be able to produce alloy flake and magnets in Stage III and comply with the terms of our agreement with GM.
The production of alloy flake and magnets is a capital-intensive business, and the completion of the Fort Worth Facility will require the commitment of substantial resources; unanticipated costs or delays associated with this project could have a material adverse effect on our financial condition or results of operations.
In February 2022, we commenced construction of our initial rare earth metal, alloy and magnet manufacturing facility in Fort Worth, Texas, in support of our Stage III initiatives. The Fort Worth Facility will require a substantial capital commitment to complete and there may be unanticipated costs or delays associated with the construction of our Fort Worth Facility. In addition, our ability to reach our full revenue potential will be dependent on our ability to complete the construction of our Fort Worth Facility and commence the production of alloy flake and finished magnets. Our proposed timeline for producing alloy flake and magnets is based on certain estimates and assumptions we have made about our business over the next few years, including the successful completion and commissioning of our Stage II project and the ability to obtain the equipment on a timely basis from third party vendors. If any of these estimates or assumptions prove to be wrong or we are unable to complete and commission our Stage II project, it may significantly hinder our ability to complete the Fort Worth Facility within the expected time frame or at all. If we are unsuccessful in being able to construct and commence production at our Fort Worth
Facility, within the expected time frame or at all, we will not be able to take advantage of our downstream value creation opportunity and thus we may not be able to reach our full revenue potential.
If we infringe, or are accused of infringing, the intellectual property rights of third parties, it may increase our costs or prevent us from being able to commercialize new products.
There is a risk that we may infringe, or may be accused of infringing, the proprietary rights of third parties under patents and pending patent applications belonging to third parties that may exist in the United States and elsewhere in the world that relate to our rare earth products and processes, including our planned future production of alloy flake and magnets in Stage III. Because the patent application process can take several years to complete, there may be currently pending applications that may later result in issued patents that cover our products and processes. In addition, our products and processes may infringe existing patents.
Defending ourselves against third-party claims, including litigation in particular, would be costly and time consuming and would divert management’s attention from our business, which could lead to delays in our Stage II project or Stage III downstream expansion. If third parties are successful in their claims, we might have to pay substantial damages or take other actions that are adverse to our business. As a result of intellectual property infringement claims, or to avoid potential claims, we might:
•be prohibited from, or delayed in, selling rare earth products, including alloy flake and magnets, or licensing some of our products or using some of our processes unless the patent holder licenses the patent to us, which it is not required to do;
•be required to pay substantial royalties or grant a cross license to our patents to another patent holder; or
•be required to redesign a product or process so it does not infringe a third party’s patent, which may not be possible or could require substantial funds and time.
In addition, we could be subject to claims that our employees, or we, have inadvertently or otherwise used or disclosed trade secrets or other proprietary information of third parties.
If we are unable to resolve claims that may be brought against us by third parties related to their intellectual property rights on terms acceptable to us, we may be precluded from offering some of our products or using some of our processes.
We may not be able to adequately protect our intellectual property rights. If we fail to adequately enforce or defend our intellectual property rights, our business may be harmed.
Much of the technology used in the markets in which we compete is protected by patents and trade secrets, and our commercial success will depend in significant part on our ability to obtain and maintain patent and trade secret protection for our products and methods. To compete in these markets, we rely on a combination of trade secret protection, nondisclosure and licensing agreements, patents and trademarks to establish and protect our proprietary intellectual property rights, including our proprietary rare earth production processes that are not patented. Our intellectual property rights may be challenged or infringed upon by third parties or we may be unable to maintain, renew or enter into new license agreements with third-party owners of intellectual property on reasonable terms. In addition, our intellectual property may be subject to infringement or other unauthorized use outside of the United States. In such case, our ability to protect our intellectual property rights by legal recourse or otherwise may be limited, particularly in countries where laws or enforcement practices are undeveloped or do not recognize or protect intellectual property rights to the same extent as the United States. Unauthorized use of our intellectual property rights or our inability to preserve existing intellectual property rights could adversely impact our competitive position and results of operations. The loss of our patents could reduce the value of the related products. In addition, the cost to litigate infringements of our patents, or the cost to defend ourselves against patent infringement actions by others, could be substantial and, if incurred, could materially affect our business and financial condition.
Proprietary trade secrets and unpatented know-how are also very important to our business. We rely on trade secrets to protect certain aspects of our technology, especially where we do not believe that patent protection is appropriate or obtainable. However, trade secrets are difficult to protect. Our employees, consultants, contractors, outside scientific collaborators and other advisors may unintentionally or willfully disclose our confidential information to competitors, and confidentiality agreements may not provide an adequate remedy in the event of unauthorized disclosure of confidential or proprietary information. It is expensive and time consuming, with no certain outcome, to pursue a claim that a third party illegally obtained and is using our trade secrets. Moreover, our competitors may independently develop equivalent knowledge, methods and know-how. Failure to obtain or maintain trade secret protection could adversely affect our competitive business position.
We may not be able to obtain additional patents and the legal protection afforded by any additional patents may not adequately protect our rights or permit us to gain or keep any competitive advantage.
Our ability to obtain additional patents is uncertain and the legal protection afforded by these patents is limited and may not adequately protect our rights or permit us to gain or keep any competitive advantage. In addition, the specific content required of patents and patent applications that are necessary to support and interpret patent claims is highly uncertain due to the complex nature of the relevant legal, scientific and factual issues. Changes in either patent laws or interpretations of patent laws in the United States or elsewhere may diminish the value of our intellectual property or narrow the scope of our patent protection. Even if patents are issued regarding our products and processes, our competitors may challenge the validity of those patents. Patents also will not protect our products and processes if competitors devise ways of making products without infringing our patents.
If we are unable to perform the obligations under our long-term supply agreement with GM, this will have a material adverse effect on our financial position and results of operations.
We entered into a binding long-term supply agreement with GM. Our ability to fulfil the obligations under our long-term agreement with GM to supply them with rare earth alloy flake and finished magnets is subject to a number of risks and contingencies. We are embarking on building the first scaled rare earth magnet manufacturing facility in the United States in several decades. While we will be relying on a number of experienced engineers and other third parties in the design, engineering and construction of the Fort Worth Facility, we will be making a number of judgments and assumptions on process design, equipment selection and design, and plant operations, that may or may not prove to be correct. Design, engineering or construction delays may impair our ability to perform under our long-term supply agreement with GM. In addition, we will need to procure all of the necessary equipment and materials needed to produce alloy flake and magnets, some of which may be difficult to obtain. There can be no assurance that such equipment and materials will be procured on time or not be delayed due to circumstances beyond our control.
Further, we will need to hire and recruit a sufficient number of engineers, operators and other professionals to successfully design and operate the Fort Worth Facility. It may be difficult for us to hire employees with the experience, education and skills needed to produce alloy flake and magnets, and we may need to hire employees from other countries if we cannot recruit employees in the United States. We will also face competition for these employees.
There can be no assurance that even if we complete construction of the Fort Worth Facility, obtain the equipment and materials needed, and hire the necessary employees, that we will successfully produce alloy flake and magnets at the volumes and quality necessary to meet the requirements under our long-term supply agreement with GM. In the event that we are not able to mitigate these risks and fail to comply with the terms of the agreement with GM, this will have a material adverse effect on our financial position and results of operations.
We may not be able to convert current commercial discussions with customers for the sale of REO products into contracts, which may have a material adverse effect on our financial position and results of operations.
We are actively working to complete our Stage II project, which includes installing a concentrate drying and roasting circuit, upgrading and restarting the product leaching circuit, recommissioning separation and extraction circuits, improving materials handling and brine management capability, and constructing new product finishing circuits to re-establish the full capability to produce separated rare earth products at Mountain Pass. Upon reaching anticipated production rates for REO and other planned downstream products at Mountain Pass, we expect to produce approximately 20,000 MTs of separated REO per year, which includes approximately 6,075 MTs of NdPr oxide per year, excluding cerium concentrate. Prior to reaching expected production rates for REO and other planned downstream products at Mountain Pass, we intend to enter into short- and long-term sales contracts with new customers. However, there can be no assurance that these customers will enter into sales contracts for REO. The failure to enter into such contracts may have a material adverse effect on our financial position and results of operations.
We may not successfully establish or maintain collaborative, joint venture and licensing arrangements, which could adversely affect our ability to vertically integrate into further downstream processing of our REO.
A key element of our long-term business strategy is to vertically integrate into further downstream processing of our REO into rare earth metal, alloys, and finished magnets. To implement this vertical integration strategy successfully, we may need to license certain intellectual property related to these downstream processes and/or develop the ability, or collaborate with, purchase, or form a joint venture with existing participants in the metal, alloy, and magnet production supply chain. In addition, other licenses that may be necessary for some of these downstream processing steps have not yet been obtained. Any failure to establish or maintain collaborative, joint venture or licensing arrangements for the production of downstream products on
favorable terms could adversely affect our business prospects, financial condition or ability to develop and commercialize downstream rare earth products.
The COVID-19 pandemic, or other outbreaks, epidemics or pandemics, could have an adverse effect on our business.
The COVID-19 pandemic, or other outbreaks, epidemics or pandemics, can significantly impact the national and global economy and commodity and financial markets. The full extent and impact of the COVID-19 pandemic is unknown and to date has included, among other things, extreme volatility in financial markets, a slowdown in economic activity, extreme volatility in commodity prices and a global recession. The response to COVID-19 has led to significant restrictions on travel, temporary business closures, quarantines, and a general reduction in consumer activity and sentiment, globally. The outbreak has affected our business and operations and may continue to do so, by among others, increasing the cost of operations and reducing employee productivity, limiting travel of our personnel, adversely affecting the health and welfare of our personnel, or preventing or delaying important third-party service providers from performing normal and contracted activities crucial to the operation of our business. In addition, since the onset of the COVID-19 pandemic in the first quarter of 2020, we have periodically experienced shipping delays due to port slowdowns and container shortages from congestion at port facilities and trucking shortages, which has resulted in supply chain disruptions. Congestion at U.S. and international ports could affect the capacity at ports to receive deliveries of products or the loading of shipments onto vessels.
The outbreak has resulted in significant governmental measures being implemented to control the spread of the virus, including, among others, restrictions on manufacturing and the movement of employees in many regions of China, the U.S. and other countries. These disruptions could continue to impact the rare earth market, particularly the supply chain in China and the U.S., which in turn could impact our business or business prospects, including our ability to benefit from our Offtake Agreement with Shenghe.
Decisions beyond our control, such as canceled events, restricted travel, barriers to entry, temporary closures or limited availability of county, state or federal government agencies, or other factors may affect our ability to perform mining operations, corporate activities, and other actions that would normally be accomplished without such limitations. The extent to which the COVID-19 pandemic and other variants will impact our operations, our business and the economy is highly uncertain and will also depend on future developments that cannot be predicted, including new information which may emerge concerning the severity of the disease, the duration and spread of the outbreak, including the spread of other variants, the scope of travel restrictions imposed, mandatory or voluntary business closures, the impact on businesses and financial and capital markets, and the extent and effectiveness of actions taken throughout the world to contain the virus or treat its impact, including the effectiveness and availability of vaccines. We cannot predict the impact of the COVID-19 pandemic, or other outbreaks, epidemics or pandemics, but it may materially and adversely affect our business, financial condition and results of operations.
A power outage or shortage at Mountain Pass could temporarily delay mining and processing operations and increase costs, which may materially adversely impact our business.
Our facilities at Mountain Pass are currently powered by a natural gas-powered combined heat and power (“CHP”) plant, which was installed at Mountain Pass to produce electricity and steam and to minimize or eliminate reliance on the regional electric power grid. Our CHP plant has the capability to provide all the electricity and steam needed for the industrial operations of Stage I. In addition, operation of the CHP plant is necessary to support the entire energy demand of Stage II. While we believe that the CHP plant will provide sufficient electricity and steam to operate our facilities at Mountain Pass, there can be no assurance that there will not be intermittent interruptions in the ability to produce electricity and steam. Instability in electrical supply could cause sporadic outages or brownouts. Any such outages or brownouts could have a negative impact on our production. If the CHP plant is unable to provide sufficient energy for the operation of Mountain Pass or if additional growth projects require energy needs in excess of CHP capacity, we may be required to obtain electricity from a single utility company in Southern California. We could incur higher operating costs, remain subject to the effects of occasional grid power outages and brownouts, and could experience temporary interruptions of processing operations. As a result, our revenue could be adversely impacted and our relationships with our customers could suffer, adversely impacting our ability to generate future revenue and otherwise perform our contractual obligations.
Increasing costs or limited access to raw materials may adversely affect our profitability.
We will use significant amounts of chemical reagents to process REE. Though Mountain Pass includes a chlor-alkali facility, we intend to purchase chemical reagents from third parties on the open market for some period of time. Prior to potentially commencing production of chlor-alkali chemicals on-site, during any production disruption or for chemicals we cannot produce, we will need to purchase chemical reagents from third parties in the open market. We, therefore, would be subject to significant volatility in the cost and availability of these chemicals and to restrictions on chemical use imposed by environmental regulations or law. In addition, third parties may not honor their agreements with us and as a result, we may need
to obtain such chemical reagents from other parties at higher costs and expense and there may be a delay in obtaining such chemical reagents. Further, supply chains reliant on sea vessels, train, and/or truck may subject us to transportation delays in obtaining these chemical reagents. We also may not be able to store such chemical reagents without incurring substantial costs. We may not be able to pass increased costs for these chemical reagents through to our customers in the form of price increases. A significant increase in the price or decrease in the availability of these chemicals before we potentially restart our production of them on-site, or restrictions imposed by environmental regulations or law on chemical use, could materially increase our operating costs and adversely affect our profit margins and production volumes. There can be no assurance that we will be able to purchase the necessary chemical reagents from third parties on terms that are acceptable to us. The failure to obtain chemical reagents as needed will have an adverse effect on our financial condition and results of operations.
Fluctuations in transportation costs or disruptions in transportation services or damage or loss during transport could decrease our competitiveness or impair our ability to supply rare earth minerals or products to our customers, which could adversely affect our results of operations.
We currently transport our rare earth concentrate product via ocean freight. At times during 2021 and 2022, there was a backlog of container ships off the coast of Southern California that delayed shipments in and out of the ports of Los Angeles and Long Beach, the ports that we use to ship our rare earth concentrate product. While we managed to mitigate these intermittent delays in shipping rare earth concentrate product through these ports, our ability to continue to maintain stable shipments may be impacted if port delays due to congestion return or worsen.
In addition, we will in the future need to transport our products to our future customers wherever they may be located. Finding affordable and dependable transportation is necessary for us to be able to supply customers around the world. Labor disputes, embargoes, government restrictions, work stoppages, pandemics, derailments, damage or loss events, adverse weather conditions, other environmental events, seasonal changes in supply and demand for transportation, changes to rail or ocean freight systems, domestic or international laws or regulations, permits or other approvals, or other events and activities beyond our control could interrupt or limit available transport services, which could result in customer dissatisfaction and loss of sales and could materially adversely affect our results of operations. Such events and conditions, including flooding and other natural disasters, could also impact the facilities of our customers which could have a material adverse effect on our ability to deliver our product to our customers.
We will need to process REE to exacting specifications in order to provide future customers with a consistently high-quality product. An inability to process REO that meet individual customer specifications may have a material adverse effect on our financial condition or results of operations.
Upon the completion and commissioning of our Stage II project, we expect to be able to process REE to meet customer needs and specifications and to provide customers with a consistently high-quality product while meeting ever-stricter purity requirements. An inability to meet individual customer specifications may have a material adverse effect on our financial condition or results of operations. In addition, customer needs and specifications may change with time. Any delay or failure in developing processes to meet changing customer needs and specifications may have a material adverse effect on our financial condition or results of operations.
Diminished access to water may adversely affect our operations.
Processing of REO requires significant amounts of water. The technology we currently use to beneficiate REO is a sustainable process with dry tailings that limits the need for fresh water usage. Although we believe our current process is sustainable, any disruption in the process could prompt the need for significant access to fresh water. Additionally, once we complete and commission our Stage II project, we will require an even greater amount of water for our CHP plant, separation and extraction processes, and product finishing operations, including significant demand for highly-pure water. We maintain and operate one water supply well field for potable and process water and own land and wells in another water supply well field that we may be able to operate in the future. Any disruption to our current process, including our water treatment plant used to make highly-pure water; decreases in available water supply; or inability to recycle sufficient volumes of distillate may have a material adverse effect on our operations and our financial condition or results of operations.
Uncertainty in our estimates of REO reserves could result in lower-than-expected revenues and higher-than-expected costs.
We base our REO reserve estimates on engineering, economic and geological data assembled and analyzed by outside firms, which are reviewed by our engineers and geologists. Ore reserve estimates, however, are necessarily imprecise and depend to some extent on professional interpretation, including statistical inferences drawn from available drilling data, which may prove unreliable. There are numerous uncertainties inherent in estimating quantities and qualities of REO reserves and
costs to mine recoverable reserves, including many factors beyond our control. Estimates of economically recoverable REO reserves necessarily depend upon a number of variable factors and assumptions, all of which may vary considerably from actual results, such as:
•geological, mining and processing conditions and/or effects from prior mining that may not be fully identified by available data or that may differ from experience;
•changes to the strategic approach to mining and processing the deposit depending upon market demand, corporate strategy and other prevailing economic conditions;
•assumptions concerning future prices of rare earth products, foreign exchange rates, process recovery rates, transportation costs, operating costs, capital costs and reclamation costs; and
•assumptions concerning future effects of regulation, including the issuance of required permits and taxes by governmental agencies and foreign government policies relating to the import or export of rare earth products.
Uncertainty in our estimates related to our REO reserves could result in lower-than-expected revenues and higher-than-expected costs or a shortened estimated life for the mine at the Mountain Pass facility. Fluctuations in factors out of our control such as changes in future product pricing, foreign government policies on the import or export of rare earths and foreign exchange rates can have a significant impact on the estimates of reserves and can result in significant changes in the quantum of our reserves period-to-period.
Period-to-period conversion of probable REO reserves to proven ore reserves may result in increases or decreases to the total reported amount of ore reserves. Conversion rates are affected by a number of factors, including geological variability, applicable mining methods and changes in safe mining practices, economic considerations and new regulatory requirements.
Our profitability could be adversely affected if we fail to maintain satisfactory labor relations; work stoppages or similar difficulties could significantly disrupt our operations, reduce our revenues and materially adversely affect our results of operations.
Production at Mountain Pass is dependent upon the efforts of our employees. Although none of our employees are currently subject to any collective bargaining arrangements, our employees could, in the future, choose to be represented as a collective unit, which may result in labor disputes, work stoppages or other disruptions in our production efforts that could adversely affect us.
A work stoppage by any of the third parties providing services in connection with the construction projects at Mountain Pass and our magnet facility being developed in Fort Worth, Texas could significantly delay our Stage II and Stage III projects, respectively, and disrupt our operations, reduce our revenues and materially adversely affect our results of operations.
A shortage of skilled technicians and engineers may further increase operating costs, which may materially adversely affect our results of operations.
Efficient production of rare earth products, alloy flake and magnets using modern techniques and equipment requires skilled technicians and engineers. In addition, our optimization and downstream efforts will significantly increase the number of skilled operators, maintenance technicians, engineers and other personnel required to successfully operate our business. In the event that we are unable to hire, train and retain the necessary number of skilled technicians, engineers and other personnel there could be an adverse impact on our labor costs and our ability to reach anticipated production levels in a timely manner, which could have a material adverse effect on our results of operations.
We depend on key personnel for the success of our business.
We depend on the services of our senior management team and other key personnel. The loss of the services of any member of senior management or a key employee could have an adverse effect on our business. We may not be able to locate, attract or employ on acceptable terms qualified replacements for senior management or other key employees if their services are no longer available.
Because of the dangers involved in the mining of minerals and the manufacture of mineral products, there is a risk that we may incur liability or damages as we conduct our business.
The mining of minerals and the manufacture of mineral products involves numerous hazards, including: (i) unusual and unexpected rock formations affecting ore or wall rock characteristics; (ii) ground or slope failures (including open pits, waste rock and tailings disposal areas); (iii) environmental hazards; (iv) industrial accidents; (v) bodily injury or harm; (vi) processing
problems; (vii) periodic interruptions due to inclement or hazardous weather conditions or other acts of God; and (viii) mechanical equipment failure and facility performance problems.
Although we maintain insurance to address certain risks involved in our business, such as coverage for property damage, business interruption, natural disasters, terrorism and workers compensation, there can be no assurance that our coverage will be adequate for liabilities incurred or that insurance will continue to be available to us on economically reasonable terms. Additionally, we cannot be certain that all claims we may make under our insurance policies will be deemed to be within the scope of, or fully covered by, our policies. We might also become subject to liability for environmental issues, damage or other hazards that may be uninsurable or for which we may elect not to insure because of premium costs or commercial impracticality. These policies contain limits of coverage and exclusions that are typical of such policies generally. The payment of such premiums, or the assumption of such liabilities, may have a material adverse effect on our financial position and results of operations.
Our facilities or operations could be adversely affected by events outside of our control, such as natural disasters, wars or health epidemics or pandemics.
We may be impacted by natural disasters, wars, health epidemics or pandemics or other events outside of our control. For example, Mountain Pass is located in San Bernardino County, California near active faults, which could lead to nearby earthquakes. If major disasters such as earthquakes, wild fires, health epidemics or pandemics, floods or other events occur, or our information system or communications network breaks down or operates improperly, our ability to continue operations at Mountain Pass may be seriously damaged, or we may have to stop or delay production and shipment of our products. We may incur expenses or delays relating to such events outside of our control, which could have a material adverse impact on our business, operating results and financial condition.
We are dependent upon information technology systems, which are subject to cyber threats, disruption, damage and failure.
We depend upon information technology systems in the conduct of our operations. Our information technology systems are subject to disruption, damage or failure from a variety of sources, including, without limitation, computer viruses, security breaches, cyber-attacks, natural disasters and defects in design. Cybersecurity incidents, in particular, are evolving and include, but are not limited to, malicious software, attempts to gain unauthorized access to data and other electronic security breaches that could lead to disruptions in systems, unauthorized release of confidential or otherwise protected information or the corruption of data. Various measures have been implemented to manage our risks related to information technology systems and network disruptions. However, given the unpredictability of the timing, nature and scope of information technology disruptions, we could potentially be subject to downtimes, operational delays, the compromising of confidential or otherwise protected information, destruction or corruption of data, security breaches, other manipulation or improper use of our systems and networks or financial losses from remedial actions, any of which could have a material adverse effect on our business, operating results and financial condition.
Risks Related to Environmental Regulation
Our operations are subject to extensive and costly environmental requirements; current and future laws, regulations and permits impose significant costs, liabilities or obligations or could limit or prevent our ability to continue our current operations or to undertake new operations.
We are subject to numerous and detailed federal, state and local environmental laws, certifications, regulations, permits, and other legal requirements applicable to the mining and mineral processing industry, including, without limitation, those pertaining to employee health and safety, air emissions, water usage, wastewater and stormwater discharges, air quality standards, GHG emissions, waste management, plant and wildlife protection, handling and disposal of hazardous and radioactive substances and waste, remediation of soil and groundwater contamination, land use, reclamation and restoration of properties, the discharge of materials into the environment, procurement of certain materials used in our operations, and groundwater quality and availability. These requirements may result in significant costs, liabilities and obligations, impose conditions that are difficult to achieve or otherwise delay, limit or prohibit current or planned operations and future growth. Consequently, the modernization and expansion of the Mountain Pass facility and the development of our Fort Worth Facility may be delayed, limited or prevented and current operations may be curtailed. Failure to comply with these laws, regulations and permits, including as they evolve, may result in the assessment of administrative, civil and criminal penalties, the issuance of injunctions to limit or cease operations, fines, or the suspension or revocation of permits and other sanctions. Pursuant to such requirements, we may also be subject to third-party claims, including for damages to property or injury to persons arising from our operations. Moreover, environmental legislation and regulation are evolving in a manner that may impose stricter standards and enforcement, increased fines and penalties for non-compliance, cessation of operations, more stringent
environmental assessments, and a heightened degree of responsibility for companies and their officers, directors and employees. In addition, mine safety has been the subject of increasing scrutiny resulting in federal and state legislatures and other regulatory authorities imposing more stringent regulatory requirements on mining operations. Any changes in environmental laws, regulations or permits (or the interpretation or enforcement thereof) or any sanctions, damages, costs, obligations or liabilities in respect of these matters could have a material adverse effect on our business and/or the results of our operations and financial condition.
Our operations use hazardous materials and generate hazardous waste and radioactive byproducts. While we maintain procedures for and conduct training on the handling and disposing of chemicals or other substances by our personnel, risks, including bodily injury and property damage, persist. Moreover, mining and processing of rare earths has occurred at Mountain Pass since 1952, and contamination is known to exist around the facility. We may be subject to claims under environmental laws, for toxic torts, natural resource damages and other liabilities, as well as for the investigation and remediation of soil, surface water, groundwater and other environmental media. Mountain Pass is subject to an order issued by the Lahontan Regional Water Quality Control Board, primarily related to contamination emanating from certain on-site impoundments active during prior periods of operation, pursuant to which we and previous owners have conducted various investigatory and remedial actions. These remedial activities include groundwater monitoring, extraction and treatment. We are still in the process of delineating the extent of groundwater contamination at and around the facility and cannot assure you that we will not incur material costs relating to the remediation of such contamination. Also, prior to our acquisition of Mountain Pass, leaks in a wastewater pipeline from Mountain Pass to offsite evaporation ponds on the Ivanpah dry lake bed caused contamination. Pursuant to a settlement agreement, that contamination has been remediated by Chevron Mining Inc., which retained ownership of the ponds and the pipeline and provided a full indemnity to the previous buyer of Mountain Pass for liabilities related to the Ivanpah wastewater pipeline. In 2022, the remaining portion of the pipeline was removed from the Mountain Pass facility and safely disposed. In addition to claims arising out of our current or former properties, such claims may arise in connection with contaminated third-party sites at which we have disposed of waste. Under the federal Comprehensive Environmental Response, Compensation and Liability Act, and analogous state statutes, our liability for claims for contamination at our current or former properties, and at third-party sites at which we disposed of waste, may be joint and several, so that we may be held responsible for more than our share of any contamination, or even for the entire share. These and similar unforeseen impacts that our operations may have on the environment, as well as human exposure to hazardous or radioactive materials or wastes, could have a material adverse effect on our business, reputation, results of operations and financial condition.
We must obtain a number of additional or amended permits that impose strict requirements relating to various environmental and health and safety matters in connection with our current and future operations, including the modernization and expansion of Mountain Pass. To obtain certain permits, we may be required to conduct environmental studies and present data to governmental authorities pertaining to the potential impact of our current and future operations upon the environment and take steps to avoid or mitigate those impacts, particularly impacts to desert flora and fauna. Furthermore, the permitting processes and development of supporting materials, including any environmental impact statements, may be costly and time-consuming. These permit processes and requirements, and the interpretation and enforcement thereof, change frequently, and any such future changes could materially adversely affect our mining operations and results of operations. In some cases, the public (including environmental interest groups) has the right to comment upon, and submit objections to, permit applications and environmental impact statements prepared in connection therewith, and otherwise participate in the permitting process, including challenging the issuance of permits. Accordingly, permits required for our operations, including the modernization and expansion of Mountain Pass, may not be issued, maintained, amended or renewed in a timely fashion or at all, or may be issued or renewed upon conditions that restrict our ability to conduct operations. Any such failure to obtain, maintain, amend or renew permits, or other permitting delays, including in connection with any environmental impact analyses, could have a material adverse effect on our results of operations and financial condition or otherwise impose significant restrictions on our ability to conduct our business.
Legislation and increased regulation regarding climate change could impose significant costs on us and our suppliers, including costs related to increased energy requirements, capital equipment, environmental monitoring, permitting, reporting and other costs to comply with such regulations. Our operations emit greenhouse gases and with the restart of our CHP plant in 2022, our emissions exceeded inclusion thresholds of the California cap-and-trade program, resulting in the Company being re-entered into the program. As such, allowances will be directly allocated to us annually, with fluctuations based on energy usage and regulatory provisions. Additional allowances will need to be purchased, with the price of allowances subject to market volatility. Any adopted future climate change regulations could negatively impact our ability to compete with companies situated in areas and countries not subject to such limitations. Given the political significance, regulatory or compliance obligations and uncertainty around the impact of climate change and how it should be addressed, we cannot predict how legislation and regulation will affect our financial condition, operating performance and ability to compete. Furthermore, even without such regulation, increased awareness and any adverse publicity in the global marketplace, including the investing community, about potential impacts on climate change by us or other companies in our industry could harm our reputation or
our access to capital. The potential physical impacts of climate change on our operations are highly uncertain and would be particular to the geographic circumstances in areas in which we operate. These impacts may adversely impact the cost, production and financial performance of our operations.
Our inability to acquire, maintain or renew financial assurances related to the reclamation and restoration of mining property, or inaccuracies in the assumption underlying our reclamation plan and mine closure obligations, could have a material adverse effect on our business, results of operations and financial condition.
Under the California Surface Mining and Reclamation Act we are generally obligated to restore property after it has been mined in accordance with regulatory standards and our approved mining plan. Additionally, we are required under various federal, state and local laws to maintain financial assurances, such as surety bonds, to secure such obligations. The failure to acquire, maintain or renew such assurances, as required by federal, state and local laws, could subject us to fines and penalties as well as the revocation of our mining permits. Such failure could result from a variety of factors, including:
•the lack of availability, higher expense or unreasonable terms of such financial assurances;
•the ability of current and future financial assurance counterparties to increase required collateral; and
•the exercise by third-party financial assurance counterparties of any rights to refuse to renew the financial assurance instruments.
It has become increasingly difficult for mining companies to secure new or renew existing surety bonds without posting partial or full collateral to secure the bonds. In addition, the cost to obtain surety bonds has increased while the market terms of the surety bonds generally have become less favorable. It is possible that surety bond issuers may refuse to provide or renew bonds or may demand additional collateral upon the issuance or renewal of the bonds. Our inability to acquire or failure to maintain or renew such bonds or other financial assurances could have a material adverse effect on our business, financial condition and results of operations.
Federal, state and local laws and regulations establish reclamation and closure standards applicable to our surface mining and other operations as well. Estimates of our total reclamation and mine closing liabilities are based upon our reclamation plan, third-party expert reports, current applicable laws and regulations, certain permit terms, our engineering expertise related to these requirements and review by regulatory agencies. Any change in the underlying assumptions, permissions, or other variation between the estimated liabilities and actual costs could materially and adversely affect our business, results of operations and financial condition.
Risks Related to Our Common Stock
A recent decision of the Delaware Court of Chancery in Garfield v. Boxed, Inc. may create uncertainty regarding the validity of some of our authorized and issued shares of common stock.
On February 16, 2023, we filed a petition in the Delaware Court of Chancery pursuant to Section 205 (“Section 205”) of the Delaware General Corporation Law, seeking validation of an amendment to our Amended and Restated Certificate of Incorporation (the “Charter Amendment”) undertaken at a special meeting of our stockholders held on November 13, 2020, which increased our authorized Class A common stock and preferred stock by a majority vote of the then-outstanding shares of our Class A common stock and Class F common stock, voting as a single class, and seeking validation of the shares that may be issued pursuant to the Charter Amendment. A recent decision of the Delaware Court of Chancery in Garfield v. Boxed, Inc. may create uncertainty regarding the validity of the Charter Amendment. While we believe the Court is likely to grant the Section 205 petition, the outcome is not certain. If we are not successful in the Section 205 proceeding, uncertainty relating to the Charter Amendment and shares issued pursuant thereto could continue, which may have a material adverse effect on our business.
Our stock price has experienced, and may in the future experience, volatility, and you could lose all or part of your investment as a result.
The trading price of our common stock has historically experienced, and may continue to experience, significant volatility, which could cause you to lose all or part of your investment. Moreover, the stock market recently has experienced extreme volatility, in part as a result of strong and atypical retail investor interest in particular stocks. In many cases, this volatility often has been unrelated or disproportionate to the operating performance of particular companies. You may not be able to resell your shares at an attractive price due to a number of factors such as those listed in “Risks Relating to our Business and Industry” above and the following: (a) results of operations that vary from the expectations of securities analysts and investors; (b) changes in expectations as to the Company’s future financial performance, including financial estimates and investment recommendations by securities analysts and investors; (c) declines in the market prices of stocks generally and market prices of
mining-related companies in particular; (d) strategic actions by the Company or its competitors; (e) announcements by the Company or its competitors of significant contracts, acquisitions, joint ventures, other strategic relationships or capital commitments; (f) any significant change in the Company’s management; (g) changes in general economic or market conditions or trends in the Company’s industry or markets; (h) changes in business or regulatory conditions, including new laws or regulations or new interpretations of existing laws or regulations applicable to the Company’s business; (i) future sales of the Company’s common stock or other securities; (j) investor perceptions of the investment opportunity associated with the Company’s common stock relative to other investment alternatives; (k) the public’s response to press releases or other public announcements by the Company or third parties, including the Company’s filings with the SEC; (l) litigation involving the Company, the Company’s industry, or both, or investigations by regulators into the Company’s operations or those of our competitors; (m) guidance, if any, that the Company provides to the public, any changes in this guidance or the Company’s failure to meet this guidance; (n) the development and sustainability of an active trading market for the Company’s stock; (o) actions by institutional or activist stockholders; (p) declines in the market price of our stock as a result of negative reports on the Company by research firms that engage in short selling; (q) changes in accounting standards, policies, guidelines, interpretations or principles; and (r) other events or factors, including those resulting from natural disasters, war, acts of terrorism, health pandemics or responses to these events.
Volatility in our stock price could adversely affect our business and financing opportunities. These broad market and industry fluctuations may adversely affect the market price of our common stock, regardless of the Company’s actual operating performance. In addition, price volatility may be greater if the public float and trading volume of our common stock is low.
In the past, following periods of market volatility, stockholders have instituted securities class action litigation. If the Company was involved in securities litigation, it could have a substantial cost and divert resources and the attention of executive management from the Company’s business regardless of the outcome of such litigation.
Because there are no current plans to pay cash dividends on our common stock for the foreseeable future, you may not receive any return on investment unless you sell your common stock for a price greater than that which you paid for it.
We intend to retain future earnings, if any, for future operations, expansion and debt repayment and there are no current plans to pay any cash dividends for the foreseeable future. The declaration, amount and payment of any future dividends on shares of our common stock will be at the sole discretion of our Board. Our Board may take into account general and economic conditions, our financial condition and results of operations, our available cash and current and anticipated cash needs, capital requirements, contractual, legal, tax, and regulatory restrictions, implications on the payment of dividends to our stockholders or by our subsidiaries to us and such other factors as our Board may deem relevant. In addition, our ability to pay dividends may be limited by covenants of any future indebtedness we incur. As a result, you may not receive any return on an investment in our common stock unless you sell our common stock for a price greater than that which you paid for it.
Future sales, or the perception of future sales, by us or our stockholders in the public market could cause the market price for our common stock to decline.
The sale of shares of common stock in the public market, or the perception that such sales could occur, could harm the prevailing market price of shares of common stock. These sales, or the possibility that these sales may occur, also might make it more difficult for us to sell equity securities in the future at a time and at a price that we deem appropriate.
In the future, we may also issue our securities in connection with investments or acquisitions. The amount of shares of common stock issued in connection with an investment or acquisition could constitute a material portion of our then-outstanding shares of common stock. Any issuance of additional securities in connection with investments or acquisitions may result in additional dilution to our stockholders.
Anti-takeover provisions in our organizational documents could delay or prevent a change of control.
Certain provisions of our Second Amended and Restated Certificate of Incorporation and Amended and Restated Bylaws may have an anti-takeover effect and may delay, defer or prevent a merger, acquisition, tender offer, takeover attempt or other change of control transaction that a stockholder might consider in its best interest, including those attempts that might result in a premium over the market price for the shares held by our stockholders.
These provisions provide for, among other things: (i) no cumulative voting with respect to the election of our Board; (ii) the division of the our Board into three classes, with only one class of directors being elected in each year; (iii) the ability of our Board to issue one or more series of preferred stock; (iv) advance notice for nominations of directors by stockholders and for stockholders to include matters to be considered at our annual meetings; (v) certain limitations on convening special stockholder meetings; (vi) limiting the ability of stockholders to act by written consent; (vii) the ability of our Board to fill a
vacancy created by the expansion of the board of directors or the resignation, death, or removal of a director in certain circumstances; (viii) providing that our Board is expressly authorized to make, alter or repeal our bylaws; (ix) the removal of directors only for cause; and (x) that certain provisions may be amended only by the affirmative vote of at least 66.7% of the shares of common stock entitled to vote generally in the election of our directors.
These anti-takeover provisions could make it more difficult for a third party to acquire us, even if the third party’s offer may be considered beneficial by many of our stockholders. As a result, our stockholders may be limited in their ability to obtain a premium for their shares. These provisions could also discourage proxy contests and make it more difficult for you and other stockholders to elect directors of your choosing and to cause us to take other corporate actions you desire.
Our Second Amended and Restated Certificate of Incorporation designates the Court of Chancery of the State of Delaware as the sole and exclusive forum for certain types of actions and proceedings that may be initiated by our stockholders, which could limit our stockholders’ ability to obtain a favorable judicial forum for disputes with us or our directors, officers, employees or stockholders.
The Second Amended and Restated Certificate of Incorporation provides that, subject to limited exceptions, any (i) derivative action or proceeding brought on behalf of the Company, (ii) action asserting a claim of breach of a fiduciary duty owed by any director, officer, stockholder or employee to the Company or its stockholders, (iii) action asserting a claim arising pursuant to any provision of the Delaware General Corporation Law or our Second Amended and Restated Certificate of Incorporation or our Amended and Restated Bylaws or (iv) action asserting a claim governed by the internal affairs doctrine shall, to the fullest extent permitted by law, be exclusively brought in the Court of Chancery of the State of Delaware or, if such court does not have subject matter jurisdiction thereof, another state or federal court located within the State of Delaware. The Second Amended and Restated Certificate of Incorporation also provides that, to the fullest extent permitted by law, the federal district courts of the United States of America will be the exclusive forum for resolving any complaint asserting a cause of action arising under the United States federal securities laws, including the Securities Act and the Exchange Act. Additionally, investors cannot waive our compliance with federal securities laws and the rules and regulations thereunder. Any person or entity purchasing or otherwise acquiring any interest in shares of our capital stock shall be deemed to have notice of and to have consented to the provisions of our certificate of incorporation described above. This choice of forum provision may limit a stockholder’s ability to bring a claim in a judicial forum that it finds favorable for disputes with the Company or its directors, officers or other employees, which may discourage such lawsuits against the Company and its directors, officers and employees. There is uncertainty as to whether a court would enforce such an exclusive forum provision with respect to claims under the Securities Act. If a court were to find these provisions of our Second Amended and Restated Certificate of Incorporation inapplicable to, or unenforceable in respect of, one or more of the specified types of actions or proceedings, we may incur additional costs associated with resolving such matters in other jurisdictions, which could adversely affect our business and financial condition.
Increased scrutiny regarding our sustainability and ESG practices could impact our reputation and our stock price.
In July 2022, we released our first ESG report for fiscal year 2021, which highlights our key achievements, metrics and ESG strategy. Our sustainability report also includes our policies and practices on a variety of ESG matters, including water management and preservation; recycling; diversity, equity, and inclusion (“DEI”); employee health and safety; and human capital management. In addition, our business faces increasing scrutiny related to ESG issues, including sustainable development, renewable resources, environmental stewardship, supply chain management, climate change, DEI, workplace conduct, human rights, philanthropy and support for local communities. Implementation of our environmental and sustainability initiatives will require financial expenditures and employee resources.
The publication of our sustainability report may result in increased investor, media, employee, and other stakeholder attention to our ESG initiatives, and such stakeholders may not be satisfied with our ESG practices or initiatives. Organizations that inform investors on ESG matters have developed rating systems for evaluating companies on their approach to ESG. Unfavorable ratings may lead to negative investor sentiment, which could negatively impact our stock price. Any failure, or perceived failure, to respond to ESG concerns could harm our business and reputation. In addition, certain influential institutional investors are also increasing their focus on ESG practices and are placing importance on the implications and social cost of their investments. If our ESG practices do not meet the standards set by these investors, they may choose not to invest in our common stock, or if our peer companies outperform us in their ESG initiatives, potential or current investors may elect to invest with our competitors instead. If we do not comply with investor or stockholder expectations and standards in connection with our ESG initiatives, or are perceived to have not responded appropriately to address ESG issues within our company, our brand and reputation, as well as our business, financial condition, and results of operations could be negatively impacted, and our share price could be materially and adversely affected.
Risks Relating to our Convertible Notes
The conditional conversion feature of our Convertible Notes, if triggered, may adversely affect our financial condition and operating results.
We completed an offering of Convertible Notes in March 2021. In the event the conditional conversion feature of our Convertible Notes is triggered, holders of the Convertible Notes will be entitled to convert them at any time during specified periods at their option. If one or more holders elect to convert their Convertible Notes, unless we elect to satisfy our conversion obligation by delivering solely shares of our common stock (other than paying cash in lieu of delivering any fractional share), we would be required to settle a portion or all of our conversion obligation through the payment of cash, which could adversely affect our liquidity. In addition, even if holders do not elect to convert their Convertible Notes, we could be required under applicable accounting rules to reclassify all or a portion of the outstanding principal of the Convertible Notes as a current rather than long-term liability, which would result in a material reduction of our net working capital.
Conversion of our Convertible Notes may dilute the ownership interest of our stockholders or may otherwise depress the price of our common stock.
The conversion of some or all of our Convertible Notes may dilute the ownership interests of our stockholders. Upon conversion of the notes, we have the option to pay or deliver, as the case may be, cash, shares of our common stock, or a combination of cash and shares of our common stock. If we elect to settle our conversion obligation in shares of our common stock or a combination of cash and shares of our common stock, any sales in the public market of our common stock issuable upon such conversion could adversely affect prevailing market prices of our common stock. In addition, the existence of the Convertible Notes may encourage short selling by market participants that engage in hedging or arbitrage activity, and anticipated conversion of the notes into shares of our common stock could depress the price of our common stock.
Certain provisions in the indenture governing the Convertible Notes may delay or prevent an otherwise beneficial takeover attempt of us.
Certain provisions in the indenture governing the Convertible Notes may make it more difficult or expensive for a third party to acquire us. For example, the indenture governing the Convertible Notes requires us to repurchase the notes for cash upon the occurrence of a fundamental change (as defined in the indenture governing the Convertible Notes) of us and, in certain circumstances, to increase the conversion rate for a holder that converts their Convertible Notes in connection with a make-whole fundamental change (as defined in the indenture governing the Convertible Notes). A takeover of us may trigger the requirement that we repurchase the Convertible Notes and/or increase the conversion rate, which could make it more costly for a potential acquirer to engage in such takeover. Such additional costs may have the effect of delaying or preventing a takeover of us that would otherwise be beneficial to investors.
Servicing our debt requires a significant amount of cash, and we may not have sufficient cash flow from our business to pay our debt.
Our ability to make scheduled payments of the principal of, to pay interest on, or to refinance our indebtedness, including our Convertible Notes, depends on our future performance, which is subject to economic, financial, competitive and other factors beyond our control. In addition, holders of the Convertible Notes will have the right to require us to repurchase their notes for cash upon the occurrence of certain fundamental changes. Upon conversion of the Convertible Notes, unless we elect to deliver solely shares of our common stock to settle such conversion (other than paying cash in lieu of delivering any fractional share), we will be required to make cash payments in respect of the notes being converted. Our business may not continue to generate cash flow from operations in the future sufficient to service our debt and make necessary capital expenditures. If we are unable to generate such cash flow, we may be required to adopt one or more alternatives, such as selling assets, restructuring debt or obtaining additional equity capital on terms that may be onerous or highly dilutive. Our ability to refinance our indebtedness will depend on the capital markets and our financial condition at such time. We may not be able to engage in any of these activities or engage in these activities on desirable terms, which could result in a default on our debt obligations.
ITEM 1B. UNRESOLVED STAFF COMMENTS
None.
ITEM 2. PROPERTIES
Mountain Pass
The Company owns and operates the Mountain Pass Rare Earth Mine and Processing Facility (previously defined as “Mountain Pass”), which is located on 2,222 fee simple acres of land, approximately 50 miles southwest of Las Vegas, Nevada near Mountain Pass, San Bernardino County, California at geographic coordinates 35°28’56”N latitude and 115°31’54”W longitude. Mountain Pass includes an open-pit mine in the production stage, infrastructure supporting mining and processing operations, overburden and ore stockpiles, a crusher and mill/flotation plant, separation plants, product finishing facilities, tailings processing and storage facilities, a water treatment plant, a chlor-alkali facility, and on-site evaporation ponds, as well as laboratory facilities to support product analysis and research and development activities, offices, maintenance shops, warehouses and support buildings. The majority of the Company’s facilities and infrastructure currently used to produce a rare earth concentrate were completed between 2012 and 2015, is in good operating condition, and benefits from routine maintenance. Recommissioning activities are currently underway on certain previously idle facilities and infrastructure that the Company expects to use to separate its rare earth concentrate into other products, including NdPr oxide, with recommissioning activities completed for certain of the assets. The carrying amount of the property, plant and equipment used in the operation of Mountain Pass was approximately $443 million as of December 31, 2022.
Mountain Pass directly abuts Interstate 15 and may be accessed by existing hard-surface roads. Water at Mountain Pass is supplied through active water wells, pit dewatering, and process water recovery. MP Materials’ facilities at Mountain Pass are powered by a natural gas-powered CHP plant, which was installed at Mountain Pass to produce electricity and steam and to minimize or eliminate reliance on the regional electric power grid.
The Company also owns mining and mill site claims over a further 15,000 acres of adjacent land. Approximately 1,118 acres of the 2,222 acres are currently in use (e.g., existing buildings, infrastructure or active disturbance). Portions of the fee lands, none of which are actively being mined or are currently anticipated to be mined for the purpose of recovering ore, are subject to mineral reservations in favor of the United States for some properties and the State of California for other properties. The specific minerals reserved on those parcels vary according to the type of land patent or conveyance document through which the land was acquired or conveyed. The lands surrounding Mountain Pass are mostly public lands managed by the Bureau of Land Management and the National Park Service. In addition, MP Materials holds 525 unpatented lode and mineral mining claims and mill sites under the provisions of The Mining Law of 1872. These mining claims and mill sites provide land for mining, ancillary facilities and expansion capacity around Mountain Pass.
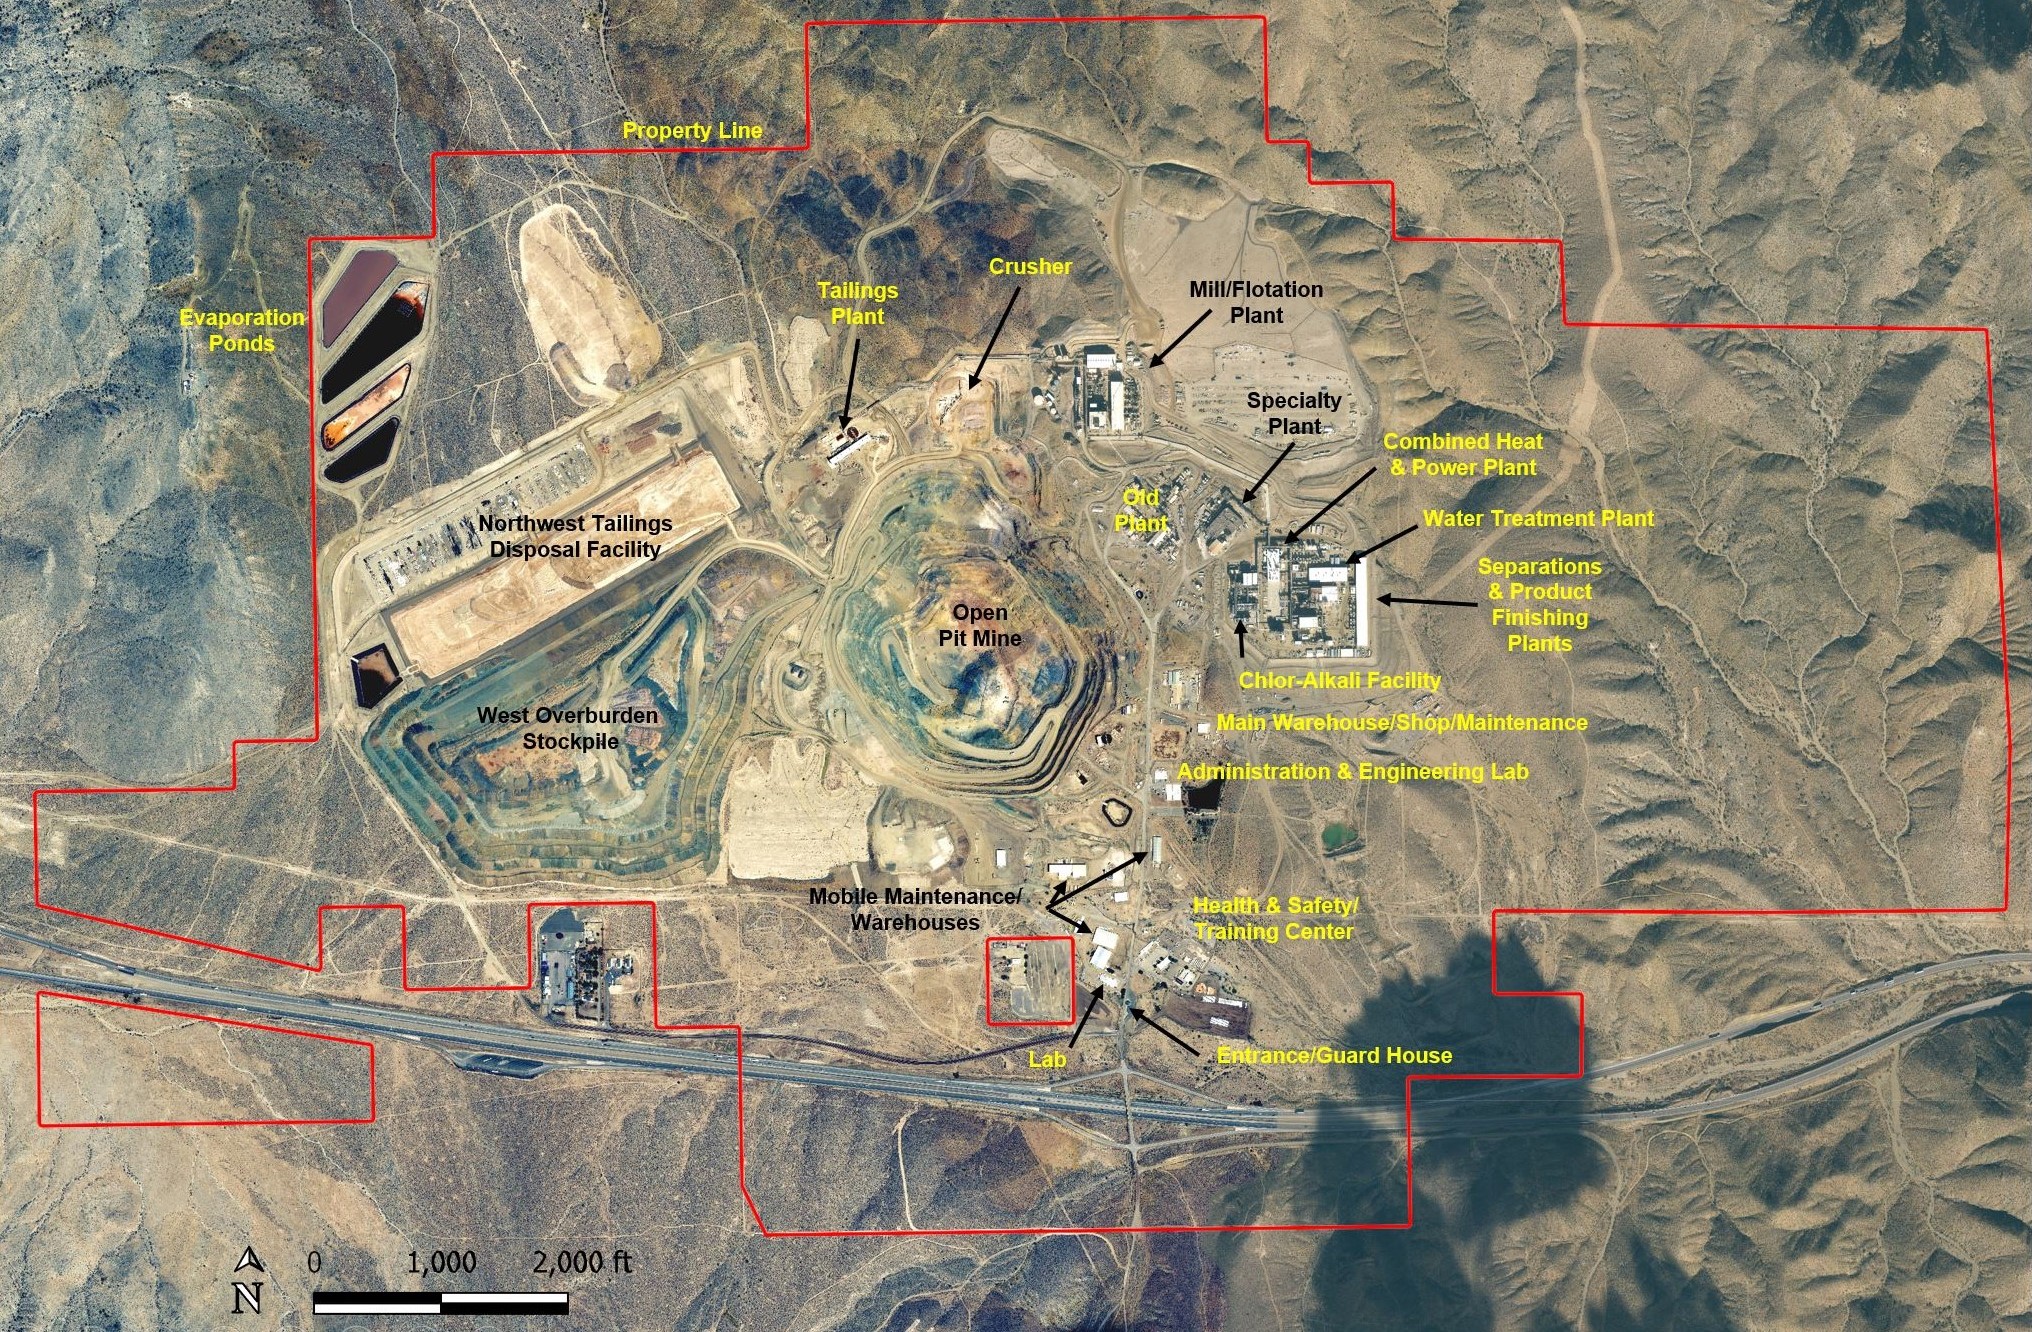
Mountain Pass represents the largest commercial source of rare earth materials in the Western hemisphere. Molybdenum Corporation of America began REE mining operations at Mountain Pass in 1952. Mining, milling and separation processes continued under Unocal Corporation, which purchased Molybdenum Corporation of America in 1977, until 1998. In 2005, ChevronTexaco Corporation acquired Unocal Corporation and then, in 2008, Molycorp Minerals, LLC acquired Mountain Pass from Chevron Mining Inc. Operations relating to mining, milling and separations resumed under Molycorp until they were placed into cold-idle status in mid-2015. In July 2017, the Company acquired Mountain Pass from the Molycorp estate.
The Company holds the necessary permits to operate Mountain Pass, including conditional use and minor use permits from San Bernardino County, California, and an associated environmental impact report, all of which were issued in 2004, which currently allow continued operation of Mountain Pass through 2042, though the Company expects to extend such permits to allow for continued operation through at least 2056. Since restarting operations at the facility in the fourth quarter of 2017, the Company’s activities have focused on the milling and flotation processes, leading to production of a bastnaesite concentrate, rich in REE, with the first concentrate sales in the first quarter of 2018.
The bastnaesite ore body at Mountain Pass has been mined as a principal source of REE for a period of over 60 years. The Mountain Pass REE deposit is located within an uplifted block of Precambrian metamorphic and igneous rocks that are bounded to the south and east by basin-fill deposits in California’s Ivanpah Valley. The two main groups of rocks in the Mountain Pass area are Early Proterozoic high-grade metamorphic rocks and Middle Proterozoic ultrapotassic rocks and monazitic carbonatites, which carbonatites are associated with higher levels of REE. The total orebody strike length is approximately 2,750 feet and dip extent is 3,000 feet; true thickness of the more than 2% total rare earth oxide (“TREO”) grade zone ranges between 15 feet and 250 feet. The percentage of each rare earth material contained in typical Mountain Pass bastnaesite concentrate is estimated to be as follows: | | | | | |
| Estimated Distribution of TREO Content |
| Element | |
| Cerium | 50.2 | % |
| Lanthanum | 32.3 | % |
| Neodymium-Praseodymium | 15.7 | % |
SEG+(1) | 1.8 | % |
Fort Worth Facility
The Company owns approximately 18 acres of land in Fort Worth, Texas, on which it is building a metal, alloy, and magnet manufacturing facility as a part of its Stage III strategy.
Corporate Offices
The Company has a lease for corporate office space at 1700 S. Pavilion Center Drive, 8th Floor, Las Vegas, Nevada 89135. The lease for the Company’s former corporate office space at 6720 Via Austi Parkway, Suites 450 and 430, Las Vegas, Nevada 89119, expired on December 31, 2022.
Rare Earth Resources and Reserves
Introduction
Mineral resources and mineral reserves were estimated by SRK Consulting (U.S.) Inc. (“SRK”) pursuant to the requirements of Regulation S-K Subpart 1300 (“S-K 1300”). SRK prepared a pre-feasibility level Technical Report Summary for Mountain Pass with an effective date of September 30, 2021 (the “2021 TRS”) (refer to Exhibit 96.1 to this Annual Report). All material assumptions and information pertaining to the disclosure of the Company’s mineral resources and mineral reserves, including material assumptions relating to all modifying factors, price estimates, and scientific and technical information, and as described in the 2021 TRS, remain current as of December 31, 2022. We therefore refer to the 2021 TRS given that it remains current in all material respects. The mineral resources and mineral reserves estimated in the 2021 TRS were subsequently depleted by SRK to present an estimate of the Company’s resources and reserves as of December 31, 2021, as disclosed in the Company’s annual report on Form 10-K for the year ended December 31, 2021. The further depletion removed by SRK in this Annual Report represents resources and reserves that were extracted from the Mountain Pass open pit from January 1, 2022, through December 31, 2022.
Mineral Resource and Mineral Reserve Definitions
Mineral Resources
Item 1300 of S-K 1300 defines a “mineral resource” as a concentration or occurrence of material of economic interest in or on the Earth’s crust in such form, grade or quality, and quantity that there are reasonable prospects for economic extraction. A mineral resource is a reasonable estimate of mineralization, taking into account relevant factors such as cut-off grade, likely mining dimensions, location or continuity, that, with the assumed and justifiable technical and economic conditions, is likely to, in whole or in part, become economically extractable. It is not merely an inventory of all mineralization drilled or sampled.
A “measured mineral resource” is that part of a mineral resource for which quantity and grade or quality are estimated on the basis of conclusive geological evidence and sampling. The level of geological certainty associated with a measured mineral resource is sufficient to allow a qualified person to apply modifying factors, as defined in this section, in sufficient detail to support detailed mine planning and final evaluation of the economic viability of the deposit. Because a measured mineral resource has a higher level of confidence than the level of confidence of either an indicated mineral resource or an inferred mineral resource, a measured mineral resource may be converted to a proven mineral reserve or to a probable mineral reserve.
An “indicated mineral resource” is that part of a mineral resource for which quantity and grade or quality are estimated on the basis of adequate geological evidence and sampling. The level of geological certainty associated with an indicated mineral resource is sufficient to allow a qualified person to apply modifying factors in sufficient detail to support mine planning and evaluation of the economic viability of the deposit. Because an indicated mineral resource has a lower level of confidence than the level of confidence of a measured mineral resource, an indicated mineral resource may only be converted to a probable mineral reserve.
An “inferred mineral resource” is that part of a mineral resource for which quantity and grade or quality are estimated on the basis of limited geological evidence and sampling. The level of geological uncertainty associated with an inferred mineral resource is too high to apply relevant technical and economic factors likely to influence the prospects of economic extraction in a manner useful for evaluation of economic viability. Because an inferred mineral resource has the lowest level of geological confidence of all mineral resources, which prevents the application of the modifying factors in a manner useful for evaluation of economic viability, an inferred mineral resource may not be considered when assessing the economic viability of a mining project and may not be converted to a mineral reserve.
Mineral Reserves
Item 1300 of S-K 1300 defines a “mineral reserve” as an estimate of tonnage and grade or quality of indicated and measured mineral resources that, in the opinion of the qualified person, can be the basis of an economically viable project. More specifically, it is the economically mineable part of a measured or indicated mineral resource, which includes diluting materials and allowances for losses that may occur when the material is mined or extracted. A “proven mineral reserve” is the economically mineable part of a measured mineral resource and can only result from conversion of a measured mineral resource. A “probable mineral reserve” is the economically mineable part of an indicated and, in some cases, a measured mineral resource.
Estimation Methodology
Mineral Resources
The mineral resource estimate has been constrained by a geological model considering relevant rock types, structure, and mineralization envelopes as defined by TREO content within relevant geological features. This geological model is informed principally by diamond core drilling and multiple phases of geological mapping. Sectional interpretation based on the combination of these data were used to influence implicit modeling of the geological data with manual controls where appropriate. Data has been composited to reasonable lengths based on the original sample lengths and expected mining unit scale, and outliers have been addressed during estimation using restrictions on influence.
A number of internal controls have been applied over the history of the Mountain Pass deposit to demonstrate the consistency and reliability of historical analytical data supporting mineral resource estimation. Almost all data supporting the mineral resource has been generated by an iteration of a site-based laboratory at the Mountain Pass mine. The Mountain Pass laboratory uses various quality assurance and quality control (“QA/QC”) measures to calibrate modern equipment and ensure analytical precision and accuracy. QA/QC generated by previous laboratories has undergone check assays at independent third-party laboratories, and generally demonstrate no consistent bias. The quality analytical database is also supported by a limited amount of blind quality control samples inserted during a re-assay program, including site-specific standards of known TREO
content, a variety of duplicate samples, and blank samples. The implementation and results of these various QA/QC programs have not been fully aligned with current industry standards and are not comprehensive but are considered satisfactory for use in mineral resource estimation.
Estimates have been validated to the input data using statistical and visual comparisons, localized swath plot comparisons of mean grades, and review of the limited mine production reconciliation data to the model. In general, estimates of grade quality are shown to align closely with the input exploration data, but have been demonstrated to be under-reporting relative to the grade control drilling. SRK has categorized uncertainty and risk at Mountain Pass by classifying the contained mineral resource by varying degrees of confidence in the estimate. The mineral resources at the Mountain Pass deposit have been classified in accordance with S-K 1300 definitions. The classification parameters are defined by the distance to composited data, the number of drillholes used to inform estimated block grades and a geostatistical indicator of relative estimation quality (kriging efficiency). As an overall modifier to classification, SRK considered the results from the QA/QC noted above and the observed variability in production reconciliation in the mineral resource classification as well, both of which preclude the assignment of measured resources, as defined by the SEC. Bulk density is based on average density measurements collected from the various rock types over the years, and carbonatite density in particular is supported by extensive mining and processing experience with the materials.
An economic cut-off grade (“COG”) of 2.28% TREO has been developed to ensure that material reported as a mineral resource can satisfy the definition of having reasonable prospects for economic extraction (“RPEE”) as required for SEC definition. Mineral resources have been constrained within an economic pit shell based on reserve input parameters. For mineral resources, a revenue factor of 1.0 is selected which corresponds to a break-even pit shell volume. SRK notes that the pit selected for mineral resources has been influenced by setbacks relative to critical infrastructure such as the tailing storage and the mill and flotation facilities.
A description of the methodology used to calculate mineral resources is provided in Exhibit 96.1 to this Annual Report. Mineral Reserves
SRK developed a life-of-mine (“LoM”) plan for the Mountain Pass operation in support of mineral reserves. For economic modeling, 2022 production was assumed to be bastnaesite concentrate. From 2023 onward, it was assumed that the Company will operate a separations facility at Mountain Pass that will allow the Company to separate bastnaesite concentrate into four individual REO products for sale: neodymium and praseodymium (previously defined as “NdPr”) oxide, samarium, europium, and gadolinium (“SEG+”) oxalate, lanthanum carbonate, and cerium chloride. Forecast economic parameters are based on historical cost performance for process, transportation, and administrative costs, as well as a first principles estimation of future mining costs. Forecast revenue from concentrate sales and individual separated product sales is based on a preliminary market study commissioned by the Company.
From this evaluation, pit optimization was performed based on an equivalent concentrate price of $6,139 per dry short ton (“ST”) of 60% TREO concentrate (net of the incremental benefits and costs related to REE separations). The results of pit optimization guided the design and scheduling of the ultimate pit. SRK generated a cash flow model which indicated positive economics for the LoM plan, which provides the basis for the reserves. Reserves within the new ultimate pit are sequenced for the remaining 34-year LoM.
The costs used for pit optimization include estimated mining, processing, sustaining capital, transportation, and administrative costs, including an allocation of corporate costs. Processing and selling, general and administrative (“SG&A”) costs used for pit optimization were based on historical actual costs.
Processing recovery for concentrate is variable based on a mathematical relationship to estimate overall TREO recovery versus ore grade. The calculated COG for the reserves is 2.49% TREO, which was applied to indicated blocks contained within an ultimate pit, the design of which was guided by economic pit optimization.
The optimized pit shell selected to guide final pit design was based on a combination of the revenue factor (“RF”) 0.45 pit (used on the north half of the deposit) and the RF 1.00 pit shell (used on the south half of the deposit). The inter-ramp pit slopes used for the design are based on geotechnical studies and range from 42° to 47°.
Measured resources in stockpiles were converted to proven reserves. Indicated pit resources were converted to probable reserves by applying the appropriate modifying factors to potential mining pit shapes created during the mine design process. Inferred resources present within the LoM pit are treated as waste. Internal controls to demonstrate the consistency and reliability of the historic analytical data supporting the mineral resource estimate (which forms the basis for the mineral reserve estimate) are discussed above.
A description of the methodology used to calculate mineral reserves is provided in Exhibit 96.1 to this Annual Report. Results
Mineral Resources
As of December 31, 2022, SRK estimates total indicated resources of 1.43 million short tons (“STs”) with an average grade of 2.83% TREO and 8.90 million STs of inferred resources with an average grade of 5.13% TREO. Mineral resources are reported exclusive of mineral reserves. The reference point for the mineral resources is in situ material.
| | | | | | | | | | | | | | | | | | | | | | | | | | | | | |
| Category | Resource Type | Cut-Off TREO (%) | Mass | Average Value |
| Million Short Tons (dry) | TREO(1) (%) | La2O3(2) (%) | CeO2 (%) | Pr6O11 (%) | Nd2O3 (%) | Sm2O3 (%) |
| Indicated | Within the Reserve Pit | 2.28-2.49 | 0.91 | 2.38 | 0.78 | 1.19 | 0.10 | 0.29 | 0.02 |
| Within the Resource Pit | 2.28 | 0.52 | 3.61 | 1.18 | 1.80 | 0.16 | 0.44 | 0.03 |
| Total Indicated | | | 1.43 | 2.83 | 0.92 | 1.41 | 0.12 | 0.34 | 0.03 |
| Inferred | Within the Reserve Pit | 2.28-2.49 | 6.80 | 5.54 | 1.80 | 2.77 | 0.23 | 0.67 | 0.05 |
| Within the Resource Pit | 2.28 | 2.10 | 3.81 | 1.24 | 1.90 | 0.16 | 0.46 | 0.03 |
| Total Inferred | | | 8.90 | 5.13 | 1.67 | 2.56 | 0.22 | 0.62 | 0.05 |
(1)TREO% represents the total of individually assayed light rare earth oxides on a 99.7% basis of total contained TREO, based on the historical site analyses.
(2)Percentage of individual light rare earth oxides are based on the average ratios; La2O3 is calculated at a ratio of 32.6% grade of TREO% equivalent estimated grade, CeO2 is calculated at a ratio of 49.9% of TREO% equivalent estimated grade, Pr6O11 is calculated at a ratio of 4.3% of TREO% equivalent estimated grade, Nd2O3 is calculated at a ratio of 12.1% of TREO% equivalent estimated grade, and Sm2O3 is calculated at a ratio of 0.9% of TREO% equivalent estimated grade. The sum of light rare earths averages 99.7%; the additional 0.3% cannot be accounted for based on the analyses available to date and has been discounted from this resource statement.
General Notes:
•Mineral Resources are reported exclusive of Mineral Reserves.
•Mineral Resources are not Mineral Reserves and do not have demonstrated economic viability. There is no certainty that all or any part of the Mineral Resources estimated will be converted into the Mineral Reserves estimate.
•Mineral Resource tonnage and contained metal have been rounded to reflect the accuracy of the estimate, any apparent rounding errors are considered insignificant.
•Mineral Resource tonnage and grade are reported as diluted.
•The Mineral Resource model has been depleted for historical mining based on the December 31, 2022, pit topography.
•Pit optimization cut-off grade is based on an average TREO% equivalent concentrate price of $7,059 per ST of dry concentrate (60% TREO, net of the incremental benefits and costs related to REE separations), average mining cost at the pit exit of $1.825 per ST mined plus $0.018 per ST mined for each 15 feet bench above or below the pit exit, combined milling and G&A costs of $69.90 per ST milled, concentrate freight of $177 per ST of dry concentrate, and an average overall pit slope angle of 42° including ramps.
•The mineral resource statement reported herein only includes the rare earth elements cerium, lanthanum, neodymium, praseodymium, and samarium (often referred to as light rare earths). While other rare earth elements, often referred to as heavy rare earths, are present in the deposit, they are not accounted for in this estimate due to historic data limitations.
The following table is provided to show the change in mineral resources from December 31, 2021, to December 31, 2022:
| | | | | | | | | | | | | | | | | | | | | | | | | | |
| Description | Estimate Date | Million Short Tons (dry) | TREO | La2O3 | CeO2 | Pr6O11 | Nd2O3 | Sm2O3 |
(%) | (%) | (%) | (%) | (%) | (%) |
Measured and Indicated Mineral Resources | December 31, 2022 | 1.43 | 2.83 | 0.92 | 1.41 | 0.12 | 0.34 | 0.03 |
Measured and Indicated Mineral Resources | December 31, 2021 | 1.43 | 2.83 | 0.92 | 1.41 | 0.12 | 0.34 | 0.03 |
Difference | | — | | — | | — | | — | | — | | — | | — | |
% Difference | | — | % | — | % | — | % | — | % | — | % | — | % | — | % |
Inferred Mineral Resources | December 31, 2022 | 8.90 | 5.13 | 1.67 | 2.56 | 0.22 | 0.62 | 0.04 |
Inferred Mineral Resources | December 31, 2021 | 9.08 | 5.10 | 1.66 | 2.54 | 0.22 | 0.62 | 0.05 |
Difference | | (0.18) | 0.03 | 0.01 | 0.02 | 0.00 | 0.00 | (0.01) |
% Difference | | (2.0) | % | 0.7 | % | 0.6 | % | 0.9 | % | (1.2) | % | 0.4 | % | (9.4) | % |
There is no change to the Measured and Indicated resources because they are exclusive of reserves and are located outside of the reserves pit.
The reason for the difference between the two estimates of Inferred resources (a portion of which is inside the reserves pit) is due to Inferred resources that were mined and processed during 2022. It is noted that mineral resource depletion due to mining and processing during 2022 was partially offset by additional above cut-off grade material that was identified by closely spaced blasthole sampling. This above cut-off grade material was not included in the previous resource estimate because the material had not been identified by the wider spaced resource drilling that informed the resource block model utilized for the 2021 TRS.
Mineral Reserves
As of December 31, 2022, SRK estimates total proven reserves of 0.34 million STs of ore with an average grade of 7.40% TREO and 28.96 million STs of probable reserves with an average ore grade of 6.31%. Our total proven and probable reserves are estimated as 29.30 million STs with an average grade of 6.32%. The reference point for the mineral reserves is material delivered to the Mountain Pass mill and flotation facilities.
Based on these estimated reserves and the Company’s expected annual production rate upon completion and commissioning of the Stage II project (separations facility), the Company’s expected remaining mine life is approximately 34 years, including a partial year in 2056 to complete the processing of stockpiles and separations.
The following table states the amount of the Company’s proven and probable mineral reserves as of December 31, 2022.
| | | | | | | | | | | | | | | | | |
| Category | Description | Run-of-Mine | TREO% | MY% | Concentrate |
| Million Short Tons (dry) | Million Short Tons (dry) |
| Proven | Current Stockpiles | 0.34 | 7.40 | 8.40 | 0.03 |
| In situ | — | — | — | — |
| Proven Totals | 0.34 | 7.40 | 8.40 | 0.03 |
| Probable | Current Stockpiles | — | — | — | — |
| In situ | 28.96 | 6.31 | 6.67 | 1.93 |
| Probable Totals | 28.96 | 6.31 | 6.67 | 1.93 |
| Proven + Probable | Current Stockpiles | 0.34 | 7.40 | 8.40 | 0.03 |
| In situ | 28.96 | 6.31 | 6.67 | 1.93 |
| Proven + Probable Totals | 29.30 | 6.32 | 6.69 | 1.96 |
General Notes:
•Reserves stated as contained within an economically mineable open pit design stated above a 2.49% TREO COG.
•Mineral reserves tonnage and contained metal have been rounded to reflect the accuracy of the estimate, and numbers may not add due to rounding.
•MY% (mass yield) calculation is based on 60% concentrate grade of the product and the ore grade dependent metallurgical recovery. MY% = (TREO% * Met recovery)/60% concentrate TREO grade.
•Indicated mineral resources have been converted to Probable reserves. Measured mineral resources have been converted to Proven reserves.
•Reserves are diluted at the contact of the 2% TREO geological model triangulation (further to dilution inherent to the resource model and assume selective mining unit of 15 feet x 15 feet x 30 feet).
•Mineral reserves tonnage and grade are reported as diluted.
•Pit optimization COG is based on an average TREO% equivalent concentration price of $6,139 per ST of dry concentrate (60% TREO, net of the incremental benefits and costs related to REE separations), average mining cost at the pit exit of $1.825 per ST mined plus $0.018 per ST mined for each 15 feet bench above or below the pit exit, combined milling and G&A costs of $69.90 per ST milled, concentrate freight of $177 per ST of dry concentrate, and an average overall pit slope angle of 42° including ramps.
•The topography used was from December 31, 2022.
•Reserves contain material inside and outside permitted mining but within mineral lease.
•Reserves assume 100% mining recovery.
•The strip ratio for the remaining reserves is 5.7 to 1 (waste to ore ratio).
•The mineral reserves were estimated by SRK.
The following table is provided to show the change in reserves from December 31, 2021, to December 31, 2022:
| | | | | | | | | | | | | | | | | |
| Description | Estimate Date | Run-of-Mine | TREO% | MY% | Concentrate |
| Million Short Tons (dry) | Million Short Tons (dry) |
| Proven + Probable Reserves | December 31, 2022 | 29.30 | 6.32 | 6.69 | 1.98 |
| Proven + Probable Reserves | December 31, 2021 | 30.13 | 6.34 | 6.72 | 2.02 |
| Difference | | (0.83) | (0.02) | (0.03) | (0.04) |
| % Difference | | (2.8)% | (0.3)% | (0.4)% | (1.7)% |
The reason for the differences between the two estimates is due to reserves that were mined and processed during 2022. It is noted that reserves depletion due to mining and processing during 2022 was partially offset by additional above cut-off grade material that was identified by closely spaced blasthole sampling. This above cut-off grade material was not included in the previous reserves estimate because the material had not been identified by the wider spaced resource drilling that informed the resource block model utilized for the 2021 TRS.
Factors and Assumptions Affecting Mineral Resource and Mineral Reserve Estimates
There are numerous uncertainties inherent in estimating quantities and qualities of REO reserves and costs to mine recoverable reserves, including many factors beyond our control. We will regularly evaluate our REO reserve estimates. This may be done in conjunction with additional exploration drilling programs. The estimates of REO reserves as to both quantity and quality will also be updated to reflect new drilling or other data received. Estimates of economically recoverable REO reserves, however, necessarily depend upon a number of variable factors and assumptions, all of which may vary considerably from actual results, such as:
•geological, mining and processing conditions and/or effects from prior mining that may not be fully identified by available data or that may differ from experience;
•the strategic approach to mining and processing the deposit may change depending upon market demand, corporate strategy and other prevailing economic conditions;
•assumptions concerning future prices of rare earth products, foreign exchange rates, process recovery rates, transportation costs, operating costs, capital costs, and reclamation costs; and
•assumptions concerning future effects of regulation, including the issuance of required permits and taxes by governmental agencies and foreign government policy relating to import or export of rare earth products.
Actual REO tonnage recovered from identified REO reserves and revenues and expenditures with respect to the same may vary materially from estimates. Further, period-to-period, our future estimates of REO reserves may fluctuate significantly as macroeconomic conditions and our level of understanding with respect to the deposit change. These estimates may not accurately reflect our actual REO reserves. Any inaccuracy in our estimates related to our REO reserves could result in lower-than-expected revenues and higher-than-expected costs.
ITEM 3. LEGAL PROCEEDINGS
From time to time, we may be subject to legal and governmental proceedings and claims in the ordinary course of business. We are not currently a party to any material legal or governmental proceedings, and, to our knowledge, none is threatened.
ITEM 4. MINE SAFETY DISCLOSURES
The information concerning mine safety violations or other regulatory matters required by Section 1503(a) of the Dodd-Frank Wall Street Reform and Consumer Protection Act and Item 104 of Regulation S-K is included in Exhibit 95.1 to this Annual Report. PART II
ITEM 5. MARKET FOR REGISTRANT’S COMMON EQUITY, RELATED STOCKHOLDER MATTERS AND ISSUER PURCHASES OF EQUITY SECURITIES
Market Information and Trading Symbol for Common Stock
The Company’s common stock is currently quoted on the NYSE under the symbol “MP”.
Holders of Record
According to Continental Stock Transfer & Trust Company, the Company’s transfer agent, there were 129 active holders of record of the Company’s common stock as of February 15, 2023. The actual number of stockholders is greater than these numbers and includes holders who are beneficial owners, but whose shares are held in street name by brokers and other nominees. These numbers of active holders of record also do not include holders whose shares may be held in trust by other entities.
Dividends
The Company has not paid any cash dividends on its common stock to date. The payment of cash dividends in the future will be dependent upon the Company’s revenues and earnings, capital requirements and general financial condition. The payment of any cash dividends will be within the discretion of the Company’s Board of Directors at such time. In addition, the Company is not currently contemplating and does not anticipate declaring any stock dividends in the foreseeable future as it is currently expected that available cash resources will be utilized in connection with our ongoing operations and development projects, including for the completion of our Stage II project, HREE Facility at Mountain Pass, and Fort Worth Facility.
Unregistered Sales of Equity Securities
The Company did not have any sales of unregistered equity securities during the three months ended December 31, 2022.
Repurchase of Securities
During the three months ended December 31, 2022, neither the Company nor any of its affiliates repurchased shares of the Company’s common stock registered under Section 12 of the Exchange Act.
Stock Performance Graph
The following graph compares the cumulative total stockholder return for the Company’s common stock to the cumulative total returns for the Russell 2000 Index, S&P MidCap 400 Index and a peer group. The peer group consists of the following companies: Albemarle Corporation, Westlake Chemical Corporation, CF Industries Holdings, Inc., Reliance Steel & Aluminum Co., The Mosaic Company, Steel Dynamics, Inc., Axalta Coating Systems Ltd., Ashland Global Holdings Inc., Quaker Chemical Corporation, Cleveland-Cliffs Inc., Alcoa Corporation, Commercial Metals Company, Cabot Corporation and Compass Minerals International, Inc. The total cumulative return calculations are for the period commencing November 18, 2020, for investments in stock, or October 31, 2020, for investments in index, and ending December 31, 2022, and include the reinvestment of dividends. The stock price performance shown in this graph is based on historical data and is neither indicative of, nor intended to forecast, future stock price performance.

*$100 invested on November 18, 2020, in stock or October 31, 2020, in index, including reinvestment of dividends. Fiscal year ended December 31st.
Copyright © 2023 Russell Investment Group. Copyright © 2023 Standard & Poor’s, a division of S&P Global. All rights reserved.
| | | | | | | | | | | | | | | | | | | | | | | |
| 11/18/20 | | 12/31/20 | | 12/31/21 | | 12/31/22 |
| MP Materials Corp. | $ | 100.00 | | | $ | 213.19 | | | $ | 300.99 | | | $ | 160.90 | |
| Russell 2000 Index | $ | 100.00 | | | $ | 128.68 | | | $ | 147.75 | | | $ | 117.55 | |
| S&P MidCap 400 Index | $ | 100.00 | | | $ | 121.73 | | | $ | 151.87 | | | $ | 132.03 | |
| Peer Group | $ | 100.00 | | | $ | 112.07 | | | $ | 170.93 | | | $ | 180.34 | |
ITEM 6. [RESERVED]
ITEM 7. MANAGEMENT’S DISCUSSION AND ANALYSIS OF FINANCIAL CONDITION AND RESULTS OF OPERATIONS
You should read the following discussion and analysis of our financial condition and results of operations together with our Consolidated Financial Statements and related notes appearing elsewhere in this annual report on Form 10-K for the year ended December 31, 2022 (this “Annual Report”). A discussion of changes in our results of operations and cash flows between years ended December 31, 2021 and 2020, has been omitted from this Annual Report, but may be found in “Part II, Item 7. Management’s Discussion and Analysis of Financial Condition and Results of Operations, Comparison of the Years Ended December 31, 2021, 2020, and 2019,” of our annual report on Form 10-K for the year ended December 31, 2021, filed with the U.S. Securities and Exchange Commission on February 28, 2022. This discussion and analysis contains forward-looking statements that involve risks, uncertainties and assumptions. The actual results may differ materially from those anticipated in these forward-looking statements as a result of certain factors, including, but not limited to, those set forth under “Item 1A. Risk Factors” and elsewhere in this Annual Report. See also “Cautionary Note Regarding Forward-Looking Statements.” Executive Overview
MP Materials Corp., including its subsidiaries (the “MP Materials,” “we,” “our,” and “us”), is the largest producer of rare earth materials in the Western Hemisphere. We own and operate the Mountain Pass Rare Earth Mine and Processing Facility (“Mountain Pass”), the only rare earth mining and processing site of scale in North America. We currently produce a rare earth concentrate that is principally sold pursuant to the Offtake Agreement to Shenghe (as such terms are defined in Note 3 “Relationship and Agreements with Shenghe,” in the notes to the Consolidated Financial Statements), that, in turn, typically sells that product to refiners in China. These refiners separate the constituent rare earth elements (“REE”) contained in our concentrate and sell the separated products to their customers. Upon completing commissioning of the Stage II optimization project (“Stage II”), we anticipate producing and selling separated rare earth products, including neodymium-praseodymium (“NdPr”) oxide. In addition, we are constructing our initial rare earth metal, alloy and magnet manufacturing facility in Fort Worth, Texas (the “Fort Worth Facility”), where we anticipate manufacturing, among other products, neodymium-iron-boron (“NdFeB”) permanent magnets. Furthermore, in April 2022, we entered into a long-term supply agreement with General Motors Company (NYSE: GM) (“GM”) to supply U.S.-sourced and manufactured rare earth materials, alloy and finished magnets for the electric motors in more than a dozen models using GM’s Ultium Platform, with a gradual production ramp that is expected to begin in late 2023, starting with alloy. These developments are a part of our Stage III downstream expansion strategy (“Stage III”).
Certain REE serve as critical inputs for the rare earth magnets located inside the electric motors and generators powering carbon-reducing technologies such as electric vehicles (“EVs”) and wind turbines, as well as drones, defense systems, robotics and many other high-growth, advanced technologies. Our integrated operations at Mountain Pass combine low production costs with high environmental standards, thereby restoring American leadership to a critical industry with a strong commitment to sustainability.
Highlights from the year ended December 31, 2022, include:
•Revenue of $527.5 million, representing growth of 59% year over year, driven by an increase in realized price per rare earth oxide (“REO”) equivalent metric ton (“MT”);
•Net income of $289.0 million, representing growth of 114% year over year, largely driven by higher revenue, offset by higher cost of sales and selling, general and administrative expenses;
•Adjusted EBITDA (see below) of $388.6 million, representing growth of 77% year over year, driven by higher per-unit profitability, offset partially by higher personnel and other general and administrative costs;
•Adjusted Net Income (see below) of $320.6 million, representing growth of 108% year over year, largely driven by higher Adjusted EBITDA;
•Diluted earnings per share of $1.52, compared to $0.73 per share in the prior year;
•Net cash provided by operating activities of $343.5 million, an increase from $102.0 million in the prior year;
•Strong concentrate production volumes that remained steady year over year despite significant Stage II construction and recommissioning activities;
•Maintained strong balance sheet with cash, cash equivalents and short-term investments totaling $1,182.3 million as of December 31, 2022, despite significant capital expenditures to support Stage II and the Fort Worth Facility;
•Substantially completed construction and/or commissioning of several circuits of the Stage II optimization project, including concentrate drying and roasting;
•Commenced construction of our Fort Worth Facility, including completion of the building shell in September 2022, and the entrance into a long-term supply agreement with GM to supply U.S.-sourced and manufactured rare earth materials, alloy and finished magnets; and
•Awarded a $35.0 million contract in February 2022 by the Department of Defense’s Office of Industrial Base Policy and Sustainment Program to design and build a facility to process heavy rare earth elements (“HREE”) at Mountain Pass.
Our results of operations for the year ended December 31, 2022, demonstrate our strong operational execution as demand for rare earth materials continues to grow, driving the higher realized prices for rare earth products, particularly those used in NdFeB magnets. Our Stage I concentrate operations continue to deliver strong production levels despite the significant Stage II-related work, including commissioning of the concentrate drying and roasting circuits and other Stage II circuits. We continue to expect that we will reach normalized separated oxide production levels by the end of 2023 after we complete the final commissioning of the Stage II assets. In addition, our Stage III magnetics team has made significant progress on our strategy to repatriate magnet manufacturing to the United States, starting with our initial facility in Fort Worth, Texas, while rapidly growing the organization’s engineering and manufacturing technology capabilities.
We consider net income (loss) and diluted earnings (loss) per share (“EPS”) to be the most directly comparable financial measures calculated in accordance with generally accepted accounting principles in the United States (“GAAP”) to Adjusted EBITDA, Adjusted Net Income, and Adjusted Diluted EPS, which are non-GAAP financial measures. Refer to the “Non-GAAP Financial Measures” section below for the definitions of Adjusted EBITDA, Adjusted Net Income, and Adjusted Diluted EPS, as well as a reconciliation of net income (loss) to Adjusted EBITDA and Adjusted Net Income, and Diluted EPS to Adjusted Diluted EPS. Key Performance Indicators
We have historically used the following key performance indicators to evaluate the performance of our business. However, as we evolve as a business and transition from a producer of rare earth concentrate to a producer of separated rare earth products upon completing the commissioning of our Stage II project, the metrics that management anticipates using to evaluate the business may change or be revised. For example, in completing the transition to separated rare earth products, we may determine that production cost per REO MT, which is a metric focused solely on Stage I concentrate operations, is no longer meaningful in evaluating and understanding our business or operating results. Our calculations of these performance indicators may differ from similar measures published by other companies in our industry or in other industries. The following table presents our key performance indicators:
| | | | | | | | | | | | | | | | | | | | | | | | | | | | | | | | | | | | | | | | | |
| Year ended December 31, | | Amount Change | | % Change |
| (in whole units or dollars, except percentages) | 2022 | | 2021 | | 2020 | | 2022 vs. 2021 | | 2021 vs. 2020 | | 2022 vs. 2021 | | 2021 vs. 2020 |
| REO production volume (MTs) | 42,499 | | | 42,413 | | | 38,503 | | | 86 | | | 3,910 | | | — | % | | 10 | % |
| REO sales volume (MTs) | 43,198 | | | 42,158 | | | 38,367 | | | 1,040 | | | 3,791 | | | 2 | % | | 10 | % |
| Realized price per REO MT | $ | 11,974 | | | $ | 7,745 | | | $ | 3,311 | | | $ | 4,229 | | | $ | 4,434 | | | 55 | % | | 134 | % |
| Production cost per REO MT | $ | 1,728 | | | $ | 1,493 | | | $ | 1,430 | | | $ | 235 | | | $ | 63 | | | 16 | % | | 4 | % |
REO Production Volume
We measure our REO-equivalent production volume for a given period in MTs, our principal unit of sale. This measure refers to the REO content contained in the rare earth concentrate we produce. Our REO production volume is a key indicator of our mining and processing capacity and efficiency.
The rare earth concentrate we currently produce is a processed, concentrated form of our mined rare earth-bearing ores. While our unit of production and sale is a MT of embedded REO equivalent, the actual weight of our rare earth concentrate is significantly greater, as the concentrate also contains non-REO minerals, loss-on-ignition, and residual moisture from the production process. We target REO content of greater than 60% per dry MT of concentrate (referred to as “REO grade”). The elemental distribution of REO in our concentrate is relatively consistent over time and production lot. We consider this the natural distribution, as it reflects the distribution of elements contained, on average, in our ore.
REO Sales Volume
Our REO sales volume for a given period is calculated in MTs. A unit, or MT, is considered sold for purposes of this performance indicator once we recognize revenue on its sale. Our REO sales volume is a key measure of our ability to convert our production into revenue.
Realized Price per REO MT
We calculate the realized price per REO MT for a given period as the quotient of: (i) our Total Value Realized (see below) for a given period and (ii) our REO sales volume for the same period. We define Total Value Realized, which is a non-GAAP financial measure, as our product sales adjusted for the revenue impact of tariff rebates related to prior period sales, and, in connection with our sales to Shenghe between January 1, 2020, and June 5, 2020 under the terms of the Original Offtake Agreement, the Shenghe Implied Discount (as defined and discussed in Note 3 “Relationship and Agreements with Shenghe,” and Note 4 “Revenue Recognition,” in the notes to the Consolidated Financial Statements). Realized price per REO MT is an important measure of the market price of our concentrate product. Accordingly, we calculate realized price per REO MT to reflect a consistent basis between periods by eliminating the revenue impact of tariff rebates and the impact of recognizing revenue at a discount during the period between January 1, 2020, and June 5, 2020. See the “Non-GAAP Financial Measures” section below for a reconciliation of our Total Value Realized, which is a non-GAAP financial measure, to our product sales, which is determined in accordance with GAAP, as well as the calculation of realized price per REO MT. Production Cost per REO MT
We calculate the production cost per REO MT for a given period as the quotient of: (i) our Production Costs (see below) for a given period and (ii) our REO sales volume for the same period. We define Production Costs, which is a non-GAAP financial measure, as our cost of sales (excluding depletion, depreciation and amortization) less stock-based compensation expense included in cost of sales, shipping and freight costs, and costs attributable to certain other sales.
Production cost per REO MT is a key indicator of our concentrate production efficiency. As a significant portion of our cash costs of Stage I production are fixed, our production cost per REO MT is influenced by mineral recovery, REO grade, plant feed rate and production uptime. See the “Non-GAAP Financial Measures” section below for a reconciliation of our Production Costs, which is a non-GAAP financial measure, to our cost of sales (excluding depletion, depreciation and amortization), which is determined in accordance with GAAP, as well as the calculation of production cost per REO MT. Key Factors Affecting Our Performance
We believe we are uniquely positioned to capitalize on the key trends of electrification and supply chain security, particularly as domestic EV production grows and demand for green technologies increases. Our continued success depends to a significant extent on our ability to take advantage of the following opportunities and meet the challenges associated with them.
Demand for REE
The key demand driver for REE is their use in a diverse array of growing end markets, including: clean-energy and transportation technologies (e.g., traction motors in EVs and hybrid electric vehicles, and generators in wind power turbines); consumer and medical applications (e.g., miniaturization of smart phones and other mobile devices, computing devices, speakers and microphones, fiber optics, lasers, robotics, medical ventilators, etc.); critical defense systems (e.g., guidance and control systems, global positioning systems, radar and sonar, drones, etc.); and essential industrial infrastructure (e.g., power tools, pollution-control systems in traditional internal-combustion automobiles, glass polishing, etc.).
We believe we benefit from the continued growth of the rare earth market, particularly the market for NdPr and permanent magnets, and from several demand tailwinds for REE. These include the trend toward electrification; geographic supply chain diversification, particularly in relation to China; the U.S. government initiatives to restore domestic supply of key minerals; and the increasing acceptance of environmental, social and governance mandates. However, changes in technology could also drive down the use of REE, including NdPr, in the components in which they are now used, or lead to a decline in reliance on such components altogether. We also operate in a competitive industry, and many of our key competitors are based in China, where competitors may not be subject to the same rigorous environmental standards and production costs are typically lower than in the United States.
Maximizing Production Efficiency
In 2022, REO production continued to be approximately 3.5x greater than the highest ever production in a twelve-month period achieved at Mountain Pass prior to the implementation and completion of Stage I. These results were achieved through an optimized reagent scheme, lower process temperatures, better management of the tailings facility, and a commitment to operational excellence, driving approximately 95% uptime. Our Stage I optimization project enabled us to achieve what we believe to be world-class production cost levels for rare earth concentrate.
The success of our business reflects our ability to continue to manage our costs. Our production achievements in Stage I have provided economies of scale to lower production costs per MT of REO produced in concentrate. Furthermore, Stage II was designed to enable us to continue to manage our cost structure for separating REE through an optimized facility process flow. The reintroduction of the oxidizing roasting step will allow us to capitalize on the inherent advantages of the bastnaesite ore at Mountain Pass, which is uniquely suitable to low-cost refining by selectively eliminating the need to carry cerium, a lower-value mineral, through the separations process. Additionally, our location offers significant transportation advantages that create meaningful cost efficiencies in securing incoming supplies and shipping of our final products.
We currently operate a single site in a single location, and any stoppage in activity, including for reasons outside of our control, could adversely impact our production, results of operations and cash flows. In addition, several of our current and potential competitors are government supported and may have access to substantially more capital, which may allow them to make similar or greater efficiency improvements or undercut market prices for our product.
Development of Our REE Refining, Metal Alloy, and Magnet-Making Capabilities
Stage II advances our operations from the production of rare earth concentrate to the separation of individual REE. Significant commissioning activities commenced in the fourth quarter of 2022 beginning with the concentrate drying and roasting circuits. Construction and recommissioning of certain other circuits was also substantially complete in the fourth quarter of 2022. The project incorporated upgrades and enhancements to the prior facility process flow to reliably produce separated REE at a low cost and with the intent of minimizing our impact on the environment. As part of Stage II, we have reintroduced an oxidizing roasting circuit, reoriented portions of the plant process flow, increased product finishing capacity, improved wastewater management, and made other improvements to materials handling and storage. Upon reaching run-rate production of REE in Stage II, we expect to be a global low-cost, high-volume producer of NdPr oxide, which represents a majority of the value contained in our concentrate.
In February 2022, we were awarded a $35.0 million contract by the Department of Defense’s Office of Industrial Base Policy and Sustainment Program to design and build a facility to process HREE. Successful completion of this project will establish, for the first time in many years, commercial-scale processing and separation of HREE in support of commercial and defense applications in the United States. The HREE processing and separations facility (the “HREE Facility”) will be built at Mountain Pass and will be integrated into the rest of our Stage I and Stage II facilities. The Company is currently advancing the facilitating works, engineering and procurement for the HREE Facility, which is expected to support the separating of HREE contained in the Mountain Pass ore as well as from third-party feedstocks.
In addition, we are currently constructing the Fort Worth Facility, and developing engineering and manufacturing technology to process NdPr oxide into metal alloys and magnets, while incorporating magnet recycling capabilities. These initiatives support our long-term plans to become a leading global source for rare earth magnets. We believe integration into magnet production will provide some protection from commodity pricing volatility, while also enhancing our business profile as the producer of a critical industrial output in addition to a producer of resources. We expect our Stage III efforts to continue to benefit from geopolitical developments, including initiatives to repatriate critical materials supply chains.
Our Mineral Reserves
Our ore body has proven over more than 60 years of operations to be one of the world’s largest and highest-grade rare earth resources. As of December 31, 2022, SRK Consulting (U.S.), Inc., an independent consulting firm that we retained to assess our reserves, estimated total proven and probable reserves of 1.96 million short tons of REO contained in 29.30 million short tons of ore at Mountain Pass, with an average ore grade of 6.32%. These estimates use an estimated economical cut-off of 2.49% total rare earth oxide. Based on these estimated reserves and our expected annual production rate of REO upon completing the commissioning of Stage II, our expected mine life was approximately 34 years as of December 31, 2022. Over time, we expect to be able to continue to grow our expected mine life through additional exploratory drilling and improved processing capabilities, which may result in changes to various assumptions underlying our mineral reserve estimate.
Mining activities in the United States are heavily regulated, particularly in California. Regulatory changes may make it more challenging for us to access our reserves. In addition, new mineral deposits may be discovered elsewhere, which could make our operations less competitive.
Results of Operations
Comparison of the Years Ended December 31, 2022, 2021, and 2020
The following table summarizes our results of operations:
| | | | | | | | | | | | | | | | | | | | | | | | | | | | | | | | | | | | | | | | | |
| For the year ended December 31, | | Amount Change | | % Change |
| (in thousands, except percentages) | 2022 | | 2021 | | 2020 | | 2022 vs. 2021 | | 2021 vs. 2020 | | 2022 vs. 2021 | | 2021 vs. 2020 |
| Revenue: | | | | | | | | | | | | | |
| Product sales | $ | 517,267 | | | $ | 328,563 | | | $ | 133,697 | | | $ | 188,704 | | | $ | 194,866 | | | 57 | % | | 146 | % |
| Other sales | 10,243 | | | 3,389 | | | 613 | | | 6,854 | | | 2,776 | | | 202 | % | | 453 | % |
| Total revenue | 527,510 | | | 331,952 | | | 134,310 | | | 195,558 | | | 197,642 | | | 59 | % | | 147 | % |
| | | | | | | | | | | | | |
| Operating costs and expenses: | | | | | | | | | | | | | |
Cost of sales(1) | 92,218 | | | 76,253 | | | 63,798 | | | 15,965 | | | 12,455 | | | 21 | % | | 20 | % |
| Selling, general and administrative | 75,840 | | | 56,646 | | | 26,767 | | | 19,194 | | | 29,879 | | | 34 | % | | 112 | % |
| Advanced projects, start-up, development and other | 11,817 | | | 4,573 | | | 140 | | | 7,244 | | | 4,433 | | | 158 | % | | n.m. |
| Depreciation, depletion and amortization | 18,356 | | | 24,382 | | | 6,931 | | | (6,026) | | | 17,451 | | | (25) | % | | 252 | % |
| Accretion of asset retirement and environmental obligations | 1,477 | | | 2,375 | | | 2,255 | | | (898) | | | 120 | | | (38) | % | | 5 | % |
| Loss on sale or disposal of long-lived assets, net | 391 | | | 569 | | | 101 | | | (178) | | | 468 | | | (31) | % | | 463 | % |
| Royalty expense | — | | | — | | | 2,406 | | | — | | | (2,406) | | | n.m. | | (100) | % |
| Write-down of inventories | — | | | 1,809 | | | — | | | (1,809) | | | 1,809 | | | (100) | % | | n.m. |
| Settlement charge | — | | | — | | | 66,615 | | | — | | | (66,615) | | | n.m. | | (100) | % |
| Total operating costs and expenses | 200,099 | | | 166,607 | | | 169,013 | | | 33,492 | | | (2,406) | | | 20 | % | | (1) | % |
| Operating income (loss) | 327,411 | | | 165,345 | | | (34,703) | | | 162,066 | | | 200,048 | | | 98 | % | | n.m. |
| Interest expense, net | (5,786) | | | (8,904) | | | (5,009) | | | 3,118 | | | (3,895) | | | (35) | % | | 78 | % |
| Other income, net | 19,527 | | | 3,754 | | | 251 | | | 15,773 | | | 3,503 | | | 420 | % | | n.m. |
| Income (loss) before income taxes | 341,152 | | | 160,195 | | | (39,461) | | | 180,957 | | | 199,656 | | | 113 | % | | n.m. |
| Income tax benefit (expense) | (52,148) | | | (25,158) | | | 17,636 | | | (26,990) | | | (42,794) | | | 107 | % | | n.m. |
| Net income (loss) | $ | 289,004 | | | $ | 135,037 | | | $ | (21,825) | | | $ | 153,967 | | | $ | 156,862 | | | 114 | % | | n.m. |
| | | | | | | | | | | | | |
Adjusted EBITDA(2) | $ | 388,631 | | | $ | 219,077 | | | $ | 42,609 | | | $ | 169,554 | | | $ | 176,468 | | | 77 | % | | 414 | % |
Adjusted Net Income(2) | $ | 320,557 | | | $ | 154,187 | | | $ | 19,748 | | | $ | 166,370 | | | $ | 134,439 | | | 108 | % | | 681 | % |
n.m. - Not meaningful.
(1)Excludes depreciation, depletion and amortization.
Revenue consists primarily of product sales, which pertain to our sales of rare earth concentrate principally to Shenghe under the Original Offtake Agreement, the A&R Offtake Agreement, or the Offtake Agreement. The sales price of rare earth concentrate sold to Shenghe under these agreements is based on an agreed-upon price per MT, subject to certain quality adjustments depending on the measured characteristics of the product, with an adjustment for the ultimate market price of the product realized by Shenghe upon sales to their customers, including the impact of changes in the exchange rate between the Chinese Yuan and the U.S. dollar. As discussed above, revenue recorded on sales under the Original Offtake Agreement also reflects the Shenghe Implied Discount.
The increase in product sales for the year ended December 31, 2022, as compared to the prior year, was driven by a higher realized price per REO MT, which increased by 55%, reflecting higher demand for rare earth products. REO sales volume and REO production volume were relatively unchanged for the year ended December 31, 2022, as compared to the prior year, with higher ore feed rates largely offsetting lower ore feed grade. REO sales volume varies period to period based on the timing of shipments, but generally tracks our REO production volumes over time given our take-or-pay arrangements with Shenghe. See the “Quarterly Performance Trend” section below.
The increase in other sales for the year ended December 31, 2022, as compared to the prior year, was driven primarily by $8.5 million of revenue related to a sales agreement with Shenghe entered into in March 2022 for certain stockpiles of rare earth fluoride (“REF”).
Cost of sales (excluding depreciation, depletion and amortization) consists of production- and processing-related labor costs (including wages and salaries, benefits, and bonuses), mining and processing supplies (such as reagents), parts and labor for the maintenance of our mining fleet and processing facilities, other facilities-related costs (such as property taxes and utilities), packaging materials, and shipping and freight costs.
Cost of sales for the year ended December 31, 2022, increased year over year primarily due to increase in production cost per REO from $1,493 for the year ended December 31, 2021, to $1,728 for the year ended December 31, 2022. The increase in production cost per REO MT was driven by higher materials, supplies and payroll costs, including an increase in employee headcount to support the expansion of operations, as well as higher energy costs incurred following the restart of our combined heat and power (“CHP”) plant in January 2022. These increases in costs offset production efficiencies achieved during the year ended December 31, 2022. Additionally, shipping and freight costs increased by $4.1 million for the year ended December 31, 2022, as compared to the prior year, largely driven by higher diesel fuel costs. Production cost per REO MT varies period to period based on the timing of scheduled outages of our production facilities for maintenance. See the “Quarterly Performance Trend” section below. Selling, general and administrative expenses consist primarily of accounting, finance and administrative personnel costs, including stock-based compensation expense related to these personnel; professional services (including legal, regulatory, audit and others); certain engineering expenses; insurance, license and permit costs; facilities rent and other costs; office supplies; general facilities expenses; and certain environmental, health and safety expenses.
Selling, general and administrative expenses for the year ended December 31, 2022, increased by $19.2 million, or 34%, as compared to prior year, driven by higher stock-based compensation expense, which increased by $10.3 million when compared to prior year, primarily from a grant of restricted stock units made to our Chief Executive Officer during the fourth quarter of 2021. Other year-over-year increases included higher personnel costs (other than stock-based compensation expense), which increased $6.5 million, and other general and administrative costs required to further build out our corporate infrastructure and support our separations business and magnetics initiatives.
Advanced projects, start-up, development and other consists principally of costs incurred in connection with research and development of new processes or to significantly enhance our existing processes, certain government contracts, and start-up costs, as well as costs incurred to support growth initiatives or pursue other opportunities. Advanced projects, start-up, development and other for the year ended December 31, 2022, increased year over year primarily due to an increase in start-up costs of $7.2 million, associated with the restart of our CHP plant, our Stage II optimization project and our Stage III initiatives, as well as continued investment in research and development activities, particularly with regards to magnetics.
Depreciation, depletion and amortization primarily consists of depreciation of property, plant and equipment and depletion of mineral rights. The year-over-year decrease in depreciation, depletion and amortization for the year ended December 31, 2022, was primarily driven by a decrease in depletion of $5.0 million as a result of a revision to extend our estimate of the remaining useful life of the mineral rights at the beginning of the fourth quarter of 2021. In addition, the year ended December 31, 2022, includes a reduction in depreciation of $2.7 million as a result of a decrement to our asset retirement obligation (see Note 10, “Asset Retirement and Environmental Obligations,” in the notes to the Consolidated Financial Statements for more information). Accretion of asset retirement and environmental obligations is based on the estimated future cash flows required to reclaim our mine pit and certain related facilities at Mountain Pass and to monitor groundwater contamination, respectively. Accretion of asset retirement and environmental obligations for the year ended December 31, 2022, decreased year over year primarily as a result of the decrements to our asset retirement obligation recorded during the fourth quarter of 2021 and the third quarter of 2022, the latter of which will further reduce the accretion of our asset retirement obligation in future periods.
Royalty expense relates to our obligation to pay SNR (as defined in the “Other Information” section below) for the right to extract rare earth ores contained in our mine. Following the Business Combination (as defined in the “Other Information” section below), we no longer incur royalty expenses on a consolidated basis. Write-down of inventories for the year ended December 31, 2021, pertains to a non-cash write-down of a portion of our legacy low-grade stockpile inventory during the second quarter of 2021. See Note 6, “Inventories,” in the notes to the Consolidated Financial Statements for more information.
Settlement charge of $66.6 million for the year ended December 31, 2020, which was non-cash, was recorded in connection with the termination of the distribution and marketing agreement (the “DMA”) with Shenghe. See Note 3, “Relationship and Agreements with Shenghe,” in the notes to the Consolidated Financial Statements for a discussion of the termination of the DMA and associated accounting treatment. Interest expense, net principally consists of the expense associated with the 0.25% per annum interest rate and the amortization of the debt issuance costs on our Convertible Notes (as defined in the “Liquidity and Capital Resources” section below) and the amortization of the discount on our debt obligation to Shenghe, offset by interest capitalized. Interest expense, net for the year ended December 31, 2022, decreased year over year due to the full repayment of the Offtake Advances in the first quarter of 2022, offset by the timing of the issuance of the Convertible Notes in March 2021. During the year ended December 31, 2022, we capitalized interest of $0.4 million as compared to $0.3 million in the prior year. Other income, net consists of interest and investment income and non-operating gains or losses. Other income, net for the year ended December 31, 2022, increased year over year as a result of interest and investment income earned on our short-term investments, which were purchased starting in the second quarter of 2022. The year-over-year increase was offset by a non-cash gain recognized during the second quarter of 2021 as a result of the Small Business Administration’s approval to forgive the Paycheck Protection Loan, which had a principal amount of $3.4 million.
Income tax benefit (expense) consists of an estimate of U.S. federal and state income taxes and income taxes in the jurisdictions in which we conduct business, adjusted for federal, state and local allowable income tax benefits, the effect of permanent differences and any valuation allowance against deferred tax assets. The effective tax rate (income taxes as a percentage of income or loss before income taxes) was 15.3% and 15.7% for the years ended December 31, 2022 and 2021, respectively. The effective tax rates differed from the statutory tax rate of 21% primarily due to benefits for percentage depletion and foreign-derived intangible income, excess tax benefits on stock-based compensation, and a partial release of the valuation allowance against deferred tax assets, offset by state income tax expense and a deduction limitation on officer’s compensation.
On August 16, 2022, the U.S. government enacted the Inflation Reduction Act of 2022 which, among other things, implements a 15% minimum tax on book income of certain large corporations, a 1% excise tax on net stock repurchases, and provides several tax incentives to promote clean energy for tax years beginning after December 31, 2022. At this time, we do not expect the minimum tax or excise tax to have a material impact on our Consolidated Financial Statements. We are continuing to evaluate the impact of the clean energy incentives.
Quarterly Performance Trend
While our business is not highly seasonal in nature, we sometimes experience a timing lag between production and sales, which may result in volatility in our results of operations between periods. In addition, quarterly production is impacted by the timing of scheduled outages of our production facilities for maintenance, which typically occur in the second and fourth quarter. As noted above, as we evolve as a business and transition from a producer of rare earth concentrate to a producer of separated rare earth products, the metrics that management anticipates using to evaluate the business may change or be revised.
The following table presents our key performance indicators for the quarterly periods indicated:
| | | | | | | | | | | | | | | | | | | | | | | | | | | | | | | | | | | | | | | | | | | | | | | | | | | | | | | | | | | | | | | | | | | | | | | | |
| FY2022 | | FY2021 | | FY2020 | |
| (in whole units or dollars) | Q4 | | Q3 | | Q2 | | Q1 | | Q4 | | Q3 | | Q2 | | Q1 | | Q4 | | Q3 | | Q2 | | Q1 | |
| REO production volume (MTs) | 10,485 | | | 10,886 | | | 10,300 | | | 10,828 | | | 10,261 | | | 11,998 | | | 10,305 | | | 9,849 | | | 9,337 | | | 10,197 | | | 9,287 | | | 9,682 | | |
| REO sales volume (MTs) | 10,816 | | | 10,676 | | | 10,000 | | | 11,706 | | | 9,674 | | | 12,814 | | | 9,877 | | | 9,793 | | | 10,320 | | | 9,429 | | | 10,297 | | | 8,321 | | |
Realized price per REO MT | $ | 8,515 | | | $ | 11,636 | | | $ | 13,918 | | | $ | 13,818 | | | $ | 10,101 | | | $ | 7,693 | | | $ | 7,343 | | | $ | 5,891 | | | $ | 4,070 | | | $ | 3,393 | | | $ | 3,093 | | | $ | 2,544 | | |
| Production cost per REO MT | $ | 1,928 | | | $ | 1,653 | | | $ | 1,750 | | | $ | 1,594 | | | $ | 1,525 | | | $ | 1,449 | | | $ | 1,538 | | | $ | 1,475 | | | $ | 1,589 | | | $ | 1,389 | | | $ | 1,412 | | | $ | 1,300 | | |
Liquidity and Capital Resources
Liquidity refers to our ability to generate sufficient cash flows to meet the cash requirements of our business operations, including working capital and capital expenditure needs, contractual obligations, debt service and other commitments. In recent years, our principal sources of liquidity have been financing through the consummation of the Business Combination, the issuance of the Convertible Notes in March 2021, and net cash from operating activities. As of December 31, 2022, we had $1,182.3 million of cash, cash equivalents and short-term investments and $690.0 million principal amount of long-term debt.
Our results of operations and cash flows depend in large part upon the market prices of REO and particularly the price of rare earth concentrate. Rare earth concentrate is not quoted on any major commodities market or exchange and demand is
currently limited to a relatively limited number of refiners, a significant majority of which are based in China. Although we believe that our cash flows from operations and cash on hand are adequate to meet our liquidity requirements for the foreseeable future, uncertainty exists as to the market price of REO, as evidenced by the volatility experienced in 2022, especially in light of the ongoing COVID-19 pandemic, including the emergence of new and potential future variants.
Our current working capital needs relate mainly to our mining and beneficiation operations. However, as we transition to selling separated REO and other rare earth products, and advance our Stage III magnetics initiatives, we anticipate our working capital needs will increase significantly. Our principal capital expenditure requirements relate mainly to completing the commissioning of our Stage II optimization project, constructing the HREE Facility, and developing the Fort Worth Facility, as well as periodic replacement of mining or processing equipment. Our future capital requirements will also depend on several other factors, including future acquisitions and potential additional investments in further downstream production.
The completion of our mission to become a fully integrated domestic magnetics producer is expected to be capital intensive. In accelerating the strategic opportunity for the separation of HREE, enhancements were made to the initial scope of the Stage II project. Including these enhancements and other factors impacting the remaining cost of completion and including certain early design and procurement costs associated with the HREE Facility, and the development and construction costs of the Fort Worth Facility, as well as other growth and infrastructure investments at Mountain Pass, we expect to spend approximately $300 million of capital costs in 2023. We expect to incur further costs to complete the HREE Facility and the Fort Worth Facility in 2024, in addition to investing in other growth and maintenance projects.
Our estimated costs or estimated time to complete and commission these projects may increase, potentially significantly, due to factors outside of our control. While we believe that we have sufficient cash resources to fund these initiatives and operating working capital in the near term, we cannot assure this. If our available resources prove inadequate to fund our plans or commitments, we may be forced to revise our strategy and business plans or could be required, or elect, to seek additional funding through public or private equity or debt financings; however, such funding may not be available on terms acceptable to us, if at all. Any delays in our ongoing capital projects or substantial cost increases, including construction costs and related materials costs related to their execution, could significantly impact our ability to maximize our revenue opportunities and adversely impact our business and cash flows.
Debt and Other Long-Term Obligations
Convertible Notes: In March 2021, we issued $690.0 million aggregate principal amount of 0.25% unsecured green convertible senior notes that mature, unless earlier converted, redeemed or repurchased, on April 1, 2026 (the “Convertible Notes”), at a price of par. Interest on the Convertible Notes is payable on April 1st and October 1st of each year, beginning on October 1, 2021.
The Convertible Notes may, at our election, be settled in cash, shares of our common stock, or a combination thereof. We have the option to redeem the Convertible Notes, in whole or in part, beginning on April 5, 2024. The Convertible Notes are convertible into shares of our common stock at an initial conversion price of $44.28 per share, or 22.5861 shares, per $1,000 principal amount of notes, subject to adjustment upon the occurrence of certain corporate events. However, in no event will the conversion exceed 28.5714 shares of common stock per $1,000 principal amount of notes.
Prior to January 1, 2026, at their election, holders of the Convertible Notes may convert their outstanding notes under the following circumstances: (i) during any calendar quarter commencing with the third quarter of 2021 if the last reported sale price of our common stock for at least 20 trading days (whether or not consecutive) during the period of 30 consecutive trading days ending on, and including, the last trading day of the immediately preceding calendar quarter is greater than or equal to 130% of the conversion price on each applicable trading day; (ii) during the five business day period after any five consecutive trading day period (the “measurement period”) in which the trading price (as defined in the indenture governing the Convertible Notes) per $1,000 principal amount of Convertible Notes for each trading day of the measurement period was less than 98% of the product of the last reported sale price of our common stock and the conversion rate on each such trading day; (iii) if we call any or all of the Convertible Notes for redemption, at any time prior to the close of business on the scheduled trading day immediately preceding the redemption date; or (iv) upon the occurrence of specified corporate events set forth in the indenture governing the Convertible Notes. On or after January 1, 2026, and prior to the maturity date of the Convertible Notes, holders may convert their outstanding notes at any time, regardless of the foregoing circumstances.
If we undergo a fundamental change (as defined in the indenture governing the Convertible Notes), holders may require us to repurchase for cash all or any portion of their outstanding notes at a price equal to 100% of the principal amount of the notes to be repurchased, plus accrued and unpaid interest to, but excluding, the fundamental change repurchase date. In addition, following certain corporate events that occur prior to the maturity date of the Convertible Notes or if we deliver a notice of
redemption, we will, in certain circumstances, increase the conversion rate for holders who elect to convert their outstanding notes in connection with such corporate event or notice of redemption, as the case may be.
We aim to allocate an amount equal to the net proceeds from the Convertible Notes offering to existing or future investments in, or the financing or refinancing of, eligible “green projects.” Eligible green projects are intended to reduce our environmental impact and/or enable the production of low-carbon technologies. Pending such allocation of the net proceeds to eligible green projects, we may use the net proceeds from the Convertible Notes offering for general corporate purposes.
Equipment Notes: We have previously entered into several financing agreements for the purchase of equipment, including trucks, tractors, loaders, graders, and various other machinery. As of December 31, 2022, we had $7.1 million in principal (and accrued interest) outstanding under the equipment notes, of which $2.4 million is due within the next 12 months.
Leases: We have lease arrangements for certain equipment and facilities, including office space, vehicles and equipment used in our operations. As of December 31, 2022, we had future expected lease payment obligations, including leases that have not yet commenced, totaling $10.7 million, with $1.7 million due within the next 12 months.
Purchase Obligations: Our outstanding purchase obligations as of December 31, 2022, primarily consist of purchase orders initiated with vendors and suppliers in the ordinary course of business for operating and maintenance capital expenditures that will be settled within one year. In certain instances, we are permitted to cancel, reschedule or adjust these orders. Consequently, only a small portion of these outstanding purchase orders relate to firm, non-cancelable and unconditional obligations. We have also entered into long-term supply arrangements for certain chemical reagents used in our operations, which is based on current consumption requirements.
Other: In order to support our Stage II separations, HREE Facility, and Fort Worth Facility, we expect to hire at least an additional 175 full-time employees within the next two years, which will result in additional cash requirements for salaries, benefits and training. In addition, we expect to spend approximately $8 million to $10 million within the next two years on implementing a new enterprise resource planning system. Lastly, our engineering, procurement, and construction contracts are typically cancellable.
Cash Flows
The following table summarizes our cash flows:
| | | | | | | | | | | | | | | | | | | | | | | | | | | | | | | | | | | | | | | | | |
| For the year ended December 31, | | Amount Change | | % Change |
| (in thousands, except percentages) | 2022 | | 2021 | | 2020 | | 2022 vs 2021 | | 2021 vs 2020 | | 2022 vs 2021 | | 2021 vs 2020 |
| Net cash provided by (used in): | | | | | | | | | | | | | |
| Operating activities | $ | 343,514 | | | $ | 101,971 | | | $ | 3,277 | | | $ | 241,543 | | | $ | 98,694 | | | 237 | % | | n.m. |
| Investing activities | $ | (1,356,971) | | | $ | (119,363) | | | $ | (22,370) | | | $ | (1,237,608) | | | $ | (96,993) | | | n.m. | | 434 | % |
| Financing activities | $ | (24,191) | | | $ | 666,109 | | | $ | 521,961 | | | $ | (690,300) | | | $ | 144,148 | | | n.m. | | 28 | % |
n.m. - Not meaningful.
Net Cash Provided by Operating Activities: Net cash provided by operating activities increased by $241.5 million for the year ended December 31, 2022, as compared to the prior year, reflecting the increase in product sales and a net increase due to the timing of receipt or payment of working capital items, such as accounts receivable, despite a year-over-year build in inventories, partially offset by increases in our cost of sales; selling, general and administrative expenses; and payments for income taxes of $18.9 million. In addition, $13.6 million of our product sales was excluded from cash provided by operating activities for the year ended December 31, 2022, since that portion of the sales price was retained by Shenghe to reduce the debt obligation, compared to $54.8 million in the prior year.
Net Cash Used in Investing Activities: Net cash used in investing activities increased by $1,237.6 million for the year ended December 31, 2022, as compared to the prior year, reflecting gross purchases of short-term investments of $2,779.7 million and sales and maturities of short-term investments of $1,744.2 million; an increase in additions to property, plant and equipment relating primarily to our Stage II optimization project and the construction of our Fort Worth Facility; and a $0.7 million increase in proceeds from government awards used for construction, specifically our Stage II optimization project.
Net Cash Provided by (Used in) Financing Activities: Net cash used in financing activities was $24.2 million for the year ended December 31, 2022, compared to net cash provided by financing activities of $666.1 million in the prior year. The current year consisted primarily of tax withholding on stock-based awards and principal payments on debt obligations and finance leases while the prior year consisted primarily of the net proceeds received from the issuance of the Convertible Notes in March 2021 of $672.3 million.
Non-GAAP Financial Measures
We present Total Value Realized, Production Costs, Adjusted EBITDA, Adjusted Net Income, Adjusted Diluted EPS, and Free Cash Flow, which are non-GAAP financial measures that we use to supplement our results presented in accordance with GAAP. These measures may be similar to measures reported by other companies in our industry and are regularly used by securities analysts and investors to measure companies’ financial performance. Total Value Realized, Production Costs, Adjusted EBITDA, Adjusted Net Income, Adjusted Diluted EPS, and Free Cash Flow are not intended to be a substitute for any GAAP financial measure and, as calculated, may not be comparable to other similarly titled measures of performance or liquidity of other companies within our industry or in other industries.
Total Value Realized
Total Value Realized, which we use to calculate our key performance indicator, realized price per REO MT, is a non-GAAP financial measure. As mentioned above, realized price per REO MT is an important measure of the market price of our product. The following table presents a reconciliation of our Total Value Realized, to our product sales, which is determined in accordance with GAAP, as well as the calculation of realized price per REO MT:
| | | | | | | | | | | | | | | | | |
| For the year ended December 31, |
| (in thousands, unless otherwise stated) | 2022 | | 2021 | | 2020 |
| Product sales | $ | 517,267 | | | $ | 328,563 | | | $ | 133,697 | |
| Adjusted for: | | | | | |
Shenghe Implied Discount(1) | — | | | — | | | 3,664 | |
Tariff rebates(2) | — | | | (2,050) | | | (10,347) | |
| | | | | |
| | | | | |
| Total Value Realized | 517,267 | | | 326,513 | | | 127,014 | |
| Divided by: | | | | | |
| REO sales volume (in MTs) | 43,198 | | | 42,158 | | | 38,367 | |
| Realized Price per REO MT (in dollars) | $ | 11,974 | | | $ | 7,745 | | | $ | 3,311 | |
(1)Represents the difference between the contractual amount realized by Shenghe and the amount of deferred revenue we recognized.
(2)Represents non-cash revenue recognized in connection with tariff rebates relating to product sales from prior periods. See Note 4, “Revenue Recognition,” in the notes to the Consolidated Financial Statements. Production Costs
Production Costs, which we use to calculate our key performance indicator, production cost per REO MT, is a non-GAAP financial measure. Production cost per REO MT is a key indicator of our concentrate production efficiency. As mentioned above, in completing the transition to separated rare earth products, we may determine that production cost per REO MT, which is a metric focused solely on Stage I concentrate operations, and consequently, Production Costs, are no longer meaningful in evaluating and understanding our business or operating results. The following table presents a reconciliation of our Production
Costs to our cost of sales (excluding depreciation, depletion and amortization), which is determined in accordance with GAAP, as well as the calculation of production cost per REO MT:
| | | | | | | | | | | | | | | | | |
| For the year ended December 31, |
| (in thousands, unless otherwise stated) | 2022 | | 2021 | | 2020 |
Cost of sales (excluding depreciation, depletion and amortization) | $ | 92,218 | | | $ | 76,253 | | | $ | 63,798 | |
| Adjusted for: | | | | | |
Stock-based compensation expense(1) | (2,853) | | | (4,294) | | | (277) | |
Shipping and freight(2) | (13,002) | | | (8,923) | | | (8,220) | |
Other(3) | (1,715) | | | (79) | | | (446) | |
| | | | | |
| | | | | |
| Production Costs | 74,648 | | | 62,957 | | | 54,855 | |
| Divided by: | | | | | |
| REO sales volume (in MTs) | 43,198 | | | 42,158 | | | 38,367 | |
| Production Cost per REO MT (in dollars) | $ | 1,728 | | | $ | 1,493 | | | $ | 1,430 | |
(1)Pertains only to the amount of stock-based compensation expense included in cost of sales.
(2)Includes $1.3 million for the year ended December 31, 2022, of shipping and freight costs associated with sales of REF stockpiles.
(3)Amount for the year ended December 31, 2022, pertains primarily to costs (excluding shipping and freight) attributable to sales of REF stockpiles.
Adjusted EBITDA
We define Adjusted EBITDA as our GAAP net income or loss before interest expense, net; income tax expense or benefit; and depreciation, depletion and amortization; further adjusted to eliminate the impact of stock-based compensation expense; transaction-related, start-up and other non-recurring costs; accretion of asset retirement and environmental obligations; gain or loss on sale or disposal of long-lived assets; write-downs of inventories; royalty expense; settlement charge; tariff rebates; and other income or loss. We present Adjusted EBITDA because it is used by management to evaluate our underlying operating and financial performance and trends. Adjusted EBITDA excludes certain expenses that are required in accordance with GAAP because they are non-recurring, non-cash or are not related to our underlying business performance. This non-GAAP financial measure is intended to supplement our GAAP results and should not be used as a substitute for financial measures presented in accordance with GAAP.
The following table presents a reconciliation of our Adjusted EBITDA, which is a non-GAAP financial measure, to our net income (loss), which is determined in accordance with GAAP:
| | | | | | | | | | | | | | | | | |
| For the year ended December 31, |
| (in thousands) | 2022 | | 2021 | | 2020 |
| Net income (loss) | $ | 289,004 | | | $ | 135,037 | | | $ | (21,825) | |
| Adjusted for: | | | | | |
| Depreciation, depletion and amortization | 18,356 | | | 24,382 | | | 6,931 | |
| Interest expense, net | 5,786 | | | 8,904 | | | 5,009 | |
| Income tax expense (benefit) | 52,148 | | | 25,158 | | | (17,636) | |
Stock-based compensation expense(1) | 31,780 | | | 22,931 | | | 5,014 | |
Transaction-related, start-up and other non-recurring costs(2) | 9,216 | | | 3,716 | | | 4,438 | |
| Accretion of asset retirement and environmental obligations | 1,477 | | | 2,375 | | | 2,255 | |
| Loss on sale or disposal of long-lived assets, net | 391 | | | 569 | | | 101 | |
| Write-down of inventories | — | | | 1,809 | | | — | |
Royalty expense | — | | | — | | | 2,406 | |
Settlement charge | — | | | — | | | 66,615 | |
Tariff rebates(3) | — | | | (2,050) | | | (10,347) | |
Other income, net(4) | (19,527) | | | (3,754) | | | (352) | |
| Adjusted EBITDA | $ | 388,631 | | | $ | 219,077 | | | $ | 42,609 | |
(1)Principally included in “Selling, general and administrative” within our Consolidated Statements of Operations.
(2)Amount for the year ended December 31, 2022, is principally comprised of start-up costs, which relate to the restart of our CHP plant as well as certain costs associated with our Stage II optimization project and Stage III initiatives. Amount for the year ended December 31, 2021, includes mainly advisory, consulting, accounting and legal expenses principally in connection with secondary equity offerings and the redemption of our Public Warrants in May and June 2021. Amount for the year ended December 31, 2020, includes mainly advisory, consulting, accounting, legal expenses and one-time employee bonuses in connection with the Business Combination, as well as non-recurring costs for SAP implementation.
(3)Represents non-cash revenue recognized in connection with tariff rebates received relating to product sales from prior periods.
(4)Amount for the year ended December 31, 2022, is principally comprised of interest and investment income. Amount for the year ended December 31, 2021, principally represents a non-cash gain recognized as a result of the Small Business Administration’s approval to forgive the Paycheck Protection Loan.
Adjusted Net Income and Adjusted Diluted EPS
We calculate Adjusted Net Income as our GAAP net income or loss excluding the impact of stock-based compensation expense; transaction-related, start-up and other non-recurring costs; gain or loss on sale or disposal of long-lived assets; write-downs of inventories; royalty expense; settlement charge; tariff rebates; and other items that we do not consider representative of our underlying operations; adjusted to give effect to the income tax impact of such adjustments; and the release of valuation allowance. We calculate Adjusted Diluted EPS as our GAAP diluted EPS excluding the per share impact, using GAAP diluted weighted-average shares outstanding as the denominator, of stock-based compensation expense; transaction-related, start-up and other non-recurring costs; gain or loss on sale or disposal of long-lived assets; write-downs of inventories; royalty expense; settlement charge; tariff rebates; and other items that we do not consider representative of our underlying operations; adjusted to give effect to the income tax impact of such adjustments; and the release of valuation allowance. Adjusted Net Income and Adjusted Diluted EPS exclude certain expenses that are required in accordance with GAAP because they are non-recurring, non-cash, or not related to our underlying business performance. To calculate the income tax impact of such adjustments on a year-to-date basis, we utilize an effective tax rate equal to our income tax expense excluding material discrete costs and benefits, with any impacts of changes in effective tax rate being recognized in the current period. We present Adjusted Net Income and Adjusted Diluted EPS because it is used by management to evaluate our underlying operating and financial performance and trends. These non-GAAP financial measures are intended to supplement our GAAP results and should not be used as a substitute for financial measures presented in accordance with GAAP.
Historically, we had excluded the depletion on the mineral rights for the rare earth ores contained in our mine, which were recorded at fair value upon the acquisition of SNR, from Adjusted Net Income and Adjusted Diluted EPS. Effective September 30, 2022, we no longer exclude depletion expense when calculating and presenting Adjusted Net Income and Adjusted Diluted EPS. For purposes of comparability, we have revised the prior years for this change.
The following table presents a reconciliation of our Adjusted Net Income, which is a non-GAAP financial measure, to our net income (loss), which is determined in accordance with GAAP:
| | | | | | | | | | | | | | | | | |
| For the year ended December 31, |
| (in thousands) | 2022 | | 2021 | | 2020 |
| Net income (loss) | $ | 289,004 | | | $ | 135,037 | | | $ | (21,825) | |
| Adjusted for: | | | | | |
| | | | | |
Stock-based compensation expense(1) | 31,780 | | | 22,931 | | | 5,014 | |
Transaction-related, start-up and other non-recurring costs(2) | 9,216 | | | 3,716 | | | 4,438 | |
| Loss on sale or disposal of long-lived assets, net | 391 | | | 569 | | | 101 | |
| Write-down of inventories | — | | | 1,809 | | | — | |
Royalty expense | — | | | — | | | 2,406 | |
| Settlement charge | — | | | — | | | 66,615 | |
Tariff rebates(3) | — | | | (2,050) | | | (10,347) | |
Other(4) | (273) | | | (3,754) | | | (352) | |
Tax impact of adjustments above(5) | (6,716) | | | (4,071) | | | (16,969) | |
Release of valuation allowance | (2,845) | | | — | | | (9,333) | |
| Adjusted Net Income | $ | 320,557 | | | $ | 154,187 | | | $ | 19,748 | |
(1)Principally included in “Selling, general and administrative” within our Consolidated Statements of Operations.
(2)Amount for the year ended December 31, 2022, is principally comprised of start-up costs, which relate to the restart of our CHP plant as well as certain costs associated with our Stage II optimization project and Stage III initiatives. Amount for the year ended December 31, 2021, includes mainly advisory, consulting, accounting and legal expenses principally in connection with secondary equity offerings and the redemption of our Public
Warrants in May and June 2021. Amount for the year ended December 31, 2020, includes mainly advisory, consulting, accounting, legal expenses and one-time employee bonuses in connection with the Business Combination, as well as non-recurring costs for SAP implementation.
(3)Represents non-cash revenue recognized in connection with tariff rebates received relating to product sales from prior periods.
(4)Amount for the year ended December 31, 2021, principally represents a non-cash gain recognized as a result of the Small Business Administration’s approval to forgive the Paycheck Protection Loan, which is included in “Other income, net” within our Consolidated Statements of Operations.
(5)Tax impact of adjustments is calculated using an adjusted effective tax rate, which excludes the impact of discrete tax costs and benefits, to each adjustment. The adjusted effective tax rates were 16.3%, 17.5% and 25.0% for the years ended December 31, 2022, 2021 and 2020, respectively. See Note 11, “Income Taxes,” in the notes to the Consolidated Financial Statements for more information on the effective tax rate. The following table presents a reconciliation of our Adjusted Diluted EPS, which is a non-GAAP financial measure, to our diluted EPS, which is determined in accordance with GAAP:
| | | | | | | | | | | | | | | | | |
| For the year ended December 31, |
| (in thousands) | 2022 | | 2021 | | 2020 |
| Diluted EPS | $ | 1.52 | | | $ | 0.73 | | | $ | (0.27) | |
| Adjusted for: | | | | | |
| | | | | |
| Stock-based compensation expense | 0.16 | | | 0.12 | | | 0.06 | |
Transaction-related, start-up and other non-recurring costs(1) | 0.05 | | | 0.02 | | | 0.06 | |
| Loss on sale or disposal of long-lived assets, net | — | | | — | | | — | |
| Write-down of inventories | — | | | 0.01 | | | — | |
Royalty expense | — | | | — | | | 0.03 | |
| Settlement charge | — | | | — | | | 0.84 | |
Tariff rebates(2) | — | | | (0.01) | | | (0.13) | |
Other(3) | — | | | (0.02) | | | — | |
Tax impact of adjustments above(4) | (0.04) | | | (0.02) | | | (0.22) | |
Release of valuation allowance | (0.01) | | | — | | | (0.12) | |
| Adjusted Diluted EPS | $ | 1.68 | | | $ | 0.83 | | | $ | 0.25 | |
Diluted weighted-average shares outstanding | 193,453,087 | | | 189,844,028 | | | 79,690,821 | |
(1)Amount for the year ended December 31, 2022, is principally comprised of start-up costs, which relate to the restart of our CHP plant as well as certain costs associated with our Stage II optimization project and Stage III initiatives. Amount for the year ended December 31, 2021, includes mainly advisory, consulting, accounting and legal expenses principally in connection with secondary equity offerings and the redemption of our Public Warrants in May and June 2021. Amount for the year ended December 31, 2020, includes mainly advisory, consulting, accounting, legal expenses and one-time employee bonuses in connection with the Business Combination, as well as non-recurring costs for SAP implementation.
(2)Represents non-cash revenue recognized in connection with tariff rebates received relating to product sales from prior periods.
(3)Amount for the year ended December 31, 2021, principally represents a non-cash gain recognized as a result of the Small Business Administration’s approval to forgive the Paycheck Protection Loan, which is included in “Other income, net” within our Consolidated Statements of Operations.
(4)Tax impact of adjustments is calculated using an adjusted effective tax rate, which excludes the impact of discrete tax costs and benefits, to each adjustment. The adjusted effective tax rates were 16.3%, 17.5% and 25.0% for the years ended December 31, 2022, 2021 and 2020, respectively. See Note 11, “Income Taxes,” in the notes to the Consolidated Financial Statements for more information on the effective tax rate. Free Cash Flow
We calculate Free Cash Flow as net cash provided by operating activities less additions to property, plant and equipment, net of proceeds from government awards used for construction. We believe Free Cash Flow is useful for comparing our ability to generate cash with that of our peers. The presentation of Free Cash Flow is not meant to be considered in isolation or as an alternative to cash flows from operating activities and does not necessarily indicate whether cash flows will be sufficient to fund cash needs.
The following table presents a reconciliation of our Free Cash Flow, which is a non-GAAP financial measure, to our net cash provided by operating activities, which is determined in accordance with GAAP:
| | | | | | | | | | | | | | | | | |
| For the year ended December 31, |
| (in thousands) | 2022 | | 2021 | | 2020 |
Net cash provided by operating activities(1) | $ | 343,514 | | | $ | 101,971 | | | $ | 3,277 | |
Additions to property, plant and equipment, net(2) | (321,465) | | | (119,488) | | | (22,370) | |
| Free Cash Flow | $ | 22,049 | | | $ | (17,517) | | | $ | (19,093) | |
(1)As a result of the accounting treatment for the A&R Offtake Agreement, $13.6 million, $54.8 million and $21.3 million of our product sales for the years ended December 31, 2022, 2021, and 2020, respectively, were excluded from cash provided by operating activities since that portion of the sales price was retained by Shenghe to reduce the debt obligation.
(2)Amounts for the years ended December 31, 2022 and 2021, are net of $5.1 million and $4.4 million, respectively, in proceeds from government awards used for construction, specifically our Stage II optimization project.
Critical Accounting Estimates
Preparation of the Consolidated Financial Statements in accordance with GAAP requires our management to make judgments, estimates and assumptions that impact the reported amount of revenue and operating expenses, assets and liabilities and the disclosure of contingent assets and liabilities. We consider an accounting judgment, estimate or assumption to be critical when (i) the estimate or assumption is complex in nature or requires a high degree of judgment and (ii) the use of different judgments, estimates and assumptions could have a material impact on our Consolidated Financial Statements. Our significant accounting policies are described in Note 2, “Significant Accounting Policies,” in the notes to the Consolidated Financial Statements. Our critical accounting estimates are described below. Revenue
We recognize revenue from sales of rare earth products produced from our facility. Our principal customer, Shenghe, purchased the vast majority of our production for the years ended December 31, 2022, 2021 and 2020, and is an affiliate of an equity holder of MP Materials. We recognize revenue at the point in time control of the products transfers to the customer and, under our offtake agreements with Shenghe, our performance obligation is typically satisfied when we deliver products to the agreed-upon shipping point. The transaction price with Shenghe is typically based on an agreed-upon price per MT but subject to certain quality adjustments based on REO content, with an adjustment for the ultimate market price of the product realized by Shenghe in their sales to their customers, further adjusted for certain contractually negotiated amounts. We typically negotiate with and bill an initial price to Shenghe; such prices are then updated based on final adjustments for REO content and/or actual sales prices realized by Shenghe. In addition, sales to Shenghe under the Original Offtake Agreement between January 1, 2020, and June 5, 2020, also reflected an adjustment for the Shenghe Implied Discount.
Debt Obligations and Imputed Interest Rate Applied to Debt Discount
In connection with the June 2020 Modification, we recorded a total principal amount of $94.0 million in debt due to the nature of our obligations, including a carrying amount of $85.7 million based on the fair value of the instrument upon issuance, offset by the resulting debt discount of $8.3 million. Since the A&R Offtake Agreement did not have a stated rate, and the timing and method of repayment was contingent on several factors, including our production and sales volumes, market prices realized by Shenghe, our sales to other parties, our asset sales and the amount of our annual net income, we estimated the timing of payments and other reductions to the outstanding balance to determine an imputed interest rate.
The debt discount represented the difference between the fair value of the debt liability issued and the total amount of the contractual obligation as a result of our entrance into the A&R Offtake Agreement. The imputed interest rate was calculated by amortizing the debt discount over the time period that management expected to bring the total outstanding principal balance to zero and determining the annualized interest rate necessary to fully amortize the discount in the same period when final principal reduction was expected to occur. Actual repayments or reductions in the principal balance differed in timing and amount from our estimates, and we therefore updated our estimates each reporting period. We recognized adjustments from these estimates using the prospective method. Under the prospective method, we updated our estimate of the effective imputed interest rate in future periods based on revised estimates of the timing of remaining principal reductions. This rate was then used to recognize interest expense for subsequent reporting periods, until the estimates were updated again. Under this method, the effective interest rate was not constant, and changes were recognized prospectively as an adjustment to the effective yield.
In March 2022, we made a $2.9 million payment to Shenghe pursuant to an obligation under the A&R Offtake Agreement to pay Shenghe, on an annual basis, an amount equal to our annual net income, less any amounts recouped through the Gross Profit Recoupment mechanism during such year, until the Prepaid Balance was reduced to zero. Upon payment, the Prepaid Balance was repaid in full, and the A&R Offtake Agreement was terminated. See Note 3, “Relationship and Agreements with Shenghe,” and Note 8, “Debt Obligations,” in the notes to the Consolidated Financial Statements for further discussion. Asset Retirement Obligations
We recognize asset retirement obligations for estimated costs of legally and contractually required closure, dismantlement, and reclamation activities associated with Mountain Pass. Asset retirement obligations are initially recognized at their estimated fair value in the period in which the obligation is incurred. In determining fair value, management makes estimates based on the expected timing of reclamation activities; cash flows to perform activities, which involves utilizing an assumption for future
inflation; amount and uncertainty associated with the cash flows, including adjustments for a market risk premium; and discounts such amounts using a credit-adjusted risk-free rate. Although we base our estimates on historical experience and reevaluate our estimated timing and cash flows regularly, since the majority of the cash flows to settle our asset retirement obligations occur decades in the future, it is inherently difficult to accurately predict the ultimate cash flows used to settle such obligations. As a result, these estimates and assumptions are subjective and can vary over time.
As illustrated in Note 10, “Asset Retirement and Environmental Obligations,” in the notes to the Consolidated Financial Statements, our asset retirement obligations have decreased from $25.6 million as of December 31, 2020, to $5.5 million as of December 31, 2022, as a result of revisions in our estimated timing and cash flows pertaining to required reclamation activities. In particular, as a result of an updated life-of-mine, which revised the estimated timing of cash flows by approximately an additional 13 years, we recorded a decrement of $9.8 million during the year ended December 31, 2021. Furthermore, during the year ended December 31, 2022, we recorded another decrement of $13.1 million, the effect of removing estimated cash flows pertaining to certain of our processing and separations facilities at Mountain Pass that no longer required reclamation. Recently Adopted and Issued Accounting Pronouncements
Other Information
COVID-19 Pandemic
The COVID-19 pandemic remains on-going and continues to impact the global economy. Through the end of 2022, varying degrees of preventative measures were still in place in China and other parts of the world, including city-wide lockdowns, travel restrictions, closures of non-essential businesses and other quarantine measures. Since the first quarter of 2020, we have experienced, at times, significant shipping delays due to congestion and slowdowns at U.S. and international ports caused by shortages in vessels, containers, and truckers, also disrupting the global supply chain. Congestion and slowdowns have affected and may continue to affect the capacity at ports to receive deliveries of products or the loading of shipments onto vessels. Despite these factors, we have not experienced a reduction in production or sales due to the COVID-19 pandemic; however, the COVID-19 pandemic has contributed to certain cost and schedule pressures on the Stage II optimization project. We have worked proactively and diligently to adjust working schedules and hours to optimize logistics and shipping, which has thus far prevented a significant negative impact on our product sales and has mitigated certain impacts on Stage II construction and recommissioning progress.
As the situation continues to evolve, including as a result of new and potential future variants of COVID-19, the possibility of federal or state mandates on vaccinations, or other factors that may affect international shipping and logistics or involve responses to government actions such as strikes or other disruptions, it is impossible to predict the effect and ultimate impact of the COVID-19 pandemic on our business, results of operations, production and sales volumes, or growth projects. Accordingly, the extent and duration of any business disruptions, and related financial impact, cannot be estimated at this time.
Business Combination and Reverse Recapitalization
Pursuant to the terms of the Agreement and Plan of Merger, dated as of July 15, 2020, as amended on August 26, 2020 (the “Merger Agreement”), on November 17, 2020, MP Mine Operations LLC (“MPMO”), the company that owns the Mountain Pass mine and processing facilities, and Secure Natural Resources LLC (“SNR”), the company that holds the mineral rights to the Mountain Pass mine and surrounding areas as well as intellectual property rights related to the processing and development of rare earth minerals, were combined with Fortress Value Acquisition Corp., a special purpose acquisition company (“FVAC”) (the “Business Combination”), and became indirect wholly-owned subsidiaries of FVAC, which was in turn renamed MP Materials Corp.
The Business Combination was accounted for as a reverse recapitalization, with no goodwill or other intangible assets recorded, and the acquisition of SNR was treated as an asset acquisition. Furthermore, MPMO was deemed to be the accounting acquirer and FVAC the accounting acquiree, which, for financial reporting purposes, resulted in MPMO’s historical financial information becoming that of MP Materials Corp.
ITEM 7A. QUANTITATIVE AND QUALITATIVE DISCLOSURES ABOUT MARKET RISK
We have in the past and may in the future be exposed to certain market risks, including commodity price, foreign currency, and interest rate risks, in the ordinary course of our business, as discussed further below.
Commodity Price Risk
Our results of operations depend in large part upon the market prices of REO and particularly the price of rare earth concentrate. Rare earth concentrate is not quoted on any major commodities market or exchange as product attributes vary and demand is currently constrained to a relatively limited number of refiners, a significant majority of which are based in China.
Our rare earth concentrate contains a significant amount of NdPr. We expect demand for NdPr to continue to grow, driving demand for our concentrate, and in the future, separated NdPr oxide and permanent magnets containing NdPr. However, actual demand and pricing may fluctuate for numerous reasons beyond our control, including, among other things, supply of NdPr from other producers, discoveries of new mineral properties, technological changes that lead to diminished reliance on NdPr and/or permanent magnets, and shifts in underlying end-user demand for products or components manufactured with NdPr. We have not entered into derivative contracts to protect the price of our products, and do not expect to do so in the foreseeable future, as there is no liquid market for such contracts and their cost may be prohibitive, if they could be obtained at all.
The solvent extraction and finishing processes are highly reliant upon standard commodity reagents. These reagents, as well as certain other raw materials and supplies we use in our operations, are subject to price volatility caused by weather, supply conditions, political and economic variables and other unpredictable factors. We have not historically used options or swap contracts to manage the volatility related to the above exposures. When possible, we seek to limit our exposure by entering into long-term contracts and price increase limitations in contracts. Also, we currently use natural gas to operate our CHP plant which powers our processing and separations facilities at Mountain Pass, and expect to use natural gas to power generators at our Fort Worth Facility in the future. We generally purchase or expect to purchase natural gas from suppliers at market or tariff rates. From time to time, we use commodity contracts to hedge energy exposures. Such commodity price fluctuations may cause volatility in our results of operations and cash flows in the future.
Foreign Currency Risk
While we currently generate revenue in the United States and in U.S. dollars, the market transactions are denominated mainly in the Chinese Yuan, and we are therefore exposed to currency volatility and devaluation risks. For example, we negotiate monthly U.S. dollar REO prices with Shenghe, which are based in part on the exchange rate between the U.S. dollar and the Chinese Yuan. Geopolitical tensions between the U.S. and China may lead to increased tariffs, preferences for local producers, some of which may be government-supported, changes in taxing regimes or other trade barriers. Foreign currency risk has not historically had a material impact on our results of operations or cash flows. However, as we expand internationally, we become further exposed to foreign currency risk by entering new markets with additional foreign currencies. The economic impact of currency exchange rate movements is often linked to variability in real growth, inflation, interest rates, governmental actions and other factors. Accordingly, to the extent that foreign currency risk becomes material, we may enter into hedging transactions to manage our exposure to fluctuations in foreign currency exchange rates.
Interest Rate Risk
We had cash, cash equivalents and short-term investments totaling $1,182.3 million as of December 31, 2022, of which $1,175.0 million was invested in money market funds, U.S. Treasury and agency securities. Our cash, cash equivalents and short-term investments are held for working capital and general corporate purposes. We have not historically entered into investments for trading or speculative purposes.
Our cash equivalents and short-term investments are subject to market risk due to changes in interest rates. Fixed rate securities may have their market value adversely affected due to a rise in interest rates. Due in part to these factors, our future investment income may fall short of our expectations due to changes in interest rates or we may suffer losses in principal if we are forced to sell securities that decline in market value due to changes in interest rates. As our short-term investments are classified as available-for-sale, no gains are recognized due to changes in interest rates. As losses due to changes in interest rates are generally not considered to be credit related, no losses in such investments are recognized due to changes in interest rates unless we intend to sell, it is more likely than not that we will be required to sell, we sell prior to maturity, or we otherwise determine that all or a portion of the decline in fair value is due to credit related factors.
As of December 31, 2022, a hypothetical increase of 100-basis points in interest rates would not have a material impact on the value of our cash equivalents or short-term investments in our Consolidated Financial Statements.
ITEM 8. FINANCIAL STATEMENTS AND SUPPLEMENTARY DATA
REPORT OF INDEPENDENT REGISTERED PUBLIC ACCOUNTING FIRM
To the Stockholders and the Board of Directors
MP Materials Corp.:
Opinions on the Consolidated Financial Statements and Internal Control Over Financial Reporting
We have audited the accompanying consolidated balance sheets of MP Materials Corp. and subsidiaries (the Company) as of December 31, 2022 and 2021, the related consolidated statements of operations, comprehensive income (loss), changes in stockholders’ equity (deficit), and cash flows for each of the years in the three-year period ended December 31, 2022, and the related notes (collectively, the consolidated financial statements). We also have audited the Company’s internal control over financial reporting as of December 31, 2022, based on criteria established in Internal Control – Integrated Framework (2013) issued by the Committee of Sponsoring Organizations of the Treadway Commission.
In our opinion, the consolidated financial statements referred to above present fairly, in all material respects, the financial position of the Company as of December 31, 2022 and 2021, and the results of its operations and its cash flows for each of the years in the three-year period ended December 31, 2022, in conformity with U.S. generally accepted accounting principles. Also in our opinion, the Company maintained, in all material respects, effective internal control over financial reporting as of December 31, 2022 based on criteria established in Internal Control – Integrated Framework (2013) issued by the Committee of Sponsoring Organizations of the Treadway Commission.
Basis for Opinions
The Company’s management is responsible for these consolidated financial statements, for maintaining effective internal control over financial reporting, and for its assessment of the effectiveness of internal control over financial reporting, included in the accompanying Management’s Annual Report on Internal Control Over Financial Reporting. Our responsibility is to express an opinion on the Company’s consolidated financial statements and an opinion on the Company’s internal control over financial reporting based on our audits. We are a public accounting firm registered with the Public Company Accounting Oversight Board (United States) (PCAOB) and are required to be independent with respect to the Company in accordance with the U.S. federal securities laws and the applicable rules and regulations of the Securities and Exchange Commission and the PCAOB.
We conducted our audits in accordance with the standards of the PCAOB. Those standards require that we plan and perform the audits to obtain reasonable assurance about whether the consolidated financial statements are free of material misstatement, whether due to error or fraud, and whether effective internal control over financial reporting was maintained in all material respects.
Our audits of the consolidated financial statements included performing procedures to assess the risks of material misstatement of the consolidated financial statements, whether due to error or fraud, and performing procedures that respond to those risks. Such procedures included examining, on a test basis, evidence regarding the amounts and disclosures in the consolidated financial statements. Our audits also included evaluating the accounting principles used and significant estimates made by management, as well as evaluating the overall presentation of the consolidated financial statements. Our audit of internal control over financial reporting included obtaining an understanding of internal control over financial reporting, assessing the risk that a material weakness exists, and testing and evaluating the design and operating effectiveness of internal control based on the assessed risk. Our audits also included performing such other procedures as we considered necessary in the circumstances. We believe that our audits provide a reasonable basis for our opinions.
Definition and Limitations of Internal Control Over Financial Reporting
A company’s internal control over financial reporting is a process designed to provide reasonable assurance regarding the reliability of financial reporting and the preparation of financial statements for external purposes in accordance with generally accepted accounting principles. A company’s internal control over financial reporting includes those policies and procedures that (1) pertain to the maintenance of records that, in reasonable detail, accurately and fairly reflect the transactions and dispositions of the assets of the company; (2) provide reasonable assurance that transactions are recorded as necessary to permit preparation of financial statements in accordance with generally accepted accounting principles, and that receipts and expenditures of the company are being made only in accordance with authorizations of management and directors of the company; and (3) provide reasonable assurance regarding prevention or timely detection of unauthorized acquisition, use, or disposition of the company’s assets that could have a material effect on the financial statements.
Because of its inherent limitations, internal control over financial reporting may not prevent or detect misstatements. Also, projections of any evaluation of effectiveness to future periods are subject to the risk that controls may become inadequate because of changes in conditions, or that the degree of compliance with the policies or procedures may deteriorate.
Critical Audit Matter
The critical audit matter communicated below is a matter arising from the current period audit of the consolidated financial statements that was communicated or required to be communicated to the audit committee and that: (1) relates to accounts or disclosures that are material to the consolidated financial statements and (2) involved our especially challenging, subjective, or complex judgments. The communication of a critical audit matter does not alter in any way our opinion on the consolidated financial statements, taken as a whole, and we are not, by communicating the critical audit matter below, providing a separate opinion on the critical audit matter or on the accounts or disclosures to which it relates.
Identification and disclosure of related party transactions with Shenghe
As discussed in Notes 3 and 18 to the consolidated financial statements, the Company has entered into a series of commercial agreements with Shenghe Resources (Singapore) International Trading Pte. Ltd (Shenghe), a related party. Under the agreements, Shenghe purchases rare earth products produced by the Company at specified prices.
We identified the identification and disclosure of the related party transactions with Shenghe as a critical audit matter. Subjective auditor judgment was required in assessing the sufficiency of the procedures performed to determine whether all such transactions were identified and disclosed properly by the Company.
The following are the primary procedures we performed to address this critical audit matter. We evaluated the design and tested the operating effectiveness of certain internal controls related to the identification and disclosure of transactions with Shenghe. We applied auditor judgment to determine the nature and extent of procedures to be performed to identify transactions with Shenghe. We evaluated the identification and disclosure of transactions with Shenghe by:
•inquiring of management of the Company and the Audit Committee of the Board of Directors regarding (i) the Shenghe relationship and (ii) transactions between the Company and Shenghe
•reading the minutes from meetings of the Board of Directors
•obtaining and analyzing underlying documentation for a sample of sales transactions and comparing it to the contractual agreements with Shenghe
•confirming transactions and contractual agreements with Shenghe as of and for the year ended December 31, 2022 and comparing the responses to the Company’s consolidated financial statements
•reading the contractual agreements with Shenghe and comparing the terms to the disclosures in the Company’s consolidated financial statements.
We evaluated the sufficiency of audit evidence obtained by assessing the results of procedures performed over the transactions with Shenghe, including the appropriateness of such evidence.
/s/ KPMG LLP
We have served as the Company’s auditor since 2017.
Denver, Colorado
February 28, 2023
MP MATERIALS CORP. AND SUBSIDIARIES
CONSOLIDATED BALANCE SHEETS
| | | | | | | | | | | |
| December 31, |
| (in thousands, except share and per share data) | 2022 | | 2021 |
| Assets | | | |
| Current assets | | | |
| Cash and cash equivalents | $ | 136,627 | | | $ | 1,179,297 | |
| Short-term investments | 1,045,718 | | | — | |
| Total cash, cash equivalents and short-term investments | 1,182,345 | | | 1,179,297 | |
| Accounts receivable (including related party) | 32,856 | | | 51,009 | |
| Inventories | 57,554 | | | 38,692 | |
| Income taxes receivable | 2,201 | | | — | |
| Prepaid expenses and other current assets | 18,872 | | | 7,809 | |
| Total current assets | 1,293,828 | | | 1,276,807 | |
| Non-current assets | | | |
| | | |
| Property, plant and equipment, net | 935,743 | | | 610,612 | |
| Non-current inventories | 5,744 | | | — | |
| Other non-current assets | 2,472 | | | 2,247 | |
| | | |
| Total non-current assets | 943,959 | | | 612,859 | |
| Total assets | $ | 2,237,787 | | | $ | 1,889,666 | |
Liabilities and stockholders’ equity | | | |
| Current liabilities | | | |
| Accounts payable, construction payables and accrued liabilities | $ | 72,265 | | | $ | 35,734 | |
| Income taxes payable | 21,163 | | | 3,463 | |
| | | |
Current installments of long-term debt—related party | — | | | 16,082 | |
| | | |
| Other current liabilities | 4,053 | | | 4,264 | |
| Total current liabilities | 97,481 | | | 59,543 | |
| Non-current liabilities | | | |
| Asset retirement obligations | 5,295 | | | 17,615 | |
| Environmental obligations | 16,580 | | | 16,598 | |
| Long-term debt, net of current portion | 678,444 | | | 674,927 | |
| | | |
| | | |
| Deferred income taxes | 122,353 | | | 104,500 | |
| Other non-current liabilities | 5,000 | | | 7,751 | |
| Total non-current liabilities | 827,672 | | | 821,391 | |
| Total liabilities | 925,153 | | | 880,934 | |
Commitments and contingencies (Note 12) | | | |
Stockholders’ equity: | | | |
Preferred stock ($0.0001 par value, 50,000,000 shares authorized, none issued and outstanding in either year) | — | | | — | |
Common stock ($0.0001 par value, 450,000,000 shares authorized, 177,706,608 and 177,816,554 shares issued and outstanding, as of December 31, 2022 and December 31, 2021, respectively) | 18 | | | 18 | |
| Additional paid-in capital | 951,008 | | | 936,299 | |
| Retained earnings | 361,419 | | | 72,415 | |
| Accumulated other comprehensive income | 189 | | | — | |
| Total stockholders’ equity | 1,312,634 | | | 1,008,732 | |
| Total liabilities and stockholders’ equity | $ | 2,237,787 | | | $ | 1,889,666 | |
See accompanying notes to the Consolidated Financial Statements.
MP MATERIALS CORP. AND SUBSIDIARIES
CONSOLIDATED STATEMENTS OF OPERATIONS
| | | | | | | | | | | | | | | | | |
| For the year ended December 31, |
| (in thousands, except share and per share data) | 2022 | | 2021 | | 2020 |
| Revenue: | | | | | |
| Product sales (including related party) | $ | 517,267 | | | $ | 328,563 | | | $ | 133,697 | |
| Other sales (including related party) | 10,243 | | | 3,389 | | | 613 | |
| Total revenue | 527,510 | | | 331,952 | | | 134,310 | |
| | | | | |
| Operating costs and expenses: | | | | | |
Cost of sales (including related party)(excluding depreciation, depletion and amortization) | 92,218 | | | 76,253 | | | 63,798 | |
| Selling, general and administrative | 75,840 | | | 56,646 | | | 26,767 | |
| Advanced projects, start-up, development and other | 11,817 | | | 4,573 | | | 140 | |
| Depreciation, depletion and amortization | 18,356 | | | 24,382 | | | 6,931 | |
| Accretion of asset retirement and environmental obligations | 1,477 | | | 2,375 | | | 2,255 | |
| Loss on sale or disposal of long-lived assets, net | 391 | | | 569 | | | 101 | |
| Royalty expense | — | | | — | | | 2,406 | |
| Write-down of inventories | — | | | 1,809 | | | — | |
| Settlement charge | — | | | — | | | 66,615 | |
| Total operating costs and expenses | 200,099 | | | 166,607 | | | 169,013 | |
| Operating income (loss) | 327,411 | | | 165,345 | | | (34,703) | |
| Interest expense, net | (5,786) | | | (8,904) | | | (5,009) | |
| Other income, net | 19,527 | | | 3,754 | | | 251 | |
| Income (loss) before income taxes | 341,152 | | | 160,195 | | | (39,461) | |
| Income tax benefit (expense) | (52,148) | | | (25,158) | | | 17,636 | |
| Net income (loss) | $ | 289,004 | | | $ | 135,037 | | | $ | (21,825) | |
| | | | | |
| Earnings (loss) per share: | | | | | |
| Basic | $ | 1.64 | | | $ | 0.78 | | | $ | (0.27) | |
| Diluted | $ | 1.52 | | | $ | 0.73 | | | $ | (0.27) | |
| | | | | |
| Weighted-average shares outstanding: | | | | | |
| Basic | 176,519,203 | | | 173,469,546 | | | 79,690,821 | |
| Diluted | 193,453,087 | | | 189,844,028 | | | 79,690,821 | |
See accompanying notes to the Consolidated Financial Statements.
MP MATERIALS CORP. AND SUBSIDIARIES
CONSOLIDATED STATEMENTS OF COMPREHENSIVE INCOME (LOSS)
| | | | | | | | | | | | | | | | | |
| For the year ended December 31, |
| (in thousands) | 2022 | | 2021 | | 2020 |
| Net income (loss) | $ | 289,004 | | | $ | 135,037 | | | $ | (21,825) | |
| Other comprehensive income, net of tax: | | | | | |
| | | | | |
| | | | | |
| | | | | |
| Change in net unrealized gains on available-for-sale securities | 189 | | | — | | | — | |
| Total comprehensive income (loss) | $ | 289,193 | | | $ | 135,037 | | | $ | (21,825) | |
See accompanying notes to the Consolidated Financial Statements.
MP MATERIALS CORP. AND SUBSIDIARIES
CONSOLIDATED STATEMENTS OF CHANGES IN STOCKHOLDERS’ EQUITY (DEFICIT)
| | | | | | | | | | | | | | | | | | | | | | | | | | | | | | | | | | | | | | | | | | | | | | | | | | | | | |
| Preferred Stock | | Common Stock | | Shenghe Warrant | | Additional Paid-in Capital | | Retained Earnings (Accumulated
Deficit) | | Accumulated Other Comprehensive Income | | Total Stockholders’ Equity (Deficit) |
| (in thousands, except share data) | Shares | | Amount | | Shares | | Amount | | | | |
| Balance as of January 1, 2020 | — | | | $ | — | | | 66,556,975 | | | $ | 7 | | | $ | — | | | $ | 22,768 | | | $ | (40,797) | | | $ | — | | | $ | (18,022) | |
| Issuance of Shenghe Warrant | — | | | — | | | — | | | — | | | 53,846 | | | — | | | — | | | — | | | 53,846 | |
| Business Combination, including PIPE Financing | — | | | — | | | 60,738,714 | | | 6 | | | (53,846) | | | 563,115 | | | — | | | — | | | 509,275 | |
| SNR Mineral Rights Acquisition | — | | | — | | | 19,999,942 | | | 2 | | | — | | | 326,647 | | | — | | | — | | | 326,649 | |
| Common stock issuances | — | | | — | | | 21,484,898 | | | 2 | | | — | | | (2) | | | — | | | — | | | — | |
| Stock-based compensation | — | | | — | | | 2,013,006 | | | — | | | — | | | 5,014 | | | — | | | — | | | 5,014 | |
| Shares used to settle payroll tax withholding | — | | | — | | | (69,083) | | | — | | | — | | | (996) | | | — | | | — | | | (996) | |
| Net loss | — | | | — | | | — | | | — | | | — | | | — | | | (21,825) | | | — | | | (21,825) | |
| Other | — | | | — | | | (4,473) | | | — | | | — | | | (64) | | | — | | | — | | | (64) | |
| Balance as of December 31, 2020 | — | | | — | | | 170,719,979 | | | 17 | | | — | | | 916,482 | | | (62,622) | | | — | | | 853,877 | |
| Redemption of Public Warrants | — | | | — | | | 7,080,005 | | | 1 | | | — | | | (2) | | | — | | | — | | | (1) | |
| Stock-based compensation | — | | | — | | | 180,026 | | | — | | | — | | | 22,931 | | | — | | | — | | | 22,931 | |
| Forfeiture of restricted stock | — | | | — | | | (90,000) | | | — | | | — | | | — | | | — | | | — | | | — | |
| Shares used to settle payroll tax withholding | — | | | — | | | (73,456) | | | — | | | — | | | (3,330) | | | — | | | — | | | (3,330) | |
| Net income | — | | | — | | | — | | | — | | | — | | | — | | | 135,037 | | | — | | | 135,037 | |
| Other | — | | | — | | | — | | | — | | | — | | | 218 | | | — | | | — | | | 218 | |
| Balance as of December 31, 2021 | — | | | — | | | 177,816,554 | | | 18 | | | — | | | 936,299 | | | 72,415 | | | — | | | 1,008,732 | |
| Stock-based compensation | — | | | — | | | 357,845 | | | — | | | — | | | 33,066 | | | — | | | — | | | 33,066 | |
| Shares used to settle payroll tax withholding | — | | | — | | | (467,791) | | | — | | | — | | | (18,357) | | | — | | | — | | | (18,357) | |
| Net income | — | | | — | | | — | | | — | | | — | | | — | | | 289,004 | | | — | | | 289,004 | |
| Unrealized gains on available-for-sale securities | — | | | — | | | — | | | — | | | — | | | — | | | — | | | 189 | | | 189 | |
| Balance as of December 31, 2022 | — | | | $ | — | | | 177,706,608 | | | $ | 18 | | | $ | — | | | $ | 951,008 | | | $ | 361,419 | | | $ | 189 | | | $ | 1,312,634 | |
See accompanying notes to the Consolidated Financial Statements.
MP MATERIALS CORP. AND SUBSIDIARIES
CONSOLIDATED STATEMENTS OF CASH FLOWS | | | | | | | | | | | | | | | | | |
| For the year ended December 31, |
| (in thousands) | 2022 | | 2021 | | 2020 |
| Operating activities: | | | | | |
| Net income (loss) | $ | 289,004 | | | $ | 135,037 | | | $ | (21,825) | |
| Adjustments to reconcile net income (loss) to net cash provided by operating activities: | | | | | |
| Depreciation, depletion and amortization | 18,356 | | | 24,382 | | | 6,931 | |
| Accretion of asset retirement and environmental obligations | 1,477 | | | 2,375 | | | 2,255 | |
| Accretion of discount on short-term investments | (9,958) | | | — | | | — | |
| Gain on forgiveness of Paycheck Protection Loan | — | | | (3,401) | | | — | |
| Loss on sale or disposal of long-lived assets, net | 391 | | | 569 | | | 101 | |
| Stock-based compensation expense | 31,780 | | | 22,931 | | | 5,014 | |
| Accretion of debt discount and amortization of debt issuance costs | 4,034 | | | 7,384 | | | 3,146 | |
| Write-down of inventories | — | | | 1,809 | | | — | |
| Non-cash settlement charge | — | | | — | | | 66,615 | |
| Revenue recognized in exchange for debt principal reduction | (13,566) | | | (54,828) | | | (21,312) | |
| Deferred income taxes | 17,789 | | | 17,425 | | | (17,792) | |
| Decrease (increase) in operating assets: | | | | | |
| Accounts receivable (including related party) | 18,153 | | | (47,420) | | | (3,219) | |
| Inventories | (24,314) | | | (8,229) | | | (9,224) | |
| Income taxes receivable | (2,201) | | | — | | | — | |
| Prepaid expenses, other current and non-current assets | (6,022) | | | (4,154) | | | 1,794 | |
| Increase (decrease) in operating liabilities: | | | | | |
| Accounts payable and accrued liabilities | 1,962 | | | 5,530 | | | (3,848) | |
| Income taxes payable | 17,700 | | | 3,463 | | | — | |
| Refund liability to related party | — | | | — | | | (2,746) | |
| Deferred revenue from related party | — | | | — | | | 1,933 | |
| Other current and non-current liabilities | (1,071) | | | (902) | | | (4,546) | |
| Net cash provided by operating activities | 343,514 | | | 101,971 | | | 3,277 | |
| Investing activities: | | | | | |
| Additions to property, plant and equipment | (326,595) | | | (123,870) | | | (22,370) | |
| Purchases of short-term investments | (2,779,666) | | | — | | | — | |
| Proceeds from sales of short-term investments | 1,463,160 | | | — | | | — | |
| Proceeds from maturities of short-term investments | 281,000 | | | — | | | — | |
| Proceeds from sale of property, plant and equipment | — | | | 125 | | | — | |
| Proceeds from government awards used for construction | 5,130 | | | 4,382 | | | — | |
| Net cash used in investing activities | (1,356,971) | | | (119,363) | | | (22,370) | |
| Financing activities: | | | | | |
Proceeds from issuance of long-term debt | — | | | 690,000 | | | 3,364 | |
| Proceeds from Second Additional Advance | — | | | — | | | 35,450 | |
| Proceeds from Business Combination, including PIPE Financing | — | | | — | | | 544,712 | |
| Principal payments on debt obligations and finance leases | (5,834) | | | (2,435) | | | (20,180) | |
| Payment of underwriting and transaction costs | — | | | — | | | (40,325) | |
| Payment of debt issuance costs | — | | | (17,749) | | | — | |
| Tax withholding on stock-based awards | (18,357) | | | (3,330) | | | (996) | |
| Other | — | | | (377) | | | (64) | |
| Net cash provided by (used in) financing activities | (24,191) | | | 666,109 | | | 521,961 | |
| Net change in cash, cash equivalents and restricted cash | (1,037,648) | | | 648,717 | | | 502,868 | |
| Cash, cash equivalents and restricted cash beginning balance | 1,181,157 | | | 532,440 | | | 29,572 | |
| Cash, cash equivalents and restricted cash ending balance | $ | 143,509 | | | $ | 1,181,157 | | | $ | 532,440 | |
| | | | | |
| Reconciliation of cash, cash equivalents and restricted cash: | | | | | |
| Cash and cash equivalents | $ | 136,627 | | | $ | 1,179,297 | | | $ | 519,652 | |
| Restricted cash, current | 6,287 | | | 1,344 | | | 3,688 | |
| Restricted cash, non-current | 595 | | | 516 | | | 9,100 | |
| Total cash, cash equivalents and restricted cash | $ | 143,509 | | | $ | 1,181,157 | | | $ | 532,440 | |
See accompanying notes to the Consolidated Financial Statements.
MP MATERIALS CORP. AND SUBSIDIARIES
NOTES TO CONSOLIDATED FINANCIAL STATEMENTS
NOTE 1—DESCRIPTION OF BUSINESS AND BASIS OF PRESENTATION
Description of Business: MP Materials Corp., including its subsidiaries (the “Company” or “MP Materials”), is the largest producer of rare earth materials in the Western Hemisphere. The Company, which is headquartered in Las Vegas, Nevada, owns and operates the Mountain Pass Rare Earth Mine and Processing Facility (“Mountain Pass”), the only active rare earth mining and processing site of scale in North America. MP Materials currently produces a rare earth concentrate that is principally sold pursuant to the Offtake Agreement to Shenghe (as such terms are defined in Note 3, “Relationship and Agreements with Shenghe,”), a related party of the Company, that, in turn, typically sells that product to refiners in China. These refiners separate the constituent rare earth elements contained in the Company’s concentrate and sell the separated products to their customers. Upon completing commissioning of the Stage II optimization project (“Stage II”), the Company anticipates producing and selling separated rare earth products, including neodymium-praseodymium (“NdPr”) oxide, to customers globally. In addition, the Company is constructing its initial rare earth metal, alloy and magnet manufacturing facility in Fort Worth, Texas (the “Fort Worth Facility”), where it anticipates manufacturing, among other products, neodymium-iron-boron (“NdFeB”) permanent magnets. Furthermore, in April 2022, the Company entered into a long-term supply agreement with General Motors Company (NYSE: GM) (“GM”) to supply U.S.-sourced and manufactured rare earth materials, alloy and finished magnets for the electric motors in more than a dozen models using GM’s Ultium Platform, with a gradual production ramp that is expected to begin in late 2023, starting with alloy. These developments are a part of the Company’s Stage III downstream expansion strategy (“Stage III”).
Operating segments are defined as components of an enterprise about which separate financial information is available and evaluated regularly by the chief operating decision maker (“CODM”), or decision-making group, in deciding how to allocate resources and in assessing performance. The Company’s CODM views the Company’s operations and manages the business as one reportable segment.
The cash flows and profitability of the Company’s operations are significantly affected by the market price of rare earth products. The prices of rare earth products are affected by numerous factors beyond the Company’s control. The products of the Company are sold globally, with a primary focus in the Asian market due to the refining capabilities of the region. Rare earth products are critical inputs in hundreds of existing and emerging clean-tech applications including electric vehicles and wind turbines as well as drones and defense applications.
Basis of Presentation: The Consolidated Financial Statements of the Company have been prepared in accordance with generally accepted accounting principles in the United States (“GAAP”) and with the rules and regulations of the U.S. Securities and Exchange Commission (the “SEC”).
NOTE 2—SIGNIFICANT ACCOUNTING POLICIES
Principles of Consolidation: The Consolidated Financial Statements include the accounts of MP Materials Corp. and its subsidiaries. All intercompany accounts and transactions have been eliminated in consolidation.
Concentration of Risk: Financial instruments that potentially subject the Company to credit risk consist principally of cash, cash equivalents and short-term investments, and trade accounts receivable. The Company believes that its credit risk is limited because the Company’s current contracts are with companies that have a reliable payment history. The Company does not believe it is exposed to any significant risks related to its cash accounts, money market funds, or short-term investments.
As of December 31, 2022, Shenghe was the Company’s principal customer and accounted for more than 90% of product sales. Demand for rare earth concentrate is currently constrained to a relatively limited number of refiners, a significant majority of which are based in China. Furthermore, while revenue is generated in the United States, Shenghe conducts its primary operations in China and may transport and sell products in the Chinese market. Therefore, the Company’s revenue is affected by Shenghe’s ultimate realized prices in China, including the impact of changes in the exchange rate between the Chinese Yuan and the U.S. dollar. In addition, there has been ongoing economic conflict between China and the United States that has previously resulted in tariffs and trade barriers that may negatively affect the Company’s business and results of operations. See Note 3, “Relationship and Agreements with Shenghe,” and Note 18, “Related-Party Transactions,” for additional information.
The COVID-19 pandemic remains ongoing and continues to impact the global economy. Through the end of 2022, varying degrees of preventative measures were still in place in China and other parts of the world, including city-wide lockdowns, travel restrictions, closures of non-essential businesses and other quarantine measures. Since the first quarter of 2020, the Company has experienced, at times, significant shipping delays due to congestion and slowdowns at U.S. and international ports caused by shortages in vessels, containers, and truckers, also disrupting the global supply chain. Congestion and slowdowns have affected and may continue to affect the capacity at ports to receive deliveries of products or the loading of shipments onto vessels. Despite these factors, the Company has not experienced a reduction in production or sales due to the COVID-19 pandemic; however, the COVID-19 pandemic has contributed to certain cost and schedule pressures on the Stage II optimization project. The Company has worked proactively and diligently to adjust working schedules and hours to optimize logistics and shipping, which has thus far prevented a significant negative impact on the Company’s product sales and has mitigated certain impacts on Stage II construction and recommissioning progress.
As the situation continues to evolve, including as a result of new and potential future variants of COVID-19, the possibility of federal or state mandates on vaccinations, or other factors that may affect international shipping and logistics or involve responses to government actions such as strikes or other disruptions, it is impossible to predict the effect and ultimate impact of the COVID-19 pandemic on the Company’s business, results of operations, production and sales volumes, or growth projects. Accordingly, the extent and duration of any business disruptions, and related financial impact, cannot be estimated at this time.
Use of Estimates: The preparation of the Consolidated Financial Statements in conformity with GAAP requires management to make estimates and assumptions that affect (i) the reported amounts of assets and liabilities, (ii) the disclosure of contingent assets and liabilities at the date of the Consolidated Financial Statements, and (iii) the reported amounts of revenues and expenses during the reporting period. The more significant areas requiring the use of management estimates and assumptions relate to the useful lives and recoverability of long-lived assets (such as the effects of mineral reserves and cash flows from operating the mine in determining the life of the mine); the valuation allowance of deferred tax assets; asset retirement and environmental obligations; and determining the fair value of assets and liabilities in acquisitions and financial instruments in connection with transactions that require initial measurement to be at fair value. Management bases its estimates on historical experience and on various other assumptions that are believed to be reasonable under the circumstances. Accordingly, actual results may differ from those estimates.
Cash, Cash Equivalents and Investments: Cash and cash equivalents consist of all cash balances and highly liquid investments, including U.S. treasury and agency securities, with a maturity of three months or less at the time of purchase.
The Company’s investments in U.S. treasury and agency securities have been classified and accounted for as available-for-sale securities and the Company reevaluates the classification each reporting period. The Company classifies its available-for-sale securities that do not otherwise meet the requirements to be accounted for as cash equivalents as either current or non-current based on each instrument’s underlying contractual maturity date as well as the Company’s expectations of sales and redemptions within the next twelve months. See Note 5, “Cash, Cash Equivalents and Investments,” for additional information. Available-for-sale securities are recorded at fair value each reporting period. For unrealized losses in securities that the Company intends to hold and will not more likely than not be required to sell before recovery, the Company further evaluates whether declines in fair value below amortized cost are due to credit or non-credit related factors. The Company considers credit related impairments to be changes in value that are driven by a change in the creditor’s ability to meet its payment obligations, and records an allowance and recognizes a corresponding loss when the impairment is incurred.
Unrealized non-credit related losses and unrealized gains are reported, net of income taxes, in “Accumulated other comprehensive income” within the Company’s Consolidated Balance Sheets, until realized. Realized gains and losses are determined based on the specific identification method and are reported in “Other income, net” within the Company’s Consolidated Statements of Operations upon realization. Premiums and discounts are amortized or accreted over the life of the related available-for-sale security as an adjustment to yield using the straight-line method. Interest income is recognized when earned. These amounts are reported in “Other income, net” within the Company’s Consolidated Statements of Operations. Accrued interest receivable was $2.5 million as of December 31, 2022, and is included in “Prepaid expenses and other current assets” within the Company’s Consolidated Balance Sheets.
Restricted Cash: Restricted cash consists of funds that are contractually restricted as to usage or withdrawal due to legal agreement. The Company determines current or non-current classification based on the expected duration of the restriction. Current and non-current restricted cash is included in “Prepaid expenses and other current assets” and “Other non-current assets,” respectively, within the Consolidated Balance Sheets.
Accounts Receivable: Accounts receivable pertain to receivables arising from contracts with customers and are recorded at the invoiced amount and do not bear interest. The Company evaluates its estimate of expected credit losses based on historical
experience and current economic conditions for each portfolio of customers, though at present, the amounts are typically concentrated in a single customer. As of December 31, 2022 and 2021, the Company did not have an allowance for expected credit losses, as principally all of the Company’s receivables are from Shenghe and there is no history or expectation of uncollectible amounts.
Inventories: Inventories consist of raw materials and supplies, work in process (referred to as “in-process inventory”), and finished goods. Materials and supplies consist of raw materials, spare parts, reagent chemicals, maintenance supplies, and packaging materials used in the production of rare earth products. In-process inventory primarily consists of mine ore stockpiles and bastnaesite ore in various stages of the production process. Finished goods primarily consist of either packaged bastnaesite concentrate or roasted bastnaesite concentrate that is ready for sale.
Raw materials, in-process inventory and finished goods are carried at average cost. Supplies are carried at moving average cost. All inventories are carried at the lower of cost or net realizable value, which represents the estimated selling price of the product during the ordinary course of business based on current market conditions less costs to sell. Inventory cost includes all expenses directly attributable to the manufacturing process, including labor and stripping costs, and an appropriate portion of production overhead, including depletion, based on normal operating capacity.
Stockpiled ore tonnages are verified by periodic surveys. The Company evaluates the carrying amount of inventory on a periodic basis, considering slow-moving items, obsolescence, excess inventory levels, and other factors and recognizes related write-downs if it is determined that the inventory is impaired. Mine ore stockpiles that are not expected to be processed within the next twelve months are classified as non-current. See also Note 6, “Inventories.” Property, Plant and Equipment: Property, plant and equipment are recorded at cost and depreciated over their useful lives. Expenditures for new property, plant and equipment and improvements that extend the useful life or functionality of the assets are recorded at their cost of acquisition or construction. Depreciation on property, plant and equipment is recognized on a straight-line basis over their estimated useful lives, as follows:
| | | | | |
| Years |
| Land improvements | 25 |
| Buildings and building improvements | 10-40 |
| Machinery and equipment | 3-20 |
Assets under construction include costs directly attributable to the construction or development of long-lived assets. These costs may include labor and employee benefits associated with the construction of the asset, site preparation, permitting, engineering, installation and assembly, procurement, insurance, legal, commissioning, and interest on borrowings to finance the construction of the assets. Depreciation is not recorded on the related assets until they are ready for their intended use. Repair and maintenance costs that do not extend the useful life of an asset are expensed as incurred. Gains and losses arising from the sale or disposal of property, plant and equipment are determined as the difference between the proceeds from sale or disposal and the carrying amount of the asset.
Property, plant and equipment primarily relate to the Company’s open-pit mine and processing and separating facility at Mountain Pass. In addition to the mine, Mountain Pass includes a crusher and mill/flotation plant, mineral recovery and separation plants, tailings processing and storage facilities, product finishing facilities, on-site evaporation ponds, a combined heat and power plant, water treatment plant, a chlor-alkali plant, as well as laboratory facilities to support research and development activities, offices, warehouses and support infrastructure. See also Note 7, “Property, Plant and Equipment.” Mineral Rights: The Company capitalizes costs for acquiring and leasing mining properties and expenses costs to maintain mineral rights as incurred. Depletion on mineral rights is recognized on a straight-line basis over the estimated remaining useful life of the mine, which was approximately 33 years as of December 31, 2022. The Company determined that the straight-line method of depletion appropriately captures the estimated economic costs of extracting the minerals of the mine across its estimated useful life, and aligns with the benefit obtained from the depletion of the asset consistent with the current mine plan. Mineral rights are classified as a component of “Property, plant and equipment” within the Company’s Consolidated Balance Sheets. See also Note 7, “Property, Plant and Equipment.” Leases: The Company determines if an arrangement is, or contains, a lease at contract inception. In some cases, the Company has determined that its lease arrangements include both lease and non-lease components. The Company has elected to use a practical expedient to account for each separate lease component and its associated non-lease components as a single lease component for the majority of its asset classes. The Company recognizes right-of-use (“ROU”) assets and lease liabilities upon commencement for all leases with a lease term greater than 12 months. The Company has elected to use a practical expedient to
not recognize leases with a lease term of 12 months or less in the Consolidated Balance Sheets for the majority of its asset classes. These short-term leases are expensed on a straight-line basis over the lease term. The ROU assets are included in “Other non-current assets” within the Consolidated Balance Sheets and the current and non-current portions of lease liabilities are included in “Other current liabilities” and “Other non-current liabilities,” respectively, within the Consolidated Balance Sheets.
ROU assets represent the Company’s right to use an underlying asset for the lease term and lease liabilities represent the Company’s obligation to make lease payments arising from the lease. ROU assets and lease liabilities are recognized at commencement date of the lease based on the present value of lease payments over the lease term. When the rate implicit to the lease cannot be readily determined, the Company utilizes its incremental borrowing rate in determining the present value of the future lease payments. Lease liabilities are accreted each period and reduced for payments. The ROU asset also includes other adjustments, such as for the effects of escalating rents, rent abatements or initial lease costs. The lease term may include periods covered by options to extend or terminate the lease when it is reasonably certain that the Company will exercise a renewal option, or reasonably certain it will not exercise an early termination option. For operating leases, lease expense is recognized on a straight-line basis over the expected lease term. For finance leases, the ROU asset amortizes on a straight-line basis over the lease term (or the useful life of the underlying asset if title transfers at the end of the lease term or there is a purchase option the Company is reasonably certain to exercise) and the lease liability accretes interest based on the interest method using the discount rate determined at lease commencement. See also Note 9, “Leases.” Impairment of Long-Lived Assets: Long-lived assets, including mineral rights, are reviewed for impairment whenever events or changes in circumstances indicate that the carrying amount of an asset or asset group may not be recoverable. In estimating undiscounted cash flows, assets are grouped at the lowest level for which there are identifiable cash flows that are largely independent of undiscounted cash flows from other asset groups. The Company’s estimates of undiscounted cash flows are based on numerous assumptions, and it is possible that actual cash flows may differ significantly from estimates, as actual produced reserves, prices, commodity-based and other costs, and closure costs are each subject to significant risks and uncertainties. The estimated undiscounted cash flows used to assess recoverability of long-lived assets and to measure the fair value of the Company’s mining operations are derived from current business plans, which are developed using short-term price forecasts reflective of the current price environment and the Company’s projections for long-term average prices. In addition to short- and long-term price assumptions, other assumptions include estimates of production costs; proven and probable mineral reserves estimates, including the timing and cost to develop and produce the reserves; value beyond proven and probable estimates; and estimated future closure costs.
If the carrying amount of the long-lived asset or asset groups is not recoverable on an undiscounted cash flows basis, an impairment is recognized to the extent that the carrying amount exceeds its fair value. Fair value is determined through various valuation techniques, including discounted cash flow models, quoted market values, and third-party independent appraisals, based on the approach the Company believes a market participant would use. An impairment loss, if any, is recorded for the excess of the asset’s (or asset group’s) carrying amount over its fair value, as determined by a valuation technique appropriate to the given circumstances. See also Note 7, “Property, Plant and Equipment.” Offtake Advances Accounted for as Debt Obligations and Debt Discount: Subsequent to the June 2020 Modification to the Original Offtake Agreement and through the final repayment of the Prepaid Balance (as such terms are defined in Note 3, “Relationship and Agreements with Shenghe”) in March 2022, the Company accounted for prepayments or other advances received from Shenghe prior to or in connection with the June 2020 Modification as debt. The associated debt discount, which reduced the carrying amount of the debt, was amortized to interest expense using the effective interest method over the Company’s estimated contractual term of the underlying indebtedness. See also, Note 8, “Debt Obligations.” Asset Retirement Obligations: The Company recognizes asset retirement obligations (“ARO”) for estimated costs of legally and contractually required closure, dismantlement, and reclamation activities associated with Mountain Pass. ARO are initially recognized at their estimated fair value in the period in which the obligation originates. Fair value is based on the expected timing of reclamation activities, cash flows to perform activities, amount and uncertainty associated with the cash flows, including adjustments for a market risk premium, and discounted using a credit-adjusted risk-free rate. The liability is accreted over time through periodic charges to earnings and reduced as reclamation activities occur with differences between estimated and actual amounts recognized as an adjustment to operating expenses.
Subsequent increments in expected undiscounted cash flows are measured at their discounted values using updated estimates of the Company’s credit-adjusted risk-free rate applied to the increment only. Subsequent decrements in expected undiscounted cash flows are reduced based on the weighted-average credit-adjusted risk-free rate associated with the obligation. When increments and decrements are caused by a change in the estimated timing of settlement, the Company treats the increase in cash flows in the year of the updated estimate as an increment and the increase in cash flows in the original year as a
decrement. Associated asset retirement costs, including the effect of increments and decrements, are recognized as adjustments to the related asset’s carrying amount and depreciated over the related asset’s remaining useful life. If a decrement is greater than the carrying amount of the related asset, the difference is recognized as a reduction to depreciation expense. See also Note 10, “Asset Retirement and Environmental Obligations.” Environmental Obligations: The Company has certain environmental remediation obligations that primarily relate to groundwater monitoring activities. Estimated remediation costs are accrued based on management’s best estimate at the end of each reporting period of the costs expected to be incurred to settle the obligation when those amounts are probable and estimable. Such cost estimates may include ongoing care, maintenance and monitoring costs associated with remediation activities. Changes in remediation estimates are reflected in earnings in the period the estimate is revised. Remediation costs included in environmental obligations are discounted to their present value when payments are readily estimable, and are discounted using a risk-free rate, which the Company derives from U.S. Treasury yields. See also Note 10, “Asset Retirement and Environmental Obligations.” Debt Issuance Costs: Costs that are incurred by the Company in connection with the issuance of debt are deferred and amortized to interest expense using the effective interest method over the contractual term of the underlying indebtedness. Debt issuance costs reduce the carrying amount of the associated debt.
Revenue Recognition: The Company’s revenue comes from sales of rare earth products produced at Mountain Pass. The Company’s sales are primarily to an affiliate of Shenghe. The Company’s performance obligation is to deliver rare earth products to the agreed-upon delivery point, and the Company recognizes revenue at the point in time control of the products transfers to the customer, which is typically when the rare earth products are delivered to the agreed-upon shipping point. At that time, the customer has the ability to direct the use of and obtain substantially all of the remaining benefits from the products, and the customer bears the risk of loss.
For sales to unrelated third parties, the transaction price is agreed to at the time the sale is entered into. For sales to Shenghe, the transaction price is typically based on an agreed-upon price per metric ton (“MT”), subject to certain quality adjustments depending on the measured characteristics of the product, with an adjustment for the ultimate market price of the product realized by Shenghe upon sales to their customers and certain other discounts. These ultimate market prices are forms of variable consideration. The Company typically negotiates with and bills an initial price to Shenghe; such prices are then updated based on final adjustments for quality differences and/or actual sales prices realized by Shenghe. Initial pricing is typically billed upon delivering the product to the agreed-upon shipping point and paid within 30 days or less. Final adjustments to prices may take longer to resolve. When the final price has not been resolved by the end of a reporting period, the Company estimates the expected sales price based on the initial price, current market pricing and known quality measurements, and further constrains such amounts to an amount that is probable not to result in a significant reversal of previously-recognized revenue. Revenue from product sales is recorded net of taxes collected from customers that are remitted to governmental authorities. When necessary and appropriate, the Company applies a portfolio approach in estimating a refund obligation. See also Note 4, “Revenue Recognition.” Government Grants: In accounting for grants received from the government, the grant proceeds are recognized when there is reasonable assurance the conditions of the grant will be met, and the grant will be received. When a grant is related to an expense item, it is recognized as income (or a reduction of expense) over the periods necessary to match the grant on a systematic basis to the costs that it is intended to compensate. When a grant is related to an asset, the funds received are recorded as reductions of the related asset’s carrying amount, thereby reducing future depreciation expense. See also Note 7, “Property, Plant and Equipment.” Stock-Based Compensation: The cost of employee services received in exchange for an award of equity instruments is based on the grant-date fair value of the award and the expense is recognized ratably over the requisite service period. The fair value of Stock Awards (as defined in Note 15, “Stock-based Compensation,”) is equal to the fair value of the Company’s stock on the grant date. Stock Awards with graded vesting schedules are recognized on a straight-line basis over the requisite service period for each separately vesting portion of the award. The Company accounts for forfeitures in the period in which they occur based on actual forfeitures. See also Note 15, “Stock-based Compensation.” Start-up Costs: Costs associated with restarting an existing facility or commissioning a new facility, circuit or process of the Company’s production, manufacturing, or separations facilities prior to achievement of commercial production, that do not qualify for capitalization, are expensed as incurred and considered start-up costs. Such costs may include certain salaries and wages, outside services, parts, training, and utilities, among other items, used or consumed directly in these start-up activities. Start-up costs are included in “Advanced projects, start-up, development and other” within the Company’s Consolidated Statements of Operations.
Earnings (Loss) Per Share: Basic earnings (loss) per share (“EPS”) is computed by dividing net income (loss) by the weighted-average number of common shares outstanding during the period. Diluted EPS reflects the additional dilution for all potentially dilutive securities such as unvested restricted stock awards. See also Note 17, “Earnings (Loss) per Share.” Commitments and Contingencies: Liabilities for loss contingencies arising from claims, assessments, litigation, fines and penalties, and other sources are recorded when it is probable that a liability has been incurred and the amount can be reasonably estimated. If a loss contingency is not probable or reasonably estimable, disclosure of the contingency and estimated range of loss, if determinable, is made in the financial statements when it is at least reasonably possible that a material loss could be incurred. Legal costs incurred in connection with loss contingencies are expensed as incurred. See also Note 12, “Commitments and Contingencies.” Income Taxes: The Company accounts for income taxes using the balance sheet method, recognizing certain temporary differences between the book basis of the liabilities and assets and the related income tax basis for such liabilities and assets. This method generates either a net deferred income tax liability or asset for the Company, as measured by the statutory tax rates in effect. The Company derives a deferred income tax expense or benefit by recording the change in either the net deferred income tax liability or asset balance for the year. The Company’s policy, if it were to have uncertain tax positions, is to recognize interest and/or penalties related to unrecognized tax benefits as part of its income tax expense. See also Note 11, “Income Taxes.” Valuation of Deferred Tax Assets: The Company’s deferred income tax assets include certain future tax benefits. The Company records a valuation allowance against any portion of those deferred income tax assets when it believes, based on the weight of available evidence, it is more likely than not that some portion or all of the deferred income tax asset will not be realized. The Company reviews the likelihood that the benefit of the deferred tax assets will be realized and the need for valuation allowances on a quarterly basis, or more frequently if events indicate that a review is required. In determining the requirement for a valuation allowance, the Company evaluates all available positive and negative evidence.
Certain categories of evidence carry more weight in the analysis than others based upon the extent to which the evidence may be objectively verified. The Company looks to the nature and severity of cumulative pretax losses (if any) in the current three-year period ending on the evaluation date, recent pretax losses and/or expectations of future pretax losses. Other factors considered in the determination of the probability of the realization of the deferred tax assets include, but are not limited to: earnings history; projected future financial and taxable income based upon existing reserves and long-term estimates of commodity prices; the duration of statutory carry forward periods; prudent and feasible tax planning strategies readily available that may alter the timing of reversal of the temporary difference; nature of temporary differences and predictability of reversal patterns of existing temporary differences; and the sensitivity of future forecasted results to commodity prices and other factors.
Concluding that a valuation allowance is not required is difficult when there is significant negative evidence which is objective and verifiable, such as cumulative losses in recent years. However, recent cumulative losses are not solely determinative of the need for a valuation allowance. The Company also considers all other available positive and negative evidence in its analysis. See also Note 11, “Income Taxes.” Recently Issued Accounting Pronouncements: There were no new accounting pronouncements recently issued or effective during the year ended December 31, 2022, that had or would be expected to have a material impact on the Company’s Consolidated Financial Statements.
Reclassifications: Certain amounts in prior periods have been reclassified to conform to the current year presentation.
NOTE 3—RELATIONSHIP AND AGREEMENTS WITH SHENGHE
Offtake Agreement
In March 2022, the Company entered into an offtake agreement (the “Offtake Agreement”) with Shenghe Resources (Singapore) International Trading Pte. Ltd. (“Shenghe”), a majority-owned subsidiary of Leshan Shenghe Rare Earth Co., Ltd. (“Leshan Shenghe”) whose ultimate parent is Shenghe Resources Holding Co., Ltd., a leading global rare earth company listed on the Shanghai Stock Exchange. The Offtake Agreement became effective upon the termination of the A&R Offtake Agreement (as discussed and defined below). The initial term of the Offtake Agreement is two years, with the option to extend the term at the Company’s discretion for an additional one-year period.
Pursuant to the Offtake Agreement, and subject to certain exclusions, Shenghe shall purchase on a “take-or-pay” basis the rare earth concentrate produced by the Company as the exclusive distributor in China, with certain exceptions for the Company’s direct sales globally. In addition, at the discretion of the Company, Shenghe may be required to purchase on a
“take-or-pay” basis certain non-concentrate rare earth products, although the Company may sell all non-concentrate rare earth products in its sole discretion to customers or end users in any jurisdiction. Under the Offtake Agreement, Shenghe is paid a variable commission on net proceeds to the Company.
Similar to the A&R Offtake Agreement, the sales price of rare earth concentrate sold to Shenghe is based on an agreed-upon price per MT, subject to certain quality adjustments depending on the measured characteristics of the product, with an adjustment for the ultimate market price of the product realized by Shenghe upon sales to their customers. The sales price and other terms applicable to a quantity of offtake products are set forth in monthly purchase agreements between the Company and Shenghe.
Original Commercial Agreements
In May 2017, the Company entered into a set of commercial arrangements with Shenghe to fund the restart of operations at the mine, identify operational efficiencies, and sell products to Shenghe and third parties. As part of these arrangements, Shenghe (and its controlled affiliates) became both the principal customer and a related party when Leshan Shenghe obtained 110.98 MP Mine Operations LLC (“MPMO”) preferred units, which represented a 9.99% non-voting preferred interest in MPMO at the time. In connection with the Business Combination (as defined and discussed in Note 13, “Business Combination and Reverse Recapitalization,”), these MPMO preferred units were exchanged for the Company’s Common Stock. The original commercial arrangements principally consisted of a technical services agreement (the “TSA”), an offtake agreement (the “Original Offtake Agreement”), and a distribution and marketing agreement (the “DMA”). The Original Offtake Agreement required Shenghe to advance the Company an initial $50.0 million (the “Initial Prepayment Amount”) and the TSA required Shenghe to fund any additional operating and capital expenditures to bring Mountain Pass to full operability. In connection with the Company’s acquisition of Mountain Pass, Shenghe also agreed to provide additional funding of $30.0 million to the Company pursuant to a separate letter agreement dated June 20, 2017 (the “Letter Agreement”) (the “First Additional Advance”) via a short-term, non-interest-bearing note, which required repayment within one year. In addition to the repayment of the First Additional Advance, pursuant to the Letter Agreement, the Initial Prepayment Amount increased by $30.0 million. The aggregate prepayments made by Shenghe pursuant to the Original Offtake Agreement and the Framework Agreement (as defined below), as adjusted for Gross Profit Recoupment (as defined below) amounts and any other qualifying repayments to Shenghe, inclusive of the $30.0 million increase to the Initial Prepayment Amount, are referred to herein as the “Prepaid Balance.”
Under the Original Offtake Agreement, the Company sold to Shenghe, and Shenghe purchased on a firm “take-or-pay” basis, all of the rare earth products produced at Mountain Pass. Shenghe marketed and sold these products to customers, and retained the gross profits earned on subsequent sales. The gross profits were credited against the Prepaid Balance, and provided the means by which MP Materials repaid, and Shenghe recovered, such amounts (the “Gross Profit Recoupment”).
As originally entered, the DMA was to become effective upon termination of the Original Offtake Agreement. As compensation for Shenghe’s distribution and marketing services, the DMA entitled Shenghe to a portion of the net profits from the sale of rare earth products produced at Mountain Pass (the “Net Profit-Based Commission”). See below for further discussion of the DMA termination and associated accounting treatment.
The entrance into the Letter Agreement constituted a modification to the Original Offtake Agreement for accounting purposes (referred to as the “June 2017 Modification”). Based on the relationship between (i) the adjusted deemed proceeds the Company would ultimately receive from the Initial Prepayment Amount and (ii) the contractual amount owed to Shenghe at the time, the June 2017 Modification resulted in an implied discount on the Company’s sales prices to Shenghe under the Original Offtake Agreement, for accounting purposes (the “Shenghe Implied Discount”).
The Shenghe Implied Discount was applicable to Shenghe’s gross profit on the sales of rare earth products to its own customers (for sales made between July 2019 and early June 2020). That gross profit was a contractually determined amount based on Shenghe’s realized sales price (net of taxes, tariffs, and certain other adjustments) compared to the agreed-upon cash cost Shenghe would pay to the Company. The Shenghe Implied Discount amounted to 36% of that contractually determined gross profit amount. See also Note 4, “Revenue Recognition.” Framework Agreement and Restructured Commercial Agreements
In May 2020, the Company entered into a framework agreement and amendment (the “Framework Agreement”) with Shenghe and Leshan Shenghe that restructured the commercial arrangements and provided for, among other things, a revised funding amount and schedule to settle Shenghe’s prepayment obligations to the Company, as well as an amendment to the Original Offtake Agreement, as discussed below.
Pursuant to the Framework Agreement, the Company entered into an amended and restated offtake agreement with Shenghe on May 19, 2020 (the “A&R Offtake Agreement”), which, upon effectiveness, superseded and replaced the Original Offtake Agreement, and MP Materials issued to Shenghe a warrant on June 2, 2020 (the “Shenghe Warrant”), exercisable at a nominal price for 89.88 MPMO preferred units, which, at the time, reflected approximately 7.5% of the Company’s equity on a diluted basis, subject to certain restrictions. Pursuant to the Framework Agreement, Shenghe funded the remaining portion of the Initial Prepayment Amount and agreed to fund an additional $35.5 million advance (the “Second Additional Advance” and together with the Initial Prepayment Amount, inclusive of the $30.0 million increase pursuant to the Letter Agreement, the “Offtake Advances”), which amounts were fully funded on June 5, 2020. The Shenghe Warrant was exchanged for the Company’s Common Stock in connection with the Business Combination.
Upon the funding of the remaining obligations on June 5, 2020, among other things, (i) the TSA and the DMA were terminated (as described below) and (ii) the A&R Offtake Agreement and the Shenghe Warrant became effective (such events are collectively referred to as the “June 2020 Modification”).
The A&R Offtake Agreement maintained the key take-or-pay, amounts owed on actual and deemed advances from Shenghe, and other terms of the Original Offtake Agreement, with the following changes, among other items: (i) as to the offtake products subject to the A&R Offtake Agreement, provided that if the Company sold such offtake products to a third party, then, until the Prepaid Balance was reduced to zero, the Company would pay an agreed percentage of its revenue from such sales to Shenghe, to be credited against the amounts owed on Offtake Advances; (ii) provided that the sales price to be paid by Shenghe for the Company’s rare earth products (a portion of which reduced the Prepaid Balance rather than being paid in cash) would be based on market prices (net of taxes, tariffs and certain other agreed charges) less applicable discounts; and (iii) obliged the Company to pay Shenghe, on an annual basis, an amount equal to the Company’s annual net income, less any amounts recouped through the Gross Profit Recoupment mechanism over the course of the year, until the Prepaid Balance was reduced to zero.
The sales price and other terms applicable to a quantity of offtake products were set forth in monthly purchase agreements between the Company and Shenghe. In March 2022, the Company made a $2.9 million payment to Shenghe pursuant to item (iii) discussed above. Upon payment by the Company, the Prepaid Balance was repaid in full, and the A&R Offtake Agreement was terminated.
Accounting for the June 2020 Modification
As noted above, in May 2020, the Company renegotiated various aspects of its relationship with Shenghe and entered into the Framework Agreement to restructure the aforementioned set of arrangements. Prior to the June 2020 Modification, for accounting purposes, the Original Offtake Agreement constituted a deferred revenue arrangement; however, as a result of the June 2020 Modification, the A&R Offtake Agreement constituted a debt obligation as well as provided for the issuance of the Shenghe Warrant. For further discussion of the deferred revenue arrangement, see Note 4, “Revenue Recognition,” and for further discussion of the debt obligation, see Note 8, “Debt Obligations.” The DMA provided Shenghe with the right of first refusal to be the Company’s distribution and marketing agent for product sales after the expiration of the Original Offtake Agreement and until April 2047 in exchange for the Net Profit-Based Commission. Under the Original Offtake Agreement, Shenghe would also have been responsible for funding additional advance payments toward the Company’s Stage II optimization project. The agency relationship was not to commence until any such additional amount was also recovered under the Original Offtake Agreement. Although it had not yet commenced, the DMA was enforceable, and could only be terminated upon the mutual agreement of the parties involved.
At its inception in May 2017, the DMA was determined to be at-market, as it provided an expected commission to Shenghe for its services that was consistent with the Company’s expectations for a regular sales commission based on its revenue and cost expectations at the time. In connection with the June 2020 Modification, the Company determined that the existing arrangement within the DMA now provided Shenghe with a favorable, off-market return for the future distribution and marketing services, due in part to (i) favorable changes in expected profitability, driven partially by changes in tariffs, as well as cost performance in Stage I, (ii) favorable estimates of the capital cost of the Stage II optimization project, and (iii) favorable changes in expected production, based on higher than forecast contained rare earth oxide equivalent production in Stage I.
Taken together, the Company concluded that the above factors would likely result in materially lower per-unit costs (including depreciation) and higher profitability versus its original estimates. Therefore, these changes in circumstances meant that the Net Profit-Based Commission would no longer be commensurate with the value of the service; and therefore, created an off-market feature. These same factors would also result in the Company fulfilling its obligations under the Original Offtake Agreement more quickly, resulting in a longer period of payments under the now-unfavorable terms of the DMA.
In addition, as noted above, Shenghe would still have had to provide the additional advances required to complete Stage II, which would have created a near-term cash commitment for Shenghe and Shenghe would have remained exposed to the potential that actual costs would exceed estimates and remained committed to fund them. Further, these upfront payments were to be non-interest bearing, exposing Shenghe to economic cost from the time value of money. Therefore, as part of the renegotiations, the Company and Shenghe agreed to terminate the DMA. As a result of the June 2020 Modification, specifically the termination of the DMA, the Company recorded a non-cash settlement charge of $66.6 million during the year ended December 31, 2020.
NOTE 4—REVENUE RECOGNITION
Sales to Shenghe Under the Original Offtake Agreement: Beginning in July 2019 and through early June 2020, the Company and Shenghe periodically agreed on a cash sales price for each MT of rare earth concentrate delivered by the Company, which was recognized as revenue upon each sale. This sales price was intended to approximate the Company’s cash cost of production. Sales during this period were made under the Original Offtake Agreement and were impacted by the Shenghe Implied Discount, which is discussed in Note 3, “Relationship and Agreements with Shenghe.” The Shenghe Implied Discount amounted to 36% of the difference between Shenghe’s realized price on its sales of rare earth products to its own customers (net of taxes, tariffs, and certain other adjustments, such as demurrage) and the agreed-upon cash cost for those products (i.e., its gross profit). In addition to the revenue the Company recognized from the cash sales prices, it also realized an amount of deferred revenue applicable to these sales equal to 64% of Shenghe’s gross profit. The full gross profit amount realized by Shenghe on such sales reduced the Prepaid Balance (and consequently, the Company’s contractual obligations to Shenghe), but the remaining 36% was not recognized as revenue.
In addition, sales to Shenghe under the Original Offtake Agreement typically provided Shenghe with a discount in the amount of between 3% and 6% of the initial cash price of the Company’s rare earth products sold in consideration of Shenghe’s sales efforts to resell such rare earth products (the “Shenghe Sales Discount”). The Shenghe Sales Discount was considered a reduction in the transaction price and thus was not recognized as revenue. Additionally, the Shenghe Sales Discount was not applied to reduce the Prepaid Balance; however, it was considered as part of Shenghe’s cost of acquiring the Company’s product in the calculation of Shenghe’s gross profit.
Sales to Shenghe Under the A&R Offtake Agreement: Beginning after the June 2020 Modification and through February 2022, the sales price (and other terms applicable to the quantity of products sold) were set forth in monthly purchase agreements with Shenghe. Furthermore, the June 2020 Modification provided that the sales price to be paid by Shenghe for the Company’s rare earth products would be based on market prices (net of taxes, tariffs and certain other agreed charges) less applicable discounts. A portion of the sales price was in the form of debt repayment, with the remainder paid in cash. See Note 8, “Debt Obligations,” for further information. As a result of the June 2020 Modification, revenue recognized under the A&R Offtake Agreement did not include the Shenghe Implied Discount. In addition, rather than adjusting the sales price for the Shenghe Sales Discount, as was the case with sales made under the Original Offtake Agreement, revenue under the A&R Offtake Agreement was reduced by a fixed monthly sales charge (similarly accounted for as a reduction in the transaction price). The A&R Offtake Agreement was terminated in March 2022 when the Company entered into the Offtake Agreement.
Sales to Shenghe Under the Offtake Agreement: Beginning in March 2022, pursuant to the Offtake Agreement and similar to the A&R Offtake Agreement, the sales price of rare earth concentrate sold to Shenghe is based on an agreed-upon price per MT, subject to certain quality adjustments depending on the measured characteristics of the product, with an adjustment for the ultimate market price of the product realized by Shenghe upon sales to their customers. Under the Offtake Agreement, Shenghe is paid a variable commission on net proceeds to the Company, which is accounted for as a reduction in the transaction price. The sales price and other terms applicable to a quantity of offtake products are set forth in monthly purchase agreements between the Company and Shenghe.
Deferred Revenue: As mentioned in Note 3, “Relationship and Agreements with Shenghe,” the Original Offtake Agreement was accounted for as a deferred revenue arrangement and the June 2020 Modification effectively replaced this deferred revenue arrangement with a debt obligation (see Note 8, “Debt Obligations”). Prior to the June 2020 Modification, Offtake Advances received from Shenghe were accounted for as deferred revenue. Under the Original Offtake Agreement, Shenghe’s gross profit was retained by Shenghe and applied to reduce the Prepaid Balance.
Activity for the deferred revenue balance (including current portion) was as follows:
| | | | | |
| (in thousands) | For the year ended December 31, 2020 |
Opening balance(1) | $ | 35,543 | |
Prepayments received(2) | 11,050 | |
Revenue recognized(3) | (9,117) | |
Effect of June 2020 Modification(4) | (37,476) | |
| Ending balance | $ | — | |
(1)Of this amount, $6.6 million was classified as current based on when such amounts were expected to be realized.
(2)Related to the remaining contractual commitment for Shenghe to provide funds to the Company (the Initial Prepayment Amount).
(3)As discussed above, as a result of the Shenghe Implied Discount, the Company recognized an amount of deferred revenue applicable to sales made under the Original Offtake Agreement equal to 64% of the gross profit realized by Shenghe on sales of this product to its own customers. As discussed below, this amount included a tariff rebate of $1.4 million received in May 2020, but excluded the tariff rebate realized in August 2020.
(4)The remaining balance of deferred revenue was derecognized in connection with the June 2020 Modification.
Tariff-Related Rebates: In May 2020, the government of the People’s Republic of China suspended certain tariffs that had been charged to consignees of the Company’s product on imports, and provided such relief retroactive to March 2020. In addition, Shenghe began negotiating for tariff rebates from sales prior to March 2020, which affected Shenghe’s realized prices, and thus the contractual Prepaid Balance. These, in turn, affected the Company’s realized prices and, as a result, the deferred revenue and the Shenghe Implied Discount on the Company’s prior sales. The Company realized $1.4 million of revenue related to tariff rebates received in May 2020, which included amounts related to prior periods. While additional tariff rebates were possible, the Company did not have insight into Shenghe’s negotiations or their probability of success, and such negotiations were outside of the Company’s control. Thus, the Company fully constrained estimates of any future tariff rebates that may have been realized at that time.
In January 2021 and August 2020, the Company received additional information from Shenghe regarding its successful negotiation of additional tariff rebates. Consequently, the Company revised its estimates of variable consideration and recognized $2.0 million and $9.3 million of revenue for the years ended December 31, 2021 and 2020, respectively, primarily related to additional tariff credits realized for sales from the pre-modification period. Since these rebates were recognized after the June 2020 Modification, the amounts were treated as a reduction to the principal balance of the debt obligation, partially offset by a proportionate reduction in the related debt discount, as discussed in Note 8, “Debt Obligations.” NOTE 5—CASH, CASH EQUIVALENTS AND INVESTMENTS
The following table presents the Company’s cash, cash equivalents and short-term investments:
| | | | | | | | | | | | | | | | | | | | | | | | | | | | | | | | | | | | | | | | | | | | | | | |
| December 31, 2022 | | December 31, 2021 |
| (in thousands) | Amortized Cost Basis | | Unrealized Gains | | Unrealized Losses | | Estimated Fair Value | | Amortized Cost Basis | | Unrealized Gains | | Unrealized Losses | | Estimated Fair Value |
| Cash: | | | | | | | | | | | | | | | |
| Demand deposits | $ | 7,373 | | | $ | — | | | $ | — | | | $ | 7,373 | | | $ | 26,536 | | | $ | — | | | $ | — | | | $ | 26,536 | |
| Cash equivalents: | | | | | | | | | | | | | | | |
| Money market funds | 64,855 | | | — | | | — | | | 64,855 | | | 1,152,761 | | | — | | | — | | | 1,152,761 | |
| U.S. agency securities | 63,605 | | | 1 | | | (2) | | | 63,604 | | | — | | | — | | | — | | | — | |
| U.S. Treasury securities | 795 | | | — | | | — | | | 795 | | | — | | | — | | | — | | | — | |
| Total cash equivalents | 129,255 | | | 1 | | | (2) | | | 129,254 | | | 1,152,761 | | | — | | | — | | | 1,152,761 | |
| Total cash and equivalents | 136,628 | | | 1 | | | (2) | | | 136,627 | | | 1,179,297 | | | — | | | — | | | 1,179,297 | |
| Short-term investments: | | | | | | | | | | | | | | | |
| U.S. agency securities | 979,878 | | | 361 | | | (17) | | | 980,222 | | | — | | | — | | | — | | | — | |
| U.S. Treasury securities | 65,586 | | | 1 | | | (91) | | | 65,496 | | | — | | | — | | | — | | | — | |
| Total short-term investments | 1,045,464 | | | 362 | | | (108) | | | 1,045,718 | | | — | | | — | | | — | | | — | |
| Total cash, cash equivalents and short-term investments | $ | 1,182,092 | | | $ | 363 | | | $ | (110) | | | $ | 1,182,345 | | | $ | 1,179,297 | | | $ | — | | | $ | — | | | $ | 1,179,297 | |
The Company does not intend to sell, nor is it more likely than not that the Company will be required to sell, any investments in unrealized loss positions before recovery of their amortized cost basis. The Company did not recognize any credit losses related to its available-for-sale investments during the year ended December 31, 2022. The unrealized losses on the
Company’s available-for-sale investments were primarily due to unfavorable changes in interest rates subsequent to initial purchase. None of the available-for-sale investments held as of December 31, 2022, were in a continuous unrealized loss position for greater than 12 months and the unrealized losses and the related risk of expected credit losses were not material.
The Company recognized $0.3 million of gross realized gains and $0.6 million of gross realized losses during the year ended December 31, 2022. Additionally, the Company recognized $19.8 million of interest and investment income on its available-for-sale securities and other money market funds for the year ended December 31, 2022. These amounts are included in “Other income, net” within the Company’s Consolidated Statements of Operations.
As of December 31, 2022, the fair values of available-for-sale investments, by remaining contractual maturity, were as follows:
| | | | | |
| (in thousands) | |
| Due within one year | $ | 1,052,364 | |
| Due after one year through two years | 57,753 | |
| Total | $ | 1,110,117 | |
NOTE 6—INVENTORIES
The Company’s inventories consisted of the following:
| | | | | | | | | | | |
| December 31, |
| (in thousands) | 2022 | | 2021 |
Materials and supplies(1) | $ | 28,590 | | | $ | 10,711 | |
In-process | 27,212 | | | 25,574 | |
Finished goods | 1,752 | | | 2,407 | |
| Total current inventories | 57,554 | | | 38,692 | |
Add: Non-current portion(2) | 5,744 | | | — | |
| Total inventories | $ | 63,298 | | | $ | 38,692 | |
(1)Includes materials acquired during the third quarter of 2022 to support activities pertaining to the Company’s rare earth metal, alloy and magnet manufacturing facility as a part of Stage III.
(2)Represents stockpiled ore that is not expected to be processed within the next 12 months.
During the second quarter of 2021, the Company recognized a non-cash write-down of a portion of its legacy low-grade stockpile inventory of $1.8 million, after determining that it contained a significant amount of alluvial material that did not meet the Company’s requirement for mill feed and, as a result, was deemed unusable. The write-down is included in the Consolidated Statement of Operations for the year ended December 31, 2021, as “Write-down of inventories.” No write-down of inventories was recorded for the years ended December 31, 2022 or 2020.
NOTE 7—PROPERTY, PLANT AND EQUIPMENT
The Company’s property, plant and equipment consisted of the following:
| | | | | | | | | | | |
| December 31, |
| (in thousands) | 2022 | | 2021 |
| Land and land improvements | $ | 16,102 | | | $ | 7,925 | |
| Buildings and building improvements | 15,111 | | | 8,791 | |
| Machinery and equipment | 186,388 | | | 61,822 | |
| Assets under construction | 338,482 | | | 134,327 | |
| Mineral rights | 438,395 | | | 437,376 | |
| Property, plant and equipment, gross | 994,478 | | | 650,241 | |
| Less: Accumulated depreciation and depletion | (58,735) | | | (39,629) | |
| Property, plant and equipment, net | $ | 935,743 | | | $ | 610,612 | |
Additions to Property, Plant and Equipment: The Company capitalized expenditures related to property, plant and equipment of $361.2 million, $138.0 million and $26.2 million for the years ended December 31, 2022, 2021 and 2020, respectively, including amounts not yet paid (see Note 19, “Supplemental Cash Flow Information”). The capitalized expenditures for the year ended December 31, 2022, related to machinery, equipment, and assets under construction to support the Company’s Stage II optimization project, and assets under construction for its rare earth metal, alloy and magnet manufacturing facility as a part of Stage III, including the purchase of approximately 18 acres of land in Fort Worth, Texas. The capitalized expenditures for the years ended December 31, 2021 and 2020, mostly related to vehicles, machinery, equipment, and assets under construction to support the Stage II optimization project and other capital projects at Mountain Pass. Placement of Certain Stage II Assets into Service: At the end of the fourth quarter of 2022, the Company transferred certain of its assets totaling $121.0 million and pertaining to its Stage II optimization project from assets under construction to buildings, machinery and equipment, with $115.2 million relating to machinery and equipment.
Government Awards: In November 2020, the Company was awarded a Defense Production Act Title III technology investment agreement (“TIA”) from the Department of Defense (“DOD”) to establish domestic processing for separated light rare earth elements (this “project”) in the amount of $9.6 million. Pursuant to the terms of the TIA, the Company was required to utilize the funds to acquire property and equipment that contribute to the mission of this project. Furthermore, in exchange for these funds, the Company is required to provide the DOD with periodic reporting specific to this project for up to approximately five years.
During the years ended December 31, 2022 and 2021, pursuant to the TIA, the Company received $5.1 million and $4.4 million, respectively, in reimbursements from the DOD. The funds received reduced the carrying amount of certain fixed assets associated with the Company’s Stage II optimization project, which were included in machinery and equipment as of December 31, 2022, and assets under construction as of December 31, 2021. As of December 31, 2022, the Company is entitled to receive an additional $0.1 million from the DOD under the TIA.
In February 2022, the Company was awarded a $35.0 million contract by the DOD’s Office of Industrial Base Analysis and Sustainment Program to design and build a facility to process heavy rare earth elements (“HREE”) at Mountain Pass (the “HREE Production Project Agreement”). The Company must utilize the funds to acquire property and equipment that will contribute to commercial-scale production of separated HREE at Mountain Pass. The Company will be paid fixed amounts upon the completion of certain project milestones. In exchange for these funds, the DOD will have certain rights to technical data following the completion of the project. The funds received pursuant to the HREE Production Project Agreement will reduce the carrying amount of the fixed assets associated with the Company’s HREE processing and separations facility. As of December 31, 2022, the Company has not yet received any funds from the DOD.
Change in Estimates of Asset Retirement Costs: As a result of a decrement to the Company’s ARO during the third quarter of 2022 and fourth quarter of 2021, the carrying amount of the Company’s total property, plant and equipment was reduced by $10.4 million and $8.7 million, respectively, the majority of which pertained to buildings, machinery and equipment, and assets under construction, in the amounts of $0.6 million, $2.7 million and $6.7 million, respectively, and $2.0 million, $2.4 million and $3.2 million, respectively. Additionally, the Company’s depreciation expense for the years ended December 31, 2022 and 2021, was reduced by $2.7 million and $1.1 million, respectively, reflecting the excess of the decrement over the carrying amount of the related property, plant and equipment. See Note 10, “Asset Retirement and Environmental Obligations,” for further information on the decrements. The Company’s depreciation and depletion expense were as follows:
| | | | | | | | | | | | | | | | | |
| For the year ended December 31, |
| (in thousands) | 2022 | | 2021 | | 2020 |
| Depreciation expense | $ | 5,808 | | | $ | 6,825 | | | $ | 4,702 | |
Depletion expense(1) | $ | 12,209 | | | $ | 17,200 | | | $ | 1,961 | |
(1)At the beginning of the fourth quarter of 2021, as a result of an updated life of mine, the Company revised its estimate of the remaining useful life of the mineral rights to approximately 35 years from approximately 23 years. The effect of the change in estimate was a reduction in depletion expense for the years ended December 31, 2022 and 2021 of $6.1 million and $1.5 million, respectively.
There were no impairments recognized for the years ended December 31, 2022, 2021 and 2020.
NOTE 8—DEBT OBLIGATIONS
The Company’s current and non-current portions of long-term debt were as follows:
| | | | | | | | | | | |
| December 31, |
| (in thousands) | 2022 | | 2021 |
| Long-term debt | | | |
| Convertible Notes due 2026 | $ | 690,000 | | | $ | 690,000 | |
| Less: Unamortized debt issuance costs | (11,556) | | | (15,073) | |
| | | |
| | | |
| Long-term debt, net of current portion | $ | 678,444 | | | $ | 674,927 | |
| | | |
| Long-term debt to related party | | | |
| Offtake Advances | $ | — | | | $ | 16,599 | |
| Less: Unamortized debt discount | — | | | (517) | |
| Net carrying amount | — | | | 16,082 | |
| Less: Current installments of long-term debt to related party | — | | | (16,082) | |
| Long-term debt to related party, net of current portion | $ | — | | | $ | — | |
Convertible Notes
On March 26, 2021, the Company issued $690.0 million aggregate principal amount of 0.25% unsecured green convertible senior notes that mature, unless earlier converted, redeemed or repurchased, on April 1, 2026 (the “Convertible Notes”), at a price of par. Interest on the Convertible Notes is payable on April 1st and October 1st of each year, beginning on October 1, 2021. The Convertible Notes may, at the Company’s election, be settled in cash, shares of the Company’s Common Stock, or a combination thereof. The Company has the option to redeem the Convertible Notes, in whole or in part, beginning on April 5, 2024. The Company received net proceeds of $672.3 million from the issuance of the Convertible Notes.
The Convertible Notes are convertible into shares of the Company’s Common Stock at an initial conversion price of $44.28 per share, or 22.5861 shares, per $1,000 principal amount of notes, subject to adjustment upon the occurrence of certain corporate events. However, in no event will the conversion price exceed 28.5714 shares of Common Stock per $1,000 principal amount of notes. As of December 31, 2022, based on the initial conversion price, the maximum number of shares that could be issued to satisfy the conversion feature of the Convertible Notes was 19,714,266. The Convertible Notes’ if-converted value did not exceed its principal amount as of December 31, 2022.
Prior to January 1, 2026, at their election, holders of the Convertible Notes may convert their outstanding notes under the following circumstances: (i) during any calendar quarter commencing with the third quarter of 2021 if the last reported sale price of the Company’s Common Stock for at least 20 trading days (whether or not consecutive) during the period of 30 consecutive trading days ending on, and including, the last trading day of the immediately preceding calendar quarter is greater than or equal to 130% of the conversion price on each applicable trading day; (ii) during the five business day period after any five consecutive trading day period (the “measurement period”) in which the trading price (as defined in the indenture governing the Convertible Notes) per $1,000 principal amount of Convertible Notes for each trading day of the measurement period was less than 98% of the product of the last reported sale price of the Company’s Common Stock and the conversion rate on each such trading day; (iii) if the Company calls any or all of the Convertible Notes for redemption, at any time prior to the close of business on the scheduled trading day immediately preceding the redemption date; or (iv) upon the occurrence of specified corporate events set forth in the indenture governing the Convertible Notes. On or after January 1, 2026, and prior to the maturity date of the Convertible Notes, holders may convert their outstanding notes at any time, regardless of the foregoing circumstances.
If the Company undergoes a fundamental change (as defined in the indenture governing the Convertible Notes), holders may require it to repurchase for cash all or any portion of their outstanding notes at a price equal to 100% of the principal amount of the notes to be repurchased, plus accrued and unpaid interest to, but excluding, the fundamental change repurchase date. In addition, following certain corporate events that occur prior to the maturity date of the Convertible Notes or if the Company delivers a notice of redemption, it will, in certain circumstances, increase the conversion rate for holders who elect to convert their outstanding notes in connection with such corporate event or notice of redemption, as the case may be.
Interest expense related to the Convertible Notes was as follows:
| | | | | | | | | | | | | | | | | |
| For the year ended December 31, |
| (in thousands) | 2022 | | 2021 | | 2020 |
| Coupon interest | $ | 1,725 | | | $ | 1,318 | | | $ | — | |
| Amortization of debt issuance costs | 3,517 | | | 2,675 | | | — | |
| Convertible Notes interest expense | $ | 5,242 | | | $ | 3,993 | | | $ | — | |
The debt issuance costs are being amortized to interest expense over the term of the Convertible Notes at an effective interest rate of 0.51%. The remaining term of the Convertible Notes was 3.3 years as of December 31, 2022.
Offtake Advances
In connection with the June 2020 Modification, which is discussed in Note 3, “Relationship and Agreements with Shenghe,” Shenghe agreed to fund an additional $35.5 million advance to the Company (previously defined as the “Second Additional Advance”) and the Company issued the Shenghe Warrant. For accounting purposes, the June 2020 Modification effectively replaced the deferred revenue arrangement relating to the Original Offtake Agreement with a debt obligation relating to the A&R Offtake Agreement and the issuance of the Shenghe Warrant. Under the A&R Offtake Agreement, a portion of the sales prices of products sold to Shenghe was paid in the form of debt reduction, rather than cash. In addition, the Company was required to pay the following amounts to Shenghe in cash to reduce the debt obligation until repaid in full: (i) an agreed-upon percentage of sales of products to parties other than Shenghe; (ii) 100% of net profits from asset sales; and (iii) 100% of net income determined under GAAP, less the tax-effected amount of total non-cash recoupment from sales of products to Shenghe. For the years ended December 31, 2022, 2021 and 2020, $14.2 million, $52.8 million and $12.0 million, respectively, of the sales prices of products sold to Shenghe was paid in the form of debt reduction (see Note 19, “Supplemental Cash Flow Information”). During both the years ended December 31, 2022 and 2021, the Company made a payment to Shenghe of $0.2 million based on sales to other parties. No amounts were required to be paid based on asset sales. The A&R Offtake Agreement did not have a stated rate (and was non-interest-bearing), and repayment was contingent on a number of factors, including market prices realized by Shenghe, the Company’s sales to other parties, asset sales, and the Company’s annual net income. The imputed interest rate was a function of this discount taken together with the Company’s expectations about the timing of the anticipated reductions of the debt obligation. The Company had determined that it would recognize adjustments from these estimates following a prospective method where the Company updated its estimate of the effective interest rate in future periods based on revised estimates of the timing of remaining principal reductions at that time. The effective rate applicable from the June 5, 2020, inception to full repayment, was between 4.41% and 24.75%.
As discussed in Note 4, “Revenue Recognition,” in January 2021 and August 2020, the Company was informed of tariff rebates of $2.2 million and $9.7 million, respectively, that Shenghe received, which increased the gross profit earned by Shenghe on certain sales. In addition, during the year ended December 31, 2020, after the June 2020 Modification, but relating to sales made prior the June 2020 Modification, Shenghe realized higher gross profit than estimated by the Company in the amount of $0.4 million due to higher market prices. As a result of these events, for the years ended December 31, 2021 and 2020, the Company recorded reductions in the principal amount of the debt obligation of $2.2 million and $10.1 million, respectively, and the corresponding debt discount of $0.2 million and $0.8 million, respectively. As discussed in Note 3, “Relationship and Agreements with Shenghe,” the Company made a $2.9 million payment to Shenghe in March 2022 pursuant to item (iii) above. Upon payment by the Company, the Prepaid Balance was repaid in full, and the A&R Offtake Agreement was terminated. Equipment Notes
The Company has entered into several financing agreements for the purchase of equipment, including trucks, tractors, loaders, graders, and various other machinery. The Company’s equipment notes, which are secured by the purchased equipment, have terms of between 4 to 5 years and interest rates of between 0.0% and 6.5% per annum. See also Note 19, “Supplemental Cash Flow Information.”
The current and non-current portions of the equipment notes, which are included within the Consolidated Balance Sheets in “Other current liabilities” and “Other non-current liabilities,” respectively, were as follows:
| | | | | | | | | | | |
| December 31, |
| (in thousands) | 2022 | | 2021 |
| Equipment notes | | | |
| Current | $ | 2,392 | | | $ | 2,566 | |
| Non-current | 4,743 | | | 7,095 | |
| $ | 7,135 | | | $ | 9,661 | |
Paycheck Protection Loan
In April 2020, the Company obtained a loan of $3.4 million pursuant to the Paycheck Protection Program under the CARES Act (the “Paycheck Protection Loan”). In June 2021, the Company received notification from the Small Business Administration that the Paycheck Protection Loan and related accrued interest was forgiven. Consequently, for the year ended December 31, 2021, the Company recorded a gain on forgiveness of the Paycheck Protection Loan in the amount of $3.4 million, which is included in “Other income, net” within the Company’s Consolidated Statements of Operations.
Interest expense, net
Interest expense, net, was as follows:
| | | | | | | | | | | | | | | | | |
| For the year ended December 31, |
| (in thousands) | 2022 | | 2021 | | 2020 |
| Interest expense | $ | 6,146 | | | $ | 9,168 | | | $ | 5,171 | |
| Interest capitalized to property, plant and equipment, net | (360) | | | (264) | | | (162) | |
| Interest expense, net | $ | 5,786 | | | $ | 8,904 | | | $ | 5,009 | |
Debt Maturities
The following is a schedule of debt repayments as of December 31, 2022:
| | | | | | | | | | | | | |
| (in thousands) | Convertible Notes | | Equipment Notes | | |
| Year ending December 31, | | | | | |
| 2023 | $ | — | | | $ | 2,392 | | | |
| 2024 | — | | | 2,106 | | | |
| 2025 | — | | | 2,098 | | | |
| 2026 | 690,000 | | | 539 | | | |
| 2027 | — | | | — | | | |
| Thereafter | — | | | — | | | |
| Total minimum payments | $ | 690,000 | | | $ | 7,135 | | | |
As of December 31, 2022, none of the agreements governing the Company’s indebtedness contain financial covenants.
NOTE 9—LEASES
The Company has operating and finance leases for certain office space, warehouses, vehicles and equipment used in its operations, with lease terms ranging from one month to five years, excluding any leases that have not yet commenced. These leases require monthly lease payments that may be subject to annual increases throughout the lease term. Certain of these leases also include renewal options at the election of the Company to renew or extend the lease for an additional one to five years. These optional periods have not been considered in the determination of the ROU asset or lease liabilities associated with these leases as the Company did not consider it reasonably certain it would exercise the options. The Company’s leases do not contain any termination options or material residual value guarantees, reasonably certain purchase options, or restrictive covenants.
In November 2021, the Company entered into a lease agreement for corporate office space in a building that is currently being constructed by the landlord. The lease, which is estimated to commence by the end of the first quarter of 2023, has an initial term of 91 months, with one subsequent five-year renewal option on the same terms and conditions, exercisable at the Company’s option. The initial annual base rent payment will be $1.2 million, subject to an annual escalator. Pursuant to the lease agreement, the Company is entitled to receive a tenant improvement allowance of $1.8 million. As of December 31, 2022 and 2021, the Company has paid $0.6 million and $0.2 million, respectively, in prepaid rent and a security deposit, which were included in “Prepaid expenses and other current assets” and “Other non-current assets,” respectively, within the Consolidated Balance Sheet.
Total lease cost included the following components:
| | | | | | | | | | | | | | | | | | | | | | | |
| Location on Consolidated Statements of Operations | | For the year ended December 31, |
| | 2022 | | 2021 | | 2020 |
| Operating lease cost | Primarily Cost of sales (including related party) (excluding depreciation, depletion and amortization) | | $ | 424 | | | $ | 780 | | | $ | 2,466 | |
| Finance lease cost | | | | | | | |
| Amortization of right-of-use assets | Depreciation, depletion and amortization | | 339 | | | 357 | | | 268 | |
| Interest on lease liabilities | Interest expense, net | | 44 | | | 60 | | | 50 | |
| | | 383 | | | 417 | | | 318 | |
| | | | | | | |
| Short-term lease cost | Primarily Cost of sales (including related party) (excluding depreciation, depletion and amortization) | | 1,509 | | | 1,163 | | | 1,246 | |
| | | $ | 2,316 | | | $ | 2,360 | | | $ | 4,030 | |
NOTE 10—ASSET RETIREMENT AND ENVIRONMENTAL OBLIGATIONS
Asset Retirement Obligations
The Company estimates ARO based on the requirements to reclaim certain land and facilities associated with mining activity at Mountain Pass. Minor reclamation activities related to discrete portions of the Company’s operations are ongoing. As of December 31, 2022, the Company estimated a significant portion of the cash outflows for major reclamation activities including the retirement of Mountain Pass will be incurred beginning in 2056 and 2057.
In June 2021, San Bernardino County approved a re-zoning request for certain of the Company’s properties such that certain of the Company’s processing and separations facilities would be zoned for industrial end uses as opposed to the prior “resource conservation” designation. In September 2022, and as a result of the re-zoning of this land, the Company received final approval from San Bernardino County and the Division of Mine Reclamation (California) on a revised reclamation plan. The revision removed from the regulatory oversight under The Surface Mining and Reclamation Act of 1975 the majority of the buildings and equipment used in the processing and separations facilities, including the land underlying such buildings and equipment.
As a result of the final approval of the reclamation plan, in the third quarter of 2022, the Company revised its estimated cash flows pertaining to the settlement of the reclamation and removal activities associated with Mountain Pass, including removing the previous estimates of the cash flows associated with the processing and separations facilities that no longer require reclamation. The changes in estimates resulted in an ARO decrement of $13.1 million, of which $10.4 million reduced the carrying amounts of the associated property, plant and equipment, and $2.7 million, reflecting the excess of the decrement over the carrying amount of the related property, plant and equipment, was recorded as a reduction to depreciation expense for the year ended December 31, 2022.
In the fourth quarter of 2021, the Company revised its estimated timing and cash flows pertaining to the settlement of the reclamation and removal activities associated with Mountain Pass as a result of an updated life of mine where the Company determined that the estimated commencement of the reclamation and removal activities will now occur in 2056 and 2057 for a significant portion of the assets requiring reclamation at the time. The changes in estimates resulted in an ARO decrement of $9.8 million, of which $8.7 million reduced the carrying amounts of the associated property, plant and equipment, and $1.1 million, reflecting the excess of the decrement over the carrying amount of the related property, plant and equipment, was recorded as a reduction to depreciation expense for the year ended December 31, 2021.
The following is a summary of the Company’s ARO:
| | | | | | | | | | | |
| December 31, |
| (in thousands) | 2022 | | 2021 |
| Beginning balance | $ | 17,757 | | | $ | 25,646 | |
| Obligations settled | (144) | | | (199) | |
| Accretion expense | 976 | | | 1,876 | |
| Additional ARO | — | | | 213 | |
| | | |
| Revisions in estimated cash flows | (13,114) | | | (9,779) | |
| Ending balance | $ | 5,475 | | | $ | 17,757 | |
The balance as of December 31, 2022 and 2021, included current portions of $0.2 million and $0.1 million, respectively. The total estimated future undiscounted cash flows required to satisfy the Company’s ARO as of December 31, 2022 and 2021, were $50.4 million and $167.3 million, respectively. As of December 31, 2022, the credit-adjusted risk-free rate ranged between 6.5% and 12.0% depending on the timing of expected settlement and when the increment was recognized. There were no significant increments for the years ended December 31, 2022 and 2021, and there were no significant increments or decrements for the year ended December 31, 2020.
Environmental Obligations
The Company has certain environmental remediation liabilities related to the monitoring of groundwater contamination. The Company engaged an environmental consultant to develop a remediation plan and remediation cost projections based upon that plan. Utilizing the remediation plan developed by the environmental consultant, the Company developed an estimate of future cash payments for the remediation plan.
As of December 31, 2022, the Company estimated the cash outflows related to these environmental activities will be incurred annually over the next 25 years. The Company’s environmental remediation liabilities are measured at the expected value of future cash outflows discounted to their present value using a discount rate of 2.93%. There were no significant changes in the estimated remaining remediation costs for the years ended December 31, 2022, 2021 and 2020.
The total estimated aggregate undiscounted cost of $27.2 million and $27.7 million as of December 31, 2022 and 2021, respectively, principally related to water monitoring activities required by state and local agencies. Based on the Company’s estimate of the cost and timing and the assumption that payments are considered to be fixed and reliably determinable, the Company has discounted the liability. The balance as of December 31, 2022 and 2021, included current portions of $0.5 million.
As of December 31, 2022, the total environmental remediation costs were as follows (in thousands):
| | | | | |
| Year ending December 31, | |
| 2023 | $ | 520 | |
| 2024 | 536 | |
| 2025 | 552 | |
| 2026 | 569 | |
| 2027 | 587 | |
| Thereafter | 24,411 | |
| Total | 27,175 | |
| Effect of discounting | (10,075) | |
| Total environmental obligations | $ | 17,100 | |
Financial Assurances
The Company is required to provide the applicable government agencies with financial assurances relating to the closure and reclamation obligations. As of December 31, 2022 and 2021, the Company had financial assurance requirements of $43.5 million and $39.0 million, respectively, which were satisfied with surety bonds placed with California state and regional agencies.
NOTE 11—INCOME TAXES
Income tax benefit (expense) consisted of the following:
| | | | | | | | | | | | | | | | | |
| For the year ended December 31, |
| (in thousands) | 2022 | | 2021 | | 2020 |
| Current: | | | | | |
| Federal | $ | (24,382) | | | $ | (4,818) | | | $ | — | |
| State | (9,977) | | | (2,915) | | | (156) | |
| Total current | (34,359) | | | (7,733) | | | (156) | |
| Deferred: | | | | | |
| Federal | (19,236) | | | (15,851) | | | 14,088 | |
| State | 1,447 | | | (1,574) | | | 3,704 | |
| Total deferred | (17,789) | | | (17,425) | | | 17,792 | |
| Total tax benefit (expense) | $ | (52,148) | | | $ | (25,158) | | | $ | 17,636 | |
During the years ended December 31, 2021 and 2020, the Company recorded $0.4 million and $4.7 million, respectively, related to certain deductible expenditures incurred in connection with the Business Combination to “Additional paid-in capital.”
Income (loss) before income taxes, by tax jurisdiction, was as follows:
| | | | | | | | | | | | | | | | | |
| For the year ended December 31, |
| (in thousands) | 2022 | | 2021 | | 2020 |
| United States | $ | 341,152 | | | $ | 160,195 | | | $ | (39,461) | |
Income taxes differed from the amounts computed by applying the U.S. federal income tax rate of 21% to pretax income (loss) as a result of the following:
| | | | | | | | | | | | | | | | | | | | | | | | | | | | | | | | | | | |
| For the year ended December 31, |
| 2022 | | 2021 | | 2020 |
| (in thousands, except tax rates) | Percent | | Amount | | Percent | | Amount | | Percent | | Amount |
| Computed income tax benefit (expense) at the statutory rate | 21.0 | % | | $ | (71,642) | | | 21.0 | % | | $ | (33,641) | | | 21.0 | % | | $ | 8,287 | |
| Changes resulting from: | | | | | | | | | | | |
| State and local income taxes, net of federal benefits | 3.3 | % | | (11,395) | | | 2.7 | % | | (4,288) | | | 4.3 | % | | 1,729 | |
| Limitation on officer’s compensation | 2.3 | % | | (8,067) | | | 1.7 | % | | (2,638) | | | (1.2) | % | | (478) | |
| Depletion in excess of basis | (4.5) | % | | 15,248 | | | (6.1) | % | | 9,663 | | | 1.1 | % | | 425 | |
| Paycheck Protection Loan forgiveness | — | % | | — | | | (0.5) | % | | 714 | | | — | % | | — | |
| Foreign-derived intangible income | (4.0) | % | | 13,676 | | | (1.8) | % | | 2,886 | | | — | % | | — | |
| California Competes Tax Credit, net of federal detriment | (0.9) | % | | 3,160 | | | (1.2) | % | | 1,975 | | | — | % | | — | |
| Excess tax benefits on stock-based compensation | (1.0) | % | | 3,575 | | | (0.6) | % | | 974 | | | — | % | | — | |
| Valuation allowance | (0.8) | % | | 2,845 | | | 0.5 | % | | (821) | | | 23.7 | % | | 9,333 | |
| Other, net | (0.1) | % | | 452 | | | — | % | | 18 | | | (4.2) | % | | (1,660) | |
| Total effective tax rate and income tax benefit (expense) | 15.3 | % | | $ | (52,148) | | | 15.7 | % | | $ | (25,158) | | | 44.7 | % | | $ | 17,636 | |
The tax effects of temporary differences that gave rise to significant portions of the deferred income tax assets and deferred income tax liabilities were as follows:
| | | | | | | | | | | |
| December 31, |
| (in thousands) | 2022 | | 2021 |
| Deferred tax assets: | | | |
| Asset retirement and environmental obligations | $ | 5,643 | | | $ | 8,744 | |
| Net operating losses | — | | | 2,174 | |
| | | |
| Inventories | 12,448 | | | 6,695 | |
| | | |
| | | |
| Offtake Advances, net of debt discount | — | | | 4,034 | |
| Shenghe Warrant | — | | | 2,329 | |
| Research and experimental costs | 691 | | | — | |
| Stock-based compensation | 3,785 | | | 2,688 | |
| Organization costs | 776 | | | 860 | |
| Credits | 346 | | | 764 | |
| Other | 351 | | | 636 | |
| Gross deferred tax assets | 24,040 | | | 28,924 | |
| Less: Valuation allowance | (346) | | | (3,192) | |
| Net deferred tax assets | 23,694 | | | 25,732 | |
| | | |
| Deferred tax liabilities: | | | |
| Property, plant and equipment | (36,481) | | | (14,077) | |
| Prepaid expenses | (1,567) | | | (1,192) | |
| Deferred revenue | (6,604) | | | (9,938) | |
| | | |
| Mineral rights | (101,195) | | | (104,735) | |
| Other | (200) | | | (290) | |
| Total deferred tax liabilities | (146,047) | | | (130,232) | |
| Non-current deferred tax liabilities, net | $ | (122,353) | | | $ | (104,500) | |
For income tax purposes, the Business Combination was treated as a tax-free reorganization whereby the taxable years of MPMO and Secure Natural Resources LLC (“SNR”) ended on November 17, 2020, and the Company became the new parent and sole filer of a tax return for the remainder of 2020 as MPMO and SNR became disregarded entities. Although the SNR Mineral Rights Acquisition was treated as an asset acquisition, the assets, liabilities and other attributes took carryover basis for income tax purposes because of the tax-free reorganization nature of the transaction.
As of December 31, 2022 and 2021, the Company did not have any net operating loss carryforwards for federal income tax purposes, and had zero and $7.4 million, respectively, for state income tax purposes. As of December 31, 2022, the Company considered the positive and negative evidence to determine the need for a valuation allowance to offset its deferred tax assets and has concluded that it is more likely than not that, with the exception of certain deferred tax assets related to California Alternative Minimum Tax credits, its deferred tax assets will be realized through future taxable temporary differences, principally resulting from the deferred tax liability recorded as a result of the SNR Mineral Rights Acquisition which occurred during the 2020 tax year.
During the fourth quarter of 2021, the Company received notice from the State of California that it had been awarded a California Competes Tax Credit (“CCTC”) of $14.8 million that is available to be offset against the Company’s California state income tax liability over the next several years. The credit is allocated in varying amounts over a five-year period based on the Company’s ability to meet certain milestones related to California employees hired, the annual wage of these employees, and the capital investments made by the Company in California. Once the annual milestones are met, a credit amount is awarded. However, a portion of the credit could be “clawed back” if the milestones are not continually met for each of the three following years. For the years ended December 31, 2022 and 2021, it was determined that the Company had met the relevant annual milestones for the CCTC and as a result, the Company recorded a credit of $4.0 million and $2.5 million, respectively, which resulted in an income tax benefit and a reduction to the Company’s California state income tax payable for the 2022 and 2021 tax years.
On August 16, 2022, the U.S. government enacted the Inflation Reduction Act of 2022 which, among other things, implements a 15% minimum tax on book income of certain large corporations, a 1% excise tax on net stock repurchases, and provides several tax incentives to promote clean energy for tax years beginning after December 31, 2022. At this time, we do not expect the minimum tax or excise tax to have a material impact on the Company’s Consolidated Financial Statements. We are continuing to evaluate the impact of the clean energy incentives.
The Company has evaluated its tax positions for the years ended December 31, 2022, 2021 and 2020 and determined that there were no uncertain tax positions requiring recognition in the Consolidated Financial Statements. The tax years from 2019 onward remain open to examination by the taxing jurisdictions to which the Company is subject.
NOTE 12—COMMITMENTS AND CONTINGENCIES
Litigation: The Company may become party to lawsuits, administrative proceedings and government investigations, including environmental, regulatory, and other matters, in the ordinary course of business. Large, and sometimes unspecified, damages or penalties may be sought in some matters, and certain matters may require years to resolve. The Company is not aware of any pending or threatened litigation that would have a material adverse effect on its Consolidated Financial Statements.
In January 2019, a former employee filed a complaint with the California Labor & Workforce Development Agency alleging numerous violations of California labor law, and subsequently filed a representative action against the Company. In October 2021, the Company entered into a memorandum of understanding to settle the lawsuit in the amount of approximately $1 million, including legal fees, which is included in “Selling, general and administrative” within the Consolidated Statement of Operations for the year ended December 31, 2021. In August 2022, the court granted final approval of the class settlement, and in September 2022, the Company paid the settlement amount.
NOTE 13—BUSINESS COMBINATION AND REVERSE RECAPITALIZATION
Pursuant to the terms of the Agreement and Plan of Merger, dated as of July 15, 2020, as amended on August 26, 2020 (the “Merger Agreement”), on November 17, 2020, MPMO and SNR were combined with Fortress Value Acquisition Corp., a special purpose acquisition company (“FVAC”) (the “Business Combination”), and became wholly-owned subsidiaries of FVAC, which was in turn renamed MP Materials Corp.
As of December 31, 2019, and through the date of the Business Combination, MPMO had outstanding 1,000 voting common units with no par value and 110.98 non-voting preferred units with no par value, which were held by Leshan Shenghe. In addition, as discussed in Note 3, “Relationship and Agreements with Shenghe,” in connection with the June 2020 Modification, MPMO issued the Shenghe Warrant. Immediately prior to the Business Combination, the Shenghe Warrant was exercised and MPMO issued 89.88 non-voting preferred units with no par value to Leshan Shenghe. As a result, 200.86 non-voting preferred units were outstanding immediately prior to the Business Combination. In connection with the Business Combination and pursuant to the Merger Agreement, the Company issued shares of its common stock with a par value of $0.0001 per share (“Common Stock”) to unitholders of MPMO at an exchange ratio of approximately 59,908.35 shares of the Company’s Common Stock for each common unit and preferred unit of MPMO, resulting in the issuance of 71,941,538 shares of the Company’s Common Stock. In addition, in connection with the SNR Mineral Rights Acquisition, 19,999,942 shares (adjusted for fractional shares) of the Company’s Common Stock were issued to SNR unitholders. See below for further discussion of the SNR Mineral Rights Acquisition.
Immediately prior to the consummation of the Business Combination and pursuant to the Parent Sponsor Warrant Exchange Agreement, entered into by FVAC and Fortress Acquisition Sponsor LLC, a Delaware limited liability company (the “Sponsor”), on July 15, 2020, the Sponsor exchanged all 5,933,333 of its private placement warrants (the “Private Placement Warrants”) for an aggregate of 890,000 shares of FVAC Class F common stock that, upon the consummation of the Business Combination, were converted into Common Stock of the Company (the “Parent Sponsor Warrant Exchange”).
In connection with the consummation of the Business Combination, the Company issued, in a private placement transaction, an aggregate of 20,000,000 shares of Common Stock for an aggregate purchase price of $200.0 million, to PIPE investors pursuant to the terms of respective subscription agreements entered into separately between the Company and each PIPE investor, each dated July 15, 2020 (the “PIPE Financing”).
After giving effect to the above, shares of the Company’s Common Stock issued and outstanding immediately after the closing of the Business Combination were as follows (including restricted stock issued to certain executives upon closing):
| | | | | | | | |
| Stockholder | | Number of Shares |
FVAC public stockholders(1) | | 34,464,151 | |
| Private Placement Warrants | | 890,000 | |
MPMO unitholders(2) | | 71,941,538 | |
| SNR unitholders | | 19,999,942 | |
| PIPE Financing | | 20,000,000 | |
| Restricted stock issued to certain MPMO executives | | 2,013,006 | |
| Total | | 149,308,637 | |
(1)Represents the outstanding shares held by FVAC’s public stockholders (Class A common stock) which were not redeemed in connection with the Business Combination. The Company received gross proceeds of $344.7 million and net proceeds of $332.6 million after $12.1 million of underwriting commissions in connection with the sale of these shares.
(2)Includes 5,384,563 shares issued relating to the Shenghe Warrant.
MPMO’s merger with FVAC was accounted for as a reverse recapitalization in accordance with GAAP. Under this method of accounting, MPMO was determined to be the accounting acquirer and FVAC was treated as the acquired company for financial reporting purposes. Accordingly, for accounting purposes, the merger was treated as the equivalent of MPMO issuing stock for the net assets of FVAC, accompanied by a recapitalization. The net assets of FVAC are stated at historical cost, with no goodwill or other intangible assets recorded.
Pursuant to the amended and restated letter agreement dated July 15, 2020, and amended and restated on August 26, 2020, by and among FVAC and the holders of FVAC Class F common stock, all of the shares of FVAC Class A common stock issued upon the conversion of FVAC Class F common stock (held by insiders initially purchased prior to the FVAC initial public offering (“IPO”), were subject to certain vesting and forfeiture provisions (the “Vesting Shares”) based on the achievement of certain volume weighted-average price (“VWAP”) thresholds of the Company’s Common Stock.
The holders of MPMO Holding Company, which was a Delaware corporation formed by MPMO pursuant to the Merger Agreement (“MPMO HoldCo”), preferred stock and common stock and SNR Holding Company, LLC, which was a Delaware limited liability company formed by SNR pursuant to the Merger Agreement (“SNR HoldCo”), common stock immediately prior to the closing of the Business Combination were given the contingent right to receive up to an additional 12,860,000 shares of the Company’s Common Stock (the “Earnout Shares”) based on the achievement of certain VWAP thresholds of the Company’s Common Stock.
The Company determined that the Earnout Shares issued to the Sponsor, holders of MPMO HoldCo preferred stock and common stock, and holders of SNR HoldCo common stock met the criteria for equity classification under ASC Subtopic 815-40, “Contracts in Entity’s Own Equity.” The Company estimated that the total fair value of the Earnout Shares at closing of the Business Combination was $171.2 million, consisting of $134.0 million and $37.2 million ascribed to the MPMO and SNR earnouts, respectively.
In December 2020, 8,625,000 Vesting Shares vested, and 12,859,898 Earnout Shares (adjusted for fractional shares) were issued after achievement of the aforementioned VWAP thresholds. As of December 31, 2022 and 2021, the Vesting Shares and the Earnout Shares delivered to the equityholders were recorded as equity with an allocation between common stock at par value and additional paid-in capital, and the Earnout Shares delivered to MPMO equityholders were accounted for as a distribution. Since all Earnout Shares were determined to be equity-classified at initial recognition and through the date of achievement of the thresholds, no remeasurement was required.
SNR Mineral Rights Acquisition
The acquisition of SNR did not meet the criteria for the acquisition of a business under ASC Topic 805, “Business Combinations” (“ASC 805”), and was accounted for as an asset acquisition since substantially all of the fair value of the assets acquired was concentrated in a single asset, the mineral rights for the rare earth ores contained in the Company’s mine. The net assets acquired in the SNR Mineral Rights Acquisition were $324.1 million, which was principally comprised of a mineral rights asset of $434.7 million, net of the associated deferred tax liability of $109.1 million.
MPMO and SNR had a relationship prior to the Business Combination, specifically related to a royalty agreement and an intellectual property license. The Company considered the provisions of ASC 805 regarding the settlement of pre-existing relationships. Immediately prior to the consummation of the Business Combination, MPMO had a $3.9 million liability related to the minimum royalty, which was effectively settled through intercompany when MPMO and SNR became wholly-owned subsidiaries of the Company. The settlement of the liability was reflected in the cost of the acquisition due to the pre-existing contractual relationship being cancellable without penalty and no gain or loss was recognized.
Transaction Costs
In connection with the Business Combination, the Company incurred direct and incremental costs of $33.5 million, consisting of legal and professional fees, of which $28.2 million was related to equity issuance costs and recorded to “Additional paid-in capital” as a reduction of proceeds at the time of the Business Combination, $3.3 million was recorded to “Selling, general and administrative” expenses, for the year ended December 31, 2020, and $2.0 million was related to the SNR Mineral Rights Acquisition, which was included as a component of the cost of the acquisition.
NOTE 14—STOCKHOLDERS’ EQUITY
Common Stock and Preferred Stock
On November 17, 2020, in connection with the consummation of the Business Combination, FVAC amended and restated its first amended and restated certificate of incorporation (the “Second Amended and Restated Certificate of Incorporation”). Pursuant to the terms of the Second Amended and Restated Certificate of Incorporation, the Company increased the number of authorized shares of all classes of capital stock from 221,000,000 shares to 500,000,000, consisting of (i) 450,000,000 shares of Common Stock and (ii) 50,000,000 shares of preferred stock (“Preferred Stock”), each with a par value of $0.0001 per share.
Public Warrants
Warrants to purchase 11,499,968 shares of the Company’s Common Stock at $11.50 per share were issued in connection with FVAC’s IPO (the “Public Warrants”) pursuant to the Warrant Agreement, dated April 29, 2020 (the “Warrant Agreement”), by and between the Company and Continental Stock Transfer & Trust Company (“CST”), as warrant agent. These warrants qualified as equity instruments as they were indexed to the Company’s stock and settlement in shares was within the Company’s control.
On May 4, 2021, at the direction of the Company, CST, in its capacity as warrant agent, delivered a notice of redemption to each of the registered holders of the outstanding Public Warrants for a redemption price of $0.01 per warrant (the “Redemption Price”), that remained outstanding on June 7, 2021 (the “Redemption Date”). In accordance with the Warrant Agreement, the Company’s Board of Directors elected to require that, upon delivery of the notice of redemption, all Public Warrants were to be exercised only on a “cashless basis.” Accordingly, a holder exercising a Public Warrant was deemed to pay the $11.50 per warrant exercise price by the surrender of 0.3808 of a share of Common Stock that such holder would have been entitled to receive upon a cash exercise, resulting in exercising warrant holders receiving 0.6192 of a share of Common Stock for each Public Warrant surrendered for exercise. All Public Warrants that remained unexercised on the Redemption Date were delisted, voided and no longer exercisable, and the holders had no rights with respect to those Public Warrants, except to receive the Redemption Price.
During the year ended December 31, 2021, the Company issued 7,080,005 shares of its Common Stock as a result of the cashless exercise of 11,434,455 Public Warrants. The Company redeemed the remaining 65,513 Public Warrants outstanding at the Redemption Date for a nominal amount.
NOTE 15—STOCK-BASED COMPENSATION
2020 Incentive Plan: In November 2020, the Company’s stockholders approved the MP Materials Corp. 2020 Stock Incentive Plan (the “2020 Incentive Plan”), which permits the Company to issue stock options (incentive and/or non-qualified); stock appreciation rights (“SARs”); restricted stock, restricted stock units (“RSUs”) and other stock awards (“Stock Awards”); and performance awards. As of December 31, 2022, the Company has not issued any stock options, SARs or performance awards.
Pursuant to the 2020 Incentive Plan, 9,653,671 shares of Common Stock were initially available for issuance. The number of shares of Common Stock available under the 2020 Incentive Plan may be increased annually on the first day of each calendar year, beginning with the year ended December 31, 2021, and continuing until (and including) the year ending December 31, 2030, with such annual increase equal to the lesser of (i) 2% of the number of shares of stock issued and outstanding on
December 31st of the immediately preceding fiscal year and (ii) an amount determined by the Board of Directors. The number of shares of Common Stock that remain available for future grants under the 2020 Incentive Plan shall be reduced by the sum of the aggregate number of shares of Common Stock that become subject to outstanding options, outstanding free-standing SARs, outstanding Stock Awards, and outstanding performance awards denominated in shares of Common Stock, other than substitute awards. As of December 31, 2022, there were 6,551,497 shares available for future grants under the 2020 Incentive Plan.
Stock Awards: Pursuant to the terms and conditions of certain executive employment agreements, in connection with the consummation of the Business Combination, 2,013,006 shares of restricted stock were issued during the year ended December 31, 2020, of which 200,000 shares immediately vested and the remainder of shares were to vest ratably pursuant the respective employment agreements over the requisite service period of four years.
The Company also granted 382,742, 1,026,387 and 386,639 RSUs to employees, during the years ended December 31, 2022, 2021, and 2020, respectively, which, with the exception of 36,461 and 80,350 RSUs granted during the years ended December 31, 2022 and 2021, respectively, that vested immediately, vest ratably in equal installments over the requisite service period of four years.
Additionally, the Company granted 23,975, 18,394 and 15,922 RSUs to non-employee directors during the years ended December 31, 2022, 2021, and 2020, respectively, of which, 6,881 and 5,810 vested immediately into tax-deferred stock units (“DSUs”) during the years ended December 31, 2022 and 2021, respectively. The remaining RSUs granted vest into DSUs upon the earlier of one year after the grant date and the next annual stockholder meeting, The DSUs are settled as shares of Common Stock of the Company upon the earlier of (i) June 15th of the fifth year after grant, (ii) a change in control of the Company, or (iii) the director’s separation from the Board, unless the director elects to defer settlement until retirement.
The grant date fair value of the Company’s Stock Awards is based on the closing stock price of the Company’s shares of Common Stock on the date of grant. The weighted-average grant date fair value of Stock Awards granted during the years ended December 31, 2022, 2021, and 2020 was $38.52, $41.24 and $14.53, respectively.
The following table contains information on the Company’s Stock Awards:
| | | | | | | | | | | |
| Number of Shares | | Weighted-Average Grant Date Fair Value |
| Nonvested as of January 1, 2022 | 2,869,680 | | | $ | 23.51 | |
| Granted | 406,717 | | | $ | 38.52 | |
| Vested | (1,032,513) | | | $ | 22.17 | |
| Forfeited | (35,721) | | | $ | 32.51 | |
| Nonvested as of December 31, 2022 | 2,208,163 | | | $ | 26.76 | |
As of December 31, 2022, the unamortized compensation cost not yet recognized related to Stock Awards totaled $29.9 million and the weighted-average period over which the costs are expected to be recognized was 1.9 years. The total fair value of Stock Awards that vested during the years ended December 31, 2022, 2021 and 2020, was $40.0 million, $10.9 million and $2.9 million, respectively.
Stock-Based Compensation: The Company’s stock-based compensation and related income tax benefit were recorded as follows:
| | | | | | | | | | | | | | | | | |
| For the year ended December 31, |
| (in thousands) | 2022 | | 2021 | | 2020 |
| Cost of sales | $ | 2,853 | | | $ | 4,294 | | | $ | 277 | |
| Selling, general and administrative | 28,554 | | | 18,246 | | | 4,737 | |
| Advanced projects, start-up, development and other | 373 | | | 391 | | | — | |
| Total stock-based compensation expense | $ | 31,780 | | | $ | 22,931 | | | $ | 5,014 | |
| | | | | |
| Stock-based compensation capitalized to property, plant and equipment, net | $ | 1,286 | | | $ | — | | | $ | — | |
| Income tax benefit for stock-based compensation arrangements | $ | 4,256 | | | $ | 3,185 | | | $ | 1,259 | |
NOTE 16—FAIR VALUE MEASUREMENTS
ASC Topic 820, “Fair Value Measurements and Disclosures” (“ASC 820”), establishes a fair value hierarchy that prioritizes the inputs to valuation techniques used to measure fair value. The hierarchy gives the highest priority to unadjusted quoted prices in active markets for identical assets or liabilities (Level 1 measurements) and the lowest priority to unobservable inputs (Level 3 measurements). The three levels of the fair value hierarchy are described below:
| | | | | | | | |
| Level 1 | Unadjusted quoted prices in active markets that are accessible at the measurement date for identical, unrestricted assets or liabilities; |
| | |
| Level 2 | Quoted prices in markets that are not active, quoted prices for similar assets or liabilities in active markets, quoted prices or inputs that are observable, either directly or indirectly, for substantially the full term of the asset or liability and model-based valuation techniques (e.g. the Black-Scholes model) for which all significant inputs are observable in active markets. |
| | |
| Level 3 | Prices or valuation techniques that require inputs that are both significant to the fair value measurement and unobservable (supported by little or no market activity). |
The Company’s assessment of the significance of a particular input to the fair value measurement requires judgment and may affect the valuation of assets and liabilities and their placement within the fair value hierarchy. The following methods and assumptions are used to estimate the fair value of each class of financial instruments for which it is practicable to estimate. The fair value of the Company’s accounts receivable, accounts payable, and accrued liabilities approximates the carrying amounts because of the immediate or short-term maturity of these financial instruments.
Cash, Cash Equivalents and Restricted Cash
The Company’s cash, cash equivalents and restricted cash are classified within Level 1 of the fair value hierarchy. The carrying amounts reported in the Consolidated Balance Sheets approximate the fair value of cash, cash equivalents and restricted cash due to the short-term nature of these assets.
Short-term Investments
The fair value of the Company’s short-term investments, which are classified as available-for-sale securities, is estimated based on quoted prices in active markets and is classified as a Level 1 measurement.
Convertible Notes
The fair value of the Company’s Convertible Notes is estimated based on quoted prices in active markets and is classified as a Level 1 measurement.
Offtake Advances
The Company’s Offtake Advances were classified within Level 3 of the fair value hierarchy as of December 31, 2021, because there were unobservable inputs that followed an imputed interest rate model to calculate the amortization of the embedded debt discount, which was recognized as non-cash interest expense, by estimating the timing of anticipated payments and reductions of the debt principal balance. This model-based valuation technique, for which there were unobservable inputs, was used to estimate the fair value of the liability classified within Level 3 of the fair value hierarchy as of December 31, 2021.
Equipment Notes
The Company’s equipment notes are classified within Level 2 of the fair value hierarchy because there are inputs that are directly observable for substantially the full term of the liability. Model-based valuation techniques for which all significant inputs are observable in active markets were used to calculate the fair values of liabilities classified within Level 2 of the fair value hierarchy.
Assets and liabilities are classified in their entirety based on the lowest level of input that is significant to the fair value measurement. The carrying amounts and estimated fair values by input level of the Company’s financial instruments were as follows:
| | | | | | | | | | | | | | | | | | | | | | | | | | | | | |
| December 31, 2022 |
| (in thousands) | Carrying Amount | | Fair Value | | Level 1 | | Level 2 | | Level 3 |
| Financial assets: | | | | | | | | | |
| Cash and cash equivalents | $ | 136,627 | | | $ | 136,627 | | | $ | 136,627 | | | $ | — | | | $ | — | |
| Short-term investments | $ | 1,045,718 | | | $ | 1,045,718 | | | $ | 1,045,718 | | | $ | — | | | $ | — | |
| Restricted cash | $ | 6,882 | | | $ | 6,882 | | | $ | 6,882 | | | $ | — | | | $ | — | |
| Financial liabilities: | | | | | | | | | |
| Convertible Notes | $ | 678,444 | | | $ | 610,650 | | | $ | 610,650 | | | $ | — | | | $ | — | |
| Equipment notes | $ | 7,135 | | | $ | 6,807 | | | $ | — | | | $ | 6,807 | | | $ | — | |
| | | | | | | | | | | | | | | | | | | | | | | | | | | | | |
| December 31, 2021 |
| (in thousands) | Carrying Amount | | Fair Value | | Level 1 | | Level 2 | | Level 3 |
| Financial assets: | | | | | | | | | |
| Cash and cash equivalents | $ | 1,179,297 | | | $ | 1,179,297 | | | $ | 1,179,297 | | | $ | — | | | $ | — | |
| Restricted cash | $ | 1,860 | | | $ | 1,860 | | | $ | 1,860 | | | $ | — | | | $ | — | |
| Financial liabilities: | | | | | | | | | |
| Convertible Notes | $ | 674,927 | | | $ | 880,026 | | | $ | 880,026 | | | $ | — | | | $ | — | |
| Offtake Advances | $ | 16,082 | | | $ | 16,501 | | | $ | — | | | $ | — | | | $ | 16,501 | |
| Equipment notes | $ | 9,661 | | | $ | 9,737 | | | $ | — | | | $ | 9,737 | | | $ | — | |
NOTE 17—EARNINGS (LOSS) PER SHARE
Pursuant to the Second Amended and Restated Certificate of Incorporation and as a result of the Business Combination and reverse recapitalization, the Company has retrospectively adjusted the weighted-average shares outstanding prior to November 17, 2020, to give effect to the exchange ratio used to determine the number of shares of Common Stock into which the MPMO common units and preferred units, which were outstanding prior the Business Combination, converted.
Basic EPS is computed based on the weighted-average number of common shares outstanding during the period. Diluted EPS is based on the weighted-average number of common shares outstanding plus the effect of dilutive potential common shares outstanding during the period using the treasury stock method or the if-converted method, as applicable. During the periods when there is a net loss, potentially dilutive common stock equivalents have been excluded from the calculation of diluted loss per share as their effect is anti-dilutive.
| | | | | | | | | | | | | | | | | |
| For the year ended December 31, |
| 2022 | | 2021 | | 2020 |
| Weighted-average shares outstanding, basic | 176,519,203 | | | 173,469,546 | | | 79,690,821 | |
| Assumed conversion of Public Warrants | — | | | 2,840,624 | | | — | |
| Assumed conversion of Convertible Notes | 15,584,409 | | | 11,997,860 | | | — | |
| Assumed conversion of restricted stock | 921,772 | | | 1,257,360 | | | — | |
| Assumed conversion of RSUs | 427,703 | | | 278,638 | | | — | |
| Weighted-average shares outstanding, diluted | 193,453,087 | | | 189,844,028 | | | 79,690,821 | |
The following table presents the calculation of basic and diluted EPS for the Company’s Common Stock:
| | | | | | | | | | | | | | | | | |
| For the year ended December 31, |
| (in thousands, except share and per share data) | 2022 | | 2021 | | 2020 |
| Calculation of basic EPS: | | | | | |
| Net income (loss) | $ | 289,004 | | | $ | 135,037 | | | $ | (21,825) | |
| Weighted-average shares outstanding, basic | 176,519,203 | | | 173,469,546 | | | 79,690,821 | |
| Basic EPS | $ | 1.64 | | | $ | 0.78 | | | $ | (0.27) | |
| | | | | |
| Calculation of diluted EPS: | | | | | |
| Net income (loss) | $ | 289,004 | | | $ | 135,037 | | | $ | (21,825) | |
Interest expense, net of tax(1): | | | | | |
| Convertible Notes | 4,441 | | | 3,366 | | | — | |
| Diluted income (loss) | $ | 293,445 | | | $ | 138,403 | | | $ | (21,825) | |
| Weighted-average shares outstanding, diluted | 193,453,087 | | | 189,844,028 | | | 79,690,821 | |
| Diluted EPS | $ | 1.52 | | | $ | 0.73 | | | $ | (0.27) | |
(1)The years ended December 31, 2022 and 2021, were tax-effected at a rate of 15.3% and 15.7%, respectively. As discussed in Note 8, “Debt Obligations,” the Convertible Notes were issued in March 2021; therefore, no adjustment is required for the year ended December 31, 2020. The following potentially dilutive securities have been excluded from the computation of diluted weighted-average shares of common stock outstanding as they would be anti-dilutive:
| | | | | | | | | | | | | | | | | |
| For the year ended December 31, |
| 2022 | | 2021 | | 2020 |
| Public Warrants | — | | | — | | | 11,499,968 | |
| Restricted stock | — | | | — | | | 1,813,006 | |
| RSUs | 24,442 | | | 18,322 | | | 397,662 | |
| Total | 24,442 | | | 18,322 | | | 13,710,636 | |
NOTE 18—RELATED-PARTY TRANSACTIONS
Revenue and Cost of Sales: Sales of rare earth concentrate under sales agreements with Shenghe, which are included in the Consolidated Statements of Operations in “Product sales (including related party),” were $487.0 million, $326.6 million and $133.7 million for the years ended December 31, 2022, 2021 and 2020, respectively. During the year ended December 31, 2022, the Company also entered into sales agreements with Shenghe for non-concentrate products, including certain stockpiles of rare earth fluoride (“REF”). These sales, which are included in the Consolidated Statements of Operations in “Other sales (including related party),” were $9.7 million for the year ended December 31, 2022. Cost of sales, which includes shipping and freight, related to these agreements with Shenghe, was $88.6 million, $76.0 million and $63.3 million for the years ended December 31, 2022, 2021 and 2020, respectively.
Purchases of Materials and Supplies: The Company purchases certain reagent products (generally produced by an unrelated third party manufacturer) used in the flotation process as well as other materials from Shenghe in the ordinary course of business. Total purchases for the years ended December 31, 2022, 2021 and 2020, totaled $18.5 million, $4.8 million and $2.6 million, respectively.
Accounts Receivable: As of December 31, 2022 and 2021, $29.8 million and $49.9 million of the accounts receivable, respectively, and as stated on the Consolidated Balance Sheets, were receivable from and pertained to sales made to Shenghe in the ordinary course of business.
NOTE 19—SUPPLEMENTAL CASH FLOW INFORMATION
Supplemental cash flow information and non-cash investing and financing activities were as follows:
| | | | | | | | | | | | | | | | | |
| For the year ended December 31, |
| (in thousands) | 2022 | | 2021 | | 2020 |
| Supplemental cash flow information: | | | | | |
| Cash paid for interest | $ | 2,096 | | | $ | 1,204 | | | $ | 3,089 | |
| Cash payments related to income taxes, net | $ | 18,860 | | | $ | 4,172 | | | $ | 255 | |
| Supplemental non-cash investing and financing activities: | | | | | |
| Property, plant and equipment acquired with equipment notes | $ | — | | | $ | 9,407 | | | $ | 1,216 | |
| Property, plant and equipment purchased but not yet paid | $ | 34,569 | | | $ | 14,082 | | | $ | 4,054 | |
| SNR Mineral Rights Acquisition | $ | — | | | $ | — | | | $ | 324,125 | |
| Revenue recognized in exchange for debt principal reduction | $ | 13,566 | | | $ | 54,802 | | | $ | 21,312 | |
| Paycheck Protection Loan forgiveness | $ | — | | | $ | 3,401 | | | $ | — | |
| Decrease in estimates of asset retirement costs | $ | 10,395 | | | $ | 8,713 | | | $ | — | |
| Operating right-of-use assets obtained in exchange for lease liabilities | $ | 168 | | | $ | — | | | $ | 2,932 | |
| Finance right-of-use assets obtained in exchange for lease liabilities | $ | 42 | | | $ | 88 | | | $ | 724 | |
| | | | | |
ITEM 9. CHANGES IN AND DISAGREEMENTS WITH ACCOUNTANTS ON ACCOUNTING AND FINANCIAL DISCLOSURE
None.
ITEM 9A. CONTROLS AND PROCEDURES
Disclosure Controls and Procedures
Under the supervision and with the participation of our management, including our principal executive officer and principal financial and accounting officer, we conducted an evaluation of the effectiveness of our disclosure controls and procedures (as such term is defined in Rules 13a-15(e) and 15d-15(e) under the Securities Exchange Act of 1934, as amended (the “Exchange Act”)) as of December 31, 2022. Based on this evaluation, our Chief Executive Officer and Chief Financial Officer have concluded that, as of the end of the period covered by this Annual Report on Form 10-K (this “Annual Report”), our disclosure controls and procedures were effective to provide reasonable assurance that information required to be disclosed by us in reports we file or submit under the Exchange Act is recorded, processed, summarized, and reported within the time periods specified in SEC rules and forms, and is accumulated and communicated to management, including our Chief Executive Officer and Chief Financial Officer, as appropriate, to allow timely decisions regarding required disclosures.
Management’s Annual Report on Internal Control Over Financial Reporting
Our management is responsible for establishing and maintaining a system of internal control over financial reporting as defined in Rules 13a-15(f) and 15d-15(f) under the Exchange Act. Internal control over financial reporting is designed to provide reasonable assurance regarding the reliability of our financial reporting and preparation of financial statements for external purposes in accordance with accounting principles generally accepted in the United States of America. Internal control over financial reporting includes maintaining records that in reasonable detail accurately and fairly reflect our transactions; providing reasonable assurance that transactions are recorded as necessary for preparation of our financial statements in accordance with accounting principles generally accepted in the United States of America; providing reasonable assurance that our receipts and expenditures are made in accordance with authorizations of our management and directors; and providing reasonable assurance that unauthorized acquisition, use or disposition of our assets that could have a material effect on our financial statements would be prevented or detected on a timely basis.
Management conducted an assessment of the effectiveness of our internal control over financial reporting based on the framework set forth by the Committee of Sponsoring Organizations of the Treadway Commission in the Internal Control— Integrated Framework (2013). Based on this assessment, our management concluded that our internal control over financial reporting was effective as of December 31, 2022, to provide reasonable assurance regarding the reliability of financial reporting and preparation of financial statements for external reporting purposes in accordance with accounting principles generally accepted in the United States of America.
Attestation Report of the Registered Public Accounting Firm
The effectiveness of our internal control over financial reporting as of December 31, 2022, has been audited by KPMG LLP, an independent registered public accounting firm, as stated in their report which is included in Part II, Item 8 of this Annual Report. Changes in Internal Control Over Financial Reporting
During the fourth quarter of the year ended December 31, 2022, there were no changes in our internal control over financing reporting (as defined in Rules 13a-15(f) and 15d-15(f) under the Exchange Act) that have materially affected, or are reasonably likely to materially affect our internal control over financing reporting.
ITEM 9B. OTHER INFORMATION
None.
ITEM 9C. DISCLOSURE REGARDING FOREIGN JURISDICTIONS THAT PREVENT INSPECTIONS
Not applicable.
PART III
ITEM 10. DIRECTORS, EXECUTIVE OFFICERS AND CORPORATE GOVERNANCE
The remaining information required by this item concerning directors and corporate governance is hereby incorporated by reference to the Company’s definitive proxy statement for its Annual Meeting of Stockholders (the “2023 Proxy Statement”), to be filed with the SEC within 120 days after December 31, 2022, pursuant to Regulation 14A under the Securities Act. Information required by this item concerning executive officers is included in Part I of this Annual Report on Form 10-K. ITEM 11. EXECUTIVE COMPENSATION
The information required by this item is hereby incorporated by reference to the 2023 Proxy Statement.
ITEM 12. SECURITY OWNERSHIP OF CERTAIN BENEFICIAL OWNERS AND MANAGEMENT AND RELATED STOCKHOLDER MATTERS
The information required by this item is hereby incorporated by reference to the 2023 Proxy Statement.
ITEM 13. CERTAIN RELATIONSHIPS AND RELATED TRANSACTIONS, AND DIRECTOR INDEPENDENCE
The information required by this item is hereby incorporated by reference to the 2023 Proxy Statement.
ITEM 14. PRINCIPAL ACCOUNTANT FEES AND SERVICES
The information required by this item is hereby incorporated by reference to the 2023 Proxy Statement.
PART IV
ITEM 15. EXHIBIT AND FINANCIAL STATEMENT SCHEDULES
(a) The following documents are filed as part of this Annual Report:
Auditor Name: KPMG LLP
Auditor Location: Denver, CO
Auditor Firm ID: 185
(2)Financial Statement Schedules (Schedules to the Financial Statements have been omitted because the information required to be set forth therein is not applicable or is shown in the accompanying Financial Statements or notes thereto).
(3)Exhibits (incorporated herein by reference or filed as part of this Annual Report).
| | | | | | | | |
| Exh. No. | | Description |
| 2.1 | | |
| | |
| 2.2 | | |
| | |
| 3.1 | | |
| | |
| | | | | | | | |
| Exh. No. | | Description |
| 3.2 | | |
| | |
| 4.1 | | |
| | |
| 4.2 | | |
| | |
| 4.3 | | |
| | |
| 10.1 | | |
| | |
| 10.2 | | |
| | |
| 10.3† | | |
| | |
| 10.4 | | |
| | |
| 10.5† | | |
| | |
| 10.6† | | |
| | |
| 10.7† | | |
| | |
| 10.8† | | |
| | |
| 10.9† | | |
| | |
| 10.10† | | |
| | |
| 10.11† | | |
| | |
| 10.12† | | |
| | |
| 10.13+++ | | |
| | |
| | | | | | | | |
| Exh. No. | | Description |
| 10.14+++ | | |
| | |
| 10.15† | | |
| | |
| 21.1* | | |
| | |
| 23.1* | | |
| | |
| 23.2* | | |
| | |
| 23.3* | | |
| | |
| 23.4* | | |
| | |
| 24.1* | | |
| | |
| 31.1* | | |
| | |
| 31.2* | | |
| | |
| 32.1** | | |
| | |
| 32.2** | | |
| | |
| 95.1* | | |
| | |
| 96.1 | | |
| | |
| 101.INS | | Inline XBRL Instance Document - the instance document does not appear in the Interactive Data File because its XBRL tags are embedded within the Inline XBRL document. |
| | |
| 101.SCH | | Inline XBRL Taxonomy Extension Schema Document. |
| | |
| 101.CAL | | Inline XBRL Taxonomy Extension Calculation Linkbase Document. |
| | |
| 101.DEF | | Inline XBRL Taxonomy Extension Definition Linkbase Document. |
| | |
| 101.LAB | | Inline XBRL Taxonomy Extension Label Linkbase Document. |
| | |
| 101.PRE | | Inline XBRL Taxonomy Extension Presentation Linkbase Document. |
| | |
| 104 | | Cover Page Inline XBRL File (included in Exhibit 101). |
| | |
| * | | Filed herewith. |
| | |
| ** | | Furnished herewith. |
| | |
| † | | Indicates a management contract or compensatory plan or arrangement. |
| | |
| + | | Annexes, schedules and/or exhibits have been omitted pursuant to Item 601(a)(5) of Regulation S-K. MP Materials Corp. agrees to furnish supplementally a copy of any omitted attachment to the SEC on a confidential basis upon request. |
| | |
| ++ | | Certain portions of this exhibit (indicated by “[***]”) have been omitted pursuant to Regulation S-K, Item (601)(b)(10). |
ITEM 16. FORM 10-K SUMMARY
Not applicable.
SIGNATURES
Pursuant to the requirements of Section 13 or 15(d) of the Securities Exchange Act of 1934, the registrant has duly caused this report to be signed on its behalf by the undersigned, thereunto duly authorized.
| | | | | | | | | | | |
| | MP MATERIALS CORP. |
| | | |
| Dated: | February 28, 2023 | By: | /s/ Ryan Corbett |
| | | Ryan Corbett |
| | | Chief Financial Officer |
POWER OF ATTORNEY AND SIGNATURES
We, the undersigned officers and directors of MP Materials Corp. hereby severally constitute and appoint James H. Litinsky and Ryan Corbett, and each of them singly (with full power to each of them to act alone), our true and lawful attorneys-in-fact and agents, with full power of substitution and resubstitution in each of them for her or him and in her or his name, place and stead, and in any and all capacities, to sign any and all amendments to this Annual Report on Form 10‑K, and generally to do all things in our names and on our behalf in such capacities to enable MP Materials Corp. to comply with the provisions of the Securities Exchange Act of 1934, as amended, and all the requirements of the Securities Exchange Commission.
Pursuant to the requirements of the Securities Exchange Act of 1934, as amended, this report has been signed below by the following persons on behalf of the registrant and in the capacities and on the dates indicated.
| | | | | | | | | | | | | | |
| Name | | Title | | Date |
| | | | |
/s/ James H. Litinsky | | Chief Executive Officer (principal executive officer), Chairman of the Board of Directors and Director | | February 28, 2023 |
| James H. Litinsky | | |
| | | | |
| /s/ Ryan Corbett | | Chief Financial Officer (principal financial and accounting officer) | | February 28, 2023 |
Ryan Corbett | | |
| | | | |
/s/ Gen. Richard B. Myers | | Director | | February 28, 2023 |
| Gen. Richard B. Myers | | |
| | | | |
/s/ Andrew A. McKnight | | Director | | February 28, 2023 |
| Andrew A. McKnight | | |
| | | | |
/s/ Daniel Gold | | Director | | February 28, 2023 |
| Daniel Gold | | |
| | | | |
/s/ Randall Weisenburger | | Director | | February 28, 2023 |
| Randall Weisenburger | | |
| | | | |
/s/ Maryanne R. Lavan | | Director | | February 28, 2023 |
| Maryanne R. Lavan | | |
| | | | |
/s/ Connie K. Duckworth | | Director | | February 28, 2023 |
| Connie K. Duckworth | | |
