false2024Q20001794669--12-31P6YP13Y3M18DP3YP10YP8YP10Y1P3Y455459xbrli:sharesiso4217:USDiso4217:USDxbrli:sharesfour:modelxbrli:pureiso4217:EURfour:performanceObligationfour:contractiso4217:USDfour:Unit00017946692024-01-012024-06-300001794669us-gaap:CommonClassAMember2024-08-020001794669us-gaap:CommonClassBMember2024-08-020001794669us-gaap:CommonClassCMember2024-08-0200017946692024-06-3000017946692023-12-310001794669four:ResidualCommissionBuyoutsMember2024-06-300001794669four:ResidualCommissionBuyoutsMember2023-12-310001794669four:CapitalizedAcquisitionCostsMember2024-06-300001794669four:CapitalizedAcquisitionCostsMember2023-12-310001794669us-gaap:OtherIntangibleAssetsMember2024-06-300001794669us-gaap:OtherIntangibleAssetsMember2023-12-310001794669us-gaap:CommonClassAMember2023-12-310001794669us-gaap:CommonClassAMember2024-06-300001794669us-gaap:CommonClassBMember2023-12-310001794669us-gaap:CommonClassBMember2024-06-300001794669us-gaap:CommonClassCMember2024-06-300001794669us-gaap:CommonClassCMember2023-12-3100017946692024-04-012024-06-3000017946692023-04-012023-06-3000017946692023-01-012023-06-300001794669us-gaap:CommonClassAMember2024-04-012024-06-300001794669us-gaap:CommonClassAMember2023-04-012023-06-300001794669us-gaap:CommonClassAMember2024-01-012024-06-300001794669us-gaap:CommonClassAMember2023-01-012023-06-300001794669us-gaap:CommonClassCMember2024-04-012024-06-300001794669us-gaap:CommonClassCMember2023-04-012023-06-300001794669us-gaap:CommonClassCMember2024-01-012024-06-300001794669us-gaap:CommonClassCMember2023-01-012023-06-300001794669us-gaap:CommonStockMemberus-gaap:CommonClassAMember2023-12-310001794669us-gaap:CommonStockMemberus-gaap:CommonClassBMember2023-12-310001794669us-gaap:CommonStockMemberus-gaap:CommonClassCMember2023-12-310001794669us-gaap:AdditionalPaidInCapitalMember2023-12-310001794669us-gaap:TreasuryStockCommonMember2023-12-310001794669us-gaap:RetainedEarningsMember2023-12-310001794669us-gaap:AccumulatedOtherComprehensiveIncomeMember2023-12-310001794669us-gaap:NoncontrollingInterestMember2023-12-310001794669us-gaap:RetainedEarningsMember2024-01-012024-03-310001794669us-gaap:NoncontrollingInterestMember2024-01-012024-03-3100017946692024-01-012024-03-310001794669us-gaap:AdditionalPaidInCapitalMember2024-01-012024-03-310001794669us-gaap:CommonStockMemberus-gaap:CommonClassAMember2024-01-012024-03-310001794669us-gaap:AccumulatedOtherComprehensiveIncomeMember2024-01-012024-03-310001794669us-gaap:CommonStockMemberus-gaap:CommonClassAMember2024-03-310001794669us-gaap:CommonStockMemberus-gaap:CommonClassBMember2024-03-310001794669us-gaap:CommonStockMemberus-gaap:CommonClassCMember2024-03-310001794669us-gaap:AdditionalPaidInCapitalMember2024-03-310001794669us-gaap:TreasuryStockCommonMember2024-03-310001794669us-gaap:RetainedEarningsMember2024-03-310001794669us-gaap:AccumulatedOtherComprehensiveIncomeMember2024-03-310001794669us-gaap:NoncontrollingInterestMember2024-03-3100017946692024-03-310001794669us-gaap:RetainedEarningsMember2024-04-012024-06-300001794669us-gaap:NoncontrollingInterestMember2024-04-012024-06-300001794669us-gaap:AdditionalPaidInCapitalMember2024-04-012024-06-300001794669us-gaap:TreasuryStockCommonMember2024-04-012024-06-300001794669us-gaap:CommonStockMemberus-gaap:CommonClassAMember2024-04-012024-06-300001794669us-gaap:CommonStockMemberus-gaap:CommonClassBMember2024-04-012024-06-300001794669us-gaap:CommonStockMemberus-gaap:CommonClassCMember2024-04-012024-06-300001794669us-gaap:AccumulatedOtherComprehensiveIncomeMember2024-04-012024-06-300001794669us-gaap:CommonStockMemberus-gaap:CommonClassAMember2024-06-300001794669us-gaap:CommonStockMemberus-gaap:CommonClassBMember2024-06-300001794669us-gaap:CommonStockMemberus-gaap:CommonClassCMember2024-06-300001794669us-gaap:AdditionalPaidInCapitalMember2024-06-300001794669us-gaap:TreasuryStockCommonMember2024-06-300001794669us-gaap:RetainedEarningsMember2024-06-300001794669us-gaap:AccumulatedOtherComprehensiveIncomeMember2024-06-300001794669us-gaap:NoncontrollingInterestMember2024-06-300001794669us-gaap:CommonStockMemberus-gaap:CommonClassAMember2022-12-310001794669us-gaap:CommonStockMemberus-gaap:CommonClassBMember2022-12-310001794669us-gaap:CommonStockMemberus-gaap:CommonClassCMember2022-12-310001794669us-gaap:AdditionalPaidInCapitalMember2022-12-310001794669us-gaap:TreasuryStockCommonMember2022-12-310001794669us-gaap:RetainedEarningsMember2022-12-310001794669us-gaap:AccumulatedOtherComprehensiveIncomeMember2022-12-310001794669us-gaap:NoncontrollingInterestMember2022-12-3100017946692022-12-310001794669us-gaap:RetainedEarningsMember2023-01-012023-03-310001794669us-gaap:NoncontrollingInterestMember2023-01-012023-03-3100017946692023-01-012023-03-310001794669us-gaap:CommonStockMemberus-gaap:CommonClassAMember2023-01-012023-03-310001794669us-gaap:AdditionalPaidInCapitalMember2023-01-012023-03-310001794669us-gaap:CommonStockMemberus-gaap:CommonClassBMember2023-01-012023-03-310001794669us-gaap:CommonStockMemberus-gaap:CommonClassCMember2023-01-012023-03-310001794669us-gaap:AccumulatedOtherComprehensiveIncomeMember2023-01-012023-03-310001794669us-gaap:CommonStockMemberus-gaap:CommonClassAMember2023-03-310001794669us-gaap:CommonStockMemberus-gaap:CommonClassBMember2023-03-310001794669us-gaap:CommonStockMemberus-gaap:CommonClassCMember2023-03-310001794669us-gaap:AdditionalPaidInCapitalMember2023-03-310001794669us-gaap:TreasuryStockCommonMember2023-03-310001794669us-gaap:RetainedEarningsMember2023-03-310001794669us-gaap:AccumulatedOtherComprehensiveIncomeMember2023-03-310001794669us-gaap:NoncontrollingInterestMember2023-03-3100017946692023-03-310001794669us-gaap:RetainedEarningsMember2023-04-012023-06-300001794669us-gaap:NoncontrollingInterestMember2023-04-012023-06-300001794669us-gaap:CommonStockMemberus-gaap:CommonClassAMember2023-04-012023-06-300001794669us-gaap:AdditionalPaidInCapitalMember2023-04-012023-06-300001794669us-gaap:TreasuryStockCommonMember2023-04-012023-06-300001794669us-gaap:CommonStockMemberus-gaap:CommonClassBMember2023-04-012023-06-300001794669us-gaap:CommonStockMemberus-gaap:CommonClassCMember2023-04-012023-06-300001794669us-gaap:AccumulatedOtherComprehensiveIncomeMember2023-04-012023-06-300001794669us-gaap:CommonStockMemberus-gaap:CommonClassAMember2023-06-300001794669us-gaap:CommonStockMemberus-gaap:CommonClassBMember2023-06-300001794669us-gaap:CommonStockMemberus-gaap:CommonClassCMember2023-06-300001794669us-gaap:AdditionalPaidInCapitalMember2023-06-300001794669us-gaap:TreasuryStockCommonMember2023-06-300001794669us-gaap:RetainedEarningsMember2023-06-300001794669us-gaap:AccumulatedOtherComprehensiveIncomeMember2023-06-300001794669us-gaap:NoncontrollingInterestMember2023-06-3000017946692023-06-300001794669four:SeniorNotesDueTwoThousandTwentyFiveMember2024-06-300001794669four:A2027ConvertibleNotesMemberus-gaap:ConvertibleDebtMember2024-06-300001794669four:TheGivingBlockIncMember2024-06-300001794669four:TheGivingBlockIncMember2023-12-310001794669four:ConvertibleNotesDueTwoThousandTwentyFiveAndConvertibleNotesDueTwoThousandTwentySevenMember2019-11-052019-11-050001794669four:VectronSystemsAGMember2024-06-300001794669four:VectronSystemsAGMember2024-06-142024-06-140001794669four:VectronSystemsAGMember2024-06-300001794669four:VectronSystemsAGMember2024-06-140001794669four:VectronSystemsAGMember2024-01-012024-06-300001794669four:AcardoMember2024-06-140001794669four:AcardoMember2024-01-012024-06-300001794669four:VectronSystemsAGMemberfour:AcquiredTechnologyMember2024-06-142024-06-140001794669four:VectronSystemsAGMemberfour:MerchantRelationshipsMember2024-06-142024-06-140001794669four:VectronSystemsAGMemberus-gaap:TradeNamesMember2024-06-142024-06-140001794669four:RevelSystemsInc.Member2024-06-130001794669four:RevelSystemsInc.Member2024-06-132024-06-130001794669four:RevelSystemsInc.Memberfour:AcquiredTechnologyMember2024-06-132024-06-130001794669four:RevelSystemsInc.Memberfour:MerchantRelationshipsMember2024-06-132024-06-130001794669four:RevelSystemsInc.Memberus-gaap:TradeNamesMember2024-06-132024-06-130001794669four:FinaroMember2023-10-260001794669four:FinaroMember2023-10-262023-10-260001794669four:FinaroMemberus-gaap:CommonClassAMember2023-10-262023-10-260001794669four:FinaroMemberfour:ContingentConsiderationEarnedPriorToAcquisitionMember2023-10-262023-10-260001794669four:FinaroMemberfour:ContingentConsiderationEarnoutReceivedFourthQuarterOf2023Member2023-10-262023-10-260001794669four:FinaroMemberfour:ContingentConsiderationEarnoutReceivedSecondQuarterOf2024Member2023-10-262023-10-260001794669four:FinaroMemberfour:ContingentConsiderationEarnoutSharesIssuableCurrentMember2023-10-262023-10-260001794669four:FinaroMember2024-01-012024-06-300001794669four:FinaroMemberfour:AcquiredTechnologyMember2023-10-260001794669four:FinaroMemberfour:MerchantRelationshipsMember2023-10-260001794669four:FinaroMemberfour:FinaroBankingLicenseMember2023-10-260001794669four:FinaroMemberfour:AcquiredTechnologyMember2023-10-262023-10-260001794669four:FinaroMemberfour:MerchantRelationshipsMember2023-10-262023-10-260001794669four:FinaroMemberfour:FinaroBankingLicenseMember2023-10-262023-10-260001794669us-gaap:RestrictedStockUnitsRSUMemberfour:FinaroMember2023-10-262023-10-260001794669four:AppetizeMember2023-10-020001794669four:AppetizeMember2023-10-022023-10-020001794669four:AppetizeMemberfour:MerchantRelationshipsMember2023-10-022023-10-020001794669four:PaymentsBasedRevenueMember2024-04-012024-06-300001794669four:PaymentsBasedRevenueMember2023-04-012023-06-300001794669four:PaymentsBasedRevenueMember2024-01-012024-06-300001794669four:PaymentsBasedRevenueMember2023-01-012023-06-300001794669four:SubscriptionAndOtherRevenuesMember2024-04-012024-06-300001794669four:SubscriptionAndOtherRevenuesMember2023-04-012023-06-300001794669four:SubscriptionAndOtherRevenuesMember2024-01-012024-06-300001794669four:SubscriptionAndOtherRevenuesMember2023-01-012023-06-300001794669four:RevelSystemsInc.Member2024-01-012024-06-300001794669four:ResidualCommissionBuyoutsMember2024-04-012024-06-300001794669us-gaap:OtherIntangibleAssetsMember2024-04-012024-06-300001794669four:CapitalizedAcquisitionCostsMember2024-04-012024-06-300001794669four:EquipmentUnderLeaseMember2024-04-012024-06-300001794669us-gaap:PropertyPlantAndEquipmentMember2024-04-012024-06-300001794669four:ResidualCommissionBuyoutsMember2023-04-012023-06-300001794669us-gaap:OtherIntangibleAssetsMember2023-04-012023-06-300001794669four:CapitalizedAcquisitionCostsMember2023-04-012023-06-300001794669four:EquipmentUnderLeaseMember2023-04-012023-06-300001794669us-gaap:PropertyPlantAndEquipmentMember2023-04-012023-06-300001794669four:ResidualCommissionBuyoutsMember2024-01-012024-06-300001794669us-gaap:OtherIntangibleAssetsMember2024-01-012024-06-300001794669four:CapitalizedAcquisitionCostsMember2024-01-012024-06-300001794669four:EquipmentUnderLeaseMember2024-01-012024-06-300001794669us-gaap:PropertyPlantAndEquipmentMember2024-01-012024-06-300001794669four:ResidualCommissionBuyoutsMember2023-01-012023-06-300001794669us-gaap:OtherIntangibleAssetsMember2023-01-012023-06-300001794669four:CapitalizedAcquisitionCostsMember2023-01-012023-06-300001794669four:EquipmentUnderLeaseMember2023-01-012023-06-300001794669us-gaap:PropertyPlantAndEquipmentMember2023-01-012023-06-300001794669four:AcquiredIntangibleAssetsMember2024-04-012024-06-300001794669four:NonAcquiredIntangibleAssetsMember2024-04-012024-06-300001794669four:AcquiredIntangibleAssetsMember2023-04-012023-06-300001794669four:NonAcquiredIntangibleAssetsMember2023-04-012023-06-300001794669four:AcquiredIntangibleAssetsMember2024-01-012024-06-300001794669four:NonAcquiredIntangibleAssetsMember2024-01-012024-06-300001794669four:AcquiredIntangibleAssetsMember2023-01-012023-06-300001794669four:NonAcquiredIntangibleAssetsMember2023-01-012023-06-300001794669four:ResidualCommissionBuyoutsFromAssetAcquisitionsMember2024-06-300001794669four:ResidualCommissionBuyoutsFromBusinessCombinationsMember2024-06-300001794669four:ResidualCommissionBuyoutsFromAssetAcquisitionsMember2023-12-310001794669four:ResidualCommissionBuyoutsFromBusinessCombinationsMember2023-12-310001794669four:MerchantRelationshipsMember2024-06-300001794669four:AcquiredTechnologyMember2024-06-300001794669us-gaap:TrademarksAndTradeNamesMember2024-06-300001794669four:CapitalizedSoftwareDevelopmentCostsMember2024-06-300001794669four:FinaroBankingLicenseMember2024-06-300001794669four:MerchantRelationshipsMember2023-12-310001794669four:AcquiredTechnologyMember2023-12-310001794669us-gaap:TrademarksAndTradeNamesMember2023-12-310001794669four:CapitalizedSoftwareDevelopmentCostsMember2023-12-310001794669four:FinaroBankingLicenseMember2023-12-310001794669four:EquipmentUnderLeaseMember2024-01-012024-06-300001794669four:EquipmentUnderLeaseMember2024-06-300001794669four:EquipmentHeldForLeaseMember2024-06-300001794669four:EquipmentUnderLeaseMember2023-01-012023-12-310001794669four:EquipmentUnderLeaseMember2023-12-310001794669four:EquipmentHeldForLeaseMember2023-12-310001794669us-gaap:EquipmentMember2024-06-300001794669us-gaap:EquipmentMember2023-12-310001794669us-gaap:SoftwareAndSoftwareDevelopmentCostsMember2024-06-300001794669us-gaap:SoftwareAndSoftwareDevelopmentCostsMember2023-12-310001794669us-gaap:LeaseholdImprovementsMember2024-06-300001794669us-gaap:LeaseholdImprovementsMember2023-12-310001794669us-gaap:FurnitureAndFixturesMember2024-06-300001794669us-gaap:FurnitureAndFixturesMember2023-12-310001794669us-gaap:VehiclesMember2024-06-300001794669us-gaap:VehiclesMember2023-12-310001794669four:ConvertibleNotesDueTwoThousandTwentyFiveMember2024-01-012024-06-300001794669four:ConvertibleNotesDueTwoThousandTwentyFiveMember2024-06-300001794669four:ConvertibleNotesDueTwoThousandTwentyFiveMember2023-12-310001794669four:ConvertibleNotesDueTwoThousandTwentySevenMember2024-01-012024-06-300001794669four:ConvertibleNotesDueTwoThousandTwentySevenMember2024-06-300001794669four:ConvertibleNotesDueTwoThousandTwentySevenMember2023-12-310001794669four:FourPointSixTwoFiveSeniorNotesDueTwoThousandTwentySixMember2024-06-300001794669four:FourPointSixTwoFiveSeniorNotesDueTwoThousandTwentySixMember2024-01-012024-06-300001794669four:FourPointSixTwoFiveSeniorNotesDueTwoThousandTwentySixMember2023-12-310001794669us-gaap:RevolvingCreditFacilityMemberus-gaap:LineOfCreditMember2024-06-300001794669four:OnlinePaymentsGroupAGMember2022-09-290001794669four:OnlinePaymentsGroupAGMember2022-09-292022-09-290001794669four:OnlinePaymentsGroupAGMember2024-06-300001794669four:RestaurantTechnologyPartner2023Member2024-01-012024-06-300001794669four:RestaurantTechnologyPartner2023Member2024-06-300001794669four:ResidualCommissionBuyoutsMember2024-06-300001794669four:ContingentConsiderationLiabilityAcquisitionsMember2023-12-310001794669four:ContingentConsiderationLiabilityResidualCommissionBuyoutsMember2023-12-310001794669four:ContingentConsiderationLiabilityAcquisitionsMember2024-01-012024-06-300001794669four:ContingentConsiderationLiabilityResidualCommissionBuyoutsMember2024-01-012024-06-300001794669four:ContingentConsiderationLiabilityAcquisitionsMember2024-06-300001794669four:ContingentConsiderationLiabilityResidualCommissionBuyoutsMember2024-06-300001794669us-gaap:CarryingReportedAmountFairValueDisclosureMemberfour:ConvertibleNotesDueTwoThousandTwentyFiveMember2024-06-300001794669us-gaap:FairValueInputsLevel2Memberus-gaap:EstimateOfFairValueFairValueDisclosureMemberfour:ConvertibleNotesDueTwoThousandTwentyFiveMember2024-06-300001794669us-gaap:CarryingReportedAmountFairValueDisclosureMemberfour:ConvertibleNotesDueTwoThousandTwentyFiveMember2023-12-310001794669us-gaap:FairValueInputsLevel2Memberus-gaap:EstimateOfFairValueFairValueDisclosureMemberfour:ConvertibleNotesDueTwoThousandTwentyFiveMember2023-12-310001794669us-gaap:CarryingReportedAmountFairValueDisclosureMemberfour:ConvertibleNotesDueTwoThousandTwentySevenMember2024-06-300001794669us-gaap:FairValueInputsLevel2Memberus-gaap:EstimateOfFairValueFairValueDisclosureMemberfour:ConvertibleNotesDueTwoThousandTwentySevenMember2024-06-300001794669us-gaap:CarryingReportedAmountFairValueDisclosureMemberfour:ConvertibleNotesDueTwoThousandTwentySevenMember2023-12-310001794669us-gaap:FairValueInputsLevel2Memberus-gaap:EstimateOfFairValueFairValueDisclosureMemberfour:ConvertibleNotesDueTwoThousandTwentySevenMember2023-12-310001794669us-gaap:CarryingReportedAmountFairValueDisclosureMemberfour:FourPointSixTwoFiveSeniorNotesDueTwoThousandTwentySixMember2024-06-300001794669us-gaap:FairValueInputsLevel2Memberus-gaap:EstimateOfFairValueFairValueDisclosureMemberfour:FourPointSixTwoFiveSeniorNotesDueTwoThousandTwentySixMember2024-06-300001794669us-gaap:CarryingReportedAmountFairValueDisclosureMemberfour:FourPointSixTwoFiveSeniorNotesDueTwoThousandTwentySixMember2023-12-310001794669us-gaap:FairValueInputsLevel2Memberus-gaap:EstimateOfFairValueFairValueDisclosureMemberfour:FourPointSixTwoFiveSeniorNotesDueTwoThousandTwentySixMember2023-12-310001794669us-gaap:CarryingReportedAmountFairValueDisclosureMember2024-06-300001794669us-gaap:FairValueInputsLevel2Memberus-gaap:EstimateOfFairValueFairValueDisclosureMember2024-06-300001794669us-gaap:CarryingReportedAmountFairValueDisclosureMember2023-12-310001794669us-gaap:FairValueInputsLevel2Memberus-gaap:EstimateOfFairValueFairValueDisclosureMember2023-12-310001794669us-gaap:RevolvingCreditFacilityMemberus-gaap:LineOfCreditMember2023-12-310001794669four:IncreasedProfitabilityLowerForeignRateDifferentialInOverseasJurisdictionsMember2024-04-012024-06-300001794669four:IncreasedProfitabilityLowerForeignRateDifferentialInOverseasJurisdictionsMember2024-01-012024-06-300001794669four:AcquiredDeferredTaxLiabilitiesFromFocusMember2023-04-012023-06-300001794669four:AcquiredDeferredTaxLiabilitiesFromFocusMember2023-01-012023-06-300001794669four:LegalEntityRestructuringMember2023-01-012023-06-300001794669four:AccruedExpensesAndOtherCurrentLiabilitiesMember2024-06-300001794669us-gaap:OtherNoncurrentLiabilitiesMember2024-06-300001794669four:RookHoldingsIncorporationMember2023-12-310001794669four:OperatingLeaseAgreementsMember2024-04-012024-06-300001794669four:OperatingLeaseAgreementsMember2024-01-012024-06-300001794669four:OperatingLeaseAgreementsMember2023-04-012023-06-300001794669four:OperatingLeaseAgreementsMember2023-01-012023-06-3000017946692024-07-012024-06-300001794669us-gaap:RelatedPartyMember2024-04-012024-06-300001794669us-gaap:RelatedPartyMember2024-01-012024-06-300001794669us-gaap:RelatedPartyMember2023-04-012023-06-300001794669us-gaap:RelatedPartyMember2023-01-012023-06-300001794669us-gaap:RelatedPartyMember2024-06-300001794669us-gaap:RelatedPartyMember2023-12-3100017946692021-11-300001794669four:RookHoldingsIncorporationMember2024-06-300001794669us-gaap:RelatedPartyMemberfour:VPFContractsWithDealerMember2021-09-012021-09-300001794669us-gaap:RelatedPartyMemberus-gaap:CommonClassAMemberfour:VPFContractWithDealerNumberOneMember2021-09-012021-09-300001794669us-gaap:RelatedPartyMemberus-gaap:CommonClassAMemberfour:VPFContractWithDealerNumberTwoMember2021-09-012021-09-300001794669us-gaap:RelatedPartyMemberfour:VPFContractWithDealerNumberTwoMember2021-09-300001794669us-gaap:RelatedPartyMemberfour:VPFContractWithDealerNumberOneMember2021-09-300001794669us-gaap:RelatedPartyMemberus-gaap:CommonClassBMembersrt:MaximumMemberfour:VariablePrepaidForwardContractMember2021-09-300001794669us-gaap:CommonClassBMember2024-01-012024-06-3000017946692024-05-310001794669four:Shift4PaymentsLLCMemberfour:Shift4PaymentsIncMember2024-06-300001794669four:Shift4PaymentsLLCMemberfour:Shift4PaymentsIncMember2024-01-012024-06-300001794669four:Shift4PaymentsLLCMemberfour:Shift4PaymentsIncMember2023-12-310001794669four:Shift4PaymentsLLCMemberfour:Shift4PaymentsIncMember2023-01-012023-12-310001794669four:Shift4PaymentsLLCMemberfour:RookHoldingsIncorporationMember2024-06-300001794669four:Shift4PaymentsLLCMemberfour:RookHoldingsIncorporationMember2024-01-012024-06-300001794669four:Shift4PaymentsLLCMemberfour:RookHoldingsIncorporationMember2023-12-310001794669four:Shift4PaymentsLLCMemberfour:RookHoldingsIncorporationMember2023-01-012023-12-310001794669four:Shift4PaymentsLLCMemberfour:Shift4PaymentsIncAndRookHoldingsIncorporationMember2024-06-300001794669four:Shift4PaymentsLLCMemberfour:Shift4PaymentsIncAndRookHoldingsIncorporationMember2024-01-012024-06-300001794669four:Shift4PaymentsLLCMemberfour:Shift4PaymentsIncAndRookHoldingsIncorporationMember2023-12-310001794669four:Shift4PaymentsLLCMemberfour:Shift4PaymentsIncAndRookHoldingsIncorporationMember2023-01-012023-12-3100017946692022-06-012022-06-300001794669four:RestrictedStockUnitsAndPerformanceBasedRestrictedStockUnitsMember2023-12-310001794669four:RestrictedStockUnitsAndPerformanceBasedRestrictedStockUnitsMember2024-01-012024-06-300001794669four:RestrictedStockUnitsAndPerformanceBasedRestrictedStockUnitsMember2024-06-300001794669us-gaap:RestrictedStockUnitsRSUMemberus-gaap:CommonClassAMember2024-04-012024-06-300001794669us-gaap:RestrictedStockUnitsRSUMemberus-gaap:CommonClassAMember2023-04-012023-06-300001794669us-gaap:RestrictedStockUnitsRSUMemberus-gaap:CommonClassAMember2024-01-012024-06-300001794669us-gaap:RestrictedStockUnitsRSUMemberus-gaap:CommonClassAMember2023-01-012023-06-300001794669us-gaap:StockCompensationPlanMember2024-04-012024-06-300001794669us-gaap:StockCompensationPlanMember2023-04-012023-06-300001794669us-gaap:StockCompensationPlanMember2024-01-012024-06-300001794669us-gaap:StockCompensationPlanMember2023-01-012023-06-300001794669us-gaap:RestrictedStockUnitsRSUMember2024-04-012024-06-300001794669us-gaap:RestrictedStockUnitsRSUMember2023-04-012023-06-300001794669us-gaap:RestrictedStockUnitsRSUMember2024-01-012024-06-300001794669us-gaap:RestrictedStockUnitsRSUMember2023-01-012023-06-300001794669four:NancyDismanMember2024-01-012024-06-300001794669four:NancyDismanMember2024-04-012024-06-300001794669four:NancyDismanMember2024-06-300001794669four:JordanFrankelMember2024-01-012024-06-300001794669four:JordanFrankelMember2024-04-012024-06-300001794669four:JordanFrankelMember2024-06-30
UNITED STATES
SECURITIES AND EXCHANGE COMMISSION
Washington, D.C. 20549
__________________________________________________
FORM 10-Q
__________________________________________________
| | | | | |
| x | QUARTERLY REPORT PURSUANT TO SECTION 13 OR 15(d) OF THE SECURITIES EXCHANGE ACT OF 1934 |
For the quarterly period ended June 30, 2024
or
| | | | | |
| o | TRANSITION REPORT PURSUANT TO SECTION 13 OR 15(d) OF THE SECURITIES EXCHANGE ACT OF 1934 |
For the transition period from _______ to _______
Commission File Number: 001-39313
__________________________________
SHIFT4 PAYMENTS, INC.
(Exact name of registrant as specified in its charter)
__________________________________
| | | | | | | | |
| Delaware | | 84-3676340 |
| (State or other jurisdiction of incorporation or organization) | | (I.R.S. Employer Identification No.) |
3501 Corporate Parkway Center Valley, Pennsylvania | | 18034 |
| (Address of principal executive offices) | | (Zip Code) |
(888) 276-2108
(Registrant’s telephone number, including area code)
N/A
(Former name, former address and former fiscal year, if changed since last report)
Securities registered pursuant to Section 12(b) of the Act:
| | | | | | | | |
| Title of each class | Trading Symbol(s) | Name of each exchange on which registered |
| Class A Common Stock, $0.0001 par value per share | FOUR | The New York Stock Exchange |
Indicate by check mark whether the registrant (1) has filed all reports required to be filed by Section 13 or 15(d) of the Securities Exchange Act of 1934 during the preceding 12 months (or for such shorter period that the registrant was required to file such reports), and (2) has been subject to such filing requirements for the past 90 days. Yes x No o
Indicate by check mark whether the registrant has submitted electronically every Interactive Data File required to be submitted pursuant to Rule 405 of Regulation S-T (§232.405 of this chapter) during the preceding 12 months (or for such shorter period that the registrant was required to submit such files). Yes x No o
Indicate by check mark whether the registrant is a large accelerated filer, an accelerated filer, a non-accelerated filer, a smaller reporting company, or an emerging growth company. See the definitions of “large accelerated filer,” “accelerated filer,” “smaller reporting company,” and “emerging growth company” in Rule 12b-2 of the Exchange Act.
| | | | | | | | | | | |
| Large accelerated filer | x | Accelerated filer | o |
| Non-accelerated filer | o | Smaller reporting company | o |
| Emerging growth company | o | | |
If an emerging growth company, indicate by check mark if the registrant has elected not to use the extended transition period for complying with any new or revised financial accounting standards provided pursuant to Section 13(a) of the Exchange Act. ¨
Indicate by check mark whether the registrant is a shell company (as defined in Rule 12b-2 of the Exchange Act).
Yes o No x
As of August 2, 2024, there were 65,195,489 shares of the registrant’s Class A common stock, $0.0001 par value per share, outstanding, 21,733,490 shares of the registrant’s Class B common stock, $0.0001 par value per share, outstanding and 1,665,854 shares of the registrant’s Class C common stock, $0.0001 par value per share, outstanding.
SHIFT4 PAYMENTS, INC.
TABLE OF CONTENTS
CAUTIONARY NOTE REGARDING FORWARD-LOOKING STATEMENTS
This Quarterly Report on Form 10-Q (“Quarterly Report”) contains forward-looking statements. We intend such forward-looking statements to be covered by the safe harbor provisions for forward-looking statements contained in Section 27A of the Securities Act of 1933, as amended (the “Securities Act”), and Section 21E of the Securities Exchange Act of 1934, as amended (“the Exchange Act”). All statements other than statements of historical fact contained in this Quarterly Report, including, without limitation, statements relating to our position as a leader within our industry; our future results of operations and financial position, business strategy and plans; the anticipated benefits of and costs associated with recent acquisitions; and objectives of management for future operations and activities, including, among others, statements regarding expected growth, international expansion, future capital expenditures, debt covenant compliance, financing activities, debt service obligations, and the timing of any of the foregoing, are forward-looking statements. These statements involve known and unknown risks, uncertainties and other important factors that may cause our actual results, performance or achievements to be materially different from any future results, performance or achievements expressed or implied by the forward-looking statements.
In some cases, you can identify forward-looking statements by terms such as “may,” “will,” “should,” “expect,” “plan,” “anticipate,” “could,” “intend,” “target,” “project,” “contemplate,” “believe,” “estimate,” “predict,” “potential,” or “continue” or the negative of these terms or other similar expressions, though not all forward-looking statements can be identified by such terms or expressions. The forward-looking statements in this Quarterly Report are only predictions. We have based these forward-looking statements largely on our current expectations and projections about future events and financial trends that we believe may affect our business, financial condition and results of operations. These forward-looking statements speak only as of the date of this Quarterly Report and are subject to a number of important factors that could cause actual results to differ materially from those in the forward-looking statements, including, but not limited to, those factors described in the sections titled “Risk Factors” and “Management’s Discussion and Analysis of Financial Condition and Results of Operations” in our Annual Report on Form 10-K for the fiscal year ended December 31, 2023, filed on February 29, 2024 (the “2023 Form 10-K”).
Moreover, we operate in an evolving environment. New risk factors and uncertainties may emerge from time to time, and it is not possible for management to predict all risk factors and uncertainties.
You should read this Quarterly Report and the documents that we reference herein completely and with the understanding that our actual future results may be materially different from what we expect. We qualify all of our forward-looking statements by these cautionary statements. Except as required by applicable law, we do not plan to publicly update or revise any forward-looking statements contained herein, whether as a result of any new information, future events, changed circumstances or otherwise.
PART I: FINANCIAL INFORMATION
Item 1. Financial Statements (unaudited)
SHIFT4 PAYMENTS, INC.
CONDENSED CONSOLIDATED BALANCE SHEETS
(Unaudited)(in millions, except share and per share amounts) | | | | | | | | | | | |
| June 30, 2024 | | December 31, 2023 |
| Assets | | | |
| Current assets | | | |
| Cash and cash equivalents | $ | 205.0 | | | $ | 455.0 | |
| Restricted cash | 74.8 | | | 84.4 | |
| Settlement assets | 279.1 | | | 321.2 | |
| Accounts receivable, net | 310.5 | | | 256.8 | |
| Inventory | 8.1 | | | 3.4 | |
| Prepaid expenses and other current assets | 50.2 | | | 32.5 | |
| Total current assets | 927.7 | | | 1,153.3 | |
| Noncurrent assets | | | |
| Equipment for lease, net | 144.5 | | | 123.1 | |
| Property, plant and equipment, net | 28.5 | | | 28.6 | |
| Right-of-use assets | 29.7 | | | 22.8 | |
| Investments in securities | 72.9 | | | 62.2 | |
| Collateral held by the card networks | 37.5 | | | 37.7 | |
| Goodwill | 1,299.9 | | | 1,111.3 | |
| Residual commission buyouts, net | 187.4 | | | 229.6 | |
| Capitalized customer acquisition costs, net | 59.0 | | | 51.7 | |
| Other intangible assets, net | 674.0 | | | 548.8 | |
| Other noncurrent assets | 33.1 | | | 18.7 | |
| | | |
| Total assets | $ | 3,494.2 | | | $ | 3,387.8 | |
| Liabilities and Stockholders' Equity | | | |
| Current liabilities | | | |
| Settlement liabilities | $ | 274.4 | | | $ | 315.2 | |
| Accounts payable | 263.9 | | | 204.6 | |
| Accrued expenses and other current liabilities | 120.5 | | | 83.9 | |
| Deferred revenue | 18.6 | | | 20.6 | |
| Bank deposits | — | | | 72.3 | |
| Current lease liabilities | 8.9 | | | 7.8 | |
| Total current liabilities | 686.3 | | | 704.4 | |
| Noncurrent liabilities | | | |
| Long-term debt | 1,754.3 | | | 1,750.2 | |
| Deferred tax liability | 31.1 | | | 28.7 | |
| Noncurrent lease liabilities | 24.4 | | | 18.8 | |
| Other noncurrent liabilities | 39.3 | | | 17.3 | |
| | | |
| Total liabilities | 2,535.4 | | | 2,519.4 | |
| Commitments and contingencies (Note 16) | | | |
| Stockholders' equity | | | |
Preferred stock, $0.0001 par value, 20,000,000 shares authorized at June 30, 2024 and December 31, 2023, none issued and outstanding | — | | | — | |
Class A common stock, $0.0001 par value per share, 300,000,000 shares authorized, 61,967,248 and 60,664,171 shares issued and outstanding at June 30, 2024 and December 31, 2023, respectively | — | | | — | |
Class B common stock, $0.0001 par value per share, 100,000,000 shares authorized, 23,750,968 and 23,831,883 shares issued and outstanding at both June 30, 2024 and December 31, 2023, respectively. | — | | | — | |
Class C common stock, $0.0001 par value per share, 100,000,000 shares authorized, 1,665,854 and 1,694,915 shares issued and outstanding at both June 30, 2024 and December 31, 2023, respectively. | — | | | — | |
| Additional paid-in capital | 1,005.7 | | | 985.9 | |
| | | |
| Accumulated other comprehensive income (loss) | (7.1) | | | 14.1 | |
| Retained deficit | (297.8) | | | (346.7) | |
| Total stockholders' equity attributable to Shift4 Payments, Inc. | 700.8 | | | 653.3 | |
| Noncontrolling interests | 258.0 | | | 215.1 | |
| Total stockholders' equity | 958.8 | | | 868.4 | |
| Total liabilities and stockholders' equity | $ | 3,494.2 | | | $ | 3,387.8 | |
See accompanying notes to unaudited condensed consolidated financial statements. |
SHIFT4 PAYMENTS, INC.
CONDENSED CONSOLIDATED STATEMENTS OF OPERATIONS
(Unaudited) (in millions, except share and per share amounts)
| | | | | | | | | | | | | | | | | | | | | | | |
| Three Months Ended June 30, | | Six Months Ended June 30, |
| 2024 | | 2023 | | 2024 | | 2023 |
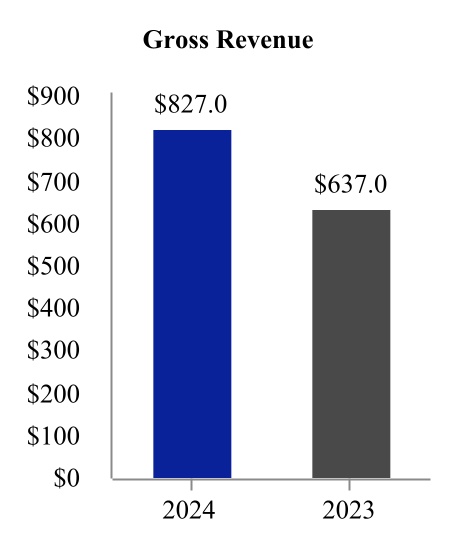
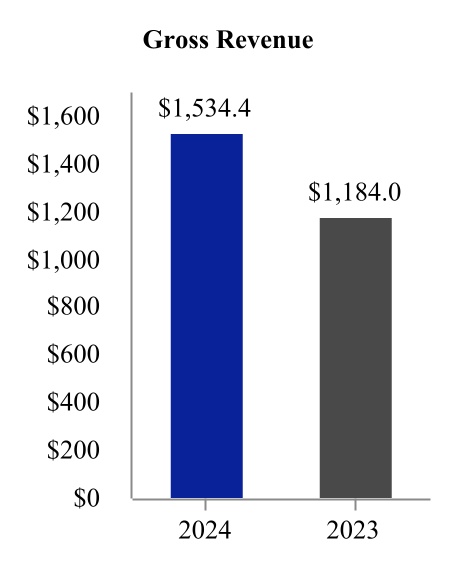
| Gross revenue | $ | 827.0 | | | $ | 637.0 | | | $ | 1,534.4 | | | $ | 1,184.0 | |
| Cost of sales (exclusive of certain depreciation and amortization expense shown separately below) | (595.2) | | | (470.1) | | | (1,114.8) | | | (871.7) | |
| General and administrative expenses | (110.1) | | | (82.1) | | | (217.2) | | | (167.8) | |
| Revaluation of contingent liabilities | (0.3) | | | (5.6) | | | (2.4) | | | (12.6) | |
| Depreciation and amortization expense (a) | (46.7) | | | (35.9) | | | (91.5) | | | (71.2) | |
| Professional expenses | (11.6) | | | (5.4) | | | (19.6) | | | (11.5) | |
| | | | | | | |
| Advertising and marketing expenses | (3.9) | | | (4.0) | | | (8.3) | | | (6.5) | |
| | | | | | | |
| Income from operations | 59.2 | | | 33.9 | | | 80.6 | | | 42.7 | |
| | | | | | | |
| Interest income | 5.0 | | | 8.8 | | | 10.4 | | | 16.4 | |
| Other income (expense), net | 0.4 | | | (0.4) | | | 1.8 | | | (0.3) | |
| Unrealized gain (loss) on investments in securities | (0.2) | | | — | | | 10.8 | | | 8.9 | |
| Change in TRA liability | (3.6) | | | (0.8) | | | (4.8) | | | (1.3) | |
| Interest expense | (8.1) | | | (8.0) | | | (16.2) | | | (16.1) | |
| Income before income taxes | 52.7 | | | 33.5 | | | 82.6 | | | 50.3 | |
| Income tax benefit | 1.8 | | | 3.3 | | | 0.4 | | | 6.9 | |
| Net income | 54.5 | | | 36.8 | | | 83.0 | | | 57.2 | |
| Less: Net income attributable to noncontrolling interests | (15.3) | | | (11.7) | | | (23.2) | | | (17.3) | |
| Net income attributable to Shift4 Payments, Inc. | $ | 39.2 | | | $ | 25.1 | | | $ | 59.8 | | | $ | 39.9 | |
| | | | | | | |
| Basic net income per share | | | | | | | |
| Class A net income per share - basic | $ | 0.59 | | | $ | 0.43 | | | $ | 0.90 | | | $ | 0.68 | |
| Class A weighted average common stock outstanding - basic | 64,438,168 | | | 56,914,370 | | | 64,441,324 | | | 56,079,923 | |
| Class C net income per share - basic | $ | 0.59 | | | $ | 0.43 | | | $ | 0.90 | | | $ | 0.68 | |
| Class C weighted average common stock outstanding - basic | 1,689,805 | | | 2,061,569 | | | 1,692,360 | | | 2,151,111 | |
| | | | | | | |
| Diluted net income per share | | | | | | | |
| Class A net income per share - diluted | $ | 0.58 | | | $ | 0.42 | | | $ | 0.89 | | | $ | 0.67 | |
| Class A weighted average common stock outstanding - diluted | 65,564,817 | | | 58,173,624 | | | 65,763,523 | | | 57,444,069 | |
| Class C net income per share - diluted | $ | 0.58 | | | $ | 0.42 | | | $ | 0.89 | | | $ | 0.67 | |
| Class C weighted average common stock outstanding - diluted | 1,689,805 | | | 2,061,569 | | | 1,692,360 | | | 2,151,111 | |
| See accompanying notes to unaudited condensed consolidated financial statements. |
(a)Depreciation and amortization expense includes depreciation of equipment under lease of $13.0 million and $24.9 million for the three and six months ended June 30, 2024, respectively, and $8.2 million and $15.4 million for the three and six months ended June 30, 2023, respectively.
SHIFT4 PAYMENTS, INC.
CONDENSED CONSOLIDATED STATEMENTS OF COMPREHENSIVE INCOME
(Unaudited) (in millions)
| | | | | | | | | | | | | | | | | | | | | | | |
| Three Months Ended June 30, | | Six Months Ended June 30, |
| 2024 | | 2023 | | 2024 | | 2023 |
| Net income | $ | 54.5 | | | $ | 36.8 | | | $ | 83.0 | | | $ | 57.2 | |
| Other comprehensive income (loss) | | | | | | | |
| Unrealized gain (loss) on foreign currency translation adjustment | (14.0) | | | (0.1) | | | (28.5) | | | 2.9 | |
| | | | | | | |
| | | | | | | |
| Comprehensive income | 40.5 | | | 36.7 | | | 54.5 | | | 60.1 | |
| Less: Comprehensive income attributable to noncontrolling interests | (11.9) | | | (11.7) | | | (15.9) | | | (18.2) | |
| Comprehensive income attributable to Shift4 Payments, Inc. | $ | 28.6 | | | $ | 25.0 | | | $ | 38.6 | | | $ | 41.9 | |
| See accompanying notes to unaudited condensed consolidated financial statements. |
SHIFT4 PAYMENTS, INC.
CONDENSED CONSOLIDATED STATEMENTS OF CHANGES IN STOCKHOLDERS’ EQUITY
(Unaudited) (in millions, except share amounts)
| | | | | | | | | | | | | | | | | | | | | | | | | | | | | | | | | | | | | | | | | | | | | | | | | | | | | | | | | | | | | | | | | | | | | | | | | | | | | |
| | Class A Common Stock | | Class B Common Stock | | Class C Common Stock | | Additional Paid-In Capital | | Treasury Stock | | Retained Deficit | | Accumulated Other Comprehensive Income | | Noncontrolling Interests | | Total Equity |
| Shares | | Amount | | Shares | | Amount | | Shares | | Amount | | | Shares | | Amount | | | | |
| Balances at December 31, 2023 | 60,664,171 | | | $ | — | | | 23,831,883 | | | $ | — | | | 1,694,915 | | | $ | — | | | $ | 985.9 | | | — | | | $ | — | | | $ | (346.7) | | | $ | 14.1 | | | $ | 215.1 | | | $ | 868.4 | |
| Net income | — | | | — | | | — | | | — | | | — | | | — | | | — | | | — | | | — | | | 20.6 | | | — | | | 7.9 | | | 28.5 | |
| | | | | | | | | | | | | | | | | | | | | | | | | |
| | | | | | | | | | | | | | | | | | | | | | | | | |
| | | | | | | | | | | | | | | | | | | | | | | | | |
| | | | | | | | | | | | | | | | | | | | | | | | | |
| Distributions to noncontrolling interests | — | | | — | | | — | | | — | | | — | | | — | | | — | | | — | | | — | | | — | | | — | | | (0.3) | | | (0.3) | |
| Equity-based compensation | — | | | — | | | — | | | — | | | — | | | — | | | 22.8 | | | — | | | — | | | — | | | — | | | — | | | 22.8 | |
| Vesting of restricted stock units, net of tax withholding | 151,053 | | | — | | | — | | | — | | | — | | | — | | | (11.6) | | | — | | | — | | | — | | | — | | | 2.5 | | | (9.1) | |
| Other comprehensive loss | — | | | — | | | — | | | — | | | — | | | — | | | — | | | — | | | — | | | — | | | (10.6) | | | (3.9) | | | (14.5) | |
| Balances at March 31, 2024 | 60,815,224 | | | — | | | 23,831,883 | | | — | | | 1,694,915 | | | — | | | 997.1 | | | — | | | — | | | (326.1) | | | 3.5 | | | 221.3 | | | 895.8 | |
| Net income | — | | | — | | | — | | | — | | | — | | | — | | | — | | | — | | | — | | | 39.2 | | | — | | | 15.3 | | | 54.5 | |
| Recognition of Vectron noncontrolling interest | — | | | — | | | — | | | — | | | — | | | — | | | — | | | — | | | — | | | — | | | — | | | 25.9 | | | 25.9 | |
| Repurchases of Class A common stock to treasury stock | — | | | — | | | — | | | — | | | — | | | — | | | (1.0) | | | (230,400) | | | (15.9) | | | — | | | — | | | 1.0 | | | (15.9) | |
| Issuance of Class A common stock, net of tax withholding | 1,230,309 | | | — | | | — | | | — | | | — | | | — | | | 1.6 | | | — | | | — | | | — | | | — | | | 0.4 | | | 2.0 | |
| Retirement of treasury stock | (230,400) | | | — | | | — | | | — | | | — | | | — | | | (5.0) | | | 230,400 | | | 15.9 | | | (10.9) | | | — | | | — | | | — | |
| Exchange of shares held by Rook | 109,976 | | | — | | | (80,915) | | | — | | | (29,061) | | | — | | | 0.1 | | | — | | | — | | | — | | | — | | | (0.1) | | | — | |
| Distributions to noncontrolling interests | — | | | — | | | — | | | — | | | — | | | — | | | — | | | — | | | — | | | — | | | — | | | (1.7) | | | (1.7) | |
| Equity-based compensation | — | | | — | | | — | | | — | | | — | | | — | | | 14.3 | | | — | | | — | | | — | | | — | | | — | | | 14.3 | |
| Vesting of restricted stock units, net of tax withholding | 42,139 | | | — | | | — | | | — | | | — | | | — | | | (1.4) | | | — | | | — | | | — | | | — | | | (0.7) | | | (2.1) | |
| Other comprehensive loss | — | | | — | | | — | | | — | | | — | | | — | | | — | | | — | | | — | | | — | | | (10.6) | | | (3.4) | | | (14.0) | |
| Balances at June 30, 2024 | 61,967,248 | | | $ | — | | | 23,750,968 | | | $ | — | | | 1,665,854 | | | $ | — | | | $ | 1,005.7 | | | — | | | $ | — | | | $ | (297.8) | | | $ | (7.1) | | | $ | 258.0 | | | $ | 958.8 | |
| | | | | | | | | | | | | | | | | | | | | | | | | |
| | | | | | | | | | | | | | | | | | | | | | | | | |
| | | | | | | | | | | | | | | | | | | | | | | | | |
| | | | | | | | | | | | | | | | | | | | | | | | | |
| | | | | | | | | | | | | | | | | | | | | | | | | |
| | | | | | | | | | | | | | | | | | | | | | | | | |
| | | | | | | | | | | | | | | | | | | | | | | | | |
| | | | | | | | | | | | | | | | | | | | | | | | | |
| | | | | | | | | | | | | | | | | | | | | | | | | |
| | | | | | | | | | | | | | | | | | | | | | | | | |
| | | | | | | | | | | | | | | | | | | | | | | | | | | | | | | | | | | | | | | | | | | | | | | | | | | | | | | | | | | | | | | | | | | | | | | | | | | | | |
| | Class A Common Stock | | Class B Common Stock | | Class C Common Stock | | Additional Paid-In Capital | | Treasury Stock | | Retained Deficit | | Accumulated Other Comprehensive Income | | Noncontrolling Interests | | Total Equity |
| Shares | | Amount | | Shares | | Amount | | Shares | | Amount | | | Shares | | Amount | | | | |
| Balances at December 31, 2022 | 54,153,218 | | | $ | — | | | 25,829,016 | | | $ | — | | | 2,889,811 | | | $ | — | | | $ | 702.6 | | | — | | | $ | — | | | $ | (363.6) | | | $ | 8.3 | | | $ | 133.3 | | | $ | 480.6 | |
| Net income | — | | | — | | | — | | | — | | | — | | | — | | | — | | | — | | | — | | | 14.8 | | | — | | | 5.6 | | | 20.4 | |
| Issuance of Class A common stock and contingent share earnout in connection with an acquisition | 27,780 | | | — | | | — | | | — | | | — | | | — | | | 5.5 | | | — | | | — | | | — | | | — | | | 2.1 | | | 7.6 | |
| Exchange of shares held by Rook | 2,465,770 | | | — | | | (1,666,665) | | | — | | | (799,105) | | | — | | | 4.9 | | | — | | | — | | | — | | | — | | | (4.9) | | | — | |
| Distributions to noncontrolling interests | — | | | — | | | — | | | — | | | — | | | — | | | — | | | — | | | — | | | — | | | — | | | (1.8) | | | (1.8) | |
| Equity-based compensation | — | | | — | | | — | | | — | | | — | | | — | | | 21.9 | | | — | | | — | | | — | | | — | | | — | | | 21.9 | |
| Vesting of restricted stock units, net of tax withholding | 123,846 | | | — | | | — | | | — | | | — | | | — | | | (4.7) | | | — | | | — | | | — | | | — | | | (0.6) | | | (5.3) | |
| Other comprehensive income | — | | | — | | | — | | | — | | | — | | | — | | | — | | | — | | | — | | | — | | | 2.1 | | | 0.9 | | | 3.0 | |
| Balances at March 31, 2023 | 56,770,614 | | | — | | | 24,162,351 | | | — | | | 2,090,706 | | | — | | | 730.2 | | | — | | | — | | | (348.8) | | | 10.4 | | | 134.6 | | | 526.4 | |
| Net income | — | | | — | | | — | | | — | | | — | | | — | | | — | | | — | | | — | | | 25.1 | | | — | | | 11.7 | | | 36.8 | |
| Issuance of Class A common stock | 295,699 | | | — | | | — | | | — | | | — | | | — | | | 6.4 | | | — | | | — | | | — | | | — | | | 4.6 | | | 11.0 | |
| Repurchases of Class A common stock to treasury stock | — | | | — | | | — | | | — | | | — | | | — | | | 22.7 | | | (1,515,000) | | | (97.3) | | | — | | | — | | | (22.7) | | | (97.3) | |
| Retirement of treasury stock | (1,515,000) | | | — | | | — | | | — | | | — | | | — | | | (33.4) | | | 1,515,000 | | | 97.3 | | | (63.9) | | | — | | | — | | | — | |
| Exchange of shares held by Rook | 661,901 | | | — | | | (330,468) | | | — | | | (331,433) | | | — | | | 1.9 | | | — | | | — | | | — | | | — | | | (1.9) | | | — | |
| Distributions to noncontrolling interests | — | | | — | | | — | | | — | | | — | | | — | | | — | | | — | | | — | | | — | | | — | | | (0.4) | | | (0.4) | |
| Equity-based compensation | — | | | — | | | — | | | — | | | — | | | — | | | 13.1 | | | — | | | — | | | — | | | — | | | — | | | 13.1 | |
| Vesting of restricted stock units, net of tax withholding | 253,919 | | | — | | | — | | | — | | | — | | | — | | | (7.1) | | | — | | | — | | | — | | | — | | | (3.2) | | | (10.3) | |
| Other comprehensive loss | — | | | — | | | — | | | — | | | — | | | — | | | — | | | — | | | — | | | — | | | (0.1) | | | — | | | (0.1) | |
| Balances at June 30, 2023 | 56,467,133 | | | $ | — | | | 23,831,883 | | | $ | — | | | 1,759,273 | | | $ | — | | | $ | 733.8 | | | — | | | $ | — | | | $ | (387.6) | | | $ | 10.3 | | | $ | 122.7 | | | $ | 479.2 | |
| | | | | | | | | | | | | | | | | | | | | | | | | |
| | | | | | | | | | | | | | | | | | | | | | | | | |
| | | | | | | | | | | | | | | | | | | | | | | | | |
| | | | | | | | | | | | | | | | | | | | | | | | | |
| | | | | | | | | | | | | | | | | | | | | | | | | |
| | | | | | | | | | | | | | | | | | | | | | | | | |
| | | | | | | | | | | | | | | | | | | | | | | | | |
| | | | | | | | | | | | | | | | | | | | | | | | | |
| | | | | | | | | | | | | | | | | | | | | | | | | |
| | | | | | | | | | | | | | | | | | | | | | | | | |
| See accompanying notes to unaudited condensed consolidated financial statements. |
SHIFT4 PAYMENTS, INC.
CONDENSED CONSOLIDATED STATEMENTS OF CASH FLOWS
(Unaudited) (in millions)
| | | | | | | | | | | |
| Six Months Ended June 30, |
| 2024 | | 2023 |
| Operating activities | | | |
| Net income | $ | 83.0 | | | $ | 57.2 | |
| Adjustments to reconcile net income to net cash provided by operating activities | | | |
| Depreciation and amortization | 135.8 | | | 97.6 | |
| Equity-based compensation expense | 37.1 | | | 34.0 | |
| Revaluation of contingent liabilities | 2.4 | | | 12.6 | |
| | | |
| Unrealized gain on investments in securities | (10.8) | | | (8.9) | |
| Change in TRA liability | 4.8 | | | 1.3 | |
| Amortization of capitalized financing costs | 4.1 | | | 4.1 | |
| Provision for bad debts | 3.9 | | | 5.5 | |
| Deferred income taxes | (9.3) | | | (8.4) | |
| Unrealized foreign exchange gains | (1.8) | | | — | |
| Other noncash items | (1.6) | | | 0.3 | |
| Change in operating assets and liabilities | | | |
| Settlement activity, net | (54.0) | | | — | |
| Accounts receivable | (36.8) | | | (37.9) | |
| Prepaid expenses and other assets | (14.3) | | | (0.9) | |
| Inventory | 2.9 | | | 2.5 | |
| Capitalized customer acquisition costs | (19.1) | | | (16.3) | |
| Accounts payable | 36.7 | | | 19.6 | |
| Accrued expenses and other liabilities | 23.8 | | | 9.8 | |
| Payments on contingent liabilities in excess of initial fair value | (0.3) | | | — | |
| Right-of-use assets and lease liabilities, net | (0.4) | | | 0.1 | |
| Deferred revenue | (13.3) | | | (0.9) | |
| Net cash provided by operating activities | 172.8 | | | 171.3 | |
| | | |
| Investing activities | | | |
| Acquisitions, net of cash acquired | (301.4) | | | (36.3) | |
| Acquisition of equipment to be leased | (46.4) | | | (37.0) | |
| Capitalized software development costs | (31.5) | | | (17.9) | |
| Acquisition of property, plant and equipment | (3.5) | | | (6.1) | |
| Residual commission buyouts | (1.3) | | | (8.7) | |
| Purchase of intangible assets | — | | | (2.0) | |
| Proceeds from sale of investments in securities | 2.6 | | | — | |
| | | |
| Net cash used in investing activities | (381.5) | | | (108.0) | |
| | | |
| Financing activities | | | |
| Repurchases of Class A common stock | (15.9) | | | (96.8) | |
| Payments for withholding tax related to vesting of restricted stock units | (11.2) | | | (15.7) | |
| Payments on contingent liabilities | (0.9) | | | (0.5) | |
| Distributions to noncontrolling interests | (2.0) | | | (2.2) | |
| Net change in bank deposits | (70.8) | | | — | |
| | | |
| | | |
| | | |
| Net cash used in financing activities | (100.8) | | | (115.2) | |
| Effect of exchange rate changes on cash and cash equivalents and restricted cash | (9.0) | | | 0.7 | |
| Change in cash and cash equivalents and restricted cash | (318.5) | | | (51.2) | |
| | | |
| Cash and cash equivalents and restricted cash, beginning of period | 721.8 | | | 776.5 | |
| Cash and cash equivalents and restricted cash, end of period | $ | 403.3 | | | $ | 725.3 | |
| See accompanying notes to unaudited condensed consolidated financial statements. |
SHIFT4 PAYMENTS, INC.
NOTES TO CONDENSED CONSOLIDATED FINANCIAL STATEMENTS
(Unaudited) (in millions, except share and per share amounts)
1.Organization, Basis of Presentation and Significant Accounting Policies
Organization
Shift4 Payments, Inc. (“Shift4 Payments” or “the Company”) was incorporated in Delaware in order to carry on the business of Shift4 Payments, LLC and its consolidated subsidiaries. The Company is a leading independent provider of software and payment processing solutions in the United States (“U.S.”) based on total volume of payments processed.
Basis of Presentation
The accompanying interim condensed consolidated financial statements of the Company are unaudited. These interim condensed consolidated financial statements have been prepared in accordance with generally accepted accounting principles in the U.S. (“U.S. GAAP”) and the applicable rules and regulations of the U.S. Securities and Exchange Commission (“SEC”) for interim financial information. These financial statements do not include all information and footnotes required by U.S. GAAP for complete financial statements. The December 31, 2023 Condensed Consolidated Balance Sheet was derived from audited financial statements as of that date, but does not include all of the information and footnotes required by U.S. GAAP for complete financial statements.
In the opinion of management, the unaudited condensed consolidated financial statements reflect all adjustments consisting only of normal recurring adjustments necessary to state fairly the financial position, results of operations and cash flows for the periods presented in conformity with U.S. GAAP applicable to interim periods. The results of operations for the interim periods presented are not necessarily indicative of results for the full year or future periods. These unaudited condensed consolidated financial statements should be read in conjunction with the audited consolidated financial statements and the related notes thereto as of and for the fiscal year ended December 31, 2023, as disclosed in the Company’s Annual Report on Form 10-K for the fiscal year ended December 31, 2023 (the “2023 Form 10-K”).
The unaudited condensed consolidated financial statements include the accounts of Shift4 Payments, Inc. and its wholly-owned subsidiaries. Shift4 Payments, Inc. consolidates the financial results of Shift4 Payments, LLC, which is considered a variable interest entity. Shift4 Payments, Inc. is the primary beneficiary and sole managing member of Shift4 Payments, LLC and has decision making authority that significantly affects the economic performance of the entity. As a result, the Company consolidates Shift4 Payments, LLC and reports a noncontrolling interest representing the economic interest in Shift4 Payments, LLC held by Rook Holdings Inc. (“Rook”). All intercompany balances and transactions have been eliminated in consolidation.
The assets and liabilities of Shift4 Payments, LLC represent substantially all of the consolidated assets and liabilities of Shift4 Payments, Inc. with the exception of certain cash balances, amounts payable under the Tax Receivable Agreement (“TRA”), and the aggregate principal amount of $690.0 million of 2025 Convertible Notes and $632.5 million of 2027 Convertible Notes (together, the “Convertible Notes”) that are held by Shift4 Payments, Inc. directly. As of June 30, 2024 and December 31, 2023, $5.5 million and $3.6 million of cash, respectively, was directly held by Shift4 Payments, Inc. As of June 30, 2024 and December 31, 2023, the TRA liability was $8.2 million and $5.1 million, respectively. In connection with the issuance of the Convertible Notes, Shift4 Payments, Inc. entered into Intercompany Convertible Notes with Shift4 Payments, LLC, whereby Shift4 Payments, Inc. provided the net proceeds from the issuance of the Convertible Notes to Shift4 Payments, LLC in the amount of $1,322.5 million. Shift4 Payments, Inc., which was incorporated on November 5, 2019, has not had any material operations on a standalone basis since its inception, and all of the operations of the Company are carried out by Shift4 Payments, LLC and its subsidiaries.
Use of Estimates
The preparation of financial statements in conformity with U.S. GAAP requires management to make estimates and assumptions that affect the amounts reported in the Company’s unaudited condensed consolidated financial statements and accompanying notes. Significant estimates inherent in the preparation of the accompanying unaudited condensed consolidated financial statements include estimates of fair value of acquired assets and liabilities through business combinations, fair value of contingent liabilities related to earnout payments, deferred income tax valuation allowances, amounts associated with the Company’s tax receivable agreement with Rook and certain affiliates of Searchlight Capital Partners, L.P. (together, the “Continuing Equity Owners”), fair value of debt instruments, allowance for doubtful accounts, income taxes, investments in securities and noncontrolling interests. Estimates are based on past experience and other considerations reasonable under the circumstances. Actual results may differ from these estimates.
Significant Accounting Policies
The Company’s significant accounting policies are discussed in Note 1 to Shift4 Payments, Inc.’s consolidated financial statements as of and for the year ended December 31, 2023 in the 2023 Form 10-K. There have been no significant changes to these policies which have had a material impact on the Company’s unaudited condensed consolidated financial statements and related notes during the six months ended June 30, 2024.
Cash and Cash Equivalents and Restricted Cash
Highly liquid investments with maturities of three months or less at the date of purchase are considered to be cash equivalents and are stated at cost, which approximates fair value. The Company’s cash equivalents consist of highly liquid investments in money market funds.
The Company classifies certain cash that is not available for use in its operations as restricted. Substantially all of the Company’s Restricted cash balance is related to a deposit in its U.S. sponsor bank merchant settlement account.
In the fourth quarter of 2023, the Company acquired Credorax, Inc. d/b/a Finaro (“Finaro”). Finaro’s principal activities consist of the provision of integrated acquiring and payment processing services to merchants located in Europe and the United Kingdom (the “U.K.”). Unlike the Company’s U.S. business, Finaro operates as a full acquirer, and without a sponsor bank like the Company has historically operated with in the U.S. As a result, the Company’s European and U.K. business includes settlement processing assets and liabilities. These assets primarily include settlement-related cash and funds receivable from card networks. Cash and cash equivalents held on behalf of merchants and other payees are included within “Settlement assets” on the unaudited Condensed Consolidated Balance Sheet. The changes in settlement cash and cash equivalents are included within “Settlement activity, net” within Operating activities on the Company’s unaudited Condensed Consolidated Statements of Cash Flows. The following table provides a reconciliation between cash and cash equivalents on the unaudited Condensed Consolidated Balance Sheets and the unaudited Condensed Consolidated Statements of Cash Flows:
| | | | | | | | | | | |
| June 30, 2024 | | December 31, 2023 |
| Cash and cash equivalents | $ | 205.0 | | | $ | 455.0 | |
| Restricted cash | 74.8 | | | 84.4 | |
| Cash and cash equivalents included in Settlement assets | 123.5 | | | 182.4 | |
| Total cash and cash equivalents and restricted cash on the unaudited Condensed Consolidated Statements of Cash Flows | $ | 403.3 | | | $ | 721.8 | |
The Company maintains its cash with what are widely considered to be high credit quality financial institutions. U.S. cash balances are insured by the Federal Deposit Insurance Corporation (“FDIC”) up to $250 thousand per bank. The Company maintains cash and cash equivalent balances in excess of FDIC limits. The Company does not believe that it is subject to unusual credit risk beyond the normal credit risk associated with commercial banking relationships.
Settlement Assets and Liabilities
Settlement assets and liabilities are balances related to the settlement process which involves the transferring of funds between card issuers, merchants and other third parties. The Company currently operates under two different models: (1) a sponsorship model and (2) a direct member model. In the U.S., the Company operates under the sponsorship model and outside the U.S. the Company primarily operates under the direct member model. The Company’s operations outside the U.S. are primarily related to the business of Finaro, which was acquired in the fourth quarter of 2023.
Sponsorship Model
In the U.S., the Company operates under the sponsorship model. In order for the Company to provide payment processing services, Visa, MasterCard and other payment networks require sponsorship by a member clearing bank. The Company has an agreement with banks and financial institutions (the “Sponsoring Member”), to provide sponsorship services to the Company. The sponsorship services allow the Company to route transactions under the Sponsoring Members’ membership to clear card transactions through card networks. Under this model, the standards of the payment networks restrict the Company from performing funds settlement and require that these funds be in the possession of the Sponsoring Member until the merchant is funded. Accordingly, settlement assets and obligations resulting from the submission of settlement files to the network or cash received from the network in advance of funding the network are the responsibility of the Sponsoring Member and are not recorded on the Company’s unaudited Condensed Consolidated Balance Sheets.
Direct Member Model
The Company’s European and U.K. business (previously known as Finaro) operates as a full acquirer and without a sponsor bank. Under the direct member model, the Company’s Consolidated Balance Sheets include settlement assets and liabilities that represent balances arising from the settlement process which involves the transferring of funds between card issuers, payment networks, processors, and merchants, as well as collateral held to manage merchant credit risk. As a processor, the Company facilitates the clearing and settlement activity for the merchant and records settlement assets and liabilities on the Consolidated Balance Sheets upon processing a payment transaction. Settlement assets represent cash received or amounts receivable primarily from payment networks or bank partners. Settlement liabilities primarily represent amounts payable to merchants. Settlement assets are in excess of Settlement liabilities due to prefunding provided to certain merchants.
Amounts included on the unaudited Condensed Consolidated Balance Sheets as Collateral held by card networks relate to collateral required by the card networks to operate as a direct member.
Recent Accounting Pronouncements
Accounting Pronouncements Adopted
In June 2022, the Financial Accounting Standards Board (“FASB”) issued Accounting Standards Update (“ASU”) 2022-03, Fair Value Measurement of Equity Securities Subject to Contractual Sale Restrictions, to clarify that a contractual restriction on the sale of an equity security is not considered part of the unit of account of the equity security and, therefore, is not considered in measuring the fair value of the equity security. ASU 2022-03 also clarifies that an entity cannot recognize and measure a contractual sale restriction as a separate unit of account. The amendments in ASU 2022-03 became effective for the Company on January 1, 2024 on a prospective basis. The adoption did not have a significant impact on the Company’s unaudited condensed consolidated financial statements.
Accounting Pronouncements Not Yet Adopted
In December 2023, the FASB issued ASU 2023-09, Income Taxes: Improvements to Income Tax Disclosures, which provides qualitative and quantitative updates to the rate reconciliation and income taxes paid disclosures, among others, in order to enhance the transparency of income tax disclosures, including consistent categories and greater disaggregation of information in the rate reconciliation and disaggregation by jurisdiction of income taxes paid. The amendments in ASU 2023-09 are effective for fiscal 2025, with early adoption permitted. The amendments should be applied prospectively, however, retrospective application is also permitted. The Company does not plan to early adopt ASU 2023-09 and is evaluating the impact of the amendments on the Company’s unaudited condensed consolidated financial statements.
2.Acquisitions
Each of the following acquisitions was accounted for as a business combination using the acquisition method of accounting. The respective purchase prices were allocated to the assets acquired and liabilities assumed based on the estimated fair values at the date of acquisition. The excess of the purchase price over the fair value of the net assets acquired was allocated to goodwill and represents the future economic benefits arising from other assets acquired, which cannot be individually identified or separately recognized.
Vectron
On June 14, 2024, the Company acquired a majority stake in Vectron Systems AG (“Vectron”). Based in Germany, Vectron is a supplier of POS systems to the restaurant and hospitality verticals that management believes will provide the Company with local product expertise and a European distribution network of POS resellers. Throughout the remainder of June 2024, the Company purchased additional shares of Vectron’s common stock through a public tender offer and open market purchases. As of June 30, 2024, the Company owned approximately 74% of Vectron’s common stock, for which it paid $59.0 million of total purchase consideration, net of cash acquired. Subsequent to June 30, 2024, the Company will attempt to acquire additional ownership through the public tender offer and implement a process to gain operational control of Vectron. The Company consolidates 100% of Vectron’s assets, liabilities, revenues and expenses and records a noncontrolling interest balance for the 26% economic interest in Vectron not held by the Company. Total purchase consideration was as follows:
| | | | | |
| Cash | $ | 63.2 | |
| Contingent consideration (a) | 2.9 | |
| Total purchase consideration | 66.1 | |
| Less: cash acquired | (7.1) | |
| Total purchase consideration, net of cash acquired | 59.0 | |
| Noncontrolling interest as of June 30, 2024 | 25.9 | |
| Fair value of net assets acquired | $ | 84.9 | |
| |
|
(a) The Company agreed to a cash earnout due to certain former shareholders of Vectron based on the achievement against certain operational metrics over the next three years. The actual earn out can range between zero and €7.0 million. The fair value of the earnout was included in the initial purchase consideration and will be revalued and recorded quarterly until the end of the earnout period as a fair value adjustment within “Revaluation of contingent liabilities” in the Company’s unaudited Condensed Consolidated Statements of Operations. As of June 30, 2024, the fair value of the earnout was $2.9 million, which is recognized in “Other noncurrent liabilities” on the Company’s unaudited Condensed Consolidated Balance Sheets. |
The following table summarizes the fair value assigned to the assets acquired and liabilities assumed at the acquisition date. These amounts reflect various preliminary fair value estimates and assumptions, and are subject to change within the measurement period as valuations are finalized. The primary area of preliminary purchase price allocation subject to change relates to the valuation of accounts receivable, prepaid expenses and other current assets, other intangible assets, accounts payable, accrued expenses and other current liabilities, and residual goodwill.
| | | | | |
| Accounts receivable | $ | 8.2 | |
| Inventory | 3.5 | |
| Prepaid expenses and other current assets | 6.3 | |
| Goodwill (a) | 79.9 | |
| Other intangible assets | 28.6 | |
| Property, plant and equipment, net | 1.5 | |
| Right-of-use assets | 8.9 | |
| Other noncurrent assets | 2.5 | |
| Accounts payable | (5.3) | |
| Accrued expenses and other current liabilities | (5.9) | |
| Deferred revenue | (4.6) | |
| Current lease liabilities | (1.2) | |
| Deferred tax liability | (11.4) | |
| Noncurrent lease liabilities | (7.9) | |
| Other noncurrent liabilities (b) | (18.2) | |
| Net assets acquired | $ | 84.9 | |
| |
| (a) Goodwill is not deductible for tax purposes. |
(b) In connection with the Company’s majority stake in Vectron and due to Vectron’s acquisition of acardo group AG (“Acardo”) in December 2022, the Company became party to an earnout agreement with certain former shareholders of Acardo. The earnout is payable in multiple tranches, with up to €25.0 million payable in 2026. This amount is based on a multiple of the average of Acardo’s earnings before interest and taxes (“EBIT”) achieved in 2024 and 2025. Additionally, a percentage of Acardo’s net income for fiscal years 2023, 2024 and 2025 are payable in 2024, 2025 and 2026, respectively. Each portion of the earnout is expected to be paid in cash. The fair value of the earnout was included in the initial purchase consideration and will be revalued quarterly until the end of the earnout period as a fair value adjustment within “Revaluation of contingent liabilities” in the Company’s unaudited Condensed Consolidated Statements of Operations. As of June 30, 2024, the fair value of the earnout was $14.3 million, which was recognized in “Other noncurrent liabilities” on the Company’s unaudited Condensed Consolidated Balance Sheets. |
The fair values of other intangible assets were estimated using inputs classified as Level 3 under the income approach using the relief-from-royalty method for acquired technology and the trade name, and the multi-period excess earnings method for merchant relationships. This transaction was not taxable for income tax purposes. The estimated life of acquired technology, merchant relationships and trade name are six, thirteen and seven years, respectively.
The acquisition of Vectron did not have a material impact on the Company’s unaudited condensed consolidated financial statements.
Revel
On June 13, 2024, the Company completed the acquisition of Revel Systems, Inc. (“Revel”) by acquiring 100% of its common stock for $245.3 million of total purchase consideration, net of cash acquired. Revel offers a cloud-based POS system primarily for multi-location merchants, focusing on restaurants, as well as back office and marketing tools that management believes will strengthen the Company’s presence within the restaurant and retail markets. Total purchase consideration was as follows:
| | | | | |
| Cash (a) | $ | 255.3 | |
| Total purchase consideration | 255.3 | |
| Less: cash acquired | (10.0) | |
| Total purchase consideration, net of cash acquired | $ | 245.3 | |
| |
| (a) Subject to customary post-closing adjustments. |
The following table summarizes the fair value assigned to the assets acquired and liabilities assumed at the acquisition date. These amounts reflect various preliminary fair value estimates and assumptions, and are subject to change within the measurement period as valuations are finalized. The primary area of preliminary purchase price allocation subject to change relates to the valuation of accounts receivable, prepaid expenses and other current assets, other intangible assets, accounts payable, accrued expenses and other current liabilities, and residual goodwill.
| | | | | |
| Accounts receivable | $ | 15.4 | |
| Inventory | 2.1 | |
| Prepaid expenses and other current assets | 4.3 | |
| Right-of-use assets | 1.5 | |
| Goodwill (a) | 117.6 | |
| Other intangible assets | 123.3 | |
| |
| Other noncurrent assets | 7.2 | |
| Accounts payable | (11.1) | |
| Accrued expenses and other current liabilities | (7.3) | |
| Deferred revenue | (6.1) | |
| Current lease liabilities | (0.6) | |
| Noncurrent lease liabilities | (1.0) | |
| |
| Net assets acquired | $ | 245.3 | |
| |
| (a) Goodwill is not deductible for tax purposes. |
The fair values of other intangible assets were estimated using inputs classified as Level 3 under the income approach using the relief-from-royalty method for acquired technology and the trade name, and the multi-period excess earnings method for merchant relationships. This transaction was not taxable for income tax purposes. The estimated life of acquired technology, merchant relationships and trade name are three, ten and three years, respectively.
The acquisition of Revel did not have a material impact on the Company’s unaudited condensed consolidated financial statements.
Finaro
On October 26, 2023, the Company completed the acquisition of Finaro by acquiring 100% of its common stock for $330.8 million of total purchase consideration, net of cash acquired. Finaro is a cross-border eCommerce platform and bank specializing in solving complex payment problems for multi-national merchants that we believe will help drive our expansion into international markets. Total purchase consideration was as follows:
| | | | | |
| Cash | $ | 211.9 | |
| Shares of Class A common stock (a) | 302.0 | |
| Contingent consideration (b) | 2.8 | |
| Settlement of preexisting relationship | 1.3 | |
| Total purchase consideration | 518.0 | |
| Less: cash acquired | (187.2) | |
| Total purchase consideration, net of cash acquired | $ | 330.8 | |
| |
(a) Approximately 7.4 million shares of the Company’s Class A common stock are to be issued in connection with the acquisition, of which approximately 1.0 million shares relate to an earnout which was fully achieved prior to the acquisition date. 3.7 million shares were issued during the fourth quarter of 2023 and 1.2 million shares were issued during the second quarter of 2024. The remaining 2.5 million shares are expected to be issued over the course of the twelve months post-acquisition. The total equity of $302.0 million was recorded to “Additional Paid-in Capital” in the Company’s Consolidated Balance Sheets upon closing of the acquisition. |
(b) The Company agreed to pay additional cash consideration to the sellers equal to the proceeds realized from the sale of an investment in certain securities held by Finaro, when and if realized, after the deduction of tax payments, if any. The fair value of the contingent consideration was included in the initial purchase consideration and will be revalued quarterly until settlement. As of June 30, 2024, the fair value of the contingent consideration was $3.8 million. |
The following table summarizes the fair value assigned to the assets acquired and liabilities assumed at the acquisition date. These amounts reflect various preliminary fair value estimates and assumptions, and are subject to change within the measurement period as valuations are finalized. The primary area of preliminary purchase price allocation subject to change relates to the valuation of accounts receivable, prepaid expenses and other current assets, accounts payable, accrued expenses and other current liabilities, and residual goodwill.
| | | | | |
| Settlement assets, excluding cash (a) | $ | 67.6 | |
| Accounts receivable | 15.2 | |
| Investments in securities | 2.2 | |
| Prepaid expenses and other current assets | 10.9 | |
| Goodwill (b) | 280.6 | |
| Acquired technology | 130.0 | |
| Merchant relationships | 75.0 | |
| Banking license | 3.0 | |
| Property, plant and equipment | 2.1 | |
| Collateral held by the card networks | 36.4 | |
| Right-of-use assets | 3.0 | |
| Other noncurrent assets | 4.1 | |
| Settlement liabilities | (193.5) | |
| Accounts payable | (13.0) | |
| Accrued expenses and other current liabilities | (6.6) | |
| Bank deposits | (70.5) | |
| Current lease liabilities | (1.4) | |
| Noncurrent lease liabilities | (1.6) | |
| Deferred tax liability | (10.4) | |
| Other noncurrent liabilities | (2.3) | |
| Net assets acquired | $ | 330.8 | |
| |
(a) Excludes settlement-related cash of $134.9 million. |
| (b) Goodwill is not deductible for tax purposes. |
The fair values of other intangible assets were estimated using inputs classified as Level 3 under the income approach using the multi-period excess earnings method for acquired technology, the with and without method for merchant relationships, and the replacement cost method for the banking license. This transaction was not taxable for income tax purposes. Management’s estimates of fair value are based upon assumptions related to projected revenues, earnings before interest income, interest expense, income taxes, and depreciation and amortization (“EBITDA”) margins, research and development addback, obsolescence rates, and discount rates. The estimated life of acquired technology, merchant relationships and the banking license are eight, ten and two years respectively. The goodwill arising from the acquisition largely consisted of revenue synergies associated with a larger total addressable market.
In connection with the transaction, the Company also entered into compensation arrangements with employees of Finaro. In aggregate, these agreements included approximately $25.0 million of restricted stock units that were issued in the first quarter of 2024 and vest over three years. These awards are accounted for as compensation expense.
Appetize
On October 2, 2023, the Company completed the acquisition of SpotOn Technologies, Inc.’s sports and entertainment division, formerly known as Appetize, by acquiring 100% of its membership interests for $108.7 million of total purchase consideration, net of cash acquired. Appetize is a payments and software company that has served clients that management believes will strengthen the Company’s presence within the sports and entertainment market. Total purchase consideration was as follows:
| | | | | |
| Cash | $ | 109.5 | |
| Total purchase consideration | 109.5 | |
| Less: cash acquired | (0.8) | |
| Total purchase consideration, net of cash acquired | $ | 108.7 | |
The following table summarizes the fair value assigned to the assets acquired and liabilities assumed at the acquisition date. These amounts reflect various preliminary fair value estimates and assumptions, and are subject to change within the measurement period as valuations are finalized. The primary area of preliminary purchase price allocation subject to change relates to the valuation of accounts receivable, accounts payable, accrued expenses and other current liabilities, and residual goodwill.
| | | | | |
| Accounts receivable | $ | 14.0 | |
| Inventory | 1.2 | |
| Prepaid expenses and other current assets | 1.0 | |
| Goodwill (a) | 75.0 | |
| Other intangible assets | 38.3 | |
| Other noncurrent assets | 0.2 | |
| Accounts payable | (4.9) | |
| Accrued expenses and other current liabilities | (4.5) | |
| Deferred revenue | (11.0) | |
| Other noncurrent liabilities | (0.6) | |
| Net assets acquired | $ | 108.7 | |
| |
| (a) Goodwill is deductible for tax purposes. |
The fair value of other intangible assets was estimated using inputs classified as Level 3 under the income approach using the multi-period excess earnings method for merchant relationships. This transaction was taxable for income tax purposes. The estimated life of merchant relationships is ten years. The goodwill arising from the acquisition largely consisted of revenue synergies associated with the ability to cross-sell newly acquired customers and technology capabilities.
The acquisition of Appetize did not have a material impact on the Company’s unaudited condensed consolidated financial statements.
3.Revenue
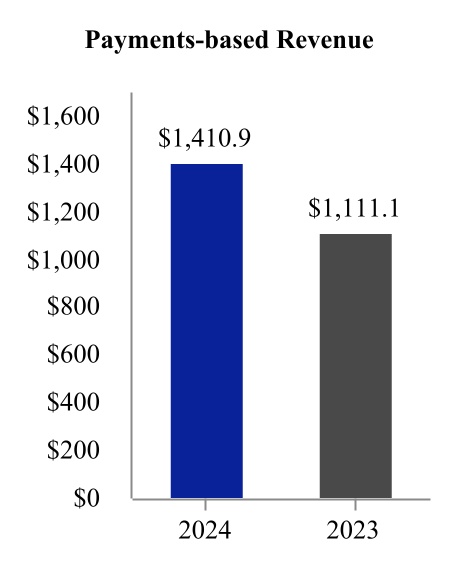
The Company’s revenue is comprised primarily of payments-based revenue which includes fees for payment processing and gateway services. Payment processing fees are primarily driven as a percentage of payment volume.
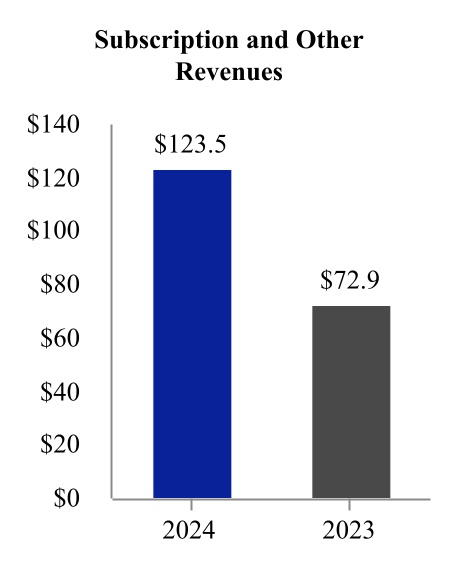
The Company also generates revenues from recurring fees which are based on the technology deployed to the merchant. Under ASC 606, the Company typically has three separate performance obligations under its recurring software as a service (“SaaS”) agreements for point-of-sale systems provided to merchants: (1) point-of-sale software, (2) lease of hardware and (3) other support services.
Disaggregated Revenue
The following table presents a disaggregation of the Company’s revenue from contracts with customers based on similar operational characteristics:
| | | | | | | | | | | | | | | | | | | | | | | |
| Three Months Ended June 30, | | Six Months Ended June 30, |
| 2024 | | 2023 | | 2024 | | 2023 |
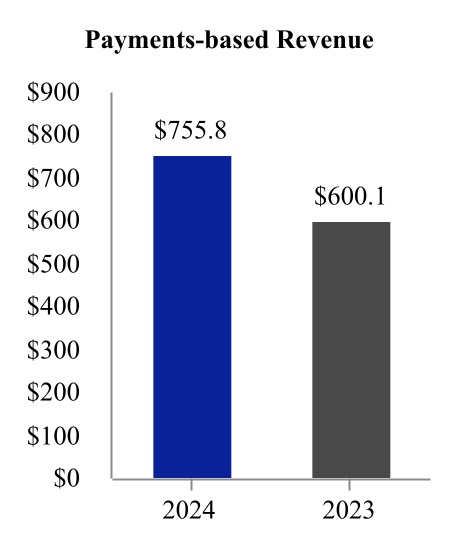
| Payments-based revenue | $ | 755.8 | | | $ | 600.1 | | | $ | 1,410.9 | | | $ | 1,111.1 | |
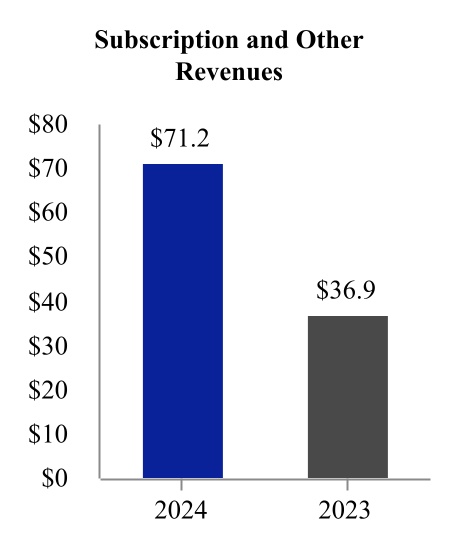
| Subscription and other revenues | 71.2 | | | 36.9 | | | 123.5 | | | 72.9 | |
| Total | $ | 827.0 | | | $ | 637.0 | | | $ | 1,534.4 | | | $ | 1,184.0 | |
Substantially all of the Company’s revenue is recognized over time.
Contract Liabilities
The Company charges merchants for various post-contract license support and service fees. These fees typically relate to a period of one year. The Company recognizes the revenue on a straight-line basis over its respective period. As of June 30, 2024 and December 31, 2023, the Company had deferred revenue of $19.9 million and $22.5 million, respectively. The change in the contract liabilities was primarily the result of a timing difference between payment from the customer and the Company’s satisfaction of each performance obligation.
The amount of gross revenue recognized that was included in the December 31, 2023 balance of deferred revenue was $7.0 million and $17.2 million for the three and six months ended June 30, 2024, respectively.
Allowance for Doubtful Accounts
The change in the Company’s allowance for doubtful accounts was as follows:
| | | | | | | | | | | |
| Six Months Ended June 30, |
| 2024 | | 2023 |
| Beginning balance | $ | 22.7 | | | $ | 18.1 | |
| Additions to expense | 3.9 | | | 5.5 | |
| Write-offs, net of recoveries and other adjustments | (3.4) | | | (2.0) | |
| Ending balance | $ | 23.2 | | | $ | 21.6 | |
4.Goodwill
The changes in the carrying amount of goodwill were as follows:
| | | | | |
| Balance at December 31, 2023 | $ | 1,111.3 | |
| |
| |
| Vectron acquisition (Note 2) | 79.9 | |
| Revel acquisition (Note 2) | 117.6 | |
| Purchase price adjustments related to prior period acquisitions | 1.7 | |
| Effect of foreign currency translation | (10.6) | |
| Balance at June 30, 2024 | $ | 1,299.9 | |
5.Depreciation and Amortization
Amounts charged to expense in the Company’s unaudited Condensed Consolidated Statements of Operations for depreciation and amortization were as follows:
| | | | | | | | | | | | | | | | | | | | | | | | | | | | | | | | | | | | | | |
| | Amortization | | Depreciation | | |
| | Residual Commission Buyouts | | Other Intangible Assets | | Capitalized Customer Acquisition Costs | | Equipment Under Lease | | Property, Plant and Equipment | | Total |
| Three Months Ended June 30, 2024 | | | | | |
| Depreciation and amortization expense | | $ | 21.7 | | | $ | 9.3 | | | $ | — | | | $ | 13.0 | | | $ | 2.7 | | | $ | 46.7 | |
| Cost of sales | | — | | | 16.8 | | | 6.1 | | | — | | | 0.1 | | | 23.0 | |
| Total depreciation and amortization (a) | | $ | 21.7 | | | $ | 26.1 | | | $ | 6.1 | | | $ | 13.0 | | | $ | 2.8 | | | $ | 69.7 | |
| | | | | | | | | | | | |
| Three Months Ended June 30, 2023 | | | | | | | | | | | | |
| Depreciation and amortization expense | | $ | 20.7 | | | $ | 5.5 | | | $ | — | | | $ | 8.2 | | | $ | 1.5 | | | $ | 35.9 | |
| Cost of sales | | — | | | 9.2 | | | 4.7 | | | — | | | 0.2 | | | 14.1 | |
| Total depreciation and amortization (b) | | $ | 20.7 | | | $ | 14.7 | | | $ | 4.7 | | | $ | 8.2 | | | $ | 1.7 | | | $ | 50.0 | |
| | | | | | | | | | | | |
| Six Months Ended June 30, 2024 | | | | | | |
| Depreciation and amortization expense | | $ | 43.5 | | | $ | 18.0 | | | $ | — | | | $ | 24.9 | | | $ | 5.1 | | | $ | 91.5 | |
| Cost of sales | | — | | | 32.3 | | | 11.8 | | | — | | | 0.2 | | | 44.3 | |
| Total depreciation and amortization (c) | | $ | 43.5 | | | $ | 50.3 | | | $ | 11.8 | | | $ | 24.9 | | | $ | 5.3 | | | $ | 135.8 | |
| | | | | | | | | | | | |
| Six Months Ended June 30, 2023 | | | | | | |
| Depreciation and amortization expense | | $ | 42.3 | | | $ | 10.7 | | | $ | — | | | $ | 15.4 | | | $ | 2.8 | | | $ | 71.2 | |
| Cost of sales | | — | | | 17.5 | | | 8.5 | | | — | | | 0.4 | | | 26.4 | |
| Total depreciation and amortization (d) | | $ | 42.3 | | | $ | 28.2 | | | $ | 8.5 | | | $ | 15.4 | | | $ | 3.2 | | | $ | 97.6 | |
(a) Total amortization of $53.9 million consisted of amortization of acquired intangibles of $38.8 million and amortization of non-acquired intangibles of $15.1 million.
(b) Total amortization of $40.1 million consisted of amortization of acquired intangibles of $29.8 million and amortization of non-acquired intangibles of $10.3 million.
(c) Total amortization of $105.6 million consisted of amortization of acquired intangibles of $76.8 million and amortization of non-acquired intangibles of $28.8 million.
(d) Total amortization of $79.0 million consisted of amortization of acquired intangibles of $59.7 million and amortization of non-acquired intangibles of $19.3 million.
As of June 30, 2024, the estimated amortization expense for each of the five succeeding years and thereafter is as follows:
| | | | | | | | | | | | | | | | | | | | | | | |
| Residual Commission Buyouts | | Other Intangible Assets | | Capitalized Customer
Acquisition Costs | | Total Amortization |
| 2024 (remaining six months) | $ | 43.4 | | | $ | 62.8 | | | $ | 12.4 | | | $ | 118.6 | |
| 2025 | 85.1 | | | 114.6 | | | 21.3 | | | 221.0 | |
| 2026 | 51.1 | | | 96.0 | | | 15.3 | | | 162.4 | |
| 2027 | 2.6 | | | 72.1 | | | 8.8 | | | 83.5 | |
| 2028 | 1.7 | | | 57.2 | | | 1.2 | | | 60.1 | |
| Thereafter | 3.5 | | | 271.3 | | | — | | | 274.8 | |
| Total | $ | 187.4 | | | $ | 674.0 | | | $ | 59.0 | | | $ | 920.4 | |
6.Residual Commission Buyouts
Residual commission buyouts represent transactions with certain third-party distribution partners, pursuant to which the Company acquires their ongoing merchant relationships that subscribe to the Company’s end-to-end payments platform.
Residual commission buyouts, net consisted of the following:
| | | | | | | | | | | | | | | | | | | | | | | | | | |
| | Weighted Average Amortization Period (in years) | | June 30, 2024 |
| | Carrying Value | | Accumulated Amortization | | Net Carrying Value |
| Residual commission buyouts from asset acquisitions | | 4 | | $ | 324.9 | | | $ | (148.4) | | | $ | 176.5 | |
| Residual commission buyouts from business combinations | | 8 | | 13.9 | | | (3.0) | | | 10.9 | |
| Total residual commission buyouts | | | | $ | 338.8 | | | $ | (151.4) | | | $ | 187.4 | |
| | | | | | | | |
| | Weighted Average Amortization Period (in years) | | December 31, 2023 |
| | Carrying Value | | Accumulated Amortization | | Net Carrying Value |
| Residual commission buyouts from asset acquisitions | | 4 | | $ | 323.6 | | | $ | (105.7) | | | $ | 217.9 | |
| Residual commission buyouts from business combinations | | 8 | | 13.9 | | | (2.2) | | | 11.7 | |
| Total residual commission buyouts | | | | $ | 337.5 | | | $ | (107.9) | | | $ | 229.6 | |
7.Other Intangible Assets, Net
Other intangible assets, net consisted of the following:
| | | | | | | | | | | | | | | | | | | | | | | |
| Weighted Average Amortization Period (in years) | | June 30, 2024 |
| Carrying Value | | Accumulated Amortization | | Net Carrying Value |
| Merchant relationships | 11 | | $ | 470.2 | | | $ | (73.1) | | | $ | 397.1 | |
| Acquired technology | 8 | | 267.4 | | | (95.8) | | | 171.6 | |
| Trademarks and trade names | 12 | | 31.1 | | | (7.7) | | | 23.4 | |
| Capitalized software development costs | 3 | | 126.7 | | | (46.6) | | | 80.1 | |
| Finaro banking license | 1 | | 2.9 | | | (1.1) | | | 1.8 | |
| Total other intangible assets, net | | | $ | 898.3 | | | $ | (224.3) | | | $ | 674.0 | |
| | | | | | | | | | | | | | | | | | | | | | | |
| Weighted Average Amortization Period (in years) | | December 31, 2023 |
| Carrying Value | | Accumulated Amortization | | Net Carrying Value |
| Merchant relationships | 11 | | $ | 340.6 | | | $ | (57.8) | | | $ | 282.8 | |
| Acquired technology | 9 | | 257.6 | | | (80.8) | | | 176.8 | |
| Trademarks and trade names | 13 | | 28.1 | | | (6.3) | | | 21.8 | |
| Capitalized software development costs | 3 | | 98.8 | | | (34.1) | | | 64.7 | |
| Finaro banking license | 2 | | 3.0 | | | (0.3) | | | 2.7 | |
| Total other intangible assets, net | | | $ | 728.1 | | | $ | (179.3) | | | $ | 548.8 | |
8.Capitalized Customer Acquisition Costs, Net
Capitalized customer acquisition costs, net consisted of the following:
| | | | | | | | | | | | | | | | | | | | | | | | | | |
| | Weighted Average Amortization Period (in years) | | | | | | |
| | Carrying Value | | Accumulated Amortization | | Net Carrying Value |
| Total costs as of June 30, 2024 | | 4 | | $ | 107.2 | | | $ | (48.2) | | | $ | 59.0 | |
| Total costs as of December 31, 2023 | | 4 | | $ | 96.6 | | | $ | (44.9) | | | $ | 51.7 | |
9.Equipment for Lease, Net
Equipment for lease, net consisted of the following:
| | | | | | | | | | | | | | | | | | | | | | | |
| Weighted Average Depreciation Period (in years) | | June 30, 2024 |
| Carrying Value | | Accumulated Depreciation | | Net Carrying Value |
| Equipment under lease | 4 | | $ | 212.6 | | | $ | (77.8) | | | $ | 134.8 | |
| Equipment held for lease (a) | N/A | | 9.7 | | | — | | | 9.7 | |
| Total equipment for lease, net | | | $ | 222.3 | | | $ | (77.8) | | | $ | 144.5 | |
| | | | | | | | | | | | | | | | | | | | | | | |
| Weighted Average Depreciation Period (in years) | | December 31, 2023 |
| Carrying Value | | Accumulated Depreciation | | Net Carrying Value |
| Equipment under lease | 4 | | $ | 181.2 | | | $ | (69.6) | | | $ | 111.6 | |
| Equipment held for lease (a) | N/A | | 11.5 | | | — | | | 11.5 | |
| Total equipment for lease, net | | | $ | 192.7 | | | $ | (69.6) | | | $ | 123.1 | |
| | | | | | | |
| (a) Represents equipment that was not yet initially deployed to a merchant and, accordingly, is not being depreciated. |
10.Property, Plant and Equipment, Net
Property, plant and equipment, net consisted of the following:
| | | | | | | | | | | |
| June 30,
2024 | | December 31,
2023 |
| Equipment | $ | 19.9 | | | $ | 21.9 | |
| Capitalized software | 4.4 | | | 3.5 | |
| Leasehold improvements | 18.7 | | | 18.7 | |
| Furniture and fixtures | 2.4 | | | 2.2 | |
| Vehicles | 0.4 | | | 0.4 | |
| Total property, plant and equipment, gross | 45.8 | | | 46.7 | |
| Less: Accumulated depreciation | (17.3) | | | (18.1) | |
| Total property, plant and equipment, net | $ | 28.5 | | | $ | 28.6 | |
11.Debt
The Company’s outstanding debt consisted of the following:
| | | | | | | | | | | | | | | | | | | | | | | | | | |
| | | Maturity | | Effective Interest Rate | | June 30,
2024 | | December 31,
2023 |
| Convertible Senior Notes due 2025 ("2025 Convertible Notes") | | December 15, 2025 | | 0.49% | | $ | 690.0 | | | $ | 690.0 | |
| Convertible Senior Notes due 2027 ("2027 Convertible Notes") | | August 1, 2027 | | 0.90% | | 632.5 | | | 632.5 | |
4.625% Senior Notes due 2026 ("2026 Senior Notes") | | November 1, 2026 | | 5.13% | | 450.0 | | | 450.0 | |
| Total borrowings | |
| | | | 1,772.5 | | | 1,772.5 | |
| Less: Unamortized capitalized financing fees | | | | | | (18.2) | | | (22.3) | |
| Total long-term debt | | | | | | $ | 1,754.3 | | | $ | 1,750.2 | |
Amortization of capitalized financing fees is included within “Interest expense” in the Company’s unaudited Condensed Consolidated Statements of Operations. Amortization expense for capitalized financing fees was $2.0 million and $4.1 million for the three and six months ended June 30, 2024, respectively, and $2.0 million and $4.1 million for the three and six months ended June 30, 2023, respectively.
Future principal payments
As of June 30, 2024, future principal payments associated with the Company’s long-term debt were as follows:
| | | | | | | | |
| 2024 | | $ | — | |
| 2025 | | 690.0 | |
| 2026 | | 450.0 | |
| 2027 | | 632.5 | |
| Total | | $ | 1,772.5 | |
Revolving Credit Facility
As of June 30, 2024, there were no borrowings on the Revolving Credit Facility and borrowing capacity was $100.0 million.
Restrictions and Covenants
The 2025 Convertible Notes, 2026 Senior Notes, 2027 Convertible Notes (collectively, the “Notes”) and Revolving Credit Facility include certain restrictions on the ability of Shift4 Payments, LLC to make loans, advances, or pay dividends to Shift4 Payments, Inc.
As of June 30, 2024 and December 31, 2023, the Company was in compliance with all financial covenants under its debt agreements. The Company expects to be in compliance with such financial covenants for at least 12 months following the issuance of these unaudited condensed consolidated financial statements.
12.Fair Value Measurement
U.S. GAAP defines a fair value hierarchy that prioritizes the inputs to valuation techniques used to measure fair value. The hierarchy gives the highest priority to unadjusted quoted prices in active markets for identical assets or liabilities (Level 1 measurements) and the lowest priority to unobservable inputs (Level 3 measurements).
The Company determines the fair values of its assets and liabilities that are recognized or disclosed at fair value in accordance with the hierarchy described below. The following three levels of inputs may be used to measure fair value:
•Level 1—Quoted prices in active markets for identical assets or liabilities;
•Level 2—Observable inputs other than Level 1 prices such as quoted prices for similar assets or liabilities, quoted prices in markets that are not active, or other inputs that are observable or can be corroborated by observable market data for substantially the full term of the assets or liabilities; and
•Level 3—Unobservable inputs that are supported by little or no market activity and that are significant to the fair value of the assets or liabilities. Level 3 assets and liabilities include items where the determination of fair value requires significant management judgment or estimation.
The Company makes recurring fair value measurements of contingent liabilities arising from certain acquisitions and residual commission buyouts using Level 3 unobservable inputs. Contingent liabilities for residual commission buyouts are expected earnout payments related to the number of existing point-of-sale merchants that convert to full acquiring merchants. Contingent liabilities included in the purchase price of an acquisition are based on achievement of specified performance metrics as defined in the purchase agreement.
Acquisition-Related Contingent Consideration
The Company’s acquisitions often include contingent consideration, or earnout, provisions. The total fair value of contingent consideration related to the acquisitions of Vectron, Finaro, Online Payments Group, and Restaurant Technology Partners as of June 30, 2024 was $49.7 million, of which $30.6 million is included in “Accrued expenses and other current liabilities” and $19.1 million is included within “Other noncurrent liabilities” on the Company’s unaudited Condensed Consolidated Balance Sheets. The change in fair value of these liabilities is included in “Revaluation of contingent liabilities” on the Company’s unaudited Condensed Consolidated Statements of Operations. Each of these fair value measurements utilize Level 3 inputs, such as projected revenues, discount rates and other subjective inputs. See Note 2 for further information on the contingent consideration for Vectron and Finaro.
Online Payments Group
The Company entered into an earnout agreement with the former shareholders of Online Payments Group, not to exceed $60.0 million, with $30.0 million of the earnout payable as of September 2023 (“Tranche 1”) if key customers of Online Payments Group contribute a specified amount of revenue from September 29, 2022 to September 28, 2023 and the remaining $30.0 million payable as of September 2024 (“Tranche 2”) if key customers contribute a specified amount of revenue from September 29, 2022 to September 28, 2024. Each portion of the earnout will be paid 50% in shares of the Company’s Class A common stock and 50% in cash. The fair value of the earnout was included in the initial purchase consideration and is revalued quarterly until the end of the earnout period as a fair value adjustment within “Revaluation of contingent liabilities” in the Company’s unaudited Condensed Consolidated Statements of Operations. Tranche 1 was fully earned and paid in 2023. The fair value of Tranche 2 as of June 30, 2024 was estimated to be $28.3 million and is included in “Accrued expenses and other current liabilities” on the Company’s unaudited Condensed Consolidated Balance Sheets as of June 30, 2024.
Restaurant Technology Partners
The Company entered into an earnout agreement with certain former shareholders of the restaurant technology partner acquired in 2023, calculated as a multiple of the number of the restaurant technology partner’s merchants that are converted to the Company’s end-to-end payments platform during the 24 months following September 1, 2022, not to exceed $2.5 million in total. The earnout is expected to be paid in cash. The fair value of the earnout was included in the initial purchase consideration and will be revalued quarterly until the end of the earnout period as a fair value adjustment within “Revaluation of contingent liabilities” in the Company’s unaudited Condensed Consolidated Statements of Operations. As of June 30, 2024, the fair value of the earnout was $0.4 million, which is recognized in “Accrued expenses and other current liabilities” on the Company’s unaudited Condensed Consolidated Balance Sheets.
Asset-Related Contingent Consideration
As of June 30, 2024, the estimated fair value of the Company’s contingent consideration agreements entered into in conjunction with residual commission buyouts and the acquisition of other intangible assets was $0.6 million, which is included in “Accrued expenses and other current liabilities” on the Company’s unaudited Condensed Consolidated Balance Sheets. The fair values of the contingent consideration were estimated based on the projected attrition rates and other financial metrics within the respective merchant portfolios over the earnout periods.
The table below provides a reconciliation of the beginning and ending balances for the Level 3 contingent liabilities:
| | | | | | | | | | | | | | | | | |
| Six Months Ended June 30, 2024 |
| Contingent Liabilities for Acquisitions | | Contingent Liabilities for Assets Acquired | | Total Contingent Liabilities |
| Balance at beginning of period | $ | 32.2 | | | $ | 1.4 | | | $ | 33.6 | |
| Contingent consideration | 17.2 | | | — | | | 17.2 | |
| Fair value adjustments | 2.4 | | | 0.4 | | | 2.8 | |
| Impact of foreign exchange | (0.1) | | | — | | | (0.1) | |
Contingent liabilities that achieved earnout | (2.0) | | | (1.2) | | | (3.2) | |
| | | | | |
| Balance at end of period | $ | 49.7 | | | $ | 0.6 | | | $ | 50.3 | |
| | | | | |
|
|
Fair value adjustments for contingent liabilities for acquisitions are recorded within “Revaluation of contingent liabilities” in the Company’s unaudited Condensed Consolidated Statements of Operations. There were no transfers into or out of Level 3 during the six months ended June 30, 2024.
The estimated fair value of the Company’s outstanding debt using quoted prices from over-the-counter markets, considered Level 2 inputs, was as follows:
| | | | | | | | | | | | | | | | | | | | | | | |
| June 30, 2024 | | December 31, 2023 |
| Carrying
Value (a) | | Fair
Value | | Carrying
Value (a) | | Fair
Value |
| 2025 Convertible Notes | $ | 685.3 | | | $ | 777.4 | | | $ | 683.6 | | | $ | 766.5 | |
| 2027 Convertible Notes | 624.7 | | | 600.4 | | | 623.5 | | | 593.2 | |
| 2026 Senior Notes | 444.8 | | | 436.1 | | | 443.7 | | | 438.2 | |
| Total | $ | 1,754.8 | | | $ | 1,813.9 | | | $ | 1,750.8 | | | $ | 1,797.9 | |
| | | | | | | |
(a) Carrying value excludes unamortized debt issuance costs related to the Revolving Credit Facility of $0.5 million and $0.6 million as of June 30, 2024 and December 31, 2023, respectively. |
The estimated fair value of the Company’s investments in non-marketable equity securities was $72.9 million and $62.2 million as of June 30, 2024 and December 31, 2023, respectively. These non-marketable equity investments have no readily determinable fair values and are measured using the measurement alternative, which is defined as cost, less impairment, adjusted for observable price changes from orderly transactions for identical or similar investments of the same issuer. Adjustments for these investments, if any, are recorded in “Unrealized gain on investments in securities” on the Company’s unaudited Condensed Consolidated Statements of Operations. The Company recognized fair value adjustments to its non-marketable equity investments of $(0.2) million and $10.8 million for the three and six months ended June 30, 2024, respectively, the entire amount of which related to securities still held as of June 30, 2024, based primarily on secondary offerings of identical securities by the respective companies in 2024. The Company has recognized cumulative fair value adjustments to its non-marketable equity investments of $38.1 million.
The estimated fair value of the Company’s crypto settlement assets and crypto settlement liabilities was $7.5 million and $3.5 million as of June 30, 2024 and December 31, 2023, respectively. The Company has valued the assets and liabilities using quoted prices from active cryptocurrency exchanges for the underlying crypto assets, considered Level 2 inputs.
Other financial instruments not measured at fair value on the Company’s unaudited Condensed Consolidated Balance Sheets at June 30, 2024 and December 31, 2023 include cash and cash equivalents, restricted cash, settlement assets, accounts receivable, prepaid expenses and other current assets, collateral held by the card networks, other noncurrent assets, settlement liabilities, accounts payable, accrued expenses and other current liabilities, bank deposits, and other noncurrent liabilities, as their estimated fair values reasonably approximate their carrying value as reported on the Company’s unaudited Condensed Consolidated Balance Sheets.
13.Income Taxes
The Company holds an economic interest in Shift4 Payments, LLC and consolidates its financial position and results. The remaining ownership of Shift4 Payments, LLC not held by the Company is considered a noncontrolling interest. Shift4 Payments, LLC is treated as a partnership for income tax reporting and its members, including the Company, are liable for federal, state, and local income taxes based on their share of the LLC’s taxable income. In addition, Shift4 Payments, LLC wholly owns various U.S. and foreign subsidiaries which are taxed as corporations for tax reporting. Taxable income or loss from these subsidiaries is not passed through to Shift4 Payments, LLC. Instead, such taxable income or loss is taxed at the corporate level subject to the prevailing corporate tax rates.
The Company’s effective tax rate was (3)% and (0.5)% for the three and six months ended June 30, 2024, respectively. The Company’s effective tax rate was (10)% and (14)% for the three and six months ended June 30, 2023, respectively. The effective tax rate for the three and six months ended June 30, 2024 was different than the U.S. federal statutory income tax rate of 21% primarily due to the income allocated to the noncontrolling interest, the full valuation allowance on Shift4 Payments, Inc., a $5.2 million tax benefit related to the valuation allowance release on certain corporate subsidiaries, and the lower foreign rate differential in overseas jurisdictions compared to the U.S. federal statutory income tax rate. The effective tax rate for the three and six months ended June 30, 2023 was different than the U.S. federal statutory income tax rate of 21% primarily due to the income allocated to the noncontrolling interest, the full valuation allowances on Shift4 Payments, Inc. and certain corporate subsidiaries in the U.S. and a $1.5 million tax benefit related to the valuation allowance release due to acquired deferred tax liabilities from Focus POS Systems (“Focus”). In addition, the six months ended June 30, 2023 included a $4.8 million tax benefit related to the valuation allowance release due to a legal entity restructuring.
The Company has assessed the realizability of the net deferred tax assets and in that analysis has considered the relevant positive and negative evidence available to determine whether it is more likely than not that some portion or all of the deferred tax assets will be realized. The Company has recorded a valuation allowance against the majority of Shift4 Payments, Inc.’s deferred tax assets as of June 30, 2024, and December 31, 2023. The Company intends to continue maintaining a valuation allowance on the deferred tax assets until there is sufficient evidence to support the reversal of all or some portion of these allowances. However, given the current earnings and anticipated future earnings, the Company believes there is a reasonable possibility that within the next 12 months, sufficient positive evidence may become available to allow the Company to reach a conclusion that a significant portion of the valuation allowance will no longer be needed. Release of the valuation allowance would result in the recognition of certain deferred tax assets and an increase to income tax benefit for the period the release is recorded. The exact timing and amount of the valuation allowance release are subject to change on the basis of the level of profitability that is able to be achieved.
Uncertain Tax Positions
The effects of uncertain tax positions are recognized in the Company’s unaudited condensed consolidated financial statements if these positions meet a “more-likely-than-not” threshold. For those uncertain tax positions that are recognized in the condensed consolidated financial statements, liabilities are established to reflect the portion of those positions it cannot conclude “more-likely-than-not” to be realized upon ultimate settlement. The Company’s policy is to recognize interest and penalties related to unrecognized tax benefits within “Income tax benefit (expense)” in the Company’s unaudited Condensed Consolidated Statements of Operations. Accrued interest and penalties, if any, are included within “Deferred tax liability” in the Company’s unaudited Condensed Consolidated Balance Sheets. As of June 30, 2024 and December 31, 2023, $6.9 million and $4.7 million, respectively, of uncertain tax positions were recognized within “Other noncurrent liabilities” in the Company’s unaudited Condensed Consolidated Balance Sheets, which were primarily recognized in conjunction with acquisitions.
Tax Receivable Agreement
The Company expects to obtain an increase in its share of the tax basis in the net assets of Shift4 Payments, LLC as LLC Interests are redeemed from or exchanged by the Continuing Equity Owners, at the option of the Company, determined solely by the Company’s independent directors. The Company intends to treat any redemptions and exchanges of LLC Interests as direct purchases of LLC Interests for U.S. federal income tax purposes. These increases in tax basis may reduce the amounts that it would otherwise pay in the future to various tax authorities. In connection with the Company’s initial public offering in June 2020 and certain organizational transactions that the Company effected in connection with it, the Company entered into the TRA with the Continuing Equity Owners.
The TRA provides for the payment by Shift4 Payments, Inc. of 85% of the amount of any tax benefits the Company actually realizes, or in some cases is deemed to realize, as a result of (i) increases in the Company’s share of the tax basis in the net assets of Shift4 Payments, LLC resulting from any redemptions or exchanges of LLC Interests, (ii) tax basis increases attributable to payments made under the TRA, and (iii) deductions attributable to imputed interest pursuant to the TRA. The Company expects to benefit from the remaining 15% of any of cash savings that it realizes.
As of June 30, 2024 and December 31, 2023, the Company recognized a TRA liability of $8.2 million and $5.1 million, respectively, after concluding it was probable that, based on estimates of future taxable income, the Company will realize tax benefits associated with the TRA. As of June 30, 2024, $4.1 million of the liability is recognized in “Accrued expenses and other current liabilities” on the Company’s unaudited Condensed Consolidated Balance Sheets and $4.1 million of the liability is recognized in “Other noncurrent liabilities” on the Company’s unaudited Condensed Consolidated Balance Sheets. As of June 30, 2024, the Company has not recognized the remaining $284.8 million liability under the TRA after concluding it was not probable that the Company will be able to realize the remaining tax benefits based on estimates of future taxable income. A payment of $1.7 million was made to the Continuing Equity Owners pursuant to the TRA during the three and six months ended June 30, 2024. No payments were made to the Continuing Equity Owners pursuant to the TRA during the three and six months ended June 30, 2023. The estimation of liability under the TRA is by its nature imprecise and subject to significant assumptions regarding the amount, character, and timing of the taxable income of Shift4 Payments, Inc. in the future. If the valuation allowance recorded against the deferred tax assets applicable to the tax attributes referenced above is released in a future period, the remaining TRA liability may be considered probable at that time and recorded within earnings.
If Rook were to exchange any of its LLC Interests subsequent to June 30, 2024, such exchanges could generate additional deferred tax assets and TRA liability. As of December 31, 2023, the estimated impact of the exchange of all of Rook’s LLC Interests was an additional deferred tax asset of approximately $545 million and a TRA liability of approximately $463 million. The actual amounts as of June 30, 2024 could differ materially from those disclosed as of December 31, 2023 as they are impacted by the timing of the exchanges, the valuation of corporate subsidiaries, the price of the Company’s shares of Class A common stock at the time of the exchange, and the tax rates then in effect.
Organisation for Economic Co-operation and Development (“OECD”) - Pillar Two
In December 2021, the Organisation for Economic Co-operation and Development issued model rules for a new global minimum tax framework (“Pillar Two”), and various governments around the world have passed, or are in the process of passing, legislation on this. Certain Pillar Two rules take effect in 2024 and 2025, depending on whether a particular jurisdiction has integrated the legislation into local law. The Company is continuing to monitor these impacts on its operating footprint and anticipates an increase in income tax expense associated with jurisdictions that have implemented an income inclusion rule or a Qualifying Minimum Top-up Tax (“QDMTT”). The Company is continuing to monitor and assess the impacts of rules set to take effect in 2025, such as the under-taxed profits rule. The impacts of Pillar Two to the Company are subject to change based on expansion and future acquisitions within jurisdictions that the Company does not currently operate.
14.Lease Agreements
The Company provides hardware, including terminals and point-of-sale equipment, to its merchants under operating leases as the lessor. The Company’s operating leases generally include options to extend the contract for successive one-year periods. Extension options are not included in the determination of lease income unless, at lease inception, it is reasonably certain that the option will be exercised. The Company’s operating leases do not include purchase options.
Lease payments received are recognized as income on a straight-line basis over the term of the agreement in accordance with ASC 606 and classified as gross revenue on the Company’s unaudited Condensed Consolidated Statements of Operations.
Total lease income for the three and six months ended June 30, 2024 was $6.6 million and $12.0 million, respectively, and $5.2 million and $10.5 million for the three and six months ended June 30, 2023, respectively.
The Company expects to receive future minimum lease payments for hardware provided under the Company’s SaaS agreements of $16.0 million from July 1, 2024 through June 30, 2025.
15.Related Party Transactions
The Company has a service agreement with Jared Isaacman, the Company’s Chief Executive Officer and founder (“Founder”), including access to aircrafts and a property. Total expense for this service, which is included in “General and administrative expenses” in the Company’s unaudited Condensed Consolidated Statements of Operations, was $0.3 million and $0.5 million for the three and six months ended both June 30, 2024, and 2023. There were no amounts outstanding at June 30, 2024 or December 31, 2023. In addition, during the six months ended June 30, 2024, the Company made $2.0 million of distributions related to income taxes paid on behalf of Rook, which are included in “Distributions to noncontrolling interests” in the Company’s unaudited Condensed Consolidated Statements of Cash Flows.
In November 2021, the Company implemented a one-time discretionary equity award program for non-management employees. The Founder agreed to fund 50% of this program through a contribution of shares of his Class C common stock. As of June 30, 2024, the expected contribution from the Founder totaled 592,219 shares of his Class C common stock. The one-time discretionary equity award program will vest in three equal installments annually beginning in 2024. Vesting of the awards is subject to the continued employment of non-management employees.
Rook has entered into margin loan agreements, pursuant to which, in addition to other collateral, it has pledged LLC Interests and shares of the Company’s Class A and Class B common stock (collectively, “Rook Units”) to secure a margin loan. If Rook were to default on its obligations under the margin loan and fail to cure such default, the lender would have the right to exchange and sell up to 15,000,000 Rook units to satisfy Rook’s obligation.
In September 2021, the Founder, through a wholly-owned special purpose vehicle (“SPV”), entered into two variable prepaid forward contracts (“VPF Contracts”) with an unaffiliated dealer (“Dealer”), one covering approximately 2.18 million shares of the Company’s Class A common stock and the other covering approximately 2.26 million shares of the Company’s Class A common stock. The VPF Contracts both settle on specified dates in June, July, August and September 2024, at which time the actual number of shares of the Company’s Class A common stock to be delivered by the SPV will be determined based on the price of the Company’s Class A common stock on such dates relative to the forward floor price of approximately $66.424 per share and the forward cap price of approximately $112.09 per share for the contract covering approximately 2.18 million shares of the Company’s Class A common stock, and to the forward floor price of $66.424 per share and the forward cap price of approximately $120.39 per share for the contract covering approximately 2.26 million shares of the Company’s Class A common stock, with the aggregate number not to exceed approximately 4.44 million shares, which is the aggregate number of shares of the Company’s Class B common stock and LLC Interests pledged by Rook to secure its obligations under the contracts. Subject to certain conditions, the SPV can also elect to settle the VPF Contracts in cash and thereby retain full ownership of the pledged shares and units. During the six months ended June 30, 2024, 80,915 shares of the Company’s Class B common stock owned by the SPV were effectively converted to Class A common stock and delivered to the SPV through the VPF Contracts.
If Rook were to default on its obligations under the VPF Contracts and fail to cure such default, the Dealer would have the right to exchange the pledged Class B common stock and LLC Interests for an equal number of the Company’s Class A common stock, and sell such Class A common stock to satisfy Rook’s obligation.
16.Commitments and Contingencies
From time to time, the Company may become involved in various lawsuits and legal proceedings, which arise in the ordinary course of business. However, litigation is subject to inherent uncertainties, and an adverse result in these, or other matters, may arise from time to time that may harm the Company’s business.
On August 18, 2023, a shareholder filed a putative securities class action against the Company and certain of its current and former executive officers in the U.S. District Court for the Eastern District of Pennsylvania, captioned O’Meara v. Shift4 Payments, Inc., et al., Case No. 5:23-cv-03206-JFL (the “O’Meara Action”). Plaintiff O’Meara seeks to represent purchasers of the Company’s securities between November 10, 2021 and April 18, 2023. On October 13, 2023, another shareholder represented by the same law firm as O’Meara filed a similar complaint against the same defendants in the same court, captioned Baer v. Shift4 Payments, Inc., et al., Case No. 5:23-cv-03969-JFL (the “Baer Action”). Plaintiff Baer seeks to represent purchasers of the Company’s securities between June 5, 2020, and April 18, 2023. Both complaints allege violations of Sections 10(b) and 20(a) of the Securities Exchange Act of 1934 and Rule 10b-5 promulgated thereunder, based on allegedly false and misleading statements about the Company’s business, operations, and compliance policies, and both seek unspecified damages. On October 19, 2023, Plaintiff Baer filed a motion to consolidate the O’Meara Action and the Baer Action and appoint Baer as lead plaintiff.
On November 3, 2023, the court consolidated the O’Meara and Baer Actions and appointed Plaintiff Baer as the lead plaintiff in the consolidated action. Lead Plaintiff Baer and Plaintiff O’Meara filed an amended complaint on January 5, 2024, purportedly brought on behalf of purchasers of the Company’s securities between June 5, 2020 and April 18, 2023, and alleging violations of Sections 10(b) and 20(a) of the Securities Exchange Act of 1934 and Rule 10b-5 promulgated thereunder, based on allegedly false and misleading statements about the Company’s business, operations, and compliance policies. The Company moved to dismiss the consolidated amended complaint on February 19, 2024. A hearing is not yet scheduled on the Company’s motion to dismiss.
The Company disputes the allegations in the above-referenced matters, intends to defend the matters vigorously, and believes that the claims are without merit. Certain legal and regulatory proceedings, such as the above-referenced matters, may be based on complex claims involving substantial uncertainties and unascertainable damages. Accordingly, it is not possible to determine the probability of loss or estimate damages for any of the above matters, and therefore, the Company has not established reserves for any of these proceedings. When the Company determines that a loss is both probable and reasonably estimable, the Company records a liability, and, if the liability is material, discloses the amount of the liability reserved. Given that such proceedings are subject to uncertainty, there can be no assurance that such legal proceedings, either individually or in the aggregate, will not have a material adverse effect on our business, results of operations, financial condition or cash flows.
The Company is currently not aware of any legal proceedings or claims other than those described above that the Company believes could have a material adverse effect on its business, financial condition or operating results.
17.Stockholders’ Equity
Stock Repurchases
May 2024 Program
In May 2024, the Company’s Board of Directors (the “Board”) authorized a new stock repurchase program (the “May 2024 Program”), pursuant to which the Company is authorized to repurchase up to $500.0 million of its Class A common stock through December 31, 2025. The May 2024 Program replaced the Company’s prior stock repurchase program from December 2023. As of June 30, 2024, $484.2 million remains available under the May 2024 Program.
Repurchases under the May 2024 Program may be made in the open market, in privately negotiated transactions or otherwise, with the amount and timing of repurchases depending on market conditions and corporate needs. Open market repurchases will be structured to occur within the pricing and volume requirements of Rule 10b-18. The Company may also, from time to time, enter into Rule 10b5-1 plans to facilitate repurchases of its shares pursuant to the May 2024 Program.
The May 2024 Program does not obligate the Company to acquire any particular amount of common stock. The May 2024 Program may be extended, modified, suspended or discontinued at any time at the Company’s discretion.
During the three and six months ended June 30, 2024, the Company repurchased 230,400 shares of Class A common stock for $15.9 million, including commissions paid, at an average price paid of $68.79 per share. During the three and six months ended June 30, 2023, the Company repurchased 1,515,000 shares of Class A common stock for $97.3 million, including commissions paid and accrued excise tax, at an average price paid of $63.89 per share.
18.Noncontrolling Interests
Shift4 Payments, Inc. is the sole managing member of Shift4 Payments, LLC, and consolidates the financial results of Shift4 Payments, LLC. The noncontrolling interests balance represents the economic interest in Shift4 Payments, LLC held by Rook, which amounted to $232.1 million and $215.1 million as of June 30, 2024 and December 31, 2023, respectively. The following table summarizes the ownership of LLC Interests in Shift4 Payments, LLC:
| | | | | | | | | | | | | | | | | | | | | | | |
| June 30, 2024 | | December 31, 2023 |
| LLC Interests | | Ownership % | | LLC Interests | | Ownership % |
| Shift4 Payments, Inc. (a) | 66,091,025 | | | 73.6 | % | | 66,100,484 | | | 73.5 | % |
| Rook | 23,750,968 | | | 26.4 | % | | 23,831,883 | | | 26.5 | % |
| Total | 89,841,993 | | | 100.0 | % | | 89,932,367 | | | 100.0 | % |
(a) June 30, 2024 and December 31, 2023 included 2.4 million and 3.7 million shares, respectively, related to the acquisition of Finaro that had been committed but not issued. These shares will be issued over the course of 2024, in accordance with the terms of the acquisition.
Rook has the right to require the Company to redeem their LLC Interests for, at the option of the Company, determined solely by the Company’s independent directors, newly-issued shares of Class A common stock on a one-for-one basis or a cash payment equal to a volume weighted average market price of one share of Class A common stock for each LLC Interest redeemed. In connection with the exercise of the redemption or exchange of LLC Interests, (1) Rook will be required to surrender a number of shares of Class B common stock, which the Company will cancel for no consideration on a one-for-one basis with the number of LLC Interests so redeemed or exchanged and (2) Rook will surrender LLC Interests to Shift4 Payments, LLC for cancellation.
In June 2024, the Company acquired 74% of the common stock of Vectron, a German corporation providing POS systems, POS software, and digital and cloud-based services worldwide. The acquisition was accounted for as a business combination under ASC 805. The Company consolidates 100% of Vectron’s assets, liabilities, revenues and expenses. The noncontrolling interests balance represents the 26% economic interest in Vectron not held by the Company, which amounted to $25.9 million as of June 30, 2024 and was calculated as the number of shares of Vectron’s common stock not owned by the Company, multiplied by the market price of Vectron’s common stock.
19.Equity-based Compensation
The Company recognized equity-based compensation expense of $14.3 million and $37.1 million for the three and six months ended June 30, 2024, respectively, and $13.1 million and $34.0 million for the three and six months ended June 30, 2023, respectively.
2020 Incentive Award Plan
The Company’s 2020 Incentive Award Plan, as amended and restated in June 2022 (the “Restated Equity Plan”), provides for the grant of restricted stock units (“RSUs”), performance restricted stock units (“PRSUs”), stock options, restricted stock dividend equivalents, stock payments, stock appreciation rights, and other stock or cash awards. The number of shares available for issuance is subject to an annual increase on the first day of each year beginning in 2023 and ending in and including 2032, equal to the lesser of (1) 2% of the shares outstanding (on an as-converted basis, taking into account any and all securities convertible into, or exercisable, exchangeable or redeemable for, shares of Class A common stock (including LLC Interests of Shift4 Payments, LLC)) on the last day of the immediately preceding fiscal year and (2) such smaller number of shares as determined by the Board.
As of June 30, 2024, a maximum of 1,764,471 shares of the Company’s Class A common stock were available for issuance under the Restated Equity Plan.
RSUs and PRSUs
RSUs and PRSUs represent the right to receive shares of the Company’s Class A common stock at a specified date in the future.
The RSU and PRSU activity for the six months ended June 30, 2024 was as follows:
| | | | | | | | | | | |
| Six Months Ended June 30, 2024 |
Number of RSUs and PRSUs | | Weighted Average
Grant Date
Fair Value |
| Unvested balance at December 31, 2023 | 2,345,210 | | | $ | 57.35 | |
| Granted | 1,057,336 | | | 66.54 | |
| Vested | (308,251) | | | 68.80 | |
| Forfeited or cancelled | (189,289) | | | 60.94 | |
| Unvested balance at June 30, 2024 | 2,905,006 | | | $ | 59.19 | |
The grant date fair value of RSUs and PRSUs subject to continued service or those that vest immediately was determined based on the price of the Company’s Class A common stock on the grant date.
As of June 30, 2024, the Company had $117.0 million of total unrecognized equity-based compensation expense related to outstanding RSUs and PRSUs, which is expected to be recognized over a weighted-average period of 2.39 years.
20.Basic and Diluted Net Income per Share
Basic net income per share has been computed by dividing net income attributable to common shareholders by the weighted average number of shares of common stock outstanding for the same period. Shares issued during the period and shares reacquired during the period are weighted for the portion of the period in which the shares were outstanding. Diluted net income per share has been computed in a manner consistent with that of basic net income per share while giving effect to all shares of potentially dilutive common stock that were outstanding during the period. The following table presents the calculation of basic and diluted net income per share under the two-class method.
| | | | | | | | | | | | | | | | | | | | | | | |
| Three Months Ended June 30, | | Six Months Ended June 30, |
| 2024 | | 2023 | | 2024 | | 2023 |
| Net income | $ | 54.5 | | | $ | 36.8 | | | $ | 83.0 | | | $ | 57.2 | |
| Less: Net income attributable to noncontrolling interests | (15.3) | | | (11.7) | | | (23.2) | | | (17.3) | |
| | | | | | | |
| | | | | | | |
| Net income attributable to Shift4 Payments, Inc. and common stockholders | $ | 39.2 | | | $ | 25.1 | | | $ | 59.8 | | | $ | 39.9 | |
| | | | | | | |
| Numerator - allocation of net income attributable to common stockholders: | | | | | | | |
| Net income allocated to Class A common stock - basic | $ | 38.1 | | | $ | 24.2 | | | $ | 58.2 | | | $ | 38.4 | |
| Reallocation of net income attributable to common stockholders due to effect of dilutive securities | 0.2 | | | 0.2 | | | 0.4 | | | 0.2 | |
| Net income allocated to Class A common stock - diluted | $ | 38.3 | | | $ | 24.4 | | | $ | 58.6 | | | $ | 38.6 | |
| | | | | | | |
| Net income allocated to Class C common stock - basic | $ | 1.1 | | | $ | 0.9 | | | $ | 1.6 | | | $ | 1.5 | |
| Reallocation of net income attributable to common stockholders due to effect of dilutive securities | — | | | — | | | — | | | (0.1) | |
| Net income allocated to Class C common stock - diluted | $ | 1.1 | | | $ | 0.9 | | | $ | 1.6 | | | $ | 1.4 | |
| | | | | | | |
| Denominator: | | | | | | | |
| Weighted average shares of Class A common stock outstanding - basic (a) | 64,438,168 | | | 56,914,370 | | | 64,441,324 | | | 56,079,923 | |
| Effect of dilutive securities: | | | | | | | |
| | | | | | | |
| RSUs | 1,126,649 | | | 1,259,254 | | | 1,322,199 | | | 1,364,146 | |
| | | | | | | |
| | | | | | | |
| Weighted average shares of Class A common stock outstanding - diluted | 65,564,817 | | | 58,173,624 | | | 65,763,523 | | | 57,444,069 | |
| | | | | | | |
| Weighted average shares of Class C common stock outstanding - basic and diluted | 1,689,805 | | | 2,061,569 | | | 1,692,360 | | | 2,151,111 | |
| | | | | | | |
| Net income per share - Basic: | | | | | | | |
| Class A common stock | $ | 0.59 | | | $ | 0.43 | | | $ | 0.90 | | | $ | 0.68 | |
| Class C common stock | $ | 0.59 | | | $ | 0.43 | | | $ | 0.90 | | | $ | 0.68 | |
| Net income per share - Diluted: | | | | | | | |
| Class A Common Stock | $ | 0.58 | | | $ | 0.42 | | | $ | 0.89 | | | $ | 0.67 | |
| Class C Common Stock | $ | 0.58 | | | $ | 0.42 | | | $ | 0.89 | | | $ | 0.67 | |
(a) For the three and six months ended June 30, 2024, included 2,457,923 shares that had been committed but not issued as of June 30, 2024. For the three and six months ended June 30, 2023, included 25,293 shares that had been committed but not issued as of June 30, 2023. Committed but not issued shares as of June 30, 2024 primarily relate to the acquisition of Finaro.
The following were excluded from the calculation of diluted net income per share as the effect would be anti-dilutive:
| | | | | | | | | | | | | | | | | | | | | | | |
| Three Months Ended June 30, | | Six Months Ended June 30, |
| 2024 | | 2023 | | 2024 | | 2023 |
| LLC Interests that convert into potential Class A common shares | 23,830,105 | | | 23,852,259 | | | 23,830,994 | | | 24,688,216 | |
| RSUs | 224,906 | | | 60,958 | | | 112,453 | | | 60,958 | |
| | | | | | | |
| Total | 24,055,011 | | | 23,913,217 | | | 23,943,447 | | | 24,749,174 | |
Diluted EPS was computed using the treasury stock method for RSUs and the if-converted method for convertible instruments.
For the three and six months ended June 30, 2024, the Company has excluded from the calculation of diluted net income per share the effect of the following:
•the conversion of the 2025 Convertible Notes and 2027 Convertible Notes, as the last reported sales price of the Company’s Class A common stock was less than the conversion price, per the terms of each respective agreement, and
•shares of the Company’s Class A common stock to be issued in connection with Tranche 2 of the earnout due to the former shareholders of Online Payments Group. See Note 12 for more information about shares to be issued in connection with earnouts.
For the three and six months ended June 30, 2023, the Company has excluded from the calculation of diluted net income per share the effect of the following:
•the conversion of the 2025 Convertible Notes and 2027 Convertible Notes, as the last reported sales price of the Company’s Class A common stock was less than the conversion price, per the terms of each respective agreement, and
•shares of the Company’s Class A common stock to be issued in connection with the earnouts due to the former shareholders of Online Payments Group and certain restaurant technology partners. See Note 12 for more information about shares to be issued in connection with earnouts.
ITEM 2. MANAGEMENT’S DISCUSSION AND ANALYSIS OF FINANCIAL CONDITION AND RESULTS OF OPERATIONS
The following discussion and analysis of our financial condition and results of operations should be read in conjunction with the information presented in our unaudited condensed consolidated financial statements and the related notes and other financial data included elsewhere in this Quarterly Report on Form 10-Q (“Quarterly Report”), as well as our audited consolidated financial statements and related notes as disclosed in our Annual Report on Form 10-K for the fiscal year ended December 31, 2023, filed with the U.S. Securities and Exchange Commission (“SEC”) on February 29, 2024 (the “2023 Form 10-K”). In addition to historical information, the following discussion contains forward-looking statements, such as statements regarding our expectation for future performance, liquidity and capital resources, that involve risks, uncertainties and assumptions that could cause actual results to differ materially from our expectations. Our actual results may differ materially from those contained in or implied by any forward-looking statements. Factors that could cause such differences include those identified below and those described in “Cautionary Note Regarding Forward-Looking Statements,” and “Risk Factors” in Part I, Item 1A. of our 2023 Form 10-K. We assume no obligation to update any of these forward-looking statements.
As used in this Quarterly Report, unless the context otherwise requires, references to:
•“we,” “us,” “our,” the “Company,” “Shift4” and similar references refer to Shift4 Payments, Inc. and, unless otherwise stated, all of its subsidiaries.
•“Continuing Equity Owners” refers collectively to Rook and Searchlight Capital Partners, L.P., a Delaware limited partnership, and certain of its affiliated funds, who may redeem at each of their options, in whole or in part from time to time, their LLC Interests for, at our election, cash or newly-issued shares of Shift4 Payments, Inc.’s Class A common stock.
•“LLC Interests” refers to the common units of Shift4 Payments, LLC.
•“Founder” refers to Jared Isaacman, our Chief Executive Officer and the sole stockholder of Rook.
•“Rook” refers to Rook Holdings Inc., a Delaware corporation wholly-owned by our Founder and for which our Founder is the sole stockholder.
Overview
We are a leading independent provider of software and payment processing solutions in the United States (“U.S.”) based on total volume of payments processed. We have achieved our leadership position through decades of solving business and operational challenges facing our customers’ overall commerce needs. Our merchants range in size from small owner-operated local businesses to multinational enterprises conducting commerce throughout the world. We distribute our services through a scaled network of seasoned internal sales and support teams, as well as through our network of software partners. Our software partners are comprised of independent software vendors (“ISVs”) and value-added resellers (“VARs”). For our software partners, we offer a single integration to a global end-to-end payment offering, a proprietary gateway and a robust suite of technology solutions to enhance the value of their software and simplify payment acceptance. For our merchants, we provide a seamless, unified consumer experience and fulfill business needs that would otherwise require multiple software, hardware and payment vendors.
Recent Acquisitions
Revel
On June 13, 2024, we completed the acquisition of Revel Systems, Inc. (“Revel”) and its subsidiaries. Revel offers a cloud-based POS system primarily for multi-location merchants, focusing on restaurants, as well as back office and marketing tools that we believe will strengthen our presence within the restaurant and retail markets.
Vectron
On June 14, 2024, we acquired a majority stake in Vectron Systems AG (“Vectron”). Based in Germany, Vectron is a supplier of POS systems to the restaurant and hospitality verticals and we believe also provides us with local product expertise and a European distribution network of POS resellers.
See Note 2 to the accompanying unaudited condensed consolidated financial statements for more information.
Key Financial Definitions
The following briefly describes the components of revenue and expenses as presented in the accompanying unaudited Condensed Consolidated Statements of Operations.
Gross revenue consists of payments-based revenue and subscription and other revenues:
Payments-based revenue includes fees for payment processing services and gateway services. Payment processing fees are primarily driven as a percentage of end-to-end payment volume. They may also have a fixed fee, a minimum monthly usage fee and a fee based on transactions. Gateway services, data encryption and tokenization fees are primarily driven by per transaction fees as well as monthly usage fees. Included in payments-based revenue are fees earned from our international payments platform, strategic enterprise merchant relationships, and alternative payments methods, including cryptocurrency and stock donations.
Subscription and other revenues include software as a service (“SaaS”) fees for point of sale (“POS”) systems and terminals provided to merchants. POS and terminal SaaS fees are assessed based on the type and quantity of equipment deployed to the merchant. SaaS fees also include statement fees, fees for our proprietary business intelligence software and other annual fees. Subscription and other revenues also includes revenue derived from hardware sales, software license sales, third-party residuals and fees charged for technology support.
Cost of sales consists of interchange and processing fees, residual commissions, equipment and other costs of sales:
Interchange and processing fees represent amounts owed to card issuing banks and assessments paid to card associations based on transaction processing volume. These also include fees incurred by third-parties for data transmission and settlement of funds, such as processors and our sponsor bank.
Residual commissions represent monthly payments to third-party distribution partners. These costs are typically based on a percentage of payments-based revenue.
Equipment represents our costs of devices that are sold to merchants.
Other costs of sales includes amortization of internally developed capitalized software development costs, purchased capitalized software, acquired technology and capitalized customer acquisition costs. It also includes shipping and handling costs related to the delivery of devices. Capitalized software development costs are amortized using the straight-line method on a product-by-product basis over the estimated useful life of the software. Capitalized software, acquired technology and capitalized customer acquisition costs are also amortized on a straight-line basis.
General and administrative expenses consist primarily of compensation, benefits and other expenses associated with corporate management, finance, sales, human resources, shared services, information technology and other activities.
Revaluation of contingent liabilities represents adjustments to the fair value of contingent liabilities associated with acquisitions.
Depreciation and amortization expense consists of depreciation and amortization expenses related to merchant relationships, trademarks and trade names, residual commission buyouts, equipment under lease, leasehold improvements, other intangible assets, and property, plant and equipment. We depreciate and amortize our assets on a straight-line basis. Leasehold improvements are depreciated over the lesser of the estimated life of the leasehold improvement or the remaining lease term. Maintenance and repairs, which do not extend the useful life of the respective assets, are charged to expense as incurred. Intangible assets are amortized on a straight-line basis over their estimated useful lives which range from two years to twenty years.
Professional expenses consists of costs incurred for accounting, tax, legal, and consulting services. These include professional services related to acquisitions.
Advertising and marketing expenses relate to costs incurred to participate in industry tradeshows and dealer conferences, advertising initiatives to build brand awareness, and expenses to fulfill loyalty program rewards earned by software partners.
Interest income primarily consists of interest income earned on our cash and cash equivalents.
Other income (expense), net primarily consists of other non-operating items. This includes transactional gains and losses related to foreign currency.
Unrealized gain (loss) on investments in securities represents adjustments to the fair value of our investments in securities.
Change in TRA liability represents adjustments to the Tax Receivable Agreement (“TRA”) liability.
Interest expense consists of interest costs incurred on our borrowings and amortization of capitalized financing costs.
Income tax benefit represents federal, state, local and foreign income taxes.
Net income attributable to noncontrolling interests arises from net income from the non-owned portion of businesses where we have a controlling interest but less than 100% ownership. This represents the noncontrolling interests in Shift4 Payments, LLC and its consolidated subsidiaries, which is comprised of the income allocated to Continuing Equity Owners as a result of their proportional ownership of LLC Interests. In addition, this represents the income allocated to shareholders of Vectron common stock besides us.
Comparison of Results for the Three Months Ended June 30, 2024 and 2023
The following table sets forth the consolidated statements of operations for the periods presented:
| | | | | | | | | | | | | | | | | | | |
| Three Months Ended June 30, | | | | |
| (in millions) | 2024 | | 2023 | | $ change | | |
| Payments-based revenue | $ | 755.8 | | | $ | 600.1 | | | $ | 155.7 | | | |
| Subscription and other revenues | 71.2 | | | 36.9 | | | 34.3 | | | |
| Gross revenue | 827.0 | | | 637.0 | | | 190.0 | | | |
| Network fees | (506.4) | | | (408.9) | | | (97.5) | | | |
| Other costs of sales (exclusive of certain depreciation and amortization expense shown separately below) | (88.8) | | | (61.2) | | | (27.6) | | | |
| General and administrative expenses | (110.1) | | | (82.1) | | | (28.0) | | | |
| Revaluation of contingent liabilities | (0.3) | | | (5.6) | | | 5.3 | | | |
| Depreciation and amortization expense (a) | (46.7) | | | (35.9) | | | (10.8) | | | |
| Professional expenses | (11.6) | | | (5.4) | | | (6.2) | | | |
| Advertising and marketing expenses | (3.9) | | | (4.0) | | | 0.1 | | | |
| Income from operations | 59.2 | | | 33.9 | | | 25.3 | | | |
| | | | | | | |
| Interest income | 5.0 | | | 8.8 | | | (3.8) | | | |
| Other income (expense), net | 0.4 | | | (0.4) | | | 0.8 | | | |
| Unrealized loss on investments in securities | (0.2) | | | — | | | (0.2) | | | |
| Change in TRA liability | (3.6) | | | (0.8) | | | (2.8) | | | |
| Interest expense | (8.1) | | | (8.0) | | | (0.1) | | | |
| Income before income taxes | 52.7 | | | 33.5 | | | 19.2 | | | |
| Income tax benefit | 1.8 | | | 3.3 | | | (1.5) | | | |
| Net income | 54.5 | | | 36.8 | | | 17.7 | | | |
| Less: Net income attributable to noncontrolling interests | (15.3) | | | (11.7) | | | (3.6) | | | |
| Net income attributable to Shift4 Payments, Inc. | $ | 39.2 | | | $ | 25.1 | | | $ | 14.1 | | | |
(a)Depreciation and amortization expense includes depreciation of equipment under lease of $13.0 million and $8.2 million for the three months ended June 30, 2024 and 2023, respectively.
Results of Operations
Three months ended June 30, 2024 compared to three months ended June 30, 2023
Revenues (in millions)
Gross revenue increased by $190.0 million, or 30%, compared to the prior year period. Gross revenue is comprised of payments-based revenue and subscription and other revenues.
Payments-based revenue increased by $155.7 million, or 26%, compared to the prior year period, primarily due to:
•The increase in end-to-end payment volume of $13.3 billion, or 50%, for the three months ended June 30, 2024 compared to the three months ended June 30, 2023.
•Growth in end-to-end payment volume outpaced payments-based revenue growth, primarily due to our continued onboarding of larger merchants with lower unit pricing than our existing customer base.
Subscription and other revenues increased by $34.3 million, or 93%, compared to the prior year period. The increase in subscription and other revenues was primarily driven by higher SaaS revenue associated with our SkyTab solutions as well as the impact of recent acquisitions.
Cost of Sales
| | | | | | | | | | | | | | | | | | | |
| Three Months Ended June 30, | | | | |
| (in millions) | 2024 | | 2023 | | $ Change | | |
| Network fees | $ | (506.4) | | | $ | (408.9) | | | $ | (97.5) | | | |
The 24% increase in network fees was primarily due to the increase in payments-based revenue, which increased 26%, compared to the prior year period.
Gross revenue less network fees increased by $92.5 million, or 41%, compared to the prior year period, primarily due to the increase in end-to-end payment volume. See Key Performance Indicators and Non-GAAP Measures for a discussion and reconciliation of gross revenue less network fees.
| | | | | | | | | | | | | | | | | | | |
| Three Months Ended June 30, | | | | |
| (in millions) | 2024 | | 2023 | | $ Change | | |
| Other costs of sales (exclusive of certain depreciation and amortization expense) | $ | (88.8) | | | $ | (61.2) | | | $ | (27.6) | | | |
The increase in other costs of sales was primarily driven by our recent acquisitions and incremental residual commissions associated with revenue growth.
Operating Expenses
| | | | | | | | | | | | | | | | | | | |
| Three Months Ended June 30, | | | | |
| (in millions) | 2024 | | 2023 | | $ Change | | |
| General and administrative expenses | $ | (110.1) | | | $ | (82.1) | | | $ | (28.0) | | | |
The increase in general and administrative expenses was primarily due to expenses associated with our growth, which includes the impact of our recent acquisitions.
| | | | | | | | | | | | | | | | | | | |
| Three Months Ended June 30, | | | | |
| (in millions) | 2024 | | 2023 | | $ Change | | |
| Revaluation of contingent liabilities | $ | (0.3) | | | $ | (5.6) | | | $ | 5.3 | | | |
The expense for revaluation of contingent liabilities during the three months ended June 30, 2024 was primarily driven by fair value adjustments to contingent liabilities arising from various acquisitions we completed in 2022 and 2023. There were no significant revaluations during the three months ended June 30, 2024. The expense for revaluation of contingent liabilities during the three months ended June 30, 2023 was primarily driven by the remeasurement of the contingent liability related to the acquisition of Online Payments Group.
| | | | | | | | | | | | | | | | | | | |
| Three Months Ended June 30, | | | | |
| (in millions) | 2024 | | 2023 | | $ Change | | |
| Depreciation and amortization expense | $ | (46.7) | | | $ | (35.9) | | | $ | (10.8) | | | |
The increase in depreciation and amortization expense was primarily due to:
•Increased equipment under lease associated with the growth of our SkyTab offering, and;
•The amortization of intangible assets recognized in connection with recent acquisitions.
| | | | | | | | | | | | | | | | | | | |
| Three Months Ended June 30, | | | | |
| (in millions) | 2024 | | 2023 | | $ Change | | |
| Professional expenses | $ | (11.6) | | | $ | (5.4) | | | $ | (6.2) | | | |
Professional expenses included expenses associated with acquisitions. The increase in professional expenses was primarily driven by higher acquisition-related costs as compared to the prior year period.
| | | | | | | | | | | | | | | | | | | |
| Three Months Ended June 30, | | | | |
| (in millions) | 2024 | | 2023 | | $ Change | | |
| Advertising and marketing expenses | $ | (3.9) | | | $ | (4.0) | | | $ | 0.1 | | | |
Advertising and marketing expenses remained consistent for the three months ended June 30, 2024, compared to the three months ended June 30, 2023.
| | | | | | | | | | | | | | | | | | | |
| Three Months Ended June 30, | | | | |
| (in millions) | 2024 | | 2023 | | $ Change | | |
| Interest income | $ | 5.0 | | | $ | 8.8 | | | $ | (3.8) | | | |
The decrease in interest income was primarily due to a decrease in our average interest-earning cash balance.
| | | | | | | | | | | | | | | | | | | |
| Three Months Ended June 30, | | | | |
| (in millions) | 2024 | | 2023 | | $ Change | | |
| Other income (expense), net | $ | 0.4 | | | $ | (0.4) | | | $ | 0.8 | | | |
The increase in other income was primarily due to transactional gains related to foreign currency in 2024, as compared to losses in 2023.
| | | | | | | | | | | | | | | | | | | |
| Three Months Ended June 30, | | | | |
| (in millions) | 2024 | | 2023 | | $ Change | | |
| Unrealized loss on investments in securities | $ | (0.2) | | | $ | — | | | $ | (0.2) | | | |
Changes in the fair value of investments in securities for the three months ended June 30, 2024 were not significant.
| | | | | | | | | | | | | | | | | | | |
| Three Months Ended June 30, | | | | |
| (in millions) | 2024 | | 2023 | | $ Change | | |
| Change in TRA liability | $ | (3.6) | | | $ | (0.8) | | | $ | (2.8) | | | |
In the future, if we conclude it is probable that we will be able to realize additional tax benefits associated with the TRA, it could result in a material increase to the TRA liability. As of June 30, 2024, we have not recognized the remaining $284.8 million liability under the TRA after concluding it was not probable that we will be able to realize the remaining tax benefits based on estimates of future taxable income. See Note 13 to the accompanying unaudited condensed consolidated financial statements for more information on the TRA.
| | | | | | | | | | | | | | | | | | | |
| Three Months Ended June 30, | | | | |
| (in millions) | 2024 | | 2023 | | $ Change | | |
| Interest expense | $ | (8.1) | | | $ | (8.0) | | | $ | (0.1) | | | |
Interest expense remained consistent for the three months ended June 30, 2024, compared to the three months ended June 30, 2023.
| | | | | | | | | | | | | | | | | | | |
| Three Months Ended June 30, | | | | |
| (in millions) | 2024 | | 2023 | | $ Change | | |
| Income tax benefit | $ | 1.8 | | | $ | 3.3 | | | $ | (1.5) | | | |
|
The effective tax rate for the three months ended June 30, 2024 was approximately (3)%, compared to the effective tax rate for the three months ended June 30, 2023 of approximately (10)%.
The effective tax rate for the three months ended June 30, 2024 was different than the U.S. federal statutory income tax rate of 21% primarily due to the income allocated to the noncontrolling interest, the full valuation allowance on Shift4 Payments, Inc., a $5.2 million tax benefit related to the valuation allowance release on certain corporate subsidiaries, and the lower foreign rate differential in overseas jurisdictions compared to the U.S. federal statutory income tax rate. The effective tax rate for the three months ended June 30, 2023 was different than the U.S. federal statutory income tax rate of 21% primarily due to the income allocated to the noncontrolling interest, the full valuation allowances on Shift4 Payments, Inc. and certain corporate subsidiaries in the U.S., and a $1.5 million tax benefit related to the valuation allowance release due to acquired deferred tax liabilities from Focus POS Systems (“Focus”).
Comparison of Results for the Six Months Ended June 30, 2024 and 2023
The following table sets forth the consolidated statements of operations for the periods presented:
| | | | | | | | | | | | | | | | | | | |
| Six Months Ended June 30, | | | | |
| (in millions) | 2024 | | 2023 | | $ change | | |
| Payments-based revenue | $ | 1,410.9 | | | $ | 1,111.1 | | | $ | 299.8 | | | |
| Subscription and other revenues | 123.5 | | | 72.9 | | | 50.6 | | | |
| Gross revenue | 1,534.4 | | | 1,184.0 | | | 350.4 | | | |
| Network fees | (950.1) | | | (755.9) | | | (194.2) | | | |
| Other costs of sales (exclusive of certain depreciation and amortization expense shown separately below) | (164.7) | | | (115.8) | | | (48.9) | | | |
| General and administrative expenses | (217.2) | | | (167.8) | | | (49.4) | | | |
| Revaluation of contingent liabilities | (2.4) | | | (12.6) | | | 10.2 | | | |
| Depreciation and amortization expense (a) | (91.5) | | | (71.2) | | | (20.3) | | | |
| Professional expenses | (19.6) | | | (11.5) | | | (8.1) | | | |
| Advertising and marketing expenses | (8.3) | | | (6.5) | | | (1.8) | | | |
| Income from operations | 80.6 | | | 42.7 | | | 37.9 | | | |
| | | | | | | |
| Interest income | 10.4 | | | 16.4 | | | (6.0) | | | |
| Other income (expense), net | 1.8 | | | (0.3) | | | 2.1 | | | |
| Unrealized gain on investments in securities | 10.8 | | | 8.9 | | | 1.9 | | | |
| Change in TRA liability | (4.8) | | | (1.3) | | | (3.5) | | | |
| Interest expense | (16.2) | | | (16.1) | | | (0.1) | | | |
| Income before income taxes | 82.6 | | | 50.3 | | | 32.3 | | | |
| Income tax benefit | 0.4 | | | 6.9 | | | (6.5) | | | |
| Net income | 83.0 | | | 57.2 | | | 25.8 | | | |
| Less: Net income attributable to noncontrolling interests | (23.2) | | | (17.3) | | | (5.9) | | | |
| Net income attributable to Shift4 Payments, Inc. | $ | 59.8 | | | $ | 39.9 | | | $ | 19.9 | | | |
(a)Depreciation and amortization expense includes depreciation of equipment under lease of $24.9 million and $15.4 million for the six months ended June 30, 2024 and 2023, respectively.
Results of Operations
Six months ended June 30, 2024 compared to six months ended June 30, 2023
Revenues (in millions)
Gross revenue increased by $350.4 million, or 30%, compared to the prior year period. Gross revenue is comprised of payments-based revenue and subscription and other revenues.
Payments-based revenue increased by $299.8 million, or 27%, compared to the prior year period, primarily due to:
•The increase in end-to-end payment volume of $24.4 billion, or 50%, for the six months ended June 30, 2024 compared to the six months ended June 30, 2023.
•Growth in end-to-end payment volume outpaced payments-based revenue growth, primarily due to our continued onboarding of larger merchants with lower unit pricing than our existing customer base.
Subscription and other revenues increased by $50.6 million, or 69%, compared to the prior year period. The increase in subscription and other revenues was primarily driven by higher SaaS revenue associated with our SkyTab solutions as well as the impact of recent acquisitions.
Cost of Sales
| | | | | | | | | | | | | | | | | | | |
| Six Months Ended June 30, | | | | |
| (in millions) | 2024 | | 2023 | | $ Change | | |
| Network fees | $ | (950.1) | | | $ | (755.9) | | | $ | (194.2) | | | |
The 26% increase in network fees was primarily due to the increase in payments-based revenue, which increased 27%, compared to the prior year period.
Gross revenue less network fees increased by $156.2 million, or 36%, compared to the prior year period, primarily due to the increase in end-to-end payment volume. See Key Performance Indicators and Non-GAAP Measures for a discussion and reconciliation of gross revenue less network fees.
| | | | | | | | | | | | | | | | | | | |
| Six Months Ended June 30, | | | | |
| (in millions) | 2024 | | 2023 | | $ Change | | |
| Other costs of sales (exclusive of certain depreciation and amortization expense) | $ | (164.7) | | | $ | (115.8) | | | $ | (48.9) | | | |
The increase in other costs of sales was primarily driven by our recent acquisitions and incremental residual commissions associated with revenue growth.
Operating Expenses
| | | | | | | | | | | | | | | | | | | |
| Six Months Ended June 30, | | | | |
| (in millions) | 2024 | | 2023 | | $ Change | | |
| General and administrative expenses | $ | (217.2) | | | $ | (167.8) | | | $ | (49.4) | | | |
The increase in general and administrative expenses was primarily due to expenses associated with our growth, which includes the impact of our recent acquisitions.
| | | | | | | | | | | | | | | | | | | |
| Six Months Ended June 30, | | | | |
| (in millions) | 2024 | | 2023 | | $ Change | | |
| Revaluation of contingent liabilities | $ | (2.4) | | | $ | (12.6) | | | $ | 10.2 | | | |
The expense for revaluation of contingent liabilities during the six months ended June 30, 2024 was primarily driven by fair value adjustments to contingent liabilities arising from various acquisitions we completed in 2022 and 2023. The expense for revaluation of contingent liabilities during the six months ended June 30, 2023 was primarily driven by the remeasurement of the contingent liability related to the acquisition of Online Payments Group.
| | | | | | | | | | | | | | | | | | | |
| Six Months Ended June 30, | | | | |
| (in millions) | 2024 | | 2023 | | $ Change | | |
| Depreciation and amortization expense | $ | (91.5) | | | $ | (71.2) | | | $ | (20.3) | | | |
The increase in depreciation and amortization expense was primarily due to:
•Increased equipment under lease associated with the growth of our SkyTab offering, and
•The amortization of intangible assets recognized in connection with recent acquisitions.
| | | | | | | | | | | | | | | | | | | |
| Six Months Ended June 30, | | | | |
| (in millions) | 2024 | | 2023 | | $ Change | | |
| Professional expenses | $ | (19.6) | | | $ | (11.5) | | | $ | (8.1) | | | |
Professional expenses included expenses associated with acquisitions. The increase in professional expenses was primarily driven by higher acquisition-related costs as compared to the prior year period.
| | | | | | | | | | | | | | | | | | | |
| Six Months Ended June 30, | | | | |
| (in millions) | 2024 | | 2023 | | $ Change | | |
| Advertising and marketing expenses | $ | (8.3) | | | $ | (6.5) | | | $ | (1.8) | | | |
The increase in advertising and marketing expenses was primarily due to higher marketing and sponsorship expenses.
| | | | | | | | | | | | | | | | | | | |
| Six Months Ended June 30, | | | | |
| (in millions) | 2024 | | 2023 | | $ Change | | |
| Interest income | $ | 10.4 | | | $ | 16.4 | | | $ | (6.0) | | | |
The decrease in interest income was primarily due to a decrease in our average interest-earning cash balance.
| | | | | | | | | | | | | | | | | | | |
| Six Months Ended June 30, | | | | |
| (in millions) | 2024 | | 2023 | | $ Change | | |
| Other income (expense), net | $ | 1.8 | | | $ | (0.3) | | | $ | 2.1 | | | |
The increase in other income was primarily due to transactional gains related to foreign currency in 2024, as compared to losses in 2023.
| | | | | | | | | | | | | | | | | | | |
| Six Months Ended June 30, | | | | |
| (in millions) | 2024 | | 2023 | | $ Change | | |
| Unrealized gain on investments in securities | $ | 10.8 | | | $ | 8.9 | | | $ | 1.9 | | | |
The unrealized gain on investments in securities for both the six months ended June 30, 2024 and 2023 was primarily due to fair value adjustments to our non-marketable equity investment in Space Exploration Technologies Corp, commonly known as SpaceX.
| | | | | | | | | | | | | | | | | | | |
| Six Months Ended June 30, | | | | |
| (in millions) | 2024 | | 2023 | | $ Change | | |
| Change in TRA liability | $ | (4.8) | | | $ | (1.3) | | | $ | (3.5) | | | |
In the future, if we conclude it is probable that we will be able to realize additional tax benefits associated with the TRA, it could result in a material increase to the TRA liability. As of June 30, 2024, we have not recognized the remaining $284.8 million liability under the TRA after concluding it was not probable that we will be able to realize the remaining tax benefits based on estimates of future taxable income. See Note 13 to the accompanying unaudited condensed consolidated financial statements for more information on the TRA.
| | | | | | | | | | | | | | | | | | | |
| Six Months Ended June 30, | | | | |
| (in millions) | 2024 | | 2023 | | $ Change | | |
| Interest expense | $ | (16.2) | | | $ | (16.1) | | | $ | (0.1) | | | |
Interest expense remained consistent for the six months ended June 30, 2024, compared to the six months ended June 30, 2023.
| | | | | | | | | | | | | | | | | | | |
| Six Months Ended June 30, | | | | |
| (in millions) | 2024 | | 2023 | | $ Change | | |
| Income tax benefit | $ | 0.4 | | | $ | 6.9 | | | $ | (6.5) | | | |
|
The effective tax rate for the six months ended June 30, 2024 was approximately (0.5)%, compared to the effective tax rate for the six months ended June 30, 2023 of approximately (14)%.
The effective tax rate for the six months ended June 30, 2024 was different than the U.S. federal statutory income tax rate of 21% primarily due to the income allocated to the noncontrolling interest, the full valuation allowance on Shift4 Payments, Inc., a $5.2 million tax benefit related to the valuation allowance release on certain corporate subsidiaries, and the lower foreign rate differential in overseas jurisdictions compared to the U.S. federal statutory income tax rate. The effective tax rate for the six months ended June 30, 2023 was different than the U.S. federal statutory income tax rate of 21% primarily due to the income allocated to the noncontrolling interest, the full valuation allowances on Shift4 Payments, Inc. and certain corporate subsidiaries in the U.S., a $4.8 million tax benefit related to the valuation allowance release due to a legal entity restructuring and a $1.5 million tax benefit related to the valuation allowance release due to acquired deferred tax liabilities from Focus.
Key Performance Indicators and Non-GAAP Measures
The following table sets forth our key performance indicators and non-GAAP measures for the periods presented:
| | | | | | | | | | | | | | | | | | | | | | | |
| Three Months Ended June 30, | | Six Months Ended June 30, |
| (in millions) | 2024 | | 2023 | | 2024 | | 2023 |
| End-to-end payment volume | $ | 40,081.6 | | | $ | 26,793.5 | | | $ | 73,435.9 | | | $ | 49,050.4 | |
| Gross revenue less network fees | 320.6 | | | 228.1 | | | 584.3 | | | 428.1 | |
| EBITDA | 125.5 | | | 82.7 | | | 224.2 | | | 147.6 | |
| Adjusted EBITDA | 162.4 | | | 110.0 | | | 284.1 | | | 199.3 | |
End-to-end payment volume
End-to-end payment volume is defined as the total dollar amount of payments that we deliver for settlement on behalf of our merchants. Included in end-to-end volume are dollars routed via our international payments platform and alternative payment methods, including cryptocurrency and stock donations, plus volume we route to one or more third party merchant acquirers on behalf of strategic enterprise merchant relationships. This volume does not include volume processed through our legacy gateway-only offering.
Gross revenue less network fees, EBITDA and Adjusted EBITDA
We use supplemental measures of our performance which are derived from our consolidated financial information but which are not presented in our condensed consolidated financial statements prepared in accordance with GAAP. These non-GAAP financial measures include: gross revenue less network fees, which includes interchange and assessment fees; earnings before interest expense, interest income, income taxes, depreciation, and amortization (“EBITDA”); and Adjusted EBITDA.
Gross revenue less network fees represents a key performance metric that management uses to measure changes in the mix and value derived from our customer base as we continue to execute our strategy to expand our reach to serve larger, complex merchants.
Adjusted EBITDA is the primary financial performance measure used by management to evaluate its business and monitor results of operations. Adjusted EBITDA represents EBITDA further adjusted for certain non-cash and other nonrecurring items that management believes are not indicative of ongoing operations. These adjustments include acquisition, restructuring and integration costs, revaluation of contingent liabilities, unrealized gains or losses on investments in securities, changes in TRA liability, equity-based compensation expense, and foreign exchange and other nonrecurring items. The financial impact of certain elements of these activities is often significant to our overall financial performance and can adversely affect the comparability of our operating results and investors’ ability to analyze the business from period to period.
We use non-GAAP financial measures to supplement financial information presented on a GAAP basis. We believe that excluding certain items from our GAAP results allows management to better understand our consolidated financial performance from period to period and better project our future consolidated financial performance as forecasts are developed at a level of detail different from that used to prepare GAAP-based financial measures. Moreover, we believe these non-GAAP financial measures provide our stakeholders with useful information to help them evaluate our operating results by facilitating an enhanced understanding of our operating performance and enabling them to make more meaningful period to period comparisons. There are limitations to the use of the non-GAAP financial measures presented in this Quarterly Report. Our non-GAAP financial measures may not be comparable to similarly titled measures of other companies. Other companies, including companies in our industry, may calculate non-GAAP financial measures differently than we do, limiting the usefulness of those measures for comparative purposes.
The non-GAAP financial measures are not meant to be considered as indicators of performance in isolation from, or as a substitute for, financial information prepared in accordance with GAAP, and should be read only in conjunction with financial information presented on a GAAP basis. Reconciliations of gross revenue less network fees, EBITDA and Adjusted EBITDA to its most directly comparable GAAP financial measure are presented below. We encourage you to review the reconciliations in conjunction with the presentation of the non-GAAP financial measures for each of the periods presented. In future periods, we may exclude such items and may incur income and expenses similar to these excluded items.
Reconciliations of gross revenue less network fees, EBITDA and Adjusted EBITDA
The tables below provide reconciliations of gross profit to gross revenue less network fees and net income on a consolidated basis for the periods presented to EBITDA and Adjusted EBITDA.
Gross revenue less network fees:
| | | | | | | | | | | | | | | | | | | | | | | |
| Three Months Ended June 30, | | Six Months Ended June 30, |
| (in millions) | 2024 | | 2023 | | 2024 | | 2023 |
| Gross revenue | $ | 827.0 | | | $ | 637.0 | | | $ | 1,534.4 | | | $ | 1,184.0 | |
| Less: Network fees | (506.4) | | | (408.9) | | | (950.1) | | | (755.9) | |
| Less: Other costs of sales (exclusive of depreciation of equipment under lease) | (88.8) | | | (61.2) | | | (164.7) | | | (115.8) | |
| 231.8 | | | 166.9 | | | 419.6 | | | 312.3 | |
| Less: Depreciation of equipment under lease | (13.0) | | | (8.2) | | | (24.9) | | | (15.4) | |
| Gross profit (a) | $ | 218.8 | | | $ | 158.7 | | | $ | 394.7 | | | $ | 296.9 | |
| | | | | | | |
| Gross profit (a) | $ | 218.8 | | | $ | 158.7 | | | $ | 394.7 | | | $ | 296.9 | |
| Add back: Other costs of sales | 88.8 | | | 61.2 | | | 164.7 | | | 115.8 | |
| Add back: Depreciation of equipment under lease | 13.0 | | | 8.2 | | | 24.9 | | | 15.4 | |
| Gross revenue less network fees | $ | 320.6 | | | $ | 228.1 | | | $ | 584.3 | | | $ | 428.1 | |
(a)The determination of gross profit is inclusive of depreciation of equipment under lease that is included in Depreciation and amortization expense on the Condensed Consolidated Statements of Operations. The table reflects the determination of gross profit for all periods presented. Although gross profit is not presented on the Condensed Consolidated Statements of Operations, it represents the most comparable metric calculated under U.S. GAAP to non-GAAP gross revenues less network fees.
EBITDA and Adjusted EBITDA:
| | | | | | | | | | | | | | | | | | | | | | | |
| | Three Months Ended June 30, | | Six Months Ended June 30, |
| (in millions) | 2024 | | 2023 | | 2024 | | 2023 |
| Net income | $ | 54.5 | | | $ | 36.8 | | | $ | 83.0 | | | $ | 57.2 | |
| Interest expense | 8.1 | | | 8.0 | | | 16.2 | | | 16.1 | |
| Interest income | (5.0) | | | (8.8) | | | (10.4) | | | (16.4) | |
| Income tax benefit | (1.8) | | | (3.3) | | | (0.4) | | | (6.9) | |
| Depreciation and amortization | 69.7 | | | 50.0 | | | 135.8 | | | 97.6 | |
| EBITDA | 125.5 | | | 82.7 | | | 224.2 | | | 147.6 | |
| Acquisition, restructuring and integration costs (a) | 13.7 | | | 5.8 | | | 17.7 | | | 10.1 | |
| Revaluation of contingent liabilities (b) | 0.3 | | | 5.6 | | | 2.4 | | | 12.6 | |
| | | | | | | |
| Unrealized (gain) loss on investments in securities (c) | 0.2 | | | — | | | (10.8) | | | (8.9) | |
| Change in TRA liability (d) | 3.6 | | | 0.8 | | | 4.8 | | | 1.3 | |
| Equity-based compensation (e) | 14.5 | | | 13.7 | | | 37.7 | | | 34.9 | |
| Foreign exchange and other nonrecurring items | 4.6 | | | 1.4 | | | 8.1 | | | 1.7 | |
| Adjusted EBITDA | $ | 162.4 | | | $ | 110.0 | | | $ | 284.1 | | | $ | 199.3 | |
(a)For the three months ended June 30, 2024, consisted of $7.6 million of restructuring costs and $6.1 million of acquisition-related costs. For the six months ended June 30, 2024, primarily consisted of $9.0 million of restructuring costs and $8.7 million of acquisition-related costs. For the three months ended June 30, 2023, primarily consisted of $3.8 million of restructuring costs and $2.0 million of acquisition-related costs. For the six months ended June 30, 2023, primarily consisted of $5.8 million of acquisition-related costs and $4.2 million of restructuring costs.
(b)Consisted of fair value adjustments to contingent liabilities arising from acquisitions.
(c)See Note 12 to the accompanying condensed consolidated financial statements for more information on the investments in non-marketable securities.
(d)See Note 13 to the accompanying condensed consolidated financial statements for more information on the TRA.
(e)Consisted of equity-based compensation expense for RSUs, including employer taxes for vested RSUs. See Note 19 to the accompanying condensed consolidated financial statements for more information on equity-based compensation.
Liquidity and Capital Resources
Overview
We have historically sourced our liquidity requirements primarily with cash flow from operations and, when needed, with debt or equity financing. The principal uses for liquidity have been acquisitions, capital expenditures, share repurchases and debt service. As of June 30, 2024, our cash and cash equivalents balance was $205.0 million, of which approximately $115.9 million was held outside of the U.S. by our foreign legal entities. We also have $74.8 million of funds deposited in a sponsor bank merchant settlement account that is legally restricted and not available for use in operations. This amount is presented as “Restricted cash” in the unaudited condensed consolidated balance sheet. In addition, “Settlement assets” includes $123.5 million of cash that will be used to settle merchant liabilities. The cash included within Settlement assets is typically paid to merchants within a few days of receipt in order to settle related liabilities.
We do not intend to pay cash dividends on our Class A common stock in the foreseeable future. Shift4 Payments, Inc. is a holding company that does not conduct any business operations of its own. As a result, Shift4 Payments, Inc.’s ability to pay cash dividends on its common stock, if any, is dependent upon cash dividends and distributions and other transfers from Shift4 Payments, LLC. The amounts available to Shift4 Payments, Inc. to pay cash dividends are subject to the covenants and distribution restrictions in its subsidiaries’ agreements governing its indebtedness, including covenants in such agreements providing that the payments of dividends or other distributions are subject to annual limitations based on our market capitalization.
The following table sets forth summary cash flow information for the periods presented:
| | | | | | | | | | | |
| Six Months Ended June 30, |
| (in millions) | 2024 | | 2023 |
| Net cash provided by operating activities | $ | 172.8 | | | $ | 171.3 | |
| Net cash used in investing activities | (381.5) | | | (108.0) | |
| Net cash used in financing activities | (100.8) | | | (115.2) | |
| Effect of exchange rate changes on cash and cash equivalents and restricted cash | (9.0) | | | 0.7 | |
| Change in cash and cash equivalents and restricted cash | $ | (318.5) | | | $ | (51.2) | |
Operating activities
Net cash provided by operating activities consists of net income adjusted for certain non-cash items and changes in other assets and liabilities.
For the six months ended June 30, 2024, net cash provided by operating activities of $172.8 million was primarily a result of net income of $83.0 million adjusted for non-cash expenses, including depreciation and amortization of $135.8 million and equity-based compensation of $37.1 million, partially offset by the unrealized gain on investments in securities of $(10.8) million and the impact from settlement activity of $(54.0) million. Settlement assets includes both cash and receivables from card networks. From period to period, the mix of cash and receivables included in Settlement assets may change, driving increases or decreases in operating cash flow.
For the six months ended June 30, 2023, net cash provided by operating activities of $171.3 million was primarily a result of net income of $57.2 million adjusted for non-cash expenses, including depreciation and amortization of $97.6 million, equity-based compensation of $34.0 million, revaluation of contingent liabilities of $12.6 million, and unrealized gain on investments in securities of $(8.9) million. This was partially offset by an impact from working capital items of $(24.0) million.
Investing activities
Net cash used in investing activities includes cash paid for acquisitions, residual commission buyouts, purchases of property, plant and equipment, purchases of equipment to be leased, purchases of intangible assets, investments in securities, and capitalized software development costs.
Net cash used in investing activities was $381.5 million for the six months ended June 30, 2024, an increase of $273.5 million compared to net cash used in investing activities of $108.0 million for the six months ended June 30, 2023. This increase was primarily the result of a $265.1 million increase in net cash paid for acquisitions.
Financing activities
Net cash used in financing activities was $100.8 million for the six months ended June 30, 2024, a decrease of $14.4 million compared to net cash used in financing activities of $115.2 million for the six months ended June 30, 2023. This decrease was primarily due to a $80.9 million decrease in payments for the repurchase of common stock, partially offset by $70.8 million of bank deposits being returned to depositors in 2024.
Convertible Notes, Senior Notes and Revolving Credit Facility
As of June 30, 2024 and December 31, 2023, we had $1,772.5 million total principal amount of debt outstanding, including $690.0 million of 2025 Convertible Notes, $632.5 million of 2027 Convertible Notes, and $450.0 million of 2026 Senior Notes.
Stock repurchases
In May 2024, the Board authorized a new stock repurchase program (the “May 2024 Program”), pursuant to which we are authorized to repurchase up to $500.0 million of our Class A common stock through December 31, 2025. The May 2024 Program replaces our prior stock repurchase program from December 2023. During the six months ended June 30, 2024, we repurchased 230,400 shares of Class A common stock for $15.9 million, including commissions paid, at an average price paid of $68.79 per share. As of June 30, 2024, $484.2 million remains available under the May 2024 Program.
Cash Requirements
We believe that our cash and cash equivalents and future cash flow from operations will be sufficient to fund our operating expenses and capital expenditure requirements for at least the next twelve months and into the foreseeable future based on our current operating plan. Our material cash requirements include the following contractual obligations:
Debt
As of June 30, 2024, we had $1,772.5 million of fixed rate debt principal outstanding with maturities beginning in 2025. Future interest payments associated with the outstanding debt total $63.1 million, with $24.0 million payable within twelve months. In addition, we have $3.8 million of finance lease liabilities.
Contingent Liabilities
As of June 30, 2024, the fair value of contingent liabilities to potentially be paid out in cash was $36.6 million, with $17.5 million payable within twelve months. As of June 30, 2024, the maximum amount of contingent liabilities to potentially be paid out in cash was $56.2 million, with $20.0 million payable within twelve months.
Critical Accounting Estimates
Our discussion and analysis of our historical financial condition and results of operations for the periods described is based on our audited consolidated financial statements, and our accompanying unaudited condensed consolidated financial statements, each of which have been prepared in accordance with U.S. GAAP. The preparation of these historical financial statements in conformity with U.S. GAAP requires management to make estimates, assumptions and judgments in certain circumstances that affect the reported amounts of assets, liabilities and contingencies as of the date of the financial statements and the reported amounts of revenue and expenses during the reporting periods. We evaluate our assumptions and estimates on an ongoing basis. We base our estimates on historical experience and on various other assumptions that we believe to be reasonable under the circumstances, the results of which form the basis for making judgments about the carrying values of assets and liabilities that are not readily apparent from other sources. Actual results may differ from these estimates under different assumptions or conditions. In many cases, the accounting treatment of a particular transaction is specifically dictated by U.S. GAAP and does not require management’s judgment in its application, while in other cases, significant judgment is required in selecting among available alternative accounting standards the allow different accounting treatment for similar transactions. We consider these policies requiring significant management judgment to be critical accounting policies, which are:
•Revenue recognition;
•Business combinations and the valuation of acquired assets and liabilities;
•Impairment assessments;
•Useful lives of equipment for lease, property, plant and equipment, residual commission buyouts, capitalized customer acquisition costs, and intangible assets; and
•Income taxes.
There have been no material changes to our critical accounting estimates from those disclosed in our Annual Report on Form 10-K for the year ended December 31, 2023.
We have provided a summary of our significant accounting policies in Note 1 in the notes to the accompanying unaudited condensed consolidated financial statements.
ITEM 3. QUANTITATIVE AND QUALITATIVE DISCLOSURES ABOUT MARKET RISK
Our future income, cash flows and fair values relevant to financial instruments are subject to risks relating to interest rates.
As of June 30, 2024, we had $1,772.5 million of fixed rate debt principal outstanding with a fair value of $1,813.9 million. Since these notes bear interest at fixed rates, they do not result in any risk associated with changes in interest rates. However, the fair value of these notes can fluctuate as interest rates change. We may be subject to interest rate risk at the time of refinancing any fixed rate debt.
We also have a Revolving Credit Facility available to us with available borrowing capacity of $100.0 million. We are obligated to pay interest on loans under the Revolving Credit Facility as well as other customary fees, including an upfront fee and an unused commitment fee based on our debt rating. Borrowings under the Revolving Credit Facility, if any, bear interest at floating rates. As a result, we are exposed to risks related to fluctuations in interest rates to the extent it impacts our borrowings. As of June 30, 2024 and December 31, 2023, we had no amounts outstanding under the Revolving Credit Facility. See “Liquidity and Capital Resources” in “Management’s Discussion and Analysis of Financial Condition and Results of Operations” in Part I, Item 2. of this Quarterly Report and Note 11 to the accompanying unaudited condensed consolidated financial statements for more information.
ITEM 4. CONTROLS AND PROCEDURES
Limitations on Effectiveness of Disclosure Controls and Procedures
In designing and evaluating our disclosure controls and procedures, management recognizes that any controls and procedures, no matter how well designed and operated, can provide only reasonable assurance of achieving the desired control objectives. In addition, the design of disclosure controls and procedures must reflect the fact that there are resource constraints and that management is required to apply judgment in evaluating the benefits of possible controls and procedures relative to their costs.
Evaluation of Disclosure Controls and Procedures
Our management, with the participation of our principal executive officer and principal financial officer, evaluated, as of the end of the period covered by this Quarterly Report, the effectiveness of our disclosure controls and procedures (as defined in Rules 13a-15(e) and 15d-15(e) under the Exchange Act). Based on that evaluation, our principal executive officer and principal financial officer concluded that, as of June 30, 2024, our disclosure controls and procedures were effective at the reasonable assurance level.
Changes in Internal Control Over Financial Reporting
There were no changes in our internal control over financial reporting (as defined in Rules 13a-15(f) and 15d-15(f) under the Exchange Act) during the quarter ended June 30, 2024 that have materially affected, or are reasonably likely to materially affect, our internal control over financial reporting.
PART II: OTHER INFORMATION
ITEM 1. LEGAL PROCEEDINGS
Our material legal proceedings are described in Part I, Item 1 of this Quarterly Report in the notes to Condensed Consolidated Financial Statements in Note 16, “Commitments and Contingencies.”
ITEM 1A. RISK FACTORS
Investing in our Class A common stock involves a high degree of risk. You should carefully consider the risks described under the heading “Risk Factors” in Part I, Item 1A. of our 2023 Form 10-K, the other information in this Quarterly Report, including our unaudited condensed consolidated financial statements and the related notes, as well as our other public filings with the SEC, before deciding to invest in our Class A common stock. There have been no material changes to the Company’s risk factors previously disclosed in our 2023 Form 10-K, other than the below. The occurrence of any of the events described therein could harm our business, financial condition, results of operations, liquidity or prospects. In such an event, the market price of our Class A common stock could decline, and you may lose all or part of your investment.
Restrictions on Shift4’s dealings with Vectron may delay the implementation of our acquisition strategy and could adversely impact our results of operations.
On June 14, 2024, we acquired a majority stake in Vectron. Based in Germany, Vectron is a supplier of POS systems to the restaurant and hospitality verticals, and we believe provides us with local product expertise and a European distribution network of POS resellers. Under German law, we are subject to certain restrictions in our dealings with Vectron. Until a Domination and/or Profit and Loss Transfer Agreement (“DPLTA”) is established, we will not have control over the day-to-day operations of Vectron. These restrictions could delay the implementation of our strategy and may adversely impact our results of operations. There can be no assurance that a DPLTA will be established.
If Shift4 enters into a DPLTA with Vectron, the Company may be subject to certain risks that could adversely affect its business, financial condition or results of operations.
We intend to enter into a DPLTA with Vectron and its minority shareholders. According to the applicable provisions of the German Stock Corporation Act, under a DPLTA, we would be obligated to compensate any annual net loss of Vectron. Furthermore, each remaining minority Vectron shareholder would have the option to either:
•Remain a Vectron shareholder and receive an adequate fixed or variable annual guaranteed dividend in the case of a domination agreement, or annual recurring compensation in the case of a profit and loss transfer agreement, as stipulated by the German Stock Corporation Act.
•Receive adequate exit compensation in exchange for their Vectron shares, in accordance with the provisions of the German Stock Corporation Act.
Vectron shareholders choosing the first option may later elect the second option for as long as the offer for the exit compensation remains open. Our obligation to pay an adequate fixed or variable annual guaranteed dividend or annual recurring compensation could result in a continuous payment obligation that may be higher than the dividends otherwise distributed to Vectron’s shareholders.
ITEM 2. UNREGISTERED SALES OF EQUITY SECURITIES AND USE OF PROCEEDS
| | | | | | | | | | | | | | | | | | | | | | | | | | |
| Period | | Total Number of Shares Purchased | | Average Price Paid Per Share | | Total Number of Shares Purchased as Part of Publicly Announced Plans or Programs (a) | | Approximate Dollar Value of Shares that May Yet Be Purchased under the Plans or Programs (in millions) |
| April 1, 2024 through April 30, 2024 | | — | | | — | | | — | | | N/A |
| May 1, 2024 through May 31, 2024 | | 128,900 | | | $ | 67.00 | | | 128,900 | | | $ | 491.4 | |
| June 1, 2024 through June 30, 2024 | | 101,500 | | | 71.07 | | | 101,500 | | | 484.2 | |
| Total | | 230,400 | | | | | | | |
|
(a) On May 8, 2024, our Board authorized a stock repurchase program, pursuant to which we were authorized to repurchase up to $500.0 million of our Class A common stock through December 31, 2025, subject to the terms of the program, market conditions, contractual restrictions and other factors. Repurchases under the program may be made in the open market, in privately negotiated transactions or otherwise, with the amount and timing of repurchases depending on market conditions and corporate needs, subject to the terms of the program. Open market repurchases will be structured to occur within the pricing and volume requirements of Rule 10b-18 under the Exchange Act. We may also, from time to time, enter into Rule 10b5-1 trading arrangements under the Exchange Act to facilitate repurchases of its shares of common stock under this authorization. This program does not obligate us to acquire any new particular amount of common stock. The program replaces any and all prior repurchase programs, and the program may be extended, modified, suspended or discontinued at any time at our Board’s discretion. |
ITEM 3. DEFAULTS UPON SENIOR SECURITIES
None.
ITEM 4. MINE SAFETY DISCLOSURES
Not applicable.
ITEM 5. OTHER INFORMATION
(a) Disclosure in lieu of reporting on a Current Report on Form 8-K.
None.
(b) Material changes to the procedures by which security holders may recommend nominees to the board of directors.
None.
(c) Insider trading arrangements and policies.
On June 14, 2024, Nancy Disman, our Chief Financial Officer, entered into a trading plan pursuant to Rule 10b5-1 of the Exchange Act. Ms. Disman’s Rule 10b5-1 trading plan provides for the sale from time to time of a maximum of 27,592 shares of our Class A common stock pursuant to the terms of the plan. Ms. Disman’s Rule 10b5-1 trading plan expires on September 12, 2025, or earlier if all transactions under the trading arrangement are completed. The trading arrangement is intended to satisfy the affirmative defense in Rule 10b5-1(c).
On June 14, 2024, Jordan Frankel, our Secretary, General Counsel and Executive Vice President, Legal, Risk and Compliance, entered into a trading plan pursuant to Rule 10b5-1 of the Exchange Act. Mr. Frankel’s Rule 10b5-1 trading plan provides for the sale from time to time of a maximum of 35,000 shares of our Class A common stock pursuant to the terms of the plan. Mr. Frankel’s Rule 10b5-1 trading plan expires on September 16, 2025, or earlier if all transactions under the trading arrangement are completed. The trading arrangement is intended to satisfy the affirmative defense in Rule 10b5-1(c).
Other than as described above, during the three months ended June 30, 2024, no director or officer of the Company adopted or terminated a “Rule 10b5-1 trading arrangement” or “non-Rule 10b5-1 trading arrangement,” as each term is defined in Item 408(a) of Regulation S-K.
ITEM 6. EXHIBITS
The following is a list of exhibits filed as part of this Quarterly Report.
INDEX TO EXHIBITS
| | | | | | | | | | | | | | | | | | | | | | | | | | | | | | | | | | | | | | |
| | | | | Incorporated by Reference | | |
Exhibit Number | | Exhibit Description | | Form | | File No. | | Exhibit | | Filing Date | | Filed/Furnished Herewith |
| | | | | | | | | | | | | |
| 3.1 | | | | S-8 | | 333-239042 | | 4.1 | | 06/09/2020 | | |
| | | | | | | | | | | | | |
| 3.2 | | | | S-8 | | 333-239042 | | 4.2 | | 06/09/2020 | | |
| | | | | | | | | | | | | |
| 4.1 | | | | S-1/A | | 333-238307 | | 4.1 | | 06/01/2020 | | |
| | | | | | | | | | | | |
| 4.2 | | | | 8-K | | 001-39313 | | 4.1 | | 10/29/2020 | | |
| | | | | | | | | | | | |
| 4.3 | | | | 8-K | | 001-39313 | | 4.1 | | 12/07/2020 | | |
| | | | | | | | | | | | | |
| 4.4 | | | | 8-K | | 001-39313 | | 4.1 | | 07/26/2021 | | |
| | | | | | | | | | | | |
| 4.5 | | | | 10-Q | | 001-39313 | | 4.5 | | 05/06/2022 | | |
| | | | | | | | | | | | |
| 31.1 | | | | | | | | | | | | * |
| | | | | | | | | | | | | |
| 31.2 | | | | | | | | | | | | * |
| | | | | | | | | | | | | |
| 32.1 | | | | | | | | | | | | ** |
| | | | | | | | | | | | | |
| 32.2 | | | | | | | | | | | | ** |
| | | | | | | | | | | | | |
| 101.INS | | Inline XBRL Instance Document - the instance document does not appear in the Interactive Data File because its XBRL tags are embedded within the Inline XBRL document. | | | | | | | | | | * |
| | | | | | | | | | | | | |
| 101.SCH | | Inline XBRL Taxonomy Extension Schema Document. | | | | | | | | | | * |
| | | | | | | | | | | | | |
| 101.CAL | | Inline XBRL Taxonomy Extension Calculation Linkbase Document. | | | | | | | | | | * |
| | | | | | | | | | | | | |
| 101.DEF | | Inline XBRL Taxonomy Extension Definition Linkbase Document. | | | | | | | | | | * |
| | | | | | | | | | | | | |
| 101.LAB | | Inline XBRL Taxonomy Extension Label Linkbase Document. | | | | | | | | | | * |
| | | | | | | | | | | | | |
| 101.PRE | | Inline XBRL Taxonomy Extension Presentation Linkbase Document. | | | | | | | | | | * |
| | | | | | | | | | | | |
| 104 | | Cover Page Interactive Data File (formatting as Inline XBRL and contained in Exhibit 101). | | | | | | | | | | * |
| | | | | | | | | | | | |
* Filed herewith. |
** Furnished herewith. |
|
|
SIGNATURES
Pursuant to the requirements of the Securities Exchange Act of 1934, the registrant has duly caused this report to be signed on its behalf by the undersigned thereunto duly authorized.
| | | | | | | | | | | |
| | Shift4 Payments, Inc. |
| | | |
| | | |
| | By: | /s/ Jared Isaacman |
| | | Jared Isaacman |
| Date: | August 8, 2024 | | Chief Executive Officer (principal executive officer) |
| | | |
| | | |
| | By: | /s/ Nancy Disman |
| | | Nancy Disman |
| Date: | August 8, 2024 | | Chief Financial Officer (principal financial officer) |
| | | |
| | | |
| | By: | /s/ James Whalen |
| | | James Whalen |
| Date: | August 8, 2024 | | Chief Accounting Officer (principal accounting officer) |
| | | |
| | | |
| | | |
| | | |