The
COVID-19
pandemic could materially adversely affect our business, financial condition and results of operations.
The
COVID-19
pandemic, the measures attempting to contain and mitigate the effects of the
COVID-19
pandemic, including
business closure, and other restrictive orders, and the resulting changes in consumer behavior, have disrupted our normal operations and impacted our employees, suppliers, partners and customers. We expect these disruptions and impacts to continue until the
COVID-19
pandemic is sufficiently controlled. In response to the
COVID-19
pandemic, we have taken a number of actions that have impacted, and continue to impact, our business, including transitioning employees across all our offices (including our corporate headquarters) to remote work-from-home arrangements and imposing travel and other related restrictions. Given the continued spread of the
COVID-19
pandemic and the resulting personal, economic and governmental reactions, we may have to implement additional measures in the future that could harm our business, financial condition and results of operations. While we have a distributed workforce and our employees are accustomed to working remotely or working with other remote employees, our workforce has not historically been fully remote. Prior to the
COVID-19
pandemic, certain of our employees traveled frequently to establish and maintain relationships with one another and with our customers, partners and investors. We continue to monitor the impacts of the
COVID-19
pandemic and may adjust our current policies as more information and guidance become available. Suspending travel and the lack of doing business
in-person
on a long-term basis could negatively impact our marketing efforts, our ability to enter into subscription deals in a timely manner, our international expansion efforts and our ability to recruit employees across our organization. These changes could negatively impact our sales and marketing in particular, which could have longer-term effects on our sales pipeline, or create operational or other challenges as our workforce remains predominantly remote. Any of these impacts could harm our business. In addition, our management team has spent, and will likely continue to spend, significant time, attention, and resources monitoring the
COVID-19
pandemic and associated global economic uncertainty and seeking to manage its effects on our business and workforce.
In response to the
COVID-19
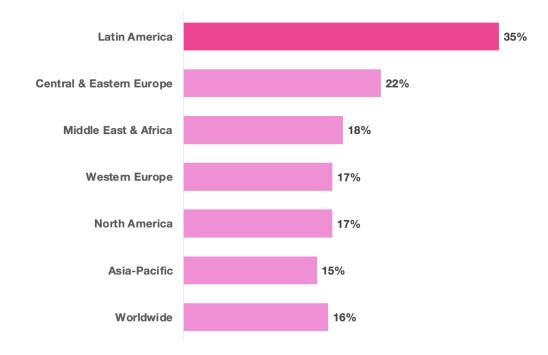
pandemic, governments across the countries in which we operate have instituted lockdowns, social distancing and similar measures to slow infection rates. These restrictions have prompted shifts in sales from traditional
commerce to ecommerce, which has increased usage of our services. When the
COVID-19
pandemic abates, our customers’
end-consumers
may resume purchasing from
stores to the detriment of our customers’ ecommerce stores, and as such, their online channels may experience decreases or decreased growth rates in transactions, which would negatively affect our business, financial condition and operating results. Similarly, once the
COVID-19
pandemic is sufficiently controlled, we may also generally experience decreases or decreased growth rates in sales of new subscriptions plans to customers, as our prospective and existing customers’
end-consumers
may be less inclined to purchase online, which would negatively affect our business, financial condition and operating results.
The degree to which
COVID-19
will affect our business and results of operations will depend on future developments that are highly uncertain and cannot currently be predicted. These developments include, but are not limited to, the duration, extent and severity of the
COVID-19
pandemic, actions taken to contain the
COVID-19
pandemic, the impact of the
COVID-19
pandemic and related restrictions on economic activity and domestic and international trade, and the extent of the impact of these and other factors on our employees, suppliers, partners and customers. The
COVID-19
pandemic and related restrictions could limit our customers’ ability to continue to operate, to obtain inventory, generate sales, or make timely payments to us. It could disrupt or delay the ability of employees to work because they become sick or are required to care for those who become sick, or for dependents for whom external care is not available. It could cause delays or disruptions in services provided by key suppliers and vendors, make us, our partners and our service providers more vulnerable to security breaches, denial of service attacks or other hacking or phishing attacks, or have other unpredictable effects.
The
COVID-19
pandemic has also caused heightened uncertainty in the global economy. If economic conditions further deteriorate, consumers may not have the financial means to make purchases from our customers and may delay or reduce discretionary purchases, negatively impacting our customers and our results of operations. Uncertainty from the
COVID-19
pandemic may cause prospective or existing customers to defer investment in ecommerce. Since the impact of the
COVID-19
pandemic is ongoing, the effect of the
COVID-19
pandemic and the related impact on the global economy may not be fully reflected in our results of operations until future periods. Volatility in the capital markets has been heightened during recent months and such volatility may continue, which may cause declines in the price of our Class A common shares.