| Lowes Katy TX July 2024 Investor Presentation |
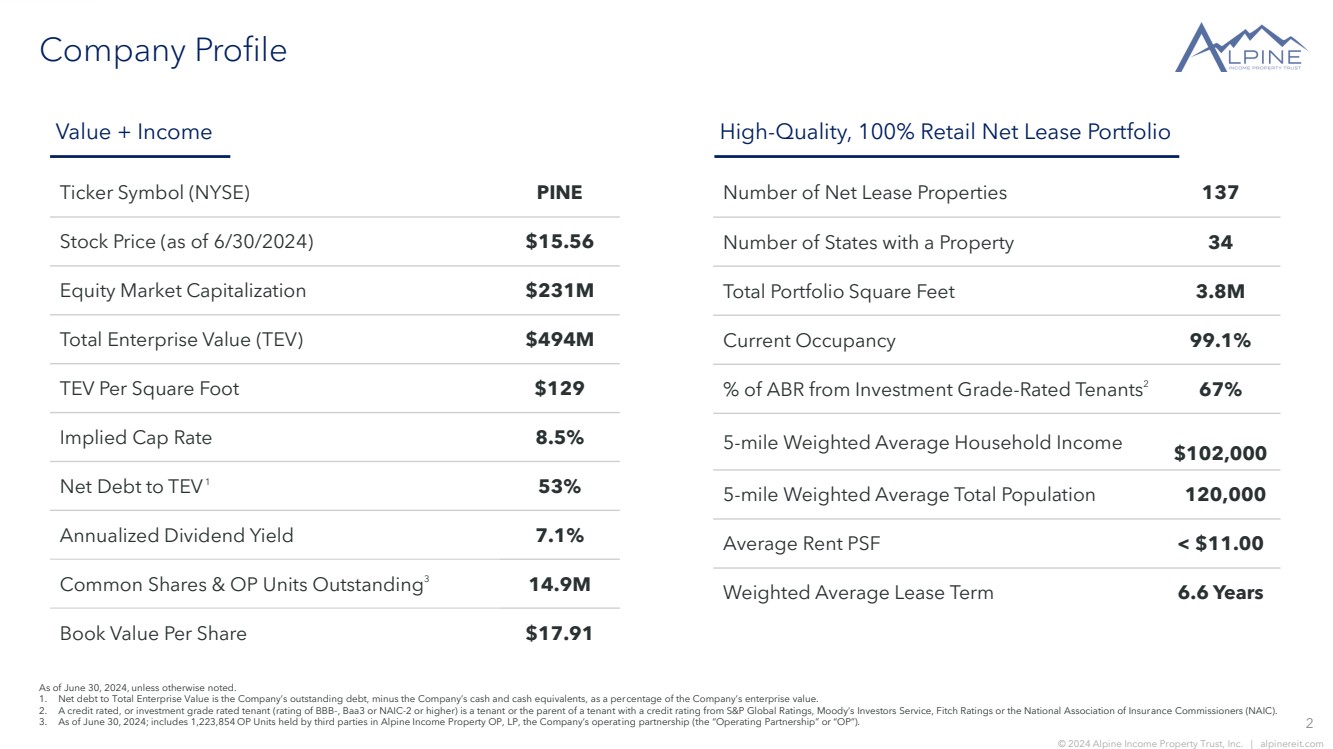
| 2 © 2024 Alpine Income Property Trust, Inc. | alpinereit.com Company Profile Ticker Symbol (NYSE) PINE Stock Price (as of 6/30/2024) $15.56 Equity Market Capitalization $231M Total Enterprise Value (TEV) $494M TEV Per Square Foot $129 Implied Cap Rate 8.5% Net Debt to TEV1 53% Annualized Dividend Yield 7.1% Common Shares & OP Units Outstanding3 14.9M Book Value Per Share $17.91 Number of Net Lease Properties 137 Number of States with a Property 34 Total Portfolio Square Feet 3.8M Current Occupancy 99.1% % of ABR from Investment Grade-Rated Tenants2 67% 5-mile Weighted Average Household Income $102,000 5-mile Weighted Average Total Population 120,000 Average Rent PSF < $11.00 Weighted Average Lease Term 6.6 Years As of June 30, 2024, unless otherwise noted. 1. Net debt to Total Enterprise Value is the Company’s outstanding debt, minus the Company’s cash and cash equivalents, as a percentage of the Company’s enterprise value. 2. A credit rated, or investment grade rated tenant (rating of BBB-, Baa3 or NAIC-2 or higher) is a tenant or the parent of a tenant with a credit rating from S&P Global Ratings, Moody’s Investors Service, Fitch Ratings or the National Association of Insurance Commissioners (NAIC). 3. As of June 30, 2024; includes 1,223,854 OP Units held by third parties in Alpine Income Property OP, LP, the Company’s operating partnership (the “Operating Partnership” or “OP”). Value + Income High-Quality, 100% Retail Net Lease Portfolio |
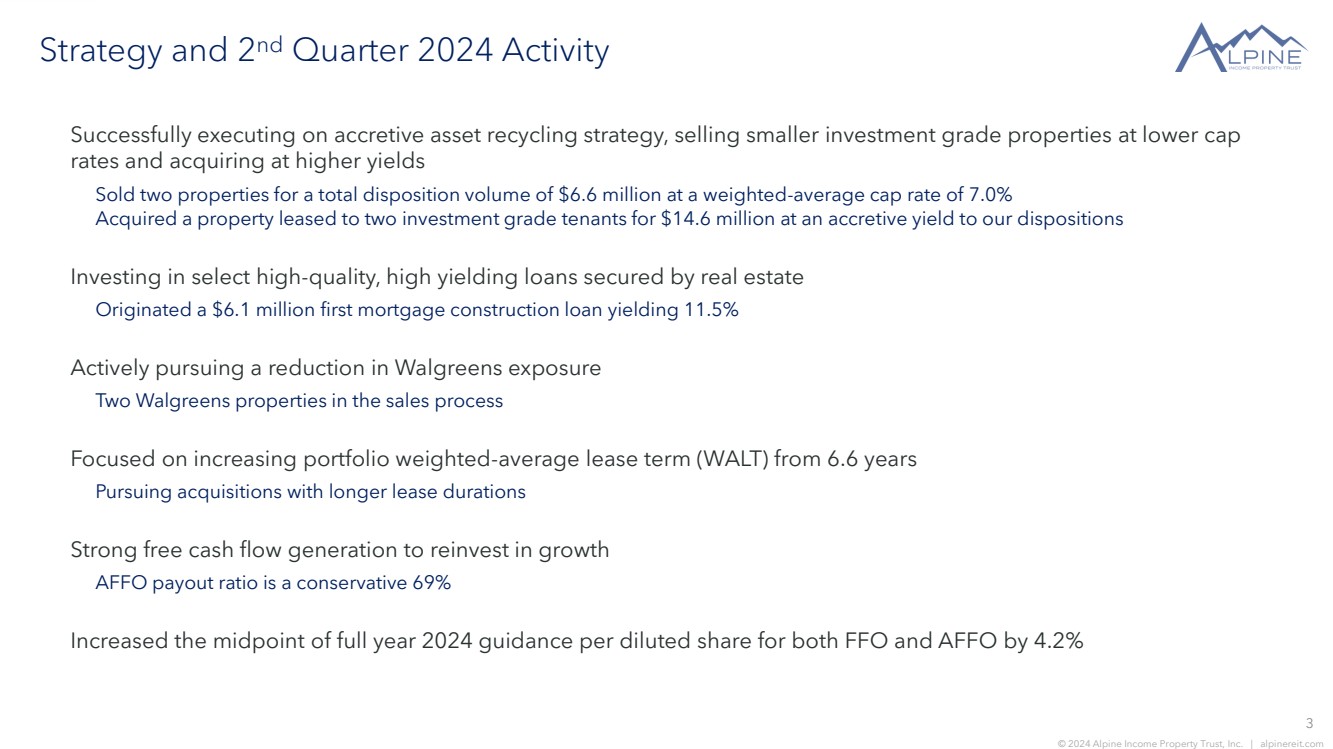
| 3 © 2024 Alpine Income Property Trust, Inc. | alpinereit.com Strategy and 2nd Quarter 2024 Activity Successfully executing on accretive asset recycling strategy, selling smaller investment grade properties at lower cap rates and acquiring at higher yields Sold two properties for a total disposition volume of $6.6 million at a weighted-average cap rate of 7.0% Acquired a property leased to two investment grade tenants for $14.6 million at an accretive yield to our dispositions Investing in select high-quality, high yielding loans secured by real estate Originated a $6.1 million first mortgage construction loan yielding 11.5% Actively pursuing a reduction in Walgreens exposure Two Walgreens properties in the sales process Focused on increasing portfolio weighted-average lease term (WALT) from 6.6 years Pursuing acquisitions with longer lease durations Strong free cash flow generation to reinvest in growth AFFO payout ratio is a conservative 69% Increased the midpoint of full year 2024 guidance per diluted share for both FFO and AFFO by 4.2% |
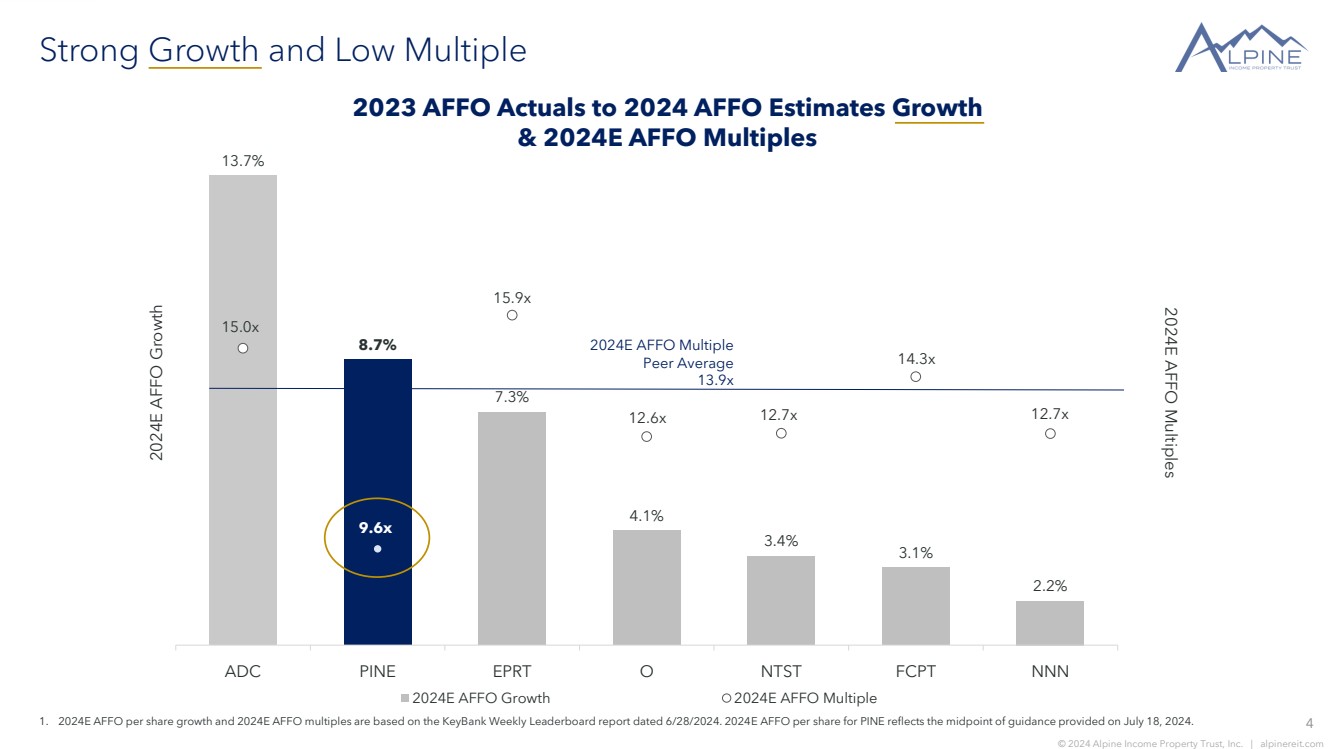
| 4 © 2024 Alpine Income Property Trust, Inc. | alpinereit.com Strong Growth and Low Multiple 1. 2024E AFFO per share growth and 2024E AFFO multiples are based on the KeyBank Weekly Leaderboard report dated 6/28/2024. 2024E AFFO per share for PINE reflects the midpoint of guidance provided on July 18, 2024. 13.7% 8.7% 7.3% 4.1% 3.4% 3.1% 2.2% 15.0x 9.6x 15.9x 12.6x 12.7x 14.3x 12.7x ADC PINE EPRT O NTST FCPT NNN 2024E AFFO Growth 2024E AFFO Growth 2024E AFFO Multiple 2024E AFFO Multiple Peer Average 13.9x 2023 AFFO Actuals to 2024 AFFO Estimates Growth & 2024E AFFO Multiples 2024E AFFO Multiples |
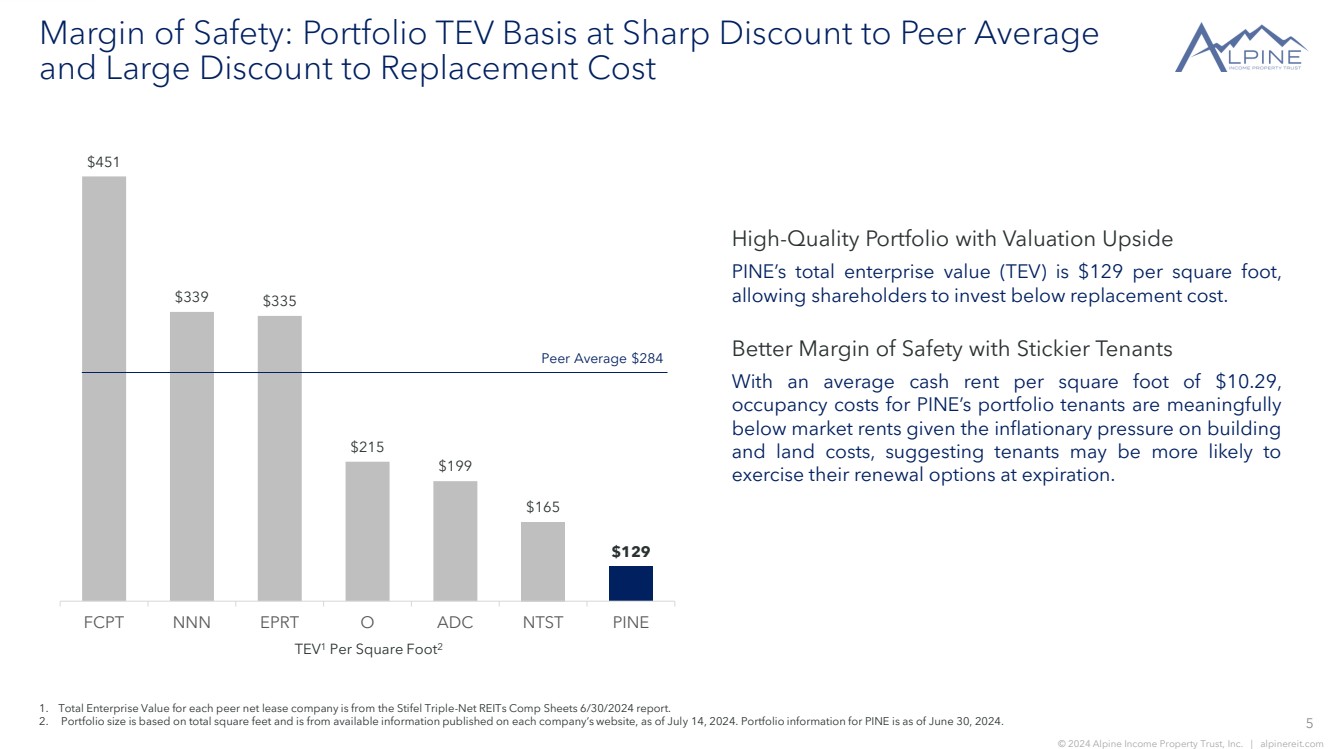
| 5 © 2024 Alpine Income Property Trust, Inc. | alpinereit.com Margin of Safety: Portfolio TEV Basis at Sharp Discount to Peer Average and Large Discount to Replacement Cost High-Quality Portfolio with Valuation Upside PINE’s total enterprise value (TEV) is $129 per square foot, allowing shareholders to invest below replacement cost. Better Margin of Safety with Stickier Tenants With an average cash rent per square foot of $10.29, occupancy costs for PINE’s portfolio tenants are meaningfully below market rents given the inflationary pressure on building and land costs, suggesting tenants may be more likely to exercise their renewal options at expiration. 1. Total Enterprise Value for each peer net lease company is from the Stifel Triple-Net REITs Comp Sheets 6/30/2024 report. 2. Portfolio size is based on total square feet and is from available information published on each company’s website, as of July 14, 2024. Portfolio information for PINE is as of June 30, 2024. TEV1 Per Square Foot2 $451 $339 $335 $215 $199 $165 $129 FCPT NNN EPRT O ADC NTST PINE Peer Average $284 |
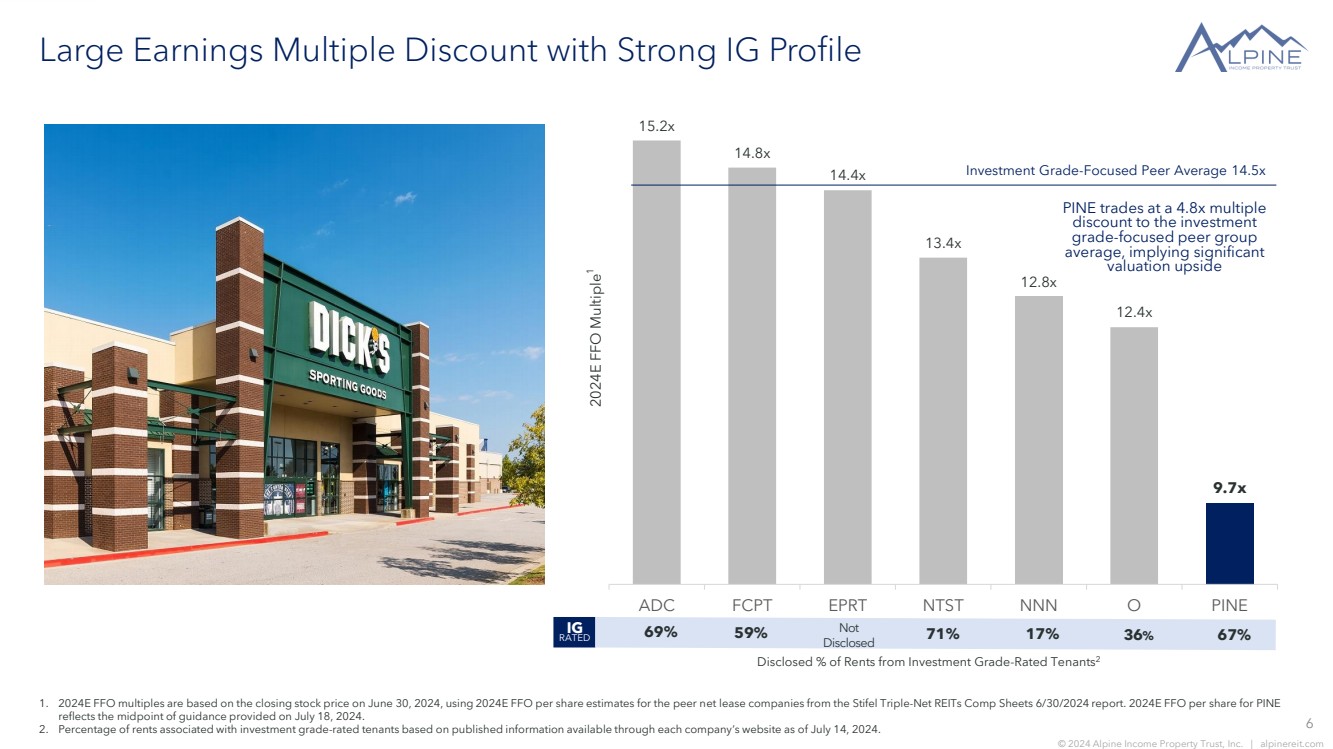
| 6 © 2024 Alpine Income Property Trust, Inc. | alpinereit.com Large Earnings Multiple Discount with Strong IG Profile 15.2x 14.8x 14.4x 13.4x 12.8x 12.4x 9.7x ADC FCPT EPRT NTST NNN O PINE 2024E FFO Multiple 1 PINE trades at a 4.8x multiple discount to the investment grade-focused peer group average, implying significant valuation upside Investment Grade-Focused Peer Average 14.5x 69% 59% 71% 17% 67% 1. 2024E FFO multiples are based on the closing stock price on June 30, 2024, using 2024E FFO per share estimates for the peer net lease companies from the Stifel Triple-Net REITs Comp Sheets 6/30/2024 report. 2024E FFO per share for PINE reflects the midpoint of guidance provided on July 18, 2024. 2. Percentage of rents associated with investment grade-rated tenants based on published information available through each company’s website as of July 14, 2024. IG RATED Disclosed % of Rents from Investment Grade-Rated Tenants2 Not Disclosed 36% |
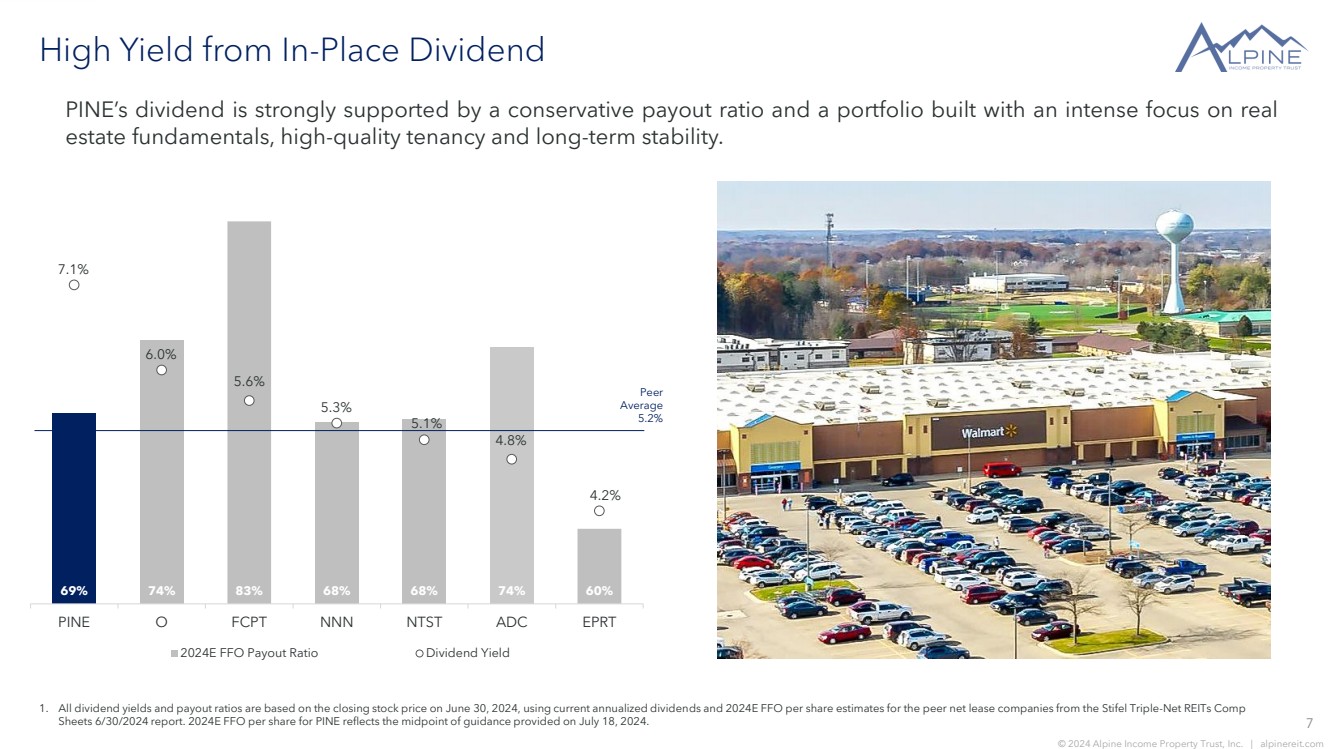
| 7 © 2024 Alpine Income Property Trust, Inc. | alpinereit.com High Yield from In-Place Dividend 1. All dividend yields and payout ratios are based on the closing stock price on June 30, 2024, using current annualized dividends and 2024E FFO per share estimates for the peer net lease companies from the Stifel Triple-Net REITs Comp Sheets 6/30/2024 report. 2024E FFO per share for PINE reflects the midpoint of guidance provided on July 18, 2024. 69% 74% 83% 68% 68% 74% 60% 7.1% 6.0% 5.6% 5.3% 5.1% 4.8% 4.2% PINE O FCPT NNN NTST ADC EPRT 2024E FFO Payout Ratio Dividend Yield Peer Average 5.2% PINE’s dividend is strongly supported by a conservative payout ratio and a portfolio built with an intense focus on real estate fundamentals, high-quality tenancy and long-term stability. |
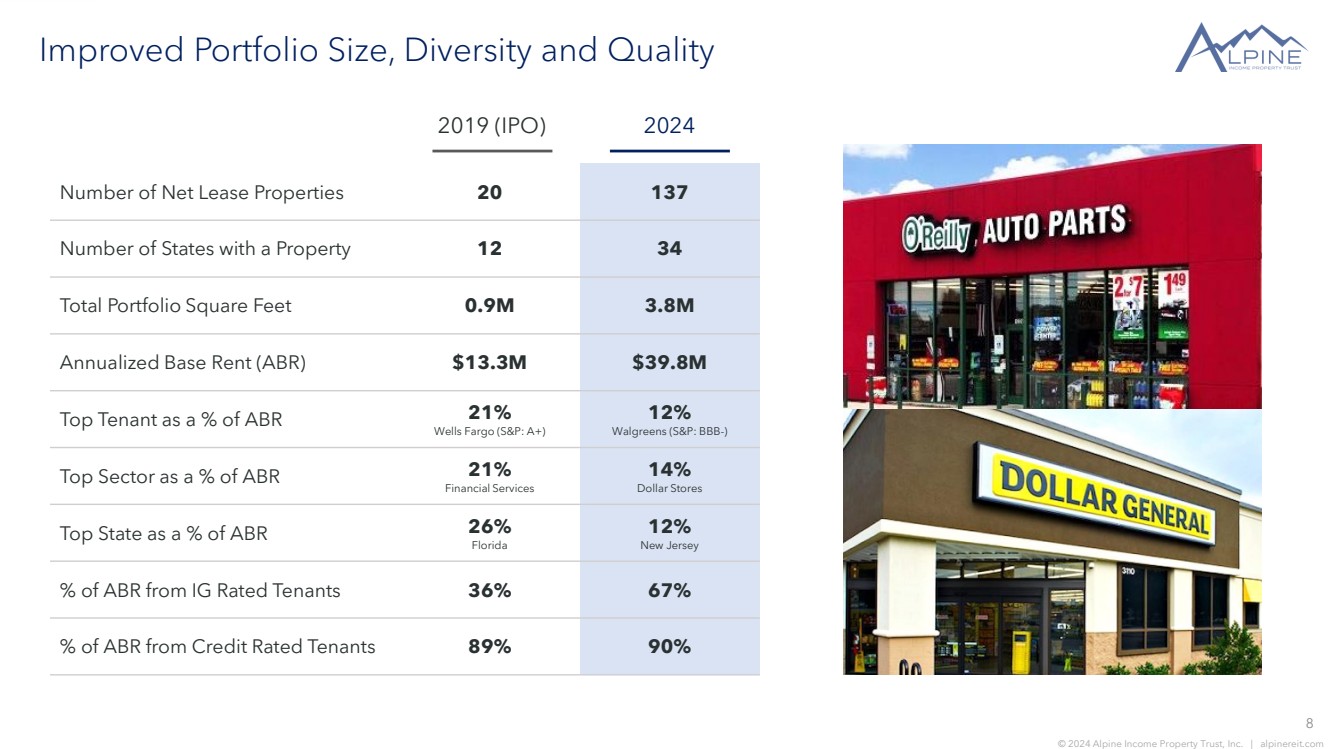
| 8 © 2024 Alpine Income Property Trust, Inc. | alpinereit.com Improved Portfolio Size, Diversity and Quality 2019 (IPO) Number of Net Lease Properties 20 137 Number of States with a Property 12 34 Total Portfolio Square Feet 0.9M 3.8M Annualized Base Rent (ABR) $13.3M $39.8M Top Tenant as a % of ABR 21% Wells Fargo (S&P: A+) 12% Walgreens (S&P: BBB-) Top Sector as a % of ABR 21% Financial Services 14% Dollar Stores Top State as a % of ABR 26% Florida 12% New Jersey % of ABR from IG Rated Tenants 36% 67% % of ABR from Credit Rated Tenants 89% 90% 2024 |
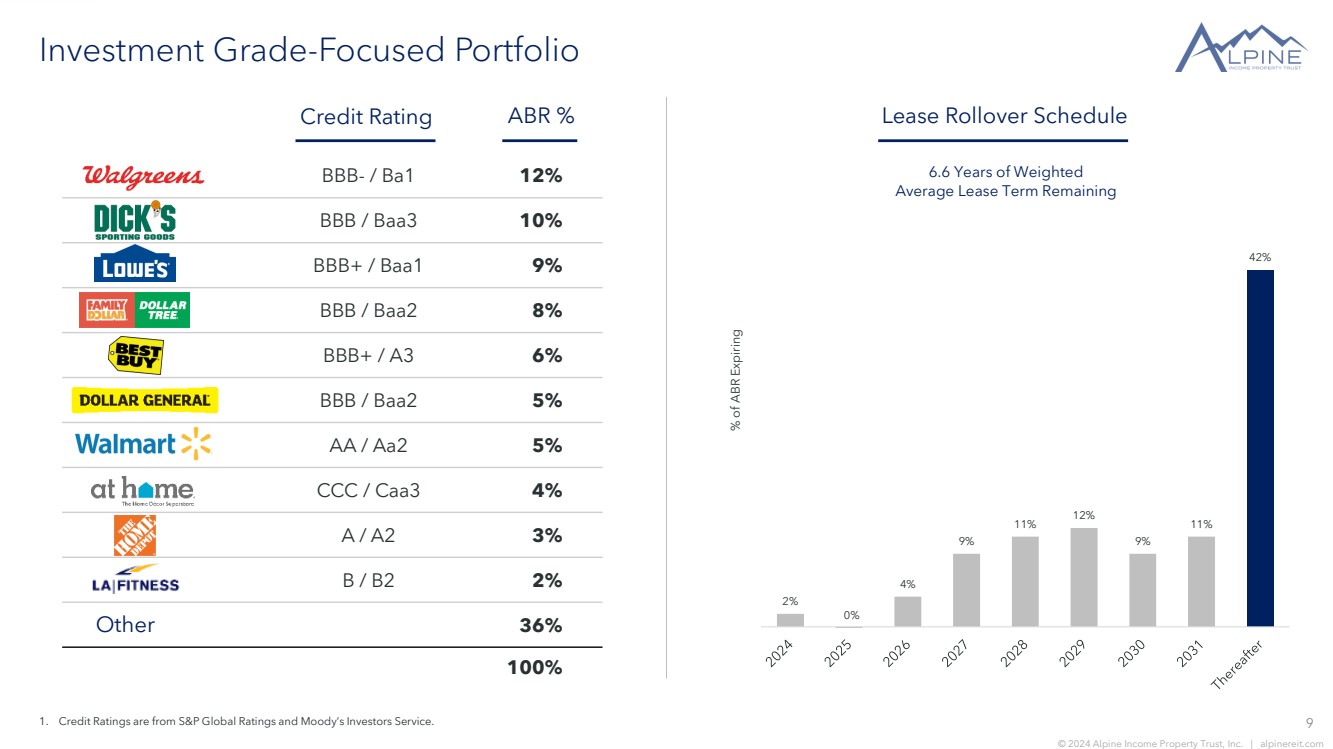
| 9 © 2024 Alpine Income Property Trust, Inc. | alpinereit.com Investment Grade-Focused Portfolio Credit Rating BBB- / Ba1 12% BBB / Baa3 10% BBB+ / Baa1 9% BBB / Baa2 8% BBB+ / A3 6% BBB / Baa2 5% AA / Aa2 5% CCC / Caa3 4% A / A2 3% B / B2 2% 36% 100% ABR % Other 2% 4% 9% 11% 12% 9% 11% 42% Lease Rollover Schedule % of ABR Expiring 6.6 Years of Weighted Average Lease Term Remaining 1. Credit Ratings are from S&P Global Ratings and Moody’s Investors Service. 0% |
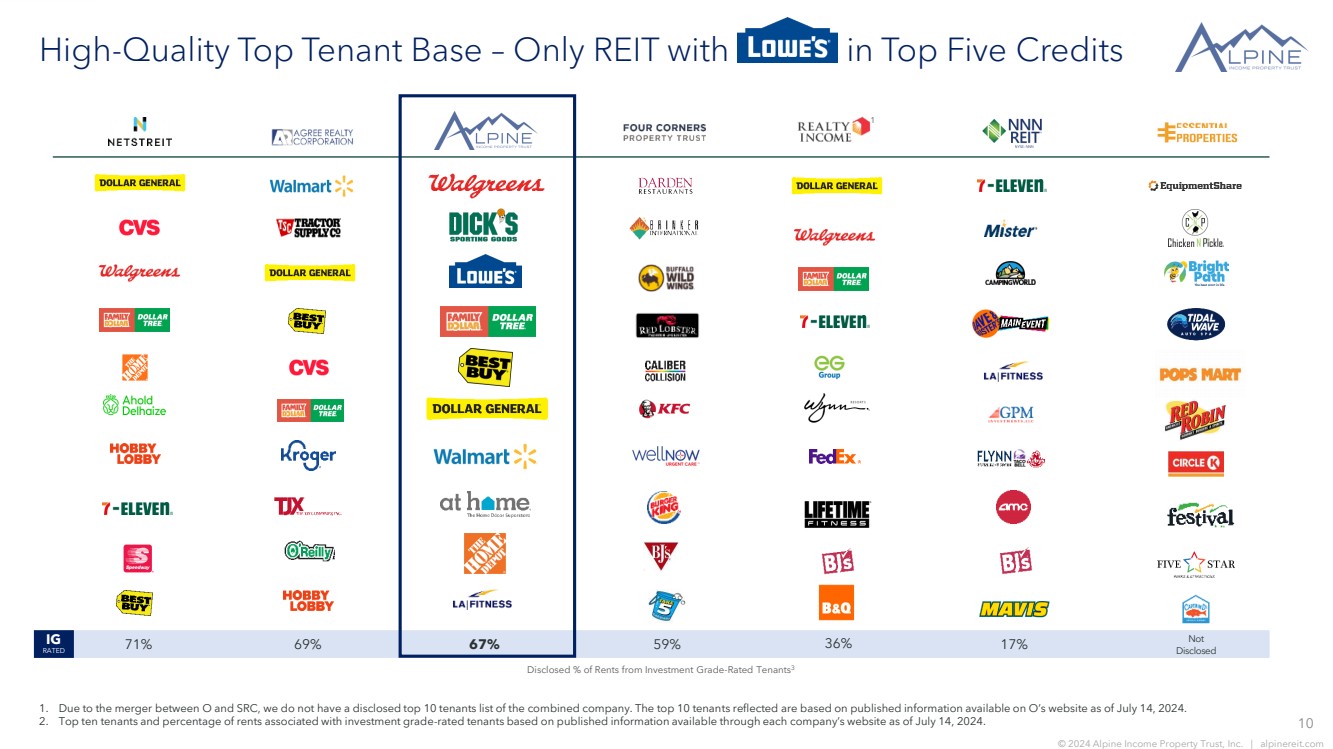
| 10 © 2024 Alpine Income Property Trust, Inc. | alpinereit.com High-Quality Top Tenant Base – Only REIT with Lowe’s in Top Five Credits Disclosed % of Rents from Investment Grade-Rated Tenants3 RATED IG 71% 69% 59% 17% 1. Due to the merger between O and SRC, we do not have a disclosed top 10 tenants list of the combined company. The top 10 tenants reflected are based on published information available on O’s website as of July 14, 2024. 2. Top ten tenants and percentage of rents associated with investment grade-rated tenants based on published information available through each company’s website as of July 14, 2024. Not Disclosed 67% 1 36% |
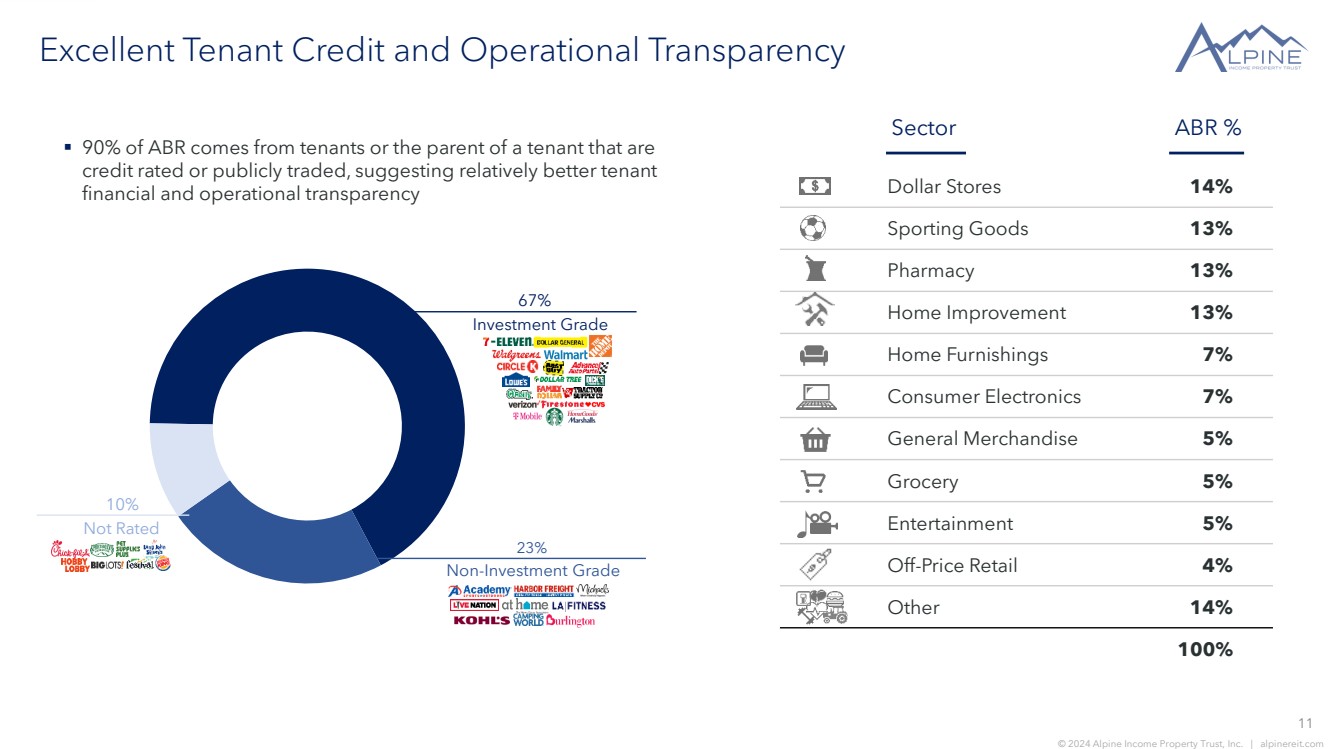
| 11 © 2024 Alpine Income Property Trust, Inc. | alpinereit.com Excellent Tenant Credit and Operational Transparency Investment Grade 67% Not Rated 10% Non-Investment Grade 23% Dollar Stores 14% Sporting Goods 13% Pharmacy 13% Home Improvement 13% Home Furnishings 7% Consumer Electronics 7% General Merchandise 5% Grocery 5% Entertainment 5% Off-Price Retail 4% Other 14% 100% ABR % ▪ 90% of ABR comes from tenants or the parent of a tenant that are credit rated or publicly traded, suggesting relatively better tenant financial and operational transparency Sector |
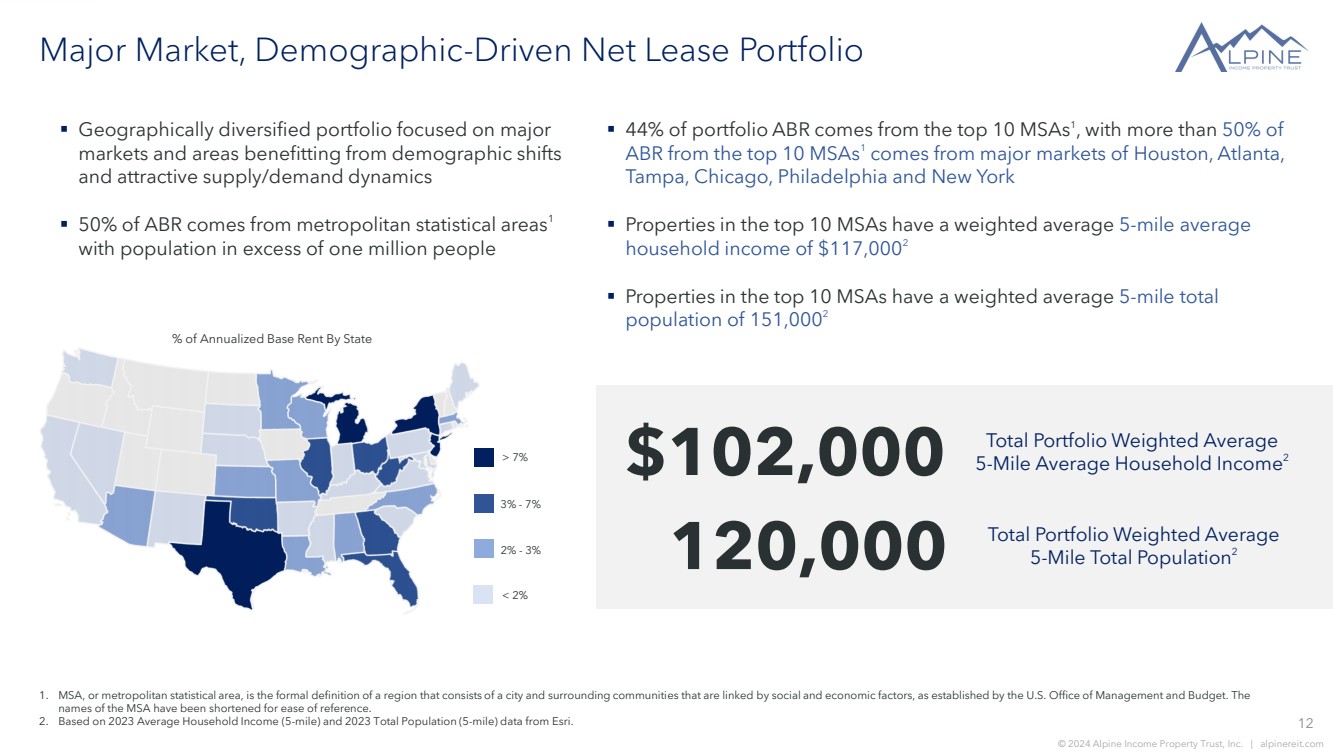
| 12 © 2024 Alpine Income Property Trust, Inc. | alpinereit.com Major Market, Demographic-Driven Net Lease Portfolio ▪ Geographically diversified portfolio focused on major markets and areas benefitting from demographic shifts and attractive supply/demand dynamics ▪ 50% of ABR comes from metropolitan statistical areas1 with population in excess of one million people % of Annualized Base Rent By State 3% - 7% > 7% 2% - 3% < 2% 1. MSA, or metropolitan statistical area, is the formal definition of a region that consists of a city and surrounding communities that are linked by social and economic factors, as established by the U.S. Office of Management and Budget. The names of the MSA have been shortened for ease of reference. 2. Based on 2023 Average Household Income (5-mile) and 2023 Total Population (5-mile) data from Esri. Total Portfolio Weighted Average 5-Mile Average Household Income $102,000 2 Total Portfolio Weighted Average 5-Mile Total Population 120,000 2 ▪ 44% of portfolio ABR comes from the top 10 MSAs1 , with more than 50% of ABR from the top 10 MSAs1 comes from major markets of Houston, Atlanta, Tampa, Chicago, Philadelphia and New York ▪ Properties in the top 10 MSAs have a weighted average 5-mile average household income of $117,0002 ▪ Properties in the top 10 MSAs have a weighted average 5-mile total population of 151,0002 |
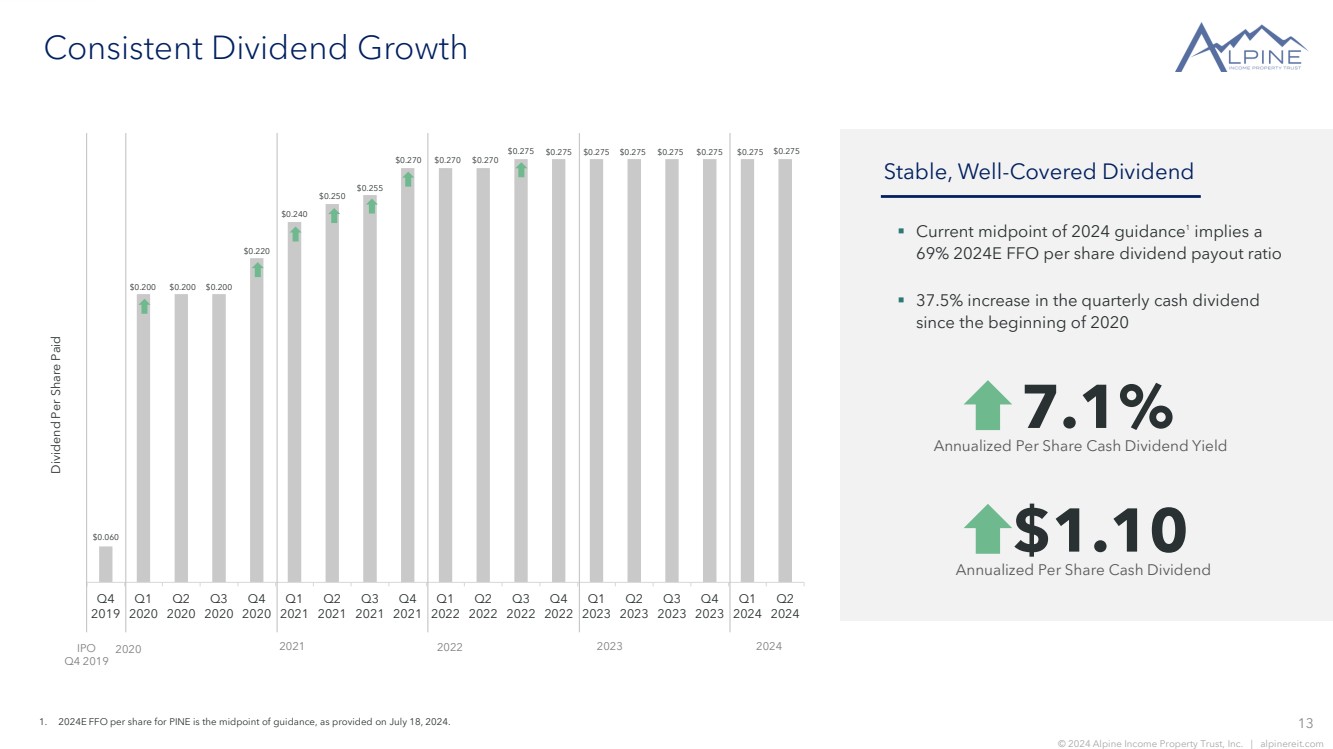
| 13 © 2024 Alpine Income Property Trust, Inc. | alpinereit.com Consistent Dividend Growth Stable, Well-Covered Dividend ▪ Current midpoint of 2024 guidance1 implies a 69% 2024E FFO per share dividend payout ratio ▪ 37.5% increase in the quarterly cash dividend since the beginning of 2020 Annualized Per Share Cash Dividend $1.10 Annualized Per Share Cash Dividend Yield 7.1% 1. 2024E FFO per share for PINE is the midpoint of guidance, as provided on July 18, 2024. $0.060 $0.200 $0.200 $0.200 $0.220 $0.240 $0.250 $0.255 $0.270 $0.270 $0.270 $0.275 $0.275 $0.275 $0.275 $0.275 $0.275 $0.275 $0.275 Q4 2019 Q1 2020 Q2 2020 Q3 2020 Q4 2020 Q1 2021 Q2 2021 Q3 2021 Q4 2021 Q1 2022 Q2 2022 Q3 2022 Q4 2022 Q1 2023 Q2 2023 Q3 2023 Q4 2023 Q1 2024 Q2 2024 IPO Q4 2019 Dividend Per Share Paid 2020 2021 2022 2023 2024 |
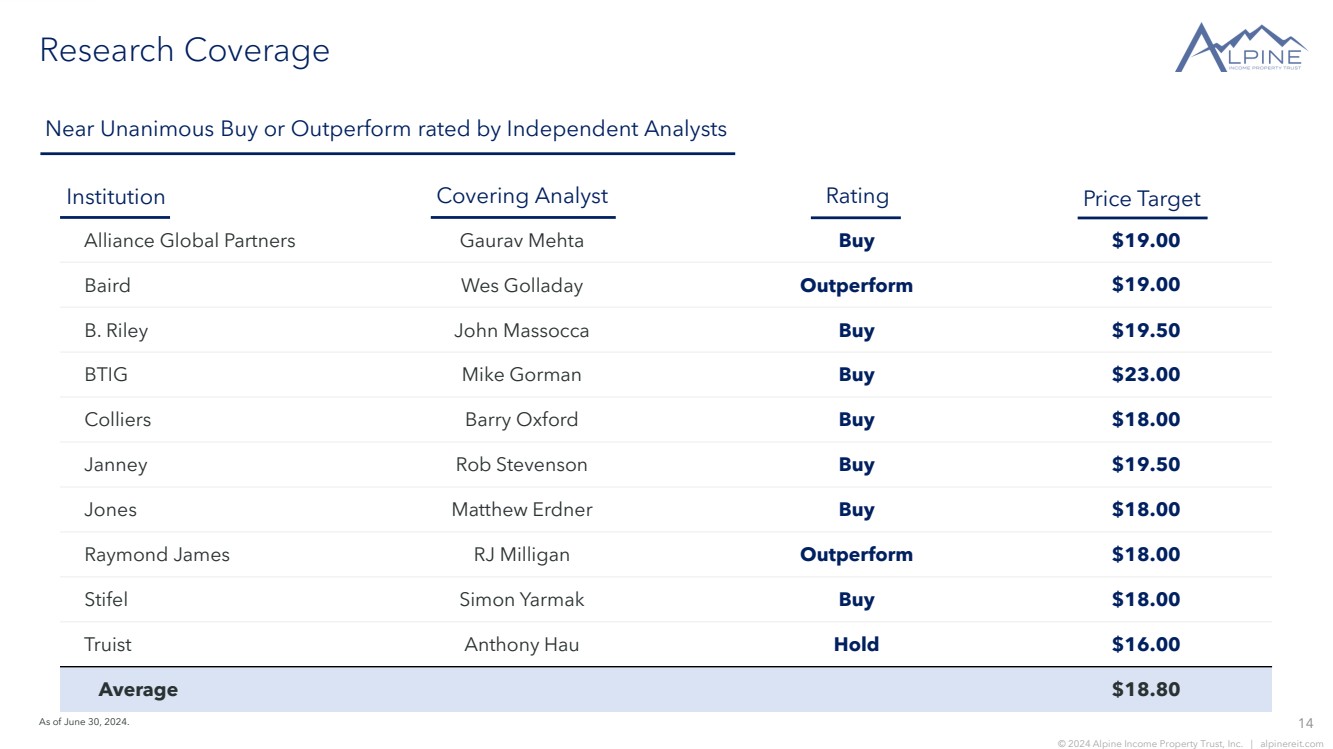
| 14 © 2024 Alpine Income Property Trust, Inc. | alpinereit.com Research Coverage Near Unanimous Buy or Outperform rated by Independent Analysts Alliance Global Partners Gaurav Mehta Buy $19.00 Baird Wes Golladay Outperform $19.00 B. Riley John Massocca Buy $19.50 BTIG Mike Gorman Buy $23.00 Colliers Barry Oxford Buy $18.00 Janney Rob Stevenson Buy $19.50 Jones Matthew Erdner Buy $18.00 Raymond James RJ Milligan Outperform $18.00 Stifel Simon Yarmak Buy $18.00 Truist Anthony Hau Hold $16.00 Average $18.80 Institution Covering Analyst Rating Price Target As of June 30, 2024. |
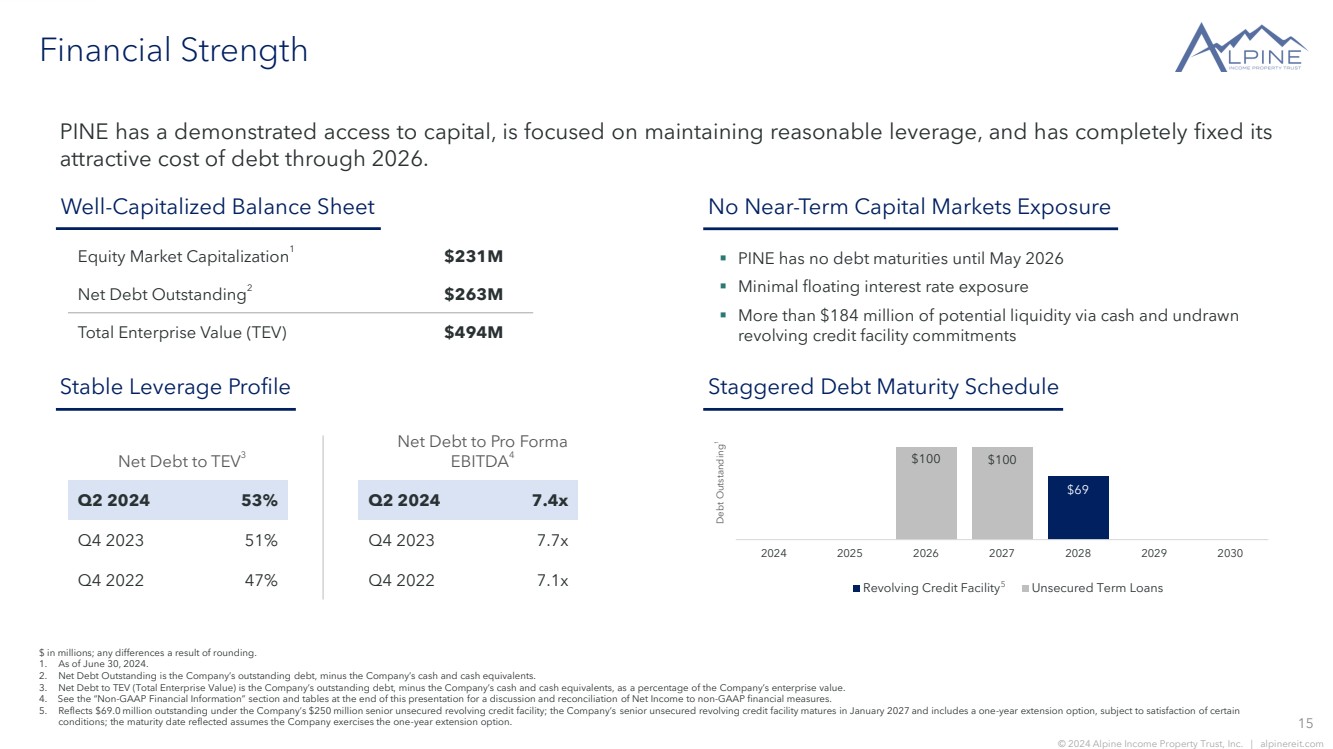
| 15 © 2024 Alpine Income Property Trust, Inc. | alpinereit.com Financial Strength PINE has a demonstrated access to capital, is focused on maintaining reasonable leverage, and has completely fixed its attractive cost of debt through 2026. Equity Market Capitalization1 $231M Net Debt Outstanding2 $263M Total Enterprise Value (TEV) $494M Well-Capitalized Balance Sheet Q2 2024 53% Q2 2024 7.4x Q4 2023 51% Q4 2023 7.7x Q4 2022 47% Q4 2022 7.1x No Near-Term Capital Markets Exposure Stable Leverage Profile $69 $100 $100 2024 2025 2026 2027 2028 2029 2030 Revolving Credit Facility Unsecured Term Loans Staggered Debt Maturity Schedule Net Debt to TEV3 Net Debt to Pro Forma EBITDA4 Debt Outstanding 1 5 ▪ PINE has no debt maturities until May 2026 ▪ Minimal floating interest rate exposure ▪ More than $184 million of potential liquidity via cash and undrawn revolving credit facility commitments $ in millions; any differences a result of rounding. 1. As of June 30, 2024. 2. Net Debt Outstanding is the Company’s outstanding debt, minus the Company’s cash and cash equivalents. 3. Net Debt to TEV (Total Enterprise Value) is the Company’s outstanding debt, minus the Company’s cash and cash equivalents, as a percentage of the Company’s enterprise value. 4. See the “Non-GAAP Financial Information” section and tables at the end of this presentation for a discussion and reconciliation of Net Income to non-GAAP financial measures. 5. Reflects $69.0 million outstanding under the Company’s $250 million senior unsecured revolving credit facility; the Company’s senior unsecured revolving credit facility matures in January 2027 and includes a one-year extension option, subject to satisfaction of certain conditions; the maturity date reflected assumes the Company exercises the one-year extension option. |
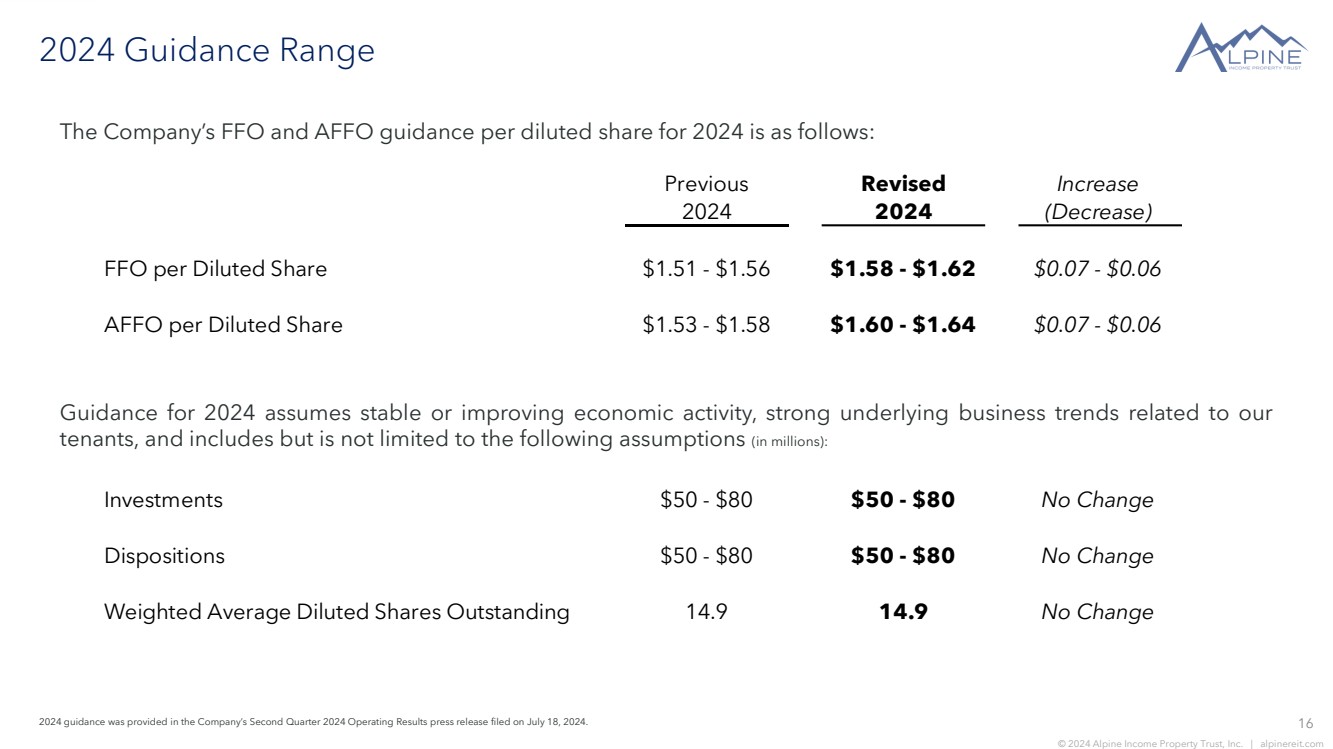
| 16 © 2024 Alpine Income Property Trust, Inc. | alpinereit.com 2024 Guidance Range The Company’s FFO and AFFO guidance per diluted share for 2024 is as follows: 2024 guidance was provided in the Company’s Second Quarter 2024 Operating Results press release filed on July 18, 2024. Investments $50 - $80 $50 - $80 No Change Dispositions $50 - $80 $50 - $80 No Change Weighted Average Diluted Shares Outstanding 14.9 14.9 No Change Guidance for 2024 assumes stable or improving economic activity, strong underlying business trends related to our tenants, and includes but is not limited to the following assumptions (in millions): Previous Revised Increase 2024 2024 (Decrease) FFO per Diluted Share $1.51 - $1.56 $1.58 - $1.62 $0.07 - $0.06 AFFO per Diluted Share $1.53 - $1.58 $1.60 - $1.64 $0.07 - $0.06 |
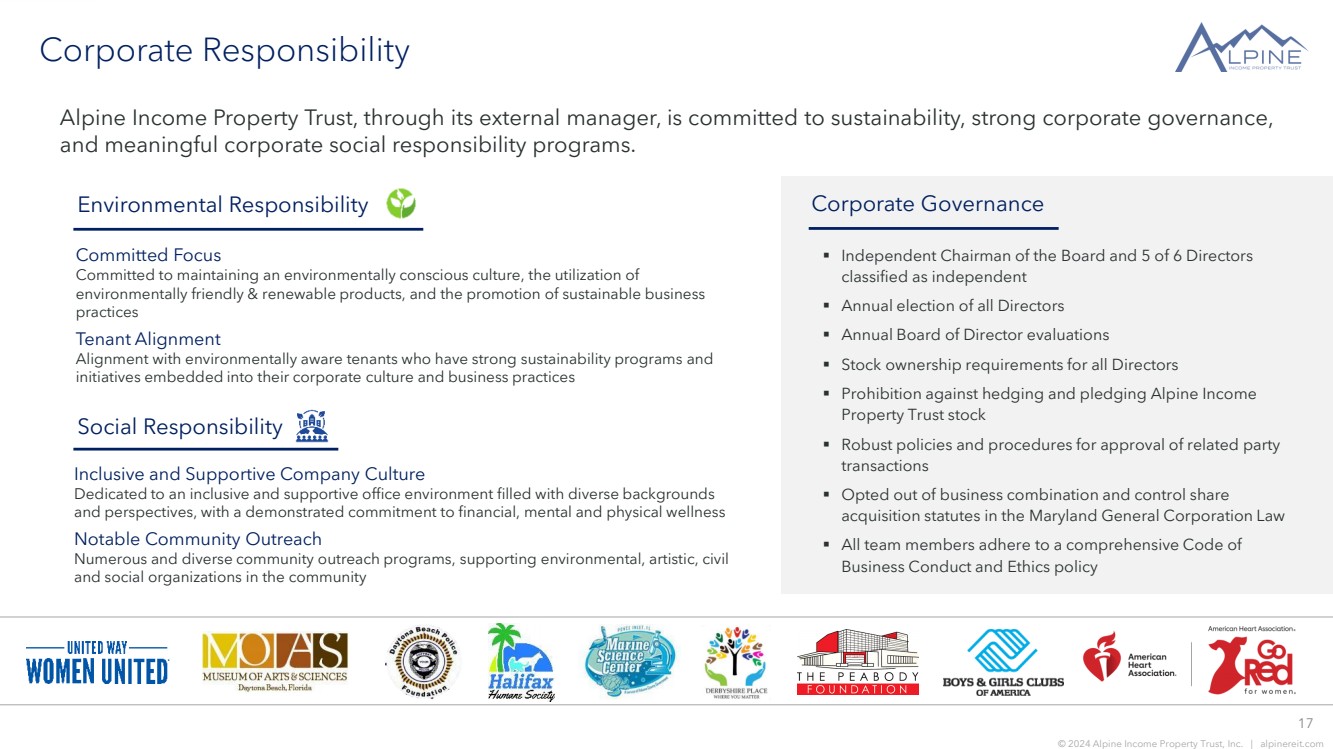
| 17 © 2024 Alpine Income Property Trust, Inc. | alpinereit.com Corporate Responsibility Alpine Income Property Trust, through its external manager, is committed to sustainability, strong corporate governance, and meaningful corporate social responsibility programs. Committed Focus Committed to maintaining an environmentally conscious culture, the utilization of environmentally friendly & renewable products, and the promotion of sustainable business practices Tenant Alignment Alignment with environmentally aware tenants who have strong sustainability programs and initiatives embedded into their corporate culture and business practices Social Responsibility Environmental Responsibility Corporate Governance ▪ Independent Chairman of the Board and 5 of 6 Directors classified as independent ▪ Annual election of all Directors ▪ Annual Board of Director evaluations ▪ Stock ownership requirements for all Directors ▪ Prohibition against hedging and pledging Alpine Income Property Trust stock ▪ Robust policies and procedures for approval of related party transactions ▪ Opted out of business combination and control share acquisition statutes in the Maryland General Corporation Law ▪ All team members adhere to a comprehensive Code of Business Conduct and Ethics policy Inclusive and Supportive Company Culture Dedicated to an inclusive and supportive office environment filled with diverse backgrounds and perspectives, with a demonstrated commitment to financial, mental and physical wellness Notable Community Outreach Numerous and diverse community outreach programs, supporting environmental, artistic, civil and social organizations in the community |
| 18 © 2024 Alpine Income Property Trust, Inc. | alpinereit.com External Management Alignment As of June 30, 2024. Aligned Ownership CTO currently owns an approximate 16% interest in PINE, meaningfully aligning its interests with PINE shareholders Independent Board of Directors PINE has its own independent Board of Directors and realizes economies of scale from the 34-member CTO team without the corresponding G&A expense Internalization Anticipated in the Future Internalization of management for PINE is anticipated in the future when the Company approaches or exceeds critical mass Opportunities for Collaboration PINE reviews transaction opportunities resulting from CTO’s acquisition efforts that it otherwise would not see in the market through normal single tenant acquisition efforts and relationships Benefits and Alignment of External Management Notable Management Agreement Terms ▪ Five-year initial term (initial expiration November 2024), with one-year extension options thereafter ▪ Quarterly management fee of 0.375%, calculated on equity, net of share buybacks and issuance costs ▪ Terminable with payment of a one-time fee of 3x the annualized average management fee for the preceding 24-months Alpine Income Property Trust is externally managed by CTO Realty Growth (NYSE: CTO) under an agreement that, combined with CTO’s ownership in PINE, provides economies of scale, significant shareholder alignment and a flexible/collapsible structure. |
| 19 © 2024 Alpine Income Property Trust, Inc. | alpinereit.com Disclaimer This press presentation may contain “forward-looking statements.” Forward-looking statements include statements that may be identified by words such as “could,” “may,” “might,” “will,” “likely,” “anticipates,” “intends,” “plans,” “seeks,” “believes,” “estimates,” “expects,” “continues,” “projects” and similar references to future periods, or by the inclusion of forecasts or projections. Forward-looking statements are based on the Company’s current expectations and assumptions regarding capital market conditions, the Company’s business, the economy and other future conditions. Because forward-looking statements relate to the future, by their nature, they are subject to inherent uncertainties, risks and changes in circumstances that are difficult to predict. As a result, the Company’s actual results may differ materially from those contemplated by the forward-looking statements. Important factors that could cause actual results to differ materially from those in the forward-looking statements include general business and economic conditions, continued volatility and uncertainty in the credit markets and broader financial markets, risks inherent in the real estate business, including tenant defaults, potential liability relating to environmental matters, credit risk associated with the Company investing in first mortgage investments, illiquidity of real estate investments and potential damages from natural disasters, the impact of epidemics or pandemics (such as the COVID-19 Pandemic and its variants) on the Company’s business and the business of its tenants and the impact of such epidemics or pandemics on the U.S. economy and market conditions generally, other factors affecting the Company’s business or the business of its tenants that are beyond the control of the Company or its tenants, and the factors set forth under “Risk Factors” in the Company’s Annual Report on Form 10-K for the year ended December 31, 2023 and other risks and uncertainties discussed from time to time in the Company’s filings with the U.S. Securities and Exchange Commission. Any forward-looking statement made in this presentation speaks only as of the date on which it is made. The Company undertakes no obligation to publicly update or revise any forward-looking statement, whether as a result of new information, future developments or otherwise. References in this presentation: 1. All information is as of June 30, 2024, unless otherwise noted and any differences in calculations are assumed to be a function of rounding. 2. Annualized straight-line Base Rent (“ABR” or “Rent”) and the statistics based on ABR are calculated based on our current portfolio as of June 30, 2024. 3. Dividends are set by the Board of Directors and declared on a quarterly basis and there can be no assurances as to the likelihood or amount of dividends in the future. 4. The Company defines an Investment Grade (“IG”) Rated Tenant as a tenant or the parent of a tenant with a credit rating from S&P Global Ratings, Moody’s Investors Service, Fitch Ratings or the National Association of Insurance Commissioners of Baa3, BBB-, or NAIC-2 or higher. If applicable, in the event of a split rating between S&P Global Ratings and Moody’s Investors Services, the Company utilizes the higher of the two ratings as its reference point as to whether a tenant is defined as an Investment Grade Rated Tenant. 5. The Company defines a Credit Rated Tenant as a tenant or the parent of a tenant with a credit rating from S&P Global Ratings, Moody’s Investors Service, Fitch Ratings or the National Association of Insurance Commissioners. |
| 20 © 2024 Alpine Income Property Trust, Inc. | alpinereit.com Non-GAAP Financial Information Our reported results are presented in accordance with accounting principles generally accepted in the United States of America (“GAAP”). We also disclose Funds From Operations (“FFO”) Adjusted Funds From Operations (“AFFO”), and Pro Forma Earnings Before Interest, Taxes, Depreciation and Amortization (“Pro Forma EBITDA”), all of which are non-GAAP financial measures. We believe these non-GAAP financial measures are useful to investors because they are widely accepted industry measures used by analysts and investors to compare the operating performance of REITs. FFO, AFFO, and Pro Forma EBITDA do not represent cash generated from operating activities and are not necessarily indicative of cash available to fund cash requirements; accordingly, they should not be considered alternatives to net income as a performance measure or cash flows from operations as reported on our statement of cash flows as a liquidity measure and should be considered in addition to, and not in lieu of, GAAP financial measures. We compute FFO in accordance with the definition adopted by the Board of Governors of the National Association of Real Estate Investment Trusts, or NAREIT. NAREIT defines FFO as GAAP net income or loss adjusted to exclude real estate related depreciation and amortization, as well as extraordinary items (as defined by GAAP) such as net gain or loss from sales of depreciable real estate assets, impairment write-downs associated with depreciable real estate assets and impairments associated with the implementation of current expected credit losses on commercial loans and investments at the time of origination, including the pro rata share of such adjustments of unconsolidated subsidiaries. To derive AFFO, we further modify the NAREIT computation of FFO to include other adjustments to GAAP net income related to non-cash revenues and expenses such as loss on extinguishment of debt, amortization of above- and below-market lease related intangibles, straight-line rental revenue, amortization of deferred financing costs, non-cash compensation, and other non-cash income or expense. Such items may cause short-term fluctuations in net income but have no impact on operating cash flows or long-term operating performance. We use AFFO as one measure of our performance when we formulate corporate goals. To derive Pro Forma EBITDA, GAAP net income or loss is adjusted to exclude extraordinary items (as defined by GAAP), net gain or loss from sales of depreciable real estate assets, impairment write-downs associated with depreciable real estate assets and impairments associated with the implementation of current expected credit losses on commercial loans and investments at the time of origination and/or payoff, and real estate related depreciation and amortization including the pro rata share of such adjustments of unconsolidated subsidiaries, non-cash revenues and expenses such as straight-line rental revenue, amortization of deferred financing costs, loss on extinguishment of debt, above- and below-market lease related intangibles, non-cash compensation, other non-cash income or expense, and other non-recurring items such as disposition management fees and commission fees. Cash interest expense is also excluded from Pro Forma EBITDA, and GAAP net income or loss is adjusted for the annualized impact of acquisitions, dispositions and other similar activities. FFO is used by management, investors and analysts to facilitate meaningful comparisons of operating performance between periods and among our peers primarily because it excludes the effect of real estate depreciation and amortization and net gains or losses on sales, which are based on historical costs and implicitly assume that the value of real estate diminishes predictably over time, rather than fluctuating based on existing market conditions. We believe that AFFO is an additional useful supplemental measure for investors to consider because it will help them to better assess our operating performance without the distortions created by other non-cash revenues or expenses. We also believe that Pro Forma EBITDA is an additional useful supplemental measure for investors to consider as it allows for a better assessment of our operating performance without the distortions created by other non-cash revenues, expenses or certain effects of the Company’s capital structure on our operating performance. FFO, AFFO, and Pro Forma EBITDA may not be comparable to similarly titled measures employed by other companies. |
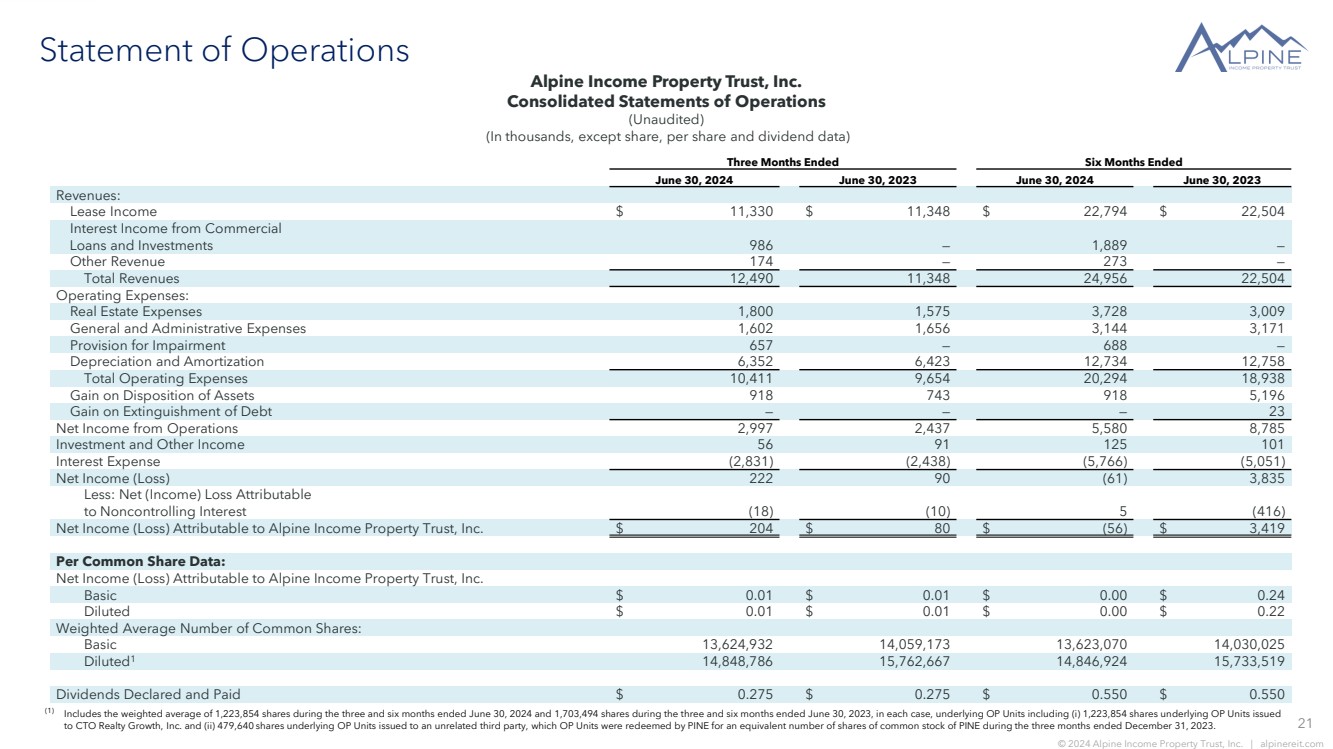
| 21 © 2024 Alpine Income Property Trust, Inc. | alpinereit.com Statement of Operations Alpine Income Property Trust, Inc. Consolidated Statements of Operations (Unaudited) (In thousands, except share, per share and dividend data) (1) Includes the weighted average of 1,223,854 shares during the three and six months ended June 30, 2024 and 1,703,494 shares during the three and six months ended June 30, 2023, in each case, underlying OP Units including (i) 1,223,854 shares underlying OP Units issued to CTO Realty Growth, Inc. and (ii) 479,640 shares underlying OP Units issued to an unrelated third party, which OP Units were redeemed by PINE for an equivalent number of shares of common stock of PINE during the three months ended December 31, 2023. Three Months Ended Six Months Ended June 30, 2024 June 30, 2023 June 30, 2024 June 30, 2023 Revenues: Lease Income $ 11,330 $ 11,348 $ 22,794 $ 22,504 Interest Income from Commercial Loans and Investments 986 — 1,889 — Other Revenue 174 — 273 — Total Revenues 12,490 11,348 24,956 22,504 Operating Expenses: Real Estate Expenses 1,800 1,575 3,728 3,009 General and Administrative Expenses 1,602 1,656 3,144 3,171 Provision for Impairment 657 — 688 — Depreciation and Amortization 6,352 6,423 12,734 12,758 Total Operating Expenses 10,411 9,654 20,294 18,938 Gain on Disposition of Assets 918 743 918 5,196 Gain on Extinguishment of Debt — — — 23 Net Income from Operations 2,997 2,437 5,580 8,785 Investment and Other Income 56 91 125 101 Interest Expense (2,831) (2,438) (5,766) (5,051) Net Income (Loss) 222 90 (61) 3,835 Less: Net (Income) Loss Attributable to Noncontrolling Interest (18) (10) 5 (416) Net Income (Loss) Attributable to Alpine Income Property Trust, Inc. $ 204 $ 80 $ (56) $ 3,419 Per Common Share Data: Net Income (Loss) Attributable to Alpine Income Property Trust, Inc. Basic $ 0.01 $ 0.01 $ 0.00 $ 0.24 Diluted $ 0.01 $ 0.01 $ 0.00 $ 0.22 Weighted Average Number of Common Shares: Basic 13,624,932 14,059,173 13,623,070 14,030,025 Diluted1 14,848,786 15,762,667 14,846,924 15,733,519 Dividends Declared and Paid $ 0.275 $ 0.275 $ 0.550 $ 0.550 |
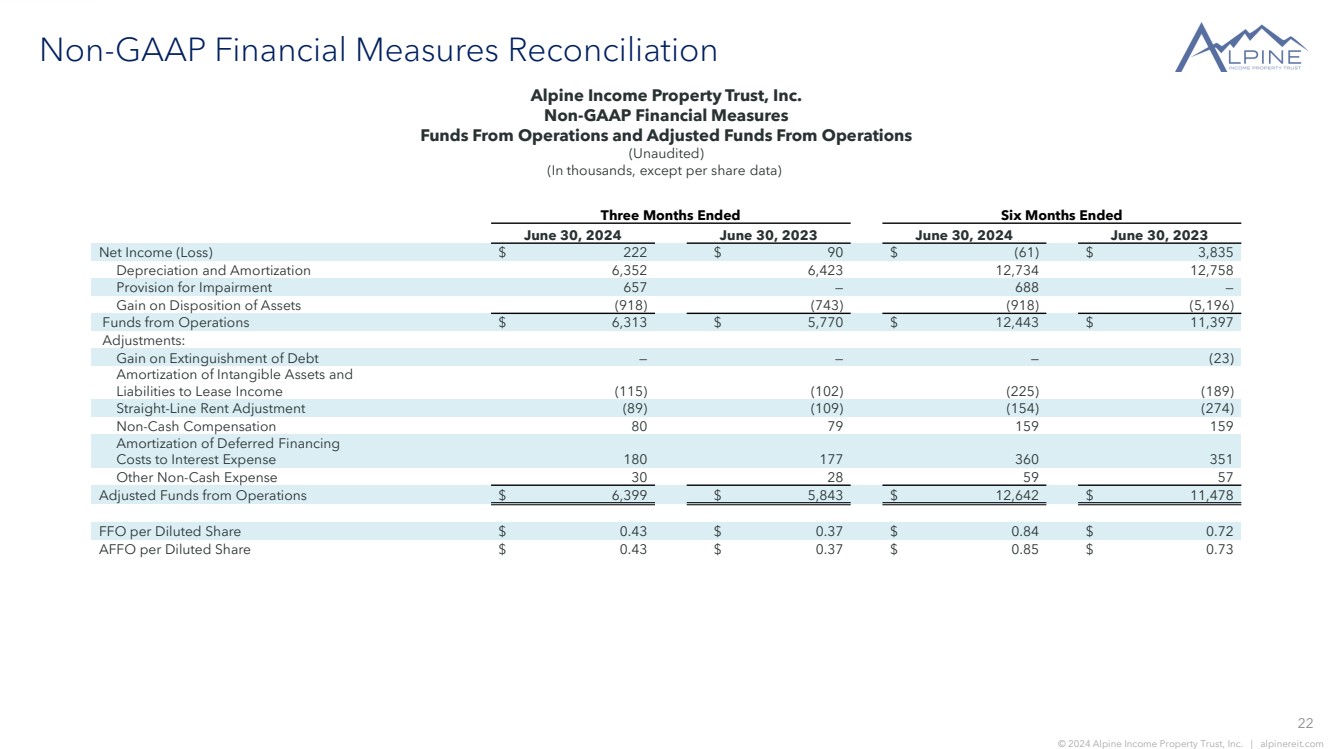
| 22 © 2024 Alpine Income Property Trust, Inc. | alpinereit.com Non-GAAP Financial Measures Reconciliation Alpine Income Property Trust, Inc. Non-GAAP Financial Measures Funds From Operations and Adjusted Funds From Operations (Unaudited) (In thousands, except per share data) Three Months Ended Six Months Ended June 30, 2024 June 30, 2023 June 30, 2024 June 30, 2023 Net Income (Loss) $ 222 $ 90 $ (61) $ 3,835 Depreciation and Amortization 6,352 6,423 12,734 12,758 Provision for Impairment 657 — 688 — Gain on Disposition of Assets (918) (743) (918) (5,196) Funds from Operations $ 6,313 $ 5,770 $ 12,443 $ 11,397 Adjustments: Gain on Extinguishment of Debt — — — (23) Amortization of Intangible Assets and Liabilities to Lease Income (115) (102) (225) (189) Straight-Line Rent Adjustment (89) (109) (154) (274) Non-Cash Compensation 80 79 159 159 Amortization of Deferred Financing Costs to Interest Expense 180 177 360 351 Other Non-Cash Expense 30 28 59 57 Adjusted Funds from Operations $ 6,399 $ 5,843 $ 12,642 $ 11,478 FFO per Diluted Share $ 0.43 $ 0.37 $ 0.84 $ 0.72 AFFO per Diluted Share $ 0.43 $ 0.37 $ 0.85 $ 0.73 |
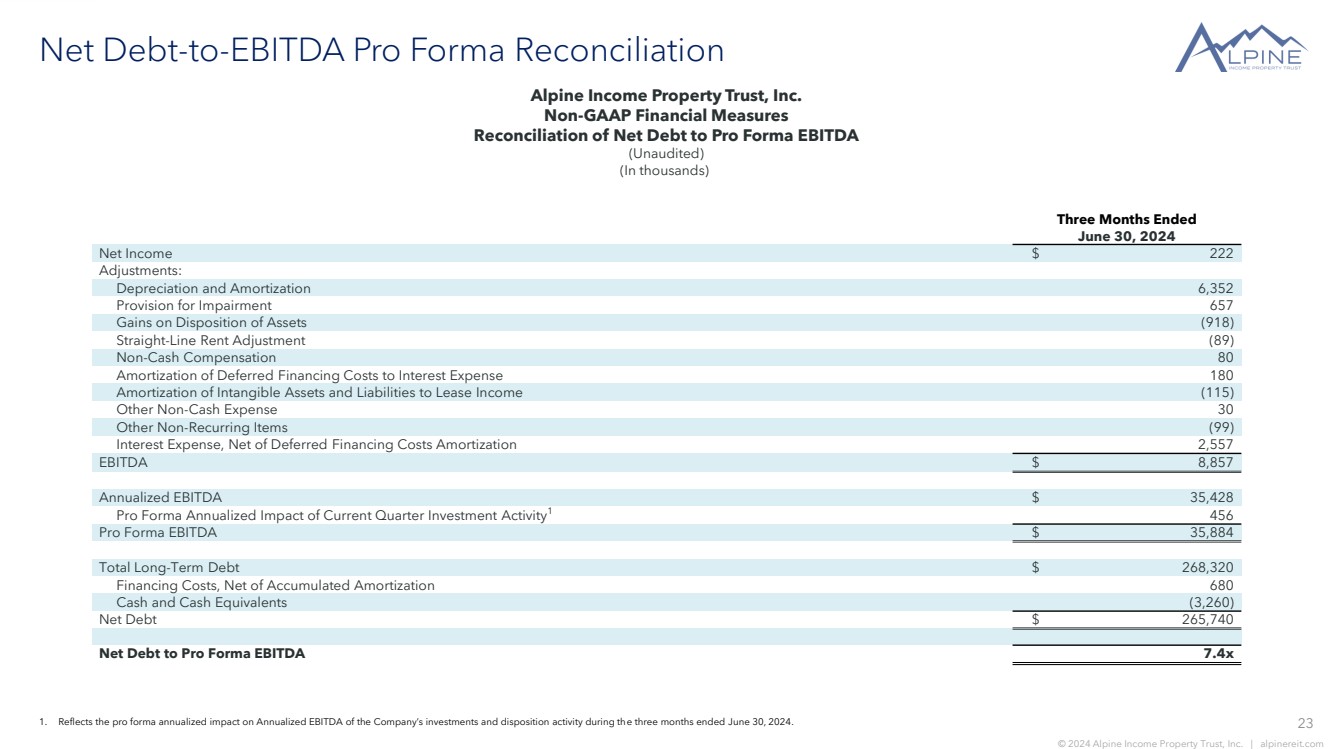
| 23 © 2024 Alpine Income Property Trust, Inc. | alpinereit.com Net Debt-to-EBITDA Pro Forma Reconciliation Alpine Income Property Trust, Inc. Non-GAAP Financial Measures Reconciliation of Net Debt to Pro Forma EBITDA (Unaudited) (In thousands) 1. Reflects the pro forma annualized impact on Annualized EBITDA of the Company’s investments and disposition activity during the three months ended June 30, 2024. Three Months Ended June 30, 2024 Net Income $ 222 Adjustments: Depreciation and Amortization 6,352 Provision for Impairment 657 Gains on Disposition of Assets (918) Straight-Line Rent Adjustment (89) Non-Cash Compensation 80 Amortization of Deferred Financing Costs to Interest Expense 180 Amortization of Intangible Assets and Liabilities to Lease Income (115) Other Non-Cash Expense 30 Other Non-Recurring Items (99) Interest Expense, Net of Deferred Financing Costs Amortization 2,557 EBITDA $ 8,857 Annualized EBITDA $ 35,428 Pro Forma Annualized Impact of Current Quarter Investment Activity1 456 Pro Forma EBITDA $ 35,884 Total Long-Term Debt $ 268,320 Financing Costs, Net of Accumulated Amortization 680 Cash and Cash Equivalents (3,260) Net Debt $ 265,740 Net Debt to Pro Forma EBITDA 7.4x |
| Investor Inquiries: Philip R. Mays, Chief Financial Officer and Treasurer, (407) 904-3324, pmays@alpinereit.com |