Table of Contents
As submitted confidentially with the Securities and Exchange Commission on November 19, 2019, as Amendment No. 1 to the
Confidential Submission. This draft registration statement has not been publicly filed with the Securities and
Exchange Commission and all information herein remains strictly confidential.
Registration No. 333-
UNITED STATES
SECURITIES AND EXCHANGE COMMISSION
Washington, D.C. 20549
FORM S-1 REGISTRATION STATEMENT
UNDER THE SECURITIES ACT OF 1933
Lulu’s Fashion Lounge Holdings, Inc.
(Exact name of registrant as specified in its charter)
| Delaware | 5961 | 20-8442468 | ||
| (State or Other Jurisdiction of Incorporation or Organization) |
(Primary Standard Industrial Classification Code Number) |
(IRS Employer Identification No.) |
195 Humboldt Avenue
Chico, California 95928
Telephone: (530) 343-3545
(Address, including zip code, and telephone number, including area code, of registrant’s principal executive offices)
Colleen Winter
Chief Executive Officer
195 Humboldt Avenue
Chico, California 95928
Telephone: (530) 343-3545
(Name, address, including zip code, and telephone number, including area code, of agent for service)
Copies to:
| Marc D. Jaffe Adam J. Gelardi |
Naomi Beckman-Straus General Counsel 195 Humboldt Avenue Chico, California 95928 Telephone: (530) 343-3545 |
Kristin VanderPas Andrew S. Williamson David Peinsipp Cooley LLP San Francisco, California 94111 |
Approximate date of commencement of proposed sale to the public: As soon as practicable after the effective date of this Registration Statement.
If any of the securities being registered on this Form are to be offered on a delayed or continuous basis pursuant to Rule 415 under the Securities Act of 1933, as amended, or the Securities Act, check the following box. ☐
If this Form is filed to register additional securities for an offering pursuant to Rule 462(b) under the Securities Act, please check the following box and list the Securities Act registration statement number of the earlier effective registration statement for the same offering. ☐
If this Form is a post-effective amendment filed pursuant to Rule 462(c) under the Securities Act, check the following box and list the Securities Act registration statement number of the earlier effective registration statement for the same offering. ☐
If this Form is a post-effective amendment filed pursuant to Rule 462(d) under the Securities Act, check the following box and list the Securities Act registration statement number of the earlier effective registration statement for the same offering. ☐
Indicate by check mark whether the registrant is a large accelerated filer, an accelerated filer, a non-accelerated filer, a smaller reporting company, or an emerging growth company. See the definitions of “accelerated filer,” “large accelerated filer.” “smaller reporting company” and “emerging growth company” in Rule 12b-2 of the Exchange Act.
| Large accelerated filer | ☐ | Accelerated filer | ☐ | |||
| Non-accelerated filer | ☒ | Smaller reporting company | ☐ | |||
| Emerging growth company | ☒ | |||||
If an emerging growth company, indicate by check mark if the registrant has elected not to use the extended transition period for complying with any new or revised financial accounting standards provided pursuant to Section 7(a)(2)(B) of the Securities Act. ☐
CALCULATION OF REGISTRATION FEE
|
| ||||
| Title of Each Class of Securities to be Registered |
Proposed Maximum Offering Price(1) |
Amount of Registration Fee | ||
| Common stock, par value $0.001 per share |
$ | $ | ||
|
| ||||
|
| ||||
| (1) | Estimated solely for the purpose of calculating the registration fee in accordance with Rule 457(o) promulgated under the Securities Act of 1933, as amended. Includes shares of common stock that may be issuable upon exercise of an option to purchase additional shares granted to the underwriters. |
The Registrant hereby amends this Registration Statement on such date or dates as may be necessary to delay its effective date until the Registrant shall file a further amendment which specifically states that this Registration Statement shall thereafter become effective in accordance with Section 8(a) of the Securities Act or until the Registration Statement shall become effective on such date as the Commission acting pursuant to said Section 8(a), may determine.
Table of Contents
The information contained in this preliminary prospectus is not complete and may be changed. We may not sell these securities until the registration statement filed with the Securities and Exchange Commission is effective. This preliminary prospectus is not an offer to sell these securities and is not soliciting an offer to buy these securities in any jurisdiction where the offer or sale is not permitted.
SUBJECT TO COMPLETION, DATED , 2019
Shares

Common Stock
This is the initial public offering of shares of common stock of Lulu’s Fashion Lounge Holdings, Inc. We are offering shares of common stock. The selling stockholders identified in this prospectus are offering an additional shares of common stock. We will not receive any proceeds from the sale of common stock being sold by the selling stockholders.
Prior to this offering, there has been no public market for our common stock. It is currently estimated that the initial public offering price will be between $ and $ per share.
We have applied to list our common stock on under the symbol “ .”
We are an “emerging growth company” as defined under the federal securities laws and, as such, have elected to comply with certain reduced public company reporting requirements in this prospectus and may elect to do so in future filings.
Investing in our common stock involves risks. See the section titled “Risk Factors” beginning on page 17 to read about factors you should consider before deciding to invest in shares of our common stock.
Neither the Securities and Exchange Commission nor any state securities commission has approved or disapproved of these securities or passed upon the accuracy or adequacy of this prospectus. Any representation to the contrary is a criminal offense.
| Per Share | Total | |||||||
| Initial public offering price |
$ | $ | ||||||
| Underwriting discounts and commissions(1) |
$ | $ | ||||||
| Proceeds, before expenses, to us |
$ | $ | ||||||
| Proceeds, before expenses, to the selling stockholders |
$ | $ | ||||||
| (1) | See the section titled “Underwriting” for a description of the compensation payable to the underwriters. |
We have granted the underwriters an option for a period of 30 days to purchase up to an additional shares of common stock from us and up to an additional shares of common stock from the selling stockholders at the initial public offering price, less underwriting discounts and commissions.
The underwriters expect to deliver the shares against payment in New York, New York on , 2019.
Goldman Sachs & Co. LLC
Prospectus dated , 2019
Table of Contents
| 1 | ||||
| 17 | ||||
| 53 | ||||
| 55 | ||||
| 56 | ||||
| 57 | ||||
| 58 | ||||
| 60 | ||||
| 62 | ||||
| MANAGEMENT’S DISCUSSION AND ANALYSIS OF FINANCIAL CONDITION AND RESULTS OF OPERATIONS |
64 | |||
| 86 | ||||
| 101 | ||||
| 109 | ||||
| 119 | ||||
| 122 | ||||
| 124 | ||||
| 128 | ||||
| 132 | ||||
| MATERIAL U.S. FEDERAL INCOME AND ESTATE TAX CONSIDERATIONS FOR NON-U.S. HOLDERS |
134 | |||
| 138 | ||||
| 145 | ||||
| 145 | ||||
| 146 | ||||
| F-1 |
You should rely only on the information contained in this prospectus or in any free writing prospectus we may authorize to be delivered or made available to you. Neither we, the selling stockholders, nor the underwriters (or any of our or their respective affiliates) have authorized anyone to provide any information other than that contained in this prospectus or in any free writing prospectus prepared by or on behalf of us or to which we have referred you. Neither we, the selling stockholders, nor the underwriters (or any of our or their respective affiliates) take any responsibility for, and can provide no assurance as to the reliability of, any other information that others may give you. We, the selling stockholders and the underwriters (or any of our or their respective affiliates) are not making an offer to sell these securities in any jurisdiction where the offer or sale is not permitted. The information contained in this prospectus is only accurate as of the date on the front cover of this prospectus.
Until , 2019 (25 days after the date of this prospectus), all dealers that buy, sell or trade our common stock, whether or not participating in this offering, may be required to deliver a prospectus. This is in addition to the dealers’ obligation to deliver a prospectus when acting as underwriters and with respect to their unsold allotments or subscriptions.
For investors outside the United States: Neither we, the selling stockholders, nor the underwriters (or any of their respective affiliates) have done anything that would permit this offering or possession or distribution of this prospectus in any jurisdiction, other than the United States, where action for that purpose is required. Persons outside the United States who come into possession of this prospectus must inform themselves about, and observe any restrictions relating to, the offering of our shares and the distribution of this prospectus outside the United States.
i
Table of Contents
Basis of Presentation
On August 28, 2017, we executed a reorganization of our corporate structure. Our original parent company was called Lulu’s Holdings, LLC. This entity was converted to a limited partnership, and is now known as Lulu’s Holdings, L.P. We formed two new subsidiaries, Lulu’s Fashion Lounge Holdings, Inc., the issuer in this offering, and Lulu’s Fashion Lounge Parent, LLC, to sit between the partnership and our operating company. Our operating company, previously known as Lulu’s Fashion Lounge, Inc., was converted from a California corporation to a Delaware limited liability company, Lulu’s Fashion Lounge, LLC an indirect wholly-owned subsidiary of the issuer. Unless otherwise indicated or the context otherwise requires, references in this prospectus to the terms “Lulus,” “we,” “us,” “our,” or the “Company” refer to Lulu’s Fashion Lounge Holdings, Inc. and its consolidated subsidiaries.
Our fiscal year is a “52-53 week” year ending on the Sunday closest in proximity to December 31, such that each quarterly period will be 13 weeks in length, except during a 53 week year when the fourth quarter will be 14 weeks. References herein to “2018” relate to the year ended December 30, 2018, references herein to “2017” relate to the year ended December 31, 2017, and references herein to “2016” relate to the year ended January 1, 2017. The years ended December 30, 2018 and December 31, 2017 were 52 week years, and the year ended January 1, 2017 was a 53 week year.
Throughout this prospectus, we provide a number of key performance indicators used by management and typically used by our competitors in our industry. These and other key performance indicators are discussed in more detail in the section entitled “Management’s Discussion and Analysis of Financial Condition and Results of Operations—Key Operating and Financial Metrics.” In this prospectus, we also reference Adjusted EBITDA and Adjusted free cash flow, which are non-GAAP (accounting principles generally accepted in the United States of America) financial measures. See “Prospectus Summary—Summary Historical Consolidated Financial Data” for a discussion of Adjusted EBITDA, and Adjusted free cash flow, as well as a reconciliation of net income to Adjusted EBITDA and a reconciliation of net cash provided by operating activities to Adjusted free cash flow, net income and net cash provided by operating activities are the most directly comparable financial measures required by, or presented in accordance, with GAAP. We define certain terms and other terms used throughout this prospectus as follows:
| • | Active Customers is defined as the number of customers who have made at least one purchase from www.lulus.com in the prior 12-month period. |
| • | Total Orders Placed is defined as the number of customer orders placed on www.lulus.com during the prior 12-month period. An order is counted on the day the customer places the order. We do not adjust the number of total orders placed for any cancellation or return that may have occurred subsequent to a customer placing an order. |
| • | Average Order Value (“AOV”) is defined as the sum of the total gross sales before returns from www.lulus.com in a given period, plus shipping revenue, less discounts and markdowns, divided by the total orders placed in that period. |
| • | Average Unit Retail (“AUR”) is defined as the sum of the total gross sales before returns from www.lulus.com in a given period, plus shipping revenue, less discounts and markdowns, divided by the total number of units sold in that period. |
ii
Table of Contents
This summary highlights selected information contained elsewhere in this prospectus. This summary does not contain all the information that you should consider before deciding to invest in our common stock. You should read the entire prospectus carefully, including “Risk Factors,” “Forward-Looking Statements,” and our consolidated financial statements and related notes included elsewhere in this prospectus, before deciding whether to invest in our common stock.
Overview
Lulus is a customer-driven, digitally-native fashion brand primarily serving Millennial and Gen Z women. We focus relentlessly on giving our customers what they want. We do this by using data coupled with human insight to deliver a curated and continuously evolving assortment of on-point, affordable luxury fashion. Our customer obsession sets the tone for everything we do, from our personalized online shopping experience to our exceptional customer service.
Over the past 11 years as a pure-play eCommerce brand, we have focused on building authentic personal relationships with our customers and offering them coveted products they cannot purchase elsewhere. We incorporate the pulse of the consumer by engaging with her where she is, across the web, social media and on our site, through reviews, feedback, and one-on-one interactions with our Style Advisors, Fit Experts, and Bridal Concierge. Customers express their love for our brand on social media and by word-of-mouth (in person and online). We have more than 3.5 million followers across social media, and the popular #lovelulus hashtag has generated over 4.4 billion impressions. We have a Net Promoter Score (“NPS”) score of +60 among existing Lulus customers as of June 2019, a signal of the genuine customer affinity for our brand.
A key differentiator of our business model from traditional fashion retail is our use of data to optimize all elements of our business. Nowhere is this more pronounced than in our product creation and curation cycle. We leverage a “test, learn, and reorder” strategy to bring new products to market in as few as three weeks. We launch new styles virtually every weekday; we test them in small batches, learn about customer demand, and reorder winning products in higher volume. This strategy allows us to rapidly convert new SKUs into profitable sales on a consistent and repeatable basis while minimizing fashion and trend risk. We sell thousands of SKUs each month across a broad range of categories, and 93% of our reorders in 2018 were sold without markdown.
We are proud of our large, diverse community of loyal customers. While our target customer is typically in her mid-20s, we serve women in their mid-to-late teens through their 30s and beyond. We design our broad assortment of affordable luxury fashion for practically all occasions. Our affordable luxury positioning, underscored by our average unit retail of $49 in 2017 and 2018, respectively, means that we appeal to a large segment of the market. In the twelve months ended September 29, 2019, we served 2.8 million Active Customers compared to 2.3 million in the twelve months ended September 30, 2018.
Our business model has resulted in strong historical growth and profitability. Between 2016 and 2018, we grew net sales by 124.2%. In 2018, we had a net income margin of 0.4% and an Adjusted EBITDA margin of 10.1%. During the nine months ended September 29, 2019, we had a net income margin of 0.2% and an Adjusted EBITDA margin of 6.0%.
1
Table of Contents
Our Industry
Apparel is a Massive Market, but Traditional Brands and Retailers are Under Pressure
Euromonitor, a consumer market research company, estimates that the aggregate apparel, footwear, and accessories industry in the United States represented a $473.9 billion market in 2018. Euromonitor expects this market to grow to $556.8 billion by 2023, representing an expected compound annual growth rate (“CAGR”) of 3.3%.
Traditional apparel brand and retail models are increasingly under pressure. Offline retail models have generally failed to keep up with changing consumer preferences and are burdened by vast, inflexible physical store footprints, inventory management challenges, demand seasonality, and a highly promotional environment as competitors seek to capture any sales available to cover high fixed costs. Additionally, offline models face an elongated and unattractive merchandising and buying cycle that requires brands and retailers to forecast fashion trends and consumer demand several months to quarters into the future. This economic model also results in higher initial retail prices to consumers due to the wholesale-to-retail markup. Finally, Millennial and Gen Z consumers increasingly prefer to shop online, which has forced many traditional retailers to respond by closing a significant portion of their previously profitable physical stores over the last several years.
eCommerce is Taking Share, but Has Inherited Challenges of Traditional Models
Consumers are typically spending less time in malls and more time online. According to Nielsen Social Media Report (2016), on average, Millennials are spending 6 hours per week on social media. According to an online publication, among Gen Z consumers, this trend towards online consumption of media and adoption of eCommerce is even more pronounced, with 45% saying they are online “almost constantly.” This massive segment of the population represents the first generations to have come of age communicating, learning, and shopping online and on their mobile devices. This has resulted in a new “discovery journey” for consumers whereby brand and product discovery, evaluation, and purchase increasingly occur online.
As a result, eCommerce is responsible for driving all of the recent growth in the apparel and footwear market. Between 2015 and 2018, Euromonitor estimates that the eCommerce portion of this market grew from $49.1 billion to $78.6 billion, which represents a CAGR of 17.0%. Over this same time period, Euromonitor estimates that the penetration of eCommerce as a percentage of total revenue grew from 14.4% in 2015 to 21.9% in 2018. Euromonitor estimates that apparel and footwear spend excluding eCommerce in 2015 and 2018 was $292.4 billion and $281.1 billion, respectively, indicating that the offline portion of the market decreased at a (1.3)% CAGR over this time period.
The rise of eCommerce has been driven by two new business models: first, brick and mortar retailers adopting omni-channel models, and second, the emergence of a new generation of online department stores. As brick and mortar retailers move online, they market products to consumers through legacy offline channels (e.g., department stores and owned stores) as well as emerging online channels (e.g., eCommerce retailers and owned websites). Consistent with broader industry trends, growth in the online businesses of these traditional brands and retailers has generally outpaced growth in their respective offline businesses. In addition, a new generation of online department stores offers consumers the convenience to shop online for a variety of third-party or private label brands. These online venues have the advantage of being able to offer a broader assortment and more personalized shopping experience relative to their offline counterparts.
2
Table of Contents
While both the omni-channel and online department store models represent an improvement from the traditional offline-only model, they continue to be burdened by many of the challenges of their brick and mortar predecessors. Key among these challenges is an elongated merchandising and buying cycle that requires brands and retailers to forecast fashion trends and consumer demand several months to quarters into the future. As a result, inventory management becomes a critical pain point, whereby inventory shortage results in lost sales, and inventory surplus results in markdowns, which
impair margins and damage brand equity. Other challenges include the wholesale-to-retail markup, which results in higher initial retail prices as well as potential margin erosion, as consumers can easily price shop third-party brands online and purchase from the lowest cost provider. Additionally, legacy and eCommerce retailers may be conflicted when developing and promoting their own private label brands, and are often reliant on third-party brands, which can pose supply risk.
Digitally-Native Brands are Best Positioned to Win
Against this backdrop, we believe that digitally-native brands are best positioned to succeed due to the following key attributes they possess:
| • | Ability to offer their own brands without reliance on third-party brands; |
| • | Direct engagement with customers; |
| • | Large, real-time customer-centric data sets offering insights across the business; |
| • | Product creation driven by customer feedback and purchase patterns; |
| • | Technology that is purpose-built for eCommerce; |
| • | Asset-light distribution model; and |
| • | Opportunity to selectively test and open temporary and/or permanent physical retail stores. |
Lulus: A Customer-Driven Fashion Brand
Lulus is a customer-driven fashion brand that leverages the power of digitally-native eCommerce. We have built a community of loyal customers by listening to them and engaging with them. When we ask customers to describe Lulus, they tell us they think of the brand as “trendy,” “affordable,” and “stylish.” We take a deliberate, measured approach to developing products that feature high-end stylistic details as well as flattering silhouettes that empower our customer to look and feel her best, whether it is during the work week or on the weekend. As a result of our brand authenticity and focus on delivering what our customer wants, we have earned deep customer loyalty and brand affinity. Based on a June 2019 survey we commissioned conducted by Stax, an independent consumer market research firm, we have an NPS of +60 among existing Lulus customers. Key brand attributes that our customers consider to be most important include style/design, overall product quality, and price of products. According to the same survey, our aided brand awareness remains modest at 18% among females 18 years of age and older in the United States, implying significant opportunity to continue to attract new customers.
Our Customer
We are proud of our large, diverse community of loyal customers. While our target customer is typically in her mid-20s, we serve women in their mid-to-late teens through their 30s and beyond. The Lulus brand spans many categories, including dresses, tops, bottoms, bridal, intimates, footwear, and
3
Table of Contents
accessories. A customer who might have discovered Lulus when shopping for her high school prom can continue to shop our broad assortment that caters to later life events such as graduations and weddings, as well as for desk to date and everything in between.
Our affordable luxury positioning is underscored by our AUR of $49 in 2018, which we believe helps us to appeal to a large segment of the market. According to the survey conducted by Stax, our customers spend a median of $1,150 on their fashion purchases per year. This compares to average net sales per Active Customer of $129 in 2018, which implies 11% share of wallet. We believe our customers’ strong brand affinity and our affordable price point helps position us to grow our share of wallet over time.
In the twelve months ended September 29, 2019, we served 2.8 million Active Customers. On social media, we benefit from the longevity and strength of our social presence and have more than 3.5 million followers across our social media platforms, including Instagram, Facebook, Pinterest, YouTube, and Twitter, and have more than 1,500 brand ambassadors in our influencer network.
Why We Win
| • | Customer-Driven Fashion Brand: Lulus is one of the first digitally-native fashion brands in the United States primarily serving Millennial and Gen Z women. Over the last decade, the Lulus customer has come to us for on-point fashion that is high quality yet affordable. We take pride in our ability to offer more luxurious fabrics and incorporate elevated stylistic details into our products relative to what is offered by other comparably priced brands. As a result, our customers consistently remark on the quality of our products, as well as the newness of our assortment, with an average of over 200 SKUs released each week in 2018. Our obsessive focus on customer preferences has created deep personal connections with our customers, who have in turn rewarded us with their loyalty and word-of-mouth sharing of the brand. While other brands rely on internal design teams to create styles that reflect a particular brand aesthetic, we listen first and foremost to customer feedback and then focus our efforts on creating and curating an assortment that she will love. |
| • | Customer-Centric Experience: We are passionate about building a brand synonymous with exceptional customer service. We have effectively brought the boutique experience online, developing one-on-one relationships with our customers in order to learn and then address their individual needs. Our custom-built digital platform allows customers to share their Lulus experience and get answers to questions without the hassle of taking the search offline. Our extensive database of nearly 440,000 customer reviews, including over 39,000 photo reviews, and access to personalized assistance help customers identify the perfect style and fit. Unlike many eCommerce retailers who offer a variety of different brands with inconsistent sizing, we offer standardized sizing across the Lulus brand assortment, simplifying the shopping experience and giving our customer confidence that she is selecting the perfect size. |
| • | Leveraging Data to Best Serve our Customer: We have built a massive data set which gives us strong insight into our customers. Millions of customers have interacted with us, leaving detailed reviews, interacting with our on-demand Style Advisors, Fit Experts, and Bridal Concierge, and completing checkout surveys. Across Instagram, Facebook, Pinterest, YouTube, Snapchat, and Twitter, our 3.5 million followers engage with us through their comments, feedback, and photographs, and support of our brand with their digital followers. In aggregate, this data set gives us a deep understanding of our customers’ preferences. Our business is driven by the symbiosis between our data set, marketing strategy, and product creation and curation process. |
4
Table of Contents
| • | Marketing and Engagement Strategy: We engage with our customer where she is, in authentic and personalized ways, through our website, email, and on social media. This strategy helps drive brand awareness while fostering deep connections with our customers. We have built our digital footprint through strong relationships with customers and influencers over more than ten years and benefit from longevity and consistency of message. Our authentic partnerships with brand ambassadors span the full spectrum of followership and engagement levels, from nano- and micro-influencers, to college ambassadors, to celebrities, all of whom wear and genuinely love our brand. These genuine brand ambassadors, driven by a strong emotional connection to Lulus, help drive authentic brand awareness and customer engagement. Our free, organic, and low-cost initiatives coupled with profitable performance media drive traffic to our website, which is custom-built to allow for continuous updating and personalization for each customer. Our unified cross-platform strategy consistently reinforces the same brand values. Our marketing approach results in attractive customer acquisition, strong retention, and compelling lifetime value characteristics. |
| • | Data-Driven Product Creation Strategy: Our innovative product creation strategy leverages the power of data and our “test, learn, and reorder” approach to bring new styles online virtually every weekday. In 2018, we brought to market an average of 211 SKUs per week. Traditional merchandising approaches are characterized by extended in-house design cycles, seasonal assortment decisions, deep buys, limited customer feedback, and high markdowns. We leverage our large dataset to upend this traditional approach, rapidly bringing new designs to market that we know our customers will love. This means we are not limited to offering just one style or aesthetic across our assortment as is typical with most brands. In lieu of maintaining dedicated in-house product design overhead, we source raw designs from a broad network of design and manufacturing partners, who ensure that we see trends in real-time and often produce products exclusively for Lulus. Next, our creative buyers use our data-driven understanding of trends and customer preference to customize designs for fit, style, and color, creating branded SKUs exclusive to Lulus. We then test these SKUs with limited initial orders, which drive traffic and “need to own” scarcity among our customers, and our proprietary reorder algorithm utilizes real-time purchase data to inform subsequent reorder decisions. Because we are trend adapters rather than trend creators, we do not have to forecast expected future demand for a particular style or design, which is a challenge that most of our competitors face each season. As a result, we are able to optimize our inventory levels to meet customer demand and minimize returns as well as markdowns. Customer feedback via reviews and social media helps us to refine merchandise in advance of reordering, further enhancing our product. In 2018, 93% of our reorders were sold without markdown. |
| • | Experienced Founder-Led Team: We are led by our visionary chief executive officer, Colleen Winter, who founded the business in 1996 with her mother Debra Cannon. Our management team’s commitment to personalized, superior customer service, and long-term orientation is central to our ongoing success. Members of our executive team have significant experience in successfully growing businesses across various industries, including retail, advertising, and technology. These team members have had experience working at leading companies such as Alibaba, Havas Media, MAC Cosmetics, Michael Kors, and SunGard. |
5
Table of Contents
Our Growth Strategies
Grow Brand Awareness and Attract New Customers
Due to the mass market appeal of our brand, we believe there is a significant opportunity to bring new customers into the Lulus community through increased brand awareness. As of June 2019, according to a customer survey conducted by Stax, our aided brand awareness among females of 18 years of age and older in the United States was 18%. Historically, a large portion of our customers have become aware of our brand through word-of-mouth and social media. We intend to grow awareness of the Lulus brand and attract new customers through the following strategies:
| • | Further investment in performance digital marketing strategies (e.g., performance search marketing, social advertising, and remarketing); |
| • | Exploration and expansion of marketing channels, including radio, podcasts, outdoor media, on-demand video, and television; |
| • | Continued expansion of our brand ambassador program at all engagement tiers, including celebrity, micro- and nano-influencers, and college ambassadors to introduce Lulus to new audiences; |
| • | Expansion of our refer-a-friend program, which leverages word-of-mouth referral in a scalable online platform through email, text, and social media; |
| • | Development and testing of physical retail opportunities, such as in-store partnerships with third-party retailers and small-format pop-ups and showrooms; and |
| • | Continued development of brand partnerships, with a clear focus on brands with strong customer affinity and crossover potential. This includes collaborations with apparel brands and influencers, as well as adjacent category opportunities such as beauty, home, and lifestyle. |
Enhance and Retain Existing Customer Relationships
We have a large and growing Lulus community, with 2.8 million Active Customers in the twelve months ended September 29, 2019 and 2.3 million Active Customers in the twelve months ended September 30, 2018. We believe we have a significant opportunity to deepen our relationships with our existing customer base and further improve the customer journey, as we continue to leverage customer insights and undertake initiatives to become a one-stop online boutique for Millennial and Gen Z women. For example, we have had success leveraging data-driven insights across categories to offer personalized suggestions and reminders at targeted points in time, and we are focused on expanding these capabilities to provide enhanced real-time recommendations and post-purchase engagement. Our Love Rewards loyalty program, which launched in October 2018, is focused on driving repeat purchase behavior, and has significant opportunity to be further developed and scaled. Additionally, we continually develop and evaluate new tools and programs designed to improve the key customer metrics that drive our business, such as frequency of purchase and average order value through the following strategies:
| • | Optimization of our website and mobile experience through continued A/B and multivariate testing; |
| • | Improvement of customer segmentation and personalization features; |
| • | Leveraging our expanded multi-region distribution facilities to offer faster order delivery and develop new shipping options for loyal customers; |
| • | Expansion of our Love Rewards loyalty program to incorporate additional tiers and associated offers and perks; |
6
Table of Contents
| • | Enhancement of our customer service and engagement experience through the expansion of our Style Advisors, Fit Experts, and Bridal Concierge dedicated to creating a truly personalized digital boutique experience; and |
| • | Continued development of our affordable luxury brand positioning and content. |
We have learned that enhancing our existing customers’ experience drives increased word-of-mouth (in-person and online) recommendations, which in turn helps grow brand awareness.
Pursue Category Expansion
We believe there is tremendous potential to continue to drive growth in our underpenetrated categories. We have a significant opportunity to grow our share of total apparel budget with existing and new customers by building out existing categories that are currently underpenetrated and testing categories that are new to Lulus. Our deep and personal engagement with our customers through product reviews, exit surveys, and social media feedback helps us understand the product categories they are most interested in shopping and will continue to inform the categories we offer. According to a consumer survey we commissioned conducted by Stax in June 2019, a significant percentage of Lulus customers sampled indicated they would be interested in purchasing merchandise in new categories, such as athleisure, lounge, and denim, from us in the future.
Due to our customer data-driven product creation strategy, we have the ability to test new categories with minimal upfront investment and risk. New categories are opened with a controlled assortment of branded and partner products through which we learn to understand customer demand via our reorder algorithms.
Pursue International Expansion
While we expect the majority of our near-term growth to continue to come from the United States, we believe that serving international customers represents a long-term future growth opportunity. To date, we have shipped our merchandise to over 140 countries, while spending minimal dollars on marketing outside of the United States, demonstrating our global appeal and broader market opportunity. We intend to increase our focus on global performance media and to optimize our website and distribution processes for international customers, allowing for more flexibility across languages and currencies. We believe that providing a localized shopping experience will significantly enhance our ability to serve customers in international markets. As we begin to execute on our international expansion strategy, we intend to initially focus our efforts on large, English-speaking international markets such as the United Kingdom, Canada, and Australia. Over time, we believe the Lulus brand has the potential to succeed in many other developed and major developing markets.
Risks Associated With Our Business
Investing in our common stock involves a high degree of risk. You should consider carefully the risks described in “Risk Factors” before making a decision to invest in our common stock. If any of these risks actually occur, our business, financial condition, and results of operations would likely be materially adversely affected. In such case, the trading price of our common stock would likely decline, and you may lose all or part of your investment. Below is a summary of some of the principal risks that we face.
| • | If we are not able to successfully maintain our desired merchandise assortment or manage our inventory effectively, we may be unable to attract a sufficient number of customers or sell |
7
Table of Contents
| sufficient quantities of our merchandise, which could result in excess inventories, markdowns, and foregone sales; |
| • | Our success depends on our ability to anticipate, measure, identify, and respond quickly to customer data on new and rapidly changing fashion trends, customer preferences, and demands and other factors; |
| • | Our efforts to acquire or retain customers may not be successful, which could prevent us from maintaining or increasing our sales; |
| • | We may be unable to maintain a high level of engagement with our customers and increase their spending with us, which could harm our business, financial condition, or results of operations; |
| • | If we fail to provide high-quality customer support, it could have a material adverse effect on our business, financial condition, and results of operations; |
| • | Our business depends on our ability to maintain a strong community around the Lulus brand with engaged customers and influencers. We may not be able to maintain and enhance our existing brand community if we receive customer complaints, negative publicity or otherwise fail to live up to consumers’ expectations, which could materially adversely affect our business, financial condition, and results of operations; |
| • | We operate in the highly competitive retail apparel industry, and the size and resources of some of our competitors may allow them to compete more effectively than we can, which could adversely impact our growth and market share, and have a material adverse effect on our business, financial condition, and results of operations; and |
| • | We may not be able to successfully implement our growth strategy. |
Our Equity Sponsor
H.I.G. Capital, LLC (“H.I.G.” or our “Sponsor”) is a leading global private equity and alternative assets firm with more than $30 billion in equity capital under management. Since its founding in 1993, H.I.G., through various affiliates and subsidiaries, has invested in and managed more than 300 companies with combined revenues in excess of $30 billion. H.I.G.’s investors include leading financial institutions, insurance companies, university endowments, pension funds and sovereign wealth funds.
Upon completion of this offering, affiliates of H.I.G. will control shares of our common stock (representing % of all common stock outstanding), or shares of our common stock (representing % of all common stock outstanding) if the underwriters exercise their option to purchase additional shares from us in full.
Corporate Information
We were organized in California January 23, 2007 under the name Lulu’s Fashion Lounge, Inc. Through a series of reorganizations we currently operate our business as Lulu’s Fashion Lounge Holdings, Inc. and through our indirect wholly-owned operating subsidiary Lulu’s Fashion Lounge, LLC. Our principal offices are located at 195 Humboldt Avenue, Chico, California 95928. Our telephone number is (530) 343-3545. We maintain a website at www.lulus.com. The information contained on, or that can be accessed through, our website is not part of, and is not incorporated into, this prospectus, and you should not rely on any such information in making the decision as to whether to purchase our common stock.
8
Table of Contents
We own or have the rights to use various trademarks, service marks, and trade names referred to in
this prospectus, including, among others LULUS® and
 ®. Solely for convenience, we refer to trademarks, service marks, and trade names in this prospectus without the ™, SM, and ® symbols. Such references are not intended to indicate, in any way, that
we will not assert, to the fullest extent permitted by law, our rights to our trademarks, service marks, and trade names. Other trademarks, service marks, or trade names appearing in this prospectus are the property of their respective owners.
®. Solely for convenience, we refer to trademarks, service marks, and trade names in this prospectus without the ™, SM, and ® symbols. Such references are not intended to indicate, in any way, that
we will not assert, to the fullest extent permitted by law, our rights to our trademarks, service marks, and trade names. Other trademarks, service marks, or trade names appearing in this prospectus are the property of their respective owners.
Implications of Being an Emerging Growth Company
We are an “emerging growth company,” as defined in the Jumpstart Our Business Startups Act of 2012 (the “JOBS Act”). We will remain an emerging growth company until the earlier of (1) December 31, 2024 (the last day of the fiscal year following the fifth anniversary of our initial public offering), (2) the last day of the fiscal year in which we have total annual gross revenue of at least $1.07 billion, (3) the last day of the fiscal year in which we are deemed to be a “large accelerated filer,” as defined in the rules under the Securities Exchange Act of 1934, as amended (the “Exchange Act”), or (4) the date on which we have issued more than $1.0 billion in non-convertible debt during the prior three year period. Any reference herein to “emerging growth company” has the meaning ascribed to it in the JOBS Act.
An emerging growth company may take advantage of reduced reporting requirements that are otherwise applicable to public companies. These provisions include, but are not limited to:
| • | being permitted to present only two years of audited financial statements in this prospectus and only two years of related “Management’s Discussion and Analysis of Financial Condition and Results of Operations” in our registration statements, including this prospectus; |
| • | not being required to comply with the auditor attestation requirements of Section 404 of the Sarbanes-Oxley Act of 2002, as amended (the “Sarbanes-Oxley Act”); |
| • | reduced disclosure obligations regarding executive compensation in our periodic reports, proxy statements, and registration statements, including in this prospectus; and |
| • | exemptions from the requirements of holding a nonbinding advisory vote on executive compensation and stockholder approval of any golden parachute payments not previously approved. |
We have elected to take advantage of certain of the reduced disclosure obligations in this prospectus and may elect to take advantage of other reduced reporting requirements in our future filings with the Securities and Exchange Commission (“the SEC”). As a result, the information that we provide to our stockholders may be different than you might receive from other public reporting companies in which you hold equity interests.
An emerging growth company can delay the adoption of certain accounting standards until those standards would otherwise apply to private companies. Section 107 of the JOBS Act provides that any decision to opt out of the extended transition period for complying with new or revised accounting standards is irrevocable. We have elected to use this extended transition period under the JOBS Act.
9
Table of Contents
The Offering
| Common stock offered by us |
shares ( shares if the underwriters exercise their option to purchase additional shares in full). |
| Common stock offered by the selling stockholders |
shares ( shares if the underwriters exercise their option to purchase additional shares in full). |
| Option to purchase additional shares of common stock |
The underwriters also have the option to purchase up to an additional shares of common stock from us and an additional shares of common stock from the selling stockholders identified in this prospectus. The underwriters can exercise this option at any time within 30 days from the date of this prospectus. |
| Common stock to be outstanding immediately after this offering |
shares ( shares if the underwriters exercise their option to purchase additional shares in full). |
| Use of proceeds |
We estimate that the net proceeds to us from our sale of shares of common stock in this offering will be approximately $ million (or approximately $ million if the underwriters exercise their option to purchase additional shares in full), assuming an initial public offering price of $ per share, the midpoint of the price range set forth on the cover page of this prospectus, after deducting underwriting discounts and commissions and estimated offering expenses payable by us. We intend to use the proceeds from this offering for repayment of debt, and general corporate purposes. We will not receive any proceeds from the sale of shares by the selling stockholders, which include entities affiliated with members of our board of directors ("Board of Directors”). See “Use of Proceeds.” |
| Risk factors |
Investing in our common stock involves a high degree of risk. See “Risk Factors” beginning on page 17 of this prospectus for a discussion of factors you should consider carefully before investing in our common stock. |
| Proposed trading symbol |
“ .” |
10
Table of Contents
The number of shares of our common stock to be outstanding after this offering is based on shares of our common stock (including our Series A convertible Preferred Stock (the “Series A Preferred Stock”) on an as-converted basis) outstanding as of , 2019 and excludes shares of our common stock reserved for future issuance under our employee option programs as described in “Executive Compensation—Equity Compensation Plans.”
Unless otherwise indicated, all information contained in this prospectus reflects and assumes the following:
| • | the automatic conversion of all outstanding shares of our Series A Preferred Stock into an aggregate of shares of our common stock immediately prior to the completion of this offering; |
| • | the filing and effectiveness of our amended and restated certificate of incorporation and the adoption of our amended and restated bylaws, which will occur immediately prior to the completion of this offering; |
| • | the liquidation of Lulu’s Holdings, L.P. (the “LP”) in which the unit holders of LP will receive shares of common stock in exchange for their units of the LP, which will occur immediately prior to the completion of this offering; |
| • | the acceleration of vesting of certain Class P units at the LP and the distribution of our common stock for each Class P unit held immediately prior to the completion of this offering; |
| • |
a -for- stock split of our common stock to be effected prior to the effectiveness of the registration statement of which this prospectus is a part; and |
| • | no exercise by the underwriters of their option to purchase additional shares of common stock from us and the selling stockholders in this offering. |
11
Table of Contents
Summary Historical Consolidated Financial Data
The following tables set forth Lulu’s Fashion Lounge Holdings, Inc.’s summary historical consolidated financial data for the periods ended on and as of the dates indicated. We derived the consolidated statements of income and comprehensive income data and the consolidated statements of cash flow data for the years ended December 31, 2017 and December 30, 2018 from our audited consolidated financial statements and the related notes thereto included elsewhere in this prospectus. We derived the consolidated statements of income and comprehensive income data and the consolidated statements of cash flow data for the nine months ended September 30, 2018 and September 29, 2019 and the consolidated balance sheet data as of September 29, 2019 from our unaudited interim condensed consolidated financial statements and the related notes thereto included elsewhere in this prospectus.
Our historical results are not necessarily indicative of future results of operations, and the results of operations for the nine months ended September 29, 2019 are not necessarily indicative of results for the full year. The unaudited interim condensed consolidated financial statements have been prepared on the same basis as the audited annual consolidated financial statements and reflect, in the opinion of management, all adjustments of a normal, recurring nature that are necessary for a fair statement of the unaudited interim condensed consolidated financial statements. You should read the information set forth below together with “Selected Consolidated Financial Data,” “Management’s Discussion and Analysis of Financial Condition and Results of Operations,” our consolidated financial statements and the related notes thereto, and our unaudited interim condensed consolidated financial statements and the related notes thereto included elsewhere in this prospectus.
| Year Ended | Nine Months Ended | |||||||||||||||
| December 31, 2017 |
December 30, 2018 |
September 30, 2018 |
September 29, 2019 |
|||||||||||||
| (in thousands, except share and per share amounts) | ||||||||||||||||
| (unaudited) | ||||||||||||||||
| Consolidated Statements of Income and Comprehensive Income Data: |
||||||||||||||||
| Net sales |
$ | 232,469 | $ | 297,111 | $ | 230,930 | $ | 285,990 | ||||||||
| Cost of goods sold |
122,234 | 164,814 | 126,375 | 160,500 | ||||||||||||
|
|
|
|
|
|
|
|
|
|||||||||
| Gross profit |
110,235 | 132,297 | 104,555 | 125,490 | ||||||||||||
| Selling and marketing expenses |
32,906 | 56,639 | 42,594 | 56,241 | ||||||||||||
| General and administrative expenses |
43,461 | 57,030 | 42,102 | 56,603 | ||||||||||||
|
|
|
|
|
|
|
|
|
|||||||||
| Income from operations |
33,868 | 18,628 | 19,859 | 12,646 | ||||||||||||
|
|
|
|
|
|
|
|
|
|||||||||
| Other income (expense), net: |
||||||||||||||||
| Interest expense |
(9,290 | ) | (13,700 | ) | (10,236 | ) | (11,396 | ) | ||||||||
| Loss on debt extinguishment |
(1,170 | ) | — | — | ||||||||||||
| Other income |
33 | 417 | 393 | 193 | ||||||||||||
|
|
|
|
|
|
|
|
|
|||||||||
| Total other expense, net |
(10,427 | ) | (13,283 | ) | (9,843 | ) | (11,203 | ) | ||||||||
|
|
|
|
|
|
|
|
|
|||||||||
| Income before provision for income taxes |
23,441 | 5,345 | 10,016 | 1,443 | ||||||||||||
| Provision for income taxes |
8,531 | 4,219 | 4,864 | 791 | ||||||||||||
|
|
|
|
|
|
|
|
|
|||||||||
| Net income and comprehensive income |
$ | 14,910 | $ | 1,126 | $ | 5,152 | $ | 652 | ||||||||
|
|
|
|
|
|
|
|
|
|||||||||
| Net income attributable to common stockholder: |
||||||||||||||||
| Basic and Diluted |
$ | 14,910 | $ | 1,002 | $ | 4,659 | $ | 553 | ||||||||
|
|
|
|
|
|
|
|
|
|||||||||
| Net income per share attributable to common stockholder: |
||||||||||||||||
| Basic and Diluted |
$ | 0.72 | $ | 0.05 | $ | 0.25 | $ | 0.03 | ||||||||
|
|
|
|
|
|
|
|
|
|||||||||
| Shares used to compute net income per share attributable to common stockholder: |
||||||||||||||||
| Basic and Diluted |
20,591,917 | 18,328,291 | 18,620,133 | 17,462,283 | ||||||||||||
|
|
|
|
|
|
|
|
|
|||||||||
12
Table of Contents
| Year Ended | Nine Months Ended | |||||||||||||||
| December 31, 2017 |
December 30, 2018 |
September 30, 2018 |
September 29, 2019 |
|||||||||||||
| (in thousands, except share and per share amounts) | ||||||||||||||||
| (unaudited) | ||||||||||||||||
| Pro Forma Consolidated Statements of Income Data(1): |
||||||||||||||||
| Pro forma net income attributable to common stockholders: |
||||||||||||||||
| Basic and Diluted |
$ | 1,126 | $ | 652 | ||||||||||||
|
|
|
|
|
|||||||||||||
| Pro forma net income per share attributable to common stockholders: |
||||||||||||||||
| Basic and Diluted |
0.05 | $ | 0.03 | |||||||||||||
|
|
|
|
|
|||||||||||||
| Shares used to compute pro forma net income per share attributable to common stockholders: |
||||||||||||||||
| Basic and Diluted |
20,591,917 | 20,591,917 | ||||||||||||||
|
|
|
|
|
|||||||||||||
| Year Ended | Nine Months Ended | |||||||||||||||
| December 31, 2017 |
December 30, 2018 |
September 30, 2018 |
September 29, 2019 |
|||||||||||||
| (in thousands) | ||||||||||||||||
| (unaudited) | ||||||||||||||||
| Consolidated Statements of Cash Flows Data: |
||||||||||||||||
| Net cash provided by operating activities |
$ | 10,828 | $ | 9,471 | $ | 21,352 | $ | 14,691 | ||||||||
| Net cash used in investing activities |
(3,595 | ) | (3,488 | ) | (2,839 | ) | (3,471 | ) | ||||||||
| Net cash used in financing activities |
(6,681 | ) | (3,872 | ) | (3,865 | ) | (8,305 | ) | ||||||||
| As of September 29, 2019 | ||||||||||||
| Actual | Pro Forma(2) | Pro Forma As Adjusted(3)(4) |
||||||||||
| (in thousands) | ||||||||||||
| (unaudited) |
||||||||||||
| Consolidated Balance Sheet Data: |
||||||||||||
| Cash and cash equivalents |
$ | 10,661 | $ | $ | ||||||||
| Total current assets |
56,457 | |||||||||||
| Total assets |
|
119,494 |
|
|||||||||
| Total current liabilities |
57,785 | |||||||||||
| Long-term debt, net of current portion |
98,659 | |||||||||||
| Total liabilities |
159,964 | |||||||||||
| Convertible preferred stock |
117,038 | |||||||||||
| Total stockholder’s (deficit) equity |
(157,508 | ) | ||||||||||
| (1) | See Note 13 to our consolidated financial statements for the year ended December 31, 2018 and Note 11 to our unaudited interim condensed consolidated financial statements for the nine months ended September 29, 2019 for an explanation of the calculations of our pro forma basic and diluted net income per share attributable to common stockholders and the pro forma weighted-average number of shares used in the computation of the per share amounts. |
| (2) | Gives effect to (i) the automatic conversion of all of our outstanding shares of our Series A Preferred Stock into an aggregate of shares of common stock and (ii) the filing of our amended and restated certificate of incorporation and the adoption of our amended and restated bylaws, each of which will occur immediately prior to the consummation of this offering. |
13
Table of Contents
| (3) | Gives effect to the pro forma adjustments described in footnote (2) above plus (i) the sale and issuance of shares of common stock in this offering at an assumed initial public offering price of $ per share, the midpoint of the price range set forth on the cover of this prospectus, after deducting the underwriting discounts and commissions and estimated offering expenses payable by us and the application of the net proceeds thereof as described in the “Use of Proceeds,” and (ii) the acceleration of vesting of certain Class P units at the LP immediately prior to the completion of this offering. |
| (4) | Each $1.00 increase or decrease in the assumed initial public offering price of $ per share, which is the midpoint of the price range set forth on the cover page of this prospectus, would increase or decrease, as applicable, each of our pro forma as adjusted cash and cash equivalents, total assets, and total stockholder’s (deficit) equity by $ million, assuming the number of shares offered, as set forth on the cover page of this prospectus, remains the same, and after deducting the underwriting discounts and commissions, and estimated offering expenses payable by us. We may also increase or decrease the number of shares we are offering. Each increase or decrease of 1.0 million shares in the number of shares offered by us would increase or decrease, as applicable, each of our pro forma as adjusted cash and cash equivalents, total assets, and total stockholder’s (deficit) equity by $ million, assuming that the assumed initial offering price to the public remains the same, and after deducting underwriting discounts and commissions, and estimated offering expenses payable by us. The pro forma as adjusted information is illustrative only, and we will adjust this information based on the actual initial public offering price, the number of shares offered, and the other terms of this offering determined at pricing. |
| Year Ended | Nine Months Ended | |||||||||||||||
| December 31, 2017 |
December 30, 2018 |
September 30, 2018 |
September 29, 2019 |
|||||||||||||
| (in thousands, except percentage and per unit data) | ||||||||||||||||
| (unaudited) | ||||||||||||||||
| Key Operating and Financial Metrics(1): |
||||||||||||||||
| Gross margin |
47.4 | % | 44.5 | % | 45.3 | % | 43.9 | % | ||||||||
| Adjusted EBITDA(2) |
$ | 37,845 | $ | 29,892 | $ | 29,501 | $ | 17,106 | ||||||||
| Adjusted free cash flow(2) |
$ | 7,233 | $ | 5,983 | $ | 18,513 | $ | 11,602 | ||||||||
| Active Customers |
1,822 | 2,301 | 2,250 | 2,757 | ||||||||||||
| Total Orders Placed |
3,268 | 4,216 | 4,096 | 5,021 | ||||||||||||
| Average Order Value |
$ | 106 | $ | 110 | $ | 111 | $ | 112 | ||||||||
| (1) | See the definitions of key operating and financial metrics in “Management’s Discussion and Analysis of Financial Condition and Results of Operations—Key Operating and Financial Metrics.” As defined therein, Active Customers and Total Orders Placed are for the twelve months prior to the period end dates. |
| (2) | Adjusted EBITDA and Adjusted free cash flow are supplemental measures of our performance and liquidity that are not required by, or presented in accordance with, GAAP. Adjusted EBITDA and Adjusted free cash flow are not measurements of our financial performance under GAAP and should not be considered as an alternative to net income or any other performance measure derived in accordance with GAAP, or as an alternative to cash flows from operating activities as a measure of our liquidity. |
We define Adjusted EBITDA as income before interest expense, income taxes, depreciation and amortization, adjusted to exclude the effect of equity-based compensation expense, management fees, and transaction fees. We caution investors that amounts presented in accordance with our definition of Adjusted EBITDA may not be comparable to similar measures disclosed by our competitors, because not all companies and analysts calculate Adjusted EBITDA in the same manner. We present Adjusted EBITDA because we consider it to be an important supplemental measure of our performance and believe it is frequently used by securities analysts, investors and other interested parties in the evaluation of companies in our industry. Management believes that investors’ understanding of our performance is enhanced by including this non-GAAP financial measure as a reasonable basis for comparing our ongoing results of operations.
14
Table of Contents
We define Adjusted free cash flow as net cash provided by operating activities less net cash used in capital expenditures and capitalized software. We present Adjusted free cash flow because we believe Adjusted free cash flow is a useful supplemental financial measure for us and investors in assessing our ability to pursue business opportunities and investments and to service our debt. Management believes that investors’ understanding of our performance is enhanced by including this non-GAAP financial measure as a reasonable basis for comparing our ongoing results of operations.
Management uses Adjusted EBITDA and Adjusted free cash flow:
| • | as a measurement of operating performance because it assists us in comparing the operating performance of our business on a consistent basis, as it removes the impact of items not directly resulting from our core operations; |
| • | for planning purposes, including the preparation of our internal annual operating budget and financial projections; |
| • | to evaluate the performance and effectiveness of our operational strategies; and |
| • | to evaluate our capacity to expand our business. |
By providing these non-GAAP financial measures, together with reconciliations, we believe we are enhancing investors’ understanding of our business and our results of operations, as well as assisting investors in evaluating how well we are executing our strategic initiatives. Adjusted EBITDA and Adjusted free cash flow have limitations as analytical tools, and should not be considered in isolation, or as an alternative to, or a substitute for net income or other financial statement data presented in our consolidated financial statements as indicators of financial performance or liquidity. Some of the limitations are:
| • | Adjusted EBITDA does not reflect our cash expenditures, or future requirements for capital expenditures or contractual commitments; |
| • | Adjusted EBITDA does not reflect changes in, or cash requirements for, our working capital needs; |
| • | Adjusted EBITDA does not reflect the interest expense, or the cash requirements necessary to service interest or principal payments on our debt; |
| • | Adjusted EBITDA does not reflect our tax expense or the cash requirements to pay our taxes; |
| • | although depreciation and amortization are non-cash charges, the assets being depreciated and amortized will often have to be replaced in the future and such measures do not reflect any cash requirements for such replacements; and |
| • | other companies in our industry may calculate such measures differently than we do, limiting their usefulness as comparative measures. |
Due to these limitations, Adjusted EBITDA and Adjusted free cash flow should not be considered as measures of discretionary cash available to us to invest in the growth of our business. We compensate for these limitations by relying primarily on our GAAP results and using these non-GAAP measures only supplementally. As noted in the table below, Adjusted EBITDA includes adjustments to exclude the impact of equity-based compensation expense, management fees paid to our sponsors and transaction fees associated with our convertible preferred stock financing in 2018 and debt refinancing in 2017. It is reasonable to expect that these items will occur in future periods. However, we believe these adjustments are appropriate because the amounts recognized can vary significantly from period to period, do not directly relate to the ongoing operations of our business and may complicate comparisons of our internal results of operations and results of operations of other companies over time. In addition, Adjusted EBITDA
15
Table of Contents
includes adjustments for other items that we do not expect to regularly record following this offering. Each of the normal recurring adjustments and other adjustments described in this paragraph and in the reconciliation table below help management with a measure of our core operating performance over time by removing items that are not related to day-to-day operations.
The following tables reconcile (i) net income, the most directly comparable GAAP financial performance measure to Adjusted EBITDA and (ii) net cash provided by operating activities, the most directly comparable GAAP financial performance measure to Adjusted free cash flow:
Adjusted EBITDA:
| Year Ended | Nine Months Ended | |||||||||||||||
| December 31, 2017 | December 30, 2018 | September 30, 2018 | September 29, 2019 | |||||||||||||
| (in thousands) | ||||||||||||||||
| (unaudited) | ||||||||||||||||
| Net income and comprehensive income |
$ | 14,910 | $ | 1,126 | $ | 5,152 | $ | 652 | ||||||||
| Interest expense |
9,290 | 13,700 | 10,236 | 11,396 | ||||||||||||
| Provision for income taxes |
8,531 | 4,219 | 4,864 | 791 | ||||||||||||
| Depreciation and amortization |
1,682 | 2,564 | 1,927 | 2,232 | ||||||||||||
| Equity-based compensation expense(a) |
641 | 4,047 | 3,305 | 1,690 | ||||||||||||
| Management fees(b) |
440 | 679 | 460 | 345 | ||||||||||||
| Transaction fees(c) |
2,351 | 3,557 | 3,557 | — | ||||||||||||
|
|
|
|
|
|
|
|
|
|||||||||
| Adjusted EBITDA |
$ | 37,845 | $ | 29,892 | $ | 29,501 | $ | 17,106 | ||||||||
|
|
|
|
|
|
|
|
|
|||||||||
| (a) | Represents equity-based compensation expense related to vesting of Class P unit awards to certain members of management. |
| (b) | Represents the amount paid pursuant to the professional services agreement with the Sponsor and Institutional Venture Partners for consulting and other services. See “Certain Relationships and Related Person Transactions—Professional Services Agreement.” |
| (c) | Represents fees and expenses associated with our Series A Preferred Stock financing in 2018 and the debt refinancing in 2017. |
Adjusted free cash flow:
| Year Ended | Nine Months Ended | |||||||||||||||
| December 31, 2017 | December 30, 2018 | September 30, 2018 | September 29, 2019 | |||||||||||||
| (in thousands) |
||||||||||||||||
| (unaudited) | ||||||||||||||||
| Net cash provided by operating activities |
$ | 10,828 | $ | 9,471 | $ | 21,352 | $ | 14,691 | ||||||||
| Capital expenditures |
(2,153 | ) | (1,626 | ) | (1,440 | ) | (1,690 | ) | ||||||||
| Capitalized software |
(1,442 | ) | (1,862 | ) | (1,399 | ) | (1,399 | ) | ||||||||
|
|
|
|
|
|
|
|
|
|||||||||
| Adjusted free cash flow |
$ | 7,233 | $ | 5,983 | $ | 18,513 | $ | 11,602 | ||||||||
|
|
|
|
|
|
|
|
|
|||||||||
16
Table of Contents
An investment in our common stock involves a high degree of risk. Investors should consider carefully the following risk factors and all of the other information in this prospectus, including our consolidated financial statements and related notes to those statements, before deciding to invest in our common stock. If any of the following risks actually occur, it could have a material adverse effect on our business, financial condition, and results of operations. As a result, the trading price of our common stock could decline and investors could lose part or all of their investment.
Risks Related to Our Business and Industry
If we are not able to successfully maintain our desired merchandise assortment or manage our inventory effectively, we may be unable to attract a sufficient number of customers or sell sufficient quantities of our merchandise, which could result in excess inventories, markdowns, and foregone sales.
We offer our customers a broad merchandise assortment with new styles introduced virtually everyday in small batches. This enables us to learn about customer demand using our proprietary reorder algorithm, which allows us to reorder winning products in higher volume. We believe this strategy has contributed significantly to the success of our business in recent years. Among other things, we believe that this strategy creates a constant sense of newness and scarcity value, which we have designed to drive repeat visits to our website and increase sales. In addition, we believe that this strategy helps us reduce markdowns and avoid excess inventory. We cannot assure investors that we will be able to continue to stock a broad assortment of merchandise at our current frequency. If we are unable to offer a broad merchandise assortment or manage our inventory effectively, customers may choose to visit our website less frequently, our brand could be impaired, we could lose sales, and our ability to compete successfully and our market share may decline. Further, any failure to manage our merchandise assortment could lead to excess inventories which could lead to markdowns. We have experienced logistics issues that have adversely affected our ability to manage our inventory in the past and may experience such issues in the future. If we are unable to successfully maintain our desired merchandise assortment, it could have a material adverse effect on our business, financial condition, and results of operations.
Our business depends on our ability to maintain a strong community around the Lulus brand with engaged customers and influencers. We may not be able to maintain and enhance our existing brand community if we receive customer complaints, negative publicity or otherwise fail to live up to consumers’ expectations, which could materially adversely affect our business, financial condition, and results of operations.
We believe that maintaining our brand image, particularly with our core target customers, is important to maintaining and expanding our customer base and sales. Maintaining and enhancing our brand image may require us to make additional investments in areas such as merchandising, marketing, online operations, online displays and other promotions, and employee training. These investments may be substantial and may not ultimately be successful. If we are unable to maintain or enhance our brand image, brand awareness, and reputation, our business, financial condition, and results of operations may be materially and adversely affected.
Over the course of 2018, we offered over 18,500 styles through our website. Lulus brand products comprised approximately 83% of our units sold in 2018. Our ability to identify new styles and maintain and enhance our existing brand is critical to retaining and expanding our base of customers. A significant portion of our customers’ experience depends on third parties outside of our control, including suppliers and logistics providers such as UPS and the U.S. Postal Service. If these third parties do not meet our or our customers’ expectations or if they increase their rates, our business may
17
Table of Contents
suffer irreparable damage or our costs may increase. In addition, maintaining and enhancing relationships with third-party brands may require us to make substantial investments, and these investments may not be successful. Also, if we fail to promote and maintain our brand, or if we incur excessive expenses in this effort, our business, financial condition, and results of operations may be materially adversely affected. We anticipate that, as our market becomes increasingly competitive, maintaining, and enhancing our brand may become increasingly difficult and expensive.
Customer complaints or negative publicity about www.lulus.com, products, merchandise quality, product delivery times, customer data handling and security practices or customer support, especially on social media, blogs, and in reviews, could rapidly and severely diminish consumer use of www.lulus.com and customer and supplier confidence in us, and result in harm to our brand. We believe that much of the growth in our customer base to date has originated from word-of-mouth, including social media and our influencer-driven marketing strategy. If we are not able to develop and maintain positive relationships with our network of influencers or our online customer community, our ability to promote and maintain or enhance awareness of Lulus and leverage social media platforms to drive visits to www.lulus.com may be adversely affected.
Our efforts to acquire or retain customers may not be successful, which could prevent us from maintaining or increasing our sales.
Our success depends on our ability to acquire customers in a cost effective manner. In order to expand our customer base, we must appeal to and acquire customers who have historically used other means of commerce in shopping for apparel and may prefer alternatives to our offerings, such as traditional brick-and-mortar retailers and the websites and mobile apps of our competitors. We have made significant investments related to customer acquisition and expect to continue to spend significant amounts to acquire additional customers. For example, we engage in social media marketing campaigns and maintain relationships with thousands of social media and celebrity influencers. Such campaigns can be expensive and may not result in cost effective acquisition of customers. We cannot assure that the benefit of acquiring new customers will exceed the cost. If we fail to deliver a quality shopping experience, or if consumers do not perceive the products we offer to be of high value and quality, we may not be able to acquire new customers. If we are unable to acquire or retain customers who purchase products in numbers sufficient to grow our business, we may not be able to generate the scale necessary to drive beneficial network effects with our suppliers, our net sales may decrease, and our business, financial condition, and results of operations may be materially adversely affected.
We also seek to engage with our customers and build awareness of our brands through sponsoring unique events and experiences such as Lulus Style Studio events, which are experiences we create for our customers and influencers. We anticipate that our marketing initiatives may become increasingly expensive as competition increases, and generating a meaningful return on those initiatives may be difficult. If our marketing efforts are not successful in promoting awareness of our brands and products, driving customer engagement or attracting new customers, or if we are not able to effectively manage our marketing expenses, our business, financial condition, and results of operations will be adversely affected.
We obtain a significant amount of traffic via social networking platforms or other online channels used by our current and prospective customers. As eCommerce and social networking platforms continue to rapidly evolve, we must continue to maintain and establish relationships with these channels and may be unable to develop or maintain these relationships on acceptable terms. We also acquire and retain customers through paid search/product listing ads, paid social, retargeting, affiliate marketing, and personalized email and direct mail marketing. If we are unable to cost-effectively drive traffic to www.lulus.com, our ability to acquire new customers and our financial condition would suffer.
18
Table of Contents
We may be unable to maintain a high level of engagement with our customers and increase their spending with us, which could harm our business, financial condition or results of operations.
A high proportion of our net sales comes from repeat purchases by existing customers, especially those existing customers who are highly engaged and purchase a significant amount of merchandise from us. If existing customers no longer find our merchandise appealing, they may make fewer purchases and may stop shopping with us. Even if our existing customers find our merchandise appealing, if customer buying preferences change they may decide to purchase less merchandise over time. Additionally, if customers who purchase a significant amount of merchandise from us were to make fewer purchases or stop shopping with us, then our sales may decline. A decrease in the number of our customers or a decrease in their spending on the merchandise we offer could negatively impact our business, financial condition, and results of operations. Further, we believe that our future success will depend in part on our ability to increase sales to our existing customers over time and, if we are unable to do so, our business may suffer.
Our success depends on our ability to anticipate, identify, measure and respond quickly to new and rapidly changing fashion trends, customer preferences and demands and other factors.
Our core market of apparel, footwear, and accessories for women is subject to new and rapidly changing fashion trends, constantly evolving consumer preferences and demands, and a lack of brand loyalty. Accordingly, our success is dependent on our ability to anticipate, identify, measure and respond to the latest fashion trends and customer demands, and to translate such trends and demands into appropriate, desirable product offerings in a timely manner. A select team of our employees are primarily responsible for performing this analysis and making initial product decisions, and they rely on feedback on fashion trends from a variety of sources, which may not accurately predict evolving fashion trends. Our failure to anticipate, identify or react swiftly and appropriately to new and changing styles, trends or desired customer preferences or to accurately anticipate and forecast demand for certain product offerings is likely to lead to lower demand for our merchandise, which could cause, among other things, sales declines, excess inventories, a greater number of markdowns and lower margins. Further, if we are not able to anticipate, identify and respond to changing fashion trends and customer preferences, we may lose customers and market share to our competitors who are able to better anticipate, identify and respond to such trends and preferences. In addition, because our success depends on our brand image, our business could be materially adversely affected if new product offerings are not accepted by our customers. We cannot assure investors that our new product offerings will be met with the same level of acceptance as our past product offerings or that we will be able to adequately respond to fashion trends or the preferences of our customers in a timely manner or at all. If we do not accurately anticipate, identify, forecast, or analyze fashion trends and sales levels, it could have a material adverse effect on our business, financial condition, and results of operations.
Our ability to obtain merchandise on a timely basis at competitive prices could suffer as a result of any deterioration or change in our supplier relationships or events that adversely affect our suppliers or their ability to obtain financing for their operations.
We have many important supplier relationships. We do not own or operate any manufacturing facilities. Instead, we purchase nearly all of our merchandise from third-party suppliers. In the year ended December 30, 2018, our top 16 suppliers accounted for approximately 50% of our purchases, with no single supplier accounting for more than 9% of our purchases. Our business and financial performance depend in large part on our ability to evaluate merchandise quickly for style and then modify if needed or to improve the quality, look, and fit of the item. We must also be able to quickly source merchandise and place orders in order to successfully execute our strategy of rapidly responding to evolving fashion trends. Merchandise may not be available to meet our fashion needs on
19
Table of Contents
a timely basis, at competitive prices, or at all. Due to the nature of our product strategy, we do not have long-term commitments with any of our suppliers, and we generally operate without any contractual assurances of continued supply, pricing or access to new products. Our standard terms and conditions do not commit us or our suppliers to any particular quantities, which are established on a purchase order basis.
Our supplier relationships, and therefore our business, could be materially adversely affected if our suppliers:
| • | raise the prices they charge us; |
| • | change pricing terms to require us to pay upfront or upon delivery; |
| • | reduce our access to styles, brands, and merchandise by entering into broad exclusivity arrangements with our competitors or otherwise in the marketplace; |
| • | sell similar merchandise to our competitors with similar or better pricing, many of whom already purchase merchandise in significantly greater volume and, in some cases, at lower prices than we do; |
| • | lengthen their lead times; |
| • | decrease the quality of their merchandise; |
| • | initiate or expand sales of apparel, footwear, and accessories to retail customers directly through their own stores, catalogs, or on the internet and compete with us directly; or |
| • | otherwise choose to discontinue selling merchandise to us. |
The success of our business is driven in part by the price-value proposition we offer our customers. If the costs of the raw materials, for example cotton, synthetics, and trim, or other inputs, such as energy costs or prevailing wages, used in producing our merchandise increase, our suppliers may look to pass these cost increases along to us. The price and availability of such raw materials may fluctuate significantly, depending on many factors which are outside of our control, including commodity prices, crop yields and weather patterns. In addition, the costs of other inputs are also outside of our control. If our suppliers attempt to pass any cost increases on to us and we refuse to pay the increases, we could lose those suppliers, resulting in the risk that we could not fill our purchase orders in a timely manner or at all. If we pay the increases, we could either attempt to raise retail prices for our merchandise, which could adversely affect our sales and our brand image, or choose not to raise prices, which could adversely affect the profitability of our merchandise sales. As a result, any increase in the cost of raw materials or other inputs could have a material adverse effect on our business, financial condition, and results of operations.
We historically have established good working relationships with many suppliers, some of which have more limited resources, production capacities and operating histories than others. Market and economic events that adversely impact our suppliers could impair our ability to obtain merchandise in sufficient quantities. Such events include difficulties or problems associated with our suppliers’ business, finances, ability to import or ship merchandise as a result of strikes, labor disruptions or other events, costs, production, insurance and reputation. We cannot assure investors that we will be able to acquire desired merchandise in sufficient quantities on acceptable terms or at all in the future, especially if we need significantly greater amounts of inventory in connection with the growth of our business, or that we will be able to get such merchandise delivered to our distribution facilities or our third-party logistics provider on a timely basis. We may need to develop new relationships, as our current suppliers may be unable to supply us with needed quantities and we may not be able to find similar merchandise on the same terms. If we are unable to acquire suitable merchandise in sufficient quantities, at acceptable prices with adequate delivery times due to the loss of or a deterioration or
20
Table of Contents
change in our relationship with one or more of our key suppliers or if events harmful to our suppliers occur, it could have a material adverse effect on our business, financial condition, and results of operations.
Our business, including our costs and supply chain, is subject to risks associated with sourcing, manufacturing, and warehousing.
We currently source nearly all of the merchandise we offer from third-party suppliers, and as a result we may be subject to price fluctuations or demand disruptions. Our results of operations would be negatively impacted by increases in the prices of our merchandise, and we have no guarantees that prices will not rise. In addition, as we expand into new categories and product types, we expect that we may not have strong purchasing power in these new areas, which could lead to higher prices than we have historically seen in our current categories. We may not be able to pass increased prices on to customers, which could adversely affect our results of operations. Moreover, in the event of a significant disruption in the supply of the fabrics or raw materials used in the manufacture of the merchandise we offer, the suppliers we work with might not be able to locate alternative suppliers of materials of comparable quality at an acceptable price. For example, natural disasters could increase raw material costs, impacting pricing with certain of our suppliers, or cause shipping delays for certain of our merchandise. Any delays, interruption, damage to or increased costs in the manufacture of the merchandise we offer could result in higher prices to acquire the merchandise or non-delivery of merchandise altogether, and could adversely affect our results of operations.
We believe that we have strong supplier relationships, and we work continuously with our suppliers to manage cost increases. Our overall profitability depends, in part, on the success of our ability to mitigate rising costs or shortages of raw materials used to manufacture our merchandise. Cotton, synthetics and other raw materials used to manufacture our merchandise are subject to availability constraints and price volatility impacted by a number of factors, including supply and demand for fabrics, weather, government regulations, economic climate, and other unpredictable factors. In addition, our sourcing costs may fluctuate due to labor conditions, transportation, or freight costs, energy prices, currency fluctuations, or other unpredictable factors. The cost of labor at many of our third-party suppliers has been increasing in recent years, and we believe it is unlikely that such cost pressures will abate.
Most of our merchandise is shipped from our suppliers by ocean vessel. If a disruption occurs in the operation of ports through which our merchandise is imported, we may incur increased costs related to air freight or use of alternative ports. Shipping by air is significantly more expensive than shipping by ocean and our margins and profitability could be reduced. Shipping to alternative ports could also lead to delays in receipt of our merchandise. We rely on third-party shipping companies to deliver our merchandise to us. Failures by these shipping companies to deliver our merchandise to us or lack of capacity in the shipping industry could lead to delays in receipt of our merchandise or increased expense in the delivery of our merchandise. Any of these developments could have a material adverse effect on our business, financial condition, and results of operations.
In addition, we cannot guarantee that merchandise we receive from suppliers will be of sufficient quality or free from damage, or that such merchandise will not be damaged during shipping, while stored in one of our distribution facilities or when returned by customers. While we take measures to ensure merchandise quality and avoid damage, including evaluating supplier product samples, conducting inventory inspections and inspecting returned product, we cannot control merchandise while it is out of our possession or prevent all damage while in our distribution facilities. We may incur additional expenses and our reputation could be harmed if customers and potential customers believe that our merchandise is not of sufficiently high quality or may be damaged.
21
Table of Contents
We have two distribution facilities and are in the process of strengthening the disaster recovery procedures that we have implemented there. Disruptions to the operations at these locations could have a material adverse effect on our business, financial condition, and results of operations.
Our distribution facilities are located in Chico, California and Easton, Pennsylvania. All of our merchandise is shipped from our suppliers to one of our distribution facilities or to a third-party consolidation center (which then ships to our distribution facilities) and then packaged and shipped from our distribution facilities to our customers. The success of our business depends on our timely receipt of merchandise so we can continuously bring new, on-trend products online for sale. The success of our business also depends on customer orders being timely processed and delivered to meet promised delivery dates and satisfy our customers. The efficient flow of our merchandise requires that we have adequate capacity and uninterrupted service in our distribution facilities to support both our current level of operations and the anticipated increased levels that may follow from our growth plans. In order to accommodate future growth, we will either need to expand and upgrade our existing distribution facilities or open additional distribution facilities. Upgrading our existing distribution facilities or transferring our operations to a facility with greater capacity will require us to incur additional costs, which could be significant, and may require us to secure additional favorable real estate or may require us to obtain additional financing. Appropriate locations or financing for the purchase or lease of such additional real estate may not be available at reasonable costs or at all. Our failure to provide adequate order fulfillment, secure additional distribution capacity when necessary, or retain a suitable third-party logistics provider could impede our growth plans. Further increasing this capacity could increase our costs, which in turn could have a material adverse effect on our business, financial condition, and results of operations.
In addition, if we encounter difficulties associated with our distribution facilities or if they were to shut down or be unable to operate for any reason, including because of fire, natural disaster, power outage, or other event, we could face inventory shortages, resulting in “out-of-stock” conditions on our website, and delays in shipments, resulting in significantly higher costs and longer lead times distributing our merchandise. In addition, operations and distribution staff could need to find an alternative location, causing further disruption to our business and operations and increased costs associated with opening a new location.
We are in the process of strengthening our disaster recovery, business continuity and document storage plans that would allow us to be operational despite casualties or unforeseen events impacting our distribution facilities or corporate offices. However, without stronger disaster recovery, business continuity and document retention plans, if we encounter difficulties or disasters with our distribution facilities or corporate offices, our critical systems, operations and information may not be restored in a timely manner, or at all, and this could have a material adverse effect on our business, financial condition, and results of operations.
We rely on third parties to drive traffic to our website, and these providers may change their algorithms or pricing in ways that could negatively affect our business, financial condition, and results of operations.
Our success depends on our ability to attract customers cost effectively. With respect to our marketing channels, we rely heavily on relationships with providers of online services, search engines, social media, directories and other websites and eCommerce businesses to provide content, advertising banners and other links that direct customers to our websites. We rely on these relationships to provide significant traffic to our website. In particular, we rely on digital platforms, such as Google and Facebook, as important marketing channels. Digital channels change their algorithms periodically, and our rankings in organic searches and visibility in social media feeds may be adversely
22
Table of Contents
affected by those changes, as has occurred from time to time, requiring us to increase our spending on paid marketing to offset the loss in traffic. Search engine companies may also determine that we are not in compliance with their guidelines and consequently penalize us in their algorithms as a result. Even with an increase in marketing spend to offset any loss in search engine optimization traffic as a result of algorithm changes, the recovery period in organic traffic may span multiple quarters or years. If digital platforms change or penalize us with their algorithms, terms of service, display and featuring of search results, or if competition increases for advertisements, we may be unable to cost-effectively attract customers.
Our relationships with digital platforms are not covered by long-term contractual agreements and do not require any specific performance commitments. In addition, many of the platforms and agencies with whom we have advertising arrangements provide advertising services to other companies, including retailers with whom we compete. As competition for online advertising has increased, the cost for some of these services has also increased. A significant increase in the cost of the marketing providers upon which we rely could adversely impact our ability to attract customers cost effectively and harm our business, financial condition, results of operations, and prospects.
Use of social media, influencers, affiliate marketing, email, text messages, and direct mail may adversely impact our brand and reputation or subject us to fines or other penalties.
We use social media including Instagram, Facebook, Twitter, Pinterest, YouTube, and Snapchat, as well as affiliate marketing, email and direct mail as part of our multi-channel approach to marketing, and we encourage our customers to use social media while shopping. We may also utilize text messages as part of our marketing strategy in the future. We also maintain relationships with thousands of social media influencers and engage in sponsorship initiatives. Laws and regulations governing the use of these platforms and other digital marketing channels are rapidly evolving. It may become more difficult for us or our partners to comply with such laws, and future data privacy laws and regulations may restrict or limit our ability to use some or all of the marketing strategies on which we currently rely. The failure by us, our employees or third parties acting at our direction to abide by applicable laws and regulations in the use of these platforms could adversely impact our reputation or subject us to fines or other penalties. In addition, our employees or third parties acting at our direction may knowingly or inadvertently make use of social media in ways that could lead to the loss or infringement of intellectual property, as well as the public disclosure of proprietary, confidential or sensitive personal information of our business, employees, customers or others. Any such inappropriate use of social media tools could also cause business interruptions and reputational damage.
Customers value readily available information concerning retailers and their goods and services and often act on such information without further investigation and without regard to its accuracy. Information concerning us, whether accurate or not, may be posted on social media platforms at any time and may have a disproportionately adverse impact on our brand, reputation or business. The harm may be immediate without affording us an opportunity for redress or correction and could have a material adverse effect on our business, financial condition, and results of operations.
In addition, an increase in the use of social media for product promotion and marketing may cause an increase in the burden on us to monitor compliance of such materials, and increase the risk that such materials could contain problematic product or marketing claims in violation of applicable regulations. For example, in some cases, the Federal Trade Commission (“FTC”) has sought enforcement action where an endorsement has failed to clearly and conspicuously disclose a financial relationship between an influencer and an advertiser.
Negative commentary regarding us, our products or influencers and other third parties who are affiliated with us may also be posted on social media platforms and may be adverse to our reputation or business. Influencers with whom we maintain relationships could engage in behavior or use their
23
Table of Contents
platforms to communicate directly with our customers in a manner that reflects poorly on our brand and may be attributed to us or otherwise adversely affect us. It is not possible to prevent such behavior, and the precautions we take to detect this activity may not be effective in all cases. Our target customers often value readily available information and often act on such information without further investigation and without regard to its accuracy. The harm may be immediate, without affording us an opportunity for redress or correction.
We have not historically used traditional advertising channels, and if we become unable to continue to connect with our target customer base, it could have a material adverse effect on our business, financial condition, and results of operations.
We utilize organic, content, affiliate marketing, email, direct mail, paid search, and social media marketing to capture the interest of our customers and drive them to our website. We historically have not used traditional advertising channels, such as newspapers, magazines, and television, which are used by some of our competitors. In the future, we expect to increase our use of social media, such as Instagram, Facebook and Pinterest, for marketing purposes. If our marketing efforts are not successful, there may be no immediately available or cost effective alternative marketing channel for us to use to build or maintain brand awareness. As we execute our growth strategy, our ability to successfully integrate into our target customers’ communities or to expand into new markets will be dependent on our ability to connect with our target customers through marketing channels. Failure to successfully connect with our target customers in new and existing markets could have a material adverse effect on our business, financial condition, and results of operations.
The global apparel industry is subject to intense pricing pressure.
The apparel industry is characterized by low barriers to entry for both suppliers and marketers, global sourcing through suppliers located throughout the world, trade liberalization, continuing movement of product sourcing to lower cost countries, regular promotional activity and the ongoing emergence of new competitors with widely varying strategies and resources. These factors have contributed, and may continue to contribute in the future, to intense pricing pressure and uncertainty throughout the supply chain. Pricing pressure has been exacerbated by the availability of raw materials in recent years. This pressure could have adverse effects on our business and financial condition, including:
| • | reduced gross margins across our product lines and distribution channels; |
| • | increased supplier demands for allowances, incentives and other forms of economic support; and |
| • | increased pressure on us to reduce our product costs and operating expenses. |
We may not accurately forecast income and appropriately plan our expenses.
We base our current and future expense levels on our operating forecasts and estimates of future income. Income and results of operations are difficult to forecast because they generally depend on the volume and timing of the orders we receive, which are uncertain. Additionally, our business is affected by general economic and business conditions around the world. A softening in income, whether caused by changes in customer preferences or a weakening in global economies, may result in decreased net sales levels, and we may be unable to adjust our spending in a timely manner to compensate for any unexpected shortfall in income. This inability could cause our (loss)/income after tax in a given quarter to be (higher)/lower than expected. We also will make certain assumptions when forecasting the amount of expense we expect related to our future share based payments, which includes the expected volatility of our share price, the expected life of share awards granted and the expected rate of share awards forfeitures. These assumptions are partly based on historical results. If actual results differ from our estimates, our net income in a given quarter may be lower than expected.
24
Table of Contents
We operate in the highly competitive retail apparel industry, and the size and resources of some of our competitors may allow them to compete more effectively than we can, which could adversely impact our growth and market share, and have a material adverse effect on our business, financial condition, and results of operations.
We operate in the highly competitive retail apparel industry. We compete on the basis of a combination of factors, including our quality, concept, price, breadth, and style of merchandise, as well as our online experience and level of customer service, our brand image, and our ability to anticipate, identify and respond to new and changing fashion trends and customer demands. While we believe that we compete primarily with apparel retailers and internet businesses that specialize in women’s apparel, footwear, and accessories, we also face competition from national and regional department stores, specialty retailers, fast-fashion retailers, value retailers and mass merchants. In addition, our expansion into markets served by our competitors and entry of new competitors or expansion of existing competitors into our markets could have a material adverse effect on our business, financial condition, and results of operations.
We also compete with a wide variety of large and small retailers for customers, suppliers, influencers and personnel. The competitive landscape we face, particularly among apparel retailers, is subject to rapid change as new competitors emerge and existing competitors change their offerings. We cannot assure investors that we will be able to continue to compete successfully and navigate the shifts in the competitive landscape in our markets.
Many of our existing and potential competitors are, and many of our potential competitors may be, larger and have greater name recognition and access to greater financial, marketing and other resources than us. Therefore, these competitors may be able to adapt to changes in trends and customer desires more quickly, devote greater resources to the marketing and sale of their products, generate greater brand recognition or adopt more aggressive pricing policies than we can. Many of our competitors also utilize advertising and marketing media which we have not historically used, including advertising via newspapers, magazines, and television, which may provide them with greater brand recognition than we have. As a result, we may lose market share, which could reduce our sales and have a material adverse effect on our business, financial condition, and results of operations.
Our competitors may also sell certain products or substantially similar products through outlet centers or discount stores, increasing the competitive pressure for those products. We cannot assure investors that we will continue to be able to compete successfully against existing or future competitors. Our expansion into markets served by our competitors and entry of new competitors or expansion of existing competitors into our markets could have a material adverse effect on us. Competitive forces and pressures may intensify as our presence in the retail marketplace grows.
We do not possess exclusive rights to many of the elements that comprise our online experience and merchandise offerings. Some apparel retailers offer a personalized shopping experience that in certain ways is similar to the one we strive to provide to our customers. Our competitors may seek to emulate facets of our business strategy, including “test, learn, and reorder”, speed-to-market and online experience, which could result in a reduction of any competitive advantage or special appeal that we might possess. In addition, some of our merchandise offerings are sold to us on a non-exclusive basis. As a result, our current and future competitors, especially those with greater financial, marketing or other resources, may be able to duplicate or improve upon some or all of the elements of our online experience or merchandise offerings that we believe are important in differentiating our website and our customers’ shopping experience. If our competitors were to duplicate or improve upon some or all of the elements of our online experience or product offerings, our competitive position could suffer, which could have a material adverse effect on our business, financial condition, and results of operations.
25
Table of Contents
If new trade restrictions are imposed or existing trade restrictions become more burdensome, our ability to source imported merchandise efficiently and cost effectively could be materially adversely affected.
We purchase a portion of our inventory from foreign manufacturers, including those based in China, which is either directly imported by us from foreign suppliers or imported by domestic importers. Suppliers, to the extent they obtain merchandise from outside of the United States, are subject to trade restrictions, including tariffs, safeguards or quotas, changes to which could increase the cost or reduce the supply of merchandise available to us. Under the World Trade Organization Agreement, effective January 1, 2005, the United States and other World Trade Organization member countries removed quotas on goods from World Trade Organization members, which in certain instances we believe affords our suppliers greater flexibility in importing textile and apparel products from World Trade Organization countries from which they source our merchandise. However, as the removal of quotas resulted in an import surge from China, the United States imposed safeguard quotas on a number of categories of goods and apparel from China and may impose additional quotas in the future. These and other trade restrictions could have a significant impact on our suppliers’ sourcing patterns in the future. The extent of this impact, if any, and the possible effect on our purchasing patterns and costs, cannot be determined at this time. We cannot predict whether any of the countries in which our suppliers’ merchandise is currently manufactured or may be manufactured in the future will be subject to additional trade restrictions imposed by the United States or foreign governments, nor can we predict the likelihood, type or effect of any restrictions. Trade restrictions, including increased tariffs or quotas, embargoes, safeguards and customs restrictions against items we offer, as well as U.S. or foreign labor strikes, work stoppages or boycotts, could increase the cost or reduce the supply of merchandise to our suppliers, and we would expect the costs to be passed along in increased prices to us, which we may be unable to pass on to our customers, which could have a material adverse effect on our business, financial condition, and results of operations.
If we fail to provide high-quality customer support, it could have a material adverse effect on our business, financial condition, and results of operations.
Our ongoing customer support is important to the successful marketing and sale of our merchandise. Providing this support requires that our customer support personnel have fashion, retail, technical, and other knowledge and expertise, making it difficult for us to hire qualified personnel and scale our support operations. The demand on our customer support organization will increase as we expand our business and pursue new customers, and such increased support could require us to devote significant development services and support personnel, which could strain our team and infrastructure and reduce our profit margins. If we do not help our customers quickly resolve issues and provide effective ongoing customer support, our ability to sell additional merchandise to existing and future customers could suffer and our reputation would be harmed. If we are unable to hire and retain customer support personnel capable of consistently providing customer support at a high level, as demonstrated by their enthusiasm for our culture, understanding of our customers, and knowledge of the merchandise that we offer, our ability to expand our business may be impaired.
The estimates of market opportunity and forecasts of market growth included in this prospectus may prove to be inaccurate, and even if the markets in which we compete achieve the forecasted growth, our business may not grow at similar rates, or at all.
Market opportunity estimates and growth forecasts included in this prospectus are subject to significant uncertainty and are based on assumptions and estimates which may not prove to be accurate. The estimates and forecasts included in this prospectus relating to size and expected growth of our target market may prove to be inaccurate. Even if the markets in which we compete meet the size estimates and growth forecasts included in this prospectus, our business may not grow at similar
26
Table of Contents
rates, or at all. Our growth is subject to many factors, including our success in implementing our business strategy, which is subject to many risks and uncertainties.
System security risk issues, including any real or perceived failure to protect confidential or personal information against security breaches and disruption of our internal operations or information technology systems, could have a material adverse effect on our business, financial condition, and results of operations.
External parties, such as experienced computer programmers and hackers, or even internal users, may be able to penetrate or create systems disruptions or cause shutdowns of our networks, systems and applications or those of third-party companies with which we have contracted to provide services. We collect and use personal information about our employees, customers and others, and sometimes rely upon third-party service providers to maintain or process data on our behalf and to provide security for the information in their possession. Any real or perceived compromise of such information could deter customers from using our website, subject us to governmental investigations and/or enforcement actions, fines and penalties, litigation, claims and other liabilities, and harm our reputation, which could have a material adverse effect on our business, financial condition and results of operations. Moreover, we could incur significant expenses or disruptions of our operations in connection with system failures or other factors beyond our control, including fire, natural disasters, power outages and other events. Such failures or breaches in our information systems could also result in the disclosure, misappropriation or misuse of our confidential or proprietary information, unauthorized access to personal information, disruption of our operations or damage to our networks and systems. An increasing number of websites, including several large internet companies, have recently disclosed breaches of their security, some of which have involved increasingly sophisticated and highly targeted attacks on portions of their sites. For example, online businesses have been targeted with attacks aimed at compromising the security of payment card information submitted by customers for online purchases, including by injecting malicious code or scripts on website pages or by gaining unauthorized access to payment systems. As an online retailer, we may be targeted with similar attempts.
Although we take steps to protect our networks, systems, applications and data, we or our service providers may be unable to anticipate, defend against, or timely identify and respond to such activity, including hacking, malware, viruses, social engineering (such as phishing or other scams), extortion, account takeover attacks, denial or degradation of service attacks, computer and network vulnerabilities or the negligence and malfeasance of individuals with authorized access to our data. For example, an unauthorized actor interfered with one of our payment processing systems during a five-day period in August 2016, and intermittently may have been able to intercept approximately 12,500 payment card numbers used for purchases by customers entering a new payment card on our website during that period. We remediated the incident and notified affected customers and state regulators of the incident in accordance with our response plan. In addition to remediating the issue, we have subsequently implemented various additional security measures to prevent and mitigate the attack vectors used to gain access to the www.lulus.com file system. When we notified potentially affected customers, we provided them with information on how to help detect and prevent abuse of their personal and credit card information. The incident did not appear to have any negative impact on customers’ purchasing confidence. In addition, sophisticated hardware and operating system software and applications that we buy or license from third parties may contain defects in design or manufacture, including “bugs” and other problems that could unexpectedly interfere with the security and operation of the systems. The costs to us to eliminate or alleviate security problems, viruses and bugs, or any problems associated with the outsourced services provided to us, could be significant, and efforts to address these problems could result in interruptions, delays or cessation of service that may impede our sales, distribution, or other critical functions and have a material adverse effect on our business, financial condition and results of operations.
27
Table of Contents
In addition, many governments have enacted laws or regulations that require companies to notify individuals about certain types of security incidents or breaches, and any such disclosures may lead to negative publicity and may deter customers from shopping on our website. It is also possible that security breaches affecting our competitors or others in our industry could also result in negative publicity that indirectly harms our reputation. Increasing public and governmental focus on privacy and data security may continue to lead to additional legislative and regulatory action, and the increased emphasis on privacy may lead customers to request that we take additional measures to enhance security or restrict the manner in which we collect and use customer information to gather insights into customer behavior and craft our marketing programs. As a result, we may have to modify our business systems and practices with the goal of further improving data security, which could result in reduced net sales, increased expenditures and operating complexity. Any compromise of our security or security breach could result in a violation of applicable privacy and other laws, significant legal and financial exposure or damage to our reputation, which could have a material adverse effect on our business, financial condition, and results of operations.
Our existing general liability and cybersecurity insurance may not cover any, or cover only a portion of any, potential claims or expenses related to security breaches that affect us or may not be adequate to indemnify us for all or any portion of liabilities that may be imposed. In addition, we cannot assure investors that the limitations on liability in our contracts would be enforceable or adequate or would otherwise protect us from any such liabilities with respect to any particular claim. Any imposition of liability that is not covered by insurance or is in excess of insurance coverage would increase our operating expenses and reduce our net income.
We rely on third-party suppliers, manufacturers, distributors, and other suppliers, and they may not continue to produce products or provide services that are consistent with our standards or applicable regulatory requirements, which could harm our brand, cause consumer dissatisfaction, and require us to find alternative suppliers of our products or services.
We do not own or operate any manufacturing facilities. We use multiple third-party suppliers who source from manufacturers based primarily in China and, to a lesser extent, Brazil, the Dominican Republic, Guatemala, India, Italy, Korea, Mexico, Nicaragua, Spain, United States, and Vietnam, to source and manufacture all of our products under our owned brand and third-party brands. We engage our third-party suppliers and manufacturers on a purchase order basis combined with customary terms and conditions, and are not party to any long-term contracts containing purchase obligations. The ability of these third parties to supply and manufacture our products may be affected by competing orders placed by other clients and the demands of those clients. If we experience significant increases in demand, or need to replace a significant number of existing suppliers or manufacturers, we cannot assure that additional supply and manufacturing capacity will be available when required on terms that are acceptable to us, or at all, or that any supplier or manufacturer will allocate sufficient capacity to us in order to meet our requirements.
In addition, quality control problems, such as the use of materials and delivery of products that do not meet our quality control standards and specifications or comply with applicable laws or regulations, could harm our business. We do not regularly inspect our suppliers and quality control problems could result in regulatory action, such as restrictions on importation, products of inferior quality or product stock outages or shortages, harming our sales and creating inventory write-downs for unusable products.
Further, our third-party manufacturers, suppliers, and distributors may:
| • | have economic or business interests or goals that are inconsistent with ours; |
| • | take actions contrary to our instructions, requests, policies or objectives; |
28
Table of Contents
| • | be unable or unwilling to fulfill their obligations under relevant purchase orders, including obligations to meet our production deadlines, quality standards, pricing guidelines and product specifications, and to comply with applicable regulations, including those regarding the safety and quality of products; |
| • | have financial difficulties; |
| • | encounter raw material or labor shortages; |
| • | encounter increases in raw material or labor costs which may affect our procurement costs; |
| • | disclose our confidential information or intellectual property to competitors or third parties; |
| • | engage in activities or employ practices that may harm our reputation; and |
| • | work with, be acquired by, or come under control of, our competitors. |
Any failure by us or our suppliers to comply with product safety, labor or other laws, or our standard terms and conditions, or to provide safe factory conditions for their workers may damage our reputation and brand and harm our business.
The merchandise we sell to our customers is subject to regulation by the Federal Consumer Product Safety Commission (the “FTC”) and similar state and international regulatory authorities. As a result, such merchandise could be in the future subject to recalls and other remedial actions. Product safety, labeling, and licensing concerns may require us to voluntarily remove selected merchandise from our inventory. Such recalls or voluntary removal of merchandise can result in, among other things, lost sales, diverted resources, potential harm to our reputation, and increased customer service costs and legal expenses, which could have a material adverse effect on our results of operations.
Some of the merchandise we sell may expose us to product liability claims and litigation or regulatory action relating to personal injury or environmental or property damage. Although we maintain liability insurance, we cannot be certain that our coverage will be adequate for liabilities actually incurred or that insurance will continue to be available to us on economically reasonable terms or at all. In addition, some of our agreements with our suppliers may not indemnify us from product liability for a particular supplier’s merchandise or our suppliers may not have sufficient resources or insurance to satisfy their indemnity and defense obligations.
We purchase our merchandise from numerous domestic and international suppliers. Our standard vendor terms and conditions require suppliers to comply with applicable laws. Failure of our suppliers to comply with applicable laws and regulations and contractual requirements could lead to litigation against us, resulting in increased legal expenses and costs. In addition, the failure of any such suppliers to provide safe and humane factory conditions and oversight at their facilities could damage our reputation with customers or result in legal claims against us.
Merchandise returns could harm our business.
We allow our customers to return merchandise, subject to our return policy. If merchandise return economics become more costly, our business, financial condition, and results of operations could be harmed. Further, we modify our policies relating to returns from time to time, which may result in customer dissatisfaction or an increase in the number of merchandise returns. Supplier non-compliance can also result in increased returns. From time to time our products are damaged in transit, which can increase return rates and harm our brand. Competitive pressures could cause us to alter our return policies or our shipping policies, which could result in an increase in damaged products and an increase in merchandise returns.
29
Table of Contents
Our current and future products may experience quality problems from time to time that could result in negative publicity, litigation, product recalls and warranty claims, which could result in decreased net sales and harm to our brand.
We cannot assure that we will be able to detect, prevent or fix all defects that may affect our merchandise. Inconsistency of legislation and regulations may also affect the costs of compliance with such laws and regulations. Such problems could hurt the image of our brand, which is critical to maintaining and expanding our business. Any negative publicity or lawsuits filed against us related to the perceived quality of our products could harm our brand and decrease demand for our products.
We rely upon independent third-party transportation providers for substantially all of our merchandise shipments and any disruptions or increased transportation costs could have a material adverse effect on our business, financial condition, and results of operations.
We currently rely upon independent third-party transportation providers for substantially all of our merchandise shipments, including shipments to all of our distribution facilities and our customers. Our shipments are subject to risks, including increases in fuel prices, which would increase our distribution costs, and employee strikes and inclement weather, which may impact the third party’s ability to provide delivery services that adequately meet our needs. For example, it can take as long as six to seven days to get shipments to the east coast from our distribution facility in California. If we change shipping companies, we could face logistical difficulties that could adversely impact deliveries and we would incur costs and expend resources in connection with such change. Moreover, we may not be able to obtain terms as favorable as those received from the independent third-party transportation providers we currently use, which would increase our costs. Historically, the shipping and handling fees we charge our customers are intended to partially offset the related shipping and handling expenses. Pure-play and omni-channel retailers are increasing their focus on delivery services, as customers are increasingly seeking faster, guaranteed delivery times and low-price or free shipping. To remain competitive, we may be required to offer discounted, free or other more competitive shipping options to our customers, including expedited delivery services, which may result in declines in our shipping and handling fees and increased shipping and handling expense. Any increase in shipping costs or any other significant shipping difficulties or disruptions could have a material adverse effect on our business, financial condition, and results of operations.
We depend on our senior management personnel and may not be able to retain or replace these individuals or recruit additional personnel, which could have a material adverse effect on our business, financial condition, and results of operations.
Our future success is substantially dependent on the continued service of our senior management, particularly Colleen Winter, our Chief Executive Officer. She has extensive experience both with our company and in our industry and is familiar with our business, systems, and processes. The loss of services of Ms. Winter or any other of our key employees could impair our ability to manage our business effectively, as we may not be able to find suitable individuals to replace them on a timely basis or at all, which could have a material adverse effect on our business, financial condition, and results of operations. In addition, any departures of key personnel could be viewed in a negative light by investors and analysts, which could cause our common stock price to decline. We do not maintain key person insurance on any employee.
In addition to our CEO, we have other employees in positions, including those employees responsible for our merchandising, marketing, software development, accounting, finance, information technology and operations departments, that, if vacant, could cause a temporary disruption in our operations until such positions are filled, which could have a material adverse effect on our business, financial condition, and results of operations. Our success depends in part upon our ability to attract, motivate and retain a sufficient number of employees who understand our business, customers, brand
30
Table of Contents
and corporate culture. Our planned growth will require us to hire and train even more personnel to manage such growth. If we are unable to hire and retain personnel capable of consistently performing at a high level, our ability to expand our business may be impaired.
We may be unable to sustain our growth, and we may become unprofitable in the future.
Although our net sales and profitability have grown rapidly from 2014 through 2018, this should not be considered as indicative of our future performance. As we grow our business, we expect our net sales growth rates may slow in future periods due to a number of reasons, which may include slowing demand for our merchandise, increasing competition, a decrease in the growth of our overall market, and our failure to capitalize on growth opportunities or the maturation of our business.
Our expenses have increased in recent periods, and we expect expenses to increase substantially in the near term, particularly as we make significant investments in our marketing initiatives, expand our operations and infrastructure, develop and introduce new merchandise offerings and hire additional personnel. Investors in our common stock should recognize that we may not always pursue short-term profits but are often focused on long-term growth and this may impact the return on investment. In addition, in connection with operating as a public company, we will incur additional significant legal, accounting and other expenses that we did not incur as a private company. If our net sales do not increase to offset increases in our operating expenses, we may not be profitable in future periods.
We may not be able to successfully implement our growth strategy.
Our future growth, profitability and cash flows depend upon our ability to successfully implement our business strategy, which, in turn, is dependent upon a number of factors, including our ability to:
| • | grow our brand awareness and attract new customers; |
| • | enhance and retain our existing customer relationships; |
| • | pursue category expansion; and |
| • | pursue international expansion. |
We cannot assure that we can successfully achieve any or all of the above initiatives in the manner or time period that we expect. Further, achieving these objectives will require investments which may result in short-term costs without generating any current net sales and therefore may be dilutive to our earnings. We cannot provide any assurance that we will realize, in full or in part, the anticipated benefits we expect our strategy will achieve. The failure to realize those benefits could have a material adverse effect on our business, financial condition, and results of operations.
Our business is affected by seasonality, which could result in fluctuations in our results of operations.
We experience moderate fluctuations in aggregate sales volume during the year. Historically, our net sales have been highest in our second fiscal quarter. The seasonality of our business has resulted in variability in our total net sales quarter-to-quarter. In addition, our customers may change their order patterns and buying habits, including frequency of purchase and/or number of items per order. As a result, we may not be able to accurately predict our quarterly sales. Accordingly, our results of operations are likely to fluctuate significantly from period to period. This seasonality, along with other factors that are beyond our control, including general economic conditions, changes in consumer preferences, weather conditions, including the effects of climate change, the availability of import quotas, transportation disruptions and foreign currency exchange rate fluctuations, could adversely affect our business and cause our results of operations to fluctuate.
31
Table of Contents
We rely on consumer discretionary spending and may be adversely affected by economic downturns and other macroeconomic conditions or trends.
Our business and results of operations are subject to global economic conditions and their impact on consumer discretionary spending. Customer purchases of discretionary retail items and specialty retail products, which include our apparel, footwear, and accessories, may be adversely affected by economic conditions such as employment levels, salary and wage levels, the availability of customer credit, inflation, high interest rates, high tax rates, high fuel prices, and customer confidence with respect to current and future economic conditions. Customer purchases may decline during recessionary periods or at other times when unemployment is higher, fuel prices are higher or disposable income is lower. These risks may be exacerbated for retailers like us that focus significantly on selling discretionary fashion merchandise to customers who seek value. Customer willingness to make discretionary purchases may decline, may stall or may be slow to increase due to national and regional economic conditions.
Our sales may be particularly susceptible to economic and other conditions in certain regions or states. Considerable uncertainty and volatility remains in the national and global economy, and any further or future slowdowns or disruptions in the economy could adversely affect online shopping traffic and customer discretionary spending and could have a material adverse effect on our business, financial condition, and results of operations. In addition, we may not be able to maintain our recent rate of growth in net sales if there is a decline in customer spending.
Our business relies heavily on email and other messaging services, and any restrictions on the sending of emails or messages or an inability to timely deliver such communications could materially adversely affect our business, financial condition, and results of operations.
Our business is highly dependent upon email and other messaging services for promoting our brand and website. We send promotional emails to inform customers of new products, shipping specials and other offers, and transactional emails to communicate updates to customer orders and returns. We believe these messages are an important part of our customer experience. If we are unable to successfully deliver emails or other messages to our subscribers, or if subscribers decline to open or read our messages, our net sales and profitability would be materially adversely affected. Changes in how web and mail services block, organize and prioritize email may reduce the number of subscribers who receive or open our emails. For example, Google’s Gmail service has a feature that organizes incoming emails into categories (for example, primary, social and promotions). Such categorization or similar inbox organizational features may result in our emails being delivered in a less prominent location in a subscriber’s inbox or viewed as “spam” by our subscribers and may reduce the likelihood of that subscriber reading our emails. Actions by third parties to block, impose restrictions on or charge for the delivery of emails or other messages could also adversely impact our business. From time to time, emails service providers or other third parties may block bulk email transmissions or otherwise experience technical difficulties that could result in our inability to successfully deliver emails or other messages to customers. Changes in the laws or regulations that limit our ability to send such communications or impose additional requirements upon us in connection with sending such communications would also materially adversely impact our business. Our use of email and other messaging services to send communications to customers may also result in legal claims against us, which may cause us increased expense, and if successful might result in fines or orders with costly reporting and compliance obligations or might limit or prohibit our ability to send emails or other messages. We also rely on social media platforms to communicate with our customers and to encourage our customers to engage with our brand. Changes to the terms of these social networking services to limit promotional communications, any restrictions that would limit our ability or our customers’ ability to send communications through their services, disruptions or downtime experienced by these social media platforms or decline in the use of or engagement with social media platforms by consumers could materially adversely affect our business, financial condition, and results of operations.
32
Table of Contents
Our current growth plans may place a strain on our existing resources and could cause us to encounter challenges we have not faced before.
As we expand, our operations will become more complex. We have grown rapidly, with our total net sales increasing from $133 million in 2016 to $297 million in 2018 and from $231 million for the nine months ended September 30, 2018 to $286 million for the nine months ended September 29, 2019. We expect our growth to bring new challenges. Among other difficulties that we may encounter, this growth may place a strain on our existing infrastructure, including our distribution facilities, information technology systems, financial controls, merchandising, and operations personnel. We may also place increased demands on our suppliers, to the extent we increase the size of our merchandise orders. The increased demands that our growth plans may place on our infrastructure may cause us to operate our business less efficiently or effectively, which could cause a deterioration in the performance of our business. New order delivery times could lengthen as a result of the strains that growth may place on our existing resources, and our growth may make it otherwise difficult for us to respond quickly to changing trends, customer preferences and other factors. This could impair our ability to continue to offer on-trend merchandise which could result in excess inventory, greater markdowns, loss of market share and decreased sales which, in turn, could have a material adverse effect on our business, financial condition, and results of operations.
In addition, our planned expansion may place increased demands on our existing operational, managerial, administrative and other resources. Specifically, our inventory management systems and personnel processes may need to be further upgraded to keep pace with our growth strategy. We cannot anticipate all of the demands that our expanding operations will impose on our business, and our failure to appropriately address these demands could have an adverse effect on business, financial condition, and results of operations.
We continually update, augment and add technology systems, which could potentially disrupt our operations and have a material adverse effect on our business, financial condition, and results of operations.
Over the years, we have found a balance between developing proprietary applications that are optimized for and tailored to our business and customers’ needs on the one hand, and best-in-class third-party solutions on the other hand. We periodically evaluate whether our proprietary application solutions can be replaced by either more advanced or more cost effectively scaled third-party solutions. While currently our order and warehouse management systems are developed in-house, when suitable third-party solutions become available, we might replace our internal systems depending on the growth and the demands of the business.
For example, in 2017 we implemented a data warehouse solution that in near real-time integrates data from our proprietary software applications and third-party software applications to unlock the various data silos and allow for holistic business intelligence analysis and reporting. The actionable insights we have been able to gather from these analytics have allowed us to detect and act on trends sooner, identify improvement opportunities and implement predictive analysis models to gain efficiencies.
The risks associated with the above information technology systems changes, as well as any failure of such systems to operate effectively, could disrupt and adversely impact the promptness and accuracy of our merchandise distribution, transaction processing, financial accounting and reporting, and our internal controls over financial reporting, the efficiency of our operations and our ability to properly forecast earnings and cash requirements. We could be required to make significant additional expenditures to remediate any such failures or problems in the future.
We may not be able to successfully implement these new systems or, if implemented, we may still face unexpected disruptions or cost overruns in the future, any of which could have a material adverse effect on our business, financial condition, and results of operations.
33
Table of Contents
We rely significantly on technology and systems to support our supply chain, payments, financial reporting and other key aspects of our business. Any failure, inadequacy, interruption or security failure of those systems could have a material adverse effect on our business, financial condition, and results of operations.
Our ability to effectively manage our business depends significantly on our information systems and platforms provided by third parties, which we use primarily to manage items, purchase orders, stock ledgers and allocation and supply chain planning. To manage the growth of our operations and personnel, we will need to continue to improve and expand our operational and financial systems, transaction processing and internal controls and business processes; in doing so, we could encounter transitional issues and incur substantial additional expenses. If we are unable to maintain our current relationships with these service providers, there is no assurance that we will be able to locate replacements on a timely basis or on acceptable terms. The failure of our information systems to operate effectively, problems with transitioning to upgraded or replacement systems or expanding them, or a breach in security of these systems, could materially adversely affect the promptness and accuracy of our merchandise distribution, transaction processing, financial accounting and reporting, the efficiency of our operations and our ability to properly forecast earnings and cash requirements. We could be required to make significant additional expenditures to remediate any such failure, problem or breach. Any such events could have a material adverse effect on our business, financial condition, and results of operations.
Further, we house many of our systems offsite at third-party data centers. Our data centers may be subject to cyber-attacks or other technology-related incidents, and also break-ins, sabotage and intentional acts of vandalism that could cause disruptions in our ability to serve our customers and protect data. Some of our systems are not fully redundant, and our disaster recovery planning cannot account for all eventualities. The occurrence of a natural disaster, intentional sabotage or other anticipated problems could result in lengthy interruptions to our service. Any errors or vulnerability in our systems or damage to or failure of our systems, or a third-party data center hosting our data, could result in interruptions in our operations and could have a material adverse effect on our business, financial condition, and results of operations. Security breaches and other security incidents, including any breaches of our security measures or those of parties with whom we have commercial relationships (e.g., third-party data centers) that result in the unauthorized access of our customers’ confidential, proprietary or personal data, or the belief that any of these have occurred, could damage our reputation and expose us to a risk of loss or litigation and possible liability.
In addition, we may now and in the future implement new systems to increase efficiencies and profitability. We may encounter transitional issues and incur substantial additional expenses in connection with any implementation or change to existing processes, any of which could have a material adverse effect on our business, financial condition, and results of operations.
We are subject to payment-related risks.
We accept payments online via credit and debit cards, Apple Pay, Google Pay, Amazon Pay, and PayPal, which subjects us to certain regulations and risk of fraud, and we may in the future offer new payment options to customers that would be subject to additional regulations and risks. We pay interchange and other fees in connection with credit card payments, which may increase over time and adversely affect our results of operations. While we use a third party to process payments, we are subject to payment card association operating rules and certification requirements, including the Payment Card Industry Data Security Standard and rules governing electronic funds transfers. If we fail to comply with applicable rules and regulations or experience a security breach involving payment card information, we may be subject to fines, assessments and/or higher transaction fees and may lose our ability to accept online payments or other payment card transactions. If any of these events were to occur, our business, financial condition, and results of operations could be adversely affected.
34
Table of Contents
We may incur significant losses from fraud.
We have in the past incurred and may in the future incur significant losses from various types of fraud, including stolen credit card numbers, claims that a customer did not authorize a purchase, merchant fraud, and customers who have closed bank accounts or have insufficient funds in open bank accounts to satisfy payments. In addition to the direct costs of such losses, if the fraud is related to credit card transactions and becomes excessive, it could potentially result in us paying higher fees or losing the right to accept credit cards for payment. In addition, under current credit card practices, we are liable for fraudulent credit card transactions because we do not obtain a cardholder’s signature. Our failure to adequately prevent fraudulent transactions could damage our reputation, result in litigation or regulatory action and lead to expenses that could substantially impact our results of operations.
Unfavorable changes or failure by us to comply with evolving internet and eCommerce regulations could substantially harm our business and results of operations.
We are subject to general business regulations and laws as well as regulations and laws specifically governing the internet and eCommerce. These regulations and laws may involve taxes, privacy and data security, customer protection, the ability to collect and/or share necessary information that allows us to conduct business on the internet, marketing communications and advertising, content protection, electronic contracts or gift cards. Furthermore, the regulatory landscape impacting internet and eCommerce businesses is constantly evolving.
We collect personally identifiable information and other data from our employees, customers, prospective customers and others. We use this information to provide services and relevant products to our customers, to support, expand and improve our business, and to tailor our marketing and advertising efforts. We may also share customers’ personal data with certain third parties as authorized by the customer or as described in our privacy policy.
As a result, we are subject to or affected by laws, governmental regulation and other legal obligations related to data protection, privacy and information security in certain countries where we do business, and there has been and will continue to be new proposed laws and regulations and changes to existing legal frameworks that govern how we collect, use, share, and process personal data.
In the United States, the federal government and various state governments have adopted or proposed guidelines or rules for the collection, distribution, use and storage of information collected from or about individuals or their devices. For example, California recently enacted the California Consumer Privacy Act (the “CCPA”), which is expected to come into effect on January 1, 2020. The CCPA gives California residents expanded rights to access and delete their personal information, opt out of certain personal information sharing, and receive detailed information about how their personal information is used. The CCPA provides for civil penalties for violations, as well as a private right of action for data breaches that is expected to increase data breach litigation. The impact of this law on us and others in our industry may remain unclear until proposed bills amending the CCPA have wound their way through the legislative process and until regulations are issued by the California Attorney General. Other state regulators and the FTC with authority to enforce federal and state customer protection laws may also impose standards for the online collection, use and dissemination of data.
In Europe, the European Union (the “EU”) has adopted the General Data Protection Regulation (the “GDPR”) which went into effect in May 2018 and introduced stringent requirements for processing personal data. The GDPR has increased compliance burdens on us, including by mandating extensive documentation requirements and granting certain rights to individuals to control how we collect, use, disclose, retain and leverage information about them or how we obtain consent from them. The
35
Table of Contents
processing of sensitive personal data, such as physical health condition, may impose heightened compliance burdens under the GDPR and is a topic of active interest among foreign regulators. In addition, the GDPR provides for breach reporting requirements, more robust regulatory enforcement and greater penalties for noncompliance than previous data protection laws, including fines of up to €20 million or 4% of a noncompliant company’s global annual revenues for the preceding financial year, whichever is greater.
As we continue to expand and new laws are enacted or existing laws change, we may be subject to new laws, regulations or standards or new interpretations of existing laws, regulations or standards, which could require us to incur additional costs and restrict our business operations. Furthermore, these obligations may be interpreted and applied inconsistently from one jurisdiction to another and may conflict with other requirements or our practices. Any failure or perceived failure by us to comply with rapidly evolving data protection laws and regulations, policies (including our own stated privacy policies), legal obligations, contractual obligations or industry standards, or any security incident that results in the unauthorized release or transfer of personally identifiable information or other customer data, may result in governmental investigations and/or enforcement actions, litigation (including customer class actions), claims by our customers and other third parties, fines, penalties and other liabilities, damage to our reputation or adverse publicity, and could cause our customers to lose trust in us, which could have a material adverse effect on our business, results of operations, financial condition, and prospects.
If our suppliers fail to comply with applicable laws, including a failure to use acceptable labor practices, or if our suppliers suffer disruptions in their businesses, we could suffer adverse business consequences.
Our suppliers source the merchandise we sell from manufacturers both inside and outside of the United States. Although each of our purchase orders is subject to our terms and conditions, which require compliance with all applicable laws including labor and employment, immigration, customs, environmental and product safety, we do not own, supervise or control our suppliers or the manufacturers that produce the merchandise we sell. In the past we have purchased merchandise from our suppliers solely within the United States. In the future, we expect to increase direct purchases from suppliers outside the United States, which may expose us to additional risks. The violation, or perception of any violation, of any labor, immigration, product safety or other laws by any of our suppliers, their U.S. and non-U.S. manufacturers, or our direct suppliers, such as use of child labor, or the divergence of the labor practices followed by any of our suppliers or these manufacturers from those generally accepted in the United States, could damage our brand image or subject us to boycotts by our customers or activist groups which could have a material adverse effect on our business, financial condition, and results of operations.
Any event causing a sudden disruption of manufacturing or imports, including the imposition of additional import restrictions, could interrupt, or otherwise disrupt the shipment of finished products to us by our suppliers. Political and financial instability outside the United States, strikes, adverse weather conditions or natural disasters that may occur or acts of war or terrorism in the United States or worldwide, may affect the production, shipment or receipt of merchandise. These factors, which are beyond our control, may require us to modify our current business practices or incur increased costs and could have a material adverse effect on our business, financial condition, and results of operations.
36
Table of Contents
Changes in laws, including employment laws and laws related to our merchandise, could make conducting our business more expensive or otherwise cause us to change the way we do business, which could have a material adverse effect on our business, financial condition, and results of operations.
We are subject to numerous regulations, including labor and employment, truth-in-advertising, California’s Proposition 65 and other environmental laws and regulations, customer protection and zoning and occupancy laws and ordinances that regulate retailers generally or govern the promotion and sale of merchandise and the operation of warehouse facilities. If these regulations were to change or were violated by our management, employees or suppliers, the costs of certain goods could increase, or we could experience delays in shipments of our goods, be subject to fines or penalties or suffer reputational harm, which could reduce demand for our merchandise and have a material adverse effect on our business, financial condition, and results of operations. In addition to increased regulatory compliance requirements, changes in laws could make the ordinary conduct of our business more expensive or require us to change the way we do business.
Laws related to employee benefits and treatment of employees, including laws related to limitations on employee hours, immigration laws, child labor laws, supervisory status, leaves of absence, wages, mandated health benefits or overtime pay, could also increase compensation and benefits costs. Moreover, changes in product safety or other customer protection laws, could lead to increased costs to us for some merchandise, or additional labor costs associated with readying merchandise for sale. It is often difficult for us to plan and prepare for potential changes to applicable laws, and future actions or increased costs related to these changes could have a material adverse effect on our business, financial condition, and results of operations.
We may be unable to protect our trademarks or other intellectual property rights.
We believe that our trademarks are integral to our business and our success in building our brand image and customer loyalty. We rely on trademark registrations and common law trademark rights to protect the distinctiveness of our brand and have registered, or have applied to register, those trademarks that we believe are important to our business with the United States Patent and Trademark Office and in many foreign countries. We cannot assure that our applications will be approved or that these registrations will prevent imitation of our name, merchandising concept, website design or merchandise or the infringement of our other intellectual property rights by others. Third parties may also oppose our trademark applications or otherwise challenge our use of the trademarks. In certain cases, the merchandise we sell is purchased on a non-exclusive basis from suppliers that also sell to our competitors. While we use our brand name on these items, our competitors may seek to replicate aspects of our business strategy and online experience, thereby diluting the experience we offer and adversely affecting our brand and competitive position. Imitation of our name, concept, website design or merchandise in a manner that projects lesser quality or carries a negative connotation of our brand image could have a material adverse effect on our business, financial condition, and results of operations.
We cannot be certain that the actions we have taken to establish, police and protect our trademarks or our resources will be adequate to prevent imitation of our merchandise by others or to prevent others from seeking to block sales of our merchandise as a violation of the trademarks or proprietary rights of others. If disputes arise in the future, we may not be able to successfully resolve these types of conflicts to our satisfaction. In the event that our trademarks are successfully challenged, we could be forced to rebrand our products, which could result in loss of brand recognition and could require us to devote resources to advertising and marketing new brands. Although we cannot currently estimate the likelihood of success of any such lawsuit or ultimate resolution of such a conflict, such a conflict, regardless of outcome, could have an adverse effect on our business, financial condition, and results of operations.
37
Table of Contents
Litigation may be necessary to protect our trademarks and other intellectual property rights or to enforce these rights. Any litigation or claims brought by us could result in substantial costs and diversion of our resources, which could have a material adverse effect on our business, financial condition, and results of operations.
There are claims made against us from time to time that can result in litigation that could distract management from our business activities and result in significant liability or damage to our brand.
As a growing company with expanding operations, we increasingly face the risk of litigation and other claims against us. Litigation and other claims may arise in the ordinary course of our business and include employee claims, commercial disputes, intellectual property issues, privacy and customer protection claims and product-oriented allegations. These claims can raise complex factual and legal issues that are subject to risks and uncertainties and could require significant management time and allocation. Litigation and other claims and regulatory proceedings against us could result in unexpected expenses and liabilities, which could have a material adverse effect on our business, financial condition, and results of operations.
We may be subject to liability and other risks if we, our suppliers or the manufacturers of our merchandise infringe upon the trademarks, copyrights or other intellectual property rights of third parties, including the risk that we could acquire merchandise from our suppliers without the full right to sell it.
We purchase merchandise that may be subject to copyrights, design patents, trademark, trade dress or otherwise may incorporate protected intellectual property. Typically we are not involved in the manufacture of any of the merchandise that we purchase from our suppliers for sale to our customers, and we do not independently investigate whether our suppliers or the manufacturers with whom they do business hold intellectual property rights to the merchandise we purchase. Third parties have and may bring legal claims, or threaten to bring legal claims, against us that their intellectual property rights are being infringed or violated by our use of intellectual property if our suppliers or the manufacturers of our merchandise infringe upon the intellectual property rights of third parties. Litigation or threatened litigation, regardless of merit, could be costly, time consuming to defend, require us to redesign or rebrand our products or packaging, if feasible, distract our senior management from operating our business and require us to enter into royalty or licensing agreements in order to obtain the right to use a third party’s intellectual property. Any such royalty or licensing agreements, if required, may not be available to us on acceptable terms or at all. If we were to be found liable for any such infringement, we could be required to pay substantial damages which our indemnifying suppliers may not be able to fully pay, and could be subject to injunctions preventing further infringement. In addition, any payments we are required to make and any injunctions with which we are required to comply as a result of infringement claims could be costly. While our standard terms and conditions require our suppliers to indemnify us against third-party intellectual property claims, certain agreements with our suppliers may not indemnify us from intellectual property claims for a particular supplier’s merchandise or our suppliers may not have sufficient resources or insurance to satisfy their indemnity and defense obligations. Any legal claims or litigation could have a material adverse effect on our business, financial condition, and results of operations.
If a third party claims to have licensing rights with respect to merchandise we purchased from a supplier, or if we acquire unlicensed merchandise, we may be obligated to remove this merchandise from our website, incur costs associated with this removal if the distributor or supplier is unwilling or unable to reimburse us and be subject to liability under various civil and criminal causes of action, including actions to recover unpaid royalties and other damages and injunctions. Additionally, we could need to purchase new merchandise to replace any we remove. Any such events could have a material adverse effect on our business, financial condition, and results of operations.
38
Table of Contents
We may not be able to manage our growth effectively, and such rapid growth may adversely affect our corporate culture.
We have rapidly and significantly expanded our operations and anticipate expanding further as we pursue our growth strategies. Such expansion increases the complexity of our business and places a significant strain on our management, operations, technical systems, financial resources and internal control over financial reporting functions. Our current and planned personnel, systems, procedures and controls may not be adequate to support and effectively manage our future operations.
Our collaborative culture is important to us, and we believe it has been a major contributor to our success. We may have difficulties maintaining our culture or adapting it sufficiently to meet the needs of our future and evolving operations as we continue to grow including as we expand internationally. In addition, our ability to maintain our culture as a public company, with the attendant changes in policies, practices, corporate governance and management requirements may be challenging. Failure to maintain our culture could have a material adverse effect on our business, financial condition, and results of operations.
As we pursue our international growth strategy, we will become subject to international business uncertainties.
We intend to increase sales of our products to customers located outside the United States. Further, we may establish additional relationships in other countries to grow our operations. The substantial up-front investment required, the lack of consumer awareness of our products in jurisdictions outside of the United States, differences in consumer preferences and trends between the United States and other jurisdictions, the risk of inadequate intellectual property protections and differences in packaging, labeling and related laws, rules and regulations are all substantial matters that need to be evaluated prior to doing business in new territories. We cannot assure that our international efforts will be successful. International sales and increased international operations may be subject to risks such as:
| • | difficulties in staffing and managing foreign operations; |
| • | burdens of complying with a wide variety of laws and regulations, including more stringent regulations relating to data privacy and security, particularly in the EU; |
| • | adverse tax effects and foreign exchange controls making it difficult to repatriate earnings and cash; |
| • | political and economic instability; |
| • | natural disasters; |
| • | trade restrictions; |
| • | differing employment practices and laws and labor disruptions; |
| • | the imposition of government controls; |
| • | an inability to use or to obtain adequate intellectual property protection for our key brands and products; |
| • | tariffs and customs duties and the classifications of our goods by applicable governmental bodies; |
| • | a legal system subject to undue influence or corruption; |
| • | a business culture in which illegal sales practices may be prevalent; |
| • | logistics and sourcing; |
39
Table of Contents
| • | military conflicts; and |
| • | acts of terrorism. |
The occurrence of any of these risks could negatively affect our international business and consequently our overall business, financial condition, and results of operations.
Amendments to existing tax laws, rules or regulations or enactment of new unfavorable tax laws, rules or regulations could have an adverse effect on our business, financial condition, and results of operations.
Many of the underlying laws, rules or regulations imposing taxes and other obligations were established before the growth of the internet and eCommerce. Tax authorities in non-U.S. jurisdictions and at the U.S. federal, state and local levels are currently reviewing the appropriate treatment of companies engaged in internet commerce and considering changes to existing tax or other laws that could regulate our transmissions and/or levy sales, income, consumption, use or other taxes relating to our activities, and/or impose obligations on us to collect such taxes. For example, in March 2018 the European Commission proposed new rules for taxing digital business activities in the EU. As another example, many U.S. states have enacted or are enacting new sales tax laws following the U.S. Supreme Court’s 2018 decision in South Dakota vs Wayfair, as discussed below under “—The application of indirect taxes and the impact of managing our business model transition to a commissionaire structure could adversely affect our business and results of operations.” We cannot predict the effect of current attempts to impose taxes on commerce over the internet. If such tax or other laws, rules or regulations were amended, or if new unfavorable laws, rules or regulations were enacted, the results could increase our tax payments or other obligations, prospectively or retrospectively, subject us to interest and penalties, decrease the demand for our services if we pass on such costs to the consumer, result in increased costs to update or expand our technical or administrative infrastructure or effectively limit the scope of our business activities if we decided not to conduct business in particular jurisdictions. As a result, these changes may have a material adverse effect on our business, financial condition, results of operations, and prospects.
In addition, various governments and intergovernmental organizations could introduce proposals for tax legislation, or adopt tax laws, that may have a significant adverse effect on our worldwide effective tax rate, or increase our tax liabilities, the carrying value of deferred tax assets, or our deferred tax liabilities. For example, in October 2015, the Organization for Economic Co-Operation and Development (the “OECD”) released a final package of recommended tax measures for member nations to implement in an effort to limit “base erosion and profit shifting” (the “BEPS”) by multinational companies. Since then, the OECD has continued to monitor key areas of action and issue additional reports and guidance on implementation of the BEPS recommendations. Multiple jurisdictions, including some of the countries in which we operate, have begun implementing recommended changes aimed at addressing perceived issues within their respective tax systems that may lead to reduced tax liabilities among multinational companies. It is possible that other jurisdictions in which we operate or do business could react to the BEPS initiative or their own concerns by enacting tax legislation that could adversely affect us through increasing our tax liabilities.
Recent changes in U.S. tax laws may adversely affect our financial condition, results of operations and cash flows.
On December 22, 2017, President Trump signed into law the Tax Cuts and Jobs Act (“TCJA”). Among a number of significant changes to the current U.S. federal income tax rules, the TCJA reduced the marginal U.S. corporate income tax rate from 35% to 21%, limited the deduction for net business interest expense, shifted the United States toward a more territorial tax system, imposed a one-time tax on accumulated offshore earnings held in cash and illiquid assets, and imposed new taxes to combat erosion of the U.S. federal income tax base. The legislation is unclear in many respects and
40
Table of Contents
could be subject to potential amendments and technical corrections. The Treasury Department and the IRS have signaled their intent to issue guidance on a number of open questions relating to the implementation of the TCJA. In addition, it is unclear how these U.S. federal income tax changes will affect state and local taxation. The future impact that the TCJA will have on our business is uncertain at this time.
The application of indirect taxes could adversely affect our business and results of operations.
The application of indirect taxes, such as sales and use tax, value-added tax, provincial taxes, goods and services tax, business tax and gross receipt tax, to our business and to our retailers and brands is a complex and evolving issue. Significant judgment is required to evaluate applicable tax obligations. As a result, amounts recorded may be subject to adjustments by the relevant tax authorities. In many cases, the ultimate tax determination is uncertain because it is not clear how new and existing statutes might apply to our business or to the businesses of our retailers and brands. One or more states, the federal government or other countries may seek to impose additional reporting, record-keeping or indirect tax collection obligations on businesses like ours that facilitate eCommerce. For example, state and local taxing authorities in the United States and taxing authorities in other countries have identified eCommerce platforms as a means to calculate, collect and remit indirect taxes for transactions taking place over the internet. Multiple U.S. states have enacted related legislation and other states are now considering similar legislation. Such legislation could require us to incur substantial costs in order to comply, including costs associated with legal advice, tax calculation, collection, remittance and audit requirements, which could make selling in such markets less attractive and could adversely affect our business. The U.S. Supreme Court recently held in South Dakota v. Wayfair that a U.S. state may require an online retailer to collect sales taxes imposed by that state, even if the retailer has no physical presence in that state, thus permitting a wider enforcement of such sales tax collection requirements.
U.S. import taxation levels may increase and could harm our business.
Increases in taxes imposed on goods imported to the United States have been proposed by U.S. lawmakers and the President of the United States and, if enacted, may impede our growth and negatively affect our results of operations. The majority of our inventory is made outside of the United States and would be subject to increased taxation if new taxes on imports were imposed. Such taxes would increase the cost of our inventory and would raise retail prices of our merchandise to the extent we pass the increased costs on to customers, which could adversely affect our results of operations.
A failure to comply with current laws, rules and regulations or changes to such laws, rules and regulations and other legal uncertainties may adversely affect our business, financial performance, results of operations or business growth.
Our business and financial performance could be adversely affected by unfavorable changes in or interpretations of existing laws, rules, and regulations or the promulgation of new laws, rules and regulations applicable to us and our businesses, including those relating to the internet and eCommerce, including geo-blocking and other geographically based restrictions, internet advertising and price display, customer protection, anti-corruption, antitrust and competition, economic and trade sanctions, tax, banking, data security, data protection, and privacy. As a result, regulatory authorities could prevent or temporarily suspend us from carrying on some or all of our activities or otherwise penalize us if our practices were found not to comply with applicable regulatory or licensing requirements or any binding interpretation of such requirements. Unfavorable changes or interpretations could severely damage our reputation and our relationship with our customers, associates and investors as well as decrease demand for our services, limit marketing methods and capabilities, affect our margins, increase costs or subject us to additional liabilities.
41
Table of Contents
For example, there are, and will likely continue to be, an increasing number of laws and regulations pertaining to the internet and eCommerce that may relate to liability for information retrieved from or transmitted over the internet, display of certain taxes and fees, online editorial and customer-generated content, user privacy, data security, behavioral targeting and online advertising, taxation, liability for third-party activities and the quality of services. Furthermore, the growth and development of eCommerce may prompt calls for more stringent customer protection laws and more aggressive enforcement efforts, which may impose additional burdens on online businesses generally.
Likewise, the SEC, the U.S. Department of Justice, the U.S. Treasury Department’s Office of Foreign Assets Controls (“OFAC”), the U.S. Department of State, as well as other foreign regulatory authorities continue to enforce economic and trade regulations and anti-corruption laws, across industries. U.S. trade sanctions relate to transactions with designated foreign countries and territories, including Cuba, Iran, North Korea, Syria, and the Crimea region of Ukraine, as well as specifically targeted individuals and entities that are identified on U.S. and other blacklists, and those owned by them or those acting on their behalf. Anti-corruption laws, including the U.S. Foreign Corrupt Practices Act (the “FCPA”), generally prohibit direct or indirect corrupt payments to government officials and, under certain laws, private persons to obtain or retain business or an improper business advantage.
Although we have policies and procedures in place designed to promote compliance with laws and regulations, which we review and update as we expand our operations in existing and new jurisdictions in order to proportionately address risks of non-compliance with applicable laws and regulations, our employees, partners, or agents could take actions in contravention of our policies and procedures, or violate applicable laws or regulations. As regulations continue to develop and regulatory oversight continues to focus on these areas, we cannot guarantee that our policies and procedures will ensure compliance at all times with all applicable laws or regulations. In the event our controls should fail or we are found to be not in compliance for other reasons, we could be subject to monetary damages, civil and criminal monetary penalties, withdrawal of business licenses or permits, litigation, and damage to our reputation and the value of our brand.
As we expand our operations in existing and new jurisdictions internationally, we will need to increase the scope of our compliance programs to address the risks relating to the potential for violations of the FCPA and other anti-bribery and anti-corruption laws. Further, the promulgation of new laws, rules and regulations, or the new interpretation of existing laws, rules and regulations, in each case that restrict or otherwise unfavorably impact the ability or manner in which we or our retailers and brands conduct business could require us to change certain aspects of our business, operations and commercial relationships to ensure compliance, which could decrease demand for services, reduce net sales, increase costs or subject us to additional liabilities.
Our results of operations could be adversely affected by natural disasters, public health crises, political crises, or other catastrophic events.
Our principal offices and one of our distribution facilities are located in Chico, California, an area which has a history of wildfires and flooding, and are thus vulnerable to damage. We also operate offices and distribution facilities in other cities and states. Natural disasters, such as earthquakes, wildfires, hurricanes, tornadoes, floods, and other adverse weather and climate conditions; unforeseen public health crises, such as pandemics and epidemics; political crises, such as terrorist attacks, war, and other political instability; or other catastrophic events, whether occurring in the United States or internationally, could disrupt our operations in any of our offices and distribution facilities or the operations of one or more of our third-party providers or suppliers. For example, in the fall of 2018 there was a wildfire near Chico, California where our headquarters and one of our distribution facilities are located. In particular, these types of events could impact our merchandise supply chain, including our ability to ship merchandise to customers from or to the impacted region, our suppliers’ ability to
42
Table of Contents
ship merchandise or our ability to operate www.lulus.com. In addition, these types of events could negatively impact customer spending in the impacted regions. Sales of certain seasonal apparel items are dependent in part on the weather and may decline when weather conditions do not favor the use of this apparel. To the extent any of these events occur, our business and results of operations could be adversely affected.
Risks Related to Our Indebtedness
We have substantial indebtedness and we may incur additional indebtedness in the future, which may require us to use a substantial portion of our cash flow to service debt and limit our financial and operating flexibility.
We have substantial indebtedness and we may incur additional indebtedness in the future. As of September 29, 2019, we had a total of $119 million of indebtedness, consisting of amounts outstanding under our credit facility (the “Credit Facility”) with Credit Suisse AG, Cayman Islands Branch, with $135,000,000 committed as a term loan (the “Term Loan”) and $10,000,000 committed as a revolving credit facility (the “Revolving Facility”), and capital lease obligations. Upon the completion of this offering, after giving effect to the use of proceeds described in this prospectus, we expect to have total indebtedness of $ million. Our existing and future indebtedness will require interest payments and need to be repaid or refinanced, and could require us to divert funds identified for other purposes to service our debt, could result in cash demands and impair our liquidity position and could result in financial risk for us. Diverting funds identified for other purposes for debt service may adversely affect our growth prospects. If we cannot generate sufficient cash flow from operations to service our debt, we may need to refinance our debt, dispose of assets or issue equity to obtain necessary funds. We do not know whether we would be able to take any of these actions on a timely basis, on terms satisfactory to us, or at all.
Our level of indebtedness has important consequences to investments in our common stock. For example, our level of indebtedness might:
| • | require us to use a substantial portion of our cash flow from operations to pay interest and principal on our debt, which would reduce the funds available to us for working capital, capital expenditures, and other general corporate purposes; |
| • | limit our ability to pay future dividends; |
| • | limit our ability to obtain additional financing for working capital, capital expenditures, expansion plans, and other investments, which may limit our ability to implement our business strategy; |
| • | heighten our vulnerability to downturns in our business, the retail apparel industry or in the general economy and limit our flexibility in planning for, or reacting to, changes in our business and the retail apparel industry; or |
| • | prevent us from taking advantage of business opportunities as they arise or successfully carrying out our plans to expand our product offerings. |
Our business may not generate sufficient cash flow from operations or future borrowings may be unavailable to us in amounts sufficient to enable us to make payments on our indebtedness or to fund our operations. If we are unable to service our debt or repay or refinance our indebtedness when due, it could have a material adverse effect on our business, financial condition, and results of operations.
43
Table of Contents
The terms of our existing senior secured credit facilities do, and the terms of any additional debt financing may, restrict our current and future operations, and our debt may be downgraded, which could adversely affect our ability to manage our operations and respond to changes in our business.
Our existing Credit Facility contains, and any additional debt financing we may incur would likely contain, covenants that restrict our operations, including limitations on our ability to grant liens, incur additional debt, pay dividends, redeem our common stock, make certain investments and engage in certain merger, consolidation or asset sale transactions. A failure by us to comply with the covenants or financial ratios contained in our Credit Facility or any additional debt financing we may incur could result in an event of default, which could have a material adverse effect on our business, financial condition, and results of operations. Upon the occurrence of an event of default, the lenders could elect to declare all amounts outstanding to be due and payable and exercise other remedies. If the indebtedness under Credit Facility or any additional debt financing we may incur were to be accelerated, it could have a material adverse effect on our business, financial condition and results of operations. See “Management’s Discussion and Analysis of Financial Condition and Results of Operations—Liquidity and Capital Reserve—Credit Facilities” for additional information on the terms of our Credit Facility.
A decrease in the ratings that rating agencies assign to our short and long-term debt may negatively impact our access to the debt capital markets and increase our cost of borrowing, which could have a material adverse effect on our business, financial condition, and results of operations.
We may not be able to generate sufficient cash to service our indebtedness.
It is possible that we will in the future draw down on our Credit Facility or enter into new debt obligations. Our ability to make scheduled payments or to refinance such debt obligations depends on numerous factors, including the amount of our cash balances and our actual and projected financial and operating performance. We may be unable to maintain a level of cash balances or cash flows sufficient to permit us to pay the principal, premium, if any, and interest on our existing or future indebtedness. If our cash flows and capital resources are insufficient to fund our debt service obligations, we may be forced to reduce or delay capital expenditures, sell assets or operations, seek additional capital, or restructure or refinance our indebtedness. We may not be able to take any of these actions, and even if we are, these actions may be insufficient to permit us to meet our scheduled debt service obligations. In addition, in the event of our breach of the Credit Facility, we may be required to repay any outstanding amounts.
Risks Related to Our Company and Our Ownership Structure
The requirements of being a public company may strain our resources, divert management’s attention and affect our ability to attract and retain executive management and qualified board members.
As a privately held company, we were not required to comply with certain corporate governance and financial reporting practices and policies required of a publicly traded company. As a publicly traded company, we will incur significant legal, accounting, and other expenses that we were not required to incur in the recent past, particularly after we are no longer an emerging growth company as defined under the JOBS Act. After this offering, we will be required to file with the SEC annual and quarterly information and other reports that are specified in Section 13 of the Exchange Act. We will also be required to ensure that we have the ability to prepare financial statements that are fully compliant with all SEC reporting requirements on a timely basis. We will also become subject to other reporting and corporate governance requirements, including the requirements of , and certain
44
Table of Contents
provisions of the Sarbanes-Oxley Act and the regulations promulgated thereunder, which will impose significant compliance obligations upon us. As a public company, we will, among other things:
| • | prepare and distribute periodic public reports and other stockholder communications in compliance with our obligations under the federal securities laws and applicable rules; |
| • | create or expand the roles and duties of our Board of Directors and committees of the board; |
| • | institute more comprehensive financial reporting and disclosure compliance functions; |
| • | enhance our investor relations function; |
| • | establish new internal policies, including those relating to disclosure controls and procedures; and |
| • | involve and retain to a greater degree outside counsel and accountants in the activities listed above. |
These changes will require a significant commitment of additional resources and many of our competitors already comply with these obligations. We may not be successful in complying with these obligations and the significant commitment of resources required for complying with them could have a material adverse effect on our business, financial condition, and results of operations. In addition, if we fail to implement the requirements with respect to our internal accounting and audit functions, our ability to report our results of operations on a timely and accurate basis could be impaired and we could suffer adverse regulatory consequences or violate listing standards. There could also be a negative reaction in the financial markets due to a loss of investor confidence in us and the reliability of our consolidated financial statements, which could have a material adverse effect on our business, financial condition, and results of operations.
The changes necessitated by becoming a public company require a significant commitment of resources and management oversight that has increased and may continue to increase our costs and might place a strain on our systems and resources. As a result, our management’s attention might be diverted from other business concerns. If we fail to maintain an effective internal control environment or to comply with the numerous legal and regulatory requirements imposed on public companies, we could make material errors in, and be required to restate, our consolidated financial statements. Any such restatement could result in a loss of public confidence in the reliability of our consolidated financial statements and sanctions imposed on us by the SEC.
Our management team currently manages a private company and the transition to managing a public company will present new challenges.
Following the completion of this offering, we will be subject to various regulatory requirements, including those of the SEC and . These requirements include record keeping, financial reporting and corporate governance rules and regulations. While certain members of our management team have experience managing a public company, we do not have the resources typically found in a public company. Our internal infrastructure may not be adequate to support our increased reporting obligations, and we may be unable to hire, train or retain necessary staff and may be reliant on engaging outside consultants or professionals to overcome our lack of experience or personnel. If our internal infrastructure is inadequate, we are unable to engage outside consultants or are otherwise unable to fulfill our public company obligations, it could have a material adverse effect on our business, financial condition, and results of operations.
45
Table of Contents
Our internal control over financial reporting does not currently meet the standards required by Section 404 of the Sarbanes-Oxley Act, and failure to achieve and maintain effective internal control over financial reporting in accordance with Section 404 of the Sarbanes-Oxley Act could have a material adverse effect on our business, financial condition, and results of operations.
As a privately held company, we have not been required to evaluate our internal control over financial reporting in a manner that meets the standards of publicly traded companies required by Section 404 of the Sarbanes-Oxley Act. Section 404 of the Sarbanes-Oxley Act requires annual management assessments of the effectiveness of our internal control over financial reporting, starting with the second annual report that we file with the SEC as a public company, and generally requires in the same report a report by our independent registered public accounting firm on the effectiveness of our internal control over financial reporting. However, under the recently enacted JOBS Act, our independent registered public accounting firm will not be required to attest to the effectiveness of our internal control over financial reporting pursuant to Section 404 of the Sarbanes-Oxley Act until we are no longer an emerging growth company. We could be an emerging growth company for up to five years subsequent to becoming a public company.
Once we are no longer an emerging growth company, our independent registered public accounting firm will be required to attest to the effectiveness of our internal control over financial reporting on an annual basis. The rules governing the standards that must be met for our management to assess our internal control over financial reporting are complex and require significant documentation, testing and possible remediation and the incurrence of significant additional expenditures.
In connection with the implementation of the necessary procedures and practices related to internal control over financial reporting, we may identify deficiencies that we may not be able to remediate in time to meet the deadline imposed by the Sarbanes-Oxley Act for compliance with the requirements of Section 404. In addition, we may encounter problems or delays in completing the implementation of any requested improvements and receiving a favorable attestation in connection with the attestation provided by our independent registered public accounting firm. We will be unable to issue securities in the public markets through the use of a shelf registration statement if we are not in compliance with the applicable provisions of Section 404. Furthermore, failure to achieve and maintain an effective internal control environment could limit our ability to report our financial results accurately and timely and have a material adverse effect on our business, financial condition, and results of operations.
We are an emerging growth company, and the reduced disclosure requirements applicable to emerging growth companies may make our common stock less attractive to investors.
We are an emerging growth company as defined in the JOBS Act. Under the JOBS Act, emerging growth companies can delay adopting new or revised financial accounting standards until such time as those standards apply to private companies. We intend to take advantage of the extended transition period for adopting new or revised financial accounting standards under the JOBS Act as an emerging growth company.
For as long as we continue to be an emerging growth company, we may also take advantage of other exemptions from certain reporting requirements that are applicable to other public companies, including not being required to comply with the auditor attestation requirements of Section 404(b) of the Sarbanes-Oxley Act, exemption from any rules that may be adopted by the Public Company Accounting Oversight Board requiring mandatory audit firm rotations or a supplement to the report of independent registered public accounting firm, reduced disclosure obligations regarding executive compensation in our periodic reports and proxy statements, exemptions from the requirements of
46
Table of Contents
holding a nonbinding advisory vote on executive compensation and any golden parachute arrangements, and reduced financial reporting requirements. Investors may find our common stock less attractive because we will rely on these exemptions, which could result in a less active trading market for our common stock, increased price fluctuation, and a decrease in the trading price of our common stock.
We will remain an emerging growth company until the earliest of (i) the end of the fiscal year in which the market value of our common stock that is held by non-affiliates is at least $700 million as of the last business day of our most recently completed second fiscal quarter, (ii) the end of the fiscal year in which we have total annual gross revenues of $1.07 billion or more during such fiscal year, (iii) the date on which we issue more than $1 billion in non-convertible debt in a three-year period, or (iv) the end of the fiscal year in which the fifth anniversary of the date of this prospectus occurs.
Concentration of ownership among our existing executive officers, directors and principal stockholders may prevent new investors from influencing significant corporate decisions.
Upon completion of this offering, and assuming no exercise of the underwriters’ option to purchase additional shares, our executive officers, directors and principal stockholders will own, in the aggregate, approximately % of our outstanding common stock, or approximately % assuming the the acceleration of certain Class P units at the LP and the distribution of our common stock for each Class P unit held immediately prior to the completion of this offering owned by our executive officers. These stockholders will be able to exercise significant control over all matters requiring stockholder approval, including the election of directors, amendment of our amended and restated certificate of incorporation and approval of significant corporate transactions and will have significant control over our management and policies. This concentration of influence could be disadvantageous to other stockholders with interests different from those of our officers, directors and principal stockholders and could have an adverse effect on the price of our common stock.
In addition, these stockholders could take actions that have the effect of delaying or preventing a change-in-control of us or discouraging others from making tender offers for our shares, which could prevent stockholders from receiving a premium for their shares. These actions may be taken even if other stockholders oppose them.
Anti-takeover provisions in our amended and restated certificate of incorporation and bylaws and under Delaware law could make an acquisition of us more difficult, limit attempts by our stockholders to replace or remove our current management and limit the market price of our common stock.
Provisions in our certificate of incorporation and bylaws, as amended and restated in connection with this offering, may have the effect of delaying or preventing a change of control or changes in our management. Our amended and restated certificate of incorporation and amended and restated bylaws will include provisions that:
| • | authorize our Board of Directors to issue, without further action by the stockholders, up to shares of undesignated preferred stock; |
| • | subject to certain exceptions, require that any action to be taken by our stockholders be effected at a duly called annual or special meeting and not by written consent; |
| • | specify that special meetings of our stockholders can be called only by a majority of our Board of Directors, the Chair of our Board of Directors or our Chief Executive Officer; |
| • | establish an advance notice procedure for stockholder proposals to be brought before an annual meeting, including proposed nominations of persons for election to our Board of Directors; |
47
Table of Contents
| • | establish that our Board of Directors is divided into three classes, with each class serving three-year staggered terms; |
| • | prohibit cumulative voting in the election of directors; and |
| • | provide that vacancies on our Board of Directors may be filled only by a majority of directors then in office, even though less than a quorum. |
These provisions may frustrate or prevent any attempts by our stockholders to replace or remove our current management by making it more difficult for stockholders to replace members of our Board of Directors, which is responsible for appointing the members of our management.
In addition, because we are incorporated in Delaware, we have opted out of the provisions of Section 203 of the Delaware General Corporation Law “the DGCL”, which generally prohibits a Delaware corporation from engaging in any of a broad range of business combinations with any “interested” stockholder (any stockholder with 15% or more of our capital stock) for a period of three years following the date on which the stockholder became an “interested” stockholder. However, our amended and restated certificate of incorporation will contain a provision that provides us with protections similar to Section 203 of the DGCL and will prevent us from engaging in a business combination with a person who acquires at least 15% of our common stock for a period of three years from the date such person acquired such common stock unless board or stockholder approval is obtained prior to the acquisition, except that it will provide that or any affiliate thereof, or any person or entity to which any of the foregoing stockholders transfers shares of our voting stock (subject to specified exceptions), in each case regardless of the total percentage of our voting stock owned by such stockholder or such person or entity, shall not be deemed an “interested stockholder” for purposes of this provision of our amended and restated certificate of incorporation and therefore not subject to the restrictions set forth in this provision.
Our amended and restated certificate of incorporation that will be in effect on the completion of this offering will provide that the Court of Chancery of the State of Delaware and the federal district courts of the United States will be the exclusive forums for substantially all disputes between us and our stockholders, which could limit our stockholders’ ability to obtain a favorable judicial forum for disputes with us or our directors, officers or employees.
Our amended and restated certificate of incorporation that will be in effect on the completion of this offering will provide that the Court of Chancery of the State of Delaware is the exclusive forum for the following types of actions or proceedings under Delaware statutory or common law:
| • | any derivative action or proceeding brought on our behalf; |
| • | any action asserting a breach of fiduciary duty; |
| • | any action asserting a claim against us arising under the DGCL, our amended and restated certificate of incorporation or our amended and restated bylaws; and |
| • | any action asserting a claim against us that is governed by the internal-affairs doctrine; |
provided that the exclusive forum provisions will not apply to suits brought to enforce any liability or duty created by the Securities Act or the Exchange Act, or to any claim for which the federal courts have exclusive jurisdiction. The choice of forum provision may limit a stockholder’s ability to bring a claim in a judicial forum that it finds favorable for disputes with us or our directors, officers, or other employees, which may discourage such lawsuits against us and our directors, officers, and other employees. Alternatively, if a court were to find the choice of forum provision contained in our amended and restated certificate of incorporation to be inapplicable or unenforceable in an action, we may incur additional costs associated with resolving such action in other jurisdictions, which could harm our business, results of operations, and financial condition.
48
Table of Contents
Lulu’s Fashion Lounge Holdings, Inc. is a holding company with no operations of its own and, as such, it depends on its subsidiaries for cash to fund its operations and expenses, including future dividend payments, if any.
As a holding company, our principal source of cash flow will be distributions or payments from our operating subsidiaries. Therefore, our ability to fund and conduct our business, service our debt, and pay dividends, if any, in the future will depend on the ability of our subsidiaries and intermediate holding companies to make upstream cash distributions or payments to us, which may be impacted, for example, by their ability to generate sufficient cash flow or limitations on the ability to repatriate funds whether as a result of currency liquidity restrictions, monetary or exchange controls, or otherwise. Our operating subsidiaries and intermediate holding companies are separate legal entities, and although they are directly or indirectly wholly owned and controlled by us, they have no obligation to make any funds available to us, whether in the form of loans, dividends, or otherwise. In addition, our operating Company and indirectly owned subsidiary, Lulu’s Fashion Lounge, LLC, is restricted under the terms of the Term Loan from paying dividends to us except in limited circumstances.
Risks Related to This Offering and Ownership of Our Common Stock
Prior to this offering, there has been no public market for shares of our common stock and an active trading market for our common stock may never develop or be sustained.
Prior to this offering, there has not been a public market for our common stock. An active market for our common stock may not develop following the completion of this offering, or if it does develop, may not be maintained. If an active trading market does not develop, investors may have difficulty selling any of our common stock they have bought. The initial public offering price for the shares of our common stock will be determined by negotiations between us and the representatives of the underwriters and may not be indicative of prices that will prevail in the open market following this offering. Consequently, we cannot assure investors of their ability to sell shares of common stock when desired or the prices that may obtained for shares of common stock.
We expect that our stock price will fluctuate significantly, which could cause the value of investments in our common stock to decline, and investors may not be able to resell their shares at a price at or above the initial public offering price.
Securities markets worldwide have experienced, and are likely to continue to experience, significant price and volume fluctuations. The market volatility, as well as general economic, market or political conditions, could reduce the market price of our common stock regardless of our results of operations. The trading price of our common stock is likely to be volatile and subject to significant price fluctuations in response to many factors, including:
| • | market conditions or trends in our industry or the economy as a whole and, in particular, in the retail sales environment; |
| • | changes in our merchandise mix and supplier base; |
| • | timing of promotional events; |
| • | changes in key personnel; |
| • | entry into new markets; |
| • | changes in customer preferences and fashion trends; |
| • | announcements by us or our competitors of new product offerings or significant acquisitions, divestitures, strategic partnerships, joint ventures or capital commitments; |
| • | actions by competitors; |
49
Table of Contents
| • | inventory shrinkage beyond our historical average rates; |
| • | changes in operating performance and stock market valuations of other retail companies; |
| • | investors’ perceptions of our prospects and the prospects of the retail industry; |
| • | fluctuations in quarterly results of operations, as well as differences between our actual financial and results of operations and those expected by investors; |
| • | the public’s response to press releases or other public announcements by us or third parties, including our filings with the SEC; |
| • | announcements media reports or other public forum comments related to litigation, claims or reputational charges against us; |
| • | guidance, if any, that we provide to the public, any changes in this guidance or our failure to meet this guidance; |
| • | changes in financial estimates or ratings by any securities analysts who follow our common stock, our failure to meet these estimates or the failure of those analysts to initiate or maintain coverage of our common stock; |
| • | the development and sustainability of an active trading market for our common stock; |
| • | investor perceptions of the investment opportunity associated with our common stock relative to other investment alternatives; |
| • | future sales of our common stock by our officers, directors, and significant stockholders; |
| • | other events or factors, including those resulting from system failures and disruptions, earthquakes, hurricanes, war, acts of terrorism, other natural disasters, or responses to these events; and |
| • | changes in accounting principles. |
These and other factors may cause the market price and demand for shares of our common stock to fluctuate substantially, which may limit or prevent investors from readily selling their shares of our common stock and may otherwise negatively affect the liquidity of our common stock. As a result of these factors, our quarterly and annual results of operations and sales may fluctuate significantly. Accordingly, results for any one quarter are not necessarily indicative of results to be expected for any other quarter or for any year and sales for any particular future period may decrease. In the future, our results of operations may fall below the expectations of securities analysts and investors. In that event, the price of our common stock would likely decrease. In the past, when the market price of a stock has been volatile, security holders have often instituted class action litigation against the company that issued the stock. If we become involved in this type of litigation, regardless of the outcome, we could incur substantial legal costs and our management’s attention could be diverted from the operation of our business, which could have a material adverse effect on our business, financial condition, and results of operations.
Future sales of our common stock in the public market could cause the market price of our common stock to decrease significantly.
Sales of substantial amounts of our common stock in the public market following this offering by our existing stockholders, upon the exercise of stock options granted in the future or by persons who acquire shares in this offering may cause the market price of our common stock to decrease significantly. The perception that such sales could occur could also depress the market price of our common stock. Any such sales could also create public perception of difficulties or problems with our business and might also make it more difficult for us to raise capital through the sale of equity securities in the future at a time and price that we deem appropriate.
50
Table of Contents
Upon the completion of this offering, we will have outstanding shares of common stock, of which:
| • | shares are shares that we are selling in this offering and, unless purchased by affiliates, may be resold in the public market immediately after this offering; and |
| • | shares will be “restricted securities,” as defined under Rule 144 under the Securities Act and eligible for sale in the public market subject to the requirements of Rule 144, of which shares are subject to lock-up agreements and will become available for resale in the public market beginning 180 days after the date of this prospectus and of which will become available for resale in the public market immediately following this offering. |
In addition, we have reserved shares of common stock for issuance under our equity incentive plans. See “Executive Compensation—Equity Compensation Plans.”
With limited exceptions as described under the caption “Underwriting,” the lock-up agreements with the underwriters of this offering prohibit a stockholder from selling, contracting to sell or otherwise disposing of any common stock or securities that are convertible or exchangeable for common stock or entering into any arrangement that transfers the economic consequences of ownership of our common stock for at least 180 days from the date of the prospectus filed in connection with our initial public offering, although the lead underwriters may, in their sole discretion and at any time without notice, release all or any portion of the securities subject to these lock-up agreements. Upon a request to release any shares subject to a lock-up, the lead underwriters would consider the particular circumstances surrounding the request including, but not limited to, the length of time before the lock-up expires, the number of shares requested to be released, reasons for the request, the possible impact on the market for our common stock and whether the holder of our shares requesting the release is an officer, director or other affiliate of ours. As a result of these lock-up agreements, notwithstanding earlier eligibility for sale under the provisions of Rule 144, none of these shares may be sold until at least 180 days after the date of this prospectus. See “Shares Eligible for Future Sale” and “Underwriting.”
As restrictions on resale expire or as shares are registered, our share price could drop significantly if the holders of these restricted or newly registered shares sell them or are perceived by the market as intending to sell them. These sales might also make it more difficult for us to raise capital through the sale of equity securities in the future at a time and at a price that we deem appropriate.
See the information under the heading “Shares Eligible for Future Sale” for a more detailed description of the shares that will be available for future sales upon completion of this offering.
We do not intend to pay dividends on our common stock and, consequently, the ability of common stockholders to achieve a return on investment will depend on appreciation, if any, in the price of our common stock.
Investors should not rely on an investment in our common stock to provide dividend income. Because we do not expect to pay any cash dividends for the foreseeable future, investors may be forced to sell their shares in order to realize a return on their investment, if any. We do not anticipate that we will pay any dividends to holders of our common stock for the foreseeable future. Any payment of cash dividends will be at the discretion of our Board of Directors and will depend on our financial condition, capital requirements, legal requirements, earnings and other factors. Our ability to pay dividends is restricted by the terms of our Credit Facility and might be restricted by the terms of any indebtedness that we incur in the future. Consequently, investors in our common stock should not rely on dividends in order to receive a return on their investment. Accordingly, investors must rely on sales of their common stock after price appreciation, which may never occur, as the only way to realize any
51
Table of Contents
return on their investment. As a result, investors seeking cash dividends should not purchase our common stock. See “Dividend Policy.”
If securities analysts or industry analysts downgrade our shares, publish negative research or reports, or do not publish reports about our business, our share price and trading volume could decline.
The trading market for our common stock will be influenced by the research and reports that industry or securities analysts publish about us, our business and our industry. If one or more analysts adversely change their recommendation regarding our shares or our competitors’ stock, our share price would likely decline. If one or more analysts cease coverage of us or fail to regularly publish reports on us, we could lose visibility in the financial markets, which in turn could cause our share price or trading volume to decline. As a result, the market price for our common stock may decline below the initial public offering price and shares of our common stock may not be resold at or above the initial public offering price.
If investors purchase shares of common stock sold in this offering, they will incur immediate and substantial dilution as a result of this offering.
The initial public offering price per share is substantially higher than the pro forma net tangible book value per share immediately after this offering. As a result, investors will pay a price per share that substantially exceeds the book value of our assets after subtracting the book value of our liabilities. Based on our pro forma net tangible book value as of September 29, 2019 and assuming an offering price of $ per share, the midpoint of the price range set forth on the cover page of this prospectus, investors will incur immediate and substantial dilution in the amount of $ per share. See “Dilution.”
52
Table of Contents
This prospectus contains statements about future events and expectations that constitute forward-looking statements. Forward-looking statements are based on our beliefs, assumptions and expectations of our future financial and operating performance and growth plans, taking into account the information currently available to us. These statements are not statements of historical fact. Forward-looking statements involve risks and uncertainties that may cause our actual results to differ materially from the expectations of future results we express or imply in any forward-looking statements and you should not place undue reliance on such statements. Factors that could contribute to these differences include, but are not limited to, the following:
| • | If we are not able to successfully maintain our desired merchandise assortment or manage our inventory effectively, we may be unable to attract a sufficient number of customers or sell sufficient quantities of our merchandise, which could result in excess inventories, markdowns, and foregone sales; |
| • | Our success depends on our ability to anticipate, identify, measure, and respond quickly to customer data on new and rapidly changing fashion trends, customer preferences and demands and other factors; |
| • | Our efforts to acquire or retain customers may not be successful, which could prevent us from maintaining or increasing our sales; |
| • | We may be unable to maintain a high level of engagement with our customers and increase their spending with us, which could harm our business, financial condition or results of operations; |
| • | If we fail to provide high-quality customer support, it could have a material adverse effect on our business, financial condition, and results of operations; |
| • | Our business depends on our ability to maintain a strong community around the Lulus brand with engaged customers and influencers. We may not be able to maintain and enhance our existing brand community if we receive customer complaints, negative publicity or otherwise fail to live up to consumers’ expectations, which could materially adversely affect our business, financial condition, and results of operations; |
| • | Our business, including our costs and supply chain, is subject to risks associated with sourcing, manufacturing, and warehousing; |
| • | We rely upon independent third-party transportation providers for substantially all of our merchandise shipments and any disruptions or increased transportation costs could have a material adverse effect on our business, financial condition, and results of operations; |
| • | We have two distribution facilities and are in the process of strengthening the disaster recovery procedures that we have implemented there. Disruptions to the operations at these locations could have a material adverse effect on our business, financial condition and results of operations; |
| • | If our suppliers fail to comply with applicable laws, including a failure to use acceptable labor practices, or if our suppliers suffer disruptions in their businesses, we could suffer adverse business consequences; and |
| • | System security risk issues, including any real or perceived failure to protect confidential or personal information against security breaches and disruption of our internal operations or information technology systems, could have a material adverse effect on our business, financial condition, and results of operations. |
Words such as “anticipates,” “believes,” “continues,” “estimates,” “expects,” “goal,” “objectives,” “intends,” “may,” “opportunity,” “plans,” “potential,” “near-term,” “long-term,” “projections,”
53
Table of Contents
“assumptions,” “projects,” “guidance,” “forecasts,” “outlook,” “target,” “trends,” “should,” “could,” “would,” “will,” and similar expressions are intended to identify such forward-looking statements. We qualify any forward-looking statements included in this prospectus entirely by these cautionary factors. Other risks, uncertainties and factors, including those discussed under “Risk Factors,” could cause our actual results to differ materially from those projected in any forward-looking statements we make. We assume no obligation to update or revise these forward-looking statements included in this prospectus for any reason, or to update the reasons actual results could differ materially from those anticipated in these forward-looking statements, even if new information becomes available in the future.
You should read this prospectus and the documents that we reference in this prospectus and have filed as exhibits to the registration statement, of which this prospectus is a part, completely and with the understanding that our actual future results may be materially different from what we expect. We qualify all of our forward-looking statements by these cautionary statements.
54
Table of Contents
MARKET AND INDUSTRY INFORMATION
We are responsible for the disclosure in this prospectus. Market data and industry information used throughout this prospectus is based on management’s knowledge of the industry and the good faith estimates of management. We also relied, to the extent available, upon management’s review of independent industry surveys and publications and other publicly available information prepared by a number of sources, including Euromonitor International Limited (“Euromonitor”). In addition, we commissioned an independent research report from Stax Inc. (“Stax”) for market and industry information. All of the market data and industry information used in this prospectus involves a number of assumptions and limitations, and you are cautioned not to give undue weight to such estimates. While we believe the estimated market position, market opportunity and market size information included in this prospectus is generally reliable, such information, which is derived in part from management’s estimates and beliefs, is inherently uncertain and imprecise. Projections, assumptions, and estimates of our future performance and the future performance of the industry in which we operate are necessarily subject to a high degree of uncertainty and risk due to a variety of factors, including those described in “Risk Factors,” “Forward-Looking Statements,” and elsewhere in this prospectus. These and other factors could cause results to differ materially from those expressed in our estimates and beliefs and in the estimates prepared by independent parties.
55
Table of Contents
We estimate that the net proceeds to us from our issuance and sale of shares of common stock in this offering will be approximately $ million, or approximately $ million if the underwriters exercise their option to purchase additional shares from us in full, based on the assumed initial public offering price of $ per share, the midpoint of the price range set forth on the cover page of this prospectus, after deducting underwriting discounts and commissions and estimated offering expenses payable by us.
Each $1.00 increase or decrease in the assumed initial public offering price of $ per share, the midpoint of the price range set forth on the cover page of this prospectus, would increase or decrease, as applicable, the net proceeds to us from this offering by approximately $ million, assuming that the number of shares offered by us, as set forth on the cover page of this prospectus, remains the same, and after deducting underwriting discounts and commissions. We may also increase or decrease the number of shares we are offering. Each 1.0 million share increase or decrease in the number of shares we are offering would increase or decrease, as applicable, the net proceeds to us from this offering by approximately $ million, assuming the assumed initial public offering price stays the same, and after deducting underwriting discounts and commissions. We do not expect that a change in the initial price to the public or the number of shares by these amounts would have a material effect on the uses of the proceeds from this offering, although it may accelerate the time at which we will need to seek additional capital.
We intend to use the net proceeds from this offering to repay $ million of outstanding indebtedness and for general corporate purposes. As of , 2019, we had $ million of borrowings outstanding under our Term Loan, which matures in August 2022. The interest rate under our Term Loan was % as of the quarter ended , 2019. See “Management’s Discussion and Analysis of Financial Condition and Results of Operations—Liquidity and Capital Resources—Credit Facilities” and “Description of Certain Indebtedness” for a more detailed description of our Credit Facility.
The expected use of net proceeds from this offering represents our intentions based upon our present plans and business conditions. The timing and amount of our actual expenditures will be based on many factors, including cash flows from operations and the anticipated growth of our business. Pending their use, we intend to invest the net proceeds of this offering in a variety of capital-preservation investments, including short and intermediate-term, interest-bearing, investment-grade securities, and government securities.
We will not receive any proceeds from the sale of shares by the selling stockholders, which include entities affiliated with members of our Board of Directors.
56
Table of Contents
During 2016 and 2017, we paid cash dividends in the aggregate amounts of $27.5 million and $61.2 million, respectively. We currently intend to retain all available funds and any future earnings for the operation and expansion of our business. Accordingly, following this offering, we do not anticipate declaring or paying cash dividends in the foreseeable future. The payment of any future dividends will be at the discretion of our Board of Directors and will depend on our results of operations, capital requirements, financial condition, prospects, contractual arrangements, any limitations on payment of dividends present in our current and future debt agreements, and other factors that our Board of Directors may deem relevant. In addition, the terms of our Credit Facility restrict our ability to pay dividends to limited circumstances. We may also be subject to covenants under future debt arrangements that place restrictions on our ability to pay dividends.
57
Table of Contents
The following table sets forth our cash and cash equivalents and capitalization as of September 29, 2019, on:
| • | an actual basis; |
| • | a pro forma basis, giving effect to: (i) the automatic conversion of all of our outstanding shares of our Series A Preferred Stock into an aggregate of 3,129,634 shares of common stock and (ii) the filing of our amended and restated certificate of incorporation and the adoption of our amended and restated bylaws, which will occur immediately prior to the consummation of this offering; and |
| • | a pro forma as adjusted basis to reflect: (i) the pro forma adjustments described above, (ii) the sale and issuance of shares of common stock in this offering at an assumed initial public offering price of $ per share, the midpoint of the price range set forth on the cover of this prospectus, after deducting the underwriting discounts and commissions and estimated offering expenses payable by us and the application of the net proceeds thereof as described in the “Use of Proceeds,” and (iii) the acceleration of vesting on certain Class P units at the LP immediately prior to the completion of this offering. |
This table should be read together with “Selected Consolidated Financial Data” and “Management’s Discussion and Analysis of Financial Condition and Results of Operations”, our audited consolidated financial statements and the related notes thereto, and our unaudited interim condensed consolidated financial statements and the related notes thereto included elsewhere in this prospectus.
| As of September 29, 2019 | ||||||||||||
| Actual | Pro Forma | Pro Forma As Adjusted(1) |
||||||||||
| |
(in thousands, except share and per share amounts) |
| ||||||||||
| (unaudited) | ||||||||||||
| Cash and cash equivalents |
$ | 10,661 | $ | $ | ||||||||
|
|
|
|
|
|
|
|||||||
| Total debt: |
||||||||||||
| Term loan |
114,750 | |||||||||||
| Revolving facility |
4,500 | |||||||||||
| Less: debt issuance costs |
(5,966 | ) | ||||||||||
|
|
|
|
|
|
|
|||||||
| Total debt, net of issuance costs |
113,284 | |||||||||||
|
|
|
|
|
|
|
|||||||
| Convertible preferred stock: $0.001 par value; 3,129,634 shares authorized, issued, and outstanding; no shares issued and outstanding, pro forma and pro forma adjusted |
117,038 | — | — | |||||||||
| Stockholder’s deficit: |
||||||||||||
| Common stock: $0.001 par value; 20,591,917 shares authorized; and 17,462,283 actual, 20,591,917, pro forma, and pro forma adjusted issued and outstanding |
18 | 21 | ||||||||||
| Additional paid-in capital |
1,690 | 118,725 | ||||||||||
| Accumulated deficit |
(159,216 | ) | (159,216 | ) | ||||||||
|
|
|
|
|
|
|
|||||||
| Total stockholder’s (deficit) equity |
(157,508 | ) | (40,470 | ) | ||||||||
|
|
|
|
|
|
|
|||||||
| Total capitalization |
$ | 72,814 | $ | $ | ||||||||
|
|
|
|
|
|
|
|||||||
| (1) | Each $1.00 increase or decrease in the assumed initial public offering price of $ per share, which is the midpoint of the price range set forth on the cover page of this prospectus, would increase or decrease, as applicable, each of cash and cash equivalents, total stockholder’s |
58
Table of Contents
| (deficit) equity, and total capitalization by $ million, assuming the number of shares offered, as set forth on the cover page of this prospectus, remains the same, and after deducting the underwriting discounts and commissions and estimated offering expenses payable by us. We may also increase or decrease the number of shares we are offering. Each increase or decrease of 1.0 million shares in the number of shares offered by us would increase or decrease, as applicable, each of our pro forma as adjusted cash and cash equivalents, total assets and total stockholder’s (deficit) equity by $ million, assuming that the assumed initial offering price to the public remains the same, and after deducting underwriting discounts and commissions payable by us. The pro forma as adjusted information is illustrative only, and we will adjust this information based on the actual initial public offering price, the number of shares offered, and the other terms of this offering determined at pricing. |
The number of our shares of common stock to be issued and outstanding, pro forma and pro forma as adjusted in the table above is based on shares of our common stock (including our Series A Preferred Stock on an as-converted basis) outstanding as of , 2019 and excludes shares of common stock reserved for future issuance under our employee option programs as described in “Executive Compensation—Equity Compensation Plans.”
59
Table of Contents
If you invest in our common stock, your interest will be diluted to the extent of the difference between the initial public offering price per share of our common stock and the pro forma as adjusted net tangible book value per share of our common stock immediately after the completion of this offering. Dilution results from the fact that the per share offering price of our common stock is in excess of the book value per share attributable to new investors.
Our historical net tangible book (deficit) value as of September 29, 2019, was $ million, or $ per share of common stock. Our historical net tangible book (deficit) value per share represents the amount of total tangible assets less total liabilities, and net tangible book value per share represents net tangible book value divided by the number of shares of common stock outstanding after giving effect to the consummation of this offering.
As of September 29, 2019, we had a pro forma net tangible book value of $ million, corresponding to a pro forma net tangible book value of $ per share. Pro forma net tangible book value per share represents the amount of our total assets less our total liabilities, excluding goodwill and other intangible assets, divided by the total number of our shares of common stock outstanding, after giving effect to (i) the automatic conversion of all of our outstanding shares of our Series A Preferred Stock into an aggregate of shares of common stock and (ii) the filing of our amended and restated certificate of incorporation and the adoption of our amended and restated bylaws, which will occur immediately prior to the consummation of this offering;
After giving effect to (i) the pro forma adjustments described above, (ii) the sale and issuance of shares of common stock in this offering at an assumed initial public offering price of $ per share, the midpoint of the price range set forth on the cover of this prospectus, after deducting the underwriting discounts and commissions and estimated offering expenses payable by us and (iii) the acceleration of vesting on certain Class P units at the LP immediately prior to the completion of this offering our pro forma as adjusted net tangible book value at September 29, 2019 would have been approximately $ million, representing $ per share. This represents an immediate increase in pro forma net tangible book value of $ per share to existing stockholders and an immediate dilution in pro forma net tangible book value of $ per share to new investors purchasing shares of common stock in this offering at the assumed initial public offering price. Dilution in pro forma net tangible book value per share to new investors is determined by subtracting pro forma as adjusted net tangible book value per share after this offering from the assumed initial public offering price per share paid by new investors.
The following table illustrates this dilution on a per share basis to new investors:
| Assumed initial public offering price per share of common stock |
$ | |||||||
| Historical net tangible book (deficit) value per share as of September 29, 2019, |
$ | |||||||
| Pro forma increase in net tangible book value per share attributable to as of September 29, 2019 |
||||||||
| Pro forma net tangible book value per share as of September 29, 2019 |
||||||||
| Increase in pro forma net tangible book value per share attributable to new investors purchasing shares from us in this offering |
||||||||
| Pro forma as adjusted net tangible book value per share after this offering |
||||||||
|
|
|
|||||||
| Dilution per share to new investors participating in this offering |
$ | |||||||
|
|
|
The pro forma as adjusted dilution information discussed above is illustrative only and will change based on the actual initial public offering price and other terms of this offering determined at pricing.
60
Table of Contents
Each $1.00 increase or decrease in the assumed initial public offering price of $ per share, the midpoint of the price range set forth on the cover page of this prospectus, would increase or decrease, as applicable, the pro forma as adjusted net tangible book value per share by $ per share and the dilution per share to investors participating in this offering by $ per share, assuming that the number of shares offered by us, as set forth on the cover page of this prospectus, remains the same and after deducting underwriting discounts and commissions. We may also increase or decrease the number of shares we are offering. Each 1.0 million share increase or decrease in the number of shares offered by us, as set forth on the cover page of this prospectus, would increase or decrease, as applicable, the pro forma as adjusted net tangible book value per share by $ and decrease the dilution per share to investors participating in this offering by $ , assuming the assumed initial public offering price of $ per share, the midpoint of the price range set forth on the cover page of this prospectus, remains the same and after deducting underwriting discounts and commissions payable by us.
If the underwriters exercise their option to purchase additional shares in full, the pro forma as adjusted net tangible book value of our common stock would increase to $ per share, representing an immediate increase to existing stockholders of $ per share and an immediate dilution of $ per share to investors participating in this offering.
The following table summarizes as of September 29, 2019, on the pro forma as adjusted basis described above, the total number of shares of common stock purchased from us, the total cash consideration paid to us, or to be paid, and the average price per share paid, or to be paid, by our existing investors and by new investors purchasing shares in this offering, at an assumed initial public offering price of $ per share, which is the midpoint of the price range set forth on the cover page of this prospectus, before deducting the underwriting discounts and commissions and estimated offering expenses payable by us:
| Shares Purchased | Total Consideration | Average Price Per Share |
||||||||||||||||||
| Number | Percent | Amount | Percent | |||||||||||||||||
| Existing stockholders |
% | $ | % | $ | ||||||||||||||||
| New investors |
||||||||||||||||||||
| Total |
100 | % | $ | 100 | % | |||||||||||||||
If the underwriters were to fully exercise their option to purchase additional shares of our common stock from us and the selling stockholders, the percentage of shares of our common stock held by existing investors would be %, and the percentage of shares of our common stock held by new investors would be %.
The foregoing tables and calculations (other than the historical net tangible book value calculation) are based on shares of our common stock (including our Series A Preferred Stock on an as-converted basis) outstanding as of September 29, 2019 and excludes shares of common stock reserved for future issuance under our employee option programs as described in “Executive Compensation—Equity Compensation Plans.”
To the extent that outstanding options are exercised, new options or other securities are issued under our equity incentive plans, or we issue additional shares of common stock in the future, there will be further dilution to investors participating in this offering. In addition, we may choose to raise additional capital because of market conditions or strategic considerations, even if we believe that we have sufficient funds for our current or future operating plans. If we raise additional capital through the sale of equity or convertible debt securities, the issuance of these securities could result in further dilution to our stockholders.
61
Table of Contents
SELECTED CONSOLIDATED FINANCIAL DATA
The following tables set forth Lulu’s Fashion Lounge Holdings, Inc.’s selected consolidated financial data for the periods ended on and as of the dates indicated. We derived the consolidated statements of income and comprehensive income data, the consolidated statements of cash flow data and the consolidated balance sheets data as of and for the years ended December 31, 2017 and December 30, 2018 from our audited consolidated financial statements and the related notes thereto included elsewhere in this prospectus. We derived the consolidated statements of income and comprehensive income data and the consolidated statements of cash flow data for the nine months ended September 30, 2018 and September 29, 2019 and the consolidated balance sheet data as of September 29, 2019 from our unaudited interim condensed consolidated financial statements and the related notes thereto included elsewhere in this prospectus.
Our historical results are not necessarily indicative of future results of operations, and the results of operations for the nine months ended September 29, 2019 are not necessarily indicative of results for the full year. The unaudited interim condensed consolidated financial statements have been prepared on the same basis as the audited annual consolidated financial statements and reflect, in the opinion of management, all adjustments of a normal, recurring nature that are necessary for a fair statement of the unaudited interim condensed consolidated financial statements. You should read the information set forth below together with “Risk Factors,” “Management’s Discussion and Analysis of Financial Condition and Results of Operations,” our consolidated financial statements and the related notes thereto, and our unaudited interim condensed consolidated financial statements and the related notes thereto included elsewhere in this prospectus.
| Year Ended | Nine Months Ended | |||||||||||||||
| December 31, 2017 |
December 30, 2018 |
September 30, 2018 |
September 29, 2019 |
|||||||||||||
| (in thousands, except share and per share amounts) | ||||||||||||||||
| (unaudited) | ||||||||||||||||
| Consolidated Statements of Income and Comprehensive Income Data: |
||||||||||||||||
| Net sales |
$ | 232,469 | $ | 297,111 | $ | 230,930 | $ | 285,990 | ||||||||
| Cost of goods sold |
122,234 | 164,814 | 126,375 | 160,500 | ||||||||||||
|
|
|
|
|
|
|
|
|
|||||||||
| Gross profit |
110,235 | 132,297 | 104,555 | 125,490 | ||||||||||||
| Selling and marketing expenses |
32,906 | 56,639 | 42,594 | 56,241 | ||||||||||||
| General and administrative expenses |
43,461 | 57,030 | 42,102 | 56,603 | ||||||||||||
|
|
|
|
|
|
|
|
|
|||||||||
| Income from operations |
33,868 | 18,628 | 19,859 | 12,646 | ||||||||||||
|
|
|
|
|
|
|
|
|
|||||||||
| Other income (expense), net: |
||||||||||||||||
| Interest expense |
(9,290 | ) | (13,700 | ) | (10,236 | ) | (11,396 | ) | ||||||||
| Loss on debt extinguishment |
(1,170 | ) | — | — | ||||||||||||
| Other income |
33 | 417 | 393 | 193 | ||||||||||||
|
|
|
|
|
|
|
|
|
|||||||||
| Total other expense, net |
(10,427 | ) | (13,283 | ) | (9,843 | ) | (11,203 | ) | ||||||||
|
|
|
|
|
|
|
|
|
|||||||||
| Income before provision for income taxes |
23,441 | 5,345 | 10,016 | 1,443 | ||||||||||||
| Provision for income taxes |
8,531 | 4,219 | 4,864 | 791 | ||||||||||||
|
|
|
|
|
|
|
|
|
|||||||||
| Net income and comprehensive income |
$ | 14,910 | $ | 1,126 | $ | 5,152 | $ | 652 | ||||||||
|
|
|
|
|
|
|
|
|
|||||||||
| Net income attributable to common stockholder: |
||||||||||||||||
| Basic and Diluted |
$ | 14,910 | $ | 1,002 | $ | 4,659 | $ | 553 | ||||||||
|
|
|
|
|
|
|
|
|
|||||||||
| Net income per share attributable to common stockholder: |
||||||||||||||||
| Basic and Diluted |
$ | 0.72 | $ | 0.05 | $ | 0.25 | $ | 0.03 | ||||||||
|
|
|
|
|
|
|
|
|
|||||||||
| Shares used to compute net income per share attributable to common stockholder: |
||||||||||||||||
| Basic and Diluted |
20,591,917 | 18,328,291 | 18,620,133 | 17,462,283 | ||||||||||||
|
|
|
|
|
|
|
|
|
|||||||||
62
Table of Contents
| Year Ended | Nine Months Ended | |||||||||||||||
| December 31, 2017 |
December 30, 2018 |
September 30, 2018 |
September 29, 2019 |
|||||||||||||
| (in thousands, except share and per share amounts) | ||||||||||||||||
| (unaudited) | ||||||||||||||||
| Pro Forma Consolidated Statements of Income Data(1): |
||||||||||||||||
| Pro forma net income attributable to common stockholders: |
||||||||||||||||
| Basic and Diluted |
$ | 1,126 | $ | 652 | ||||||||||||
|
|
|
|
|
|||||||||||||
| Pro forma net income per share attributable to common stockholders: |
||||||||||||||||
| Basic and Diluted |
0.05 | $ | 0.03 | |||||||||||||
|
|
|
|
|
|||||||||||||
| Shares used to compute pro forma net income per share attributable to common stockholders: |
||||||||||||||||
| Basic and Diluted |
20,591,917 | 20,591,917 | ||||||||||||||
|
|
|
|
|
|||||||||||||
| (1) | See Note 13 to our consolidated financial statements for the year ended December 31, 2018 and Note 11 to our unaudited interim condensed consolidated financial statements for the nine months ended September 29, 2019 for an explanation of the calculations of our pro forma basic and diluted net income per share attributable to common stockholders and the pro forma weighted-average number of shares used in the computation of the per share amounts. |
| Year Ended | Nine Months Ended | |||||||||||||||
| December 31, 2017 |
December 30, 2018 |
September 30, 2018 |
September 29, 2019 |
|||||||||||||
| (in thousands) | ||||||||||||||||
| (unaudited) | ||||||||||||||||
| Consolidated Statements of Cash Flows Data: |
||||||||||||||||
| Net cash provided by operating activities |
$ | 10,828 | $ | 9,471 | $ | 21,352 | $ | 14,691 | ||||||||
| Net cash used in investing activities |
(3,595 | ) | (3,488 | ) | (2,839 | ) | (3,471 | ) | ||||||||
| Net cash used in financing activities |
(6,681 | ) | (3,872 | ) | (3,865 | ) | (8,305 | ) | ||||||||
| As of | ||||||||||||
| December 31, 2017 |
December 30, 2018 |
September 29, 2019 |
||||||||||
| (in thousands) | ||||||||||||
| (unaudited) | ||||||||||||
| Consolidated Balance Sheets Data: |
||||||||||||
| Cash and cash equivalents |
$ | 5,637 | $ | 7,747 | $ | 10,661 | ||||||
| Total current assets |
33,098 | 42,327 | 56,457 | |||||||||
| Total assets |
92,460 | 103,681 | 119,494 | |||||||||
| Total current liabilities |
28,457 | 36,607 | 57,785 | |||||||||
| Long-term debt, net of current portion |
113,934 | 108,203 | 98,659 | |||||||||
| Total liabilities |
144,187 | 146,493 | 159,964 | |||||||||
| Convertible preferred stock |
— | 117,038 | 117,038 | |||||||||
| Total stockholder’s deficit |
(51,727 | ) | (159,850 | ) | (157,508 | ) | ||||||
63
Table of Contents
MANAGEMENT’S DISCUSSION AND ANALYSIS OF
FINANCIAL CONDITION AND RESULTS OF OPERATIONS
You should read the following discussion and analysis of our financial condition and results of operations in conjunction with the section entitled “Selected Consolidated Financial Data,” our historical consolidated financial statements and the related notes thereto included elsewhere in this prospectus. This discussion contains forward-looking statements and involves numerous risks and uncertainties, including, but not limited to, those described in the “Risk Factors” section of this prospectus. Actual results could differ materially from those contained in any forward-looking statements.
Overview
Lulus is a customer-driven, digitally-native fashion brand primarily serving Millennial and Gen Z women. We focus relentlessly on giving our customers what they want. We do this by using data coupled with human insight to deliver a curated and continuously evolving assortment of on-point, affordable luxury fashion. Our customer obsession sets the tone for everything we do, from our personalized online shopping experience to our exceptional customer service.
Over the past 11 years as a pure-play eCommerce brand, we have focused on building authentic personal relationships with our customers and offering them coveted products they cannot purchase elsewhere. We incorporate the pulse of the consumer by engaging with her where she is, across the web, social media and on our site, through reviews, feedback, and one-on-one interactions with our Style Advisors, Fit Experts, and Bridal Concierge. Customers express their love for our brand on social media and by word-of-mouth (in person and online). We have more than 3.5 million followers across social media, and the popular #lovelulus hashtag has generated over 4.4 billion impressions. We have an NPS score of +60 among existing Lulus customers, as of June 2019, a signal of the genuine customer affinity for our brand.
A key differentiator of our business model from traditional fashion retail is our use of data to optimize all elements of our business. Nowhere is this more pronounced than in our product creation and curation cycle. Traditional merchandising approaches are characterized by extended in-house design cycles, seasonal assortment decisions, deep buys, limited customer feedback, and high markdowns. We leverage a “test, learn, and reorder” strategy to bring new products to market. In lieu of the overhead of maintaining a dedicated in-house product design team, we source raw designs from a broad network of design and manufacturing partners, who ensure that we see trends in real-time and often produce products exclusively for Lulus. Our creative buyers then use our data-driven understanding of trends and customer preference to customize designs for fit, style, and color, creating branded SKUs exclusive to Lulus. We then test these SKUs with limited initial orders, which drive traffic and “need to own” scarcity among our customers, and our proprietary reorder algorithm utilizes real-time purchase data to inform subsequent reorder decisions. Because we are trend adapters rather than trend creators, we do not have to forecast expected future demand for a particular style or design, which is a challenge that most of our competitors face each season. As a result, we are able to optimize our inventory levels to meet customer demand and minimize returns as well as markdowns. In 2018, we brought to market an average of 211 SKUs per week, and 93% of our reorders in 2018 were sold without markdown. We fulfill our customers’ orders from our leased distribution facilities in Chico, California and Easton, Pennsylvania. We began shipping product from Easton in late March 2019.
We are proud of our large, diverse community of loyal customers. While our target customer is typically in her mid-20s, we serve women from their mid-to-late teens through their 30s and beyond. We design our broad assortment of affordable luxury fashion for practically all occasions. We engage with our customer where she is, in authentic and personalized ways, through our website, email, and
64
Table of Contents
social media. This strategy helps drive brand awareness while fostering deep connections with our customers. We have built our digital footprint through strong relationships with customers and influencers over more than ten years and benefit from longevity and consistency of message. Our authentic partnerships with brand ambassadors span the full spectrum of followership and engagement levels, from nano- and micro-influencers, to college ambassadors, to celebrities all of whom wear and genuinely love our brand. These genuine brand ambassadors, driven by a strong emotional connection to Lulus, help drive authentic brand awareness and customer engagement. Our free, organic, and low-cost initiatives coupled with profitable performance media drive traffic to our website, which is custom-built to allow for continuous updating and personalization for each customer. Our unified cross-platform strategy consistently reinforces the same brand values. Our marketing approach results in attractive customer acquisition, strong retention, and compelling lifetime value characteristics. In the twelve months ended September 29, 2019, we served 2.8 million Active Customers compared to 2.3 million in the twelve months ended September 30, 2018.
Our business model has resulted in strong historical growth and profitability. Between 2016 and 2018, we grew net sales by 124.2%. In 2018, we had a net income margin of 0.4% and an Adjusted EBITDA margin of 10.1%. During the nine months ended September 29, 2019 we had a net income margin of 0.2% and an Adjusted EBITDA margin of 6.0%.
History
We began as a brick and mortar boutique in 1996, but in the midst of rising consumer adoption of eCommerce and growing influence of social media, we shifted to an online-only model in order to reach our target customer where she prefers to engage. Over the last decade, we have successfully grown our net sales and our customer base on a national scale through continued commitment to efficient product development, high quality yet affordable products, and superior customer service.
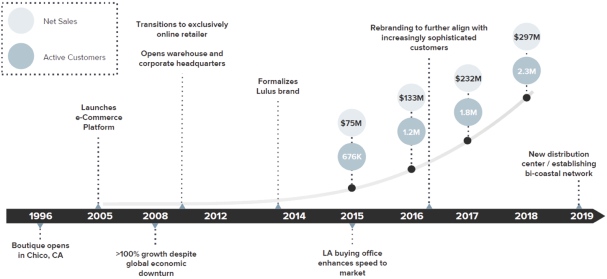
65
Table of Contents
Key Operating and Financial Metrics
We collect and analyze operating and financial data to assess the performance of our business and allocate our resources. The following table sets forth our key performance indicators for the periods presented.
| Year Ended | Nine Months Ended | |||||||||||||||
| December 31, 2017 |
December 30, 2018 |
September 30, 2018 |
September 29, 2019 |
|||||||||||||
| (in thousands, except per unit data) | ||||||||||||||||
| (unaudited) | ||||||||||||||||
| Gross margin |
47.4 | % | 44.5 | % | 45.3 | % | 43.9 | % | ||||||||
| Adjusted EBITDA(1) |
$ | 37,845 | $ | 29,892 | $ | 29,501 | $ | 17,106 | ||||||||
| Adjusted free cash flow(1) |
$ | 7,233 | $ | 5,983 | $ | 18,513 | $ | 11,602 | ||||||||
| Active Customers |
1,822 | 2,301 | 2,250 | 2,757 | ||||||||||||
| Total Orders Placed |
3,268 | 4,216 | 4,096 | 5,021 | ||||||||||||
| Average Order Value |
$ | 106 | $ | 110 | $ | 111 | $ | 112 | ||||||||
| (1) | For a reconciliation of non-GAAP financial measures to the most directly comparable GAAP financial measure and why we consider it useful, see “Prospectus Summary—Summary Historical Consolidated Financial Data.” |
Gross Margin. Gross profit is equal to our net sales less cost of goods sold. We calculate gross margin as gross profit as a percentage of our net sales. Cost of goods sold consist of the product costs of merchandise sold to customers; shipping and handling costs, including all inbound, outbound, and return shipping expenses; rent, insurance, business property tax, utilities, and repairs and maintenance related to our distribution facilities; and charges related to inventory shrinkage, damages, and our allowances for excess or obsolete inventory.
Our gross margin varies across Lulus, exclusive to Lulus, and third-party branded products. Exclusive to Lulus consists of products that we develop with design partners and have exclusive rights to sell through www.lulus.com, but that do not bear the Lulus brand. Gross margin on sales of Lulus and exclusive to Lulus merchandise is generally higher than gross margin on sales of third-party branded products, which we offer for customers to “round out” the basket. Lulus merchandise represented approximately 82% and 83% of units sold in 2017 and 2018, respectively. We do not expect this mix to change materially going forward.
Certain of our competitors and other retailers report cost of goods sold differently than we do. As a result, the reporting of our gross profit and gross margin may not be comparable to other companies.
Adjusted EBITDA. Adjusted EBITDA is a non-GAAP financial measure that we calculate as income before interest expense, income taxes, depreciation and amortization, adjusted to exclude the effects of equity-based compensation expense, management fees, and transaction fees. Adjusted EBITDA is a key measure used by management to evaluate our operating performance, generate future operating plans and make strategic decisions regarding the allocation of capital. In particular, the exclusion of certain expenses in calculating Adjusted EBITDA facilitates operating performance comparisons on a period-to-period basis and, in the case of exclusion of the impact of equity-based compensation, excludes an item that we do not consider to be indicative of our core operating performance. See “Prospectus Summary—Summary Historical Consolidated Financial Data” for information regarding our use of Adjusted EBITDA and a reconciliation of net income, the most directly comparable GAAP measure, to Adjusted EBITDA for the periods presented.
Adjusted Free Cash Flow. Adjusted free cash flow is a non-GAAP financial measure that we calculate as net cash provided by operating activities less net cash used in capital expenditures and
66
Table of Contents
capitalized software. We consider Adjusted free cash flow an important indicator of our liquidity because it measures the amount of cash we generate in a particular period. See “Prospectus Summary—Summary Historical Consolidated Financial Data” for information regarding our use of Adjusted free cash flow and a reconciliation of net cash provided by operating activities, the most directly comparable GAAP measure, to Adjusted free cash flow for the periods presented.
Active Customers. We define an active customer as the number of customers who have made at least one purchase from www.lulus.com in the prior 12-month period. We consider the number of active customers to be a key performance metric on the basis that it is directly related to consumer awareness of our brand, our ability to attract visitors to our digital platform, and our ability to convert visitors to paying customers.
Total Orders Placed. We define total orders placed as the number of customer orders placed on www.lulus.com during the prior 12-month period. An order is counted on the day the customer places the order. We do not adjust the number of Total Orders Placed for any cancellation or return that may have occurred subsequent to a customer placing an order. We consider total orders placed as a key performance metric on the basis that it is directly related to our ability to attract and retain customers as well as drive purchase frequency. Total orders placed, together with average order value, is an indicator of the net sales we expect to generate in a particular period.
Average Order Value. Average order value (“AOV”) is the sum of the total gross sales before returns from www.lulus.com in a given period, plus shipping revenue, less discounts and markdowns, divided by the total orders placed in that period. AOV reflects average basket size of our customers. AOV may fluctuate as we continue investing in the development and introduction of new Lulus merchandise and as a result of our promotional discount activity.
Factors Affecting Our Performance
Our financial condition and results of operations have been, and will continue to be, affected by a number of important factors, including the following:
Customer Acquisition and Retention
To grow our business, we must continue to acquire and retain customers. Our ability to successfully attract new customers and retain existing customers directly impacts growth in Active Customers and total orders placed.
67
Table of Contents
In 2018, we had 2.3 million Active Customers, an increase of 26% relative to Active Customers of 1.8 million in 2017. During 2017 and 2018, we grew Total Orders Placed by 29% from 3.3 million to 4.2 million, respectively. In the twelve months ended September 29, 2019, we had 2.8 million Active Customers, an increase of 21.7% relative to Active Customers of 2.3 million in the twelve months ended September 30, 2018. In the twelve months ended September 30, 2018 and September 29, 2019, we grew total orders placed by 22.0% from 4.1 million to 5.0 million, respectively. The ratio of Total Orders Placed to Active Customers has increased from 1.79x in 2017 to 1.83x in 2018.
|
|
|
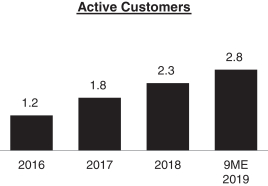
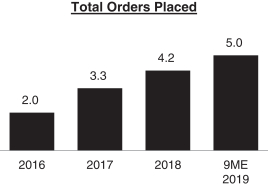
To measure our ability to acquire and drive lifetime value of our customers, we analyze customer behavior by cohort based on cumulative gross sales as well as cumulative gross sales less cost to acquire customers. Gross sales in this analysis reflects gross retail revenue transacted, including shipping revenue less discounts, before any adjustments for deferred revenue, before returns and cancelations, and excluding wholesale revenue, outlet revenue, and stored-value card breakage.
On a gross sales basis, we have seen consistent expansion of cumulative spend over the course of our customers’ lives and across cohorts. As the vast majority of our sales are from the Lulus brand, we seek to increase engagement and monetization over several years, as demonstrated by this expansion in gross sales lifetime value. Over the last four years, we have expanded the gross sales contribution per cohort by approximately 1.5x on average between the first and second year, and by approximately 1.3x on average between the second and third year. We consider gross sales lifetime value to be an indicator of the success we have retaining our customers and driving cumulative spend.
Our cohorts are defined as follows:
| • | Sep 2016 LTM cohort: Last twelve months (“LTM”) ended September 25, 2016 cohort (“Sep 2016 LTM cohort”) includes all customers that placed their first order between September 28, 2015 and September 25, 2016; |
| • | Sep 2017 LTM cohort: LTM ended October 1, 2017 cohort (“Sep 2017 LTM cohort”) includes all customers that placed their first order between September 26, 2016 and October 1, 2017; |
| • | Sep 2018 LTM cohort: LTM ended September 30, 2018 cohort (“Sep 2018 LTM cohort”) includes all customers that placed their first order between October 2, 2017 and September 30, 2018; and |
| • | Sep 2019 LTM cohort: LTM ended September 29, 2019 cohort (“Sep 2019 LTM cohort”) includes all customers that placed their first order between October 1, 2018 and September 29, 2019. |
In the charts that follow, the horizontal axis represents the timeframe relative to the beginning of the LTM period that defines a particular cohort – e.g. gross sales generated by a customer in the
68
Table of Contents
Sep 2016 LTM cohort falls into the “12-24 months” timeframe if those gross sales were generated by order(s) placed between September 26, 2016 and September 25, 2017.
Cumulative Gross Sales ($mm)
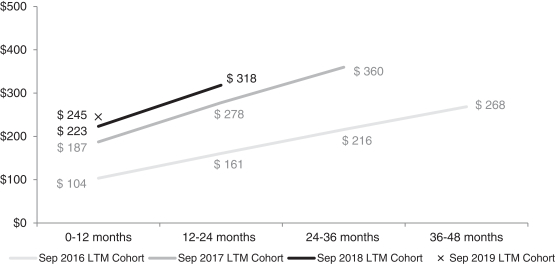
We define cost to acquire customers (“CAC”) as marketing spend, including paid search, remarketing, social, display, influencer expenses, photo shoots and other, and excluding search engine optimization (“SEO”) and email marketing costs. Our gross sales from new cohorts has exceeded CAC for these cohorts. We look at gross sales less CAC as an indicator of our success in acquiring new customers.
Cumulative Gross Sales Less CAC ($mm)
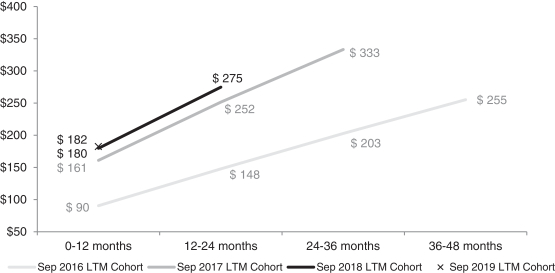
To measure our ability to drive loyalty and share of wallet of our customers on an individual basis, we look at average gross sales per Active Customer over time. Over the last four years, average gross sales per Active Customer has expanded by approximately 1.7x between the first and second year, by
69
Table of Contents
approximately 1.1x between the second and third year, and by approximately 1.1x between the third and fourth year. The material jump in average customer spend in the second year demonstrates our ability to earn customer loyalty and brand devotion once we have retained a customer. The growth in average customer spend moderates over time as we successfully drive incremental share of wallet.
The chart below reflects the average annual gross sales per Active Customer for the following cohort groups:
| • | The 0-12 month period includes all four cohorts (Sep 2016 LTM cohort, Sep 2017 LTM cohort, Sep 2018 LTM cohort, and Sep 2019 LTM cohort); |
| • | The 12-24 month period includes three cohorts (Sep 2016 LTM cohort, Sep 2017 LTM cohort, and Sep 2018 LTM cohort); |
| • | The 24-36 month period includes two cohorts (Sep 2016 LTM cohort and Sep 2017 LTM cohort); and |
| • | The 36-48 month period includes Sep 2016 LTM cohort only. |
Average Annual Gross Sales per Active Customer ($)
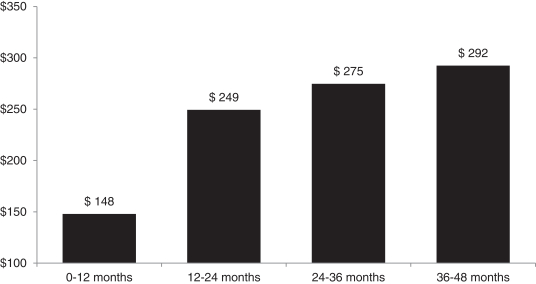
Inventory Management
We utilize a data-driven strategy that leverages our proprietary reorder algorithm to manage inventory as efficiently as possible. Our “test, learn, and reorder” approach consists of limited inventory purchases followed by the analysis of proprietary data including real-time transaction data and customer feedback, which then informs our selection and customization of popular merchandise prior to reordering in larger quantities. While our initial orders are limited in size and financial risk and our supplier partners are highly responsive, we nonetheless purchase inventory in anticipation of future demand and therefore are exposed to potential shifts in customer preferences and price sensitivity over time. As we continue to grow, we will adjust our inventory purchases to align with the current needs of the business.
70
Table of Contents
Investment in Our Operations and Infrastructure
We will continue to invest in our operations and infrastructure to facilitate further growth of our business. While we expect our expenses to increase accordingly, we will harness the strength of our existing platform and our on-trend fashion expertise to make informed investment decisions. We intend to invest in headcount, inventory, fulfillment, logistics, and our software and data capabilities in order to improve our platform, expand into international markets, and drive operational efficiencies. We cannot guarantee that increased spending on these investments will be cost effective or result in future growth in our customer base. However, we set a high bar for approval of any capital spending initiative. We believe that our disciplined approach to capital spending will enable us to generate positive returns on our investments over the long term.
Components of Our Results of Operations
Net Sales
Net sales consist primarily of gross sales, net of merchandise returns and promotional discounts, generated from the sale of apparel, footwear, and accessories. Net sales exclude sales taxes assessed by governmental authorities. We recognize net sales at the point in time when control of the promised product is transferred to the customer, which we determine to have occurred upon shipment of an order.
Net sales are impacted by our number of customers and their spending habits, average order value, product assortment and availability, and marketing and promotional activities. Net sales are also impacted by use of coupons and other discounts, which reduce our net sales by the amount of such promotional discounts. During any given period, we may seek to increase sales by increasing promotional discounts, and in other periods we may instead seek to increase sales by increasing our selling and marketing expenses. We consider both actions together, so increased promotional discounts in a period, which would reduce net sales accordingly in such period, might also result in lower selling and marketing expenses in such period. Similarly, if we increase selling and marketing expenses in a given period, promotional discounts may be correspondingly reduced, thereby improving net sales. We expect our net sales to increase in absolute dollars as we grow our business, although our net sales growth rate may slow in future periods.
Cost of Goods Sold and Gross Margin
Cost of goods sold consist of the product costs of merchandise sold to customers; shipping and handling costs, including all inbound, outbound, and return shipping expenses; rent, insurance, business property tax, utilities, and repairs and maintenance related to our distribution facilities; and charges related to inventory shrinkage, damages, and our allowance for excess or obsolete inventory. Cost of goods sold is primarily driven by growth in orders placed by customers, the mix of the product available for sale on our site, and transportation costs related to inventory receipts from our suppliers. We expect our cost of goods sold to fluctuate as a percentage of net sales primarily due to how we manage our inventory and merchandise mix.
Gross profit is equal to our net sales less cost of goods sold. We calculate gross margin as gross profit as a percentage of our net sales. Our gross margin varies across Lulus, exclusive to Lulus, and third-party branded products. Exclusive to Lulus consists of products that we develop with design partners and have exclusive rights to sell through www.lulus.com, but that do not bear the Lulus brand. Gross margin on sales of Lulus and exclusive to Lulus merchandise is generally higher than gross margin on sales of third-party branded products, which we offer for customers to “round out” the basket. Lulus merchandise represented approximately 82% and 83% of units sold in 2017 and 2018, respectively. We expect our gross margin to increase modestly over the long term, as we continue to
71
Table of Contents
optimize our distribution capabilities as well as utilize purchasing scale economies, although our gross margin may fluctuate from period to period depending on the interplay of these factors.
Selling and Marketing Expenses
Our selling and marketing expenses consist primarily of customer service, payment processing fees, advertising, targeted online performance marketing, and search engine optimization costs. Selling and marketing expenses also include our spend on brand marketing channels, including cash and free clothing compensation to social media influencers, events, and other forms of online and offline marketing related to growing and retaining the customer base. As discussed in “Net Sales” above, in any given period, the amount of our selling and marketing expense can be affected by the use of promotional discounts in such period. We expect our selling and marketing expenses to increase in absolute dollars as we continue to invest in increasing brand awareness.
General and Administrative Expenses
General and administrative expenses consist primarily of payroll and benefits costs, including equity-based compensation for our employees involved in general corporate functions including finance, merchandising, marketing, and technology, as well as costs associated with the use by these functions of facilities and equipment, including depreciation, rent, and other occupancy expenses. General and administrative expenses are primarily driven by increases in headcount required to support business growth and meeting our obligations as a public company.
In the near term, we also expect to incur significant legal, accounting, and other expenses that we did not incur as a private company. We expect that compliance with the Sarbanes-Oxley Act and the Dodd-Frank Wall Street Reform and Consumer Protection Act, as well as rules and regulations subsequently implemented by the SEC, will increase our legal and financial compliance costs and will make some activities more time consuming and costly. In that regard, we expect to hire additional accounting and financial staff with appropriate public company experience and technical accounting knowledge. We expect our general and administrative expenses to increase in absolute dollars as we continue to grow our business.
Other Income (Expense), Net
Other income (expense), net consists primarily of interest expense, loss on debt extinguishment, and other miscellaneous income.
Provision for Income Taxes
The provision for income taxes represents federal, state, and local income taxes. The effective rate differs from statutory rates due to adjustments for allowable credits, deductions, and the valuation allowance against deferred tax assets, as applicable. Our effective tax rate will change from quarter to quarter based on recurring and nonrecurring factors including, but not limited to, the geographical mix of earnings, enacted tax legislation, state and local income taxes, the impact of permanent tax adjustments, tax audit settlements, and the interaction of various tax strategies.
72
Table of Contents
Results of Operations
The following table shows our consolidated results of operations for the periods presented below and as a percentage of net sales.
| Year Ended | Nine Months Ended | |||||||||||||||
| December 31, 2017 |
December 30, 2018 |
September 30, 2018 |
September 29, 2019 |
|||||||||||||
| (unaudited) |
||||||||||||||||
| (in thousands) |
||||||||||||||||
| Net sales |
$ | 232,469 | $ | 297,111 | $ | 230,930 | $ | 285,990 | ||||||||
| Cost of goods sold |
122,234 | 164,814 | 126,375 | 160,500 | ||||||||||||
|
|
|
|
|
|
|
|
|
|||||||||
| Gross profit |
110,235 | 132,297 | 104,555 | 125,490 | ||||||||||||
| Selling and marketing expenses |
32,906 | 56,639 | 42,594 | 56,241 | ||||||||||||
| General and administrative expenses |
43,461 | 57,030 | 42,102 | 56,603 | ||||||||||||
|
|
|
|
|
|
|
|
|
|||||||||
| Income from operations |
33,868 | 18,628 | 19,859 | 12,646 | ||||||||||||
|
|
|
|
|
|
|
|
|
|||||||||
| Other income (expense), net: |
||||||||||||||||
| Interest expense |
(9,290 | ) | (13,700 | ) | (10,236 | ) | (11,396 | ) | ||||||||
| Loss on debt extinguishment |
(1,170 | ) | — | — | — | |||||||||||
| Other income |
33 | 417 | 393 | 193 | ||||||||||||
|
|
|
|
|
|
|
|
|
|||||||||
| Total other expense, net |
(10,427 | ) | (13,283 | ) | (9,843 | ) | (11,203 | ) | ||||||||
|
|
|
|
|
|
|
|
|
|||||||||
| Income before provision for income taxes |
23,441 | 5,345 | 10,016 | 1,443 | ||||||||||||
| Provision for income taxes |
8,531 | 4,219 | 4,864 | 791 | ||||||||||||
|
|
|
|
|
|
|
|
|
|||||||||
| Net income and comprehensive income |
$ | 14,910 | $ | 1,126 | $ | 5,152 | $ | 652 | ||||||||
|
|
|
|
|
|
|
|
|
|||||||||
| Net sales |
100.0 | % | 100.0 | % | 100.0 | % | 100.0 | % | ||||||||
| Cost of goods sold |
52.6 | 55.5 | 54.7 | 56.1 | ||||||||||||
|
|
|
|
|
|
|
|
|
|||||||||
| Gross profit |
47.4 | 44.5 | 45.3 | 43.9 | ||||||||||||
| Selling and marketing expenses |
14.2 | 19.1 | 18.4 | 19.7 | ||||||||||||
| General and administrative expenses |
18.7 | 19.2 | 18.2 | 19.8 | ||||||||||||
|
|
|
|
|
|
|
|
|
|||||||||
| Income from operations |
14.6 | 6.3 | 8.7 | 4.4 | ||||||||||||
|
|
|
|
|
|
|
|
|
|||||||||
| Other income (expense), net: |
||||||||||||||||
| Interest expense |
(4.0 | ) | (4.6 | ) | (4.5 | ) | (4.0 | ) | ||||||||
| Loss on debt extinguishment |
(0.5 | ) | — | — | — | |||||||||||
| Other income |
— | 0.1 | 0.1 | 0.1 | ||||||||||||
|
|
|
|
|
|
|
|
|
|||||||||
| Total other expense, net |
(4.5 | ) | (4.5 | ) | (4.4 | ) | (3.9 | ) | ||||||||
|
|
|
|
|
|
|
|
|
|||||||||
| Income before provision for income taxes |
10.1 | 1.8 | 4.3 | 0.5 | ||||||||||||
| Provision for income taxes |
3.7 | 1.4 | 2.1 | 0.3 | ||||||||||||
|
|
|
|
|
|
|
|
|
|||||||||
| Net income and comprehensive income |
6.4 | % | 0.4 | % | 2.2 | % | 0.2 | % | ||||||||
|
|
|
|
|
|
|
|
|
|||||||||
Comparison of the nine months ended September 30, 2018 and September 29, 2019
Net sales
Net sales were $286.0 million for the nine months ended September 29, 2019, an increase of $55.1 million, or 23.8%, compared to $230.9 million for the nine months ended September 30, 2018. The increase in net sales was primarily driven by an increase of 21.7% in the Total Orders Placed, which was primarily driven by a 22.0% increase in Active Customers, which was the result of an increase in marketing spend that led to higher brand awareness, as well as an increase in repeat customer purchases. There were no significant changes in pricing during the nine months ended September 29, 2019.
73
Table of Contents
Gross profit, gross margin and cost of goods sold
Cost of goods sold for the nine months ended September 29, 2019 increased by $34.1 million, or 27.0%, compared to the nine months ended September 30, 2018, which was primarily driven by the increase in products sold as well as additional costs incurred as a result. Gross profit was $125.5 million for the nine months ended September 29, 2019, an increase of $20.9 million, or 20.0%, compared to $104.6 million for the nine months ended September 30, 2018. Gross margin declined from 45.3% for the nine months ended September 30, 2018 to 43.9% for the nine months ended September 29, 2019, primarily as a result of increased promotional discounts and higher markdowns due to suboptimal inventory mix and quantity driven largely by integration issues experienced during 2018 with our third-party logistics providers having a residual impact on the quality of inventory assortment through the nine months ended September 29, 2019. This in turn resulted in an increase in shipping and handling costs attributable to multiple shipments per customer order and return. We terminated the arrangement with our third-party logistics provider during the three months ended March 31, 2019 and opened a Lulus operated distribution facility in Easton, Pennsylvania around the same time.
Selling and marketing expenses
Selling and marketing expenses were $56.2 million for the nine months ended September 29, 2019, an increase of $13.6 million, or 32.0%, compared to $42.6 million for the nine months ended September 30, 2018. The increase in selling and marketing expenses was primarily driven by growth in the business as well as an increase in marketing spend to offset a suboptimal inventory mix and quantity in the first half of 2019, driven largely by integration issues with our third-party logistics providers.
General and administrative expenses
General and administrative expenses were $56.6 million for the nine months ended September 29, 2019, an increase of $14.5 million, or 34.4%, compared to $42.1 million for the nine months ended September 30, 2018. The increase in general and administrative expenses was primarily driven by a $8.0 million increase in payroll and benefits expense to build out our team to support our growth and in preparation for this offering, a $5.2 million increase in outsourced labor related to third-party contractors and temporary labor utilized to build out our new Pennsylvania distribution facility that opened in February 2019, a $2.2 million increase in professional fees due to external consultants used in the planning for our new Pennsylvania distribution facility, as well as costs related to this offering, and a $0.8 million increase in recruiting and relocation costs associated with staffing our new Pennsylvania distribution facility. Increases were slightly offset by a $1.6 million decrease in equity-based compensation expense related to distributions payable by the LP to Class P holders as a result of the Series A Preferred Stock transaction that occurred in April 2018 and no such costs existed in 2019.
Interest expense
Interest expense for the nine months ended September 29, 2019 increased by $1.2 million, or 11.3%, compared to the nine months ended September 30, 2018, which was primarily attributable to increased borrowings under our Revolving Facility in the three months ended March 31, 2019.
Provision for Income Taxes
Our provision for income taxes reflects an effective tax rate of 48.6% and 54.8% for the nine months ended September 30, 2018 and September 29, 2019, respectively. Our effective tax rate increased from September 30, 2018 to September 29, 2019 primarily due to an increase in uncertain tax position interest, partially offset by an increase in tax credits and the absence of adjustments related to the accounting for the Tax Cuts and Jobs Act.
74
Table of Contents
Comparison of years ended December 31, 2017 and December 30, 2018
Net sales
Net sales were $297.1 million for the year ended December 30, 2018, an increase of $64.6 million, or 27.8%, compared to $232.5 million for the year ended December 31, 2017. The increase in net sales was primarily driven by an increase of 29.0% in the Total Orders Placed, which was primarily driven by a 26.4% increase in Active Customers, which was the result of an increase in marketing spend that led to higher brand awareness, as well as an increase in repeat customer purchases. There were no significant changes in pricing during the year.
Gross profit, gross margin and cost of goods sold
Cost of goods sold for the year ended December 30, 2018 increased by $42.6 million, or 34.9%, compared to the year ended December 31, 2017, which was primarily driven by the increase in products sold. Gross profit was $132.3 million for the year ended December 30, 2018, an increase of $22.1 million, or 20.1%, compared to $110.2 million for the year ended December 31, 2017. Gross margin declined from 47.4% for the year ended December 31, 2017 to 44.5% for the year ended December 30, 2018, primarily as a result of increased investments in the growth of the business as well as increased promotional discounts and higher markdowns due to suboptimal inventory mix and quantity driven largely by temporary integration issues with our third-party logistics providers. This in turn resulted in an increase in shipping and handling costs attributable to multiple shipments per customer order and return.
Selling and marketing expenses
Selling and marketing expenses were $56.6 million for the year ended December 30, 2018, an increase of $23.7 million, or 72.0%, compared to $32.9 million for the year ended December 31, 2017. The increase in selling and marketing expenses was primarily driven by growth in the business. To a lesser extent, there was an increase in marketing spend to offset a decline in SEO traffic, resulting from algorithm changes by Google, as well as a suboptimal inventory mix and quantity in the second half of 2018, driven largely by temporary integration issues with our third-party logistics providers.
General and administrative expenses
General and administrative expenses were $57.0 million for the year ended December 30, 2018, an increase of $13.5 million, or 31.0%, compared to $43.5 million for the year ended December 31, 2017. The increase in general and administrative expenses was primarily driven by a $3.5 million increase in payroll and benefits expense to build out our team to support our growth and in preparation for this offering, $3.5 million increase in equity-based compensation expense related to distributions payable by LP to Class P holders as a result of the Series A Preferred Stock transaction as well as previously vested distributions due to Class P holders, a $4.0 million increase in outsourced labor related to our third-party logistics provider arrangements used for expanding our distribution network and non-recurring warehouse inefficiencies, and a $2.4 million increase in professional fees due to external consultants used in the planning for our new Pennsylvania distribution facility that opened in March 2019, as well as initial public offering readiness.
Interest expense
Interest expense for the year ended December 30, 2018 increased by $4.4 million, or 47.5%, compared to the year ended December 31, 2017, which was primarily attributable to increased borrowings under our new Credit Facility in the second half of 2017. Interest expense for the year ended December 30, 2018 reflects a full year’s interest expense for our Credit Facility.
75
Table of Contents
Provision for Income Taxes
Our provision for income taxes reflects an effective tax rate of 36.4% and 79.06% for 2017 and 2018, respectively. Our effective tax rate and provision for income taxes increased from 2017 to 2018 primarily due to an increase in uncertain tax position for prior year state liabilities, an increase in the non-deductible portion of equity-based compensation expense, and transaction fees in connection with the Series A Preferred Stock transaction.
Quarterly Results of Operations
The following tables set forth our unaudited quarterly consolidated statements of operations data in dollars and as a percentage of revenue for the periods presented. The unaudited quarterly consolidated statements of operations data were prepared on the same basis as the audited annual consolidated financial statements and reflect, in the opinion of management, all adjustments of a normal, recurring nature that are necessary for a fair statement of the unaudited quarterly financial information set forth in such data. Our historical results are not necessarily indicative of the results that may be expected in the future and operating results for interim periods are not necessarily indicative of the results that may be expected for a full year. You should read this data together with our consolidated financial statements and the related notes thereto as well as the unaudited interim condensed consolidated financial statements and the related notes thereto included elsewhere in this prospectus.
The following table sets forth our selected unaudited quarterly consolidated statements of operations data for the periods presented:
| Three months ended (unaudited) |
||||||||||||||||||||||||||||||||||||||||||||
| Apr. 2, 2017 |
July 2, 2017 |
Oct. 1, 2017 |
Dec. 31, 2017 |
Apr. 1, 2018 |
July 1, 2018 |
Sept. 30, 2018 |
Dec. 30, 2018 |
Mar. 31, 2019 |
June 30, 2019 |
Sept. 29, 2019 |
||||||||||||||||||||||||||||||||||
| (in thousands) | ||||||||||||||||||||||||||||||||||||||||||||
| Consolidated Statements of Operations Data: |
||||||||||||||||||||||||||||||||||||||||||||
| Net sales |
$ | 49,902 | $ | 65,870 | $ | 59,032 | $ | 57,665 | $ | 71,182 | $ | 93,237 | $ | 66,511 | $ | 66,181 | $ | 85,690 | $ | 108,644 | $ | 91,656 | ||||||||||||||||||||||
| Cost of goods sold |
25,267 | 33,165 | 31,733 | 32,069 | 38,407 | 49,852 | 38,116 | 38,439 | 49,774 | 60,411 | 50,315 | |||||||||||||||||||||||||||||||||
|
|
|
|
|
|
|
|
|
|
|
|
|
|
|
|
|
|
|
|
|
|
|
|||||||||||||||||||||||
| Gross profit |
24,635 | 32,705 | 27,299 | 25,596 | 32,775 | 43,385 | 28,395 | 27,742 | 35,916 | 48,233 | 41,341 | |||||||||||||||||||||||||||||||||
| Selling and marketing expenses |
7,910 | 9,943 | 7,705 | 7,348 | 12,014 | 16,853 | 13,727 | 14,045 | 17,139 | 21,978 | 17,124 | |||||||||||||||||||||||||||||||||
| General and administrative expenses |
7,826 | 12,839 | 12,027 | 10,769 | 11,260 | 18,744 | 12,098 | 14,928 | 19,454 | 19,696 | 17,453 | |||||||||||||||||||||||||||||||||
|
|
|
|
|
|
|
|
|
|
|
|
|
|
|
|
|
|
|
|
|
|
|
|||||||||||||||||||||||
| Income (loss) from operations |
8,899 | 9,923 | 7,567 | 7,479 | 9,501 | 7,788 | 2,570 | (1,231 | ) | (677 | ) | 6,559 | 6,764 | |||||||||||||||||||||||||||||||
|
|
|
|
|
|
|
|
|
|
|
|
|
|
|
|
|
|
|
|
|
|
|
|||||||||||||||||||||||
| Other income (expense), net: |
||||||||||||||||||||||||||||||||||||||||||||
| Interest expense |
(1,762 | ) | (1,777 | ) | (2,536 | ) | (3,215 | ) | (3,433 | ) | (3,390 | ) | (3,413 | ) | (3,464 | ) | (3,596 | ) | (3,738 | ) | (4,062 | ) | ||||||||||||||||||||||
| Loss on debt extinguishment |
— | — | (1,170 | ) | — | — | — | — | — | — | — | — | ||||||||||||||||||||||||||||||||
| Other income |
1 | 10 | 18 | 4 | 362 | 12 | 19 | 24 | 55 | 74 | 64 | |||||||||||||||||||||||||||||||||
|
|
|
|
|
|
|
|
|
|
|
|
|
|
|
|
|
|
|
|
|
|
|
|||||||||||||||||||||||
| Total other expense, net |
(1,761 | ) | (1,767 | ) | (3,688 | ) | (3,211 | ) | (3,071 | ) | (3,378 | ) | (3,394 | ) | (3,440 | ) | (3,541 | ) | (3,664 | ) | (3,998 | ) | ||||||||||||||||||||||
|
|
|
|
|
|
|
|
|
|
|
|
|
|
|
|
|
|
|
|
|
|
|
|||||||||||||||||||||||
| Income (loss) before provision (benefit) for income taxes |
7,138 | 8,156 | 3,879 | 4,268 | 6,430 | 4,410 | (824 | ) | (4,671 | ) | (4,218 | ) | 2,895 | 2,766 | ||||||||||||||||||||||||||||||
| Provision (benefit) for income taxes |
2,786 | 3,195 | 1,692 | 858 | 1,741 | 2,825 | 298 | (645 | ) | (991 | ) | 926 | 856 | |||||||||||||||||||||||||||||||
|
|
|
|
|
|
|
|
|
|
|
|
|
|
|
|
|
|
|
|
|
|
|
|||||||||||||||||||||||
| Net income (loss) and comprehensive income (loss) |
$ | 4,352 | $ | 4,961 | $ | 2,187 | $ | 3,410 | $ | 4,689 | $ | 1,585 | $ | (1,122 | ) | $ | (4,026 | ) | $ | (3,227 | ) | $ | 1,969 | $ | 1,910 | |||||||||||||||||||
|
|
|
|
|
|
|
|
|
|
|
|
|
|
|
|
|
|
|
|
|
|
|
|||||||||||||||||||||||
76
Table of Contents
The following table sets forth our unaudited quarterly consolidated results of operations data for each of the periods indicated as a percentage of net sales:
| Three months ended (unaudited) |
||||||||||||||||||||||||||||||||||||||||||||
| Apr. 2, 2017 |
July 2, 2017 |
Oct. 1, 2017 |
Dec. 31, 2017 |
Apr. 1, 2018 |
July 1, 2018 |
Sept. 30, 2018 |
Dec. 30, 2018 |
Mar. 31, 2019 |
June 30, 2019 |
Sept. 29, 2019 |
||||||||||||||||||||||||||||||||||
| Consolidated Statements of Operations Data: |
||||||||||||||||||||||||||||||||||||||||||||
| Net sales |
100.0 | % | 100.0 | % | 100.0 | % | 100.0 | % | 100.0 | % | 100.0 | % | 100.0 | % | 100.0 | % | 100.0 | % | 100.0 | % | 100.0 | % | ||||||||||||||||||||||
| Cost of goods sold |
50.6 | % | 50.3 | % | 53.8 | % | 55.6 | % | 54.0 | % | 53.5 | % | 57.3 | % | 58.1 | % | 58.1 | % | 55.6 | % | 54.9 | % | ||||||||||||||||||||||
|
|
|
|
|
|
|
|
|
|
|
|
|
|
|
|
|
|
|
|
|
|
|
|||||||||||||||||||||||
| Gross profit |
49.4 | % | 49.7 | % | 46.2 | % | 44.4 | % | 46.0 | % | 46.5 | % | 42.7 | % | 41.9 | % | 41.9 | % | 44.4 | % | 45.1 | % | ||||||||||||||||||||||
| Selling and marketing expenses |
15.9 | % | 15.1 | % | 13.0 | % | 12.7 | % | 16.9 | % | 18.1 | % | 20.6 | % | 21.2 | % | 20.0 | % | 20.2 | % | 18.7 | % | ||||||||||||||||||||||
| General and administrative expenses |
15.7 | % | 19.5 | % | 20.4 | % | 18.7 | % | 15.8 | % | 20.1 | % | 18.2 | % | 22.6 | % | 22.7 | % | 18.1 | % | 19.1 | % | ||||||||||||||||||||||
|
|
|
|
|
|
|
|
|
|
|
|
|
|
|
|
|
|
|
|
|
|
|
|||||||||||||||||||||||
| Income (loss) from operations |
17.8 | % | 15.1 | % | 12.8 | % | 13.0 | % | 13.3 | % | 8.3 | % | 3.9 | % | (1.9 | )% | (0.8 | )% | 6.1 | % | 7.3 | % | ||||||||||||||||||||||
|
|
|
|
|
|
|
|
|
|
|
|
|
|
|
|
|
|
|
|
|
|
|
|||||||||||||||||||||||
| Other income (expense), net: |
||||||||||||||||||||||||||||||||||||||||||||
| Interest expense |
(3.5 | )% | (2.7 | )% | (4.3 | )% | (5.6 | )% | (4.8 | )% | (3.6 | )% | (5.1 | )% | (5.2 | )% | (4.2 | )% | (3.5 | )% | (4.4 | )% | ||||||||||||||||||||||
| Loss on debt extinguishment |
— | — | (2.0 | )% | — | — | — | — | — | — | — | — | ||||||||||||||||||||||||||||||||
| Other income |
— | — | — | — | 0.5 | % | — | — | — | 0.1 | % | 0.1 | % | 0.1 | % | |||||||||||||||||||||||||||||
|
|
|
|
|
|
|
|
|
|
|
|
|
|
|
|
|
|
|
|
|
|
|
|||||||||||||||||||||||
| Total other expense, net |
(3.5 | )% | (2.7 | )% | (6.3 | )% | (5.6 | )% | (4.3 | )% | (3.6 | )% | (5.1 | )% | (5.2 | )% | (4.1 | )% | (3.4 | )% | (4.3 | )% | ||||||||||||||||||||||
|
|
|
|
|
|
|
|
|
|
|
|
|
|
|
|
|
|
|
|
|
|
|
|||||||||||||||||||||||
| Income (loss) before provision (benefit) for income taxes |
14.3 | % | 12.4 | % | 6.5 | % | 7.4 | % | 9.0 | % | 4.7 | % | (1.2 | )% | (7.1 | )% | (4.9 | )% | 2.7 | % | 3.0 | % | ||||||||||||||||||||||
| Provision (benefit) for income taxes |
5.6 | % | 4.9 | % | 2.8 | % | 1.5 | % | 2.4 | % | 3.0 | % | 0.5 | % | (1.0 | )% | (1.1 | )% | 0.9 | % | 0.9 | % | ||||||||||||||||||||||
|
|
|
|
|
|
|
|
|
|
|
|
|
|
|
|
|
|
|
|
|
|
|
|||||||||||||||||||||||
| Net income (loss) and comprehensive income (loss) |
8.7 | % | 7.5 | % | 3.7 | % | 5.9 | % | 6.6 | % | 1.7 | % | (1.7 | )% | (6.1 | )% | (3.8 | )% | 1.8 | % | 2.1 | % | ||||||||||||||||||||||
|
|
|
|
|
|
|
|
|
|
|
|
|
|
|
|
|
|
|
|
|
|
|
|||||||||||||||||||||||
77
Table of Contents
The following table sets forth the reconciliation of our unaudited quarterly net income (loss) to Adjusted EBITDA:
| Three months ended (unaudited) |
||||||||||||||||||||||||||||||||||||||||||||
| Apr. 2, 2017 |
July 2, 2017 |
Oct. 1, 2017 |
Dec. 31, 2017 |
Apr. 1, 2018 |
July 1, 2018 |
Sept. 30, 2018 |
Dec. 30, 2018 |
Mar. 31, 2019 |
June 30, 2019 |
Sept. 29, 2019 |
||||||||||||||||||||||||||||||||||
| (in thousands) | ||||||||||||||||||||||||||||||||||||||||||||
| Net income (loss) and comprehensive income (loss) |
$ | 4,352 | $ | 4,961 | $ | 2,187 | $ | 3,410 | $ | 4,689 | $ | 1,585 | $ | (1,122 | ) | $ | (4,026 | ) | $ | (3,227 | ) | $ | 1,969 | $ | 1,910 | |||||||||||||||||||
| Interest expense |
1,762 | 1,777 | 2,536 | 3,215 | 3,433 | 3,390 | 3,413 | 3,464 | 3,596 | 3,738 | 4,062 | |||||||||||||||||||||||||||||||||
| Provision (benefit) for income taxes |
2,786 | 3,195 | 1,692 | 858 | 1,741 | 2,825 | 298 | (645 | ) | (991 | ) | 926 | 856 | |||||||||||||||||||||||||||||||
| Depreciation and amortization |
343 | 399 | 444 | 496 | 605 | 680 | 642 | 637 | 699 | 753 | 780 | |||||||||||||||||||||||||||||||||
| Equity-based compensation expense |
— | — | 526 | 115 | 157 | 2,406 | 742 | 742 | 563 | 563 | 564 | |||||||||||||||||||||||||||||||||
| Management fees |
110 | 110 | 110 | 110 | 110 | 225 | 125 | 219 | 189 | 156 | — | |||||||||||||||||||||||||||||||||
| Transaction fees |
— | — | 2,351 | — | — | 3,557 | — | — | — | — | — | |||||||||||||||||||||||||||||||||
|
|
|
|
|
|
|
|
|
|
|
|
|
|
|
|
|
|
|
|
|
|
|
|||||||||||||||||||||||
| Adjusted EBITDA |
$ | 9,353 | $ | 10,442 | $ | 9,846 | $ | 8,204 | $ | 10,735 | $ | 14,668 | $ | 4,098 | $ | 391 | $ | 829 | $ | 8,105 | $ | 8,172 | ||||||||||||||||||||||
|
|
|
|
|
|
|
|
|
|
|
|
|
|
|
|
|
|
|
|
|
|
|
|||||||||||||||||||||||
Quarterly Trends
We experience moderate fluctuations in aggregate sales volume during the year. We do not experience traditional retail seasonality in our business, particularly as compared to retailers that experience high concentration of revenue in the fourth fiscal quarter. Historically, our net sales are highest in our second fiscal quarter due to higher demand for special event dresses, which generally drives higher AOV, and spring and summer fashion (our “busy season”). The seasonality of our business has resulted in variability in our total net sales quarter-to-quarter. As a result, we believe that comparisons of net sales and results of operations for a given quarter to net sales and results of operations for the corresponding quarter in the prior fiscal year are generally more meaningful than comparisons of net sales and results of operations for sequential quarters. On a year over year growth basis, net sales has increased for each period presented and is primarily driven by an increase in Active Customers, which was the result of an increase in marketing spend that led to higher brand awareness, as well as an increase in repeat customer purchases.
Our quarterly gross profit has fluctuated primarily due to how we manage our inventory and merchandise mix and has been in line with fluctuations in net sales, except for the three months ended December 30, 2018 and March 31, 2019. Our gross profit for these two periods decreased due to increased promotional discounts and higher markdowns and increased marketing spend due to suboptimal inventory mix and quantity driven largely by integration issues with our third-party logistics providers. These integration issues began in the three months ended July 1, 2018. This in turn resulted in an increase in shipping and handling costs attributable to multiple shipments per customer order and return. We terminated the arrangement with our third-party logistics provider during the three months ended March 31, 2019 and opened our new Lulus operated distribution facility in Easton, Pennsylvania around the same time. Prior to terminating the arrangement, we experienced the greatest impact from the integration issues during the three months ended September 30, 2018 and December 30, 2018.
78
Table of Contents
Selling and marketing expenses generally fluctuate with net sales and are highest during our busy season. Further, in any given period, the amount of our selling and marketing expenses can be affected by the use of promotional discounts in such period. Our selling and marketing expenses for the three months ended September 30, 2018 was also partially impacted by algorithm changes by Google, as well as a manual penalty assessed by Google in response to misuse of links to our domain name on unauthorized third party sites in January 2018, all of which resulted in increased marketing spend to offset a decline in SEO traffic. The manual penalty was lifted in March 2018, but the recovery period in organic traffic spanned several quarters. In addition, as discussed above, the three months ended September 30, 2018, December 30, 2018, March 31, 2019, and June 30, 2019 were impacted by a suboptimal inventory mix and quantity driven largely by integration issues with our third-party logistics providers, which resulted in higher marketing spend to offset these issues.
General and administrative expenses consist primarily of payroll and benefit costs and as such vary quarter to quarter due to changes in number of seasonal workers to meet demand based on our seasonality. Our general and administrative expenses during the three months ended December 30, 2018 and March 31, 2019 were impacted due to an increase in outsourced labor related to third-party contractors and temporary labor utilized to build out our new Pennsylvania distribution facility that opened in February 2019 as well as an increase in professional fees due to external consultants used in the planning for our new Pennsylvania distribution facility.
We had net income for all periods presented except for the three months ended September 30, 2018, December 30, 2018 and March 31, 2019. Our net loss for the three months ended September 30, 2018 was primarily driven by increased selling and marketing expenses as discussed above. Our net losses for the three months ended December 30, 2018 and March 31, 2019 were driven by both the increased selling and marketing expenses and increased general and administrative expenses as discussed above.
Liquidity and Capital Resources
General
Our primary sources of liquidity and capital resources are cash generated from operating activities and availability under our Credit Facility. Our primary requirements for liquidity and capital are payroll and general operating expenses, capital expenditures associated with distribution, network expansion and capitalized software and debt service requirement.
We believe that our current sources of liquidity and capital will be sufficient to finance our continued operations, growth strategy and additional expenses we expect to incur as a public company for at least the next twelve months. We cannot assure that our business will generate sufficient cash flows from operations or that future borrowings will be available under our Credit Facility or otherwise to enable us to service our indebtedness, or to make capital expenditures in the future. Our future operating performance and our ability to service or extend our indebtedness will be subject to future economic conditions and to financial, business, and other factors, many of which are beyond our control.
79
Table of Contents
Cash Flow Analysis
The following table shows summary cash flow information for the periods presented.
| Year Ended | Nine Months Ended | |||||||||||||||
| December 31, 2017 | December 30, 2018 | September 30, 2018 | September 29, 2019 | |||||||||||||
| (in thousands) | ||||||||||||||||
| (unaudited) | ||||||||||||||||
| Net cash provided by operating activities |
$ | 10,828 | $ | 9,471 | $ | 21,352 | $ | 14,691 | ||||||||
| Net cash used in investing activities |
(3,595 | ) | (3,488 | ) | (2,839 | ) | (3,471 | ) | ||||||||
| Net cash used in financing activities |
(6,681 | ) | (3,872 | ) | (3,865 | ) | (8,305 | ) | ||||||||
|
|
|
|
|
|
|
|
|
|||||||||
| Net increase in cash, cash equivalents and restricted cash |
$ | 552 | $ | 2,111 | $ | 14,648 | $ | 2,915 | ||||||||
|
|
|
|
|
|
|
|
|
|||||||||
Net cash provided by operating activities
Cash from operating activities consists primarily of net income adjusted for certain non-cash items, including depreciation, equity-based compensation, and the effect of changes in working capital and other activities.
In the nine months ended September 29, 2019, net cash provided by operating activities was $14.7 million and consisted of net income of $0.7 million, changes in operating assets and liabilities of $10.0 million and non-cash items of $4.0 million. Changes in operating assets and liabilities related primarily to an increase in accrued expenses and accounts payable of $11.6 million and $5.1 million, respectively, partially offset by increases in inventory of $5.4 million. Non-cash items primarily related to depreciation and amortization of $2.2 million, equity-based compensation expense of $1.7 million and amortization of debt issuance cost of $1.5 million offset by deferred income taxes of $1.3 million.
In the nine months ended September 30, 2018, net cash provided by operating activities was $21.4 million and consisted of net income of $5.2 million, changes in operating assets and liabilities of $10.0 million and non-cash items of $6.2 million. Changes in operating assets and liabilities related primarily to an increase in accrued expenses and accounts payable of $9.9 million and $3.5 million, respectively, partially offset by increases in accounts receivable of $3.0 million. Non-cash items primarily related to equity-based compensation expense of $3.3 million, depreciation and amortization of $1.9 million and amortization of debt issuance cost of $1.4 million offset by deferred income taxes of $0.5 million.
In 2018, net cash provided by operating activities was $9.5 million and consisted of net income of $1.1 million, changes in operating assets and liabilities of $1.2 million and non-cash items of $7.1 million. Changes in operating assets and liabilities related primarily to an increase in accrued expenses of $9.8 million, partially offset by increases in inventory and income tax refund receivable of $5.3 million, and $1.4 million, respectively, and a decrease in accounts payable of $1.5 million. Non-cash items primarily related to depreciation and amortization of $2.6 million, equity-based compensation expense of $4.0 million and amortization of debt issuance cost of $1.9 million offset by deferred income taxes of $1.4 million.
In 2017, net cash provided by operating activities was $10.8 million and consisted of net income of $14.9 million, changes in operating assets and liabilities of $(8.4) million and non-cash items of $4.3 million. Changes in operating assets and liabilities primarily reflect increases in inventory and
80
Table of Contents
income tax receivable of $11.4 million and $2.4 million, respectively, partially offset by cash inflows due to increases in accounts payable and accrued expenses of $2.9 million and $2.8 million, respectively. Non-cash items primarily related to depreciation and amortization of $1.6 million, amortization of debt issuance costs of $1.0 million and a loss on extinguishment of debt of $1.1 million.
Net cash used in investing activities
Our primary investing activities have consisted of purchases of equipment to support our overall business growth and internally developed software for the continued development of our proprietary technology infrastructure. Purchases of property and equipment may vary from period-to-period due to timing of the expansion of our operations.
In the nine months ended September 29, 2019, net cash used in investing activities was $3.5 million. This was attributable to capital expenditures relating to equipment for our general operations, software and hardware purchases, and internally developed software. In addition, during the three months ended March 31, 2019, we made additional capital expenditures, mainly around equipment, in anticipation of opening our new distribution facility. In addition, we made an advance to the Parent for $2.4 million which was offset by a repayment on the advance of $2.0 million, resulting in net cash used of $0.4 million.
In the nine months ended September 30, 2018, net cash used in investing activities was $2.8 million. This was attributable to capital expenditures relating to equipment for our general operations, software and hardware purchases, and internally developed software.
In 2018, net cash used in investing activities was $3.5 million. This was attributable to capital expenditures relating to equipment for our general operations, software and hardware purchases, and internally developed software.
In 2017, net cash used in investing activities was $3.6 million. This was attributable to capital expenditures relating to equipment for our general operations, software and hardware purchases, and internally developed software.
Net cash used in financing activities
Financing activities consist primarily of borrowings and repayments related to our Credit Facility and dividends and repurchases of common stock.
During the nine months ended September 29, 2019, net cash used in financing activities was $8.3 million, which was attributable to repayments on our Credit Facility and Revolving Facility of $14.6 million, $0.9 million paid for costs associated with the debt modification in May 2019, and $1.8 million paid for deferred costs associated with the initial public offering. Payments were offset by proceeds from borrowing on the Revolving Facility of $9.0 million.
During the nine months ended September 30, 2018, net cash used in financing activities was $3.9 million, which was attributable to the repurchase of common stock of $113.3 million and the issuance of our Series A Preferred Stock of $117.0 million as well as repayments on our Credit Facility of $7.6 million.
In 2018, net cash used in financing activities was $3.9 million, which was attributable to the repurchase of common stock of $113.3 million and the issuance of our Series A Preferred Stock of $117.0 million as well as repayments on our Credit Facility of $7.6 million.
In 2017, net cash used in financing activities was $6.7 million, which was attributable to entering into our Credit Facility in the second half of 2017 and subsequent repayment of our previously outstanding related party debt and distribution to the LP.
81
Table of Contents
Credit Facilities
On August, 28, 2017, our indirect wholly-owned subsidiary Lulu’s Fashion Lounge, LLC entered into a $145 million credit facility, (the “Credit Facility”) with Credit Suisse AG, Cayman Islands Branch, as the administrative agent and collateral agent for all lenders, with $135 million committed as a term loan (the “Term Loan”) and $10 million committed as a revolving credit facility (the “Revolving Facility”). The proceeds from the Term Loan were used to repay other long-term debt and to pay dividends to the LP, and the proceeds of the Revolving Facility are available for general working capital and other corporate purposes.
On May 30, 2019, we entered into a waiver and amendment of our Credit Facility. As part of the waiver and amendment, certain terms and covenants were modified and the lenders waived our default for failure to comply with certain leverage ratio levels from the original Credit Facility agreement. The amended Term Loan pricing is detailed below.
The Term Loans bear interest at either (i) a rate per annum equal to an adjusted LIBOR rate (the “Adjusted LIBOR Rate”) (subject to a minimum floor of 1.00%) plus an applicable margin based on the consolidated total net leverage ratio of Lulu’s Fashion Lounge Parent, LLC, our direct wholly-owned subsidiary (“Parent LLC”), ranging from 7.00% to 9.00% per annum or (ii) a base rate equal to the greater of the “prime rate”, the federal funds effective rate plus 1/2 of 1.0% and the Adjusted LIBOR Rate (the “Base Rate”) plus an applicable margin of ranging from 6.00% to 8.00% per annum based on the consolidated total net leverage ratio of Parent LLC. Loans under the Revolving Facility bear interest at either (i) the Adjusted LIBOR Rate (subject to a floor of 0.00%) plus an applicable margin based on the consolidated total net leverage ratio of Parent LLC ranging from 6.00% to 7.00% per annum, or (ii) the Base Rate plus an applicable margin based on the consolidated total net leverage ratio of Parent LLC ranging from 5.00% to 6.00% per annum.
Additionally, under the amendment to the Revolving Facility, proceeds from an initial public offering constitute a mandatory repayment, so that the leverage ratio as of the last day of the most recently ended period of four fiscal quarters shall not be in excess of 2.00 to 1.00.
On July 27, 2017, the U.K. Financial Conduct Authority (the authority that regulates LIBOR) announced that it intends to cease compelling banks to submit rates for the calculation of LIBOR after 2021. In the event LIBOR is no longer available, the Term Loan stipulates the use of a widely recognized alternative index rate. We cannot predict the effect that changes to, or the elimination of, LIBOR will have on the interest rate of our Term loan.
The Credit Facility requires prepayment of outstanding loans, subject to certain exceptions. Amortization installment payments on the Term Loan are required to be made in quarterly installments of $2.5 million, with the remaining outstanding amount to be payable on August 28, 2022, the maturity date for the Term Loan.
As of September 29, 2019, there were $114.8 million of borrowings outstanding under the Term Loan and $4.6 million of remaining capacity under the Revolving Facility (net of outstanding letters of credit). As of September 29, 2019, we had outstanding borrowings of $4.5 million and outstanding letters of credit of $0.9 million under the Revolving Facility. As of September 29, 2019, the interest rate on the Term Loan was the Adjusted LIBOR Rate plus 9.00% and the interest rate on the loans under the Revolving Facility was the Adjusted LIBOR Rate plus 7.00%.
Principal amounts outstanding under the Revolving Facility will be due and payable in full on May 29, 2022. All obligations under the Credit Facility are unconditionally guaranteed by Parent LLC, our direct wholly-owned subsidiary, and, subject to certain exceptions, each of its current and future
82
Table of Contents
domestic subsidiaries. Our Credit Facility contains certain covenants restricting our activities. See “Description of Certain Indebtedness.”
Contractual obligations
The following table sets forth our contractual obligations as of December 30, 2018 (in thousands):
| Obligation |
Less than 1 year |
1-3 years | 3-5 years |
More than 5 years |
Total | |||||||||||||||
| Long-term debt obligations |
$ | 10,125 | $ | 114,750 | — | — | $ | 124,875 | ||||||||||||
| Term Loan Interest |
$ | 12,745 | $ | 32,657 | — | — | $ | 45,402 | ||||||||||||
| Operating lease obligations |
$ | 2,386 | $ | 4,897 | $ | 3,502 | $ | 1,983 | $ | 12,768 | ||||||||||
| Unrecognized tax benefits(1) |
— | — | — | — | — | |||||||||||||||
|
|
|
|
|
|
|
|
|
|
|
|||||||||||
| Total |
$ | 25,256 | $ | 152,304 | $ | 3,502 | $ | 1,983 | $ | 183,045 | ||||||||||
|
|
|
|
|
|
|
|
|
|
|
|||||||||||
| (1) | Due to the uncertainty with respect to the timing of future cash flows associated with our unrecognized tax benefits, we are unable to make reasonably reliable estimates of the period of cash settlement with the respective taxing authorities. Therefore, the related balances have not been included in the “Payments Due by Period” section of the table. |
On October 8, 2019 we signed a lease agreement for office space in Los Angeles, California in an approximately 18,000 square foot facility. The lease commenced in October 2019 with annual rent payments of $456,000 to $492,000 commencing on January 1, 2020 for a period of four years.
Off Balance Sheet Arrangements
We did not have any off balance sheet arrangements as of December 30, 2018 or September 29, 2019.
Critical Accounting Policies
Our consolidated financial statements are prepared in conformity with GAAP. In preparing our audited consolidated financial statements, we make assumptions, judgments, and estimates that can have a significant impact on amounts reported in our consolidated financial statements. We base our assumptions, judgments, and estimates on historical experience and various other factors that we believe to be reasonable under the circumstances. Actual results could differ materially from these estimates under different assumptions or conditions. We regularly reevaluate our assumptions, judgments, and estimates. Our significant accounting estimates and judgments are described in Note 2 to our audited consolidated financial statements included elsewhere in this prospectus.
Inventory
Inventory consists of finished goods, which are recorded at the lower of cost or net realizable value, with cost determined using the first-in-first-out method. The costs of inventory consist of merchandise costs and inbound freight costs. Inventory levels are reviewed to identify slow-moving merchandise and promotions and markdowns are used to clear merchandise. We establish a reserve for inventory that is expected to be sold below cost. Historically such reserve has been immaterial.
83
Table of Contents
Revenue Recognition
We generate revenue from the sale of merchandise products sold directly to end customers. We recognize revenue when the product is transferred to the customer, which is generally upon shipment. We estimate a reserve of future returns based on historical return rates. There is judgment in utilizing historical trends for estimating future returns. Our refund liability for sales returns is included in returns reserve on the consolidated balance sheets and represents the expected value of the refund that will be due to our customers. We also have a corresponding asset for recovery that represents the expected net realizable value of the merchandise inventory to be returned.
We sell stored-value gift cards to customers and offer merchandise credit stored-value cards for certain returns. Such stored-value cards do not have an expiration date. We recognize revenue from stored-value cards when the card is redeemed by the customer. Subject to requirements to remit balances to governmental agencies, starting in 2018 breakage is recognized as revenue in proportion to the pattern of rights exercised by our customer, which is substantially within 36 months from the date of issuance. Breakage income recognized was $740,000 during 2018 and $846,000 during the nine months ended September 29, 2019.
Goodwill and Tradename
Goodwill is stated at the excess of the acquisition price over the fair value of net assets acquired in a purchase acquisition and is not amortized. Our tradename is an indefinite-lived intangible asset and is not amortized. We review goodwill and our tradename for impairment at least annually (on the first day of the fourth quarter) or more frequently whenever events or changes in circumstances indicate that the carrying amount may be impaired. There were no additions to, disposals of, or impairments of goodwill or our tradename during 2017, 2018, and the nine months ended September 29, 2019. In addition, there was no accumulated impairment of goodwill or our tradename at December 31, 2017, December 30, 2018, and September 29, 2019.
Recently Issued Accounting Pronouncements Not Yet Effective
Please see Note 3 to our consolidated financial statements included elsewhere in this prospectus for a description of our Recently Issued Accounting Pronouncements Not Yet Effective.
Interest Rate Risk
We are exposed to interest rate risk primarily related to the effect of interest rate changes on borrowings outstanding under our Credit Facility. As of September 29, 2019, we had $119.3 million outstanding under our Credit Facility with a weighted-average effective interest rate of 11.9%. Based on the outstanding borrowings under the Credit Facility, we estimate that a 1.00% increase in the average interest rate on our borrowings would have increased interest expense by $1.2 million in the nine months ended September 29, 2019. The impact on future interest expense as a result of future changes in interest rates will depend largely on the gross amount of our borrowings at that time.
Foreign Currency Risk
All of our sales are denominated in U.S. dollars, and therefore, our net sales are not currently subject to significant foreign currency risk. Our purchase of inventory and operating expenses are denominated in U.S. dollars. To date, foreign currency transaction gains and losses have not been material to our consolidated financial statements, and we have not engaged in any foreign currency hedging transactions.
84
Table of Contents
Inflation
We do not believe that inflation has had a material effect on our business, financial condition, or results of operations. We continue to monitor the impact of inflation in order to minimize its effects through pricing strategies, productivity improvements and cost reductions. If our costs were to become subject to significant inflationary pressures, we may not be able to fully offset such higher costs through price increases. Our inability or failure to do so could harm our business, financial condition, and results of operations.
JOBS Act
Section 107 of the JOBS Act provides that an “emerging growth company” can take advantage of the extended transition period provided in Section 7(a)(2)(B) of the Securities Act for complying with new or revised accounting standards. In other words, an “emerging growth company” can delay the adoption of certain accounting standards until those standards would otherwise apply to private companies. Section 107 of the JOBS Act provides that any decision to opt out of the extended transition period for complying with new or revised accounting standards is irrevocable. We have elected to use this extended transition period under the JOBS Act.
85
Table of Contents
Overview
Lulus is a customer-driven, digitally-native fashion brand primarily serving Millennial and Gen Z women. We focus relentlessly on giving our customers what they want. We do this by using data coupled with human insight to deliver a curated and continuously evolving assortment of on-point, affordable luxury fashion. Our customer obsession sets the tone for everything we do, from our personalized online shopping experience to our exceptional customer service.
Over the past 11 years as a pure-play eCommerce brand, we have focused on building authentic personal relationships with our customers and offering them coveted products they cannot purchase elsewhere. We incorporate the pulse of the consumer by engaging with her where she is, across the web, social media and on our site, through reviews, feedback, and one-on-one interactions with our Style Advisors, Fit Experts, and Bridal Concierge. Customers express their love for our brand on social media and by word-of-mouth (in person and online). We have more than 3.5 million followers across social media, and the popular #lovelulus hashtag has generated over 4.4 billion impressions. We have an NPS score of +60 among existing Lulus customers as of June 2019, a signal of the genuine customer affinity for our brand.
A key differentiator of our business model from traditional fashion retail is our use of data to optimize all elements of our business. Nowhere is this more pronounced than in our product creation and curation cycle. We leverage a “test, learn, and reorder” strategy to bring new products to market in as few as three weeks. We launch new styles virtually every weekday; we test them in small batches, learn about customer demand, and reorder winning products in higher volume. This strategy allows us to rapidly convert new SKUs into profitable sales on a consistent and repeatable basis while minimizing fashion and trend risk. We sell thousands of SKUs each month across a broad range of categories, and 93% of our reorders in 2018 were sold without markdown.
We are proud of our large, diverse community of loyal customers. While our target customer is typically in her mid-20s, we serve women in their mid-to-late teens through their 30s and beyond. We design our broad assortment of affordable luxury fashion for practically all occasions. Our affordable luxury positioning, underscored by our AUR of $49 in 2017 and 2018, respectively, means that we appeal to a large segment of the market. In the twelve months ended September 29, 2019, we served 2.8 million Active Customers compared to 2.3 million in the twelve months ended September 30, 2018.
Our business model has resulted in strong historical growth and profitability. Between 2016 and 2018, we grew net sales by 124.2%. In 2018, we had a net income margin of 0.4% and an Adjusted EBITDA margin of 10.1%. During the nine months ended September 29, 2019 we had a net income margin of 0.2% and an Adjusted EBITDA margin of 6.0%.
Our Industry
Apparel is a Massive Market, but Traditional Brands and Retailers are Under Pressure
Euromonitor, a consumer market research company, estimates that the aggregate apparel, footwear, and accessories industry in the United States represented a $473.9 billion market in 2018. Euromonitor expects this market to grow to $556.8 billion by 2023, representing an expected CAGR of 3.3%.
Traditional apparel brand and retail models are increasingly under pressure. Offline retail models have generally failed to keep up with changing consumer preferences and are burdened by vast,
86
Table of Contents
inflexible physical store footprints, inventory management challenges, demand seasonality, and a highly promotional environment as competitors seek to capture any sales available to cover high fixed costs. Additionally, offline models face an elongated and unattractive merchandising and buying cycle that requires brands and retailers to forecast fashion trends and consumer demand several months to quarters into the future. This economic model also results in higher initial retail prices to consumers due to the wholesale-to-retail markup. Finally, Millennial and Gen Z consumers increasingly prefer to shop online, which has forced many traditional retailers to respond by closing a significant portion of their previously profitable physical stores over the last several years.
eCommerce is Taking Share, but Has Inherited Challenges of Traditional Models
Consumers are typically spending less time in malls and more time online. According to Nielsen Social Media Report (2016), on average, Millennials are spending 6 hours per week on social media. According to an online publication, among Gen Z consumers, this trend towards online consumption of media and adoption of eCommerce is even more pronounced, with 45% saying they are online “almost constantly.” This massive segment of the population represents the first generations to have come of age communicating, learning, and shopping online and on their mobile devices. This has resulted in a new “discovery journey” for consumers whereby brand and product discovery, evaluation, and purchase increasingly occur online.
As a result, eCommerce is responsible for driving all of the recent growth in the apparel and footwear market. Between 2015 and 2018, Euromonitor estimates that the eCommerce portion of this market grew from $49.1 billion to $78.6 billion, which represents a CAGR of 17.0%. Over this same time period, Euromonitor estimates that the penetration of eCommerce as a percentage of total revenue grew from 14.4% in 2015 to 21.9% in 2018. Euromonitor estimates that apparel and footwear spend excluding eCommerce in 2015 and 2018 was $292.4 billion and $281.1 billion, respectively, indicating that the offline portion of the market decreased at a (1.3)% CAGR over this time period.
The rise of eCommerce has been driven by two new business models: first, brick and mortar retailers adopting omni-channel models, and second, the emergence of a new generation of online department stores. As brick and mortar retailers move online, they market products to consumers through legacy offline channels (e.g., department stores and owned stores) as well as emerging online channels (e.g., eCommerce retailers and owned websites). Consistent with broader industry trends, growth in the online businesses of these traditional brands and retailers has generally outpaced growth in their respective offline businesses. In addition, a new generation of online department stores offers consumers the convenience to shop online for a variety of third-party or private label brands. These online venues have the advantage of being able to offer a broader assortment and more personalized shopping experience relative to their offline counterparts.
While both the omni-channel and online department store models represent an improvement from the traditional offline-only model, they continue to be burdened by many of the challenges of their brick and mortar predecessors. Key among these challenges is an elongated merchandising and buying cycle that requires brands and retailers to forecast fashion trends and consumer demand several months to quarters into the future. As a result, inventory management becomes a critical pain point, whereby inventory shortage results in lost sales, and inventory surplus results in markdowns, which impair margins and damage brand equity. Other challenges include the wholesale-to-retail markup, which results in higher initial retail prices as well as potential margin erosion, as consumers can easily
price shop third-party brands online and purchase from the lowest cost provider. Additionally, legacy and eCommerce retailers may be conflicted when developing and promoting their own private label brands, and are often reliant on third-party brands, which can pose supply risk.
87
Table of Contents
Digitally-Native Brands are Best Positioned to Win
Against this backdrop, we believe that digitally-native brands are best positioned to succeed due to the following key attributes they possess:
| • | Ability to offer their own brands without reliance on third-party brands; |
| • | Direct engagement with customers; |
| • | Large, real-time customer-centric data sets offering insights across the business; |
| • | Product creation driven by customer feedback and purchase patterns; |
| • | Technology that is purpose-built for eCommerce; |
| • | Asset-light distribution model; and |
| • | Opportunity to selectively test and open temporary and/or permanent physical retail stores. |
Lulus: A Customer-Driven Fashion Brand
Lulus is a customer-driven fashion brand that leverages the power of digitally-native eCommerce. We have built a community of loyal customers by listening to them and engaging with them. When we ask customers to describe Lulus, they tell us they think of the brand as “trendy,” “affordable,” and “stylish.” We take a deliberate, measured approach to developing products that feature high-end stylistic details as well as flattering silhouettes that empower our customer to look and feel her best, whether it is during the work week or on the weekend. As a result of our brand authenticity and focus on delivering what our customer wants, we have earned deep customer loyalty and brand affinity. Based on a June 2019 survey we commissioned conducted by Stax, an independent consumer market research firm, we have an NPS of +60 among existing Lulus customers. Key brand attributes that our customers consider to be most important include style/design, overall product quality, and price of products. According to the same survey, our aided brand awareness remains modest at 18% among females 18 years of age and older in the United States, implying significant opportunity to continue to attract new customers.
Our Customer
We are proud of our large, diverse community of loyal customers. While our target customer is typically in her mid-20s, we serve women in their mid-to-late teens through their 30s and beyond. The Lulus brand spans many categories, including dresses, tops, bottoms, bridal, intimates, footwear, and accessories. A customer who might have discovered Lulus when shopping for her high school prom can continue to shop our broad assortment that caters to later life events such as graduations and weddings, as well as for desk to date and everything in between.
Our affordable luxury positioning is underscored by our AUR of $49 in 2018, which we believe helps us to appeal to a large segment of the market. According to the survey conducted by Stax, our customers spend a median of $1,150 on their fashion purchases per year. This compares to average net sales per Active Customer of $129 in 2018, which implies 11% share of wallet. We believe our customers’ strong brand affinity and our affordable price point helps position us to grow our share of wallet over time.
In the twelve months ended September 29, 2019, we served 2.8 million Active Customers. On social media, we benefit from the longevity and strength of our social presence and have more than 3.5 million followers across our social media platforms, including Instagram, Facebook, Pinterest, YouTube, and Twitter, and have more than 1,500 brand ambassadors in our influencer network.
88
Table of Contents
Why We Win
| • | Customer-Driven Fashion Brand: Lulus is one of the first digitally-native fashion brands in the United States primarily serving Millennial and Gen Z women. Over the last decade, the Lulus customer has come to us for on-point fashion that is high quality yet affordable. We take pride in our ability to offer more luxurious fabrics and incorporate elevated stylistic details into our products relative to what is offered by other comparably priced brands. As a result, our customers consistently remark on the quality of our products, as well as the newness of our assortment, with an average of over 200 SKUs released each week in 2018. Our obsessive focus on customer preferences has created deep personal connections with our customers, who have in turn rewarded us with their loyalty and word-of-mouth sharing of the brand. While other brands rely on internal design teams to create styles that reflect a particular brand aesthetic, we listen first and foremost to customer feedback and then focus our efforts on creating and curating an assortment that she will love. |
| • | Customer-Centric Experience: We are passionate about building a brand synonymous with exceptional customer service. We have effectively brought the boutique experience online, developing one-on-one relationships with our customers in order to learn and then address their individual needs. Our custom-built digital platform allows customers to share their Lulus experience and get answers to questions without the hassle of taking the search offline. Our extensive database of nearly 440,000 customer reviews, including over 39,000 photo reviews, and access to personalized assistance help customers identify the perfect style and fit. Unlike many eCommerce retailers who offer a variety of different brands with inconsistent sizing, we offer standardized sizing across the Lulus brand assortment, simplifying the shopping experience and giving our customer confidence that she is selecting the perfect size. |
| • | Leveraging Data to Best Serve our Customer: We have built a massive data set which gives us strong insight into our customers. Millions of customers have interacted with us, leaving detailed reviews, interacting with our on-demand Style Advisors, Fit Experts, and Bridal Concierge, and completing checkout surveys. Across Instagram, Facebook, Pinterest, YouTube, Snapchat, and Twitter, our 3.5 million followers engage with us through their comments, feedback, and photographs, and support of our brand with their digital followers. In aggregate, this data set gives us a deep understanding of our customers’ preferences. Our business is driven by the symbiosis between our data set, marketing strategy, and product creation and curation process. |
| • | Marketing and Engagement Strategy: We engage with our customer where she is, in authentic and personalized ways, through our website, email, and on social media. This strategy helps drive brand awareness while fostering deep connections with our customers. We have built our digital footprint through strong relationships with customers and influencers over more than ten years and benefit from longevity and consistency of message. Our authentic partnerships with brand ambassadors span the full spectrum of followership and engagement levels, from nano- and micro-influencers, to college ambassadors, to celebrities, all of whom wear and genuinely love our brand. These genuine brand ambassadors, driven by a strong emotional connection to Lulus, help drive authentic brand awareness and customer engagement. Our free, organic, and low-cost initiatives coupled with profitable performance media drive traffic to our website, which is custom-built to allow for continuous updating and personalization for each customer. Our unified cross-platform strategy consistently reinforces the same brand values. Our marketing approach results in attractive customer acquisition, strong retention, and compelling lifetime value characteristics. |
| • | Data-Driven Product Creation Strategy: Our innovative product creation strategy leverages the power of data and our “test, learn, and reorder” approach to bring new styles online virtually every weekday. In 2018, we brought to market an average of 211 SKUs per |
89
Table of Contents
| week. Traditional merchandising approaches are characterized by extended in-house design cycles, seasonal assortment decisions, deep buys, limited customer feedback, and high markdowns. We leverage our large dataset to upend this traditional approach, rapidly bringing new designs to market that we know our customers will love. This means we are not limited to offering just one style or aesthetic across our assortment as is typical with most brands. In lieu of maintaining dedicated in-house product design overhead, we source raw designs from a broad network of design and manufacturing partners, who ensure that we see trends in real-time and often produce products exclusively for Lulus. Next, our creative buyers use our data-driven understanding of trends and customer preference to customize designs for fit, style, and color, creating branded SKUs exclusive to Lulus. We then test these SKUs with limited initial orders, which drive traffic and “need to own” scarcity among our customers, and our proprietary reorder algorithm utilizes real-time purchase data to inform subsequent reorder decisions. Because we are trend adapters rather than trend creators, we do not have to forecast expected future demand for a particular style or design, which is a challenge that most of our competitors face each season. As a result, we are able to optimize our inventory levels to meet customer demand and minimize returns as well as markdowns. Customer feedback via reviews and social media helps us to refine merchandise in advance of reordering, further enhancing our product. In 2018, 93% of our reorders were sold without markdown. |
| • | Experienced Founder-Led Team: We are led by our visionary chief executive officer, Colleen Winter, who founded the business in 1996 with her mother Debra Cannon. Our management team’s commitment to personalized, superior customer service, and long-term orientation is central to our ongoing success. Members of our executive team have significant experience in successfully growing businesses across various industries, including retail, advertising, and technology. These team members have had experience working at leading companies such as Alibaba, Havas Media, MAC Cosmetics, Michael Kors, and SunGard. |
Product Creation and Curation Model
Our product creation and curation model leverages a “test, learn, and reorder” strategy. This approach allows us to bring new merchandise to market in as few as three weeks, which is significantly faster than the traditional apparel retail model.
90
Table of Contents
Lulus’ Product Creation and Curation Process
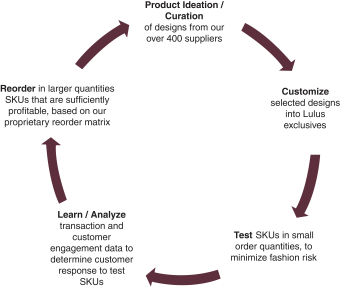
| • | Product Ideation and Curation: Our team of creative buyers, strategically located in the Los Angeles fashion district, reviews up to 500 designs daily. We collaborate with a network of more than 400 suppliers, who serve as our design and manufacturing partners. These suppliers often give us priority access and exclusivity to designs given the strong relationships we have built over the last two decades. This collaboration is guided by our ongoing dialogue with our customer. With the benefit of real-time data around customer preferences and trends, our team interprets those trends and selects and develops styles. In 2018, we brought to market nearly 11,000 styles and rejected multiples more. We follow this process in the creation of new products as well as the iteration of existing products, developing updates and iterations of popular products based on customer feedback. |
| • | Customize: Following the selection of a design, we customize our products across multiple criteria including style, fabric, print, color, length, fit, and quality. |
| • | Test: We then place a limited initial order, which we market online to test customer demand. We systematically display SKUs across several categories in a variety of page and sort positions to gauge customer reaction. |
| • | Learn / Analyze: We then measure each SKU against our proprietary reorder algorithm and evaluate real-time customer feedback and make timely product modifications prior to reordering. This limits the inventory risk that most traditional retail brands struggle with when ordering inventory in bulk. |
| • | Reorder: All of this data helps us determine whether a SKU is sufficiently profitable, at which point we reorder it in larger quantity. Over time, we have enhanced our evaluation processes and increased our rate of successful testing, driving our reorder as a percent of total net sales from approximately 41% in 2015 to approximately 60% in 2018. We believe our ability to test, learn, and reorder in a rapid manner enables us to sell a higher percentage of product at full retail price, minimize returns, and capture the associated margin benefit. |
This efficient, data-driven process, coupled with human insight, allows us to respond to fashion trends with incredible speed and precision while significantly reducing risk in our business.
91
Table of Contents
In 2018, Lulus products made up approximately 83% of units sold. In addition to our own brand, we also sell other established and emerging brands to create a boutique shopping experience and round out our assortment. By doing so, we are able to selectively test new categories and collect insights that we can leverage to further develop our own brand.
Marketing and Engagement
Our marketing strategy leverages our strong visual brand presence to build awareness and drive engagement with our large, diverse community of loyal customers. We integrate the power of data across multiple channels to offer a singular brand voice that speaks to Millennial and Gen Z women. We meet the Lulus customer wherever she is, enabling her discovery of the brand and providing her numerous opportunities to interact with others in the Lulus community. Through this engagement with our customers, we strive to build personal connections that are authentic and durable.
How we attract and engage customers
We attract and engage customers through a combination of owned, earned, and performance media.
| • | Owned: Owned media primarily consists of our website, social media platforms and email, which we actively manage in order to be accessible and responsive to our active and prospective customers. Through brand content posted on social media platforms such as Instagram, Facebook, Pinterest, YouTube, Snapchat, and Twitter, we maintain an ongoing dialogue with an audience of 3.5 million followers. We leverage this direct connection to drive engagement by sharing authentic original content and creating engaging experiences, such as exclusive brand contests and limited-time promotions. |
| • | Earned: Awareness of our brand initially grew through word-of-mouth, as locals told friends about the Lulus boutique, and that growth has continued as online platforms have enabled word-of-mouth marketing at scale. Today, we enjoy positive, authentic brand exposure both online and offline. This consists of customer sharing of our content, social media influencer endorsement, as well as exposure in fashion blogs, magazines, and television. We have built a competitive advantage through our long-term commitment to a broad-based influencer marketing approach, developing longstanding relationships with true customers and brand ambassadors who love Lulus as much as we do. This has proven scalable and cost effective. In the twelve months ending September 2019, we worked with over 2,600 influencers who serve as genuine Lulus ambassadors. Our #lovelulus hashtag has garnered over 4.4 billion impressions, while our extensive online backlink history helps us to drive significant free, organic, and low-cost traffic to our website. |
| • | Performance: Performance media primarily consists of paid advertisement on search engines such as Google and Bing, and social media platforms such as Facebook and Instagram. As one of the first digitally-native brands, we have built a robust online infrastructure over time. We are especially well-positioned to leverage our data and expertise to effectively drive demand generation through performance media channels, which we use to augment the reach and impact of our owned digital properties and earned media. In addition, our strong partnerships with the key players in the performance space including Google, Facebook, Instagram, and Pinterest give us access to early betas and pilot programs to test new advertising opportunities before they are broadly available. |
92
Table of Contents
How we drive conversion
Upon attracting a new or existing customer to our website or mobile experience, we seek to maximize conversion through various strategies.
| • | Brand Strength and Exclusivity: As a digitally-native fashion brand, we benefit from the ability to focus our resources, as well as our customers’ attention, primarily on the Lulus brand, without the distraction or complexity of managing and marketing a large multi-brand portfolio. As a result, we focus on offering the best possible assortment of Lulus product for our customers. Our drive to provide our customers with products that cannot be found elsewhere creates reengagement opportunities through new product drops while also protecting us from comparison shopping and competitor pricing. Our customers look to our elevated content for styling inspiration and ideas; they value our curated collections and our single-brand focus, which differentiate us from other eCommerce retailers that function as online department stores. |
| • | Product Reviews: One of the most important aspects of our digital shopping experience is our extensive database of proprietary customer product reviews, which we first enabled in 2012 and now amounts to over 400,000. In 2018, we added functionality to allow customers to upload their own product photos along with their reviews, which bring the products to life on diverse body types. To date, customers have uploaded over 39,000 photos from verified purchases. Reviews provide our customers with an opportunity to share their experience with a past purchase, fostering a diverse and inclusive community in which customers share style and fit feedback, which in turn informs other customers’ purchase decisions. All of our customer-written reviews and photos can be sorted and filtered by various criteria that allow shoppers to make informed decisions based on how our products fit others in the community with similar body types, thus increasing both propensity to purchase and the likelihood that the product will look and fit as expected. |
| • | Boutique Styling Experience: We strive to offer exceptional customer service before, during, and after each purchase transaction. We accomplish this by continuously improving the boutique experience on our platform, through features such as our product recommendation engine and targeted messaging, and with our in-house team of customer service associates who maintain deep expertise of our brand, products, and systems. Our Style Advisors, Fit Experts, and Bridal Concierge offer styling suggestions via live chat, phone, and email, facilitating a seamless shopping experience from browse to purchase and post-purchase. Customer benefits such as free shipping on orders above a minimum price point, expedited shipping, and a customer-friendly free returns policy serve to bolster the affordable luxury boutique experience while eliminating the friction of online shopping. |
| • | Personalized and Optimized Shopping Experience: We customize and personalize our interactions with each Lulus customer by monitoring information such as how she arrives on our site, her on-site behavior, and what she buys. By monitoring real-time behavior and trends, analyzing our customer transaction and engagement data, and absorbing feedback, we develop a better understanding of the desires and behavior of our customers. As a result, we can more accurately predict what will drive conversion. Our customer insights, predictive capabilities, product recommendations, and custom-built website work seamlessly together to offer each customer a personalized experience across web, mobile, and email. |
| • | Loyalty Program: Our Love Rewards loyalty program which launched in October 2018, enables us to recognize and reward customers for repeat purchases. Through exclusives such as VIP early access to sales, new products, and restocks, as well as special gifts and promos for anniversaries and birthdays, we aim to drive retention and engagement of our customers. Program expansion plans include the introduction of additional benefits tiers for our very best customers, including special shipping offers and other benefits. |
93
Table of Contents
These strategies work in unison to help drive order conversion. Whether she is browsing social media or providing feedback on a recent purchase, we engage with our customer across a multitude of touchpoints throughout the discovery and purchase journey.
Technology
The www.lulus.com website, merchandising, customer, order, and warehouse management systems are proprietary, purpose-built solutions with a singular focus: to deliver the best possible customer experience. From PCI-compliant checkout to the software running on RF scanners in order fulfillment, all key software processes are developed, maintained, and enhanced by Lulus’ in-house engineering team to meet and exceed our customers’ expectations. Our technology integrates all transactional data with customer behavior on www.lulus.com, transactional and promotional emails, customer feedback, and customer support interactions, providing a truly 360-degree view of our customer, including her preferences, merchandise affinities, and demand elasticity. This available data allows Lulus to truly personalize our customer’s shopping experience: from personalized merchandise recommendations, to optimized site search results, individualized email campaigns, and one-to-one customer support interactions. Continuous analysis of the performance of our merchandising assortment, combined with customer merchandise feedback, enable our proprietary predictive demand forecasting algorithms to test, learn, and reorder merchandise to minimize inventory risk, optimize inventory availability across size ranges, and improve revenue opportunity.
We have built our software development and deployment cycles such that software changes can be deployed daily after being verified by fully automated testing, as well as by human functional testing. Multiple data centers, with fully redundant infrastructure within each data center, as well as with full failover capability between data centers, allow us to serve our customers 24/7. Our infrastructure is flexible and scalable to provide our customers with the best possible shopping experience.
Our Growth Strategies
Grow Brand Awareness and Attract New Customers
Due to the mass market appeal of our brand, we believe there is a significant opportunity to bring new customers into the Lulus community through increased brand awareness. As of June 2019, according to a customer survey conducted by Stax, our aided brand awareness among females of 18 years of age and older in the United States was 18%. Historically, a large portion of our customers have become aware of our brand through word-of-mouth and social media. We intend to grow awareness of the Lulus brand and attract new customers through the following strategies:
| • | Further investment in performance digital marketing strategies (e.g., performance search marketing, social advertising, and remarketing); |
| • | Exploration and expansion of marketing channels, including radio, podcasts, outdoor media, on-demand video, and television; |
| • | Continued expansion of our brand ambassador program at all engagement tiers, including celebrity, micro- and nano-influencers, and college ambassadors to introduce Lulus to new audiences; |
| • | Expansion of our refer-a-friend program, which leverages word-of-mouth referral in a scalable online platform through email, text, and social media; |
| • | Development and testing of physical retail opportunities, such as in-store partnerships with third-party retailers and small-format pop-ups and showrooms; and |
94
Table of Contents
| • | Continued development of brand partnerships, with a clear focus on brands with strong customer affinity and crossover potential. This includes collaborations with apparel brands and influencers, as well as adjacent category opportunities such as beauty, home, and lifestyle. |
Enhance and Retain Existing Customer Relationships
We have a large and growing Lulus community, with 2.8 million Active Customers in the twelve months ended September 29, 2019 and 2.3 million Active Customers in the twelve months ended September 30, 2018. We believe we have a significant opportunity to deepen our relationships with our existing customer base and further improve the customer journey, as we continue to leverage customer insights and undertake initiatives to become a one-stop online boutique for Millennial and Gen Z women. For example, we have had success leveraging data-driven insights across categories to offer personalized suggestions and reminders at targeted points in time, and we are focused on expanding these capabilities to provide enhanced real-time recommendations and post-purchase engagement. Our Love Rewards loyalty program, which launched in October 2018, is focused on driving repeat purchase behavior, and has significant opportunity to be further developed and scaled. Additionally, we continually develop and evaluate new tools and programs designed to improve the key customer metrics that drive our business, such as frequency of purchase and average order value through the following strategies:
| • | Optimization of our website and mobile experience through continued A/B and multivariate testing; |
| • | Improvement of customer segmentation and personalization features; |
| • | Leveraging our expanded multi-region distribution facilities to offer faster order delivery and develop new shipping options for loyal customers; |
| • | Expansion of our Love Rewards loyalty program to incorporate additional tiers and associated offers and perks; |
| • | Enhancement of our customer service and engagement experience through the expansion of our Style Advisors, Fit Experts, and Bridal Concierge dedicated to creating a truly personalized digital boutique experience; and |
| • | Continued development of our affordable luxury brand positioning and content. |
We have learned that enhancing our existing customers’ experience drives increased word-of-mouth (in-person and online) recommendations, which in turn helps grow brand awareness.
Pursue Category Expansion
We believe there is tremendous potential to continue to drive growth in our underpenetrated categories. We have a significant opportunity to grow our share of total apparel budget with existing and new customers by building out existing categories that are currently underpenetrated and testing categories that are new to Lulus. Our deep and personal engagement with our customers through product reviews, exit surveys, and social media feedback helps us understand the product categories they are most interested in shopping and will continue to inform the categories we offer. According to a consumer survey we commissioned conducted by Stax in June 2019, a significant percentage of Lulus customers sampled indicated they would be interested in purchasing merchandise in new categories, such as athleisure, lounge, and denim, from us in the future.
Due to our customer data-driven product creation strategy, we have the ability to test new categories with minimal upfront investment and risk. New categories are opened with a controlled assortment of branded and partner products through which we learn to understand customer demand via our reorder algorithms.
95
Table of Contents
Pursue International Expansion
While we expect the majority of our near-term growth to continue to come from the United States, we believe that serving international customers represents a long-term future growth opportunity. To date, we have shipped our merchandise to over 140 countries, while spending minimal dollars on marketing outside of the United States, demonstrating our global appeal and broader market opportunity. We intend to increase our focus on global performance media and to optimize our website and distribution processes for international customers, allowing for more flexibility across languages and currencies. We believe that providing a localized shopping experience will significantly enhance our ability to serve customers in international markets. As we begin to execute on our international expansion strategy, we intend to initially focus our efforts on large, English-speaking international markets such as the United Kingdom, Canada, and Australia. Over time, we believe the Lulus brand has the potential to succeed in many other developed and major developing markets.
Security and Data Protection
We are committed to the security of our customers’ data and personal information. We aggregate and analyze data in order to optimize the customer experience internally, and do not monetize the information we collect by selling it to third parties for their own external purposes. We use both on-premise and cloud-based technologies and undertake technical and other administrative measures to ensure the protection of our systems and customer data stored within. We use various in-house and third-party tools to support our security policies and procedures including user access controls, server monitoring, (web) firewalls, security content policies, and data encryption. We also use external certified security partners to test for vulnerabilities in our software and infrastructure, and assist in our security practices, which are designed to comply with the Payment Card Industry Data Security Standard. Finally, we implement processes and procedures to allow customers to review and remove their non-transactional account data.
Competition
The women’s apparel, footwear, and accessories industry is large, fragmented, highly competitive and rapidly evolving. The industry consists of various brands and retailers that employ several different operating models at varying price points, and consumers have the option to shop both offline and online. Our competition includes traditional brands and retailers who market to consumers via offline and online channels. Our competition also includes eCommerce retailers that generally operate as online department stores for third-party and/or private label brands. We compete primarily on the basis of brand quality and strength of brand relationships, design, service, quality, and value. Further, we may face new competitors and increased competition from existing competitors as we increase our brand awareness, expand our categories, and pursue international expansion.
Competition in our industry is based on, among other things, quality, concept, price, breadth, and style of merchandise, as well as customer service, brand image, brand quality, strength of brand relationships, and ability to anticipate, identify, and respond to new and changing fashion trends. Because we are an early mover in our category, we believe we have a significant head start on becoming the go-to brand for Millennial and Gen Z consumers. As one of the first digitally-native brands, Lulus is well-positioned to capitalize on our deep digital footprint and social media infrastructure, loyal and active customer community, and product creation model. As a vertically integrated business, we retain full control of critical aspects of our business including brand, product, marketing, distribution, and customer service. Our long operating history means that we have collected a valuable data set over the last decade while refining an efficient, scalable business model. However, many of our competitors are larger and have substantially greater financial, marketing, and other
96
Table of Contents
resources than we do. Moreover, we recognize that we do not possess exclusive rights to many of the elements that comprise our product offerings. Our competitors can emulate facets of our business strategy, which could result in a reduction of any competitive advantage or special appeal that we might possess.
Our Facilities
We do not own any real property. Our corporate headquarters are located in an approximately 13,500 square foot facility in Chico, California and is leased under an agreement expiring in 2020 with options to renew for two additional three year terms. We also operate a customer support center in Chico, California in an approximately 10,000 square foot facility that is leased under an agreement expiring in December 2019 with options to renew for two additional three year terms.
We operate two distribution facilities: an approximately 89,000 square foot facility located in Chico, California under a lease agreement expiring in December 2022, with an option to renew for an additional three year term and an approximately 258,000 square foot facility located in Easton, Pennsylvania under a lease agreement expiring in 2026, with one option to renew for an additional five year term. Some of our facilities located in Chico are leased from related persons. See “Certain Relationships and Related Person Transactions—Leasing Arrangements” for additional information.
Our creative buying and inventory planning offices are located in Los Angeles, California. They are currently leased under lease agreements expiring in 2019 and 2020. In anticipation of the expiring leases, our creative buying and inventory teams are transitioning to office space in Los Angeles, California in an approximately 18,000 square foot facility that is leased under an agreement expiring in December 2023 with two options to renew for an additional four year term each.
We believe that our current facilities are adequate to meet our current needs.
Trademark and Intellectual Property
Our
trademarks, including LULUS® and
®, are registered with the United States Patent and Trademark Office. We also own the registrations for LULU’S®, LOVELULUS®, and COVETED CURATED COLLECTED®. We own the domain name
www.lulus.com. We believe the Lulus® trademark has significant value in the marketing of our merchandise. We have registrations in Canada, the EU, the United Kingdom, Australia, Mexico, and
several other countries, as well as additional pending international applications. We vigorously protect our intellectual property rights.
We rely on an intellectual property license in our standard vendor terms and conditions to obtain rights to display our suppliers’ intellectual property, including supplier-provided images and trademarks, in connection with our sales of their products. We also rely on proprietary know-how and confidential information and employ various methods, including entering into confidentiality, non-disclosure and non-compete agreements with our employees and third parties, including our suppliers, service providers and potential business partners, to protect our intellectual property and proprietary information. Our employees and contractors also enter into agreements obligating them to assign to us all rights related to intellectual property created in connection with their employment or engagement with us.
Circumstances outside our control could pose a threat to our intellectual property rights. For example, effective intellectual property protection may not be available in the United States or other countries or territories in which we may operate in the future. Also, the efforts we have taken to protect our trademarks and confidential information may not be sufficient or effective. We may be unable to
97
Table of Contents
prevent competitors from acquiring domain names or marks that are similar to, infringe upon or diminish the value of our domain names, marks, copyrights and our other intellectual property rights. Any significant impairment of our intellectual property rights could harm our business or our ability to compete. Also, protecting and enforcing our intellectual property rights is costly and time-consuming. Any unauthorized disclosure or use of our confidential information could make it more expensive to do business and harm our operating results.
Companies in the eCommerce, apparel, retail, and other industries may own large numbers of patents, copyrights, and marks and may frequently request license agreements, threaten litigation or file suit against us based on allegations of infringement or other violations of intellectual property rights. We routinely offer select third-party goods, promote third-party content and feature third-party brands. We have been subject to, and expect to continue to face, allegations that we have infringed or otherwise violated the marks, copyrights, patents and other intellectual property or proprietary rights of third parties. Any intellectual property infringement claim or similar claim against us, regardless of merit, could be time-consuming and expensive to settle or litigate and could divert our management’s attention and other resources. These claims also could subject us to significant liability for damages and could result in our having to stop using technology, content, branding or business methods found to be in violation of another party’s rights. Further, although we contractually require our suppliers to indemnify us against any liability for claims that arise out of their brands and their materials being featured on www.lulus.com, suppliers may not be solvent or financially able to indemnify us. We might be required or may opt to seek a license for rights to intellectual property rights held by others, which may not be available on commercially reasonable terms, or at all. Even if a license is available, we could be required to pay significant royalties, which would increase our operating expenses. We may also be required to develop alternative non-infringing technology, content, branding or business methods, which could require significant effort and expense and which we may not be able to perform efficiently or at all. If we cannot use, license or develop technology, content, branding, or business methods for any allegedly infringing aspect of our business, we may be unable to compete effectively. Further, as we face increasing competition and as our business grows, we will likely face more claims of infringement.
Regulation and Legislation
We are subject to labor and employment laws, laws governing advertising and promotions, privacy laws, safety regulations, customer protection regulations and other laws that regulate retailers and govern the promotion and sale of merchandise and warehouse facilities. We monitor changes in these laws and believe that we are in material compliance with applicable laws.
We are also subject to a number of domestic and foreign laws and regulations that affect companies conducting business on the internet, many of which are still evolving and could be interpreted in ways that could harm our business. These laws and regulations include federal and state consumer protection laws and regulations, which address, among other things, the privacy and security of consumer information, sending of commercial email, and unfair and deceptive trade practices.
Under applicable federal and state laws and regulations addressing privacy and data security, we must provide notice to consumers of our policies with respect to the collection and use of personal information, our sharing of personal information with third parties, and notice of any changes to our data handling practices. In some instances, we may be obligated to give customers the right to prevent sharing of their personal information with third parties. Under applicable federal and state laws, we also are required to adhere to a number of requirements when sending commercial email to consumers, including identifying advertising and promotional emails as such, ensuring that subject lines are not deceptive, giving consumers an opportunity to opt-out of further communications and clearly disclosing
98
Table of Contents
our name and physical address in each commercial email. Regulation of privacy and data security matters is an evolving area, with new laws and regulations enacted frequently. For example, California recently enacted legislation that, among other things, will require new disclosures to California consumers, and afford such consumers new abilities to opt out of certain sales of personal information, when the legislation goes into effect on January 1, 2020. In addition, under applicable federal and state unfair competition laws, including the California Consumer Legal Remedies Act and FTC regulations, we must, and our network of influencers may be required to, accurately identify product offerings, not make misleading claims on our websites or in advertising, and use qualifying disclosures where and when appropriate. The growth and demand for eCommerce could result in more stringent domestic and foreign consumer protection laws that impose additional compliance burdens on companies that transact substantial business on the internet.
Our international business is subject to additional laws and regulations, including restrictions on imports from, exports to, and services provided to persons located in certain countries and territories, as well as foreign laws and regulations addressing topics such as advertising and marketing practices, customs duties and taxes, privacy, data protection, information security and consumer rights, any of which might apply by virtue of our sales in foreign countries and territories or our contacts with consumers in such foreign countries and territories. For example, the United States and China and the United States and Mexico, where certain of our products are manufactured, have recently engaged in an escalating trade war, which has led to each side threatening tariffs that could adversely affect our business and results of operations or cause us to relocate manufacturing to other countries and territories, which could disrupt our operations. In addition, the EU has implemented the GDPR which imposes stringent requirements regarding the handling of personal data of individuals from the EU and provides for substantial penalties for noncompliance. More generally, many foreign jurisdictions have laws, regulations, or other requirements relating to privacy, data protection, and consumer protection, and countries and territories are adopting new legislation or other obligations with increasing frequency. Many of these laws may require consent from consumers for the use of data for various purposes, including marketing, which may reduce our ability to market our products.
In many jurisdictions, there is great uncertainty whether or how existing laws governing issues such as property ownership, sales and other taxes, libel and personal privacy apply to the internet and eCommerce. New legislation or regulation, the application of laws and regulations from jurisdictions whose laws do not currently apply to our business or the application of existing laws and regulations to the internet and eCommerce could result in significant additional obligations on our business or may necessitate changes to our business practices. These obligations or required changes could have an adverse effect on our cash flows and results of operations. Further, any actual or alleged failure to comply with any of these laws or regulations by us, our suppliers or our network of influencers could hurt our reputation, brand and business, force us to incur significant expenses in defending against proceedings or investigations, distract our management, increase our costs of doing business, result in a loss of customers and suppliers and may result in the imposition of monetary penalties. See “Risk Factors—Risks Related to Our Business and Industry—A failure to comply with current laws, rules and regulations, or changes to such laws, may adversely affect our business, financial performance, results of operations, or business growth.”
Our Personnel
As of September 29, 2019, we had 849 total employees, of which 817 were full-time employees and 32 were part-time employees. We use contingent labor in varying levels throughout the year to augment our workforce. None of our employees are represented by a labor union, and we have had no labor-related work stoppages. We believe that we have good relationships with our employees.
99
Table of Contents
Legal Proceedings
We are from time to time subject to various legal proceedings and claims, including employment claims, wage and hour claims, intellectual property claims, contractual and commercial disputes and other matters that arise in the ordinary course of our business. While the outcome of these and other claims cannot be predicted with certainty, we do not believe that the outcome of these matters will have a material adverse effect on our business, financial condition, or results of operations. We are not presently a party to any legal proceedings that we believe would, if determined adversely to us, materially and adversely affect our future business, financial condition, or results of operations.
100
Table of Contents
Directors, Executive Officers and Key Employees
The following table sets forth certain information regarding members of our Board of Directors and our executive officers as of November 1, 2019.
| Name |
Age | Position | ||||
| Executive Officers and Employee Directors | ||||||
| Colleen Winter |
49 | Chief Executive Officer and Director | ||||
| Crystal Landsem |
36 | Chief Financial Officer and Co-Chief Operating Officer | ||||
| Mark Vos |
50 | Chief Information Officer and Co-Chief Operating Officer | ||||
| Non-Employee Directors | ||||||
| John Black |
55 | Director | ||||
| Debra A. Cannon |
69 | Director | ||||
| Evan Karp |
43 | Director | ||||
| John Kim |
52 | Director | ||||
| Eric Liaw |
41 | Director | ||||
| Michael Mardy |
70 | Director | ||||
| Danielle Qi |
35 | Director | ||||
Set forth below is a description of the business experience of the foregoing persons.
Executive Officers and Employee Directors
Colleen Winter. Ms. Winter is one of the Co-Founders of our company and has served as its Chief Executive Officer since our company’s founding in January 2007 and on our Board of Directors since July 2014. She graduated from San Diego State with a degree in Geography and Urban Planning.
As a result of Ms. Winter’s extensive experience in the retail industry and her service as our Chief Executive Officer, she brings to the board, among other skills and qualifications, her significant knowledge and understanding of the industry and our business and her extensive operating experience.
Crystal Landsem. Ms. Landsem has served as our Chief Financial Officer since September 2015 and our Co-Chief Operating Officer since July 2019. Previously, she was the Co-Founder and CFO of sqwrl LLC, a consulting and project management services firm, where she provided interim CFO services including oversight of finance and accounting functions, budgeting, forecasting, cash management, accounting, and analysis for small to mid-sized eCommerce companies from August 2015 to January 2016.
Ms. Landsem also served the Director of Finance for 11 Main, an Alibaba Group Company, where she was responsible for the administrative, financial, and risk management operations of five U.S.-based Alibaba companies from May 2012 to August 2015. Ms. Landsem holds a CPA in California and received her B.A. in Accounting from California State University-Chico.
Mark Vos. Mr. Vos has served as our Chief Information Officer since January 2018 and our Co-Chief Operating Officer since July 2019. Prior to that Mr. Vos held roles of increasing responsibility since April 2016. Previously, Mr. Vos was the Co-Founder and CEO of sqwrl LLC, a consulting and project management services firm from July 2015 to March 2016. He also served as Senior Director of Engineering at 11 Main, an Alibaba Group Company from December 2013 to July 2015.
101
Table of Contents
Mr. Vos holds a Masters in International Management from Universität zu Köln and a MSc in Business Administration from Erasmus University Rotterdam.
Non-Employee Directors
John Black. Mr. Black has been the Group Head of H.I.G. Growth Equity, the dedicated growth equity investment group for H.I.G. Capital, LLC since March 2010.
Since joining H.I.G. in 1996, Mr. Black has led or had a significant role in more than forty H.I.G. investments in technology, media, healthcare, consumer oriented, and business service companies. His investments have supported management in the development and implementation of their growth strategies in a wide range of transaction dynamics including owner-operated/family business recapitalizations, corporate divestitures, take-private transactions, consolidations and minority growth equity investments.
Prior to H.I.G., Mr. Black was a senior professional with several leading firms working with lower middle market businesses to identify and implement operational initiatives to enable the businesses to realize their full growth potential. Mr. Black has held several executive level management positions including chief operating officer and chief financial officer. Mr. Black began his career in the Corporate Finance Group at Ernst & Young.
Mr. Black received his Bachelor of Arts in Applied Mathematics from Harvard University.
Mr. Black’s experience as a chief financial officer, chief operating officer and in senior leadership roles in the technology, media, healthcare, and consumer industries and vast knowledge of financial reporting operations provide him with valuable and relevant experience in finance, accounting, reporting, as well as operational matters, and leadership of complex organizations, and provides him with the qualifications and skills to serve as a director.
Debra A. Cannon. Ms. Cannon is one of the Co-Founders of our company and has served on our Board of Directors since July 2014. Ms. Canon received her B.A. in American studies from California State University, Chico.
As a result of Ms. Cannon’s extensive experience in the retail industry and her service as our Co-Founder, she brings to the board, among other skills and qualifications, her significant knowledge and understanding of the industry and our business and her extensive operating experience.
Evan Karp. Mr. Karp has served on our Board of Directors since August 25, 2017 and as a board member of Lulu’s Holdings, LLC as of July 25, 2014. Mr. Karp has been a Managing Director at H.I.G. Growth Partners, focusing on eCommerce, tech-enabled business services, and consumer-oriented investments since January 2018, prior to that he was a principal at H.I.G from May 2012 to December 2017. Prior to H.I.G. Growth Partners, Mr. Karp was a Principal at Parallel Investment Partners (formerly d/b/a SKM Growth Investors) investing primarily in consumer oriented, multi-channel businesses and served as a board representative for numerous portfolio companies from July 2001 to April 2012.
Prior to joining Parallel, he was an Associate at J.H. Whitney & Co. He began his career at Salomon Smith Barney focusing on telecom mergers & acquisitions advisory services. In addition to Lulus, Mr. Karp currently serves on the boards of SCUF Gaming, and Tax Defense Network. He previously served on the board of Pet Services Operating Company.
Mr. Karp graduated from the Business Honors Program at the University of Texas at Austin with a B.A. in Finance.
102
Table of Contents
Mr. Karp’s involvement with his respective firms’ investments in many eCommerce and branded consumer companies over the past 18 years, including investments in the retail industry, in-depth knowledge and industry experience, coupled with his skills in private financing and strategic planning, provides him with the qualifications and skills to serve as a director.
John Kim. Mr. Kim has served on our Board of Directors since August 25, 2017 and as a board member of Lulu’s Holdings, LLC since July 25, 2014. Mr. Kim has been a Managing Director at H.I.G. Growth Partners, focusing primarily on internet, eCommerce, media and technology investments since November 2002. In addition to serving on our board, he currently serves on the boards of Cuyana, Funambol, Parachute Home, and SCUF Gaming and formerly served on the boards of SpotX and Triad Retail Media.
Mr. Kim received an M.S. and B.S. with Phi Beta Kappa honors in Industrial Engineering from Stanford University and an M.B.A. degree with distinction from Harvard Business School.
Mr. Kim’s involvement with his respective firms’ investments in many eCommerce and branded consumer companies, including investments in the retail industry, in-depth knowledge and industry experience, coupled with his skills in private financing and strategic planning, provides him with the qualifications and skills to serve as a director.
Eric Liaw. Mr. Liaw has served as a member of our Board of Directors since April 2018. Since March 2011, Mr. Liaw has served in roles of increasing responsibility at Institutional Venture Partners, a venture capital firm, where he currently serves as a general partner. From August 2003 to January 2011, Mr. Liaw served in several roles at Technology Crossover Ventures, a venture capital firm, including most recently as a vice president. From 2014 to February 2019, Mr. Liaw served on the board of directors of Mindbody, Inc. Mr. Liaw serves on the boards of directors of a number of privately held companies.
Mr. Liaw holds a B.A. degree in Economics with a minor in Computer Science and an M.S. degree in Management Science and Engineering from Stanford University.
Mr. Liaw’s involvement with his respective firms’ investments in many eCommerce and branded consumer companies, including investments in the retail industry, in-depth knowledge and industry experience, coupled with his skills in private financing and strategic planning, provides him with the qualifications and skills to serve as a director.
Michael Mardy. Mr. Mardy has served on our Board of Directors and as Audit Committee Chair since October 2017. Mr. Mardy currently serves on the board of directors of Vince Holding Corp. and acts as the audit committee chair. Mr. Mardy previously served on the board of directors of David’s Tea Inc. Mr. Mardy served as Executive Vice President and director of specialty retailer, Tumi Holding Inc. from July 2003 to August 2016. Prior to joining Tumi, from 1996 to 2002, he served as Executive Vice President and Chief Financial Officer of Keystone Foods LLC, a processor and distributor, supplying the quick service restaurant industry. From 1982 to 1996, he served as Senior Vice President, Chief Financial Officer and in various other finance positions at Nabisco Biscuit Company, a snack food and consumer products company. Mr. Mardy served on the board of directors of Keurig Green Mountain Inc. from 2007 until 2016 and ModusLink Global Solutions, Inc. from 2003 until 2013 acting as audit committee chair and a member of their respective compensation committees. Mr. Mardy had also served on the New York Stock Exchange Advisory Board from 2014 until 2016 and is a trustee of the New Jersey chapter of the financial Executive Institute.
Mr. Mardy holds an MBA from Rutgers University and undergraduate degree from Princeton University. He is a member of the American institute of Certified Public Accountants, and the New
103
Table of Contents
Jersey Society of Certified Public Accountants, as well as a member of the National Association of Corporate Directors.
Mr. Mardy’s experience as a chief financial officer in the consumer products industry and vast knowledge of operations provide him with valuable and relevant experience in management, operations and leadership of complex organizations, as well as extensive industry knowledge, and provides him with the qualifications and skills to serve as a director.
Danielle Qi. Danielle Qi has served on our Board of Directors since August 25, 2017 and as a board member of Lulu’s Holdings, LLC as of July 31, 2017. Ms. Qi has served as a Principal at H.I.G. since July 2018 and prior to that was a Vice President since July 2015, focusing primarily on the technology-enabled services, internet, media, and consumer sectors.
Prior to H.I.G. Growth Partners, Ms. Qi was with Alliance Holdings, a private equity firm focused on lower middle market companies in a wide range of industries from December 2012 to June 2015.
Ms. Qi received a B.S. in Economics (The Wharton School) and B.A. in History from the University of Pennsylvania and an M.B.A. from the Kellogg School of Management at Northwestern University.
Ms. Qi’s experience as a private equity principal and in other senior executive leadership roles working with companies in a wide range of industries, including the technology-enabled services, internet, media, and consumer sectors and knowledge of complex financial matters provide her with valuable and relevant experience in strategic planning, corporate finance, financial reporting, and leadership of complex organizations, and provides her with the qualifications and skills to serve as a director.
Family Relationships
Debra A. Cannon is the mother of Colleen Winter. There are no other family relationships among any of our executive officers or directors.
Board of Directors
Our business and affairs are managed under the direction of our Board of Directors. Our amended and restated certificate of incorporation provides that our Board of Directors will consist of between and directors, as long as any shares of common stock are outstanding and that our Board of Directors will be divided into three classes, with one class being elected at each annual meeting of stockholders. Each director will serve a three-year term, with termination staggered according to class. Class I will initially consist of directors, Class II will initially consist of directors, and Class III will initially consist of directors.
Upon the consummation of this offering, our Board of Directors will initially consist of directors.
Our amended and restated certificate of incorporation provides that directors may only be removed for cause by the affirmative vote of the remaining members of our Board of Directors or the holders of at least a majority of the voting power of all outstanding shares of common stock then entitled to vote on the election of directors.
104
Table of Contents
Director Independence
Our Board of Directors has assessed the independence of each of our directors and has determined that each of are independent under the listing standards. As required by the listing standards, our independent directors will meet in regularly scheduled executive sessions at which only independent directors are present.
Board Committees
Our Board of Directors will establish an audit committee, a compensation committee and a nominating and corporate governance committee. Each committee will operate under a charter that will be approved by our Board of Directors. Each committee will have the composition and responsibilities described below. Members serve on these committees until their resignations or until otherwise determined by our Board of Directors. The charter and composition of each committee will be effective upon the consummation of this offering. The charter of each committee will be available on our website.
Audit Committee
The primary purposes of our audit committee are to assist our Board of Directors’ oversight of:
| • | the integrity of our consolidated financial statements; |
| • | our internal financial reporting and compliance with our disclosure controls and procedures; |
| • | the qualifications, engagement, compensation, independence and performance of our independent registered public accounting firm; |
| • | our independent registered public accounting firm’s annual audit of our consolidated financial statements and any engagement to provide other services; |
| • | the performance of our internal audit function; |
| • | our legal and regulatory compliance; and |
| • | the application of our code of business conduct and ethics as established by management and our Board of Directors. |
Upon the consummation of this offering, and prior to the listing of our common stock, our audit committee will be composed of , and . will serve as chair of the audit committee. qualifies as an “audit committee financial expert” as such term has been defined by the SEC in Item 407(d)(5) of Regulation S-K. Our Board of Directors has affirmatively determined that meets the definition of an “independent director” for the purposes of serving on the audit committee under applicable rules and Rule 10A-3 under the Exchange Act. We intend to comply with these independence requirements for all members of the audit committee within the time periods specified under such rules. The audit committee will be governed by a charter that complies with the rules of .
Compensation Committee
The primary purposes of our compensation committee are to:
| • | assist our Board of Directors in discharging its responsibilities regarding compensation of our executive officers; |
105
Table of Contents
| • | review and approve corporate goals and objectives relevant to the compensation of our Chief Executive Officer and evaluate our Chief Executive Officer’s performance in light of those goals and objectives; |
| • | review and determine the compensation of our Chief Executive Officer and other executive officers; |
| • | make recommendations to our Board of Directors with respect to our incentive and equity-based compensation plans; |
| • | provide oversight of our compensation policies, plans, and benefit programs including reviewing and administering all compensation and employee benefit plans, policies and programs; and |
| • | produce, approve and recommend to our Board of Directors for approval reports on compensation matters required to be included in our annual proxy statement or annual report. |
Upon the consummation of this offering, and prior to the listing of our common stock, our compensation committee will be composed of , and . will serve as the chair of the compensation committee. We intend to comply with the independence requirements for all members of the compensation committee within the time periods specified under such rules. Our Board of Directors will adopt a written charter for our compensation committee.
Nominating and Corporate Governance Committee
The primary purposes of our nominating and corporate governance committee are to:
| • | recommend to our Board of Directors for approval the qualifications, qualities, skills, and expertise required for Board of Directors membership; |
| • | identify potential members of our Board of Directors consistent with the criteria approved by our Board of Directors and select and recommend to our Board of Directors the director nominees for election at the next annual meeting of stockholders or to otherwise fill vacancies; |
| • | evaluate and make recommendations regarding the structure, membership and governance of the committees of our Board of Directors; |
| • | develop and make recommendations to our Board of Directors with regard to our corporate governance policies and principles; and |
| • | oversee the annual review of our Board of Directors’ performance. |
Upon the consummation of this offering, and prior to the listing of our common stock, our nominating and corporate governance committee will be composed of , and . will serve as the chair of the nominating and corporate governance committee. We intend to comply with the independence requirements for all members of the nominating and corporate governance committee within the time periods specified under such rules. Our Board of Directors will adopt a written charter for our nominating and corporate governance committee.
Director Compensation
Historically, we have not had a formalized non-employee director compensation program. However, we have paid each of our non-employee directors who are not associated with our institutional investors, Debra Cannon and Michael Mardy, an annual cash retainer of $120,000 for their services as members of our Board of Directors. In addition, we reimburse our non-employee directors for travel and other necessary business expenses incurred in the performance of their services for us.
106
Table of Contents
We intend to approve and implement a compensation policy for our non-employee directors to be effective on the consummation of this offering.
The following table sets forth information concerning the compensation earned by our non-employee directors during the year ended December 30, 2018.
| Name |
Fees Earned or Paid in Cash ($) |
All Other Compensation ($) |
Total ($) | |||||||||
| Debra A. Cannon |
$ | 120,000 | — | $ | 120,000 | |||||||
| John Kim |
— | — | — | |||||||||
| Evan Karp |
— | — | — | |||||||||
| Danielle Qi |
— | — | — | |||||||||
| John Black |
— | — | — | |||||||||
| Michael Mardy |
$ | 120,000 | — | $ | 120,000 | |||||||
| Eric Liaw |
— | — | — | |||||||||
None of our non-employee directors held unexercised options or unvested equity awards as of December 30, 2018.
Code of Business Conduct and Ethics
We will adopt a written code of business conduct and ethics that applies to our directors, officers and employees, including our principal executive officer, principal financial officer, principal accounting officer or controller, or persons performing similar functions. Following this offering, a current copy of the code will be posted on our website. Any amendment to our code of conduct, or any waiver of its requirements for which disclosure is required, will be disclosed on our website promptly following the date of such amendment.
Disclosure Committee and Charter
We do not have a disclosure committee and disclosure committee charter. After this offering, we plan to establish a disclosure committee and will operate under a charter. The purpose of a disclosure committee would be to provide assistance to the principal executive officer and the principal financial officer in fulfilling their responsibilities regarding the identification and disclosure of material information about us and the accuracy, completeness and timeliness of our financial reports.
Compensation Committee Interlocks and Insider Participation
Upon the completion of this offering, none of our executive officers will serve on the compensation committee or Board of Directors of any other company of which any members of our compensation committee or any of our directors is an executive officer.
Indemnification of Directors and Officers
Our amended and restated certificate of incorporation provides that we will indemnify our directors and officers to the fullest extent permitted by the DGCL.
Our amended and restated certificate of incorporation provides that our directors will not be liable for monetary damages for breach of fiduciary duty, except for liability relating to any breach of the director’s duty of loyalty, acts or omissions not in good faith or which involve intentional misconduct or a knowing violation of law, violations under Section 174 of the DGCL or any transaction from which the director derived an improper personal benefit.
107
Table of Contents
Prior to the completion of this offering, we will enter into indemnification agreements with each of our directors. The indemnification agreements will provide the directors with contractual rights to indemnification, expense advancement and reimbursement, to the fullest extent permitted under the DGCL.
We have customary directors’ and officers’ indemnity insurance in place for our directors and executive officers.
108
Table of Contents
The following is a discussion and analysis of compensation arrangements of our named executive officers (“NEOs”). This discussion contains forward-looking statements that are based on our current plans, considerations, expectations, and determinations regarding future compensation programs. Actual compensation programs that we adopt may differ materially from currently planned programs as summarized in this discussion. As an emerging growth company as defined in the JOBS Act, we are not required to include a Compensation Discussion and Analysis section and have elected to comply with the scaled disclosure requirements applicable to emerging growth companies.
We seek to ensure that the total compensation paid to our executive officers is reasonable and competitive. Compensation of our executives is structured around the achievement of individual performance and near-term corporate targets as well as long-term business objectives. Our NEOs are employed with the Company and all employee compensation matters have historically been decided by the Board of Directors of the Company except for grants of equity awards, which have been made by the board of managers of LP. Following the closing of this offering, all compensation matters in respect to our NEOs will be determined by the Company’s Board of Directors or its compensation committee. All references to “we,” “us,” or “our” in this Executive Compensation section will refer to the Company for actions taken in respect of cash compensation prior to the completion of this offering, LP for actions taken in respect of equity compensation prior to the completion of this offering and to the Company for actions taken on and after the completion of this offering.
Our NEOs for 2018 were as follows:
| • | Colleen Winter, Chief Executive Officer; |
| • | Crystal Landsem, Chief Financial Officer; and |
| • | Mark Vos, Chief Information Officer. |
2018 Summary Compensation Table
The following table sets forth information concerning the compensation of our named executive officers for the year ended December 30, 2018.
| Name and Principal Position |
Year | Salary ($) | All Other Compensation($)(1) |
Total ($) | ||||||||||||
| Colleen Winter |
2018 | 401,500 | 21,800 | 423,300 | ||||||||||||
| Chief Executive Officer |
||||||||||||||||
| Crystal Landsem |
2018 | 277,200 | 11,000 | 288,200 | ||||||||||||
| Chief Financial Officer |
||||||||||||||||
| Mark Vos |
2018 | 252,154 | 11,000 | 263,154 | ||||||||||||
| Chief Information Officer |
||||||||||||||||
| (1) | For Ms. Winter, amounts represent the incremental value of the monthly clothing allowance provided by us to Ms. Winter to buy clothes from us. |
Narrative to Summary Compensation Table
2018 Salaries
Our NEOs each receive a base salary to compensate them for services rendered to our company. The base salary payable to each named executive officer is intended to provide a fixed component of compensation reflecting the executive’s skill set, experience, role, and responsibilities.
109
Table of Contents
For fiscal year 2018, Ms. Winter’s annual base salary was $401,500, Ms. Landsem’s annual base salary was $277,200, and Mr. Vos’ annual base salary was $252,154.
Our Board of Directors and compensation committee may adjust base salaries from time to time in their discretion.
2018 Bonuses
We maintain an annual performance-based cash bonus program in which each of our NEOs participated in 2018. Each NEO’s target bonus is expressed as a percentage of the NEO’s annual base salary which can be achieved by meeting company and individual goals at target level. The 2018 annual bonuses for Ms. Winter, Ms. Landsem, and Mr. Vos were targeted at 50%, 30%, and 30% of their respective base salaries. Our Board of Directors has historically reviewed these target percentages to ensure they are adequate but does not follow a formula. Instead, our Board of Directors set these rates based on each NEO’s experience in his role with us and the level of responsibility held by the NEO, which we believe directly correlates to his ability to influence corporate results.
For determining performance bonus amounts, our Board of Directors set certain corporate performance goals after receiving input from our Chief Executive Officer, where company profitability goals as well as individual goals both need to be met. Following its review and determinations of corporate and individual performance for 2018, our Board of Directors determined individual achievement levels were met for Ms. Winter, Ms. Landsem, and Mr. Vos, but based on the Company’s financial performance, no bonuses were paid. The actual amount of the 2018 annual bonus paid to each NEO for 2018 performance are set forth above in the Summary Compensation Table in the column titled “Non-Equity Incentive Plan Compensation.”
Equity-Based Compensation
We did not make any equity award grants to our NEOs in 2018. We intend to adopt a 2019 Incentive Award Plan (“the 2019 Plan”), in order to facilitate the grant of cash and equity incentives to directors, employees (including our named executive officers) and consultants of our company and certain of its affiliates and to enable us to obtain and retain services of these individuals, which is essential to our long-term success. We expect that the 2019 Plan will be effective on the date on which it is adopted by our Board of Directors, subject to approval of such plan by our stockholders. For additional information about the 2019 Plan, please see the section titled “Equity Compensation Plans” below.
We have issued Class P Units of LP to our NEOs from time to time in recognition of their service to us and to align their interests with the interests of our stockholders. Each Class P Unit has a value equal to share of our common stock. Ms. Landsem and Mr. Vos each hold 202,380 Class P Units, one-third of which vested in 2017, one-third on December 31, 2018, and the remainder on December 31, 2019. Distributions made in respect of Class P Units prior to vesting are held until the units vest. Accordingly, on December 31, 2018, Ms. Landsem and Mr. Vos vested into $422,244 and $441,740, respectively from LP, of accumulated distributions with respect to outstanding incentive awards of Class P Units in LP. Subject to Ms. Landsem’s and Mr. Vos’ continued service to us through December 31, 2019, each will vest into approximately an additional $430,000 and $448,000, respectively, of accumulated distributions to be paid on, or shortly after, December 31, 2019 or the completion of this offering.
On July 22, 2019, we issued 142,018 additional Class P Units of LP to each of Ms. Landsem and Mr. Vos. These units will vest monthly over four years from July 22, 2019, subject to her or his continued service to us through the applicable vesting date.
110
Table of Contents
Other Elements of Compensation
Retirement Savings and Health and Welfare Benefits
The Company currently maintains a 401(k) retirement savings plan for our employees, including our named executive officers, who satisfy certain eligibility requirements. Our named executive officers are eligible to participate in the 401(k) plan on the same terms as other full-time employees. The Company matches 100% of each participating employee’s deferral up to a maximum of 4% of eligible compensation. The Company may make additional discretionary matching contributions up to 6% of eligible compensation. We believe that providing a vehicle for tax-deferred retirement savings though our 401(k) plan adds to the overall desirability of our executive compensation package and further incentivizes our employees, including our named executive officers, in accordance with our compensation policies.
All of our full-time employees, including our named executive officers, are eligible to participate in our health and welfare plans, including medical, dental and vision benefits; medical and dependent care flexible spending accounts; short-term and long-term disability insurance; and life and AD&D insurance.
Perquisites and Other Personal Benefits
We provide limited perquisites to our named executive officers, such as the clothing allowance provided to Ms. Winter, as described below under “Employment Agreements—Colleen Winter,” when our compensation committee determines that such perquisites are necessary or advisable to fairly compensate or incentivize our employees.
Outstanding Equity Awards at Fiscal Year-End
The following table summarizes the number of LP Class P Units underlying outstanding incentive awards for Ms. Landsem and Mr. Vos. Ms. Winter does not hold any outstanding equity awards as of December 30, 2018. In connection with this offering, LP will distribute to NEOs who hold Class P Units equivalent shares of Company common stock and the Class P Units will cease to remain outstanding.
| Class P Unit Awards | ||||||||
| Name |
Number of Units That Have Not Vested (#)(1) |
Market Value of Units That Have Not Vested ($)(2) |
||||||
| Crystal Landsem |
134,927 | |||||||
| Mark Vos |
134,927 | |||||||
| (1) | The Class P Units vest in two equal installments on each of December 31, 2018 and the earlier of December 31, 2019 or the completion of this offering, in each case, subject to the NEOs continued service to us through such date. |
| (2) | Each Class P Unit held by the NEOs has a value equivalent to one share of Company common stock. The value reported is based on the initial public offering price of the Company’s common stock of $ per share. |
Executive Compensation Arrangements
Employment Agreements
Colleen Winter. We have entered into an employment agreement with Ms. Winter, which sets forth the terms and conditions of her employment as our Chief Executive Officer. In addition to her
111
Table of Contents
base salary, Ms. Winter is also eligible for participation in the Company’s annual incentive bonus plans. Ms. Winter is entitled to participate in all applicable health and welfare benefit programs for which other executive employees of the Company are generally eligible. She is also entitled to 6 weeks of paid vacation per calendar year. She also receives a $500 monthly clothing allowance to buy clothes from the Company.
Ms. Winter’s employment agreement provides that if her employment is terminated by the Company for reasons other than death, disability, or “cause,” or at her election “for good reason,” then she will be entitled to receive severance payments of (i) an amount equal to her base salary, payable for a period of up to 6 months, (ii) any earned but unpaid performance bonus, and (iii) any outstanding COBRA payment. All such payments are contingent upon her compliance with certain non-compete, confidentiality and other provisions as set forth in her employment agreement, and the execution of a general release of claims against the Company.
Pursuant to the employment agreement, “cause” is defined as the executive’s (i) conviction (or plea of no contest) to a felony or other crime involving moral turpitude or the commission of any other material act or omission involving misappropriation, dishonesty, disloyalty, fraud or breach of fiduciary duty which could reasonably be expected to, or which does, cause the Company material economic harm, (ii) repeatedly reporting to work under the influence of alcohol which is not cured to the Board of Director’s reasonable satisfaction within 15 days of written notice, (iii) the use of illegal drugs or other misconduct, even if not in conjunction with her duties hereunder, which could reasonably be expected to, or which does, cause the Company material economic harm, (iv) repeated failure to perform lawful duties consistent with her office as reasonably directed by the Board of Directors which is not cured within 15 days written notice, (v) gross negligence or willful misconduct with respect to the Company or in the performance of her duties which could reasonably be expected to, or does, cause the Company material economic harm, (vi) obtaining any personal profit not thoroughly disclosed to and approved by the Board of Directors in connection with any transaction entered into by, or on behalf of, or in relation to, the Company in violation of the her statutory or contractual duties to the Company, (vii) violating any of the material terms of the Company’s written policies which, if curable, is not cured to the Board of Director’s reasonable satisfaction within 15 days written notice, or (viii) any other material breach of the employment agreement, which is not cured within 15 days.
Pursuant to Ms. Winter’s employment agreement “good reason” is defined as (i) she is assigned duties materially inconsistent with her position (but only during the first 90 days following the assignment and not if the assignment is an isolated action taken in good faith), (ii) any material breach of the employment agreement by the Company, which is not cured within 15 days of the Company receiving written notice of the breach, or (iii) the Company requiring Ms. Winter, without her prior consent, to be permanently based at any office located more than 30 miles away from the office she was employed at when the agreement was signed (excluding travel reasonably required in performance of her duties).
Equity Compensation Plans
The following summarizes the material terms of the long-term incentive compensation plan in which our named executive officers will be eligible to participate following the consummation of this offering and our incentive award agreements evidencing Class P Units of LP, under which we have previously made periodic grants of equity and equity-based awards to our named executive officers and other key employees.
2019 Incentive Award Plan
We intend to adopt the 2019 Plan, which will be effective on the day prior to the first public trading date of our common stock. The principal purpose of the 2019 Plan is to attract, retain and motivate
112
Table of Contents
selected employees, consultants and directors through the granting of equity-based compensation awards and cash-based performance bonus awards. The material terms of the 2019 Plan, as it is currently contemplated, are summarized below.
Share Reserve. Under the 2019 Plan, shares of our common stock will be initially reserved for issuance pursuant to a variety of equity-based compensation awards, including stock options, stock appreciation rights (“SARs”), restricted stock awards, restricted stock unit awards and other equity-based awards. The number of shares initially reserved for issuance or transfer pursuant to awards under the 2019 Plan will be increased by an annual increase on the first day of each fiscal year beginning in 2020 and ending in 2029, equal to the lesser of (A) % of the shares of stock outstanding (on an as converted basis) on the last day of the immediately preceding fiscal year and (B) such smaller number of shares of stock as determined by our Board of Directors; provided, however, that no more than shares of stock may be issued upon the exercise of incentive stock options.
The following counting provisions will be in effect for the share reserve under the 2019 Plan:
| • | to the extent that an award terminates, expires or lapses for any reason or an award is settled in cash without the delivery of shares, any shares subject to the award at such time will be available for future grants under the 2019 Plan; |
| • | to the extent shares are tendered or withheld to satisfy the grant, exercise price or tax withholding obligation with respect to any award under the 2019 Plan, such tendered or withheld shares will be available for future grants under the 2019 Plan; |
| • | to the extent shares subject to stock appreciation rights are not issued in connection with the stock settlement of stock appreciation rights on exercise thereof, such shares will be available for future grants under the 2019 Plan; |
| • | to the extent that shares of our common stock are repurchased by us prior to vesting so that shares are returned to us, such shares will be available for future grants under the 2019 Plan; |
| • | the payment of dividend equivalents in cash in conjunction with any outstanding awards will not be counted against the shares available for issuance under the 2019 Plan; and |
| • | to the extent permitted by applicable law or any exchange rule, shares issued in assumption of, or in substitution for, any outstanding awards of any entity acquired in any form of combination by us or any of our subsidiaries will not be counted against the shares available for issuance under the 2019 Plan. |
Administration. The compensation committee of our Board of Directors is expected to administer the 2019 Plan unless our Board of Directors assumes authority for administration. The compensation committee must consist of at least three members of our Board of Directors, each of whom is intended to qualify as a “non-employee director” for purposes of Rule 16b-3 under the Exchange Act and an “independent director” within the meaning of the rules of the applicable stock exchange, or other principal securities market on which shares of our common stock are traded. The 2019 Plan provides that the Board of Directors or compensation committee may delegate its authority to grant awards to employees other than executive officers and certain senior executives of the company to a committee consisting of one or more members of our Board of Directors or one or more of our officers, other than awards made to our non-employee directors, which must be approved by our full Board of Directors.
Subject to the terms and conditions of the 2019 Plan, the administrator has the authority to select the persons to whom awards are to be made, to determine the number of shares to be subject to awards and the terms and conditions of awards, and to make all other determinations and to take all
113
Table of Contents
other actions necessary or advisable for the administration of the 2019 Plan. The administrator is also authorized to adopt, amend or rescind rules relating to administration of the 2019 Plan. Our Board of Directors may at any time remove the compensation committee as the administrator and revest in itself the authority to administer the 2019 Plan. The full Board of Directors will administer the 2019 Plan with respect to awards to non-employee directors.
Eligibility. Options, SARs, restricted stock and all other equity-based and cash-based awards under the 2019 Plan may be granted to individuals who are then our officers, employees or consultants or are the officers, employees or consultants of certain of our subsidiaries. Such awards also may be granted to our directors. Only employees of our company or certain of our subsidiaries may be granted incentive stock options (“ISOs”).
Awards. The 2019 Plan provides that the administrator may grant or issue stock options, SARs, restricted stock, restricted stock units, other stock- or cash-based awards and dividend equivalents, or any combination thereof. Each award will be set forth in a separate agreement with the person receiving the award and will indicate the type, terms and conditions of the award.
| • | Nonstatutory Stock Options (“NSOs”) will provide for the right to purchase shares of our common stock at a specified price which may not be less than fair market value on the date of grant, and usually will become exercisable (at the discretion of the administrator) in one or more installments after the grant date, subject to the participant’s continued employment or service with us and/or subject to the satisfaction of corporate performance targets and individual performance targets established by the administrator. NSOs may be granted for any term specified by the administrator that does not exceed ten years. |
| • | Incentive Stock Options will be designed in a manner intended to comply with the provisions of Section 422 of the Code and will be subject to specified restrictions contained in the Code. Among such restrictions, ISOs must have an exercise price of not less than the fair market value of a share of common stock on the date of grant, may only be granted to employees, and must not be exercisable after a period of ten years measured from the date of grant. In the case of an ISO granted to an individual who owns (or is deemed to own) at least 10% of the total combined voting power of all classes of our capital stock, the 2019 Plan provides that the exercise price must be at least 110% of the fair market value of a share of common stock on the date of grant and the ISO must not be exercisable after a period of five years measured from the date of grant. |
| • | Restricted Stock may be granted to any eligible individual and made subject to such restrictions as may be determined by the administrator. Restricted stock, typically, may be forfeited for no consideration or repurchased by us at the original purchase price if the conditions or restrictions on vesting are not met. In general, restricted stock may not be sold or otherwise transferred until restrictions are removed or expire. Purchasers of restricted stock, unlike recipients of options, will have voting rights and will have the right to receive dividends, if any, prior to the time when the restrictions lapse, however, extraordinary dividends will generally be placed in escrow, and will not be released until restrictions are removed or expire. |
| • | Restricted Stock Units may be awarded to any eligible individual, typically without payment of consideration, but subject to vesting conditions based on continued employment or service or on performance criteria established by the administrator. Like restricted stock, restricted stock units may not be sold, or otherwise transferred or hypothecated, until vesting conditions are removed or expire. Unlike restricted stock, stock underlying restricted stock units will not be issued until the restricted stock units have vested, and recipients of restricted stock units generally will have no voting or dividend rights prior to the time when vesting conditions are satisfied. |
114
Table of Contents
| • | Stock Appreciation Rights SARs may be granted in connection with stock options or other awards, or separately. SARs granted in connection with stock options or other awards typically will provide for payments to the holder based upon increases in the price of our common stock over a set exercise price. The exercise price of any SAR granted under the 2019 Plan must be at least 100% of the fair market value of a share of our common stock on the date of grant. SARs under the 2019 Plan will be settled in cash or shares of our common stock, or in a combination of both, at the election of the administrator. |
| • | Other Stock or Cash Based Awards are awards of cash, fully vested shares of our common stock and other awards valued wholly or partially by referring to, or otherwise based on, shares of our common stock. Other stock or cash based awards may be granted to participants and may also be available as a payment form in the settlement of other awards, as standalone payments and as payment in lieu of base salary, bonus, fees or other cash compensation otherwise payable to any individual who is eligible to receive awards. The plan administrator will determine the terms and conditions of other stock or cash based awards, which may include vesting conditions based on continued service, performance and/or other conditions. |
| • | Dividend Equivalents represent the right to receive the equivalent value of dividends paid on shares of our common stock and may be granted alone or in tandem with awards other than stock options or SARs. Dividend equivalents are credited as of dividend payments dates during the period between a specified date and the date such award terminates or expires, as determined by the plan administrator. In addition, dividend equivalents with respect to shares covered by a performance award will only be paid to the participant at the same time or times and to the same extent that the vesting conditions, if any, are subsequently satisfied and the performance award vests with respect to such shares. |
Any award may be granted as a performance award, meaning that the award will be subject to vesting and/or payment based on the attainment of specified performance goals.
Change in Control. In the event of a change in control, unless the plan administrator elects to terminate an award in exchange for cash, rights or other property, or cause an award to accelerate in full prior to the change in control, such award will continue in effect or be assumed or substituted by the acquirer, provided that any performance-based portion of the award will be subject to the terms and conditions of the applicable award agreement. In the event the acquirer refuses to assume or replace awards granted, prior to the consummation of such transaction, awards issued under the 2019 Plan will be subject to accelerated vesting such that 100% of such awards will become vested and exercisable or payable, as applicable. The administrator may also make appropriate adjustments to awards under the 2019 Plan and is authorized to provide for the acceleration, cash-out, termination, assumption, substitution or conversion of such awards in the event of a change in control or certain other unusual or nonrecurring events or transactions.
Adjustments of Awards. In the event of any stock dividend or other distribution, stock split, reverse stock split, reorganization, combination or exchange of shares, merger, consolidation, split-up, spin-off, recapitalization, repurchase, or any other corporate event affecting the number of outstanding shares of our common stock or the share price of our common stock that would require adjustments to the 2019 Plan or any awards under the 2019 Plan in order to prevent the dilution or enlargement of the potential benefits intended to be made available thereunder, the administrator will make appropriate, proportionate adjustments to: (i) the aggregate number and type of shares subject to the 2019 Plan; (ii) the number and kind of shares subject to outstanding awards and terms and conditions of outstanding awards (including, without limitation, any applicable performance targets or criteria with respect to such awards); and (iii) the grant or exercise price per share of any outstanding awards under the 2019 Plan.
115
Table of Contents
Amendment and Termination. The administrator may terminate, amend or modify the 2019 Plan at any time and from time to time. However, we must generally obtain stockholder approval to the extent required by applicable law, rule, or regulation (including any applicable stock exchange rule). Notwithstanding the foregoing, an option may be amended to reduce the per share exercise price below the per share exercise price of such option on the grant date and options may be granted in exchange for, or in connection with, the cancellation or surrender of options having a higher per share exercise price without receiving additional stockholder approval.
No incentive stock options may be granted pursuant to the 2019 Plan after the tenth anniversary of the effective date of the 2019 Plan, and no additional annual share increases to the 2019 Plan’s aggregate share limit will occur from and after such anniversary. Any award that is outstanding on the termination date of the 2019 Plan will remain in force according to the terms of the 2019 Plan and the applicable award agreement.
Award Agreements Evidencing Class P Units
The Board of Directors of LP previously granted incentive awards of Class P Units to certain eligible employees and non-employee directors pursuant to award agreements entered into with each individual. Immediately prior to the closing of this offering, LP will distribute of the Company’s common stock for each Class P Unit held by our NEO’s and other participants in the Class P Units plan. As of December 30, 2017, 400,307 Class P Units were vested, 317,031 Class P Units vested on December 31, 2018, 317,126 Class P Units will vest upon the earlier of December 31, 2019 or upon the completion of this offering, and up to 384,522 additional Class P Units will vest upon the completion of this offering. Shares of Company common stock distributed will be subject to the same vesting conditions as the related Class P Units.
2019 Employee Stock Purchase Plan
We intend to adopt and ask our stockholders to approve the 2019 Employee Stock Purchase Plan (the “ESPP”), which will be effective upon the day prior to the effectiveness of the registration statement to which this prospectus relates. The ESPP is designed to allow our eligible employees to purchase shares of our common stock, at semi-annual intervals, with their accumulated payroll deductions. The ESPP is intended to qualify under Section 423 of the Code. The material terms of the ESPP, as it is currently contemplated, are summarized below.
Administration. Subject to the terms and conditions of the ESPP, our compensation committee will administer the ESPP. Our compensation committee can delegate administrative tasks under the ESPP to the services of an agent and/or employees to assist in the administration of the ESPP. The administrator will have the discretionary authority to administer and interpret the ESPP. Interpretations and constructions of the administrator of any provision of the ESPP or of any rights thereunder will be conclusive and binding on all persons. We will bear all expenses and liabilities incurred by the ESPP administrator.
Share Reserve. The maximum number of shares of our common stock which will be authorized for sale under the ESPP is equal to the sum of (a) shares of common stock and (b) an annual increase on the first day of each year beginning in 2020 and ending in 2029, equal to the lesser of (i) 1% of the shares of common stock outstanding (on an as converted basis) on the last day of the immediately preceding fiscal year and (ii) such number of shares of common stock as determined by our Board of Directors; provided, however, no more than shares of our common stock may be issued under the ESPP. The shares reserved for issuance under the ESPP may be authorized but unissued shares or reacquired shares.
116
Table of Contents
Eligibility. Employees eligible to participate in the ESPP for a given offering period generally include employees who are employed by us or one of our subsidiaries on the first day of the offering period, or the enrollment date. Our employees (and, if applicable, any employees of our subsidiaries) who customarily work less than five months in a calendar year or are customarily scheduled to work less than 20 hours per week will not be eligible to participate in the ESPP. Finally, an employee who owns (or is deemed to own through attribution) 5% or more of the combined voting power or value of all our classes of stock or of one of our subsidiaries will not be allowed to participate in the ESPP.
Participation. Employees will enroll under the ESPP by completing a payroll deduction form permitting the deduction from their compensation of at least 1% of their compensation but not more than the lesser of 15% of their compensation or $50,000. Such payroll deductions may be expressed as either a whole number percentage or a fixed dollar amount, and the accumulated deductions will be applied to the purchase of shares on each purchase date. However, a participant may not purchase more than 15,000 shares in each offering period and may not subscribe for more than $25,000 in fair market value of shares of our common stock (determined at the time the option is granted) during any calendar year. The ESPP administrator has the authority to change these limitations for any subsequent offering period.
Offering. Under the ESPP, participants are offered the option to purchase shares of our common stock at a discount during a series of successive offering periods, the duration and timing of which will be determined by the ESPP administrator. However, in no event may an offering period be longer than 27 months in length.
The option purchase price will be the lower of 85% of the closing trading price per share of our common stock on the first trading date of an offering period in which a participant is enrolled or 85% of the closing trading price per share on the purchase date, which will occur on the last trading day of each offering period.
Unless a participant has previously canceled his or her participation in the ESPP before the purchase date, the participant will be deemed to have exercised his or her option in full as of each purchase date. Upon exercise, the participant will purchase the number of whole shares that his or her accumulated payroll deductions will buy at the option purchase price, subject to the participation limitations listed above.
A participant may cancel his or her payroll deduction authorization at any time prior to the end of the offering period. Upon cancellation, the participant will have the option to either (i) receive a refund of the participant’s account balance in cash without interest or (ii) exercise the participant’s option for the current offering period for the maximum number of shares of common stock on the applicable purchase date, with the remaining account balance refunded in cash without interest. Following at least one payroll deduction, a participant may also decrease (but not increase) his or her payroll deduction authorization once during any offering period. If a participant wants to increase or decrease the rate of payroll withholding, he or she may do so effective for the next offering period by submitting a new form before the offering period for which such change is to be effective.
A participant may not assign, transfer, pledge or otherwise dispose of (other than by will or the laws of descent and distribution) payroll deductions credited to a participant’s account or any rights to exercise an option or to receive shares of our common stock under the ESPP, and during a participant’s lifetime, options in the ESPP shall be exercisable only by such participant. Any such attempt at assignment, transfer, pledge or other disposition will not be given effect.
Adjustments upon Changes in Recapitalization, Dissolution, Liquidation, Merger or Asset Sale. In the event of any increase or decrease in the number of issued shares of our common stock
117
Table of Contents
resulting from a stock split, reverse stock split, stock dividend, combination or reclassification of the common stock, or any other increase or decrease in the number of shares of common stock effected without receipt of consideration by us, we will proportionately adjust the aggregate number of shares of our common stock offered under the ESPP, the number and price of shares which any participant has elected to purchase under the ESPP and the maximum number of shares which a participant may elect to purchase in any single offering period. If there is a proposal to dissolve or liquidate us, then the ESPP will terminate immediately prior to the consummation of such proposed dissolution or liquidation, and any offering period then in progress will be shortened by setting a new purchase date to take place before the date of our dissolution or liquidation. We will notify each participant of such change in writing at least ten business days prior to the new exercise date. If we undergo a merger with or into another corporation or sell all or substantially all of our assets, each outstanding option will be assumed or an equivalent option substituted by the successor corporation or the parent or subsidiary of the successor corporation. If the successor corporation refuses to assume the outstanding options or substitute equivalent options, then any offering period then in progress will be shortened by setting a new purchase date to take place before the date of our proposed sale or merger. We will notify each participant of such change in writing at least ten business days prior to the new exercise date.
Amendment and Termination. Our Board of Directors may amend, suspend or terminate the ESPP at any time. However, the Board of Directors may not amend the ESPP without obtaining stockholder approval within twelve months before or after such amendment to the extent required by applicable laws.
118
Table of Contents
CERTAIN RELATIONSHIPS AND RELATED PERSON TRANSACTIONS
We describe below transactions and series of similar transactions, since December 28, 2015 or currently proposed, to which we were a party or will be a party, in which:
| • | the amounts involved exceed $120,000; and |
| • | any of our directors, executive officers or beneficial holders of more than 5% of any class of our capital stock had or will have a direct or indirect material interest. |
Other than as described below, there have not been, nor are there any currently proposed, transactions or series of similar transactions meeting these criteria to which we have been or will be a party other than compensation arrangements, which are described where required under “Management” and “Executive Compensation.”
Transaction Services Agreement
We entered into a transaction services agreement (the “Transaction Services Agreement”) with our Sponsor and certain other related parties on July 25, 2014 whereby we agreed to compensate our Sponsor for services provided related to the Sponsor’s acquisition of Company equity, and our Sponsor agreed to provide certain financial and strategic advisory services and consulting services. Under the Transaction Services Agreement, we incurred the following:
| 2016 | 2017 | 2018 | Nine months ended September 29, 2019 |
|||||||||||||
| (unaudited) | ||||||||||||||||
| Sponsor |
$ | 458,000 | $ | 1,399,000 | $ | 2,595,000 | $ | — | ||||||||
| Other related parties |
74,000 | 952,000 | 962,000 | — | ||||||||||||
|
|
|
|
|
|
|
|
|
|||||||||
| Total |
$ | 532,000 | $ | 2,351,000 | $ | 3,557,000 | $ | — | ||||||||
|
|
|
|
|
|
|
|
|
|||||||||
We have agreed to indemnify our Sponsor and, among others, its officers, directors, stockholders, and affiliates, against all losses, claims, liabilities, suits, costs, damages, and expenses arising from their performance of services under the Transaction Services Agreement.
Professional Services Agreement
We entered into a professional services agreement (the “Professional Services Agreement”) with our Sponsor and certain other related parties on July 25, 2014 whereby our Sponsor agreed to provide certain management services and consulting services. Under the Professional Services Agreement, we incurred the following:
| 2016 | 2017 | 2018 | Nine months ended September 29, 2019 |
|||||||||||||
| (unaudited) | ||||||||||||||||
| Sponsor management fees |
$ | 440,000 | $ | 440,000 | $ | 585,000 | $ | 283,000 | ||||||||
| Sponsor other reimbursement |
10,000 | 169,000 | 115,000 | 69,000 | ||||||||||||
| Other related parties |
111,000 | 98,000 | 214,000 | 154,000 | ||||||||||||
|
|
|
|
|
|
|
|
|
|||||||||
| Total |
$ | 561,000 | $ | 707,000 | $ | 914,000 | $ | 506,000 | ||||||||
|
|
|
|
|
|
|
|
|
|||||||||
We have agreed to indemnify the Sponsor and, among others, its officers, directors, stockholders, and affiliates, against all losses, claims, liabilities, suits, costs, damages, and expenses arising from their performance of services under the Professional Services Agreement.
119
Table of Contents
Investors’ Rights Agreement
On April 12, 2018, we entered into an Investors’ Rights Agreement with Lulu’s Holdings, L.P., H.I.G.-GPII, Inc., LFL Acquisition Corp., Institutional Venture Partners XVI, L.P., Institutional Venture Partners XV, L.P., Institutional Venture Partners XV Executive Fund, L.P., Canada Pension Plan Investment Board, (the “Investors’ Rights Agreement”), pursuant to which such investors have certain demand registration rights, short-form registration rights and piggyback registration rights in respect of any shares of common stock or common stock issuable or issued upon conversion of the Series A Preferred Stock and related indemnification rights from us, subject to customary restrictions and exceptions. All fees, costs and expenses of registrations, other than underwriting discounts and commissions, are expected to be borne by us.
Advance to LP
On January 31, 2019, we paid a cash advance to the LP of $2.4 million, which was used for the payment of accrued Class P Unit distributions to certain current employees, including Crystal Landsem and Mark Vos. We recorded interest income on the advance of $145,000 for the nine months ended September 29, 2019. On September 16, 2019, LP made a repayment of $2,084,000, which included $60,000 of accrued interest. The outstanding balance of the cash advance will be repaid prior to the public filing of the registration statement of which this prospectus forms a part.
Leasing Arrangements
We lease approximately 27,585 square feet of space for warehouse and office space and a parking lot located in Chico, California from South Chico Chicas, LLC, a limited liability company owned by Colleen Winter, our CEO and co-founder, and Debra Cannon, a director and co-founder. Our lease for 269 Humboldt Avenue, Chico, California 95928 began on April 15, 2014 and is month-to-month, and we made average payments of $1,662 per month under this lease for the nine months ended September 29, 2019. Our lease for 185 Humboldt Avenue, Chico, California 95928 began on May 1, 2013 and is month-to-month and we made average payments of $6,110 per month under this lease for the nine months ended September 29, 2019. Our lease for 281 Humboldt Avenue, Chico, California 95928, the parking lot, began on June 1, 2015 and is month-to-month, and we made average payments of $609 per month under this lease for the nine months ended September 29, 2019.
We also lease approximately 2,800 square feet of space for an outlet store located at 232 Broadway Street, Chico, California 95928 from the Luke Winter/Winter Family Trust, an entity owned in-part by Colleen Winter and her husband, Luke Winter. This lease began on November 1, 2017 and expires on October 31, 2020, with an option to renew for an additional year. As of September 29, 2019 the lease provided for a base monthly rent payments of $3,844.
Our total rent expense to these related parties was $110,000, $125,000, and $110,000 for 2017, 2018, and the nine months ended September 29, 2019, respectively.
Employment Agreements
We have entered into employment agreements with our executive officers. For more information regarding these agreements, see “Executive Compensation—Summary Compensation Table.”
The employment agreements will be filed as exhibits to the registration statement of which this prospectus forms a part.
120
Table of Contents
Indemnification Agreements and Directors’ and Officers’ Liability Insurance
We will enter into indemnification agreements with each of our directors and executive officers. These agreements will require us to, among other things, indemnify each director and executive officer to the fullest extent permitted by Delaware law, including indemnification of expenses such as attorneys’ fees incurred by the director or executive officer in any action or proceeding, including any action or proceeding by or in right of us, arising out of the person’s services as a director or executive officer. We have obtained an insurance policy that insures our directors and officers against certain liabilities, including liabilities arising under applicable securities laws.
Policies for Approval of Related Person Transactions
In connection with this offering, we will adopt a written policy relating to the approval of related person transactions. Our audit committee will review and approve or ratify all relationships and related person transactions between us and (i) our directors, director nominees, executive officers or their immediate family members, (ii) any 5% record or beneficial owner of our common stock, or (iii) any immediate family member of any person specified in (i) and (ii) above. Our compliance director will be primarily responsible for the development and implementation of processes and controls to obtain information from our directors and executive officers with respect to related party transactions and for determining, based on the facts and circumstances, whether we or a related person have a direct or indirect material interest in the transaction.
As set forth in the related person transaction policy, in the course of its review and approval or ratification of a related party transaction, the committee will consider:
| • | the nature of the related person’s interest in the transaction; |
| • | the availability of other sources of comparable products or services; |
| • | the material terms of the transaction, including, without limitation, the amount and type of transaction; and |
| • | the importance of the transaction to us. |
Any member of the audit committee who is a related person with respect to a transaction under review will not be permitted to participate in the discussions or approval or ratification of the transaction. However, such member of the audit committee will provide all material information concerning the transaction to the audit committee.
121
Table of Contents
PRINCIPAL AND SELLING STOCKHOLDERS
The following table shows information as of , 2019 regarding the beneficial ownership of our common stock (1) prior to this offering and (2) as adjusted to give effect to this offering by:
| • | each person or group who is known by us to own beneficially more than 5% of our common stock; |
| • | each member of our Board of Directors and each of our named executive officers; |
| • | all members of our Board of Directors and our executive officers as a group; and |
| • | each selling stockholder. |
For further information regarding material transactions between us and certain of our selling stockholders, see “Certain Relationship and Related Person Transactions.”
Beneficial ownership of shares is determined under rules of the SEC and generally includes any shares over which a person exercises sole or shared voting or investment power. Except as noted by footnote, and subject to community property laws where applicable, we believe based on the information provided to us that the persons and entities named in the table below have sole voting and investment power with respect to all shares of our common stock shown as beneficially owned by them. Percentage of beneficial ownership is based on shares of common stock outstanding as of , 2019 and shares of common stock outstanding after giving effect to this offering, assuming no exercise of the underwriters’ option to purchase additional shares, or shares of common stock, assuming the underwriters exercise their option to purchase additional shares in full. Shares of common stock subject to options currently exercisable or exercisable within 60 days of the date of this prospectus are deemed to be outstanding and beneficially owned by the person holding the options for the purposes of computing the percentage of beneficial ownership of that person and any group of which that person is a member, but are not deemed outstanding for the purpose of computing the percentage of beneficial ownership for any other person. Except as otherwise indicated, the persons named in the table below have sole voting and investment power with respect to all shares of capital stock held by them. Unless otherwise indicated, the address for each holder listed below is 195 Humboldt Avenue, Chico, California 95928.
122
Table of Contents
| Shares of common stock beneficially owned before this offering |
Shares offered | Shares of common stock beneficially owned after this offering (assuming no exercise of the option to purchase additional shares) |
Shares of common stock beneficially owned after this offering (assuming full exercise of the option to purchase additional shares) |
|||||||||||||||||||||||||||||
| Name and address of |
Number of shares |
Percentage of shares |
Number of shares |
Percentage of shares |
Number of shares |
Percentage of shares |
Number of shares |
Percentage of shares |
||||||||||||||||||||||||
| 5% stockholders: |
||||||||||||||||||||||||||||||||
|
|
||||||||||||||||||||||||||||||||
| Named executive officers and directors: |
||||||||||||||||||||||||||||||||
| Colleen Winter |
||||||||||||||||||||||||||||||||
| Crystal Landsem |
||||||||||||||||||||||||||||||||
| Mark Vos |
||||||||||||||||||||||||||||||||
| John Black |
||||||||||||||||||||||||||||||||
| Debra A. Cannon |
||||||||||||||||||||||||||||||||
| Evan Karp |
||||||||||||||||||||||||||||||||
| John Kim |
||||||||||||||||||||||||||||||||
| Eric Liaw |
||||||||||||||||||||||||||||||||
| Michael Mardy |
||||||||||||||||||||||||||||||||
| Danielle Qi |
||||||||||||||||||||||||||||||||
| All Board of Director members and executive officers as a group (10 persons) |
||||||||||||||||||||||||||||||||
| Selling stockholders: |
||||||||||||||||||||||||||||||||
|
|
||||||||||||||||||||||||||||||||
| * | Represents beneficial ownership of less than 1% of our outstanding common stock. |
123
Table of Contents
DESCRIPTION OF CERTAIN INDEBTEDNESS
Credit Facility
Overview
On August, 28, 2017, our indirect wholly-owned subsidiary Lulu’s Fashion Lounge, LLC entered into a $145 million credit facility, (the “Credit Facility”) with Credit Suisse AG, Cayman Islands Branch, as the administrative agent and collateral agent for all lenders, with $135 million committed as a term loan (the “Term Loan”) and $10 million committed as a revolving credit facility (the “Revolving Facility”). The proceeds from the Term Loan were used to repay other long-term debt and to pay dividends to the LP, and the proceeds of the Revolving Facility are available for general working capital and other corporate purposes.
As of September 29, 2019, there were $114.8 million of borrowings outstanding under the Term Loan and $4.5 million of borrowings outstanding under the Revolving Facility.
On May 30, 2019, Lulu’s Fashion Lounge, LLC entered into a waiver and amendment to the Credit Facility pursuant to which the lenders, among other things, waived a financial covenant default for the period ending March 31, 2019 and agreed to certain changes to the financial maintenance covenant levels.
Interest Rate and Fees
The Term Loans bear interest at either (i) a rate per annum equal to an adjusted LIBOR rate (the “Adjusted LIBOR Rate”) (subject to a minimum floor of 1.00%) plus an applicable margin based on the consolidated total net leverage ratio of Lulu’s Fashion Lounge, LLC ranging from 7.00% to 9.00% per annum, as indicated below or (ii) a base rate equal to the greater of the “prime rate”, the federal funds effective rate plus 1⁄2 of 1.0% and the Adjusted LIBOR Rate (the “Base Rate”) plus an applicable margin of ranging from 6.00% to 8.00% per annum based on the consolidated total net leverage ratio of Lulu’s Fashion Lounge, LLC, as indicated below.
| Pricing Level |
Consolidated Total Net Leverage Ratio |
Applicable Margin for LIBOR Rate Term Loans |
Applicable Margin for Base Rate Term Loans |
|||||||
| I |
Greater than 3.50 to 1.00 | 9.00 | % | 8.00 | % | |||||
| II |
Less than or equal to 3.50 to 1.00, but greater than 2.25 to 1.00 | 8.00 | % | 7.00 | % | |||||
| III |
Less than or equal to 2.25 to 1.00 | 7.00 | % | 6.00 | % | |||||
Loans under the Revolving Facility bear interest at either (i) the Adjusted LIBOR Rate (subject to a floor of 0.00%) plus an applicable margin based on the consolidated total net leverage ratio of Lulu’s Fashion Lounge, LLC ranging from 6.00% to 7.00% per annum, as indicated below or (ii) the Base Rate plus an applicable margin based on the consolidated total net leverage ratio of Lulu’s Fashion Lounge, LLC ranging from 5.00% to 6.00% per annum, as indicated below.
| Pricing Level |
Consolidated Total Net Leverage Ratio |
Applicable Margin for LIBOR Rate Revolving Loans |
Applicable Margin for Base Rate Revolving Loans |
Applicable Margin for Unused Commitment Fee |
||||||||||
| I |
Greater than 2.50 to 1.00 | 7.00 | % | 6.00 | % | 0.5 | % | |||||||
| II |
Less than or equal to 2.50 to 1.00, but greater than 2.00 to 1.00 | 6.50 | % | 5.50 | % | 0.375 | % | |||||||
| III |
Less than or equal to 2.00 to 1.00 | 6.00 | % | 5.00 | % | 0.375 | % | |||||||
124
Table of Contents
As of September 29, 2019, the interest rate on the Term Loan was the Adjusted LIBOR Rate plus 9.00% and the interest rate on loans under the Revolving Facility was the Adjusted LIBOR Rate plus 7.00%.
Interest on borrowings under the Credit Facility is payable (i) on the last day of any interest period with respect to LIBOR borrowing with an applicable interest period of six months or less, (ii) every three months with respect to LIBOR borrowings with an interest period of greater than six months or (iii) on the last business day of each March, June, September, and December with respect to base rate borrowings. In addition, the Credit Facility requires payment of an unused fee equal to a rate based on the consolidated total net leverage ratio of the Lulu’s Fashion Lounge, LLC and ranging from 0.375% to 0.50% as indicated in the above chart, times the average daily amount by which the unutilized commitments exceed the amount outstanding under the Revolving Facility. The unused fee is payable on the last day of each quarter. The borrowers are also required to pay customary letter of credit fees and annual agency fees.
Prepayments
The Credit Facility requires prepayment of outstanding loans, subject to certain exceptions, with:
| • | 100% of the net cash proceeds of all non-ordinary course asset dispositions or events of loss in excess of $2,500,000 by the loan parties and their respective subsidiaries, (i) if we do not reinvest those net cash proceeds in assets to be used in our business within 180 days of the receipt of such net cash proceeds or (ii) if we do not commit to reinvest such net cash proceeds within 180 days of the receipt thereof and do not actually reinvest such net cash proceeds within 360 days of the receipt thereof; and |
| • | 100% of the net proceeds of (1) any issuance or incurrence of debt by the loan parties or any of their respective subsidiaries, other than debt permitted under the Credit Facility and (ii) any receipt by the loan parties or any of their respective subsidiaries of the proceeds of specified equity contributions;. |
| • | 75% (which percentage will be reduced to 50% if our consolidated total net leverage ratio is less than 2.00:1.00, as determined as of the last day of the applicable fiscal year and subject to certain reductions) of our annual excess cash flow (defined as EBITDA less certain customary deductions including, without limitation, unfinanced capital expenditures, fees and expenses under loan documents, insurance proceeds and others); |
The foregoing mandatory prepayments are used to first reduce the principal installments of the Term Loan on a pro rata basis based on the respective amounts thereof and, second, to the outstanding loans under the Revolving Facility (without a corresponding reduction in the revolving credit commitment).
We may voluntarily repay outstanding loans under the Credit Facility subject to prepayment penalties. Any prepayment before August 29, 2019 must be accompanied by a 2.00% prepayment premium. Any prepayment after August 29, 2019 and before August 29, 2020 must be accompanied by a 1.00% prepayment premium. Any prepayment thereafter is not subject to a prepayment premium.
Amortization
Amortization installment payments on the Term Loan are required to be made in quarterly installments of $2,531,250, with the remaining outstanding amount to be payable on August 28, 2022, the maturity date for the Term Loan Facility. Principal amounts outstanding under the Revolving Facility will be due and payable in full on May 29, 2022.
125
Table of Contents
Guarantee and Security
All obligations under the Credit Facility are unconditionally guaranteed by Lulu’s Fashion Lounge Parent, LLC and, subject to certain exceptions, each of its current and future domestic subsidiaries. All obligations under our Credit Facility, and the guarantees of those obligations, are secured by substantially all of the following assets of the borrower and each guarantor, subject to certain exceptions, including:
| • | a pledge of 100% of the common units of the borrower and 100% of the equity interests directly held by the borrower and each guarantor in any subsidiary of the borrower or guarantor, subject to certain exceptions; and |
| • | a security interest in substantially all tangible and intangible assets (including intellectual property) of each borrower and guarantor, subject to certain exceptions. |
Certain Covenants and Events of Default
The Credit Facility contains a number of covenants that, among other things, restrict the ability of the loan parties and their respective subsidiaries to (subject to certain exceptions):
| • | create liens on assets; |
| • | sell or otherwise dispose of assets; |
| • | engage in mergers or consolidations; |
| • | make investments, loans or advances; |
| • | incur additional indebtedness or issue preferred stock; |
| • | engage in certain transactions with affiliates; |
| • | pay dividends and distributions or repurchase our capital stock; |
| • | repay certain subordinated indebtedness; |
| • | make certain acquisitions; |
| • | change the line of business; |
| • | amend organizational documents materially adversely affect the interests of the agent or lenders; |
| • | change the fiscal year; |
| • | amend material agreements governing subordinated indebtedness; |
| • | enter into negative pledges; and |
| • | make certain capital expenditures. |
The Credit Facility also contains customary representations and warranties, affirmative covenants, notice provisions and events of default, including a change of control. The change of control provision is triggered (a) upon or after the consummation of a qualified initial public offering, if any person or group other than our Sponsor and its affiliates, Company management, RLJ Credit Opportunity Fund I, L.P., LFL Acquisition Corp., or Emigrant Capital Corp. (collectively, the “Permitted Holders”) or a group that includes the Permitted Holders becomes the beneficial owner, directly or indirectly, of voting equity interests of Lulu’s Fashion Lounge Parent LLC representing more than 35% of the voting equity interests of Lulu’s Fashion Lounge Parent LLC and a greater percentage of voting equity interests of Lulu’s Fashion Lounge Parent LLC than is then beneficially owned, directly or indirectly, in the aggregate by the Permitted Holders or any group that includes the Permitted Holders;
126
Table of Contents
(b) on or after the date of an initial public offering, if a majority of the Board of Directors (i) does not consist of directors that were on the Board of Directors as of the date of the Credit Agreement, (ii) was not nominated or approved by the Board of Directors, or (iii) was not appointed by directors nominated or approved by the Board of Directors; and (c) the Lulu’s Fashion Lounge Parent, LLC fails to own 100% of the outstanding equity interests of Lulu’s Fashion Lounge, LLC.
The Credit Facility includes certain financial maintenance covenants, which, after giving effect to a waiver and amendment entered into on May 30, 2019, consist of (a) a quarterly maximum consolidated total net leverage ratio of not more than 3.50 to 1.00 for the 12-month period ended June 30, 2019, with gradual step-downs to 2.00 to 1.00 for the 12-month period ending December 31, 2020 and thereafter, and (b) a monthly minimum consolidated cumulative unadjusted EBITDA for the period commencing on May 6, 2019 and ending on the last day of the calendar month of June 2019 through and including December 2019, with such minimum levels set, initially, at $5,000,000 and increasing to $16,192,000 by December 31, 2019.
This description of the Credit Facility does not purport to be complete and is qualified in its entirety by reference to the full text of the credit documents, which are filed as exhibits to the registration statement of which this prospectus forms a part.
127
Table of Contents
The following discussion is a summary of the terms of our common stock, our amended and restated certificate of incorporation and bylaws as they will be in effect at the time of the offering. Copies of our amended and restated certificate of incorporation and bylaws are exhibits to the registration statement of which this prospectus is a part.
Authorized Capitalization
Following the consummation of this offering, our authorized capital stock will consist of shares of common stock, par value $ per share, and shares of preferred stock, par value $ per share. All of our authorized preferred stock upon the completion of this offering will be undesignated.
Common Stock
As of , 2019, after giving effect to the conversion of all outstanding shares of our Series A Preferred Stock into shares of common stock in connection with the completion of this offering, there would have been outstanding shares of common stock held by stockholders.
Holders of our common stock are entitled to the following rights.
Voting Rights
Directors will be elected by a plurality of the votes entitled to be cast except as set forth below with respect to directors to be elected by the holders of common stock. Our stockholders will not have cumulative voting rights. Except as otherwise provided in our amended and restated certificate of incorporation or as required by law, all matters to be voted on by our stockholders other than matters relating to the election and removal of directors must be approved by a majority of the shares present in person or by proxy at the meeting and entitled to vote on the subject matter or by a written resolution of the stockholders representing the number of affirmative votes required for such matter at a meeting.
Dividend Rights
Holders of common stock will share equally in any dividend declared by our Board of Directors, subject to the rights of the holders of any outstanding preferred stock.
Liquidation Rights
In the event of any voluntary or involuntary liquidation, dissolution, or winding up of our affairs, holders of our common stock would be entitled to share ratably in our assets that are legally available for distribution to stockholders after payment of liabilities. If we have any preferred stock outstanding at such time, holders of the preferred stock may be entitled to distribution and/or liquidation preferences. In either such case, we must pay the applicable distribution to the holders of our preferred stock before we may pay distributions to the holders of our common stock.
Other Rights
Our stockholders have no preemptive or other rights to subscribe for additional shares. All holders of our common stock are entitled to share equally on a share-for-share basis in any assets available for distribution to common stockholders upon our liquidation, dissolution, or winding up. All outstanding shares are, and all shares offered by this prospectus will be, when sold, validly issued, fully paid, and nonassessable.
128
Table of Contents
Preferred Stock
Upon closing of this offering, no shares of preferred stock will be outstanding. Our Board of Directors is authorized to provide for the issuance of preferred stock in one or more series and to fix the preferences, powers and relative, participating, optional or other special rights and qualifications, limitations or restrictions thereof, including the dividend rate, conversion rights, voting rights, redemption rights and liquidation preference and to fix the number of shares to be included in any such series without any further vote or action by our stockholders. Any preferred stock so issued may rank senior to our common stock with respect to the payment of dividends or amounts upon liquidation, dissolution or winding up, or both. In addition, any such shares of preferred stock may have class or series voting rights. The issuance of preferred stock may have the effect of delaying, deferring or preventing a change in control of our company without further action by the stockholders and may adversely affect the voting and other rights of the holders of our common stock.
Registration Rights
Our existing stockholders have certain registration rights with respect to our common stock pursuant to the Investors’ Rights Agreement. See “Certain Relationships and Related Person Transactions—Investors’ Rights Agreement.”
Anti-takeover Provisions
Our amended and restated certificate of incorporation and amended and restated bylaws contain provisions that delay, defer or discourage transactions involving an actual or potential change in control of us or change in our management. We expect that these provisions, which are summarized below, will discourage coercive takeover practices or inadequate takeover bids. These provisions are also designed to encourage persons seeking to acquire control of us to first negotiate with our Board of Directors, which we believe may result in an improvement of the terms of any such acquisition in favor of our stockholders. However, they also give our Board of Directors the power to discourage transactions that some stockholders may favor, including transactions in which stockholders might otherwise receive a premium for their shares or transactions that our stockholders might otherwise deem to be in their best interests. Accordingly, these provisions could adversely affect the price of our common stock.
Classified Board
Our amended and restated certificate of incorporation provides that our Board of Directors will consist of between and directors, as long as any shares of common stock are outstanding and that our Board of Directors will be divided into three classes, with one class being elected at each annual meeting of stockholders. Each director will serve a three-year term, with termination staggered according to class. Class I will initially consist of directors, Class II will initially consist of , , and directors, and Class III will initially consist of directors , , and .
Upon consummation of this offering, our Board of Directors will initially consist of directors.
Our amended and restated certificate of incorporation provides that directors may only be removed for cause by the affirmative vote of the remaining members of our Board of Directors or the holders of at least a majority of the voting power of all outstanding shares of common stock then entitled to vote on the election of directors.
The classification of our Board or Directors could make it more difficult for a third-party to acquire, or discourage a third party from seeking to acquire, control of our company.
129
Table of Contents
Requirements for Advance Notification of Stockholder Meetings, Nominations and Proposals
Our amended and restated certificate of incorporation provides that special meetings of the stockholders may be called only upon the request of a majority of our board, the Chief Executive Officer or the Chair of the Board of Directors. Our amended and restated bylaws prohibit the conduct of any business at a special meeting other than as specified in the notice for such meeting. These provisions may have the effect of deferring, delaying or discouraging hostile takeovers or changes in control or management of our company.
Our amended and restated bylaws establish advance notice procedures with respect to stockholder proposals and the nomination of candidates for election as directors, other than nominations made by or at the direction of our Board of Directors or a committee of our Board of Directors. In order for any matter to be “properly brought” before a meeting, a stockholder will have to comply with the advance notice requirements of directors, which may be filled only by a vote of a majority of directors then in office, even though less than a quorum, and not by the stockholders. Our amended and restated bylaws allow the presiding officer at a meeting of the stockholders to adopt rules and regulations for the conduct of meetings which may have the effect of precluding the conduct of certain business at a meeting if the rules and regulations are not followed. These provisions may also defer, delay or discourage a potential acquirer from conducting a solicitation of proxies to elect the acquirer’s own slate of directors or otherwise attempting to obtain control of our company.
No Stockholder Action by Written Consent
Our amended and restated certificate of incorporation provides that, subject to the rights of any holders of preferred stock to act by written consent instead of a meeting, stockholder action may be taken only at an annual meeting or special meeting of stockholders and may not be taken by written consent instead of a meeting. Failure to satisfy any of the requirements for a stockholder meeting could delay, prevent or invalidate stockholder action.
Section 203 of the DGCL
Our amended and restated certificate of incorporation provides that the provisions of Section 203 of the DGCL, which relate to business combinations with interested stockholders, do not apply to us. Section 203 of the DGCL prohibits a publicly held Delaware corporation from engaging in a business combination transaction with an interested stockholder (a stockholder who owns more than 15% of our common stock) for a period of three years after the interested stockholder became such unless the transaction fits within an applicable exemption, such as board approval of the business combination or the transaction that resulted in such stockholder becoming an interested stockholder. These provisions would apply even if the business combination could be considered beneficial by some stockholders. However, our amended and restated certificate of incorporation contains a provision that provides us with protections similar to Section 203 of the DGCL and will prevent us from engaging in a business combination with a person who acquires at least 15% of our common stock for a period of three years from the date such person acquired such common stock unless board or stockholder approval is obtained prior to the acquisition.
Exclusive Forum
The Court of Chancery of the State of Delaware will be the sole and exclusive forum for the following types of actions or proceedings under Delaware statutory or common law: (i) any derivative action or proceeding brought on behalf of the company, (ii) any action asserting a claim of breach of fiduciary duty owed by any director, officer, or other employee of the company to the company or the company’s stockholders, (iii) any action asserting a claim arising pursuant to any provision of the
130
Table of Contents
DGCL, or (iv) any action asserting a claim governed by the internal affairs doctrine. This exclusive forum provision will not apply to any causes of action arising under the Securities Act or the Exchange Act or any other claim for which the federal courts have exclusive jurisdiction. Any person or entity purchasing or otherwise acquiring any interest in shares of capital stock of the company shall be deemed to have notice of and consented to the foregoing forum selection provisions. The provision would not apply to suits brought to enforce a duty or liability created by the Exchange Act.
Listing
We intend to apply to have our common stock listed on under the symbol “ .”
Transfer Agent and Registrar
The transfer agent and registrar for our common stock is American Stock Transfer & Trust Company, LLC. The transfer agent and registrar’s address is 6201 15th Avenue, Brooklyn, NY 11219.
131
Table of Contents
SHARES ELIGIBLE FOR FUTURE SALE
Prior to this offering, there has been no public market for our common stock. Future sales of our common stock in the public market, or the perception that sales may occur, could materially adversely affect the prevailing market price of our common stock at such time and our ability to raise equity capital in the future.
Sale of Restricted Securities
Upon consummation of this offering, we will have shares of our common stock outstanding (or shares, if the underwriters exercise their option to purchase additional shares in full). Of these shares, all shares sold in this offering will be freely tradable without further restriction or registration under the Securities Act, except that any shares purchased by our affiliates may generally only be sold in compliance with Rule 144, which is described below. Of the remaining outstanding shares, shares will be deemed “restricted securities” under the Securities Act.
Lock-Up Agreements
In connection with this offering, we, each of our directors, executive officers and the selling stockholders, as well as substantially all of our other securityholders, will enter into lock-up agreements described under “Underwriting” that restrict the sale of our securities for up to 180 days after the date of this prospectus without the prior written consent of Goldman Sachs & Co. LLC on behalf of the underwriters, subject to certain exceptions.
Following the lock-up periods described above, all of the shares of our common stock that are restricted securities or are held by our affiliates as of the date of this prospectus will be eligible for sale in the public market in compliance with Rule 144 under the Securities Act.
Rule 144
The shares of our common stock sold in this offering will generally be freely transferable without restriction or further registration under the Securities Act, except that any shares of our common stock held by an “affiliate” of ours may not be resold publicly except in compliance with the registration requirements of the Securities Act or under an exemption under Rule 144 or otherwise. Rule 144 permits our common stock that has been acquired by a person who is an affiliate of ours, or has been an affiliate of ours within the past three months, to be sold into the market in an amount that does not exceed, during any three-month period, the greater of:
| • | one percent of the total number of shares of our common stock outstanding; or |
| • | the average weekly reported trading volume of our common stock for the four calendar weeks prior to the sale. |
Such sales are also subject to specific manner of sale provisions, a six-month holding period requirement, notice requirements and the availability of current public information about us.
Rule 144 also provides that a person who is not deemed to have been an affiliate of ours at any time during the three months preceding a sale, and who has for at least six months beneficially owned shares of our common stock that are restricted securities, will be entitled to freely sell such shares of our common stock subject only to the availability of current public information regarding us. A person who is not deemed to have been an affiliate of ours at any time during the three months preceding a
132
Table of Contents
sale, and who has beneficially owned for at least one year shares of our common stock that are restricted securities, will be entitled to freely sell such shares of our common stock under Rule 144 without regard to the current public information requirements of Rule 144.
Rule 701
In general, under Rule 701, as currently in effect, any of our employees, directors, officers, consultants or advisors who purchase shares from us in connection with a compensatory stock or option plan or other written agreement before the effective date of this offering is entitled to resell such shares 90 days after the effective date of this offering in reliance on Rule 144.
Securities issued in reliance on Rule 701 are restricted securities and, subject to the contractual restrictions described above, beginning 90 days after the date of this prospectus, may be sold by persons other than “affiliates,” as defined in Rule 144, subject only to the manner of sale provisions of Rule 144 and by “affiliates” under Rule 144 without compliance with its one-year minimum holding period requirement.
Additional Registration Statements
We intend to file a registration statement on Form S-8 under the Securities Act to register shares of our common stock to be issued or reserved for issuance under our equity incentive plans. Such registration statement is expected to be filed soon after the date of this prospectus and will automatically become effective upon filing with the SEC. Accordingly, shares registered under such registration statement will be available for sale in the open market, unless such shares are subject to vesting restrictions with us or the lock-up restrictions described above.
133
Table of Contents
MATERIAL U.S. FEDERAL INCOME TAX CONSIDERATIONS FOR NON-U.S. HOLDERS
The following discussion is a summary of the material U.S. federal income tax consequences to Non-U.S. Holders (as defined below) of the purchase, ownership and disposition of our common stock issued pursuant to this offering, but does not purport to be a complete analysis of all potential tax effects. The effects of other U.S. federal tax laws, such as estate and gift tax laws, and any applicable state, local or non-U.S. tax laws are not discussed. This discussion is based on the U.S. Internal Revenue Code of 1986, as amended (“the Code”), Treasury Regulations promulgated thereunder, judicial decisions, and published rulings and administrative pronouncements of the U.S. Internal Revenue Service (“the IRS”), in each case in effect as of the date hereof. These authorities may change or be subject to differing interpretations. Any such change or differing interpretation may be applied retroactively in a manner that could adversely affect a Non-U.S. Holder. We have not sought and will not seek any rulings from the IRS regarding the matters discussed below. There can be no assurance the IRS or a court will not take a contrary position to that discussed below regarding the tax consequences of the purchase, ownership and disposition of our common stock.
This discussion is limited to Non-U.S. Holders that hold our common stock as a “capital asset” within the meaning of Section 1221 of the Code (generally, property held for investment). This discussion does not address all U.S. federal income tax consequences relevant to a Non-U.S. Holder’s particular circumstances, including the impact of the Medicare contribution tax on net investment income. In addition, it does not address consequences relevant to Non-U.S. Holders subject to special rules, including, without limitation:
| • | U.S. expatriates and former citizens or long-term residents of the United States; |
| • | persons subject to the alternative minimum tax; |
| • | persons holding our common stock as part of a hedge, straddle or other risk reduction strategy or as part of a conversion transaction or other integrated investment; |
| • | banks, insurance companies and other financial institutions; |
| • | brokers, dealers or traders in securities; |
| • | “controlled foreign corporations,” “passive foreign investment companies” and corporations that accumulate earnings to avoid U.S. federal income tax; |
| • | partnerships or other entities or arrangements treated as partnerships for U.S. federal income tax purposes (and investors therein); |
| • | tax-exempt organizations or governmental organizations; |
| • | persons deemed to sell our common stock under the constructive sale provisions of the Code; |
| • | tax-qualified retirement plans; and |
| • | “qualified foreign pension funds” as defined in Section 897(l)(2) of the Code and entities all of the interests of which are held by qualified foreign pension funds. |
If an entity treated as a partnership for U.S. federal income tax purposes holds our common stock, the tax treatment of a partner in the partnership will depend on the status of the partner, the activities of the partnership and certain determinations made at the partner level. Accordingly, partnerships holding our common stock and the partners in such partnerships should consult their tax advisors regarding the U.S. federal income tax consequences to them.
THIS DISCUSSION IS NOT TAX ADVICE. INVESTORS SHOULD CONSULT THEIR TAX ADVISORS WITH RESPECT TO THE APPLICATION OF THE U.S. FEDERAL INCOME TAX LAWS
134
Table of Contents
TO THEIR PARTICULAR SITUATIONS AS WELL AS ANY TAX CONSEQUENCES OF THE PURCHASE, OWNERSHIP AND DISPOSITION OF OUR COMMON STOCK ARISING UNDER THE U.S. FEDERAL ESTATE OR GIFT TAX LAWS OR UNDER THE LAWS OF ANY STATE, LOCAL OR NON-U.S. TAXING JURISDICTION OR UNDER ANY APPLICABLE INCOME TAX TREATY.
Definition of Non-U.S. Holder
For purposes of this discussion, a “Non-U.S. Holder” is any beneficial owner of our common stock that is neither a “U.S. person” nor an entity treated as a partnership for U.S. federal income tax purposes. A U.S. person is any person that, for U.S. federal income tax purposes, is or is treated as any of the following:
| • | an individual who is a citizen or resident of the United States; |
| • | a corporation created or organized under the laws of the United States, any state thereof, or the District of Columbia; |
| • | an estate, the income of which is subject to U.S. federal income tax regardless of its source; or |
| • | a trust that (1) is subject to the primary supervision of a U.S. court and all substantial decisions of which are subject to the control of one or more “United States persons” (within the meaning of Section 7701(a)(30) of the Code), or (2) has a valid election in effect to be treated as a United States person for U.S. federal income tax purposes. |
Distributions
As described in the section of this prospectus titled “Dividend Policy,” we have never declared or paid cash dividends on our common stock, and we do not intend to pay any cash dividends on our common stock in the foreseeable future. However, if we do make distributions of cash or property on our common stock, such distributions will constitute dividends for U.S. federal income tax purposes to the extent paid from our current or accumulated earnings and profits, as determined under U.S. federal income tax principles. Amounts not treated as dividends for U.S. federal income tax purposes will constitute a return of capital and first be applied against and reduce a Non-U.S. Holder’s adjusted tax basis in its common stock, but not below zero. Any excess will be treated as capital gain and will be treated as described below under “—Sale or Other Taxable Disposition.”
Subject to the discussion below regarding effectively connected income, dividends paid to a Non-U.S. Holder will be subject to U.S. federal withholding tax at a rate of 30% of the gross amount of the dividends (or such lower rate specified by an applicable income tax treaty, provided the Non-U.S. Holder furnishes a valid IRS Form W-8BEN or W-8BEN-E (or other applicable documentation) certifying qualification for the lower treaty rate). A Non-U.S. Holder that does not timely furnish the required documentation, but that qualifies for a reduced treaty rate, may obtain a refund of any excess amounts withheld by timely filing an appropriate claim for refund with the IRS. Non-U.S. Holders should consult their tax advisors regarding their entitlement to benefits under any applicable tax treaties.
If dividends paid to a Non-U.S. Holder are effectively connected with the Non-U.S. Holder’s conduct of a trade or business within the United States (and, if required by an applicable income tax treaty, the Non-U.S. Holder maintains a permanent establishment in the United States to which such dividends are attributable), the Non-U.S. Holder will be exempt from the U.S. federal withholding tax described above. To claim the exemption, the Non-U.S. Holder must furnish to the applicable withholding agent a valid IRS Form W-8ECI, certifying that the dividends are effectively connected with the Non-U.S. Holder’s conduct of a trade or business within the United States.
135
Table of Contents
Any such effectively connected dividends will be subject to U.S. federal income tax on a net income basis at the regular graduated rates. A Non-U.S. Holder that is a corporation also may be subject to a branch profits tax at a rate of 30% (or such lower rate specified by an applicable income tax treaty) on such effectively connected dividends, as adjusted for certain items. Non-U.S. Holders should consult their tax advisors regarding any applicable tax treaties that may provide for different rules.
Sale or Other Taxable Disposition
Subject to the discussions below regarding backup withholding, a Non-U.S. Holder will not be subject to U.S. federal income tax on any gain realized upon the sale or other taxable disposition of our common stock unless:
| • | the gain is effectively connected with the Non-U.S. Holder’s conduct of a trade or business within the United States (and, if required by an applicable income tax treaty, the Non-U.S. Holder maintains a permanent establishment in the United States to which such gain is attributable); |
| • | the Non-U.S. Holder is a nonresident alien individual present in the United States for 183 days or more during the taxable year of the disposition and certain other requirements are met; or |
| • | our common stock constitutes a U.S. real property interest (“a USRPI”), by reason of our status as a U.S. real property holding corporation (“a USRPHC”), for U.S. federal income tax purposes. |
Gain described in the first bullet point above generally will be subject to U.S. federal income tax on a net income basis at the regular graduated rates. A Non-U.S. Holder that is a corporation also may be subject to a branch profits tax at a rate of 30% (or such lower rate specified by an applicable income tax treaty) on such effectively connected gain, as adjusted for certain items.
Gain described in the second bullet point above will be subject to U.S. federal income tax at a rate of 30% (or such lower rate specified by an applicable income tax treaty), which may be offset by certain U.S. source capital losses of the Non-U.S. Holder (even though the individual is not considered a resident of the United States), provided the Non-U.S. Holder has timely filed U.S. federal income tax returns with respect to such losses.
With respect to the third bullet point above, we believe we currently are not, and do not anticipate becoming, a USRPHC. Because the determination of whether we are a USRPHC depends, however, on the fair market value of our USRPIs relative to the fair market value of our non-U.S. real property interests and our other business assets, there can be no assurance we currently are not a USRPHC or will not become one in the future. Even if we are or were to become a USRPHC, gain arising from the sale or other taxable disposition by a Non-U.S. Holder will not be subject to U.S. federal income tax if our common stock is “regularly traded,” as defined by applicable Treasury Regulations, on an established securities market, and such Non-U.S. Holder owned, actually and constructively, 5% or less of our common stock throughout the shorter of the five-year period ending on the date of the sale or other taxable disposition or the Non-U.S. Holder’s holding period.
Non-U.S. Holders should consult their tax advisors regarding any applicable tax treaties that may provide for different rules.
Information Reporting and Backup Withholding
Payments of dividends on our common stock will not be subject to backup withholding, provided the Non-U.S. Holder certifies its non-U.S. status, such as by furnishing a valid IRS Form W-8BEN,
136
Table of Contents
W-8BEN-E or W-8ECI, or otherwise establishes an exemption. However, information returns are required to be filed with the IRS in connection with any dividends on our common stock paid to the Non-U.S. Holder, regardless of whether any tax was actually withheld. In addition, proceeds of the sale or other taxable disposition of our common stock within the United States or conducted through certain U.S.-related brokers generally will not be subject to backup withholding or information reporting if the applicable withholding agent receives the certification described above or the Non-U.S. Holder otherwise establishes an exemption. Proceeds of a disposition of our common stock conducted through a non-U.S. office of a non-U.S. broker that does not have certain enumerated relationships with the United States generally will not be subject to backup withholding or information reporting.
Copies of information returns that are filed with the IRS may also be made available under the provisions of an applicable treaty or agreement to the tax authorities of the country in which the Non-U.S. Holder resides or is established.
Backup withholding is not an additional tax. Any amounts withheld under the backup withholding rules may be allowed as a refund or a credit against a Non-U.S. Holder’s U.S. federal income tax liability, provided the required information is timely furnished to the IRS.
Additional Withholding Tax on Payments Made to Foreign Accounts
Withholding taxes may be imposed under Sections 1471 to 1474 of the Code, such Sections commonly referred to as the Foreign Account Tax Compliance Act (“FATCA”), on certain types of payments made to non-U.S. financial institutions and certain other non-U.S. entities. Specifically, a 30% withholding tax may be imposed on dividends on, or (subject to the proposed Treasury Regulations discussed below) gross proceeds from the sale or other disposition of, our common stock paid to a “foreign financial institution” or a “non-financial foreign entity” (each as defined in the Code), unless (1) the foreign financial institution undertakes certain diligence and reporting obligations, (2) the non-financial foreign entity either certifies it does not have any “substantial United States owners” (as defined in the Code) or furnishes identifying information regarding each substantial United States owner, or (3) the foreign financial institution or non-financial foreign entity otherwise qualifies for an exemption from these rules. If the payee is a foreign financial institution and is subject to the diligence and reporting requirements in (1) above, it must enter into an agreement with the U.S. Department of the Treasury requiring, among other things, that it undertake to identify accounts held by certain “specified United States persons” or “United States-owned foreign entities” (each as defined in the Code), annually report certain information about such accounts, and withhold 30% on certain payments to non-compliant foreign financial institutions and certain other account holders. Foreign financial institutions located in jurisdictions that have an intergovernmental agreement with the United States governing FATCA may be subject to different rules.
Under the applicable Treasury Regulations and administrative guidance, withholding under FATCA generally applies to payments of dividends on our common stock. While, beginning on January 1, 2019, withholding under FATCA would have applied also to payments of gross proceeds from the sale or other disposition of our common stock, recently proposed Treasury Regulations eliminate FATCA withholding on payments of gross proceeds entirely. Taxpayers generally may rely on these proposed Treasury Regulations until final Treasury Regulations are issued.
Prospective investors should consult their tax advisors regarding the potential application of withholding under FATCA to their investment in our common stock.
137
Table of Contents
We and the underwriters named below have entered into an underwriting agreement with respect to the shares being offered. Subject to certain conditions, each underwriter has severally agreed to purchase the number of shares indicated in the following table. Goldman Sachs & Co. LLC is the representative of the underwriters.
| Underwriters |
Number of Shares |
|||
| Goldman Sachs & Co. LLC |
||||
|
|
|
|||
| Total |
||||
|
|
|
|||
The underwriters are committed to take and pay for all of the shares being offered, if any are taken, other than the shares covered by the option described below unless and until this option is exercised.
The underwriters have an option to buy up to an additional shares from us to cover sales by the underwriters of a greater number of shares than the total number set forth in the table above. They may exercise that option for 30 days. If any shares are purchased pursuant to this option, the underwriters will severally purchase shares in approximately the same proportion as set forth in the table above.
The following table shows the per share and total underwriting discounts and commissions to be paid to the underwriters by us. Such amounts are shown assuming both no exercise and full exercise of the underwriters’ option to purchase up to additional shares from us.
| No Exercise | Full Exercise | |||||||
| Per Share |
$ | $ | ||||||
| Total |
$ | $ | ||||||
Shares sold by the underwriters to the public will initially be offered at the initial public offering price set forth on the cover of this prospectus. Any shares sold by the underwriters to securities dealers may be sold at a discount of up to $ per share from the initial public offering price. After the initial offering of the shares, the representative may change the offering price and the other selling terms.
The offering of the shares by the underwriters is subject to receipt and acceptance and subject to the underwriters’ right to reject any order in whole or in part.
We and our executive officers, directors, and holders of substantially all of our capital stock, warrants and options have agreed or will agree with the underwriters, subject to certain exceptions, not to dispose of or hedge any of our or their common stock or securities convertible into or exchangeable for shares of common stock during the period from the date of this prospectus continuing through the date 180 days after the date of this prospectus, except with the prior written consent of Goldman Sachs & Co. LLC. This agreement does not apply to any existing employee benefit plans. See the section of this prospectus titled “Shares Eligible for Future Sale” for a discussion of certain transfer restrictions.
Before this offering, there has been no public market for our common stock. The initial public offering price was determined through negotiations among us, the selling stockholders, and the representatives. In addition to prevailing market conditions, the factors considered in determining the initial public offering price were:
| • | the valuation multiples of publicly traded companies that the representatives believe to be comparable to us; |
138
Table of Contents
| • | our financial information; |
| • | the history of, and the prospects for, our company and the industry in which we compete; |
| • | an assessment of our management, our past and present operations, and the prospects for, and timing of, our future financial performance; |
| • | the present state of our development; and |
| • | the above factors in relation to market values and various valuation measures of other companies engaged in activities similar to ours. |
An active trading market for the shares may not develop. It is also possible that after the offering the shares will not trade in the public market at or above the initial public offering price.
In connection with the offering, the underwriters may purchase and sell shares of our common stock in the open market. These transactions may include short sales, stabilizing transactions and purchases to cover positions created by short sales. Short sales involve the sale by the underwriters of a greater number of shares than they are required to purchase in the offering, and a short position represents the amount of such sales that have not been covered by subsequent purchases. A “covered short position” is a short position that is not greater than the amount of additional shares for which the underwriters’ option described above may be exercised. The underwriters may cover any covered short position by either exercising their option to purchase additional shares or purchasing shares in the open market. In determining the source of shares to cover the covered short position, the underwriters will consider, among other things, the price of shares available for purchase in the open market as compared to the price at which they may purchase additional shares pursuant to the option described above. “Naked” short sales are any short sales that create a short position greater than the amount of additional shares for which the option described above may be exercised. The underwriters must cover any such naked short position by purchasing shares in the open market. A naked short position is more likely to be created if the underwriters are concerned that there may be downward pressure on the price of the common stock in the open market after pricing that could adversely affect investors who purchase in the offering. Stabilizing transactions consist of various bids for or purchases of common stock made by the underwriters in the open market prior to the completion of the offering.
The underwriters may also impose a penalty bid. This occurs when a particular underwriter repays to the underwriters a portion of the underwriting discount received by it because the representative has repurchased shares sold by or for the account of such underwriter in stabilizing or short covering transactions.
Purchases to cover a short position and stabilizing transactions, as well as other purchases by the underwriters for their own accounts, may have the effect of preventing or retarding a decline in the market price of our stock, and together with the imposition of the penalty bid, may stabilize, maintain or otherwise affect the market price of the common stock. As a result, the price of the common stock may be higher than the price that otherwise might exist in the open market. The underwriters are not required to engage in these activities and may end any of these activities at any time. These transactions may be effected on the , in the over-the-counter market or otherwise.
We estimate that our share of the total expenses of the offering, excluding underwriting discounts and commissions, will be approximately $ . We have agreed to reimburse the underwriters for certain of their expenses in an amount up to $ .
We have agreed to indemnify the several underwriters against certain liabilities, including liabilities under the Securities Act.
139
Table of Contents
The underwriters and their respective affiliates are full service financial institutions engaged in various activities, which may include sales and trading, commercial and investment banking, advisory, investment management, investment research, principal investment, hedging, market making, brokerage and other financial and non-financial activities and services. Certain of the underwriters and their respective affiliates have provided, and may in the future provide, a variety of these services to the issuer and to persons and entities with relationships with the issuer, for which they received or will receive customary fees and expenses.
In the ordinary course of their various business activities, the underwriters and their respective affiliates, officers, directors and employees may purchase, sell or hold a broad array of investments and actively traded securities, derivatives, loans, commodities, currencies, credit default swaps and other financial instruments for their own account and for the accounts of their customers, and such investment and trading activities may involve or relate to assets, securities or instruments of the issuer (directly, as collateral securing other obligations or otherwise) or persons and entities with relationships with the issuer. The underwriters and their respective affiliates may also communicate independent investment recommendations, market color or trading ideas or publish or express independent research views in respect of such assets, securities or instruments and may at any time hold, or recommend to clients that they should acquire, long and/or short positions in such assets, securities and instruments.
European Economic Area
In relation to each Member State of the European Economic Area which has implemented the Prospectus Directive, each, a “Relevant Member State,” an offer to the public of our common stock may not be made in that Relevant Member State, except that an offer to the public in that Relevant Member State of our common stock may be made at any time under the following exemptions under the Prospectus Directive:
| • | To any legal entity which is a qualified investor as defined in the Prospectus Directive; |
| • | To fewer than 150 natural or legal persons (other than qualified investors as defined in the Prospectus Directive), subject to obtaining the prior consent of Goldman Sachs & Co. LLC for any such offer; or |
| • | In any other circumstances falling within Article 3(2) of the Prospectus Directive; |
provided that no such offer or shares of our common stock shall require us or any underwriter to publish a prospectus pursuant to Article 3 of the Prospectus Directive.
For the purposes of this provision, the expression an “offer to public” in relation to our common stock in any Relevant Member State means the communication in any form and by any means of sufficient information on the terms of the offer and our common stock to be offered so as to enable an investor to decide to purchase our common stock, as the same may be varied in that Member State by any measure implementing the Prospectus Directive in that Member State, and the expression “Prospectus Directive” means Directive 2003/71/EC (as amended), including by Directive 2010/73/EU and includes any relevant implementing measure in the Relevant Member State.
This European Economic Area selling restriction is in addition to any other selling restrictions set out below.
United Kingdom
In the United Kingdom, this prospectus is only addressed to and directed at qualified investors who are (i) investment professionals falling within Article 19(5) of the Financial Services and Markets
140
Table of Contents
Act 2000 (Financial Promotion) Order 2005 (the “Order”); or (ii) high net worth entities and other persons to whom it may lawfully be communicated, falling within Article 49(2)(a) to (d) of the Order (all such persons together being referred to as “relevant persons”). Any investment or investment activity to which this prospectus relates is available only to relevant persons and will only be engaged in with relevant persons. Any person who is not a relevant person should not act or rely on this prospectus or any of its contents.
Canada
The securities may be sold in Canada only to purchasers purchasing, or deemed to be purchasing, as principal that are accredited investors, as defined in National Instrument 45-106 Prospectus Exemptions or subsection 73.3(1) of the Securities Act (Ontario), and are permitted clients, as defined in National Instrument 31-103 Registration Requirements, Exemptions, and Ongoing Registrant Obligations. Any resale of the securities must be made in accordance with an exemption form, or in a transaction not subject to, the prospectus requirements of applicable securities laws.
Securities legislation in certain provinces or territories of Canada may provide a purchaser with remedies for rescission or damages if this prospectus (including any amendment thereto) contains a misrepresentation, provided that the remedies for rescission or damages are exercised by the purchaser within the time limit prescribed by the securities legislation of the purchaser’s province or territory. The purchaser should refer to any applicable provisions of the securities legislation of the purchaser’s province or territory for particulars of these rights or consult with a legal advisor.
Pursuant to section 3A.3 of National Instrument 33-105 Underwriting Conflicts (NI 33-105), the underwriters are not required to comply with the disclosure requirements of NI 33-105 regarding underwriter conflicts of interest in connection with this offering.
Hong Kong
The securities may not be offered or sold in Hong Kong by means of any document other than (i) in circumstances which do not constitute an offer to the public within the meaning of the Companies (Winding Up and Miscellaneous Provisions) Ordinance (Cap. 32 of the Laws of Hong Kong), or the Companies (Winding Up and Miscellaneous Provisions Ordinance, or which do not constitute an invitation to the public within the meaning of the Securities and Futures Ordinance (Cap. 571 of the Laws of Hong Kong), or the Securities and Futures Ordinance, or (ii) to “professional investors” as defined in the Securities and Futures Ordinance and any rules made thereunder, or (iii) in other circumstances which do not result in the document being a “prospectus” as defined in the Companies (Winding Up and Miscellaneous Provisions) Ordinance, and no advertisement, invitation or document relating to the securities may be issued or may be in the possession of any person for the purpose of issue (in each case whether in Hong Kong or elsewhere), which is directed at, or the contents of which are likely to be accessed or read by, the public in Hong Kong (except if permitted to do so under the securities laws of Hong Kong) other than with respect to shares which are or are intended to be disposed of only to persons outside Hong Kong or only to “professional investors” in Hong Kong as defined in the Securities and Futures Ordinance and any rules made thereunder.
Singapore
This prospectus has not been registered as a prospectus with the Monetary Authority of Singapore. Accordingly, the shares of common stock were not offered or sold or caused to be made the subject of an invitation for subscription or purchase and will not be offered or sold or caused to be made the subject of an invitation for subscription or purchase, and has not circulated or distributed, nor will it circulate or distribute, this prospectus or any other document or material in connection with the
141
Table of Contents
offer or sale, or invitation for subscription or purchase, of the shares of common stock, whether directly or indirectly, to any person in Singapore other than (i) to an institutional investor (as defined in Section 4A of the Securities and Futures Act (Chapter 289) of Singapore, as modified or amended from time to time (the “SFA”)) pursuant to Section 274 of the SFA, (ii) to a relevant person (as defined in Section 275(2) of the SFA) pursuant to Section 275(1) of the SFA, or any person pursuant to Section 275(1A) of the SFA, and in accordance with the conditions specified in Section 275 of the SFA, or (iii) otherwise pursuant to, and in accordance with the conditions of, any other applicable provision of the SFA.
Where the shares of common stock are subscribed or purchased under Section 275 of the SFA by a relevant person which is:
| (a) | a corporation (which is not an accredited investor (as defined in Section 4A of the SFA)) the sole business of which is to hold investments and the entire share capital of which is owned by one or more individuals, each of whom is an accredited investor; or |
| (b) | a trust (where the trustee is not an accredited investor) whose sole purpose is to hold investments and each beneficiary of the trust is an individual who is an accredited investor, |
securities or securities-based derivatives contracts (each term as defined in Section 2(1) of the SFA) of that corporation or the beneficiaries’ rights and interest (howsoever described) in that trust shall not be transferred within six months after that corporation or that trust has acquired the shares of common stock pursuant to an offer made under Section 275 of the SFA except:
| (a) | to an institutional investor or to a relevant person, or to any person arising from an offer referred to in Section 275(1A) or Section 276(4)(i)(B) of the SFA; |
| (b) | where no consideration is or will be given for the transfer; |
| (c) | where the transfer is by operation of law; or |
| (d) | as specified in Section 276(7) of the SFA. |
In connection with Section 309B of the SFA and the Capital Markets Products (the “CMP”) Regulations 2018, the shares of common stock are prescribed capital markets products (as defined in the CMP Regulations 2018) and Excluded Investment Products (as defined in Monetary Authority of Singapore Notice SFA 04-N12: Notice on the Sale of Investment Products and Monetary Authority of Singapore Notice FAA-N16: Notice on Recommendations on Investment Products).
Japan
The securities have not been and will not be registered under the Financial Instruments and Exchange Act of Japan (Act No. 25 of 1948, as amended), or the FIEA. The securities may not be offered or sold, directly or indirectly, in Japan or to or for the benefit of any resident of Japan (including any person resident in Japan or any corporation or other entity organized under the laws of Japan) or to others for reoffering or resale, directly or indirectly, in Japan or to or for the benefit of any resident of Japan, except pursuant to an exemption from the registration requirements of the FIEA and otherwise in compliance with any relevant laws and regulations of Japan.
Australia
No placement document, prospectus, product disclosure statement or other disclosure document has been lodged with the Australian Securities and Investments Commission, or ASIC, in relation to the offering. This offering document does not constitute a prospectus, product disclosure statement or other disclosure document under the Corporations Act 2001, or the Corporations Act, and does not purport to include the information required for a prospectus, product disclosure statement or other disclosure document under the Corporations Act.
142
Table of Contents
Any offer in Australia of the shares may only be made to persons, or the Exempt Investors, who are “sophisticated investors” (within the meaning of section 708(8) of the Corporations Act), “professional investors” (within the meaning of section 708(11) of the Corporations Act) or otherwise pursuant to one or more exemptions contained in section 708 of the Corporations Act so that it is lawful to offer the shares without disclosure to investors under Chapter 6D of the Corporations Act.
The shares applied for by Exempt Investors in Australia must not be offered for sale in Australia in the period of twelve months after the date of allotment under the offering, except in circumstances where disclosure to investors under Chapter 6D of the Corporations Act would not be required pursuant to an exemption under section 708 of the Corporations Act or otherwise or where the offer is pursuant to a disclosure document which complies with Chapter 6D of the Corporations Act. Any person acquiring shares must observe such Australian on-sale restrictions.
This offering document contains general information only and does not take account of the investment objectives, financial situation or particular needs of any particular person. It does not contain any securities recommendations or financial product advice. Before making an investment decision, investors need to consider whether the information in this offering document is appropriate to their needs, objectives and circumstances, and, if necessary, seek expert advice on those matters.
Dubai International Financial Centre
This offering document relates to an Exempt Offer in accordance with the Offered Securities Rules of the Dubai Financial Services Authority, or the DFSA. This offering document is intended for distribution only to persons of a type specified in the Offered Securities Rules of the DFSA. It must not be delivered to, or relied on by, any other person. The DFSA has no responsibility for reviewing or verifying any documents in connection with Exempt Offers. The DFSA has not approved this prospectus nor taken steps to verify the information set forth in this prospectus and has no responsibility for the offering document. The securities to which this offering document relates may be illiquid and/or subject to restrictions on their resale. Prospective purchasers of the securities offered should conduct their own due diligence on the securities. If you do not understand the contents of this offering document you should consult an authorized financial advisor.
Switzerland
We have not and will not register with the Swiss Financial Market Supervisory Authority, or the FINMA, as a foreign collective investment scheme pursuant to Article 119 of the Federal Act on Collective Investment Scheme of 23 June 2006, as amended, or CISA, and accordingly the securities being offered pursuant to this prospectus have not and will not be approved, and may not be licenseable, with FINMA. Therefore, the securities have not been authorized for distribution by FINMA as a foreign collective investment scheme pursuant to Article 119 CISA and the securities offered hereby may not be offered to the public (as this term is defined in Article 3 CISA) in or from Switzerland. The securities may solely be offered to “qualified investors,” as this term is defined in Article 10 CISA, and in the circumstances set out in Article 3 of the Ordinance on Collective Investment Scheme of 22 November 2006, as amended, or CISO, such that there is no public offer. Investors, however, do not benefit from protection under CISA or CISO or supervision by FINMA. This prospectus and any other materials relating to the securities are strictly personal and confidential to each offeree and do not constitute an offer to any other person. This prospectus may only be used by those qualified investors to whom it has been handed out in connection with the offer described in this prospectus and may neither directly or indirectly be distributed or made available to any person or entity other than its recipients. It may not be used in connection with any other offer and shall in particular not be copied and/or distributed to the public in Switzerland or from Switzerland. This prospectus does not constitute an issue prospectus as that term is understood pursuant to Article 652a
143
Table of Contents
and/or 1156 of the Swiss Federal Code of Obligations. We have not applied for a listing of the securities on the SIX Swiss Exchange or any other regulated securities market in Switzerland, and consequently, the information presented in this prospectus does not necessarily comply with the information standards set out in the listing rules of the SIX Swiss Exchange and corresponding prospectus schemes annexed to the listing rules of the SIX Swiss Exchange.
144
Table of Contents
Latham & Watkins LLP, has passed upon the validity of the shares of common stock offered hereby on our behalf. The underwriters are being represented by Cooley LLP, in connection with the offering.
The consolidated financial statements as of December 30, 2018 and December 31, 2017 and for the years ended December 30, 2018 and December 31, 2017, included in this prospectus have been audited by Deloitte & Touche LLP (“Deloitte”), an independent registered public accounting firm, as stated in their report appearing herein (which report expresses an unqualified opinion on the consolidated financial statements and includes an explanatory paragraph referring to the reorganization described in Note 1 to the consolidated financial statements). Such consolidated financial statements have been so included in reliance upon the report of such firm given upon their authority as experts in accounting and auditing.
Deloitte advised the Audit Committee of the Company’s Board of Directors (the “Audit Committee”) that two loaned staff arrangements, a contingent fee arrangement, and a business relationship had been entered into between companies owned by funds affiliated with H.I.G. Capital (the “HIG Funds”) and Deloitte Touche Tohmatsu Limited entities in four separate foreign countries during certain periods in 2017, 2018, and 2019. Although these relationships were entered into when the companies were not considered affiliates of the Company pursuant to the standards under which the prior audit engagements were performed (U.S. GAAS), these relationships were deemed to be prohibited under the SEC’s auditor independence rules.
Deloitte informed the Audit Committee that Deloitte maintained objectivity and impartiality on all issues encompassed within its audits of the Company’s consolidated financial statements for the year ending December 29, 2019 and years ended December 30, 2018 and December 31, 2017 because:
| • | the impermissible loaned staff arrangements, contingent fee arrangement, and business relationship had no impact on the Company’s financial statements and were not subject to Deloitte’s audits; |
| • | the impermissible loaned staff arrangements, contingent fee arrangement, and business relationship had been performed for HIG Funds portfolio companies that are immaterial to HIG and unrelated to the Company (other than the common ownership of the HIG Funds); |
| • | Deloitte’s audit team for the Company had not been previously aware of the impermissible loaned staff arrangements, contingent fee arrangement, and business relationship and was not involved in the provision of such services; and |
| • | the impermissible loaned staff arrangements, contingent fee arrangement, and business relationship have been terminated. |
After considering the facts and circumstances, the Audit Committee concurred with Deloitte’s conclusion that, for the reasons described above, the impermissible relationships did not impair Deloitte’s objectivity and impartiality with respect to the planning and execution of the audits of the Company’s consolidated financial statements for the year ending December 29, 2019 and years ended December 30, 2018 and December 31, 2017. The Audit Committee was the Audit Committee prior to this offering and consisted of Michael Mardy, John Kim, and Evan Karp.
145
Table of Contents
WHERE YOU CAN FIND MORE INFORMATION
We have filed with the SEC a registration statement on Form S-1 under the Securities Act with respect to the shares of common stock offered hereby. This prospectus does not contain all of the information set forth in the registration statement and the exhibits and schedules thereto. For further information with respect to us and the shares of common stock offered hereby, you should refer to the registration statement and to the exhibits and schedules filed therewith. Statements contained in this prospectus regarding the contents of any contract or any other document that is filed as an exhibit to the registration statement are not necessarily complete, and each such statement is qualified in all respects by reference to the full text of such contract or other document filed as an exhibit to the registration statement. When we complete this offering, we will be required to file annual, quarterly and current reports, proxy statements and other information with the SEC. The SEC maintains a website at www.sec.gov that contains reports, proxy and information statements and other information regarding registrants that file electronically with the SEC.
You can read our SEC filings, including the registration statement, over the internet at the SEC’s website at www.sec.gov. Upon completion of this offering, we will be subject to the information reporting requirements of the Exchange Act, and we will file reports, proxy statements and other information with the SEC. These reports, proxy statements, and other information will be available via the SEC’s website at www.sec.gov. We also maintain a website at www.lulus.com, at which you may access these materials free of charge as soon as reasonably practicable after they are electronically filed with, or furnished to, the SEC. However, the information contained in or accessible through our website is not part of this prospectus or the registration statement of which this prospectus forms a part, and investors should not rely on such information in making a decision to purchase our common stock in this offering.
146
Table of Contents
LULU’S FASHION LOUNGE HOLDINGS, INC.
INDEX TO CONSOLIDATED FINANCIAL STATEMENTS
| Page | ||||
| Audited Consolidated Financial Statements |
||||
| F-2 | ||||
| Financial Statements: |
||||
| F-3 | ||||
| F-4 | ||||
| Consolidated Statements of Convertible Preferred Stock and Stockholder’s Deficit |
F-5 | |||
| F-6 | ||||
| F-7 | ||||
| Unaudited Condensed Consolidated Financial Statements |
||||
| Financial Statements: |
||||
| F-27 | ||||
| Condensed Consolidated Statements of Income and Comprehensive Income |
F-28 | |||
| Condensed Consolidated Statements of Convertible Preferred Stock and Stockholder’s Deficit |
F-29 | |||
| F-30 | ||||
| F-31 | ||||
F-1
Table of Contents
REPORT OF INDEPENDENT REGISTERED PUBLIC ACCOUNTING FIRM
To the stockholders and Board of Directors of Lulu’s Fashion Lounge Holdings, Inc.
Opinion on the Financial Statements
We have audited the accompanying consolidated balance sheets of Lulu’s Fashion Lounge Holdings, Inc. and subsidiaries (the “Company”) as of December 30, 2018 and December 31, 2017, the related consolidated statements of income and comprehensive income, convertible preferred stock and stockholder’s deficit, and cash flows, for the years ended December 30, 2018 and December 31, 2017, and the related notes (collectively referred to as the “financial statements”). In our opinion, the financial statements present fairly, in all material respects, the financial position of the Company as of December 30, 2018 and December 31, 2017, and the results of its operations and its cash flows for the years ended December 30, 2018 and December 31, 2017, in conformity with accounting principles generally accepted in the United States of America.
Basis for Opinion
These financial statements are the responsibility of the Company’s management. Our responsibility is to express an opinion on the Company’s financial statements based on our audits. We are a public accounting firm registered with the Public Company Accounting Oversight Board (United States) (PCAOB) and are required to be independent with respect to the Company in accordance with the U.S. federal securities laws and the applicable rules and regulations of the Securities and Exchange Commission and the PCAOB.
We conducted our audits in accordance with the standards of the PCAOB and in accordance with auditing standards generally accepted in the United States of America. Those standards require that we plan and perform the audit to obtain reasonable assurance about whether the financial statements are free of material misstatement, whether due to error or fraud. The Company is not required to have, nor were we engaged to perform, an audit of its internal control over financial reporting. As part of our audits, we are required to obtain an understanding of internal control over financial reporting but not for the purpose of expressing an opinion on the effectiveness of the Company’s internal control over financial reporting. Accordingly, we express no such opinion.
Our audits included performing procedures to assess the risks of material misstatement of the financial statements, whether due to error or fraud, and performing procedures that respond to those risks. Such procedures included examining, on a test basis, evidence regarding the amounts and disclosures in the financial statements. Our audits also included evaluating the accounting principles used and significant estimates made by management, as well as evaluating the overall presentation of the financial statements. We believe that our audits provide a reasonable basis for our opinion.
Emphasis of a Matter
As discussed in Note 1 to the financial statements, on August 25, 2017, Lulu’s Holdings, L.P. (formerly Lulu’s Holdings, LLC), the Company’s parent, completed a multi-step internal corporate reorganization that resulted in Lulu’s Fashion Lounge, LLC (formerly Lulu’s Fashion Lounge, Inc.) becoming an indirect wholly-owned subsidiary of the Company. As a result of the reorganization, the accompanying consolidated statements of income and comprehensive income, convertible preferred stock and stockholder’s deficit, and cash flows for the year ended December 31, 2017 include the historical operations of Lulu’s Fashion Lounge, LLC prior to the reorganization.
/s/ Deloitte & Touche LLP
San Francisco, California
June 21, 2019 (November 19, 2019, as to Note 15)
We have served as the Company’s auditor since 2017.
F-2
Table of Contents
LULU’S FASHION LOUNGE HOLDINGS, INC.
Consolidated Balance Sheets
(In thousands, except share and per share amounts)
| As of December 31, 2017 |
As of December 30, 2018 |
Pro Forma As of December 30, 2018 |
||||||||||
| (Unaudited) | ||||||||||||
| Assets |
||||||||||||
| Current assets: |
||||||||||||
| Cash and cash equivalents |
$ | 5,637 | $ | 7,747 | ||||||||
| Accounts receivable |
1,368 | 2,282 | ||||||||||
| Inventories |
19,004 | 24,315 | ||||||||||
| Asset for recovery |
2,856 | 2,882 | ||||||||||
| Income tax refund receivable |
2,619 | 2,920 | ||||||||||
| Prepaids and other current assets |
1,614 | 2,181 | ||||||||||
|
|
|
|
|
|||||||||
| Total current assets |
33,098 | 42,327 | ||||||||||
| Restricted cash |
502 | 503 | ||||||||||
| Property and equipment, net |
2,579 | 3,100 | ||||||||||
| Goodwill |
35,430 | 35,430 | ||||||||||
| Tradename |
18,509 | 18,509 | ||||||||||
| Other intangible assets, net |
2,042 | 2,488 | ||||||||||
| Other non-current assets |
300 | 1,324 | ||||||||||
|
|
|
|
|
|||||||||
| Total assets |
$ | 92,460 | $ | 103,681 | ||||||||
|
|
|
|
|
|||||||||
| Liabilities, Convertible Preferred Stock and Stockholder’s Deficit |
||||||||||||
| Current liabilities: |
||||||||||||
| Accounts payable |
$ | 7,203 | $ | 5,559 | ||||||||
| Accrued expenses |
3,555 | 10,397 | ||||||||||
| Returns reserve |
6,043 | 7,493 | ||||||||||
| Stored-value card liability |
1,531 | 3,033 | ||||||||||
| Long-term debt, current portion |
10,125 | 10,125 | ||||||||||
|
|
|
|
|
|||||||||
| Total current liabilities |
28,457 | 36,607 | ||||||||||
| Long-term debt, net of current portion |
113,934 | 108,203 | ||||||||||
| Other non-current liabilities |
1,796 | 1,683 | ||||||||||
|
|
|
|
|
|||||||||
| Total liabilities |
144,187 | 146,493 | ||||||||||
|
|
|
|
|
|||||||||
| Commitments and Contingencies (Note 8) |
— | — | ||||||||||
| Convertible preferred stock: $0.001 par value—3,129,634 shares authorized, issued and outstanding as of December 30, 2018; no shares issued and outstanding, pro forma (unaudited) |
— | 117,038 | $ | — | ||||||||
| Stockholder’s deficit: |
||||||||||||
| Common stock of Lulu’s Fashion Lounge Holdings, Inc.; $0.001 par value—20,591,917 shares authorized and 20,591,917 and 17,462,283 issued and outstanding as of December 31, 2017 and December 30, 2018, respectively; 20,591,917 shares issued and outstanding, pro forma (unaudited) |
21 | 18 | 21 | |||||||||
| Additional paid-in capital |
— | — | 117,035 | |||||||||
| Accumulated deficit |
(51,748 | ) | (159,868 | ) | (159,868 | ) | ||||||
|
|
|
|
|
|
|
|||||||
| Total stockholder’s deficit |
(51,727 | ) | (159,850 | ) | $ | (42,812 | ) | |||||
|
|
|
|
|
|
|
|||||||
| Total liabilities, convertible preferred stock and stockholder’s deficit |
$ | 92,460 | $ | 103,681 | ||||||||
|
|
|
|
|
|||||||||
The accompanying notes are an integral part of the consolidated financial statements.
F-3
Table of Contents
LULU’S FASHION LOUNGE HOLDINGS, INC.
Consolidated Statements of Income and Comprehensive Income
(In thousands, except share and per share amounts)
| Year ended December 31, 2017 |
Year ended December 30, 2018 |
|||||||
| Net sales |
$ | 232,469 | $ | 297,111 | ||||
| Cost of goods sold |
122,234 | 164,814 | ||||||
|
|
|
|
|
|||||
| Gross profit |
110,235 | 132,297 | ||||||
| Selling and marketing expenses |
32,906 | 56,639 | ||||||
| General and administrative expenses |
43,461 | 57,030 | ||||||
|
|
|
|
|
|||||
| Income from operations |
33,868 | 18,628 | ||||||
|
|
|
|
|
|||||
| Other income (expense), net: |
||||||||
| Interest expense |
(9,290 | ) | (13,700 | ) | ||||
| Loss on debt extinguishment |
(1,170 | ) | — | |||||
| Other income |
33 | 417 | ||||||
|
|
|
|
|
|||||
| Total other expense, net |
(10,427 | ) | (13,283 | ) | ||||
|
|
|
|
|
|||||
| Income before provision for income taxes |
23,441 | 5,345 | ||||||
| Provision for income taxes |
8,531 | 4,219 | ||||||
|
|
|
|
|
|||||
| Net income and comprehensive income |
$ | 14,910 | $ | 1,126 | ||||
|
|
|
|
|
|||||
| Net income attributable to common stockholder—Basic and Diluted |
$ | 14,910 | $ | 1,002 | ||||
|
|
|
|
|
|||||
| Net income per share attributable to common stockholder—Basic and Diluted |
$ | 0.72 | $ | 0.05 | ||||
|
|
|
|
|
|||||
| Shares used to compute net income per share attributable to common stockholder—Basic and Diluted |
20,591,917 | 18,328,291 | ||||||
|
|
|
|
|
|||||
| Pro forma net income attributable to common stockholders—Basic and Diluted (unaudited) |
$ | 1,126 | ||||||
|
|
|
|||||||
| Pro forma net income per share attributable to common stockholders—Basic and Diluted (unaudited) |
$ | 0.05 | ||||||
|
|
|
|||||||
| Shares used to compute pro forma net income per share attributable to common stockholders—Basic and Diluted (unaudited) |
20,591,917 | |||||||
|
|
|
|||||||
The accompanying notes are an integral part of the consolidated financial statements.
F-4
Table of Contents
LULU’S FASHION LOUNGE HOLDINGS, INC.
Consolidated Statements of Convertible Preferred Stock and Stockholder’s Deficit
(In thousands, except share amounts)
| Convertible Preferred Stock |
Lulu’s Fashion Lounge Holdings, Inc. Common Stock |
Lulu’s Fashion Lounge Holdings, Inc. Common Stock |
Additional Paid-In Capital |
Accumulated Deficit |
Total Stockholder’s Deficit |
|||||||||||||||||||||||||||||||
| Units | Amount | Units | Amount | Units | Amount | |||||||||||||||||||||||||||||||
| Balance at January 1, 2017 |
— | $ | — | 2,000 | $ | — | — | $ | — | $ | — | $ | (6,094 | ) | $ | (6,094 | ) | |||||||||||||||||||
| Reorganization |
— | — | (2,000 | ) | — | 20,591,917 | 21 | — | (21 | ) | — | |||||||||||||||||||||||||
| Equity-based compensation expense (Note 12) |
— | — | — | — | — | — | 641 | — | 641 | |||||||||||||||||||||||||||
| Dividends to Parent |
— | — | — | — | — | — | (641 | ) | (60,543 | ) | (61,184 | ) | ||||||||||||||||||||||||
| Net Income |
— | — | — | — | — | — | — | 14,910 | 14,910 | |||||||||||||||||||||||||||
|
|
|
|
|
|
|
|
|
|
|
|
|
|
|
|
|
|
|
|||||||||||||||||||
| Balance at December 31, 2017 |
— | — | — | — | 20,591,917 | 21 | — | (51,748 | ) | (51,727 | ) | |||||||||||||||||||||||||
| Series A Preferred Stock issuance, net of issuance costs |
3,129,634 | 117,038 | — | — | — | — | — | — | — | |||||||||||||||||||||||||||
| Repurchase of Common Stock from Parent |
— | — | — | — | (3,129,634 | ) | (3 | ) | (4,047 | ) | (109,246 | ) | (113,296 | ) | ||||||||||||||||||||||
| Equity-based compensation expense (Note 12) |
— | — | — | — | — | — | 4,047 | — | 4,047 | |||||||||||||||||||||||||||
| Net Income |
— | — | — | — | — | — | — | 1,126 | 1,126 | |||||||||||||||||||||||||||
|
|
|
|
|
|
|
|
|
|
|
|
|
|
|
|
|
|
|
|||||||||||||||||||
| Balance at December 30, 2018 |
3,129,634 | $ | 117,038 | — | $ | — | 17,462,283 | $ | 18 | $ | — | $ | (159,868 | ) | $ | (159,850 | ) | |||||||||||||||||||
|
|
|
|
|
|
|
|
|
|
|
|
|
|
|
|
|
|
|
|||||||||||||||||||
The accompanying notes are an integral part of the consolidated financial statements.
F-5
Table of Contents
LULU’S FASHION LOUNGE HOLDINGS, INC.
Consolidated Statements of Cash Flows
(In thousands, except share amounts)
| Year ended December 31, 2017 |
Year ended December 30, 2018 |
|||||||
| Cash Flows from Operating Activities |
||||||||
| Net income |
$ | 14,910 | $ | 1,126 | ||||
| Adjustments to reconcile net income to net cash provided by operating activities: |
||||||||
| Depreciation and amortization |
1,682 | 2,564 | ||||||
| Amortization of debt discount and debt issuance costs |
1,037 | 1,927 | ||||||
| Equity-based compensation expense |
641 | 4,047 | ||||||
| Deferred income taxes |
(332 | ) | (1,419 | ) | ||||
| Loss on debt extinguishment |
1,115 | — | ||||||
| Other |
200 | — | ||||||
| Changes in operating assets and liabilities: |
||||||||
| Accounts receivable |
706 | (914 | ) | |||||
| Inventories |
(11,364 | ) | (5,311 | ) | ||||
| Asset for recovery |
(798 | ) | (26 | ) | ||||
| Income tax refund receivable |
(2,375 | ) | (1,389 | ) | ||||
| Prepaids and other assets |
(322 | ) | (567 | ) | ||||
| Accounts payable |
2,906 | (1,520 | ) | |||||
| Accrued expenses and other liabilities |
2,822 | 9,764 | ||||||
| Non-current liabilities |
— | 1,189 | ||||||
|
|
|
|
|
|||||
| Net cash provided by operating activities |
10,828 | 9,471 | ||||||
|
|
|
|
|
|||||
| Cash Flows from Investing Activities |
||||||||
| Capitalized software expenditures |
(1,442 | ) | (1,862 | ) | ||||
| Purchases of property and equipment |
(2,153 | ) | (1,626 | ) | ||||
|
|
|
|
|
|||||
| Net cash used in investing activities |
(3,595 | ) | (3,488 | ) | ||||
|
|
|
|
|
|||||
| Cash Flows from Financing Activities |
||||||||
| Proceeds from issuance of long-term debt, net of discount |
130,950 | — | ||||||
| Repayment of long-term debt |
(71,128 | ) | (7,594 | ) | ||||
| Payment of debt issuance costs |
(5,319 | ) | — | |||||
| Dividends to Parent |
(61,184 | ) | — | |||||
| Repurchase of Common Stock from Parent |
— | (113,296 | ) | |||||
| Proceeds from issuance of Series A Preferred Stock, net of issuance costs |
— | 117,038 | ||||||
| Other |
— | (20 | ) | |||||
|
|
|
|
|
|||||
| Net cash used in financing activities |
(6,681 | ) | (3,872 | ) | ||||
|
|
|
|
|
|||||
| Net increase in cash, cash equivalents and restricted cash |
552 | 2,111 | ||||||
| Cash, cash equivalents and restricted cash at beginning of period |
5,587 | 6,139 | ||||||
|
|
|
|
|
|||||
| Cash, cash equivalents and restricted cash at end of period |
$ | 6,139 | $ | 8,250 | ||||
|
|
|
|
|
|||||
| Supplemental Disclosure of Non-Cash Investing Activities |
||||||||
| Purchases of property and equipment included in accounts payable |
$ | 178 | $ | 54 | ||||
| Supplemental Disclosure |
||||||||
| Cash paid for income taxes |
$ | 11,265 | $ | 5,833 | ||||
| Cash paid for interest |
$ | 7,992 | $ | 10,799 | ||||
The accompanying notes are an integral part of the consolidated financial statements.
F-6
Table of Contents
LULU’S FASHION LOUNGE HOLDINGS, INC.
Notes to Consolidated Financial Statements
| 1. | Description of Business |
Pursuant to a reorganization, Lulu’s Fashion Lounge Holdings, Inc., a Delaware Corporation (“we”, “our”, “us”, “Lulus”, or the “Company), was formed on August 25, 2017 as a holding company and its primary asset is an indirect membership interest in Lulu’s Fashion Lounge, LLC (“LFL”) (previously Lulu’s Fashion Lounge, Inc.). Prior to the sale of the Company’s Series A convertible preferred stock, the Company was wholly-owned by Lulu’s Holdings, L.P. (the “Parent”) (previously Lulu’s Holdings, LLC). As of December 30, 2018, the Company is majority-owned by the Parent.
LFL was founded in 1996, starting as a vintage boutique in Chico, CA that began selling online in 2005 and transitioned to a purely online business in 2008. The Parent was formed in 2014 as a holding company and purchased 100% of LFL’s outstanding common stock in 2014. The Company, through LFL, is an online retailer of women’s clothing, shoes and accessories based in Chico, CA.
2017 Reorganization
Prior to August 2017, Lulu’s Fashion Lounge, Inc. was a wholly-owned subsidiary of Lulu’s Holdings, LLC. In August 2017, the Company went through a multi-step internal corporate reorganization as follows:
| • | Lulu’s Holdings, LLC converted from a Delaware limited liability company to a Delaware limited partnership and changed its name to Lulu’s Holdings, L.P. (the “Parent”). |
| • | Lulu’s Fashion Lounge, Inc. was converted from a California corporation into a Delaware limited liability company, changed its name to Lulu’s Fashion Lounge, LLC and its 2,000 shares of common stock were converted to one membership unit. |
| • | The Parent created the Company and contributed all of its interest in LFL to the Company in exchange for all 20,591,917 issued and outstanding shares of common stock of the Company. |
| • | The Company created a wholly-owned subsidiary, Lulu’s Fashion Lounge Parent, LLC, a Delaware limited liability company (“Holdco”), as a holding company and contributed its membership interest in LFL to Holdco in exchange for all of the issued and outstanding membership interests of Holdco. |
The reorganization has been accounted for as a reorganization of interests under common control and, accordingly, did not have any impact on the Company’s financial position or results of operations.
After the completion of the reorganization, LFL became a consolidated subsidiary of the Company. Accordingly, LFL’s financial statements prior to the reorganization are the Company’s historical financial statements. The historical financial statements of LFL are reflected herein based on the historical ownership of Lulu’s Holdings, LLC.
On April 12, 2018, the Company’s Board of Directors approved an amendment to the certificate of incorporation of the Company to authorize 20,591,917 shares of $0.001 par value common stock and to effect a 20,591.917-for-1 stock split (“Stock Split”) of shares of the Company’s issued and outstanding common stock, which was effected on April 12, 2018. All of the share information included in the accompanying consolidated financial statements and notes to the consolidated financial statements has been adjusted to reflect the Stock Split.
F-7
Table of Contents
LULU’S FASHION LOUNGE HOLDINGS, INC.
Notes to Consolidated Financial Statements (Continued)
| 2. | Significant Accounting Policies |
Basis of Presentation and Fiscal Year
The consolidated financial statements of the Company have been prepared in accordance with accounting principles generally accepted in the United States of America (“GAAP”) and include the financial statements of the Company and its subsidiary. All intercompany balances and transactions have been eliminated in consolidation. Our fiscal year consists of a 52-week or 53-week period ending on the Sunday nearest December 31. The fiscal years ended December 31, 2017 (“2017”) and December 30, 2018 (“2018”) consisted of 52 weeks, respectively.
Segment Reporting
Operating segments are components of an enterprise for which separate financial information is available that is evaluated by the chief operating decision maker, who is our Chief Executive Officer, in deciding how to allocate resources and in assessing performance. Utilizing these criteria, the Company manages its business on the basis of one operating and reportable segment, retail.
Net sales for each group of similar products and geographic areas is not reported to our chief operating decision maker. The separate identification for purposes of segment disclosure is impracticable, as it is not readily available and the cost to develop would be excessive. All our long-lived assets are located in the United States as of December 31, 2017 and December 30, 2018, respectively.
Use of Estimates
The preparation of consolidated financial statements in conformity with GAAP requires management to make estimates and assumptions that affect the reported amount of assets and liabilities and disclosure of contingent assets and liabilities at the date of the consolidated financial statements and the reported amounts of revenue and expenses during the reporting period. The significant estimates and assumptions made by management relate to valuation of inventory, capitalized software, equity-based compensation expense, revenue recognition and income taxes. Actual results could differ from those estimates and such differences may be material to the consolidated financial statements.
Unaudited Pro Forma Balance Sheet Information
The accompanying unaudited pro forma balance sheet information as of December 30, 2018 assumes conversion of the outstanding shares of the convertible preferred stock into shares of common stock in connection with our initial public offering (“IPO”) (assumes each share of convertible preferred stock converts into one share of common stock). The unaudited pro forma stockholders’ equity does not assume any proceeds from the IPO.
Cash and Cash Equivalents and Restricted Cash
The Company considers all highly liquid instruments purchased with original maturities of three months or less when issued as cash equivalents. These consist primarily of time deposit bank accounts and money market funds. Due to the nature of the Company’s cash flow, amounts on deposit in individual banks may temporarily exceed the insured amount throughout the period.
F-8
Table of Contents
LULU’S FASHION LOUNGE HOLDINGS, INC.
Notes to Consolidated Financial Statements (Continued)
Restricted cash represents deposits with a financial institution to serve as collateral for the Company’s corporate credit cards.
The following table provides a reconciliation of cash, cash equivalents, and restricted cash reported within the consolidated balance sheets that sum to the total of the same amounts shown in the consolidated statements of cash flows (in thousands):
| December 31, 2017 |
December 30, 2018 |
|||||||
| Cash and cash equivalents |
$ | 5,637 | $ | 7,747 | ||||
| Restricted cash |
502 | 503 | ||||||
|
|
|
|
|
|||||
| Total cash and restricted cash |
$ | 6,139 | $ | 8,250 | ||||
|
|
|
|
|
|||||
Accounts Receivable
Accounts receivable consist primarily of receivables from credit card processing agencies. Based on historical collections from these agencies, no allowance for doubtful accounts was deemed necessary at December 31, 2017 and December 30, 2018.
Concentration of Credit Risks
The Company deposits its cash with creditworthy financial institutions, however, its deposits, at times, may exceed federally insured limits. To date, the Company has not experienced any losses on its cash deposits. No customer accounted for greater than 10% of the Company’s total net sales during 2017 and 2018, respectively.
Inventory
Inventory consists of finished goods, which are recorded at the lower of cost or net realizable value, with cost determined using the first-in-first-out method. The costs of inventory consist of merchandise costs and inbound freight costs. An adjustment is recorded when future estimated selling price, less costs to sell, is less than cost. Inventory levels are reviewed to identify slow-moving merchandise and promotions and markdowns are used to clear merchandise.
Prepaids and Other Current Assets
Prepaid expenses and other current assets consist primarily of prepaid rent, prepaid insurance, prepaid marketing, prepaid software, and prepaid postage.
Property and Equipment, net
Property and equipment are recorded at cost and depreciated on a straight-line basis over their estimated useful lives, which range from 3 to 8 years. Improvements that extend the life of a specific asset are capitalized, while normal maintenance and repairs are charged to expense as incurred. When assets are sold or otherwise retired, their cost and related accumulated depreciation are removed with the resulting gain or loss reflected in the consolidated statements of income and comprehensive income.
F-9
Table of Contents
LULU’S FASHION LOUNGE HOLDINGS, INC.
Notes to Consolidated Financial Statements (Continued)
Goodwill and Intangible Assets
Goodwill is stated at the excess of the acquisition price over the fair value of net assets acquired in a purchase acquisition and is not amortized. Goodwill arose from the Parent’s purchase of 100% of the outstanding common stock of LFL on July 25, 2014. The Company’s tradename is an indefinite-lived intangible asset and is not amortized. The Company reviews its goodwill and tradename for impairment at least annually (on the first day of the fourth quarter) or more frequently whenever events or changes in circumstances indicate that the carrying amount may be impaired.
When testing goodwill for impairment, the Company first performs an assessment of qualitative factors (“Step 0 Test”). If qualitative factors indicate that it is more likely than not that the fair value of the relevant reporting unit is less than its carrying amount, the Company tests goodwill for impairment at the reporting unit level using a two-step approach. In step one, the Company determines if the fair value of the reporting unit exceeds the unit’s carrying value. If step one indicates that the fair value of the reporting unit is less than its carrying value, the Company performs step two, determining the fair value of goodwill and, if the carrying value of goodwill exceeds its implied fair value, an impairment charge is recorded. The Company performed the Step 0 Test for goodwill impairment in 2017 and 2018. There were no additions to, disposals of, or impairments of goodwill during 2017 and 2018, respectively. In addition, there is no accumulated impairment of goodwill at December 31, 2017 and December 30, 2018.
When testing the tradename for impairment, the Company first performs an assessment of qualitative factors. If qualitative factors indicate that it is more likely than not that the fair value of the tradename is less than its carrying amount, the Company tests the tradename for impairment at the asset level. The Company determines the fair value of the tradename and compares it to the carrying value. If the carrying value of the tradename exceeds the fair value, the Company recognizes an impairment loss in an amount equal to the excess. The Company performed the Step 0 Test for the tradename in 2017 and 2018. There were no additions to, disposals of, or impairments of the tradename during 2017 and 2018, respectively. In addition, there is no accumulated impairment of the tradename at December 31, 2017 and December 30, 2018.
Other intangible assets primarily represent capitalized internally developed software, which is amortized over a 3-year period. Capitalization of such costs begins when the preliminary project stage is completed and it is probable that the project will be completed and the software will be used to perform the function intended. A subsequent addition, modification or upgrade to internal-use software is capitalized to the extent that it enhances the software’s functionality or extends its useful life. Costs related to design or maintenance are expensed as incurred. Intangible asset amortization expense was $1,188,000 and $1,417,000 for 2017 and 2018, respectively.
Long-Lived Asset Impairment
The Company evaluates long-lived assets for impairment periodically whenever events or changes in circumstances indicate that their related carrying amounts may not be recoverable. In evaluating long-lived assets for recoverability, the Company uses its best estimate of future cash flows expected to result from the use of the asset and eventual disposition. To the extent that projected undiscounted future net cash flows attributable to the asset are less than the carrying amount, an impairment loss is recognized in an amount equal to the difference between the carrying value of such asset and its estimated fair value. There was no impairment recorded during 2017 or 2018.
F-10
Table of Contents
LULU’S FASHION LOUNGE HOLDINGS, INC.
Notes to Consolidated Financial Statements (Continued)
Revenue Recognition
On January 2, 2017, the Company early adopted Financial Accounting Standards Board (“FASB”) Accounting Standards Update (“ASU”) No. 2014-09, Revenue from Contracts with Customers (Topic 606), on a full retrospective basis. The Company generates revenue primarily from the sale of merchandise products sold directly to end customers. The sale of products is a distinct performance obligation, and revenue is recognized at a point in time when control of the promised product is transferred to customers, which the Company determined occurs upon shipment based on its evaluation of the related shipping terms. Revenue is recognized in an amount that reflects the transaction price consideration that the Company expects to receive in exchange for those products. The Company’s payment terms are typically at the point of sale for merchandise product sales.
The Company elected to exclude from revenue taxes assessed by governmental authorities, including value-added and other sales-related taxes, that are imposed on and concurrent with revenue-producing activities. The Company has elected to apply the practical expedient, relative to e-commerce sales, which allows an entity to account for shipping and handling as fulfillment activities, and not a separate performance obligation. Accordingly, the Company recognizes revenue for only one performance obligation, the sale of the product, at shipping point (when the customer gains control). Shipping and handling costs associated with outbound freight are accounted for as fulfillment costs and are included in cost of goods sold. The Company has elected to apply the practical expedient to expense costs as incurred for incremental costs to obtain a contract when the amortization period would have been one year or less.
Revenue from merchandise product sales is reported net of sales returns, which includes an estimate of future returns based on historical return rates, with a corresponding reduction to cost of sales. There is judgment in utilizing historical trends for estimating future returns. The Company’s refund liability for sales returns is included in returns reserve on its consolidated balance sheets and represents the expected value of the refund that will be due to the Company’s customers. The Company also has a corresponding asset for recovery that represents the expected net realizable value of the merchandise inventory to be returned.
The Company sells stored-value gift cards to customers and offers merchandise credit stored-value cards for certain returns. Such stored-value cards do not have an expiration date. The Company recognizes revenue from stored-value cards when the card is redeemed by the customer. The Company did not recognize any stored-value card breakage in 2017. In 2018, the Company determined sufficient evidence exists to support an estimate for stored-value card breakage. Subject to requirements to remit balances to governmental agencies, starting in 2018 breakage is recognized as revenue in proportion to the pattern of rights exercised by the customer, which is substantially within thirty-six months from the date of issuance.
The Company has two types of contractual liabilities: (i) cash collections from its customers prior to delivery of products purchased (“deferred revenue”), which are initially recorded as “Other” within “Accrued Expenses” and are recognized as revenue when the products are shipped, (ii) unredeemed gift cards and online store credits, which are initially recorded within “Stored-value cards” and are recognized as revenue in the period they are redeemed.
F-11
Table of Contents
LULU’S FASHION LOUNGE HOLDINGS, INC.
Notes to Consolidated Financial Statements (Continued)
The following table summarizes the significant changes in the contract liabilities balances during 2017 and 2018 (in thousands):
| Deferred Revenue |
Stored-Value Cards |
|||||||
| Balance as of January 1, 2017 |
$ | 260 | $ | 599 | ||||
| Revenue recognized that was included in contract liability balance at the beginning of the period |
(260 | ) | (363 | ) | ||||
| Increase due to cash received, excluding amounts recognized as revenue during the period |
160 | 1,295 | ||||||
|
|
|
|
|
|||||
| Balance as of December 31, 2017 |
160 | 1,531 | ||||||
| Revenue recognized that was included in contract liability balance at the beginning of the period |
(160 | ) | (904 | ) | ||||
| Increase due to cash received, excluding amounts recognized as revenue during the period |
652 | 2,406 | ||||||
|
|
|
|
|
|||||
| Balance as of December 30, 2018 |
$ | 652 | $ | 3,033 | ||||
|
|
|
|
|
|||||
Cost of Goods Sold
Cost of goods sold consists of the product costs of merchandise sold to customers; shipping and handling costs including all inbound, outbound, and return shipping expenses; rent, insurance, business property tax, utilities, and repairs and maintenance related to our distribution centers; and charges related to inventory shrinkage, damages, and the allowance for excess or obsolete inventory.
Selling and Marketing Expenses
Selling and marketing expenses consist primarily of customer service, payment processing fees, advertising, targeted online performance marketing, and search engine optimization costs. Selling and marketing expenses also include our spend on brand marketing channels, including cash and free clothing compensation to influencers, events and other forms of online and offline marketing related to growing and retaining the customer base. Advertising costs are expensed as incurred. Advertising costs included in selling and marketing expenses were $26,416,000 and $48,508,000 for 2017 and 2018, respectively.
General and Administrative Expenses
General and administrative expenses consist primarily of payroll and benefits costs, including equity-based compensation for our employees involved in general corporate functions including finance, merchandising, marketing, and technology, as well as costs associated with the use by these functions of facilities and equipment, including depreciation, rent, and other occupancy expenses.
Equity-Based Compensation
Certain of the Company’s employees participate in equity incentive programs offered by the Parent. Compensation cost related to these equity grants are recognized as general and administrative expense in the Company’s consolidated statements of income and comprehensive income.
F-12
Table of Contents
LULU’S FASHION LOUNGE HOLDINGS, INC.
Notes to Consolidated Financial Statements (Continued)
Income Taxes
The Company accounts for income taxes using the asset and liability method, under which deferred tax assets and liabilities are recognized for the expected future tax consequences of temporary differences between the financial reporting and tax bases of assets and liabilities and for operating losses and tax credit carryforwards. Deferred tax assets and liabilities are measured using the currently enacted tax rates that apply to taxable income in effect for the years in which they are expected to be realized or settled.
The Company believes that it is more likely than not that forecasted income, potential income from tax planning strategies, together with future reversals of existing taxable temporary differences and results of recent operations, will be sufficient to fully recover the deferred tax assets. In the event that the Company determines all or part of the net deferred tax assets are not realizable in the future, the Company would record a valuation allowance.
The Company recognizes tax benefits from uncertain tax positions only if it is more likely than not that the tax position will be sustained on examination by the taxing authorities, based on the technical merits of the position. The tax benefits recognized in the consolidated financial statements from such positions are then measured based on the largest benefit that has a greater than 50% likelihood of being realized upon ultimate settlement. The Company recognizes interest and penalties related to unrecognized tax benefits, if any, as income tax expense.
Net Income Per Common Share
Basic net income per common share is computed using net income attributable to common stockholder divided by the weighted-average number of common shares outstanding during the period. Diluted net income per common share represents net income attributable to common stockholder divided by the weighted-average number of common shares outstanding during the period, including the effects of any dilutive securities outstanding. Basic and diluted net income per common share attributable to common stockholder are the same for 2017 and 2018, respectively, as the Company did not have any dilutive securities outstanding.
Unaudited Pro Forma Net Income Per Common Share
The unaudited pro forma basic and diluted net income per share attributable to common stockholders assume the automatic conversion of the convertible preferred stock into shares of common stock using the if-converted method upon the completion of the IPO as though the conversion had occurred as of the original issue date of the convertible preferred stock.
Comprehensive Income
Comprehensive income represents net income for the period plus the results of certain other changes in stockholders (deficit) equity. The Company’s comprehensive income was equal to its net income in 2017 and 2018, respectively.
| 3. | Recently Issued Accounting Pronouncements |
Recently Issued Accounting Pronouncements Not Yet Effective
In August 2018, the FASB issued ASU No. 2018-15, Intangibles—Goodwill and Other—Internal-use Software: Customer’s Accounting for Implementation Costs Incurred in a Cloud Computing
F-13
Table of Contents
LULU’S FASHION LOUNGE HOLDINGS, INC.
Notes to Consolidated Financial Statements (Continued)
Arrangement That Is a Service Contract (a consensus of the FASB Emerging Issues Task Force), which clarifies the accounting for implementation costs in cloud computing arrangements. The update effectively aligns the requirements for capitalizing implementation costs incurred in a cloud computing arrangement service contract with the requirements for capitalizing implementation costs incurred to develop or obtain internal-use software. ASU 2018-15 is effective for fiscal years, and interim periods within, beginning after December 15, 2020, with early adoption permitted. The Company is currently evaluating the potential impact of adopting this guidance on its consolidated financial statements.
In January 2017, the FASB issued ASU No. 2017-04, Intangibles—Goodwill and Other (Topic 350): Simplifying the Test for Goodwill Impairment, which eliminates the requirement to calculate the implied fair value of goodwill to measure a goodwill impairment charge. For public business entities that are SEC filers, this standard is effective for the annual or any interim goodwill impairment tests in fiscal years beginning after December 15, 2019. For public business entities that are not SEC filers, this standard is effective for the annual or any interim goodwill impairment tests in fiscal years beginning after December 15, 2020. For all other entities, this standard is effective for the annual or any interim goodwill impairment tests in fiscal years beginning after December 15, 2021. This standard will apply to the Company’s reporting requirements in performing goodwill impairment testing and we expect to adopt this standard in our first quarter of 2022. The Company is currently evaluating the potential impact of adopting this guidance on its consolidated financial statements.
In February 2016, the FASB issued ASU No. 2016-02, Leases (Topic 842), which requires lessees to put most leases on their balance sheets but recognize expenses on their income statement and eliminates the real estate-specific provisions for all entities. The guidance is effective for fiscal years beginning after December 15, 2019, including interim periods within those fiscal years. We expect to adopt this standard in our first quarter of 2020. In July 2018, the FASB issued ASU No. 2018-11 Leases (Topic 842): Targeted Improvements which allows entities the option to adopt this standard prospectively with a cumulative-effect adjustment to opening equity and include required disclosures for the prior period. The Company anticipates implementing the standard by taking advantage of the alternative transition method and will apply the transition approach as of the beginning of the period of adoption and will not be restating comparative periods. The Company is currently evaluating the impact that this standard will have on its consolidated financial statements; however, we expect that it will result in an increase in our long-term assets and liabilities.
| 4. | Fair Value Measurements |
The Company discloses and recognizes the fair value of its assets and liabilities using a hierarchy that prioritizes the inputs to valuation techniques used to measure fair value. Fair value is defined as the price that would be received to sell an asset or paid to transfer a liability (an exit price) in an orderly transaction between market participants at the measurement date. The guidance establishes three levels of the fair value hierarchy as follows:
| Level 1 | Inputs are unadjusted, quoted prices in active markets for identical assets or liabilities at the measurement date; | |
| Level 2 |
Inputs are observable, unadjusted quoted prices in active markets for similar assets or liabilities, unadjusted quoted prices for identical or similar assets or liabilities in markets that are not active, or other inputs that are observable or can be corroborated by observable market data for substantially the full term of the related assets or liabilities; and | |
F-14
Table of Contents
LULU’S FASHION LOUNGE HOLDINGS, INC.
Notes to Consolidated Financial Statements (Continued)
| Level 3 | Unobservable inputs that are significant to the measurement of the fair value of the assets or liabilities that are supported by little or no market data. | |
The Company’s financial instruments consist of cash and cash equivalents, restricted cash, accounts payable, accrued expenses and long-term debt. At December 31, 2017 and December 30, 2018, the carrying values of cash and cash equivalents, restricted cash, accounts payable and accrued expenses approximated fair value due to their short-term maturities. The fair value of long-term debt approximates its carrying value as the stated interest rate resets monthly at LIBOR + 7% and as such approximates market rates currently available to the Company. The Company does not have any financial instruments that were determined to be Level 3.
| 5. | Property and Equipment, net |
Property and equipment, net consisted of the following (in thousands):
| December 31, 2017 |
December 30, 2018 |
|||||||
| Leasehold improvements |
$ | 1,419 | $ | 2,585 | ||||
| Equipment |
1,051 | 1,652 | ||||||
| Furniture and fixtures |
441 | 1,256 | ||||||
| Construction in progress |
914 | 2 | ||||||
|
|
|
|
|
|||||
| Total property and equipment |
3,825 | 5,495 | ||||||
| Less: accumulated depreciation and amortization |
(1,246 | ) | (2,395 | ) | ||||
|
|
|
|
|
|||||
| Property and equipment, net |
$ | 2,579 | $ | 3,100 | ||||
|
|
|
|
|
|||||
Depreciation and amortization expense for 2017 and 2018 was $494,000 and $1,147,000, respectively.
| 6. | Accrued Expenses |
Accrued expenses consisted of the following (in thousands):
| December 31, 2017 |
December 30, 2018 |
|||||||
| Accrued compensation and benefits |
$ | 2,154 | $ | 1,320 | ||||
| Accrued marketing expense |
17 | 3,263 | ||||||
| Accrued interest |
63 | 1,018 | ||||||
| Other |
1,321 | 4,796 | ||||||
|
|
|
|
|
|||||
| Total accrued expenses |
$ | 3,555 | $ | 10,397 | ||||
|
|
|
|
|
|||||
F-15
Table of Contents
LULU’S FASHION LOUNGE HOLDINGS, INC.
Notes to Consolidated Financial Statements (Continued)
| 7. | Long-Term Debt |
Long-term debt consisted of the following (in thousands):
| December 31, 2017 |
December 30, 2018 |
|||||||
| Principal | Principal | |||||||
| Term loan |
$ | 132,469 | $ | 124,875 | ||||
| Less: Unamortized discount and debt issuance costs |
(8,410 | ) | (6,547 | ) | ||||
|
|
|
|
|
|||||
| 124,059 | 118,328 | |||||||
| Less: Current portion |
(10,125 | ) | (10,125 | ) | ||||
|
|
|
|
|
|||||
| Total long-term debt, net |
$ | 113,934 | $ | 108,203 | ||||
|
|
|
|
|
|||||
In August 2017, the Company entered into a term loan with a principal amount of $135,000,000 (“Term Loan”) and a revolving credit facility of $10,000,000 (“Revolving LOC”) with certain financial institutions for which Credit Suisse is acting as an administrative agent. The Term Loan was issued at a discount of 3%, or $4,050,000. The net proceeds of $130,950,000 from the Term Loan were used to repay other long-term debt and to pay dividends to the Parent. As part of the repayment of the other long-term debt, the Company recorded a loss on debt extinguishment of $1,170,000 comprised primarily of the write-off of unamortized discount and debt issuance costs. Debt issuance costs paid in 2017 were approximately $7,670,000, of which $5,319,000 was capitalized and $2,351,000 paid to related parties was included in general and administrative expense in the consolidated statements of income and comprehensive income.
Interest on borrowings accrues at a rate of LIBOR plus 7% or the Base Rate plus an applicable margin (as defined in the agreement), at the Company’s election. The Company has elected to make interest payments monthly based on LIBOR. Principal payments of $2,531,250 are due quarterly beginning December 31, 2017 through the final maturity date of August 28, 2022. The effective interest rate for the Term Loan was 8.25% and 8.97% for 2017 and 2018, respectively.
The Term Loan requires mandatory additional prepayments in May of each year if the Company’s Excess Cash Flow (“ECF”) for the preceding year exceeds the ECF as defined in the Term Loan agreement. For 2017, the ECF period is defined as the Company’s fourth quarter results of operations, for all future years, the ECF period is the full year. There were no ECF payments due in 2018 and no ECF payments will be due in 2019 related to 2017 and 2018, respectively.
Outstanding amounts under the Revolving LOC bear interest at variable rates with a minimum of 7.00%. Unused portions of the Revolving LOC bear a variable commitment fee of a minimum 0.375% to 0.50% per annum and are paid quarterly. The Revolving LOC expires May 29, 2022. As of December 30, 2018 the Company had not drawn down any amounts under the Revolving LOC.
The Term Loan and Revolving LOC are secured by all the assets of the Company and contain financial and reporting covenants, including restrictions on LFL with respect to the payment of dividends, which the Company was in compliance with as of December 31, 2017 and December 30, 2018. Substantially all of LFL’s assets are restricted from distribution to the Company. The Company does not have any material assets or liabilities, other than its indirect investment in LFL. For all of the years reported in these consolidated financial statements, the Company has not and does not have any material operations on a standalone basis, and all of the operations of the Company are carried out by LFL.
F-16
Table of Contents
LULU’S FASHION LOUNGE HOLDINGS, INC.
Notes to Consolidated Financial Statements (Continued)
Debt discounts and issuance costs are deferred and amortized over the life of the related loan using the effective interest method. The associated expense is included in interest expense in the consolidated statements of income and comprehensive income and was $1,037,000 and $1,927,000 for 2017 and 2018, respectively. Debt discounts and issuance costs are presented as a reduction of long-term debt with the exception of debt issuance costs related to the revolving loan agreement of $300,000 and $236,000 at December 31, 2017 and December 30, 2018, respectively, which are included in other non-current assets in the consolidated balance sheets. Future discount and debt issuance cost amortization expense at December 30, 2018 over each of the next four years will be approximately $1,898,000, $1,871,000, $1,831,000, and $1,183,000.
Future maturities of long-term debt for the next four years are (in thousands):
| Fiscal Year Ending | Amounts | |||
| 2019 |
$ | 10,125 | ||
| 2020 |
10,125 | |||
| 2021 |
10,125 | |||
| 2022 |
94,500 | |||
|
|
|
|||
| Total |
$ | 124,875 | ||
|
|
|
|||
| 8. | Commitments and Contingencies |
Operating Leases
As of December 30, 2018, the Company had non-cancelable operating leases for its corporate offices and warehouses expiring at various dates through 2026, some of which have renewal provisions. Rental expense classified within general and administrative expenses in the consolidated statements of income and comprehensive income totaled $724,000 and $1,881,000 for 2017 and 2018, respectively.
In December 2018, the Company signed a lease agreement for a warehouse in Pennsylvania, with an effective date of January 7, 2019 and a rent commencement date of February 1, 2019. The lease has an initial term of seven years (through January 31, 2026) with an option to extend the term for an additional five years. The base rent under the agreement is $128,000 per month for the first year, escalating approximately 3.0% annually thereafter. No rental expense was recorded for this lease in 2018. Future minimum lease payments for this lease have been included in table below.
Future minimum lease payments under non-cancelable leases are as follows (in thousands):
| Fiscal Year ending: | Amounts | |||
| 2019 |
$ | 2,386 | ||
| 2020 |
1,596 | |||
| 2021 |
1,626 | |||
| 2022 |
1,675 | |||
| 2023 |
1,725 | |||
| Thereafter |
3,760 | |||
|
|
|
|||
| Total |
$ | 12,768 | ||
|
|
|
|||
F-17
Table of Contents
LULU’S FASHION LOUNGE HOLDINGS, INC.
Notes to Consolidated Financial Statements (Continued)
Other
During the normal course of business, the Company may be a party to claims that are not covered by insurance. While the ultimate liability, if any, arising from these claims cannot be predicted with certainty, management does not believe that the resolution of any such claims would have a material adverse effect on the Company’s consolidated financial statements.
| 9. | Convertible Preferred Stock |
On April 12, 2018, the Company amended and restated its certificate of incorporation to, among other things, (i) authorize 3,129,634 shares of $0.001 par value Series A Preferred Stock (“Series A stock”), and (ii) set forth the rights, preferences and privileges of the Series A Preferred Stock. The Company, Parent and Purchasers (consisting of Institutional Venture Partners and Canada Pension Plan Investment Board) then entered into a Series A Preferred Stock Purchase agreement (“Series A Agreement”) under which the Company 1) sold 3,129,634 shares of its Series A Preferred Stock in a private placement to Purchasers for $38.34 per share, for a total purchase price of $120,000,000 ($117,038,000, net of issuance costs of $2,962,000) and 2) the Company repurchased 3,129,634 shares of its common stock from the Parent for a total repurchase price of $113,296,000 (includes transaction costs of $2,025,000). Additional transaction costs related to the Series A Preferred Stock issuance of $3,557,000 paid to the Parent and other related parties were included in general and administrative expense in the consolidated statements of income and comprehensive income.
Significant provisions of the convertible preferred stock are as follows:
Dividends—Before any dividends on common stock shall be declared or paid, the holders of outstanding shares of Series A Preferred Stock shall be entitled to receive dividends on an as-converted basis. For dividends on non-convertible class or series, dividends to Series A Preferred Stock holders will be determined by dividing the dividend payable on each class/series of capital stock by the original issuance price (adjusted for stock split, stock dividend, etc.) and multiplying such fraction by the Series A original issue price. As of December 30, 2018, no dividends have been declared or paid.
Liquidation—In the event of any voluntary or involuntary liquidation, dissolution, winding up of the Company (a “liquidation event”), the holders of the convertible preferred stock shall be entitled to receive, before any payment made to the holders of common stock, an amount per share for each share of convertible preferred stock held by them equal to the greater of 1) the sum of original issue price multiplied by an applicable factor per the Series A Agreement (1.4 as of December 30, 2018) plus any declared but unpaid dividends on preferred stock; and ii) the amount per share as would have been payable if all shares of preferred stock had been converted to common stock (the “Series A Liquidation Amount”). The aggregate liquidation preference of the convertible preferred stock as of December 30, 2018 was $168,000,000.
Voting—Each share of Series A Preferred Stock is entitled to voting rights equal to the number of shares of common stock it can be converted to. Series A Preferred Stock holders are entitled to elect two directors of the Company, as long as there are more than 782,409 shares of Series A Preferred Stock outstanding.
Conversion—At the option of the holder, each share of Series A Preferred Stock is convertible into shares of common stock. As of December 30, 2018, each share of Series A Preferred Stock was convertible into one share of common stock, adjusted for stock splits, combinations, dividends and
F-18
Table of Contents
LULU’S FASHION LOUNGE HOLDINGS, INC.
Notes to Consolidated Financial Statements (Continued)
distributions. All outstanding shares of Series A Preferred Stock will automatically be converted into shares of common stock at the then effective conversion rate upon one of the following conversion events: (i) the closing of a firm commitment underwritten initial public offering, provided that the aggregate gross proceeds to the Company are not less than $100,000,000; or (ii) by vote or written consent for conversion from the holders of a majority of the outstanding shares of Series A Preferred Stock.
Redemption—On or after April 12, 2024, all outstanding shares of Series A Preferred Stock will be redeemable upon written notice of at least 50% of the then outstanding shares requesting redemption of all or part of the stock held by such holders. The shares shall be redeemed in up to two installments, at a price equal to the then applicable Series A Liquidation Amount. The initial redemption date shall be within sixty days of receiving written notice and the Company shall redeem at least 50% of the shares at that time. The remaining shares to be redeemed shall accrue interest at a rate of 12.0% per annum and shall be redeemed no later than six months following the initial redemption date.
The Company classifies its convertible preferred stock outside of stockholders (deficit) equity because the shares contain a redemption feature that is not within the Company’s control. In 2018, the Company did not adjust the carrying value of the convertible preferred stock to the redemption value as a qualifying redemption event was not probable. Subsequent adjustments to the carrying value to the ultimate redemption value will be made only when it becomes probable that such a redemption event will occur.
As of December 30, 2018, there were 3,129,634 preferred shares issued and outstanding. There were no preferred shares authorized, issued or outstanding as of December 31, 2017.
| 10. | Stockholder’s Deficit |
Common Stock
Lulu’s Fashion Lounge Holdings, Inc. has one class of $0.001 par value common stock with pari-passu voting rights.
Equity-Based Compensation
During 2017 and 2018, the Company recognized $641,000 and $4,047,000, respectively, in equity-based compensation expense related to Class P units in Parent, which were granted to employees of Lulus.
Parent’s Class P units are available to be issued as incentive compensation to employees, officers, directors, and other nonemployee service providers or consultants of the Company and are considered profits interests for United States federal income tax purposes. The Class P units have no voting rights and generally do not become vested until the occurrence of the sale of the Company, subject to continuing employment by the Class P holder. Such vesting condition is considered a performance condition for which no expense is recognized related to these awards until the performance condition becomes probable of occurring, which is upon consummation of the sale of the Company or Public Offering. The Class P units themselves are not considered a substantive class of equity but rather, are akin to a profit-sharing arrangement. Additionally, Class P holders are only entitled to payment of pre-vesting distributions allocated to Class P units upon vesting of the Class P units. Such pre-vesting distributions are considered changes to the fair value of the Class P units and
F-19
Table of Contents
LULU’S FASHION LOUNGE HOLDINGS, INC.
Notes to Consolidated Financial Statements (Continued)
are recorded as equity-based compensation expense under FASB Accounting Standards Codification (ASC) Topic No. 710, Compensation—General (ASC 710), once the contingent payment becomes probable of payment, which is upon vesting.
In 2017, Parent modified the vesting conditions of 951,188 Class P units granted to five employees to provide for service-based vesting of the awards prior to the sale of the Company. The modified awards vested 25% on July 11, 2017 and an additional 8.33% vested on December 31, 2017. An additional 33.33% vested on December 31, 2018 and 33.34% will vest on December 31, 2019. Vesting is accelerated to 100% upon a change of control or sale of the Company. The Company recognized equity-based compensation expense (transactions with Parent, see Note 12) of $641,000 and $2,472,000 for the pre-vesting distributions payable by the Parent during 2017 and 2018, respectively.
In 2018, the Company recognized $1,575,000 in equity-based compensation expense (transactions with Parent, see Note 12) for the distributions payable by the Parent to Class P holders as a result of the Series A transaction.
The following table summarizes the rollforward of unvested Class P units for 2017 and 2018:
| Unvested Units |
||||
| Balance at January 1, 2017 |
1,335,710 | |||
| Units granted |
— | |||
| Units vested |
(317,031 | ) | ||
| Units cancelled |
— | |||
|
|
|
|||
| Balance at December 31, 2017 |
1,018,679 | |||
| Units granted |
— | |||
| Units vested |
— | |||
| Units cancelled |
— | |||
|
|
|
|||
| Balance at December 30, 2018 |
1,018,679 | |||
|
|
|
|||
As of December 30, 2018, the total unrecognized equity-based compensation expense related to unvested Class P units modified in 2017 was approximately $2,253,000, which is expected to be recognized over an estimated weighted-average period of 1 year. As of December 30, 2018, the total unrecognized equity-based compensation expense related to unvested Class P units not modified in 2017 was approximately $3,652,000, which is expected to be recognized upon sale of the Company or a Public Offering.
F-20
Table of Contents
LULU’S FASHION LOUNGE HOLDINGS, INC.
Notes to Consolidated Financial Statements (Continued)
| 11. | Income Taxes |
All of the Company’s income before provision for income taxes is from the United States. The components of the provision (benefit) for income taxes are as follows (in thousands):
| 2017 | 2018 | |||||||
| Current: |
||||||||
| Federal |
$ | 7,161 | $ | 4,322 | ||||
| State |
1,702 | 1,316 | ||||||
|
|
|
|
|
|||||
| Total current |
8,863 | 5,638 | ||||||
|
|
|
|
|
|||||
| Deferred: |
||||||||
| Federal |
(487 | ) | (1,188 | ) | ||||
| State |
155 | (231 | ) | |||||
|
|
|
|
|
|||||
| Total deferred |
(332 | ) | (1,419 | ) | ||||
|
|
|
|
|
|||||
| Provision for income taxes |
$ | 8,531 | $ | 4,219 | ||||
|
|
|
|
|
|||||
Deferred income taxes reflect the net effects of (a) temporary differences between the carrying amounts of assets and liabilities for financial reporting purposes and the amount used for income tax purposes, and (b) operating losses and tax credit carryforwards.
The components of net deferred tax (liabilities) assets are as follows (in thousands):
| December 31, 2017 |
December 30, 2018 |
|||||||
| Deferred tax assets: |
||||||||
| Returns reserve accrual |
$ | 951 | $ | 1,284 | ||||
| Interest disallowance |
— | 1,134 | ||||||
| Other |
766 | 1,663 | ||||||
|
|
|
|
|
|||||
| Gross deferred tax assets |
1,717 | 4,081 | ||||||
|
|
|
|
|
|||||
| Deferred tax liabilities: |
||||||||
| Depreciation and amortization |
(3,513 | ) | (4,431 | ) | ||||
| Other |
— | (27 | ) | |||||
|
|
|
|
|
|||||
| Gross deferred tax liabilities |
(3,513 | ) | (4,458 | ) | ||||
|
|
|
|
|
|||||
| Net deferred tax liabilities |
$ | (1,796 | ) | $ | (377 | ) | ||
|
|
|
|
|
|||||
Deferred tax liabilities are included in other non-current liabilities on the consolidated balance sheets as of December 31, 2017 and December 30, 2018.
On December 22, 2017, the U.S. government enacted comprehensive tax legislation, commonly referred to as the Tax Cuts and Jobs Act (“TCJA”). The TCJA made significant changes to the U.S. federal income tax laws including, among other changes, a federal corporate tax rate reduction from 35% to 21% for tax years beginning after December 31, 2017, repeal of the corporate AMT tax system, and immediate expensing of certain types of business assets placed in service after September 27, 2017 (“bonus depreciation”). Based on the reduction of the U.S. federal corporate tax to 21% and the impact of bonus depreciation, the Company recorded $822,000 in tax expense in 2017, with a corresponding reduction to net deferred tax assets as of December 31, 2017. For the tax year ended
F-21
Table of Contents
LULU’S FASHION LOUNGE HOLDINGS, INC.
Notes to Consolidated Financial Statements (Continued)
December 30, 2018, this legislation establishes new limitations on the deductibility of interest expense and allows a domestic corporation an immediate deduction for a portion of its foreign-derived intangible income.
We recognized the income tax effects of the TCJA in our 2017 financial statements in accordance with Staff Accounting Bulletin No. 118 (SAB 118), which provides Securities and Exchange Commission (SEC) staff guidance for the application of FASB ASC Topic 740, Income Taxes (ASC 740), in the reporting period in which the TCJA was signed into law. The guidance addresses how a company recognizes provisional amounts when a company does not have the necessary information available, prepared or analyzed (including computations) in reasonable detail to complete its accounting for the effect of the changes in the Tax Reform Act. As such, the financial results for 2017 reflect the income tax effects of the TCJA for which the accounting under ASC 740 was complete and provisional amounts for those specific income tax effects of the TCJA for which the accounting under ASC 740 was incomplete but a reasonable estimate could be determined. Pursuant to SAB 118, we are allowed a measurement period of up to one year after the enactment date of the TCJA to finalize the recording of the related tax impacts. As of December 30, 2018, we have completed our accounting for the tax effects of the TCJA, resulting in additional tax expense of $288,000, with a corresponding reduction to net deferred tax assets as of December 30, 2018.
ASC 740 requires that the tax benefit of net operating losses, temporary differences and credit carryforwards be recorded as an asset to the extent that management assesses the realization is “more likely than not.” Realization of the future tax benefit is dependent on the Company’s ability to generate sufficient taxable income within the carryforward period. Because of the Company’s recent history of consistent earnings and its expected future profitability, management believes that recognition of the deferred tax assets arising from the above-mentioned future tax benefits is currently more likely than not to be realized, and accordingly, has not provided a valuation allowance.
The reconciliation of our effective tax rate to the statutory federal rate is as follows:
| 2017 | 2018 | |||||||
| Federal statutory rate |
35.00 | % | 21.00 | % | ||||
| State income taxes, net of federal tax benefit |
5.30 | (0.55 | ) | |||||
| Non-deductible transaction fees |
— | 14.45 | ||||||
| Non-deductible equity-based compensation expense |
1.00 | 15.92 | ||||||
| Tax credits |
(0.70 | ) | (2.36 | ) | ||||
| Tax reform—change in federal statutory rate |
(3.50 | ) | 5.40 | |||||
| Change in uncertain tax position |
— | 18.47 | ||||||
| Prior year adjustments |
— | 7.92 | ||||||
| Deduction for foreign derived intangible income |
— | (1.44 | ) | |||||
| Other |
(0.70 | ) | 0.25 | |||||
|
|
|
|
|
|||||
| Effective tax rate |
36.40 | % | 79.06 | % | ||||
|
|
|
|
|
|||||
F-22
Table of Contents
LULU’S FASHION LOUNGE HOLDINGS, INC.
Notes to Consolidated Financial Statements (Continued)
A reconciliation of the beginning and ending amount of unrecognized tax benefits (excluding interest and penalties) is as follows (in thousands):
| 2017 | 2018 | |||||||
| Beginning Balance |
$ | — | $ | — | ||||
| Increases related to tax positions taken during a prior year |
— | 643 | ||||||
| Increases related to tax positions taken during the current year |
— | 242 | ||||||
|
|
|
|
|
|||||
| Ending Balance |
$ | — | $ | 885 | ||||
|
|
|
|
|
|||||
During tax year 2018, the Company accrued interest and penalties related to uncertain tax positions of $304,000. As of December 30, 2018, the Company had $304,000 of accrued interest and penalties related to the uncertain tax positions. The Company has elected to record interest and penalties in the financial statements as a component of income tax expense. We anticipate that the entire balance of $885,000 of the uncertain tax positions, including the interest and penalties of $304,000, will be settled over the next twelve months. During the twelve months beginning December 31, 2018, the Company expects that its unrecognized tax benefits could be reduced by approximately $885,000, including interest and penalties of $304,000.
Our federal and state income tax returns are generally not subject to examination by taxing authorities for fiscal years before 2015 and 2014, respectively.
| 12. | Related Party Transactions |
Transactions with Parent
The Company’s transactions with its Parent are classified as a component within additional paid-in capital in the Company’s consolidated statements of stockholder’s deficit as there are no defined payments or other terms associated with these transactions. Such transactions included equity-based compensation expense of $641,000 and $4,047,000 for 2017 and 2018, respectively.
Management & Consulting Fees
The Company paid management and consulting fees to H.I.G. Capital, LLC (“H.I.G.”), Institutional Venture Partners (“IVP”), the Parent’s ultimate parent, and certain board members. Expenses for such services were $609,000 to H.I.G. and $98,000 to other related parties for 2017 and were $700,000 to H.I.G and $214,000 to other related parties for 2018. There were no accrued liabilities related to these services at December 31, 2017 and $170,000 accrued liabilities related to these services at December 30, 2018.
Transaction Fees
The Company paid investment banking and legal fees to H.I.G. and other affiliates and limited partners of the Parent. Expenses for such services were $1,399,000 to H.I.G. and $952,000 to other related parties for 2017 and were $2,595,000 to H.I.G. and $962,000 to other related parties for 2018.
Operating Leases
The Company leases operations and warehouse spaces from a limited partner of the Parent. Total rent expense to the related party was $110,000 and $125,000 for 2017 and 2018, respectively.
F-23
Table of Contents
LULU’S FASHION LOUNGE HOLDINGS, INC.
Notes to Consolidated Financial Statements (Continued)
| 13. | Net Income Per Share and Pro Forma Net Income Per Share Attributable to Common Stockholders |
Net Income Per Share Attributable to Common Stockholder
The following is a reconciliation of the numerator and denominator used in the basic and diluted net income per share attributable to common stockholder (in thousands, except share and per share amounts):
| 2017 | 2018 | |||||||
| Numerator: |
||||||||
| Net income |
$ | 14,910 | $ | 1,126 | ||||
| Less: Undistributed earnings to participating securities |
— | (124 | ) | |||||
|
|
|
|
|
|||||
| Net income attributable to common stockholder—basic and diluted |
14,910 | 1,002 | ||||||
|
|
|
|
|
|||||
| Denominator: |
||||||||
| Weighted-average shares of common stock-basic |
20,591,917 | 18,328,291 | ||||||
|
|
|
|
|
|||||
| Weighted-average shares of common stock-diluted |
20,591,917 | 18,328,291 | ||||||
|
|
|
|
|
|||||
| Net income per share attributable to common stockholder: |
||||||||
| Basic |
$ | 0.72 | $ | 0.05 | ||||
| Diluted |
$ | 0.72 | $ | 0.05 | ||||
Basic and diluted net income per share attributable to common stockholder are computed using the two-class method as the Series A stock is determined to be participating stock and the application of the if-converted method is not more dilutive.
Unaudited Pro Forma Net Income Per Share Attributable to Common Stockholders
The following table sets forth the computation of our unaudited pro forma basic and diluted net income per share attributable to common stockholders (in thousands, except share and per share amounts) assuming the automatic conversion of the convertible preferred stock upon consummation of an IPO as if such event had occurred as of the original issue date of the convertible preferred stock:
| 2018 | ||||
| Numerator: |
||||
| Net income |
$ | 1,126 | ||
| Adjustments to numerator |
— | |||
|
|
|
|||
| Net income used in calculating pro forma net income per share attributable to common stockholders—basic and diluted |
$ | 1,126 | ||
|
|
|
|||
| Denominator: |
||||
| Weighted-average shares used to calculate net income per share attributable to common stockholders outstanding—basic and diluted |
18,328,291 | |||
| Pro forma adjustment to reflect assumed conversion of all outstanding shares of convertible preferred stock |
2,263,626 | |||
|
|
|
|||
| Pro forma weighted average number of shares outstanding—Basic and Diluted |
20,591,917 | |||
|
|
|
|||
| Pro forma net income per share attributable to common stockholders: |
||||
| Basic |
$ | 0.05 | ||
| Diluted |
$ | 0.05 | ||
F-24
Table of Contents
LULU’S FASHION LOUNGE HOLDINGS, INC.
Notes to Consolidated Financial Statements (Continued)
| 14. | Defined Contribution Plans |
The Company sponsors a participant-directed 401(k) profit sharing plan for employees who have been working full-time at the Company for at least three months and are at least 21 years of age. Participants may make wage-deferred contributions up to the maximum allowed by law. The Company matches 100% of each participating employee’s deferral up to a maximum of 4% of eligible compensation. The Company may make additional discretionary matching contributions up to 6% of eligible compensation. The Company made matching contributions of $407,000 and $584,000 for 2017 and 2018, respectively.
| 15. | Subsequent Events |
On January 31, 2019 the Company paid a cash advance to the Parent of $2,406,000, which was used for the payment of Class P unit distributions due to certain current employees of the Company. On September 16, 2019 the Parent made a repayment of $2,084,000 to the Company, which included $60,000 of accrued interest.
On January 4, 2019, under the terms of the lease agreement for the warehouse in Pennsylvania, the Company provided the Landlord an irrevocable letter of credit in the amount of $500,000 as a security deposit. The letter of credit was issued against the Revolving LOC.
On May 30, 2019 the Company entered into a Waiver and Fourth Amendment to the Credit Agreement and Amendment to the Guaranty and Security Agreement (the “Amendment”). Under the Amendment, the lenders waived the Company’s Default for failure to comply with the maximum Consolidated Total Net Leverage Ratio level required under the Financial Covenant for the quarter ended March 31, 2019. Further, the Amendment resets the maximum Consolidated Total Net Leverage Ratio covenant levels for the duration of the loan and added a minimum Consolidated Cumulative Unadjusted EBITDA Financial Covenant for fiscal year 2019.
The Amendment modified the Applicable Margin on the Term Loan, specifically, the Company will pay interest at either the LIBOR Rate plus an Applicable Margin of 9.00% or the Base Rate plus an Applicable Margin of 8.00% (up from 7.00% and 6.00%, respectively) from the Fourth Amendment Effective Date (i.e. May 30, 2019) to the date on which financial statements and accompanying Compliance Certificate for the first full fiscal quarter ending after the Fourth Amendment Effective Date are delivered. Thereafter, the Applicable Margin on the Term Loan will be subject to adjustment based on the Consolidated Total Net Leverage Ratio with a range of 7.00% to 9.00% for LIBOR Rate Term Loans and 6.00% to 8.00% for Base Rate Term Loans.
Additionally, under the Amendment, proceeds from an Initial Public Offering constitute a Mandatory Repayment, so that the Leverage Ratio as of the last day of the most recently ended period of four fiscal quarters shall not be in excess of 2.00 to 1.00.
On July 22, 2019, the Parent granted 284,036 Class P units to two employees of the Company, which vest monthly over four years from the grant date with vesting for 50% of the awards accelerated upon the sale of the Parent or if the employee is terminated without cause within twelve months after the date of the Sale of the Parent. On September 30, 2019, the Parent granted an additional 317,952 Class P units to nine employees of the Company. The vesting terms are either (a) 25% of the Class P units vest in September 2020 with the remaining Class P units vesting monthly over the next three years from September 2020 or (b) the Class P units vest monthly over four years from the grant date.
F-25
Table of Contents
LULU’S FASHION LOUNGE HOLDINGS, INC.
Notes to Consolidated Financial Statements (Continued)
On October 8, 2019 the Company signed a lease agreement for office space in Los Angeles, California. The lease commences in October 2019 with annual rent of $456,000 to $492,000 commencing on January 1, 2020 for a period of four years. The lease has two renewal options to extend the lease for an additional four years each.
Management evaluates events occurring subsequent to the date of the financial statements in determining the accounting for and disclosure of transactions and events that affect the financial statements. Subsequent events have been evaluated through November 19, 2019, which is the date that the financial statements were available to be issued.
F-26
Table of Contents
LULU’S FASHION LOUNGE HOLDINGS, INC.
Condensed Consolidated Balance Sheets
(Unaudited)
(In thousands, except share and per share amounts)
| As of December 30, 2018 |
As of September 29, 2019 |
Pro Forma As of September 29, 2019 |
||||||||||
| Assets |
||||||||||||
| Current assets: |
||||||||||||
| Cash and cash equivalents |
$ | 7,747 | $ | 10,661 | ||||||||
| Accounts receivable |
2,282 | 5,321 | ||||||||||
| Inventories |
24,315 | 29,727 | ||||||||||
| Asset for recovery |
2,882 | 4,519 | ||||||||||
| Income tax refund receivable |
2,920 | 1,239 | ||||||||||
| Advance to Parent |
— | 467 | ||||||||||
| Prepaids and other current assets |
2,181 | 4,523 | ||||||||||
|
|
|
|
|
|
|
|||||||
| Total current assets |
42,327 | 56,457 | ||||||||||
| Restricted cash |
503 | 504 | ||||||||||
| Property and equipment, net |
3,100 | 3,739 | ||||||||||
| Goodwill |
35,430 | 35,430 | ||||||||||
| Tradename |
18,509 | 18,509 | ||||||||||
| Other intangible assets, net |
2,488 | 2,691 | ||||||||||
| Other non-current assets |
1,324 | 2,164 | ||||||||||
|
|
|
|
|
|
|
|||||||
| Total assets |
$ | 103,681 | $ | 119,494 | ||||||||
|
|
|
|
|
|
|
|||||||
| Liabilities, Convertible Preferred Stock and Stockholders’ Deficit |
||||||||||||
| Current liabilities: |
||||||||||||
| Accounts payable |
$ | 5,559 | $ | 10,654 | ||||||||
| Accrued expenses |
10,397 | 15,729 | ||||||||||
| Returns reserve |
7,493 | 12,800 | ||||||||||
| Stored-value card liability |
3,033 | 3,977 | ||||||||||
| Revolving line of credit |
— | 4,500 | ||||||||||
| Long-term debt, current portion |
10,125 | 10,125 | ||||||||||
|
|
|
|
|
|
|
|||||||
| Total current liabilities |
36,607 | 57,785 | ||||||||||
| Long-term debt, net of current portion |
108,203 | 98,659 | ||||||||||
| Other non-current liabilities |
1,683 | 3,520 | ||||||||||
|
|
|
|
|
|
|
|||||||
| Total liabilities |
146,493 | 159,964 | ||||||||||
|
|
|
|
|
|
|
|||||||
| Commitments and Contingencies (Note 6) |
— | — | ||||||||||
| Convertible preferred stock: $0.001 par value—3,129,634 shares authorized, issued and outstanding |
117,038 | 117,038 | — | |||||||||
|
|
|
|
|
|
|
|||||||
| Stockholders’ deficit: |
||||||||||||
| Common stock of Lulu’s Fashion Lounge Holdings, Inc.; $0.001 par value—20,591,917 shares authorized and 17,462,283 issued and outstanding, respectively; 20,591,917 shares issued and outstanding, pro forma |
18 | 18 | $ | 21 | ||||||||
| Additional paid-in capital |
— | 1,690 | 118,725 | |||||||||
| Accumulated deficit |
(159,868 | ) | (159,216 | ) | (159,216 | ) | ||||||
|
|
|
|
|
|
|
|||||||
| Total stockholders’ deficit |
(159,850 | ) | (157,508 | ) | $ | (40,470 | ) | |||||
|
|
|
|
|
|
|
|||||||
| Total liabilities, convertible preferred stock and stockholders’ deficit |
$ | 103,681 | $ | 119,494 | ||||||||
|
|
|
|
|
|
|
|||||||
The accompanying notes are an integral part of the condensed consolidated financial statements.
F-27
Table of Contents
LULU’S FASHION LOUNGE HOLDINGS, INC.
Condensed Consolidated Statements of Income and Comprehensive Income
(Unaudited)
(In thousands, except share and per share amounts)
| Nine months ended | ||||||||
| September 30, 2018 |
September 29, 2019 |
|||||||
| Net sales |
$ | 230,930 | $ | 285,990 | ||||
| Cost of goods sold |
126,375 | 160,500 | ||||||
|
|
|
|
|
|||||
| Gross profit |
104,555 | 125,490 | ||||||
| Selling and marketing expenses |
42,594 | 56,241 | ||||||
| General and administrative expenses |
42,102 | 56,603 | ||||||
|
|
|
|
|
|||||
| Income from operations |
19,859 | 12,646 | ||||||
|
|
|
|
|
|||||
| Other income (expenses), net: |
||||||||
| Interest expense |
(10,236 | ) | (11,396 | ) | ||||
| Other income |
393 | 193 | ||||||
|
|
|
|
|
|||||
| Total other expense, net |
(9,843 | ) | (11,203 | ) | ||||
|
|
|
|
|
|||||
| Income before provision for income taxes |
10,016 | 1,443 | ||||||
| Provision for income taxes |
4,864 | 791 | ||||||
|
|
|
|
|
|||||
| Net income and comprehensive income |
$ | 5,152 | $ | 652 | ||||
|
|
|
|
|
|||||
| Net income attributable to common stockholder—Basic and Diluted |
$ | 4,659 | $ | 553 | ||||
| Net income per share attributable to common stockholder—Basic and Diluted |
$ | 0.25 | $ | 0.03 | ||||
| Shares used to compute net income per share attributable to common stockholder—Basic and Diluted |
18,620,133 | 17,462,283 | ||||||
| Pro forma net income attributable to common stockholders—Basic and Diluted |
$ | 652 | ||||||
| Pro forma net income per share attributable to common stockholders—Basic and Diluted |
$ | 0.03 | ||||||
| Shares used to compute pro forma net income per share attributable to common stockholders—Basic and Diluted |
20,591,917 | |||||||
The accompanying notes are an integral part of the condensed consolidated financial statements.
F-28
Table of Contents
LULU’S FASHION LOUNGE HOLDINGS, INC.
Condensed Consolidated Statements of Convertible Preferred Stock and Stockholders’ Deficit
(Unaudited)
(In thousands, except share amounts)
| For the Nine Months Ended September 30, 2018 | ||||||||||||||||||||||||||||
| Convertible Preferred Stock |
Common Stock | Additional Paid-In Capital |
Accumulated Deficit |
Total Stockholders’ Deficit |
||||||||||||||||||||||||
| Units | Amount | Units | Amount | |||||||||||||||||||||||||
| Balance at December 31, 2017 |
— | $ | — | 20,591,917 | $ | 21 | $ | — | $ | (51,748 | ) | $ | (51,727 | ) | ||||||||||||||
| Series A Preferred Stock purchase, net of issuance costs |
3,129,634 | 117,038 | — | — | — | — | — | |||||||||||||||||||||
| Repurchase of Common Stock from Parent |
— | — | (3,129,634 | ) | (3 | ) | (3,305 | ) | (109,988 | ) | (113,296 | ) | ||||||||||||||||
| Equity-based compensation expense |
— | — | — | — | 3,305 | — | 3,305 | |||||||||||||||||||||
| Net income |
— | — | — | — | — | 5,152 | 5,152 | |||||||||||||||||||||
|
|
|
|
|
|
|
|
|
|
|
|
|
|
|
|||||||||||||||
| Balance at September 30, 2018 |
3,129,634 | $ | 117,038 | 17,462,283 | $ | 18 | $ | — | $ | (156,584 | ) | $ | (156,566 | ) | ||||||||||||||
|
|
|
|
|
|
|
|
|
|
|
|
|
|
|
|||||||||||||||
| For the Nine Months Ended September 29, 2019 | ||||||||||||||||||||||||||||
| Convertible Preferred Stock |
Common Stock | Additional Paid-In Capital |
Accumulated Deficit |
Total Stockholders’ Deficit |
||||||||||||||||||||||||
| Units | Amount | Units | Amount | |||||||||||||||||||||||||
| Balance at December 30, 2018 |
3,129,634 | $ | 117,038 | 17,462,283 | $ | 18 | $ | — | $ | (159,868 | ) | $ | (159,850 | ) | ||||||||||||||
| Equity-based compensation expense |
— | — | — | — | 1,690 | — | 1,690 | |||||||||||||||||||||
| Net income |
— | — | — | — | — | 652 | 652 | |||||||||||||||||||||
|
|
|
|
|
|
|
|
|
|
|
|
|
|
|
|||||||||||||||
| Balance at September 29, 2019 |
3,129,634 | $ | 117,038 | 17,462,283 | $ | 18 | $ | 1,690 | $ | (159,216 | ) | $ | (157,508 | ) | ||||||||||||||
|
|
|
|
|
|
|
|
|
|
|
|
|
|
|
|||||||||||||||
The accompanying notes are an integral part of the condensed consolidated financial statements.
F-29
Table of Contents
LULU’S FASHION LOUNGE HOLDINGS, INC.
Condensed Consolidated Statements of Cash Flows
(Unaudited)
(In thousands, except share amounts)
| Nine months ended | ||||||||
| September 30, 2018 |
September 29, 2019 |
|||||||
| Cash Flows from Operating Activities |
||||||||
| Net income |
$ | 5,152 | $ | 652 | ||||
| Adjustments to reconcile net income to net cash provided by operating activities: |
||||||||
| Depreciation and amortization |
1,927 | 2,232 | ||||||
| Amortization of debt discount and debt issuance costs |
1,444 | 1,504 | ||||||
| Equity-based compensation expense |
3,305 | 1,690 | ||||||
| Deferred income taxes |
(449 | ) | (1,265 | ) | ||||
| Other |
— | (85 | ) | |||||
| Changes in operating assets and liabilities: |
||||||||
| Accounts receivable |
(2,956 | ) | (3,039 | ) | ||||
| Inventories |
1,230 | (5,412 | ) | |||||
| Asset for recovery |
(854 | ) | (1,637 | ) | ||||
| Income tax refund receivable / payable |
(519 | ) | 1,681 | |||||
| Prepaids and other assets |
(293 | ) | (568 | ) | ||||
| Accounts payable |
3,459 | 5,132 | ||||||
| Accrued expenses and other liabilities |
9,906 | 11,577 | ||||||
| Non-current liabilities |
— | 2,229 | ||||||
|
|
|
|
|
|||||
| Net cash provided by operating activities |
21,352 | 14,691 | ||||||
|
|
|
|
|
|||||
| Cash Flows from Investing Activities |
||||||||
| Capitalized software expenditures |
(1,399 | ) | (1,399 | ) | ||||
| Purchases of property and equipment |
(1,440 | ) | (1,690 | ) | ||||
| Advance to Parent |
— | (2,406 | ) | |||||
| Repayments of Advance to Parent |
— | 2,024 | ||||||
|
|
|
|
|
|||||
| Net cash used in investing activities |
(2,839 | ) | (3,471 | ) | ||||
|
|
|
|
|
|||||
| Cash Flows from Financing Activities |
||||||||
| Borrowings on revolving line of credit |
— | 9,000 | ||||||
| Repayment of revolving line of credit |
— | (4,500 | ) | |||||
| Repayment of long-term debt |
(7,594 | ) | (10,125 | ) | ||||
| Payment of debt issuance costs |
— | (875 | ) | |||||
| Payment of deferred offering costs |
— | (1,774 | ) | |||||
| Repurchase of Common Stock from Parent |
(113,296 | ) | — | |||||
| Proceeds from issuance of Series A Preferred Stock, net of issuance costs |
117,038 | — | ||||||
| Other |
(13 | ) | (31 | ) | ||||
|
|
|
|
|
|||||
| Net cash used in financing activities |
(3,865 | ) | (8,305 | ) | ||||
|
|
|
|
|
|||||
| Net increase in cash, cash equivalents and restricted cash |
14,648 | 2,915 | ||||||
| Cash, cash equivalents and restricted cash at beginning of period |
6,139 | 8,250 | ||||||
|
|
|
|
|
|||||
| Cash, cash equivalents and restricted cash at end of period |
$ | 20,787 | $ | 11,165 | ||||
|
|
|
|
|
|||||
The accompanying notes are an integral part of the condensed consolidated financial statements.
F-30
Table of Contents
LULU’S FASHION LOUNGE HOLDINGS, INC.
Notes to Condensed Consolidated Financial Statements
(Unaudited)
| 1. | Description of Business |
Pursuant to a reorganization, Lulu’s Fashion Lounge Holdings, Inc., a Delaware Corporation (“Lulu’s”, “we”, “our”, “us”, “Lulus”, or the “Company), was formed on August 25, 2017 as a holding company and its primary asset is an indirect membership interest in Lulu’s Fashion Lounge, LLC (“LFL”) (previously Lulu’s Fashion Lounge, Inc.). Prior to the sale of the Company’s Series A convertible preferred stock, the Company was wholly-owned by Lulu’s Holdings, L.P. (the “Parent”) (previously Lulu’s Holdings, LLC). As of September 29, 2019, the Company is majority-owned by the Parent.
LFL was founded in 1996, starting as a vintage boutique in Chico, CA that began selling online in 2005 and transitioned to a purely online business in 2008. The Parent was formed in 2014 as a holding company and purchased 100% of LFL’s outstanding common stock in 2014. The Company, through LFL, is an online retailer of women’s clothing, shoes and accessories based in Chico, CA.
On April 12, 2018, the Company’s board of directors approved an amendment to the certificate of incorporation of the Company to authorize 20,591,917 shares of $0.001 par value common stock and to effect a 20,591.917-for-1 stock split (“Stock Split”) of shares of the Company’s issued and outstanding common stock, which was effected on April 12, 2018. All of the share information included in the accompanying condensed consolidated financial statements and notes to the condensed consolidated financial statements has been adjusted to reflect the Stock Split.
| 2. | Significant Accounting Policies |
Basis of Presentation and Fiscal Year
Our fiscal year consists of a 52-week or 53-week period ending on the Sunday nearest December 31.
The condensed consolidated financial statements include the accounts of the Company and its wholly owned subsidiary and have been prepared in accordance with accounting principles generally accepted in the United States of America (“GAAP”) and the requirements of the U.S. Securities and Exchange Commission (“SEC”) for interim reporting. As permitted under those rules, certain footnotes or other financial information that are normally required by GAAP can be condensed or omitted. These financial statements have been prepared on the same basis as our annual consolidated financial statements and, in the opinion of management, reflect all adjustments, consisting only of normal recurring adjustments, which are necessary for the fair statement of our financial information. These interim results are not necessarily indicative of the results to be expected for the fiscal year ending December 29, 2019, or for any other interim period or for any other future year. All intercompany balances and transactions have been eliminated in consolidation.
The condensed consolidated balance sheet at December 30, 2018 has been derived from the audited consolidated financial statements of the Company, which are included in the prospectus herein. These condensed consolidated financial statements should be read in conjunction with the consolidated financial statements and notes thereto included in the prospectus herein.
Use of Estimates
The preparation of condensed consolidated financial statements in conformity with GAAP requires management to make estimates and assumptions that affect the reported amount of assets
F-31
Table of Contents
LULU’S FASHION LOUNGE HOLDINGS, INC.
Notes to Condensed Consolidated Financial Statements (Continued)
(Unaudited)
and liabilities and disclosure of contingent assets and liabilities at the date of the condensed consolidated financial statements and the reported amounts of revenue and expenses during the reporting period. The significant estimates and assumptions made by management relate to valuation of inventory, capitalized software, equity-based compensation expense, revenue recognition and income taxes. Actual results could differ from those estimates and such differences may be material to the condensed consolidated financial statements.
Unaudited Pro Forma Balance Sheet Information
The accompanying unaudited pro forma balance sheet information as of September 29, 2019 assumes conversion of the outstanding shares of the convertible preferred stock into shares of common stock in connection with our initial public offering (“IPO”) (assumes each share of convertible preferred stock converts into one share of common stock). The unaudited pro forma stockholders’ equity does not assume any proceeds from the IPO.
Segment Reporting
The Company manages its business on the basis of one operating and reportable segment, retail. All our long-lived assets are located in the United States.
Concentration of Credit Risks
The Company deposits its cash with creditworthy financial institutions, however, its deposits, at times, may exceed federally insured limits. To date, the Company has not experienced any losses on its cash deposits. No customer accounted for greater than 10% of the Company’s total net sales during the nine months ended September 30, 2018 and September 29, 2019, respectively.
Cash and Cash Equivalents and Restricted Cash
The following table provides a reconciliation of cash, cash equivalents, and restricted cash reported within the condensed consolidated balance sheets that sum to the total of the same amounts shown in the condensed consolidated statements of cash flows (in thousands):
| December 30, 2018 |
September 29, 2019 |
|||||||
| Cash and cash equivalents |
$ | 7,747 | $ | 10,661 | ||||
| Restricted cash |
503 | 504 | ||||||
|
|
|
|
|
|||||
| Cash, cash equivalents and restricted cash |
$ | 8,250 | $ | 11,165 | ||||
|
|
|
|
|
|||||
Revenue Recognition
The Company generates revenue primarily from the sale of merchandise products sold directly to end customers. The sale of products is a distinct performance obligation, and revenue is recognized at a point in time when control of the promised product is transferred to customers, which the Company determined occurs upon shipment based on its evaluation of the related shipping terms. Revenue is recognized in an amount that reflects the transaction price consideration that the Company expects to receive in exchange for those products. The Company’s payment terms are typically at the point of sale for merchandise product sales.
F-32
Table of Contents
LULU’S FASHION LOUNGE HOLDINGS, INC.
Notes to Condensed Consolidated Financial Statements (Continued)
(Unaudited)
The Company elected to exclude from revenue taxes assessed by governmental authorities, including value-added and other sales-related taxes, that are imposed on and concurrent with revenue-producing activities. The Company has elected to apply the practical expedient, relative to e-commerce sales, which allows an entity to account for shipping and handling as fulfillment activities, and not a separate performance obligation. Accordingly, the Company recognizes revenue for only one performance obligation, the sale of the product, at shipping point (when the customer gains control). Shipping and handling costs associated with outbound freight are accounted for as fulfillment costs and are included in cost of goods sold. The Company has elected to apply the practical expedient to expense costs as incurred for incremental costs to obtain a contract when the amortization period would have been one year or less.
Revenue from merchandise product sales is reported net of sales returns, which includes an estimate of future returns based on historical return rates, with a corresponding reduction to cost of sales. There is judgment in utilizing historical trends for estimating future returns. The Company’s refund liability for sales returns is included in returns reserve on its condensed consolidated balance sheets and represents the expected value of the refund that will be due to the Company’s customers. The Company also has a corresponding asset for recovery that represents the expected net realizable value of the merchandise inventory to be returned.
The Company sells stored-value gift cards to customers and offers merchandise credit stored-value cards for certain returns. Such stored-value cards do not have an expiration date. The Company recognizes revenue from stored-value cards when the card is redeemed by the customer. In 2018, the Company determined sufficient evidence exists to support an estimate for stored-value card breakage. Subject to requirements to remit balances to governmental agencies, starting in 2018 breakage is recognized as revenue in proportion to the pattern of rights exercised by the customer, which is substantially within thirty-six months from the date of issuance.
The Company has two types of contractual liabilities: (i) cash collections from its customers prior to delivery of products purchased (“deferred revenue”), which are initially recorded as “Other” within “Accrued Expenses” and are recognized as revenue when the products are shipped, (ii) unredeemed gift cards and online store credits, which are initially recorded within “Stored-value cards” and are recognized as revenue in the period they are redeemed.
The following table summarizes the significant changes in the contract liabilities balances during the nine months ended September 30, 2018 and September 29, 2019 (in thousands):
| Deferred Revenue |
Stored-Value Cards |
|||||||
| Balance as of December 31, 2017 |
$ | 160 | $ | 1,531 | ||||
| Revenue recognized that was included in contract liability balance at the beginning of the period |
(160 | ) | (768 | ) | ||||
| Increase due to cash received, excluding amounts recognized as revenue during the period |
1,511 | 2,522 | ||||||
|
|
|
|
|
|||||
| Balance as of September 30, 2018 |
$ | 1,511 | $ | 3,285 | ||||
|
|
|
|
|
|||||
F-33
Table of Contents
LULU’S FASHION LOUNGE HOLDINGS, INC.
Notes to Condensed Consolidated Financial Statements (Continued)
(Unaudited)
| Deferred Revenue |
Stored-Value Cards |
|||||||
| Balance as of December 30, 2018 |
$ | 652 | $ | 3,033 | ||||
| Revenue recognized that was included in contract liability balance at the beginning of the period |
(652 | ) | (2,073 | ) | ||||
| Increase due to cash received, excluding amounts recognized as revenue during the period |
2,437 | 3,017 | ||||||
|
|
|
|
|
|||||
| Balance as of September 29, 2019 |
$ | 2,437 | $ | 3,977 | ||||
|
|
|
|
|
|||||
Net Income Per Common Share
Basic net income per common share is computed using net income attributable to common stockholders divided by the weighted average number of common shares outstanding during the period. Diluted net income per common share represents net income attributable to common stockholders divided by the weighted average number of common shares outstanding during the period, including the effects of any dilutive securities outstanding. Basic and diluted net income per common share attributable to common stockholders are the same for the nine months ended September 30, 2018 and September 29, 2019, as the Company did not have any dilutive securities outstanding.
Unaudited Pro Forma Net Income Per Common Share
The unaudited pro forma basic and diluted net income per share attributable to common stockholders assume the automatic conversion of the convertible preferred stock into shares of common stock using the if-converted method upon the completion of the IPO as though the conversion had occurred as of the original issue date of the convertible preferred stock.
| 3. | Recently Issued Accounting Pronouncements |
Recently Issued Accounting Pronouncements Not Yet Effective
In August 2018, the Financial Accounting Standards Board (FASB) issued Accounting Standards Update (ASU) 2018-15, Intangibles—Goodwill and Other—Internal-use Software: Customer’s Accounting for Implementation Costs Incurred in a Cloud Computing Arrangement That Is a Service Contract (a consensus of the FASB Emerging Issues Task Force), which clarifies the accounting for implementation costs in cloud computing arrangements. The update effectively aligns the requirements for capitalizing implementation costs incurred in a cloud computing arrangement service contract with the requirements for capitalizing implementation costs incurred to develop or obtain internal-use software. ASU 2018-15 is effective for fiscal years, and interim periods within, beginning after December 15, 2020, with early adoption permitted. The Company is currently evaluating the potential impact of adopting this guidance on its condensed consolidated financial statements.
In January 2017, the FASB issued ASU No. 2017-04, Intangibles—Goodwill and Other (Topic 350): Simplifying the Test for Goodwill Impairment, which eliminates the requirement to calculate the implied fair value of goodwill to measure a goodwill impairment charge. For public business entities that are SEC filers, this standard is effective for the annual or any interim goodwill impairment tests in fiscal years beginning after December 15, 2019. For public business entities that are not SEC filers,
F-34
Table of Contents
LULU’S FASHION LOUNGE HOLDINGS, INC.
Notes to Condensed Consolidated Financial Statements (Continued)
(Unaudited)
this standard is effective for the annual or any interim goodwill impairment tests in fiscal years beginning after December 15, 2020. For all other entities, this standard is effective for the annual or any interim goodwill impairment tests in fiscal years beginning after December 15, 2021. This standard will apply to the Company’s reporting requirements in performing goodwill impairment testing and we expect to adopt this standard in our first quarter of 2022. The Company is currently evaluating the potential impact of adopting this guidance on its condensed consolidated financial statements.
In August 2016, the FASB issued ASU No. 2016-15, Statement of Cash Flows (Topic 230), which clarifies guidance on eight cash flow classification issues including debt prepayment or debt extinguishment costs, settlement of zero-coupon debt instruments or other debt instruments with coupon interest rates that are insignificant in relation to the effective interest rate of the borrowing, contingent consideration payments made after a business combination, proceeds from the settlement of insurance claims, proceeds from the settlement of corporate-owned life insurance policies, including bank-owned life insurance policies, distributions received from equity method investees, beneficial interests in securitization transactions, and separately identifiable cash flows and application of the predominance principle. This standard is effective for public business entities for annual periods beginning after December 15, 2017, including interim periods within those periods. For all other entities, this standard is effective for annual periods beginning after December 15, 2018, and interim periods within fiscal years beginning after December 15, 2019. The adoption of this standard is not anticipated to have a material impact on the Company’s condensed consolidated financial statements.
In February 2016, the FASB issued ASU No. 2016-02, Leases (Topic 842), which requires lessees to put most leases on their balance sheets but recognize expenses on their income statement and eliminates the real estate-specific provisions for all entities. The guidance, as amended by ASU No. 2019-10, Financial Instruments —Credit Losses (Topic 326), Derivatives and Hedging (Topic 815), and Leases (Topic 842): Effective Dates, is effective for fiscal years beginning after December 15, 2020, including interim periods within those fiscal years. We expect to adopt this standard in our first quarter of 2021. In July 2018, the FASB issued ASU 2018-11 Leases (Topic 842): Targeted Improvements which allows entities the option to adopt this standard prospectively with a cumulative-effect adjustment to opening equity and include required disclosures for the prior period. The Company anticipates implementing the standard by taking advantage of the alternative transition method and will apply the transition approach as of the beginning of the period of adoption and will not be restating comparative periods. The Company is currently evaluating the impact that this standard will have on its condensed consolidated financial statements; however, we expect that it will result in an increase in our long-term assets and liabilities.
| 4. | Fair Value Measurements |
The Company’s financial instruments consist of cash and cash equivalents, restricted cash, accounts payable, accrued expenses, revolving line of credit and long-term debt. At December 30, 2018 and September 29, 2019, the carrying values of cash and cash equivalents, restricted cash, accounts payable and accrued expenses approximate fair value due to their short-term maturities. The fair values of long-term debt and revolving line of credit approximate their carrying value as the stated interest rates reset monthly at LIBOR + Applicable Margin (9.0% and 7.0% for the Term Loan and Revolving LOC, respectively, as of September 29, 2019) and as such approximate market rates currently available to the Company.
F-35
Table of Contents
LULU’S FASHION LOUNGE HOLDINGS, INC.
Notes to Condensed Consolidated Financial Statements (Continued)
(Unaudited)
| 5. | Long-Term Debt |
Long-term debt consisted of the following (in thousands):
| December 30, 2018 |
September 29, 2019 |
|||||||
| Principal | Principal | |||||||
| Term loan |
$ | 124,875 | $ | 114,750 | ||||
| Less: Unamortized discount and debt issuance costs |
(6,547 | ) | (5,966 | ) | ||||
|
|
|
|
|
|||||
| 118,328 | 108,784 | |||||||
| Less: Current portion |
(10,125 | ) | (10,125 | ) | ||||
|
|
|
|
|
|||||
| Total long-term debt, net |
$ | 108,203 | $ | 98,659 | ||||
|
|
|
|
|
|||||
In August 2017, the Company entered into a term loan with a principal amount of $135,000,000 (“Term Loan”) and a revolving credit facility of $10,000,000 (“Revolving LOC”) with certain financial institutions for which Credit Suisse is acting as an administrative agent.
On May 30, 2019 the Company entered into a Waiver and Fourth Amendment to the Credit Agreement and Amendment to the Guaranty and Security Agreement (“the Amendment”). Under the Amendment, the lenders waived the Company’s Default for failure to comply with the maximum Consolidated Total Net Leverage Ratio level required under the Financial Covenant for the quarter ended March 31, 2019. Further, the Amendment resets the maximum Consolidated Total Net Leverage Ratio covenant levels for the duration of the loan and added a minimum Consolidated Cumulative Unadjusted EBITDA Financial Covenant for fiscal year 2019.
The Amendment modified the Applicable Margin on the Term Loan, specifically, the Company will pay interest at either the LIBOR Rate plus an Applicable Margin of 9.00% or the Base Rate plus an Applicable Margin of 8.00% (up from 7.00% and 6.00%, respectively) from the Fourth Amendment Effective Date (May 30, 2019) to the date on which financial statements and accompanying Compliance Certificate for the first full fiscal quarter ending after the Fourth Amendment Effective Date are delivered. Thereafter, the Applicable Margin on the Term Loan will be subject to adjustment based on the Consolidated Total Net Leverage Ratio with a range of 7.00% to 9.00% for LIBOR Rate Term Loans and 6.00% to 8.00% for Base Rate Term Loans. The interest rate for the Term Loan as of September 29, 2019 was 11.1%. The effective interest rates for the nine months ended September 30, 2018 and September 29, 2019 were 10.4% and 12.0%, respectively.
Additionally, under the Amendment, proceeds from an Initial Public Offering constitute a Mandatory Repayment, so that the Leverage Ratio as of the last day of the most recently ended period of four fiscal quarters shall not be in excess of 2.00 to 1.00.
The Term Loan requires mandatory additional prepayments in May of each year if the Company’s Excess Cash Flow (“ECF”) for the preceding year exceeds the ECF as defined in the Term Loan agreement. For 2017, the ECF period is defined as the Company’s fourth quarter results of operations, for all future years, the ECF period is the full year. There were no ECF payments due in 2018 and for the nine months ended September 29, 2019 related to 2017 and 2018, respectively.
F-36
Table of Contents
LULU’S FASHION LOUNGE HOLDINGS, INC.
Notes to Condensed Consolidated Financial Statements (Continued)
(Unaudited)
Amortization installment payments on the Term Loan are required to be made in quarterly installments of $2,531,250, with the remaining outstanding amount to be payable on August 28, 2022, the maturity date for the Term Loan.
Outstanding amounts under the Revolving LOC bear interest at variable rates with a minimum of 7.00%. The interest rate for the Revolving LOC was 9.0% as of September 29, 2019. The effective interest rate was 10.3% for the nine months ended September 29, 2019. Unused portions of the Revolving LOC bear a variable commitment fee of a minimum 0.375% to 0.50% per annum and are paid quarterly. The Revolving LOC expires May 29, 2022. As of September 29, 2019, there was $4,500,000 outstanding on the Revolving LOC and the Company had $4,650,000 remaining capacity under the Revolving LOC (net of outstanding letters of credit). As of September 29, 2019, we had letters of credit of $850,000 outstanding under the Revolving LOC.
The Term Loan and Revolving LOC are secured by all the assets of the Company and contain financial and reporting covenants, including restrictions on LFL with respect to the payment of dividends, which the Company was in compliance with as of December 30, 2018 and September 29, 2019. Substantially all of LFL’s assets are restricted from distribution to the Company. The Company does not have any material assets or liabilities, other than its indirect investment in LFL. For all of the periods reported in these condensed consolidated financial statements, the Company has not and does not have any material operations on a standalone basis, and all of the operations of the Company are carried out by LFL.
Debt discounts and issuance costs are deferred and amortized over the life of the related loan using the effective interest method. The associated expense is included in interest expense in the condensed consolidated statements of income and comprehensive income. Debt discounts and issuance costs are presented as a reduction of long-term debt with the exception of debt issuance costs related to the revolving loan agreement which are included in other non-current assets in the condensed consolidated balance sheets.
Future maturities of long-term debt for the next four years are (in thousands):
| Fiscal Year Ending | Amounts | |||
| 2019 (remaining three months) |
$ | 2,531 | ||
| 2020 |
10,125 | |||
| 2021 |
10,125 | |||
| 2022 |
91,969 | |||
|
|
|
|||
| Total |
$ | 114,750 | ||
|
|
|
|||
| 6. | Commitments and Contingencies |
Operating Leases
As of September 29, 2019, the Company had non-cancelable operating leases for its corporate offices and warehouses expiring at various dates through 2026, some of which have renewal provisions. Rental expense classified within general and administrative expenses in the condensed consolidated statements of income and comprehensive income totaled $1,421,000 and $2,123,000 for the nine months ended September 30, 2018 and September 29, 2019, respectively.
F-37
Table of Contents
LULU’S FASHION LOUNGE HOLDINGS, INC.
Notes to Condensed Consolidated Financial Statements (Continued)
(Unaudited)
Future minimum lease payments under non-cancelable leases are as follows (in thousands):
| Fiscal year ending: | Amounts | |||
| 2019 (remaining three months) |
$ | 638 | ||
| 2020 |
2,375 | |||
| 2021 |
2,256 | |||
| 2022 |
2,193 | |||
| 2023 |
1,725 | |||
| Thereafter |
3,760 | |||
|
|
|
|||
| Total |
$ | 12,947 | ||
|
|
|
|||
Other
During the normal course of business, the Company may be a party to claims that are not covered by insurance. While the ultimate liability, if any, arising from these claims cannot be predicted with certainty, management does not believe that the resolution of any such claims would have a material adverse effect on the Company’s condensed consolidated financial statements.
| 7. | Convertible Preferred Stock |
On April 12, 2018, the Company amended and restated its certificate of incorporation to, among other things, (i) authorize 3,129,634 shares of $0.001 par value Series A convertible preferred stock (“Series A stock”), and (ii) set forth the rights, preferences and privileges of the Series A stock. The Company, Parent and Purchasers (consisting of Institutional Venture Partners and Canada Pension Plan Investment Board) then entered into a Series A Preferred Stock Purchase agreement (“Series A Agreement”) under which the Company 1) sold 3,129,634 shares of its Series A stock in a private placement to Purchasers for $38.34 per share, for a total purchase price of $120,000,000 ($117,038,000, net of issuance costs of $2,962,000) and 2) the Company repurchased 3,129,634 shares of its common stock from the Parent for a total repurchase price of $113,296,000 (includes transaction costs of $2,025,000). Additional transaction costs related to the Series A stock issuance of $3,557,000 paid to the Parent and other related parties were included in general and administrative expense in the condensed consolidated statements of income and comprehensive income.
Significant provisions of the convertible preferred stock are as follows:
Dividends—Before any dividends on common stock shall be declared or paid, the holders of outstanding shares of Series A stock shall be entitled to receive dividends on an as-converted basis. For dividends on non-convertible class or series, dividends to Series A stock holders will be determined by dividing the dividend payable on each class/series of capital stock by the original issuance price (adjusted for stock split, stock dividend, etc.) and multiplying such fraction by the Series A original issue price. As of September 29, 2019 no dividends have been declared or paid.
Liquidation—In the event of any voluntary or involuntary liquidation, dissolution, winding up of the Company (a “liquidation event”), the holders of the convertible preferred stock shall be entitled to receive, before any payment made to the holders of common stock, an amount per share for each share of convertible preferred stock held by them equal to the greater of 1) the sum of original issue price multiplied by an applicable factor per the Series A Agreement (1.6 as of September 29, 2019)
F-38
Table of Contents
LULU’S FASHION LOUNGE HOLDINGS, INC.
Notes to Condensed Consolidated Financial Statements (Continued)
(Unaudited)
plus any declared but unpaid dividends on preferred stock; and ii) the amount per share as would have been payable if all shares of preferred stock had been converted to common stock (the “Series A Liquidation Amount”). The aggregate liquidation preference of the convertible preferred stock as of September 29, 2019 was $192,000,000.
Voting—Each share of Series A stock is entitled to voting rights equal to the number of shares of common stock it can be converted to. Series A stockholders are entitled to elect two directors of the Company, as long as there are more than 782,409 shares of Series A stock outstanding.
Conversion—At the option of the holder, each share of Series A stock is convertible into shares of common stock. As of September 29, 2019, each share of Series A stock was convertible into one share of common stock, adjusted for stock splits, combinations, dividends and distributions. All outstanding shares of Series A stock will automatically be converted into shares of common stock at the then effective conversion rate upon one of the following conversion events: (i) the closing of a firm commitment underwritten initial public offering, provided that the aggregate gross proceeds to the Company are not less than $100,000,000; or (ii) by vote or written consent for conversion from the holders of a majority of the outstanding shares of Series A stock.
Redemption—On or after April 12, 2024, all outstanding shares of Series A stock will be redeemable upon written notice of at least 50% of the then outstanding shares requesting redemption of all or part of the stock held by such holders. The shares shall be redeemed in up to two installments, at a price equal to the then applicable Series A Liquidation Amount. The initial redemption date shall be within sixty days of receiving written notice and the Company shall redeem at least 50% of the shares at that time. The remaining shares to be redeemed shall accrue interest at a rate of 12.0% per annum and shall be redeemed no later than six months following the initial redemption date.
The Company classifies its convertible preferred stock outside of stockholders’ equity because the shares contain a redemption feature that is not within the Company’s control. As of September 29, 2019, the Company has not adjusted the carrying value of the convertible preferred stock to the redemption value as a qualifying redemption event was not probable. Subsequent adjustments to the carrying value to the ultimate redemption value will be made only when it becomes probable that such a redemption event will occur.
As of September 30, 2018 and September 29, 2019 there were 3,129,634 preferred shares issued and outstanding.
| 8. | Stockholders’ Deficit |
Common Stock
Lulu’s Fashion Lounge Holdings Inc. has one class of $0.001 par value common stock with pari-passu voting rights.
Equity-Based Compensation
The Company recognized $3,305,000 and $1,690,000, for the nine months ended September 30, 2018 and September 29, 2019, respectively, in equity-based compensation expense related to Class P units in Parent, which were granted to employees of Lulu’s. Equity-based compensation expense were recognized as general and administrative expense in the Company’s condensed consolidated statements of income and comprehensive income.
F-39
Table of Contents
LULU’S FASHION LOUNGE HOLDINGS, INC.
Notes to Condensed Consolidated Financial Statements (Continued)
(Unaudited)
In 2017, Parent modified the vesting conditions of 951,188 Class P units granted to five employees to provide for service-based vesting of the awards prior to the sale of the Company. The modified awards vested 25% on July 11, 2017, 8.33% on December 31, 2017 and 33.33% on December 31, 2018. An additional 33.34% will vest on December 31, 2019. Vesting is accelerated to 100% upon a change of control or sale of the Company.
On July 22, 2019 the Parent granted 284,036 Class P Units to two employees of the Company, which vest monthly over four years from the grant date with vesting for 50% of the awards accelerated upon the sale of the Parent or if the employee is terminated without cause within twelve months after the date of the Sale of the Parent.
The following table summarizes the rollforward of unvested Class P units for the nine months ended September 29, 2019:
| Unvested Units |
||||
| Balance at December 30, 2018 |
1,018,679 | |||
| Units granted |
284,036 | |||
| Units vested |
(328,866) | |||
| Units cancelled |
— | |||
|
|
|
|||
| Balance at September 29, 2019 |
973,849 | |||
|
|
|
|||
| 9. | Income Taxes |
All of the Company’s income before provision for income taxes is from the United States. The following table summarizes our provision (benefit) for income taxes and our effective tax rates for the periods presented (in thousands):
| Nine months ended | ||||||||
| September 30, 2018 |
September 29, 2019 |
|||||||
| Income (loss) before provision for income taxes |
$ | 10,016 | $ | 1,443 | ||||
| Provision for income taxes |
4,864 | 791 | ||||||
|
|
|
|
|
|||||
| Effective tax rate |
48.6 | % | 54.8 | % | ||||
|
|
|
|
|
|||||
Our effective tax rate for the nine months ended September 29, 2019 differs from the federal income tax rate of 21% primarily due to non-deductible equity-based compensation expense and uncertain tax positions, partially offset by tax credits.
Our effective tax rate for the nine months ended September 30, 2018 differs from the federal income tax rate of 21% primarily due to state taxes, non-deductible transaction fees and non-deductible equity-based compensation expenses.
| 10. | Related Party Transactions |
Transactions with Parent
The Company’s transactions with its Parent are classified as a component within additional paid-in capital in the Company’s condensed consolidated statements of stockholders’ deficit as there are no
F-40
Table of Contents
LULU’S FASHION LOUNGE HOLDINGS, INC.
Notes to Condensed Consolidated Financial Statements (Continued)
(Unaudited)
defined payments or other terms associated with these transactions. Such transactions included equity-based compensation expense of $3,305,000 and $1,690,000 for the nine months ended September 30, 2018 and September 29, 2019, respectively.
Management & Consulting Fees
The Company paid management and consulting fees to H.I.G. Capital, LLC (“H.I.G.”), Institutional Venture Partners (“IVP”), the Parent’s ultimate parent, and certain board members. For the nine months ended September 30, 2018 and September 29, 2019 expenses to HIG for such services were $509,000 and $352,000, respectively, and $90,000 and $154,000, respectively, to other related parties. Amounts due to related parties for management and consulting fees as of December 30, 2018 and September 29, 2019 were $170,000 and $10,000, respectively.
Transaction Fees
The Company paid investment banking fees to H.I.G. and other affiliates and limited partners of the Parent in connection with the Series A Preferred Stock transaction. Expenses for such services were $2,595,000 to H.I.G. and $962,000 to other related parties for the nine months ended September 30, 2018. No transactions fees were paid during the nine months ended September 29, 2019.
Advance to Parent
On January 31, 2019 the Company paid a cash advance to the Parent of $2,406,000, which was used for the payment of accrued Class P unit distributions to certain current employees of the Company. The Company recorded interest income on the advance of $145,000 for the nine months ended September 29, 2019. On September 16, 2019 the Parent made a repayment of $2,084,000 to the Company, which included $60,000 of accrued interest.
Operating Leases
The Company leases operations and warehouse spaces from a limited partner of the Parent. Total rent expense to the related party was $88,000 and $110,000 for the nine months ended September 30, 2018 and September 29, 2019, respectively.
F-41
Table of Contents
LULU’S FASHION LOUNGE HOLDINGS, INC.
Notes to Condensed Consolidated Financial Statements (Continued)
(Unaudited)
| 11. | Net Income Per Share and Pro Forma Net Income Per Share Attributable to Common Stockholders |
Net Income Per Share Attributable to Common Stockholder
The following is a reconciliation of the numerator and denominator in the basic and diluted net income per common share computations (in thousands, except share and per share amounts):
| Nine months ended | ||||||||
| September 30, 2018 |
September 29, 2019 |
|||||||
| Numerator: |
||||||||
| Net income |
$ | 5,152 | $ | 652 | ||||
| Less: Undistributed earnings to participating securities |
(493 | ) | (99 | ) | ||||
|
|
|
|
|
|||||
| Net income attributable to common stockholder—basic and diluted |
$ | 4,659 | $ | 553 | ||||
|
|
|
|
|
|||||
| Denominator: |
||||||||
| Weighted average shares of common stock—basic |
18,620,133 | 17,462,283 | ||||||
|
|
|
|
|
|||||
| Weighted average shares of common stock—diluted |
18,620,133 | 17,462,283 | ||||||
|
|
|
|
|
|||||
| Net income per share attributable to common stockholder: |
||||||||
| Basic |
$ | 0.25 | $ | 0.03 | ||||
| Diluted |
$ | 0.25 | $ | 0.03 | ||||
Basic and diluted net income per share attributable to common stockholder are computed using the two-class method as the Series A stock is determined to be participating stock and the application of the if-converted method is not more dilutive.
F-42
Table of Contents
LULU’S FASHION LOUNGE HOLDINGS, INC.
Notes to Condensed Consolidated Financial Statements (Continued)
(Unaudited)
Unaudited Pro Forma Net Income Per Share Attributable to Common Stockholders
The following table sets forth the computation of our unaudited pro forma basic and diluted net income per share attributable to common stockholders (in thousands, except share and per share amounts) assuming the automatic conversion of the convertible preferred stock upon consummation of an IPO as if such event had occurred as of the original issue date of the convertible preferred stock:
| Nine months ended September 29, 2019 |
||||
| Numerator: |
||||
| Net income |
$ | 652 | ||
| Adjustments to numerator |
— | |||
|
|
|
|||
| Net income used in calculating pro forma net income per share attributable to common stockholders—basic and diluted |
$ | 652 | ||
|
|
|
|||
| Denominator: |
||||
| Weighted-average shares used to calculate net income per share attributable to common stockholders outstanding—basic and diluted |
17,462,283 | |||
| Pro forma adjustment to reflect assumed conversion of all outstanding shares of convertible preferred stock |
3,129,634 | |||
|
|
|
|||
| Pro forma weighted average number of shares outstanding—basic and diluted |
20,591,917 | |||
|
|
|
|||
| Pro forma net income per share attributable to common stockholders: |
||||
| Basic |
$ | 0.03 | ||
| Diluted |
$ | 0.03 | ||
| 12. | Subsequent Events |
On September 30, 2019 the Parent granted an additional 317,952 Class P units to nine employees of the Company. The vesting terms are either (a) 25% of the Class P units vest in September 2020 with the remaining Class P units vesting monthly over the next three years from September 2020 or (b) the Class P units vest monthly over four years from the grant date.
On October 8, 2019 the Company signed a lease agreement for office space in Los Angeles, California. The lease commences in October 2019 with annual rent of $456,000 to $492,000 commencing on January 1, 2020 for a period of four years. The lease has two renewal options to extend the lease for an additional four years each.
Management evaluates events occurring subsequent to the date of the financial statements in determining the accounting for and disclosure of transactions and events that affect the financial statements. Subsequent events have been evaluated through November 19, 2019, which is the date that the financial statements were available to be issued.
F-43
Table of Contents
Shares
Common Stock

Goldman Sachs & Co. LLC
Table of Contents
PART II
INFORMATION NOT REQUIRED IN PROSPECTUS
ITEM 13. Other Expenses of Issuance and Distribution.
The following table sets forth all costs and expenses, other than underwriting discounts and commissions, payable by us in connection with the sale of the common stock being registered. All amounts shown are estimates except for the Securities and Exchange Commission (the “SEC”) registration fee, the Financial Industry Regulatory Authority (“FINRA”), filing fee, and the (the “Exchange”) listing fee.
| SEC Registration Fee |
$ | * | ||
| FINRA Filing Fee |
* | |||
| Exchange Listing Fee |
* | |||
| Printing and Engraving Expenses |
* | |||
| Legal Fees and Expenses |
* | |||
| Accounting Fees and Expenses |
* | |||
| Blue Sky Fees and Expenses |
* | |||
| Transfer Agent and Registrar Fees |
* | |||
| Miscellaneous Fees and Expenses |
* | |||
|
|
|
|||
| Total |
$ | * | ||
|
|
|
| * | To be completed by amendment. |
ITEM 14. Indemnification of Directors and Officers.
The Registrant is governed by the Delaware General Corporation Law (the “DGCL”). Section 145 of the DGCL provides that a corporation may indemnify any person, including an officer or director, who was or is, or is threatened to be made, a party to any threatened, pending or completed legal action, suit or proceeding, whether civil, criminal, administrative or investigative (other than an action by or in the right of such corporation), by reason of the fact that such person was or is an officer, director, employee or agent of such corporation or is or was serving at the request of such corporation as a director, officer, employee or agent of another corporation or enterprise. The indemnity may include expenses (including attorneys’ fees), judgments, fines and amounts paid in settlement actually and reasonably incurred by such person in connection with such action, suit or proceeding, provided such officer, director, employee or agent acted in good faith and in a manner such person reasonably believed to be in, or not opposed to, the corporation’s best interest and, for criminal proceedings, had no reasonable cause to believe that such person’s conduct was unlawful. A Delaware corporation may indemnify any person, including an officer or director, who was or is, or is threatened to be made, a party to any threatened, pending or contemplated action or suit by or in the right of such corporation, under the same conditions, except that such indemnification is limited to expenses (including attorneys’ fees) actually and reasonably incurred by such person, and except that no indemnification is permitted without judicial approval if such person is adjudged to be liable to such corporation. Where an officer or director of a corporation is successful, on the merits or otherwise, in the defense of any action, suit or proceeding referred to above, or any claim, issue or matter therein, the corporation must indemnify that person against the expenses (including attorneys’ fees) which such officer or director actually and reasonably incurred in connection therewith.
The Registrant’s amended and restated certificate of incorporation authorizes the indemnification of its officers and directors, consistent with Section 145 of the DGCL. Reference is made to Section 102(b)(7) of the DGCL, which enables a corporation in its original certificate of incorporation or
II-1
Table of Contents
an amendment thereto to eliminate or limit the personal liability of a director for violations of the director’s fiduciary duty, except (i) for any breach of the director’s duty of loyalty to the corporation or its stockholders, (ii) for acts or omissions not in good faith or which involve intentional misconduct or a knowing violation of law, (iii) pursuant to Section 174 of the DGCL, which provides for liability of directors for unlawful payments of dividends of unlawful stock purchase or redemptions or (iv) for any transaction from which a director derived an improper personal benefit. As permitted by the DGCL, we have included in our amended and restated certificate of incorporation a provision to eliminate the personal liability of our directors for monetary damages for breach of their fiduciary duties as directors, subject to certain exceptions. In addition, our amended and restated certificate of incorporation and bylaws provide that we are required to indemnify our officers and directors under certain circumstances, including those circumstances in which indemnification would otherwise be discretionary, and we are required to advance expenses to our officers and directors as incurred in connection with proceedings against them for which they may be indemnified.
The Registrant intends to enter into indemnification agreements with each of its directors. These agreements, among other things, will require the Registrant to indemnify each director to the fullest extent permitted by Delaware law, including indemnification of expenses such as attorneys’ fees, judgments, fines and settlement amounts incurred by the director in any action or proceeding, including any action or proceeding by or in right of the Registrant, arising out of the person’s services as a director.
The Registrant maintains directors’ and officers’ liability insurance for the benefit of its directors and officers.
The proposed form of Underwriting Agreement to be filed as Exhibit 1.1 to this Registration Statement provides for indemnification to the Registrant’s directors and officers by the underwriters against certain liabilities.
ITEM 15. Recent Sales of Unregistered Securities.
The following sets forth information regarding all unregistered securities sold or granted by us during the three years preceding the filing of this registration statement:
On April 12, 2018, we issued an aggregate of 3,129,634 shares of our Series A Preferred Stock at a price per share of $38.34314 for aggregate proceeds to us of $120,000,000.00.
No underwriters were used in the foregoing transaction. The sale of securities described in paragraph (1) above was deemed to be exempt from registration pursuant to Section 4(a)(2) of the Securities Act as transactions by an issuer not involving a public offering. All of the purchasers in this transaction represented to us in connection with their purchase that they were acquiring the shares for investment and not distribution, and that they could bear the risks of the investment and could hold the securities for an indefinite period of time. Such purchasers received written disclosures that the securities had not been registered under the Securities Act and that any resale must be made pursuant to a registration or an available exemption from such registration. All of the foregoing securities are deemed restricted securities for the purposes of the Securities Act.
ITEM 16. Exhibits and Financial Statement Schedules
(a) Exhibits
| Exhibit |
Description of Exhibits | |
| 1.1* | Form of Underwriting Agreement. | |
II-2
Table of Contents
| Exhibit |
Description of Exhibits | |
| 3.1* | Form of Amended and Restated Certificate of Incorporation of the Registrant, to be effective upon consummation of this offering. | |
| 3.2* | Form of Amended and Restated Bylaws of the Registrant, to be effective upon consummation of this offering. | |
| 4.1* | Form of Common Stock Certificate. | |
| 4.2 | Investors’ Rights Agreement, dated as of April 12, 2018, among the Registrant, the Investors listed on Schedule A thereto, Lulus Holdings, L.P. and LFL Acquisition Corp. | |
| 5.1* | Opinion of Latham & Watkins LLP. | |
| 10.1* | 2019 Incentive Award Plan. | |
| 10.2* | 2019 Employee Stock Purchase Plan. | |
| 10.3 | Form of Option Award Agreement Evidencing Class P Units. | |
| 10.4* | Form of Indemnification Agreement. | |
| 10.5 | Credit Agreement, dated as of August 28, 2017, among Lulu’s Fashion Lounge, LLC, Lulu’s Fashion Lounge Parent, LLC, Credit Suisse AG, Cayman Islands Branch, the Lenders party thereto, Credit Suisse Securities (USA) LLC, Lazard Middle Market LLC and Monroe Capital Management Advisors, LLC. | |
| 10.6 | Amendment No. 1 to the Credit Agreement, dated as of February 12, 2018, among Lulu’s Fashion Lounge, LLC, Lulu’s Fashion Lounge Parent, LLC, Credit Suisse AG, and Cayman Islands Branch. | |
| 10.7 | Amendment No. 2 to the Credit Agreement, dated as of April 25, 2018, among Lulu’s Fashion Lounge, LLC, Lulu’s Fashion Lounge Parent, LLC, Credit Suisse AG, and Cayman Islands Branch. | |
| 10.8 | Waiver and Amendment No. 3 to the Credit Agreement, dated as of February 15, 2019, among Lulu’s Fashion Lounge, LLC, Lulu’s Fashion Lounge Parent, LLC, Credit Suisse AG, and Cayman Islands Branch. | |
| 10.9 | Waiver and Amendment No. 4 to the Credit Agreement, dated as of May 30, 2019, among Lulu’s Fashion Lounge, LLC, Lulu’s Fashion Lounge Parent, LLC, Credit Suisse AG, and Cayman Islands Branch. | |
| 10.10 | Commercial Lease, dated as of March 16, 2018, between South Chico Chicas, LLC and the Registrant. | |
| 10.11 | Commercial Lease, dated as of March 16, 2018, between South Chico Chicas, LLC and the Registrant. | |
| 10.12 | Commercial Lease Agreement, dated as of March 16, 2018, between South Chico Chicas, LLC and the Registrant. | |
| 10.13 | Commercial Lease Agreement, dated as of October 16, 2016, between Hegan Lane Partnership and Lulu’s Fashion Lounge, Inc. | |
| 10.14 | Addendum to the Commercial Lease Agreement, dated as of September 6, 2019, between Hegan Lane Partnership and Lulu’s Fashion Lounge, Inc. | |
| 10.15 | Commercial Lease Agreement, dated as of October 26, 2017, between the Winter Family Trust and the Registrant. | |
| 10.16 | Lease Agreement, dated as of January 7, 2019, between Chrin-Carson Development, LLC and the Registrant. | |
II-3
Table of Contents
| Exhibit |
Description of Exhibits | |
| 10.17 | First Amendment to Lease, dated as of February 24, 2019, between Chrin-Carson Development, LLC and the Registrant. | |
| 10.18 | Transactions Services Agreement, dated as of July 25, 2014, between H.I.G. Capital, LLC and Lulu’s Holdings, LLC. | |
| 10.19 | Professional Services Agreement, dated as of July 25, 2014, between H.I.G. Capital, LLC and Lulu’s Holdings, LLC. | |
| 21.1* | List of Subsidiaries of the Registrant. | |
| 23.1* | Consent of Deloitte & Touche LLP, Independent Registered Public Accounting Firm for the Registrant. | |
| 23.2* | Consent of Latham & Watkins LLP (included in the opinion filed as Exhibit 5.1 hereto). | |
| 23.3* | Consent of Stax Inc. | |
| 24.1* | Power of Attorney (included on signature page). | |
| * | To be filed by amendment |
(b) Financial statement schedules.
No financial statements are provided because the information called for is not applicable or is shown in the financial statements or notes thereto.
ITEM 17. Undertakings
The undersigned registrant hereby undertakes to provide to the underwriters at the closing specified in the underwriting agreement, certificates in such denominations and registered in such names as required by the underwriters to permit prompt delivery to each purchaser.
Insofar as indemnification for liabilities arising under the Securities Act may be permitted to directors, officers and controlling persons of the registrant pursuant to the foregoing provisions, or otherwise, the registrant has been advised that in the opinion of the SEC such indemnification is against public policy as expressed in the Securities Act and is, therefore, unenforceable. In the event that a claim for indemnification against such liabilities (other than the payment by the registrant of expenses incurred or paid by a director, officer, or controlling person of the registrant in the successful defense of any action, suit or proceeding) is asserted by such director, officer or controlling person in connection with the securities being registered hereunder, the registrant will, unless in the opinion of its counsel the matter has been settled by controlling precedent, submit to a court of appropriate jurisdiction the question of whether such indemnification by it is against public policy as expressed in the Securities Act and will be governed by the final adjudication of such issue.
The undersigned registrant hereby undertakes that:
| (1) | For purposes of determining any liability under the Securities Act, the information omitted from the form of prospectus filed as part of this registration statement in reliance upon Rule 430A and contained in a form of prospectus filed by the registrant pursuant to Rule 424(b)(1) or (4) or 497(h) under the Securities Act shall be deemed to be part of this registration statement as of the time it was declared effective. |
| (2) | For the purpose of determining any liability under the Securities Act, each post-effective amendment that contains a form of prospectus shall be deemed to be a new registration statement relating to the securities offered therein, and the offering of such securities at that time shall be deemed to be the initial bona fide offering thereof. |
II-4
Table of Contents
| (3) | For the purpose of determining liability under the Securities Act to any purchaser, if the registrant is subject to Rule 430C, each prospectus filed pursuant to Rule 424(b) as part of a registration statement relating to an offering, other than registration statements relying on Rule 430B or other than prospectuses filed in reliance on Rule 430A, shall be deemed to be part of and included in the registration statement as of the date it is first used after effectiveness. Provided, however, that no statement made in a registration statement or prospectus that is part of the registration statement or made in a document incorporated or deemed incorporated by reference into the registration statement or prospectus that is part of the registration statement will, as to a purchaser with a time of contract of sale prior to such first use, supersede or modify any statement that was made in the registration statement or prospectus that was part of the registration statement or made in any such document immediately prior to such date of first use. |
| (4) | For the purpose of determining liability of the registrant under the Securities Act to any purchaser in the initial distribution of the securities, the undersigned registrant undertakes that in a primary offering of securities of the undersigned registrant pursuant to this registration statement, regardless of the underwriting method used to sell the securities to the purchaser, if the securities are offered or sold to such purchaser by means of any of the following communications, the undersigned registrant will be a seller to the purchaser and will be considered to offer or sell such securities to such purchaser. |
| (a) | Any preliminary prospectus or prospectus of the undersigned registrant relating to the offering required to be filed pursuant to Rule 424; |
| (b) | Any free writing prospectus relating to the offering prepared by or on behalf of the undersigned registrant or used or referred to by the undersigned registrant; |
| (c) | The portion of any other free writing prospectus relating to the offering containing material information about the undersigned registrant or its securities provided by or on behalf of the undersigned registrant; and |
| (d) | Any other communication that is an offer in the offering made by the undersigned registrant to the purchaser. |
II-5
Table of Contents
SIGNATURES
Pursuant to the requirements of the Securities Act of 1933, as amended, the registrant has duly caused this Registration Statement to be signed on its behalf by the undersigned, thereunto duly authorized, in the City of Chico, State of California, on the day of , 2019.
| LULU’S FASHION LOUNGE HOLDINGS, INC. | ||
| By: |
| |
| Name: Colleen Winter | ||
| Title: Chief Executive Officer | ||
KNOW ALL MEN BY THESE PRESENTS, that each of the undersigned constitutes and appoints each of Colleen Winter and Crystal Landsem, each acting alone, his or her true and lawful attorney-in-fact and agent, with full power of substitution and resubstitution, for such person and in his or her name, place and stead, in any and all capacities, to sign this Registration Statement on Form S-1 (including all pre-effective and post-effective amendments and registration statements filed pursuant to Rule 462(b) under the Securities Act of 1933), and to file the same, with all exhibits thereto, and other documents in connection therewith, with the Securities and Exchange Commission, granting unto said attorneys-in-fact and agents, each acting alone, full power and authority to do and perform each and every act and thing requisite and necessary to be done in and about the premises, as fully to all intents and purposes as he or she might or could do in person, hereby ratifying and confirming that any such attorney-in-fact and agent, or his or her substitute or substitutes, may lawfully do or cause to be done by virtue hereof.
Pursuant to the requirements of the Securities Act of 1933, this registration statement has been signed by the following persons in the capacities and on the dates indicated.
| Signature |
Title |
Date | ||
|
Colleen Winter |
Chief Executive Officer and Director (Principal Executive Officer) |
, 2019 | ||
|
Crystal Landsem |
Chief Financial Officer (Principal Financial and Accounting Officer) |
, 2019 | ||
|
Debra A. Cannon |
Director | , 2019 | ||
|
John Kim |
Director | , 2019 | ||
|
Evan Karp |
Director | , 2019 | ||
|
Danielle Qi |
Director | , 2019 | ||
|
John Black |
Director | , 2019 | ||
|
Michael Mardy |
Director | , 2019 | ||
|
Eric Liaw |
Director | , 2019 | ||