UNITED STATES Washington, D.C. 20549
| ||
FORM | ||
CURRENT REPORT
| ||
Date
of Report (Date of earliest event reported):
| ||
(Exact name of registrant as specified in its charter)
| ||
(State or other jurisdiction of incorporation) |
(Commission File Number) |
(IRS Employer Identification No.) |
(Address of principal executive offices) | ||
Registrant’s telephone number, including area code: ( | ||
Not Applicable (Former name or former address, if changed since last report) | ||
| ||
Check the appropriate box below if the Form 8-K filing is intended to simultaneously satisfy the filing obligation of the registrant under any of the following provisions:
Securities registered pursuant to Section 12(b) of the Act:
|
Title of each class | Trading Symbol(s) | Name of each exchange on which registered |
None | None | None |
Indicate by check mark whether the registrant is an emerging growth company as defined in Rule 405 of the Securities Act of 1933 (§230.405 of this chapter) or Rule 12b-2 of the Securities Exchange Act of 1934 (§240.12b-2 of this chapter).
Emerging growth company
If an emerging growth company, indicate by check mark if the registrant has elected not to use the extended transition period for complying with any new or revised financial accounting standards provided pursuant to Section 13(a) of the Exchange Act. ¨
Item 2.02 | Results of Operations and Financial Condition. |
On August 8, 2022 (August 9, 2022 in Australia), Coronado Global Resources Inc. (the “Company”) filed an earnings release with the Australian Securities Exchange (“ASX”) regarding its 2022 half-year results. A copy of the earnings release is attached as Exhibit 99.1 to this Current Report on Form 8-K.
The information in this Item 2.02, including the exhibit attached hereto, is being furnished and shall not be deemed to be filed for the purposes of Section 18 of the Securities Exchange Act of 1934 (the “Exchange Act”), or incorporated by reference into any filing under the Securities Act of 1933 or the Exchange Act, unless such subsequent filing specifically references this Current Report on Form 8-K.
Item 7.01 | Regulation FD Disclosure. |
On August 8, 2022 (August 9, 2022 in Australia), the Company posted an investor presentation regarding its 2022 half-year results on its website at www.coronadoglobal.com.au. A copy of the investor presentation is attached as Exhibit 99.2 to this Current Report on Form 8-K.
The information in this Item 7.01, including the exhibit attached hereto, is being furnished and shall not be deemed to be filed for the purposes of Section 18 of the Exchange Act, or incorporated by reference into any filing under the Securities Act of 1933 or the Exchange Act, unless such subsequent filing specifically references this Current Report on Form 8-K.
Item 9.01 | Financial Statements and Exhibits. |
(d) Exhibits.
The following exhibits are filed with this report on Form 8-K:
Exhibit |
Description | |
99.1 | Earnings Release | |
99.2 | 2022 Half-Year Results Presentation | |
104 | Cover Page Interactive Data File (embedded within the Inline XBRL document) |
1
SIGNATURES
Pursuant to the requirements of the Securities Exchange Act of 1934, the registrant duly caused this report to be signed on its behalf by the undersigned hereunto duly authorized.
CORONADO GLOBAL RESOURCES INC. | ||
By: | /s/ Christopher P. Meyering | |
Name: | Christopher P. Meyering | |
Title: | Vice President, Chief Legal Officer and Secretary | |
Date: August 8, 2022 |
2
Exhibit 99.1
ASX ANNOUNCEMENT - 2022 HALF YEAR RESULTS
9 August 2022
Record half year financial results:
ü | Revenue US$1,980m, Net Income US$562m, Adjusted EBITDA US$849m, Group Average Realised Met Coal Price US$293/tonne |
ü | Strong Net Cash position of US$171m and Available Liquidity of US$586m |
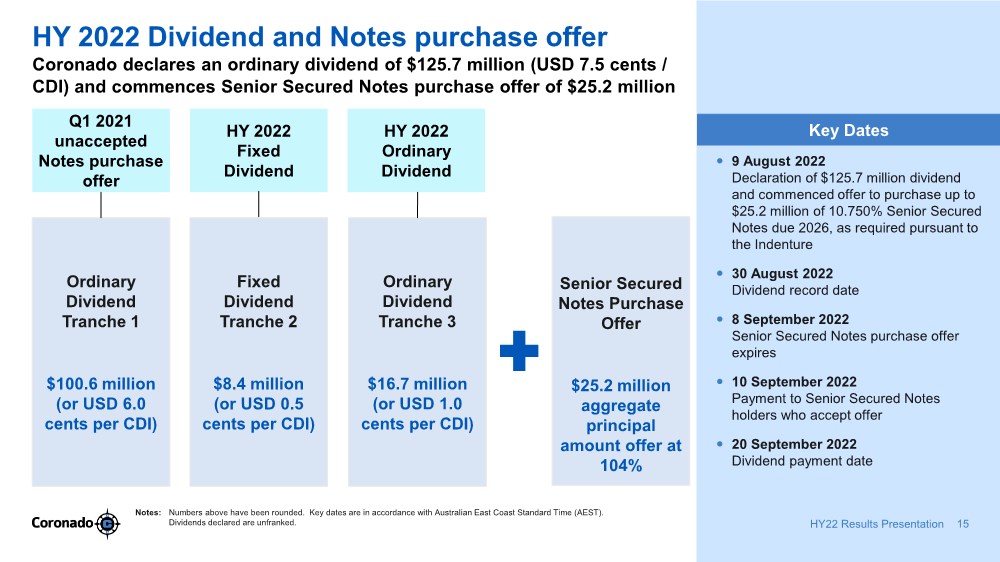
ü | Half year dividend declaration of US$125m (US 7.5 cents per CDI) and offer to purchase up to US$25m Senior Secured Notes |
RESULTS | HY22 | HY21 | Variance % | |||||||||
Revenue ($m) | 1,979.8 | 800.4 | 147.4 | |||||||||
Net Income / (Loss) ($m) | 561.9 | (96.1 | ) | 685.0 | ||||||||
Adjusted EBITDA ($m) | 849.3 | 25.7 | 3,204.7 | |||||||||
Net Cash / (Debt) ($m) | 171.2 | (236.6 | ) | 172.4 | ||||||||
Saleable Production (MMt) | 7.5 | 8.8 | (14.8 | ) | ||||||||
Sales Volume (MMt) | 8.3 | 8.9 | (7.0 | ) | ||||||||
Group Average Realised Met Price per tonne sold ($/t) | 292.8 | 99.8 | 193.4 | |||||||||
Mining Cost per tonne sold ($/t) | 85.2 | 64.2 | 32.7 | |||||||||
Operating Cost per tonne sold ($/t) | 134.5 | 85.8 | 56.8 | |||||||||
Capital Expenditure ($m) | 91.5 | 52.3 | 74.9 |
Coronado Global Resources Inc. (Coronado, Company or the Group) (ASX: CRN) has released its half year financial results for the six months to 30 June 2022 (HY22). All amounts quoted in this release are in USD and million metric tonnes (MMt). Comparisons are to the six-month period ended 30 June 2021 (HY21) unless otherwise stated.
HY22 HIGHLIGHTS
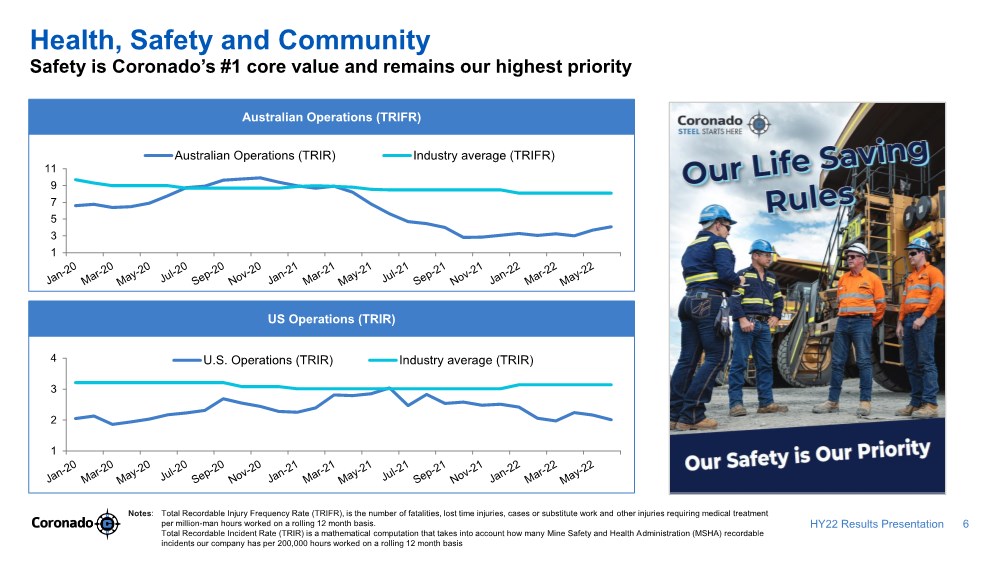
· | Safety is Coronado’s number one core value and remains our highest priority. Australian TRIFR was 4.08 and U.S. TRIR was 2.01 at 30 June 2022, representing year-on-year improvements of 28% and 34% respectively. |
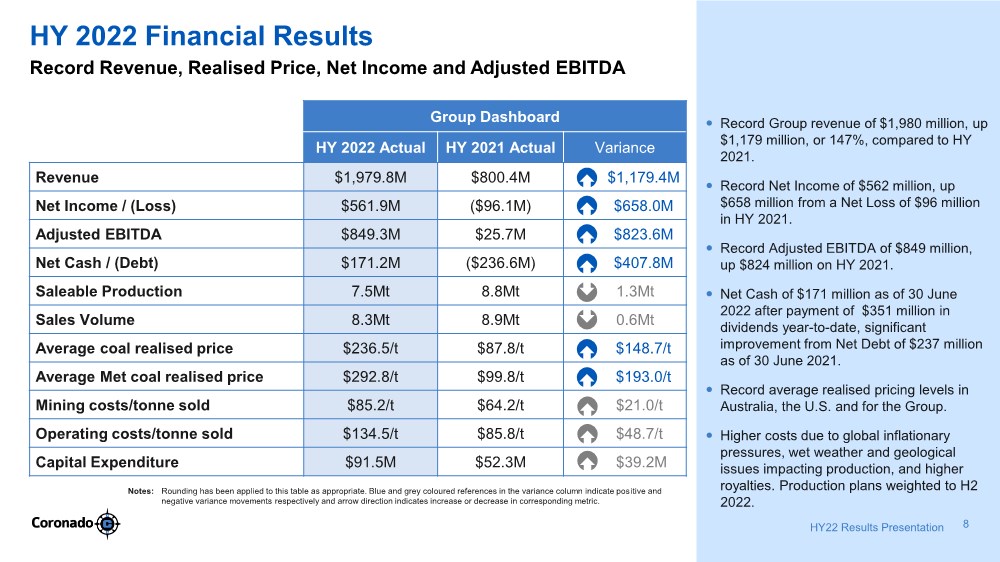
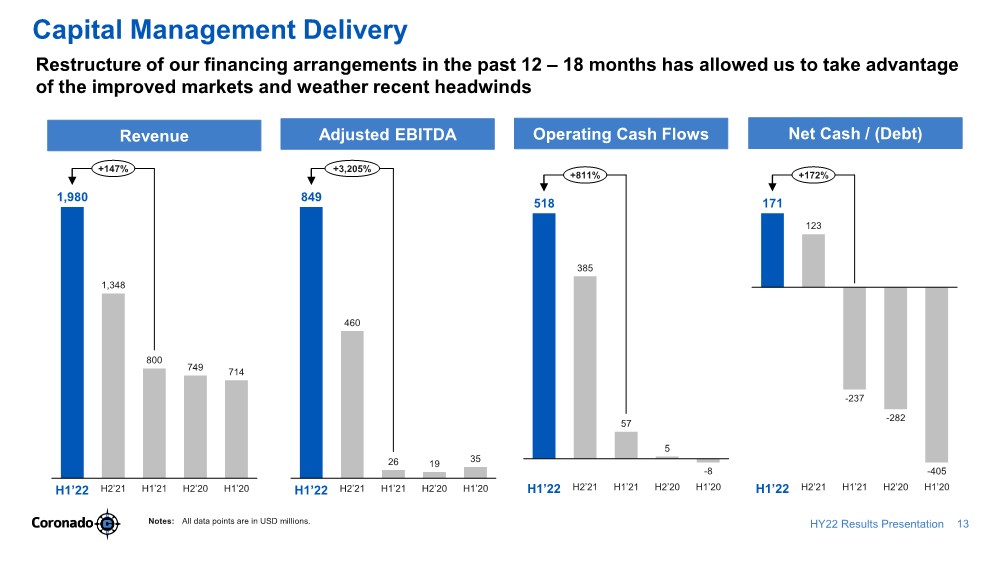
· | Record Group Revenue of $1,979.8 million, up 147% due to the improvement in Met coal pricing, strong global demand for steel and tight Met coal supply during HY22. |
· | Record Group Average Realised Met Coal Price of $292.8 per tonne, up 193% compared to the prior year. |
· | Record Net Income of $561.9 million, an improvement of 685% from a Net Loss of $96.1 million in the prior year. |
· | Record Adjusted EBITDA of $849.3 million, up more than 3,000% due to the higher Met coal price environment. |
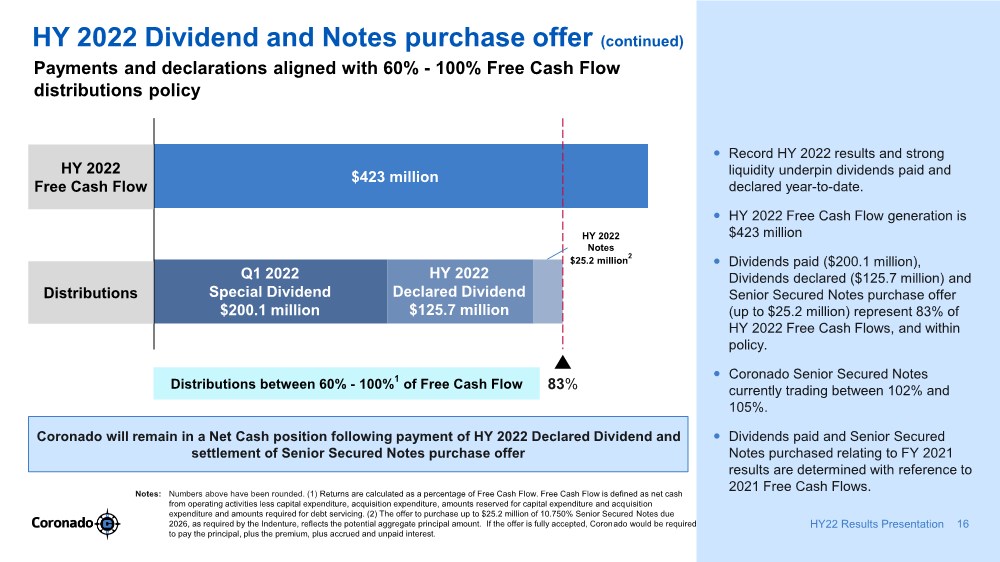
· | Year-to-date, Coronado has distributed $351 million in cash dividends to Shareholders. |
· | Strong HY22 results enable Coronado to declare a further dividend of $125.7 million (US 7.5 cents per CDI) to Shareholders inclusive of the US 0.5 cents per CDI fixed dividend component; and offer to purchase up to $25.2 million of the outstanding aggregate principal amount of Senior Secured Notes at 104%, pursuant to the terms of the Indenture. |
· | Strong closing Net Cash of $171.2 million at 30 June 2022, compared to Net Debt of $236.6 million at 30 June 2021. |
1
· | Available liquidity of $585.6 million at 30 June 2022, comprising $485.6 million of cash (excluding restricted cash) and $100.0 million of undrawn funds under the Asset Based Loan (ABL) facility. |
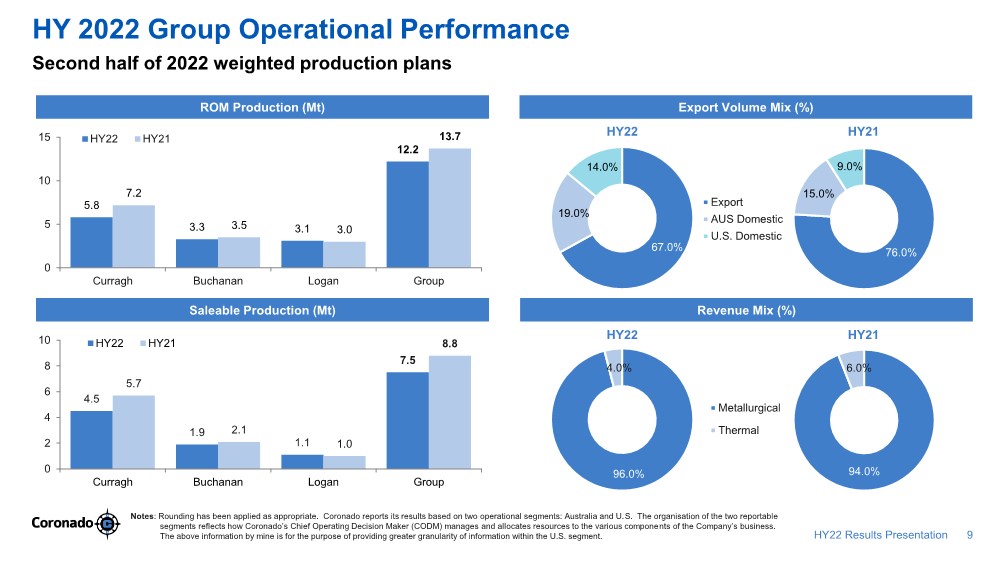
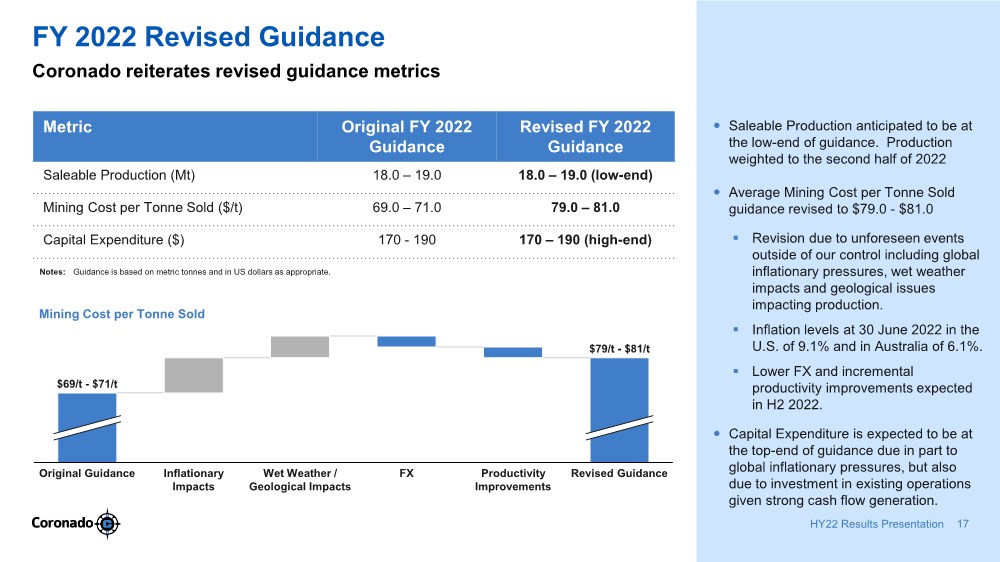
· | Sales and Production volumes lower than prior year due to wet weather impacts, geological issues and scheduled planned downtime for key maintenance activities. Volumes are weighted to the second half of 2022. Saleable Production market guidance anticipated to be at the low-end of 18.0 – 19.0 MMt, exceeding FY21 production levels (17.4 MMt). |
· | Costs per tonne sold higher than prior year. Increases associated with global inflationary pressures, lower year-to-date production volumes and higher royalties (Stanwell rebate, Government royalties) due to higher realised pricing. Revised FY22 Mining Costs per tonne sold between $79 - $81 per tonne. |
· | Capital expenditure of $91.5 million, up 74.9%. Full-year run-rate aligned with market guidance. |
· | Coronado is pursuing optionality of switching certain U.S. high vol and Australian PCI / Semi Met coal products to the Thermal market to meet the high price and demand for energy coal. |
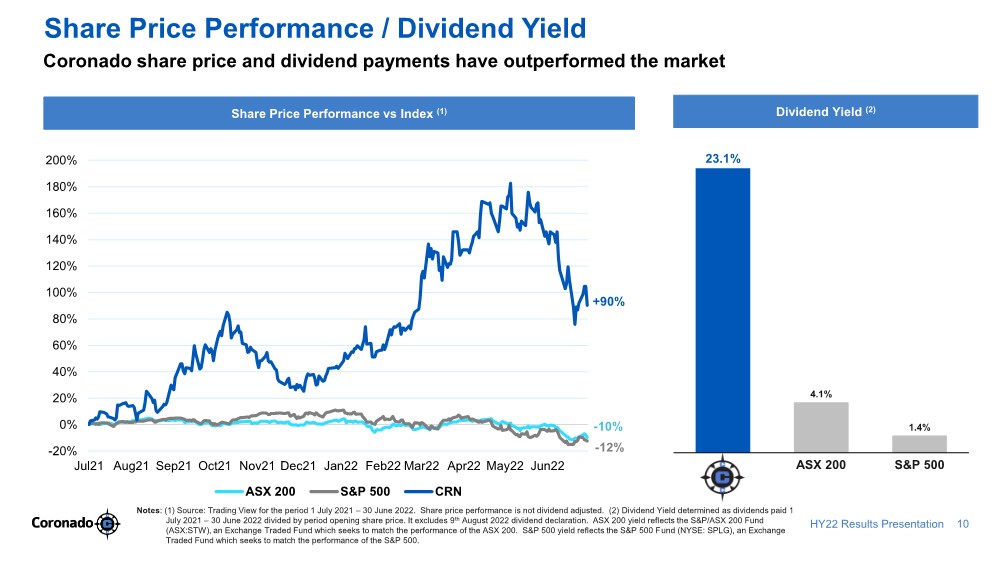
· | S&P Dow Jones Indices announced the inclusion of Coronado in the S&P / ASX 200 index effective 20 June 2022. |
· | Coronado released its 2021 Sustainability Report, revealing a heightened focus on environment and climate including emission reduction plans and targets. |
COMMENTS FROM MANAGING DIRECTOR AND CEO, GERRY SPINDLER
“In the first half of 2022, Coronado has delivered on its capital management goals. We have generated record Revenue, Net Income and Adjusted EBITDA and distributed $351 million in cash dividends to Shareholders while remaining in a Net Cash position. Coronado’s half-year Adjusted EBITDA eclipses the highest full-year Adjusted EBITDA ever reported in the history of Coronado. These strong results are due to the higher price environment, which has resulted in record price realisations for our high-quality metallurgical coal products, but also from the structural changes made to our business over the past 12 – 18 months that have allowed us to take advantage of the improved markets.
“I am proud of our financial results and am equally proud of a significant number of other achievements delivered by the Coronado team. We have improved our reportable safety rates year-on-year; released our fourth Sustainability Report in which we include emission reduction plans and targets; completed critical planned maintenance activities; improved performance at Curragh from our Draglines and newly transitioned fleets under Coronado management; entered the S&P / ASX 200 index for the first time; and continued to reinvest in our business via capital expenditure to secure future production plans and growth.
“We experienced unforeseen headwinds outside of our control during the first half of 2022 from significant wet weather in Queensland, which impacted production, and growing inflationary cost pressures for labour, transport and materials and supplies. Royalty costs also significantly increased during the period due to the substantially higher coal price. As a result, year-to-date costs per tonne are not reflective of our cost expectations for the second half of 2022, nor are they a reasonable comparison to prior year in which we operated in a very different market dynamic. Despite the headwinds, Coronado remains an effective and agile operator ready to deliver on its near, and longer term, growth plans.
“As we look to the second half of 2022, the prospect of strong financial returns remains despite recent reductions in Metallurgical coal prices. Thermal pricing remains at significantly elevated levels, and we will divert Metallurgical tonnes into Thermal markets to achieve higher realisations where we have the flexibility to do so. Coronado’s capital investment in its operations drives the second half weighted production plans, which we anticipate will see us deliver production levels exceeding 2021 levels and lower second half costs. I remain extremely confident in our ability to weather the headwinds and continue to provide enhanced value and returns to all Shareholders,” Mr Spindler said.
HEALTH AND SAFETY
The safety and well-being of our workforce continue to be Coronado’s number one priority.
In Australia, the 12-month rolling average Total Reportable Injury Frequency Rate (TRIFR) at 30 June 2022 was 4.08, compared to 5.63 at 30 June 2021, reflecting a 28% year-on-year improvement. In the U.S., the 12-month rolling average Total Reportable Incident Rate (TRIR) at 30 June 2022 was 2.01, compared to 3.04 at 30 June 2021, reflecting a 34% year-on-year improvement.
2
Safety results have improved year on year due to several factors, including hazard identification and critical control verification programs, effectiveness audits and enhanced training programs. Reportable rates in Australia and the U.S. remain below the relevant industry averages.
New and revised health and safety initiatives across all Coronado operations continue to be implemented quarterly. In Australia, Curragh continued to reinforce the importance of safety by developing and communicating to the workforce ‘Our Life-Saving Rules’. These rules apply to all employees and contractors on site and reinforce to everyone that safety is our priority and our key accountability. In the U.S., we continued to train our existing workforce and develop new miners. This has resulted in 9,500 hours of discretionary training year to date, which has helped set solid expectations for new hires and articulate Coronado’s safety culture and focus.
Coronado’s Covid-19 Steering Committee continues to monitor the status and impacts on our workforce from the Covid-19 pandemic. Throughout the first half of the year, the Committee remained vigilant in dealing with variants and their impacts on our people, operations and customers. Following the successful implementation of the Coronado Vaccine Inventive Plan at our U.S. operations, we are seeing workforce absenteeism reduce and workforce availability levels increase.
FINANCIAL PERFORMANCE
Coronado delivered record financial results and finished HY22 in a very strong financial position. While the business incurred higher costs from global inflationary pressures, lower production from wet weather and geological issues, and higher royalties, these were mitigated by peaking Met coal prices. As a result, liquidity levels are high, and our balance sheet is in a significantly stronger position than this time last year.
HY22 Revenue of $1,979.8 million was $1,179.5 million, or 147.4%, higher than HY21 and a record for the Company. Record revenues were driven by substantially higher realised Met coal pricing despite lower Sales Volumes. Coronado delivered record quarterly revenue in the recent June quarter of $1,032.7 million.
Coronado reported record Net Income of $561.9 million, an improvement of $658.0 million from the $96.1 million Net Loss reported in HY21.
Adjusted EBITDA was $849.3 million, an increase of $823.6 million compared to HY21, and a record for the Company. HY22 Adjusted EBITDA is higher than any full-year Adjusted EBITDA reported by the Company since inception.
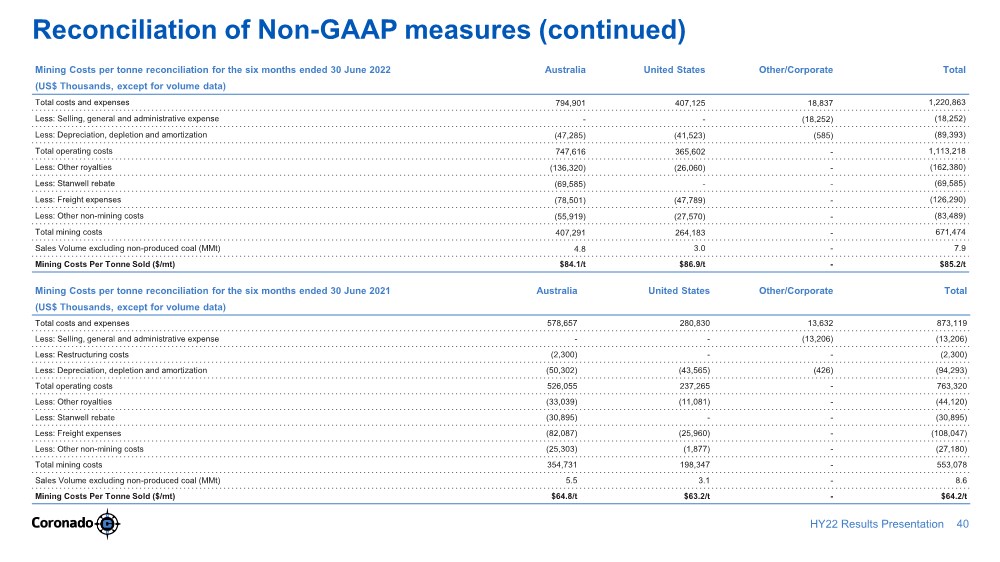
Mining costs per tonne sold of $85.2 per tonne were up from $64.2 per tonne in HY21 due primarily to unforeseen events outside our control including global inflationary pressures, wet weather impacts, and geological issues impacting production. Inflation levels at 30 June 2022 in the U.S. reached a 40-year high of 9.1% and in Australia reached a 20-year high of 6.1% and are expected to remain at elevated levels for the balance of 2022. Coronado anticipates that these increases will be partly mitigated by lower FX and incremental productivity improvements in the second half of 2022.
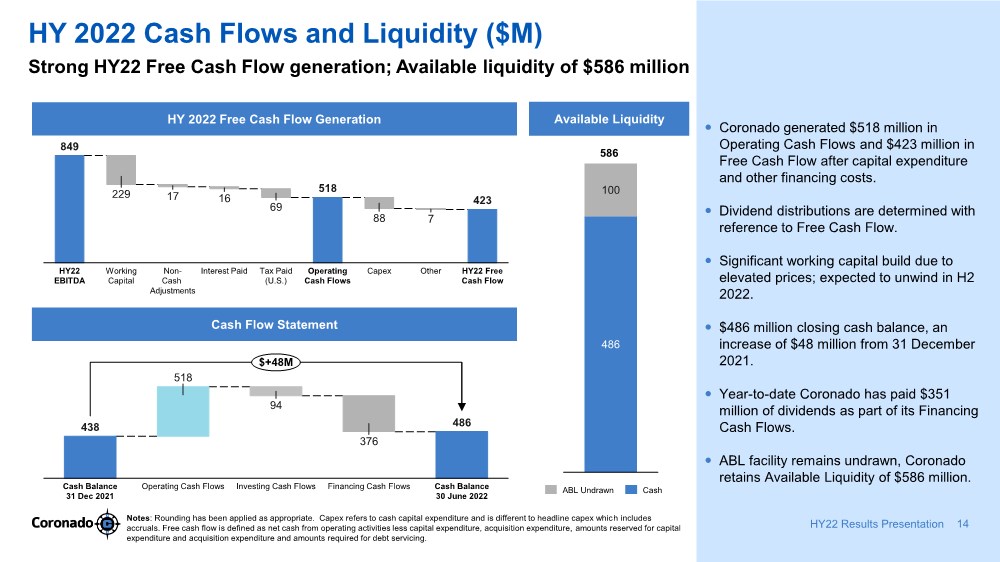
Cash generated from operating activities was $518.3 million for HY22, an increase of $461.4 million compared to cash generated of $56.9 million in HY21. Cash generated from operating activities in HY22 eclipses the cash generated for the full 2021 year.
High margins and strong cash flow generation in HY22 saw Coronado finish with Net Cash of $171.2 million at 30 June 2022, after payment of the $351 million in cash dividends distributed year-to-date. Coronado’s Net Cash position consists of a closing cash balance (excluding restricted cash) of $485.6 million and $314.5 million aggregate principal amount of outstanding 10.750% Senior Secured Notes due 2026 (“Notes”).
Coronado has Available Liquidity of $585.6 million (comprising cash and cash equivalents, excluding restricted cash, and available borrowings under our ABL facility).
DIVIDENDS AND CAPITAL MANAGEMENT
Today, Coronado’s Board of Directors declares an HY22 unfranked dividend of $125.7 million, or USD 7.5 cents per CDI (Fixed Dividend USD 0.5 cents per CDI; Ordinary Dividend USD 7.0 cents per CDI) to Shareholders.
The HY22 unfranked dividend record date is 30 August 2022, and payment date is 20 September 2022. It is anticipated that the Company will be able to pay franked dividends from early 2023.
3
Following the payment of the HY22 dividend, Coronado will have distributed $477 million in cash dividends to Shareholders in the calendar year, and $1.2 billion in cumulative dividends since listing on the ASX in October 2018.
The Company also announces an offer to purchase up to $25.2 million of the outstanding aggregate principal amount of the Notes, at a price of 104% of their principal amount, pursuant to the terms of the Indenture governing such Notes. The payment of the $125.7 million dividend to shareholders is not contingent on acceptance of the offer to purchase the Notes. All distributions will be made from available cash, and the Company expects to remain in a Net Cash position post distribution.
The Company’s primary focus is to maintain a strong balance sheet, sustainable profits and investment flexibility through volatile price cycles. A strong balance sheet allows further investment in existing operations and positions the Company well to take advantage of acquisition opportunities as they arise. Coronado expects consolidation in the Met coal industry over time. The Company is uniquely positioned to pursue acquisitions of Met coal assets as the larger diversified miners look to exit. Maintaining prudent cash and debt levels will ensure the Company has sufficient liquidity and the necessary flexibility to pursue acquisition opportunities.
Coronado’s year-to-date paid and declared distributions are made with the confidence that a strong balance sheet is retained. The Company is cognisant of ongoing geopolitical uncertainty, global inflationary pressures, capital expenditure plans underpinning future growth, and other unforeseen events. The Board of Directors will consider these factors, among others, before assessing the likelihood of further distributions as the year progresses.
OPERATIONS
ROM production for HY22 was 12.2 MMt (11.0% lower), saleable production was 7.5 MMt (14.8% lower), and sales volume was 8.3 MMt (7.0% lower) compared to HY21.
The Curragh mine and most of the Bowen Basin were significantly impacted by wet weather during the June quarter. Blackwater, the nearest town to Curragh, received 213mm of rain in the quarter, representing nearly a 300% increase on the 10-year rainfall average for the area. At the height of the rain event, the mine was evacuated due to road closures and flooding in the surrounding regions to ensure the safety of our people travelling to and from the site. The consistent rain from late April through May was a key contributor to the lower production volumes in Australia. Production levels at our U.S. operations were broadly aligned with the first half of 2021 despite the impacts from a rock intrusion at the Buchanan mine in April.
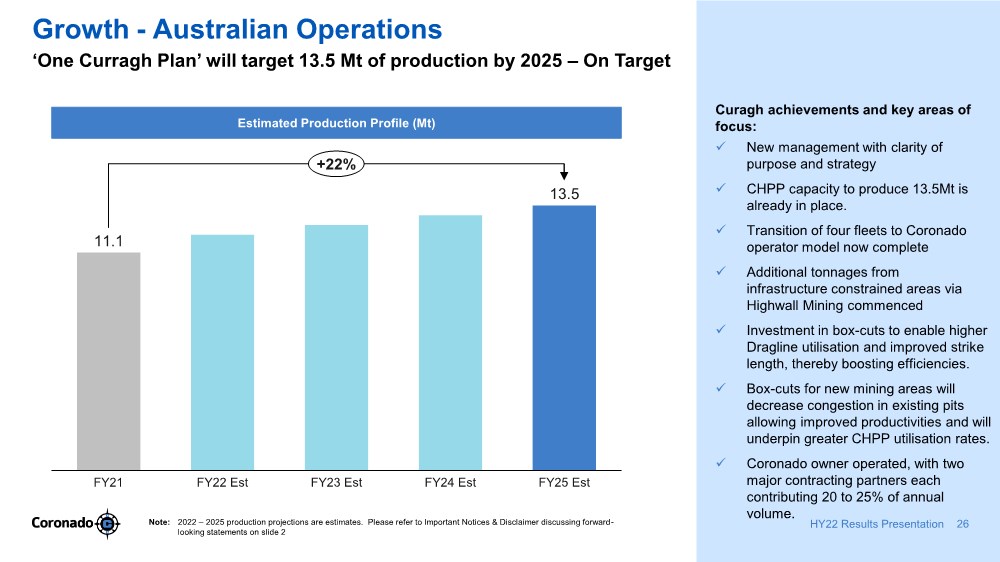
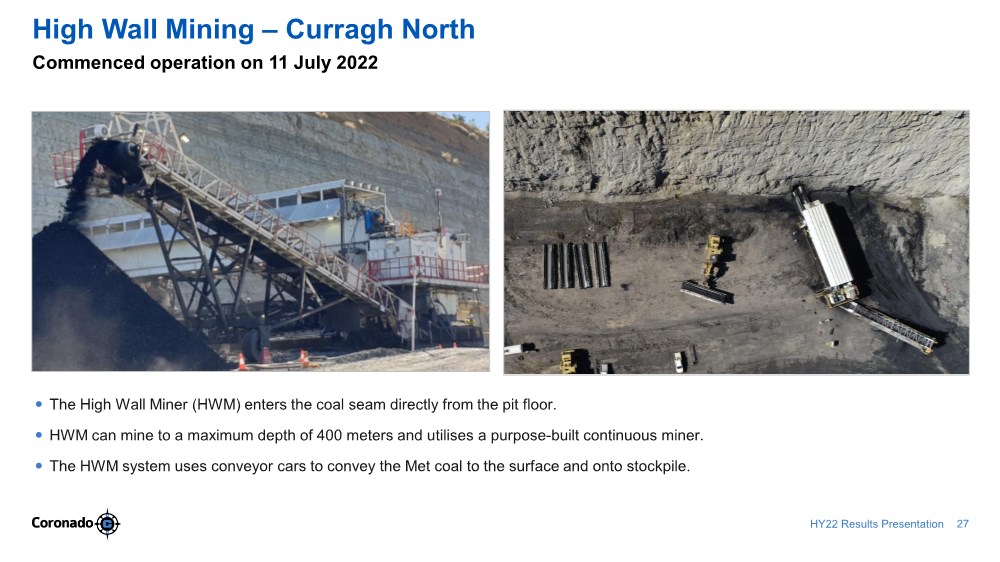
Despite the impacts of the Bowen Basin rain events, Curragh successfully completed major planned maintenance activities on the CHPP and two Draglines. Completion of this maintenance was essential to the mine’s second-half 2022 weighted production plans. During HY22, Curragh also significantly progressed the conversion of four fleets to a Coronado operator model, which is now complete, and has also now commenced high-wall mining operations in Curragh North. The mine’s focus on waste movement in the first half of the year is also evident, with waste movement YTD broadly aligned with the same period in the prior year despite heavy rain (June 2022 YTD: 88.0 Mbcms vs June 2021 YTD: 90.9 Mbcms).
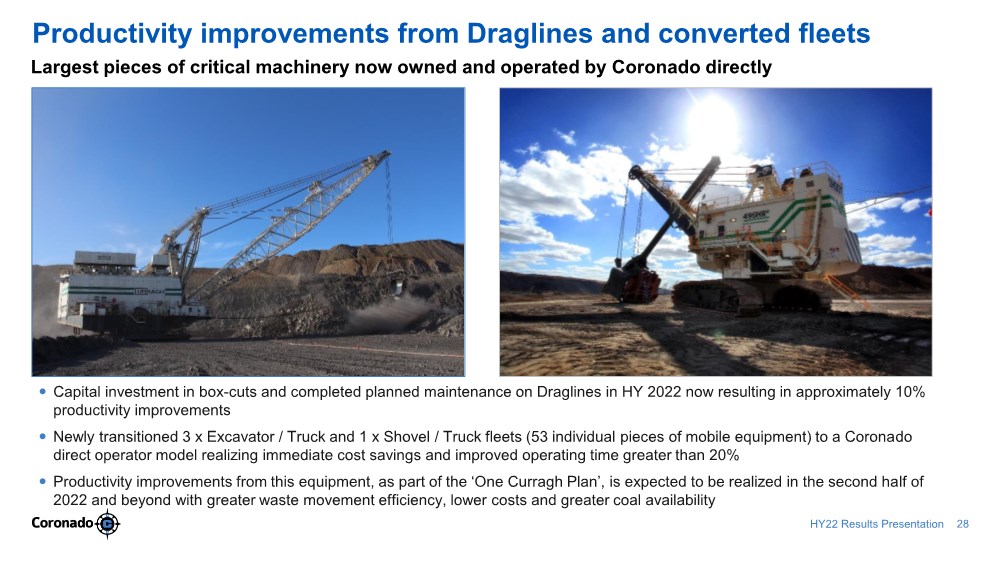
The “One Curragh Plan” utilizing our new management structure is producing positive results. The continued focus on improving Dragline productivity has resulted in an approximately 10% productivity improvement in two of Curragh’s draglines, with focus swinging to the remaining two draglines in the second half of the year. The newly transitioned excavator fleets, which replaced contractor units, operated with approximately 20% lower costs and 30% more operating time compared with previous contractor rates in Curragh North. We expect to see these changes deliver continually improved results in the remainder of the year.
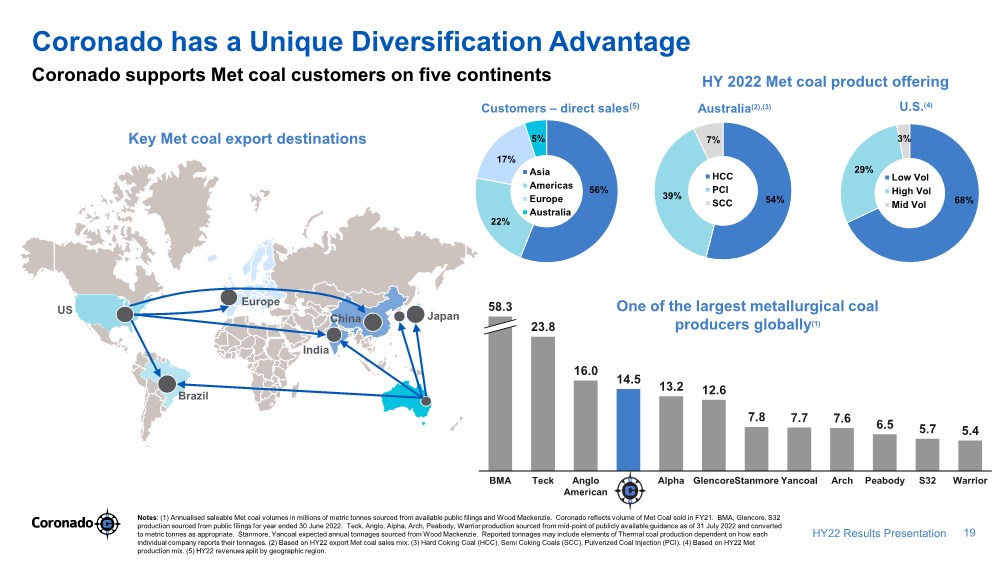
Met and thermal coal sales represented 96% and 4%, respectively, of total coal revenues for HY22. Export, Australian domestic and U.S. domestic sales represented 67%, 19% and 14%, respectively, of total coal volumes sold.
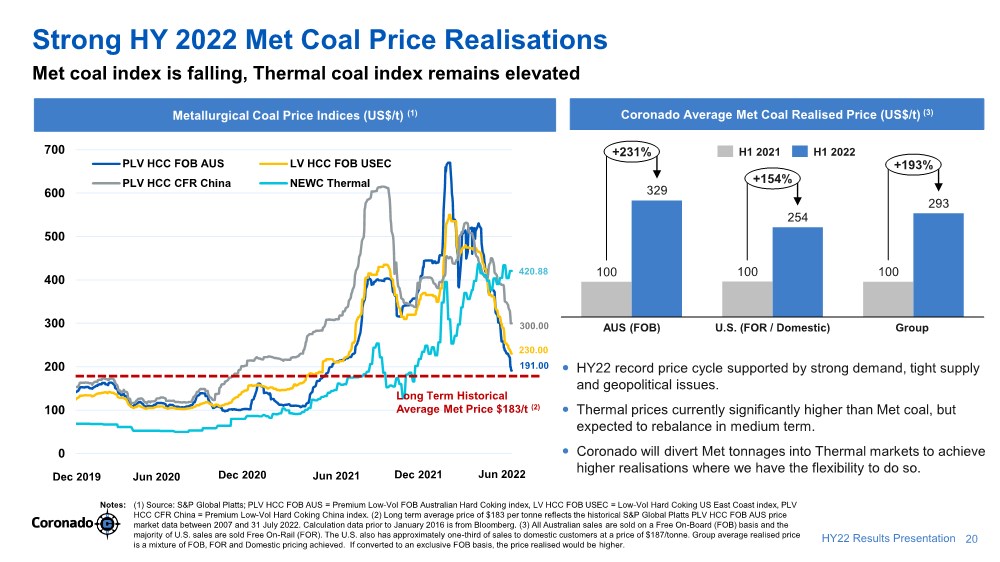
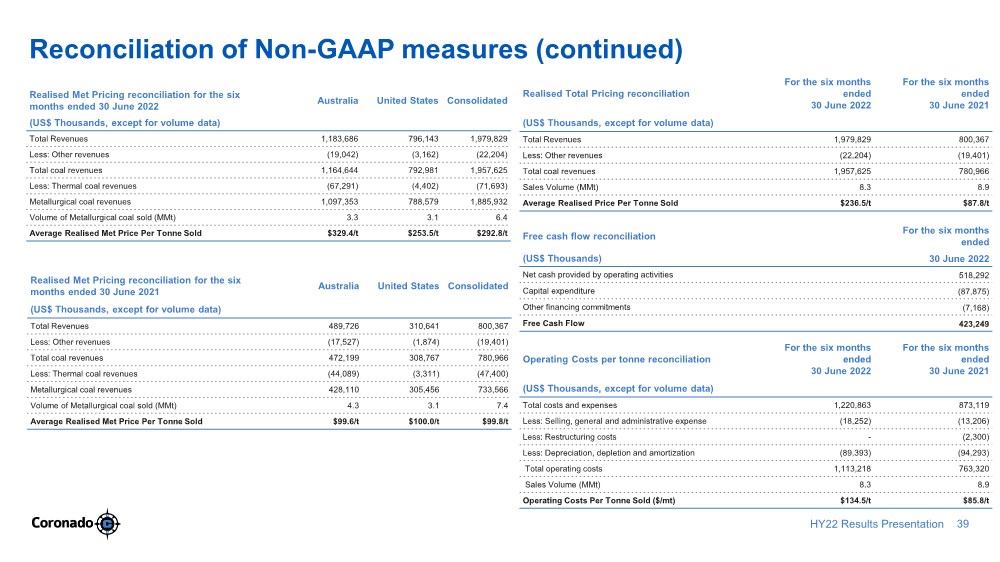
Met coal prices for shipments from both our U.S. and Australian operations reached record levels in the second quarter of FY22. The increase in benchmark prices since mid-2021 resulted in an HY22 Group average realised Met coal price of $292.8 per metric tonne sold (mixture of FOR, FOB and domestic terms), 193.4% higher compared to HY21.
On a segmental basis, the U.S. average realised Met coal price of $253.5 per metric tonne sold (primarily FOR basis), up 153.5% from HY21, reflecting a combination of contracted domestic and export prices. This realised price includes the $187 per metric tonne (FOR) price on domestic contracts received for FY22 U.S. volumes. The Australia average realised Met coal price per metric tonne sold, across all grades of Met coal produced from the Curragh operation, was $329.4 per metric tonne (FOB basis), up 230.7% from HY21.
4
SUSTAINABILITY
On 19 May 2022, Coronado released its fourth Sustainability Report, revealing a heightened focus on the environment and climate and a significant ongoing commitment to its people and communities.
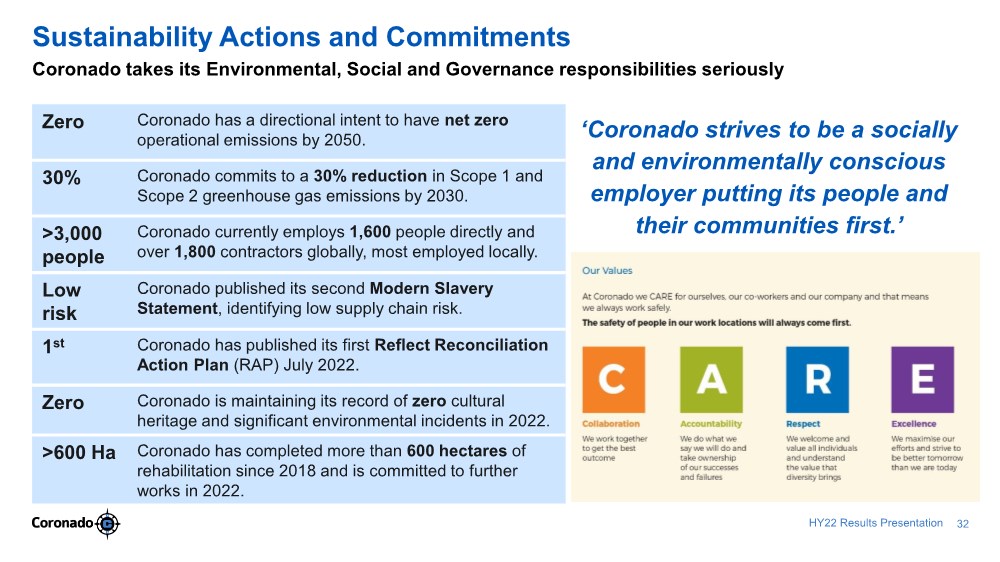
The report, which summarises Coronado’s performance for the financial year ended 31 December 2021, highlights our commitment to sustainability through new targets, including a 30% reduction in greenhouse gas emissions by 2030, as part of Coronado’s directional intent to be net zero by 2050.
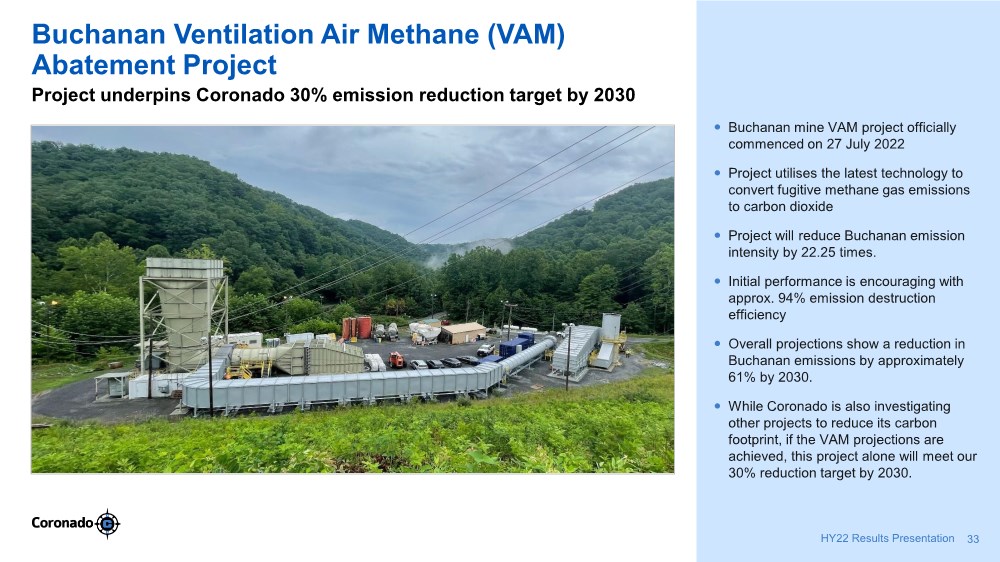
Underpinning our 30% reduction targets is the commencement on 27 July 2022 of our Ventilation Air Methane (VAM) project at our Buchanan Mine. Utilising the latest technology, the VAM project converts fugitive methane gas emissions to carbon dioxide, reducing the mine’s carbon footprint by 22.25 times. Overall projections show a reduction in Buchanan emissions by approximately 61% by 2030. While Coronado is also investigating other projects to reduce our carbon footprint, if the VAM projections are achieved, this project alone will meet our 30% reduction target.
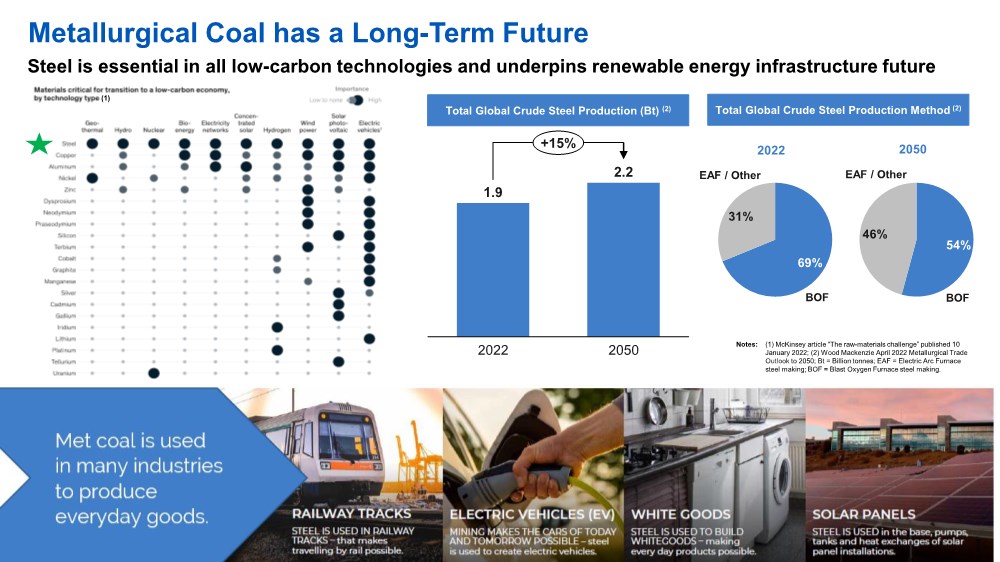
Coronado recognises its pivotal role in meeting the growing demand for steel globally. Steel is an essential material in creating future green technologies, including electric vehicles, solar panels and wind turbines. As technologies evolve and new solutions are found, we expect to leverage these, in addition to our identified projects, to achieve our emissions reduction goals.
The 2021 Sustainability Report can be accessed at https://coronadoglobal.com/environment-social-governance/.
5
METALLURGICAL COAL MARKET OUTLOOK 1
Interest in spot cargoes of Met Coal reduced significantly late in HY22 as steel production decreased globally and Australian coal supply improved. Covid-19 lockdowns in China have also led to disruptions to logistics along the steel value chain, including the supply of steel to end-users and raw materials to steel mills, lowering domestic steel and Met Coal demand in the short term.
Traditional market fundamentals continue to be challenged by the pandemic and the war in Ukraine. With European gas supplies under threat and Russian coal sales restricted, global demand for thermal coal has led to high energy prices and a market where thermal coal prices are currently above metallurgical coal prices. We expect these markets to revert to historical norms over the medium term.
Coronado Met Coal remains in high demand. Our high-quality products and unique geographical diversification allow us to switch products into different geographical markets or market segments that provide the highest return, for example, moving U.S. exports from China to Europe, or blending high-volatile coking coals for thermal applications, to take advantage of current unique market fundamentals created by trade restrictions.
Metallurgical coals can be utilized as thermal coal in thermal boilers if blended correctly. Depending on the technical design of the power station, there are some limitations concerning volatile matter content and free-swelling index, which must meet certain thresholds, making it harder to switch some Met coals than others. For example, specific PCI or Semi-Soft Coking Coals (SSCC) and other High Volatile Met coals, including Coronado US High Vol coals, have a greater ability to switch to the thermal coal market than the premium low volatile coals, which require a specifically designed power station (a smaller market segment).
In recent times, Coronado has seen the emergence of demand for our US high-volatile coking coals marketed as thermal coals into the European thermal market and similar demand for Australian PCI-type coals for Asian thermal markets and will switch to these markets where it makes sense to do so.
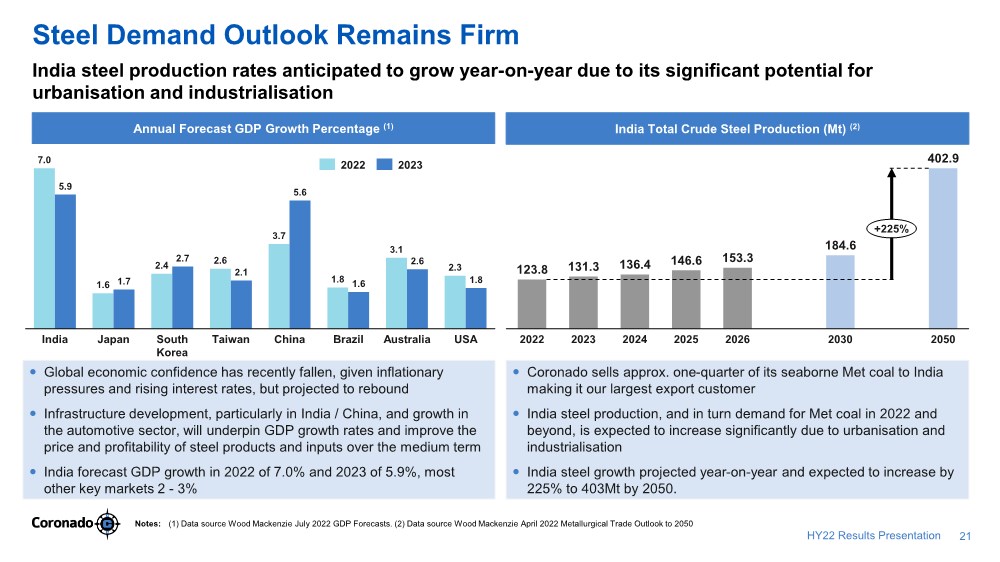
Global economic confidence has recently fallen, given global inflationary pressures and rising interest rates. However, confidence is projected to return in the longer term, which will underpin infrastructure projects requiring steel. India, Coronado’s largest single market, is forecasting GDP growth rates in 2022 and 2023 of 7.0% and 5.9%, respectively, with most other key markets forecasting modest growth rates of approximately 2% or higher.
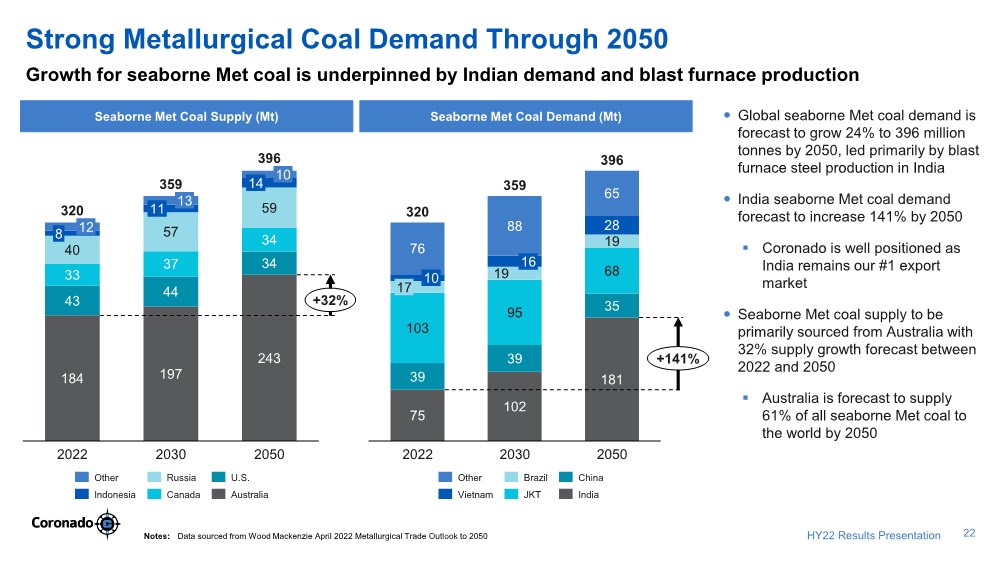
Long-term growth in global Met coal demand is anticipated to push seaborne trade up from an estimated 320 MMt in 2022 to 396 MMt in 2050. India is expected to lead all countries in import demand growth due to its significant potential for urbanisation and industrialisation. Imports are expected to increase to 181 MMt by 2050, up 141% from expected 2022 levels. Indian crude steel production is expected to grow from 124 MMt to 403 MMt by 2050, an increase underpinned by Blast Furnace steel generation methods. Coronado traditionally sells approximately one-quarter of its seaborne Met coal to India making it Coronado’s largest market.
For the remainder of 2022, Coronado expects Met Coal demand to be balanced between downward pressure on steel demand due to the current short-term global growth outlook and upward pressure from the seaborne coal trade restrictions on Russian coal taking effect from August 2022 and expectations of India restocking following the monsoon season. Despite the uncertainties, Met Coal prices are expected to remain above historical averages supported by the global automotive sector improving as the supply crunch eases and high energy costs benefit thermal coal prices, providing support to Met Coal prices.
1 Source: Wood Mackenzie April 2022 Metallurgical Trade Outlook to 2050; Wood Mackenzie July 2022 GDP forecasts.
FY22 GUIDANCE
Original FY 2022 Guidance | Revised FY 2022 Guidance | |||
Saleable Production (MMt) | 18.0 – 19.0 | 18.0 – 19.0 (low-end) | ||
Mining Cost per Tonne Sold ($) * | 69.0 – 71.0 | 79.0 – 81.0 | ||
Capex ($m) | 170 - 190 | 170 – 190 (high-end) |
* Mining Cost per Tonne Sold revised guidance assumes an average AUD : USD foreign exchange rate assumption of 0.71 for FY22.
6
Mining Cost per Tonne Sold guidance for FY2022 is revised to $79.0 - $81.0 due to unforeseen events outside of our control including global inflationary pressures exceeding original budget estimates and year-to-date wet weather impacts and geological issues impacting production. Inflation levels at 30 June 2022 in the U.S. reached a 40-year high of 9.1% and in Australia reached a 20-year high of 6.1%, and are expected to remain at elevated levels for the balance of 2022. Coronado anticipates that these increases will be partly mitigated by lower FX and incremental productivity improvements in H2 2022.
For a detailed review of Coronado’s operating and financial performance, investors should refer to the Company’s Quarterly Report on Form 10-Q, Appendix 4D, and the Investor Presentation released to the Australian Securities Exchange and the Securities and Exchange Commission on 9 August 2022 (AEST).
Approved for release by the Board of Directors of Coronado Global Resources Inc.
For further information, please contact:
Investors Andrew Mooney Vice President Investor Relations & Communications P: +61 458 666 639 E: amooney@coronadoglobal.com E: investors@coronadoglobal.com |
Media Helen McCombie Citadel Magnus P: +61 411 756 248 E: hmccombie@citadelmagnus.com
|
7
Cautionary Notice Regarding Forward–Looking Statements
This report contains forward-looking statements concerning our business, operations, financial performance and condition, the coal, steel and other industries, as well as our plans, objectives and expectations for our business, operations, financial performance and condition. Forward-looking statements may be identified by words such as "may," "could," "believes," "estimates," "expects," "intends," “plans”, "considers", “forecasts”, “targets” and other similar words that involve risk and uncertainties. Forward-looking statements provide management's current expectations or predictions of future conditions, events or results. All statements that address operating performance, events or developments that we expect or anticipate will occur in the future are forward-looking statements. They may include estimates of revenues, income, earnings per share, cost savings, capital expenditures, dividends, share repurchases, liquidity, capital structure, market share, industry volume, or other financial items, descriptions of management’s plans or objectives for future operations, or descriptions of assumptions underlying any of the above. All forward-looking statements speak only as of the date they are made and reflect the company's good faith beliefs, assumptions and expectations, but they are not guarantees of future performance or events. Furthermore, the company disclaims any obligation to publicly update or revise any forward-looking statement, except as required by law. By their nature, forward-looking statements are subject to risks and uncertainties that could cause actual results to differ materially from those suggested by the forward-looking statements. Factors that might cause such differences include, but are not limited to, a variety of economic, competitive and regulatory factors, many of which are beyond the Company's control, that are described in our Annual Report on Form 10-K filed with the ASX and SEC on 23 February 2022 (AEST), our Quarterly Report on Form 10-Q filed with the ASX and SEC on 10 May 2022 (AEST) and our Quarterly Report on Form 10-Q filed with the ASX and SEC on 9 August 2022 (AEST), as well as additional factors we may describe from time to time in other filings with the ASX and SEC. You may get such filings for free at our website at www.coronadoglobal.com. You should understand that it is not possible to predict or identify all such factors and, consequently, you should not consider any such list to be a complete set of all potential risks or uncertainties.
Reconciliation of Non-GAAP Measures
This report which includes a discussion of results of operations includes references to and analysis of certain non-GAAP measures (as described below), which are financial measures not recognized in accordance with U.S. GAAP. Non-GAAP financial measures are used by the Company and investors to measure operating performance.
Management uses a variety of financial and operating metrics to analyze performance. These metrics are significant factors in assessing operating results and profitability. These financial and operating metrics include: (i) safety and environmental metrics; (ii) Adjusted EBITDA, (iii) total sales volumes and average realised price per Mt sold, which we define as total coal revenues divided by total sales volume; (iv) Metallurgical coal sales volumes and average realized metallurgical price per tonne sold, which we define as metallurgical coal revenues divided by metallurgical sales volume; (v) Mining costs per Mt sold, which we define as mining cost of coal revenues divided by sales volumes (excluding non-produced coal) for the respective segment; (vi) Operating costs per Mt sold, which we define as operating costs divided by sales volumes for the respective segment. Investors should be aware that the Company’s presentation of Adjusted EBITDA and other non-GAAP measures may not be comparable to similarly titled financial measures used by other companies. We define Net Cash / (Debt) as cash and cash equivalents (excluding restricted cash) less the outstanding aggregate principal amount of 10.750% senior secured notes due 2026.
Reconciliations of certain forward-looking non-GAAP financial measures, including our 2022 Mining Cost per Tonne Sold guidance, to the most directly comparable GAAP financial measures are not provided because the Company is unable to provide such reconciliations without unreasonable effort, due to the uncertainty and inherent difficulty of predicting the occurrence and the financial impact of items impacting comparability and the periods in which such items may be recognised. For the same reasons, the Company is unable to address the probable significance of the unavailable information, which could be material to future results.
8
MINING AND OPERATING COSTS PER TONNE RECONCILIATION
For the six months ended 30 June 2022 | |||||||||||||||
(In US$’000, except for volume data) | Australia | United States |
Other / Corporate | Total Consolidated |
|||||||||||
Total costs and expenses | 794,901 | 407,125 | 18,837 | 1,220,863 | |||||||||||
Less: Selling, general and administrative expense | - | - | (18,252 | ) | (18,252) | ||||||||||
Less: Depreciation, depletion and amortization | (47,285 | ) | (41,523 | ) | (585 | ) | (89,393) | ||||||||
Total operating costs | 747,616 | 365,602 | - | 1,113,218 | |||||||||||
Less: Other royalties | (136,320 | ) | (26,060 | ) | - | (162,380) | |||||||||
Less: Stanwell rebate | (69,585 | ) | - | - | (69,585) | ||||||||||
Less: Freight expenses | (78,501 | ) | (47,789 | ) | - | (126,290) | |||||||||
Less: Other non-mining costs | (55,919 | ) | (27,570 | ) | - | (83,489) | |||||||||
Total mining costs | 407,291 | 264,183 | - | 671,474 | |||||||||||
Sales Volume excluding non-produced coal (MMt) | 4.8 | 3.0 | - | 7.9 | |||||||||||
Mining Costs Per Tonne Sold | $ | 84.1 | /t | $ | 86.9 | /t | - | $ | 85.2 | /t |
For the six months ended 30 June 2021 | ||||||||||||||||
(In US$’000, except for volume data) | Australia | United States | Other / Corporate | Total Consolidated | ||||||||||||
Total costs and expenses | 578,657 | 280,830 | 13,632 | 873,119 | ||||||||||||
Less: Selling, general and administrative expense | - | - | (13,206 | ) | (13,206 | ) | ||||||||||
Less: Restructuring costs | (2,300 | ) | - | - | (2,300 | ) | ||||||||||
Less: Depreciation, depletion and amortization | (50,302 | ) | (43,565 | ) | (426 | ) | (94,293 | ) | ||||||||
Total operating costs | 526,055 | 237,265 | - | 763,320 | ||||||||||||
Less: Other royalties | (33,039 | ) | (11,081 | ) | - | (44,120 | ) | |||||||||
Less: Stanwell rebate | (30,895 | ) | - | - | (30,895 | ) | ||||||||||
Less: Freight expenses | (82,087 | ) | (25,960 | ) | - | (108,047 | ) | |||||||||
Less: Other non-mining costs | (25,303 | ) | (1,877 | ) | - | (27,180 | ) | |||||||||
Total mining costs | 354,731 | 198,347 | - | 553,078 | ||||||||||||
Sales Volume excluding non-produced coal (MMt) | 5.5 | 3.1 | - | 8.6 | ||||||||||||
Mining Costs Per Tonne Sold | $ | 64.8 | /t | $ | 63.2 | /t | - | $ | 64.2 | /t |
(In US$’000, except for volume data) | For the six months ended 30 June 2022 | For the six months ended 30 June 2021 | ||||||
Total costs and expenses | 1,220,863 | 873,119 | ||||||
Less: Selling, general and administrative expense | (18,252 | ) | (13,206 | ) | ||||
Less: Restructuring costs | - | (2,300 | ) | |||||
Less: Depreciation, depletion and amortization | (89,393 | ) | (94,293 | ) | ||||
Total operating costs | 1,113,218 | 763,320 | ||||||
Sales Volume (MMt) | 8.3 | 8.9 | ||||||
Operating Costs Per Tonne Sold | $ | 134.5 | /t | $ | 85.8 | /t |
9
REALISED PRICING RECONCILIATION
For the six months ended 30 June 2022 | ||||||||||||
(In US$’000, except for volume data) | Australia | United States | Consolidated | |||||||||
Total Revenues | 1,183,686 | 796,143 | 1,979,829 | |||||||||
Less: Other revenues | (19,042 | ) | (3,162 | ) | (22,204 | ) | ||||||
Total coal revenues | 1,164,644 | 792,981 | 1,957,625 | |||||||||
Less: Thermal coal revenues | (67,291 | ) | (4,402 | ) | (71,693 | ) | ||||||
Metallurgical coal revenues | 1,097,353 | 788,579 | 1,885,932 | |||||||||
Volume of Metallurgical coal sold (MMt) | 3.3 | 3.1 | 6.4 | |||||||||
Average Realised Met Price Per Tonne Sold | $ | 329.4 | /t | $ | 253.5 | /t | $ | 292.8 | /t |
For the six months ended 30 June 2021 | ||||||||||||
(In US$’000, except for volume data) | Australia | United States | Consolidated | |||||||||
Total Revenues | 489,726 | 310,641 | 800,367 | |||||||||
Less: Other revenues | (17,527 | ) | (1,874 | ) | (19,401 | ) | ||||||
Total coal revenues | 472,199 | 308,767 | 780,966 | |||||||||
Less: Thermal coal revenues | (44,089 | ) | (3,311 | ) | (47,400 | ) | ||||||
Metallurgical coal revenues | 428,110 | 305,456 | 733,566 | |||||||||
Volume of Metallurgical coal sold (MMt) | 4.3 | 3.1 | 7.4 | |||||||||
Average Realised Met Price Per Tonne Sold | $ | 99.6 | /t | $ | 100.0 | /t | $ | 99.8 | /t |
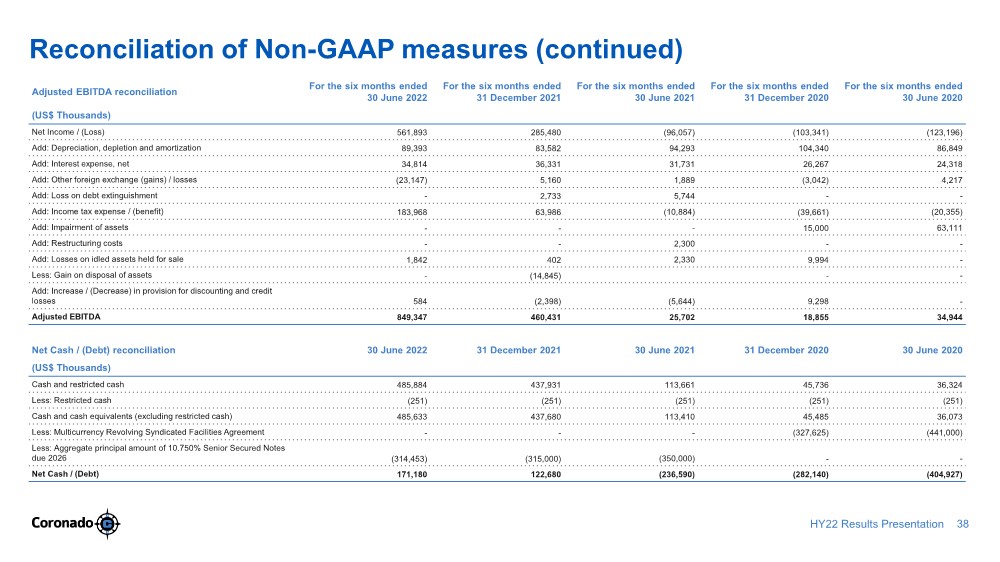
ADJUSTED EBITDA RECONCILIATION
(In US$’000) | For the six months 30 June 2022 | For the six months 30 June 2021 | ||||||
Reconciliation to Adjusted EBITDA: | ||||||||
Net Income / (Loss) | 561,893 | (96,057 | ) | |||||
Add: Depreciation, depletion and amortization | 89,393 | 94,293 | ||||||
Add: Interest expense, net | 34,814 | 31,731 | ||||||
Add: Other foreign exchange (gains) / losses | (23,147 | ) | 1,889 | |||||
Add: Loss on debt extinguishment | - | 5,744 | ||||||
Add: Income tax expense / (benefit) | 183,968 | (10,884 | ) | |||||
Add: Restructuring costs | - | 2,300 | ||||||
Add: Losses on idled assets held for sale | 1,842 | 2,330 | ||||||
Add: Increase / (Decrease) in provision for discounting and credit losses | 584 | (5,644 | ) | |||||
Adjusted EBITDA | 849,347 | 25,702 |
NET CASH / (DEBT) RECONCILIATION
(In US$’000) | 30 June 2022 | 30 June 2021 | ||||||
Reconciliation to Net Cash / (Debt): | ||||||||
Cash and restricted cash | 485,884 | 113,661 | ||||||
Less: Restricted cash | (251 | ) | (251 | ) | ||||
Cash and cash equivalents (excluding restricted cash) | 485,633 | 113,410 | ||||||
Less: Aggregate principal amount of 10.750% Senior Secured Notes due 2026 | (314,453 | ) | (350,000 | ) | ||||
Net Cash / (Debt) | 171,180 | (236,590 | ) |
10
Exhibit 99.2
2022 Half Year Results Presentation GERRY SPINDLER Managing Director and CEO GERHARD ZIEMS Group Chief Financial Officer 9 August 2022 (All units in USD and metric tonnes, unless otherwise stated) |
The material contained in this presentation is intended to be general background information on Coronado Global Resources (Coronado) and its activities. The information is supplied in summary form and is therefore not necessarily complete. It is not intended that it be relied upon as advice to investors or potential investors, who should consider seeking independent professional advice depending upon their specific investment objectives, financial situation or particular needs. The material contained in this presentation may include information derived from publicly available sources that have not been independently verified. No representation or warranty is made as to the accuracy, completeness or reliability of the information. All amounts are in United States dollars unless otherwise indicated. The presentation of certain financial information may not be compliant with financial captions in the primary financial statements prepared under US GAAP. Refer to Coronado’s Quarterly Report on Form 10- Q for the quarterly period ended 30 June 2022 available at www.coronadoglobal.com for details of the basis primary financial statements prepared under US GAAP. This presentation contains statements that constitute “forward-looking statements” within the meaning of Section 27A of the US Securities Act of 1933 and Section 21E of the US Securities Exchange Act of 1934. Forward looking statements are statements about matters that are not historical facts. Forward-looking statements appear in a number of places in this presentation and include statements regarding our intent, belief or current expectations with respect to our business and operations, market conditions and results of operations. This report contains forward-looking statements concerning our business, operations, financial performance and condition, the coal, steel and other industries, as well as our plans, objectives and expectations for our business, operations, financial performance and condition. Forward-looking statements may be identified by words such as "may," "could," "believes," "estimates," "expects," "intends," “plans”, "considers", “forecasts”, “targets” and other similar words that involve risk and uncertainties. Forward-looking statements provide management's current expectations or predictions of future conditions, events or results. All statements that address operating performance, events or developments that we expect or anticipate will occur in the future are forward-looking statements. They may include estimates of revenues, income, earnings per share, cost savings, capital expenditures, dividends, share repurchases, liquidity, capital structure, market share, industry volume, or other financial items, descriptions of management’s plans or objectives for future operations, or descriptions of assumptions underlying any of the above. All forward-looking statements speak only as of the date they are made and reflect the company's good faith beliefs, assumptions and expectations, but they are not guarantees of future performance or events. Furthermore, the company disclaims any obligation to publicly update or revise any forward-looking statement, except as required by law. By their nature, forward-looking statements are subject to risks and uncertainties that could cause actual results to differ materially from those suggested by the forward-looking statements. Factors that might cause such differences include, but are not limited to, a variety of economic, competitive and regulatory factors, many of which are beyond the Company's control, that are described in our Annual Report on Form 10-K filed with the ASX and SEC on 23 February 2022 (AEST), our Quarterly Report on Form 10-Q filed with the ASX and SEC on 10 May 2022 (AEST) and our Quarterly Report on Form 10-Q filed with the ASX and SEC on 9 August 2022 (AEST), as well as additional factors we may describe from time to time in other filings with the ASX and SEC. You may get such filings for free at our website at www.coronadoglobal.com. You should understand that it is not possible to predict or identify all such factors and, consequently, you should not consider any such list to be a complete set of all potential risks or uncertainties. In this presentation, references to ore reserves (Reserves) are compliant with the Australasian Code for Reporting of Exploration Results, Mineral Resources and Ore Reserves 2012 (JORC Code) and are measured in accordance with the JORC Code. Information in this presentation relating to Coal Reserves and Coal Resources is extracted from information published by Coronado and available on the Coronado and ASX websites (2021 JORC Statement also released to the ASX on 23 February 2022). For details of the Coal Reserves and Coal Resources estimates and the Competent Persons statements, refer to relevant Australian and US Operations sections in the 2021 JORC Statement. As an SEC registrant, our SEC disclosures of resources and reserves follow the requirements of subpart 1300 of Regulation S-K under the US Securities Exchange Act of 1934. Accordingly, our estimates of resources and reserves in this presentation and in our other ASX disclosures may be different than our estimates of resources and reserves as reported in our Annual Report on Form 10-K for the year ended 31 December 2021 and in other reports that we are required to file with the SEC. 2 Important Notices and Disclaimer HY22 Results Presentation |
The leading international producer of high-quality metallurgical coal, an essential element in the production of steel. 3 |
4 Metallurgical Coal has a Long-Term Future HY22 Results Presentation Steel is essential in all low-carbon technologies and underpins renewable energy infrastructure future 1.9 2.2 2022 2050 +15% Total Global Crude Steel Production (Bt) (2) (1) 69% 31% BOF EAF / Other 54% 46% BOF EAF / Other Total Global Crude Steel Production Method (2) Notes: (1) McKinsey article “The raw-materials challenge” published 10 January 2022; (2) Wood Mackenzie April 2022 Metallurgical Trade Outlook to 2050; Bt = Billion tonnes; EAF = Electric Arc Furnace steel making; BOF = Blast Oxygen Furnace steel making. 2022 2050 |
‘Safety is the most important aspect of our operations and is our number one priority’ 5 |
6 Health, Safety and Community 1 2 3 4 U.S. Operations (TRIR) Industry average (TRIR) Australian Operations (TRIFR) US Operations (TRIR) Notes: Total Recordable Injury Frequency Rate (TRIFR), is the number of fatalities, lost time injuries, cases or substitute work and other injuries requiring medical treatment per million-man hours worked on a rolling 12 month basis. Total Recordable Incident Rate (TRIR) is a mathematical computation that takes into account how many Mine Safety and Health Administration (MSHA) recordable incidents our company has per 200,000 hours worked on a rolling 12 month basis 1 3 5 7 9 11 Australian Operations (TRIR) Industry average (TRIFR) Safety is Coronado’s #1 core value and remains our highest priority HY22 Results Presentation |
HY 2022 Summary Results GERRY SPINDLER MANAGING DIRECTOR AND CEO Review images 7 |
HY 2022 Financial Results Record Revenue, Realised Price, Net Income and Adjusted EBITDA Notes: Rounding has been applied to this table as appropriate. Blue and grey coloured references in the variance column indicate positive and negative variance movements respectively and arrow direction indicates increase or decrease in corresponding metric. Group Dashboard HY 2022 Actual HY 2021 Actual Variance Revenue $1,979.8M $800.4M $1,179.4M Net Income / (Loss) $561.9M ($96.1M) $658.0M Adjusted EBITDA $849.3M $25.7M $823.6M Net Cash / (Debt) $171.2M ($236.6M) $407.8M Saleable Production 7.5Mt 8.8Mt 1.3Mt Sales Volume 8.3Mt 8.9Mt 0.6Mt Average coal realised price $236.5/t $87.8/t $148.7/t Average Met coal realised price $292.8/t $99.8/t $193.0/t Mining costs/tonne sold $85.2/t $64.2/t $21.0/t Operating costs/tonne sold $134.5/t $85.8/t $48.7/t Capital Expenditure $91.5M $52.3M $39.2M Record Group revenue of $1,980 million, up $1,179 million, or 147%, compared to HY 2021. Record Net Income of $562 million, up $658 million from a Net Loss of $96 million in HY 2021. Record Adjusted EBITDA of $849 million, up $824 million on HY 2021. Net Cash of $171 million as of 30 June 2022 after payment of $351 million in dividends year-to-date, significant improvement from Net Debt of $237 million as of 30 June 2021. Record average realised pricing levels in Australia, the U.S. and for the Group. Higher costs due to global inflationary pressures, wet weather and geological issues impacting production, and higher royalties. Production plans weighted to H2 2022. 8 HY22 Results Presentation |
9 HY 2022 Group Operational Performance HY22 Results Presentation Second half of 2022 weighted production plans Export Volume Mix (%) ROM Production (Mt) Saleable Production (Mt) Revenue Mix (%) 5.8 3.3 3.1 12.2 7.2 3.5 3.0 13.7 0 5 10 15 Curragh Buchanan Logan Group HY22 HY21 4.5 1.9 1.1 7.5 5.7 2.1 1.0 8.8 0 2 4 6 8 10 Curragh Buchanan Logan Group HY22 HY21 76.0% 15.0% 9.0% Export AUS Domestic U.S. Domestic 67.0% 19.0% 14.0% HY22 HY21 94.0% 6.0% Metallurgical Thermal 96.0% 4.0% HY22 HY21 Notes: Rounding has been applied as appropriate. Coronado reports its results based on two operational segments: Australia and U.S. The organisation of the two reportable segments reflects how Coronado’s Chief Operating Decision Maker (CODM) manages and allocates resources to the various components of the Company’s business. The above information by mine is for the purpose of providing greater granularity of information within the U.S. segment. |
10 Share Price Performance / Dividend Yield HY22 Results Presentation Coronado share price and dividend payments have outperformed the market 1.4% S&P 500 ASX 200 23.1% 4.1% Notes: (1) Source: Trading View for the period 1 July 2021 – 30 June 2022. Share price performance is not dividend adjusted. (2) Dividend Yield determined as dividends paid 1 July 2021 – 30 June 2022 divided by period opening share price. It excludes 9th August 2022 dividend declaration. ASX 200 yield reflects the S&P/ASX 200 Fund (ASX:STW), an Exchange Traded Fund which seeks to match the performance of the ASX 200. S&P 500 yield reflects the S&P 500 Fund (NYSE: SPLG), an Exchange Traded Fund which seeks to match the performance of the S&P 500. Share Price Performance vs Index (1) Dividend Yield (2) -10% -12% +90% -20% 0% 20% 40% 60% 80% 100% 120% 140% 160% 180% 200% Jul21 Aug21 Sep21 Oct21 Nov21 Dec21 Jan22 Feb22 Mar22 Apr22 May22 Jun22 ASX 200 S&P 500 CRN |
Financial Performance & Capital Management GERHARD ZIEMS GROUP CHIEF FINANCIAL OFFICER |
Capital Management 12 HY22 Results Presentation 1. Strong Balance Sheet Maintaining a strong balance sheet with enhanced liquidity and prudent debt levels Fundamental strategy is to return funds to Shareholders Prioritise growth expenditure projects to increase existing production rates Uniquely positioned, with flexibility from strong balance sheet, to pursue acquisitions as diversified miners exit Coronado’s capital management strategy focuses on maintaining a strong balance sheet, sustainable profits and investment flexibility through volatile price cycles, underpinned by operating safe and reliable operations that produce high-quality Met coal for our customers 2. Shareholder Returns 4. In-Organic Growth 3. Organic Growth |
Capital Management Delivery 13 HY22 Results Presentation Restructure of our financing arrangements in the past 12 – 18 months has allowed us to take advantage of the improved markets and weather recent headwinds 1,980 1,348 800 749 714 H1’21 H2’21 H1’22 H2’20 H1’20 +147% 849 460 26 19 35 H1’22 H2’21 H1’20 H1’21 H2’20 +3,205% 171 123 -237 -282 -405 H1’20 H1’22 H2’21 H1’21 H2’20 +172% 518 385 57 5 -8 H1’21 H1’22 H2’21 H2’20 H1’20 +811% Notes: All data points are in USD millions. Revenue Adjusted EBITDA Operating Cash Flows Net Cash / (Debt) |
HY 2022 Cash Flows and Liquidity ($M) Strong HY22 Free Cash Flow generation; Available liquidity of $586 million Coronado generated $518 million in Operating Cash Flows and $423 million in Free Cash Flow after capital expenditure and other financing costs. Dividend distributions are determined with reference to Free Cash Flow. Significant working capital build due to elevated prices; expected to unwind in H2 2022. $486 million closing cash balance, an increase of $48 million from 31 December 2021. Year-to-date Coronado has paid $351 million of dividends as part of its Financing Cash Flows. ABL facility remains undrawn, Coronado retains Available Liquidity of $586 million. 14 HY22 Results Presentation Notes: Rounding has been applied as appropriate. Capex refers to cash capital expenditure and is different to headline capex which includes accruals. Free cash flow is defined as net cash from operating activities less capital expenditure, acquisition expenditure, amounts reserved for capital expenditure and acquisition expenditure and amounts required for debt servicing. HY 2022 Free Cash Flow Generation 849 518 423 229 17 16 69 88 7 HY22 EBITDA Non- Cash Adjustments Working Capital Interest Paid Tax Paid (U.S.) Operating Cash Flows Capex Other HY22 Free Cash Flow Available Liquidity 486 100 586 ABL Undrawn Cash Cash Flow Statement 438 486 518 94 376 Cash Balance 31 Dec 2021 Cash Balance 30 June 2022 Operating Cash Flows Financing Cash Flows Investing Cash Flows $+48M |
HY 2022 Dividend and Notes purchase offer 15 HY22 Results Presentation Coronado declares an ordinary dividend of $125.7 million (USD 7.5 cents / CDI) and commences Senior Secured Notes purchase offer of $25.2 million 9 August 2022 Declaration of $125.7 million dividend and commenced offer to purchase up to $25.2 million of 10.750% Senior Secured Notes due 2026, as required pursuant to the Indenture 30 August 2022 Dividend record date 8 September 2022 Senior Secured Notes purchase offer expires 10 September 2022 Payment to Senior Secured Notes holders who accept offer 20 September 2022 Dividend payment date Key Dates HY 2022 Fixed Dividend Ordinary Dividend Tranche 1 $100.6 million (or USD 6.0 cents per CDI) Fixed Dividend Tranche 2 $8.4 million (or USD 0.5 cents per CDI) Notes: Numbers above have been rounded. Key dates are in accordance with Australian East Coast Standard Time (AEST). Dividends declared are unfranked. Q1 2021 unaccepted Notes purchase offer HY 2022 Ordinary Dividend Ordinary Dividend Tranche 3 $16.7 million (or USD 1.0 cents per CDI) Senior Secured Notes Purchase Offer $25.2 million aggregate principal amount offer at 104% |
HY 2022 Dividend and Notes purchase offer (continued) 16 HY22 Results Presentation Payments and declarations aligned with 60% - 100% Free Cash Flow distributions policy Record HY 2022 results and strong liquidity underpin dividends paid and declared year-to-date. HY 2022 Free Cash Flow generation is $423 million Dividends paid ($200.1 million), Dividends declared ($125.7 million) and Senior Secured Notes purchase offer (up to $25.2 million) represent 83% of HY 2022 Free Cash Flows, and within policy. Coronado Senior Secured Notes currently trading between 102% and 105%. Dividends paid and Senior Secured Notes purchased relating to FY 2021 results are determined with reference to 2021 Free Cash Flows. Distributions between 60% - 100%1 of Free Cash Flow Notes: Numbers above have been rounded. (1) Returns are calculated as a percentage of Free Cash Flow. Free Cash Flow is defined as net cash from operating activities less capital expenditure, acquisition expenditure, amounts reserved for capital expenditure and acquisition expenditure and amounts required for debt servicing. (2) The offer to purchase up to $25.2 million of 10.750% Senior Secured Notes due 2026, as required by the Indenture, reflects the potential aggregate principal amount. If the offer is fully accepted, Coronado would be required to pay the principal, plus the premium, plus accrued and unpaid interest. 83% HY 2022 Free Cash Flow Distributions HY 2022 Declared Dividend $125.7 million Q1 2022 Special Dividend $200.1 million HY 2022 Notes $25.2 million2 $423 million Coronado will remain in a Net Cash position following payment of HY 2022 Declared Dividend and settlement of Senior Secured Notes purchase offer |
FY 2022 Revised Guidance 17 HY22 Results Presentation Metric Original FY 2022 Guidance Revised FY 2022 Guidance Saleable Production (Mt) 18.0 – 19.0 18.0 – 19.0 (low-end) Mining Cost per Tonne Sold ($/t) 69.0 – 71.0 79.0 – 81.0 Capital Expenditure ($) 170 - 190 170 – 190 (high-end) Saleable Production anticipated to be at the low-end of guidance. Production weighted to the second half of 2022 Average Mining Cost per Tonne Sold guidance revised to $79.0 - $81.0 ▪ Revision due to unforeseen events outside of our control including global inflationary pressures, wet weather impacts and geological issues impacting production. ▪ Inflation levels at 30 June 2022 in the U.S. of 9.1% and in Australia of 6.1%. ▪ Lower FX and incremental productivity improvements expected in H2 2022. Capital Expenditure is expected to be at the top-end of guidance due in part to global inflationary pressures, but also due to investment in existing operations given strong cash flow generation. Notes: Guidance is based on metric tonnes and in US dollars as appropriate. Coronado reiterates revised guidance metrics Revised Guidance Wet Weather / Geological Impacts Inflationary Impacts Original Guidance FX Productivity Improvements $69/t - $71/t $79/t - $81/t Mining Cost per Tonne Sold |
18 HY21 Results Presentation Metallurgical Coal Markets Update for HY 18 |
19 Coronado has a Unique Diversification Advantage Coronado supports Met coal customers on five continents Notes: (1) Annualised saleable Met coal volumes in millions of metric tonnes sourced from available public filings and Wood Mackenzie. Coronado reflects volume of Met Coal sold in FY21. BMA, Glencore, S32 production sourced from public filings for year ended 30 June 2022. Teck, Anglo, Alpha, Arch, Peabody, Warrior production sourced from mid-point of publicly available guidance as of 31 July 2022 and converted to metric tonnes as appropriate. Stanmore, Yancoal expected annual tonnages sourced from Wood Mackenzie. Reported tonnages may include elements of Thermal coal production dependent on how each individual company reports their tonnages. (2) Based on HY22 export Met coal sales mix. (3) Hard Coking Coal (HCC), Semi Coking Coals (SCC), Pulverized Coal Injection (PCI). (4) Based on HY22 Met production mix. (5) HY22 revenues split by geographic region. One of the largest metallurgical coal producers globally(1) 54% 39% 7% HCC PCI SCC 68% 29% 3% Low Vol High Vol Mid Vol Europe Japan India Brazil China US Key Met coal export destinations 56% 22% 17% 5% Asia Americas Europe Australia Customers – direct sales(5) Australia(2),(3) U.S.(4) HY 2022 Met coal product offering 23.8 16.0 14.5 13.2 12.6 7.8 7.7 7.6 6.5 5.7 5.4 58.3 Anglo American BMA Teck Alpha GlencoreStanmore Yancoal Arch Peabody S32 Warrior HY22 Results Presentation |
Strong HY 2022 Met Coal Price Realisations 20 100 100 100 329 254 293 AUS (FOB) U.S. (FOR / Domestic) Group +231% +154% +193% H1 2021 H1 2022 Coronado Average Met Coal Realised Price (US$/t) (3) Notes: (1) Source: S&P Global Platts; PLV HCC FOB AUS = Premium Low-Vol FOB Australian Hard Coking index, LV HCC FOB USEC = Low-Vol Hard Coking US East Coast index, PLV HCC CFR China = Premium Low-Vol Hard Coking China index. (2) Long term average price of $183 per tonne reflects the historical S&P Global Platts PLV HCC FOB AUS price market data between 2007 and 31 July 2022. Calculation data prior to January 2016 is from Bloomberg. (3) All Australian sales are sold on a Free On-Board (FOB) basis and the majority of U.S. sales are sold Free On-Rail (FOR). The U.S. also has approximately one-third of sales to domestic customers at a price of $187/tonne. Group average realised price is a mixture of FOB, FOR and Domestic pricing achieved. If converted to an exclusive FOB basis, the price realised would be higher. Met coal index is falling, Thermal coal index remains elevated Metallurgical Coal Price Indices (US$/t) (1) 0 100 200 300 400 500 600 700 PLV HCC FOB AUS LV HCC FOB USEC PLV HCC CFR China NEWC Thermal Jun 2020 Jun 2022 Jun 2021 Dec 2021 Dec 2020 Long Term Historical Average Met Price $183/t (2) HY22 record price cycle supported by strong demand, tight supply and geopolitical issues. Thermal prices currently significantly higher than Met coal, but expected to rebalance in medium term. Coronado will divert Met tonnages into Thermal markets to achieve higher realisations where we have the flexibility to do so. HY22 Results Presentation Dec 2019 191.00 230.00 300.00 420.88 |
Steel Demand Outlook Remains Firm Notes: (1) Data source Wood Mackenzie July 2022 GDP Forecasts. (2) Data source Wood Mackenzie April 2022 Metallurgical Trade Outlook to 2050 Annual Forecast GDP Growth Percentage (1) India Total Crude Steel Production (Mt) (2) 7.0 1.6 2.4 2.6 3.7 1.8 3.1 2.3 5.9 1.7 2.7 2.1 5.6 1.6 2.6 1.8 India China Japan Taiwan Australia South Korea Brazil USA 2022 2023 123.8 131.3 136.4 146.6 153.3 184.6 402.9 2025 2022 2050 2026 2023 2024 2030 +225% Global economic confidence has recently fallen, given inflationary pressures and rising interest rates, but projected to rebound Infrastructure development, particularly in India / China, and growth in the automotive sector, will underpin GDP growth rates and improve the price and profitability of steel products and inputs over the medium term India forecast GDP growth in 2022 of 7.0% and 2023 of 5.9%, most other key markets 2 - 3% Coronado sells approx. one-quarter of its seaborne Met coal to India making it our largest export customer India steel production, and in turn demand for Met coal in 2022 and beyond, is expected to increase significantly due to urbanisation and industrialisation India steel growth projected year-on-year and expected to increase by 225% to 403Mt by 2050. 21 India steel production rates anticipated to grow year-on-year due to its significant potential for urbanisation and industrialisation HY22 Results Presentation |
Strong Metallurgical Coal Demand Through 2050 22 Growth for seaborne Met coal is underpinned by Indian demand and blast furnace production Notes: Data sourced from Wood Mackenzie April 2022 Metallurgical Trade Outlook to 2050 Seaborne Met Coal Supply (Mt) Seaborne Met Coal Demand (Mt) Global seaborne Met coal demand is forecast to grow 24% to 396 million tonnes by 2050, led primarily by blast furnace steel production in India India seaborne Met coal demand forecast to increase 141% by 2050 ▪ Coronado is well positioned as India remains our #1 export market Seaborne Met coal supply to be primarily sourced from Australia with 32% supply growth forecast between 2022 and 2050 ▪ Australia is forecast to supply 61% of all seaborne Met coal to the world by 2050 184 197 243 43 44 34 33 37 34 40 57 59 12 2030 2022 8 13 11 10 14 2050 320 359 396 +32% Other Russia Indonesia Canada U.S. Australia 75 102 181 39 39 35 103 95 68 19 19 28 76 88 65 2050 2022 10 17 2030 16 320 359 396 +141% Other China JKT Vietnam India Brazil HY22 Results Presentation |
Strategy / Growth Plans GERRY SPINDLER MANAGING DIRECTOR AND CEO 23 |
24 Reserves & Resources (Mt) HY22 Results Presentation Coronado maintains long-life operating assets ~20 years Notes: Charts reflect reserves and resources as at 31 December 2021 in millions of metric tonnes. Coal resources are inclusive of coal reserves. Australian resources are reported on a 5.3% in-situ moisture basis. United States resources are reported on a dry basis. Refer to market announcement titled Coronado 2021 Statement of Coal Reserves and Resources for Coronado Global Resources, Inc., released to the ASX on 23 February 2022, outlining the above information in tabular form and in accordance with the Australasian Code for Reporting of Exploration Results, Mineral Resources and Mineral Reserves, 2012 (JORC Code) and the ASX Listing Rules. Certain reserves and resources may vary to those reported under Subpart 1300 of Regulation S-K promulgated by the SEC. Resources (Mt) Reserves (Mt) 266 160 137 12 197 50 822 0 200 400 600 800 1,000 937 190 264 55 514 159 2,119 0 500 1,000 1,500 2,000 2,500 |
Key focus areas for second half 2022 and 2023 Coronado will drive a strong safety culture and continue to implement safety initiatives to reduce injuries: An improvement in reportable TRIFR and TRIR incidents Increased focus on training and supervisory development programs Increased incident reduction initiatives including enhanced hazard recognition, inspections and audits Remain vigilant and execute action plans in response to Covid-19 variants; promote vaccinations and boosters Safety Coronado is focused on improving production rates: Delivering second half 2022 weighted production plans from high quality Met coal operations Continue implementing productivity improvements from Draglines and transitioned fleets under the ‘One Curragh Plan’ Maintain flexibility to divert Met tonnes to Thermal markets to achieve higher realisations where possible Continue to invest in operations to underpin strategic growth plans Production Coronado remains focused on maintaining a strong balance sheet: Execute Capital Management strategy Improve operational efficiencies and manage costs despite global inflationary pressures Prudent cash distribution plans in accordance with policy Maintain flexibility for potential M&A opportunities Progress non-core asset sales Progress ESG strategies Financial/Corporate As one of the largest independent producers of Met coal globally, Coronado is inherently focused on maintaining safe operations and delivering production plans 25 HY22 Results Presentation |
Growth - Australian Operations 26 HY22 Results Presentation Estimated Production Profile (Mt) Curagh achievements and key areas of focus: ✓ New management with clarity of purpose and strategy ✓ CHPP capacity to produce 13.5Mt is already in place. ✓ Transition of four fleets to Coronado operator model now complete ✓ Additional tonnages from infrastructure constrained areas via Highwall Mining commenced ✓ Investment in box-cuts to enable higher Dragline utilisation and improved strike length, thereby boosting efficiencies. ✓ Box-cuts for new mining areas will decrease congestion in existing pits allowing improved productivities and will underpin greater CHPP utilisation rates. ✓ Coronado owner operated, with two major contracting partners each contributing 20 to 25% of annual volume. ‘One Curragh Plan’ will target 13.5 Mt of production by 2025 – On Target Note: 2022 – 2025 production projections are estimates. Please refer to Important Notices & Disclaimer discussing forward- looking statements on slide 2 11.1 13.5 FY21 FY22 Est FY23 Est FY24 Est FY25 Est +22% |
27 High Wall Mining – Curragh North HY22 Results Presentation Commenced operation on 11 July 2022 The High Wall Miner (HWM) enters the coal seam directly from the pit floor. HWM can mine to a maximum depth of 400 meters and utilises a purpose-built continuous miner. The HWM system uses conveyor cars to convey the Met coal to the surface and onto stockpile. |
28 HY22 Results Presentation Capital investment in box-cuts and completed planned maintenance on Draglines in HY 2022 now resulting in approximately 10% productivity improvements Newly transitioned 3 x Excavator / Truck and 1 x Shovel / Truck fleets (53 individual pieces of mobile equipment) to a Coronado direct operator model realizing immediate cost savings and improved operating time greater than 20% Productivity improvements from this equipment, as part of the ‘One Curragh Plan’, is expected to be realized in the second half of 2022 and beyond with greater waste movement efficiency, lower costs and greater coal availability Productivity improvements from Draglines and converted fleets Largest pieces of critical machinery now owned and operated by Coronado directly |
Growth - U.S. Operations 29 Estimated Production Profile (Mt) Buchanan: Construction of new raw coal storage areas underway to increase capacity and decrease bottlenecks. Installation of additional skips Preparation plant upgrades planned to increase throughput and yield Additional production from Permac reclamation project Logan: Planned increases to production from the Eagle mine with additional equipment and labour New Winifrede mine has commenced Plans for High-wall mining for incremental tonnes at Logan Met surface mines HY22 Results Presentation 6.3 6.9 FY22 Est FY21 FY23 Est FY24 Est FY25 Est +10% Growth plans at our High-Quality Buchanan and Logan Met mines on track Notes: 2022 – 2025 production projections are estimates. Please refer to Important Notices & Disclaimer discussing forward-looking statements on slide 2 |
Mon Valley Development Project 30 Located 22.5km southeast of Pittsburgh ▪ Reserves: 197 Mt of Reserves ▪ Production Capacity: >2 Mt per year ▪ Coal Quality: High-Vol HCC ▪ Transportation: Barge with alternate rail access on CSX ▪ Seam: Upper Freeport Strategically holding transportation advantage located along the Monongahela River only a few miles from multiple coke works end users Coronado controls the mineral rights of the Freeport coal seam in three reserve pods of which 95% is owned and 5% is leased Permitting and planning activities for the project are underway HY22 Results Presentation Strategic greenfield development opportunity in Southwest Pennsylvania Notes: Refer to market announcement titled FY2021 Coal Resources and Coal Reserves for Coronado Global Resources, Inc., released to the ASX on 23 February 2022, outlining reserve and resource information in tabular form and in accordance with the Australasian Code for Reporting of Exploration Results, Mineral Resources and Mineral Reserves, 2012 (JORC Code) and the ASX Listing Rules. |
Coronado 2021 Sustainability Report https://coronadoglobal.com/sustainability/ 31 |
32 Sustainability Actions and Commitments Zero Coronado has a directional intent to have net zero operational emissions by 2050. 30% Coronado commits to a 30% reduction in Scope 1 and Scope 2 greenhouse gas emissions by 2030. >3,000 people Coronado currently employs 1,600 people directly and over 1,800 contractors globally, most employed locally. Low risk Coronado published its second Modern Slavery Statement, identifying low supply chain risk. 1st Coronado has published its first Reflect Reconciliation Action Plan (RAP) July 2022. Zero Coronado is maintaining its record of zero cultural heritage and significant environmental incidents in 2022. >600 Ha Coronado has completed more than 600 hectares of rehabilitation since 2018 and is committed to further works in 2022. ‘Coronado strives to be a socially and environmentally conscious employer putting its people and their communities first.’ Coronado takes its Environmental, Social and Governance responsibilities seriously HY22 Results Presentation |
33 Buchanan Ventilation Air Methane (VAM) Abatement Project HY22 Results Presentation Greenbrier Project underpins Coronado 30% emission reduction target by 2030 Buchanan mine VAM project officially commenced on 27 July 2022 Project utilises the latest technology to convert fugitive methane gas emissions to carbon dioxide Project will reduce Buchanan emission intensity by 22.25 times. Initial performance is encouraging with approx. 94% emission destruction efficiency Overall projections show a reduction in Buchanan emissions by approximately 61% by 2030. While Coronado is also investigating other projects to reduce its carbon footprint, if the VAM projections are achieved, this project alone will meet our 30% reduction target by 2030. |
34 ‘A pure-play metallurgical coal company ready to embrace the next stage of growth’ Buchanan Mine Logan Mine Curragh Mine 34 |
Questions 35 |
Supplementary Information |
This report, which includes a discussion of results of operations, includes references to and analysis of certain non-GAAP measures (as described below), which are financial measures not recognized in accordance with U.S. GAAP. Non-GAAP financial measures are used by the Company and investors to measure operating performance. Management uses a variety of financial and operating metrics to analyze performance. These metrics are significant factors in assessing operating results and profitability. These financial and operating metrics include:(i) safety and environmental metrics;(ii) Adjusted EBITDA, (iii) total sales volumes and average realized price per Mt sold, which we define as total coal revenues divided by total sales volume:(iv) Metallurgical coal sales volumes and average realized price per metallurgical coal sold, which we define as metallurgical coal revenues divided by metallurgical sales volume; and (v) average segment mining costs per Mt sold, which we define as mining cost of coal revenues divided by sales volumes (excluding non-produced coal) for the respective segment;(vi) average segment operating costs per Mt sold, which we define as operating costs divided by sales volumes for the respective segment. Investors should be aware that the Company’s presentation of Adjusted EBITDA and other non-GAAP measures may not be comparable to similarly titled financial measures used by other companies. We define Net Cash /(Debt) as cash and cash equivalents (excluding restricted cash) less the outstanding aggregate principal amount of 10.750% senior secured notes due 2026, or, less the syndicated facilities agreement, as appropriate. Reconciliations of certain forward-looking non-GAAP financial measures, including our 2022 Mining Cost per Tonne Sold guidance, to the most directly comparable GAAP financial measures are not provided because the Company is unable to provide such reconciliations without unreasonable effort, due to the uncertainty and inherent difficulty of predicting the occurrence and the financial impact of items impacting comparability and the periods in which such items may be recognised. For the same reasons, the Company is unable to address the probable significance of the unavailable information, which could be material to future results. 37 Reconciliation of Non-GAAP measures HY22 Results Presentation |
Reconciliation of Non-GAAP measures (continued) HY22 Results Presentation 38 Adjusted EBITDA reconciliation For the six months ended 30 June 2022 For the six months ended 31 December 2021 For the six months ended 30 June 2021 For the six months ended 31 December 2020 For the six months ended 30 June 2020 (US$ Thousands) Net Income / (Loss) 561,893 285,480 (96,057) (103,341) (123,196) Add: Depreciation, depletion and amortization 89,393 83,582 94,293 104,340 86,849 Add: Interest expense, net 34,814 36,331 31,731 26,267 24,318 Add: Other foreign exchange (gains) / losses (23,147) 5,160 1,889 (3,042) 4,217 Add: Loss on debt extinguishment - 2,733 5,744 -- Add: Income tax expense / (benefit) 183,968 63,986 (10,884) (39,661) (20,355) Add: Impairment of assets --- 15,000 63,111 Add: Restructuring costs -- 2,300 -- Add: Losses on idled assets held for sale 1,842 402 2,330 9,994 - Less: Gain on disposal of assets -(14,845) -- Add: Increase / (Decrease) in provision for discounting and credit losses 584 (2,398) (5,644) 9,298 - Adjusted EBITDA 849,347 460,431 25,702 18,855 34,944 Net Cash / (Debt) reconciliation 30 June 2022 31 December 2021 30 June 2021 31 December 2020 30 June 2020 (US$ Thousands) Cash and restricted cash 485,884 437,931 113,661 45,736 36,324 Less: Restricted cash (251) (251) (251) (251) (251) Cash and cash equivalents (excluding restricted cash) 485,633 437,680 113,410 45,485 36,073 Less: Multicurrency Revolving Syndicated Facilities Agreement ---(327,625) (441,000) Less: Aggregate principal amount of 10.750% Senior Secured Notes due 2026 (314,453) (315,000) (350,000) -- Net Cash / (Debt) 171,180 122,680 (236,590) (282,140) (404,927) |
Reconciliation of Non-GAAP measures (continued) Realised Met Pricing reconciliation for the six months ended 30 June 2022 Australia United States Consolidated (US$ Thousands, except for volume data) Total Revenues 1,183,686 796,143 1,979,829 Less: Other revenues (19,042) (3,162) (22,204) Total coal revenues 1,164,644 792,981 1,957,625 Less: Thermal coal revenues (67,291) (4,402) (71,693) Metallurgical coal revenues 1,097,353 788,579 1,885,932 Volume of Metallurgical coal sold (MMt) 3.3 3.1 6.4 Average Realised Met Price Per Tonne Sold $329.4/t $253.5/t $292.8/t Realised Met Pricing reconciliation for the six months ended 30 June 2021 Australia United States Consolidated (US$ Thousands, except for volume data) Total Revenues 489,726 310,641 800,367 Less: Other revenues (17,527) (1,874) (19,401) Total coal revenues 472,199 308,767 780,966 Less: Thermal coal revenues (44,089) (3,311) (47,400) Metallurgical coal revenues 428,110 305,456 733,566 Volume of Metallurgical coal sold (MMt) 4.3 3.1 7.4 Average Realised Met Price Per Tonne Sold $99.6/t $100.0/t $99.8/t HY22 Results Presentation 39 Realised Total Pricing reconciliation For the six months ended 30 June 2022 For the six months ended 30 June 2021 (US$ Thousands, except for volume data) Total Revenues 1,979,829 800,367 Less: Other revenues (22,204) (19,401) Total coal revenues 1,957,625 780,966 Sales Volume (MMt) 8.3 8.9 Average Realised Price Per Tonne Sold $236.5/t $87.8/t Free cash flow reconciliation For the six months ended (US$ Thousands) 30 June 2022 Net cash provided by operating activities 518,292 Capital expenditure (87,875) Other financing commitments (7,168) Free Cash Flow 423,249 Operating Costs per tonne reconciliation For the six months ended 30 June 2022 For the six months ended 30 June 2021 (US$ Thousands, except for volume data) Total costs and expenses 1,220,863 873,119 Less: Selling, general and administrative expense (18,252) (13,206) Less: Restructuring costs -(2,300) Less: Depreciation, depletion and amortization (89,393) (94,293) Total operating costs 1,113,218 763,320 Sales Volume (MMt) 8.3 8.9 Operating Costs Per Tonne Sold ($/mt) $134.5/t $85.8/t |
Reconciliation of Non-GAAP measures (continued) Mining Costs per tonne reconciliation for the six months ended 30 June 2022 Australia United States Other/Corporate Total (US$ Thousands, except for volume data) Total costs and expenses 794,901 407,125 18,837 1,220,863 Less: Selling, general and administrative expense --(18,252) (18,252) Less: Depreciation, depletion and amortization (47,285) (41,523) (585) (89,393) Total operating costs 747,616 365,602 - 1,113,218 Less: Other royalties (136,320) (26,060) -(162,380) Less: Stanwell rebate (69,585) --(69,585) Less: Freight expenses (78,501) (47,789) -(126,290) Less: Other non-mining costs (55,919) (27,570) -(83,489) Total mining costs 407,291 264,183 - 671,474 Sales Volume excluding non-produced coal (MMt) 4.8 3.0 - 7.9 Mining Costs Per Tonne Sold ($/mt) $84.1/t $86.9/t - $85.2/t Mining Costs per tonne reconciliation for the six months ended 30 June 2021 Australia United States Other/Corporate Total (US$ Thousands, except for volume data) Total costs and expenses 578,657 280,830 13,632 873,119 Less: Selling, general and administrative expense --(13,206) (13,206) Less: Restructuring costs (2,300) --(2,300) Less: Depreciation, depletion and amortization (50,302) (43,565) (426) (94,293) Total operating costs 526,055 237,265 - 763,320 Less: Other royalties (33,039) (11,081) -(44,120) Less: Stanwell rebate (30,895) --(30,895) Less: Freight expenses (82,087) (25,960) -(108,047) Less: Other non-mining costs (25,303) (1,877) -(27,180) Total mining costs 354,731 198,347 - 553,078 Sales Volume excluding non-produced coal (MMt) 5.5 3.1 - 8.6 Mining Costs Per Tonne Sold ($/mt) $64.8/t $63.2/t - $64.2/t 40 HY22 Results Presentation |
CONTACTS Investors: Andrew Mooney Vice President Investor Relations & Communications P: +61 458 666 639 E: amooney@coronadoglobal.com E: investors@coronadoglobal.com Media: Helen McCombie Citadel Magnus P: +61 411 756 248 E: hmccombie@citadelmagnus.com Registered Office: Coronado Global Resources Inc. Level 33, Central Plaza One, 345 Queen Street Brisbane, QLD, Australia, 4000 (GPO Box 51, Brisbane, QLD, Australia, 4000) P: +61 7 3031 7777 F: +61 7 3229 7401 W: www.coronadoglobal.com 41 |
*OES%^YD+>6Q!64<$XZC],<_SJM'?>;?N]LD
M?E%RV[803(I 8\C/M^O>KIUWT6I%2"EZ%K38$BA*Q0QJ^S#*HX;Y1C/ ]_S-
M1FSTQ;J.W19UD;[R,^5(.?4>WM^G-F&:5;B5PB@+$@ ,/AIK
M'A^,ZA97#:A;KDR^7&5>+G.[&3QZD?EBN>BU.75%BGDG(EB78"%"AN0.N"1Q
MW&*S=#E0N:[LSVSX:W/VBQO.6(#@C=UP?GR>>X'I6+);_;G$Z-+"(SPC
M=QGW[_C6JJ4WU,I3GT1WHU[3S*4^T8([E3C\ZD76; C_ (^HQQGFN)59%D5)
M)HRS@LK!>!]3TI$\E6"SN0W]X+C/YU:G2>]R/:55T/0(+N&YC#PRK(O3(-/9
MU12SL%4=2:X-TCC6"8 C)P%;H>^?I2W=^]S' DDL3HZ[0C%AR.W!]QS64ZL%
M\.IK&4OM([-M2LT(#7*9)( ]35.[\0VMO;O)$C2NHSM''Y^E<6]N[62&:1;=
M,;V&W+C/'7KFI(98@$DA(=G($A;DY'?OU_H*QE68U)O0VK3Q/>3+)D@L?X40
M83ICJ>>](-,XQ69J.U+
V.>IY_GQ4T;)'+*JR8DX
MW-C&?3) Y_STK<.^>,AD7[F1\V59O0_C_.LIUI1=XKW3\JX.&\81%_*9IAU'?'X=:&@>Y#2+@$X/&<-S_G\JS6&2>X+$M[(
M[IY&F1)03[XDX)SQG_/-2",[)8)H=RR AMO*C/3W_*N?T34%AM6MK@$!6)VX
MR3Z\]*UUO4F20Q*Z2"/(W\9ZGKT!K.47'2QT0<6N9D\44$,+>?*J*!G:'^\/
M09XK.NFA.1%%'N1E?AA\N>I]O0?R-1H9X6S)!($FCY1R/GXYXZY]N*FOXK9E
MB:>-T=,-L9B=PYP"!G(YII-2U!M23MT*ZVD\V1<71^SN00&X(7GH1CG..:=;
M,EA&MO\ Z^0C)?\ O8]%''[T"*.\B8J5V[0JQC(P<>_P"'3THAL0\YBN&6
M,HGR&,$9)P3_ "'XU3?
C*KO! R3\O X[<5*TUKN;S?+,H(+.N ,\\_D<
.U)K=ZT4)#A3*4.QE8\<=#SU]^GI7*I3=X,+I+F1;F,4K^5
?DX)&X#H
M/PKL+?PGJWBZYM/[-V111,RSSNN(XR!@>Y;TP.XR1C-2Z;YE!,F.JND8DI>P
MN-\LT8MW &0S,S'H,
]&FB;U'*^YIKX^\;"^
M:)M:NRH8@D)D#!QU5:K:KXK\3ZQ&MGJ-^\D#$2!)_D"D \@$ GK6%_9TM[(L
MQ7*[
-_?..P) Y]<5!XDTTS7-
MLUBK^2QV2QVQ&%*>P/H<9']:NZ9
>W[!]7D8]0S<_C6O8C4@EO=
MW.IWE]:7<"LK3396.4$[EVC@GT/UQ6'?-C4KC_KHW\Z*1,T)?,WV3='%YK;M
MOEY.7R#V')Z&JUI%(H,R"4NU9V[#Y7?4YZ+1K
MV2;S8K5H5#$E%7D<<]L=3^E:EM:ZE!!(J6TTBKPPBB8%B>F,#@GG/KS5U+V<
M)^\F,:A>&+X##ID?B/TIZW9,DG(EZ<\=,G-1)OJ0GKH8\<.J;F26"6
M6&7@CRLD>G/7CCK0NC7D<31P6\I!.AV\,:W>B0;I,,EL"2YY^6;L?\ ='%.
MS3T#1F'86$%FMK ;+1W-Q'YT;S:>97*!1C+'I@8X.,[<]
?P%5'9$-ZZ'FVDQ-)XTBD0Y8
MWV,#J< <\UZ)&[IX@T92KJR?90>3G.RY/X].]<'H,8;Q/;L
O?UK3EU>*RCB+NQW*
'S'%*IDMYK>-UWS0%CD#C
ME7')P>F.U5X+8Q):^3&Q>*5C^^&!'C8>H)'8Y/'>MO6;E[GPDTT$IAA6&,I"
M!Q'^\"GY@.?N9]LC [URMG")TM3),I=IRH/][)7''UJ8R;C=C>FINZ[=:?
M#'=&VM 4$OD6P')V]^3G\:Y5#)C*(VU".?8TC["1"7P V>.,>U6K>&,Z?<*
MK3!\A0V/E _7G'OUJ+61#=V6X=RL^V,N0/3Y>1W.