Professional courses
Our professional courses primarily consist of courses designed for working adults preparing for professional qualification exams, including teacher’s qualification, the Chartered Financial Analyst designation, securities qualification exams, and others.
Our professional courses focus on test-taking techniques designed to help students achieve high scores on the admissions and assessment tests. Our instructors regularly review the latest examinations to ensure the corresponding course materials are up to date.
Admission courses
We also offer admission courses designed to boost students’ ability to achieve high scores in admission tests, including national graduate entrance examination, civil service examinations, and others.
Other Service Offerings
We also operate Weishi, our interactive learning platform on WeChat for users, including instructors and students, who follow our account.
Dual-teacher System
We have engineered a dual-teacher system, comprised of high quality instructors and professional tutors, to facilitate a disciplined and interactive learning environment. We pair our instructors with a group of dedicated tutors who are well trained in the course materials and attend to each student to further improve their engagement and learning effectiveness. For our K-12 courses, we break each large-class into multiple smaller groups, and assign a tutor into each group to closely follow up with each student before, during and after each lesson. Tutors are responsible for addressing students’ in-class queries, correcting students’ post-class exercises, providing support to students and parents after class, and instilling discipline in the students to attend the classes and learn. We also train our tutors to provide emotional support to students to help cope with the challenging aspects of their studies. This system allows large-class students to simultaneously learn from our high quality instructors while enjoying personalized tutoring services.
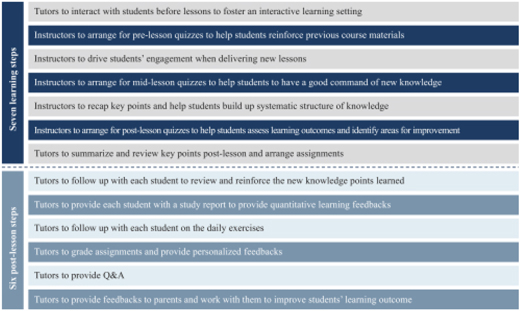
We have designed a unique “” learning methodology integrated into our dual-teacher system to encompass every step that is essential for students’ effective learning. Our “” learning methodology includes seven steps for pre-lesson, mid-lesson and post-lesson learning activities to ensure delivery of consistent teaching quality and six steps for post-lesson reviewing activities provided by tutors to enhance an effective learning experience and reinforce knowledge retention for students.
7+6 Steps
7+6 Steps
41