EXHIBIT 99.1
IMPORTANT NOTICE
This Technical Report was prepared in accordance with National Instrument 43-101 Standards of Disclosure for Mineral Projects (NI 43-101) for Equinox Gold Corp. (Equinox) by AGP Mining Consultants Inc. (AGP) and Equity Exploration Consultants Ltd. (Equity) collectively the Report Authors. The quality of information, conclusions, and estimates contained herein is consistent with the level of effort involved in the Report Authors’ services, based on i) information available at the time of preparation of the report, ii) data supplied by outside sources, and iii) the assumptions, conditions, and qualifications set forth in this report. This report is intended for use by Equinox subject to the terms and conditions of their contracts with the Report Authors. Those contracts permit Equinox to file this report as a Technical Report with Canadian Securities Regulatory Authorities pursuant to NI 43-101. Except for the purposes legislated under applicable Canadian provincial, territorial, and federal securities laws, any other use of this report by any third party is at that party’s sole risk.
| TECHNICAL REPORT ON THE AURIZONA GOLD MINE EXPANSION PRE-FEASIBILITY STUDY |
Contents
| 1 | Summary | 1-1 |
| 1.1 | Introduction | 1-1 |
| 1.2 | Property Location, Accessibility, and Infrastructure | 1-1 |
| 1.3 | Property Ownership | 1-2 |
| 1.4 | Climate, Local Resources, and Physiography | 1-3 |
| 1.5 | History | 1-3 |
| 1.6 | Geological Setting and Mineralization | 1-4 |
| 1.7 | Exploration and Drilling | 1-5 |
| 1.7.1 | Exploration | 1-5 |
| 1.7.2 | Drilling | 1-5 |
| 1.8 | Sample Preparation and Data Verification | 1-5 |
| 1.8.1 | Sample Preparation, Analyses, and Security | 1-5 |
| 1.8.2 | Data Verification | 1-6 |
| 1.9 | Mineral Resource Estimate | 1-6 |
| 1.10 | Mineral Processing and Metallurgical Testing | 1-9 |
| 1.11 | Mineral Reserves Estimate | 1-10 |
| 1.12 | Mining | 1-11 |
| 1.13 | Processing | 1-15 |
| 1.14 | Property Infrastructure | 1-15 |
| 1.15 | Environmental and Community | 1-16 |
| 1.16 | Capital and Operating Costs | 1-17 |
| 1.17 | Financial Analysis | 1-19 |
| 1.18 | Conclusions | 1-21 |
| 1.18.1 | Geology and Exploration | 1-21 |
| 1.18.2 | Mining and Geotechnical | 1-22 |
| 1.18.3 | Metallurgy and Infrastructure | 1-23 |
| 1.18.4 | Costs and Financial Model | 1-23 |
| 1.19 | Recommendations | 1-23 |
| 2 | Introduction | 2-1 |
| 2.1 | Issuer and Purpose | 2-1 |
| 2.2 | Site Visits and Scope of Personal Inspection | 2-3 |
| 2.3 | Effective Dates | 2-3 |
| 2.4 | Information Sources and References | 2-3 |
| 2.5 | Previous Technical Reports | 2-3 |
| 2.6 | Units of Measure | 2-5 |
| 2.7 | Terms of Reference (Abbreviations & Acronyms) | 2-6 |
| | T O C | 1-1 |
| 04/11/2021 |
| TECHNICAL REPORT ON THE AURIZONA GOLD MINE EXPANSION PRE-FEASIBILITY STUDY |
| 3 | Reliance on Other Experts | 3-1 |
| 3.1 | Ownership, Mineral Tenure and Surface Rights | 3-1 |
| 3.2 | Environmental Liabilities and Permitting | 3-1 |
| 3.3 | Taxation | 3-1 |
| 4 | Property Description and Location | 4-1 |
| 4.1 | Property and Title in Maranhão, Brazil | 4-1 |
| 4.2 | Brazilian Mining Rights | 4-1 |
| 4.3 | Equinox’s Mining Rights at Aurizona Project | 4-1 |
| 4.4 | Surface Rights | 4-5 |
| 4.5 | Royalties and Encumbrances | 4-5 |
| 4.6 | Property Agreements | 4-6 |
| 4.7 | Permits | 4-6 |
| 4.8 | Environmental Liabilities | 4-6 |
| 4.9 | Social License | 4-7 |
| 4.10 | Significant Risk Factors | 4-7 |
| 5 | Accessibility, Climate, Local Resources, Infrastructure, and Physiography | 5-1 |
| 5.1 | Accessibility | 5-1 |
| 5.2 | Climate | 5-1 |
| 5.3 | Local Resources and Infrastructure | 5-1 |
| 5.3.1 | Mining Personnel | 5-2 |
| 5.3.2 | Power | 5-2 |
| 5.3.3 | Water | 5-2 |
| 5.3.4 | Processing Plant | 5-2 |
| 5.3.5 | Waste and Tailings Storage Facilities | 5-3 |
| 5.3.6 | Physiography | 5-3 |
| 5.4 | Surface Rights | 5-3 |
| 6 | History | 6-1 |
| 6.1 | Property Ownership Changes | 6-1 |
| 6.2 | Exploration by Previous Owners | 6-2 |
| 6.2.1 | Cesbra-Gencor Unamgen JV (1991 - 1995) | 6-2 |
| 6.2.2 | Cesbra-Eldorado Unamgen JV (1996 - 2007) | 6-3 |
| 6.3 | Historical Mineral Resource Estimates | 6-4 |
| 6.4 | Historical Production | 6-4 |
| 7 | Geological Setting and Mineralization | 7-1 |
| 7.1 | Regional Geology | 7-1 |
| 7.2 | Project Geology | 7-3 |
| 7.2.1 | Lithology | 7-3 |
| 7.2.2 | Structure | 7-6 |
| 7.2.3 | Regolith Profile | 7-7 |
| 7.3 | Property Mineralization | 7-9 |
| | T O C | 1-2 |
| 04/11/2021 |
| TECHNICAL REPORT ON THE AURIZONA GOLD MINE EXPANSION PRE-FEASIBILITY STUDY |
| 7.3.1 | Piaba | 7-9 |
| 7.3.2 | Boa Esperança | 7-10 |
| 7.3.3 | Tatajuba | 7-11 |
| 7.3.4 | Genipapo | 7-11 |
| 7.3.5 | Touro | 7-12 |
| 7.4 | Prospects/Exploration Targets | 7-12 |
| 7.4.1 | Micote | 7-12 |
| 7.4.2 | Mestre Chico | 7-13 |
| 8 | Deposit Types | 8-1 |
| 9 | Exploration | 9-1 |
| 9.1 | Grids and Surveys | 9-4 |
| 9.2 | Geological Mapping and Rock Sampling | 9-5 |
| 9.3 | Geochemical Sampling | 9-6 |
| 9.4 | Geophysics | 9-6 |
| 9.4.1 | Airborne Geophysical Surveys | 9-6 |
| 9.4.2 | Ground Geophysical Surveys | 9-7 |
| 9.5 | Pits and Trenches | 9-8 |
| 10 | Drilling | 10-1 |
| 10.1 | Exploration Drilling | 10-3 |
| 10.1.1 | Drill Responsibilities | 10-3 |
| 10.1.2 | Diamond Drilling | 10-4 |
| 10.1.3 | RC Drilling | 10-4 |
| 10.1.4 | Piaba Drilling | 10-5 |
| 10.2 | Grade Control Drilling | 10-5 |
| 10.3 | Regional Exploration Drilling | 10-6 |
| 10.4 | Auger Drilling | 10-7 |
| 10.5 | Data Adequacy | 10-7 |
| 11 | Sample Preparation, Analyses, and Security | 11-1 |
| 11.1 | Historic Sampling Methods | 11-1 |
| 11.1.1 | Assaying | 11-1 |
| 11.1.2 | Quality Assurance/Quality Control | 11-1 |
| 11.2 | Equinox Sampling Methods | 11-2 |
| 11.2.1 | Sample Security & Transport | 11-2 |
| 11.3 | Equinox Analytical and Test Laboratories | 11-3 |
| 11.4 | Equinox Sample Preparation and Analysis | 11-3 |
| 11.4.1 | Sample Preparation | 11-3 |
| 11.4.2 | Assay | 11-3 |
| 11.5 | Quality Assurance/Quality Control | 11-5 |
| 11.6 | Density Determinations | 11-6 |
| 11.7 | Grade Control | 11-8 |
| 11.8 | Auger | 11-9 |
| | T O C | 1-3 |
| 04/11/2021 |
| TECHNICAL REPORT ON THE AURIZONA GOLD MINE EXPANSION PRE-FEASIBILITY STUDY |
| 11.9 | Databases | 11-9 |
| 11.10 | Data Adequacy | 11-10 |
| 12 | Data Verification | 12-1 |
| 12.1 | Site Visit | 12-1 |
| 12.2 | Resource Data | 12-1 |
| 12.2.1 | Drill Hole Location Verification | 12-1 |
| 12.2.2 | Geological Data Verification and Interpretation | 12-1 |
| 12.3 | Drillhole Assay Verification | 12-2 |
| 12.3.1 | Performance of Exploration QA/QC Samples | 12-2 |
| 12.3.2 | Performance of Piaba & Boa Esperança Grade Control QA/QC Samples | 12-8 |
| 12.3.3 | Performance of Tatajuba Exploration & Auger QA/QC Samples | 12-11 |
| 12.4 | Density Determinations | 12-11 |
| 12.5 | Data Adequacy | 12-11 |
| 13 | Mineral Processing and Metallurgical Testing | 13-1 |
| 13.1 | Introduction | 13-1 |
| 13.2 | Metallurgical Testing on Tatajuba | 13-1 |
| 13.2.1 | Sample Selection | 13-1 |
| 13.2.2 | Tatajuba Test Work Summary Results | 13-3 |
| 13.2.3 | Comminution Tests | 13-3 |
| 13.2.4 | Gravity Tests | 13-4 |
| 13.2.5 | CIL Tests | 13-4 |
| 13.2.6 | Overall Tatajuba Gold Recoveries | 13-6 |
| 13.3 | Metallurgical Testing on Piaba Underground | 13-7 |
| 13.3.1 | Sample Selection | 13-7 |
| 13.3.2 | Piaba Underground Test Work Summary Results | 13-9 |
| 13.3.3 | Comminution Tests | 13-11 |
| 13.3.4 | Gravity Tests | 13-11 |
| 13.3.5 | CIL Tests | 13-11 |
| 13.3.6 | Overall Piaba Gold Recoveries | 13-12 |
| 13.3.7 | Piaba Test Work Recommendations | 13-13 |
| 13.4 | Test Work Conclusions | 13-13 |
| 14 | Mineral Resource Estimates | 14-1 |
| 14.1 | Methodology and Data Sources | 14-1 |
| 14.1.1 | Software | 14-1 |
| 14.1.2 | Regolith Model | 14-1 |
| 14.1.3 | Editing of the Block Models | 14-1 |
| 14.1.4 | Reasonable Prospects of Eventual Economic Extraction | 14-2 |
| 14.2 | Factors That May Affect the Mineral Resource Estimate | 14-5 |
| 14.3 | Piaba | 14-5 |
| 14.3.1 | Drill Hole Database | 14-5 |
| 14.3.2 | Geological Models | 14-6 |
| 14.3.3 | Grade Capping | 14-13 |
| 14.3.4 | Compositing | 14-19 |
| | T O C | 1-4 |
| 04/11/2021 |
| TECHNICAL REPORT ON THE AURIZONA GOLD MINE EXPANSION PRE-FEASIBILITY STUDY |
| 14.3.5 | Variography | 14-21 |
| 14.3.6 | Gold Grade Estimation | 14-21 |
| 14.3.7 | Validation of Grade Estimates | 14-23 |
| 14.3.8 | Classification of Mineral Resources | 14-31 |
| 14.3.9 | Density | 14-33 |
| 14.3.10 | Mineral Resource Statement | 14-33 |
| 14.4 | Boa Esperança | 14-37 |
| 14.4.1 | Drill Hole Database | 14-37 |
| 14.4.2 | Geological Models | 14-37 |
| 14.4.3 | Grade Capping | 14-39 |
| 14.4.4 | Compositing | 14-41 |
| 14.4.5 | Exploratory Data Analysis | 14-42 |
| 14.4.6 | Variography | 14-43 |
| 14.4.7 | Gold Grade Estimation | 14-43 |
| 14.4.8 | Validation of Grade Estimates | 14-44 |
| 14.4.9 | Classification of Mineral Resources | 14-47 |
| 14.4.10 | Density | 14-48 |
| 14.4.11 | Mineral Resource Statement | 14-48 |
| 14.5 | Tatajuba | 14-51 |
| 14.5.1 | Drill Hole Database | 14-51 |
| 14.5.2 | Geological Models | 14-51 |
| 14.5.3 | Composites | 14-53 |
| 14.5.4 | Exploratory Data Analysis | 14-53 |
| 14.5.5 | Grade Capping | 14-54 |
| 14.5.6 | Declustering | 14-55 |
| 14.5.7 | Variography | 14-56 |
| 14.5.8 | Boundary Analysis | 14-57 |
| 14.5.9 | Gold Grade Estimation | 14-58 |
| 14.5.10 | Validation of Grade Estimates | 14-58 |
| 14.5.11 | Classification of Mineral Resources | 14-61 |
| 14.5.12 | Density | 14-61 |
| 14.5.13 | Mineral Resource Statement | 14-62 |
| 14.6 | Genipapo | 14-65 |
| 14.6.1 | Drill Hole Database | 14-65 |
| 14.6.2 | Geological Models | 14-65 |
| 14.6.3 | Grade Capping | 14-69 |
| 14.6.4 | Composites | 14-70 |
| 14.6.5 | Exploratory Data Analysis | 14-70 |
| 14.6.6 | Variography | 14-72 |
| 14.6.7 | Boundary Analysis | 14-73 |
| 14.6.8 | Gold Grade Estimation | 14-76 |
| 14.6.9 | Validation of Grade Estimates | 14-77 |
| 14.6.10 | Classification of Mineral Resources | 14-79 |
| 14.6.11 | Density | 14-79 |
| 14.6.12 | Mineral Resource Statement | 14-80 |
| 14.7 | Touro | 14-82 |
| 14.7.1 | Drill Hole Database | 14-82 |
| | T O C | 1-5 |
| 04/11/2021 |
| TECHNICAL REPORT ON THE AURIZONA GOLD MINE EXPANSION PRE-FEASIBILITY STUDY |
| 14.7.2 | Geological Models | 14-83 |
| 14.7.3 | Grade Capping | 14-86 |
| 14.7.4 | Composites | 14-86 |
| 14.7.5 | Exploratory Data Analysis | 14-86 |
| 14.7.6 | Variography | 14-88 |
| 14.7.7 | Gold Grade Estimation | 14-89 |
| 14.7.8 | Validation of Grade Estimates | 14-90 |
| 14.7.9 | Classification of Mineral Resources | 14-93 |
| 14.7.10 | Density | 14-94 |
| 14.7.11 | Mineral Resource Statement | 14-94 |
| 14.8 | Summary of Aurizona Mineral Resource Estimates | 14-96 |
| 15 | Mineral Reserve Estimates | 15-1 |
| 15.1 | Mining Method and Mining Costs | 15-2 |
| 15.1.1 | Geotechnical Considerations | 15-2 |
| 15.1.2 | Economic Pit Shell Development | 15-2 |
| 15.1.3 | Cut-off Grade | 15-4 |
| 15.1.4 | Dilution | 15-5 |
| 15.2 | Mine Design | 15-6 |
| 15.2.1 | Open Pit | 15-6 |
| 15.2.2 | Underground | 15-7 |
| 15.3 | Mine Reserves Statement - By Area | 15-7 |
| 16 | Mining Methods | 16-1 |
| 16.1 | Introduction | 16-1 |
| 16.2 | Geologic Models | 16-1 |
| 16.3 | Geotechnical Information | 16-2 |
| 16.3.1 | Open Pit and Waste Dumps | 16-2 |
| 16.3.2 | Piaba, Piaba East | 16-3 |
| 16.3.3 | Boa Esperança | 16-10 |
| 16.3.4 | Tatajuba, Genipapo North and South | 16-10 |
| 16.3.5 | Waste Dumps | 16-12 |
| 16.3.6 | Underground | 16-14 |
| 16.3.7 | Hydrogeology | 16-19 |
| 16.3.8 | Water Quality | 16-21 |
| 16.3.9 | Inflow Estimates - Underground | 16-21 |
| 16.4 | Open Pit Economic Pit Shell Development | 16-22 |
| 16.5 | Open Pit Design | 16-33 |
| 16.5.1 | Open Pit Cut-off Grade | 16-33 |
| 16.5.2 | Open Pit Dilution Calculation | 16-33 |
| 16.5.3 | Open Pit Design | 16-34 |
| 16.5.4 | Waste Dump Design | 16-53 |
| 16.5.5 | Open Pit Mine Equipment | 16-56 |
| 16.5.6 | Open Pit Blasting and Explosives | 16-56 |
| 16.5.7 | Grade Control | 16-56 |
| 16.6 | Underground Design | 16-57 |
| 16.6.1 | Mining Method Selection | 16-57 |
| | T O C | 1-6 |
| 04/11/2021 |
| TECHNICAL REPORT ON THE AURIZONA GOLD MINE EXPANSION PRE-FEASIBILITY STUDY |
| 16.6.2 | Portal Location | 16-60 |
| 16.6.3 | Exploration Decline | 16-61 |
| 16.6.4 | Stope Design | 16-63 |
| 16.6.5 | Development Design | 16-65 |
| 16.6.6 | Recovery of Pillars | 16-69 |
| 16.6.7 | Stope Optimisation Check Analyses | 16-71 |
| 16.6.8 | Backfill | 16-72 |
| 16.6.9 | Ventilation | 16-74 |
| 16.6.10 | Safety | 16-77 |
| 16.6.11 | Mine Infrastructure | 16-78 |
| 16.7 | Mine Schedule | 16-84 |
| 16.8 | Mine Plan Sequence | 16-88 |
| 17 | Recovery Methods | 17-1 |
| 17.1 | Overview | 17-1 |
| 17.2 | Process Description | 17-5 |
| 17.2.1 | Primary Crushing | 17-5 |
| 17.2.2 | Mill Feed System | 17-5 |
| 17.2.3 | Grinding | 17-5 |
| 17.2.4 | Gravity Circuit | 17-6 |
| 17.2.5 | Intensive Leaching - Acacia | 17-6 |
| 17.2.6 | Pre-Leach Thickening and CIL | 17-6 |
| 17.2.7 | Elution and Carbon Regeneration | 17-6 |
| 17.2.8 | Carbon Reactivation | 17-7 |
| 17.2.9 | Electrowinning Circuit and Gold Room | 17-7 |
| 17.2.10 | Cyanide Detoxification and Tailings Disposal | 17-7 |
| 17.2.11 | Reagents | 17-7 |
| 17.2.12 | Water and Air Supply | 17-8 |
| 17.3 | Assay and Metallurgical Laboratory | 17-8 |
| 18 | Project Infrastructure | 18-1 |
| 18.1 | Power Supply and Distribution | 18-1 |
| 18.2 | Water Supply and Management | 18-1 |
| 18.3 | Roads | 18-3 |
| 18.3.1 | Community Access Road | 18-3 |
| 18.3.2 | Mine Roads | 18-3 |
| 18.4 | Mine Facilities | 18-3 |
| 18.5 | Tailings Storage Facility | 18-3 |
| 18.6 | Waste Rock Storage Facilities (WRSF) | 18-8 |
| 18.7 | Camp | 18-9 |
| 19 | Market Studies and Contracts | 19-1 |
| 19.1 | Markets | 19-1 |
| 19.2 | Contracts | 19-1 |
| 20 | Environmental Studies, Permitting, and Social or Community Impact | 20-1 |
| 20.1 | Status of Current Permits | 20-2 |
| | T O C | 1-7 |
| 04/11/2021 |
| TECHNICAL REPORT ON THE AURIZONA GOLD MINE EXPANSION PRE-FEASIBILITY STUDY |
| 20.2 | Potential Environmental Impacts and Mitigation Measures | 20-5 |
| 20.2.1 | Monitoring Locations | 20-5 |
| 20.2.2 | Air Quality Monitoring | 20-7 |
| 20.2.3 | Noise Analysis | 20-7 |
| 20.2.4 | Effluent Quality and Quantity Monitoring | 20-8 |
| 20.2.5 | Groundwater Level and Monitoring | 20-8 |
| 20.2.6 | Cyanide Management | 20-9 |
| 20.3 | Water Management | 20-9 |
| 20.4 | Future Permitting Requirements | 20-10 |
| 20.4.1 | Piaba | 20-12 |
| 20.4.2 | Tatajuba | 20-12 |
| 20.4.3 | Genipapo | 20-12 |
| 20.4.4 | Road Upgrades | 20-12 |
| 20.5 | ARD Waste Monitoring and Management | 20-13 |
| 20.6 | Social and Community Engagement | 20-13 |
| 20.7 | Mine Closure Requirements and Reclamation Costs | 20-15 |
| 20.7.1 | Closure Objectives and Assumptions | 20-16 |
| 20.7.2 | Post-Closure Land Use | 20-16 |
| 20.7.3 | Water Management | 20-17 |
| 20.7.4 | Piaba, Boa Esperança, Tatajuba, Genipapo Pits | 20-17 |
| 20.7.5 | Piaba Underground | 20-18 |
| 20.7.6 | Waste Rock Storage Facilities (WRSF) | 20-18 |
| 20.7.7 | Tailings Storage Facility (TSF) | 20-19 |
| 20.7.8 | Process Plant | 20-20 |
| 20.7.9 | Buildings and Infrastructure | 20-20 |
| 20.7.10 | Monitoring | 20-21 |
| 20.7.11 | Closure Management and Security | 20-21 |
| 20.7.12 | Mine Closure Schedule | 20-21 |
| 20.7.13 | Relinquishment | 20-21 |
| 21 | Capital and Operating Costs | 21-22 |
| 21.1 | Summary | 21-22 |
| 21.2 | Capital Cost Estimates | 21-22 |
| 21.2.1 | Summary | 21-22 |
| 21.2.2 | Open Pit Mine Capital Costs | 21-23 |
| 21.2.3 | Underground Mine Capital Costs | 21-23 |
| 21.2.4 | Processing Capital Costs | 21-25 |
| 21.2.5 | Infrastructure Capital Costs | 21-25 |
| 21.2.6 | Environmental Capital Costs | 21-26 |
| 21.2.7 | Contingency | 21-26 |
| 21.3 | Operating Cost Estimates | 21-27 |
| 21.3.1 | Open Pit Operating Costs | 21-27 |
| 21.3.2 | Underground Mining Operating Costs | 21-30 |
| 21.3.3 | Process Operating Costs | 21-37 |
| 21.3.4 | General and Administrative Operating Costs | 21-40 |
| | T O C | 1-8 |
| 04/11/2021 |
| TECHNICAL REPORT ON THE AURIZONA GOLD MINE EXPANSION PRE-FEASIBILITY STUDY |
| 22 | Economic Analysis | 22-1 |
| 22.1 | Introduction | 22-1 |
| 22.2 | Summary Economic Analysis | 22-1 |
| 22.3 | Mine Production Statistics | 22-2 |
| 22.4 | Plant Production Statistics | 22-3 |
| 22.5 | Marketing Terms | 22-3 |
| 22.6 | Capital Expenditures | 22-3 |
| 22.6.1 | Capital | 22-3 |
| 22.6.2 | Salvage Value | 22-5 |
| 22.6.3 | Reclamation/Closure Costs | 22-5 |
| 22.7 | Net Revenue | 22-5 |
| 22.8 | Royalties | 22-6 |
| 22.9 | Operating Cost | 22-6 |
| 22.10 | Taxation | 22-6 |
| 22.10.1 | Applicable Taxes | 22-7 |
| 22.10.2 | Depreciation / Depletion | 22-9 |
| 22.11 | Project Financial Indicators | 22-9 |
| 22.11.1 | Sensitivity Analysis | 22-14 |
| 23 | Adjacent Properties | 23-1 |
| 24 | Other Relevant Data and Information | 24-1 |
| 24.1 | Aurizona Mine Expansion Timeline | 24-1 |
| 25 | Interpretation and Conclusions | 25-1 |
| 25.1 | Geology and Exploration | 25-1 |
| 25.2 | Mining | 25-2 |
| 25.3 | Metallurgy and Processing | 25-2 |
| 25.4 | Infrastructure and Site Layout | 25-2 |
| 25.5 | Capital and Operating Costs | 25-2 |
| 25.6 | Economic Analysis | 25-2 |
| 26 | Recommendations | 26-1 |
| 26.1 | Geology | 26-1 |
| 26.1.1 | Laboratory | 26-1 |
| 26.1.2 | Exploration Drilling | 26-1 |
| 26.1.3 | Geologic Modelling | 26-2 |
| 26.2 | Geotechnical | 26-2 |
| 26.2.1 | Open Pit | 26-2 |
| 26.2.2 | Underground | 26-2 |
| 26.2.3 | Hydrogeology | 26-3 |
| 26.3 | Mining | 26-4 |
| 26.3.1 | All Pits | 26-4 |
| 26.3.2 | Piaba | 26-4 |
| | T O C | 1-9 |
| 04/11/2021 |
| TECHNICAL REPORT ON THE AURIZONA GOLD MINE EXPANSION PRE-FEASIBILITY STUDY |
| 26.3.3 | Tatajuba and Genipapo | 26-5 |
| 26.3.4 | Underground | 26-5 |
| 26.4 | Metallurgy | 26-5 |
| 26.5 | Infrastructure | 26-6 |
| 26.6 | Environmental | 26-6 |
| 27 | References | 27-1 |
| 28 | Certificate of Authors | 28-1 |
| 28.1 | Eleanor Black, P.Geo. | 28-1 |
| 28.2 | Trevor Rabb, P. Geo. | 28-2 |
| 28.3 | Gordon Zurowski, P. Eng. | 28-3 |
| 28.4 | Neil Lincoln, P. Eng. | 28-4 |
Tables
| Table 1-1: Consolidated Mineral Resource Statement Exclusive of Reserves for Aurizona Property, Maranhão, Brazil | 1-7 |
| Table 1-2: Pit Optimisation Parameters for Open Pit Resources | 1-8 |
| Table 1-3: Pit Optimisation Parameters for Piaba, Boa Esperança, Tatajuba, Genipapo, and Touro | 1-9 |
| Table 1-4: Underground Mining Assumptions | 1-9 |
| Table 1-5: Aurizona Mine - Proven and Probable Reserves - June 30, 2021 | 1-11 |
| Table 1-6: Life of Mine Schedule | 1-14 |
| Table 1-7: Aurizona Mine Capital Cost Estimate | 1-18 |
| Table 1-8: Aurizona Mine Operating Cost Estimate | 1-18 |
| Table 1-9: Aurizona Mine - Discounted Cashflow Financial Summary | 1-20 |
| Table 1-10: After-Tax Sensitivity | 1-21 |
| Table 1-11: Estimate of Recommended Feasibility Budgets | 1-23 |
| Table 2-1: Aurizona Mine Technical Report Qualified Persons and Areas of Responsibility | 2-2 |
| Table 2-2: Dates of Site Visits | 2-3 |
| Table 2-3 Technical Report Table and Figure Sources | 2-3 |
| Table 2-4: Summary of Technical Reports on the Aurizona Project | 2-4 |
| Table 2-5: Units of Measure | 2-5 |
| Table 2-6: Terms of Reference | 2-6 |
| Table 2-7: Conversions for Common Units | 2-11 |
| Table 4-1: Annual Tax per Hectare (TAH) rates as of January 2020 | 4-1 |
| Table 4-2: Summary of Aurizona Tenure | 4-3 |
| Table 4-3: NSR Agreement between Sandstorm and Equinox | 4-5 |
| Table 6-1: Summary of Operators and Exploration Activities to 2007 | 6-1 |
| Table 6-2: Historical Piaba Deposit Mineral Resources (non-compliant - for information purposes only) | 6-4 |
| Table 6-3: Aurizona Mine Production from the Piaba Deposit from 2010 to 2021 | 6-5 |
| Table 7-1: Overview of Main Volcano-sedimentary and Intrusive Units Comprising the São Luís Craton | 7-3 |
| Table 7-2: Summary of Lithology Codes used on the Aurizona Project | 7-6 |
| Table 7-3: Summary of the Piaba Regolith Profile Thickness and Geochemistry | 7-7 |
| Table 9-1: Summary of Exploration Activities to April 2021 | 9-2 |
| Table 10-1: Summary of Aurizona Drilling by Deposit and Drill Type | 10-1 |
| Table 10-2: Summary of Drilling by Operator | 10-2 |
| | T O C | 1-10 |
| 04/11/2021 |
| TECHNICAL REPORT ON THE AURIZONA GOLD MINE EXPANSION PRE-FEASIBILITY STUDY |
| Table 10-3: Summary of the Piaba Grade Control Drilling | 10-5 |
| Table 10-4: Summary of Regional Aurizona Exploration Drilling by Area | 10-6 |
| Table 10-5: Summary of Auger Drilling on the Aurizona Property | 10-7 |
| Table 11-1: Assay Labs Used by Equinox | 11-3 |
| Table 11-2: Summary of Analysis | 11-4 |
| Table 11-3: Sample Summary for Diamond and RC Exploration Drilling | 11-6 |
| Table 11-4: Bulk Density Measurement for Deposit Targets | 11-7 |
| Table 11-5: Sample Summary of Grade Control Drilling | 11-9 |
| Table 11-6: Resource Database Delivery | 11-10 |
| Table 12-1: CV AVR(%) Best & Acceptable Practise Values for Coarse to Medium Grained Gold | 12-2 |
| Table 12-2: CRM Performance for Exploration Samples | 12-3 |
| Table 12-3: Summary of Quality Assurance Samples and Performance for Piaba Exploration | 12-5 |
| Table 12-4: Duplicate Pair Statistics for Exploration Samples | 12-6 |
| Table 12-5: Summary of Quality Assurance Samples & Performance for Grade Control | 12-8 |
| Table 12-6: CRM Performance for Grade Control Samples (2018-2020) | 12-9 |
| Table 12-7: Duplicate Pair Statistics for Exploration Samples | 12-11 |
| Table 12-8: CRM Performance for Tatajuba Auger QA | 12-11 |
| Table 13-1: Tatajuba Test Work Summary Results | 13-3 |
| Table 13-2: Summary of Composites | 13-9 |
| Table 13-3: Piaba U/G Test Work Summary Results | 13-10 |
| Table 14-1: Pit Optimisation Parameters for Open Pit Resources | 14-3 |
| Table 14-2: Pit Optimisation Mining Cost and Recovery Assumptions | 14-4 |
| Table 14-3: Underground Mining Assumptions | 14-5 |
| Table 14-4: Piaba Drill Hole Database Summary | 14-6 |
| Table 14-5: Piaba Open Pit Estimation Domains | 14-10 |
| Table 14-6: Piaba High-grade Domains | 14-10 |
| Table 14-7: Piaba Fault Nomenclature and Impact to Resource Model | 14-12 |
| Table 14-8: Summary of Top Cut Analysis for Piaba Gold Zone & Waste | 14-14 |
| Table 14-9: Summary of Top Cut Analysis for Piaba High-grade Domains | 14-15 |
| Table 14-10: Piaba Composite | 14-21 |
| Table 14-11: Variogram Model Parameters for Piaba Gold Zone (PGZ) | 14-21 |
| Table 14-12: Piaba Open Pit Block Model Index | 14-22 |
| Table 14-13: Piaba Search Interpolation Parameters | 14-22 |
| Table 14-14: Comparison of Average Block Estimates versus Composite Samples within a Block for Piaba | 14-30 |
| Table 14-15: Comparison of Different Estimation Techniques for Piaba | 14-30 |
| Table 14-16: Reconciliation of Current Resource Model to 2020 Production | 14-31 |
| Table 14-17: Piaba Open Pit and Underground Resource Classification Criteria | 14-32 |
| Table 14-18: Summary of Bulk Density Values and Number of Samples for Each Piaba Domain | 14-33 |
| Table 14-19: Mineral Resource Statement (Exclusive of Reserves) for Piaba deposit, Maranhão, Brazil, Equity Exploration Consultants, effective date June 30, 2021 | 14-34 |
| Table 14-20: Boa Esperança Drill Hole Database Summary | 14-37 |
| Table 14-21: Boa Esperança Resource Domains | 14-39 |
| Table 14-22: Summary of Boa Esperança Capping Values by Resource Domain | 14-40 |
| Table 14-23: Boa Esperança Composite Sample Summary | 14-42 |
| Table 14-24: Boa Grade Control Domain Variogram Model Parameters | 14-43 |
| Table 14-25: Boa Esperança Block Model Index | 14-43 |
| Table 14-26: Search Interpolation Parameters for Boa Esperança Resource Model | 14-44 |
| Table 14-27: Comparison of Average Block Estimates versus Composite Samples within a Block for Boa Esperança | 14-47 |
| | T O C | 1-11 |
| 04/11/2021 |
| TECHNICAL REPORT ON THE AURIZONA GOLD MINE EXPANSION PRE-FEASIBILITY STUDY |
| Table 14-28: Comparison of Different Estimation Techniques for Boa Esperança Grade Control Domain | 14-47 |
| Table 14-29: Boa Esperança Resource Classification Criteria | 14-48 |
| Table 14-30: Summary of Bulk Density Values used for Boa Esperança Resource Domains | 14-48 |
| Table 14-31: Mineral Resource Statement (Exclusive of Reserves) for Boa Esperança deposit, Maranhão, Brazil Equity Exploration Consultants, effective date June 30, 2021. | 14-49 |
| Table 14-32: Tatajuba Drill Hole Database Summary | 14-51 |
| Table 14-33: Tatajuba Resource Domains | 14-53 |
| Table 14-34: Summary of Capping Values for Tatajuba | 14-55 |
| Table 14-35: Summary of Boundary Analysis for Tatajuba | 14-57 |
| Table 14-36: Tatajuba Block Model Index | 14-58 |
| Table 14-37: Search Interpolation Parameters for Tatajuba Resource Model | 14-58 |
| Table 14-38: Summary of Composite Sample Average and Block Estimate Average for Tatajuba | 14-59 |
| Table 14-39: Tatajuba Resource Classification Criteria | 14-61 |
| Table 14-40: Summary of Bulk Density Values Used for Tatajuba Resource Domains | 14-62 |
| Table 14-41: Mineral Resource Statement (Exclusive of Reserves) for Tatajuba deposit, Maranhão, Brazil Equity Exploration Consultants, effective date June 30, 2021 | 14-63 |
| Table 14-42: Genipapo Drill Hole Database Summary | 14-65 |
| Table 14-43: Genipapo Ore Domains by Regolith | 14-69 |
| Table 14-44: Summary of Genipapo Capping Values by Resource Domain | 14-70 |
| Table 14-45: Geostatistical Variogram Model Parameters for Genipapo Gold Zones (GGZ) | 14-73 |
| Table 14-46: Genipapo North Block Model Index | 14-76 |
| Table 14-47: Genipapo South Block Model Index | 14-76 |
| Table 14-48: Search Interpolation Parameters for Genipapo North Resource Model | 14-76 |
| Table 14-49: Search Interpolation Parameters for Genipapo South Resource Model | 14-77 |
| Table 14-50: Summary of Composite Sample Average and Block Estimate Average for Genipapo | 14-77 |
| Table 14-51: Genipapo North and South Resource Classification Criteria | 14-79 |
| Table 14-52: Summary of Bulk Density Values used for Genipapo Resource Domains | 14-80 |
| Table 14-53: Mineral Resource Statement (Exclusive of Reserves) for Genipapo deposit, Maranhão, Brazil Equity Exploration Consultants, effective date June 30, 2021 | 14-80 |
| Table 14-54: Touro Drill Hole Database Summary | 14-83 |
| Table 14-55: Touro Resource Domains | 14-86 |
| Table 14-56: Summary of Touro Capping Values by Resource Domain | 14-86 |
| Table 14-57: Geostatistical Variogram Model Parameters for Touro Gold Zones (TGZ) | 14-89 |
| Table 14-58: Touro Block Model Index | 14-89 |
| Table 14-59: Search Interpolation Parameters for Touro Resource Model | 14-90 |
| Table 14-60: Comparison of Different Estimation Techniques for Touro Gold Zone | 14-93 |
| Table 14-61: Comparison of Average Block Estimates versus Composite Samples within a Block for Touro | 14-93 |
| Table 14-62: Touro Resource Classification Criteria | 14-93 |
| Table 14-63: Summary of Bulk Density Values used for Touro Resource Domains | 14-94 |
| Table 14-64: Mineral Resource Statement (Exclusive of Reserves) for Touro deposit, Maranhão, Brazil Equity Exploration Consultants, effective date June 30, 2021 | 14-95 |
| Table 14-65 Resources Exclusive of Reserves for Aurizona | 14-97 |
| Table 14-66 Resources Inclusive of Reserves for Aurizona | 14-98 |
| Table 15-1: Aurizona Mine - Proven and Probable Reserves - June 30, 2021 | 15-1 |
| Table 15-2: Open Pit Optimization Parameters | 15-3 |
| Table 15-3: Aurizona Mine Reserve Cut-off Grades - Gold Grade (g/t) | 15-4 |
| Table 15-4: Dilution Percentage by Pit Area | 15-5 |
| Table 15-5: Underground Dilution and Modifying Factors | 15-6 |
| | T O C | 1-12 |
| 04/11/2021 |
| TECHNICAL REPORT ON THE AURIZONA GOLD MINE EXPANSION PRE-FEASIBILITY STUDY |
| Table 15-6: Aurizona Proven and Probable Reserves - by Area (June 30, 2021) | 15-7 |
| Table 16-1: MinePlan Model Framework and File Names | 16-1 |
| Table 16-2: Model Importation Comparison - Piaba Detail | 16-2 |
| Table 16-3: Model Importation Comparisons - All Models Summary | 16-2 |
| Table 16-4: Summary of Hydraulic Conductivity Values from Packer Tests and Pumping Tests | 16-20 |
| Table 16-5: Open Pit Optimization Parameters | 16-25 |
| Table 16-6: Pit Optimization Pit Slopes - Piaba | 16-27 |
| Table 16-7: Aurizona Mine Open Pit Cut-off Grades - Gold Grade (g/t) | 16-33 |
| Table 16-8: Dilution Percentage by Pit Area | 16-34 |
| Table 16-9: Piaba Pit Phase Design - Pit Shell Ranking | 16-36 |
| Table 16-10: Piaba Pit Tonnage and Grades by Phase | 16-43 |
| Table 16-11: Piaba East - Tonnes and Grade | 16-44 |
| Table 16-12: Boa Esperança - Tonnes and Grade | 16-45 |
| Table 16-13: Tatajuba - Tonnages and Grades by Phase | 16-47 |
| Table 16-14: Genipapo North - Tonnes and Grade | 16-48 |
| Table 16-15: Genipapo South - Tonnes and Grade | 16-49 |
| Table 16-16: Crown Pillar - Tonnage and Grades | 16-53 |
| Table 16-17: Final Design - Phase Tonnes and Grades | 16-53 |
| Table 16-18: Pit Area Waste Volumes | 16-54 |
| Table 16-19: Waste Dump Capacities | 16-54 |
| Table 16-20: Contractor Mining Fleet | 16-56 |
| Table 16-21: Comparison of LHwPRP and LHwC Design Aspects | 16-60 |
| Table 16-22: Comparison of the Mineral Reserve Generated by DSO and the PFS Manual Methodology | 16-72 |
| Table 16-23: CRF Mix Specifications | 16-73 |
| Table 16-24: Life of Mine Rockfill Requirements | 16-74 |
| Table 16-25: Maximum Mine Air Quantity Requirements (2028) | 16-75 |
| Table 16-26: Velocity Limits | 16-75 |
| Table 16-27: Modelled Air Velocity | 16-76 |
| Table 16-28: Estimated Mine Water Inflow | 16-79 |
| Table 16-29: Pump Station Designs | 16-81 |
| Table 16-30: Mine Production 2021 - 2032 | 16-85 |
| Table 17-1: Process Plant Performance Summary (2019-H1 2021) | 17-1 |
| Table 17-2: Consumption Rates for Main Consumables and Reagents | 17-8 |
| Table 18-1: Waste Rock Storage Facilities | 18-8 |
| Table 20-1: Environmental Permits Matrix | 20-3 |
| Table 20-2: Parameter Monitoring | 20-5 |
| Table 20-3: Aurizona Mine: Air Quality Analysis | 20-7 |
| Table 20-4: Aurizona Mine: Noise Analysis | 20-8 |
| Table 20-5: Aurizona Open Doors Yearly Engagement | 20-14 |
| Table 20-6: Post Closure Land Use | 20-17 |
| Table 20-7: Preliminary Mine Closure Schedule | 20-21 |
| Table 21-1: Aurizona Mine Capital Cost Estimate | 21-22 |
| Table 21-2: Aurizona Mine Operating Cost Estimate | 21-22 |
| Table 21-3: Open Pit Capitalized Stripping Cost ($M) | 21-23 |
| Table 21-4: LOM Underground Capital Costs ($M) | 21-24 |
| Table 21-5: Infrastructure Capital - Major Categories | 21-25 |
| Table 21-6: PFS Contingency Percentages and Value | 21-26 |
| Table 21-7: Mine Operating Costs ($/tonne Moved) | 21-29 |
| | T O C | 1-13 |
| 04/11/2021 |
| TECHNICAL REPORT ON THE AURIZONA GOLD MINE EXPANSION PRE-FEASIBILITY STUDY |
| Table 21-8: Effective Working Hours | 21-31 |
| Table 21-9: Hourly Paid Labour Requirements | 21-32 |
| Table 21-10: Staff Requirements | 21-33 |
| Table 21-11: Mobile Equipment List | 21-34 |
| Table 21-12: Equipment Fleet Requirements | 21-35 |
| Table 21-13: Underground Mine LOM Operating Costs | 21-37 |
| Table 21-14: Process Operating Costs - $/tonne Ore Processed | 21-38 |
| Table 21-15: Aurizona Mill Annual Process Unit Cost | 21-39 |
| Table 21-16: General and Administrative Costs (G&A) - LOM | 21-40 |
| Table 22-1: Aurizona Project - Discounted Cash Flow Financial Summary | 22-2 |
| Table 22-2: Mill Feed, Waste and Metal Grades | 22-3 |
| Table 22-3: Aurizona Project Capital Costs (US$) | 22-4 |
| Table 22-4: Royalties Summary | 22-6 |
| Table 22-5: Operating Cost Summary | 22-6 |
| Table 22-6: Depreciation and Depletion | 22-9 |
| Table 22-7: Detailed Financial Model | 22-10 |
| Table 22-8: After Tax Sensitivity | 22-14 |
| Table 22-9: Fresh Rock Recovery Sensitivity - After Taxes | 22-15 |
| Table 26-1: Estimate of Recommended Feasibility Budgets | 26-1 |
Figures
| Figure 1-1: Aurizona Mine Location | 1-2 |
| Figure 1-2: Overall Site Plan (End of Mine Life) | 1-16 |
| Figure 1-3: Recovered Gold versus AISC (includes H1 2021 Actuals) | 1-21 |
| Figure 4-1: Aurizona Project Tenure Map | 4-2 |
| Figure 7-1: Regional Geology of the Aurizona Project Area | 7-2 |
| Figure 7-2: Geology of the Aurizona Project | 7-4 |
| Figure 7-3: Cross Section of the Lithological Model through the Piaba Deposit | 7-5 |
| Figure 7-4: Cross Section of the Weathering Profile of the Piaba Deposit | 7-8 |
| Figure 7-5: Geology of the Piaba Deposit | 7-10 |
| Figure 9-1: Map of Exploration Targets, Gold Deposits, and Artisanal Workings | 9-3 |
| Figure 9-2: Map of Regional Exploration Targets, Gold Deposits, and Artisanal Workings | 9-4 |
| Figure 9-3: Litho-Structural Interpretation of the Aurizona Property | 9-5 |
| Figure 9-4: Total Magnetic Intensity Map from 2017 Regional Airborne Magnetic Survey | 9-7 |
| Figure 10-1: Map of Aurizona Deposit Drilling | 10-2 |
| Figure 10-2: Map of Regional Drilling | 10-6 |
| Figure 11-1: Box and Whisker Plot of the Bulk Density by Modelled Lithology for Piaba Deposit | 11-7 |
| Figure 11-2: Box and Whisker Plot of the Bulk Density by Modelled Weathering for Piaba Deposit | 11-8 |
| Figure 12-1: Shewart Performance Chart for Gold in S Series CRMs from the Exploration Datasets | 12-4 |
| Figure 12-2: Shewart Performance Chart for Gold in O Series CRMs from the Exploration Datasets | 12-4 |
| Figure 12-3: Blank Performance Chart for Gold in with the Exploration Datasets | 12-5 |
| Figure 12-4: RMA Duplicate Plot for Exploration Sample Pulp Duplicates | 12-6 |
| Figure 12-5: RMA Duplicate Plot for Exploration Sample Preparation Duplicates | 12-7 |
| Figure 12-6: RMA Duplicate Plot for Exploration Sample Twin Sample Duplicates | 12-7 |
| Figure 12-7: Shewart Performance Chart for Gold in S Series CRMs from the Grade Control Datasets | 12-10 |
| Figure 12-8: Blank Performance Chart for Gold in with the Grade Control Datasets | 12-10 |
| Figure 13-1: Tatajuba Sample Selection Locations | 13-2 |
| | T O C | 1-14 |
| 04/11/2021 |
| TECHNICAL REPORT ON THE AURIZONA GOLD MINE EXPANSION PRE-FEASIBILITY STUDY |
| Figure 13-2: CIL Gold Extraction of Tatajuba Gravity Tailings Samples | 13-5 |
| Figure 13-3: Overall Tatajuba Gold Recoveries | 13-6 |
| Figure 13-4: Overall Tatajuba Gold Recoveries vs % Sulphur | 13-7 |
| Figure 13-5: Piaba Sample Locations - Underground Mine | 13-8 |
| Figure 13-6: CIL Gold Extraction of Piaba Gravity Tailings Samples | 13-12 |
| Figure 13-7: Overall Piaba Gold Recoveries | 13-13 |
| Figure 14-1: Isometric View of Piaba Lithology Model | 14-7 |
| Figure 14-2: Isometric View of Piaba Silicification Model | 14-7 |
| Figure 14-3: Isometric View of Piaba Sulphide Mineralization Model | 14-8 |
| Figure 14-4: Isometric View of Piaba and Piaba West Gold Zones Resource Domains | 14-8 |
| Figure 14-5: Piaba Underground Central and Footwall High-grade Gold Zones | 14-9 |
| Figure 14-6: Piaba Underground Hangingwall High-grade Gold Zones | 14-9 |
| Figure 14-7: Piaba Cross Section 100W Looking East (078°) Showing Drill Holes and Regolith Model | 14-11 |
| Figure 14-8: Isometric View of Piaba Gold Zone Showing Fault Model | 14-13 |
| Figure 14-9: Boxplot of Piaba Assay Sample Statistics | 14-16 |
| Figure 14-10: Boxplot of Piaba High-grade Domain Assay Sample Statistics | 14-17 |
| Figure 14-11: Boxplot of Piaba Capped Composite Sample Statistics | 14-18 |
| Figure 14-12: Boxplot of Piaba High-grade Domain Capped Composite Sample Statistics | 14-19 |
| Figure 14-13: Original Sample Lengths for Drill Hole and Grade Control Sample for Piaba | 14-20 |
| Figure 14-14: Vertical and Oriented Swath Plots of Piaba Gold Zone Domains | 14-24 |
| Figure 14-15: Vertical and Oriented Swath Plots of Piaba Gold Zone Domain 24 and High-grade Domains | 14-28 |
| Figure 14-16 Cross Section of the Piaba Open Pit Block Model | 14-36 |
| Figure 14-17: Plan and Northwest Perspective View of Boa Esperança Gold Zone Resource Domains | 14-38 |
| Figure 14-18: Original Sample Lengths for Drill Hole and Grade Control Sample for Piaba | 14-41 |
| Figure 14-19: Boxplots of Composite Samples for Boa Esperança Resource Domains | 14-42 |
| Figure 14-20: Easting Swath Plots for Boa Esperança Gold Zone Resource Domains | 14-45 |
| Figure 14-21: Vertical Swath Plots for Boa Esperança Gold Zone Resource Domains | 14-46 |
| Figure 14-22: Cross Section of the Boa Esperança Open Pit Block Model | 14-50 |
| Figure 14-23: Tatajuba Lithology Model | 14-52 |
| Figure 14-24: Tatajuba Gold Zones Resource Domains | 14-52 |
| Figure 14-25: Boxplot of 2 m Composite Samples for Tatajuba Deposit Area | 14-54 |
| Figure 14-26: Box and Whisker Plots and Summary Statistics for Declustered 2 m Capped Composite Samples for Tatajuba | 14-56 |
| Figure 14-27: Omnidirectional Semi Variograms | 14-57 |
| Figure 14-28 Boundary Analysis of Tatajuba Gold Zone Domains | 14-57 |
| Figure 14-29: Swath Plots Comparing Block Estimates, Nearest Neighbor, and Composite Samples | 14-60 |
| Figure 14-30 Cross Section of the Tatajuba Open Pit Block Model | 14-64 |
| Figure 14-31: Genipapo Lithology Model of North and South Zones in of Plan View | 14-66 |
| Figure 14-32: Genipapo Mineralization Model of North and South Zones in Plan View | 14-67 |
| Figure 14-33: Plan and Northeast Perspective view of Genipapo North and South Gold Zone Domains | 14-68 |
| Figure 14-34: Boxplot of uncapped length weighted Samples for Genipapo Deposit Area | 14-71 |
| Figure 14-35: Boxplot of Capped 1 m Composite Samples for Genipapo Deposits | 14-72 |
| Figure 14-36 Boundary Analysis of Genipapo North Gold Zone Regolith Domains | 14-74 |
| Figure 14-37 Boundary Analysis of Genipapo Gold Zone Domains | 14-75 |
| Figure 14-38: Swath Plots for Genipapo North and South Resource Models | 14-78 |
| Figure 14-39: Cross Section of the Genipapo South Open Pit Block Model | 14-81 |
| Figure 14-40: Cross Section of the Genipapo North Open Pit Block Model | 14-82 |
| Figure 14-41: Isometric View of Touro Lithology Model | 14-84 |
| | T O C | 1-15 |
| 04/11/2021 |
| TECHNICAL REPORT ON THE AURIZONA GOLD MINE EXPANSION PRE-FEASIBILITY STUDY |
| Figure 14-42: Isometric View of Touro Mineralization Model | 14-85 |
| Figure 14-43: Boxplot of uncapped length weighted Samples for Touro Deposit Area | 14-87 |
| Figure 14-44: Boxplot of Capped 1 m Composite Samples for Touro Deposit Area | 14-88 |
| Figure 14-45: Northeast Swath Plots for Touro | 14-91 |
| Figure 14-46: Vertical Swath Plots for Touro | 14-92 |
| Figure 14-47 Cross Section of the Touro Open Pit Block Model | 14-96 |
| Figure 16-1: Piaba and Piaba East Design Sectors | 16-4 |
| Figure 16-2: Piaba Pit Wall Slope Parameters | 16-6 |
| Figure 16-3: Piaba Pit - August 2021 (Looking West) | 16-7 |
| Figure 16-4: Piaba East Wall - August 2021 (Looking West) | 16-8 |
| Figure 16-5: General Instrumentation - Aurizona Mine | 16-9 |
| Figure 16-6: Tatajuba - Longitudinal Cross-section looking South | 16-11 |
| Figure 16-7: Tatajuba - August 2021 (Looking East) | 16-12 |
| Figure 16-8: Piaba Pit Optimization Shells - Net Profit vs Tonnes | 16-28 |
| Figure 16-9: Boa Esperança Pit Optimization Shells - Net Profit vs Tonnes | 16-29 |
| Figure 16-10: Tatajuba Pit Optimization Shells - Net Profit vs Tonnes | 16-30 |
| Figure 16-11: Genipapo North Pit Optimization Shells - Net Profit vs Tonnes | 16-31 |
| Figure 16-12: Genipapo South Pit Optimization Shells - Net Profit vs Tonnes | 16-32 |
| Figure 16-13: Piaba Pit Phase Analysis | 16-36 |
| Figure 16-14: Piaba Pit Phase Conceptualization | 16-37 |
| Figure 16-15: Piaba Pit Phases | 16-38 |
| Figure 16-16: Phase 4 Design | 16-38 |
| Figure 16-17: Phase 5 Design | 16-39 |
| Figure 16-18: Phase 5 Sub-phases | 16-40 |
| Figure 16-19: Phase 5C and Existing Road | 16-41 |
| Figure 16-20: Phase 6 Design | 16-42 |
| Figure 16-21: Phase 7 Design | 16-43 |
| Figure 16-22: Piaba East Pit Design | 16-44 |
| Figure 16-23: Boa Esperança Pit Design | 16-45 |
| Figure 16-24: Tatajuba Pit Design - Phase 1 | 16-46 |
| Figure 16-25: Tatajuba Pit Design - Phase 2 | 16-47 |
| Figure 16-26: Genipapo North Design | 16-48 |
| Figure 16-27: Genipapo South Design | 16-49 |
| Figure 16-28: Piaba Pit - Crown Pillar Locations (Looking Northwest) | 16-51 |
| Figure 16-29: Crown Pillar - Area A Design | 16-52 |
| Figure 16-30: Crown Pillar - Area B Design | 16-52 |
| Figure 16-31: Ultimate Aurizona Mine Pit and Waste Management Facilities | 16-55 |
| Figure 16-32: Long hole with Permanent Rib Pillar (LHwPRP) | 16-58 |
| Figure 16-33: Long hole with Cement Fill (LHwC) | 16-59 |
| Figure 16-34: Portal and Service Raise Locations with Exploration Decline | 16-61 |
| Figure 16-35: Exploration Decline Layout | 16-62 |
| Figure 16-36: Long Section of Stoping Methods by Zone and Ore Reserves | 16-64 |
| Figure 16-37: Access Development Relative to Metasediments | 16-66 |
| Figure 16-38: Piaba Development Design - Looking Southeast | 16-68 |
| Figure 16-39: Typical Level Access | 16-69 |
| Figure 16-40: Crown Pillar Long Section | 16-71 |
| Figure 16-41: Year 2026 to 2027 Ventilation (Looking South) | 16-77 |
| Figure 16-42: Water Inflow for Design Purposes | 16-80 |
| | T O C | 1-16 |
| 04/11/2021 |
| TECHNICAL REPORT ON THE AURIZONA GOLD MINE EXPANSION PRE-FEASIBILITY STUDY |
| Figure 16-43: Plant Feed - Open Pit and Underground | 16-86 |
| Figure 16-44: Total Tonnages by Open Pit Area | 16-87 |
| Figure 16-45: End of 2021 | 16-89 |
| Figure 16-46: End of 2022 | 16-90 |
| Figure 16-47: End of 2025 | 16-91 |
| Figure 16-48: End of 2028 | 16-92 |
| Figure 16-49: Open Pit End of 2032 | 16-93 |
| Figure 16-50: Underground Mine - End of 2022 (Looking South) | 16-94 |
| Figure 16-51: Underground Mine - End of 2023 (Looking South) | 16-94 |
| Figure 16-52: Underground Mine - End of 2024 (Looking South) | 16-95 |
| Figure 16-53: Underground Mine - End of 2025 (Looking South) | 16-95 |
| Figure 16-54: Underground Mine - End of 2026 (Looking South) | 16-96 |
| Figure 16-55: Underground Mine - End of 2027 (Looking South) | 16-96 |
| Figure 16-56: Underground Mine - End of 2028 (Looking South) | 16-97 |
| Figure 16-57: Underground Mine - End of 2029 (Looking South) | 16-97 |
| Figure 16-58: Underground Mine - End of 2030 (Looking South) | 16-98 |
| Figure 16-59: Underground Mine - End of 2031 (Looking South) | 16-98 |
| Figure 16-60: Underground Mine - End of 2032 (Looking South) | 16-99 |
| Figure 17-1: Plant Process Flowsheet | 17-3 |
| Figure 18-1: Overall Site Plan | 18-2 |
| Figure 18-2: Vené Dam Typical Cross-Section | 18-5 |
| Figure 18-3: Vené 2 First Phase Construction | 18-6 |
| Figure 18-4: Vené 2 Second Phase Construction | 18-7 |
| Figure 18-5: Vené 2 Final Phase Construction | 18-7 |
| Figure 18-6: Vené 3 with South Dump at End of Mine Life | 18-8 |
| Figure 20-1: Monitoring Locations | 20-6 |
| Figure 20-2: Project Permitting Timeline | 20-11 |
| Figure 21-1: Utilised Power | 21-36 |
| Figure 22-1: Aurizona Project Capital Cost by Year | 22-5 |
| Figure 22-2: Recovered Gold versus AISC (Includes H1 2021 Actuals) | 22-13 |
| Figure 22-3: Aurizona PFS Cashflow - Post Tax | 22-13 |
| Figure 22-4: Net Revenue versus Operating Cost, Capital Cost and Taxes | 22-14 |
| Figure 22-5: Sensitivity Analysis - NPV @ 5% | 22-15 |
| Figure 24-1: PFS Mine Development Timeline | 24-2 |
| | T O C | 1-17 |
| 04/11/2021 |
| TECHNICAL REPORT ON THE AURIZONA GOLD MINE EXPANSION PRE-FEASIBILITY STUDY |
Forward Looking Statements
This Technical Report, including the economics analysis, contains forward-looking statements within the meaning of the United States Private Securities Litigation Reform Act of 1995 and forward-looking information within the meaning of applicable Canadian securities laws. While these forward-looking statements are based on expectations about future events as at the effective date of this Report, the statements are not a guarantee of Equinox Gold Corp’s future performance and are subject to risks, uncertainties, assumptions, and other factors, which could cause actual results to differ materially from future results expressed or implied by such forward-looking statements. Such risks, uncertainties, factors, and assumptions include, amongst others but not limited to metal prices, Mineral Resources, Mineral Reserves, capital and operating cost forecasts, economic analyses, smelter terms, labour rates, consumable costs, and equipment pricing. There can be no assurance that any forward-looking statements contained in this Report will prove to be accurate, as actual results and future events could differ materially from those anticipated in such statements.
| | T O C | 1-18 |
| 04/11/2021 |
| TECHNICAL REPORT ON THE AURIZONA GOLD MINE EXPANSION PRE-FEASIBILITY STUDY |
| 1 | Summary |
| 1.1 | Introduction |
Equinox Gold Corp. (Equinox or the Company) retained independent consultants to prepare a Technical Report (the Report) for a Prefeasibility Study (PFS) to include an underground mining operation of the Piaba gold deposit at the existing Piaba open pit plus additional open pits at Piaba East, Boa Esperança, Tatajuba and Genipapo.
The Report also is an update to the Aurizona Mine (the mine or the Property) Mineral Resources and Mineral Reserves. The Aurizona Mine Mineral Resources and Mineral Reserves include the Piaba, Boa Esperança, Tatajuba, and Genipapo gold deposits and the Mineral Resources for the Touro gold deposit in northern Brazil. The Aurizona Mine, is considered an active open pit operation presently mining the Piaba and Piaba East deposits. Equinox, through its indirect wholly-owned subsidiary Mineração Aurizona S.A. (MASA), holds a 100% interest in the Property.
Equinox is an intermediate gold producer. Equinox operates seven mines: Los Filos and Mercedes in Mexico, Mesquite and Castle Mountain (Phase 1) in USA, and Aurizona, Fazenda, and RDM in Brazil. Additional Equinox development stage projects include the Los Filos expansion in Mexico, Castle Mountain (Phase 2) in the USA and Santa Luz in Brazil.
The following consultants were the primary contributors to this study:
| • | AGP Mining Consultants Inc. (AGP) |
| • | Equity Exploration Consultants Ltd. (Equity) |
| • | Knight Piésold Ltd. (KP) |
| 1.2 | Property Location, Accessibility, and Infrastructure |
The Aurizona Property is located in the state of Maranhão in northeastern Brazil between the cities of São Luis and Belém. The Property is centered at approximately 01°18’ south latitude and 45°45’ west longitude.
The Property is on the Atlantic coast of northern Brazil and is accessed by regularly maintained laterite road 16 km from the town of Godofredo Viana, which is connected by State highways MA-101 and MA-206 to BR316. Year-round road access is available from the state capital cities of Belém, Pará (400 km), and São Luis, Maranhão (320 km), the latter requiring a ferry transfer from São Luis island to the mainland or a longer bypass by road on land. The main federal highway connecting both capitals has been resurfaced in both states and is in good condition. A state highway connects the federal highway with the town of Godofredo Viana, from which the Property is accessed by 16 km of a regularly maintained eight-metre-wide laterite road (Figure 1-1).
The existing Aurizona Mine site includes the open pit operation and infrastructure such as camp facilities, tailings storage areas, waste disposal areas, power, water, and the processing plant. The Aurizona process plant currently treats the ore via a conventional crushing, griding and cyanidation process.
| | P a g e | 1-1 |
| 04/11/2021 |
| TECHNICAL REPORT ON THE AURIZONA GOLD MINE EXPANSION PRE-FEASIBILITY STUDY |
Figure 1-1: Aurizona Mine Location

| 1.3 | Property Ownership |
The Property includes one active mining license totaling 9,982 ha and twelve exploration licenses totaling approximately 97,042 ha for a total land package of approximately 107,023 ha.
All thirteen licenses are 100% held by Equinox via its wholly owned subsidiaries MASA and Luna Gold Pesquisa Mineral LTDA (Luna Gold). The Piaba and Boa Esperança deposits, as well as several near-mine exploration targets are covered by the mining licence. There are two mining license applications that cover Tatajuba, Genipapo and Touro deposits.
Equinox, through its indirect wholly-owned subsidiary MASA., owns all surface rights required for the operation of the Aurizona Mine.
Royalties on the Property are held by the Brazilian government and Sandstorm Gold Royalties Ltd. (Sandstorm). The Mining License is subject to a government royalty of 1.5% which is applied to gross revenue from sales payable to the Brazilian government. Previously, Aurizona was subject to a 17% gold stream payable to Sandstorm. This gold stream has been terminated and replaced by two net smelter return (NSR) royalties (the Aurizona Property NSR and the Greenfields NSR) and a convertible debenture in favour of Sandstorm dated January 3, 2018 (the Sandstorm Debenture).
| | P a g e | 1-2 |
| 04/11/2021 |
| TECHNICAL REPORT ON THE AURIZONA GOLD MINE EXPANSION PRE-FEASIBILITY STUDY |
The Aurizona Property NSR covers the mining license and the four brownfield exploration licenses including all the Mineral Resource estimates presented in this Report, and any future resources from these properties that would be processed through the Aurizona mill net of third-party refining costs. The Aurizona Property NSR is a sliding scale royalty based on the price of gold as follows:
| • | 3% if the price of gold is less than or equal to $1,500/oz |
| • | 4% if the price of gold is between $1,500 and $2,000/oz |
| • | 5% if the price of gold is greater than $2,000/oz |
The Greenfields NSR covers the other eight exploration licences on the Property and are subject to a 2% royalty. Sandstorm holds a right of first refusal on any future streams or royalties on the licences covered in the Aurizona Property NSR or Greenfields NSR.
| 1.4 | Climate, Local Resources, and Physiography |
The Property experiences a dry-summer tropical savanna climate bordering on a tropical monsoon climate. There is a dry season from August to December and a wet season from January to July. Average daily highs and lows (for the state capital of São Luis) range between 31˚C and 23˚C for the entire year, with ≤2˚C variance for the hottest and coldest months.
Precipitation data has been collected from the Mineração Aurizona S.A (MASA) meteorological stations in the area of the camp, the dam, and the mine since 2010. Monthly rainfall from 2010 to 2019 varied from 0 mm during the dry season, up to 1,110 mm during the rainy season. Annual precipitation over that period ranged from 1,692 to 3,319 mm with an average of 2,482 mm. Annual evaporation is estimated at approximately 1,650 mm.
Mining personnel comprise a combination of a local workforce for the operation and support services, along with select technical experts from throughout Brazil. Many local workers are based in the village of Aurizona (population 2,100) and town of Godofredo Viana (population 5,370), <1 km and 16 km away from the mine site, respectively. Both towns offer a limited range of services and supplies.
The Property lies on a peneplain near the Atlantic Ocean and is characterized by rounded flat knolls and wide estuaries. Elevation ranges from 0 - 90 m above mean sea level (amsl) with the Aurizona Mine located approximately 10 - 40 m above sea level (asl). The isthmus that joins the Aurizona Peninsula to the mainland consists of low-lying flats that are subject to mild flooding at high neap tide, although this does not affect project access or operations.
Vegetation consists of mangrove swamp near the coastline, giving way inland to low-lying grassland with dense tropical vegetation on the low rounded hills.
| 1.5 | History |
The Property has a long history of artisanal gold production dating back to the arrival of Jesuit missionaries in the 17th century.
| | P a g e | 1-3 |
| 04/11/2021 |
| TECHNICAL REPORT ON THE AURIZONA GOLD MINE EXPANSION PRE-FEASIBILITY STUDY |
In 1978, subsidiary companies of Brascan Recursos Naturais S.A.(Brascan) started exploration programs in alluvium that lasted through to 1985. In 1988 MASA, a subsidiary of Brascan, received a license to mine in what is now the Aurizona mining license (800256/1978).
From 1991 to 2007, extensive development work including geophysical and geochemical surveys were carried out near the Piaba deposit, along with geological mapping and drilling. The regional infrastructure improved markedly in this time frame in terms of road access, telecommunications, and grid power availability.
In January 2007, Luna Gold completed a purchase agreement (the Purchase Agreement) to acquire all outstanding shares of Aurizona Goldfields Corporation (AGC) from Brascan and Eldorado, with AGC owning 100% of MASA and the Aurizona Project (Luna Gold Corp, 2006). In July 2011, all obligations were satisfied regarding the Purchase Agreement and Luna Gold assumed 100% ownership of the Project.
In March 2017, JDL Gold Corp. merged with Luna Gold to form Trek Mining Inc. (Trek) after which Trek merged with NewCastle Gold Ltd. and Anfield Gold Corp. to form Equinox
Production from the Aurizona Mine for the period 2010 to 2021 is all from the Piaba deposit. The mine has produced 594,000 oz (recovered) from 16.0 Mt of laterite, saprolite, and transition ore with an average gold grade of 1.31 g/t and overall gold recovery of 89%.
| 1.6 | Geological Setting and Mineralization |
The Aurizona Property mineralization is characterized as a greenstone-hosted orogenic gold system. Mineralization occurs as structurally-controlled gold deposits including the Piaba deposit, which is currently being mined. Piaba, Boa Esperança, Tatajuba and Genipapo deposits are on and adjacent to the Aurizona Shear Zone (ASZ), a regional northeast-striking structure. Touro is 16 km southwest of the Aurizona Mine which hosts gold mineralization within an intrusive unit. These deposits are hosted by Paleoproterozoic volcano-sedimentary and intrusive rocks of the São Luis Craton, an eastern extension of the Guyana Shield which contains several major Proterozoic gold deposits including Las Cristinas, Omai, and Rosebel, extending from Venezuela to Brazil.
The Property geology is dominated by volcano-sedimentary sequences of the 2.23-2.24 Ga Aurizona Group (Klein et al, 2015), and granitoids of the Tromaí Intrusive Suite. The Aurizona Group is comprised of felsic, intermediate, and mafic volcanic and volcaniclastic rocks, as well as metasedimentary rocks. The bedrock units are covered by Phanerozoic sedimentary basin deposits and recent coastal sediments.
Gold mineralization at Piaba and the other deposits is generally associated with subvertical tabular zones of intense shearing and hydrothermal alteration consisting of quartz-carbonate-sericite±chlorite. Quartz±carbonate shear veins are the primary host for gold mineralization with flat to shallow dipping quartz±carbonate extensional veins also carrying gold. Pyrite is the dominant sulphide with lesser arsenopyrite or pyrrhotite, except at Tatajuba and Touro where arsenopyrite mineralization is commonly observed. Native gold is observed within the grey shear veins, commonly occurring along vein margins.
| | P a g e | 1-4 |
| 04/11/2021 |
| TECHNICAL REPORT ON THE AURIZONA GOLD MINE EXPANSION PRE-FEASIBILITY STUDY |
An aerially extensive regolith profile has developed across the Property with distinct effects on geochemical dispersion and physical properties within each regolith domain type. The regolith profile overprints mineralization and can extend to vertical depths of more than 60 m, and is underlain by fresh, sulphide-bearing rocks that host primary gold mineralization.
| 1.7 | Exploration and Drilling |
| 1.7.1 | Exploration |
In 2020, MASA completed drilling on numerous targets including Piaba, Boa Esperança, Genipapo and Touro. A total of 29,543 m of drilling in 65 diamond drill holes (DD) was executed in support of the Piaba underground resource for the Pre-feasibility Study herein. The Boa Esperança deposit was reverse circulation (RC) drilled for grade control purposes with 495 holes for a total of 15,919 m. Additional drilling on the Genipapo and Touro contributed to the datasets that support inaugural resource statements for these deposits.
| 1.7.2 | Drilling |
There are five deposit areas within this Report including the Piaba, Boa Esperança, Tatajuba, Genipapo and Touro deposits, which have a total of 178,943 m of drilling in 1,182 holes. The dominant drilling method for the deposit areas was HQ sized, DD with a total meterage of 152,049 m in 744 holes. RC was also utilized for 438 holes with 26,896 m. Drilling is typically oriented to the southeast or to the south to intersect steeply dipping, northeast to east-west striking mineralized zones. Grade control drilling in the Piaba open pit and at Boa Esperança is executed with RC drilling methods. There is an additional 26,567 m in 278 holes of regional diamond and RC drilling on the Property. Auger drilling has been used to delineate trends and for condemnation of site infrastructure.
| 1.8 | Sample Preparation and Data Verification |
| 1.8.1 | Sample Preparation, Analyses, and Security |
Equinox maintains a Quality Assurance/Quality Control (QA/QC) sampling program, including insertion and review of coarse blanks, certified reference materials (CRM), and duplicates. Blanks, CRMs, and quarter core duplicates are included with routine samples at a 3-4% insertion rate per material type.
Sample intervals are a nominal 1 m and range from 0.3 m to 4.0 m length and can cross geological and regolith boundaries. Core is consistently sampled on the same side and the remaining half of the core is stored in the core box for reference.
RC samples are collected at the drill rig by the contracted drilling personnel. The entire sample representing a 1 m run length is collected at the drill site. RC samples are not processed or split prior to shipment. Entire RC samples are shipped to the commercial assay laboratory where they are dried and split before analysis. Blanks and CRMs are inserted in a similar manner as with drill core samples.
After the cutting and bagging of individual samples, sample shipments are prepared in sealed rice sacks. Sample shipments are transported by a commercial transport company directly from the core facility to the preparation laboratory. The chain of custody procedures includes long term storage of records documenting transport to and receipt of sample shipments at the laboratory. The sample shipments are prepared by MASA staff and have adequate security and tracking measures employed during preparation, packing and transport.
| | P a g e | 1-5 |
| 04/11/2021 |
| TECHNICAL REPORT ON THE AURIZONA GOLD MINE EXPANSION PRE-FEASIBILITY STUDY |
Equinox has used ALS Global (ALS) as its primary independent laboratory since 2008, and ACME Analytical Laboratories Ltd (ACME, now Bureau Veritas) in 2007 and late in 2011. A variety of laboratory locations have been used to prepare and assay samples, all of which of follow ISO procedures.
From 2007 to 2016 all drilling samples were analysed by fire assay with atomic absorption spectroscopy (AAS) finish and samples returning greater than 10 g/t gold were automatically re-analysed via fire assay with gravimetric finish. In 2017, the procedure was modified to include assay of samples that return greater than 10 g/t gold by screen fire assay to address the presence of coarse gold.
The QA/QC materials are appropriately matched to the mineralization at Property. The results are reviewed on a batch by batch basis to monitor the accuracy and precision of the results. A series of rules are followed to audit the QA/QC results and possible failures and subsequent follow up actions are taken as required. The sample preparation, analysis and security procedures demonstrate that the resultant dataset is adequate for use in Mineral Resource estimation and preparation of Mineral Reserves.
| 1.8.2 | Data Verification |
The data used in the resource models and resource estimation was reviewed for critical errors and to evaluate the quality of the analytical data. Location data for the collars and downhole survey measurements were checked for gross errors. Measured physical property values were used to recalculate and verify the in-situ bulk density values being used. The assay data was checked for ranking accuracy and the QA/QC results were evaluated statistically and plotted for visual evaluation. The results of the data verification demonstrate the data is adequate for use in Mineral Resource estimation and preparation of Mineral Reserves.
| 1.9 | Mineral Resource Estimate |
The current Mineral Resource estimate of the Aurizona Property comprises the Piaba, Boa Esperança, Tatajuba, Genipapo and Touro deposits. The resource estimate is an update of the previous Mineral Resource estimates with effective dates of December 31, 2019, for Piaba and Boa Esperança, and effective date of February 28, 2020, for Tatajuba. The Mineral Resource estimates for Genipapo and Touro are presented for the first time. The Mineral Resources from the Piaba, Boa Esperança, Tatajuba, Genipapo and Touro deposits presented herein have an effective date of June 30, 2021 and are shown in Table 1-1.
| | P a g e | 1-6 |
| 04/11/2021 |
| TECHNICAL REPORT ON THE AURIZONA GOLD MINE EXPANSION PRE-FEASIBILITY STUDY |
Table 1-1: Consolidated Mineral Resource Statement Exclusive of Reserves for Aurizona Property, Maranhão, Brazil
| Deposit | Area | Category | Cut-Off Grade | Tonnes | Gold | Gold |
| Gold (g/t) | (kt) | (g/t) | (koz) | |||
| Piaba | Open Pit | Measured | 0.3 | 2,438 | 1.21 | 95 |
| Indicated | 3,114 | 1.19 | 121 | |||
| Inferred | 53 | 0.77 | 1 | |||
| Boa Esperança | Open Pit | Measured | 0.3 | 66 | 0.60 | 1 |
| Indicated | 0.3 | 427 | 1.03 | 14 | ||
| Inferred | 438 | 1.11 | 16 | |||
| Genipapo | Open Pit | Indicated | 0.3 | 249 | 0.84 | 7 |
| Inferred | 6 | 0.76 | 0 | |||
| Tatajuba | Open Pit | Indicated | 0.3 | 181 | 1.39 | 8 |
| Touro | Open Pit | Indicated | 0.3 | 2,965 | 0.78 | 75 |
| Inferred | 1,763 | 0.72 | 41 | |||
| Total Open Pit | M&I | 0.3 | 9,441 | 0.80 | 320 | |
| Inferred | 2,260 | 0.80 | 58 | |||
| Piaba | Underground | Measured | 1.0 | 1,000 | 2.10 | 67 |
| Indicated | 7,212 | 1.96 | 454 | |||
| Inferred | 9,448 | 2.46 | 747 | |||
| Tatajuba | Underground | Indicated | 1.0 | 464 | 1.73 | 26 |
| Inferred | 981 | 2.84 | 90 | |||
| Total Underground | M&I | 1.0 | 8,676 | 1.96 | 547 | |
| Inferred | 10,430 | 2.50 | 837 | |||
| Total Aurizona Resource | M&I | 18,117 | 1.49 | 868 | ||
| Inferred | 12,689 | 2.19 | 895 | |||
| Notes: |
| 1. | Mineral Resources are reported exclusive of reserves. |
| 2. | The Open Pit Mineral Resource is constrained using an optimized pit that has been generated using Lerchs-Grossman pit optimisation algorithm with parameters outlined in Table 1-3 |
| 3. | The Underground Mineral Resources are constrained using a 1.00 g/t gold grade shell occurring the lower of 20 m below the transition-fresh rock contact, or 20 m below the Reserve pit. |
| 4. | Mineral Resources are based on the Mineral Resource statements for each respective deposit and area, and have been prepared by Trevor Rabb, P.Geo who is a qualified person as defined by NI 43-101. |
| 5. | Mineral Resources are not Mineral Reserves and do not have demonstrated economic viability. |
| 6. | The Mineral Resource statement has been prepared in accordance with NI43-101 Standards of Disclosure for Mineral Projects (May 2016) and the CIM Definition Standards for Mineral Resources and Mineral Reserves (May 2014). |
| 7. | Any discrepancies in the totals are due to rounding effects. |
| 8. | Mineral Resources presented herein have an effective date of June 30, 2021. |
Mineral Resources are reported using a cut-off grade of 0.30 g/t gold for open pit resources and 1.00 g/t gold for underground resources, based on assumptions presented in The Mineral Resources presented conform with the most recent CIM Definition Standards (CIM, 2014), and have been prepared according to CIM Best Practice Guidelines (CIM, 2019).
| | P a g e | 1-7 |
| 04/11/2021 |
| TECHNICAL REPORT ON THE AURIZONA GOLD MINE EXPANSION PRE-FEASIBILITY STUDY |
To sufficiently test the reasonable prospects for eventual economic extraction by an open pit, AGP used MinePlan’s pit optimiser with input parameters to evaluate the portions of the block model that could be extracted economically. The pit optimization parameters are summarised in Table 1-2, Table 1-3, and Table 1-4 . The results of the pit optimisation are used to constrain the Mineral Resource with respect to the CIM Definition Standards and does not constitute an attempt to estimate reserves. The open pit resources are restricted to blocks contained within the optimised pit, and above a datum that is the lower of 20 m below the reserve pit or 20 m below the fresh rock – transition contact.
Block model quantities and grade estimates were classified in accordance with the CIM Definition Standards for Mineral Resources and Mineral Reserves by Trevor Rabb, P.Geo. (Equity). Geologic interpretations were performed by MASA and Equity in Datamine Studio and Micromine software. Interpretations were imported into Leapfrog software to assist with generating final resource domains. Estimation of Mineral Resources was completed using Micromine software. The databases were provided by Equinox and validated for adequacy by Eleanor Black, P.Geo. (Equity).
Table 1-2 The Mineral Resources presented conform with the most recent CIM Definition Standards (CIM, 2014), and have been prepared according to CIM Best Practice Guidelines (CIM, 2019).
To sufficiently test the reasonable prospects for eventual economic extraction by an open pit, AGP used MinePlan’s pit optimiser with input parameters to evaluate the portions of the block model that could be extracted economically. The pit optimization parameters are summarised in Table 1-2, Table 1-3, and Table 1-4 . The results of the pit optimisation are used to constrain the Mineral Resource with respect to the CIM Definition Standards and does not constitute an attempt to estimate reserves. The open pit resources are restricted to blocks contained within the optimised pit, and above a datum that is the lower of 20 m below the reserve pit or 20 m below the fresh rock – transition contact.
Block model quantities and grade estimates were classified in accordance with the CIM Definition Standards for Mineral Resources and Mineral Reserves by Trevor Rabb, P.Geo. (Equity). Geologic interpretations were performed by MASA and Equity in Datamine Studio and Micromine software. Interpretations were imported into Leapfrog software to assist with generating final resource domains. Estimation of Mineral Resources was completed using Micromine software. The databases were provided by Equinox and validated for adequacy by Eleanor Black, P.Geo. (Equity).
Table 1-2: Pit Optimisation Parameters for Open Pit Resources
| Metal Prices | |
| Gold Price (US$ per Au oz) | $1,500 |
| Payability (% ) | 99.9% |
| Refining/Transportation (US$ per Au oz) | $23.52 |
| Royalty (%) | 3% |
| Wall Slopes (Overall Angle in Degrees) | |
| Laterite | 33° |
| Saprolite | 45° |
| Transition | 39° |
| Rock | 60° |
| | P a g e | 1-8 |
| 04/11/2021 |
| TECHNICAL REPORT ON THE AURIZONA GOLD MINE EXPANSION PRE-FEASIBILITY STUDY |
Table 1-3: Pit Optimisation Parameters for Piaba, Boa Esperança, Tatajuba, Genipapo, and Touro
| Waste Mining Costs (US$/t moved) | Piaba | Boa | Tatajuba | Genipapo | Touro |
| Laterite/Saprolite | $1.90 | $1.90 | $1.91 | $1.91 | $1.91 |
| Hard Saprolite/Transition | $2.40 | $2.40 | $2.27 | $2.27 | $2.27 |
| Rock | $2.52 | $2.52 | $3.49 | $3.49 | $3.49 |
| Ore Mining Costs (US$/t/6 m Bench) | Piaba | Boa | Tatajuba | Genipapo | Touro |
| Laterite/Saprolite | $2.32 | $2.32 | $4.53 | $2.53 | $8.53 |
| Hard Saprolite/Transition | $3.18 | $3.18 | $5.06 | $3.06 | $9.06 |
| Rock | $3.55 | $3.55 | $5.49 | $3.49 | $9.49 |
| Incremental Mining Costs (US$/t/6 m Bench) | Piaba | Boa | Tatajuba | Genipapo | Touro |
| Laterite/Saprolite | $0.01 | $0.01 | $0.01 | $0.01 | $0.01 |
| Hard Saprolite/Transition | $0.01 | $0.01 | $0.00 | $0.00 | $0.00 |
| Rock | $0.01 | $0.01 | $0.00 | $0.00 | $0.00 |
| Process Costs (US$/t processed) | Piaba | Boa | Tatajuba | Genipapo | Touro |
| Laterite/Saprolite | $7.57 | $7.57 | $7.75 | $7.57 | $7.57 |
| Hard Saprolite/Transition | $7.75 | $7.75 | $7.75 | $7.75 | $7.75 |
| Rock | $9.34 | $9.34 | $9.34 | $9.34 | $9.34 |
| G&A Costs | $4.89 | $4.89 | $4.89 | $4.89 | $4.89 |
| Process Recovery (%) | Piaba | Boa | Tatajuba | Genipapo | Touro |
| Laterite | 93.1% | 91.8% | 91.4% | 91.4% | 91.4% |
| Saprolite | 93.1% | 91.8% | 91.4% | 91.4% | 91.4% |
| Transition | 94.1% | 97.1% | 91.4% | 91.4% | 91.4% |
| Fresh | 90.0% | 90.0% | 91.4% | 91.4% | 91.4% |
Table 1-4: Underground Mining Assumptions
| Ta | Unit Cost | Amount |
| Gold Price | US$ per oz | $1,500 |
| Payability | % | 100 |
| Refining/Transportation | US$ per oz | $19.50 |
| Royalty | % | 4 |
| Mining Costs | US$ /t | $32.92 |
| Process Costs | US$/t processed | $9.34 |
| Process Recovery | % | 90 |
| 1.10 | Mineral Processing and Metallurgical Testing |
Significant metallurgical test work has been completed on ore samples from various parts of the Aurizona deposit. Metallurgical test work has historically been completed on laterite, saprolite, transition and fresh rock types from the various deposits. Detailed summaries of previous metallurgical test work programs can be found in previous technical reports such as Lycopodium et al, 2017.
| | P a g e | 1-9 |
| 04/11/2021 |
| TECHNICAL REPORT ON THE AURIZONA GOLD MINE EXPANSION PRE-FEASIBILITY STUDY |
Recent metallurgical test work has been completed on samples of Tatajuba ore and Piaba underground ore relevant to the subject of this technical report. The Piaba metallurgical test work program is still on-going at the time of this report publishing. In general, the ore samples tested from Tatajuba and Piaba underground resulted in a similar metallurgical response of previous ore tested and fall within the expected ranges of historical test work results and are not expected to result in significant flowsheet or operational changes to the existing process plant.
| 1.11 | Mineral Reserves Estimate |
The Proven and Probable Mineral Reserves at the Aurizona Mine have been classified in accordance with the 2014 CIM Definition Standards for Mineral Resources and Mineral Reserves. Mineral Reserves are defined within a mine plan, with open pit phase designs guided by Lerchs-Grossmann optimized pit shells.
The Mineral Reserve estimate for the Aurizona Mine, effective June 30, 2021, is summarized in Table 1-5.
| | P a g e | 1-10 |
| 04/11/2021 |
| TECHNICAL REPORT ON THE AURIZONA GOLD MINE EXPANSION PRE-FEASIBILITY STUDY |
Table 1-5: Aurizona Mine - Proven and Probable Reserves - June 30, 2021
| Proven | Probable | Total | |||||||
| Ore Type | Tonnes (kt) | Gold Grade (g/t) | Gold (koz) | Tonnes (kt) |
Gold Grade (g/t) |
Gold (koz) | Tonnes (kt) | Gold Grade (g/t) | Gold (koz) |
| Laterite | 23 | 0.71 | 1 | 448 | 0.87 | 12 | 471 | 0.86 | 13 |
| Saprolite | 1,525 | 1.28 | 63 | 2,342 | 1.23 | 92 | 3,867 | 1.25 | 155 |
| Transition | 2,435 | 1.08 | 84 | 853 | 0.90 | 25 | 3,288 | 1.03 | 109 |
| Rock | 12,598 | 1.46 | 592 | 12,106 | 2.03 | 791 | 24,704 | 1.74 | 1,383 |
| Total | 16,581 | 1.39 | 740 | 15,749 | 1.82 | 920 | 32,330 | 1.60 | 1,660 |
| Note: |
| 1. | This Mineral Reserve estimate is as of June 30, 2021 and is based on the Mineral Resource estimates for Piaba, Boa Esperança, Tatajuba, and Genipapo all dated June 30, 2021 by Equity Exploration. The Mineral Reserve calculation was completed under the supervision of Gordon Zurowski, P.Eng. of AGP., who is a Qualified Person as defined under NI 43-101. Mineral Reserves are stated within the final design pits based on a $1,350/oz gold price. |
| 2. | The gold cut-off grades used were: |
| • | Piaba Open Pit - 0.35 g/t (laterite, saprolite, transition), 0.41 g/t (rock) |
| • | Tatajuba Open Pit - 0.43 g/t (laterite, saprolite, transition), 0.47 g/t (rock) |
| • | Boa Esperança, Genipapo Open Pit - 0.36 g/t (laterite, saprolite) |
| • | Piaba Underground - 1.80 g/t (rock) |
| 3. | Open pit mining costs varied by area but averaged $2.25/t mined and included an extra $2/t for ore haulage to the process plant from Tatajuba. |
| 4. | Underground Mining costs averaged $32.78/t ore mined. |
| 5. | Processing costs averaged $11.52/t ore based on variable costs by material type of $7.84/t for laterite/saprolite, $8.08/t for transition and $12.63/t for fresh rock. |
| 6. | G&A was $6.47/t ore processed. |
| 7. | LOM gold recovery is 90.5%. Recoveries varied by area and material type. |
| 1.12 | Mining |
The Aurizona Mine is an open pit operation using conventional mining equipment. Open pit mining is being completed by a local Brazilian contractor. The Life-of-Mine (LOM) plan includes the addition of underground mining beneath the Piaba pit that assists in extending the mine life to 2032.
The mine schedule is based on 2021 reserves using the Piaba, Piaba East, Boa Esperança, Tatajuba, and Genipapo pit areas plus the Piaba Underground. It totals 32.3 Mt of proven and probable ore grading 1.60 g/t gold to the process plant over a current design life of 11 years. The ore tonnage is made up of 16.6 Mt of proven reserves grading 1.39 g/t gold and 15.7 Mt of probable reserves grading 1.82 g/t gold and includes 0.3 Mt of proven ore at 0.92 g/t gold currently in the stockpile from 2021 mining activity.
Waste tonnage totals 96.9 Mt to be placed in the various waste rock management facilities. The overall strip ratio is 3.79:1 mined.
| | P a g e | 1-11 |
| 04/11/2021 |
| TECHNICAL REPORT ON THE AURIZONA GOLD MINE EXPANSION PRE-FEASIBILITY STUDY |
Highwall slope angle criteria vary by area and pit. Previous slope study work by third party consultants remains valid and was used in the update of the pit designs. The slope information from Piaba was applied to Tatajuba and Genipapo due to similar lithology and weathering profiles.
In general, the inter-ramp angles vary from 33 to 60 degrees depending on pit area and wall orientation. This is due to foliation present parallel to the walls in certain zones.
Five open pit areas are considered in the reserves statement: Piaba (4 phases), Piaba East, Boa Esperança, Tatajuba (2 phases), and Genipapo (2 pit areas each with 1 phase). The Boa Esperança open pit will become a freshwater storage facility once excavated.
Underground mining beneath the Piaba open pit will be accessed with a portal located in fresh rock at the western end of the Piaba pit. The main ramp will initially be a single decline for the first 735 m where it will connect with the main return ventilation raise and utilidor/emergency egress. From there the ramp will become a twin development with the second decline designated as the return air decline for ventilation. This method avoids the need for costly ventilation raises through laterite, saprolite and transition materials.
The initial access will be used to for exploration, geotechnical data collection and training purposes while the mining permit is in process, then transitions to the production ramp once mining commences. The final ramp will access the seven underground zones outlined as part of the mine plan and comprising the reserves over its 2 km length from the portal. Additional development for each of the zones will come off the main ramp.
The method employed will be longhole mining with a 23 m sub-level vertical interval and will use either a permanent rib pillar or cemented rockfill. The use of cemented rockfill has been allocated to the crown pillar area and stopes with widths exceeding 8 m due to geotechnical considerations. A 28 day curing period has been included in the mine schedule for cemented stopes. The other stopes will use a permanent rib pillar with uncemented rock backfill. The percentage of stopes with rockfill is 83% while the percentage requiring cemented rock fill is 17%.
Underground mining will be completed with an owner-operated equipment except for occasional specialized contractor work. The normal underground support equipment is part of the fleet plus the following major underground mining equipment:
| • | 1 - 6 t LHD |
| • | 11 - 10 t LHD |
| • | 16 - 27 t Highway trucks |
| • | 4 - Drill jumbos (2 boom) |
| • | 3 - Longhole drills |
| • | 1 - Slot raise borer |
Underground production is expected to begin in the last quarter of 2023. The daily mining rate is expected to increase to 580 t/d by the end of 2024 and be at 2,700 t/d at the end of 2025. Underground mine production will maintain a daily rate above 3,100 t/d from 2026 until the middle of 2029 at which time daily production will decline until the mine is exhausted in mid-2031.
| | P a g e | 1-12 |
| 04/11/2021 |
| TECHNICAL REPORT ON THE AURIZONA GOLD MINE EXPANSION PRE-FEASIBILITY STUDY |
Underground mine infrastructure includes a utilidor raise to surface, dewatering system, power distribution, communications, underground workshop, fuel and lube supply, hydraulic bulkheads for crown pillar removal, and temporary explosive storage.
The mine schedule anticipates a peak of 3.15 Mt of ore to the plant in 2023 then lesser amounts in the following years. This peak is possible due to the higher percentage of laterite, saprolite and transition material which allows a slight increase in plant throughput. Total mine production peaks at 25.8 Mt in 2023 then declines as the mine advances. Underground mine feed is expected to start in 2023 and continues until 2031. Production in 2031 and 2032 includes the crown pillar removal. The mine schedule is shown in Table 1-6.
| | P a g e | 1-13 |
| 04/11/2021 |
| TECHNICAL REPORT ON THE AURIZONA GOLD MINE EXPANSION PRE-FEASIBILITY STUDY |
Table 1-6: Life of Mine Schedule
| Units | 2021 | 2022 | 2023 | 2024 | 2025 | 2026 | 2027 | 2028 | 2029 | 2030 | 2031 | 2032 | Total | |
| Plant Feed | Mt | 1.72 | 3.11 | 3.15 | 2.92 | 2.92 | 2.92 | 2.92 | 2.82 | 2.82 | 2.82 | 2.82 | 1.41 | 32.34 |
| Gold Grade | g/t | 1.46 | 1.63 | 1.18 | 1.61 | 1.55 | 1.90 | 1.95 | 2.05 | 1.82 | 1.59 | 0.91 | 1.35 | 1.60 |
| Plant Feed Type | ||||||||||||||
| Lat/Sap | % | 16.0 | 7.7 | 28.3 | 37.5 | 13.0 | 0.2 | 5.4 | 3.6 | 0.0 | 9.8 | 32.7 | 0.0 | 13.4 |
| Transition | % | 35.4 | 30.2 | 27.0 | 6.8 | 4.3 | 7.9 | 8.2 | 1.8 | 0.0 | 1.7 | 0.0 | 0.0 | 10.2 |
| Rock | % | 48.6 | 62.1 | 44.7 | 55.7 | 82.7 | 91.9 | 86.3 | 94.6 | 100.0 | 88.5 | 67.3 | 100.0 | 76.4 |
| Plant Feed Area | ||||||||||||||
| Open Pit | Mt | 1.72 | 3.11 | 3.13 | 2.77 | 2.30 | 1.60 | 1.56 | 1.50 | 1.94 | 2.17 | 2.60 | 1.41 | 25.81 |
| OP Grade | g/t | 1.46 | 1.63 | 1.17 | 1.57 | 1.26 | 1.32 | 1.19 | 1.29 | 1.36 | 1.26 | 0.75 | 1.35 | 1.30 |
| Underground | Mt | - | - | 0.02 | 0.15 | 0.62 | 1.32 | 1.36 | 1.32 | 0.88 | 0.65 | 0.22 | - | 6.53 |
| UG Grade | g/t | - | - | 2.48 | 2.45 | 2.66 | 2.61 | 2.81 | 2.93 | 2.85 | 2.70 | 2.83 | - | 2.76 |
| Total Material | Mt | 15.7 | 24.7 | 25.8 | 23.0 | 11.8 | 4.8 | 6.0 | 5.7 | 6.1 | 3.2 | 0.7 | 1.4 | 129.0 |
| Recovered Gold | koz | 74 | 148 | 109 | 138 | 132 | 161 | 165 | 168 | 149 | 130 | 75 | 55 | 1,503 |
| Open Pit | koz | 74 | 148 | 108 | 127 | 84 | 61 | 54 | 56 | 77 | 79 | 57 | 55 | 981 |
| Underground | koz | - | - | 1 | 11 | 48 | 100 | 111 | 112 | 72 | 51 | 18 | - | 522 |
Note: Values shown for 2021 are only for H2 2021
| | P a g e | 1-14 |
| 04/11/2021 |
| TECHNICAL REPORT ON THE AURIZONA GOLD MINE EXPANSION PRE-FEASIBILITY STUDY |
| 1.13 | Processing |
The Aurizona process plant currently treats the ore via a conventional cyanidation process. Run-of-mine (ROM) ore is processed using a conventional primary crusher and SAG-Ball mill comminution circuit followed by a gravity circuit, CIL process and associated gold recovery and carbon handling circuits to produce gold doré. CIL tailings are treated via cyanide destruction process prior to storage in a TSF.
The process plant was upgraded during the recent construction project in 2018-2019 and recommenced operations in May 2019. The details of that plant installation are documented in Lycopodium et al, 2017. The leach/CIP circuit was subsequently converted to a CIL circuit in 2020.
The process plant was upgraded to treat 8,000 t/d ore (2.9 Mt/a) based on a blend of laterite/saprolite, transition and fresh rock. The process plant has been generally treating ore feed grades nominally ranging from 1 g/t to 2 g/t, mainly laterite, saprolite and transition ore blends, and achieving approximately 90.5% average recovery. The process plant is not expected to require any major modifications with the mine expansion plans, including the Piaba underground, however the installation of a new pebble crusher in planned for 2022 as higher percentages of fresh rock begin to be mined.
The LOM average fresh rock percentage is 76% while the later years will have periods of 100% fresh rock. The average gold recovery is expected to remain at 90.5%.
| 1.14 | Property Infrastructure |
The overall site plan showing major infrastructure is shown in Figure 1-2.
The regional utility, Companhia Energética do Maranhão (CEMAR), provides 15 MW power supply via a 69 kV overhead powerline to an outdoor substation located adjacent to the process plant.
The Aurizona site has a net positive water balance due to the high levels of precipitation annually. Process water included with the tailings is stored in the Tailings Storage Facility (TSF) and recycled to the process plant. Fresh water storage will be sourced from the Boa Esperança reservoir, following the mining of this small pit later in 2021. The Boa Esperança reservoir will have a capacity of 900,000 m3 of fresh water.
A drainage ditch around the Piaba pit is being expanded along the southern perimeter and extended further north along the northern limit of the pit. This ditch collects surface water to prevent it from entering the active pit area and allows the water to drain away from surface infrastructure to pumping locations.
The TSF will be expanded based on having a capacity for 33.2 Mt of processed ore and there is potential for future expansions. After detoxification of cyanide, slurried tailings are pumped from the process plant to the TSF and spigoted from the dam crest. Water is recycled to the process plant.
There are six different Waste Rock Storage Facilities (WRSF) required over the Life-of-Mine (LOM) to accommodate the 96.9 Mt (53.1 Mm3) of waste material. The designs can accommodate the full volume of waste material.
| | P a g e | 1-15 |
| 04/11/2021 |
| TECHNICAL REPORT ON THE AURIZONA GOLD MINE EXPANSION PRE-FEASIBILITY STUDY |
Two new roads are required to access Tatajuba and Genipapo, respectively. The road to Tatajuba will be 4.1 km long and connect with the existing haulroad along the north side of the Piaba pit. The Genipapo access road will be 2.7 km long and connect to the Piaba East access road. The Piaba pit will expand to the west which requires the relocation of the community access road.
Figure 1-2: Overall Site Plan (End of Mine Life)

| 1.15 | Environmental and Community |
MASA maintains an Environmental Operating License supported by the ANM mining concession No. 1201/1988, ratification No. 25/2019, totalling 9,982 ha. The process for change or expansion involves one mining concession application with the three-phased (Preliminary License - LP, Installation License - LI, Operation License - LO) environmental process in progress.
MASA has obtained permits and authorizations from federal, state, and local agencies to operate current facilities and activities. Equinox is in compliance with all issued permits.
| | P a g e | 1-16 |
| 04/11/2021 |
| TECHNICAL REPORT ON THE AURIZONA GOLD MINE EXPANSION PRE-FEASIBILITY STUDY |
MASA carries out regular and frequent monitoring of noise, vibration, effluents discharge, and air quality as part of MASA's Environmental Management Plan, as well as its environmental influence in the community area. Residue management is carried out systematically, with garbage collection, focusing on reduction, reuse, and recycling, and completing this control. There is an industrial incinerator that performs > 98% reduction of non-recyclable and hazardous residues.
MASA maintains an Environmental Recovery Program for Degraded Areas with the application of techniques to enrich the vegetation and rehabilitation. Specimens of flora for application in the rehabilitation of areas are gathered and maintained in a nursery. The nursery produces up to 18,000 seedlings a year to be used in reforestation. With the support of MASA’s Security team, forest protection actions are also carried out daily to inhibit hunting and fishing in the areas of legal reserve and permanent preservation.
Equinox is a signatory to the International Cyanide Management Code; the mine is seeking to become International Cyanide Code “Certified” through the development and implementation of a Cyanide Management Plan (and training). Control and prevention procedures and actions are in use for the handling, use in the process, treatment, and neutralization of cyanide in the tailings.
MASA will be required to update licenses and permits in compliance with regulatory requirements to permit the construction and operation of the proposed Aurizona expansion to Piaba underground and satellite open pits.
Equinox has developed excellent working relationships with regulatory agencies and the public. One of the key tools in ensuring effective communication between the company and the communities is the grievance mechanism and the broad aspects of social investment. The site operations maintain a direct dialogue with the areas of influence, keeping track of all communication and relation through a record data that enhance the principles of Cultural Appropriateness, Accessibility, Transparency and Accountability.
The social investment is organized to work with local assets and necessities, engaging the communities to provide internal solutions for their challenges and at the same time providing external resources, through training, revenue generation projects, education, culture, and sports initiatives. The site operations also monitor and define constantly initiatives to adopt as infrastructure investments to improve local conditions and allow the regions to develop alongside the production throughout the years.
| 1.16 | Capital and Operating Costs |
The life of mine capital costs over the 11-year mine life are estimated to be $537 M. Currency is in US dollars (US$), unless otherwise noted. The mine is currently operating; therefore, the majority of the capital costs may be considered to be sustaining. The initiation of underground mining beneath the Piaba pit has been shown as initial mining capital up until the underground mine design rate has been achieved.
The capital costs for the Aurizona mine are primarily associated with Infrastructure (tailings expansion) and Underground (Initial and Sustaining) and are summarized in Table 1-7. The open pit mining capital is the amount considered as capitalized stripping when stripping exceeds the life of mine strip ratio.
| | P a g e | 1-17 |
| 04/11/2021 |
| TECHNICAL REPORT ON THE AURIZONA GOLD MINE EXPANSION PRE-FEASIBILITY STUDY |
Table 1-7: Aurizona Mine Capital Cost Estimate
| Area | Initial ($M) | Sustaining ($M) | Total ($M) |
| Open Pit Mining | - | 79 | 79 |
| Underground Mining | 134 | 60 | 194 |
| Processing | - | 14 | 14 |
| Infrastructure | - | 178 | 178 |
| Environmental | - | 10 | 10 |
| Contingency | 20 | 43 | 63 |
| Total | 154 | 383 | 537 |
The total operating cost for the Aurizona Mine is $33.14/ t processed until the end of the mine life in 2032. Operating costs are broken into three primary areas: mining, processing, and G&A.
The open mining cost estimate is based contractor mining within the reserves pit designs and takes into consideration haulage distances, depth of mining, contractor mining costs and expected consumable and maintenance costs. Mine operating costs are based on the current contract and recent mine site forecasts. They are estimated to be $2.25/ t moved ($10.79/ t ore mined) for the life of mine with capitalized stripping and tax credits applied.
Underground mining costs have been estimated with based on being owner-operated. The majority of the mine will be backfilled with uncemented rockfill but 17% of the stopes will use cemented backfill where necessary due to width. The underground mining cost is estimated at $32.78/ t ore.
The process operating cost also is based on the material type forecast, current operating history and forecast consumable and material costs. This cost is estimated to be $11.52/ t ore processed until the end of mineral processing in 2032.
G&A operating costs are based on the current forecast with a 15% increase associated with the underground mine in operation from 2023 onwards. These costs include the site overhead, social programs, and cost sharing of local offices. The forecast is $6.47/ t ore processed life of mine.
The operating costs are summarized in Table 1-8.
Table 1-8: Aurizona Mine Operating Cost Estimate
| Area | Units | LOM Cost ($M) | $/tonne |
| Open Pit Mining | $/t mined | 2.25 | |
| Open Pit Mining | $/t ore mined | 10.79 | |
| Underground Mining | $/t ore mined | 32.78 | |
| Open Pit Mining | $/t milled | 276 | 8.53 |
| Underground Mining | $/t milled | 214 | 6.62 |
| Mining Total | $/t milled | 490 | 15.15 |
| Processing | $/t milled | 373 | 11.52 |
| General and Administrative | $/t milled | 209 | 6.47 |
| Total | 1,072 | 33.14 |
| | P a g e | 1-18 |
| 04/11/2021 |
| TECHNICAL REPORT ON THE AURIZONA GOLD MINE EXPANSION PRE-FEASIBILITY STUDY |
| 1.17 | Financial Analysis |
A discounted cash flow model was prepared to complete the economic analysis. The economic analysis uses the Mineral Reserves and LOM plan presented in this report and confirms the outcome is positive cash flow that supports the statement of Mineral Reserves. The analysis was completed with a gold price of $1,500/oz and is shown in Table 1-9.
The results indicate a post-tax NPV5% of $314 M for the 11-year mine life.
Taxation included in the analysis reflects the current Brazilian legislation. The applicable fiscal benefits are also included in this economic analysis.
Royalty payments are included for several royalties, both private and the Brazilian government. The estimated royalty payments for the life of the mine totals $100 M.
The analysis indicates the project is most sensitive to gold price followed by exchange rate. This is shown in Table 1-10.
Capital costs associated with the initiation of the underground mine and expansion of the tailings facility increase the AISC in 2023. There is an increase in recovered gold ounces from the addition of the underground mine in 2024 which contributes to a steady decline in the AISC for Aurizona from then onwards as shown in Figure 1-3.
| | P a g e | 1-19 |
| 04/11/2021 |
| TECHNICAL REPORT ON THE AURIZONA GOLD MINE EXPANSION PRE-FEASIBILITY STUDY |
Table 1-9: Aurizona Mine - Discounted Cashflow Financial Summary
| Parameter | Units | Pre-Tax | Post-Tax | |
| Gold Price | US$/oz | 1,500 | ||
| Exchange Rate | R$:US$ | 4.75 | ||
| Economic Indicators | ||||
| Net Present Value (5%) | US$ M | 354 | 314 | |
| Gold Revenue less Royalties | US$ M | 2,120 | ||
| Total Operating Cost | US$ M | 1,072 | ||
| Life of Mine Capital Cost | US$ M | 538 | ||
| Net Taxes | US$ M | - | 46 | |
| Net Cash Flow | US$ M | 510 | 464 | |
| Cash Costs | US$/oz | 803 | ||
| All-in Sustaining Cost | US$/oz | 1,058 | ||
| Gold - Payable | Moz | 1.50 | ||
| Mine Life | Years | 11 | ||
| Operating Costs | ||||
| US$ M | $/t Ore Milled | $/t Ore Mined | ||
| Open Pit Mining | 276 | 8.53 | 10.79 | |
| Underground Mining | 214 | 6.62 | 32.78 | |
| Processing | 373 | 11.52 | ||
| G & A | 209 | 6.47 | ||
| Total | 1,072 | 33.14 | ||
| Capital Costs | ||||
| Initial Capital | US$ M | 154 | ||
| Sustaining Capital | US$ M | 383 | ||
| Total Capital | US$ M | 537 | ||
| $/t ore | 16.62 | |||
| Production Summary | ||||
| Open Pit | Underground | Total | ||
| Mine Mill Feed | Mt | 25.8 | 6.5 | 32.3 |
| Gold Grade | g/t | 1.30 | 2.77 | 1.60 |
| Waste | Mt | 96.9 | ||
| Strip Ratio | W:O | 3.8 | ||
| Gold Ounces | Insitu | 1,080,400 | 580,400 | 1,660,800 |
| Recovered | 980,500 | 522,400 | 1,502,900 | |
| | P a g e | 1-20 |
| 04/11/2021 |
| TECHNICAL REPORT ON THE AURIZONA GOLD MINE EXPANSION PRE-FEASIBILITY STUDY |
Table 1-10: After-Tax Sensitivity
| Variance | Operating Cost NPV @5% $M |
Capital Cost NPV @5% $M |
Exchange Rate | Gold Price | ||
| (R$:US$) | NPV @5% $M | $/oz | NPV @5% $M | |||
| -20 % | 457.2 | 381.6 | 3.80 | 25.5 | $1,200 | -21.7 |
| -10 % | 386.0 | 347.9 | 4.28 | 185.9 | $1,350 | 146.3 |
| Base | 314.2 | 314.2 | 4.75 | 314.2 | $1,500 | 314.2 |
| 10 % | 230.4 | 280.5 | 5.23 | 398.3 | $1,650 | 457.4 |
| 20% | 146.6 | 246.8 | 5.70 | 467.9 | $1,800 | 600.1 |
Figure 1-3: Recovered Gold versus AISC (includes H1 2021 Actuals)

| 1.18 | Conclusions |
Based on the evaluation of the data available and the design work completed, the Qualified Persons (QPs) confirm there are no known factors related to, environmental, permitting, legal, title, taxation, socio-economic, marketing, or political issues which could materially affect the Mineral Resource or Reserve estimates.
| 1.18.1 | Geology and Exploration |
The Piaba, Boa Esperança, Tatajuba and Genipapo deposits form relatively continuous steeply dipping zones of structurally controlled gold mineralisation associated with favorable volcano-sedimentary host rocks, strong hydrothermal alteration that is coincident with quartz veining and sulphide mineralization. The Touro deposit is located 16 km southwest of the Aurizona Mine, with gold mineralization hosted by extensional quartz veins within an altered diorite unit.
| | P a g e | 1-21 |
| 04/11/2021 |
| TECHNICAL REPORT ON THE AURIZONA GOLD MINE EXPANSION PRE-FEASIBILITY STUDY |
The Aurizona Property has combined Measured and Indicated Mineral Resources exclusive of Mineral Reserves that are amenable to open pit mining that total 9.4 Mt at 0.80 g/t gold for 320 koz. These Mineral Resources occur within a variety of regolith materials including laterite, saprolite, transition, and fresh rock.
Measured and Indicated Mineral Resources exclusive of Mineral Reserves amenable to underground mining beneath Piaba and Tatajuba total 8.7 Mt at 1.96 g/t gold for 547 koz of contained gold. These Mineral Resources occur entirely within fresh rock.
The combined open pit and underground Measured and Indicated Mineral Resources exclusive of Mineral Reserves on the Aurizona Property total 18.1 Mt grading 1.49 g/t for 868 koz of contained gold.
Areas of uncertainty that may affect the mineral resource estimates include mining cost assumptions, metal prices, process recoveries and changes to the geological model.
Reconciliation between the Mineral Resource model and production has shown good reconciliation with the gold grade of mill feed, with additional tonnage. It is anticipated with greater operational maturity that a more robust reconciliation program can be implemented to assess the performance of the resource model and estimation methodology.
Exploration potential exists for expanding the mine life in the underground portion of Piaba and at Tatajuba. This may provide additional feed in the future for the Piaba process facility and work is ongoing to examine this potential.
| 1.18.2 | Mining and Geotechnical |
The LOM plan is based upon Proven and Probable Mineral Reserves of 32.3 Mt with a gold grade of 1.6 g/t for contained gold ounces of 1.66 Moz. Underground reserves account for 6.5 Mt grading 2.76 g/t for 0.60 Moz.
Mining of the open pit is currently completed with a local mining contractor. This is assumed to continue for the life of the open pit. Underground mining will be operated as an Owner operated mine. The mine plans are appropriate for the style of mineralization and the geometry of the deposit.
Geotechnical concerns affecting open pit wall slopes are understood and that knowledge is being expanded with additional study/drilling planned for Piaba and the satellite pit areas.
Underground geotechnical information is limited but sufficient for the PFS. Additional study will be required prior to production. The use of the exploration decline to obtain further geotechnical information will provide confidence in the designs and permit changes to occur prior to production.
Further optimization of the mine plan is underway to investigate opportunities improve the project economics or advance the mine development schedule which may bring ounces forward in the schedule.
| | P a g e | 1-22 |
| 04/11/2021 |
| TECHNICAL REPORT ON THE AURIZONA GOLD MINE EXPANSION PRE-FEASIBILITY STUDY |
| 1.18.3 | Metallurgy and Infrastructure |
The metallurgical recoveries used are to a level sufficient to support Mineral Reserves declaration.
The existing and planned infrastructure, availability of staff, existing power, water and any planned modifications or the requirements to establish such, are understood by Equinox.
| 1.18.4 | Costs and Financial Model |
Detailed capital and operating cost estimates developed includes initial capital requirements of the underground mine and sustaining capital needs for the open pits, process plant, infrastructure, and reclamation and closure costs.
The economic analysis, including taxation, shows the Aurizona Mine PFS has positive economics and technical merit.
| 1.19 | Recommendations |
The QPs recommend that Equinox proceed with a Feasibility study as part of the Aurizona Mine development plan. Recommendations and associated budgets are provided by the QPs to ensure sufficient information is available going forward. These are broken down by geology, geotechnical, mining, both open pit and underground, metallurgy, infrastructure and environmental. A detailed discussion is provided in Section 26.
Some of the costs for the Feasibility are carried as part of the study itself but supporting studies or field work are quoted in the appropriate areas.
The total estimated budget for the recommended Feasibility Study and the associated work is outlined in Table 1-11.
Table 1-11: Estimate of Recommended Feasibility Budgets
| Area of Study | Approximate Cost (US$ M) |
| Geology | $7.5 |
| Geotechnical | $2.9 |
| Mining - Open Pit and Underground | $0.6 |
| Metallurgy | $0.3 |
| Infrastructure | $0.1 |
| Environmental | $0.3 |
| Feasibility Study | $1.5 |
| TOTAL | $13.2 |
| | P a g e | 1-23 |
| 04/11/2021 |
| TECHNICAL REPORT ON THE AURIZONA GOLD MINE EXPANSION PRE-FEASIBILITY STUDY |
| 2 | Introduction |
| 2.1 | Issuer and Purpose |
Equinox retained independent industry consultants to prepare a Pre-Feasibility Study Technical Report on the underground Aurizona Mine near Godofredo Viana, Maranhão, Brazil. Equinox, through its indirect wholly-owned subsidiary MASA, holds a 100% interest in the Property.
The preparation of the Report is led by AGP Mining Consultants Inc. (AGP) but includes contributions by Equity Exploration Consultants Ltd. (Equity) and Knight Piésold Ltd. (Knight Piésold).
This The Report was prepared in compliance with National Instrument 43-101 Standards of Disclosure for Mineral Projects (NI 43-101) and summarizes the results of the estimation of Mineral Resources and Mineral Reserves on the Aurizona Project, which includes include the Piaba, Boa Esperança, Tatajuba, and Genipapo deposits. The Touro deposit does not have any Mineral Reserves.
Unless specified, all measurements in this Report use the metric system. The Report currency is expressed in US dollars. The map projection for all coordinates is PSAD69 UTM zone 23S.
The study includes updates to the Mineral Resource and Mineral Reserve estimates. Key aspects included in the study are further advancement on metallurgical testwork, pit design, updated mine schedule, proposed underground operations, costs, and financial model. The findings and conclusions are based on information available at the time of preparation and data supplied by other consultants as indicated Qualified Persons.
The Qualified Persons (QPs), as that term is defined in NI 43-101, responsible for the preparation of the Report include:
| • | Eleanor Black, P.Geo., Senior Geologist (Equity) |
| • | Trevor Rabb, P.Geo., Resource Geologist (Equity) |
| • | Gordon Zurowski, P.Eng., Principal Mine Engineer (AGP) |
| • | Neil Lincoln, P. Eng., Principal Process Engineer (AGP) |
Table 2-1 provides a summary listing of the QPs who have contributed to the preparation and content of this Technical Report.
| | P a g e | 2-1 |
| 04/11/2021 |
| TECHNICAL REPORT ON THE AURIZONA GOLD MINE EXPANSION PRE-FEASIBILITY STUDY |
Table 2-1: Aurizona Mine Technical Report Qualified Persons and Areas of Responsibility
| Name | Professional |
Title | Responsible for Sections |
| Ms. Eleanor Black | P.Geo | Senior
Geologist, Equity Exploration Consultants |
Sections 1.2 - 1.8, 1.20.1, 4, 5, 6, 7, 8, 9, 10, 11, 12, 25.1, and 26.1 |
| Mr. Trevor Rabb | P.Geo | Resource
Geologist, Equity Exploration Consultants |
Sections 1.9, 1.20.4, 14 |
| Mr. Gordon Zurowski | P. Eng. | Principal
Mine Engineer AGP Mining Consultants |
Sections 1.1, 1.11, 1.12, 1.14 - 1.19, 1.20.2 - 1.20.7, 2, 3, 15, 16, 18, 19, 20, 21,22, 23, 24, 25.2, 25.4 - 25.7, 26.2, 26.3, 26.5 - 26.7 |
| Mr. Neil Lincoln | P. Eng. | Principal
Process Engineer AGP Mining Consultants |
Sections 1.10, 1.13, 13, 17, 25.3, and 26.4 |
| | P a g e | 2-2 |
| 04/11/2021 |
| TECHNICAL REPORT ON THE AURIZONA GOLD MINE EXPANSION PRE-FEASIBILITY STUDY |
| 2.2 | Site Visits and Scope of Personal Inspection |
AGP and Equity QPs have conducted site visits to the Aurizona Mine as shown in Table 2-2.
Table 2-2: Dates of Site Visits
| Name | Site Visit | Duration and Dates |
| Eleanor Black, P. Geo | Yes | November 11 - 18, 2017 |
| Trevor Rabb, P. Geo. | Yes |
November 11 - 14, 2019 October 28 - November 14, 2017 |
| Gordon Zurowski, P. Eng. | Yes | August 18-19, 2021 |
| Neil Lincoln, P. Eng. | Yes | December 2, 2014 |
| 2.3 | Effective Dates |
The effective date for the Mineral Resource estimate for the Piaba, Boa Esperança, Tatajuba, Genipapo and Touro gold deposits is June 30, 2021.
The effective date for the Mineral Reserve estimate for the combined the Piaba, Boa Esperança, Tatajuba, and Genipapo gold deposits is June 30, 2021.
The effective date of the Report is September 20, 2021.
| 2.4 | Information Sources and References |
AGP, Equity, and Knight Piésold have sourced information from reports and other reference documents as cited in the text and summarized in Section 27 of this Report. The sources for all figures and tables are cited as per Table 2-3. Technical data for preparation of the Mineral Resource and Reserve estimation, was provided by Equinox.
Table 2-3 Technical Report Table and Figure Sources
| In-Text Source Citation | Description |
| KP (2021) | Created by Knight Piésold for the Report |
| Equinox (2021) | Created by Equinox for the Report |
| Lycopodium (2017) | Created by Lycopodium for the previous 2017 Technical Report (see Table 2-4) |
| Other | All other figures and tables are cited using references in Section 27 |
| 2.5 | Previous Technical Reports |
Equinox, or a predecessor to Equinox, has filed the following historical Technical Reports for the Project as summarized in Table 2-4 below.
| | P a g e | 2-3 |
| 04/11/2021 |
| TECHNICAL REPORT ON THE AURIZONA GOLD MINE EXPANSION PRE-FEASIBILITY STUDY |
Table 2-4: Summary of Technical Reports on the Aurizona Project
| Technical Report Title | Company | Lead Author (Issuer) |
Effective Date | Authors | In-text Reference |
| NI 43-101 Technical Report, Mineração Aurizona, S.A., Piaba Project, Maranhão, Brazil | Luna Gold Corp. | SRK Consulting | May 9, 2008 | Mach, L. and Clarke, P. | |
| NI 43-101 Technical Report, Mineração Aurizona, S.A., Piaba Project, Maranhão, Brazil | Luna Gold Corp. | SRK Consulting | September 1, 2010 | Mach, L., Swanson, B. and Olin, E. | |
| NI 43-101 Technical Report Mineração Aurizona S.A. Aurizona Project | Luna Gold Corp. | SRK Consulting | January 23, 2012 | Mach, L., Swanson, B. and Olin, E. | Mach, et al., 2012 |
| Resource Report Aurizona Project, Brazil | Luna Gold Corp. | Luna Gold | January 29, 2013 | Mah, P., Reyes, A., Lindeman, D., Mach, L. and Haggan, T. | |
| NI 43-101 Technical Report Aurizona Mine Update, Brazil | Luna Gold Corp. | Luna Gold | March 27, 2015 | Leduc, M., Pearce, R., and Malhotra, D., | Leduc et al., 2015 |
| NI-43-101 Technical Report, Pre-Feasibility Study on Aurizona Mine Project | Luna Gold Corp. | Lycopodium Minerals Canada | September 12, 2016 | Evans, D., Breckenridge, J.L., Cheng, S., Fisher, B., Lincoln, N., Luz, A., Marsh, B., and Zurowski, G. | |
| NI 43-101 Technical Report, Feasibility Study on the Aurizona Gold Mine Project, Maranhão, Brazil | Trek Mining Inc. | Lycopodium Minerals Canada | July 10, 2017 | Lincoln, N., Tortosa, M., Cheng, S., Day, S., Hormazabal, E., Hoekstra, D., Nowak, M., Parshley, J., Royle, M., Siddorn, J., Virgili, J., and Zurowski, G. | Lycopodium, 2017 |
| NI 43-101 Technical Report, Technical Report on the Aurizona Gold Mine Maranhão, Brazil | Equinox Gold Corp. | AGP Mining Consultants Inc. | January 24, 2020 | Black, E.; Lincoln, N.; Rabb, T.; and Zurowski, G. |
| | P a g e | 2-4 |
| 04/11/2021 |
| TECHNICAL REPORT ON THE AURIZONA GOLD MINE EXPANSION PRE-FEASIBILITY STUDY |
| 2.6 | Units of Measure |
This report uses the International System of Units (SI) including metric tonnes “t”. Monetary units are expressed in United States Dollars ($) unless otherwise specified. Table 2-5 shows the Units of Measure used in this study.
Table 2-5: Units of Measure
| Unit | Abbreviation | Unit | Abbreviation | |
| Above mean sea level | amsl | Acre | ac | |
| Ampere | A | Annum (year) | a | |
| Billion | B | Billion tonnes | Bt | |
| Centimetre | cm | |||
| Cubic centimetre | cm3 | Cubic feet per minute | cfm | |
| Cubic feet | ft3 | Cubic feet per second | ft3/s | |
| Cubic inch | in3 | Cubic metre | m3 | |
| Cubic yard | yd3 | Coefficients of variation | CVs | |
| Day | d | Days per week | d/wk | |
| Days per year (annum) | d/a | Dead weight tonnes | DWT | |
| Decibel | dB | Decibel adjusted | dBa | |
| Degree | degree | Degrees Celsius | °C | |
| Diameter | Ø | Dollar (American) | US$ | |
| Dollar (Canadian) | C$ | Dry metric ton | dmt | |
| Foot | ft | Gallon | gal | |
| Gallons per minute (US) | gpm | Gigajoule | GJ | |
| Gigapascal | GPa | Gigawatt | g | |
| Gram | g | Grams per litre | g/L | |
| Grams per tonne | g/t | Greater than | > | |
| Hectare (10,000 m2) | ha | Hertz | Hz | |
| Horsepower | hp | Hour | h | |
| Hours per day | h/d | Hours per week | h/wk | |
| Hours per year | h/a | Inch | “ | |
| Kilo (thousand) | k | Kilogram | kg | |
| Kilograms per cubic metre | kg/m3 | Kilograms per hour | kg/h | |
| Kilograms per square metre | kg/m2 | Kilometre | km | |
| Kilometres per hour | km/h | Kilopascal | kPa | |
| Kilotonne | kt | Kilovolt | kV | |
| Kilovolt-ampere | kVA | Kilowatt | kW | |
| Kilowatt hour | kWh | Kilowatt hours per tonne (metric ton) | kWh/t | |
| Kilowatt hours per year | kWh/a | Less than | < | |
| Litre | L | Litres per minute | L/min |
| | P a g e | 2-5 |
| 04/11/2021 |
| TECHNICAL REPORT ON THE AURIZONA GOLD MINE EXPANSION PRE-FEASIBILITY STUDY |
| Unit | Abbreviation | Unit | Abbreviation | |
| Megabytes per second | Mb/sec | Megapascal | MPa | |
| Megavolt-ampere | MVA | Megawatt | MW | |
| Metre | m | Metres above sea level | masl | |
| Metres Baltic sea level | mbsl | Metres per minute | m/min | |
| Metres per second | m/s | Metric ton (tonne) | t | |
| Microns | ųm | Milligram | mg | |
| Milligrams per litre | mg/L | Millilitre | mL | |
| Millimetre | mm | Million | M | |
| Million bank cubic metres | Mbm3 | Million tonnes | Mt | |
| Minute (plane angle) | ‘ | Minute (time) | min | |
| Month | mo | Ounce | oz | |
| Pascal | Pa | Parts per million | ppm | |
| Parts per billion | ppB | Percent | % | |
| Pound(s) | lb(s) | Pounds per square inch | psi | |
| Revolutions per minute | rpm | Second (plane angle) | “ | |
| Second (time) | sec | Specific gravity | SG | |
| Square centimetre | cm2 | Square foot | ft2 | |
| Square inch | in2 | Square kilometre | km2 | |
| Square metre | m2 | Thousand tonnes | kt | |
| Three dimensional | 3D | Tonne (1,000 kg) | t | |
| Tonnes per day | t/d | Tonnes per hour | t/h | |
| Tonnes per year (annum) | t/a | Tonnes seconds per hour metre cubed | ts/hm3 | |
| Total | T | Volt | V | |
| Week | wk | Weight per weight | w/w | |
| Wet metric ton | wmt |
| 2.7 | Terms of Reference (Abbreviations & Acronyms) |
Table 2-6 shows Terms and Abbreviations used in this study. Table 2-7 shows the Conversions for Common Units.
Table 2-6: Terms of Reference
| Unit | Abbreviation/Acronym |
| Absolute Relative Difference | ABRD |
| Acid Base Accounting | ABA |
| Acid Rock Drainage | ARD |
| ACME Analytical Laboratories Ltd | ACME |
| Advanced Mineral Technology Laboratory, Ltd. | AMTL |
| Albite Altered Diorite | ADT |
| Alpine Tundra | AT |
| | P a g e | 2-6 |
| 04/11/2021 |
| TECHNICAL REPORT ON THE AURIZONA GOLD MINE EXPANSION PRE-FEASIBILITY STUDY |
| Unit | Abbreviation/Acronym |
| AGP Mining Consultants Inc. | AGP |
| ALS Global | ALS |
| Annual Tax per Hectare | TAH |
| Atomic Absorption Spectrophotometer | AAS |
| Atomic Absorption | AA |
| Atomic Absorption Spectrometry | AAS |
| Aurizona Goldfields Corporation | AGC |
| Aurizona Shear Zone | ASZ |
| Bureau Veritas Commodities Canada Ltd. | BV |
| Bondar Clegg Laboratories | Bondar Clegg |
| Brascan Recursos Naturais S.A. | Brascan |
| Câmara Comercial de Negócios de Energia Elétrica Brasileira | CCEE |
| Canadian Institute of Mining, Metallurgy, and Petroleum | CIM |
| Carbon-in-Leach | CIL |
| Carbon-in-Pulp | CIP |
| Certified Reference Material | CRM |
| Cesbra S.A. | Cesbra |
| Closed-circuit Television | CCTV |
| Coefficient of Variation | CV |
| Community Development Committee | CDC |
| Compagnie Générale de Géophysique | CGG |
| Companhia Energética do Maranhão | CEMAR |
| Contrato de Compra e Venda de Energia Elétrica | CCVEE |
| Copper | Cu |
| Copper Equivalent | CuEq |
| Counter-current decantation | CCD |
| Cyanide Soluble | CN |
| Diamond Drilling | DD |
| Digital Elevation Model | DEM |
| Direct Leach | DL |
| Distributed Control System | DCS |
| Drilling and Blasting | D&B |
| Eldorado Gold Corporation | Eldorado |
| Eldorado and Cesbra Joint Venture | Eldorado JV |
| Electro Magnitudes | EM |
| Environmental Impact Assessment | EIA |
| Environmental Management System | EMS |
| Equinox Gold Corp. | Equinox |
| Equity Exploration Consultants Ltd. | Equity |
| Feldspar Quartz Diorite | FQD |
| | P a g e | 2-7 |
| 04/11/2021 |
| TECHNICAL REPORT ON THE AURIZONA GOLD MINE EXPANSION PRE-FEASIBILITY STUDY |
| Unit | Abbreviation/Acronym |
| Flocculant | floc |
| Frequency Domain Electromagnetics | FDE |
| Gabbro intrusive rocks | GBB |
| Gemcom International Inc. | Gemcom |
| Gencor Ltd. | Gencor |
| Gencor Joint Venture Company | Gencor JV |
| General and Administration | G&A |
| Global Positioning System | GPS |
| Gold | Au |
| Gold Equivalent | AuEq |
| Heating, Ventilating, and Air Conditioning | HVAC |
| High Pressure Grinding Rolls | HPGR |
| Indicator Kriging | IK |
| Induced Polarization | IP |
| Inductively Coupled Plasma | ICP |
| Inductively Coupled Plasma Atomic Emission Spectroscopy | ICP-AES |
| Industrial Air Services | SAI |
| Inspectorate America Corp. | Inspectorate |
| Interior Cedar-Hemlock | ICH |
| Internal Rate of Return | IRR |
| International Congress on Large Dams | ICOLD |
| Inverse Distance | ID |
| Inverse Distance cubed | ID3 |
| Inverse Distance squared | ID2 |
| Joint Venture | JV |
| Knight Piésold Ltd. | KP |
| Koeppern Machinery Australia | Koeppern |
| Land and Resource Management Plan | LRMP |
| Lerchs-Grossman | LG |
| Light Detection and Ranging | LiDAR |
| Life-of-Mine | LOM |
| Load-haul Dump | LHD |
| Locally Varying Anisotropy | LVA |
| Locked Cycle Tests | LCTs |
| Loss on Ignition | LOI |
| Luna Gold Pesquisa Mineral LTDA | Luna Gold |
| Metais de Goías S.A. | Metago |
| Metcon Research | Metcon |
| Metal Mining Effluent Regulations | MMER |
| Metavolcaniclastic rocks | MVC |
| | P a g e | 2-8 |
| 04/11/2021 |
| TECHNICAL REPORT ON THE AURIZONA GOLD MINE EXPANSION PRE-FEASIBILITY STUDY |
| Unit | Abbreviation/Acronym |
| Methyl Isobutyl Carbinol | MIBC |
| Metres East | mE |
| Metres West | mW |
| Metres North | mN |
| Metres South | mS |
| Mineração Aurizona S.A. | MASA |
| Mineral Deposits Research Unit | MDRU |
| Mineral Titles Online | MTO |
| Nation Instrument 43-101 | NI 43-101 |
| Nearest Neighbour | NN |
| Net Invoice Value | NIV |
| Net Present Value | NPV |
| Net Smelter Price | NSP |
| Net Smelter Return | NSR |
| Neutralization Potential | NP |
| Nomos Laboratories | Nomos |
| Northwest Transmission Line | NTL |
| Official Community Plans | OCPs |
| Operator Interface Station | OIS |
| Ordinary Kriging | OK |
| Organic Carbon | org |
| Paleoproterozoic São Luís Craton | SLC |
| Paulo Abib Engenharia S.A. | PAE |
| Pesquisas Geológicas Ltda. | Geoserv |
| Potassium Amyl Xanthate | PAX |
| Predictive Ecosystem Mapping | PEM |
| Preg-robbing Index | PRI |
| Preliminary Assessment | PA |
| Preliminary Economic Assessment | PEA |
| Qualified Person | QP |
| Quality Assurance | QA |
| Quality Control | QC |
| Quality Assurance and Quality Control | QA/QC |
| Real Time Kinetic Global Positioning System | RTK GPS |
| Reconsult Geofísica Ltda. | Reconsult |
| Reduced Major Axis | RMA |
| Reverse Circulation | RC |
| Rhenium | Re |
| Rock Mass Rating | RMR |
| Rock Quality Designation | RQD |
| | P a g e | 2-9 |
| 04/11/2021 |
| TECHNICAL REPORT ON THE AURIZONA GOLD MINE EXPANSION PRE-FEASIBILITY STUDY |
| Unit | Abbreviation/Acronym |
| Run-of-Mine | ROM |
| SAG Mill/Ball Mill/Pebble Crushing | SABC |
| Sandstorm Gold Royalties Ltd. | Sandstorm |
| Secretaria de Estado do Meio Ambiente e Recursos Naturais | SEMA-MA |
| Semi-autogenous Grinding | SAG |
| Serviço do Patrimônio da União | SPU |
| Serviços Técnicos Minerais Ltda | Seta |
| Silver | Ag |
| Silver Equivalent | AgEq |
| SNC-Lavalin Inc. | SNC |
| Standards Council of Canada | SCC |
| Stanford University Geostatistical Software Library | GSLIB |
| Superintendência do Desenvolvimento do Nordeste | SUDENE |
| Tailings Storage Facility | TSF |
| Terrestrial Ecosystem Mapping | TEM |
| Total Dissolved Solids | TDS |
| Total Suspended Solids | TSS |
| Trek Mining Inc. | Trek |
| Tunnel Boring Machine | TBM |
| Ultramafic rocks | UMR |
| Unamgen Mineração e Metalurgia S.A. | Unamgen |
| Underflow | U/F |
| Valued Ecosystem Components | VECs |
| Waste Rock Storage Facility | WRSF |
| Water Balance Model | WBM |
| Weak Acid Dissociable | WAD |
| Work Breakdown Structure | WBS |
| Workplace Hazardous Materials Information System | WHMIS |
| World Health Organization | WHO |
| X-ray Fluorescence Spectrometer | XRF |
| | P a g e | 2-10 |
| 04/11/2021 |
| TECHNICAL REPORT ON THE AURIZONA GOLD MINE EXPANSION PRE-FEASIBILITY STUDY |
Table 2-7: Conversions for Common Units
| Metric Unit | Imperial Measure | |||
| 1 hectare | 2.47 acres | |||
| 1 metre | 3.28 feet | |||
| 1 kilometre | 0.62 miles | |||
| 1 gram | 0.032 ounces (troy) | |||
| 1 tonne | 1.102 tons (short) | |||
| 1 gram/tonne | 0.029 ounces (troy)/ton (short) | |||
| 1 tonne | 2,204.62 pounds | |||
| Imperial Measure | Metric Unit | |||
| 1 acre | 0.4047 hectares | |||
| 1 foot | 0.3048 metres | |||
| 1 mile | 1.609 kilometres | |||
| 1 ounce (troy) | 31.1 grams | |||
| 1 ton (short) | 0.907 tonnes | |||
| 1 ounce (troy)/ton (short) | 34.28 grams/tonne | |||
| 1 pound | 0.00045 tonnes | |||
| | P a g e | 2-11 |
| 04/11/2021 |
| TECHNICAL REPORT ON THE AURIZONA GOLD MINE EXPANSION PRE-FEASIBILITY STUDY |
| 3 | Reliance on Other Experts |
The QP’s conclusions, opinions and estimate contained herein are based on:
| • | information available at the time of preparation of this report |
| • | assumptions, conditions, and qualifications as set forth in this report |
| • | data, reports, and other information supplied by Equinox and other third-party sources |
| 3.1 | Ownership, Mineral Tenure and Surface Rights |
Ownership information was provided by Equinox, and this has been relied upon by the QP’s who have not independently researched property title, mineral rights or overlying surface rights for the Project and express no opinion as to the ownership status of the Property.
The QP’s have fully relied upon and disclaim responsibility for information derived from Equinox staff and legal experts. This information is used in Section 4 of the Report and in support of the Mineral Resource estimate in Section 14, Mining Reserves in Section 15, and the financial analysis in Section 22.
| 3.2 | Environmental Liabilities and Permitting |
Explanation of the Environmental Liabilities and Permitting information was provided by Equinox’s Cesar Torresini for Section 20. The QP’s have relied upon this information and have not researched this information nor express an opinion as to the current status of the various permits and compliance.
| 3.3 | Taxation |
Equinox and MASA provided guidance on applicable taxes, royalties, and other government levies or interests, applicable to revenue or income from Project. The QP’s have fully relied upon and disclaim responsibility for taxation information derived from experts retained by Equinox for this information.
Equinox provided the explanation for royalties on the project which are discussed in more detail in Section 4.5 of this technical report. The QP’s have fully relied upon and disclaim responsibility for information derived from this information.
Except for the purposes legislated under provincial securities laws, any use of this report by any third party is at that party’s sole risk.
| | P a g e | 3-1 |
| 04/11/2021 |
| TECHNICAL REPORT ON THE AURIZONA GOLD MINE EXPANSION PRE-FEASIBILITY STUDY |
| 4 | Property Description and Location |
This section is adapted from the technical reports from 2015 (Leduc et al., 2015) and 2017 (Lycopodium, 2017), supplemented with additional research, news releases from Equinox, and personal communications with Equinox personnel.
| 4.1 | Property and Title in Maranhão, Brazil |
The Aurizona Property consists of 13 mineral licenses covering 107,023 ha (1,070 km2) in the municipality of Godofredo Viana (population 10,635), state of Maranhão, along the northeastern coast of Brazil. The Aurizona Mine is centered at approximately 01°18’ south latitude and 45°45’ west longitude. Coordinates are recorded in Universal Transverse Mercator PSAD69 / UTM zone 23 south.
Equinox, through its indirect wholly-owned subsidiary MASA, owns 100% of the Property. All mineral licenses are held by Equinox’s wholly-owned subsidiaries MASA and Luna Gold. The Aurizona Mine is operated by MASA and is comprised of an operating open pit mine at the Piaba deposit with the mine site including a camp, process plant, tailings storage facility, and associated infrastructure. Adjacent development and exploration activities are operated from the main camp infrastructure by MASA.
| 4.2 | Brazilian Mining Rights |
Mining rights in Brazil are governed by the Mining Code and additional rules enacted by the National Mining Agency (ANM). Each application for an exploration or mining license is represented by a mineral claim submitted to the ANM.
Obligations of an exploration license holder to the ANM include: (1) payment of an Annual Tax per Hectare (TAH) based on the number of hectares held (Table 4-1), 2) payment of all expenses related to ANM site inspections of the license area; and (3) submission of an exploration work report before the authorization’s expiration date. The 107,023 ha held under license by Equinox equates to an estimated aggregate TAH of R$383,000, which is equivalent to US$88,800. Compliance with these obligations is essential for keeping the mineral licenses in good standing with a failure to meet obligations allowing ANM to impose penalties and possibly cancel the mineral licenses.
Table 4-1: Annual Tax per Hectare (TAH) rates as of January 2020
| Term | Rate |
| Effective period of authorization in its original term (Phase 1) | R$2.63/ha |
| Extended authorizations (Phase 2) | R$3.58/ha |
| 4.3 | Equinox’s Mining Rights at Aurizona Project |
The mineral licenses for the Property include one active mining license, one mining license application, and eleven exploration licenses as detailed in Figure 4-1 and Table 4-2; of the eleven exploration licenses, four are in good standing and seven are under application for extension.
| | P a g e | 4-1 |
| 04/11/2021 |
| TECHNICAL REPORT ON THE AURIZONA GOLD MINE EXPANSION PRE-FEASIBILITY STUDY |
Figure 4-1: Aurizona Project Tenure Map

| | P a g e | 4-2 |
| 04/11/2021 |
| TECHNICAL REPORT ON THE AURIZONA GOLD MINE EXPANSION PRE-FEASIBILITY STUDY |
Table 4-2: Summary of Aurizona Tenure
| ANM Process | License Number | Area (Ha) | Holder | Status | Expiration Date |
| 800.256/1978 | 25/2019 | 9,982 | Mineracão Aurizona S.A. | Mining License | N/A |
| 806.042/2003 | 7084 | 5,029 | Mineracão Aurizona S.A. | Mining License Application | Pending ANM |
| 806.111/1996 | 2302 | 150 | Mineracão Aurizona S.A. | Exploration License - Phase 2 | Pending ANM |
| 800.330/1991 | 2639 | 9,838 | Mineracão Aurizona S.A. | Exploration License - Phase 2 | Pending ANM |
| 800.329/1991 | 2640 | 10,000 | Mineracão Aurizona S.A. | Exploration License - Phase 2 | Pending ANM |
| 800.331/1991 | 2638 | 10000 | Mineracão Aurizona S.A. | Exploration License - Phase 2 | Pending ANM |
| 806.218/2007 | 12679 / 6401 | 9,039 | Luna Gold Pesquisa Mineral LTDA | Exploration License - Phase 2 | Pending ANM |
| 806.219/2007 | 12680 / 6402 | 7,784 | Luna Gold Pesquisa Mineral LTDA | Exploration License - Phase 2 | Pending ANM |
| 806.284/2007 | 802 | 9,754 | Luna Gold Pesquisa Mineral LTDA | Exploration License - Phase 2 | Pending ANM |
| 806.010/2010 | 15604 | 9,453 | Luna Gold Pesquisa Mineral LTDA | Exploration License - Phase 3 | 2024-08-24 |
| 806.011/2010 | 15605 | 8,483 | Luna Gold Pesquisa Mineral LTDA | Exploration License - Phase 3 | 2024-08-24 |
| 806.012/2010 | 15606 | 9,689 | Luna Gold Pesquisa Mineral LTDA | Exploration License - Phase 3 | 2024-08-24 |
| 806.013/2010 | 15607 | 7,823 | Luna Gold Pesquisa Mineral LTDA | Exploration License - Phase 3 | 2024-08-24 |
| Aurizona Property | 107,023 |
Source: Equinox, 2021 The active mining license (800.256/1978) includes the Piaba and Boa Esperança deposits, as well as several near-mine exploration targets and unnamed soil anomalies. All accessible vertices of this mining license have monuments, as required by Brazilian mining legislation. The mining license application (806.042/2003) covers the Tatajuba deposit. The license application (806.111/1996) covers the Genipapo deposit, which has a Phase 2 exploration licence with Positive Final Exploration Report (PFER) Submitted. The mining license application (800.330/1991) covers the Touro deposit.
| | P a g e | 4-3 |
| 04/11/2021 |
| TECHNICAL REPORT ON THE AURIZONA GOLD MINE EXPANSION PRE-FEASIBILITY STUDY |
| 4.4 | Surface Rights |
Surface rights in Brazil are administrated by the Serviço do Patrimônio da União (SPU), an institution within the Ministry of Economy of the Federal Government of Brazil. Equinox has secured all the required surface rights for operation of the Aurizona Mine.
| 4.5 | Royalties and Encumbrances |
The mining license is subject to a government royalty of 1.5% that is applied to gross gold sales from gold produced from the mining claims that are the subject of the mining license.
Previously Aurizona was subject to a 17% gold stream payable to Sandstorm. This gold stream has been terminated and replaced by two net smelter return (NSR) royalties, the Aurizona Project NSR, the Greenfields NSR, and a convertible debenture in favour of Sandstorm dated January 3, 2018 (Sandstorm Debenture). The Aurizona Project NSR is on a 3% to 5% sliding scale, based on the gold price (Table 4-3), and applies to all gold production from the Piaba mining license and five contiguous exploration licenses (800.256/1978, 806.042/2003, 800.329/1991, 800.330/1991, 800.331/1991, 806.111/1996), net of third-party refining costs.
Table 4-3: NSR Agreement between Sandstorm and Equinox
| Royalty | Gold Price (US$) | NSR |
| Aurizona Project NSR | ≤ $1,500 | 3% |
| > $1,500 to ≤ $2,000 | 4% | |
| > $2,000 | 5% | |
| Greenfields NSR | NA | 2% |
Source: Lycopodium (2017)
The Greenfields NSR is a 2% royalty that applies to all the other exploration licenses of the Aurizona Property held by Equinox. Sandstorm holds a right of first refusal on any future streams or royalties on the tenements subject to the Aurizona Project NSR and Greenfields NSR.
Sandstorm also holds a US$30 million debenture that was partially converted in June 2019 to common shares of Equinox, with Equinox issuing 11,139,175 common shares (Common Shares) of the Company at a conversion price of C$1.23 to repay US$9,000,000 in principal (9,593,415 Common Shares) and US$1,450,145 in accrued interest (1,545,760 Common Shares) (Equinox, 2019a).
Equinox holds an Appraisal Certificate from the Superintendent for the Development of the Northeast Region (Superintendência do Desenvolvimento do Nordeste or SUDENE) that allows for a 75% reduction of the Brazilian corporate income tax rate of 25%. This certificate was approved in 2011 and is valid for 10 years (the Eligible Period), expiring in 2021. As such, Equinox currently pays a corporate income tax rate of 6.25% along with a social tax rate of 9.0%, for a total income tax rate of approximately 15.25%.
| | P a g e | 4-4 |
| 04/11/2021 |
| TECHNICAL REPORT ON THE AURIZONA GOLD MINE EXPANSION PRE-FEASIBILITY STUDY |
Equinox applied for the extension of the benefit on the model of total modernization, which includes expanded mine production. In December of 2019, SUDENE granted, through the constitutive report nº. 0186/2019 the new incentive which is valid from January 1, 2020 to December 31, 2029.
| 4.6 | Property Agreements |
On 13 August 2018, Equinox announced that AngloGold Ashanti Holdings plc (AngloGold) had terminated the earn-in joint venture (JV) on 180,000 ha (1,800 km2) of exploration licenses, with Equinox retaining its 100% interest in these licenses (Equinox, 2018). As part of this JV, AngloGold had spent approximately US$9 million to complete 43,000 line-km of high-resolution airborne geophysical surveys (magnetic, radiometric, electromagnetic) in addition to extensive soil sampling and geological mapping campaigns, and 10,000 m of drilling on eight targets.
There are no other agreements on the Aurizona Property.
| 4.7 | Permits |
The initial environmental operating license for the Aurizona Mine was first issued by the Secretaria de Estado do Meio Ambiente e Recursos Naturais (SEMA-MA) on the 11th of July 2007. This operating license was re-issued in March 2010 and then July 2016, with the latter valid to July 2020. The operational license was reissued in May 2019 including the incorporation of the mining expansion, crushing and mill process units, and new facilities. Another permit was re-issued in August 2019 and included the permanent water discharge from the pit. All operating license requirements have been met and a request for a further renewal has been submitted to SEMA-MA.
MASA currently has permits for operating the TSF and has completed the dam raise to a crest elevation of 38 m. The permits to discharge water from the TSF are tied to the TSF installation license and are valid to July 2021. There is a permit submission in place for an Installation License for Vene 2 TSF (Phase 1) which should be processed by the first quarter of 2022. Permits related to chemical storage, water use, fuel station, and effluents discharge have been granted and are currently valid. Other required permits to the future operations are planned and/or under the application or renewal process.
Equinox holds certifications from the Federal Police and Brazilian Army through its wholly owned subsidiary, MASA, for the import, storage, and handling of controlled explosives and chemical products.
| 4.8 | Environmental Liabilities |
Soil, sediment, and water assays of samples collected during the 2009 environmental impact assessment found that mercury levels were below thresholds set to define “impacted areas”, even in those areas with a long history of artisanal mining. As such, the environmental impact from artisanal mining is currently not considered an environmental liability.
There are no known environmental liabilities.
| | P a g e | 4-5 |
| 04/11/2021 |
| TECHNICAL REPORT ON THE AURIZONA GOLD MINE EXPANSION PRE-FEASIBILITY STUDY |
| 4.9 | Social License |
Equinox and its subsidiaries have social license to operate the Aurizona Mine and explore the surrounding licenses. The approach to maintaining this license is based on early and open communication, hiring, buying locally, and supporting local initiatives (Equinox, 2020). The Aurizona Mine workforce is nearly 100% Brazilian with the majority of the employees and contractors living in nearby communities.
MASA continues to invest in programs and projects in the communities within the area of influence of the mine that are focused on infrastructure improvement, skills training, education, behavioural change, and strengthening of local institutional and leadership skills. These programs and projects have been developed in partnership with the local communities, the state institutions, and the Industry State Federation. One of the key tools in ensuring effective communication between the company and the communities was the establishment of the Community Development Committee. The volunteer committee, which meets monthly, is comprised of local leaders and authorities that discuss local issues, seek solutions, and implement cooperative strategies for local business development (Equinox, 2021).
| 4.10 | Significant Risk Factors |
The authors are unaware of any other significant factors or risks associated with the Project that may affect access, title, or the right or ability to perform work on the property.
| | P a g e | 4-6 |
| 04/11/2021 |
| TECHNICAL REPORT ON THE AURIZONA GOLD MINE EXPANSION PRE-FEASIBILITY STUDY |
| 5 | Accessibility, Climate, Local Resources, Infrastructure, and Physiography |
This section is adapted from the technical reports from 2015 (Leduc et al., 2015) and 2017 (Lycopodium, 2017), supplemented with additional research.
| 5.1 | Accessibility |
Year-round road access is available from Belém, and São Luis, the state capital cities of Pará and Maranhão, located 300 km due west and 215 km southeast of the project area, respectively. The main federal highway (BR316) connecting the two capitals is in good condition. The Property is accessed by regularly maintained laterite road 16 km from the town of Godofredo Viana, which is connected by State highways MA-101 and MA-206 to BR316.
The drive from Belém takes approximately six to seven hours; access from São Luis is usually longer, requiring a ferry transfer from São Luis Island to the mainland or a longer bypass road on land.
There is also a landing strip for light aircraft at Godofredo Viana, which takes approximately one hour of flying from either Belém or São Luis. The driving time from the airstrip to the mine site is an additional 1.5 hours.
| 5.2 | Climate |
The Property experiences a dry-summer tropical savanna climate bordering on a tropical monsoon climate. There is a dry season from August to December and a wet season from January to July. Average daily highs and lows (for the state capital of São Luis) range between 31˚C and 23˚C for the entire year, with ≤2˚C variance for the hottest and coldest months.
Precipitation data has been collected from the Mineração Aurizona S.A (MASA) meteorological stations in the area of the camp, the dam, and the mine since 2010. Monthly rainfall from 2010 to 2019 varied from 0 mm during the dry season, up to 1,110 mm during the rainy season. Annual precipitation over that period ranged from 1,692 to 3,319 mm with an average of 2,482 mm. Annual evaporation is estimated at approximately 1,650 mm.
Year-round exploration, mining, and processing activities can be conducted on the Property but are more challenging in the period of heaviest rainfall between February and May.
| 5.3 | Local Resources and Infrastructure |
This section summarizes the local resources and infrastructure available to the Aurizona Mine, including mining personnel, power, and water. Descriptions of mine infrastructure, including tailings storage areas, waste disposal areas, and the processing plant site are provided in Section 18.
| | P a g e | 5-1 |
| 04/11/2021 |
| TECHNICAL REPORT ON THE AURIZONA GOLD MINE EXPANSION PRE-FEASIBILITY STUDY |
| 5.3.1 | Mining Personnel |
Mining personnel comprise a combination of a local workforce for the operation and support services, along with select technical experts from throughout Brazil. Many local workers are based in the village of Aurizona (population 2,100) and town of Godofredo Viana (population 5,370), <1 km and 16 km away from the mine site, respectively. Both towns offer a limited range of services and supplies.
| 5.3.2 | Power |
A more detailed description of the power supply to the Project is provided in Section 18.
The regional utility, Companhia Energética do Maranhão (CEMAR), provides 15 MW power supply via a 69 kV overhead powerline to an outdoor substation located adjacent to the process plant. The substation is equipped with two 69/41.6 kV step-down transformers, one 12.5/10 MVA and one 7.5/5 MVA. The plant maximum demand varies based on the annual mine plan and the variation in hardness of rock in the plant feed primarily. The plant is currently operating at around 9 to 10 MW, and that is increasing with the higher percentages of fresh rock processed.
In 2018 MASA became a member of the Câmara Comercial de Negócios de Energia Elétrica Brasileira (CCEE) and as such now purchases electrical power from “free” energy suppliers (Contrato de Compra e Venda de Energia Elétrica or CCVEEs). On the “free” energy market or spot market, electricity is purchased by contract for a specific amount of supplied power for a specific period of time.
A 2 MW emergency generator is synchronized with the relevant 4.16 kV buses for continuous service to specific users at the site when power from the national grid is unavailable.
| 5.3.3 | Water |
A more detailed description of the water supply to the Project is provided in Section 18.
Water sources are required for mineral processing, potable uses, and industrial uses. All sources are currently approved by SEMA-MA. The major sources of raw water supply for the plant are provided from Lake Pirocaua and reclaim water at site. Raw water storage at site is 1.5 M m3.
Reclaim water is sourced from the Vené Tailings Storage Facility, Piaba pit dewatering, and recirculation of solution recovered from the pre-leach. Once excavated, the Boa Esperança pit will serve as a water storage reservoir.
Potable water is drawn from a cased well with a flow rate of approximately 4 m3/hour, as well as from the municipal water treatment plant (Lycopodium, 2017). Water quality is monitored in accordance with standards established by the Ministry of Health.
Upgrades to infrastructure completed in 2018 include a sewage treatment plant.
| 5.3.4 | Processing Plant |
The historical process plant at the Aurizona Mine was originally designed to treat soft saprolitic ores at a rate of 5,500 t/d. In 2019 the plant was upgraded. The main upgrade for the throughput expansion has been to the comminution circuit, making it capable of processing various mill feeds from the saprolite, transition, and fresh rock mineralization zones at a nominal processing rate of 8,000 t/d. The comminution circuit was developed based on the grindability test results, engineering experience, the topography of the plant site, and operability of the system. The current process plant comprises crushing, grinding, gravity concentration, and leach (CIL) circuit. This is further described in Section 17.
| | P a g e | 5-2 |
| 04/11/2021 |
| TECHNICAL REPORT ON THE AURIZONA GOLD MINE EXPANSION PRE-FEASIBILITY STUDY |
| 5.3.5 | Waste and Tailings Storage Facilities |
The TSF, WRSF, and processing plant are described in Section 18. The Vene TSF has been constructed and is operational. Tailings are thickened and detoxified prior to disposal.
There are six waste rock storage facilities including the north, west, south, east, Tatajuba, and Genipapo.
| 5.3.6 | Physiography |
The Property lies on a peneplain near the Atlantic Ocean and is characterized by rounded flat knolls and wide estuaries. Elevation ranges from 0 - 90 m above mean sea level (amsl) with the Aurizona Mine located approximately 10 - 40 m above sea level (asl). The isthmus that joins the Aurizona Peninsula to the mainland consists of low-lying flats that are subject to mild flooding at high neap tide, although this does not affect project access or operations.
Vegetation consists of mangrove swamp near the coastline, giving way inland to low-lying grassland with dense tropical vegetation on the low rounded hills.
| 5.4 | Surface Rights |
Equinox controls sufficient surface rights for the infrastructure and operation of the Aurizona Mine.
| | P a g e | 5-3 |
| 04/11/2021 |
| TECHNICAL REPORT ON THE AURIZONA GOLD MINE EXPANSION PRE-FEASIBILITY STUDY |
| 6 | History |
The following section is adapted from the Technical Report (Lycopodium, 2017), which in turn is adapted from previous reports (e.g.: Leduc et al., 2015).
The Property has a long history of artisanal gold production dating back to the arrival of Jesuit missionaries in the 17th century. There are anecdotal reports of corporate mining ventures in the 1880’s followed by peaks in activity around 1912 and 1931. Artisanal miners (garimpeiros) have been active in the region since that time and have recovered gold nuggets over 30 kg in size from the alluvial flats.
From 1978, the historical ownership and activities at the Aurizona Mine are documented and summarized in Table 6-1.
Table 6-1: Summary of Operators and Exploration Activities to 2007
| Year(s) Work Performed | Operating Company / Year | Activities |
| 17th century to 1978 | Various | Corporate and artisanal mining |
| 1978-1985 | Brascan Corp (subsidiary, Cesbra) 1978-1991 | Exploration in alluvium |
| 1988-1991 | Received license for gold mining | |
| 1991-1993 |
Cesbra-Gencor Unamgen JV 1991-1995 |
Airborne magnetic and radiometric survey, photogrammetry, soil geochemistry, mapping, rock sampling, ground geophysics (IP, EM, magnetic, gamma), drilling (auger, RC, DD) |
| 1994 | Metallurgy, economic study, EIA, permitting, consultation | |
| 1997 | Cesbra-Eldorado Unamgen JV 1996-2007 | Drilling (RC, DD), airborne magnetic and radiometric survey |
| 1998-2007 | No work performed except minor work to maintain mineral titles | |
| 1999-2000 | Gravity pilot plant |
| 6.1 | Property Ownership Changes |
In 1978, subsidiary companies of Brascan Recursos Naturais S.A.(Brascan) started exploration programs in alluvium that lasted through to 1985. In 1988 MASA, a subsidiary of Brascan, received a license to mine in what is now the Aurizona mining license (800256/1978).
In 1991, a JV agreement was signed between Cesbra S.A. (Cesbra), another Brascan subsidiary, and Unamgen Mineração e Metalurgia S.A. (Unamgen), an exploration subsidiary of Gencor Ltd. (Gencor), a South African mining company. Unamgen assumed the position of operator of the Gencor Joint Venture Company (Gencor JV) and then applied for a five-year suspension of mining operations with the intent of evaluating primary gold resources.
| | P a g e | 6-1 |
| 04/11/2021 |
| TECHNICAL REPORT ON THE AURIZONA GOLD MINE EXPANSION PRE-FEASIBILITY STUDY |
From 1991 to 1993, extensive geophysical and geochemical surveys were carried out near the Piaba deposit, along with geological mapping and drilling. Preliminary processing tests at Mintek, in South Africa were followed up with more comprehensive test work in 1994, done by Paulo Abib Engenharia S.A. (PAE) at the Metais de Goías S.A. (Metago) metallurgical process facility in Goiania, Brazil. PAE was subsequently acquired by Kilborn Engineering, now SNC-Lavalin Inc., located in São Paulo. Testwork was done with a diesel generator-powered gravity-only process plant from Cesbra’s tin operations in Rondônia, Brazil and resulted in a positive economic evaluation of the Piaba deposit. At the same time, a technical report, and an Environmental Impact Assessment (EIA) for mining the weathered part of the Piaba deposit were submitted to government agencies and public consultation commenced.
While metallurgical work was being finalized, Gencor was in the process of acquiring BHP Billiton’s Brazilian minerals assets from Royal Dutch/Shell. Upon finalizing this acquisition in 1994, Gencor reversed course and divested all its gold assets and exploration properties. As a result, the Gencor JV was terminated in 1995.
In 1996, Gencor agreed to sell its Brazilian gold assets to Eldorado Gold Corporation (Eldorado), leading to a new JV between Eldorado and Cesbra (Eldorado JV) with Unamgen, now a subsidiary of Eldorado, as the operator. A year long drill program commenced in 1997 that included DD and RC drilling along strike of the Piaba deposit.
Poor market conditions for gold impeded exploration and development activity at Piaba from late 1997 to 2007, with work limited to that necessary for maintaining title. Fortuitously, the regional infrastructure improved markedly in this period in terms of road access, telecommunications, and grid power availability.
In January 2007, Luna Gold completed a purchase agreement (the Purchase Agreement) to acquire all outstanding shares of AGC from Brascan and Eldorado, with AGC owning 100% of MASA and the Aurizona Project (Luna Gold Corp, 2006). In July 2011, all obligations were satisfied regarding the Purchase Agreement and Luna Gold assumed 100% ownership of the Project.
In March 2017, JDL Gold Corp. merged with Luna Gold to form Trek Mining Inc. (Trek) after which Trek merged with NewCastle Gold Ltd. and Anfield Gold Corp. to form Equinox
| 6.2 | Exploration by Previous Owners |
This section provides more detail on exploration work carried out from 1991 to 1997 by the Cesbra-Gencor and Cesbra-Eldorado Unamgen JVs, as well as by Cesbra in 1999 and 2000.
| 6.2.1 | Cesbra-Gencor Unamgen JV (1991 - 1995) |
From 1991 to 1993, work carried out by the Gencor JV was focused on identifying bulk tonnage gold deposits amenable to open pit mining methods. Work programs carried out during this period include airborne and ground geophysical surveys, photogrammetry, mapping and sampling of artisanal mining pits, soil sampling, and drilling (DD, RC, and auger).
A helicopter-borne airborne magnetic and radiometric survey was done by AERODAT in 1991, covering 182 km2 through 1,045 line-km at 200 m line spacing. Ground geophysical surveys done in this time included magnetics, induced polarization (IP), frequency domain electromagnetics (EM), electrical resistivity, very-low frequency EM, and gamma ray spectrometry. IP turned out to be one of the more successful methods, defining the graphitic metasedimentary unit that forms the footwall and southern margin of the Piaba deposit. Magnetics and gamma ray spectrometry were useful for characterizing regional geological trends.
| | P a g e | 6-2 |
| 04/11/2021 |
| TECHNICAL REPORT ON THE AURIZONA GOLD MINE EXPANSION PRE-FEASIBILITY STUDY |
Twelve soil grids were established with lines spaced at 100 m and sample stations at 25 m. Each soil sample was analyzed for gold, arsenic, copper, molybdenum, lead, nickel, and zinc. Results helped define a significant east to northeast trending gold-in-soil anomaly that includes both the Piaba and Tatajuba deposits, as well as several near-mine exploration targets. The gold anomaly over Piaba is associated with moderate copper and zinc values.
Gencor JV drilled 142 diamond drillholes (BRAZD001 to BRAZD142) of mostly HQ (63.5 mm) diameter core, mostly within the saprolite domain of the Piaba deposit. Gencor JV also drilled 67 RC holes (BRAZP001 to BRAZP067), most of which were also concentrated at Piaba. Drilling was initially conducted on 50 m spaced sections and later infilled to 25 m sections. Gencor JV also drilled several nearby targets including Tatajuba and Micote. All this drilling was carried out by a private Brazilian drilling firm, Serviços Técnicos Minerais Ltda (Seta).
Shallow drilling via both manual and mechanized augers was used to verify gold-in-soil anomalies and to evaluate select artisanal mine tailings dumps. Auger holes were drilled to an average depth of 8 m.
In 1994, Gencor JV commissioned PAE to produce an economic viability study and EIA for mining saprolite gold at Piaba.
| 6.2.2 | Cesbra-Eldorado Unamgen JV (1996 - 2007) |
From 1996 to 1997 the Eldorado JV drilled 61 diamond drill holes (BRAZD143 to BRAZD203) at Aurizona using HQ (63.5 mm) diameter core, the majority of which were collared in the oxide portions of the Piaba and Tatajuba deposits. At Piaba, Eldorado JV drilling extended the deposit strike to the northeast and southwest, as well as demonstrating depth potential with deep holes drilled into fresh rock. The Eldorado JV also drilled 26 RC holes (BRAZP068 to BRAZP092A), mostly in saprolite of the Piaba deposit. Scout drilling was done at several near mine exploration targets, including Boa Esperança, Pé Grande, Ferradura, and Conceição. All this drilling was carried out by a private Brazilian firm, Pesquisas Geológicas Ltda. (Geoserv).
In 1996, Geomag conducted a 22,863 line-km airborne magnetic and radiometric survey at 250 m line spacing. Late in 1997, Eldorado JV shut down their Brazilian exploration efforts due to a downturn in gold prices and conducted no further exploration work on the Property.
In 1999, Cesbra commissioned a gravity pilot plant to test the saprolite and garimpeiro tailings at Piaba. This pilot plant test work was completed in February 2000.
The Property was placed on care and maintenance from 2000 until March 2007, when Luna Gold acquired the Aurizona Project from Eldorado JV and commenced an exploration program. Luna Gold’s exploration work initially focused on the Piaba and Tatajuba deposits including systematic exploration via soil sampling, geologic mapping, geophysical surveying, auger drilling, trenching, DD, and RC drilling.
| | P a g e | 6-3 |
| 04/11/2021 |
| TECHNICAL REPORT ON THE AURIZONA GOLD MINE EXPANSION PRE-FEASIBILITY STUDY |
| 6.3 | Historical Mineral Resource Estimates |
Historical mineral resources at Piaba are displayed for information purposes only, within Table 6-2. The Gencor JV and MASA mineral resources were estimated prior to the institution of NI 43-101 and TR guidelines and are presented for interest only and should not be relied upon. The Eldorado JV mineral resources were also estimated prior to NI 43-101 guidelines and were publicly reported by Eldorado between 2000 and 2005 (Eldorado, 2005). The QP has not done enough work to classify the historical estimates as current Mineral Resources or Mineral Reserves. Equinox is not treating these historical estimates as current Mineral Resources or Mineral Reserves.
Table 6-2: Historical Piaba Deposit Mineral Resources (non-compliant - for information purposes only)
| Source/Year |
Cut-off Au (g/t) |
Measured and Indicated | Inferred | ||||
| Tonnes | Grade Au | Contained | Tonnes | Grade Au | Contained | ||
| (Kt) | (g/t) | Ounces | (Kt) | (g/t) | Ounces | ||
| (Koz) | (Koz) | ||||||
|
Eldorado (2000-2005)(1) |
0.3 | 6.3 | 1.27 | 256 | 4.3 | 1.27 | 178 |
| Cesbra-Eldorado Unamgen JV (2000) | 0.3 | 12.5 | 1.27 | 500 | 8.6 | 1.27 | 350 |
| Cesbra-Gencor Unamgen JV (1995) | 0.75 | 5 | 1.78 | 286 | |||
(1)Eldorado’s Attributable Mineral Resources represent 50% of the total Mineral Resource at Piaba (Eldorado Gold Corp., 2005).
Source: Lycopodium (2017)
| 6.4 | Historical Production |
Historical artisanal mine production from the Property has been from small pits and cannot be quantified.
Production from the Aurizona Mine for the period 2010 to June 30, 2021, is all from the Piaba deposit and is shown in Table 6-3. The mine has produced approximately 594,000 oz (recovered) from 16.0 Mt of ore with an average grade of 1.31 g/t and overall gold recovery of 89%.
| | P a g e | 6-4 |
| 04/11/2021 |
| TECHNICAL REPORT ON THE AURIZONA GOLD MINE EXPANSION PRE-FEASIBILITY STUDY |
Table 6-3: Aurizona Mine Production from the Piaba Deposit from 2010 to 2021
| Description | 2010 | 2011 | 2012 | 2013 | 2014 | 2015 | 2019 | 2020 | H1 2021 | Total |
| Dry Ore (kt) | 747 | 1,276 | 2,155 | 1,934 | 2,014 | 1,010 | 1,926 | 3,267 | 1,629 | 15,958 |
| Au (g/t) | 1.15 | 1.3 | 1.21 | 1.43 | 1.22 | 1.34 | 1.33 | 1.39 | 1.22 | 1.31 |
| Contained Ounces (oz) | 27,642 | 53,313 | 83,709 | 88,854 | 79,008 | 43,392 | 82,522 | 146,450 | 64,126 | 669,016 |
| Recovery (%) | 59 | 78 | 87 | 90 | 87 | 81 | 90 | 90 | 91 | 89 |
| Recovered Ounces (oz) | 15,759 | 43,055 | 74,269 | 79,229 | 74,622 | 42,108 | 75,282 | 130,929 | 59,120 | 594,373 |
Note: There was no production from H2 2015 to May 2019 as the mine was on care and maintenance
| | P a g e | 6-5 |
| 04/11/2021 |
| TECHNICAL REPORT ON THE AURIZONA GOLD MINE EXPANSION PRE-FEASIBILITY STUDY |
| 7 | Geological Setting and Mineralization |
Mineralization on the Aurizona Project consists of structurally-controlled gold deposits hosted by Paleoproterozoic volcano-sedimentary and intrusive rocks of the São Luis Craton. The following section establishes the regional to property-scale context of gold mineralization, along with descriptions of the significant deposits and occurrences.
| 7.1 | Regional Geology |
The region surrounding the Aurizona Project is mostly underlain by the Paleoproterozoic São Luís Craton (“SLC”) and Gurupi Belt which are locally covered by Neoproterozoic-Cambrian sedimentary rocks and cut by Early Cambrian dikes.
The SLC is a Paleoproterozoic fragment of the West African Craton left behind on the South American Platform following the break-up of the Pangea super continent c. 175 Ma (Klein and Moura, 2008). This cratonic fragment underlies a 400 x 120 km area with a long axis trending northwest to southeast. The south-western and eastern margins are bound by the Gurupi Belt while the north-western and eastern sides extend offshore into the Atlantic Ocean and are obscured by unconsolidated sediments.
Lithologies of the SLC are typical of granite-greenstone belts, comprising greenschist-facies volcano-sedimentary sequences intruded by granitoid suites (Figure 7-1 and Table 7-1). The most widespread of the volcano-sedimentary sequences is the 2.23-2.24 Ga Aurizona Group (Klein et al, 2015), which consists of felsic, intermediate, and mafic volcanic and volcaniclastic rocks, as well as metasedimentary rocks. Geochemical work suggests these rocks were generated in an island arc setting (Klein and Moura, 2008) during the accretionary phase (2.15-2.24 Ga) of the Trans-Amazonian/ Eburnean Orogen.
The “granite” component of the SLC is split into older (2.15-2.17 Ga) and younger (2.06-2.09 Ga) granitoid suites, most likely related to the accretion (2.15-2.24 Ga) and collision (2.08 ± 0.02) phases of the Trans-Amazonian/Eburnean orogen, respectively. Older granitoids are dominated by the Tromaí Intrusive Suite, which show major and trace element geochemical signatures consistent with petrogenesis in an intra-oceanic setting that possibly transitioned into a continental margin (Klein et al., 2008). Younger granitoids, like the Negra Velha Granite, have more alkaline geochemistry and higher elemental concentrations of Rb-Sr-B that are consistent with post-orogenic emplacement.
The Gurupi Belt is formed by the Neoproterozoic Gurupi Group and fragments of the same Paleoproterozoic (2.07-2.16 Ga) volcano-sedimentary and intrusive rocks that form the SLC, both of which are cut by small granitoid intrusions dated at 0.73, 0.62 and 0.55 Ga (Klein et al., 2005; Klein and Lopes, 2011; Palheta et al., 2009). The Gurupi Group consists of turbidite with subordinate siltstone, quartzite, and conglomerate (Costa et al., 1996) and is interpreted as a passive margin sequence that was inverted and deformed in the Neoproterozoic to Early Cambrian.
| | P a g e | 7-1 |
| 04/11/2021 |
| TECHNICAL REPORT ON THE AURIZONA GOLD MINE EXPANSION PRE-FEASIBILITY STUDY |
Figure 7-1: Regional Geology of the Aurizona Project Area

Source: Equinox (2021)
Other Neoproterozoic to early Cambrian (c. 0.5-0.7 Ga) sedimentary rocks include the Viseu and Igarapé de Areia formations, both of which comprise arkose sandstone and conglomerate inhabiting fault-bounded extensional basins developed within the SLC (Abreu et al., 1980).
The later stages of Early Cambrian (c. 500-540 Ma) extension are associated with the regional emplacement of northerly striking diabase and microgabbro dikes (Klein et al., 2013).
Doming and uplift that preceded the rifting of the Atlantic Ocean, at c. 175 Ma, is estimated to have eroded more than 6 km of Mesozoic and Paleozoic sedimentary rocks (Rezende and Pamplona, 1970), and exposed the SLC and Phanerozoic sedimentary rocks at surface. Along the coastline, these older rocks are covered with unconsolidated sediments.
The subdued topography and tropical climate have formed a well-developed weathering profile consisting of laterite on the more elevated areas and saprolite extending to depths of up to 100 m below the surface.
| | P a g e | 7-2 |
| 04/11/2021 |
| TECHNICAL REPORT ON THE AURIZONA GOLD MINE EXPANSION PRE-FEASIBILITY STUDY |
Table 7-1: Overview of Main Volcano-sedimentary and Intrusive Units Comprising the São Luís Craton
| Group/Suite | Formation or Unit | Lithology | Age (Ga) |
| Volcano-sedimentary Rocks | |||
| Unspecified | Rosilha volcanic | Felsic volcanic | 2.07 |
| Unspecified | Rio Diamante Formation | Calc-alkaline felsic volcanic | 2.16 |
| Unspecified | Serra do Jacaré volcanic | Andesite, dacite >> mafic volcanic | 2.16 |
| Aurizona Group | Pirocaua Formation | Rhyolite, dacite (calc-alkaline) | 2.23-2.24 |
| Matará Formation | Mafic, ultramafic (tholeiitic) | ||
| Intrusive Rocks | |||
| Unspecified | Negra Velha Granite | Shoshonitic granite | 2.06-2.08 |
| Tracuateua | Collision-type granite | 2.09 | |
| Tromaí | Calc-alkaline granitoid | 2.15-2.17 | |
| Unspecified | “Piaba quartz diorite -like” | Granophyre | 2.21 |
| 7.2 | Project Geology |
| 7.2.1 | Lithology |
The geological map of the Property (Figure 7-2) is based on limited outcrop exposure tied together with regional-scale airborne magnetic surveys, saprolite ± bedrock exposure in artisanal gold mining pits, and exploration drilling (DD and RC). This work has shown that the Aurizona project area is mostly underlain by Paleoproterozoic rocks of the SLC cut by northerly striking andesite dikes.
The SLC in the project area consists mostly of undivided Aurizona Group with subordinate dike-like granitoid intrusions that predate the Tromaí Intrusive Suite (i.e. 2.21 Ga “granophyre” in Table 7-1). The undivided Aurizona Group consists mostly of metavolcanics with lesser abundances of volcaniclastic, sedimentary, and ultramafic rocks. Volcanic rocks are referred to as “diorite” (“DRT”) by MASA geologists and consist mostly of dacitic to andesitic flows. These flows show sharp to gradational contacts with subvolcanic gabbro intrusive rocks (“GBB”) characterized by acicular hornblende crystals 1-2 cm up to 4 cm in length. Metavolcaniclastic rocks (“MVC”) are also of dacitic to andesitic composition.
| | P a g e | 7-3 |
| 04/11/2021 |
| TECHNICAL REPORT ON THE AURIZONA GOLD MINE EXPANSION PRE-FEASIBILITY STUDY |
Figure 7-2: Geology of the Aurizona Project

Source: Equinox (2021)
Sedimentary rocks include chert (“MCH”), rhythmite (“MRC”; or argillite) and greywacke (“MGV”); all of which are locally graphite-bearing. Original sedimentary textures are locally preserved, with some greywacke layers showing graded beds that suggest top-to-the-north facing stratigraphy (Leduc et al., 2015).
Ultramafic rocks (“UMR”) are identified by an abundance of talc, which has a distinct soapy feel, and with four-acid analytical data showing high concentrations of Ni, Mg, and Cr.
Gold mineralization at Piaba and other known deposits and prospects on the Aurizona Property are generally associated with subvertical tabular bodies of quartz diorite (“QDT”; formerly “tonalite”). This lithology is inequigranular with phenocrysts of blue quartz (10-40%) and plagioclase, as well as spherulites and graphic texture that support an intrusive origin (Leduc et al., 2015). Most quartz diorite units are also strongly deformed and altered, obscuring primary lithological texture and mineralogy; they have cataclastic texture, abundant fractures and quartz veins, and strong sericite, silica, and sulphide alteration. Klein et al. (2015) suggest that the quartz diorite unit is an early (2214 ± 3 Ma) subvolcanic intrusion that acted as a locus for later gold mineralization; an alternative interpretation is that quartz diorite is pervasively altered cataclasite derived from Aurizona Group protolith.
| | P a g e | 7-4 |
| 04/11/2021 |
| TECHNICAL REPORT ON THE AURIZONA GOLD MINE EXPANSION PRE-FEASIBILITY STUDY |
Figure 7-3: Cross Section of the Lithological Model through the Piaba Deposit

Source: Equinox (2021)
| | P a g e | 7-5 |
| 04/11/2021 |
| TECHNICAL REPORT ON THE AURIZONA GOLD MINE EXPANSION PRE-FEASIBILITY STUDY |
Table 7-2: Summary of Lithology Codes used on the Aurizona Project
| Unit | Age (Ga) | Lith Code | Lithologic Name |
| No core, undefined | NA | CNR, UND | No core, undefined |
| Man-made sediments | 0 | COL, REJ | "Landfill", "tailings" |
| Overburden | <0.01 | SOL | Soil |
| <0.01? | LAT | Laterite | |
| Diabase dikes | c. 0.54 | AND | Andesite |
| Piaba-like orogenic gold system | c. 2.0 | VQZ | Quartz vein |
| QDT | Quartz diorite | ||
| FQD | Feldspar quartz diorite | ||
| Aurizona Group (undivided) | 2.23-2.24 | DRT | Diorite |
| GBB | Gabbro | ||
| UMR | Ultramafic | ||
| MCH | Chert | ||
| MRC | Rhythmite (or argillite) | ||
| MGV | Greywacke | ||
| MVC | Volcaniclastic | ||
| FLC | Carbonaceous phyllite | ||
| BIF | Banded iron formation | ||
| DAC | Dacite |
The feldspar quartz diorite (“FQD”) unit is spatially associated with quartz diorite and exhibits the same tabular form. Feldspar quartz diorite at the Piaba deposit contains large phenocrysts of feldspar and quartz, whereas at Tatajuba it consists mostly of chlorite with 5-10% blue quartz phenocrysts. Like the quartz diorite unit, the feldspar quartz diorite is either a deformed dike-like intrusive body or pervasively altered Aurizona Group that is marginal to quartz diorite cataclasite.
The contact of the footwall metavolcanic-sedimentary rocks with the overlying quartz diorite is often marked by a fractured zone filled with quartz, sulphide, and carbonate. The contact of the hangingwall diorite unit with the underlying quartz diorite unit is gradational, but locally exhibits thin, ductile shear zones (1-10 m) or fault zones with intense fracturing and infill by carbonaceous-graphitic material. The gold bearing quartz diorite unit is generally strongly silicified, whereas the footwall and hangingwall units are dominated by chlorite alteration.
Andesitic (“AND”) dikes cut across the Aurizona Group, diorite, and quartz diorite units; these dikes are subvertical and northerly striking (i.e.: NNW to NNE) and may comprise part of a regionally extensive diabase and microgabbro swarm emplaced c.0.54 Ga, in the early extensional stages following the Neoproterozoic orogeny that built up the Gurupi Belt (Klein et al, 2013).
| 7.2.2 | Structure |
Structures related to the 2.1-2.2 Ga Trans-Amazonian/Eburnean orogen include several ENE-WSW to NE-SW, steeply north dipping, brittle-ductile shear zones that are sub concordant to Aurizona Group stratigraphy. The best-known of these structures is the ASZ, which hosts the Piaba gold deposit as well as the Tatajuba deposit along strike to the southwest. The ASZ, and presumably other structures of similar age and orientation, are defined by ductile deformation fabrics overprinted by brittle ones, as well as relatively strong alteration and gold mineralization.
| | P a g e | 7-6 |
| 04/11/2021 |
| TECHNICAL REPORT ON THE AURIZONA GOLD MINE EXPANSION PRE-FEASIBILITY STUDY |
Ductile deformation fabrics include penetrative foliation, deformation banding and shear folds (Leduc et al., 2015). Indicators of brittle deformation include cataclastic texture with fractures infilled by hydrothermal and alteration minerals. Alteration assemblages consist of quartz-sericite-carbonate-pyrite in the quartz diorite core of the structure, flanked by chlorite-carbonate +/- epidote (i.e. “total chlorination of mafic rocks”, Leduc et al., 2015) within the adjacent feldspar quartz diorite and/or diorite units. Where wall rocks consist of chert, rhythmite (or argillite) or greywacke, the relative paucity of Fe-Mg minerals results in more abundant carbonate, silica, and/or sericite alteration.
Airborne interpretation, and to a lesser extent drilling, suggest the presence of younger northerly trending faults. There may be a relationship between these faults and northerly trending diabase/microgabbro dikes.
| 7.2.3 | Regolith Profile |
The regolith profile consists of laterite, saprolite, and transition zones. Laterite averages 5 - 6 m in thickness and forms relict plateaus on the more elevated parts of the Property (Figure 7-4). It forms a dark red crust of quartz grains cemented by limonite and/or goethite, with four-acid geochemistry indicating high concentrations of Fe, V, and Cu coupled with low Ca, Mg, Mn, and Na.
The underlying saprolite layer generally averages 45 - 50 m in true vertical thickness. The upper-most part, immediately below the laterite, typically shows a mottled texture. The deepest intercept of saprolite extends to 217 m vertically below the ground surface. Four-acid geochemistry data indicates relatively high Al and Cu coupled with low Ca, Mn, and Na.
The transition zone, which occurs between saprolite and bedrock, is on average approximately 26 - 30 m thick. Geochemistry is comparable to that of the underlying bedrock.
Each regolith domain has unique geochemical signatures, gold distribution, and physical properties including rock strength and density which are discussed in further detail in Section 10 and Section 14.
Table 7-3: Summary of the Piaba Regolith Profile Thickness and Geochemistry
| Unit | Code | Average (m)* | Range (m)** | Max (m) | Geochemistry |
| Laterite | LAT | 5-6 | 1-12 | 25 | High As, Cr, Cu, Fe, S, V; low Ca, Mg, Mn, Na |
| Saprolite | SAP | 45-50 | 14-106 | 217 | High Al, Cr, Cu, K; low Ca, Mn, Na |
| Transition Zone | TRA | 26-30 | 6-69 | 104 | Similar to bedrock |
Average = range of median and mean; range = 5th to 95th percentile
In the eastern end of Piaba there is an aluminum rich horizon in the upper portion of the saprolite. The horizon is 20 - 50 m thick and has a limited extent lateral of 700 - 600 m. It is grade destructive and is abundant in kaolinite clay (Figure 7-4).
| | P a g e | 7-7 |
| 04/11/2021 |
| TECHNICAL REPORT ON THE AURIZONA GOLD MINE EXPANSION PRE-FEASIBILITY STUDY |
Figure 7-4: Cross Section of the Weathering Profile of the Piaba Deposit

Source: Equinox (2021)
| | P a g e | 7-8 |
| 04/11/2021 |
| TECHNICAL REPORT ON THE AURIZONA GOLD MINE EXPANSION PRE-FEASIBILITY STUDY |
| 7.3 | Property Mineralization |
The primary mineralization style on the Property consists of orogenic-style gold deposits, typically associated with the quartz diorite and feldspar quartz diorite units in brittle-ductile structures like the ASZ. Significant gold occurrences in the project area include the Piaba, Boa Esperança, Tatajuba and Genipapo deposits, as well as the Mestre Chico and Micote targets. Each of these is briefly described below.
| 7.3.1 | Piaba |
Piaba is a structurally-controlled, tabular, orogenic gold deposit with a strike length of ~3.3 km, width of 10 - 50 m, and down-dip extent of at least 700 m (Figures 7-3, 7-4 and 7-5), beyond which the deposit is sparsely explored. The deposit is hosted in the brittle-ductile ASZ that is ENE-WSW striking and steeply north dipping to the NNW.
Within the Piaba deposit, the ASZ system is divided into ten shear zones and/or brittle faults, partially segmenting the deposit with limited offsets. The maximum offset observed is 100 m, whereas most offsets are in the order of 10 m. The Pirocaua fault zone at the east-northeast end of the deposit is a significant structure. This brittle fault zone is up to 350 m wide and locally disrupts the Piaba gold zone with a maximum offset of 75 m. At the western end of Piaba on section 1900W there is a northwest striking fault, which truncates the gold zone at depth. Near surface mineralization continues west of the fault in Piaba west area although the possible offset of the mineralization at depth has not been tested.
Mineralization is primarily hosted in the quartz diorite that is also described as a dike-like c. 2.0 Ga granophyric granodiorite (e.g. Freitas and Klein, 2013; Klein et al., 2015) but has also been interpreted as a cataclasite unit. Ore-related alteration includes strong to intense sericite-carbonate-silica-sulphide alteration in the central part of the structure (i.e. in the quartz diorite) flanked by chlorite-dominant alteration in the footwall and hangingwall. Gold occurs in thin, millimetre to centimetre-scale, and quartz -carbonate ± sulphide± tourmaline bearing shear veins. Native gold is rarely observed at wall rock-vein contacts. Sub-horizontal quartz-carbonate extensional veins commonly cut shear veins and can contain gold. Increased vein density and sulphide abundance are the best indicators of gold mineralization.
Fluid inclusion, stable isotope, and radiometric isotope data (Klein et al., 2015) indicate the Piaba deposit was formed from a reduced, low-salinity, aqueous-carbonic metamorphic fluid, with ore deposition occurring at 250-330 °C, 1.25 to 2.8 kbar (c. 4 - 9 km depth), and between 1.98 - 2.01 Ga.
| | P a g e | 7-9 |
| 04/11/2021 |
| TECHNICAL REPORT ON THE AURIZONA GOLD MINE EXPANSION PRE-FEASIBILITY STUDY |
Figure 7-5: Geology of the Piaba Deposit

Source: Equinox (2020)
| 7.3.2 | Boa Esperança |
The Boa Esperança deposit is located approximately one kilometre south of the Piaba deposit and consists of four sub-parallel gold-bearing zones that are continuous along strike for ~1000 m (Figure 7-5). The four gold-bearing zones are each about 5 ± 2 m wide and developed in a corridor ranging from 40 - 75 m in width, narrowing to 20 m at the northeastern end where there are generally just two zones. The four gold bearing zones coalesce within the saprolite and laterite portions of the eastern margin of the deposit. The deposit extends to at least 230 m below the surface and is hosted within a brittle-ductile structure trending ENE-WSW and dipping steeply (80°-90°) to the NNW.
Mineralization is hosted in strongly altered and deformed Aurizona Group rocks, likely derived from the adjacent Aurizona Group diorite, gabbro, and minor metasedimentary rocks. The mineralized corridor shows moderate to strong silica-sericite-albite-carbonate alteration, along with increased disseminated pyrite (2 - 5 modal percent) and density of quartz-carbonate-sulphide veins.
| | P a g e | 7-10 |
| 04/11/2021 |
| TECHNICAL REPORT ON THE AURIZONA GOLD MINE EXPANSION PRE-FEASIBILITY STUDY |
| 7.3.3 | Tatajuba |
The Tatajuba deposit is also hosted within the ASZ, with the eastern end of the deposit located ~2 km west of the western end of the Piaba deposit. The Tatajuba deposit comprises a tabular zone that is east-west striking and steeply north-dipping; the zone measures ~700 m long, 5 - 30 m thick and 300 m in downdip extent. Within the eastern portion of the Tatajuba deposit, the ASZ system is interpreted to be cross-cut by subvertical NNW-trending structures. The maximum offset observed is between sections 200E and 300E, where the deposit is offset by 10 m, through sinistral shearing and/or faulting.
Gold mineralization is hosted in a subvertical to north dipping quartz diorite unit with concordant shear veins and moderately south dipping extensional veins. The quartz diorite shows granular cataclastic texture and is silica-carbonate-sericite-altered, grading outward into strongly chlorite-carbonate-altered rocks. Shear and extension veins are mostly restricted to the tabular quartz diorite unit, with shear veins sub-concordant to this unit and consisting of quartz ± carbonate ± chlorite ± pyrite ± arsenopyrite. Extension veins appear to be moderately south dipping to sub-horizontal and consist of quartz with ~1-10% pyrite. Visible gold occurs in both vein types but is most abundant within the extension veins. Gold values are correlated with arsenic and associated with arsenopyrite.
| 7.3.4 | Genipapo |
The Genipapo North and South deposits are located about one kilometre east of the eastern margin of the Piaba deposit, with Genipapo North approximately 400 m north of Genipapo South. These deposits form in splays off the ASZ. The geology, geochemistry and magnetic data indicate a horsetail structure off the ASZ structure. Numerous fault structures and discontinuous splays of metavolcanoclastic and ultramafic units have been interpreted at Genipapo and the surrounding area. The metavolcaniclastic sequences are comprised of metatuffs, metagraywackes, phyllites and are in fault contact with ultramafic rocks. Gold mineralization is associated with shear-hosted smoky quartz veins and millimetre-scale extensional veins that form a stockwork. The mineralization forms in quartz ± albite ± sericite alteration with pyrite and arsenopyrite minerals. There is a strong correlation between gold and arsenic.
Genipapo North consists of a single mineralized zone that strikes WNW (~295˚) and steeply dips to the NE (~85°). The zone is hosted within a dacite unit with a diorite and metagreywacke. The which is form a well in the regolith profile where the saprolite profile is thickened likely at intersecting structures and alteration. The saprolite profile is thickened likely at intersecting structures and alteration within the dacite. Mineralization has a strike length of 200 m, extends to at least 150 m below the surface, and ranges from 5 - 15 m in width, expanding to 40 - 45 m within the transitional and saprolite weathering zones.
Genipapo South consists of two parallel mineralized zones that have a strike length of roughly 500 m, a steep northerly dip (~80°) and a depth extent to of 130 m. The zones are 3-10 m true width. Gold mineralization is strongly controlled by lithological contact between the diorite and the footwall ultramafic unit, which is reliably tracked with Cr, Mg, and Ni geochemical signatures.
| | P a g e | 7-11 |
| 04/11/2021 |
| TECHNICAL REPORT ON THE AURIZONA GOLD MINE EXPANSION PRE-FEASIBILITY STUDY |
| 7.3.5 | Touro |
Touro is located about 20 km southwest of the Piaba deposit. The Touro deposit is hosted in a coarse-grained DRT and strongly deformed MVC rocks from Aurizona Group. A regional northeast-southwest treading mylonitic shear zone the host rocks which are cut by late andesite and aplite to pegmatite dykes.
The mineralized zone trends 340° and is 600 m long, 130 m thick and roughly 150 m depth extents. Gold mineralization is hosted in albite altered diorite (ADT) with extensional quartz veins system. The ADT unit shows equigranular texture and is composed of albite-silica-sulfide (pyrite ± pyrrhotite ± sphalerite). Extensional veins are the most abundant vein type, composed of quartz ± pyrite ± chlorite ± carbonate that are moderately south dipping to sub-horizontal. Visible gold occurs in both extensional and shear vein types. Gold values are associated with sodium alteration (albite) zones.
Touro area has a long history of artisanal gold production since the second half of 17th century, having unofficial production of ~1 ton gold, according to Geological Survey of Brazil. Currently, artisanal miners have been active in the artisanal pits developed in saprolite domain, using mechanical excavators and gravity concentration after high-pressure water hoses method.
| 7.4 | Prospects/Exploration Targets |
There are numerous gold prospects and exploration targets within the Aurizona Property mineral licenses, many of which are described in previous technical reports (e.g. Lycopodium, 2017; Leduc et al., 2015). There are multiple prospects which occur proximal to the Piaba deposit that are one kilometre to the northwest of the Piaba resource pit on what is interpreted to be splays of the ASZ. These targets include Micote, and Mestre Chico.
| 7.4.1 | Micote |
The Micote target lies ~2.4 km due east of the eastern end of the Piaba deposit and consists of at least two, sub-parallel, mineralized zones that both strike ENE to E-W and dip steeply (75°-80°) to the north. Mineralization occurs along 300 m of strike length but is discontinuous (individual zones range around 110 - 175 m in length). Both mineralized zones are 10 - 15 m wide and are defined to depths of 60 and 130 m below the surface.
Mineralized zones are hosted in a tightly intercalated sequence of diorite, intermediate volcaniclastic, ultramafic, gabbro, argillite, and muscovite schist, with many of these units ranging from 5 - 25 m in thickness. This intercalated nature is consistent with a shear zone-type setting, matching regional trends that suggest the Micote target occurs at a merging of the structures that host the Piaba and Boa Esperança deposits.
Drilling on the Micote targets has returned 3.28 g/t Au over 9.0 m and 1.90 g/t Au over 11.0 m in hole BRAZD554, 84.3 g/t Au over 21.0 m including 1,005 g/t Au over 1 m and 735 g/t Au over 1 m in hole BRAZD612.
| | P a g e | 7-12 |
| 04/11/2021 |
| TECHNICAL REPORT ON THE AURIZONA GOLD MINE EXPANSION PRE-FEASIBILITY STUDY |
| 7.4.2 | Mestre Chico |
The Mestre Chico target lies 2 km ENE of the eastern end of the Piaba deposit. Mineralization is restricted to a single drill section and is either discontinuous or developed on an atypical trend. It is therefore not possible to comment on zonal dimensions or orientation. The target is defined by several closely spaced drill intercepts, drilled in holes which cross the structure from opposite orientations.
Drilling on the Mestre Chico targets has returned 1.05 g/t Au over 30.0 m in hole BRAZD600, 1.56 g/t Au over 16.0 m and 8.50 g/t Au over 5.0 m in hole BRAZD615.
| | P a g e | 7-13 |
| 04/11/2021 |
| TECHNICAL REPORT ON THE AURIZONA GOLD MINE EXPANSION PRE-FEASIBILITY STUDY |
| 8 | Deposit Types |
The main deposit type in the Aurizona project area is greenstone-hosted orogenic gold, a subtype of the larger orogenic class of gold deposits. The deposit summary provided below is based on overview descriptions by Dubé and Gosselin (2007), Goldfarb et al. (2005), Goldfarb et al. (2001), and Groves et al. (1998).
Orogenic gold systems form some of the largest gold deposits and districts in the world (e.g. Kalgoorlie in Australia, Timmins in Ontario, and Ashanti in Ghana). Their name reflects a temporal and spatial association with late stages of orogenesis. Formation of most orogenic gold mineralization was concentrated during the Neoarchean (2.8 to 2.55 Ga), Paleoproterozoic (2.1 to 1.8 Ga), and Phanerozoic (600 to 50 Ma); these periods coincide with major orogenic events. An important subtype of orogenic gold deposits is those that are dominantly hosted by mafic metamorphic rocks in granite-greenstone terranes, referred to here as greenstone-hosted orogenic gold.
Greenstone-hosted orogenic gold deposits are structurally controlled epigenetic deposits. Gold occurs in networks of laminated quartz-carbonate fault-fill veins hosted in moderately to steeply dipping, brittle-ductile shear zones and faults, with locally associated extensional veins and hydrothermal breccias. Most of these deposits are hosted by meta-mafic rocks of greenschist to locally lower amphibolite facies and formed at depths of 5 - 10 km. The relative timing of mineralization is typically syn- to late-deformation and syn- to post-peak metamorphism. They are formed from low salinity, H2O- and CO2-rich hydrothermal fluids with typically anomalous concentrations of CH4, N2, K, and S. Gold may also occur outside of veins within iron-rich sulphidized wall rock.
Orogenic gold systems are typically associated with deep-crustal fault zones that mark the convergent margins between major lithological blocks. Furthermore, some of the largest greenstone-hosted orogenic gold deposits are spatially associated with fluvio-alluvial conglomerate (e.g. Timiskaming conglomerate) distributed along these crustal fault zones (e.g. Destor Porcupine Fault), suggesting an empirical space-time relationship between large-scale deposits and regional unconformities.
Large gold camps are commonly associated with curvatures, flexures, and jogs along these deep fault zones, which created dilational zones and a related increased ingress of hydrothermal fluid. Ore shoots can be localized by dilational jogs or various intersections between a structural element (e.g. fault, shear, vein) and a favourable lithological unit, such as a competent gabbroic sill, an iron formation, or a particularly reactive rock. Individual vein thickness varies from just a few centimetres to over 10 m, developed over widths of up to 1 km, and continuous along strike for as much as 2 - 5 km. Some deposits have been economically mined to depths of 3 km.
The main ore mineral is native gold that is typically associated with pyrite, pyrrhotite, and/or chalcopyrite, along with trace amounts of molybdenite and telluride in some deposits. Arsenopyrite commonly represents the main sulphide phase in amphibolite-facies rocks, and in deposits hosted by clastic sediments. Sulphide minerals generally constitute less than 10%, and typically less than 5%, of the volume of the ore bodies and exhibit little vertical zoning. The main gangue minerals are quartz and carbonate, with variable amounts of white mica, chlorite, tourmaline, and locally, scheelite.
| | P a g e | 8-1 |
| 04/11/2021 |
| TECHNICAL REPORT ON THE AURIZONA GOLD MINE EXPANSION PRE-FEASIBILITY STUDY |
Gold-bearing veins are typically enveloped by alteration halos that in greenschist-facies rocks, grade outwards from iron-carbonate + sericite + sulphide (pyrite ± arsenopyrite) assemblages to various amounts of chlorite, calcite, and locally, magnetite. The dimensions of these alteration haloes vary with the composition of the host rocks and may envelop entire deposits hosted by mafic and ultramafic rocks. Pervasive chromium- or vanadium-rich green micas (fuchsite and roscoelite) and ankerite with zones of quartz-carbonate stockwork are common in sheared ultramafic rocks. Hydrothermal assemblages associated with gold mineralization in amphibolite-facies rocks include biotite, amphibole, pyrite, pyrrhotite, and arsenopyrite; at higher grades they include biotite/phlogopite, diopside, garnet, pyrrhotite, and/or arsenopyrite with variable proportions of feldspar, calcite, and clinozoisite. The variations in alteration styles have been interpreted as a direct reflection of the depth of formation of the deposits.
Exploration drilling on the Aurizona Project is mostly guided by coincident occurrences of gold-in-soil anomalies and faults interpreted from airborne geophysical data. If drilling is undertaken on a target, subsequent drill core logging would then focus on signs of pervasive fault-related hydrothermal alteration, sulphidization, and ideally, gold mineralization.
| | P a g e | 8-2 |
| 04/11/2021 |
| TECHNICAL REPORT ON THE AURIZONA GOLD MINE EXPANSION PRE-FEASIBILITY STUDY |
| 9 | Exploration |
Exploration since 2007 has been operated by MASA working out of the Aurizona Mine camp. The exception is the work performed by AngloGold on the regional greenfields joint venture between 2016 and 2018, which was operated by AngloGold personnel. In May 2016, AngloGold entered into earn-in JV agreement on Equinox’s Greenfields Concessions at Aurizona. The JV covered approximately 1,700 km2 of regional exploration ground (Luna Gold, 2016). Roughly $9 M in expenditures was spent on exploration including completion of more than 43,000 line-kilometres of airborne geophysics, approximately 10,000 m of drilling, and soil geochemistry and geologic mapping surveys. In August 2018, the JV was terminated, and Equinox retained its 100% interest in the greenfield concessions (Equinox, 2018).
Exploration activities on the Property are summarized in Table 9-1, most of which have been focused on the targets which now have Mineral Resource estimates, shown on Figure 9-1 and Figure 9-2. Within this Report, the deposit areas include Piaba, Boa Esperança, Tatajuba, Genipapo and Touro, all of which have sufficient drill density to support Mineral Resource estimates. Other near mine and greenfields targets with drilling are tabulated in the regional drilling within Section 10.3.
| | P a g e | 9-1 |
| 04/11/2021 |
| TECHNICAL REPORT ON THE AURIZONA GOLD MINE EXPANSION PRE-FEASIBILITY STUDY |
Table 9-1: Summary of Exploration Activities to April 2021
| Historic | 2007 | 2008 | 2009 | 2010 | 2011 | 2012 | 2013 | 2014 | 2015 | 2016 | 2017 | 2018 | 2019 | 2020 | 2021 | TOTAL | |
| Surface Sampling | |||||||||||||||||
| Soil
Sampling (samples) |
23,484 | 2,500 | 3,041 | 15,142 | 19,148 | 9,074 | 3,408 | 308 | 4,176 | 2,875 | 682 | 1,400 | 85,238 | ||||
| Rock
Sampling (samples) |
738 | 13 | 106 | 87 | 171 | 267 | 957 | 151 | 551 | 362 | 23 | 213 | 253 | 8 | 3,900 | ||
| Channel
Sampling (metres) |
128 | 1,944 | 231 | 145 | 157 | 97 | 291 | 457 | 3,450 | ||||||||
| Trenching (metres) | 3,187 | 253 | 3,440 | ||||||||||||||
| Geophysical Surveys | |||||||||||||||||
| Airborne
Magnetics/ Radiometrics (line km) |
23,908 | 37,726 | 61,634 | ||||||||||||||
Airborne EM (line km) |
5,586 | 5,586 | |||||||||||||||
| Ground
Magnetics (line km) |
50 | 265 | 236 | 249 | 19 | 819 | |||||||||||
IP (line km) |
9 | 34 | 43 | ||||||||||||||
| | P a g e | 9-2 |
| 04/11/2021 |
| TECHNICAL REPORT ON THE AURIZONA GOLD MINE EXPANSION PRE-FEASIBILITY STUDY |
Figure 9-1: Map of Exploration Targets, Gold Deposits, and Artisanal Workings

Source: Equinox (2021)
| | P a g e | 9-3 |
| 04/11/2021 |
| TECHNICAL REPORT ON THE AURIZONA GOLD MINE EXPANSION PRE-FEASIBILITY STUDY |
Figure 9-2: Map of Regional Exploration Targets, Gold Deposits, and Artisanal Workings

Source: Equinox (2021)
| 9.1 | Grids and Surveys |
Starting in 2019, a monthly scan of the topography, pit and stockpiles is completed using a Riegl VZ1000 laser scanner which produces high resolution point cloud. The end of month surveys for the Aurizona Mine are completed using this methodology. There is laser scan survey for Touro from late 2019 which captures the current topography and artisanal workings and settling ponds.
A one-centimetre resolution Lidar survey was flown from December 15 - 16, 2017, by Industrial Air Services (SAI) from São Paulo, Brazil (Moreira, J., 2018). The survey covers 35 km2 over Piaba, Boa Esperança, Genipapo resource pits and mine infrastructure but was not extended to the west to capture Tatajuba. Survey data was collected and processed by SAI with deliverables including a text file point cloud and registered orthophotos.
A 2014 LIDAR survey was completed with 0.5 m resolution. The survey covered 200 km2 including all of the mining licence and the mining licence application.
| | P a g e | 9-4 |
| 04/11/2021 |
| TECHNICAL REPORT ON THE AURIZONA GOLD MINE EXPANSION PRE-FEASIBILITY STUDY |
| 9.2 | Geological Mapping and Rock Sampling |
Geological mapping has been carried out alongside other regional exploration activities, at Piaba, Boa Esperança, Tatajuba, Genipapo, Touro, Mestre Chico, Micote and other prospects. Although outcrop mapping is limited due to mature weathering profile, exposures can be found within artisanal mining pits, along rivers and on hill tops. Outcrop mapping has been supplemented with several property-scale litho-structural interpretations generated from the 2017 aeromagnetic and radiometric data (Figure 9-3).
Figure 9-3: Litho-Structural Interpretation of the Aurizona Property

Source: Equinox (2020)
Rock samples collected during mapping exercises are submitted to an analytical lab for gold assay on a 30 g aliquot by fire assay with an AAS finish. Prior to analysis, the sample is weighed, dried (110°C), crushed to better than 70% passing a 2 mm screen, then split into a 0.250 kg fraction that is pulverized to >85% passing a 75-micron mesh.
| | P a g e | 9-5 |
| 04/11/2021 |
| TECHNICAL REPORT ON THE AURIZONA GOLD MINE EXPANSION PRE-FEASIBILITY STUDY |
| 9.3 | Geochemical Sampling |
Equinox has completed several soil sampling programs with the objectives of identifying new targets and refining the footprint of known surface gold anomalies. Areas covered include Piaba, Boa Esperança, Tatajuba, East Brownfields, Touro, Ferradura, Delta and numerous other prospects. These programs are supervised by trained mining technicians who also map the soil and laterite profiles and collect prospecting samples. Soil samples are collected at a nominal depth of 50 cm, typically at 25 m sample spacing and on grid lines spaced 100 m apart. These lines have been surveyed in with a handheld GPS. Most soil surveys were done prior to mechanized artisanal mining in the region and as such, are considered uncontaminated and useful for targeting.
Soil samples are submitted to an analytical lab where they are first weighed, dried (110°C), crushed to >70% passing a 2 mm screen, split into a 0.250 kg fraction, and then pulverized to >85% passing a 75-micron screen. A 50 g aliquot is then analyzed for gold by fire assay with AAS finish.
| 9.4 | Geophysics |
| 9.4.1 | Airborne Geophysical Surveys |
In January 2010, Equinox retained Reconsult Geofísica Ltda. (“Reconsult”) to reprocess and interpret the historical airborne magnetic and radiometric survey data collected by Unamgen in 1991 and 1996. Both surveys were reprocessed and merged using Geosoft Oasis Montaj 7.1.1, followed by interpretation and integration with existing geological maps and databases in order to improve the understanding of geology and the controls on gold mineralization. The magnetic data was most useful for this purpose as it helped to define a regional geologic and structural framework that guided exploration efforts until late 2016. Radiometric data, on the other hand, generally failed to penetrate through laterite and unconsolidated sediments, and so mostly shows drainage patterns and differences in the cover sequences
Between November 17, 2016 and March 16, 2017, Compagnie Générale de Géophysique (CGG) conducted a high-resolution airborne magnetic gradient and gamma-ray spectrometry survey, on behalf of AngloGold, over the Tromaí area (CGG, 2017a). The survey was performed at 100 m line spacing for a total of 37,726 line- km, covering all of Equinox’s exploration licenses at that time (Figure 9-4). The survey was collected, verified, and processed by CGG.
| | P a g e | 9-6 |
| 04/11/2021 |
| TECHNICAL REPORT ON THE AURIZONA GOLD MINE EXPANSION PRE-FEASIBILITY STUDY |
Figure 9-4: Total Magnetic Intensity Map from 2017 Regional Airborne Magnetic Survey

Source: Equinox (2020)
CGG completed an airborne magnetic and HELITEM survey between July 2 and August 7, 2017 on behalf of AngloGold (CGG, 2017b). This survey was based out of Godofredo Viana, Maranhão, and covered 5,585.5 line-km at a line spacing of 200 m. Data for this survey was also collected, verified, and processed by CGG.
| 9.4.2 | Ground Geophysical Surveys |
To refine drill targeting of airborne magnetic surveys, Equinox has conducted numerous ground magnetic surveys using trained company employees and company-owned equipment. These surveys were done with GSM-19 v7.0 Overhauser magnetometers running Novatel SuperStar II global positioning system (GPS) board adaptation kits. One unit served as a permanent base station whereas two other units were used to collect magnetic data over target areas. Collected data were processed by Reconsult. To date, ground surveys have been completed over several targets that include Tatajuba, Ferradura, Conceição, São Lourenço, Micote, Genipapo, and Barriguda.
In 2012 and 2013, the Company contracted Fugro to carry out an orientation study of ground-based IP surveying at the Eastern Brownfields northeast of Piaba and Touro. Several IP anomalies were subsequently tested with no significant results.
| | P a g e | 9-7 |
| 04/11/2021 |
| TECHNICAL REPORT ON THE AURIZONA GOLD MINE EXPANSION PRE-FEASIBILITY STUDY |
| 9.5 | Pits and Trenches |
Equinox has completed a total of 3,440 m of trenching. These trenches are generally oriented perpendicular to the gold-in-soil anomalies they are testing and are generally dug to a depth of 3 - 5 m. Trenches are dug by excavator under MASA supervision. Detailed trench mapping and sampling is completed in each excavation. Sampling contiguous panels along the trench walls is the common sampling technique with analytical procedures consistent with rock sampling described in Section 9.2.
| | P a g e | 9-8 |
| 04/11/2021 |
| TECHNICAL REPORT ON THE AURIZONA GOLD MINE EXPANSION PRE-FEASIBILITY STUDY |
| 10 | Drilling |
Equinox has drilled extensively on the Piaba, Boa Esperança, Tatajuba, Genipapo and Touro deposits (Table 10-1 and Figure 10-1) in addition to regional exploration targets. Drill density on the regional exploration targets ranges from cursory to delineation-type drilling. In 2020, MASA drilled 65 diamond drillholes for a total of 25,943 m at Piaba that have been used to support the underground resources for this Study.
Diamond and RC methods are employed at the exploration stage, along with auger drilling, to locate near surface mineralization and test mineralized trends. Grade control drilling within the Piaba open pit operation and at Boa Esperança is done with RC methods.
Table 10-1: Summary of Aurizona Drilling by Deposit and Drill Type
| Area | Number of Holes | Total Metres | Number of Diamond Holes | Total Diamond Metres | Number of RC Holes | Total RC Metres |
| Piaba | 792 | 135,208 | 553 | 122,775 | 239 | 12,434 |
| Boa Esperança | 115 | 9,568 | 15 | 2,790 | 100 | 6,778 |
| Tatajuba | 101 | 14,073 | 101 | 14,073 | ||
| Genipapo | 132 | 11,285 | 33 | 3,602 | 99 | 7,684 |
| Touro | 42 | 8,809 | 42 | 8809 |
Drilling has been completed by two different operators: Unamgen and Equinox through MASA. The drilling executed by MASA makes up the significant proportion of total metres drilled at the Aurizona Project (Table 10-2) greater than 87% of the metres contributing to the resource databases for Piaba, Boa Esperança, Genipapo and Touro. For Tatajuba, 78% of the resource database is comprised of Equinox operated data.
| | P a g e | 10-1 |
| 04/11/2021 |
| TECHNICAL REPORT ON THE AURIZONA GOLD MINE EXPANSION PRE-FEASIBILITY STUDY |
Table 10-2: Summary of Drilling by Operator
| Meters Drilled by Equinox |
Equinox 2007-2021 |
Unamgen 1991-1997 | |||
| Area | Percentage | Number of Holes | Total Metres | Number of Holes | Total Metres |
| Piaba | 87% | 597 | 117,917 | 195 | 17,292 |
| Boa Esperança | 92% | 106 | 8,794 | 9 | 774 |
| Tatajuba | 78% | 69 | 11,006 | 32 | 3,067 |
| Genipapo | 93% | 120 | 10,534 | 12 | 752 |
| Touro | 58% | 42 | 8,809 | ||
The pre-2007 Unamgen data was comprised of hardcopy records that were stored at the Project exploration office. These records have been digitized and verified by MASA, with verification including cross-validated duplicate data entries, spot checking, and rectification of incongruencies.
Figure 10-1: Map of Aurizona Deposit Drilling

Source: Equinox (2021)
| | P a g e | 10-2 |
| 04/11/2021 |
| TECHNICAL REPORT ON THE AURIZONA GOLD MINE EXPANSION PRE-FEASIBILITY STUDY |
| 10.1 | Exploration Drilling |
Exploration drilling is operated out of the Aurizona Mine camp, managed by MASA personnel and guided by established protocols. The operations and grade control drilling are supported from a gated compound that includes offices and an open-air, core logging and storage facility.
| 10.1.1 | Drill Responsibilities |
The exploration manager is responsible for drill hole planning which is typically done in collaboration with project geologists. Drill programs are approved by the EVP Exploration. The exploration manager is responsible for designing drill holes that are consistent with the objectives of the exploration program, with the location and orientation of these holes then passed on to the project geologists and senior technicians.
Prior to drilling, the senior mining technician liaises with landowners to discuss the program and obtain their authorization for the drill to mobilize onto their property. If the landowner is agreeable, the exploration manager obtains the required permits and a field visit is made to document and photograph the planned drill site, vegetation type, proximity to any preserved areas, and access. Drill pads and access routes are constructed to minimize impact to the environment and landowners.
Drilling and drill mobilization are monitored by MASA, including daily checks to ensure all personnel and contractors are equipped with personal protective equipment and all tools and ancillary equipment are in good working order.
The exploration manager and project geologists are responsible for ensuring logging geologists and technicians are aware of, and follow, the logging, sampling, and sample shipment procedures, including security and chain of custody procedures. From 2007 - 2017, all logging, sampling, and shipment data was recorded on paper templates that were then digitally captured in Datamine’ s Fusion database system. Starting in 2018 this data was entered directly into a tablet computer using MX Deposit logging software, which also serves as the database platform for the Project.
Transportation Procedures
The drilling contractor is responsible for transporting the diamond drill core or RC samples from the drill site to the core facility. Core or RC chips are secured and covered prior to transport along local and mine roads, to minimize or eliminate shifting, or loss of material. Equinox staff help to unload and examine the quality of the delivered drilling materials.
Location Procedures
Drill collar casings are capped, and the locations are marked with a labelled cement monument. Hole collar locations are surveyed using a Total Station to achieve sub-metre accuracy for all coordinates. Downhole surveys from 2017 - 2021 were conducted using Reflex Gyro with readings every 3 m. From 2015 - 2016, downhole surveys were completed with a Reflex Maxibor II or Reflex EZ-Trac tool recording measurements every 3 m downhole. Prior to 2015, drill holes were surveyed at 30 - 50 m intervals using a variety of tools, including Reflex EZ shot, Tro-Pari, Sperry Sun, and Peewee instruments.
| | P a g e | 10-3 |
| 04/11/2021 |
| TECHNICAL REPORT ON THE AURIZONA GOLD MINE EXPANSION PRE-FEASIBILITY STUDY |
| 10.1.2 | Diamond Drilling |
Geotechnical Procedures
All drill core is prepared by a trained technician prior to geological logging and sampling. This preparation work includes reassembly and orientation of drill core pieces, washing drill fluids or dirt off of core, checking and correction of block errors, drawing bottom of hole core orientation marks on core, measuring offset angles of bottom of hole marks (interlock angles), and placing down-hole metre marks. The technicians also measure core recovery, rock quality designation, and magnetic susceptibility. All downhole measurements are collected to the nearest centimetre. Each core box is permanently labelled with the drill hole number, box number, and depth interval using permanent marker. The core is stored in racks at the core storage facility.
Geological Logging
Core is logged for lithology, weathering profile, alteration minerals, mineralization, and vein style, and density. Geological boundaries and annotations are marked with grease pencils on the portion of core that is retained in the box after cutting and sampling. Lithologies are split out for intervals greater than 1 m in core length unless they are of geological significance, in which case shorter intervals are allowed. Mineralized veins, with a minimum width of 20 cm, are captured in the veining table. Samples for point load testing and bulk density determination intervals are marked by the logging geologist after the geological logging is complete.
Structural Data
As of 2015 all diamond drill core has been oriented with the Reflex ACTII core orientation tool, allowing for true orientation measurements of structures and veins. Data capture also includes tracking the quality (or confidence) of the orientation data by recording the quality of the orientation line, lock angle, and whether the interval is oriented or lost. Select measurements are verified with a “rocket launcher”, which recreates the position of the drill core in the hole. The structural data is reviewed and analysed using stereonets and software with 3D visualization capabilities.
Photography
All drill core is systematically photographed in dry and wet states, and in a dedicated photo room with a mounted digital camera. Digital photos are saved on the server and named with the hole ID, box number, and downhole depth. Prior to 2007, core photographs were printed and stored in photo albums.
| 10.1.3 | RC Drilling |
MASA has completed several RC drill programs at the Project since 2011. Drill cuttings samples are collected at continuous 1 m intervals in large plastic sacks. Samples are not split on site; the entire sample is sealed, labelled, and shipped to the commercial sample preparation laboratory following Equinox’s chain of custody procedures.
| | P a g e | 10-4 |
| 04/11/2021 |
| TECHNICAL REPORT ON THE AURIZONA GOLD MINE EXPANSION PRE-FEASIBILITY STUDY |
Geological Logging
The chip logging consists of a mesoscopic petrographic description of lithology, color, regolith profile, grain size, mineral assemblage, and textures/structure.
| 10.1.4 | Piaba Drilling |
The azimuth of drill holes at Piaba is mostly from northwest to southeast on sections trending 030° and spaced 50 m apart. Some sections have holes drilled from southeast to northwest to scissor and drill somewhat along the dip of the steeply north dipping gold zone. The dominant core size is a variant of HQ though some holes (N=74) are collared with PQ and reduced to HQ.
Seventeen holes were drilled for geotechnical purposes, totalling 2,275 m. No dedicated metallurgical holes were drilled, with all metallurgical composites taken from exploration and resource definition holes.
| 10.2 | Grade Control Drilling |
Grade control drilling at Piaba and Boa Esperança is done with RC drilling (Table 10-3). Grade control drilling at Piaba can be split into two phases. Phase 1, from 2012 to 2014, supported the first phase of mining and involved drilling of 14,851 vertical RC holes between 1 - 71 m in length, for a total of 194,860 m. Phase 2 represents the grade control drilling associated with the resumption of Piaba mining operations in 2018, with data in this report tabulated from January 2018 to a data cut-off of December 16, 2020. This phase involved drilling of 3,502 holes for a total of 82,885 m at Piaba and of 495 holes for a total of 15,919 m at Boa Esperança. Grade control drilling is ongoing at Piaba.
The RC holes are drilled on a nominal 5 x 10 m grid that covers the gold zone and adjacent wall rocks. The hole locations are surveyed prior to drilling using a real time kinetic global positioning system (RTK GPS). Hole depths average 30 m with a maximum of 120 m. The bulk of the Phase 2 holes (72%) are vertical holes and with the remainder angled drilled at inclinations between -47˚ and -83˚. The Boa Esperança grade control drilling is dominantly vertical holes and with some angled drilling at inclinations between -55˚ and -61˚ The RC holes are not surveyed with downhole tools.
Table 10-3: Summary of the Piaba Grade Control Drilling
| Years / Drill Type | Number of Holes | Total Meters |
| Phase 1: 2012-2014 | 14,851 | 164,065 |
| RC | 14,851 | 164,065 |
| Phase 2: 2018-2020 | 3,989 | 127,021 |
| DDH | 3 | 300 |
| RC | 3,986 | 126,721 |
| Boa Esperanca | 495 | 15,919 |
| RC | 495 | 15,919 |
| | P a g e | 10-5 |
| 04/11/2021 |
| TECHNICAL REPORT ON THE AURIZONA GOLD MINE EXPANSION PRE-FEASIBILITY STUDY |
| 10.3 | Regional Exploration Drilling |
In addition to the extensive drilling carried out on the Piaba, Boa Esperança, Tatajuba and Genipapo deposits, Equinox has completed a significant amount of RC and DD on regional targets as summarized below in Table 10-4. The procedures for drilling are consistent with those outlined in Section 10.1.
Table 10-4: Summary of Regional Aurizona Exploration Drilling by Area
| Target | Number of Holes | Total Meters |
| Boa Esperança Trend | 27 | 2,150 |
| East Brownfields | 65 | 7,002 |
| Ferradura Trend | 107 | 9,798 |
| Tatajuba North Area | 14 | 1,628 |
| Other Targets | 65 | 5,991 |
| Total | 278 | 26,567 |
Figure 10-2: Map of Regional Drilling

Source: Equinox (2021)
| | P a g e | 10-6 |
| 04/11/2021 |
| TECHNICAL REPORT ON THE AURIZONA GOLD MINE EXPANSION PRE-FEASIBILITY STUDY |
| 10.4 | Auger Drilling |
Auger drilling is logistically simple and has been successful in defining sub-cropping mineralization within laterite and saprolite. Several auger drilling campaigns have been completed using company-owned, motorized, Honda auger drills fabricated by Trado Equipamentos e Servicios Ltda (Table 10-5). Initial auger drill programs were focused on condemnation drilling of areas intended for mine infrastructure (plant site, waste, and tailings storage). Subsequent auger drill programs were focused on the systematic testing of the near-mine targets lying on structural lineaments that host, or are parallel to, the Piaba, Boa Esperança, and Tatajuba gold zones. Auger drill teams are supervised by trained mining technicians. Holes are drilled to a typical depth of 10 m within laterite and/or saprolite. Samples are collected at 1 m intervals using a 10.16 cm diameter collector and with average sample weights of 16 kg.
Table 10-5: Summary of Auger Drilling on the Aurizona Property
| Area | Number of Holes | Total Metres |
| Piaba Trend | 177 | 1,569 |
| Tatajuba Area | 802 | 6,897 |
| East Brownfields Area | 525 | 3,815 |
| Boa Esperança Trend | 234 | 1,911 |
| Ferradura Trend | 197 | 1,819 |
| Touro Area | 804 | 5,677 |
| Other Near Mine Targets | 1,650 | 11,858 |
| Total | 4,389 | 33,546 |
| 10.5 | Data Adequacy |
It is the QP’s opinion that the drilling procedures are adequate to support Mineral Resource estimation. There are no known drilling or sampling factors that could materially impact the accuracy and reliability of the results.
| | P a g e | 10-7 |
| 04/11/2021 |
| TECHNICAL REPORT ON THE AURIZONA GOLD MINE EXPANSION PRE-FEASIBILITY STUDY |
| 11 | Sample Preparation, Analyses, and Security |
| 11.1 | Historic Sampling Methods |
The sampling methods employed by Unamgen, operating on behalf of both Gencor and Eldorado, were not documented. Equinox employs senior mining technicians who worked for Unamgen in the 1990s who state that the Unamgen methodology for sampling core was similar to that currently used by Equinox. Core recovery was calculated as recovered length divided by drilled length and RC recovery was calculated as the sample weight divided by the representative weight of 1 m of sample.
Unamgen’s diamond drill core sampling procedure was also similar to the current Equinox procedures, which are outlined in Section 10.1.2. RC sampling was conducted at 1 m intervals. For the initial Unamgen RC drill holes, the samples were homogenized at the drill site via cone and quartering with one quarter of the samples sent to the lab. For RC drill holes, drilled from 1991 - 1996 the whole sample was homogenized and split at the Aurizona sample preparation facility prior to being sent for assay.
| 11.1.1 | Assaying |
Following sample preparation (i.e.: crushing and pulverizing) at the Aurizona sample preparation facility, approximately 120 g aliquots of each sample were shipped to an independent commercial laboratory. Gencor samples were assayed by Nomos Laboratories (Nomos) in Rio de Janeiro, Brazil whereas Eldorado samples were assayed by Bondar Clegg Laboratories (Bondar Clegg) in Luziânia, Brazil. All historical drill samples were analyzed by fire assay with atomic absorption (AA) finish on a 50 g sample. Original assay certificates are available for all historical drill samples. In addition, approximately 70% of all historical reject and pulp samples are preserved and stored in the Aurizona core processing facility.
| 11.1.2 | Quality Assurance/Quality Control |
Gencor and Eldorado both operated QA/QC programs on their drilling programs which involved the insertion of blank and reference material (RM) samples in all sample batches. In addition, some samples were sent to a second laboratory for check assays. Audit checks were carried out on the assay laboratories by Gencor and Eldorado staff. The historical drill database contains approximately 5% of internal QA/QC sample for Piaba.
Gencor and Eldorado developed several RM for gold during their drill programs. The samples were prepared from reject material and drill core in their sample preparation laboratory and sent to several commercial laboratories for round robin analysis. Mean gold values were calculated by Nomos but standard deviations were neither calculated nor documented.
Gencor and Eldorado used alluvial quartz sand for the blank material in all drill programs. Gencor and Eldorado also sent samples to Bondar Clegg and Nomos for check analyses. The results of these check assay programs are not available.
| | P a g e | 11-1 |
| 04/11/2021 |
| TECHNICAL REPORT ON THE AURIZONA GOLD MINE EXPANSION PRE-FEASIBILITY STUDY |
| 11.2 | Equinox Sampling Methods |
The project geologist is responsible for ensuring the sampling procedure is carried out to the specifications required by the exploration manager.
Sample interval selection is the responsibility of the logging geologist. Sample intervals are a nominal 1 m length, but may range from 0.3 m to 4.0 m, and can cross geological boundaries.
The geologist marks the sample intervals on the core box core using red grease pencils. The core orientation line is drawn with arrows pointing downhole. The cut line is drawn so that it is perpendicular to the predominant fabric in the rock, to the right of the orientation line in an attempt to preserve the orientation line.
Drill core is cut with an electric core saw. Saprolite and similar softer material (i.e. fault gouge) is cut manually with a large knife or machete, as it is susceptible to washing away during cutting. The saw and knife/machete are washed with water between each sample interval. Core is consistently sampled on the same side (right of the red line) with the remaining half of the core stored in the box as a record. Samples are placed in pre-labelled polythene bags which are double bagged for added security. Each sample is given a unique pre-numbered, barcoded Tyvek sample tag that starts with the prefix “DH-“. For each sample, the sampler notes hole ID, depth, sample type, and interval in both the sample book and on the sample record form. One sample ticket number is placed inside the bag and another outside the sealed bag. Internal QA/QC samples (blanks, CRMs, and quarter core duplicates) are assigned routine DH-numbers and inserted at regular intervals into the sample stream. Insertion of these QA/QC controls is the responsibility of the core logging geologist. Core and QA/QC samples are placed into individual sample bags that are then collated into rice sacks, sealed, addressed, and compiled into batches for shipment to the lab. The sample sequence, including QA/QC samples, is recorded on paper records, and then entered into the database. After the drill core has been sampled, it is stored in the core storage facility for future reference.
RC samples are collected at the drilling rig by the drilling contractor. The entire sample representing 1 m is collected and no sample processing or splitting is conducted at the drill site. The samples are then directly shipped to the commercial assay laboratory where they are dried and processed with the same methods as the drill core samples. Blanks and CRMs are inserted at the same intervals as drill core sampling and are placed in tagged bags that accompany the primary samples. Since the entire drilled sample is collected and submitted to the laboratory, field duplicates are not collected for RC. Current laboratory preparation and analysis procedures are discussed in Section 11.4
| 11.2.1 | Sample Security & Transport |
After the cutting and bagging of samples, sample shipments are prepared in labelled sacks with seals. Each shipment is accompanied with a physical sample list and laboratory requisition form that are also submitted to the laboratory via email.
Sample shipments are transported by a commercial transport company directly from the core facility to the preparation laboratory. Each truck provides daily location and security updates as it travels to the laboratory. Upon arrival, the laboratory cross-checks the samples received against the sample shipment list and informs the database manager of any discrepancies. Hard copy records of requisition forms, delivery reports, and work order reports is maintained at the project site.
| | P a g e | 11-2 |
| 04/11/2021 |
| TECHNICAL REPORT ON THE AURIZONA GOLD MINE EXPANSION PRE-FEASIBILITY STUDY |
| 11.3 | Equinox Analytical and Test Laboratories |
Equinox has used ACME Analytical Laboratories Ltd (ACME, now Bureau Veritas) and ALS as its primary independent laboratories (Table 11-1). Samples submitted to ACME were delivered to Maraba, Brazil for sample preparation and then sent to Vancouver, Canada for analysis. Equinox used ALS in Belo Horizonte, Brazil, as its secondary independent laboratory for analytical work done in 2007. Since January 2008, Equinox has been using ALS in Belo Horizonte and Goiania, Brazil as its primary preparation facility and ALS in Lima, Peru, and Perth, Australia, as its primary assay laboratory. From September 2011 - December 2011 Equinox also used ACME labs in Goiania and Santiago, Chile due to backlogs at ALS. Starting in 2015, pulps were sent to ALS in North Vancouver, Canada for multi-element analysis by four acid digestion.
Table 11-1: Assay Labs Used by Equinox
| Campaign | Primary Lab | Primary Prep Lab | Umpire Lab | Multi-Element |
| 2007 | ACME - Vancouver, Canada | ACME - Maraba, Brazil | ALS - Belo Horizonte, Brazil | ACME - Vancouver, Canada |
| 2008-2020 | ALS -Lima, Peru/Perth, Australia | ALS - Belo Horizonte/Goiania, Brazil | ALS - North Vancouver, Canada | |
|
2011 (Sept- Dec) |
ACME - Santiago, Chile/Goiânia, Brazil |
ACME Vancouver is accredited under the general ISO 9001:2000 regulations. ALS labs in Peru, Brazil, and Chile have ISO 17025:2005 and ISO 9001:2008 accreditation. The Australian and Canadian ALS facilities have ISO 17025:2005 and ISO 9001:2008 accreditation.
Each of the labs used for exploration drilling and surface samples is independent of Equinox.
| 11.4 | Equinox Sample Preparation and Analysis |
| 11.4.1 | Sample Preparation |
Sample preparation procedures involve crushing to a minimum of 80% passing 10 mesh for all drill core samples, followed by sample pulverization to greater than 85% passing 200 mesh for all drill core pulps. Pulp aliquots are generally 250 g to better address any coarse gold associated with high-grade quartz veins; however, ACME used 500 g splits during analysis work in 2007.
RC samples are weighed, dried (110°C), and crushed to better than 70% passing 2 mm, then split into a 1 kg subsample that is pulverized to >85% passing a 75 μm screen.
| 11.4.2 | Assay |
Analytical method and detection limits are summarized in Table 11-2.
| | P a g e | 11-3 |
| 04/11/2021 |
| TECHNICAL REPORT ON THE AURIZONA GOLD MINE EXPANSION PRE-FEASIBILITY STUDY |
Table 11-2: Summary of Analysis
| Year | Primary Lab | Method | Element | Preferred Method Ranking | Description | Lower Detection Limit (g/t) | Upper Detection Limit (g/t) |
| 2007 | ACME | G6 | Au | 2 | 30 g fire assay with AAS finish | 0.01 | 10.00 |
| 2007 | ACME | G6 | Au | 1 | 30 g fire assay with gravimetric finish | 0.01 | 10,000 |
| 2008-2017 | ALS | Au-AA23 Au-AA24 | Au | 4 | 30 g fire assay with AAS finish 50 g fire assay with AAS finish |
0.005 | 10.00 |
| 2008-2020 | ALS | Au-AA25 Au-AA26 | Au | 3 | 30 g fire assay with AAS finish (ore grade) 50 g fire assay with AAS finish (ore grade) |
0.01 | 100.00 |
| 2008-2016 | ALS | Au-GRA21 | Au | 2 | 30 g fire assay with gravimetric finish | 0.005 | 10,000 |
| 2017-2020 | ALS | Au-SCR21 | Au | 1 | 1 kg pulp screened to 100 μm. Duplicate assay on screen undersize. Assay of entire oversize fraction. 30 g nominal sample | 0.05 | 100,000 |
| 2016-2020 | ALS | ME-ICP61 | Multi | 0.5 g Four-acid digest with ICP-AES finish | Various | Various |
| | P a g e | 11-4 |
| 04/11/2021 |
| TECHNICAL REPORT ON THE AURIZONA GOLD MINE EXPANSION PRE-FEASIBILITY STUDY |
Drill core samples prepared by ACME in Maraba, Brazil, a 125 g aliquot of each sample was pulverised and shipped to ACME’s analytical facilities in Vancouver, Canada or Santiago, Chile via international courier. All drill samples assayed by ACME were analyzed in sequential order via Method Group 6 (FA on a 30 g sample with AA finish). Over limit samples, which returned >10 g/t Au, were all re-analysed via gravimetric gold analysis.
For all drill core samples prepared by ALS, approximately 150 g aliquot of each sample was shipped to ALS analytical facilities in Lima, Peru or Perth, Australia. Starting in 2008, ALS prepared samples in Belo Horizonte and then the preparation lab shipped the pulps to the assay lab in Lima, Peru for fire assay. All drill samples were analyzed in sequential order via package AA23 (fire assay on a 30 g sample with AAS finish or Au-AA24 (fire assay on a 50 g sample with AAS finish). Over limit samples (>10 g/t Au) were re-assayed with method AA25 (ore grade fire assay on a 30 g sample with AA finish) or Au-AA26 (50 g aliquot by fire assay with AA finish) respectively. Over limit samples that returned >100 g/t Au were re-assayed by method Au-GRA21 (30 g fire assay with gravimetric finish). Starting in 2017, samples that assayed >10 g/t were sent for screen fire assay to address the presence of coarse gold (Au-SCR21). These screen assays are done on a 1 kg pulp with a nominal 30 g sample aliquot. Starting in 2015, pulps were also submitted to ALS in North Vancouver, Canada for 33 multi-element analysis by four acid digestions with ICP-AES finish.
In the assay database compiled by MASA, the ACME and ALS assay methods are each ranked by the preferred assay method of most to least representative (Table 11-2). The methods are prioritized as follows: screen fire assay over gravimetric finish followed by ore grade fire assay with AAS finish over exploration grade fire assay with AA finish.
Reject and pulp samples are returned to Equinox on a regular basis and kept in the Aurizona core storage facility for future reference.
| 11.5 | Quality Assurance/Quality Control |
Equinox has conducted QA/QC monitoring of gold assays on all of its drill programs by inserting blanks, CRMs, and duplicates into the sample stream. Table 11-3 summarizes this QA/QC work along with historical QA/QC sample counts from Gencor and Eldorado (Unamgen), for a complete documentation of QA/QC data for the project. Equinox also uses multi-element CRMs to monitor QA/QC of iron analyses for processing control; results of this work are not presented in this report.
QA/QC analyses for gold are reviewed on a batch by batch basis by the database manager. A series of protocols are followed to define QA/QC failures and determine the type of follow up action required. Some failures require re-analysis of part, or all, of the batch by the same method. If the re-analysis, then passes QA/QC protocols they will replace the original failed analyses in the database. An annual review of CRM, blank, and duplicate performance is also done to review the global performance of the QA/QC program.
| | P a g e | 11-5 |
| 04/11/2021 |
| TECHNICAL REPORT ON THE AURIZONA GOLD MINE EXPANSION PRE-FEASIBILITY STUDY |
Table 11-3: Sample Summary for Diamond and RC Exploration Drilling
| Deposit | Number of Primary Samples | Field Blanks | Reference Materials | Duplicates | Total QA\QC Samples | QA\QC Insertion Rate |
| Piaba | 93,518 | 3,519 | 5,242 | 3,668 | 12,429 | 13% |
| Boa Esperança | 8,919 | 403 | 385 | 27 | 815 | 9% |
| Tatajuba | 12,712 | 632 | 162 | 367 | 1,161 | 9% |
| Genipapo | 12,475 | 480 | 521 | 181 | 1,182 | 9% |
| Touro | 8,772 | 326 | 362 | 175 | 863 | 10% |
Equinox uses 21 ROCKLABS (New Zealand) CRMs to evaluate the accuracy of laboratory gold analyses and a total of 28 CRMs to monitor all relevant elements. These reference materials are inserted into the sample stream approximately 1 in every 25 samples. Historical reference materials (used by Gencor and Eldorado) were non-certified and were specifically created for the Project (see Section 11.1.2).
Coarse field blanks are inserted at a rate of 1 in 25 to monitor carry-over (or contamination). From 1991 - 1997, Gencor and Eldorado used alluvial quartz sand as blank material for all drill programs. From 2007 - 2021, Equinox used local occurrences of granite as a coarse field blank material to monitor for gold carry-over in core samples, whereas commercial quartz sand was used as blank material for RC and auger samples. Prior to their use, Equinox analysed ten samples of each blank material for gold to confirm that all samples reported below the warning threshold for blank sample evaluation (ten times the method detection limit). Barren granite for the coarse blank is collected in bulk, transported to a sterile area within the site, and then broken into small pieces and visually screened to discard any vein or pegmatite-vein related material. The selected blank material is then stored in locked and sealed plastic containers.
Duplicate sample types include field duplicates, crushed preparation duplicates (prep duplicates), and pulp umpire duplicates (pulp duplicates). Field duplicates are inserted by cutting the core in quarters at selected intervals, with one quarter submitted as the primary sample and the other quarter submitted as the field duplicate. Field duplicates are inserted at a rate of 1 in 40 from 2007 - 2020. Pulp and preparation duplicates were inserted during specific campaigns between 2007 - 2011 and typically inserted at a rate of 1 in 40. The results are reviewed in Section 12.3
| 11.6 | Density Determinations |
Bulk density has been determined with the wax immersion method (Crawford, 2013) following Equation 1 (see below). Samples have a minimum sample length of 4 cm and are taken roughly every 5 m downhole to provide sufficient sampling of different lithology and weathering types. Lithology and weathering are recorded for each density sample by the logging geologist, along with the other sample parameters. A summary of the samples collected in each of the Brownfield targets is shown in Table 11-4 demonstrating the range of values and overall number of measurements. Additional analysis of this data used in the resource estimation is provided in Section 12.4 and Section 14.
| • | Equation 1: Bulk Density by Wax Immersion |
| • | Bulk Density = A / ( B - C - [(B - A) / D] ) |
| | P a g e | 11-6 |
| 04/11/2021 |
| TECHNICAL REPORT ON THE AURIZONA GOLD MINE EXPANSION PRE-FEASIBILITY STUDY |
| • | Where: |
| • | A = weight of sample in air |
| • | B = weight of waxed sample in air |
| • | C = weight of waxed sample suspended in water |
| • | D = density of wax |
Table 11-4: Bulk Density Measurement for Deposit Targets
| Area | Number of Samples | Average Bulk Density | Minimum Bulk Density | Maximum Bulk Density |
| Piaba | 18,767 | 2.40 | 1.01 | 4.10 |
| Boa Esperança | 993 | 2.53 | 1.39 | 3.24 |
| Tatajuba | 2,554 | 2.42 | 1.20 | 3.44 |
| Genipapo | 674 | 2.15 | 1.18 | 3.38 |
| Touro | 831 | 2.67 | 1.31 | 3.42 |
Results for the different rock types within the vicinity of mineralization are summarized in Figure 11-1. Significantly, these values do not vary much between lithology type. Weathering profile has a pronounced effect on the bulk density of the materials as shown in Figure 11-2.
Figure 11-1: Box and Whisker Plot of the Bulk Density by Modelled Lithology for Piaba Deposit

| | P a g e | 11-7 |
| 04/11/2021 |
| TECHNICAL REPORT ON THE AURIZONA GOLD MINE EXPANSION PRE-FEASIBILITY STUDY |
Figure 11-2: Box and Whisker Plot of the Bulk Density by Modelled Weathering for Piaba Deposit

| 11.7 | Grade Control |
Grade control drilling samples are collected at the drill rig by the contracted drilling personnel. The entire sample representing either 1 or 3 m (based on run length) is collected. No sample processing or splitting is conducted at the drill site. The samples are transported via truck to the core shed where each sample is first dried and then homogenized by running through a large Jones splitter six times. A 1 kg split is the taken as the primary sample. A field duplicate is included in each batch, whereby a 1/8 split is taken from a primary sample, using a Jones splitter, and then submitted with a new sample ID. Samples are bagged and tagged with numbered, barcoded tags given the prefix “RC-MG-“. In addition, ROCKLABS CRMs and coarse granite blanks are inserted at similar frequency to the exploration QA/QC sample protocol, as outlined in Section 11.5.
Grade control samples submitted to the site lab from 2012 - 2013 did not include QA/QC samples. In 2014, a QA/QC program was implemented to include 13% total insertion rate of CRMs and blanks. The Phase 1 data is not suitable for use in resource estimation and as such is omitted. With the restart of mining activities in 2018, batches of 50 - 77 grade control samples were submitted with at least one blank, one CRM, and one field duplicate, corresponding to a total insertion rate of approximately 5%. Each grade control batch is submitted to the site laboratory with a requisition form and sample list. A summary of QA/QC samples is shown in Table 11-5.
| | P a g e | 11-8 |
| 04/11/2021 |
| TECHNICAL REPORT ON THE AURIZONA GOLD MINE EXPANSION PRE-FEASIBILITY STUDY |
Table 11-5: Sample Summary of Grade Control Drilling
| Grade Control Sampling Program | Number of Samples | Field Blanks | Reference Materials | Duplicates | Total QC Samples | QC Insertion Rate |
| Phase 1: 2012 - 2013 | 42,609 | - | - | - | - | 0% |
| Phase 1: 2014 | 27,154 | 1,905 | 1,657 | - | 3,562 | 13% |
| Phase 2: 2018-2020 | 58,577 | 942 | 1,033 | 1,402 | 3,377 | 6% |
| Boa Esperanca | 6,117 | 88 | 84 | 83 | 255 | 4% |
All grade control samples are prepared and analysed at the site laboratory that is managed by MASA and operated by SGS Geosol. Preparation at the site laboratory includes sample weighing, drying at 105°C, and crushing to greater than 75% passing a 2 mm screen. The sample is then homogenized and quartered, and a 500 g split is then taken and pulverized to >85% passing a 75 μm screen. From this, a 50 g aliquot is then analysed for gold by fire assay with atomic absorption finish (FA505). Starting in 2018, the chips are also analysed by portable XRF for multi-element assay and by LECO for sulphur. At least one pulp from each batch is re-assayed as part of a check analysis at the site lab.
| 11.8 | Auger |
Auger samples were submitted with the same ALS preparation and assay laboratories as outlined in Section 11.5, with all auger samples analyzed by Au-AA24 and over-limit (> 10 g/t) analyzed by Au-AA26.
CRMs and silica sand blanks were inserted into auger sample shipments at a rate of 4% for each type, as outlined in Section 11.4. Sample shipment procedures are the same for auger sample shipments as for all exploration drill samples.
| 11.9 | Databases |
Assay data for the Aurizona project is stored in an MX Deposit database hosted on the cloud platform with secure socket layer encryption starting in 2018. Prior to that, the data was managed in Datamine’s Fusion Database Platform. Drillhole databases specific to each deposit were supplied by Equinox with the corresponding delivery dates shown in Table 11-6.
| | P a g e | 11-9 |
| 04/11/2021 |
| TECHNICAL REPORT ON THE AURIZONA GOLD MINE EXPANSION PRE-FEASIBILITY STUDY |
Table 11-6: Resource Database Delivery
| Resource Dataset | Delivery (Month/Day/Year) |
| Piaba | 01/28/2021 |
| Piaba Grade Control (Open Pit) | 12/16/2020 |
| Boa Esperança | 01/28/2021 |
| Boa Esperança Grade Control | 10/12/2020 |
| Tatajuba | 01/25/2021 |
| Genipapo | 2/18/2021 |
| Touro | 2/10/2021 |
| 11.10 | Data Adequacy |
It is the QP’s opinion that the sample preparation, security, and analytical procedures are adequate to support Mineral Resource estimation with the exception of the Piaba Phase 1 grade control data that has been omitted due to poor data quality.
| | P a g e | 11-10 |
| 04/11/2021 |
| TECHNICAL REPORT ON THE AURIZONA GOLD MINE EXPANSION PRE-FEASIBILITY STUDY |
| 12 | Data Verification |
| 12.1 | Site Visit |
Trevor Rabb visited the site from October 28 - November 14, 2017 and November 11 - 14, 2019. The first trip was to review the geology and examine drill core before estimation of the Mineral Resource. During the 2019 visit Mr. Rabb audited the 2019 reconciliation grade control practices and reviewed geology and procedures for the Tatajuba drill program. Eleanor Black visited the site from November 11 - 18, 2017 to review drilling and sampling procedures, drill core production, and to review the 3D geological modelling approach.
| 12.2 | Resource Data |
Multiple drill hole databases per target area were received from Equinox. Each table was imported into Micromine™ 3D software for validation and use. Spatial 2D and 3D files were provided as DXFs and shapefiles.
The QPs have consulted on the Project since 2017 and through this work have taken the following steps to verify the database, including:
| • | validation of the drill hole database using Micromine™ software drill database validation tools |
| • | validation of the geological sectional interpretations with logged geological data |
| • | independently reviewing and plotting QA/QC results |
| • | independently loading and comparing all 2020 certificates against the delivered database |
| • | verification of bulk density determinations |
| • | reviewing the reconciliation of modelled grades to grade control and mill results. |
| 12.2.1 | Drill Hole Location Verification |
The surveyed collar locations for Piaba, Boa Esperança, Genipapo and Touro correlate well with the digital elevation model from the 2017 LIDAR survey completed prior to recommencement of operations, except where Piaba drilling was collared on pre-mining topography over what is now the open pit. Tatajuba collar coordinates correlate well with the digital elevation model from the 2014 LIDAR survey.
Downhole survey data was validated by identifying discrepancies greater than three degrees between sequential dip and azimuth readings. No significant discrepancies were identified for any of the resource datasets.
| 12.2.2 | Geological Data Verification and Interpretation |
The geological data from each database and cross-sectional interpretation polylines were used to build 3D geological models for each deposit, as described in Section 14. In general, there is good section-to-section correlation of lithology, weathering, and gold zone interpretation, indicating the drill hole database has good integrity and geological continuity is well established.
| | P a g e | 12-1 |
| 04/11/2021 |
| TECHNICAL REPORT ON THE AURIZONA GOLD MINE EXPANSION PRE-FEASIBILITY STUDY |
Geological data for all drillholes is available over the entire length of each drill hole. Data records do not exceed the recorded total depth.
| 12.3 | Drillhole Assay Verification |
The following checks were completed for all drillholes:
| • | sample intervals do not exceed the total depth of its hole |
| • | ranking of fire assay methods against the result in the “Au ppm” column, which was used in the resource estimate |
| • | compilation and charting of QA/QC data to validate assay results. |
No deficiencies were identified from these checks.
Core recovery for Piaba averaged 97%. There is no relationship between core recovery and gold grade.
The QA/QC programs from all the database were evaluated including Piaba Boa Esperança, Tatajuba, Genipapo and Touro deposits. For CRMs, a Z-score was calculated, with “failure” defined as any CRM analysis returning a Z-score of >3 or <-3. Several failures were due to mis-handling errors where the CRMs were likely swapped at insertion. Blanks were reviewed for carry-over exceeding ten times the detection limit, equal to 0.05 g/t gold.
Duplicates were paired using the duplicates parent sample ID which is recorded with the duplicate sample. The mean, coefficient of variation (CV), and reduced major axis (RMA) were calculated for each pair. The pulp and preparation duplicates were run after the original batch was returned and are all above a reproducible threshold, greater than 0.1 g/t gold. Field duplicates on the core show higher variance and were therefore evaluated at values greater than ten times the detection limit, equal to 0.05 g/t gold. Duplicate pairs were reviewed using guidelines for coarse-grained gold mineralization presented in Table 12-1 by Abzalov, M.Z. (2008).
Table 12-1: CV AVR(%) Best & Acceptable Practise Values for Coarse to Medium Grained Gold
| Deposit Type | Element | Duplicate | Best CV (%) | Acceptable CV (%) |
| Coarse- to medium-grained gold | Au | Field | 20 | 30-40 |
| Pulp | 10 | 20 |
Source: Abzalov, M. (2008)
| 12.3.1 | Performance of Exploration QA/QC Samples |
First pass calculation of Z-scores showed a failure rate of 3%. Omitting samples where there is obvious mishandling or labelling errors results in reduction of the overall failure rate to 2% (Table 12-2). Plotting of the CRMs shows there is no systematic bias (Figure 12-1; Figure 12-2). CRMs therefore indicate that analyses are unbiased and sufficiently accurate.
| | P a g e | 12-2 |
| 04/11/2021 |
| TECHNICAL REPORT ON THE AURIZONA GOLD MINE EXPANSION PRE-FEASIBILITY STUDY |
Table 12-2: CRM Performance for Exploration Samples
| Original CRM Insertion | Failures | ||||||||
| CRM | Expected Average (Au ppm) | Standard Deviation | Number of Samples |
Average (Au ppm) | Average Z-Score | Total Fails | Handling Errors | True Fails | True Fail Rate |
| OXC58 | 0.201 | 0.007 | 133 | 0.213 | 1.72 | 2 | 2 | 0 | 2% |
| OXC72 | 0.205 | 0.008 | 138 | 0.245 | 5.01 | 4 | 4 | 0 | 3% |
| OXC88 | 0.203 | 0.01 | 212 | 0.202 | -0.09 | 5 | 3 | 2 | 1% |
| OXD108 | 0.414 | 0.012 | 341 | 0.418 | 0.37 | 0 | 0 | 0 | 0% |
| OXE150 | 0.658 | 0.016 | 57 | 0.652 | -0.39 | 0 | 0 | 0 | 0% |
| OXE56 | 0.611 | 0.015 | 136 | 0.602 | -0.62 | 9 | 4 | 5 | 3% |
| OXI121 | 1.834 | 0.05 | 68 | 1.831 | -0.07 | 0 | 0 | 0 | 0% |
| OXI54 | 1.868 | 0.066 | 98 | 1.805 | -0.96 | 4 | 4 | 0 | 4% |
| OxJ161 | 2.501 | 0.054 | 107 | 2.477 | -0.44 | 2 | 1 | 1 | 1% |
| OXJ64 | 2.366 | 0.079 | 47 | 2.377 | 0.14 | 1 | 1 | 0 | 2% |
| OXJ68 | 2.342 | 0.064 | 248 | 2.322 | -0.32 | 11 | 9 | 2 | 4% |
| OXJ80 | 2.331 | 0.042 | 132 | 2.359 | 0.67 | 15 | 5 | 10 | 4% |
| SE68 | 0.599 | 0.013 | 406 | 0.601 | 0.17 | 3 | 0 | 3 | 0% |
| SF45 | 0.848 | 0.028 | 247 | 0.935 | 3.12 | 8 | 8 | 0 | 3% |
| SF57 | 0.848 | 0.03 | 367 | 0.835 | -0.42 | 2 | 1 | 1 | 0% |
| SG66 | 1.086 | 0.032 | 718 | 1.087 | 0.02 | 1 | 1 | 0 | 0% |
| SH82 | 1.333 | 0.027 | 174 | 1.308 | -0.93 | 7 | 4 | 3 | 2% |
| SI64 | 1.78 | 0.042 | 575 | 1.793 | 0.31 | 3 | 0 | 3 | 0% |
| SK33 | 4.041 | 0.103 | 15 | 4.191 | 1.45 | 0 | 0 | 0 | 0% |
| SL34 | 5.893 | 0.14 | 84 | 5.765 | -0.91 | 6 | 4 | 2 | 5% |
| SL51 | 5.909 | 0.136 | 259 | 5.809 | -0.74 | 30 | 20 | 10 | 8% |
| SN38 | 8.573 | 0.158 | 50 | 8.565 | -0.05 | 1 | 0 | 1 | 0% |
| SN50 | 8.685 | 0.18 | 108 | 8.636 | -0.27 | 0 | 0 | 0 | 0% |
| SN60 | 8.595 | 0.223 | 14 | 8.78 | 0.83 | 0 | 0 | 0 | 0% |
| SP37 | 18.14 | 0.38 | 12 | 18.417 | 0.73 | 2 | 1 | 1 | 8% |
| | P a g e | 12-3 |
| 04/11/2021 |
| TECHNICAL REPORT ON THE AURIZONA GOLD MINE EXPANSION PRE-FEASIBILITY STUDY |
Figure 12-1: Shewart Performance Chart for Gold in S Series CRMs from the Exploration Datasets

Figure 12-2: Shewart Performance Chart for Gold in O Series CRMs from the Exploration Datasets

| | P a g e | 12-4 |
| 04/11/2021 |
| TECHNICAL REPORT ON THE AURIZONA GOLD MINE EXPANSION PRE-FEASIBILITY STUDY |
The exploration data includes 4,631 coarse blank samples, 16 (<1%) of which exceed a threshold of ten times the detection limit (i.e. 0.05 g/t gold) that is typically used to indicate contamination (Table 12-3). These counts include 310 historical blanks, of which five returned >0.05 g/t gold.
Table 12-3: Summary of Quality Assurance Samples and Performance for Piaba Exploration
| QA Type | Number
of Primary Samples |
QA Count | QA Insertion Rate | Failure Count | Failure Rate |
| Exploration | |||||
| CRM | 144,100 | 4,746 | 3% | 29 | 1% |
| Blanks | 144,100 | 4,631 | 3% | 16 | 0.3% |
Figure 12-3: Blank Performance Chart for Gold in with the Exploration Datasets

The exploration data includes 4,441 duplicates, comprising 2,007 field (core), 1,268 preparation, and 1,116 pulp duplicate samples (Table 12-4). The coefficient of variation (CV) is 38%, 41% and 35% respectively (Figure 12-4, Figure 12-5, and Figure 12-6). The bias is weighted towards the original sample for all the duplicate types. The pulp duplicates have a higher than expected CV based on the values in Table 12-1 by Abzalov, M.Z. (2008).
| | P a g e | 12-5 |
| 04/11/2021 |
| TECHNICAL REPORT ON THE AURIZONA GOLD MINE EXPANSION PRE-FEASIBILITY STUDY |
Table 12-4: Duplicate Pair Statistics for Exploration Samples
| QC Type | Number
of Primary Samples |
Number Duplicate Samples | QC Insertion Rate | Average Au (g/t) | CV |
| Pulp | 144,100 | 1,166 | 1% | 3.43 | 35% |
| Preparation | 144,100 | 1,268 | 1% | 3.34 | 41% |
| Field | 144,100 | 2,007 | 1% | 0.13 | 38% |
| Total Duplicates | 144,100 | 4,441 | 4% |
Figure 12-4: RMA Duplicate Plot for Exploration Sample Pulp Duplicates

| | P a g e | 12-6 |
| 04/11/2021 |
| TECHNICAL REPORT ON THE AURIZONA GOLD MINE EXPANSION PRE-FEASIBILITY STUDY |
Figure 12-5: RMA Duplicate Plot for Exploration Sample Preparation Duplicates

Figure 12-6: RMA Duplicate Plot for Exploration Sample Twin Sample Duplicates

| | P a g e | 12-7 |
| 04/11/2021 |
| TECHNICAL REPORT ON THE AURIZONA GOLD MINE EXPANSION PRE-FEASIBILITY STUDY |
| 12.3.2 | Performance of Piaba & Boa Esperança Grade Control QA/QC Samples |
The grade control QA/QC described below describes the Piaba Phase 2 and the Boa Esperança grade control samples. Only the Piaba Phase 2 grade control following the restart of mining operations in January 2018, were considered as part of the Piaba resource model, due to the materiality of the results in the operations and revisions to the gold zone model based on these results. The Phase 1 samples do not have acceptable quality for use in the Mineral Resource estimation. QA/QC results for the 2018 - 2020 grade control programs is summarized in Table 12-5 and Table 12-6.
The overall quality assurance program has insertion rates of just 4% for CRMs and blanks. QA/QC sample counts include CRM handling errors. The total number of failures without handling errors is 32, which 4% failure rate, which is slightly outside the acceptable range for failures of maximum 3%. Overall, the grade control CRMs bias lower than the expected value as shown in Figure 12-7: Shewart Performance Chart for Gold in S Series CRMs from the Grade Control Datasets
Only three of the coarse or silica sand blanks exceed the contamination threshold (Table 12-5, Figure 12-8), indicating that carryover is not a problem. Figure 12-8 shows multiple lower detection limits in the coarse blanks.
Table 12-5: Summary of Quality Assurance Samples & Performance for Grade Control
| QA Type | Number of Primary Samples | QA Count | QA Insertion rate | Failure Count | Failure Rate |
| CRM | 64,434 | 1,117 | 2% | 32 | 4% |
| Blanks | 64,434 | 1,030 | 2% | 3 | 1% |
| | P a g e | 12-8 |
| 04/11/2021 |
| TECHNICAL REPORT ON THE AURIZONA GOLD MINE EXPANSION PRE-FEASIBILITY STUDY |
Table 12-6: CRM Performance for Grade Control Samples (2018-2020)
| Original CRM Insertion | Failures | ||||||||
| CRM | Expected Average (Au ppm) | Standard Deviation | Number of Samples | Average (Au ppm) | Average Z-Score | Total Fails | Handling Errors | True Fails | True Fail Rate |
| OXD108 | 0.414 | 0.012 | 3 | 0.4 | -1.14 | 0 | 0 | 0 | 0% |
| OXD127 | 0.459 | 0.012 | 82 | 0.45 | -0.78 | 0 | 0 | 0 | 0% |
| OxD151 | 0.43 | 0.009 | 44 | 0.415 | -1.65 | 7 | 1 | 6 | 2% |
| OXE150 | 0.658 | 0.016 | 1 | 0.623 | -2.19 | 0 | 0 | 0 | 0% |
| OxF162 | 0.832 | 0.027 | 115 | 0.796 | -1.35 | 5 | 1 | 4 | 1% |
| OxG140 | 1.019 | 0.022 | 45 | 1.011 | -0.37 | 1 | 1 | 0 | 2% |
| OXJ137 | 2.416 | 0.069 | 95 | 2.446 | 0.44 | 0 | 0 | 0 | 0% |
| OxJ161 | 2.501 | 0.054 | 90 | 2.414 | -1.6 | 1 | 0 | 1 | 0% |
| OXJ80 | 2.331 | 0.042 | 26 | 2.343 | 0.29 | 0 | 0 | 0 | 0% |
| OXL118 | 5.828 | 0.149 | 58 | 5.827 | -0.01 | 3 | 1 | 2 | 2% |
| SE-101 | 0.606 | 0.013 | 17 | 0.585 | -1.61 | 4 | 2 | 2 | 12% |
| SE114 | 0.634 | 0.016 | 48 | 0.627 | -0.41 | 0 | 0 | 0 | 0% |
| SE68 | 0.599 | 0.013 | 46 | 0.635 | 2.73 | 4 | 2 | 2 | 4% |
| SG66 | 1.086 | 0.032 | 3 | 1.1 | 0.45 | 0 | 0 | 0 | 0% |
| SG-84 | 1.026 | 0.025 | 41 | 0.995 | -1.24 | 0 | 0 | 0 | 0% |
| SG99 | 1.041 | 0.019 | 124 | 1.014 | -1.42 | 17 | 9 | 8 | 7% |
| SH82 | 1.333 | 0.027 | 128 | 1.295 | -1.41 | 8 | 3 | 5 | 2% |
| SJ-95 | 2.789 | 0.054 | 134 | 2.754 | -0.65 | 2 | 0 | 2 | 0% |
| SL-76 | 5.96 | 0.192 | 17 | 5.927 | -0.17 | 0 | 0 | 0 | 0% |
| | P a g e | 12-9 |
| 04/11/2021 |
| TECHNICAL REPORT ON THE AURIZONA GOLD MINE EXPANSION PRE-FEASIBILITY STUDY |
Figure 12-7: Shewart Performance Chart for Gold in S Series CRMs from the Grade Control Datasets

Figure 12-8: Blank Performance Chart for Gold in with the Grade Control Datasets

| | P a g e | 12-10 |
| 04/11/2021 |
| TECHNICAL REPORT ON THE AURIZONA GOLD MINE EXPANSION PRE-FEASIBILITY STUDY |
The 904 field duplicates within the grade control dataset are 1/8th splits of the original sample. All field duplicate pairs show a high CV of 63% for a nuggety gold mineralization with a bias towards the original sample (Table 12-7). The 505 pulp duplicates show bias to the original sample and a high CV of 42%.
Table 12-7: Duplicate Pair Statistics for Exploration Samples
| QC Type | Number of Primary Samples | Number Duplicate Samples | QC Insertion Rate | Average Au (g/t) | CV |
| Pulp | 64,434 | 505 | <1% | 1.86 | 42% |
| Field | 64,434 | 904 | <1% | 1.67 | 63% |
| 12.3.3 | Performance of Tatajuba Exploration & Auger QA/QC Samples |
Tatajuba has acceptable performance for the auger QA/QC samples (Table 12-8). The auger samples have acceptable quality assurance performance with no failure in the CRMs and 1% failure rate in blanks.
Table 12-8: CRM Performance for Tatajuba Auger QA
| CRM |
Expected Average (Au g/t) |
Standard Deviation | Number of Samples | Average (Au g/t) | Average Z-Score |
| OXC58 | 0.20 | 0.007 | 11 | 0.20 | -0.1 |
| OXC72 | 0.21 | 0.008 | 28 | 0.20 | -0.9 |
| OXE56 | 0.61 | 0.015 | 1 | 0.59 | -1.7 |
| OXJ64 | 2.37 | 0.079 | 2 | 2.33 | -0.5 |
| OXJ68 | 2.34 | 0.064 | 40 | 2.32 | -0.3 |
| SF45 | 0.85 | 0.028 | 38 | 0.88 | 1.2 |
| SN38 | 8.57 | 0.158 | 12 | 8.46 | -0.7 |
| SN50 | 8.69 | 0.180 | 30 | 8.61 | -0.4 |
| 12.4 | Density Determinations |
Density values were re-calculated using the original data. No significant discrepancies were observed.
| 12.5 | Data Adequacy |
It is the opinion of the QP that the location, downhole survey, density, and assay data supplied by Equinox is of adequate quality for use in estimating Mineral Resources and Reserves.
| | P a g e | 12-11 |
| 04/11/2021 |
| TECHNICAL REPORT ON THE AURIZONA GOLD MINE EXPANSION PRE-FEASIBILITY STUDY |
| 13 | Mineral Processing and Metallurgical Testing |
| 13.1 | Introduction |
Significant metallurgical test work has been completed on ore samples from various parts of the Aurizona deposit. Metallurgical test work has historically been completed on laterite, saprolite, transition and fresh rock types from the various deposits. Detailed summaries of previous metallurgical test work programs can be found in previous technical reports such as Lycopodium et al, 2017.
Recent metallurgical test work has been completed on samples of Tatajuba ore and Piaba underground ore relevant to the subject of this technical report. At the time of writing this section, the Piaba metallurgical test work program was still on-going. The test results from the Tatajuba and preliminary results from the Piaba metallurgical programs are summarized and discussed below.
| 13.2 | Metallurgical Testing on Tatajuba |
During 2020, a metallurgical test work program was completed by SGS Geosol on samples from Tatajuba ore. The objective of the test work program was to verify the metallurgical response of Tatajuba ore via the existing treatment route at the Aurizona process plant. The scope of the test work program consisted of sample preparation, head assays, comminution tests, gravity pre-concentration followed by leaching of gravity tailings to test treatment of the ore via the existing Aurizona flowsheet.
| 13.2.1 | Sample Selection |
Twelve samples for the test work program were selected and based the three main Tatajuba rock types, i.e. saprolite, transition and fresh rock and sample selection represented in Figure 13-1. Based on historical tests, fresh rock samples with elevated arsenic levels were also selected to investigate the metallurgical response of the ore. Samples selected had gold assays ranging from 0.7 to 3.0 g/t Au with one high-grade sample at 13.3 g/t Au which was chosen for high arsenic content, and elevated sulphur levels for the fresh rock samples. The high arsenic and sulphur levels are not expected to be normal feed to the process plant and these samples were selected to test the limits of treatment of Tatajuba ore.
| | P a g e | 13-1 |
| 04/11/2021 |
| TECHNICAL REPORT ON THE AURIZONA GOLD MINE EXPANSION PRE-FEASIBILITY STUDY |
Figure 13-1: Tatajuba Sample Selection Locations

| | P a g e | 13-2 |
| 04/11/2021 |
| TECHNICAL REPORT ON THE AURIZONA GOLD MINE EXPANSION PRE-FEASIBILITY STUDY |
| 13.2.2 | Tatajuba Test Work Summary Results |
The Tatajuba test work results are summarized in Table 13-1.
Table 13-1: Tatajuba Test Work Summary Results
| Sample ID | Rock Type | Head Assay | BWi (kWh/t) | Au Rec% Gravity |
Au
Rec% |
Au Rec% Gravity +CIL (24h) | |||
| Au g/t | %S | Cu ppm | As ppm | ||||||
| MT-00509 | Saprolite | 0.70 | 0.03 | 32 | 393 | 13.2 | 36.7 | 90.6 | 94.3 |
| MT-00510 | Saprolite | 1.15 | 0.03 | 39 | 443 | 14.2 | 11.8 | 93.6 | 94.8 |
| MT-00511 | Saprolite | 2.12 | 0.03 | 61 | 875 | 11.1 | 26.4 | 92.7 | 95.3 |
| MT-00512 | Transition | 0.55 | 0.88 | 41 | 305 | 6.6 | 17.3 | 89.1 | 92.7 |
| MT-00513 | Transition | 1.65 | 1.73 | 35 | 271 | 7.0 | 54.7 | 91.3 | 95.8 |
| MT-00514 | Fresh Rock | 0.71 | 1.24 | 22 | 290 | 13.1 | 47.1 | 82.6 | 91.5 |
| MT-00515 | Fresh Rock | 1.39 | 1.20 | 21 | 660 | 13.3 | 37.2 | 86.3 | 91.4 |
| MT-00516 | Fresh Rock | 2.44 | 2.16 | 24 | 567 | 12.4 | 35.4 | 89.2 | 93.4 |
| MT-00517 | Fresh Rock | 1.42 | 1.49 | 18 | 1,544 | 12.6 | 27.2 | 81.3 | 88.0 |
| MT-00518 | Fresh Rock | 2.69 | 2.19 | 26 | 1,439 | 13.2 | 35.0 | 87.7 | 91.4 |
| MT-00519 | Fresh Rock | 3.00 | 2.22 | 34 | 3,475 | 12.6 | 30.2 | 76.6 | 84.0 |
| MT-00520 | Fresh Rock | 13.3 | 2.37 | 35 | 10,000 | 13.1 | 58.9 | 83.0 | 92.9 |
Source: SGS Geosol (2021)
Pertinent observations from the test work results include:
| • | The average Bond Ball Work Index (BWi) values for the saprolite, transition and fresh rock samples were 12.8, 6.8 and 12.9 kWh/t, respectively. |
| • | Gravity gold recoveries ranged from approximately 12% to 60%. |
| • | Gold recoveries via CIL treatment ranged from approximately 77% to 94%, and no appreciable difference in gold extraction were seen with leaching longer the 16 hours. |
| • | Overall gold recovery (gravity and CIL combined) ranged from approximately 84% to 96%. |
| • | The gold recovery result of the high arsenic sample chosen fell within the range of the other samples tested. |
| 13.2.3 | Comminution Tests |
The BWi tests were completed in a series of batch grinds using a 305 x 305 mm lab mill in closed circuit with a control screen of fixed aperture. Approximately 10 kg of ore sample with a top size of 3.35 mm was used.
The following observations and conclusions are noted:
| • | The saprolite samples tested resulted in an average BWi of 12.8 kWh/t which was higher than expected. Historical BWi results on saprolite samples from Aurizona were about 6-8 kWh/t. The higher BWI for Tatajuba is not expected to have a significant impact on grinding throughput but recommended to test additional saprolite samples to confirm the BWi. |
| | P a g e | 13-3 |
| 04/11/2021 |
| TECHNICAL REPORT ON THE AURIZONA GOLD MINE EXPANSION PRE-FEASIBILITY STUDY |
| • | The transition samples tested resulted in an average BWi of 6.8 kWh/t which was lower than expected. Transition material has historically had BWi around 10-11 kWh/t. As with the saprolite results, it is recommended to test additional transitional samples to confirm the BWi. |
| • | The fresh rock samples tested resulted in an average BWi of 12.9 kWh/t which was lower than expected. The results were higher than transition and saprolite results which was expected. |
| 13.2.4 | Gravity Tests |
Gravity gold recovery tests were completed as follows. Samples were first prepared by grinding 1 kg sub-samples in 8x12 in batch rod mill to P80 of 106µm. The mill was operated at 67 rpm with a charge of 20 kg of stainless steel rods and the ore pulped to 60% solids. Gravity separation was then conducted using a Knelson MD-3 centrifuge using 20 kg of the prepared sample. Test conditions were 40% solids, 60G gravitational field and fluidizing water set at 12 l/min. The Knelson concentrate was analyzed for gold via fire assay and the tailings were dried, weighted, split into 1 kg sub-samples, and analyzed in triplicate.
The following observations and conclusions are noted:
| • | Gravity gold recovery was highly variable over the twelve samples tested and ranged from 12% to 60%. The variability is the same observed from historical gravity tests. |
| • | There was no correlation between gravity recovery and rock types. |
| 13.2.5 | CIL Tests |
Gravity tailings from the twelve samples with a grind size of P80 of 106µm were leached in standard bottle roll tests. All leach tests were conducted at 42% solids slurry density, 1000ppm free cyanide concentration and 20 g/L carbon concentration. Gold extraction was subsequently measured 8, 16, 24 and 48 hours as shown in Figure 13-2. Cyanide consumption ranged from 0.8 to 2.0 kg/t.
| | P a g e | 13-4 |
| 04/11/2021 |
| TECHNICAL REPORT ON THE AURIZONA GOLD MINE EXPANSION PRE-FEASIBILITY STUDY |
Figure 13-2: CIL Gold Extraction of Tatajuba Gravity Tailings Samples

The following observations are noted:
| • | Maximum gold extraction was achieved around 16 hours of leaching for all twelve samples, and it is important to note that there is no benefit seen from leaching longer than 16 hours in any sample. CIL-leach time falls within the existing design capacity of the existing process plant. |
| • | The tests with the lowest gold extraction results generally had higher sulphur values in the head sample which is to be expected in a CIL circuit. The worst performing sample was MT-00519 (fresh rock) which had a head assay of 3 g/t Au, 2.22% S and 3,475 ppm As, resulting in a gold leach extraction of 80%. |
| • | The fresh rock sample with highest arsenic content resulted in a gold extraction of 85% which was better than expected. Historical test work showed lower recoveries with high arsenic values. However as noted in previous technical reports, high arsenic material account for less than 1.5% of the overall body and not considered a major risk to gold recoveries. |
| • | The saprolite samples with an average leach feed grade of 1.0 g/t Au and the transition samples with an average leach feed grade of 0.6 g/t Au had an overall average gold leach extraction of 91% which was expected. |
| • | The average gold extraction at 16 hours for the fresh rock samples was 86% which is approximately 5% lower than saprolite and transition material which is to be expected. |
| | P a g e | 13-5 |
| 04/11/2021 |
| TECHNICAL REPORT ON THE AURIZONA GOLD MINE EXPANSION PRE-FEASIBILITY STUDY |
| 13.2.6 | Overall Tatajuba Gold Recoveries |
The overall gold recoveries, including gravity plus CIL recovery (24h), of the twelve samples are shown in Figure 13-3.
Figure 13-3: Overall Tatajuba Gold Recoveries

The following observations are noted:
| • | In general, the saprolite and transition ore samples performed as expected with an overall gold recovery of 94.6% (gravity and CIL). |
| • | The fresh rock samples generally had an overall lower gold recovery of 90.4%. The lower recovery samples had higher sulphur and arsenic values. The overall trend of gold recoveries versus sulphur in the head sample is provided in Figure 13-4. |
| | P a g e | 13-6 |
| 04/11/2021 |
| TECHNICAL REPORT ON THE AURIZONA GOLD MINE EXPANSION PRE-FEASIBILITY STUDY |
Figure 13-4: Overall Tatajuba Gold Recoveries vs % Sulphur

| 13.3 | Metallurgical Testing on Piaba Underground |
In March of 2021, a metallurgical test work program commenced with SGS Geosol to test samples from the Piaba underground ore. The objective of the test work program was to verify the metallurgical response of the ore from the Piaba ore body at depth via the existing Aurizona treatment route. The scope of the test work program consisted of sample preparation, head assays, mineralogy, comminution tests (SMC and BWi), gravity tests and leaching of gravity tailings by CIL. The test work program was completed over two phases, i.e. variability test work using 18 samples and test work of two composite blends.
| 13.3.1 | Sample Selection |
For the Piaba variability test work program, 18 variability samples were selected based on rock type and location within the deposit represented in Figure 13-5. Samples selected had gold assays ranging from 1.97 to 12.70 g/t Au, a high arsenic sample (4005 ppm As), and sulphur sample levels, ranging from 0.4% to 4%. The samples were selected to test the limits of treatment of Piaba ore.
| | P a g e | 13-7 |
| 04/11/2021 |
| TECHNICAL REPORT ON THE AURIZONA GOLD MINE EXPANSION PRE-FEASIBILITY STUDY |
Figure 13-5: Piaba Sample Locations - Underground Mine

| | P a g e | 13-8 |
| 04/11/2021 |
| TECHNICAL REPORT ON THE AURIZONA GOLD MINE EXPANSION PRE-FEASIBILITY STUDY |
For the second phase of the test work program, two composite blends were prepared based on two periods of the future mine plan, as shown in Table 13-2.
Table 13-2: Summary of Composites
| Composite #1 | % Split | ||||
| Year 2025 | %Split | g/t | Piaba OP | Piaba UG | |
| HG Fresh Rock | 60% | 2.16 | 65% | 35% | |
| LG Saprolite | 15% | 0.57 | 100% | 0% | |
| LG Fresh Rock | 25% | 0.64 | 100% | 0% | |
| Total | 100% | 1.54 | |||
| Composite #2 | % Split | ||||
| Year 2027 | %Split | g/t | Piaba OP | Piaba UG | Tatajuba |
| HG Fresh | 60% | 2.51 | 10% | 70% | 20% |
| LG Sap | 15% | 0.61 | 100% | ||
| LG Trans/Fresh | 25% | 0.65 | 40% | 60% | |
| Total | 100% | 1.76 | |||
| 13.3.2 | Piaba Underground Test Work Summary Results |
The Piaba test work results are summarized in Table 13-3. At the time of writing this technical report, the SMC and composites tests were on- going.
| | P a g e | 13-9 |
| 04/11/2021 |
| TECHNICAL REPORT ON THE AURIZONA GOLD MINE EXPANSION PRE-FEASIBILITY STUDY |
Table 13-3: Piaba U/G Test Work Summary Results
| MASA Sample | Rock
Type |
Location | Au
(g/t) Head SGS |
S (%) Average Grade | Cu (g/t) Average Grade | As (ppm) Average Grade | BWi kwh/t |
Ai
(g) |
Gravity
(Knelson) Recovery |
CIL
48h Recovery |
Overall Recovery |
| MT-521 | QDT | Central East | 1.97 | 0.69 | 9 | 46 | 16.1 | - | 61.8% | 82.7% | 93.4% |
| MT-522 | QDT | Central East | 2.78 | 1.83 | 12 | 7 | 15.7 | - | 62.0% | 85.1% | 94.3% |
| MT-523 | QDT | Central West | 2.90 | 2.26 | 29 | 80 | 13.4 | - | 69.0% | 91.0% | 97.2% |
| MT-524 | QDT | West | 2.60 | 2.24 | 20 | 9 | - | - | 67.3% | 91.1% | 97.1% |
| MT-525 | QDT | Central | 2.44 | 3.6 | 97 | 31 | - | - | 60.7% | 85.6% | 94.3% |
| MT-526 | QDT | Central | 2.62 | 1.08 | 40 | 50 | 15.8 | - | 58.9% | 82.1% | 92.6% |
| MT-527 | QDT | Central East | 2.74 | 2.31 | 33 | 19 | - | - | 59.9% | 87.9% | 95.1% |
| MT-528 | QDT | West, Central West, East | 3.26 | 2.31 | 55 | 8 | 14.2 | 2.2 | 63.5% | 90.0% | 96.4% |
| MT-529 | QDT | All | 3.31 | 3.62 | 59 | 17 | 14.5 | 1.3 | 64.3% | 87.8% | 95.6% |
| MT-530 | QDT | Central East | 3.63 | 1.16 | 10 | 76 | 15.2 | - | 71.2% | 86.6% | 96.1% |
| MT-531 | QDT | Central East | 5.40 | 1.95 | 16 | 7 | 15.9 | - | 68.5% | 87.9% | 96.2% |
| MT-532 | QDT | All | 6.87 | 4.01 | 56 | 15 | - | - | 71.3% | 90.2% | 97.2% |
| MT-533 | QDT | All | 12.70 | 2.86 | 39 | 19 | 15.2 | 0.6 | 67.1% | 88.4% | 96.2% |
| MT-534 | QDT | All | 3.97 | 1.95 | 62 | 4005 | - | - | 40.9% | 50.6% | 70.8% |
| MT-535 | FQD | All | 2.68 | 0.63 | 36 | 115 | 14.0 | - | 67.8% | 66.7% | 89.3% |
| MT-536 | FQD | All | 2.35 | 1.96 | 24 | 13 | 13.8 | 1.1 | 70.3% | 89.4% | 96.9% |
| MT-537 | FQD | All | 3.03 | 0.44 | 42 | 77 | 12.3 | 0.3 | 78.5% | 92.8% | 98.5% |
| MT-538 | FQD | All | 3.94 | 1.63 | 152 | 37 | 13.5 | - | 77.7% | 89.3% | 97.6% |
| | P a g e | 13-10 |
| 04/11/2021 |
| TECHNICAL REPORT ON THE AURIZONA GOLD MINE EXPANSION PRE-FEASIBILITY STUDY |
Pertinent observations from the test work results include:
| • | The average BWi values ranged from 12.3 kWh/t to 16.1 kWh/t. |
| • | Gravity gold recoveries ranged from approximately 41% to 79%. |
| • | Gold recoveries via CIL treatment ranged from approximately 51% to 93%. |
| • | Overall gold recovery (gravity and CIL combined) ranged from approximately 71% to 99%. |
| 13.3.3 | Comminution Tests |
As before, the BWi tests were completed in a series of batch grinds using approximately 10 kg of ore sample with a top size of 3.35 mm.
The following observations and conclusions are noted:
| • | Most of the BWi results were very consistent with an overall average of 14.6 kWh/t ± 1 kWh/t |
| • | The Piaba BWi results are similar to the BWi of fresh rock at Aurizona and is not expected to have any significant impact on throughput at the existing comminution circuit. |
| • | The average Bond abrasion index is 1.08 which is higher than historical tests. The higher abrasion index will result in higher crusher liner and grinding media consumption. |
SMC test work was being completed at the time of writing the report
| 13.3.4 | Gravity Tests |
As before, gravity gold recovery tests were completed. The sample procedure was the same as for the Tatajuba tests.
The following observations are noted:
| • | Gravity gold recovery was high with an average of 66% for the 18 samples. The results were higher than expected as historical gravity recovery for Piaba fresh rock were about 40% |
| • | The sample with high arsenic had the lowest gravity recovery of 40.9% which is to be expected. |
| 13.3.5 | CIL Tests |
Gravity tailings from the 18 samples with a grind size of P80 of 106µm were leached in standard bottle roll tests. All leach tests were conducted at 42% solids slurry density, 1000ppm free cyanide concentration and 20 g/L carbon concentration. Gold extraction was subsequently measured 8, 16, 24 and 48 hours as shown in Figure 13-6.
| | P a g e | 13-11 |
| 04/11/2021 |
| TECHNICAL REPORT ON THE AURIZONA GOLD MINE EXPANSION PRE-FEASIBILITY STUDY |
Figure 13-6: CIL Gold Extraction of Piaba Gravity Tailings Samples

The following observations are noted:
| • | Maximum gold extraction was achieved around 16 hours of leaching for all 18 samples. |
| • | The average gold extraction for all 18 samples via CIL at 16 hour residence time was 82%. When excluding the two poor performing samples (MT-534 and MT-535), the average gold extraction increased to 84.8%. |
| • | Sample MT-534 had the lowest gold extraction of 49.6% and is attributed to the high arsenic content due to sub-microscopic gold and gold inclusions associated with arsenopyrite. This is well known and has been previously tested on high arsenic samples at Aurizona. See Lycopodium et al, 2017 for detailed analysis. |
| • | Sample MT-535 had low gold extraction at 69.3%. Although the head grade was 2.48 g/t Au, 0.8% S and 182 ppm As and the gold extraction was expected to be higher. It is recommended to complete a gold deportment study to further investigate the poor recovery of this sample. |
| 13.3.6 | Overall Piaba Gold Recoveries |
The overall gold recoveries of the 18 samples are shown in Figure 13-7. The overall gold recovery for 16 samples (excluding MT-534 and MT-535) is 95.9% (blue dots).
| | P a g e | 13-12 |
| 04/11/2021 |
| TECHNICAL REPORT ON THE AURIZONA GOLD MINE EXPANSION PRE-FEASIBILITY STUDY |
Figure 13-7: Overall Piaba Gold Recoveries

| 13.3.7 | Piaba Test Work Recommendations |
It is recommended to continue the existing metallurgical test work program as follows:
| • | Complete the planned SMC test work |
| • | Continue to investigate gold recovery issues with sample MT-535 (gold deportment study) |
| • | Continue with the metallurgical test program to evaluate the two composite samples that represent two mining years. |
| 13.4 | Test Work Conclusions |
In general, the ore samples tested from Tatajuba and Piaba underground resulted in a similar metallurgical response of previous ore tested and fall within the expected ranges of historical test work results and are not expected to result in significant flowsheet or operational changes to the existing process plant.
| | P a g e | 13-13 |
| 04/11/2021 |
| TECHNICAL REPORT ON THE AURIZONA GOLD MINE EXPANSION PRE-FEASIBILITY STUDY |
| 14 | Mineral Resource Estimates |
The current Mineral Resource estimate of the Aurizona Property comprises Piaba, Boa Esperança, Tatajuba and Genipapo and Touro deposits with a common effective date of June 30, 2021 for all deposits. The Piaba deposit’s Mineral Resources are described in Section 14.3, the Boa Esperança deposit’s Mineral Resources are described in Section 14.4 and the Tatajuba deposit’s Mineral Resource are described in Section 14.5. The Mineral Resources of the Genipapo and Touro deposits represent inaugural Mineral Resource estimates (Sections 14.6 and 14.7, respectively).
| 14.1 | Methodology and Data Sources |
The following section discusses the methodology and data sources common to all deposit resource models. Differences in methodology are described within each deposit’s respective sections.
| 14.1.1 | Software |
Geologic interpretations were performed by MASA and Equity in Leapfrog v6.0, Datamine Studio and Micromine 2021. Leapfrog v6.0 was used to assist with generating final resource domains. Estimation of resources was completed using Micromine 2021.
| 14.1.2 | Regolith Model |
Regolith contacts between laterite-saprolite, saprolite-transition and transition-fresh were generated for all deposits. The criteria for surface generation relied on logged regolith data and point load test data. These surfaces were used to cut the gold zones (GZ) into their respective regolith domains. Each regolith domain has unique gold concentration and mineralization geometry within the ore body in addition to unique mining parameters such as open pit slope angles, mining, and processing costs.
| 14.1.3 | Editing of the Block Models |
Each block model was assigned density, topography, and regolith and partial percentages of blocks within the gold zone domains.
Topography
A digital elevation model (“DEM”) for each deposit was generated from a LIDAR survey completed in 2017 and combined with an as-built mine survey dated December 30, 2020. The as-built surveys rely on laser scans from the active portions of the deposit where mining and stockpiling are occurring as described in Sec 9.1. The Piaba resource model uses an as-built survey from June 30, 2021, and Boa Esperança and Genipapo resource models use an as-built survey from December 30, 2020, as no relevant changes to the topography surface have occurred. Tatajuba is covered by the 2014 LIDAR survey. The topography used for the Touro resource model was generated by combining laser scan surveys completed by MASA in 2019 and 2020 and combined with a regional scale 2017 LiDAR survey.
| | P a g e | 14-1 |
| 04/11/2021 |
| TECHNICAL REPORT ON THE AURIZONA GOLD MINE EXPANSION PRE-FEASIBILITY STUDY |
The resulting DEMs were assigned to the block model. Percent air was assigned to the block model using partial percentages for partial blocks straddling the DEM. Gold zone wireframes were cut against the same DEM surface to generate a partial percent of the respective gold zone below topography.
Domain Assignment for Regolith and Gold Zone Domains
Blocks were initially coded based on majority of block within each regolith domain using the regolith model explained in Section 14.1.2. Remaining blocks that were unassigned, were assigned to regolith domains based on block centroids. The gold zone domains were combined with the regolith domains and blocks were assigned to the combined gold zone and regolith domains based on majority percentage of blocks contained within the gold zone.
Piaba High-grade Domains
Fourteen high-grade domains were generated for the Piaba deposit. The high-grade domains were constrained to the fresh portion of the deposit. Blocks were assigned partial percentages for each individual high-grade domain.
Piaba Low-grade Domains
A low-grade domain was generated for the Piaba deposit by excluding the high-grade domains from the fresh portion of the gold zone. Blocks were assigned partial percentages for the low-grade domain.
Piaba Underground Resource Datum
To define the limits for reporting open pit and underground resources, an underground resource datum was generated using the lower of the transition-fresh rock contact and the base of the reserve pit. The final datum uses the lower of 20 m below the reserve pit or 20m below the transition-fresh contact. Above this datum, resources that are within the resource pit are included in the open pit resource. Below this datum, resources that are included with the reported grade shell are included in the underground resource.
Reserves
Portions of the gold zone domains that occur within reserve shapes, including pit designs and underground development and stopes, were excluded for reporting resources exclusive of reserves.
| 14.1.4 | Reasonable Prospects of Eventual Economic Extraction |
The CIM Definition Standards on Mineral Resources and Reserves (CIM Definition Standards, May 2014) state that:
| | P a g e | 14-2 |
| 04/11/2021 |
| TECHNICAL REPORT ON THE AURIZONA GOLD MINE EXPANSION PRE-FEASIBILITY STUDY |
“A Mineral Resource is a concentration or occurrence of solid material of economic interest in or on the Earth’s crust in such form, grade or quality and quantity that there are reasonable prospects for eventual economic extraction”.
To sufficiently test the reasonable prospects for eventual economic extraction by an open pit, AGP used the MineSight pit optimiser with the input parameters summarised in Table 14-1. The results of the pit optimisation partially form the basis of the Mineral Resource statement. The results of the pit optimisation are used to constrain the Mineral Resources with respect to the CIM Definition Standards and does not constitute an attempt to estimate reserves. For Piaba, the open pit resources are restricted to blocks contained within the optimised pit, and above the Underground Resource Datum (Section 14.1.3).
Table 14-1: Pit Optimisation Parameters for Open Pit Resources
| Metal Prices | |
| Gold Price (US$ per Au oz) | $1,500 |
| Payability (% ) | 99.9% |
| Refining/Transportation (US$ per Au oz) | $23.52 |
| Royalty (%) | 3% |
| Wall Slopes (Overall Angle in Degrees) | |
| Laterite | 33° |
| Saprolite | 45° |
| Transition | 39° |
| Rock | 60° |
| | P a g e | 14-3 |
| 04/11/2021 |
| TECHNICAL REPORT ON THE AURIZONA GOLD MINE EXPANSION PRE-FEASIBILITY STUDY |
Table 14-2: Pit Optimisation Mining Cost and Recovery Assumptions
| Waste Mining Costs (US$/t moved) | Piaba | Boa | Tatajuba | Genipapo | Touro |
| Laterite/Saprolite | $1.90 | $1.90 | $1.91 | $1.91 | $1.91 |
| Hard Saprolite/Transition | $2.40 | $2.40 | $2.27 | $2.27 | $2.27 |
| Rock | $2.52 | $2.52 | $3.49 | $3.49 | $3.49 |
| Ore Mining Costs (US$/t/6m Bench) | Piaba | Boa | Tatajuba | Genipapo | Touro |
| Laterite/Saprolite | $2.32 | $2.32 | $4.53 | $2.53 | $8.53 |
| Hard Saprolite/Transition | $3.18 | $3.18 | $5.06 | $3.06 | $9.06 |
| Rock | $3.55 | $3.55 | $5.49 | $3.49 | $9.49 |
| Incremental Mining Costs (US$/t/6m Bench) | Piaba | Boa | Tatajuba | Genipapo | Touro |
| Laterite/Saprolite | $0.01 | $0.01 | $0.01 | $0.01 | $0.01 |
| Hard Saprolite/Transition | $0.01 | $0.01 | $0.00 | $0.00 | $0.00 |
| Rock | $0.01 | $0.01 | $0.00 | $0.00 | $0.00 |
| Process Costs (US$/t processed ) | Piaba | Boa | Tatajuba | Genipapo | Touro |
| Laterite/Saprolite | $7.57 | $7.57 | $7.75 | $7.57 | $7.57 |
| Hard Saprolite/Transition | $7.75 | $7.75 | $7.75 | $7.75 | $7.75 |
| Rock | $9.34 | $9.34 | $9.34 | $9.34 | $9.34 |
| G&A Costs | $4.89 | $4.89 | $4.89 | $4.89 | $4.89 |
| Process Recovery (%) | Piaba | Boa | Tatajuba | Genipapo | Touro |
| Laterite | 93.1% | 91.8% | 91.4% | 91.4% | 91.4% |
| Saprolite | 93.1% | 91.8% | 91.4% | 91.4% | 91.4% |
| Transition | 94.1% | 97.1% | 91.4% | 91.4% | 91.4% |
| Fresh | 90.0% | 90.0% | 91.4% | 91.4% | 91.4% |
To sufficiently test the reasonable prospects for eventual economic extraction by underground mining, underground mining cost assumptions that are presented in Table 14-3 were used. These assumptions suggest that an underground mining scenario would support mining at a marginal cut-off grade of 1.0 g/t gold. To assess continuity of blocks greater than 1.0 g/t gold within the resource model, outer shells of the block model were generated using a tolerance of 25 m. Blocks within this grade shell form the basis for the underground resources.
| | P a g e | 14-4 |
| 04/11/2021 |
| TECHNICAL REPORT ON THE AURIZONA GOLD MINE EXPANSION PRE-FEASIBILITY STUDY |
Table 14-3: Underground Mining Assumptions
| Parameter | Unit Cost | Amount |
| Gold Price | US$ per oz | $1,500 |
| Payability | % | 100 |
| Refining/Transportation | US$ per oz | $19.50 |
| Royalty | % | 4 |
| Mining Costs | US$ /t | $32.92 |
| Process Costs | US$/t processed | $9.34 |
| Process Recovery | % | 90 |
| 14.2 | Factors That May Affect the Mineral Resource Estimate |
Areas of uncertainty that may affect the Mineral Resource estimates include:
| • | changes to pit optimisation input parameters |
| • | changes to underground mining cost assumptions |
| • | changes to the geological models |
There are no known factors related to metallurgical, environmental, permitting, legal, title, taxation, socio-economic, marketing, or political issues which could materially affect the Mineral Resource estimates.
| 14.3 | Piaba |
This section describes the Piaba deposit’s Mineral Resource estimate.
| 14.3.1 | Drill Hole Database |
The drill hole database supporting the Piaba deposit Mineral Resource was provided by Equinox and has a cut off date of January 28, 2021. The database is comprised of two datasets that include the exploration drill hole database that includes diamond and RC drill holes completed drilling as of November 14, 2020, and a current grade control drill hole database with a data cut off date of December 16, 2020, that includes holes completed up to November 24, 2020.
The drill hole databases were accepted as is with few modifications that included:
| • | intervals representing unsampled or missing assay results were omitted |
| • | grade control drill holes predating 2018 are omitted from estimation |
| • | auger drill holes were omitted from estimation |
| • | zero grade assay intervals were assigned a grade of 0.0025g/t gold |
| • | intervals below detection limit were assigned 0.0025g/t gold, representing half detection limit |
| | P a g e | 14-5 |
| 04/11/2021 |
| TECHNICAL REPORT ON THE AURIZONA GOLD MINE EXPANSION PRE-FEASIBILITY STUDY |
| • | grade control drill holes that had unresolved analytical QA/QC failures were omitted |
| • | grade control drilling from 2014 and earlier years was omitted |
Drill Hole Data Statistics
The Piaba drill hole database consists of two separate databases: an exploration drilling database and a grade control database. The exploration drilling database represents drilling performed using diamond drilling and RC techniques. The grade control database represents drilling performed using RC drilling techniques. The two databases are reflective of different QA/QC and data collection procedures that are outlined in Section 11 and 12.
The two drill hole databases are summarised in Table 14-4.
Table 14-4: Piaba Drill Hole Database Summary
| Database | Drilling Method | Number of Holes | Total Metres | Number of Samples | |
| Exploration | RC | 239 | 12,434 | 12,152 | |
| DDH | 531 | 118,377 | 81,465 | ||
| Grade Control | RC | 3,907 | 123,637 | 61,060 | |
| DDH | 1 | 50 | 17 |
| 14.3.2 | Geological Models |
Gold mineralization is structurally controlled primarily within a quartz diorite host lithology, and is associated with quartz veining, silicification, and increased sulphide abundance. The mineralization exists as a tabular body that dips steeply to the north-northwest. The gold zone was interpreted on section and in plan orientations to honour the hydrothermal system that hosts mineralization. Initial interpretation of the gold zone focused on modelling silicification, sulphide mineralization, lithology, and composite intervals of gold grades greater than 0.30 g/t with less than 5 m of low-grade or waste intervals. The three models (Figure 14-1 to Figure 14-3) support the Piaba gold zone (PGZ) and Piaba West gold zone (PWGZ) resource domains (
Figure 14-4). Within the fresh portion of the Piaba gold zone, internal high-grade domains were generated. These domains focus on narrow, high-grade structures. Fourteen high-grade domains were generated within the fresh zone of the Piaba deposit and can be grouped as central (n=4), footwall (n=6), and hanging wall (n=4) domains. Interpretation of the high-grade gold zone focused quartz veining greater than 5%, sulphide mineralization greater than
| | P a g e | 14-6 |
| 04/11/2021 |
| TECHNICAL REPORT ON THE AURIZONA GOLD MINE EXPANSION PRE-FEASIBILITY STUDY |
Figure 14-6 is an oblique inclined view looking south.
Figure 14-1: Isometric View of Piaba Lithology Model

Figure 14-2: Isometric View of Piaba Silicification Model

| | P a g e | 14-7 |
| 04/11/2021 |
| TECHNICAL REPORT ON THE AURIZONA GOLD MINE EXPANSION PRE-FEASIBILITY STUDY |
Figure 14-3: Isometric View of Piaba Sulphide Mineralization Model

Figure 14-4: Isometric View of Piaba and Piaba West Gold Zones Resource Domains

| | P a g e | 14-8 |
| 04/11/2021 |
| TECHNICAL REPORT ON THE AURIZONA GOLD MINE EXPANSION PRE-FEASIBILITY STUDY |
Figure 14-5: Piaba Underground Central and Footwall High-grade Gold Zones

Figure 14-6: Piaba Underground Hangingwall High-grade Gold Zones

| | P a g e | 14-9 |
| 04/11/2021 |
| TECHNICAL REPORT ON THE AURIZONA GOLD MINE EXPANSION PRE-FEASIBILITY STUDY |
Table 14-5: Piaba Open Pit Estimation Domains
| Estimation Domain | Regolith Profile |
Domain Number |
| Piaba Gold Zone (PGZ) | Laterite | 21 |
| Saprolite | 22 | |
| Transition | 23 | |
| Fresh | 24 | |
| Piaba West Gold Zone (PWGZ) | Laterite | 41 |
| Saprolite | 42 | |
| Transition | 43 | |
| Fresh | 44 | |
| Waste | Laterite | 11 |
| Saprolite | 12 | |
| Transition | 13 | |
| Fresh | 14 |
Table 14-6: Piaba High-grade Domains
| Estimation Domain | Regolith Profile |
Domain Number |
| Central | Fresh | 324 |
| Fresh | 424 | |
| Fresh | 824 | |
| Fresh | 1624 | |
| Hanging Wall | Fresh | 124 |
| Fresh | 524 | |
| Fresh | 724 | |
| Fresh | 1024 | |
| Footwall | Fresh | 224 |
| Fresh | 924 | |
| Fresh | 1124 | |
| Fresh | 1224 | |
| Fresh | 1324 | |
| Fresh | 1424 | |
| PGZ Excluding High-grade Domains | Fresh | 24 |
Regolith Modelling
A regolith model was developed using the methodology described in Section 14.1.2 and is shown Figure 14-7.
| | P a g e | 14-10 |
| 04/11/2021 |
| TECHNICAL REPORT ON THE AURIZONA GOLD MINE EXPANSION PRE-FEASIBILITY STUDY |
Figure 14-7: Piaba Cross Section 100W Looking East (078°) Showing Drill Holes and Regolith Model

| | P a g e | 14-11 |
| 04/11/2021 |
| TECHNICAL REPORT ON THE AURIZONA GOLD MINE EXPANSION PRE-FEASIBILITY STUDY |
Fault Modelling
Ten faults are modelled within the Piaba deposit. These faults interact with the geological resource by introducing minor offsets. The faults have been named according to their location with the current mine grid and are summarized in Table 14-7 and shown in Figure 14-8.
Table 14-7: Piaba Fault Nomenclature and Impact to Resource Model
| Fault Name | Offset | Impact to Resource Model |
| 1600W | Moderate | Moderate offset, 10 m |
| 1100W | Moderate | Moderate bend |
| 1350W | Moderate | Moderate offset, 10 to 15 m |
| 100W | Moderate | Moderate bend, offset < 10 m |
| 550E | Moderate | Moderate bend |
| 650W | Minor | Minor bend |
| 700E | Minor | Minor bend |
| 800E | Minor | Minor bend |
| 950E | Minor | Minor bend |
| 1900W | Moderate | Separates Piaba and Piaba West |
| Pirocaua | Major | Terminates East end of Piaba |
Figure 14-8 shows major faults that truncate the resource in orange, moderate faults are shown in green. Second order faults only have moderate offsets and disrupt the gold zone thickness along strike. Minor faults are shown in blue and do not interact with the resource model in any significant way.
| | P a g e | 14-12 |
| 04/11/2021 |
| TECHNICAL REPORT ON THE AURIZONA GOLD MINE EXPANSION PRE-FEASIBILITY STUDY |
Figure 14-8: Isometric View of Piaba Gold Zone Showing Fault Model

| 14.3.3 | Grade Capping |
Grade capping was completed in a stepwise manner, initially on raw sample data and then checked after compositing the sample data. The methodology used is summarised as follows:
Uncapped samples were evaluated to determine the spatial continuity of outliers - specifically samples that are two standard deviations away from the mean.
Sample statistics were generated by applying both length and declustered weights using probability plots, cumulative frequency plots, mean versus top cut value and coefficient of variation versus top cut value.
Top cut values were applied on raw sample data and then composited using the methods described in Section 14.3.4 prior to compositing.
Capped composite sample statistics were checked with respect to the selected top cut values for population breaks using probability plots and cumulative frequency plots.
Estimates were generated using capped sample data to determine the spatial influence of capped outliers.
| | P a g e | 14-13 |
| 04/11/2021 |
| TECHNICAL REPORT ON THE AURIZONA GOLD MINE EXPANSION PRE-FEASIBILITY STUDY |
Four high-grade domains warranted lower capping values to limit the influence of outliers and required capping composite samples.
Most outliers occur scattered throughout the Piaba gold zone and generally have continuity with other high-grade samples associated with thicker portions of the Piaba gold zone. To manage the spatial influence of potential outliers, top cut values were selected based on population breaks observed on probability plots. These top cut values were compared to decile analysis using a similar method described by Parrish (1997). Capping analysis was completed on assay sample data using length and declustered sample weights.
Table 14-8: Summary of Top Cut Analysis for Piaba Gold Zone & Waste
| Domain | Number
of Assays |
Length
(Au, g/t) |
Capping Value (Au, g/t) |
Number
of Samples Capped |
Length (Au, g/t) |
Number
of Composite Samples |
Average Composite Samples (Au, g/t) |
| 11 | 1752 | 0.22 | 2 | 17 | 0.20 | 1612 | 0.15 |
| 12 | 38355 | 0.19 | 2 | 500 | 0.11 | 29260 | 0.08 |
| 13 | 16209 | 0.32 | 2 | 384 | 0.18 | 12255 | 0.08 |
| 14 | 31434 | 0.13 | 2 | 322 | 0.08 | 36779 | 0.06 |
| 21 | 3455 | 0.99 | 30 | 5 | 0.94 | 2735 | 0.94 |
| 22 | 20605 | 1.37 | 45 | 31 | 1.30 | 8913 | 1.18 |
| 23 | 18417 | 1.34 | 30 | 46 | 1.27 | 6445 | 1.04 |
| 24 | 16483 | 1.05 | 50 | 18 | 1.02 | 11420 | 0.75 |
| 41 | 87 | 0.15 | 30 | 0 | 0.15 | 88 | 0.15 |
| 42 | 122 | 1.67 | 45 | 0 | 1.67 | 122 | 1.67 |
| 43 | 46 | 0.59 | 30 | 0 | 0.59 | 46 | 0.59 |
| 44 | 157 | 0.60 | 50 | 0 | 0.60 | 159 | 0.60 |
| | P a g e | 14-14 |
| 04/11/2021 |
| TECHNICAL REPORT ON THE AURIZONA GOLD MINE EXPANSION PRE-FEASIBILITY STUDY |
Table 14-9: Summary of Top Cut Analysis for Piaba High-grade Domains
| Domain | Number of Assays |
Length Weighted Average (Au, g/t) | Capping
Value (Au, g/t) |
Number
of Samples Capped |
Capped
Sample (Au, g/t) |
Number of Composite Samples | Composite Sample Average (Au, g/t) | Composite Sample Capping Value (g/t) |
Number of Composites Capped | Composite Sample Average (Au, g/t) |
| 124 | 42 | 2.70 | 20 | 1 | 2.49 | 45 | 2.49 | 20 | - | 2.49 |
| 224 | 38 | 2.17 | 20 | 0 | 2.17 | 36 | 2.16 | 20 | - | 2.16 |
| 324 | 811 | 2.06 | 35 | 4 | 1.89 | 715 | 1.95 | 35 | - | 1.95 |
| 424 | 992 | 3.27 | 35 | 10 | 2.78 | 792 | 2.93 | 35 | - | 2.93 |
| 524 | 87 | 3.82 | 20 | 5 | 2.07 | 64 | 2.66 | 20 | - | 2.66 |
| 724 | 139 | 2.79 | 20 | 2 | 2.54 | 142 | 2.54 | 20 | - | 2.54 |
| 824 | 2176 | 1.92 | 50 | 7 | 1.87 | 1596 | 2.27 | 50 | - | 2.27 |
| 924 | 85 | 4.65 | 20 | 2 | 2.90 | 79 | 2.97 | 20 | - | 2.97 |
| 1024 | 228 | 2.21 | 20 | 3 | 2.13 | 251 | 2.12 | 20 | - | 2.12 |
| 1124 | 69 | 2.16 | 20 | 1 | 2.04 | 66 | 2.04 | 20 | - | 2.04 |
| 1224 | 71 | 4.11 | 20 | 5 | 3.51 | 65 | 3.67 | 15 | 4 | 3.36 |
| 1324 | 139 | 2.61 | 20 | 3 | 2.36 | 130 | 2.43 | 15 | 2 | 2.35 |
| 1424 | 189 | 3.34 | 20 | 1 | 3.33 | 176 | 3.32 | 15 | 5 | 3.26 |
| 1624 | 1060 | 1.70 | 35 | 4 | 1.63 | 767 | 1.96 | 15 | 9 | 1.85 |
| | P a g e | 14-15 |
| 04/11/2021 |
| TECHNICAL REPORT ON THE AURIZONA GOLD MINE EXPANSION PRE-FEASIBILITY STUDY |
Figure 14-9: Boxplot of Piaba Assay Sample Statistics
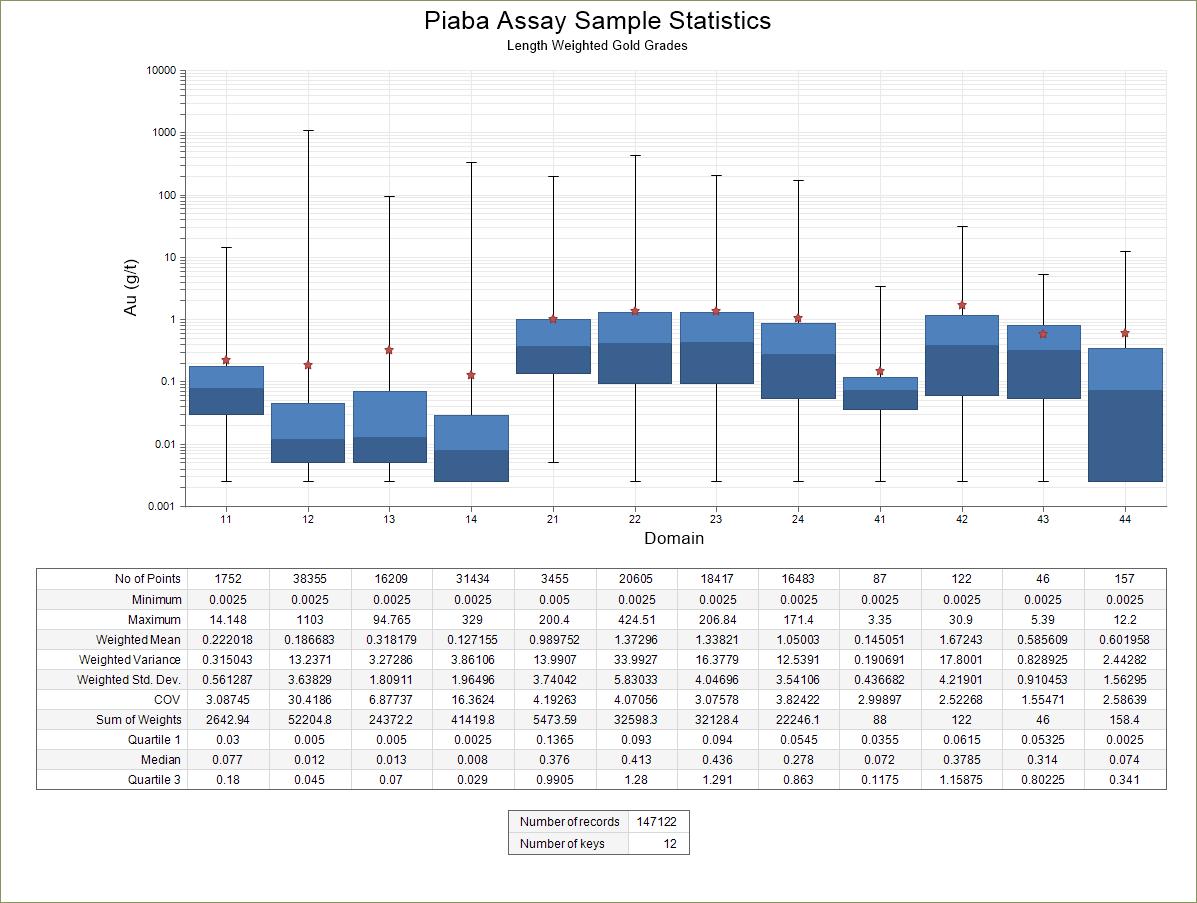
| | P a g e | 14-16 |
| 04/11/2021 |
| TECHNICAL REPORT ON THE AURIZONA GOLD MINE EXPANSION PRE-FEASIBILITY STUDY |
Figure 14-10: Boxplot of Piaba High-grade Domain Assay Sample Statistics

| | P a g e | 14-17 |
| 04/11/2021 |
| TECHNICAL REPORT ON THE AURIZONA GOLD MINE EXPANSION PRE-FEASIBILITY STUDY |
Figure 14-11: Boxplot of Piaba Capped Composite Sample Statistics

| | P a g e | 14-18 |
| 04/11/2021 |
| TECHNICAL REPORT ON THE AURIZONA GOLD MINE EXPANSION PRE-FEASIBILITY STUDY |
Figure 14-12: Boxplot of Piaba High-grade Domain Capped Composite Sample Statistics

| 14.3.4 | Compositing |
Prior to compositing samples, sample length was investigated as well as capping extreme outliers. Original sample lengths are shown in Figure 14-13. Modal sample lengths are 1 m for the drill hole samples and 3 m for the grade control samples.
| | P a g e | 14-19 |
| 04/11/2021 |
| TECHNICAL REPORT ON THE AURIZONA GOLD MINE EXPANSION PRE-FEASIBILITY STUDY |
Figure 14-13: Original Sample Lengths for Drill Hole and Grade Control Sample for Piaba

A composite length of 1 m was selected for the exploration samples due to the modal presence of 1 m samples. 1 m composite samples were generated down the hole from the collar to final depth of the drill holes. Composite samples were broken at domain boundaries with residual sample lengths of less than 1 m were backstitched to the final composite sample. Sample lengths less than 0.25 m were discarded.
Grade control sample data contains modal sample lengths of 1 and 3 m where 3 m sample lengths represent 70% of the total sampled length. The grade control samples were composited to 6 m bench intervals to reduce the variability of the sample data. Samples less then 1 m were discarded. For grade control holes with missing sample intervals, accumulated length weighted average grades were used. Composite samples yielding bench intervals with less than 1 m accumulated sample length were discarded.
| | P a g e | 14-20 |
| 04/11/2021 |
| TECHNICAL REPORT ON THE AURIZONA GOLD MINE EXPANSION PRE-FEASIBILITY STUDY |
Table 14-10: Piaba Composite
| Composite Samples | Database | Number of Holes |
Number of Samples |
Cumulative Metres | |
| 1 m Downhole | Exploration | 770 | 105760 | 105405 | |
| 6 m Bench | Grade Control | 1,923 | 10,890 | 60,582 |
| 14.3.5 | Variography |
Variograms were modelled using traditional directional variograms using the composite samples generated for estimation. Modelled variograms for the Piaba gold zone are summarised in Table 14-11. The variogram model generated for the fresh domain excludes samples within the high-grade domains. To assist in calculating a stable variogram, high-grade domains making up the central portion of the Piaba gold zone were combined for variogram modelling.
Table 14-11: Variogram Model Parameters for Piaba Gold Zone (PGZ)
| Domain | Direction | Azimuth | Plunge | Range 1 | CC 1 | Range 2 | CC 2 | Nugget |
| 21 | D1 | 68 | 0 | 15 | 0.24 | 80 | 0.57 | 0.19 |
| Laterite PGZ | D2 | 158 | 0 | 10 | 20 | |||
| H | 180 | 90 | 2 | 5 | ||||
| 22 | D1 | 346 | 66 | 5 | 0.39 | 40 | 0.11 | 0.5 |
| Saprolite PGZ | D2 | 76 | 0 | 80 | 130 | |||
| H | 166 | 24 | 7.5 | 20 | ||||
| 23 | D1 | 338 | 70 | 2 | 0.43 | 30 | 0.36 | 0.2 |
| Transition PGZ | D2 | 68 | 0 | 15 | 60 | |||
| H | 158 | 20 | 5 | 30 | ||||
| 24 | D1 | 35 | 59 | 8 | 0.33 | 60 | 0.44 | 0.22 |
| Fresh PGZ | D2 | 81 | -23 | 10 | 50 | |||
| H | 162 | 20 | 5 | 10 | ||||
| 324, 424, 824 | D1 | 346 | 78 | 15 | 0.52 | 80 | 0.31 | 0.17 |
| HG Domains | D2 | 76 | 0 | 50 | 80 | |||
| H | 166 | 12 | 7 | 15 |
| 14.3.6 | Gold Grade Estimation |
Gold grade estimation for the Piaba open pit resource model was completed using ordinary kriging (“OK”). A single block model was generated for the Piaba deposit. Block dimensions of 5 m (east) by 5 m (north) and block height of 3 m was selected to reflect the geometry of the gold zone and current mining method. The block model was rotated counter-clockwise 20 degrees to match the strike of the ore body. The block model definitions are summarised in Table 14-12.
| | P a g e | 14-21 |
| 04/11/2021 |
| TECHNICAL REPORT ON THE AURIZONA GOLD MINE EXPANSION PRE-FEASIBILITY STUDY |
Table 14-12: Piaba Open Pit Block Model Index
| Axis | Block Size | Rotation | Base Point | Block Count |
| X | 5 | 0 | 413,500 | 1100 |
| Y | 5 | 0 | 9,855,100 | 344 |
| Z | 3 | -20 | -716 | 292 |
| Total | 110,492,800 | |||
Estimates were generated using two estimation passes, with the exception of domain 24 which relied on three passes. The first estimation pass honours the modelled variogram ranges, while the second pass interpolation distances are generally 1 and a half times the modelled variogram ranges. Estimates used capped composite samples described in Section 14.3.4. The search parameters used are summarised in Table 14-13.
Table 14-13: Piaba Search Interpolation Parameters
| Domain | Pass | Search Axis Orientation | LVA | Search Radii | Min Sample |
Max Sample |
Limit by Hole | ||||
| Azimuth | Plunge | Rotation | X | Y | Z | ||||||
| 21, 41 | 1 | 68 | 0 | 0 | No | 80 | 20 | 10 | 12 | 36 | 8 |
| 2 | 68 | 0 | 0 | No | 120 | 30 | 20 | 3 | 36 | 8 | |
| 22 | 1 | 346 | 66 | 0 | Yes | 40 | 80 | 20 | 12 | 36 | 8 |
| 2 | 346 | 66 | 0 | Yes | 60 | 120 | 30 | 3 | 36 | 8 | |
| 23 | 1 | 346 | 66 | 0 | Yes | 30 | 60 | 20 | 12 | 36 | 8 |
| 2 | 346 | 66 | 0 | Yes | 45 | 90 | 45 | 3 | 36 | 8 | |
| 24 | 1 | 346 | 66 | 0 | Yes | 60 | 50 | 10 | 12 | 36 | 8 |
| 2 | 346 | 66 | 0 | Yes | 90 | 75 | 15 | 2 | 36 | 8 | |
| 3 | 346 | 66 | 0 | Yes | 120 | 120 | 30 | 2 | 36 | 8 | |
| 42 | 1 | 346 | 66 | 0 | No | 40 | 80 | 20 | 12 | 36 | 8 |
| 2 | 346 | 66 | 0 | No | 60 | 120 | 30 | 3 | 36 | 8 | |
| 43 | 1 | 346 | 66 | 0 | No | 30 | 60 | 20 | 12 | 36 | 8 |
| 2 | 346 | 66 | 0 | No | 45 | 90 | 45 | 3 | 36 | 8 | |
| 44 | 1 | 346 | 66 | 0 | No | 80 | 80 | 20 | 12 | 36 | 8 |
| 2 | 346 | 66 | 0 | No | 120 | 120 | 30 | 3 | 36 | 8 | |
| High-grade Domains | 1 | 346 | 66 | 0 | Yes | 80 | 80 | 20 | 12 | 36 | 8 |
| 2 | 346 | 66 | 0 | Yes | 120 | 120 | 30 | 2 | 36 | 8 | |
For waste domains, the second pass for each respective regolith domain was used. Within the saprolite, transition and fresh portions of the Piaba gold zone and high-grade domains, locally varying anisotropy (“LVA”) was applied based on a reference surface representing the midpoints between the Piaba gold zone footwall and hangingwall. Search ellipse orientations for the anisotropy model were coded to the block model.
| | P a g e | 14-22 |
| 04/11/2021 |
| TECHNICAL REPORT ON THE AURIZONA GOLD MINE EXPANSION PRE-FEASIBILITY STUDY |
| 14.3.7 | Validation of Grade Estimates |
Grade estimates were validated by completing a series of visual checks in plan and cross section, swath plots for each domain, comparing block estimates to composite samples (cross validation), and comparing OK estimates with inverse distance (“ID”) and comparing past production to the estimates generated.
Swath Plots
Swath plots were completed for the main Piaba gold zone domains using the Piaba cross section index. Figure 14-14 shows the block estimates in blue, nearest neighbour in red, composite samples in black. Grey histograms represent the number of samples within each swath. Figure 14-14 shows blended grades for domain 24, whereas Figure 14-15 shows domain 24 (excluding high-grade domain) and high-grade domains. In general, the trends of estimated gold grades are reproduced by the resource model where there are sufficient samples. Areas of the model that show elevated nearest neighbour estimates compared to blended grade estimates occur in areas where there are stacked high-grade domains.
| | P a g e | 14-23 |
| 04/11/2021 |
| TECHNICAL REPORT ON THE AURIZONA GOLD MINE EXPANSION PRE-FEASIBILITY STUDY |
Figure 14-14: Vertical and Oriented Swath Plots of Piaba Gold Zone Domains


| | P a g e | 14-24 |
| 04/11/2021 |
| TECHNICAL REPORT ON THE AURIZONA GOLD MINE EXPANSION PRE-FEASIBILITY STUDY |


| | P a g e | 14-25 |
| 04/11/2021 |
| TECHNICAL REPORT ON THE AURIZONA GOLD MINE EXPANSION PRE-FEASIBILITY STUDY |


| | P a g e | 14-26 |
| 04/11/2021 |
| TECHNICAL REPORT ON THE AURIZONA GOLD MINE EXPANSION PRE-FEASIBILITY STUDY |


| | P a g e | 14-27 |
| 04/11/2021 |
| TECHNICAL REPORT ON THE AURIZONA GOLD MINE EXPANSION PRE-FEASIBILITY STUDY |
Figure 14-15: Vertical and Oriented Swath Plots of Piaba Gold Zone Domain 24 and High-grade Domains


| | P a g e | 14-28 |
| 04/11/2021 |
| TECHNICAL REPORT ON THE AURIZONA GOLD MINE EXPANSION PRE-FEASIBILITY STUDY |


| | P a g e | 14-29 |
| 04/11/2021 |
| TECHNICAL REPORT ON THE AURIZONA GOLD MINE EXPANSION PRE-FEASIBILITY STUDY |
Cross Validation
Cross validation was completed to check for reproduction of composite sample grades to estimated grades.
Table 14-14 summarises the comparison of composite sample average grades versus average block gold estimates. The correlation coefficient for most domains is above 0.7, with the exception of the transition gold zone. The weaker correlation coefficient within the transition domain is attributed to the closer spaced drilling and where overlapping grade control and exploration data occur. The averages represented by the composite samples are honoured by the block model.
Table 14-14: Comparison of Average Block Estimates versus Composite Samples within a Block for Piaba
| Domain Number |
Block Average Grade (Au, g/t) | Correlation Coefficient | |
| Composite Samples |
Block Estimates | ||
| 21 | 0.90 | 0.91 | 0.88 |
| 22 | 1.15 | 1.16 | 0.71 |
| 23 | 1.09 | 1.1 | 0.72 |
| 24 | 0.80 | 0.8 | 0.70 |
| HG | 2.41 | 2.37 | 0.76 |
Comparison of Estimation Techniques
Estimates were generated using inverse distance (squared and cubed), simulation, and nearest neighbour. The comparisons of these grade estimates over an area representing the 2020 production volume are presented in Table 14-15.
Table 14-15: Comparison of Different Estimation Techniques for Piaba
| Interpolator | Number of Blocks > 0.6 g/t Au |
Average Grade (g/t Au ) |
|
| OK | 17,246 | 1.41 | |
| ID2 | 17,423 | 1.42 | |
| ID3 | 16,302 | 1.49 | |
| Simulation | 14,425 | 1.60 | |
| NN | 10,562 | 2.23 |
The ordinary kriging technique compares well to simulation and inverse distance estimators but does not compare well to nearest neighbour (“NN”). For the simulation estimate, 100 realisations were averaged.
| | P a g e | 14-30 |
| 04/11/2021 |
| TECHNICAL REPORT ON THE AURIZONA GOLD MINE EXPANSION PRE-FEASIBILITY STUDY |
Reconciliation to Past Production
During the 2020 calendar year the Aurizona Mine produced 146,450 oz of gold from 3.3 Mt at a head grade of 1.39 g/t gold from Piaba and Piaba East open pit operations. Current mining practices include stockpiling and ore blending that do not permit short term reconciliation of the mined quantities to gold produced. Long term reconciliation is possible and reduces errors introduced from ore re-handling and stockpiling. The mine production was compared to the current estimate to assess the accuracy of the current resource model over the 2020 calendar year.
Table 14-16: Reconciliation of Current Resource Model to 2020 Production
| Source | Ore Mined (Kt) |
Grade (Au, g/t) |
Contained Metal (Au, oz) |
| 2021 Resource Model (PGZ Only) | 2,871 | 1.41 | 130,249 |
| 2021 Resource Model (PGZ + Waste) | 3,424 | 1.37 | 151,083 |
| 2020 Production | 3,267 | 1.39 | 146,450 |
In summary, the current resource model at a cut-off grade of 0.6 g/t gold shows 12% fewer tonnes at 2% higher grade for 11% fewer contained ounces of gold compared to 2020 production. The reconciliation of the Mineral Resource estimate to production only considers tonnage from the Piaba gold zone. It should be highlighted that additional tonnage contributing to the total mined ore tonnes can occur outside of the Piaba gold zone and likely accounts for the balance based on combined tonnage from the Piaba gold zone and waste domains above 0.6 g/t gold cut-off.
| 14.3.8 | Classification of Mineral Resources |
Block model quantities and grade estimates were classified in accordance with the CIM Definition Standards for Mineral Resources and Mineral Reserves by Trevor Rabb, P.Geo. (APEGBC #39599), an appropriate independent qualified person for the purpose of NI 43-101.
Mineral Resource classification is subjective in nature and is guided by the data used in preparing the estimate. Classification of resources has considered geological continuity, data spacing, data type, data source, data quality, and geostatistical evaluation of these data. The criteria used for resource classification is summarised in Table 14-17.
| | P a g e | 14-31 |
| 04/11/2021 |
| TECHNICAL REPORT ON THE AURIZONA GOLD MINE EXPANSION PRE-FEASIBILITY STUDY |
Table 14-17: Piaba Open Pit and Underground Resource Classification Criteria
| Classification | Criteria for Resource Classification - Piaba | |||||
| Number of holes used |
Average Distance to Samples |
Zone Width | Probability of block greater than 0.3 g/t |
Vertical distance from current topography |
Nominal Drill Hole Spacing | |
| Measured | ≥ 3 | ≤ 50 m | ≥ 15 m | 70% | ≤ 150 m | ≤ 50 m |
| Indicated | ≥ 3 | ≤ 50 m | No Restriction | No Restriction | No restriction | ≤ 80 m |
| Inferred | ≥ 1 | ≥ 50 m | No Restriction | No Restriction | No restriction | ≥ 80 m |
Estimated blocks were assigned to measured classification if:
| 1. | samples from at least three holes were used to estimate the block, |
| 2. | the average distance of samples used for the estimate are less than 50 m, |
| 3. | the gold zone width at least 15 m, |
| 4. | there is a 70% probability that the block is greater than 0.3 g/t gold, and |
| 5. | blocks were within 150 m vertical extent of the current topography. |
Nominal drill hole spacing within the measured classification shell is 50 m or less, and averages 30 m.
Estimated blocks are assigned to indicated classification if:
| 1. | samples from at least three holes were used to estimate the block, |
| 2. | the average distance of samples used for the estimate are less than 50 m. |
Nominal drill hole spacing within the indicated classification shell is 80 m or less, and averages 40 m.
All other blocks with nominal drill hole spacing of 300 m or less, and averages 118 m were assigned to inferred classification.
| | P a g e | 14-32 |
| 04/11/2021 |
| TECHNICAL REPORT ON THE AURIZONA GOLD MINE EXPANSION PRE-FEASIBILITY STUDY |
| 14.3.9 | Density |
Density was estimated using inverse distance squared (ID2) for the gold zone and waste domains. Density values used relied on the wax immersion method for density determination (see section 11.7) The search parameters used for estimating density were the same as for the second pass of the gold grade estimation (see Table 14-13). Unestimated blocks were assigned domain averages from their respective regolith domains shown in
Table 14-18.
Table 14-18: Summary of Bulk Density Values and Number of Samples for Each Piaba Domain
| Domain | Domain Number | Average Bulk Density | Number of Samples |
| Waste | |||
| Laterite | 11 | 2.14 | 285 |
| Saprolite | 12 | 1.79 | 4275 |
| Transition | 13 | 2.25 | 1968 |
| Fresh | 14 | 2.77 | 6987 |
| Gold Zone | |||
| Laterite | 21 | 2.03 | 239 |
| Saprolite | 22 | 1.92 | 1035 |
| Transition | 23 | 2.35 | 670 |
| Fresh | 24 | 2.75 | 2480 |
| 14.3.10 | Mineral Resource Statement |
The open pit and underground Mineral Resources for Piaba are summarised in Table 14-19 and illustrated in Figure 14-16.
| | P a g e | 14-33 |
| 04/11/2021 |
| TECHNICAL REPORT ON THE AURIZONA GOLD MINE EXPANSION PRE-FEASIBILITY STUDY |
Table 14-19: Mineral Resource Statement (Exclusive of Reserves) for Piaba deposit, Maranhão, Brazil, Equity Exploration Consultants, effective date June 30, 2021
| Classification | Area | Cut-off
Grade Gold |
Tonnage | Gold Grade | Contained Gold | |||
| (g/t) | (kt) | (g/t) | (koz) | |||||
| Measured | Open Pit | 0.3 | 2,438 | 1.21 | 95 | |||
| Indicated | 0.3 | 3,114 | 1.19 | 121 | ||||
| M&I | 0.3 | 5,552 | 1.20 | 215 | ||||
| Inferred | 0.3 | 53 | 0.77 | 1 | ||||
| Measured | Laterite | 0.3 | - | - | - | |||
| Saprolite | 0.3 | 318 | 1.00 | 10 | ||||
| Transition | 0.3 | 416 | 1.00 | 13 | ||||
| Fresh Rock | 0.3 | 1,705 | 1.30 | 72 | ||||
| Indicated | Laterite | 0.3 | 74 | 0.68 | 2 | |||
| Saprolite | 0.3 | 906 | 1.20 | 34 | ||||
| Transition | 0.3 | 537 | 0.90 | 16 | ||||
| Fresh Rock | 0.3 | 1,596 | 1.30 | 69 | ||||
| M & I (open pit) | Laterite | 0.3 | 74 | 0.68 | 2 | |||
| Saprolite | 0.3 | 1,224 | 1.15 | 44 | ||||
| Transition | 0.3 | 954 | 0.94 | 29 | ||||
| Fresh Rock | 0.3 | 3,301 | 1.30 | 141 | ||||
| Total | 0.3 | 5,552 | 1.20 | 215 | ||||
| Inferred | Laterite | 0.3 | 37 | 0.55 | 1 | |||
| Saprolite | 0.3 | 11 | 1.39 | 0 | ||||
| Transition | 0.3 | 4 | 1.10 | 0 | ||||
| Fresh Rock | 0.3 | 1 | 0.90 | 0 | ||||
| Measured | Underground | 1.0 | 1,000 | 2.10 | 67 | |||
| Indicated | 1.0 | 7,212 | 1.96 | 454 | ||||
| M&I | 1.0 | 8,212 | 1.98 | 521 | ||||
| Inferred | 1.0 | 9,448 | 2.46 | 747 | ||||
| Measured | Total Open Pit and Underground | 3,438 | 1.47 | 162 | ||||
| Indicated | 10,326 | 1.73 | 575 | |||||
| M&I | 13,764 | 1.66 | 737 | |||||
| Inferred | 9,501 | 2.45 | 748 | |||||
| | P a g e | 14-34 |
| 04/11/2021 |
| TECHNICAL REPORT ON THE AURIZONA GOLD MINE EXPANSION PRE-FEASIBILITY STUDY |
| Notes: |
| 1. | Mineral Resources are reported exclusive of reserves. |
| 2. | Mineral Resources are reported using a cut-off grade of 0.30 g/t gold for open pit and 1.00 g/t gold for underground and a gold price of USD$1500 /oz gold. |
| 3. | The Open Pit Mineral Resource is constrained using an optimized pit that has been generated using Lerchs - Grossman pit optimisation algorithm with parameters outlined in Table 14-1. |
| 4. | The Piaba Open Pit Mineral Resource statement has been prepared by Trevor Rabb, P.Geo. who is a qualified person as defined by NI 43-101. |
| 5. | Mineral Resources are not Mineral Reserves and do not have demonstrated economic viability. |
| 6. | The Piaba Open Pit Mineral Resource statement has been prepared in accordance with NI43-101 Standards of Disclosure for Mineral Projects (May 2016) and the CIM Definition Standards for Mineral Resources and Mineral Reserves (May 2014). |
| 7. | The number of metric tonnes and gold ounces are rounded to the nearest thousand. Any discrepancies in the totals are due to rounding. |
| 8. | Mineral Resources from Piaba Open Pit have a data cut off date of December 16, 2020, and an effective date of June 30, 2021. |
| | P a g e | 14-35 |
| 04/11/2021 |
| TECHNICAL REPORT ON THE AURIZONA GOLD MINE EXPANSION PRE-FEASIBILITY STUDY |
Figure 14-16 Cross Section of the Piaba Open Pit Block Model
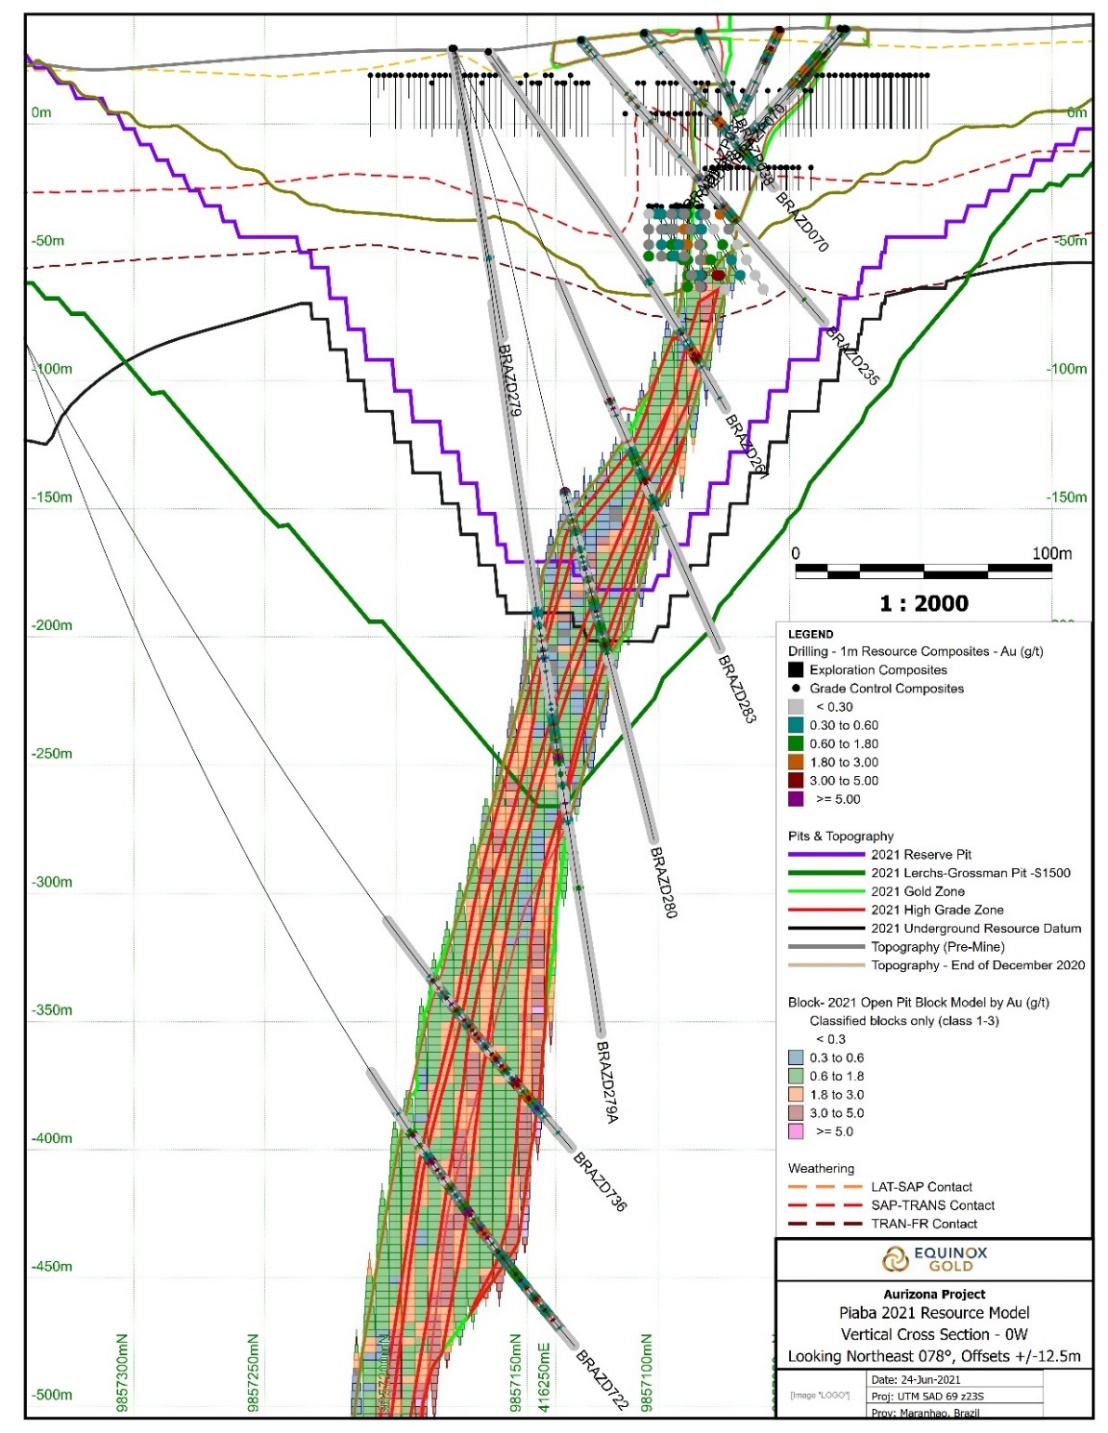
| | P a g e | 14-36 |
| 04/11/2021 |
| TECHNICAL REPORT ON THE AURIZONA GOLD MINE EXPANSION PRE-FEASIBILITY STUDY |
| 14.4 | Boa Esperança |
This section describes the Boa Esperança Mineral Resource estimate.
| 14.4.1 | Drill Hole Database |
The drill hole database supporting the Boa Esperança Mineral Resource was provided by Equinox and includes an exploration and grade control database. The exploration database includes holes drilled up until June 12, 2016. No further exploration drilling has been completed from June 12, 2016, up to June 30, 2021. The grade control database has a cut-off date of May 6, 2020. No additional grade control drilling within the Boa Esperança area had been completed by MASA from May 6, 2020, up to June 30, 2021.
The drill hole database was accepted with few modifications; these included:
| • | Intervals representing unsampled or missing assay results were omitted, |
| • | Zero grade assay intervals were assigned a grade of 0.0025 g/t gold, |
| • | Intervals below detection limit were assigned 0.0025 g/t gold, representing half detection limit. |
Drill Hole Data Statistics
The drill hole data statistics used for the Boa Esperança resource estimate are summarised in Table 14-20.
Table 14-20: Boa Esperança Drill Hole Database Summary
| Database | Drilling Method | Number of Holes | Total Metres | Number of Samples | |
| Exploration | RC | 101 | 6,808 | 6,197 | |
| DDH | 15 | 2,790 | 2,153 | ||
| Grade Control | RC | 495 | 15,919 | 6,117 |
| 14.4.2 | Geological Models |
The Boa Esperança mineralised domains represent sub-vertical shear zones coincident with 0.3 g/t gold or greater and moderate veining. A domain representing the near surface mineralization within the saprolite, and laterite profile was created (100). This domain represents the coalescing of the subvertical zones and dispersion within the laterite and saprolite weathering profile. Six domains have been generated for Boa Esperança that are shown in Figure 14-17. The estimation domains for Boa Esperança are summarised in Table 14-21.
| | P a g e | 14-37 |
| 04/11/2021 |
| TECHNICAL REPORT ON THE AURIZONA GOLD MINE EXPANSION PRE-FEASIBILITY STUDY |
Figure 14-17: Plan and Northwest Perspective View of Boa Esperança Gold Zone Resource Domains


| | P a g e | 14-38 |
| 04/11/2021 |
| TECHNICAL REPORT ON THE AURIZONA GOLD MINE EXPANSION PRE-FEASIBILITY STUDY |
Table 14-21: Boa Esperança Resource Domains
| Estimation Domain | Domain Number |
| Grade Control | 100 |
| Boa 1 | 110 |
| Boa 2 | 120 |
| Boa 3 | 130 |
| Boa 4 | 140 |
| Boa 5 | 150 |
| Waste - Laterite | 11 |
| Waste - Saprolite | 12 |
| Waste - Transition | 13 |
| Waste Fresh | 14 |
| 14.4.3 | Grade Capping |
To manage the spatial influence of potential outliers, sample statistics were examined using probability plots, cumulative frequency plots, mean versus top cut value and coefficient of variation versus top cut value. Top cut values were selected predominantly based on population breaks observed on probability plots. Domains containing sufficient samples had these top cut values compared to decile analysis using a similar method described by Parrish (1997). Capping analysis was completed on the un-composited assay data. Capping values are summarised in Table 14-22.
| | P a g e | 14-39 |
| 04/11/2021 |
| TECHNICAL REPORT ON THE AURIZONA GOLD MINE EXPANSION PRE-FEASIBILITY STUDY |
Table 14-22: Summary of Boa Esperança Capping Values by Resource Domain
| Domain | Number
of Assays |
Length
Weighted Average grade (Au, g/t) |
Capping
Value (Au, g/t) |
Number
of Samples Capped |
Length Weighted Average Capped Grade (Au, g/t) |
Number
of Composite Samples |
Average Composite Samples (Au, g/t) |
Declustered Composite Sample Average (Au, g/t) |
| 100 | 4117 | 0.78 | 13 | 14 | 0.75 | 3893 | 0.74 | 0.73 |
| 110 | 539 | 0.60 | 10 | 2 | 0.46 | 490 | 0.56 | 0.49 |
| 120 | 428 | 0.55 | 10 | 1 | 0.54 | 392 | 0.66 | 0.59 |
| 130 | 380 | 0.54 | 10 | 0.54 | 368 | 0.73 | 0.58 | |
| 140 | 278 | 0.58 | 10 | 1 | 0.54 | 272 | 0.59 | 0.52 |
| 150 | 23 | 0.59 | 10 | 0.59 | 23 | 0.60 | 0.79 | |
| Waste | 8704 | 0.13 | 2 | 52 | 0.11 | 8855 | 0.09 | 0.09 |
| | P a g e | 14-40 |
| 04/11/2021 |
| TECHNICAL REPORT ON THE AURIZONA GOLD MINE EXPANSION PRE-FEASIBILITY STUDY |
| 14.4.4 | Compositing |
Prior to compositing samples, sample length was investigated as well as capping extreme outliers. Original sample lengths are shown in Figure 14-18. Modal sample lengths are 1 m for the drill hole samples and 3 m for the grade control samples.
Figure 14-18: Original Sample Lengths for Drill Hole and Grade Control Sample for Piaba

A composite length of 1 m was selected for the exploration samples due to the modal presence of 1 m samples. 1 m composite samples were generated down the hole from the collar to final depth of the drill holes. Composite samples were broken at domain boundaries with residual sample lengths of less than 1 m backstitched to the final composite sample. Sample lengths less than 0.25 m were discarded.
Grade control drilling at Boa Esperança includes predominantly vertical holes within the laterite and saprolite. Grade control sampling includes modal sample lengths of 1 and 3 m where 3 m sample lengths represent 91% of the total sampled length. Therefore, the grade control samples were composited to 3 m intervals to honor the original sample lengths. Samples less then 1 m were discarded.
| | P a g e | 14-41 |
| 04/11/2021 |
| TECHNICAL REPORT ON THE AURIZONA GOLD MINE EXPANSION PRE-FEASIBILITY STUDY |
Table 14-23: Boa Esperança Composite Sample Summary
| Composite Samples | Database | Number of Holes |
Number of Samples |
Cumulative Metres |
||
| 1 m Downhole | Exploration | 116 | 8,996 | 8,985 | ||
| 3 m Downhole | Grade Control | 495 | 5,293 | 15,515 |
| 14.4.5 | Exploratory Data Analysis |
Gold grade distributions of the composite samples was investigated to assist with understanding the spatial distribution of the data. The capped composite sample statistics for the Boa Esperança resource domains are summarised in Figure 14-19.
Figure 14-19: Boxplots of Composite Samples for Boa Esperança Resource Domains

| | P a g e | 14-42 |
| 04/11/2021 |
| TECHNICAL REPORT ON THE AURIZONA GOLD MINE EXPANSION PRE-FEASIBILITY STUDY |
| 14.4.6 | Variography |
Variograms were calculated and modelled within the grade control domain. The variogram parameters are summarised in Table 14-24. Due to the low number of samples in the remaining domains, only unstable variograms were calculated; therefore, no variogram modelling was attempted for domains 110 to 150.
Table 14-24: Boa Grade Control Domain Variogram Model Parameters
| Domain | Direction | Azimuth | Plunge | Range 1 | CC 1 | Range 2 | CC 2 | Nugget |
| 100 | D1 | 240 | 0 | 14 | 0.52 | 70 | 0.15 | 0.34 |
| Grade Control | D2 | 330 | 80 | 3 | 15 | |||
| H | 160 | 10 | 5 | 30 |
| 14.4.7 | Gold Grade Estimation |
Gold grade estimation for the Boa Esperança resource model was completed using inverse distance cubed (ID3). A single block model was generated for the Boa Esperança deposit. Block dimensions of 10 m (east) by 5 m (north) and block height of 3 m were selected to reflect the geometry of the gold zone and future mining method. The block model was rotated counter-clockwise 25 degrees to match the strike of the ore body. Domains were not broken at regolith boundaries. The block model definitions are summarised in Table 14-25.
Table 14-25: Boa Esperança Block Model Index
| Axis | Block Size | Rotation | Base Point | Block Count |
| X | 10 | 0 | 416,400 | 145 |
| Y | 5 | 0 | 9,855,917 | 110 |
| Z | 3 | -25 | -200 | 100 |
| Total | 1,595,000 | |||
Estimates were generated using two estimation passes with capped 2 m composites. The search parameters used are summarised in Table 14-26.
| | P a g e | 14-43 |
| 04/11/2021 |
| TECHNICAL REPORT ON THE AURIZONA GOLD MINE EXPANSION PRE-FEASIBILITY STUDY |
Table 14-26: Search Interpolation Parameters for Boa Esperança Resource Model
| Domain | Pass | Search Axis Orientation | LVA | Search Radii | ||||
| X | Y | Dip | X | Y | Z | |||
| 100 | 1 | 65 | 335 | -80 | No | 80 | 20 | 30 |
| 2 | 65 | 335 | -75 | No | 120 | 30 | 45 | |
| 110-150 | 1 | 65 | 335 | -75 | Yes | 50 | 50 | 25 |
| 2 | 65 | 335 | -75 | Yes | 90 | 90 | 35 | |
| Waste | 1 | 65 | 335 | -75 | No | 90 | 90 | 35 |
| Pass | Min Sample | Max Sample | Limit by Hole | |||||
| 1 | 12 | 36 | 8 | |||||
| 2 | 2 | 36 | 8 | |||||
| 14.4.8 | Validation of Grade Estimates |
Swath Plots
Swath plots and cross validation methods were used to validate the Boa Esperança model. Swath plots were generated using 40 m swaths using the same orientation as the block model (Figure 14-20). Vertical swath plots (Figure 14-21) were generated using 12 m vertical swaths. Swath plots show blended block grade estimates in blue, nearest neighbor values in red, and composite samples in black. Light grey histograms represent the number of composite samples within each swath index.
| | P a g e | 14-44 |
| 04/11/2021 |
| TECHNICAL REPORT ON THE AURIZONA GOLD MINE EXPANSION PRE-FEASIBILITY STUDY |
Figure 14-20: Easting Swath Plots for Boa Esperança Gold Zone Resource Domains

| | P a g e | 14-45 |
| 04/11/2021 |
| TECHNICAL REPORT ON THE AURIZONA GOLD MINE EXPANSION PRE-FEASIBILITY STUDY |
Figure 14-21: Vertical Swath Plots for Boa Esperança Gold Zone Resource Domains

Cross Validation
Cross validation was completed to check for localised accuracy of estimates and compare domain average composite sample grades to estimated grades.
Table 14-1427 summarises the comparison of composite sample average grades versus average block gold estimates. The correlation coefficient for most domains is above 0.8, with the exception of domain 110. The averages represented by the block averaged composite samples are also honoured by the block model.
| | P a g e | 14-46 |
| 04/11/2021 |
| TECHNICAL REPORT ON THE AURIZONA GOLD MINE EXPANSION PRE-FEASIBILITY STUDY |
Table 14-27: Comparison of Average Block Estimates versus Composite Samples within a Block for Boa Esperança
| Domain Number |
Block Average Grade (Au, g/t) |
Correlation Coefficient | |
| Composite Samples |
Block Estimates | ||
| 100 | 0.73 | 0.74 | 0.86 |
| 110 | 0.58 | 0.57 | 0.76 |
| 120 | 0.60 | 0.59 | 0.83 |
| 130 | 0.59 | 0.63 | 0.84 |
| 140 | 0.55 | 0.53 | 0.82 |
| 150 | 0.79 | 0.73 | 0.85 |
Comparison of Estimation Techniques
Several different estimation techniques were employed to compare sensitivities to the chosen estimator. Within the grade control domain, estimates were generated using OK, inverse distance (squared and cubed), and nearest neighbour. A summary of the interpolators for Domain 100 are shown in Table 14-28.
Table 14-28: Comparison of Different Estimation Techniques for Boa Esperança Grade Control Domain
| Interpolator | Number of Blocks > 0.6 g/t Au |
Average Grade (g/t Au ) |
|
| OK | 3,684 | 1.06 | |
| ID2 | 3,829 | 1.04 | |
| ID3 | 3,285 | 1.17 | |
| NN | 2,261 | 1.80 |
| 14.4.9 | Classification of Mineral Resources |
The criteria shown in 14-29 outlines the criteria for Mineral Resource classification for the Boa Esperança resource model.
| | P a g e | 14-47 |
| 04/11/2021 |
| TECHNICAL REPORT ON THE AURIZONA GOLD MINE EXPANSION PRE-FEASIBILITY STUDY |
Table 14-29: Boa Esperança Resource Classification Criteria
| Classification | Criteria for Resource Classification - Boa Esperança | |||
| Number of Holes Used |
Average Distance to Samples |
Nominal Drill Hole Spacing |
Distance to Surface | |
| Measured | ≥ 3 | ≤ 20 m | ≤ 10 m | ≤ 30 |
| Indicated | ≥ 3 | ≤ 30 m | ≤ 70 m | ≤ 100 |
| Inferred | ≥ 2 | ≤ 60 m | ≤ 150 m | - |
| or | ||||
| Inferred | 1 | ≤ 30 m | ≤ 150 m | - |
Resources were classified as measured resources if samples from at least three holes were used, and average distance of samples used for the estimate are less then 20 m and blocks are 30 m from surface. Nominal drill hole spacing for measured resources is 10 m.
Resources were classified as indicated resources if samples from at least three holes were used to estimate the block, and the average distance of samples used for the estimate are less than 30 m. Nominal drill hole spacing for indicated resources is 70 m or less, and averages 32 m.
Resources were classified as inferred resources if samples from at least two holes were used, and the average distance to samples is 60 m or less. If only 1 hole was used to estimate the grade, the average distance of samples used for the estimate is 30 m or less. Nominal drill hole spacing within this domain is 150 m or less, and averages 65 m.
| 14.4.10 | Density |
Boa Esperança did not have enough data to support a bulk density estimation therefore average bulk density values were assigned to Boa Esperança based on an average wax-coated bulk density determination from Boa Esperança and surrounding area. These bulk density values are summarised in Table 14-30.
Table 14-30: Summary of Bulk Density Values used for Boa Esperança Resource Domains
| Domain | Average Bulk Density | Number of Samples |
| Laterite | 2.00 | 33 |
| Saprolite | 1.84 | 236 |
| Transition | 2.45 | 65 |
| Fresh | 2.81 | 659 |
| 14.4.11 | Mineral Resource Statement |
A summary of the Measured, Indicated, and Inferred resources is summarised in Table 14-31 within an optimised pit shell and illustrated in Figure 14-22.
| | P a g e | 14-48 |
| 04/11/2021 |
| TECHNICAL REPORT ON THE AURIZONA GOLD MINE EXPANSION PRE-FEASIBILITY STUDY |
Table 14-31: Mineral Resource Statement (Exclusive of Reserves) for Boa Esperança deposit, Maranhão, Brazil Equity Exploration Consultants, effective date June 30, 2021.
| Classification | Area | Cut-off Grade Gold (g/t) | Tonnage (kt) | Gold Grade (g/t) | Contained Gold (koz) |
| Measured | Laterite | 0.3 | 1 | 0.45 | 0.01 |
| Saprolite | 0.3 | 65 | 0.6 | 1 | |
| Transition | 0.3 | - | - | - | |
| Fresh Rock | 0.3 | - | - | - | |
| Total | 0.3 | 66 | 0.6 | 1 | |
| Indicated | Laterite | 0.3 | 8 | 1.07 | 0.27 |
| Saprolite | 0.3 | 211 | 0.97 | 7 | |
| Transition | 0.3 | 143 | 1.06 | 5 | |
| Fresh Rock | 0.3 | 65 | 1.15 | 2 | |
| Total | 0.3 | 427 | 1.03 | 14 | |
| Measured & Indicated | Laterite | 0.3 | 9 | 0.99 | 0.29 |
| Saprolite | 0.3 | 276 | 0.89 | 8 | |
| Transition | 0.3 | 143 | 1.06 | 5 | |
| Fresh Rock | 0.3 | 65 | 1.15 | 2 | |
| Total | 0.3 | 494 | 0.97 | 15 | |
| Inferred | Laterite | 0.3 | 161 | 0.92 | 5 |
| Saprolite | 0.3 | 189 | 1.08 | 7 | |
| Transition | 0.3 | 39 | 1.32 | 2 | |
| Fresh Rock | 0.3 | 50 | 1.67 | 3 | |
| Total | 0.3 | 438 | 1.11 | 16 |
| Notes: |
| 1. | Mineral Resources are reported exclusive of reserves. |
| 2. | Mineral Resources are reported using a cut-off grade of 0.3 g/t gold. |
| 3. | Mineral Resources are reported at a gold price of US$1500 /oz gold. |
| 4. | The Open Pit Mineral Resource is constrained using an optimized pit that has been generated using Lerchs -Grossman pit optimisation algorithm with parameters outlined in Table 14-1. |
| 5. | The Boa Esperança Mineral Resource statement has been prepared by Trevor Rabb, P.Geo. who is a qualified person as defined by NI 43-101. |
| 6. | Mineral Resources are not Mineral Reserves and do not have demonstrated economic viability. |
| 7. | The Boa Esperança Mineral Resource statement has been prepared in accordance with NI43-101 Standards of Disclosure for Mineral Projects (May 2016) and the CIM Definition Standards for Mineral Resources and Mineral Reserves (May 2014). |
| 8. | The number of metric tonnes and gold ounces are rounded to the nearest thousand. Any discrepancies in the totals are due to rounding effects. |
| 9. | Mineral Resources from Boa Esperança presented herein have a data cut off date of December 30, 2020, and an effective date of June 30, 2021. |
| | P a g e | 14-49 |
| 04/11/2021 |
| TECHNICAL REPORT ON THE AURIZONA GOLD MINE EXPANSION PRE-FEASIBILITY STUDY |
Figure 14-22: Cross Section of the Boa Esperança Open Pit Block Model

| | P a g e | 14-50 |
| 04/11/2021 |
| TECHNICAL REPORT ON THE AURIZONA GOLD MINE EXPANSION PRE-FEASIBILITY STUDY |
| 14.5 | Tatajuba |
This section describes the Tatajuba deposit’s open pit Mineral Resources.
| 14.5.1 | Drill Hole Database |
The drill hole database supporting the Tatajuba deposit Mineral Resource was provided by Equinox and has a cut off date of January 24, 2020. The database is comprised of a single database containing diamond drill holes (DDH) and auger (AG) drill holes completed up to December 20, 2019. Between January 24, 2020, and June 30, 2021, no additional drilling has been completed, and therefore the Mineral Resource Statement presented herein is considered current with an effective date of June 30, 2021.
The drill hole database was accepted as is with few modifications that included:
| • | Intervals representing unsampled or missing assay results were omitted, |
| • | Intervals reporting below detection limit were assigned a value of 0.0025 g/t gold, representing a value approximately half the detection limit. |
Drill Hole Data Statistics
The drill hole data statistics used for the Tatajuba deposit Mineral Resource estimates are summarised in Table 14-32.
Table 14-32: Tatajuba Drill Hole Database Summary
| Database | Hole Type | Number of Holes |
Metres | Number of Samples |
|
| Exploration | DDH | 86 | 12,094 | 10,921 | |
| AG | 362 | 3,085 | 3,097 | ||
| Total | 448 | 15,178 | 14,018 |
| 14.5.2 | Geological Models |
Mineralisation at Tatajuba is associated with elevated quartz veining, abundant sulphides, and silicified quartz diorite host rock. Discontinuous pods of ultramafic and mafic to intermediate rock bodies occur in the hanging wall and footwall. In addition to the quartz diorite unit, the mafic and ultramafic rock types are host rocks to the mineralisation. To assist with generating resource domains, three models representing regolith, lithology (Figure 14-23), and silicification were generated. Resource domains are shown in in Figure 14-24 and summarised in Table 14-33.
| | P a g e | 14-51 |
| 04/11/2021 |
| TECHNICAL REPORT ON THE AURIZONA GOLD MINE EXPANSION PRE-FEASIBILITY STUDY |
Figure 14-23: Tatajuba Lithology Model

Figure 14-24: Tatajuba Gold Zones Resource Domains

| | P a g e | 14-52 |
| 04/11/2021 |
| TECHNICAL REPORT ON THE AURIZONA GOLD MINE EXPANSION PRE-FEASIBILITY STUDY |
Table 14-33: Tatajuba Resource Domains
| Estimation Domain | Regolith Profile | Domain Number |
| Tatajuba Gold Zone | Laterite | 81 |
| Saprolite | 82 | |
| Transition | 83 | |
| Fresh | 84 | |
| Waste | Laterite | 11 |
| Saprolite | 12 | |
| Transition | 13 | |
| Fresh | 14 |
| 14.5.3 | Composites |
Original sample lengths for Tatajuba are almost entirely taken at 1 m intervals. A composite sample length of 2 m was selected to honor block size and future mining method. Residual samples less than 0.5 m were added to the final downhole interval. The compositing process was broken at domain boundaries respecting regolith contacts.
| 14.5.4 | Exploratory Data Analysis |
Gold grade distribution of the composite samples was completed to assist with understanding the spatial distribution of the data. Boxplot and summary statistics of the uncapped composite samples are shown in Figure 14-25.
| | P a g e | 14-53 |
| 04/11/2021 |
| TECHNICAL REPORT ON THE AURIZONA GOLD MINE EXPANSION PRE-FEASIBILITY STUDY |
Figure 14-25: Boxplot of 2 m Composite Samples for Tatajuba Deposit Area

| 14.5.5 | Grade Capping |
To manage the spatial influence of potential outliers, composite sample statistics were examined using probability plots, cumulative frequency plots, mean versus top cut value and coefficient of variation versus top cut value. Top cut values selected based on population breaks observed on probability plots. These top cut values were compared to decile analysis using a similar method described by Parrish (1997). Capping analysis was completed on the 2 m composite samples. Summary of the capping values are summarised in Table 14-34.
| | P a g e | 14-54 |
| 04/11/2021 |
| TECHNICAL REPORT ON THE AURIZONA GOLD MINE EXPANSION PRE-FEASIBILITY STUDY |
Table 14-34: Summary of Capping Values for Tatajuba
| Estimation Domain | Regolith | Domain Number | Number of Data | Capped Value | Number Capped | Average Capped | Average Uncapped | Percent Difference |
| Gold Zone | Laterite | 81 | 273 | - | 0 | 0.62 | 0.62 | 0.0% |
| Saprolite | 82 | 354 | 35 | 2 | 1.52 | 1.74 | 12.7% | |
| Transition | 83 | 160 | - | 0 | 0.94 | 0.94 | 0.0% | |
| Fresh | 84 | 695 | 35 | 1 | 1.35 | 1.36 | 0.1% | |
| Waste | Laterite | 11 | 578 | 2 | 1 | 0.10 | 0.11 | 9.5% |
| Saprolite | 12 | 2,410 | 2 | 6 | 0.07 | 0.07 | 4.0% | |
| Transition | 13 | 815 | 2 | 1 | 0.05 | 0.06 | 9.8% | |
| Fresh | 14 | 2,562 | 2 | 9 | 0.06 | 0.07 | 7.4% |
| 14.5.6 | Declustering |
Several holes are drilled subparallel to the Tatajuba gold zone. To assist with generating representative estimates, composite sample weights were generated using cell declustering to the same scale as the block model for samples within the gold zone. Box and whisker plots with summary statistics for the gold zone showing capped, declustered values are summarised in Figure 14-26.
| | P a g e | 14-55 |
| 04/11/2021 |
| TECHNICAL REPORT ON THE AURIZONA GOLD MINE EXPANSION PRE-FEASIBILITY STUDY |
Figure 14-26: Box and Whisker Plots and Summary Statistics for Declustered 2 m Capped Composite Samples for Tatajuba

| 14.5.7 | Variography |
Individual domains for the Tatajuba deposit do not have enough samples over the entire range to reliably model directional variograms. Omnidirectional variograms were calculated and modelled for combined laterite-saprolite and transition-fresh Tatajuba gold zone domains (Figure 14-27). Modelled omnidirectional variogram ranges are 70 m for the laterite-saprolite domains, and 90 m for the transition-fresh domains. These ranges were used a guide for interpolation parameters used for the Tatajuba Mineral Resource estimate.
| | P a g e | 14-56 |
| 04/11/2021 |
| TECHNICAL REPORT ON THE AURIZONA GOLD MINE EXPANSION PRE-FEASIBILITY STUDY |
Figure 14-27: Omnidirectional Semi Variograms

| 14.5.8 | Boundary Analysis |
To determine the treatment of domain boundaries during estimation, boundary analysis was completed between all regolith domains within the Tatajuba gold zone. Contact plots are shown in Figure 14-28 and summarised in Table 14-35.
Figure 14-28 Boundary Analysis of Tatajuba Gold Zone Domains


Table 14-35: Summary of Boundary Analysis for Tatajuba
| Estimation Domain | Regolith | Boundary Type | Contact Buffer Distance (m) |
| Gold Zone | Laterite - Saprolite | Semi-Hard | 24 |
| Saprolite - Transition | Hard | - | |
| Transition - Fresh | Semi-Hard | 18 |
Estimation of the laterite portion of the gold zone used a semi-hard boundary during estimation. A buffer of 24 m surrounding the laterite-saprolite contact was used to estimate the laterite portion of the gold zone.
Estimation of the saprolite and transition portions of the gold zone used hard boundaries.
| | P a g e | 14-57 |
| 04/11/2021 |
| TECHNICAL REPORT ON THE AURIZONA GOLD MINE EXPANSION PRE-FEASIBILITY STUDY |
Estimation of the fresh portion of the gold zone used semi-hard boundaries. A buffer of 18 m surrounding the transition-fresh contact was used to estimate the fresh portions of the gold zone.
| 14.5.9 | Gold Grade Estimation |
Gold grade estimation for the Tatajuba resource models were completed using inverse distance cubed (ID3) using capped, declustered composite samples. Block dimensions of 10 m (east) by 5 m (north) and block height of 6 m were selected to reflect the geometry of the gold zone and future mining method. No rotation was applied to the block model. The block model definitions of Tatajuba are summarised in Table 14-36.
Table 14-36: Tatajuba Block Model Index
| Axis | Block Size | Rotation | Base Point | Block Count |
| X | 10 | 0 | 411,470 | 117 |
| Y | 5 | 0 | 9,855,300 | 113 |
| Z | 6 | 0 | -260 | 60 |
| Total | 793,260 | |||
Estimates were generated using two estimation passes with capped 2 m composite samples. Declustered weights were used during estimation. Search parameters are summarised in Table 14-37.
Table 14-37: Search Interpolation Parameters for Tatajuba Resource Model
| Domain | Pass | Search Axis Orientation | Search Radii | ||||
| X | Y | Dip | X | Y | Z | ||
| 81 | 1 | 80 | 350 | 0 | 50 | 30 | 10 |
| 2 | 80 | 350 | 0 | 70 | 50 | 10 | |
| 82 | 1 | 80 | 350 | -80 | 50 | 50 | 15 |
| 2 | 80 | 350 | -80 | 70 | 70 | 15 | |
| 83 | 1 | 80 | 350 | -80 | 50 | 50 | 15 |
| 2 | 80 | 350 | -80 | 70 | 70 | 15 | |
| 84 | 1 | 80 | 350 | -80 | 50 | 50 | 15 |
| 2 | 80 | 350 | -80 | 90 | 90 | 20 | |
Search orientations for the saprolite, transition and fresh domains use locally varying anisotropy to compensate for minor bends in the gold zone domain. Estimates were generated for the waste domains using the first pass interpolation parameters for each respective regolith domain.
| 14.5.10 | Validation of Grade Estimates |
Validation of grade estimates was completed using visual checking, and geostatistical evaluation of sample grades against block estimates, swath plots, and comparing histograms of composite samples versus block estimates.
The cross validation shows good local reproducibility and reproduction of composite sample means (Table 14-38). The transition portion of the Tatajuba gold zone shows the weakest correlation between estimates and average of composites within a block. This is mainly due to the thin profile of the transition gold zone domain, and few samples occurring within the central portion of the Tatajuba transition gold zone where the transition profile is thinnest.
| | P a g e | 14-58 |
| 04/11/2021 |
| TECHNICAL REPORT ON THE AURIZONA GOLD MINE EXPANSION PRE-FEASIBILITY STUDY |
Table 14-38: Summary of Composite Sample Average and Block Estimate Average for Tatajuba
| Domain Number |
Average Grade (Au, g/t) | Correlation Coefficient | |
| Composite Samples |
Block Estimates | ||
| 81 | 0.56 | 0.55 | 0.89 |
| 82 | 1.80 | 1.65 | 0.93 |
| 83 | 0.98 | 0.97 | 0.68 |
| 84 | 1.37 | 1.34 | 0.92 |
Swath plots were generated on 6 m elevation intervals and on 40 m easting intervals (Figure 14-29). The blue line represents block average grade, red line represents nearest neighbor grade, and black line represents composite sample grade. The light blue histogram represents composite sample counts within each swath. In general, the estimates show good correlation with sample grade profiles across and vertically within the model.
| | P a g e | 14-59 |
| 04/11/2021 |
| TECHNICAL REPORT ON THE AURIZONA GOLD MINE EXPANSION PRE-FEASIBILITY STUDY |
Figure 14-29: Swath Plots Comparing Block Estimates, Nearest Neighbor, and Composite Samples


| | P a g e | 14-60 |
| 04/11/2021 |
| TECHNICAL REPORT ON THE AURIZONA GOLD MINE EXPANSION PRE-FEASIBILITY STUDY |
| 14.5.11 | Classification of Mineral Resources |
Block model quantities and grade estimates were classified in accordance with the CIM Definition Standards for Mineral Resources and Mineral Reserves by Trevor Rabb, P.Geo. (EGBC #39599), an appropriate independent qualified person for the purpose of NI 43-101.
Mineral Resource classification is subjective in nature and is guided by the data used in preparing the estimate. Classification of resources has considered geological continuity, data spacing, data type, data source, data quality, and geostatistical evaluation of these data. The criteria used for Resource classification is summarised in Table 14-39.
Table 14-39: Tatajuba Resource Classification Criteria
| Classification | Criteria for Resource Classification | ||
| Number of holes used |
Average Distance to Samples |
Nominal Drill Hole Spacing | |
| Indicated | ≥ 2 | ≤ 50 m | 50 m by 20 m |
| Inferred | ≤ 2 | > 50 m | 50 m by > 20 m |
Estimated blocks were assigned to indicated classification if samples from at least two drill holes were used to estimate the block and the average distance of samples used for the estimate are less than 50 m. Nominal drill hole spacing from within the Indicated classification shell is completed on 50 m spaced sections and 20 m apart on section.
All other blocks were assigned to the inferred classification. The deposit model was truncated at -260 m elevation to honor holes drilled orthogonal to the resource domain. Most blocks within the Inferred classification shell occur along the periphery of the Indicated classification shell and represent grade estimates based on the deepest drill holes on each section.
| 14.5.12 | Density |
Average densities from each respective domain were assigned to the block model Table 14-40 summarises the density values used for each domain and the number of density determinations for each domain.
| | P a g e | 14-61 |
| 04/11/2021 |
| TECHNICAL REPORT ON THE AURIZONA GOLD MINE EXPANSION PRE-FEASIBILITY STUDY |
Table 14-40: Summary of Bulk Density Values Used for Tatajuba Resource Domains
| Domain | Average Bulk Density |
Number of Samples |
| Waste | ||
| Laterite | 1.94 | 58 |
| Saprolite | 1.86 | 525 |
| Transition | 2.39 | 301 |
| Fresh | 2.79 | 887 |
| Gold Zone | ||
| Laterite | 2.01 | 28 |
| Saprolite | 1.90 | 98 |
| Transition | 2.39 | 58 |
| Fresh | 2.77 | 267 |
| 14.5.13 | Mineral Resource Statement |
A summary of the Indicated and Inferred resources is summarised in Table 14-41 and illustrated in Figure 14-30.
| | P a g e | 14-62 |
| 04/11/2021 |
| TECHNICAL REPORT ON THE AURIZONA GOLD MINE EXPANSION PRE-FEASIBILITY STUDY |
Table 14-41: Mineral Resource Statement (Exclusive of Reserves) for Tatajuba deposit, Maranhão, Brazil Equity Exploration Consultants, effective date June 30, 2021
| Classification | Area | Cut-off Grade Gold |
Tonnage | Gold Grade |
Contained Gold |
| (g/t) | (kt) | (g/t) | (koz) | ||
| Indicated | Laterite | 0.3 | |||
| Saprolite | 0.3 | ||||
| Transition | 0.3 | 5 | 0.93 | ||
| Fresh Rock | 0.3 | 175 | 1.40 | 8 | |
| Total | 0.3 | 181 | 1.39 | 8 | |
| Inferred | Laterite | 0.3 | |||
| Saprolite | 0.3 | ||||
| Transition | 0.3 | ||||
| Fresh Rock | 0.3 | ||||
| Total | 0.3 | ||||
| Indicated | Underground | 1.0 | 464 | 1.73 | 26 |
| Inferred | 1.0 | 981 | 2.84 | 90 |
| Notes: |
| 1. | Mineral Resources are reported exclusive of reserves. |
| 2. | Mineral Resources are reported using a cut-off grade of 0.30 g/t gold for open pit and 1.00 g/t gold for underground using a gold price of US$1500/oz gold. |
| 3. | The Open Pit Mineral Resource is constrained using an optimized pit that has been generated using Lerchs -Grossman pit optimisation algorithm with parameters outlined in Table 14-1. |
| 4. | The underground Mineral Resource is constrained using a 1.00 g/t gold grade shell |
| 5. | The Tatajuba Mineral Resource statement has been prepared by Trevor Rabb, P.Geo. who is a qualified person as defined by NI 43-101. |
| 6. | Mineral Resources are not Mineral Reserves and do not have demonstrated economic viability. |
| 7. | The Tatajuba Mineral Resource statement has been prepared in accordance with NI43-101 Standards of Disclosure for Mineral Projects (May 2016) and the CIM Definition Standards for Mineral Resources and Mineral Reserves (May 2014). |
| 8. | The number of metric tonnes and gold ounces are rounded to the nearest . Any discrepancies in the totals are due to rounding effects. |
| 9. | Mineral Resources from Tatajuba have a data cut off date of January 24, 2020, and an effective date of June 30, 2021. |
| | P a g e | 14-63 |
| 04/11/2021 |
| TECHNICAL REPORT ON THE AURIZONA GOLD MINE EXPANSION PRE-FEASIBILITY STUDY |
Figure 14-30 Cross Section of the Tatajuba Open Pit Block Model

| | P a g e | 14-64 |
| 04/11/2021 |
| TECHNICAL REPORT ON THE AURIZONA GOLD MINE EXPANSION PRE-FEASIBILITY STUDY |
| 14.6 | Genipapo |
This section describes the Genipapo deposit’s open pit Mineral Resources.
| 14.6.1 | Drill Hole Database |
The drill hole database supporting the Genipapo deposit Mineral Resource was provided by Equinox and has a cut-off date of February 18, 2021. The database comprises exploration drill holes that include diamond and RC drill holes drilled up to December 14, 2020. Between February 18, 2021, and June 30, 2021, no additional drilling has been completed, and therefore the Mineral Resource Statement presented herein is considered current with an effective date of June 30, 2021.
The drill hole databases were accepted as is with few modifications that included:
| • | Intervals representing unsampled or missing assay results were omitted, |
| • | Zero grade assay intervals were assigned a grade of 0.0025 g/t gold, |
| • | Intervals below detection limit were assigned 0.0025 g/t gold, representing half detection limit. |
Drill Hole Data Statistics
The drill hole data statistics used for the Genipapo deposit Mineral Resource estimates are summarised in Table 14-42.
Table 14-42: Genipapo Drill Hole Database Summary
| Database | Hole Type | Number of Holes |
Metres | Number of Samples |
|
| Exploration | DDH | 33 | 3,602 | 3,637 | |
| RC | 100 | 7,761 | 7,631 | ||
| Total | 133 | 11,363 | 11,268 |
| 14.6.2 | Geological Models |
The geological model for Genipapo consists of North and South deposits that were modelled independently. Mineralisation at Genipapo South is associated with grey quartz veins and breccia textures related to shear zones. The two shear zones within Genipapo South, the footwall (FW) and Hangingwall (HW) are partially controlled by the lithological contact between the quartz diorite and the footwall ultramafic unit. Mineralisation at Genipapo North is associated with stockwork of quartz veins and veinlets, in a quartz-plagioclase rich unit (logged as dacite) with disseminated pyrite and arsenopyrite. Lithological contacts, and mineralised zones coincident with grades greater than 0.3 g/t gold were interpreted on cross section and plan orientation. Wireframes were developed from the interpreted domains with Leapfrog implicit modelling, using drill hole interval selections and polylines based on the interpretations. Figure 14-31 and Figure 14-32 show the lithology model and mineralised domains, respectively.
| | P a g e | 14-65 |
| 04/11/2021 |
| TECHNICAL REPORT ON THE AURIZONA GOLD MINE EXPANSION PRE-FEASIBILITY STUDY |
Figure 14-31: Genipapo Lithology Model of North and South Zones in of Plan View

| | P a g e | 14-66 |
| 04/11/2021 |
| TECHNICAL REPORT ON THE AURIZONA GOLD MINE EXPANSION PRE-FEASIBILITY STUDY |
Figure 14-32: Genipapo Mineralization Model of North and South Zones in Plan View

Regolith Modelling
Surfaces representing the regolith present over the Genipapo area were developed using drill hole interval selection and cross section interpretation. The regolith domains include laterite, saprolite, transition and fresh rock zones. Regolith domains were combined with the Mineralization model to produce Ore domains representing each regolith profile. The domains for the Genipapo North and South mineralisation are shown in Figure 14-33 and summarised in Table 14-43.
| | P a g e | 14-67 |
| 04/11/2021 |
| TECHNICAL REPORT ON THE AURIZONA GOLD MINE EXPANSION PRE-FEASIBILITY STUDY |
Figure 14-33: Plan and Northeast Perspective view of Genipapo North and South Gold Zone Domains

| | P a g e | 14-68 |
| 04/11/2021 |
| TECHNICAL REPORT ON THE AURIZONA GOLD MINE EXPANSION PRE-FEASIBILITY STUDY |
Table 14-43: Genipapo Ore Domains by Regolith
| Estimation Domain | Genipapo Gold Zone |
Regolith Profile | Domain Number |
| North Gold Zone | 50 | Laterite | 51 |
| Saprolite | 52 | ||
| Transition | 53 | ||
| Fresh | 54 | ||
| South Gold Zone (FW) | 60 | Laterite | 61 |
| Saprolite | 62 | ||
| Transition | 63 | ||
| Fresh | 64 | ||
| South Gold Zone (HW) | 40 | Laterite | 41 |
| Saprolite | 42 | ||
| Transition | 43 | ||
| Fresh | 44 | ||
| Waste | Laterite | 11 | |
| Saprolite | 12 | ||
| Transition | 13 | ||
| Fresh | 14 |
| 14.6.3 | Grade Capping |
To manage the spatial influence of potential outliers, sample statistics were examined using probability plots, cumulative frequency plots, mean versus top cut value and coefficient of variation versus top cut value. Top cut values were selected based on population breaks observed on probability plots. These top cut values were compared to decile analysis using a similar method described by Parrish (1997). Capping was applied prior to compositing.
A top cut value of 6.0 g/t gold was used to cap high-grade outliers. Summary statistics of the capped composites are shown in Table 14-44.
| | P a g e | 14-69 |
| 04/11/2021 |
| TECHNICAL REPORT ON THE AURIZONA GOLD MINE EXPANSION PRE-FEASIBILITY STUDY |
Table 14-44: Summary of Genipapo Capping Values by Resource Domain
| Domain | Number of Assays |
Length Weighted Average grade (Au, g/t) |
Capping Value (Au, g/t) |
Number of Samples Capped |
Length Weighted Average Capped Grade (Au, g/t) |
Number of Composite Samples |
Average Composite Samples (Au, g/t) |
| 40 | 196 | 0.90 | 6 | 3 | 0.70 | 195 | 0.70 |
| 50 | 995 | 0.53 | 6 | 7 | 0.50 | 1012 | 0.49 |
| 60 | 423 | 0.78 | 6 | 5 | 0.66 | 428 | 0.65 |
| Waste | 8964 | 0.05 | 2 | 18 | 0.05 | 9070 | 0.05 |
| 14.6.4 | Composites |
Original sample lengths for Genipapo are almost entirely taken at 1 m intervals. A composite sample length of 1 m was selected. Residual samples less than 0.5 m were added to the final downhole interval. The compositing process was broken at domain boundaries respecting regolith contacts.
| 14.6.5 | Exploratory Data Analysis |
Gold grade distributions of the composite samples was completed to assist with understanding the spatial distribution of the data. Boxplot and summary statistics of uncapped length weighted samples is shown in Figure 14-34.
| | P a g e | 14-70 |
| 04/11/2021 |
| TECHNICAL REPORT ON THE AURIZONA GOLD MINE EXPANSION PRE-FEASIBILITY STUDY |
Figure 14-34: Boxplot of uncapped length weighted Samples for Genipapo Deposit Area
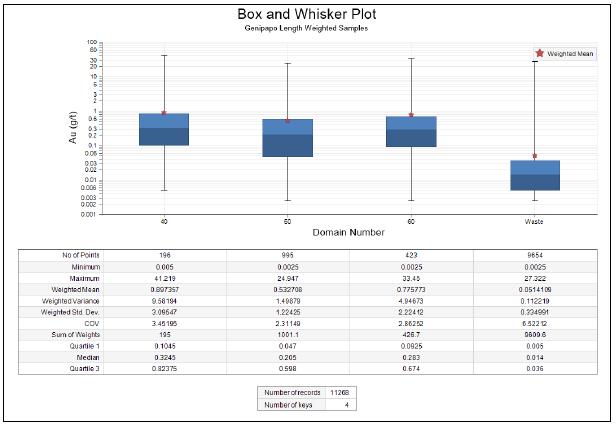
Boxplots and summary statistics of the capped composites are shown inFigure 14-35.
| | P a g e | 14-71 |
| 04/11/2021 |
| TECHNICAL REPORT ON THE AURIZONA GOLD MINE EXPANSION PRE-FEASIBILITY STUDY |
Figure 14-35: Boxplot of Capped 1 m Composite Samples for Genipapo Deposits

| 14.6.6 | Variography |
Traditional directional variograms were modelled for Genipapo North (50), and South Hanging wall (60) domains. Due to insufficient number of points, a reliable directional variogram could not be modelled for Genipapo South Footwall (40) z. Modelled variograms for the Genipapo gold zones (GGZ) are summarised in Table 14-35.
| | P a g e | 14-72 |
| 04/11/2021 |
| TECHNICAL REPORT ON THE AURIZONA GOLD MINE EXPANSION PRE-FEASIBILITY STUDY |
Table 14-45: Geostatistical Variogram Model Parameters for Genipapo Gold Zones (GGZ)
| Domain | Direction | Azimuth | Plunge | Range 1 | CC 1 | Range 2 | CC 2 | Nugget |
| 50 | D1 | 300 | 0 | 50 | 0.70 | 0 | ||
| North GGZ | D2 | 30 | 85 | 40 | ||||
| H | 210 | 5 | 40 | |||||
| 60 | D1 | 270 | 0 | 38 | 0.95 | 0.1 | ||
| South (FW) GGZ |
D2 | 0 | 90 | 35 | ||||
| H | 180 | 0 | 16 |
These variogram ranges established a maximum extent of spatial continuity. The variograms were used for ordinary kriging estimation, however better estimation results were achieved using inverse distance weighted cubed estimator, and the ordinary kriging estimation was solely used for comparison and validation.
| 14.6.7 | Boundary Analysis |
To determine the treatment of domain boundaries during estimation, boundary analysis was completed between all regolith domains within the Genipapo North (50) domain, displayed in Figure 14-36. Due to lack of sample numbers in Genipapo south domains, reliable boundary analysis could not be produced.
Based on the soft boundary of regolith domains in Genipapo North domain, and lack of sample numbers in the two Genipapo South domains, estimation parameters were kept the same across the regolith boundaries. The boundary analysis of gold domains used for estimations are shown in Figure 14-37.
| | P a g e | 14-73 |
| 04/11/2021 |
| TECHNICAL REPORT ON THE AURIZONA GOLD MINE EXPANSION PRE-FEASIBILITY STUDY |
Figure 14-36 Boundary Analysis of Genipapo North Gold Zone Regolith Domains


| | P a g e | 14-74 |
| 04/11/2021 |
| TECHNICAL REPORT ON THE AURIZONA GOLD MINE EXPANSION PRE-FEASIBILITY STUDY |
Figure 14-37 Boundary Analysis of Genipapo Gold Zone Domains

| | P a g e | 14-75 |
| 04/11/2021 |
| TECHNICAL REPORT ON THE AURIZONA GOLD MINE EXPANSION PRE-FEASIBILITY STUDY |
| 14.6.8 | Gold Grade Estimation |
Gold grade estimation for the Genipapo North and South resource models were completed using inverse distance weighted cubed (ID3). Due to the distance between Genipapo North and South deposits, in addition to the differences in geometry between the two deposits, two separate block models were generated. Block dimensions of 10 m (east) by 5 m (north) and block height of 6 m were selected to reflect the geometry of the gold zone and future mining method. For Genipapo North, the block model was rotated clockwise 20 degrees. For Genipapo South, the model was not rotated. The block model definitions of Genipapo North and South are summarised inTable 14-46 and Table 14-47 respectively.
Table 14-46: Genipapo North Block Model Index
| Axis | Block Size | Rotation | Base Point | Block Count |
| X | 10 | 0 | 417,975 | 53 |
| Y | 5 | 0 | 9,858,027.5 | 84 |
| Z | 6 | 20 | -198 | 43 |
| Block Count | 191,436 | |||
Table 14-47: Genipapo South Block Model Index
| Axis | Block Size | Rotation | Base Point | Block Count |
| X | 10 | 0 | 417,920 | 81 |
| Y | 5 | 0 | 9,857,500 | 66 |
| Z | 6 | 0 | -196 | 42 |
| Block Count | 224,532 | |||
Estimates were generated using two estimation passes with capped 1 m composites. The search parameters used for Genipapo North, and South are summarised in Table 14-48 and Table 14-49 respectively.
Table 14-48: Search Interpolation Parameters for Genipapo North Resource Model
| Domain | Pass | Search Axis Orientation | Search Radii | |||||
| X | Y | Dip | X | Y | Z | |||
| North | 1 | 30 | 330 | -85 | 25 | 20 | 20 | |
| 2 | 30 | 330 | -85 | 50 | 40 | 40 | ||
| Pass | Min Sample | Max Sample | Limit by Hole | |||||
| 1 | 12 | 32 | 8 | |||||
| 2 | 3 | 32 | 8 | |||||
| | P a g e | 14-76 |
| 04/11/2021 |
| TECHNICAL REPORT ON THE AURIZONA GOLD MINE EXPANSION PRE-FEASIBILITY STUDY |
Table 14-49: Search Interpolation Parameters for Genipapo South Resource Model
| Domain | Pass | Search Axis Orientation | Search Radii | ||||
| X | Y | Dip | X | Y | Z | ||
| South (HW) | 1 | 0 | 0 | -90 | 20 | 20 | 20 |
| 2 | 0 | 0 | -90 | 40 | 40 | 40 | |
| South (FW) | 1 | 0 | 0 | -90 | 19 | 17.5 | 8 |
| 2 | 0 | 0 | -90 | 38 | 35 | 16 | |
| Pass | Min Sample | Max Sample | Limit by Hole | ||||
| 1 | 12 | 32 | 8 | ||||
| 2 | 3 | 32 | 8 | ||||
| 14.6.9 | Validation of Grade Estimates |
Validation of grade estimates was completed using visual checking, and geostatistical evaluation of sample grades against block estimates, swath plots, and comparing histograms of composite samples versus block estimates (Table 14-50).
Table 14-50: Summary of Composite Sample Average and Block Estimate Average for Genipapo
| Domain Number | Block Average Grade (Au, g/t) | Scattergram Correlation Coefficient | |
| Composite Samples | Block Estimates | ||
| North (50) | 0.47 | 0.48 | 0.85 |
| South FW (60) | 0.75 | 0.68 | 0.87 |
| South HW (40) | 0.65 | 0.67 | 0.89 |
Swath plots were completed in the vertical direction and orthogonal to the block model. Swath plots in Figure 14-38 show estimated block grades in blue, nearest neighbor in red and composite samples in black.
| | P a g e | 14-77 |
| 04/11/2021 |
| TECHNICAL REPORT ON THE AURIZONA GOLD MINE EXPANSION PRE-FEASIBILITY STUDY |
Figure 14-38: Swath Plots for Genipapo North and South Resource Models

| | P a g e | 14-78 |
| 04/11/2021 |
| TECHNICAL REPORT ON THE AURIZONA GOLD MINE EXPANSION PRE-FEASIBILITY STUDY |
| 14.6.10 | Classification of Mineral Resources |
Block model quantities and grade estimates were classified in accordance with the CIM Definition Standards for Mineral Resources and Mineral Reserves by Trevor Rabb, P.Geo. (EGBC #39599), an appropriate independent qualified person for the purpose of NI 43-101.
Mineral Resource classification is subjective in nature and is guided by the data used in preparing the estimate. Classification of resources has considered geological continuity, data spacing, data type, data source, data quality, and geostatistical evaluation of these data. The criteria used for Mineral Resource classification is summarised in Table 14-51.
Table 14-51: Genipapo North and South Resource Classification Criteria
| Classification | Criteria for Resource Classification | ||
| Number of holes used |
Average Distance to Samples |
Nominal Drill Hole Spacing | |
| Indicated | ≥ 2 | ≤ 35 m | 25 m |
| Inferred | 1 | > 35 m | > 25m |
Estimated blocks were assigned to indicated classification if samples from at least two holes were used to estimate the block, and the average distance of samples used for the estimate are less than 35 m. Nominal drill hole spacing from within the indicated classification shell is 25 m.
All other estimated blocks within the mineralised domains were assigned to inferred classification. Nominal drill hole spacing within Inferred resources is 35 m for Genipapo North and 30 m for Genipapo South deposits.
| 14.6.11 | Density |
Genipapo did not have enough data to support a bulk density estimation. Only 84 bulk density analysis were available for the mineralized domains at Genipapo North and South deposits. Therefore, average bulk density was calculated based on the four regolith domains, and subsequently assigned to block model based on each block’s regolith surface assignment. In total, 610 measurements were used to determine average bulk density values. These bulk density values are summarised in Table 14-52.
| | P a g e | 14-79 |
| 04/11/2021 |
| TECHNICAL REPORT ON THE AURIZONA GOLD MINE EXPANSION PRE-FEASIBILITY STUDY |
Table 14-52: Summary of Bulk Density Values used for Genipapo Resource Domains
| Domain | Average Bulk Density (g/cm3) |
Sample Count |
| Laterite | 2.08 | 59 |
| Saprolite | 1.89 | 289 |
| Transition | 2.24 | 91 |
| Fresh | 2.70 | 171 |
| 14.6.12 | Mineral Resource Statement |
A summary of the Indicated and Inferred resources is summarised in Table 14-53 within an optimised pit shell shown in Figure 14-39 and Figure 14-40.
Table 14-53: Mineral Resource Statement (Exclusive of Reserves) for Genipapo deposit, Maranhão, Brazil Equity Exploration Consultants, effective date June 30, 2021
| Classification | Area | Cut-off Grade Gold (g/t) |
Tonnage (kt) |
Gold Grade (g/t) |
Contained Gold (koz) |
| Indicated | Laterite | 0.3 | - | - | - |
| Saprolite | 0.3 | 203 | 0.77 | 5 | |
| Transition | 0.3 | 47 | 1.14 | 2 | |
| Total | 0.3 | 249 | 0.84 | 7 | |
| Inferred | Laterite | 0.3 | 0 | 0.43 | 0 |
| Saprolite | 0.3 | 5 | 0.78 | 0.1 | |
| Transition | 0.3 | 1 | 0.72 | 0 | |
| Total | 0.3 | 6 | 0.76 | 0.1 |
| Notes: |
| 1. | Mineral Resources are reported exclusive of reserves. |
| 2. | Mineral Resources are reported using a cut-off grade of 0.30 g/t gold and a gold price of US$1500/oz gold. |
| 3. | The Open Pit Mineral Resource is constrained using an optimized pit that has been generated using Lerchs -Grossman pit optimisation algorithm with parameters outlined in Table 14-1. |
| 4. | The Genipapo Mineral Resource statement has been prepared by Trevor Rabb, P.Geo who is a qualified person as defined by NI 43-101. |
| 5. | Mineral Resources are not Mineral Reserves and do not have demonstrated economic viability. |
| 6. | The Genipapo Mineral Resource statement has been prepared in accordance with NI43-101 Standards of Disclosure for Mineral Projects (May 2016) and the CIM Definition Standards for Mineral Resources and Mineral Reserves (May 2014). |
| 7. | The number of metric tonnes was rounded to the nearest hundred. Any discrepancies in the totals are due to rounding effects. |
| | P a g e | 14-80 |
| 04/11/2021 |
| TECHNICAL REPORT ON THE AURIZONA GOLD MINE EXPANSION PRE-FEASIBILITY STUDY |
Figure 14-39: Cross Section of the Genipapo South Open Pit Block Model

| | P a g e | 14-81 |
| 04/11/2021 |
| TECHNICAL REPORT ON THE AURIZONA GOLD MINE EXPANSION PRE-FEASIBILITY STUDY |
Figure 14-40: Cross Section of the Genipapo North Open Pit Block Model

| 14.7 | Touro |
This section describes the Touro deposit’s open pit Mineral Resources.
| 14.7.1 | Drill Hole Database |
The drill hole database supporting the Touro deposit Mineral Resource was provided by Equinox and has a cut-off date of February 10, 2021. The database is comprised of a single database containing exploration drill holes that include only diamond drill holes completed up to December 21, 2020. Between February 10, 2021, and June 30, 2021, no additional drilling has been completed, and therefore the Mineral Resource Statement presented herein is considered current with an effective date of June 30, 2021.
| | P a g e | 14-82 |
| 04/11/2021 |
| TECHNICAL REPORT ON THE AURIZONA GOLD MINE EXPANSION PRE-FEASIBILITY STUDY |
The drill hole databases were accepted as is with few modifications that included:
| • | Intervals representing unsampled or missing assay results were omitted, |
| • | Zero grade assay intervals were assigned a grade of 0.0025 g/t gold, |
| • | Intervals below detection limit were assigned 0.0025 g/t gold, representing half detection limit. |
Drill Hole Data Statistics
The drill hole data statistics used for the Touro deposit Mineral Resource estimates are summarised in Table 14-54.
Table 14-54: Touro Drill Hole Database Summary
| Database | Drilling Method | Number of Holes | Total Metres |
Number of Samples |
|
| Exploration | DDH | 42 | 8,809 | 8,772 |
| 14.7.2 | Geological Models |
The geological model for Touro consists of a single northeast striking domain that dips steeply to the southwest and plunges to the northwest. Mineralisation at Touro is associated with an altered diorite that is characterised by broad zones of silicification, veining as discrete and stockwork zones hosted in a granodiorite stock that are coincident with elevated gold grades. Elevated veining and sulphide mineralisation is coincident with grades greater than 0.3 g/t gold were interpreted on cross section and plan orientation using Leapfrog implicit modelling, using drill hole interval selections and polylines based on the interpretations. Figure 14-41 and Figure 14-42 show the lithology model and mineralised domains, respectively.
| | P a g e | 14-83 |
| 04/11/2021 |
| TECHNICAL REPORT ON THE AURIZONA GOLD MINE EXPANSION PRE-FEASIBILITY STUDY |
Figure 14-41: Isometric View of Touro Lithology Model

| | P a g e | 14-84 |
| 04/11/2021 |
| TECHNICAL REPORT ON THE AURIZONA GOLD MINE EXPANSION PRE-FEASIBILITY STUDY |
Figure 14-42: Isometric View of Touro Mineralization Model

Regolith Modelling
Surfaces representing the regolith present over the Touro area were developed using drill hole interval selection and cross section interpretation. The regolith domains include laterite, saprolite, transition and fresh rock zones. Regolith domains were combined with the geological model to produce estimation domains representing each regolith profile, however too few samples precluded a valid boundary analysis. Therefore, the Touro gold zone (TGZ) was treated as a single domain for estimation. The Touro domains are summarised in Table 14-55.
| | P a g e | 14-85 |
| 04/11/2021 |
| TECHNICAL REPORT ON THE AURIZONA GOLD MINE EXPANSION PRE-FEASIBILITY STUDY |
Table 14-55: Touro Resource Domains
| Estimation Domain | Domain Number |
| Touro Gold Zone (TGZ) | 20 |
| Waste - Laterite | 11 |
| Waste - Saprolite | 12 |
| Waste - Transition | 13 |
| Waste Fresh | 14 |
| 14.7.3 | Grade Capping |
To manage the spatial influence of potential outliers, sample statistics were examined using probability plots, cumulative frequency plots, mean versus top cut value and coefficient of variation versus top cut value. Top cut values were selected based on population breaks observed on probability plots. These top cut values were compared to decile analysis using a similar method described by Parrish (1997). Capping was applied to assay values prior to compositing.
A top cut value of 13.0 g/t Au was used to cap high-grade outliers. Summary statistics of the capped composites are shown in Table 14-56.
Table 14-56: Summary of Touro Capping Values by Resource Domain
| Domain | Number of Assays |
Length Weighted Average Grade (Au, g/t) |
Capping Value (Au, g/t) |
Number of Samples Capped |
Length Weighted Average Capped Grade (Au, g/t) |
Number of Composite Samples |
Average Composite Samples (Au, g/t) |
| TGZ | 2200 | 0.69 | 13 | 8 | 0.58 | 2201 | 0.58 |
| Waste | 6572 | 0.11 | 2 | 32 | 0.08 | 6384 | 0.08 |
| 14.7.4 | Composites |
Original sample lengths are almost entirely taken at 1 m intervals therefore a composite sample length of 1 m was selected. Residual samples less than 0.5 m were added to the final downhole interval. The compositing process was broken at domain boundaries and regolith contacts.
| 14.7.5 | Exploratory Data Analysis |
Gold grade distributions of the composite samples were completed to assist with understanding the spatial distribution of the data. Boxplot and summary statistics of uncapped length weighted samples is shown in Figure 14-43 and boxplots and summary statistics of the capped composites are shown in Table 14-55.
| | P a g e | 14-86 |
| 04/11/2021 |
| TECHNICAL REPORT ON THE AURIZONA GOLD MINE EXPANSION PRE-FEASIBILITY STUDY |
Figure 14-43: Boxplot of uncapped length weighted Samples for Touro Deposit Area

| | P a g e | 14-87 |
| 04/11/2021 |
| TECHNICAL REPORT ON THE AURIZONA GOLD MINE EXPANSION PRE-FEASIBILITY STUDY |
Figure 14-44: Boxplot of Capped 1 m Composite Samples for Touro Deposit Area

| 14.7.6 | Variography |
Traditional directional variograms were modelled for the Touro gold zone domain. Modelled variograms for the Touro Gold zones are summarised in Table 14-57.
| | P a g e | 14-88 |
| 04/11/2021 |
| TECHNICAL REPORT ON THE AURIZONA GOLD MINE EXPANSION PRE-FEASIBILITY STUDY |
Table 14-57: Geostatistical Variogram Model Parameters for Touro Gold Zones (TGZ)
| Domain | Direction | Azimuth | Plunge | Range 1 | CC | Nugget |
| 20 | D1 | 40 | 0 | 70 | 0.9 | 0.1 |
| TGZ | D2 | 130 | 75 | 50 | ||
| H | 310 | 15 | 15 |
| 14.7.7 | Gold Grade Estimation |
Gold grade estimation for the Touro gold zone were completed using Ordinary Kriging (OK). A block model was generated for the Touro deposit using block dimensions of 10 m (east) by 5 m (north) and block height of 3 m were selected to reflect the geometry of the gold zone and future mining method. The block model was rotated 60 degrees counter-clockwise. The block model definitions are summarised in Table 14-58.
Table 14-58: Touro Block Model Index
| Axis | Block Size | Rotation | Base Point | Block Count |
| X | 10 | 0 | 406,400 | 130 |
| Y | 5 | 0 | 9,842,800 | 170 |
| Z | 3 | -60 | -500 | 200 |
| Total | 4,420,000 |
Estimates were generated using two estimation passes with capped 1 m composites. Estimation of the waste domains used a single pass with the second pass search parameters. The search parameters used for Touro are summarized in Table 14-59
| | P a g e | 14-89 |
| 04/11/2021 |
| TECHNICAL REPORT ON THE AURIZONA GOLD MINE EXPANSION PRE-FEASIBILITY STUDY |
Table 14-59: Search Interpolation Parameters for Touro Resource Model
| Domain | Pass | Search Axis Orientation | Search Radii | ||||
| X | Y | Dip | X | Y | Z | ||
| 100 | 1 | 40 | 0 | -74 | 70 | 50 | 25 |
| 2 | 40 | 0 | -74 | 70 | 50 | 25 | |
| Waste | 1 | 40 | 0 | -74 | 70 | 50 | 25 |
| Pass | Min Sample | Max Sample | Limit by Hole | ||||
| 1 | 24 | 36 | 12 | ||||
| 2 | 2 | 36 | 12 | ||||
| 14.7.8 | Validation of Grade Estimates |
Validation of grade estimates was completed using swath plots, cross validation of grade estimates versus composite sample grades and comparing different estimation techniques against block estimates, swath plots, and comparing histograms of composite samples versus block estimates.
Swath Plots
Swath plots were used to validate the Touro resource model’s gold grade estimates. Swath plots were generated using 30 m swaths using the same orientation as the block model (
Figure 14-45). Vertical swath plots (Figure 14-46) were generated using 3 m vertical swaths. Swath plots show block grade estimates in blue, nearest neighbor block estimates in red, and composite samples in black. Light grey histograms represent the number of composite samples within each swath index.
| | P a g e | 14-90 |
| 04/11/2021 |
| TECHNICAL REPORT ON THE AURIZONA GOLD MINE EXPANSION PRE-FEASIBILITY STUDY |
Figure 14-45: Northeast Swath Plots for Touro

| | P a g e | 14-91 |
| 04/11/2021 |
| TECHNICAL REPORT ON THE AURIZONA GOLD MINE EXPANSION PRE-FEASIBILITY STUDY |
Figure 14-46: Vertical Swath Plots for Touro

Comparison of Estimation Techniques
Several different interpolants were used to compare sensitivities to the chosen estimator. A summary of the results for different interpolators for the Touro gold zone are shown in Table 14-60.
| | P a g e | 14-92 |
| 04/11/2021 |
| TECHNICAL REPORT ON THE AURIZONA GOLD MINE EXPANSION PRE-FEASIBILITY STUDY |
Table 14-60: Comparison of Different Estimation Techniques for Touro Gold Zone
| Interpolator | Number of Blocks > 0.6 g/t Au |
Average Grade (g/t Au) |
||
| OK | 20,490 | 0.99 | ||
| ID3 | 21,882 | 0.96 | ||
| ID2 | 22,204 | 0.95 | ||
| NN | 16,178 | 1.54 |
Cross Validation
Cross validation was completed to check for localised accuracy of estimates and compare domain average composite sample grades to estimated grades. Table 14-61 summarizes block average Composite Samples and Block Estimates for Touro.
Table 14-61: Comparison of Average Block Estimates versus Composite Samples within a Block for Touro
| Domain Number |
Block Average Grade (Au, g/t) | Correlation Coefficient | |
| Composite Samples |
Block Estimates | ||
| 20 | 0.58 | 0.60 | 0.66 |
| 14.7.9 | Classification of Mineral Resources |
Block model quantities and grade estimates were classified in accordance with the CIM Definition Standards for Mineral Resources and Mineral Reserves by Trevor Rabb, P.Geo. (EGBC #39599), an appropriate independent qualified person for the purpose of NI 43-101.
Mineral Resource classification is subjective in nature and is guided by the data used in preparing the estimate. Classification of resources has considered geological continuity, data spacing, data type, data source, data quality, and geostatistical evaluation of these data. The criteria used for Resource classification is summarised in Table 14-62.
Table 14-62: Touro Resource Classification Criteria
| Classification | Criteria for Resource Classification | ||
| Number of holes used |
Average Distance to Samples |
Nominal Drill Hole Spacing | |
| Indicated | ≥ 2 | ≤ 50 m | 50m |
| Inferred | ≤ 2 | > 50 m | > 50m |
| | P a g e | 14-93 |
| 04/11/2021 |
| TECHNICAL REPORT ON THE AURIZONA GOLD MINE EXPANSION PRE-FEASIBILITY STUDY |
Estimated blocks were assigned to indicated classification if samples from at least two drill holes were used to estimate the block and the average distance of samples used for the estimate are less than 50 m. Nominal drill hole spacing from within the Indicated classification shell is completed on 50 m spaced sections and varies from 30 to 50 m spacing between holes drilled on the same section, with most sections coinciding with Indicated Resources having at least three holes present.
All other blocks were assigned to Inferred classification. Drill hole spacing for Inferred resources are generally spaced on 50 m sections, with most sections within the Inferred classified resources have only 1 to two holes drilled per section.
| 14.7.10 | Density |
The Touro deposit did not have enough data to support a bulk density estimation, therefore, average bulk density was calculated based on the four regolith domains, and subsequently assigned to block model based on the majority of each block occupying each regolith domain. In total, 831 measurements were used to determine average bulk density values. These bulk density values are summarised in Table 14-63.
Table 14-63: Summary of Bulk Density Values used for Touro Resource Domains
| Domain | Average Bulk Density |
Number of Samples |
| Laterite | 1.47 | 15 |
| Saprolite | 1.89 | 70 |
| Transition | 2.63 | 54 |
| Fresh | 2.78 | 692 |
| 14.7.11 | Mineral Resource Statement |
A summary of the Indicated and Inferred resources is summarised in Table 14-64 within an optimised pit shell shown in Figure 14-47.
| | P a g e | 14-94 |
| 04/11/2021 |
| TECHNICAL REPORT ON THE AURIZONA GOLD MINE EXPANSION PRE-FEASIBILITY STUDY |
Table 14-64: Mineral Resource Statement (Exclusive of Reserves) for Touro deposit, Maranhão, Brazil Equity Exploration Consultants, effective date June 30, 2021
| Classification | Area | Cut-off Grade Gold (g/t) |
Tonnage (kt) |
Gold Grade (g/t) |
Contained Gold (koz) |
| Indicated | Laterite | 0.3 | 40 | 0.75 | 1 |
| Saprolite | 0.3 | 273 | 0.75 | 7 | |
| Transition | 0.3 | 316 | 0.78 | 8 | |
| Fresh | 0.3 | 2,335 | 0.79 | 59 | |
| Total | 0.3 | 2,965 | 0.78 | 75 | |
| Inferred | Laterite | 0.3 | 183 | 0.80 | 5 |
| Saprolite | 0.3 | 369 | 0.78 | 9 | |
| Transition | 0.3 | 354 | 0.70 | 8 | |
| Fresh | 0.3 | 857 | 0.69 | 19 | |
| Total | 0.3 | 1,763 | 0.72 | 41 |
| Notes: |
| 1. | Mineral Resources are reported exclusive of reserves. |
| 2. | Mineral Resources are reported using a cut-off grade of 0.30 g/t gold and a gold price of US$1500/oz gold. |
| 3. | The Open Pit Mineral Resource is constrained using an optimized pit that has been generated using Lerchs -Grossman pit optimisation algorithm with parameters outlined in Table 14-1. |
| 4. | The Touro Mineral Resource statement has been prepared by Trevor Rabb, P.Geo who is a qualified person as defined by NI 43-101. |
| 5. | Mineral Resources are not Mineral Reserves and do not have demonstrated economic viability. |
| 6. | The Touro Mineral Resource statement has been prepared in accordance with NI43-101 Standards of Disclosure for Mineral Projects (May 2016) and the CIM Definition Standards for Mineral Resources and Mineral Reserves (May 2014). |
| 7. | The number of metric tonnes and gold ounces is rounded to the nearest thousand. Any discrepancies in the totals are due to rounding effects. |
| | P a g e | 14-95 |
| 04/11/2021 |
| TECHNICAL REPORT ON THE AURIZONA GOLD MINE EXPANSION PRE-FEASIBILITY STUDY |
Figure 14-47 Cross Section of the Touro Open Pit Block Model

| 14.8 | Summary of Aurizona Mineral Resource Estimates |
A consolidated summary of the Aurizona Property Mineral Resources exclusive of Reserves are presented in Table 14-65. A consolidated summary of the Aurizona Property Mineral Resources inclusive of Reserves are presented in Table 14-66.
| | P a g e | 14-96 |
| 04/11/2021 |
| TECHNICAL REPORT ON THE AURIZONA GOLD MINE EXPANSION PRE-FEASIBILITY STUDY |
Table 14-65 Resources Exclusive of Reserves for Aurizona
| Deposit | Area | Category | Cut-Off Grade |
Tonnes | Gold Grade | Contained Gold |
| Gold (g/t) | (kt) | (g/t) | (koz) | |||
| Piaba | Open Pit | Measured | 0.3 | 2,438 | 1.21 | 95 |
| Indicated | 3,114 | 1.19 | 121 | |||
| Inferred | 53 | 0.77 | 1 | |||
| Boa Esperança | Open Pit | Measured | 0.3 | 66 | 0.60 | 1 |
| Indicated | 0.3 | 427 | 1.03 | 14 | ||
| Inferred | 438 | 1.11 | 16 | |||
| Genipapo | Open Pit | Indicated | 0.3 | 249 | 0.84 | 7 |
| Inferred | 6 | 0.76 | 0 | |||
| Tatajuba | Open Pit | Indicated | 0.3 | 181 | 1.39 | 8 |
| Touro | Open Pit | Indicated | 0.3 | 2,965 | 0.78 | 75 |
| Inferred | 1,763 | 0.72 | 41 | |||
| Total Open Pit | M&I | 0.3 | 9,441 | 0.80 | 320 | |
| Inferred | 2,260 | 0.80 | 58 | |||
| Piaba | Underground | Measured | 1.0 | 1,000 | 2.10 | 67 |
| Indicated | 7,212 | 1.96 | 454 | |||
| Inferred | 9,448 | 2.46 | 747 | |||
| Tatajuba | Underground | Indicated | 1.0 | 464 | 1.73 | 26 |
| Inferred | 981 | 2.84 | 90 | |||
| Total Underground | M&I | 1.0 | 8,676 | 1.96 | 547 | |
| Inferred | 10,430 | 2.50 | 837 | |||
| Total Aurizona Resource | M&I | 18,117 | 1.49 | 868 | ||
| Inferred | 12,689 | 2.19 | 895 | |||
| Notes: |
| 1. | Mineral Resources are reported inclusive of reserves. |
| 2. | Mineral Resources are reported using a cut-off grade of 0.30 g/t gold for open pit resources and 1.00 g/t gold for underground resources, based on assumptions presented in Section 14.1.4. |
| 3. | The Open Pit Mineral Resource is constrained using an optimized pit that has been generated using Lerchs -Grossman pit optimisation algorithm with parameters outlined in Table 14-1. |
| 4. | The Underground Mineral Resources are constrained using a 1.00 g/t Au grade shell occurring the lower of 20 m below the transition-fresh rock contact, or 20 m below the Reserve pit. |
| 5. | The Mineral Resources are based on the Mineral Resource statements for each respective deposit and area, and have been prepared by Trevor Rabb, P.Geo who is a qualified person as defined by NI 43-101. |
| 6. | Mineral Resources are not Mineral Reserves and do not have demonstrated economic viability. |
| 7. | The Mineral Resource statement has been prepared in accordance with NI43-101 Standards of Disclosure for Mineral Projects (May 2016) and the CIM Definition Standards for Mineral Resources and Mineral Reserves (May 2014). |
| 8. | The number of metric tonnes is rounded to the nearest hundred. Any discrepancies in the totals are due to rounding effects. |
| | P a g e | 14-97 |
| 04/11/2021 |
| TECHNICAL REPORT ON THE AURIZONA GOLD MINE EXPANSION PRE-FEASIBILITY STUDY |
Table 14-66 Resources Inclusive of Reserves for Aurizona
| Deposit | Area | Category | Cut-Off Grade Gold (g/t) |
Tonnes (kt) |
Gold Grade (g/t) |
Contained Gold (koz) |
| Piaba | Open Pit | Measured | 0.3 | 17,752 | 1.37 | 782 |
| Indicated | 7,843 | 1.21 | 306 | |||
| Inferred | 106 | 0.83 | 3 | |||
| Boa Esperança | Open Pit | Measured | 0.3 | 862 | 0.81 | 22 |
| Indicated | 0.3 | 593 | 0.94 | 18 | ||
| Inferred | 568 | 1.03 | 19 | |||
| Genipapo | Open Pit | Indicated | 0.3 | 908 | 0.83 | 24 |
| Inferred | 71 | 0.70 | 2 | |||
| Tatajuba | Open Pit | Indicated | 0.3 | 2,116 | 1.32 | 96 |
| Touro | Open Pit | Indicated | 0.3 | 2,965 | 0.78 | 75 |
| Inferred | 1,763 | 0.72 | 41 | |||
| Total Open Pit | M&I | 0.3 | 33,039 | 1.24 | 1,323 | |
| Inferred | 2,508 | 0.80 | 64 | |||
| Piaba | Underground | Measured | 1.0 | 1,236 | 2.22 | 88 |
| Indicated | 15,105 | 2.58 | 1,252 | |||
| Inferred | 9,578 | 2.47 | 761 | |||
| Tatajuba | Underground | Indicated | 1.0 | 464 | 1.73 | 26 |
| Inferred | 981 | 2.84 | 90 | |||
| Total Underground | M&I | 1.0 | 16,805 | 2.53 | 1,366 | |
| Inferred | 10,559 | 2.50 | 850 | |||
| Total Aurizona Resource | M&I | 49,844 | 1.67 | 2,689 | ||
| Inferred | 13,067 | 2.18 | 915 | |||
| Notes: |
| 1. | Mineral Resources are reported inclusive of reserves. |
| 2. | Mineral Resources are reported using a cut-off grade of 0.30 g/t gold for open pit resources and 1.00 g/t gold for underground resources, based on assumptions presented in Section 14.1.4. |
| 3. | The Open Pit Mineral Resource is constrained using an optimized pit that has been generated using Lerchs -Grossman pit optimisation algorithm with parameters outlined in Table 14-1. |
| 4. | The Underground Mineral Resources are constrained using a 1.00 g/t Au grade shell occurring the lower of 20 m below the transition-fresh rock contact, or 20 m below the Reserve pit. |
| 5. | The Mineral Resources are based on the Mineral Resource statements for each respective deposit and area, and have been prepared by Trevor Rabb, P.Geo who is a qualified person as defined by NI 43-101. |
| 6. | Mineral Resources are not Mineral Reserves and do not have demonstrated economic viability. |
| 7. | The Mineral Resource statement has been prepared in accordance with NI43-101 Standards of Disclosure for Mineral Projects (May 2016) and the CIM Definition Standards for Mineral Resources and Mineral Reserves (May 2014). |
| 8. | The number of metric tonnes and gold ounces is rounded to the nearest hundred. Any discrepancies in the totals are due to rounding effects. |
| | P a g e | 14-98 |
| 04/11/2021 |
| TECHNICAL REPORT ON THE AURIZONA GOLD MINE EXPANSION PRE-FEASIBILITY STUDY |
| 15 | Mineral Reserve Estimates |
The reserves for the Aurizona Mine are based on the conversion of Measured and Indicated resources within the Piaba, Piaba East, Boa Esperança, Tatajuba and Genipapo Open Pits using the current mine designs. The reserves also include the conversion of the Measured and Indicated resources in the Piaba Underground design which lies directly below the Piaba Open pit. Measured resources are converted to Proven Reserves and Indicated resources are converted directly to Probable Reserves.
The total reserves for the Aurizona Mine are shown in Error! Reference source not found.. Some variation may exist due to rounding.
The QP has not identified any known legal, political, environmental, or other risks that would materially affect the potential development of the Mineral Reserves.
Table 15-1: Aurizona Mine - Proven and Probable Reserves - June 30, 2021
| Proven | Probable | Total | |||||||
| Ore Type | Tonnes (kt) |
Gold Grade (g/t) |
Gold (koz) |
Tonnes (kt) |
Gold Grade (g/t) |
Gold (koz) |
Tonnes (kt) |
Gold Grade (g/t) |
Gold (koz) |
| Laterite | 23 | 0.71 | 1 | 448 | 0.87 | 12 | 471 | 0.86 | 13 |
| Saprolite | 1,525 | 1.28 | 63 | 2,342 | 1.23 | 92 | 3,867 | 1.25 | 155 |
| Transition | 2,435 | 1.08 | 84 | 853 | 0.90 | 25 | 3,288 | 1.03 | 109 |
| Rock | 12,598 | 1.46 | 592 | 12,106 | 2.03 | 791 | 24,704 | 1.74 | 1,383 |
| Total | 16,581 | 1.39 | 740 | 15,749 | 1.82 | 920 | 32,330 | 1.60 | 1,660 |
Notes:
| 1. | This Mineral Reserve estimate is as of June 30, 2021 and is based on the Mineral Resource estimates for Piaba, Boa Esperança, Tatajuba, and Genipapo all dated June 30, 2021 by Equity Exploration. The Mineral Reserve calculation was completed under the supervision of Gordon Zurowski, P.Eng. of AGP., who is a Qualified Person as defined under NI 43-101. Mineral Reserves are stated within the final design pits based on a $1,350/oz gold price. |
| 2. | The gold cut-off grades used were: |
| • | Piaba Open Pit - 0.35 g/t (laterite, saprolite, transition), 0.41 g/t (rock) |
| • | Tatajuba Open Pit - 0.43 g/t (laterite, saprolite, transition), 0.47 g/t (rock) |
| • | Boa Esperança, Genipapo Open Pit - 0.36 g/t (laterite, saprolite) |
| • | Piaba Underground - 1.80 g/t (rock) |
| 3. | Open pit mining costs varied by area but averaged $2.25/t mined and included an extra $2/t for ore haulage to the process plant from Tatajuba. |
| 4. | Underground Mining costs averaged $32.78/t ore mined. |
| 5. | Processing costs averaged $11.52/t ore based on variable costs by material type of $7.84/t for laterite/saprolite, $8.08/t for transition and $12.63/t for fresh rock. |
| 6. | G&A was $6.47/t ore processed. |
| 7. | LOM gold recovery is 90.5%. Recoveries varied by area and material type. |
| | P a g e | 15-1 |
| 04/11/2021 |
| TECHNICAL REPORT ON THE AURIZONA GOLD MINE EXPANSION PRE-FEASIBILITY STUDY |
| 15.1 | Mining Method and Mining Costs |
The Aurizona Mine is currently an open pit only operation using conventional mining equipment. The mine will transition to include an underground component beneath the Piaba open pit as well as the satellite deposits, Tatajuba and Genipapo.
Open pit mining is completed by contract mining.
Underground mining will be accomplished with an owner operated fleet.
All work is based on the current life of mine operating plans generated for this PFS.
Costs are based on current contractual mining terms, actual operating costs, estimated mining costs for the underground mine and proposed capital budgets for the remaining mine life.
The current resource models dated June 30, 2021 are used for all mine design work. Only Measured and Indicated resources were used in the determination of reserves for the Aurizona Mine.
| 15.1.1 | Geotechnical Considerations |
Open pit highwall slope angle criteria vary by area and pit. The current operating practice for the open pits at the Aurizona Mine, as previously described in Lycopodium et al (2017) was used in this update of the open pit reserves. No geotechnical work has been completed specifically for the Tatajuba or Genipapo areas, but the material is of similar character to the material at Piaba. Observed slopes from artisanal mining at Tatajuba indicated steeper slopes than are presently employed at Piaba although over a shallower depth.
In general, the inter ramp angles vary from 33 to 60 degrees depending on pit area and wall orientation. This is due to a foliation that is present parallel to the walls in certain zones. The geotechnical consultants have provided detailed information for each pit slope area.
Heights between safety benches vary by material type. In the saprolite and transition zones the benches are placed each 6m while in the fresh rock they are placed each 12 m. Berm widths vary from 3.5 m to 6.0 m depending on the zone. Every 54 m vertically in saprolite and transition zones, a 10 m berm is required.
A larger catch berm of 20 m is in the design at the -44 level which roughly represents the base of the transition zone. This is expected to be a dewatering zone for the slope due to the higher permeability of the material.
The various criteria have been loaded into the geologic model by lithological unit for use by mine planners. This is used for the pit optimization as well as pit design work.
The underground geotechnical aspects were provided by Knight Piesold for use in the underground design.
| 15.1.2 | Economic Pit Shell Development |
The final pit designs are based on pit shells using the Lerch-Grossman procedure in Hexagon Mining’s MinePlan software. The parameters for the pit shells are shown in Table 15-2.
| | P a g e | 15-2 |
| 04/11/2021 |
| TECHNICAL REPORT ON THE AURIZONA GOLD MINE EXPANSION PRE-FEASIBILITY STUDY |
Table 15-2: Open Pit Optimization Parameters
| Parameter | Units | Piaba
Piaba East |
Boa Esperança |
Tatajuba | Genipapo |
| Metal Price | |||||
| Gold Price | $/oz | 1,350 | 1,350 | 1,350 | 1,350 |
| Payable | % | 99.9 | 99.9 | 99.9 | 99.9 |
| Refining/Transportation | $/oz | 23.12 | 23.12 | 23.12 | 23.12 |
| Royalty | % | 4.0 | 4.0 | 4.0 | 4.0 |
| Geotechnical (Overall Slope Range dependent by Sector) | |||||
| Laterite | degrees | 33 | 33 | 33 | 33 |
| Saprolite | degrees | 29-37 | 39 | 38-44 | 35-39 |
| Transition | degrees | 25-39 | 32 | 21-39 | 28 |
| Fresh Rock | degrees | 33-59 | 47 | 47-59 | 47-59 |
| Process Recovery | |||||
| Laterite/Saprolite | % | 93.1 | 91.8 | 91.4 | 91.4 |
| Hard SAP/Transition | % | 94.1 | 97.1 | 91.4 | 91.4 |
| Fresh Rock | % | 90.0 | 90.0 | 91.4 | 91.4 |
| Costs | |||||
| Waste Mining | |||||
| Laterite/Saprolite - Base Cost | $/t moved | 1.90 | 1.90 | 1.91 | 1.91 |
| Laterite/Saprolite - Incremental Cost | $/t/6m bench | 0.008 | 0.008 | 0.005 | 0.005 |
| Transition - Base Cost | $/t moved | 2.40 | 2.40 | 2.27 | 2.27 |
| Transition - Incremental Cost | $/t/6m bench | 0.007 | 0.007 | 0.004 | 0.004 |
| Fresh Rock - Base Cost | $/t moved | 2.52 | 2.52 | 3.49 | 3.49 |
| Fresh Rock - Incremental Cost | $/t/6m bench | 0.007 | 0.007 | 0.003 | 0.003 |
| Ore Mining | |||||
| Laterite/Saprolite - Base Cost | $/t moved | 2.32 | 2.32 | 2.53 | 2.53 |
| Laterite/Saprolite - Ore Haul to Plant | $/t moved | - | - | 2.00 | - |
| Laterite/Saprolite - Total Base | $/t moved | 2.32 | 2.32 | 4.53 | 2.53 |
| Laterite/Saprolite - Incremental Cost | $/t/6m bench | 0.013 | 0.013 | 0.003 | 0.003 |
| Transition - Base Cost | $/t moved | 3.18 | 3.18 | 3.06 | 3.06 |
| Transition - Ore Haul to Plant | $/t moved | - | - | 2.00 | - |
| Transition - Total Base | $/t moved | 3.18 | 3.18 | 5.06 | 3.06 |
| Transition - Incremental Cost | $/t/6m bench | 0.012 | 0.012 | 0.003 | 0.003 |
| Fresh Rock - Base Cost | $/t moved | 3.55 | 3.55 | 3.49 | 3.49 |
| Fresh Rock - Ore Haul to Plant | $/t moved | - | - | 2.00 | - |
| Fresh Rock - Total Base | $/t moved | 3.55 | 3.55 | 5.49 | 3.49 |
| Fresh Rock - Incremental Cost | $/t/6m bench | 0.012 | 0.012 | 0.003 | 0.003 |
| Processing | |||||
| Laterite/Saprolite | $/t ore | 7.57 | 7.57 | 7.57 | 7.57 |
| Hard SAP/Transition | $/t ore | 7.75 | 7.75 | 7.75 | 7.75 |
| Fresh Rock | $/t ore | 9.34 | 9.34 | 9.34 | 9.34 |
| General and Administrative | $/t ore | 4.89 | 4.89 | 4.89 | 4.89 |
| | P a g e | 15-3 |
| 04/11/2021 |
| TECHNICAL REPORT ON THE AURIZONA GOLD MINE EXPANSION PRE-FEASIBILITY STUDY |
Only Measured and Indicated blocks were used in the pit shell generation.
Discrepancies between the costs used in the pit optimization (Table 15-2) and the cashflow model reflect further refining throughout the study to arrive at more accurate values.
Pits were generated using various revenue factors of the $1,350 /oz gold price. For Piaba and Piaba East the $1,148/oz gold price was used to evaluate the pit designs and used as the basis for the final phase designs. This is equivalent to a revenue factor (RF)=0.85.
For Boa Esperança, the design shape was based on the $1,080 /oz gold price or RF=0.80. The focus for Boa Esperança was the storage capacity for water of 600,000 m3 of fresh water for plant operations. The current design can hold 900,000 m3 with sufficient freeboard.
Tatajuba used a RF=0.90 pit or $1,215 /oz gold price for design purposes.
Genipapo North used a RF=0.95 or $1,283 /oz gold price while Genipapo South used a RF=0.90 or $1,215 /oz gold price. These were selected based on resource extraction potential and logical design of the pit.
A boundary of 80 m was applied from the toe of the TSF for the Piaba pit. Work during the Feasibility Study indicated that 80 m provides sufficient offset for long-term slope stability.
| 15.1.3 | Cut-off Grade |
The marginal cut-off was used for the statement of reserves for the Aurizona Mine pit areas and an elevated cut-off for the underground mine. Using the updated cost estimates and metal pricing for 2021 the gold cut-offs calculated are shown by material type and area in Table 15-3.
Table 15-3: Aurizona Mine Reserve Cut-off Grades - Gold Grade (g/t)
| Pit Area | Laterite/Saprolite (g/t) | Transition (g/t) | Fresh Rock (g/t) |
| Piaba, Piaba East, Crown Pillar | 0.35 | 0.35 | 0.41 |
| Boa Esperança | 0.36 | 0.36 | 0.41 |
| Tatajuba | 0.43 | 0.43 | 0.47 |
| Genipapo - North and South | 0.36 | 0.36 | 0.40 |
| Underground | - | - | 1.8 |
It should be noted that the cut-off grade for the Piaba and Piaba East pits in previous years was fixed at an elevated cut-off value of 0.6 g/t. The cut-off grade for Boa Esperança was fixed at 0.41 g/t. These cut-offs have been lowered to reflect current operating practices. The additional pits added to the reserves statement have been completed only at the new cut-offs as shown in Table 15-3.
The marginal cut-off calculation for underground mining indicated a value of 1.68 g/t gold. An elevated cut-off was maintained to help improve profitability of the underground mine as well as better match the open pit tonnages to ensure the plant capacity was fully utilized. Additional underground feed material at the end of the mine life would have resulted in the plant operating at less than its design capacity which would result in higher operating and G&A costs raising the cut-off.
| | P a g e | 15-4 |
| 04/11/2021 |
| TECHNICAL REPORT ON THE AURIZONA GOLD MINE EXPANSION PRE-FEASIBILITY STUDY |
| 15.1.4 | Dilution |
The resource models are all ore percent models. No grades were estimated outside of the low-grade wireframe.
Open Pit
The percentage of dilution is calculated for each contact side using the same assumed 0.5m contact dilution distance. If one side of the 5 m block is touching waste, then it is estimated that dilution of 10.0% would result. If two sides are contacting, it would rise to 20.0%. Three sides would be 30.0%, and four sides 40.0%. Four sides represent an isolated block of ore.
The ore block was determined based on the marginal cut-off grade.
MinePlan enables the user to query surrounding blocks against a set of conditions. For the dilution percentage calculation, the procedure was run to determine how many waste blocks contacted an ore block, which determined the dilution percentage to apply. This dilution percentage was stored in the block.
The dilution percentage was added to the existing ore percent item and stored in a new diluted ore percent item used in reporting mined tonnages. The gold grade was stored as a diluted gold item for reporting of grades.
The pit tonnages were then reported with these diluted items for use in mine scheduling. The results of the dilution calculation on all the models by area is shown in Table 15-4.
Table 15-4: Dilution Percentage by Pit Area
| Piaba | Piaba East | Boa Esperança |
Tatajuba | Genipapo North |
Genipapo South | |
| Insitu Ore (t) | 18,548,000 | 1,417,000 | 812,000 | 1,785,000 | 374,000 | 217,000 |
| Insitu Grade (g/t) | 1.38 | 1.46 | 0.86 | 1.52 | 0.82 | 1.03 |
| Diluted Ore (t) | 19,630,000 | 1,524,000 | 882,000 | 1,975,000 | 397,000 | 255,000 |
| Diluted Grade (g/t) | 1.31 | 1.36 | 0.80 | 1.39 | 0.78 | 0.89 |
| Ore Difference (%) | 5.8 | 7.6 | 8.6 | 10.6 | 6.2 | 17.4 |
| Grade Difference (%) | -5.1 | -6.8 | -7.3 | -9.0 | -4.9 | -13.5 |
Tonnes and grade for the open pit designs and reserves are reported with the diluted tonnes and grade and assume a 100% recovery of material.
Underground
Dilution for the underground shapes was applied differently depending upon the mining method and location of the workings. This is shown in Table 15-5.
| | P a g e | 15-5 |
| 04/11/2021 |
| TECHNICAL REPORT ON THE AURIZONA GOLD MINE EXPANSION PRE-FEASIBILITY STUDY |
Table 15-5: Underground Dilution and Modifying Factors
| Description | Factor/Action |
|
Development Tonnes Recovery Grade |
100% Model Design Grade |
|
Longhole with Permanent Rib Pillar Rib Pillar Hangingwall Dilution Footwall Dilution Rockfill Floor Broken Ore Tonnes Recovery |
Removed from Reserve 0.75m 0.50m 0.25m @ zero grade 95% |
|
Longhole with Cemented Fill Hangingwall Dilution Footwall Dilution Rockfill Vertical Wall Rockfill Floor Broken Ore Tonnes Recovery |
0.75m 0.50m 0.75m @ zero grade 0.25m @ zero grade 95% |
| Sill Pillar | Removed from Reserve |
| Upper 25m Crown Pillar | Included in Open Pit Reserve |
The background grade of the unmined mineralised envelope in each mining zone was interrogated in the geological model. HW and FW dilution was applied at this background grade to stopes in each mining zone. The background grades varied from 0.37 g/t Au to 0.92 g/t Au.
| 15.2 | Mine Design |
The mine schedule utilizes the pit and phase designs to send a peak of 3.1 Mt of ore to the plant in 2023 then lesser amounts in the following years. This value includes underground ore also. This peak is possible due to the higher percentage of saprolite which allows a slight increase in plant throughput. Total mine production peaks at 27.3 Mt in 2023 then declines as the mine advances.
| 15.2.1 | Open Pit |
The detailed pit phase designs at Aurizona Mine are based on the wall slope parameters inter-ramp angles. The pit optimization shells are generated with the current resource model date June 30, 2021.
Six pit areas are considered in the reserves statement:
| 1) | Piaba | - 4 phases |
| 2) | Piaba East | - 1 phase |
| 3) | Boa Esperança | - 1 phase |
| 4) | Tatajuba | - 2 phases |
| 5) | Genipapo North | - 1 phase |
| 6) | Genipapo South | - 1 phase |
Equipment sizing for ramps and working benches is based on the use of 91 t rigid frame trucks currently in use by the mining contractor. The ramp width is designed for a truck with an operating width of 6.7m. This means that single lane access is 18.9m (2x operating width plus berm and ditch) and double lane widths are 25.6m (3x operating width plus berm and ditch). Ramp uphill gradients are 10% in the pit and 8% uphill on the dump access roads. Working benches were designed for 35 m to 40 m minimum on pushbacks, although some push-backs do work in a retreat manner to facilitate access and minimize waste stripping.
| | P a g e | 15-6 |
| 04/11/2021 |
| TECHNICAL REPORT ON THE AURIZONA GOLD MINE EXPANSION PRE-FEASIBILITY STUDY |
The mine schedule is based on June 30, 2021 reserves. A total of 32.3 Mt of Proven and Probable ore grading 1.60 g/t gold is delivered to the process plant over a current design life of 11 years. The ore tonnage is made up of 16.6 Mt of Proven Reserves and 15.7 Mt of Probable Reserves and includes 0.3 Mt of Proven ore currently in the stockpile from current 2021 mining activity.
Within the mine schedule, a total of 6.5 Mt grading 2.76 g/t of Proven and Probable from the underground is included. This is made up of 0.2 Mt Proven and 6.3 Mt of Probable. This is the first time underground reserves have been included.
Waste tonnage totals 96.9 Mt to be placed in the various waste rock management facilities. The overall strip ratio is 3.75:1 (waste: ore).
| 15.2.2 | Underground |
The underground mine provides feed to the mill starting in 2023 but is at full capacity in 2026 onwards. Peak underground production is 1.36 Mt in 2027.
The underground mine is developed using conventional longhole mining methods. In locations where the stope thickness is less than 8.0 m wide mining was done by Longhole Open Stoping with Permanent Rib Pillars (LHwPRP). For stopes wider than 8.0 m the mining method was Longhole Open Stoping with Cemented Rockfill (LHwC).
| 15.3 | Mine Reserves Statement - By Area |
The total reserves for the Aurizona Mine by area are shown in Table 15-6.
Table 15-6: Aurizona Proven and Probable Reserves - by Area (June 30, 2021)
| Proven | Probable | Total | ||||||||
| Ore Type | Cutoff Grade(g/t) | Tonnes (kt) | Gold Grade (g/t) | Gold (koz) | Tonnes (kt) | Gold Grade (g/t) | Gold (koz) | Tonnes (kt) | Gold Grade (g/t) | Gold (koz) |
| Piaba | ||||||||||
| Laterite | 0.35 | - | - | - | 1 | 0.59 | - | 1 | 0.59 | - |
| Saprolite | 0.35 | 581 | 1.0 | 19 | 163 | 1.20 | 6 | 744 | 1.04 | 25 |
| Transition | 0.35 | 2,157 | 1.10 | 76 | 307 | 0.76 | 8 | 2,464 | 1.06 | 84 |
| Fresh Rock | 0.41 | 11,737 | 1.44 | 543 | 3,952 | 1.20 | 153 | 15,689 | 1.38 | 696 |
| Total | 14,475 | 1.37 | 638 | 4,423 | 1.17 | 167 | 18,898 | 1.32 | 805 | |
| | P a g e | 15-7 |
| 04/11/2021 |
| TECHNICAL REPORT ON THE AURIZONA GOLD MINE EXPANSION PRE-FEASIBILITY STUDY |
| Proven | Probable | Total | ||||||||
| Ore Type | Cutoff Grade(g/t) | Tonnes (kt) | Gold Grade (g/t) | Gold (koz) | Tonnes (kt) | Gold Grade (g/t) | Gold (koz) | Tonnes (kt) | Gold Grade (g/t) | Gold (koz) |
| Piaba East | ||||||||||
| Laterite | 0.35 | 1 | 0.85 | - | 66 | 0.79 | 2 | 67 | 0.79 | 2 |
| Saprolite | 0.35 | 798 | 1.60 | 41 | 341 | 1.30 | 14 | 1,139 | 1.51 | 55 |
| Transition | 0.35 | 29 | 1.20 | 1 | 7 | 1.36 | - | 36 | 1.23 | 1 |
| Fresh Rock | 0.41 | - | - | - | - | - | - | - | - | - |
| Total | 828 | 1.59 | 42 | 414 | 1.22 | 16 | 1,242 | 1.46 | 58 | |
| Boa Esperança | ||||||||||
| Laterite | 0.36 | 22 | 0.71 | 1 | 197 | 0.87 | 6 | 219 | 0.85 | 7 |
| Saprolite | 0.36 | 146 | 0.62 | 3 | 516 | 0.84 | 14 | 662 | 0.79 | 17 |
| Transition | 0.34 | - | - | - | - | - | - | - | - | - |
| Fresh Rock | 0.41 | - | - | - | - | - | - | - | - | - |
| Total | 168 | 0.63 | 4 | 713 | 0.85 | 20 | 881 | 0.81 | 24 | |
| Tatajuba | ||||||||||
| Laterite | 0.43 | - | - | - | 141 | 0.98 | 4 | 141 | 0.98 | 4 |
| Saprolite | 0.43 | - | - | - | 691 | 1.87 | 41 | 691 | 1.87 | 41 |
| Transition | 0.43 | - | - | - | 539 | 0.97 | 17 | 539 | 0.97 | 17 |
| Fresh Rock | 0.47 | - | - | - | 603 | 1.31 | 25 | 603 | 1.31 | 25 |
| Total | - | - | - | 1,974 | 1.39 | 87 | 1,974 | 1.39 | 87 | |
| Genipapo North | ||||||||||
| Laterite | 0.36 | - | - | - | 22 | 0.54 | - | 22 | 0.54 | - |
| Saprolite | 0.36 | - | - | - | 397 | 0.78 | 10 | 397 | 0.78 | 10 |
| Transition | 0.36 | - | - | - | - | - | - | - | - | - |
| Fresh Rock | 0.40 | - | - | - | - | - | - | - | - | - |
| Total | - | - | - | 419 | 0.77 | 10 | 419 | 0.77 | 10 | |
| Genipapo South | ||||||||||
| Laterite | 0.36 | - | - | - | 21 | 0.69 | - | 21 | 0.69 | - |
| Saprolite | 0.36 | - | - | - | 234 | 0.91 | 7 | 234 | 0.91 | 7 |
| Transition | 0.36 | - | - | - | - | - | - | - | - | - |
| Fresh Rock | 0.40 | - | - | - | - | - | - | - | - | - |
| Total | - | - | - | 255 | 0.89 | 7 | 255 | 0.89 | 7 | |
| Piaba Underground | ||||||||||
| Laterite | 1.8 | - | - | - | - | - | - | - | - | - |
| Saprolite | 1.8 | - | - | - | - | - | - | - | - | - |
| Transition | 1.8 | - | - | - | - | - | - | - | - | - |
| Fresh Rock | 1.8 | 223 | 2.42 | 17 | 6,305 | 2.77 | 562 | 6,528 | 2.76 | 579 |
| Total | 223 | 2.42 | 17 | 6,305 | 2.77 | 562 | 6,528 | 2.76 | 579 | |
| | P a g e | 15-8 |
| 04/11/2021 |
| TECHNICAL REPORT ON THE AURIZONA GOLD MINE EXPANSION PRE-FEASIBILITY STUDY |
| Proven | Probable | Total | ||||||||
| Ore Type | Cutoff Grade(g/t) | Tonnes (kt) | Gold Grade (g/t) | Gold (koz) | Tonnes (kt) | Gold Grade (g/t) | Gold (koz) | Tonnes (kt) | Gold Grade (g/t) | Gold (koz) |
| Crown Pillar | ||||||||||
| Laterite | 0.35 | - | - | - | - | - | - | - | - | - |
| Saprolite | 0.35 | - | - | - | - | - | - | - | - | - |
| Transition | 0.35 | - | - | - | - | - | - | - | - | - |
| Fresh Rock | 0.41 | 638 | 1.54 | 32 | 1,246 | 1.27 | 51 | 1,884 | 1.36 | 83 |
| Total | 638 | 1.54 | 32 | 1,246 | 1.27 | 51 | 1,884 | 1.36 | 83 | |
| ROM Stockpile | ||||||||||
| Laterite | - | - | - | - | - | - | - | - | - | - |
| Saprolite | - | - | - | - | - | - | - | - | - | - |
| Transition | - | 249 | 0.92 | 7 | - | - | - | 249 | 0.92 | 7 |
| Fresh Rock | - | - | - | - | - | - | - | - | - | - |
| Total | 249 | 0.92 | 7 | - | - | - | 249 | 0.92 | 7 | |
| TOTALS | ||||||||||
| Laterite | 23 | 0.71 | 1 | 448 | 0.87 | 12 | 471 | 0.86 | 13 | |
| Saprolite | 1,525 | 1.28 | 63 | 2,342 | 1.23 | 92 | 3,867 | 1.25 | 155 | |
| Transition | 2,435 | 1.08 | 84 | 853 | 0.9 | 25 | 3,288 | 1.03 | 109 | |
| Fresh Rock | 12,598 | 1.46 | 592 | 12,106 | 2.03 | 791 | 24,704 | 1.74 | 1,383 | |
| Total | 16,581 | 1.39 | 740 | 15,749 | 1.82 | 920 | 32,330 | 1.60 | 1,660 | |
| | P a g e | 15-9 |
| 04/11/2021 |
| TECHNICAL REPORT ON THE AURIZONA GOLD MINE EXPANSION PRE-FEASIBILITY STUDY |
| 16 | Mining Methods |
| 16.1 | Introduction |
The Aurizona Mine is currently an operating open pit mine with ore processing by gravity concentration and cyanide leach (CIL) circuit which restarted operations in 2018 after three years on care and maintenance. This PFS considers the addition of an underground mine beneath the existing Piaba pit that will assist in extending the mine life to 2032. The additional open pit areas of Tatajuba and Genipapo have been incorporated in the mine plan.
| 16.2 | Geologic Models |
The geologic models have been described in depth in Section 14 of this report. The original models were generated in Micromine 2021 then exported to Hexagon’s MinePlan for use in the mining software. The resource estimates have been summarized in Section 14 of this report and have an effective date of June 30, 2021.
Only Measured and Indicated resources were used for the PFS preparation. All Inferred resources were considered to be waste.
The models were imported to MineSight with the parameters and file names shown in Table 16-1. All the models were ore percent models.
Table 16-1: MinePlan Model Framework and File Names
| Framework | Piaba | Boa Esperança |
Tatajuba | Genipapo North |
Genipapo South |
Touro |
| File 10 | PA2110.dat | BOA410.dat | TTB210.dat | GN2110.dat | GS2110.dat | TOU10.dat |
| File 15 | pa2021.15 | Boa21.15 | ttb215.dat | Gn2115.dat | Gs21.dat | Tou21.15 |
| X origin | 413,500 | 416,400 | 411,470 | 417,975 | 417,920 | 406,400 |
| Y origin | 9,855,100 | 98,55,917 | 9,855,300 | 9,858,027.5 | 9,857,500 | 9,842,800 |
| Z origin (min) | -716 | -200 | -260 | -198.00 | -196.00 | -500.00 |
| Rotation | 340 | 335 | 0 | 20 | 0 | 300 |
| Blocks - X direction | 5,800 | 1,590 | 1190 | 590 | 370 | 1300 |
| Blocks - Y direction | 3,525 | 1,145 | 775 | 515 | 340 | 850 |
| Blocks - Z direction | 888 | 306 | 372 | 270 | 240 | 600 |
| X block size (m) | 5 | 10 | 10 | 10 | 10 | 10 |
| Y block size (m) | 5 | 5 | 5 | 5 | 5 | 5 |
| Z block size (m) | 3 | 3 | 6 | 6 | 6 | 3 |
| | P a g e | 16-1 |
| 04/11/2021 |
| TECHNICAL REPORT ON THE AURIZONA GOLD MINE EXPANSION PRE-FEASIBILITY STUDY |
The Piaba model has a smaller block size in the Z axis. This was to accommodate the underground mine planning and maintain the same model for both open pit and underground. This avoids complications around the interface where different interpretation in those blocks may lead to errors in the contained metal.
During the importation process, the tonnes, and grades at various cut-offs for each model are compared to the original geologic models to ensure no errors occurred at this first step in the design process. An example of the importation comparison is shown for the Piaba model in Table 16-2. Note these tonnes are for the entire block model and not just within the resource estimate shell.
Table 16-2: Model Importation Comparison - Piaba Detail
| Gold Cutoff | Geology Model (A) | MinePlan (B) | (A-B) Difference (%) | |||||
| Tonnes | Volume | Au (g/t) | Tonnes | Volume | Au (g/t) | Tonnes | Au (g/t) | |
| 1 | 50,744,988 | 18,820,054 | 1.97 | 50,782,900 | 18,834,017 | 1.97 | -0.07% | 0.04% |
| 0.9 | 5,502,356 | 2,052,140 | 0.95 | 5,495,078 | 2,049,741 | 0.95 | 0.13% | 0.07% |
| 0.8 | 5,713,731 | 2,144,124 | 0.85 | 5,709,954 | 2,142,441 | 0.85 | 0.07% | 0.06% |
| 0.7 | 7,228,178 | 2,688,882 | 0.75 | 7,231,937 | 2,690,390 | 0.75 | -0.05% | 0.05% |
| 0.6 | 7,391,977 | 2,751,383 | 0.65 | 7,391,844 | 2,751,413 | 0.65 | 0.00% | 0.06% |
| 0.5 | 8,754,869 | 3,248,827 | 0.55 | 8,764,199 | 3,252,102 | 0.55 | -0.11% | 0.07% |
| 0.4 | 8,556,954 | 3,171,476 | 0.45 | 8,552,031 | 3,169,847 | 0.45 | 0.06% | 0.10% |
| 0 | 18,939,947 | 7,014,103 | 0.26 | 18,874,816 | 6,989,991 | 0.26 | 0.34% | -0.04% |
| Total | 112,833,001 | 41,890,990 | 1.19 | 112,802,760 | 41,879,943 | 1.19 | 0.03% | -0.03% |
The summary of all the importation comparisons is shown in Table 16-3.
Table 16-3: Model Importation Comparisons - All Models Summary
| Block Model | Geology Models (A) | MinePlan (B) | (A-B) Difference (%) | |||
| Tonnes | Au (g/t) | Tonnes | Au (g/t) | Tonnes | Au (g/t) | |
| Piaba | 112,833,001 | 1.19 | 112,802,760 | 1.19 | 0.03% | -0.03% |
| Boa Esperança | 4,913,381 | 0.83 | 4,913,410 | 0.83 | 0.00% | 0.00% |
| Tatajuba | 5,981,934 | 1.34 | 5,981,888 | 1.34 | 0.00% | 0.11% |
| Genipapo South | 1,939,878 | 0.48 | 1,938,495 | 0.48 | 0.07% | 0.15% |
| Genipapo North | 1,120,999 | 0.63 | 1,120,999 | 0.63 | 0.00% | 0.00% |
These models are considered to be imported successfully and sufficient for PFS level design work.
| 16.3 | Geotechnical Information |
| 16.3.1 | Open Pit and Waste Dumps |
Previous Open Pit Geotechnical Studies
Work completed in 2015 and 2017 supported the current mine operations restart, while ongoing studies on the waste dumps have been completed by Knight Piesold to assist the mine operations.
| | P a g e | 16-2 |
| 04/11/2021 |
| TECHNICAL REPORT ON THE AURIZONA GOLD MINE EXPANSION PRE-FEASIBILITY STUDY |
No additional studies by external consultants for the open pit slopes have been completed.
Some additional work regarding hydrogeology was underway during the preparation of the PFS and this information is expected to be utilized in future work.
The reports used for the PFS include:
| • | Pre-feasibility Level Geotechnical Pit Slope Design Report, Aurizona Gold Mine - Piaba Pit, Crux Engineering Group (CEG) dated 25 November 2015 |
| • | Memo - Slope Stability Optimization & Geotechnical Design Aurizona Mine, SRK Consulting (SRK) dated 24 April 2017. |
| • | Aurizona Gold Mine - North Waste Storage Facility Detailed Design Report, Knight Piesold Ltd. (KP) dated 20 November 2020 |
| • | Aurizona Gold Mine - South Waste Storage Facility Detailed Design Report, Knight Piesold Ltd. (KP) dated 10 November 2020 |
| • | Aurizona Gold Mine - South and North Waste Storage Facilities - Operations, Maintenance and Surveillance Manual and Emergency Preparedness and Response Plan, Knight Piesold Ltd. (KP) dated 23 June 2021. |
These reports helped guide the final designs incorporated in the pits and waste dumps.
| 16.3.2 | Piaba, Piaba East |
No recent study work has been completed on the Piaba pit slopes by external consultants since the work completed by SRK Consulting S.A. (Chile) in 2017 prior to the mine recommencing production. The following sector nomenclature was established and remains in use for current design activities. The sectors are shown in Figure 16-1.
| | P a g e | 16-3 |
| 04/11/2021 |
| TECHNICAL REPORT ON THE AURIZONA GOLD MINE EXPANSION PRE-FEASIBILITY STUDY |
Figure 16-1: Piaba and Piaba East Design Sectors

Source: CEG 2015
Each sector is further subdivided into the weathering profiles of laterite, saprolite, transition and fresh rock. The weathering profile is provided by the geology team and updated with current drill information in each model update.
In general, the inter-ramp angles vary from 33 to 60 degrees depending on pit sector and wall orientation. This is due to the presence of foliation parallel to the walls in certain zones.
Within the Piaba pit there are four main joint set orientations:
| • | Joint Set 1 (J1): 89/034 |
| • | Joint Set 2 (J2): 89/328 |
| • | Joint Set 3 (J3): 53/206 |
| • | Joint Set 4 (J4): 02/163 |
In sector HW V, this particular sector has a persistent joint set that requires the bench face angles to be limited to 49 degrees in the saprolite and transition and 80 degrees in the rock to decrease the likelihood of wedge failures from the benches.
This sector is where the pit walls face to the south or southwest with an azimuth greater than about 160 degree. With this orientation, joint sets J2 and J3 form a wedge intersection that dips out of the face. This wedge intersection and its relationship to the orientation of the pit walls dictates the bench face angles.
| | P a g e | 16-4 |
| 04/11/2021 |
| TECHNICAL REPORT ON THE AURIZONA GOLD MINE EXPANSION PRE-FEASIBILITY STUDY |
Another aspect of this sector is that the azimuth of the end wall needs to be almost perpendicular to the orebody strike. This is to further avoid issues with the joint set having the opportunity to create wedges with the intersection of joint set J3.
Spacing between safety benches vary by material type. In the laterite, saprolite and transition the bench height is 6 m, while in the rock they are to be placed each 12 m. Berm widths vary from 3.5 m to 6.0 m depending on the zone. Every 54 m vertically in laterite, saprolite and transition, a 10 m geotechnical berm is required which is larger than the normal of 5.0 m (laterite), 3.5 m (saprolite) and 5.8 m (transition).
A larger catch berm of 20 m is proposed at the -44 level which roughly represents the base of the transition zone. This is expected to be a dewatering zone for the slope due to the higher permeability of the material.
A recent deviation from the early design occurs in the rock zone. The recommendation was for a 9 m wide berm every 18 m vertically. This resulted in a mismatch between the berm elevations for potential cleaning. Mine operations made a change in the rock slope parameters to a 6 m berm every 12 m which is what is used. The face slope angle of 85 degrees (80 degrees in Sector V) is maintained. This allows the inter-ramp angle to remain at 60 degrees while still maintaining a reasonable berm width for effective catchment. It also reduces the required pre-shear drilling height from 18 m to 12 m which operationally will reduce drillhole deviation.
The design pit wall parameters used are shown in 16-2.
| | P a g e | 16-5 |
| 04/11/2021 |
| TECHNICAL REPORT ON THE AURIZONA GOLD MINE EXPANSION PRE-FEASIBILITY STUDY |
Figure 16-2: Piaba Pit Wall Slope Parameters

| | P a g e | 16-6 |
| 04/11/2021 |
| TECHNICAL REPORT ON THE AURIZONA GOLD MINE EXPANSION PRE-FEASIBILITY STUDY |
The geotechnical criteria have been loaded into the geologic model by weathering unit for pit design work. For pit optimization the same criteria are applied but with the ramp allowance for the approximation of overall slopes.
Monitoring of the slopes as they are developed is ongoing with the mine technical team. Within the existing pit, the mine team has observed alluvial channels at the western end which have contained water and caused some localized failures.
A photo of this occurrence is shown in Figure 16-3. The failure is located in the distance in the photo. The mine is currently planning to lay the slope further back to excavate the alluvial material and divert surface water flow away.
In the foreground is typical wall development in laterite and saprolite with localized features causing bench scale instability.
Figure 16-3: Piaba Pit - August 2021 (Looking West)

A further example of current wall slope development in laterite/saprolite is shown in Figure 16-4. The wall is well built with localized runoff features.
| | P a g e | 16-7 |
| 04/11/2021 |
| TECHNICAL REPORT ON THE AURIZONA GOLD MINE EXPANSION PRE-FEASIBILITY STUDY |
Figure 16-4: Piaba East Wall - August 2021 (Looking West)

The mine technical team is monitoring the existing slopes and their performance relative to the existing parameters.
The current instrumentation of the Piaba pit is shown in Figure 16-5.
| | P a g e | 16-8 |
| 04/11/2021 |
| TECHNICAL REPORT ON THE AURIZONA GOLD MINE EXPANSION PRE-FEASIBILITY STUDY |
Figure 16-5: General Instrumentation - Aurizona Mine

Source: Equinox (2021)
| | P a g e | 16-9 |
| 04/11/2021 |
| TECHNICAL REPORT ON THE AURIZONA GOLD MINE EXPANSION PRE-FEASIBILITY STUDY |
Work by the site team continues with the expectation that additional review will be completed by external consultants as the mine progresses.
| 16.3.3 | Boa Esperança |
Criteria used for the Piaba and Piaba East pits in laterite and saprolite are considered to be relevant and are applied in the Boa Esperança pit design. The Boa Esperança pit is only 52 m deep at its maximum depth which is less than the depth of Piaba and Piaba East, both which have shown stability with the design parameters.
| 16.3.4 | Tatajuba, Genipapo North and South |
Geotechnical guidance for the outlying areas of Tatajuba, Genipapo North and South have relied upon the earlier work for Piaba as guidance for the PFS.
The majority of Tatajuba is in lateritic and saprolitic material (61%) which is expected to behave in a manner similar to the Piaba pits. The thickness of the laterite and saprolite material totals a maximum of 46 m. A longitudinal cross section of the Tatajuba final pit is shown in Figure 16-6.
The transition and fresh rock account only for 22% and 17% respectively and are predominantly at the east and west extents of the pit with a maximum combined thickness of 65 m.
The geotechnical design parameters used at Tatajuba are the same as at Piaba.
| | P a g e | 16-10 |
| 04/11/2021 |
| TECHNICAL REPORT ON THE AURIZONA GOLD MINE EXPANSION PRE-FEASIBILITY STUDY |
Figure 16-6: Tatajuba - Longitudinal Cross-section looking South

| | P a g e | 16-11 |
| 04/11/2021 |
| TECHNICAL REPORT ON THE AURIZONA GOLD MINE EXPANSION PRE-FEASIBILITY STUDY |
Previous garimpeiro workings in the laterite and saprolite material are still standing at steeper apparent slopes (Figure 16-7) than the design parameters suggest. Based on this, AGP believes the current Piaba parameters are appropriate for the PFS, but additional site specific study is recommended prior to mining activity commencing.
Figure 16-7: Tatajuba - August 2021 (Looking East)

The Genipapo North pit is 51 m deep, and the South pit is 48 m. Both pits are entirely in laterite and saprolite. The shallow depth is not considered to be a concern using the Piaba FS slope parameters.
| 16.3.5 | Waste Dumps |
North Dump
Extensive review of the North dump design parameters by Knight Piesold occurred after a failure of this dump in July of 2018 on the southern portion of the existing dump. A second failure on the northwest side of the facility also occurred in November 2018.
| | P a g e | 16-12 |
| 04/11/2021 |
| TECHNICAL REPORT ON THE AURIZONA GOLD MINE EXPANSION PRE-FEASIBILITY STUDY |
This review, detailed in their November 20th, 2020 design report, outlined updated parameters for the design and operation of the waste dump facility resulting in a reduction of the dump capacity and a flattening of the slopes. Additional guidance on foundation preparation and surface water control was also provided. Improper initial construction techniques coupled with poorer quality material placement in the foundation combined to generate excess pore pressures. This was determined to be the main cause that triggered the failure events requiring remedial measures and new criteria which were outlined in their memo and implemented immediately in the design process.
Stability analysis of the proposed dump parameters indicate that the configuration is stable and meets the required Factors of Safety under static and seismic (pseudo-static) loading conditions.
These parameters are used in the updated waste dump designs for the PFS.
The original parameters from the FS considered:
| • | Lift Height = 10 m |
| • | Berm Width = 8 m |
| • | Face Slope = 33.5 degrees (1.5H:1V) |
| • | Overall Angle = 24 degrees (2.25H:1V) |
Concurrent reclamation was to occur which would re-slope the waste dump to the overall angle of 24 degrees.
The updated design parameters for the North dump now use:
| • | Lift Height = 10 m |
| • | Berm Width = 6 m |
| • | Face Slope = 21.8 degrees (2.5H:1.0V) |
| • | Overall Angle = 18 degrees (3.1H:1.0V) |
Concurrent reclamation is still considered to be part of the dump management plan.
South Dump
The South dump has gone through several design iterations as the design of the future Vene tailings facility has progressed. As the South dump has two sides that provide support to the tailings facility in the form of a buttress, the evolution of the Vene designs impacts the final configuration of the South dump.
Like the North dump, the South dump parameters have been flattened to provide stability based on poor foundation conditions, although no failures have occurred in the South dump to date. Lessons learned from the North dump have been incorporated into the South dump design. The design parameters for the South dump are the same as the North dump. Those are:
| • | Lift Height = 10 m |
| • | Berm Width = 6 m |
| • | Face Slope = 21.8 degrees (2.5H:1V) |
| • | Overall Angle = 18 degrees (3.1H:1V) |
Resloping where possible is to be used.
| | P a g e | 16-13 |
| 04/11/2021 |
| TECHNICAL REPORT ON THE AURIZONA GOLD MINE EXPANSION PRE-FEASIBILITY STUDY |
Tatajuba and Genipapo Dumps
The dump locations for Tatajuba and Genipapo represent new area developments. AGP anticipates that proper foundation controls will be established in these locations based on the experience of the North and South dumps. With proper foundation controls, use of parameters similar to the FS may be considered to be possible. Sufficient dumping space is available to accommodate any changes in slopes that may be required after detailed site investigations.
For the purposes of the PFS, AGP applied the following parameters for the design of the Tatajuba and Genipapo dumps:
| • | Lift Height = 10 m |
| • | Berm Width = 8 m |
| • | Face Slope = 26.5 degrees (2.0H:1.0V) |
| • | Overall Angle = 19.6 degrees |
The face slope angle is flatter than was proposed for the FS as the quantity of waste rock is expected to be significantly less than what is proposed for the North and South dumps at Piaba.
Additional study is required for all the dump areas to monitor and improve on the existing and proposed criteria.
| 16.3.6 | Underground |
Geotechnical Studies
Geotechnical and Hydrogeological studies for the underground portion of the PFS were provided by Knight Piesold Consulting (KP).
KP provided reports and appendices as follows:
| • | Geotechnical: - “Piaba Deposit- Prefeasibility Study Level Underground Mine Geomechanical Recommendations” dated 15 July 2021. |
| • | Hydrogeology: “Aurizona Gold Mine - Piaba Deposit - Hydrogeology Summary and Underground Inflow Estimate” dated 26 July 2021. |
Introduction
A site investigation program was completed in 2020 to characterize the geomechanical conditions at the deposit in order to provide the basis for pre-feasibility level input to the underground mine design. Drilling was completed between March and September 2020, with geomechanical logging being completed between May and November 2020. The site investigation program activities included:
| • | 52 HQ3 diameter triple tube diamond drillholes with core orientation. Approximately 24.3 km of drilling was completed. |
| • | Detailed geomechanical logging of approximately 9.5 km of core recovered from 50 drillholes. |
| • | Laboratory strength testing of core samples from the drillholes. |
| | P a g e | 16-14 |
| 04/11/2021 |
| TECHNICAL REPORT ON THE AURIZONA GOLD MINE EXPANSION PRE-FEASIBILITY STUDY |
The encountered rock masses were grouped into geomechanical domains. Each domain contains rock masses with similar engineering characteristics that are expected to perform similarly when excavated. Separate domains have been defined for rock mass quality and rock mass structure.
The deposit geometry and the selection of the underground mining method strongly influences the rock mechanics design input required to support the mine design. The underground mining strategy proposed includes:
| • | Mining Extents - Between elevation 140 m below ground surface (mbgs) and 500 mbgs, with a strike length of approximately 2,250 m. |
| • | Mining Method - Longitudinal open stoping retreating to a central access. |
| • | Mining Width - Typically between 3 and 6 m, with a minimum stope width of 2 m and maximum of 15 m. |
| • | Sub-Level Spacing - The sub-level spacing is 23 m, except for the two levels directly below the open pit which have a sub-level spacing of 29.5 m. |
| • | Overall Access - Single ramp access from surface, with a twinned ventilation ramp starting approximately 1 km along the decline. Secondary egress is via the ventilation ramp and raises. |
| • | Development Dimensions - The main ramp is planned to be 5 m wide x 5.5 m high. The overcut and undercuts will be 4.5 m high with a span between 4 m and 6 m, depending on the width of the ore body. |
| • | Backfill - Unconsolidated rockfill is proposed for stopes with a hangingwall (HW) - footwall (FW) thickness less than 8 m. As a result, rib pillars are required between those stopes. Cemented rockfill will be used for wider stopes. |
| • | Sequence - Underground and open pit mining are planned to be completed concurrently. The underground mining will progress in a series of mining zones, working in an overhanded sequence. Sill pillars are proposed between the upper and lower portions of mining zones 5 and 6, to allow the upper part of each zone to be mined first. The sequencing of the open pit and the underground mine were not available at the time of the geotechnical study. |
| • | Interaction with the Open Pit - The underground mine will be located directly below the operating open pit. During the rainy season, water accumulates at the base of the open pit and can have a depth of up to 40 m. This has influenced the design input provided for this study. |
Lithology
The dominant lithological units at the Piaba deposit are:
| • | Diorite (DRT) |
| • | Quartz Diorite (QDT) - host of main gold mineralization |
| • | Feldspar Quartz Diorite (FQD) |
| • | Ultramafics (UMR) - portion of main ramp located in this lithology |
| • | Metasedimentary (MCH, MRC, MGV) - located on footwall and hangingwall |
| • | Andesite (AND) |
| | P a g e | 16-15 |
| 04/11/2021 |
| TECHNICAL REPORT ON THE AURIZONA GOLD MINE EXPANSION PRE-FEASIBILITY STUDY |
Structure
Large Scale
The structural model for the deposit consists of twelve large-scale structures (i.e., shears and faults). The structures are typically steeply dipping and strike NW-SE or N-W, crosscutting the deposit. The structures are typically less than 5 m thick and consist of broken rock with little to no gouge.
The major Pirocaua Fault strikes NW-SE and crosses the eastern end of the ore body. The fault is associated with a 75 m offset in the mineralization as well as a zone of low-grade or barren material up to 350 m along strike. The planned underground mine is located to the west of this fault which is not intersected underground.
Small Scale
The following dominant discontinuity orientations were observed in the core orientation data for all of the lithologies except the UMR.
| • | Joint set (A) strikes NE-SW and is steeply dipping to the NW. |
| • | Joint set (B) strikes approximately E-W and is steeply dipping to the N. This set is oriented approximately parallel to the lithological units and ore body. |
| • | Joint set (D) strikes WNW-ESE and is steeply dipping to the NE. Some of the modeled faults are sub parallel to this orientation. |
| • | A cross-cutting joint set (E) striking N-S to SE-NW and moderately dipping to the W to SW. The majority of the drillholes are oriented sub-parallel to this joint set and the discontinuity orientation data set is biased against it as a result. |
| • | A sub-horizontal joint set (C). |
| • | A Preferred Orientation (PO) was also noted sub-parallel to the cross-cutting faults, striking NW-SE, and dipping steeply to the NE. A PO is a concentration of discontinuities that is notable but not significant enough to be considered a joint set. |
Only Joint Sets D, E and C were observed within the UMR. Joint Sets A and B were not observed.
All of the drillholes were drilled on section and have similar orientations. As a result, they are biased against joint sets striking N-S. Joint Set E may be more prominent than the data currently suggest, particularly in the underground mine area to the west of the Pirocaua Fault.
The coexistence of Joint Sets A, B and D was evaluated. The evaluation indicated that there are some intervals where the sets coexist and some intervals where the sets alternated down the drillhole. As the discontinuity data are limited to three discontinuities per geomechanical logging run, they are not adequate to confidently determine whether the three joint sets coexist or not. The three joint sets are currently assumed to coexist.
Rock Mass Quality
The rock mass quality of each of the encountered rock masses was characterized using the Rock Mass Rating (RMR89; Bieniawski, 1989) and Norwegian Geological Institute Tunneling Quality Index (NGI-Q) rock mass classification systems (Barton et al., 1974). The characterization is based upon the detailed geomechanical logging and field UCS estimates completed during the 2020 site investigation program.
| | P a g e | 16-16 |
| 04/11/2021 |
| TECHNICAL REPORT ON THE AURIZONA GOLD MINE EXPANSION PRE-FEASIBILITY STUDY |
The rock mass quality domains were ultimately defined by the major lithology and weathering groupings, as well as spatial position relative to the mineralization. The design RMR89 values for each domain are based on the 30th and 50th percentile value of the rock mass quality distribution, weighted by length. The anticipated rock mass quality and strength characteristics of each domain are described below:
| • | Saprolite (SAP) - Properties for the saprolite were based on the SRK open pit feasibility study (2017). (Not intersected by the planned underground mine) |
| • | Transition Zone (TRANS) - This domain is characterized by a mixture of Saprolite and stronger rock fragments, referred to as corestones. The domain is characterized as POOR quality, with RMR89 values between 30 and 40. Note that the applicability of the RMR89 system for weak rock is limited. The UCS of the Transition Zone was estimated to be 25 MPa based on the field estimates of UCS. (Not intersected by the planned underground mine) |
| • | Diorite (DRT) - This domain is characterized by an average UCS of 145 MPa and a mi of 10. The domain is classified as GOOD quality rock with a RMR89 design value of 70. The Q’ design values are between 5.5 and 8. |
| • | Metasediments HW - This domain consists of the MRC and MCH lithologies. The HW metasediments are characterized by an average UCS of 70 MPa and a mi of 6. The domain is classified as FAIR quality rock with RMR89 design values between 55 and 60. The Q’ design values are between 2.5 and 4. |
| • | Ultramafics (UMR) - This domain is characterized by an average UCS of 50 MPa and a mi of 7. The Ultramafics are classified as GOOD rock mass quality with RMR89 design values between 65 and 70. The Q’ design values are between 7 and 11.5. |
| • | Mineralized Zone - This domain consists of the QDT and FQT. The mineralized zone is characterized by an average UCS of 110 MPa and a mi of 13. It is classified as GOOD quality rock with RMR89 design values between 65 and 70. The Q’ design values are between 5.5 and 8. |
| • | Metasediments FW - This domain consists of the MRC and MCH lithologies. The FW metasediments are characterized by an average UCS of 70 MPa and a mi of 6. It is classified as FAIR to GOOD quality rock with RMR89 design values between 55 and 65. The Q’ design values are between 3 and 5.5. |
A review of the transition between the transition rock and fresh rock was completed to assess if lower rock mass quality was observed in the fresh rock in close proximity to the transition zone. The data suggest that the rock mass quality transition between the two zones is rapid (often less than 3 m) and that there is a significant increase in quality. A zone of reduced rock mass quality was not observed in the fresh rock below the transition zone.
Mine Design Recommendations
Empirical stability analyses and numerical modelling were completed in order to provide PFS level underground rock mechanics design input for longitudinal open stoping at the Piaba deposit. The analyses were based on the updated PFS underground mine plan received on May 6, 2021.
| | P a g e | 16-17 |
| 04/11/2021 |
| TECHNICAL REPORT ON THE AURIZONA GOLD MINE EXPANSION PRE-FEASIBILITY STUDY |
Underground rock mechanics design recommendations were provided for the following:
| • | Stope Dimensions - Achievable stope dimensions for longitudinal open stoping were evaluated using the empirical Stability Graph Method. The analyses considered the achievable HW-FW spans and strike lengths for different stope configurations. The achievable strike lengths are expected to be between 20 and 30 m for stopes with a HW-FW span less than 8 m depending on stope dip and the installation of long support. Stopes with a HW-FW span from 8 to 15 m are expected to have an achievable strike length of 20 m. |
| • | Stope Dilution - The expected dilution for the recommended stope geometries was estimated using the Equivalent Linear Overbreak/Slough (ELOS) Method and experience at other operations. The ELOS method is best-suited to estimating HW dilution in steeply dipping stopes. However, for the current level of study, it is thought to provide a reasonable approximation of FW dilution. HW dilution is estimated to be approximately 0.5 to 1 m and FW dilution is typically expected to be 0.5 m. |
| • | Crown Pillar - The mine plan incorporates a permanent crown pillar between the Piaba open pit and the proposed underground workings. The stability and required dimensions of the crown pillar were assessed using the Critical Scaled Span method. Due to the climate, two crown pillar cases were evaluated: one during the dry season when the open pit is dry, and one during the rainy season when up to 30 or 40 m of water can be stored in the open pit. Based on the analyses, a 50 m thick crown pillar is recommended. Near the end of mine life it is anticipated that the lower 25 m of the crown pillar can be recovered during the dry season, leaving the remaining 25 m crown pillar in place during the life of the underground mine. The majority of the remaining 25 m crown pillar would be extracted via the open pit mine once underground mining is completed and the mine decommissioned. |
| • | Inter-Lode Pillar Dimensions - The stability of the inter-lode pillars was assessed using experience at other mines. The review expects that the pillars will be largely de-stressed, and the most likely failure mode is ravelling rather than instabilities related to pillar loading. Based on the assessment, a 5 m inter-lode pillar is thought to be appropriate, assuming that the FW vein can excavated before the HW vein and that the pillar will be supported by backfill. |
| • | Rib Pillar Dimensions - The proposed mine plan includes rib pillars to separate laterally adjacent stopes with HW-FW spans of up to 8 m. The expected rib pillar performance was evaluated using numerical, empirical, and kinematic analyses. The results indicate that at least some of the rib pillars may degrade under the imposed loads, however they are expected fulfill their design intent providing that they are confined by fill in a timely way and that reasonable drilling and blasting practices are employed. As such, a rib pillar thickness equal to 67% of the HW-FW span, with a minimum of thickness of 3 m, is thought to be appropriate. |
| • | Sill Pillar Dimensions - The proposed mine plan includes permanent sill pillars in zones 5 and 6 on Level 385. The stability of the sill pillars was evaluated using numerical and empirical analyses. Based on the results of the analyses, a permanent sill pillar thickness of 10 m is expected to be achievable if the span is limited to 8 m. |
| • | Ground Support - Ground support recommendations have been developed for the access development, stopes, and underground workshop. The recommended support systems were based on Canadian mining practice, experience at other operations, and the ability of the ground support to manage wedges. The wedge analyses were based on the expected discontinuity orientations and utilized an in-house static stability program, Unwedge, and empirical design methods for cables. |
| | P a g e | 16-18 |
| 04/11/2021 |
| TECHNICAL REPORT ON THE AURIZONA GOLD MINE EXPANSION PRE-FEASIBILITY STUDY |
| • | Mine Plan Review - The underground mine design and the PFS mine plan were reviewed to provide guidance on mine layout and geometry with respect to rock mechanics considerations. |
| 16.3.7 | Hydrogeology |
Introduction
The majority of groundwater recharge is expected to occur during the wet season (January to July), and particularly during the highest rainfall months of March through May. Recharge to groundwater is expected to be primarily from precipitation with some contribution from natural and anthropogenic surface water bodies in the vicinity of the mine. Tidal estuarine rivers are located within 2 km of the mine.
The mine is situated in a flat coastal area and is locally situated along a topographic high. The regional groundwater flow direction is north and south away from the topographic high although groundwater at the mine locally flows toward the open pit. The depth to groundwater ranges from near surface to approximately 30 mbgs near the open pit. Inflows to the open pit originate as background groundwater flow and from Tailings Storage Facility (TSF) seepage and may also include recharge from other surface water features.
Average dry season groundwater flows into the open pit are currently estimated at 2500 to 4200 m3/d. Flow into the pit is visible at seeps, which are mapped within the saprolite and transition zone. To date seeps have not been linked to mapped structures but have been linked to groundwater originating as infiltration and water from the TSF.
Groundwater flow into the proposed underground mine is anticipated to be focused within fracture zones and faults given the low permeability of the competent bedrock.
The open pit and the underground mine will be separated by a crown pillar approximately 50 m thick. The open pit is anticipated to be dewatered when the underground mine is advanced; however, water may accumulate in the pit bottom during the wet season resulting in up to 40 m of water above the base of the pit. Pumping within the pit is matched to the water removal requirement. Pumping rates in excess of 2,600 m3/h have been required depending on particular rain events. Typically in the wet season pumping from the pit averages 1,500 m3/hr. This average rate can be increased to reduce the water accumulation above the underground mine.
The base of the open pit and proposed underground mine is the lowest point in the hydrogeologic system. A regional groundwater gradient towards the mine may cause saltwater to intrude toward the mine if water level drawdowns associated with the mine extend to the tidal estuaries.
Hydraulic Conductivity
Available hydraulic conductivity data from previous studies is summarized lithology in
Table 16-4.
| | P a g e | 16-19 |
| 04/11/2021 |
| TECHNICAL REPORT ON THE AURIZONA GOLD MINE EXPANSION PRE-FEASIBILITY STUDY |
Table 16-4: Summary of Hydraulic Conductivity Values from Packer Tests and Pumping Tests
| Lithology | Hydraulic Conductivity | Number of Tests |
Approximate Depth Range(mbgs) | ||
| Geometric Mean (m/s) |
Minimum (m/s) |
Maximum (m/s) | |||
| Laterite/Saprolite | 2x10⁻⁶ | 1x10⁻⁶ | 4x10⁻⁶ | 4 | 7 to 20 |
| Transition | 4x10⁻⁶ | 8x10⁻⁷ | 4x10⁻⁵ | 6 | 70 to 110 |
| Competent Bedrock | 4x10⁻⁸ | 1x10⁻⁸ | 8x10⁻⁷ | 11 | 90 to 270 |
| Fracture Zone | NA | 5x10⁻⁸ | 4x10⁻⁵ | 4 | 75 to 135 |
Occasional reports of artesian conditions and/or excessive water encountered in drillholes during drilling suggest structures may act as hydraulic features.
Seep surveys in the existing open pit were conducted at the beginning of the dry season in August 2019 and at the end of the dry season in October 2020. Sampling for water quality analysis was also conducted in February 2021.
Conceptual Underground Hydrogeological Model
A conceptual hydrogeological model for the underground mine was developed to help describe the behaviour of groundwater flow.
A hydrostratigraphic unit (HSU) is a simplified representation of the geology, organized by hydraulic properties to identify geologic units that influence groundwater flow. The primary HSUs expected to control groundwater flow to the underground mine include:
| • | Laterite/Saprolite - The overburden horizon averages approximately 50 m thick, except along the east wall of the Piaba deposit where it extends up to a depth of 200 m. The unit is characterized as silty clay. The water table is typically located in the Saprolite. |
| • | Transition Zone - The weathered rock transitions from a soil to bedrock texture across a thickness of approximately 26 to 30 m. The unit has a higher hydraulic conductivity than the overlying and underlying layers and is expected to act as a horizontal drainage layer. |
| • | Competent Bedrock - Bedrock is expected to have a lower permeability than the overlying weathered horizons and to decrease in value with depth. Groundwater flow through the bedrock is expected primarily within joint sets and fracture zones. |
| • | Faults/Shears - Younger shears cross-cut the Aurizona Shear Zone and may be features with higher hydraulic conductivity. Twelve cross-cutting faults are mapped in the structural model and seven are expected to intersect the stopes. |
A metasediments HSU present in the footwall at site has not been distinguished from the competent bedrock HSU but has potential to influence hydrogeology at the site if exposed by or hydraulically connected to the underground mine. The metasediments HSU present in the footwall consists of carbonaceous metachert that is very foliated and weaker than the surrounding bedrock. The metasediments are typically up to 10 m thick, and the unit is oriented parallel to the ore body. The coal-graphite type material is typically about 50% broken rock with some intact core intervals and has been noted to be weathering fast where exposed at surface. It may have a higher permeability than the competent bedrock HSU. The metasediments are generally mapped to be more than 20 m away from the proposed stopes although there are a few areas the where the unit encroaches within 10 m of a stope.
| | P a g e | 16-20 |
| 04/11/2021 |
| TECHNICAL REPORT ON THE AURIZONA GOLD MINE EXPANSION PRE-FEASIBILITY STUDY |
Another metasediment HSU is also present in the hanging wall. This metasediments HSU consists of carbonaceous metaritmites with coal-graphite type material that has been noted to have water entering into it. This metasediments unit is expected to have similar hydrogeological properties as the competent bedrock unit.
| 16.3.8 | Water Quality |
Salinity
Groundwater quality information in the vicinity of the open pit was reviewed to assess the potential that water pumped from the underground mine may be saline and could require treatment prior to discharge. The open pit and proposed underground mine will act as a regional groundwater sink that may cause intrusion of saltwater from the ocean toward the mine.
Water quality data available during the study was limited to information collected during seep surveys in 2019, 2020, and 2021 and consisted of measurements of field parameters (salinity in 2019; temperature, electrical conductivity (EC), and oxidation-reduction [redox] potential in 2020), isotope sampling in 2020, and water quality sampling in 2021.
The review of the available data suggests that brackish water (defined by a total dissolved solids [TDS] greater than 1000 ppm) is present in the deposit area.
Acidity
Components of the underground mine that intersect the ore zone have the highest likelihood to encounter potentially acid generating (PAG) rock. The potential for PAG rock is expected to decrease with increasing distance from the ore body where the sulphide content within the rock is expected to be lower. Water entering the underground mine is expected to interact with the ore body which may result in the water having an ARD signature.
Neutral pH metal leaching (ML), such as arsenic, was identified as potentially occurring within the waste rock. Arsenic can be mobile at a neutral pH, so the water quality from the underground workings may be susceptible to higher arsenic concentrations, regardless of ARD potential, and will need monitoring during development.
| 16.3.9 | Inflow Estimates - Underground |
An estimate of groundwater inflows was completed using the available data and the hydrogeological conceptual model presented above. A base case groundwater inflow estimate is provided along with lower and upper bound estimates to account for the range of uncertainty.
Groundwater inflow to the mine was approximated by separating the potential inflow into three components:
| 1. | Horizontal inflow into the underground mine from the bulk bedrock |
| 2. | Inflow via potential permeable faults |
| 3. | Vertical inflow through the crown pillar from a seasonal pit lake |
| | P a g e | 16-21 |
| 04/11/2021 |
| TECHNICAL REPORT ON THE AURIZONA GOLD MINE EXPANSION PRE-FEASIBILITY STUDY |
The estimated average annual inflow is provided per 100 m length of underground development since the underground mining schedule was not available to allow calculation of total estimated inflows as mine development progresses. The full height of underground workings was assumed to be open along the 100 m length of mine development in the calculation.
| • | Estimated inflows contributed from the bulk bedrock per 100 m of length of open underground mine are on the order of 0.4 L/s to shallower stopes extending to -275 masl and 0.2 L/s to deeper stopes extending to -400 masl. Upper and lower bounds of the inflows from the bulk bedrock are estimated to range from less than 0.1 to 1 L/s per 100 m for the full height of the underground workings for both shallower and deeper stopes. |
| • | Inflows during the wet season when up to 40 m of water could be stored in the open pit could reasonably increase by 5 L/s per 100 m of length of the pit lake in addition to the flows contributed by the bulk bedrock. These inflows could be an order of magnitude higher if a broken bedrock zone is present in the crown pillar. Inflows would increase if conduits for water flow extend through the base of the open pit into the underground, such as permeable geologic structures or open boreholes. The inflow estimate does not account for the presence of permeable conduits and assumes these will be grouted or managed. |
| • | Inflows contributed by the intersection of a permeable geologic structure (fault) could contribute an additional 5 to 20 L/s per fault. Significant faults could contribute flows on the order of 30 L/s per fault. It is plausible that the mine could intersect several faults that are water bearing. Work has not been conducted to date to identify specific faults that could be conduits for flow to the underground mine. |
The inflow estimate assumes that the broken and potentially more permeable metasediments unit located in the footwall will not be intersected or hydraulically connected to the underground mine. If the underground mine encroaches on the metasediments unit, the inflows to the mine could be higher than estimated. Care should be taken to maintain distance from the unit and to assess any potential hydraulic connection with it.
Identifying water-bearing features (i.e., potential faults) in advance of mining and implementing mitigation measures can help manage water inflows. These mitigation measures can include depressurization drillholes or pilot dewatering wells to allow the features to be drained or pressure grouting to seal the features off from a source of recharge. Sealing high yielding fractures during mine development may be warranted to reduce inflows given the shallow depth to water and proximity to water bodies that could provide a constant source of water to the mine. Where grouting is used, it is preferable to complete it in advance of mining to allow the grout to set before mining reaches the area.
| 16.4 | Open Pit Economic Pit Shell Development |
The final pit designs are based on pit shells using the Lerch-Grossman algorithm in MinePlan. The parameters for the pit shells are shown in Table 16-5. The parameters were developed in conjunction with the Equinox Technical Services teams using current mine and process plant data and costs to provide the most up to date analysis. Only Measured and Indicated blocks were used in the pit shell generation for pit design purposes.
| | P a g e | 16-22 |
| 04/11/2021 |
| TECHNICAL REPORT ON THE AURIZONA GOLD MINE EXPANSION PRE-FEASIBILITY STUDY |
The geotechnical parameters discussed in Section 16.3 were applied with some modification. The information provided by the geotechnical consultants defined inter-ramp angles. For the pit optimization, the number of haulroads or extra width berms is estimated which lowers the overall angle of the pit. The Piaba pit design is complex with its numerous sectors and material types. The wall angles used by material type and zone are shown in Table 16-6. These same assumptions are used for Tatajuba and Genipapo. In certain instances only a single lane road is included in the slope based on AGP’s understanding of the deposit and the possible depth of the pit in those locations.
The pit shells were run at various revenue factors (RF) with the gold price of $1,350 /oz being RF=1.0. The lower prices for gold were used to determine phasing.
For Piaba only, a crest offset of 80 m was applied from the toe of the TSF. Previous geotechnical work indicated that 80 m provides sufficient offset for long-term slope stability. A buffer zone around the existing process plant was included as well as an offset from Piracaua Lake.
The resulting pit shells for Piaba and Piaba East are shown in Figure 16-8. The net profit shown does not consider capital or taxes.
At a gold price of $1,148/oz (RF=0.85), a flattening of the net profit curve is noted. The RF=0.85 pit recovers 98% of the RF=1 pit value but only needs to move 81% of the RF=1 pit waste. This was a savings of approximately 23 Mt tonnes in waste storage requirements. As shown by the net profit curve, the value of mining a larger pit is diminished. The Piaba East pit also used the RF=0.85 pit shell.
It should be noted that the TSF offset restricts the depth of the Piaba pit. Without this constraint, the Net Profit vs Tonnes curve shown in Figure 16-8 would be different, but the offset is a practical constraint that is adhered to for the pit design work.
For Boa Esperança, the design shape was based on the $1,080/oz gold price or RF=0.80. The primary reason to mine Boa Esperança is for the freshwater storage capacity estimated to be 600,000 m3 for plant operations. The current pit design can hold 900,000 m3 with sufficient freeboard. The next larger pits required a significant jump in waste material for limited additional ore. The pit shell chosen provided 91% of the RF=1 pit but only moved 27% of the waste material. The revenue generated by the pit makes this infrastructure item a profit center for the mine. The Boa Esperança net profit curve is shown in Figure 16-9.
The Tatajuba pit shells are shown in Figure 16-10. A RF=0.90 pit or $1,215 /oz gold price was used for design purposes. Similarly to Piaba, this equated to recovering 98% of the RF=1 pit value while only moving 75% of the waste material. A lower value RF=0.65 pit shell, ($878 /oz gold) was used for the internal phase design which was at a point in the curve where the waste tonnage was starting to increase significantly.
It was noted there was a significant increase in waste for the Tatajuba pits after the selected ultimate pit shell. In the model, the grade appeared to increase at depth. This indicates a strong possibility for an underground target beneath the pit that should be explored.
| | P a g e | 16-23 |
| 04/11/2021 |
| TECHNICAL REPORT ON THE AURIZONA GOLD MINE EXPANSION PRE-FEASIBILITY STUDY |
Genipapo North used a RF=0.95 or $1,283 /oz gold price while Genipapo South used a RF=0.90 or $1,215 /oz gold price as shown in Figure 16-11 and Figure 16-12. These were selected based on resource extraction potential and logical design of the pit.
The selected pit shells from each mining area were used in the design of the detailed pits.
| | P a g e | 16-24 |
| 04/11/2021 |
| TECHNICAL REPORT ON THE AURIZONA GOLD MINE EXPANSION PRE-FEASIBILITY STUDY |
Table 16-5: Open Pit Optimization Parameters
| Parameter | Units | Piaba Piaba East |
Boa Esperança |
Tatajuba |
Genipapo |
| Metal Price | |||||
| Gold Price | $/oz | 1,350 | 1,350 | 1,350 | 1,350 |
| Payable | % | 99.9 | 99.9 | 99.9 | 99.9 |
| Refining/Transportation | $/oz | 23.12 | 23.12 | 23.12 | 23.12 |
| Royalty | % | 4.0 | 4.0 | 4.0 | 4.0 |
| Geotechnical (Overall Slope Range dependent by Sector) | |||||
| Laterite | degrees | 33 | 33 | 33 | 33 |
| Saprolite | degrees | 29-37 | 39 | 38-44 | 35-39 |
| Transition | degrees | 25-39 | 32 | 21-39 | 28 |
| Fresh Rock | degrees | 33-59 | 47 | 47-59 | 47-59 |
| Process Recovery | |||||
| Laterite/Saprolite | % | 93.1 | 91.8 | 91.4 | 91.4 |
| Hard SAP/Transition | % | 94.1 | 97.1 | 91.4 | 91.4 |
| Fresh Rock | % | 90.0 | 90.0 | 91.4 | 91.4 |
| Costs | |||||
| Waste Mining | |||||
| Laterite/Saprolite - Base Cost | $/t moved | 1.90 | 1.90 | 1.91 | 1.91 |
| Laterite/Saprolite - Incremental Cost | $/t/6 m bench | 0.008 | 0.008 | 0.005 | 0.005 |
| Transition - Base Cost | $/t moved | 2.40 | 2.40 | 2.27 | 2.27 |
| Transition - Incremental Cost | $/t/6 m bench | 0.007 | 0.007 | 0.004 | 0.004 |
| Fresh Rock - Base Cost | $/t moved | 2.52 | 2.52 | 3.49 | 3.49 |
| Fresh Rock - Incremental Cost | $/t/6 m bench | 0.007 | 0.007 | 0.003 | 0.003 |
| Ore Mining | |||||
| Laterite/Saprolite - Base Cost | $/t moved | 2.32 | 2.32 | 2.53 | 2.53 |
| Laterite/Saprolite - Ore Haul to Plant | $/t moved | - | - | 2.00 | - |
| Laterite/Saprolite - Total Base | $/t moved | 2.32 | 2.32 | 4.53 | 2.53 |
| Laterite/Saprolite - Incremental Cost | $/t/6 m bench | 0.013 | 0.013 | 0.003 | 0.003 |
| Transition - Base Cost | $/t moved | 3.18 | 3.18 | 3.06 | 3.06 |
| Transition - Ore Haul to Plant | $/t moved | - | - | 2.00 | - |
| Transition - Total Base | $/t moved | 3.18 | 3.18 | 5.06 | 3.06 |
| Transition - Incremental Cost | $/t/6 m bench | 0.012 | 0.012 | 0.003 | 0.003 |
| Fresh Rock - Base Cost | $/t moved | 3.55 | 3.55 | 3.49 | 3.49 |
| Fresh Rock - Ore Haul to Plant | $/t moved | - | - | 2.00 | - |
| Fresh Rock - Total Base | $/t moved | 3.55 | 3.55 | 5.49 | 3.49 |
| Fresh Rock - Incremental Cost | $/t/6 m bench | 0.012 |
0.012 | 0.003 | 0.003 |
| | P a g e | 16-25 |
| 04/11/2021 |
| TECHNICAL REPORT ON THE AURIZONA GOLD MINE EXPANSION PRE-FEASIBILITY STUDY |
| Processing | |||||
| Laterite/Saprolite | $/t ore | 7.57 | 7.57 | 7.57 | 7.57 |
| Hard SAP/Transition | $/t ore | 7.75 | 7.75 | 7.75 | 7.75 |
| Fresh Rock | $/t ore | 9.34 | 9.34 | 9.34 | 9.34 |
| General and Administrative | $/t ore | 4.89 | 4.89 | 4.89 | 4.89 |
| | P a g e | 16-26 |
| 04/11/2021 |
| TECHNICAL REPORT ON THE AURIZONA GOLD MINE EXPANSION PRE-FEASIBILITY STUDY |
Table 16-6: Pit Optimization Pit Slopes - Piaba
| Zone | Material
Type |
Inter- Ramp Angle (deg) |
Bench Face Angle (deg) | Bench Height (m) | Stacked
Height (m) |
Bench
Width (m) |
Number
of Haul Roads |
Haul Road Width (m) |
Geotech Berms |
Geotech Berm Width (m) |
Slope Height (m) |
Overall Angle (deg) |
| HW I | Laterite | 33 | 55 | 6 | 6 | 5.0 | 20 | 33 | ||||
| Saprolite | 45 | 67 | 6 | 6 | 3.5 | 1 | 25.6 | 2 | 15 | 80 | 30 | |
| Transition | 39 | 75 | 6 | 6 | 5.8 | 1 | 10 | 20 | 29 | |||
| Fresh Rock | 60 | 85 | 6 | 12 | 6.0 | 1 | 10 | 20 | 42 | |||
| HW II | Laterite | 33 | 55 | 6 | 6 | 5.0 | 20 | 33 | ||||
| Saprolite | 45 | 67 | 6 | 6 | 3.5 | 2 | 25.6 | 2 | 15 | 90 | 29 | |
| Transition | 39 | 75 | 6 | 6 | 5.8 | 1 | 10 | 20 | 29 | |||
| Fresh Rock | 60 | 85 | 6 | 12 | 6.0 | 1 | 10 | 40 | 50 | |||
| HW III | Laterite | 33 | 55 | 6 | 6 | 5.0 | 20 | 33 | ||||
| Saprolite | 45 | 67 | 6 | 6 | 3.5 | 1 | 25.6 | 2 | 15 | 80 | 30 | |
| Transition | 39 | 75 | 6 | 6 | 5.8 | 1 | 25.6 | 30 | 25 | |||
| Fresh Rock | 60 | 85 | 6 | 12 | 6.0 | 1 | 25.6 | 1 | 10 | 120 | 48 | |
| HW IV | Laterite | 33 | 55 | 6 | 6 | 5.0 | 30 | 33 | ||||
| Saprolite | 45 | 67 | 6 | 6 | 3.5 | 1 | 10 | 30 | 36 | |||
| Transition | 39 | 75 | 6 | 6 | 5.8 | 1 | 20 | 30 | 27 | |||
| Fresh Rock | 60 | 85 | 6 | 12 | 6.0 | 1 | 10 | 100 | 55 | |||
| HW V | Laterite | 33 | 55 | 6 | 6 | 5.0 | 30 | 33 | ||||
| Saprolite | 35 | 49 | 6 | 6 | 3.5 | 1 | 10 | 120 | 33.1 | |||
| Transition | 35 | 49 | 6 | 6 | 3.5 | 1 | 10 | 40 | 30 | |||
| Fresh Rock | 56 | 80 | 6 | 12 | 6.0 | 1 | 10 | 40 | 47 | |||
| HW VI | Laterite | 33 | 55 | 6 | 6 | 5.0 | 20 | 33 | ||||
| Saprolite | 45 | 67 | 6 | 6 | 3.5 | 120 | 44 | |||||
| Transition | 39 | 75 | 6 | 6 | 5.8 | 20 | 39 | |||||
| Fresh Rock | 60 | 85 | 6 | 12 | 6.0 | 1 | 18.9 | 20 | 33 | |||
| FW I | Laterite | 33 | 55 | 6 | 6 | 5.0 | 30 | 33 | ||||
| Saprolite | 45 | 67 | 6 | 6 | 3.5 | 1 | 18.9 | 1 | 20 | 80 | 34 | |
| Transition | 39 | 75 | 6 | 6 | 5.8 | 1 | 10 | 30 | 33 | |||
| Fresh Rock | 60 | 85 | 6 | 12 | 6.0 | 1 | 10 | 20 | 43 | |||
| FW II | Laterite | 33 | 55 | 6 | 6 | 5.0 | 30 | 33 | ||||
| Saprolite | 45 | 67 | 6 | 6 | 3.5 | 1 | 20 | 90 | 39 | |||
| Transition | 39 | 75 | 6 | 6 | 5.8 | 1 | 10 | 30 | 32 | |||
| Fresh Rock | 60 | 85 | 6 | 12 | 6.0 | 1 | 10 | 60 | 52 | |||
| FW III | Laterite | 33 | 55 | 6 | 6 | 5.0 | 30 | 33 | ||||
| Saprolite | 45 | 67 | 6 | 6 | 3.5 | 1 | 10 | 20 | 33 | |||
| Transition | 39 | 75 | 6 | 6 | 5.8 | 1 | 20 | 40 | 29 | |||
| Fresh Rock | 60 | 85 | 6 | 12 | 6.0 | 1 | 10 | 100 | 55 | |||
| FW IV | Laterite | 33 | 55 | 6 | 6 | 5.0 | 20 | 33 | ||||
| Saprolite | 45 | 67 | 6 | 6 | 3.5 | 2 | 18.9 | 120 | 37 | |||
| Transition | 39 | 75 | 6 | 6 | 5.8 | 20 | 39 | |||||
| Fresh Rock | 60 | 85 | 6 | 12 | 6.0 | 20 | 59 |
| | P a g e | 16-27 |
| 04/11/2021 |
| TECHNICAL REPORT ON THE AURIZONA GOLD MINE EXPANSION PRE-FEASIBILITY STUDY |
Figure 16-8: Piaba Pit Optimization Shells - Net Profit vs Tonnes

| | P a g e | 16-28 |
| 04/11/2021 |
| TECHNICAL REPORT ON THE AURIZONA GOLD MINE EXPANSION PRE-FEASIBILITY STUDY |
Figure 16-9: Boa Esperança Pit Optimization Shells - Net Profit vs Tonnes

| | P a g e | 16-29 |
| 04/11/2021 |
| TECHNICAL REPORT ON THE AURIZONA GOLD MINE EXPANSION PRE-FEASIBILITY STUDY |
Figure 16-10: Tatajuba Pit Optimization Shells - Net Profit vs Tonnes

| | P a g e | 16-30 |
| 04/11/2021 |
| TECHNICAL REPORT ON THE AURIZONA GOLD MINE EXPANSION PRE-FEASIBILITY STUDY |
Figure 16-11: Genipapo North Pit Optimization Shells - Net Profit vs Tonnes

| | P a g e | 16-31 |
| 04/11/2021 |
| TECHNICAL REPORT ON THE AURIZONA GOLD MINE EXPANSION PRE-FEASIBILITY STUDY |
Figure 16-12: Genipapo South Pit Optimization Shells - Net Profit vs Tonnes

| | P a g e | 16-32 |
| 04/11/2021 |
| TECHNICAL REPORT ON THE AURIZONA GOLD MINE EXPANSION PRE-FEASIBILITY STUDY |
| 16.5 | Open Pit Design |
The detailed pit phase designs are based on the selected pit optimization shells for each area as described in Section 16.4. Dilution calculations were completed prior to the design work to properly assess each phase when detailing the slopes.
| 16.5.1 | Open Pit Cut-off Grade |
The marginal cut-off was used for the statement of reserves for the Aurizona Mine pit areas. Using the updated cost estimates and metal pricing for 2021 the gold cut-offs calculated are shown by material type and area in Table 16-7.
Table 16-7: Aurizona Mine Open Pit Cut-off Grades - Gold Grade (g/t)
| Pit Area | Laterite/Saprolite (g/t) | Transition (g/t) | Fresh Rock (g/t) |
| Piaba, Piaba East, Crown Pillar | 0.35 | 0.35 | 0.41 |
| Boa Esperança | 0.36 | 0.36 | 0.41 |
| Tatajuba | 0.43 | 0.43 | 0.47 |
| Genipapo - North and South | 0.36 | 0.36 | 0.40 |
| 16.5.2 | Open Pit Dilution Calculation |
The resource models used are all ore percent models. No grades were estimated outside of the low-grade wireframe.
In each block model, the percentage of dilution is calculated for each contact side using the same assumed 0.5 m contact dilution distance. If one side of the 5 m block is touching waste, then it is estimated that dilution of 10.0% would result. If two sides are contacting, it would rise to 20.0%. Three sides would be 30.0%, and four sides 40.0%. Four sides represent an isolated block of ore.
The ore block was determined based on the marginal cut-off grades.
MinePlan enables the user to query surrounding blocks against a set of conditions. For the dilution percentage calculation, the procedure was run to determine how many waste blocks contacted an ore block, which determined the dilution percentage to apply. This dilution percentage was stored in the block.
The dilution percentage was added to the existing ore percent item and stored in a new diluted ore percent item used in reporting mined tonnages. The gold grade was stored as a diluted gold item for reporting of grades.
The pit tonnages were then reported with these diluted items for use in mine scheduling. The results of the dilution calculation on all the models by area is shown in Table 16-8.
| | P a g e | 16-33 |
| 04/11/2021 |
| TECHNICAL REPORT ON THE AURIZONA GOLD MINE EXPANSION PRE-FEASIBILITY STUDY |
Table 16-8: Dilution Percentage by Pit Area
| Piaba | Piaba East | Boa Esperança |
Tatajuba | Genipapo North |
Genipapo South | |
| Insitu Ore (t) | 18,548,000 | 1,417,000 | 812,000 | 1,785,000 | 374,000 | 217,000 |
| Insitu Grade (g/t) | 1.38 | 1.46 | 0.86 | 1.52 | 0.82 | 1.03 |
| Diluted Ore (t) | 19,630,000 | 1,524,000 | 882,000 | 1,975,000 | 397,000 | 255,000 |
| Diluted Grade (g/t) | 1.31 | 1.36 | 0.80 | 1.39 | 0.78 | 0.89 |
| Ore Difference (%) | 5.8 | 7.6 | 8.6 | 10.6 | 6.2 | 17.4 |
| Grade Difference (%) | -5.1 | -6.8 | -7.3 | -9.0 | -4.9 | -13.5 |
Tonnes and grade for the open pit designs and reserves are reported with the diluted tonnes and grade and assume a 100% recovery of material.
| 16.5.3 | Open Pit Design |
The detailed pit phase designs at Aurizona Mine are based on the wall slope parameters inter-ramp angles by zone and material type.
Equipment sizing for ramps and working benches is based on the use of 91 t rigid frame trucks currently in use by the mining contractor. The ramp width is designed for a truck with an operating width of 6.7 m. This means that single lane access is 18.9 m (2x operating width plus berm and ditch), and double lane widths are 25.6 m (3x operating width plus berm and ditch). Ramp uphill gradients are 10% in the pit and 8% uphill on the dump access roads. Working benches were designed for 35 m to 40 m minimum on pushbacks, although some push-backs do work in a retreat manner to facilitate access and minimize waste stripping.
Piaba
The Piaba pit is the primary active pit. Work completed in the January 2020 Technical Report for Aurizona had outlined a potential underground mine with suggested locations of potential underground infrastructure within the open pit. This included the main portal and ventilation drift. Because of the thickness of laterite and saprolite present, it would be difficult and expensive to bring a traditional ventilation raise to surface on the pit perimeter. The portal was located in the pit bottom at the western end of the Piaba pit. This location was chosen because the rock contact was closest to the surface in this area and once mined was out of the way pit activity to the east including blasting. All these aspects needed to be incorporated in final design.
An additional pit design item is the squared wall in the east end. This design aspect is difficult to model in the pit optimization routine, so it results in some additional waste material needing to be mined in the final design.
To integrate with the planned underground design, the design of the pit bottom has been made flat where possible. Typical open pit designs consider “diving” for the remnants in the floor of the pit to maximize extraction. This creates an undulating surface that is difficult for the underground mine to follow from both a production and safety (breaching) perspective. With the high annual rainfall, significant water is contained in the pit bottom during the wet season until it can be pumped clear of the pit.
| | P a g e | 16-34 |
| 04/11/2021 |
| TECHNICAL REPORT ON THE AURIZONA GOLD MINE EXPANSION PRE-FEASIBILITY STUDY |
With additional exploration drilling, both from the surface and while the underground mine is in operation, it is anticipated that the underground mine life will be extended beyond the current plan outlined in this PFS, likely going deeper. A connection between the open pit bottom and underground prior to the underground mine being completed is not desirable.
A review of emergency egress in the preliminary design of the underground resulted in a ventilation shaft along the north wall of the pit, where modelling indicates rock is closer to the surface. This location required some additional waste be moved in the open pit design to allow this underground infrastructure to not impact open pit operations and allow sufficient working space for the underground team. Together with the ventilation raise, a utilidor was also located in this spot which provided the emergency egress in the event the portal entrance was unusable. This utilidor is a raise that contains the utility lines to the underground mine including the mine electrical cabling.
Various iterations of the Piaba ultimate pit design were generated to fine tune wall slopes, underground infrastructure locations, east end wall orientation and in particular the south wall adjacent to the tailings storage facility.
With the ultimate pit determined, phase design then involved a review of the incremental pit shells generated by the pit optimization. Due to the nature of the deposit, several target areas occur at the bottom of the incremental pit shells. Trying to dive into each with a ramp system results in them becoming connected due to the flatter slopes that would result.
Ideally the pit phases would be mined in concentric rings around the ore body but maintaining access in this configuration with a long narrow pit makes the working faces too narrow when the ramp width is considered. Earlier reviews examined various approaches, and the concept of working from west to east and expanding downward and outward was used. This also allowed the pit to advance quickly in one area for mining in the dry season and that area becomes the pit water sump during the wet season.
The same phase naming nomenclature used by mine operations is maintained in this PFS. Phase 4 is currently active in the pit with Phase 5 in pre-stripping. The new designs look at tweaking those phases with the new model information and underground infrastructure needs.
In reviewing the incremental shells, the RF=0.55 pit was used to determine areas with higher value. This pit shell includes 63% of the ultimate pit revenue but only 19% of the waste. This is shown in Figure 16-13 with the high-grade areas labelled as A through F. The upper portion of the figure is a cross section looking northwest with the ultimate pit design with the RF=0.55 shell within it. The bottom portion of the figure are those same shapes in plan view on the current topography.
| | P a g e | 16-35 |
| 04/11/2021 |
| TECHNICAL REPORT ON THE AURIZONA GOLD MINE EXPANSION PRE-FEASIBILITY STUDY |
Figure 16-13: Piaba Pit Phase Analysis

The tonnes and grade within the smaller areas in the pit shell were determined and a value attributed to them using the design criteria gold price, operating costs, and recoveries. The results of that evaluation are shown in Table 16-9. Area F is discussed later.
Table 16-9: Piaba Pit Phase Design - Pit Shell Ranking
| Phase Area |
Ore (kt) |
Gold Grade (g/t) |
Waste (Kt) |
Total (Kt) |
Strip Ratio |
Value (M$) |
Value ($/t ore) |
| A | 152 | 1.73 | 283 | 435 | 1.86 | 6.3 | 41.38 |
| B | 1,813 | 1.70 | 4,960 | 6,773 | 2.74 | 69.1 | 38.11 |
| C | 3,860 | 1.45 | 9,776 | 13,636 | 2.53 | 113.4 | 29.37 |
| D | 1,646 | 1.41 | 2,064 | 3,710 | 1.25 | 51.1 | 31.06 |
| E | 733 | 1.79 | 3,930 | 4,663 | 5.36 | 25.6 | 34.92 |
This analysis indicated was the western end of the pit (A) contained small tonnages of higher grade material. The far eastern end of the pit (E) contained higher grade, but on a value per tonne ore basis areas (A) and (B) were more significant. The advantage of the center area, (C), is the quantity of ore present relative to the other areas.
Mine Operations has been targeting ore in area C with the access ramps established. It made sense to continue with this direction in the phase design. That would be followed with the sections A and B followed by D and E. This sequence mirrored previous work and appeared justified with the new resource model. A rough outline of the sequence is shown in Figure 16-14.
| | P a g e | 16-36 |
| 04/11/2021 |
| TECHNICAL REPORT ON THE AURIZONA GOLD MINE EXPANSION PRE-FEASIBILITY STUDY |
The concern with this concept is that mining all of the western end (Phase 5) to the ultimate limit brings in more waste material, diluting the value per tonne of ore. But this decision was also made to provide early access to a preferred portal location for going underground because of the lower depth to fresh rock.
Figure 16-14: Piaba Pit Phase Conceptualization

It should be noted that Phase 6 mines beneath Phase 4 in the concept. But Phase 5 is mined to the ultimate pit. This was decided for two reasons: access and water storage. Having Phase 5 as the deepest area later in the mine sequence allows this to be the pit water sump.
The phase designs were then organized in the manner shown in Figure 16-15.
| | P a g e | 16-37 |
| 04/11/2021 |
| TECHNICAL REPORT ON THE AURIZONA GOLD MINE EXPANSION PRE-FEASIBILITY STUDY |
Figure 16-15: Piaba Pit Phases

The Phase 4 design maintains the ore haulroad along the south wall for shorter haulage to the primary crusher. Phase 4 is shown in Figure 16-16.
Figure 16-16: Phase 4 Design

While the ultimate pit is shown for Phase 4, a smaller sub-phase was designed for mine operations to bring forward higher grade material earlier in the schedule. It also provides a sump for water for the wet season of 2022.
The ultimate Phase 5 design is shown in Figure 16-17.
| | P a g e | 16-38 |
| 04/11/2021 |
| TECHNICAL REPORT ON THE AURIZONA GOLD MINE EXPANSION PRE-FEASIBILITY STUDY |
Figure 16-17: Phase 5 Design

Phase 5 maintains the bridge across the pit to access the south wall haulroad. This creates a large sump on the western side of this bridge to help store water for pumping during the wet season. There is also a shorter access road along the south wall to help with waste haulage to the south dump. This is used in the mining of Phase 5 and also can be used by other phases until the bridge of material is removed.
The location of the underground vent raise and utilidor is part of the Phase 5 design on the north end. This area is also the location of the main haulroad crossing. As the pit deepens and advances to the east, this intersection helps direct waste to either the South dump or the North Dump. Ore also is directed to the east out of the pit.
Phase 5, like Phase 4, has been divided up into sub-phases to help advance higher grade material and also due to surface infrastructure restrictions. The location of the various Phase 5 sub-phases are shown in Figure 16-18.
The phase is sequenced to advance 5A and 5B over 5C until such time as the current municipal road is relocated. This is planned for later in 2021 before the wet season. Mining of 5C during the wet season provides a short haul waste mining location with material destined for the South Dump and also prepares the area for the underground portal construction.
| | P a g e | 16-39 |
| 04/11/2021 |
| TECHNICAL REPORT ON THE AURIZONA GOLD MINE EXPANSION PRE-FEASIBILITY STUDY |
Figure 16-18: Phase 5 Sub-phases

Phase 5C mining is restricted by the current municipal road and cannot be mined until the road is relocated, which is planned for later in 2021. The road is located as shown in Figure 16-19.
| | P a g e | 16-40 |
| 04/11/2021 |
| TECHNICAL REPORT ON THE AURIZONA GOLD MINE EXPANSION PRE-FEASIBILITY STUDY |
Figure 16-19: Phase 5C and Existing Road

Phase 6 mines deeper in the center section of the pit taking the western end to its full extent retreating along the ore body. The main haulroad for Phase 6 and later Phase 7 is established with this phase. This is shown in the purple shading in Figure 16-20. Phase 5 is the teal coloured lines and the connection of the haulroads can be clearly seen.
| | P a g e | 16-41 |
| 04/11/2021 |
| TECHNICAL REPORT ON THE AURIZONA GOLD MINE EXPANSION PRE-FEASIBILITY STUDY |
Figure 16-20: Phase 6 Design

Phase 7 uses a temporary ramp system on the north wall to save on waste stripping requirements. It helps to shorten the waste haulage distance and directs waste from Phase 7 to the East dump. The idea is to maintain a ramp in the saprolite material along the north side. This does not require drilling and blasting. The phase would be deepened until a connection with another temporary ramp is made to the Phase 6 ramp system.
The concept is to have the second temporary ramp in the ore body dropping from east to west. This ramp means that material will have to be hauled downhill for a short time then uphill again. When the second ramp system is in place, the north temporary access ramp will be mined leaving a clean wall behind.
The north ramp remnant is used later by the underground team for access to a second ventilation raise later in the underground mine life. It is located on an extra width safety bench.
The final Phase 7 design is shown in Figure 16-21 in purple and reaches the ultimate depth of -212 masl.
| | P a g e | 16-42 |
| 04/11/2021 |
| TECHNICAL REPORT ON THE AURIZONA GOLD MINE EXPANSION PRE-FEASIBILITY STUDY |
Figure 16-21: Phase 7 Design

The contained tonnes and grade by phase in the Piaba pit are shown in Table 16-10.
Table 16-10: Piaba Pit Tonnage and Grades by Phase
| Pit and Phase | Ore (kt) | Gold Grade (g/t) | Waste (Kt) | Total (Kt) | Strip Ratio |
| Piaba - Phase 4 | 3,324.3 | 1.30 | 4,205.2 | 7,529.5 | 1.26 |
| Piaba - Phase 5 | 3,278.5 | 1.27 | 15,916.2 | 19,194.7 | 4.85 |
| Piaba - Phase 6 | 6,113.4 | 1.37 | 29,288.9 | 35,402.3 | 4.79 |
| Piaba - Phase 7 | 6,182.1 | 1.32 | 27,102.4 | 33,284.5 | 4.38 |
| Total | 18,898.3 | 1.30 | 76,512.7 | 95,411.0 | 4.05 |
Piaba East
Piaba East is Area F as described earlier. The Piaba East pit has benefited from additional exploration drilling resulting in a larger pit design compared to previous designs. The old designs had a significant bridge of waste between the two ends of the pit. This has been eliminated in the new design. This allows for haulage of material along contour to the south helping to shorten the waste haulage and provide access to the process plant and stockpile areas for the ore.
The new design is shown in Figure 16-22 and the quantities detailed in Table 16-11. The pit bottom is -20 masl which makes the pit 94 m deep.
| | P a g e | 16-43 |
| 04/11/2021 |
| TECHNICAL REPORT ON THE AURIZONA GOLD MINE EXPANSION PRE-FEASIBILITY STUDY |
Figure 16-22: Piaba East Pit Design

Table 16-11: Piaba East - Tonnes and Grade
| Pit | Ore (kt) | Gold Grade (g/t) | Waste (Kt) | Total (Kt) | Strip Ratio |
| Piaba East | 1,242.8 | 1.46 | 6,634.0 | 7,876.8 | 5.34 |
Boa Esperança
The Boa Esperança pit has always been considered as a freshwater storage facility rather than a proper pit. Additional close spaced drilling in this pit helped increase the understanding of the deposit and resulted in additional contained material than previously considered. The pit is still designed as a simple facility for storage of fresh water for plant operations. But the value contained has increased.
The pit design is shown in Figure 16-23 with the ramp access and pit bottom at -8 masl. The contained material is shown in Table 16-12.
| | P a g e | 16-44 |
| 04/11/2021 |
| TECHNICAL REPORT ON THE AURIZONA GOLD MINE EXPANSION PRE-FEASIBILITY STUDY |
Figure 16-23: Boa Esperança Pit Design

Table 16-12: Boa Esperança - Tonnes and Grade
| Pit | Ore (kt) | Gold Grade (g/t) | Waste (Kt) | Total (Kt) | Strip Ratio |
| Boa Esperança | 881.9 | 0.81 | 1,426.7 | 2,308.6 | 1.62 |
The pit design is limited by plant facilities to the west but still provides 900,000 m3 of freshwater capacity without a dam using a 2 m freeboard around the edge of the pit. The water level for this water storage volume is 31 masl. The overall pit depth is 54 m.
Tatajuba
The Tatajuba pit was split into two phases. It was noted in the pit shell net value curves that a significant portion of the ultimate pit value could be obtained in a smaller phase. This corresponded to a revenue factor = 0.65 or $878 /oz gold pit shell. This shell yielded 82% of the overall revenue but only required 20% of the waste movement.
The Tatajuba deposit is long and narrow, similar to Piaba. This allows a slot type pit to be developed along its length. The first phase was a narrow extraction of the higher grade saprolite material in the upper portion of the deposit. This went to a depth of -26 masl and is shown in Figure 16-24.
| | P a g e | 16-45 |
| 04/11/2021 |
| TECHNICAL REPORT ON THE AURIZONA GOLD MINE EXPANSION PRE-FEASIBILITY STUDY |
Figure 16-24: Tatajuba Pit Design - Phase 1

The second phase is expanded laterally on the first phase and had an ultimate pit depth of -80 masl for an overall pit depth of approximately 130 m. Phase 2 is shown in Figure 16-25.
| | P a g e | 16-46 |
| 04/11/2021 |
| TECHNICAL REPORT ON THE AURIZONA GOLD MINE EXPANSION PRE-FEASIBILITY STUDY |
Figure 16-25: Tatajuba Pit Design - Phase 2

The tonnage and grade by phase for Tatajuba are shown in Table 16-13.
Table 16-13: Tatajuba - Tonnages and Grades by Phase
| Pit | Ore (kt) | Gold Grade (g/t) | Waste (Kt) | Total (Kt) | Strip Ratio |
| Tatajuba - Phase 1 | 868.4 | 1.66 | 1,722.2 | 2,590.6 | 1.98 |
| Tatajuba - Phase 2 | 1,106.1 | 1.17 | 8,428.5 | 9,534.6 | 7.62 |
| Total | 1,974.5 | 1.39 | 10,150.7 | 12,125.2 | 5.14 |
Genipapo North
The Genipapo North pit shell indicated a circular style pit. The design then became a simple spiral with single lane access to the bottom. The pit bottom in the design is -22 masl which is achieved by excavating the floor with hydraulic excavators. The overall depth of the pit is 54 m. The pit design clipped to topography is shown in Figure 16-26 and the tonnes and grade in Table 16-14.
| | P a g e | 16-47 |
| 04/11/2021 |
| TECHNICAL REPORT ON THE AURIZONA GOLD MINE EXPANSION PRE-FEASIBILITY STUDY |
Figure 16-26: Genipapo North Design

Table 16-14: Genipapo North - Tonnes and Grade
| Pit | Ore (kt) | Gold Grade (g/t) | Waste (Kt) | Total (Kt) | Strip Ratio |
| Genipapo - North | 418.7 | 0.77 | 771.2 | 1,189.9 | 1.84 |
Genipapo South
The Genipapo South design has two deeper portions of the pit that allow a longer pit to be designed. Single lane access is again used to reduce waste movement. As well, excavation of the floor by hydraulic excavators is employed to maximize ore extraction. The deepest portion of the pit is -24 masl which makes the overall depth 54 m. The pit design is shown in Figure 16-27 and Table 16-15.
| | P a g e | 16-48 |
| 04/11/2021 |
| TECHNICAL REPORT ON THE AURIZONA GOLD MINE EXPANSION PRE-FEASIBILITY STUDY |
Figure 16-27: Genipapo South Design

Table 16-15: Genipapo South - Tonnes and Grade
| Pit | Ore (kt) | Gold Grade (g/t) | Waste (Kt) | Total (Kt) | Strip Ratio |
| Genipapo - South | 254.6 | 0.89 | 1,417.3 | 1,671.9 | 5.57 |
Crown Pillar
The crown pillar thickness is based on current geotechnical information as described in Section 16.3. The initial thickness is intended to be 50 m from the base of the open pit with a final thickness of 25 m after underground extraction of the lower portion. The portion extracted by underground is to be backfilled, tight packed and cemented to leave a competent pillar and minimizing the gap. This is done in this manner to allow underground mining to continue beneath this extracted material.
This leaves the upper 25 m of ore in the pillar available for extraction from the open pit after underground mining is completed. This is scheduled at the end of the mine life to coincide with the completion of the underground mine as it is presently designed.
Mining of the upper portion of the crown pillar will occur in the dry season and requires the pit to be pumped dry. Experience at Aurizona has shown this can be completed and provide for six months of productive time in the pit bottom depending on the particular year. The removal of this material is expected to occur over two dry seasons.
| | P a g e | 16-49 |
| 04/11/2021 |
| TECHNICAL REPORT ON THE AURIZONA GOLD MINE EXPANSION PRE-FEASIBILITY STUDY |
The value of the upper crown pillar was determined along the length of the open pit bottom to assign tonnage, grade, and potential captive value. It is estimated that there is approximately $59 M in value.
Extraction of the upper portion of the crown pillar by backhoe is what has been considered for the PFS. The method is a vertically staged system with backhoes to lift up the material in the manner that building excavations are completed for high rise buildings. For this reason, the final safety berm was left to ensure the safety of the excavator operator in the various lifts.
The concept is to use a team of excavators to take the 25 m of crown pillar remaining in three passes. The drills would blast the full crown pillar as a choked blast. The excavators would then dig into the blasted material to open platforms for the excavators to work. The bottom excavator would dig to the cemented underground pillar and lift the material to their level behind them. A second excavator one level up would pick up this material and lift it behind itself. A third excavator would then lift this material and load the trucks. The mining of the crown pillar would progress from west to east retreating along the ore body.
The design is based on a shape in the pit bottom with an 80 degree wall slope and 25 m deep. A bench width of 6 m has been offset before the slope of the crown pillar removal to provide the safety bench above the excavators working. Ore and waste separation in tight working conditions was assumed to be difficult so all the material extracted was to be processed including the waste. With the wide swath of low-grade present this was considered a reasonable assumption.
There are two areas in the open pit where the crown pillar will be extracted. They are shown in Figure 16-28.
| | P a g e | 16-50 |
| 04/11/2021 |
| TECHNICAL REPORT ON THE AURIZONA GOLD MINE EXPANSION PRE-FEASIBILITY STUDY |
Figure 16-28: Piaba Pit - Crown Pillar Locations (Looking Northwest)

The location “A” is available earlier and will be higher up in the pit bottom away from the water. Location “B” represents the majority of the tonnes and grade. This portion of the Piaba deposit, both open pit and underground, tends to have higher grades.
Cross-sections of the excavation are shown in Figure 16-29 and Figure 16-30.
| | P a g e | 16-51 |
| 04/11/2021 |
| TECHNICAL REPORT ON THE AURIZONA GOLD MINE EXPANSION PRE-FEASIBILITY STUDY |
Figure 16-29: Crown Pillar - Area A Design

Figure 16-30: Crown Pillar - Area B Design

The tonnage and grade in the crown pillar are fully diluted and the full volume in the design is mined and sent to the plant as ore. The tonnage by area in the crown pillar are shown in Table 16-16.
| | P a g e | 16-52 |
| 04/11/2021 |
| TECHNICAL REPORT ON THE AURIZONA GOLD MINE EXPANSION PRE-FEASIBILITY STUDY |
Table 16-16: Crown Pillar - Tonnage and Grades
| Pit | Ore (kt) | Gold Grade (g/t) | Waste (Kt) | Total (Kt) | Strip Ratio |
| Crown Pillar - A | 321.1 | 1.24 | - | 321.1 | - |
| Crown Pillar - B | 1,563.1 | 1.38 | - | 1,563.1 | - |
| Total | 1,884.3 | 1.36 | - | 1,884.3 | - |
Open Pit Total
The final design phase tonnes and grades are shown in Table 16-17.
Table 16-17: Final Design - Phase Tonnes and Grades
| Pit and Phase | Ore (kt) | Gold Grade (g/t) | Waste (Kt) | Total (Kt) | Strip Ratio |
| Piaba - Phase 4 | 3,324.3 | 1.30 | 4,205.2 | 7,529.5 | 1.26 |
| Piaba - Phase 5 | 3,278.5 | 1.27 | 15,916.2 | 19,194.7 | 4.85 |
| Piaba - Phase 6 | 6,113.4 | 1.37 | 29,288.9 | 35,402.3 | 4.79 |
| Piaba - Phase 7 | 6,182.1 | 1.32 | 27,102.4 | 33,284.5 | 4.38 |
| Crown Pillar | 1,884.3 | 1.36 | - | 1,884.3 | - |
| Piaba East | 1,242.8 | 1.46 | 6,634.0 | 7,876.8 | 5.34 |
| Boa Esperança | 881.9 | 0.81 | 1,426.7 | 2,308.6 | 1.62 |
| Tatajuba - Phase 1 | 868.4 | 1.66 | 1,722.2 | 2,590.6 | 1.98 |
| Tatajuba - Phase 2 | 1,106.1 | 1.17 | 8,428.5 | 9,534.6 | 7.62 |
| Genipapo - North | 418.7 | 0.77 | 771.2 | 1,189.9 | 1.84 |
| Genipapo - South | 254.6 | 0.89 | 1,417.3 | 1,671.9 | 5.57 |
| Total Open Pit | 25,555.0 | 1.31 | 96,912.6 | 122,467.6 | 3.79 |
| 16.5.4 | Waste Dump Design |
The ultimate pit area at the end of the mine life is shown in Figure 16-31 with Piaba East backfilled with waste material from Piaba.
The waste dump designs are based on the geotechnical criteria discussed in Section 16.3.5. The volumes used were based on the mined tonnage within each pit design and appropriate swell factor applied.
Material from the Piaba pit is placed in the North, West, South and East dumps. Piaba East and Boa Esperança waste material is stored only in the East dump.
Tatajuba pit waste is placed only in the Tatajuba dump.
Material from the Genipapo North and South pits are the only source for the Genipapo dump.
Waste volumes by material type were determined from the block model to generate the bank volume (bcm). Swell factors were applied to this dependent upon the material type. The swell factors were:
| • | Laterite and Saprolite = 15% |
| • | Transition = 20% |
| | P a g e | 16-53 |
| 04/11/2021 |
| TECHNICAL REPORT ON THE AURIZONA GOLD MINE EXPANSION PRE-FEASIBILITY STUDY |
| • | Rock = 30% |
The loose cubic metres of waste material that needed to be stored by pit area are shown in Table 16-18.
Table 16-18: Pit Area Waste Volumes
| Pit | Waste (Mt) | Waste (Mbcm) | Waste (Mlcm) |
| Piaba | 77.0 | 33.3 | 40.8 |
| Piaba East | 6.2 | 3.7 | 4.3 |
| Boa Esperança | 1.4 | 0.8 | 0.9 |
| Tatajuba | 10.2 | 4.9 | 5.8 |
| Genipapo North | 1.4 | 0.7 | 0.8 |
| Genipapo South | 0.8 | 0.4 | 0.5 |
| Total | 97.0 | 43.9 | 53.1 |
The waste dump capacities are shown in Table 16-19, both required and designed. Note that excess capacity exists in the designs for the East dump and Tatajuba dump.
Table 16-19: Waste Dump Capacities
| Waste Dump | Required Volume (Mlcm) | Actual Design (Mlcm) |
| North Dump | 8.3 | 8.3 |
| West Dump | 8.2 | 8.2 |
| South Dump | 15.3 | 15.3 |
| East Dump | 14.2 | 15.0 |
| Tatajuba | 5.8 | 5.9 |
| Genipapo | 1.3 | 1.3 |
| Total | 53.1 | 54.0 |
Fine tuning of the South and East dumps is expected as the Vene tailings facility design is finalized. The Tatajuba waste dump has room to expand vertically and laterally if further exploration uncovers additional material.
| | P a g e | 16-54 |
| 04/11/2021 |
| TECHNICAL REPORT ON THE AURIZONA GOLD MINE EXPANSION PRE-FEASIBILITY STUDY |
Figure 16-31: Ultimate Aurizona Mine Pit and Waste Management Facilities

| | P a g e | 16-55 |
| 04/11/2021 |
| TECHNICAL REPORT ON THE AURIZONA GOLD MINE EXPANSION PRE-FEASIBILITY STUDY |
| 16.5.5 | Open Pit Mine Equipment |
The current contractor equipment fleet is shown in Table 16-20.
Table 16-20: Contractor Mining Fleet
| Major Equipment | Quantity | Size |
| Hydraulic Excavator - Hitachi EX 2500 | 3 | 16.5 m3 |
| Hydraulic Excavator - Hitachi EX 1200 | 2 | 6.7 m3 |
| Hydraulic Excavator - Cat 374 | 3 | 4.1 m3 |
| Conventional Trucks - Mercedes Actros | 5 | 32 mt |
| Articulated Truck - Cat 740B | 18 | 39 mt |
| Rigid Body Truck - Cat 777 | 21 | 91 mt |
| Drill - Sandvick DP 1500i | 5 | 127 mm |
Going forward, the quantity and make-up of the fleet will vary based on production needs or equipment replacement. The articulated trucks are used more in the wet season while the larger rigid body trucks see more use during the dry season when higher production is possible and required.
The larger EX2500 excavators are used for waste mining only. The smaller equipment is used both for waste and ore mining.
The support equipment fleet includes numerous smaller excavators, fuel trucks, dozers, graders, etc.
| 16.5.6 | Open Pit Blasting and Explosives |
The drill contractor employs various drills to provide the broken material for mining. The typical bit diameter is 140 mm with a different pattern size for ore and waste.
The pattern sizes currently for ore blasting is 3.2 m x 3.8 m with a powder factor of 0.45 kg/t. This is to provide finer fragmentation for the crushing circuit.
The waste pattern is 4.5 m x 3.9 m with a powder factor of 0.26 kg/t.
The explosives vendor delivers explosives to the drilled hole as part of their contract. They store the explosives on site near the Piaba East pit.
| 16.5.7 | Grade Control |
Grade control drilling is completed with a separate reverse circulation drill rig managed by the mining team. The grade control holes serve to define the mineralization at a closer spacing which is used to determine ore/waste contacts.
Due to the confined nature of the pit bottom the grade control holes are drilled vertically on a 10 m (along strike) by 5 m (dip direction) pattern for a depth of 3 benches or 18 m. Samples are collected each 3 m for two samples per mining bench. Samples collected are assayed then used in short range model updates.
| | P a g e | 16-56 |
| 04/11/2021 |
| TECHNICAL REPORT ON THE AURIZONA GOLD MINE EXPANSION PRE-FEASIBILITY STUDY |
| 16.6 | Underground Design |
| 16.6.1 | Mining Method Selection |
At the commencement of the PFS a mining method selection study was undertaken to compare potential longitudinal mining methods:
| • | Longhole with permanent rib pillars (LHwPRP) |
| • | Longhole with cemented fill (LHwC) |
| • | Longhole with temporary rib pillars (LHwTRP) |
| • | Modified Avoca |
| • | Avoca |
All the methods considered utilise long hole drilling which is best applied to deposits with regular dip. Cut and fill mining methods were not considered due to low productivity and higher mining costs as long hole methods are less labour intensive with lower cost. Variation in dip within a stope is likely to result in increased dilution and potential ore loss. It was not possible to adequately assess the vertical regularity of the contacts from the block model. Based on earlier work a 23 m sub-level vertical interval (measured floor to floor) was selected for all the mining methods considered after consultation with KP. It should be noted that as the development for each mining method is generally common it would be easy to change from one method to any other should circumstances dictate.
KP provided preliminary assumptions for the stope and pillar dimensions used in this study together with its initial estimates of dilution criteria for each situation.
First principle models were created for each mining method describing the geometry and particular physical criteria applied. A constant assumed insitu resource grade was applied, and the models were designed to be interactive with particular reference to variable deposit width. Key economic indicators were calculated for each mining method to select the best one:
| • | Net revenue/day for all vein widths considered. |
| • | Ranking value, defined as net revenue/day/insitu contained gold oz (taking into account the efficiency in recovering the insitu contained gold). |
Other advantages and disadvantages for each mining method were also considered.
The following criteria were used in order of priority:
| 1) | Maximisation of mine NPV - equivalent to net revenue/Day |
| 2) | Recovery of resource - equivalent to ranking value |
The following disadvantages for particular mining methods were noted:
| • | Avoca methods are expected to have higher dilution (lower millfeed grade) which negatively impacts net revenue/day and therefore NPV. |
| • | There was concern that the remote blasting costs using WIFI detonators for temporary pillar recovery in LHwTRP may have been unreliable. |
| | P a g e | 16-57 |
| 04/11/2021 |
| TECHNICAL REPORT ON THE AURIZONA GOLD MINE EXPANSION PRE-FEASIBILITY STUDY |
The conclusion was LHwC and LHwPRP are the favoured methods. Based on the results of the study the LHwPRP mining method would be used to recover veins of up to 8m in width with LHwC used for veins over 8m width for stope stability.
Long Hole with Permanent Rib Pillar (LHwPRP)
LHwPRP is illustrated in Figure 16-32.
Figure 16-32: Long hole with Permanent Rib Pillar (LHwPRP)

The unrecoverable rib pillar is required only to act as a barrier between the uncemented fill material placed in the previous stope and the current active production stope; it does not require long-term structural integrity. A bored 0.65 m diameter slot raise is located at the farthest extent with the stope blasting of largely parallel drill holes retreating toward the access. Mining commences at the bottom of the mining zone and progresses upwards. Stope mucking takes place within the deposit, largely by remote control, on the uncemented rockfill floor provided by the previously mined stope below. There is no stope development in waste.
KP advice from a geotechnical perspective was that where average vein dips are in excess of 700 stope the strike length can be longer than in flatter dip areas. Stope strike length can be increased by installing stope cablebolts. Stope cablebolting was included in estimation to increase open stope strike length thereby controlling dilution, improving productivity, and decreasing the proportion of unrecoverable rib pillar.
Long Hole with Cemented Fill (LHwC)
LHwC is illustrated in Figure 16-33.
| | P a g e | 16-58 |
| 04/11/2021 |
| TECHNICAL REPORT ON THE AURIZONA GOLD MINE EXPANSION PRE-FEASIBILITY STUDY |
Figure 16-33: Long hole with Cement Fill (LHwC)

LHwC is essentially the same mining method as LHwPRP except there are no rib pillars. The method will be applied to veins over 8.0 m wide. Maximum planned stope width is 12.6 m. Geotechnical advice dictates that the stope face is retreated 20 m and mucked clean then the resulting void is filled with cemented rockfill. A 28 day curing period for the cement is required before stope blasting can recommence. This curing period is the main reason for reduced stope productivity however tonnage recovery is maximised as there are no rib pillars. Due to the greater widths increased cablebolt support is required. Design aspects for LHwPRP and LHwC are compared in Table 16-21.
| | P a g e | 16-59 |
| 04/11/2021 |
| TECHNICAL REPORT ON THE AURIZONA GOLD MINE EXPANSION PRE-FEASIBILITY STUDY |
Table 16-21: Comparison of LHwPRP and LHwC Design Aspects
| Description | LHwPRP | LHwC | |
| Sub level Interval | 23 m | 23 m | |
| Vein Width | 2 m to 8.0 m | 8.0 m to 12.6 m | |
| Rib Pillar Width | 67% vein width, minimum 3 m | None | |
| Stope Strike Length | Zone 3, 4, 5 and 6 Strike Length (dip >700 ) |
25 m unsupported 30 m supported |
Supported 20 m |
| Zone 1-2 and 7 Strike Length (dip <700 ) |
20 m unsupported 25 m supported | ||
| Development | 4.5 mH x 4.0 mW to 4.5 mH x 6.0 mW |
4.5 mH x 6.0 mW | |
| Cablebolt Support | Development 4.0 mW | 1.5 x 9 m cables/m strike |
N/A |
| Development 6.0 mW | 5 x 9 m cables/m strike | ||
| Slot Raise | 0.65 m bored | ||
| Stope Drilling | 64 mm diameter - 7.3 to 9.0 t/m drilled | ||
| Stope Blasting | Emulsion - 0.4 to 0.5 kg/t | ||
| Dilution | Wall Rock (HW + FW) Rockfill Floor Vertical Rockfill Wall |
1.25 m @ background grade 0.25 m @ zero grade |
1.25 m @ background grade 0.25 m @ zero grade 0.75 m @ zero grade |
| Tonnage Recovery | 95% | ||
| Rockfill | Uncemented | 3% Cemented | |
| Overall Stope Productivity (incl Rockfill) | 250 tpd | 210 tpd | |
| 16.6.2 | Portal Location |
Portal location was influenced by several factors of which a key one was ensuring good ground conditions to establish the portal face. The mine area is overlain by weak saprolite which in turn overlies a zone of transition into fresh rock. A box cut to establish a portal from surface would be very large due to the weak rock conditions and the thickness of the weaker material present near surface. No such area is available within the confined mining area on site. Therefore a portal location within the Piaba open pit was considered more ideal.
At the eastern end of the open pit the fresh rock surface is at a depth of approximately 140 m or less from surface. The depth to fresh rock varies but is generally at higher elevations at the western end of the open pit, approximately 60 m or less from surface. It was therefore considered preferable to locate the portal in the western part of the pit, owing partially to the greater depth to fresh rock in the eastern part and the continued open pit mining activity in the east as the underground develops. Avoiding congestion between open pit and underground activities was another consideration. Figure 16-34 shows the locations selected in the western area of the open pit and the location of the return air and utilidor (service) raises.
| | P a g e | 16-60 |
| 04/11/2021 |
| TECHNICAL REPORT ON THE AURIZONA GOLD MINE EXPANSION PRE-FEASIBILITY STUDY |
Figure 16-34: Portal and Service Raise Locations with Exploration Decline

| 16.6.3 | Exploration Decline |
The potential to commence the development of an exploration decline in advance of the full mine permitting was identified as a key step moving forward. While providing underground diamond drilling locations to more closely confirm the conditions within the initial mining Zone 1-2 and 3, the development can be extended once the underground mine permitting is completed for continued use throughout the life of mine.
The exploration decline is shown in Figure 16-35.
It is planned that development of the exploration decline will commence at the start of Q3 2022 and be completed after 9 months at the end of Q1 2023 and then be ready for exploration drilling and the raise boring of the utilidor to establish flow through ventilation. Once full mine permitting has been received, the exploration development decline can be extended into the remainder of the mine design. For the purposes of the PFS, it has been assumed that permitting will not cause any delay in the currently scheduled mine development at this stage, however the exploration decline can operate for stand-alone exploration drilling operations as necessary if a permitting delay were to occur.
The area at the bottom of the exploration decline will be the location of a future main pump station (Zone 3), the start of the return air decline and the holing points for both the utilidor (3 m diameter) and main return ventilation raise (4.75 m diameter). Establishment of stubs for the future development and the holing points for the raises will allow for temporary pumping facilities and subsequent seamless extension of the mine development down-dip.
While care has been taken to locate the portal and initial decline development in the best ground possible, a cost allowance has been made for additional support for the first 50 m of the decline. Furthermore, the open pit walls above the portal entrance and above the return ventilation and utilidor raises will require support. This support requirement has not been examined in the PFS, but a cost allowance has been applied at each location.
| | P a g e | 16-61 |
| 04/11/2021 |
| TECHNICAL REPORT ON THE AURIZONA GOLD MINE EXPANSION PRE-FEASIBILITY STUDY |
Figure 16-35: Exploration Decline Layout

| | P a g e | 16-62 |
| 04/11/2021 |
| TECHNICAL REPORT ON THE AURIZONA GOLD MINE EXPANSION PRE-FEASIBILITY STUDY |
| 16.6.4 | Stope Design |
Stope design considered the recovery of measured and indicated Mineral Resources. An initial insitu cut off grade of 2.0 g/t Au was applied to determine potentially economic stopes. A level spacing of 23 vertical m was chosen for all stoping areas. Subdivision of the underground mine into separate mining areas provides the opportunity to optimise level spacing and location for each of the separate mining areas should that prove advantageous in future studies.
A stope development drift height of 4.5 m was selected to suit medium-sized mobile production equipment. Thus, all production stopes were designed to be 18.5 vertical m in height (23 m less 4.5 m). A minimum stope design width of 1.8 m true width was applied.
Longhole stope outlines were designed on 5 m-spaced sections using the 2.0 g/t Au grade shell and vein wireframe as a guide. There are several areas where two or more (up to four) potentially sub parallel economic veins are located in close proximity to each other on the same level. Based on geotechnical advice a minimum 5 m interval was applied between adjacent stopes. Where the vein interval was less than 5 m, multiple veins were included in the stope outlines if the resulting grade exceeded cut-off grade.
Overall, the underground mine has a total strike length in the order of 2.3 km in length. The long strike length required that the underground mine to be logically split into smaller strike length ‘mining zones’ that can be accessed and mined independent from each other, thereby increasing the available working places and allow for a relatively high overall production rate from the underground mine. The deposit was divided into the following seven mining zones, each with an average strike length of the mining areas varied from 200 m to about 500 m in length:
| • | Zone 1-2 |
| • | Zone 3 - Single stope available for test mining |
| • | Zone 4 |
| • | Zone 5 Upper- commencing above a 10 m high sill pilar |
| • | Zone 6 Upper- commencing above a 10 m high sill pilar |
| • | Zone 5-6 Lower - commencing at the base of the deposit and including one level of uphole stoping to define the base of the 10 m high sill pill |
| • | Zone 7 |
Internal study confirmed positive economics for each mining area.
The modifying factors described in Table 16-21 were applied to the stope designs. The estimated run of mine grade of each stope was then interrogated and a run of mine cut off grade of 1.8g/t Au was applied. Only those stopes with a run of mine grade greater than 1.8 g/t Au were included in the PFS plan.
A long section showing the mining zones, stoping method and ore reserves is shown in Figure 16-36.
| | P a g e | 16-63 |
| 04/11/2021 |
| TECHNICAL REPORT ON THE AURIZONA GOLD MINE EXPANSION PRE-FEASIBILITY STUDY |
Figure 16-36: Long Section of Stoping Methods by Zone and Ore Reserves

| | P a g e | 16-64 |
| 04/11/2021 |
| TECHNICAL REPORT ON THE AURIZONA GOLD MINE EXPANSION PRE-FEASIBILITY STUDY |
In-vein development will be extended in both directions from a central access to the farthest economic extent of the vein. Where multiple veins are present each vein requires a separate drift. Minimum development dimensions of 4.5 mH x 4.0 mW were planned. As stope widths increase maximum development dimensions will be 4.5 mH x 6.0 mW. Cable bolts, 9 m long, will be installed supporting the stope back at the rate of 1.5 bolts/ strike m where stope width is less than 6 m wide and 5 bolts/strike m in wider stopes supporting the stope back and walls. In certain isolated areas in-vein development will traverse sub-economic ground to access farther stopes. This development will not require cable bolts, but all in-vein development associated with stope extraction will be cablebolted.
Stope extraction will commence at the farthest extent, retreating towards the central access. A 650 mm slot raise will be bored using a Rhino 100 raise drill adjacent to the rib pillar (LHwPRP) or cemented rockfill wall (LHwC). The slot will be opened to vein width and the stope extended along strike by lines of parallel 64 mm drillholes, fanned outwards where necessary to achieve planned stope width. Emulsion explosive will be used in conjunction with non-electric (NONEL) detonators. A drilling rate of around 7.5 to 9.0 t/m is planned with approximately 0.45kg explosive/t consumed. Centralised blasting will be employed.
Mucking will be undertaken on the lower level by a 10 t LHD. The majority of mucking will require remote control operation to recover the broken ore in the stope. The LHD will deliver ore to an ore bay at the central access from where it will be re-loaded into the 27 t mine trucks.
Once stope extraction is completed, the stope will be filled with rockfill on the upper drilling level from the central access by 10 t LHD. For LHwPRP extraction can re-commence at the rib pillar immediately. For LHwC a curing period of 28 days is required to allow the cemented rockfill to strengthen before production can re-commence.
Once stoping is completed along the lateral extents on the mining level and the final stope backfilled, stoping can commence on the level above. The in-vein development of the set of stopes on the level above is independent from the stoping activities on the levels below, allowing the stopes on the level above to commence production in quick succession after the final stope on the level below is mined and backfilled.
| 16.6.5 | Development Design |
All mine access development is located on the hangingwall side of the orebody for geotechnical reasons:
| • | The desire to keep mine development out of the poorer metasediment rock units on either side of the deposit. There is sufficient room between the hangingwall metasediment unit and the ore zone to locate virtually all mine development in the better-quality rock, as illustrated in Figure 16-37 which shows the metasediments and access development piercings. |
| • | On levels where two or more stopes are in proximity to one another the preferred extraction sequence is to extract the stopes from the footwall side of the deposit to the hangingwall side. This is more easily accomplished with mine access development located on the hangingwall side of the orebody. |
| | P a g e | 16-65 |
| 04/11/2021 |
| TECHNICAL REPORT ON THE AURIZONA GOLD MINE EXPANSION PRE-FEASIBILITY STUDY |
Figure 16-37: Access Development Relative to Metasediments

The internal ramp systems for each mining zone will be accessed from surface by a common -15% gradient main decline shared by all mining areas. The development design is shown in Figure 16-38.
A 4.75 m diameter main return air raise will be bored from a suitable location identified in the open pit, paralleled by a separate 3.0 m diameter utilidor (service) raise. Both raises are planned to be located entirely in fresh rock. Below the main return air raise a double parallel decline system was designed to facilitate both fresh and return air ventilation and obviate the requirement for the mining of ventilation raises through weak unconsolidated material close to surface. A 30 m offset distance will be maintained between the main and return air declines. The return air decline will act as the second egress from the mine with a ladderway installed in the utilidor raise.
| | P a g e | 16-66 |
| 04/11/2021 |
| TECHNICAL REPORT ON THE AURIZONA GOLD MINE EXPANSION PRE-FEASIBILITY STUDY |
At the bottom of the main and return air decline, at the base of the Zone 6 Upper stopes, a further 3.5 m diameter fresh air intake raise, bored entirely in fresh rock, is required for mine ventilation. This raise will not require a ventilation fan.
The main decline system will provide access to all of the mining areas along the 2.3 km long strike length of the underground mine. The western main decline will provide the only vehicular point of entry into the underground during the life of mine.
Additional features incorporated in the design of the main decline system include:
| • | main decline - return air decline connecting drifts at 150 m intervals including stub for transformers or storage of materials etc. |
| • | truck loading bays at 150 m intervals |
| • | main decline passing areas at 300 m intervals |
| • | seven pump stations with sumps |
| • | underground workshop and refueling station |
| • | explosives and detonator store |
| • | an ore pass for Zone 6 Upper |
| • | a total of 920 m of exploration drilling drift to assist delineation of the Zone 5, 6 and 7 deposits |
| • | separated return air connection from zone return air raises to the return air decline |
Each mining zone includes a centrally located stope access and are serviced by a separate ramp over the full vertical extent of the zone.
Each internal zone ramp system features a -15% gradient access ramp. A crosscut will be mined on each sub-level to access the veins with access ramp gradient flattened to 0% at the entry point for ease of access. Each crosscut will be approximately 60 m in length and incorporate the following bays and stubs:
| • | truck loading bay |
| • | ore re-handling bay |
| • | rockfill re-handling bay |
| • | cement rockfill mixing bay (if cemented rockfill is required on the sub-level) |
| • | cement storage bay (if cemented rockfill is required on the sub-level) |
| • | miscellaneous bay (electrical bay or materials storage bay) |
| • | local sump |
| • | connection to a 3 x 3 m return air ventilation raise including a ladderway for secondary egress. |
A typical level access is shown in Figure 16-39.
| | P a g e | 16-67 |
| 04/11/2021 |
| TECHNICAL REPORT ON THE AURIZONA GOLD MINE EXPANSION PRE-FEASIBILITY STUDY |
Figure 16-38: Piaba Development Design - Looking Southeast

| | P a g e | 16-68 |
| 04/11/2021 |
| TECHNICAL REPORT ON THE AURIZONA GOLD MINE EXPANSION PRE-FEASIBILITY STUDY |
Figure 16-39: Typical Level Access

| 16.6.6 | Recovery of Pillars |
Rib Pillars
The rib pillars incorporated in the LHwPRP mining method are unrecoverable.
Sill Pillar
In order to quickly advance production of higher grade ore in Zones 5 and 6 a 10 m sill pillar is planned to separate Zone 5 Upper and Zone 6 Upper from Zone 5/6 Lower below.
The half-height stopes below the sill pillar in Zone 5/6 Lower are recovered by the drilling of up-holes and will not be backfilled. Rib pillars will be left behind, similar to the other stopes. In order to manage the performance of the inter-lode pillars, one of the veins would be left unmined on the sub-level directly below the sill pillar (i.e., where two veins are present, only one is be mined; where three veins are present, only the outer two are mined).
Crown Pillar
The crown pillar separates the open pit from the underground stoping operation. Climatic conditions add complexity to crown pillar design. Rainfall in the peak of the wet season, extending from February to May, is very heavy. While, generally, open pit pumping systems are capable of controlling water inflows typically the base of the open pit does flood. During the wet season open pit operations are scheduled to mine at the higher elevations of the open pit as the open pit floor becomes inaccessible. A lake of deep standing water typically forms in the base of the pit each wet season. The underground mine must be protected from inundation with particular concern around the location of open diamond drill holes and or open geological structures e.g. faults. Future investigation is required to ensure such possible water conduits are grouted and sealed.
| | P a g e | 16-69 |
| 04/11/2021 |
| TECHNICAL REPORT ON THE AURIZONA GOLD MINE EXPANSION PRE-FEASIBILITY STUDY |
Analyses undertaken by KP suggest a 50 m thick crown pillar will provide a probability of failure of 1%, which is considered suitable for wet season conditions with 40 m of water in the open pit. The same analyses indicate a probability of failure of 5% with a crown pillar thickness of 25 m which is considered suitable for dry season conditions.
Accordingly, a preliminary crown pillar with a thickness slightly in excess of the recommended 50 m was designed below the open pit floor. The lower 29.5 m (25 m of pillar and the 4.5 m drift) of the crown pillar is partially recoverable from underground near the end of underground mine life under particular mining constraints:
| • | Maximum stope width (HW-FW) to be 8m with cablebolt support of the stope hangingwall and roof. |
| • | Mining will only be undertaken within the lower 29.5 m of the crown pillar during the dry season near to the end of mine life. |
| • | Drive through water bulkheads will be installed in the overcut accesses for each level to contain water infiltration from the open pit during the wet season. A system will be put in place to drain the water from behind the bulkhead so that access can be re-established in the following dry season. |
| • | The stopes within the crown pillar will be backfilled with cemented rock fill to act as a plug and limit water flow into the undercut and lower mining blocks. |
| • | The overcuts above mined stopes should be tight-filled with uncemented rockfill. The purpose of the back fill is to provide long-term support for the crown pillar. |
| • | Instrumentation should be installed in the permanent crown to monitor pillar performance |
A long section of the crown pillar is illustrated in Figure 16-40.
| | P a g e | 16-70 |
| 04/11/2021 |
| TECHNICAL REPORT ON THE AURIZONA GOLD MINE EXPANSION PRE-FEASIBILITY STUDY |
Figure 16-40: Crown Pillar Long Section

A further complication was noted associated with the extraction of the planned single Zone 3 stope. Figure 16-40 shows that this stope is located within the final crown pillar. However extraction of this test stope is planned to occur early in the mine life between 2023 and mid 2024 when the distance between the base of the open pit and the top of the stope exceeds 50 m. Substantial permanent fixed bulkheads are planned to be installed after the completion of stope extraction in the upper and lower stope access drifts thus isolating the stope opening and protecting the mine in later life.
In the PFS it is planned that the final 25 m crown pillar will be recovered by open pit mining after the completion of the underground mine.
When considering the extraction of the crown pillar area there are factors mitigating the complexity and potential risks involved:
| • | The PFS mine design is confined to the extraction of currently identified Measured and Indicated resources. There remain considerable inferred resources with potential for further future expansion. Crown pillar extraction will only take place near the end of mine life. AGP believes mine life will be extended in future study, thereby postponing the need to undertake crown pillar extraction. |
| • | Crown pillar design was based on the ultimate open pit outline. It should be noted that the final crown pillar dimensions are only created late in the life of both the open pit and underground mines. Mining boundaries of the open pit and underground only converge to start forming the crown pillar in 2029 and last for only the final three years of mine life. |
| 16.6.7 | Stope Optimisation Check Analyses |
A validation of the manually generated stope designs was completed using Deswik Stope Optimizer software (DSO).
A comparison of the DSO Mineral Reserve result with those generated by the PFS manual design is shown in Table 16-22.
| | P a g e | 16-71 |
| 04/11/2021 |
| TECHNICAL REPORT ON THE AURIZONA GOLD MINE EXPANSION PRE-FEASIBILITY STUDY |
Table 16-22: Comparison of the Mineral Reserve Generated by DSO and the PFS Manual Methodology
| Description | Tonnes | Grade | Oz Au |
| DSO Mineral Reserve | 6,283,000 | 2.85 | 575,886 |
| PFS Manual Mineral Reserve | 6,527,847 | 2.76 | 579,414 |
| Variance (DSO vs PFS) | -3.9% | +3.2% | -0.6% |
Overall, the two stope design methodologies compare closely to each other for both tonnes and gold grade.
| 16.6.8 | Backfill |
Minefill Services undertook backfill testwork and design work for the PFS.
The first phase of the MineFill scope was to complete a trade-off study of cemented rockfill versus paste fill. In summary, the paste option appeared to be almost fatally flawed for three reasons:
| • | The whole mill tailings did not produce a suitable paste and must be amended by adding sand, or by desliming. |
| • | The reticulation of paste to all of the longhole stopes in the mine plan was going to be very expensive, and difficult logistically, as it would require the use of booster pump(s). |
| • | The life of mine and monthly demand for paste backfill is far too small to justify the expense and logistics of constructing and operating a paste plant. |
The following advantages of cemented rockfill (CRF) were noted as follows:
| • | The CRF option does not have any limitations or complexity associated with backfill delivery to any stopes in the mine plan. |
| • | The CRF option allows most of the stopes in the mine plan to be filled with uncemented rockfill which is considerably cheaper than cemented paste fill. Hence the demand for cemented fills is far lower with the CRF option. |
| • | A fully automated CRF plant would allow dayshift production of backfill to meet the demand. |
The preferred option for the filling of completed stopes was therefore uncemented and cemented rockfill and this was carried through to the PFS level design.
Based on the test work results , MineFill developed the following CRF general specifications:
| • | CRF density - 1.98 t/m3 |
| • | Aggregate top size of 75 mm |
| • | 60% passing 10 mm |
| • | <5% passing 2 mm |
| • | Coarse stockpile - 10 mm to 75 mm |
| • | Fines stockpile - 2 mm to 10 mm |
| • | Water to cement ratio of 1.2 for end-dumped fills |
| • | Nominal binder content of 3% to achieve 0.25 MPa at 7 days. |
| | P a g e | 16-72 |
| 04/11/2021 |
| TECHNICAL REPORT ON THE AURIZONA GOLD MINE EXPANSION PRE-FEASIBILITY STUDY |
The above parameters were used to develop the following CRF mix recipes shown in Table 16-23.
Table 16-23: CRF Mix Specifications
| Parameter | |
| Type of Placement | End Dump |
| Coarse Aggregate | wt % 60 |
| 6Fine Aggregate | wt % 40 |
| Cure Period | 28 day |
| Binder - wt % | 3.0% |
| Water: Cement | Ratio 1.2 |
A two-stage crushing, and screening plant is required to meet the above specifications. A flowsheet and mass balance for a 100 t/h plant was developed for the PFS.
The major components of the plant comprised:
| • | 46 x 16 in grizzly feeder with a 24 x 36 in jaw crusher for coarse material |
| • | secondary semi-mobile plant consisting of a 6-ft x 16-ft 2 deck screen and a 36 in cone crusher for fine material |
| • | plant components are connected by a series of 30 in conveyors: |
Given the relatively small size of the underground mine, and the nominal demand for backfill, a simple Mixing Pit arrangement will be implemented in lieu of a fully automated CRF batch plant. The mixing pit uses a colloidal style tangential mixer to produce a cement slurry which is then mixed with the dry aggregate. The cement slurry will be mixed on surface and then transported underground by agi-transmixer.
All the rockfill returning underground will be loaded into 27 t production trucks returning to the mine after delivering ore to the process plant. The 27 t trucks will tip the material destined for both uncemented and cemented rockfill into backfill bays located on each sub-level adjacent to the access ramp. Uncemented rockfill will then be transferred to the empty stope by a 10 t LHD. During rockfilling operations, a proportion of the waste development will be trucked directly to the backfill bays for uncemented fill to avoid haulage to surface.
Material for CRF will be transferred from the backfill bay by 10 t LHD. The LHD will then mix the crushed and screened rock with measured doses of cement slurry via spray bars. The LHD will then transfer the cemented rockfill to the empty stope.
Rockfill requirements were estimated using the following assumptions:
| • | 95% of the stope volume will be filled. |
| • | Where used, cement rockfill is only required to provide strength at the future stope face. The farthest end of the empty stope can be filled with uncemented rockfill. It was assumed that 25% of the fill in a designated cemented fill stope can in fact be uncemented. |
| • | Because of proximity to the final crown pillar, Zone 3 stope and the Zone 4, 5 and 6 stopes immediately below the final crown pillar will be cement filled. |
| | P a g e | 16-73 |
| 04/11/2021 |
| TECHNICAL REPORT ON THE AURIZONA GOLD MINE EXPANSION PRE-FEASIBILITY STUDY |
| • | In steady-state fill operations 75% of current waste development arisings will be trucked directly as uncemented rockfill. |
The estimated life of mine rockfill requirements are shown in Table 16-24.
Table 16-24: Life of Mine Rockfill Requirements
| Source/Type | Units | Value (kt) |
| Uncemented Rockfill from Surface | t fill | 2,782 |
| Uncemented Rockfill from UG Development | t fill | 655 |
| Sub-Total Uncemented Rockfill | t fill | 3,437 |
| Cemented Rockfill Required | t fill | 993 |
| Total Rockfill | t fill | 4,430 |
| 16.6.9 | Ventilation |
The Piaba Deposit will be developed using two “pull-type” exhaust systems, with the major exhaust system serving Zones 3,4,5,6, and 7 and a smaller exhaust system for Zones 1 and 2. Fresh air will enter the mine through both the decline and a dedicated fresh air raise (FAR) located near Zone 6 (Zone 6 FAR).
Due to the mine strike length a total of eight ramps will be ultimately developed. These ramp systems will all use a similar ventilation method, that is fresh air will be pulled through each ramp system by a dedicated exhaust raise system. Fresh air to the levels will be provided by the use of auxiliary fans which will pull fresh air off the ramps, and the regulated level exhaust system will pull the contaminated air to the exhaust decline and force it ultimately to surface.
The Piaba underground mine will use the Brazil regulation NR22 as design guidelines. The ventilation system for Piaba was modeled using Ventsim Visual™ Advanced. The total mine air requirement of the entire mine is approximately 341 m3/s (as shown in Table 16-25). This airflow is based on the highest equipment usage requirement period in the schedule which is 2028.
| | P a g e | 16-74 |
| 04/11/2021 |
| TECHNICAL REPORT ON THE AURIZONA GOLD MINE EXPANSION PRE-FEASIBILITY STUDY |
Table 16-25: Maximum Mine Air Quantity Requirements (2028)
| Equipment Type | HP/Unit | Fleet | Utilization | Utilized HP | Airflow Required m3/sec |
| 6.7t LHD | 201 | 1 | 20.0% | 40 | 2 |
| 10t LHD | 295 | 11 | 68.0% | 2,206 | 97 |
| 27t Diesel truck | 493 | 16 | 51.0% | 4,025 | 178 |
| Boom Truck | 149 | 3 | 25.0% | 112 | 5 |
| Fuel/Lube | 149 | 1 | 25.0% | 37 | 2 |
| Shotcrete | 149 | 1 | 25.0% | 37 | 2 |
| 22 Man Personnel | 149 | 2 | 25.0% | 74 | 3 |
| Scissors | 149 | 8 | 25.0% | 298 | 13 |
| Transmixer | 149 | 3 | 25.0% | 112 | 5 |
| Emulsion Loader | 149 | 2 | 25.0% | 74 | 3 |
| Grader | 158 | 1 | 25.0% | 40 | 2 |
| Mobile Breaker | 152 | 2 | 25.0% | 76 | 3 |
| Toyota Runaround | 129 | 12 | 25.0% | 386 | 17 |
| Mechanics Runaround | 129 | 1 | 25.0% | 32 | 1 |
| Telehandler | 100 | 2 | 25.0% | 50 | 2 |
| Sanitation | 93 | 1 | 10.0% | 9 | 0 |
| Production emulsion Charger | 93 | 1 | 25.0% | 23 | 1 |
| Rescue/First Aid | 129 | 1 | 5.0% | 6 | 0 |
| Explosives Transport | 146 | 1 | 25.0% | 37 | 2 |
| 339 | |||||
| UG Labour (Estimate) | 2 | ||||
| Total Airflow | 341 |
Table 16-26 outlines the velocity design criteria for the underground mine. These upper limit values are in line with industry standards used in Canada and elsewhere and generally align with industry best practice. Included are specific Brazilian regulations stating a maximum 8.0 m/s in pedestrian accessible areas.
Table 16-26: Velocity Limits
| Type of Opening | Velocity Limits (m/s) | Comments |
| Fresh Air Decline | 8 | above stopes, vehicular traffic only |
| Return Air Decline | 13 | no pedestrian access |
| Stope and Level Accesses | 7 | in mining areas to minimize dust |
| Return Air Raises | 20 | rule of thumb, airway economics |
| Return Air Raises | 7.0 to 12.0 | design outside this range to minimize water blanketing |
| Ventilation Transfer Drifts | 13 | no pedestrian access |
| | P a g e | 16-75 |
| 04/11/2021 |
| TECHNICAL REPORT ON THE AURIZONA GOLD MINE EXPANSION PRE-FEASIBILITY STUDY |
Modelled air velocity in key ventilation drifts at Piaba are shown in Table 16-27.
Table 16-27: Modelled Air Velocity
| Main Ventilation Opening | Area m2 | Max Airflow m3/s | Velocity m/s |
| Zone 1-2 Return | 9 | 75 | 8.3 |
| Main Ramp | 25.5 | 205 | 8.0 |
| Return ramp | 25.5 | 325 | 12.7 |
| Fresh Air Raise | 9.6 | 107 | 11.1 |
| Return Air Raise | 17.7 | 341 | 19.2 |
| Utilidor | 4.9 | 4 | 0.8 |
The main return air fans will be located on surface. This installation will be a two fan system and will be commissioned in a staged method. Both axial and centrifugal fans will work in this application. The return air installation will be controlled with variable frequency drives (VFD) to allow fluctuation in air volumes during the life of the mine.
The return air fan installation will pull fresh air from both the main Fresh Air Decline and from the eastern Zone 6 Fresh Air Raise and will be capable of providing the required volume flow rates and pressures over the full range of operating conditions.
Based on the diesel equipment list the main booster fans will deliver to the underground a maximum of approximately 350 m3/s.
The 1-2 Zone Return Air fan will be a dedicated system used only for those zones. It will take some of the pressure off the overall system requirements. This system will be in operation over the entire mine life, with the tonnage requirements peaking in 2027. This system will be controlled with a variable frequency drive (VFD) to allow fluctuation in air volumes during the life of the mine to a maximum of approximately 75 m3/s.
Years 2026 and 2027 has the highest volume of air consumption in the life of mine, as the maximum volume of 341 m3/s is achieved. Zones active in this period, either through development or production, include 1,2,3,4,5 upper and lower 6 upper and lower and Zone 7 as shown in Figure 16-41.
| | P a g e | 16-76 |
| 04/11/2021 |
| TECHNICAL REPORT ON THE AURIZONA GOLD MINE EXPANSION PRE-FEASIBILITY STUDY |
Figure 16-41: Year 2026 to 2027 Ventilation (Looking South)

| 16.6.10 | Safety |
Stench Gas System
The emergency notification system will be in the form of a stench gas system which can be released into the fresh air stream at both the main portal and in the Zone 6 FAR. These systems are simple and very effective in a high-volume intake system as proposed at Piaba.
Emergency Egress
The main ramp is planned to provide primary egress from the underground workings. The parallel return air ramp has been located in excess of 30 m from the main ramp to facilitate an independent secondary emergency egress. Connections between the main ramp and the return air ramp are mined at approximately 150 m intervals. A ventilation control bulkhead with man-access will be installed in each connection. The return air ramp culminates at the utilidor raise in which steel ladders and platforms will be installed for access to the open pit. The separate access locations for the main ramp portal and the utilidor raise provide protection against any open pit wall failure that could block the portal.
Ladderway systems will also be installed in the return air raise adjacent to each zone access ramp providing secondary egress from each sub-level in every mining zone.
Refuge Stations
Purpose built self-contained portable refuge stations will be installed at specific locations within the underground workings. The refuge stations can be moved to new locations as the mine expands and areas of activity change. It has assumed that a selection of 12 man and 20-man capacity refuges will be provided. The refuge stations will be equipped with compressed air, potable water, and first aid equipment. They will also be equipped with a fixed telephone line and emergency lighting. The refuge chambers will be sealable to prevent the entry of gases.
| | P a g e | 16-77 |
| 04/11/2021 |
| TECHNICAL REPORT ON THE AURIZONA GOLD MINE EXPANSION PRE-FEASIBILITY STUDY |
No permanent refuges or lunchrooms will be provided. The workforce will be provided with a meal on surface at the start of shift with only a mid-shift snack that can be consumed at the workplace.
Self-rescuers will be allocated to personnel to ensure safe passage to refuge chambers in case of smoke or gas.
Mine Rescue
A fully trained and equipped Mine Rescue Team is essential to the safe operation of any mine and will be provided at Piaba with a dedicated rescue centre and equipment. Team members will be drawn from volunteers from the mine workforce. The mine rescue team will be trained for surface and underground emergencies. A dedicated mine rescue/first aid vehicle will be purchased.
Fire Prevention
Fire extinguishers will be provided and maintained in accordance with regulations and best practices at the underground refuge stations, electrical substations, pump stations, fuelling stations, explosive magazines, and other strategic areas. Every vehicle would carry at least one fire extinguisher; the correct size and type will depend on the type of vehicle. All underground heavy equipment will be equipped with automatic fire suppression systems (Ansul system).
Traffic Control
A traffic control system will be installed in the main access ramp and at other strategic locations. Provision for this system has been included in the mine communications system.
| 16.6.11 | Mine Infrastructure |
Mine infrastructure general arrangement design and cost estimation for the PFS include the following major infrastructure installations:
| • | utilidor raise service layout |
| • | dewatering system |
| • | hydraulic bulkheads for crown pillar recovery |
| • | surface power distribution |
| • | underground power distribution |
| • | Communications system |
| • | Underground workshop |
| • | Fuel and lube supply |
| • | Temporary explosive storage |
Utilidor (Service) Raise
A manway complete with ladders, platforms, piping, and cables is required in the 3 m diameter raise located between Zone 3 and the open pit wall adjacent to the main ventilation fan.
| | P a g e | 16-78 |
| 04/11/2021 |
| TECHNICAL REPORT ON THE AURIZONA GOLD MINE EXPANSION PRE-FEASIBILITY STUDY |
Dewatering
The hydrogeological study inflow estimates were used to inform the PFS dewatering system design. The dewatering system design consists of six main pump stations that pump clean water from the various zones. A summary of the water inflow estimation is provided in Table 16-28.
Table 16-28: Estimated Mine Water Inflow
| Bulk Bedrock | Permeable Structure |
Service Water | Additional
Wet Season Inflow |
Water Inflow | ||||
| Assumption | 2
l/s per 100 Initial 50% |
12
l/s x 10 Faults
Initial 50% |
17.2
m3/h x
Initial 100% |
5
l/s per 100 m of 1.76km lake in open pit |
||||
| Block Height (m) |
Block Strike (m) |
m3/h | m3/h | m3/h | m3/h | m3/h | ||
| Zone 1-2 | 120 | 530 | Initial | 5.7 | 56.1 | 6.9 | 68.7 | |
| Final | 11.4 | 112.2 | 6.9 | 130.5 | ||||
| Peak | 11.4 | 112.2 | 6.9 | 130.5 | ||||
| Zone 4 | 180 | 300 | Initial | 4.9 | 31.8 | 6.9 | 43.5 | |
| Final | 9.7 | 63.5 | 6.9 | 80.1 | ||||
| Peak | 9.7 | 63.5 | 6.9 | 89.7 | 169.8 | |||
| Zone 5 Upper | 130 | 400 | Initial | 4.7 | 42.4 | 6.9 | 53.9 | |
| Final | 9.4 | 84.7 | 6.9 | 100.9 | ||||
| Peak | 9.4 | 84.7 | 6.9 | 119.6 | 220.5 | |||
| Zone 6 Upper | 150 | 360 | Initial | 4.9 | 38.1 | 6.9 | 49.8 | |
| Final | 9.7 | 76.2 | 6.9 | 92.8 | ||||
| Peak | 9.7 | 76.2 | 6.9 | 107.7 | 200.5 | |||
| Zone 5 - 6 Lower | 85 | 450 | Initial | 3.4 | 47.6 | 6.9 | 58.0 | |
| Final | 6.9 | 95.3 | 6.9 | 109.0 | ||||
| Peak | 6.9 | 95.3 | 6.9 | 109.0 | ||||
| Zone 7 (to Zone 6 Upper) | 140 | 175 | Initial | 2.2 | - | 6.9 | 9.1 | |
| Final | 4.4 | - | 6.9 | 11.3 | ||||
| Peak | 4.4 | - | 6.9 | 11.3 | ||||
| Ramp (12.5 l/s) | - | - | - | 45.0 | ||||
As can be seen in Table 16-28 estimated mine water inflow is most heavily influenced by the potential presence of a permeable structure, generally rock fractures, or faults. It is not known how many faults will be intersected by the underground mine, where they may be relative to the mining zones, or the condition of any faults and hence the water inflow. Permeable structure inflow is considered to be an allowance more than an estimate at this time given limited data. There is uncertainty regarding mine water inflows and hence the dewatering study designs and cost estimates could be high or low, and further study is recommended to identify expected water inflow estimates more closely. The data shown in Table 16-28 was rationalised slightly upwards for the PFS pump station design criteria as shown in Figure 16-42.
| | P a g e | 16-79 |
| 04/11/2021 |
| TECHNICAL REPORT ON THE AURIZONA GOLD MINE EXPANSION PRE-FEASIBILITY STUDY |
Figure 16-42: Water Inflow for Design Purposes

| | P a g e | 16-80 |
| 04/11/2021 |
| TECHNICAL REPORT ON THE AURIZONA GOLD MINE EXPANSION PRE-FEASIBILITY STUDY |
The main features of the dewatering design system are as follows:
| • | A main Zone 3 pump station located at the utilidor raise from which all mine water will be pumped to surface. |
| • | Zone 5/6 Lower station pumps water to Zone 6 Upper pump station. |
| • | Zone 6 Upper and all other Zone stations pump water through an individual dedicated pipelines located in the return air ramp to Zone 3 pump station. |
| • | Hydraulic calculations were performed to estimate the pipe sizes and the required pump total dynamic heads. |
The number of duty pumps, pump capacity and pump duty cycles for each main pump station are summarized in Table 16-29.
Table 16-29: Pump Station Designs
| Pump Size | Description | Initial |
Final |
Peak | |
| Zone 5/6L | 250 HP | Inflow (m3/h) | 65 | 110 | 110 |
| # of Duty Pumps | 1 | 1 | 1 | ||
| Pump Capacity (m3/h) | 250 | 250 | 250 | ||
| Pump Duty Cycle | 26% | 44% | 44% | ||
| Zone 6U | 500 HP | Inflow (m3/h) | 157 | 247 | 355 |
| # of Duty Pumps | 1 | 2 | 2 | ||
| Pump Capacity (m3/h) | 350 | 700 | 700 | ||
| Pump Duty Cycle | 45% | 35% | 51% | ||
| Zone 5U | 500HP | Inflow (m3/h) | 65 | 110 | 230 |
| # of Duty Pumps | 1 | 1 | 1 | ||
| Pump Capacity (m3/h) | 350 | 350 | 350 | ||
| Pump Duty Cycle | 19% | 31% | 66% | ||
| Zone 4 | 500 HP | Inflow (m3/h) | 50 | 90 | 180 |
| # of Duty Pumps | 1 | 1 | 1 | ||
| Pump Capacity (m3/h) | 350 | 350 | 350 | ||
| Pump Duty Cycle | 14% | 26% | 51% | ||
| Zone 1/2 | 250 HP | Inflow (m3/h) | 70 | 140 | 140 |
| # of Duty Pumps | 1 | 1 | 1 | ||
| Pump Capacity (m3/h) | 250 | 250 | 250 | ||
| Pump Duty Cycle | 28% | 56% | 56% | ||
| Zone 3 | 500 HP | Inflow (m3/h) | 360 | 605 | 923 |
| # of Duty Pumps | 2 | 3 | 5 | ||
| Pump Capacity (m3/h) | 700 | 1,050 | 1,750 | ||
| Pump Duty Cycle | 51% | 58% | 53% |
Note: All pump stations designs included one additional standby pump.
Hydraulic Bulkhead for Crown Pillar Recovery
When mining the lower part of the crown pillar between the underground mine and the open pit, protection is required from the lake that forms in the open pit each wet season in case water finds a path through into the underground. Four water-tight bulkheads with a 2.5 m x 2.5 m door opening are installed in four access drifts for vehicular access in the dry season. The potential hydraulic head on the bulkheads is estimated to be up to 100 m.
| | P a g e | 16-81 |
| 04/11/2021 |
| TECHNICAL REPORT ON THE AURIZONA GOLD MINE EXPANSION PRE-FEASIBILITY STUDY |
Aurizona Substation and Surface Power Distribution
The existing power system to site is provided by the local utility CEMAR and includes a 69 kV transmission supply with two existing 69 kV to 4.16 kV step-down transformers at the Aurizona substation that primarily services the process plant. It is reasonable that this station be left in service to supply all existing 4.16 kV loads at the site; however, provisions were made in the PFS design for a new substation to carry this existing load along with the required underground mine load. This would be provided with two 13.8 kV to 4.16 kV transformers and feeder positions in the future. By allowing for the existing load to be transitioned to the new station in the future, initial capital costs can be deferred.
A new substation is proposed to supply the new underground and surface loads as well as the existing remote 13.8 kV loads in the mine. The station would consist of two 15/20 MVA transformers.
The surface power distribution for the site originates at the new surface substation. The aim of the study was to supply all new underground loads, new surface loads (fans, buildings) and any existing remote loads operating at 13.8 kV. The surface substation would be connected to a double circuit overhead line that travels approximately 3 km to the utilidor raise. Each line transitions to underground 15 kV cable at the utilidor raise.
An additional overhead line is proposed to be constructed about 2.8 km to the location of the surface fans. A line loop is included toward the office/dry, crusher, aggregate substation, and workshop. The circuit loop is also proposed to connect to the surface fan substation and provide a backup supply.
At each location, a sub station transformer will be installed to reduce the 13.9 kV overhead line power to the voltage required.
Underground Power Distribution
The mine electrical infrastructure includes provisions to support ramp development, the dewatering pump stations, production activities and an underground maintenance shop.
Six main pump stations will be established, each supplied by a local Mine Power Centre (MPC).
Further, the Zone 5 Upper MPC is expected to supply power to the underground maintenance shop located just off the ramp in that location. Loads for the underground shop were estimated to considering the need to supply lighting, small tools, a welder, and some ventilation.
Additionally, provisions have been made for 15 booster fans located throughout the mine, with load distributed evenly across all six MPC stations.
Communication Systems and Traffic Control
The proposed topology for communications and automation will be through a primary fiber optic trunk network. Fiber interface panels will be located at key locations to provide interconnectivity to associated users and provide VOIP and data connections for automation purposes.
| | P a g e | 16-82 |
| 04/11/2021 |
| TECHNICAL REPORT ON THE AURIZONA GOLD MINE EXPANSION PRE-FEASIBILITY STUDY |
The fiber optics communications network design proposed uses fibre optic cabling to provide communications for mining activities, voice telephony, PLC panels, fan controls, pump controls, control valves, flow meters, and other process equipment.
A leaky feeder communications system is installed to permit radio communications through the mine. Leaky feeder coaxial cable is cost effective and simple to maintain. By providing leaky feeder communications, mine wide Wi-Fi network coverage is not required, and reliable communications can be extended into each mining zone.
A traffic control system is proposed. This would include:
| • | Traffic light heads - located at each entry point to the main ramp, including the surface portal entry. |
| • | Pull cord switches/proximity sensors to indicate to the PLC control system that there is a “demand” to access the ramp from a specific location. |
| • | Programmable logic controller (PLC) - decisions follow pre-programmed logic to determine when it is safe for an operator to enter the ramp space. |
Workshop
Underground shops are located near the Zone 5 Upper ramp access. The underground shops area consists of two access drifts, a main service bay, two smaller service bays, a lube bay and fuel bay, a wash bay, an electrical shop, a tool room, a welding bay, and a warehouse/office space.
Underground shops will be equipped with services running throughout including a fire suppression sprinkler system, compressed air distribution system, service water, and power receptacles and lighting.
The main service bay is an area designated for performing preventative maintenance, servicing, and repairs on underground mobile equipment. The area includes a dual overhead bridge crane assembly with two hoists that covers the area of the main service bay and extends into the welding bay.
The two identical service bays each include a ramp constructed of concrete, with a maintenance pit underneath. lube dispensing station will be provided in each of these service bays.
The access drifts provide two locations for trucks and personnel to enter the underground shops area. The two access drifts are identical and provide a means of entry/egress via the main access drift at opposite ends of the shop. Each entry location is equipped with a bulkhead containing an overhead door for equipment access and a man door for personnel access.
Fuel and Lube Supply System
A fuel delivery system will be used to transport fuel from the mine’s surface via the utilidor to a fuel receiving station that which also acts as a fuel dispensing station for use underground. The fuel station will be located in the underground shops area. The underground fuel station will have a ~2000 L capacity and be capable of receiving two full batches of fuel. When a batch of fuel is required underground, fuel is pumped through piping from the batch tank to the top of the utilidor raise from where it flows by gravity to the underground fuel receiving station. The underground fuel receiving station will be provided with built-in spill containment, fire doors, all necessary fire suppression, instrumentation, and fuel dispensing hoses and nozzles.
| | P a g e | 16-83 |
| 04/11/2021 |
| TECHNICAL REPORT ON THE AURIZONA GOLD MINE EXPANSION PRE-FEASIBILITY STUDY |
Lube will be transported underground in totes to the lube bay that is located in the underground shops area.
| 16.7 | Mine Schedule |
The mine schedule has been developed for the period of June 30, 2021 until the end of 2032. The schedule reflects the current mine reserves only from the pit and underground designs. Included within the plant feed is the stockpile tonnage as of June 30, 2021 totaling 0.25 Mt grading 0.92 g/t. That is not included as part of the total material movement.
There are several key milestones which affect the mine plan timing:
| 1. | Municipal road relocation - 2021 |
| a. | Estimated completion - end 2021 |
| b. | Allows Phase 5C to advance to completion - 2022 |
| c. | Allows preparation of pit bottom for the underground portal - 2022 |
| 2. | Underground Development |
| d. | Establish the underground portal - 2022 |
| e. | Construct the Exploration Decline - 2022/2023 |
| f. | Develop the ventilation raise to the exploration decline - 2023 |
| g. | Start twin development for underground towards Zone 5 and 6 - 2023 |
| h. | Commencement of underground production - 2023 |
| 3. | Construction of Tatajuba Access - 2023 |
| 4. | Construction of Genipapo Access - 2023 |
| 5. | Crown Pillar Removal - 2031/2032 dry seasons |
These milestones depend greatly on the permitting process which is underway in various areas including the permitting of Tatajuba. This schedule is based on the discussions with the Environmental team for timing of the various areas.
The combined open pit and underground mine production schedule is shown in Table 16-30. The schedule also tracks the percentage of saprolite, transition and rock in the feed. As the percentage of rock increases the overall plant throughput is reduced and this is reflected in the mine schedule.
The plant feed tonnage and grades by open pit and underground by year are shown in Figure 16-43.
Material mined by open pit phase by year is shown in Figure 16-44.
| | P a g e | 16-84 |
| 04/11/2021 |
| TECHNICAL REPORT ON THE AURIZONA GOLD MINE EXPANSION PRE-FEASIBILITY STUDY |
Table 16-30: Mine Production 2021 - 2032
| Units | 2021 | 2022 | 2023 | 2024 | 2025 | 2026 | 2027 | 2028 | 2029 | 2030 | 2031 | 2032 | Total | |
| Plant Feed | kt | 1,720 | 3,105 | 3,147 | 2,920 | 2,920 | 2,920 | 2,920 | 2,820 | 2,820 | 2,820 | 2,820 | 1,406 | 32,338 |
| Gold Grade | g/t | 1.46 | 1.63 | 1.18 | 1.61 | 1.55 | 1.90 | 1.95 | 2.05 | 1.82 | 1.59 | 0.91 | 1.35 | 1.60 |
| Plant Feed Type | ||||||||||||||
| Saprolite | % | 16.0 | 7.7 | 28.3 | 37.5 | 13.0 | 0.2 | 5.4 | 3.6 | 0.0 | 9.8 | 32.7 | 0.0 | 13.4 |
| Transition | % | 35.4 | 30.2 | 27.0 | 6.8 | 4.3 | 7.9 | 8.2 | 1.8 | 0.0 | 1.7 | 0.0 | 0.0 | 10.2 |
| Rock | % | 48.6 | 62.1 | 44.7 | 55.7 | 82.7 | 91.9 | 86.3 | 94.6 | 100.0 | 88.5 | 67.3 | 100.0 | 76.4 |
| Plant Feed Area | ||||||||||||||
| Open Pit | kt | 1,720 | 3,105 | 3,131 | 2,769 | 2,303 | 1,599 | 1,558 | 1,504 | 1,943 | 2,171 | 2,602 | 1,406 | 25,810 |
| OP Grade | g/t | 1.46 | 1.63 | 1.17 | 1.57 | 1.26 | 1.32 | 1.19 | 1.29 | 1.36 | 1.26 | 0.75 | 1.35 | 1.30 |
| Underground Feed | kt | - | - | 16 | 151 | 617 | 1,321 | 1,362 | 1,316 | 877 | 649 | 218 | - | 6,528 |
| UG Grade | g/t | - | - | 2.48 | 2.45 | 2.66 | 2.61 | 2.81 | 2.93 | 2.85 | 2.70 | 2.83 | - | 2.76 |
| Total Material Movement | kt | 15,725 | 24,721 | 25,803 | 22,982 | 11,808 | 4,808 | 6,004 | 5,743 | 6,118 | 3,186 | 697 | 1,406 | 129,002 |
| Piaba | kt | 13,417 | 23,176 | 19,657 | 12,989 | 9,537 | 3,487 | 1,463 | 3,913 | 5,241 | 2,538 | 479 | 1,406 | 97,301 |
| Piaba East | kt | - | 1,545 | 5,329 | 1,002 | - | - | - | - | - | - | - | - | 7,877 |
| Boa Esperança | kt | 2,308 | - | - | - | - | - | - | - | - | - | - | - | 2,309 |
| Tatajuba | kt | - | - | 800 | 8,146 | - | - | 3,179 | - | - | - | - | - | 12,125 |
| Genipapo North | kt | - | - | - | - | 676 | - | - | 514 | - | - | - | - | 1,190 |
| Genipapo South | kt | - | - | - | 694 | 978 | - | - | - | - | - | - | - | 1,672 |
| Underground | kt | - | - | 16 | 151 | 617 | 1,321 | 1,362 | 1,316 | 877 | 649 | 218 | - | 6,528 |
| Recovered Gold | koz | 74 | 148 | 109 | 138 | 132 | 161 | 165 | 168 | 149 | 130 | 75 | 55 | 1,503 |
| Open Pit | koz | 74 | 148 | 108 | 127 | 84 | 61 | 54 | 56 | 77 | 79 | 57 | 55 | 981 |
| Underground | koz | - | - | 1 | 11 | 48 | 100 | 111 | 112 | 72 | 51 | 18 | - | 522 |
| | P a g e | 16-85 |
| 04/11/2021 |
| TECHNICAL REPORT ON THE AURIZONA GOLD MINE EXPANSION PRE-FEASIBILITY STUDY |
Figure 16-43: Plant Feed - Open Pit and Underground

| | P a g e | 16-86 |
| 04/11/2021 |
| TECHNICAL REPORT ON THE AURIZONA GOLD MINE EXPANSION PRE-FEASIBILITY STUDY |
Figure 16-44: Total Tonnages by Open Pit Area

| | P a g e | 16-87 |
| 04/11/2021 |
| TECHNICAL REPORT ON THE AURIZONA GOLD MINE EXPANSION PRE-FEASIBILITY STUDY |
| 16.8 | Mine Plan Sequence |
Various end of year positions for the open pits are shown in Figure 16-45 to Figure 16-49. The include 2021, 2022, 2025, 2028 and 2032. The end of period for 2030 - 2032 is the same but only the crown pillar removal is completed by the open pit contractor at that time.
The underground advance is shown annually in Figure 16-50 to Figure 16-60. Annual mining areas are shown in pink with previously mined areas in blue.
| | P a g e | 16-88 |
| 04/11/2021 |
| TECHNICAL REPORT ON THE AURIZONA GOLD MINE EXPANSION PRE-FEASIBILITY STUDY |
Figure 16-45: End of 2021

| | P a g e | 16-89 |
| 04/11/2021 |
| TECHNICAL REPORT ON THE AURIZONA GOLD MINE EXPANSION PRE-FEASIBILITY STUDY |
Figure 16-46: End of 2022

| | P a g e | 16-90 |
| 04/11/2021 |
| TECHNICAL REPORT ON THE AURIZONA GOLD MINE EXPANSION PRE-FEASIBILITY STUDY |
Figure 16-47: End of 2025

| | P a g e | 16-91 |
| 04/11/2021 |
| TECHNICAL REPORT ON THE AURIZONA GOLD MINE EXPANSION PRE-FEASIBILITY STUDY |
Figure 16-48: End of 2028

| | P a g e | 16-92 |
| 04/11/2021 |
| TECHNICAL REPORT ON THE AURIZONA GOLD MINE EXPANSION PRE-FEASIBILITY STUDY |
Figure 16-49: Open Pit End of 2032

| | P a g e | 16-93 |
| 04/11/2021 |
| TECHNICAL REPORT ON THE AURIZONA GOLD MINE EXPANSION PRE-FEASIBILITY STUDY |
Figure 16-50: Underground Mine - End of 2022 (Looking South)

Figure 16-51: Underground Mine - End of 2023 (Looking South)

| | P a g e | 16-94 |
| 04/11/2021 |
| TECHNICAL REPORT ON THE AURIZONA GOLD MINE EXPANSION PRE-FEASIBILITY STUDY |
Figure 16-52: Underground Mine - End of 2024 (Looking South)

Figure 16-53: Underground Mine - End of 2025 (Looking South)

| | P a g e | 16-95 |
| 04/11/2021 |
| TECHNICAL REPORT ON THE AURIZONA GOLD MINE EXPANSION PRE-FEASIBILITY STUDY |
Figure 16-54: Underground Mine - End of 2026 (Looking South)

Figure 16-55: Underground Mine - End of 2027 (Looking South)

| | P a g e | 16-96 |
| 04/11/2021 |
| TECHNICAL REPORT ON THE AURIZONA GOLD MINE EXPANSION PRE-FEASIBILITY STUDY |
Figure 16-56: Underground Mine - End of 2028 (Looking South)

Figure 16-57: Underground Mine - End of 2029 (Looking South)

| | P a g e | 16-97 |
| 04/11/2021 |
| TECHNICAL REPORT ON THE AURIZONA GOLD MINE EXPANSION PRE-FEASIBILITY STUDY |
Figure 16-58: Underground Mine - End of 2030 (Looking South)

Figure 16-59: Underground Mine - End of 2031 (Looking South)

| | P a g e | 16-98 |
| 04/11/2021 |
| TECHNICAL REPORT ON THE AURIZONA GOLD MINE EXPANSION PRE-FEASIBILITY STUDY |
Figure 16-60: Underground Mine - End of 2032 (Looking South)

| | P a g e | 16-99 |
| 04/11/2021 |
| TECHNICAL REPORT ON THE AURIZONA GOLD MINE EXPANSION PRE-FEASIBILITY STUDY |
| 17 | Recovery Methods |
| 17.1 | Overview |
The Aurizona process plant currently treats the ore via a conventional cyanidation process. Run-of-mine (ROM) ore is processed using a conventional primary crusher and SAG-Ball mill comminution circuit followed by gravity circuit, CIL process and associated gold recovery and carbon handling circuits to produce gold doré. CIL tailings are treated via cyanide destruction process prior to storage in a TSF.
The process plant was upgraded during the recent construction project in 2018-2019 and recommenced operations in May 2019. The details of that plant installation are documented in Lycopodium et al, 2017. The leach/CIP circuit was subsequently converted to a CIL circuit in 2020.
The process plant was upgraded to treat 8,000 t/d ore (2.9 Mt/a) based on a blend of laterite/saprolite, transition and fresh rock. Process plant performance from 2019 to mid 2021 is summarized in Table 17-1. The process plant has been generally treating ore feed grades nominally ranging from 1 g/t to 2 g/t, mainly saprolite and transition ore blends, and achieving approximately 90.5% average recovery. The process plant is not expected to require any major modifications with the mine expansion plans, including the Piaba underground, however the installation of a new pebble crusher in planned for 2022 as higher percentages of fresh rock begin to be mined.
Recent historical production data is presented in Table 17-1.
Table 17-1: Process Plant Performance Summary (2019-H1 2021)
| Units | 2019 (May start) | 2020 | H1 2021 | |
| Total ore fed to mill | kt | 1,926 | 3,227 | 1,629 |
| Average Hourly Rate | t/h | 383 | 415 | 436 |
| Daily Average Throughput | t/d | 7,800 | 8,841 | 9,000 |
| Utilization | % | 91 | 89 | 86 |
| Feed grade | g/t | 1.36 | 1.41 | 1.22 |
| Recovery | % | 91.0 | 89.7 | 90.6 |
| Tailings | g/t | 0.13 | 0.14 | 0.11 |
| Gold Produced | oz | 76,426 | 130,933 | 58,104 |
A simplified process flowsheet of the Aurizona process plant is shown in Figure 17-1 and consists of the following unit operations:
| • | primary crushing and associated material handling equipment |
| • | crushed ore surge bin, emergency stockpile, associated feed and reclaim systems |
| • | grinding circuit consisting of a SAG mill, ball mill, cyclone classification and associated pumping and material handling systems |
| • | gravity circuit with intensive leach reactor and associated equipment |
| | P a g e | 17-1 |
| 04/11/2021 |
| TECHNICAL REPORT ON THE AURIZONA GOLD MINE EXPANSION PRE-FEASIBILITY STUDY |
| • | CIL circuit, gold recovery and carbon handling circuits, including pre-leach thickening, CIL tanks, acid wash and elution, carbon reactivation, electrowinning, and smelting |
| • | cyanide destruction |
| • | tailings pumping |
| | P a g e | 17-2 |
| 04/11/2021 |
| TECHNICAL REPORT ON THE AURIZONA GOLD MINE EXPANSION PRE-FEASIBILITY STUDY |
Figure 17-1: Plant Process Flowsheet

| | P a g e | 17-3 |
| 04/11/2021 |
| TECHNICAL REPORT ON THE AURIZONA GOLD MINE EXPANSION PRE-FEASIBILITY STUDY |
| 17.2 | Process Description |
| 17.2.1 | Primary Crushing |
ROM is trucked from the open pits and dumped directly into the crusher feed bin or stockpiled on the ROM storage pad and then reclaimed by a front-end loader to the 120 m3 ROM bin. The ore is reclaimed by an apron feeder.
The ROM is fed onto the vibrating grizzly feeder where the screen oversize is directed to the jaw crusher (Metso C120 type with a 160kW motor). The jaw crusher crushes the ore to a P80 of approximately <120 mm. The crushed ore, along with the vibrating screen undersize material, is conveyed to the SAG mill feed surge bin.
| 17.2.2 | Mill Feed System |
The SAG mill feed surge bin has a live capacity of 9 minutes (45 m3). The crushed material is reclaimed from the surge bin by an apron feeder onto a belt conveyor to feed the SAG mill. During crusher operation, the surge bin feed rate exceeds the discharge rate, and the feed is diverted from the bin. The diverted ore is conveyed to an emergency stockpile for reclaim by FEL during crusher or ROM feed outages. The crushed ore dead stockpile has 30 hours of storage capacity.
| 17.2.3 | Grinding |
The grinding circuit consists of a SAG mill (8.5 m diameter x 4.0 m EGL with a 5,300 kW variable frequency drive) in open circuit with a small pebble recycle stream and a ball mill (5.5 m diameter x 7.4 m EGL with a 3,800 kW fixed speed drive) in closed circuit with cyclones.
The SAG mill discharge is screened by a short trommel screen that is integrated with the SAG mill. The trommel screen has an opening of 10mm (slot width). Steel balls are manually added into the SAG mill and ball mill on a batch basis as grinding media.
One magnet and one metal detector are provided to remove and detect any metal.
The SAG mill trommel undersize and the product from the ball mill discharges by gravity into the cyclone feed pump box where the slurry is pumped to the cyclones for classification. The cyclone underflow returns to the ball mill, creating a circulating load to the ball mill of approximately 250%. The cyclone overflow with a P80 of 75 µm flows by gravity to the pre-leach thickener prior to subsequent cyanidation treatment. The pulp density of the cyclone overflow is approximately 32% w/w solids.
Dilution water is added to the grinding circuit as required. Lime is added to the SAG mill to maintain a slurry pH of 10.5 or higher.
The grinding mills have 9.1 MW of total installed grinding power providing sufficient power for the duty feed rate at the predicted feed blends in the LOM plan. During times when the feed contains less than 50% of the harder fresh rock material the comminution circuit can handle a higher throughput, up to 10,000 t/d or higher, without sacrificing grind size. A pebble crusher, which was deferred from the original mill upgrade in 2019, is expected to be installed in 2022 to handle an increasing portion of fresh rock.
| | P a g e | 17-4 |
| 04/11/2021 |
| TECHNICAL REPORT ON THE AURIZONA GOLD MINE EXPANSION PRE-FEASIBILITY STUDY |
| 17.2.4 | Gravity Circuit |
The gravity concentration process recovers coarse gold particles from a portion of the cyclone underflow. Approximately 25% of the cyclone underflow reports to two gravity concentrator feed screens. The screen undersize flows by gravity to a single KC-XS-40 centrifugal concentrator while the screen oversize materials reports to the gravity tails pump box. The tailings from the gravity concentrator report to the gravity tails pump box and is pumped to the ball mill feed chute. The gravity concentrate flows by gravity to a concentrate storage hopper in a secure area prior to gold leaching in an intensive leach reactor system (Acacia CS2000). The leach residue is washed and pumped back to the grinding circuit.
| 17.2.5 | Intensive Leaching - Acacia |
The Acacia reactor is an automated system that leaches the free gold concentrates from the gravity concentration. The leaching takes 12 hours at 54°C, in a solution containing 2.5% sodium cyanide and 1.5% sodium hydroxide to recover the gold at pH 14. The pregnant Acacia leached solution is then pumped to a storage tank in the refinery area to be treated further on the electrowinning cells.
| 17.2.6 | Pre-Leach Thickening and CIL |
The cyclone overflow is screened via a trash screen to remove any oversize material. The trash screen undersize flows by gravity to the 50 m pre-leach feed thickener to increase slurry density for the downstream cyanidation. The thickener overflow reports to a pre-leach thickener overflow tank which is then pumped to the cyclone feed pump box.
The thickener underflow at 50% w/w solids is pumped to the CIL circuit consisting of 11 CIL tanks, made up of three newer large 4,100 m3 tanks, and eight refurbished smaller tanks with 1,500 m3 capacity. The CIL tanks provide a total retention time of 36 hours at the nominal feed rate of 8,000 t/d. The tanks are aerated with compressed air. The CIL tanks are equipped with inter-stage screens and pumps to advance the loaded carbon upwards to the next CIL tank. Activated carbon is added into the CIL tanks 7 and 8 and the loaded carbon leaves the CIL circuit from the first and second CIL tanks. Activated carbon concentrations vary between 10 and 20 g/L slurry within the CIL tanks.
Sodium cyanide is added to the CIL 2 and 3 tanks to dissolve the gold. Lime slurry is added to maintain the slurry pH to approximately 10.2.
The loaded carbon is transferred to the carbon stripping circuit, while the leach residue from the last tank is sent to a carbon safety screen to recover the fine carbon grains lost. The screen undersize is pumped to the cyanide destruction circuit.
| 17.2.7 | Elution and Carbon Regeneration |
The loaded carbon from the CIL circuit is pumped to a 6 t fiberglass reinforced plastic (FRP) acid wash vessel and washed with a dilute 5% hydrochloric acid solution to remove any passivating, inorganic mineral deposits on the surface of the carbon. Afterwards, the acid washed carbon is rinsed with fresh water and transferred to the 6 t elution vessel.
The gold is stripped from the loaded activated carbon by the pressurized AARL elution process.
| | P a g e | 17-5 |
| 04/11/2021 |
| TECHNICAL REPORT ON THE AURIZONA GOLD MINE EXPANSION PRE-FEASIBILITY STUDY |
The pregnant solution generated from the elution process reports to the pregnant solution holding tanks for subsequent gold recovery by electrowinning.
At the end of the elution process, the stripped carbon is discharged from the bottom of the vessel through a regulating valve to the stripped carbon tank and then pumped to carbon regeneration circuit for reactivation.
| 17.2.8 | Carbon Reactivation |
Stripped carbon is transferred by a recessed impeller pump to a stationary dewatering screen for dewatering and then to 12 t capacity carbon regeneration kiln feed hopper, prior to reactivation. The carbon regeneration kiln can regenerate the barren carbon at a rate of 500 kg carbon per hour. The kiln is heated electrically and operates at approximately 650°C - 700°C in an inert atmosphere. The hot, reactivated carbon then leaves the kiln and is quenched in a quench tank flooded with water. The regenerated carbon is then screened and circulated back into the CIL circuit. As required by operations, make-up fresh carbon is added.
| 17.2.9 | Electrowinning Circuit and Gold Room |
Pregnant solution from the loaded carbon elution circuit is pumped from the pregnant solution holding tank to the electrowinning circuit where the gold is electrochemically deposited onto woven wool, stainless steel cathodes. The electrowinning circuit consists of three 0.9 m3 electrowinning cells with eight cathodes per cell and related rectifiers. The cells operate in parallel mode with two cells in service and one on standby. Periodically, the stainless-steel cathodes are cleaned by pressure washing to remove precious metals in the form of sludge. The gold sludge is pumped to a plate and frame filter press for dewatering on a batch basis. The depleted solution from the electrowinning circuit is sent to the leach circuit.
The filtered and dried gold sludge cake is mixed with flux and melted at approximately 1200°C in a 170-kW induction furnace to produce gold doré.
| 17.2.10 | Cyanide Detoxification and Tailings Disposal |
The leach residue from the carbon safety screen in the CIL circuit is pumped to the cyanide detoxification circuit comprising of two tank reactors and uses the conventional sulphur dioxide/air oxidation process to lower weak acid dissociable (WAD) levels in the tailings slurry. Sodium metabisulphite (SMBS), copper sulphate and lime are used as reagents. An emergency discharge pond adjacent to the cyanide detoxification tanks is provided for any emergency discharges of the leach slurry.
After detoxification, the tailings slurry is pumped to the TSF located west of the process plant. The supernatant from the TSF is reclaimed by pumping to the process water pond for reuse in the plant.
| 17.2.11 | Reagents |
All reagents are prepared in a separate reagent preparation and storage facility in a contained area. Solutions are stored in separate holding tanks before being added to various addition points by metering pumps.
| | P a g e | 17-6 |
| 04/11/2021 |
| TECHNICAL REPORT ON THE AURIZONA GOLD MINE EXPANSION PRE-FEASIBILITY STUDY |
The main consumables and reagent consumption for the Aurizona process plant are summarized in Table 17-2.
Table 17-2: Consumption Rates for Main Consumables and Reagents
| Item | Consumption Rate |
| Grinding media | 1.27 kg/t ore |
| Sodium Cyanide (CIL) | 0.65 kg/t ore |
| Lime | 2.70 kg/t ore |
| Carbon | 30 g/t ore |
| Flocculant | 20 g/t ore |
| Sodium Hydroxide | 0.34 kg/t ore |
| Hydrochloric Acid | 0.12 kg/t ore |
| SMBS | 1.16 kg/t ore |
| 17.2.12 | Water and Air Supply |
| • | Raw Water: Water is sourced as reclaim water from the TSF supernatant and in combination with other local fresh water sources. Raw water is used for fire water for emergency use, cooling water for mill gearboxes and mill lubrication systems, carbon elution/intensive leach/dust suppression, reagent preparation and gland water. A new fresh water source will be made available in 2022 when mining ceases at the Boa Esperança pit and that then becomes a freshwater storage pond. |
| • | Air Supply: Plant air service systems supply air to: CIL (high pressure air by dedicated oil-free type air compressors), cyanide destruction (low pressure air by blowers), plant air and instrument services (high pressure air for various services by dedicated air compressors). |
| 17.3 | Assay and Metallurgical Laboratory |
The onsite assay laboratory is operated by SGS Geosol Laboratórios Ltda. and is equipped with necessary sample preparation equipment and analytical instruments to provide routine assays for the mine, process, and environmental departments. The assay laboratory provides various assays, including gold fire assay. The assays are used for routine process optimization and metallurgical balance accounting.
There is also a laboratory equipped with metallurgical test equipment located in the process plant. The laboratory performs metallurgical tests to optimize the process flow sheet and improve metallurgical performance.
| | P a g e | 17-7 |
| 04/11/2021 |
| TECHNICAL REPORT ON THE AURIZONA GOLD MINE EXPANSION PRE-FEASIBILITY STUDY |
| 18 | Project Infrastructure |
The Aurizona mine and processing facility was restarted in 2019 after being placed on care and maintenance in 2015. Infrastructure was upgraded as part of the construction project in 2018-2019, including a tailings dam raise, an upgrade to the 69 kV incoming powerline, and the addition of a number of buildings including a new administration facility. This is documented in Lycopodium et al, 2017. Since 2019 that infrastructure has been updated, including two further raises to the existing TSF.
The overall site plan of the Aurizona Mine is shown in Figure 18-1, representing the ultimate build out at the end of the mine life in 2032. With the inclusion of Tatajuba and Genipapo as part of the overall project, the mine infrastructure will expand to service those areas properly, and the TSF facility will be further expanded to meet the needs of processing ore as outlined in this PFS.
| 18.1 | Power Supply and Distribution |
The regional utility, Companhia Energética do Maranhão (CEMAR), provides 15 MW power supply via a 69 kV overhead powerline to an outdoor substation located adjacent to the process plant. The substation is equipped with two 69/41.6 kV step-down transformers, one 12.5/10 MVA and one 7.5/5 MVA. The plant maximum demand varies based on the annual mine plan and the variation in hardness of rock in the plant feed primarily. The plant is currently operating at around 9 to 10 MW, and that is increasing with the higher percentages of fresh rock processed.
The addition of the underground electrical power loads are expected to peak at approximately 7 MW of additional demand and will require an upgrade to the main power line and Aurizona substation, including the primary transformers. This is described in Section 16. A study by a specialist electrical consulting firm in Brazil is being undertaken to assess the potential options for and will be completed prior to underground mining commencing.
| 18.2 | Water Supply and Management |
The Aurizona site has a net positive water balance due to the high levels of precipitation annually. Process water included with the tailings is stored in the Tailings Storage Facility (TSF) and recycled to the process plant. Fresh water storage will be sourced from the Boa Esperança reservoir, following the mining of this small pit later in 2021. The level of the supernatant in the TSF fluctuates significantly from wet season to dry season and it is continuously monitored to update the water balance and calibrated twice annually using bathymetry.
The Piaba pit is dewatered, and excess water diverted to the Edmilson curve area for natural drainage into the into the Aurizona river basin. There is currently a permit application under consideration by SEMA-MA to discharge pit and surface water to the Sao Jose River, and this change will be made pending approval.
| | P a g e | 18-1 |
| 04/11/2021 |
| TECHNICAL REPORT ON THE AURIZONA GOLD MINE EXPANSION PRE-FEASIBILITY STUDY |
Figure 18-1: Overall Site Plan

| | P a g e | 18-2 |
| 04/11/2021 |
| TECHNICAL REPORT ON THE AURIZONA GOLD MINE EXPANSION PRE-FEASIBILITY STUDY |
| 18.3 | Roads |
| 18.3.1 | Community Access Road |
With the mine plan looking to incorporate satellite areas to Piaba, the road network will grow. The initial road change will be the main site road relocation slated for completion in 2021. The new road alignment will provide the community a permanent route solution that is not prone to flooding during peak rain events and provides for the expansion projects required to extend the life of mine. This allows the mining of the western portion of Piaba pit and provides area for the Vené 2 construction.
| 18.3.2 | Mine Roads |
An ore haulroad from Tatajuba to the process plant at Piaba will be required. This new construction will be 4.1 km long and tie into the existing haulroad on the north side of Piaba. The road will be sufficient to double lane traffic with a running surface of 20 m. The road will be required in 2023.
To access the Genipapo pits, an expansion of an existing road will be required to allow haul traffic. The road will be 2.7 km long with a 20 m running surface for use by the mine trucks. This road will connect with the Piaba East pit access road initially and later will tie into the East Dump as it expands over time. The road will be required in 2023 to allow opening of the Genipapo pit.
| 18.4 | Mine Facilities |
The current open pit mine is a contractor operation and the contractor manages his own on-site workshops including equipment maintenance, welding, and wash area.
The explosives storage facility is located to the east of the Piaba East pit. This facility is within a fenced and guarded area. Access is currently via a road through the Piaba East pit. As the pit deepens, the access road will have to be relocated to travel along the eastern side of the Piaba East pit and join with the mine access road to Genipapo.
A drainage ditch around the Piaba pit is being expanded along the southern perimeter (currently in progress) and extended further north along the northern boundary of the pit. This north extension is due to the later phases of Piaba mining into the current ditch location. This drainage ditch collects surface water to prevent it from entering the active pit area. It also allows the water to drain away from other surface infrastructure to defined pumping locations.
| 18.5 | Tailings Storage Facility |
The TSF designs are based on 33.2 Mt of processed ore and there is potential for future expansions. After detoxification of cyanide, slurried tailings are pumped from the process plant to the TSF and spigoted from the dam crest to maintain the water pool towards the water reclaim pumps located within the reservoir area and away from the main dam embankments. A typical cross section of the Vené Tailings Dam is shown in Figure 18-2.
| | P a g e | 18-3 |
| 04/11/2021 |
| TECHNICAL REPORT ON THE AURIZONA GOLD MINE EXPANSION PRE-FEASIBILITY STUDY |
The Vené facility was initially constructed in 2009 and was increased to 31.6 masl in 2019 and has been recently lifted to its current height of 38 masl. It is intended to continue to increase the Vené TSF to a maximum elevation of 41 masl. The raise to 41 m elevation will be the final construction phase for Vené and will be completed in 2021.
| | P a g e | 18-4 |
| 04/11/2021 |
| TECHNICAL REPORT ON THE AURIZONA GOLD MINE EXPANSION PRE-FEASIBILITY STUDY |
Figure 18-2: Vené Dam Typical Cross-Section

| | P a g e | 18-5 |
| 04/11/2021 |
| TECHNICAL REPORT ON THE AURIZONA GOLD MINE EXPANSION PRE-FEASIBILITY STUDY |
Subsequent expansions of tailings storage will be constructed adjacent to Vené called Vené 2 and Vené 3. They will be constructed to accommodate the volume of tailings expected to be produced over the current life of mine plan.
Vené 2 construction will commence in 2022 and have an initial elevation of 29.8 masl. Subsequent lifts will bring Vené 2 to a height of 41 masl and Vené 2 will operate for four years from 2023 to 2026.
Vené 3 construction is expected to be constructed in 2026 with a final capacity of 4.24 Mm3 The final level for Vené 3 is currently designed at 41 masl.
All of the embankments for the TSF’s are designed as stand-alone, compacted earth fill or rock fill structures with a sand chimney and blanket internal drains. A liner will be placed on the upstream face of the dam for added protection. For additional long-term stability, the Southwest Waste Rock Dump will buttress a portion of the existing Vené and new Vené 2 TSF facilities. Spillway channels for each TSF will be designed to safely convey the 10,000-year storm event and will be constructed and maintained during operations.
Reclaimed water from the TSF will be pumped back to the plant for reuse.
The sequence of the Vené 2 and 3 construction is shown in Figure 18-3 to Figure 18-6.
Figure 18-3: Vené 2 First Phase Construction

| | P a g e | 18-6 |
| 04/11/2021 |
| TECHNICAL REPORT ON THE AURIZONA GOLD MINE EXPANSION PRE-FEASIBILITY STUDY |
Figure 18-4: Vené 2 Second Phase Construction

Figure 18-5: Vené 2 Final Phase Construction

| | P a g e | 18-7 |
| 04/11/2021 |
| TECHNICAL REPORT ON THE AURIZONA GOLD MINE EXPANSION PRE-FEASIBILITY STUDY |
Figure 18-6: Vené 3 with South Dump at End of Mine Life

| 18.6 | Waste Rock Storage Facilities (WRSF) |
There are several different WRSF required over the life of the mine to accommodate the 96.9 Mt (53.1 Mm3) of waste material produced during the life of mine (Figure 18-1). They are shown in Table 18-1.
Table 18-1: Waste Rock Storage Facilities
| Waste Rock Storage Facility | Design Capacity (Mm3) | Utilized Capacity (Mm3) |
| North Dump | 8.3 | 8.3 |
| West Dump | 8.2 | 8.2 |
| South Dump | 15.3 | 15.3 |
| East Dump | 15.0 | 14.2 |
| Tatajuba Dump | 6.7 | 5.8 |
| Genipapo Dump | 1.4 | 1.3 |
| Total | 54.9 | 53.1 |
Additional capacity can be added vertically at the Tatajuba Dump and the East Dump. The East Dump extra capacity is not being utilized in the PFS to allow for storage and separation of various mill feed types from the pit for use during the rainy season or longer term blending requirements.
| | P a g e | 18-8 |
| 04/11/2021 |
| TECHNICAL REPORT ON THE AURIZONA GOLD MINE EXPANSION PRE-FEASIBILITY STUDY |
| 18.7 | Camp |
A camp is located in the Aurizona village with an infirmary, offices, lodging facilities, and kitchen/dining area for serving meals mainly to the administration staff. The majority of the employees and contractor personnel live in the surrounding communities.
| | P a g e | 18-9 |
| 04/11/2021 |
| TECHNICAL REPORT ON THE AURIZONA GOLD MINE EXPANSION PRE-FEASIBILITY STUDY |
| 19 | Market Studies and Contracts |
| 19.1 | Markets |
No market study has been undertaken. The gold markets are mature global markets with reputable smelters and refiners located throughout the world.
Gold is a principal metal traded at spot prices for immediate delivery.
| 19.2 | Contracts |
Gold Dore bars are shipped from site to major refineries. Aurizona currently has a refining agreement with Asahi. The terms and conditions are consistent with standard industry practices. Refining charges include treatment and transportation.
Mining is completed using a Brazilian mining contractor, U&M. The terms and conditions are consistent with standard industry practices.
Consumables such as diesel fuel, cyanide, and other normal operating supplies are sourced from local vendors following standard terms and conditions consistent with normal mine operating practices for supply and delivery.
| | P a g e | 19-1 |
| 04/11/2021 |
| TECHNICAL REPORT ON THE AURIZONA GOLD MINE EXPANSION PRE-FEASIBILITY STUDY |
| 20 | Environmental Studies, Permitting, and Social or Community Impact |
Mining rights in Brazil are regulated by the National Mining Agency (ANM). The ANM was created in 2017 under Brazil 2017 Law No. 13575 and the ANM regulates and supervises activities for the use of Mineral Resources in Brazil.
As required by Brazilian National Environmental Policy established on August 31, 1981 (Federal Law 6.938), all potentially or effectively polluting activities are subject to an environmental licensing process. According to the Brazilian Federal Resolution CONAMA No. 237/97, the environmental licensing for a mining project is handled by the state in which the project resides.
The State Environmental Agency for the state of Maranhão (SEMA-MA) analyzes and approves proposed projects for mining activities in stages as follows:
| • | Preliminary License (Licença Prévia - LP) is required for the preliminary phase of the project planning or activity, approving its location and conception, attesting to environmental viability, and establishing the basic requirements to be fulfilled in the next phases of the Project implementation. |
| • | Installation License (Licença de Instalação - LI) authorizes the installation of the project or activity according to the specifications contained in the plans, approved programs, and designs, including environmental constraints and control measures. |
| • | Operation License (Licença de Operação - LO) authorizes the Project’s operation, after verification of effective fulfillment of the conditions, which appear on the previous two licences, with the environmental constraints and control measures determined for the operation. |
SEMA re-issued the Operational License (LO) in May 2019 incorporating of the mining expansion, and new crushing and milling facilities. The permit was re-issued in August 2019 to include the permanent water discharge from the pit.
In the case of Maranhão Environmental State Agency there is a specific three-phases licencing process (LP-LI-LO) for the tailings dam since 2016.
MASA maintains an Environmental Operating License supported by the ANM mining concession No. 1201/1988, ratification No. 25/2019, totalling 9,982 ha. One mining concession application with the three-phased environmental process (LP, LI, LO) in progress.
Equinox and its predecessors have developed plans and obtained federal, state, and local approvals for waste and tailings disposal, site monitoring, and water management; both during operations and post mine closure.
The mining activity and plant operation noise monitoring is included as part of MASA's Environmental Management Plan, as well as its environmental influence in the community area. Vibration monitoring when explosives are used in blasting in the pit is also part of the normal operation. The effluents discharge is evaluated daily to confirm the basic water quality parameters within the established legal standards. Surface and groundwater plus water for human consumption are sampled monthly for laboratory analyses to confirm they meet the standards required by the Brazilian legislation.
| | P a g e | 20-1 |
| 04/11/2021 |
| TECHNICAL REPORT ON THE AURIZONA GOLD MINE EXPANSION PRE-FEASIBILITY STUDY |
The air quality monitoring is carried out by a specialized company in periods determined by the condition of the company's operating license. To control fugitive dust MASA keeps the road surfaces watered within the operational area of the mine and external areas to ensure the quality of the surrounding air. Residue management is carried out systematically, with garbage collection, focusing on reduction, reuse, and recycling, and completing this control. There is an industrial incinerator that performs > 98% reduction of non-recyclable and hazardous residues. The incineration process operates at temperatures between 800°C and 1000°C. Food leftovers and ingesta (organic material) are treated in an industrial composter and in a handmade composter that converts organic residue into fertilizer, which will be used in the reforestation activities.
MASA maintains an Environmental Recovery Program for Degraded Areas with the application of techniques to enrich the vegetation and rehabilitation. Specimens of flora for application in the rehabilitation of areas are gathered and maintained in a nursery. The nursery also produces seedlings and has a production capacity of 18,000 seedlings to be used in reforestation. Also used in the rehabilitation program are hydroseeding and bio mats for slope and berm re-grassing to protect against erosive processes. In parallel with the environmental rehabilitation, the company monitors its legal reserve and wildlife, where it runs a biodiversity monitoring program aiming gather knowledge and continue to protect wild animals existing within the company's protected areas. With the support of MASA’s Security team, forest protection actions are also carried out on a daily basis to inhibit hunting and fishing in the areas of legal reserve and permanent preservation. On permanent alert, MASA has been maintaining a forestry brigade to fight fires that may affect the company's property.
| 20.1 | Status of Current Permits |
MASA has obtained permits and authorizations from federal, state, and local agencies to operate current facilities and activities. Table 20-1 provides a current list of the permits and plans being, or having been, operated under. Equinox is in compliance with all material aspects with issued permits.
| | P a g e | 20-2 |
| 04/11/2021 |
| TECHNICAL REPORT ON THE AURIZONA GOLD MINE EXPANSION PRE-FEASIBILITY STUDY |
Table 20-1: Environmental Permits Matrix
| Permit (Name) | Agency (Authority) | Permit # | Date | Expiration | Comment |
| Piaba and Boa Esperança | |||||
| Operation License including permit for water discharge from the pit | SEMA - State Environment Agency | 019/2013 | Aug 20 2019 | Jun 26 2020 | Renewal request on Feb 17, 2020. The current one stays valid until the renewal process is completed. |
| Operating License for the Vené TSF | SEMA - State Environment Agency | 08/2017 | June 5 2019 | Sept 25 2021 | Renewal request on May 1, 2021, for the Vené TSF to EL. 38m. Current license is valid until the renewal process is completed. |
| Installation License to raise dam to EL. 41.0m | SEMA - State Environment Agency | 1123104/2021 | July 22 2021 | July 22 2023 | Installation License issued approved on July 22 - LI nº 1123104/2021 - |
| Vegetation Suppression License (2019-2021). | SEMA - State Environment Agency | 20219201904544/2019 | Jul 08 2019 | Jul 08 2021 | Vegetation suppression completed for Vené tailings dam area and Boa Esperança pit. The Vegetation suppression license can be revalidated anytime within 12 months after expiring and is in the process of being updated. |
| Army Certificate of Registration for controlled products and explosives magazine | Defense Ministry | 53653 | Aug 02 2021 | Jun 13 2023 | The registration certificate includes the explosives magazine and usage. |
| Annual Operation License Certificate for controlled goods | Federal Police | 2020-00573228 | Nov 24 2020 | Nov 23 2021 | Monthly consumption and inventory control reporting of controlled products are being met. Annual renewal process starts 2 months before expiration. |
| TSF Construction permit | Godofredo Viana City Hall | 252/2021 | May 22 2021 | May 22 2022 | Permit for the TSF EL 41.0 m currently in use. |
| | P a g e | 20-3 |
| 04/11/2021 |
| TECHNICAL REPORT ON THE AURIZONA GOLD MINE EXPANSION PRE-FEASIBILITY STUDY |
| Permit (Name) | Agency (Authority) | Permit # | Date | Expiration | Comment |
| Annual Plant operation permit | Godofredo Viana City Hall | 189/2021 | Jan 05 2021 | Dec 31 2021 | Requirements met and permit in use with normal renewal process to occur. |
| Annual Health Permit | Godofredo Viana City Hall | 188/2021 | Jan 14 2021 | Dec 31 2021 | Requirements met and permit in use with normal renewal process to occur. |
| Annual Land use and occupation certificate | Godofredo Viana City Hall | N/A | Jun 07 2021 | Jun 07 2022 | Requirements met and permit in use with normal renewal process to occur. |
| Authorization for the Archaeological Monitoring and Rescue of Aurizona archaeo sites #1 and #4 | IPHAN - The National Historic and Artistic Heritage Institute | 01494.000473/2017-11 | Dec 11 2020 | Dec 11 2021 | It is ongoing and the RAIPA Program to IPHAN with the Integrated Management Plan is being implemented. Monitoring and archaeological rescue are underway. |
| Approval Certificate (Plant and Office) | Fire Department - Maranhão State | 2068120 | Sep 18 2020 | Sep 18 2021 | The Fire Fighting and Panic systems (Plant and Office) have been approved and the facilities are currently being used and updated approval underway. |
| Approval Certificate (Fuel Station) | Fire Department - Maranhão State | 2146920 | Sep 18 2020 | Sep 18 2021 | The Fire Fighting and Panic systems (Fuel Station) have been approved and are currently being used and updated approval underway. |
| Tatajuba | |||||
| Preliminary License - Tatajuba Project | SEMA - State Environment Agency | 1084800/2021 | Aug 10 2021 | Aug 10 2023 | License issued. Moving forward with an Installation License (LI) request. |
| | P a g e | 20-4 |
| 04/11/2021 |
| TECHNICAL REPORT ON THE AURIZONA GOLD MINE EXPANSION PRE-FEASIBILITY STUDY |
| 20.2 | Potential Environmental Impacts and Mitigation Measures |
The Aurizona Mine has potential environmental impacts which are mitigated through well established practices that have been previous documented (Lycopodium 2017). These include mitigation measures for air quality, noise, effluent quality and quantity, groundwater levels and quantity, geochemical and ARD monitoring, cyanide management, and land use impacts. MASA has an extensive environmental monitoring and management programs and some of the key programs are described below. As part of on-going operations MASA continues to monitor the following parameters outlined in Tables 20.2. Monitoring stations are shown in Figure 20-1.
Table 20-2: Parameter Monitoring
| Parameter | Number of Stations |
Frequency of Readings |
| Air Quality | 3 | Quarterly |
| Noise | 3 | Quarterly |
| Effluent Quality and Quantity | 1 | Monthly |
| Groundwater Levels and Quality | 10 | Quarterly |
| Cyanide Management | 2 | Quarterly |
All of the monitoring results are reported annually as part of the Environmental Performance Annual Report (RADA) sent to the State Environmental Agency.
| 20.2.1 | Monitoring Locations |
Various monitoring locations are maintained around the project site. These are shown in Figure 20-1 and are tabulated in Figure 20-1.
| | P a g e | 20-5 |
| 04/11/2021 |
| TECHNICAL REPORT ON THE AURIZONA GOLD MINE EXPANSION PRE-FEASIBILITY STUDY |
Figure 20-1: Monitoring Locations

| | P a g e | 20-6 |
| 04/11/2021 |
| TECHNICAL REPORT ON THE AURIZONA GOLD MINE EXPANSION PRE-FEASIBILITY STUDY |
| 20.2.2 | Air Quality Monitoring |
Equinox contracts a specialized service to performs air quality monitoring tests quarterly as directed by the Brazilian normative standard (ABNT) for particulate material measurements. The concentration of the suspended particulate matter (SPM) in the mining, processing plant and community areas are determined.
To assist in the control of fugitive dust, Equinox and its contractors have a program of dust suppression on internal and external roads.
Recent results from this sampling program are shown below in Table 20-3Error! Reference source not found..
Table 20-3: Aurizona Mine: Air Quality Analysis
| Point | Description of the sampling point | PTS Result (µg/m³/24 h) | Limit | ||||
| 2020 Q1 |
2020 Q2 |
2020 Q3 |
2021 Q1 |
2021 Q2 | |||
| AR-01 | Confluence Points of Aurizona Village and São José (WTP) | 26 | 40 | 50 | 42 | 290.81 | 240 |
| AR-02 | Mine Area with Xavier Shed | 12 | 72 | 3251 | 188 | 87.9 | 240 |
| AR-03 | Plant | 27 | 25 | 56 | 47 | 51.9 | 240 |
| NOTE: |
| 1. | When there are readings out of specifications, the recommended action is to increase the time of watering of the internal access roads and directly affected surrounding areas with the use of water trucks. |
| 2. | Due to restrictions associated with Covid-19, monitoring during Q4 2020 was not possible |
| 20.2.3 | Noise Analysis |
Equinox measures noise levels in the community to determine the sound pressure to ensure limits are not exceeded and ensure the community is not disturbed at night or during the daytime. Some examples of the sound measurements are shown in Table 20-4.
| | P a g e | 20-7 |
| 04/11/2021 |
| TECHNICAL REPORT ON THE AURIZONA GOLD MINE EXPANSION PRE-FEASIBILITY STUDY |
Table 20-4: Aurizona Mine: Noise Analysis
| Monitoring Stations | Day | Day | Day | Day | Day | |||||
| Point | Point | Feb. 2020 | Jun. 2020 | Sep. 2020 | Jan. 2021 | Limits (dB) | ||||
| RD 01 | Rd 01 - In front of the Church and camp gate | 46 | 43 | 45 | 51 | 60 | ||||
| RD 02 | Rd 02 - Roundabout in the entrance of Aurizona Village | 45 | 43 | 48 | 50 | 55 | ||||
| RD 03 | RD 03 - Commerce Street | 44 | 43 | 45 | 53 | 55 | ||||
| Monitoring Stations | Night | Night | Night | Night | Night | |||||
| Point | Point | Feb. 2020 | Jun. 2020 | Sep. 2020 | Jan. 2021 | Limits (dB) | ||||
| RD 01 | Rd 01 - In front of the Church and camp gate | 50 | 48 | 44 | 52 | 55 | ||||
| RD 02 | Rd 02 - Roundabout in the entrance of Aurizona Village | 46 | 45 | 46 | 44 | 50 | ||||
| RD 03 | RD 03 - Commerce Street | 49 | 52 | 45 | 45 | 50 | ||||
| 20.2.4 | Effluent Quality and Quantity Monitoring |
The monitoring of liquid effluents is performed to verify and control the physical-chemical parameters of the quality of the final effluents from the Aurizona project. Daily, self-monitoring is performed by the MASA Environmental Technical area, collecting effluents to measure the main quality parameters such as pH, turbidity, color, and free cyanide. In this way, it is possible to immediately correct any deviation in the effluent quality that may be found during the discharge of effluents into the environment. Approximately 54 quality parameters are analyzed in the effluent discharged for an average flow of 9,918m³/day (year 2020) into the environment through the control point EFL 04, located in the place called Curva do Edmilson. All the monitoring controls are complemented with quarterly analyses, performed by an external laboratory that has the proper certification required by the current legislation and defined in the conditionings of the operation license issued by the Environmental Agency
| 20.2.5 | Groundwater Level and Monitoring |
Additional groundwater and surface water points are periodically monitored, and the results of the ongoing monitoring program are within the required Brazilian standards and regularly reported to SEMA.
The legal requirements are based on State Law 8149/2004. All water quality parameters must be maintained in accordance with CONAMA Resolution 396/2008. The wells are monitored on a quarterly basis with water collection to assess the environmental quality of groundwater. The analyzed parameters are pH, dissolved oxygen, temperature, conductivity, bacteria (enterococci, streptococci, and E. Coli), organic compounds, organochlorines, metals, salts, nitrate, nitrite, and sulfates. In the first campaign performed on February 5th, 2020, wells PM01, PM02 and PM 06 showed altered levels of Aluminum, and well PM05 showed altered levels of Manganese. However, in subsequent monitoring there were no parameters out of the specifications.
| | P a g e | 20-8 |
| 04/11/2021 |
| TECHNICAL REPORT ON THE AURIZONA GOLD MINE EXPANSION PRE-FEASIBILITY STUDY |
| 20.2.6 | Cyanide Management |
Equinox is a signatory to the International Cyanide Management Code; the mine is seeking to become International Cyanide Code “Certified” through the development and implementation of a Cyanide Management Plan (and training). The Cyanide Code is a voluntary program designed to assist the global gold mining industry and the producers and transporters of cyanide used in gold mining in improving cyanide management practices, and to publicly demonstrate their compliance with the Cyanide Code through an independent and transparent process. The Cyanide Code is intended to reduce the potential exposure of workers and communities to harmful concentrations of cyanide‚ to limit releases of cyanide to the environment‚ and to enhance response actions in the event of an exposure or release.
Control and prevention procedures and actions are in use for the handling, use in the process, treatment, and neutralization of cyanide in the tailings. The company has detection instruments and sensors responsible for warning about the use of the correct amounts of sodium cyanide without offering environmental and occupational risks. Caustic soda or lime-based chemical products are used to keep the cyanide stable at an alkaline pH and to neutralize its effect after the generation of the process tailings using aeration, sodium metabisulfite and copper sulphate. After neutralizing the tailings containing cyanide, they are sent to the Vené TSF, where they undergo, because of photolysis, the complete decomposition of the cyanide to levels within legal standards. At MASA, the tailing undergoes decantation in the dam's reservoir and wastewater is again captured through the reuse in the hydrometallurgical process.
| 20.3 | Water Management |
All uses are subject to environmental diagnostics, including hydrogeological studies. This work is important for evaluating future uses and forecasting environmental impacts.
The surface and underground water sources are annually submitted to hydrological studies to evaluate the recovery capacity and hydro availability.
| • | Surface: |
| ○ | MASA monitors the surface water level and conducts bathymetric studies in the lagoons. Bathymetry is carried out in the driest period to determine the ecological flow of raw water extraction to maintain a safe level and not impact the ecosystem. |
| • | Underground: |
| ○ | The sampling consists of performing Flow testing which is a tool used to assess the hydraulic behavior of wells to determine their production capacity, lowering and recovery, equipment sizing for extraction of water from the wells and the determination of the hydrodynamic parameters of the aquifers. The Cooper and Jacob method is the most used in this test. |
These studies are the basis for requesting and obtaining grants for the use of water. For groundwater, MASA has two permits ensuring the right to use water. The first legal process (1160511/2018) authorizes the use of 10 m³/h (200 m³/day) of water and the second legal process (130210/2018) authorizes the catchment of 6 m³/h (120 m³/day) for industrial use purposes. For surface water, MASA has the grant of use No. 0354201/2019 for the catchment of 600m³/day (25m³/h) from Boa Esperança Lagoon, grant of use No. 0500001/2019 for the catchment of 660m³/day (27m³/h) from Louro Lagoon and grant of use No. 0431503/2018 for the catchment of 360m³/day (15m³/h) from Zé Bolacha.
| | P a g e | 20-9 |
| 04/11/2021 |
| TECHNICAL REPORT ON THE AURIZONA GOLD MINE EXPANSION PRE-FEASIBILITY STUDY |
| 20.4 | Future Permitting Requirements |
MASA will be required to update licenses and permits in compliance with regulatory requirements to permit the construction and operation of the proposed Aurizona expansion to Piaba underground and satellite open pits.
Various development areas have been included in the expansion of the Aurizona mine. These are expected to provide additional ore for the ongoing Aurizona mine to extend the operation to 2031. The timing and the overall schedule and proposed timeline of the permitting activities are shown in Figure 20-2.
Further discussion of the next steps and required permits is discussed in the following sections.
| | P a g e | 20-10 |
| 04/11/2021 |
| TECHNICAL REPORT ON THE AURIZONA GOLD MINE EXPANSION PRE-FEASIBILITY STUDY |
Figure 20-2: Project Permitting Timeline
| 2021 | 2022 | 2023 | 2024 | 2025 | |||||||||||||||
| Agency Responsible | Q1 | Q2 | Q3 | Q4 | Q1 | Q2 | Q3 | Q4 | Q1 | Q2 | Q3 | Q4 | |||||||
| Piaba UG | |||||||||||||||||||
| Exploration Drift Permit | Mining Agency/Environmental | ||||||||||||||||||
| Forestry Permit (Vegetation Suppression) | Environmental State Agency | ||||||||||||||||||
| Environmental Term of Reference Application | Environmental State Agency | ||||||||||||||||||
| Installation Licence Application for UG Project | Environmental State Agency | ||||||||||||||||||
| Incorporation of UG Project to Operation Licence | Environmental State Agency | ||||||||||||||||||
| Underground Mining Permit Application (PAE) | Mining Agency | ||||||||||||||||||
| Tatajuba | |||||||||||||||||||
| Preliminary License Issuing/Complete Conditions | Environmental State Agency | ||||||||||||||||||
| Installation Licence Issuing/Complete Conditions | Environmental State Agency | ||||||||||||||||||
| Operation License Issuing | Environmental State Agency | ||||||||||||||||||
| ASV Vegetation Suppression | Environmental State Agency | ||||||||||||||||||
| Boa Esperanca | |||||||||||||||||||
| Forestry Permit Update | Environmental State Agency | ||||||||||||||||||
| Genipapo | |||||||||||||||||||
| PAE Submission | Mining Agency | ||||||||||||||||||
| Mining Concession Request | Mining Agency | ||||||||||||||||||
| Mining Concession Approval | Mining Agency | ||||||||||||||||||
| Environ Term of Reference Application for EIS | Environmental State Agency | ||||||||||||||||||
| EIS Application | Environmental State Agency | ||||||||||||||||||
| Preliminary License Issuing/Complete Conditions | Environmental State Agency | ||||||||||||||||||
| Installation Licence Issuing/Complete Conditions | Environmental State Agency | ||||||||||||||||||
| Operation License Issuing | Environmental State Agency | ||||||||||||||||||
| ASV Vegetation Suppression | Environmental State Agency | ||||||||||||||||||
| | P a g e | 20-11 |
| 04/11/2021 |
| TECHNICAL REPORT ON THE AURIZONA GOLD MINE EXPANSION PRE-FEASIBILITY STUDY |
| 20.4.1 | Piaba |
An updated Economic Exploitation Plan [Plano de Aproveitamento Econômico (PAE)] for Piaba was submitted in May 2017 to and after evaluation the ANM granted the resuming operations related to the Mining Concession No. 1201/1988, ratification No. 25/2019.
The existing Piaba PAE will require a complete review and update to include the underground mine operation ahead of re-submitting it for approval from ANM. The pre-feasibility study which is the subject of this report will form the basis for the revised PAE.
In parallel, an assessment of the environmental impacts and measures to control and prevent pollution will be submitted to the SEMA. The assessment will result in changes to the current Operation License (LO). Key aspects requiring study are hydrogeological and geotechnical to guarantee safety and non-contamination of the surface and underground water in additional to proper state of the mine, but additional studies may be required regarding environmental data.
| 20.4.2 | Tatajuba |
The Tatajuba PAE was submitted to the Mining Agency in 14/03/2021, and the mining concession requested. MASA received the Preliminary License is moving to Installation License. To obtain the Installation License (LI), the company must fulfill all the requirements stated in the Preliminary License that includes the PBA (Basic Environmental Plan) with the detail of the programs and sub-programs for environmental monitoring control. Upon the completion of the documents to attend the LP and SEMA’s evaluation, the Installation License will be released
After submitting the LI to the ANM, the mining concession is published in the Federal Gazette and will become in force when the Operation License is released by SEMA.
Along with the application for the Installation License, which will be in Q1 2022, the vegetation suppression authorization will be requested, aiming to starting the suppression for the infrastructure and future exploitation.
| 20.4.3 | Genipapo |
Genipapo area is an exploration permit with a positive final report under assessment by ANM. After ANM´s approval an Economic Exploitation Plan (PAE) will be submitted requesting the mining concession.
In the future, the Genipapo area will be submitted to the Environmental State Office (SEMA), so that it can undergo environmental studies to start the environmental licensing process, necessary to acquire the mining concession.
| 20.4.4 | Road Upgrades |
The authorization to prepare the pre-mining infrastructure and facilities will be due when SEMA grant the Installation License.
The access road to Tatajuba will have a length of 4.1 km to connect with the main Piaba ore haulroad on the northern side of the pit. Approximately half of that road will be an upgrade/enhancement of an existing road. A controlled crossing will be required on the access road to Aurizona. The nature and operation of this crossing will be discussed with the local road users to ensure a fully discussed option is constructed. This may be level crossing with gates or lights during its use.
| | P a g e | 20-12 |
| 04/11/2021 |
| TECHNICAL REPORT ON THE AURIZONA GOLD MINE EXPANSION PRE-FEASIBILITY STUDY |
The Genipapo access is an upgrade of 2.7 km of existing road on the southeastern side of Piaba East. This does not have any crossings of concern, but local traffic will have to be controlled due to the mining activities in the area. Communication on this will be discussed as part of the permitting process.
| 20.5 | ARD Waste Monitoring and Management |
Previous geochemical analyses have indicated that near surface rock has been weathered extensively and has negligible potential for acid generation. The transition zone corresponds to rock that is partially weathered, with approximately 50% of that being PAG waste. At greater depths, the proportion of PAG waste decreases to about 10% in un-weathered fresh rock.
Current pit water samplings have not indicated an issue with acid generation.
Previous studies have provided an initial protocol for sampling of the material to determine ARD potential. This is being reviewed in light of new equipment (XRF) which may have an ability to make in field material routing choices.
The protocol will be focused on providing timely results for planning purposes. During mine operation, samples of waste rock for analysis will be taken from blast hole chips/cuttings collected routinely for gold and other analyses. Drilling chips from different depth intervals will be collected as drilling progresses. Bagged and labelled samples will be examined by a geologist to record the presence of ARD indicators (sulphides, carbonates) as part of grade control procedures, including the routine recording of lithology and other geological parameters of interest. Blast hole chips will then be pulverized, and sub-samples split out for analysis.
Other rock samples, such as drill chips obtained by drilling in advance of mining, will also be analyzed. Geologists during their field inspections of bench faces and blasted rock will make note of ARD indicators (sulphides, carbonates, changes in lithology, etc.). The short range block model can then incorporate the ARD-related analyses to assist the mining team to properly route the trucks in the same manner as the ore/waste routing occurs.
PAG waste material will be stored within the southern portion of each of the Piaba waste facilities. This allows the collection of PAG contact water seepage or surface runoff. This collected runoff will be analyzed for an estimate of the potential acid drainage and mitigative measures applied to provide the necessary pH correction.
| 20.6 | Social and Community Engagement |
Equinox has developed excellent working relationships with regulatory agencies and the public. One of the key tools in ensuring effective communication between the company and the communities is the grievance mechanism and the broad aspects of social investment. The site operations maintain a direct dialogue with the areas of influence, keeping track of all communication and relation through a record data that enhance the principles of Cultural Appropriateness, Accessibility, Transparency and Accountability.
| | P a g e | 20-13 |
| 04/11/2021 |
| TECHNICAL REPORT ON THE AURIZONA GOLD MINE EXPANSION PRE-FEASIBILITY STUDY |
The social investment is organized to work with local assets and necessities, engaging the communities to provide internal solutions for their challenges and at the same time providing external resources, through training, revenue generation projects, education, culture, and sports initiatives. The site operations also monitor and define constantly initiatives to adopt as infrastructure investments to improve local conditions and allow the regions to develop alongside the production throughout the years.
In order to enhance local content, human resources procedures take into consideration high levels of local, regional, and state workforce. Through that, the company and contractors are always capable to hire workers as close as possible to site, prioritizing the income generation and opportunities aiming its area of influence.
Equinox organizes all social projects based on two programs, Open Doors, and Integrated Local Development through which the local community and public administrations are engaged in many scopes, from environmental education and training to agriculture development, heritage, and culture enhancement.
Open Doors represents an important initiative to bring together the company and community in different activities. Most of the activities are developed in-house, with the engagement of employees as specialists in many themes, like environmental education, geology, and nutrition. The program is also supported by a local team hired from the communities as professors or tutors who engage the community members. Some metrics from the Open Doors program are shown in Table 20-5 below.
Table 20-5: Aurizona Open Doors Yearly Engagement
| Activities | Participants |
| Environmental Education | 188 |
| Education Development | 89 |
| Cinema Audience | 17,807 |
| Sponsored Culture Groups | 28 |
| Sports | 289 |
| Guided Visits on Site | 161 |
Focused on local content, Integrated Local Development is a program that prioritizes opportunities on training and income generation. Annually the site and contractors hire 35 young apprentices who have the opportunity to study, be trained and have a work contract during the whole period, increasing their employability.
Since 2016, 700 hundred people from local communities have received training in 22 different kinds of courses, comprising 7,260 hours of preparation.
On the revenue generation, the foundation of a local agriculture cooperative, COOPAIS, was possible after several years of engagement and investment to promote association and collaboration between farmers who increased their production, and also provide agroecological products to the local consumers.
All the social projects are supported by members from the community who develop different kinds of services and activities. Through this engagement, around 20 local entrepreneurs (teachers, tutors, and small contractors) have their income and work related to the social investment straight from their own community, creating a wide chain of value.
| | P a g e | 20-14 |
| 04/11/2021 |
| TECHNICAL REPORT ON THE AURIZONA GOLD MINE EXPANSION PRE-FEASIBILITY STUDY |
Recently, Equinox also built a new school fully equipped for the community. The school will have attendance all the communities around the site, improving conditions for teachers and students.
| 20.7 | Mine Closure Requirements and Reclamation Costs |
The Mine Closure has been documented in a report titled Piaba and Boa Esperança Mine Closure Plan - Aurizona Mining, GOLDER 2019. This document requires periodic review during the mine operation and will be revised to include the operations related to the new Life of Mine plan.
The Aurizona Mine Closure Plan describes the permanent closure of groundwater wells, WRSF, waste dump, the process plant, TSF and supporting facilities. The closure is expected to occur throughout various stages of operations. Physical, chemical, biological, and anthropogenic stability of the site will be achieved by ensuring ground and slope stability, prevention of release of pollutants, reclaiming areas with the sustainable restoration of biota, and meaningful community engagement.
In general, this plan calls for the return of the mine area to three different land uses:
| • | Forest Parkland or Lake |
| • | Forest Production |
| • | Commercial Agriculture |
Forest Parkland/Lake is to return that area to late stage Amazonian forests or shallow estuaries. This includes the open pit and tailings facilities.
Forest production will have similar to native species found in nearby undisturbed forests. This is planned for the waste rock management facility.
Commercial agriculture is where the development of fast-growing grasses or bushes for erosion control will take place. This is outlined for reclaimed roads, mill site, laydown areas and the administration, camp, and shop areas.
Operational stormwater channels will be used to convey site seepage and runoff during the active closure period; they will be allowed to vegetate and fail naturally during post-closure. Runoff from facilities during post- closure is expected to meet discharge objectives.
The key closure objectives for both pits will have restricted public access and to manage the quantity and quality of water in the pits. Pit walls will be monitored for stability until the pits are considered geotechnically stable. The surrounding disturbance and berms will be revegetated for Forest Parkland land use. The Piaba and Boa Esperança pits will be filled up, and they will be allowed to establish dynamic balanced water levels.
The current life of mine allocation of funds for reclamation beyond the concurrent reclamation is $9.7 M USD ($46.2 M BRL). Funding will continue to be reviewed on an annual basis and increased or decreased based on new liability, including mine expansion, and inflation or to account for completed mine reclamation, respectively.
| | P a g e | 20-15 |
| 04/11/2021 |
| TECHNICAL REPORT ON THE AURIZONA GOLD MINE EXPANSION PRE-FEASIBILITY STUDY |
The Mine Closure Plan review must comply with the ANM Resolution # 68/2021. The Aurizona Mine Closure Plan describes the permanent closure of groundwater wells, WRSF, landfill, the process plant, TSF and supporting facilities. Closure is expected to occur throughout various stages of operations. Physical, chemical, biological, and anthropogenic stability of the site will be achieved by ensuring ground and slope stability, prevention of release of pollutants, sustainable restoration of biota, and meaningful community engagement.
This plan is based on the best available information at the time of preparation; it will be reviewed every three years and updated with new data obtained from ongoing operations, changing regulatory requirements and advances in environmental rehabilitation. The next update is planned for later in 2021.
| 20.7.1 | Closure Objectives and Assumptions |
Closure strategies were designed to meet the following closure objectives:
| • | ensure health and safety of workers and of public |
| • | identify and mitigate social risks/impacts on the community, Equinox, and the overall success of the closure process |
| • | safeguard the sustainability of community interests |
| • | minimize residual environmental impacts by avoiding conditions that might cause environmental degradation |
| • | ensure geotechnical and geochemical stability of mine site features |
| • | establish effective vegetation cover and return the land to suitable post-mining land use |
Closure strategies were based on the following assumptions:
| • | identifying post-closure land uses will be acceptable to the local community and regulators |
| • | government and local communities will assume site responsibility after closure |
| • | local communities will be interested in utilizing the remaining facilities to support small-scale commercial agriculture |
| • | facility footprints will allow regrading without infringing on the operational stormwater control channels |
| • | vegetation will mature and prevent erosion of cover within two years of placement |
| • | environmental factors that may affect closure actions include high annual precipitation, the influence of tides on estuaries near mine facilities, and the historical environmental impact of Garimpeiros around the site. |
| 20.7.2 | Post-Closure Land Use |
Three main post-closure land uses have been identified for the various mine facilities, each with their own approach to revegetation (Table 20-6). Results from a current revegetation study and work will inform future revegetation programs as well as associated wildlife rehabilitation efforts.
| | P a g e | 20-16 |
| 04/11/2021 |
| TECHNICAL REPORT ON THE AURIZONA GOLD MINE EXPANSION PRE-FEASIBILITY STUDY |
Table 20-6: Post Closure Land Use
| Facility/Area | Land Use | Vegetation Species |
| Open Pits | Forest
Parkland/Lake |
Late-stage Amazonian forests/shallow estuaries |
| Underground Mine | Lake | Not
applicable. The accesses will be closed, cemented and beneath the final pit lake. |
| Tailings Facility | Forest
Parkland/Lake |
Late-stage Amazonian forests/shallow estuaries |
| Waste Rock Storage Facility | Forest Production | Similar
to native species found in nearby undisturbed forests |
| Reclaimed roads | Commercial Agriculture | Fast-growing
grasses or bushes for erosion control |
| Disturbed flat areas (camps, mill site, laydown yards, etc.) | Commercial Agriculture | Fast-growing
grasses or bushes for erosion control |
| Infrastructure (administration, camp, shops, etc.) | Commercial Agriculture | Fast-growing
grasses or bushes for erosion control |
Following closure and relinquishment, the mine area may be used by the local population or other entities in unanticipated and/or uncontrolled ways, some of which may compromise the closure activities implemented by Equinox.
| 20.7.3 | Water Management |
Operational stormwater channels will be used to convey site seepage and runoff during the active closure period; they will be allowed to vegetate and fail naturally during post-closure. Runoff from facilities during post-closure is expected to meet discharge objectives. More details are listed in the respective sections for each facility.
| 20.7.4 | Piaba, Boa Esperança, Tatajuba, Genipapo Pits |
The key closure objectives for the four pits will be to restrict public access and to manage the quantity and quality of water collecting in the pits. Pit walls will be monitored for stability until the pits are considered geotechnically stable. The surrounding disturbance and berms will be revegetated for Forest Parkland land use. The pits will fill and will be allowed to establish their respective dynamic equilibrium water levels.
Flooding of oxidized walls in the Piaba pit may cause temporary acid generation. This will be mitigated by treating the pit water annually with lime for the first two years after closure, if required. The final water elevation is predicted to prevent further acid generation. The Piaba pit will overflow to the southwest, flow through an excavated channel and discharge into the tidal estuary to the east.
During operations and at the end of mine life, the Boa Esperança pit will store water predicted to contain manganese above discharge standards. To discharge this water during the closure period, the São José pipeline and discharge structure will be used to pump the remaining water out of the pit and will be removed at closure. The water entering the pit after the initial pumping campaign is predicted to meet discharge standards after closure.
| | P a g e | 20-17 |
| 04/11/2021 |
| TECHNICAL REPORT ON THE AURIZONA GOLD MINE EXPANSION PRE-FEASIBILITY STUDY |
The various pits will fill and will be allowed to establish a dynamic equilibrium between pluvial inflows and evaporation and surface and groundwater discharge.
When Tatajuba and Genipapo areas have their respective installation licenses issued, there will be an update of the current Mine Closure Plan to include the mine closure cost estimates using the assumptions and best mine closure practices already planned for the Piaba and Boa Esperança pits. This will consider the typical closing activities as elimination of environmental liabilities, the conditions of stabilization and environmental rehabilitation and its future use as indicated in Table 20-6.
| 20.7.5 | Piaba Underground |
In a similar manner to the open pit closure, the key closure objective for the underground will be to restrict public access to the facility. As well the control of water from the underground will also be required.
It is expected that upon completion of underground mining and removal of the water pumping systems, the underground workings will flood naturally from inflows of the surrounding rock. Areas around the crown pillar have been designed with water bulkheads which will prevent the mixing of surface and ground water. Upon closure these bulkheads would be further enhanced with a cement plug in the access drift.
The portal and ventilation infrastructure will have all mechanical equipment removed. In the case of the ventilation raises, they will be backfilled and then capped with a concrete plug. The portal will have entrance capped with a concrete plug then material placed over this. The portal entrance is expected to be under the Piaba pit lake that results on closure of the Piaba mine. The concrete plus is expected to prevent mixing of underground water with the Piaba pit water.
| 20.7.6 | Waste Rock Storage Facilities (WRSF) |
Closure steps of WRSFs will occur during operations as well and will be concluded after end of life of the facilities.
| • | Each waste rock lift will be reclaimed concurrently with mining operations by regrading to reclamation slope (3:1 H:V) and by placing Saprolite at the edges of the lift and over the regraded slope. The minimum thickness of Saprolite will be 0.3 m. Equinox assumes that the last lift of each waste rock facility will be completed during the closure period. |
| • | During operations, PAG waste will be directed to selective locations in the North WRSF, doused with lime, as required, and encapsulated with Saprolite. Seepage from these areas will flow into their respective pits (Piaba, Tatajuba, Genipapo). |
| • | The reclamation cover is designed to isolate PAG and NON-PAG rock from surface exposure and promote growth of native vegetation but is not designed to limit infiltration into the dump. |
| • | Facility lifts will be vegetated with local species as soon as they are completed, sloped, and covered. Once the vegetation is established and mature, the runoff will be considered non-contact and should meet discharge requirements. |
| • | Seepage from the East, South and West WRSFs, and north side of the North WRSF at Piaba is predicted to meet discharge water quality standards. |
| • | Seepage from the south-western area of the Piaba North WRSF is predicted to contain some metals above discharge limits. Seepage from this area will be combined with surface runoff and directed to the Piaba pit where it is predicted to have a negligible effect on the water flowing from the pit after closure. |
| | P a g e | 20-18 |
| 04/11/2021 |
| TECHNICAL REPORT ON THE AURIZONA GOLD MINE EXPANSION PRE-FEASIBILITY STUDY |
| • | In the case of the Tatajuba and Genipapo pits, the greater percentage of saprolite material is believed to result in less concerns of metal discharge. Seepage from these areas will also be combined with surface runoff and directed to their respective pit with negligible effect expected on water flowing from the pits after closure. |
| • | A Forest Commercial land use is planned after closure. Equinox does not anticipate an interest by the communities for use of the WRSF’s. Although post-mining activities should avoid extensive disturbance to protect the cover and vegetation from erosion and mass instability, passive foraging and selective planting of commercial trees could occur without adversely impacting the slopes. Further study is needed prior to including this option in a final closure plan. |
| 20.7.7 | Tailings Storage Facility (TSF) |
Three TSFs are planned to be present at time of closure. The existing Vené TSF was first constructed in 2009 and is planned to operate until year-end 2022. A new facility, Vene 2 TSF will be constructed in 2022 and operate for four years (2023 to 2026). The third TSF facility, Vene 3 will be constructed by 2026 and will operate until closure in 2032.
All of the embankments for the TSF’s are designed as stand-alone compacted earth fill or rock fill structures with internal drains. For additional long-term stability, the Southwest Waste Rock Dump will buttress a portion of the existing Vene and the new Vene 2 TSF’s. The conceptual closures for the TSFs are based on the following assumptions.
| • | Tailings waste will remain saturated and hence will not be acid generating under operating conditions |
| • | Spillway channels for each TSF will be designed to safely convey the 10,000-year storm event and will be constructed and maintained during operations. |
Near the end of tailings deposition in any of the TSFs, the spigotting plan will be modified to partially fill in the supernatant pond area and create a shallow slope to drain the tailings surface towards the spillway. Prior to closure, any ponded water remaining in the TSF will be pumped from the tailings surface to the Boa Esperança Reservoir in preparation for cover placement. Cover will be placed over the tailings surface to create a shallow slope towards the spillway. Cover placement will be designed to limit water pooling to less than 1 m during the wet season.
Once the tailings cover is complete, surface water will be allowed to inundate the tailings up to the spillway elevation and flow over the spillway without further treatment. The closure surface will be revegetated with a perennial grass and shrub mix that will tolerate periodic inundation (i.e. over a wet season). Equinox expects that runoff, even prior to mature vegetation, will meet discharge limits and will be allowed to discharge to the environment without further control.
| | P a g e | 20-19 |
| 04/11/2021 |
| TECHNICAL REPORT ON THE AURIZONA GOLD MINE EXPANSION PRE-FEASIBILITY STUDY |
| 20.7.8 | Process Plant |
Prior to dismantling, the mill will be decontaminated, and any remaining reagents will be returned to vendors or be safely disposed. Remaining scrap metal will be removed from the site and recycled. Concrete foundations will be buried in-place beneath a minimum of 2 m of soil. The area will be regraded to moderate any significant variations in topography and to ensure surface drainage without excessive erosion. Surface drainage from this area will be directed onto the Vené tailings surface.
The mill and crusher facility will be sold, dismantled, and removed from the site.
| 20.7.9 | Buildings and Infrastructure |
Buildings, roads, and other infrastructure will be preserved if needed, or otherwise safely disposed or recycled.
| • | Buildings with an identified post-mining land use will remain for use by the community. The buildings will be cleaned out and any stored reagents will be returned to vendors or properly disposed prior to relinquishment. |
| • | Most roads needed for post-closure access will remain. Roads with no defined post-mining land use will be reclaimed by grading, ripping, and revegetating. |
| • | The powerlines and distribution system that are needed to support the remaining infrastructure will remain. The rest will be recycled or disposed in a permitted off-site facility. |
| • | The stormwater channels and ponds will continue to be used during closure to manage seepage and runoff from the facilities. No additional sedimentation ponds will be constructed but some existing diversions will be reconfigured, and some new diversions will be constructed. Changes to the stormwater management system for closure are outlined in the detailed closure report Aurizona Closure Plan. |
| • | The fuel storage and distribution facility will be dismantled and sold or recycled after emptying and rinsing of tanks and lines, and excess fuel returned to the vendor. |
| • | Soil surrounding the fuel storage and transfer facilities will be analysed for the presence of hydrocarbons. Any contaminated soil will be excavated and disposed or treated according to government regulations for hazardous materials. |
| • | All explosives remaining at the end of mine life will be returned to the vendor. Storage buildings will be demolished if not needed post-mining, and the debris will be hauled to the nearest waste dump. |
| • | All concrete foundations will be broken and buried by a minimum of 2 m of soil or Saprolite. Disturbed areas will be revegetated pertinent to Commercial Farmland use. |
| • | Yard areas, generally flat lying, will require minimal grading to blend the topography into the surrounding landscape and control stormwater runoff and erosion. The areas will be ripped to mitigate compaction from traffic. The disturbed areas will be revegetated with the vegetation mix consistent with Commercial Farmland use. |
| | P a g e | 20-20 |
| 04/11/2021 |
| TECHNICAL REPORT ON THE AURIZONA GOLD MINE EXPANSION PRE-FEASIBILITY STUDY |
| 20.7.10 | Monitoring |
Prior to closure, Equinox will prepare a post-closure monitoring plan that will comply with any post-closure permit requirements and provide data necessary to demonstrate successful closure of the site. This plan, based on data collected during operations and consultation with the regulatory agencies, can typically include monitoring of geotechnical stability of the waste dumps, pit walls and tailings dams; of biodiversity; and of water quality (surface water and groundwater).
| 20.7.11 | Closure Management and Security |
Personnel needed at closure will include a closure manager, an environmental monitoring technician, equipment operators, and safety and administration staff as required. A security team will be maintained during closure until a post-mining land use plan is implemented.
| 20.7.12 | Mine Closure Schedule |
Most of the planned closure actions will occur during mining operations with some being completed during the closure period. The Vené 3 will be closed during the closure period. A preliminary closure schedule, based on the actions defined herein, is presented in Table 20-7.
Preparation of the final closure plan will be completed two years prior to closure to determine any additional information, actions and approvals that will be needed prior to closure.
Table 20-7: Preliminary Mine Closure Schedule
| Facility/Area | 2021-2032 | 2033 | 2034 | 2035-2045 |
| Operation | Closure | Monitoring | ||
| Open Pits | ||||
| Underground Mine | ||||
| Tailings | ||||
| Waste Rock Dumps | Ongoing | |||
| Roads | ||||
| Process Plant | ||||
| Infrastructure | ||||
| Monitoring | ||||
| 20.7.13 | Relinquishment |
Return of the mining concessions to the Government of Brazil will occur once the mine reclamation and closure actions are complete and monitoring has demonstrated successful rehabilitation consistent with the selected Land Use and negotiated terms with regulators.
After mine closure and site handover, ongoing management and monitoring measures may be required for the rehabilitated site, and responsibility for this will need to be determined. This may include control of vegetation, grazing animals, and public access as well as fire management and maintenance of safety fences and signs.
| | P a g e | 20-21 |
| 04/11/2021 |
| TECHNICAL REPORT ON THE AURIZONA GOLD MINE EXPANSION PRE-FEASIBILITY STUDY |
| 21 | Capital and Operating Costs |
| 21.1 | Summary |
The life of mine capital costs are summarized in Table 21-1. All costs are expressed in US currency (US$) unless otherwise stated and based on 2021 H1 pricing.
Table 21-1: Aurizona Mine Capital Cost Estimate
| Area |
Initial ($M) |
Sustaining ($M) |
Total ($M) |
| Open Pit Mining | - | 79 | 79 |
| Underground Mining | 134 | 60 | 194 |
| Processing | - | 14 | 14 |
| Infrastructure | - | 178 | 178 |
| Environmental | - | 10 | 10 |
| Contingency | 20 | 43 | 63 |
| Total | 154 | 383 | 537 |
The life of mine operating cost estimate summary is shown in Table 21-2.
Table 21-2: Aurizona Mine Operating Cost Estimate
| Area | Units | LOM Cost ($M) | $/tonne |
| Open Pit Mining | $/t mined | 2.25 | |
| Open Pit Mining | $/t ore mined | 10.79 | |
| Underground Mining | $/t ore mined | 32.78 | |
| Open Pit Mining | $/t milled | 276 | 8.53 |
| Underground Mining | $/t milled | 214 | 6.62 |
| Mining Total | $/t milled | 490 | 15.15 |
| Processing | $/t milled | 373 | 11.52 |
| General and Administrative | $/t milled | 209 | 6.47 |
| Total | 1,072 | 33.14 |
The exchange rate used in various calculations for the Brazilian Real to US Dollar is 4.75:1 (R$:US$).
| 21.2 | Capital Cost Estimates |
| 21.2.1 | Summary |
Capital costs for the Aurizona Mine in order to meet current reserves production are expected to total $537 M over the mine life. This is split into:
| 1. | Initial Capital $154 M |
| 2. | Sustaining Capital $383 M |
| | P a g e | 21-22 |
| 04/11/2021 |
| TECHNICAL REPORT ON THE AURIZONA GOLD MINE EXPANSION PRE-FEASIBILITY STUDY |
The mine is currently operating; therefore the majority of the capital costs may be considered to be sustaining. The initiation of underground mining beneath the Piaba pit has been shown as initial mining capital up until the underground mine design rate has been achieved.
The capital costs for the Aurizona mine are primarily associated with Infrastructure (tailings expansion) and Underground (Initial and Sustaining).
Contingency accounts for $20 M of the Initial capital and $43 M of the Sustaining capital for a total contingency of $63 M.
| 21.2.2 | Open Pit Mine Capital Costs |
The open pits are mined by contractor. Any new pits and road costs are tabulated in Infrastructure capital discussed later. The only open pit mine capital costs are capitalization of mine stripping.
Capitalized stripping was calculated for each year based on that years strip ratio versus the life of mine plan overall strip ratio. The life of mine strip ratio is 3.79:1. Any year the planned strip ratio exceeds the life of mine ratio the tonnage difference is determined and the unit mining cost for that year applied. That value is the amount that is capitalized.
The capitalized stripping cost by year is shown in Table 21-3.
Table 21-3: Open Pit Capitalized Stripping Cost ($M)
| Capital Cost | 2022 | 2023 | 2024 | 2025 | Total |
| Capitalized Stripping | 16.5 | 42.2 | 18.8 | 1.3 | 78.8 |
| 21.2.3 | Underground Mine Capital Costs |
The Underground capital costs life of mine are shown in Table 21-4. The costs were separated into Initial and Sustaining Capital using the end of Q1 2025, when the underground mine reaches greater than 50% of planned production capacity, as the separation point in time.
The categories for the underground mine capital include:
| • | Capital Development |
| • | Operating Cost - Capitalized |
| • | Mobile Equipment |
| • | Replacement Mobile Equipment |
| • | Mine Infrastructure |
Capital development as the name implies refers to the development necessary for accessing the various mining areas. The main haulage decline is included in this category and all lateral and raise development in waste.
Capitalized operating costs refer to those costs normally considered to be operating costs but are treated as capital. For the PFS, the operating costs incurred until Q2 2025 were capitalized. The underground production rate was below 1,000 tpd in that period. After that time, the production rate jumps to 1,700 tpd and continued to increase up to full production at the end of 2025.
| | P a g e | 21-23 |
| 04/11/2021 |
| TECHNICAL REPORT ON THE AURIZONA GOLD MINE EXPANSION PRE-FEASIBILITY STUDY |
Table 21-4: LOM Underground Capital Costs ($M)
| 2022 | 2023 | 2024 | 2025 | 2026 | 2027 | 2028 | 2029 | 2030 | 2031 | Total | ||
| Initial Capital | ||||||||||||
| Capital Development | 3.2 | 14.4 | 22.1 | 6.2 | - | - | - | - | - | - | 45.9 | |
| Operating Cost - Capitalized | 0.9 | 5.9 | 3.0 | - | - | - | - | - | - | - | 9.7 | |
| Mobile Equipment | 8.9 | 16.4 | 8.0 | 0.9 | - | - | - | - | - | - | 34.2 | |
| Replacement Mobile Equipment | - | - | 0.2 | 0.1 | - | - | - | - | - | - | 0.3 | |
| Mine Infrastructure | 8.5 | 15.7 | 12.7 | 7.3 | - | - | - | - | - | - | 44.2 | |
| Sub-Total Initial Capital | 21.5 | 52.3 | 46.0 | 14.5 | - | - | - | - | - | - | 134.3 | |
| Sustaining Capital | ||||||||||||
| Capital Development | - | - | - | 3.8 | 7.0 | 5.0 | 6.5 | 2.5 | 0.7 | - | 25.6 | |
| Operating Cost - Capitalized | - | - | - | - | - | - | - | - | - | - | - | |
| Mobile Equipment | - | - | - | 5.3 | 3.3 | 0.4 | - | - | - | - | 9.0 | |
| Replacement Mobile Equipment | - | - | - | 0.4 | 4.1 | 5.0 | 5.1 | - | - | - | 14.6 | |
| Mine Infrastructure | - | - | - | 1.5 | 0.1 | 5.7 | 3.6 | 0.2 | - | - | 11.1 | |
| Sub-Total Sustaining Capital | - | - | - | 10.9 | 14.5 | 16.1 | 15.2 | 2.7 | 0.7 | - | 60.2 | |
| Total Underground Capital | 21.5 | 52.3 | 46.0 | 25.4 | 14.5 | 16.1 | 15.2 | 2.7 | 0.7 | - | 194.4 | |
Mobile Equipment includes all the production and support equipment purchases required for the operation of the mine. The mobile equipment for underground mine is based on purchase, rather than lease of the equipment. New purchases of mobile equipment are included in this category.
Replacement mobile equipment is where costs associated with mid-life rebuilds and replacement of equipment are collected.
Mine infrastructure for the underground includes the following cost items:
| • | UG Power Distribution |
| • | Dewatering Stations |
| • | Ventilation Systems |
| • | Portals and Raises |
| • | Workshops |
| • | Communication and Lighting |
| • | Return Air Vent Fans |
| • | Surface Infrastructure |
| • | EPCM |
The majority of the mine infrastructure capital cost estimate was provided by specialist companies following preliminary designs and obtained quotations. These items comprised 83% of the total underground mine infrastructure capital estimate. The remaining items comprised allowances provided based on previous project experience.
| | P a g e | 21-24 |
| 04/11/2021 |
| TECHNICAL REPORT ON THE AURIZONA GOLD MINE EXPANSION PRE-FEASIBILITY STUDY |
| 21.2.4 | Processing Capital Costs |
The processing capital cost estimate covers typical sustaining cost items associated with the ongoing operation of the various circuits within the process plant. The total process capital life of mine was $13.7 M.
Normal plant capital cost requirements vary between $0.9 M and $1.3 M annually. A large capital requirement is forecast in 2022 at $5.3 M, associated with four large expenditures:
| 1. | Pebble crusher and surge bin - $1.4 M |
| 2. | Cyanide code compliance project - $1.0 M |
| 3. | Critical spares motor purchase - $0.9 M |
| 4. | Crane purchase - $1.1 M |
The remainder of the cost in that year is associated with typical sustaining capital.
| 21.2.5 | Infrastructure Capital Costs |
Infrastructure capital covers various items including tailings construction and lifts, mine power grid upgrades, new access roads and dewatering systems at Tatajuba and Genipapo and some exploration costs. Costs associated with the underground mine infrastructure are included in the underground mine capital with the exception of the surface substation which is included in this category.
The life of mine breakdown in the major areas is shown in Table 21-5.
Table 21-5: Infrastructure Capital - Major Categories
| Area |
Initial Capital |
| General Infrastructure | 53 |
| Tailings | 96 |
| Power | 22 |
| Tatajuba | 5 |
| Genipapo | 3 |
| Total | 178 |
The General Infrastructure line item encompasses:
| 1. | Maintenance and upgrading of the numerous site buildings and camp facilities |
| 2. | Vehicle and machine purchases |
| 3. | Land purchases for mine footprint expansion |
| 4. | Exploration costs related to mine expansion |
The majority of the cost is associated with buildings and vehicles ($23 M) and exploration ($15 M).
Tailings dam costs are associated with three items:
| 1. | Dam Raise to elevation 40 masl - $2.5 M (2021) |
| 2. | Long term dam raises/Vene expansion - $46 M (2021 - 2023) |
| | P a g e | 21-25 |
| 04/11/2021 |
| TECHNICAL REPORT ON THE AURIZONA GOLD MINE EXPANSION PRE-FEASIBILITY STUDY |
| 3. | Long term dam raises/Vene expansion - $47 M (2024 - 2032) |
The electrical grid will require an upgrade to include the additional power needs of the underground mine. A study examining upgrade options is underway at the time of this report writing with an allowance included in the cost estimate. The mine upgrade to a potential 138kV is forecast at $15 M with an additional substation for the underground costing $6.3 M.
The access road cost for Tatajuba is based on the current contractor rates in use for the municipal road relocation. The 4.1 km of road is expected to cost $1.3 M and will require widening and berming of an existing road as well as some new construction in the pit area. An additional $2.4 M will be required for deforestation of 97 Ha around the Tatajuba pit, dump and access road areas based on current pricing. The dewatering system will require $1 M for pumps and piping initially.
Genipapo’s road is only 2.8 km long in comparison and will cost $0.9 M to establish and will also expand on an existing road. The deforestation of 52 Ha is estimated at $1.3 million with a further $0.5 M for the dewatering system.
| 21.2.6 | Environmental Capital Costs |
The environmental capital costs are at the end of the mine life and represent an estimate for mine closure. They will be incurred from years 2031 to 2034 in the estimate. The total environmental closure cost is estimated at $9.7 M.
Dump reclamation is considered to be concurrent with mining where possible with only the active area and top to be completed at the end of mining. This final closure cost is forecast at $1.4 M.
The underground mine closure is expected to be straightforward with the plugging and capping of the mine entrances then covering and revegetating. This is estimated to cost $0.6 M.
Closure of the open pits and accesses plus other closure measures has been estimated at $2.4 M for all pit areas and roads.
The tailings closure is the largest cost at $4.3 M.
The net cost for removal of the plant and reclamation of that area is estimated at $1 M.
| 21.2.7 | Contingency |
Contingency is calculated based on different percentages for each category. The percentages applied and their respective values are listed in Table 21-6.
Table 21-6: PFS Contingency Percentages and Value
| Area | Contingency Percentage (%) |
Initial Value |
Sustaining Value |
Total Contingency ($M) |
| Open Pit Mining | 5% | - | 3.9 | 3.9 |
| Underground Mining | 15% | 20.1 | 9.0 | 29.2 |
| Processing | 10% | - | 1.4 | 1.4 |
| Infrastructure | 15% | - | 26.7 | 26.7 |
| Environmental | 10% | - | 1.5 | 1.5 |
| Total | 20.1 | 42.5 | 62.7 |
| | P a g e | 21-26 |
| 04/11/2021 |
| TECHNICAL REPORT ON THE AURIZONA GOLD MINE EXPANSION PRE-FEASIBILITY STUDY |
| 21.3 | Operating Cost Estimates |
The total operating cost for the Aurizona Mine is $33.14 per tonne processed until the end of the mine life in 2032. Operating costs are broken into four primary areas:
| • | Open Pit Mining |
| • | Underground Mining |
| • | Processing |
| • | General and Administrative |
Capitalized stripping is not included in the operating costs. No contingency has been applied to the operating costs
| 21.3.1 | Open Pit Operating Costs |
The mining cost estimate is based on the reserves pit designs and takes into consideration haulage distances, depth of mining, and expected contractor mining costs. Mine operating costs are based on the mining schedule with the forecast contractor unit rates (taxes included) applied for the various haulage distances and material types.
The open pit using a contract mining firm to complete all mining. There is also an Equinox management team that provides engineering and geologic control for the mining operation. These costs are applied to the overall cost as well.
A summary of the open pit mining costs by year is shown in Table 21-7 as the total annual mining cost and cost per tonne of material moved by category. Detail on the individual mining cost centers are also shown. The increased haulage distance and reduced tonnages impact the unit costs at the end of the mine life. The various cost centers are as noted from the contractor. As the percentage of rock in the overall material movement increases, the cost per tonne moved also increases for drilling, and blasting.
The haulage cost is a blended rate which includes the longer ore haulage from Tatajuba. But as a percentage the amount of material is not as big a component as the deeper Piaba pit haul which provides the bulk of the ore tonnage over the life of the mine.
The plant feed category is the cost associated with the rehandle of the stockpile material and the need for a constant front end loader at the primary crusher. This is also covered by the contractor.
Ore control costs relate to the reverse circulation program that is drilled in advance of mining to define the ore/waste contacts and provide updates to the short range grade model.
Pumping costs relate to the pumping of the various pits. As the amount of underground mine tonnage increases and the total material mined by open pit decreases, the pumping unit cost rises dramatically. This cost is estimated to hold steady at $1.2 M per year for Piaba with increases due to Tatajuba and Genipapo between 2023 and 2027.
The mine General and Administrative (G&A) covers costs associated with the mine technical team including mine engineering, geology, and geotechnical monitoring.
Capitalized stripping is the reduction in those years shown for stripping above the LOM strip ratio
| | P a g e | 21-27 |
| 04/11/2021 |
| TECHNICAL REPORT ON THE AURIZONA GOLD MINE EXPANSION PRE-FEASIBILITY STUDY |
As the contractor rates included taxation, the PIS/COFINS credit are shown as deductions from the full cost estimate. The taxation rate applied was 9.25% for domestic contract services.
| | P a g e | 21-28 |
| 04/11/2021 |
| TECHNICAL REPORT ON THE AURIZONA GOLD MINE EXPANSION PRE-FEASIBILITY STUDY |
Table 21-7: Mine Operating Costs ($/tonne Moved)
| Mining Cost | 2021 | 2022 | 2023 | 2024 | 2025 | 2026 | 2027 | 2028 | 2029 | 2030 | 2031 | 2032 | LOM |
| Cost ($M) | 37.0 | 44.8 | 29.1 | 44.1 | 32.7 | 13.9 | 16.6 | 16.0 | 18.8 | 11.1 | 5.0 | 6.7 | 275.9 |
| Unit Cost ($/t moved) | 2.35 | 1.81 | 1.13 | 1.93 | 2.92 | 3.98 | 3.58 | 3.62 | 3.59 | 4.39 | 10.46 | 4.76 | 2.25 |
| G&A Contractor | 0.02 | 0.02 | 0.02 | 0.02 | 0.02 | 0.02 | 0.02 | 0.02 | 0.02 | 0.02 | 0.02 | 0.02 | 0.02 |
| Drilling | 0.12 | 0.15 | 0.19 | 0.19 | 0.26 | 0.31 | 0.30 | 0.27 | 0.31 | 0.33 | 0.35 | 0.35 | 0.20 |
| Blasting | 0.12 | 0.14 | 0.20 | 0.19 | 0.31 | 0.37 | 0.34 | 0.33 | 0.37 | 0.37 | 0.37 | 0.37 | 0.22 |
| Loading | 0.45 | 0.44 | 0.43 | 0.44 | 0.47 | 0.53 | 0.50 | 0.51 | 0.53 | 0.62 | 0.69 | 0.69 | 0.46 |
| Hauling | 1.43 | 1.45 | 1.47 | 1.48 | 1.51 | 1.61 | 1.51 | 1.67 | 1.69 | 1.67 | 1.72 | 1.72 | 1.50 |
| Plant Feed | 0.10 | 0.12 | 0.12 | 0.12 | 0.25 | 0.80 | 0.60 | 0.61 | 0.52 | 1.07 | 5.65 | 0.96 | 0.25 |
| Ore Control | 0.08 | 0.08 | 0.11 | 0.13 | 0.13 | 0.13 | 0.11 | 0.08 | 0.08 | 0.08 | 0.08 | 0.08 | 0.11 |
| Pumping | 0.04 | 0.04 | 0.08 | 0.09 | 0.15 | 0.37 | 0.28 | 0.26 | 0.22 | 0.46 | 2.42 | 0.82 | 0.13 |
| G&A Mine | 0.22 | 0.22 | 0.27 | 0.28 | 0.23 | 0.22 | 0.27 | 0.23 | 0.22 | 0.22 | 0.22 | 0.22 | 0.24 |
| Sub-Total | 2.59 | 2.67 | 2.88 | 2.95 | 3.33 | 4.38 | 3.94 | 3.99 | 3.96 | 4.84 | 11.53 | 5.24 | 3.13 |
| Less Capitalized Stripping | - | 0.67 | 1.64 | 0.82 | 0.12 | - | - | - | - | - | - | - | 0.64 |
| PIS/COFINS Credit | 0.24 | 0.18 | 0.12 | 0.20 | 0.30 | 0.41 | 0.36 | 0.37 | 0.37 | 0.45 | 1.07 | 0.48 | 0.23 |
| Total | 2.35 | 1.81 | 1.13 | 1.93 | 2.92 | 3.98 | 3.58 | 3.62 | 3.59 | 4.39 | 10.46 | 4.76 | 2.25 |
| | P a g e | 21-29 |
| 04/11/2021 |
| TECHNICAL REPORT ON THE AURIZONA GOLD MINE EXPANSION PRE-FEASIBILITY STUDY |
| 21.3.2 | Underground Mining Operating Costs |
Methodology
A series of first principle unit cost models was adapted to reflect the direct capital development and operating cost activities at Piaba underground mine. Each of the models was developed reflecting the mine design criteria and other general engineering estimates of performance. The mine was assumed to work on the basis of three 8 hour shifts per day, 365 days per year. Costs were estimated on a quarterly basis throughout the life of mine.
The cost models included design and ground support assumptions provided by the geotechnical study. The unit rates were applied to the scheduled quantities in order to estimate the direct costs.
Non recoverable taxes were added as a separate line item after the base calculation.
All activities were assumed to be undertaken by owner crews apart from raise boring and delineation drilling which will be completed by contractors.
Additional models were designed to reflect overhead-type activities at the mine:
| 4. | Mine Services (including labour, supplies and equipment for construction, materials transport, road maintenance and sanitation). Diesel maintenance labour costs are also included. |
| 5. | Cemented Rockfill Crushing and Screening: Operating and maintenance labour supplies and equipment. |
| 6. | Owners Mine Supervision and Technical (including mine management, production supervision, maintenance supervision, and mine technical and safety staff). |
| 7. | Mine Power (developed from aggregation of mine loads and estimated usage). |
Overheads were estimated by quarter and applied as a fixed daily cost. The overheads for each period were split between operating and capital development estimates in the ratio of the respective direct costs.
The models were also used to track labour and equipment hours to identify annual requirements in each labour category and equipment type.
Replacement capital for fixed plant was included in the daily overhead cost estimates. Replacement capital for mobile mining equipment was estimated by tracking equipment fleet operating hours with a mid-life rebuild equivalent to 50% of the purchase price and replacement after assumed useful life. Rebuild and replacement capital was excluded from the mine operating costs and accounted as capital items.
Labour
Annual manpower plans were developed to support the life of mine plan and the activities scheduled to meet production objectives. The manpower tables provided reflect the underground workforce required to support development and production activities.
The labour rates, bonus, social taxes, and benefits were based on local rates. The rates exclude meals and transport to and from site which are accounted in general and administration costs.
| | P a g e | 21-30 |
| 04/11/2021 |
| TECHNICAL REPORT ON THE AURIZONA GOLD MINE EXPANSION PRE-FEASIBILITY STUDY |
Hourly paid employees will workday, afternoon and night shifts, each of 8 hours. Four crews will be employed to allow for continuous operations, 365 mine operating days per year. Brazilian mine employment regulations limit employee time underground (portal-in to portal-out) to 6 hours. The estimate of effective working hours during the shift for hourly paid underground workers is shown in Table 21-8.
Table 21-8: Effective Working Hours
| Description | Unit | Value |
| Shift length | h | 8.0 |
| Surface Start Shift/Meal | h | 0.75 |
| Safety huddle | h | 0.25 |
| Surface End Shift | h | 1.00 |
| Travel UG to/from Portal | h | 0.50 |
| UG Snack | h | 0.25 |
| Efficiency Factor 1 | % | 83% |
| Effective Hours | h/shift | 4.4 |
*1 - Equivalent to a 50 minute working hour
In order to maximise mine production at Piaba, additional staggered-shift LHD and truck operators will maximise effective operating hours for these rock movement activities. A potential schedule was developed to employ an additional crew (33%) of LHD and truck drivers, staggering the non-productive times, to increase the equipment effective hours working hours from 4.4 h/shift to 5.8 h/shift. Adoption of this schedule serves to reduce the number of trucks and LHDs in operation thereby also reducing ventilation requirements.
The most senior managers and superintendents will have shared responsibility between underground and open pit operations. The majority of staff will work 8 hours per day, 5 days per week. Some job categories will be manned on a one, two or three shifts per day basis depending on the position to support continuous operations. A duty roster and call-out system will be employed to ensure effective coverage for ongoing operation during off-duty time.
Hourly paid labour for selected periods during the life of mine are shown in Table 21-9. Staff requirements are shown in Table 21-10.
| | P a g e | 21-31 |
| 04/11/2021 |
| TECHNICAL REPORT ON THE AURIZONA GOLD MINE EXPANSION PRE-FEASIBILITY STUDY |
Table 21-9: Hourly Paid Labour Requirements
| Job | 2022 Q3 |
2023 Q2 |
2024 Q1 |
2025 Q1 |
2026 Q1 |
2027 Q1 |
2028 Q1 |
2029 Q1 |
2030 Q1 |
2031 Q1 |
| Welder | 3 | 3 | 4 | 4 | 5 | 5 | 5 | 5 | 4 | 4 |
| Mechanics - Specialist | 4 | 5 | 10 | 13 | 16 | 17 | 17 | 17 | 12 | 9 |
| Mechanics - General | 5 | 7 | 20 | 28 | 38 | 40 | 41 | 40 | 26 | 19 |
| Electrician | 2 | 2 | 3 | 3 | 3 | 3 | 3 | 3 | 3 | 3 |
| Instrument Technicians | - | - | 2 | 2 | 2 | 2 | 2 | 2 | 2 | 2 |
| Development Jumbo Operator | 2 | 3 | 12 | 15 | 14 | 12 | 13 | 15 | 3 | - |
| Bolter Operator | 3 | 4 | 19 | 27 | 25 | 20 | 23 | 25 | 4 | - |
| Shotcrete Operator | 1 | 1 | 1 | 1 | 1 | 1 | 1 | 1 | 1 | - |
| Development Helper | 4 | 5 | 21 | 28 | 27 | 22 | 27 | 28 | 5 | - |
| Longhole Jumbo Operator | - | - | 1 | 3 | 9 | 11 | 10 | 9 | 9 | 6 |
| Longhole Helper | - | - | 1 | 2 | 8 | 9 | 9 | 8 | 7 | 5 |
| Blaster | 1 | 1 | 4 | 5 | 7 | 8 | 8 | 8 | 4 | 2 |
| Blasting Helper | 1 | 1 | 4 | 6 | 10 | 12 | 11 | 10 | 7 | 4 |
| LHD Driver | 2 | 2 | 11 | 19 | 44 | 49 | 50 | 49 | 33 | 21 |
| Truck Driver | 2 | 4 | 17 | 31 | 69 | 78 | 81 | 80 | 52 | 33 |
| Construction | - | 12 | 12 | 12 | 12 | 12 | 12 | 12 | 12 | 12 |
| Materials Transport | 5 | 21 | 21 | 21 | 21 | 21 | 21 | 21 | 21 | 21 |
| Pump Operator | 5 | 5 | 5 | 9 | 9 | 9 | 9 | 9 | 9 | 9 |
| Road Maintenance | - | 2 | 2 | 2 | 6 | 6 | 6 | 6 | 6 | 6 |
| UG Magazine Attendant | - | - | 5 | 5 | 5 | 5 | 5 | 5 | 5 | 5 |
| Portal Attendant | 5 | 5 | 5 | 5 | 5 | 5 | 5 | 5 | 5 | 5 |
| Breaker Operator | - | - | - | 5 | 9 | 9 | 9 | 9 | 9 | 9 |
| Total Hourly Paid | 45 | 83 | 180 | 246 | 345 | 356 | 368 | 367 | 239 | 175 |
| | P a g e | 21-32 |
| 04/11/2021 |
| TECHNICAL REPORT ON THE AURIZONA GOLD MINE EXPANSION PRE-FEASIBILITY STUDY |
Table 21-10: Staff Requirements
| Position | 2022 Q3 |
2023 Q2 |
2024 Q1 |
2025 Q1 |
2026 Q1 |
2027 Q1 |
2028 Q1 |
2029 Q1 |
2030 Q1 |
2031 Q1 |
| Maintenance Superintendent | 0.5 | 0.5 | 0.5 | 0.5 | 0.5 | 0.5 | 0.5 | 0.5 | 0.5 | 0.5 |
| Maintenance General Foremen | 1 | 1 | 1 | 3 | 3 | 3 | 3 | 3 | 1 | 1 |
| Maintenance Planner | - | 1 | 1 | 1 | 1 | 1 | 1 | 1 | - | - |
| Maintenance Foremen | 1 | 3 | 3 | 4 | 4 | 4 | 4 | 4 | 3 | 1 |
| UG Lamproom Technician | 1 | 1 | 3 | 3 | 3 | 3 | 3 | 3 | 1 | 1 |
| Secretary/Clerk/Stores | 3 | 4 | 4 | 6 | 6 | 6 | 6 | 6 | 4 | 3 |
| Senior Safety Technician | 1 | 1 | 1 | 1 | 1 | 1 | 1 | 1 | 1 | 1 |
| Mining Manager | 0.5 | 0.5 | 0.5 | 0.5 | 0.5 | 0.5 | 0.5 | 0.5 | 0.5 | 0.5 |
| Mine General Foreman | 1 | 1 | 1 | 2 | 2 | 2 | 2 | 2 | 1 | 1 |
| Mine Operations General Supervisor | 4 | 8 | 8 | 17 | 17 | 17 | 17 | 17 | 13 | 8 |
| Chief Engineer | 0.5 | 0.5 | 0.5 | 0.5 | 0.5 | 0.5 | 0.5 | 0.5 | 0.5 | 0.5 |
| Senior Engineer | 1 | 1 | 1 | 1 | 1 | 1 | 1 | 1 | 1 | 1 |
| UG Planning Engineer | 1 | 3 | 3 | 6 | 6 | 6 | 6 | 6 | 4 | 3 |
| Blasting/Geotechnical Technician | 1 | 1 | 3 | 3 | 3 | 3 | 3 | 3 | 3 | 1 |
| Surveyor/Mining Technician | 1 | 1 | 1 | 1 | 1 | 1 | 1 | 1 | 1 | 1 |
| Surveyor/Mine Technician Helper | 4 | 6 | 7 | 7 | 7 | 7 | 7 | 7 | 6 | 6 |
| Chief Geologist | 0.5 | 0.5 | 0.5 | 0.5 | 0.5 | 0.5 | 0.5 | 0.5 | 0.5 | 0.5 |
| Senior Geologist | 1 | 1 | 1 | 1 | 1 | 1 | 1 | 1 | 1 | 1 |
| UG Mine Geologist | - | 3 | 3 | 3 | 3 | 3 | 3 | 3 | 1 | 1 |
| UG Grade Control Geologist/Modeler | 1 | 1 | 6 | 6 | 6 | 6 | 6 | 6 | 3 | 3 |
| Total Staff | 27 | 41 | 49 | 66 | 66 | 66 | 66 | 66 | 47 | 37 |
| Total Labour (Staff + Hourly) | 72 | 124 | 227 | 310 | 409 | 417 | 429 | 431 | 283 | 211 |
Consumables
Some local consumable and material unit pricing was received for the PFS. The cost of other items was taken using recent data from other mining projects. Where necessary, costs were escalated at the rate of 2% per annum from the date of information to reflect Q2 2021 costs.
Mobile Equipment
Equipment requirements are based on modelled operational hours. Potential exists for the fleet size to be reduced by rescheduling and optimization of activities.
Quotations received for this PFS, and other recent projects were used for the equipment types selected. Where quotations were older than one year, they were escalated by 2% per annum (pa) from the date of quotation where necessary. An allowance for initial spare parts (5%) was included in the purchase price used for modeling, but freight to site was excluded. Mechanical availability, utilization and operational life were estimated for each equipment type and the hourly operating costs were assessed. A mid-life rebuild equivalent to 50% of the purchase price was included in the capital estimate to increase operational life. The mobile equipment list is shown in Table 21-11 with vendor, model and origin of equipment selected.
| | P a g e | 21-33 |
| 04/11/2021 |
| TECHNICAL REPORT ON THE AURIZONA GOLD MINE EXPANSION PRE-FEASIBILITY STUDY |
Table 21-11: Mobile Equipment List
| Equipment Type | Vendor | Model | Origin |
| 6.7t LHD | Sandvik | LH307 | Finland |
| 10t LHD | Sandvik | LH410 | Finland |
| 27 t Diesel truck | Volvo | FMX 460 6x4 | Brazil |
| 2 Boom Development Jumbo | Sandvik | DD321 -40 | Finland |
| Longhole Drill | Sandvik | DL331 | Finland |
| Slot Raise Borer | Rhino/Sandvik | Rhino 100 | Finland |
| Rockbolter | Maclean | Maclean Omnia Bolter | Finland |
| Boom Truck | MacLean | Mine Mate BT3 | Canada |
| Fuel/Lube | MacLean | Mine Mate FL3 | Canada |
| Shotcrete | MacLean | Mine Mate SS3 | Canada |
| 22 Man Personnel | MacLean | Mine Mate PC3 | Canada |
| Scissors | MacLean | Mine Mate SL3 | Canada |
| Transmixer | MacLean | Mine Mate TM3 | Canada |
| Emulsion Loader | MacLean | Mine Mate EC3 | Canada |
| Grader | CAT | CAT 12K | Brazil |
| Mobile Breaker | Volvo | Volvo EW60 | Brazil |
| Toyota Runaround | Miller Tech | Toyota | Brazil |
| Mechanics Runaround | Miller Tech | Toyota Mechanics | USA |
| Surface FEL | CAT | CAT 966H | Brazil |
| Telehandler | CAT | CAT TH407C | USA |
| Surface Bus 30 Seater | TBA | Surface Bus 30-Seater | Brazil |
| Sanitation | Maclean | Mine Mate CS3 Cassette | Canada |
| Production emulsion Charger | Maclean | CS3 Prod Emulsion Charger | Canada |
| Rescue/First Aid | Miller Tech | Toyota Rescue | Brazil |
Equipment fleet requirements for selected periods during the life of mine are provided in Table 21-12.
| | P a g e | 21-34 |
| 04/11/2021 |
| TECHNICAL REPORT ON THE AURIZONA GOLD MINE EXPANSION PRE-FEASIBILITY STUDY |
Table 21-12: Equipment Fleet Requirements
| Equipment Type | 2023 Q3 |
2024 Q1 |
2025 Q1 |
2026 Q1 |
2027 Q1 |
2028 Q1 |
2029 Q1 |
2030 Q1 |
2031 Q1 |
| 6.7t LHD | 1 | 1 | 1 | 1 | 1 | 1 | 1 | 1 | 1 |
| 10t LHD | 2 | 3 | 5 | 10 | 11 | 11 | 11 | 8 | 5 |
| 27 t Diesel truck | 3 | 4 | 7 | 14 | 16 | 16 | 16 | 11 | 7 |
| 2 Boom Development Jumbo | 2 | 3 | 4 | 4 | 4 | 4 | 3 | 1 | |
| Longhole Drill | 1 | 1 | 1 | 2 | 3 | 3 | 2 | 2 | 2 |
| Slot Raise Borer | 1 | 1 | 1 | 1 | 1 | 1 | 1 | 1 | 1 |
| Rockbolter | 4 | 5 | 7 | 7 | 6 | 7 | 7 | 2 | |
| Boom Truck | 1 | 2 | 3 | 3 | 3 | 3 | 3 | 3 | 3 |
| Fuel/Lube | 1 | 1 | 1 | 1 | 1 | 1 | 1 | 1 | 1 |
| Shotcrete | 1 | 1 | 1 | 1 | 1 | 1 | 1 | 1 | |
| 22 Man Personnel | 1 | 2 | 2 | 2 | 2 | 2 | 2 | 2 | 2 |
| Scissors | 5 | 7 | 9 | 9 | 7 | 8 | 9 | 3 | 1 |
| Transmixer | 2 | 2 | 3 | 3 | 3 | 3 | 3 | 3 | 2 |
| Emulsion Loader | 1 | 1 | 2 | 2 | 1 | 2 | 2 | 1 | |
| Grader | 1 | 1 | 1 | 1 | 1 | 1 | 1 | 1 | |
| Mobile Breaker | 1 | 2 | 2 | 2 | 2 | 2 | 2 | ||
| Toyote Runaround | 4 | 8 | 12 | 12 | 12 | 12 | 12 | 8 | 4 |
| Mechanics Runaround | 1 | 1 | 1 | 1 | 1 | 1 | 1 | 1 | 1 |
| Surface FEL | 1 | 2 | 3 | 3 | 3 | 3 | 3 | 2 | |
| Telehandler | 1 | 2 | 2 | 2 | 2 | 2 | 2 | 2 | 2 |
| Surface Bus 30 Seater | 1 | 2 | 2 | 2 | 2 | 2 | 2 | 1 | 1 |
| Sanitation | 1 | 1 | 1 | 1 | 1 | 1 | 1 | 1 | 1 |
| Production Emulsion Charger | 1 | 1 | 1 | 1 | 1 | 1 | 1 | ||
| Rescue/First Aid | 1 | 1 | 1 | 1 | 1 | 1 | 1 | 1 | 1 |
| Explosives Transport | 1 | 1 | 1 | 1 | 1 | 1 | 1 | 1 | 1 |
The option to use 45t rigid frame diesel trucks supplied by Sandvik for underground use was considered using a comparative cost model. The economics of various truck selection options were run through the cost model. This showed the underground only cash flow NPV 5% increased by $20 M when using the 27 t truck and was therefore selected for use in the PFS.
Power
A load list was compiled for the underground mine. With reference to the activity schedules and milestone achievements each line item of the load list was reviewed on a period by period basis to estimate the power requirements by quarter.
The resulting schedule of utilised power is shown in Figure 21-1. Features of note are:
| • | The changes in ventilation requirements as mine production increases and then reduces. |
| • | Increasing dewatering requirements as the extraction of mining zones increases and seasonal variation during the wet and dry seasons. |
| | P a g e | 21-35 |
| 04/11/2021 |
| TECHNICAL REPORT ON THE AURIZONA GOLD MINE EXPANSION PRE-FEASIBILITY STUDY |
Figure 21-1: Utilised Power

Estimation Results
The underground mine cost model was used to calculate pre-tax cost estimates. The non recoverable taxes were subsequently added afterwards based on tax advice provided as a line item.
In the mine plan initial development commences in Q2 2022 with final mine production in Q2 2031. Mine life was divided into a project capital phase ending in Q1 2025 and an operating phase thereafter. Operating costs incurred prior to Q2 2025 were transferred to the capital estimate as discussed in Section 21.2.3. A summary of life of mine operating costs Q2 2025 to Q2 2031 is shown by element and by activity in Table 21-13.
| | P a g e | 21-36 |
| 04/11/2021 |
| TECHNICAL REPORT ON THE AURIZONA GOLD MINE EXPANSION PRE-FEASIBILITY STUDY |
Table 21-13: Underground Mine LOM Operating Costs
| Description |
Cost |
Unit Cost |
| OPERATING COSTS BY ELEMENT | ||
| Labour | 37 | 5.63 |
| Supplies | 60 | 9.17 |
| Equipment | 70 | 10.74 |
| Fuel | 21 | 3.29 |
| Power | 15 | 2.24 |
| Sub-Total | 203 | 31.07 |
| Non Recoverable Taxes | 11 | 1.72 |
| Total | 214 | 32.78 |
| OPERATING COSTS BY ACTIVITY | ||
| Vein Development | 38 | 5.76 |
| Stope Drill & Blast | 10 | 1.52 |
| Stope Mucking | 13 | 2.03 |
| Truck Haulage | 38 | 5.90 |
| Rockfill | 30 | 4.61 |
| Delineation Drilling | 13 | 2.01 |
| Mine Services | 28 | 4.23 |
| Supervision & Technical | 18 | 2.78 |
| Leasing | - | - |
| Power | 15 | 2.24 |
| Sub-Total | 203 | 31.07 |
| Non Recoverable Taxes | 11 | 1.72 |
| Total | 214 | 32.78 |
| 21.3.3 | Process Operating Costs |
The process operating costs per major rock type (laterite, saprolite, transition and fresh rock) are summarized in Table 21-14. They include the non-recoverable taxes.
The basis for developing the process operating costs are based on current costs and 2021 forecast values. They are as follows:
| • | Labour costs are based on the current Aurizona process plant organizational chart. |
| • | Operating consumables include crusher and mill liner costs, grinding media, screen wear parts, reagent consumption costs (lime, sodium cyanide, carbon, flocculant, elution and gold room reagents, diesel fuel for mobile equipment and the elution heater). |
| • | Services costs include the laboratory, rental, consultants, and other minor services. |
| | P a g e | 21-37 |
| 04/11/2021 |
| TECHNICAL REPORT ON THE AURIZONA GOLD MINE EXPANSION PRE-FEASIBILITY STUDY |
| • | Power costs are based on the average power consumption at the process plant applied to the grid power unit cost of $0.058/kWh. Grinding power costs account for approximately half of the total power costs and have been derived based on the major rock types. |
| • | Maintenance costs include mechanical, electrical, and light vehicle maintenance related to the process plant. |
| • | Other costs include foreign exchange adjustments |
Table 21-14: Process Operating Costs - $/tonne Ore Processed
| Processing Area | Laterite/Saprolite | Transition | Fresh Rock | |||
| $M/year | $/ t Ore | $M/year | $/ t Ore | $M/year | $/ t Ore | |
| Plant Labour | 4.3 | 1.47 | 4.3 | 1.47 | 4.3 | 1.47 |
| Operating Consumables | 13.2 | 4.51 | 13.9 | 4.75 | 21.0 | 7.35 |
| Services | 0.9 | 0.32 | 0.9 | 0.32 | 0.9 | 0.32 |
| Power | 0.2 | 0.08 | 0.3 | 0.09 | 6.0 | 2.04 |
| Maintenance | 3.0 | 1.02 | 3.0 | 1.02 | 3.0 | 1.02 |
| Other Costs | 1.3 | 0.44 | 1.3 | 0.44 | 1.3 | 0.44 |
| Total Process Cost | 22.9 | 7.84 | 23.6 | 8.08 | 36.9 | 12.63 |
The costs by ore material type vary as does the percentage of each type of material over the life of mine. The percentage of laterite, saprolite and transition material in the plant feed is forecast to drop over the life of the mine as a result of the increasing depth of Piaba pit and the addition of the higher grade underground ore. This will result in higher annual processing costs due to the higher cost of processing fresh rock.
It also results in a lower annual throughput to the design capacity of the plant. With higher percentages of softer laterite, saprolite and transition the plant has been able to exceed design capacity. While Tatajuba and Genipapo add additional softer material for blending, the longer term fresh rock percentage still increases.
The percentages by year of each type and corresponding process cost have been shown in Table 21-15.
| | P a g e | 21-38 |
| 04/11/2021 |
| TECHNICAL REPORT ON THE AURIZONA GOLD MINE EXPANSION PRE-FEASIBILITY STUDY |
Table 21-15: Aurizona Mill Annual Process Unit Cost
| Units | 2021 | 2022 | 2023 | 2024 | 2025 | 2026 | 2027 | 2028 | 2029 | 2030 | 2031 | 2032 | LOM | ||
| Feed Percentage | |||||||||||||||
| Laterite/Saprolite % | % | 16.0 | 7.7 | 28.3 | 37.5 | 13.0 | 0.2 | 5.4 | 3.6 | - | 9.8 | 32.7 | - | 13.4 | |
| Transition % | % | 35.4 | 30.2 | 27.0 | 6.8 | 4.3 | 7.9 | 8.2 | 1.8 | - | 1.7 | - | - | 10.2 | |
| Fresh Rock % | % | 48.6 | 62.1 | 44.7 | 55.7 | 82.7 | 91.9 | 86.3 | 94.6 | 100 | 88.5 | 67.3 | 100.0 | 76.4 | |
| Feed Tonnage | Mt | 1.72 | 3.11 | 3.15 | 2.92 | 2.92 | 2.92 | 2.92 | 2.82 | 2.82 | 2.82 | 2.82 | 1.41 | 32.34 | |
| Process Cost | $/t | 10.25 | 10.89 | 10.05 | 10.52 | 11.81 | 12.26 | 11.99 | 12.37 | 12.63 | 12.08 | 11.06 | 12.63 | 11.52 | |
| | P a g e | 21-39 |
| 04/11/2021 |
| TECHNICAL REPORT ON THE AURIZONA GOLD MINE EXPANSION PRE-FEASIBILITY STUDY |
| 21.3.4 | General and Administrative Operating Costs |
G&A operating costs are based on actual mine site costs and the 2021 forecast. These costs include the site overhead, social programs, consultant fees, and other site related costs.
The 2021 forecast has a value of $17.75 M for the year. The major costs are:
| 8. | Labour 39% |
| 9. | Cost Sharing 17% |
The various other line items account for the remaining costs in G&A.
The labour costs for G&A and consultants are increased by 15% over the forecast from 2023 until the end of the mine life. This was included to consider the impact of the underground on overall site costs and expected support requirements from others.
The G&A costs expressed as costs per tonne of ore processed are shown in Table 21-16.
Table 21-16 General and Administrative Costs (G&A) - LOM
| G&A Cost | Units | 2021 | 2022 | 2023 | 2024 | 2025 | 2026 | 2027 | 2028 | 2029 | 2030 | 2031 | 2032 | LOM |
| Cost | $M | 10.4 | 17.8 | 19.0 | 19.1 | 19.1 | 19.1 | 19.1 | 19.1 | 19.1 | 19.1 | 19.1 | 9.5 | 209.4 |
| Unit Cost | $/t ore | 6.05 | 5.72 | 6.02 | 6.54 | 6.54 | 6.54 | 6.54 | 6.77 | 6.77 | 6.77 | 6.77 | 6.77 | 6.47 |
| | P a g e | 21-40 |
| 04/11/2021 |
| TECHNICAL REPORT ON THE AURIZONA GOLD MINE EXPANSION PRE-FEASIBILITY STUDY |
| 22 | Economic Analysis |
| 22.1 | Introduction |
This section presents the life of mine cash flow forecast model for the Aurizona mine. This is used in the financial evaluation to determine the Net Present Value (NPV) of the mine, including the expansion project as outlined. The calculation for Internal Rate of Return (IRR) and payback period are not included as the addition of the other new areas (satellite open pits and underground) are additive to the existing operation and makes IRR and payback somewhat irrelevant values.
Annual cash flow projections were estimated over the life of the mine based on the current mine estimates of capital expenditures, plus the additional items necessary for the inclusion of the underground mine and open pit mining at Tatajuba and Genipapo. Production costs are estimated with the current contract mining terms for the open pits and base principles calculation for the underground in an owner operated configuration. The sales revenue is based on the production of a gold bullion. The estimates of capital expenditures and site production costs have been developed specifically for this project and have been presented in earlier sections of this report.
For the purposes of this cash flow forecast, the timeline starts as of June 30, 2021.
The following key parameters were used in the construction of the cash flow model and the economic results:
| • | gold price at US$1,500/oz |
| • | 100% equity financing with no debt component |
| • | revenues and costs reported in constant Q3 2021 U.S. dollar terms without escalation |
This analysis was completed primarily utilizing a Microsoft Excel-based discounted cash flow model. Currency is provided in US dollars.
Taxation calculations were completed with the assistance of L&M Advisory, a local Brazilian firm familiar with the project from previous studies. Their analysis was also reviewed by the Equinox teams in Brazil and Canada together with AGP.
| 22.2 | Summary Economic Analysis |
Table 22-1 presents the summary economic analysis results for the Aurizona PFS project at $1500/oz gold price.
| | P a g e | 22-1 |
| 04/11/2021 |
| TECHNICAL REPORT ON THE AURIZONA GOLD MINE EXPANSION PRE-FEASIBILITY STUDY |
Table 22-1: Aurizona Project - Discounted Cash Flow Financial Summary
| Parameter | Units | Pre-Tax | Post-Tax | |
| Gold Price | US$/oz | 1,500 | ||
| Exchange Rate | R$:US$ | 4.75 | ||
| Economic Indicators | ||||
| Net Present Value (5%) | US$ M | 354 | 314 | |
| Gold Revenue less Royalties | US$ M | 2,120 | ||
| Total Operating Cost | US$ M | 1,072 | ||
| Life of Mine Capital Cost | US$ M | 538 | ||
| Net Taxes | US$ M | - | 46 | |
| Net Cash Flow | US$ M | 510 | 464 | |
| Cash Costs | US$/oz | 803 | ||
| All-in Sustaining Cost | US$/oz | 1,058 | ||
| Gold - Payable | Moz | 1.50 | ||
| Mine Life | Years | 11 | ||
| Operating Costs | ||||
| US$ M | $/t Ore Milled | $/t Ore Mined | ||
| Open Pit Mining | 276 | 8.53 | 10.79 | |
| Underground Mining | 214 | 6.62 | 32.78 | |
| Processing | 373 | 11.52 | ||
| G & A | 209 | 6.47 | ||
| Total | 1,072 | 33.14 | ||
| Capital Costs | ||||
| Initial Capital | US$ M | 154 | ||
| Sustaining Capital | US$ M | 383 | ||
| Total Capital | US$ M | 537 | ||
| $/t ore | 16.62 | |||
| Production Summary | ||||
| Open Pit | Underground | Total | ||
| Mine Mill Feed | Mt | 25.8 | 6.5 | 32.3 |
| Gold Grade | g/t | 1.30 | 2.77 | 1.60 |
| Waste | Mt | 96.9 | ||
| Strip Ratio | W:O | 3.8 | ||
| Gold Ounces | Insitu | 1,080,400 | 580,400 | 1,660,800 |
| Recovered | 980,500 | 522,400 | 1,502,900 | |
| 22.3 | Mine Production Statistics |
Mine production is reported as open pit mill feed ore and waste as well as underground mill feed ore. The annual production figures were obtained from the mine plans discussed in Section 16 earlier in this report. The life of mine ore, waste quantities, and ore grade are presented in Table 22-2.
| | P a g e | 22-2 |
| 04/11/2021 |
| TECHNICAL REPORT ON THE AURIZONA GOLD MINE EXPANSION PRE-FEASIBILITY STUDY |
Table 22-2: Mill Feed, Waste and Metal Grades
| Units | Open Pit | Underground | Total | ||
| Mine Mill Feed | Mt | 25.8 | 6.5 | 32.3 | |
| Gold Grade | g/t | 1.30 | 2.77 | 1.60 | |
| Waste | Mt | 96.9 | - | 96.9 | |
| Total | Mt | 122.7 | 6.5 | 129.2 | |
| 22.4 | Plant Production Statistics |
Feed from the open pits and underground is a mixture of laterite, saprolite, transition and fresh rock. Over the life of mine, fresh rock accounts for 76% of the material. The 8,000 tpd of mill feed will be processed using a conventional primary crusher and SAG-Ball mill comminution circuit. This is followed by a gravity circuit, CIL process and associated gold recovery and carbon handling circuits to produce gold doré. A pebble crusher will be added to handle the larger percentage of fresh rock starting in 2022.
The estimated gold recoveries varied by material type and area but over the life of mine averaged 90.5%.
| 22.5 | Marketing Terms |
A doré bar is produced and sent to a precious metal refinery. The refining charges are negotiable at the time of the agreement. The refining terms and transportation charges used in this analysis are $23.12 per oz.
| 22.6 | Capital Expenditures |
| 22.6.1 | Capital |
The financial indicators have been determined with 100% equity financing of the initial capital. Capital costs included in the financial model are shown below in Table 22-3, Figure 22-1 and detailed in Section 21. The highest expenditure on capital is in 2023.
| | P a g e | 22-3 |
| 04/11/2021 |
| TECHNICAL REPORT ON THE AURIZONA GOLD MINE EXPANSION PRE-FEASIBILITY STUDY |
Table 22-3: Aurizona Project Capital Costs (US$)
| Units | Initial | Sustaining | Total | ||
| Open Pit | US$ M | - | 79 | 79 | |
| Underground | US$ M | 134 | 60 | 194 | |
| Processing | US$ M | - | 14 | 14 | |
| Infrastructure | US$ M | - | 178 | 178 | |
| Environmental | US$ M | - | 10 | 10 | |
| Contingency | US$ M | 20 | 43 | 63 | |
| Total | US$ M | 154 | 383 | 537 | |
Initial Capital
As the Aurizona mine is a currently operating entity, the only initial capital is that envisaged to advance the underground mine to full production and the associated contingency. This includes all development, infrastructure and equipment purchases from 2022 until Q2 2025. The total initial underground capital is $154 M including contingency
Sustaining Capital
Sustaining capital expenditures during the production period have been included in the financial analysis. The bulk of this is associated with TSF expansions. The sustaining capital contained in the financial model is estimated at $383 M including contingency.
| | P a g e | 22-4 |
| 04/11/2021 |
| TECHNICAL REPORT ON THE AURIZONA GOLD MINE EXPANSION PRE-FEASIBILITY STUDY |
Figure 22-1: Aurizona Project Capital Cost by Year

Note: Reclamation costs occur in from 2031-2034 which have not been shown in this graph
| 22.6.2 | Salvage Value |
No allowance has been included in the cash flow analysis for salvage value.
| 22.6.3 | Reclamation/Closure Costs |
Reclamation and closure costs are estimated to be $10 M and account for activities required to comply with anticipated future amendments to the mine and reclamation plan associated with the mine expansion. These activities include facility decommissioning, land recontouring and revegetation.
| 22.7 | Net Revenue |
The average New York spot gold price for 2020 was $1,773 per troy ounce. The New York price as of June 30, 2021, was $1,771 per troy ounce. The three-year, five-year, and ten-year rolling average prices through the end of June 2021 are $1,559, $1,446, and $1,420 per troy ounce, respectively.
Net revenue was determined by applying estimated gold prices to the payable gold estimated for each year. Sales prices have been applied to all life of mine production without escalation or hedging. The revenue is the value of payable metals sold minus treatment and transportation charges. The gold sales price used in the evaluation is $1,500/oz.
| | P a g e | 22-5 |
| 04/11/2021 |
| TECHNICAL REPORT ON THE AURIZONA GOLD MINE EXPANSION PRE-FEASIBILITY STUDY |
| 22.8 | Royalties |
Royalty payments are included for several royalties, both private and the Brazilian government. The estimated royalty payments for the life of the mine totals $100 M and are shown in Table 22-4.
Table 22-4: Royalties Summary
| Royalty | % | Royalty Value ($M) |
Owner |
| Sandstorm | 3.0 | 67 | Sandstorm Gold Royalties |
| CFEM | 1.5 | 33 | Compensação Financeira pela Exploração de Recursos Minerais - CFEM |
| 22.9 | Operating Cost |
Life of mine Cash Operating Costs include mine operations, process plant operations, general administrative cost, and refining/transportation charges. Table 22-5 shows the estimated operating cost by area per tonne of ore processed.
Table 22-5: Operating Cost Summary
| Description | Units | Value |
| Open Pit Mining | $/t mined | 2.25 |
| Open Pit Mining | $/t ore mined | 10.79 |
| Underground Mining | $/t ore mined | 32.78 |
| Open Pit Mining | $/t ore milled | 8.53 |
| Underground Mining | $/t ore milled | 6.62 |
| Mining - Subtotal | $/t ore milled | 15.15 |
| Processing | $/t ore milled | 11.52 |
| General and Administrative | $/t ore milled | 6.47 |
| Total | $/t ore milled | 33.14 |
| 22.10 | Taxation |
The taxation on the Aurizona project reflects the current Brazilian legislation. The applicable fiscal benefits are included in this economic analysis. The relevant taxes and fiscal benefits by level of government are summarized below.
| | P a g e | 22-6 |
| 04/11/2021 |
| TECHNICAL REPORT ON THE AURIZONA GOLD MINE EXPANSION PRE-FEASIBILITY STUDY |
| 22.10.1 | Applicable Taxes |
Federal Taxes
II: Imposto de Importação.
IPI: Imposto sobre Produtos Industrializados.
IRPJ: Imposto de Renda da Pessoa Jurídica.
CSLL: Contribuição Social sobre o Lucro Líquido.
COFINS: Contribuição para o Financiamento da Seguridade Social.
PIS: Programa de Integração Social.
State Taxes
ICMS: Imposto sobre Operações Relativas à Circulação de Mercadorias e sobre Prestação de Serviços de Transporte Interestadual e Intermunicipal e de Comunicação.
DIFAL: ICMS complimentary rate due to the State of Maranhão.
Municipal Taxes
ISSQN: Imposto sobre Serviços de Qualquer Natureza.
Fiscal Benefits
Federal Level
The results presented in this economic analysis utilize the tax benefits provided for mainly export companies and also those benefits targeted to new investments:
RECAP - Suspension of PIS and COFINS on the acquisitions of machinery, instrumentation, and equipment in the construction phase. The rules and the granting of the benefit are determined by the Secretaria da Receita Federal do Brasil (“SRF”). The legal basis of RECAP is in effect and provided for in Articles 12 to 16 of Law Nº 11,196, of November 21, 2005, and the list of items considered as “BK” is contained in the Federal Decree Nº 6581 of September 26, 2008.
DRAWBACK - Suspension of Import Duty, IPI, PIS and COFINS on imported inputs and raw materials. The tax regime of Drawback consists of the suspension of payment of taxes due, in customs clearance of inputs (raw materials, intermediate products and packaging materials), for a maximum period of up to one year, provided that the products resulting from the manufacturing process are effectively exported. Legal basis: Decree-Law 37/66 and Portaria Secex Nº 23, of July 14, 2011.
PREPON-EX - Suspension of PIS and COFINS on purchases of inputs and raw materials to be consumed in the production process for companies that exports the minimum of 60% of its production. Excluded from this benefit are energy and diesel. Legal basis: articles 14, 16 and 44 of Law Nº. 11,196, of November 21, 2005, and on normative instruction SRF Nº 595 of December 27, 2005.
| | P a g e | 22-7 |
| 04/11/2021 |
| TECHNICAL REPORT ON THE AURIZONA GOLD MINE EXPANSION PRE-FEASIBILITY STUDY |
SUDENE: INCOME TAX - The Company is subject to corporate income tax in Brazil at a rate of 25% and to social contribution tax at a rate of 9%. The Company has a valid agreement with the Superintendence for the Development of the Northeast (“SUDENE”) which provides a 75% reduction to the corporate income taxes payable on eligible profits earned for the year in relation to the Aurizona operations. It’s considered the current agreement with SUDENE will be renewed for the period of 2030 to 2032.
PIS & COFINS CREDITS ANTICIPATION - SUDENE: Granting period of 12 months from the purchase of credits of the contribution for the PIS and COFINS. Legal basis: art. 31 of Law Nº 11196 of November 21, 2005; item III of §1 of art. 3 of Law Nº 10637, of December 30, 2002; item III of §1 of art. 3 of Law Nº 10833, of December 29, 2003; paragraph 4 of art.15 of Law Nº 10865, of April 30, 2004; Decree Nº 5988, of December 19, 2006; Decree Nº 5789, of May 25, 2006; Decree Nº 4212, of April 26, 2002; and Decree Nº 4213, of April 26, 2002. This benefit ensures that the PIS and COFINS paid on purchases are credited.
PIS/COFINS OFFSETS: Accumulated PIS/COFINS credits can be offset against Income tax payable (IRPJ after the benefit of SUDENE and CSLL), as well as against any other federal taxes payable. Any balances of un-off-set credits may be carried forward up to a maximum period of 5 years. In this PFS PIS/COFINS credits from purchases of permanent assets and operational supplies and consumables will be fully offset during the life of the mine.
State Level
ICMS DEFERRAL ON IMPORTS - For new investments, Maranhão State grants the benefit of ICMS deferral on imports of machinery, equipment, and instruments, as well as their parts, components and accessories that are cleared inside the State’s territory. This benefit should be applied to items intended for the fixed assets of the project, according to the conditions laid down in Article 11 of annex 1.3 of the ICMS Regulation, approved by State Decree Nº 19714, of July 10, 2003.
ICMS CREDITS RECEIVABLES - The ICMS is a value-added tax. Given that sales of gold to markets outside of Brazil are not taxed, the result is a cumulative balance of credits arising from the tax paid on capital and operating expenditures. However, the laws of Maranhão State provide that, if the Company obtains authorization from the State Government, this balance can be converted into a receivable and subsequently be sold in the market to other local taxpayers.
The Government of Maranhão State may approve the conversion of credits within regular terms, which this Study assumes as up to one year. Legal basis: articles 34, 35, 36, 38, 40 and 45 of the State Law Nº 7,799, of December 19, 2002 (tax system of Maranhão State) and State Law Nº 8,616, of June 05, 2007 (ICMS credits transfer). The other parameters adopted are in accordance with MASA's practices in its ongoing operations. Once approved by the state government, the credits are sold at a discount of 20% for receipt in two equal instalments, one in the same year and the other in the following year. Due to the current trading limit of R$1 M (one million Brazilian Reals) per month currently imposed by the state government (approximately $2.5 M per annum), at the end of the life of the mine there will be an unused balance of ICMS in the amount of $ 18.0 M.
Municipal Level
No benefit for the ISSQN has been considered in this PFS.
| | P a g e | 22-8 |
| 04/11/2021 |
| TECHNICAL REPORT ON THE AURIZONA GOLD MINE EXPANSION PRE-FEASIBILITY STUDY |
| 22.10.2 | Depreciation / Depletion |
Depreciation and depletion expenses have been estimated using the following methods and rates shown in Table 22-6.
Table 22-6: Depreciation and Depletion
| Depreciation/Depletion | Method | Rate |
| Mobile Equipment | Straight line | 20% p.a. |
| Process Equipment | Straight line | 10% p.a. |
| Mine Development, Infrastructure | Production units | Gold ounces produced |
| 22.11 | Project Financial Indicators |
The financial evaluation presents the determination of the Net Present Value (NPV) for the Aurizona PFS. The evaluation shows the following financial indicators with contract mining for the open pit and owner operated mining of the underground using a $1,500 per ounce gold price:
| • | Undiscounted Cashflow, After-Tax $464 M |
• NPV @ 5%, After-Tax $314 M
The detailed information in the cashflow model is shown in Table 22-7. The All In Sustaining Cost (AISC) against payable gold by year is shown in Figure 22-2. The Aurizona PFS Cumulative Cashflow is shown in Figure 22-3. The Net Revenue versus operating and capital costs plus taxes is shown in Figure 22-4.
| | P a g e | 22-9 |
| 04/11/2021 |
| TECHNICAL REPORT ON THE AURIZONA GOLD MINE EXPANSION PRE-FEASIBILITY STUDY |
Table 22-7: Detailed Financial Model

| | P a g e | 22-10 |
| 04/11/2021 |
| TECHNICAL REPORT ON THE AURIZONA GOLD MINE EXPANSION PRE-FEASIBILITY STUDY |

| | P a g e | 22-11 |
| 04/11/2021 |
| TECHNICAL REPORT ON THE AURIZONA GOLD MINE EXPANSION PRE-FEASIBILITY STUDY |

| | P a g e | 22-12 |
| 04/11/2021 |
| TECHNICAL REPORT ON THE AURIZONA GOLD MINE EXPANSION PRE-FEASIBILITY STUDY |
Figure 22-2: Recovered Gold versus AISC (Includes H1 2021 Actuals)

Figure 22-3: Aurizona PFS Cashflow - Post Tax

| | P a g e | 22-13 |
| 04/11/2021 |
| TECHNICAL REPORT ON THE AURIZONA GOLD MINE EXPANSION PRE-FEASIBILITY STUDY |
Figure 22-4: Net Revenue versus Operating Cost, Capital Cost and Taxes

| 22.11.1 | Sensitivity Analysis |
The following tables illustrate the Base Case project economics and the sensitivity of the project to changes in the base case gold prices, exchange rate, operating costs, and capital costs. As is typical with precious metal projects, the Aurizona PFS is most sensitive to gold prices, followed by exchange rate, operating cost and then capital costs. The sensitivities are presented in Table 22-8 and are also shown graphically in Error! Reference source not found..
Table 22-8: After Tax Sensitivity
| Variance | Operating
Cost NPV @5% $M |
Capital
Cost NPV @5% $M |
Exchange Rate | Gold Price | ||
| (R$:US$) | NPV @5% $M | $/oz | NPV @5% $M | |||
| -20 % | 457.2 | 381.6 | 3.80 | 25.5 | $1,200 | -21.7 |
| -10 % | 386.0 | 347.9 | 4.28 | 185.9 | $1,350 | 146.3 |
| Base | 314.2 | 314.2 | 4.75 | 314.2 | $1,500 | 314.2 |
| 10 % | 230.4 | 280.5 | 5.23 | 398.3 | $1,650 | 457.4 |
| 20% | 146.6 | 246.8 | 5.70 | 467.9 | $1,800 | 600.1 |
| | P a g e | 22-14 |
| 04/11/2021 |
| TECHNICAL REPORT ON THE AURIZONA GOLD MINE EXPANSION PRE-FEASIBILITY STUDY |
Figure 22-5: Sensitivity Analysis - NPV @ 5%

The sensitivity to fresh rock recovery was also examined. As normally large variations of 10-20% are not expected it was run separately from the other sensitivities. It should be noted that for the comparison, the higher recovery in fresh rock for Tatajuba and Genipapo was reduced to 90% from 91.4%. The results of this are shown in Table 22-9.
Table 22-9: Fresh Rock Recovery Sensitivity - After Taxes
| Variance | Recovery | NPV @ 5% ($M) |
| -2.3 % | 88% | 284.2 |
| -1.1 % | 89% | 299.1 |
| Base | 90% | 313.9 |
| 1.1 % | 91% | 326.7 |
| 2.2% | 92% | 339.4 |
| | P a g e | 22-15 |
| 04/11/2021 |
| TECHNICAL REPORT ON THE AURIZONA GOLD MINE EXPANSION PRE-FEASIBILITY STUDY |
| 23 | Adjacent Properties |
There are no adjacent properties to the Project.
| | P a g e | 23-1 |
| 04/11/2021 |
| TECHNICAL REPORT ON THE AURIZONA GOLD MINE EXPANSION PRE-FEASIBILITY STUDY |
| 24 | Other Relevant Data and Information |
| 24.1 | Aurizona Mine Expansion Timeline |
A key result of the PFS is it generates higher project NPV to develop the underground as soon as possible. This is due to increasing the process plant feed grade at an earlier stage and providing more time to further define additional underground resource than currently planned. The ideal situation is the concurrent mining of open pit and underground material to fully utilize the plant capacity.
The underground mine as presently designed with a maximum production rate of 3,500 t/d for a period of three years, demonstrates that it will not be able to fully supply the process plant at 8,000 t/d. Therefore, additional open pit feed is required to maintain the plant at full capacity.
Exploration for additional surface deposits is on-going, but the Piaba open pit is limited in size due to the proximity of the TSF and the other areas amenable to open pit development will be further away from existing infrastructure. The sooner the Piaba underground can reach a reasonable production rate, the more lower grade open pit material is pushed into the future, extending the overall mine life.
Delays in bringing the underground feed online results in fewer ounces to the plant and fewer tonnes from the underground in the overall mine schedule. The costs of running the plant and underground at less than 8,000 t/d are higher and the economics of the mine operation are not as attractive. Matching of the open pit and underground feed to maximize the plant throughput was a key consideration of the PFS.
The most significant recommendation of this study is to advance the exploration decline as soon as possible. The construction timeline for the underground development and the expansion of satellite pits was developed with reasonable timelines provided by the Environmental team to allow for permitting to proceed.
Various options around portal locations and methods of advancing the underground were discussed but decisions around the main portal location need to be made as soon as possible so that permitting may advance.
The intent of the early-stage exploration decline is to help advance the underground development while expanding the knowledge base around underground mining prior to full underground mine production. This will enable the underground to integrate with the overall mine production sooner. It also helps to establish procedures and improve efficiencies which should help lower operating costs. Providing locations for the exploration team to begin drilling underground to discover and upgrade classification on underground resources will greatly benefit the Aurizona expansion project plans.
To provide a fuller understanding of the interactions, a simple Gantt chart has been prepared and is shown in Figure 24-1.
| | P a g e | 24-1 |
| 04/11/2021 |
| TECHNICAL REPORT ON THE AURIZONA GOLD MINE EXPANSION PRE-FEASIBILITY STUDY |
Figure 24-1: PFS Mine Development Timeline

| | P a g e | 24-2 |
| 04/11/2021 |
| TECHNICAL REPORT ON THE AURIZONA GOLD MINE EXPANSION PRE-FEASIBILITY STUDY |
The various stages of the permitting process are shown including the vegetation suppression. Once the Installation License has been received, infrastructure for the mine can be constructed after the vegetation suppression has occurred.
Road construction has been scheduled for the dry season which ensures the road will be constructed properly. With the road in place mining can commence during the wet season at a reduced rate.
| | P a g e | 24-3 |
| 04/11/2021 |
| TECHNICAL REPORT ON THE AURIZONA GOLD MINE EXPANSION PRE-FEASIBILITY STUDY |
| 25 | Interpretation and Conclusions |
The Aurizona Gold Mine Expansion includes an underground operation beneath the Piaba pit plus the addition of the satellite deposits Tatajuba and Genipapo as open pits. The various areas continue to supply feed to the existing processing facility until 2032.
This PFS provides a clear conclusion that the Aurizona Mine as envisaged is economically viable based on the assumptions laid out for metal price, metallurgical recovery, and all other available data such as underground mine implementation and production ramp up.
There are no known factors related to, environmental, permitting, legal, title, taxation, socio-economic, marketing, or political issues which could materially affect the Mineral Resource or Reserves estimates.
Based on evaluation of the data available from the Aurizona Project, the authors of this report have drawn conclusions as set out below.
| 25.1 | Geology and Exploration |
The Piaba, Boa Esperança, Tatajuba and Genipapo deposits form relatively continuous steeply dipping zones of structurally controlled gold mineralisation associated with favorable volcano-sedimentary host rocks, structures along or proximal to the Aurizona Shear Zone, and strong hydrothermal alteration that is coincident with quartz veining and sulphide mineralization. The Touro deposit is located 16 km southwest of the Aurizona Mine, with gold mineralization hosted by extensional quartz veins within an altered diorite unit.
The Aurizona Property has combined Measured and Indicated Mineral Resources exclusive of Mineral Reserves that are amenable to open pit mining that total 9.4 Mt at 0.80 g/t gold for 320 koz. These Mineral Resources occur within a variety of regolith materials including laterite, saprolite, transition, and fresh rock.
Measured and Indicated Mineral Resources exclusive of Mineral Reserves amenable to underground mining beneath Piaba and Tatajuba total 8.7 Mt at 1.96 g/t gold for 547 koz of contained gold. These Mineral Resources occur entirely within fresh rock.
The combined open pit and underground Measured and Indicated mineral resources exclusive of Mineral Reserves on the Aurizona Property total 18.1 Mt grading 1.49 g/t gold for 868 koz of contained gold.
Areas of uncertainty that may affect the Mineral Resource estimates include mining cost assumptions, metal prices, process recoveries and changes to the geological model.
Reconciliation between the Mineral Resource model and production has shown good reconciliation with the gold grade of mill feed, with additional tonnage. It is anticipated with greater operational maturity that a more robust reconciliation program can be implemented to assess the performance of the resource model and estimation methodology.
| | P a g e | 25-1 |
| 04/11/2021 |
| TECHNICAL REPORT ON THE AURIZONA GOLD MINE EXPANSION PRE-FEASIBILITY STUDY |
Exploration potential exists for expanding the mine life in the underground portion of Piaba and at Tatajuba. This may provide additional feed in the future for the Piaba process facility and work is ongoing to examine this potential.
| 25.2 | Mining |
The PFS LOM plan is based upon Proven and Probable Mineral Reserves of 32.3 Mt with a gold grade of 1.6 g/t for contained gold ounces of 1.66 Moz. Underground reserves account for 6.5 Mt grading 2.76 g/t for 0.60 Moz.
Mining of the open pit is currently completed with a local mining contractor. This is assumed to continue for the life of the open pit. Underground mining will be operated as an Owner- operated mine. The mine plans are appropriate for the style of mineralization and the geometry of the deposit.
Geotechnical concerns affecting open pit wall slopes are understood and that knowledge is being expanded with additional study/drilling planned for Piaba and the satellite pit areas.
Underground geotechnical information is limited but sufficient for the PFS. Additional study will be required prior to production. The use of the exploration decline to obtain further geotechnical information will provide confidence in the designs and permit changes to occur prior to production.
Further optimization of the mine plan is underway to investigate opportunities improve the project economics or advance the mine development schedule which may bring ounces forward in the schedule.
| 25.3 | Metallurgy and Processing |
The metallurgical recoveries used are to a level sufficient to support Mineral Reserves declaration.
| 25.4 | Infrastructure and Site Layout |
The existing and planned infrastructure, availability of staff, existing power, water and any planned modifications or the requirements to establish such, are understood by Equinox.
| 25.5 | Capital and Operating Costs |
Detailed capital and operating cost estimates developed for the PFS including consideration for all direct and indirect costs associated with the mine production. This includes initial capital requirements of the underground mine and sustaining capital needs for the open pits, process plant, infrastructure, and reclamation and closure costs.
| 25.6 | Economic Analysis |
The economic analysis, including taxation, shows the Aurizona Mine PFS has positive economics and technical merit.
| | P a g e | 25-2 |
| 04/11/2021 |
| TECHNICAL REPORT ON THE AURIZONA GOLD MINE EXPANSION PRE-FEASIBILITY STUDY |
| 26 | Recommendations |
The QP’s recommend that Equinox proceed with a Feasibility level of study as part of the Aurizona Mine development plan. Recommendations and associated budgets are provided by the QP’s to ensure sufficient information is available going forward.
Some of the costs for the Feasibility are carried as part of the study itself but supporting studies or field work are quoted in the appropriate areas. Estimated cost table is provide in Table 26-1.
Table 26-1: Estimate of Recommended Feasibility Budgets
| Area of Study | Approximate Cost (US$ M) |
| Geology | $7.5 |
| Geotechnical | $2.9 |
| Mining - Open Pit and Underground | $0.6 |
| Metallurgy | $0.3 |
| Infrastructure | $0.1 |
| Environmental | $0.3 |
| Feasibility Study | $1.5 |
| TOTAL | $13.2 |
| 26.1 | Geology |
| 26.1.1 | Laboratory |
The following recommendations are made for laboratory and assay management:
| • | improve care and process when inserting CRMs into grade control samples to minimize handling errors |
| • | increase insertion rates of CRMs in the grade control batches to track analytical accuracy at the mine lab |
| • | monitor laboratory pulp and preparation duplicates of exploration and grade control samples to determine if improvements on reproducibility can be obtained |
| • | complete a detection limit study to determine capability of the mine laboratory |
| 26.1.2 | Exploration Drilling |
The following recommendations are made from a mineral exploration expansion and testing perspective:
| • | infill and expanded drilling totaling 42,000 m is recommended on underground targets and to test near surface targets at Piaba, Boa Esperança, Tatajuba, Genipapo and Touro deposits as well as regionally on the Property |
| | P a g e | 26-1 |
| 04/11/2021 |
| TECHNICAL REPORT ON THE AURIZONA GOLD MINE EXPANSION PRE-FEASIBILITY STUDY |
| 26.1.3 | Geologic Modelling |
The following recommendations are made for Mineral Resource estimation perspective:
| • | improve the fault models for Piaba in support of underground studies |
| • | improve the geological model for Touro |
| 26.2 | Geotechnical |
While there is overlap on some of the items related to the mine geotechnical, some programs are specific to either the open pit or underground. The recommendations are shown for each below:
| 26.2.1 | Open Pit |
Piaba and Piaba East
| • | slope stability review with focus on alluvial channels, eastern wall alignment and south wall stability |
| • | dump stability analysis for the west, south and east dumps in the proposed configurations |
| • | stability of the open pit slopes should be re-evaluated to account for the underground openings planned below and behind the open pit walls |
Tatajuba and Genipapo
| • | slope stability drilling and analysis for updated slope parameter recommendations |
| • | oriented core drilling and logging |
| • | laboratory material analysis and testwork |
| • | dump foundation site investigations and analysis to provide guidance on foundation preparation and updated dump slope parameters |
| • | test pit analysis |
| • | core drilling |
| • | material classification |
| 26.2.2 | Underground |
Additional data requirements include:
| • | additional oriented core diamond drilling and/or televiewer surveys |
| • | reduce the bias in the discontinuity orientation data |
| • | confirm the co-existence of the major joint sets |
| • | allow for the calculation of the true joint spacing for each of the joint sets |
| • | additional laboratory strength testing in each of the major lithology units to better define the intact rock properties |
| • | Portal and Ventilation Raise area work to confirm the presence of fresh rock and the rock mass characteristics in the vicinity of these infrastructure items |
| | P a g e | 26-2 |
| 04/11/2021 |
| TECHNICAL REPORT ON THE AURIZONA GOLD MINE EXPANSION PRE-FEASIBILITY STUDY |
| • | oriented core diamond drilling |
| • | detailed geomechanical logging and laboratory strength testing |
Additional domain definition and stability analyses should be completed including:
| • | further investigation of the spatial variation in the rock mass quality of the MRC and MCH |
| • | calculating the true joint spacing based on the results of additional oriented core drilling and/or mapping |
| • | further investigation of the variation in the prominence of Joint Set E along the strike of the deposit |
| • | a 3D numerical model should be developed to evaluate the interaction between the open pit and underground mine; the results of the model can also be used to comment on infrastructure placement and stope sequencing |
| • | a local 3D numerical model should be developed to refine the design of the rib pillars, sill pillars and inter-lode pillars |
| • | a squeezing ground assessment based on the Hard Rock Squeezing Index should be completed for the portion of the main ramp that is located within the UMR and MRC/MCH |
| • | the performance of the proposed raises should be evaluated from a rock mechanics perspective |
| 26.2.3 | Hydrogeology |
All areas would benefit with additional hydrogeological understanding. This includes:
| • | Water Quality and Quantity |
| • | Transmissivity by Material type and depth - both open pit and potential underground (Tatajuba) |
Additional data collection is recommended to reduce uncertainty in the groundwater flow regime and inflow estimate for the underground design:
| • | conduct additional hydraulic testing in the bedrock and faults |
| ○ | gaps in available hydraulic conductivity data exist for bedrock deeper than 200 m, faults that cross-cut the ore, and bedrock in the crown pillar |
| ○ | hydraulic testing of the footwall metasediments is recommended |
| ○ | packer testing is recommended when advancing future geotechnical and exploration drillholes |
| • | record notes of drill water circulation loss and artesian conditions during all exploration and geotechnical drilling campaigns |
| • | install groundwater monitoring sites to collect water levels and groundwater quality data to better understand groundwater flow directions, hydraulic gradients, and groundwater salinity |
| ○ | groundwater quality data will support understanding of water treatment requirements and potential for corrosion of pumps and pipes |
| • | conduct hydraulic conductivity (slug) testing on existing wells that have not yet been tested |
| | P a g e | 26-3 |
| 04/11/2021 |
| TECHNICAL REPORT ON THE AURIZONA GOLD MINE EXPANSION PRE-FEASIBILITY STUDY |
| • | continue the seep monitoring program to identify any faults below the weathered bedrock horizon that may act as permeable conduits and provide higher inflows to the underground |
| • | continue to monitor groundwater levels at all monitoring points to assess seasonal fluctuations in groundwater levels and to monitor the extent of groundwater drawdown with mine progression |
| 26.3 | Mining |
Various additional studies should be undertaken as part of the Feasibility study or prior to the start of the Feasibility as internal studies. Some of these will help align and improve the interaction of the open pit and underground. Others may assist in lowering operating costs providing an opportunity to include additional material that may be near the marginal cut-off or currently not classified as Indicated or Measured.
The most significant recommendation is to advance the exploration decline as soon as possible. Therefore, decisions around the main portal location need to be made as soon as possible then advanced to permitting. This exploration decline provides the various technical groups the opportunity to expand the knowledge base prior to mine production and also enable the underground to integrate with the overall project sooner.
To match open pit and underground production, having the underground mine available sooner for production ensures:
| 1) | Availability of feed material to the plant in the event of open pit production interruption. |
| 2) | Time to establish procedures and improve efficiencies which should help lower operating costs. |
| 3) | Extend the life of the project but allowing the mixing of open pit and underground ores longer. |
| 4) | Allow time for focused drilling to discover and upgrade classification on underground resources. |
Some specific recommendations by open pit and underground are discussed below.
| 26.3.1 | All Pits |
| • | examine alternate open pit and underground schedules to maximize schedule NPV |
| • | examine ore handling systems to reduce costs especially from distant pit areas or at depth in Piaba |
| • | fine tune phase design size and placement in each pit to improve project NPV |
| • | review surrounding surface exploration targets to determine if an alternate access to the Piaba underground is possible |
| 26.3.2 | Piaba |
| • | review haulage ramp placement in conjunction with underground portal location options, vent raises and secondary accesses |
| • | review phase sequence/sizes to determine if improved NPV sequence is possible |
| | P a g e | 26-4 |
| 04/11/2021 |
| TECHNICAL REPORT ON THE AURIZONA GOLD MINE EXPANSION PRE-FEASIBILITY STUDY |
| • | examine eastern wall orientations to reduce waste stripping requirements |
| • | work closely with tailings design team to fine-tune the South and East Dump storage capacity to enhance waste and tailings storage and reduce haulage costs |
| • | incorporate updated slope parameters resulting from internal review around alluvial channels in western end of pit near the proposed underground portal location |
| • | work with geotechnical team to position vent raise and utilidor location in a safe location and in fresh rock |
| 26.3.3 | Tatajuba and Genipapo |
| • | complete detailed design of mine access road system |
| • | update design with new geotechnical parameters from field program |
| • | examine opportunities for waste storage in closer proximity to the pit |
| 26.3.4 | Underground |
As stated above it is important to advance exploration decline as soon as possible and begin development underground. Additional study work that should be undertaken from an underground perspective includes:
| • | finalize initial portal location(s) after reviewing alternate locations for improved access and ventilation |
| • | examine elimination of virtually all CRF stopes to improve underground production rate |
| • | examine alternate ore haulage strategies (conveyor, RailVeyor, electric vehicles, etc.) and changes to design which may be required if mine goes deeper or to reduce ventilation requirements |
| • | level spacing review |
| • | research different stope drilling/blasting methodology to improve stope cycle time |
| ○ | possible example may be Musselwhite’s “slotless blasting” methodology |
| • | investigate opportunity of ramp backbone located lower by 50-75 m from current plan |
| ○ | a lower backbone ramp relative to the known mining zones may achieve: |
| ■ | faster development to the bottom of four mining zones |
| ■ | possibility of an ore pass in one zone |
| • | re-examine pastefill applicability and costing |
| 26.4 | Metallurgy |
It is recommended to continue the existing Piaba metallurgical test work program as follows:
| • | complete the planned SMC test work |
| • | continue to investigate gold recovery issues with sample MT-535 (gold deportment study) |
| • | continue with the metallurgical test program to evaluate the two composite samples that represent two mining years |
| | P a g e | 26-5 |
| 04/11/2021 |
| TECHNICAL REPORT ON THE AURIZONA GOLD MINE EXPANSION PRE-FEASIBILITY STUDY |
| 26.5 | Infrastructure |
The addition of an underground operation at Aurizona requires various items examined or reviewed from an infrastructure perspective. The key one is electrical supply to the site to ensure it is sufficient for forecast needs. Aurizona is currently an operating mine and electrical needs are already being considered with a recommended grid study in progress.
Tailings studies are underway as part of the normal capital requirements of the mine. These studies need to coordinate with the mining team to examine if there is potential to use pit material to construct portions of the facilities to save costs but also understand the overall cost to the mine with different configurations.
Road layouts for Tatajuba and Genipapo need to examine traffic patterns and interactions with the local communities. They will also provide the necessary specifications for construction to withstand the loads expected during both the dry and wet seasons.
| 26.6 | Environmental |
Permitting activities are required to allow the Piaba underground, Tatajuba and Genipapo open pits to proceed. This is normally part of the Environmental teams work but additional studies may be required by the regulators as part of the process. This could include further flora and fauna studies, and deforestation evaluations.
| | P a g e | 26-6 |
| 04/11/2021 |
| TECHNICAL REPORT ON THE AURIZONA GOLD MINE EXPANSION PRE-FEASIBILITY STUDY |
| 27 | References |
Abreu, F.M., Vilas, R.N.N., and Hasui, Y., 1980. Esboço estratigráfico do Pré-Cambriano da região do Gurupi, estados do Pará e Maranhão. XXXI Brazilian Congress of Geology, Camboriú, Brazil, Extended Abstracts, v. 2, p. 647-658.CGG, 2017a. Logistics and Processing Report Airborne High Resolution Magnetic Gradient and Radiometric Geophysical Survey of the Tromaí Block, Northern Brazil. CGG Project number 511156, p. 35.
Abzalov, M., 2008. Quality Control of Assay Data: A Review of Procedures for Measuring and Monitoring Precision and Accuracy. Exploration and Mining Geology, Vol. 17, Nos. 3-4, p. 131-144.
AGP Mining Consultants, March 2020 Technical Report on the Aurizona Gold Mine, Brazil
CGG, 2017. Geophysical Survey Report Airborne Magnetic and HELITEM Survey of the Tromai Block, Northern Brazil. CGG Project number 700152 / 701488, p. 61.
Costa, J.L., Almeida, H., Ricci, P., 1996. Metamorfismo e divisão tectonoestratigráfica do Grupo Gurupi no nordeste do Pará e noroeste do Maranhão. Symposium of Amazônia Geology, 5, Belém, Brazil, Extended Abstracts, p. 110-112.
Crawford, Kacy Mackenzey, "Determination of bulk density of rock core using standard industry methods ", Master's report, Michigan Technological University, 2013. http://digitalcommons.mtu.edu/etds/661.
Crux Engineering Group (CEG), 25 November 2015 Pre-feasibility Level Geotechnical Pit Slope Design Report, Aurizona Gold Mine - Piaba Pit
Dubé, B., and Gosselin, P., 2007, Greenstone-hosted quartz-carbonate vein deposits in Goodfellow, W. D., ed., Mineral deposits of Canada: A synthesis of major deposit-types, district metallogeny, the evolution of geological provinces, and exploration methods, Special Publication 5, Mineral Deposits Division, Geological Association of Canada, p. 49-73.
Eldorado Gold Corp., 2005. Annual Information Form for the year ended December 31, 2005. March 23, 2006, p. 71.
Equinox Gold Corp, 2018. Equinox Gold announces termination of earn-in JV agreement on Brazil greenfield concessions. Equinox Gold Corp news release dated 13 August 2018.
Equinox Gold Corp, 2019a. Equinox Gold announces conversion of debenture held by Sandstorm. Equinox Gold Corp news release dated 28 June 2019.
Equinox Gold Corp, 2019b. Equinox Gold achieves commercial production at the Aurizona gold mine. Equinox Gold Corp new release dated 2 July 2019.
| | P a g e | 27-1 |
| 04/11/2021 |
| TECHNICAL REPORT ON THE AURIZONA GOLD MINE EXPANSION PRE-FEASIBILITY STUDY |
Equinox Gold Corp, 2020. Our communities. Website. Retrieved from https://www.equinoxgold.com/responsible-mining/communities.
Equinox Gold Corp, 2021. Annual Information Form, for the year ended December 31, 2020. Dated 24 May 2021.
Evans, D., Breckenridge, J.L., Cheng, S., Fisher, B., Lincoln, N., Luz, A., Marsh, B., and Zurowski, G., 2016. Pre-Feasibility Study on Aurizona Mine Project Maranhão, Brazil (Amended), NI 43-101 Technical Report prepared for Luna Gold Corp., p. 468.
Freitas, S.C.F., and Klein, E.L., 2013. The mineralizing fluid in the Piaba gold deposit, São Luís cratonic fragment (NW-Maranhão, Brazil) based on fluid inclusion studies in quartz veins. Brazilian Journal of Geology, v. 43, p. 70-84.
Goldfarb, R. J., Baker, T., Dube, B., Groves, D. I., Hart, C. J. R., and Gosselin, P., 2005, Distribution, Character, and Genesis of Gold Deposits in Metamorphic Terranes: Economic Geology 100th Anniversary Volume, p. 407-450.
Goldfarb, R. J., Groves, D. I., and Gardoll, S. J., 2001, Orogenic gold and geologic time: a global synthesis: Ore Geology Reviews, v. 18, p. 1-75.
Groves, D. I., Goldfarb, R. J., Gebre-Mariam, M., Hagemann, S. G., and Robert, F., 1998, Orogenic gold deposits: A proposed classification in the context of their crustal distribution and relationship to other gold deposit types: Ore Geology Reviews, v. 13, p. 7-27.
J L Richards Ltd., June 2021 Design Report - AGP Equinox Gold Aurizona PFS
Klein, E.L., Angélica, R.S., Harris, C., Jourdan, F., and Babinski, M., 2013. Mafic dykes intrusive into Pre-Cambrian rocks of the São Luís cratonic fragment and Gurupi belt (Parnaíba Province), north-northeastern Brazil: geochemistry, Sr-Nd-Pb-O isotopes, 40Ar/39Ar geochronology, and relationships to CAMP magmatism. Lithos, v. 172-173, p. 222-242.
Klein, E.L., and Lopes, E.C.S., 2011. Geology and mineral resources of the Centro Novo do Maranhão SA.23-YBI sheet. 1:100,000, CPRM, Belém (CD-ROM).
Klein, E.L., Lucas, F., Queiroz, J., Freitas, S., Renac, C., Galarza, M., Jourdan, F., and Armstrong, R., 2015. Metallogenesis of the Paleoproterozoic Piaba orogenic gold deposit, São Luís cratonic fragment, Brazil. Ore geology Reviews, v. 65, p. 1-25.
Klein, E.L., Luzardo, R., Moura, C.A.V., and Armstrong, R., 2008. Geochemistry and zircon geochronology of Paleoproterozoic granitoids: further evidence on the magmatic and crustal evolution of the Sao Luis cratonic fragment, Brazil. Precambrian Research, v. 165, p. 221-242.
Klein, E.L., and Moura, C.A.V., 2008. São Luís craton and Gurupi belt (Brazil): possible links with the West African craton and surrounding Pan-African belts. In: Pankhurst, R.J., Trouw, R.A.J., de Brito Neves, B.B., and de Wit, M.J. (eds), West Gondwana: Pre-Cenozoic correlations across the South Atlantic region, Geological Society of London Special Publications, v. 294, p. 137-151.
| | P a g e | 27-2 |
| 04/11/2021 |
| TECHNICAL REPORT ON THE AURIZONA GOLD MINE EXPANSION PRE-FEASIBILITY STUDY |
Klein, E.L., Moura, C.A.V., Krymsky, R., Griffin, W.L., 2005. The Gurupi belt, northern Brazil: Lithostratigraphy, geochronology, and geodynamic evolution. Precambrian Research, v. 141 (3), p. 83-105.
Knight Piésold Ltd., July 2021 Aurizona Gold Mine - Piaba Deposit - Hydrogeology Summary and Underground Inflow Estimate
Knight Piésold Ltd., July 2021 Piaba Deposit - Pre-Feasibility Level Underground Mine Geomechanical Recommendations
Knight Piesold Ltd., 20 November 2020, Aurizona Gold Mine - North Waste Storage Facility Detailed Design Report
Knight Piesold Ltd., 10 November 2020, Aurizona Gold Mine - South Waste Storage Facility Detailed Design Report
Knight Piesold Ltd., 23 June 2021, Aurizona Gold Mine - South and North Waste Storage Facilities - Operations, Maintenance and Surveillance Manual and Emergency Preparedness and Response Plan
Leduc, M., Pearce, R., and Malhotra, D., 2015. NI 43-101 Technical report, Aurizona mine update, Brazil. NI 43-101 technical report prepared for Luna Gold Corp., p. 219.
Lincoln, N., Tortosa, M., Cheng, S., Day, S., Hormazabal, E., Hoekstra, D., Nowak, M., Parshley, J., Royle, M., Siddorn, J., Virgili, J., and Zurowski, G., 2017. Feasibility study on the Aurizona gold mine project, Maranhão, Brazil. NI 43-101 report for Trek Mining, p. 450. [Cited throughout this Technical Report as, Lycopodium, 2017]
Luna Gold Corp., 2006. News Release December 21, 2006, p. 5.
Luna Gold Corp., 2016. News Release May 27, 2016, p. 2.
Mach, L., Swanson, B. and Olin, E., 2012. NI 43-101 Technical Report Mineração Aurizona S.A. Aurizona Project. NI 43-101 report for Luna Gold, p. 161.
Minefill Services, May 2021 Aurizona Piaba Mine - Backfill Prefeasibility Study
Moreira, J., 2018. Relatório Técnico Aurizona Mineração Perfilamento Laser. Serviços Aéreos Industriais Brasil. Project CEP: 04511-011., p. 51.
Palheta, E., Abreu, F.M., Moura, C.A.V., 2009. Granitóides proterzóicos como marcadores da evolução geotectônica da região nordeste do Pará - Brasil. Revista Brasileira de Geosciências, v. 39, p. 647-657.
Parrish, I.S., 1997. Geologist’s Gordian Knot: To cut or not to cut. Mining Engineering, vol 49, issue 4, p. 45-49.
| | P a g e | 27-3 |
| 04/11/2021 |
| TECHNICAL REPORT ON THE AURIZONA GOLD MINE EXPANSION PRE-FEASIBILITY STUDY |
SGS Geosol, 2020, Technological Characterization of Twelve Gold Ore Samples (MT00509 to MT00520), 0540-1901 Rev 01, 7 August 2020
SGS Geosol, 2021, Technological Characterization of Eighteen Gold Ore Samples (MT00521 to MT00538), 0540-2101 Progress Report, 3 August 2021
SRK Consulting (SRK) Memo, 24 April 2017, Slope Stability Optimization & Geotechnical Design Aurizona Mine
| | P a g e | 27-4 |
| 04/11/2021 |
| TECHNICAL REPORT ON THE AURIZONA GOLD MINE EXPANSION PRE-FEASIBILITY STUDY |
| 28 | Certificate of Authors |
| 28.1 | Eleanor Black, P.Geo. |
I, Eleanor Black, P.Geo., am employed as a Senior Geologist and Partner of Equity Exploration Consultants Ltd. (Equity), EGBC registrant permit #1000183. Equity is a mining exploration management and consulting company located at 1238 - 200 Granville Street, Vancouver, British Columbia, V6C 1S4.
This certificate accompanies the technical report titled “Technical Report on the Aurizona Gold Mine Expansion Pre-Feasibility Study, Aurizona Gold Mine, Maranhão, Brazil” (the Technical Report) prepared for Equinox Gold Corp. (Equinox) November 4, 2021 with an effective date September 20, 2021. I hereby certify the following:
| • | I am a member in good standing of the Engineers and Geoscientists of British Columbia, membership #42632, Professional Geologist. |
| • | I graduated from the University of British Columbia (2004) with a Bachelor of Science degree in Geology. |
| • | I have practiced my profession in the mining industry continuously since graduation. |
| • | I have over 17 years relevant experience having been directly involved in managing exploration programs focused on identifying and delineating orogenic gold, porphyry, VMS, and other deposit types in British Columbia, Nunavut, Ontario and Yukon, Canada as well as Finland, Brazil, and the USA. As a result of my experience and qualifications, I am a Qualified Person as defined in NI 43-101. |
| • | I visited the Aurizona Mine between November 11-18, 2017. |
| • | I am responsible for Sections 1.2 through 1.8, 1.20.1, 4 through 12, 25.1 and 26.1 of this technical report titled “Technical Report on The Aurizona Gold Mine Expansion Pre-Feasibility Study”. |
| • | I am independent of Equinox as described by Section 1.5 of the instrument. |
| • | I have I have had no previous involvement with the Aurizona Mine. |
| • | I have read NI 43-101 and the sections of the Technical Report for which I am responsible have been prepared in compliance with that Instrument. |
As of the effective date of the Technical Report, to the best of my knowledge, information, and belief, the sections of the Technical Report that I am responsible for, contain all scientific and technical information that is required to be disclosed to make those sections of the Technical Report not misleading.
Dated: November 4, 2021
| “Signed and sealed” |
| Eleanor Black, P.Geo. |
| | P a g e | 28-1 |
| 04/11/2021 |
| TECHNICAL REPORT ON THE AURIZONA GOLD MINE EXPANSION PRE-FEASIBILITY STUDY |
| 28.2 | Trevor Rabb, P. Geo. |
I, Trevor Rabb, P.Geo., am employed as a Resource Geologist and Partner of Equity Exploration Consultants Ltd. (Equity), EGBC registrant permit #1000183. Equity is a mining exploration management and consulting company located at 1238 - 200 Granville Street, Vancouver, British Columbia, V6C 1S4.
This certificate accompanies the technical report titled “Technical Report on the Aurizona Gold Mine Expansion Pre-Feasibility Study, Aurizona Gold Mine, Maranhão, Brazil” (the Technical Report) prepared for Equinox Gold Corp. (Equinox) November 4, 2021 with an effective date September 20, 2021. I hereby certify the following:
| • | I am a member in good standing of Engineers and Geoscientists of British Columbia, membership #39599. |
| • | I graduated from Simon Fraser University (2009) with a Bachelor of Science degree in Geology. |
| • | I have practiced my profession in the mining industry continuously since graduation. |
| • | I have over 12 years relevant experience having been directly involved in managing exploration, practising geostatistics and resource modelling and estimating resources. I have practiced as a geologist since 2009 and have worked managing exploration programs focused on identifying and delineating copper porphyry, VMS, orogenic gold, nickel and other deposits in British Columbia, Yukon, Ontario, Australia, and Brazil. I have specialised in geochemistry, geostatistics and resource modelling for six years on various underground and open pit base metal and gold deposits in Canada, the United States, Central and South America. I have practiced Mineral Resource estimation for five years on various underground and open pit base metal and gold deposits in Canada, the United States, Central and South America. As a result of my experience and qualifications, I am a Qualified Person as defined in NI 43-101. |
| • | I visited the Aurizona Mine between Oct. 28 - Nov. 14, 2017 and Nov. 11-14, 2019. |
| • | I am responsible for Sections 1.9, 1.20.4 and 14 of this technical report titled “Technical Report on The Aurizona Gold Mine Expansion Pre-Feasibility Study”. |
| • | I am independent of Equinox as described by Section 1.5 of the instrument. |
| • | I have had no previous involvement with the Aurizona Mine. |
| • | I have read NI 43-101 and the sections of the technical report for which I am responsible have been prepared in compliance with that Instrument. |
As of the effective date of the Technical Report, to the best of my knowledge, information, and belief, the sections of the Technical Report that I am responsible for, contain all scientific and technical information that is required to be disclosed to make those sections of the Technical Report not misleading.
Dated: November 4, 2021
| “Signed and sealed” |
| Trevor Rabb, P.Geo. |
| | P a g e | 28-2 |
| 04/11/2021 |
| TECHNICAL REPORT ON THE AURIZONA GOLD MINE EXPANSION PRE-FEASIBILITY STUDY |
| 28.3 | Gordon Zurowski, P. Eng. |
I, Gordon Zurowski, P.Eng. am employed as a Principal Mine Engineer with AGP Mining Consultants Inc. (AGP) located at #246-132K Commerce Park Drive, Barrie ON Canada.
This certificate accompanies the technical report titled “Technical Report on the Aurizona Gold Mine Expansion Pre-Feasibility Study, Aurizona Gold Mine, Maranhão, Brazil” (the Technical Report) prepared for Equinox Gold Corp. (Equinox) November 4, 2021 with an effective date September 20, 2021. I hereby certify the following:
| • | I am a member in good standing with the Professional Engineers of Ontario (PEO) in Canada, membership #100077750. |
| • | I graduated from the University of Saskatchewan with a B.Sc. Geological Engineering, 1989. |
| • | I have practiced my profession in the mining industry continuously since graduation. |
| • | I have been directly involved in Mineral Resource and Reserve estimations and feasibility studies for over 30 years in Canada, the United States, Central and South America, Europe, Asia, Africa, and Australia. As a result of my experience and qualifications, I am a Qualified Person as defined in NI 43-101. |
| • | I visited the Aurizona Mine on August 18-19, 2021. |
| • | I am responsible for Sections 1.1, 1.11, 1.12, 1.14 - 1.19, 1.20.2 - 1.20.7, 2, 3, 15, 16, 18, 19, 20, 21, 22, 23, 24, 25.2, 25.4 - 25.7, 26.2, 26.3, 26.5 - 26.7 of this technical report titled “Technical Report on The Aurizona Gold Mine Expansion Pre-Feasibility Study”. |
| • | I am independent of Equinox as described by Section 1.5 of the instrument. |
| • | I was previously involved with the Aurizona Mine project in connection with multiple technical reports. |
| • | I have read NI 43-101 and the Technical Report sections for which I am responsible have been prepared in compliance with that Instrument. |
As of the effective date of the Technical Report, to the best of my knowledge, information, and belief, the sections of the Technical Report that I am responsible for, contain all scientific and technical information that is required to be disclosed to make those sections of the technical report not misleading.
Signed and dated at Stouffville ON, on November 4, 2021.
| “Signed and sealed” |
| Gordon Zurowski, P.Eng. |
| | P a g e | 28-3 |
| 04/11/2021 |
| TECHNICAL REPORT ON THE AURIZONA GOLD MINE EXPANSION PRE-FEASIBILITY STUDY |
| 28.4 | Neil Lincoln, P. Eng. |
I, Neil Lincoln, P.Eng. am an independent Metallurgical Consultant engaged as a Principal Process Engineer under contract by AGP Mining Consultants, 132 Commerce Park Drive, Unit K #246, Barrie, Ontario, Canada.
This certificate accompanies the technical report titled “Technical Report on the Aurizona Gold Mine Expansion Pre-Feasibility Study, Aurizona Gold Mine, Maranhão, Brazil” (the Technical Report) prepared for Equinox Gold Corp. (Equinox) November 4, 2021 with an effective date September 20, 2021. I hereby certify the following:
| • | I am a professional engineer in good standing with the Professional Engineers of Ontario (PEO) in Canada (no. 100039153). |
| • | I graduated from the University of the Witwatersrand, South Africa, in 1994 with a Bachelor of Science in Metallurgy and Materials Engineering (Minerals Process Engineering) degree. |
| • | I have practiced my profession in the mining industry continuously since graduation. |
| • | I have over 27 years experience as a metallurgist. I have sufficient relevant experience having worked on numerous projects ranging from scoping studies, prefeasibility and feasibility studies to project implementation related to processing plants. My mineral processing commodity and unit operations experience includes precious metals, base metals and industrial minerals covering metallurgical test work to process plant design. As a result of my experience and qualifications, I am a Qualified Person as defined in NI 43-101. Select gold projects include: |
| • | Valentine Lake Gold Project (PEA) for Marathon Gold, Canada |
| • | Natougou Gold Project (feasibility study) for Semafo (now Endeavour Mining), Burkina Faso |
| • | Boto Gold Project (feasibility study) for Iamgold, Senegal |
| • | I visited the Aurizona process plant on 2 December 2014. |
| • | I am responsible for Sections 1.10, 1.13, 13, 17, 25.3 and 26.4 of this technical report titled “Technical Report on The Aurizona Gold Mine Expansion Pre-Feasibility Study”. |
| • | I am independent of Equinox as described by Section 1.5 of the instrument. |
| • | I have had previous involvement with the Property as a QP for previous technical reports prepared in respect of the Aurizona Gold Mine. |
| • | I have read NI 43-101 and the sections of the Technical Report for which I am responsible have been prepared in compliance with that Instrument. |
As of the effective date of the technical report, to the best of my knowledge, information, and belief, the sections of the Technical Report that I am responsible for, contain all scientific and technical information that is required to be disclosed to make those sections of the Technical Report not misleading.
Dated: November 4, 2021
| “Signed and sealed” |
| Neil Lincoln, P.Eng. |
| | P a g e | 28-4 |
| 04/11/2021 |