| Preliminary Draft – Confidential Prepared at the Request of Counsel Project Achieve Selected Pages from April 24th Presentation Materials May 16, 2023 |
| Preliminary Draft – Confidential Prepared at the Request of Counsel Project Achieve These materials have been prepared by Evercore Group L.L.C. (“Evercore”) for the Special Committee of Arco Platform Limited (the “Company”) to whom such materials are directly addressed and delivered and may not be used or relied upon for any purpose other than as specifically contemplated. These materials are based on information provided by or on behalf of the Company and/or other potential transaction participants, from public sources or otherwise reviewed by Evercore. Evercore assumes no responsibility for independent investigation or verification of such information and has relied on such information being complete and accurate in all material respects. To the extent such information includes estimates and forecasts of future financial performance prepared by or reviewed with the management of the Company and/or other potential transaction participants or obtained from public sources, Evercore has assumed that such estimates and forecasts have been reasonably prepared on bases reflecting the best currently available estimates and judgments of such management (or, with respect to estimates and forecasts obtained from public sources, represent reasonable estimates). No representation or warranty, express or implied, is made as to the accuracy or completeness of such information and nothing contained herein is, or shall be relied upon as, a representation, whether as to the past, the present or the future. These materials were designed for use by specific persons familiar with the business and affairs of the Company. These materials are not intended to provide the sole basis for evaluating, and should not be considered a recommendation with respect to, any transaction or other matter. These materials have been developed by and are proprietary to Evercore and were prepared exclusively for the benefit and internal use of the Special Committee of the Company. These materials were compiled on a confidential basis for use by the Special Committee of the Company in evaluating the potential transaction described herein and not with a view to public disclosure or filing thereof under state or federal securities laws, and may not be reproduced, disseminated, quoted or referred to, in whole or in part, without the prior written consent of Evercore. These materials do not constitute an offer or solicitation to sell or purchase any securities and are not a commitment by Evercore (or any affiliate) to provide or arrange any financing for any transaction or to purchase any security in connection therewith. Evercore assumes no obligation to update or otherwise revise these materials. These materials may not reflect information known to other professionals in other business areas of Evercore and its affiliates. Evercore and its affiliates do not provide legal, accounting or tax advice. Accordingly, any statements contained herein as to tax matters were neither written nor intended by Evercore or its affiliates to be used and cannot be used by any taxpayer for the purpose of avoiding tax penalties that may be imposed on such taxpayer. Each person should seek legal, accounting and tax advice based on his, her or its particular circumstances from independent advisors regarding the impact of the transactions or matters described herein. Unless otherwise specified, all projections reflect Company management estimates as of April 2023. |
| Preliminary Draft – Confidential Prepared at the Request of Counsel Project Achieve Table of Contents Situation Overview Preliminary Valuation Analysis Appendix Section I II |
| Preliminary Draft – Confidential Prepared at the Request of Counsel I. Situation Overview |
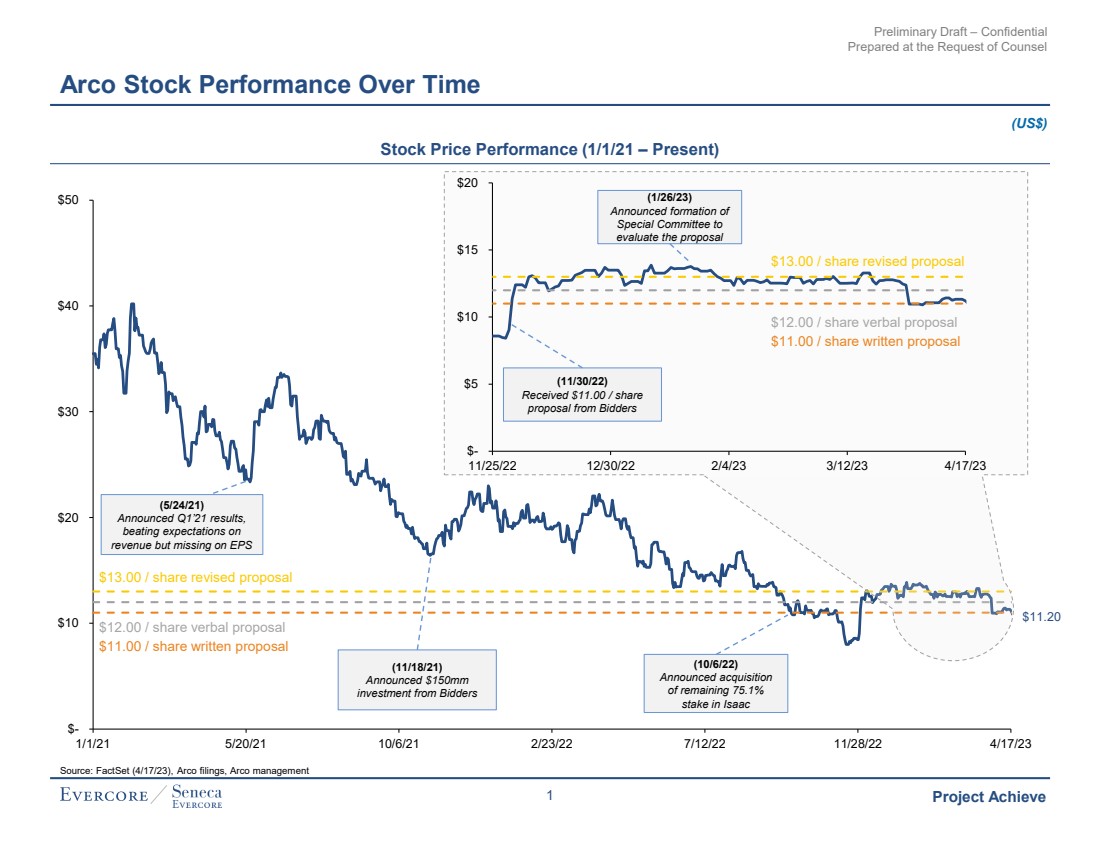
| Preliminary Draft – Confidential Prepared at the Request of Counsel Project Achieve $11.20 $- $10 $20 $30 $40 $50 1/1/21 5/20/21 10/6/21 2/23/22 7/12/22 11/28/22 4/17/23 $- $5 $10 $15 $20 11/25/22 12/30/22 2/4/23 3/12/23 4/17/23 Arco Stock Performance Over Time (10/6/22) Announced acquisition of remaining 75.1% stake in Isaac Source: FactSet (4/17/23), Arco filings, Arco management (11/18/21) Announced $150mm investment from Bidders (5/24/21) Announced Q1’21 results, beating expectations on revenue but missing on EPS (1/26/23) Announced formation of Special Committee to evaluate the proposal (11/30/22) Received $11.00 / share proposal from Bidders Stock Price Performance (1/1/21 – Present) (US$) $13.00 / share revised proposal $11.00 / share written proposal $12.00 / share verbal proposal $13.00 / share revised proposal $11.00 / share written proposal $12.00 / share verbal proposal 1 |
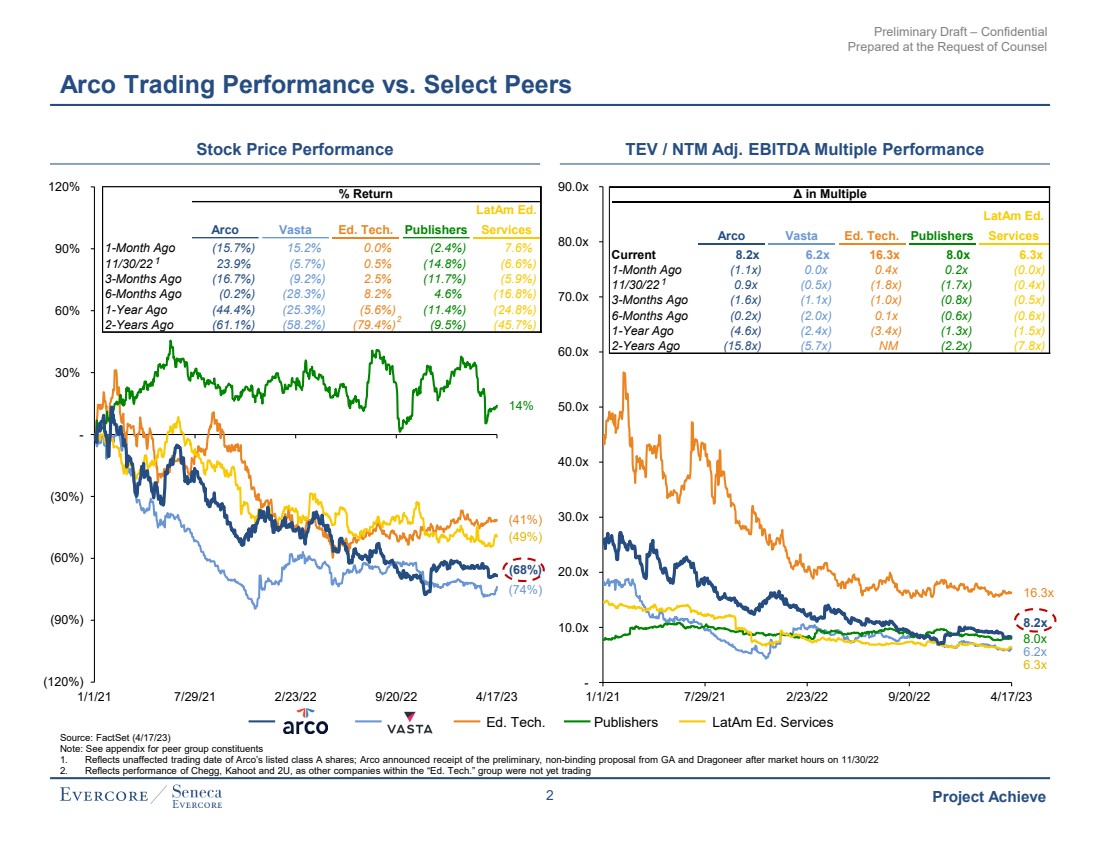
| Preliminary Draft – Confidential Prepared at the Request of Counsel Project Achieve Arco Trading Performance vs. Select Peers Source: FactSet (4/17/23) Note: See appendix for peer group constituents 1. Reflects unaffected trading date of Arco’s listed class A shares; Arco announced receipt of the preliminary, non-binding proposal from GA and Dragoneer after market hours on 11/30/22 2. Reflects performance of Chegg, Kahoot and 2U, as other companies within the “Ed. Tech.” group were not yet trading Stock Price Performance TEV / NTM Adj. EBITDA Multiple Performance Ed. Tech. Publishers LatAm Ed. Services (74%) (41%) 14% (49%) (68%) (120%) (90%) (60%) (30%) - 30% 60% 90% 120% 1/1/21 7/29/21 2/23/22 9/20/22 4/17/23 6.2x 16.3x 8.0x 6.3x 8.2x - 10.0x 20.0x 30.0x 40.0x 50.0x 60.0x 70.0x 80.0x 90.0x 1/1/21 7/29/21 2/23/22 9/20/22 4/17/23 % Return Arco Vasta Ed. Tech. Publishers LatAm Ed. Services 1-Month Ago (15.7%) 15.2% 0.0% (2.4%) 7.6% 11/30/22 23.9% (5.7%) 0.5% (14.8%) (6.6%) 3-Months Ago (16.7%) (9.2%) 2.5% (11.7%) (5.9%) 6-Months Ago (0.2%) (28.3%) 8.2% 4.6% (16.8%) 1-Year Ago (44.4%) (25.3%) (5.6%) (11.4%) (24.8%) 2-Years Ago (61.1%) (58.2%) (79.4%) (9.5%) (45.7%) 2 Δ in Multiple Arco Vasta Ed. Tech. Publishers LatAm Ed. Services Current 8.2x 6.2x 16.3x 8.0x 6.3x 1-Month Ago (1.1x) 0.0x 0.4x 0.2x (0.0x) 11/30/22 0.9x (0.5x) (1.8x) (1.7x) (0.4x) 3-Months Ago (1.6x) (1.1x) (1.0x) (0.8x) (0.5x) 6-Months Ago (0.2x) (2.0x) 0.1x (0.6x) (0.6x) 1-Year Ago (4.6x) (2.4x) (3.4x) (1.3x) (1.5x) 2-Years Ago (15.8x) (5.7x) NM (2.2x) (7.8x) 1 1 2 |
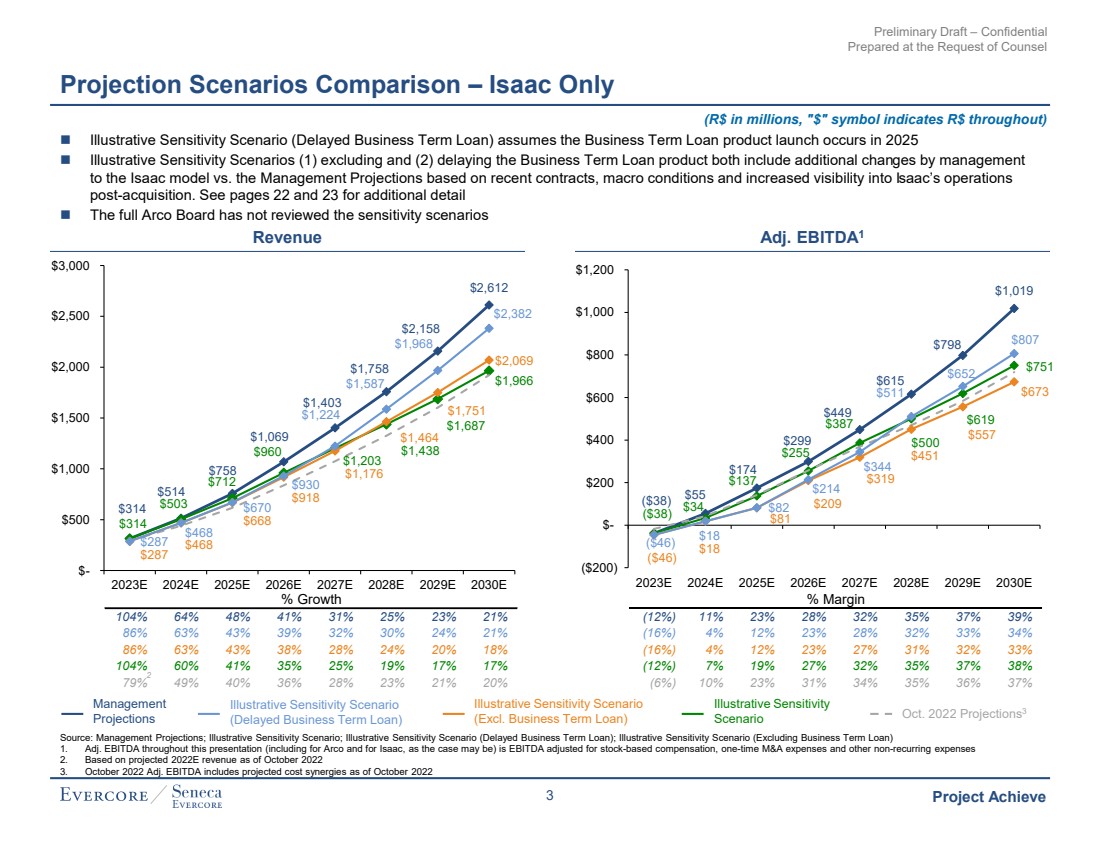
| Preliminary Draft – Confidential Prepared at the Request of Counsel Project Achieve 104% 64% 48% 41% 31% 25% 23% 21% 86% 63% 43% 39% 32% 30% 24% 21% 86% 63% 43% 38% 28% 24% 20% 18% 104% 60% 41% 35% 25% 19% 17% 17% 79% 49% 40% 36% 28% 23% 21% 20% % Growth $314 $514 $758 $1,069 $1,403 $1,758 $2,158 $2,612 $314 $503 $712 $960 $1,203 $1,438 $1,687 $1,966 $287 $468 $668 $918 $1,176 $1,464 $1,751 $2,069 $287 $468 $670 $930 $1,224 $1,587 $1,968 $2,382 $- $500 $1,000 $1,500 $2,000 $2,500 $3,000 2023E 2024E 2025E 2026E 2027E 2028E 2029E 2030E Projection Scenarios Comparison – Isaac Only (R$ in millions, "$" symbol indicates R$ throughout) Revenue Management Projections Illustrative Sensitivity Scenario (Delayed Business Term Loan) (12%) 11% 23% 28% 32% 35% 37% 39% (16%) 4% 12% 23% 28% 32% 33% 34% (16%) 4% 12% 23% 27% 31% 32% 33% (12%) 7% 19% 27% 32% 35% 37% 38% (6%) 10% 23% 31% 34% 35% 36% 37% % Margin ($38) $55 $174 $299 $449 $615 $798 $1,019 ($38) $34 $137 $255 $387 $500 $619 $751 ($46) $18 $81 $209 $319 $451 $557 $673 ($46) $18 $82 $214 $344 $511 $652 $807 ($200) $- $200 $400 $600 $800 $1,000 $1,200 2023E 2024E 2025E 2026E 2027E 2028E 2029E 2030E Adj. EBITDA1 2 Oct. 2022 Projections3 Illustrative Sensitivity Scenario (Excl. Business Term Loan) Illustrative Sensitivity Scenario Source: Management Projections; Illustrative Sensitivity Scenario; Illustrative Sensitivity Scenario (Delayed Business Term Loan); Illustrative Sensitivity Scenario (Excluding Business Term Loan) 1. Adj. EBITDA throughout this presentation (including for Arco and for Isaac, as the case may be) is EBITDA adjusted for stock-based compensation, one-time M&A expenses and other non-recurring expenses 2. Based on projected 2022E revenue as of October 2022 3. October 2022 Adj. EBITDA includes projected cost synergies as of October 2022 ◼ Illustrative Sensitivity Scenario (Delayed Business Term Loan) assumes the Business Term Loan product launch occurs in 2025 ◼ Illustrative Sensitivity Scenarios (1) excluding and (2) delaying the Business Term Loan product both include additional changes by management to the Isaac model vs. the Management Projections based on recent contracts, macro conditions and increased visibility into Isaac’s operations post-acquisition. See pages 22 and 23 for additional detail ◼ The full Arco Board has not reviewed the sensitivity scenarios 3 |
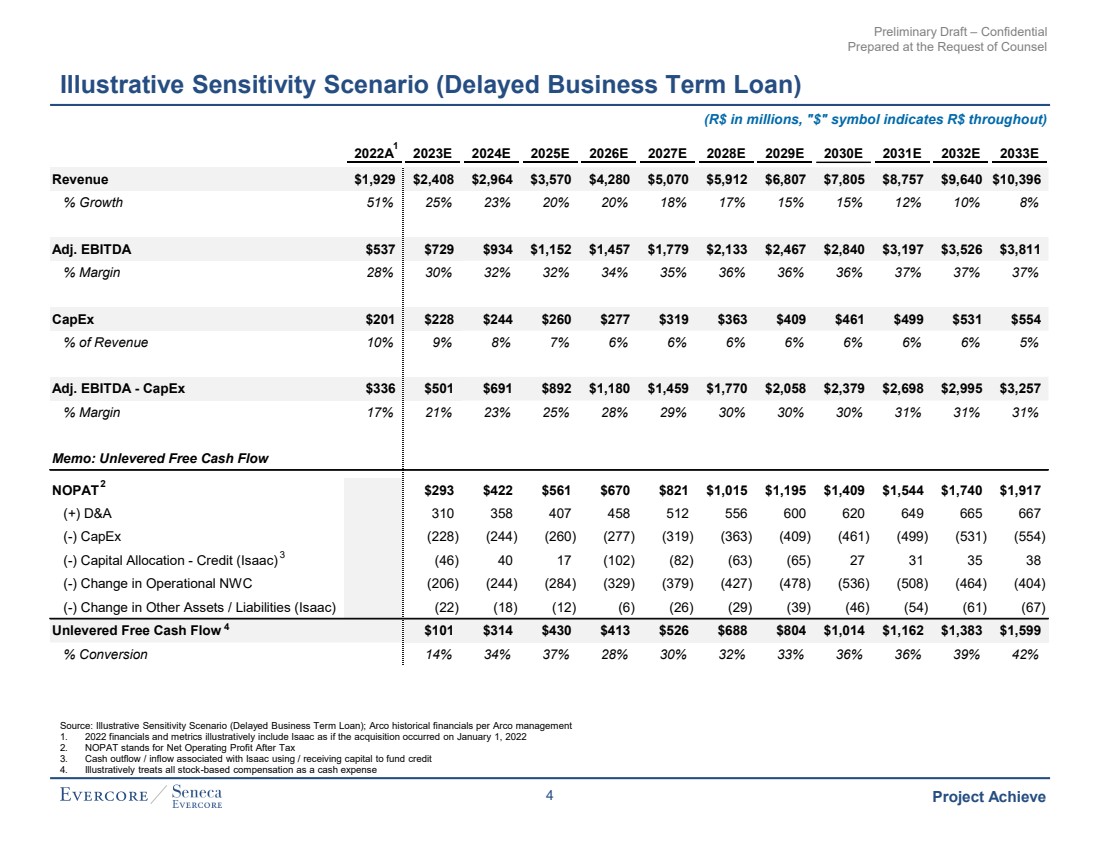
| Preliminary Draft – Confidential Prepared at the Request of Counsel Project Achieve Illustrative Sensitivity Scenario (Delayed Business Term Loan) Source: Illustrative Sensitivity Scenario (Delayed Business Term Loan); Arco historical financials per Arco management 1. 2022 financials and metrics illustratively include Isaac as if the acquisition occurred on January 1, 2022 2. NOPAT stands for Net Operating Profit After Tax 3. Cash outflow / inflow associated with Isaac using / receiving capital to fund credit 4. Illustratively treats all stock-based compensation as a cash expense 2022A 2023E 2024E 2025E 2026E 2027E 2028E 2029E 2030E 2031E 2032E 2033E Revenue $1,929 $2,408 $2,964 $3,570 $4,280 $5,070 $5,912 $6,807 $7,805 $8,757 $9,640 $10,396 % Growth 51% 25% 23% 20% 20% 18% 17% 15% 15% 12% 10% 8% Adj. EBITDA $537 $729 $934 $1,152 $1,457 $1,779 $2,133 $2,467 $2,840 $3,197 $3,526 $3,811 % Margin 28% 30% 32% 32% 34% 35% 36% 36% 36% 37% 37% 37% CapEx $201 $228 $244 $260 $277 $319 $363 $409 $461 $499 $531 $554 % of Revenue 10% 9% 8% 7% 6% 6% 6% 6% 6% 6% 6% 5% Adj. EBITDA - CapEx $336 $501 $691 $892 $1,180 $1,459 $1,770 $2,058 $2,379 $2,698 $2,995 $3,257 % Margin 17% 21% 23% 25% 28% 29% 30% 30% 30% 31% 31% 31% Memo: Unlevered Free Cash Flow NOPAT $293 $422 $561 $670 $821 $1,015 $1,195 $1,409 $1,544 $1,740 $1,917 (+) D&A 310 358 407 458 512 556 600 620 649 665 667 (-) CapEx (228) (244) (260) (277) (319) (363) (409) (461) (499) (531) (554) (-) Capital Allocation - Credit (Isaac) (46) 40 17 (102) (82) (63) (65) 27 31 35 38 (-) Change in Operational NWC (206) (244) (284) (329) (379) (427) (478) (536) (508) (464) (404) (-) Change in Other Assets / Liabilities (Isaac) (22) (18) (12) (6) (26) (29) (39) (46) (54) (61) (67) Unlevered Free Cash Flow $101 $314 $430 $413 $526 $688 $804 $1,014 $1,162 $1,383 $1,599 % Conversion 14% 34% 37% 28% 30% 32% 33% 36% 36% 39% 42% 4 1 2 3 (R$ in millions, "$" symbol indicates R$ throughout) 4 |
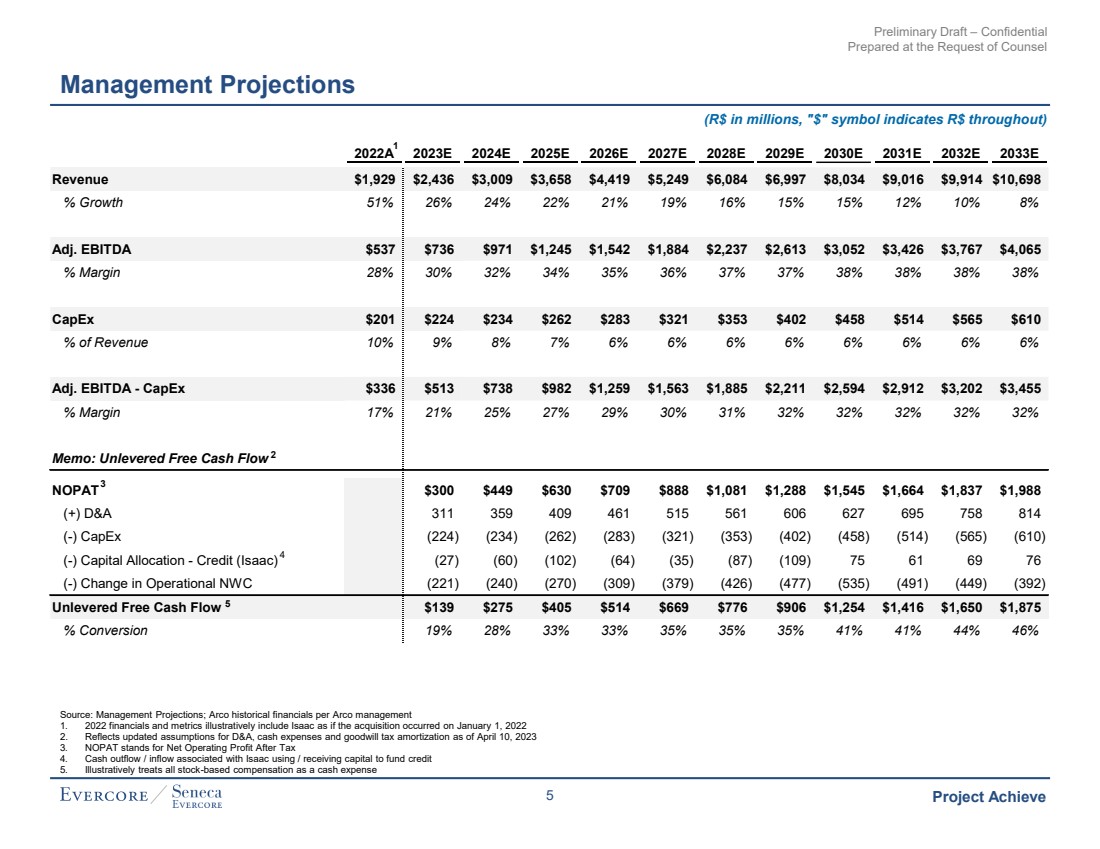
| Preliminary Draft – Confidential Prepared at the Request of Counsel Project Achieve 2022A 2023E 2024E 2025E 2026E 2027E 2028E 2029E 2030E 2031E 2032E 2033E Revenue $1,929 $2,436 $3,009 $3,658 $4,419 $5,249 $6,084 $6,997 $8,034 $9,016 $9,914 $10,698 % Growth 51% 26% 24% 22% 21% 19% 16% 15% 15% 12% 10% 8% Adj. EBITDA $537 $736 $971 $1,245 $1,542 $1,884 $2,237 $2,613 $3,052 $3,426 $3,767 $4,065 % Margin 28% 30% 32% 34% 35% 36% 37% 37% 38% 38% 38% 38% CapEx $201 $224 $234 $262 $283 $321 $353 $402 $458 $514 $565 $610 % of Revenue 10% 9% 8% 7% 6% 6% 6% 6% 6% 6% 6% 6% Adj. EBITDA - CapEx $336 $513 $738 $982 $1,259 $1,563 $1,885 $2,211 $2,594 $2,912 $3,202 $3,455 % Margin 17% 21% 25% 27% 29% 30% 31% 32% 32% 32% 32% 32% Memo: Unlevered Free Cash Flow NOPAT $300 $449 $630 $709 $888 $1,081 $1,288 $1,545 $1,664 $1,837 $1,988 (+) D&A 311 359 409 461 515 561 606 627 695 758 814 (-) CapEx (224) (234) (262) (283) (321) (353) (402) (458) (514) (565) (610) (-) Capital Allocation - Credit (Isaac) (27) (60) (102) (64) (35) (87) (109) 75 61 69 76 (-) Change in Operational NWC (221) (240) (270) (309) (379) (426) (477) (535) (491) (449) (392) Unlevered Free Cash Flow $139 $275 $405 $514 $669 $776 $906 $1,254 $1,416 $1,650 $1,875 % Conversion 19% 28% 33% 33% 35% 35% 35% 41% 41% 44% 46% Management Projections Source: Management Projections; Arco historical financials per Arco management 1. 2022 financials and metrics illustratively include Isaac as if the acquisition occurred on January 1, 2022 2. Reflects updated assumptions for D&A, cash expenses and goodwill tax amortization as of April 10, 2023 3. NOPAT stands for Net Operating Profit After Tax 4. Cash outflow / inflow associated with Isaac using / receiving capital to fund credit 5. Illustratively treats all stock-based compensation as a cash expense 5 1 3 4 (R$ in millions, "$" symbol indicates R$ throughout) 2 5 |
| Preliminary Draft – Confidential Prepared at the Request of Counsel II. Preliminary Valuation Analysis |
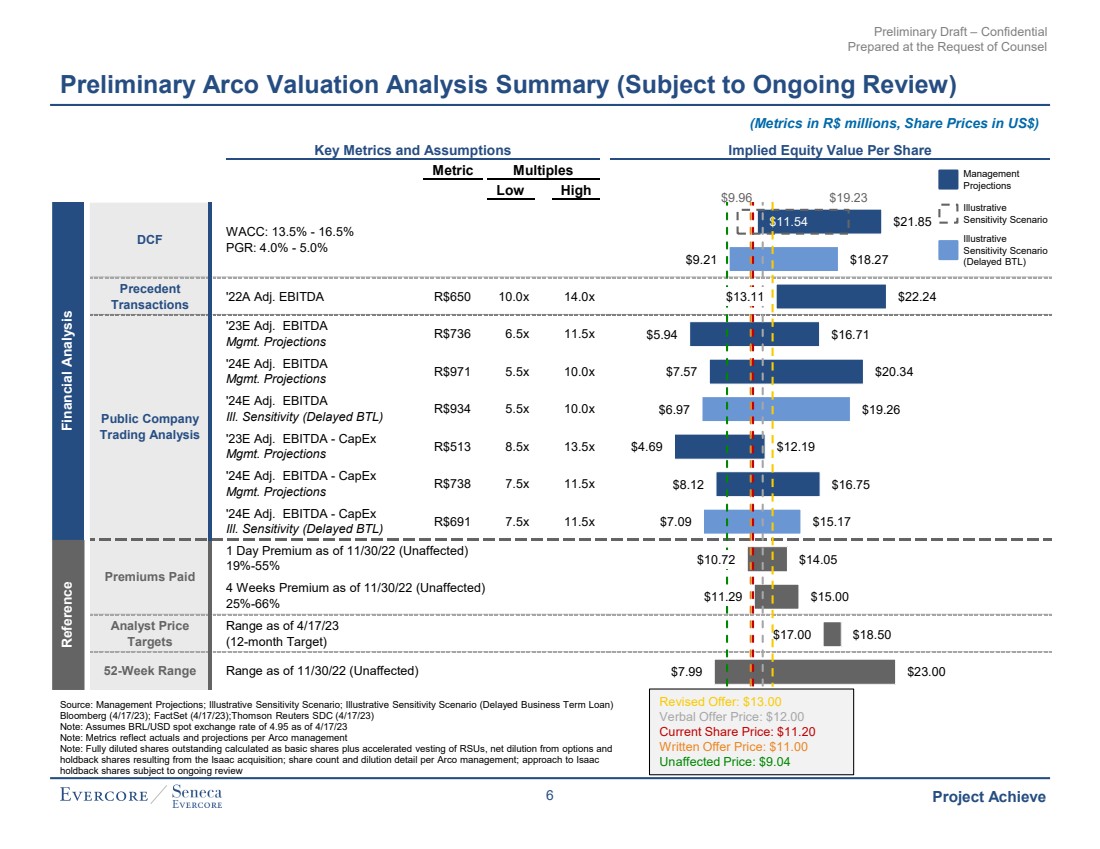
| Preliminary Draft – Confidential Prepared at the Request of Counsel Project Achieve Key Metrics and Assumptions Implied Equity Value Per Share Primary Bars Metric Multiples Low Low High Precedent Transactions '22A Adj. EBITDA R$650 10.0x 14.0x '23E Adj. EBITDA Mgmt. Projections R$736 6.5x 11.5x '24E Adj. EBITDA Mgmt. Projections R$971 5.5x 10.0x '24E Adj. EBITDA Ill. Sensitivity (Delayed BTL) R$934 5.5x 10.0x '23E Adj. EBITDA - CapEx Mgmt. Projections R$513 8.5x 13.5x '24E Adj. EBITDA - CapEx Mgmt. Projections R$738 7.5x 11.5x '24E Adj. EBITDA - CapEx Ill. Sensitivity (Delayed BTL) R$691 7.5x 11.5x Analyst Price Targets Range as of 4/17/23 (12-month Target) 52-Week Range Range as of 11/30/22 (Unaffected) 1 Day Premium as of 11/30/22 (Unaffected) 19%-55% 4 Weeks Premium as of 11/30/22 (Unaffected) 25%-66% DCF WACC: 13.5% - 16.5% PGR: 4.0% - 5.0% Financial Analysis Public Company Trading Analysis Premiums Paid Reference $21.85 $18.27 $22.24 $16.71 $20.34 $19.26 $12.19 $16.75 $15.17 $14.05 $15.00 $18.50 $23.00 $11.54 $9.21 $13.11 $5.94 $7.57 $6.97 $4.69 $8.12 $7.09 $10.72 $11.29 $17.00 $7.99 $9.96 $19.23 Preliminary Arco Valuation Analysis Summary (Subject to Ongoing Review) Source: Management Projections; Illustrative Sensitivity Scenario; Illustrative Sensitivity Scenario (Delayed Business Term Loan) Bloomberg (4/17/23); FactSet (4/17/23);Thomson Reuters SDC (4/17/23) Note: Assumes BRL/USD spot exchange rate of 4.95 as of 4/17/23 Note: Metrics reflect actuals and projections per Arco management Note: Fully diluted shares outstanding calculated as basic shares plus accelerated vesting of RSUs, net dilution from options and holdback shares resulting from the Isaac acquisition; share count and dilution detail per Arco management; approach to Isaac holdback shares subject to ongoing review Revised Offer: $13.00 Verbal Offer Price: $12.00 Current Share Price: $11.20 Written Offer Price: $11.00 Unaffected Price: $9.04 Management Projections Illustrative Sensitivity Scenario (Metrics in R$ millions, Share Prices in US$) Illustrative Sensitivity Scenario (Delayed BTL) 6 |
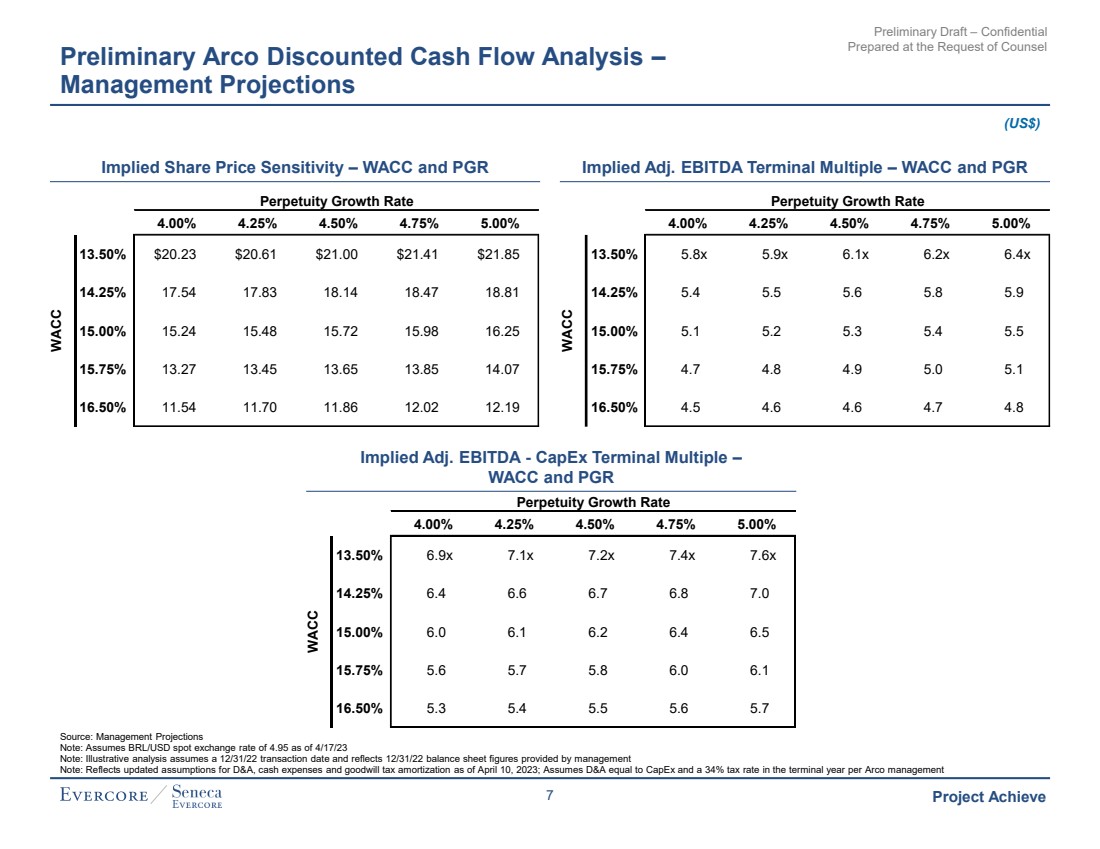
| Preliminary Draft – Confidential Prepared at the Request of Counsel Project Achieve Preliminary Arco Discounted Cash Flow Analysis – Management Projections (US$) Implied Share Price Sensitivity – WACC and PGR Implied Adj. EBITDA Terminal Multiple – WACC and PGR Implied Adj. EBITDA - CapEx Terminal Multiple – WACC and PGR Perpetuity Growth Rate Perpetuity Growth Rate 4.00% 4.25% 4.50% 4.75% 5.00% 13.50% $20.23 $20.61 $21.00 $21.41 $21.85 14.25% 17.54 17.83 18.14 18.47 18.81 15.00% 15.24 15.48 15.72 15.98 16.25 15.75% 13.27 13.45 13.65 13.85 14.07 16.50% 11.54 11.70 11.86 12.02 12.19 WACC Perpetuity Growth Rate 4.00% 4.25% 4.50% 4.75% 5.00% 13.50% 5.8x 5.9x 6.1x 6.2x 6.4x 14.25% 5.4 5.5 5.6 5.8 5.9 15.00% 5.1 5.2 5.3 5.4 5.5 15.75% 4.7 4.8 4.9 5.0 5.1 16.50% 4.5 4.6 4.6 4.7 4.8 WACC Perpetuity Growth Rate 4.00% 4.25% 4.50% 4.75% 5.00% 13.50% 6.9x 7.1x 7.2x 7.4x 7.6x 14.25% 6.4 6.6 6.7 6.8 7.0 15.00% 6.0 6.1 6.2 6.4 6.5 15.75% 5.6 5.7 5.8 6.0 6.1 16.50% 5.3 5.4 5.5 5.6 5.7 WACC Source: Management Projections Note: Assumes BRL/USD spot exchange rate of 4.95 as of 4/17/23 Note: Illustrative analysis assumes a 12/31/22 transaction date and reflects 12/31/22 balance sheet figures provided by management Note: Reflects updated assumptions for D&A, cash expenses and goodwill tax amortization as of April 10, 2023; Assumes D&A equal to CapEx and a 34% tax rate in the terminal year per Arco management 7 |
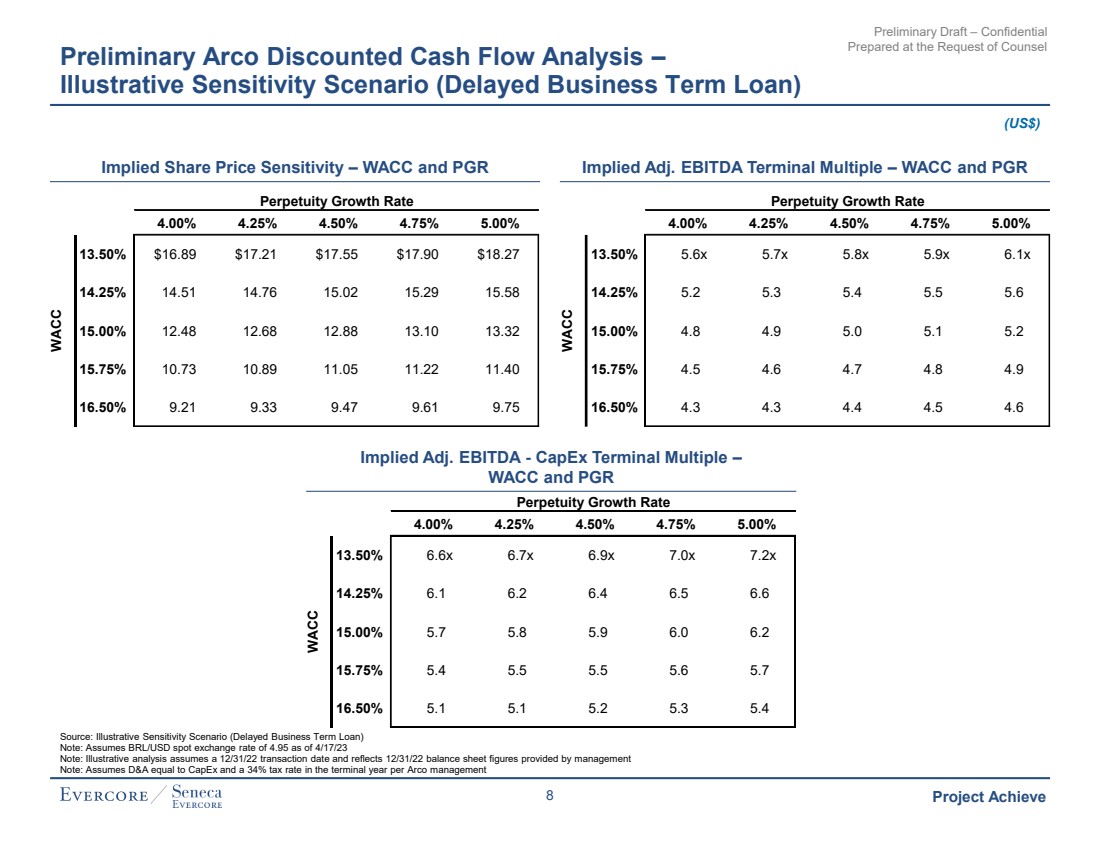
| Preliminary Draft – Confidential Prepared at the Request of Counsel Project Achieve Preliminary Arco Discounted Cash Flow Analysis – Illustrative Sensitivity Scenario (Delayed Business Term Loan) (US$) Implied Share Price Sensitivity – WACC and PGR Implied Adj. EBITDA Terminal Multiple – WACC and PGR Implied Adj. EBITDA - CapEx Terminal Multiple – WACC and PGR Perpetuity Growth Rate Perpetuity Growth Rate 4.00% 4.25% 4.50% 4.75% 5.00% 13.50% $16.89 $17.21 $17.55 $17.90 $18.27 14.25% 14.51 14.76 15.02 15.29 15.58 15.00% 12.48 12.68 12.88 13.10 13.32 15.75% 10.73 10.89 11.05 11.22 11.40 16.50% 9.21 9.33 9.47 9.61 9.75 WACC Perpetuity Growth Rate 4.00% 4.25% 4.50% 4.75% 5.00% 13.50% 5.6x 5.7x 5.8x 5.9x 6.1x 14.25% 5.2 5.3 5.4 5.5 5.6 15.00% 4.8 4.9 5.0 5.1 5.2 15.75% 4.5 4.6 4.7 4.8 4.9 16.50% 4.3 4.3 4.4 4.5 4.6 WACC Perpetuity Growth Rate 4.00% 4.25% 4.50% 4.75% 5.00% 13.50% 6.6x 6.7x 6.9x 7.0x 7.2x 14.25% 6.1 6.2 6.4 6.5 6.6 15.00% 5.7 5.8 5.9 6.0 6.2 15.75% 5.4 5.5 5.5 5.6 5.7 16.50% 5.1 5.1 5.2 5.3 5.4 WACC Source: Illustrative Sensitivity Scenario (Delayed Business Term Loan) Note: Assumes BRL/USD spot exchange rate of 4.95 as of 4/17/23 Note: Illustrative analysis assumes a 12/31/22 transaction date and reflects 12/31/22 balance sheet figures provided by management Note: Assumes D&A equal to CapEx and a 34% tax rate in the terminal year per Arco management 8 |
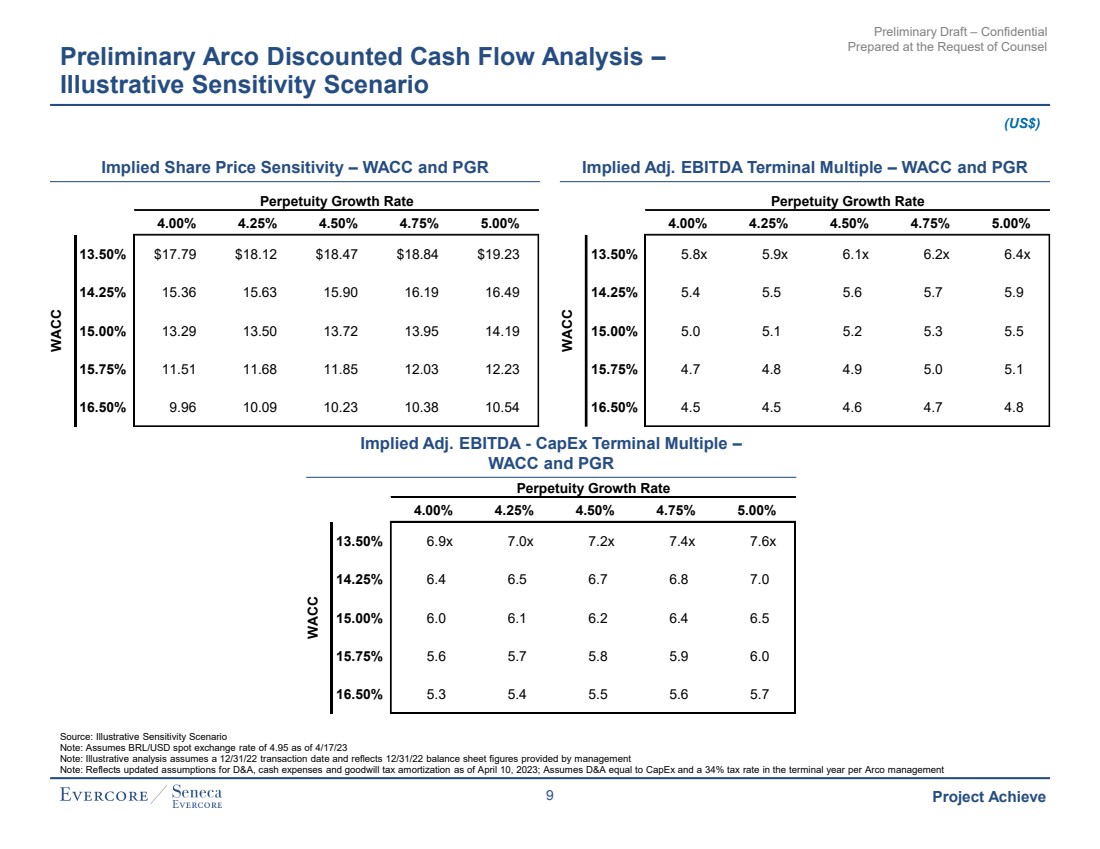
| Preliminary Draft – Confidential Prepared at the Request of Counsel Project Achieve Preliminary Arco Discounted Cash Flow Analysis – Illustrative Sensitivity Scenario (US$) Implied Share Price Sensitivity – WACC and PGR Implied Adj. EBITDA Terminal Multiple – WACC and PGR Implied Adj. EBITDA - CapEx Terminal Multiple – WACC and PGR Perpetuity Growth Rate Perpetuity Growth Rate 4.00% 4.25% 4.50% 4.75% 5.00% 13.50% $17.79 $18.12 $18.47 $18.84 $19.23 14.25% 15.36 15.63 15.90 16.19 16.49 15.00% 13.29 13.50 13.72 13.95 14.19 15.75% 11.51 11.68 11.85 12.03 12.23 16.50% 9.96 10.09 10.23 10.38 10.54 WACC Perpetuity Growth Rate 4.00% 4.25% 4.50% 4.75% 5.00% 13.50% 5.8x 5.9x 6.1x 6.2x 6.4x 14.25% 5.4 5.5 5.6 5.7 5.9 15.00% 5.0 5.1 5.2 5.3 5.5 15.75% 4.7 4.8 4.9 5.0 5.1 16.50% 4.5 4.5 4.6 4.7 4.8 WACC Perpetuity Growth Rate 4.00% 4.25% 4.50% 4.75% 5.00% 13.50% 6.9x 7.0x 7.2x 7.4x 7.6x 14.25% 6.4 6.5 6.7 6.8 7.0 15.00% 6.0 6.1 6.2 6.4 6.5 15.75% 5.6 5.7 5.8 5.9 6.0 16.50% 5.3 5.4 5.5 5.6 5.7 WACC Source: Illustrative Sensitivity Scenario Note: Assumes BRL/USD spot exchange rate of 4.95 as of 4/17/23 Note: Illustrative analysis assumes a 12/31/22 transaction date and reflects 12/31/22 balance sheet figures provided by management Note: Reflects updated assumptions for D&A, cash expenses and goodwill tax amortization as of April 10, 2023; Assumes D&A equal to CapEx and a 34% tax rate in the terminal year per Arco management 9 |
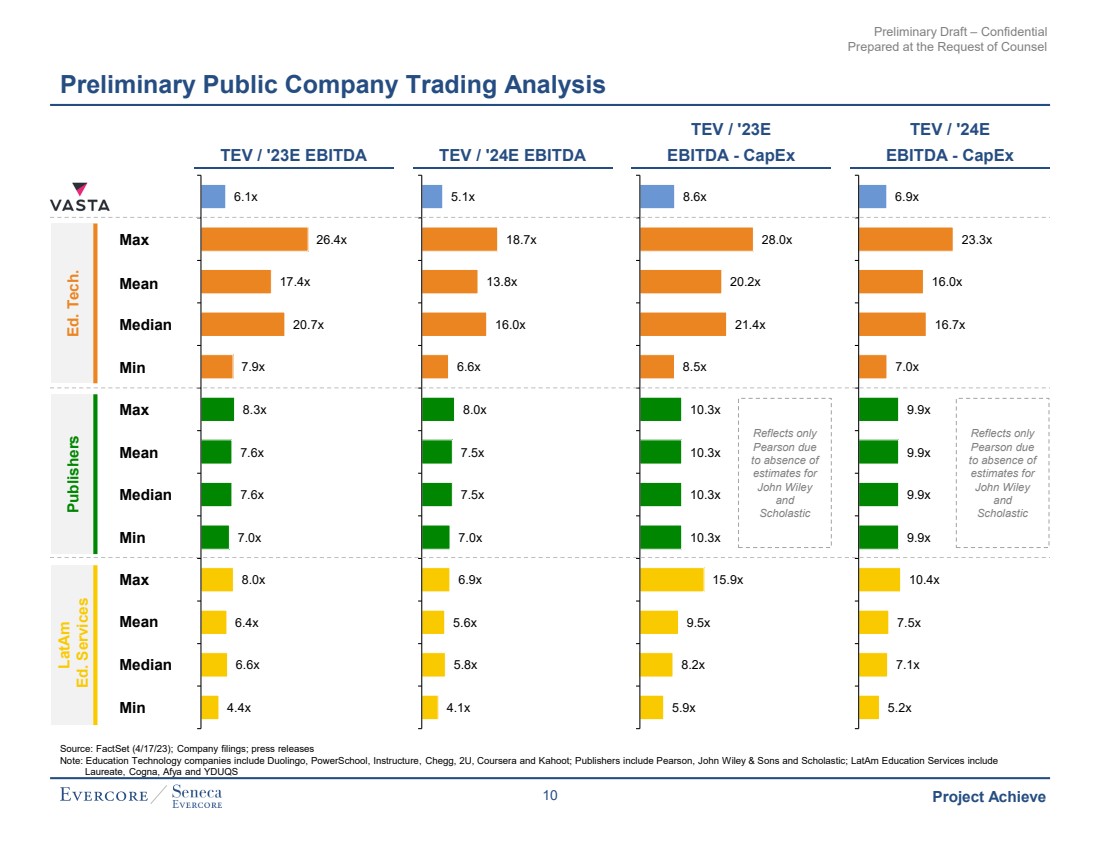
| Preliminary Draft – Confidential Prepared at the Request of Counsel Project Achieve TEV / '23E EBITDA TEV / '24E EBITDA TEV / '23E EBITDA - CapEx TEV / '24E EBITDA - CapEx 6.1x 26.4x 17.4x 20.7x 7.9x 8.3x 7.6x 7.6x 7.0x 8.0x 6.4x 6.6x 4.4x 5.1x 18.7x 13.8x 16.0x 6.6x 8.0x 7.5x 7.5x 7.0x 6.9x 5.6x 5.8x 4.1x 8.6x 28.0x 20.2x 21.4x 8.5x 10.3x 10.3x 10.3x 10.3x 15.9x 9.5x 8.2x 5.9x 6.9x 23.3x 16.0x 16.7x 7.0x 9.9x 9.9x 9.9x 9.9x 10.4x 7.5x 7.1x 5.2x Preliminary Public Company Trading Analysis Ed. Tech. LatAm Ed. Services Publishers Max Mean Median Min Max Mean Median Min Max Mean Median Min Reflects only Pearson due to absence of estimates for John Wiley and Scholastic Source: FactSet (4/17/23); Company filings; press releases Note: Education Technology companies include Duolingo, PowerSchool, Instructure, Chegg, 2U, Coursera and Kahoot; Publishers include Pearson, John Wiley & Sons and Scholastic; LatAm Education Services include Laureate, Cogna, Afya and YDUQS Reflects only Pearson due to absence of estimates for John Wiley and Scholastic 10 |
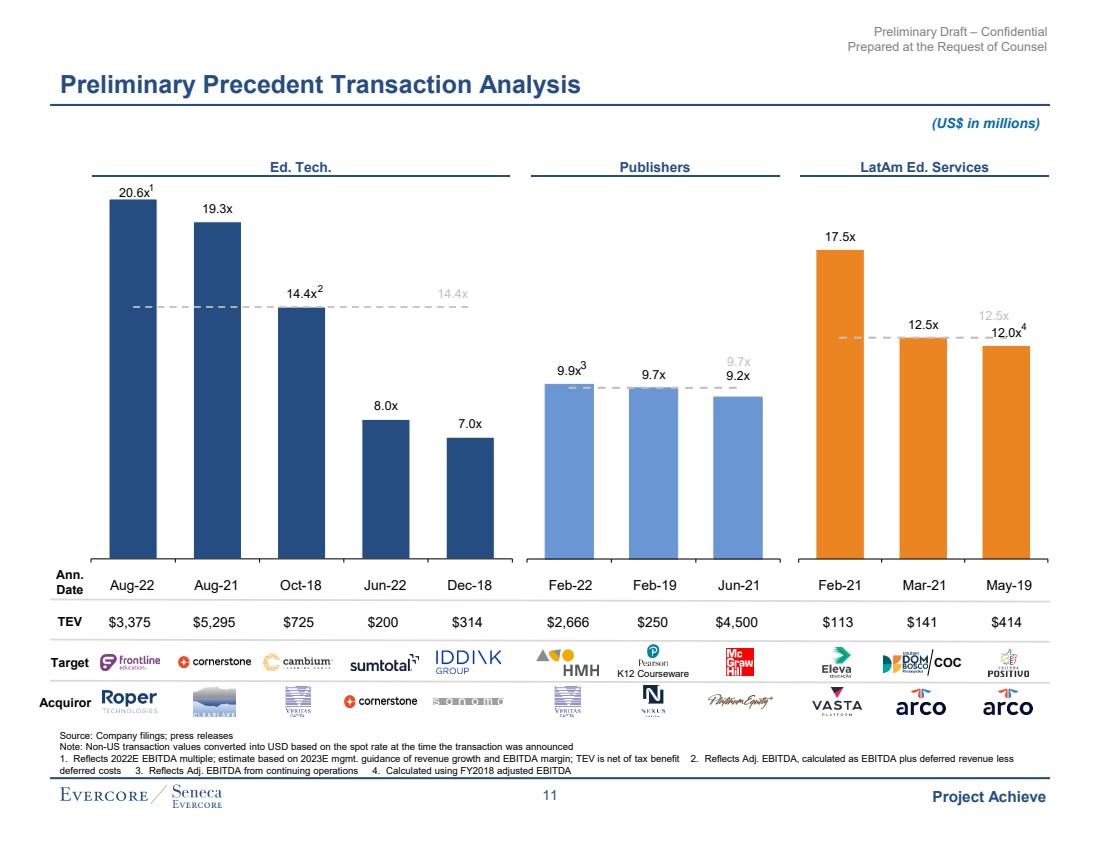
| Preliminary Draft – Confidential Prepared at the Request of Counsel Project Achieve Preliminary Precedent Transaction Analysis (US$ in millions) Ed. Tech. Publishers LatAm Ed. Services Aug-22 Aug-21 Oct-18 Jun-22 Dec-18 Feb-22 Feb-19 Jun-21 Feb-21 Mar-21 May-19 $3,375 $5,295 $725 $200 $314 $2,666 $250 $4,500 $113 $141 $414 20.6x 19.3x 14.4x 8.0x 7.0x 14.4x 9.9x 9.7x 9.2x 9.7x 17.5x 12.5x 12.0x 12.5x Source: Company filings; press releases Note: Non-US transaction values converted into USD based on the spot rate at the time the transaction was announced 1. Reflects 2022E EBITDA multiple; estimate based on 2023E mgmt. guidance of revenue growth and EBITDA margin; TEV is net of tax benefit 2. Reflects Adj. EBITDA, calculated as EBITDA plus deferred revenue less deferred costs 3. Reflects Adj. EBITDA from continuing operations 4. Calculated using FY2018 adjusted EBITDA 1 4 Ann. Date TEV Target Acquiror 2 3 K12 Courseware COC 11 |
| Preliminary Draft – Confidential Prepared at the Request of Counsel Appendix |
| Preliminary Draft – Confidential Prepared at the Request of Counsel A. Additional Analyses |
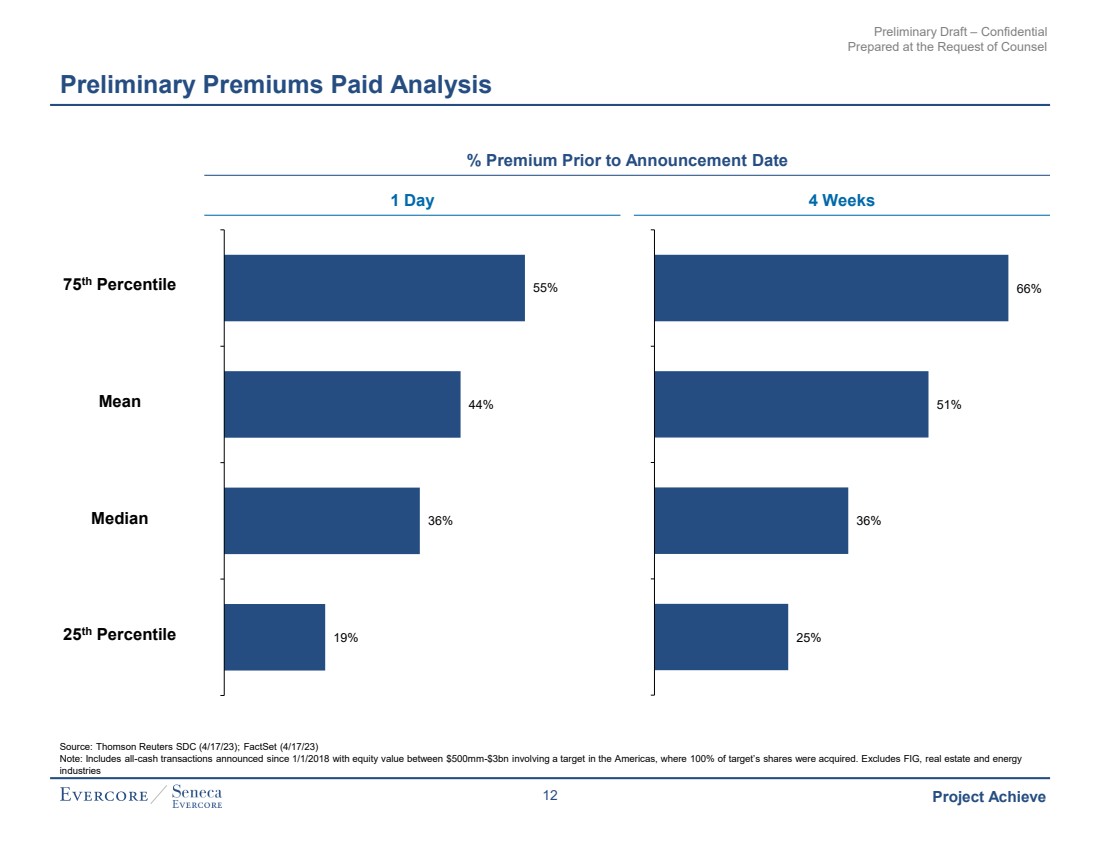
| Preliminary Draft – Confidential Prepared at the Request of Counsel Project Achieve Preliminary Premiums Paid Analysis % Premium Prior to Announcement Date 1 Day 4 Weeks 55% 44% 36% 19% 75th Percentile Mean Median 25th Percentile 66% 51% 36% 25% Source: Thomson Reuters SDC (4/17/23); FactSet (4/17/23) Note: Includes all-cash transactions announced since 1/1/2018 with equity value between $500mm-$3bn involving a target in the Americas, where 100% of target’s shares were acquired. Excludes FIG, real estate and energy industries 12 |
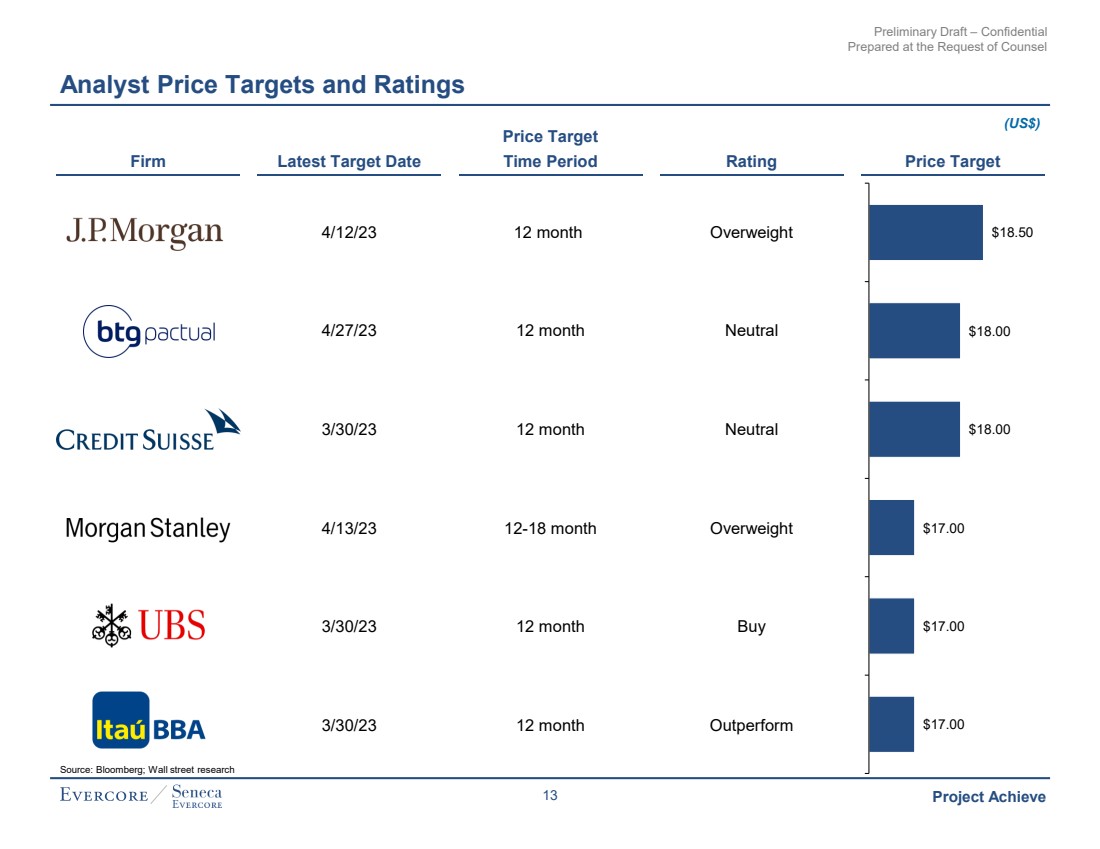
| Preliminary Draft – Confidential Prepared at the Request of Counsel Project Achieve Firm Latest Target Date Price Target Time Period Rating Price Target 4/12/23 12 month Overweight 4/27/23 12 month Neutral 3/30/23 12 month Neutral 4/13/23 12-18 month Overweight 3/30/23 12 month Buy 3/30/23 12 month Outperform $18.50 $18.00 $18.00 $17.00 $17.00 $17.00 Analyst Price Targets and Ratings Source: Bloomberg; Wall street research (US$) 13 |
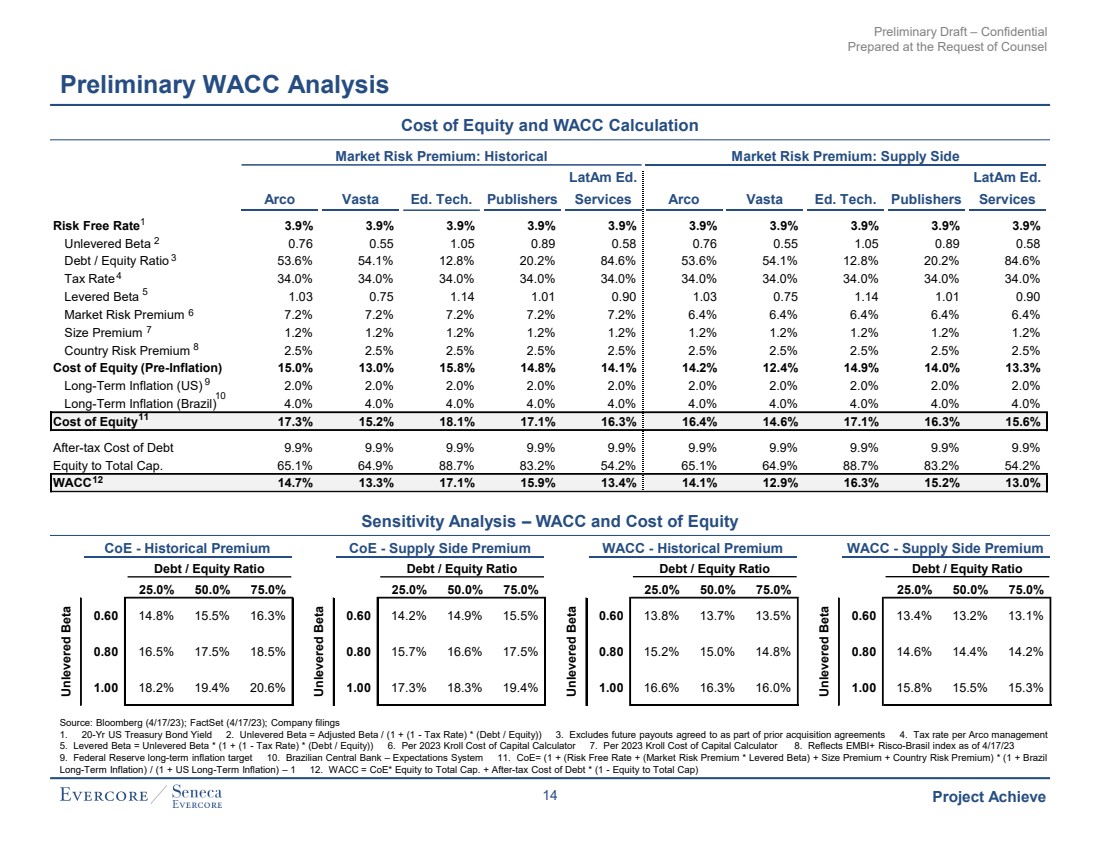
| Preliminary Draft – Confidential Prepared at the Request of Counsel Project Achieve Preliminary WACC Analysis Cost of Equity and WACC Calculation Sensitivity Analysis – WACC and Cost of Equity Market Risk Premium: Historical Market Risk Premium: Supply Side Arco Vasta Ed. Tech. Publishers LatAm Ed. Services Arco Vasta Ed. Tech. Publishers LatAm Ed. Services Risk Free Rate 3.9% 3.9% 3.9% 3.9% 3.9% 3.9% 3.9% 3.9% 3.9% 3.9% Unlevered Beta 0.76 0.55 1.05 0.89 0.58 0.76 0.55 1.05 0.89 0.58 Debt / Equity Ratio 53.6% 54.1% 12.8% 20.2% 84.6% 53.6% 54.1% 12.8% 20.2% 84.6% Tax Rate 34.0% 34.0% 34.0% 34.0% 34.0% 34.0% 34.0% 34.0% 34.0% 34.0% Levered Beta 1.03 0.75 1.14 1.01 0.90 1.03 0.75 1.14 1.01 0.90 Market Risk Premium 7.2% 7.2% 7.2% 7.2% 7.2% 6.4% 6.4% 6.4% 6.4% 6.4% Size Premium 1.2% 1.2% 1.2% 1.2% 1.2% 1.2% 1.2% 1.2% 1.2% 1.2% Country Risk Premium 2.5% 2.5% 2.5% 2.5% 2.5% 2.5% 2.5% 2.5% 2.5% 2.5% Cost of Equity (Pre-Inflation) 15.0% 13.0% 15.8% 14.8% 14.1% 14.2% 12.4% 14.9% 14.0% 13.3% Long-Term Inflation (US) 2.0% 2.0% 2.0% 2.0% 2.0% 2.0% 2.0% 2.0% 2.0% 2.0% Long-Term Inflation (Brazil) 4.0% 4.0% 4.0% 4.0% 4.0% 4.0% 4.0% 4.0% 4.0% 4.0% Cost of Equity 17.3% 15.2% 18.1% 17.1% 16.3% 16.4% 14.6% 17.1% 16.3% 15.6% After-tax Cost of Debt 9.9% 9.9% 9.9% 9.9% 9.9% 9.9% 9.9% 9.9% 9.9% 9.9% Equity to Total Cap. 65.1% 64.9% 88.7% 83.2% 54.2% 65.1% 64.9% 88.7% 83.2% 54.2% WACC 14.7% 13.3% 17.1% 15.9% 13.4% 14.1% 12.9% 16.3% 15.2% 13.0% Source: Bloomberg (4/17/23); FactSet (4/17/23); Company filings 1. 20-Yr US Treasury Bond Yield 2. Unlevered Beta = Adjusted Beta / (1 + (1 - Tax Rate) * (Debt / Equity)) 3. Excludes future payouts agreed to as part of prior acquisition agreements 4. Tax rate per Arco management 5. Levered Beta = Unlevered Beta * (1 + (1 - Tax Rate) * (Debt / Equity)) 6. Per 2023 Kroll Cost of Capital Calculator 7. Per 2023 Kroll Cost of Capital Calculator 8. Reflects EMBI+ Risco-Brasil index as of 4/17/23 9. Federal Reserve long-term inflation target 10. Brazilian Central Bank – Expectations System 11. CoE= (1 + (Risk Free Rate + (Market Risk Premium * Levered Beta) + Size Premium + Country Risk Premium) * (1 + Brazil Long-Term Inflation) / (1 + US Long-Term Inflation) – 1 12. WACC = CoE* Equity to Total Cap. + After-tax Cost of Debt * (1 - Equity to Total Cap) CoE - Historical Premium CoE - Supply Side Premium Debt / Equity Ratio Debt / Equity Ratio 25.0% 50.0% 75.0% 0.60 14.8% 15.5% 16.3% 0.80 16.5% 17.5% 18.5% Unlevered Beta 1.00 18.2% 19.4% 20.6% WACC - Supply Side Premium Debt / Equity Ratio 25.0% 50.0% 75.0% 0.60 13.4% 13.2% 13.1% 0.80 14.6% 14.4% 14.2% Unlevered Beta 1.00 15.8% 15.5% 15.3% CoE - Supply Side Premium Debt / Equity Ratio 25.0% 50.0% 75.0% 0.60 14.2% 14.9% 15.5% 0.80 15.7% 16.6% 17.5% Unlevered Beta 1.00 17.3% 18.3% 19.4% WACC - Historical Premium WACC - Supply Side Premium Debt / Equity Ratio Debt / Equity Ratio 25.0% 50.0% 75.0% 0.60 13.8% 13.7% 13.5% 0.80 15.2% 15.0% 14.8% Unlevered Beta 1.00 16.6% 16.3% 16.0% 1 2 5 6 7 8 9 10 4 11 12 3 14 |
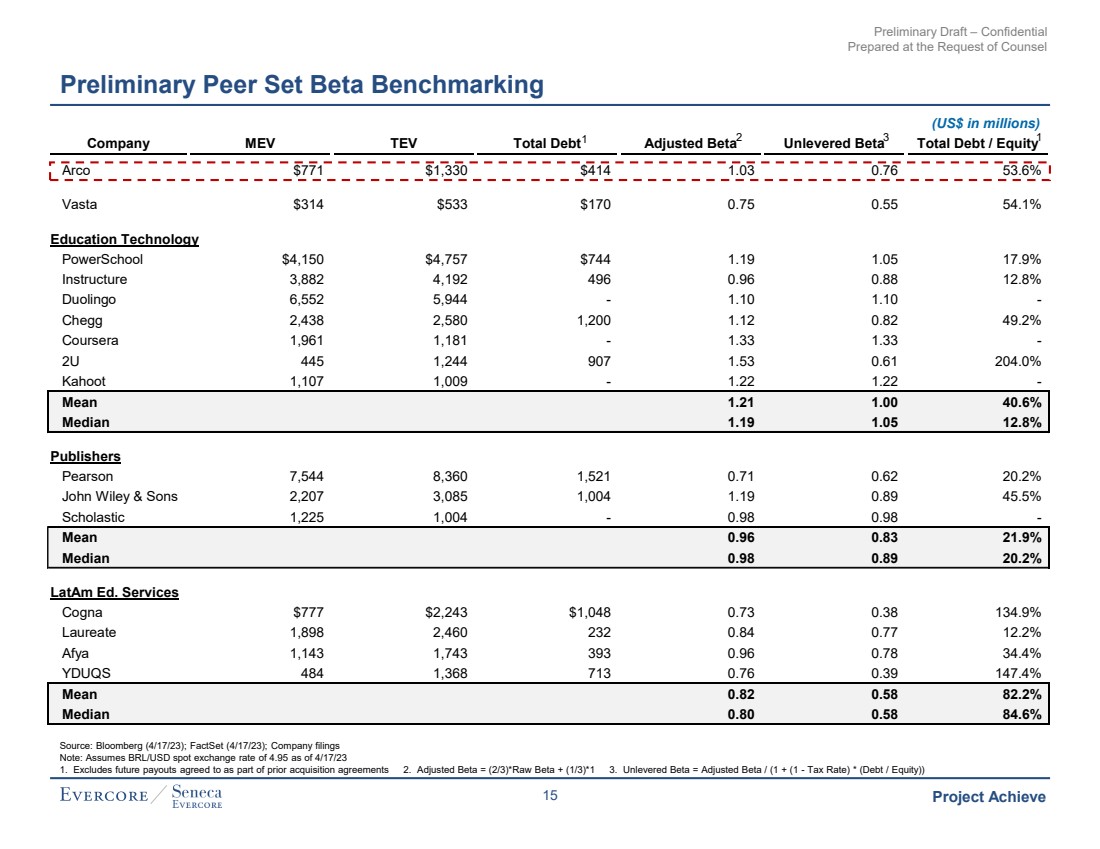
| Preliminary Draft – Confidential Prepared at the Request of Counsel Project Achieve Preliminary Peer Set Beta Benchmarking Source: Bloomberg (4/17/23); FactSet (4/17/23); Company filings Note: Assumes BRL/USD spot exchange rate of 4.95 as of 4/17/23 1. Excludes future payouts agreed to as part of prior acquisition agreements 2. Adjusted Beta = (2/3)*Raw Beta + (1/3)*1 3. Unlevered Beta = Adjusted Beta / (1 + (1 - Tax Rate) * (Debt / Equity)) Company MEV TEV Total Debt Adjusted Beta Unlevered Beta Total Debt / Equity Arco $771 $1,330 $414 1.03 0.76 53.6% Vasta $314 $533 $170 0.75 0.55 54.1% Education Technology PowerSchool $4,150 $4,757 $744 1.19 1.05 17.9% Instructure 3,882 4,192 496 0.96 0.88 12.8% Duolingo 6,552 5,944 - 1.10 1.10 - Chegg 2,438 2,580 1,200 1.12 0.82 49.2% Coursera 1,961 1,181 - 1.33 1.33 - 2U 445 1,244 907 1.53 0.61 204.0% Kahoot 1,107 1,009 - 1.22 1.22 - Mean 1.21 1.00 40.6% Median 1.19 1.05 12.8% Publishers Pearson 7,544 8,360 1,521 0.71 0.62 20.2% John Wiley & Sons 2,207 3,085 1,004 1.19 0.89 45.5% Scholastic 1,225 1,004 - 0.98 0.98 - Mean 0.96 0.83 21.9% Median 0.98 0.89 20.2% LatAm Ed. Services Cogna $777 $2,243 $1,048 0.73 0.38 134.9% Laureate 1,898 2,460 232 0.84 0.77 12.2% Afya 1,143 1,743 393 0.96 0.78 34.4% YDUQS 484 1,368 713 0.76 0.39 147.4% Mean 0.82 0.58 82.2% Median 0.80 0.58 84.6% (US$ in millions) 3 j 1 2 1 15 |
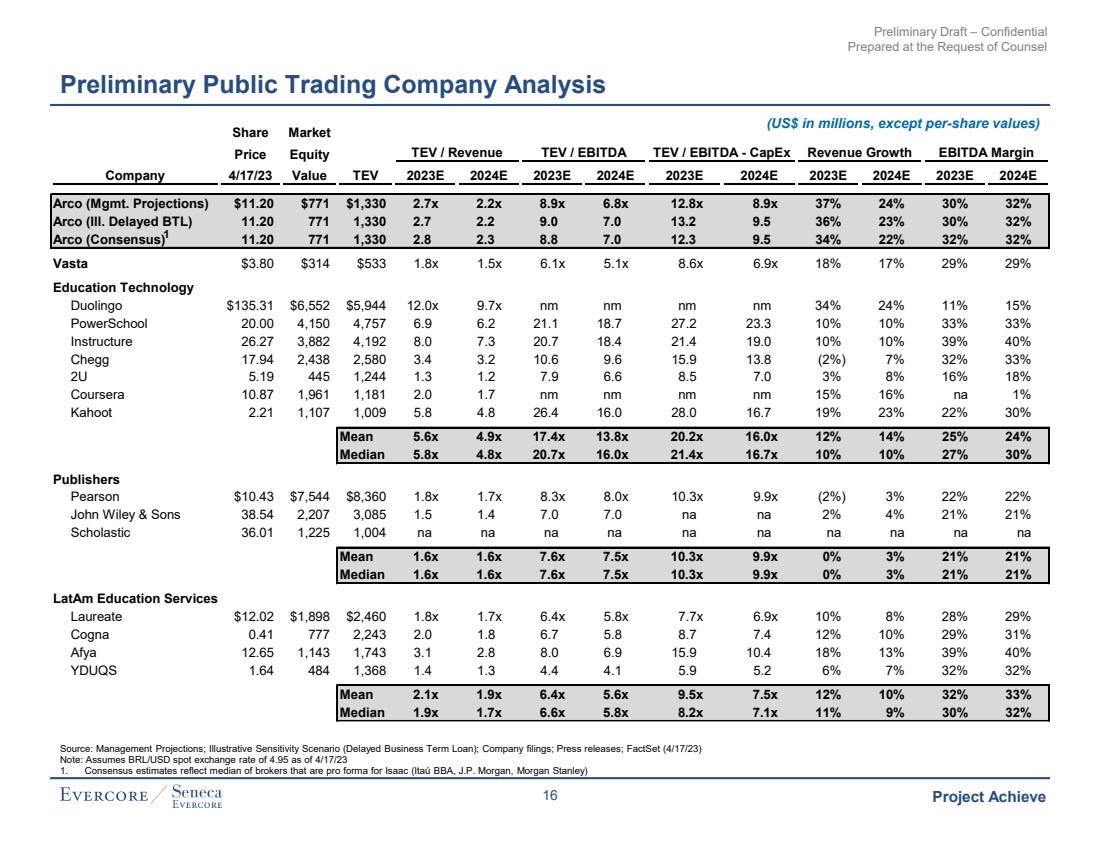
| Preliminary Draft – Confidential Prepared at the Request of Counsel Project Achieve Share Market Price Equity TEV / Revenue TEV / EBITDA TEV / EBITDA - CapEx Revenue Growth EBITDA Margin Revenue Company 4/17/23 Value TEV 2023E 2024E 2023E 2024E 2023E 2024E 2023E 2024E 2023E 2024E Arco (Mgmt. Projections) $11.20 $771 $1,330 2.7x 2.2x 8.9x 6.8x 12.8x 8.9x 37% 24% 30% 32% Arco (Ill. Delayed BTL) 11.20 771 1,330 2.7 2.2 9.0 7.0 13.2 9.5 36% 23% 30% 32% Arco (Consensus) 11.20 771 1,330 2.8 2.3 8.8 7.0 12.3 9.5 34% 22% 32% 32% Vasta $3.80 $314 $533 1.8x 1.5x 6.1x 5.1x 8.6x 6.9x 18% 17% 29% 29% Education Technology Duolingo $135.31 $6,552 $5,944 12.0x 9.7x nm nm nm nm 34% 24% 11% 15% PowerSchool 20.00 4,150 4,757 6.9 6.2 21.1 18.7 27.2 23.3 10% 10% 33% 33% Instructure 26.27 3,882 4,192 8.0 7.3 20.7 18.4 21.4 19.0 10% 10% 39% 40% Chegg 17.94 2,438 2,580 3.4 3.2 10.6 9.6 15.9 13.8 (2%) 7% 32% 33% 2U 5.19 445 1,244 1.3 1.2 7.9 6.6 8.5 7.0 3% 8% 16% 18% Coursera 10.87 1,961 1,181 2.0 1.7 nm nm nm nm 15% 16% na 1% Kahoot 2.21 1,107 1,009 5.8 4.8 26.4 16.0 28.0 16.7 19% 23% 22% 30% Mean 5.6x 4.9x 17.4x 13.8x 20.2x 16.0x 12% 14% 25% 24% Median 5.8x 4.8x 20.7x 16.0x 21.4x 16.7x 10% 10% 27% 30% Publishers Pearson $10.43 $7,544 $8,360 1.8x 1.7x 8.3x 8.0x 10.3x 9.9x (2%) 3% 22% 22% John Wiley & Sons 38.54 2,207 3,085 1.5 1.4 7.0 7.0 na na 2% 4% 21% 21% Scholastic 36.01 1,225 1,004 na na na na na na na na na na Mean 1.6x 1.6x 7.6x 7.5x 10.3x 9.9x 0% 3% 21% 21% Median 1.6x 1.6x 7.6x 7.5x 10.3x 9.9x 0% 3% 21% 21% LatAm Education Services Laureate $12.02 $1,898 $2,460 1.8x 1.7x 6.4x 5.8x 7.7x 6.9x 10% 8% 28% 29% Cogna 0.41 777 2,243 2.0 1.8 6.7 5.8 8.7 7.4 12% 10% 29% 31% Afya 12.65 1,143 1,743 3.1 2.8 8.0 6.9 15.9 10.4 18% 13% 39% 40% YDUQS 1.64 484 1,368 1.4 1.3 4.4 4.1 5.9 5.2 6% 7% 32% 32% Mean 2.1x 1.9x 6.4x 5.6x 9.5x 7.5x 12% 10% 32% 33% Median 1.9x 1.7x 6.6x 5.8x 8.2x 7.1x 11% 9% 30% 32% Preliminary Public Trading Company Analysis (US$ in millions, except per-share values) Source: Management Projections; Illustrative Sensitivity Scenario (Delayed Business Term Loan); Company filings; Press releases; FactSet (4/17/23) Note: Assumes BRL/USD spot exchange rate of 4.95 as of 4/17/23 1. Consensus estimates reflect median of brokers that are pro forma for Isaac (Itaú BBA, J.P. Morgan, Morgan Stanley) 1 16 |
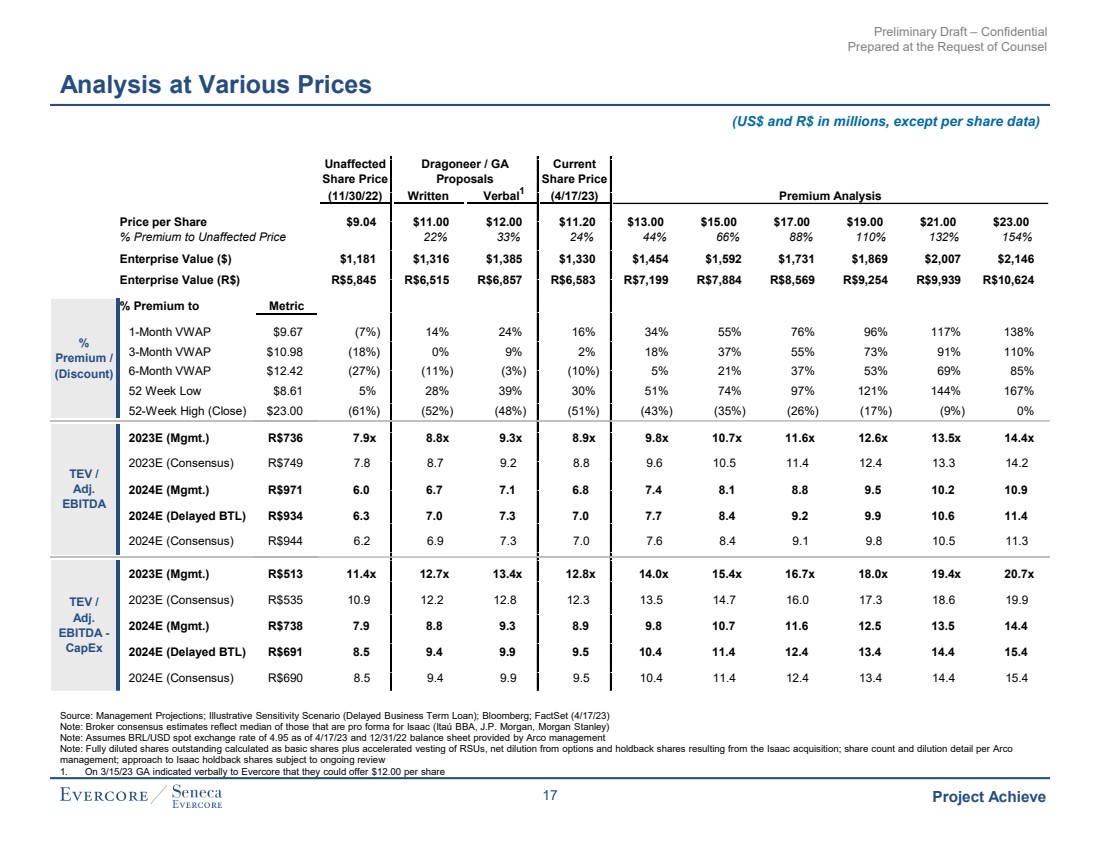
| Preliminary Draft – Confidential Prepared at the Request of Counsel Project Achieve Unaffected Dragoneer / GA Current Share Price Proposals Share Price (11/30/22) Written Verbal (4/17/23) Premium Analysis Price per Share $9.04 $11.00 $12.00 $11.20 $13.00 $15.00 $17.00 $19.00 $21.00 $23.00 % Premium to Unaffected Price 22% 33% 24% 44% 66% 88% 110% 132% 154% Enterprise Value ($) $1,181 $1,316 $1,385 $1,330 $1,454 $1,592 $1,731 $1,869 $2,007 $2,146 Enterprise Value (R$) R$5,845 R$6,515 R$6,857 R$6,583 R$7,199 R$7,884 R$8,569 R$9,254 R$9,939 R$10,624 % Premium to Metric 1-Month VWAP $9.67 (7%) 14% 24% 16% 34% 55% 76% 96% 117% 138% 3-Month VWAP $10.98 (18%) 0% 9% 2% 18% 37% 55% 73% 91% 110% 6-Month VWAP $12.42 (27%) (11%) (3%) (10%) 5% 21% 37% 53% 69% 85% 52 Week Low $8.61 5% 28% 39% 30% 51% 74% 97% 121% 144% 167% 52-Week High (Close) $23.00 (61%) (52%) (48%) (51%) (43%) (35%) (26%) (17%) (9%) 0% 2023E (Mgmt.) R$736 7.9x 8.8x 9.3x 8.9x 9.8x 10.7x 11.6x 12.6x 13.5x 14.4x 2023E (Consensus) R$749 7.8 8.7 9.2 8.8 9.6 10.5 11.4 12.4 13.3 14.2 2024E (Mgmt.) R$971 6.0 6.7 7.1 6.8 7.4 8.1 8.8 9.5 10.2 10.9 2024E (Delayed BTL) R$934 6.3 7.0 7.3 7.0 7.7 8.4 9.2 9.9 10.6 11.4 2024E (Consensus) R$944 6.2 6.9 7.3 7.0 7.6 8.4 9.1 9.8 10.5 11.3 2023E (Mgmt.) R$513 11.4x 12.7x 13.4x 12.8x 14.0x 15.4x 16.7x 18.0x 19.4x 20.7x 2023E (Consensus) R$535 10.9 12.2 12.8 12.3 13.5 14.7 16.0 17.3 18.6 19.9 2024E (Mgmt.) R$738 7.9 8.8 9.3 8.9 9.8 10.7 11.6 12.5 13.5 14.4 2024E (Delayed BTL) R$691 8.5 9.4 9.9 9.5 10.4 11.4 12.4 13.4 14.4 15.4 2024E (Consensus) R$690 8.5 9.4 9.9 9.5 10.4 11.4 12.4 13.4 14.4 15.4 % Premium / (Discount) TEV / Adj. EBITDA - CapEx TEV / Adj. EBITDA Analysis at Various Prices (US$ and R$ in millions, except per share data) Source: Management Projections; Illustrative Sensitivity Scenario (Delayed Business Term Loan); Bloomberg; FactSet (4/17/23) Note: Broker consensus estimates reflect median of those that are pro forma for Isaac (Itaú BBA, J.P. Morgan, Morgan Stanley) Note: Assumes BRL/USD spot exchange rate of 4.95 as of 4/17/23 and 12/31/22 balance sheet provided by Arco management Note: Fully diluted shares outstanding calculated as basic shares plus accelerated vesting of RSUs, net dilution from options and holdback shares resulting from the Isaac acquisition; share count and dilution detail per Arco management; approach to Isaac holdback shares subject to ongoing review 1. On 3/15/23 GA indicated verbally to Evercore that they could offer $12.00 per share 1 17 |
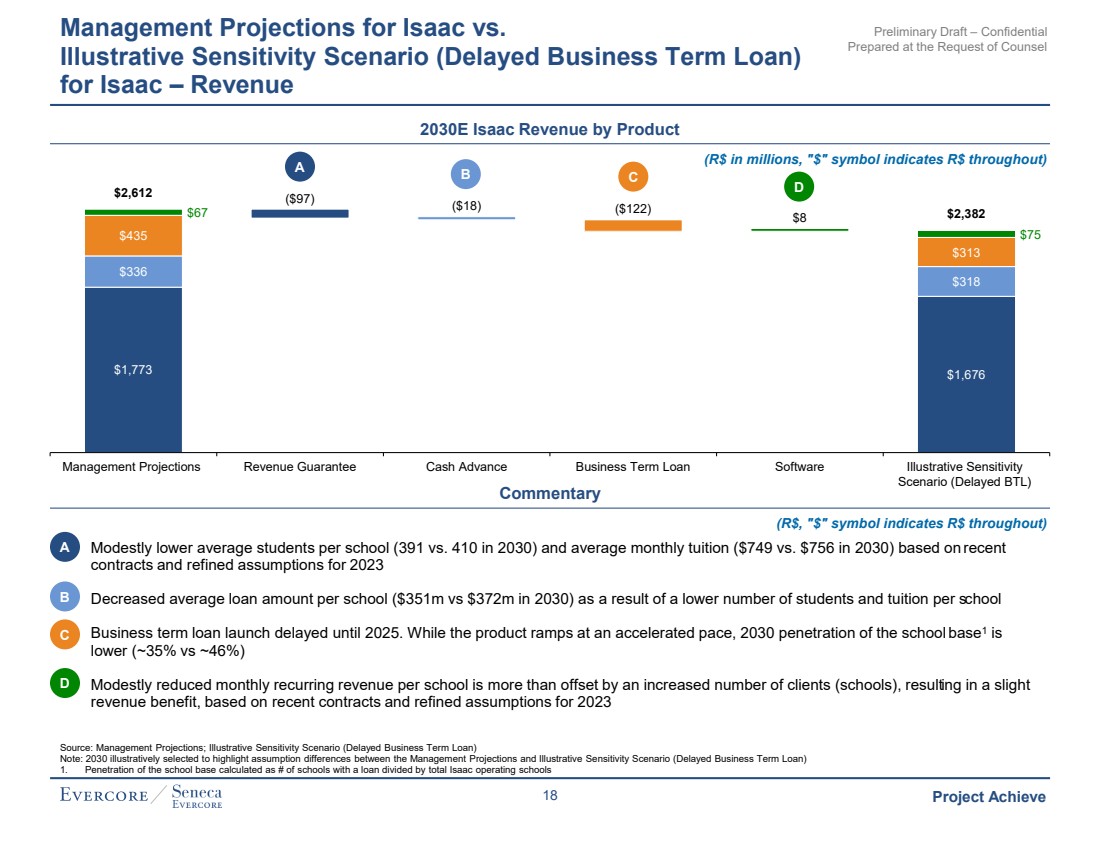
| Preliminary Draft – Confidential Prepared at the Request of Counsel Project Achieve ◼ Modestly lower average students per school (391 vs. 410 in 2030) and average monthly tuition ($749 vs. $756 in 2030) based onrecent contracts and refined assumptions for 2023 ◼ Decreased average loan amount per school ($351m vs $372m in 2030) as a result of a lower number of students and tuition per school ◼ Business term loan launch delayed until 2025. While the product ramps at an accelerated pace, 2030 penetration of the school base 1 is lower (~35% vs ~46%) ◼ Modestly reduced monthly recurring revenue per school is more than offset by an increased number of clients (schools), resulting in a slight revenue benefit, based on recent contracts and refined assumptions for 2023 Management Projections for Isaac vs. Illustrative Sensitivity Scenario (Delayed Business Term Loan) for Isaac – Revenue 2030E Isaac Revenue by Product $1,773 $1,676 $336 $318 $435 $313 $67 ($97) ($18) ($122) $8 $75 $2,612 $2,382 Management Projections Revenue Guarantee Cash Advance Business Term Loan Software Illustrative Sensitivity Scenario (Delayed BTL) Commentary A B C D A B C D Source: Management Projections; Illustrative Sensitivity Scenario (Delayed Business Term Loan) Note: 2030 illustratively selected to highlight assumption differences between the Management Projections and Illustrative Sensitivity Scenario (Delayed Business Term Loan) 1. Penetration of the school base calculated as # of schools with a loan divided by total Isaac operating schools (R$ in millions, "$" symbol indicates R$ throughout) (R$, "$" symbol indicates R$ throughout) 18 |
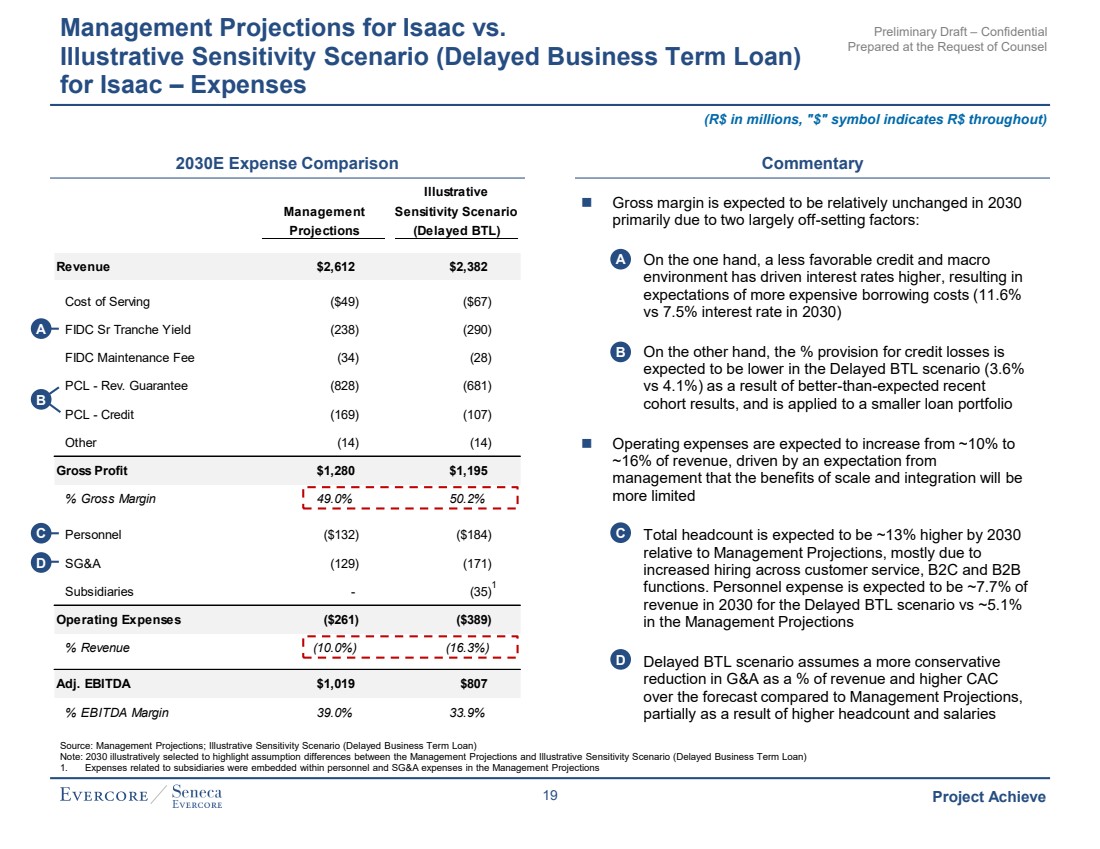
| Preliminary Draft – Confidential Prepared at the Request of Counsel Project Achieve Management Projections for Isaac vs. Illustrative Sensitivity Scenario (Delayed Business Term Loan) for Isaac – Expenses 2030E Expense Comparison Commentary Source: Management Projections; Illustrative Sensitivity Scenario (Delayed Business Term Loan) Note: 2030 illustratively selected to highlight assumption differences between the Management Projections and Illustrative Sensitivity Scenario (Delayed Business Term Loan) 1. Expenses related to subsidiaries were embedded within personnel and SG&A expenses in the Management Projections (R$ in millions, "$" symbol indicates R$ throughout) Illustrative Management Sensitivity Scenario Projections (Delayed BTL) Revenue $2,612 $2,382 Cost of Serving ($49) ($67) FIDC Sr Tranche Yield (238) (290) FIDC Maintenance Fee (34) (28) PCL - Rev. Guarantee (828) (681) PCL - Credit (169) (107) Other (14) (14) Gross Profit $1,280 $1,195 % Gross Margin 49.0% 50.2% Personnel ($132) ($184) SG&A (129) (171) Subsidiaries - (35) Operating Expenses ($261) ($389) % Revenue (10.0%) (16.3%) Adj. EBITDA $1,019 $807 % EBITDA Margin 39.0% 33.9% ◼ Gross margin is expected to be relatively unchanged in 2030 primarily due to two largely off-setting factors: On the one hand, a less favorable credit and macro environment has driven interest rates higher, resulting in expectations of more expensive borrowing costs (11.6% vs 7.5% interest rate in 2030) On the other hand, the % provision for credit losses is expected to be lower in the Delayed BTL scenario (3.6% vs 4.1%) as a result of better-than-expected recent cohort results, and is applied to a smaller loan portfolio ◼ Operating expenses are expected to increase from ~10% to ~16% of revenue, driven by an expectation from management that the benefits of scale and integration will be more limited Total headcount is expected to be ~13% higher by 2030 relative to Management Projections, mostly due to increased hiring across customer service, B2C and B2B functions. Personnel expense is expected to be ~7.7% of revenue in 2030 for the Delayed BTL scenario vs ~5.1% in the Management Projections Delayed BTL scenario assumes a more conservative reduction in G&A as a % of revenue and higher CAC over the forecast compared to Management Projections, partially as a result of higher headcount and salaries A B C D A B C D 1 19 |
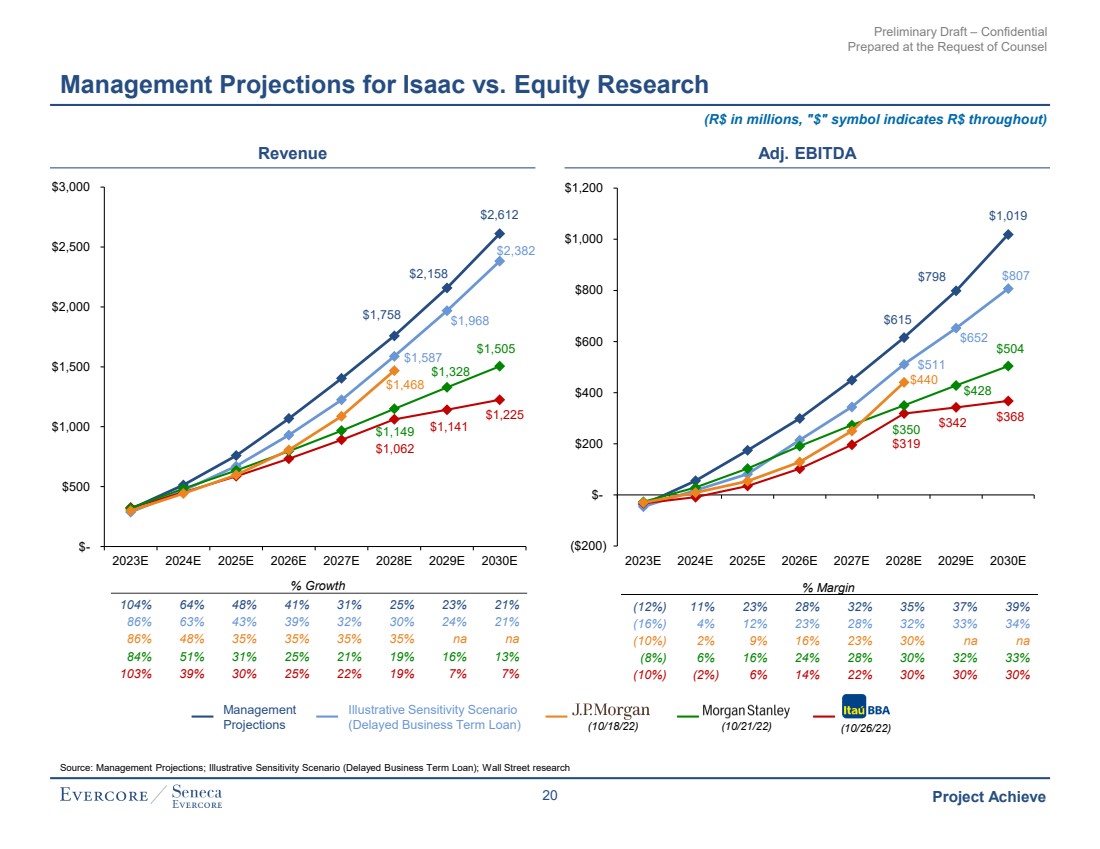
| Preliminary Draft – Confidential Prepared at the Request of Counsel Project Achieve Management Projections for Isaac vs. Equity Research (R$ in millions, "$" symbol indicates R$ throughout) Source: Management Projections; Illustrative Sensitivity Scenario (Delayed Business Term Loan); Wall Street research Revenue Adj. EBITDA % Growth % Margin 104% 64% 48% 41% 31% 25% 23% 21% 86% 63% 43% 39% 32% 30% 24% 21% 86% 48% 35% 35% 35% 35% na na 84% 51% 31% 25% 21% 19% 16% 13% 103% 39% 30% 25% 22% 19% 7% 7% $1,758 $2,158 $2,612 $1,587 $1,968 $2,382 $1,062 $1,141 $1,225 $1,149 $1,328 $1,505 $1,468 $- $500 $1,000 $1,500 $2,000 $2,500 $3,000 2023E 2024E 2025E 2026E 2027E 2028E 2029E 2030E % Margin (12%) 11% 23% 28% 32% 35% 37% 39% (16%) 4% 12% 23% 28% 32% 33% 34% (10%) 2% 9% 16% 23% 30% na na (8%) 6% 16% 24% 28% 30% 32% 33% (10%) (2%) 6% 14% 22% 30% 30% 30% $615 $798 $1,019 $511 $652 $807 $319 $342 $368 $350 $428 $504 $440 ($200) $- $200 $400 $600 $800 $1,000 $1,200 2023E 2024E 2025E 2026E 2027E 2028E 2029E 2030E Management Projections Illustrative Sensitivity Scenario (Delayed Business Term Loan) (10/18/22) (10/21/22) (10/26/22) 20 |
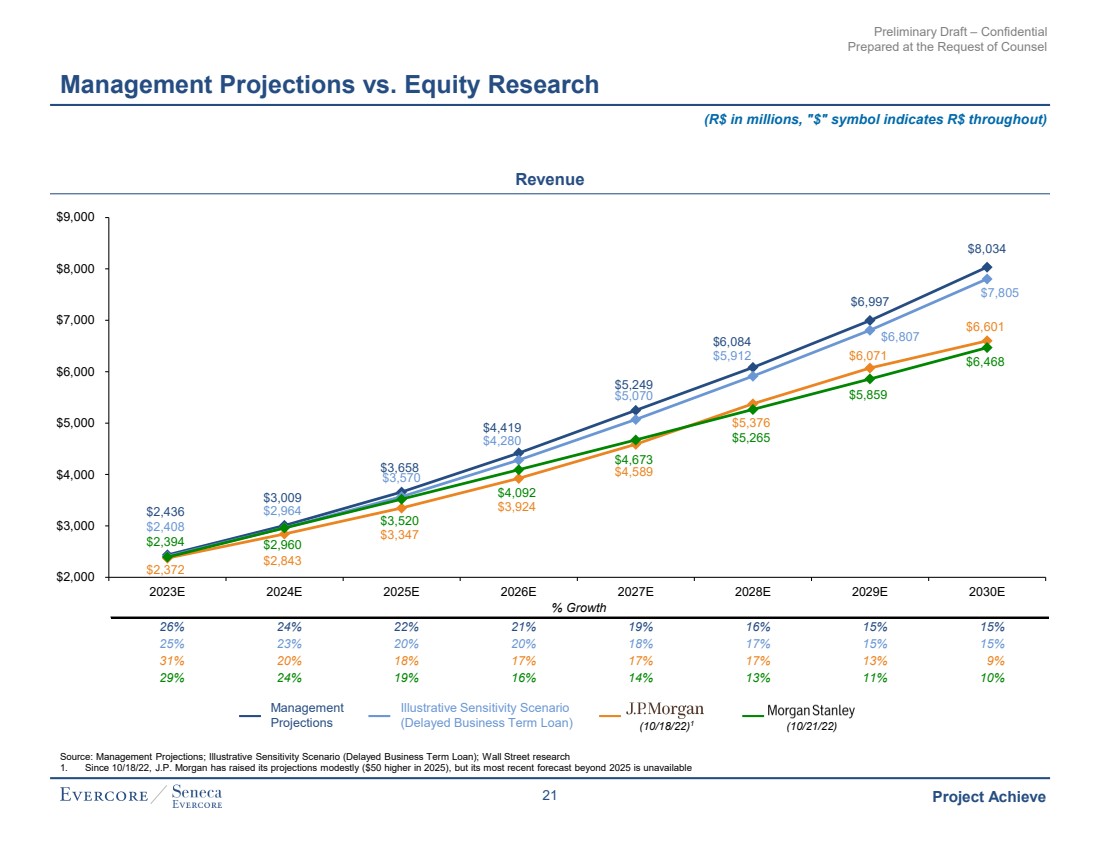
| Preliminary Draft – Confidential Prepared at the Request of Counsel Project Achieve Management Projections vs. Equity Research (R$ in millions, "$" symbol indicates R$ throughout) Revenue Source: Management Projections; Illustrative Sensitivity Scenario (Delayed Business Term Loan); Wall Street research 1. Since 10/18/22, J.P. Morgan has raised its projections modestly ($50 higher in 2025), but its most recent forecast beyond 2025 is unavailable Management Projections Illustrative Sensitivity Scenario (Delayed Business Term Loan) (10/18/22)1 (10/21/22) % Growth 26% 24% 22% 21% 19% 16% 15% 15% 25% 23% 20% 20% 18% 17% 15% 15% 31% 20% 18% 17% 17% 17% 13% 9% 29% 24% 19% 16% 14% 13% 11% 10% $2,436 $3,009 $3,658 $4,419 $5,249 $6,084 $6,997 $8,034 $2,408 $2,964 $3,570 $4,280 $5,070 $5,912 $6,807 $7,805 $2,372 $2,843 $3,347 $3,924 $4,589 $5,376 $6,071 $6,601 $2,394 $2,960 $3,520 $4,092 $4,673 $5,265 $5,859 $6,468 $2,000 $3,000 $4,000 $5,000 $6,000 $7,000 $8,000 $9,000 2023E 2024E 2025E 2026E 2027E 2028E 2029E 2030E 21 |
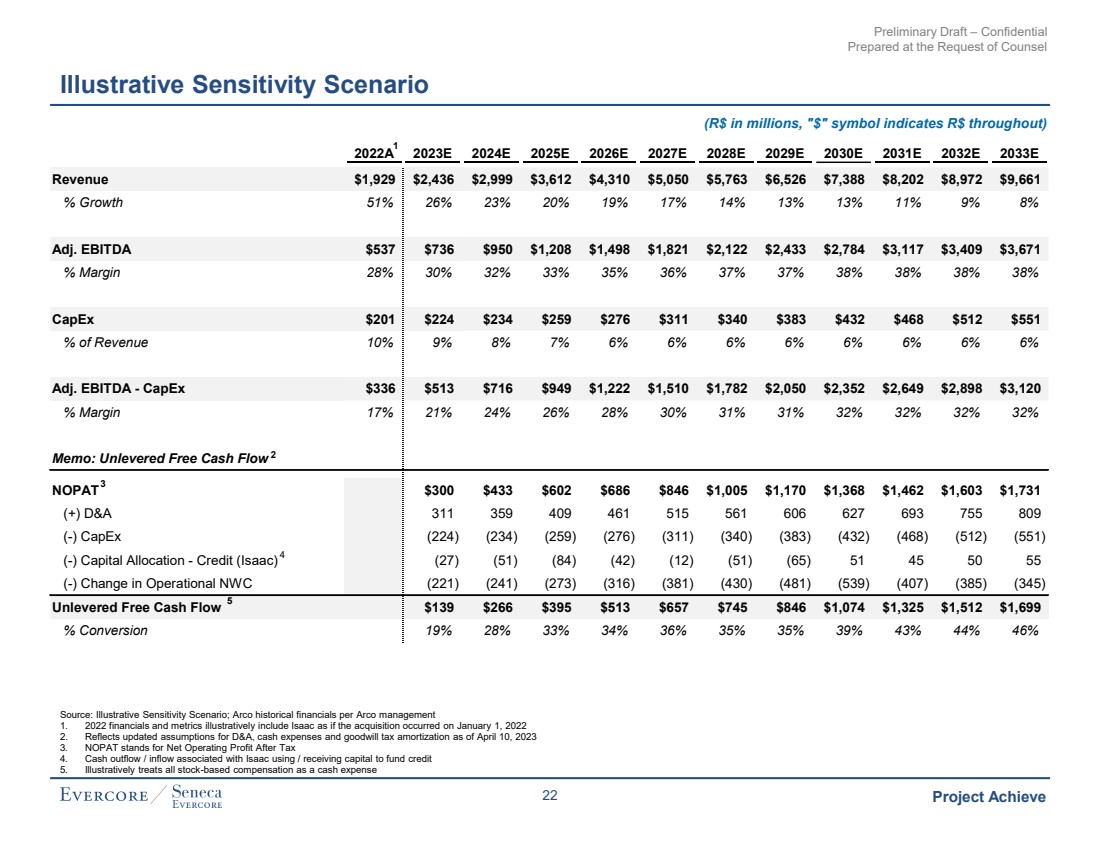
| Preliminary Draft – Confidential Prepared at the Request of Counsel Project Achieve Illustrative Sensitivity Scenario (R$ in millions, "$" symbol indicates R$ throughout) Source: Illustrative Sensitivity Scenario; Arco historical financials per Arco management 1. 2022 financials and metrics illustratively include Isaac as if the acquisition occurred on January 1, 2022 2. Reflects updated assumptions for D&A, cash expenses and goodwill tax amortization as of April 10, 2023 3. NOPAT stands for Net Operating Profit After Tax 4. Cash outflow / inflow associated with Isaac using / receiving capital to fund credit 5. Illustratively treats all stock-based compensation as a cash expense 2022A 2023E 2024E 2025E 2026E 2027E 2028E 2029E 2030E 2031E 2032E 2033E Revenue $1,929 $2,436 $2,999 $3,612 $4,310 $5,050 $5,763 $6,526 $7,388 $8,202 $8,972 $9,661 % Growth 51% 26% 23% 20% 19% 17% 14% 13% 13% 11% 9% 8% Adj. EBITDA $537 $736 $950 $1,208 $1,498 $1,821 $2,122 $2,433 $2,784 $3,117 $3,409 $3,671 % Margin 28% 30% 32% 33% 35% 36% 37% 37% 38% 38% 38% 38% CapEx $201 $224 $234 $259 $276 $311 $340 $383 $432 $468 $512 $551 % of Revenue 10% 9% 8% 7% 6% 6% 6% 6% 6% 6% 6% 6% Adj. EBITDA - CapEx $336 $513 $716 $949 $1,222 $1,510 $1,782 $2,050 $2,352 $2,649 $2,898 $3,120 % Margin 17% 21% 24% 26% 28% 30% 31% 31% 32% 32% 32% 32% Memo: Unlevered Free Cash Flow NOPAT $300 $433 $602 $686 $846 $1,005 $1,170 $1,368 $1,462 $1,603 $1,731 (+) D&A 311 359 409 461 515 561 606 627 693 755 809 (-) CapEx (224) (234) (259) (276) (311) (340) (383) (432) (468) (512) (551) (-) Capital Allocation - Credit (Isaac) (27) (51) (84) (42) (12) (51) (65) 51 45 50 55 (-) Change in Operational NWC (221) (241) (273) (316) (381) (430) (481) (539) (407) (385) (345) Unlevered Free Cash Flow $139 $266 $395 $513 $657 $745 $846 $1,074 $1,325 $1,512 $1,699 % Conversion 19% 28% 33% 34% 36% 35% 35% 39% 43% 44% 46% 5 1 3 4 2 22 |