Developer Services
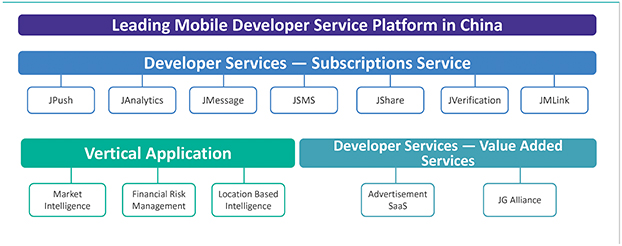
We provide a comprehensive suite of services to mobile app developers in China. Starting from 2020, we further breakdown the Developer Service revenue into Subscription Service and Value-Added Service. Our subscription service under developer services provides codes and allow for simple integration into a wide variety of mobile apps. We also offer application programming interfaces (APIs) that create connectivity and automate the process of message exchange between the mobile apps and our backend network. Moreover, we also provide app developers using our services with an
core in-app functionalities
needed by developers, including push notification, instant messaging, analytics, sharing and short message service (SMS), one-click
verification and other services under JG Alliance. Our value-added service include both JG Alliance and Advertisement SAAS. The functionalities of our developer services are delivered in the form of SDKs that contain ready-to-use source
interactive web-based service
dashboard, allowing them to utilize and monitor our services through simple controls on an ongoing basis. Our developer services easily integrate with all types of mobile apps and support all major mobile operating systems, including iOS, Android and Winphone. Through these functionalities, developers are able to accelerate the development and deployment of their apps into the market and focus their efforts on optimizing their app operations and improving end-user experience.
Our developer services had been used by a cumulative number of approximately 591,000 developers in mobile apps in a wide variety of industries, such as media, entertainment, gaming, financial services, tourism, ecommerce, and education, as of December 31, 2020. The number of mobile apps utilizing at least one of our developer services, or the cumulative app installations, increased from over 1,076,000 as of December 31, 2018 to over 1,452,000 as of December 31, 2019 and further to over 1,698,000 as of December 31, 2020. Almost all of the app developers who use our developer services use our push notification services, and a portion of those developers also use other developer services in addition to push notification. We believe as we expand and deepen our relationship with developers, more developers will utilize multiple services we offer. We are proud to have received “2018 Best Big Data Application Award” from China Electronic Commerce Committee and the “2018 Annual Global Award for Outstanding Achievement On Big Data Application Platform” from iiMedia Research in 2018, and have been recognized as the “2018 Brilliant Business Partner on Tencent Social Network KA Service” by Tencent and as “2018 Top 20
Fin-Tech
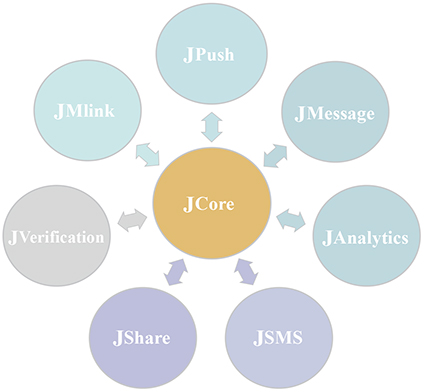
Service Platform of Banking Industry” by Yibencaijing in 2018, and as the “Best 2016-2017 SAAS Service Provider” by China SAAS Application Conference Committee in 2017, and as the “InfoQ 2020 Best Technology Community Driver Award”. Our developer services (subscription services) are standardized to maximize efficiency and cohesiveness of operations. Our developer services are built upon our proprietary common module JCore, allowing developers to easily integrate additional and multiple functionalities provided by our developer services, as well as enabling us to react to market change and customer demand by developing and adding additional functionalities quickly and cost-effectively.
47