Laws and Regulations Related to Security and Censorship
The principal pieces of PRC legislation concerning information security and censorship are:
| • | The Internet Security Law |
| • | The Measures for Cybersecurity Review |
| • | The Regulations on Security Protection of Critical Information Infrastructure |
| • | The Data Security Law |
| • | The Draft Data Security Regulations |
| • | The Law of the People’s Republic of China on the Preservation of State Secrets |
| • | The Law of the People’s Republic of China Regarding Anti-spy |
| • | The Working Regulations for the Anti-spy Security Precautions |
| • | Rules of the People’s Republic of China for Protecting the Security of Computer Information Systems |
| • | Administrative Regulations for the Protection of Secrecy on Railway Computer Information Systems Connected to International Networks |
| • | Regulations for the Protection of State Secrets for Computer Information Systems on the Internet |
| • | Notice issued by the Ministry of Public Security of the People’s Republic of China Regarding Issues Relating to the Implementation of the Administrative Measure for the Security Protection of International Connections to Computer Information Networks |
| • | The Decision of the Standing Committee of the National People’s Congress Regarding the Safeguarding of Internet Security |
These pieces of legislation specifically prohibit the use of Internet infrastructure where it results in a breach of public security, the provision of socially destabilizing content or the divulgence of State secrets, as follows:
| • | “A breach of public security” |
| • | “Socially destabilizing content” |
| • | “State secrets” |
Under the aforementioned legislation, it is mandatory for Internet companies in the PRC to complete security filing procedures with the local public security bureau and for them provide regular updates to the local public security bureau regarding information security and censorship systems for their Websites. In this regard, on October 1, 2004, the (“Commercial Websites Filing Rules”) were promulgated by the Beijing Administration of Market Regulation (the “Beijing AMR”) to replace the promulgated by the Beijing AMR on September 1, 2000. The Commercial Websites Filing Rules state that operators of commercial Websites must comply with the following requirements:
Administrative Rules on the Filing of Commercial Websites
Detailed Implementing Rules for the Measures for the Administration of Commercial Website Filings for the Record
91
| • | filing with the Beijing AMR and obtain electronic registration marks for the Websites; |
| • | placing the registration marks on the Websites’ homepages; and |
| • | registering the Website names with the Beijing AMR. |
Sohu Internet and Gamease have successfully registered the Sohu.com website, the Changyou.com website and the cy.com website with the Beijing AMR and the electronic registration marks for these websites are displayed prominently on the homepages of these websites.
On November 7, 2016, the Standing Committee of the National People’s Congress issued the Internet Security Law, which took effect on June 1, 2017. The Internet Security Law requires providers of services over Internet networks to keep user information that they have collected in strict confidence and to establish rigorous systems for the protection of user information. Such service providers must provide notice of the purpose, methods and scope of their collection and use of user information, and obtain the consent of each person whose personal information will be collected. Providers of services over Internet networks may not collect any personal information that is not related to the services they provide, or disclose or tamper with personal information that they have collected, unless such information is encoded to prevent identification of individuals whose information is so disclosed or tampered with. The Internet Security Law provides that providers of services over Internet networks must set up internal security management systems that meet the requirements of a classified protection system for cyber security, including appointing dedicated cyber security personnel; taking technical measures to prevent computer viruses, network attacks and intrusions; taking technical measures to monitor and record network operation status and cyber security incidents; and taking data security measures such as data classification, backups and encryption. Providers of services over Internet networks are also obliged to take immediate remedial measures and report relevant information to authorities when security defects or loophole risks in the network products or services are found. The Internet Security Law sets stringent requirements for the operators of “critical information infrastructure.” These include requirements, among others, that personal information and important business data must be stored in the PRC, and requirements for national security review of any network products or services that may impact national security. Service providers who do not comply with the Internet Security Law may be subject to fines, suspension of their businesses, shutdown of their websites, and revocation of their business licenses. On July 30, 2021, the State Council promulgated the (the “CII Regulations”), effective on September 1, 2021. According to the CII Regulations, “critical information infrastructure” means an important network facility and information system in important industries such as public communications and information services, as well as other important network facilities and information systems that may seriously endanger national security, the national economy, people’s livelihoods, or the public interest in the event of damage, loss of function, or data leakage. The competent governmental authorities and supervision and management authorities of the above-mentioned industries will be responsible for (i) organizing the identification of critical information infrastructures in their respective industries in accordance with certain identification rules, and (ii) promptly notifying the identified CIIOs and the State Council’s public security department of the results.
Regulations on Security Protection of Critical Information Infrastructure
On December 28, 2021, several PRC governmental authorities, including the CAOC, issued the Measures for Cybersecurity Review, which took effect on February 15, 2022 and replaced the previous version promulgated on April 13, 2020. Under the Measures for Cybersecurity Review, the following activities are subject to a cybersecurity review: (i) the purchase by critical information infrastructure operators of Internet products and services which affect or may affect national security, (ii) listings abroad by Internet platform operators that hold personal information of over one million users, and (iii) Internet platform operators’ data processing activities which affect or may affect national security. In addition, the relevant PRC governmental authorities may initiate a cybersecurity review if they determine that the network products or services, or data processing activities, affect or may affect national security. Under the Measures for Cybersecurity Review, “Internet products and services” primarily refers to core network equipment, high-performance computers and servers, mass storage equipment, large databases and applications, network security equipment, critical communication products, cloud computing services, and other network products and services that may have a significant impact on the security of critical information infrastructure cybersecurity and data security. Under the Measures for Cybersecurity Review, before purchasing any network products or services, CIIOs must assess potential national security risks that may arise from the launch or use of such products or services, and apply for a cybersecurity review with the CAOC if national security will or may be affected.
On June 10, 2021, the Standing Committee of the National People’s Congress promulgated the Data Security Law, which took effect on September 1, 2021. The Data Security Law establishes a classified and tiered system for data protection based on the level of importance of the data in economic and social development, as well as the level of danger the data presents to national security, public interests, or the legal interests of individuals and organizations in the event of any manipulation, destruction, leakage, illegal acquisition or illegal usage. Under the Data Security Law, data processing activities must be carried out in accordance with PRC laws and regulations, and data processors must establish and continually improve data security management covering all of their processes, organize and carry out data security education and training, and take corresponding technical measures and other measures necessary to guarantee data security. The Data Security Law provides a national data security review system, under which data processing activities that affect or may affect national security are subject to national security review. Furthermore, processors of important data must carry out regular risk assessments of their data processing activities and submit risk assessment reports to the competent authorities. Organizations and individuals who engage in data processing activities that violate the Data Security Law may be subject to civil, administrative, or criminal penalties, depending on the circumstances.
92
On November 14, 2021, the CAOC issued for public comment the Draft Data Security Regulations, which provide specific requirements with respect to the protection of personal data, maintenance of the safety of significant data, and obligations of internet platform operators in connection with processing Internet data. For example, data processors must delete or anonymize personal information within fifteen business days if (i) the purpose for processing the personal information has been achieved or the personal information is no longer needed; (ii) the period for the storage of information agreed to by the processors and the users or specified in the processors’ personal information processing standards has expired; (iii) the service has been terminated or the account has been cancelled by the individual; or (iv) personal information was collected unnecessarily or without the consent of the individual, through unavoidable methods such as the processors’ use of automatic data collection technology. For the processing of significant data, among other specific requirements under the Draft Data Security Regulations, data processors must specify the persons who will be in charge of and responsible for data safety, establish a data safety management department and make related informational filings with the competent office of the CAOC within fifteen business days after important data are identified by the data processors. The Internet platform operators are also required to solicit public comments on their official websites and personal information protection related sections for no less than 30 working days when they formulate platform rules or privacy policies or make any amendments that may have a significant impact on users’ rights and interests. In addition, the Draft Data Security Regulations define large Internet platforms as the Internet platform operators that have more than 50 million users, process a large amount of personal information and important data, and have strong social mobilization capabilities and a dominant market position. Under the Draft Data Security Regulations, large Internet platforms are obliged to, among other things, entrust a third party to conduct an annual audit of the platform’s data security, implementation of the platform’s rules and commitments, protection of personal information, and the development and utilization of data and to disclose such audit results. The CAOC has been soliciting comments on this draft, but there is no timetable as to when it will be enacted.
In addition, the State Security Bureau has issued regulations authorizing the blocking of access to any site it deems to be leaking State secrets or failing to comply with legislation regarding the protection of State secrets in the distribution of information online. Specifically, Internet companies in China with message boards, chat rooms or similar services, such as Sohu does through VIEs, must apply for approval of the State Secrets Bureau prior to operating such services.
Amendment (IX) provides, among other things discussed elsewhere in this report, that network service providers who do not comply with laws and regulations regarding the safe management of information on their networks and fail to correct their conduct after they receive notice of such , issued on October 21, 2019, further clarifies standards for conviction of the crimes of failing to fulfill obligations for the safe management of information on the Internet and assisting in criminal activities related to information networks.
non-compliance
from relevant regulatory authorities, with results such as the dissemination of a substantial amount of illegal information or serious loss of evidence in criminal cases, may be convicted of the crime of failing to fulfill their obligations for the safe management of information on the Internet. In addition, entities and individuals are prohibited from offering such technical and other support for Internet access, online data storage, and communication transmission while knowing that recipients of any such support are conducting criminal activities through the Internet. The Interpretation of the Supreme People’s Court and the Supreme People’s Procuratorate
on Several Issues Concerning the Application of Law in of Criminal Cases Involving Illegal Use of Information Networks and Assistance in Criminal Activities Committed through Information Networks
Accordingly, we have established an internal security committee and adopted security maintenance measures, employed a full-time supervisor and exchanged information on a regular basis with the local public security bureau with regard to sensitive or censored information and Websites.
On December 31, 2021, the CAOC, MIIT, MPS and SAMR jointly issued the the “Algorithm Recommendation Provisions”), which took effect on March 1, 2022. The Algorithm Recommendation Provisions provide that providers of algorithm recommendation services are not allowed to use algorithms to create fake registered user accounts, block information, or give excessive recommendations. In addition, providers of algorithm recommendation services that have the potential to influence public opinions or provoke social movement must conduct security self-assessments and enter certain information, such as the names of the service providers, the types of algorithms, and the algorithm self-assessment reports in a nationwide online system within 10 days after they start providing algorithm recommendation services. Under the Algorithm Recommendation Provisions, providers of algorithm recommendation services are required to clearly disclose to users the basic principles, purposes and primary operating mechanisms of the algorithm recommendation services. Providers of algorithm recommendation services must also provide their users with options that are not based on the users’ preferences or habits, and must cease providing the relevant algorithmic recommendation services when users choose to terminate them.
Administrative Provisions on Algorithm Recommendations by Internet Information Services (
Internet Content and Anti-Pornography
The PRC government has promulgated measures relating to Internet content through a number of government authorities, including the MIIT, the MCT, the SAPPRFT and the MPS. These measures specifically prohibit certain Internet activities, including the operation of online games, which results in the publication of any content which is found to, among other things, propagate obscenity, gambling or violence, instigate crimes, undermine public morality or the cultural traditions of the PRC, or compromise State security or secrets. If an ICP license holder violates these measures, the PRC government may revoke its ICP license and shut down its Websites.
93
In addition, the PRC government has issued several regulations concerning the installation of filter software to filter out unhealthy and vulgar content from the Internet. In April 1, 2009, the Ministry of Education, the MIIT and certain other PRC ministries and agencies issued a notice requiring that, by the end of May 2009, all computer terminals connected with the Internet at all elementary and secondary schools be able to include and operate Green
Dam-Youth
Escort, which is software aimed at filtering out unhealthy and vulgar content in text and graphics from the Internet and which, according to the Website for the software, may be used to control time spent on the Internet, prohibit access to computer games, and filter out unhealthy Websites. The MIIT further expanded the scope of required use of this filter software by issuing a notice on May 19, 2009 requiring that, effective as of July 1, 2009, all computers manufactured and sold in China have the latest available version of Green Dam-Youth
Escort preinstalled when they leave the factory and that all imported computers have the latest available version of Green Dam-Youth
Escort preinstalled before being sold in China. Green-Dam
Youth Escort is to be preinstalled on the hard drive of the computer or in the form of a CD accompanying the computer and is also to be included in the backup partition and system restore CD. However, on June 30, 2009, the MIIT postponed the implementation of this requirement regarding pre-installation
of Green Dam-Youth
Escort. On December 4, 2009, the MIIT and three other PRC government authorities jointly issued the (“Anti-Pornography Notice”), to crack down on online pornography. Pursuant to the Anti-Pornography Notice, rewards of up to RMB10,000 will be provided to Internet users who report Websites that feature pornography, and a committee has been established to review such reports to determine an appropriate award. During a PRC anti-pornography campaign, which continued during 2014, many Websites (including mobile Websites) that contained pornography were closed down. In addition, China Mobile announced a temporary suspension of billing for Wireless Application Protocol (“WAP”) services, as a means of fighting against Websites providing pornographic content.
Incentives Measures for Report of Pornographic, Obscene and Vulgar Messages on Internet and Mobile Media
On April 13, 2014, the National Working Group on Anti-Pornography and three other PRC government authorities jointly issued the (the “Anti-Pornography Proclamation”). Under the Anti-Pornography Proclamation, Internet service providers must immediately remove texts, images, video, advertisements and other information that contain pornographic content. The relevant government authority may order enterprises or individuals who flagrantly produce or disseminate pornographic content to stop conducting business, and may revoke relevant administrative permits. Moreover, an enterprise or individual who provides telecom operation services, network access services, advertising services or payment services to facilitate dissemination of pornographic content may have criminal or civil penalties imposed under the PRC Criminal Law and other relevant laws and regulations.
Proclamation of Special Action Regarding Crackdown on Online Pornographic Content
Laws and Regulations Related to Unfair Competition
Pursuant to the (the “Unfair Competition Law”) adopted by the Standing Committee of the National People’s Congress on November 4, 2017 and effective on April 23, 2019, a business operator is prohibited from taking any of the following actions:
Unfair Competition Law of the PRC
| • | unauthorized use of marks that are the same as or similar to the names, packaging, or decoration of another party’s products; |
| • | unauthorized use of another party’s organizational name or the name of an individual; |
| • | unauthorized use of another party’s domain name, website name, or webpage; and |
| • | other actions causing a third party to mistakenly believe that another party’s product is that of the business operator. |
The Unfair Competition Law forbids business operators to pay bribes in order to gain an opportunity or competitive advantage in a business transaction or to misappropriate the trade secrets of another. “Trade secrets,” as defined in the Unfair Competition Law, refers to technical information, operating information, and other commercial information with commercial value that has not been released to the public, and is subject to appropriate measures to protect its confidentiality. On September 10, 2020, the Supreme People’s Court promulgated the
Regulations on Several Issues Concerning the Application of Law in the Trial of Civil Cases of Infringement of Trade Secrets
, which clarify the definition of trade secrets under the Unfair Competition Law, and provides guidance concerning, among other matters, confidentiality obligations, determination of infringement, and civil liabilities.
The Unfair Competition Law also stipulates that an Internet business operator may not, without the consent of another Internet business operator, insert links into the Internet products and services of such other Internet business operator in order to
re-direct
user traffic; may not mislead or compel users to modify, terminate, or un-install
any Internet products or services of another Internet business operator; and may not take actions in bad faith to cause an Internet product or service of another Internet business operator to be unusable by users of the other business operator’s properties. 94
An amendment of the Unfair Competition Law that became effective on January 1, 2018 increases the maximum amount of administrative penalties that may be imposed for violations. An additional amendment of the Unfair Competition Law that became effective on April 23, 2019 increases the amount of administrative penalties that may be imposed for malicious misappropriation of trade secrets.
In addition, on March 16, 2022, the Supreme People’s Court promulgated the , which became effective on March 20, 2022. This interpretation provides guidance on how to conduct trials involving unfair competition, protect the legal rights and interests of business operators, and maintain orderly market competition.
Interpretation of the Supreme People’s Court on Several Issues Concerning the Application of the Unfair Competition Law of the People’s Republic of China
Regulation of M&A and Overseas Listings
On August 8, 2006, six PRC regulatory agencies, including the MOFCOM, the State Assets Supervision and Administration Commission, the State Administration of Taxation (“SAT”), the SAMR, the CSRC, and the SAFE, jointly issued the (“M&A Rule”), which became effective on September 8, 2006 and amended on June 22, 2009. The M&A Rule includes provisions that purport to require that an Offshore special purpose vehicle formed for purposes of the overseas listing of equity interests in PRC companies and controlled directly or indirectly by PRC companies or individuals obtain the approval of the CSRC prior to the listing and trading of such special purpose vehicle’s securities on an overseas stock exchange.
Regulations on Mergers and Acquisitions of Domestic Enterprises by Foreign Investors
On September 21, 2006, the CSRC published on its official Website procedures regarding its approval of overseas listings by special purpose vehicles. The CSRC approval procedures require the filing of a number of documents with the CSRC. The application of this PRC regulation remains unclear, with no consensus currently existing among leading PRC law firms regarding the scope of the applicability of the CSRC approval requirement.
On July 6, 2021, several PRC authorities jointly promulgated the, which called for the enhanced administration and supervision of China-based companies listing outside the PRC, proposed to revise the relevant regulations governing the issuance and listing of shares outside the PRC by such companies, and clarified the related responsibilities of competent PRC industry regulators and government authorities. On December 24, 2021, the CRSC published two draft regulations relating to listings outside the PRC, consisting of the and . Pursuant to such draft regulations, PRC companies that wish to conduct direct or indirect initial listings or
Opinions on Strictly Combating Illegal Securities Activities in Accordance with the Law
Provisions of the State Council on the Administration of Overseas Securities Offering and Listing
by Domestic Companies (Draft for Comments)
Administrative Measures for the Filing of Overseas Securities Offering and Listing by Domestic Companies (Draft for Comments)
follow-on
securities offerings outside the PRC are required to make filings with and report to the CRSC. The CRSC may take up to 20 working days to review such initial listings or follow-on
offerings after all required documents are submitted. The issued by the NDRC and MOFCOM on December 27, 2021 stipulates that any domestic enterprise engaging in any of the prohibited fields specified in the 2021 Restricted List must obtain the consent of the relevant governmental authorities if it wishes to conduct securities offerings and listings outside of Mainland China, overseas investors are not permitted to participate in the operation and management of the domestic enterprise, and overseas investors’ shareholding percentage in the domestic enterprise will be subject to relevant provisions with respect to the administration of domestic securities investment by overseas investors.
2021 Restricted List
The M&A Rules also establish procedures and requirements that could make some acquisitions of Chinese companies by foreign investors more time-consuming and complex, including requirements in some instances that the MOFCOM be notified in advance of any transaction in which a foreign investor takes control of a Chinese domestic enterprise.
change-of-control
In February 2011, the General Office of the State Council promulgated Circular 6, which established a security review system for mergers and acquisitions of domestic enterprises by foreign investors. Under Circular 6, a security review is required for mergers and acquisitions by foreign investors having “national defense and security” concerns and mergers and acquisitions by which foreign investors may acquire “de facto control” of domestic enterprises with “national security” concerns. In August 2011, the MOFCOM promulgated the (“MOFCOM Security Review Rules to replace the promulgated by the MOFCOM in March 2011. The MOFCOM Security Review Rules, which came into effect on September 1, 2011, provide that the MOFCOM will look into the substance and actual impact of a transaction and prohibit foreign investors from bypassing the security review requirement by structuring transactions through proxies, trusts, indirect investments, leases, loans, control through contractual arrangements or Offshore transactions.
Rules on Implementation of Security Review System
”),
Interim Provisions of the Ministry of Commerce on Matters Relating to the Implementation of the Security Review System for Mergers and Acquisitions of Domestic Enterprises by Foreign Investors
On October 23, 2019, the SAFE issued , which cancelled restrictions on the use by foreign-invested companies that are not investment companies of their capital funds for equity investments.
the Notice of the State Administration of Foreign Exchange to Further the Facilitation of Cross-border Trade and Investment
The Security Review Measures
95
Laws and Regulations Related to Antitrust
On August 30, 2007, the Standing Committee of the National People’s Congress of the PRC adopted the PRC Anti-Monopoly Law , which took effect on August 1, 2008. Pursuant to the AML, monopolistic conduct, including entering into monopolistic agreements, abuses of dominant market position, and Concentrations of Undertakings that have the effect of eliminating or restricting competition, is prohibited. To further implement the Antitrust Law and clarify certain issues, the State Council, the MOFCOM, the NDRC, and the SAMR issued several regulations and rules, including issued by the State Council on August 3, 2008 and amended on September 18, 2018, issued by the SAMR on June 26, 2019, issued by the SAMR on June 26, 2019, issued by the MOFCOM on January 5, 2009, amended on June 6, 2014, and issued by the SAMR on October 23, 2020.
(“AML”)
the Provisions on Thresholds for Prior Notification of Concentrations of Undertakings
the Interim Regulations on the Prohibition of Monopolistic Agreements
the Interim Regulations on the Prohibition of Conduct Constituting an Abuse of a Dominant Market Position
the Declaration Rules for Concentrations of Undertakings
re-issued
by the SAMR on September 29, 2018, and the Interim Provisions on Reviewing Concentration of Undertakings
Taken together these various laws and regulations provide for the following:
Monopolistic Agreement
medium-sized
enterprises. Sanctions for violations include an order to cease the relevant activities, confiscation of illegal gains and fines (from 1% to 10% of sales revenue from the previous year, or RMB500,000 if the intended monopolistic agreement has not been performed). Abuse of Dominant Market Position
Concentration of Undertakings
| • | the combined worldwide turnover of all of the subject enterprises in the preceding financial year is more than RMB10.00 billion (or approximately $1.55 billion), and the nationwide turnover within China of each of at least two of the subject enterprises in the preceding financial year is more than RMB400.0 million (or approximately $62.0 million); or |
| • | the combined nationwide turnover within China of all the subject enterprises in the preceding financial year is more than RMB2.00 billion (or approximately $309.9 million), and the nationwide turnover within China of each of at least two of the subject enterprises in the preceding financial year is more than RMB400.0 million (or approximately $62.0 million). |
If business operators fail to comply with these mandatory declaration provisions, the antitrust authority is empowered to terminate and/or unwind the transaction, dispose of relevant assets, shares or businesses and impose fines up to RMB500,000 (or approximately $77,482).
On February 7, 2021, the Anti-Monopoly Committee of the State Council issued the Platform Guidelines. The Platform Guidelines were drafted under the framework of the Antitrust Law and, while taking into account the characteristics of the Internet platform economy, give guidance for Internet platform economy operators regarding monopolistic agreements, abuses of dominance, and Concentrations of Undertakings. The Platform Guidelines also stipulate that any Concentrations of Undertakings involving VIE structures fall within the scope of anti-monopoly review.
96
Regulation of Foreign Currency Exchange and Dividend Distribution
The principal regulations governing foreign currency exchange in China are the, which were last amended in August 2008. Under the FX Regulations, the RMB is freely convertible for current account items, including the distribution of dividends, interest payments, trade and service-related foreign exchange transactions, but not for capital account items, such as direct investments, loans, repatriation of investments and investments in securities outside of China, unless the prior approval of the SAFE is obtained and prior registration with the SAFE is made. Dividends paid by a PRC subsidiary to its overseas shareholder are deemed income of the shareholder and are taxable in the PRC. Pursuant to , FIEs in the PRC may purchase or remit foreign currency, subject to a cap approved by the SAFE, for settlement of current account transactions without the approval of the SAFE. Foreign currency transactions under the capital account are still subject to limitations and require approvals from, or registration with, the SAFE and other relevant PRC governmental authorities.
Foreign Exchange Administration Regulations (“FX Regulations”)
the Administration Rules of the Settlement, Sale and Payment of Foreign Exchange
In July 2014, the SAFE promulgated (“Circular 37”) which replaced (“Circular 75”).Circular 37 requires PRC residents, including PRC institutions and individuals, to register with the local SAFE branch in connection with their direct establishment or indirect control of an Offshore entity, referred to in Circular 37 as a “special purpose vehicle,” for the purpose of holding domestic or Offshore assets or interests. PRC residents must also file amendments to their registrations in the event of any significant changes with respect to the special purpose vehicle, such as increase or decrease of capital contributed by PRC individuals, share transfer or exchange, merger, division or other material event. Under these regulations, PRC residents’ failure to comply with specified registration procedures may result in restrictions being imposed on the foreign exchange activities of the relevant PRC entity, including the payment of dividends and other distributions to its Offshore parent, as well as restrictions on capital inflows from the Offshore entity to the PRC entity, including restrictions on the ability to contribute additional capital to the PRC entity. Further, failure to comply with the various SAFE registration requirements could result in liability under PRC law for evasion of foreign exchange regulations.
the Circular on Issues Concerning Foreign Exchange Administration Over the Overseas Investment and Financing and Roundtrip Investment by Domestic Residents Via Special Purpose Vehicles
Relevant Issues Concerning Foreign Exchange Control on Domestic Residents’ Corporate Financing and Roundtrip Investment through Offshore Special Purpose Vehicles
Under Circular 37, if a
non-listed
special purpose vehicle uses its own equity to grant equity incentives to any directors, supervisors, senior management or any other employees directly employed by a domestic enterprise which is directly or indirectly controlled by such special purpose vehicle, or with which such an employee has established an employment relationship, related PRC residents and individuals may, prior to exercising their rights, apply to the SAFE for foreign exchange registration formalities for such special purpose vehicle. However, in practice, different local SAFE branches may have different views and procedures on the interpretation and implementation of the SAFE regulations, and since Circular 37 was the first regulation to regulate the foreign exchange registration of a non-listed
special purpose vehicle’s equity incentives granted to PRC residents, there remains uncertainty with respect to its implementation. On December 25, 2006, the PBOC issued the and related were issued by the SAFE on January 5, 2007 and amended on May 29, 2016. Both became effective on February 1, 2007. Under these regulations, all foreign exchange transactions involving an employee share incentive plan, share option plan, or similar plan participated in by individuals in the PRC may be conducted only with approval from the SAFE or its authorized branch. Under the (“Offshore Share Incentives Rules”), which was issued by the SAFE on February 15, 2012, PRC citizens who are granted share options, restricted share units or restricted shares by an overseas publicly listed company are required to register with the SAFE or its authorized branch and to comply with a series of other requirements. In November 2011, the SAFE approved our application to designate our PRC subsidiary Sohu Media to handle the registrations and other procedures required by the Offshore Share Incentives Rules. In February 2012, the SAFE approved Changyou’s application to designate its PRC subsidiary AmazGame to handle the registrations and other procedures required by the Offshore Share Incentive Rules. If we, Changyou or the PRC employees of Changyou and us who hold options, restricted share units or restricted shares fail to comply with these registration or other procedural requirements, we, Changyou and/or such employees may be subject to fines and other legal sanctions.
Administration Measures on Individual Foreign Exchange Control,
Implementation Rules
Notice of Issues Related to the Foreign Exchange Administration for Domestic Individuals Participating in Stock Incentive Plan of Overseas Listed Company
The SAFE promulgated Circular 19 and Circular 16, effective June 1, 2015 and June 9, 2016, to replace previous regulations limiting an FIE’s use of its
RMB-settled
registered capital. Circular 19 and Circular 16 provide, among other restrictions, that an FIE may use its RMB funds converted from foreign currencies through capital contributions by or loans from its overseas investor(s) only for purposes within the FIE’s approved business scope, and that violations of the regulations can result in severe penalties, including large fines. These regulations may limit our ability to transfer and use our overseas funds through capital contributions or loans to our PRC subsidiaries and the VIEs to invest in or acquire other businesses. The principal law and regulations governing distribution of dividends of foreign holding companies were the (1986), which was amended in October 2000 and October 2016, and the (2001), which were amended in February 2014. This law and the related regulations were replaced by the Foreign Investment Law and the respectively, which both became effective on January 1, 2020. Under the new law and regulations, requirements for the distribution of dividends of newly-established FIEs will be consistent with those that apply to domestic companies, which are included in the Company Law of the PRC. Under the Company Law of the PRC,
Foreign Investment Enterprise Law
Administrative Rules under the Foreign Investment Enterprise Law
Implementing Regulations of the Foreign Investment Law,
newly-established
FIEs are required to set aside 10% of their after-tax
profits each year to fund statutory common reserves until such reserves equal 50% of the amount of registered capital. 97
Furthermore, under the CIT Law, which became effective on January 1, 2008 and was amended on February 24, 2017 and December 29, 2018, the maximum rate for withholding tax imposed on dividend payments from PRC
foreign-invested
companies to their overseas investors that are not regarded as “resident” for tax purposes is 20%. The rate was reduced to 10% under the Implementing Regulations for the CIT Law issued by the State Council. However, a lower withholding tax rate of 5% might be applied if there is a tax treaty between China and the jurisdiction of the foreign holding companies, such as is the case with Hong Kong, and certain requirements specified by PRC tax authorities are satisfied. Laws and Regulations Related to Employment and Labor Protection
On June 29, 2007, the National People’s Congress promulgated the (“Employment Contract Law”), which became effective as of January 1, 2008 and was amended on December 28, 2012. The Employment Contract Law requires employers to provide written contracts to their employees, restricts the use of temporary workers and aims to give employees long-term job security.
Employment Contract Law of PRC
Pursuant to the Employment Contract Law, employment contracts lawfully concluded prior to the implementation of the Employment Contract Law and continuing as of the date of its implementation shall continue to be performed. Where an employment relationship was established prior to the implementation of the Employment Contract Law but no written employment contract was concluded, a contract must be concluded within one month after its implementation.
On September 18, 2008, the State Council promulgated the which came into effect immediately. These regulations interpret and supplement the provisions of the Employment Contract Law
Implementing Regulations for the PRC Employment Contract Law
.
We have modified our standard employment contract to comply with the requirements of the Employment Contract Law and its implementing regulations We have entered into written employment contracts with all of our employees.
.
Conclusion
In the opinion of Haiwen, our principal PRC Subsidiaries and principal VIEs are approved to engage in the specific online services (categorized and addressed in the above sections) as described in the respective scopes indicated in the corresponding licenses and/or permits issued to the respective companies.
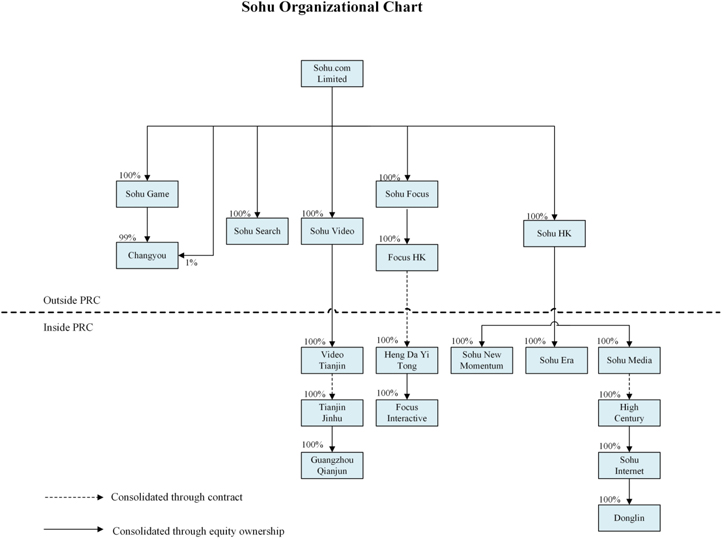
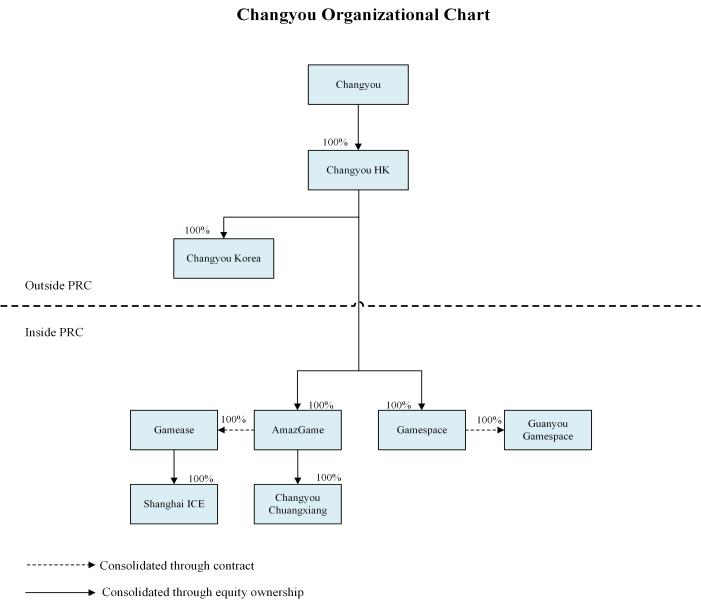
ORGANIZATIONAL STRUCTURE
The charts below present the principal consolidated entities of Sohu.com Limited, not including our consolidated Changyou entities, and our principal consolidated Changyou entities as of December 31, 2021. Certain intermediate holding companies that are not significant to the Sohu Group have been eliminated.
98
99
100