UNITED STATES
SECURITIES AND EXCHANGE COMMISSION
Washington, D.C. 20549
Form 6-K
REPORT OF FOREIGN PRIVATE ISSUER PURSUANT TO RULE 13a-16 or 15d-16 UNDER THE SECURITIES EXCHANGE ACT OF 1934
For the month of January , 2019.
Commission File Number 001-38708
APHRIA INC. |
(Translation of registrant’s name into English) |
265 TALBOT ST. W. LEAMINGTON, ONTARIO, N8H 4H3, CANADA |
(Address of principal executive office) |
Indicate by check mark whether the registrant files or will file annual reports under cover Form 20-F or Form 40-F
Form 20-F | o | Form 40-F ☒ |
Indicate by check mark if the registrant is submitting the Form 6-K in paper as permitted by Regulation S-T Rule 101(b)(1): o
Note: Regulation S-T Rule 101(b)(1) only permits the submission in paper of a Form 6-K if submitted solely to provide an attached annual report to security holders. |
Indicate by check mark if the registrant is submitting the Form 6-K in paper as permitted by Regulation S-T Rule 101(b)(7): o
Note: Regulation S-T Rule 101(b)(7) only permits the submission in paper of a Form 6-K if submitted to furnish a report or other document that the registrant foreign private issuer must furnish and make public under the laws of the jurisdiction in which the registrant is incorporated, domiciled or legally organized (the registrant’s “home country”), or under the rules of the home country exchange on which the registrant’s securities are traded, as long as the report or other document is not a press release, is not required to be and has not been distributed to the registrant’s security holders, and, if discussing a material event, has already been the subject of a Form 6-K submission or other Commission filing on EDGAR. |
SIGNATURE
Pursuant to the requirements of the Securities Exchange Act of 1934, the registrant has duly caused this report to be signed on its behalf by the undersigned, thereunto duly authorized.
APHRIA INC. |
Date: January 11, 2019 |
/s/ Carl Merton______________________ Carl Merton Chief Financial Officer |
INDEX TO EXHIBITS
Exhibit 99.1
Aphria Inc.
CONDENSED INTERIM CONSOLIDATED FINANCIAL STATEMENTS
FOR THE THREE MONTHS AND SIX MONTHS ENDED NOVEMBER 30, 2018 AND NOVEMBER 30, 2017
(Unaudited, expressed in thousands of Canadian Dollars, unless otherwise noted)
Aphria Inc.
Condensed Interim Consolidated Statements of Financial Position
(Unaudited - in thousands of Canadian dollars)
Note | November 30, 2018 | May 31, 2018 | ||||||||||
Assets | ||||||||||||
Current assets | ||||||||||||
Cash and cash equivalents | $ | 152,074 | $ | 59,737 | ||||||||
Marketable securities | 4 | 32,747 | 45,062 | |||||||||
Accounts receivable | 13,807 | 3,386 | ||||||||||
Other current assets | 5 | 28,700 | 14,384 | |||||||||
Inventory | 6 | 40,342 | 22,150 | |||||||||
Biological assets | 7 | 6,096 | 7,331 | |||||||||
Assets held for sale | – | 40,620 | ||||||||||
Current portion of convertible notes receivable | 12 | 16,396 | 1,942 | |||||||||
290,162 | 194,612 | |||||||||||
Capital assets | 9 | 413,963 | 303,151 | |||||||||
Intangible assets | 10 | 425,234 | 226,444 | |||||||||
Convertible notes receivable | 12 | 12,595 | 16,129 | |||||||||
Interest in equity investees | 13 | 9,612 | 4,966 | |||||||||
Long-term investments | 14 | 162,035 | 46,028 | |||||||||
Promissory note receivable | 15 | 128,859 | – | |||||||||
Goodwill | 11 | 656,039 | 522,762 | |||||||||
$ | 2,098,499 | $ | 1,314,092 | |||||||||
Liabilities | ||||||||||||
Current liabilities | ||||||||||||
Accounts payable and accrued liabilities | $ | 49,953 | $ | 31,517 | ||||||||
Income taxes payable | 7,645 | 3,584 | ||||||||||
Deferred revenue | 35,395 | 2,607 | ||||||||||
Current portion of promissory note payable | 18 | 604 | 610 | |||||||||
Current portion of long-term debt | 19 | 3,388 | 2,140 | |||||||||
Current portion of option payment liability | 20 | 11,654 | – | |||||||||
Current portion of derivative liability | – | 3,396 | ||||||||||
108,639 | 43,854 | |||||||||||
Long-term liabilities | ||||||||||||
Long-term debt | 19 | 51,165 | 28,337 | |||||||||
Option payment liability | 20 | 32,722 | – | |||||||||
Derivative liability | – | 9,055 | ||||||||||
Deferred tax liability | 16 | 110,239 | 59,253 | |||||||||
302,765 | 140,499 | |||||||||||
Shareholders’ equity | ||||||||||||
Share capital | 21 | 1,650,077 | 1,113,981 | |||||||||
Warrants | 22 | 1,336 | 1,375 | |||||||||
Share-based payment reserve | 22,701 | 22,006 | ||||||||||
Accumulated other comprehensive loss | – | (801 | ) | |||||||||
Non-controlling interest | 24 | 18,612 | 9,580 | |||||||||
Retained earnings | 103,008 | 27,452 | ||||||||||
1,795,734 | 1,173,593 | |||||||||||
$ | 2,098,499 | $ | 1,314,092 |
Nature of operations (Note 1)
Commitments and contingencies (Note 32)
Subsequent events (Note 33)
Approved on behalf of the Board:
“John Cervini” | “Cole Cacciavillani” |
Signed: Director | Signed: Director |
The accompanying notes are an integral part of these condensed interim consolidated financial statements
2 |
Aphria Inc.
Condensed Interim Consolidated Statements of Income and Comprehensive Income
(Unaudited - in thousands of Canadian dollars, except share and per share amounts)
For
the three months ended November 30, | For
the six months ended November 30, | |||||||||||||||||||
Note | 2018 | 2017 | 2018 | 2017 | ||||||||||||||||
Revenue | $ | 24,524 | $ | 8,504 | $ | 37,816 | $ | 14,624 | ||||||||||||
Excise taxes | (2,856 | ) | – | (2,856 | ) | – | ||||||||||||||
Net revenue | 21,668 | 8,504 | 34,960 | 14,624 | ||||||||||||||||
Production costs | 6 | 9,971 | 2,746 | 14,412 | 4,092 | |||||||||||||||
Other costs of sales | 1,540 | – | 1,933 | – | ||||||||||||||||
Gross profit before fair value adjustments | 10,157 | 5,758 | 18,615 | 10,532 | ||||||||||||||||
Fair value adjustment on sale of inventory | 6 | 8,328 | 2,671 | 12,533 | 3,807 | |||||||||||||||
Fair value adjustment on growth of biological assets | 7 | (4,154 | ) | (3,115 | ) | (13,665 | ) | (7,380 | ) | |||||||||||
Gross profit | 5,983 | 6,202 | 19,747 | 14,105 | ||||||||||||||||
Operating expenses: | ||||||||||||||||||||
General and administrative | 25 | 12,276 | 1,973 | 21,127 | 3,708 | |||||||||||||||
Share-based compensation | 26 | 2,574 | 2,200 | 8,696 | 4,709 | |||||||||||||||
Selling, marketing and promotion | 8,336 | 2,819 | 13,077 | 4,767 | ||||||||||||||||
Amortization | 2,617 | 276 | 5,891 | 515 | ||||||||||||||||
Research and development | 612 | 80 | 874 | 170 | ||||||||||||||||
Transaction costs | 1,123 | – | 1,988 | – | ||||||||||||||||
27,538 | 7,348 | 51,653 | 13,869 | |||||||||||||||||
(21,555 | ) | (1,146 | ) | (31,906 | ) | 236 | ||||||||||||||
Non-operating items: | ||||||||||||||||||||
Consulting revenue | – | 183 | – | 476 | ||||||||||||||||
Foreign exchange (loss) gain | (194 | ) | 282 | (253 | ) | 131 | ||||||||||||||
Gain (loss) on marketable securities | 4 | 57 | 55 | (110 | ) | (1,691 | ) | |||||||||||||
Loss on sale of capital assets | 9 | – | – | – | (7 | ) | ||||||||||||||
Gain (loss) from equity investees | 13 | 46,896 | (457 | ) | 58,739 | (1,746 | ) | |||||||||||||
Deferred gain on sale of intellectual property | 107 | 233 | 340 | 467 | ||||||||||||||||
Finance income, net | 27 | 4,855 | 862 | 5,914 | 1,328 | |||||||||||||||
Unrealized gain on convertible notes receivable | 12 | 2,567 | 665 | 2,862 | 1,212 | |||||||||||||||
Gain on long-term investments | 28 | 30,503 | 6,075 | 53,203 | 25,157 | |||||||||||||||
Unrealized loss on financial liabilities | (560 | ) | – | (975 | ) | – | ||||||||||||||
84,231 | 7,898 | 119,720 | 25,327 | |||||||||||||||||
Income before income taxes | 62,676 | 6,752 | 87,814 | 25,563 | ||||||||||||||||
Income taxes | 16 | 7,902 | 297 | 11,864 | 4,067 | |||||||||||||||
Net income | 54,774 | 6,455 | 75,950 | 21,496 | ||||||||||||||||
Other comprehensive gain (loss) | ||||||||||||||||||||
Other comprehensive gain (loss) from equity investee | 13 | – | 520 | – | (801 | ) | ||||||||||||||
Net comprehensive income | $ | 54,774 | $ | 6,975 | $ | 75,950 | $ | 20,695 | ||||||||||||
Total comprehensive income is attributable to: | ||||||||||||||||||||
Shareholders of Aphria Inc. | 54,970 | 6,975 | 76,357 | 20,695 | ||||||||||||||||
Non-controlling interest | 24 | (196 | ) | – | (407 | ) | – | |||||||||||||
$ | 54,774 | $ | 6,975 | $ | 75,950 | $ | 20,695 | |||||||||||||
Weighted average number of common shares - basic | 244,873,891 | 138,839,530 | 235,166,745 | 138,775,253 | ||||||||||||||||
Weighted average number of common shares - diluted | 249,303,182 | 145,878,443 | 239,417,492 | 146,075,449 | ||||||||||||||||
Earnings per share - basic | 29 | $ | 0.22 | $ | 0.05 | $ | 0.32 | $ | 0.15 | |||||||||||
Earnings per share - diluted | 29 | $ | 0.22 | $ | 0.04 | $ | 0.32 | $ | 0.15 |
The accompanying notes are an integral part of these condensed interim consolidated financial statements
3 |
Aphria Inc.
Condensed Interim Consolidated Statements of Changes in Equity
(Unaudited - in thousands of Canadian dollars, except share amounts)
Number of common shares | Share capital (Note 21) | Warrants (Note 22) | Share-based payment reserve | Accumulated other comprehensive loss | Non-controlling interest (Note 24) | Retained | Total | |||||||||||||||||||||||||
Balance at May 31, 2017 | 138,628,704 | $ | 274,317 | $ | 445 | $ | 3,230 | $ | – | $ | – | $ | (4,123 | ) | $ | 273,869 | ||||||||||||||||
Share issuance - November 2017 bought deal | 12,689,675 | 86,661 | – | – | – | – | – | 86,661 | ||||||||||||||||||||||||
Share issuance - warrants exercised | 417,855 | 638 | – | – | – | – | – | 638 | ||||||||||||||||||||||||
Share issuance - options exercised | 132,488 | 249 | – | (92 | ) | – | – | – | 157 | |||||||||||||||||||||||
Share issuance - deferred share issuance costs | 2,525 | 15 | – | – | – | – | – | 15 | ||||||||||||||||||||||||
Share-based payments | – | – | – | 4,495 | – | – | – | 4,495 | ||||||||||||||||||||||||
Income tax recovery on share issuance costs | – | 1,412 | – | – | – | – | – | 1,412 | ||||||||||||||||||||||||
Shares held in escrow for services not yet earned | – | 187 | – | – | – | – | – | 187 | ||||||||||||||||||||||||
Net comprehensive income for the period | – | – | – | – | (801 | ) | – | 21,496 | 20,695 | |||||||||||||||||||||||
Balance at November 30, 2017 | 151,871,247 | $ | 363,479 | $ | 445 | $ | 7,633 | $ | (801 | ) | $ | – | $ | 17,373 | $ | 388,129 | ||||||||||||||||
Number of common shares | Share capital (Note 21) | Warrants (Note 22) | Share-based payment reserve | Accumulated other comprehensive loss | Non-controlling interest (Note 24) | Retained earnings | Total | |||||||||||||||||||||||||
Balance at May 31, 2018 | 210,169,924 | $ | 1,113,981 | $ | 1,375 | $ | 22,006 | $ | (801 | ) | $ | 9,580 | $ | 27,452 | $ | 1,173,593 | ||||||||||||||||
Share issuance - June 2018 bought deal | 21,835,510 | 245,925 | – | – | – | – | – | 245,925 | ||||||||||||||||||||||||
Additional share issuance - Broken Coast acquisition | 19,963 | 297 | – | – | – | – | – | 297 | ||||||||||||||||||||||||
Share issuance - LATAM acquisition | 15,678,310 | 273,900 | – | – | – | – | – | 273,900 | ||||||||||||||||||||||||
Share issuance - warrants exercised | 316,063 | 1,409 | (39 | ) | – | – | – | – | 1,370 | |||||||||||||||||||||||
Share issuance - options exercised | 1,911,974 | 11,139 | – | (7,390 | ) | – | – | – | 3,749 | |||||||||||||||||||||||
Income tax recovery on share issuance costs | – | 3,426 | – | – | – | – | – | 3,426 | ||||||||||||||||||||||||
Share-based payments | – | – | – | 8,085 | – | – | – | 8,085 | ||||||||||||||||||||||||
Elimination of CTA on disposal of equity investee | – | – | – | – | 801 | – | (801 | ) | – | |||||||||||||||||||||||
Non-controlling interest | – | – | – | – | – | 9,439 | – | 9,439 | ||||||||||||||||||||||||
Net comprehensive income for the period | – | – | – | – | – | (407 | ) | 76,357 | 75,950 | |||||||||||||||||||||||
Balance at November 30, 2018 | 249,931,744 | $ | 1,650,077 | $ | 1,336 | $ | 22,701 | $ | – | $ | 18,612 | $ | 103,008 | $ | 1,795,734 |
The accompanying notes are an integral part of these condensed interim consolidated financial statements
4 |
Aphria Inc.
Condensed Interim Consolidated Statements of Cash Flows
(Unaudited - in thousands of Canadian dollars)
For the six months ended November 30, | ||||||||||||
Note | 2018 | 2017 | ||||||||||
Cash generated from (used in) operating activities: | ||||||||||||
Net income for the period | $ | 75,950 | $ | 21,496 | ||||||||
Adjustments for: | ||||||||||||
Future income taxes | 16 | 3,785 | 3,702 | |||||||||
Fair value adjustment on sale of inventory | 6 | 12,533 | 3,807 | |||||||||
Fair value adjustment on growth of biological assets | 7 | (13,665 | ) | (7,380 | ) | |||||||
Loss on marketable securities | 4 | 110 | 1,691 | |||||||||
Unrealized foreign exchange gain | (6 | ) | (77 | ) | ||||||||
Amortization | 9,10 | 8,860 | 1,404 | |||||||||
Loss on sale of capital assets | 9 | – | 7 | |||||||||
Unrealized gain on convertible notes receivable | 12 | (2,862 | ) | (1,212 | ) | |||||||
Gain on dilution of ownership in equity investee | 13 | (2,210 | ) | (7,535 | ) | |||||||
Loss from equity investees | 13 | 822 | 9,281 | |||||||||
Gain on sale of equity investee | 13 | (57,351 | ) | – | ||||||||
Deferred gain recognized | (618 | ) | (467 | ) | ||||||||
Consulting revenue | 18 | – | (476 | ) | ||||||||
Other non-cash items | (1 | ) | 4 | |||||||||
Share-based compensation | 26 | 8,696 | 4,709 | |||||||||
Gain on long-term investments | 28 | (53,203 | ) | (25,157 | ) | |||||||
Unrealized loss on financial liabilities | 13 | 975 | – | |||||||||
Change in non-cash working capital | 30 | 2,013 | (3,382 | ) | ||||||||
(16,172 | ) | 415 | ||||||||||
Cash provided by financing activities: | ||||||||||||
Share capital issued, net of cash issuance costs | 245,925 | 86,661 | ||||||||||
Share capital issued on warrants and options exercised | 5,119 | 810 | ||||||||||
Advances from related parties | 8 | 968 | 2,823 | |||||||||
Repayment of amounts due to related parties | 8 | (968 | ) | (2,327 | ) | |||||||
Proceeds from long-term debt | 19 | 24,927 | – | |||||||||
Repayment of long-term debt | 19 | (863 | ) | (375 | ) | |||||||
275,108 | 87,592 | |||||||||||
Cash used in investing activities: | ||||||||||||
Investment in marketable securities | 4 | – | (5,000 | ) | ||||||||
Proceeds from disposal of marketable securities | 4 | 12,205 | 34,801 | |||||||||
Investment in capital and intangible assets, net of shares issued | 9,10 | (113,399 | ) | (59,023 | ) | |||||||
Proceeds from disposal of capital assets | 9 | – | 200 | |||||||||
Convertible notes advances | 12 | (10,000 | ) | (14,001 | ) | |||||||
Repayment of convertible notes receivable | 1,942 | – | ||||||||||
Investment in long-term investments and equity investees | (61,027 | ) | (10,897 | ) | ||||||||
Proceeds from disposal of long-term investments and equity investees | 5,027 | 2,090 | ||||||||||
Net cash paid on business acquisitions and investment in CannInvest Africa Ltd. | (1,347 | ) | – | |||||||||
(166,599 | ) | (51,830 | ) | |||||||||
Net increase in cash and cash equivalents | 92,337 | 36,177 | ||||||||||
Cash and cash equivalents, beginning of period | 59,737 | 79,910 | ||||||||||
Cash and cash equivalents, end of period | $ | 152,074 | $ | 116,087 |
The accompanying notes are an integral part of these condensed interim consolidated financial statements
5 |
Aphria Inc. Notes to the Condensed Interim Consolidated Financial Statements For the three and six months ended November 30, 2018 and November 30, 2017 (Unaudited - in thousands of Canadian dollars, except share and per share amounts) |
1. | Nature of operations |
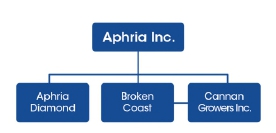
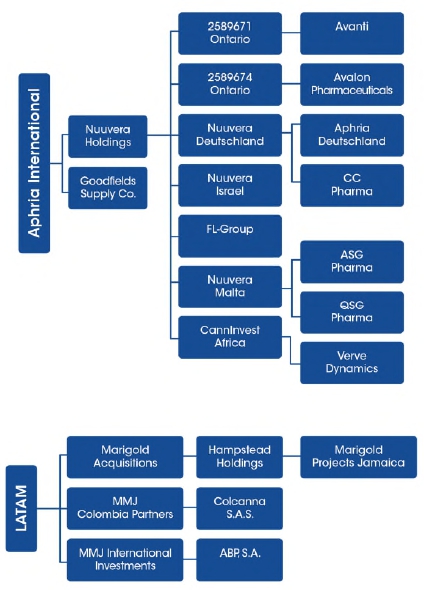
Aphria Inc. (the "Company" or “Aphria”) was continued in Ontario and is licensed to produce and sell cannabis under The Cannabis Act. In February 2018, the Company acquired Broken Coast Cannabis Ltd. (“Broken Coast”) (Note 11). Broken Coast is licensed to produce and sell cannabis under The Cannabis Act. In March 2018, the Company acquired Nuuvera Inc. (“Nuuvera”) (Note 11). Nuuvera is an international organization with a focus on building a global cannabis brand, with operations in Germany, Italy, Malta, and Lesotho. In July 2018, Aphria Inc. and its wholly-owned subsidiary, Pure Natures Wellness Inc. (o/a Aphria) amalgamated. In September 2018, the Company acquired LATAM Holdings Inc. (“LATAM”) (Note 11). This purchase provides Aphria an early foothold into the Latin American cannabis market whereby LATAM holds licenses and license applications presently in-process for production, import, export and sale of cannabis and cannabis derivatives in Colombia, Argentina and Jamaica.
1974568 Ontario Ltd. (“Aphria Diamond”) is a 51% majority owned subsidiary of the Company, incorporated in November 2017. Aphria Diamond has applied for its cultivation licence under the provisions of The Cannabis Act.
The registered office of the Company is located at 5300 Commerce Court West, 199 Bay Street, Toronto, Ontario. However, the Company is in the process of registering a new address.
The Company’s common shares are listed under the symbol “APHA” on the Toronto Stock Exchange (“TSX”) in Canada and the New York Stock Exchange (“NYSE”) in the United States.
These condensed interim consolidated financial statements were approved by the Company’s Board of Directors on January 10, 2019.
2. | Basis of preparation |
(a) | Statement of compliance |
The Company’s condensed interim consolidated financial statements have been prepared in accordance with IAS 34, “Interim Financial Reporting”. These condensed interim consolidated financial statements do not include all notes of the type normally included within the annual financial report and should be read in conjunction with the audited financial statements of the Company for the year ended May 31, 2018, which have been prepared in accordance with International Financial Reporting Standards (“IFRS”) as issued by the International Accounting Standards Board and Interpretations of the IFRS Interpretations Committee.
(b) | Basis of measurement |
These condensed interim consolidated financial statements have been prepared on the going concern basis, under the historical cost convention except for certain financial instruments that are measured at fair value and biological assets that are measured at fair value less costs to sell, as detailed in the Company’s accounting policies.
(c) | Functional currency |
The Company and its subsidiaries’ functional currency, as determined by management, is Canadian dollars. These condensed interim consolidated financial statements are presented in Canadian dollars.
(d) | Foreign currency translation |
All figures presented in the condensed interim consolidated financial statements are reflected in Canadian dollars, which is the functional currency of the Company and all of its subsidiaries.
Foreign currency transactions are translated into Canadian dollars at exchange rates in effect on the date of the transactions. Monetary assets and liabilities denominated in foreign currencies are translated to Canadian dollars at the foreign exchange rate applicable at the statement of financial position date. Realized and unrealized exchange gains and losses are recognized through profit and loss.
The assets and liabilities of foreign operations, including marketable securities, long-term investments and promissory notes payable, are translated in Canadian dollars at period-end exchange rates. Income and expenses, and cash flows of foreign operations are translated into Canadian dollars using average exchange rates. Exchange differences resulting from translating foreign operations are recognized in other comprehensive income and accumulated in equity.
6 |
Aphria Inc. Notes to the Condensed Interim Consolidated Financial Statements For the three and six months ended November 30, 2018 and November 30, 2017 (Unaudited - in thousands of Canadian dollars, except share and per share amounts) |
(e) | Basis of consolidation |
Subsidiaries are entities controlled by the Company. Control exists when the Company has the power, directly and indirectly, to govern the financial and operating policies of an entity and be exposed to the variable returns from its activities. The financial statements of subsidiaries are included in the condensed interim consolidated financial statements from the date that control commences until the date that control ceases.
Subsidiaries | Jurisdiction of incorporation | Ownership interest (1) |
Aphria (Arizona) Inc.(2) | Arizona, United States | 100% |
Cannan Growers Inc. | British Columbia, Canada | 100% |
Nuuvera Inc. | Ontario, Canada | 100% |
Nuuvera Holdings Ltd. | Ontario, Canada | 100% |
ARA - Avanti Rx Analytics Inc. | Ontario, Canada | 100% |
Avalon Pharmaceuticals Inc. | Ontario, Canada | 100% |
2589671 Ontario Inc. | Ontario, Canada | 100% |
2589674 Ontario Inc. | Ontario, Canada | 100% |
Nuuvera Israel Ltd.(2) | Israel | 100% |
Nuuvera Deutschland GmbH | Germany | 100% |
Aphria Deutschland GmbH | Germany | 100% |
FL-Group | Italy | 100% |
Broken Coast Cannabis Ltd. | British Columbia, Canada | 100% |
Goodfields Supply Co. Ltd. | United Kingdom | 100% |
LATAM Holdings Inc. | British Columbia, Canada | 100% |
MMJ Colombia Partners Inc. | Ontario, Canada | 100% |
Marigold Acquisitions Inc. | British Columbia, Canada | 100% |
Hampstead Holdings Ltd. | Bermuda | 100% |
MMJ International Investments Inc. | British Columbia, Canada | 100% |
ABP, S.A. | Argentina | 100% |
Marigold Projects Jamaica Limited | Jamaica | 95% |
Nuuvera Malta Ltd. | Malta | 90% |
ASG Pharma Ltd. | Malta | 90% |
QSG Health Ltd. | Malta | 90% |
ColCanna S.A.S. | Colombia | 90% |
1974568 Ontario Ltd. | Ontario, Canada | 51% |
Aphria Italy S.p.A. | Italy | 50.1% |
CannInvest Africa Ltd. | South Africa | 50% |
Verve Dynamics Incorporated (Pty) Ltd. | Lesotho | 30% |
(1) The Company defines ownership interest as the interest in which the Company is entitled a proportionate share of net income. Legal ownership of some subsidiaries may differ from ownership interest shown above.
(2) Represents inactive subsidiaries, which have no operations and does not own any assets, save and except for a related party balance owing to the entity related to a tax liability.
Intragroup balances, and any unrealized gains and losses or income and expenses arising from transactions with jointly controlled entities are eliminated to the extent of the Company’s interest in the entity.
The Company treats transactions with non-controlling interests that do not result in a loss of control as transactions with equity owners of the Company. A change in ownership interest results in an adjustment between the carrying amounts of the controlling and non-controlling interests to reflect their relative interests in the subsidiary. Any difference between the amount of the adjustment to non-controlling interests and any consideration paid or received is recognized in a separate reserve within equity attributable to the owners of the Company.
7 |
Aphria Inc. Notes to the Condensed Interim Consolidated Financial Statements For the three and six months ended November 30, 2018 and November 30, 2017 (Unaudited - in thousands of Canadian dollars, except share and per share amounts) |
(f) | Amalgamation |
Effective June 1, 2017, CannWay Pharmaceuticals Ltd. (“CannWay”), a wholly-owned subsidiary of the Company, was amalgamated with Pure Natures Wellness Inc. (o/a Aphria). The Company had historically presented all balances and activities of CannWay as a fully consolidated entity for financial statement presentation purposes. As of the date of amalgamation, CannWay did not have any assets or outstanding liabilities. There are no material changes to be considered prospectively or to the comparative consolidated statements as a result of the amalgamation.
Effective July 23, 2018, Pure Natures Wellness Inc. (o/a Aphria). (“PNW”), a wholly-owned subsidiary of the Company, was amalgamated with Aphria Inc. The Company had historically presented all balances and activities of PNW as a fully consolidated entity for financial statement presentation purposes. There were no material changes to be considered prospectively or to the comparative consolidated statements as a result of the amalgamation.
(g) | Interest in equity investees |
The Company’s interest in equity investees is comprised of its interest in Althea Company Pty Ltd. (“Althea”).
In accordance with IFRS 10, associates are those in which the Company has significant influence, but not control or joint control over the financial and accounting policies.
Interests in associates are accounted for using the equity method in accordance with IAS 28. They are recognized initially at cost, which includes transaction costs. After initial recognition, the condensed interim consolidated financial statements include the Company’s share of the profit or loss and other comprehensive income (“OCI”) of equity investees until the date on which significant influence ceases.
If the Company’s share of losses in an equity investment equals or exceeds its interest in the entity, including any other unsecured long-term receivables, the group does not recognize further losses, unless it has incurred obligations or made payments on behalf of the other entity.
Unrealized gains on transactions between the Company and its associates are eliminated to the extent of the Company’s interest in these entities. Unrealized losses are also eliminated unless the transaction provides evidence of an impairment of the asset transferred.
The carrying amount of equity investments is tested for impairment in accordance with the policy described in the annual audited financial statements.
3. | Significant accounting policies |
These condensed interim consolidated financial statements have been prepared following the same accounting policies used in the preparation of the audited financial statements of the Company for the year ended May 31, 2018.
New standards applicable during the reporting period
IFRS 9 - Financial Instruments; Classification and Measurement, effective for annual periods beginning on or after January 1, 2018, with early adoption permitted, introduces new requirements for the classification, measurement and derecognition of financial instruments and introduces a new impairment model for financial assets.
Under IFRS 9, financial instruments are initially measured at fair value plus, in the case of a financial asset or financial liability not at fair value through profit or loss, transaction costs. Subsequently, all assets within scope of IFRS 9 are measured at:
(i) | Amortized cost; |
(ii) | Fair value through other comprehensive income (“FVOCI”); or |
(iii) | Fair value through profit or loss (“FVTPL”). |
The classification is based on whether the contractual cash flows give rise to payments on specified dates that are solely payments of principal and interest (the “SPPI test”), and the objective of the Company’s business model is to hold assets only to collect cash flows, or to collect cash flows and to sell (the “Business Model test”). Financial assets are required to be reclassified only when the business model under which they are managed has changed. All reclassifications are to be applied prospectively from the reclassification date.
8 |
Aphria Inc. Notes to the Condensed Interim Consolidated Financial Statements For the three and six months ended November 30, 2018 and November 30, 2017 (Unaudited - in thousands of Canadian dollars, except share and per share amounts) |
The impairment requirements under IFRS 9 are based on an expected credit loss model, replacing the IAS 39 incurred loss model. The expected credit loss model applies to debt instruments recorded at amortized cost or at FVOCI, such as loans, debt, securities and trade receivables, lease receivables and most loan commitments and financial guarantee contracts.
The following table summarizes the original measurement categories under IAS 39 and the new measurement categories under IFRS 9 for each class of the Company’s financial assets and financial liabilities:
Financial assets/liabilities | IAS 39 Classification | IFRS 9 Classification |
Cash and cash equivalents | FVTPL | FVTPL |
Marketable securities | FVTPL | FVTPL |
Accounts receivable | loans and receivables | amortized cost |
Other receivables | loans and receivables | amortized cost |
Convertible notes receivable | AFS | FVTPL |
Long-term investments | FVTPL | FVTPL |
Accounts payable and accrued liabilities | other financial liabilities | other financial liabilities |
Income taxes payable | other financial liabilities | other financial liabilities |
Promissory note payable | other financial liabilities | other financial liabilities |
Long-term debt | other financial liabilities | other financial liabilities |
Derivative liability | derivative financial instruments | FVTPL |
There were no other changes on adoption aside from the above classification changes.
IFRS 15 - Revenue from Contracts with Customers; effective for annual periods beginning on or after January 1, 2018, specifies how and when to recognize revenue, based on a five-step model, and enhances relevant disclosures to be applied to all contracts with customers.
The Company has applied IFRS 15 retrospectively and determined that there is no change to the comparative periods or transitional adjustments required as a result of the adoption of this standard. The Company’s accounting policy for revenue recognition under IFRS 15 is as follows:
To recognize revenue under IFRS 15, the Company applies the following five steps:
1. | Identify the contract(s) with a customer |
2. | Identify the performance obligations in the contract |
3. | Determine the transaction price |
4. | Allocate the transaction price to the performance obligations in the contract |
5. | Recognize revenue when or as the Company satisfies a performance obligation |
Revenue from the direct sale of cannabis to medical customers for a fixed price is recognized when the company transfers control of the good to the customer
New standards and interpretations issued but not yet adopted
IFRS 16 - Leases; in January 2016, the IASB issued IFRS 16, which specifies how an IFRS reporter will recognise, measure, present and disclose leases. The standard provides a single lessee accounting model, requiring lessees to recognise assets and liabilities for all leases unless the lease term is 12 months or less or the underlying asset has a low value. Lessors continue to classify leases as operating or finance, with IFRS 16’s approach to lessor accounting substantially unchanged from its predecessor, IAS 17. IFRS 16 is effective for annual reporting periods beginning on or after January 1, 2019, and a lessee shall either apply IFRS 16 with full retrospective effect or alternatively not restate comparative information but recognise the cumulative effect of initially applying IFRS 16 as an adjustment to opening equity at the date of initial application. Early adoption is permitted if IFRS 15 has also been adopted. Based on its current assets, interests and investments and review of existing lease arrangements, no significant impact is anticipated from the new standard.
9 |
Aphria Inc. Notes to the Condensed Interim Consolidated Financial Statements For the three and six months ended November 30, 2018 and November 30, 2017 (Unaudited - in thousands of Canadian dollars, except share and per share amounts) |
There are no other standards that are not yet effective and that would be expected to have a material impact on the Company in the current or future reporting periods and on foreseeable future transactions.
The Company has reclassified certain immaterial items on the comparative consolidated statements of financial position, consolidated statements of income and comprehensive income, and consolidated statements of cash flows to improve clarity.
4. | Marketable securities |
Marketable securities are classified as fair value through profit or loss, and are comprised of:
S&P rating at purchase | Interest rate |
Maturity date |
November 30, 2018 |
May 31, 2018 | ||
Fixed Income: | ||||||
Ford Motor Credit Co. LLC | BBB | 3.700% | 8/2/2018 | $ - | $ 1,015 | |
Sobeys Inc. | BB+ | 3.520% | 8/8/2018 | - | 3,040 | |
Canadian Western Bank | A- | 3.077% | 1/14/2019 | 1,519 | 1,528 | |
Sun Life Financial Inc. | A | 2.770% | 5/13/2019 | 3,007 | 3,018 | |
Ford Motor Credit Co. LLC | BBB | 3.140% | 6/14/2019 | 5,072 | 5,101 | |
Canadian Western Bank | A- | 3.463% | 12/17/2019 | 1,020 | 1,025 | |
Laurentian Bank of Canada | BBB | 2.500% | 1/23/2020 | - | 3,003 | |
Enercare Solutions Inc. | BBB | 4.600% | 2/3/2020 | 3,930 | 3,974 | |
Enbridge Inc. | BBB+ | 4.530% | 3/9/2020 | 5,145 | 5,203 | |
Choice Properties REIT | BBB | 3.600% | 4/20/2020 | 5,045 | 5,091 | |
Westcoast Energy Inc. | BBB+ | 4.570% | 7/2/2020 | - | 5,293 | |
Citigroup Inc. (USD) | BBB+ | 2.050% | 12/17/2018 | 4,029 | 3,914 | |
Royal Bank of Canada (USD) | AA- | 1.625% | 4/15/2019 | 3,980 | 3,857 | |
$ 32,747 | $ 45,062 |
The cost of marketable securities as at November 30, 2018 was $33,274 (May 31, 2018 - $45,863). During the three and six months ended November 30, 2018, the company divested of certain marketable securities for proceeds of $8,205 and $12,205 (2017 - $24,702 and $34,801), resulting in a loss on disposal of $91 and $146 (2017 - $256 and $387), and re-invested $nil and $nil (2017 - $nil and $5,000). During the three and six months ended November 30, 2018, the Company recognized a gain (loss) of $57 and $(110) (2017 - $55 and ($1,691)) on its marketable securities portfolio, of which $148 and $36 (2017 - $311 and ($1,304)) represented unrealized fair value adjustments.
5. | Other current assets |
Other current assets are comprised of:
November 30, 2018 | May 31, 2018 | |||||||
Sales tax receivable | $ | 13,198 | $ | 10,840 | ||||
Accrued interest | 2,549 | 831 | ||||||
Credit card receivable | 39 | 170 | ||||||
Prepaid assets | 10,752 | 1,720 | ||||||
Other | 2,162 | 823 | ||||||
$ | 28,700 | $ | 14,384 |
10 |
Aphria Inc. Notes to the Condensed Interim Consolidated Financial Statements For the three and six months ended November 30, 2018 and November 30, 2017 (Unaudited - in thousands of Canadian dollars, except share and per share amounts) |
6. | Inventory |
Inventory is comprised of:
Capitalized cost | Fair value adjustment | November 30, 2018 | May 31, 2018 | |||||||||||||
Harvested cannabis | $ | 7,142 | $ | 8,355 | $ | 15,497 | $ | 12,331 | ||||||||
Harvested cannabis trim | 1,593 | 1,605 | 3,198 | 2,277 | ||||||||||||
Cannabis oil | 9,104 | 5,987 | 15,091 | 6,578 | ||||||||||||
Softgel capsules | 136 | 112 | 248 | – | ||||||||||||
Other inventory items | 6,308 | – | 6,308 | 964 | ||||||||||||
$ | 24,283 | $ | 16,059 | $ | 40,342 | $ | 22,150 |
During the three and six months ended November 30, 2018, the Company recorded $9,971 and $14,412 (2017 - $2,746 and $4,092) of production costs. Included in production costs for the three and six months ended November 30, 2018 is $1,047 and $1,194 of cannabis oil conversion costs (2017 - $54 and $95), $48 and $113 related to the cost of accessories (2017 - $61 and $98), and amortization of $1,020 and $1,533 (2017 - $500 and $889). During the three and six months ended November 30, 2018, the Company expensed $8,328 and $12,533 (2017 - $2,671 and $3,807) of fair value adjustments on the growth of its biological assets included in inventory sold.
During the three and six months ended November 30, 2018, the Company also disposed of nil and 13,642 plants prior to harvest. Included in production costs is $nil and $979 of accumulated costs relating to these plants which were not harvested.
The Company holds 4,229.8 kilograms of harvested cannabis (May 31, 2018 - 3,221.3 kgs), 1,057.9 kilograms of harvested cannabis trim (May 31, 2018 - 702.0 kgs), 19,079.7 litres of cannabis oils or 4,239.9 kilograms equivalent (May 31, 2018 - 7,724.7 litres or 1,716.6 kilograms equivalent), 278.3 litres of cannabis oils used in softgel capsules or 61.84 kilograms equivalent (May 31, 2018 - nil) at November 30, 2018.
7. | Biological assets |
Biological assets are comprised of:
Amount | |||||
Balance at May 31, 2018 | $ 7,331 | ||||
Changes in fair value less costs to sell due to biological transformation | 13,665 | ||||
Production costs capitalized | 14,469 | ||||
Transferred to inventory upon harvest | (29,369) | ||||
Balance at November 30, 2018 | $ 6,096 |
The Company values medical cannabis plants at fair value. Management determined that cost approximates fair value from the date of initial clipping from mother plants until the fourth week prior to harvest. Measurement of the biological transformation of the plant at fair value less costs to sell begins in the fourth week prior to harvest and is recognized evenly until the point of harvest. The number of weeks in the growing cycle is between twelve and sixteen weeks from propagation to harvest. The Company has determined the fair value less costs to sell of harvested cannabis and harvested cannabis trim to be $3.50 and $2.75 per gram respectively (May 31, 2018 - $3.75 and $3.00 per gram), upon harvest for greenhouse produced cannabis and $4.00 and $3.25 per gram respectively (May 31, 2018 - $4.25 and $3.50 per gram), upon harvest for indoor produced cannabis.
The effect of the fair value less cost to sell over and above historical cost was an increase in non-cash value of biological assets and inventory of $4,154 and $13,665 during the three and six months ended November 30, 2018 (2017 - $3,115 and $7,380).
11 |
Aphria Inc. Notes to the Condensed Interim Consolidated Financial Statements For the three and six months ended November 30, 2018 and November 30, 2017 (Unaudited - in thousands of Canadian dollars, except share and per share amounts) |
The fair value of biological assets is determined using a valuation model to estimate expected harvest yield per plant applied to the estimated price per gram less processing and selling costs. When there is a material change from the expected fair value used for cannabis, will the Company necessitate the fair value used in this calculation be adjusted. In this quarter, as a result of the newly enacted adult-use market along with the introduction of the excise duty tax, the Company determined a reduction of $0.25 per gram was warranted. The majority of the adult-use transactions are wholesale through provincial distribution agencies and as a result the net selling price and the selling costs are lower.
In determining the fair value of biological assets, management has made the following estimates in this valuation model:
• | The harvest yield is between 40 grams and 80 grams per plant; |
• | The selling price is between $3.00 and $7.00 per gram; |
• | Processing costs include drying and curing, testing, post-harvest overhead allocation, packaging and labelling costs between $0.30 and $0.80 per gram; |
• | Selling costs include shipping, order fulfilment, patient acquisition and patient maintenance costs between $0.00 and $1.50 per gram; |
Sales price used in the valuation of biological assets is based on the historical average selling price of all cannabis products and can vary based on different strains being grown as well as the proportion of sales derived from wholesale compared to retail. The low-end of the selling price, processing costs and selling costs are derived from historical wholesale sales, while the higher end prices and costs are from historical retail sales. Selling costs vary depending on methods of selling and are considered based on the expected method of selling and the determined additional costs which would be incurred. Expected yields for the cannabis plant is also subject to a variety of factors, such as strains being grown, length of growing cycle, and space allocated for growing. Management reviews all significant inputs, at each reporting period, based on historical information obtained as well as based on planned production schedules.
Management has quantified the sensitivity of the inputs and determined the following:
• | Selling price per gram - a decrease in the average selling price per gram by 5% would result in the biological asset value decreasing by $318 (May 31, 2018 - $267) and inventory decreasing by $1,820 (May 31, 2018 - $1,040) |
• | Harvest yield per plant - a decrease in the harvest yield per plant of 5% would result in the biological asset value decreasing by $155 (May 31, 2018 - $179) |
These inputs are level 3 on the fair value hierarchy, and are subject to volatility in market prices and several uncontrollable factors, which could significantly affect the fair value of biological assets in future periods.
8. | Related party transactions |
During the period, the Company disposed of its remaining shares in Liberty Health Sciences Inc. (“Liberty”) (note 13).
During the quarter, the Company appointed new board members. As a result of previous transactions, the Company held with related party corporations $900 in long-term investments for a U.S. legalization option (note 14), as at November 30, 2018.
The Company funded a portion of the Canadian operating costs of Liberty, for which Liberty reimburses the Company quarterly. Additionally, the Company purchases certain electrical generation equipment from and pays rent to a company owned by a director. These parties are related as they are corporations that are controlled by certain officers and directors of the Company.
During the three and six months ended November 30, 2018, related party corporations charged or incurred expenditures on behalf of the Company (including rent) totaling $53 and $138 (2017 - $54 and $93). Included in this amount was rent of $4 and $8 charged during the three and six months ended November 30, 2018 (2017 - $9 and $17).
Amount | |||||
Balance due to (from) related parties as at May 31, 2018 | $ - | ||||
Related party charges in the period | 138 | ||||
Payments to related parties in the period | (138) | ||||
Payments made on behalf of related parties in the period | (830) | ||||
Repayments made by related parties in the period | 830 | ||||
Balance at November 30, 2018 | $ - |
12 |
Aphria Inc. Notes to the Condensed Interim Consolidated Financial Statements For the three and six months ended November 30, 2018 and November 30, 2017 (Unaudited - in thousands of Canadian dollars, except share and per share amounts) |
Key management personnel compensation for the six months ended November 30, 2018 and 2017 was comprised of:
For the six months ended November 30, | ||||||||
2018 | 2017 | |||||||
Salaries | $ | 1,677 | $ | 660 | ||||
Short-term employment benefits (included in office and general) | 58 | 36 | ||||||
Share-based compensation | 1,302 | 2,217 | ||||||
$ | 3,037 | $ | 2,913 |
Key management personnel compensation for the three months ended November 30, 2018 and 2017 was comprised of:
For the three months ended November 30, | ||||||||
2018 | 2017 | |||||||
Salaries | $ | 889 | $ | 354 | ||||
Short-term employment benefits (included in office and general) | 31 | 18 | ||||||
Share-based compensation | (678 | ) | 459 | |||||
$ | 242 | $ | 831 |
Directors and officers of the Company control 7.53% or 18,827,595 of the voting shares of the Company.
9. | Capital assets |
Land | Production Facility | Equipment | Leasehold improvements | Construction in process | Total capital assets | ||||||||||||||||||||
Cost | |||||||||||||||||||||||||
At May 31, 2017 | $ | 10,829 | $ | 16,170 | $ | 5,340 | $ | 262 | $ | 42,159 | $ | 74,760 | |||||||||||||
Business acquisitions | 854 | 6,992 | 2,860 | 1,388 | 5,947 | 18,041 | |||||||||||||||||||
Additions | 12,716 | 47,149 | 4,759 | 15 | 151,899 | 216,538 | |||||||||||||||||||
Transfers | 105 | 29,338 | 2,990 | – | (32,433 | ) | – | ||||||||||||||||||
Disposals | – | (207 | ) | – | – | (415 | ) | (622 | ) | ||||||||||||||||
At May 31, 2018 | 24,504 | 99,442 | 15,949 | 1,665 | 167,157 | 308,717 | |||||||||||||||||||
Business acquisitions | 166 | 90 | 56 | 182 | – | 494 | |||||||||||||||||||
Additions | 2,217 | 1,412 | 11,157 | 49 | 99,080 | 113,915 | |||||||||||||||||||
Transfers | – | 1,737 | 1,247 | (1,389 | ) | (1,595 | ) | – | |||||||||||||||||
At November 30, 2018 | $ | 26,887 | $ | 102,681 | $ | 28,409 | $ | 507 | $ | 264,642 | $ | 423,126 | |||||||||||||
Accumulated depreciation | |||||||||||||||||||||||||
At May 31, 2017 | $ | – | $ | 983 | $ | 1,260 | $ | 62 | $ | – | $ | 2,305 | |||||||||||||
Amortization | – | 1,517 | 1,697 | 47 | – | 3,261 | |||||||||||||||||||
At May 31, 2018 | – | 2,500 | 2,957 | 109 | – | 5,566 | |||||||||||||||||||
Amortization | – | 1,587 | 1,995 | 15 | – | 3,597 | |||||||||||||||||||
At November 30, 2018 | $ | – | $ | 4,087 | $ | 4,952 | $ | 124 | $ | – | $ | 9,163 | |||||||||||||
Net book value | |||||||||||||||||||||||||
At May 31, 2017 | $ | 10,829 | $ | 15,187 | $ | 4,080 | $ | 200 | $ | 42,159 | $ | 72,455 | |||||||||||||
At May 31, 2018 | $ | 24,504 | $ | 96,942 | $ | 12,992 | $ | 1,556 | $ | 167,157 | $ | 303,151 | |||||||||||||
At November 30, 2018 | $ | 26,887 | $ | 98,594 | $ | 23,457 | $ | 383 | $ | 264,642 | $ | 413,963 |
13 |
Aphria Inc. Notes to the Condensed Interim Consolidated Financial Statements For the three and six months ended November 30, 2018 and November 30, 2017 (Unaudited - in thousands of Canadian dollars, except share and per share amounts) |
10. | Intangible assets |
Customer relationships | Corporate website | Licences, permits & applications | Non-compete agreements | Tokyo Smoke licensing agreement | Intellectual property, trademarks & brands | Total intangible assets | |||||||||||||||||||||||
Cost | |||||||||||||||||||||||||||||
At May 31, 2017 | $ | – | $ | 218 | $ | 1,250 | $ | – | $ | 459 | $ | 4,428 | $ | 6,355 | |||||||||||||||
Business acquisitions | 11,730 | 39 | 137,920 | 1,930 | – | 76,190 | 227,809 | ||||||||||||||||||||||
Additions | – | 152 | – | – | – | 9 | 161 | ||||||||||||||||||||||
At May 31, 2018 | 11,730 | 409 | 139,170 | 1,930 | 459 | 80,627 | 234,325 | ||||||||||||||||||||||
Business acquisitions | – | – | 191,066 | – | – | – | 191,066 | ||||||||||||||||||||||
Additions | – | 79 | 11,703 | – | – | 1,205 | 12,987 | ||||||||||||||||||||||
At November 30, 2018 | $ | 11,730 | $ | 488 | $ | 341,939 | $ | 1,930 | $ | 459 | $ | 81,832 | $ | 438,378 | |||||||||||||||
Accumulated depreciation | |||||||||||||||||||||||||||||
At May 31, 2017 | $ | – | $ | 156 | $ | 153 | $ | – | $ | – | $ | 4,155 | $ | 4,464 | |||||||||||||||
Amortization | 1,274 | 100 | 124 | 314 | 92 | 1,513 | 3,417 | ||||||||||||||||||||||
At May 31, 2018 | 1,274 | 256 | 277 | 314 | 92 | 5,668 | 7,881 | ||||||||||||||||||||||
Amortization | 1,960 | 55 | 375 | 484 | 46 | 2,343 | 5,263 | ||||||||||||||||||||||
At November 30, 2018 | $ | 3,234 | $ | 311 | $ | 652 | $ | 798 | $ | 138 | $ | 8,011 | $ | 13,144 | |||||||||||||||
Net book value | |||||||||||||||||||||||||||||
At May 31, 2017 | $ | – | $ | 62 | $ | 1,097 | $ | – | $ | 459 | $ | 273 | $ | 1,891 | |||||||||||||||
At May 31, 2018 | $ | 10,456 | $ | 153 | $ | 138,893 | $ | 1,616 | $ | 367 | $ | 74,959 | $ | 226,444 | |||||||||||||||
At November 30, 2018 | $ | 8,496 | $ | 177 | $ | 341,287 | $ | 1,132 | $ | 321 | $ | 73,821 | $ | 425,234 |
11. | Business Acquisitions |
Acquisition of Broken Coast Cannabis Ltd.
On February 13, 2018, the Company entered into a share purchase agreement to purchase all of the shares of Cannan Growers Inc. (“Cannan”), a holding company owning shares of Broken Coast Cannabis Ltd. (“Broken Coast”), and to acquire the remaining shares, for a combined total of 99.86%, of the issued and outstanding shares of Broken Coast. The combined purchase price was $214,168 satisfied through the issuance of an aggregate 14,373,675 common shares. The share purchase agreement entitled the Company to control Broken Coast effective on February 1, 2018, which became the effective acquisition date. In August 2018, the Company came to terms with the holder of the remaining 0.14% of the issued and outstanding shares of Broken Coast. In exchange for purchasing the remaining shares, the Company issued 19,963 shares to the holder.
14 |
Aphria Inc. Notes to the Condensed Interim Consolidated Financial Statements For the three and six months ended November 30, 2018 and November 30, 2017 (Unaudited - in thousands of Canadian dollars, except share and per share amounts) |
The table below summarizes the fair value of the assets acquired and the liabilities assumed at the acquisition date:
Note | Number of shares | Share price | Amount | |||||||||||||
Consideration paid | ||||||||||||||||
Shares issued | (i) | 14,393,638 | $ | 14.90 | $ | 214,465 | ||||||||||
Total consideration paid | $ | 214,465 | ||||||||||||||
Net assets acquired | ||||||||||||||||
Current assets | ||||||||||||||||
Cash and cash equivalents | 2,007 | |||||||||||||||
Accounts receivable | 299 | |||||||||||||||
Other current assets | 43 | |||||||||||||||
Inventory | 2,572 | |||||||||||||||
Biological assets | 826 | |||||||||||||||
Long-term assets | ||||||||||||||||
Capital assets | 13,298 | |||||||||||||||
Customer relationships | 11,730 | |||||||||||||||
Corporate website | 39 | |||||||||||||||
Licences, permits & applications | 6,320 | |||||||||||||||
Non-competition agreements | 1,930 | |||||||||||||||
Intellectual property, trademarks & brands | 72,490 | |||||||||||||||
Goodwill | 146,091 | |||||||||||||||
Total assets | 257,645 | |||||||||||||||
Current liabilities | ||||||||||||||||
Accounts payable and accrued liabilities | 10,455 | |||||||||||||||
Income taxes payable | 922 | |||||||||||||||
Long-term liabilities | ||||||||||||||||
Deferred tax liability | 25,889 | |||||||||||||||
Long-term debt | 5,914 | |||||||||||||||
Total liabilities | 43,180 | |||||||||||||||
Total net assets acquired | $ | 214,465 |
(i) | Share price based on the price of the shares on February 1, 2018. |
Net income and comprehensive net income for the Company would have been higher by approximately $567 and $1,134 for the three and six months ended November 30, 2017, if the acquisition had taken place on June 1, 2017. In connection with this transaction, the Company expensed transaction costs of $1,643.
Acquisition of Nuuvera Corp.
On March 23, 2018, the Company completed a definitive arrangement agreement (the “Arrangement Agreement”) pursuant to which the Company acquired, by way of a court-approved plan of arrangement, under the Business Corporations Act (Ontario) (the “Transaction”), 100% of the issued and outstanding common shares (on a fully diluted basis) of Nuuvera for a total consideration of $0.62 in cash plus 0.3546 of an Aphria share for each Nuuvera share held. All of Nuuvera’s outstanding options were exchanged for an equivalent option granted pursuant to Aphria’s stock option plan (each, a “Replacement Option”) to purchase from Aphria the number of common shares (rounded to the nearest whole share) equal to: (i) the exchange ratio multiplied by (ii) the number of Nuuvera shares subject to such Nuuvera Option. Each such Replacement Option shall provide for an exercise price per common share (rounded to the nearest whole cent) equal to: (i) the exercise price per Nuuvera share purchasable pursuant to such Nuuvera Option; divided by (ii) the exchange ratio.
15 |
Aphria Inc. Notes to the Condensed Interim Consolidated Financial Statements For the three and six months ended November 30, 2018 and November 30, 2017 (Unaudited - in thousands of Canadian dollars, except share and per share amounts) |
The table below summarizes the fair value of the assets acquired and the liabilities assumed at the effective acquisition date:
Note | Number of shares | Share price | Amount | |||||||||||||
Consideration paid | ||||||||||||||||
Cash | $ | 54,604 | ||||||||||||||
Shares issued | (i) | 31,226,910 | $ | 13.17 | 411,258 | |||||||||||
Warrants outstanding | (ii) | 1,345,866 | 1,015 | |||||||||||||
Replacement options issued | (Ii) | 1,280,330 | 12,133 | |||||||||||||
479,010 | ||||||||||||||||
Fair value of previously held investment | ||||||||||||||||
Shares held by Aphria | (i) | 1,878,738 | $ | 14.92 | 28,028 | |||||||||||
Warrants held by Aphria | (ii) | 322,365 | 243 | |||||||||||||
28,271 | ||||||||||||||||
Total fair value of consideration | $ | 507,281 | ||||||||||||||
Net assets acquired | ||||||||||||||||
Current assets | ||||||||||||||||
Cash and cash equivalents | 35,033 | |||||||||||||||
Accounts receivable | 464 | |||||||||||||||
Other current assets | 1,142 | |||||||||||||||
Inventory | 401 | |||||||||||||||
Long-term assets | ||||||||||||||||
Capital assets | 4,743 | |||||||||||||||
Intellectual property, trademarks & brands | 3,700 | |||||||||||||||
Licences, permits & applications | 131,600 | |||||||||||||||
Goodwilll | 377,221 | |||||||||||||||
Total assets | 554,304 | |||||||||||||||
Current liabilities | ||||||||||||||||
Accounts payable and accrued liabilities | 11,000 | |||||||||||||||
Long-term liabilities | ||||||||||||||||
Deferred tax liability | 36,023 | |||||||||||||||
Total liabilities | 47,023 | |||||||||||||||
Total net assets acquired | $ | 507,281 |
(i) | Share price based on the price of the shares on March 23, 2018; shares held by Aphria include the cash consideration paid. |
(ii) | Options and warrants are valued using the Black-Scholes option pricing model using the following assumptions: the risk-free rate of 2.19%; expected life of 1- 10 years; volatility of 30% based on volatility used for similar instruments on the open market; forfeiture rate of nil; dividend yield of nil; and the exercise price of $2.52 - $20.30. |
Net income and comprehensive net income for the Company would have been lower by approximately $4,902 and $9,804 for the three and six months ended November 30, 2017, if the acquisition had taken place on June 1, 2017. In connection with this transaction, the Company expensed transaction costs of $3,439.
Acquisition of LATAM Holdings Inc.
On July 17, 2018, the Company signed a share purchase agreement with Scythian Biosciences Corp. (“Scythian”) to purchase 100% of the issued and outstanding shares of LATAM Holdings Inc. (“LATAM Holdings”); a direct wholly-owned subsidiary of Scythian. As outlined in the share purchase agreement, the negotiated purchase price was to be settled with the issuance of 15,678,310 shares of the Company valued on July 17, 2018 at $193,000 and the assumption of $1,000 short-term liabilities. The acquisition of LATAM Holdings closed on September 27, 2018. Therefore, in accordance with IFRS 3 - Business Combinations, the equity consideration transferred was measured at fair value at the acquisition date, which is the date control was obtained, which in this case was determined to be September 27, 2018. The fair value of the consideration shares on September 27, 2018 was $273,900.
16 |
Aphria Inc. Notes to the Condensed Interim Consolidated Financial Statements For the three and six months ended November 30, 2018 and November 30, 2017 (Unaudited - in thousands of Canadian dollars, except share and per share amounts) |
LATAM Holdings, through other subsidiaries, provides the Company with access to the emerging cannabis markets in Latin America and the Caribbean. Through this acquisition, the Company has secured key licenses in Colombia, Argentina and Jamaica which is anticipated to provide substantial first mover advantage in these countries. In addition, the Company acquired an option and rights of first refusal to purchase a Brazilian incorporated entity, with the option and right of first refusal vesting only upon the entity obtaining a medical cannabis cultivation, processing and distribution license in Brazil.
The Company is in the process of assessing the fair value of the net assets acquired and, as a result, the fair value of the net assets acquired may be subject to adjustments pending completion of final valuations and post closing adjustments. The table below summarizes the preliminary estimated fair value of the assets acquired and the liabilities assumed at the effective acquisition date:
Note | Number of shares | Share price | Amount | |||||||||||||
Consideration paid | ||||||||||||||||
Shares issued | (i) | 15,678,310 | $ | 17.47 | $ | 273,900 | ||||||||||
Total consideration paid | $ | 273,900 | ||||||||||||||
Net assets acquired | ||||||||||||||||
Current assets | ||||||||||||||||
Cash and cash equivalents | 2,704 | |||||||||||||||
Accounts receivable | 571 | |||||||||||||||
Other current assets | 106 | |||||||||||||||
Inventory | 65 | |||||||||||||||
Long-term assets | ||||||||||||||||
Capital assets | 494 | |||||||||||||||
Licences, permits & applications | 191,066 | |||||||||||||||
Goodwill | 131,527 | |||||||||||||||
Total assets | 326,533 | |||||||||||||||
Current liabilities | ||||||||||||||||
Accounts payable and accrued liabilities | 1,986 | |||||||||||||||
Income taxes payable | 20 | |||||||||||||||
Long-term liabilities | ||||||||||||||||
Deferred tax liability | 50,627 | |||||||||||||||
Total liabilities | 52,633 | |||||||||||||||
Total net assets acquired | $ | 273,900 |
(i) | Share price based on the price of the shares on September 27th, 2018. |
Net income and comprehensive net income for the Company would have been lower by approximately $1,139 and $2,278 for the three and six months ended November 30, 2017, if the acquisition had taken place on June 1, 2017. In connection with this transaction, the Company expensed transaction costs of $1,133.
Goodwill is comprised of:
November 30, 2018 | May 31, 2018 | |||||||
CannWay goodwill | $ | 1,200 | $ | 1,200 | ||||
Broken Coast goodwill | 146,091 | 145,794 | ||||||
Nuuvera goodwill | 377,221 | 375,768 | ||||||
LATAM goodwill | 131,527 | – | ||||||
$ | 656,039 | $ | 522,762 |
17 |
Aphria Inc. Notes to the Condensed Interim Consolidated Financial Statements For the three and six months ended November 30, 2018 and November 30, 2017 (Unaudited - in thousands of Canadian dollars, except share and per share amounts) |
12. | Convertible notes receivable |
November 30, 2018 | May 31, 2018 | |||||||
Copperstate Farms Investors, LLC | $ | – | $ | 1,942 | ||||
HydRx Farms Ltd. (d/b/a Scientus Pharma) | 16,396 | 16,129 | ||||||
Fire & Flower Inc. | 12,595 | – | ||||||
28,991 | 18,071 | |||||||
Deduct - current portion | (16,396 | ) | (1,942 | ) | ||||
$ | 12,595 | $ | 16,129 |
Copperstate Farms Investors, LLC
As at November 30, 2018, this note was paid in full.
HydRx Farms Ltd. (d/b/a Scientus Pharma)
On August 14, 2017, Aphria purchased $11,500 in secured convertible debentures of Scientus Pharma (“SP”). The convertible debenture bears interest at 8%, paid semi-annually, matures in two years and includes the right to convert the debenture into common shares of SP at $2.75 per common share at any time before maturity. SP maintains the option of forced conversion of the convertible debenture if the common shares of SP trade on a stock exchange at a value of $3.02 or more for 30 consecutive days. The Company maintains a first charge on all assets of SP. In October 2018, the Company agreed to share its first charge on all assets of SP with a third party on a pari passu basis. As at November 30, 2018, the third party has not completed its investment.
During the three and six months ended November 30, 2018, the Company’s note receivable from SP increased by $112 and $267, representing the change in fair value on the note. As at November 30, 2018, the convertible note receivable totalled $16,396.
Fire & Flower Inc.
On July 26, 2018, Aphria purchased $10,000 in unsecured convertible debentures of Fire & Flower Inc. (“F&F”). The convertible debentures bear interest at 8% per annum compounded, accrued and paid semi-annually in arrears (the “Debentures”). The Debentures mature on the earlier of a public liquidity event or July 31, 2020, at which point, they automatically convert into common shares of F&F at the lower of $1.15 and the share price on July 31, 2020. The Debentures may also be converted into a loan on July 31, 2020 bearing interest at 12%, at the holder’s option.
During the three and six months ended November 30, 2018, the Company’s note receivable from F&F increased by $2,455 and $2,595, representing the change in fair value on the note. As at November 30, 2018, the convertible note receivable totalled $12,595.
Convertible notes receivable
During the period, the Company purchased a total of $10,000 in convertible notes. The unrealized gain on convertible notes receivable recognized in the results of operations amounts to $2,567 and $2,862 for the three and six months ended November 30, 2018 (2017 - $665 and $1,212).
The fair value was determined using the Black-Scholes option pricing model using the following assumptions: the risk-free rate of 0.85-1.51%; expected life of the convertible note; volatility of 70% based on comparable companies; forfeiture rate of nil; dividend yield of nil; and, the exercise price of the respective conversion feature.
18 |
Aphria Inc. Notes to the Condensed Interim Consolidated Financial Statements For the three and six months ended November 30, 2018 and November 30, 2017 (Unaudited - in thousands of Canadian dollars, except share and per share amounts) |
13. | Interest in equity investees |
Summary of equity investees:
November 30, 2018 | May 31, 2018 | |||||||
Associated company | ||||||||
Althea Company Pty Ltd. | $ | 9,612 | $ | 4,966 | ||||
$ | 9,612 | $ | 4,966 |
Summary of gain/loss from equity investees:
For the three months ended November 30, | For the six months ended November 30, | |||||||||||||||
2018 | 2017 | 2018 | 2017 | |||||||||||||
(Loss) gain on dilution of ownership in equity investee | $ | – | $ | (16 | ) | $ | 2,210 | $ | 7,535 | |||||||
Loss from equity investees | (575 | ) | (441 | ) | (822 | ) | (9,281 | ) | ||||||||
Gain on sale of equity investee | 47,471 | – | 57,351 | – | ||||||||||||
$ | 46,896 | $ | (457 | ) | $ | 58,739 | $ | (1,746 | ) |
Liberty Health Sciences Inc.
In February 2018, the Company entered into a call/put obligation (“Obligation Agreement”) for the remaining shares held in Liberty, which were subject to CSE mandatory escrow requirements. As each new tranche of shares became freely trading, the Obligation Agreement resulted in the buyers acquiring the newly freely trading shares at an 18% discount to the market price of Liberty, based on Liberty’s 10 day volume weighted trading price.
The Obligation Agreement included an opt-out for Aphria’s benefit, in the event that the Toronto Stock Exchange amended their regulations such that it permitted investments by Canadian companies in U.S. based cannabis businesses, and in such instance, the Obligation Agreement would be automatically terminated. In exchange for the opt-out, the Company agreed to pay the buyers a $2,500 termination fee.
Based on the terms of the Obligation Agreement, the Company determined that the remaining shares held in Liberty met the requirements under IFRS 5 and were reclassified from interest in equity investees to assets held for sale. The Company ceased accounting for the investment as an equity investment as of November 30, 2017 and transferred the carrying value to assets held for sale.
In July 2018, 16,029,615 shares were released from escrow and sold as part of the Obligation Agreement. The Company received gross proceeds of $11,514 and recognized a gain on sale of equity investee of $9,880. As part of the transaction, the Company paid $480 in exchange for an option to buy back the shares at $1.00 a share, subject to certain downside risk protection which results in the purchaser sharing a portion of the difference between the share price on the day the option is exercised and the exercise price, provided the share price exceeds $1.25. The option to repurchase the shares is subject to the following conditions (collectively, the enumerated conditions (1) through (5), the “Conditions”):
(1) | Cannabis becoming legalized federally in the United States; and |
One or more of the following conditions have been satisfied:
(2) | The TSX has provided its approval for the purchase of the U.S. cannabis assets; |
(3) | The TSX revises its rules such that it no longer has a prohibition against its listed companies having an interest in US assets which are involved in the cannabis business; |
(4) | The common shares of the Company are voluntarily or involuntarily delisted from the TSX; and/or |
(5) | The Company is acquired by another entity, provided that the common shares of the Company will be delisted from the TSX upon the change of control. |
This option has been included in long-term investments (Note 14).
19 |
Aphria Inc. Notes to the Condensed Interim Consolidated Financial Statements For the three and six months ended November 30, 2018 and November 30, 2017 (Unaudited - in thousands of Canadian dollars, except share and per share amounts) |
During the period, the Company and the third party agreed to terminate the Obligation Agreement, in exchange for a $1,000 termination fee. The Company then entered into a share purchase agreement to divest of the remaining 64,118,462 Liberty shares in exchange for consideration in the form of a promissory note in the amount of $59,098, bearing interest at a rate of 12% due in 5 years (Note 15). As a security for the promissory note, the Liberty shares have been placed in trust with an escrow agent. The purchaser is able to remove the Liberty shares from the escrow at any time by paying off the promissory note. In the event that the Company enforces the security, the escrow agent will return the shares to the Company, provided that the Conditions are met. In the event they are not met, the escrow agent will transfer the securities to a third-party investment bank for liquidation, with the proceeds of liquidation delivered to the Company. Simultaneously with this sale, the Company entered into an option agreement to repurchase the Liberty shares for the amount of the promissory note (Note 14). The Company will pay an annual fee equal to 12.975% of the face value of the promissory note to maintain this option (Note 20). The option to repurchase the shares is subject to the Conditions described above. During the three and six months ended November 30, 2018, the Company reported a gain on sale of equity investee of $47,471 and $57,351.
During the three and six months ended November 30, 2017, the Company reported a total (loss) gain on dilution of ownership in equity investee of $(16) and $7,535. Prior to the Company no longer recording Liberty as an equity investee, Liberty reported a net loss of $23,493 and a net comprehensive loss of $27,001. In accordance with the equity method, the Company recorded a loss of $441 and $9,281 and other comprehensive gain (loss) of $520 and $(801).
Althea Company Pty Ltd. (“Althea”)
As at November 30, 2018 the Company held 50,750,000 common shares of Althea (May 31, 2018 - 4,500) representing an ownership interest of 25% (May 31, 2018 - 37.5%).
The following table summarizes, in aggregate, the financial information of the Company’s associate as included in their own financial statements.
September 30, 2018 | March 31, 2018 | |||||
Current assets | $ | 22,441 | $3,857 | |||
Non-current assets | – | 3 | ||||
Current liabilities | (141 | ) | (14) | |||
Non-current liabilities | (13 | ) | - | |||
Net assets | $ | 22,287 | $3,846 |
For the period from April 1 to September 30, 2018 the investee, Althea, reported a net loss of $2,327 AUD on its financial statements. In accordance with the equity method, the Company recorded a loss of $575 and $822 for the three and six months ended November 30, 2018 from its investee relative to its ownership of the outstanding common shares at the time.
During the period, Althea completed a share split of 7,500 shares for each existing share. Althea also issued 101,310,000 common shares for total proceeds of $19,650 AUD during the quarter. The Company participated in the financing of Althea contributing $3,400 AUD ($3,258 CAD) of the total $19,650 AUD raised. This additional raise reduced the Company’s ownership interest in Althea from 37.5% to 25% and accordingly, the Company recognized a gain on dilution of $2,210.
November 30, 2018 | May 31, 2018 | |||||||
Reconciliation to carrying amount: | ||||||||
Opening balance | $ | 4,966 | $ | – | ||||
Transfer from long-term investments | – | 2,483 | ||||||
Cash contributions, net of share issuance costs | 3,258 | 2,497 | ||||||
Gain on account of dilution of ownership | 2,210 | – | ||||||
Share of reported net (loss) income | (822 | ) | (14 | ) | ||||
Closing balance | $ | 9,612 | $ | 4,966 |
20 |
Aphria Inc. Notes to the Condensed Interim Consolidated Financial Statements For the three and six months ended November 30, 2018 and November 30, 2017 (Unaudited - in thousands of Canadian dollars, except share and per share amounts) |
14. | Long-term investments |
Cost May 31, 2018 | Fair value May 31, 2018 | Investment | Divesture/ Transfer | Subtotal November 30, 2018 | Change in fair value | Fair value November 30, 2018 | ||||||||||||||||||||||
Level 1 on fair value hierarchy | ||||||||||||||||||||||||||||
CannaRoyalty Corp. | $ | 1,500 | $ | 3,765 | $ | – | $ | (3,765 | ) | $ | – | $ | – | $ | – | |||||||||||||
MassRoots, Inc. | 304 | 164 | – | (164 | ) | – | – | – | ||||||||||||||||||||
Tetra Bio-Pharma Inc. | 2,300 | 6,800 | 7,107 | – | 13,907 | 3,669 | 17,576 | |||||||||||||||||||||
Hiku Brands Company Ltd. | 9,775 | 13,558 | – | (13,558 | ) | – | – | – | ||||||||||||||||||||
Scythian Biosciences Corp. | 9,349 | 8,603 | 298 | (8,901 | ) | – | – | – | ||||||||||||||||||||
National Access Cannabis Corp. | 1,093 | 710 | 10,481 | – | 11,191 | (4,384 | ) | 6,807 | ||||||||||||||||||||
Emblem Corp. | – | – | 10,000 | – | 10,000 | (2,075 | ) | 7,925 | ||||||||||||||||||||
24,321 | 33,600 | 27,886 | (26,388 | ) | 35,098 | (2,790 | ) | 32,308 | ||||||||||||||||||||
Level 2 on fair value hierarchy | ||||||||||||||||||||||||||||
Hiku Brands Company Ltd. | 2,336 | 1,906 | 16,787 | (18,693 | ) | – | – | – | ||||||||||||||||||||
Scythian Biosciences Corp. | 3,153 | 661 | – | (661 | ) | – | – | – | ||||||||||||||||||||
5,489 | 2,567 | 16,787 | (19,354 | ) | – | – | – | |||||||||||||||||||||
Level 3 on fair value hierarchy | ||||||||||||||||||||||||||||
Copperstate Farms, LLC | 1,755 | 5,300 | – | (5,300 | ) | – | – | – | ||||||||||||||||||||
Copperstate Farms Investors, LLC | 9,407 | 14,700 | – | (14,700 | ) | – | – | – | ||||||||||||||||||||
Resolve Digital Health Inc. | 718 | 3,300 | – | – | 3,300 | – | 3,300 | |||||||||||||||||||||
Resolve Digital Health Inc. | 282 | 1,916 | – | – | 1,916 | 224 | 2,140 | |||||||||||||||||||||
Green Acre Capital Fund I | 1,600 | 2,042 | 400 | – | 2,442 | 1,708 | 4,150 | |||||||||||||||||||||
Green Acre Capital Fund II | – | – | 3,000 | – | 3,000 | (75 | ) | 2,925 | ||||||||||||||||||||
Green Tank Holdings Corp. | 650 | 647 | – | – | 647 | 18 | 665 | |||||||||||||||||||||
IBBZ Krankenhaus GmbH | 1,956 | 1,956 | – | – | 1,956 | 3 | 1,959 | |||||||||||||||||||||
Greenwell Brands GmbH | – | – | 152 | – | 152 | – | 152 | |||||||||||||||||||||
Rapid Dose Therapeutics Inc. | – | – | 5,400 | – | 5,400 | – | 5,400 | |||||||||||||||||||||
HighArchy Ventures Ltd. | – | – | 9,995 | – | 9,995 | – | 9,995 | |||||||||||||||||||||
Fire & Flower Inc. | – | – | 3,416 | – | 3,416 | – | 3,416 | |||||||||||||||||||||
US legalization options | – | – | 54,762 | – | 54,762 | 40,863 | 95,625 | |||||||||||||||||||||
16,368 | 29,861 | 77,125 | (20,000 | ) | 86,986 | 42,741 | 129,727 | |||||||||||||||||||||
Deduct - assets held for sale | (11,162 | ) | (20,000 | ) | – | 20,000 | – | – | – | |||||||||||||||||||
$ | 35,016 | $ | 46,028 | $ | 121,798 | $ | (45,742 | ) | $ | 122,084 | $ | 39,951 | $ | 162,035 |
The fair value attached to warrants in both Level 2 and Level 3 were determined using the Black-Scholes option pricing model using the following assumptions: risk-free rate of 0.75-1.70% on the date of grant; expected life of 1 and 2 years; volatility of 70% based on comparable companies; forfeiture rate of 0%; dividend yield of nil; and, the exercise price of the respective warrant.
CannaRoyalty Corp. (“CR”)
During the period, the Company sold its remaining 750,000 shares of CR for proceeds of $4,111, resulting in an accounting gain of $346 (Note 28). The Company notes that as measured against the original cost of the shares, the Company recorded a total gain of $2,611 on its investment in CR.
MassRoots, Inc.
During the period, the Company sold its remaining 500,000 common shares in MassRoots, Inc. for proceeds of $1, resulting in a loss of $163 (Note 28).
Tetra Bio-Pharma Inc.
During the period, the Company purchased an additional 6,900,000 units of Tetra Bio-Pharma Inc. at a total cost of $7,107. Each unit is comprised of one Class A common share and one common share purchase warrant with an exercise price of $1.29 expiring November 2021. The Company owns 16,900,000 common shares and 6,900,000 warrants at a cost of $9,407, with a fair value of $17,576 as at November 30, 2018.
21 |
Aphria Inc. Notes to the Condensed Interim Consolidated Financial Statements For the three and six months ended November 30, 2018 and November 30, 2017 (Unaudited - in thousands of Canadian dollars, except share and per share amounts) |
Hiku Brands Company Ltd. (“Hiku”)
During the period the Company exercised its 7,993,605 warrants at $2.10 per warrant. Subsequent to exercising its warrants the Company sold all of its shares of Hiku in exchange for $48,153, resulting in a gain on disposal of $15,902 (Note 28).
As part of the purchase of Hiku by a third party, the third party terminated the Hiku supply agreement with the Company. The third party purported to terminate the Tokyo Smoke supply agreement with the Company at approximately the same time. The Company does not believe that the agreement could be terminated by the third party and is pursuing all available legal options associated with the position taken by the third party.
Scythian Biosciences Inc. (“Scythian”)
During the period the Company purchased 123,800 common shares of Scythian at a total cost of $298. During the period, the Company sold its 2,812,300 common shares and 672,125 common share purchase warrants in Scythian in exchange for $6,609, resulting in a loss on disposal of $2,953 (Note 28).
National Access Cannabis Corp.
During the period, the Company purchased 10,344,505 common shares of National Access Cannabis Corp. at a total cost of $10,481. The Company owns 11,344,505 common shares in National Access Cannabis Corp. at a cost of $11,574, with a fair value of $6,807 as at November 30, 2018.
Emblem Corp. (“Emblem”)
During the period, the Company entered into a 5-year supply agreement with Emblem as part of the supply agreement the Company received 6,952,169 common shares to satisfy a deposit valued at $10,000. The Company owns 6,952,169 common shares in Emblem at a cost of $10,000, with a fair value of $7,925. The shares are subject to various hold restrictions tied to terms within the supply agreement.
US legalization options
During the period, the Company purchased an option to acquire 16,029,615 Liberty shares at $1.00 a share, expiring January 23, 2020. This option includes specific downside risk protection in which the purchaser will share a portion of the difference between the share price on the day the option is exercised and the exercise price, provided the share price exceeds $1.25. The cost of the option is $480. The option to repurchase the shares is subject to the Conditions described in note 13.
During the period, the Company entered into an option agreement to repurchase 64,118,462 Liberty shares in exchange for settlement of a promissory note receivable, expiring September 6, 2023 (Note 13 and Note 20). The cost of this option is a gross annual fee of $7,668, however the Company also receives $7,092 of interest income associated with the promissory note receivable, resulting in a net annual cost to the Company of $576. The option to repurchase the shares is subject to the Conditions described in note 13.
During the period, the Company contributed assets with a fair value of $55,000 to an investment fund. Simultaneously, the Company entered into an option agreement to purchase the Company’s proportionate share of the securities held in the investment fund at a cost of $55,000, expiring September 24, 2023 (Note 20). The cost of this option is a gross fee of $6,765, however the Company also receives $6,600 of interest income associated with the promissory note receivable, resulting in a net annual cost to the Company of $165. In the event the securities in the fund represent direct or indirect ownership of, or investment in, entities engaging in activities related to the cultivation, distribution or possession of cannabis in the United States, the option to purchase the securities is subject to the Conditions described in note 13.
The Company used the Black-Scholes option pricing model to determine the fair value of the options using the following assumptions: risk-free rate of 2.19-2.19%; expected life of 1.15 - 5 years; volatility of 70-90% based on comparable companies; forfeiture rate of 0%; dividend yield of nil; and, the exercise price of the respective option. The Company discounted the determined Black-Scholes value by 11.60% for the options expiring in January 2020, and 70.25% for the options expiring in September 2023, as the probability the Conditions described in note 13 will be met.
Copperstate Farms, LLC (“Copperstate”) and Copperstate Farms Investors, LLC (“CSF”)
During the period, the Company received the $20,000 from the sale of the shares of Copperstate and CSF, which were previously held as available for sale.
22 |
Aphria Inc. Notes to the Condensed Interim Consolidated Financial Statements For the three and six months ended November 30, 2018 and November 30, 2017 (Unaudited - in thousands of Canadian dollars, except share and per share amounts) |
Resolve Digital Health Inc. (“Resolve”)
The Company owns 2,200,026 common shares and 2,200,026 warrants in Resolve at a total cost of $1,000, with a fair value of $5,440 as at November 30, 2018. The Company determined the fair value of its investment based on Resolve’s most recent financing. Each warrant is exercisable at $0.65 per warrant expiring December 1, 2021.
Green Acre Capital Fund I
The Company committed $2,000 to Green Acre Capital Fund I and, as of the balance sheet date, has funded the full $2,000. The Company determined the fair value of its investment, based on its proportionate share of net assets, to be $4,150 as at November 30, 2018. During the period, the Company received a dividend of $700 from its investment in Green Acre Capital Fund I.
Green Acre Capital Fund II
During the period, the Company committed to a $15,000 investment in Green Acre Capital Fund II, and as of the balance sheet date, has funded $3,000. The Company determined that the fair value of its investments, based on its proportionate share of net assets, was $2,925 as at November 30, 2018.
Green Tank Holdings Corp. (“Green Tank”)
The Company owns 98,425 preferred shares in Green Tank for a total cost of $500 USD ($650 CAD). The Company determined the fair value of its investment, based on Green Tank’s most recent financing at the same price, is equal to its carrying value. The Company recognized a gain from the change in fair value of $18 due to changes in the foreign exchange rate.
IBBZ Krankenhaus GmbH Klinik Hygiea (“Krankenhaus”)
The Company owns 25.1% of Krankenhaus, which is the owner and operator of Berlin-based Schöneberg Hospital, for €1,294 ($1,956 CAD). Through this investment, the Company is entitled to 5% of the net income (loss) for the years 2018 to 2021, and 10% of the net income (loss) for the period thereafter. The Company determined that the fair value of its investment, based on Krankenhaus’ most recent financing at the same price, is equal to its carrying value. The Company recognized a gain from the change in fair value of $3 due to changes in the foreign exchange rate.
Greenwell Brands GmbH (“Greenwell”)
In September 2018, the Company entered into an investment and shareholder agreement with Greenwell for the purchase of 1,250 common shares, for a total cost of €100 ($152CAD). The Company determined that the fair value of its investment, based on the most recent financing at the same price, is equal to its carrying value.
Rapid Dose Therapeutics Inc. (“RDT”)
In August 2018, the Company entered into a subscription agreement with RDT for the purchase of 7,200,000 common shares, for a total cost of $5,400. The Company determined that the fair value of its investment, based on the most recent financing at the same price, is equal to its carrying value. Subsequent to quarter-end, RDT’s common shares began trading on the Canadian Stock Exchange. The Company will reclassify this investment to Level 1 beginning next quarter.
HighArchy Ventures Ltd.
In October 2018, the Company entered into a subscription agreement with HighArchy Ventures Ltd. for the purchase of 1,999 Class A shares and 1,999 Class B shares, for a total cost of $9,995. The Company determined that the fair value of its investment, based on the most recent financing at the same price, is equal to its carrying value.
Fire & Flower Inc.
In October 2018, the Company entered into a subscription agreement with Fire & Flower Inc. for the purchase of 2,277,000 common shares, for a total cost of $3,416. The Company determined that the fair value of its investment, based on the most recent financing at the same price, is equal to its carrying value.
23 |
Aphria Inc. Notes to the Condensed Interim Consolidated Financial Statements For the three and six months ended November 30, 2018 and November 30, 2017 (Unaudited - in thousands of Canadian dollars, except share and per share amounts) |
15. | Promissory note receivable |
May 31, 2018 |
Additions | Payments | November 30, 2018 | ||
September 6, 2018 - $59,098 - 12%, due | $ - | $ 59,098 | $ - | $ 59,098 | |
September 6, 2023 | |||||
September 24, 2018 - $55,000 - 12%, due | - | 55,000 | - | 55,000 | |
September 24, 2023 | |||||
October 11, 2018 - GBP £4,600 - 3.25%, due | - | 7,952 | - | 7,952 | |
October 11, 2021 | |||||
October 31, 2018 - $6,609 - 12%, due | - | 6,609 | - | 6,609 | |
October 31, 2023 | |||||
November 1, 2018 - $200 - interest free, due | - | 200 | - | 200 | |
May 1, 2020 | |||||
$ - | $ 128,859 | $ - | $ 128,859 |
16. | Income taxes and deferred income taxes |
A reconciliation of income taxes at the statutory rate with the reported taxes is as follows:
For the six months ended November 30, | ||||||||
2018 | 2017 | |||||||
Income before income taxes | $ | 87,814 | $ | 25,563 | ||||
Statutory rate | 26.5 | % | 26.5 | % | ||||
Expected income tax expense at combined basic federal and provincial tax rate | 23,271 | 6,774 | ||||||
Effect on income taxes of: | ||||||||
Foreign tax differential | (174 | ) | – | |||||
Permanent differences | 1,055 | – | ||||||
Non-deductible share-based compensation and other expenses | 2,717 | 1,267 | ||||||
Non-taxable portion of losses (gains) | (15,035 | ) | (3,677 | ) | ||||
Other | (104 | ) | (297 | ) | ||||
Tax assets not recognized | 134 | – | ||||||
$ | 11,864 | $ | 4,067 | |||||
Income tax expense is comprised of: | ||||||||
Current | $ | 8,079 | $ | 851 | ||||
Future | 3,785 | 3,216 | ||||||
$ | 11,864 | $ | 4,067 |
24 |
Aphria Inc. Notes to the Condensed Interim Consolidated Financial Statements For the three and six months ended November 30, 2018 and November 30, 2017 (Unaudited - in thousands of Canadian dollars, except share and per share amounts) |
The following table summarizes the components of deferred tax:
November 30, 2018 | May 31, 2018 | |||||||
Deferred tax assets | ||||||||
Non-capital loss carry forward | $ | 7,137 | $ | 4,567 | ||||
Capital loss carry forward | – | 405 | ||||||
Share issuance and financing fees | 7,730 | 5,443 | ||||||
Unrealized loss | – | 916 | ||||||
Other | 941 | 27 | ||||||
Deferred tax liabilities | ||||||||
Net book value in excess of undepreciated capital cost | (719 | ) | (1,017 | ) | ||||
Intangible assets in excess of tax costs | (113,767 | ) | (64,120 | ) | ||||
Unrealized gain | (6,695 | ) | (1,097 | ) | ||||
Biological assets and inventory in excess of tax costs | (4,866 | ) | (4,377 | ) | ||||
Net deferred tax (liabilities) assets | $ | (110,239 | ) | $ | (59,253 | ) |
17. | Bank indebtedness |
The Company secured an operating line of credit in the amount of $1,000 which bears interest at the lender’s prime rate plus 75 basis points. As of the November 30, 2018, the Company has not drawn on the line of credit. The operating line of credit is secured by a first charge on the property at 265 Talbot St. West, Leamington, Ontario and a first ranking position on a general security agreement.
18. | Promissory note payable |
During the prior year, the Company entered into a promissory note with Althea for $700 AUD ($686), as part of the purchase of Althea common shares. The note is due and payable on December 31, 2020. The Company reached an agreement with Althea where the promissory note amount will be used by Althea to purchase products from the Company in connection with a supply agreement entered into in September 2017.
November 30, 2018 |
May 31, 2018 | ||||
Note payable to Althea Company Pty Ltd - $700 AUD ($686), opening balance, | $ 610 | $ 686 | |||
non-interest bearing, due and payable on December 31, 2020 | |||||
Reduction of Promissory note payable balance with respect to products provided | - | (63) | |||
Foreign exchange (gain) loss | (6) | (13) | |||
Balance remaining | 604 | 610 | |||
Deduct - principal portion included in current liabilities | (604) | (610) | |||
$ - | $ - |
25 |
Aphria Inc. Notes to the Condensed Interim Consolidated Financial Statements For the three and six months ended November 30, 2018 and November 30, 2017 (Unaudited - in thousands of Canadian dollars, except share and per share amounts) |
19. | Long-term debt |
November 30, 2018 | May 31, 2018 | |||||||
Term loan - $25,000 - Canadian Five Year Bond interest rate plus 2.73% with a minimum 4.50%, 5 year term, with a 15-year amortization, repayable in blended monthly payments sufficient to repay the loan by July 2033 | $ | 24,618 | $ | – | ||||
Term loan - $25,000 - 3.95%, compounded monthly, 5 year term with a 15-year amortization, repayable in equal monthly instalments of $188 including interest, due in April 2022 | 24,023 | 24,107 | ||||||
Term loan - $1,250 - 3.99%, 5-year term, with a 10-year amortization, repayable in equal monthly instalments of $13 including interest, due in July 2021 | 1,002 | 1,057 | ||||||
Mortgage payable - $3,750 - 3.95%, 5-year term, with a 20-year amortization, repayable in equal monthly instalments of $23 including interest, due in July 2021 | 3,449 | 3,515 | ||||||
Vendor take-back mortgage owed to related party - $2,850 - 6.75%, 5-year term, repayable in equal monthly instalments of $56 including interest, due in June 2021 | 1,593 | 1,869 | ||||||
54,685 | 30,548 | |||||||
Deduct - unamortized financing fees | (132 | ) | (71 | ) | ||||
- principal portion included in current liabilities | (3,388 | ) | (2,140 | ) | ||||
$ | 51,165 | $ | 28,337 |
Total long-term debt repayments are as follows:
Next 12 months | $ 3,388 | ||||
2 years | 3,547 | ||||
3 years | 3,434 | ||||
4 years | 3,182 | ||||
Thereafter | 41,134 | ||||
Balance of obligation | $ 54,685 |
The term loan of $24,618 was entered into on July 27, 2018 and is secured by a first charge on the property at 223, 231, 239, 265, 269, 271 and 275 Talbot Street West, Leamington Ontario, a first position on a general security agreement, and an assignment of fire insurance to the lender. Principal payments started on the term loan in August 2018. The effective interest rate during the period was 4.68%.
The term loan of $24,023 was entered into on May 9, 2017 and is secured by a first charge on the property at 265 Talbot Street West, Leamington Ontario, a first position on a general security agreement, and an assignment of fire insurance to the lender. Principal payments started on the term loan in March 2018.
The term loan of $1,002 and mortgage payable of $3,449 were entered into on July 22, 2016 and are secured by a first charge on the property at 265 Talbot Street West, Leamington, Ontario and a first position on a general security agreement.
The vendor take-back mortgage payable of $1,592, owed to a director of the Company, was entered into on June 30, 2016 in conjunction with the acquisition of the property at 265 Talbot Street West. The mortgage is secured by a second charge on the property at 265 Talbot Street West, Leamington, Ontario.
The Company acquired term loans of $3,000 and $1,201, and a mortgage payable of $1,713 as part of the acquisition of Broken Coast (Note 11). These loans and mortgages were paid in full during the prior year.
26 |
Aphria Inc. Notes to the Condensed Interim Consolidated Financial Statements For the three and six months ended November 30, 2018 and November 30, 2017 (Unaudited - in thousands of Canadian dollars, except share and per share amounts) |
20. | Option payment liability |
May 31, 2018 | Additions | Settlement | Change in fair value | November 30, 2018 | ||||||||||||||||
US legalization options | $ | – | $ | 58,271 | $ | (14,433 | ) | $ | 538 | $ | 44,376 | |||||||||
Deduct - current portion | – | (11,654 | ) | |||||||||||||||||
$ | – | $ | 32,722 |
During the period, the Company entered into an option agreement to repurchase 64,118,462 Liberty shares in exchange for settlement of a promissory note receivable, expiring September 6, 2023 (Note 13 and Note 14). The cost of this option is an annual fee of $7,668 paid at the beginning of each year; however, the Company also receives $7,092 of interest income associated with the promissory note receivable, resulting in a net annual cost to the Company of $576. The fair value of the payments from this contract was $30,958 at inception, and $23,660 as at November 30, 2018, using a discount rate of 12%.
During the period, the Company entered into an option agreement to repurchase the Company’s proportionate share of securities held by an investment fund at a cost of $55,000, expiring September 24, 2023 (Note 14). The cost of this option is an annual fee of $6,765 paid at the beginning of each year; however, the Company also receives $6,600 of interest income associated with the promissory note receivable, resulting in a net annual cost to the Company of $165. The fair value of the payments from this contract was $27,313 at inception, and $20,716 as at November 30, 2018, using a discount rate of 12%.
21. | Share capital |
The Company is authorized to issue an unlimited number of common shares. As at November 30, 2018, the Company has 249,931,744 shares issued and outstanding and 19,963 shares to be issued, of which 1,777,971 shares were held and subject to various escrow agreements.
Common Shares | Number of shares | Amount | ||||||
Balance at May 31, 2018 | 210,169,924 | $ | 1,113,981 | |||||
June 2018 bought deal, net of cash issuance costs | 21,835,510 | 245,925 | ||||||
Broken Coast acquisition | 19,963 | 297 | ||||||
LATAM acquisition | 15,678,310 | 273,900 | ||||||
Warrants exercised | 316,063 | 1,409 | ||||||
Options exercised | 1,911,974 | 11,139 | ||||||
Income tax recovery on share issuance costs | – | 3,426 | ||||||
249,931,744 | $ | 1,650,077 | ||||||
a) | Throughout the period, 316,063 warrants with exercise prices ranging from $1.50 to $20.30 were exercised for a value of $1,409 including any cash consideration. |
b) | Throughout the period, 1,911,974 shares were issued from the exercise of stock options with exercise prices ranging from $0.60 to $20.19 for a value of $11,139, including any cash consideration. |
c) | In June 2018, the Company closed a bought deal financing in which it issued 21,835,510 common shares at a purchase price of $11.85 per share for $245,925 net of cash issuance costs. |
d) | During the period, the Company agreed to terms to acquire the remaining 0.14% of Broken Coast (Note 11) and accordingly, the Company agreed to issue 19,963 shares. |
e) | In September 2018, the Company completed the acquisition of LATAM (note 11) in which it issued 15,678,310 common shares at a purchase price of $17.47 per share for $273,900. |
f) | During the period, the Company recognized a $3,426 income tax recovery on share issuance costs. |
27 |
Aphria Inc. Notes to the Condensed Interim Consolidated Financial Statements For the three and six months ended November 30, 2018 and November 30, 2017 (Unaudited - in thousands of Canadian dollars, except share and per share amounts) |
22. | Warrants |
The warrant details of the Company are as follows:
Type of warrant | Expiry date | Number of warrants | Weighted average price | Amount | ||||||||||
Warrant | December 11, 2018 | 7,003 | 1.75 | $ | – | |||||||||
Warrant | December 2, 2019 | 1,026,269 | 1.50 | – | ||||||||||
Warrant | September 26, 2021 | 200,000 | 3.14 | 360 | ||||||||||
Nuuvera warrant | February 14, 2020 | 1,293,803 | 20.30 | 976 | ||||||||||
2,527,075 | $ | 11.26 | $ | 1,336 | ||||||||||
November 30, 2018 | May 31, 2018 | ||||||||||||||
Number of warrants | Weighted average price | Number of warrants | Weighted average price | ||||||||||||
Outstanding, beginning of the period | 2,843,138 | $ | 10.52 | 3,885,908 | $1.61 | ||||||||||
Issued during the period | – | – | 1,345,866 | 20.30 | |||||||||||
Exercised during the period | (316,063 | ) | 4.62 | (2,388,636 | ) | 1.54 | |||||||||
Outstanding, end of the period | 2,527,075 | $ | 11.25 | 2,843,138 | $10.52 |
In March 2018, the Company completed the acquisition of Nuuvera (Note 11) in which it reserved 1,345,866 common shares for issuance to the holders of certain common share purchase warrants of Nuuvera (“Nuuvera Warrants”). There are 3,795,450 Nuuvera Warrants, exercisable for Nuuvera shares at an exercise price of $7.20 per share, the Nuuvera shares would convert to 0.3546 Aphria shares and $0.62 cash.
23. | Stock options |
The Company adopted a stock option plan under which it is authorized to grant options to officers, directors, employees and consultants enabling them to acquire common shares of the Company. The maximum number of common shares reserved for issuance of stock options that can be granted under the plan is 10% of the issued and outstanding common shares of the Company. The options granted can be exercised for up to a maximum of 10 years and vest as determined by the Board of Directors. The exercise price of each option can not be less than the market price of the common shares on the date of grant.
The Company recognized a share-based compensation expense of $3,910 and $8,085 during the three and six months ended November 30, 2018 (2017 - $2,055 and $4,495). The total fair value of options granted during the period was $10,884 (2017 - $6,091).
November 30, 2018 | May 31, 2018 | |||||||||||||||
Number of options | Weighted average price | Number of options | Weighted average price | |||||||||||||
Outstanding, beginning of the period | 8,956,195 | $ | 7.60 | 5,926,001 | $1.99 | |||||||||||
Exercised during the period | (2,127,001 | ) | 3.72 | (2,637,363 | ) | 2.30 | ||||||||||
Issued during the period | 1,400,000 | 13.61 | 6,703,330 | 11.12 | ||||||||||||
Cancelled during the period | (96,037 | ) | 8.43 | (1,035,773 | ) | 11.77 | ||||||||||
Outstanding, end of the period | 8,133,157 | $ | 9.63 | 8,956,195 | $7.60 | |||||||||||
Exercisable, end of the period | 4,204,447 | $ | 6.63 | 3,919,542 | $1.36 |
In June 2018, the Company issued 250,000 stock options at an exercise price of $11.78 per share, exercisable for 3 years to officers of the Company. 83,331 vested immediately and the remainder vest over 2 years.
In July 2018, the Company issued 820,000 stock options at an exercise price between $11.51 and $11.85 per share, exercisable for 5 years to employees of the Company. 50,000 vested immediately and the remainder vest over 3 years.
28 |
Aphria Inc. Notes to the Condensed Interim Consolidated Financial Statements For the three and six months ended November 30, 2018 and November 30, 2017 (Unaudited - in thousands of Canadian dollars, except share and per share amounts) |
In September 2018, the Company issued 250,000 stock options at an exercise price of $19.38, exercisable for 5 years to employees of the Company. Nil vested immediately and the remainder vest over 3 years.
In October 2018, the Company issued 80,000 stock options at an exercise price of $19.70, exercisable for 5 years to employees of the Company. Nil vested immediately and the remainder vest over 3 years.
The outstanding option details of the Company are as follows:
Expiry date | Weighted average exercise price | Number of options | Vested and exercisable | |||||||||
February 2019 | $ | 11.40 | 200,000 | – | ||||||||
April 2019 | $ | 1.67 | 30,000 | 30,000 | ||||||||
June 2019 | $ | 0.60 | 400,000 | 400,000 | ||||||||
September 2019 | $ | 3.00 | 42,365 | 42,365 | ||||||||
October 2019 | $ | 3.47 | 7,400 | 7,400 | ||||||||
November 2019 | $ | 3.90 | 817,019 | 817,019 | ||||||||
December 2019 | $ | 5.25 | 400,000 | 33,333 | ||||||||
January 2020 | $ | 5.72 | 19,168 | 4,167 | ||||||||
April 2020 | $ | 7.92 | 90,000 | 56,666 | ||||||||
June 2020 | $ | 5.44 | 216,668 | 133,333 | ||||||||
July 2020 | $ | 5.24 | 698,645 | 552,964 | ||||||||
September 2020 | $ | 0.85 | 185,000 | 185,000 | ||||||||
October 2020 | $ | 6.90 | 360,000 | 223,332 | ||||||||
November 2020 | $ | 9.05 | 250,000 | 156,666 | ||||||||
November 2020 | $ | 9.28 | 50,000 | 33,333 | ||||||||
December 2020 | $ | 14.06 | 100,000 | 33,333 | ||||||||
January 2021 | $ | 21.70 | 10,000 | 3,333 | ||||||||
January 2021 | $ | 22.89 | 150,000 | 43,330 | ||||||||
January 2021 | $ | 22.08 | 50,000 | 16,666 | ||||||||
March 2021 | $ | 14.39 | 30,000 | 16,666 | ||||||||
March 2021 | $ | 11.40 | 300,000 | 100,000 | ||||||||
March 2021 | $ | 9.98 | 200,000 | 66,666 | ||||||||
March 2021 | $ | 12.39 | 50,000 | 16,666 | ||||||||
April 2021 | $ | 11.40 | 423,334 | 186,664 | ||||||||
April 2021 | $ | 11.45 | 100,000 | 33,333 | ||||||||
May 2021 | $ | 20.19 | 908,500 | 241,832 | ||||||||
June 2021 | $ | 1.40 | 191,669 | 191,669 | ||||||||
June 2021 | $ | 11.78 | 250,000 | 83,331 | ||||||||
August 2021 | $ | 1.64 | 110,000 | 89,991 | ||||||||
October 2022 | $ | 6.90 | 74,000 | 74,000 | ||||||||
July 2023 | $ | 11.51 | 100,000 | – | ||||||||
July 2023 | $ | 11.85 | 708,000 | 50,000 | ||||||||
September 2023 | $ | 19.38 | 250,000 | – | ||||||||
October 2023 | $ | 19.70 | 80,000 | – | ||||||||
July 2027 | $ | 2.52 | 82,427 | 82,427 | ||||||||
November 2027 | $ | 6.29 | 39,792 | 39,792 | ||||||||
March 2028 | $ | 12.29 | 119,378 | 119,378 | ||||||||
March 2028 | $ | 14.38 | 39,792 | 39,792 | ||||||||
Outstanding, end of the period | $ | 9.63 | 8,133,157 | 4,204,447 |
29 |
Aphria Inc. Notes to the Condensed Interim Consolidated Financial Statements For the three and six months ended November 30, 2018 and November 30, 2017 (Unaudited - in thousands of Canadian dollars, except share and per share amounts) |
The Company used the Black-Scholes option pricing model to determine the fair value of options granted using the following assumptions: risk-free rate of 2.00-2.08% on the date of grant; expected life of 3 - 5 years; volatility of 70% based on comparable companies; forfeiture rate of 0%; dividend yield of nil; and, the exercise price of the respective option.
24. | Non-controlling interest |
The following tables summarise the information relating to the Company’s subsidiaries, 1974568 Ontario Ltd. (“Aphria Diamond”), CannInvest Africa Ltd., Verve Dynamics Incorporated (Pty) Ltd. (“Verve Dynamics”), Nuuvera Malta Ltd., Marigold Projects Jamaica Limited (“Marigold”), and ColCanna S.A.S. before intercompany eliminations.
Aphria Diamond | CannInvest Africa Ltd. | Verve Dynamics | Nuuvera Malta Ltd. | Marigold | ColCanna S.A.S. | November 30, 2018 | ||||||||||||||||||||||
Current assets | $ | 8,089 | $ | 34 | $ | – | $ | 2,506 | $ | 193 | $ | 8,995 | $ | 19,817 | ||||||||||||||
Non-current assets | 139,312 | 3 | 13,503 | 448 | 337 | 298 | 153,901 | |||||||||||||||||||||
Current liabilities | (8,109 | ) | (43 | ) | – | (270 | ) | – | (91 | ) | (8,513 | ) | ||||||||||||||||
Non-current liabilities | (120,398 | ) | – | – | (3,056 | ) | (1,067 | ) | (9,509 | ) | (134,030 | ) | ||||||||||||||||
Net assets | 18,894 | (6 | ) | 13,503 | (372 | ) | (537 | ) | (307 | ) | 31,175 | |||||||||||||||||
Non-controlling interest % | 49 | % | 50 | % | 70 | % | 10 | % | 5 | % | 10 | % | ||||||||||||||||
Non-controlling interest | $ | 9,258 | $ | (3 | ) | $ | 9,452 | $ | (37 | ) | $ | (27 | ) | $ | (31 | ) | $ | 18,612 |
Aphria Diamond | CannInvest Africa Ltd. | Verve Dynamics | Nuuvera Malta Ltd. | Marigold | ColCanna S.A.S. | November 30, 2018 | ||||||||||||||||||||||
Revenue | $ | – | $ | – | $ | – | $ | 141 | $ | – | $ | 2 | $ | 143 | ||||||||||||||
Total expenses | 657 | 7 | – | 514 | 358 | 257 | 1,793 | |||||||||||||||||||||
Non-controlling interest % | 49 | % | 50 | % | 70 | % | 10 | % | 5 | % | 10 | % | ||||||||||||||||
$ | (322 | ) | $ | (4 | ) | $ | – | $ | (37 | ) | $ | (18 | ) | $ | (26 | ) | $ | (407 | ) |
Aphria Diamond | CannInvest Africa Ltd. | Verve Dynamics | Nuuvera Malta Ltd. | Marigold | ColCanna S.A.S. | May 31, 2018 | ||||||||||||||||||||||
Current assets | $ | 7,313 | $ | – | $ | – | $ | – | $ | – | $ | – | $ | 7,313 | ||||||||||||||
Non-current assets | 83,207 | – | – | – | – | – | 83,207 | |||||||||||||||||||||
Current liabilities | (10,085 | ) | – | – | – | – | – | (10,085 | ) | |||||||||||||||||||
Non-current liabilities | (60,884 | ) | – | – | – | – | – | (60,884 | ) | |||||||||||||||||||
Net assets | 19,551 | – | – | – | – | – | 19,551 | |||||||||||||||||||||
Non-controlling interest % | 49 | % | 0 | % | 0 | % | 0 | % | 0 | % | 0 | % | ||||||||||||||||
Non-controlling interest | $ | 9,580 | $ | – | $ | – | $ | – | $ | – | $ | – | $ | 9,580 |
30 |
Aphria Inc. Notes to the Condensed Interim Consolidated Financial Statements For the three and six months ended November 30, 2018 and November 30, 2017 (Unaudited - in thousands of Canadian dollars, except share and per share amounts) |
25. | General and administrative expenses |
For the three months ended November 30, | For the six months ended November 30, | |||||||||||||||
2018 | 2017 | 2018 | 2017 | |||||||||||||
Executive compensation | $ | 846 | $ | 354 | 1,681 | $ | 660 | |||||||||
Consulting fees | 1,427 | 63 | 2,358 | 158 | ||||||||||||
Office and general | 5,660 | 567 | 7,467 | 1,119 | ||||||||||||
Professional fees | 485 | 480 | 2,047 | 697 | ||||||||||||
Salaries and wages | 3,019 | 317 | 6,111 | 725 | ||||||||||||
Travel and accommodation | 689 | 168 | 1,160 | 304 | ||||||||||||
Rent | 150 | 24 | 303 | 45 | ||||||||||||
$ | 12,276 | $ | 1,973 | $ | 21,127 | $ | 3,708 |
26. | Share-based compensation |
Share-based compensation is comprised of:
For the three months ended November 30, |
For the six months ended November 30, | |||||
2018 | 2017 | 2018 | 2017 | |||
Amounts charged to share-based payment reserve in | $ 3,910 | $ 2,055 | $ 8,085 | $ 4,495 | ||
respect of share-based compensation | ||||||
Share-based compensation accrued in the prior period | - | - | - | (44) | ||
Share-based compensation issued on behalf of a | - | - | - | (32) | ||
related party | ||||||
Shares for services compensation | - | 74 | - | 187 | ||
Deferred share units expensed in the period | (1,336) | 71 | 611 | 103 | ||
$ 2,574 | $ 2,200 | $ 8,696 | $ 4,709 |
During the period, the Company issued 18,925 deferred share units to certain directors of the Company under the terms of the Company’s Omnibus Long-Term Incentive Plan. In May 2018, directors and officers of the Company forfeited 312,000 deferred share units which were granted during the prior year.
As at November 30, 2018, the Company had 219,482 deferred share units outstanding.
27. | Finance income, net |
Finance income, net, is comprised of:
For the three months ended November 30, | For the six months ended November 30, | |||||||||||||||
2018 | 2017 | 2018 | 2017 | |||||||||||||
Interest income | $ | 5,603 | $ | 1,193 | $ | 7,095 | $ | 1,995 | ||||||||
Interest expense | (748 | ) | (331 | ) | (1,181 | ) | (667 | ) | ||||||||
$ | 4,855 | $ | 862 | $ | 5,914 | $ | 1,328 |
31 |
Aphria Inc. Notes to the Condensed Interim Consolidated Financial Statements For the three and six months ended November 30, 2018 and November 30, 2017 (Unaudited - in thousands of Canadian dollars, except share and per share amounts) |
28. | Gain on long-term investments |
Gain on long-term investments for the three and six months ended November 30, 2018 is comprised of:
Investment | Proceeds | Opening fair value / cost | Gain (loss) on disposal | Change in fair value | Total | |||||||||||||||
Level 1 on fair value hierarchy | ||||||||||||||||||||
CannaRoyalty Corp. - shares | $ | 4,111 | $ | 3,765 | $ | 346 | $ | – | $ | 346 | ||||||||||
MassRoots, Inc. - shares | 1 | 164 | (163 | ) | – | (163 | ) | |||||||||||||
North Bud Farms - shares | 373 | 253 | 120 | – | 120 | |||||||||||||||
Hiku Brands Company Ltd. - shares | 30,542 | 13,558 | 16,984 | – | 16,984 | |||||||||||||||
Scythian Biosciences Corp. - shares | 6,609 | 8,901 | (2,292 | ) | – | (2,292 | ) | |||||||||||||
Level 2 on fair value hierarchy | ||||||||||||||||||||
Hiku Brands Company Ltd. - warrants | 17,611 | 18,693 | (1,082 | ) | – | (1,082 | ) | |||||||||||||
Scythian Biosciences Corp. - warrants | – | 661 | (661 | ) | – | (661 | ) | |||||||||||||
Level 3 on fair value hierarchy | ||||||||||||||||||||
Copperstate Farms, LLC - shares | 5,300 | 5,300 | – | – | – | |||||||||||||||
Copperstate Farms Investors, LLC - shares | 14,700 | 14,700 | – | – | – | |||||||||||||||
Long-term investments (Note 14) | – | – | – | 39,951 | 39,951 | |||||||||||||||
Six months ended November 30, 2018 | $ | 79,247 | $ | 65,995 | $ | 13,252 | $ | 39,951 | $ | 53,203 | ||||||||||
Less transactions in previous quarters: | ||||||||||||||||||||
August 31, 2018 | 24,112 | 23,929 | 183 | 22,517 | 22,700 | |||||||||||||||
Three months ended November 30, 2018 | $ | 55,135 | $ | 42,066 | $ | 13,069 | $ | 17,434 | $ | 30,503 |
29. | Earnings per share |
The calculation of earnings per share for the three months ended November 30, 2018 was based on the net income attributable to common shareholders of $54,774 (2017 - $6,455) and a weighted average number of common shares outstanding of 244,873,891 (2017 - 138,839,530) calculated as follows:
2018 | 2017 | ||
Basic earnings per share: | |||
Net income for the period | $ 54,774 | $ 6,455 | |
Average number of common shares outstanding during the period | 244,873,891 | 138,839,530 | |
Earnings per share - basic | $ 0.22 | $ 0.05 |
2018 | 2017 | ||||
Diluted earnings per share: | |||||
Net income for the period | $ 54,774 | $ 6,455 | |||
Average number of common shares outstanding during the period | 244,873,891 | 138,839,530 | |||
"In the money" warrants outstanding during the period | 1,109,499 | 2,735,654 | |||
"In the money" options outstanding during the period | 3,319,792 | 4,303,259 | |||
249,303,182 | 145,878,443 | ||||
Earnings per share - diluted | $ 0.22 | $ 0.04 |
32 |
Aphria Inc. Notes to the Condensed Interim Consolidated Financial Statements For the three and six months ended November 30, 2018 and November 30, 2017 (Unaudited - in thousands of Canadian dollars, except share and per share amounts) |
The calculation of earnings per share for the six months ended November 30, 2018 was based on the net income attributable to common shareholders of $75,950 (2017 - $21,496) and a weighted average number of common shares outstanding of 235,166,745 (2017 - 138,775,253) calculated as follows:
2018 | 2017 | |||||||||
Basic earnings per share: | ||||||||||
Net income for the period | $ | 75,950 | $21,496 | |||||||
Average number of common shares outstanding during the period | 235,166,745 | 138,775,253 | ||||||||
Earnings per share - basic | $ | 0.32 | $0.15 |
2018 | 2017 | |||||||||
Diluted earnings per share: | ||||||||||
Net income for the period | $ | 75,950 | $21,496 | |||||||
Average number of common shares outstanding during the period | 235,166,745 | 138,775,253 | ||||||||
"In the money" warrants outstanding during the period | 1,096,145 | 2,796,468 | ||||||||
"In the money" options outstanding during the period | 3,154,602 | 4,503,728 | ||||||||
239,417,492 | 146,075,449 | |||||||||
Earnings per share - diluted | $ | 0.32 | $0.15 |
30. | Change in non-cash working capital |
Change in non-cash working capital is comprised of:
For the six months ended November 30, | ||||||||
2018 | 2017 | |||||||
Decrease (increase) in accounts receivable | $ | (9,850 | ) | $ | (1,840 | ) | ||
Decrease (increase) in other current assets | (14,210 | ) | (3,212 | ) | ||||
Decrease (increase) in inventory, net of fair value adjustment | (10,885 | ) | (8,626 | ) | ||||
Decrease (increase) in biological assets, net of fair value adjustment | (4,875 | ) | 7,345 | |||||
Increase (decrease) in accounts payable and accrued liabilities | 14,386 | 2,586 | ||||||
Increase (decrease) in income taxes payable | 4,041 | 365 | ||||||
Increase (decrease) in deferred revenue | 23,406 | – | ||||||
$ | 2,013 | $ | (3,382 | ) |
31. | Financial risk management and financial instruments |
Financial instruments
The Company has classified its cash and cash equivalents, marketable securities, convertible notes receivable, long-term investments, option payment liability and derivative liability as fair value through profit or loss (“FVTPL”), accounts receivable, other current assets and promissory note receivable as amortized cost, and accounts payable and accrued liabilities, income taxes payable, promissory notes payable, and long-term debt as other financial liabilities.
The carrying values of accounts receivable, other current assets, promissory notes receivable, accounts payable and accrued liabilities, and promissory notes payable approximate their fair values due to their short periods to maturity.
The Company’s long-term debt of $54,685 is subject to fixed interest rates. The Company’s long-term debt is valued based on discounting the future cash outflows associated with the long-term debt. The discount rate is based on the incremental premium above market rates for Government of Canada securities of similar duration. In each period thereafter, the incremental premium is held constant while the Government of Canada security is based on the then current market value to derive the discount rate. The fair value of the Company’s long-term debt in repayment as at November 30, 2018 was $52,465.
33 |
Aphria Inc. Notes to the Condensed Interim Consolidated Financial Statements For the three and six months ended November 30, 2018 and November 30, 2017 (Unaudited - in thousands of Canadian dollars, except share and per share amounts) |
Fair value hierarchy
Financial instruments recorded at fair value are classified using a fair value hierarchy that reflects the significance of inputs used in making the measurements. Cash and cash equivalents are Level 1. The hierarchy is summarized as follows:
Level 1 | quoted prices (unadjusted) in active markets for identical assets and liabilities |
Level 2 | inputs that are observable for the asset or liability, either directly (prices) or indirectly (derived from prices) from observable market data |
Level 3 | inputs for assets and liabilities not based upon observable market data |
Level 1 | Level 2 | Level 3 | November 30, 2018 | |||||||||||||
Financial assets at FVTPL | ||||||||||||||||
Cash and cash equivalents | $ | 152,074 | $ | – | $ | – | $ | 152,074 | ||||||||
Marketable securities | 32,747 | – | – | 32,747 | ||||||||||||
Convertible notes receivable | – | – | 28,991 | 28,991 | ||||||||||||
Long-term investments | 32,308 | – | 129,727 | 162,035 | ||||||||||||
Outstanding, end of the period | $ | 217,129 | $ | – | $ | 158,718 | $ | 375,847 |
Level 1 | Level 2 | Level 3 | May 31, 2018 | |||||||||||
Financial assets at FVTPL | ||||||||||||||
Cash and cash equivalents | $ | 59,737 | $ | – | $ | – | $59,737 | |||||||
Marketable securities | 45,062 | – | – | 45,062 | ||||||||||
Convertible notes receivable | – | – | 18,071 | 18,071 | ||||||||||
Long-term investments | 33,600 | 2,567 | 29,861 | 66,028 | ||||||||||
Outstanding, end of the period | $ | 138,399 | $ | 2,567 | $ | 47,932 | $188,898 |
The following table presents the changes in level 3 items for the three and six months ended November 30, 2018:
Unlisted equity securities | Trading derivatives | Total | ||||||||||
Closing balance May 31, 2018 | $ | 29,861 | $ | 18,071 | $ | 47,932 | ||||||
Acquisitions | 77,125 | 10,000 | 87,125 | |||||||||
Disposals | (20,000 | ) | (1,942 | ) | (21,942 | ) | ||||||
Unrealized gain on fair value | 42,741 | 2,862 | 45,603 | |||||||||
Closing balance November 30, 2018 | $ | 129,727 | $ | 28,991 | $ | 158,718 |
Financial risk management
The Company has exposure to the following risks from its use of financial instruments: credit; liquidity; currency rate; and, interest rate price.
(a) | Credit risk |
The maximum credit exposure at November 30, 2018 is the carrying amount of cash and cash equivalents, marketable securities, accounts receivable and other current assets and promissory notes receivable. The Company does not have significant credit risk with respect to customers. All cash and cash equivalents are placed with major Canadian financial institutions. Marketable securities are placed with major Canadian investment banks and are represented by investment grade corporate bonds.
34 |
Aphria Inc. Notes to the Condensed Interim Consolidated Financial Statements For the three and six months ended November 30, 2018 and November 30, 2017 (Unaudited - in thousands of Canadian dollars, except share and per share amounts) |
The Company mitigates its credit risk and volatility on its marketable securities through its investment policy, which permits investments in Federal or Provincial government securities, Provincial utilities or bank institutions and Investment grade corporate bonds.
Total | 0-30 days | 31-60 days | 61-90 days | 90+ days | ||||||||||||||||
Trade receivables | $ | 13,807 | $ | 9,946 | $ | 2,198 | $ | 1,224 | $ | 439 | ||||||||||
72 | % | 16 | % | 9 | % | 3 | % |
(b) | Liquidity risk |
As at November 30, 2018, the Company’s financial liabilities consist of accounts payable and accrued liabilities, which have contractual maturity dates within one-year, promissory note payable, which have a contractual maturity within 15 months and long-term debt, which have contractual maturities over the next five years. The Company manages its liquidity risk by reviewing its capital requirements on an ongoing basis. Based on the Company’s working capital position at November 30, 2018, management regards liquidity risk to be low.
(c) | Currency rate risk |
As at November 30, 2018, a portion of the Company’s financial assets and liabilities held in United States Dollars (“USD”) and Euros consist of cash and cash equivalents, marketable securities, convertible notes receivable, long-term investments and a promissory note payable. The Company’s objective in managing its foreign currency risk is to minimize its net exposure to foreign currency cash flows by transacting, to the greatest extent possible, with third parties in Canadian dollars. The Company does not currently use foreign exchange contracts to hedge its exposure of its foreign currency cash flows as management has determined that this risk is not significant at this point in time.
The Company is exposed to unrealized foreign exchange risk through its cash and cash equivalents. As at November 30, 2018 the majority of the Company’s cash and cash equivalents was in Canadian dollars, and therefore the Company did not have significant exposure to unrealized foreign exchange risk.
(d) | Interest rate price risk |
The Company manages interest rate risk by restricting the type of investments and varying the terms of maturity and issuers of marketable securities. Varying the terms to maturity reduces the sensitivity of the portfolio to the impact of interest rate fluctuations.
(e) | Capital management |
The Company’s objectives when managing its capital are to safeguard its ability to continue as a going concern, to meet its capital expenditures for its continued operations, and to maintain a flexible capital structure which optimizes the cost of capital within a framework of acceptable risk. The Company manages its capital structure and adjusts it in light of changes in economic conditions and the risk characteristics of the underlying assets. To maintain or adjust its capital structure, the Company may issue new shares, issue new debt, or acquire or dispose of assets. The Company is not subject to externally imposed capital requirements.
Management reviews its capital management approach on an ongoing basis and believes that this approach, given the relative size of the Company, is reasonable. There have been no changes to the Company’s capital management approach in the year. The Company considers its cash and cash equivalents and marketable securities as capital.
35 |
Aphria Inc. Notes to the Condensed Interim Consolidated Financial Statements For the three and six months ended November 30, 2018 and November 30, 2017 (Unaudited - in thousands of Canadian dollars, except share and per share amounts) |
32. | Commitments and contingencies |
The Company had a lease commitment until December 31, 2018 for rental of office space from a related party. On December 31, 2018, the Company extended the lease for an additional 5-years. The Company has an option to extend this lease for an additional 5-year period. The Company has lease commitments for the use of two motor vehicles expiring September 2019 and August 2020 in the amounts payable of $9 and $35, respectively. In April of 2017, the Company indemnified the landlord of the office space leased by Liberty with annual rent from $180 to $190 expiring June 2023. The Company has agreed to contribute $12,000 to Green Acre Capital Fund II. The Company has a lease for rental office space from December 2018 until November 30, 2028. The Company has committed purchase orders outstanding at November 30, 2018 related to capital asset expansion of $81,515, all of which are expected to be paid within the next year. Minimum payments payable over the next five years are as follows:
Years ending May 31, | ||||||
2019 | $ | 93,854 | ||||
2020 | 325 | |||||
2021 | 331 | |||||
2022 | 331 | |||||
2023 | 3,384 | |||||
$ | 98,225 |
From time to time, the Company and/or its subsidiaries may become defendants in legal actions arising out of the ordinary course and conduct of its business.
33. | Subsequent events |
The following events occurred subsequent to November 30th, 2018:
(a) The Company became aware that its investee, Resolve, began sales of cannabis in the United States. The Company immediately notified Resolve that it needed to convert its common shares in Resolve into Exchangeable Shares in Resolve, which are exchangeable only on the sale of shares to a third party or upon the Conditions being met. Resolve held a shareholders meeting to approve changes to its capital structure and has swapped the Company’s common shares for Exchangeable Shares.
(b) The Company was either served or became aware of an intent to serve statements of claims in class action lawsuits against the Company and certain of its officers, related to the drop in its share price from December 3 to 5, 2018. At the present time, the Company is aware of six such claims, four of which are domiciled in the United States and two of which are domiciled in Canada. The total amounts claimed in each of the lawsuits have not been quantified at the present time. The Company intends on vigorously defending itself in the litigation. As at November 30, 2018, the Company has not recorded any uninsured amount related to this contingency.
(c) The Company completed its acquisition of CC Pharma GmbH, a leading distributor of pharmaceutical products to more than 13,000 pharmacies in Germany. The Company paid €18,920 in cash at closing, with an earn-out multiple on future EBITDA of up to another €23,500 following closing, if certain performance milestones are met.
36
Exhibit 99.2
APHRIA INC.
Management’s Discussion & Analysis
This management discussion and analysis (“MD&A”) of the financial condition and results of operations of Aphria Inc., (the “Company” or “Aphria”), is for the three and six months ended November 30, 2018. It is supplemental to, and should be read in conjunction with the Company’s consolidated financial statements and the accompanying notes for the period ended November 30, 2018, as well as the audited financial statements and MD&A for the year ended May 31, 2018. The Company’s financial statements are prepared in accordance with International Financial Reporting Standards (“IFRS”).
This MD&A has been prepared by reference to the MD&A disclosure requirements established under National Instrument 51-102 “Continuous Disclosure Obligations” (“NI 51-102”) of the Canadian Securities Administrators. Additional information regarding Aphria Inc. is available on our website at www.aphria.ca or through the System for Electronic Document Analysis and Retrieval (SEDAR) website at www.sedar.com.
In this MD&A, reference is made to gram equivalents, “all-in” cost of sales of dried cannabis per gram, cash costs to produce dried cannabis per gram, gross profit before fair value adjustments, adjusted gross margin, adjusted EBITDA, adjusted EBITDA from Canadian cannabis operations, adjusted EBITDA from international operations, strategic investments, capital and intangible asset expenditures - wholly owned subsidiaries, and capital and intangible asset expenditures - majority owned subsidiaries which are not measures of financial performance under IFRS. The Company calculates each as follows:
• | “Gram equivalents” include both grams of dried cannabis as well as grams of cannabis oil as derived using the an ‘equivalency factor’ of 1 gram per 4.5 mL of cannabis oil. Management believes this measure provides useful information as a benchmark of the Company against its competitors. |
• | “All-in” cost of sales of dried cannabis per gram is equal to production costs less the costs of accessories less cannabis oil conversion costs (“cost of sales of dried cannabis”) plus (minus) increase (decrease) in plant inventory divided by gram equivalents of cannabis sold in the quarter. This measure provides the cost per gram of dry cannabis and gram equivalent of oil sold before the packaging and post harvesting processing costs to create oil or other ancillary products. |
• | Cash costs to produce dried cannabis per gram is equal to cost of sales of dried cannabis less amortization and packaging costs plus (minus) increase (decrease) in plant inventory divided by gram equivalents of cannabis sold in the quarter. Management believes this measure provides useful information as it removes non-cash and post production expenses tied to our growing costs and provides a benchmark of the Company against its competitors. |
• | Gross profit before fair value adjustments is equal to gross profit less the non-cash increase (plus the non-cash decrease) in the fair value adjustments on sale of inventory and on growth of biological assets, if any. Management believes this measure provides useful information as it removes fair value metrics tied to increasing stock levels (decreasing stock levels) required by IFRS. |
• | Adjusted gross margin is gross profit before fair value adjustments divided by net revenue. Management believes this measure provides useful information as it represents the gross profit based on the Company’s cost to produce inventory sold and removes fair value metrics tied to increasing stock levels (decreasing stock levels) required by IFRS. |
• | Adjusted EBITDA is net income (loss), plus (minus) income taxes (recovery) plus (minus) finance income, net, plus amortization, plus share-based compensation, plus (minus) non-cash fair value adjustments on sale of inventory and on growth of biological assets, plus impairment of intangible assets, plus transaction costs, plus (minus) loss (gain) on disposal of capital assets, plus (minus) loss (gain) on foreign exchange, plus (minus) loss (gain) on marketable securities, plus (minus) loss (gain) from equity investees, minus deferred gain on sale of intellectual property, plus (minus) unrealized loss (gain) on convertible notes receivable, plus unrealized loss on financial liabilities, plus (minus) loss (gain) on long-term investments and certain one-time non-operating expenses, as determined by management. Management believes this measure provides useful information as it is a commonly used measure in the capital markets and as it is a close proxy for repeatable cash generated by operations. |
• | Adjusted EBITDA from Canadian cannabis operations is calculated based on the same approach outlined above for Adjusted EBITDA, based on the operations of the following entities in the Company’s consolidated financial statements; Aphria Inc, Cannan Growers Inc., Broken Coast Cannabis Ltd., and 1974568 Ontario Ltd. Management believes this measure provides useful information as it is a commonly used measure in the capital markets and it is a close proxy for repeatable cash generated from the Company’s operations in the Canadian cannabis regulated industry. |
• | Adjusted EBITDA from international operations is Adjusted EBITDA minus Adjusted EBITDA from Canadian cannabis operations. Management believes this measure provides useful information as it is a commonly used measure in the capital markets and as it is a close proxy for repeatable cash generated by the Company’s international operations. |
• | Strategic investments are the total cash out flows used in investing activities relating to investment in long-term investments and equity investees as well as both notes and convertible notes advanced. Management believes this measure provides useful information as it helps provide an indication of the use of capital raised by the Company outside of its operating activities. |
• | Capital and intangible asset expenditures - wholly owned subsidiaries are all cash out flows used in investing activities relating to investment in capital assets and investment in intangible assets, net of shares issued for wholly owned subsidiaries. Management believes this measure provides useful information as it helps provide an indication of the use of capital raised by the Company outside of its operating activities. |
• | Capital and intangible asset expenditures - majority owned subsidiaries are all cash out flows used in investing activities relating to investment in capital assets and investment in intangible assets, net of shares issued for majority owned subsidiaries. Management believes this measure provides useful information as it helps provide an indication of the use of capital raised by the Company outside of its operating activities. |
These measures are not necessarily comparable to similarly titled measures used by other companies.
All amounts in this MD&A are expressed in thousands of Canadian dollars, except share and per share amounts, unless otherwise indicated.
This MD&A is prepared as of January 10, 2019.
![]() | Page | 1 |
APHRIA INC. |
MANAGEMENT’S DISCUSSION & ANALYSIS |
Company Overview
Aphria Inc. (“Aphria”), a company amalgamated under the laws of the province of Ontario, is licensed to produce and sell medical and adult-use cannabis and cannabis-derived extracts in Canada under the provisions of The Cannabis Act. Aphria received its licence to produce and sell medical cannabis on November 26, 2014, followed by its licence to sell cannabis extracts on August 18, 2016. These licences were extended to include the adult-use market on October 17, 2018. Aphria’s head office is based in Leamington, Ontario, adjacent to Aphria One, the Company’s original 300,000 square foot Leamington greenhouse facility. Throughout this MD&A, Aphria will refer to its original Leamington campus as “Aphria One”.
The Company’s common shares are listed under the symbol “APHA” on the Toronto Stock Exchange (“TSX”) and on the New York Stock Exchange (“NYSE”).
Canadian Cannabis Operations
The Company’s domestic Canadian cannabis operations are comprised of the original Aphria One greenhouse facility (described above) together with its Leamington-based Extraction Centre of Excellence, its wholly-owned British Columbia-based subsidiary Broken Coast, and its 51% majority owned Leamington-based subsidiary, Aphria Diamond.
The Extraction Centre of Excellence is being constructed as an integral part of the Company’s Leamington production facilities to provide the necessary production capacity to process more than 200,000 kgs per year of gram equivalent cannabis-derived extracts primarily for use in product offerings for the adult-use market as they become legal to sell in Canada.
Broken Coast Cannabis Ltd. (“Broken Coast”), a subsidiary of the Company acquired in February 2018, is licensed to produce and sell medical cannabis under the provisions of The Cannabis Act. Broken Coast’s purpose-built, indoor cannabis production facility on Vancouver Island provides Aphria with ‘B.C. Bud’ and is a leading premium cannabis brand.
1974568 Ontario Ltd. (“Aphria Diamond”) is a 51% majority owned subsidiary of the Company, incorporated in November 2017. This entity is the Company’s venture with Double Diamond Farms (“Double Diamond”). Aphria Diamond has applied for a second site cultivation licence under the provisions of The Cannabis Act.
Capacity expansion is awaiting Health Canada approval at various of the Company’s Canadian production facilities as described later in this MD&A. Once these expanded facilities are licensed and operating at capacity and in full crop rotation, the Company will have more than 2.4 million square feet of space under cultivation capable of annual production of more than 255,000 kgs of cannabis.
International Operations
Nuuvera Inc. (“Aphria International”) is a subsidiary of the Company acquired in March 2018. Aphria International is an international organization with a focus on building a global cannabis brand, through its subsidiaries ARA - Avanti Rx Analytics Inc., Avalon Pharmaceuticals Inc., 2589671 Ontario Inc., 2589674 Ontario Inc., Nuuvera Israel Ltd., Nuuvera Deutschland GmbH, Nuuvera Malta Ltd., ASG Pharma Ltd., QSG Health Ltd. and FL-Group. Through these subsidiaries, Aphria International has operations in Canada, Germany, Italy, Malta and Lesotho.
LATAM Holdings Inc. (“LATAM”) is a subsidiary of the Company acquired in September 2018. LATAM holds key licences in Colombia, Argentina and Jamaica through its subsidiaries MMJ Colombia Partners Inc., Marigold Acquisitions Inc., Hampstead Holdings Ltd., MMJ International Investments Inc., ABP, S.A., Marigold Projects Jamaica Limited, and ColCanna S.A.S. Through the LATAM acquisition, the Company also obtained the rights to purchase a majority interest in a Brazilian incorporated entity, upon that Brazilian entity obtaining a medical cannabis cultivation, processing and distribution licence in Brazil.
The Company’s majority and wholly-owned subsidiaries are as follows:
![]() | Page | 2 |
APHRIA INC. |
MANAGEMENT’S DISCUSSION & ANALYSIS |
Subsidiaries | Jurisdiction of incorporation | Ownership interest (1) |
Aphria (Arizona) Inc.(2) | Arizona, United States | 100% |
Cannan Growers Inc. | British Columbia, Canada | 100% |
Nuuvera Inc. | Ontario, Canada | 100% |
Nuuvera Holdings Ltd. | Ontario, Canada | 100% |
ARA - Avanti Rx Analytics Inc. | Ontario, Canada | 100% |
Avalon Pharmaceuticals Inc. | Ontario, Canada | 100% |
2589671 Ontario Inc. | Ontario, Canada | 100% |
2589674 Ontario Inc. | Ontario, Canada | 100% |
Nuuvera Israel Ltd.(2) | Israel | 100% |
Nuuvera Deutschland GmbH | Germany | 100% |
Aphria Deutschland GmbH | Germany | 100% |
FL-Group | Italy | 100% |
Broken Coast Cannabis Ltd. | British Columbia, Canada | 100% |
Goodfields Supply Co. Ltd. | United Kingdom | 100% |
LATAM Holdings Inc. | British Columbia, Canada | 100% |
MMJ Colombia Partners Inc. | Ontario, Canada | 100% |
Marigold Acquisitions Inc. | British Columbia, Canada | 100% |
Hampstead Holdings Ltd. | Bermuda | 100% |
MMJ International Investments Inc. | Ontario, Canada | 100% |
ABP, S.A. | Argentina | 100% |
CC Pharma GmbH | Germany | 100% |
Marigold Projects Jamaica Limited | Jamaica | 95% |
Nuuvera Malta Ltd. | Malta | 90% |
ASG Pharma Ltd. | Malta | 90% |
QSG Health Ltd. | Malta | 90% |
ColCanna S.A.S. | Colombia | 90% |
1974568 Ontario Ltd. | Ontario, Canada | 51% |
Aphria Italy S.p.A. | Italy | 50.1% |
CannInvest Africa Ltd. | South Africa | 50% |
Verve Dynamics Incorporated (Pty) Ltd. | South Africa | 30% |
(1) | The Company defines ownership interest as the interest in which the Company is entitled a proportionate share of net income. Legal ownership of some subsidiaries may differ from ownership interest shown above. |
(2) | Represents inactive subsidiaries, which have no operations and do not own any assets, save and except for a related party balance owing to the entity related to a tax liability. |
STRATEGY AND OUTLOOK
Aphria, a leading global cannabis company, is setting the standard for the low-cost production of safe, clean and pure pharmaceutical-grade cannabis grown in the most natural conditions possible. The Company is one of the first cannabis companies in Canada and the first Canadian cannabis company to fully exploit greenhouse cultivation and industrial-scale production to deliver sustainable operating profit margins in the emerging cannabis industry. Through its international operations, the Company also seeks opportunities to create long-term shareholder value by identifying partnership and investment opportunities where Aphria is able to apply the experience and knowledge it has gained in the Canadian cannabis industry to other jurisdictions where a national cannabis legalization framework is developing or is expected to develop and local market characteristics are expected to support the Company’s competitive strengths.
![]() | Page | 3 |
APHRIA INC. |
MANAGEMENT’S DISCUSSION & ANALYSIS |
Canadian Cannabis Operations
Canadian Cannabis Operations include the results of: (i) the parent Aphria; (ii) Canadian subsidiaries which hold investments and have no other operations (Cannan Growers Inc.); (iii) companies which are applicants and are expected to become licensed cannabis producers in Canada (Aphria Diamond); and, (iv) companies which also actively produce and sell cannabis under The Cannabis Act (Broken Coast).
|
![]() |
Licences
The Company previously communicated that it expected to have first sale of cannabis products from both its Aphria One and Aphria Diamond facilities by the end of January 2019, both of which were subject to Health Canada approval. As of the date of this MD&A, both facilities are complete, as it relates to being inspection ready for Health Canada. Further, the Company has submitted licence amendment or initial licence application requests to Health Canada for the respective facilities. As of the date of this MD&A, Health Canada has not attended at either facility to perform the inspections it deems necessary to approve the licence amendment for Aphria One or the licence grant for Aphria Diamond. Until the Company receives the licence amendment or initial licence, as it relates to the respective properties, the Company cannot plant it first crop. The Company anticipates having its first harvest approximately eight weeks after it plants its first crop and having cannabis available for sale, approximately five weeks thereafter.
Production
LOCATION | CURRENT SIZE | CURRENT CAPACITY(1) | EXPECTED CAPACITY(1) | STATUS | CURRENT LICENCES | ||
CULTIVATION | PROCESSING / SALE | ||||||
Aphria One | Leamington, Ontario, Canada | 1,100,000 sq. ft.(2) | 30,000 kg/year cultivation | 110,000 kg/year cultivation | Licence amendment submitted(2) | X | X |
Aphria Diamond | Leamington, Ontario, Canada | 1,300,000 sq. ft. | N/A |
140,000 kg/year cultivation |
Licence amendment submitted | ||
Broken Coast | Duncan, British Columbia, Canada | 4,500 sq. ft. | 5,000 kg/year cultivation | 5,000 kg/year cultivation | Licensed expansion underway | X | X |
Extraction Centre of Excellence | Leamington, Ontario, Canada | N/A | N/A | 200,000 kg/year processing | Under construction |
|
(1) | These figures are considered forward-looking information and are based on the Company’s experience in growing cannabis, and data available concerning the wide variety of strains under the growing conditions maintained at its facilities. Material assumptions to derive capacity at full completion include, but are not limited to: the number of plants expected to occupy each facility, the number of harvest cycles and average yield per harvest cycle per year for the strains expected to be grown at each facility. |
(2) | Currently only 300,000 sq. ft. licensed, application has been submitted for the remaining 800,000 sq. ft. facility is completed, however awaiting Health Canada approval. |
Aphria One
The Company’s original flagship greenhouse facility, Aphria One, accounts for more than 90% of the Company’s current production.
The Company currently has 300,000 square feet of licensed production space at Aphria One capable of producing 30,000 kgs annually. The Company has allocated a portion of this space to mother and vegetative plants which will be used as the initial growing crops in the Part IV and Part V expansions. This has effectively lowered Aphria One’s functional capacity in this quarter, to 20,000 kgs per annum, but will ensure Part IV can commence growing operations without delay upon approval from Health Canada. With the Part IV and Part V greenhouse expansions completed and application submitted, the Company has over 1,100,000 sq. ft. of state-of-the-art operational greenhouse facilities, subject to Health Canada approvals. Upon full crop rotation being completed in the Part IV expansion, the Company anticipates production quantities of 110,000 kgs per year, producing high quality cannabis at a cost level commensurate with its industry leading low-cost producer status.
![]() | Page | 4 |
APHRIA INC. |
MANAGEMENT’S DISCUSSION & ANALYSIS |
In October 2018, the Board approved additional expenditures of $20,000 for additional capital spending on further automation equipment and improvements to the processing rooms. These additional items are expected to be completed prior to first harvest from Part IV and Part V.
As of November 30, 2018, the Company has spent approximately $148,000 of its expected cost of $154,000 budgeted for the Part IV and Part V expansion of Aphria One, an increase of $6,000 (4%) from the original combined budget.
On receiving Health Canada approval for the Part IV and Part V expansions, the Company is positioned to be the first licensed producer to bring industrial horticulture production technology into the cultivation of cannabis within a greenhouse environment. This cutting-edge technology will automate the following functions of the plant growing cycle:
• | Transplanting cuttings through various stages into the final pots for flowering; |
• | Aiding in evaluation of the health and quality of plants to ensure plants meet the Company’s stringent quality standards throughout the many stages of the growing cycle; |
• | Monitoring and providing the necessary water and vital nutrients to the plants during the growing cycle; and |
• | Transporting plants through different areas in the greenhouse including to the processing room once harvested. |
Once this innovative technology has been implemented, the only human interaction to occur throughout the plants’ growth cycle will be at the initial phase of taking the cuttings and in the final phase to trim and prune the plants which will occur in work bays outside of the greenhouse.
Additional state-of-the-art automation is already employed by the Company including processes that involve:
• | Cutting the plants, and transferring them to be processed; |
• | Automating the de-budding and trimming process; |
• | Disposing of waste produced in the cutting, de-budding and trimming phase of production; and |
• | Distributing the buds into trays in a drying rack to evenly dry and cure the harvested product. |
Automating labour-intensive parts of the production process enables the Company to achieve optimal product consistency and quality control while significantly reducing operating costs. In addition to the reduction of labour costs, the Company has also introduced measures that significantly reduce energy costs and consumption.
The Company installed a co-generation power plant that utilizes natural gas to generate its own electricity and as a by-product of this process, hot and cold water and CO2. This combined-cycle process not only generates electricity for use in the greenhouse to operate the lights and air conditioners, but also hot and cold water that is used to control the temperature and humidity in the greenhouse. The residual gas emissions created by this process are directed through a catalytic converter to create CO2 which is used during the growing cycle. This co-generation power plant also incorporates state-of-the-art power switching capability that automatically selects between the public electrical grid and the Company’s private power co-generation equipment to ensure it is constantly using the most cost-effective energy available.
In addition to these energy saving initiatives, the Company has installed systems that recycle the water used in the irrigation process. The ‘used’ water is sterilized through a pasteurization process which then allows it to be reused to irrigate additional plants thereby reducing the total amount and cost of water used on a per gram basis.
![]() | Page | 5 |
APHRIA INC. |
MANAGEMENT’S DISCUSSION & ANALYSIS |
Aphria Diamond
Through this 51% owned subsidiary, the Company has partnered with Double Diamond, a company with multi-generational expertise in the commercial greenhouse industry. This partnership provides Aphria with access to an industry leading team of growers and operators with expertise in large-scale greenhouse operations as well as contracted exclusive access to all of the production from the Aphria Diamond joint venture.
A portion of the infrastructure associated with Aphria Diamond was delayed by two months due to an Ontario Ministry of Transportation approval required as a result of the facility being located adjacent to a provincial highway. Despite the delay, the Company anticipates that the infrastructure will be complete in time for the first harvest from the Aphria Diamond greenhouse expected in the Company’s first quarter of the next fiscal year, subject to Health Canada approval.
The Company provided $10,200 of initial capital to the venture with Double Diamond contributing $9,800. Aphria Diamond acquired 100 acres of land, including almost 32 acres of greenhouses for $42,389, and spent an additional $75,083 as at November 30, 2018 on the retrofit. The Company expects the project to cost an additional $3,500 to complete. All funds above the initial seed capital are currently being funded by the Company and will be repaid in full by Aphria Diamond.
Aphria Diamond is implementing similar levels of automation, as described above in Aphria One.
All production from Aphria Diamond will be sold to Aphria at an agreed upon transfer price, allowing Aphria to recognize 100% of the remaining profit from any further processing into derivative, and 100% of the wholesale margin from branding on all product from Aphria Diamond.
Broken Coast
Broken Coast is the Company’s premium brand of indoor-grown cannabis. Broken Coast provides the Company access to the quality associated with British Columbia-grown cannabis as well as an award-winning genetic bank of cannabis strains which in turn can be produced at scale through the Company’s Aphria One and Aphria Diamond facilities. Broken Coast will continue the development of new premium strains and continue to represent what is the highest level of premium cannabis grown through their state-of-the-art custom-built indoor facilities. Broken Coast’s current capacity is approximately 5,000 kgs. per annum, Broken Coast’s Phase IV expansion remains under review as the Company searches for real property appropriate for the project.
Extraction Centre of Excellence
The Company’s $55,000 state-of-the-art Extraction Centre of Excellence was subject to the same delay as a portion of Aphria Diamond’s infrastructure. The Company currently anticipates that the Extraction Centre of Excellence will be available for use in May 2019, subject to Health Canada approval.
This facility will provide the necessary production capacity to process over 200,000 kgs per year. It will incorporate the Company’s currently developed extraction technologies and further expand on these technologies to create new and innovative product offerings for the adult-use market as they become legal to sell in Canada. The facility will be equipped to conduct a wide range of cannabis extractions, including CO2, butane, ethanol, and to produce world-class cannabis concentrates, including fractionated distillates.
The Canadian cannabis market is in the early stages of its evolution with a limited focus on the sale of cannabis as a product, in the form of dried flower or bud, shake or trim, as well as cannabis oil in its many forms, including tinctures, softgel capsules, and oral sprays. The Company believes that as the global cannabis industry evolves, this focus on cannabis as a product will evolve into cannabis as an ingredient. The Extraction Centre of Excellence was created to facilitate Aphria’s leadership in the evolution of cannabis as an ingredient.
As at November 30, 2018, the Company has spent approximately $8,000 of its expected cost of $55,000 budgeted, for the completion of the Extraction Centre of Excellence. The Extraction Centre of Excellence is on schedule to be completed by May 2019.
![]() | Page | 6 |
APHRIA INC. |
MANAGEMENT’S DISCUSSION & ANALYSIS |
Licences
The Company holds two licences under The Cannabis Act for cultivation processing and sale: Aphria One and Broken Coast.
The Company has an open licence amendment to expand the licensed growing area at Aphria One from 300,000 sq. ft. to over 1,100,000 sq. ft. The Company also has submitted an application for a second site licence for Aphria Diamond, once approved will provide an additional 1,300,000 sq. ft. of licensed greenhouse growing area.
The licences provide the Company with the ability to cultivate, process and sell cannabis within Canada and to other countries where the importation of cannabis is legal.
Canadian medical market brands
Since 2014, the Aphria brand has been a leading choice for patients seeking safe, clean, and pure pharmaceutical-grade medical cannabis. As the Canadian adult-use market continues to develop, the Company expects to continue to focus and invest in the Canadian medical market while concurrently developing cannabis-based products and brands targeting the adult-use market.
Canadian adult-use market brands
The Company is investing capital and resources to establish a leading position in the adult-use market in Canada. These investments are focused on brand development, product innovation, marketing, sales, education and research to enable the Company to capture, retain and grow a tier-one share of this market as it continues to develop.
Aphria developed its initial portfolio of adult-use brands to specifically meet the needs of identified market segments where the Company was able to leverage its unique combination of product attributes - from price through to potency. The suite of brands created by the Company for Canada’s adult-use market include Solei, RIFF, Good Supply, Goodfields and Broken Coast. Each brand is unique to a specific offering of products representing various target demographics, described below:
![]() |
Solei Sungrown Cannabis (“Solei”) is designed for current and novice users and pairs an assortment of carefully curated strains and product formats with different experiences.
|
![]() |
RIFF is a community and cannabis brand that is co-created by the Co.LAB, a collective of creators and artists. The brand will have high potency offerings available for experienced users.
|
![]() |
Good Supply is a value-priced brand without the frills, designed for the everyday cannabis user.
|
![]() |
Goodfields is for current and new cannabis users interested in quality cannabis from a trusted source, cultivated with care.
|
![]() | Page | 7 |
APHRIA INC. |
MANAGEMENT’S DISCUSSION & ANALYSIS |
![]() |
Complementing Aphria’s in-house brands, the Company’s wholly-owned subsidiary Broken Coast is a multi-award-winning craft grower that delivers a premium product and provides consumers with an opportunity to access a brand synonymous British Columbia-grown cannabis. Broken Coast’s craft cannabis is grown on the shores of the Salish Sea in small batches using single-strain growing rooms. All flower is hand-trimmed and slow-cured ensuring premium product quality and consistency. |
Product development
The Canadian government has committed to regulating the sale of cannabis infused products in 2019. Based on customer behavior and product preferences demonstrated in other existing legal markets, we believe cannabis infused products (edibles, beverages, etc.) could represent more than 50% of the total cannabis market upon becoming federally legal in Canada. Aphria is investing capital and resources in product research, development and production technologies in anticipation of the legalization of these new emerging categories. As a part of these R&D efforts, the Company is investing in the following areas in order to develop consistent and unique formulations that can be used in its end-products:
• | Industrial-scale extraction technologies using different methods including CO2, butane and ethanol; |
• | The effective isolation of terpenes, cannabinoids and other cannabis compounds; |
• | The development of distillates and formulations to optimize water solubility while insuring bio-availability. |
In terms of end products, the Company is developing a suite of edibles, RTDs (ready-to-drink), concentrates, topicals, quick dissolve strips and vapes as well as new medical delivery systems. These new value-added products and brands will be available for sale once permitted by law.
The Company has retained Perennial Inc., a subsidiary of DATA Communications Management Corp. (“DCM”), to support the development of new product brands and product categories to serve the adult-use market.
Distribution
The Company has signed supply agreements with all the provinces and the Yukon Territory in Canada, representing access to 99.8% of Canadians, showing the Company’s commitment to becoming a leader in the adult-use market. The Company is one of a handful of licensed producers which has agreements with every province in Canada.
The Company has signed an exclusive distribution agreement with Great North Distributors Inc. (“Great North Distributors”), a wholly-owned Canadian subsidiary of Southern Glazer’s Wine & Spirits (“Southern Glazer’s”), to provide the Company with the sales force and wholesale/retail channel expertise required to efficiently distribute the Company’s product through each of the provincial/territorial cannabis control agencies. As one of the leading distributors of alcoholic beverages in Canada, Great North Distributors has extensive expertise in managing compliance with the unique rules that govern the marketing of controlled substances in each of the jurisdictions where the Company has supply agreements. The Company has leveraged the Great Northern Distributors agreement by signing a subsequent agreement with We Grow BC Ltd. (“We Grow”), a Vancouver-based licensed producer of premium cannabis, to become We Grow’s exclusive sales representatives across Canada.
In addition to the above new distribution agreements for the adult-use market, the Company is expanding its distribution in the medical cannabis market with its five-year supply agreement with Shoppers Drug Mart.
![]() | Page | 8 |
APHRIA INC. |
MANAGEMENT’S DISCUSSION & ANALYSIS |
International Operations
Outside of Canada, the Company is developing partnerships and making direct investments in countries where there is an existing or emerging national legal cannabis market. The Company’s international strategy is currently focused on medical cannabis markets in stable economic and political jurisdictions that have developed or are developing effective regulations and enforcement mechanism that limit licensed production and control importation and distribution.
Through the acquisitions of Aphria International and LATAM, the Company secured access to key international markets, management team bench strength with a proven knowledge and executional success within the industries and jurisdictions in which they operate. The Company believes that with its significant experience in the highly regulated Canadian cannabis market, it will be able to export its industry leading knowledge and practices to its global subsidiaries as these markets mature.
As part of its international strategy, the Company is developing regional hubs in Pan-Asia, the European Union, South America, North America, the Caribbean and Africa. These hubs will represent key countries for investment and will aid in the flow of cannabis goods across the globe. The Company chose Australia as its Pan-Asian hub. The Company chose Malta as its hub for the European Union and Colombia for South America. The Company chose Jamaica as its hub for the Caribbean and Lesotho as its hub for Africa. |
![]()
|
The Company has international operations in Australia, Argentina, Colombia, Denmark, Germany, Italy, Jamaica, Lesotho, Malta, Paraguay and maintains an option for entry into Brazil. With these markets still in their infancy, and the regulatory environment around them still being formed, these countries are looking to Canada as a leader in developing the regulatory environment. The Company provides a unique opportunity to bring the experience from working within Canada during the development of the cannabis regulations, to provide this expertise and knowledge to develop these global cannabis markets.
Export facility from Canada
Through the acquisition of Aphria International, the Company acquired Brampton-based ARA - Avanti RX Analytics Inc. (“Avanti”), which currently holds four Canadian licences: (i) Cannabis Licence; (ii) Establishment Licence; (iii) Site Licence; and, (iv) Medical Device Establishment Licence.
In addition to allowing the Company to possess and handle cannabis and cannabis derivative products, these licences allow Avanti to engage in the possession, production, packaging, sale, transportation and delivery and testing of codeine, morphine, cocaine, cannabis and related cannabinoids. The Company is also able to complete testing/analysis of active pharmaceutical ingredients.
![]() | Page | 9 |
APHRIA INC. |
MANAGEMENT’S DISCUSSION & ANALYSIS |
The Company is currently in the process of securing EU-GMP certification on the Avanti lab, which will then be used as the Canadian staging site for international bound GMP certified products. The Company’s EU-GMP certification will cover the extraction, post processing, testing, packaging and shipping process.
Pan-Asia
Australia
The Australian market is very similar to the Canadian medical cannabis market three years ago. The Company has access to the Australian medical cannabis market through a 25% equity investment in Althea Company Pty Ltd. (“Althea”), and a supply agreement with Althea until they are able to complete construction of their new facility and fulfill their own production requirements.
Althea currently holds a licence to cultivate and manufacture cannabis-derivative medications issued by the Office of Drug Control (“ODC”). Althea previously had secured import permits from the ODC. Aphria obtained the related export permit from Health Canada and Aphria has shipped product to Althea in Australia on multiple occasions. The products sold by Althea in Australia are co-branded with Aphria.
Aphria International also maintains relationships in Australia with two companies conducting medical cannabis clinical trials. Medlab Pty Ltd. is currently in a clinical trial related to oncology pain using an Aphria proprietary blend of cannabis strains oil, subsequently converted in Australia into a nanocell mucosol spray. CannPal Pty Ltd., is currently in a clinical trial related to animal pain in cats and dogs, using Aphria strains.
European Union
Germany
The German market is considered to be one of the most highly sought-after medical cannabis markets in the world. German law currently permits import of cannabis only. Germany currently allows cannabis and cannabis extracts in pharmacies. These cannabis-based products are also required by German law to be covered by insurance companies. This coverage provides a greater number of medical cannabis patients with access to the full use and benefits of these products.
The Company’s approach in Germany is a three-pronged approach covering: demand; supply; and, distribution.
Demand
Through the acquisition of a 25.1% interest in Berlin-based Schöneberg Hospital, the Company has access to doctors and patients, to support the education of the benefits of medical cannabinoids. The Company also plans to build and operate pain treatment centers including the new possibilities of digital health care throughout Germany, which will further provide access to patients. The Company has partnered with a leading company in digital apps and medical software to build a modern, patient centric clinic for telemedicine.
Supply
The Company will, through imports, supply products into the German market. The Company entered into a strategic partnership with a prominent European flower producer, Schroll Flowers, to obtain access to EU GMP-certified organic medical cannabis. This agreement ensures the Company will have further access to cannabis for distribution throughout the EU.
Distribution
Through the acquisition of CC Pharma GmbH (“CC Pharma”), the Company obtained a leading importer and distributor of EU-pharmaceuticals for the German market. With over 317 active German national pharmaceutical licences, 690 active EU pharmaceutical licences, and access to approximately 13,000 active pharmacy accounts, CC Pharma operates a production, repackaging and labelling facility. The Company will expand CC Pharma’s operations to distribute cannabis throughout the German pharmacies leveraging its existing business and know-how to further the Company’s global cannabis business.
![]() | Page | 10 |
APHRIA INC. |
MANAGEMENT’S DISCUSSION & ANALYSIS |
Malta
Through majority-owned subsidiary ASG Pharma Ltd. (“ASG”), the Company received the first import certificate for medical cannabis issued by the Government of Malta’s Ministry of Health. The Company intends on using the Malta facility to import cannabis resin and dried flower for processing, packaging and distribution of EU-GMP certified cannabis products throughout large parts of Europe.
This Malta facility will provide the Company with the ability to bring low-cost production of cannabis product from outside of Europe into an EU-GMP certified facility for further processing and distribution throughout Europe.
Through majority-owned subsidiary QSG Health Ltd. (“QSG”), the Company will pursue the health and wellness market with CBD based products. These products will not have the THC component found in cannabis, and will focus on diversifying the Company’s product offerings throughout Europe.
Italy
The Company’s wholly owned subsidiary, FL-Group, is authorized for the distribution of pharmaceutical products, including cannabis-based and cannabinoids products in Italy to pharmacies. FL-Group holds one of only seven cannabis import licences in Italy. The FL-Group acts as the Company’s distributor to the Italian cannabis market. The Company maintains a partial ownership interest in a separate subsidiary, Aphria Italy S.p.A., in Italy.
Africa
Lesotho
The Company entered into a new venture in CannInvest Africa Ltd. (“CannInvest”), a South African corporation. Aphria’s partner in CannInvest is the Verve Group of Companies, founded by Richard Davies, a South African with more than 20 years experience in phytoextraction of African medicinal plants. Through this transaction, the Company obtained a controlling interest in Verve Dynamics Incorporated (Pty) Ltd. (“Verve”). Verve holds a licence in Lesotho for prohibited drug operations, which allows Verve to cultivate, manufacture, supply, distribute, store, export and import cannabis and cannabis resin for medical purposes or scientific use.
The Company also entered into a supply agreement with Verve, where Verve will supply cannabis THC and CBD extract from its planned EU-GMP certified facility. This is expected to provide the Company with access to low-cost GMP certified extract for distribution into South Africa and other federally legal markets, including the European Union.
Construction of a new extraction and processing facility is underway. Upon completion, the Company will apply for EU-GMP certification which will allow all product from the Lesotho site to be distributed within the EU.
South America
LATAM Holdings Inc.
The acquisition of LATAM provides the Company with various production, distribution and market development opportunities in South America and the Caribbean, including Colombia, Argentina, Jamaica and potentially Brazil.
Colombia
The acquisition of LATAM provides the Company with 90% ownership of Colcanna S.A.S. (“Colcanna”). This ownership provides the Company with the ability to further develop the global Aphria brand with Aphria branded products distributed to patients in Colombia. Upon Colcanna developing its 54 acres of land, including its recent commitment to acquire an additional 20 acres of land, for the cultivation of cannabis, which is expected to provide 50,000 kgs annually, the Company will maintain the control of the cultivation and distribution of cannabis in Colombia. Until the emerging Colombian market demand grows to match the Company’s Colombian production, the Company will be able to utilize its export licence to distribute the excess production globally.
![]() | Page | 11 |
APHRIA INC. |
MANAGEMENT’S DISCUSSION & ANALYSIS |
Argentina
The acquisition of LATAM provides the Company with sole ownership of ABP, S.A. (“APB”), providing the Company with a significant first-mover advantage, as APB is the first company with an in-country medical cannabis research licence. The Company also continues to work with Hospital Garrahan, a leading pediatric hospital in Buenos Aires. The Company believes that once the Argentinian government approves medical cannabis, in-country cultivation opportunities will be attractive.
Jamaica
The acquisition of LATAM provides the Company with a 49% ownership interest in Marigold Projects Jamaica Limited (“Marigold”), through multiple subsidiaries and a 95% royalty on profits through an Intellectual Property agreement. This acquisition will provide the Company with several key licences including a Tier 3 cultivation licence, a conditional Tier 2 herb house licence, as well as conditional licences for import, export and research purposes.
Brazil
Finally, the acquisition of LATAM provides the Company with an option to purchase 50.1% of a Brazilian entity for $24,000 USD once it secures a medical cannabis licence from the Brazilian government and a right of first offer and refusal on another 20% to 39% of the Brazilian entity. This right of first refusal provides the Company with lower risk at a fixed price to enter into the Brazilian cannabis market pending the Brazilian company obtaining a licence.
Strategic Investments and Acquisitions
The Company continues to invest in companies to advance its corporate strategic goals. These investments allow the Company access into ancillary markets within the cannabis industry, in which the Company is otherwise not active, leading to supply or purchasing agreements or other relationships to further these corporate strategic goals.
Green Acre Capital Fund I
Aphria agreed to invest $2,000 in Green Acre Capital Fund I, and as of the balance sheet date, has funded the full $2,000. During the quarter, the fund paid a $700 dividend to Aphria. Green Acre Capital Fund I is a private investment fund. The fund invests in sectors across the cannabis value chain including production, research, consumer products and retail.
Green Acre Capital Fund II
Aphria agreed to invest $15,000 in Green Acre Capital Fund II, and as of the balance sheet date, has funded $3,000. Green Acre Capital Fund II is a private investment fund. The fund invests in sectors across the cannabis value chain including production, research, consumer products and retail.
These investments provide the Company a way of recognizing a share of the growth of the ancillary markets of the cannabis industry in which it is not currently active. The investment serves to assist in identifying new technology and innovations, which the Company may participate in directly, or acquire. These opportunities are identified and analyzed by the management team of Green Acre, without any further costs to the Company. The Company does not exercise any discretion over the investment decisions of the funds.
GA Opportunities
The Company transferred assets worth $55,000 to GA Opportunities Corp. (the “Fund”), in exchange for a promissory note, bearing interest at 12% per annum, due in 5 years. In addition, the Company secured an option to purchase the assets of the Fund for the value of the promissory note. The option is for a 5-year period, at an annual cost of 12.3%, and in the event the assets are considered to be U.S. cannabis assets, the option to repurchase the shares is subject to the following conditions (collectively, the enumerated conditions (1) through (5), the “Conditions”):
(1) | Cannabis becoming legalized federally in the United States; and |
One or more of the following conditions have been satisfied:
(2) | The TSX has provided its approval for the purchase of the U.S. cannabis assets; |
(3) | The TSX revises its rules such that it no longer has a prohibition against its listed companies having an interest in US assets which are involved in the cannabis business; |
(4) | The common shares of the Company are voluntarily or involuntarily delisted from the TSX; and/or |
(5) | The Company is acquired by another entity, provided that the common shares of the Company will be delisted from the TSX upon the change of control. |
![]() | Page | 12 |
APHRIA INC. |
MANAGEMENT’S DISCUSSION & ANALYSIS |
The net cost of the option is $165 annually and provides the Company with potential exposure to the U.S. cannabis market, subject to the Conditions above.
National Access Cannabis Corp.
The Company made a strategic investment in National Access Cannabis Corp. (“NAC”). The Company made this investment to participate in and gain economic exposure to the retail portion of the adult-use cannabis market.
Emblem Corp.
The Company entered into a supply agreement with Emblem to supply cannabis, as part of the supply agreement the Company obtained 6,952,169 common shares at no cash cost to the Company, as fulfillment of the down payment for the 5-year supply agreement.
HighArchy Ventures Ltd.
The Company made a strategic investment in HighArchy Ventures Ltd. The Company made this investment to participate in and gain economic exposure to the retail portion of the adult-use cannabis market.
Divesture of equity investment in passive US assets
The Company completed the sale of 80,148,077 of its shares in Liberty Health Sciences Inc. (“Liberty”) for $70,612 during the year-to-date period. The Company retained options to repurchase the 80,148,077 shares in Liberty, subject to the same Conditions as described above. The Company expects that, in the battle for market share once cannabis becomes legalized federally in the United States, the cost to acquire an interest in the United States cannabis market will significantly increase. These option agreements allow the Company an access point into the United States cannabis market at a price fixed before any increase arising from cannabis becoming a federally legal substance.
Equity Financing Activities
During the year-to-date period, the Company closed a bought deal financing for net proceeds of over $245,000.
The Company has sufficient funds and capital to complete the existing expansion of the Canadian cannabis operations including capital investments for the build out of the Company’s Aphria One, Aphria Diamond and Broken Coast facilities. The Company may require additional funds for any additional expansion, acquisitions or adjustments to current planned activities in Canada or further international expansion.
![]() | Page | 13 |
APHRIA INC. |
MANAGEMENT’S DISCUSSION & ANALYSIS |
INVESTOR HIGHLIGHTS
Q2 - 2019 | Q1 - 2019 | |||||
Net revenue | $ | 21,668 | $ | 13,292 | ||
Kilograms equivalents sold | 3,408.9 | 1,778.2 | ||||
Production costs | $ | 9,971 | $ | 4,441 | ||
Cash cost to produce dried cannabis / gram1 | $ | 1.76 | $ | 1.30 | ||
"All-in" cost of sales of dried cannabis / gram1 | $ | 2.60 | $ | 1.83 | ||
Adjusted gross margin1 | 46.9 | % | 63.6 | % | ||
Adjusted EBITDA from Canadian cannabis operations1 | $ | (6,073 | ) | $ | (828 | ) |
Cash and cash equivalents & marketable securities | $ | 184,821 | $ | 313,982 | ||
Working capital | $ | 181,523 | $ | 363,245 | ||
Capital and intangible asset expenditures - wholly owned subsidiaries1 | $ | 49,061 | $ | 28,036 | ||
Capital and intangible asset expenditures - majority owned subsidiaries1 | $ | 6,575 | $ | 29,727 | ||
Strategic investments1 | $ | 43,006 | $ | 29,368 |
1 - Non-GAAP measure
• | On June 21, 2018, Bill C-45, The Cannabis Act, reached Royal Assent, and came into force October 17, 2018 |
• | Current production capacity 34,500 kgs (annualized) |
• | Mid-term capacity upgraded to 255,000 kgs (annualized) production capability, pending Health Canada approval |
• | Signed LOI with Perennial to establish joint venture to develop new, consumer-centric, cannabis-infused product categories and brands |
• | Entered into a representative agreement to be the exclusive sales representative for We Grow BC Ltd. |
• | Launched the Company’s portfolio of adult-use brands: Solei Sungrown Cannabis, RIFF, Good Supply, and Goodfields |
• | Signed agreements to supply every Canadian province and the Yukon Territory, securing access to 99.8% of Canadians |
• | Completed first shipments in the adult-use cannabis market |
• | Successfully completed acquisitions of LATAM and CC Pharma expanding the Company’s global presence |
• | Successfully divested of all US cannabis assets1, and listed on the NYSE |
• | Bought deal closed during the year-to-date period for net proceeds of over $245,000 |
• | Strong executive team |
• | 20+ years of Pharmaceutical experience |
• | 35+ years of potted plant greenhouse growing experience |
• | 30+ years of vegetable greenhouse growing experience |
• | 10+ years of tobacco sales and marketing experience |
• | 30+ years of spirit sales and marketing experience |
1In accordance with existing TSX precedent.
FAIR VALUE MEASUREMENTS
Impact of fair value metrics on biological assets and inventory
In accordance with IFRS, the Company is required to record its biological assets at fair value. During the main growth phase, the cost of each plant is accumulated on a weekly basis. This occurs from the date of clipping from a mother plant up to the end of the twelfth week of growth for Aphria One and ninth week of growth for Broken Coast. For the remainder of the growing period, the cost of each plant continues to be accumulated on a weekly basis but also includes an allocation of the fair value of the plant. At the time of harvest, the Company increases the carrying value of the harvested produce to its full fair value less costs to sell.
![]() | Page | 14 |
APHRIA INC. |
MANAGEMENT’S DISCUSSION & ANALYSIS |
As at November 30, 2018, the Company’s harvested cannabis and cannabis oil, as detailed in Note 6, and biological assets, as detailed in Note 7 of its financial statements, are as follows:
November 30, 2018 | August 31, 2018 | ||||||||||
Harvested cannabis - at cost | $ | 7,142 | $ | 7,321 | |||||||
Harvested cannabis - fair value increment | 8,355 | 11,497 | |||||||||
Harvested cannabis trim - at cost | 1,593 | 831 | |||||||||
Harvested cannabis trim - fair value increment | 1,605 | 1,449 | |||||||||
Cannabis oil - at cost | 9,104 | 4,374 | |||||||||
Cannabis oil - fair value increment | 5,987 | 6,871 | |||||||||
Softgel capsules - at cost | 136 | 124 | |||||||||
Softgel capsules - fair value increment | 112 | 175 | |||||||||
Biological assets - at cost | 3,795 | 4,091 | |||||||||
Biological assets - fair value increment | 2,301 | 2,542 | |||||||||
Cannabis products - at fair value | $ | 40,130 | $ | 39,275 |
In an effort to increase transparency, Aphria One’s biological assets are carried at cost plus fair value increments of $0.53, $1.05, $1.58 and $2.11 per gram for weeks 13, 14, 15 and 16, respectively. Broken Coast’s biological assets are carried at cost plus fair value increments of $0.64, $1.27, $1.91 and $2.55 per gram for weeks 10, 11, 12 and 13 respectively. Harvested cannabis and harvested cannabis trim are carried at fair values of $3.25 per gram and $2.75 per gram, respectively (August 31, 2018 - $3.75 and $3.00) for greenhouse produced cannabis. Harvested cannabis and harvested cannabis trim are carried at fair values of $4.00 per gram, $3.25 per gram, respectively (August 31, 2018 - $4.25 and $3.50) for indoor produced cannabis. Cannabis oil and softgel capsules include the relative fair value based on the amount of harvested cannabis or harvested cannabis trim used in the production of each product.
The individual components of fair values are as follows:
November 30, 2018 |
August 31, 2018 | |||||||||
Harvested cannabis - at cost - per gram | $ | 1.69 | $ | 1.50 | ||||||
Harvested cannabis - fair value increment - per gram | $ | 1.98 | $ | 2.35 | ||||||
Harvested cannabis trim - at cost - per gram | $ | 1.51 | $ | 1.19 | ||||||
Harvested cannabis trim - fair value increment - per gram | $ | 1.52 | $ | 2.07 | ||||||
Cannabis oil - at cost - per mL | $ | 0.48 | $ | 0.35 | ||||||
Cannabis oil - fair value increment - per mL | $ | 0.31 | $ | 0.56 | ||||||
Softgel capsules - at cost - per mL | $ | 0.49 | $ | 0.39 | ||||||
Softgel capsules - fair value increment - per mL | $ | 0.40 | $ | 0.55 |
The temporary increase in the cost of harvested cannabis, harvested cannabis trim, and cannabis oil is a result of the following two factors:
1. | The increase in overhead and other growing costs associated with the Part III expansion being intentionally utilized with lower functional production. This temporary lower functional production is a result of the Company allocating additional space from the Part III expansion to mother and vegetative plants which will be required for the Part IV, Part V and Aphria Diamond expansions. This temporary increase in costs over lower production has been done to ease the ramp-up in our newest expansions immediately upon obtaining Health Canada approval. The impact of these costs over lower production increased the cost per gram by an estimated $0.25 per gram of harvested cannabis, $0.14 per gram of harvested cannabis trim and $0.03 per mL of cannabis oil. This increase in cost is expected to remain until 9 months after Part IV, Part V and Aphria Diamond have received Health Canada approval, and the facilities are in a full crop rotation. |
![]() | Page | 15 |
APHRIA INC. |
MANAGEMENT’S DISCUSSION & ANALYSIS |
2. | During the quarter, the Company completed the first harvest from a new growing method, which has been identified to improve potency and quality of the harvested cannabis, as well as create a plant which will work better with the developed automation in Part IV and Part V. This new growing method requires smaller plants, and lowers the yield per plant; however, it will allow for additional plants per square foot of growing space resulting in a similar yield per square foot once fully implemented. The impact of these costs over lower production increased the cost per gram by an estimated $0.27 per gram of harvested cannabis, $0.23 per gram of harvested cannabis trim and $0.05 per mL of cannabis oil. This increase in cost is expected to remain until 9 months after Part IV and Part V have received Health Canada approval, and the facilities are in a full crop rotation with the new growing method. |
COST PER GRAM
Calculation of “all-in” costs of sales of dried cannabis per gram
The Company calculates “all-in” cost of sales of dried cannabis per gram as follows:
Three months ended | |||||||
”All-in” cost of sales of dried cannabis per gram | November 30, 2018 | August 31, 2018 | |||||
Production costs | $ | 9,971 | $ | 4,441 | |||
Less: | |||||||
Cost of accessories | $ | (48 | ) | $ | (65) | ||
Cannabis oil conversion costs | $ | (1,047 | ) | $ | (147) | ||
Disposal of plants | $ | — | $ | (979) | |||
Adjusted "All-in" cost of sales of dried cannabis | $ | 8,876 | $ | 3,250 | |||
Gram equivalents sold during the quarter | 3,408,909 | 1,778,232 | |||||
"All-in" cost of sales of dried cannabis per gram | $ | 2.60 | $ | 1.83 |
In prior quarters the Company recorded adjustments to “All-in” cost of sales of dried cannabis per gram, for increases in plant inventory. This adjustment was made as a result of the Company using a standard cost method and allocating additional costs to plant inventory, when as part of a planned expansion, there was a significant increase in the number of plants, while the incremental costs with the new capacity have not materialized. The increase in number of plants before the corresponding increase in costs, led to the Company allocating more costs than incurred to date, to biological assets resulting in over absorbed overhead. To maintain comparability of this figure from quarter to quarter, the Company determined it was appropriate to normalize this item as part of the above calculation. This adjustment is subjective, and requires management to make significant assumptions as to whether the increase in cost included in biological assets, is a result of improved operations, a result of an expansion or a result of other factors.
During the prior quarter, the Company disposed of 13,642 plants prior to harvest. The Company was unable to fill all of the open greenhouse positions due to a lack of qualified local labour, which left it with insufficient staff to harvest the levels of production produced in the Aphria One greenhouse. As a result of the lower staff levels, one week’s crop rotation outgrew its optimal harvest period. In an effort to maintain the highest quality for its patients and maintain its strict harvesting process, the Company disposed of the plants associated with the one week of production to ensure the next week’s harvest was grown in optimal conditions. Included in production costs $979 of accumulated costs relating to these plants which were not harvested. Subsequent to the first quarter, Aphria doubled the size of the greenhouse staff in Leamington. Automation and temperature controls became operational during the quarter, as part of the Part IV expansion was completed.
With the launch of the adult-use market in the quarter, the Company invested in new packaging directed at the new consumers in the adult-use market and to develop resounding message for these brands. This packaging was also designed to meet the strict criteria required for packaging under The Cannabis Act, this new packaging increased “all-in” cost of sales of dried cannabis per gram by $0.31.
The Company recognized a temporary increase in the “all-in” cost of sale of dried cannabis per gram and cash costs to produce dried cannabis per gram as a result of the allocation of production space in the Part III expansion to mother and vegetative plants for the Part IV and Part V expansions increasing the “all-in” cost of sale of dried cannabis per gram and cash costs to produce dried cannabis per gram by an estimated $0.20. The Company also recognized lower yields in the quarter due to a change in growing method, described above. The lower yield increased the current quarter “all-in” cost of sale of dried cannabis per gram and cash costs to produce dried cannabis per gram by an estimated $0.48.
![]() | Page | 16 |
APHRIA INC. |
MANAGEMENT’S DISCUSSION & ANALYSIS |
Calculation of cash costs to produce dried cannabis per gram
The Company calculates cash costs to produce dried cannabis per gram as follows:
Three months ended | |||||||
Cash costs to produce dried cannabis per gram | November 30, 2018 | August 31, 2018 | |||||
Adjusted "All-in" cost of sales of dried cannabis | $ | 8,876 | $ | 3,250 | |||
Less: | |||||||
Amortization | $ | (1,020 | ) | $ | (513) | ||
Packaging costs | $ | (1,856 | ) | $ | (423) | ||
Cash costs to produce dried cannabis | $ | 6,000 | $ | 2,314 | |||
Gram equivalents sold during the quarter | 3,408,909 | 1,778,232 | |||||
Cash costs to produce per gram | $ | 1.76 | $ | 1.30 |
Results of Operations
Net revenue
Net revenue for the three months ended November 30, 2018 was $21,668 versus $8,504 in the same period of the prior year and $13,292 in the first quarter of fiscal 2019, representing an increase of 154.8% from the prior year and an 63.0% increase from the prior quarter. During the quarter, the Company incurred $2,856 in excise taxes, which represent a new tax, which entered into legislation effective October 17th, 2018.
Net revenue for the six months ended November 30, 2018 was $34,960 versus $14,624 in the same period of the prior year, representing a 139.1% increase.
The increase in net revenue during the quarter from the prior quarter was related to:
• | Launch of adult-use market resulting in 1,946,975 gram equivalents sold in the quarter, compared to nil in the prior quarter; and, |
• | Increase in revenue from non-cannabis products sold in Canada and from international operations of $1,596 from $633 to $2,229. Included in the current quarter’s revenue from non-cannabis products sold in Canada and from international operations is the two months of revenue from ABP of $1,145. ABP was part of the Company’s LATAM acquisition, which closed on September 27, 2018. |
These factors were partially offset by:
• | Decrease in the average retail selling price (excluding wholesale) before excise taxes to medical patients during the quarter from $8.99 to $7.51; |
• | Decrease in wholesale orders during the quarter from 312,023 gram equivalents to 18,376 gram equivalents. Included within this amount is 18,376 gram equivalents delivered to partners conducting clinical drug trials and nil gram equivalents to other Licensed Producers; |
![]() | Page | 17 |
APHRIA INC. |
MANAGEMENT’S DISCUSSION & ANALYSIS |
• | Decrease in the medical cannabis sales by 22,651 gram equivalents to 1,443,558 gram equivalents sold in the current quarter, compared to 1,466,209 gram equivalents sold in the prior quarter; |
• | Lower average selling price before excise taxes to adult-use market of $6.32; and, |
• | Decrease in the percentage of cannabis oil sold from 39.1% to 18.8% based on gram equivalents. The significant decrease is a result of the adult-use market having a significantly larger quantity of grams sold of dried flower. |
Gross profit and gross margin
The gross profit for the three months ended November 30, 2018 was $8,615, compared to $6,202 in the same quarter in the prior year and $13,764 in the previous quarter. The increase in gross profit from the prior year is consistent with the much larger patient base over the prior year, the acquisition of Broken Coast, and the increase in the net fair value adjustment for biological assets. The decrease from the previous quarter is due to the lower fair value adjustment on growth of biological assets and increase in production costs for the quarter.
Three months ended | |||||||
November 30, 2018 | August 31, 2018 | ||||||
Net revenue | 21,668 | 13,292 | |||||
Production costs | 9,971 | 4,441 | |||||
Other costs of sales | 1,540 | 393 | |||||
Gross profit before fair value adjustments | 10,157 | 8,458 | |||||
Fair value adjustment on sale of inventory | 8,328 | 4,205 | |||||
Fair value adjustment on growth of biological assets | (4,154 | ) | (9,511) | ||||
4,174 | (5,306) | ||||||
Gross profit | $ | 5,983 | $ | 13,764 | |||
Gross margin | 27.6 | % | 103.6% |
Cost of sales currently consist of three main categories: (i) production costs and, (ii) fair value adjustment on sale of inventory and (iii) fair value adjustment on growth of biological assets:
(i) Production costs include all direct and indirect costs of production, related to the medical cannabis sold. This includes costs relating to growing, cultivation and harvesting costs, stringent quality assurance and quality control, cannabis oil processing costs, as well as packaging, labelling and amortization of production equipment and greenhouse infrastructure utilized in the production of medical cannabis. All medical cannabis shipped and sold by Aphria has been grown and produced by the Company.
(ii) Fair value adjustment on sale of inventory is part of the Company’s cost of sales due to IFRS standards relating to agriculture and biological assets (i.e. living plants or animals). This line item represents the effect of the non-cash fair value adjustment of inventory sold in the period.
(iii) Fair value adjustment on growth of biological assets is part of the Company’s cost of sales due to IFRS standards relating to agriculture and biological assets (i.e. living plants or animals). This line item represents the effect of the non-cash fair value adjustment of biological assets (medical cannabis) produced in the period. In an effort to increase transparency, inventory of harvested cannabis (Note 6 - Consolidated financial statements for the three months and six months ended November 30, 2018) consists of harvested cannabis and harvested cannabis trim to be $3.75 and $3.00 per gram respectively, for greenhouse produced cannabis and $4.25 and $3.50 per gram respectively, for indoor produced cannabis.
![]() | Page | 18 |
APHRIA INC. |
MANAGEMENT’S DISCUSSION & ANALYSIS |
Management believes that the use of non-cash IFRS adjustments in calculating gross profit and gross margin can be confusing due to the large value of non-cash fair value metrics required. Accordingly, management believes the use of gross profit before fair value adjustments and adjusted gross margin provides a better representation of performance by excluding non-cash fair value metrics required by IFRS.
Gross profit before fair value adjustments and adjusted gross margin are non-GAAP financial measures that do not have any standardized meaning prescribed by IFRS and may not be comparable to similar measures presented by other companies.
The following is the Company’s gross profit before fair value adjustments and adjusted gross margin as compared to IFRS for the three months ended November 30, 2018:
Three months ended November
30, 2018 |
Adjustments | Three months ended November 30, 2018 (Adjusted) | |||
Net revenue | 21,668 | - | 21,668 | ||
Production costs | 9,971 | - | 9,971 | ||
Other costs of sales | 1,540 | - | 1,540 | ||
Fair value adjustment on sale of inventory | 8,328 | (8,328) | - | ||
Fair value adjustment on biological assets | (4,154) | 4,154 | - | ||
15,685 | (4,174) | 11,511 | |||
Gross profit | $ 5,983 | $ 4,174 | $ 10,157 | ||
Gross margin | 27.6% | 46.9% |
The Company recognized a decline in adjusted gross profit and adjusted gross margin this quarter as a result of the previously discussed decrease in yield during the quarter, and an increase in revenue from international operations which had lower gross margin.
Other factors affecting the lower adjusted gross profit and adjusted gross margin were:
• | the temporary increase in production costs as a result of the allocation of production space in the Part III expansion to mother and vegetative plants for the Part IV and Part V expansion; |
• | introduction of wholesale pricing for the adult-use market; |
• | increased packaging costs associated with the introduction of the adult-use market; and, |
• | the lower yields due to moving plants into the Part III expansion prior to all automation, and temperature control equipment being fully operational. |
The gross profit for the six months ended November 30, 2018 was $22,379, compared to $14,105 in the same period of the prior year. The increase in gross profit from the prior year is consistent with the Company’s much larger patient base combined with the increase in the net fair value adjustments for biological assets as a result of the Company’s increased production levels.
![]() | Page | 19 |
APHRIA INC. |
MANAGEMENT’S DISCUSSION & ANALYSIS |
The following is the Company’s gross profit before fair value adjustments and adjusted gross margin as compared to IFRS for the six months ended November 30, 2018:
Six months ended November 30, 2018 (IFRS) |
Adjustments | Six months ended November 30, 2018 (Adjusted) | |||
Net revenue | 34,960 | - | 34,960 | ||
Production costs | 14,412 | - | 14,412 | ||
Other costs of sales | 1,933 | - | 1,933 | ||
Fair value adjustment on sale of inventory | 12,533 | (12,533) | - | ||
Fair value adjustment on biological assets | (13,665) | 13,665 | - | ||
15,213 | 1,132 | 16,345 | |||
Gross profit | $ 19,747 | $ (1,132) | $ 18,615 | ||
Gross margin | 56.5% | 53.2% |
Selling, general and administrative costs
For the three months ended November 30, |
For the six months ended | ||||
2018 | 2017 | 2018 | 2017 | ||
General and administrative | $ 12,276 | $ 1,973 | $ 21,127 | $ 3,708 | |
Share-based compensation | 2,574 | 2,200 | 8,696 | 4,709 | |
Selling, marketing and promotion | 8,336 | 2,819 | 13,077 | 4,767 | |
Amortization | 2,617 | 276 | 5,891 | 515 | |
Research and development | 612 | 80 | 874 | 170 | |
Transaction costs | 1,123 | - | 1,988 | - | |
$ 27,538 | $ 7,348 | $ 51,653 | $ 13,869 | ||
Selling, general and administrative expenses are comprised of general and administrative, share-based compensation, selling, marketing and promotion, amortization, research and development and transaction costs. These costs increased by $20,190 to $27,538 from $7,348 in the same quarter in the prior year.
General and administrative costs
For the three months ended November 30, |
For the six months ended November 30, | ||||
2018 | 2017 | 2018 | 2017 | ||
Executive compensation | $ 846 | $ 354 | $ 1,681 | $ 660 | |
Consulting fees | 1,427 | 63 | 2,358 | 158 | |
Office and general | 5,660 | 567 | 7,467 | 1,119 | |
Professional fees | 485 | 480 | 2,047 | 697 | |
Salaries and wages | 3,019 | 317 | 6,111 | 725 | |
Travel and accomondation | 689 | 168 | 1,160 | 304 | |
Rent | 150 | 24 | 303 | 45 | |
$ 12,276 | $ 1,973 | $ 21,127 | $ 3,708 | ||
![]() | Page | 20 |
APHRIA INC. |
MANAGEMENT’S DISCUSSION & ANALYSIS |
The increase in general and administrative costs during the quarter was largely related to an increase in:
• | Office and general as a result of increased cost of insurance from the increase in operations, and head count for directors and officers, as well as the inclusion and growth of the Company’s international presence; |
• | Salaries and wages, and travel and accommodation as a result of the introduction of Aphria International and LATAM activities, increased headcount and other activity within the business over the same period in the prior year; |
• | Executive compensation as a result of the increase in executive headcount over the same period in the prior year; and, |
• | Consulting fees as a result of increased work on corporate development, and international initiatives. |
Share-based compensation
The Company recognized share-based compensation expense of $2,574 for the three months ended November 30, 2018 compared to $2,200 for the prior year. Share-based compensation was valued using the Black-Scholes valuation model and represents a non-cash expense. The increase in share-based compensation is a result of an increase in deferred share units (“DSUs”), stock options vesting, as well as an increase in stock price used in the valuation of DSUs and options issued in the current period. The Company issued 3,041 DSUs and 330,000 stock options in the current quarter compared, to nil DSUs and 813,000 stock options in the same period of the prior year. Of the stock options granted in the quarter, none vested in the quarter.
For the six months ended November 30, 2018, the Company incurred share-based compensation of $8,696 as opposed to $4,709 for the prior year. The increase in share-based compensation is a result of an increase in stock options vesting, as well as an increase in stock price used in the valuation of options issued in the current period. The Company issued 1,400,000 in the current year-to-date quarter compared to 2,078,000 in the same period of the prior year. Of the stock options granted in the period, 133,331 vested in the period.
Selling, marketing and promotion costs
For the three months ended November 30, 2018, the Company incurred selling, marketing and promotion costs of $8,336, or 38.5% of net revenue versus $2,819 or 33.1% of net revenue in the comparable prior period. These costs relate to brand development expenses prior to The Cannabis Act coming into effect, patient acquisition and ongoing patient maintenance, the Company’s call center operations, shipping costs, marketing department, as well as the development of promotional and information materials. Patient acquisition and ongoing patient maintenance costs include payments to individual clinics to perform medical studies as well as reimbursement of operating costs incurred by clinics on the Company’s behalf. During the quarter, the Company invested approximately $2,600, or 12% of net revenue, in developing, advertising and marketing its adult-use brands, prior to The Cannabis Act coming into effect.
For the six months ended November 30, 2018, the Company incurred selling, marketing and promotion costs of $13,077 or 37.4% of net revenue, as opposed to $4,767 or 32.6% of net revenue, in the comparable prior period. The increase in costs in the six-month period is consistent with the increase in the three-month period.
Amortization
The Company incurred non-production related amortization charges of $2,617 for the three months ended November 30, 2018 compared to $276 for the same period in the prior year. The increase in amortization charges are a result of the intangibles acquired as part of the acquisition of Broken Coast, as well as the assets that have been transferred into use from the capital expenditures incurred in the current and prior fiscal year.
The Company incurred amortization charges of $5,891 for the six months ended November 30, 2018 compared to $515 for the same period in the previous year. The increase for the six-month period is consistent with the increase for the three-month period.
![]() | Page | 21 |
APHRIA INC. |
MANAGEMENT’S DISCUSSION & ANALYSIS |
Research and development
Research and development costs of $612, or 3% of net revenue were expensed during the three months ended November 30, 2018 compared to $80, or 1% of net revenue in same period last year. These relate to costs associated with the development of new cannabis products. Although the Company spends a significant amount on research and development, the majority of these costs remain in production costs, as the Company does not reclassify costs performing R&D on product which can still be sold.
For the six months ended November 30, 2018, the Company incurred research and development costs of $874 as opposed to $170 in the same period in the previous year.
Transaction costs
Transaction costs of $1,123 were expensed during the three months ended November 30, 2018 compared to $nil in same period last year. These relate to costs associated with the completed acquisitions and various other potential acquisitions the Company has considered and abandoned, or is still considering.
For the six months ended November 30, 2018, the Company incurred transaction costs of $1,988 as opposed to $nil in the same period in the previous year.
Non-operating items
For the three months ended November 30, |
For the six months ended November 30, | ||||
2018 | 2017 | 2018 | 2017 | ||
Consulting revenue | $ - | $ 183 | $ - | $ 476 | |
Foreign exchange (loss) gain | (194) | 282 | (253) | 131 | |
Gain (loss) on marketable securities | 57 | 55 | (110) | (1,691) | |
Loss on sale of capital assets | - | - | - | (7) | |
Gain (loss) from equity investees | 46,896 | (457) | 58,739 | (1,746) | |
Deferred gain on sale of intellectual property | 107 | 233 | 340 | 467 | |
Finance income, net | 4,855 | 862 | 5,914 | 1,328 | |
Unrealized gain on convertible notes receivable | 2,567 | 665 | 2,862 | 1,212 | |
Gain on long-term investments | 30,503 | 6,075 | 53,203 | 25,157 | |
Unrealized loss on financial liabilities | (560) | - | (975) | - | |
$ 84,231 | $ 7,898 | $ 119,720 | $ 25,327 |
For the three and six months ended November 30, 2018, the Company recognized a gain on long-term investment of $30,503 and $53,203, respectively. This gain relates largely to unrealized gains on the Company’s portfolio of long-term investments and a realized gain of $16,984 and $nil on the disposal of the Company’s shares in Hiku Brands Company Ltd. The Company also recognized gain from equity investees of $46,896 and $58,739, which is largely from a realized gain of $47,471 and $57,351 on the disposal of its shares in Liberty.
Net income
The Company recorded net income for the three months ended November 30, 2018 of $54,970 or $0.22 per share as opposed to net income of $6,455 or $0.05 per share in the prior year.
The Company recorded net income for the six months ended November 30, 2018 of $76,950 of $0.32 per share as opposed to net income of $21,496 or $0.15 per share in the same period of the prior year.
![]() | Page | 22 |
APHRIA INC. |
MANAGEMENT’S DISCUSSION & ANALYSIS |
Adjusted EBITDA
Adjusted EBITDA is a non-GAAP financial measure that does not have any standardized meaning prescribed by IFRS and may not be comparable to similar measures presented by other companies. The Company calculates adjusted EBITDA from operations as net income (loss), plus (minus) income taxes (recovery), plus (minus) finance income, net, plus amortization, plus share-based compensation, plus (minus) non-cash fair value adjustments on sale of inventory and on growth of biological assets, plus impairment of intangible assets, plus transaction costs, plus (minus) loss (gain) on disposal of capital assets, plus (minus) loss (gain) on foreign exchange, plus (minus) loss (gain) on marketable securities, plus (minus) loss (gain) from equity investees, minus deferred gain on sale of intellectual property, plus (minus) unrealized loss (gain) on convertible notes receivable, plus unrealized loss on financial liabilities, plus (minus) loss (gain) on long-term investments and certain one-time non-operating expenses, as determined by management, all as follows:
For the three months ended November 30, |
For the six months ended November 30, | ||||
2018 | 2017 | 2018 | 2017 | ||
Net income | $ 54,774 | $ 6,455 | $ 75,950 | $ 21,496 | |
Income taxes | 7,902 | 297 | 11,864 | 4,067 | |
Finance income, net | (4,855) | (862) | (5,914) | (1,328) | |
Amortization | 4,154 | 776 | 8,860 | 1,404 | |
Share-based compensation | 2,574 | 2,200 | 8,696 | 4,709 | |
Fair value adjustment on growth of biological assets | (4,154) | (3,115) | (13,665) | (7,380) | |
Fair value adjustment on sale of inventory | 8,328 | 2,671 | 12,533 | 3,807 | |
Transaction costs | 1,123 | - | 1,988 | - | |
Loss on sale of capital assets | - | - | - | 7 | |
Foreign exchange loss (gain) | 194 | (282) | 253 | (131) | |
(Gain) loss on marketable securities | (57) | (55) | 110 | 1,691 | |
(Gain) loss from equity investees | (46,896) | 457 | (58,739) | 1,746 | |
Deferred gain on sale of intellectual property | (107) | (233) | (340) | (467) | |
Unrealized gain on convertible notes receivable | (2,567) | (665) | (2,862) | (1,212) | |
Unrealized loss on financial liabilities | 560 | - | 975 | - | |
Gain on long-term investments | (30,503) | (6,075) | (53,203) | (25,157) | |
Adjusted EBITDA from Aphria International | 3,457 | - | 6,593 | - | |
Adjusted EBITDA from Canadian cannabis operations | $ (6,073) | $ 1,569 | $ (6,901) | $ 3,252 |
For the three months ended November 30, |
For the six months ended November 30, | |||
2018 | 2017 | 2018 | 2017 | |
Adjusted EBITDA from Canadian cannabis operations | $ (6,073) | $ 1,569 | $ (6,901) | $ 3,252 |
Adjusted EBITDA from Aphria International | (3,457) | - | (6,593) | - |
Adjusted EBITDA | $ (9,530) | $ 1,569 | $ (13,494) | $ 3,252 |
Last year, the Company reported adjusted EBITDA of $890 and $1,914 for the three and six months ended November 30, 2017. In a prior quarter, the Company re-assessed the definition of adjusted EBITDA, particularly as it related to presenting a repeatable proxy for cash. As a result, the Company removed the following from EBITDA adjustments from the current periods but also removed from the prior periods for comparison purposes:
![]() | Page | 23 |
APHRIA INC. |
MANAGEMENT’S DISCUSSION & ANALYSIS |
(i) | allowance for bad debts as, although this is a non-cash item, the Company believes it represents an estimate on future cash flows in the amount of $52 and $65 for the three and six months ended November 30, 2017; |
(ii) | amortization of certain non-capital assets in the amount of $nil and $3 for the three and six months ended November 30, 2017; and, |
(iii) | EBITDA loss from equity investee in the amount of $(731) and $(1,406) for the three and six months ended November 30, 2017. |
LIQUIDITY and capital resources
Cash flow used in operations for the period decreased by $16,587 from cash flow generated from operations of $415 in the prior year to cash flow used in operations of $16,172 in the current six-month period. The decrease in cash flow generated from operations is primarily a result of:
• | Increase in investments in developing international operations; and |
• | Additional cash production costs expensed due to increase in cash costs to produce dried cannabis per gram. |
Cash resources / working capital requirements
The Company constantly monitors and manages its cash flows to assess the liquidity necessary to fund operations. As at November 30, 2018, Aphria maintained $152,074 of cash and cash equivalents on hand plus $32,747 in liquid marketable securities, compared to $59,737 in cash and cash equivalents plus $45,062 marketable securities at May 31, 2018. Liquid sources of cash decreased $129,161 in the quarter.
Working capital provides funds for the Company to meet its operational and capital requirements. As at November 30, 2018, the Company maintained working capital of $181,523. Management expects that the Company’s existing cash and cash equivalents balance and cash flow from operations will be adequate to meet the Company’s announced expansion of facilities and operational activities.
Capital and intangible asset expenditures
For the three months ended November 30, 2018, the Company invested $49,061 in capital and intangible assets through wholly owned subsidiaries, exclusive of business acquisitions, of which $4,894 are considered maintenance CAPEX and the remaining $44,167 growth CAPEX related to Extraction Centre of Excellence, Aphria One’s Part IV and Part V expansions.
For the three months ended November 30, 2018, the Company invested $6,575 in capital and intangible assets through majority owned subsidiaries, of which $nil are considered maintenance CAPEX and the remaining $6,575 growth CAPEX.
Financial covenants
The Company met its financial covenants at all times since they have come into effect. The Company believes that it has sufficient operating room with respect to its financial covenants for the next fiscal year and does not anticipate being in breach of any of its financial covenants during this period.
Contractual obligations and off-balance sheet financing
In April 2017, the Company indemnified the landlord of the office space to be used by its then equity investee, Liberty Health Sciences Inc., with annual rent from $180 to $190 expiring June 2023.
The Company continues to lease office space from a related party. The lease commitment ended December 31, 2018; however, was renewed for an additional 5-year period. The Company maintains an option to renew for an additional 5-year period. As disclosed previously, the Company agreed to contribute $12,000 to Green Acre Capital Fund II. The Company has lease commitments until September 2019 and August 2020 for the use of two motor vehicles. The Company has a lease for rental office space from December 2018 until November 30, 2028.
![]() | Page | 24 |
APHRIA INC. |
MANAGEMENT’S DISCUSSION & ANALYSIS |
Minimum payments payable over the next five years are as follows:
Payments due by period | ||||||||||||||||||||||
Total | Less than 1 year | 1 - 3 years | 4 - 5 years | After 5 years | ||||||||||||||||||
Outstanding capital related | ||||||||||||||||||||||
commitments | $ | 81,515 | $ | 81,515 | $ | — | $ | — | $ | — | ||||||||||||
Investment commitment | 12,000 | 12,000 | — | — | — | |||||||||||||||||
Operating leases | 4,666 | 310 | 972 | 704 | 2,680 | |||||||||||||||||
Motor vehicle leases | 44 | 29 | 15 | — | — | |||||||||||||||||
Long-term debt | 54,685 | 3,388 | 6,981 | 3,182 | 41,134 | |||||||||||||||||
Total | $ | 152,910 | $ | 97,242 | $ | 7,968 | $ | 3,886 | $ | 43,814 |
From time to time, the Company and/or its subsidiaries may become defendants in legal actions arising out of the ordinary course and conduct of its business.
Except as disclosed elsewhere in this MD&A, there have been no material changes with respect to the contractual obligations of the Company during the year-to-date period.
Share capital
Aphria has the following securities issued and outstanding, as at January 10, 2019:
Presently outstanding | Exercisable | Exercisable & in-the-money | Fully diluted | ||||
Common stock | 250,233,273 | - | - | 250,233,273 | |||
Warrants | 2,480,076 | 2,480,076 | 1,186,272 | 1,186,272 | |||
Stock options | 7,655,086 | 3,877,042 | 2,696,052 | 2,696,052 | |||
Fully diluted | 254,115,597 |
*Based on closing price on January 10, 2019
Quarterly results
The following table sets out certain unaudited financial information for each of the eight fiscal quarters up to and including the second quarter of fiscal 2019, ended November 30, 2018. The information has been derived from the Company’s unaudited consolidated financial statements, which in management’s opinion, have been prepared on a basis consistent with the audited consolidated financial statements filed in the Company’s 2018 Annual Report and include all adjustments necessary for a fair presentation of the information presented. Past performance is not a guarantee of future performance and this information is not necessarily indicative of results for any future period.
![]() | Page | 25 |
APHRIA INC. |
MANAGEMENT’S DISCUSSION & ANALYSIS |
Feb/18 | May/18 | Aug/18 | Nov/18 | ||||
Net revenue | $ 10,267 | $ 12,026 | $ 13,292 | $ 21,668 | |||
Net income (loss) | 12,944 | (4,992) | 21,176 | 54,774 | |||
Earnings (loss) per share - basic | 0.08 | (0.06) | 0.09 | 0.22 | |||
Earnings (loss) per share - fully diluted | 0.08 | (0.04) | 0.09 | 0.22 | |||
Feb/17 | May/17 | Aug/17 | Nov/17 | ||||
Net revenue | $ 5,119 | $ 5,718 | $ 6,120 | $ 8,504 | |||
Net income (loss) | 4,950 | (2,593) | 15,041 | 6,455 | |||
Earnings (loss) per share - basic | 0.04 | (0.02) | 0.11 | 0.05 | |||
Income (loss) per share - fully diluted | 0.04 | (0.02) | 0.10 | 0.04 |
related party balances and transactions
During the quarter, the Company disposed of its remaining shares in Liberty Health Sciences Inc.
During the quarter, the Company appointed new board members. As a result of previous transactions, the Company held with related party corporations $900 in long-term investments for a U.S. legalization option, as at November 30, 2018.
The Company funded a portion of the Canadian operating costs of Liberty, for which Liberty reimburses the Company quarterly. Additionally, the Company purchases certain electrical generation equipment from and pays rent to a company owned by a director. These parties are related as they are corporations that are controlled by certain officers and directors of the Company.
During the three and six months ended November 30, 2018, related party corporations charged or incurred expenditures on behalf of the Company (including rent) totaling $53 and $138 (2017 - $54 and $93). Included in this amount was rent of $4 and $8 charged during the three and six months ended November 30, 2018 (2017 - $9 and $17).
The Company previously entered into an agreement with a director of the Company, granting it the right of first refusal to acquire an additional acre of property adjacent to its Aphria One facility. The director also maintains a put option on the same property valued at $1,000 subject to annual inflationary adjustments equal to the increases in the Consumer Price Index, which put option can only be exercised upon one of the following conditions occurring:
(i) | The director ceasing to be employed by the Company; |
(ii) | The director and his affiliated group collectively ceasing to own greater than 10% of the shares of the Company; or |
(iii) | A change of control in the Company. |
As at November 30, 2018, the director and his affiliated group collectively own less than 10% of the shares of the Company; however, the director has not exercised the put option.
CORPORATE POSITION ON CONDUCTING BUSINESS IN THE UNITED STATES AND OTHER INTERNATIONAL JURISDICTIONS WHERE CANNABIS IS FEDERALLY ILLEGAL
As cannabis is currently federally illegal in the U.S., The Company does not engage in any U.S. cannabis related activities as defined in Canadian Securities Administrators Staff Notice 51-352 (Revised). While the Company has historically held certain interests in U.S. cannabis related activities as at the date of this MD&A, it has divested1 itself of all such interests. The Company will only conduct business activities related to growing or processing cannabis, in jurisdictions where it is federally legal to do so. While the Company will not engage in cannabis-related activities in the U.S related to growing and processing cannabis so long as cannabis is federally-illegal, the Company has developed specific plans related to establishing business operations in the U.S. in the event cannabis becomes federally legal. The Company has entered into option agreements to purchase certain ownership interest in companies which operate in the U.S. cannabis industry should cannabis be rescheduled to become a legal substance in the U.S.
1In accordance with existing TSX precedent.
![]() | Page | 26 |
APHRIA INC. |
MANAGEMENT’S DISCUSSION & ANALYSIS |
INDUSTRY TRENDS AND RISKS
The Company’s overall performance and results of operations are subject to a number of risks and uncertainties, of which the below are considered to be the Company’s principal risks. For a more detailed and complete discussion of economic, industry and risk factors of the Company, please see the “Risk Factors” section in our most recent Annual Information Form, dated July 31, 2018.
Volatile Market Price of the Common Shares
The market price of the Common Shares may be volatile and subject to wide fluctuations in response to numerous factors, many of which are beyond the Company’s control. This volatility may affect the ability of holders of Common Shares to sell their securities at an advantageous price. Market price fluctuations in the Common Shares may be due to the Company’s operating results failing to meet expectations of securities analysts or investors in any period, downward revision in securities analysts’ estimates, adverse changes in general market conditions or economic trends, acquisitions, dispositions or other material public announcements by the Company or its competitors, along with a variety of additional factors. These broad market fluctuations may adversely affect the market price of the Common Shares.
Financial markets historically at times experience significant price and volume fluctuations that have particularly affected the market prices of equity securities of companies and that have often been unrelated to the operating performance, underlying asset values or prospects of such companies. Accordingly, the market price of the Common Shares may decline even if the Company’s operating results, underlying asset values or prospects have not changed. Additionally, these factors, as well as other related factors, may cause decreases in asset values that are deemed to be other than temporary, which may result in impairment losses. There can be no assurance that continuing fluctuations in price and volume will not occur. If such increased levels of volatility and market turmoil continue, the Company’s operations could be adversely impacted, and the trading price of the Common Shares may be materially adversely affected.
Risk Factors Related to Dilution
The Company may issue additional Common Shares in the future, which may dilute a shareholder’s holdings in the Company. The Company’s articles permit the issuance of an unlimited number of Common Shares, and shareholders will have no pre-emptive rights in connection with such further issuance. The directors of the Company have discretion to determine the price and the terms of issue of further issuances. Moreover, additional Common Shares will be issued by the Company on the exercise of options under the Company’s stock option plan and upon the exercise of outstanding warrants.
Reliance on Veterans Affairs Canada (‘‘VAC’’) medical cannabis reimbursement policies
As the Company has previously disclosed, VAC reimburses certain medical cannabis purchases for eligible retired Canadian Armed Forces veterans. The current reimbursement policy includes a three gram per day limit, subject to certain exceptions, and an $8.50 per gram price cap. The Company maintains a number of veterans as part of its overall medical patient list, although as discussed in the Company’s previous continuous disclosure, veteran sales have decreased over the prior quarter. As the Company grows larger and, more particularly, when adult-use of cannabis is implemented by the Canadian Federal Government, the Company anticipates that veteran patients will become less and less material to its overall sales as a relative percentage. However, should VAC further amend its reimbursement policies prior to the introduction of adult-use of cannabis, the Company may be materially adversely affected.
![]() | Page | 27 |
APHRIA INC. |
MANAGEMENT’S DISCUSSION & ANALYSIS |
Securing Adequate Financing to Fund Operations and Meet Expected Consumer Demand
There is no guarantee that the Company will be able to achieve its business objectives. The continued development of the Company may require additional financing. The failure to raise such capital could result in the delay or indefinite postponement of current business objectives or the Company ceasing to carry on business. There can be no assurance that additional capital or other types of financing will be available if needed or that, if available, the terms of such financing will be favorable to the Company. In addition, from time to time, the Company may enter into transactions to acquire assets or the shares of other corporations. These transactions may be financed wholly or partially with debt, which may increase the Company’s debt levels above industry standards. Any debt financing secured in the future could involve restrictive covenants relating to capital raising activities and other financial and operational matters, which may make it more difficult for the Company to obtain additional capital and to pursue business opportunities, including potential acquisitions. Debt financings may also contain provisions which, if breached, may entitle lenders or their agents to accelerate repayment of loans and/or realize upon security over the assets of the Company, and there is no assurance that the Company would be able to repay such loans in such an event or prevent the enforcement of security granted pursuant to such debt financing.
Reliance on Key Personnel
The success of the Company is dependent upon the ability, expertise, judgment, discretion and good faith of its senior management (collectively, “Key Personnel”). The Company’s future success depends on its continuing ability to attract, develop, motivate and retain highly qualified and skilled employees. Qualified individuals are in high demand, and the Company may incur significant costs to attract and retain them. The loss of the services of a Key Person, or an inability to attract other suitably qualified persons when needed, could have a material adverse effect on the Company’s ability to execute on its business plan and strategy, and the Company may be unable to find adequate replacements on a timely basis, or at all. A failure by a Key Person to maintain or renew his or her security clearance, would result in a material adverse effect on the Company’s business, financial condition and results of operations. In addition, if a Key Person leaves the Company, and the Company is unable to find a suitable replacement in a timely manner, or at all, there could occur a material adverse effect on the Company’s business, financial condition and results of operations. While employment agreements are customarily used as a primary method of retaining the services of Key Personnel, these agreements cannot assure the continued services of such employees.
Environmental Regulations and Risks
The Company’s operations are subject to environmental regulation in the various jurisdictions in which it operates. These regulations mandate, among other things, the maintenance of air and water quality standards and land reclamation. They also set forth limitations on the generation, transportation, storage and disposal of solid and hazardous waste. Environmental legislation is evolving in a manner which will require stricter standards and enforcement, increased fines and penalties for non-compliance, more stringent environmental assessments of proposed projects and a heightened degree of responsibility for companies and their officers, directors and employees. There is no assurance that future changes in environmental regulation, if any, will not adversely affect the Company’s operations. Government approvals and permits are currently, and may in the future be required in connection with the Company’s operations. To the extent such approvals are required and not obtained, the Company may be curtailed or prohibited from its proposed production of medical cannabis or from proceeding with the development of its operations as currently proposed. Failure to comply with applicable laws, regulations and permitting requirements may result in enforcement actions thereunder, including orders issued by regulatory or judicial authorities causing operations to cease or be curtailed, and may include corrective measures requiring capital expenditures, installation of additional equipment, or remedial actions. The Company may be required to compensate those suffering loss or damage by reason of its operations and may have civil or criminal fines or penalties imposed for violations of applicable laws or regulations. Amendments to current laws, regulations and permits governing the production of medical cannabis, or more stringent implementation thereof, could have a material adverse impact on the Company and cause increases in expenses, capital expenditures or production costs or reduction in levels of production or require abandonment or delays in development.
Reliance on a Single Facility
![]() | Page | 28 |
APHRIA INC. |
MANAGEMENT’S DISCUSSION & ANALYSIS |
To date, the Company’s activities and resources have been primarily focused on the premises in Leamington, Ontario. Aphria expects to continue the focus on this facility for the foreseeable future. Adverse changes or developments affecting the existing facility could have a material and adverse effect on the Company’s ability to continue producing medical cannabis, its business, financial condition and prospects.
Regulatory Compliance
The commercial medical and adult-use cannabis industry is a new industry in regulated under The Cannabis Act. These regulations subject the Company to a new regulatory regime governed by new regulations, guidelines and policies relating to the manufacture, processing, import, export, management, packaging/labelling, advertising, sale, transportation, storage and disposal of cannabis but also laws and regulations relating to drugs containing cannabis, amended security measures and outdoor cultivation. While, to the knowledge of management, the Company is currently in compliance with the current regulatory regime, any changes to such laws, regulations, guidelines and policies may have a material adverse effect on its business, financial condition and results of operations.
Changes in Laws, Regulations and Guidelines
On December 20, 2017, the Prime Minister communicated that the Canadian Federal Government intends to legalize cannabis in the summer of 2018, despite previous reports of a July 1, 2018 deadline. On June 7, 2018, Bill C45 passed the third reading in the Senate with a number of amendments to the language of The Cannabis Act. On June 20, 2018, Prime Minister Trudeau announced that cannabis would be legal by October 17, 2018. On June 21, 2018, the Government of Canada announced that Bill C-45 received Royal Assent. The Bill-C-45 will came into force on October 17, 2018. On July 11, 2018, the regulations made pursuant to The Cannabis Act were published. The regulations under The Cannabis Act contemplate the various licences including cultivation, processing, analytical testing, sale (including medical sales), analytical testing and scientific research. The regulations introduced the nursery and made outdoor cultivation permissible. Finally, the requirements for packaging and labelling of products for both medical and non-medical consumption were explicitly set forth. The impact of changes in the regulatory enforcement by Health Canada under The Cannabis Act and its regulations, particularly in respect of product packaging, labelling, marketing, advertising and promotions and product approvals and its impact on the Company’s business are unknown at this time.
In addition, with respect to the retail cannabis framework in each province, there is no guarantee that provincial legislation regulating the distribution and sale of cannabis for adult use purposes will remain unchanged. It is possible for significant legislative amendments to arise in each province to address any regulatory issues or perceived shortcomings in the distribution of cannabis at the retail level.
Reliance on Third Party Suppliers, Manufacturers and Contractors
The Company intends to maintain a full supply chain for the provision of products and services to the regulated cannabis industry. Due to the novel regulatory landscape for regulating cannabis in Canada and the variability surrounding the regulation of cannabis in the United States, the Company’s third party suppliers, manufacturers and contractors may elect, at any time, to decline or withdraw services necessary for the Company’s operations. Loss of these suppliers, manufacturers and contractors may have a material adverse effect on the Company’s business and operational results.
Risks Inherent in an Agricultural Business
Aphria’s business involves the growing of medical cannabis, an agricultural product. Such business will be subject to the risks inherent in the agricultural business, such as insects, plant diseases and similar agricultural risks. Although Aphria expects that any such growing will be completed indoors under climate controlled conditions, there can be no assurance that natural elements will not have a material adverse effect on any such future production.
![]() | Page | 29 |
APHRIA INC. |
MANAGEMENT’S DISCUSSION & ANALYSIS |
Third Party Transportation
In order for customers of Aphria to receive their product, Aphria must rely on third party mail and courier services. This can cause logistical problems with and delays in patients obtaining their orders and cannot be directly controlled by Aphria. Any delay by third party transportation and/or rising costs associated with these services may adversely affect Aphria’s financial performance. Moreover, security of the product during transportation to and from the Company’s facilities is critical due to the nature of the product. A breach of security during transport could have material adverse effects on Aphria’s business, financials and prospects. Any such breach could impact Aphria’s ability to continue operating under its licences or the prospect of renewing its licences.
Product Liability
As a distributor of products designed to be ingested by humans, Aphria faces an inherent risk of exposure to product liability claims, regulatory action and litigation if its products are alleged to have caused significant loss or injury. In addition, the sale of Aphria’s products involves the risk of injury to consumers due to tampering by unauthorized third parties or product contamination. Previously unknown adverse reactions resulting from human consumption of Aphria’s products alone or in combination with other medications or substances could occur. Aphria may be subject to various product liability claims, including, among others, that Aphria’s products caused injury or illness, include inadequate instructions for use or include inadequate warnings concerning possible side effects or interactions with other substances. A product liability claim or regulatory action against Aphria could result in increased costs, could adversely affect Aphria’s reputation with its clients and consumers generally, and could have a material adverse effect on our results of operations and financial condition of Aphria. There can be no assurances that Aphria will be able to obtain or maintain product liability insurance on acceptable terms or with adequate coverage against potential liabilities. Such insurance is expensive and may not be available in the future on acceptable terms, or at all. The inability to obtain sufficient insurance coverage on reasonable terms or to otherwise protect against potential product liability claims could prevent or inhibit the commercialization of Aphria’s potential products.
Product Recalls
Manufacturers and distributors of products are sometimes subject to the recall or return of their products for a variety of reasons, including product defects, such as contamination, unintended harmful side effects or interactions with other substances, packaging safety and inadequate or inaccurate labelling disclosure. If any of Aphria’s products are recalled due to an alleged product defect or for any other reason, Aphria could be required to incur the unexpected expense of the recall and any legal proceedings that might arise in connection with the recall. Aphria may lose a significant amount of sales and may not be able to replace those sales at an acceptable margin or at all. In addition, a product recall may require significant management attention. Although Aphria has detailed procedures in place for testing its products, there can be no assurance that any quality, potency or contamination problems will be detected in time to avoid unforeseen product recalls, regulatory action or lawsuits. Additionally, if one of Aphria’s significant brands were subject to recall, the image of that brand and Aphria could be harmed. A recall for any of the foregoing reasons could lead to decreased demand for Aphria’s products and could have a material adverse effect on the results of operations and financial condition of Aphria and the Resulting Issuer. Additionally, product recalls may lead to increased scrutiny of Aphria’s operations by Health Canada or other regulatory agencies, requiring further management attention and potential legal fees and other expenses.
![]() | Page | 30 |
APHRIA INC. |
MANAGEMENT’S DISCUSSION & ANALYSIS |
Regulatory or Agency proceedings, Investigations and Audits
The Company’s business requires compliance with many laws and regulations. Failure to comply with these laws and regulations could subject the Company to regulatory or agency proceedings or investigations and could also lead to damage awards, fines and penalties. Aphria may become involved in a number of government or agency proceedings, investigations and audits. The outcome of any regulatory or agency proceedings, investigations, audits, and other contingencies could harm the Company’s reputation, require the Company to take, or refrain from taking, actions that could harm its operations or require Aphria to pay substantial amounts of money, harming its financial condition. There can be no assurance that any pending or future regulatory or agency proceedings, investigations and audits will not result in substantial costs or a diversion of management’s attention and resources or have a material adverse impact on the Company’s business, financial condition and results of operation.
Information technology systems and cyber-attacks
Aphria has entered into agreements with third parties for hardware, software, telecommunications and other information technology (“IT”) services in connection with its operations. The Company’s operations depend, in part, on how well it and its suppliers protect networks, equipment, IT systems and software against damage from a number of threats, including, but not limited to, cable cuts, damage to physical plants, natural disasters, intentional damage and destruction, fire, power loss, hacking, computer viruses, vandalism and theft. The Company’s operations also depend on the timely maintenance, upgrade and replacement of networks, equipment, IT systems and software, as well as pre-emptive expenses to mitigate the risks of failures. Any of these and other events could result in information system failures, delays and/or increase in capital expenses. The failure of information systems or a component of information systems could, depending on the nature of any such failure, adversely impact the Company’s reputation and results of operations.
Aphria has not experienced any material losses to date relating to cyber-attacks or other information security breaches, but there can be no assurance that the Company will not incur such losses in the future. The Company’s risk and exposure to these matters cannot be fully mitigated because of, among other things, the evolving nature of these threats. As a result, cyber security and the continued development and enhancement of controls, processes and practices designed to protect systems, computers, software, data and networks from attack, damage or unauthorized access is a priority. As cyber threats continue to evolve, the Company may be required to expend additional resources to continue to modify or enhance protective measures or to investigate and remediate any security vulnerabilities.
Insurance coverage
Except as described herein, the Company has insurance to protect its assets, operations and its directors and employees in Canada. The Company is currently pursuing additional insurance coverage over its crop, product liability claims and for business interruption. While the Company believes the insurance coverage addresses all material risks to which it is exposed and is adequate and customary in the current state of operations, such insurance is subject to coverage limits and exclusions and may not be available for the risks and hazards to which the Company is exposed to. In addition, no assurance can be given that such insurance will be adequate to cover our liabilities or will be generally available in the future or, if available, that premiums will be commercially justifiable. If the Company were to incur substantial liability and such damages were not covered by insurance or were in excess of policy limits, or if the Company were to incur such liability at a time when it is not able to obtain liability insurance, the business, results of operations and financial condition could be materially adversely affected.
Litigation
The Company may become party to litigation from time to time in the ordinary course of business which could adversely affect its business. Should any litigation in which the Company becomes involved be determined against the Company, such a decision could adversely affect the Company’s ability to continue operating and the value of the Common Shares and could use significant resources. Even if Aphria is involved in litigation and wins, litigation can redirect significant Company resources, including the time and attention of management and available working capital. Litigation may also create a negative perception of the Company’s brand.
![]() | Page | 31 |
APHRIA INC. |
MANAGEMENT’S DISCUSSION & ANALYSIS |
Internal Investigation
On December 6, 2018, the Company announced its Board of Directors appointed a special committee of independent directors (the “Special Committee”) to review the Company’s previously completed acquisition of LATAM Holdings Inc. in response to public statements by certain short-sellers. The Company is unable to determine whether there will be any potential regulatory and/or enforcement action resulting from these matters or, if any such action is taken, whether it will have a material adverse effect on the Company’s business, financial position, profitability or liquidity. If regulatory or enforcement authorities determine to take action against the Company, the Company may be, among other things, subject to fines and/or penalties which may be material.
Intellectual Property
The ownership and protection of trademarks, patents, trade secrets and intellectual property rights are significant aspects of the Company’s future success. Unauthorized parties may attempt to replicate or otherwise obtain and use the Company’s products and technology. Policing the unauthorized use of the Company’s current or future trademarks, patents, trade secrets or intellectual property rights could be difficult, expensive, time-consuming and unpredictable, as may be enforcing these rights against unauthorized use by others. Identifying unauthorized use of intellectual property rights is difficult as Aphria may be unable to effectively monitor and evaluate the products being distributed by its competitors, including parties such as unlicensed dispensaries, and the processes used to produce such products. In addition, in any infringement proceeding, some or all of the Company’s trademarks, patents or other intellectual property rights or other proprietary know-how, or arrangements or agreements seeking to protect the same for the benefit of the Company, may be found invalid, unenforceable, anti-competitive or not infringed. An adverse result in any litigation or defense proceedings could put one or more of the Company’s trademarks, patents or other intellectual property rights at risk of being invalidated or interpreted narrowly and could put existing intellectual property applications at risk of not being issued. Any or all of these events could materially and adversely affect the business, financial condition and results of operations of the Company.
In addition, other parties may claim that the Company’s products infringe on their proprietary rights. Such claims, whether or not meritorious, may result in the expenditure of significant financial and managerial resources, legal fees, result in injunctions, temporary restraining orders and/or require the payment of damages. As well, Aphria may need to obtain licences from third parties who allege that the Company has infringed on their lawful rights. However, such licences may not be available on terms acceptable to the Company or at all. In addition, the Company may not be able to obtain or utilize on terms that are favorable to it, or at all, licences or other rights with respect to intellectual property that it does not own.
Unfavourable Publicity or Negative Consumer Perception
The Company believes the cannabis industry is highly dependent upon consumer perception regarding the medical benefits, safety, efficacy and quality of the cannabis distributed for medical purposes to such consumers. Consumer perception of Aphria’s products can be significantly influenced by scientific research or findings, regulatory investigations, litigation, political statements both in Canada and in other countries, media attention and other publicity (whether or not accurate or with merit) regarding the consumption of cannabis products for medical or recreational purposes, including unexpected safety or efficacy concerns arising with respect to the products of the Company or its competitors. There can be no assurance that future scientific research, findings, regulatory proceedings, litigation, media attention or other research findings or publicity will be favorable to the medical cannabis market or any particular product, or consistent with earlier publicity. Future research reports, findings, regulatory proceedings, litigation, media attention or other publicity that are perceived as less favorable than, or that question, earlier research reports, findings or publicity could have a material adverse effect on the demand for the Company’s products and the business, results of operations and financial condition of the Company. The Company’s dependence upon consumer perceptions means that adverse scientific research reports, findings, regulatory proceedings, litigation, media attention or other publicity (whether or not accurate or with merit), could have an adverse effect on any demand for Aphria’s products which could have a material adverse effect on the Company’s business, financial condition and results of operations. Further, adverse publicity reports or other media attention regarding the safety, efficacy and quality of cannabis for medical purposes in general, or the Company’s products specifically, or associating the consumption of cannabis with illness or other negative effects or events, could have such a material adverse effect. Such adverse publicity reports or other media attention could arise even if the adverse effects associated with such products resulted from consumers’ failure to consume such products legally, appropriately or as directed.
![]() | Page | 32 |
APHRIA INC. |
MANAGEMENT’S DISCUSSION & ANALYSIS |
Risk Factors Related to International Activities
Expansion into Foreign Jurisdictions
The Company’s expansion into jurisdictions outside of Canada is subject to risks. In addition, in jurisdictions outside of Canada, there can be no assurance that any market for the Company’s products will develop. The Company may face new or unexpected risks or significantly increase its exposure to one or more existing risk factors, including economic instability, changes in laws and regulations, and the effects of competition. These factors may limit the Company’s ability to successfully expand its operations into such jurisdictions and may have a material adverse effect on the Company’s business, financial condition and results of operations.
The Company’s Operations in Emerging Markets are Subject to Political and Other Risks Associated with Operating in a Foreign Jurisdiction
The Company has operations in various emerging markets and may have operations in additional emerging markets in the future. Such operations expose the Company to the socio-economic conditions as well as the laws governing the cannabis industry in such countries. Inherent risks with conducting foreign operations include, but are not limited to: high rates of inflation; extreme fluctuations in currency exchange rates, military repression; war or civil war; social and labour unrest; organized crime; hostage taking; terrorism; violent crime; expropriation and nationalization; renegotiation or nullification of existing licences, approvals, permits and contracts; changes in taxation policies; restrictions on foreign exchange and repatriation; and changing political norms, banking and currency controls and governmental regulations that favour or require the Company to award contracts in, employ citizens of, or purchase supplies from, the jurisdiction.
Governments in certain foreign jurisdictions intervene in their economies, sometimes frequently, and occasionally make significant changes in policies and regulations. Changes, if any, in cannabis industry or investment policies or shifts in political attitude in the countries in which the Company operates may adversely affect the Company’s operations or profitability. Operations may be affected in varying degrees by government regulations with respect to, but not limited to, restrictions on production, price controls, export controls, currency remittance, importation of product and supplies, income and other taxes, royalties, the repatriation of profits, expropriation of property, foreign investment, maintenance of concessions, licences, approvals and permits, environmental matters, land use, land claims of local people, water use and workplace safety. Failure to comply strictly with applicable laws, regulations and local practices could result in loss, reduction or expropriation of licences, or the imposition of additional local or foreign parties as joint venture partners with carried or other interests.
The Company continues to monitor developments and policies in the emerging markets in which it operates and assess the impact thereof to its operations; however such developments cannot be accurately predicted and could have an adverse effect on the Company’s operations or profitability.
Corruption and Fraud in Certain Emerging Markets Relating to Ownership of Real Property May Adversely Affect the Company’s Business
There are uncertainties, corruption and fraud relating to title ownership of real property in certain emerging markets in which the Company operates or may operate. Property disputes over title ownership are frequent in emerging markets, and, as a result, there is a risk that errors, fraud or challenges in respect of ownership of real property could adversely affect the Company’s ability to operate in such jurisdictions.
![]() | Page | 33 |
APHRIA INC. |
MANAGEMENT’S DISCUSSION & ANALYSIS |
Inflation in Emerging Markets, Along with Governmental Measures to Combat Inflation, may have a Significant Negative Effect on Local Economies and also on the Company’s Financial Condition and Results of Operations
In the past, high levels of inflation have adversely affected emerging economies and financial markets, and the ability of government to create conditions that stimulate or maintain economic growth. Moreover, governmental measures to curb inflation and speculation about possible future governmental measures have contributed to the negative economic impact of inflation and have created general economic uncertainty. The emerging markets in which the Company operates or may operate may experience high levels of inflation in the future. Inflationary pressures may weaken investor confidence in such countries and lead to further government intervention in the economy. If countries in which the Company operates experience high levels of inflation in the future and/or price controls are imposed, the Company may not be able to adjust the rates the Company charges the Company’s customers to fully offset the impact of inflation on the Company’s cost structures, which could adversely affect the Company’s results of operations or financial condition.
The Company’s Operations may be Impaired as a Result of Restrictions on the Acquisition or Use of Properties by Foreign Investors or Local Companies under Foreign Control
Non-resident individuals and non-domiciled foreign legal entities may be subject to restrictions on the acquisition or lease of properties in certain emerging markets. Limitations also apply to legal entities domiciled in such countries which are controlled by foreign investors, such as the entities through which the Company operates in certain countries. Accordingly, the Company’s current and future operations may be impaired as a result of such restrictions on the acquisition or use of property, and the Company’s ownership or access rights in respect of any property it owns or leases in such jurisdictions may be subject to legal challenges, all of which could result in a material adverse effect on the Company’s business, results of operations, financial condition and cash flows.
The Company May Expand into Other Geographic Areas, which could Increase the Company’s Operational, Regulatory and Other Risks
In addition to the jurisdictions described elsewhere in this MD&A, the Company may in the future expand into other geographic areas, which could increase the Company’s operational, regulatory, compliance, reputational and foreign exchange rate risks. The failure of the Company’s operating infrastructure to support such expansion could result in operational failures and regulatory fines or sanctions. Future international expansion could require the Company to incur a number of up-front expenses, including those associated with obtaining regulatory approvals, as well as additional ongoing expenses, including those associated with infrastructure, staff and regulatory compliance. The Company may not be able to successfully identify suitable acquisition and expansion opportunities or integrate such operations successfully with the Company’s existing operations.
The Company may be Responsible for Corruption and Anti-bribery Law Violations
The Company’s business is subject to Canadian laws which generally prohibit companies and employees from engaging in bribery or other prohibited payments to foreign officials for the purpose of obtaining or retaining business. In addition, the Company is subject to the anti-bribery laws of any other countries in which it conducts business now or in the future. The Company’s employees or other agents may, without its knowledge and despite its efforts, engage in prohibited conduct under the Company’s policies and procedures and anti-bribery laws for which the Company may be held responsible. The Company’s policies mandate compliance with these anti-corruption and anti-bribery laws. However, there can be no assurance that the Company’s internal control policies and procedures will always protect it from recklessness, fraudulent behaviour, dishonesty or other inappropriate acts committed by its affiliates, employees, contractors or agents. If the Company’s employees or other agents are found to have engaged in such practices, the Company could suffer severe penalties and other consequences that may have a material adverse effect on its business, financial condition and results of operations.
![]() | Page | 34 |
APHRIA INC. |
MANAGEMENT’S DISCUSSION & ANALYSIS |
INTERNAL CONTROLS OVER FINANCIAL REPORTING
Disclosure controls and procedures are designed to provide reasonable assurance that material information required to be publicly disclosed by a public company is gathered and reported to senior management, including the Chief Executive Officer (“CEO”) and the Chief Financial Officer (“CFO”), on a timely basis so that appropriate decisions can be made regarding public disclosure. An evaluation of the effectiveness of the Company’s disclosure controls and procedures was conducted as of May 31, 2018, based on the criteria set forth in the Internal Control-Integrated Framework (2013) issued by the Committee of Sponsoring Organizations of the Treadway Commission (“COSO”) by and under the supervision of the Company’s management, including the CEO and the CFO. Based on this evaluation, the CEO and the CFO concluded that the Company’s disclosure controls and procedures (as defined in National Instrument 52-109 - Certification of Disclosure in Issuers’ Annual and Interim Filings of the Canadian Securities Administrators) were effective in providing reasonable assurance that material information relating to the Company is made known to them and information required to be disclosed by the Company is recorded, processed, summarized and reported within the time periods specified in such legislation.
Under the supervision of the CEO and CFO, the Company designed internal controls over financial reporting (as defined in National Instrument 52-109) to provide reasonable assurance regarding the reliability of financial reporting and the preparation of financial statements for external purposes in accordance with IFRS. The Company’s management team used COSO to design the Company’s internal controls over financial reporting.
It is important to understand that there are inherent limitations of internal controls as stated within COSO. Internal controls, no matter how well designed and operated, can only provide reasonable assurance to management and the Board of Directors regarding achievement of an entity’s objectives. A system of controls, no matter how well designed, has inherent limitations, including the possibility of human error and the circumvention or overriding of the controls or procedures. As a result, there is no certainty that an organization's disclosure controls and procedures or internal control over financial reporting will prevent all errors or all fraud. Even disclosure controls and procedures and internal control over financial reporting determined to be effective can only provide reasonable assurance of achieving their control objectives.
The Company’s management, with the participation of its Chief Executive Officer and Chief Financial Officer, has limited the scope of the design of the Company’s disclosure controls and procedures and internal controls over financial reporting to exclude controls, policies and procedures and internal controls over financial reporting of the recently acquired operations of LATAM, acquired on September 27, 2018. The operations of LATAM, represent approximately 4% of total current assets, 16% of total assets, 2% of current liabilities and 1% of total liabilities as at November 30, 2018, 5% and 3% of the Company’s revenues and 2% and 1% of the Company’s operating expenses for the three and six months ended November 30, 2018.
There have been no changes in the Company’s internal controls over financial reporting during the three months ended November 30, 2018 that have materially affected, or are reasonably likely to materially affect, the Company’s internal controls over financial reporting.
Subsequent events
The following events occurred subsequent to November 30th, 2018:
(a) | The Company became aware that its investee, Resolve, began sales of cannabis in the United States. The Company immediately notified Resolve that it needed to convert its common shares in Resolve into Exchangeable Shares in Resolve, which are exchangeable only on the sale of shares to a third party or upon the Conditions being met. Resolve held a shareholders meeting to approve changes to its capital structure and has swapped the Company’s common shares for Exchangeable Shares. | |
(b) | The Company was either served or became aware of an intent to serve statements of claims in class action lawsuits against the Company and certain of its officers, related to the drop in its share price from December 3 to 5, 2018. At the present time, the Company is aware of six such claims, four of which are domiciled in the United States and two of which are domiciled in Canada. The total amounts claimed in each of the lawsuits have not been quantified at the present time. The Company intends on vigorously defending itself in the litigation. As at November 30, 2018, the Company has not recorded any uninsured amount related to this contingency. |
![]() | Page | 35 |
APHRIA INC. |
MANAGEMENT’S DISCUSSION & ANALYSIS |
(c) | The Company completed its acquisition of CC Pharma GmbH, a leading distributor of pharmaceutical products to more than 13,000 pharmacies in Germany. The Company paid €18,920 in cash at closing, with an earn-out multiple on future EBITDA of up to another €23,500 following closing, if certain performance milestones are met. | |
(d) | The Company formed a Special Committee (the “Special Committee”) to comprehensively review the acquisition of LATAM Holdings completed on September 27, 2018. The formation of this Special Committee was in response to a report published by a short seller which included allegations the LATAM Holdings assets acquired for $193,000 were overvalued. The Special Committee is composed of the Company’s independent directors: John M. Herhalt, Shlomo Bibas and Tom Looney. | |
This MD&A contains forward-looking statements within the meaning of applicable securities legislation with regards to expected financial performance, strategy and business conditions. We use words such as “forecast”, “future”, “should”, “could”, “enable”, “potential”, “contemplate”, “believe”, “anticipate”, “estimate”, “plan”, “expect”, “intend”, “may”, “project”, “will”, “would” and similar expressions are intended to identify forward-looking statements, although not all forward-looking statements contain these identifying words. These statements reflect management’s current beliefs with respect to future events and are based on information currently available to management. Forward-looking statements involve significant known and unknown risks and uncertainties. Many factors could cause actual results, performance or achievement to be materially different from any future forward-looking statements. Factors that may cause such differences include, but are not limited to, general economic and market conditions, investment performance, financial markets, legislative and regulatory changes, technological developments, catastrophic events and other business risks. These forward-looking statements are as of the date of this MD&A and the Company and management assume no obligation to update or revise them to reflect new events or circumstances except as required by securities laws. The Company and management caution readers not to place undue reliance on any forward-looking statements, which speak only as of the date made.
Some of the specific forward-looking statements in this MD&A include, but are not limited to, statements with respect to the following:
• | the intended expansion of the Company’s facilities and receipt of approval from Health Canada to complete such expansion; |
• | the expected cost to produce a gram of dried cannabis; |
• | the expected cost to process cannabis oil; |
• | the anticipated future gross margins of the Company’s operations; and, |
• | The Company’s investments in the United States, the characterization and consequences of those investments under Federal Law, and the framework for the enforcement of medical cannabis and cannabis-related offenses in the United States. |
![]() | Page | 36 |
Exhibit 99.3
FORM 52-109F2 CERTIFICATION OF INTERIM FILINGS FULL CERTIFICATE
I, Vic Neufeld, Chief Executive Officer, Aphria Inc. certify
the following:
1. Review: I have reviewed
the interim financial report and interim MD&A (together, the “interim filings”) of Aphria Inc. (the
“issuer”) for the interim period ended November 30, 2018.
2. No misrepresentations: Based
on my knowledge, having exercised reasonable diligence, the interim filings do not contain any untrue statement of a material fact
or omit to state a material fact required to be stated or that is necessary to make a statement not misleading in light of the
circumstances under which it was made, with respect to the period covered by the interim filings.
3. Fair presentation: Based
on my knowledge, having exercised reasonable diligence, the interim financial report together with the other financial information
included in the interim filings fairly present in all material respects the financial condition, financial performance and cash
flows of the issuer, as of the date of and for the periods presented in the interim filings.
4. Responsibility: The
issuer’s other certifying officer(s) and I are responsible for establishing and maintaining disclosure controls and procedures
(DC&P) and internal control over financial reporting (ICFR), as those terms are defined in National Instrument 52-109 Certification
of Disclosure in Issuers’ Annual and Interim Filings, for the issuer.
5. Design: Subject to
the limitations, if any, described in paragraphs 5.2 and 5.3, the issuer’s other certifying officer(s) and I have, as at
the end of the period covered by the interim filings
a. | designed DC&P, or caused it to be designed under our supervision, to provide reasonable assurance that |
i. | material information relating to the issuer is made known to us by others, particularly during the period in which the interim filings are being prepared; and |
ii. | information required to be disclosed by the issuer in its annual filings, interim filings or other reports filed or submitted by it under securities legislation is recorded, processed, summarized and reported within the time periods specified in securities legislation; and |
b. | designed ICFR, or caused it to be designed under our supervision, to provide reasonable assurance regarding the reliability of financial reporting and the preparation of financial statements for external purposes in accordance with the issuer’s GAAP. |
5.1 Control framework: The
control framework the issuer’s other certifying officer(s) and I used to design the issuer’s ICFR is the
Internal Control - Integrated Framework (COSO Framework 213) published by The Committee of Sponsoring Organizations of the Treadway
Commission (COSO).
5.2 ICFR - material weakness relating to design: N/A
5.3 Limitation on scope of design: The issuer has disclosed in its interim MD&A
a) | the fact that the issuer’s other certifying officer and I have limited the scope of our design of DC&P and ICFR to exclude controls, policies and procedures of a business that the issuer acquired not more than 365 days before the last day of the period covered by the interim filings; and, |
b) | summary financial information about the business that the issuer acquired that has been consolidated in the issuer’s financial statements. |
6. Reporting changes in ICFR: The
issuer has disclosed in its interim MD&A any change in the issuer’s ICFR that occurred during the period beginning on September
1, 2018 and ended on November 30, 2018 that
has materially affected, or is reasonably likely to materially affect, the issuer’s ICFR.
Date: January 11, 2019
__”Vic Neufeld”_________
Vic Neufeld
Chief Executive Officer
FORM 52-109F2 CERTIFICATION OF INTERIM FILINGS FULL CERTIFICATE
I, Carl Merton, Chief Financial Officer, Aphria Inc. certify
the following:
1. Review: I have reviewed
the interim financial reports and interim MD&A (together, the “interim filings”) of Aphria Inc. (the
“issuer”) for the interim period ended November 30, 2018.
2. No misrepresentations: Based
on my knowledge, having exercised reasonable diligence, the interim filings do not contain any untrue statement of a material fact
or omit to state a material fact required to be stated or that is necessary to make a statement not misleading in light of the
circumstances under which it was made, with respect to the period covered by the interim filings.
3. Fair presentation: Based
on my knowledge, having exercised reasonable diligence, the interim financial reports together with the other financial information
included in the interim filings fairly present in all material respects the financial condition, financial performance and cash
flows of the issuer, as of the date of and for the periods presented in the interim filings.
4. Responsibility: The
issuer’s other certifying officer(s) and I are responsible for establishing and maintaining disclosure controls and procedures
(DC&P) and internal control over financial reporting (ICFR), as those terms are defined in National Instrument 52-109 Certification
of Disclosure in Issuers’ Annual and Interim Filings, for the issuer.
5. Design: Subject to
the limitations, if any, described in paragraphs 5.2 and 5.3, the issuer’s other certifying officer(s) and I have, as at
the end of the period covered by the interim filings
a. | designed DC&P, or caused it to be designed under our supervision, to provide reasonable assurance that |
i. | material information relating to the issuer is made known to us by others, particularly during the period in which the interim filings are being prepared; and |
ii. | information required to be disclosed by the issuer in its annual filings, interim filings or other reports filed or submitted by it under securities legislation is recorded, processed, summarized and reported within the time periods specified in securities legislation; and |
b. | designed ICFR, or caused it to be designed under our supervision, to provide reasonable assurance regarding the reliability of financial reporting and the preparation of financial statements for external purposes in accordance with the issuer’s GAAP. |
5.1 Control framework: The
control framework the issuer’s other certifying officer(s) and I used to design the issuer’s ICFR is the
Internal Control - Integrated Framework (COSO Framework 213) published by The Committee of Sponsoring Organizations of the Treadway
Commission (COSO).
5.2 ICFR - material weakness relating to design: N/A
5.3 Limitation on scope of design: The issuer has disclosed in its interim MD&A
a) | the fact that the issuer’s other certifying officer and I have limited the scope of our design of DC&P and ICFR to exclude controls, policies and procedures of a business that the issuer acquired not more than 365 days before the last day of the period covered by the interim filings; and, |
b) | summary financial information about the business that the issuer acquired that has been consolidated in the issuer’s financial statements. |
6. Reporting changes in ICFR: The
issuer has disclosed in its interim MD&A any change in the issuer’s ICFR that occurred during the period beginning on September
1, 2018 and ended on November 30, 2018 that
has materially affected, or is reasonably likely to materially affect, the issuer’s ICFR.
Date: January 11, 2019
__”Carl Merton”_________
Carl Merton
Chief Financial Officer
_[+O_!2?X9?M">(=-\ Z_HLWPV^(6KJT>AZ?=:E'K7AKQ1=Q1R/
M+9:)X@2WTZ:#5W6&66'1-5TNU>=5^SZ;J.K7O^CUWTO_ 3N_8Z_L5](B^"N
MBVP^RR0#5;;6_%\7B ;XV4S?VW_PD37\DH9C*JSR3VPD"DVS(H2OPK^&/P@B
MTW]O_0?A)\/-4OM:TOP)\>X%L-;D2WGF3P[\//%+^(-9N;N[M+=0EY9:/HFI
M6-Y*D-M97UU:2M9W%D9DL9O.QV9^,7 &;\,U,]X@R[BC <0YSA,I>7TZ=.<_
M:UZN&56G2_X3 5Y2U"JZ>-S2E2H?G' 624UG.69EFE."P].G
MBLUH4:UXJ."RVE4K5LWKPY6UA*-:G3HX*,TEC<
O
MK#4]/M-
&T=HFU_1HY(W*.C:K8+(CJ2&CD1IP8W# AE?:P(((!!Q^
M=OACPW:^"OBY\(8M*N[]_P"V=%\'^(+XW,T3,;SQ%;2+J$$8MX;=/L 1BD$$
MB2LBLP:5VPR\7+X9L]?U/XO:G/-