REGISTRATION STATEMENT PURSUANT TO SECTION 12(b) OR 12(g) OF THE SECURITIES EXCHANGE ACT OF 1934 |
ANNUAL REPORT PURSUANT TO SECTION 13 OR 15(d) OF THE SECURITIES EXCHANGE ACT OF 1934 |
TRANSITION REPORT PURSUANT TO SECTION 13 OR 15(d) OF THE SECURITIES EXCHANGE ACT OF 1934 |
SHELL COMPANY REPORT PURSUANT TO SECTION 13 OR 15(d) OF THE SECURITIES EXCHANGE ACT OF 1934 |
Title of each class |
Trading symbol(s) |
Name of each exchange on which registered | ||
representing one Class A ordinary share, par value US$0.0001 per share |
||||
par value US$0.0001 per share* |
(1) * | t for trading, but only in connection with the listing on the New York Stock Exchange of our American depositary shares, each representing one Class A ordinary share. |
☒ |
Accelerated filer ☐ |
Non-accelerated filer ☐ |
Emerging growth company |
☒ |
International Financial Reporting Standards as issued by the International Accounting Standards Board ☐ |
Other ☐ |
1 |
||||||
2 |
||||||
3 |
||||||
ITEM 1. |
3 |
|||||
ITEM 2. |
3 |
|||||
ITEM 3. |
3 |
|||||
ITEM 4. |
55 |
|||||
ITEM 4.A. |
85 |
|||||
ITEM 5. |
86 |
|||||
ITEM 6. |
109 |
|||||
ITEM 7. |
120 |
|||||
ITEM 8. |
123 |
|||||
ITEM 9. |
124 |
|||||
ITEM 10. |
124 |
|||||
ITEM 11. |
142 |
|||||
ITEM 12. |
142 |
|||||
144 |
||||||
ITEM 13. |
144 |
|||||
ITEM 14. |
144 |
|||||
ITEM 15. |
145 |
|||||
ITEM 16.A. |
146 |
|||||
ITEM 16.B. |
146 |
|||||
ITEM 16.C. |
147 |
|||||
ITEM 16.D. |
147 |
|||||
ITEM 16.E. |
147 |
|||||
ITEM 16.F. |
147 |
|||||
ITEM 16.G. |
147 |
|||||
ITEM 16.H. |
148 |
|||||
148 |
||||||
ITEM 17. |
148 |
|||||
ITEM 18. |
148 |
|||||
ITEM 19. |
148 |
|||||
152 |
• | “ADSs” refers to our American depositary shares, each of which represents one Class A ordinary share; |
• | “China” or “PRC” refers to the People’s Republic of China, excluding, for the purpose of this annual report only, Hong Kong, Macau and Taiwan; |
• | “Class A ordinary shares” refers to our Class A ordinary shares of par value US$0.0001 per share; |
• | “Class B ordinary shares” refers to our Class B ordinary shares of par value US$0.0001 per share; |
• | “JOYY” refers to JOYY Inc. (Nasdaq: YY), formerly known as YY Inc.; |
• | “MAUs”, or “monthly active users” for any period refers to the sum of users who accessed our platform through our mobile apps, our websites, our PC clients, or YY Client, a PC client offered by JOYY, at least once during such relevant period. The calculations of our MAUs may not reflect the actual number of people who accessed our platform, such as it is possible that some people may use more than one device, or some people may share one device, or some people may access our platform through multiple channels. Average MAUs for any period is calculated by dividing (i) the sum of MAUs for each month during such relevant period, by (ii) the number of months during such relevant period; |
• | “mobile MAUs” for any period refers to the sum of users who accessed our platform through our mobile apps at least once during such relevant period. The calculations of our mobile MAUs may not reflect the actual number of people who accessed our platform, such as it is possible that some people may use more than one device, or some people may share one device, or some people may access our platform through multiple channels. Average mobile MAUs for any period is calculated by dividing (i) the sum of our mobile MAUs for each month during such relevant period, by (ii) the number of months during such relevant period; |
• | “monthly active broadcasters” for any period refers to the sum of broadcaster accounts that live broadcasted on our platform at least once during such relevant period. Average monthly active broadcasters for any period is calculated by dividing (i) the sum of our monthly active broadcasters for each month during such relevant period, by (ii) the number of months during such relevant period; |
• | “paying users” for any period refers to the sum of user accounts that made payments for various products and services on our platform at least once during such relevant period. A paying user is not necessarily a unique user, however, as a unique user may set up multiple paying user accounts on our platform; |
• | “RMB” and “Renminbi” refer to the legal currency of China; |
• | “shares” or “ordinary shares” refers to our Class A and Class B ordinary shares, par value $0.0001 per share; |
• | “Tencent” refers to Tencent Holdings Limited ; |
• | “US$,” “U.S. dollars,” “$,” and “dollars” refer to the legal currency of the United States; and |
• | “we,” “us,” “our company,” “our” and “Huya” refer to HUYA Inc., a Cayman Islands company, and its subsidiaries, and, in the context of describing our operations and combined and consolidated financial information, also include its variable interest entity and its subsidiaries in the PRC. |
• | our goals and strategies; |
• | our future business development, financial conditions and results of operations; |
• | the expected growth of the live streaming market in China; |
• | our expectations regarding demand for and market acceptance of our products and services; |
• | our ability to retain and increase the number of users, broadcasters, talent agencies and advertisers, and expand our product and service offerings; |
• | competition in our industry; |
• | general economic and business condition in China and elsewhere; |
• | relevant government policies and regulations relating to our industry; and |
• | assumptions underlying or related to any of the foregoing. |
A. |
Selected Financial Data |
For the year ended December 31, |
||||||||||||||||||||
2016 |
2017 |
2018 |
2019 |
|||||||||||||||||
RMB |
RMB |
RMB |
RMB |
US$ |
||||||||||||||||
(in thousands, except for share, ADS, per share and per ADS data) |
||||||||||||||||||||
Selected Consolidated Statements of Comprehensive Loss: |
||||||||||||||||||||
Net revenues: |
||||||||||||||||||||
Live streaming |
791,978 |
2,069,536 |
4,442,845 |
7,976,214 |
1,145,711 |
|||||||||||||||
Advertising and others |
4,926 |
115,280 |
220,595 |
398,287 |
57,210 |
|||||||||||||||
Total net revenues |
796,904 |
2,184,816 |
4,663,440 |
8,374,501 |
1,202,921 |
|||||||||||||||
Cost of revenues (1) |
(1,094,644 |
) | (1,929,864 |
) | (3,933,647 |
) | (6,892,579 |
) | (990,057 |
) | ||||||||||
Gross (loss) profit |
(297,740 |
) | 254,952 |
729,793 |
1,481,922 |
212,864 |
||||||||||||||
Operating expenses: |
||||||||||||||||||||
Research and development expenses (1) |
(188,334 |
) | (170,160 |
) | (265,152 |
) | (508,714 |
) | (73,072 |
) | ||||||||||
Sales and marketing expenses (1) |
(68,746 |
) | (87,292 |
) | (189,207 |
) | (438,396 |
) | (62,972 |
) | ||||||||||
General and administrative expenses (1) |
(71,325 |
) | (101,995 |
) | (287,710 |
) | (352,824 |
) | (50,680 |
) | ||||||||||
Total operating expenses |
(328,405 |
) | (359,447 |
) | (742,069 |
) | (1,299,934 |
) | (186,724 |
) | ||||||||||
Other income |
— |
9,629 |
38,938 |
79,390 |
11,404 |
|||||||||||||||
Operating (loss) income |
(626,145 |
) | (94,866 |
) | 26,662 |
261,378 |
37,544 |
|||||||||||||
Interest and short-term investments income |
518 |
14,049 |
156,549 |
304,491 |
43,737 |
|||||||||||||||
Fair value loss on derivative liabilities |
— |
— |
(2,285,223 |
) | — |
— |
||||||||||||||
Foreign currency exchange gains, net |
— |
— |
51 |
1,157 |
166 |
|||||||||||||||
(Loss) income before income tax benefits (expenses) |
(625,627 |
) | (80,817 |
) | (2,101,961 |
) | 567,026 |
81,447 |
||||||||||||
Income tax benefits (expenses) |
— |
— |
50,943 |
(96,078 |
) | (13,801 |
) | |||||||||||||
(Loss) income before share of (loss) income in equity method investments, net of income taxes |
(625,627 |
) | (80,817 |
) | (2,051,018 |
) | 470,948 |
67,646 |
||||||||||||
Share of (loss) income in equity method investments, net of income taxes |
— |
(151 |
) | 113,329 |
(2,775 |
) | (399 |
) | ||||||||||||
Net (loss) income attributable to HUYA Inc. |
(625,627 |
) | (80,968 |
) | (1,937,689 |
) | 468,173 |
67,247 |
||||||||||||
Accretion to preferred shares redemption value |
— |
(19,842 |
) | (71,628 |
) | — |
— |
|||||||||||||
Deemed dividend to series A preferred shareholders |
— |
— |
(496,995 |
) | — |
— |
||||||||||||||
Net (loss) income attributable to ordinary shareholders |
(625,627 |
) | (100,810 |
) | (2,506,312 |
) | 468,173 |
67,247 |
||||||||||||
Net (loss) income |
(625,627 |
) | (80,968 |
) | (1,937,689 |
) | 468,173 |
67,247 |
||||||||||||
Foreign currency translation adjustments, net of nil tax |
— |
308 |
366,259 |
157,568 |
22,633 |
|||||||||||||||
Total comprehensive (loss) income attributable to HUYA Inc. |
(625,627 |
) | (80,660 |
) | (1,571,430 |
) | 625,741 |
89,880 |
||||||||||||
Net (loss) income per ADS (2) |
||||||||||||||||||||
Basic |
(6.26 |
) | (1.01 |
) | (15.02 |
) | 2.18 |
0.31 |
||||||||||||
Diluted |
(6.26 |
) | (1.01 |
) | (15.02 |
) | 2.02 |
0.29 |
||||||||||||
Weighted average number of ADSs used in calculating net (loss) income per ADS |
||||||||||||||||||||
Basic |
100,000,000 |
100,000,000 |
166,828,435 |
214,811,862 |
214,811,862 |
|||||||||||||||
Diluted |
100,000,000 |
100,000,000 |
166,828,435 |
232,024,961 |
232,024,961 |
|||||||||||||||
Net (loss) income per ordinary share |
Basic |
(6.26 |
) | (1.01 |
) | (15.02 |
) | 2.18 |
0.31 |
||||||||||||
Diluted |
(6.26 |
) | (1.01 |
) | (15.02 |
) | 2.02 |
0.29 |
||||||||||||
Weighted average number of ordinary shares used in calculating net (loss) income per ordinary share |
||||||||||||||||||||
Basic |
100,000,000 |
100,000,000 |
166,828,435 |
214,811,862 |
214,811,862 |
|||||||||||||||
Diluted |
100,000,000 |
100,000,000 |
166,828,435 |
232,024,961 |
232,024,961 |
(1) | Share-based compensation expenses were allocated in cost of revenues and operating expenses as follows: |
For the year ended December 31, |
||||||||||||||||||||
2016 |
2017 |
2018 |
2019 |
|||||||||||||||||
RMB |
RMB |
RMB |
RMB |
US$ |
||||||||||||||||
(in thousands) |
||||||||||||||||||||
Cost of revenues |
5,677 |
2,877 |
10,472 |
31,593 |
4,538 |
|||||||||||||||
Research and development expenses |
19,538 |
9,174 |
30,643 |
86,296 |
12,396 |
|||||||||||||||
Sales and marketing expenses |
326 |
791 |
1,832 |
5,919 |
850 |
|||||||||||||||
General and administrative expenses |
26,557 |
27,266 |
183,748 |
157,936 |
22,686 |
(2) | Each ADS represents one Class A ordinary share |
As of December 31, |
||||||||||||||||||||
2016 |
2017 |
2018 |
2019 |
|||||||||||||||||
RMB |
RMB |
RMB |
RMB |
US$ |
||||||||||||||||
(in thousands, except for share and per share data) |
||||||||||||||||||||
Selected Consolidated Balance Sheet Data: |
||||||||||||||||||||
Cash and cash equivalents |
6,187 |
442,532 |
709,019 |
1,113,193 |
159,900 |
|||||||||||||||
Restricted cash |
— |
— |
— |
1,392 |
200 |
|||||||||||||||
Short-term deposits |
95,000 |
593,241 |
4,983,825 |
6,743,445 |
968,635 |
|||||||||||||||
Short-term investments |
— |
— |
300,162 |
2,219,531 |
318,816 |
|||||||||||||||
Total current assets |
156,101 |
1,250,307 |
6,595,187 |
10,591,820 |
1,521,420 |
|||||||||||||||
Investments |
— |
10,299 |
219,827 |
379,424 |
54,501 |
|||||||||||||||
Total assets |
167,234 |
1,300,541 |
7,106,187 |
11,366,550 |
1,632,703 |
|||||||||||||||
Total current liabilities |
319,928 |
685,650 |
1,380,446 |
2,446,677 |
351,444 |
|||||||||||||||
Total liabilities |
331,621 |
730,674 |
1,461,180 |
2,681,700 |
385,203 |
|||||||||||||||
Total mezzanine equity |
— |
509,668 |
— |
— |
— |
|||||||||||||||
Class A ordinary shares (US$0.0001 par value; nil, 249,957,163, 750,000,000 and 750,000,000 shares authorized, nil, 992,456, 44,639,737 and 67,101,314 shares issued and outstanding as of December 31, 2016, 2017, 2018 and 2019, respectively) |
— |
1 |
29 |
44 |
6 |
|||||||||||||||
Class B ordinary shares (US$0.0001 par value; nil, 99,007,544, 200,000,000, and 200,000,000 shares authorized, nil, 99,007,544, 159,157,321 and 152,357,321 shares issued and outstanding as of December 31, 2016, 2017, 2018 and 2019, respectively) |
— |
66 |
104 |
100 |
14 |
|||||||||||||||
Total shareholders’ (deficit) equity |
(164,387 |
) | 60,199 |
5,645,007 |
8,684,850 |
1,247,500 |
||||||||||||||
For the year ended December 31, |
||||||||||||||||||||
2016 |
2017 |
2018 |
2019 |
|||||||||||||||||
RMB |
RMB |
RMB |
RMB |
US$ |
||||||||||||||||
(in thousands) |
||||||||||||||||||||
Selected Consolidated Cash Flow Data: |
||||||||||||||||||||
Net cash (used in) provided by operating activities |
(420,451 |
) | 242,444 |
717,461 |
1,945,414 |
279,439 |
||||||||||||||
Net cash used in investing activities |
(96,135 |
) | (559,561 |
) | (4,567,452 |
) | (3,684,971 |
) | (529,314 |
) | ||||||||||
Net cash provided by financing activities |
522,773 |
774,448 |
4,126,861 |
2,133,651 |
306,480 |
|||||||||||||||
Net increase in cash and cash equivalents |
6,187 |
457,331 |
276,870 |
394,094 |
56,605 |
|||||||||||||||
Cash and cash equivalents at the beginning of the year |
— |
6,187 |
442,532 |
709,019 |
101,844 |
|||||||||||||||
Effect of exchange rate changes on cash and cash equivalents |
— |
(20,986 |
) | (10,383 |
) | 11,472 |
1,651 |
|||||||||||||
Cash and cash equivalents at the end of the year |
6,187 |
442,532 |
709,019 |
1,114,585 |
160,100 |
|||||||||||||||
B. |
Capitalization and Indebtedness |
C. |
Reasons for the Offer and Use of Proceeds |
D. |
Risk Factors |
• | challenges in formulating effective local sales and marketing strategies targeting internet and mobile users from various jurisdictions and cultures, who have a diverse range of preferences and demands; |
• | challenges in identifying appropriate local third-party business partners such as game developers and publishers, e-sports tournament and game event organizers, broadcasters and talent agencies, and establishing and maintaining good working relationships with them; |
• | challenges in recruiting quality local broadcasters to attract and engage local users; |
• | challenges in effectively managing overseas operations from our headquarters and establishing overseas IT systems and infrastructure; |
• | challenges in selecting suitable geographical regions for global expansion and the general economic condition of various regions we operate; |
• | challenges in increasing and diversifying revenues, controlling costs and expenses, and making profits; |
• | fluctuations in currency exchange rates; |
• | compliance with applicable foreign laws and regulations, including but not limited to internet content requirements, foreign exchange controls, cash repatriation restrictions, intellectual property protection rules, data privacy requirements, tax regulations and rules; and |
• | competition situations in various regions we operate. |
• | our technology, system, networks and our users’ devices have been subject to, and may continue to be the target of, cyber-attacks, computer viruses, malicious code, phishing attacks or information security breaches that could result in an unauthorized release, gathering, monitoring, misuse, loss or destruction of confidential, proprietary and other information of ours, our employees or sensitive information provided by our users, or otherwise disrupt our, our users’ or other third parties’ business operations; |
• | we periodically encounter attempts to create false accounts or use our platform to send targeted and untargeted spam messages to our users, or take other actions on our platform for purposes such as spamming or spreading misinformation, and we may not be able to repel spamming attacks; |
• | the use of encryption and other security measures intended to protect our systems and confidential data may not provide absolute security, and losses or unauthorized access to or releases of confidential information may still occur; |
• | our security measures may be breached due to employee error, malfeasance or unauthorized access to sensitive information by our employees, who may be induced by outside third parties, and we may not be able to anticipate any breach of our security or to implement adequate preventative measures; and |
• | we may be subject to information technology system failures or network disruptions caused by natural disasters, accidents, power disruptions, telecommunications failures, acts of terrorism or war, computer viruses, physical or electronic break-ins, or other events or disruptions. |
• | our market position and competitiveness in the live streaming service, in particular, game live streaming; |
• | our future profitability, overall financial condition, results of operations and cash flows; |
• | general market conditions for capital raising activities by live streaming and other internet companies in China; |
• | foreign currency restrictions; and |
• | economic, political and other conditions in China and internationally. |
• | Agreements with Tencent prevent us from bringing a legal claim against it in the event of a contractual breach by Tencent, notwithstanding our contractual rights under these agreements. |
• | Developing business relationships with Tencent’s competitors |
• | Employee recruiting and retention |
• | Allocation of business opportunities |
• | Our directors may have conflicts of interest |
• | Sales of shares in our company |
• | revoke our business and operating licenses; |
• | levy fines on us; |
• | confiscate any of our income that they deem to be obtained through illegal operations; |
• | require us to discontinue or restrict operations; |
• | restrict our right to collect revenues; |
• | block our mobile apps, websites, or PC clients; |
• | require us to restructure the operations in such a way as to compel us to establish a new enterprise, re-apply for the necessary licenses or relocate our businesses, staff and assets; |
• | impose additional conditions or requirements with which we may not be able to comply; or |
• | take other regulatory or enforcement actions against us that could be harmful to our business. |
• | We only have contractual control over our platform. Guangzhou Huya, our PRC variable interest entity, owns our platform due to the restriction of foreign investment in businesses providing value-added telecommunication services in China, including internet content provision services. If Guangzhou Huya breaches its contractual arrangements with us and no longer remains under our control, this may significantly disrupt our business, subject us to sanctions, compromise enforceability of related contractual arrangements, or have other harmful effects on us. |
• | There are uncertainties relating to the regulation of the internet business in China, including evolving licensing practices and the requirement for real-name registrations and its implementation in actual practice. Permits, licenses or operations at some of our subsidiaries and PRC variable interest entity levels may be subject to challenge, or we may fail to obtain permits or licenses that may be deemed necessary for our operations or we may not be able to obtain or renew certain permits or licenses. See “Risks Related to Our Business and Our Industry—If we fail to obtain and maintain the licenses and approvals required under the complex regulatory environment for internet-based businesses in China, our business, financial condition and results of operations may be materially and adversely affected,” “Item 4. Information on the Company—B. Business Overview—Government Regulations—Internet Information Services,” “Item 4. Information on the Company—B. Business Overview—Government Regulations—Internet Publication and Cultural Products,” “Item 4. Information on the Company—B. Business Overview—Government Regulations—Online Music and Entertainment” and “Item 4. Information on the Company—B. Business Overview—Government Regulations—Online Transmission of Audio-Visual Programs.” In addition, if we were required to implement real-name registration system on our platform with stricter and higher standards, we may lose large numbers of registered user accounts for various reasons, because users may no longer maintain multiple accounts and users who dislike giving out their private information may cease to use our products and services altogether. |
• | The evolving PRC regulatory system for the internet industry may lead to the establishment of new regulatory agencies. For example, in May 2011, the State Council announced the establishment of a new department, the State Internet Information Office (now known as the Cyberspace Administration of China or Office of the Central Cyberspace Affairs Commission). The primary role of this new agency is to facilitate the policy-making and legislative development in this field to direct and coordinate with the relevant departments in connection with online content administration and to deal with cross-ministry regulatory matters in relation to the internet industry. We are unable to determine what policies this new agency or any new agencies to be established in the future may have or how they may interpret existing laws, regulations and policies and how they may affect us. Further, new laws, regulations or policies may be promulgated or announced that will regulate internet activities, including online video and online advertising businesses. If these new laws, regulations or policies are promulgated, additional licenses may be required for our operations. If our operations do not comply with these new regulations after they become effective, or if we fail to obtain any licenses required under these new laws and regulations, we could be subject to penalties. |
• | variations in our revenues, earnings, cash flow and data related to our user base or user engagement; |
• | announcements of new investments, acquisitions, strategic partnerships or joint ventures by us or our competitors; |
• | announcements of new product and service offerings, solutions and expansions by us or our competitors; |
• | changes in financial estimates by securities analysts; |
• | detrimental adverse publicity about us, our services or our industry; |
• | additions or departures of key personnel; and |
• | potential litigation or regulatory investigations. |
• | we have failed to timely provide the depositary with notice of meeting and related voting materials; |
• | we have instructed the depositary that we do not wish a discretionary proxy to be given; |
• | we have informed the depositary that there is substantial opposition as to a matter to be voted on at the meeting; |
• | a matter to be voted on at the meeting would have a material adverse impact on shareholders; or |
• | the voting at the meeting is to be made on a show of hands. |
• | the rules under the Exchange Act requiring the filing with the SEC of quarterly reports on Form 10-Q or current reports on Form 8-K; |
• | the sections of the Exchange Act regulating the solicitation of proxies, consents, or authorizations in respect of a security registered under the Exchange Act; |
• | the sections of the Exchange Act requiring insiders to file public reports of their stock ownership and trading activities and liability for insiders who profit from trades made in a short period of time; and |
• | the selective disclosure rules by issuers of material nonpublic information under Regulation FD. |
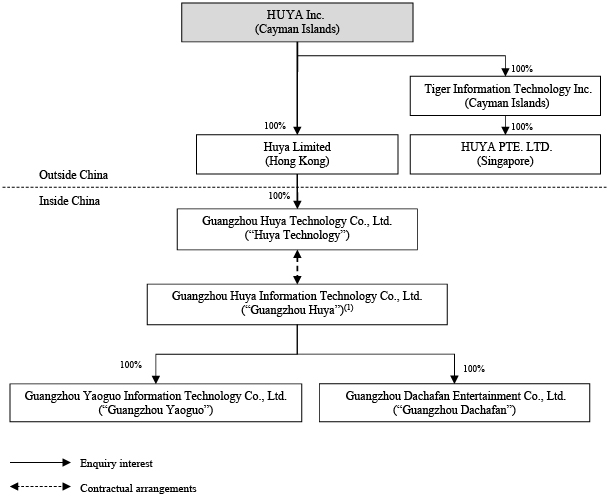
(1) | The shareholders of Guangzhou Huya are Guangzhou Huaduo and Guangzhou Qinlv Investment Consulting Co., Ltd., or Guangzhou Qinlv, holding 99.01% and 0.99% of Guangzhou Huya’s equity interest, respectively. The shareholders of Guangzhou Huaduo are Mr. David Xueling Li, our director, and Beijing Tuda Science and Technology Co., Ltd, or Beijing Tuda, a variable interest entity of JOYY. The sole shareholder of Guangzhou Qinlv is Mr. Rongjie Dong, our chief executive officer and director. |
• | exercise effective control over Guangzhou Huya and its subsidiaries; |
• | receive substantially all of the economic benefits of Guangzhou Huya and its subsidiaries; and |
• | have an exclusive option to purchase all or part of the equity interests in Guangzhou Huya when and to the extent permitted by PRC law. |
• | the ownership structures of Huya Technology and Guangzhou Huya are in compliance with PRC laws or regulations currently in effect; and |
• | the contractual arrangements among Huya Technology, Guangzhou Huya and the shareholders of Guangzhou Huya governed by PRC law, are valid, binding and enforceable under PRC law, and do not and will not result in any violation of applicable PRC laws or regulations currently in effect. |
D. |
Property, Plants and Equipment |
ITEM 4.A. |
UNRESOLVED STAFF COMMENTS |
ITEM 5. |
OPERATING AND FINANCIAL REVIEW AND PROSPECTS |
A. |
Operating Results |
For the year ended December 31, |
||||||||||||||||||||||||||||
2017 |
2018 |
2019 |
||||||||||||||||||||||||||
RMB |
% |
RMB |
% |
RMB |
US$ |
% |
||||||||||||||||||||||
(in thousands, except for percentages) |
||||||||||||||||||||||||||||
Net revenues: |
||||||||||||||||||||||||||||
Live streaming |
2,069,536 |
94.7 |
4,442,845 |
95.3 |
7,976,214 |
1,145,711 |
95.2 |
|||||||||||||||||||||
Advertising and others |
115,280 |
5.3 |
220,595 |
4.7 |
398,287 |
57,210 |
4.8 |
|||||||||||||||||||||
Total net revenues |
2,184,816 |
100.0 |
4,663,440 |
100.0 |
8,374,501 |
1,202,921 |
100.0 |
|||||||||||||||||||||
Cost of revenues (1) |
(1,929,864 |
) | (88.3 |
) | (3,933,647 |
) | (84.4 |
) | (6,892,579 |
) | (990,057 |
) | (82.3 |
) | ||||||||||||||
Gross profit |
254,952 |
11.7 |
729,793 |
15.6 |
1,481,922 |
212,864 |
17.7 |
|||||||||||||||||||||
Operating expenses: |
||||||||||||||||||||||||||||
Research and development expenses (1) |
(170,160 |
) | (7.8 |
) | (265,152 |
) | (5.7 |
) | (508,714 |
) | (73,072 |
) | (6.1 |
) | ||||||||||||||
Sales and marketing expenses (1) |
(87,292 |
) | (4.0 |
) | (189,207 |
) | (4.1 |
) | (438,396 |
) | (62,972 |
) | (5.2 |
) | ||||||||||||||
General and administrative expenses (1) |
(101,995 |
) | (4.7 |
) | (287,710 |
) | (6.1 |
) | (352,824 |
) | (50,680 |
) | (4.2 |
) | ||||||||||||||
Total operating expenses |
(359,447 |
) | (16.5 |
) | (742,069 |
) | (15.9 |
) | (1,299,934 |
) | (186,724 |
) | (15.5 |
) | ||||||||||||||
Other income |
9,629 |
0.5 |
38,938 |
0.8 |
79,390 |
11,404 |
0.9 |
|||||||||||||||||||||
Operating (loss) income |
(94,866 |
) | (4.3 |
) | 26,662 |
0.5 |
261,378 |
37,544 |
3.1 |
|||||||||||||||||||
Interest and short-term investments income |
14,049 |
0.6 |
156,549 |
3.4 |
304,491 |
43,737 |
3.6 |
|||||||||||||||||||||
Fair value loss on derivative liabilities |
— |
— |
(2,285,223 |
) | (49.0 |
) | — |
— |
— |
|||||||||||||||||||
Foreign currency exchange gains, net |
— |
— |
51 |
0.0 |
1,157 |
166 |
0.0 |
|||||||||||||||||||||
(Loss) income before income tax benefits (expenses) |
(80,817 |
) | (3.7 |
) | (2,101,961 |
) | (45.1 |
) | 567,026 |
81,447 |
6.7 |
|||||||||||||||||
Income tax benefits (expenses) |
— |
— |
50,943 |
1.1 |
(96,078 |
) | (13,801 |
) | (1.1 |
) | ||||||||||||||||||
(Loss) income before share of (loss) income in equity method investments, net of income taxes |
(80,817 |
) | (3.7 |
) | (2,051,018 |
) | (44.0 |
) | 470,948 |
67,646 |
5.6 |
|||||||||||||||||
Share of (loss) income in equity method investments, net of income taxes |
(151 |
) | (0.0 |
) | 113,329 |
2.4 |
(2,775 |
) | (399 |
) | (0.0 |
) | ||||||||||||||||
Net (loss) income |
(80,968 |
) | (3.7 |
) | (1,937,689 |
) | (41.6 |
) | 468,173 |
67,247 |
5.6 |
|||||||||||||||||
(1) | Share-based compensation was allocated in cost of revenues and operating expenses as follows: |
For the year ended December 31, |
||||||||||||||||
2017 |
2018 |
2019 |
||||||||||||||
RMB |
RMB |
RMB |
US$ |
|||||||||||||
(in thousands) |
||||||||||||||||
Cost of revenues |
2,877 |
10,472 |
31,593 |
4,538 |
||||||||||||
Research and development expenses |
9,174 |
30,643 |
86,296 |
12,396 |
||||||||||||
Sales and marketing expenses |
791 |
1,832 |
5,919 |
850 |
||||||||||||
General and administrative expenses |
27,266 |
183,748 |
157,936 |
22,686 |
For the year ended December 31, |
||||||||||||||||||||||||||||
2017 |
2018 |
2019 |
||||||||||||||||||||||||||
RMB |
% |
RMB |
% |
RMB |
US$ |
% |
||||||||||||||||||||||
(in thousands, except for percentages) |
||||||||||||||||||||||||||||
Cost of revenues: |
||||||||||||||||||||||||||||
Revenue sharing fees and content costs |
1,394,832 |
72.3 |
3,060,836 |
77.8 |
5,552,712 |
797,597 |
80.6 |
|||||||||||||||||||||
Bandwidth costs |
411,027 |
21.3 |
652,758 |
16.6 |
800,827 |
115,032 |
11.6 |
|||||||||||||||||||||
Salaries and welfare |
52,372 |
2.7 |
101,939 |
2.6 |
255,258 |
36,666 |
3.7 |
|||||||||||||||||||||
Payment handling costs |
14,071 |
0.7 |
22,780 |
0.6 |
120,429 |
17,299 |
1.7 |
|||||||||||||||||||||
Depreciation and amortization |
32,562 |
1.7 |
26,697 |
0.7 |
40,082 |
5,757 |
0.6 |
|||||||||||||||||||||
Share-based compensation |
2,877 |
0.1 |
10,472 |
0.3 |
31,593 |
4,538 |
0.5 |
|||||||||||||||||||||
Other taxes and surcharges |
8,283 |
0.4 |
14,747 |
0.4 |
22,694 |
3,260 |
0.3 |
|||||||||||||||||||||
Others |
13,840 |
0.8 |
43,418 |
1.0 |
68,984 |
9,908 |
1.0 |
|||||||||||||||||||||
Total cost of revenues |
1,929,864 |
100.0 |
3,933,647 |
100.0 |
6,892,579 |
990,057 |
100.0 |
|||||||||||||||||||||
• | Huya Technology was qualified as a Software Enterprise, and enjoyed the zero preferential tax rate starting from 2017 and 12.5% preferential tax rate starting from 2019. In 2019, Huya Technology is qualified as a KNSE and applied the income tax rate of 10% for the year of 2019 pursuant to SAT Public Notice [2018] No.23 (“Circular 23”). |
• | Guangzhou Huya applied for the HNTE qualification and obtained approval in November 2018. It entitled to enjoy the preferential tax rate of 15% as an HNTE for three years starting from 2018, and should apply for HNTE qualification renewal in 2021. |
• | Most of the remaining PRC subsidiaries and VIEs were subject to 25% EIT for the years reported. |
Date of valuation |
Fair Value Per Share (US$) |
Discount of Lack of Marketability (DLOM) |
Discount Rate |
|||||||||
August 9, 2017 |
2.74 |
20% |
24% |
|||||||||
October 8, 2017 |
2.74 |
20% |
24% |
|||||||||
March 15, 2018 |
7.16 |
10% |
19% |
|||||||||
March 31, 2018 |
7.16 |
10% |
19% |
Valuation Date |
||||||||
2017 |
2018 |
|||||||
Weighted average fair value per option granted |
US$ | 1.3798 |
US$ | 5.2130 |
||||
Weighted average exercise price |
US$ | 2.55 |
US$ | 2.47 |
||||
Risk-free interest rate (1) |
2.25% |
2.83% |
||||||
Expected term (in year) (2) |
10 |
10 |
||||||
Expected volatility (3) |
55% |
55% |
||||||
Dividend yield (4) |
— |
— |
(1) | The risk-free interest rate of periods within the contractual life of the share option is based on the China Government Bond yield as at the valuation dates. |
(2) | The expected term is the contract life of the option. |
(3) | Expected volatility is estimated based on the average of historical volatilities of the comparable companies in the same industry as at the valuation dates. |
(4) | We have no history or expectation of paying dividend on our ordinary shares. The expected dividend yield was estimated based on our expected dividend policy over the expected term of the option. |
For the year ended December 31, 2017 |
||||
Discount rate |
25 |
%-35% | ||
Risk-free interest rate |
1.70 |
% | ||
Volatility |
50 |
%-80% |
Valuation Date |
March 8, 2018 |
May 10, 2018 |
||||||
Volatility |
50% |
50% |
||||||
Risk-free rate (3 months) |
1.66% |
1.58% |
||||||
Risk-free rate (4 years) |
2.52% |
2.46% |
||||||
Dividend yield |
0% |
0% |
B. |
Liquidity and Capital Resources |
For the year ended December 31, |
||||||||||||||||
2017 |
2018 |
2019 |
||||||||||||||
RMB |
RMB |
RMB |
US$ |
|||||||||||||
(in thousands) |
||||||||||||||||
Summary Consolidated Cash Flow Data: |
||||||||||||||||
Net cash provided by operating activities |
242,444 |
717,461 |
1,945,414 |
279,439 |
||||||||||||
Net cash used in investing activities |
(559,561 |
) | (4,567,452 |
) | (3,684,971 |
) | (529,314 |
) | ||||||||
Net cash provided by financing activities |
774,448 |
4,126,861 |
2,133,651 |
306,480 |
||||||||||||
Net increase in cash and cash equivalents |
457,331 |
276,870 |
394,094 |
56,605 |
||||||||||||
Cash and cash equivalents at the beginning of the year |
6,187 |
442,532 |
709,019 |
101,844 |
||||||||||||
Effect of exchange rate changes on cash and cash equivalents |
(20,986 |
) | (10,383 |
) | 11,472 |
1,651 |
||||||||||
Cash and cash equivalents at the end of the year |
442,532 |
709,019 |
1,114,585 |
160,100 |
||||||||||||
Net revenues (1) |
Total assets (1) |
|||||||||||||||||||
For the year ended December 31, |
As of December 31, |
|||||||||||||||||||
2017 |
2018 |
2019 |
2018 |
2019 |
||||||||||||||||
HUYA Inc. and its wholly-owned subsidiaries |
0.3 |
% | 0.1 |
% | 1.0 |
% | 71.2 |
% | 76.5 |
% | ||||||||||
Variable interest entity and its subsidiaries |
99.7 |
% | 99.9 |
% | 99.0 |
% | 28.8 |
% | 23.5 |
% | ||||||||||
Total |
100.0 |
% | 100.0 |
% | 100.0 |
% | 100.0 |
% | 100.0 |
% | ||||||||||
(1) | The percentages exclude the inter-company transactions and balances between HUYA Inc. and its wholly-owned subsidiaries and variable interest entity and its subsidiaries. |
• | AI and big data analytics |
• | Live streaming technologies state-of-the art audio and video coding and streaming technologies enable low-latency and low-loss rates in delivering voice and video data on our platform, even with weak internet connection, which provides our users with superior viewing experience. Audio and video technologies have been our main focus since our inception. For instance, we offer stable 8-12M pixels blue-ray quality live streaming. |
• | Servers and other infrastructure back-end architecture that enables smooth and expedient upgrades of our platform software infrastructure. Our advanced peer-to-peer streaming technologies help us manage bandwidth utilization more efficiently amid fast growing user base and constantly improving streaming video quality, which further enhanced scalability. |
D. |
Trend Information |
E. |
Off-Balance Sheet Arrangements |
F. |
Tabular Disclosure of Contractual Obligations |
Payment due by period |
||||||||||||||||||||
Total |
Less than 1 year |
1 - 3 years |
3 - 5 years |
More than 5 years |
||||||||||||||||
(in RMB thousands) |
||||||||||||||||||||
Operating Lease Obligations (1) |
135,010 |
43,591 |
65,432 |
25,987 |
— |
(1) | Represents our non-cancellable operating leases and property management fees for offices expiring on different dates. |
G. |
Safe Harbor |
ITEM 6. |
DIRECTORS, SENIOR MANAGEMENT AND EMPLOYEES |
A. |
Directors and Executive Officers |
Age |
Position/Title | ||||
Lingdong Huang |
43 |
Chairman of Board of Directors | ||||
Rongjie Dong |
43 |
Director, Chief Executive Officer | ||||
David Xueling Li |
45 |
Director | ||||
Zhi Cheng |
37 |
Director | ||||
Hai Tao Pu |
49 |
Director | ||||
Guang Xu |
37 |
Director | ||||
Lei Zheng |
43 |
Director | ||||
Hongqiang Zhao |
43 |
Independent Director | ||||
Xiaopeng He |
42 |
Independent Director | ||||
Catherine Xiaozheng Liu |
43 |
Chief Financial Officer | ||||
Ligao Lai |
41 |
Chief Technology Officer |
B. |
Compensation of Directors and Executive Officers |
Name |
Class A Ordinary Shares Underlying Options Awarded |
Exercise Price (US$/Share) |
Date of Grant |
Date of Expiration | ||||||
Rongjie Dong |
5,647,700 |
US$2.55 |
August 9, 2017 |
August 8, 2027 | ||||||
David Xueling Li |
5,882,353 |
US$2.55 |
March 15, 2018 |
March 14, 2028 | ||||||
Ligao Lai |
* |
US$2.55 |
August 9, 2017 |
August 8, 2027 | ||||||
Other individuals as a group |
2,593,608 |
US$2.53 |
August 9, 2017, March 15, 2018 and July 1, 2018 |
August 8, 2027, March 14, 2028 and June 30, 2028 |
* | Less than 1% of our total outstanding shares. |
Name |
Class A Ordinary Shares Underlying Restricted Share Units Awarded |
Date of Grant |
Date of Expiration | |||
Rongjie Dong |
* |
March 31, 2018 |
March 30, 2028 | |||
Catherine Xiaozheng Liu |
* |
December 9, 2019 |
December 8, 2029 | |||
Other individuals as a group |
5,446,147 |
March 31, 2018 to February 15,2020 |
March 30, 2028 to February 14, 2030 |
* | Less than 1% of our total outstanding shares . |
C. |
Board Practices |
• | appointing the independent auditors and pre-approving all auditing and non-auditing services permitted to be performed by the independent auditors; |
• | reviewing with the independent auditors any audit problems or difficulties and management’s response; |
• | discussing the annual audited financial statements with management and the independent auditors; |
• | reviewing the adequacy and effectiveness of our accounting and internal control policies and procedures and any steps taken to monitor and control major financial risk exposures; |
• | reviewing and approving all proposed related party transactions; |
• | meeting separately and periodically with management and the independent auditors; and |
• | monitoring compliance with our code of business conduct and ethics, including reviewing the adequacy and effectiveness of our procedures to ensure proper compliance. |
• | reviewing and approving, or recommending to the board for its approval, the compensation for our chief executive officer and other executive officers; |
• | reviewing and recommending to the board for determination with respect to the compensation of our non-employee directors; |
• | reviewing periodically and approving any incentive compensation or equity plans, programs or similar arrangements, and |
• | selecting compensation consultant, legal counsel or other adviser only after taking into consideration all factors relevant to that person’s independence from management. |
• | selecting and recommending nominees for election by the shareholders or appointment by the board; |
• | reviewing annually with the board the current composition of the board with regards to characteristics such as independence, knowledge, skills, experience and diversity; |
• | making recommendations on the frequency and structure of board meetings and monitoring the functioning of the committees of the board; |
• | advising the board periodically with regards to significant developments in the law and practice of corporate governance as well as our compliance with applicable laws and regulations; and |
• | making recommendations to the board on all matters of corporate governance and on any remedial action to be taken. |
• | convening shareholders’ annual general meetings and reporting its work to shareholders at such meetings; |
• | declaring dividends and distributions; |
• | appointing officers and determining the term of office and its responsibilities of the officers; |
• | exercising the borrowing powers of our company and mortgaging the property of our company; and |
• | approving the transfer of shares in our company, including the registration of such shares in our share register. |
D. |
Employees |
As of December 31, 2019 |
||||||||
Number |
% |
|||||||
Customer services and operations |
672 |
36.1 |
||||||
Research and development |
860 |
46.1 |
||||||
Sales and marketing |
147 |
7.9 |
||||||
General and administrative |
185 |
9.9 |
||||||
Total |
1,864 |
100.0 |
||||||
E. |
Share Ownership |
• | each of our directors and executive officers; and |
• | each person known to us to own beneficially 5% or more of our total outstanding ordinary shares. |
Ordinary Shares Beneficially Owned |
||||||||||||||||||||
Class A ordinary Shares(†) |
Class B ordinary Shares(††) |
Total ordinary shares on an as-converted basis |
% of total ordinary shares on an as converted basis |
% of aggregate voting power (†††) |
||||||||||||||||
Directors and Executive Officers:** |
||||||||||||||||||||
Lingdong Huang |
— |
— |
— |
— |
— |
|||||||||||||||
Rongjie Dong (1) |
8,231,919 |
2,970,804 |
11,202,723 |
5.0 |
2.0 |
|||||||||||||||
David Xueling Li (2) |
7,885,514 |
— |
7,885,514 |
3.5 |
0.1 |
|||||||||||||||
Zhi Cheng |
— |
— |
— |
— |
— |
|||||||||||||||
Hai Tao Pu (3) |
— |
— |
— |
— |
— |
|||||||||||||||
Guang Xu |
— |
— |
— |
— |
— |
|||||||||||||||
Lei Zheng |
— |
— |
— |
— |
— |
|||||||||||||||
Hongqiang Zhao (4) |
— |
— |
— |
— |
— |
|||||||||||||||
Xiaopeng He (5) |
— |
— |
— |
— |
— |
|||||||||||||||
Catherine Xiaozheng Liu |
— |
— |
— |
— |
— |
|||||||||||||||
Ligao Lai |
* |
— |
* |
* |
* |
|||||||||||||||
All directors and executive officers as a group |
17,193,433 |
2,970,804 |
20,164,237 |
8.9 |
2.1 |
|||||||||||||||
Principal Shareholders: |
||||||||||||||||||||
Tencent Holdings Limited (6) |
— |
81,012,054 |
81,012,054 |
36.9 |
50.9 |
|||||||||||||||
JOYY (7) |
— |
68,374,463 |
68,374,463 |
31.2 |
43.0 |
|||||||||||||||
Capital Research and Management Company (8) |
12,340,227 |
— |
12,340,227 |
5.6 |
0.8 |
* | Less than 1% of total outstanding ordinary shares. |
** | Except for Mr. Lingdong Huang, Mr. Zhi Cheng, Mr. Guang Xu and Mr. Lei Zheng, and as indicated otherwise below, the business address for our directors and executive officers listed in the table is Building A3, E-Park, 280 Hanxi Road, Panyu District, Guangzhou 511446, the People’s Republic of China. The business address of Mr. Lingdong Huang, Mr. Zhi Cheng, Mr. Guang Xu and Mr. Lei Zheng is Building C, Kexing Science Park, Nanshan District, Shenzhen, the People’s Republic of China. |
† | For each person and group included in this column, percentage ownership is calculated by dividing the number of Class A ordinary shares beneficially owned by such person or group, including Class A ordinary shares that such person or group has the right to acquire within 60 days of April 3, 2020, by the sum of the total number of Class A ordinary shares outstanding as of April 3, 2020 and the number of Class A ordinary shares underlying the options held by such person or group that are exercisable within 60 days of April 3, 2020. |
†† | For each person and group included in this column, percentage ownership is calculated by dividing the number of Class B ordinary shares beneficially owned by such person or group, including Class B ordinary shares that such person or group has the right to acquire within 60 days of April 3, 2020, by the sum of the total number of Class B ordinary shares outstanding as of April 3, 2020 and the number of Class B ordinary shares underlying the options held by such person or group that are exercisable within 60 days of April 3, 2020. |
††† |
For each person or group included in this column, percentage of total voting power represents voting power based on both Class A and Class B ordinary shares held by such person or group, including Class A and Class B ordinary shares that such person or group has the right to acquire within 60 days of April 3, 2020, with respect to all outstanding shares of our Class A and Class B ordinary shares as a single class. Each holder of Class A ordinary shares is entitled to one vote per Class A ordinary share. Each holder of our Class B ordinary shares is entitled to ten votes per Class B ordinary share. Our Class B ordinary shares are convertible at any time by the holder into Class A ordinary shares on a share-for-share basis. |
(1) | Represents (i) 2,220,804 Class B ordinary shares directly held by All Worth Limited, a British Virgin Islands company controlled by Mr. Rongjie Dong, and (ii) 750,000 Class B ordinary shares directly held by Oriental Luck International Limited, a British Virgin Islands company wholly owned by a family trust controlled by Mr. Rongjie Dong, and (iii) 6,247,700 Class A ordinary shares issuable upon the vesting of the restricted shares units and the exercise of the options within 60 days after April 3, 2020 held by Mr. Rongjie Dong, and (iv) 1,984,219 Class A ordinary shares in the form of ADSs held by All Worth Limited. The registered offices of All Worth Limited and Oriental Luck International Limited are both Vistra Corporate Services Centre, Wickhams Cay II, Road Town, Tortola, VG1110, British Virgin Islands. |
(2) | Represents (i) 223,526 Class A ordinary shares directly held by Rosy Bay Limited, a British Virgin Islands company controlled by Mr. David Xueling Li, (ii) 1,411,765 Class A ordinary shares directly held by New Wales Holdings Limited, a British Virgin Islands company wholly owned by Mr. David Xueling Li, (iii) 367,870 Class A ordinary shares directly held by Savvy Direction Limited, a British Virgin Islands company controlled by Mr. David Xueling Li, and (iv) 5,882,353 Class A ordinary shares issuable upon the exercise of options within 60 days after April 3, 2020 held by Mr. David Xueling Li. The registered offices of Rosy Bay Limited, New Wales Holdings Limited, Legend Rank Ventures Limited and Savvy Direction Limited are Vistra Corporate Services Centre, Wickhams Cay II, Road Town, Tortola, VG1110, British Virgin Islands. The business address of Mr. David Xueling Li is Building B-1, North Block of Wanda Plaza, No. 79 Wanbo 2nd Road, Panyu District, Guangzhou, 511442, the People’s Republic of China. |
(3) | The business address of Mr. Hai Tao Pu is 29/F, Three Pacific Place, 1 Queen’s Road East, Wanchai, Hong Kong. |
(4) | The business address of Mr. Hongqiang Zhao is No. 10 Furong Street, Chaoyang District, Beijing, the People’s Republic of China. |
(5) | The business address of Mr. Xiaopeng He is No. 8 Songgang Road, Changxing Street, Cencun, Tianhe District, Guangzhou, the People’s Republic of China. |
(6) | Represents 81,012,054 Class B ordinary shares directly held by Linen Investment Limited, as reported in a Schedule 13D jointly filed by Tencent Holdings Limited and Linen Investment Limited on April 10, 2020. Tencent Holdings Limited is a Cayman Islands company. Linen Investment Limited is a British Virgin Islands company and a direct wholly owned subsidiary of Tencent Holdings Limited. The principal business address of each of Tencent Holdings Limited and Linen Investment Limited is Level 29, Three Pacific Place, No. 1 Queen’s Road East, Wanchai, Hong Kong. |
(7) | Represents 68,374,463 Class B ordinary shares directly held by JOYY Inc., as reported in a Schedule 13G amendment filed by JOYY Inc. on April 10, 2020. JOYY Inc. is a Cayman Islands company. The principal business address of JOYY Inc. is Building B-1, North Block of Wanda Plaza, No. 79 Wanbo 2nd Road, Nancun Town, Panyu District, Guangzhou 511442, the People’s Republic of China. |
(8) | Represents (i) 7,746,520 Class A ordinary shares held by Capital World Investors, as reported in a Schedule 13G amendment filed by Capital World Investors on February 14, 2020 and (ii) 4,593,707 Class A ordinary shares held by Capital International Investors, as reported in a Schedule 13G filed by Capital International Investors on February 14, 2020. Capital World Investors and Capital International Investors are divisions of Capital Research and Management Company. The principal business office of Capital World Investors is located at 333 South Hope Street Los Angeles, CA 90071. The principal business office of Capital International Investors is located at 11100 Santa Monica Boulevard 16th Floor Los Angeles, CA 90025. |
A. |
Major Shareholders |
B. |
Related Party Transactions |
• | Demand registration rights. |
• | Form F-3 registration rights. F-3, JOYY may request us to file a registration statement on Form F-3. We are not obligated to effect more than six registration statements on Form F-3 that have been declared and ordered effective. |
• | Piggyback registration rights. |
C. |
Interests of Experts and Counsel Not applicable. |
ITEM 8. |
FINANCIAL INFORMATION |
A. |
Consolidated Statements and Other Financial Information |
B. |
Significant Changes |
A. |
Offering and Listing Details. |
B. |
Plan of Distribution |
C. |
Markets |
D. |
Selling Shareholders |
E. |
Dilution |
F. |
Expenses of the Issue |
A. |
Share Capital |
B. |
Memorandum and Articles of Association |
• | the instrument of transfer is lodged with us, accompanied by the certificate for the ordinary shares to which it relates and such other evidence as our board of directors may reasonably require to show the right of the transferor to make the transfer; |
• | the instrument of transfer is in respect of only one class of shares; |
• | the instrument of transfer is properly stamped, if required; |
• | in the case of a transfer to joint holders, the number of joint holders to whom the ordinary share is to be transferred does not exceed four; and |
• | a fee of such maximum sum as the NYSE may determine to be payable or such lesser sum as our directors may from time to time require is paid to us in respect thereof. |
• | the designation of the series; |
• | the number of shares of the series and the subscription price thereof if different from the par value thereof; |
• | the dividend rights, dividend rates, conversion rights, voting rights; and |
• | the rights and terms of redemption and liquidation preferences. |
• | authorize our board of directors to issue preferred shares in one or more series and to designate the price, rights, preferences, privileges and restrictions of such preferred shares without any further vote or action by our shareholders; and |
• | limit the ability of shareholders to requisition and convene general meetings of shareholders However, under Cayman Islands law, our directors may only exercise the rights and powers granted to them under our third amended and restated memorandum and articles of association for a proper purpose and for what they believe in good faith to be in the best interests of our company. |
• | increase our share capital by such sum, to be divided into shares of such classes and amount, as the resolution shall prescribe; |
• | consolidate and divide all or any of our share capital into shares of a larger amount than our existing shares; |
• | sub-divide our existing shares, or any of them into shares of a smaller amount, provided that in the subdivision the proportion between the amount paid and the amount, if any, unpaid on each reduced share shall be the same as it was in case of the share from which the reduced share is derived; or |
• | cancel any shares which, at the date of the passing of the resolution, have not been taken or agreed to be taken by any person and diminish the amount of our share capital by the amount of the shares so canceled. Our shareholders may by special resolution, subject to confirmation by the Grand Court of the Cayman Islands on an application by our company for an order confirming such reduction, reduce our share capital or any capital redemption reserve in any manner permitted by law. |
• | does not have to file an annual return of its shareholders with the Registrar of Companies; |
• | is not required to open its register of members for inspection; |
• | does not have to hold an annual general meeting; |
• | may issue negotiable or bearer shares or shares with no par value; |
• | may obtain an undertaking against the imposition of any future taxation (such undertakings are usually given for 20 years in the first instance); |
• | may register by way of continuation in another jurisdiction and be deregistered in the Cayman Islands; |
• | may register as a limited duration company; and |
• | may register as a segregated portfolio company. |
• | the names and addresses of the members, together with a statement of the shares held by each member, and such statement shall confirm (i) the amount paid or agreed to be considered as paid, on the shares of each member, (ii) the number and category of shares held by each member, and (iii) whether each relevant category of shares held by a member carries voting rights under the articles of association of the company, and if so, whether such voting rights are conditional; |
• | the date on which the name of any person was entered on the register as a member; and |
• | the date on which any person ceased to be a member. |
• | the statutory provisions as to the required majority vote have been met; |
• | the shareholders have been fairly represented at the meeting in question and the statutory majority are acting bona fide without coercion of the minority to promote interests adverse to those of the class; |
• | the arrangement is such that may be reasonably approved by an intelligent and honest man of that class acting in respect of his interest; and |
• | the arrangement is not one that would more properly be sanctioned under some other provision of the Companies Law. |
• | an act which is ultra vires or illegal and is therefore incapable of ratification by the shareholders, |
• | an act which constitutes a fraud against the minority where the wrongdoers are themselves in control of the company, and |
• | an act which requires a resolution with a qualified (or special) majority (i.e. more than a simple majority) which has not been obtained. |
• | an exempted company does not have to file an annual return of its shareholders with the Registrar of Companies; |
• | an exempted company’s register of members is not required to be open to inspection; |
• | an exempted company does not have to hold an annual general meeting; |
• | an exempted company may issue no par value shares; |
• | an exempted company may obtain an undertaking against the imposition of any future taxation (such undertakings are usually given for 30 years in the first instance); |
• | an exempted company may register by way of continuation in another jurisdiction and be deregistered in the Cayman Islands; |
• | an exempted company may register as a limited duration company; and |
• | an exempted company may register as a segregated portfolio company. |
C. |
Material Contracts |
D. |
Exchange Controls |
E. |
Taxation |
• | such excess distribution and/or gain will be allocated ratably over the U.S. holder’s holding period for the ADSs or ordinary shares; |
• | such amount allocated to the current taxable year and any taxable years in the U.S. holder’s holding period prior to the first taxable year in which we are a PFIC, or pre-PFIC year, will be taxable as ordinary income; |
• | such amount allocated to each prior taxable year, other than a pre-PFIC year, will be subject to tax at the highest tax rate in effect for that year; and |
• | an interest charge generally applicable to underpayments of tax will be imposed on the tax attributable to each prior taxable year, other than a pre-PFIC year. |
F. |
Dividends and Paying Agents |
G. |
Statement by Experts |
H. |
Documents on Display |
I. |
Subsidiary Information |
ITEM 11. |
QUANTITATIVE AND QUALITATIVE DISCLOSURES ABOUT MARKET RISK |
A. |
Debt Securities |
B. |
Warrants and Rights |
C. |
Other Securities |
D. |
American Depositary Shares |
Service |
Fees | |
• To any person to which ADSs are issued or to any person to which a distribution is made in respect of ADS distributions pursuant to stock dividends or other free distributions of stock, bonus distributions, stock splits or other distributions (except where converted to cash) |
Up to US$0.05 per ADS issued | |
• Cancelation of ADSs, including the case of termination of the deposit agreement |
Up to US$0.05 per ADS canceled | |
• Distribution of cash dividends |
Up to US$0.05 per ADS held | |
• Distribution of cash entitlements (other than cash dividends) and/or cash proceeds from the sale of rights, securities and other entitlements |
Up to US$0.05 per ADS held | |
• Distribution of ADSs pursuant to exercise of rights |
Up to US$0.05 per ADS held | |
• Distribution of securities other than ADSs or rights to purchase additional ADSs |
Up to US$0.05 per ADS held | |
• Depositary services |
Up to US$0.05 per ADS held on the applicable record date(s) established by the depositary bank |
• | Fees for the transfer and registration of ordinary shares charged by the registrar and transfer agent for the ordinary shares in the Cayman Islands (i.e., upon deposit and withdrawal of ordinary shares). |
• | Expenses incurred for converting foreign currency into U.S. dollars. |
• | Expenses for cable, telex and fax transmissions and for delivery of securities. |
• | Taxes and duties upon the transfer of securities, including any applicable stamp duties, any stock transfer charges or withholding taxes (i.e., when ordinary shares are deposited or withdrawn from deposit). |
• | Fees and expenses incurred in connection with the delivery or servicing of ordinary shares on deposit. |
• | Fees and expenses incurred in connection with complying with exchange control regulations and other regulatory requirements applicable to ordinary shares, deposited securities, ADSs and ADRs. |
• | Any applicable fees and penalties thereon. |
ITEM 13. |
DEFAULTS, DIVIDEND ARREARAGES AND DELINQUENCIES |
ITEM 14. |
MATERIAL MODIFICATIONS TO THE RIGHTS OF SECURITY HOLDERS AND USE OF PROCEEDS |
ITEM 15. |
CONTROLS AND PROCEDURES |
ITEM 16.A. |
AUDIT COMMITTEE FINANCIAL EXPERT |
ITEM 16.B. |
CODE OF ETHICS |
ITEM 16.C. |
PRINCIPAL ACCOUNTANT FEES AND SERVICES |
2018 |
2019 |
|||||||
RMB |
RMB |
|||||||
(in thousands) |
||||||||
Audit fees (1) |
9,728 |
8,797 |
||||||
Tax fees (2) |
544 |
— |
(1) | “Audit fees” represent the aggregate fees billed for each of the fiscal years listed for professional services rendered by our principal auditors for the audit or review of our annual or quarterly financial statements and fees for assurance services rendered in connection with our public offering. |
(2) | “Tax fees” means the aggregate fees billed in each of the fiscal years listed for the professional tax services rendered by our principal auditors. |
ITEM 16.D. |
EXEMPTIONS FROM THE LISTING STANDARDS FOR AUDIT COMMITTEES |
ITEM 16.E. |
PURCHASES OF EQUITY SECURITIES BY THE ISSUER AND AFFILIATED PURCHASERS |
ITEM 16.F. |
CHANGE IN REGISTRANT’S CERTIFYING ACCOUNTANT |
ITEM 16.G. |
CORPORATE GOVERNANCE |
• | an exemption from the rule that a majority of our board of directors must be independent directors; and |
• | the requirement that the nominating committee be composed entirely of independent directors. |
ITEM 16.H. |
MINE SAFETY DISCLOSURE |
ITEM 17. |
FINANCIAL STATEMENTS |
ITEM 18. |
FINANCIAL STATEMENTS |
ITEM 19. |
EXHIBITS |
Exhibit Number |
Description of Document | |||
1.1 |
||||
2.1 |
||||
2.2 |
||||
2.3 |
||||
2.4 |
||||
2.5* |
Exhibit Number |
Description of Document | |||
4.1 |
||||
4.2 |
||||
4.3 |
||||
4.4 |
||||
4.5 |
||||
4.6 |
||||
4.7 |
||||
4.8 |
||||
4.9 |
Exhibit Number |
Description of Document | |||
4.10 |
||||
4.11 |
||||
4.12 |
||||
4.13 |
||||
4.14* |
||||
4.15* |
||||
8.1* |
||||
11.1 |
||||
12.1* |
||||
12.2* |
||||
13.1** |
||||
13.2** |
||||
15.1* |
||||
15.2* |
||||
15.3* |
||||
101.INS* |
Inline XBRL Instance Document — the instance document does not appear in the Interactive Data File because its XBRL tags are embedded within the Inline XBRL document | |||
101.SCH* |
Inline XBRL Taxonomy Extension Schema Document | |||
101.CAL* |
Inline XBRL Taxonomy Extension Calculation Linkbase Document | |||
101.DEF* |
Inline XBRL Taxonomy Extension Definition Linkbase Document |
Exhibit Number |
Description of Document | |||
101.LAB* |
Inline XBRL Taxonomy Extension Label Linkbase Document | |||
101.PRE* |
Inline XBRL Taxonomy Extension Presentation Linkbase Document | |||
104* |
Cover Page Interactive Data File — the cover page XBRL tags are embedded within the Exhibit 101 Inline XBRL document set |
* | Filed herewith. |
** | Furnished herewith. |
HUYA Inc. | ||
By: /s/ Rongjie Dong | ||
Name: Rongjie Dong | ||
Title: Chief Executive Officer |
Contents |
Page |
|||
F- 2 |
||||
Consolidated Financial Statements: |
||||
F- 5 |
||||
F- 7 |
||||
F- 9 |
||||
F- 12 |
||||
F- 14 |
As of December 31, |
||||||||||||
2018 |
2019 |
2019 |
||||||||||
RMB |
RMB |
US$ |
||||||||||
(Note 2(e)) |
||||||||||||
Assets |
||||||||||||
Current assets |
||||||||||||
Cash and cash equivalents |
|
|
|
|||||||||
Restricted cash |
|
|
— |
|
|
|
|
|
|
|
|
|
Short-term deposits |
|
|
|
|||||||||
Short-term investments |
|
|
|
|||||||||
Accounts receivable, net |
|
|
|
|||||||||
Amounts due from related parties |
|
|
|
|||||||||
Prepayments and other current assets |
|
|
|
|||||||||
Total current assets |
|
|
|
|||||||||
Non-current assets |
||||||||||||
Deferred tax assets |
|
|
|
|||||||||
Investments |
|
|
|
|||||||||
Property and equipment, net |
|
|
|
|||||||||
Intangible assets, net |
|
|
|
|||||||||
Right-of-use assets, net |
|
|
|
|||||||||
Prepayments and other non-current assets |
|
|
|
|||||||||
Total non-current assets |
|
|
|
|||||||||
Total assets |
|
|
|
|||||||||
Liabilities |
||||||||||||
Current liabilities |
||||||||||||
Accounts payable (including amounts of the consolidated variable interest entity and its subsidiaries (“VIEs”) without recourse to the Company of RMB RMB |
|
|
|
|||||||||
Deferred revenue (including amounts of the consolidated VIEs without recourse to the Company of RMB RM B |
|
|
|
|||||||||
Advances from customers (including amounts of the consolidated VIEs without recourse to the Company of RMB RMB |
|
|
|
|||||||||
Income taxes payable (including amounts of the consolidated VIEs without recourse to the Company of and RMB |
|
|
|
|
|
|
|
|
|
|
|
|
Accrued liabilities and other current liabilities (including amounts of the consolidated VIEs without recourse to the Company of RMB RMB |
|
|
|
|||||||||
Amounts due to related parties (including amounts of the consolidated VIEs without recourse to the Company of RMB RMB |
|
|
|
|||||||||
Lease liabilities due within one year (including amounts of the consolidated VIEs without recourse to the Company of |
|
|
|
|||||||||
Total current liabilities |
|
|
|
|||||||||
Non-current liabilities |
||||||||||||
Lease liabilities (including amounts of the consolidated VIEs without recourse to the Company of RMB |
|
|
|
|||||||||
Deferred revenue (including amounts of the consolidated VIEs without recourse to the Company of RMB R MB |
|
|
|
|||||||||
Total non-current liabilities |
|
|
|
|||||||||
Total liabilities |
|
|
|
|||||||||
Commitments and contingencies (Note 26) |
|
|
|
|
As of December 31, |
| |||||||||
|
|
201 8 |
|
|
2019 |
|
2019 |
| ||||
|
|
RMB |
|
|
RMB |
|
|
US$ |
| |||
|
|
|
|
|
|
(Note 2(e)) |
| |||||
Shareholders’ equity |
||||||||||||
Class A ordinary shares (US$ par value; and shares and shares issued and outstanding as of December 31, 2018 and 2019, |
|
|
|
|||||||||
Class B ordinary shares (US$ par value; and shares authorized, and shares issued and outstanding as of December 31, 2018 and 2019, |
|
|
|
|||||||||
Additional paid-in capital |
|
|
|
|||||||||
Statutory reserves |
|
|
|
|||||||||
Accumulated deficit |
( |
) |
( |
) |
( |
) | ||||||
Accumulated other comprehensive income |
|
|
|
|||||||||
Total shareholders’ equity |
|
|
|
|||||||||
Total liabilities and shareholders’ equity |
|
|
|
|||||||||
For the year ended December 31, |
||||||||||||||||
2017 |
2018 |
2019 |
2019 |
|||||||||||||
RMB |
RMB |
RMB |
US$ |
|||||||||||||
(Note 2(e)) |
||||||||||||||||
Net revenues |
||||||||||||||||
Live streaming |
|
|
|
|
||||||||||||
Advertising and others (including transactions with related parties of RMB RMB |
|
|
|
|
||||||||||||
Total net revenues |
|
|
|
|
||||||||||||
Cost of revenues (1) (including transactions with related parties of RMBand RMB |
( |
) | ( |
) | ( |
) | ( |
) | ||||||||
Gross P rofit |
|
|
|
|
||||||||||||
Operating expenses (1) |
||||||||||||||||
Research and development expenses (including transactions with Parent Company of RMB a nd2019, respectively) |
( |
) | ( |
) | ( |
) | ( |
) | ||||||||
Sales and marketing expenses (including transactions with related parties of RMB respectively) |
( |
) | ( |
) | ( |
) | ( |
) | ||||||||
General and administrative expenses (including transactions with Parent Company of RMB 2019, respectively) |
( |
) | ( |
) | ( |
) | ( |
) | ||||||||
Total operating expenses |
( |
) | ( |
) | ( |
) | ( |
) | ||||||||
Other income |
|
|
|
|
||||||||||||
Operating (loss) income |
( |
) | |
|
|
|||||||||||
Interest and short-term investments income |
|
|
|
|
||||||||||||
Fair value loss on derivative liabilities |
|
( |
) | |
|
|||||||||||
Foreign currency exchange gains, net |
|
|
|
|
||||||||||||
(Loss) income before income tax benefits (expenses) |
( |
) | ( |
) | |
|
||||||||||
Income tax benefits (expenses) |
|
|
( |
) | ( |
) | ||||||||||
(Loss) income before share of (loss) income in equity method investments, net of income taxes |
( |
) | ( |
) | |
|
||||||||||
Share of (loss) income in equity method investments, net of income taxes |
( |
) | |
( |
) | ( |
) | |||||||||
Net (loss) income attributable to HUYA Inc. |
( |
) | ( |
) | |
|
||||||||||
Accretion to Series A redeemable convertible preferred shares (“Preferred Shares”) |
( |
) | ( |
) | |
|
||||||||||
Deemed dividend to Series A Preferred Shareholders |
|
( |
) | |
|
|||||||||||
Net (loss) income attributable to ordinary shareholders |
( |
) | ( |
) | |
|
||||||||||
Net (loss) income |
( |
) | ( |
) | |
|
||||||||||
Other comprehensive income: |
||||||||||||||||
Foreign currency translation adjustments, net of nil tax |
|
|
|
|
||||||||||||
Total comprehensive ( loss) attributable to HUYA Inc. income |
( |
) | ( |
) | |
|
||||||||||
For the year ended December 31, |
||||||||||||||||
2017 |
2018 |
2019 |
2019 |
|||||||||||||
RMB |
RMB |
RMB |
US$ |
|||||||||||||
(Note 2(e)) |
||||||||||||||||
Net (loss) income per ADS* |
||||||||||||||||
—Basic |
( |
) | ( |
) | |
|
||||||||||
—Diluted |
|
|
( |
) |
|
|
( |
) |
|
|
|
|
|
|
|
|
Weighted average number of ADSs used in calculating net (loss) income per ADS |
||||||||||||||||
—Basic |
|
|
|
|
||||||||||||
—Diluted |
|
|
|
|
|
|
|
|
|
|
|
|
|
|
| |
|
|
|
|
|
|
|
|
|
|
|
|
|
|
|
|
|
Net (loss) income per ordinary share* |
||||||||||||||||
—Basic |
( |
) | ( |
) | |
|
||||||||||
—Diluted |
|
|
( |
) |
|
|
( |
) |
|
|
|
|
|
|
|
|
Weighted average number of ordinary shares used in calculating net (loss) income per ordinary share |
||||||||||||||||
—Basic |
|
|
|
|
||||||||||||
—Diluted |
|
|
|
|
|
|
|
|
|
|
|
|
|
|
|
|
* | Each ADS represents one Class A ordinary share. |
For the year ended December 31, |
||||||||||||||||
2017 |
2018 |
2019 |
2019 |
|||||||||||||
RMB |
RMB |
RMB |
US$ |
|||||||||||||
(Note 2(e)) |
||||||||||||||||
Cost of revenues |
|
|
|
|
||||||||||||
Research and development expenses |
|
|
|
|
||||||||||||
Sales and marketing expenses |
|
|
|
|
||||||||||||
General and administrative expenses |
|
|
|
|
Class A ordinary shares |
Class B ordinary shares |
Additional paid-in |
Parent Company |
Accumulated |
Accumulated other comprehensive |
Total shareholders’ |
||||||||||||||||||||||||||||||
Shares |
Amount |
Shares |
Amount |
capital |
deficit |
deficit |
income |
(deficit) equity |
||||||||||||||||||||||||||||
RMB |
RMB |
RMB |
RMB |
RMB |
RMB |
RMB |
||||||||||||||||||||||||||||||
Balance at January 1, 2017 |
— |
— |
— |
— |
— |
( |
) | — |
— |
( |
) | |||||||||||||||||||||||||
Net increase in Parent Company investment |
— |
— |
— |
— |
— |
|
— |
— |
|
|||||||||||||||||||||||||||
Consummation of the c arve-out |
— |
— |
— |
— |
|
( |
) | — |
— |
— |
||||||||||||||||||||||||||
Capital contribution from VIE of JO YY |
— |
— |
— |
— |
|
— |
— |
— |
|
|||||||||||||||||||||||||||
Deemed contribution from JO YY |
— |
— |
— |
— |
|
— |
— |
— |
|
|||||||||||||||||||||||||||
Issuance of ordinary shares |
|
|
|
|
— |
— |
— |
— |
|
|||||||||||||||||||||||||||
Share-based compensation related to JO YY’s Share-based Awards |
— |
— |
— |
— |
|
— |
— |
— |
|
|||||||||||||||||||||||||||
Share-based compensation related to Huya Share-based Awards |
— |
— |
— |
— |
|
— |
— |
— |
|
|||||||||||||||||||||||||||
Share-based compensation related to the Chief Executive Officer’s (“CEO’s”) Awards |
— |
— |
— |
— |
|
— |
— |
— |
|
|||||||||||||||||||||||||||
Accretion to Series A Preferred Shares redemption value |
— |
— |
— |
— |
( |
) | — |
— |
— |
( |
) | |||||||||||||||||||||||||
Net loss |
— |
— |
— |
— |
— |
— |
( |
) | — |
( |
) | |||||||||||||||||||||||||
Foreign currency translation adjustment, net of nil tax |
— |
— |
— |
— |
— |
— |
— |
|
|
|||||||||||||||||||||||||||
Balance at December 31, 2017 |
|
|
|
|
|
— |
( |
) | |
|
||||||||||||||||||||||||||
|
Class A ordinary shares |
|
|
Class B ordinary shares |
|
|
Additional paid-in |
|
|
Statutory |
|
|
Accumulated |
|
|
Accumulated other comprehensive |
|
|
Total shareholders’ |
| ||||||||||||||||
|
Shares |
|
|
Amount |
|
|
Shares |
|
|
Amount |
|
|
capital |
|
|
reserves |
|
|
deficit |
|
|
income |
|
|
equity |
| ||||||||||
RMB |
RMB |
RMB |
RMB |
RMB |
RMB |
RMB |
||||||||||||||||||||||||||||||
Balance a t December 31, 2017 |
|
|
|
|
|
— |
( |
) |
|
|
||||||||||||||||||||||||||
Share-based compensation related to J YY’s Share-based Awards O |
— |
— |
— |
— |
|
— |
— |
— |
|
|||||||||||||||||||||||||||
Share-based compensation related to Huya Share-based Awards |
— |
— |
— |
— |
|
— |
— |
— |
|
|||||||||||||||||||||||||||
Class B ordinary shares converted to Class A ordinary shares resulted from the transfer of such shares from JO YY to other investors |
|
|
( |
) |
( |
) |
— |
— |
— |
— |
— |
|||||||||||||||||||||||||
Accretion to Series A Preferred Shares redemption value prior to the extinguishment |
— |
— |
— |
— |
( |
) |
— |
— |
— |
( |
) | |||||||||||||||||||||||||
Accretion to Series A Preferred Shares redemption value post the extinguishment |
— |
— |
— |
— |
( |
) |
— |
( |
) |
— |
( |
) | ||||||||||||||||||||||||
Accretion to Series B-2 Preferred Shares redemption value |
— |
— |
— |
— |
( |
) |
— |
( |
) |
— |
( |
) | ||||||||||||||||||||||||
Deemed dividend to Series A Preferred Shareholders |
— |
— |
— |
— |
( |
) |
— |
( |
) |
— |
( |
) | ||||||||||||||||||||||||
Issuance of Class A ordinary shares upon the completion of the initial public offering (“IPO”) |
|
|
— |
— |
|
— |
— |
— |
|
|||||||||||||||||||||||||||
Conversion of Series A Preferred Shares to ordinary shares upon the completion of the IPO |
|
|
|
|
|
— |
— |
— |
|
|||||||||||||||||||||||||||
Conversion of Series B-2 Preferred Shares to ordinary shares upon the completion of the IPO |
— |
— |
|
|
|
— |
— |
— |
|
|||||||||||||||||||||||||||
Derecognition of derivative liabilities upon conversion |
— |
— |
— |
— |
|
— |
— |
— |
|
|||||||||||||||||||||||||||
Appropriation to statutory reserves |
— |
— |
— |
— |
— |
|
( |
) |
— |
— |
||||||||||||||||||||||||||
Net loss |
— |
— |
— |
— |
— |
— |
( |
) |
— |
( |
) | |||||||||||||||||||||||||
Foreign currency translation adjustment, net of nil tax |
— |
— |
— |
— |
— |
— |
— |
|
|
|||||||||||||||||||||||||||
Balance at December 31, 2018 |
|
|
|
|
|
|
( |
) |
|
|
||||||||||||||||||||||||||
Class A ordinary shares |
Class B ordinary shares |
Additional paid-in |
Statutory |
Accumulated |
Accumulated other comprehensive |
Total shareholders’ |
||||||||||||||||||||||||||||||
Shares |
Amount |
Shares |
Amount |
capital |
reserves |
deficit |
income |
equity |
||||||||||||||||||||||||||||
RMB |
RMB |
RMB |
RMB |
RMB |
RMB |
RMB |
||||||||||||||||||||||||||||||
Balance a t December 31, 2018 |
|
|
|
|
|
|
( |
) | |
|
||||||||||||||||||||||||||
Share-based compensation related to J YY’s Share-based Awards O |
— |
— |
— |
— |
|
— |
— |
— |
|
|||||||||||||||||||||||||||
Share-based compensation related to Huya Share-based Awards |
— |
— |
— |
— |
|
— |
— |
— |
|
|||||||||||||||||||||||||||
Class B ordinary shares converted to Class A ordinary shares |
|
|
( |
) | ( |
) | — |
— |
— |
— |
— |
|||||||||||||||||||||||||
Issuance of Class A ordinary shares upon the completion of the follow-on public offering |
|
|
— |
— |
|
— |
— |
— |
|
|||||||||||||||||||||||||||
Issuance of ordinary shares for exercised share options |
|
|
— |
— |
|
— |
— |
— |
|
|||||||||||||||||||||||||||
Issuance of ordinary shares for restricted share units |
|
— |
— |
— |
— |
— |
— |
— |
— |
|||||||||||||||||||||||||||
Deemed distribution to JOYY |
— |
— |
— |
— |
( |
) | — |
— |
— |
( |
) | |||||||||||||||||||||||||
Appropriation to statutory reserves |
— |
— |
— |
— |
— |
|
( |
) | — |
— |
||||||||||||||||||||||||||
Net income |
— |
— |
— |
— |
— |
— |
|
— |
|
|||||||||||||||||||||||||||
Foreign currency translation adjustment, net of nil tax |
— |
— |
— |
— |
— |
— |
— |
|
|
|||||||||||||||||||||||||||
Balance at December 31, 2019 |
|
|
|
|
|
|
( |
) | |
|
||||||||||||||||||||||||||
For the year ended December 31, |
||||||||||||||||
2017 |
2018 |
2019 |
2019 |
|||||||||||||
RMB |
RMB |
RMB |
US$ |
|||||||||||||
Cash flows from operating activities |
||||||||||||||||
Net (loss) income attributable to HUYA Inc. |
( |
) | ( |
) | ||||||||||||
Adjustments to reconcile net (loss) income to net cash provided by operating activities |
||||||||||||||||
Depreciation of property and equipment |
||||||||||||||||
Amortization of acquired intangible assets |
||||||||||||||||
Amortization of right-of-use assets |
— |
— |
||||||||||||||
Allowance for doubtful accounts |
— |
— |
||||||||||||||
Loss (gain) on disposal of property and equipment and other long-term assets |
( |
) | ( |
) | ||||||||||||
Share-based compensation |
||||||||||||||||
Share of loss (income) in equity method investments, net of income taxes |
( |
) | ||||||||||||||
Other non-cash expense |
— |
— |
— |
|||||||||||||
Other non-cash income |
— |
— |
( |
) |
( |
) | ||||||||||
Defe r red income taxes |
— |
( |
) |
( |
) |
( |
) | |||||||||
Fair value loss of derivative liabilities |
— |
— |
— |
|||||||||||||
Short-term investments income |
— |
( |
) | ( |
) | ( |
) | |||||||||
Foreign currency exchange gains |
— |
( |
) | ( |
) | ( |
) | |||||||||
Changes in operating assets and liabilities: |
||||||||||||||||
Accounts receivable |
( |
) | ( |
) | ( |
) | ( |
) | ||||||||
Prepayments and other assets |
( |
) | ( |
) | ( |
) | ( |
) | ||||||||
Amounts due from related parties |
( |
) | ( |
) | ||||||||||||
Accounts payable |
( |
) | ||||||||||||||
Amounts due to related parties |
||||||||||||||||
Deferred revenue |
||||||||||||||||
Lease liabilities |
— |
— |
( |
) | ( |
) | ||||||||||
Advances from customers |
||||||||||||||||
Accrued liabilities and other current liabilities |
||||||||||||||||
Income tax payable |
— |
— |
||||||||||||||
Net cash provided by operating activities |
||||||||||||||||
Cash flows from investing activities |
||||||||||||||||
Placements of short-term deposits |
( |
) | ( |
) | ( |
) | ( |
) | ||||||||
Maturities of short-term deposits |
||||||||||||||||
Cash paid to purchase short-term deposits together with JOYY |
( |
) |
— |
— |
— |
|||||||||||
Cash received in connection with purchasing short-term deposits together with JOYY |
— |
— |
— |
|||||||||||||
Placement of short-term investments |
— |
( |
) | ( |
) | ( |
) | |||||||||
Maturities of short-term investments |
— |
|||||||||||||||
Purchase of property and equipment |
( |
) | ( |
) | ( |
) | ( |
) | ||||||||
Purchase of intangible assets |
( |
) | ( |
) | ( |
) | ( |
) | ||||||||
Cash paid for long-term investments |
( |
) | ( |
) | ( |
) | ( |
) | ||||||||
Prepayment for long-term investments |
— |
( |
) | — |
— |
|||||||||||
Cash received from disposal of an investment |
— |
— |
— |
|||||||||||||
Cash paid for other non-current assets |
( |
) | — |
— |
— |
|||||||||||
Proceeds from disposal of property and equipment |
||||||||||||||||
Loan to a third party |
— |
— |
( |
) |
( |
) | ||||||||||
Net cash used in investing activities |
( |
) | ( |
) | ( |
) | ( |
) | ||||||||
For the year ended December 31, |
||||||||||||||||
2017 |
2018 |
2019 |
2019 |
|||||||||||||
RMB |
RMB |
RMB |
US$ (Note 2(e)) |
|||||||||||||
Cash flows from financing activities |
||||||||||||||||
Net increase in Parent Company investment |
— |
— |
— |
|||||||||||||
Capital injection from VIE of JO YY |
— |
— |
— |
|||||||||||||
Proceeds from issuance of Series A Preferred Shares |
— |
— |
— |
|||||||||||||
Proceeds from issuance of Series B-2 Preferred Shares |
— |
— |
— |
|||||||||||||
Net proceeds from issuance of ordinary shares upon IPO |
— |
— |
— |
|||||||||||||
Net proceeds from issuance of ordinary shares upon follow-on public offering |
— |
— |
||||||||||||||
Proceeds from exercise of vested share options |
— |
— |
||||||||||||||
Net cash provided by financing activities |
||||||||||||||||
Net increase in cash and cash equivalents |
||||||||||||||||
Cash and cash equivalents at the beginning of the year |
||||||||||||||||
Effect of exchange rate changes on cash and cash equivalents |
( |
) | ( |
) | ||||||||||||
Cash and cash equivalents at the end of the year |
||||||||||||||||
For the year ended December 31, |
||||||||||||||||
2017 |
2018 |
2019 |
2019 |
|||||||||||||
RMB |
RMB |
RMB |
US$ (Note 2(e)) |
|||||||||||||
Supplemental disclosure of cash flows information: |
||||||||||||||||
- Income tax paid |
— |
— |
||||||||||||||
- Acquisition of property and equipment in form of accounts payable and amounts due to parent company |
||||||||||||||||
- Non-cash transaction for acquiring an equity investment |
— |
— |
1. |
Organization and principal activities |
(a) |
Organization and principal activities |
(b) |
Public o ffering |
( c ) |
Principal subsidiaries and VIEs |
Name |
Place of incorporation |
Date of incorporation |
% of direct or indirect economic ownership |
Principal activities | ||||||||||
Wholly foreign-owned enterprise (“WFOE”) |
||||||||||||||
Huya Limited |
% | |||||||||||||
Guangzhou Huya Technology Co., Ltd. (“Huya Technology”) |
% | |||||||||||||
HUYA PTE. LTD. |
% | |||||||||||||
VIE |
||||||||||||||
Guangzhou Huya Information Technology Co., Ltd. |
% |
1. |
Organization and principal activities (continued) |
( d ) |
Variable interest entities |
1. |
Organization and principal activities (continued) |
( d ) |
Variable interest entities (continued) |
• | Exclusive Business Cooperation Agreement |
• | Exclusive Purchase Option Agreement |
• | Equity Pledge Agreement |
• | Power of Attorney |
1. |
Organization and principal activities (continued) |
( d ) |
Variable interest entities (continued) |
• | revoke or refuse to grant or renew the Group’s business and operating licenses; |
• | restrict or prohibit related party transactions between the wholly owned subsidiary of the Group and the VIE; |
• | impose fines, confiscate income or other requirements which the Group may find difficult or impossible to comply with; |
• | require the Group to alter, discontinue or restrict its operations; |
• | restrict or prohibit the Group’s ability to finance its operations, and; |
• | take other regulatory or enforcement actions against the Group that could be harmful to the Group’s business. |
1. |
Organization and principal activities (continued) |
( d ) |
Variable interest entities (continued) |
As of December 31, |
||||||||
2018 |
2019 |
|||||||
RMB |
RMB |
|||||||
Assets |
||||||||
Current assets |
||||||||
Cash and cash equivalents |
||||||||
Restr icted c ash |
||||||||
Short-term deposits |
||||||||
Short-term investments |
||||||||
Accounts receivable, net |
||||||||
Amounts due from related parties |
||||||||
Prepayments and other current assets |
||||||||
Total current assets |
||||||||
Non-current assets |
||||||||
Deferred tax assets |
||||||||
Investments |
||||||||
Property and equipment, net |
||||||||
Intangible assets, net |
||||||||
Right of use assets, net |
||||||||
Prepayments and other non-current assets |
||||||||
Total non-current assets |
||||||||
Total assets |
||||||||
Liabilities |
||||||||
Current liabilities |
||||||||
Accounts payable |
||||||||
Deferred revenue |
||||||||
Advances from customers |
||||||||
Income taxes payable |
— |
|||||||
Accrued liabilities and other current liabilities |
||||||||
Amounts due to related parties |
||||||||
Lease liabilities due within one year |
— |
|||||||
Total current liabilities |
||||||||
Non-current liabilities |
||||||||
Lease liabilities |
— |
|||||||
Deferred revenue |
||||||||
Total non-current liabilities |
||||||||
Total liabilities |
||||||||
1. |
Organization and principal activities (continued) |
( d ) |
Variable interest entities (continued) |
For the year ended December 31, |
||||||||||||
2017 |
2018 |
2019 |
||||||||||
RMB |
RMB |
RMB |
||||||||||
Net revenues |
||||||||||||
Net (loss) income |
( |
) |
For the year ended December 31, |
||||||||||||
2017 |
2018 |
2019 |
||||||||||
RMB |
RMB |
RMB |
||||||||||
Net cash provided by operating activities |
||||||||||||
Net cash used in investing activities |
( |
) | ( |
) | ( |
) | ||||||
Net cash provided by (used in) financing activities |
( |
) | ( |
) |
2. |
Principal accounting policies |
(a) |
Basis of presentation |
(b) |
Consolidation |
(c) |
Use of estimates |
(d) |
Foreign currency translation |
2. |
Principal accounting policies (continued) |
(e) |
Convenience translation |
(f) |
Cash and cash equivalents |
i) | Readily convertible to known amounts of cash throughout the maturity period; |
ii) | So near their maturity that they present insignificant risk of changes in value because of changes in interest rates. |
(g) |
Short-term deposits |
(h) |
Short-term investments |
(i) |
Accounts receivable |
2. |
Principal accounting policies (continued) |
(j) |
Investment |
(k) |
Property and equipment |
Estimated useful lives |
Residual rate |
|||||||
Servers, computers and equipment |
%- |
% | ||||||
Leasehold improvement |
% | |||||||
Others |
% |
2. |
Principal accounting policies (continued) |
(l) |
Intangible assets |
Estimated useful lives |
||||
License |
||||
Copyrights of video content |
||||
Domain names |
||||
Software |
||||
Trademark |
(m) |
Impairment of long-lived assets |
(n) |
Mezzanine equity |
2. |
Principal accounting policies (continued) |
(o) |
Revenue |
For the year ended December 31, |
||||||||||||
2017 |
2018 |
2019 |
||||||||||
RMB |
RMB |
RMB |
||||||||||
Live streaming |
|
|
|
|||||||||
Other revenues (i) |
|
|
|
|||||||||
Total |
|
|
|
|||||||||
( i ) |
Other revenues mainly include advertising and online games revenues. |
(i) |
Live streaming |
2. |
Principal accounting policies (continued) |
(o) |
Revenue (continued) |
(i) |
Live streaming (continued) |
2. |
Principal accounting policies (continued) |
(o) |
Revenue (continued) |
(ii) |
Advertising |
2. |
Principal accounting policies (continued) |
(o) |
Revenue (continued) |
(iii) |
Online games revenues |
2. |
Principal accounting policies (continued) |
(o) |
Revenue (continued) |
2020 |
2021 and after |
Total |
||||||||||
RMB |
RMB |
RMB |
||||||||||
Revenue expected to be recognized |
2. |
Principal accounting policies (continued) |
(p) |
Cost of revenues |
(q) |
Research and development expenses |
(r) |
Sales and marketing expenses |
(s) |
General and administrative expenses |
(t) |
Employee social security and welfare benefits |
2. |
Principal accounting policies (continued) |
(u) |
Share-based compensation |
2. |
Principal accounting policies (continued) |
(u) |
Share-based compensation (continued) |
2. |
Principal accounting policies (continued) |
(v) |
Leases |
(w) |
Income taxes |
2. |
Principal accounting policies (continued) |
(x) |
Statutory reserves |
(y) |
Related parties |
(z) |
Dividends |
(aa) |
( Loss) per shareincome |
(bb) |
Segment reporting |
2. |
Principal accounting policies (continued) |
(cc) |
Recently issued accounting pronouncements |
3. |
Certain risks |
(a) |
Foreign exchange risk |
(b) |
Credit risk |
4. |
Cash and cash equivalents |
December 31, 2018 |
December 31, 2019 |
|||||||||||||||
Amount |
RMB equivalent |
Amount |
RMB equivalent |
|||||||||||||
RMB |
|
|
|
|
||||||||||||
US$ |
|
|
|
|
||||||||||||
SGD$ |
|
|
— |
|
|
|
— |
|
|
|
|
|
|
|
|
|
Total |
|
|
||||||||||||||
5. |
Restricted cash |
6. |
Short-term deposits |
December 31, 2018 |
December 31, 2019 |
|||||||||||||||
Amount |
RMB equivalent |
Amount |
RMB equivalent |
|||||||||||||
RMB |
||||||||||||||||
US$ |
||||||||||||||||
Total |
||||||||||||||||
7. |
Short-term investments |
December 31, 2018 |
December 31, 2019 |
|||||||||||||||
Amount |
RMB equivalent |
Amount |
RMB equivalent |
|||||||||||||
RMB |
||||||||||||||||
US$ |
— |
— |
||||||||||||||
Total |
||||||||||||||||
8 . |
Accounts receivable, net |
December 31, |
||||||||
2018 |
2019 |
|||||||
RMB |
RMB |
|||||||
Accounts receivable, gross |
||||||||
Less: allowance for doubtful receivables |
( |
) | ( |
) | ||||
Accounts receivable, net |
||||||||
For the year ended December 31, |
||||||||||||
2017 |
2018 |
2019 |
||||||||||
RMB |
RMB |
RMB |
||||||||||
Balance at beginning of the year |
— |
( |
) | ( |
) | |||||||
Additions charged to general and administrative expenses, net of recoveries |
( |
) | ( |
) | — |
|||||||
Write-off during the year |
— |
|||||||||||
Balance at end of the year |
( |
) | ( |
) | ( |
) | ||||||
9 . |
Prepayments and other current assets |
December 31, |
||||||||
2018 |
2019 |
|||||||
RMB |
RMB |
|||||||
Prepayments to vendors and content providers |
||||||||
Interests receivable |
||||||||
Loan to a third party |
||||||||
Receivables from exercise of vested share options |
||||||||
Others |
||||||||
Total |
||||||||
10 . |
Investments |
December 31, |
||||||||
2018 |
2019 |
|||||||
RMB |
RMB |
|||||||
Equity method investments (i) |
||||||||
Equity investments without readily determinable fair values (ii) (iii) |
||||||||
(i) | In April 2018, the Company, through Guangzhou Huya, together with Guangzhou Huaduo Network Technology Co., Ltd. (“Guangzhou Huaduo”), a consolidated VIE of JOYY, set up an onshore investment fund with capital injection amounted to RMB 810-10-15-14, the investment fund is considered to be a VIE. The Company is not considered the primary beneficiary of the investment fund due to the fact that it’s JOYY but not the Company to possess the power to direct activities of the investment fund that would most significantly impact its economic performance. As a result, JOYY is the primary beneficiary of the investment fund and then consolidates the fund, and the Company accounts for its 66% financial interest in the investment fund using the equity method of accounting pursuant to ASC 323-30 considering that the Company has significant influence over the partnership operating and financial policies. |
10 . |
Investments (continued) |
(ii) | In February 2018, the Company disposed of an investment carried at RMB |
(iii) | In 2018 an 2019, the Company acquired equity interests of d and privately-held entities that engages primarily in the business of broadcaster management with a total consideration of RMB . |
1 1 . |
Property and equipment, net |
December 31, |
||||||||
2018 |
2019 |
|||||||
RMB |
RMB |
|||||||
Gross carrying amount |
||||||||
Servers, computers and equipment |
|
|
||||||
Leasehold improvement |
|
|
— |
|
|
|
|
|
Others |
|
|
||||||
|
|
|
|
|
|
|
|
|
Total |
|
|
||||||
Less: accumulated depreciation |
( |
) | ( |
) | ||||
Property and equipment, net |
|
|
||||||
1 2 . |
Intangible assets, net |
December 31, |
||||||||
2018 |
2019 |
|||||||
RMB |
RMB |
|||||||
Gross carrying amount |
||||||||
License |
|
|
||||||
Copyrights of video content |
|
|
||||||
Domain names |
|
|
||||||
Software |
|
|
||||||
Trademark |
|
|
||||||
Total of gross carrying amount |
|
|
||||||
Less: accumulated amortization |
||||||||
License |
( |
) | ( |
) | ||||
Copyrights of video content |
( |
) | ( |
) | ||||
Domain names |
( |
) | ( |
) | ||||
Software |
( |
) | ( |
) | ||||
Trademark |
( |
) | ( |
) | ||||
Total accumulated amortization |
( |
) | ( |
) | ||||
Intangible assets, net |
|
|
||||||
Year ended December 31, |
Amortization expense of intangible assets |
|||
RMB |
||||
2020 |
|
|||
2021 |
|
|||
2022 |
|
|||
2023 |
|
|||
2024 |
|
December 31, |
||||||||
2018 |
2019 |
|||||||
License |
|
years |
||||||
Copyrights of video content |
|
years |
||||||
Domain names |
|
years |
||||||
Software |
|
year |
||||||
Trademark |
|
years |
13. |
Prepayments and other non-current assets |
December 31, |
||||||||
2018 |
2019 |
|||||||
RMB |
RMB |
|||||||
Prepayments to vendors and content providers |
|
|
||||||
Refundable l |
|
|
||||||
Prepayments for equity investments |
|
|
|
|
|
|
|
|
Others |
|
|
||||||
Total |
|
|
||||||
14 . |
Deferred revenue |
December 31, |
||||||||
2018 |
2019 |
|||||||
RMB |
RMB |
|||||||
Deferred revenue, current: |
||||||||
Live streaming |
|
|
||||||
Others |
|
|
||||||
Total current deferred revenue |
|
|
||||||
Deferred revenue, non-current: |
||||||||
Live streaming |
|
|
||||||
Total non-current deferred revenue |
|
|
||||||
1 5 . |
Accrued liabilities and other current liabilities |
December 31, |
||||||||
2018 |
2019 |
|||||||
RMB |
RMB |
|||||||
Revenue sharing fees |
|
|
||||||
Salaries and welfare |
|
|
||||||
Bandwidth costs |
|
|
||||||
Marketing and promotion expenses |
|
|
||||||
License fees |
|
|
||||||
Deposits from content providers, suppliers and advertising customers |
|
|
||||||
Other taxes payable |
|
|
||||||
Others |
|
|
||||||
Total |
|
|
||||||
1 6 . |
Cost of revenues |
For the year ended December 31, |
||||||||||||
2017 |
2018 |
2019 |
||||||||||
RMB |
RMB |
RMB |
||||||||||
Revenue sharing fees and content costs |
|
|
|
|||||||||
Bandwidth costs |
|
|
|
|||||||||
Salaries and welfare |
|
|
|
|||||||||
Payment handling costs |
|
|
|
|||||||||
Depreciation and amortization |
|
|
|
|
|
|
|
|
|
|
|
|
Share-based compensation |
|
|
|
|
|
|
|
|
|
|
|
|
Other taxes and surcharges |
|
|
|
|||||||||
Others |
|
|
|
|||||||||
Total |
|
|
|
|||||||||
1 7 . |
Other income |
1 8 . |
Taxation |
(a) |
PRC value-added tax and related surcharges |
(b) |
Income taxes |
1 8 . |
Taxation (continued) |
(b) |
Income taxes (continued) |
• |
Huya Technology was qualified as a Software Enterprise, and enjoyed the zero preferential tax rate starting from 2017 and 12.5% preferential tax rate starting from 2019. In 2019, Huya Technology is qualified as a KNSE and applied the income tax rate of 10% for the year of 2019 pursuant to SAT Public Notice [2018] No.23 (“Circular 23”). |
• |
Guangzhou Huya applied for the HNTE qualification and obtained approval in November 2018. It entitled to enjoy the preferential tax rate of 15% as an HNTE for three years starting from 2018, and should apply for HNTE qualification renewal in 2021. |
• | Most of the remaining PRC subsidiaries and VIEs were subject to |
1 8 . |
Taxation (continued) |
(b) |
Income taxes (continued) |
1 8 . |
Taxation (continued) |
(b) |
Income taxes (continued) |
For the year ended December 31, |
||||||||||||
2017 |
2018 |
2019 |
||||||||||
RMB |
RMB |
RMB |
||||||||||
PRC entities |
( |
) | |
|
||||||||
Non PRC entities (i) |
( |
) | ( |
) | ( |
) | ||||||
Total |
( |
) | ( |
) | | |||||||
(i) |
The loss before tax incurred by non-PRC entities for the year ended December 31, 2018 was mainly due to the fair value loss on derivative liabilities amounting to RMB |
For the year ended December 31, |
||||||||||||
2017 |
2018 |
2019 |
||||||||||
RMB |
RMB |
RMB |
||||||||||
Income tax benefits (expenses) applicable to China operations |
||||||||||||
Current income tax expenses |
— |
— |
( |
) | ||||||||
Deferred income tax benefits (i) |
— |
|
|
|||||||||
Subtotal income tax benefits (expenses) applicable to China operations |
— |
|
( |
) | ||||||||
Income tax expenses applicable to Non PRC operations |
|
|
|
|
|
|
|
|
|
|
|
|
Current income tax expenses |
— |
— |
( |
) | ||||||||
Total income tax benefits (expenses) |
— |
|
( |
) | ||||||||
(i) |
For the year ended December 31, 2017, the Group has incurred net accumulated operating losses since inception. As of December 31, 2017, the Group believed that it is more likely than not that these net accumulated operating losses and other deferred tax assets would not be utilized. Therefore, the Group has provided full valuation allowances for the deferred tax assets as of December 31, 2017. |
1 8 . |
Taxation (continued) |
(b) |
Income taxes (continued) |
For the year ended December 31, |
||||||||||||
2017 |
2018 |
2019 |
||||||||||
PRC Statutory income tax rate |
( |
)% |
( |
)% |
( |
)% | ||||||
Effect of tax holiday and preferential tax benefit |
( |
)% |
( |
)% |
|
% | ||||||
Effect of different tax rates available to different jurisdictions (i) |
|
% |
|
% |
|
% | ||||||
Permanent differences (ii) |
|
% |
|
% |
( |
)% | ||||||
Change in valuation allowance |
|
% |
( |
)% |
( |
)% | ||||||
Effect of Super Deduction available to the Group |
( |
)% |
( |
)% |
|
% | ||||||
Effective income tax rate |
— |
( |
)% |
( |
)% | |||||||
Effect of tax holidays inside the PRC on basic earnings per share/ADS (RMB) |
— |
|
|
|||||||||
(i) |
For the year ended December 31, 2017, effect of different tax rates available to different jurisdictions is mainly driven by the interest income derived from short term deposits which are subject to an income tax rate of 0% under the tax laws of Cayman Islands. |
(ii) |
Permanent differences mainly arise from expenses not deductible for tax purposes including primarily share-based compensation costs and expenses incurred by subsidiaries and VIEs. |
18. |
Taxation (continued) |
(b) |
Income taxes (continued) |
December 31, |
||||||||
2018 |
2019 |
|||||||
RMB |
RMB |
|||||||
Deferred tax assets |
||||||||
Tax loss carried forward |
|
|
||||||
Deferred revenue |
|
|
||||||
Others |
|
|
||||||
|
|
|||||||
Less: Valuation allowance (i) |
( |
) |
( |
) | ||||
Total deferred tax assets |
|
|
||||||
Deferred tax liabilities |
||||||||
Related to the fair value change of equity investee’s investments |
|
|
||||||
Total deferred tax liabilities |
|
|
||||||
Net deferred tax assets |
|
|
||||||
(i) | Valuation allowance is provided against deferred tax assets when the Group determines that it is more likely than not that the deferred tax assets will not be utilized in the future. In making such determination, the Group considered factors including future taxable income exclusive of reversing temporary differences and tax loss carry forwards. Valuation allowance as of December 31, 2018 and 2019 were provided for net operating loss carry forward, which was mainly incurred by the overseas subsidiaries, because such deferred tax assets are not more likely than not to be realized based on the Group’s estimate of its future taxable income. If events occur in the future that allow the Group to realize more of its deferred income tax than the presently recorded amounts, an adjustment to the valuation allowances will result in a decrease in tax expense when those events occur. |
For the year ended December 31, |
||||||||||||
2017 |
2018 |
2019 |
||||||||||
RMB |
RMB |
RMB |
||||||||||
Balance at beginning of the year |
|
|
|
|||||||||
Additions |
|
|
|
|||||||||
Reversals/write-off |
( |
) | ( |
) | ( |
) | ||||||
Balance at end of the year |
|
|
|
|||||||||
1 9 . |
Ordinary shares |
20 . |
Redeemable convertible preferred shares |
20 . |
Redeemable convertible preferred shares (continued) |
20 . |
Redeemable convertible preferred shares (continued) |
20 . |
Redeemable convertible preferred shares (continued) |
20 . |
Redeemable convertible preferred shares (continued) |
20 . |
Redeemable convertible preferred shares (continued) |
20 . |
Redeemable convertible preferred shares (continued) |
20 . |
Redeemable convertible preferred shares (continued) |
20 . |
Redeemable convertible preferred shares (continued) |
Prior to the extinguishment |
Number of shares |
Amount |
||||||
RMB |
||||||||
Mezzanine equity balance as of January 1, 2017 |
— |
— |
||||||
Issuance as of July 10, 2017 |
|
|
||||||
Accretion to Series A Preferred Shares redemption value prior to the extinguishment |
— |
|
||||||
Foreign exchange |
— |
( |
) | |||||
Mezzanine equity balance as of December 31, 2017 |
|
|
||||||
Mezzanine equity balance as of January 1, 2018 |
|
|
||||||
Accretion to Series A Preferred Shares redemption value prior to the extinguishment |
— |
|
||||||
Foreign exchange |
— |
( |
) | |||||
Mezzanine equity balance as of March 8, 2018 |
|
|
||||||
Post extinguishment |
Number of shares |
Amount |
||||||
RMB |
||||||||
Mezzanine equity balance as of the extinguishment date |
|
|
||||||
Revaluation of fair value of the whole instrument upon the extinguishment as of March 8, 2018, recognized as deemed dividend to Series A Preferred Shareholders |
— |
|
||||||
Bifurcation of conversion feature as of March 8, 2018 |
— |
( |
) | |||||
Accretion to Series A Preferred Shares redemption value from March 9, 2018 to May 10, 2018 |
— |
|
||||||
Foreign exchange |
— |
|
||||||
Conversion of Preferred Shares to ordinary shares upon the completion of the IPO |
( |
) | ( |
) | ||||
Mezzanine equity balance as of December 31, 2018 |
|
|
||||||
20 . |
Redeemable convertible preferred shares (continued) |
2 1 . |
Share-based compensation |
For the year ended December 31, |
||||||||||||
2017 |
2018 |
2019 |
||||||||||
RMB |
RMB |
RMB |
||||||||||
Share-based compensation expenses |
||||||||||||
- Related to JO YY’s Share-based Awards |
|
|
|
|||||||||
- Related to Huya Share-based Awards |
|
|
|
|||||||||
- Related to CEO’s Awards |
|
— |
|
|||||||||
Total |
|
|
|
|||||||||
(a) |
JO YY’s Share-based Awards |
2 1 . |
Share-based compensation (continued) |
(b) |
Huya Share-based Awards |
Number of options |
Weighted average exercise price (US$) |
Weighted average remaining contractual life (years) |
Aggregate intrinsic value (US$) |
|||||||||||||
As of December 31, 2016 |
|
|
— |
|
||||||||||||
Granted |
|
|
||||||||||||||
Forfeited |
( |
) | |
|||||||||||||
As of December 31, 2017 |
|
|
|
|
||||||||||||
Granted |
|
|
|
|
||||||||||||
Forfeited |
( |
) | |
|
|
|||||||||||
Cancelled |
|
|
( |
) |
|
|
|
|
|
|
|
|
|
|
|
|
As of December 31, 2018 |
|
|
|
|
|
|
|
|
|
|
|
|
|
|
|
|
Forfeited |
|
|
( |
) | |
|
|
|
|
|
|
|
|
|
|
|
Exercised |
|
|
( |
) |
|
|
|
|
|
|
|
|
|
|
|
|
As of December 31, 2019 |
|
|
|
|
||||||||||||
Expected to vest at December 31, 2019 |
|
|
|
|
||||||||||||
Exercisable as of December 31, 2019 |
|
|
|
|
||||||||||||
2 1 . |
Share-based compensation (continued) |
(b) |
Huya Share-based Awards (continued) |
201 7 |
|
201 8 |
| |||||
Weighted average fair value per option granted |
US$ |
|
|
US$ |
|
| ||
Weighted average exercise price |
US$ | |
|
US$ |
|
| ||
Risk-free interest rate (1) |
|
% |
|
|
% | |||
Expected term (in year) (2) |
|
|
|
|
| |||
Expected volatility (3) |
|
% |
|
|
% | |||
Dividend yield (4) |
|
|
|
(1) | The risk-free interest rate of periods within the contractual life of the share option is based on the China Government Bond yield as at the valuation dates. |
(2) | The expected term is the contract life of the option. |
(3) | Expected volatility is estimated based on the average of historical volatilities of the comparable companies in the same industry as at the valuation dates. |
(4) | The Company has no history or expectation of paying dividend on its ordinary shares. The expected dividend yield was estimated based on the Company’s expected dividend policy over the expected term of the option. |
2 1 . |
Share-based compensation (continued) |
(b) |
Huya Share-based Awards (continued) |
Number of restricted share units |
Weighted average grant-date fair value (US$) |
|||||||
Outstanding, January 1, 2017 and December 31, 2017 |
|
|
||||||
Granted |
|
|
||||||
Forfeited |
( |
) | |
|||||
Vested |
( |
) | |
|||||
Outstanding, December 31, 201 8 |
|
|
||||||
Granted |
|
|
|
|
|
|
|
|
Forfeited |
|
|
( |
) |
|
|
|
|
Vested |
|
|
( |
) |
|
|
|
|
Outstanding, December 31, 2019 |
|
|
|
|
|
|
|
|
Expected to vest at December 31, 2019 |
|
|
(c) |
CEO’s Awards |
22. |
Net (loss) income per share |
For the year ended December 31, |
||||||||||||
2017 |
2018 |
2019 |
||||||||||
RMB |
RMB |
RMB |
||||||||||
Numerator: |
||||||||||||
Net (loss) income |
( |
) | ( |
) | |
|||||||
Accretion to Preferred Shares redemption value |
( |
) | ( |
) | |
|||||||
Deemed dividend to Series A Preferred Shareholders |
|
( |
) | |
||||||||
Numerator for basic and diluted net (loss) income per share |
( |
) | ( |
) | |
|||||||
Denominator: |
||||||||||||
Denominator for basic calculation—weighted average number of Class A and Class B ordinary shares outstanding |
|
|
|
|||||||||
—Diluted effect of share option |
— |
— |
|
|||||||||
—Diluted effect of restricted share units |
|
|
— |
|
|
|
— |
|
|
|
| |
Denominator for diluted calculation |
|
|
|
|||||||||
Net (loss) income per ordinary share |
||||||||||||
—Basic |
( |
) | ( |
) | |
|||||||
—Diluted |
|
|
( |
) |
|
|
( |
) |
|
|
|
|
Net (loss) income per ADS* |
||||||||||||
—Basic |
( |
) | ( |
) | |
|||||||
—Diluted |
|
|
( |
) |
|
|
( |
) |
|
|
|
|
* | Each ADS represents one Class A ordinary share. |
23. |
Related party transactions |
For the year ended December 31, |
||||||||||||
2017 |
2018 |
2019 |
||||||||||
RMB |
RMB |
RMB |
||||||||||
Cash collected by JOYY as a payment platform for Huya |
|
|
|
|||||||||
Purchase of services by JOYY on behalf of Huya |
|
|
|
|||||||||
Operation support services provided by JOYY (i) |
|
|
|
|||||||||
Repayment from JOYY in relation to the payment on behalf of Huya’s employees |
— |
|
|
|||||||||
Deemed distribution to JOYY (ii) |
— |
— |
|
|||||||||
Share-based compensation expenses related to JOYY’s Share-based Awards (Note 21(a)) |
|
|
|
|||||||||
Purchase of property and equipment and intangible assets from JOYY |
|
|
|
|||||||||
Cash received in connection with purchasing short-term deposits together with JOYY |
— |
|
— |
|||||||||
Cash paid to purchase short-term deposits together with JOYY |
|
— |
— |
|||||||||
Advertising revenue from JOYY |
|
|
— |
|||||||||
Net increase in Parent Company investment through contributed service |
|
— |
— |
|||||||||
Capital contribution from VIE of JOYY |
|
— |
— |
|||||||||
Deemed contribution from JOYY (ii) |
|
— |
— |
|||||||||
Share-based compensation expenses related to CEO’s Awards (Note 21(c)) |
|
— |
— |
|||||||||
Others |
|
|
|
For the year ended December 31, |
||||||||
2018 |
2019 |
|||||||
RMB |
RMB |
|||||||
Operation support services provided by Tencent ( i ii) |
|
|
||||||
Purchase of copyrights for live streaming from Tencent |
|
|
||||||
Payment on behalf of Tencent |
|
|
— |
|
|
|
|
|
Market promotion expenses charged by Tencent |
|
|
|
|
|
|
|
|
Advertising revenue from Tencent |
|
|
||||||
Cash collected by Tencent as a game operator for Huya |
— |
|
||||||
Online games revenue shared to Tencent as a game operator |
|
|
— |
|
|
|
|
|
(i) |
Purchases of services from JOYY mainly consist of office rental, payment handling services and bandwidth services which are charged at market price. |
(ii) |
The Business was operated by JOYY until the completion of being carved out from JOYY on January 1, 2017. For the litigations of the Business related to events that took place before the completion of being carved out, any settlements that were reached ever since the completion would be borne by JOYY, representing a capital contribution to Huya for any loss or distribution from Huya for any gain, pursuant to the arrangements between JOYY and Huya. |
2 3 . |
Related party transactions (continued) |
(iii) |
Operation support services from Tencent mainly consist of bandwidth and payment handling services which are charged at market price. |
December 31, |
||||||||
2018 |
2019 |
|||||||
RMB |
RMB |
|||||||
Amounts due from related parties |
||||||||
Tencent |
||||||||
JOYY |
||||||||
Other |
||||||||
Total |
||||||||
Amounts due to related parties |
||||||||
Tencent |
||||||||
Other |
||||||||
Total |
||||||||
2 4 . |
Fair value measurements |
24. |
Fair value measurements (continued) |
As of December 31, 2018 |
||||||||||||||||
Level 1 |
Level 2 |
Level 3 |
Total |
|||||||||||||
RMB |
RMB |
RMB |
RMB |
|||||||||||||
Assets |
||||||||||||||||
Short-term investments (i) |
||||||||||||||||
Liabilities |
||||||||||||||||
Derivative liabilities (i i ) |
||||||||||||||||
As of December 31, 2019 |
||||||||||||||||
Level 1 |
Level 2 |
Level 3 |
Total |
|||||||||||||
RMB |
RMB |
RMB |
RMB |
|||||||||||||
Assets |
||||||||||||||||
Short-term investments (i) |
||||||||||||||||
Liabilities |
||||||||||||||||
Derivative liabilities(ii) |
(i) |
Short-term investments represented the investments issued by commercial banks and financial institution with a variable interest rate indexed to the performance of underlying assets within one year. For the instruments whose fair value is provided by banks at the end of each period, the Company classifies the valuation techniques that use these inputs as Level 1 of fair value measurements. For the instruments whose fair value is estimated based on quoted prices of similar products provided by banks at the end of each period, the Company classifies the valuation techniques that use these inputs as Level 2 of fair value measurements. |
(ii) |
The Company has determined that conversion feature embedded in the Series B-2 Preferred Shares is required to be bifurcated and accounted for as a derivative liability which was measured at fair value (Note 20). Upon the completion of the IPO, the derivative liabilities were derecognized and the balance was transferred to additional paid-in capital accordingly. |
Conversion feature embedded in Series A Preferred Shares |
Conversion feature embedded in Series B-2 Preferred Shares |
Total |
||||||||||
RMB |
RMB |
RMB |
||||||||||
Balance as of January 1, 2018 |
||||||||||||
Initial recognition upon the extinguishment of the Series A Preferred Shares and the issuance of Series B-2 Preferred Shares as of March 8, 2018 |
||||||||||||
Fair value loss on derivative liabilities |
||||||||||||
Foreign exchange |
||||||||||||
Derecognition of derivative liabilities upon the completion of the IPO |
( |
) |
( |
) |
( |
) | ||||||
Balance as of December 31, 2018 |
||||||||||||
Valuation Date |
March 8, 2018 |
May 10, 2018 |
||||||
Volatility |
% |
% | ||||||
Risk-free rate (3 months) |
% |
% | ||||||
Risk-free rate (4 years) |
% |
% | ||||||
Dividend yield |
% |
% |
25. |
Leases |
For the year ended December 31, |
||||
2019 |
||||
RMB |
||||
Operating lease expense |
||||
Short-term lease expense |
||||
Total lease expense |
||||
Weighted-average remaining lease term (in years) – operating leases |
||||
Weighted-average discount rate – operating leases |
% | |||
For the year ended December 31, |
Future minimum payments |
|||
RMB |
||||
2020 |
||||
2021 |
||||
2022 |
||||
2023 |
||||
2024 and thereafter |
||||
Total undiscounted cash flows |
||||
Less: imputed interest |
( |
) | ||
Total |
||||
For the year ended December 31, |
||||
2019 |
||||
RMB |
||||
Cash paid for operating leases |
||||
Lease liabilities arising from obtaining right-of-use assets |
||||
2 6 . |
Commitments and contingencies |
(a) |
Operating commitments |
||||
RMB |
||||
2019 |
||||
2020 |
||||
2021 |
||||
2022 and thereafter |
||||
Operating commitments |
||||
RMB |
||||
2020 |
||||
2021 |
||||
2022 |
||||
2023 and thereafter |
||||
(b) |
Capital and other commitment s |
26. |
Commitments and contingencies (continued) |
(c) |
Legal proceedings |
2 7 . |
Subsequent events |
2 8 . |
Restricted net assets |