UNITED STATES
SECURITIES AND EXCHANGE COMMISSION
Washington, D.C. 20549
FORM 8-K
CURRENT REPORT
Pursuant to Section 13 or 15(d)
of the Securities Exchange Act of 1934
Date of Report (Date of earliest event reported): May 4, 2020
Apergy Corporation
(Exact Name of Registrant as Specified in Its Charter)
| Delaware | 001-38441 | 82-3066826 | ||
| (State or Other Jurisdiction of Incorporation) |
(Commission File Number) |
(IRS Employer Identification No.) |
2445 Technology Forest Blvd
Building 4, 12th Floor
The Woodlands, Texas 77381
(Address of Principal Executive Offices, including Zip Code)
(281) 403-5772
(Registrant’s Telephone Number, Including Area Code)
Not Applicable
(Former Name or Former Address, if Changed Since Last Report)
Check the appropriate box below if the Form 8-K filing is intended to simultaneously satisfy the filing obligation of the registrant under any of the following provisions:
| ☒ | Written communications pursuant to Rule 425 under the Securities Act (17 CFR 230.425) |
| ☐ | Soliciting material pursuant to Rule 14a-12 under the Exchange Act (17 CFR 240.14a-12) |
| ☐ | Pre-commencement communications pursuant to Rule 14d-2(b) under the Exchange Act (17 CFR 240.14d-2(b)) |
| ☐ | Pre-commencement communications pursuant to Rule 13e-4(c) under the Exchange Act (17 CFR 240.13e-4(c)) |
Securities registered pursuant to Section 12(b) of the Act: None
| Title of each class |
Trading Symbol(s) |
Name of each exchange on which registered | ||
| Common Stock, $0.01 par value | APY | New York Stock Exchange |
Indicate by check mark whether the registrant is an emerging growth company as defined in Rule 405 of the Securities Act of 1933 (§230.405 of this chapter) or Rule 12b-2 of the Securities Exchange Act of 1934 (§240.12b-2 of this chapter).
Emerging growth company ☐
If an emerging growth company, indicate by check mark if the registrant has elected not to use the extended transition period for complying with any new or revised financial accounting standards provided pursuant to Section 13(a) of the Exchange Act. ☐
| Item 7.01. | Regulation FD Disclosure. |
On May 4, 2020, Apergy Corporation (“Apergy”) has prepared investor materials for use in investor discussions (the “Apergy Investor Presentation”). The presentation slides are being furnished as Exhibit 99.2 to this Current Report on Form 8-K and that document is incorporated herein by reference. The presentation slides are also available on Apergy’s website at https://investors.apergy.com/events-and-presentations/presentations.
The information in this Item 7.01, including Exhibit 99.2, is furnished and shall not be deemed “filed” for purposes of Section 18 of the Securities Exchange Act of 1934, as amended (the “Exchange Act”), or otherwise subject to liabilities under that section, and shall not be deemed to be incorporated by reference into the filings of the Company under the Securities Act of 1933 or the Exchange Act, regardless of any general incorporation language in such filings.
| Item 8.01. | Other Events. |
On May 4, 2020, Apergy issued a press release announcing the details of the Apergy Investor Presentation a copy of which is filed as Exhibit 99.1 and is incorporated herein by reference.
| Item 9.01 | Financial Statements and Exhibits. |
(c) Exhibits.
| 99.1 | Press Release dated May 4, 2020. | |
| 99.2 | Apergy Investor Presentation, dated May 4, 2020. | |
| 104 | Cover Page Interactive Data File (embedded within the Inline XBRL document) | |
SIGNATURES
Pursuant to the requirements of the Securities Exchange Act of 1934, the registrant has duly caused this report to be signed on its behalf by the undersigned hereunto duly authorized.
| Apergy Corporation | ||
| (Registrant) | ||
| Date: May 4, 2020 |
/s/ Jay A. Nutt | |
| Jay A. Nutt | ||
| Senior Vice President and Chief Financial Officer | ||
Exhibit 99.1

Presentation Regarding Apergy’s Planned Merger with ChampionX Posted on Apergy’s Website
The Woodlands, Texas, May 4, 2020 – Apergy Corporation (“Apergy”) (NYSE: APY) today posted a presentation regarding its planned merger with ChampionX to its website to coincide with a meeting for equity research analysts on the combined company. The presentation is available at https://investors.apergy.com/events-and-presentations/presentations.
###
About Apergy
Apergy is a leading provider of highly engineered equipment and technologies that help companies drill for and produce oil and gas safely and efficiently around the world. Apergy’s products provide efficient functioning throughout the lifecycle of a well—from drilling to completion to production. Apergy’s Production & Automation Technologies offerings consist of artificial lift equipment and solutions, including rod pumping systems, electric submersible pump systems, progressive cavity pumps and drive systems and plunger lifts, as well as a full automation and digital offering consisting of equipment and software for Industrial Internet of Things (“IIoT”) solutions for downhole monitoring, wellsite productivity enhancement, and asset integrity management. Apergy’s Drilling Technologies offering provides market leading polycrystalline diamond cutters and bearings that result in cost effective and efficient drilling. To learn more about Apergy, visit our website at http://www.apergy.com.
Important Information About the ChampionX Transaction and Where to Find It
In connection with the proposed transaction, Apergy has filed a definitive proxy statement on Schedule 14A and a registration statement on Form S-4 containing a prospectus, declared effective April 30, 2020, with the Securities and Exchange Commission (the “SEC”) and ChampionX Holding Inc. has filed a registration statement on Form S-4 and Form S-1 containing a prospectus, declared effective April 30, 2020. INVESTORS AND SECURITYHOLDERS ARE ADVISED TO READ THE REGISTRATION STATEMENTS/PROSPECTUSES AND DEFENITIVE PROXY STATEMENT AS WELL AS ANY OTHER RELEVANT DOCUMENTS WHEN THEY BECOME AVAILABLE, BECAUSE THEY CONTAIN OR WILL CONTAIN IMPORTANT INFORMATION ABOUT APERGY, ECOLAB, CHAMPIONX AND THE PROPOSED TRANSACTION. Investors and securityholders may obtain a free copy of the registration statements/prospectuses and definitive proxy statement and other documents filed by Apergy, Ecolab and ChampionX with the SEC at the SEC’s website at http://www.sec.gov. The registration statements/prospectuses and definitive proxy statement can also be obtained free of charge from Ecolab upon written request to Ecolab Inc., Attn: Investor Relations, 1 Ecolab Place, St. Paul, MN 55102, or by e-mailing investor.info@ecolab.com, or upon written request to Apergy, Investor Relations, 2445 Technology Forest Boulevard, The Woodlands, Texas 77381, or by e-mailing david.skipper@apergy.com.
Participants in the Solicitation
This communication is not a solicitation of a proxy from any security holder of Apergy. However, Apergy, Ecolab and certain of their respective directors and executive officers may be deemed to be participants in the solicitation of proxies from shareholders of Apergy in connection with the proposed transaction under the rules of the SEC. Information regarding the persons who are, under the rules of the SEC, participants in the solicitation of the stockholders of Apergy in connection with the proposed transactions, including a description of their direct or indirect interests, by security holdings or otherwise, are set forth in
Apergy’s definitive proxy statement relating to the proposed transaction, filed with the SEC on April 29, 2020. Information about the directors and executive officers of Ecolab may be found in its Annual Report on Form 10-K filed with the SEC on February 28, 2020, and its definitive proxy statement relating to its 2020 Annual Meeting of Shareholders filed with the SEC on March 20, 2020. Information about the directors and executive officers of Apergy may be found in its Annual Report on Form 10-K filed with the SEC on March 2, 2020, and its definitive proxy statement relating to its 2020 Annual Meeting of Stockholders filed with the SEC on April 2, 2020.
No Offer or Solicitation
This communication is not intended to and shall not constitute an offer to sell or the solicitation of an offer to sell or the solicitation of an offer to buy any securities or a solicitation of any vote of approval, nor shall there be any sale of securities in any jurisdiction in which such offer, solicitation or sale would be unlawful prior to registration or qualification under the securities laws of any such jurisdiction. No offer of securities shall be made except by means of a prospectus meeting the requirements of Section 10 of the Securities Act of 1933, as amended.
Investor Contact:
David Skipper – david.skipper@apergy.com – 713-230-8031
Media Contact:
John Breed – john.breed@apergy.com – 281-403-5751
Apergy Combination with ChampionX May 4, 2020 Exhibit 99.2
Forward-Looking Statements This investor presentation, and the related discussions, includes “forward-looking statements” as that term is defined in Section 27A of the Securities Act of 1933, as amended, and Section 21E of the Securities Exchange Act of 1934, as amended by the Private Securities Litigation Reform Act of 1995, including statements regarding the proposed transaction between Apergy Corporation (“Apergy”), ChampionX Holding Inc. (“ChampionX”) and Ecolab Inc. (“Ecolab”). These forward-looking statements generally are identified by the words “believe,” “project,” “expect,” “anticipate,” “estimate,” “forecast,” “outlook,” “target,” “endeavor,” “seek,” “predict,” “intend,” “strategy,” “plan,” “may,” “could,” “should,” “will,” “would,” “will be,” “will continue,” “will likely result,” or the negative thereof or variations thereon or similar terminology generally intended to identify forward-looking statements. All statements, other than historical facts, including, but not limited to, statements regarding the expected timing and structure of the proposed transaction, the ability of the parties to complete the proposed transaction, the expected benefits of the proposed transaction, including future financial and operating results and strategic benefits, the tax consequences of the proposed transaction, and the combined company’s plans, objectives, expectations and intentions, legal, economic and regulatory conditions, and any assumptions underlying any of the foregoing, are forward looking statements. These forward-looking statements are based on Apergy and ChampionX’s current expectations and are subject to risks and uncertainties, which may cause actual results to differ materially from Apergy and ChampionX’s current expectations. Should one or more of these risks or uncertainties materialize, or should underlying assumptions prove incorrect, actual results may vary materially from those indicated or anticipated by such forward-looking statements. The inclusion of such statements should not be regarded as a representation that such plans, estimates or expectations will be achieved. Important factors that could cause actual results to differ materially from such plans, estimates or expectations include, among others, (1) that one or more closing conditions to the transaction, including certain regulatory approvals, may not be satisfied or waived, on a timely basis or otherwise, including that a governmental entity may prohibit, delay or refuse to grant approval for the consummation of the proposed transaction, may require conditions, limitations or restrictions in connection with such approvals or that the required approval by the stockholders of Apergy may not be obtained; (2) the risk that the proposed transaction may not be completed on the terms or in the time frame expected by the parties, or at all; (3) unexpected costs, charges or expenses resulting from the proposed transaction; (4) uncertainty of the expected financial performance of the combined company following completion of the proposed transaction; (5) risks related to disruption of management time from ongoing business operations due to proposed transaction; (6) failure to realize the anticipated benefits of the proposed transaction, including as a result of delay in completing the proposed transaction or integrating the businesses of Apergy and ChampionX, or at all; (7) the ability of the combined company to implement its business strategy; (8) difficulties and delays in the combined company achieving revenue and cost synergies; (9) the occurrence of any event that could give rise to termination of the proposed transaction; (10) the risk that stockholder litigation in connection with the proposed transaction or other settlements or investigations may affect the timing or occurrence of the proposed transaction or result in significant costs of defense, indemnification and liability; (11) the effects of external events on the economy including COVID-19 or other pandemics; (12) evolving legal, regulatory and tax regimes; (13) changes in general economic and/or industry specific conditions (including actions taken by OPEC); (14) actions by third parties, including government agencies; (15) Apergy’s ability to remediate the material weaknesses in internal control over financial reporting described in Part II, Item 9A – Controls and Procedures in Apergy’s Annual Report on Form 10-K for the year ended December 31, 2019; and (16) other risk factors detailed from time to time in Apergy and Ecolab’s reports filed with the SEC, including Apergy and Ecolab’s annual report on Form 10-K, quarterly reports on Form 10-Q, current reports on Form 8-K and other documents filed with the SEC. The foregoing list of important factors is not exclusive. Any forward-looking statements speak only as of the date of this communication. None of Apergy, ChampionX or Ecolab undertakes any obligation to update any forward-looking statements, whether as a result of new information or development, future events or otherwise, except as required by law. Readers are cautioned not to place undue reliance on any of these forward-looking statements. Non-GAAP Measures This investor presentation, and the related discussions, contains certain non-GAAP financial measures, which should be considered only as supplemental to, and not as superior to financial measures prepared in accordance with generally accepted accounting principles (“GAAP”). Please refer to the Appendix of this investor presentation for a reconciliation of these non-GAAP financial measures to the most directly comparable financial measures prepared in accordance with GAAP and definitions and calculation methodologies of defined terms used in this investor presentation. For additional information about our non-GAAP financial measures, see our filings with the SEC. This investor presentation is not an offer to sell or the solicitation of an offer to buy any securities of Apergy, nor will there be any sales of securities of Apergy in any jurisdiction in which the offer, solicitation or sale would be unlawful prior to registration or qualification under the securities laws of such jurisdiction.

Important Additional Info and No Offer or Solicitation Important Information About the Transaction between Apergy, ChampionX, and Ecolab and Where to Find It In connection with our proposed merger with ChampionX, the upstream energy business of Ecolab, Apergy has filed a definitive proxy statement on Schedule 14A and a registration statement on Form S-4 containing a prospectus, declared effective April 30, 2020, with the SEC and ChampionX Holding Inc. has filed a registration statement on Form S-4 and Form S-1 containing a prospectus, declared effective April 30, 2020. Investors and securityholders are urged to read the registration statements/prospectuses and definitive proxy statement as well as any other relevant documents when they become available, because they contain or will contain important information about Apergy, ChampionX, Ecolab and the proposed transactions. The registration statements/prospectuses and definitive proxy statement and other documents can also be obtained free of charge from the SEC’s website at www.sec.gov. The registration statements/prospectuses and definitive proxy statement and other documents (when they are available) can also be obtained free of charge from Ecolab upon written request to Ecolab Inc., Attn: Investor Relations, 1 Ecolab Place, St. Paul, MN 55102, or by e-mailing investor.info@ecolab.com or upon written request to Apergy, Investor Relations, 2445 Technology Forest Boulevard, The Woodlands, Texas 77381 or by e-mailing david.skipper@apergy.com. Participants in the Solicitation This communication is not a solicitation of a proxy from any security holder of Apergy. However, Apergy, Ecolab and certain of their respective directors and executive officers may be deemed to be participants in the solicitation of proxies from shareholders of Apergy in connection with the proposed transaction under the rules of the SEC. Information regarding the persons who are, under the rules of the SEC, participants in the solicitation of the stockholders of Apergy in connection with the proposed transactions, including a description of their direct or indirect interests, by security holdings or otherwise, is set forth in Apergy’s definitive proxy statement relating to the proposed transaction filed with the SEC on April 29, 2020. Information about the directors and executive officers of Ecolab may be found in its Annual Report on Form 10-K filed with the SEC on February 28, 2020, and its definitive proxy statement relating to its 2020 Annual Meeting of Shareholders filed with the SEC on March 20, 2020. Information about the directors and executive officers of Apergy may be found in its Annual Report on Form 10-K filed with the SEC on March 2, 2020, and its definitive proxy statement relating to its 2020 Annual Meeting of Stockholders filed with the SEC on April 2, 2020. No Offer or Solicitation This communication is not intended to and shall not constitute an offer to sell or the solicitation of an offer to sell or the solicitation of an offer to buy any securities or a solicitation of any vote of approval, nor shall there be any sale of securities in any jurisdiction in which such offer, solicitation or sale would be unlawful prior to registration or qualification under the securities laws of any such jurisdiction. No offer of securities shall be made except by means of a prospectus meeting the requirements of Section 10 of the Securities Act of 1933, as amended.
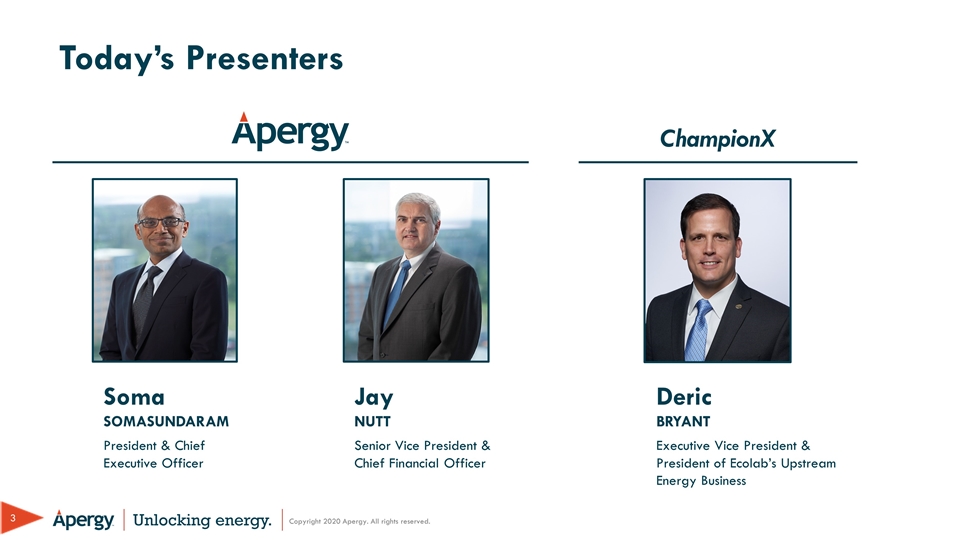
Soma SOMASUNDARAM President & Chief Executive Officer Jay NUTT Senior Vice President & Chief Financial Officer Today’s Presenters Deric BRYANT Executive Vice President & President of Ecolab’s Upstream Energy Business ChampionX
Agenda A Powerful Combination: Key Messages for Investors Overview of Apergy and ChampionX Apergy + ChampionX: Better Together Combined Company Financial Summary Appendix Summary and Q&A Synergy Opportunity Overview

A Powerful Combination: Key Messages for Investors
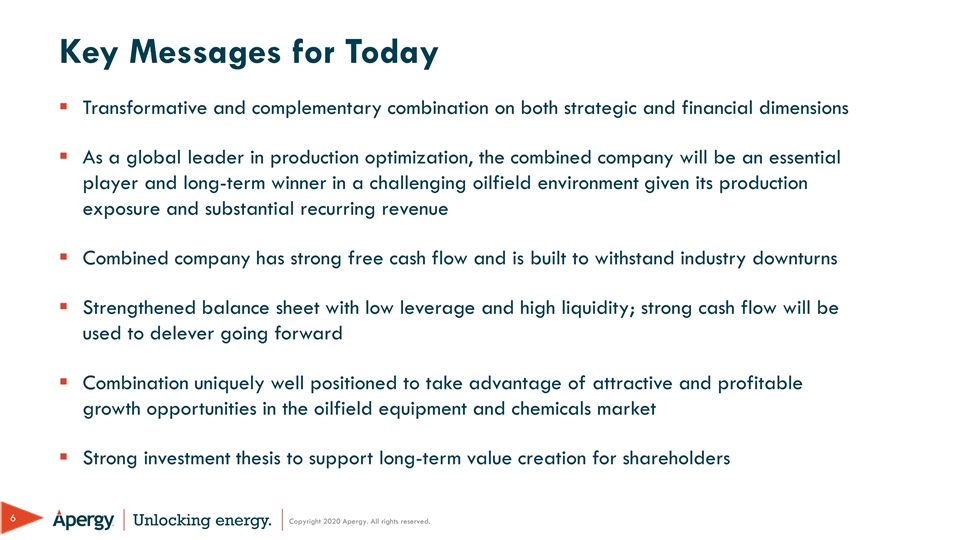
Key Messages for Today Transformative and complementary combination on both strategic and financial dimensions As a global leader in production optimization, the combined company will be an essential player and long-term winner in a challenging oilfield environment given its production exposure and substantial recurring revenue Combined company has strong free cash flow and is built to withstand industry downturns Strengthened balance sheet with low leverage and high liquidity; strong cash flow will be used to delever going forward Combination uniquely well positioned to take advantage of attractive and profitable growth opportunities in the oilfield equipment and chemicals market Strong investment thesis to support long-term value creation for shareholders
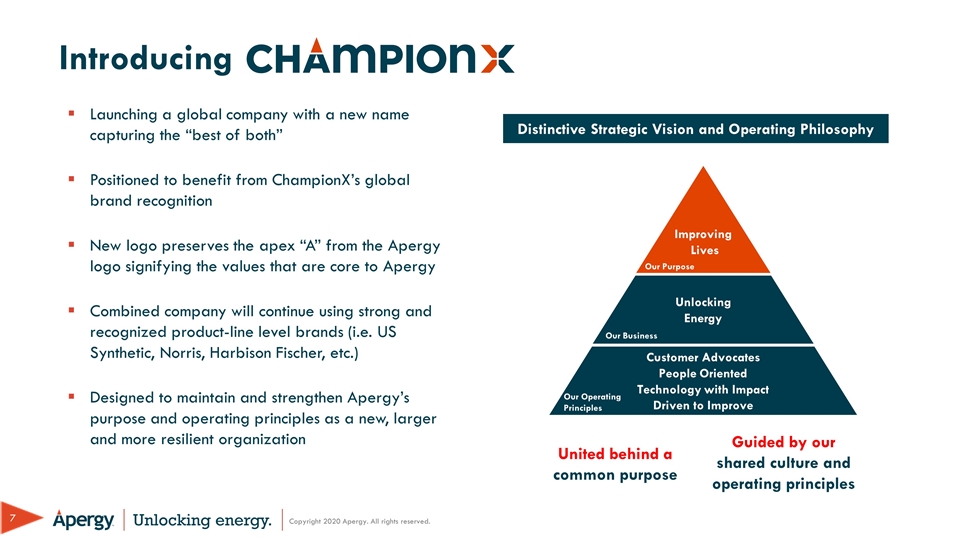
Launching a global company with a new name capturing the “best of both” Positioned to benefit from ChampionX’s global brand recognition New logo preserves the apex “A” from the Apergy logo signifying the values that are core to Apergy Combined company will continue using strong and recognized product-line level brands (i.e. US Synthetic, Norris, Harbison Fischer, etc.) Designed to maintain and strengthen Apergy’s purpose and operating principles as a new, larger and more resilient organization Unlocking Energy Customer Advocates People Oriented Technology with Impact Driven to Improve Our Purpose Our Business Our Operating Principles Improving Lives United behind a common purpose Introducing Distinctive Strategic Vision and Operating Philosophy Guided by our shared culture and operating principles
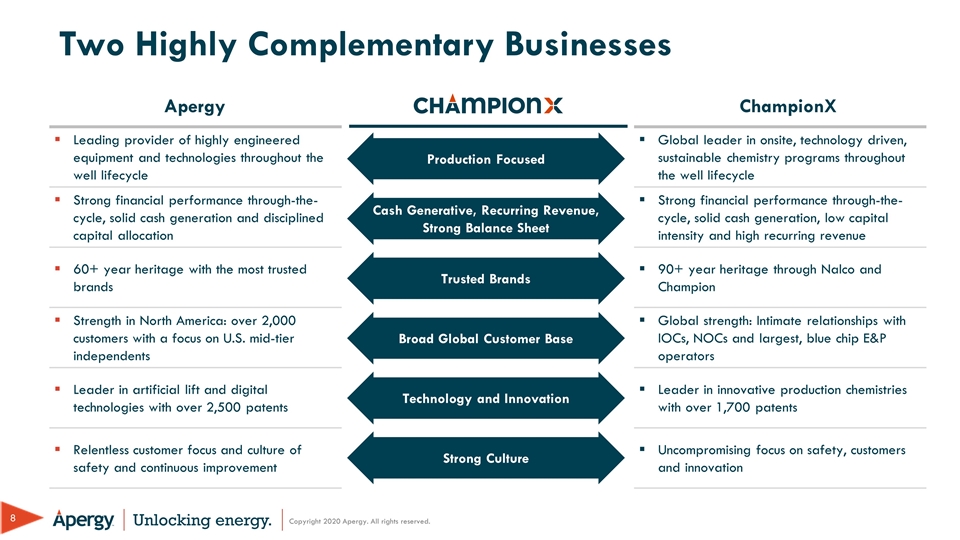
Two Highly Complementary Businesses Leading provider of highly engineered equipment and technologies throughout the well lifecycle Global leader in onsite, technology driven, sustainable chemistry programs throughout the well lifecycle Strong financial performance through-the-cycle, solid cash generation and disciplined capital allocation Strong financial performance through-the-cycle, solid cash generation, low capital intensity and high recurring revenue 60+ year heritage with the most trusted brands 90+ year heritage through Nalco and Champion Strength in North America: over 2,000 customers with a focus on U.S. mid-tier independents Global strength: Intimate relationships with IOCs, NOCs and largest, blue chip E&P operators Leader in artificial lift and digital technologies with over 2,500 patents Leader in innovative production chemistries with over 1,700 patents Relentless customer focus and culture of safety and continuous improvement Uncompromising focus on safety, customers and innovation Production Focused Trusted Brands Broad Global Customer Base Technology and Innovation Strong Culture Cash Generative, Recurring Revenue, Strong Balance Sheet Apergy ChampionX
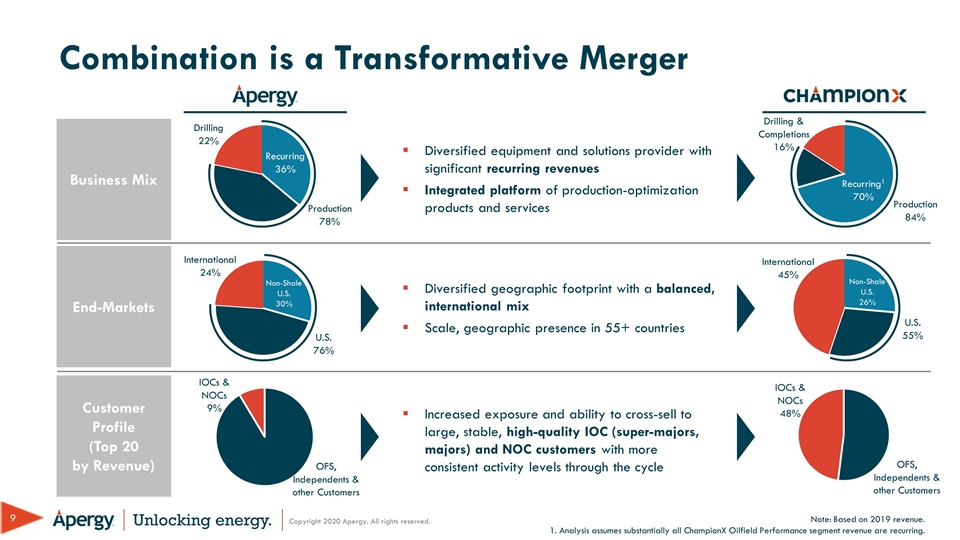
Combination is a Transformative Merger Business Mix Diversified equipment and solutions provider with significant recurring revenues Integrated platform of production-optimization products and services End-Markets Diversified geographic footprint with a balanced, international mix Scale, geographic presence in 55+ countries Customer Profile (Top 20 by Revenue) Increased exposure and ability to cross-sell to large, stable, high-quality IOC (super-majors, majors) and NOC customers with more consistent activity levels through the cycle Note: Based on 2019 revenue. 1. Analysis assumes substantially all ChampionX Oilfield Performance segment revenue are recurring. International 24% U.S. 76% International 45% U.S. 55% IOCs & NOCs 9% IOCs & NOCs 48% Drilling 22% Recurring 36% Production 78% Drilling & Completions 16% Production 84% Non-Shale U.S. 26% OFS, Independents & other Customers OFS, Independents & other Customers Recurring1 70% Non-Shale U.S. 30%
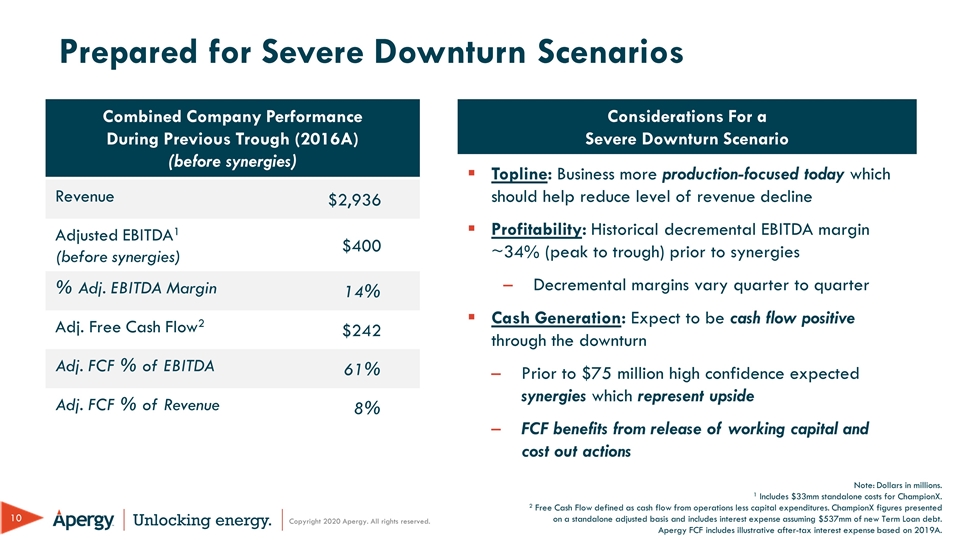
Prepared for Severe Downturn Scenarios Revenue $2,936 Adjusted EBITDA1 (before synergies) $400 % Adj. EBITDA Margin 14% Adj. Free Cash Flow2 $242 Adj. FCF % of EBITDA 61% Adj. FCF % of Revenue 8% Considerations For a Severe Downturn Scenario Topline: Business more production-focused today which should help reduce level of revenue decline Profitability: Historical decremental EBITDA margin ~34% (peak to trough) prior to synergies Decremental margins vary quarter to quarter Cash Generation: Expect to be cash flow positive through the downturn Prior to $75 million high confidence expected synergies which represent upside FCF benefits from release of working capital and cost out actions Combined Company Performance During Previous Trough (2016A) (before synergies) Note: Dollars in millions. 1 Includes $33mm standalone costs for ChampionX. 2 Free Cash Flow defined as cash flow from operations less capital expenditures. ChampionX figures presented on a standalone adjusted basis and includes interest expense assuming $537mm of new Term Loan debt. Apergy FCF includes illustrative after-tax interest expense based on 2019A.
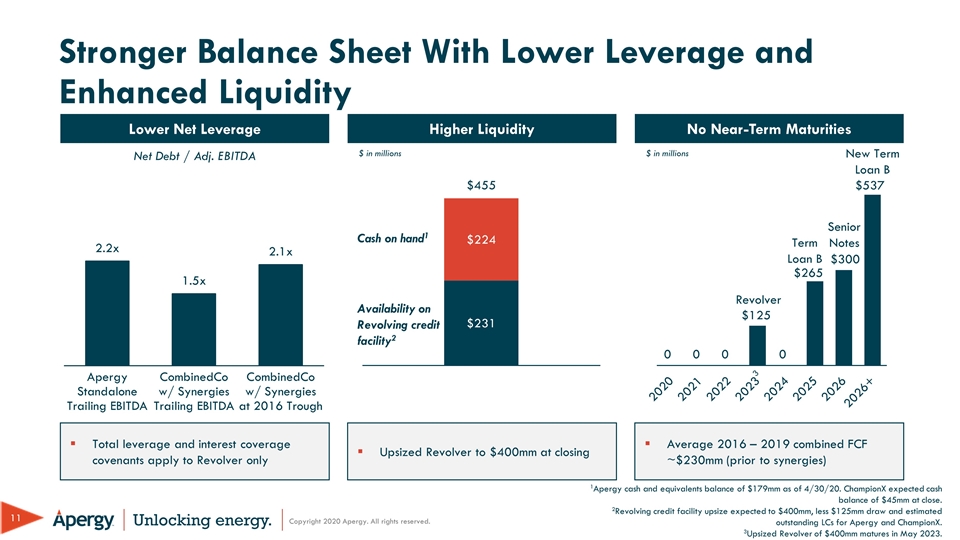
Stronger Balance Sheet With Lower Leverage and Enhanced Liquidity Lower Net Leverage Higher Liquidity No Near-Term Maturities Net Debt / Adj. EBITDA 1Apergy cash and equivalents balance of $179mm as of 4/30/20. ChampionX expected cash balance of $45mm at close. 2Revolving credit facility upsize expected to $400mm, less $125mm draw and estimated outstanding LCs for Apergy and ChampionX. 3Upsized Revolver of $400mm matures in May 2023. Term Loan B Senior Notes Cash on hand1 Availability on Revolving credit facility2 New Term Loan B 3 Total leverage and interest coverage covenants apply to Revolver only Upsized Revolver to $400mm at closing Average 2016 – 2019 combined FCF ~$230mm (prior to synergies) 0 0 0 0 Revolver $ in millions $ in millions
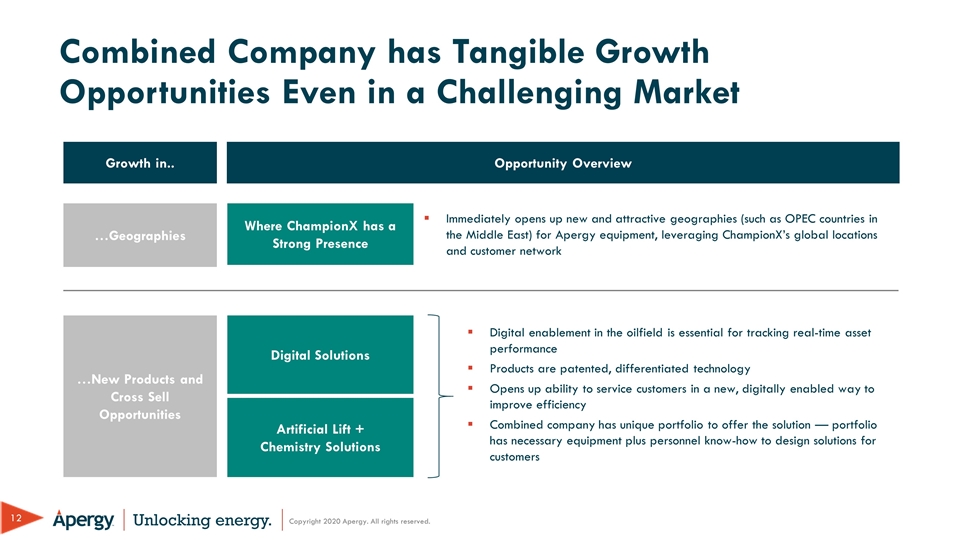
Combined Company has Tangible Growth Opportunities Even in a Challenging Market …Geographies …New Products and Cross Sell Opportunities Where ChampionX has a Strong Presence Growth in.. Opportunity Overview Immediately opens up new and attractive geographies (such as OPEC countries in the Middle East) for Apergy equipment, leveraging ChampionX’s global locations and customer network Digital Solutions Artificial Lift + Chemistry Solutions Digital enablement in the oilfield is essential for tracking real-time asset performance Products are patented, differentiated technology Opens up ability to service customers in a new, digitally enabled way to improve efficiency Combined company has unique portfolio to offer the solution — portfolio has necessary equipment plus personnel know-how to design solutions for customers
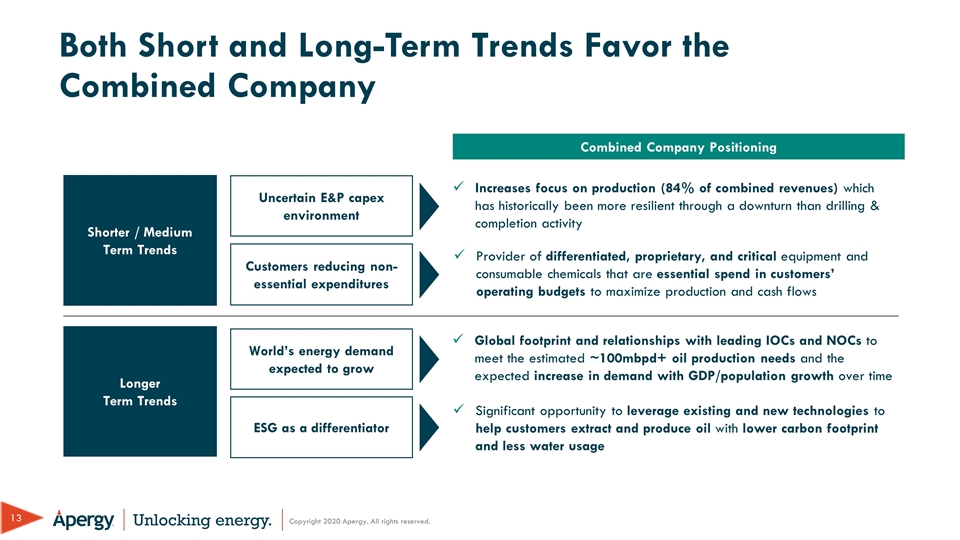
Both Short and Long-Term Trends Favor the Combined Company Shorter / Medium Term Trends Combined Company Positioning Longer Term Trends Uncertain E&P capex environment Customers reducing non-essential expenditures World’s energy demand expected to grow ESG as a differentiator Increases focus on production (84% of combined revenues) which has historically been more resilient through a downturn than drilling & completion activity Provider of differentiated, proprietary, and critical equipment and consumable chemicals that are essential spend in customers’ operating budgets to maximize production and cash flows Global footprint and relationships with leading IOCs and NOCs to meet the estimated ~100mbpd+ oil production needs and the expected increase in demand with GDP/population growth over time Significant opportunity to leverage existing and new technologies to help customers extract and produce oil with lower carbon footprint and less water usage

Apergy Overview
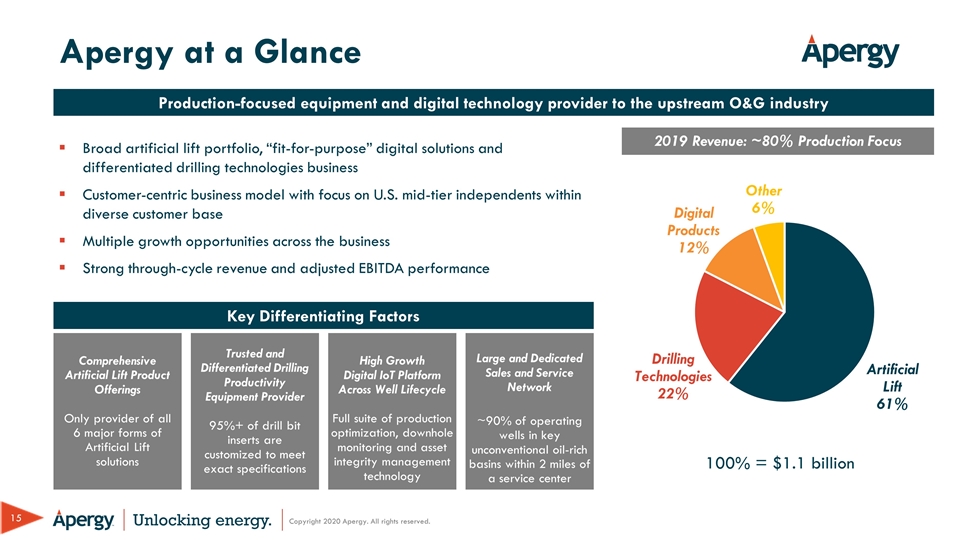
Apergy at a Glance Key Differentiating Factors Comprehensive Artificial Lift Product Offerings Only provider of all 6 major forms of Artificial Lift solutions Trusted and Differentiated Drilling Productivity Equipment Provider 95%+ of drill bit inserts are customized to meet exact specifications High Growth Digital IoT Platform Across Well Lifecycle Full suite of production optimization, downhole monitoring and asset integrity management technology Large and Dedicated Sales and Service Network ~90% of operating wells in key unconventional oil-rich basins within 2 miles of a service center Broad artificial lift portfolio, “fit-for-purpose” digital solutions and differentiated drilling technologies business Customer-centric business model with focus on U.S. mid-tier independents within diverse customer base Multiple growth opportunities across the business Strong through-cycle revenue and adjusted EBITDA performance Production-focused equipment and digital technology provider to the upstream O&G industry 2019 Revenue: ~80% Production Focus 100% = $1.1 billion
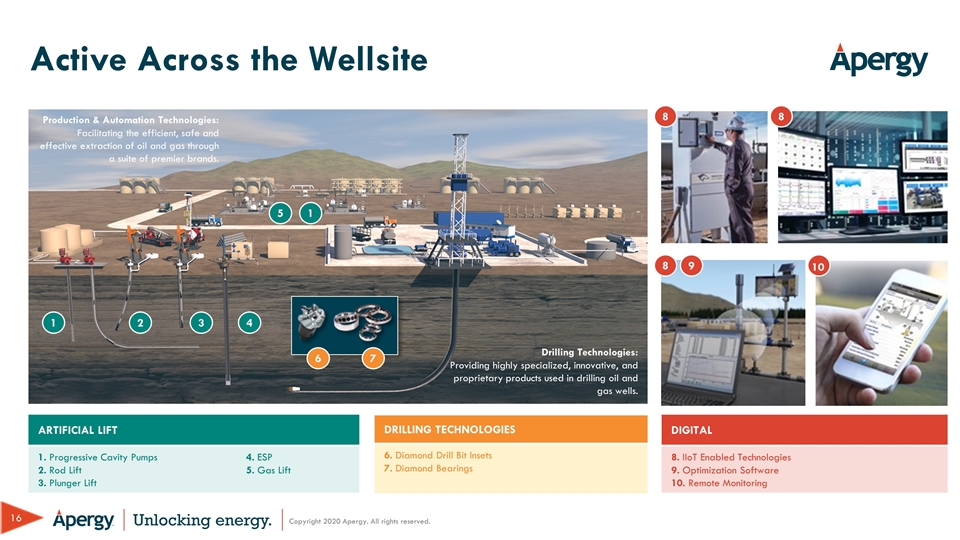
Active Across the Wellsite 8 1 Production & Automation Technologies: Facilitating the efficient, safe and effective extraction of oil and gas through a suite of premier brands. Drilling Technologies: Providing highly specialized, innovative, and proprietary products used in drilling oil and gas wells. ARTIFICIAL LIFT 1. Progressive Cavity Pumps 2. Rod Lift 3. Plunger Lift 4. ESP 5. Gas Lift 2 3 4 1 5 DIGITAL 8. IIoT Enabled Technologies 9. Optimization Software 10. Remote Monitoring 9 8 8 DRILLING TECHNOLOGIES 6. Diamond Drill Bit Insets 7. Diamond Bearings 10 6 7
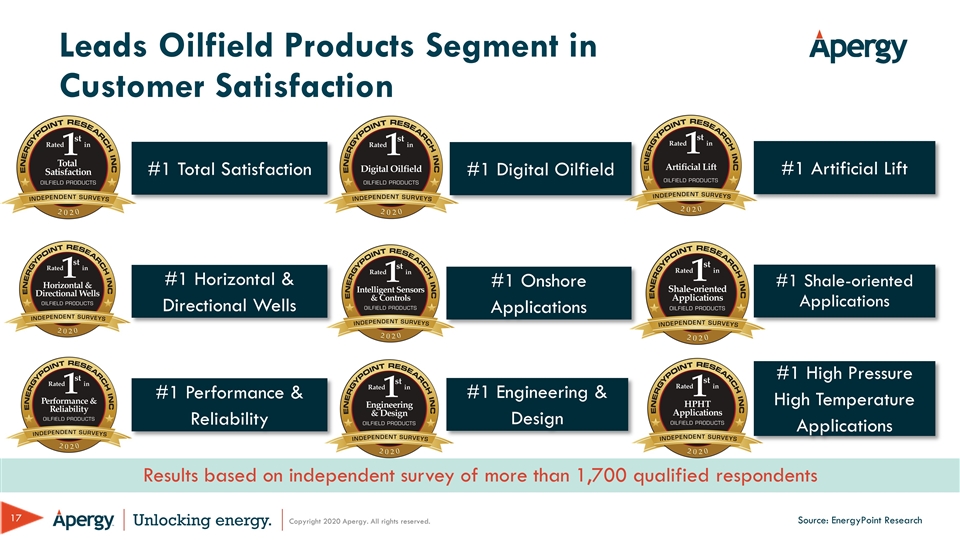
Leads Oilfield Products Segment in Customer Satisfaction #1 Total Satisfaction #1 Horizontal & Directional Wells #1 Performance & Reliability #1 Artificial Lift #1 Shale-oriented Applications #1 High Pressure High Temperature Applications Source: EnergyPoint Research #1 Digital Oilfield #1 Onshore Applications #1 Engineering & Design Results based on independent survey of more than 1,700 qualified respondents

ChampionX Overview
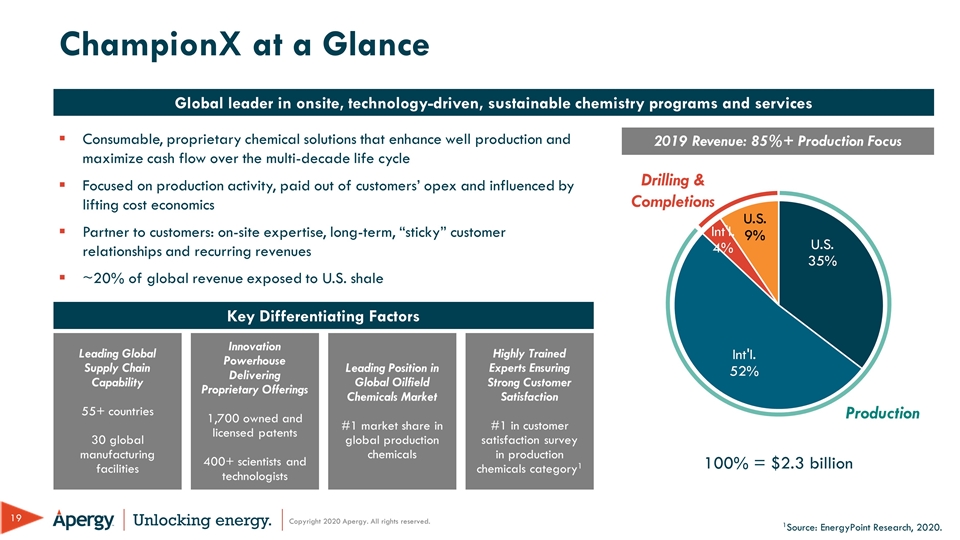
ChampionX at a Glance Key Differentiating Factors Leading Global Supply Chain Capability 55+ countries 30 global manufacturing facilities Innovation Powerhouse Delivering Proprietary Offerings 1,700 owned and licensed patents 400+ scientists and technologists Leading Position in Global Oilfield Chemicals Market #1 market share in global production chemicals Highly Trained Experts Ensuring Strong Customer Satisfaction #1 in customer satisfaction survey in production chemicals category1 Consumable, proprietary chemical solutions that enhance well production and maximize cash flow over the multi-decade life cycle Focused on production activity, paid out of customers’ opex and influenced by lifting cost economics Partner to customers: on-site expertise, long-term, “sticky” customer relationships and recurring revenues ~20% of global revenue exposed to U.S. shale Global leader in onsite, technology-driven, sustainable chemistry programs and services 2019 Revenue: 85%+ Production Focus Drilling & Completions Production 100% = $2.3 billion 1Source: EnergyPoint Research, 2020.
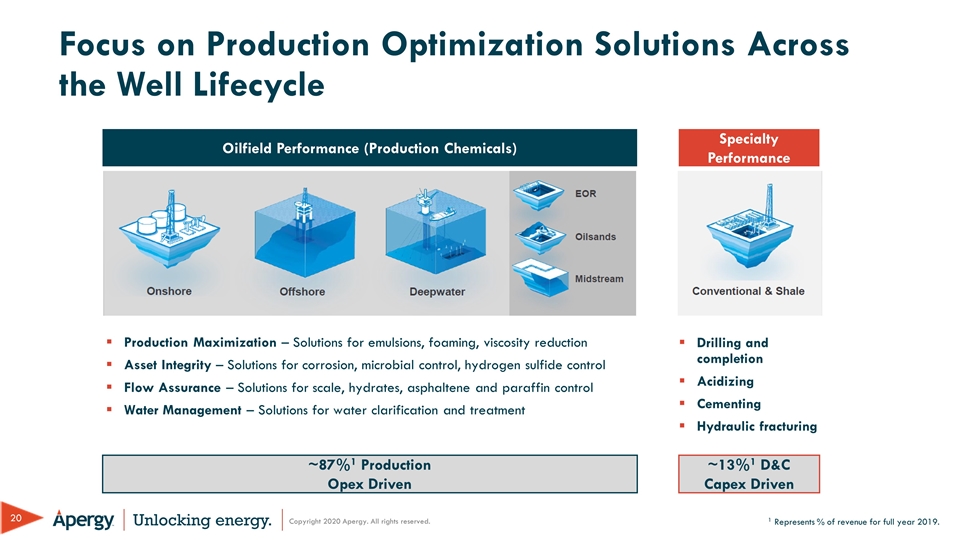
Focus on Production Optimization Solutions Across the Well Lifecycle Specialty Performance Oilfield Performance (Production Chemicals) Drilling and completion Acidizing Cementing Hydraulic fracturing Production Maximization – Solutions for emulsions, foaming, viscosity reduction Asset Integrity – Solutions for corrosion, microbial control, hydrogen sulfide control Flow Assurance – Solutions for scale, hydrates, asphaltene and paraffin control Water Management – Solutions for water clarification and treatment ~13%1 D&C Capex Driven ~87%1 Production Opex Driven 1 Represents % of revenue for full year 2019.
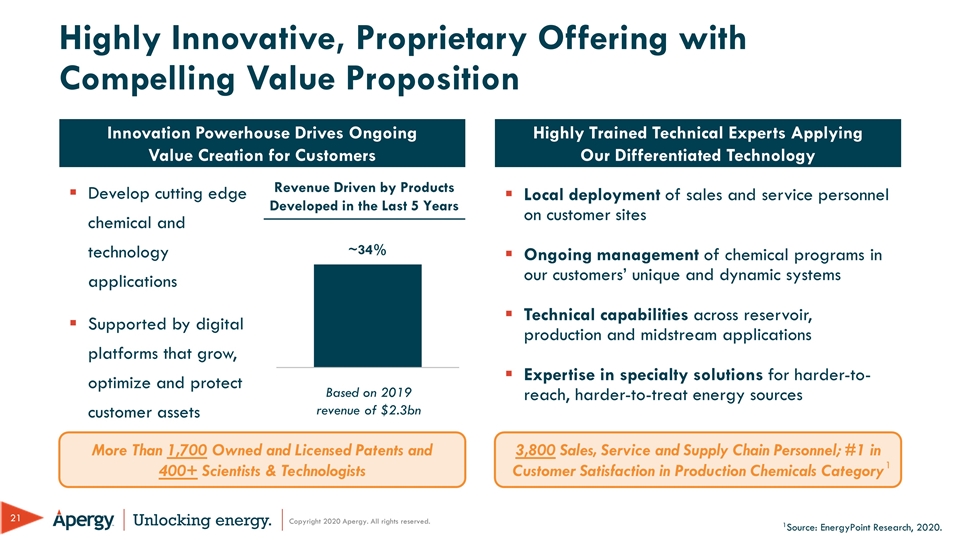
Highly Innovative, Proprietary Offering with Compelling Value Proposition Develop cutting edge chemical and technology applications Supported by digital platforms that grow, optimize and protect customer assets Local deployment of sales and service personnel on customer sites Ongoing management of chemical programs in our customers’ unique and dynamic systems Technical capabilities across reservoir, production and midstream applications Expertise in specialty solutions for harder-to-reach, harder-to-treat energy sources 3,800 Sales, Service and Supply Chain Personnel; #1 in Customer Satisfaction in Production Chemicals Category More Than 1,700 Owned and Licensed Patents and 400+ Scientists & Technologists Innovation Powerhouse Drives Ongoing Value Creation for Customers Highly Trained Technical Experts Applying Our Differentiated Technology Revenue Driven by Products Developed in the Last 5 Years ~34% Based on 2019 revenue of $2.3bn 1Source: EnergyPoint Research, 2020. 1
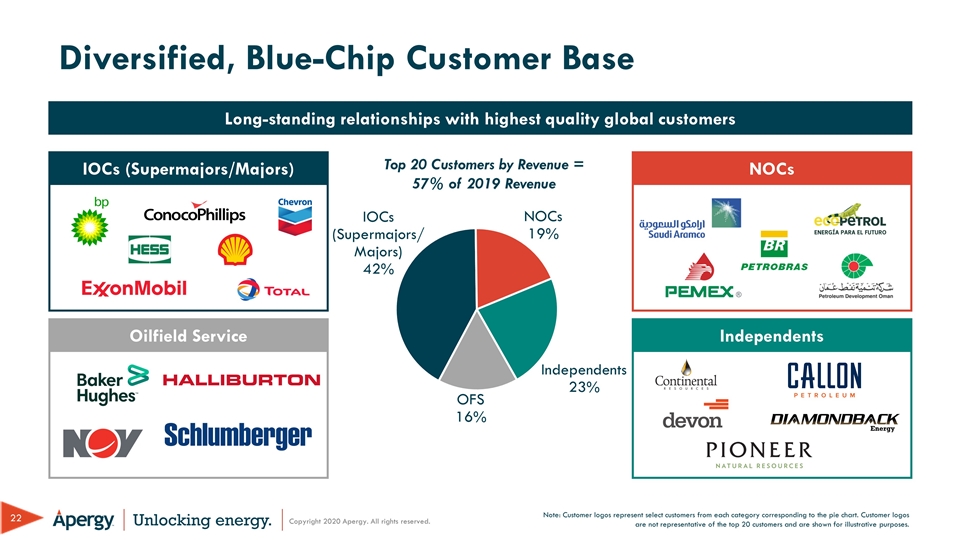
Diversified, Blue-Chip Customer Base Long-standing relationships with highest quality global customers Top 20 Customers by Revenue = 57% of 2019 Revenue IOCs (Supermajors/Majors) Independents NOCs Oilfield Service Note: Customer logos represent select customers from each category corresponding to the pie chart. Customer logos are not representative of the top 20 customers and are shown for illustrative purposes.

Apergy + ChampionX: Better Together
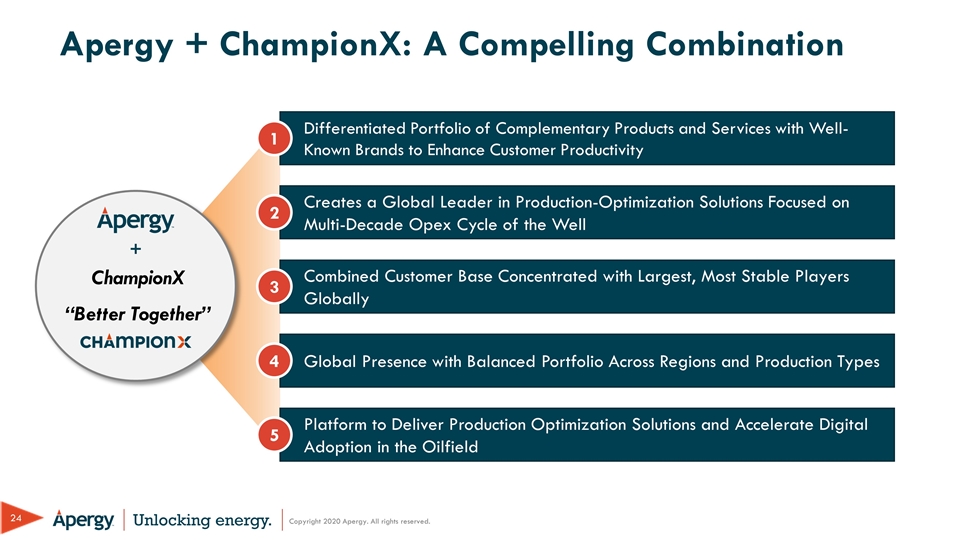
Apergy + ChampionX: A Compelling Combination Differentiated Portfolio of Complementary Products and Services with Well-Known Brands to Enhance Customer Productivity Creates a Global Leader in Production-Optimization Solutions Focused on Multi-Decade Opex Cycle of the Well Global Presence with Balanced Portfolio Across Regions and Production Types Combined Customer Base Concentrated with Largest, Most Stable Players Globally Platform to Deliver Production Optimization Solutions and Accelerate Digital Adoption in the Oilfield + 1 4 2 3 5 “Better Together” ChampionX
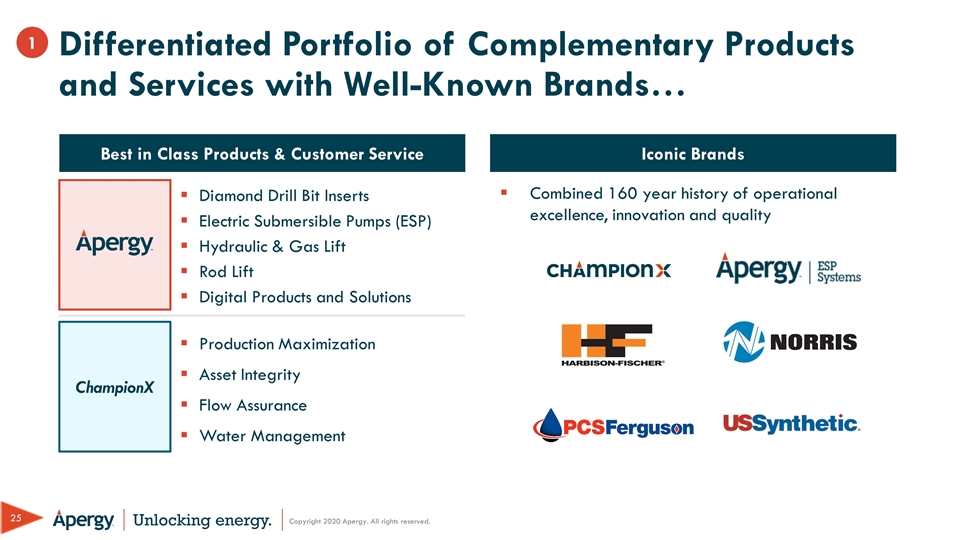
Differentiated Portfolio of Complementary Products and Services with Well-Known Brands… 1 Best in Class Products & Customer Service Iconic Brands Combined 160 year history of operational excellence, innovation and quality Diamond Drill Bit Inserts Electric Submersible Pumps (ESP) Hydraulic & Gas Lift Rod Lift Digital Products and Solutions Production Maximization Asset Integrity Flow Assurance Water Management ChampionX
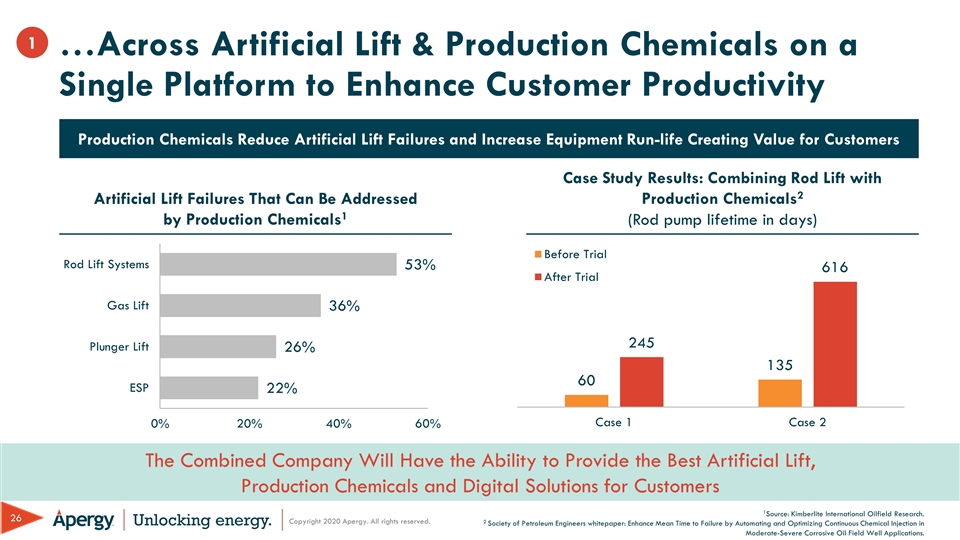
~80% APY PAT2 1Source: Kimberlite International Oilfield Research. 2 Society of Petroleum Engineers whitepaper: Enhance Mean Time to Failure by Automating and Optimizing Continuous Chemical Injection in Moderate-Severe Corrosive Oil Field Well Applications. …Across Artificial Lift & Production Chemicals on a Single Platform to Enhance Customer Productivity 1 The Combined Company Will Have the Ability to Provide the Best Artificial Lift, Production Chemicals and Digital Solutions for Customers Production Chemicals Reduce Artificial Lift Failures and Increase Equipment Run-life Creating Value for Customers Artificial Lift Failures That Can Be Addressed by Production Chemicals1 Case Study Results: Combining Rod Lift with Production Chemicals2 (Rod pump lifetime in days)
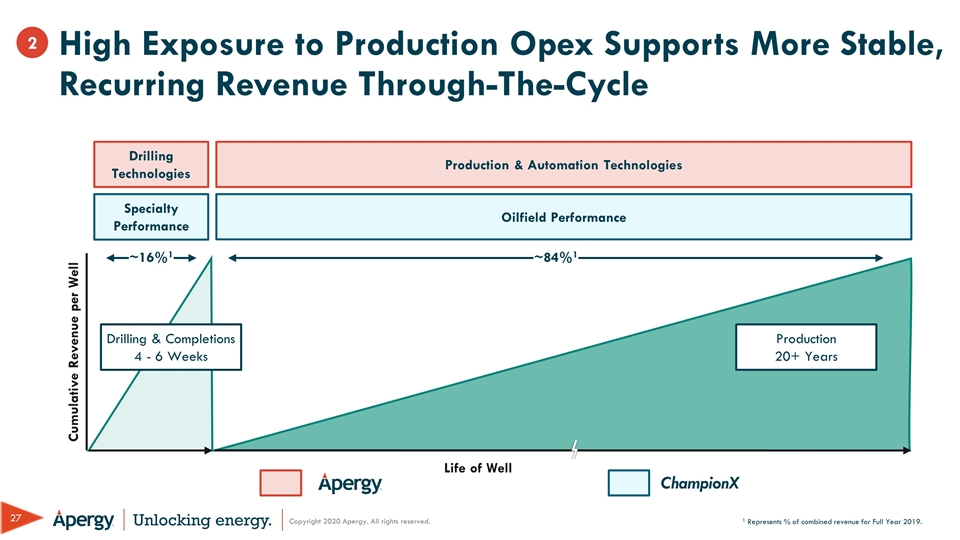
High Exposure to Production Opex Supports More Stable, Recurring Revenue Through-The-Cycle 1 Represents % of combined revenue for Full Year 2019. Cumulative Revenue per Well Drilling & Completions 4 - 6 Weeks Production 20+ Years Drilling Technologies Specialty Performance Production & Automation Technologies Oilfield Performance ~16%1 ~84%1 Life of Well 2 ChampionX
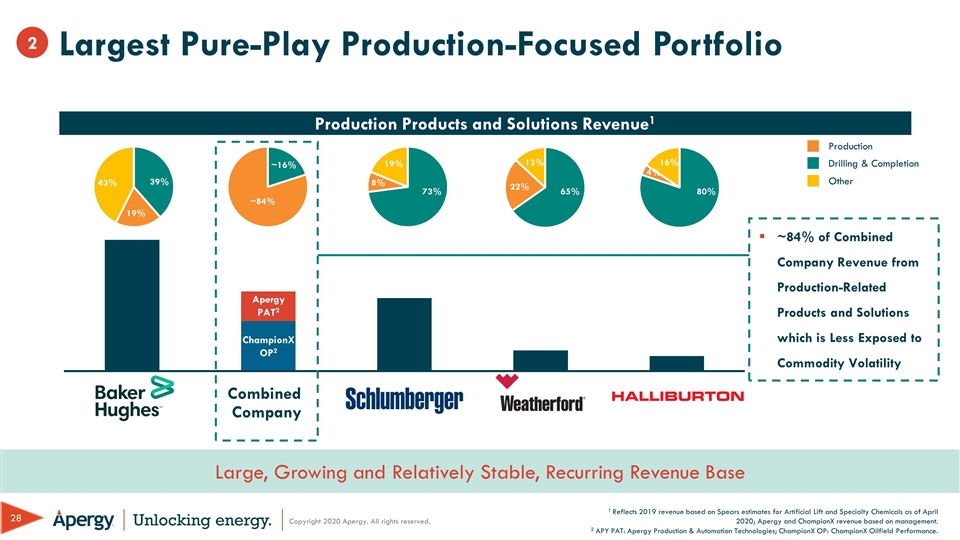
Production Products and Solutions Revenue1 Combined Company ~84% ~16% Apergy PAT2 ChampionX OP2 1 Reflects 2019 revenue based on Spears estimates for Artificial Lift and Specialty Chemicals as of April 2020; Apergy and ChampionX revenue based on management. 2 APY PAT: Apergy Production & Automation Technologies; ChampionX OP: ChampionX Oilfield Performance. Largest Pure-Play Production-Focused Portfolio 2 Large, Growing and Relatively Stable, Recurring Revenue Base 73% 8% 65% 22% 80% 4% 39% 19% Production Drilling & Completion Other ~84% of Combined Company Revenue from Production-Related Products and Solutions which is Less Exposed to Commodity Volatility 43% 19% 13% 16%
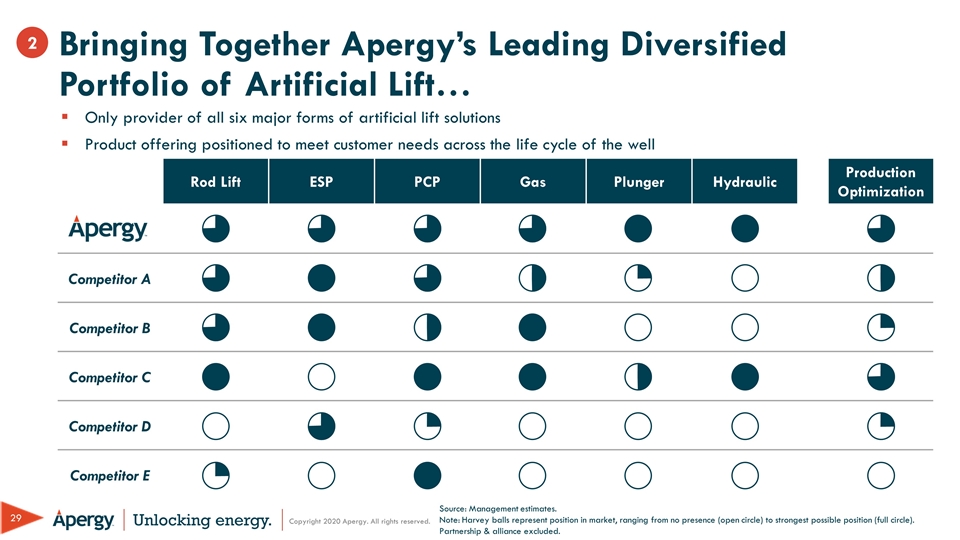
Bringing Together Apergy’s Leading Diversified Portfolio of Artificial Lift… Only provider of all six major forms of artificial lift solutions Product offering positioned to meet customer needs across the life cycle of the well Rod Lift ESP PCP Gas Plunger Hydraulic Production Optimization Competitor A Competitor B Competitor C Competitor D Competitor E Source: Management estimates. Note: Harvey balls represent position in market, ranging from no presence (open circle) to strongest possible position (full circle). Partnership & alliance excluded. 2
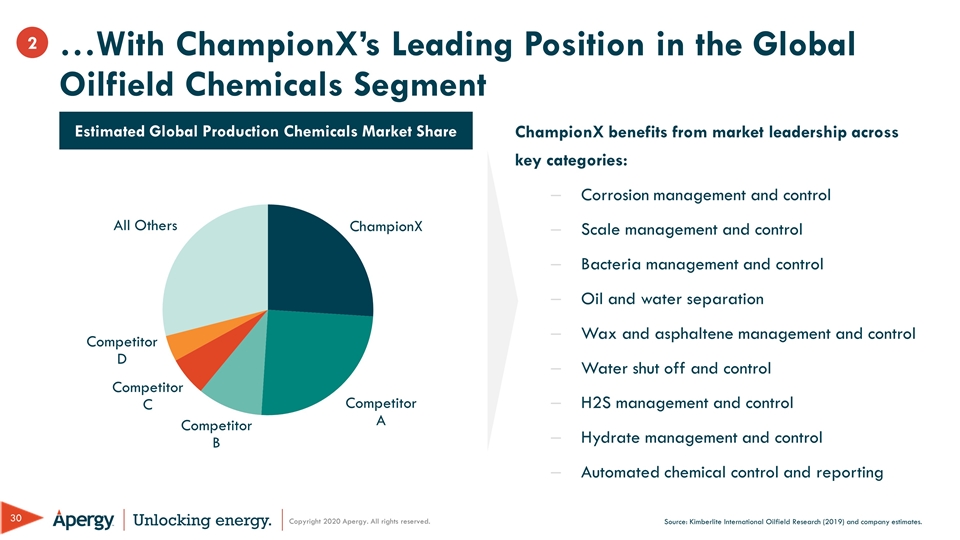
Source: Kimberlite International Oilfield Research (2019) and company estimates. ChampionX benefits from market leadership across key categories: Corrosion management and control Scale management and control Bacteria management and control Oil and water separation Wax and asphaltene management and control Water shut off and control H2S management and control Hydrate management and control Automated chemical control and reporting Estimated Global Production Chemicals Market Share …With ChampionX’s Leading Position in the Global Oilfield Chemicals Segment 2
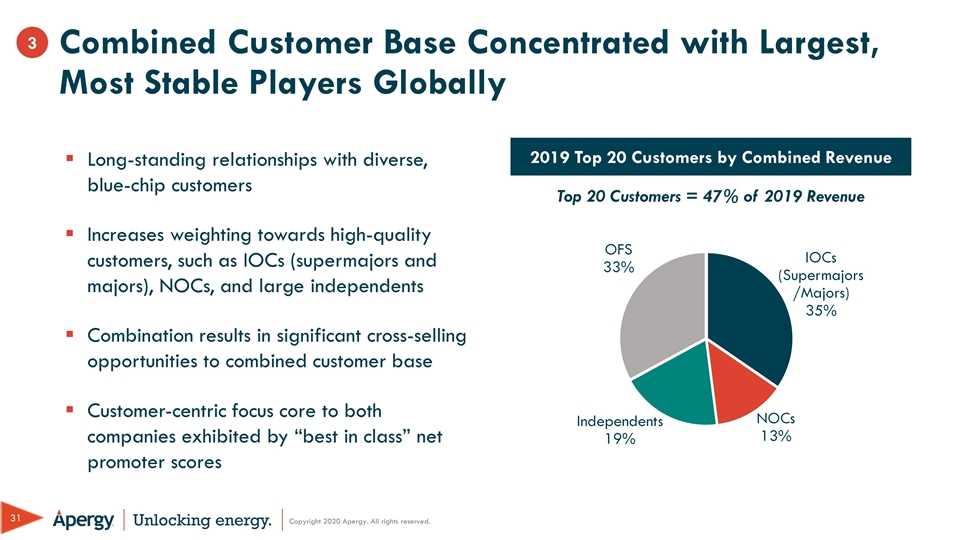
Combined Customer Base Concentrated with Largest, Most Stable Players Globally Top 20 Customers = 47% of 2019 Revenue 2019 Top 20 Customers by Combined Revenue 42% 24% 9% 7% 18% Long-standing relationships with diverse, blue-chip customers Increases weighting towards high-quality customers, such as IOCs (supermajors and majors), NOCs, and large independents Combination results in significant cross-selling opportunities to combined customer base Customer-centric focus core to both companies exhibited by “best in class” net promoter scores 3
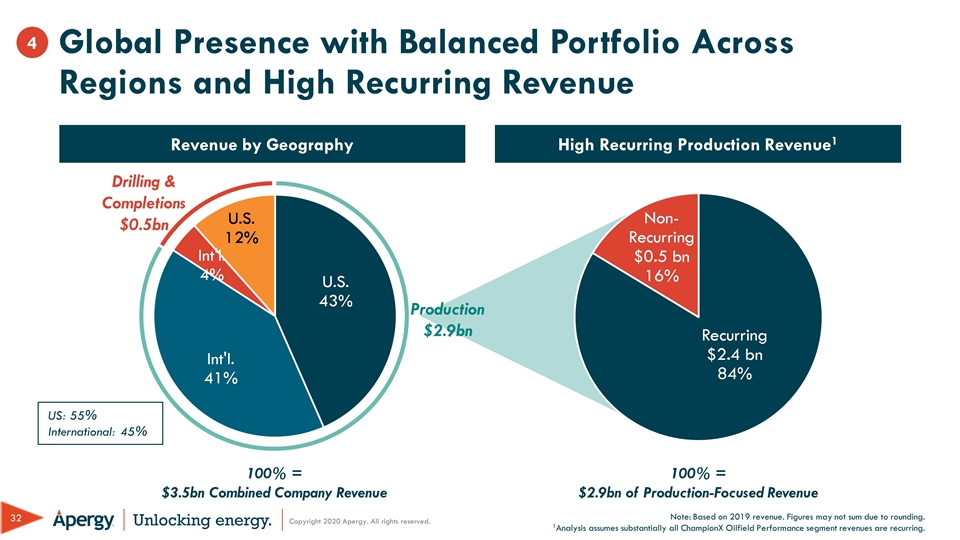
Global Presence with Balanced Portfolio Across Regions and High Recurring Revenue Revenue by Geography High Recurring Production Revenue1 Drilling & Completions $0.5bn Production $2.9bn US: 55% International: 45% 100% = $3.5bn Combined Company Revenue 100% = $2.9bn of Production-Focused Revenue Note: Based on 2019 revenue. Figures may not sum due to rounding. 1Analysis assumes substantially all ChampionX Oilfield Performance segment revenues are recurring. 4
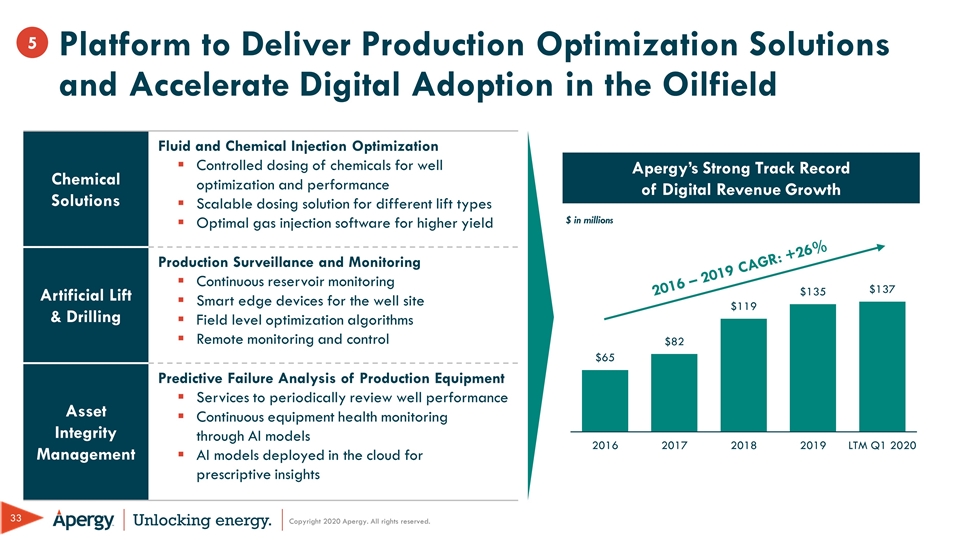
Platform to Deliver Production Optimization Solutions and Accelerate Digital Adoption in the Oilfield 5 Chemical Solutions Fluid and Chemical Injection Optimization Controlled dosing of chemicals for well optimization and performance Scalable dosing solution for different lift types Optimal gas injection software for higher yield Artificial Lift & Drilling Production Surveillance and Monitoring Continuous reservoir monitoring Smart edge devices for the well site Field level optimization algorithms Remote monitoring and control Asset Integrity Management Predictive Failure Analysis of Production Equipment Services to periodically review well performance Continuous equipment health monitoring through AI models AI models deployed in the cloud for prescriptive insights 2016 – 2019 CAGR: +26% Apergy’s Strong Track Record of Digital Revenue Growth $ in millions
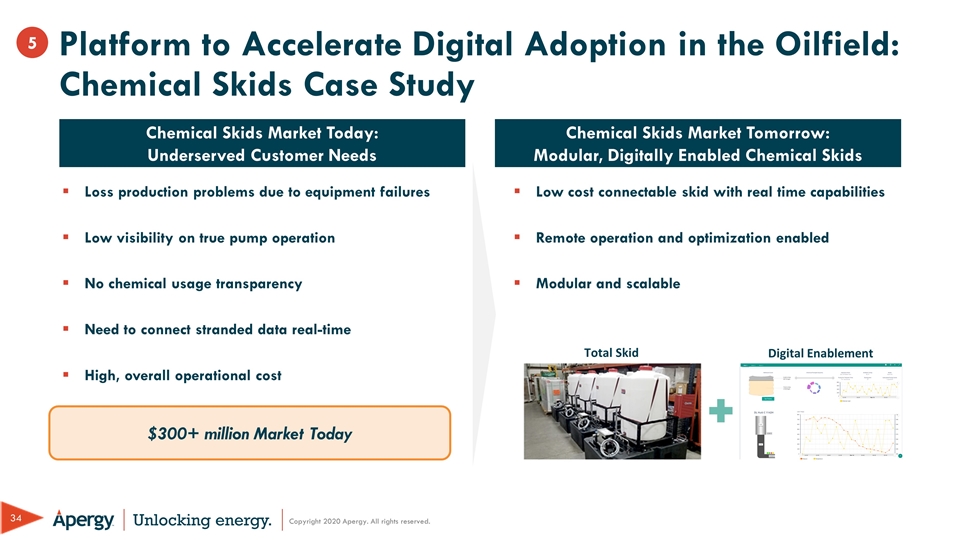
Platform to Accelerate Digital Adoption in the Oilfield: Chemical Skids Case Study Chemical Skids Market Today: Underserved Customer Needs Chemical Skids Market Tomorrow: Modular, Digitally Enabled Chemical Skids Total Skid $300+ million Market Today Loss production problems due to equipment failures Low visibility on true pump operation No chemical usage transparency Need to connect stranded data real-time High, overall operational cost Digital Enablement Low cost connectable skid with real time capabilities Remote operation and optimization enabled Modular and scalable 5
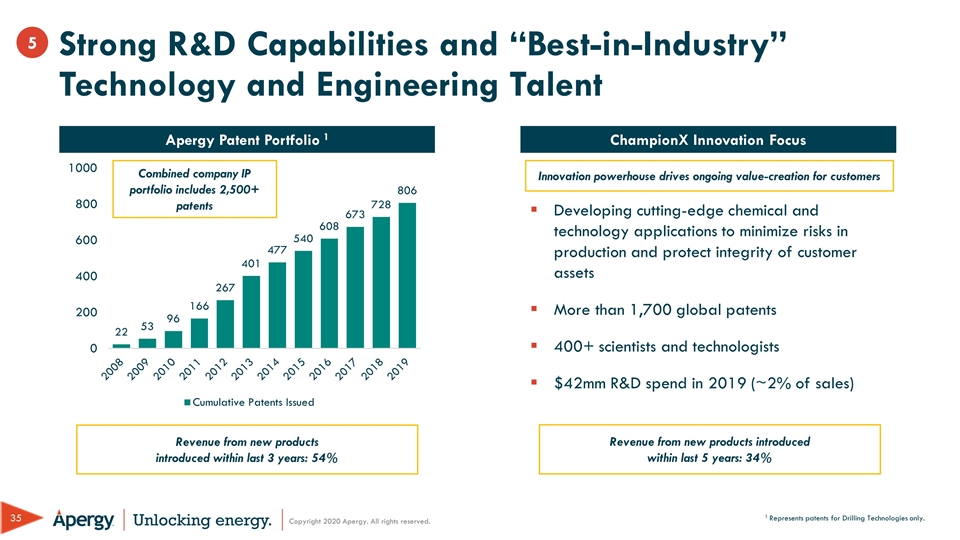
Strong R&D Capabilities and “Best-in-Industry” Technology and Engineering Talent 5 Apergy Patent Portfolio 1 ChampionX Innovation Focus Revenue from new products introduced within last 3 years: 54% Developing cutting-edge chemical and technology applications to minimize risks in production and protect integrity of customer assets More than 1,700 global patents 400+ scientists and technologists $42mm R&D spend in 2019 (~2% of sales) Innovation powerhouse drives ongoing value-creation for customers Revenue from new products introduced within last 5 years: 34% 1 Represents patents for Drilling Technologies only. Combined company IP portfolio includes 2,500+ patents

Synergy Opportunity Overview

Compelling Value Creation Through Synergies Corp Cost Avoidance Cost of Goods Sold Efficiencies G&A Efficiencies $75mm High confidence in achievable expected synergies ~$25 – 35mm Run-rate Cost Synergy Estimate $75mm in expected cost synergies Planning on track for realization Will reach ~$25-35mm run-rate expected cost synergies by end of 2020 Plus incremental sales growth opportunities Status Update
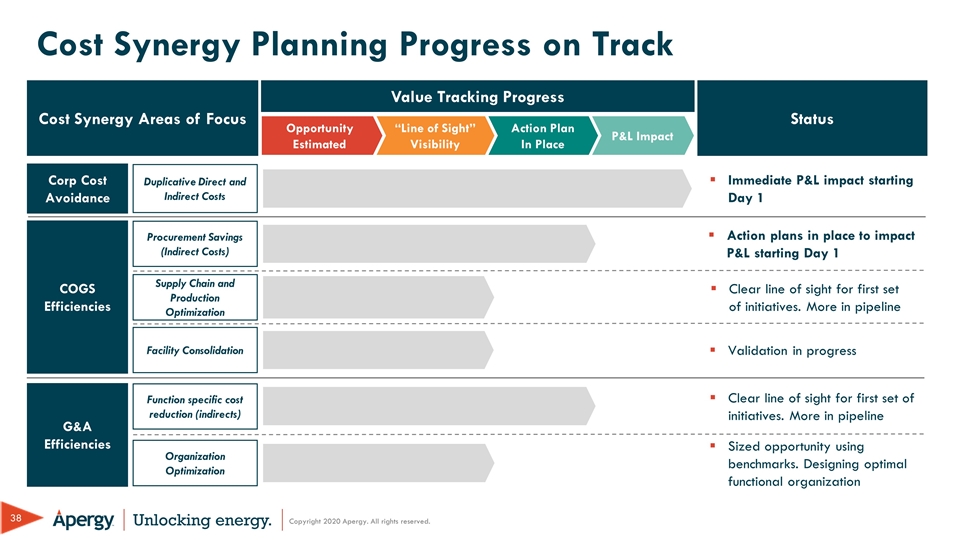
Cost Synergy Planning Progress on Track Opportunity Estimated “Line of Sight” Visibility Action Plan In Place P&L Impact Corp Cost Avoidance Duplicative Direct and Indirect Costs Procurement Savings (Indirect Costs) Supply Chain and Production Optimization Organization Optimization G&A Efficiencies Immediate P&L impact starting Day 1 Cost Synergy Areas of Focus Value Tracking Progress Status Function specific cost reduction (indirects) COGS Efficiencies Facility Consolidation Action plans in place to impact P&L starting Day 1 Clear line of sight for first set of initiatives. More in pipeline Validation in progress Clear line of sight for first set of initiatives. More in pipeline Sized opportunity using benchmarks. Designing optimal functional organization
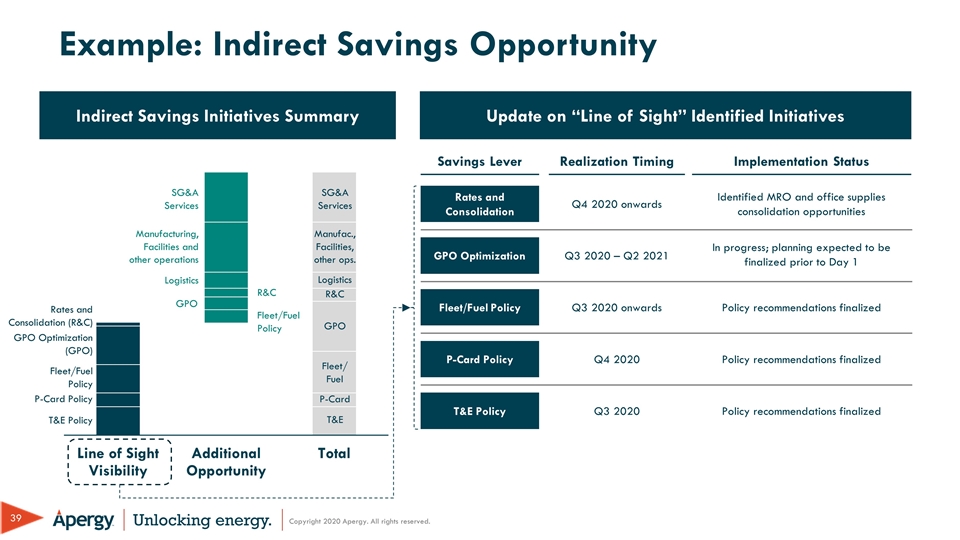
R&C Example: Indirect Savings Opportunity Corp Cost Avoidance Cost of Goods Sold Efficiencies G&A Cost Avoidance Indirect Savings Initiatives Summary Update on “Line of Sight” Identified Initiatives Savings Lever Rates and Consolidation Realization Timing Implementation Status GPO Optimization Fleet/Fuel Policy P-Card Policy T&E Policy Q4 2020 onwards Q3 2020 – Q2 2021 Q3 2020 onwards Q4 2020 Q3 2020 Identified MRO and office supplies consolidation opportunities In progress; planning expected to be finalized prior to Day 1 Policy recommendations finalized Policy recommendations finalized Policy recommendations finalized T&E Policy P-Card Policy Fleet/Fuel Policy GPO Optimization (GPO) Rates and Consolidation (R&C) SG&A Services Manufacturing, Facilities and other operations Logistics Fleet/Fuel Policy GPO T&E P-Card Fleet/Fuel GPO R&C Logistics Manufac., Facilities, other ops. SG&A Services
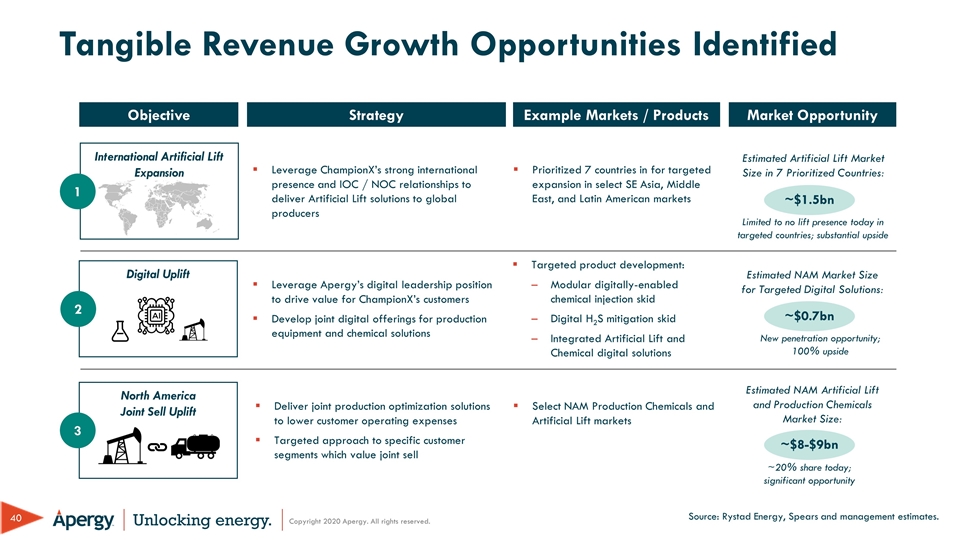
Tangible Revenue Growth Opportunities Identified Objective Strategy Example Markets / Products Market Opportunity Digital Uplift North America Joint Sell Uplift Leverage ChampionX’s strong international presence and IOC / NOC relationships to deliver Artificial Lift solutions to global producers ~$1.5bn Prioritized 7 countries in for targeted expansion in select SE Asia, Middle East, and Latin American markets Leverage Apergy’s digital leadership position to drive value for ChampionX’s customers Develop joint digital offerings for production equipment and chemical solutions Targeted product development: Modular digitally-enabled chemical injection skid Digital H2S mitigation skid Integrated Artificial Lift and Chemical digital solutions ~$0.7bn Deliver joint production optimization solutions to lower customer operating expenses Targeted approach to specific customer segments which value joint sell Select NAM Production Chemicals and Artificial Lift markets ~$8-$9bn Source: Rystad Energy, Spears and management estimates. International Artificial Lift Expansion 1 2 3 Estimated NAM Market Size for Targeted Digital Solutions: Estimated Artificial Lift Market Size in 7 Prioritized Countries: Estimated NAM Artificial Lift and Production Chemicals Market Size: Limited to no lift presence today in targeted countries; substantial upside New penetration opportunity; 100% upside ~20% share today; significant opportunity
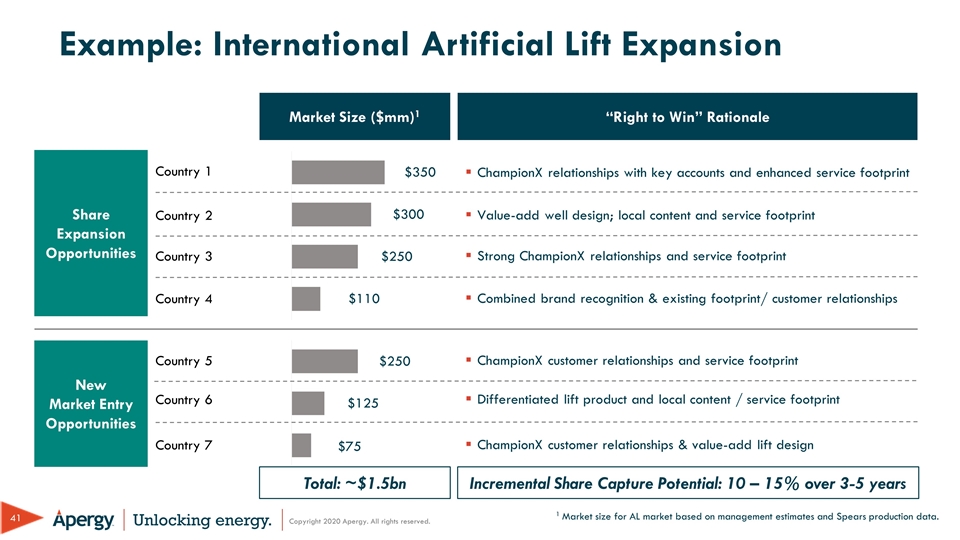
Example: International Artificial Lift Expansion Market Size ($mm)1 “Right to Win” Rationale Share Expansion Opportunities New Market Entry Opportunities Country 1 ChampionX relationships with key accounts and enhanced service footprint ChampionX customer relationships and service footprint 1 Market size for AL market based on management estimates and Spears production data. Country 2 Country 3 Country 4 Country 5 Country 6 Country 7 Value-add well design; local content and service footprint Strong ChampionX relationships and service footprint Combined brand recognition & existing footprint/ customer relationships Differentiated lift product and local content / service footprint ChampionX customer relationships & value-add lift design Total: ~$1.5bn Incremental Share Capture Potential: 10 – 15% over 3-5 years
Combined Financial Summary
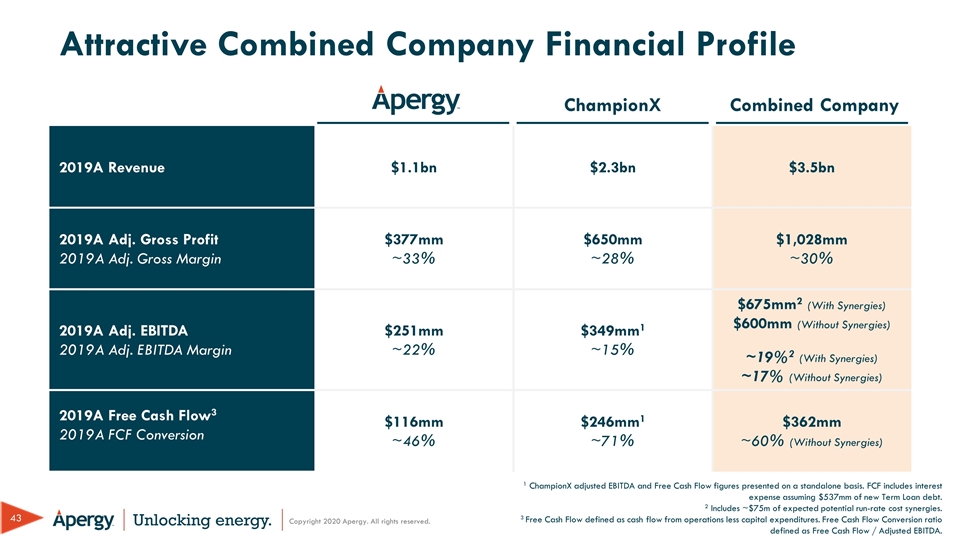
Attractive Combined Company Financial Profile 2019A Revenue $1.1bn $2.3bn $3.5bn 2019A Adj. Gross Profit 2019A Adj. Gross Margin $377mm ~33% $650mm ~28% $1,028mm ~30% 2019A Adj. EBITDA 2019A Adj. EBITDA Margin $251mm ~22% $349mm1 ~15% $675mm2 (With Synergies) $600mm (Without Synergies) ~19%2 (With Synergies) ~17% (Without Synergies) 2019A Free Cash Flow3 2019A FCF Conversion $116mm ~46% $246mm1 ~71% $362mm ~60% (Without Synergies) Combined Company 1 ChampionX adjusted EBITDA and Free Cash Flow figures presented on a standalone basis. FCF includes interest expense assuming $537mm of new Term Loan debt. 2 Includes ~$75m of expected potential run-rate cost synergies. 3 Free Cash Flow defined as cash flow from operations less capital expenditures. Free Cash Flow Conversion ratio defined as Free Cash Flow / Adjusted EBITDA. ChampionX
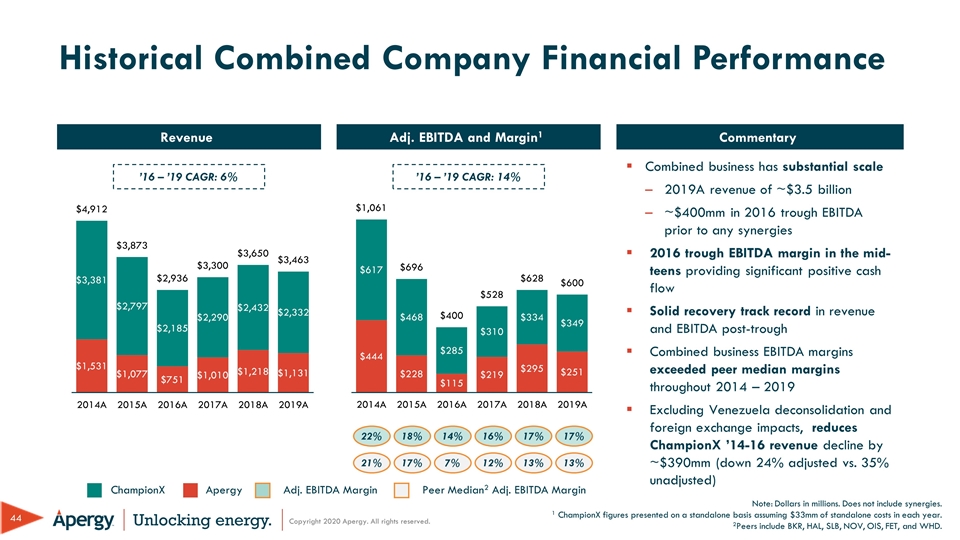
Historical Combined Company Financial Performance Revenue ChampionX Apergy Adj. EBITDA Margin 22% 18% 14% 16% 17% 17% Note: Dollars in millions. Does not include synergies. 1 ChampionX figures presented on a standalone basis assuming $33mm of standalone costs in each year. 2Peers include BKR, HAL, SLB, NOV, OIS, FET, and WHD. Adj. EBITDA and Margin1 Combined business has substantial scale 2019A revenue of ~$3.5 billion ~$400mm in 2016 trough EBITDA prior to any synergies 2016 trough EBITDA margin in the mid-teens providing significant positive cash flow Solid recovery track record in revenue and EBITDA post-trough Combined business EBITDA margins exceeded peer median margins throughout 2014 – 2019 Excluding Venezuela deconsolidation and foreign exchange impacts, reduces ChampionX ’14-16 revenue decline by ~$390mm (down 24% adjusted vs. 35% unadjusted) Commentary ’16 – ’19 CAGR: 6% ’16 – ’19 CAGR: 14% Peer Median2 Adj. EBITDA Margin 21% 17% 7% 12% 13% 13%
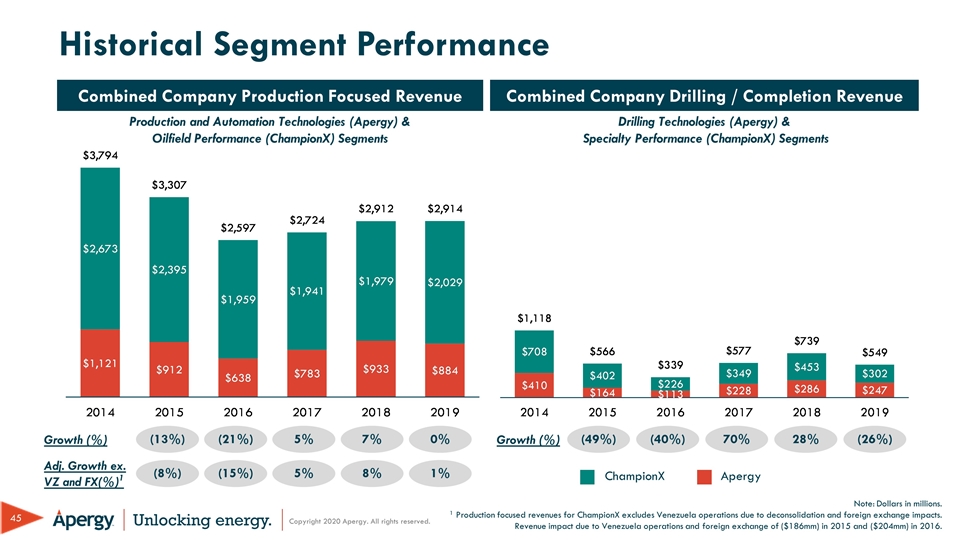
Historical Segment Performance Combined Company Production Focused Revenue Combined Company Drilling / Completion Revenue (13%) (21%) 5% 0% 7% (49%) (40%) 70% (26%) 28% Growth (%) ChampionX Apergy Production and Automation Technologies (Apergy) & Oilfield Performance (ChampionX) Segments Drilling Technologies (Apergy) & Specialty Performance (ChampionX) Segments (8%) (15%) 5% 1% 8% Adj. Growth ex. VZ and FX(%)1 Note: Dollars in millions. 1 Production focused revenues for ChampionX excludes Venezuela operations due to deconsolidation and foreign exchange impacts. Revenue impact due to Venezuela operations and foreign exchange of ($186mm) in 2015 and ($204mm) in 2016. Growth (%)
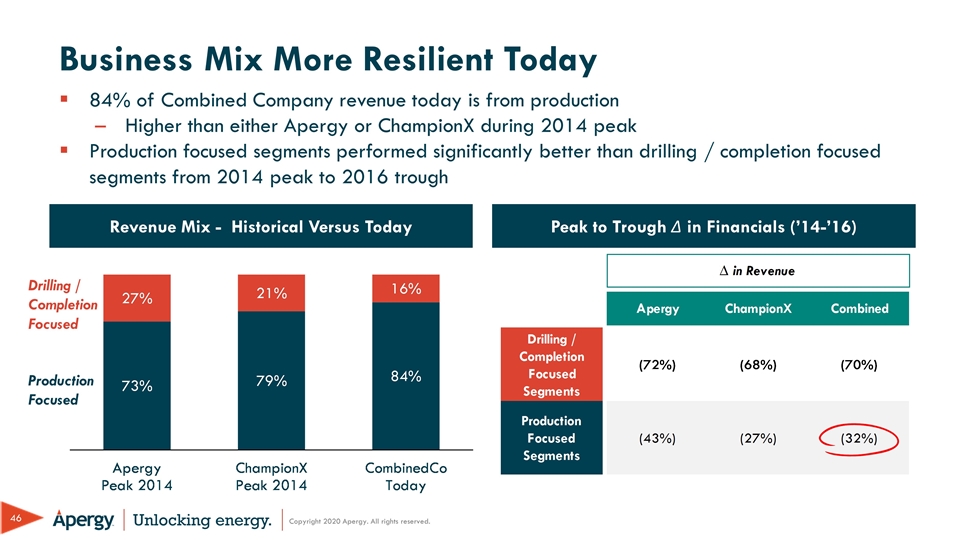
Business Mix More Resilient Today 84% of Combined Company revenue today is from production Higher than either Apergy or ChampionX during 2014 peak Production focused segments performed significantly better than drilling / completion focused segments from 2014 peak to 2016 trough Peak to Trough Δ in Financials (’14-’16) Revenue Mix - Historical Versus Today Drilling / Completion Focused Production Focused
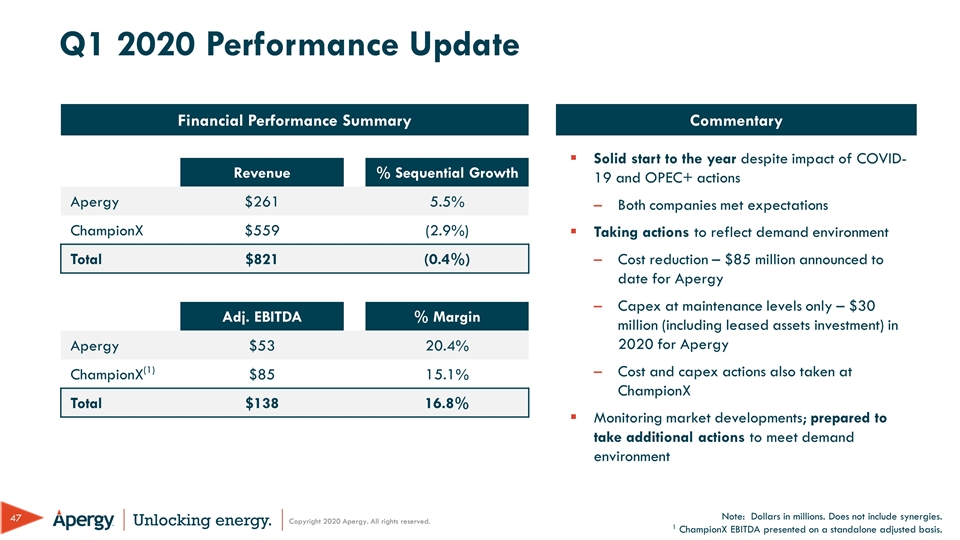
Q1 2020 Performance Update Solid start to the year despite impact of COVID-19 and OPEC+ actions Both companies met expectations Taking actions to reflect demand environment Cost reduction – $85 million announced to date for Apergy Capex at maintenance levels only – $30 million (including leased assets investment) in 2020 for Apergy Cost and capex actions also taken at ChampionX Monitoring market developments; prepared to take additional actions to meet demand environment Commentary Revenue % Sequential Growth Apergy $261 5.5% ChampionX $559 (2.9%) Total $821 (0.4%) Adj. EBITDA % Margin Apergy $53 20.4% ChampionX(1) $85 15.1% Total $138 16.8% Note: Dollars in millions. Does not include synergies. 1 ChampionX EBITDA presented on a standalone adjusted basis. Financial Performance Summary
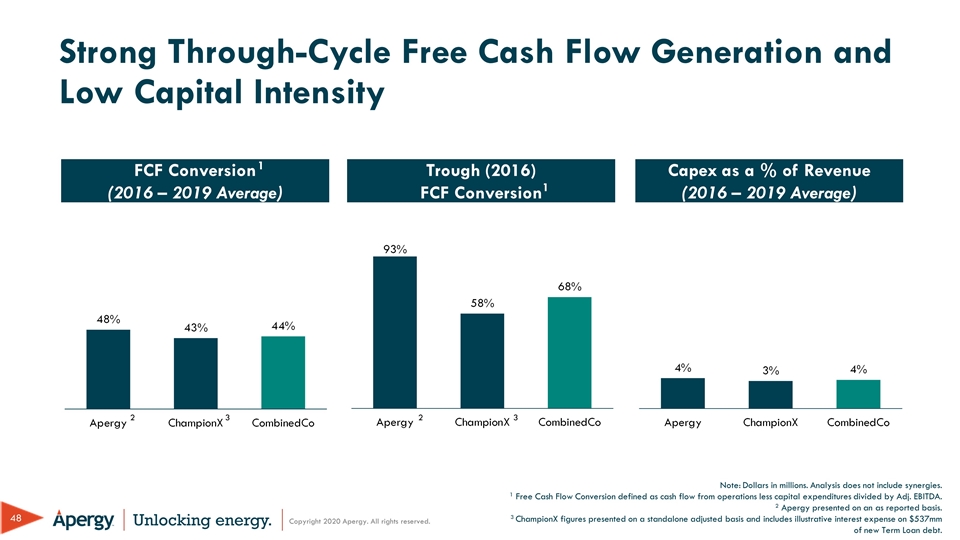
Strong Through-Cycle Free Cash Flow Generation and Low Capital Intensity FCF Conversion (2016 – 2019 Average) Capex as a % of Revenue (2016 – 2019 Average) 1 Trough (2016) FCF Conversion 1 3 3 Note: Dollars in millions. Analysis does not include synergies. 1 Free Cash Flow Conversion defined as cash flow from operations less capital expenditures divided by Adj. EBITDA. 2 Apergy presented on an as reported basis. 3 ChampionX figures presented on a standalone adjusted basis and includes illustrative interest expense on $537mm of new Term Loan debt. 2 2

Note: Dollars in millions. 1Based on Apergy net debt as of 4/30/20 and ChampionX expected net debt of $492mm at close. 2Represents ChampionX LTM Q1’20 EBITDA of $390mm on a carve-out adjusted basis less $33mm estimated standalone costs. 3Represents ChampionX 2016 EBITDA of $318mm on a carve-out adjusted basis less $33mm estimated standalone costs. Net Debt / Adjusted EBITDA Q1’20 Trailing EBITDA 2016 Trough EBITDA Net Debt 4.5x $667 $592 $475 $235 $115 Apergy ChampionX Total $235 357 $235 357 $115 285 ChampionX Net Debt Apergy Combined $492 515 $1,0071 Synergies 75 3 $515 $1,0071 $1,0071 $1,0071 $515 Apergy Standalone Apergy Standalone Combined APY+ ChampionX Combined APY+ ChampionX w/ Synergies Combined APY+ ChampionX w/ Synergies Reference EBITDA (in millions) 75 Delevering Transaction Enhances Credit Metrics 2 2

Transaction Strengthens Liquidity; No Near-Term Maturities Note: Dollars in millions. 1Apergy cash and equivalents balance of $179mm as of 4/30/20. ChampionX expected cash balance of $45mm at close. 2Revolving credit facility upsize expected to $400mm, less $125mm draw and estimated outstanding LCs for Apergy and ChampionX. 3Free Cash Flow defined as cash flow from operations less capital expenditures 4Upsized Revolver of $400mm matures in May 2023. Liquidity Combined Company Debt Maturity Schedule Term Loan B Senior Notes Cash on hand1 Availability on Revolving credit facility2 New Term Loan B 4 0 0 0 0 Revolver FCF Generation3
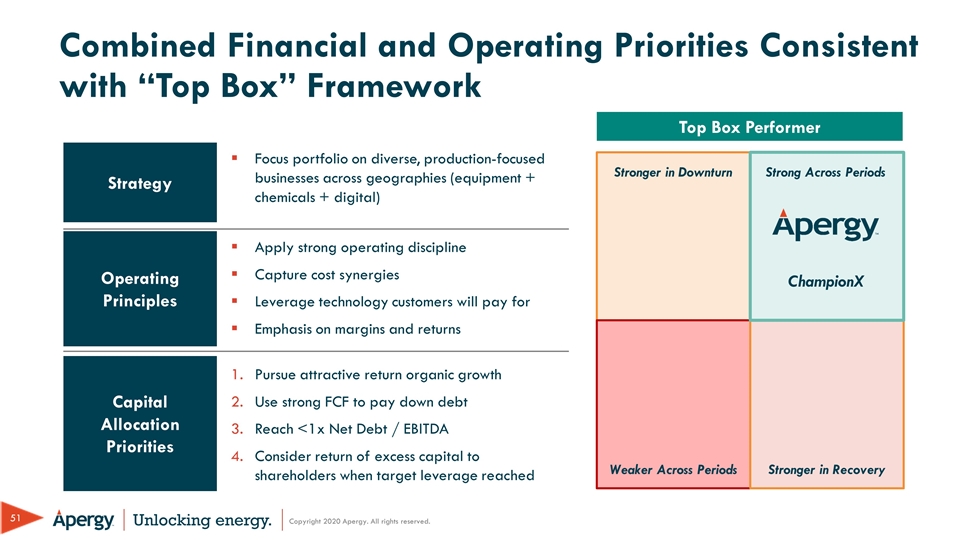
Combined Financial and Operating Priorities Consistent with “Top Box” Framework Strategy Capital Allocation Priorities Focus portfolio on diverse, production-focused businesses across geographies (equipment + chemicals + digital) Operating Principles Apply strong operating discipline Capture cost synergies Leverage technology customers will pay for Emphasis on margins and returns Stronger in Downturn Weaker Across Periods Stronger in Recovery Top Box Performer Strong Across Periods Pursue attractive return organic growth Use strong FCF to pay down debt Reach <1x Net Debt / EBITDA Consider return of excess capital to shareholders when target leverage reached ChampionX

On Track to June Close May June April ChampionX S-4/S-1 for the Exchange Offer effective Apergy S-4 for the transaction effective Apergy Proxy Statement for its special meeting of stockholders definitive Exchange Offer launched Apergy Special Shareholder Meeting (5/28) Exchange Offer expiration (6/3) Transaction close Apergy begins trading as

Summary and Q&A
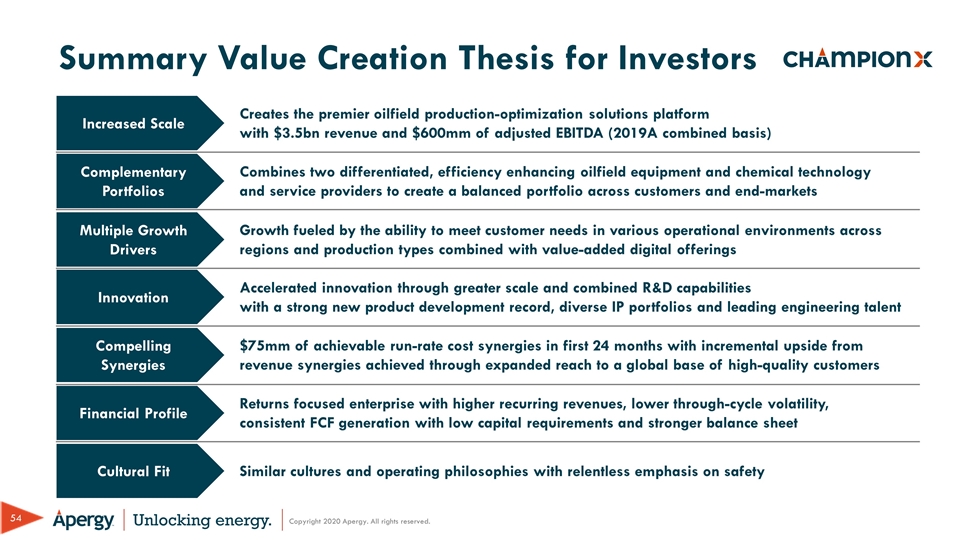
Summary Value Creation Thesis for Investors Increased Scale Complementary Portfolios Innovation Compelling Synergies Financial Profile Cultural Fit Multiple Growth Drivers Creates the premier oilfield production-optimization solutions platform with $3.5bn revenue and $600mm of adjusted EBITDA (2019A combined basis) Combines two differentiated, efficiency enhancing oilfield equipment and chemical technology and service providers to create a balanced portfolio across customers and end-markets Growth fueled by the ability to meet customer needs in various operational environments across regions and production types combined with value-added digital offerings Accelerated innovation through greater scale and combined R&D capabilities with a strong new product development record, diverse IP portfolios and leading engineering talent $75mm of achievable run-rate cost synergies in first 24 months with incremental upside from revenue synergies achieved through expanded reach to a global base of high-quality customers Returns focused enterprise with higher recurring revenues, lower through-cycle volatility, consistent FCF generation with low capital requirements and stronger balance sheet Similar cultures and operating philosophies with relentless emphasis on safety

Appendix
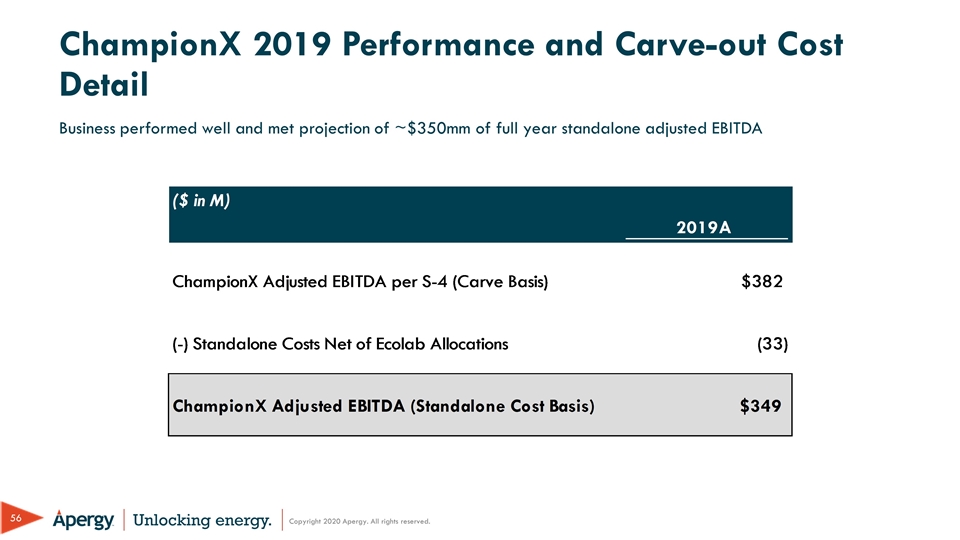
ChampionX 2019 Performance and Carve-out Cost Detail Business performed well and met projection of ~$350mm of full year standalone adjusted EBITDA

Historical Free Cash Flow Reconciliation Note: Dollars in millions. 1ChampionX figures presented on a carveout adjusted basis with $33mm of standalone costs each year. 2ChampionX operating cash flow presented on a carveout adjusted basis. 3Assumes an effective corporate tax rate of 23% on $33mm of standalone costs each year for ChampionX. 4Illustrative interest expense on $537mm of new Term Loan debt. 5Defined as cash flow from operations less capital expenditures divided by Adj. EBITDA.
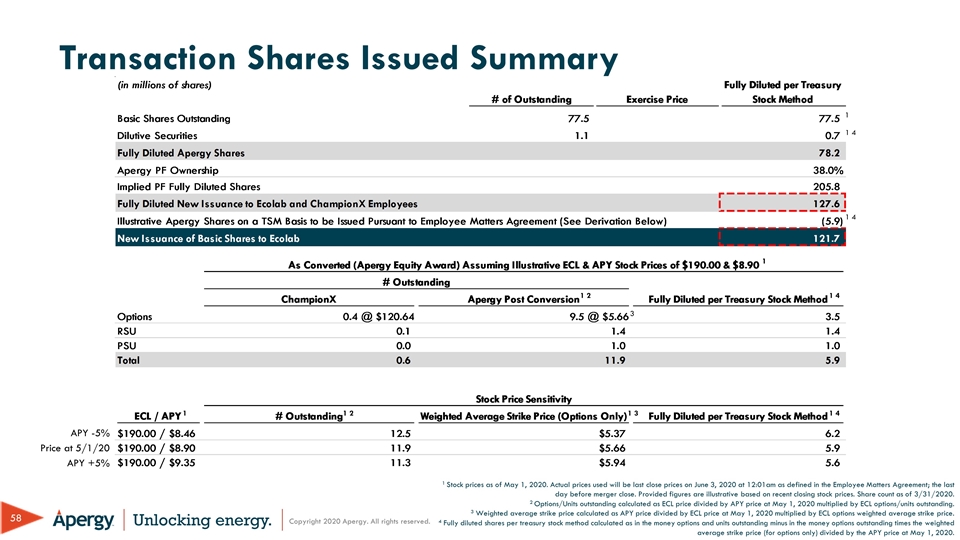
Transaction Shares Issued Summary 1 Stock prices as of May 1, 2020. Actual prices used will be last close prices on June 3, 2020 at 12:01am as defined in the Employee Matters Agreement; the last day before merger close. Provided figures are illustrative based on recent closing stock prices. Share count as of 3/31/2020. 2 Options/Units outstanding calculated as ECL price divided by APY price at May 1, 2020 multiplied by ECL options/units outstanding. 3 Weighted average strike price calculated as APY price divided by ECL price at May 1, 2020 multiplied by ECL options weighted average strike price. 4 Fully diluted shares per treasury stock method calculated as in the money options and units outstanding minus in the money options outstanding times the weighted average strike price (for options only) divided by the APY price at May 1, 2020. APY -5% APY +5% Price at 5/1/20 1 2 1 4 1 1 1 2 1 3 1 4 3 1 4 1 4 1
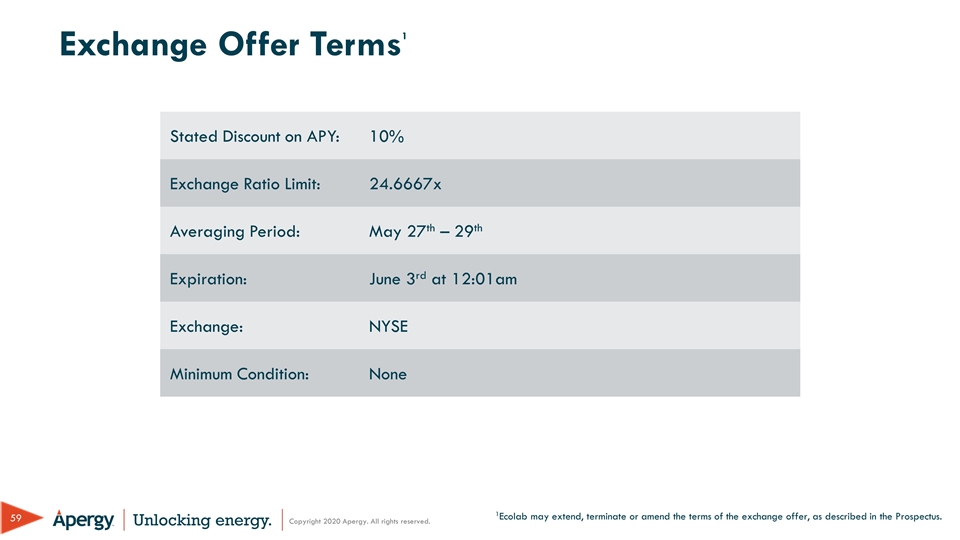
Exchange Offer Terms1 Stated Discount on APY: 10% Exchange Ratio Limit: 24.6667x Averaging Period: May 27th – 29th Expiration: June 3rd at 12:01am Exchange: NYSE Minimum Condition: None 1Ecolab may extend, terminate or amend the terms of the exchange offer, as described in the Prospectus.