0001722388
false
N-CSR
Tidal Trust III
N-1A
2024-06-30
0001722388
ist:C000198447Member
2023-07-01
2024-06-30
0001722388
2023-07-01
2024-06-30
0001722388
ist:C000198447Member
2018-08-24
2018-08-24
0001722388
ist:Russell1000IndexUSD4759BroadBasedIndexMember
2018-08-24
2018-08-24
0001722388
ist:Russell1000IndexUSD4759BroadBasedIndexMember
2024-06-30
0001722388
ist:MorningstarWomensEmpowermentIndex4759AdditionalIndexMember
2018-08-24
2018-08-24
0001722388
ist:MorningstarWomensEmpowermentIndex4759AdditionalIndexMember
2024-06-30
0001722388
ist:MorningstarUSLargeMinusMidCapIndex4759AdditionalIndexMember
2018-08-24
2018-08-24
0001722388
ist:MorningstarUSLargeMinusMidCapIndex4759AdditionalIndexMember
2024-06-30
0001722388
ist:Russell1000IndexUSD4759BroadBasedIndexMember
2018-08-24
0001722388
ist:MorningstarWomensEmpowermentIndex4759AdditionalIndexMember
2018-08-24
0001722388
ist:MorningstarUSLargeMinusMidCapIndex4759AdditionalIndexMember
2018-08-24
0001722388
ist:Russell1000IndexUSD4759BroadBasedIndexMember
2019-06-30
0001722388
ist:MorningstarWomensEmpowermentIndex4759AdditionalIndexMember
2019-06-30
0001722388
ist:MorningstarUSLargeMinusMidCapIndex4759AdditionalIndexMember
2019-06-30
0001722388
ist:Russell1000IndexUSD4759BroadBasedIndexMember
2020-06-30
0001722388
ist:MorningstarWomensEmpowermentIndex4759AdditionalIndexMember
2020-06-30
0001722388
ist:MorningstarUSLargeMinusMidCapIndex4759AdditionalIndexMember
2020-06-30
0001722388
ist:Russell1000IndexUSD4759BroadBasedIndexMember
2021-06-30
0001722388
ist:MorningstarWomensEmpowermentIndex4759AdditionalIndexMember
2021-06-30
0001722388
ist:MorningstarUSLargeMinusMidCapIndex4759AdditionalIndexMember
2021-06-30
0001722388
ist:Russell1000IndexUSD4759BroadBasedIndexMember
2022-06-30
0001722388
ist:MorningstarWomensEmpowermentIndex4759AdditionalIndexMember
2022-06-30
0001722388
ist:MorningstarUSLargeMinusMidCapIndex4759AdditionalIndexMember
2022-06-30
0001722388
ist:Russell1000IndexUSD4759BroadBasedIndexMember
2023-06-30
0001722388
ist:MorningstarWomensEmpowermentIndex4759AdditionalIndexMember
2023-06-30
0001722388
ist:MorningstarUSLargeMinusMidCapIndex4759AdditionalIndexMember
2023-06-30
0001722388
ist:C000198447Member
oef:WithoutSalesLoadMember
2023-07-01
2024-06-30
0001722388
ist:C000198447Member
oef:WithoutSalesLoadMember
2019-07-01
2024-06-30
0001722388
ist:C000198447Member
oef:WithoutSalesLoadMember
2018-08-24
2024-06-30
0001722388
ist:Russell1000IndexUSD4759BroadBasedIndexMember
2023-07-01
2024-06-30
0001722388
ist:Russell1000IndexUSD4759BroadBasedIndexMember
2019-07-01
2024-06-30
0001722388
ist:Russell1000IndexUSD4759BroadBasedIndexMember
2018-08-24
2024-06-30
0001722388
ist:MorningstarWomensEmpowermentIndex4759AdditionalIndexMember
2023-07-01
2024-06-30
0001722388
ist:MorningstarWomensEmpowermentIndex4759AdditionalIndexMember
2019-07-01
2024-06-30
0001722388
ist:MorningstarWomensEmpowermentIndex4759AdditionalIndexMember
2018-08-24
2024-06-30
0001722388
ist:MorningstarUSLargeMinusMidCapIndex4759AdditionalIndexMember
2023-07-01
2024-06-30
0001722388
ist:MorningstarUSLargeMinusMidCapIndex4759AdditionalIndexMember
2019-07-01
2024-06-30
0001722388
ist:MorningstarUSLargeMinusMidCapIndex4759AdditionalIndexMember
2018-08-24
2024-06-30
0001722388
ist:C000198447Member
2024-06-30
0001722388
ist:C000198447Member
ist:ShortMinusTermInvestmentSectorMember
2024-06-30
0001722388
ist:C000198447Member
oef:MaterialsSectorMember
2024-06-30
0001722388
ist:C000198447Member
us-gaap:RealEstateSectorMember
2024-06-30
0001722388
ist:C000198447Member
oef:UtilitiesSectorMember
2024-06-30
0001722388
ist:C000198447Member
us-gaap:EnergySectorMember
2024-06-30
0001722388
ist:C000198447Member
ist:CommunicationServicesSectorMember
2024-06-30
0001722388
ist:C000198447Member
oef:ConsumerStaplesSectorMember
2024-06-30
0001722388
ist:C000198447Member
ist:IndustrialsSectorMember
2024-06-30
0001722388
ist:C000198447Member
oef:ConsumerDiscretionarySectorMember
2024-06-30
0001722388
ist:C000198447Member
ist:FinancialsSectorMember
2024-06-30
0001722388
ist:C000198447Member
us-gaap:HealthcareSectorMember
2024-06-30
0001722388
ist:C000198447Member
oef:InformationTechnologySectorMember
2024-06-30
0001722388
ist:C000198447Member
ist:Amazoncom8089711CTIMember
2024-06-30
0001722388
ist:C000198447Member
ist:Apple8089738CTIMember
2024-06-30
0001722388
ist:C000198447Member
ist:MetaPlatforms8089989CTIMember
2024-06-30
0001722388
ist:C000198447Member
ist:EliLilly8089873CTIMember
2024-06-30
0001722388
ist:C000198447Member
ist:Microsoft8089996CTIMember
2024-06-30
0001722388
ist:C000198447Member
ist:ExxonMobil8089897CTIMember
2024-06-30
0001722388
ist:C000198447Member
ist:Adobe8089697CTIMember
2024-06-30
0001722388
ist:C000198447Member
ist:Salesforce8090103CTIMember
2024-06-30
0001722388
ist:C000198447Member
ist:UnitedHealthGroup8090157CTIMember
2024-06-30
0001722388
ist:C000198447Member
ist:Visa8090176CTIMember
2024-06-30
0001722388
ist:C000198448Member
2023-07-01
2024-06-30
0001722388
ist:C000198448Member
2018-07-18
2018-07-18
0001722388
ist:Russell1000IndexUSD4761BroadBasedIndexMember
2018-07-18
2018-07-18
0001722388
ist:Russell1000IndexUSD4761BroadBasedIndexMember
2024-06-30
0001722388
ist:MorningstarMinorityEmpowermentIndex4761AdditionalIndexMember
2018-07-18
2018-07-18
0001722388
ist:MorningstarMinorityEmpowermentIndex4761AdditionalIndexMember
2024-06-30
0001722388
ist:MorningstarUSLargeMinusMidCapIndex4761AdditionalIndexMember
2018-07-18
2018-07-18
0001722388
ist:MorningstarUSLargeMinusMidCapIndex4761AdditionalIndexMember
2024-06-30
0001722388
ist:Russell1000IndexUSD4761BroadBasedIndexMember
2018-07-18
0001722388
ist:MorningstarMinorityEmpowermentIndex4761AdditionalIndexMember
2018-07-18
0001722388
ist:MorningstarUSLargeMinusMidCapIndex4761AdditionalIndexMember
2018-07-18
0001722388
ist:Russell1000IndexUSD4761BroadBasedIndexMember
2019-06-30
0001722388
ist:MorningstarMinorityEmpowermentIndex4761AdditionalIndexMember
2019-06-30
0001722388
ist:MorningstarUSLargeMinusMidCapIndex4761AdditionalIndexMember
2019-06-30
0001722388
ist:Russell1000IndexUSD4761BroadBasedIndexMember
2020-06-30
0001722388
ist:MorningstarMinorityEmpowermentIndex4761AdditionalIndexMember
2020-06-30
0001722388
ist:MorningstarUSLargeMinusMidCapIndex4761AdditionalIndexMember
2020-06-30
0001722388
ist:Russell1000IndexUSD4761BroadBasedIndexMember
2021-06-30
0001722388
ist:MorningstarMinorityEmpowermentIndex4761AdditionalIndexMember
2021-06-30
0001722388
ist:MorningstarUSLargeMinusMidCapIndex4761AdditionalIndexMember
2021-06-30
0001722388
ist:Russell1000IndexUSD4761BroadBasedIndexMember
2022-06-30
0001722388
ist:MorningstarMinorityEmpowermentIndex4761AdditionalIndexMember
2022-06-30
0001722388
ist:MorningstarUSLargeMinusMidCapIndex4761AdditionalIndexMember
2022-06-30
0001722388
ist:Russell1000IndexUSD4761BroadBasedIndexMember
2023-06-30
0001722388
ist:MorningstarMinorityEmpowermentIndex4761AdditionalIndexMember
2023-06-30
0001722388
ist:MorningstarUSLargeMinusMidCapIndex4761AdditionalIndexMember
2023-06-30
0001722388
ist:C000198448Member
oef:WithoutSalesLoadMember
2023-07-01
2024-06-30
0001722388
ist:C000198448Member
oef:WithoutSalesLoadMember
2019-07-01
2024-06-30
0001722388
ist:C000198448Member
oef:WithoutSalesLoadMember
2018-07-18
2024-06-30
0001722388
ist:Russell1000IndexUSD4761BroadBasedIndexMember
2023-07-01
2024-06-30
0001722388
ist:Russell1000IndexUSD4761BroadBasedIndexMember
2019-07-01
2024-06-30
0001722388
ist:Russell1000IndexUSD4761BroadBasedIndexMember
2018-07-18
2024-06-30
0001722388
ist:MorningstarMinorityEmpowermentIndex4761AdditionalIndexMember
2023-07-01
2024-06-30
0001722388
ist:MorningstarMinorityEmpowermentIndex4761AdditionalIndexMember
2019-07-01
2024-06-30
0001722388
ist:MorningstarMinorityEmpowermentIndex4761AdditionalIndexMember
2018-07-18
2024-06-30
0001722388
ist:MorningstarUSLargeMinusMidCapIndex4761AdditionalIndexMember
2023-07-01
2024-06-30
0001722388
ist:MorningstarUSLargeMinusMidCapIndex4761AdditionalIndexMember
2019-07-01
2024-06-30
0001722388
ist:MorningstarUSLargeMinusMidCapIndex4761AdditionalIndexMember
2018-07-18
2024-06-30
0001722388
ist:C000198448Member
2024-06-30
0001722388
ist:C000198448Member
us-gaap:RealEstateSectorMember
2024-06-30
0001722388
ist:C000198448Member
ist:ShortMinusTermInvestmentSectorMember
2024-06-30
0001722388
ist:C000198448Member
oef:MaterialsSectorMember
2024-06-30
0001722388
ist:C000198448Member
oef:UtilitiesSectorMember
2024-06-30
0001722388
ist:C000198448Member
oef:ConsumerStaplesSectorMember
2024-06-30
0001722388
ist:C000198448Member
us-gaap:EnergySectorMember
2024-06-30
0001722388
ist:C000198448Member
oef:ConsumerDiscretionarySectorMember
2024-06-30
0001722388
ist:C000198448Member
ist:IndustrialsSectorMember
2024-06-30
0001722388
ist:C000198448Member
us-gaap:HealthcareSectorMember
2024-06-30
0001722388
ist:C000198448Member
ist:FinancialsSectorMember
2024-06-30
0001722388
ist:C000198448Member
ist:CommunicationServicesSectorMember
2024-06-30
0001722388
ist:C000198448Member
oef:InformationTechnologySectorMember
2024-06-30
0001722388
ist:C000198448Member
ist:Microsoft8090221CTIMember
2024-06-30
0001722388
ist:C000198448Member
ist:Amazoncom8089940CTIMember
2024-06-30
0001722388
ist:C000198448Member
ist:Apple8089955CTIMember
2024-06-30
0001722388
ist:C000198448Member
ist:NVIDIA8090252CTIMember
2024-06-30
0001722388
ist:C000198448Member
ist:QUALCOMM8090288CTIMember
2024-06-30
0001722388
ist:C000198448Member
ist:MetaPlatforms8090214CTIMember
2024-06-30
0001722388
ist:C000198448Member
ist:AccenturePLC8089922CTIMember
2024-06-30
0001722388
ist:C000198448Member
ist:InternationalBusinessMachines8090158CTIMember
2024-06-30
0001722388
ist:C000198448Member
ist:Alphabet8089934CTIMember
2024-06-30
0001722388
ist:C000198448Member
ist:Alphabet8089937CTIMember
2024-06-30
iso4217:USD
xbrli:shares
iso4217:USD
xbrli:shares
xbrli:pure
utr:D
ist:Holding
UNITED STATES
SECURITIES AND EXCHANGE COMMISSION
Washington, D.C. 20549
FORM N-CSR
CERTIFIED SHAREHOLDER REPORT OF REGISTERED
MANAGEMENT INVESTMENT COMPANIES
Investment Company Act file number (811-23312)
Tidal Trust III
(Exact name of registrant as specified in charter)
234 West Florida Street, Suite 203
Milwaukee,
Wisconsin 53204
(Address of principal executive offices) (Zip code)
Eric W. Falkeis
Tidal Trust III
234 West
Florida Street, Suite 203
Milwaukee, Wisconsin 53204
(Name and address of agent for service)
(844) 986-7700
Registrant’s telephone number, including area
code
Date of fiscal year end: June
30
Date of reporting period: June
30, 2024
Item 1.
Reports to Stockholders.
|
(a) |
A copy of the report transmitted to stockholders pursuant
to Rule 30e-1 under the Investment Company Act of 1940, as amended (the “1940 Act”) (17 CFR § 270.30e-1), is attached
hereto. |
Impact
Shares YWCA Women's Empowerment ETF
Principal
Listing Exchange: NYSEArca
Annual
Shareholder Report - June 30, 2024
This annual
shareholder report contains important information about Impact Shares YWCA Women's Empowerment ETF (the "Fund") for the period
from July 1, 2023 to June 30, 2024. You
can find additional information about the Fund at https://impactetfs.org/womn-etf/.
You can also request this information by calling 844-448-3383.
What
were the Fund costs for the last year?
(based
on a hypothetical $10,000 investment)
Fund Name |
Costs of a $10,000 investment |
Costs paid as a percentage of a $10,000 investment |
Impact Shares YWCA Women's Empowerment ETF |
$82 |
0.75% |
How
did the Fund perform in the last year?
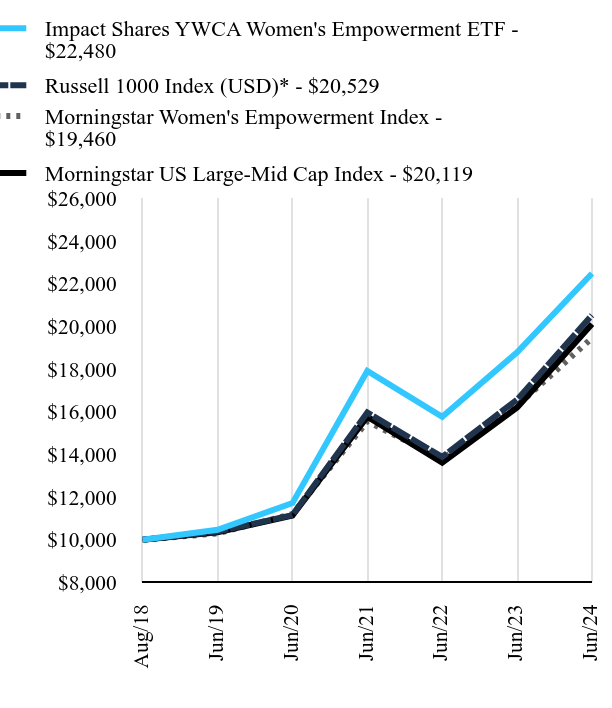
The
Fund seeks to provide investment results that, before fees and expenses, track the performance of the Morningstar®
Women’s Empowerment Index that is designed to measure the performance of U.S. large-capitalization and mid-capitalization companies
that are “empowering to women,” and to exhibit risk and return characteristics similar to those of the Russell 1000 Index.
The Fund’s underlying benchmark is the Morningstar Women’s Empowerment Index (the “Underlying Index”). From July
1, 2023 through June 30, 2024 (the “Reporting Period”), the total return for the Fund was 19.64%, and the return for the Russell
1000 was 23.88%. The trailing twelve months ending June 2024 was defined by the broad equity market performance being driven by the FED
and continued rate uncertainty. Inflation showed signs of improvement towards the end of the period, inching closer to the Fed's 2% target
after a series of unexpectedly high Consumer Price Index (CPI) reports in early 2024. This shift in inflation data led to evolving market
sentiments and prompted the Fed to adopt a more positive tone ending the period with a high likelihood of multiple rate cuts in the second
half of 2024. Additionally, the Russell 1000 was enjoyed exceptional returns from technology and communications companies associated with
AI continuing their rally, the fund did not have as much exposure to these high flying names as did the index. Meanwhile, uncertainty
around the presidential election results contributed in market volatility, with potential implications on economic policies.
Total
Return Based on $10,000 Investment
|
Impact
Shares YWCA Women's Empowerment ETF - $22480 |
Russell
1000 Index (USD)* - $20529 |
Morningstar
Women's Empowerment Index - $19460 |
Morningstar
US Large-Mid Cap Index - $20119 |
Aug/18 |
$10000 |
$10000 |
$10000 |
$10000 |
Jun/19 |
$10471 |
$10382 |
$10303 |
$10356 |
Jun/20 |
$11719 |
$11159 |
$11201 |
$11133 |
Jun/21 |
$17913 |
$15965 |
$15550 |
$15765 |
Jun/22 |
$15768 |
$13884 |
$13789 |
$13620 |
Jun/23 |
$18790 |
$16572 |
$16282 |
$16200 |
Jun/24 |
$22480 |
$20529 |
$19460 |
$20119 |
Since
its inception on August 24, 2018. The line graph represents historical performance of a hypothetical investment of $10,000 in
the Fund since inception. Returns shown do not reflect the deduction of taxes that a shareholder would pay on fund distribution or
the redemption of fund shares but assume the reinvestment of capital gains, dividends and return of capital. The table and graph
presented above do not reflect the deduction of taxes a shareholder would pay on Fund distributions or the redemption of Fund Shares. Past
performance is not indicative of future performance.Call 844-448-3383 or visit https://impactetfs.org/womn-etf/ for
current month-end performance.
Footnote
Reference*As of June 2024, pursuant to the new regulatory requirements, this index replaced the prior index as the Fund's primary benchmark to represent a broad-based securities market index.
Average
Annual Total Returns as of June 30, 2024
Fund/Index Name |
1 Year |
5 Years |
Annualized
Since
Inception |
Impact Shares YWCA Women's Empowerment ETF |
19.64% |
16.51% |
14.84% |
Russell 1000 Index (USD)* |
23.88% |
14.61% |
13.07% |
Morningstar Women's Empowerment Index |
19.52% |
13.56% |
12.04% |
Morningstar US Large-Mid Cap Index |
24.19% |
14.21% |
12.68% |
Key
Fund Statistics as of June 30, 2024
|
Total Net Assets |
Number of Holdings |
Total Advisory Fees Paid |
Portfolio Turnover Rate |
|
$55,779,835 |
180 |
$353,066 |
33% |
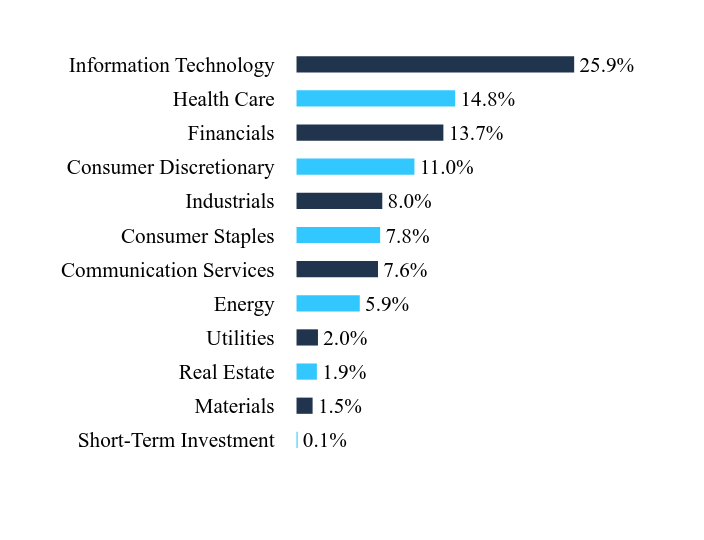
What
did the Fund invest in?
Sector
WeightingsFootnote
Reference*
Value |
Value |
Short-Term
Investment |
0.1% |
Materials
|
1.5% |
Real
Estate |
1.9% |
Utilities
|
2.0% |
Energy
|
5.9% |
Communication
Services |
7.6% |
Consumer
Staples |
7.8% |
Industrials
|
8.0% |
Consumer
Discretionary |
11.0% |
Financials
|
13.7% |
Health
Care |
14.8% |
Information
Technology |
25.9% |
| Footnote |
Description |
|
Footnote |
* Percentages are calculated based on total net assets. |
Holding
Name |
|
|
Percentage of
Total Net Assets |
Amazon.com
|
|
|
5.4% |
Apple
|
|
|
5.1% |
Meta Platforms, Class A |
|
|
5.1% |
Eli Lilly |
|
|
3.6% |
Microsoft
|
|
|
2.9% |
Exxon Mobil |
|
|
2.8% |
Adobe
|
|
|
2.4% |
Salesforce |
|
|
2.4% |
UnitedHealth Group |
|
|
2.4% |
Visa, Class A |
|
|
2.1% |
There
were no material changes during the reporting period.
Changes
in and Disagreements with Accountants
There
were no changes in or disagreements with accountants during the reporting period.
For
additional information about the Fund; including its prospectus, financial information, and holdings, visit or call:
Householding
is an option available to certain investors of the Fund. Householding is a method of delivery, based on the preference of the individual
investor, in which a single copy of certain shareholder documents can be delivered to investors who share the same address, even if their
accounts are registered under different names. Householding for the Fund is available through certain broker-dealers. If you are interested
in enrolling in householding and receiving a single copy of the prospectus and other shareholder documents, please contact your broker-dealer.
If you are currently enrolled in householding and wish to change your householding status, please contact your broker-dealer.
Impact
Shares YWCA Women's Empowerment ETF: WOMN
Principal
Listing Exchange - NYSEArca
Annual
Shareholder Report - June 30, 2024
IMP-AR-TSR-2024-2
Impact
Shares NAACP Minority Empowerment ETF
Principal
Listing Exchange: NYSEArca
Annual
Shareholder Report - June 30, 2024
This annual
shareholder report contains important information about Impact Shares NAACP Minority Empowerment ETF (the "Fund") for the period
from July 1, 2023 to June 30, 2024. You
can find additional information about the Fund at https://impactetfs.org/nacp-etf/.
You can also request this information by calling 844-448-3383.
What
were the Fund costs for the last year?
(based
on a hypothetical $10,000 investment)
Fund Name |
Costs of a $10,000 investment |
Costs paid as a percentage of a $10,000 investment |
Impact Shares NAACP Minority Empowerment ETF |
$55 |
0.49% |
How
did the Fund perform in the last year?
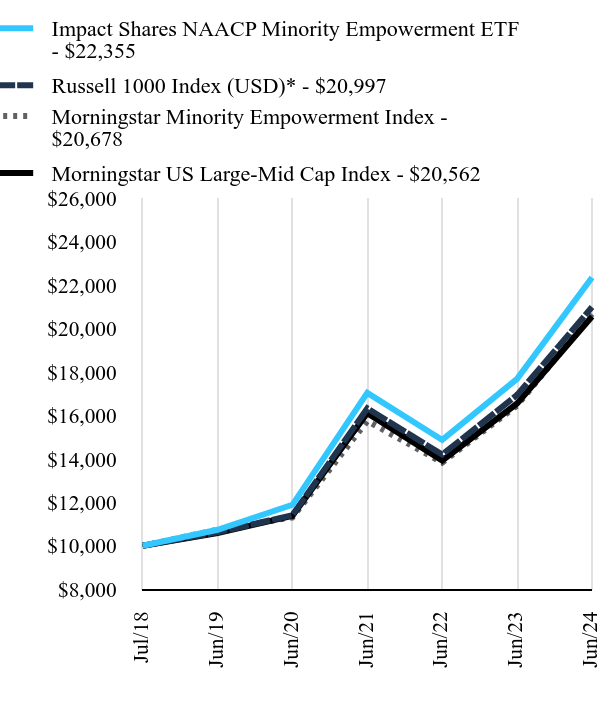
The
Fund seeks to provide investment results that, before fees and expenses, track the performance of the Morningstar Minority Empowerment
Index that is designed to measure the performance of large-capitalization and mid-capitalization companies that are “empowering
to communities of color,” and to exhibit risk and return characteristics similar to those of the Morningstar US Large-Mid Cap®
Index (the “Parent Index”). The Fund’s underlying benchmark is the Morningstar Minority Empowerment Index (the “Underlying
Index”). The Parent Index is our primary broad-market benchmark for the Fund’s performance. From July 1, 2023 through June
30, 2024 (the “Reporting Period”), the total return for the Fund was 26.38% and the return for the Russell 1000 Index was
23.88%. The trailing twelve months ending June 2024 was defined by the broad equity market performance being driven by the FED and continued
rate uncertainty. Inflation showed signs of improvement towards the end of the period, inching closer to the Fed's 2% target after a series
of unexpectedly high Consumer Price Index (CPI) reports in early 2024. This shift in inflation data led to evolving market sentiments
and prompted the Fed to adopt a more positive tone ending the period with a high likelihood of multiple rate cuts in the second half of
2024. Additionally, the Russell 1000 was enjoyed exceptional returns from technology and communications companies associated with AI continuing
their rally, the fund did not have as much exposure to these high flying names as did the index. Meanwhile, uncertainty around the presidential
election results contributed in market volatility, with potential implications on economic policies.
Total
Return Based on $10,000 Investment
|
Impact
Shares NAACP Minority Empowerment ETF - $22355 |
Russell
1000 Index (USD)* - $20997 |
Morningstar
Minority Empowerment Index - $20678 |
Morningstar
US Large-Mid Cap Index - $20562 |
Jul/18 |
$10000 |
$10000 |
$10000 |
$10000 |
Jun/19 |
$10737 |
$10618 |
$10743 |
$10584 |
Jun/20 |
$11887 |
$11413 |
$11309 |
$11378 |
Jun/21 |
$17041 |
$16329 |
$15750 |
$16113 |
Jun/22 |
$14877 |
$14200 |
$13834 |
$13920 |
Jun/23 |
$17689 |
$16950 |
$16462 |
$16557 |
Jun/24 |
$22355 |
$20997 |
$20678 |
$20562 |
Since its inception on July 18, 2018. The line graph represents historical performance of a hypothetical investment of $10,000 in
the Fund since inception. Returns shown do not reflect the deduction of taxes that a shareholder would pay on fund distribution or
the redemption of fund shares but assume the reinvestment of capital gains, dividends and return of capital. The table and graph
presented above do not reflect the deduction of taxes a shareholder would pay on Fund distributions or the redemption of Fund Shares. Past
performance is not indicative of future performance.Call 844-448-3383 or visit https://impactetfs.org/nacp-etf/ for
current month-end performance.
Footnote Reference* As of June 2024, pursuant to the new regulatory requirements, this index replaced the prior index as the Fund's primary benchmark to represent a broad-based securities market index.
Average
Annual Total Returns as of June 30, 2024
Fund/Index Name |
1 Year |
5 Years |
Annualized
Since
Inception |
Impact Shares NAACP Minority Empowerment ETF |
26.38% |
15.80% |
14.46% |
Russell 1000 Index (USD)* |
23.88% |
14.61% |
13.26% |
Morningstar Minority Empowerment Index |
25.61% |
13.99% |
12.97% |
Morningstar US Large-Mid Cap Index |
24.19% |
14.21% |
12.87% |
Key
Fund Statistics as of June 30, 2024
|
Total Net Assets |
Number of Holdings |
Total Advisory Fees Paid |
Portfolio Turnover Rate |
|
$47,335,708 |
165 |
$209,971 |
37% |
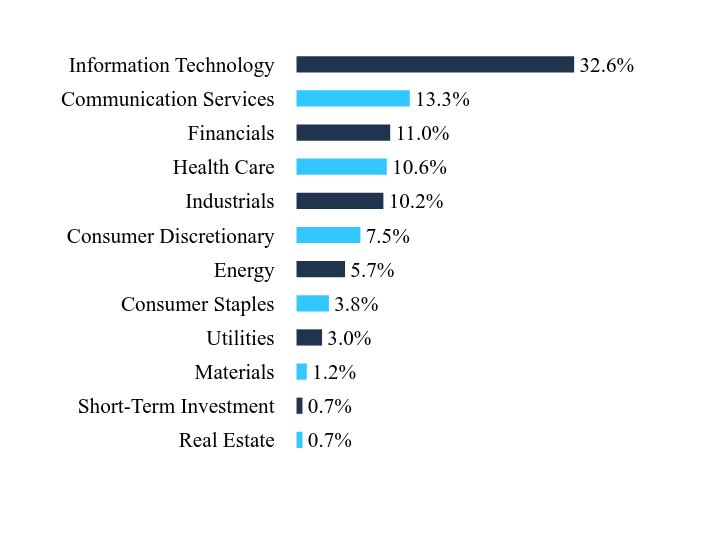
What
did the Fund invest in?
Sector
WeightingsFootnote
Reference*
Value |
Value |
Real
Estate |
0.7% |
Short-Term
Investment |
0.7% |
Materials
|
1.2% |
Utilities
|
3.0% |
Consumer
Staples |
3.8% |
Energy
|
5.7% |
Consumer
Discretionary |
7.5% |
Industrials
|
10.2% |
Health
Care |
10.6% |
Financials
|
11.0% |
Communication
Services |
13.3% |
Information
Technology |
32.6% |
| Footnote |
Description |
|
Footnote |
* Percentages are calculated based on total net assets. |
Holding Name |
|
|
Percentage of
Total Net Assets |
Microsoft
|
|
|
5.6% |
Amazon.com
|
|
|
5.5% |
Apple
|
|
|
5.3% |
NVIDIA
|
|
|
4.9% |
QUALCOMM
|
|
|
4.1% |
Meta Platforms, Class A |
|
|
3.9% |
Accenture PLC, Class A |
|
|
3.7% |
International Business Machines |
|
|
3.1% |
Alphabet, Class A |
|
|
3.0% |
Alphabet, Class C |
|
|
2.7% |
There
were no material changes during the reporting period.
Changes
in and Disagreements with Accountants
There
were no changes in or disagreements with accountants during the reporting period.
For
additional information about the Fund; including its prospectus, financial information, and holdings, visit or call:
Householding
is an option available to certain investors of the Fund. Householding is a method of delivery, based on the preference of the individual
investor, in which a single copy of certain shareholder documents can be delivered to investors who share the same address, even if their
accounts are registered under different names. Householding for the Fund is available through certain broker-dealers. If you are interested
in enrolling in householding and receiving a single copy of the prospectus and other shareholder documents, please contact your broker-dealer.
If you are currently enrolled in householding and wish to change your householding status, please contact your broker-dealer.
Impact
Shares NAACP Minority Empowerment ETF: NACP
Principal
Listing Exchange - NYSEArca
Annual
Shareholder Report - June 30, 2024
IMP-AR-TSR-2024-1
Item 2.
Code of Ethics.
The registrant has adopted a code of ethics that applies
to the registrant’s principal executive officer and principal financial officer. The registrant has not made any substantive amendments
to its code of ethics during the period covered by this report. The registrant has not granted any waivers from any provisions of the
code of ethics during the period covered by this report.
A copy of the registrant’s Code of Ethics
is filed herewith.
Item 3.
Audit Committee Financial Expert.
The registrant’s Board of Trustees of the Trust
has determined that there is at least one audit committee financial expert serving on its audit committee. Ms. Monica Byrd is the “audit
committee financial expert” and is considered to be “independent” as each term is defined in Item 3 of Form N-CSR.
Item
4. Principal Accountant Fees and Services.
The registrant
has engaged its principal accountant to perform audit services, audit-related services, tax services and other services during the past
two fiscal years. “Audit services” refer to performing an audit of the registrant's annual financial statements or services
that are normally provided by the accountant in connection with statutory and regulatory filings or engagements for those fiscal years.
“Audit-related services” refer to the assurance and related services by the principal accountant that are reasonably related
to the performance of the audit. “Tax services” refer to professional services rendered by the principal accountant for tax
compliance, tax advice, and tax planning. There were no “Other services” provided by the principal accountant. The following
table details the aggregate fees billed or expected to be billed for each of the last two fiscal years for audit fees, audit-related fees,
tax fees and other fees by the principal accountant.
Impact Shares
YWCA Women’s Empowerment ETF
| |
FYE 6/30/2024 |
FYE 6/30/2023 |
| ( a ) Audit
Fees |
$14,000 |
$14,000 |
| ( b ) Audit-Related
Fees |
N/A |
N/A |
| ( c ) Tax
Fees |
$3,000 |
$3,000 |
| (
d ) All Other Fees |
N/A |
N/A |
Impact Shares
NAACP Minority Empowerment ETF
| |
FYE 6/30/2024 |
FYE 6/30/2023 |
| ( a ) Audit
Fees |
$14,000 |
$14,000 |
| ( b ) Audit-Related
Fees |
N/A |
N/A |
| ( c ) Tax
Fees |
$3,000 |
$3,000 |
| (
d ) All Other Fees |
N/A |
N/A |
|
(e)(1) |
The audit committee has adopted pre-approval policies and procedures that require the audit committee to pre-approve
all audit and non-audit services of the registrant, including services provided to any entity affiliated with the registrant. |
|
(e)(2) |
The percentage of fees billed by Cohen & Company, Ltd. applicable to non-audit services pursuant to waiver
of pre-approval requirement were as follows: |
| |
FYE 6/30/2024 |
FYE 6/30/2023 |
| Audit-Related
Fees |
0% |
0% |
| Tax Fees |
0% |
0% |
| All
Other Fees |
0% |
0% |
|
(f) |
All of the principal accountant’s hours spent on auditing the registrant’s financial statements
were attributed to work performed by full-time permanent employees of the principal accountant. |
|
(g) |
The following table indicates the non-audit fees billed or expected to be billed by the registrant’s
accountant for services to the registrant and to the registrant’s investment adviser (and any other controlling entity, etc.—not
sub-adviser) for the last two years. |
| Non-Audit
Related Fees |
FYE 6/30/2024 |
FYE 6/30/2023 |
| Registrant |
N/A |
N/A |
| Registrant’s
Investment Adviser |
N/A |
N/A |
|
(h) |
The audit committee of the board of trustees/directors has considered whether the provision of non-audit services
that were rendered to the registrant's investment adviser is compatible with maintaining the principal accountant's independence and has
concluded that the provision of such non-audit services by the accountant has not compromised the accountant’s independence. |
|
(i) |
The registrant has not been identified by the U.S. Securities and Exchange Commission as having filed an annual
report issued by a registered public accounting firm branch or office that is located in a foreign jurisdiction where the Public Company
Accounting Oversight Board is unable to inspect or completely investigate because of a position taken by an authority in that jurisdiction. |
|
(j) |
The registrant is not a foreign issuer. |
Item
5. Audit Committee of Listed Registrants.
|
(a) |
The registrant is an issuer as defined in Rule 10A-3 under the Securities Exchange Act of 1934 (the “Act”),
and has a separately-designated standing audit committee established in accordance with Section 3(a)(58)(A) of the Act. The independent
members are as follows: Monica Byrd, Pamela Cytron and Lawrence Jules. |
Item
6. Investments.
|
(a) |
Schedule of Investments is included within the financial
statements filed under Item 7 of this Form. |
Item
7. Financial Statements and Financial Highlights for Open-End Investment Companies.
(a)

Impact
Shares YWCA Women’s Empowerment ETF (ticker: WOMN)
Impact
Shares NAACP Minority Empowerment ETF (ticker: NACP)
Core
Financial Statements
June
30, 2024
Tidal
Trust III
Table
of Contents
Each
Fund files its complete schedule of Fund holdings for the first and third quarters of each fiscal year or as an exhibit to its reports
on Form N-PORT. Each Fund’s Form N-PORT is available on the Trust’s website at https://impactetfs.org.
A
description of the policies and procedures that Impact Shares, Corp. uses to determine how to vote proxies relating to Fund securities,
as well as information relating to how a Fund voted proxies relating to Fund securities during the most recent 12-month period ended June
30, is available (i) without charge, upon request, by calling 1-844-448-3383; and (ii) on the Trust’s website at https://impactetfs.org/etfs/proxy-voting-class-actions.
Tidal
Trust III Impact Shares YWCA Women’s Empowerment ETF
Schedule
of Investments
June
30, 2024
| Description |
|
Shares |
|
|
Fair
Value |
|
| |
| COMMON STOCK — 100.1% |
| Communication Services— 7.6% |
| Electronic Arts |
|
|
637 |
|
|
$ |
88,753 |
|
| Interpublic Group |
|
|
1,019 |
|
|
|
29,643 |
|
| Meta Platforms, Cl A |
|
|
5,622 |
|
|
|
2,834,725 |
|
| Netflix* |
|
|
655 |
|
|
|
442,047 |
|
| Omnicom Group |
|
|
530 |
|
|
|
47,541 |
|
| Pinterest, Cl A* |
|
|
1,477 |
|
|
|
65,091 |
|
| T-Mobile US |
|
|
1,158 |
|
|
|
204,016 |
|
| Verizon Communications |
|
|
12,240 |
|
|
|
504,778 |
|
| |
|
|
|
|
|
|
|
|
| |
|
|
|
|
|
|
4,216,594 |
|
| |
|
|
|
|
|
|
|
|
| Consumer Discretionary— 11.0% |
| Amazon.com* |
|
|
15,443 |
|
|
|
2,984,360 |
|
| Best Buy |
|
|
1,037 |
|
|
|
87,409 |
|
| Deckers Outdoor* |
|
|
166 |
|
|
|
160,680 |
|
| DoorDash, Cl A* |
|
|
783 |
|
|
|
85,175 |
|
| eBay |
|
|
3,151 |
|
|
|
169,271 |
|
| Expedia Group* |
|
|
641 |
|
|
|
80,759 |
|
| Ford Motor |
|
|
23,606 |
|
|
|
296,019 |
|
| General Motors |
|
|
6,248 |
|
|
|
290,282 |
|
| McDonald’s |
|
|
4,326 |
|
|
|
1,102,438 |
|
| Service International |
|
|
808 |
|
|
|
57,473 |
|
| Starbucks |
|
|
6,712 |
|
|
|
522,529 |
|
| Williams-Sonoma |
|
|
322 |
|
|
|
90,923 |
|
| Yum! Brands |
|
|
1,680 |
|
|
|
222,533 |
|
| |
|
|
|
|
|
|
|
|
| |
|
|
|
|
|
|
6,149,851 |
|
| |
|
|
|
|
|
|
|
|
| Consumer Staples— 7.8% |
| Archer-Daniels-Midland |
|
|
1,434 |
|
|
|
86,685 |
|
| Campbell Soup |
|
|
522 |
|
|
|
23,589 |
|
| Church & Dwight |
|
|
634 |
|
|
|
65,733 |
|
| Clorox |
|
|
320 |
|
|
|
43,670 |
|
| Coca-Cola |
|
|
11,030 |
|
|
|
702,059 |
|
| Colgate-Palmolive |
|
|
2,184 |
|
|
|
211,935 |
|
| Conagra Brands |
|
|
1,251 |
|
|
|
35,554 |
|
| General Mills |
|
|
1,550 |
|
|
|
98,053 |
|
| Hershey |
|
|
382 |
|
|
|
70,223 |
|
| J M Smucker |
|
|
277 |
|
|
|
30,204 |
|
| Kellanova |
|
|
674 |
|
|
|
38,877 |
|
| Kimberly-Clark |
|
|
883 |
|
|
|
122,031 |
|
| Kraft Heinz |
|
|
2,562 |
|
|
|
82,548 |
|
| Kroger |
|
|
1,881 |
|
|
|
93,918 |
|
| Molson Coors Beverage, Cl B |
|
|
491 |
|
|
|
24,958 |
|
| Mondelez International, Cl A |
|
|
3,853 |
|
|
|
252,140 |
|
| PepsiCo |
|
|
4,097 |
|
|
|
675,718 |
|
| Procter & Gamble |
|
|
6,591 |
|
|
|
1,086,988 |
|
| Target |
|
|
1,427 |
|
|
|
211,253 |
|
| Walmart |
|
|
5,984 |
|
|
|
405,177 |
|
| |
|
|
|
|
|
|
|
|
| |
|
|
|
|
|
|
4,361,313 |
|
| |
|
|
|
|
|
|
|
|
| Energy— 5.9% |
| Baker Hughes, Cl A |
|
|
2,784 |
|
|
|
97,913 |
|
| Chevron |
|
|
5,466 |
|
|
|
854,992 |
|
| ConocoPhillips |
|
|
3,391 |
|
|
|
387,863 |
|
| Exxon Mobil |
|
|
13,373 |
|
|
|
1,539,500 |
|
| Occidental Petroleum |
|
|
1,768 |
|
|
|
111,437 |
|
| Phillips 66 |
|
|
1,125 |
|
|
|
158,816 |
|
| Williams |
|
|
3,129 |
|
|
|
132,982 |
|
| |
|
|
|
|
|
|
|
|
| |
|
|
|
|
|
|
3,283,503 |
|
| |
|
|
|
|
|
|
|
|
| Financials— 13.7% |
| Allstate |
|
|
693 |
|
|
|
110,645 |
|
| American Express |
|
|
1,746 |
|
|
|
404,286 |
|
| American International Group |
|
|
1,864 |
|
|
|
138,383 |
|
| Ameriprise Financial |
|
|
273 |
|
|
|
116,623 |
|
| Bank of America |
|
|
19,462 |
|
|
|
774,004 |
|
| Description |
|
Shares |
|
|
Fair
Value |
|
| |
| Bank of New York Mellon |
|
|
1,932 |
|
|
$ |
115,707 |
|
| BlackRock, Cl A |
|
|
423 |
|
|
|
333,036 |
|
| Capital One Financial |
|
|
997 |
|
|
|
138,035 |
|
| Citigroup |
|
|
5,622 |
|
|
|
356,772 |
|
| Citizens Financial Group |
|
|
578 |
|
|
|
20,825 |
|
| Fifth Third Bancorp |
|
|
1,788 |
|
|
|
65,244 |
|
| Hartford Financial Services Group |
|
|
817 |
|
|
|
82,141 |
|
| Huntington Bancshares |
|
|
3,778 |
|
|
|
49,794 |
|
| Mastercard, Cl A |
|
|
2,349 |
|
|
|
1,036,285 |
|
| MetLife |
|
|
1,722 |
|
|
|
120,867 |
|
| Moody’s |
|
|
445 |
|
|
|
187,314 |
|
| Morgan Stanley |
|
|
3,615 |
|
|
|
351,342 |
|
| Northern Trust |
|
|
542 |
|
|
|
45,517 |
|
| Principal Financial Group |
|
|
596 |
|
|
|
46,756 |
|
| Progressive |
|
|
1,738 |
|
|
|
361,000 |
|
| Prudential Financial |
|
|
962 |
|
|
|
112,737 |
|
| Raymond James Financial |
|
|
501 |
|
|
|
61,929 |
|
| Regions Financial |
|
|
2,447 |
|
|
|
49,038 |
|
| S&P Global |
|
|
885 |
|
|
|
394,710 |
|
| State Street |
|
|
756 |
|
|
|
55,944 |
|
| Synchrony Financial |
|
|
1,047 |
|
|
|
49,408 |
|
| T Rowe Price Group |
|
|
582 |
|
|
|
67,110 |
|
| US Bancorp |
|
|
4,553 |
|
|
|
180,754 |
|
| Visa, Cl A |
|
|
4,440 |
|
|
|
1,165,367 |
|
| Wells Fargo |
|
|
10,240 |
|
|
|
608,154 |
|
| Willis Towers Watson
PLC |
|
|
271 |
|
|
|
71,040 |
|
| |
|
|
|
|
|
|
|
|
| |
|
|
|
|
|
|
7,670,767 |
|
| |
|
|
|
|
|
|
|
|
| Health Care— 14.8% |
| AbbVie |
|
|
4,811 |
|
|
|
825,183 |
|
| Agilent Technologies |
|
|
533 |
|
|
|
69,093 |
|
| Amgen |
|
|
1,512 |
|
|
|
472,424 |
|
| Biogen* |
|
|
376 |
|
|
|
87,164 |
|
| BioMarin Pharmaceutical* |
|
|
488 |
|
|
|
40,177 |
|
| Cardinal Health |
|
|
682 |
|
|
|
67,054 |
|
| Cigna Group |
|
|
830 |
|
|
|
274,373 |
|
| Elevance Health |
|
|
666 |
|
|
|
360,879 |
|
| Eli Lilly |
|
|
2,242 |
|
|
|
2,029,862 |
|
| Gilead Sciences |
|
|
3,536 |
|
|
|
242,605 |
|
| Johnson & Johnson |
|
|
6,881 |
|
|
|
1,005,727 |
|
| Merck |
|
|
6,883 |
|
|
|
852,115 |
|
| Regeneron Pharmaceuticals* |
|
|
289 |
|
|
|
303,748 |
|
| UnitedHealth Group |
|
|
2,594 |
|
|
|
1,321,021 |
|
| Vertex Pharmaceuticals* |
|
|
714 |
|
|
|
334,666 |
|
| |
|
|
|
|
|
|
|
|
| |
|
|
|
|
|
|
8,286,091 |
|
| |
|
|
|
|
|
|
|
|
| Industrials— 8.0% |
| Automatic Data Processing |
|
|
1,152 |
|
|
|
274,971 |
|
| Booz Allen Hamilton Holding, Cl A |
|
|
339 |
|
|
|
52,172 |
|
| Carrier Global |
|
|
2,144 |
|
|
|
135,244 |
|
| Cummins |
|
|
380 |
|
|
|
105,233 |
|
| Delta Air Lines |
|
|
1,676 |
|
|
|
79,510 |
|
| Eaton PLC |
|
|
1,148 |
|
|
|
359,955 |
|
| Emerson Electric |
|
|
1,543 |
|
|
|
169,977 |
|
| Fortive |
|
|
1,903 |
|
|
|
141,012 |
|
| General Electric |
|
|
3,162 |
|
|
|
502,663 |
|
| Ingersoll Rand |
|
|
1,039 |
|
|
|
94,383 |
|
| Johnson Controls International PLC |
|
|
1,800 |
|
|
|
119,646 |
|
| Norfolk Southern |
|
|
603 |
|
|
|
129,458 |
|
| Owens Corning |
|
|
243 |
|
|
|
42,214 |
|
| Paychex |
|
|
824 |
|
|
|
97,694 |
|
| Pentair PLC |
|
|
432 |
|
|
|
33,122 |
|
| Republic Services, Cl A |
|
|
524 |
|
|
|
101,834 |
|
| Rockwell Automation |
|
|
297 |
|
|
|
81,758 |
|
| Stanley Black & Decker |
|
|
381 |
|
|
|
30,438 |
|
| Trane Technologies PLC |
|
|
637 |
|
|
|
209,528 |
|
| TransUnion |
|
|
502 |
|
|
|
37,228 |
|
| Uber Technologies* |
|
|
10,054 |
|
|
|
730,725 |
|
| Union Pacific |
|
|
1,775 |
|
|
|
401,611 |
|
The
accompanying notes are an integral part of the financial statements.
Tidal
Trust III Impact Shares YWCA Women’s Empowerment ETF
Schedule of Investments
June
30, 2024
| Description |
|
Shares |
|
|
Fair
Value |
|
| |
| Verisk Analytics, Cl A |
|
|
365 |
|
|
$ |
98,386 |
|
| Waste Management |
|
|
1,097 |
|
|
|
234,034 |
|
| WW Grainger |
|
|
114 |
|
|
|
102,855 |
|
| Xylem |
|
|
638 |
|
|
|
86,532 |
|
| |
|
|
|
|
|
|
|
|
| |
|
|
|
|
|
|
4,452,183 |
|
| |
|
|
|
|
|
|
|
|
| Information Technology††— 25.9% |
| Accenture PLC, Cl A |
|
|
3,508 |
|
|
|
1,064,362 |
|
| Adobe* |
|
|
2,452 |
|
|
|
1,362,184 |
|
| ANSYS* |
|
|
454 |
|
|
|
145,961 |
|
| Apple |
|
|
13,529 |
|
|
|
2,849,478 |
|
| Autodesk* |
|
|
1,103 |
|
|
|
272,937 |
|
| Cisco Systems |
|
|
23,301 |
|
|
|
1,107,030 |
|
| Hewlett Packard Enterprise |
|
|
5,899 |
|
|
|
124,882 |
|
| HP |
|
|
5,819 |
|
|
|
203,781 |
|
| HubSpot* |
|
|
307 |
|
|
|
181,066 |
|
| International Business Machines |
|
|
5,130 |
|
|
|
887,234 |
|
| Intuit |
|
|
1,539 |
|
|
|
1,011,446 |
|
| Keysight Technologies* |
|
|
937 |
|
|
|
128,135 |
|
| Microsoft |
|
|
3,668 |
|
|
|
1,639,413 |
|
| Monolithic Power Systems |
|
|
226 |
|
|
|
185,700 |
|
| Motorola Solutions |
|
|
911 |
|
|
|
351,692 |
|
| Okta, Cl A* |
|
|
821 |
|
|
|
76,854 |
|
| Salesforce |
|
|
5,283 |
|
|
|
1,358,259 |
|
| ServiceNow* |
|
|
1,061 |
|
|
|
834,657 |
|
| TE Connectivity |
|
|
1,736 |
|
|
|
261,146 |
|
| Tyler Technologies* |
|
|
226 |
|
|
|
113,628 |
|
| Workday, Cl A* |
|
|
1,211 |
|
|
|
270,731 |
|
| |
|
|
|
|
|
|
|
|
| |
|
|
|
|
|
|
14,430,576 |
|
| |
|
|
|
|
|
|
|
|
| Materials— 1.5% |
| Air Products and Chemicals |
|
|
576 |
|
|
|
148,637 |
|
| Celanese, Cl A |
|
|
259 |
|
|
|
34,937 |
|
| Corteva |
|
|
1,870 |
|
|
|
100,868 |
|
| Dow |
|
|
1,844 |
|
|
|
97,824 |
|
| DuPont de Nemours |
|
|
1,072 |
|
|
|
86,285 |
|
| Ecolab |
|
|
645 |
|
|
|
153,510 |
|
| Newmont |
|
|
2,961 |
|
|
|
123,977 |
|
| PPG Industries |
|
|
615 |
|
|
|
77,422 |
|
| |
|
|
|
|
|
|
|
|
| |
|
|
|
|
|
|
823,460 |
|
| |
|
|
|
|
|
|
|
|
| Real Estate— 1.9% |
| American Tower, Cl A‡ |
|
|
1,332 |
|
|
|
258,914 |
|
| CBRE Group, Cl A* |
|
|
822 |
|
|
|
73,248 |
|
| Equinix‡ |
|
|
275 |
|
|
|
208,065 |
|
| Equity LifeStyle Properties‡ |
|
|
455 |
|
|
|
29,634 |
|
| Essex Property Trust‡ |
|
|
163 |
|
|
|
44,369 |
|
| Host Hotels & Resorts‡ |
|
|
1,864 |
|
|
|
33,515 |
|
| Invitation Homes‡ |
|
|
1,491 |
|
|
|
53,512 |
|
| Iron Mountain‡ |
|
|
761 |
|
|
|
68,201 |
|
| Rexford Industrial Realty‡ |
|
|
520 |
|
|
|
23,187 |
|
| Ventas‡ |
|
|
1,045 |
|
|
|
53,566 |
|
| Welltower‡ |
|
|
1,607 |
|
|
|
167,530 |
|
| Zillow Group, Cl A* |
|
|
143 |
|
|
|
6,441 |
|
| Zillow Group, Cl
C* |
|
|
414 |
|
|
|
19,205 |
|
| |
|
|
|
|
|
|
|
|
| |
|
|
|
|
|
|
1,039,387 |
|
| |
|
|
|
|
|
|
|
|
| Utilities— 2.0% |
| Alliant Energy |
|
|
678 |
|
|
|
34,510 |
|
| American Electric Power |
|
|
1,396 |
|
|
|
122,485 |
|
| American Water Works |
|
|
474 |
|
|
|
61,222 |
|
| Avangrid |
|
|
184 |
|
|
|
6,538 |
|
| CenterPoint Energy |
|
|
1,646 |
|
|
|
50,993 |
|
| CMS Energy |
|
|
754 |
|
|
|
44,885 |
|
| Consolidated Edison |
|
|
923 |
|
|
|
82,535 |
|
| Edison International |
|
|
1,000 |
|
|
|
71,810 |
|
| Entergy |
|
|
575 |
|
|
|
61,525 |
|
| Exelon |
|
|
2,868 |
|
|
|
99,261 |
|
| Description |
|
Shares |
|
|
Fair
Value |
|
| |
| NiSource |
|
|
1,067 |
|
|
$ |
30,740 |
|
| PG&E |
|
|
5,585 |
|
|
|
97,514 |
|
| Pinnacle West Capital |
|
|
297 |
|
|
|
22,685 |
|
| PPL |
|
|
1,926 |
|
|
|
53,254 |
|
| Public Service Enterprise Group |
|
|
1,281 |
|
|
|
94,410 |
|
| Sempra |
|
|
1,648 |
|
|
|
125,347 |
|
| Vistra |
|
|
974 |
|
|
|
83,745 |
|
| |
|
|
|
|
|
|
|
|
| |
|
|
|
|
|
|
1,143,459 |
|
| |
|
|
|
|
|
|
|
|
| |
|
|
|
|
|
|
|
|
| Total Common Stock |
|
|
|
|
|
|
|
|
| (Cost $45,883,598) |
|
|
|
|
|
|
55,857,184 |
|
| |
| SHORT-TERM INVESTMENT — 0.1% |
| First American
Government Obligations Fund, Cl X, 5.230% (A) |
|
|
49,641 |
|
|
|
49,641 |
|
| |
|
|
|
|
|
|
|
|
| Total Short-Term Investment |
|
|
|
|
|
|
|
|
| (Cost $49,641) |
|
|
|
|
|
|
49,641 |
|
| |
|
|
|
|
|
|
|
|
| Total Investments - 100.2% |
|
|
|
|
|
|
|
|
| (Cost $45,933,239) |
|
|
|
|
|
$ |
55,906,825 |
|
|
Percentages
are based on Net Assets of $55,779,835.
| * |
Non-income producing
security. |
| ‡ |
Real Estate Investment
Trust |
| †† |
More
narrow industries are utilized for compliance purposes whereas broad sectors are utilized for reporting purposes. |
| (A) |
Rate shown represents
the 7-day effective yield as of June 30, 2024. |
| Cl
— Class |
| PLC
— Public Limited Company |
As
of June 30, 2024, all of the Fund’s investments were considered Level 1 in accordance with the authoritative guidance under U.S.
Generally Accepted Accounting Principles.
For
more information on valuation inputs, see Note 2 in Notes to Financial Statements.
The
accompanying notes are an integral part of the financial statements.
Tidal
Trust III Impact Shares NAACP Minority Empowerment ETF
Schedule
of Investments
June
30, 2024
| Description |
|
Shares |
|
|
Fair
Value |
|
| |
| COMMON STOCK — 99.6% |
| |
|
|
|
|
|
|
| Communication Services— 13.3% |
| Alphabet, Cl A |
|
|
7,767 |
|
|
$ |
1,414,759 |
|
| Alphabet, Cl C |
|
|
6,909 |
|
|
|
1,267,249 |
|
| AT&T |
|
|
12,382 |
|
|
|
236,620 |
|
| Electronic Arts |
|
|
1,653 |
|
|
|
230,312 |
|
| Interpublic Group |
|
|
2,376 |
|
|
|
69,118 |
|
| Meta Platforms, Cl A |
|
|
3,677 |
|
|
|
1,854,017 |
|
| Verizon Communications |
|
|
29,296 |
|
|
|
1,208,167 |
|
| |
|
|
|
|
|
|
|
|
| |
|
|
|
|
|
|
6,280,242 |
|
| |
|
|
|
|
|
|
|
|
| Consumer Discretionary— 7.5% |
| Amazon.com* |
|
|
13,499 |
|
|
|
2,608,682 |
|
| BorgWarner |
|
|
397 |
|
|
|
12,799 |
|
| eBay |
|
|
895 |
|
|
|
48,079 |
|
| Ford Motor |
|
|
6,579 |
|
|
|
82,501 |
|
| General Motors |
|
|
1,824 |
|
|
|
84,743 |
|
| Hilton Worldwide Holdings |
|
|
387 |
|
|
|
84,443 |
|
| Lowe’s |
|
|
1,158 |
|
|
|
255,293 |
|
| Marriott International, Cl A |
|
|
525 |
|
|
|
126,929 |
|
| MercadoLibre* |
|
|
104 |
|
|
|
170,914 |
|
| Royal Caribbean
Cruises* |
|
|
369 |
|
|
|
58,830 |
|
| |
|
|
|
|
|
|
|
|
| |
|
|
|
|
|
|
3,533,213 |
|
| |
|
|
|
|
|
|
|
|
| Consumer Staples— 3.8% |
| Archer-Daniels-Midland |
|
|
909 |
|
|
|
54,949 |
|
| Bunge Global |
|
|
250 |
|
|
|
26,692 |
|
| Campbell Soup |
|
|
336 |
|
|
|
15,184 |
|
| Coca-Cola |
|
|
7,657 |
|
|
|
487,368 |
|
| Hershey |
|
|
240 |
|
|
|
44,119 |
|
| J M Smucker |
|
|
178 |
|
|
|
19,409 |
|
| Kellanova |
|
|
429 |
|
|
|
24,745 |
|
| Kraft Heinz |
|
|
1,671 |
|
|
|
53,840 |
|
| Kroger |
|
|
1,227 |
|
|
|
61,264 |
|
| Molson Coors Beverage, Cl B |
|
|
311 |
|
|
|
15,808 |
|
| Mondelez International, Cl A |
|
|
2,774 |
|
|
|
181,531 |
|
| PepsiCo |
|
|
2,815 |
|
|
|
464,278 |
|
| US Foods Holding* |
|
|
351 |
|
|
|
18,596 |
|
| Walmart |
|
|
5,253 |
|
|
|
355,681 |
|
| |
|
|
|
|
|
|
|
|
| |
|
|
|
|
|
|
1,823,464 |
|
| |
|
|
|
|
|
|
|
|
| Energy— 5.7% |
| Cheniere Energy |
|
|
414 |
|
|
|
72,380 |
|
| Chevron |
|
|
3,753 |
|
|
|
587,044 |
|
| ConocoPhillips |
|
|
2,323 |
|
|
|
265,705 |
|
| Devon Energy |
|
|
1,085 |
|
|
|
51,429 |
|
| Exxon Mobil |
|
|
9,214 |
|
|
|
1,060,716 |
|
| Hess |
|
|
511 |
|
|
|
75,383 |
|
| Kinder Morgan |
|
|
3,288 |
|
|
|
65,333 |
|
| Marathon Petroleum |
|
|
759 |
|
|
|
131,671 |
|
| ONEOK |
|
|
960 |
|
|
|
78,288 |
|
| Phillips 66 |
|
|
908 |
|
|
|
128,182 |
|
| Valero Energy |
|
|
565 |
|
|
|
88,569 |
|
| Williams |
|
|
2,023 |
|
|
|
85,977 |
|
| |
|
|
|
|
|
|
|
|
| |
|
|
|
|
|
|
2,690,677 |
|
| |
|
|
|
|
|
|
|
|
| Financials— 11.0% |
| American Express |
|
|
1,213 |
|
|
|
280,870 |
|
| Aon PLC, Cl A |
|
|
345 |
|
|
|
101,285 |
|
| Bank of America |
|
|
13,385 |
|
|
|
532,321 |
|
| Bank of New York Mellon |
|
|
1,225 |
|
|
|
73,365 |
|
| Charles Schwab |
|
|
2,883 |
|
|
|
212,448 |
|
| Citigroup |
|
|
3,878 |
|
|
|
246,098 |
|
| Huntington Bancshares |
|
|
2,388 |
|
|
|
31,474 |
|
| JPMorgan Chase |
|
|
5,873 |
|
|
|
1,187,873 |
|
| Mastercard, Cl A |
|
|
1,620 |
|
|
|
714,679 |
|
| MetLife |
|
|
1,091 |
|
|
|
76,577 |
|
| Description |
|
Shares |
|
|
Fair
Value |
|
| |
| Moody’s |
|
|
262 |
|
|
$ |
110,284 |
|
| Morgan Stanley |
|
|
2,507 |
|
|
|
243,655 |
|
| Nasdaq |
|
|
568 |
|
|
|
34,228 |
|
| PNC Financial Services Group |
|
|
672 |
|
|
|
104,483 |
|
| Principal Financial Group |
|
|
203 |
|
|
|
15,925 |
|
| Regions Financial |
|
|
1,551 |
|
|
|
31,082 |
|
| S&P Global |
|
|
624 |
|
|
|
278,304 |
|
| Synchrony Financial |
|
|
745 |
|
|
|
35,157 |
|
| Travelers |
|
|
390 |
|
|
|
79,303 |
|
| Visa, Cl A |
|
|
3,083 |
|
|
|
809,195 |
|
| |
|
|
|
|
|
|
|
|
| |
|
|
|
|
|
|
5,198,606 |
|
| |
|
|
|
|
|
|
|
|
| Health Care— 10.6% |
| Abbott Laboratories |
|
|
3,370 |
|
|
|
350,177 |
|
| AbbVie |
|
|
3,328 |
|
|
|
570,819 |
|
| Agilent Technologies |
|
|
491 |
|
|
|
63,648 |
|
| Becton Dickinson |
|
|
476 |
|
|
|
111,246 |
|
| Boston Scientific* |
|
|
2,807 |
|
|
|
216,167 |
|
| Cigna Group |
|
|
579 |
|
|
|
191,400 |
|
| Danaher |
|
|
1,290 |
|
|
|
322,307 |
|
| Edwards Lifesciences* |
|
|
1,025 |
|
|
|
94,679 |
|
| Elevance Health |
|
|
464 |
|
|
|
251,423 |
|
| Gilead Sciences |
|
|
2,363 |
|
|
|
162,125 |
|
| GRAIL* |
|
|
44 |
|
|
|
674 |
|
| Johnson & Johnson |
|
|
4,740 |
|
|
|
692,798 |
|
| Labcorp Holdings |
|
|
148 |
|
|
|
30,120 |
|
| Merck |
|
|
4,732 |
|
|
|
585,822 |
|
| Quest Diagnostics |
|
|
189 |
|
|
|
25,870 |
|
| ResMed |
|
|
244 |
|
|
|
46,706 |
|
| Thermo Fisher Scientific |
|
|
728 |
|
|
|
402,584 |
|
| UnitedHealth Group |
|
|
1,786 |
|
|
|
909,538 |
|
| |
|
|
|
|
|
|
|
|
| |
|
|
|
|
|
|
5,028,103 |
|
| |
|
|
|
|
|
|
|
|
| Industrials— 10.2% |
| AECOM |
|
|
236 |
|
|
|
20,801 |
|
| AMETEK |
|
|
384 |
|
|
|
64,017 |
|
| Automatic Data Processing |
|
|
843 |
|
|
|
201,216 |
|
| Boeing* |
|
|
1,212 |
|
|
|
220,596 |
|
| Booz Allen Hamilton Holding, Cl A |
|
|
218 |
|
|
|
33,550 |
|
| CSX |
|
|
3,488 |
|
|
|
116,673 |
|
| Cummins |
|
|
234 |
|
|
|
64,802 |
|
| Deere |
|
|
519 |
|
|
|
193,914 |
|
| Delta Air Lines |
|
|
1,069 |
|
|
|
50,713 |
|
| Eaton PLC |
|
|
804 |
|
|
|
252,094 |
|
| Emerson Electric |
|
|
1,145 |
|
|
|
126,133 |
|
| Expeditors International of Washington |
|
|
263 |
|
|
|
32,820 |
|
| FedEx |
|
|
464 |
|
|
|
139,126 |
|
| Ferguson PLC |
|
|
369 |
|
|
|
71,457 |
|
| General Electric |
|
|
2,200 |
|
|
|
349,734 |
|
| Honeywell International |
|
|
1,261 |
|
|
|
269,274 |
|
| Howmet Aerospace |
|
|
718 |
|
|
|
55,738 |
|
| Hubbell, Cl B |
|
|
76 |
|
|
|
27,777 |
|
| Illinois Tool Works |
|
|
525 |
|
|
|
124,404 |
|
| Ingersoll Rand |
|
|
618 |
|
|
|
56,139 |
|
| JB Hunt Transport Services |
|
|
139 |
|
|
|
22,240 |
|
| Johnson Controls International PLC |
|
|
1,166 |
|
|
|
77,504 |
|
| L3Harris Technologies |
|
|
337 |
|
|
|
75,683 |
|
| Lennox International |
|
|
55 |
|
|
|
29,424 |
|
| Lincoln Electric Holdings |
|
|
98 |
|
|
|
18,487 |
|
| Nordson |
|
|
91 |
|
|
|
21,107 |
|
| Northrop Grumman |
|
|
306 |
|
|
|
133,401 |
|
| Otis Worldwide |
|
|
666 |
|
|
|
64,109 |
|
| Owens Corning |
|
|
133 |
|
|
|
23,105 |
|
| Rockwell Automation |
|
|
193 |
|
|
|
53,129 |
|
| Textron |
|
|
344 |
|
|
|
29,536 |
|
| Trane Technologies PLC |
|
|
433 |
|
|
|
142,426 |
|
| Uber Technologies* |
|
|
16,441 |
|
|
|
1,194,932 |
|
| Union Pacific |
|
|
1,204 |
|
|
|
272,417 |
|
| United Airlines Holdings* |
|
|
547 |
|
|
|
26,617 |
|
The accompanying
notes are an integral part of the financial statements.
Tidal
Trust III Impact Shares NAACP Minority Empowerment ETF
Schedule
of Investments
June
30, 2024
| Description |
|
Shares |
|
|
Fair
Value |
|
| |
| United Rentals |
|
|
119 |
|
|
$ |
76,961 |
|
| Verisk Analytics, Cl A |
|
|
242 |
|
|
|
65,231 |
|
| Xylem |
|
|
404 |
|
|
|
54,794 |
|
| |
|
|
|
|
|
|
|
|
| |
|
|
|
|
|
|
4,852,081 |
|
| |
|
|
|
|
|
|
|
|
| Information Technology††— 32.6% |
| Accenture PLC, Cl A |
|
|
5,744 |
|
|
|
1,742,787 |
|
| Apple |
|
|
11,836 |
|
|
|
2,492,898 |
|
| Dell Technologies, Cl C |
|
|
2,632 |
|
|
|
362,979 |
|
| HP |
|
|
9,323 |
|
|
|
326,492 |
|
| International Business Machines |
|
|
8,402 |
|
|
|
1,453,126 |
|
| Micron Technology |
|
|
9,073 |
|
|
|
1,193,372 |
|
| Microsoft |
|
|
5,932 |
|
|
|
2,651,307 |
|
| NVIDIA |
|
|
18,943 |
|
|
|
2,340,218 |
|
| Palo Alto Networks* |
|
|
2,770 |
|
|
|
939,058 |
|
| QUALCOMM |
|
|
9,775 |
|
|
|
1,946,984 |
|
| |
|
|
|
|
|
|
|
|
| |
|
|
|
|
|
|
15,449,221 |
|
| |
|
|
|
|
|
|
|
|
| Materials— 1.2% |
| CF Industries Holdings |
|
|
325 |
|
|
|
24,089 |
|
| DuPont de Nemours |
|
|
823 |
|
|
|
66,243 |
|
| Eastman Chemical |
|
|
200 |
|
|
|
19,594 |
|
| Ecolab |
|
|
412 |
|
|
|
98,056 |
|
| Freeport-McMoRan, Cl B |
|
|
3,100 |
|
|
|
150,660 |
|
| Martin Marietta Materials |
|
|
104 |
|
|
|
56,347 |
|
| Mosaic |
|
|
567 |
|
|
|
16,386 |
|
| PPG Industries |
|
|
393 |
|
|
|
49,475 |
|
| Southern Copper |
|
|
145 |
|
|
|
15,622 |
|
| Vulcan Materials |
|
|
221 |
|
|
|
54,959 |
|
| |
|
|
|
|
|
|
|
|
| |
|
|
|
|
|
|
551,431 |
|
| |
|
|
|
|
|
|
|
|
| Real Estate— 0.7% |
| AvalonBay Communities‡ |
|
|
232 |
|
|
|
47,999 |
|
| Crown Castle‡ |
|
|
713 |
|
|
|
69,660 |
|
| Equinix‡ |
|
|
192 |
|
|
|
145,267 |
|
| Regency Centers‡ |
|
|
255 |
|
|
|
15,861 |
|
| SBA Communications,
Cl A‡ |
|
|
170 |
|
|
|
33,371 |
|
| |
|
|
|
|
|
|
|
|
| |
|
|
|
|
|
|
312,158 |
|
| |
|
|
|
|
|
|
|
|
| Utilities— 3.0% |
| Alliant Energy |
|
|
414 |
|
|
|
21,073 |
|
| American Electric Power |
|
|
867 |
|
|
|
76,071 |
|
| CMS Energy |
|
|
483 |
|
|
|
28,753 |
|
| Consolidated Edison |
|
|
587 |
|
|
|
52,489 |
|
| DTE Energy |
|
|
323 |
|
|
|
35,856 |
|
| Duke Energy |
|
|
1,585 |
|
|
|
158,865 |
|
| Edison International |
|
|
636 |
|
|
|
45,671 |
|
| Entergy |
|
|
336 |
|
|
|
35,952 |
|
| Exelon |
|
|
1,871 |
|
|
|
64,755 |
|
| FirstEnergy |
|
|
902 |
|
|
|
34,519 |
|
| NextEra Energy |
|
|
4,458 |
|
|
|
315,671 |
|
| NiSource |
|
|
679 |
|
|
|
19,562 |
|
| NRG Energy |
|
|
383 |
|
|
|
29,820 |
|
| PG&E |
|
|
2,226 |
|
|
|
38,866 |
|
| PPL |
|
|
1,224 |
|
|
|
33,844 |
|
| Public Service Enterprise Group |
|
|
831 |
|
|
|
61,245 |
|
| Sempra |
|
|
1,048 |
|
|
|
79,711 |
|
| Southern |
|
|
2,229 |
|
|
|
172,903 |
|
| Vistra |
|
|
616 |
|
|
|
52,964 |
|
| WEC Energy Group |
|
|
526 |
|
|
|
41,270 |
|
| |
|
|
|
|
|
|
|
|
| |
|
|
|
|
|
|
1,399,860 |
|
| |
|
|
|
|
|
|
|
|
| |
|
|
|
|
|
|
|
|
| Total Common Stock |
|
|
|
|
|
|
|
|
| (Cost $36,725,873) |
|
|
|
|
|
|
47,119,056 |
|
| Description |
|
Shares |
|
|
Fair
Value |
|
| |
| SHORT-TERM INVESTMENT — 0.7% |
| First
American Government Obligations Fund, Cl X, 5.230% (A) |
|
|
335,277 |
|
|
$ |
335,277 |
|
| |
|
|
|
|
|
|
|
|
| Total Short-Term Investment |
|
|
|
|
|
|
|
|
| (Cost $335,277) |
|
|
|
|
|
|
335,277 |
|
| |
|
|
|
|
|
|
|
|
| Total Investments - 100.3% |
|
|
|
|
|
|
|
|
| (Cost $37,061,150) |
|
|
|
|
|
$ |
47,454,333 |
|
|
Percentages
are based on Net Assets of $47,335,708.
| * |
Non-income producing
security. |
| ‡ |
Real Estate Investment
Trust |
| †† |
More
narrow industries are utilized for compliance purposes whereas broad sectors are utilized for reporting purposes. |
| (A) |
Rate shown represents
the 7-day effective yield as of June 30, 2024. |
| Cl
— Class |
| PLC —
Public Limited Company |
| |
As
of June 30, 2024, all of the Fund’s investments were considered Level 1 in accordance with the authoritative guidance under U.S.
Generally Accepted Accounting Principles.
For
more information on valuation inputs, see Note 2 in Notes to Financial Statements.
The
accompanying notes are an integral part of the financial statements.
Tidal
Trust III
Statements
of Assets and Liabilities
June
30, 2024
| |
|
Impact Shares
YWCA
Women’s
Empowerment
ETF |
|
|
Impact Shares
NAACP
Minority
Empowerment
ETF |
|
| |
|
|
|
|
|
|
| Assets: |
|
|
|
|
|
|
|
|
| Investments,
at Cost |
|
$ |
45,933,239 |
|
|
$ |
37,061,150 |
|
| Investments, at Fair Value |
|
$ |
55,906,825 |
|
|
$ |
47,454,333 |
|
| Dividends Receivable |
|
|
33,080 |
|
|
|
18,970 |
|
| Reclaims Receivable |
|
|
1,650 |
|
|
|
1,457 |
|
| Total
Assets |
|
|
55,941,555 |
|
|
|
47,474,760 |
|
| |
|
|
|
|
|
|
|
|
| Liabilities: |
|
|
|
|
|
|
|
|
| Income Distributions Payable |
|
|
127,773 |
|
|
|
120,342 |
|
| Advisory Fees Payable |
|
|
33,848 |
|
|
|
18,649 |
|
| Due to Custodian |
|
|
99 |
|
|
|
61 |
|
| Total
Liabilities |
|
|
161,720 |
|
|
|
139,052 |
|
| |
|
|
|
|
|
|
|
|
| Net
Assets |
|
$ |
55,779,835 |
|
|
$ |
47,335,708 |
|
| |
|
|
|
|
|
|
|
|
| Net Assets Consist
of: |
|
|
|
|
|
|
|
|
| Paid-in Capital |
|
$ |
46,579,113 |
|
|
$ |
36,045,599 |
|
| Total Distributable
Earnings |
|
|
9,200,722 |
|
|
|
11,290,109 |
|
| |
|
|
|
|
|
|
|
|
| Net
Assets |
|
$ |
55,779,835 |
|
|
$ |
47,335,708 |
|
| |
|
|
|
|
|
|
|
|
| Outstanding Shares of Beneficial Interest
(unlimited authorization — no par value) |
|
|
1,550,000 |
|
|
|
1,200,000 |
|
| Net Asset Value, Offering and
Redemption Price Per Share |
|
$ |
35.99 |
|
|
$ |
39.45 |
|
The
accompanying notes are an integral part of the financial statements.
Tidal
Trust III
Statements
of Operations
For
the year ended June 30, 2024
| |
|
Impact Shares
YWCA
Women’s
Empowerment
ETF |
|
|
Impact Shares
NAACP
Minority
Empowerment
ETF |
|
| |
|
|
|
|
|
|
| Investment Income: |
|
|
|
|
|
|
|
|
| Dividend Income |
|
$ |
826,700 |
|
|
$ |
730,784 |
|
| Less: Foreign
Taxes Withheld |
|
|
(316 |
) |
|
|
(279 |
) |
| Total
Investment Income |
|
|
826,384 |
|
|
|
730,505 |
|
| |
|
|
|
|
|
|
|
|
| Expenses: |
|
|
|
|
|
|
|
|
| Advisory Fees |
|
|
353,066 |
|
|
|
209,971 |
|
| |
|
|
|
|
|
|
|
|
| Total
Expenses |
|
|
353,066 |
|
|
|
209,971 |
|
| |
|
|
|
|
|
|
|
|
| Net
Investment Income |
|
|
473,318 |
|
|
|
520,534 |
|
| |
|
|
|
|
|
|
|
|
| Net Realized Gain
(Loss) on: |
|
|
|
|
|
|
|
|
| Investments(1) |
|
|
1,584,468 |
|
|
|
5,309,953 |
|
| |
|
|
|
|
|
|
|
|
| Net
Realized Gain (Loss) |
|
|
1,584,468 |
|
|
|
5,309,953 |
|
| |
|
|
|
|
|
|
|
|
| Net Change in Unrealized
Appreciation (Depreciation): |
|
|
|
|
|
|
|
|
| Investments |
|
|
6,463,564 |
|
|
|
4,277,608 |
|
| |
|
|
|
|
|
|
|
|
| Net
Change in Unrealized Appreciation (Depreciation) |
|
|
6,463,564 |
|
|
|
4,277,608 |
|
| |
|
|
|
|
|
|
|
|
| Net
Realized and Unrealized Gain (Loss) |
|
|
8,048,032 |
|
|
|
9,587,561 |
|
| |
|
|
|
|
|
|
|
|
| Net
Increase in Net Assets Resulting from Operations |
|
$ |
8,521,350 |
|
|
$ |
10,108,095 |
|
| |
|
|
|
|
|
|
|
|
(1)
Includes realized gain (loss) as a result on in-kind redemptions. (See Note 4 in Notes to Financial Statements.)
The
accompanying notes are an integral part of the financial statements.
Tidal
Trust III
Statements
of Changes in Net Assets
| |
|
Impact
Shares YWCA Women’s
Empowerment
ETF |
|
| |
|
Year
ended
June 30, 2024
|
|
|
Year
ended
June 30, 2023
|
|
| Operations: |
|
|
|
|
|
|
|
|
| Net Investment Income |
|
$ |
473,318 |
|
|
$ |
414,055 |
|
| Net Realized Gain (Loss) |
|
|
1,584,468 |
|
|
|
(1,160,321 |
) |
| Net Change in Unrealized
Appreciation (Depreciation) |
|
|
6,463,564 |
|
|
|
6,996,026 |
|
| |
|
|
|
|
|
|
|
|
| Net
Increase in Net Assets Resulting from Operations |
|
|
8,521,350 |
|
|
|
6,249,760 |
|
| |
|
|
|
|
|
|
|
|
| Distributions: |
|
|
(849,726 |
) |
|
|
(2,789,774 |
) |
| |
|
|
|
|
|
|
|
|
| Capital Share Transactions: |
|
|
|
|
|
|
|
|
| Issued |
|
|
9,083,277 |
|
|
|
7,770,799 |
|
| Redeemed |
|
|
(1,562,658 |
) |
|
|
(711,911 |
) |
| |
|
|
|
|
|
|
|
|
| Increase
in Net Assets from Capital Share Transactions |
|
|
7,520,619 |
|
|
|
7,058,888 |
|
| |
|
|
|
|
|
|
|
|
| Total Increase in Net
Assets |
|
|
15,192,243 |
|
|
|
10,518,874 |
|
| |
|
|
|
|
|
|
|
|
| Net Assets: |
|
|
|
|
|
|
|
|
| Beginning of Year |
|
|
40,587,592 |
|
|
|
30,068,718 |
|
| End of Year |
|
$ |
55,779,835 |
|
|
$ |
40,587,592 |
|
| |
|
|
|
|
|
|
|
|
| Share Transactions: |
|
|
|
|
|
|
|
|
| Issued |
|
|
275,000 |
|
|
|
275,000 |
|
| Redeemed |
|
|
(50,001 |
) |
|
|
(25,000 |
) |
| Net
Increase in Shares Outstanding from Share Transactions |
|
|
224,999 |
|
|
|
250,000 |
|
The
accompanying notes are an integral part of the financial statements.
Tidal
Trust III
Statements
of Changes in Net Assets
| |
|
Impact
Shares NAACP Minority
Empowerment
ETF |
|
| |
|
Year
ended
June 30, 2024
|
|
|
Year
ended
June 30, 2023
|
|
| Operations: |
|
|
|
|
|
|
|
|
| Net Investment Income |
|
$ |
520,534 |
|
|
$ |
539,678 |
|
| Net Realized Gain (Loss) |
|
|
5,309,953 |
|
|
|
(1,276,038 |
) |
| Net Change in Unrealized
Appreciation (Depreciation) |
|
|
4,277,608 |
|
|
|
7,600,128 |
|
| |
|
|
|
|
|
|
|
|
| Net
Increase in Net Assets Resulting from Operations |
|
|
10,108,095 |
|
|
|
6,863,768 |
|
| |
|
|
|
|
|
|
|
|
| Distributions: |
|
|
(527,702 |
) |
|
|
(1,399,198 |
) |
| |
|
|
|
|
|
|
|
|
| Capital Share Transactions: |
|
|
|
|
|
|
|
|
| Issued |
|
|
1,905,221 |
|
|
|
4,349,942 |
|
| Redeemed |
|
|
(9,200,860 |
) |
|
|
— |
|
| |
|
|
|
|
|
|
|
|
| Increase
(Decrease) in Net Assets from Capital Share Transactions |
|
|
(7,295,639 |
) |
|
|
4,349,942 |
|
| |
|
|
|
|
|
|
|
|
| Total Increase in Net
Assets |
|
|
2,284,754 |
|
|
|
9,814,512 |
|
| |
|
|
|
|
|
|
|
|
| Net Assets: |
|
|
|
|
|
|
|
|
| Beginning of Year |
|
|
45,050,954 |
|
|
|
35,236,442 |
|
| End of Year |
|
$ |
47,335,708 |
|
|
$ |
45,050,954 |
|
| |
|
|
|
|
|
|
|
|
| Share Transactions: |
|
|
|
|
|
|
|
|
| Issued |
|
|
50,000 |
|
|
|
150,000 |
|
| Redeemed |
|
|
(275,000 |
) |
|
|
— |
|
| Net
Increase (Decrease) in Shares Outstanding from Share Transactions |
|
|
(225,000 |
) |
|
|
150,000 |
|
Amounts designated
as “-” are $0.
The
accompanying notes are an integral part of the financial statements.
Tidal
Trust III
Financial
Highlights
Selected
Per Share Data & Ratios
For
the year ended June 30,
For
a Share Outstanding Throughout the Year
| |
|
Net Asset Value,
Beginning of Year ($) |
|
Net
Investment
Income ($)* |
|
Net Realized and
Unrealized Gain (Loss) on Investments ($) |
|
Total from Operations
($) |
|
Distributions from
Net Investment Income ($) |
|
Distributions from
Net Realized Capital Gains ($) |
|
Total Distributions
($) |
|
Net Asset Value,
End of Year ($) |
|
Market
Price,
End of Year
(Unaudited) ($) |
|
Total
Return(%)(1) |
|
Net Assets End
of Year ($) (000) |
|
Ratio of Expenses
to Average Net Assets (%) |
|
Ratio of Net Investment
Income to Average Net Assets (%) |
|
Portfolio
Turnover
Rate (%)(2) |
| Impact Shares YWCA Women’s Empowerment ETF |
| 2024 |
|
30.63 |
|
|
0.33 |
|
|
5.63 |
|
|
5.96 |
|
|
(0.33 |
) |
|
(0.27 |
) |
|
(0.60 |
) |
|
35.99 |
|
|
36.02 |
|
|
19.64 |
|
|
55,780 |
|
|
0.75 |
|
|
1.01 |
|
|
33 |
|
| 2023 |
|
27.97 |
|
|
0.35 |
|
|
4.63 |
|
|
4.98 |
|
|
(0.34 |
) |
|
(1.98 |
) |
|
(2.32 |
) |
|
30.63 |
|
|
30.67 |
|
|
19.16 |
|
|
40,588 |
|
|
0.75 |
|
|
1.22 |
|
|
17 |
|
| 2022 |
|
32.85 |
|
|
0.27 |
|
|
(3.99 |
) |
|
(3.72 |
) |
|
(0.27 |
) |
|
(0.89 |
) |
|
(1.16 |
) |
|
27.97 |
|
|
27.92 |
|
|
(11.98 |
) |
|
30,069 |
|
|
0.75 |
|
|
0.83 |
|
|
36 |
|
| 2021 |
|
22.81 |
|
|
0.21 |
|
|
11.59 |
|
|
11.80 |
|
|
(0.47 |
) |
|
(1.29 |
) |
|
(1.76 |
) |
|
32.85 |
|
|
32.88 |
|
|
52.85 |
|
|
29,562 |
|
|
0.75 |
(3) |
|
0.73 |
|
|
39 |
|
| 2020 |
|
20.63 |
|
|
0.28 |
|
|
2.16 |
|
|
2.44 |
|
|
(0.26 |
) |
|
— |
|
|
(0.26 |
) |
|
22.81 |
|
|
22.77 |
|
|
11.92 |
|
|
7,414 |
|
|
0.75 |
(4) |
|
1.30 |
|
|
47 |
|
| Impact Shares NAACP Minority Empowerment ETF |
| 2024 |
|
31.61 |
|
|
0.42 |
|
|
7.86 |
|
|
8.28 |
|
|
(0.44 |
) |
|
— |
|
|
(0.44 |
) |
|
39.45 |
|
|
39.49 |
|
|
26.38 |
|
|
47,336 |
|
|
0.49 |
|
|
1.22 |
|
|
37 |
|
| 2023 |
|
27.64 |
|
|
0.40 |
|
|
4.63 |
|
|
5.03 |
|
|
(0.40 |
) |
|
(0.66 |
) |
|
(1.06 |
) |
|
31.61 |
|
|
31.65 |
|
|
18.90 |
|
|
45,051 |
|
|
0.49 |
|
|
1.41 |
|
|
9 |
|
| 2022 |
|
32.69 |
|
|
0.33 |
|
|
(4.25 |
) |
|
(3.92 |
) |
|
(0.32 |
) |
|
(0.81 |
) |
|
(1.13 |
) |
|
27.64 |
|
|
27.70 |
|
|
(12.70 |
) |
|
35,236 |
|
|
0.49 |
|
|
1.00 |
|
|
35 |
|
| 2021 |
|
23.17 |
|
|
0.30 |
|
|
9.68 |
|
|
9.98 |
|
|
(0.35 |
) |
|
(0.11 |
) |
|
(0.46 |
) |
|
32.69 |
|
|
32.76 |
|
|
43.35 |
|
|
31,875 |
|
|
0.50 |
(5) |
|
1.03 |
|
|
49 |
|
| 2020 |
|
21.16 |
|
|
0.28 |
|
|
1.97 |
|
|
2.25 |
|
|
(0.24 |
) |
|
— |
|
|
(0.24 |
) |
|
23.17 |
|
|
23.23 |
|
|
10.71 |
|
|
5,792 |
|
|
0.75 |
(4) |
|
1.27 |
|
|
25 |
|
Amounts
designated as “-” are $0.
| * |
Per
share data calculated using average shares method. |
| (1) |
Total
return is based on the change in net asset value of a share during the year or period and assumes reinvestment of dividends and distributions
at net asset value. The return shown does not reflect the deduction of taxes that a shareholder would pay on Fund distributions or the
redemption of Fund shares. |
| (2) |
Portfolio
turnover rate is for the period indicated and has not been annualized. Excludes effect of in-kind transfers. |
| (3) |
The
ratio of Expenses to Average Net Assets includes the voluntary expense reimbursements. If these reimbursements were excluded, the ratio
would have been 0.86% for the year ended June 30, 2021. |
| (4) |
The
ratio of Expenses to Average Net Assets includes the voluntary expense reimbursements. If these reimbursements were excluded, the ratio
would have been 1.11% for the year ended June 30, 2020. |
| (5) |
The
ratio of Expenses to Average Net Assets includes the voluntary expense reimbursements. If these reimbursements were excluded, the ratio
would have been 0.61% for the year ended June 30, 2021. |
The
accompanying notes are an integral part of the financial statements.
Tidal
Trust III
Notes
to Financial Statements
June
30, 2024
1.
ORGANIZATION
Tidal
Trust III, formerly Impact Shares Trust I (the “Trust”), is an open-end management investment company organized as a Delaware
statutory trust pursuant to a Declaration of Trust dated May 19, 2016. The Trust is registered with the Securities and Exchange Commission
(the “Commission”) under the Investment Company Act of 1940 (the “1940 Act”), as amended, as an open-end management
investment company. The financial statements herein and the related notes are those of Impact Shares YWCA Women’s Empowerment ETF
(the “Women’s ETF”) and the Impact Shares NAACP Minority Empowerment ETF (the “Minority ETF”), (each a “Fund”
and collectively, the “Funds”). The Women’s ETF and Minority ETF each seek to provide investment results that, before
fees and expenses, track the total return performance of the Morningstar Women’s Empowerment Index and the Morningstar Minority
Empowerment Index (the “Underlying Indices” or “Index”), respectively. The Funds are classified as “diversified”
funds under the 1940 Act. With respect to Minority ETF, as of January 29, 2024, Tidal Investment LLC (“Tidal”) (the “Adviser”)
serves as the investment adviser and Impact Shares, Corp. (“Impact Shares”) serves as sub-adviser. With respect to Women’s
ETF, as of September 1, 2023, Tidal serves as the investment adviser and Impact Shares serves as sub-adviser. Prior to these dates, Impact
Shares served as investment adviser to Women’s ETF and Minority ETF. The Adviser is responsible for managing the investment activities
of the Funds, the Funds’ business affairs and other administrative matters and is subject to the supervision of the Board of Trustees
(the “Board”).
The
Women’s ETF commenced operations on August 24, 2018.
The
Minority ETF commenced operations on July 18, 2018.
2.
SIGNIFICANT ACCOUNTING POLICIES
The
following is a summary of the significant accounting policies followed by the Funds:
Use
of Estimates — The Funds are registered investment companies under Accounting Standard Codification in Topic 946 by the Financial
Accounting Standards Board. The preparation of financial statements in conformity with U.S. generally accepted accounting principles (“U.S.
GAAP”) requires management to make estimates and assumptions that affect the reported amounts of assets and liabilities and disclosure
of contingent assets and liabilities at the date of the financial statements and the reported amounts of increases and decreases in net
assets from operations during the reporting period. Actual results could materially differ from those estimates.
Security
Valuation — Equity securities, including Real Estate Investment Trusts, listed on a securities exchange, market or automated
quotation system for which quotations are readily available (except for securities traded on the NASDAQ Stock Market (the “NASDAQ”)),
including securities traded over the counter, are valued at the last quoted sale price on the primary exchange or market (foreign or domestic)
on which they are traded (or at approximately 4:00 pm Eastern Time if a security’s primary exchange is normally open at that time),
or, if there is no such reported sale, at the most recent quoted bid. For securities traded on NASDAQ, the NASDAQ Official Closing Price
will be used. Debt obligations with remaining maturities of sixty days or less may be valued at their amortized cost, if the Valuation
Designee (discussed below) concludes it approximates fair value after taking into account factors such as credit, liquidity and interest
rate conditions as well as issuer specific factors. Foreign securities listed on foreign exchanges are valued based on quotations from
the primary market in which they are traded and are translated from the local currency into U.S. dollars using current exchange rates.
Foreign securities may trade on weekends or other days when the Fund does not calculate net asset value (“NAV”). As a result,
the fair value of these investments may change on days when you cannot buy or redeem shares of the Fund. Prices for most securities held
in the Funds are provided daily by recognized independent pricing agents. If a security price cannot be obtained from an independent,
third-party pricing agent, the Funds seek to obtain a bid price from at least one independent broker. Portfolio securities for which market
quotations are readily available are valued at their current market value. When market quotations are not readily available (or are deemed
unreliable) for one or more portfolio securities, the 1940 Act requires the Funds to use the investment’s fair value, as determined
in good faith. Pursuant to Rule 2a-5 under the 1940 Act, the Board has designated the Adviser as the valuation designee to perform fair
value determinations, subject to Board oversight. Pursuant to the Valuation Designee’s fair value policies and procedures, securities
for which market quotations are not readily available or for which the market price is determined to be unreliable, may include but are
not limited to securities that are subject to legal or contractual restrictions on resale, securities for which no or limited trading
activity has occurred for a period of time, or securities that are otherwise deemed to be illiquid (i.e., securities that cannot be disposed
of within seven days at approximately the price at which the security is currently priced by the Fund which holds the security). Market
quotations may also be not “readily available” if a significant event occurs after the close of the principal exchange on
which a portfolio security trades (but before the time for calculation of such Fund’s NAV) if that event affects or is likely to
affect (more than minimally) the NAV per share of such Fund. In determining the fair value price of a security, the Valuation Designee
may use a number of other methodologies, including those based on discounted cash flows, multiples, recovery rates, yield to maturity
or discounts to public comparables. The Valuation Designee may also employ independent pricing services. Fair value pricing involves judgments
that are inherently subjective
Tidal
Trust III
Notes
to Financial Statements
June
30, 2024
and
inexact; as a result, there can be no assurance that fair value pricing will reflect actual market value, and it is possible that the
fair value determined for a security will be materially different from the value that actually could be or is realized upon the sale of
that asset. Valuing the Funds’ investments using fair value pricing will result in using prices for those investments that may differ
from current market valuations. Use of fair value prices and certain current market valuations could result in a difference between the
prices used to calculate each Fund’s NAV and the prices used by each applicable Underlying Index, which, in turn, could result in
a difference between a Fund’s performance and the performance of its Underlying Index.
In
accordance with the authoritative guidance on fair value measurements and disclosure under U.S. GAAP, the Funds disclose fair value of
their investments in a hierarchy that prioritizes the inputs to valuation techniques used to measure the fair value. The objective of
a fair value measurement is to determine the price that would be received to sell an asset or paid to transfer a liability in an orderly
transaction between market participants at the measurement date (an exit price). Accordingly, the fair value hierarchy gives the highest
priority to quoted prices (unadjusted) in active markets for identical assets or liabilities (Level 1) and the lowest priority to unobservable
inputs (Level 3). The three levels of the fair value hierarchy are described below:
|
● |
Level
1 – Unadjusted quoted prices in active markets for identical, unrestricted assets or liabilities that the Funds have the ability
to access at the measurement date; |
|
● |
Level
2 – Quoted prices which are not active, or inputs that are observable (either directly or indirectly) for substantially the full
term of the asset or liability; and |
|
● |
Level
3 – Prices, inputs or exotic modeling techniques which are both significant to the fair value measurement and unobservable (supported
by little or no market activity). |
The
valuation techniques used by the Funds to measure fair value during the year ended June 30, 2024 maximized the use of observable inputs
and minimized the use of unobservable inputs.
For
the year ended June 30, 2024, there have been no significant changes to the Funds’ fair valuation methodologies.
For
details of the investment classification, reference the Schedules of Investments.
Federal
Income Taxes — It is each of the Funds’ intention to qualify as a regulated investment company for Federal income tax
purposes by complying with the appropriate provisions of Subchapter M of the Internal Revenue Code of 1986 (the “Code”), as
amended. Accordingly, no provisions for federal income taxes have been made in the financial statements.
The
Funds evaluate tax positions taken, or expected to be taken in the course of preparing the Funds’ tax returns, to determine whether
it is “more-likely-than-not” (i.e., greater than 50-percent) that each tax position will be sustained upon examination by
a taxing authority based on the technical merits of the position. Tax positions not deemed to meet the more-likely-than-not threshold
are recorded as a tax benefit or expense in the current period. The Funds did not record any tax provision in the current period. However,
management’s conclusions regarding tax positions taken may be subject to review and adjustment at a later date based on factors
including, but not limited to, examination by tax authorities (i.e., the last 3 year ends, as applicable), on-going analysis of and changes
to tax laws, regulations and interpretations thereof. As of and during the year ended June 30, 2024, the Funds did not have a liability
for any unrecognized tax benefits. The Funds recognize interest and penalties, if any, related to unrecognized tax benefits as income
tax expense in the Statements of Operations. For the year ended June 30, 2024, the Funds did not recognize any interest or penalties.
Security
Transactions and Investment Income — Security transactions are accounted for on trade date. Costs used in determining realized
gains and losses on the sale of investment securities are based on specific identification. Dividend income is recorded on the ex-dividend
date. Interest income is recognized on the accrual basis. Withholding taxes and reclaims on foreign dividends have been provided for in
accordance with the Funds’ understanding of the applicable country’s tax rules and rates. Discounts and premiums on securities
purchased are accreted and amortized using the effective interest method.
Dividends
and Distributions to Shareholders — The Funds intend to declare and pay dividends of net investment income quarterly and to
pay any capital gain distributions on an annual basis. All distributions are recorded on ex-dividend date.
Cash
and Cash Equivalents — Idle cash may be swept into various time deposits and is classified as cash and cash equivalents on the
Statements of Assets and Liabilities. The Funds maintain cash in bank deposit accounts which,
Tidal
Trust III
Notes
to Financial Statements
June
30, 2024
at
times, may exceed United States federally insured limits. Amounts swept overnight are available on the next business day.
Creation
Units — The Funds issue and redeem shares (“Shares”) at NAV in large blocks of Shares
comprised of 50,000 shares for the Funds (a “Creation Unit”). Purchasers of Creation Units at NAV must pay a standard creation
transaction fee of $300 per transaction. The fee is a single charge and will be the same regardless of the number of Creation Units purchased
by an investor on the same day. An Authorized Participant who holds Creation Units and wishes to redeem at NAV would also pay a standard
redemption transaction fee of $300 per transaction to the custodian on the date of such redemption, regardless of the number of Creation
Units redeemed that day. Creations and redemptions are also subject to an additional variable charge of up to 1% of the net asset value
per Creation Unit, inclusive of the standard transaction fee, for (i) in-kind creations or redemptions effected outside the normal Clearing
Process, (ii) in whole or partial cash creations, (iii) in whole or partial cash redemptions or (iv) non-standard orders. The variable
component is primarily designed to cover non-standard charges, e.g., brokerage, taxes, foreign exchange, execution, market impact and
other costs and expenses related to the execution of trades resulting from such transaction. In all cases, the Transaction Fee will be
limited in accordance with the requirements of the SEC applicable to management investment companies offering redeemable securities. The
Fund may determine not to charge the variable portion of a Transaction Fee on certain orders when the Adviser has determined that doing
so is in the best interests of Fund shareholders, e.g., for redemption orders that facilitate the rebalance of the Fund’s portfolio
in a more tax efficient manner than could be achieved without such order. The variable portion of a Transaction Fee may be higher or lower
than the trading expenses incurred by a Fund with respect to the transaction.
Except
when aggregated in Creation Units, Shares are not redeemable securities of the Funds. Shares of the Funds may only be purchased or redeemed
by certain financial institutions (“Authorized Participants”). An Authorized Participant is either (i) a broker-dealer or
other participant in the clearing process through the Continuous Net Settlement System of the National Securities Clearing Corporation
or (ii) a Depository Trust Company (“DTC”) participant and, in each case, must have executed an Authorized Participant Agreement
with the Funds’ distributor. Most retail investors will not qualify as Authorized Participants or have the resources to buy and
sell whole Creation Units. Therefore, they will be unable to purchase or redeem the Shares directly from the Funds. Rather, most retail
investors will purchase Shares in the secondary market with the assistance of a broker and will be subject to customary brokerage commissions
or fees.
The
size of a creation unit for a Fund may be changed from time to time in the future, if determined to be in the best interests of a Fund
by the President of the Fund.
If
a Creation Unit is purchased or redeemed in cash, a higher transaction fee will be charged. The following table discloses the Creation
Unit breakdown based on the NAV as of June 30, 2024:
| |
|
Creation Unit
Shares |
|
|
Creation
Transaction
Fee |
|
|
Value |
|
|
Redemption
Transaction
Fee
|
|
| Women’s ETF |
|
|
50,000 |
|
|
$ |
300 |
|
|
$ |
1,799,500 |
|
|
$ |
300 |
|
| Minority ETF |
|
|
50,000 |
|
|
|
300 |
|
|
|
1,972,500 |
|
|
|
300 |
|
Foreign
Currency Translation — The books and records of the Funds are maintained in U.S. dollars. Investment securities and other asset
and liabilities denominated in a foreign currency are translated into U.S. dollars on the date of valuation. Purchases and sales of investment
securities, income and expenses are translated into U.S. dollars at the relevant rates of exchange prevailing on the respective dates
of such transactions. The Funds do not isolate that portion of realized or unrealized gains and losses resulting from changes in the foreign
exchange rate from fluctuations arising from changes in the market prices of the securities. These gains and losses are included in net
realized and unrealized gains and losses on investments on the Statements of Operations. Net realized and unrealized gains and losses
on foreign currency transactions represent net foreign exchange gains or losses from foreign currency exchange contracts, disposition
of foreign currencies, currency gains or losses realized between trade and settle dates on securities transactions and the difference
between the amount of the investment income and foreign withholding taxes recorded on the Funds’ books and the U.S. dollar equivalent
amounts actually received or paid.
Indemnifications
— In the normal course of business, the Funds enter into contracts that provide general indemnifications. The Funds’ maximum
exposure under these arrangements is dependent on future claims that may be made against the Funds and, therefore, cannot be established;
however, based on experience, the risk of loss from such claims is considered remote.
Tidal
Trust III
Notes
to Financial Statements
June
30, 2024
3.
AGREEMENTS
Investment
Advisory Agreement
The
Adviser is a Delaware limited liability company, located at 234 West Florida Street, Suite 203, Milwaukee, Wisconsin 53204. The Adviser
serves as investment adviser to each of the Funds pursuant to investment advisory agreements (each an “Advisory Agreement”)
with the Trust. The Adviser arranges for transfer agency, custody, fund administration and accounting, and other non-distribution related
services necessary for the Funds to operate. The Adviser administers the Funds’ business affairs, provides office facilities and
equipment and certain clerical, bookkeeping and administrative services, and provides its officers and employees to serve as officers
or Trustees of the Trust.
For
the services it provides to the Women’s ETF and the Minority ETF, the Adviser receives a fee, which is calculated daily and paid
monthly, at an annual rate of 0.75% of average daily net assets of the Women’s ETF and 0.49% of average daily net assets with respect
to Minority ETF. Under the Advisory Agreement, the Adviser agrees to pay all expenses incurred by the Trust and Funds (except for advisory
fees payable to the Adviser under the Agreement) pursuant to this Agreement, excluding interest charges on any borrowings, dividends and
other expenses on securities sold short, taxes, brokerage commissions and other expenses incurred in placing orders for the purchase and
sale of securities and other investment instruments, acquired fund fees and expenses, accrued deferred tax liability, distribution fees
and expenses paid by the Fund under any distribution plan adopted pursuant to Rule 12b-1 under the 1940 Act, and litigation expenses,
and other non-routine or extraordinary expenses. Prior to the Adviser change to each of the Funds, the Impact Shares, Corp. (the “Previous
Adviser”) received a fee, which was calculated daily and paid monthly, at an annual rate of 0.75% of average daily net assets of
the Women’s ETF and 0.49% of average daily net assets with respect to Minority ETF. Under the Advisory Agreement, the Previous Adviser
was responsible for substantially all expenses of the Women’s ETF and Minority ETF including the cost of transfer agency, custody,
fund administration, legal, audit and other services, except for: (i) distribution and service fees payable pursuant to a Rule 12b-1 plan,
if any; (ii) taxes and governmental fees, if any, levied against a Fund; (iii) brokerage fees and commissions, and other portfolio transaction
expenses incurred by or for a Fund; (iv) expenses of a Fund’s securities lending (if any), including any securities lending agent
fees, as governed by a separate securities lending agreement; costs, including interest expenses, of borrowing money or engaging in other
types of leverage financing; (v) extraordinary expenses, including extraordinary legal expenses, as may arise, including, without limitation,
expenses incurred in connection with litigation, proceedings, other claims, contractual arrangements with Partner Charities and the legal
obligations of a Fund to indemnify its Trustees, officers, employees, shareholders, distributors, and agents with respect thereto; and
(vi) expenses of a Fund which are capitalized in accordance with generally accepted accounting principles (the “Excluded Expenses”).
Additionally,
each Investment Advisory Agreement remains in force for an initial two-year period and from year to year thereafter, subject to annual
approval by (a) the Board or (b) a “vote of a majority of the outstanding voting securities” (as defined in the 1940 Act)
of the Fund; provided that in either event continuance is also approved by a majority of the Independent Trustees, by a vote cast in person
at a meeting called for the purpose of voting such approval. Each Investment Advisory Agreement may be terminated at any time, without
payment of any penalty, by vote of the Trust’s Board, or by a “vote of a majority of the outstanding voting securities”
(as defined in the 1940 Act) of the Fund, or by the Adviser, in each case on not more than 60 days’ nor less than 30 days’
prior written notice to the other party. Each Investment Advisory Agreement will automatically terminate in the event of its “assignment,”
as defined by the 1940 Act and the rules thereunder, or upon the termination of the relevant.
Sub-Advisory
Agreement
Impact
Shares serves as the investment sub-adviser to the Women’s ETF and Minority ETF. The Sub-Adviser is responsible for the day-to-day
management of the Funds’ portfolios, including determining the securities purchased and sold by the Fund, subject to the supervision
of the Adviser and the Board. For its services, the Sub-Adviser is paid a fee by the Adviser, which is calculated daily and paid monthly.
Each
Fund is a party to contractual arrangements with various parties, including, among others, the Fund’s investment adviser, administrator,
distributor, and shareholder servicing agent, who provide services to the Fund. Shareholders are not parties to, or intended (“third-party”)
beneficiaries of, any such contractual arrangements, and such contractual arrangements are not intended to create in any individual shareholder
or group of shareholders any right to enforce them against the service providers or to seek any remedy under them against the service
providers, either directly or on behalf of the Fund.
The
Adviser has entered into a fund sponsorship agreement with the Sub-Adviser (the “Fund Sponsorship Agreement”) pursuant to
which the sub-adviser is a sponsor to the Funds. Every month, unitary management fees for the Funds are calculated and paid to the Adviser,
and the Adviser retains a portion of the unitary management fees from the Funds. After the Adviser has recouped a certain level of costs,
the Adviser has agreed to pay the
Tidal
Trust III
Notes
to Financial Statements
June
30, 2024
Sub-Adviser
a portion of any remaining profits generated by the unitary management fee for the Funds. If the amount of the unitary management fees
for the Funds exceeds the combination of: (i) the Funds’ operating expenses (including the sub-advisory fee payable to the Sub-Adviser
under the Sub-Advisory Amendment) and (ii) the Adviser- retained amount; that excess amount is considered “remaining profit.”
In that case, once the Adviser has recovered a certain level of costs, the Adviser will pay a portion of the remaining profits to the
Sub-Adviser. During months when the funds generated by the unitary management fee are insufficient to cover the entire sub-advisory fee,
that fee is automatically waived (and such waiver is not subject to recoupment).
Distribution
Agreement
SEI
Investments Distribution Co. (the “Distributor”) serves as the Funds’ underwriter and distributor of Shares pursuant
to a Distribution Agreement. Under the Distribution Agreement, the Distributor, as agent, receives orders to purchase shares in Creation
Units and transmits such orders to the Funds’ custodian and transfer agent. The Distributor has no obligation to sell any specific
quantity of Fund shares. The Distributor bears the following costs and expenses relating to the distribution of shares: (i) the expenses
of maintaining its registration or qualification as a dealer or broker under federal or state laws; (ii) filing fees; and (iii) all other
expenses incurred in connection with the distribution services, that are not reimbursed by the Adviser, as contemplated in the Distribution
Agreement. The Distributor does not maintain any secondary market in Fund Shares.
The
Funds have adopted a Distribution and Service Plan (the “Plan”) pursuant to Rule 12b-1 under the 1940 Act. In accordance with
the Plan, the Funds are authorized to pay an amount up to 0.25% of their average net assets each year for certain distribution-related
activities. For the year ended June 30, 2024, no fees were charged by the Distributor under the Plan. No payments have yet been authorized
by the Board, nor are any such expected to be made by a Fund under the Plan during the current fiscal year.
Administrator,
Custodian and Transfer Agent
SEI
Investments Global Funds Services (“SEI”) serves as the Funds’ administrator. In that capacity, SEI performs various
administrative services, including preparing various federal and state regulatory filings, reports and returns for the Fund, including
regulatory compliance monitoring and financial reporting; prepares reports and materials to be supplied to the Board; and monitors the
activities of the Fund’s custodian. Additionally, effective September 1, 2023, Tidal ETF Services LLC (“Tidal”), a Tidal
Financial Group company, and an affiliate of the Adviser, serves as the Funds’ administrator and, in that capacity, performs various
administrative and management services for the Fund. Tidal coordinates the payment of Fund related expenses and manages the Trust’s
relationships with its various service providers.
Effective
April 10, 2024, U.S. Bancorp Fund Services, LLC, doing business as U.S. Bank Global Fund Services (“Fund Services”), serves
as the Funds’ transfer agent. Prior to April 10, 2024, the Bank of New York Mellon served as the Funds’ transfer agent.
Effective
April 8, 2024, U.S. Bank N.A. (the “Custodian”), an affiliate of Fund Services, serves as the Funds’ custodian. Prior
to April 8, 2024 the Bank of New York Mellon served as the Funds’ custodian.
Certain
officers and a trustee of the Trust are affiliated with the Adviser and Tidal. Neither the affiliated trustee nor the Trust’s officers
receive compensation from the Funds.
4.
INVESTMENT TRANSACTIONS
For
the year ended June 30, 2024, the purchases and sales of investments in securities, excluding in-kind transactions and short-term securities
were:
| |
|
Purchases |
|
|
Purchases
–
U.S.
Govt. |
|
|
Sales |
|
|
Sales
–
U.S.
Govt. |
|
| Women’s ETF |
|
$ |
15,545,680 |
|
|
$ |
— |
|
|
$ |
15,571,831 |
|
|
$ |
— |
|
| Minority ETF |
|
|
17,542,807 |
|
|
|
— |
|
|
|
15,486,067 |
|
|
|
— |
|
| |
|
|
|
|
|
|
|
|
|
|
|
|
|
|
|
|
For
the year ended June 30, 2024, in-kind transactions associated with creations and redemptions were:
| |
|
Purchases |
|
|
Sales and
Maturities |
|
|
Realized
Gain/(Loss) |
|
| Women’s ETF |
|
$ |
9,074,173 |
|
|
$ |
1,558,882 |
|
|
$ |
502,982 |
|
| Minority ETF |
|
|
1,899,711 |
|
|
|
9,052,157 |
|
|
|
2,954,498 |
|
Tidal
Trust III
Notes
to Financial Statements
June
30, 2024
5. TAX INFORMATION
The
amount and character of income and capital gain distributions to be paid, if any, are determined in accordance with Federal income tax
regulations, which may differ from U.S. GAAP. As a result, net investment income (loss) and net realized gain (loss) on investment transactions
for a reporting period may differ significantly from distributions during such period. These book/tax differences may be temporary or
permanent. To the extent these differences are permanent in nature, they are charged or credited to distributable earnings or paid-in
capital, as appropriate, in the period that the differences arise.
The
permanent differences that are credited or charged to distributable earnings or Paid-in Capital as of June 30, 2024 are primarily related
to in-kind redemption gain/loss.
| |
|
Distributable
Earnings/
(Loss)
|
|
|
Paid-in Capital |
|
| Women’s ETF |
|
$ |
(443,479 |
) |
|
$ |
443,479 |
|
| Minority ETF |
|
|
(2,860,344 |
) |
|
|
2,860,344 |
|
These
reclassification had no impact on net assets or net asset value per share.
The
tax character of dividends and distributions paid during the last two fiscal years ending June 30, were as follows:
| |
|
Ordinary
Income |
|
Long-Term
Capital Gain |
|
Total |
| Women’s
ETF |
| 2024
|
|
$475,070 |
|
$374,656 |
|
$849,726 |
| 2023
|
|
1,326,246 |
|
1,463,528 |
|
2,789,774 |
| |
| Minority
ETF |
| 2024
|
|
$521,160 |
|
$6,542 |
|
$527,702 |
| 2023
|
|
938,455 |
|
460,743 |
|
1,399,198 |
| |
|
|
|
|
|
|
As
of June 30, 2024, the components of distributable earnings (accumulated losses) on a tax basis were as follows:
| |
|
Undistributed
Ordinary
Income |
|
|
Undistributed Long
Term Capital Gains |
|
|
Capital Loss Carryforwards |
|
|
Post October Losses |
|
|
Unrealized
Appreciation/
(Depreciation)
|
|
|
Other Temporary
Differences |
|
|
Total
Distributable Earnings/
(Accumulated
Losses) |
|
| Women’s ETF |
|
$ |
126,948 |
|
|
$ |
— |
|
|
$ |
— |
|
|
$ |
(206,339 |
) |
|
$ |
9,407,892 |
|
|
$ |
(127,779 |
) |
|
$ |
9,200,722 |
|
| Minority ETF |
|
|
120,342 |
|
|
|
1,016,458 |
|
|
|
— |
|
|
|
— |
|
|
|
10,273,652 |
|
|
|
(120,343 |
) |
|
|
11,290,109 |
|
| |
|
|
|
|
|
|
|
|
|
|
|
|
|
|
|
|
|
|
|
|
|
|
|
|
|
|
|
|
For
Federal income tax purposes, capital losses incurred may be carried forward and applied against future capital gains. Funds are permitted
to carry forward capital losses for an unlimited period. Additionally, capital losses that are carried forward will retain their character
as either short-term or long-term capital. As of June 30, 2024 there are no capital loss carryforwards.
During
the year ended June 30, 2024, the Funds utilized capital loss carryforwards to offset capital gains amounting to:
| |
|
Short-Term
Loss |
|
|
Long-Term
Loss |
|
|
Total |
|
| Women’s ETF |
|
$ |
369,005 |
|
|
$ |
371,964 |
|
|
$ |
740,969 |
|
| Minority ETF |
|
|
742,487 |
|
|
|
499,474 |
|
|
|
1,241,961 |
|
| |
|
|
|
|
|
|
|
|
|
|
|
|
The
Federal tax cost and aggregate gross unrealized appreciation and depreciation on investments and foreign currency transactions held by
the Funds at June 30, 2024, were as follows:
| |
|
Federal Tax Cost |
|
|
Aggregate Gross
Unrealized Appreciation |
|
|
Aggregate Gross
Unrealized Depreciation |
|
|
Net
Unrealized Appreciation/
(Depreciation)
|
|
| Women’s ETF |
|
$ |
46,498,933 |
|
|
$ |
10,654,184 |
|
|
$ |
(1,246,292 |
) |
|
$ |
9,407,892 |
|
| Minority ETF |
|
|
37,180,681 |
|
|
|
10,821,610 |
|
|
|
(547,958 |
) |
|
|
10,273,652 |
|
The
book/tax difference on cost is primarily related to wash sale adjustments.
Tidal
Trust III
Notes
to Financial Statements
June
30, 2024
6.
RISKS OF INVESTING IN THE FUNDS
As
with all exchange traded funds (“ETFs”), a shareholder of each Fund is subject to the risk that his or her investment could
lose money. The Funds are subject to the principal risks noted below, any of which may adversely affect the Fund’s NAV, trading
price, yield, total return and ability to meet its investment objective. A more complete description of principal risks is included in
the prospectus under the heading “Principal Risks”.
Under
normal circumstances, the Funds will invest at least 80% of their total assets in securities of the Index, which reflects the performance
of an investable universe of publicly-traded companies that directly or indirectly provide services or support to ETFs, including but
not limited to the management, servicing, trading or sale of ETFs (“ETF Activities”).
An
investment in each Fund is not a bank deposit and is not insured or guaranteed by the FDIC or any other government agency. As with any
investment company, there is no guarantee that the Fund will achieve its goal.
Asset
Class Risk (Both Funds) - The securities in an Underlying Index or in a Fund’s portfolio may underperform the returns of other
securities or indices that track other countries, regions, industries, groups of industries, markets, asset classes or sectors. Various
types of securities or indices tend to experience cycles of outperformance and underperformance in comparison to general securities markets.
Cash
Transaction Risk (Both Funds) - The Funds can effect creations and redemptions principally for cash, rather than for in-kind securities.
ETFs generally are able to make in-kind redemptions and avoid being taxed on gain on the distributed portfolio securities at the fund
level. Because the Funds currently can effect redemptions for cash, rather than for in-kind securities, they may be required to sell portfolio
securities in order to obtain the cash needed to distribute redemption proceeds. The Funds may recognize a capital gain on these sales
that might not have been incurred if the Funds had made a redemption in-kind, and this may decrease the tax efficiency of the Funds compared
to ETFs that utilize an in-kind redemption process and may also result in higher brokerage costs.
Counterparty
Risk (Both Funds) - The Funds may engage in transactions in securities and financial instruments that involve counterparties. Counterparty
risk is the risk that a counterparty (the other party to a transaction or an agreement or the party with whom a Fund executes transactions)
to a transaction with a Fund may be unable or unwilling to make timely principal, interest, settlement or margin payments, or otherwise
honor its obligations. If a counterparty becomes bankrupt or otherwise fails to perform its obligations due to financial difficulties,
the affected Fund’s income or the value of its assets may decrease. A Fund may experience significant delays in obtaining any recovery
in a bankruptcy or other reorganization proceeding and a Fund may obtain only limited recovery or may obtain no recovery in such circumstances.
In an attempt to limit the counterparty risk associated with such transactions, the Funds conduct business only with financial institutions
judged by Impact Shares to present acceptable credit risk. These risks may be greater when engaging in over-the-counter transactions or
when the Fund conducts business with a limited number of counterparties.
Equity
Investing Risk (Both Funds) - The market prices of equity securities owned by a Fund may go up or down, sometimes rapidly or unpredictably.
The value of a security may decline for a number of reasons that may directly relate to the issuer, such as management performance, financial
leverage, non-compliance with regulatory requirements, and reduced demand for the issuer’s goods or services. The values of equity
securities also may decline due to general industry or market conditions that are not specifically related to a particular company, such
as real or perceived adverse economic conditions, changes in the general outlook for corporate earnings, changes in interest or currency
rates, or adverse investor sentiment generally. In addition, equity markets tend to move in cycles, which may cause stock prices to fall
over short or extended periods of time.
Ethnic
Diversity Risk (Minority ETF only) - The returns on a portfolio of securities that excludes companies that are not ethnically diverse
may trail the returns on a portfolio of securities that includes companies that are not ethnically diverse. Investing only in a portfolio
of securities that are ethnically diverse may affect the Fund’s exposure to certain types of investments and may adversely impact
the Fund’s performance depending on whether such investments are in or out of favor in the market.
Exchange-Traded
Funds Risk (Both Funds) - The value of ETFs can be
expected to increase and decrease in value in proportion to increases and decreases in the indices that they are designed to track. The
volatility of different index tracking stocks can be expected to vary in proportion to the volatility of the particular index they track.
ETFs are traded similarly to stocks of individual companies. Although an ETF is designed to provide investment performance corresponding
to its index, it may not be able to exactly replicate the performance of its index because of its operating expenses and other factors.
An investment in an ETF generally presents the same primary risks as an investment in a conventional fund (i.e., one that is not exchange-traded)
that has the same investment objective, strategies, and policies. The price of an ETF can fluctuate within a wide range, and a Fund could
lose money investing in an ETF if the prices of the securities owned by the ETF go down. In addition, ETFs are subject to the following
risks that do not apply to conventional funds: (1) the market price of the ETF’s shares may trade at a
Tidal
Trust III
Notes
to Financial Statements
June
30, 2024
discount
or a premium to their net asset value; (2) an active trading market for an ETF’s shares may not develop or be maintained; and (3)
trading of an ETF’s shares may be halted by the activation of individual or market wide “circuit breakers” (which halt
trading for a specific period of time when the price of a particular security or overall market prices decline by a specified percentage),
if the shares are delisted from the Exchange without first being listed on another exchange, or if the listing exchange’s officials
deem such action appropriate in the interest of a fair and orderly market or to protect investors. In addition, shareholders bear both
their proportionate share of a Fund’s expenses and similar expenses of the underlying investment company when such Fund invests
in shares of another investment company. Most ETFs are investment companies. Therefore, a Fund’s purchases of ETF shares generally
are subject to the limitations on, and the risks of, such Fund’s investments in other investment companies.
Gender
Diversity Risk (Women’s ETF only) - The returns on a portfolio of securities that excludes companies that are not gender diverse
may trail the returns on a portfolio of securities that includes companies that are not gender diverse. Investing only in a portfolio
of securities that are gender diverse may affect the Fund’s exposure to certain types of investments and may adversely impact the
Fund’s performance depending on whether such investments are in or out of favor in the market.
Illiquid
Securities Risk (Both Funds) - Illiquid investments may be difficult to resell at approximately the price they are valued in the ordinary
course of business within seven days. When investments cannot be sold readily at the desired time or price, a Fund may have to accept
a much lower price, may not be able to sell the investment at all or may be forced to forego other investment opportunities, all of which
may adversely impact a Fund’s returns. Illiquid investments also may be subject to valuation risk.
Index
Performance Risk (Both Funds) - Each Fund seeks to track an index maintained by a third party provider unaffiliated with the Funds,
Toroso (for Women’s ETF only), or Impact Shares. There can be no guarantee or assurance that the methodology used by the third party
provider to create the index will result in the Funds achieving high, or even positive, returns. Further, there can be no guarantee that
the methodology underlying the index or the daily calculation of the index will be free from error. It is also possible that the value
of the index may be subject to intentional manipulation by third-party market participants. The particular indices used by the Funds may
underperform other asset classes and may underperform other similar indices. Each of these factors could have a negative impact on the
performance of the Funds.
Industry
Concentration Risk (Both Funds) - Because a Fund may invest 25% or more of the value of its assets in an industry or group of industries
to the extent that the Underlying Index concentrates in an industry or group of industries, a Fund’s performance may depend to a
large extent on the overall condition of such industry or group of industries and a Fund may be susceptible to economic, political and
regulatory risks or other occurrences associated with that industry or group of industries. The performance of a Fund if it invests a
significant portion of its assets in a particular sector or industry may be closely tied to the performance of companies in a limited
number of sectors or industries. Companies in a single sector often share common characteristics, are faced with the same obstacles, issues
and regulatory burdens and their securities may react similarly to adverse market conditions. The price movements of investments in a
particular sector or industry may be more volatile than the price movements of more broadly diversified investments.
Inflation
Risk (Both Funds) - Inflation risk is the risk that the value of assets or income from investments will be less in the future as inflation
decreases the value of money. As inflation increases, the present value of the Fund’s assets and distributions may decline.
Intellectual
Property Risk (Both Funds) - The Funds rely on licenses that permit Toroso (for Women’s ETF only) and Impact Shares to use the
Underlying Indices and associated trade names, trademarks and service marks, as well as the Partner Nonprofits’ names and logos
(the “Intellectual Property”) in connection with the investment strategies of each respective Fund and/or in marketing and
other materials for each Fund. Such licenses may be terminated, and, as a result, the relevant Fund may lose its ability to use the Intellectual
Property. In the event a license is terminated or the license provider does not have rights to license the Intellectual Property, the
operations of such Fund may be adversely affected.
Limited
Fund Size Risk (Both Funds) - The Funds may not attract sufficient assets to achieve or maximize investment and operational efficiencies
and remain viable. If a Fund fails to achieve sufficient scale, it may be liquidated.
Management
Risk (Both Funds) - Management risk is the risk associated with the fact that the Funds rely on Toroso’s (for Women’s
ETF only), Impact Shares’ ability to achieve its investment objective. Impact Shares has limited personnel and financial resources
and Impact Shares is a nonprofit organization. The relative lack of resources may increase the Funds’ management risk. In addition,
the NACP ETF is subject to potential trading-related challenges faced by Toroso.
Tidal
Trust III
Notes
to Financial Statements
June
30, 2024
Market
Price Variance Risk (Both Funds) - Each Fund’s shares are listed for trading on NYSE Arca, Inc. (the “Exchange”)
and are bought and sold in the secondary market at prevailing market prices. The market prices of shares will fluctuate in response to
changes in the NAV of a Fund and supply and demand for shares. As a result, the trading prices of shares may deviate significantly from
NAV of a Fund during periods of market volatility. Differences between secondary market prices and the net asset value (“NAV”)
of a Fund may be due largely to supply and demand forces in the secondary market, which may not be the same forces as those influencing
prices for securities held by a Fund at a particular time. Neither Toroso (for Women’s ETF only) or Impact Shares can predict whether
shares will trade above, below or at their NAV. Given the fact that shares can be created and redeemed in creation units, Toroso and Impact
Shares believe that large discounts or premiums to the NAV of shares should not be sustained in the long-term. There may be times when
the market price of a Fund’s shares and such Funds’ NAV vary significantly and you may pay more than such Funds’ NAV
when buying shares on the secondary market, and you may receive less than such Fund’s NAV when you sell those shares. While the
creation/redemption feature is designed to make it likely that shares normally will trade close to a Fund’s NAV, disruptions to
creations and redemptions may result in trading prices that differ significantly from a Fund’s NAV. The market price of shares,
like the price of any exchange-traded security, includes a “bid-ask spread” charged by the exchange specialist, market makers
or other participants that trade the particular security. In addition, the securities held by a Fund may be traded in markets that close
at a different time than the Exchange. Liquidity in those securities may be reduced after the applicable closing times. Accordingly, during
the time when the Exchange is open but after the applicable market closing, fixing or settlement times, bid-ask spreads and the resulting
premium or discount to shares’ NAV may widen. Further, secondary markets may be subject to irregular trading activity, wide bid/ask
spreads and extended trade settlement periods, which could cause a material decline in a Fund’s NAV. In times of market stress,
market makers and authorized participants may step away from their respective roles in making a market in a Fund’s shares or in
executing purchase and redemption orders, which could lead to variances between the market price of such Fund’s shares and the underlying
value of those shares. Also, in stressed market conditions, the market for a Fund’s shares may become less liquid in response to
deteriorating liquidity of such Fund’s portfolio holdings, which could lead to differences between the market price of such Fund’s
shares and the underlying value of those shares. During periods of high market volatility, a Fund share may trade at a significant discount
to its NAV, and in these circumstances certain types of brokerage orders may expose an investor to an increased risk of loss. A “stop
order,” sometimes called a “stop-loss order,” may cause a Fund share to be sold at the next prevailing market price
once the “stop” level is reached, which during a period of high volatility can be at a price that is substantially below NAV.
By including a “limit” criteria with your brokerage order, you may be able to limit the size of the loss resulting from the
execution of an ill-timed stop order. The Funds’ shares may be listed or traded on U.S. and non-U.S. stock exchanges other than
the U.S. stock exchange where the Funds’ primary listing is maintained, and may otherwise be made available to non-U.S. investors
through funds or structured investment vehicles similar to depositary receipts. There can be no assurance that a Fund’s shares will
continue to trade on any such stock exchange or in any market or that a Fund’s shares will continue to meet the requirements for
listing or trading on any exchange or in any market. A Fund’s shares may be less actively traded in certain markets than in others,
and investors are subject to the execution and settlement risks and market standards of the market where they or their broker direct their
trades for execution. Certain information available to investors who trade a Fund’s shares on a U.S. stock exchange during regular
U.S. market hours may not be available to investors who trade in other markets, which may result in secondary market prices in such markets
being less efficient.
A
Fund’s investment results are measured based upon the daily NAV of such Fund. Investors purchasing and selling shares in the secondary
market may not experience investment results consistent with those experienced by those purchasing and redeeming directly with the Fund.
Mid-Cap
Company Risk (Both Funds) - Investing in securities of mid-cap companies may entail greater risks than investments in larger, more
established companies. Mid-cap companies tend to have more narrow product lines, more limited financial resources and a more limited trading
market for their stocks, as compared with larger companies. As a result, their stock prices may decline significantly as market conditions
change.
Non-Diversification
Risk (Both Funds) - Due to the nature of the Fund’s investment strategies and its non-diversified status (for purposes of the
1940 Act), the Fund may invest a greater percentage of its assets in the securities of fewer issuers than a “diversified”
fund, and accordingly may be more vulnerable to changes in the value of those issuers’ securities. Since the Fund invests in the
securities of a limited number of issuers, the Fund is particularly exposed to adverse developments affecting those issuers, and a decline
in the market value of a particular security held by the Fund is likely to affect its performance more than if the Fund invested in the
securities of a larger number of issuers. Although the Fund will be “non-diversified” for purposes of the 1940 Act, the Fund
intends to comply with the diversification requirements under Subchapter M of the Code in order to be eligible to qualify as a regulated
investment company.
Tidal
Trust III
Notes
to Financial Statements
June
30, 2024
Operational
and Technology Risk (Both Funds) - The Funds, their service providers, index providers, Authorized Participants, market makers and
other market participants increasingly depend on complex information technology and communications systems to conduct business functions.
These systems are subject to a number of different threats or risks that could adversely affect the Funds and their shareholders, despite
the efforts of Toroso (solely with respect Women’s ETF) and Impact Shares, the Funds and their service providers to adopt technologies,
processes, and practices intended to mitigate these risks. For example, unauthorized third parties may attempt to improperly access, modify,
disrupt the operations of, or prevent access to these systems of the Funds, the Funds’ service providers, counterparties, or other
market participants or data within them (a “cyber-attack”). Power or communications outages, acts of god, information technology
equipment malfunctions, operational errors, and inaccuracies within software or data processing systems may also disrupt business operations
or impact critical data. Market events also may trigger a volume of transactions that overloads current information technology and communication
systems and processes, impacting the ability to conduct the Funds’ operations. Cyber-attacks, disruptions, or failures that affect
the Funds’ service providers or counterparties may adversely affect the Funds and their shareholders, including by causing losses
for the Funds or impairing the Funds’ operations. For example, the Funds or their service providers’ assets or sensitive or
confidential information may be misappropriated, data may be corrupted, and operations may be disrupted (e.g., cyber-attacks or operational
failures may cause the release of private shareholder information or confidential Fund information, interfere with the processing of shareholder
transactions, impact the ability to calculate each Fund’s NAV, and impede trading). In addition, cyber-attacks, disruptions, or
failures may cause reputational damage and subject the Funds or their service providers to regulatory fines, litigation costs, penalties
or financial losses, reimbursement or other compensation costs, and/or additional compliance costs. While the Funds and their service
providers may establish business continuity and other plans and processes to address the possibility of cyberattacks, disruptions, or
failures, there are inherent limitations in such plans and systems, including that they do not apply to third parties, such as other market
participants, as well as the possibility that certain risks have not been identified or that unknown threats may emerge in the future.
Similar types of operational and technology risks are also present for issuers of the Funds’ investments, which could have material
adverse consequences for such issuers, and may cause the Funds’ investments to lose value. In addition, cyber-attacks involving
a Fund’s counterparties could affect such counterparty’s ability to meet its obligations to such Fund, which may result in
losses to such Fund and its shareholders. Furthermore, as a result of cyber-attacks, disruptions or failures, an exchange or market may
close or issue trading halts on specific securities or the entire market, which may result in the Funds being, among other things, unable
to buy or sell certain securities or financial instruments or unable to accurately price its investments. The Funds cannot directly control
any cybersecurity plans and systems put in place by their service providers, counterparties, issuers in which the Funds invest, or securities
markets and exchanges, and such third parties may have limited indemnification obligations to Toroso, Impact Shares, or the Funds, each
of whom could be negatively impacted as a result.
Passive
Investment Risk (Both Funds) - The Funds are not actively managed and may be affected by a general decline in market segments included
in the applicable Underlying Indices. The Funds invest in securities included in, or representative of, each Fund’s respective Underlying
Index regardless of such securities’ investment merits. Each Fund will likely lose value to the extent that the applicable Underlying
Index loses value. Impact Shares does not attempt to take defensive positions under any market conditions, including during declining
markets.
Securities
Market Risk (Both Funds) - Securities market risk is the risk that the value of securities owned by a Fund may go up or down, sometimes
rapidly or unpredictably, due to factors affecting particular companies or the securities markets generally. The profitability of a Fund
substantially depends upon Impact Shares correctly assessing the future price movements of stocks, bonds, loans, options on stocks, and
other securities and the movements of interest rates. Impact Shares cannot guarantee that it will be successful in accurately predicting
price movements. The market prices of equities may decline for reasons that directly relate to the issuing company (such as poor management
performance or reduced demand for its goods or services), factors that affect a particular industry (such as a decline in demand, labor
or raw material shortages, or increased production costs) or general market conditions not specifically related to a company or industry
(such as real or perceived adverse economic conditions, changes in the general outlook for corporate earnings, changes in interest or
currency rates, or adverse investor sentiment generally or natural and environmental disasters and systemic market dislocations). The
spread of infectious disease including epidemics and pandemics also could affect the economies of many nations in ways that cannot necessarily
be foreseen. For example, the COVID-19 pandemic has resulted, and may continue to result, in significant market volatility, exchange suspensions
and closures, declines in global financial markets, higher default rates, supply chain disruptions, and a substantial economic downturn
in economies throughout the world. In addition, military action by Russia in Ukraine has, and may continue to, adversely affect global
energy and financial markets and therefore could affect the value of the Fund’s investments, including beyond the Fund’s direct
exposure to Russian issuers or nearby geographic regions. The extent and duration of the military action, sanctions, and resulting market
disruptions are impossible to predict and could be substantial. A
Tidal
Trust III
Notes
to Financial Statements
June
30, 2024
number of U.S. domestic banks and foreign (non-U.S.) banks have recently experienced financial difficulties and, in some cases, failures.
There can be no certainty that the actions taken by regulators to limit the effect of those financial difficulties and failures on other
banks or other financial institutions or on the U.S. or foreign (non-U.S.) economies generally will be successful. It is possible that
more banks or other financial institutions will experience financial difficulties or fail, which may affect adversely other U.S. or foreign
(non-U.S.) financial institutions and economies. The foregoing could lead to a significant economic downturn or recession, increased market
volatility, a greater number of market closures, higher default rates and adverse effects on the values and liquidity of securities or
other assets. Such impacts, which may vary across asset classes, may adversely affect the performance of the Fund’s investments,
the Fund and your investment in the Fund.
In
addition, the increasing popularity of passive index-based investing may have the potential to increase security price correlations and
volatility. As passive strategies generally buy or sell securities based simply on inclusion and representation in an index, securities
prices will have an increasing tendency to rise or fall based on whether money is flowing into or out of passive strategies rather than
based on an analysis of the prospects and valuation of individual securities. This may result in increased market volatility as more money
is invested through passive strategies. As a result of the nature of a Fund’s investment activities, it is possible that such Fund’s
financial performance may fluctuate substantially from period to period. Additionally, at any point in time an investment in a Fund may
be worth less than the original investment, even after taking into account the reinvestment of dividends and distributions.
Significant
Exposure Risk (Both Funds) - To the extent that the Fund invests a large percentage of its assets in a single asset class or the securities
of issuers within the same country, state, region, industry or sector, an adverse economic, business or political development may affect
the value of the Fund’s investments more than if the Fund were more broadly diversified. A significant exposure makes the Fund more
susceptible to any single occurrence and may subject the Fund to greater market risk than a fund that is more broadly diversified.
Small-Cap
Company Risk (Both Funds) - Investing in the securities of small-cap companies either directly or indirectly through investments in
ETFs, closed-end funds or mutual funds may pose greater market and liquidity risks than larger, more established companies, because of
limited product lines and/or operating history, limited financial resources, limited trading markets, and the potential lack of management
depth. In addition, the securities of such companies are typically more volatile than securities of larger capitalization companies.
Tracking
Error Risk (Both Funds) - Imperfect correlation between a Fund’s portfolio securities and those in the applicable Underlying
Indices, rounding of prices, changes to the Underlying Indices and regulatory requirements may cause tracking error, which is the divergence
of a Fund’s performance from that of its Underlying Index. This risk may be heightened during times of increased market volatility
or other unusual market conditions. Tracking error also may result because a Fund incurs fees and expenses, while its Underlying Index
does not. For example, a Fund incurs a number of operating expenses not applicable to its Underlying Index and incurs costs associated
with buying and selling securities, especially when rebalancing such Fund’s securities holdings to reflect changes in the composition
of its Underlying Index and raising cash to meet redemptions or deploying cash in connection with newly created creation units. Because
a Fund bears the costs and risks associated with buying and selling securities while such costs are not factored into the return of its
Underlying Index, such Fund’s returns may deviate significantly from the return of its Underlying Index. Because the Funds each
employ a representative sampling strategy, the Funds may experience tracking error to a greater extent than funds that seeks to replicate
an index. Impact Shares may not be able to cause a Fund’s performance to correlate to that of such Fund’s benchmark, either
on a daily or aggregate basis. Because the Underlying Index rebalances quarterly but a Fund is not obligated to do the same, the risk
of tracking error may increase following the rebalancing of such Fund’s Underlying Index.
Trading
Issues Risk (Both Funds) - Although the shares of the Fund are listed for trading on the Exchange, there can be no assurance that
an active trading market for such shares will develop or be maintained. Trading in shares on the Exchange may be halted due to market
conditions or for reasons that, in the view of the Exchange, make trading in shares inadvisable. In addition, trading in shares on the
Exchange is subject to trading halts caused by extraordinary market volatility pursuant to the Exchange’s “circuit breaker”
rules. Market makers are under no obligation to make a market in the Fund’s shares, and authorized participants are not obligated
to submit purchase or redemption orders for Creation Units. In the event market makers cease making a market in the Fund’s shares
or authorized participants stop submitting purchase or redemption orders for Creation Units, Fund shares may trade at a larger premium
or discount to their net asset value. There can be no assurance that the requirements of the Exchange necessary to maintain the listing
of the Fund will continue to be met or will remain unchanged. The Fund may have difficulty maintaining its listing on the Exchange in
the event the Fund’s assets are small or the Fund does not have enough shareholders.
Tidal
Trust III
Notes
to Financial Statements
June
30, 2024
Valuation
Risk (Both Funds) - The Fund is subject to the risk of mispricing or improper valuation of its investments, in particular to the extent
that its securities are fair valued.
7.
OTHER
At
June 30, 2024, the records of the Trust reflected that 100% of the Funds’ total Shares outstanding were held by four Authorized
Participants, in the form of Creation Units. However, the individual shares comprising such Creation Units are listed and traded on the
NYSE Arca, Inc. and have been purchased and sold by persons other than Authorized Participants.
8.
SUBSEQUENT EVENTS
On
August 21, 2024, the Board approved Foreside Fund Services, LLC (the “New Distributor”) as the Funds’ new distributor.
The distribution agreement became effective August 26, 2024.
Effective
August 26, 2024, SEI was no longer administrator to the Funds. Tidal has assumed the various administrative services previously performed
by SEI.
The
Funds have evaluated the need for additional disclosures (other than what is disclosed in the preceding paragraph) and/or adjustments
resulting from subsequent events through the date the financial statements were issued. Based on this evaluation, no additional disclosures
and/or adjustments were required to the financial statements.
Tidal
Trust III
Report
of Independent Registered Public Accounting Firm
June
30, 2024
To
the Shareholders of Impact Shares and
Board
of Trustees of Tidal Trust III
Opinion
on the Financial Statements
We
have audited the accompanying statements of assets and liabilities, including the schedules of investments, of Impact Shares YWCA Women’s
Empowerment ETF and Impact Shares NAACP Minority Empowerment ETF (the “Funds”), each a series of Tidal Trust III, as of June
30, 2024, the related statements of operations for the year then ended, the statements of changes in net assets and the financial highlights
for each of the two years in the period then ended, and the related notes (collectively referred to as the “financial statements”).
In our opinion, the financial statements present fairly, in all material respects, the financial position of each of the Funds as of June
30, 2024, the results of their operations, the changes in net assets, and the financial highlights for each of the periods indicated above,
in conformity with accounting principles generally accepted in the United States of America.
The
Funds’ financial highlights for the years ended June 30, 2022, and prior, were audited by other auditors whose report dated August
29, 2022, expressed an unqualified opinion on those financial highlights.
Basis
for Opinion
These
financial statements are the responsibility of the Funds’ management. Our responsibility is to express an opinion on the Funds’
financial statements based on our audits. We are a public accounting firm registered with the Public Company Accounting Oversight Board
(United States) (“PCAOB”) and are required to be independent with respect to the Funds in accordance with the U.S. federal
securities laws and the applicable rules and regulations of the Securities and Exchange Commission and the PCAOB.
We
conducted our audits in accordance with the standards of the PCAOB. Those standards require that we plan and perform the audit to obtain
reasonable assurance about whether the financial statements are free of material misstatement whether due to error or fraud.
Our
audits included performing procedures to assess the risks of material misstatement of the financial statements, whether due to error or
fraud, and performing procedures that respond to those risks. Such procedures included examining, on a test basis, evidence regarding
the amounts and disclosures in the financial statements. Our procedures included confirmation of securities owned as of June 30, 2024,
by correspondence with the custodian. Our audits also included evaluating the accounting principles used and significant estimates made
by management, as well as evaluating the overall presentation of the financial statements. We believe that our audits provide a reasonable
basis for our opinion.
We
have served as the Funds’ auditor since 2023. We have served as the auditor of one or more of Tidal Investment LLC’s investment
companies since 2020.

COHEN
& COMPANY, LTD.
Milwaukee,
Wisconsin
August
27, 2024
Tidal
Trust III
Notice
to Shareholders
June
30, 2024 (Unaudited)
For
shareholders that do not have a June 30, 2024 tax year end, this notice is for informational purposes only. For shareholders with a June
30, 2024 tax year end, please consult your tax advisor as to the pertinence of this notice. For the fiscal year ended June 30, 2024, the
Funds are designating the following items with regard to distributions paid during the year.
| |
Return
of
Capital |
Long
Term
Capital Gain
Distributions |
Ordinary
Income
Distributions |
Total
Distributions |
Dividends
Qualifying for
Corporate
Dividend
Receivable
Deduction (1) |
Qualifying
Dividend
Income (2) |
U.S.
Government
Interest (3) |
Interest
Related
Dividends (4) |
Qualified
Short Term
Capital
Gain (5) |
Qualifying
Business
Income (6) |
| Women’s
ETF |
0.00% |
51.89% |
48.11% |
100.00% |
100.00% |
100.00% |
0.00% |
0.00% |
0.00% |
0.00% |
| Minority
ETF |
0.00% |
1.61% |
98.39% |
100.00% |
100.00% |
100.00% |
0.00% |
0.00% |
0.00% |
0.00% |
|
(1) |
Qualifying
dividends represent dividends which qualify for the corporate dividends received deduction and is reflected as a percentage of ordinary
income distributions (the total of short term capital gain and net investment income distributions). |
|
(2) |
The
percentage in this column represents the amount of “Qualifying Dividend Income” as created by the Jobs and Growth Tax Relief
Reconciliation Act of 2003 and is reflected as a percentage of ordinary income distributions (the total of short term capital gain and
net investment income distributions). It is the intention of each of the aforementioned funds to designate the maximum amount permitted
by law. |
|
(3) |
“U.S.
Government Interest” represents the amount of interest that was derived from U.S. Government obligations and distributed during
the fiscal year. This amount is reflected as a percentage of total ordinary income distributions (the total of short term capital gain
and net investment income distributions). Generally, interest from direct U.S. Government obligations is exempt from state income tax.
However, for shareholders who are residents of California, Connecticut and New York, the statutory threshold requirements were not satisfied
to permit exemption of these amounts from state income. |
|
(4) |
The
percentage in this column represents the amount of “Interest Related Dividend” is reflected as a percentage of ordinary income
distribution. Interest related dividends are exempted from U.S. withholding tax when paid to foreign investors. |
|
(5) |
The
percentage in this column represents the amount of “Qualifying Short-Term Capital Gain” as created by the American Jobs Creation
Act of 2004 and is reflected as a percentage of short-term capital gain distributions that is exempt from U.S. withholding tax when paid
to foreign investors. |
|
(6) |
The percentage of this column represents that amount of ordinary
dividend income that qualified for 20% Business Income Deduction. |
The
information reported herein may differ from the information and distributions taxable to the shareholders for the tax year ending June
30, 2024. Complete information will be computed and reported in conjunction with your 2024 Form 1099-DIV.

Tidal
Trust III
234
West Florida Street
Suite
203
Milwaukee,
Wisconsin 53204
844-448-3383
www.impactetfs.org
Investment
Adviser:
Tidal
Investments LLC
234
West Florida Street
Suite
203
Milwaukee,
Wisconsin 53204
Distributor:
SEI
Investments Distribution Co.
One
Freedom Valley Drive
Oaks,
Pennsylvania 19456
Administrator:
Tidal
Investments LLC
234
West Florida Street
Suite
203
Milwaukee,
Wisconsin 53204
Transfer
Agent:
U.S.
Bank Global Fund Services
615
East Michigan Street
Milwaukee,
Wisconsin 53202
Custodian:
U.S.
Bank National Association
1555
North Rivercenter Drive
Milwaukee,
Wisconsin 53212
Legal
Counsel:
Sullivan
& Worcester LLP
1251 Avenue of the Americas
19th
Floor
New
York, New York 10020
Independent
Registered Public Accounting Firm:
Cohen
& Company, Ltd.
342 N. Water St.
Suite
830
Milwaukee,
Wisconsin 53202
This
information must be preceded or accompanied by a current prospectus for the Funds.
IMP-AR-001-0600
|
(a) |
Financial Highlights are included within the financial
statements filed under Item 7(a) of this Form.” |
Item
8. Changes in and Disagreements with Accountants for Open-End Investment Companies.
There were no changes in or disagreements with accountants
during the period covered by this report.
Item
9. Proxy Disclosure for Open-End Investment Companies.
At a special meeting of the shareholders held on January
25, 2024, the Minority ETF shareholders voted on the following:
| |
|
|
For
% |
|
Against
% |
|
Abstain
% |
|
|
| 1. Approve
a new Investment Advisory Agreement between the Trust and Tidal Investments LLC, formerly named Toroso Investments, LLC (“Tidal”),
on behalf of the Minority ETF. |
|
|
93.52% |
|
1.35% |
|
5.13% |
|
|
| |
|
|
|
|
|
|
|
|
|
| 2. Approve
an Amendment to the Amended and Restated Investment Advisory Agreement between the Trust and Impact Shares Corp. (“ISC”),
on behalf of the Minority ETF. |
|
|
92.87% |
|
1.93% |
|
5.20% |
|
|
| |
|
|
|
|
|
|
|
|
|
| At
a special meeting of the shareholders held on August 31, 2023, the Women's ETF shareholders voted on the following: |
| |
|
|
For
% |
|
Against
% |
|
Abstain
% |
|
Broker
Non-Vote % |
| 1. Approve
a new Investment Advisory Agreement between the Trust and Tidal Investments LLC, formerly named Toroso Investments, LLC (“Tidal”),
on behalf of the Women's ETF. |
|
|
67.15% |
|
4.23% |
|
0.95% |
|
27.67% |
| |
|
|
|
|
|
|
|
|
|
| 2. Approve
an Amendment to the Amended and Restated Investment Advisory Agreement between the Trust and Impact Shares Corp. (“ISC”),
on behalf of the Women's ETF. |
|
|
70.88% |
|
0.50% |
|
0.95% |
|
27.67% |
| |
|
|
|
|
|
|
|
|
|
| 3. Elect four new
members to the Board of Trustees: |
| |
|
|
For
% |
|
Withhold
% |
|
|
|
|
| (1) Mr.
Guillermo Trias |
|
|
96.89% |
|
3.11% |
|
|
|
|
| (2) Ms.
Monica Byrd |
|
|
98.26% |
|
1.74% |
|
|
|
|
| (3) Ms.
Pamela Cytron |
|
|
98.31% |
|
1.69% |
|
|
|
|
| (4) Mr.
Lawrence Jules |
|
|
98.12% |
|
1.88% |
|
|
|
|
| |
|
|
|
|
|
|
|
|
|
|
Item
10. Remuneration Paid to Directors, Officers, and Others of Open-End Investment Companies.
The aggregate remuneration paid to the Registrant’s trustees, officers and others, if any, is included in Item 7 of this report.
Item
11. Statement Regarding Basis for Approval of Investment Advisory Contract.
Impact Shares YWCA Women’s
Empowerment ETF
At a meeting held on September 8,
2023, the Trustees, including those Trustees who are not interested persons” (as such term is defined in Section 2(a)(19) of the
1940 Act) of the Trust (such trustees, the “Independent Trustees”), met to consider, among other things, the investment advisory
agreement with Tidal (the “Tidal Advisory Agreement”), pursuant to which Tidal would be engaged to provide advisory services
to the Empowerment ETF. The Tidal Advisory Agreement was approved at this meeting, subject to shareholder approval, for an initial two-year
term.
The Nature, Extent, and Quality of
the Services. In considering the Tidal Advisory Agreement, the Independent Trustees evaluated the nature, extent, and quality of the advisory
services to be provided to the Empowerment ETF by Tidal. They considered the terms of the Tidal Advisory Agreement and received and considered
information provided by management that described, among other matters.
|
· |
the nature and scope of the advisory
and sub-advisory services to be provided to the Empowerment ETF and information regarding the number, experience, qualifications and adequacy
of the personnel providing those services, |
|
· |
the investment program to be used
by Tidal and ISC to manage the Empowerment ETF, |
|
· |
possible fall-out benefits and potential
conflicts of interest, |
|
· |
anticipated brokerage practices,
|
|
· |
the compliance function of Tidal,
and |
|
· |
the financial resources of Tidal.
|
They also took into account information
concerning the investment processes to be used by Tidal and ISC in managing the Empowerment ETF. The Independent Trustees considered,
among other matters, that Tidal will provide the Trust with office space and personnel, and, under the unitary-fee structure set forth
in the Tidal Advisory Agreement, Tidal is responsible for bearing all of the Empowerment ETF’s expenses, including the costs of
transfer agency, custody, Empowerment ETF administration, legal, audit, and other services provided to the Empowerment ETF, with certain
noted exceptions. They also took into account the compliance and operational functions of Tidal, as well as the resources being devoted
to such functions.
The Independent Trustees considered
Tidal’s financial resources. The Independent Trustees considered that Tidal intended to financially support operating shortfalls
for the Empowerment ETF, inclusive of marketing expenses, through at least November of 2024 assuming moderate asset growth for the Empowerment
ETF.
The Independent Trustees concluded,
within the context of their overall conclusions regarding the Tidal Advisory Agreement, that the scope of the services to be provided
to the Empowerment ETF under the Tidal Advisory Agreement was consistent with the Empowerment ETF’s operational requirements; that
Tidal has the capabilities, resources and personnel necessary to provide the advisory services required by the Empowerment ETF; and that,
overall, the nature, extent and quality of the services to be provided by Tidal to the Empowerment ETF were sufficient to warrant approval
of the Tidal Advisory Agreement.
Performance. The Independent Trustees
considered that the Empowerment ETF seeks investment results that, before fees and expenses, track the performance of the Empowerment
ETF’s underlying index and the Empowerment ETF’s performance was within an acceptable level of the Empowerment ETF’s
underlying index. The 37 Impact Shares Trust I Board Considerations in Approving the Tidal Advisory Agreement December 31, 2023 (Unaudited)
Independent Trustees also considered that with ISC as adviser, the Empowerment ETF experienced performance for the three-year period ended
July 31, 2021, that was above the median for the Empowerment ETF’s Morningstar Category, with the Empowerment ETF ranking in the
second quartile of its Morningstar Category. The Independent Trustees considered that under the Tidal Advisory Agreement, although Impact
Shares, as sub-adviser, would continue to provide the day-to-day portfolio management of the Empowerment ETF, Tidal would be primarily
responsible for trading the Empowerment ETF’s securities.
The Independent Trustees concluded,
within the context of the Independent Trustees’ overall conclusions regarding the Tidal Advisory Agreement, that the performance
history for the Empowerment ETF was not inconsistent with approval of the Tidal Advisory Agreement.
The Costs of the Services Provided
by the Adviser and the Profits Realized by the Adviser. The Independent Trustees considered the cost of services to be provided by Tidal
and the impact of the proposal on the anticipated profitability to Tidal of its arrangements with the Empowerment ETF.
The Independent Trustees recognized
that Tidal should, in the abstract, be entitled to earn a reasonable level of profit for the services provided and to be provided to the
Empowerment ETF, and that it is difficult to make comparisons of profitability from advisory contracts because comparative information
is not generally available and is affected by numerous factors, including the structure of the particular adviser, the types and sizes
of Empowerment ETFs it manages, its business mix, numerous assumptions about cost allocations and Tidal’s capital structure and
cost of capital.
The Independent Trustees also considered
the compensation payable by Tidal to Impact Shares for sub-advisory services with respect to the Empowerment ETF, including the portion
of the contractual fee rate that is to be paid to Impact Share, as compared to the compensation to be paid to Tidal. The Independent Trustees
concluded that, at current assets levels, the expected profitability was not excessive and supported the approval of the Tidal Advisory
Agreement.
Fees and Other Expenses. The Independent
Trustees considered the unitary management fee to be paid by the Empowerment ETF to Tidal, as well as the Empowerment ETF’s distribution
and service (Rule 12b-1) plan, “other expenses” and total expenses. In doing so, the Independent Trustees reviewed information
provided by Tidal comparing the proposed unitary management fee rate of the Empowerment ETF to a group of peers selected by Morningstar
as mission-aligned comparables for the Empowerment ETF. The Independent Trustees noted that the proposed fee rate of 0.49% of the Empowerment
ETF’s average daily net assets was equal to the Empowerment ETF’s current unitary management fee.
The Board noted that an advisory
agreement with Tidal with respect to the Empowerment ETF was approved by the Board in November 2023, subject to shareholder approval,
with a proposed unitary management fee rate of 0.75% of the Empowerment ETF’s average daily net assets, the same unitary management
fee rate at the Empowerment ETF’s inception. The Board also noted that Tidal subsequently proposed that the Board approve the Tidal
Advisory Agreement at the Empowerment ETF’s current unitary management fee rate (0.49% of the Empowerment ETF’s average daily
net assets) following the failure of the proposal that shareholders approve an advisory agreement with Tidal at the unitary management
fee rate of 0.75% of the Empowerment ETF’s average daily net assets.
Based on this and other information,
the Independent Trustees concluded, within the context of their overall conclusions regarding the Tidal Advisory Agreement that the fees
and expenses to be charged 38 Impact Shares Trust I Board Considerations in Approving the Tidal Advisory Agreement December 31, 2023 (Unaudited)
represented reasonable compensation to Tidal in light of the services provided and to be provided to the Empowerment ETF.
Possible Fall-Out Benefits. The Independent
Trustees considered information regarding the direct and indirect benefits to Tidal from its relationship with the Empowerment ETF, including
reputational and other “fall out” benefits. The Independent Trustees considered the receipt of these benefits in light of
Tidal’s estimated profitability, and concluded that such benefits were not excessive.
Possible Economies of Scale. The
Independent Trustees considered the extent to which Tidal may realize economies of scale or other efficiencies in managing and supporting
the Empowerment ETF. The Independent Trustees considered that the Empowerment ETF did not have any breakpoints in its fee arrangement
with Tidal or Tidal’s fee arrangement with ISC. The Independent Trustees concluded that the Empowerment ETF’s overall fee
arrangements represent an appropriate sharing at the present time between Empowerment ETF shareholders and Tidal of any economies of scale
or other efficiencies in the management of the Empowerment ETF.
Based on the factors described above,
the Independent Trustees concluded that the approval of the Tidal Advisory Agreement was in the best interests of the Empowerment ETF
and should be approved.
Item
12. Disclosure of Proxy Voting Policies and Procedures for Closed-End Management Investment Companies.
Not applicable to open-end investment companies.
Item 13.
Portfolio Managers of Closed-End Management Investment Companies.
Not applicable to open-end investment companies.
Item
14. Purchases of Equity Securities by Closed-End Management Investment Company and Affiliated Purchasers.
Not applicable to open-end investment companies.
Item 15.
Submission of Matters to a Vote of Security Holders.
There have been no changes to the procedures by which
shareholders may recommend nominees to the Registrant’s Board of Trustees during the period covered by this report.
Item 16.
Controls and Procedures.
|
(a) |
The Registrant’s President/Principal Executive
Officer and Treasurer/Principal Financial Officer have reviewed the Registrant's disclosure controls and procedures (as defined in Rule 30a-3(c)
under the Investment Company Act of 1940 (the “Act”)) as of a date within 90 days of the filing of this report, as required
by Rule 30a-3(b) under the Act and Rules 13a-15(b) or 15d-15(b) under the Securities Exchange Act of 1934. Based on their
review, such officers have concluded that the disclosure controls and procedures are effective in ensuring that information required to
be disclosed in this report is appropriately recorded, processed, summarized and reported and made known to them by others within the
Registrant and by the Registrant’s service provider. |
|
(b) |
There were no changes in the Registrant's internal
control over financial reporting (as defined in Rule 30a-3(d) under the Act) that occurred during the period covered by this report that
have materially affected, or are reasonably likely to materially affect, the Registrant's internal control over financial reporting. |
Item 17.
Disclosure of Securities Lending Activities for Closed-End Management Investment Companies
Not applicable to open-end investment companies.
Item 18.
Recovery of Erroneously Awarded Compensation.
(a) Not Applicable
(b) Not Applicable
Item 19.
Exhibits.
(2) Not Applicable.
(3) A separate
certification for each principal executive officer and principal financial officer pursuant to Section 302 of the Sarbanes-Oxley
Act of 2002. Filed herewith.
(4) Not applicable to open-end investment companies.
(5) Not applicable to open-end investment companies and ETFs.
SIGNATURES
Pursuant to the requirements of
the Securities Exchange Act of 1934 and the Investment Company Act of 1940, the registrant has duly caused this report to be signed on
its behalf by the undersigned, thereunto duly authorized.
| |
(Registrant) |
Tidal
Trust III |
|
| |
|
|
|
| |
By (Signature and Title)* |
/s/ Eric W. Falkeis |
|
| |
|
Eric W. Falkeis, President/Principal Executive Officer |
|
| |
|
|
|
| |
Date |
September 6, 2024 |
|
Pursuant to the requirements of
the Securities Exchange Act of 1934 and the Investment Company Act of 1940, this report has been signed below by the following persons
on behalf of the registrant and in the capacities and on the dates indicated.
| |
By (Signature and Title)* |
/s/ Eric
W. Falkeis |
|
| |
|
Eric W. Falkeis, President/Principal Executive Officer |
|
| |
|
|
|
| |
Date |
September 6, 2024 |
|
| |
|
|
|
| |
By (Signature and Title)* |
/s/ Aaron J. Perkovich |
|
| |
|
Aaron J. Perkovich, Treasurer/Principal Financial
Officer |
|
| |
|
|
|
| |
Date |
September 6, 2024 |
|
* Print the name and title of each signing officer
under his or her signature.