UNITED STATES
SECURITIES AND EXCHANGE COMMISSION
Washington, D.C. 20549
FORM
CERTIFIED SHAREHOLDER REPORT OF REGISTERED
MANAGEMENT INVESTMENT COMPANIES
| INVESTMENT COMPANY ACT FILE NUMBER: 811-23295 | |
| EXACT NAME OF REGISTRANT AS SPECIFIED IN CHARTER: | |
| ADDRESS OF PRINCIPAL EXECUTIVE OFFICES: | 2020 Calamos Court |
| Naperville, Illinois 60563-2787 | |
| NAME AND ADDRESS OF AGENT FOR SERVICE: | John P. Calamos, Sr., Founder, Chairman and |
| Global Chief Investment Officer | |
| Calamos Advisors LLC | |
| 2020 Calamos Court | |
| Naperville, Illinois 60563-2787 | |
REGISTRANT’S TELEPHONE NUMBER, INCLUDING AREA CODE: (630) 245-7200
DATE OF FISCAL YEAR END: October 31, 2024
DATE OF REPORTING PERIOD: November 1, 2023 through
ITEM 1(a). REPORT TO SHAREHOLDERS.

TIMELY INFORMATION INSIDE


Visit www.calamos.com/paperless to enroll. You can view shareholder communications, including fund prospectuses, annual reports and other shareholder materials online long before the printed publications arrive by traditional mail.
Family of Closed-End Funds
SEMIANNUAL REPORT APRIL 30, 2024
Domestic Funds
Calamos Convertible Opportunities and Income Fund (Ticker: CHI)
Calamos Convertible and High Income Fund (Ticker: CHY)
Calamos Strategic Total Return Fund (Ticker: CSQ)
Calamos Dynamic Convertible and Income Fund (Ticker: CCD)
Global Funds
Calamos Global Dynamic Income Fund (Ticker: CHW)
Calamos Global Total Return Fund (Ticker: CGO)
Calamos Long/Short Equity & Dynamic Income Trust (Ticker: CPZ)
Experience and Foresight
Calamos is a trusted and leading provider of closed-end funds that use a diversified blend of convertible securities, equities, fixed income, and alternative investments across innovative investment strategies to support competitive distributions throughout a market cycle.
Our Managed Distribution Policy
(for Calamos Convertible Opportunities and Income Fund, Calamos Convertible and High Income Fund, Calamos Strategic Total Return Fund, Calamos Dynamic Convertible and Income Fund, and Calamos Long/Short Equity & Dynamic Income Fund)
Closed-end fund investors often seek a steady stream of income. Recognizing this important need, certain Calamos closed-end funds adhere to a managed distribution policy in which we aim to provide consistent monthly distributions through the disbursement of the following:
• Net investment income
• Net realized short-term capital gains
• Net realized long-term capital gains
• And, if necessary, return of capital
We set distributions at levels that we believe are sustainable for the long term. Each Fund's current monthly distribution per share as of April 30, 2024 is as follows:
• Calamos Convertible Opportunities and Income Fund: $0.0950
• Calamos Convertible and High Income Fund: $0.1000
• Calamos Strategic Total Return Fund: $0.1025
• Calamos Dynamic Convertible and Income Fund: $0.1950
• Calamos Long/Short Equity & Dynamic Income Fund: $
Our team focuses on delivering an attractive monthly distribution, while maintaining a long-term emphasis on risk management. The level of a Fund's distribution can be greatly influenced by market conditions, including the interest rate environment, the individual performance of securities held by the funds, our view of retaining leverage, fund tax considerations, and regulatory requirements.
You should not draw any conclusions about a Fund's investment performance from the amount of its distribution or from the terms of a Fund's plan. The Funds' Board of Trustees may amend or terminate the managed distribution policy at any time without prior notice to the Fund's shareholders. However, at this time there are no reasonably foreseeable circumstances that might cause the termination of a Fund's managed distribution policy.
For more information about any of the Calamos closed-end funds, we encourage you to contact your financial advisor or Calamos Investments at 800.582.6959 (Monday through Friday from 8:00 a.m. to 6:00 p.m., Central Time). You can also visit us at www.calamos.com.
TABLE OF CONTENTS
|
Statements of Assets and Liabilities |
1 |
||||||
|
Statements of Operations |
3 |
||||||
|
Statements of Changes In Net Assets |
5 |
||||||
|
Statements of Cash Flows |
8 |
||||||
|
Financial Highlights |
16 |
||||||
|
Schedules of Investments |
29 |
||||||
|
Notes to Financial Statements |
146 |
||||||
| Report of Independent Registered Public Accounting Firm |
159 |
||||||
|
About Closed-End Funds |
160 |
||||||
|
Managed and Level Distribution Policies |
161 |
||||||
|
Automatic Dividend Reinvestment Plan |
162 |
||||||
| Additional Fund Information: Delaware Statutory Trust Act – Control Share Acquisitions |
163 |
||||||
Statements of Assets and Liabilities April 30, 2024 (Unaudited)
| CONVERTIBLE OPPORTUNITIES AND INCOME FUND |
CONVERTIBLE AND HIGH INCOME FUND |
STRATEGIC TOTAL RETURN FUND |
DYNAMIC CONVERTIBLE AND INCOME FUND |
||||||||||||||||
|
ASSETS |
|||||||||||||||||||
|
Investments in securities, at cost |
$ |
1,185,400,692 |
$ |
1,291,268,212 |
$ |
2,671,923,425 |
$ |
793,239,835 |
|||||||||||
|
Investment in securities, at value* |
$ |
1,138,696,354 |
$ |
1,239,062,992 |
$ |
3,577,640,100 |
$ |
771,729,396 |
|||||||||||
|
Cash with custodian |
39,299,842 |
35,529,316 |
152,843,581 |
27,966,272 |
|||||||||||||||
|
Restricted cash for short positions |
— |
— |
— |
690 |
|||||||||||||||
|
Receivables: |
|||||||||||||||||||
|
Investments sold |
4,016,327 |
4,507,612 |
16,517,516 |
3,379,336 |
|||||||||||||||
|
Accrued interest and dividends |
7,402,695 |
8,017,391 |
11,018,771 |
3,322,026 |
|||||||||||||||
|
Fund shares sold |
— |
— |
2,059 |
— |
|||||||||||||||
|
Prepaid expenses |
438,112 |
474,976 |
1,672,365 |
303,554 |
|||||||||||||||
|
Other assets |
202,110 |
174,425 |
246,919 |
— |
|||||||||||||||
|
Total assets |
1,190,055,440 |
1,287,766,712 |
3,759,941,311 |
806,701,274 |
|||||||||||||||
|
LIABILITIES |
|||||||||||||||||||
|
Options written, at value (premium $2,504,579) |
— |
— |
1,666,590 |
— |
|||||||||||||||
| Mandatory Redeemable Preferred Shares ($25 liquidation value per share applicable to shares authorized, issued, and outstanding, in 000's) (Note 8) |
|||||||||||||||||||
|
Series B (1,330, 1,460, 3,220, and 850 shares, respectively)(1) |
33,231,630 |
36,479,792 |
80,455,548 |
21,238,245 |
|||||||||||||||
|
Series C (1,340, 1,480, 3,240, and 860 shares, respectively)(2) |
33,375,863 |
36,863,449 |
80,699,588 |
21,420,552 |
|||||||||||||||
|
Series D (1,320, 1,400, 2,480, and 1,120 shares, respectively)(3) |
32,858,243 |
34,850,566 |
61,732,157 |
27,876,290 |
|||||||||||||||
|
Series E (1,330, 1,460, and 850 shares, respectively)(4) |
33,046,576 |
36,278,072 |
— |
21,116,156 |
|||||||||||||||
|
Series F (4,000 shares)(5) |
— |
— |
99,523,256 |
— |
|||||||||||||||
|
Payables: |
|||||||||||||||||||
|
Notes payable (Note 7) |
314,400,000 |
340,400,000 |
860,500,000 |
210,000,000 |
|||||||||||||||
|
Distributions payable to Mandatory Redeemable Preferred Shareholders |
376,868 |
412,260 |
1,001,330 |
254,805 |
|||||||||||||||
|
Investments purchased |
7,100,732 |
8,736,609 |
15,342,602 |
2,562,477 |
|||||||||||||||
|
Affiliates: |
|||||||||||||||||||
|
Investment Advisory fees |
782,612 |
846,382 |
3,114,547 |
666,453 |
|||||||||||||||
|
Deferred compensation to trustees |
202,110 |
174,425 |
246,919 |
— |
|||||||||||||||
|
Trustees' fees and officer compensation |
13,380 |
14,200 |
29,084 |
10,241 |
|||||||||||||||
|
Other accounts payable and accrued liabilities |
1,663,229 |
1,730,347 |
4,613,012 |
1,196,159 |
|||||||||||||||
|
Total liabilities |
457,051,243 |
496,786,102 |
1,208,924,633 |
306,341,378 |
|||||||||||||||
|
NET ASSETS |
$ |
733,004,197 |
$ |
790,980,610 |
$ |
2,551,016,678 |
$ |
500,359,896 |
|||||||||||
|
COMPOSITION OF NET ASSETS |
|||||||||||||||||||
|
Common stock, no par value, unlimited shares authorized |
$ |
840,820,735 |
$ |
911,351,378 |
$ |
1,890,367,045 |
$ |
565,603,660 |
|||||||||||
|
Accumulated distributable earnings (loss) |
(107,816,538 |
) |
(120,370,768 |
) |
660,649,633 |
(65,243,764 |
) |
||||||||||||
|
NET ASSETS |
$ |
733,004,197 |
$ |
790,980,610 |
$ |
2,551,016,678 |
$ |
500,359,896 |
|||||||||||
|
Net asset value per common shares |
$ |
9.74 |
$ |
10.30 |
$ |
15.91 |
$ |
18.69 |
|||||||||||
|
Shares Outstanding |
75,238,025 |
76,762,574 |
160,369,635 |
26,772,582 |
|||||||||||||||
| * Includes securities on loan |
$ |
52,763,336 |
$ |
52,211,933 |
$ |
773,609,573 |
$ |
24,748,771 |
|||||||||||
| (1) Net of deferred offering costs (Series B) |
$ |
18,370 |
$ |
20,208 |
$ |
44,452 |
$ |
11,755 |
|||||||||||
| (2) Net of deferred offering costs (Series C) |
$ |
124,137 |
$ |
136,551 |
$ |
300,412 |
$ |
79,448 |
|||||||||||
| (3) Net of deferred offering costs (Series D) |
$ |
141,757 |
$ |
149,434 |
$ |
267,843 |
$ |
123,710 |
|||||||||||
| (4) Net of deferred offering costs (Series E) |
$ |
203,424 |
$ |
221,928 |
$ |
— |
$ |
133,844 |
|||||||||||
| (5) Net of deferred offering costs (Series F) |
$ |
— |
$ |
— |
$ |
476,744 |
$ |
— |
|||||||||||
See accompanying Notes to Financial Statements
www.calamos.com
1
Statements of Assets and Liabilities April 30, 2024 (Unaudited)
| GLOBAL DYNAMIC INCOME FUND |
GLOBAL TOTAL RETURN FUND |
LONG/SHORT EQUITY & DYNAMIC INCOME TRUST |
|||||||||||||
|
ASSETS |
|||||||||||||||
|
Investments in securities, at cost |
$ |
745,748,132 |
$ |
162,279,121 |
$ |
474,564,203 |
|||||||||
|
Investment in securities, at value* |
$ |
645,470,154 |
$ |
152,136,693 |
$ |
463,615,118 |
|||||||||
|
Cash with custodian |
31,802,833 |
7,660,406 |
207,899 |
||||||||||||
|
Restricted cash for short positions |
— |
45 |
234,728,004 |
||||||||||||
|
Foreign currency (cost $8,876, $1,745 and $154) |
8,873 |
1,744 |
154 |
||||||||||||
|
Receivables: |
|||||||||||||||
|
Investments sold |
38,152,893 |
188,665 |
8,288,974 |
||||||||||||
|
Accrued interest and dividends |
2,651,393 |
567,324 |
1,896,437 |
||||||||||||
|
Fund shares sold |
— |
— |
— |
||||||||||||
|
Prepaid expenses |
263,089 |
84,217 |
13,508 |
||||||||||||
|
Other assets |
93,822 |
59,621 |
812,545 |
||||||||||||
|
Total assets |
718,443,057 |
160,698,715 |
709,562,639 |
||||||||||||
|
LIABILITIES |
|||||||||||||||
|
Due to custodian bank |
— |
— |
39,311 |
||||||||||||
|
Due to custodian bank - Foreign currency (cost $159) |
— |
— |
159 |
||||||||||||
|
Securities sold short, at value (proceeds $211,055,532) |
— |
— |
227,122,982 |
||||||||||||
|
Options written, at value (premium $164,769, $30,987 and $4,853,310) |
398,719 |
91,504 |
4,427,252 |
||||||||||||
| Mandatory Redeemable Preferred Shares ($ and outstanding, in 000's) (Note 8) |
|||||||||||||||
|
Series B (860 and 160 shares, respectively)(1) |
21,488,059 |
3,997,795 |
— |
||||||||||||
|
Series C (880 and 160 shares, respectively)(2) |
21,919,314 |
3,985,104 |
— |
||||||||||||
|
Series D (200 and 200 shares, respectively)(3) |
4,975,856 |
4,967,220 |
— |
||||||||||||
|
Series E (860 and 160 shares, respectively)(4) |
21,353,402 |
3,962,924 |
— |
||||||||||||
|
Payables: |
|||||||||||||||
|
Notes payable (Note 7) |
147,050,000 |
34,350,000 |
120,000,000 |
||||||||||||
|
Distributions payable to Mandatory Redeemable Preferred Shareholders |
212,840 |
47,464 |
— |
||||||||||||
|
Investments purchased |
40,571,013 |
454,793 |
4,679,905 |
||||||||||||
|
Affiliates: |
|||||||||||||||
|
Investment Advisory fees |
558,140 |
131,808 |
519,094 |
||||||||||||
|
Deferred compensation to trustees |
93,822 |
59,621 |
— |
||||||||||||
|
Trustees' fees and officer compensation |
8,236 |
4,419 |
5,265 |
||||||||||||
|
Other accounts payable and accrued liabilities |
1,465,138 |
481,294 |
720,201 |
||||||||||||
|
Total liabilities |
260,094,539 |
52,533,946 |
357,514,169 |
||||||||||||
|
NET ASSETS |
$ |
458,348,518 |
$ |
108,164,769 |
$ |
352,048,470 |
|||||||||
|
COMPOSITION OF NET ASSETS |
|||||||||||||||
|
Common stock, no par value, unlimited shares authorized |
$ |
546,739,904 |
$ |
114,926,525 |
$ |
392,628,225 |
|||||||||
|
Accumulated distributable earnings (loss) |
(88,391,386 |
)(a) |
(6,761,756 |
)(a) |
(40,579,755 |
) |
|||||||||
|
NET ASSETS |
$ |
458,348,518 |
$ |
108,164,769 |
$ |
352,048,470 |
|||||||||
|
Net asset value per common shares |
$ |
7.18 |
$ |
11.01 |
$ |
|
|||||||||
|
Shares Outstanding |
63,864,387 |
9,825,838 |
|
||||||||||||
| * Includes securities on loan |
$ |
20,699,256 |
$ |
17,757,362 |
$ |
792,978 |
|||||||||
| (1) Net of deferred offering costs (Series B) |
$ |
11,941 |
$ |
2,205 |
$ |
— |
|||||||||
| (2) Net of deferred offering costs (Series C) |
$ |
80,686 |
$ |
14,896 |
$ |
— |
|||||||||
| (3) Net of deferred offering costs (Series D) |
$ |
24,144 |
$ |
32,780 |
$ |
— |
|||||||||
| (4) Net of deferred offering costs (Series E) |
$ |
146,598 |
$ |
37,076 |
$ |
— |
|||||||||
| (5) Net of deferred offering costs (Series F) |
$ |
— |
$ |
— |
$ |
— |
|||||||||
(a) Net of deferred foreign capital gains tax of $(530,016) and $(155,985), respectively.
See accompanying Notes to Financial Statements
CALAMOS CLOSED-END FAMILY OF FUNDS SEMIANNUAL REPORT
2
Statements of Operations Six Months Ended April 30, 2024 (Unaudited)
| CONVERTIBLE OPPORTUNITIES AND INCOME FUND |
CONVERTIBLE AND HIGH INCOME FUND |
STRATEGIC TOTAL RETURN FUND |
DYNAMIC CONVERTIBLE AND INCOME FUND |
||||||||||||||||
|
INVESTMENT INCOME |
|||||||||||||||||||
|
Interest |
$ |
17,441,970 |
$ |
18,714,058 |
$ |
25,990,674 |
$ |
7,786,020 |
|||||||||||
|
Interest on short sales |
— |
— |
— |
266 |
|||||||||||||||
|
(Amortization)/accretion of investment securities |
(11,929,579 |
) |
(12,903,375 |
) |
(6,058,428 |
) |
(10,480,069 |
) |
|||||||||||
|
Net interest |
5,512,391 |
5,810,683 |
19,932,246 |
(2,693,783 |
) |
||||||||||||||
|
Dividends |
1,106,324 |
1,195,541 |
18,307,248 |
824,849 |
|||||||||||||||
|
Dividend taxes withheld |
— |
— |
(39,470 |
) |
— |
||||||||||||||
|
Total investment income (loss) |
6,618,715 |
7,006,224 |
38,200,024 |
(1,868,934 |
) |
||||||||||||||
|
EXPENSES |
|||||||||||||||||||
|
Investment advisory fees |
4,724,545 |
5,108,213 |
18,055,061 |
4,025,469 |
|||||||||||||||
|
Interest expense on Notes Payable (Note 6) |
9,340,626 |
10,120,369 |
24,345,882 |
6,280,820 |
|||||||||||||||
| Interest expense and amortization of offering costs on Mandatory Redeemable Preferred Shares (Notes 1 and 7) |
2,343,682 |
2,559,078 |
6,152,250 |
1,599,364 |
|||||||||||||||
|
Printing and mailing fees |
58,063 |
63,394 |
113,687 |
39,460 |
|||||||||||||||
|
Legal fees |
45,848 |
48,663 |
149,548 |
35,124 |
|||||||||||||||
|
Accounting fees |
42,148 |
44,400 |
102,804 |
34,314 |
|||||||||||||||
|
Fund administration fees |
35,531 |
38,377 |
103,603 |
24,246 |
|||||||||||||||
|
Tax fees |
34,825 |
37,607 |
103,920 |
23,744 |
|||||||||||||||
|
Audit fees |
32,692 |
34,600 |
78,526 |
25,126 |
|||||||||||||||
|
Trustees' fees and officer compensation |
28,626 |
30,432 |
73,653 |
21,434 |
|||||||||||||||
|
Transfer agent fees |
21,896 |
19,122 |
17,394 |
18,782 |
|||||||||||||||
|
Registration fees |
9,648 |
9,852 |
20,685 |
3,417 |
|||||||||||||||
|
Custodian fees |
8,290 |
8,725 |
22,021 |
6,792 |
|||||||||||||||
|
Other |
44,630 |
46,275 |
90,429 |
36,847 |
|||||||||||||||
|
Total expenses |
16,771,050 |
18,169,107 |
49,429,463 |
12,174,939 |
|||||||||||||||
|
NET INVESTMENT INCOME (LOSS) |
(10,152,335 |
) |
(11,162,883 |
) |
(11,229,439 |
) |
(14,043,873 |
) |
|||||||||||
|
REALIZED AND UNREALIZED GAIN (LOSS) |
|||||||||||||||||||
|
Net realized gain (loss) from: |
|||||||||||||||||||
|
Investments, excluding purchased options |
4,638,338 |
4,856,363 |
(22,560,502 |
) |
8,324,267 |
||||||||||||||
|
Purchased options |
2,051,228 |
2,200,191 |
(3,982,086 |
) |
1,804,685 |
||||||||||||||
|
Foreign currency transactions |
— |
— |
(138 |
) |
— |
||||||||||||||
|
Written options |
— |
— |
746,310 |
— |
|||||||||||||||
|
Change in net unrealized appreciation/(depreciation) on: |
|||||||||||||||||||
|
Investments, excluding purchased options |
102,131,477 |
111,947,589 |
535,123,938 |
73,619,890 |
|||||||||||||||
|
Purchased options |
12,889 |
10,865 |
131,946 |
30,130 |
|||||||||||||||
|
Foreign currency translations |
— |
— |
1,668 |
— |
|||||||||||||||
|
Written options |
— |
— |
837,989 |
— |
|||||||||||||||
|
NET GAIN (LOSS) |
108,833,932 |
119,015,008 |
510,299,125 |
83,778,972 |
|||||||||||||||
|
NET INCREASE (DECREASE) IN NET ASSETS RESULTING FROM OPERATIONS |
$ |
98,681,597 |
$ |
107,852,125 |
$ |
499,069,686 |
$ |
69,735,099 |
|||||||||||
See accompanying Notes to Financial Statements
www.calamos.com
3
Statements of Operations Six Months Ended April 30, 2024 (Unaudited)
| GLOBAL DYNAMIC INCOME FUND |
GLOBAL TOTAL RETURN FUND |
LONG/SHORT EQUITY & DYNAMIC INCOME TRUST |
|||||||||||||
|
INVESTMENT INCOME |
|||||||||||||||
|
Interest |
$ |
5,905,541 |
$ |
1,205,983 |
$ |
4,152,310 |
|||||||||
|
Interest on short sales |
— |
— |
5,866,265 |
||||||||||||
|
(Amortization)/accretion of investment securities |
(1,966,663 |
) |
(526,439 |
) |
3,814 |
||||||||||
|
Net interest |
3,938,878 |
679,544 |
10,022,389 |
||||||||||||
|
Dividends |
3,145,263 |
822,807 |
2,583,032 |
||||||||||||
|
Foreign taxes withheld |
(191,775 |
) |
(54,059 |
) |
(26,204 |
) |
|||||||||
|
Total investment income (loss) |
6,892,366 |
1,448,292 |
12,579,217 |
||||||||||||
|
EXPENSES |
|||||||||||||||
|
Investment advisory fees |
3,191,506 |
750,806 |
3,101,673 |
||||||||||||
|
Interest expense on Notes Payable (Note 7) |
4,072,294 |
939,888 |
3,557,985 |
||||||||||||
|
Interest expense and amortization of offering costs on Mandatory Redeemable Preferred Shares (Notes 1 and 8) |
1,319,087 |
318,607 |
— |
||||||||||||
|
Printing and mailing fees |
41,492 |
19,898 |
28,673 |
||||||||||||
|
Legal fees |
47,122 |
15,273 |
31,285 |
||||||||||||
|
Accounting fees |
35,651 |
18,341 |
26,386 |
||||||||||||
|
Fund administration fees |
18,941 |
4,325 |
14,252 |
||||||||||||
|
Tax fees |
33,660 |
20,572 |
13,870 |
||||||||||||
|
Audit fees |
21,262 |
11,928 |
16,786 |
||||||||||||
|
Trustees' fees and officer compensation |
17,806 |
8,800 |
16,237 |
||||||||||||
|
Transfer agent fees |
18,896 |
21,406 |
10,154 |
||||||||||||
|
Registration fees |
8,276 |
1,273 |
2,544 |
||||||||||||
|
Custodian fees |
70,758 |
31,037 |
38,958 |
||||||||||||
|
Dividend or interest expense on short positions |
— |
— |
1,420,179 |
||||||||||||
|
Other |
36,022 |
22,518 |
92,709 |
||||||||||||
|
Total expenses |
8,932,773 |
2,184,672 |
8,371,691 |
||||||||||||
|
NET INVESTMENT INCOME (LOSS) |
(2,040,407 |
) |
(736,380 |
) |
4,207,526 |
||||||||||
|
REALIZED AND UNREALIZED GAIN (LOSS) |
|||||||||||||||
|
Net realized gain (loss) from: |
|||||||||||||||
|
Investments, excluding purchased options |
49,558,824 |
(a) |
12,647,614 |
(a) |
44,483,066 |
||||||||||
|
Purchased options |
(7,306,344 |
) |
(1,799,704 |
) |
(12,170,841 |
) |
|||||||||
|
Foreign currency transactions |
(143,510 |
) |
(36,239 |
) |
7,055 |
||||||||||
|
Written options |
(65,587 |
) |
8,485 |
3,734,616 |
|||||||||||
|
Short positions |
— |
— |
(24,116,164 |
) |
|||||||||||
|
Change in net unrealized appreciation/(depreciation) on: |
|||||||||||||||
|
Investments, excluding purchased options |
49,078,635 |
(b) |
11,765,134 |
(b) |
45,345,373 |
||||||||||
|
Purchased options |
5,750,091 |
1,497,129 |
874,145 |
||||||||||||
|
Foreign currency translations |
(2,461 |
) |
(720 |
) |
979 |
||||||||||
|
Written options |
(186,740 |
) |
(43,343 |
) |
(130,086 |
) |
|||||||||
|
Short positions |
— |
— |
(18,473,224 |
) |
|||||||||||
|
NET GAIN (LOSS) |
96,682,908 |
24,038,356 |
39,554,919 |
||||||||||||
|
NET INCREASE (DECREASE) IN NET ASSETS RESULTING FROM OPERATIONS |
$ |
94,642,501 |
$ |
23,301,976 |
$ |
43,762,445 |
|||||||||
(a) Net of foreign capital gains tax of $724,319 and $200,457, respectively.
(b) Net of change of $(350,512) and $(98,179), respectively in deferred capital gains tax.
See accompanying Notes to Financial Statements
CALAMOS CLOSED-END FAMILY OF FUNDS SEMIANNUAL REPORT
4
Statements of Changes in Net Assets
| CONVERTIBLE OPPORTUNITIES AND INCOME FUND |
CONVERTIBLE AND HIGH INCOME FUND |
STRATEGIC TOTAL RETURN FUND |
|||||||||||||||||||||||||
| (UNAUDITED) SIX MONTHS ENDED APRIL 30, 2024 |
YEAR ENDED OCTOBER 31, 2023 |
(UNAUDITED) SIX MONTHS ENDED APRIL 30, 2024 |
YEAR ENDED OCTOBER 31, 2023 |
(UNAUDITED) SIX MONTHS ENDED APRIL 30, 2024 |
YEAR ENDED OCTOBER 31, 2023 |
||||||||||||||||||||||
|
OPERATIONS |
|||||||||||||||||||||||||||
|
Net investment income (loss) |
$ |
(10,152,335 |
) |
$ |
(7,707,689 |
) |
$ |
(11,162,883 |
) |
$ |
(8,936,047 |
) |
$ |
(11,229,439 |
) |
$ |
(13,950,035 |
) |
|||||||||
|
Net realized gain (loss) |
6,689,566 |
86,950,149 |
7,056,554 |
95,774,113 |
(25,796,416 |
) |
196,397,180 |
||||||||||||||||||||
|
Change in unrealized appreciation/(depreciation) |
102,144,366 |
(89,072,698 |
) |
111,958,454 |
(96,449,417 |
) |
536,095,541 |
(12,807,341 |
) |
||||||||||||||||||
| Net increase (decrease) in net assets applicable to common shareholders resulting from operations |
98,681,597 |
(9,830,238 |
) |
107,852,125 |
(9,611,351 |
) |
499,069,686 |
169,639,804 |
|||||||||||||||||||
|
DISTRIBUTIONS TO COMMON SHAREHOLDERS |
|||||||||||||||||||||||||||
|
Distributions |
(42,751,460 |
) |
(84,820,549 |
) |
(45,927,090 |
) |
(91,178,228 |
) |
(98,606,102 |
) |
(196,582,807 |
) |
|||||||||||||||
|
Return of capital |
— |
— |
— |
— |
— |
— |
|||||||||||||||||||||
| Net decrease in net assets from distributions to common shareholders |
(42,751,460 |
) |
(84,820,549 |
) |
(45,927,090 |
) |
(91,178,228 |
) |
(98,606,102 |
) |
(196,582,807 |
) |
|||||||||||||||
|
CAPITAL STOCK TRANSACTIONS |
|||||||||||||||||||||||||||
|
Proceeds from shares sold |
— |
— |
— |
— |
— |
9,878,699 |
|||||||||||||||||||||
|
Reinvestment of distributions resulting in the issuance of stock |
4,292,331 |
7,716,841 |
4,234,807 |
7,782,199 |
550,419 |
10,409,380 |
|||||||||||||||||||||
| Net increase (decrease) in net assets from capital stock transactions |
4,292,331 |
7,716,841 |
4,234,807 |
7,782,199 |
550,419 |
20,288,079 |
|||||||||||||||||||||
|
TOTAL INCREASE (DECREASE) IN NET ASSETS |
60,222,468 |
(86,933,946 |
) |
66,159,842 |
(93,007,380 |
) |
401,014,003 |
(6,654,924 |
) |
||||||||||||||||||
|
NET ASSETS |
|||||||||||||||||||||||||||
|
Beginning of period |
$ |
672,781,729 |
$ |
759,715,675 |
$ |
724,820,768 |
$ |
817,828,148 |
$ |
2,150,002,675 |
$ |
2,156,657,599 |
|||||||||||||||
|
End of period |
$ |
733,004,197 |
$ |
672,781,729 |
$ |
790,980,610 |
$ |
724,820,768 |
$ |
2,551,016,678 |
$ |
2,150,002,675 |
|||||||||||||||
See accompanying Notes to Financial Statements
www.calamos.com
5
Statements of Changes in Net Assets
| DYNAMIC CONVERTIBLE AND INCOME FUND |
GLOBAL DYNAMIC INCOME FUND |
GLOBAL TOTAL RETURN FUND |
|||||||||||||||||||||||||
| (UNAUDITED) SIX MONTHS ENDED APRIL 30, 2024 |
YEAR ENDED OCTOBER 31, 2023 |
(UNAUDITED) SIX MONTHS ENDED APRIL 30, 2024 |
YEAR ENDED OCTOBER 31, 2023 |
(UNAUDITED) SIX MONTHS ENDED APRIL 30, 2024 |
YEAR ENDED OCTOBER 31, 2023 |
||||||||||||||||||||||
|
OPERATIONS |
|||||||||||||||||||||||||||
|
Net investment income (loss) |
$ |
(14,043,873 |
) |
$ |
(16,557,803 |
) |
$ |
(2,040,407 |
) |
$ |
(4,968,800 |
) |
$ |
(736,380 |
) |
$ |
(1,707,700 |
) |
|||||||||
|
Net realized gain (loss) |
10,128,952 |
81,214,594 |
42,043,383 |
21,633,158 |
10,820,156 |
7,424,177 |
|||||||||||||||||||||
|
Change in unrealized appreciation/(depreciation) |
73,650,020 |
(81,728,395 |
) |
54,639,525 |
13,418,308 |
13,218,200 |
(913,955 |
) |
|||||||||||||||||||
| Net increase (decrease) in net assets applicable to common shareholders resulting from operations |
69,735,099 |
(17,071,604 |
) |
94,642,501 |
30,082,666 |
23,301,976 |
4,802,522 |
||||||||||||||||||||
|
DISTRIBUTIONS TO COMMON SHAREHOLDERS |
|||||||||||||||||||||||||||
|
Distributions |
(31,244,451 |
) |
(61,802,066 |
) |
(19,159,316 |
) |
(19,096,474 |
) |
(4,716,402 |
) |
(6,618,494 |
) |
|||||||||||||||
|
Return of capital |
— |
— |
— |
(19,222,158 |
) |
— |
(2,813,588 |
) |
|||||||||||||||||||
| Net decrease in net assets from distributions to common shareholders |
(31,244,451 |
) |
(61,802,066 |
) |
(19,159,316 |
) |
(38,318,632 |
) |
(4,716,402 |
) |
(9,432,082 |
) |
|||||||||||||||
|
CAPITAL STOCK TRANSACTIONS |
|||||||||||||||||||||||||||
|
Proceeds from shares sold |
— |
4,371,538 |
— |
— |
— |
— |
|||||||||||||||||||||
|
Reinvestment of distributions resulting in the issuance of stock |
2,504,222 |
7,254,396 |
— |
— |
— |
23,134 |
|||||||||||||||||||||
| Net increase (decrease) in net assets from capital stock transactions |
2,504,222 |
11,625,934 |
— |
— |
— |
23,134 |
|||||||||||||||||||||
|
TOTAL INCREASE (DECREASE) IN NET ASSETS |
40,994,870 |
(67,247,736 |
) |
75,483,185 |
(8,235,966 |
) |
18,585,574 |
(4,606,426 |
) |
||||||||||||||||||
|
NET ASSETS |
|||||||||||||||||||||||||||
|
Beginning of period |
$ |
459,365,026 |
$ |
526,612,762 |
$ |
382,865,333 |
$ |
391,101,299 |
$ |
89,579,195 |
$ |
94,185,621 |
|||||||||||||||
|
End of period |
$ |
500,359,896 |
$ |
459,365,026 |
$ |
458,348,518 |
$ |
382,865,333 |
$ |
108,164,769 |
$ |
89,579,195 |
|||||||||||||||
See accompanying Notes to Financial Statements
CALAMOS CLOSED-END FAMILY OF FUNDS SEMIANNUAL REPORT
6
Statements of Changes in Net Assets
| LONG/SHORT EQUITY & DYNAMIC INCOME TRUST |
|||||||||||
| (UNAUDITED) SIX MONTHS ENDED APRIL 30, 2024 |
YEAR ENDED OCTOBER 31, 2023 |
||||||||||
|
OPERATIONS |
|||||||||||
|
Net investment income (loss) |
$ |
4,207,526 |
$ |
4,692,577 |
|||||||
|
Net realized gain (loss) |
11,937,732 |
22,502,178 |
|||||||||
|
Change in unrealized appreciation/(depreciation) |
27,617,187 |
(16,183,025 |
) |
||||||||
|
Net increase (decrease) in net assets applicable to common shareholders resulting from operations |
43,762,445 |
11,011,730 |
|||||||||
|
DISTRIBUTIONS TO COMMON SHAREHOLDERS |
|||||||||||
|
Distributions |
(16,491,043 |
) |
(32,982,086 |
) |
|||||||
|
Return of capital |
— |
— |
|||||||||
|
Net decrease in net assets from distributions to common shareholders |
(16,491,043 |
) |
(32,982,086 |
) |
|||||||
|
TOTAL INCREASE (DECREASE) IN NET ASSETS |
27,271,402 |
(21,970,356 |
) |
||||||||
|
NET ASSETS |
|||||||||||
|
Beginning of period |
$ |
324,777,068 |
$ |
346,747,424 |
|||||||
|
End of period |
$ |
352,048,470 |
$ |
324,777,068 |
|||||||
See accompanying Notes to Financial Statements
www.calamos.com
7
Statement of Cash Flows
| CONVERTIBLE OPPORTUNITIES AND INCOME FUND |
|||||||
| (UNAUDITED) SIX MONTHS ENDED APRIL 30, 2024 |
|||||||
|
CASH FLOWS FROM OPERATING ACTIVITIES: |
|||||||
|
Net increase/(decrease) in net assets from operations |
$ |
98,681,597 |
|||||
|
Adjustments to reconcile net increase/(decrease) in net assets from operations to net cash provided by (used in) operating activities: |
|||||||
|
Purchase of investment securities, including purchased options |
(313,510,631 |
) |
|||||
|
Proceeds from disposition of investment securities, including purchased options |
367,013,562 |
||||||
|
Amortization and accretion of fixed-income securities |
11,929,579 |
||||||
|
Amortization of offering costs on Mandatory Redeemable Preferred Shares |
130,841 |
||||||
|
Net realized gains/losses from investments, excluding purchased options |
(4,638,338 |
) |
|||||
|
Net realized gains/losses from purchased options |
(2,051,228 |
) |
|||||
|
Change in unrealized appreciation or depreciation on investments, excluding purchased options |
(102,131,477 |
) |
|||||
|
Change in unrealized appreciation or depreciation on purchased options |
(12,889 |
) |
|||||
|
Net change in assets and liabilities: |
|||||||
|
(Increase)/decrease in assets: |
|||||||
|
Accrued interest and dividends receivable |
78,608 |
||||||
|
Prepaid expenses |
(44,436 |
) |
|||||
|
Other assets |
(36,450 |
) |
|||||
|
Increase/(decrease) in liabilities: |
|||||||
|
Payables to affiliates |
39,021 |
||||||
|
Other accounts payable and accrued liabilities |
17,533 |
||||||
|
Net cash provided by/(used in) operating activities |
$ |
55,465,292 |
|||||
|
CASH FLOWS FROM FINANCING ACTIVITIES: |
|||||||
|
Distributions to shareholders |
(38,459,129 |
) |
|||||
|
Redemption of Distributions to Mandatory Redeemable Preferred Shareholders |
(12,158 |
) |
|||||
|
Offering costs on Mandatory Redeemable Preferred Shares |
(22,603 |
) |
|||||
|
Net cash provided by/(used in) financing activities |
$ |
(38,493,890 |
) |
||||
|
Net increase/(decrease) in cash |
$ |
16,971,402 |
|||||
|
Cash and restricted cash at beginning of period |
$ |
22,328,440 |
|||||
|
Cash at end of period |
$ |
39,299,842 |
|||||
|
Supplemental disclosure |
|||||||
|
Cash paid for interest expense on Notes Payable |
$ |
9,389,457 |
|||||
|
Cash paid for interest expense on Mandatory Redeemable Preferred Shares |
$ |
2,355,840 |
|||||
|
Non-cash financing activities not included herein consists of reinvestment of dividends and distributions |
$ |
4,292,331 |
|||||
|
The following table provides a reconciliation of cash and restricted cash reported within the Statement of Assets and Liabilities that sum to the total of the same such amounts shown in the Statements of Cash Flows. |
|||||||
|
Cash with custodian |
39,299,842 |
||||||
|
Total cash and restricted cash at period end |
$ |
39,299,842 |
|||||
See accompanying Notes to Financial Statements
CALAMOS CLOSED-END FAMILY OF FUNDS SEMIANNUAL REPORT
8
Statement of Cash Flows
| CONVERTIBLE AND HIGH INCOME FUND |
|||||||
| (UNAUDITED) SIX MONTHS ENDED APRIL 30, 2024 |
|||||||
|
CASH FLOWS FROM OPERATING ACTIVITIES: |
|||||||
|
Net increase/(decrease) in net assets from operations |
$ |
107,852,125 |
|||||
|
Adjustments to reconcile net increase/(decrease) in net assets from operations to net cash provided by (used in) operating activities: |
|||||||
|
Purchase of investment securities, including purchased options |
(338,921,105 |
) |
|||||
|
Proceeds from disposition of investment securities, including purchased options |
397,374,572 |
||||||
|
Amortization and accretion of fixed-income securities |
12,903,375 |
||||||
|
Amortization of offering costs on Mandatory Redeemable Preferred Shares |
140,117 |
||||||
|
Net realized gains/losses from investments, excluding purchased options |
(4,856,363 |
) |
|||||
|
Net realized gains/losses from purchased options |
(2,200,191 |
) |
|||||
|
Change in unrealized appreciation or depreciation on investments, excluding purchased options |
(111,947,589 |
) |
|||||
|
Change in unrealized appreciation or depreciation on purchased options |
(10,865 |
) |
|||||
|
Net change in assets and liabilities: |
|||||||
|
(Increase)/decrease in assets: |
|||||||
|
Accrued interest and dividends receivable |
84,278 |
||||||
|
Prepaid expenses |
(45,434 |
) |
|||||
|
Other assets |
(31,457 |
) |
|||||
|
Increase/(decrease) in liabilities: |
|||||||
|
Payables to affiliates |
35,196 |
||||||
|
Other accounts payable and accrued liabilities |
4,655 |
||||||
|
Net cash provided by/(used in) operating activities |
$ |
60,381,314 |
|||||
|
CASH FLOWS FROM FINANCING ACTIVITIES: |
|||||||
|
Distributions to shareholders |
(41,692,283 |
) |
|||||
|
Redemption of Distributions to Mandatory Redeemable Preferred Shareholders |
(13,291 |
) |
|||||
|
Offering costs on Mandatory Redeemable Preferred Shares |
(22,753 |
) |
|||||
|
Net cash provided by/(used in) financing activities |
$ |
(41,728,327 |
) |
||||
|
Net increase/(decrease) in cash |
$ |
18,652,987 |
|||||
|
Cash and restricted cash at beginning of period |
$ |
16,876,329 |
|||||
|
Cash at end of period |
$ |
35,529,316 |
|||||
|
Supplemental disclosure |
|||||||
|
Cash paid for interest expense on Notes Payable |
$ |
10,173,278 |
|||||
|
Cash paid for interest expense on Mandatory Redeemable Preferred Shares |
$ |
2,572,369 |
|||||
|
Non-cash financing activities not included herein consists of reinvestment of dividends and distributions |
$ |
4,234,807 |
|||||
|
The following table provides a reconciliation of cash and restricted cash reported within the Statement of Assets and Liabilities that sum to the total of the same such amounts shown in the Statements of Cash Flows. |
|||||||
|
Cash with custodian |
35,529,316 |
||||||
|
Total cash and restricted cash at period end |
$ |
35,529,316 |
|||||
See accompanying Notes to Financial Statements
www.calamos.com
9
Statement of Cash Flows
| STRATEGIC TOTAL RETURN FUND |
|||||||
| (UNAUDITED) SIX MONTHS ENDED APRIL 30, 2024 |
|||||||
|
CASH FLOWS FROM OPERATING ACTIVITIES: |
|||||||
|
Net increase/(decrease) in net assets from operations |
$ |
499,069,686 |
|||||
|
Adjustments to reconcile net increase/(decrease) in net assets from operations to net cash provided by (used in) operating activities: |
|||||||
|
Purchase of investment securities, including purchased options |
(549,281,998 |
) |
|||||
|
Proceeds paid on closing written options |
(1,514,868 |
) |
|||||
|
Proceeds from disposition of investment securities, including purchased options |
667,361,718 |
||||||
|
Premiums received from written options |
4,765,757 |
||||||
|
Amortization and accretion of fixed-income securities |
6,058,428 |
||||||
|
Amortization of offering costs on Mandatory Redeemable Preferred Shares |
267,883 |
||||||
|
Net realized gains/losses from investments, excluding purchased options |
22,560,502 |
||||||
|
Net realized gains/losses from purchased options |
3,982,086 |
||||||
|
Net realized gains/losses from written options |
(746,310 |
) |
|||||
|
Change in unrealized appreciation or depreciation on investments, excluding purchased options |
(535,123,938 |
) |
|||||
|
Change in unrealized appreciation or depreciation on purchased options |
(131,946 |
) |
|||||
|
Change in unrealized appreciation or depreciation on written options |
(837,989 |
) |
|||||
|
Net change in assets and liabilities: |
|||||||
|
(Increase)/decrease in assets: |
|||||||
|
Accrued interest and dividends receivable |
(103,245 |
) |
|||||
|
Prepaid expenses |
(638,336 |
) |
|||||
|
Other assets |
(44,532 |
) |
|||||
|
Increase/(decrease) in liabilities: |
|||||||
|
Payables to affiliates |
324,940 |
||||||
|
Other accounts payable and accrued liabilities |
267,209 |
||||||
|
Net cash provided by/(used in) operating activities |
$ |
116,235,047 |
|||||
|
CASH FLOWS FROM FINANCING ACTIVITIES: |
|||||||
|
Distributions to shareholders |
(98,055,683 |
) |
|||||
|
Redemption of Distributions to Mandatory Redeemable Preferred Shareholders |
(32,332 |
) |
|||||
|
Offering costs on Mandatory Redeemable Preferred Shares |
(24,672 |
) |
|||||
|
Proceeds from Note payable |
60,000,000 |
||||||
|
Net cash provided by/(used in) financing activities |
$ |
(38,112,687 |
) |
||||
|
Net increase/(decrease) in cash |
$ |
78,122,360 |
|||||
|
Cash and restricted cash at beginning of period |
$ |
74,721,221 |
|||||
|
Cash at end of period |
$ |
152,843,581 |
|||||
|
Supplemental disclosure |
|||||||
|
Cash paid for interest expense on Notes Payable |
$ |
24,182,841 |
|||||
|
Cash paid for interest expense on Mandatory Redeemable Preferred Shares |
$ |
6,184,582 |
|||||
|
Non-cash financing activities not included herein consists of reinvestment of dividends and distributions |
$ |
550,419 |
|||||
|
The following table provides a reconciliation of cash and restricted cash reported within the Statement of Assets and Liabilities that sum to the total of the same such amounts shown in the Statements of Cash Flows. |
|||||||
|
Cash with custodian |
152,843,581 |
||||||
|
Total cash and restricted cash at period end |
$ |
152,843,581 |
|||||
See accompanying Notes to Financial Statements
CALAMOS CLOSED-END FAMILY OF FUNDS SEMIANNUAL REPORT
10
Statement of Cash Flows
| DYNAMIC CONVERTIBLE AND INCOME FUND |
|||||||
| (UNAUDITED) SIX MONTHS ENDED APRIL 30, 2024 |
|||||||
|
CASH FLOWS FROM OPERATING ACTIVITIES: |
|||||||
|
Net increase/(decrease) in net assets from operations |
$ |
69,735,099 |
|||||
|
Adjustments to reconcile net increase/(decrease) in net assets from operations to net cash provided by (used in) operating activities: |
|||||||
|
Purchase of investment securities, including purchased options |
(234,517,145 |
) |
|||||
|
Proceeds from disposition of investment securities, including purchased options |
274,412,204 |
||||||
|
Amortization and accretion of fixed-income securities |
10,480,069 |
||||||
|
Amortization of offering costs on Mandatory Redeemable Preferred Shares |
99,058 |
||||||
|
Net realized gains/losses from investments, excluding purchased options |
(8,324,267 |
) |
|||||
|
Net realized gains/losses from purchased options |
(1,804,685 |
) |
|||||
|
Change in unrealized appreciation or depreciation on investments, excluding purchased options |
(73,619,890 |
) |
|||||
|
Change in unrealized appreciation or depreciation on purchased options |
(30,130 |
) |
|||||
|
Net change in assets and liabilities: |
|||||||
|
(Increase)/decrease in assets: |
|||||||
|
Accrued interest and dividends receivable |
(71,297 |
) |
|||||
|
Prepaid expenses |
(34,584 |
) |
|||||
|
Increase/(decrease) in liabilities: |
|||||||
|
Payables to affiliates |
1,023 |
||||||
|
Other accounts payable and accrued liabilities |
10,773 |
||||||
|
Net cash provided by/(used in) operating activities |
$ |
36,336,228 |
|||||
|
CASH FLOWS FROM FINANCING ACTIVITIES: |
|||||||
|
Distributions to shareholders |
(28,740,229 |
) |
|||||
|
Redemption of Distributions to Mandatory Redeemable Preferred Shareholders |
(8,243 |
) |
|||||
|
Offering costs on Mandatory Redeemable Preferred Shares |
(22,080 |
) |
|||||
|
Net cash provided by/(used in) financing activities |
$ |
(28,770,552 |
) |
||||
|
Net increase/(decrease) in cash |
$ |
7,565,676 |
|||||
|
Cash and restricted cash at beginning of period |
$ |
20,401,286 |
|||||
|
Cash at end of period |
$ |
27,966,962 |
|||||
|
Supplemental disclosure |
|||||||
|
Cash paid for interest expense on Notes Payable |
$ |
6,313,667 |
|||||
|
Cash paid for interest expense on Mandatory Redeemable Preferred Shares |
$ |
1,607,607 |
|||||
|
Non-cash financing activities not included herein consists of reinvestment of dividends and distributions |
$ |
2,504,222 |
|||||
|
The following table provides a reconciliation of cash and restricted cash reported within the Statement of Assets and Liabilities that sum to the total of the same such amounts shown in the Statements of Cash Flows. |
|||||||
|
Cash with custodian |
27,966,272 |
||||||
|
Restricted cash for short positions |
690 |
||||||
|
Total cash and restricted cash at period end |
$ |
27,966,962 |
|||||
See accompanying Notes to Financial Statements
www.calamos.com
11
Statement of Cash Flows
| GLOBAL DYNAMIC INCOME FUND |
|||||||
| (UNAUDITED) SIX MONTHS ENDED APRIL 30, 2024 |
|||||||
|
CASH FLOWS FROM OPERATING ACTIVITIES: |
|||||||
|
Net increase/(decrease) in net assets from operations |
$ |
94,642,501 |
|||||
|
Adjustments to reconcile net increase/(decrease) in net assets from operations to net cash provided by (used in) operating activities: |
|||||||
|
Purchase of investment securities, including purchased options |
(708,763,537 |
) |
|||||
|
Proceeds paid on closing written options |
(1,980,442 |
) |
|||||
|
Proceeds from disposition of investment securities, including purchased options |
734,500,334 |
||||||
|
Premiums received from written options |
1,965,994 |
||||||
|
Amortization and accretion of fixed-income securities |
1,966,663 |
||||||
|
Amortization of offering costs on Mandatory Redeemable Preferred Shares |
80,144 |
||||||
|
Net realized gains/losses from investments, excluding purchased options |
(50,283,143 |
) |
|||||
|
Net realized gains/losses from capital gains tax |
724,319 |
||||||
|
Net realized gains/losses from purchased options |
7,306,344 |
||||||
|
Net realized gains/losses from written options |
65,587 |
||||||
|
Change in unrealized appreciation or depreciation on investments, excluding purchased options |
(49,078,635 |
) |
|||||
|
Change in unrealized appreciation or depreciation on capital gains tax |
(350,512 |
) |
|||||
|
Change in unrealized appreciation or depreciation on purchased options |
(5,750,091 |
) |
|||||
|
Change in unrealized appreciation or depreciation on written options |
186,740 |
||||||
|
Net change in assets and liabilities: |
|||||||
|
(Increase)/decrease in assets: |
|||||||
|
Accrued interest and dividends receivable |
(281,985 |
) |
|||||
|
Prepaid expenses |
(40,052 |
) |
|||||
|
Other assets |
(16,921 |
) |
|||||
|
Increase/(decrease) in liabilities: |
|||||||
|
Payables to affiliates |
68,889 |
||||||
|
Other accounts payable and accrued liabilities |
455,940 |
||||||
|
Net cash provided by/(used in) operating activities |
$ |
25,418,137 |
|||||
|
CASH FLOWS FROM FINANCING ACTIVITIES: |
|||||||
|
Distributions to shareholders |
(19,159,316 |
) |
|||||
|
Redemption of Distributions to Mandatory Redeemable Preferred Shareholders |
(6,808 |
) |
|||||
|
Offering costs on Mandatory Redeemable Preferred Shares |
(22,094 |
) |
|||||
|
Proceeds from Note payable |
16,500,000 |
||||||
|
Net cash provided by/(used in) financing activities |
$ |
(2,688,218 |
) |
||||
|
Net increase/(decrease) in cash and foreign currency |
$ |
22,729,919 |
|||||
|
Cash and foreign currency and restricted cash at beginning of period |
$ |
9,081,787 |
|||||
|
Cash and foreign currency at end of period |
$ |
31,811,706 |
|||||
|
Supplemental disclosure |
|||||||
|
Cash paid for interest expense on Notes Payable |
$ |
4,013,807 |
|||||
|
Cash paid for interest expense on Mandatory Redeemable Preferred Shares |
$ |
1,325,895 |
|||||
|
The following table provides a reconciliation of cash and restricted cash reported within the Statement of Assets and Liabilities that sum to the total of the same such amounts shown in the Statements of Cash Flows. |
|||||||
|
Cash with custodian |
31,802,833 |
||||||
|
Foreign currency |
8,873 |
||||||
|
Total cash and restricted cash at period end |
$ |
31,811,706 |
|||||
See accompanying Notes to Financial Statements
CALAMOS CLOSED-END FAMILY OF FUNDS SEMIANNUAL REPORT
12
Statement of Cash Flows
| GLOBAL TOTAL RETURN FUND |
|||||||
| (UNAUDITED) SIX MONTHS ENDED APRIL 30, 2024 |
|||||||
|
CASH FLOWS FROM OPERATING ACTIVITIES: |
|||||||
|
Net increase/(decrease) in net assets from operations |
$ |
23,301,976 |
|||||
|
Adjustments to reconcile net increase/(decrease) in net assets from operations to net cash provided by (used in) operating activities: |
|||||||
|
Purchase of investment securities, including purchased options |
(156,156,374 |
) |
|||||
|
Proceeds paid on closing written options |
(436,054 |
) |
|||||
|
Proceeds from disposition of investment securities, including purchased options |
160,092,235 |
||||||
|
Premiums received from written options |
456,336 |
||||||
|
Amortization and accretion of fixed-income securities |
526,439 |
||||||
|
Amortization of offering costs on Mandatory Redeemable Preferred Shares |
40,484 |
||||||
|
Net realized gains/losses from investments, excluding purchased options |
(12,848,071 |
) |
|||||
|
Net realized gains/losses from capital gains tax |
200,457 |
||||||
|
Net realized gains/losses from purchased options |
1,799,704 |
||||||
|
Net realized gains/losses from written options |
(8,485 |
) |
|||||
|
Change in unrealized appreciation or depreciation on investments, excluding purchased options |
(11,765,134 |
) |
|||||
|
Change in unrealized appreciation or depreciation on capital gains tax |
(98,179 |
) |
|||||
|
Change in unrealized appreciation or depreciation on purchased options |
(1,497,129 |
) |
|||||
|
Change in unrealized appreciation or depreciation on written options |
43,343 |
||||||
|
Net change in assets and liabilities: |
|||||||
|
(Increase)/decrease in assets: |
|||||||
|
Accrued interest and dividends receivable |
(63,959 |
) |
|||||
|
Prepaid expenses |
(26,537 |
) |
|||||
|
Other assets |
(10,753 |
) |
|||||
|
Increase/(decrease) in liabilities: |
|||||||
|
Payables to affiliates |
23,860 |
||||||
|
Other accounts payable and accrued liabilities |
146,245 |
||||||
|
Net cash provided by/(used in) operating activities |
$ |
3,720,404 |
|||||
|
CASH FLOWS FROM FINANCING ACTIVITIES: |
|||||||
|
Distributions to shareholders |
(4,716,402 |
) |
|||||
|
Redemption of Distributions to Mandatory Redeemable Preferred Shareholders |
(1,527 |
) |
|||||
|
Offering costs on Mandatory Redeemable Preferred Shares |
(22,036 |
) |
|||||
|
Proceeds from Note payable |
4,250,000 |
||||||
|
Net cash provided by/(used in) financing activities |
$ |
(489,965 |
) |
||||
|
Net increase/(decrease) in cash and foreign currency |
$ |
3,230,439 |
|||||
|
Cash and foreign currency and restricted cash at beginning of period |
$ |
4,431,756 |
|||||
|
Cash, foreign currency and restricted cash at end of period |
$ |
7,662,195 |
|||||
|
Supplemental disclosure |
|||||||
|
Cash paid for interest expense on Notes Payable |
$ |
924,254 |
|||||
|
Cash paid for interest expense on Mandatory Redeemable Preferred Shares |
$ |
320,134 |
|||||
|
The following table provides a reconciliation of cash and restricted cash reported within the Statement of Assets and Liabilities that sum to the total of the same such amounts shown in the Statements of Cash Flows. |
|||||||
|
Cash with custodian |
7,660,406 |
||||||
|
Foreign currency |
1,744 |
||||||
|
Restricted cash for short positions |
45 |
||||||
|
Total cash and restricted cash at period end |
$ |
7,662,195 |
|||||
See accompanying Notes to Financial Statements
www.calamos.com
13
Statement of Cash Flows
| LONG/SHORT EQUITY & DYNAMIC INCOME TRUST |
|||||||
| (UNAUDITED) SIX MONTHS ENDED APRIL 30, 2024 |
|||||||
|
CASH FLOWS FROM OPERATING ACTIVITIES: |
|||||||
|
Net increase/(decrease) in net assets from operations |
$ |
43,762,445 |
|||||
|
Adjustments to reconcile net increase/(decrease) in net assets from operations to net cash provided by (used in) operating activities: |
|||||||
|
Purchase of investment securities, including purchased options |
(636,260,976 |
) |
|||||
|
Purchases of securities to cover securities sold short |
(362,358,491 |
) |
|||||
|
Proceeds paid on closing written options |
(20,736,053 |
) |
|||||
|
Proceeds from disposition of investment securities, including purchased options |
668,672,734 |
||||||
|
Proceeds from securities sold short |
301,715,673 |
||||||
|
Premiums received from written options |
28,293,195 |
||||||
|
Amortization and accretion of fixed-income securities |
(3,814 |
) |
|||||
|
Net realized gains/losses from investments, excluding purchased options |
(44,483,066 |
) |
|||||
|
Net realized gains/losses from purchased options |
12,170,841 |
||||||
|
Net realized gains/losses from short positions |
24,116,164 |
||||||
|
Net realized gains/losses from written options |
(3,734,616 |
) |
|||||
|
Change in unrealized appreciation or depreciation on investments, excluding purchased options |
(45,345,373 |
) |
|||||
|
Change in unrealized appreciation or depreciation on purchased options |
(874,145 |
) |
|||||
|
Change in unrealized appreciation or depreciation on short positions |
18,473,224 |
||||||
|
Change in unrealized appreciation or depreciation on written options |
130,086 |
||||||
|
Net change in assets and liabilities: |
|||||||
|
(Increase)/decrease in assets: |
|||||||
|
Accrued interest and dividends receivable |
144,261 |
||||||
|
Prepaid expenses |
(8,538 |
) |
|||||
|
Other assets |
(173,622 |
) |
|||||
|
Increase/(decrease) in liabilities: |
|||||||
|
Payables to affiliates |
4,454 |
||||||
|
Other accounts payable and accrued liabilities |
16,882 |
||||||
|
Net cash provided by/(used in) operating activities |
$ |
(16,478,735 |
) |
||||
|
CASH FLOWS FROM FINANCING ACTIVITIES: |
|||||||
|
Distributions to shareholders |
(16,491,043 |
) |
|||||
|
Net increase/(decrease) in due to custodian bank |
(1,797 |
) |
|||||
|
Net cash provided by/(used in) financing activities |
$ |
(16,492,840 |
) |
||||
|
Net increase/(decrease) in cash |
$ |
(32,971,575 |
) |
||||
|
Cash and restricted cash at beginning of period |
$ |
267,907,632 |
|||||
|
Cash at end of period |
$ |
234,936,057 |
|||||
|
Supplemental disclosure |
|||||||
|
Cash paid for interest expense on Notes Payable |
$ |
3,576,583 |
|||||
|
The following table provides a reconciliation of cash and restricted cash reported within the Statement of Assets and Liabilities that sum to the total of the same such amounts shown in the Statements of Cash Flows. |
|||||||
|
Cash with custodian |
207,899 |
||||||
|
Restricted cash for short positions |
234,728,004 |
||||||
|
Foreign currency |
154 |
||||||
|
Total cash and restricted cash at period end |
$ |
234,936,057 |
|||||
See accompanying Notes to Financial Statements
CALAMOS CLOSED-END FAMILY OF FUNDS SEMIANNUAL REPORT
14
This page intentionally left blank.
Calamos Convertible Opportunities and Income Fund Financial Highlights
Selected data for a share outstanding throughout each period were as follows:
| (UNAUDITED) SIX MONTHS ENDED APRIL 30, |
YEAR ENDED OCTOBER 31, |
||||||||||||||
|
2024 |
2023 |
2022 |
|||||||||||||
|
PER SHARE OPERATING PERFORMANCE |
|||||||||||||||
|
Net asset value, beginning of period |
$ |
8.99 |
$ |
10.26 |
$ |
15.49 |
|||||||||
|
Income from investment operations: |
|||||||||||||||
|
Net investment income (loss)* |
(0.14 |
) |
(0.10 |
) |
0.01 |
||||||||||
|
Net realized and unrealized gain (loss) |
1.46 |
(0.03 |
) |
(4.11 |
) |
||||||||||
|
Total from investment operations |
1.32 |
(0.13 |
) |
(4.10 |
) |
||||||||||
|
Less distributions to common shareholders from: |
|||||||||||||||
|
Net investment income |
(0.49 |
) |
(0.15 |
) |
(0.27 |
) |
|||||||||
|
Net realized gains |
(0.08 |
) |
(0.99 |
) |
(0.87 |
) |
|||||||||
|
Return of capital |
— |
— |
— |
||||||||||||
|
Total distributions |
(0.57 |
) |
(1.14 |
) |
(1.14 |
) |
|||||||||
|
Premiums from shares sold in at the market offerings |
— |
— |
0.01 |
||||||||||||
|
Net asset value, end of period |
$ |
9.74 |
$ |
8.99 |
$ |
10.26 |
|||||||||
|
Market value, end of period |
$ |
10.95 |
$ |
9.99 |
$ |
10.78 |
|||||||||
|
TOTAL RETURN APPLICABLE TO COMMON SHAREHOLDERS |
|||||||||||||||
|
Total investment return based on:(b) |
|||||||||||||||
|
Net asset value |
14.52 |
% |
(2.27 |
%) |
(27.32 |
%) |
|||||||||
|
Market value |
15.86 |
% |
3.37 |
% |
(25.10 |
%) |
|||||||||
|
RATIOS TO AVERAGE NET ASSETS APPLICABLE TO COMMON SHAREHOLDERS |
|||||||||||||||
|
Net expenses(c) |
4.56 |
%(d) |
4.40 |
% |
2.44 |
% |
|||||||||
|
Net investment income (loss) |
(2.76 |
%)(d) |
(1.03 |
%) |
0.08 |
% |
|||||||||
|
SUPPLEMENTAL DATA |
|||||||||||||||
|
Net assets applicable to common shareholders, end of period (000) |
$ |
733,004 |
$ |
672,782 |
$ |
759,716 |
|||||||||
|
Portfolio turnover rate |
16 |
% |
39 |
% |
39 |
% |
|||||||||
|
Average commission rate paid |
$ |
0.0200 |
$ |
0.0188 |
$ |
0.0215 |
|||||||||
| Mandatory Redeemable Preferred Shares, at redemption value ($25 per share liquidation preference) (000's omitted) |
$ |
133,000 |
$ |
133,000 |
$ |
133,000 |
|||||||||
|
Notes Payable (000's omitted) |
$ |
314,400 |
$ |
314,400 |
$ |
339,400 |
|||||||||
|
Asset coverage per $1,000 of loan outstanding(e) |
$ |
3,754 |
$ |
3,563 |
$ |
3,630 |
|||||||||
|
Asset coverage per $25 liquidation value per share of Mandatory Redeemable Preferred Shares(f) |
$ |
222 |
$ |
211 |
$ |
232 |
|||||||||
* Net investment income (loss) calculated based on average shares method.
(a) Amount is less than $0.005 per common share.
(b) Total investment return is calculated assuming a purchase of common stock on the opening of the first day and a sale on the closing of the last day of the period reported. Dividends and distributions are assumed, for purposes of this calculation, to be reinvested at prices obtained under the Fund's dividend reinvestment plan. Total return is not annualized for periods less than one year. Brokerage commissions are not reflected. NAV per share is determined by dividing the value of the Fund's portfolio securities, cash and other assets, less all liabilities, by the total number of common shares outstanding. The common share market price is the price the market is willing to pay for shares of the Fund at a given time. Common share market price is influenced by a range of factors, including supply and demand and market conditions.
(c) Ratio of net expenses, excluding interest expense on Notes Payable and interest expense and amortization of offering costs on Mandatory Redeemable Preferred Shares, to average net assets was 1.38%, 1.38%, 1.34%, 1.23%, 1.26%, 1.29%, 1.28%, 1.24%, 1.24%, 1.50%, and 1.18%, respectively.
(d) Annualized.
(e) Calculated by subtracting the Fund's total liabilities (not including Notes payable and Mandatory Redeemable Preferred Shares) from the Fund's total assets and dividing this by the amount of Notes payable outstanding, and by multiplying the result by 1,000.
(f) Calculated by subtracting the Fund's total liabilities (not including Notes payable and Mandatory Redeemable Preferred Shares) from the Fund's total assets and dividing this by the amount of Mandatory Redeemable Preferred Shares outstanding, and by multiplying the result by 25.
CALAMOS CLOSED-END FAMILY OF FUNDS SEMIANNUAL REPORT
16
Calamos Convertible Opportunities and Income Fund Financial Highlights
|
YEAR ENDED OCTOBER 31, |
|||||||||||||||||||||||||||||||||||
|
2021 |
2020 |
2019 |
2018 |
2017 |
2016 |
2015 |
2014 |
||||||||||||||||||||||||||||
|
PER SHARE OPERATING PERFORMANCE |
|||||||||||||||||||||||||||||||||||
|
Net asset value, beginning of period |
$ |
12.54 |
$ |
10.64 |
$ |
10.46 |
$ |
11.35 |
$ |
10.73 |
$ |
11.68 |
$ |
13.45 |
$ |
13.20 |
|||||||||||||||||||
|
Income from investment operations: |
|||||||||||||||||||||||||||||||||||
|
Net investment income (loss)* |
(0.26 |
) |
0.49 |
0.50 |
0.57 |
0.57 |
0.60 |
0.62 |
0.72 |
||||||||||||||||||||||||||
|
Net realized and unrealized gain (loss) |
4.31 |
2.37 |
0.64 |
(0.33 |
) |
1.19 |
(0.41 |
) |
(1.25 |
) |
0.67 |
||||||||||||||||||||||||
|
Total from investment operations |
4.05 |
2.86 |
1.14 |
0.24 |
1.76 |
0.19 |
(0.63 |
) |
1.39 |
||||||||||||||||||||||||||
|
Less distributions to common shareholders from: |
|||||||||||||||||||||||||||||||||||
|
Net investment income |
(0.31 |
) |
(0.44 |
) |
(0.48 |
) |
(1.13 |
) |
(0.67 |
) |
(0.59 |
) |
(0.81 |
) |
(0.95 |
) |
|||||||||||||||||||
|
Net realized gains |
(0.79 |
) |
(0.52 |
) |
(0.31 |
) |
— |
(0.08 |
) |
— |
(0.02 |
) |
(0.19 |
) |
|||||||||||||||||||||
|
Return of capital |
— |
— |
(0.17 |
) |
— |
(0.39 |
) |
(0.55 |
) |
(0.31 |
) |
— |
|||||||||||||||||||||||
|
Total distributions |
(1.10 |
) |
(0.96 |
) |
(0.96 |
) |
(1.13 |
) |
(1.14 |
) |
(1.14 |
) |
(1.14 |
) |
(1.14 |
) |
|||||||||||||||||||
|
Premiums from shares sold in at the market offerings |
— |
(a) |
— |
— |
0.00 |
(a) |
0.00 |
(a) |
— |
0.00 |
(a) |
0.00 |
(a) |
||||||||||||||||||||||
|
Net asset value, end of period |
$ |
15.49 |
$ |
12.54 |
$ |
10.64 |
$ |
10.46 |
$ |
11.35 |
$ |
10.73 |
$ |
11.68 |
$ |
13.45 |
|||||||||||||||||||
|
Market value, end of period |
$ |
15.81 |
$ |
10.89 |
$ |
10.67 |
$ |
9.91 |
$ |
11.59 |
$ |
9.89 |
$ |
10.41 |
$ |
13.69 |
|||||||||||||||||||
|
TOTAL RETURN APPLICABLE TO COMMON SHAREHOLDERS |
|||||||||||||||||||||||||||||||||||
|
Total investment return based on:(b) |
|||||||||||||||||||||||||||||||||||
|
Net asset value |
33.21 |
% |
29.38 |
% |
11.75 |
% |
1.81 |
% |
17.48 |
% |
3.19 |
% |
(4.69 |
%) |
10.90 |
% |
|||||||||||||||||||
|
Market value |
56.56 |
% |
12.04 |
% |
18.29 |
% |
(5.54 |
%) |
30.15 |
% |
6.72 |
% |
(16.54 |
%) |
13.83 |
% |
|||||||||||||||||||
|
RATIOS TO AVERAGE NET ASSETS APPLICABLE TO COMMON SHAREHOLDERS |
|||||||||||||||||||||||||||||||||||
|
Net expenses(c) |
1.83 |
% |
2.20 |
% |
2.88 |
% |
2.52 |
% |
1.88 |
% |
1.74 |
% |
1.84 |
% |
1.47 |
% |
|||||||||||||||||||
|
Net investment income (loss) |
(1.76 |
%) |
4.36 |
% |
4.77 |
% |
5.11 |
% |
5.17 |
% |
5.61 |
% |
4.90 |
% |
5.38 |
% |
|||||||||||||||||||
|
SUPPLEMENTAL DATA |
|||||||||||||||||||||||||||||||||||
|
Net assets applicable to common shareholders, end of period (000) |
$ |
1,111,526 |
$ |
889,577 |
$ |
754,310 |
$ |
741,306 |
$ |
797,968 |
$ |
750,773 |
$ |
817,491 |
$ |
931,703 |
|||||||||||||||||||
|
Portfolio turnover rate |
46 |
% |
76 |
% |
51 |
% |
58 |
% |
90 |
% |
34 |
% |
36 |
% |
40 |
% |
|||||||||||||||||||
|
Average commission rate paid |
$ |
0.0215 |
$ |
0.0213 |
$ |
0.0188 |
$ |
0.0270 |
$ |
0.0282 |
$ |
0.0220 |
$ |
0.0303 |
$ |
0.0294 |
|||||||||||||||||||
| Mandatory Redeemable Preferred Shares, at redemption value ($25 per share liquidation preference) (000's omitted) |
$ |
133,000 |
$ |
100,000 |
$ |
100,000 |
$ |
100,000 |
$ |
100,000 |
$ |
— |
$ |
— |
$ |
— |
|||||||||||||||||||
|
Notes Payable (000's omitted) |
$ |
399,400 |
$ |
288,400 |
$ |
277,400 |
$ |
288,000 |
$ |
275,000 |
$ |
306,000 |
$ |
353,000 |
$ |
360,000 |
|||||||||||||||||||
|
Asset coverage per $1,000 of loan outstanding(e) |
$ |
4,116 |
$ |
4,431 |
$ |
4,080 |
$ |
3,921 |
$ |
4,265 |
$ |
3,454 |
$ |
3,316 |
$ |
3,588 |
|||||||||||||||||||
|
Asset coverage per $25 liquidation value per share of Mandatory Redeemable Preferred Shares(f) |
$ |
309 |
$ |
319 |
$ |
283 |
$ |
282 |
$ |
293 |
$ |
— |
$ |
— |
$ |
— |
|||||||||||||||||||
www.calamos.com
17
Calamos Convertible and High Income Fund Financial Highlights
Selected data for a share outstanding throughout each period were as follows:
| (UNAUDITED) SIX MONTHS ENDED APRIL 30, |
YEAR ENDED OCTOBER 31, |
||||||||||||||
|
2024 |
2023 |
2022 |
|||||||||||||
|
PER SHARE OPERATING PERFORMANCE |
|||||||||||||||
|
Net asset value, beginning of period |
$ |
9.49 |
$ |
10.81 |
$ |
16.38 |
|||||||||
|
Income from investment operations: |
|||||||||||||||
|
Net investment income (loss)* |
(0.15 |
) |
(0.12 |
) |
0.00 |
||||||||||
|
Net realized and unrealized gain (loss) |
1.56 |
0.00 |
(4.38 |
) |
|||||||||||
|
Total from investment operations |
1.41 |
(0.12 |
) |
(4.38 |
) |
||||||||||
|
Less distributions to common shareholders from: |
|||||||||||||||
|
Net investment income |
(0.55 |
) |
(0.15 |
) |
(0.27 |
) |
|||||||||
|
Net realized gains |
(0.05 |
) |
(1.05 |
) |
(0.93 |
) |
|||||||||
|
Return of capital |
— |
— |
— |
||||||||||||
|
Total distributions |
(0.60 |
) |
(1.20 |
) |
(1.20 |
) |
|||||||||
|
Capital charge resulting from issuance of common and preferred shares and related offering costs |
— |
— |
— |
||||||||||||
|
Premiums from shares sold in at the market offerings |
— |
— |
0.01 |
||||||||||||
|
Net asset value, end of period |
$ |
10.30 |
$ |
9.49 |
$ |
10.81 |
|||||||||
|
Market value, end of period |
$ |
11.20 |
$ |
10.87 |
$ |
11.00 |
|||||||||
|
TOTAL RETURN APPLICABLE TO COMMON SHAREHOLDERS |
|||||||||||||||
|
Total investment return based on:(b) |
|||||||||||||||
|
Net asset value |
14.56 |
% |
(1.99 |
%) |
(27.50 |
%) |
|||||||||
|
Market value |
8.75 |
% |
10.32 |
% |
(27.25 |
%) |
|||||||||
|
RATIOS TO AVERAGE NET ASSETS APPLICABLE TO COMMON SHAREHOLDERS |
|||||||||||||||
|
Net expenses(c) |
4.57 |
%(d) |
4.41 |
% |
2.45 |
% |
|||||||||
|
Net investment income (loss) |
(2.81 |
%)(d) |
(1.11 |
%) |
(0.02 |
%) |
|||||||||
|
SUPPLEMENTAL DATA |
|||||||||||||||
|
Net assets applicable to common shareholders, end of period (000) |
$ |
790,981 |
$ |
724,821 |
$ |
817,828 |
|||||||||
|
Portfolio turnover rate |
15 |
% |
40 |
% |
36 |
% |
|||||||||
|
Average commission rate paid |
$ |
0.0200 |
$ |
0.0188 |
$ |
0.0205 |
|||||||||
| Mandatory Redeemable Preferred Shares, at redemption value ($25 per share liquidation preference) (000's omitted) |
$ |
145,000 |
$ |
145,000 |
$ |
145,000 |
|||||||||
|
Notes Payable (000's omitted) |
$ |
340,400 |
$ |
340,400 |
$ |
365,400 |
|||||||||
|
Asset coverage per $1,000 of loan outstanding(e) |
$ |
3,750 |
$ |
3,556 |
$ |
3,635 |
|||||||||
|
Asset coverage per $25 liquidation value per share of Mandatory Redeemable Preferred Shares(f) |
$ |
220 |
$ |
209 |
$ |
229 |
|||||||||
* Net investment income (loss) calculated based on average shares method.
(a) Amount is less than $0.005 per common share.
(b) Total investment return is calculated assuming a purchase of common stock on the opening of the first day and a sale on the closing of the last day of the period reported. Dividends and distributions are assumed, for purposes of this calculation, to be reinvested at prices obtained under the Fund's dividend reinvestment plan. Total return is not annualized for periods less than one year. Brokerage commissions are not reflected. NAV per share is determined by dividing the value of the Fund's portfolio securities, cash and other assets, less all liabilities, by the total number of common shares outstanding. The common share market price is the price the market is willing to pay for shares of the Fund at a given time. Common share market price is influenced by a range of factors, including supply and demand and market conditions.
(c) Ratio of net expenses, excluding interest expense on Notes Payable and interest expense and amortization of offering costs on Mandatory Redeemable Preferred Shares, to average net assets was 1.38%, 1.38%, 1.34%, 1.23%, 1.27%, 1.30%, 1.28%, 1.24%, 1.25%, 1.21%, and 1.18%, respectively.
(d) Annualized.
(e) Calculated by subtracting the Fund's total liabilities (not including Notes payable and Mandatory Redeemable Preferred Shares) from the Fund's total assets and dividing this by the amount of Notes payable outstanding, and by multiplying the result by 1,000.
(f) Calculated by subtracting the Fund's total liabilities (not including Notes payable and Mandatory Redeemable Preferred Shares) from the Fund's total assets and dividing this by the amount of Mandatory Redeemable Preferred Shares outstanding, and by multiplying the result by 25.
CALAMOS CLOSED-END FAMILY OF FUNDS SEMIANNUAL REPORT
18
Calamos Convertible and High Income Fund Financial Highlights
|
YEAR ENDED OCTOBER 31, |
|||||||||||||||||||||||||||||||||||
|
2021 |
2020 |
2019 |
2018 |
2017 |
2016 |
2015 |
2014 |
||||||||||||||||||||||||||||
|
PER SHARE OPERATING PERFORMANCE |
|||||||||||||||||||||||||||||||||||
|
Net asset value, beginning of period |
$ |
13.22 |
$ |
11.18 |
$ |
11.02 |
$ |
11.96 |
$ |
11.33 |
$ |
12.39 |
$ |
14.24 |
$ |
13.89 |
|||||||||||||||||||
|
Income from investment operations: |
|||||||||||||||||||||||||||||||||||
|
Net investment income (loss)* |
(0.30 |
) |
0.53 |
0.54 |
0.60 |
0.61 |
0.65 |
0.73 |
0.79 |
||||||||||||||||||||||||||
|
Net realized and unrealized gain (loss) |
4.61 |
2.53 |
0.64 |
(0.35 |
) |
1.22 |
(0.51 |
) |
(1.38 |
) |
0.69 |
||||||||||||||||||||||||
|
Total from investment operations |
4.31 |
3.06 |
1.18 |
0.25 |
1.83 |
0.14 |
(0.65 |
) |
1.48 |
||||||||||||||||||||||||||
|
Less distributions to common shareholders from: |
|||||||||||||||||||||||||||||||||||
|
Net investment income |
(0.29 |
) |
(0.46 |
) |
(0.51 |
) |
(1.19 |
) |
(0.70 |
) |
(0.69 |
) |
(0.98 |
) |
(1.13 |
) |
|||||||||||||||||||
|
Net realized gains |
(0.86 |
) |
(0.56 |
) |
(0.34 |
) |
— |
— |
— |
— |
— |
||||||||||||||||||||||||
|
Return of capital |
— |
— |
(0.17 |
) |
— |
(0.50 |
) |
(0.51 |
) |
(0.22 |
) |
— |
|||||||||||||||||||||||
|
Total distributions |
(1.15 |
) |
(1.02 |
) |
(1.02 |
) |
(1.19 |
) |
(1.20 |
) |
(1.20 |
) |
(1.20 |
) |
(1.13 |
) |
|||||||||||||||||||
|
Capital charge resulting from issuance of common and preferred shares and related offering costs |
— |
— |
— |
0.00 |
(a) |
— |
0.00 |
(a) |
— |
— |
|||||||||||||||||||||||||
|
Premiums from shares sold in at the market offerings |
0.00 |
(a) |
— |
— |
0.00 |
(a) |
— |
— |
— |
— |
|||||||||||||||||||||||||
|
Net asset value, end of period |
$ |
16.38 |
$ |
13.22 |
$ |
11.18 |
$ |
11.02 |
$ |
11.96 |
$ |
11.33 |
$ |
12.39 |
$ |
14.24 |
|||||||||||||||||||
|
Market value, end of period |
$ |
16.61 |
$ |
11.50 |
$ |
11.10 |
$ |
10.86 |
$ |
11.96 |
$ |
10.47 |
$ |
11.61 |
$ |
14.47 |
|||||||||||||||||||
|
TOTAL RETURN APPLICABLE TO COMMON SHAREHOLDERS |
|||||||||||||||||||||||||||||||||||
|
Total investment return based on:(b) |
|||||||||||||||||||||||||||||||||||
|
Net asset value |
33.56 |
% |
29.87 |
% |
11.46 |
% |
1.75 |
% |
17.28 |
% |
2.55 |
% |
(4.65 |
%) |
11.22 |
% |
|||||||||||||||||||
|
Market value |
55.69 |
% |
13.79 |
% |
12.29 |
% |
0.28 |
% |
26.91 |
% |
1.13 |
% |
(12.08 |
%) |
22.16 |
% |
|||||||||||||||||||
|
RATIOS TO AVERAGE NET ASSETS APPLICABLE TO COMMON SHAREHOLDERS |
|||||||||||||||||||||||||||||||||||
|
Net expenses(c) |
1.84 |
% |
2.22 |
% |
2.91 |
% |
2.54 |
% |
1.89 |
% |
1.78 |
% |
1.57 |
% |
1.47 |
% |
|||||||||||||||||||
|
Net investment income (loss) |
(1.88 |
%) |
4.45 |
% |
4.85 |
% |
5.13 |
% |
5.25 |
% |
5.73 |
% |
5.38 |
% |
5.57 |
% |
|||||||||||||||||||
|
SUPPLEMENTAL DATA |
|||||||||||||||||||||||||||||||||||
|
Net assets applicable to common shareholders, end of period (000) |
$ |
1,207,158 |
$ |
968,077 |
$ |
818,412 |
$ |
806,342 |
$ |
868,817 |
$ |
822,183 |
$ |
898,695 |
$ |
1,029,902 |
|||||||||||||||||||
|
Portfolio turnover rate |
44 |
% |
76 |
% |
47 |
% |
58 |
% |
89 |
% |
34 |
% |
37 |
% |
35 |
% |
|||||||||||||||||||
|
Average commission rate paid |
$ |
0.0216 |
$ |
0.0225 |
$ |
0.0187 |
$ |
0.0260 |
$ |
0.0282 |
$ |
0.0221 |
$ |
0.0286 |
$ |
0.0292 |
|||||||||||||||||||
| Mandatory Redeemable Preferred Shares, at redemption value ($25 per share liquidation preference) (000's omitted) |
$ |
145,000 |
$ |
110,000 |
$ |
110,000 |
$ |
110,000 |
$ |
110,000 |
$ |
— |
$ |
— |
$ |
— |
|||||||||||||||||||
|
Notes Payable (000's omitted) |
$ |
435,400 |
$ |
318,400 |
$ |
303,900 |
$ |
315,500 |
$ |
302,500 |
$ |
337,000 |
$ |
398,000 |
$ |
400,000 |
|||||||||||||||||||
|
Asset coverage per $1,000 of loan outstanding(e) |
$ |
4,106 |
$ |
4,386 |
$ |
4,055 |
$ |
3,904 |
$ |
4,236 |
$ |
3,440 |
$ |
3,258 |
$ |
3,575 |
|||||||||||||||||||
|
Asset coverage per $25 liquidation value per share of Mandatory Redeemable Preferred Shares(f) |
$ |
308 |
$ |
317 |
$ |
280 |
$ |
280 |
$ |
291 |
$ |
— |
$ |
— |
$ |
— |
|||||||||||||||||||
www.calamos.com
19
Calamos Strategic Total Return Fund Financial Highlights
Selected data for a share outstanding throughout each period were as follows:
| (UNAUDITED) SIX MONTHS ENDED APRIL 30, |
YEAR ENDED OCTOBER 31, |
||||||||||||||
|
2024 |
2023 |
2022 |
|||||||||||||
|
PER SHARE OPERATING PERFORMANCE |
|||||||||||||||
|
Net asset value, beginning of period |
$ |
13.41 |
$ |
13.57 |
$ |
18.62 |
|||||||||
|
Income from investment operations: |
|||||||||||||||
|
Net investment income (loss)* |
(0.07 |
) |
(0.09 |
) |
0.05 |
||||||||||
|
Net realized and unrealized gain (loss) |
3.18 |
1.16 |
(3.87 |
) |
|||||||||||
|
Total from investment operations |
3.11 |
1.07 |
(3.82 |
) |
|||||||||||
|
Less distributions to common shareholders from: |
|||||||||||||||
|
Net investment income |
(0.51 |
) |
(0.63 |
) |
(0.26 |
) |
|||||||||
|
Net realized gains |
(0.10 |
) |
(0.60 |
) |
(0.97 |
) |
|||||||||
|
Return of capital |
— |
— |
— |
||||||||||||
|
Total distributions |
(0.61 |
) |
(1.23 |
) |
(1.23 |
) |
|||||||||
|
Premiums from shares sold in at the market offerings(a) |
— |
0.0007 |
0.0010 |
||||||||||||
|
Net asset value, end of period |
$ |
15.91 |
$ |
13.41 |
$ |
13.57 |
|||||||||
|
Market value, end of period |
$ |
15.56 |
$ |
12.83 |
$ |
13.76 |
|||||||||
|
TOTAL RETURN APPLICABLE TO COMMON SHAREHOLDERS |
|||||||||||||||
|
Total investment return based on:(b) |
|||||||||||||||
|
Net asset value |
23.41 |
% |
7.89 |
% |
(21.11 |
%) |
|||||||||
|
Market value |
26.23 |
% |
1.80 |
% |
(21.52 |
%) |
|||||||||
|
RATIOS TO AVERAGE NET ASSETS APPLICABLE TO COMMON SHAREHOLDERS |
|||||||||||||||
|
Net expenses(c) |
4.00 |
%(d) |
4.09 |
% |
2.50 |
% |
|||||||||
|
Net investment income (loss) |
(0.91 |
%)(d) |
(0.62 |
%) |
0.31 |
% |
|||||||||
|
SUPPLEMENTAL DATA |
|||||||||||||||
|
Net assets applicable to common shareholders, end of period (000) |
$ |
2,551,017 |
$ |
2,150,003 |
$ |
2,156,658 |
|||||||||
|
Portfolio turnover rate |
11 |
% |
29 |
% |
24 |
% |
|||||||||
|
Average commission rate paid |
$ |
0.0210 |
$ |
0.0194 |
$ |
0.0189 |
|||||||||
| Mandatory Redeemable Preferred Shares, at redemption value ($25 per share liquidation preference) (000's omitted) |
$ |
323,500 |
$ |
323,500 |
$ |
323,500 |
|||||||||
|
Notes Payable (000's omitted) |
$ |
860,500 |
$ |
800,500 |
$ |
800,500 |
|||||||||
|
Asset coverage per $1,000 of loan outstanding(e) |
$ |
4,341 |
$ |
4,090 |
$ |
4,098 |
|||||||||
|
Asset coverage per $25 liquidation value per share of Mandatory Redeemable Preferred Shares(f) |
$ |
289 |
$ |
253 |
$ |
254 |
|||||||||
* Net investment income (loss) calculated based on average shares method.
(a) Amount is less than $0.005 per common share.
(b) Total investment return is calculated assuming a purchase of common stock on the opening of the first day and a sale on the closing of the last day of the period reported. Dividends and distributions are assumed, for purposes of this calculation, to be reinvested at prices obtained under the Fund's dividend reinvestment plan. Total return is not annualized for periods less than one year. Brokerage commissions are not reflected. NAV per share is determined by dividing the value of the Fund's portfolio securities, cash and other assets, less all liabilities, by the total number of common shares outstanding. The common share market price is the price the market is willing to pay for shares of the Fund at a given time. Common share market price is influenced by a range of factors, including supply and demand and market conditions.
(c) Ratio of net expenses, excluding interest expense on Notes Payable and interest expense and amortization of offering costs on Mandatory Redeemable Preferred Shares, to average net assets was 1.53%, 1.57%, 1.53%, 1.44%, 1.54%, 1.55%, 1.53%, 1.47%, 1.49%, 1.47% and 1.44%, respectively.
(d) Annualized.
(e) Calculated by subtracting the Fund's total liabilities (not including Notes payable and Mandatory Redeemable Preferred Shares) from the Fund's total assets and dividing this by the amount of Notes payable outstanding, and by multiplying the result by 1,000.
(f) Calculated by subtracting the Fund's total liabilities (not including Notes payable and Mandatory Redeemable Preferred Shares) from the Fund's total assets and dividing this by the amount of Mandatory Redeemable Preferred Shares outstanding, and by multiplying the result by 25.
CALAMOS CLOSED-END FAMILY OF FUNDS SEMIANNUAL REPORT
20
Calamos Strategic Total Return Fund Financial Highlights
|
YEAR ENDED OCTOBER 31, |
|||||||||||||||||||||||||||||||||||
|
2021 |
2020 |
2019 |
2018 |
2017 |
2016 |
2015 |
2014 |
||||||||||||||||||||||||||||
|
PER SHARE OPERATING PERFORMANCE |
|||||||||||||||||||||||||||||||||||
|
Net asset value, beginning of period |
$ |
13.30 |
$ |
12.93 |
$ |
12.25 |
$ |
12.76 |
$ |
11.13 |
$ |
11.67 |
$ |
12.51 |
$ |
11.86 |
|||||||||||||||||||
|
Income from investment operations: |
|||||||||||||||||||||||||||||||||||
|
Net investment income (loss)* |
0.10 |
0.21 |
0.18 |
0.16 |
0.26 |
0.30 |
0.38 |
0.42 |
|||||||||||||||||||||||||||
|
Net realized and unrealized gain (loss) |
6.42 |
1.24 |
1.49 |
0.32 |
2.36 |
0.15 |
(0.23 |
) |
1.16 |
||||||||||||||||||||||||||
|
Total from investment operations |
6.52 |
1.45 |
1.67 |
0.48 |
2.62 |
0.45 |
0.15 |
1.58 |
|||||||||||||||||||||||||||
|
Less distributions to common shareholders from: |
|||||||||||||||||||||||||||||||||||
|
Net investment income |
(0.29 |
) |
(0.54 |
) |
(0.16 |
) |
(0.48 |
) |
(0.85 |
) |
(0.46 |
) |
(0.66 |
) |
(0.55 |
) |
|||||||||||||||||||
|
Net realized gains |
(0.91 |
) |
(0.54 |
) |
(0.83 |
) |
(0.51 |
) |
(0.14 |
) |
(0.16 |
) |
— |
(0.16 |
) |
||||||||||||||||||||
|
Return of capital |
— |
— |
— |
— |
— |
(0.37 |
) |
(0.33 |
) |
(0.22 |
) |
||||||||||||||||||||||||
|
Total distributions |
(1.20 |
) |
(1.08 |
) |
(0.99 |
) |
(0.99 |
) |
(0.99 |
) |
(0.99 |
) |
(0.99 |
) |
(0.93 |
) |
|||||||||||||||||||
|
Premiums from shares sold in at the market offerings(a) |
0.0026 |
— |
— |
— |
— |
— |
— |
— |
|||||||||||||||||||||||||||
|
Net asset value, end of period |
$ |
18.62 |
$ |
13.30 |
$ |
12.93 |
$ |
12.25 |
$ |
12.76 |
$ |
11.13 |
$ |
11.67 |
$ |
12.51 |
|||||||||||||||||||
|
Market value, end of period |
$ |
18.98 |
$ |
12.80 |
$ |
13.02 |
$ |
11.75 |
$ |
12.33 |
$ |
9.95 |
$ |
10.20 |
$ |
11.82 |
|||||||||||||||||||
|
TOTAL RETURN APPLICABLE TO COMMON SHAREHOLDERS |
|||||||||||||||||||||||||||||||||||
|
Total investment return based on:(b) |
|||||||||||||||||||||||||||||||||||
|
Net asset value |
50.32 |
% |
12.33 |
% |
14.46 |
% |
3.81 |
% |
25.11 |
% |
5.48 |
% |
1.98 |
% |
14.46 |
% |
|||||||||||||||||||
|
Market value |
59.21 |
% |
7.36 |
% |
20.16 |
% |
3.05 |
% |
35.23 |
% |
7.89 |
% |
(5.66 |
%) |
21.46 |
% |
|||||||||||||||||||
|
RATIOS TO AVERAGE NET ASSETS APPLICABLE TO COMMON SHAREHOLDERS |
|||||||||||||||||||||||||||||||||||
|
Net expenses(c) |
2.03 |
% |
2.45 |
% |
3.05 |
% |
2.74 |
% |
2.09 |
% |
1.97 |
% |
1.81 |
% |
1.72 |
% |
|||||||||||||||||||
|
Net investment income (loss) |
0.60 |
% |
1.64 |
% |
1.42 |
% |
1.25 |
% |
2.17 |
% |
2.73 |
% |
3.11 |
% |
3.39 |
% |
|||||||||||||||||||
|
SUPPLEMENTAL DATA |
|||||||||||||||||||||||||||||||||||
|
Net assets applicable to common shareholders, end of period (000) |
$ |
2,928,463 |
$ |
2,061,019 |
$ |
2,000,709 |
$ |
1,893,000 |
$ |
1,971,910 |
$ |
1,719,456 |
$ |
1,803,026 |
$ |
1,932,218 |
|||||||||||||||||||
|
Portfolio turnover rate |
27 |
% |
36 |
% |
26 |
% |
27 |
% |
65 |
% |
31 |
% |
23 |
% |
20 |
% |
|||||||||||||||||||
|
Average commission rate paid |
$ |
0.0206 |
$ |
0.0212 |
$ |
0.0270 |
$ |
0.0217 |
$ |
0.0240 |
$ |
0.0307 |
$ |
0.0336 |
$ |
0.0210 |
|||||||||||||||||||
| Mandatory Redeemable Preferred Shares, at redemption value ($25 per share liquidation preference) (000's omitted) |
$ |
304,000 |
$ |
242,000 |
$ |
242,000 |
$ |
242,000 |
$ |
242,000 |
$ |
— |
$ |
— |
$ |
— |
|||||||||||||||||||
|
Notes Payable (000's omitted) |
$ |
880,000 |
$ |
703,000 |
$ |
668,000 |
$ |
713,000 |
$ |
543,000 |
$ |
682,000 |
$ |
716,000 |
$ |
725,000 |
|||||||||||||||||||
|
Asset coverage per $1,000 of loan outstanding(e) |
$ |
4,673 |
$ |
4,276 |
$ |
4,357 |
$ |
3,995 |
$ |
5,077 |
$ |
3,521 |
$ |
3,518 |
$ |
3,665 |
|||||||||||||||||||
|
Asset coverage per $25 liquidation value per share of Mandatory Redeemable Preferred Shares(f) |
$ |
338 |
$ |
311 |
$ |
301 |
$ |
294 |
$ |
285 |
$ |
— |
$ |
— |
$ |
— |
|||||||||||||||||||
www.calamos.com
21
Calamos Dynamic Convertible and Income Fund Financial Highlights
Selected data for a share outstanding throughout each period were as follows:
| (UNAUDITED) SIX MONTHS ENDED APRIL 30, |
YEAR ENDED OCTOBER 31, |
||||||||||
|
2024 |
2023 |
||||||||||
|
PER SHARE OPERATING PERFORMANCE |
|||||||||||
|
Net asset value, beginning of period |
$ |
17.24 |
$ |
20.19 |
|||||||
|
Income from investment operations: |
|||||||||||
|
Net investment income (loss)* |
(0.54 |
) |
(0.63 |
) |
|||||||
|
Net realized and unrealized gain (loss) |
3.16 |
0.01 |
|||||||||
|
Total from investment operations |
2.62 |
(0.62 |
) |
||||||||
|
Less distributions to common shareholders from: |
|||||||||||
|
Net investment income |
(0.97 |
) |
(0.03 |
) |
|||||||
|
Net realized gains |
(0.20 |
) |
(2.31 |
) |
|||||||
|
Return of capital |
— |
— |
|||||||||
|
Total distributions |
(1.17 |
) |
(2.34 |
) |
|||||||
|
Capital charge resulting from issuance of common and preferred shares and related offering costs |
— |
— |
|||||||||
|
Premiums from shares sold in at the market offerings |
— |
0.0078 |
(b) |
||||||||
|
Net asset value, end of period |
$ |
18.69 |
$ |
17.24 |
|||||||
|
Market value, end of period |
$ |
22.01 |
$ |
17.07 |
|||||||
|
TOTAL RETURN APPLICABLE TO COMMON SHAREHOLDERS |
|||||||||||
|
Total investment return based on:(c)(d) |
|||||||||||
|
Net asset value |
14.96 |
% |
(4.26 |
%) |
|||||||
|
Market value |
36.80 |
% |
(12.56 |
%) |
|||||||
|
RATIOS TO AVERAGE NET ASSETS APPLICABLE TO COMMON SHAREHOLDERS |
|||||||||||
|
Net expenses(d) |
4.82 |
%(e) |
4.63 |
% |
|||||||
|
Net investment income (loss) |
(5.56 |
%)(e) |
(3.19 |
%) |
|||||||
|
SUPPLEMENTAL DATA |
|||||||||||
|
Net assets applicable to common shareholders, end of period (000) |
$ |
500,360 |
$ |
459,365 |
|||||||
|
Portfolio turnover rate |
16 |
% |
44 |
% |
|||||||
|
Average commission rate paid |
$ |
0.0200 |
$ |
0.0185 |
|||||||
|
Mandatory Redeemable Preferred Shares, at redemption value ($25 per share liquidation preference) (000's omitted) |
$ |
92,000 |
$ |
92,000 |
|||||||
|
Notes Payable (000's omitted) |
$ |
210,000 |
$ |
210,000 |
|||||||
|
Asset coverage per $1,000 of loan outstanding(f) |
$ |
3,821 |
$ |
3,626 |
|||||||
|
Asset coverage per $25 liquidation value per share of Mandatory Redeemable Preferred Shares(g) |
$ |
218 |
$ |
207 |
|||||||
• Commencement of operations.
* Net investment income (loss) calculated based on average shares method.
(a) Net of sales load of $1.125 on initial shares issued and beginning net asset value of $23.875.
(b) Amount is less than $0.01.
(c) Total investment return is calculated assuming a purchase of common stock on the opening of the first day and a sale on the closing of the last day of the period reported. Dividends and distributions are assumed, for purposes of this calculation, to be reinvested at prices obtained under the Fund's dividend reinvestment plan. Total return is not annualized for periods less than one year. Brokerage commissions are not reflected. NAV per share is determined by dividing the value of the Fund's portfolio securities, cash and other assets, less all liabilities, by the total number of common shares outstanding. The common share market price is the price the market is willing to pay for shares of the Fund at a given time. Common share market price is influenced by a range of factors, including supply and demand and market conditions.
(d) Ratio of net expenses, excluding interest expense on Notes Payable and interest expense and amortization of offering costs on Mandatory Redeemable Preferred Shares, to average net assets was 1.70%, 1.70%, 1.65%, 1.51%, 1.56%, 1.61%, 1.57%, 1.51%, 1.52% and 1.56%, respectively.
(e) Annualized.
(f) Calculated by subtracting the Fund's total liabilities (not including Notes payable and Mandatory Redeemable Preferred Shares) from the Fund's total assets and dividing this by the amount of Notes payable outstanding, and by multiplying the result by 1,000.
(g) Calculated by subtracting the Fund's total liabilities (not including Notes payable and Mandatory Redeemable Preferred Shares) from the Fund's total assets and dividing this by the amount of Mandatory Redeemable Preferred Shares outstanding, and by multiplying the result by 25.
CALAMOS CLOSED-END FAMILY OF FUNDS SEMIANNUAL REPORT
22
Calamos Dynamic Convertible and Income Fund Financial Highlights
|
YEAR ENDED OCTOBER 31, |
MARCH 27, 2015• THROUGH OCTOBER 31, |
||||||||||||||||||||||||||||||||||
|
2022 |
2021 |
2020 |
2019 |
2018 |
2017 |
2016 |
2015 |
||||||||||||||||||||||||||||
|
PER SHARE OPERATING PERFORMANCE |
|||||||||||||||||||||||||||||||||||
|
Net asset value, beginning of period |
$ |
31.73 |
$ |
25.00 |
$ |
19.93 |
$ |
19.55 |
$ |
21.03 |
$ |
19.56 |
$ |
21.63 |
$ |
23.88 |
(a) |
||||||||||||||||||
|
Income from investment operations: |
|||||||||||||||||||||||||||||||||||
|
Net investment income (loss)* |
(0.43 |
) |
(1.21 |
) |
0.70 |
0.73 |
0.85 |
0.86 |
0.89 |
0.48 |
|||||||||||||||||||||||||
|
Net realized and unrealized gain (loss) |
(8.81 |
) |
10.20 |
6.37 |
1.65 |
(0.33 |
) |
2.61 |
(0.96 |
) |
(1.84 |
) |
|||||||||||||||||||||||
|
Total from investment operations |
(9.24 |
) |
8.99 |
7.07 |
2.38 |
0.52 |
3.47 |
(0.07 |
) |
(1.36 |
) |
||||||||||||||||||||||||
|
Less distributions to common shareholders from: |
|||||||||||||||||||||||||||||||||||
|
Net investment income |
(0.24 |
) |
(0.25 |
) |
(0.70 |
) |
(0.50 |
) |
(2.00 |
) |
(0.91 |
) |
(0.99 |
) |
(0.84 |
) |
|||||||||||||||||||
|
Net realized gains |
(2.10 |
) |
(2.01 |
) |
(1.30 |
) |
(0.80 |
) |
— |
— |
(0.00 |
)(b) |
— |
||||||||||||||||||||||
|
Return of capital |
— |
— |
— |
(0.70 |
) |
— |
(1.09 |
) |
(1.01 |
) |
— |
||||||||||||||||||||||||
|
Total distributions |
(2.34 |
) |
(2.26 |
) |
(2.00 |
) |
(2.00 |
) |
(2.00 |
) |
(2.00 |
) |
(2.00 |
) |
(0.84 |
) |
|||||||||||||||||||
|
Capital charge resulting from issuance of common and preferred shares and related offering costs |
— |
— |
— |
— |
— |
— |
— |
(0.05 |
) |
||||||||||||||||||||||||||
|
Premiums from shares sold in at the market offerings |
0.0384 |
0.0078 |
— |
— |
— |
— |
— |
— |
|||||||||||||||||||||||||||
|
Net asset value, end of period |
$ |
20.19 |
$ |
31.73 |
$ |
25.00 |
$ |
19.93 |
$ |
19.55 |
$ |
21.03 |
$ |
19.56 |
$ |
21.63 |
|||||||||||||||||||
|
Market value, end of period |
$ |
21.89 |
$ |
32.62 |
$ |
22.35 |
$ |
20.65 |
$ |
18.94 |
$ |
20.49 |
$ |
17.83 |
$ |
19.28 |
|||||||||||||||||||
|
TOTAL RETURN APPLICABLE TO COMMON SHAREHOLDERS |
|||||||||||||||||||||||||||||||||||
|
Total investment return based on:(c)(d) |
|||||||||||||||||||||||||||||||||||
|
Net asset value |
(29.91 |
%) |
36.76 |
% |
38.59 |
% |
13.05 |
% |
2.40 |
% |
19.19 |
% |
1.03 |
% |
(5.78 |
%) |
|||||||||||||||||||
|
Market value |
(26.08 |
%) |
57.27 |
% |
19.58 |
% |
20.85 |
% |
1.82 |
% |
27.40 |
% |
3.32 |
% |
(19.79 |
%) |
|||||||||||||||||||
|
RATIOS TO AVERAGE NET ASSETS APPLICABLE TO COMMON SHAREHOLDERS |
|||||||||||||||||||||||||||||||||||
|
Net expenses(d) |
2.75 |
% |
2.10 |
% |
2.50 |
% |
3.22 |
% |
2.82 |
% |
2.17 |
% |
2.02 |
% |
1.91 |
%(e) |
|||||||||||||||||||
|
Net investment income (loss) |
(1.73 |
%) |
(3.97 |
%) |
3.22 |
% |
3.70 |
% |
4.06 |
% |
4.26 |
% |
4.48 |
% |
3.65 |
%(e) |
|||||||||||||||||||
|
SUPPLEMENTAL DATA |
|||||||||||||||||||||||||||||||||||
|
Net assets applicable to common shareholders, end of period (000) |
$ |
526,613 |
$ |
788,554 |
$ |
612,024 |
$ |
487,709 |
$ |
477,256 |
$ |
512,737 |
$ |
477,070 |
$ |
527,472 |
|||||||||||||||||||
|
Portfolio turnover rate |
42 |
% |
48 |
% |
85 |
% |
50 |
% |
67 |
% |
78 |
% |
40 |
% |
23 |
% |
|||||||||||||||||||
|
Average commission rate paid |
$ |
0.0563 |
$ |
0.0217 |
$ |
0.0243 |
$ |
0.0182 |
$ |
0.0249 |
$ |
0.0212 |
$ |
0.0233 |
$ |
0.0198 |
|||||||||||||||||||
|
Mandatory Redeemable Preferred Shares, at redemption value ($25 per share liquidation preference) (000's omitted) |
$ |
92,000 |
$ |
92,000 |
$ |
64,000 |
$ |
64,000 |
$ |
64,000 |
$ |
64,000 |
$ |
— |
$ |
— |
|||||||||||||||||||
|
Notes Payable (000's omitted) |
$ |
230,000 |
$ |
270,000 |
$ |
204,600 |
$ |
180,600 |
$ |
187,500 |
$ |
169,000 |
$ |
195,000 |
$ |
220,000 |
|||||||||||||||||||
|
Asset coverage per $1,000 of loan outstanding(f) |
$ |
3,690 |
$ |
4,261 |
$ |
4,304 |
$ |
4,055 |
$ |
3,887 |
$ |
4,413 |
$ |
3,447 |
$ |
3,398 |
|||||||||||||||||||
|
Asset coverage per $25 liquidation value per share of Mandatory Redeemable Preferred Shares(g) |
$ |
231 |
$ |
313 |
$ |
344 |
$ |
286 |
$ |
285 |
$ |
291 |
$ |
— |
$ |
— |
|||||||||||||||||||
www.calamos.com
23
Calamos Global Dynamic Income Fund Financial Highlights
Selected data for a share outstanding throughout each period were as follows:
| (UNAUDITED) SIX MONTHS ENDED APRIL 30, |
YEAR ENDED OCTOBER 31, |
||||||||||||||
|
2024 |
2023 |
2022 |
|||||||||||||
|
PER SHARE OPERATING PERFORMANCE |
|||||||||||||||
|
Net asset value, beginning of period |
$ |
5.99 |
$ |
6.12 |
$ |
10.14 |
|||||||||
|
Income from investment operations: |
|||||||||||||||
|
Net investment income (loss)* |
(0.03 |
) |
(0.08 |
) |
(0.07 |
) |
|||||||||
|
Net realized and unrealized gain (loss) |
1.52 |
0.55 |
(3.15 |
) |
|||||||||||
|
Total from investment operations |
1.49 |
0.47 |
(3.22 |
) |
|||||||||||
|
Less distributions to common shareholders from: |
|||||||||||||||
|
Net investment income |
(0.15 |
) |
(0.10 |
) |
(0.01 |
) |
|||||||||
|
Net realized gains |
(0.15 |
) |
(0.20 |
) |
(0.09 |
) |
|||||||||
|
Return of capital |
— |
(0.30 |
) |
(0.72 |
) |
||||||||||
|
Total distributions |
(0.30 |
) |
(0.60 |
) |
(0.82 |
) |
|||||||||
|
Premiums from shares sold in at the market offerings |
— |
— |
0.0191 |
||||||||||||
|
Net asset value, end of period |
$ |
7.18 |
$ |
5.99 |
$ |
6.12 |
|||||||||
|
Market value, end of period |
$ |
6.37 |
$ |
5.22 |
$ |
5.64 |
|||||||||
|
TOTAL RETURN APPLICABLE TO COMMON SHAREHOLDERS |
|||||||||||||||
|
Total investment return based on:(a) |
|||||||||||||||
|
Net asset value |
25.95 |
% |
8.29 |
% |
(32.89 |
%) |
|||||||||
|
Market value |
28.23 |
% |
2.40 |
% |
(39.64 |
%) |
|||||||||
|
RATIOS TO AVERAGE NET ASSETS APPLICABLE TO COMMON SHAREHOLDERS |
|||||||||||||||
|
Net expenses(b) |
4.12 |
%(c) |
3.68 |
% |
2.73 |
% |
|||||||||
|
Net investment income (loss) |
(0.94 |
%)(c) |
(1.19 |
%) |
(0.85 |
%) |
|||||||||
|
SUPPLEMENTAL DATA |
|||||||||||||||
|
Net assets applicable to common shareholders, end of period (000) |
$ |
458,349 |
$ |
382,865 |
$ |
391,101 |
|||||||||
|
Portfolio turnover rate |
113 |
% |
114 |
% |
134 |
% |
|||||||||
|
Average commission rate paid |
$ |
0.0047 |
$ |
0.0036 |
$ |
0.0117 |
|||||||||
| Mandatory Redeemable Preferred Shares, at redemption value ($25 per share liquidation preference) (000's omitted) |
$ |
70,000 |
$ |
70,000 |
$ |
70,000 |
|||||||||
|
Notes Payable (000's omitted) |
$ |
147,050 |
$ |
130,550 |
$ |
109,550 |
|||||||||
|
Asset coverage per $1,000 of loan outstanding(d) |
$ |
4,593 |
$ |
4,469 |
$ |
5,209 |
|||||||||
|
Asset coverage per $25 liquidation value per share of Mandatory Redeemable Preferred Shares(e) |
$ |
241 |
$ |
208 |
$ |
204 |
|||||||||
* Net investment income (loss) calculated based on average shares method.
(a) Total investment return is calculated assuming a purchase of common stock on the opening of the first day and a sale on the closing of the last day of the period reported. Dividends and distributions are assumed, for purposes of this calculation, to be reinvested at prices obtained under the Fund's dividend reinvestment plan. Total return is not annualized for periods less than one year. Brokerage commissions are not reflected. NAV per share is determined by dividing the value of the Fund's portfolio securities, cash and other assets, less all liabilities, by the total number of common shares outstanding. The common share market price is the price the market is willing to pay for shares of the Fund at a given time. Common share market price is influenced by a range of factors, including supply and demand and market conditions.
(b) Ratio of net expenses, excluding interest expense on Notes Payable and interest expense and amortization of offering costs on Mandatory Redeemable Preferred Shares, to average net assets was 1.63%, 1.58%, 1.66%, 1.55%, 1.61%, 1.65%, 1.60%, 1.53%, 1.54%, 1.53% and 1.48%, respectively.
(c) Annualized.
(d) Calculated by subtracting the Fund's total liabilities (not including Notes payable and Mandatory Redeemable Preferred Shares) from the Fund's total assets and dividing this by the amount of Notes payable outstanding, and by multiplying the result by 1,000.
(e) Calculated by subtracting the Fund's total liabilities (not including Notes payable and Mandatory Redeemable Preferred Shares) from the Fund's total assets and dividing this by the amount of Mandatory Redeemable Preferred Shares outstanding, and by multiplying the result by 25.
CALAMOS CLOSED-END FAMILY OF FUNDS SEMIANNUAL REPORT
24
Calamos Global Dynamic Income Fund Financial Highlights
|
YEAR ENDED OCTOBER 31, |
|||||||||||||||||||||||||||||||||||
|
2021 |
2020 |
2019 |
2018 |
2017 |
2016 |
2015 |
2014 |
||||||||||||||||||||||||||||
|
PER SHARE OPERATING PERFORMANCE |
|||||||||||||||||||||||||||||||||||
|
Net asset value, beginning of period |
$ |
8.03 |
$ |
7.90 |
$ |
7.98 |
$ |
9.21 |
$ |
8.16 |
$ |
8.92 |
$ |
9.86 |
$ |
10.05 |
|||||||||||||||||||
|
Income from investment operations: |
|||||||||||||||||||||||||||||||||||
|
Net investment income (loss)* |
0.03 |
0.15 |
0.17 |
0.18 |
0.22 |
0.28 |
0.28 |
0.40 |
|||||||||||||||||||||||||||
|
Net realized and unrealized gain (loss) |
2.92 |
0.82 |
0.59 |
(0.57 |
) |
1.67 |
(0.20 |
) |
(0.38 |
) |
0.21 |
||||||||||||||||||||||||
|
Total from investment operations |
2.95 |
0.97 |
0.76 |
(0.39 |
) |
1.89 |
0.08 |
(0.10 |
) |
0.61 |
|||||||||||||||||||||||||
|
Less distributions to common shareholders from: |
|||||||||||||||||||||||||||||||||||
|
Net investment income |
(0.15 |
) |
(0.32 |
) |
(0.28 |
) |
(0.84 |
) |
(0.76 |
) |
(0.46 |
) |
(0.72 |
) |
(0.70 |
) |
|||||||||||||||||||
|
Net realized gains |
(0.69 |
) |
(0.52 |
) |
(0.14 |
) |
— |
(0.08 |
) |
— |
— |
— |
|||||||||||||||||||||||
|
Return of capital |
— |
— |
(0.42 |
) |
— |
— |
(0.38 |
) |
(0.12 |
) |
(0.10 |
) |
|||||||||||||||||||||||
|
Total distributions |
(0.84 |
) |
(0.84 |
) |
(0.84 |
) |
(0.84 |
) |
(0.84 |
) |
(0.84 |
) |
(0.84 |
) |
(0.80 |
) |
|||||||||||||||||||
|
Premiums from shares sold in at the market offerings |
0.0026 |
— |
— |
— |
— |
— |
— |
— |
|||||||||||||||||||||||||||
|
Net asset value, end of period |
$ |
10.14 |
$ |
8.03 |
$ |
7.90 |
$ |
7.98 |
$ |
9.21 |
$ |
8.16 |
$ |
8.92 |
$ |
9.86 |
|||||||||||||||||||
|
Market value, end of period |
$ |
10.39 |
$ |
7.80 |
$ |
8.13 |
$ |
7.59 |
$ |
9.13 |
$ |
7.16 |
$ |
7.68 |
$ |
9.01 |
|||||||||||||||||||
|
TOTAL RETURN APPLICABLE TO COMMON SHAREHOLDERS |
|||||||||||||||||||||||||||||||||||
|
Total investment return based on:(a) |
|||||||||||||||||||||||||||||||||||
|
Net asset value |
37.46 |
% |
14.00 |
% |
10.29 |
% |
(4.85 |
%) |
25.23 |
% |
2.98 |
% |
(0.15 |
%) |
7.02 |
% |
|||||||||||||||||||
|
Market value |
45.01 |
% |
7.60 |
% |
19.34 |
% |
(8.71 |
%) |
41.48 |
% |
4.95 |
% |
(5.92 |
%) |
10.93 |
% |
|||||||||||||||||||
|
RATIOS TO AVERAGE NET ASSETS APPLICABLE TO COMMON SHAREHOLDERS |
|||||||||||||||||||||||||||||||||||
|
Net expenses(b) |
2.27 |
% |
2.70 |
% |
3.41 |
% |
2.97 |
% |
2.23 |
% |
2.06 |
% |
1.89 |
% |
1.79 |
% |
|||||||||||||||||||
|
Net investment income (loss) |
0.26 |
% |
1.91 |
% |
2.12 |
% |
1.95 |
% |
2.58 |
% |
3.42 |
% |
2.97 |
% |
3.92 |
% |
|||||||||||||||||||
|
SUPPLEMENTAL DATA |
|||||||||||||||||||||||||||||||||||
|
Net assets applicable to common shareholders, end of period (000) |
$ |
609,038 |
$ |
476,533 |
$ |
468,186 |
$ |
471,953 |
$ |
543,275 |
$ |
481,513 |
$ |
526,508 |
$ |
581,624 |
|||||||||||||||||||
|
Portfolio turnover rate |
117 |
% |
128 |
% |
78 |
% |
93 |
% |
99 |
% |
29 |
% |
45 |
% |
32 |
% |
|||||||||||||||||||
|
Average commission rate paid |
$ |
0.0173 |
$ |
0.0210 |
$ |
0.0279 |
$ |
0.0199 |
$ |
0.0295 |
$ |
0.0289 |
$ |
0.0244 |
$ |
0.0269 |
|||||||||||||||||||
| Mandatory Redeemable Preferred Shares, at redemption value ($25 per share liquidation preference) (000's omitted) |
$ |
70,000 |
$ |
65,000 |
$ |
65,000 |
$ |
65,000 |
$ |
65,000 |
$ |
— |
$ |
— |
$ |
— |
|||||||||||||||||||
|
Notes Payable (000's omitted) |
$ |
206,500 |
$ |
153,250 |
$ |
174,500 |
$ |
204,000 |
$ |
160,000 |
$ |
196,000 |
$ |
224,400 |
$ |
230,000 |
|||||||||||||||||||
|
Asset coverage per $1,000 of loan outstanding(d) |
$ |
4,288 |
$ |
4,534 |
$ |
4,056 |
$ |
3,632 |
$ |
4,802 |
$ |
3,457 |
$ |
3,346 |
$ |
3,529 |
|||||||||||||||||||
|
Asset coverage per $25 liquidation value per share of Mandatory Redeemable Preferred Shares(e) |
$ |
316 |
$ |
267 |
$ |
272 |
$ |
285 |
$ |
295 |
$ |
— |
$ |
— |
$ |
— |
|||||||||||||||||||
www.calamos.com
25
Calamos Global Total Return Fund Financial Highlights
Selected data for a share outstanding throughout each period were as follows:
| (UNAUDITED) SIX MONTHS ENDED APRIL 30, |
YEAR ENDED OCTOBER 31, |
||||||||||||||
|
2024 |
2023 |
2022 |
|||||||||||||
|
PER SHARE OPERATING PERFORMANCE |
|||||||||||||||
|
Net asset value, beginning of period |
$ |
9.12 |
$ |
9.59 |
$ |
15.82 |
|||||||||
|
Income from investment operations: |
|||||||||||||||
|
Net investment income (loss)* |
(0.07 |
) |
(0.17 |
) |
(0.12 |
) |
|||||||||
|
Net realized and unrealized gain (loss) |
2.44 |
0.66 |
(4.96 |
) |
|||||||||||
|
Total from investment operations |
2.37 |
0.49 |
(5.08 |
) |
|||||||||||
|
Less distributions to common shareholders from: |
|||||||||||||||
|
Net investment income |
(0.24 |
) |
(0.17 |
) |
(0.08 |
) |
|||||||||
|
Net realized gains |
(0.24 |
) |
(0.50 |
) |
(0.26 |
) |
|||||||||
|
Return of capital |
— |
(0.29 |
) |
(0.84 |
) |
||||||||||
|
Total distributions |
(0.48 |
) |
(0.96 |
) |
(1.18 |
) |
|||||||||
|
Premiums from shares sold in at the market offerings |
— |
— |
0.0279 |
||||||||||||
|
Net asset value, end of period |
$ |
11.01 |
$ |
9.12 |
$ |
9.59 |
|||||||||
|
Market value, end of period |
$ |
9.96 |
$ |
8.15 |
$ |
9.12 |
|||||||||
|
TOTAL RETURN APPLICABLE TO COMMON SHAREHOLDERS |
|||||||||||||||
|
Total investment return based on:(a) |
|||||||||||||||
|
Net asset value |
26.92 |
% |
5.26 |
% |
(33.22 |
%) |
|||||||||
|
Market value |
28.46 |
% |
(0.98 |
%) |
(36.65 |
%) |
|||||||||
|
RATIOS TO AVERAGE NET ASSETS APPLICABLE TO COMMON SHAREHOLDERS |
|||||||||||||||
|
Net expenses(b) |
4.28 |
%(c) |
3.86 |
% |
2.86 |
% |
|||||||||
|
Net investment income (loss) |
(1.44 |
%)(c) |
(1.73 |
%) |
(0.93 |
%) |
|||||||||
|
SUPPLEMENTAL DATA |
|||||||||||||||
|
Net assets applicable to common shareholders, end of period (000) |
$ |
108,165 |
$ |
89,579 |
$ |
94,186 |
|||||||||
|
Portfolio turnover rate |
102 |
% |
120 |
% |
118 |
% |
|||||||||
|
Average commission rate paid |
$ |
0.0063 |
$ |
0.0038 |
$ |
0.0123 |
|||||||||
| Mandatory Redeemable Preferred Shares, at redemption value ($25 per share liquidation preference) (000's omitted) |
$ |
17,000 |
$ |
17,000 |
$ |
17,000 |
|||||||||
|
Notes Payable (000's omitted) |
$ |
34,350 |
$ |
30,100 |
$ |
26,000 |
|||||||||
|
Asset coverage per $1,000 of loan outstanding(d) |
$ |
4,644 |
$ |
4,541 |
$ |
5,276 |
|||||||||
|
Asset coverage per $25 liquidation value per share of Mandatory Redeemable Preferred Shares(e) |
$ |
235 |
$ |
201 |
$ |
202 |
|||||||||
* Net investment income (loss) calculated based on average shares method.
(a) Total investment return is calculated assuming a purchase of common stock on the opening of the first day and a sale on the closing of the last day of the period reported. Dividends and distributions are assumed, for purposes of this calculation, to be reinvested at prices obtained under the Fund's dividend reinvestment plan. Total return is not annualized for periods less than one year. Brokerage commissions are not reflected. NAV per share is determined by dividing the value of the Fund's portfolio securities, cash and other assets, less all liabilities, by the total number of common shares outstanding. The common share market price is the price the market is willing to pay for shares of the Fund at a given time. Common share market price is influenced by a range of factors, including supply and demand and market conditions.
(b) Ratio of net expenses, excluding interest expense on Notes payable and interest expense and amortization of offering costs on Mandatory Redeemable Preferred Shares, to average net assets was 1.82%, 1.82%, 1.83%, 1.69%, 1.75%, 1.75% , 1.69%,1.62%, 1.62%, 1.63%, and 1.59%, respectively.
(c) Annualized.
(d) Calculated by subtracting the Fund's total liabilities (not including Notes payable and Mandatory Redeemable Preferred Shares) from the Fund's total assets and dividing this by the amount of Notes payable outstanding, and by multiplying the result by 1,000.
(e) Calculated by subtracting the Fund's total liabilities (not including Notes payable and Mandatory Redeemable Preferred Shares) from the Fund's total assets and dividing this by the amount of Mandatory Redeemable Preferred Shares outstanding, and by multiplying the result by 25.
CALAMOS CLOSED-END FAMILY OF FUNDS SEMIANNUAL REPORT
26
Calamos Global Total Return Fund Financial Highlights
|
YEAR ENDED OCTOBER 31, |
|||||||||||||||||||||||||||||||||||
|
2021 |
2020 |
2019 |
2018 |
2017 |
2016 |
2015 |
2014 |
||||||||||||||||||||||||||||
|
PER SHARE OPERATING PERFORMANCE |
|||||||||||||||||||||||||||||||||||
|
Net asset value, beginning of period |
$ |
11.99 |
$ |
11.60 |
$ |
11.65 |
$ |
13.40 |
$ |
12.19 |
$ |
13.29 |
$ |
14.21 |
$ |
14.56 |
|||||||||||||||||||
|
Income from investment operations: |
|||||||||||||||||||||||||||||||||||
|
Net investment income (loss)* |
(0.06 |
) |
0.17 |
0.17 |
0.18 |
0.23 |
0.21 |
0.22 |
0.26 |
||||||||||||||||||||||||||
|
Net realized and unrealized gain (loss) |
5.05 |
1.40 |
0.98 |
(0.73 |
) |
2.18 |
(0.11 |
) |
0.06 |
0.59 |
|||||||||||||||||||||||||
|
Total from investment operations |
4.99 |
1.57 |
1.15 |
(0.55 |
) |
2.41 |
0.10 |
0.28 |
0.85 |
||||||||||||||||||||||||||
|
Less distributions to common shareholders from: |
|||||||||||||||||||||||||||||||||||
|
Net investment income |
(0.24 |
) |
(0.31 |
) |
(0.41 |
) |
(0.97 |
) |
(1.09 |
) |
(0.99 |
) |
(0.85 |
) |
(0.85 |
) |
|||||||||||||||||||
|
Net realized gains |
(0.96 |
) |
(0.89 |
) |
(0.24 |
) |
(0.23 |
) |
(0.11 |
) |
(0.20 |
) |
— |
(0.19 |
) |
||||||||||||||||||||
|
Return of capital |
— |
— |
(0.55 |
) |
— |
— |
(0.01 |
) |
(0.35 |
) |
(0.16 |
) |
|||||||||||||||||||||||
|
Total distributions |
(1.20 |
) |
(1.20 |
) |
(1.20 |
) |
(1.20 |
) |
(1.20 |
) |
(1.20 |
) |
(1.20 |
) |
(1.20 |
) |
|||||||||||||||||||
|
Premiums from shares sold in at the market offerings |
0.0362 |
0.0176 |
— |
0.0236 |
— |
— |
— |
— |
|||||||||||||||||||||||||||
|
Net asset value, end of period |
$ |
15.82 |
$ |
11.99 |
$ |
11.60 |
$ |
11.65 |
$ |
13.40 |
$ |
12.19 |
$ |
13.29 |
$ |
14.21 |
|||||||||||||||||||
|
Market value, end of period |
$ |
15.86 |
$ |
11.63 |
$ |
12.12 |
$ |
11.50 |
$ |
13.98 |
$ |
10.96 |
$ |
11.96 |
$ |
13.57 |
|||||||||||||||||||
|
TOTAL RETURN APPLICABLE TO COMMON SHAREHOLDERS |
|||||||||||||||||||||||||||||||||||
|
Total investment return based on:(a) |
|||||||||||||||||||||||||||||||||||
|
Net asset value |
42.86 |
% |
15.08 |
% |
10.35 |
% |
(5.06 |
%) |
21.44 |
% |
2.22 |
% |
2.39 |
% |
6.19 |
% |
|||||||||||||||||||
|
Market value |
47.65 |
% |
6.83 |
% |
16.80 |
% |
(10.17 |
%) |
40.91 |
% |
2.13 |
% |
(3.51 |
%) |
5.54 |
% |
|||||||||||||||||||
|
RATIOS TO AVERAGE NET ASSETS APPLICABLE TO COMMON SHAREHOLDERS |
|||||||||||||||||||||||||||||||||||
|
Net expenses(b) |
2.30 |
% |
2.75 |
% |
3.42 |
% |
2.98 |
% |
2.34 |
% |
2.11 |
% |
2.00 |
% |
1.92 |
% |
|||||||||||||||||||
|
Net investment income (loss) |
(0.37 |
%) |
1.50 |
% |
1.48 |
% |
1.39 |
% |
1.87 |
% |
1.73 |
% |
1.56 |
% |
1.78 |
% |
|||||||||||||||||||
|
SUPPLEMENTAL DATA |
|||||||||||||||||||||||||||||||||||
|
Net assets applicable to common shareholders, end of period (000) |
$ |
148,697 |
$ |
106,882 |
$ |
100,526 |
$ |
100,722 |
$ |
113,638 |
$ |
103,158 |
$ |
112,474 |
$ |
120,277 |
|||||||||||||||||||
|
Portfolio turnover rate |
120 |
% |
153 |
% |
81 |
% |
119 |
% |
134 |
% |
114 |
% |
76 |
% |
95 |
% |
|||||||||||||||||||
|
Average commission rate paid |
$ |
0.0179 |
$ |
0.0214 |
$ |
0.0317 |
$ |
0.0203 |
$ |
0.0272 |
$ |
0.0279 |
$ |
0.0279 |
$ |
0.0253 |
|||||||||||||||||||
| Mandatory Redeemable Preferred Shares, at redemption value ($25 per share liquidation preference) (000's omitted) |
$ |
17,000 |
$ |
12,000 |
$ |
12,000 |
$ |
12,000 |
$ |
12,000 |
$ |
— |
$ |
— |
$ |
— |
|||||||||||||||||||
|
Notes Payable (000's omitted) |
$ |
50,500 |
$ |
37,000 |
$ |
38,300 |
$ |
43,000 |
$ |
36,000 |
$ |
42,000 |
$ |
44,000 |
$ |
49,000 |
|||||||||||||||||||
|
Asset coverage per $1,000 of loan outstanding(d) |
$ |
4,281 |
$ |
4,213 |
$ |
3,938 |
$ |
3,621 |
$ |
4,490 |
$ |
3,456 |
$ |
3,556 |
$ |
3,455 |
|||||||||||||||||||
|
Asset coverage per $25 liquidation value per share of Mandatory Redeemable Preferred Shares(e) |
$ |
318 |
$ |
325 |
$ |
314 |
$ |
324 |
$ |
337 |
$ |
— |
$ |
— |
$ |
— |
|||||||||||||||||||
www.calamos.com
27
Calamos Long/Short Equity & Dynamic Income Trust Financial Highlights
Selected data for a share outstanding throughout each period were as follows:
| (UNAUDITED) SIX MONTHS ENDED APRIL 30, |
YEAR ENDED OCTOBER 31, |
NOVEMBER 29, 2019• THROUGH OCTOBER 31, |
|||||||||||||||||||||
|
2024 |
2023 |
2022 |
2021 |
2020 |
|||||||||||||||||||
|
PER SHARE OPERATING PERFORMANCE |
|||||||||||||||||||||||
|
Net asset value, beginning of period |
$ |
|
$ |
|
$ |
|
$ |
|
$ |
|
|||||||||||||
|
Income from investment operations: |
|||||||||||||||||||||||
|
Net investment income (loss)* |
0.21 |
0.24 |
0.18 |
0.22 |
0.31 |
||||||||||||||||||
|
Net realized and unrealized gain (loss) |
2.02 |
0.32 |
(2.36 |
) |
5.42 |
(1.84 |
) |
||||||||||||||||
|
Total from investment operations |
2.23 |
0.56 |
(2.18 |
) |
5.64 |
(1.53 |
) |
||||||||||||||||
|
Less distributions to common shareholders from: |
|||||||||||||||||||||||
|
Net investment income |
(0.37 |
) |
(0.34 |
) |
(0.40 |
) |
(0.55 |
) |
(0.40 |
) |
|||||||||||||
|
Net realized gains |
(0.47 |
) |
(1.34 |
) |
(1.28 |
) |
(1.01 |
) |
(0.63 |
) |
|||||||||||||
|
Total distributions |
(0.84 |
) |
(1.68 |
) |
(1.68 |
) |
(1.56 |
) |
(1.03 |
) |
|||||||||||||
|
Premiums from shares sold in at the market offerings |
— |
— |
— |
— |
— |
||||||||||||||||||
|
Net asset value, end of period |
$ |
|
$ |
|
$ |
|
$ |
|
$ |
|
|||||||||||||
|
Market value, end of period |
$ |
|
$ |
|
$ |
|
$ |
|
$ |
|
|||||||||||||
|
TOTAL RETURN APPLICABLE TO COMMON SHAREHOLDERS |
|||||||||||||||||||||||
|
Total investment return based on:(a) |
|||||||||||||||||||||||
|
Net asset value(b) |
14.66 |
% |
4.32 |
% |
(10.05 |
%) |
33.57 |
% |
(6.72 |
%) |
|||||||||||||
|
Market value |
18.03 |
% |
(2.85 |
%) |
(16.56 |
%) |
58.49 |
% |
(24.42 |
%) |
|||||||||||||
|
RATIOS TO AVERAGE NET ASSETS APPLICABLE TO COMMON SHAREHOLDERS |
|||||||||||||||||||||||
|
Net expenses(c) |
4.92 |
%(d) |
4.52 |
% |
3.21 |
% |
2.45 |
% |
2.12 |
%(d) |
|||||||||||||
|
Net investment income (loss) |
2.47 |
%(d) |
1.34 |
% |
0.89 |
% |
1.03 |
% |
1.82 |
%(d) |
|||||||||||||
|
SUPPLEMENTAL DATA |
|||||||||||||||||||||||
| Net assets applicable to common shareholders, end of period (000) |
$ |
|
$ |
|
$ |
|
$ |
|
$ |
|
|||||||||||||
|
Portfolio turnover rate |
140 |
% |
210 |
% |
222 |
% |
213 |
% |
155 |
% |
|||||||||||||
|
Average commission rate paid |
$ |
0.0137 |
$ |
0.0136 |
$ |
0.0126 |
$ |
0.0109 |
$ |
0.0113 |
|||||||||||||
|
Notes Payable (000's omitted) |
$ |
120,000 |
$ |
120,000 |
$ |
120,000 |
$ |
120,000 |
$ |
69,200 |
|||||||||||||
|
Asset coverage per $1,000 of loan outstanding(e) |
$ |
|
$ |
|
$ |
|
$ |
|
$ |
|
|||||||||||||
• Commencement of operations.
* Net investment income (loss) calculated based on average shares method.
(a) Total investment return is calculated assuming a purchase of common stock on the opening of the first day and a sale on the closing of the last day of the period reported. Dividends and distributions are assumed, for purposes of this calculation, to be reinvested at prices obtained under the Fund's dividend reinvestment plan. Total return is not annualized for periods less than one year. Brokerage commissions are not reflected. NAV per share is determined by dividing the value of the Fund's portfolio securities, cash and other assets, less all liabilities, by the total number of common shares outstanding. The common share market price is the price the market is willing to pay for shares of the Fund at a given time. Common share market price is influenced by a range of factors, including supply and demand and market conditions.
(b) Includes payment by affiliates, which impacted the total return. Excluding such payment the total return would be 3.97% (see Note 2).
(c) Ratio of net expenses, excluding interest expense on Notes Payable and dividend expense on short positions, to average net assets was 2.00%, 1.98%, 1.92%, 1.75% and 1.62%, respectively.
(d) Annualized.
(e) Calculated by subtracting the Fund's total liabilities (not including Notes payable) from the Fund's total assets and dividing this by the amount of Notes payable outstanding, and by multiplying the result by 1,000.
CALAMOS CLOSED-END FAMILY OF FUNDS SEMIANNUAL REPORT
28
| PRINCIPAL AMOUNT |
VALUE |
||||||||||
|
ASSET BACKED SECURITY (0.1%) |
|||||||||||
|
Other (0.1%) |
|||||||||||
|
765,000 |
SVC ABS, LLC Series 2023-1A, Class C* 6.700%, 02/20/53 (Cost $710,508) |
$ |
695,266 |
||||||||
|
CORPORATE BONDS (40.9%) |
|||||||||||
|
Airlines (0.6%) |
|||||||||||
|
834,487 |
Alaska Airlines Pass Through Trust Series 2020-1, Class A*µ 4.800%, 02/15/29 |
810,254 |
|||||||||
|
336,297 |
Alaska Airlines Pass Through Trust Series 2020-1, Class B* 8.000%, 02/15/27 |
340,114 |
|||||||||
|
999,940 |
American Airlines Pass Through Trust Series 2021-1, Class B 3.950%, 01/11/32 |
906,545 |
|||||||||
|
478,000 |
American Airlines, Inc. / AAdvantage Loyalty IP, Ltd.* 5.500%, 04/20/26 |
472,971 |
|||||||||
|
907,663 |
British Airways Pass Through Trust Series 2021-1, Class B* 3.900%, 03/15/33 |
824,785 |
|||||||||
|
765,300 |
JetBlue Pass Through Trust Series 2020-1, Class B 7.750%, 05/15/30 |
783,423 |
|||||||||
|
4,138,092 |
|||||||||||
|
Communication Services (4.1%) |
|||||||||||
|
800,000 |
Altice France Holding, SA* 10.500%, 05/15/27 |
286,792 |
|||||||||
|
1,100,000 |
Altice France, SA* 5.500%, 10/15/29 |
721,600 |
|||||||||
|
1,160,000 |
APi Group DE, Inc.* 4.750%, 10/15/29 |
1,056,818 |
|||||||||
|
1,025,000 |
Ashtead Capital, Inc.*^ 2.450%, 08/12/31 |
814,301 |
|||||||||
|
1,193,000 |
Audacy Capital Corp.*@ 6.750%, 03/31/29 |
42,113 |
|||||||||
|
448,000 |
6.500%, 05/01/27 |
15,989 |
|||||||||
|
856,000 |
Cincinnati Bell Telephone Company, LLC 6.300%, 12/01/28 |
781,151 |
|||||||||
|
475,000 |
Clear Channel Outdoor Holdings, Inc.* 7.875%, 04/01/30 |
466,051 |
|||||||||
|
425,000 |
9.000%, 09/15/28^ |
437,487 |
|||||||||
|
1,345,000 |
Consolidated Communications, Inc.* 6.500%, 10/01/28 |
1,168,133 |
|||||||||
|
1,450,000 |
CSC Holdings, LLC* 5.375%, 02/01/28 |
1,118,240 |
|||||||||
|
1,350,000 |
4.625%, 12/01/30 |
587,358 |
|||||||||
|
1,125,000 |
4.500%, 11/15/31 |
715,343 |
|||||||||
|
1,100,000 |
5.750%, 01/15/30 |
482,768 |
|||||||||
|
950,000 |
5.500%, 04/15/27 |
779,817 |
|||||||||
| PRINCIPAL AMOUNT |
VALUE |
||||||||||
|
487,000 |
Directv Financing, LLC / Directv Financing Co-Obligor, Inc.* 5.875%, 08/15/27 |
$ |
454,220 |
||||||||
|
1,000,000 |
Frontier California, Inc. 6.750%, 05/15/27 |
953,020 |
|||||||||
|
239,000 |
Frontier Communications Holdings, LLC* 8.750%, 05/15/30 |
243,560 |
|||||||||
|
1,519,000 |
Frontier Florida, LLC 6.860%, 02/01/28 |
1,447,212 |
|||||||||
|
1,445,000 |
Frontier North, Inc. 6.730%, 02/15/28 |
1,370,510 |
|||||||||
|
835,000 |
Go Daddy Operating Company, LLC / GD Finance Company, Inc.* 3.500%, 03/01/29 |
741,847 |
|||||||||
|
250,000 |
5.250%, 12/01/27 |
241,700 |
|||||||||
|
240,000 |
Hughes Satellite Systems Corp. 6.625%, 08/01/26 |
138,257 |
|||||||||
|
595,000 |
iHeartCommunications, Inc. 8.375%, 05/01/27 |
317,141 |
|||||||||
|
355,000 |
5.250%, 08/15/27*^ |
260,872 |
|||||||||
|
1,215,000 |
LCPR Senior Secured Financing DAC* 6.750%, 10/15/27 |
1,126,463 |
|||||||||
|
722,947 |
Ligado Networks, LLC* 15.500%, 11/01/23 15.500% PIK rate |
119,814 |
|||||||||
|
720,000 |
Lumen Technologies, Inc. 7.600%, 09/15/39 |
220,363 |
|||||||||
|
485,000 |
4.000%, 02/15/27* |
258,219 |
|||||||||
|
240,000 |
7.650%, 03/15/42 |
73,488 |
|||||||||
|
478,000 |
Match Group Holdings II, LLC* 3.625%, 10/01/31 |
395,143 |
|||||||||
|
570,000 |
Nexstar Media, Inc.* 5.625%, 07/15/27 |
536,438 |
|||||||||
|
930,000 |
Paramount Global 4.900%, 08/15/44 |
651,986 |
|||||||||
|
336,000 |
Qwest Corp. 7.250%, 09/15/25 |
333,023 |
|||||||||
|
477,000 |
Scripps Escrow II, Inc.* 3.875%, 01/15/29 |
352,970 |
|||||||||
|
239,000 |
5.375%, 01/15/31 |
141,543 |
|||||||||
|
810,000 |
Scripps Escrow, Inc.* 5.875%, 07/15/27 |
640,378 |
|||||||||
|
1,250,000 |
Sirius XM Radio, Inc.* 5.500%, 07/01/29 |
1,165,675 |
|||||||||
|
963,000 |
4.000%, 07/15/28 |
858,582 |
|||||||||
|
475,000 |
3.125%, 09/01/26 |
443,522 |
|||||||||
|
239,000 |
3.875%, 09/01/31^ |
192,287 |
|||||||||
|
874,000 |
Spanish Broadcasting System, Inc.* 9.750%, 03/01/26 |
416,610 |
|||||||||
|
2,430,000 |
Sprint, LLCµ 7.125%, 06/15/24 |
2,433,353 |
|||||||||
|
1,080,000 |
Stagwell Global, LLC* 5.625%, 08/15/29 |
968,814 |
|||||||||
www.calamos.com
29
| PRINCIPAL AMOUNT |
VALUE |
||||||||||
|
473,000 |
Telesat Canada / Telesat, LLC* 4.875%, 06/01/27 |
$ |
216,464 |
||||||||
|
385,000 |
Time Warner Cable, LLC 7.300%, 07/01/38 |
373,935 |
|||||||||
|
1,100,000 |
United States Cellular Corp. 6.700%, 12/15/33 |
1,074,062 |
|||||||||
|
724,000 |
Univision Communications, Inc.* 8.000%, 08/15/28 |
725,701 |
|||||||||
|
480,000 |
Viasat, Inc.*^ 5.625%, 04/15/27 |
440,074 |
|||||||||
|
29,801,207 |
|||||||||||
|
Consumer Discretionary (8.7%) |
|||||||||||
|
1,162,000 |
Abercrombie & Fitch Management Company* 8.750%, 07/15/25 |
1,171,877 |
|||||||||
|
955,000 |
Adams Homes, Inc.* 9.250%, 10/15/28 |
987,289 |
|||||||||
|
715,000 |
Adient Global Holdings Company*^ 8.250%, 04/15/31 |
743,214 |
|||||||||
|
840,000 |
American Axle & Manufacturing, Inc.^ 5.000%, 10/01/29 |
758,352 |
|||||||||
|
837,000 |
Ashton Woods USA, LLC / Ashton Woods Finance Company* 4.625%, 08/01/29 |
758,188 |
|||||||||
|
705,000 |
6.625%, 01/15/28 |
703,978 |
|||||||||
|
1,208,000 |
At Home Group, Inc.* 4.875%, 07/15/28 |
574,295 |
|||||||||
|
1,264,000 |
Bath & Body Works, Inc. 6.694%, 01/15/27 |
1,273,783 |
|||||||||
|
720,000 |
6.875%, 11/01/35 |
716,868 |
|||||||||
|
400,000 |
Benteler International AG* 10.500%, 05/15/28 |
426,908 |
|||||||||
|
604,000 |
Caesars Entertainment, Inc.* 4.625%, 10/15/29 |
538,937 |
|||||||||
|
472,000 |
8.125%, 07/01/27 |
479,354 |
|||||||||
|
481,000 |
Carnival Corp.* 7.625%, 03/01/26 |
484,247 |
|||||||||
|
481,000 |
4.000%, 08/01/28 |
439,466 |
|||||||||
|
60,000 |
7.000%, 08/15/29^ |
61,653 |
|||||||||
|
207,436 |
Carvana Company* 14.000%, 06/01/31 |
208,220 |
|||||||||
|
174,771 |
13.000%, 06/01/30 |
173,656 |
|||||||||
|
116,013 |
12.000%, 12/01/28 |
113,646 |
|||||||||
|
2,130,000 |
CCO Holdings, LLC / CCO Holdings Capital Corp.* 5.125%, 05/01/27 |
1,999,772 |
|||||||||
|
1,685,000 |
4.500%, 08/15/30 |
1,371,641 |
|||||||||
|
1,100,000 |
6.375%, 09/01/29 |
1,008,381 |
|||||||||
|
1,055,000 |
4.750%, 03/01/30 |
878,330 |
|||||||||
|
951,000 |
4.250%, 02/01/31 |
747,410 |
|||||||||
|
565,000 |
5.000%, 02/01/28 |
515,263 |
|||||||||
|
478,000 |
4.750%, 02/01/32 |
376,253 |
|||||||||
|
478,000 |
CDI Escrow Issuer, Inc.* 5.750%, 04/01/30 |
456,136 |
|||||||||
| PRINCIPAL AMOUNT |
VALUE |
||||||||||
|
750,000 |
Cedar Fair, LP 5.250%, 07/15/29 |
$ |
701,047 |
||||||||
|
478,000 |
Churchill Downs, Inc.* 6.750%, 05/01/31 |
474,793 |
|||||||||
|
790,000 |
Dana, Inc. 4.250%, 09/01/30 |
686,470 |
|||||||||
|
723,000 |
4.500%, 02/15/32 |
613,465 |
|||||||||
|
1,010,000 |
DISH DBS Corp. 5.125%, 06/01/29 |
408,101 |
|||||||||
|
720,000 |
5.250%, 12/01/26* |
567,914 |
|||||||||
|
595,000 |
7.375%, 07/01/28 |
267,084 |
|||||||||
|
480,000 |
5.750%, 12/01/28* |
325,781 |
|||||||||
|
408,000 |
7.750%, 07/01/26 |
257,346 |
|||||||||
|
946,000 |
DISH Network Corp.* 11.750%, 11/15/27 |
954,665 |
|||||||||
|
1,365,000 |
Empire Resorts, Inc.* 7.750%, 11/01/26 |
1,272,808 |
|||||||||
|
1,058,000 |
Everi Holdings, Inc.* 5.000%, 07/15/29 |
1,039,242 |
|||||||||
|
1,000,000 |
Ford Motor Company 6.100%, 08/19/32 |
981,230 |
|||||||||
|
1,525,000 |
Ford Motor Credit Company, LLC 4.000%, 11/13/30 |
1,331,218 |
|||||||||
|
1,245,000 |
7.200%, 06/10/30^ |
1,290,965 |
|||||||||
|
1,150,000 |
5.113%, 05/03/29 |
1,096,157 |
|||||||||
|
865,000 |
7.350%, 11/04/27 |
895,059 |
|||||||||
|
800,000 |
2.900%, 02/16/28 |
712,368 |
|||||||||
|
359,000 |
Gap, Inc.* 3.875%, 10/01/31 |
293,684 |
|||||||||
|
490,000 |
General Motors Company 5.200%, 04/01/45 |
419,808 |
|||||||||
|
1,700,000 |
goeasy, Ltd.* 9.250%, 12/01/28 |
1,799,467 |
|||||||||
|
859,000 |
7.625%, 07/01/29 |
860,409 |
|||||||||
|
515,000 |
Goodyear Tire & Rubber Company 5.250%, 07/15/31^ |
456,249 |
|||||||||
|
480,000 |
5.625%, 04/30/33 |
422,429 |
|||||||||
|
407,000 |
Group 1 Automotive, Inc.* 4.000%, 08/15/28 |
371,286 |
|||||||||
|
1,026,000 |
Guitar Center, Inc.*^& 8.500%, 01/15/26 |
907,282 |
|||||||||
|
770,000 |
International Game Technology, PLC* 6.250%, 01/15/27 |
769,546 |
|||||||||
|
262,459 |
JetBlue Pass Through Trust Series 2019-2, Class B 8.000%, 11/15/27 |
265,186 |
|||||||||
|
1,077,000 |
Kohl's Corp. 5.550%, 07/17/45 |
739,694 |
|||||||||
|
955,000 |
LCM Investments Holdings II, LLC* 8.250%, 08/01/31 |
993,907 |
|||||||||
|
965,000 |
Liberty Interactive, LLC 8.250%, 02/01/30 |
536,086 |
|||||||||
|
937,000 |
Life Time, Inc.* 8.000%, 04/15/26 |
938,574 |
|||||||||
See accompanying Notes to Schedule of Investments
CALAMOS CLOSED-END FAMILY OF FUNDS SEMIANNUAL REPORT
30
| PRINCIPAL AMOUNT |
VALUE |
||||||||||
|
480,000 |
Light & Wonder International, Inc.* 7.500%, 09/01/31 |
$ |
489,845 |
||||||||
|
360,000 |
Lindblad Expeditions Holdings, Inc.* 9.000%, 05/15/28 |
377,507 |
|||||||||
|
616,000 |
Lindblad Expeditions, LLC* 6.750%, 02/15/27 |
611,318 |
|||||||||
|
635,000 |
M/I Homes, Inc. 3.950%, 02/15/30 |
551,472 |
|||||||||
|
1,121,000 |
Macy's Retail Holdings, LLC 6.700%, 07/15/34* |
944,801 |
|||||||||
|
730,000 |
4.300%, 02/15/43^ |
577,445 |
|||||||||
|
1,219,000 |
Midwest Gaming Borrower, LLC / Midwest Gaming Finance Corp.* 4.875%, 05/01/29 |
1,114,958 |
|||||||||
|
575,000 |
Newell Brands, Inc. 5.700%, 04/01/26 |
567,237 |
|||||||||
|
500,000 |
Nordstrom, Inc. 5.000%, 01/15/44 |
379,930 |
|||||||||
|
480,000 |
6.950%, 03/15/28 |
476,976 |
|||||||||
|
465,000 |
4.250%, 08/01/31 |
401,397 |
|||||||||
|
1,449,000 |
Patrick Industries, Inc.* 4.750%, 05/01/29 |
1,318,489 |
|||||||||
|
1,105,000 |
PENN Entertainment, Inc.*^ 4.125%, 07/01/29 |
926,112 |
|||||||||
|
480,000 |
Phinia, Inc.* 6.750%, 04/15/29 |
482,054 |
|||||||||
|
1,340,000 |
Premier Entertainment Sub, LLC / Premier Entertainment Finance Corp.*^ 5.625%, 09/01/29 |
1,001,235 |
|||||||||
|
470,000 |
QVC, Inc. 5.450%, 08/15/34 |
308,762 |
|||||||||
|
480,000 |
Raising Cane's Restaurants, LLC* 9.375%, 05/01/29 |
515,208 |
|||||||||
|
1,880,000 |
Rite Aid Corp.*@ 8.000%, 11/15/26 |
1,213,220 |
|||||||||
|
478,000 |
Royal Caribbean Cruises, Ltd.* 7.250%, 01/15/30 |
492,459 |
|||||||||
|
119,000 |
6.250%, 03/15/32 |
117,327 |
|||||||||
|
1,350,000 |
Simmons Foods, Inc. / Simmons Prepared Foods, Inc. / Simmons Pet Food, Inc. / Simmons Feed* 4.625%, 03/01/29 |
1,167,750 |
|||||||||
|
1,445,000 |
Six Flags Entertainment Corp.*^ 7.250%, 05/15/31 |
1,443,295 |
|||||||||
|
1,090,000 |
Sonic Automotive, Inc.* 4.625%, 11/15/29 |
976,607 |
|||||||||
|
698,000 |
Speedway Motorsports, LLC / Speedway Funding II, Inc.* 4.875%, 11/01/27 |
658,744 |
|||||||||
|
1,005,000 |
Station Casinos, LLC* 4.500%, 02/15/28 |
932,901 |
|||||||||
|
950,000 |
STL Holding Company, LLC* 8.750%, 02/15/29 |
977,179 |
|||||||||
|
589,000 |
Taylor Morrison Communities, Inc.* 5.750%, 01/15/28 |
574,151 |
|||||||||
| PRINCIPAL AMOUNT |
VALUE |
||||||||||
|
240,000 |
Viking Cruises, Ltd.* 9.125%, 07/15/31 |
$ |
257,626 |
||||||||
|
1,100,000 |
Vista Outdoor, Inc.* 4.500%, 03/15/29 |
1,087,306 |
|||||||||
|
950,000 |
ZF North America Capital, Inc.* 7.125%, 04/14/30 |
972,952 |
|||||||||
|
300,000 |
6.875%, 04/23/32 |
303,393 |
|||||||||
|
300,000 |
6.750%, 04/23/30 |
300,897 |
|||||||||
|
64,136,990 |
|||||||||||
|
Consumer Staples (1.9%) |
|||||||||||
|
1,090,000 |
1375209 B.C., Ltd.*^ 9.000%, 01/30/28 |
1,071,339 |
|||||||||
|
1,413,000 |
Arrow Bidco, LLC* 10.750%, 06/15/25 |
1,457,594 |
|||||||||
|
970,000 |
B&G Foods, Inc.* 8.000%, 09/15/28 |
1,006,686 |
|||||||||
|
1,099,000 |
Central Garden & Pet Company* 4.125%, 04/30/31 |
953,844 |
|||||||||
|
1,092,000 |
Edgewell Personal Care Company* 4.125%, 04/01/29 |
990,313 |
|||||||||
|
1,331,000 |
Energizer Holdings, Inc.* 4.375%, 03/31/29 |
1,177,283 |
|||||||||
|
240,000 |
6.500%, 12/31/27^ |
237,879 |
|||||||||
|
1,415,000 |
JBS USA Holding LUX Sarl / JBS USA Food Company / JBS LUX Company Sarl 5.500%, 01/15/30^ |
1,367,074 |
|||||||||
|
595,000 |
5.125%, 02/01/28µ |
578,560 |
|||||||||
|
370,000 |
5.750%, 04/01/33 |
354,297 |
|||||||||
|
621,000 |
New Albertsons, LP 7.750%, 06/15/26 |
639,574 |
|||||||||
|
957,000 |
Performance Food Group, Inc.* 4.250%, 08/01/29 |
858,142 |
|||||||||
|
700,000 |
Pilgrim's Pride Corp. 4.250%, 04/15/31 |
619,934 |
|||||||||
|
475,000 |
Post Holdings, Inc.* 6.250%, 02/15/32 |
469,827 |
|||||||||
|
909,000 |
Prestige Brands, Inc.* 3.750%, 04/01/31 |
774,459 |
|||||||||
|
815,000 |
United Natural Foods, Inc.*^ 6.750%, 10/15/28 |
626,531 |
|||||||||
|
1,020,000 |
Vector Group, Ltd.* 5.750%, 02/01/29 |
928,190 |
|||||||||
|
14,111,526 |
|||||||||||
|
Energy (5.5%) |
|||||||||||
|
479,000 |
Antero Resources Corp.* 5.375%, 03/01/30 |
455,797 |
|||||||||
|
958,000 |
Apache Corp. 5.100%, 09/01/40 |
797,822 |
|||||||||
|
500,000 |
Buckeye Partners, LP 5.850%, 11/15/43 |
418,635 |
|||||||||
|
477,000 |
Cheniere Energy, Inc.µ 4.625%, 10/15/28 |
456,413 |
|||||||||
www.calamos.com
31
| PRINCIPAL AMOUNT |
VALUE |
||||||||||
|
720,000 |
Chesapeake Energy Corp.* 6.750%, 04/15/29 |
$ |
720,821 |
||||||||
|
1,341,000 |
Civitas Resources, Inc.* 8.750%, 07/01/31 |
1,427,092 |
|||||||||
|
480,000 |
Continental Resources, Inc. 4.900%, 06/01/44 |
387,014 |
|||||||||
|
477,000 |
2.875%, 04/01/32* |
381,352 |
|||||||||
|
742,000 |
DT Midstream, Inc.* 4.125%, 06/15/29 |
672,638 |
|||||||||
|
941,000 |
Earthstone Energy Holdings, LLC* 8.000%, 04/15/27 |
968,289 |
|||||||||
|
360,000 |
9.875%, 07/15/31 |
398,365 |
|||||||||
|
555,000 |
Enbridge, Inc.^‡ 7.375%, 01/15/83 5 year CMT + 3.71% |
546,270 |
|||||||||
|
525,000 |
Encino Acquisition Partners Holdings, LLC* 8.750%, 05/01/31 |
534,812 |
|||||||||
|
1,400,000 |
Energy Transfer, LP‡ 8.606%, 11/01/66 3 mo. USD SOFR + 3.28% |
1,271,704 |
|||||||||
|
700,000 |
6.500%, 11/15/26 5 year CMT + 5.69% |
679,973 |
|||||||||
|
1,235,000 |
EnLink Midstream Partners, LP 9.701%, 05/31/24‡ 3 mo. USD LIBOR + 4.11% |
1,219,649 |
|||||||||
|
1,015,000 |
4.850%, 07/15/26 |
989,605 |
|||||||||
|
600,000 |
Enlink Midstream, LLC* 6.500%, 09/01/30 |
607,716 |
|||||||||
|
1,580,000 |
EQM Midstream Partners, LP* 7.500%, 06/01/27 |
1,609,767 |
|||||||||
|
470,000 |
6.375%, 04/01/29 |
466,997 |
|||||||||
|
719,000 |
Genesis Energy, LP / Genesis Energy Finance Corp. 8.875%, 04/15/30 |
744,834 |
|||||||||
|
478,000 |
6.250%, 05/15/26 |
474,587 |
|||||||||
|
955,000 |
Gulfport Energy Corp. 8.000%, 05/17/26* |
969,373 |
|||||||||
|
288,135 |
8.000%, 05/17/26 |
292,471 |
|||||||||
|
1,340,000 |
Hilcorp Energy I, LP / Hilcorp Finance Company* 6.000%, 04/15/30 |
1,287,592 |
|||||||||
|
717,000 |
Howard Midstream Energy Partners, LLC* 6.750%, 01/15/27 |
708,711 |
|||||||||
|
950,000 |
Kodiak Gas Services, LLC* 7.250%, 02/15/29 |
961,286 |
|||||||||
|
940,000 |
Magnolia Oil & Gas Operating, LLC / Magnolia Oil & Gas Finance Corp.* 6.000%, 08/01/26 |
927,526 |
|||||||||
|
720,000 |
Matador Resources Company* 6.500%, 04/15/32 |
714,118 |
|||||||||
|
500,000 |
Moss Creek Resources Holdings, Inc.* 10.500%, 05/15/27 |
511,955 |
|||||||||
|
455,000 |
7.500%, 01/15/26 |
454,509 |
|||||||||
| PRINCIPAL AMOUNT |
VALUE |
||||||||||
|
720,000 |
Nabors Industries, Inc.* 7.375%, 05/15/27 |
$ |
714,132 |
||||||||
|
360,000 |
9.125%, 01/31/30^ |
372,622 |
|||||||||
|
720,000 |
Nabors Industries, Ltd.*^ 7.500%, 01/15/28 |
683,222 |
|||||||||
|
618,000 |
New Fortress Energy, Inc.* 6.750%, 09/15/25 |
611,474 |
|||||||||
|
1,006,000 |
Oceaneering International, Inc. 6.000%, 02/01/28 |
969,663 |
|||||||||
|
1,025,000 |
Parkland Corp.* 5.875%, 07/15/27 |
1,002,614 |
|||||||||
|
506,000 |
Patterson-UTI Energy, Inc.^ 5.150%, 11/15/29 |
483,594 |
|||||||||
|
238,000 |
Permian Resources Operating LLC* 7.000%, 01/15/32 |
243,181 |
|||||||||
|
960,000 |
Plains All American Pipeline, LP‡ 9.679%, 05/31/24 3 mo. USD LIBOR + 4.11% |
956,698 |
|||||||||
|
1,340,000 |
Rockcliff Energy II, LLC* 5.500%, 10/15/29 |
1,239,339 |
|||||||||
|
479,000 |
Southwestern Energy Company 4.750%, 02/01/32 |
431,929 |
|||||||||
|
1,291,500 |
Transocean, Inc.* 8.750%, 02/15/30 |
1,348,042 |
|||||||||
|
475,000 |
8.250%, 05/15/29 |
472,430 |
|||||||||
|
600,000 |
Venture Global Calcasieu Pass, LLC* 6.250%, 01/15/30 |
594,864 |
|||||||||
|
240,000 |
4.125%, 08/15/31 |
210,221 |
|||||||||
|
240,000 |
3.875%, 08/15/29 |
212,064 |
|||||||||
|
1,195,000 |
Venture Global LNG, Inc.* 8.375%, 06/01/31 |
1,227,301 |
|||||||||
|
715,000 |
8.125%, 06/01/28 |
731,917 |
|||||||||
|
480,000 |
9.875%, 02/01/32 |
512,251 |
|||||||||
|
480,000 |
9.500%, 02/01/29 |
516,346 |
|||||||||
|
570,000 |
Vital Energy, Inc. 7.750%, 07/31/29* |
574,224 |
|||||||||
|
499,000 |
7.875%, 04/15/32* |
506,889 |
|||||||||
|
368,000 |
9.750%, 10/15/30 |
401,304 |
|||||||||
|
1,000,000 |
VOC Escrow, Ltd.* 5.000%, 02/15/28 |
954,430 |
|||||||||
|
1,195,000 |
Weatherford International, Ltd.* 8.625%, 04/30/30 |
1,241,462 |
|||||||||
|
40,269,906 |
|||||||||||
|
Financials (7.1%) |
|||||||||||
|
1,550,000 |
Acrisure, LLC / Acrisure Finance, Inc.* 8.250%, 02/01/29 |
1,540,483 |
|||||||||
|
1,440,000 |
Aethon United BR, LP / Aethon United Finance Corp.* 8.250%, 02/15/26 |
1,451,678 |
|||||||||
|
1,675,000 |
Alliant Holdings Intermediate, LLC / Alliant Holdings Co-Issuer* 6.750%, 10/15/27 |
1,646,006 |
|||||||||
|
120,000 |
7.000%, 01/15/31 |
120,734 |
|||||||||
See accompanying Notes to Schedule of Investments
CALAMOS CLOSED-END FAMILY OF FUNDS SEMIANNUAL REPORT
32
| PRINCIPAL AMOUNT |
VALUE |
||||||||||
|
1,087,000 |
Ally Financial, Inc. 4.700%, 05/15/26‡ 5 year CMT + 3.87% |
$ |
923,483 |
||||||||
|
445,000 |
4.700%, 05/15/28‡ 7 year CMT + 3.48% |
344,866 |
|||||||||
|
402,000 |
8.000%, 11/01/31 |
435,672 |
|||||||||
|
1,923,000 |
AmWINS Group, Inc.* 4.875%, 06/30/29 |
1,750,699 |
|||||||||
|
726,000 |
Aviation Capital Group, LLC*µ 3.500%, 11/01/27 |
668,820 |
|||||||||
|
475,000 |
Brandywine Operating Partnership, LP 8.875%, 04/12/29 |
486,685 |
|||||||||
|
1,436,000 |
BroadStreet Partners, Inc.* 5.875%, 04/15/29 |
1,310,249 |
|||||||||
|
1,145,000 |
Brookfield Property REIT, Inc. / BPR Cumulus, LLC / BPR Nimbus, LLC / GGSI Sellco, LLC* 4.500%, 04/01/27 |
1,025,806 |
|||||||||
|
1,000,000 |
Burford Capital Global Financial, LLC* 6.875%, 04/15/30 |
970,330 |
|||||||||
|
925,000 |
Credit Acceptance Corp. 6.625%, 03/15/26^ |
922,789 |
|||||||||
|
635,000 |
9.250%, 12/15/28* |
673,875 |
|||||||||
|
960,000 |
Cushman & Wakefield U.S. Borrower LLC* 8.875%, 09/01/31 |
998,928 |
|||||||||
|
1,247,000 |
Enact Holdings, Inc.*µ 6.500%, 08/15/25 |
1,246,464 |
|||||||||
|
1,075,000 |
GGAM Finance, Ltd.* 8.000%, 02/15/27 |
1,104,541 |
|||||||||
|
1,197,000 |
Global Net Lease, Inc. / Global Net Lease Operating Partnership, LP* 3.750%, 12/15/27 |
1,019,509 |
|||||||||
|
1,000,000 |
GTCR W-2 Merger Sub, LLC* 7.500%, 01/15/31 |
1,032,000 |
|||||||||
|
535,000 |
HAT Holdings I LLC / HAT Holdings II LLC* 8.000%, 06/15/27 |
549,402 |
|||||||||
|
1,430,000 |
HUB International, Ltd.* 5.625%, 12/01/29 |
1,319,447 |
|||||||||
|
475,000 |
7.375%, 01/31/32 |
473,043 |
|||||||||
|
718,000 |
Icahn Enterprises, LP / Icahn Enterprises Finance Corp. 4.375%, 02/01/29 |
605,023 |
|||||||||
|
1,300,000 |
ILFC E-Capital Trust II*‡ 7.395%, 12/21/65 3 mo. USD LIBOR + 1.80% |
1,038,648 |
|||||||||
|
1,990,000 |
Iron Mountain, Inc.* 5.250%, 03/15/28 |
1,906,659 |
|||||||||
|
2,435,000 |
Jefferies Finance, LLC / JFIN Co-Issuer Corp.* 5.000%, 08/15/28 |
2,193,302 |
|||||||||
|
1,874,000 |
Ladder Capital Finance Holdings, LLLP / Ladder Capital Finance Corp.* 5.250%, 10/01/25 |
1,843,323 |
|||||||||
|
1,033,000 |
4.750%, 06/15/29 |
923,905 |
|||||||||
| PRINCIPAL AMOUNT |
VALUE |
||||||||||
|
875,000 |
LD Holdings Group, LLC* 6.125%, 04/01/28 |
$ |
664,248 |
||||||||
|
985,000 |
Level 3 Financing, Inc.* 4.250%, 07/01/28 |
385,371 |
|||||||||
|
480,000 |
4.625%, 09/15/27 |
283,080 |
|||||||||
|
720,000 |
LPL Holdings, Inc.*µ 4.000%, 03/15/29 |
653,731 |
|||||||||
|
955,000 |
Macquarie Airfinance Holdings, Ltd.* 8.125%, 03/30/29 |
1,001,021 |
|||||||||
|
476,407 |
Mallinckrodt International Finance, SA / Mallinckrodt CB, LLC* 14.750%, 11/14/28 |
519,612 |
|||||||||
|
1,498,000 |
MetLife, Inc. 6.400%, 12/15/66 |
1,494,300 |
|||||||||
|
1,300,000 |
Nationstar Mortgage Holdings, Inc.* 5.500%, 08/15/28 |
1,223,690 |
|||||||||
|
1,038,000 |
Navient Corp. 5.000%, 03/15/27 |
980,401 |
|||||||||
|
525,000 |
4.875%, 03/15/28 |
475,209 |
|||||||||
|
630,000 |
Necessity Retail REIT, Inc. / American Finance Operating Partner, LP* 4.500%, 09/30/28 |
537,957 |
|||||||||
|
475,000 |
Newmark Group, Inc.* 7.500%, 01/12/29 |
480,254 |
|||||||||
|
670,000 |
OneMain Finance Corp. 9.000%, 01/15/29 |
704,358 |
|||||||||
|
660,000 |
3.875%, 09/15/28 |
582,377 |
|||||||||
|
479,000 |
7.125%, 03/15/26^ |
483,680 |
|||||||||
|
1,493,000 |
PHH Mortgage Corp.* 7.875%, 03/15/26 |
1,435,833 |
|||||||||
|
1,100,000 |
RHP Hotel Properties, LP / RHP Finance Corp.* 4.500%, 02/15/29 |
1,013,595 |
|||||||||
|
950,000 |
6.500%, 04/01/32 |
932,245 |
|||||||||
|
450,000 |
Rocket Mortgage, LLC / Rocket Mortgage Co-Issuer, Inc.* 3.875%, 03/01/31 |
383,355 |
|||||||||
|
445,000 |
3.625%, 03/01/29 |
393,055 |
|||||||||
|
220,000 |
2.875%, 10/15/26 |
202,424 |
|||||||||
|
1,190,000 |
StoneX Group, Inc.* 7.875%, 03/01/31 |
1,204,256 |
|||||||||
|
943,000 |
8.625%, 06/15/25 |
946,847 |
|||||||||
|
1,123,000 |
United Wholesale Mortgage, LLC* 5.500%, 04/15/29 |
1,045,412 |
|||||||||
|
480,000 |
5.750%, 06/15/27 |
461,299 |
|||||||||
|
478,000 |
Uniti Group, LP / Uniti Group Finance, Inc. / CSL Capital, LLC* 10.500%, 02/15/28 |
496,523 |
|||||||||
|
465,000 |
6.500%, 02/15/29 |
374,199 |
|||||||||
|
1,100,000 |
VZ Secured Financing, BV* 5.000%, 01/15/32 |
929,599 |
|||||||||
|
1,017,000 |
XHR, LP* 6.375%, 08/15/25 |
1,016,583 |
|||||||||
|
51,830,883 |
|||||||||||
www.calamos.com
33
| PRINCIPAL AMOUNT |
VALUE |
||||||||||
|
Health Care (2.8%) |
|||||||||||
|
1,934,000 |
Bausch Health Companies, Inc.* 11.000%, 09/30/28^ |
$ |
1,514,980 |
||||||||
|
382,000 |
14.000%, 10/15/30 |
246,818 |
|||||||||
|
359,000 |
6.125%, 02/01/27^ |
263,585 |
|||||||||
|
1,917,000 |
CHS/Community Health Systems, Inc.* 6.125%, 04/01/30 |
1,357,696 |
|||||||||
|
544,000 |
8.000%, 03/15/26 |
542,167 |
|||||||||
|
538,000 |
6.875%, 04/15/29 |
399,535 |
|||||||||
|
475,000 |
10.875%, 01/15/32 |
487,198 |
|||||||||
|
120,000 |
5.250%, 05/15/30 |
98,387 |
|||||||||
|
1,139,000 |
DaVita, Inc.* 3.750%, 02/15/31 |
938,844 |
|||||||||
|
1,061,000 |
4.625%, 06/01/30 |
932,067 |
|||||||||
|
717,000 |
Embecta Corp.* 5.000%, 02/15/30^ |
553,230 |
|||||||||
|
240,000 |
6.750%, 02/15/30 |
206,431 |
|||||||||
|
470,000 |
Encompass Health Corp. 4.750%, 02/01/30 |
431,939 |
|||||||||
|
470,000 |
4.500%, 02/01/28 |
442,129 |
|||||||||
|
1,109,000 |
HCA, Inc.^ 7.500%, 11/06/33 |
1,209,786 |
|||||||||
|
300,000 |
Jazz Securities DAC* 4.375%, 01/15/29 |
274,854 |
|||||||||
|
1,215,000 |
Medline Borrower, LP* 3.875%, 04/01/29 |
1,088,275 |
|||||||||
|
1,208,000 |
5.250%, 10/01/29 |
1,125,675 |
|||||||||
|
1,760,000 |
Organon & Company / Organon Foreign Debt Co-Issuer, BV* 5.125%, 04/30/31 |
1,523,315 |
|||||||||
|
450,000 |
4.125%, 04/30/28 |
410,328 |
|||||||||
|
1,025,000 |
Team Health Holdings, Inc.* 6.375%, 02/01/25 |
954,542 |
|||||||||
|
2,250,000 |
Tenet Healthcare Corp. 6.250%, 02/01/27 |
2,245,252 |
|||||||||
|
1,315,000 |
6.875%, 11/15/31 |
1,361,235 |
|||||||||
|
1,215,000 |
Teva Pharmaceutical Finance Netherlands III, BV 5.125%, 05/09/29^ |
1,153,242 |
|||||||||
|
800,000 |
4.750%, 05/09/27 |
766,512 |
|||||||||
|
440,000 |
3.150%, 10/01/26 |
407,858 |
|||||||||
|
20,935,880 |
|||||||||||
|
Industrials (5.8%) |
|||||||||||
|
950,000 |
Aar Escrow Issuer, LLC* 6.750%, 03/15/29 |
958,541 |
|||||||||
|
1,100,000 |
ACCO Brands Corp.* 4.250%, 03/15/29 |
960,025 |
|||||||||
|
740,000 |
AerCap Holdings, NV^‡ 5.875%, 10/10/79 5 year CMT + 4.54% |
733,532 |
|||||||||
|
965,000 |
Air Lease Corp.‡ 4.125%, 12/15/26 5 year CMT + 3.15% |
835,709 |
|||||||||
| PRINCIPAL AMOUNT |
VALUE |
||||||||||
|
1,600,000 |
Albertsons Companies, Inc. / Safeway, Inc. / New Albertsons, LP / Albertsons, LLC* 4.625%, 01/15/27 |
$ |
1,529,856 |
||||||||
|
720,000 |
5.875%, 02/15/28 |
706,226 |
|||||||||
|
620,000 |
Allegiant Travel Company*^ 7.250%, 08/15/27 |
600,569 |
|||||||||
|
538,000 |
Arcosa, Inc.* 4.375%, 04/15/29 |
492,523 |
|||||||||
|
2,450,000 |
ARD Finance, SA* 6.500%, 06/30/27 7.250% PIK rate |
683,844 |
|||||||||
|
753,000 |
Beacon Roofing Supply, Inc.* 4.125%, 05/15/29 |
673,958 |
|||||||||
|
478,000 |
Boeing Company* 6.388%, 05/01/31 |
481,489 |
|||||||||
|
480,000 |
Bombardier, Inc.* 8.750%, 11/15/30 |
511,027 |
|||||||||
|
395,000 |
7.875%, 04/15/27 |
393,768 |
|||||||||
|
300,000 |
7.250%, 07/01/31 |
301,170 |
|||||||||
|
956,000 |
BWX Technologies, Inc.* 4.125%, 04/15/29 |
872,015 |
|||||||||
|
1,000,000 |
Cascades, Inc. / Cascades USA, Inc.* 5.375%, 01/15/28 |
942,750 |
|||||||||
|
239,000 |
Delta Air Lines, Inc. / SkyMiles IP, Ltd.*µ 4.750%, 10/20/28 |
231,787 |
|||||||||
|
1,265,000 |
Deluxe Corp.* 8.000%, 06/01/29 |
1,149,151 |
|||||||||
|
957,000 |
Eco Material Technologies, Inc.* 7.875%, 01/31/27 |
965,135 |
|||||||||
|
478,000 |
Emerald Debt Merger Sub, LLC* 6.625%, 12/15/30 |
475,127 |
|||||||||
|
500,000 |
EnerSys* 6.625%, 01/15/32 |
498,655 |
|||||||||
|
475,000 |
4.375%, 12/15/27 |
445,346 |
|||||||||
|
355,000 |
EquipmentShare.com, Inc.* 8.625%, 05/15/32 |
361,976 |
|||||||||
|
580,000 |
Graham Packaging Company, Inc.* 7.125%, 08/15/28 |
525,010 |
|||||||||
|
625,000 |
Graphic Packaging International, LLC* 4.750%, 07/15/27 |
599,631 |
|||||||||
|
446,000 |
3.500%, 03/01/29 |
395,147 |
|||||||||
|
1,054,000 |
Great Lakes Dredge & Dock Corp.*^ 5.250%, 06/01/29 |
890,324 |
|||||||||
|
2,244,000 |
H&E Equipment Services, Inc.* 3.875%, 12/15/28 |
1,988,229 |
|||||||||
|
1,198,000 |
Hawaiian Brand Intellectual Property, Ltd. / HawaiianMiles Loyalty, Ltd.* 5.750%, 01/20/26 |
1,126,168 |
|||||||||
|
1,250,000 |
Herc Holdings, Inc.* 5.500%, 07/15/27 |
1,215,737 |
|||||||||
|
1,120,000 |
IEA Energy Services, LLC* 6.625%, 08/15/29 |
1,069,096 |
|||||||||
CALAMOS CLOSED-END FAMILY OF FUNDS SEMIANNUAL REPORT
34
| PRINCIPAL AMOUNT |
VALUE |
||||||||||
|
564,000 |
JELD-WEN, Inc.* 4.625%, 12/15/25 |
$ |
550,735 |
||||||||
|
500,000 |
4.875%, 12/15/27 |
475,355 |
|||||||||
|
1,575,000 |
Ken Garff Automotive, LLC* 4.875%, 09/15/28 |
1,467,412 |
|||||||||
|
955,000 |
Knife River Holding Company* 7.750%, 05/01/31 |
993,935 |
|||||||||
|
234,000 |
MasTec, Inc.*µ^ 4.500%, 08/15/28 |
218,825 |
|||||||||
|
119,000 |
Miter Brands Acquisition Holdco, Inc. / MIWD Borrower, LLC* 6.750%, 04/01/32 |
118,269 |
|||||||||
|
588,000 |
Moog, Inc.* 4.250%, 12/15/27 |
550,233 |
|||||||||
|
1,198,000 |
Newfold Digital Holdings Group, Inc.* 6.000%, 02/15/29 |
900,309 |
|||||||||
|
940,000 |
Novelis Corp.* 4.750%, 01/30/30 |
858,455 |
|||||||||
|
360,000 |
OI European Group, BV* 4.750%, 02/15/30 |
329,558 |
|||||||||
|
1,100,000 |
Pactiv Evergreen Group Issuer, Inc. / Pactiv Evergreen Group Issuer, LLC* 4.000%, 10/15/27 |
1,023,264 |
|||||||||
|
743,000 |
Sealed Air Corp.* 6.125%, 02/01/28 |
734,760 |
|||||||||
|
239,000 |
5.000%, 04/15/29 |
225,050 |
|||||||||
|
240,000 |
Sealed Air Corp./Sealed Air Corp. U.S.* 7.250%, 02/15/31 |
244,817 |
|||||||||
|
450,000 |
Sensata Technologies, BV* 4.000%, 04/15/29 |
403,025 |
|||||||||
|
479,000 |
Sensata Technologies, Inc.* 3.750%, 02/15/31 |
405,833 |
|||||||||
|
717,000 |
Sinclair Television Group, Inc.* 4.125%, 12/01/30 |
493,884 |
|||||||||
|
475,000 |
5.500%, 03/01/30 |
329,451 |
|||||||||
|
955,000 |
Standard Industries, Inc.* 5.000%, 02/15/27 |
921,680 |
|||||||||
|
773,000 |
Stericycle, Inc.*^ 3.875%, 01/15/29 |
691,155 |
|||||||||
|
1,035,000 |
TransDigm, Inc.* 6.875%, 12/15/30 |
1,042,856 |
|||||||||
|
710,000 |
6.750%, 08/15/28 |
713,387 |
|||||||||
|
360,000 |
7.125%, 12/01/31 |
367,373 |
|||||||||
|
235,000 |
6.625%, 03/01/32 |
234,984 |
|||||||||
|
480,000 |
Tronox, Inc.* 4.625%, 03/15/29 |
429,806 |
|||||||||
|
353,898 |
United Airlines Pass Through Trust Series 2019-2, Class B 3.500%, 11/01/29 |
326,892 |
|||||||||
|
961,000 |
Vertiv Group Corp.* 4.125%, 11/15/28 |
890,568 |
|||||||||
|
1,004,000 |
Wabash National Corp.* 4.500%, 10/15/28 |
903,700 |
|||||||||
| PRINCIPAL AMOUNT |
VALUE |
||||||||||
|
855,000 |
Waste Pro USA, Inc.* 5.500%, 02/15/26 |
$ |
837,592 |
||||||||
|
565,000 |
Williams Scotsman, Inc.* 4.625%, 08/15/28 |
522,636 |
|||||||||
|
480,000 |
7.375%, 10/01/31 |
490,694 |
|||||||||
|
42,310,014 |
|||||||||||
|
Information Technology (1.8%) |
|||||||||||
|
238,000 |
Booz Allen Hamilton, Inc.*^ 4.000%, 07/01/29 |
218,344 |
|||||||||
|
557,000 |
Coherent Corp.* 5.000%, 12/15/29 |
514,451 |
|||||||||
|
895,000 |
CommScope, Inc.*^ 4.750%, 09/01/29 |
625,829 |
|||||||||
|
430,000 |
Dell International, LLC / EMC Corp.µ 6.020%, 06/15/26 |
432,649 |
|||||||||
|
478,000 |
Dun & Bradstreet Corp.*^ 5.000%, 12/15/29 |
435,640 |
|||||||||
|
480,000 |
Fair Isaac Corp.* 4.000%, 06/15/28 |
442,776 |
|||||||||
|
1,050,000 |
KBR, Inc.* 4.750%, 09/30/28 |
981,036 |
|||||||||
|
1,050,000 |
MPH Acquisition Holdings, LLC* 5.750%, 11/01/28^ |
773,283 |
|||||||||
|
480,000 |
5.500%, 09/01/28 |
392,131 |
|||||||||
|
477,000 |
NCL Corp., Ltd.* 8.125%, 01/15/29 |
497,239 |
|||||||||
|
478,000 |
NCR Voyix Corp.* 5.125%, 04/15/29 |
439,645 |
|||||||||
|
723,000 |
ON Semiconductor Corp.* 3.875%, 09/01/28 |
656,296 |
|||||||||
|
705,000 |
Open Text Corp.* 3.875%, 02/15/28 |
644,039 |
|||||||||
|
475,000 |
6.900%, 12/01/27 |
485,934 |
|||||||||
|
359,000 |
3.875%, 12/01/29 |
314,782 |
|||||||||
|
359,000 |
Open Text Holdings, Inc.*^ 4.125%, 12/01/31 |
308,219 |
|||||||||
|
840,000 |
Playtika Holding Corp.* 4.250%, 03/15/29 |
723,551 |
|||||||||
|
1,350,000 |
TTM Technologies, Inc.* 4.000%, 03/01/29 |
1,209,559 |
|||||||||
|
680,000 |
Twilio, Inc. 3.625%, 03/15/29 |
604,017 |
|||||||||
|
236,000 |
3.875%, 03/15/31 |
204,650 |
|||||||||
|
356,000 |
UKG, Inc.* 6.875%, 02/01/31 |
356,833 |
|||||||||
|
1,200,000 |
Viavi Solutions, Inc.* 3.750%, 10/01/29 |
1,015,620 |
|||||||||
|
1,100,000 |
ZoomInfo Technologies, LLC / ZoomInfo Finance Corp.* 3.875%, 02/01/29 |
972,763 |
|||||||||
|
13,249,286 |
|||||||||||
www.calamos.com
35
| PRINCIPAL AMOUNT |
VALUE |
||||||||||
|
Materials (1.8%) |
|||||||||||
|
500,000 |
ArcelorMittal, SA 7.000%, 10/15/39 |
$ |
529,325 |
||||||||
|
534,000 |
ATI, Inc. 5.875%, 12/01/27 |
524,564 |
|||||||||
|
242,000 |
Carpenter Technology Corp. 7.625%, 03/15/30 |
247,249 |
|||||||||
|
955,000 |
Chemours Company* 4.625%, 11/15/29 |
819,123 |
|||||||||
|
1,530,000 |
Clearwater Paper Corp.* 4.750%, 08/15/28 |
1,391,458 |
|||||||||
|
716,000 |
Cleveland-Cliffs, Inc.* 6.750%, 04/15/30 |
699,618 |
|||||||||
|
478,000 |
Commercial Metals Company 4.125%, 01/15/30 |
429,402 |
|||||||||
|
239,000 |
4.375%, 03/15/32 |
210,817 |
|||||||||
|
1,115,000 |
Constellium, SE*^ 3.750%, 04/15/29 |
990,399 |
|||||||||
|
477,000 |
HB Fuller Company 4.250%, 10/15/28 |
440,767 |
|||||||||
|
475,000 |
INEOS Finance, PLC*^ 6.750%, 05/15/28 |
467,353 |
|||||||||
|
725,000 |
JW Aluminum Continuous Cast Company* 10.250%, 06/01/26 |
732,148 |
|||||||||
|
850,000 |
Kaiser Aluminum Corp.* 4.625%, 03/01/28 |
792,599 |
|||||||||
|
235,000 |
LSF11 A5 HoldCo, LLC* 6.625%, 10/15/29 |
219,189 |
|||||||||
|
1,020,000 |
Mercer International, Inc. 5.125%, 02/01/29^ |
892,061 |
|||||||||
|
483,000 |
12.875%, 10/01/28* |
527,808 |
|||||||||
|
935,000 |
OCI, NV* 6.700%, 03/16/33 |
898,451 |
|||||||||
|
720,000 |
Owens-Brockway Glass Container, Inc.*^ 7.250%, 05/15/31 |
722,045 |
|||||||||
|
472,000 |
6.625%, 05/13/27 |
472,142 |
|||||||||
|
1,105,000 |
Silgan Holdings, Inc. 4.125%, 02/01/28 |
1,031,716 |
|||||||||
|
478,000 |
Trinseo Materials Operating SCA / Trinseo Materials Finance, Inc.* 5.125%, 04/01/29 |
123,759 |
|||||||||
|
13,161,993 |
|||||||||||
|
Other (0.1%) |
|||||||||||
|
500,000 |
Gen Digital, Inc.* 6.750%, 09/30/27 |
502,135 |
|||||||||
|
260,000 |
7.125%, 09/30/30 |
263,120 |
|||||||||
|
765,255 |
|||||||||||
|
Real Estate (0.4%) |
|||||||||||
|
764,000 |
EPR Properties 3.750%, 08/15/29 |
664,734 |
|||||||||
| PRINCIPAL AMOUNT |
VALUE |
||||||||||
|
750,000 |
Forestar Group, Inc.* 5.000%, 03/01/28 |
$ |
713,063 |
||||||||
|
502,000 |
3.850%, 05/15/26 |
477,246 |
|||||||||
|
1,073,000 |
MIWD Holdco II, LLC / MIWD Finance Corp.* 5.500%, 02/01/30 |
972,020 |
|||||||||
|
465,000 |
Service Properties Trust 5.250%, 02/15/26 |
447,590 |
|||||||||
|
3,274,653 |
|||||||||||
|
Special Purpose Acquisition Companies (0.2%) |
|||||||||||
|
955,000 |
Fertitta Entertainment, LLC / Fertitta Entertainment Finance Company, Inc.* 6.750%, 01/15/30 |
832,588 |
|||||||||
|
477,000 |
4.625%, 01/15/29 |
431,847 |
|||||||||
|
1,264,435 |
|||||||||||
|
Utilities (0.1%) |
|||||||||||
|
350,000 |
PPL Capital Funding, Inc.‡ 8.236%, 03/30/67 3 mo. USD LIBOR + 2.67% |
347,322 |
|||||||||
|
450,000 |
Vistra Corp.*‡ 7.000%, 12/15/26 5 year CMT + 5.74% |
443,164 |
|||||||||
|
250,000 |
8.000%, 10/15/26 5 year CMT + 6.93% |
252,848 |
|||||||||
|
1,043,334 |
|||||||||||
|
TOTAL CORPORATE BONDS (Cost $305,197,055) |
300,293,454 |
||||||||||
|
CONVERTIBLE BONDS (102.1%) |
|||||||||||
|
Communication Services (8.1%) |
|||||||||||
| 960,000 | Cable One, Inc.µ 0.000%, 03/15/26 |
830,275 |
|||||||||
|
8,250,000 |
Liberty Media Corp.*µ 2.375%, 09/30/53 |
8,656,395 |
|||||||||
|
9,000,000 |
Liberty Media Corp.-Liberty Formula One 2.250%, 08/15/27 |
9,373,770 |
|||||||||
|
5,250,000 |
Match Group Financeco 3, Inc.*µ 2.000%, 01/15/30 |
4,285,470 |
|||||||||
|
6,000,000 |
Perficient, Inc.µ 0.125%, 11/15/26 |
5,275,680 |
|||||||||
|
14,500,000 |
Sea, Ltd.^ 0.250%, 09/15/26 |
12,470,870 |
|||||||||
|
10,500,000 |
Snap, Inc.µ 0.000%, 05/01/27 |
8,576,715 |
|||||||||
|
5,750,000 |
0.750%, 08/01/26 |
5,966,775 |
|||||||||
|
3,500,000 |
Zillow Group, Inc.^ 1.375%, 09/01/26 |
4,041,415 |
|||||||||
|
59,477,365 |
|||||||||||
|
Consumer Discretionary (18.8%) |
|||||||||||
|
11,500,000 |
Airbnb, Inc.µ 0.000%, 03/15/26 |
10,590,695 |
|||||||||
|
4,500,000 |
Booking Holdings, Inc. 0.750%, 05/01/25 |
8,268,075 |
|||||||||
CALAMOS CLOSED-END FAMILY OF FUNDS SEMIANNUAL REPORT
36
| PRINCIPAL AMOUNT |
VALUE |
||||||||||
|
4,250,000 |
Carnival Corp. 5.750%, 12/01/27 |
$ |
6,003,635 |
||||||||
|
6,750,000 |
Chegg, Inc.µ 0.000%, 09/01/26 |
5,425,312 |
|||||||||
|
6,691,000 |
DISH Network Corp.µ 0.000%, 12/15/25 |
4,911,194 |
|||||||||
|
11,500,000 |
DraftKings Holdings, Inc.µ 0.000%, 03/15/28 |
9,571,910 |
|||||||||
|
12,750,000 |
Etsy, Inc.µ 0.125%, 09/01/27 |
10,582,372 |
|||||||||
|
16,750,000 |
Ford Motor Companyµ 0.000%, 03/15/26 |
16,721,022 |
|||||||||
|
2,435,000 |
Lucid Group, Inc.* 1.250%, 12/15/26 |
1,116,399 |
|||||||||
|
10,250,000 |
Marriott Vacations Worldwide Corp.µ 3.250%, 12/15/27 |
9,397,712 |
|||||||||
|
11,500,000 |
Rivian Automotive, Inc. 4.625%, 03/15/29 |
7,855,190 |
|||||||||
|
2,000,000 |
Royal Caribbean Cruises, Ltd.µ 6.000%, 08/15/25 |
5,700,900 |
|||||||||
|
5,750,000 |
Shake Shack, Inc.µ 0.000%, 03/01/28 |
5,212,318 |
|||||||||
|
3,250,000 |
Stride, Inc.^ 1.125%, 09/01/27 |
4,482,693 |
|||||||||
|
15,000,000 |
Vail Resorts, Inc.µ 0.000%, 01/01/26 |
13,633,050 |
|||||||||
|
13,500,000 |
Wayfair, Inc.µ 3.250%, 09/15/27 |
14,891,445 |
|||||||||
|
3,791,000 |
Winnebago Industries, Inc.*µ 3.250%, 01/15/30 |
3,747,366 |
|||||||||
|
138,111,288 |
|||||||||||
|
Consumer Staples (0.7%) |
|||||||||||
|
4,500,000 |
Post Holdings, Inc. 2.500%, 08/15/27 |
5,044,950 |
|||||||||
|
Energy (2.9%) |
|||||||||||
|
4,250,000 |
Kosmos Energy, Ltd.* 3.125%, 03/15/30 |
4,516,050 |
|||||||||
|
4,890,000 |
Nabors Industries, Inc.µ 1.750%, 06/15/29 |
3,589,456 |
|||||||||
|
4,250,000 |
Northern Oil & Gas, Inc. 3.625%, 04/15/29 |
5,260,990 |
|||||||||
|
2,750,000 |
Pioneer Natural Resources Companyµ 0.250%, 05/15/25 |
8,075,512 |
|||||||||
|
9,411,000 |
SunEdison, Inc.@ 0.000%, 01/15/49 |
94,110 |
|||||||||
|
898,000 |
0.000%, 10/01/49 |
8,980 |
|||||||||
|
21,545,098 |
|||||||||||
|
Financials (1.7%) |
|||||||||||
|
4,250,000 |
Coinbase Global, Inc.*µ 0.250%, 04/01/30 |
3,843,530 |
|||||||||
|
8,250,000 |
Global Payments, Inc.*^ 1.500%, 03/01/31 |
8,229,128 |
|||||||||
|
12,072,658 |
|||||||||||
| PRINCIPAL AMOUNT |
VALUE |
||||||||||
|
Health Care (21.6%) |
|||||||||||
|
4,500,000 |
Alnylam Pharmaceuticals, Inc.µ 1.000%, 09/15/27 |
$ |
4,147,200 |
||||||||
|
5,500,000 |
Alphatec Holdings, Inc.µ 0.750%, 08/01/26 |
5,547,410 |
|||||||||
|
9,500,000 |
CONMED Corp.µ 2.250%, 06/15/27 |
8,385,175 |
|||||||||
|
12,250,000 |
CryoPort, Inc.*µ 0.750%, 12/01/26 |
10,670,240 |
|||||||||
|
15,831,000 |
Dexcom, Inc. 0.250%, 11/15/25 |
16,599,753 |
|||||||||
|
8,000,000 |
0.375%, 05/15/28* |
8,127,200 |
|||||||||
|
2,886,000 |
Enovis Corp.* 3.875%, 10/15/28 |
3,412,580 |
|||||||||
|
6,750,000 |
Exact Sciences Corp.µ 0.375%, 03/15/27 |
6,123,195 |
|||||||||
|
3,750,000 |
2.000%, 03/01/30* |
3,866,850 |
|||||||||
|
7,250,000 |
Halozyme Therapeutics, Inc.µ 1.000%, 08/15/28 |
6,841,825 |
|||||||||
|
2,088,000 |
Immunocore Holdings, PLC*µ 2.500%, 02/01/30 |
2,067,016 |
|||||||||
|
4,250,000 |
Insmed, Inc. 0.750%, 06/01/28 |
4,353,147 |
|||||||||
|
4,500,000 |
Insulet Corp.µ 0.375%, 09/01/26 |
4,641,705 |
|||||||||
|
9,125,000 |
Integer Holdings Corp. 2.125%, 02/15/28 |
12,689,955 |
|||||||||
|
4,500,000 |
Ionis Pharmaceuticals, Inc.µ 0.000%, 04/01/26 |
4,364,865 |
|||||||||
|
4,000,000 |
iRhythm Technologies, Inc.*µ 1.500%, 09/01/29 |
4,057,840 |
|||||||||
|
9,950,000 |
Jazz Investments I, Ltd.µ 2.000%, 06/15/26 |
9,599,362 |
|||||||||
|
3,721,000 |
Lantheus Holdings, Inc.µ 2.625%, 12/15/27 |
4,208,191 |
|||||||||
|
10,250,000 |
NeoGenomics, Inc.µ 0.250%, 01/15/28 |
8,086,225 |
|||||||||
|
8,500,000 |
Omnicell, Inc.µ 0.250%, 09/15/25 |
7,991,275 |
|||||||||
|
8,000,000 |
Pacira BioSciences, Inc.µ 0.750%, 08/01/25 |
7,571,040 |
|||||||||
|
3,750,000 |
Sarepta Therapeutics, Inc. 1.250%, 09/15/27 |
4,303,388 |
|||||||||
|
8,250,000 |
Shockwave Medical, Inc.* 1.000%, 08/15/28 |
10,485,337 |
|||||||||
|
158,140,774 |
|||||||||||
|
Industrials (7.7%) |
|||||||||||
|
4,250,000 |
Axon Enterprise, Inc. 0.500%, 12/15/27 |
6,193,015 |
|||||||||
|
4,125,000 |
Fluor Corp.*^ 1.125%, 08/15/29 |
4,494,270 |
|||||||||
|
7,250,000 |
John Bean Technologies Corp.µ 0.250%, 05/15/26 |
6,550,085 |
|||||||||
www.calamos.com
37
| PRINCIPAL AMOUNT |
VALUE |
||||||||||
|
4,250,000 |
Middleby Corp.µ 1.000%, 09/01/25 |
$ |
5,008,285 |
||||||||
|
4,000,000 |
Tetra Tech, Inc.*^ 2.250%, 08/15/28 |
4,543,960 |
|||||||||
|
20,000,000 |
Uber Technologies, Inc. 0.000%, 12/15/25 |
20,883,400 |
|||||||||
|
7,804,000 |
0.875%, 12/01/28* |
8,817,349 |
|||||||||
|
56,490,364 |
|||||||||||
|
Information Technology (34.3%) |
|||||||||||
|
4,125,000 |
Advanced Energy Industries, Inc.*µ 2.500%, 09/15/28 |
4,089,154 |
|||||||||
|
8,250,000 |
Akamai Technologies, Inc. 1.125%, 02/15/29* |
8,127,240 |
|||||||||
|
4,500,000 |
0.375%, 09/01/27^ |
4,568,850 |
|||||||||
|
9,250,000 |
Bentley Systems, Inc. 0.125%, 01/15/26 |
9,398,740 |
|||||||||
|
7,500,000 |
BILL Holdings, Inc.µ 0.000%, 12/01/25 |
6,939,300 |
|||||||||
|
3,250,000 |
Camtek, Ltd.* 0.000%, 12/01/26 |
4,856,150 |
|||||||||
|
5,750,000 |
Confluent, Inc.µ 0.000%, 01/15/27 |
4,886,235 |
|||||||||
|
5,000,000 |
CyberArk Software, Ltd. 0.000%, 11/15/24 |
7,682,600 |
|||||||||
|
4,750,000 |
Datadog, Inc.µ 0.125%, 06/15/25 |
6,777,348 |
|||||||||
|
6,000,000 |
DigitalOcean Holdings, Inc.µ 0.000%, 12/01/26 |
5,013,600 |
|||||||||
|
9,066,000 |
Enphase Energy, Inc.µ 0.000%, 03/01/26 |
8,205,274 |
|||||||||
|
2,250,000 |
Five9, Inc.µ 0.500%, 06/01/25 |
2,120,648 |
|||||||||
|
6,000,000 |
NCL Corp., Ltd. 1.125%, 02/15/27µ |
5,491,320 |
|||||||||
|
4,500,000 |
2.500%, 02/15/27µ |
4,219,065 |
|||||||||
|
3,000,000 |
5.375%, 08/01/25 |
3,688,620 |
|||||||||
|
6,250,000 |
Nutanix, Inc.^ 0.250%, 10/01/27 |
7,569,812 |
|||||||||
|
4,000,000 |
Okta, Inc.µ 0.375%, 06/15/26 |
3,630,280 |
|||||||||
|
17,250,000 |
ON Semiconductor Corp.µ 0.500%, 03/01/29 |
16,720,942 |
|||||||||
|
4,250,000 |
Palo Alto Networks, Inc.µ 0.375%, 06/01/25 |
12,441,407 |
|||||||||
|
6,250,000 |
Parsons Corp.*µ 2.625%, 03/01/29 |
6,554,750 |
|||||||||
|
7,500,000 |
Rapid7, Inc.*µ 1.250%, 03/15/29 |
7,271,925 |
|||||||||
|
11,250,000 |
Repay Holdings Corp.*µ 0.000%, 02/01/26 |
10,284,637 |
|||||||||
|
5,750,000 |
Seagate HDD Cayman* 3.500%, 06/01/28 |
6,884,245 |
|||||||||
| PRINCIPAL AMOUNT |
VALUE |
||||||||||
|
13,750,000 |
Shift4 Payments, Inc.µ^ 0.000%, 12/15/25 |
$ |
14,246,650 |
||||||||
|
6,600,000 |
SK Hynix, Inc. 1.750%, 04/11/30 |
10,351,836 |
|||||||||
|
12,500,000 |
Super Micro Computer, Inc.*µ 0.000%, 03/01/29 |
12,784,000 |
|||||||||
|
10,000,000 |
Tyler Technologies, Inc.µ^ 0.250%, 03/15/26 |
10,504,800 |
|||||||||
|
12,250,000 |
Unity Software, Inc.µ 0.000%, 11/15/26 |
10,443,492 |
|||||||||
|
3,730,000 |
Vertex, Inc.* 0.750%, 05/01/29 |
3,900,648 |
|||||||||
|
8,000,000 |
Western Digital Corp.* 3.000%, 11/15/28 |
12,084,880 |
|||||||||
|
6,250,000 |
Wix.com, Ltd. 0.000%, 08/15/25 |
5,793,000 |
|||||||||
|
8,750,000 |
Wolfspeed, Inc. 1.875%, 12/01/29 |
5,012,963 |
|||||||||
|
5,338,000 |
0.250%, 02/15/28 |
3,157,907 |
|||||||||
|
4,250,000 |
Zscaler, Inc.µ 0.125%, 07/01/25 |
5,384,623 |
|||||||||
|
251,086,941 |
|||||||||||
|
Materials (1.6%) |
|||||||||||
|
1,500,000 |
ATI, Inc.^ 3.500%, 06/15/25 |
5,777,490 |
|||||||||
|
6,306,000 |
MP Materials Corp.*µ 0.250%, 04/01/26 |
5,572,171 |
|||||||||
|
11,349,661 |
|||||||||||
|
Other (0.0%) |
|||||||||||
|
475,000 |
Multiplan Corp.*µ 6.000%, 10/15/27 7.000% PIK rate |
338,385 |
|||||||||
|
Real Estate (0.7%) |
|||||||||||
|
6,000,000 |
Pebblebrook Hotel Trustµ 1.750%, 12/15/26 |
5,298,840 |
|||||||||
|
Utilities (4.0%) |
|||||||||||
|
4,250,000 |
CMS Energy Corp.* 3.375%, 05/01/28 |
4,164,193 |
|||||||||
|
6,500,000 |
PG&E Corp.*µ 4.250%, 12/01/27 |
6,522,945 |
|||||||||
|
15,250,000 |
PPL Capital Funding, Inc.µ^ 2.875%, 03/15/28 |
14,498,175 |
|||||||||
|
4,250,000 |
Southern Company^ 3.875%, 12/15/25 |
4,242,775 |
|||||||||
|
29,428,088 |
|||||||||||
|
TOTAL CONVERTIBLE BONDS (Cost $785,822,994) |
748,384,412 |
||||||||||
CALAMOS CLOSED-END FAMILY OF FUNDS SEMIANNUAL REPORT
38
| PRINCIPAL AMOUNT |
VALUE |
||||||||||
|
BANK LOANS (7.7%)¡ |
|||||||||||
|
Airlines (0.3%) |
|||||||||||
|
645,000 |
Air Canada‡ 7.833%, 03/21/31 3 mo. SOFR + 2.50% |
$ |
650,241 |
||||||||
|
640,000 |
American Airlines, Inc.‡ 10.336%, 04/20/28 3 mo. SOFR + 4.75% |
666,467 |
|||||||||
|
640,250 |
Mileage Plus Holdings, LLC‡ 10.733%, 06/21/27 3 mo. SOFR + 5.25% |
658,122 |
|||||||||
|
640,000 |
United Airlines, Inc.‡ 8.076%, 02/22/31 3 mo. SOFR + 2.75% |
643,501 |
|||||||||
|
2,618,331 |
|||||||||||
|
Communication Services (0.5%) |
|||||||||||
|
56,490 |
Audacy Capital Corp.‡ 11.430%, 08/19/24 3 mo. SOFR + 6.11% |
56,631 |
|||||||||
|
460,998 |
Clear Channel Outdoor Holdings, Inc.‡ 9.430%, 08/23/28 1 mo. SOFR + 4.00% |
461,959 |
|||||||||
|
377,146 |
DIRECTV Financing, LLC! 0.000%, 08/02/27 |
379,555 |
|||||||||
|
355,716 |
DIRECTV Financing, LLC‡ 10.430%, 08/02/27 1 mo. SOFR + 5.00% |
357,987 |
|||||||||
|
1,505,000 |
Entercom Media Corp.‡ 8.145%, 11/18/24 3 mo. SOFR + 0.00% |
815,710 |
|||||||||
|
950,493 |
Gray Television, Inc.‡ 7.942%, 01/02/26 1 mo. SOFR + 2.50% |
939,862 |
|||||||||
|
970,000 |
Telesat Canada‡ 8.355%, 12/07/26 3 mo. SOFR + 2.75% |
494,904 |
|||||||||
|
3,506,608 |
|||||||||||
|
Consumer Discretionary (1.8%) |
|||||||||||
|
475,000 |
Adient U.S., LLC‡ 8.066%, 01/31/31 1 mo. SOFR + 2.75% |
477,672 |
|||||||||
|
744,000 |
American Axle & Manufacturing, Inc.‡ 8.921%, 12/13/29 1 mo. SOFR + 3.50% |
748,419 |
|||||||||
|
960,300 |
Caesars Entertainment, Inc.‡ 8.666%, 02/06/30 1 mo. SOFR + 3.25% |
963,483 |
|||||||||
|
1,487,932 |
Carnival Corp.‡ 8.067%, 08/08/27 1 mo. SOFR + 2.75% |
1,497,462 |
|||||||||
|
889,695 |
Carnival Corp.‡ 8.067%, 10/18/28 1 mo. SOFR + 2.75% |
894,423 |
|||||||||
| PRINCIPAL AMOUNT |
VALUE |
||||||||||
|
950,000 |
Flutter Financing, BV! 0.000%, 11/25/30 |
$ |
952,883 |
||||||||
|
1,219,533 |
Hanesbrands, Inc.‡ 9.066%, 03/08/30 1 mo. SOFR + 3.75% |
1,222,070 |
|||||||||
|
530,816 |
Life Time Fitness, Inc.‡ 9.591%, 01/15/26 3 mo. SOFR + 4.00% |
534,633 |
|||||||||
|
1,122,900 |
Light & Wonder International, Inc.‡ 8.071%, 04/14/29 1 mo. SOFR + 2.75% |
1,126,796 |
|||||||||
|
2,074,888 |
PetSmart, Inc.‡ 9.166%, 02/11/28 1 mo. SOFR + 3.75% |
2,048,952 |
|||||||||
|
505,000 |
Station Casinos LLC! 0.000%, 03/14/31 |
505,654 |
|||||||||
|
445,000 |
Station Casinos, LLC‡ 7.566%, 03/14/31 1 mo. SOFR + 2.25% |
445,576 |
|||||||||
|
593,828 |
TKC Holdings, Inc.‡ 10.930%, 05/15/28 1 mo. SOFR + 5.50% |
590,488 |
|||||||||
|
971,952 |
Windsor Holdings III, LLC‡ 9.319%, 08/01/30 1 mo. SOFR + 4.00% |
981,550 |
|||||||||
|
12,990,061 |
|||||||||||
|
Consumer Staples (1.0%) |
|||||||||||
|
2,248,650 |
Amneal Pharmaceuticals, LLC‡ 10.816%, 05/04/28 1 mo. SOFR + 5.50% |
2,253,575 |
|||||||||
|
540,943 |
Fiesta Purchaser, Inc.‡ 9.316%, 02/12/31 1 mo. SOFR + 4.00% |
543,750 |
|||||||||
|
444,057 |
Fiesta Purchaser, Inc.‡ 9.318%, 02/12/31 1 mo. SOFR + 4.00% |
446,362 |
|||||||||
|
1,751,452 |
Jazz Financing Lux Sarl‡ 8.430%, 05/05/28 1 mo. SOFR + 3.00% |
1,763,773 |
|||||||||
|
960,000 |
Star Parent, Inc.‡ 9.309%, 09/27/30 3 mo. SOFR + 4.00% |
960,903 |
|||||||||
|
645,000 |
United Natural Foods, Inc.! 0.000%, 04/25/31 |
639,356 |
|||||||||
|
481,343 |
United Natural Foods, Inc.‡ 8.680%, 10/22/25 1 mo. SOFR + 3.25% |
479,813 |
|||||||||
|
7,087,532 |
|||||||||||
|
Energy (0.4%) |
|||||||||||
|
748,125 |
Buckeye Partners, LP‡ 7.816%, 11/22/30 1 mo. SOFR + 2.50% |
751,682 |
|||||||||
|
473,813 |
New Fortress Energy, Inc.‡ 10.330%, 10/27/28 3 mo. SOFR + 5.00% |
477,070 |
|||||||||
www.calamos.com
39
| PRINCIPAL AMOUNT |
VALUE |
||||||||||
|
1,194,169 |
Par Petroleum, LLC‡ 9.052%, 02/28/30 3 mo. SOFR + 3.75% |
$ |
1,199,764 |
||||||||
|
250,000 |
Par Petroleum, LLC‡! 9.738%, 02/28/30 3 mo. SOFR + 4.25% |
251,171 |
|||||||||
|
2,679,687 |
|||||||||||
|
Financials (1.2%) |
|||||||||||
|
1,050,000 |
Advisor Group, Inc.! 0.000%, 08/17/28 |
1,057,634 |
|||||||||
|
239,400 |
Advisor Group, Inc.‡ 9.816%, 08/17/28 1 mo. SOFR + 4.50% |
241,140 |
|||||||||
|
776,684 |
Alliant Holdings Intermediate, LLC‡ 8.819%, 11/06/30 1 mo. SOFR + 3.50% |
780,645 |
|||||||||
|
719,572 |
Amynta Agency Borrower, Inc.‡ 9.552%, 02/28/28 3 mo. SOFR + 4.25% |
722,914 |
|||||||||
|
775,000 |
AssuredPartners, Inc.! 0.000%, 02/14/31 |
779,270 |
|||||||||
|
455,000 |
AssuredPartners, Inc.‡ 8.816%, 02/14/31 1 mo. SOFR + 3.50% |
457,507 |
|||||||||
|
736,305 |
Avolon TLB Borrower 1 (US) LLC‡ 7.315%, 06/22/28 1 mo. SOFR + 2.00% |
738,720 |
|||||||||
|
448,875 |
Broadstreet Partners, Inc.‡ 9.066%, 01/27/29 1 mo. SOFR + 3.75% |
451,025 |
|||||||||
|
947,625 |
HUB International, Ltd.‡ 8.575%, 06/20/30 3 mo. SOFR + 3.25% |
953,486 |
|||||||||
|
2,375 |
HUB International, Ltd.‡ 8.565%, 06/20/30 3 mo. SOFR + 3.25% |
2,390 |
|||||||||
|
718,200 |
Iron Mountain, Inc.‡ 7.566%, 01/31/31 1 mo. SOFR + 2.25% |
717,600 |
|||||||||
|
475,000 |
Level 3 Financing, Inc.! 0.000%, 04/15/29 |
467,961 |
|||||||||
|
1,290,453 |
VFH Parent, LLC‡ 8.416%, 01/13/29 1 mo. SOFR + 3.00% |
1,292,272 |
|||||||||
|
8,662,564 |
|||||||||||
|
Health Care (0.5%) |
|||||||||||
|
446,023 |
Icon Luxembourg Sarl‡ 7.320%, 07/03/28 3 mo. SOFR + 2.00% |
448,404 |
|||||||||
|
988,235 |
Padagis, LLC‡ 10.314%, 07/06/28 3 mo. SOFR + 4.75% |
909,176 |
|||||||||
|
111,127 |
PRA Health Sciences, Inc.‡ 7.309%, 07/03/28 3 mo. SOFR + 2.00% |
111,720 |
|||||||||
| PRINCIPAL AMOUNT |
VALUE |
||||||||||
|
2,360,705 |
Team Health Holdings, Inc.‡ 10.580%, 03/02/27 3 mo. SOFR + 5.25% |
$ |
2,075,308 |
||||||||
|
6,770 |
Team Health Holdings, Inc.‡ 10.566%, 03/02/27 3 mo. SOFR + 5.25% |
5,952 |
|||||||||
|
3,550,560 |
|||||||||||
|
Industrials (0.4%) |
|||||||||||
|
955,045 |
ACProducts, Inc.‡ 9.814%, 05/17/28 3 mo. SOFR + 4.25% |
831,844 |
|||||||||
|
901,209 |
ChampionX Corp.‡ 8.168%, 06/07/29 1 mo. SOFR + 2.75% |
906,278 |
|||||||||
|
404,717 |
Emrld Borrower, LP‡ 7.816%, 05/31/30 1 mo. SOFR + 2.50% |
406,435 |
|||||||||
|
110,000 |
MI Windows & Doors, LLC‡ 8.816%, 03/21/31 1 mo. SOFR + 3.50% |
110,642 |
|||||||||
|
972,563 |
TransDigm, Inc.‡ 8.559%, 02/28/31 1 mo. SOFR + 3.25% |
979,366 |
|||||||||
|
3,234,565 |
|||||||||||
|
Information Technology (0.7%) |
|||||||||||
|
1,320,388 |
Banff Merger Sub, Inc.‡ 9.566%, 12/29/28 1 mo. SOFR + 4.25% |
1,330,113 |
|||||||||
|
756,093 |
Camelot US Acquisition LLC‡ 8.066%, 01/31/31 1 mo. SOFR + 2.75% |
758,456 |
|||||||||
|
913,163 |
Central Parent, Inc.‡ 9.309%, 07/06/29 3 mo. SOFR + 4.00% |
917,938 |
|||||||||
|
959,651 |
Dun & Bradstreet Corp.‡ 8.068%, 01/18/29 1 mo. SOFR + 2.75% |
963,053 |
|||||||||
|
848,119 |
II-VI, Inc.‡ 7.829%, 07/02/29 1 mo. SOFR + 2.50% |
853,153 |
|||||||||
|
500,000 |
UKG, Inc.‡ 8.814%, 02/10/31 3 mo. SOFR + 3.50% |
502,867 |
|||||||||
|
5,325,580 |
|||||||||||
|
Materials (0.7%) |
|||||||||||
|
716,400 |
Chemours Company‡ 8.817%, 08/18/28 1 mo. SOFR + 3.50% |
717,074 |
|||||||||
|
967,688 |
Ineos US Finance, LLC‡ 8.930%, 02/18/30 1 mo. SOFR + 3.50% |
971,316 |
|||||||||
|
755,670 |
Innophos, Inc.‡ 8.930%, 02/05/27 1 mo. SOFR + 3.50% |
756,539 |
|||||||||
CALAMOS CLOSED-END FAMILY OF FUNDS SEMIANNUAL REPORT
40
Convertible Opportunities and Income Fund Schedule of Investments April 30, 2024 (Unaudited)
| PRINCIPAL AMOUNT | VALUE | ||||||||||
1,200,925 | LSF11 A5 Holdco, LLC‡ 9.666%, 10/15/28 1 mo. SOFR + 4.25% | $ | 1,205,729 | ||||||||
733,683 | Trinseo Materials Operating SCA‡ 7.824%, 05/03/28 3 mo. SOFR + 2.50% | 512,698 | |||||||||
978,775 | W.R. Grace & Co.-Conn.‡ 9.321%, 09/22/28 3 mo. SOFR + 3.75% | 981,657 | |||||||||
5,145,013 | |||||||||||
Special Purpose Acquisition Companies (0.2%) | |||||||||||
471,600 | Clydesdale Acquisition Holdings, Inc.‡ 9.091%, 04/13/29 1 mo. SOFR + 3.67% | 474,168 | |||||||||
240,100 | Fertitta Entertainment, LLC‡ 9.069%, 01/27/29 1 mo. SOFR + 4.00% | 240,926 | |||||||||
985,000 | Patagonia Holdco, LLC‡ 11.064%, 08/01/29 3 mo. SOFR + 5.75% | 916,050 | |||||||||
1,631,144 | |||||||||||
TOTAL BANK LOANS (Cost $57,224,569) | 56,431,645 | ||||||||||
| NUMBER OF SHARES | VALUE | ||||||||||
CONVERTIBLE PREFERRED STOCKS (3.6%) | |||||||||||
Energy (0.0%) | |||||||||||
26 | Gulfport Energy Corp.# 10.000%, 05/31/24 15.000% PIK rate | 300,950 | |||||||||
Financials (2.0%) | |||||||||||
83,465 | Apollo Global Management, Inc. 6.750%, 07/31/26 | 5,089,696 | |||||||||
8,100 | Bank of America Corp.‡‡ 7.250%, 12/31/49 | 9,315,000 | |||||||||
14,404,696 | |||||||||||
Industrials (0.6%) | |||||||||||
75,625 | Chart Industries, Inc. 6.750%, 12/15/25 | 4,345,412 | |||||||||
Utilities (1.0%) | |||||||||||
180,300 | NextEra Energy, Inc.^ 6.926%, 09/01/25 | 7,347,225 | |||||||||
TOTAL CONVERTIBLE (Cost $28,651,882) | 26,398,283 | ||||||||||
WARRANTS (0.0%)# | |||||||||||
Energy (0.0%) | |||||||||||
47,739 | Mcdermott International, Ltd.& 06/30/27, Strike $15.98 | 5 | |||||||||
| NUMBER OF SHARES | VALUE | ||||||||||
42,965 | Mcdermott International, Ltd. 06/30/27, Strike $12.33 | $ | 4 | ||||||||
TOTAL WARRANTS (Cost $18,376) | 9 | ||||||||||
COMMON STOCKS (0.4%) | |||||||||||
Communication Services (0.0%) | |||||||||||
20,285 | Altice USA, Inc. - Class A^# | 39,150 | |||||||||
6,819 | Cumulus Media, Inc. - Class Aµ# | 17,934 | |||||||||
1 | Frontier Communications Parent, Inc.µ# | 23 | |||||||||
57,107 | |||||||||||
Consumer Staples (0.1%) | |||||||||||
7,073 | Mallinckrodt, PLC# | 374,869 | |||||||||
Energy (0.2%) | |||||||||||
1,384 | Chesapeake Energy Corp.µ | 124,394 | |||||||||
67,000 | Energy Transfer, LP | 1,053,910 | |||||||||
39,795 | Enterprise Products Partners, LP | 1,117,444 | |||||||||
6,644 | EP Energy Corp.&# | 15,779 | |||||||||
32 | Gulfport Energy Corp.µ&# | 5,079 | |||||||||
2,316,606 | |||||||||||
Special Purpose Acquisition Company (0.1%) | |||||||||||
11,411 | Intelsat Emergence, SA&# | 413,649 | |||||||||
TOTAL COMMON STOCKS (Cost $3,842,232) | 3,162,231 | ||||||||||
PREFERRED STOCKS (0.4%) | |||||||||||
Communication Services (0.1%) | |||||||||||
11,875 | United States Cellular Corp.µ 5.500%, 06/01/70 | 209,594 | |||||||||
11,375 | 5.500%, 03/01/70 | 202,134 | |||||||||
411,728 | |||||||||||
Consumer Discretionary (0.1%) | |||||||||||
6,122 | Guitar Center, Inc.&# | 480,577 | |||||||||
Energy (0.2%) | |||||||||||
29,680 | NuStar Energy, LP‡ 11.234%, 05/30/24 3 mo. USD LIBOR + 5.64% | 757,137 | |||||||||
7,294 | NuStar Energy, LP‡ 12.357%, 05/30/24 3 mo. USD LIBOR + 6.77% | 186,507 | |||||||||
43,000 | NuStar Logistics, LP‡ 12.324%, 01/15/43 3 mo. USD SOFR + 7.00% | 1,090,480 | |||||||||
2,034,124 | |||||||||||
TOTAL PREFERRED STOCKS (Cost $3,137,405) | 2,926,429 | ||||||||||
www.calamos.com
41
| NUMBER OF CONTRACTS/ NOTIONAL AMOUNT | VALUE | ||||||||||
PURCHASED OPTION (0.1%)# | |||||||||||
Industrials (0.1%) | |||||||||||
3,250 | American Airlines Group, Inc. | ||||||||||
4,390,750 | Call, 06/20/25, Strike $17.00 (Cost $795,671) | $ | 404,625 | ||||||||
| TOTAL INVESTMENTS (155.3%) (Cost $1,185,400,692) | 1,138,696,354 | ||||||||||
| MANDATORY REDEEMABLE PREFERRED SHARES, AT LIQUIDATION VALUE (-18.1%) | (133,000,000 | ) | |||||||||
LIABILITIES, LESS OTHER ASSETS (-37.2%) | (272,692,157 | ) | |||||||||
NET ASSETS (100.0%) | $ | 733,004,197 | |||||||||
NOTES TO SCHEDULE OF INVESTMENTS
* Securities issued and sold pursuant to a Rule 144A transaction are exempted from the registration requirement of the Securities Act of 1933, as amended. These securities may only be sold to qualified institutional buyers ("QIBs"), such as the Funds. Any resale of these securities must generally be effected through a sale that is registered under the Act or otherwise exempted from such registration requirements.
µ Security, or portion of security, is held in a segregated account as collateral for note payable aggregating a total value of $448,944,441.
^ Security, or portion of security, is on loan.
@ In default status and considered non-income producing.
& Illiquid security.
‡ Variable rate security. The rate shown is the rate in effect at April 30, 2024.
¡ Bank loans generally are subject to mandatory and/or optional prepayment. As a result, the actual remaining maturity of bank loans may be substantially less than the stated maturities shown.
! This position represents an unsettled loan commitment at period end. Certain details associated with this purchase are not known prior to the settlement date, including coupon rate, which will be adjusted on settlement date.
# Non-income producing security.
‡‡ Perpetual maturity.
Note: The date on options represents the expiration date of the option contract. The option contract may be exercised at any date on or before the date shown.
CALAMOS CLOSED-END FAMILY OF FUNDS SEMIANNUAL REPORT
42
The following table summarizes the Fund's investments and derivative financial instruments categorized in the fair value hierarchy as of April 30, 2024 (see Note 1):
LEVEL 1 | LEVEL 2 | LEVEL 3 | TOTAL | ||||||||||||||||
Assets: | |||||||||||||||||||
Asset Backed Securities | $ | — | $ | 695,266 | $ | — | $ | 695,266 | |||||||||||
Corporate Bonds | — | 300,293,454 | — | 300,293,454 | |||||||||||||||
Convertible Bonds | — | 748,384,412 | — | 748,384,412 | |||||||||||||||
Bank Loans | — | 56,431,645 | — | 56,431,645 | |||||||||||||||
Convertible Preferred Stocks | 26,097,333 | 300,950 | — | 26,398,283 | |||||||||||||||
Warrants | — | 9 | — | 9 | |||||||||||||||
Common Stocks | 2,357,934 | 804,297 | — | 3,162,231 | |||||||||||||||
Preferred Stocks | 2,445,852 | 480,577 | — | 2,926,429 | |||||||||||||||
Purchased Options | 404,625 | — | — | 404,625 | |||||||||||||||
Total | $ | 31,305,744 | $ | 1,107,390,610 | $ | — | $ | 1,138,696,354 | |||||||||||
SECTOR WEIGHTINGS
Information Technology | 22.8 | % | |||||
Consumer Discretionary | 18.3 | ||||||
Health Care | 15.5 | ||||||
Industrials | 9.0 | ||||||
Communication Services | 7.9 | ||||||
Financials | 7.4 | ||||||
Energy | 5.9 | ||||||
Utilities | 3.2 | ||||||
Materials | 2.5 | ||||||
Consumer Staples | 2.3 | ||||||
Real Estate | 0.7 | ||||||
Airlines | 0.6 | ||||||
Special Purpose Acquisition Companies | 0.3 | ||||||
Sector weightings are based on managed assets and may vary over time. Sector Weightings exclude any government/sovereign bonds or options on broad market indexes the Fund may hold.
ASSET ALLOCATION
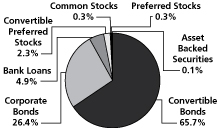
Fund asset allocations are based on total investments and may vary over time.
See accompanying Notes to Schedule of Investments
www.calamos.com
43
| PRINCIPAL AMOUNT | VALUE | ||||||||||
ASSET BACKED SECURITY (0.1%) | |||||||||||
Other (0.1%) | |||||||||||
850,000 | SVC ABS, LLC Series 2023-1A, Class C* 6.700%, 02/20/53 (Cost $789,454) | $ | 772,517 | ||||||||
CORPORATE BONDS (41.1%) | |||||||||||
Airlines (0.6%) | |||||||||||
907,051 | Alaska Airlines Pass Through Trust Series 2020-1, Class A*µ 4.800%, 02/15/29 | 880,710 | |||||||||
358,516 | Alaska Airlines Pass Through Trust Series 2020-1, Class B* 8.000%, 02/15/27 | 362,585 | |||||||||
1,076,060 | American Airlines Pass Through Trust Series 2021-1, Class B 3.950%, 01/11/32 | 975,556 | |||||||||
522,000 | American Airlines, Inc. / AAdvantage Loyalty IP, Ltd.* 5.500%, 04/20/26 | 516,509 | |||||||||
981,591 | British Airways Pass Through Trust Series 2021-1, Class B* 3.900%, 03/15/33 | 891,962 | |||||||||
833,999 | JetBlue Pass Through Trust Series 2020-1, Class B 7.750%, 05/15/30 | 853,748 | |||||||||
4,481,070 | |||||||||||
Communication Services (4.0%) | |||||||||||
800,000 | Altice France Holding, SA* 10.500%, 05/15/27 | 286,792 | |||||||||
1,200,000 | Altice France, SA* 5.500%, 10/15/29 | 787,200 | |||||||||
1,255,000 | APi Group DE, Inc.* 4.750%, 10/15/29 | 1,143,368 | |||||||||
1,100,000 | Ashtead Capital, Inc.* 2.450%, 08/12/31 | 873,884 | |||||||||
1,307,000 | Audacy Capital Corp.*@ 6.750%, 03/31/29 | 46,137 | |||||||||
490,000 | 6.500%, 05/01/27 | 17,488 | |||||||||
952,000 | Cincinnati Bell Telephone Company, LLC 6.300%, 12/01/28 | 868,757 | |||||||||
525,000 | Clear Channel Outdoor Holdings, Inc.* 7.875%, 04/01/30 | 515,109 | |||||||||
475,000 | 9.000%, 09/15/28^ | 488,956 | |||||||||
1,454,000 | Consolidated Communications, Inc.* 6.500%, 10/01/28 | 1,262,799 | |||||||||
1,630,000 | CSC Holdings, LLC* 5.375%, 02/01/28 | 1,257,056 | |||||||||
1,600,000 | 4.625%, 12/01/30 | 696,128 | |||||||||
1,220,000 | 4.500%, 11/15/31 | 775,749 | |||||||||
1,150,000 | 5.750%, 01/15/30 | 504,712 | |||||||||
1,035,000 | 5.500%, 04/15/27 | 849,590 | |||||||||
| PRINCIPAL AMOUNT | VALUE | ||||||||||
| 512,000 | Directv Financing, LLC / Directv Financing Co-Obligor, Inc.* 5.875%, 08/15/27 | $ | 477,537 | ||||||||
1,060,000 | Frontier California, Inc. 6.750%, 05/15/27 | 1,010,201 | |||||||||
261,000 | Frontier Communications Holdings, LLC* 8.750%, 05/15/30 | 265,980 | |||||||||
1,685,000 | Frontier Florida, LLC@ 6.860%, 02/01/28 | 1,605,367 | |||||||||
1,555,000 | Frontier North, Inc.@ 6.730%, 02/15/28 | 1,474,840 | |||||||||
905,000 | Go Daddy Operating Company, LLC / GD Finance Company, Inc.* 3.500%, 03/01/29 | 804,038 | |||||||||
270,000 | 5.250%, 12/01/27 | 261,036 | |||||||||
263,000 | Hughes Satellite Systems Corp. 6.625%, 08/01/26 | 151,506 | |||||||||
655,000 | iHeartCommunications, Inc. 8.375%, 05/01/27 | 349,122 | |||||||||
395,000 | 5.250%, 08/15/27*^ | 290,266 | |||||||||
1,295,000 | LCPR Senior Secured Financing DAC* 6.750%, 10/15/27 | 1,200,633 | |||||||||
791,137 | Ligado Networks, LLC* 15.500%, 11/01/23 15.500% PIK rate | 131,115 | |||||||||
785,000 | Lumen Technologies, Inc. 7.600%, 09/15/39 | 240,257 | |||||||||
525,000 | 4.000%, 02/15/27* | 279,515 | |||||||||
263,000 | 7.650%, 03/15/42 | 80,531 | |||||||||
522,000 | Match Group Holdings II, LLC* 3.625%, 10/01/31 | 431,517 | |||||||||
610,000 | Nexstar Media, Inc.* 5.625%, 07/15/27 | 574,083 | |||||||||
1,005,000 | Paramount Global 4.900%, 08/15/44 | 704,565 | |||||||||
367,000 | Qwest Corp. 7.250%, 09/15/25 | 363,748 | |||||||||
514,000 | Scripps Escrow II, Inc.* 3.875%, 01/15/29 | 380,350 | |||||||||
257,000 | 5.375%, 01/15/31 | 152,203 | |||||||||
930,000 | Scripps Escrow, Inc.* 5.875%, 07/15/27 | 735,249 | |||||||||
1,350,000 | Sirius XM Radio, Inc.* 5.500%, 07/01/29 | 1,258,929 | |||||||||
1,044,000 | 4.000%, 07/15/28 | 930,799 | |||||||||
515,000 | 3.125%, 09/01/26 | 480,871 | |||||||||
261,000 | 3.875%, 09/01/31^ | 209,988 | |||||||||
957,000 | Spanish Broadcasting System, Inc.* 9.750%, 03/01/26 | 456,173 | |||||||||
1,915,000 | Sprint, LLCµ 7.125%, 06/15/24 | 1,917,643 | |||||||||
1,170,000 | Stagwell Global, LLC* 5.625%, 08/15/29 | 1,049,548 | |||||||||
517,000 | Telesat Canada / Telesat, LLC* 4.875%, 06/01/27 | 236,600 | |||||||||
CALAMOS CLOSED-END FAMILY OF FUNDS SEMIANNUAL REPORT
44
| PRINCIPAL AMOUNT | VALUE | ||||||||||
420,000 | Time Warner Cable, LLC 7.300%, 07/01/38 | $ | 407,929 | ||||||||
1,186,000 | United States Cellular Corp. 6.700%, 12/15/33 | 1,158,034 | |||||||||
786,000 | Univision Communications, Inc.* 8.000%, 08/15/28 | 787,847 | |||||||||
525,000 | Viasat, Inc.*^ 5.625%, 04/15/27 | 481,331 | |||||||||
31,713,076 | |||||||||||
Consumer Discretionary (8.8%) | |||||||||||
1,257,000 | Abercrombie & Fitch Management Company* 8.750%, 07/15/25 | 1,267,684 | |||||||||
1,055,000 | Adams Homes, Inc.* 9.250%, 10/15/28 | 1,090,670 | |||||||||
780,000 | Adient Global Holdings Company*^ 8.250%, 04/15/31 | 810,779 | |||||||||
920,000 | American Axle & Manufacturing, Inc.^ 5.000%, 10/01/29 | 830,576 | |||||||||
913,000 | Ashton Woods USA, LLC / Ashton Woods Finance Company* 4.625%, 08/01/29 | 827,032 | |||||||||
780,000 | 6.625%, 01/15/28 | 778,869 | |||||||||
1,325,000 | At Home Group, Inc.* 4.875%, 07/15/28 | 629,918 | |||||||||
1,369,000 | Bath & Body Works, Inc. 6.694%, 01/15/27 | 1,379,596 | |||||||||
760,000 | 6.875%, 11/01/35 | 756,694 | |||||||||
600,000 | Benteler International AG* 10.500%, 05/15/28 | 640,362 | |||||||||
657,000 | Caesars Entertainment, Inc.* 4.625%, 10/15/29 | 586,228 | |||||||||
512,000 | 8.125%, 07/01/27 | 519,977 | |||||||||
523,000 | Carnival Corp.* 4.000%, 08/01/28 | 477,839 | |||||||||
520,000 | 7.625%, 03/01/26 | 523,510 | |||||||||
65,000 | 7.000%, 08/15/29^ | 66,791 | |||||||||
222,329 | Carvana Company* 14.000%, 06/01/31 | 223,169 | |||||||||
186,423 | 13.000%, 06/01/30 | 185,234 | |||||||||
123,395 | 12.000%, 12/01/28 | 120,878 | |||||||||
2,250,000 | CCO Holdings, LLC / CCO Holdings Capital Corp.* 5.125%, 05/01/27 | 2,112,435 | |||||||||
1,825,000 | 4.500%, 08/15/30 | 1,485,605 | |||||||||
1,200,000 | 6.375%, 09/01/29 | 1,100,052 | |||||||||
1,150,000 | 4.750%, 03/01/30 | 957,421 | |||||||||
1,035,000 | 4.250%, 02/01/31 | 813,427 | |||||||||
540,000 | 5.000%, 02/01/28 | 492,464 | |||||||||
522,000 | 4.750%, 02/01/32 | 410,887 | |||||||||
522,000 | CDI Escrow Issuer, Inc.* 5.750%, 04/01/30 | 498,124 | |||||||||
810,000 | Cedar Fair, LP 5.250%, 07/15/29 | 757,131 | |||||||||
| PRINCIPAL AMOUNT | VALUE | ||||||||||
520,000 | Churchill Downs, Inc.* 6.750%, 05/01/31 | $ | 516,511 | ||||||||
855,000 | Dana, Inc. 4.250%, 09/01/30 | 742,952 | |||||||||
782,000 | 4.500%, 02/15/32 | 663,527 | |||||||||
1,170,000 | DISH DBS Corp. 5.125%, 06/01/29 | 472,750 | |||||||||
775,000 | 5.250%, 12/01/26* | 611,297 | |||||||||
650,000 | 7.375%, 07/01/28 | 291,772 | |||||||||
525,000 | 5.750%, 12/01/28* | 356,323 | |||||||||
428,000 | 7.750%, 07/01/26 | 269,961 | |||||||||
1,049,000 | DISH Network Corp.* 11.750%, 11/15/27 | 1,058,609 | |||||||||
1,510,000 | Empire Resorts, Inc.* 7.750%, 11/01/26 | 1,408,015 | |||||||||
1,142,000 | Everi Holdings, Inc.* 5.000%, 07/15/29 | 1,121,752 | |||||||||
1,075,000 | Ford Motor Company 6.100%, 08/19/32 | 1,054,822 | |||||||||
1,650,000 | Ford Motor Credit Company, LLC 4.000%, 11/13/30 | 1,440,334 | |||||||||
1,350,000 | 7.200%, 06/10/30^ | 1,399,842 | |||||||||
1,280,000 | 5.113%, 05/03/29 | 1,220,070 | |||||||||
945,000 | 7.350%, 11/04/27 | 977,839 | |||||||||
800,000 | 2.900%, 02/16/28 | 712,368 | |||||||||
391,000 | Gap, Inc.* 3.875%, 10/01/31 | 319,861 | |||||||||
510,000 | General Motors Company 5.200%, 04/01/45 | 436,943 | |||||||||
1,825,000 | goeasy, Ltd.* 9.250%, 12/01/28 | 1,931,781 | |||||||||
934,000 | 7.625%, 07/01/29 | 935,532 | |||||||||
560,000 | Goodyear Tire & Rubber Company 5.250%, 07/15/31^ | 496,115 | |||||||||
525,000 | 5.625%, 04/30/33 | 462,032 | |||||||||
445,000 | Group 1 Automotive, Inc.* 4.000%, 08/15/28 | 405,951 | |||||||||
1,116,000 | Guitar Center, Inc.*^& 8.500%, 01/15/26 | 986,868 | |||||||||
825,000 | International Game Technology, PLC* 6.250%, 01/15/27 | 824,513 | |||||||||
285,653 | JetBlue Pass Through Trust Series 2019-2, Class B 8.000%, 11/15/27 | 288,621 | |||||||||
1,188,000 | Kohl's Corp. 5.550%, 07/17/45 | 815,930 | |||||||||
1,040,000 | LCM Investments Holdings II, LLC* 8.250%, 08/01/31 | 1,082,370 | |||||||||
1,045,000 | Liberty Interactive, LLC 8.250%, 02/01/30 | 580,529 | |||||||||
1,008,000 | Life Time, Inc.* 8.000%, 04/15/26 | 1,009,693 | |||||||||
525,000 | Light & Wonder International, Inc.* 7.500%, 09/01/31 | 535,768 | |||||||||
See accompanying Notes to Schedule of Investments
www.calamos.com
45
| PRINCIPAL AMOUNT | VALUE | ||||||||||
390,000 | Lindblad Expeditions Holdings, Inc.* 9.000%, 05/15/28 | $ | 408,966 | ||||||||
672,000 | Lindblad Expeditions, LLC* 6.750%, 02/15/27 | 666,893 | |||||||||
685,000 | M/I Homes, Inc. 3.950%, 02/15/30 | 594,895 | |||||||||
1,219,000 | Macy's Retail Holdings, LLC 6.700%, 07/15/34* | 1,027,398 | |||||||||
765,000 | 4.300%, 02/15/43 | 605,130 | |||||||||
1,329,000 | Midwest Gaming Borrower, LLC / Midwest Gaming Finance Corp.* 4.875%, 05/01/29 | 1,215,570 | |||||||||
625,000 | Newell Brands, Inc. 5.700%, 04/01/26 | 616,563 | |||||||||
525,000 | Nordstrom, Inc. 6.950%, 03/15/28 | 521,693 | |||||||||
500,000 | 5.000%, 01/15/44 | 379,930 | |||||||||
499,000 | 4.250%, 08/01/31 | 430,747 | |||||||||
1,573,000 | Patrick Industries, Inc.* 4.750%, 05/01/29 | 1,431,320 | |||||||||
1,195,000 | PENN Entertainment, Inc.*^ 4.125%, 07/01/29 | 1,001,541 | |||||||||
523,000 | Phinia, Inc.* 6.750%, 04/15/29 | 525,238 | |||||||||
1,460,000 | Premier Entertainment Sub, LLC / Premier Entertainment Finance Corp.*^ 5.625%, 09/01/29 | 1,090,897 | |||||||||
525,000 | QVC, Inc. 5.450%, 08/15/34 | 344,894 | |||||||||
530,000 | Raising Cane's Restaurants, LLC* 9.375%, 05/01/29 | 568,876 | |||||||||
2,039,000 | Rite Aid Corp.*@ 8.000%, 11/15/26 | 1,315,828 | |||||||||
520,000 | Royal Caribbean Cruises, Ltd.* 7.250%, 01/15/30 | 535,730 | |||||||||
131,000 | 6.250%, 03/15/32 | 129,158 | |||||||||
1,475,000 | Simmons Foods, Inc. / Simmons Prepared Foods, Inc. / Simmons Pet Food, Inc. / Simmons Feed* 4.625%, 03/01/29 | 1,275,875 | |||||||||
1,565,000 | Six Flags Entertainment Corp.*^ 7.250%, 05/15/31 | 1,563,153 | |||||||||
1,173,000 | Sonic Automotive, Inc.* 4.625%, 11/15/29 | 1,050,973 | |||||||||
753,000 | Speedway Motorsports, LLC / Speedway Funding II, Inc.* 4.875%, 11/01/27 | 710,651 | |||||||||
1,125,000 | Station Casinos, LLC* 4.500%, 02/15/28 | 1,044,292 | |||||||||
1,050,000 | STL Holding Company, LLC* 8.750%, 02/15/29 | 1,080,040 | |||||||||
636,000 | Taylor Morrison Communities, Inc.* 5.750%, 01/15/28 | 619,966 | |||||||||
260,000 | Viking Cruises, Ltd.* 9.125%, 07/15/31 | 279,094 | |||||||||
| PRINCIPAL AMOUNT | VALUE | ||||||||||
1,215,000 | Vista Outdoor, Inc.* 4.500%, 03/15/29 | $ | 1,200,979 | ||||||||
1,025,000 | ZF North America Capital, Inc.* 7.125%, 04/14/30 | 1,049,764 | |||||||||
300,000 | 6.875%, 04/23/32 | 303,393 | |||||||||
300,000 | 6.750%, 04/23/30 | 300,897 | |||||||||
69,664,947 | |||||||||||
Consumer Staples (1.9%) | |||||||||||
1,178,000 | 1375209 B.C., Ltd.*^ 9.000%, 01/30/28 | 1,157,833 | |||||||||
1,543,000 | Arrow Bidco, LLC* 10.750%, 06/15/25 | 1,591,697 | |||||||||
1,050,000 | B&G Foods, Inc.* 8.000%, 09/15/28 | 1,089,711 | |||||||||
1,191,000 | Central Garden & Pet Company* 4.125%, 04/30/31 | 1,033,693 | |||||||||
1,188,000 | Edgewell Personal Care Company* 4.125%, 04/01/29 | 1,077,373 | |||||||||
1,445,000 | Energizer Holdings, Inc.* 4.375%, 03/31/29 | 1,278,117 | |||||||||
260,000 | 6.500%, 12/31/27^ | 257,702 | |||||||||
1,575,000 | JBS USA Holding LUX Sarl / JBS USA Food Company / JBS LUX Company Sarl 5.500%, 01/15/30^ | 1,521,655 | |||||||||
650,000 | 5.125%, 02/01/28µ | 632,040 | |||||||||
390,000 | 5.750%, 04/01/33 | 373,448 | |||||||||
672,000 | New Albertsons, LP 7.750%, 06/15/26 | 692,100 | |||||||||
1,043,000 | Performance Food Group, Inc.* 4.250%, 08/01/29 | 935,258 | |||||||||
775,000 | Pilgrim's Pride Corp. 4.250%, 04/15/31 | 686,355 | |||||||||
525,000 | Post Holdings, Inc.* 6.250%, 02/15/32 | 519,283 | |||||||||
986,000 | Prestige Brands, Inc.* 3.750%, 04/01/31 | 840,062 | |||||||||
855,000 | United Natural Foods, Inc.*^ 6.750%, 10/15/28 | 657,281 | |||||||||
1,103,000 | Vector Group, Ltd.* 5.750%, 02/01/29 | 1,003,719 | |||||||||
15,347,327 | |||||||||||
Energy (5.5%) | |||||||||||
516,000 | Antero Resources Corp.* 5.375%, 03/01/30 | 491,005 | |||||||||
1,037,000 | Apache Corp. 5.100%, 09/01/40 | 863,614 | |||||||||
545,000 | Buckeye Partners, LP 5.850%, 11/15/43 | 456,312 | |||||||||
520,000 | Cheniere Energy, Inc.µ 4.625%, 10/15/28 | 497,557 | |||||||||
780,000 | Chesapeake Energy Corp.* 6.750%, 04/15/29 | 780,889 | |||||||||
CALAMOS CLOSED-END FAMILY OF FUNDS SEMIANNUAL REPORT
46
| PRINCIPAL AMOUNT | VALUE | ||||||||||
1,465,000 | Civitas Resources, Inc.* 8.750%, 07/01/31 | $ | 1,559,053 | ||||||||
525,000 | Continental Resources, Inc. 4.900%, 06/01/44 | 423,297 | |||||||||
517,000 | 2.875%, 04/01/32* | 413,331 | |||||||||
808,000 | DT Midstream, Inc.* 4.125%, 06/15/29 | 732,468 | |||||||||
1,024,000 | Earthstone Energy Holdings, LLC* 8.000%, 04/15/27 | 1,053,696 | |||||||||
390,000 | 9.875%, 07/15/31 | 431,562 | |||||||||
600,000 | Enbridge, Inc.‡ 7.375%, 01/15/83 5 year CMT + 3.71% | 590,562 | |||||||||
575,000 | Encino Acquisition Partners Holdings, LLC* 8.750%, 05/01/31 | 585,747 | |||||||||
1,520,000 | Energy Transfer, LP‡ 8.606%, 11/01/66 3 mo. SOFR + 3.28% | 1,380,707 | |||||||||
764,000 | 6.500%, 11/15/26 5 year CMT + 5.69% | 742,142 | |||||||||
1,300,000 | EnLink Midstream Partners, LP 9.701%, 05/31/24‡ 3 mo. LIBOR + 4.11% | 1,283,841 | |||||||||
1,125,000 | 4.850%, 07/15/26 | 1,096,853 | |||||||||
650,000 | Enlink Midstream, LLC* 6.500%, 09/01/30 | 658,359 | |||||||||
1,730,000 | EQM Midstream Partners, LP* 7.500%, 06/01/27 | 1,762,593 | |||||||||
525,000 | 6.375%, 04/01/29 | 521,645 | |||||||||
765,000 | Genesis Energy, LP / Genesis Energy Finance Corp. 8.875%, 04/15/30 | 792,487 | |||||||||
467,000 | 6.250%, 05/15/26 | 463,666 | |||||||||
1,105,000 | Gulfport Energy Corp. 8.000%, 05/17/26* | 1,121,630 | |||||||||
311,124 | 8.000%, 05/17/26^ | 315,807 | |||||||||
1,460,000 | Hilcorp Energy I, LP / Hilcorp Finance Company* 6.000%, 04/15/30 | 1,402,899 | |||||||||
782,000 | Howard Midstream Energy Partners, LLC* 6.750%, 01/15/27 | 772,960 | |||||||||
1,050,000 | Kodiak Gas Services, LLC* 7.250%, 02/15/29 | 1,062,474 | |||||||||
1,015,000 | Magnolia Oil & Gas Operating, LLC / Magnolia Oil & Gas Finance Corp.* 6.000%, 08/01/26 | 1,001,531 | |||||||||
784,000 | Matador Resources Company* 6.500%, 04/15/32 | 777,595 | |||||||||
540,000 | Moss Creek Resources Holdings, Inc.* 10.500%, 05/15/27 | 552,911 | |||||||||
495,000 | 7.500%, 01/15/26 | 494,465 | |||||||||
780,000 | Nabors Industries, Inc.* 7.375%, 05/15/27 | 773,643 | |||||||||
390,000 | 9.125%, 01/31/30^ | 403,673 | |||||||||
| PRINCIPAL AMOUNT | VALUE | ||||||||||
780,000 | Nabors Industries, Ltd.*^ 7.500%, 01/15/28 | $ | 740,158 | ||||||||
676,000 | New Fortress Energy, Inc.* 6.750%, 09/15/25 | 668,862 | |||||||||
1,090,000 | Oceaneering International, Inc. 6.000%, 02/01/28 | 1,050,629 | |||||||||
1,110,000 | Parkland Corp.* 5.875%, 07/15/27 | 1,085,758 | |||||||||
551,000 | Patterson-UTI Energy, Inc.^ 5.150%, 11/15/29 | 526,602 | |||||||||
260,000 | Permian Resources Operating LLC* 7.000%, 01/15/32 | 265,660 | |||||||||
1,040,000 | Plains All American Pipeline, LP‡ 9.679%, 05/31/24 3 mo. LIBOR + 4.11% | 1,036,422 | |||||||||
1,460,000 | Rockcliff Energy II, LLC* 5.500%, 10/15/29 | 1,350,325 | |||||||||
521,000 | Southwestern Energy Company 4.750%, 02/01/32 | 469,801 | |||||||||
1,402,200 | Transocean, Inc.* 8.750%, 02/15/30 | 1,463,588 | |||||||||
525,000 | 8.250%, 05/15/29 | 522,160 | |||||||||
650,000 | Venture Global Calcasieu Pass, LLC* 6.250%, 01/15/30 | 644,436 | |||||||||
260,000 | 4.125%, 08/15/31 | 227,739 | |||||||||
260,000 | 3.875%, 08/15/29 | 229,736 | |||||||||
1,300,000 | Venture Global LNG, Inc.* 8.375%, 06/01/31 | 1,335,139 | |||||||||
780,000 | 8.125%, 06/01/28 | 798,455 | |||||||||
525,000 | 9.875%, 02/01/32 | 560,275 | |||||||||
525,000 | 9.500%, 02/01/29 | 564,753 | |||||||||
605,000 | Vital Energy, Inc. 7.750%, 07/31/29* | 609,483 | |||||||||
551,000 | 7.875%, 04/15/32* | 559,711 | |||||||||
412,000 | 9.750%, 10/15/30 | 449,286 | |||||||||
1,045,000 | VOC Escrow, Ltd.* 5.000%, 02/15/28 | 997,379 | |||||||||
1,308,000 | Weatherford International, Ltd.* 8.625%, 04/30/30 | 1,358,855 | |||||||||
43,776,186 | |||||||||||
Financials (7.1%) | |||||||||||
1,650,000 | Acrisure, LLC / Acrisure Finance, Inc.* 8.250%, 02/01/29 | 1,639,869 | |||||||||
1,562,000 | Aethon United BR, LP / Aethon United Finance Corp.* 8.250%, 02/15/26 | 1,574,668 | |||||||||
1,830,000 | Alliant Holdings Intermediate, LLC / Alliant Holdings Co-Issuer* 6.750%, 10/15/27 | 1,798,323 | |||||||||
135,000 | 7.000%, 01/15/31 | 135,826 | |||||||||
1,173,000 | Ally Financial, Inc. 4.700%, 05/15/26‡ 5 year CMT + 3.87% | 996,546 | |||||||||
480,000 | 4.700%, 05/15/28‡ 7 year CMT + 3.48% | 371,990 | |||||||||
434,000 | 8.000%, 11/01/31 | 470,352 | |||||||||
www.calamos.com
47
| PRINCIPAL AMOUNT | VALUE | ||||||||||
2,082,000 | AmWINS Group, Inc.* 4.875%, 06/30/29 | $ | 1,895,453 | ||||||||
779,000 | Aviation Capital Group, LLC*µ 3.500%, 11/01/27 | 717,646 | |||||||||
525,000 | Brandywine Operating Partnership, LP 8.875%, 04/12/29 | 537,915 | |||||||||
1,559,000 | BroadStreet Partners, Inc.* 5.875%, 04/15/29 | 1,422,478 | |||||||||
1,245,000 | Brookfield Property REIT, Inc. / BPR Cumulus, LLC / BPR Nimbus, LLC / GGSI Sellco, LLC* 4.500%, 04/01/27 | 1,115,396 | |||||||||
1,000,000 | Burford Capital Global Financial, LLC* 6.875%, 04/15/30 | 970,330 | |||||||||
1,010,000 | Credit Acceptance Corp. 6.625%, 03/15/26^ | 1,007,586 | |||||||||
690,000 | 9.250%, 12/15/28* | 732,242 | |||||||||
1,045,000 | Cushman & Wakefield U.S. Borrower LLC*^ 8.875%, 09/01/31 | 1,087,375 | |||||||||
1,346,000 | Enact Holdings, Inc.*µ 6.500%, 08/15/25 | 1,345,421 | |||||||||
1,170,000 | GGAM Finance, Ltd.* 8.000%, 02/15/27 | 1,202,152 | |||||||||
1,292,000 | Global Net Lease, Inc. / Global Net Lease Operating Partnership, LP* 3.750%, 12/15/27 | 1,100,422 | |||||||||
1,050,000 | GTCR W-2 Merger Sub, LLC* 7.500%, 01/15/31 | 1,083,600 | |||||||||
585,000 | HAT Holdings I LLC / HAT Holdings II LLC* 8.000%, 06/15/27 | 600,748 | |||||||||
1,571,000 | HUB International, Ltd.* 5.625%, 12/01/29 | 1,449,546 | |||||||||
525,000 | 7.375%, 01/31/32 | 522,837 | |||||||||
781,000 | Icahn Enterprises, LP / Icahn Enterprises Finance Corp. 4.375%, 02/01/29 | 658,110 | |||||||||
1,420,000 | ILFC E-Capital Trust II*‡ 7.395%, 12/21/65 3 mo. LIBOR + 1.80% | 1,134,523 | |||||||||
2,155,000 | Iron Mountain, Inc.* 5.250%, 03/15/28 | 2,064,749 | |||||||||
2,640,000 | Jefferies Finance, LLC / JFIN Co-Issuer Corp.* 5.000%, 08/15/28 | 2,377,954 | |||||||||
2,029,000 | Ladder Capital Finance Holdings, LLLP / Ladder Capital Finance Corp.* 5.250%, 10/01/25 | 1,995,785 | |||||||||
1,127,000 | 4.750%, 06/15/29 | 1,007,978 | |||||||||
960,000 | LD Holdings Group, LLC* 6.125%, 04/01/28 | 728,774 | |||||||||
1,080,000 | Level 3 Financing, Inc.* 4.250%, 07/01/28 | 422,539 | |||||||||
525,000 | 4.625%, 09/15/27 | 309,619 | |||||||||
| PRINCIPAL AMOUNT | VALUE | ||||||||||
774,000 | LPL Holdings, Inc.*µ 4.000%, 03/15/29 | $ | 702,761 | ||||||||
1,055,000 | Macquarie Airfinance Holdings, Ltd.* 8.125%, 03/30/29 | 1,105,840 | |||||||||
480,377 | Mallinckrodt International Finance, SA / Mallinckrodt CB, LLC* 14.750%, 11/14/28 | 523,942 | |||||||||
1,623,000 | MetLife, Inc. 6.400%, 12/15/66 | 1,618,991 | |||||||||
1,415,000 | Nationstar Mortgage Holdings, Inc.* 5.500%, 08/15/28 | 1,331,939 | |||||||||
1,133,000 | Navient Corp. 5.000%, 03/15/27 | 1,070,130 | |||||||||
565,000 | 4.875%, 03/15/28 | 511,415 | |||||||||
650,000 | Necessity Retail REIT, Inc. / American Finance Operating Partner, LP* 4.500%, 09/30/28 | 555,035 | |||||||||
525,000 | Newmark Group, Inc.* 7.500%, 01/12/29 | 530,807 | |||||||||
730,000 | OneMain Finance Corp. 9.000%, 01/15/29 | 767,434 | |||||||||
715,000 | 3.875%, 09/15/28 | 630,909 | |||||||||
518,000 | 7.125%, 03/15/26^ | 523,061 | |||||||||
1,602,000 | PHH Mortgage Corp.* 7.875%, 03/15/26 | 1,540,659 | |||||||||
1,200,000 | RHP Hotel Properties, LP / RHP Finance Corp.* 4.500%, 02/15/29 | 1,105,740 | |||||||||
1,050,000 | 6.500%, 04/01/32 | 1,030,376 | |||||||||
475,000 | Rocket Mortgage, LLC / Rocket Mortgage Co-Issuer, Inc.* 3.625%, 03/01/29 | 419,553 | |||||||||
470,000 | 3.875%, 03/01/31 | 400,393 | |||||||||
240,000 | 2.875%, 10/15/26 | 220,826 | |||||||||
1,310,000 | StoneX Group, Inc.* 7.875%, 03/01/31 | 1,325,694 | |||||||||
1,047,000 | 8.625%, 06/15/25 | 1,051,272 | |||||||||
1,212,000 | United Wholesale Mortgage, LLC* 5.500%, 04/15/29 | 1,128,263 | |||||||||
525,000 | 5.750%, 06/15/27 | 504,546 | |||||||||
525,000 | Uniti Group, LP / Uniti Group Finance, Inc. / CSL Capital, LLC* 6.500%, 02/15/29 | 422,483 | |||||||||
520,000 | 10.500%, 02/15/28 | 540,150 | |||||||||
1,200,000 | VZ Secured Financing, BV* 5.000%, 01/15/32 | 1,014,108 | |||||||||
1,091,000 | XHR, LP* 6.375%, 08/15/25 | 1,090,553 | |||||||||
56,145,632 | |||||||||||
Health Care (2.9%) | |||||||||||
2,092,000 | Bausch Health Companies, Inc.* 11.000%, 09/30/28^ | 1,638,747 | |||||||||
413,000 | 14.000%, 10/15/30 | 266,848 | |||||||||
391,000 | 6.125%, 02/01/27^ | 287,080 | |||||||||
CALAMOS CLOSED-END FAMILY OF FUNDS SEMIANNUAL REPORT
48
| PRINCIPAL AMOUNT | VALUE | ||||||||||
2,075,000 | CHS/Community Health Systems, Inc.* 6.125%, 04/01/30 | $ | 1,469,598 | ||||||||
594,000 | 6.875%, 04/15/29 | 441,122 | |||||||||
583,000 | 8.000%, 03/15/26 | 581,035 | |||||||||
525,000 | 10.875%, 01/15/32 | 538,482 | |||||||||
130,000 | 5.250%, 05/15/30 | 106,586 | |||||||||
1,220,000 | DaVita, Inc.* 3.750%, 02/15/31 | 1,005,609 | |||||||||
1,154,000 | 4.625%, 06/01/30 | 1,013,766 | |||||||||
783,000 | Embecta Corp.* 5.000%, 02/15/30^ | 604,155 | |||||||||
260,000 | 6.750%, 02/15/30 | 223,634 | |||||||||
525,000 | Encompass Health Corp. 4.750%, 02/01/30 | 482,486 | |||||||||
525,000 | 4.500%, 02/01/28 | 493,868 | |||||||||
1,234,000 | HCA, Inc.^ 7.500%, 11/06/33 | 1,346,146 | |||||||||
340,000 | Jazz Securities DAC* 4.375%, 01/15/29 | 311,501 | |||||||||
1,297,000 | Medline Borrower, LP* 5.250%, 10/01/29^ | 1,208,609 | |||||||||
1,295,000 | 3.875%, 04/01/29 | 1,159,932 | |||||||||
1,900,000 | Organon & Company / Organon Foreign Debt Co-Issuer, BV* 5.125%, 04/30/31 | 1,644,488 | |||||||||
450,000 | 4.125%, 04/30/28 | 410,328 | |||||||||
1,103,000 | Team Health Holdings, Inc.* 6.375%, 02/01/25 | 1,027,180 | |||||||||
2,465,000 | Tenet Healthcare Corp. 6.250%, 02/01/27 | 2,459,799 | |||||||||
1,420,000 | 6.875%, 11/15/31 | 1,469,927 | |||||||||
1,320,000 | Teva Pharmaceutical Finance Netherlands III, BV 5.125%, 05/09/29^ | 1,252,904 | |||||||||
1,000,000 | 4.750%, 05/09/27 | 958,140 | |||||||||
500,000 | 3.150%, 10/01/26 | 463,475 | |||||||||
22,865,445 | |||||||||||
Industrials (5.8%) | |||||||||||
1,050,000 | Aar Escrow Issuer, LLC* 6.750%, 03/15/29 | 1,059,439 | |||||||||
1,200,000 | ACCO Brands Corp.* 4.250%, 03/15/29 | 1,047,300 | |||||||||
825,000 | AerCap Holdings, NV^‡ 5.875%, 10/10/79 5 year CMT + 4.54% | 817,790 | |||||||||
1,055,000 | Air Lease Corp.‡ 4.125%, 12/15/26 5 year CMT + 3.15% | 913,651 | |||||||||
1,750,000 | Albertsons Companies, Inc. / Safeway, Inc. / New Albertsons, LP / Albertsons, LLC* 4.625%, 01/15/27 | 1,673,280 | |||||||||
780,000 | 5.875%, 02/15/28 | 765,079 | |||||||||
677,000 | Allegiant Travel Company*^ 7.250%, 08/15/27 | 655,783 | |||||||||
| PRINCIPAL AMOUNT | VALUE | ||||||||||
587,000 | Arcosa, Inc.* 4.375%, 04/15/29 | $ | 537,381 | ||||||||
2,650,000 | ARD Finance, SA* 6.500%, 06/30/27 7.250% PIK rate | 739,668 | |||||||||
821,000 | Beacon Roofing Supply, Inc.* 4.125%, 05/15/29 | 734,820 | |||||||||
521,000 | Boeing Company* 6.388%, 05/01/31 | 524,803 | |||||||||
520,000 | Bombardier, Inc.* 8.750%, 11/15/30 | 553,613 | |||||||||
442,000 | 7.875%, 04/15/27 | 440,621 | |||||||||
325,000 | 7.250%, 07/01/31 | 326,268 | |||||||||
1,044,000 | BWX Technologies, Inc.* 4.125%, 04/15/29 | 952,285 | |||||||||
1,078,000 | Cascades, Inc. / Cascades USA, Inc.* 5.375%, 01/15/28 | 1,016,284 | |||||||||
257,000 | Delta Air Lines, Inc. / SkyMiles IP, Ltd.*µ 4.750%, 10/20/28 | 249,244 | |||||||||
1,360,000 | Deluxe Corp.* 8.000%, 06/01/29 | 1,235,451 | |||||||||
1,048,000 | Eco Material Technologies, Inc.* 7.875%, 01/31/27 | 1,056,908 | |||||||||
520,000 | Emerald Debt Merger Sub, LLC* 6.625%, 12/15/30 | 516,875 | |||||||||
500,000 | EnerSys* 6.625%, 01/15/32 | 498,655 | |||||||||
500,000 | 4.375%, 12/15/27 | 468,785 | |||||||||
395,000 | EquipmentShare.com, Inc.* 8.625%, 05/15/32 | 402,762 | |||||||||
634,000 | Graham Packaging Company, Inc.* 7.125%, 08/15/28 | 573,890 | |||||||||
675,000 | Graphic Packaging International, LLC* 4.750%, 07/15/27 | 647,602 | |||||||||
484,000 | 3.500%, 03/01/29 | 428,814 | |||||||||
1,141,000 | Great Lakes Dredge & Dock Corp.*^ 5.250%, 06/01/29 | 963,814 | |||||||||
2,438,000 | H&E Equipment Services, Inc.* 3.875%, 12/15/28 | 2,160,117 | |||||||||
1,289,000 | Hawaiian Brand Intellectual Property, Ltd. / HawaiianMiles Loyalty, Ltd.* 5.750%, 01/20/26 | 1,211,712 | |||||||||
1,350,000 | Herc Holdings, Inc.* 5.500%, 07/15/27 | 1,312,996 | |||||||||
1,210,000 | IEA Energy Services, LLC* 6.625%, 08/15/29 | 1,155,005 | |||||||||
727,000 | JELD-WEN, Inc.* 4.625%, 12/15/25 | 709,901 | |||||||||
540,000 | 4.875%, 12/15/27 | 513,383 | |||||||||
1,690,000 | Ken Garff Automotive, LLC* 4.875%, 09/15/28 | 1,574,556 | |||||||||
1,040,000 | Knife River Holding Company* 7.750%, 05/01/31 | 1,082,401 | |||||||||
255,000 | MasTec, Inc.*µ 4.500%, 08/15/28 | 238,463 | |||||||||
www.calamos.com
49
| PRINCIPAL AMOUNT | VALUE | ||||||||||
131,000 | Miter Brands Acquisition Holdco, Inc. / MIWD Borrower, LLC* 6.750%, 04/01/32 | $ | 130,196 | ||||||||
650,000 | Moog, Inc.* 4.250%, 12/15/27 | 608,251 | |||||||||
1,302,000 | Newfold Digital Holdings Group, Inc.* 6.000%, 02/15/29 | 978,466 | |||||||||
1,040,000 | Novelis Corp.* 4.750%, 01/30/30 | 949,780 | |||||||||
390,000 | OI European Group, BV* 4.750%, 02/15/30 | 357,022 | |||||||||
1,200,000 | Pactiv Evergreen Group Issuer, Inc. / Pactiv Evergreen Group Issuer, LLC*^ 4.000%, 10/15/27 | 1,116,288 | |||||||||
809,000 | Sealed Air Corp.* 6.125%, 02/01/28 | 800,028 | |||||||||
261,000 | 5.000%, 04/15/29 | 245,765 | |||||||||
260,000 | Sealed Air Corp./Sealed Air Corp. U.S.* 7.250%, 02/15/31 | 265,218 | |||||||||
400,000 | Sensata Technologies, BV* 4.000%, 04/15/29 | 358,244 | |||||||||
519,000 | Sensata Technologies, Inc.* 3.750%, 02/15/31 | 439,723 | |||||||||
774,000 | Sinclair Television Group, Inc.* 4.125%, 12/01/30 | 533,147 | |||||||||
515,000 | 5.500%, 03/01/30 | 357,194 | |||||||||
1,030,000 | Standard Industries, Inc.* 5.000%, 02/15/27 | 994,063 | |||||||||
835,000 | Stericycle, Inc.* 3.875%, 01/15/29 | 746,590 | |||||||||
1,125,000 | TransDigm, Inc.* 6.875%, 12/15/30 | 1,133,539 | |||||||||
790,000 | 6.750%, 08/15/28 | 793,768 | |||||||||
390,000 | 7.125%, 12/01/31 | 397,987 | |||||||||
254,000 | 6.625%, 03/01/32 | 253,982 | |||||||||
519,000 | Tronox, Inc.* 4.625%, 03/15/29 | 464,728 | |||||||||
383,042 | United Airlines Pass Through Trust Series 2019-2, Class B 3.500%, 11/01/29 | 353,812 | |||||||||
1,039,000 | Vertiv Group Corp.* 4.125%, 11/15/28 | 962,852 | |||||||||
1,095,000 | Wabash National Corp.* 4.500%, 10/15/28 | 985,609 | |||||||||
915,000 | Waste Pro USA, Inc.* 5.500%, 02/15/26 | 896,371 | |||||||||
604,000 | Williams Scotsman, Inc.* 4.625%, 08/15/28 | 558,712 | |||||||||
530,000 | 7.375%, 10/01/31 | 541,808 | |||||||||
45,982,542 | |||||||||||
Information Technology (1.8%) | |||||||||||
266,000 | Booz Allen Hamilton, Inc.*^ 4.000%, 07/01/29 | 244,031 | |||||||||
| PRINCIPAL AMOUNT | VALUE | ||||||||||
604,000 | Coherent Corp.* 5.000%, 12/15/29 | $ | 557,860 | ||||||||
955,000 | CommScope, Inc.* 4.750%, 09/01/29 | 667,784 | |||||||||
471,000 | Dell International, LLC / EMC Corp.µ 6.020%, 06/15/26 | 473,901 | |||||||||
522,000 | Dun & Bradstreet Corp.*^ 5.000%, 12/15/29 | 475,740 | |||||||||
520,000 | Fair Isaac Corp.* 4.000%, 06/15/28 | 479,674 | |||||||||
1,130,000 | KBR, Inc.* 4.750%, 09/30/28 | 1,055,782 | |||||||||
1,130,000 | MPH Acquisition Holdings, LLC* 5.750%, 11/01/28^ | 832,200 | |||||||||
520,000 | 5.500%, 09/01/28 | 424,809 | |||||||||
528,000 | NCL Corp., Ltd.* 8.125%, 01/15/29 | 550,403 | |||||||||
522,000 | NCR Voyix Corp.* 5.125%, 04/15/29 | 480,115 | |||||||||
771,000 | ON Semiconductor Corp.* 3.875%, 09/01/28 | 699,868 | |||||||||
780,000 | Open Text Corp.* 3.875%, 02/15/28 | 712,553 | |||||||||
525,000 | 6.900%, 12/01/27 | 537,086 | |||||||||
391,000 | 3.875%, 12/01/29 | 342,841 | |||||||||
391,000 | Open Text Holdings, Inc.*^ 4.125%, 12/01/31 | 335,693 | |||||||||
908,000 | Playtika Holding Corp.* 4.250%, 03/15/29 | 782,124 | |||||||||
1,450,000 | TTM Technologies, Inc.* 4.000%, 03/01/29 | 1,299,156 | |||||||||
725,000 | Twilio, Inc. 3.625%, 03/15/29 | 643,988 | |||||||||
259,000 | 3.875%, 03/15/31 | 224,594 | |||||||||
394,000 | UKG, Inc.* 6.875%, 02/01/31 | 394,922 | |||||||||
1,300,000 | Viavi Solutions, Inc.* 3.750%, 10/01/29 | 1,100,255 | |||||||||
1,200,000 | ZoomInfo Technologies, LLC / ZoomInfo Finance Corp.* 3.875%, 02/01/29 | 1,061,196 | |||||||||
14,376,575 | |||||||||||
Materials (1.8%) | |||||||||||
555,000 | ArcelorMittal, SA^ 7.000%, 10/15/39 | 587,551 | |||||||||
500,000 | ATI, Inc. 5.875%, 12/01/27 | 491,165 | |||||||||
258,000 | Carpenter Technology Corp. 7.625%, 03/15/30 | 263,596 | |||||||||
1,040,000 | Chemours Company* 4.625%, 11/15/29 | 892,029 | |||||||||
1,640,000 | Clearwater Paper Corp.* 4.750%, 08/15/28 | 1,491,498 | |||||||||
CALAMOS CLOSED-END FAMILY OF FUNDS SEMIANNUAL REPORT
50
| PRINCIPAL AMOUNT | VALUE | ||||||||||
780,000 | Cleveland-Cliffs, Inc.* 6.750%, 04/15/30 | $ | 762,154 | ||||||||
522,000 | Commercial Metals Company 4.125%, 01/15/30 | 468,928 | |||||||||
261,000 | 4.375%, 03/15/32 | 230,223 | |||||||||
1,210,000 | Constellium, SE*^ 3.750%, 04/15/29 | 1,074,783 | |||||||||
512,000 | HB Fuller Company 4.250%, 10/15/28 | 473,108 | |||||||||
525,000 | INEOS Finance, PLC*^ 6.750%, 05/15/28 | 516,548 | |||||||||
800,000 | JW Aluminum Continuous Cast Company* 10.250%, 06/01/26 | 807,888 | |||||||||
920,000 | Kaiser Aluminum Corp.* 4.625%, 03/01/28 | 857,872 | |||||||||
260,000 | LSF11 A5 HoldCo, LLC* 6.625%, 10/15/29 | 242,507 | |||||||||
1,107,000 | Mercer International, Inc. 5.125%, 02/01/29^ | 968,149 | |||||||||
520,000 | 12.875%, 10/01/28* | 568,240 | |||||||||
1,015,000 | OCI, NV* 6.700%, 03/16/33 | 975,324 | |||||||||
785,000 | Owens-Brockway Glass Container, Inc.*^ 7.250%, 05/15/31 | 787,229 | |||||||||
505,000 | 6.625%, 05/13/27 | 505,152 | |||||||||
1,194,000 | Silgan Holdings, Inc. 4.125%, 02/01/28 | 1,114,814 | |||||||||
521,000 | Trinseo Materials Operating SCA / Trinseo Materials Finance, Inc.* 5.125%, 04/01/29 | 134,892 | |||||||||
14,213,650 | |||||||||||
Other (0.1%) | |||||||||||
475,000 | Gen Digital, Inc.* 6.750%, 09/30/27 | 477,028 | |||||||||
215,000 | 7.125%, 09/30/30 | 217,580 | |||||||||
694,608 | |||||||||||
Real Estate (0.4%) | |||||||||||
834,000 | EPR Properties 3.750%, 08/15/29 | 725,638 | |||||||||
750,000 | Forestar Group, Inc.* 5.000%, 03/01/28 | 713,062 | |||||||||
551,000 | 3.850%, 05/15/26 | 523,830 | |||||||||
1,168,000 | MIWD Holdco II, LLC / MIWD Finance Corp.* 5.500%, 02/01/30 | 1,058,080 | |||||||||
485,000 | Service Properties Trust 5.250%, 02/15/26 | 466,842 | |||||||||
3,487,452 | |||||||||||
| PRINCIPAL AMOUNT | VALUE | ||||||||||
Special Purpose Acquisition Companies (0.2%) | |||||||||||
1,045,000 | Fertitta Entertainment, LLC / Fertitta Entertainment Finance Company, Inc.* 6.750%, 01/15/30 | $ | 911,052 | ||||||||
524,000 | 4.625%, 01/15/29 | 474,398 | |||||||||
1,385,450 | |||||||||||
Utilities (0.2%) | |||||||||||
379,000 | PPL Capital Funding, Inc.‡ 8.236%, 03/30/67 3 mo. LIBOR + 2.67% | 376,101 | |||||||||
525,000 | Vistra Corp.*‡ 7.000%, 12/15/26 5 year CMT + 5.74% | 517,025 | |||||||||
270,000 | 8.000%, 10/15/26 5 year CMT + 6.93% | 273,075 | |||||||||
1,166,201 | |||||||||||
| TOTAL CORPORATE BONDS (Cost $330,609,703) | 325,300,161 | ||||||||||
CONVERTIBLE BONDS (103.1%) | |||||||||||
Communication Services (8.2%) | |||||||||||
1,040,000 | Cable One, Inc.µ 0.000%, 03/15/26 | 899,465 | |||||||||
8,750,000 | Liberty Media Corp.* 2.375%, 09/30/53 | 9,181,025 | |||||||||
9,750,000 | Liberty Media Corp.-Liberty Formula One 2.250%, 08/15/27 | 10,154,917 | |||||||||
5,750,000 | Match Group Financeco 3, Inc.*µ 2.000%, 01/15/30 | 4,693,610 | |||||||||
6,750,000 | Perficient, Inc.µ 0.125%, 11/15/26 | 5,935,140 | |||||||||
16,500,000 | Sea, Ltd. 0.250%, 09/15/26 | 14,190,990 | |||||||||
11,500,000 | Snap, Inc.µ 0.000%, 05/01/27 | 9,393,545 | |||||||||
6,000,000 | 0.750%, 08/01/26 | 6,226,200 | |||||||||
3,750,000 | Zillow Group, Inc.^ 1.375%, 09/01/26 | 4,330,088 | |||||||||
65,004,980 | |||||||||||
Consumer Discretionary (19.0%) | |||||||||||
12,250,000 | Airbnb, Inc.µ 0.000%, 03/15/26 | 11,281,392 | |||||||||
5,000,000 | Booking Holdings, Inc. 0.750%, 05/01/25 | 9,186,750 | |||||||||
4,500,000 | Carnival Corp. 5.750%, 12/01/27 | 6,356,790 | |||||||||
7,500,000 | Chegg, Inc.µ 0.000%, 09/01/26 | 6,028,125 | |||||||||
7,320,000 | DISH Network Corp.µ 0.000%, 12/15/25 | 5,372,880 | |||||||||
www.calamos.com
51
| PRINCIPAL AMOUNT | VALUE | ||||||||||
12,500,000 | DraftKings Holdings, Inc.µ 0.000%, 03/15/28 | $ | 10,404,250 | ||||||||
14,000,000 | Etsy, Inc.µ 0.125%, 09/01/27 | 11,619,860 | |||||||||
18,500,000 | Ford Motor Company 0.000%, 03/15/26 | 18,467,995 | |||||||||
2,620,000 | Lucid Group, Inc.* 1.250%, 12/15/26 | 1,201,218 | |||||||||
11,000,000 | Marriott Vacations Worldwide Corp.µ 3.250%, 12/15/27 | 10,085,350 | |||||||||
12,250,000 | Rivian Automotive, Inc. 4.625%, 03/15/29 | 8,367,485 | |||||||||
2,250,000 | Royal Caribbean Cruises, Ltd. 6.000%, 08/15/25 | 6,413,512 | |||||||||
6,250,000 | Shake Shack, Inc.µ 0.000%, 03/01/28 | 5,665,563 | |||||||||
3,500,000 | Stride, Inc.µ 1.125%, 09/01/27 | 4,827,515 | |||||||||
16,250,000 | Vail Resorts, Inc.µ 0.000%, 01/01/26 | 14,769,137 | |||||||||
14,500,000 | Wayfair, Inc.µ 3.250%, 09/15/27 | 15,994,515 | |||||||||
4,028,000 | Winnebago Industries, Inc.*µ 3.250%, 01/15/30 | 3,981,638 | |||||||||
150,023,975 | |||||||||||
Consumer Staples (0.7%) | |||||||||||
| 5,000,000 | Post Holdings, Inc.µ 2.500%, 08/15/27 | 5,605,500 | |||||||||
Energy (2.9%) | |||||||||||
4,500,000 | Kosmos Energy, Ltd.* 3.125%, 03/15/30 | 4,781,700 | |||||||||
5,265,000 | Nabors Industries, Inc.µ 1.750%, 06/15/29 | 3,864,721 | |||||||||
4,500,000 | Northern Oil & Gas, Inc. 3.625%, 04/15/29 | 5,570,460 | |||||||||
| 3,000,000 | Pioneer Natural Resources Company 0.250%, 05/15/25 | 8,809,650 | |||||||||
10,545,000 | SunEdison, Inc.@& 0.000%, 01/15/49 | 105,450 | |||||||||
1,027,000 | 0.000%, 10/01/49 | 10,270 | |||||||||
23,142,251 | |||||||||||
Financials (1.7%) | |||||||||||
4,500,000 | Coinbase Global, Inc.*µ 0.250%, 04/01/30 | 4,069,620 | |||||||||
9,000,000 | Global Payments, Inc.*^ 1.500%, 03/01/31 | 8,977,230 | |||||||||
13,046,850 | |||||||||||
Health Care (21.8%) | |||||||||||
5,000,000 | Alnylam Pharmaceuticals, Inc.µ 1.000%, 09/15/27 | 4,608,000 | |||||||||
| PRINCIPAL AMOUNT | VALUE | ||||||||||
6,000,000 | Alphatec Holdings, Inc.µ 0.750%, 08/01/26 | $ | 6,051,720 | ||||||||
10,250,000 | CONMED Corp.µ 2.250%, 06/15/27 | 9,047,162 | |||||||||
13,500,000 | CryoPort, Inc.*µ 0.750%, 12/01/26 | 11,759,040 | |||||||||
17,458,000 | Dexcom, Inc. 0.250%, 11/15/25 | 18,305,760 | |||||||||
8,750,000 | 0.375%, 05/15/28*µ | 8,889,125 | |||||||||
3,067,000 | Enovis Corp.*^ 3.875%, 10/15/28 | 3,626,605 | |||||||||
7,500,000 | Exact Sciences Corp.µ 0.375%, 03/15/27 | 6,803,550 | |||||||||
4,000,000 | 2.000%, 03/01/30* | 4,124,640 | |||||||||
7,750,000 | Halozyme Therapeutics, Inc.µ 1.000%, 08/15/28 | 7,313,675 | |||||||||
2,278,000 | Immunocore Holdings, PLC*µ 2.500%, 02/01/30 | 2,255,106 | |||||||||
4,750,000 | Insmed, Inc. 0.750%, 06/01/28 | 4,865,283 | |||||||||
5,000,000 | Insulet Corp.µ 0.375%, 09/01/26 | 5,157,450 | |||||||||
9,750,000 | Integer Holdings Corp. 2.125%, 02/15/28 | 13,559,130 | |||||||||
4,750,000 | Ionis Pharmaceuticals, Inc.µ 0.000%, 04/01/26 | 4,607,358 | |||||||||
4,500,000 | iRhythm Technologies, Inc.*µ 1.500%, 09/01/29 | 4,565,070 | |||||||||
10,905,000 | Jazz Investments I, Ltd.µ 2.000%, 06/15/26 | 10,520,708 | |||||||||
4,040,000 | Lantheus Holdings, Inc.µ 2.625%, 12/15/27 | 4,568,957 | |||||||||
11,250,000 | NeoGenomics, Inc.µ 0.250%, 01/15/28 | 8,875,125 | |||||||||
9,500,000 | Omnicell, Inc.µ 0.250%, 09/15/25 | 8,931,425 | |||||||||
8,750,000 | Pacira BioSciences, Inc.µ 0.750%, 08/01/25 | 8,280,825 | |||||||||
4,000,000 | Sarepta Therapeutics, Inc. 1.250%, 09/15/27 | 4,590,280 | |||||||||
9,000,000 | Shockwave Medical, Inc.*µ 1.000%, 08/15/28 | 11,438,550 | |||||||||
172,744,544 | |||||||||||
Industrials (7.9%) | |||||||||||
4,750,000 | Axon Enterprise, Inc. 0.500%, 12/15/27 | 6,921,605 | |||||||||
4,500,000 | Fluor Corp.*µ 1.125%, 08/15/29 | 4,902,840 | |||||||||
7,750,000 | John Bean Technologies Corp.µ 0.250%, 05/15/26 | 7,001,815 | |||||||||
4,750,000 | Middleby Corp.µ 1.000%, 09/01/25 | 5,597,495 | |||||||||
See accompanying Notes to Schedule of Investments
CALAMOS CLOSED-END FAMILY OF FUNDS SEMIANNUAL REPORT
52
| PRINCIPAL AMOUNT | VALUE | ||||||||||
4,500,000 | Tetra Tech, Inc.* 2.250%, 08/15/28 | $ | 5,111,955 | ||||||||
21,750,000 | Uber Technologies, Inc. 0.000%, 12/15/25µ | 22,710,698 | |||||||||
8,646,000 | 0.875%, 12/01/28* | 9,768,683 | |||||||||
62,015,091 | |||||||||||
Information Technology (34.6%) | |||||||||||
4,500,000 | Advanced Energy Industries, Inc.*µ 2.500%, 09/15/28 | 4,460,895 | |||||||||
9,000,000 | Akamai Technologies, Inc. 1.125%, 02/15/29* | 8,866,080 | |||||||||
4,750,000 | 0.375%, 09/01/27 | 4,822,675 | |||||||||
10,000,000 | Bentley Systems, Inc. 0.125%, 01/15/26 | 10,160,800 | |||||||||
11,750,000 | BILL Holdings, Inc.µ 0.000%, 04/01/27 | 10,001,365 | |||||||||
3,500,000 | Camtek, Ltd.* 0.000%, 12/01/26 | 5,229,700 | |||||||||
6,250,000 | Confluent, Inc.µ 0.000%, 01/15/27 | 5,311,125 | |||||||||
5,250,000 | CyberArk Software, Ltd. 0.000%, 11/15/24 | 8,066,730 | |||||||||
5,125,000 | Datadog, Inc. 0.125%, 06/15/25 | 7,312,401 | |||||||||
6,750,000 | DigitalOcean Holdings, Inc.µ 0.000%, 12/01/26 | 5,640,300 | |||||||||
10,012,000 | Enphase Energy, Inc.µ 0.000%, 03/01/26 | 9,061,461 | |||||||||
2,250,000 | Five9, Inc.µ 0.500%, 06/01/25 | 2,120,648 | |||||||||
6,500,000 | NCL Corp., Ltd.µ 1.125%, 02/15/27 | 5,948,930 | |||||||||
5,000,000 | 2.500%, 02/15/27 | 4,687,850 | |||||||||
3,250,000 | 5.375%, 08/01/25 | 3,996,005 | |||||||||
6,750,000 | Nutanix, Inc. 0.250%, 10/01/27 | 8,175,397 | |||||||||
4,250,000 | Okta, Inc.µ 0.375%, 06/15/26 | 3,857,173 | |||||||||
18,500,000 | ON Semiconductor Corp.µ 0.500%, 03/01/29 | 17,932,605 | |||||||||
4,500,000 | Palo Alto Networks, Inc. 0.375%, 06/01/25 | 13,173,255 | |||||||||
6,750,000 | Parsons Corp.*µ 2.625%, 03/01/29 | 7,079,130 | |||||||||
8,250,000 | Rapid7, Inc.*µ 1.250%, 03/15/29 | 7,999,118 | |||||||||
12,250,000 | Repay Holdings Corp.*µ 0.000%, 02/01/26 | 11,198,827 | |||||||||
6,250,000 | Seagate HDD Cayman* 3.500%, 06/01/28 | 7,482,875 | |||||||||
15,000,000 | Shift4 Payments, Inc.µ^ 0.000%, 12/15/25 | 15,541,800 | |||||||||
| PRINCIPAL AMOUNT | VALUE | ||||||||||
7,000,000 | SK Hynix, Inc. 1.750%, 04/11/30 | $ | 10,979,220 | ||||||||
13,500,000 | Super Micro Computer, Inc.*µ 0.000%, 03/01/29 | 13,806,720 | |||||||||
10,750,000 | Tyler Technologies, Inc.^ 0.250%, 03/15/26 | 11,292,660 | |||||||||
13,250,000 | Unity Software, Inc.µ 0.000%, 11/15/26 | 11,296,022 | |||||||||
3,962,000 | Vertex, Inc.* 0.750%, 05/01/29 | 4,143,262 | |||||||||
8,750,000 | Western Digital Corp.* 3.000%, 11/15/28 | 13,217,837 | |||||||||
7,000,000 | Wix.com, Ltd. 0.000%, 08/15/25 | 6,488,160 | |||||||||
9,500,000 | Wolfspeed, Inc. 1.875%, 12/01/29 | 5,442,645 | |||||||||
5,711,000 | 0.250%, 02/15/28 | 3,378,570 | |||||||||
4,500,000 | Zscaler, Inc. 0.125%, 07/01/25 | 5,701,365 | |||||||||
273,873,606 | |||||||||||
Materials (1.5%) | |||||||||||
1,500,000 | ATI, Inc. 3.500%, 06/15/25 | 5,777,490 | |||||||||
6,858,000 | MP Materials Corp.*µ 0.250%, 04/01/26 | 6,059,934 | |||||||||
11,837,424 | |||||||||||
Other (0.1%) | |||||||||||
525,000 | Multiplan Corp.*µ 6.000%, 10/15/27 7.000% PIK rate | 374,005 | |||||||||
Real Estate (0.7%) | |||||||||||
6,500,000 | Pebblebrook Hotel Trustµ 1.750%, 12/15/26 | 5,740,410 | |||||||||
Utilities (4.0%) | |||||||||||
4,500,000 | CMS Energy Corp.*µ 3.375%, 05/01/28 | 4,409,145 | |||||||||
7,000,000 | PG&E Corp.*µ 4.250%, 12/01/27 | 7,024,710 | |||||||||
16,500,000 | PPL Capital Funding, Inc.µ^ 2.875%, 03/15/28 | 15,686,550 | |||||||||
4,750,000 | Southern Companyµ 3.875%, 12/15/25 | 4,741,925 | |||||||||
31,862,330 | |||||||||||
| TOTAL CONVERTIBLE BONDS (Cost $857,516,315) | 815,270,966 | ||||||||||
www.calamos.com
53
| PRINCIPAL AMOUNT | VALUE | ||||||||||
BANK LOANS (7.8%)¡ | |||||||||||
Airlines (0.4%) | |||||||||||
700,000 | Air Canada‡ 7.833%, 03/21/31 3 mo. SOFR + 2.50% | $ | 705,687 | ||||||||
704,000 | American Airlines, Inc.‡ 10.336%, 04/20/28 3 mo. SOFR + 4.75% | 733,114 | |||||||||
698,750 | Mileage Plus Holdings, LLC‡ 10.733%, 06/21/27 3 mo. SOFR + 5.25% | 718,256 | |||||||||
690,000 | United Airlines, Inc.‡ 8.076%, 02/22/31 3 mo. SOFR + 2.75% | 693,774 | |||||||||
2,850,831 | |||||||||||
Communication Services (0.5%) | |||||||||||
57,316 | Audacy Capital Corp.‡ 11.430%, 08/19/24 3 mo. SOFR + 6.11% | 57,459 | |||||||||
489,198 | Clear Channel Outdoor Holdings, Inc.‡ 9.430%, 08/23/28 1 mo. SOFR + 4.00% | 490,218 | |||||||||
425,498 | DIRECTV Financing, LLC! 0.000%, 08/02/27 | 428,215 | |||||||||
407,542 | DIRECTV Financing, LLC‡ 10.430%, 08/02/27 1 mo. SOFR + 5.00% | 410,144 | |||||||||
1,527,000 | Entercom Media Corp.&‡ 8.145%, 11/18/24 3 mo. SOFR + 0.00% | 827,634 | |||||||||
1,015,794 | Gray Television, Inc.‡ 7.942%, 01/02/26 1 mo. SOFR + 2.50% | 1,004,433 | |||||||||
1,050,000 | Telesat Canada‡ 8.355%, 12/07/26 3 mo. SOFR + 2.75% | 535,721 | |||||||||
3,753,824 | |||||||||||
Consumer Discretionary (1.9%) | |||||||||||
550,000 | Adient U.S., LLC‡ 8.066%, 01/31/31 1 mo. SOFR + 2.75% | 553,094 | |||||||||
768,000 | American Axle & Manufacturing, Inc.‡ 8.921%, 12/13/29 1 mo. SOFR + 3.50% | 772,562 | |||||||||
1,064,250 | Caesars Entertainment, Inc.‡ 8.666%, 02/06/30 1 mo. SOFR + 3.25% | 1,067,778 | |||||||||
1,602,388 | Carnival Corp.‡ 8.067%, 08/08/27 1 mo. SOFR + 2.75% | 1,612,651 | |||||||||
1,090,843 | Carnival Corp.‡ 8.067%, 10/18/28 | 1,098,343 | |||||||||
928,377 | Carnival Corp.‡ 8.067%, 10/18/28 1 mo. SOFR + 2.75% | 933,311 | |||||||||
| PRINCIPAL AMOUNT | VALUE | ||||||||||
1,050,000 | Flutter Financing, BV‡! 0.000%, 11/25/30 | $ | 1,053,187 | ||||||||
1,303,832 | Hanesbrands, Inc.‡ 9.066%, 03/08/30 1 mo. SOFR + 3.75% | 1,306,544 | |||||||||
596,912 | Life Time Fitness, Inc.‡ 9.591%, 01/15/26 3 mo. SOFR + 4.00% | 601,204 | |||||||||
1,182,000 | Light & Wonder International, Inc.‡ 8.071%, 04/14/29 1 mo. SOFR + 2.75% | 1,186,101 | |||||||||
2,269,461 | PetSmart, Inc.‡ 9.166%, 02/11/28 1 mo. SOFR + 3.75% | 2,241,093 | |||||||||
560,000 | Station Casinos, LLC! 0.000%, 03/14/31 | 560,725 | |||||||||
490,000 | Station Casinos, LLC‡ 7.566%, 03/14/31 1 mo. SOFR + 2.25% | 490,635 | |||||||||
644,735 | TKC Holdings, Inc.‡ 10.930%, 05/15/28 1 mo. SOFR + 5.50% | 641,108 | |||||||||
1,046,714 | Windsor Holdings III, LLC‡ 9.319%, 08/01/30 1 mo. SOFR + 4.00% | 1,057,050 | |||||||||
15,175,386 | |||||||||||
Consumer Staples (0.7%) | |||||||||||
2,449,781 | Amneal Pharmaceuticals, LLC‡ 10.816%, 05/04/28 1 mo. SOFR + 5.50% | 2,455,146 | |||||||||
576,639 | Fiesta Purchaser, Inc.‡ 9.316%, 02/12/31 1 mo. SOFR + 4.00% | 579,632 | |||||||||
473,361 | Fiesta Purchaser, Inc.‡ 9.318%, 02/12/31 1 mo. SOFR + 4.00% | 475,818 | |||||||||
1,050,000 | Star Parent, Inc.‡ 9.309%, 09/27/30 3 mo. SOFR + 4.00% | 1,050,987 | |||||||||
660,000 | United Natural Foods, Inc.! 0.000%, 04/25/31 | 654,225 | |||||||||
529,478 | United Natural Foods, Inc.‡ 8.680%, 10/22/25 1 mo. SOFR + 3.25% | 527,794 | |||||||||
5,743,602 | |||||||||||
Energy (0.4%) | |||||||||||
812,962 | Buckeye Partners, LP‡ 7.816%, 11/22/30 1 mo. SOFR + 2.50% | 816,828 | |||||||||
523,688 | New Fortress Energy, Inc.‡ 10.330%, 10/27/28 3 mo. SOFR + 5.00% | 527,288 | |||||||||
1,322,943 | Par Petroleum, LLC‡ 9.052%, 02/28/30 3 mo. SOFR + 3.75% | 1,329,142 | |||||||||
CALAMOS CLOSED-END FAMILY OF FUNDS SEMIANNUAL REPORT
54
| PRINCIPAL AMOUNT | VALUE | ||||||||||
225,000 | Par Petroleum, LLC! 0.000%, 02/28/30 | $ | 226,054 | ||||||||
2,899,312 | |||||||||||
Financials (1.4%) | |||||||||||
1,150,000 | Advisor Group, Inc.! 0.000%, 08/17/28 | 1,158,360 | |||||||||
264,338 | Advisor Group, Inc.‡ 9.816%, 08/17/28 1 mo. SOFR + 4.50% | 266,259 | |||||||||
862,079 | Alliant Holdings Intermediate, LLC‡ 8.819%, 11/06/30 1 mo. SOFR + 3.50% | 866,476 | |||||||||
774,160 | Amynta Agency Borrower, Inc.‡ 9.552%, 02/28/28 3 mo. SOFR + 4.25% | 777,756 | |||||||||
820,000 | AssuredPartners, Inc.! 0.000%, 02/24/31 | 824,518 | |||||||||
480,000 | AssuredPartners, Inc.‡ 8.816%, 02/14/31 1 mo. SOFR + 3.50% | 482,645 | |||||||||
786,055 | Avolon TLB Borrower 1 (US) LLC‡ 7.315%, 06/22/28 1 mo. SOFR + 2.00% | 788,633 | |||||||||
548,625 | Broadstreet Partners, Inc.‡ 9.066%, 01/27/29 1 mo. SOFR + 3.75% | 551,253 | |||||||||
1,097,250 | HUB International, Ltd.‡ 8.575%, 06/20/30 3 mo. SOFR + 3.25% | 1,104,037 | |||||||||
2,750 | HUB International, Ltd.‡ 8.565%, 06/20/30 3 mo. SOFR + 3.25% | 2,767 | |||||||||
783,038 | Iron Mountain, Inc.‡ 7.566%, 01/31/31 1 mo. SOFR + 2.25% | 782,384 | |||||||||
1,839,024 | Jazz Financing Lux Sarl‡ 8.430%, 05/05/28 1 mo. SOFR + 3.00% | 1,851,962 | |||||||||
525,000 | Level 3 Financing, Inc.! 0.000%, 04/15/29 | 517,219 | |||||||||
1,395,992 | VFH Parent, LLC‡ 8.416%, 01/13/29 1 mo. SOFR + 3.00% | 1,397,960 | |||||||||
11,372,229 | |||||||||||
Health Care (0.5%) | |||||||||||
482,652 | Icon Luxembourg Sarl‡ 7.320%, 07/03/28 3 mo. SOFR + 2.00% | 485,230 | |||||||||
1,152,941 | Padagis, LLC‡ 10.313%, 07/06/28 3 mo. SOFR + 4.75% | 1,060,706 | |||||||||
120,253 | PRA Health Sciences, Inc.‡ 7.309%, 07/03/28 3 mo. SOFR + 2.00% | 120,895 | |||||||||
| PRINCIPAL AMOUNT | VALUE | ||||||||||
2,571,116 | Team Health Holdings, Inc.‡ 10.566%, 03/02/27 3 mo. SOFR + 5.25% | $ | 2,260,281 | ||||||||
7,373 | Team Health Holdings, Inc.‡ 10.565%, 03/02/27 1 mo. SOFR + 5.25% | 6,482 | |||||||||
3,933,594 | |||||||||||
Industrials (0.4%) | |||||||||||
1,038,730 | ACProducts, Inc.‡ 9.814%, 05/17/28 3 mo. SOFR + 4.25% | 904,734 | |||||||||
985,112 | ChampionX Corp.‡ 8.168%, 06/07/29 1 mo. SOFR + 2.75% | 990,653 | |||||||||
431,096 | Emrld Borrower, LP‡ 7.816%, 05/31/30 1 mo. SOFR + 2.50% | 432,926 | |||||||||
120,000 | MI Windows & Doors, LLC‡ 8.816%, 03/21/31 1 mo. SOFR + 3.50% | 120,700 | |||||||||
1,062,338 | TransDigm, Inc.‡ 8.559%, 02/28/31 1 mo. SOFR + 3.25% | 1,069,769 | |||||||||
3,518,782 | |||||||||||
Information Technology (0.7%) | |||||||||||
1,399,891 | Banff Merger Sub, Inc.‡ 9.566%, 12/29/28 1 mo. SOFR + 4.25% | 1,410,201 | |||||||||
808,981 | Camelot US Acquisition LLC‡ 8.066%, 01/31/31 1 mo. SOFR + 2.75% | 811,509 | |||||||||
982,975 | Central Parent, Inc.‡ 9.309%, 07/06/29 3 mo. SOFR + 4.00% | 988,116 | |||||||||
1,001,782 | Dun & Bradstreet Corp.‡ 8.068%, 01/18/29 1 mo. SOFR + 2.75% | 1,005,333 | |||||||||
909,010 | II-VI, Inc.‡ 7.829%, 07/02/29 1 mo. SOFR + 2.50% | 914,405 | |||||||||
510,000 | UKG, Inc.‡ 8.814%, 02/10/31 3 mo. SOFR + 3.50% | 512,925 | |||||||||
5,642,489 | |||||||||||
Materials (0.7%) | |||||||||||
781,075 | Chemours Company‡ 8.817%, 08/18/28 1 mo. SOFR + 3.50% | 781,809 | |||||||||
1,042,125 | Ineos US Finance, LLC‡ 8.930%, 02/18/30 1 mo. SOFR + 3.50% | 1,046,033 | |||||||||
798,255 | Innophos, Inc.‡ 8.930%, 02/05/27 1 mo. SOFR + 3.50% | 799,172 | |||||||||
See accompanying Notes to Schedule of Investments
www.calamos.com
55
| PRINCIPAL AMOUNT | VALUE | ||||||||||
1,305,138 | LSF11 A5 Holdco, LLC‡ 9.666%, 10/15/28 1 mo. SOFR + 4.25% | $ | 1,310,358 | ||||||||
778,403 | Trinseo Materials Operating SCA‡ 8.105%, 05/03/28 3 mo. SOFR + 2.50% | 543,948 | |||||||||
1,067,688 | W.R. Grace & Co.-Conn.‡ 9.321%, 09/22/28 3 mo. SOFR + 3.75% | 1,070,833 | |||||||||
5,552,153 | |||||||||||
Special Purpose Acquisition Companies (0.2%) | |||||||||||
520,725 | Clydesdale Acquisition Holdings, Inc.‡ 9.091%, 04/13/29 1 mo. SOFR + 3.68% | 523,560 | |||||||||
259,700 | Fertitta Entertainment, LLC‡ 9.069%, 01/27/29 1 mo. SOFR + 3.75% | 260,594 | |||||||||
1,044,100 | Patagonia Holdco, LLC‡ 11.064%, 08/01/29 3 mo. SOFR + 5.75% | 971,013 | |||||||||
1,755,167 | |||||||||||
| TOTAL BANK LOANS (Cost $63,009,730) | 62,197,369 | ||||||||||
| NUMBER OF SHARES | VALUE | ||||||||||
COMMON STOCKS (0.4%) | |||||||||||
Communication Services (0.0%) | |||||||||||
21,970 | Altice USA, Inc. - Class A^# | 42,402 | |||||||||
7,383 | Cumulus Media, Inc. - Class Aµ# | 19,417 | |||||||||
61,819 | |||||||||||
Consumer Staples (0.0%) | |||||||||||
7,203 | Mallinckrodt, PLC# | 381,759 | |||||||||
Energy (0.3%) | |||||||||||
1,506 | Chesapeake Energy Corp.µ | 135,359 | |||||||||
72,575 | Energy Transfer, LP | 1,141,605 | |||||||||
43,085 | Enterprise Products Partners, LP | 1,209,827 | |||||||||
7,238 | Ep Energy Corp.&# | 17,190 | |||||||||
35 | Gulfport Energy Corp.µ# | 5,555 | |||||||||
2,509,536 | |||||||||||
Special Purpose Acquisition Company (0.1%) | |||||||||||
12,300 | Intelsat Emergence, SA&# | 445,875 | |||||||||
| TOTAL COMMON STOCKS (Cost $4,140,584) | 3,398,989 | ||||||||||
CONVERTIBLE PREFERRED STOCKS (3.6%) | |||||||||||
Energy (0.0%) | |||||||||||
29 | Gulfport Energy Corp. 10.000%, 05/31/24 15.000% PIK rate | 335,675 | |||||||||
| NUMBER OF SHARES | VALUE | ||||||||||
Financials (2.0%) | |||||||||||
89,885 | Apollo Global Management, Inc. 6.750%, 07/31/26 | $ | 5,481,187 | ||||||||
8,775 | Bank of America Corp. ‡‡ 7.250%, 12/31/49 | 10,091,250 | |||||||||
15,572,437 | |||||||||||
Industrials (0.6%) | |||||||||||
81,495 | Chart Industries, Inc. 6.750%, 12/15/25 | 4,682,703 | |||||||||
Utilities (1.0%) | |||||||||||
194,000 | NextEra Energy, Inc.^ 6.926%, 09/01/25 | 7,905,500 | |||||||||
| TOTAL CONVERTIBLE PREFERRED STOCKS (Cost $30,905,605) | 28,496,315 | ||||||||||
PREFERRED STOCKS (0.4%) | |||||||||||
Communication Services (0.1%) | |||||||||||
12,900 | United States Cellular Corp.µ 5.500%, 06/01/70 | 227,685 | |||||||||
12,370 | 5.500%, 03/01/70 | 219,815 | |||||||||
447,500 | |||||||||||
Consumer Discretionary (0.1%) | |||||||||||
6,662 | Guitar Center, Inc.& | 522,967 | |||||||||
Energy (0.2%) | |||||||||||
32,380 | NuStar Energy, LP‡ 11.234%, 05/30/24 3 mo. LIBOR + 5.64% | 826,014 | |||||||||
7,920 | NuStar Energy, LP‡ 12.357%, 05/30/24 3 mo. LIBOR + 6.77% | 202,514 | |||||||||
47,000 | NuStar Logistics, LP‡ 12.324%, 01/15/43 3 mo. LIBOR + 6.73% | 1,191,920 | |||||||||
2,220,448 | |||||||||||
| TOTAL PREFERRED STOCKS (Cost $3,419,819) | 3,190,915 | ||||||||||
WARRANTS (0.0%)# | |||||||||||
Energy (0.0%) | |||||||||||
52,447 | Mcdermott International, Ltd.& 06/30/27, Strike $15.98 | 5 | |||||||||
47,202 | Mcdermott International, Ltd. 06/30/27, Strike $12.33 | 5 | |||||||||
| TOTAL WARRANTS (Cost $20,126) | 10 | ||||||||||
CALAMOS CLOSED-END FAMILY OF FUNDS SEMIANNUAL REPORT
56
| NUMBER OF CONTRACTS/ NOTIONAL AMOUNT | VALUE | ||||||||||
PURCHASED OPTION (0.1%)# | |||||||||||
Industrials (0.1%) | |||||||||||
4,728,500 | American Airlines Group, Inc. | ||||||||||
350,000 | Call, 06/20/25, Strike $17.00 (Cost $856,876) | $ | 435,750 | ||||||||
| TOTAL INVESTMENTS (156.6%) (Cost $1,291,268,212) | 1,239,062,992 | ||||||||||
| MANDATORY REDEEMABLE PREFERRED SHARES, AT LIQUIDATION VALUE (-18.3%) | (145,000,000 | ) | |||||||||
LIABILITIES, LESS OTHER ASSETS (-38.3%) | (303,082,382 | ) | |||||||||
NET ASSETS (100.0%) | $ | 790,980,610 | |||||||||
NOTES TO SCHEDULE OF INVESTMENTS
* Securities issued and sold pursuant to a Rule 144A transaction are exempted from the registration requirement of the Securities Act of 1933, as amended. These securities may only be sold to qualified institutional buyers ("QIBs"), such as the Fund. Any resale of these securities must generally be effected through a sale that is registered under the Act or otherwise exempted from such registration requirements.
µ Security, or portion of security, is held in a segregated account as collateral for note payable aggregating a total value of $494,473,881.
@ In default status and considered non-income producing.
^ Security, or portion of security, is on loan.
& Illiquid security.
‡ Variable rate security. The rate shown is the rate in effect at April 30, 2024.
¡ Bank loans generally are subject to mandatory and/or optional prepayment. As a result, the actual remaining maturity of bank loans may be substantially less than the stated maturities shown.
! This position represents an unsettled loan commitment at period end. Certain details associated with this purchase are not known prior to the settlement date, including coupon rate, which will be adjusted on settlement date.
# Non-income producing security.
‡‡ Perpetual maturity.
Note: The date on options represents the expiration date of the option contract. The option contract may be exercised at any date on or before the date shown.
www.calamos.com
57
The following table summarizes the Fund's investments and derivative financial instruments categorized in the fair value hierarchy as of April 30, 2024 (see Note 1):
LEVEL 1 | LEVEL 2 | LEVEL 3 | TOTAL | ||||||||||||||||
Assets: | |||||||||||||||||||
Asset Backed Securities | $ | — | $ | 772,517 | $ | — | $ | 772,517 | |||||||||||
Corporate Bonds | — | 325,300,161 | — | 325,300,161 | |||||||||||||||
Convertible Bonds | — | 815,270,966 | — | 815,270,966 | |||||||||||||||
Bank Loans | — | 62,197,369 | — | 62,197,369 | |||||||||||||||
Common Stocks | 2,554,165 | 844,824 | — | 3,398,989 | |||||||||||||||
Convertible Preferred Stocks | 28,160,640 | 335,675 | — | 28,496,315 | |||||||||||||||
Preferred Stocks | 2,667,948 | 522,967 | — | 3,190,915 | |||||||||||||||
Warrants | — | 10 | — | 10 | |||||||||||||||
Purchased Options | 435,750 | — | — | 435,750 | |||||||||||||||
Total | $ | 33,818,503 | $ | 1,205,244,489 | $ | — | $ | 1,239,062,992 | |||||||||||
SECTOR WEIGHTINGS
Information Technology | 23.0 | % | |||||
Consumer Discretionary | 18.4 | ||||||
Health Care | 15.6 | ||||||
Industrials | 9.1 | ||||||
Communication Services | 7.9 | ||||||
Financials | 7.5 | ||||||
Energy | 5.9 | ||||||
Utilities | 3.2 | ||||||
Materials | 2.5 | ||||||
Consumer Staples | 2.1 | ||||||
Real Estate | 0.7 | ||||||
Airlines | 0.6 | ||||||
Special Purpose Acquisition Companies | 0.3 | ||||||
Sector weightings are based on managed assets and may vary over time. Sector Weightings exclude any government/sovereign bonds or options on broad market indexes the Fund may hold.
ASSET ALLOCATION
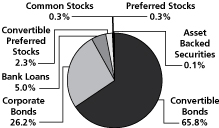
Fund asset allocations are based on total investments and may vary over time.
See accompanying Notes to Schedule of Investments
CALAMOS CLOSED-END FAMILY OF FUNDS SEMIANNUAL REPORT
58
| PRINCIPAL AMOUNT | VALUE | ||||||||||
ASSET BACKED SECURITY (0.0%) | |||||||||||
Other (0.0%) | |||||||||||
955,000 | SVC ABS, LLC Series 2023-1A, Class C* 6.700%, 02/20/53 (Cost $886,975) | $ | 867,946 | ||||||||
CORPORATE BONDS (15.6%) | |||||||||||
Airlines (0.2%) | |||||||||||
1,015,897 | Alaska Airlines Pass Through Trust Series 2020-1, Class A* 4.800%, 02/15/29 | 986,396 | |||||||||
416,135 | Alaska Airlines Pass Through Trust Series 2020-1, Class B* 8.000%, 02/15/27 | 420,858 | |||||||||
1,235,220 | American Airlines Pass Through Trust Series 2021-1, Class B 3.950%, 01/11/32 | 1,119,850 | |||||||||
589,333 | American Airlines, Inc. / AAdvantage Loyalty IP, Ltd.* 5.500%, 04/20/26 | 583,133 | |||||||||
1,125,338 | British Airways Pass Through Trust Series 2021-1, Class B* 3.900%, 03/15/33 | 1,022,584 | |||||||||
971,396 | JetBlue Pass Through Trust Series 2020-1, Class B 7.750%, 05/15/30 | 994,398 | |||||||||
5,127,219 | |||||||||||
Communication Services (1.5%) | |||||||||||
900,000 | Altice France Holding, SA* 10.500%, 05/15/27 | 322,641 | |||||||||
1,400,000 | Altice France, SA* 5.500%, 10/15/29 | 918,400 | |||||||||
1,415,000 | APi Group DE, Inc.* 4.750%, 10/15/29 | 1,289,136 | |||||||||
1,270,000 | Ashtead Capital, Inc.* 2.450%, 08/12/31 | 1,008,939 | |||||||||
1,479,000 | Audacy Capital Corp.*@ 6.750%, 03/31/29 | 52,209 | |||||||||
538,000 | 6.500%, 05/01/27 | 19,201 | |||||||||
1,070,000 | Cincinnati Bell Telephone Company, LLC 6.300%, 12/01/28 | 976,439 | |||||||||
600,000 | Clear Channel Outdoor Holdings, Inc.* 7.875%, 04/01/30 | 588,696 | |||||||||
530,000 | 9.000%, 09/15/28^ | 545,571 | |||||||||
1,665,000 | Consolidated Communications, Inc.* 6.500%, 10/01/28 | 1,446,053 | |||||||||
1,800,000 | CSC Holdings, LLC* 5.375%, 02/01/28 | 1,388,160 | |||||||||
1,800,000 | 4.625%, 12/01/30 | 783,144 | |||||||||
1,395,000 | 4.500%, 11/15/31 | 887,025 | |||||||||
1,250,000 | 5.750%, 01/15/30 | 548,600 | |||||||||
1,190,000 | 5.500%, 04/15/27 | 976,823 | |||||||||
| PRINCIPAL AMOUNT | VALUE | ||||||||||
571,000 | Directv Financing, LLC / Directv Financing Co-Obligor, Inc.* 5.875%, 08/15/27 | $ | 532,566 | ||||||||
1,210,000 | Frontier California, Inc. 6.750%, 05/15/27 | 1,153,154 | |||||||||
298,000 | Frontier Communications Holdings, LLC* 8.750%, 05/15/30 | 303,686 | |||||||||
1,933,000 | Frontier Florida, LLC@ 6.860%, 02/01/28 | 1,841,646 | |||||||||
1,785,000 | Frontier North, Inc.@ 6.730%, 02/15/28 | 1,692,983 | |||||||||
1,030,000 | Go Daddy Operating Company, LLC / GD Finance Company, Inc.* 3.500%, 03/01/29 | 915,093 | |||||||||
301,000 | 5.250%, 12/01/27 | 291,007 | |||||||||
302,000 | Hughes Satellite Systems Corp. 6.625%, 08/01/26 | 173,973 | |||||||||
750,000 | iHeartCommunications, Inc. 8.375%, 05/01/27 | 399,758 | |||||||||
450,000 | 5.250%, 08/15/27*^ | 330,683 | |||||||||
1,480,000 | LCPR Senior Secured Financing DAC* 6.750%, 10/15/27 | 1,372,152 | |||||||||
875,638 | Ligado Networks, LLC* 15.500%, 11/01/23 PIK rate | 145,119 | |||||||||
900,000 | Lumen Technologies, Inc. 7.600%, 09/15/39 | 275,454 | |||||||||
600,000 | 4.000%, 02/15/27* | 319,446 | |||||||||
300,000 | 7.650%, 03/15/42 | 91,860 | |||||||||
596,000 | Match Group Holdings II, LLC* 3.625%, 10/01/31 | 492,689 | |||||||||
695,000 | Nexstar Media, Inc.* 5.625%, 07/15/27 | 654,078 | |||||||||
1,160,000 | Paramount Global 4.900%, 08/15/44 | 813,230 | |||||||||
286,000 | 6.375%, 03/30/62‡ 5 year CMT + 4.00% | 264,825 | |||||||||
419,000 | Qwest Corp. 7.250%, 09/15/25 | 415,288 | |||||||||
235,000 | Rogers Communications, Inc.*‡ 5.250%, 03/15/82 5 year CMT + 3.59% | 223,584 | |||||||||
591,000 | Scripps Escrow II, Inc.* 3.875%, 01/15/29 | 437,328 | |||||||||
295,000 | 5.375%, 01/15/31 | 174,708 | |||||||||
985,000 | Scripps Escrow, Inc.* 5.875%, 07/15/27 | 778,731 | |||||||||
1,500,000 | Sirius XM Radio, Inc.* 5.500%, 07/01/29 | 1,398,810 | |||||||||
1,185,000 | 4.000%, 07/15/28 | 1,056,510 | |||||||||
585,000 | 3.125%, 09/01/26 | 546,232 | |||||||||
298,000 | 3.875%, 09/01/31^ | 239,756 | |||||||||
1,084,000 | Spanish Broadcasting System, Inc.* 9.750%, 03/01/26 | 516,710 | |||||||||
www.calamos.com
59
| PRINCIPAL AMOUNT | VALUE | ||||||||||
3,045,000 | Sprint, LLC 7.125%, 06/15/24 | $ | 3,049,202 | ||||||||
1,350,000 | Stagwell Global, LLC* 5.625%, 08/15/29 | 1,211,018 | |||||||||
591,000 | Telesat Canada / Telesat, LLC* 4.875%, 06/01/27 | 270,465 | |||||||||
480,000 | Time Warner Cable, LLC 7.300%, 07/01/38 | 466,205 | |||||||||
1,356,000 | United States Cellular Corp. 6.700%, 12/15/33 | 1,324,026 | |||||||||
906,000 | Univision Communications, Inc.* 8.000%, 08/15/28 | 908,129 | |||||||||
600,000 | Viasat, Inc.* 5.625%, 04/15/27 | 550,092 | |||||||||
125,000 | Vodafone Group, PLC‡ 7.000%, 04/04/79 U.S. 5 yr Swap + 4.87% | 127,411 | |||||||||
37,508,644 | |||||||||||
Consumer Discretionary (3.2%) | |||||||||||
1,435,000 | Abercrombie & Fitch Management Company* 8.750%, 07/15/25 | 1,447,197 | |||||||||
1,200,000 | Adams Homes, Inc.* 9.250%, 10/15/28 | 1,240,572 | |||||||||
905,000 | Adient Global Holdings Company*^ 8.250%, 04/15/31 | 940,711 | |||||||||
1,050,000 | American Axle & Manufacturing, Inc.^ 5.000%, 10/01/29 | 947,940 | |||||||||
1,043,000 | Ashton Woods USA, LLC / Ashton Woods Finance Company* 4.625%, 08/01/29 | 944,791 | |||||||||
856,000 | 6.625%, 01/15/28 | 854,759 | |||||||||
1,487,000 | At Home Group, Inc.* 4.875%, 07/15/28 | 706,935 | |||||||||
1,577,000 | Bath & Body Works, Inc. 6.694%, 01/15/27 | 1,589,206 | |||||||||
875,000 | 6.875%, 11/01/35 | 871,194 | |||||||||
800,000 | Benteler International AG* 10.500%, 05/15/28 | 853,816 | |||||||||
728,000 | Caesars Entertainment, Inc.* 4.625%, 10/15/29 | 649,580 | |||||||||
605,000 | 8.125%, 07/01/27 | 614,426 | |||||||||
601,000 | Carnival Corp.* 4.000%, 08/01/28 | 549,104 | |||||||||
596,000 | 7.625%, 03/01/26 | 600,023 | |||||||||
75,000 | 7.000%, 08/15/29 | 77,066 | |||||||||
257,434 | Carvana Company* 14.000%, 06/01/31 | 258,407 | |||||||||
217,140 | 13.000%, 06/01/30 | 215,755 | |||||||||
143,434 | 12.000%, 12/01/28 | 140,508 | |||||||||
2,610,000 | CCO Holdings, LLC / CCO Holdings Capital Corp.* 5.125%, 05/01/27 | 2,450,425 | |||||||||
2,110,000 | 4.500%, 08/15/30 | 1,717,603 | |||||||||
| PRINCIPAL AMOUNT | VALUE | ||||||||||
1,370,000 | 6.375%, 09/01/29 | $ | 1,255,893 | ||||||||
1,300,000 | 4.750%, 03/01/30 | 1,082,302 | |||||||||
1,198,000 | 4.250%, 02/01/31 | 941,532 | |||||||||
620,000 | 5.000%, 02/01/28 | 565,421 | |||||||||
596,000 | 4.750%, 02/01/32 | 469,135 | |||||||||
596,000 | CDI Escrow Issuer, Inc.* 5.750%, 04/01/30 | 568,739 | |||||||||
900,000 | Cedar Fair, LP^ 5.250%, 07/15/29 | 841,257 | |||||||||
600,000 | Churchill Downs, Inc.* 6.750%, 05/01/31 | 595,974 | |||||||||
985,000 | Dana, Inc. 4.250%, 09/01/30 | 855,916 | |||||||||
896,000 | 4.500%, 02/15/32 | 760,256 | |||||||||
1,265,000 | DISH DBS Corp. 5.125%, 06/01/29 | 511,136 | |||||||||
895,000 | 5.250%, 12/01/26* | 705,949 | |||||||||
739,000 | 7.375%, 07/01/28 | 331,722 | |||||||||
600,000 | 5.750%, 12/01/28* | 407,226 | |||||||||
476,000 | 7.750%, 07/01/26 | 300,237 | |||||||||
1,200,000 | DISH Network Corp.* 11.750%, 11/15/27 | 1,210,992 | |||||||||
1,675,000 | Empire Resorts, Inc.* 7.750%, 11/01/26 | 1,561,870 | |||||||||
1,308,000 | Everi Holdings, Inc.* 5.000%, 07/15/29 | 1,284,809 | |||||||||
1,240,000 | Ford Motor Company 6.100%, 08/19/32 | 1,216,725 | |||||||||
1,885,000 | Ford Motor Credit Company, LLC 4.000%, 11/13/30 | 1,645,473 | |||||||||
1,555,000 | 7.200%, 06/10/30 | 1,612,411 | |||||||||
1,450,000 | 5.113%, 05/03/29 | 1,382,111 | |||||||||
1,100,000 | 7.350%, 11/04/27 | 1,138,225 | |||||||||
1,000,000 | 2.900%, 02/16/28 | 890,460 | |||||||||
447,000 | Gap, Inc.* 3.875%, 10/01/31 | 365,673 | |||||||||
600,000 | General Motors Company 5.200%, 04/01/45 | 514,050 | |||||||||
310,000 | General Motors Financial Company, Inc.‡ 5.700%, 09/30/30^ 5 year CMT + 5.00% | 291,440 | |||||||||
155,000 | 6.500%, 09/30/28 3 mo. LIBOR + 3.44% | 148,640 | |||||||||
2,100,000 | goeasy, Ltd.* 9.250%, 12/01/28 | 2,222,871 | |||||||||
1,079,000 | 7.625%, 07/01/29 | 1,080,770 | |||||||||
635,000 | Goodyear Tire & Rubber Company 5.250%, 07/15/31^ | 562,559 | |||||||||
600,000 | 5.625%, 04/30/33 | 528,036 | |||||||||
511,000 | Group 1 Automotive, Inc.* 4.000%, 08/15/28 | 466,160 | |||||||||
1,280,000 | Guitar Center, Inc.*^ 8.500%, 01/15/26 | 1,131,891 | |||||||||
See accompanying Notes to Schedule of Investments
CALAMOS CLOSED-END FAMILY OF FUNDS SEMIANNUAL REPORT
60
Strategic Total Return Fund Schedule of Investments April 30, 2024 (Unaudited)
| PRINCIPAL AMOUNT | VALUE | ||||||||||
915,000 | International Game Technology, PLC* 6.250%, 01/15/27 | $ | 914,460 | ||||||||
328,990 | JetBlue Pass Through Trust Series 2019-2, Class B 8.000%, 11/15/27 | 332,408 | |||||||||
1,355,000 | Kohl's Corp. 5.550%, 07/17/45 | 930,628 | |||||||||
1,200,000 | LCM Investments Holdings II, LLC* 8.250%, 08/01/31 | 1,248,888 | |||||||||
1,175,000 | Liberty Interactive, LLC 8.250%, 02/01/30 | 652,748 | |||||||||
1,159,000 | Life Time, Inc.* 8.000%, 04/15/26 | 1,160,947 | |||||||||
600,000 | Light & Wonder International, Inc.* 7.500%, 09/01/31 | 612,306 | |||||||||
450,000 | Lindblad Expeditions Holdings, Inc.* 9.000%, 05/15/28 | 471,884 | |||||||||
767,000 | Lindblad Expeditions, LLC* 6.750%, 02/15/27 | 761,171 | |||||||||
780,000 | M/I Homes, Inc. 3.950%, 02/15/30 | 677,399 | |||||||||
1,392,000 | Macy's Retail Holdings, LLC 6.700%, 07/15/34* | 1,173,205 | |||||||||
905,000 | 4.300%, 02/15/43 | 715,873 | |||||||||
1,518,000 | Midwest Gaming Borrower, LLC / Midwest Gaming Finance Corp.* 4.875%, 05/01/29 | 1,388,439 | |||||||||
725,000 | Newell Brands, Inc. 5.700%, 04/01/26 | 715,212 | |||||||||
605,000 | Nordstrom, Inc. 6.950%, 03/15/28 | 601,189 | |||||||||
600,000 | 5.000%, 01/15/44 | 455,916 | |||||||||
551,000 | 4.250%, 08/01/31 | 475,634 | |||||||||
1,783,000 | Patrick Industries, Inc.* 4.750%, 05/01/29 | 1,622,405 | |||||||||
1,370,000 | PENN Entertainment, Inc.*^ 4.125%, 07/01/29 | 1,148,211 | |||||||||
605,000 | Phinia, Inc.* 6.750%, 04/15/29 | 607,589 | |||||||||
1,670,000 | Premier Entertainment Sub, LLC / Premier Entertainment Finance Corp.* 5.625%, 09/01/29 | 1,247,807 | |||||||||
600,000 | QVC, Inc. 5.450%, 08/15/34 | 394,164 | |||||||||
600,000 | Raising Cane's Restaurants, LLC* 9.375%, 05/01/29 | 644,010 | |||||||||
2,333,000 | Rite Aid Corp.*@ 8.000%, 11/15/26 | 1,505,555 | |||||||||
600,000 | Royal Caribbean Cruises, Ltd.* 7.250%, 01/15/30 | 618,150 | |||||||||
150,000 | 6.250%, 03/15/32 | 147,891 | |||||||||
| PRINCIPAL AMOUNT | VALUE | ||||||||||
1,670,000 | Simmons Foods, Inc. / Simmons Prepared Foods, Inc. / Simmons Pet Food, Inc. / Simmons Feed* 4.625%, 03/01/29 | $ | 1,444,550 | ||||||||
1,800,000 | Six Flags Entertainment Corp.* 7.250%, 05/15/31 | 1,797,876 | |||||||||
1,348,000 | Sonic Automotive, Inc.* 4.625%, 11/15/29 | 1,207,768 | |||||||||
837,000 | Speedway Motorsports, LLC / Speedway Funding II, Inc.* 4.875%, 11/01/27 | 789,927 | |||||||||
1,270,000 | Station Casinos, LLC* 4.500%, 02/15/28 | 1,178,890 | |||||||||
1,200,000 | STL Holding Company, LLC* 8.750%, 02/15/29 | 1,234,332 | |||||||||
707,000 | Taylor Morrison Communities, Inc.* 5.750%, 01/15/28 | 689,177 | |||||||||
300,000 | Viking Cruises, Ltd.* 9.125%, 07/15/31 | 322,032 | |||||||||
1,355,000 | Vista Outdoor, Inc.* 4.500%, 03/15/29 | 1,339,363 | |||||||||
1,200,000 | ZF North America Capital, Inc.* 7.125%, 04/14/30 | 1,228,992 | |||||||||
400,000 | 6.875%, 04/23/32 | 404,524 | |||||||||
400,000 | 6.750%, 04/23/30 | 401,196 | |||||||||
80,380,595 | |||||||||||
Consumer Staples (0.7%) | |||||||||||
1,335,000 | 1375209 B.C., Ltd.*^ 9.000%, 01/30/28 | 1,312,145 | |||||||||
1,739,000 | Arrow Bidco, LLC* 10.750%, 06/15/25 | 1,793,883 | |||||||||
1,210,000 | B&G Foods, Inc.* 8.000%, 09/15/28 | 1,255,762 | |||||||||
1,358,000 | Central Garden & Pet Company* 4.125%, 04/30/31 | 1,178,635 | |||||||||
1,349,000 | Edgewell Personal Care Company* 4.125%, 04/01/29 | 1,223,381 | |||||||||
1,641,000 | Energizer Holdings, Inc.* 4.375%, 03/31/29 | 1,451,481 | |||||||||
298,000 | 6.500%, 12/31/27 | 295,366 | |||||||||
1,770,000 | JBS USA Holding LUX Sarl / JBS USA Food Company / JBS LUX Company Sarl 5.500%, 01/15/30 | 1,710,050 | |||||||||
740,000 | 5.125%, 02/01/28^ | 719,554 | |||||||||
440,000 | 5.750%, 04/01/33 | 421,326 | |||||||||
290,000 | Land O' Lakes, Inc.* 7.000%, 09/18/28 | 225,713 | |||||||||
751,000 | New Albertsons, LP 7.750%, 06/15/26 | 773,462 | |||||||||
1,192,000 | Performance Food Group, Inc.* 4.250%, 08/01/29 | 1,068,866 | |||||||||
900,000 | Pilgrim's Pride Corp. 4.250%, 04/15/31 | 797,058 | |||||||||
www.calamos.com
61
| PRINCIPAL AMOUNT | VALUE | ||||||||||
600,000 | Post Holdings, Inc.* 6.250%, 02/15/32 | $ | 593,466 | ||||||||
1,124,000 | Prestige Brands, Inc.* 3.750%, 04/01/31 | 957,637 | |||||||||
1,015,000 | United Natural Foods, Inc.* 6.750%, 10/15/28 | 780,281 | |||||||||
1,257,000 | Vector Group, Ltd.* 5.750%, 02/01/29 | 1,143,858 | |||||||||
17,701,924 | |||||||||||
Energy (2.0%) | |||||||||||
598,000 | Antero Resources Corp.* 5.375%, 03/01/30 | 569,033 | |||||||||
1,187,000 | Apache Corp. 5.100%, 09/01/40 | 988,534 | |||||||||
600,000 | Buckeye Partners, LP 5.850%, 11/15/43 | 502,362 | |||||||||
591,000 | Cheniere Energy, Inc. 4.625%, 10/15/28 | 565,492 | |||||||||
892,000 | Chesapeake Energy Corp.* 6.750%, 04/15/29 | 893,017 | |||||||||
1,688,000 | Civitas Resources, Inc.* 8.750%, 07/01/31 | 1,796,370 | |||||||||
600,000 | Continental Resources, Inc. 4.900%, 06/01/44 | 483,768 | |||||||||
600,000 | 2.875%, 04/01/32* | 479,688 | |||||||||
921,000 | DT Midstream, Inc.* 4.125%, 06/15/29 | 834,905 | |||||||||
1,176,000 | Earthstone Energy Holdings, LLC* 8.000%, 04/15/27 | 1,210,104 | |||||||||
450,000 | 9.875%, 07/15/31 | 497,957 | |||||||||
1,036,000 | Enbridge, Inc.‡ 7.375%, 01/15/83 5 year CMT + 3.71% | 1,019,704 | |||||||||
395,000 | 5.750%, 07/15/80 5 year CMT + 5.31% | 362,294 | |||||||||
660,000 | Encino Acquisition Partners Holdings, LLC* 8.750%, 05/01/31 | 672,335 | |||||||||
1,735,000 | Energy Transfer, LP‡ 8.606%, 11/01/66 3 mo. SOFR + 3.28% | 1,576,005 | |||||||||
1,015,000 | 6.500%, 11/15/26 5 year CMT + 5.69% | 985,961 | |||||||||
155,000 | 8.000%, 05/15/54 | 159,845 | |||||||||
75,000 | 9.597%, 05/16/24 3 mo. USD LIBOR + 4.03 | 74,866 | |||||||||
1,775,000 | EnLink Midstream Partners, LP 9.701%, 05/31/24‡ 3 mo. LIBOR + 4.11% | 1,752,937 | |||||||||
1,285,000 | 4.850%, 07/15/26 | 1,252,849 | |||||||||
745,000 | Enlink Midstream, LLC* 6.500%, 09/01/30 | 754,581 | |||||||||
| PRINCIPAL AMOUNT | VALUE | ||||||||||
| 80,000 | Enterprise Products Operating, LLC‡ 5.250%, 08/16/77 3 mo. SOFR + 3.29% | $ | 75,401 | ||||||||
75,000 | 8.573%, 08/16/77 3 mo. LIBOR + 2.99% | 74,753 | |||||||||
1,970,000 | EQM Midstream Partners, LP* 7.500%, 06/01/27 | 2,007,115 | |||||||||
600,000 | 6.375%, 04/01/29 | 596,166 | |||||||||
885,000 | Genesis Energy, LP / Genesis Energy Finance Corp. 8.875%, 04/15/30 | 916,798 | |||||||||
543,000 | 6.250%, 05/15/26 | 539,123 | |||||||||
1,190,000 | Gulfport Energy Corp. 8.000%, 05/17/26* | 1,207,909 | |||||||||
306,527 | 8.000%, 05/17/26 | 311,140 | |||||||||
1,670,000 | Hilcorp Energy I, LP / Hilcorp Finance Company* 6.000%, 04/15/30 | 1,604,686 | |||||||||
894,000 | Howard Midstream Energy Partners, LLC* 6.750%, 01/15/27 | 883,665 | |||||||||
1,200,000 | Kodiak Gas Services, LLC* 7.250%, 02/15/29 | 1,214,256 | |||||||||
1,162,000 | Magnolia Oil & Gas Operating, LLC / Magnolia Oil & Gas Finance Corp.* 6.000%, 08/01/26 | 1,146,580 | |||||||||
907,000 | Matador Resources Company* 6.500%, 04/15/32 | 899,590 | |||||||||
600,000 | Moss Creek Resources Holdings, Inc.* 10.500%, 05/15/27 | 614,346 | |||||||||
540,000 | 7.500%, 01/15/26 | 539,417 | |||||||||
900,000 | Nabors Industries, Inc.* 7.375%, 05/15/27 | 892,665 | |||||||||
450,000 | 9.125%, 01/31/30 | 465,777 | |||||||||
900,000 | Nabors Industries, Ltd.*^ 7.500%, 01/15/28 | 854,028 | |||||||||
773,000 | New Fortress Energy, Inc.* 6.750%, 09/15/25 | 764,837 | |||||||||
1,255,000 | Oceaneering International, Inc. 6.000%, 02/01/28 | 1,209,669 | |||||||||
1,270,000 | Parkland Corp.*~ 5.875%, 07/15/27 | 1,242,263 | |||||||||
633,000 | Patterson-UTI Energy, Inc.^ 5.150%, 11/15/29 | 604,971 | |||||||||
300,000 | Permian Resources Operating LLC* 7.000%, 01/15/32 | 306,531 | |||||||||
1,390,000 | Plains All American Pipeline, LP‡ 9.679%, 05/31/24 3 mo. LIBOR + 4.11% | 1,385,218 | |||||||||
1,670,000 | Rockcliff Energy II, LLC* 5.500%, 10/15/29 | 1,544,550 | |||||||||
593,000 | Southwestern Energy Company 4.750%, 02/01/32 | 534,726 | |||||||||
CALAMOS CLOSED-END FAMILY OF FUNDS SEMIANNUAL REPORT
62
| PRINCIPAL AMOUNT | VALUE | ||||||||||
1,626,300 | Transocean, Inc.* 8.750%, 02/15/30 | $ | 1,697,499 | ||||||||
600,000 | 8.250%, 05/15/29 | 596,754 | |||||||||
750,000 | Venture Global Calcasieu Pass, LLC* 6.250%, 01/15/30 | 743,580 | |||||||||
300,000 | 4.125%, 08/15/31 | 262,776 | |||||||||
300,000 | 3.875%, 08/15/29 | 265,080 | |||||||||
1,505,000 | Venture Global LNG, Inc.* 8.375%, 06/01/31 | 1,545,680 | |||||||||
900,000 | 8.125%, 06/01/28 | 921,294 | |||||||||
600,000 | 9.875%, 02/01/32 | 640,314 | |||||||||
600,000 | 9.500%, 02/01/29 | 645,432 | |||||||||
685,000 | Vital Energy, Inc. 7.750%, 07/31/29* | 690,076 | |||||||||
630,000 | 7.875%, 04/15/32* | 639,960 | |||||||||
464,000 | 9.750%, 10/15/30 | 505,992 | |||||||||
1,200,000 | VOC Escrow, Ltd.* 5.000%, 02/15/28 | 1,145,316 | |||||||||
1,505,000 | Weatherford International, Ltd.* 8.625%, 04/30/30 | 1,563,514 | |||||||||
51,732,054 | |||||||||||
Financials (3.2%) | |||||||||||
1,900,000 | Acrisure, LLC / Acrisure Finance, Inc.* 8.250%, 02/01/29 | 1,888,334 | |||||||||
1,789,000 | Aethon United BR, LP / Aethon United Finance Corp.* 8.250%, 02/15/26 | 1,803,509 | |||||||||
255,000 | Aircastle, Ltd.*‡ 5.250%, 06/15/26 5 year CMT + 4.41% | 242,979 | |||||||||
2,100,000 | Alliant Holdings Intermediate, LLC / Alliant Holdings Co-Issuer* 6.750%, 10/15/27 | 2,063,649 | |||||||||
140,000 | 7.000%, 01/15/31 | 140,857 | |||||||||
140,000 | Allstate Corp.‡ 8.507%, 08/15/53 3 mo. LIBOR + 2.94% | 140,139 | |||||||||
1,782,000 | Ally Financial, Inc. 4.700%, 05/15/26‡ 5 year CMT + 3.87% | 1,513,934 | |||||||||
850,000 | 4.700%, 05/15/28‡ 7 year CMT + 3.48% | 658,733 | |||||||||
489,000 | 8.000%, 11/01/31 | 529,959 | |||||||||
250,000 | American International Group, Inc.‡ 5.750%, 04/01/48 3 mo. LIBOR + 2.87% | 242,310 | |||||||||
2,365,000 | AmWINS Group, Inc.* 4.875%, 06/30/29 | 2,153,096 | |||||||||
460,000 | Ares Finance Company III, LLC*‡ 4.125%, 06/30/51 5 year CMT + 3.24% | 424,230 | |||||||||
888,000 | Aviation Capital Group, LLC*^ 3.500%, 11/01/27 | 818,061 | |||||||||
350,000 | AXIS Specialty Finance, LLC‡ 4.900%, 01/15/40 | ||||||||||
| 5 year CMT + 3.19% | 313,877 | ||||||||||
| PRINCIPAL AMOUNT | VALUE | ||||||||||
439,000 | Bank of America Corp.‡ 6.125%, 04/27/27 5 year CMT + 3.23% | $ | 434,535 | ||||||||
300,000 | 4.300%, 01/28/25 3 mo. USD LIBOR + 2.66% | 292,173 | |||||||||
145,000 | 5.125%, 06/20/24 3 mo. SOFR + 3.55%3 mo. LIBOR + 3.03%3 mo. LIBOR + 3.03% | 145,136 | |||||||||
135,000 | 6.250%, 09/05/24 3 mo. SOFR + 3.97% | 134,939 | |||||||||
135,000 | 6.100%, 03/17/25 3 mo. SOFR + 4.16% | 134,949 | |||||||||
763,000 | Bank of New York Mellon Corp.‡ 4.700%, 09/20/25 5 year CMT + 4.36% | 747,671 | |||||||||
285,000 | BP Capital Markets, PLC‡ 4.375%, 06/22/25 5 year CMT + 4.04% | 279,177 | |||||||||
280,000 | 4.875%, 03/22/30 5 year CMT + 4.40% | 262,265 | |||||||||
600,000 | Brandywine Operating Partnership, LP 8.875%, 04/12/29 | 614,760 | |||||||||
1,779,000 | BroadStreet Partners, Inc.* 5.875%, 04/15/29 | 1,623,213 | |||||||||
1,435,000 | Brookfield Property REIT, Inc. / BPR Cumulus, LLC / BPR Nimbus, LLC / GGSI Sellco, LLC* 4.500%, 04/01/27 | 1,285,616 | |||||||||
1,200,000 | Burford Capital Global Financial, LLC* 6.875%, 04/15/30 | 1,164,396 | |||||||||
458,000 | Capital One Financial Corp.^‡ 3.950%, 09/01/26 5 year CMT + 3.16% | 395,900 | |||||||||
285,000 | Charles Schwab Corp.‡ 5.375%, 06/01/25 5 year CMT + 4.97% | 282,150 | |||||||||
147,000 | 4.000%, 12/01/30 10 year CMT + 3.08% | 119,704 | |||||||||
135,000 | 4.000%, 06/01/26 5 year CMT + 3.17% | 124,546 | |||||||||
509,000 | Citigroup, Inc.‡ 3.875%, 02/18/26 5 year CMT + 3.42% | 478,185 | |||||||||
166,000 | 4.150%, 11/15/26 5 year CMT + 3.00% | 152,537 | |||||||||
155,000 | 7.200%, 05/15/29 | 156,705 | |||||||||
150,000 | 7.625%, 11/15/28 5 year CMT + 3.21% | 155,190 | |||||||||
150,000 | 4.000%, 12/10/25 5 year CMT + 3.60% | 143,445 | |||||||||
140,000 | 5.950%, 05/15/25 3 mo. USD LIBOR + 3.91% | 139,434 | |||||||||
450,000 | Citizens Financial Group, Inc.‡ 4.000%, 10/06/26 5 year CMT + 3.22% | 384,826 | |||||||||
155,000 | 5.650%, 10/06/25 5 year CMT + 5.31% | 151,756 | |||||||||
www.calamos.com
63
| PRINCIPAL AMOUNT | VALUE | ||||||||||
315,000 | Comerica, Inc.‡ 5.625%, 07/01/25 5 year CMT + 5.29% | $ | 303,984 | ||||||||
145,000 | Corebridge Financial, Inc.‡ 6.875%, 12/15/52 | 143,435 | |||||||||
1,165,000 | Credit Acceptance Corp. 6.625%, 03/15/26 | 1,162,216 | |||||||||
800,000 | 9.250%, 12/15/28* | 848,976 | |||||||||
1,205,000 | Cushman & Wakefield U.S. Borrower LLC*^ 8.875%, 09/01/31 | 1,253,863 | |||||||||
250,000 | Depository Trust & Clearing Corp.*‡ 3.375%, 06/20/26 5 year CMT + 2.61 | 220,508 | |||||||||
275,000 | Discover Financial Services‡ 5.500%, 10/30/27 3 mo. SOFR + 3.34% | 231,052 | |||||||||
245,000 | 6.125%, 06/23/25 5 year CMT + 5.78% | 245,463 | |||||||||
1,533,000 | Enact Holdings, Inc.* 6.500%, 08/15/25 | 1,532,341 | |||||||||
335,000 | Enstar Finance, LLC‡ 5.500%, 01/15/42 5 year CMT + 4.01% | 316,330 | |||||||||
605,000 | Fifth Third Bancorp‡ 4.500%, 09/30/25 5 year CMT + 4.22% | 578,646 | |||||||||
70,000 | First Citizens BancShares, Inc.‡ 9.563%, 01/04/27 3 mo. SOFR + 4.23% | 70,855 | |||||||||
1,350,000 | GGAM Finance, Ltd.* 8.000%, 02/15/27 | 1,387,098 | |||||||||
1,472,000 | Global Net Lease, Inc. / Global Net Lease Operating Partnership, LP* 3.750%, 12/15/27 | 1,253,732 | |||||||||
310,000 | Goldman Sachs Group, Inc.‡ 4.400%, 02/10/25 5 year CMT + 2.85% | 301,965 | |||||||||
153,000 | 4.125%, 11/10/26 5 year CMT + 2.95% | 141,450 | |||||||||
150,000 | 7.500%, 05/10/29 5 year CMT + 2.81 | 151,893 | |||||||||
149,000 | 7.500%, 02/10/29 5 year CMT + 3.16% | 154,315 | |||||||||
1,250,000 | GTCR W-2 Merger Sub, LLC* 7.500%, 01/15/31 | 1,290,000 | |||||||||
655,000 | HAT Holdings I LLC / HAT Holdings II LLC* 8.000%, 06/15/27 | 672,633 | |||||||||
1,785,000 | HUB International, Ltd.* 5.625%, 12/01/29 | 1,647,002 | |||||||||
600,000 | 7.375%, 01/31/32 | 597,528 | |||||||||
350,000 | Huntington Bancshares, Inc.‡ 4.450%, 10/15/27 7 year CMT + 4.05% | 314,212 | |||||||||
210,000 | 5.625%, 07/15/30 10 year CMT + 4.95% | 188,206 | |||||||||
| PRINCIPAL AMOUNT | VALUE | ||||||||||
892,000 | Icahn Enterprises, LP / Icahn Enterprises Finance Corp. 4.375%, 02/01/29 | $ | 751,644 | ||||||||
1,913,000 | ILFC E-Capital Trust II*‡ 7.395%, 12/21/65 3 mo. LIBOR + 1.80% | 1,528,410 | |||||||||
2,470,000 | Iron Mountain, Inc.* 5.250%, 03/15/28 | 2,366,556 | |||||||||
3,000,000 | Jefferies Finance, LLC / JFIN Co-Issuer Corp.* 5.000%, 08/15/28 | 2,702,220 | |||||||||
775,000 | JPMorgan Chase & Company‡ 3.650%, 06/01/26^ 5 year CMT + 2.85% | 726,880 | |||||||||
300,000 | 6.100%, 10/01/24 3 mo. USD LIBOR + 3.33% | 300,879 | |||||||||
180,000 | KeyCorp‡ 5.000%, 09/15/26 3 mo. SOFR + 3.87% | 152,716 | |||||||||
2,306,000 | Ladder Capital Finance Holdings, LLLP / Ladder Capital Finance Corp.* 5.250%, 10/01/25 | 2,268,251 | |||||||||
1,296,000 | 4.750%, 06/15/29 | 1,159,129 | |||||||||
1,080,000 | LD Holdings Group, LLC* 6.125%, 04/01/28 | 819,871 | |||||||||
1,250,000 | Level 3 Financing, Inc.* 4.250%, 07/01/28 | 489,050 | |||||||||
600,000 | 4.625%, 09/15/27 | 353,850 | |||||||||
525,000 | Liberty Mutual Group, Inc.*‡ 4.125%, 12/15/51 5 year CMT + 3.32% | 478,984 | |||||||||
892,000 | LPL Holdings, Inc.* 4.000%, 03/15/29 | 809,900 | |||||||||
145,000 | M&T Bank Corp.‡ 9.179%, 08/15/24 3 mo. LIBOR + 3.61% | 145,126 | |||||||||
85,000 | 5.125%, 11/01/26 3 mo. LIBOR + 3.52% | 74,831 | |||||||||
80,000 | 5.000%, 08/01/24 5 year CMT + 3.17% | 76,512 | |||||||||
1,200,000 | Macquarie Airfinance Holdings, Ltd.* 8.125%, 03/30/29 | 1,257,828 | |||||||||
531,987 | Mallinckrodt International Finance, SA / Mallinckrodt CB, LLC* 14.750%, 11/14/28 | 580,233 | |||||||||
280,000 | Markel Corp.‡ 6.000%, 06/01/25 5 year CMT + 5.66% | 277,354 | |||||||||
2,137,000 | MetLife, Inc. 6.400%, 12/15/66 | 2,131,722 | |||||||||
225,000 | 3.850%, 09/15/25‡ 5 year CMT + 3.58% | 215,694 | |||||||||
1,615,000 | Nationstar Mortgage Holdings, Inc.* 5.500%, 08/15/28 | 1,520,199 | |||||||||
1,305,000 | Navient Corp. 5.000%, 03/15/27 | 1,232,586 | |||||||||
655,000 | 4.875%, 03/15/28 | 592,880 | |||||||||
CALAMOS CLOSED-END FAMILY OF FUNDS SEMIANNUAL REPORT
64
| PRINCIPAL AMOUNT | VALUE | ||||||||||
780,000 | Necessity Retail REIT, Inc. / American Finance Operating Partner, LP* 4.500%, 09/30/28 | $ | 666,042 | ||||||||
600,000 | Newmark Group, Inc.* 7.500%, 01/12/29 | 606,636 | |||||||||
230,000 | Northern Trust Corp.‡ 4.600%, 10/01/26 3 mo. LIBOR + 3.20% | 220,720 | |||||||||
900,000 | OneMain Finance Corp. 9.000%, 01/15/29 | 946,152 | |||||||||
820,000 | 3.875%, 09/15/28 | 723,560 | |||||||||
599,000 | 7.125%, 03/15/26 | 604,852 | |||||||||
442,000 | PartnerRe Finance B, LLC^‡ 4.500%, 10/01/50 5 year CMT + 3.82% | 399,992 | |||||||||
1,871,000 | PHH Mortgage Corp.* 7.875%, 03/15/26 | 1,799,359 | |||||||||
315,000 | PNC Financial Services Group, Inc.‡ 3.400%, 09/15/26 5 year CMT + 2.60% | 271,773 | |||||||||
140,000 | 6.200%, 09/15/27 5 year CMT + 3.24% | 137,448 | |||||||||
140,000 | 6.000%, 05/15/27 5 year CMT + 3.00% | 135,309 | |||||||||
280,000 | QBE Insurance Group, Ltd.*‡ 5.875%, 05/12/25 5 year CMT + 5.51% | 277,029 | |||||||||
1,355,000 | RHP Hotel Properties, LP / RHP Finance Corp.* 4.500%, 02/15/29 | 1,248,565 | |||||||||
1,200,000 | 6.500%, 04/01/32 | 1,177,572 | |||||||||
560,000 | Rocket Mortgage, LLC / Rocket Mortgage Co-Issuer, Inc.* 3.875%, 03/01/31 | 477,064 | |||||||||
555,000 | 3.625%, 03/01/29 | 490,215 | |||||||||
275,000 | 2.875%, 10/15/26 | 253,030 | |||||||||
1,500,000 | StoneX Group, Inc.* 7.875%, 03/01/31 | 1,517,970 | |||||||||
1,225,000 | 8.625%, 06/15/25 | 1,229,998 | |||||||||
295,000 | Truist Financial Corp.‡ 4.800%, 09/01/24 5 year CMT + 3.00% | 285,474 | |||||||||
285,000 | 4.950%, 09/01/25 5 year CMT + 4.61% | 277,630 | |||||||||
108,000 | 5.100%, 03/01/30 10 year CMT + 4.35% | 98,061 | |||||||||
320,000 | U.S. Bancorp^‡ 5.300%, 04/15/27 3 mo. SOFR + 3.18% | 300,307 | |||||||||
1,383,000 | United Wholesale Mortgage, LLC* 5.500%, 04/15/29 | 1,287,449 | |||||||||
600,000 | 5.750%, 06/15/27 | 576,624 | |||||||||
600,000 | Uniti Group, LP / Uniti Group Finance, Inc. / CSL Capital, LLC* 10.500%, 02/15/28 | 623,250 | |||||||||
600,000 | 6.500%, 02/15/29 | 482,838 | |||||||||
| PRINCIPAL AMOUNT | VALUE | ||||||||||
1,340,000 | VZ Secured Financing, BV* 5.000%, 01/15/32 | $ | 1,132,421 | ||||||||
620,000 | Wells Fargo & Company‡ 3.900%, 03/15/26 5 year CMT + 3.45% | 588,020 | |||||||||
560,000 | 7.625%, 09/15/28 5 year CMT + 3.61 | 585,850 | |||||||||
1,255,000 | XHR, LP* 6.375%, 08/15/25 | 1,254,485 | |||||||||
81,433,578 | |||||||||||
Health Care (1.0%) | |||||||||||
2,370,000 | Bausch Health Companies, Inc.* 11.000%, 09/30/28^ | 1,856,516 | |||||||||
469,000 | 14.000%, 10/15/30 | 303,030 | |||||||||
447,000 | 6.125%, 02/01/27 | 328,196 | |||||||||
2,392,000 | CHS/Community Health Systems, Inc.* 6.125%, 04/01/30 | 1,694,110 | |||||||||
663,000 | 6.875%, 04/15/29 | 492,364 | |||||||||
655,000 | 8.000%, 03/15/26 | 652,793 | |||||||||
600,000 | 10.875%, 01/15/32 | 615,408 | |||||||||
149,000 | 5.250%, 05/15/30 | 122,164 | |||||||||
1,395,000 | DaVita, Inc.* 3.750%, 02/15/31 | 1,149,857 | |||||||||
1,326,000 | 4.625%, 06/01/30 | 1,164,865 | |||||||||
894,000 | Embecta Corp.* 5.000%, 02/15/30 | 689,801 | |||||||||
298,000 | 6.750%, 02/15/30 | 256,319 | |||||||||
600,000 | Encompass Health Corp. 4.750%, 02/01/30 | 551,412 | |||||||||
600,000 | 4.500%, 02/01/28 | 564,420 | |||||||||
1,369,000 | HCA, Inc. 7.500%, 11/06/33 | 1,493,415 | |||||||||
350,000 | Jazz Securities DAC* 4.375%, 01/15/29 | 320,663 | |||||||||
1,484,000 | Medline Borrower, LP* 5.250%, 10/01/29 | 1,382,865 | |||||||||
1,480,000 | 3.875%, 04/01/29 | 1,325,636 | |||||||||
2,200,000 | Organon & Company / Organon Foreign Debt Co-Issuer, BV* 5.125%, 04/30/31 | 1,904,144 | |||||||||
500,000 | 4.125%, 04/30/28 | 455,920 | |||||||||
1,251,000 | Team Health Holdings, Inc.* 6.375%, 02/01/25 | 1,165,006 | |||||||||
2,710,000 | Tenet Healthcare Corp. 6.250%, 02/01/27 | 2,704,282 | |||||||||
1,575,000 | 6.875%, 11/15/31 | 1,630,377 | |||||||||
1,520,000 | Teva Pharmaceutical Finance Netherlands III, BV 5.125%, 05/09/29^ | 1,442,738 | |||||||||
1,100,000 | 4.750%, 05/09/27 | 1,053,954 | |||||||||
535,000 | 3.150%, 10/01/26 | 495,918 | |||||||||
25,816,173 | |||||||||||
Industrials (2.1%) | |||||||||||
1,200,000 | Aar Escrow Issuer, LLC* 6.750%, 03/15/29 | 1,210,788 | |||||||||
www.calamos.com
65
| PRINCIPAL AMOUNT | VALUE | ||||||||||
1,355,000 | ACCO Brands Corp.* 4.250%, 03/15/29 | $ | 1,182,576 | ||||||||
1,170,000 | AerCap Holdings, NV^‡ 5.875%, 10/10/79 5 year CMT + 4.54% | 1,159,774 | |||||||||
1,520,000 | Air Lease Corp.‡ 4.125%, 12/15/26 5 year CMT + 3.15% | 1,316,350 | |||||||||
320,000 | 4.650%, 06/15/26 5 year CMT + 4.08% | 301,597 | |||||||||
1,925,000 | Albertsons Companies, Inc. / Safeway, Inc. / New Albertsons, LP / Albertsons, LLC* 4.625%, 01/15/27 | 1,840,608 | |||||||||
900,000 | 5.875%, 02/15/28 | 882,783 | |||||||||
770,000 | Allegiant Travel Company* 7.250%, 08/15/27 | 745,868 | |||||||||
670,000 | Arcosa, Inc.* 4.375%, 04/15/29 | 613,365 | |||||||||
3,100,000 | ARD Finance, SA* 6.500%, 06/30/27 7.250% PIK rate | 865,272 | |||||||||
937,000 | Beacon Roofing Supply, Inc.* 4.125%, 05/15/29 | 838,643 | |||||||||
604,000 | Boeing Company* 6.388%, 05/01/31 | 608,409 | |||||||||
600,000 | Bombardier, Inc.* 8.750%, 11/15/30 | 638,784 | |||||||||
490,000 | 7.875%, 04/15/27 | 488,471 | |||||||||
376,000 | 7.250%, 07/01/31 | 377,466 | |||||||||
1,191,000 | BWX Technologies, Inc.* 4.125%, 04/15/29 | 1,086,371 | |||||||||
1,220,000 | Cascades, Inc. / Cascades USA, Inc.* 5.375%, 01/15/28 | 1,150,155 | |||||||||
295,000 | Delta Air Lines, Inc. / SkyMiles IP, Ltd.* 4.750%, 10/20/28 | 286,097 | |||||||||
1,565,000 | Deluxe Corp.* 8.000%, 06/01/29 | 1,421,677 | |||||||||
1,194,000 | Eco Material Technologies, Inc.* 7.875%, 01/31/27 | 1,204,149 | |||||||||
600,000 | Emerald Debt Merger Sub, LLC* 6.625%, 12/15/30 | 596,394 | |||||||||
600,000 | EnerSys* 6.625%, 01/15/32 | 598,386 | |||||||||
575,000 | 4.375%, 12/15/27 | 539,103 | |||||||||
450,000 | EquipmentShare.com, Inc.* 8.625%, 05/15/32 | 458,843 | |||||||||
733,000 | Graham Packaging Company, Inc.* 7.125%, 08/15/28 | 663,504 | |||||||||
750,000 | Graphic Packaging International, LLC* 4.750%, 07/15/27 | 719,557 | |||||||||
551,000 | 3.500%, 03/01/29 | 488,175 | |||||||||
1,303,000 | Great Lakes Dredge & Dock Corp.*^ 5.250%, 06/01/29 | 1,100,657 | |||||||||
| PRINCIPAL AMOUNT | VALUE | ||||||||||
2,775,000 | H&E Equipment Services, Inc.* 3.875%, 12/15/28 | $ | 2,458,705 | ||||||||
1,492,000 | Hawaiian Brand Intellectual Property, Ltd. / HawaiianMiles Loyalty, Ltd.* 5.750%, 01/20/26 | 1,402,540 | |||||||||
1,500,000 | Herc Holdings, Inc.* 5.500%, 07/15/27 | 1,458,885 | |||||||||
1,385,000 | IEA Energy Services, LLC* 6.625%, 08/15/29 | 1,322,052 | |||||||||
721,000 | JELD-WEN, Inc.* 4.625%, 12/15/25 | 704,042 | |||||||||
625,000 | 4.875%, 12/15/27 | 594,194 | |||||||||
1,940,000 | Ken Garff Automotive, LLC* 4.875%, 09/15/28 | 1,807,479 | |||||||||
1,200,000 | Knife River Holding Company* 7.750%, 05/01/31 | 1,248,924 | |||||||||
298,000 | MasTec, Inc.*^ 4.500%, 08/15/28 | 278,675 | |||||||||
150,000 | Miter Brands Acquisition Holdco, Inc. / MIWD Borrower, LLC* 6.750%, 04/01/32 | 149,079 | |||||||||
722,000 | Moog, Inc.* 4.250%, 12/15/27 | 675,626 | |||||||||
1,472,000 | Newfold Digital Holdings Group, Inc.* 6.000%, 02/15/29 | 1,106,223 | |||||||||
1,140,000 | Novelis Corp.* 4.750%, 01/30/30 | 1,041,105 | |||||||||
450,000 | OI European Group, BV* 4.750%, 02/15/30 | 411,948 | |||||||||
1,375,000 | Pactiv Evergreen Group Issuer, Inc. / Pactiv Evergreen Group Issuer, LLC* 4.000%, 10/15/27 | 1,279,080 | |||||||||
933,000 | Sealed Air Corp.* 6.125%, 02/01/28 | 922,653 | |||||||||
298,000 | 5.000%, 04/15/29 | 280,606 | |||||||||
300,000 | Sealed Air Corp./Sealed Air Corp. U.S.* 7.250%, 02/15/31 | 306,021 | |||||||||
650,000 | Sensata Technologies, BV* 4.000%, 04/15/29 | 582,146 | |||||||||
593,000 | Sensata Technologies, Inc.* 3.750%, 02/15/31 | 502,419 | |||||||||
891,000 | Sinclair Television Group, Inc.* 4.125%, 12/01/30 | 613,739 | |||||||||
600,000 | 5.500%, 03/01/30 | 416,148 | |||||||||
1,165,000 | Standard Industries, Inc.* 5.000%, 02/15/27 | 1,124,353 | |||||||||
100,000 | Stanley Black & Decker, Inc.‡ 4.000%, 03/15/60 5 year CMT + 2.66% | 87,966 | |||||||||
957,000 | Stericycle, Inc.* 3.875%, 01/15/29 | 855,673 | |||||||||
1,295,000 | TransDigm, Inc.* 6.875%, 12/15/30 | 1,304,829 | |||||||||
900,000 | 6.750%, 08/15/28 | 904,293 | |||||||||
CALAMOS CLOSED-END FAMILY OF FUNDS SEMIANNUAL REPORT
66
| PRINCIPAL AMOUNT | VALUE | ||||||||||
450,000 | 7.125%, 12/01/31 | $ | 459,216 | ||||||||
298,000 | 6.625%, 03/01/32 | 297,979 | |||||||||
583,000 | Tronox, Inc.* 4.625%, 03/15/29 | 522,036 | |||||||||
439,547 | United Airlines Pass Through Trust Series 2019-2, Class B 3.500%, 11/01/29 | 406,005 | |||||||||
1,191,000 | Vertiv Group Corp.* 4.125%, 11/15/28 | 1,103,712 | |||||||||
1,251,000 | Wabash National Corp.* 4.500%, 10/15/28 | 1,126,025 | |||||||||
1,050,000 | Waste Pro USA, Inc.* 5.500%, 02/15/26 | 1,028,622 | |||||||||
703,000 | Williams Scotsman, Inc.* 4.625%, 08/15/28 | 650,289 | |||||||||
600,000 | 7.375%, 10/01/31 | 613,368 | |||||||||
53,430,477 | |||||||||||
Information Technology (0.6%) | |||||||||||
296,000 | Booz Allen Hamilton, Inc.* 4.000%, 07/01/29 | 271,553 | |||||||||
692,000 | Coherent Corp.* 5.000%, 12/15/29 | 639,138 | |||||||||
1,100,000 | CommScope, Inc.* 4.750%, 09/01/29 | 769,175 | |||||||||
524,000 | Dell International, LLC / EMC Corp. 6.020%, 06/15/26 | 527,228 | |||||||||
596,000 | Dun & Bradstreet Corp.*^ 5.000%, 12/15/29 | 543,182 | |||||||||
586,000 | Fair Isaac Corp.* 4.000%, 06/15/28 | 540,556 | |||||||||
1,315,000 | KBR, Inc.* 4.750%, 09/30/28 | 1,228,631 | |||||||||
1,300,000 | MPH Acquisition Holdings, LLC* 5.750%, 11/01/28 | 957,398 | |||||||||
595,000 | 5.500%, 09/01/28 | 486,079 | |||||||||
600,000 | NCL Corp., Ltd.* 8.125%, 01/15/29 | 625,458 | |||||||||
589,000 | NCR Voyix Corp.* 5.125%, 04/15/29 | 541,739 | |||||||||
886,000 | ON Semiconductor Corp.* 3.875%, 09/01/28 | 804,257 | |||||||||
855,000 | Open Text Corp.* 3.875%, 02/15/28 | 781,068 | |||||||||
600,000 | 6.900%, 12/01/27 | 613,812 | |||||||||
447,000 | 3.875%, 12/01/29 | 391,943 | |||||||||
447,000 | Open Text Holdings, Inc.*^ 4.125%, 12/01/31 | 383,772 | |||||||||
1,035,000 | Playtika Holding Corp.* 4.250%, 03/15/29 | 891,518 | |||||||||
1,645,000 | TTM Technologies, Inc.* 4.000%, 03/01/29 | 1,473,871 | |||||||||
830,000 | Twilio, Inc. 3.625%, 03/15/29 | 737,256 | |||||||||
298,000 | 3.875%, 03/15/31 | 258,414 | |||||||||
| PRINCIPAL AMOUNT | VALUE | ||||||||||
450,000 | UKG, Inc.* 6.875%, 02/01/31 | $ | 451,053 | ||||||||
1,475,000 | Viavi Solutions, Inc.* 3.750%, 10/01/29 | 1,248,366 | |||||||||
1,355,000 | ZoomInfo Technologies, LLC / ZoomInfo Finance Corp.* 3.875%, 02/01/29 | 1,198,267 | |||||||||
16,363,734 | |||||||||||
Materials (0.6%) | |||||||||||
623,000 | ArcelorMittal, SA 7.000%, 10/15/39 | 659,539 | |||||||||
600,000 | ATI, Inc. 5.875%, 12/01/27 | 589,398 | |||||||||
295,000 | Carpenter Technology Corp. 7.625%, 03/15/30 | 301,398 | |||||||||
1,195,000 | Chemours Company* 4.625%, 11/15/29 | 1,024,975 | |||||||||
1,880,000 | Clearwater Paper Corp.* 4.750%, 08/15/28 | 1,709,766 | |||||||||
900,000 | Cleveland-Cliffs, Inc.* 6.750%, 04/15/30 | 879,408 | |||||||||
596,000 | Commercial Metals Company 4.125%, 01/15/30 | 535,405 | |||||||||
298,000 | 4.375%, 03/15/32 | 262,860 | |||||||||
1,375,000 | Constellium, SE*^ 3.750%, 04/15/29 | 1,221,344 | |||||||||
590,000 | HB Fuller Company 4.250%, 10/15/28 | 545,184 | |||||||||
600,000 | INEOS Finance, PLC* 6.750%, 05/15/28 | 590,340 | |||||||||
900,000 | JW Aluminum Continuous Cast Company* 10.250%, 06/01/26 | 908,874 | |||||||||
1,050,000 | Kaiser Aluminum Corp.* 4.625%, 03/01/28 | 979,093 | |||||||||
297,000 | LSF11 A5 HoldCo, LLC* 6.625%, 10/15/29 | 277,018 | |||||||||
1,266,000 | Mercer International, Inc. 5.125%, 02/01/29 | 1,107,206 | |||||||||
600,000 | 12.875%, 10/01/28* | 655,662 | |||||||||
1,175,000 | OCI, NV* 6.700%, 03/16/33 | 1,129,069 | |||||||||
900,000 | Owens-Brockway Glass Container, Inc.* 7.250%, 05/15/31 | 902,556 | |||||||||
590,000 | 6.625%, 05/13/27 | 590,177 | |||||||||
1,328,000 | Silgan Holdings, Inc. 4.125%, 02/01/28 | 1,239,927 | |||||||||
589,000 | Trinseo Materials Operating SCA / Trinseo Materials Finance, Inc.* 5.125%, 04/01/29 | 152,498 | |||||||||
16,261,697 | |||||||||||
www.calamos.com
67
| PRINCIPAL AMOUNT | VALUE | ||||||||||
Other (0.0%) | |||||||||||
625,000 | Gen Digital, Inc.* 6.750%, 09/30/27 | $ | 627,669 | ||||||||
325,000 | 7.125%, 09/30/30^ | 328,900 | |||||||||
956,569 | |||||||||||
Real Estate (0.2%) | |||||||||||
953,000 | EPR Properties 3.750%, 08/15/29 | 829,177 | |||||||||
862,000 | Forestar Group, Inc.* 5.000%, 03/01/28 | 819,547 | |||||||||
630,000 | 3.850%, 05/15/26 | 598,935 | |||||||||
1,341,000 | MIWD Holdco II, LLC / MIWD Finance Corp.* 5.500%, 02/01/30 | 1,214,798 | |||||||||
550,000 | Service Properties Trust 5.250%, 02/15/26 | 529,408 | |||||||||
3,991,865 | |||||||||||
Special Purpose Acquisition Companies (0.1%) | |||||||||||
1,195,000 | Fertitta Entertainment, LLC / Fertitta Entertainment Finance Company, Inc.* 6.750%, 01/15/30 | 1,041,825 | |||||||||
596,000 | 4.625%, 01/15/29 | 539,583 | |||||||||
1,581,408 | |||||||||||
Utilities (0.2%) | |||||||||||
340,000 | Algonquin Power & Utilities Corp.‡ 4.750%, 01/18/82 5 year CMT + 3.25% | 294,957 | |||||||||
85,000 | American Electric Power Company, Inc.‡ 3.875%, 02/15/62 5 year CMT + 2.68 | 76,361 | |||||||||
235,000 | CMS Energy Corp.‡ 4.750%, 06/01/50 5 year CMT + 4.12% | 212,513 | |||||||||
250,000 | Dominion Energy, Inc.‡ 4.650%, 12/15/24 5 year CMT + 2.99% | 244,792 | |||||||||
133,000 | 4.350%, 01/15/27 5 year CMT + 3.20% | 122,291 | |||||||||
330,000 | Duke Energy Corp.‡ 4.875%, 09/16/24 5 year CMT + 3.39% | 327,598 | |||||||||
132,000 | 3.250%, 01/15/82 5 year CMT + 2.32% | 116,470 | |||||||||
285,000 | Emera, Inc.‡ 6.750%, 06/15/76 3 mo. LIBOR + 5.44 | 282,481 | |||||||||
288,000 | National Rural Utilities Cooperative Finance Corp.‡ 7.125%, 09/15/53 | 294,733 | |||||||||
150,000 | 5.250%, 04/20/46 3 mo. LIBOR + 3.63% | 145,183 | |||||||||
320,000 | NextEra Energy Capital Holdings, Inc.‡ 3.800%, 03/15/82 5 year CMT + 2.55% | 290,042 | |||||||||
155,000 | 6.700%, 09/01/54 | 153,608 | |||||||||
| PRINCIPAL AMOUNT | VALUE | ||||||||||
591,000 | PPL Capital Funding, Inc.‡ 8.236%, 03/30/67 3 mo. LIBOR + 2.67% | $ | 586,479 | ||||||||
220,000 | Sempra‡ 4.875%, 10/15/25 5 year CMT + 4.55% | 215,052 | |||||||||
85,000 | 4.125%, 04/01/52 5 year CMT + 2.87% | 77,285 | |||||||||
442,000 | Southern Company‡ 4.000%, 01/15/51 5 year CMT + 3.73% | 422,561 | |||||||||
95,000 | 3.750%, 09/15/51 5 year CMT + 2.92% | 87,256 | |||||||||
625,000 | Vistra Corp.*‡ 7.000%, 12/15/26 5 year CMT + 5.74% | 615,506 | |||||||||
340,000 | 8.000%, 10/15/26 5 year CMT + 6.93% | 343,872 | |||||||||
80,000 | WEC Energy Group, Inc.‡ 7.681%, 05/15/67 3 mo. LIBOR + 2.11% | 77,980 | |||||||||
4,987,020 | |||||||||||
TOTAL CORPORATE BONDS (Cost $417,404,277) | 397,272,957 | ||||||||||
CONVERTIBLE BONDS (20.8%) | |||||||||||
Communication Services (1.1%) | |||||||||||
1,203,000 | Cable One, Inc. 0.000%, 03/15/26 | 1,040,439 | |||||||||
5,970,000 | Liberty Media Corp.* 2.375%, 09/30/53 | 6,264,082 | |||||||||
8,895,000 | Liberty Media Corp.-Liberty Formula One 2.250%, 08/15/27 | 9,264,409 | |||||||||
11,475,000 | Live Nation Entertainment, Inc. 3.125%, 01/15/29 | 12,483,767 | |||||||||
29,052,697 | |||||||||||
Consumer Discretionary (2.3%) | |||||||||||
8,205,000 | Airbnb, Inc. 0.000%, 03/15/26 | 7,556,231 | |||||||||
9,550,000 | Booking Holdings, Inc. 0.750%, 05/01/25 | 17,546,692 | |||||||||
1,803,000 | DISH Network Corp. 0.000%, 12/15/25 | 1,323,402 | |||||||||
14,650,000 | Ford Motor Company 0.000%, 03/15/26 | 14,624,655 | |||||||||
3,765,000 | Royal Caribbean Cruises, Ltd. 6.000%, 08/15/25 | 10,731,944 | |||||||||
2,370,000 | Wayfair, Inc. 3.250%, 09/15/27 | 2,614,276 | |||||||||
3,885,000 | Winnebago Industries, Inc.* 3.250%, 01/15/30 | 3,840,284 | |||||||||
58,237,484 | |||||||||||
CALAMOS CLOSED-END FAMILY OF FUNDS SEMIANNUAL REPORT
68
| PRINCIPAL AMOUNT | VALUE | ||||||||||
Consumer Staples (0.3%) | |||||||||||
5,735,000 | Post Holdings, Inc. 2.500%, 08/15/27 | $ | 6,429,509 | ||||||||
Energy (0.3%) | |||||||||||
6,615,000 | Northern Oil & Gas, Inc. 3.625%, 04/15/29 | 8,188,576 | |||||||||
Financials (1.0%) | |||||||||||
4,115,000 | Federal Realty OP, LP* 3.250%, 01/15/29 | 4,011,755 | |||||||||
7,915,000 | Global Payments, Inc.* 1.500%, 03/01/31 | 7,894,975 | |||||||||
11,275,000 | Morgan Stanley Finance, LLC 1.000%, 11/23/27 | 14,178,312 | |||||||||
26,085,042 | |||||||||||
Health Care (1.7%) | |||||||||||
13,555,000 | Dexcom, Inc. 0.250%, 11/15/25 | 14,213,231 | |||||||||
6,245,000 | 0.375%, 05/15/28* | 6,344,295 | |||||||||
4,085,000 | Exact Sciences Corp.* 2.000%, 03/01/30 | 4,212,289 | |||||||||
7,895,000 | Integer Holdings Corp. 2.125%, 02/15/28 | 10,979,418 | |||||||||
6,480,000 | iRhythm Technologies, Inc.* 1.500%, 09/01/29 | 6,573,701 | |||||||||
42,322,934 | |||||||||||
Industrials (3.0%) | |||||||||||
6,850,000 | American Airlines Group, Inc. 6.500%, 07/01/25 | 7,491,434 | |||||||||
4,215,000 | Axon Enterprise, Inc. 0.500%, 12/15/27 | 6,142,014 | |||||||||
7,500,000 | Fluor Corp.* 1.125%, 08/15/29 | 8,171,400 | |||||||||
13,805,000 | Middleby Corp. 1.000%, 09/01/25 | 16,268,088 | |||||||||
8,835,000 | Tetra Tech, Inc.* 2.250%, 08/15/28 | 10,036,472 | |||||||||
14,800,000 | Uber Technologies, Inc. 0.000%, 12/15/25 | 15,453,716 | |||||||||
12,000,000 | 0.875%, 12/01/28* | 13,558,200 | |||||||||
77,121,324 | |||||||||||
Information Technology (7.3%) | |||||||||||
5,910,000 | Advanced Energy Industries, Inc.* 2.500%, 09/15/28 | 5,858,642 | |||||||||
16,815,000 | Akamai Technologies, Inc. 1.125%, 02/15/29* | 16,564,793 | |||||||||
4,230,000 | 0.375%, 09/01/27 | 4,294,719 | |||||||||
7,838,000 | BILL Holdings, Inc. 0.000%, 04/01/27 | 6,671,549 | |||||||||
7,545,000 | CyberArk Software, Ltd. 0.000%, 11/15/24 | 11,593,043 | |||||||||
| PRINCIPAL AMOUNT | VALUE | ||||||||||
12,325,000 | Enphase Energy, Inc. 0.000%, 03/01/28 | $ | 10,230,736 | ||||||||
5,215,000 | NCL Corp., Ltd. 5.375%, 08/01/25 | 6,412,051 | |||||||||
7,605,000 | Nutanix, Inc. 0.250%, 10/01/27 | 9,210,948 | |||||||||
17,315,000 | ON Semiconductor Corp. 0.500%, 03/01/29 | 16,783,949 | |||||||||
2,520,000 | Palo Alto Networks, Inc. 0.375%, 06/01/25 | 7,377,023 | |||||||||
7,920,000 | Parsons Corp.* 2.625%, 03/01/29 | 8,306,179 | |||||||||
5,970,000 | Rapid7, Inc.* 1.250%, 03/15/29 | 5,788,452 | |||||||||
13,100,000 | Seagate HDD Cayman* 3.500%, 06/01/28 | 15,684,106 | |||||||||
8,400,000 | SK Hynix, Inc. 1.750%, 04/11/30 | 13,175,064 | |||||||||
8,013,000 | Super Micro Computer, Inc.* 0.000%, 03/01/29 | 8,195,055 | |||||||||
5,850,000 | Tyler Technologies, Inc.^ 0.250%, 03/15/26 | 6,145,308 | |||||||||
6,065,000 | Vertex, Inc.* 0.750%, 05/01/29 | 6,342,474 | |||||||||
16,670,000 | Western Digital Corp.* 3.000%, 11/15/28 | 25,181,869 | |||||||||
5,670,000 | Wolfspeed, Inc. 1.875%, 12/01/29 | 3,248,400 | |||||||||
187,064,360 | |||||||||||
Other (0.0%) | |||||||||||
590,000 | Multiplan Corp.* 6.000%, 10/15/27 | 420,310 | |||||||||
Real Estate (1.2%) | |||||||||||
15,115,000 | Pebblebrook Hotel Trust 1.750%, 12/15/26 | 13,348,661 | |||||||||
15,640,000 | Welltower OP, LLC* 2.750%, 05/15/28 | 17,531,815 | |||||||||
30,880,476 | |||||||||||
Utilities (2.6%) | |||||||||||
11,920,000 | Alliant Energy Corp. 3.875%, 03/15/26 | 11,696,500 | |||||||||
16,655,000 | CMS Energy Corp.* 3.375%, 05/01/28 | 16,318,736 | |||||||||
7,245,000 | PG&E Corp.* 4.250%, 12/01/27 | 7,270,575 | |||||||||
20,355,000 | PPL Capital Funding, Inc. 2.875%, 03/15/28 | 19,351,498 | |||||||||
10,540,000 | Southern Company 3.875%, 12/15/25 | 10,522,082 | |||||||||
65,159,391 | |||||||||||
TOTAL CONVERTIBLE BONDS (Cost $514,831,006) | 530,962,103 | ||||||||||
www.calamos.com
69
| PRINCIPAL AMOUNT | VALUE | ||||||||||
BANK LOANS (6.1%)¡ | |||||||||||
Airlines (0.2%) | |||||||||||
2,825,000 | Air Canada‡ 7.833%, 03/21/31 3 mo. SOFR + 2.50% | $ | 2,847,953 | ||||||||
792,000 | American Airlines, Inc.‡ 10.336%, 04/20/28 3 mo. SOFR + 4.75% | 824,753 | |||||||||
793,000 | Mileage Plus Holdings, LLC‡ 10.733%, 06/21/27 3 mo. SOFR + 5.25% | 815,137 | |||||||||
2,040,000 | United Airlines, Inc.‡ 8.076%, 02/22/31 3 mo. SOFR + 2.75% | 2,051,159 | |||||||||
6,539,002 | |||||||||||
Communication Services (0.7%) | |||||||||||
2,000,000 | APi Group DE, Inc. 7.930%, 01/03/29 1 mo. SOFR + 2.50% | 2,009,830 | |||||||||
65,874 | Audacy Capital Corp.‡ 11.430%, 08/19/24 3 mo. SOFR + 6.11% | 66,038 | |||||||||
3,274,286 | Charter Communications Operating LLC‡ 7.079%, 02/01/27 1 mo. SOFR + 1.75% | 3,274,564 | |||||||||
575,870 | Clear Channel Outdoor Holdings, Inc.‡ 9.430%, 08/23/28 1 mo. SOFR + 4.00% | 577,070 | |||||||||
531,873 | DIRECTV Financing, LLC! 0.000%, 08/02/27 | 535,269 | |||||||||
494,704 | DIRECTV Financing, LLC‡ 10.430%, 08/02/27 1 mo. SOFR + 5.00% | 497,863 | |||||||||
1,755,000 | Entercom Media Corp.‡& 8.145%, 11/18/24 3 mo. SOFR + 0.00% | 951,210 | |||||||||
1,985,025 | Go Daddy Operating Company, LLC‡ 7.316%, 11/09/29 1 mo. SOFR + 2.00% | 1,988,162 | |||||||||
1,165,745 | Gray Television, Inc.‡ 7.942%, 01/02/26 1 mo. SOFR + 2.50% | 1,152,706 | |||||||||
2,000,000 | Match Group, Inc.‡ 7.233%, 02/13/27 3 mo. SOFR + 1.75% | 2,000,000 | |||||||||
2,000,000 | Nexstar Broadcasting, Inc.‡ 7.930%, 09/18/26 1 mo. SOFR + 2.50% | 2,004,000 | |||||||||
1,200,000 | Telesat Canada‡ 8.355%, 12/07/26 3 mo. SOFR + 2.75% | 612,252 | |||||||||
2,000,000 | Virgin Media Bristol, LLC‡ 7.936%, 01/31/28 1 mo. SOFR + 2.50% | 1,965,750 | |||||||||
17,634,714 | |||||||||||
| PRINCIPAL AMOUNT | VALUE | ||||||||||
Consumer Discretionary (1.7%) | |||||||||||
2,580,000 | Adient U.S., LLC‡ 8.066%, 01/31/31 1 mo. SOFR + 2.75% | $ | 2,594,512 | ||||||||
768,000 | American Axle & Manufacturing, Inc.‡ 8.921%, 12/13/29 1 mo. SOFR + 3.50% | 772,562 | |||||||||
1,985,000 | Aramark Services, Inc.‡ 7.316%, 06/22/30 1 mo. SOFR + 2.00% | 1,986,985 | |||||||||
1,188,000 | Caesars Entertainment, Inc.‡ 8.666%, 02/06/30 1 mo. SOFR + 3.25% | 1,191,938 | |||||||||
4,898,729 | Carnival Corp.‡ 8.067%, 08/08/27 1 mo. SOFR + 2.75% | 4,930,105 | |||||||||
1,083,107 | Carnival Corp.‡ 8.067%, 10/18/28 1 mo. SOFR + 3.25% | 1,088,863 | |||||||||
1,083,107 | Carnival Corp.‡ 0.000%, 10/18/28 | 1,090,553 | |||||||||
2,000,000 | Cedar Fair, LP‡! 0.000%, 04/18/31 | 2,002,500 | |||||||||
1,995,000 | Flutter Financing, BV‡ 7.559%, 11/25/30 3 mo. SOFR + 2.25% | 2,001,055 | |||||||||
1,230,000 | Flutter Financing, BV! 0.000%, 11/25/30 | 1,233,733 | |||||||||
1,492,232 | Hanesbrands, Inc.‡ 9.066%, 03/08/30 1 mo. SOFR + 3.75% | 1,495,336 | |||||||||
2,000,000 | Hilton Domestic Operating Company, Inc.‡ 7.417%, 11/08/30 1 mo. SOFR + 2.00% | 2,006,710 | |||||||||
2,000,000 | Installed Building Products, Inc.‡ 7.316%, 03/28/31 1 mo. SOFR + 2.00% | 2,009,690 | |||||||||
2,183,120 | KFC Holding Company‡ 7.183%, 03/15/28 1 mo. SOFR + 1.75% | 2,184,823 | |||||||||
722,390 | Life Time Fitness, Inc.‡ 9.591%, 01/15/26 3 mo. SOFR + 4.00% | 727,584 | |||||||||
3,368,899 | Light & Wonder International, Inc.‡ 8.071%, 04/14/29 1 mo. SOFR + 2.75% | 3,380,589 | |||||||||
1,984,655 | Murphy USA, Inc.‡ 7.192%, 01/31/28 1 mo. SOFR + 1.75% | 1,993,834 | |||||||||
1,984,848 | PENN Entertainment, Inc.‡ 8.166%, 05/03/29 1 mo. SOFR + 2.75% | 1,989,910 | |||||||||
2,619,419 | PetSmart, Inc.‡ 9.166%, 02/11/28 1 mo. SOFR + 3.75% | 2,586,676 | |||||||||
CALAMOS CLOSED-END FAMILY OF FUNDS SEMIANNUAL REPORT
70
| PRINCIPAL AMOUNT | VALUE | ||||||||||
1,705,000 | Station Casinos LLC! 0.000%, 03/14/31 | $ | 1,707,208 | ||||||||
1,495,000 | Station Casinos, LLC‡ 7.566%, 03/14/31 1 mo. SOFR + 2.25% | 1,496,936 | |||||||||
740,959 | TKC Holdings, Inc.‡ 10.930%, 05/15/28 1 mo. SOFR + 5.50% | 736,791 | |||||||||
1,196,252 | Windsor Holdings III, LLC‡ 9.319%, 08/01/30 1 mo. SOFR + 4.00% | 1,208,065 | |||||||||
42,416,958 | |||||||||||
Consumer Staples (0.4%) | |||||||||||
2,791,704 | Amneal Pharmaceuticals, LLC‡ 10.816%, 05/04/28 1 mo. SOFR + 5.50% | 2,797,818 | |||||||||
659,016 | Fiesta Purchaser, Inc.‡ 9.316%, 02/12/31 1 mo. SOFR + 4.00% | 662,437 | |||||||||
540,984 | Fiesta Purchaser, Inc.‡ 9.318%, 02/12/31 1 mo. SOFR + 4.00% | 543,791 | |||||||||
4,128,545 | Jazz Financing Lux Sarl‡ 8.430%, 05/05/28 1 mo. SOFR + 3.00% | 4,157,589 | |||||||||
1,225,000 | Star Parent, Inc.‡ 9.309%, 09/27/30 3 mo. SOFR + 4.00% | 1,226,152 | |||||||||
800,000 | United Natural Foods, Inc.! 0.000%, 04/25/31 | 793,000 | |||||||||
543,918 | United Natural Foods, Inc.‡ 8.680%, 10/22/25 1 mo. SOFR + 3.25% | 542,188 | |||||||||
10,722,975 | |||||||||||
Energy (0.1%) | |||||||||||
952,612 | Buckeye Partners, LP‡ 7.816%, 11/22/30 1 mo. SOFR + 2.50% | 957,142 | |||||||||
573,563 | New Fortress Energy, Inc.‡ 10.330%, 10/27/28 3 mo. SOFR + 5.00% | 577,506 | |||||||||
1,486,492 | Par Petroleum, LLC‡ 9.052%, 02/28/30 3 mo. SOFR + 3.75% | 1,493,457 | |||||||||
300,000 | Par Petroleum, LLC! 9.693%, 02/28/30 3 mo. SOFR + 4.25% | 301,405 | |||||||||
3,329,510 | |||||||||||
Financials (0.6%) | |||||||||||
1,325,000 | Advisor Group, Inc.! 0.000%, 08/17/28 | 1,334,633 | |||||||||
299,250 | Advisor Group, Inc.‡ 9.816%, 08/17/28 1 mo. SOFR + 4.50% | 301,426 | |||||||||
| PRINCIPAL AMOUNT | VALUE | ||||||||||
996,271 | Alliant Holdings Intermediate, LLC‡ 8.819%, 11/06/30 1 mo. SOFR + 3.50% | $ | 1,001,351 | ||||||||
908,149 | Amynta Agency Borrower, Inc.‡ 9.552%, 02/28/28 1 mo. SOFR + 4.25% | 912,367 | |||||||||
945,000 | AssuredPartners, Inc.! 0.000%, 02/14/31 | 950,207 | |||||||||
555,000 | AssuredPartners, Inc.‡ 8.816%, 02/14/31 1 mo. SOFR + 3.50% | 558,058 | |||||||||
3,084,519 | Avolon TLB Borrower 1 (US) LLC‡ 7.315%, 06/22/28 1 mo. SOFR + 2.00% | 3,094,637 | |||||||||
598,500 | Broadstreet Partners, Inc.‡ 9.066%, 01/27/29 1 mo. SOFR + 3.75% | 601,367 | |||||||||
616,410 | Delos Aircraft Leasing DAC‡ 7.302%, 10/31/27 3 mo. SOFR + 2.00% | 617,874 | |||||||||
1,197,000 | HUB International, Ltd.‡ 8.575%, 06/20/30 3 mo. SOFR + 3.25% | 1,204,403 | |||||||||
3,000 | HUB International, Ltd.‡ 8.565%, 06/20/30 3 mo. SOFR + 3.25% | 3,018 | |||||||||
2,922,675 | Iron Mountain, Inc.‡ 7.566%, 01/31/31 1 mo. SOFR + 2.25% | 2,920,235 | |||||||||
610,000 | Level 3 Financing, Inc.! 0.000%, 04/15/29 | 600,960 | |||||||||
1,583,083 | VFH Parent, LLC‡ 8.416%, 01/13/29 1 mo. SOFR + 3.00% | 1,585,315 | |||||||||
15,685,851 | |||||||||||
Health Care (0.7%) | |||||||||||
1,419,958 | Avantor Funding, Inc.‡ 7.416%, 11/08/27 1 mo. SOFR + 2.00% | 1,426,724 | |||||||||
2,182,708 | DaVita, Inc.‡ 7.180%, 08/12/26 1 mo. SOFR + 1.75% | 2,185,229 | |||||||||
1,983,385 | Elanco Animal Health, Inc.‡ 7.177%, 08/01/27 1 mo. SOFR + 1.75% | 1,982,314 | |||||||||
1,799,971 | Icon Luxembourg Sarl‡ 7.309%, 07/03/28 3 mo. SOFR + 2.00% | 1,809,583 | |||||||||
1,995,000 | IQVIA, Inc.‡ 7.309%, 01/02/31 3 mo. SOFR + 2.00% | 2,007,249 | |||||||||
2,000,000 | Organon & Company 8.433%, 06/02/28 1 mo. SOFR + 3.00% | 2,013,440 | |||||||||
www.calamos.com
71
| PRINCIPAL AMOUNT | VALUE | ||||||||||
1,261,176 | Padagis, LLC‡ 10.314%, 07/06/28 3 mo. SOFR + 4.75% | $ | 1,160,282 | ||||||||
1,989,899 | Perrigo Investments, LLC‡ 7.666%, 04/20/29 1 mo. SOFR + 2.25% | 1,990,526 | |||||||||
448,464 | PRA Health Sciences, Inc.‡ 7.309%, 07/03/28 3 mo. SOFR + 2.00% | 450,859 | |||||||||
2,862,349 | Team Health Holdings, Inc.‡ 10.580%, 03/02/27 1 mo. SOFR + 5.25% | 2,516,305 | |||||||||
8,209 | Team Health Holdings, Inc.‡ 10.566%, 03/02/27 3 mo. SOFR + 5.25% | 7,216 | |||||||||
17,549,727 | |||||||||||
Industrials (0.6%) | |||||||||||
1,197,621 | ACProducts, Inc.‡ 9.814%, 05/17/28 3 mo. SOFR + 4.25% | 1,043,128 | |||||||||
1,984,821 | Beacon Roofing Supply, Inc.‡ 7.316%, 05/19/28 1 mo. SOFR + 2.00% | 1,993,505 | |||||||||
2,120,387 | Berry Global, Inc.‡ 7.182%, 07/01/29 1 mo. SOFR + 1.75% | 2,128,339 | |||||||||
3,123,168 | ChampionX Corp.‡ 8.168%, 06/07/29 1 mo. SOFR + 2.75% | 3,140,736 | |||||||||
1,837,435 | Emrld Borrower, LP‡ 7.816%, 05/31/30 1 mo. SOFR + 2.50% | 1,845,235 | |||||||||
1,984,821 | JELD-WEN, Inc.‡ 7.430%, 07/28/28 1 mo. SOFR + 2.00% | 1,992,512 | |||||||||
135,000 | MI Windows & Doors, LLC‡ 8.816%, 03/28/31 1 mo. SOFR + 3.50% | 135,788 | |||||||||
1,989,975 | TransDigm, Inc.‡ 8.059%, 08/24/28 3 mo. SOFR + 2.75% | 2,002,183 | |||||||||
1,197,000 | TransDigm, Inc.‡ 8.559%, 02/28/31 1 mo. SOFR + 3.25% | 1,205,373 | |||||||||
15,486,799 | |||||||||||
Information Technology (0.5%) | |||||||||||
1,622,629 | Banff Merger Sub, Inc.‡ 9.566%, 12/29/28 1 mo. SOFR + 4.25% | 1,634,580 | |||||||||
927,390 | Camelot US Acquisition LLC‡ 8.066%, 01/31/31 1 mo. SOFR + 2.75% | 930,288 | |||||||||
1,132,750 | Central Parent, Inc.‡ 9.309%, 07/06/29 3 mo. SOFR + 4.00% | 1,138,674 | |||||||||
| PRINCIPAL AMOUNT | VALUE | ||||||||||
1,160,943 | Dun & Bradstreet Corp.‡ 8.068%, 01/18/29 1 mo. SOFR + 2.75% | $ | 1,165,058 | ||||||||
2,941,760 | II-VI, Inc.‡ 7.829%, 07/02/29 1 mo. SOFR + 2.50% | 2,959,219 | |||||||||
1,844,754 | Open Text Corp.‡ 8.166%, 01/31/30 1 mo. SOFR + 2.75% | 1,852,197 | |||||||||
1,179,826 | SS&C Technologies, Inc.‡ 7.666%, 03/22/29 1 mo. SOFR + 2.25% | 1,183,714 | |||||||||
499,221 | SS&C Technologies, Inc.‡ 7.666%, 03/22/29 1 mo. SOFR + 2.25% | 500,866 | |||||||||
1,275,363 | TTM Technologies, Inc.‡ 8.077%, 05/30/30 1 mo. SOFR + 2.75% | 1,277,754 | |||||||||
600,000 | UKG, Inc.‡ 8.814%, 02/10/31 3 mo. SOFR + 3.55% | 603,441 | |||||||||
13,245,791 | |||||||||||
Materials (0.5%) | |||||||||||
1,927,144 | Axalta Coating Systems U.S. Holdings, Inc.‡ 7.330%, 12/20/29 3 mo. SOFR + 2.00% | 1,934,863 | |||||||||
2,606,900 | Chemours Company‡ 8.817%, 08/18/28 1 mo. SOFR + 3.50% | 2,609,350 | |||||||||
1,989,975 | H.B. Fuller Company‡ 7.316%, 02/15/30 1 mo. SOFR + 2.00% | 1,997,437 | |||||||||
1,191,000 | Ineos US Finance, LLC‡ 8.930%, 02/18/30 1 mo. SOFR + 3.50% | 1,195,466 | |||||||||
938,079 | Innophos, Inc.‡ 8.930%, 02/05/27 1 mo. SOFR + 3.50% | 939,158 | |||||||||
1,503,638 | LSF11 A5 Holdco, LLC‡ 9.666%, 10/15/28 1 mo. SOFR + 4.25% | 1,509,652 | |||||||||
912,256 | Trinseo Materials Operating SCA‡ 7.824%, 05/03/28 3 mo. SOFR + 2.50% | 637,485 | |||||||||
1,166,676 | W.R. Grace & Co.-Conn.‡ 9.321%, 09/22/28 3 mo. SOFR + 3.75% | 1,170,112 | |||||||||
11,993,523 | |||||||||||
Special Purpose Acquisition Companies (0.1%) | |||||||||||
584,588 | Clydesdale Acquisition Holdings, Inc.‡ 9.091%, 04/13/29 1 mo. SOFR + 3.67% | 587,771 | |||||||||
CALAMOS CLOSED-END FAMILY OF FUNDS SEMIANNUAL REPORT
72
| PRINCIPAL AMOUNT | VALUE | ||||||||||
294,000 | Fertitta Entertainment, LLC‡ 9.069%, 01/27/29 1 mo. SOFR + 3.75% | $ | 295,011 | ||||||||
1,182,000 | Patagonia Holdco, LLC‡ 11.064%, 08/01/29 3 mo. SOFR + 5.75% | 1,099,260 | |||||||||
1,982,042 | |||||||||||
TOTAL BANK LOANS (Cost $157,294,014) | 156,586,892 | ||||||||||
| NUMBER OF SHARES | VALUE | ||||||||||
CONVERTIBLE PREFERRED STOCKS (1.5%) | |||||||||||
Energy (0.0%) | |||||||||||
6,300 | Equitrans Midstream Corp.‡ 13.740%, 05/15/24 | 138,600 | |||||||||
28 | Gulfport Energy Corp.# 10.000%, 05/31/24 15.000% PIK rate | 324,100 | |||||||||
462,700 | |||||||||||
Financials (0.9%) | |||||||||||
80,250 | AMG Capital Trust II 5.150%, 10/15/37 | 4,055,835 | |||||||||
300,410 | Apollo Global Management, Inc. 6.750%, 07/31/26 | 18,319,002 | |||||||||
22,374,837 | |||||||||||
Industrials (0.1%) | |||||||||||
46,187 | Chart Industries, Inc. 6.750%, 12/15/25 | 2,653,905 | |||||||||
Utilities (0.5%) | |||||||||||
84,885 | CenterPoint Energy, Inc. (Warner Media, LLC, Charter Communications Time, Inc.)#§** 3.369%, 09/15/29 | 2,549,945 | |||||||||
262,050 | NextEra Energy, Inc.^ 6.926%, 09/01/25 | 10,678,538 | |||||||||
13,228,483 | |||||||||||
TOTAL CONVERTIBLE (Cost $40,065,483) | 38,719,925 | ||||||||||
COMMON STOCKS (95.5%) | |||||||||||
Communication Services (10.7%) | |||||||||||
661,840 | Alphabet, Inc. - Class A^# | 107,734,315 | |||||||||
199,700 | Alphabet, Inc. - Class C^# | 32,878,608 | |||||||||
25,095 | Altice USA, Inc. - Class A# | 48,433 | |||||||||
264,885 | AT&T, Inc. | 4,473,908 | |||||||||
8,434 | Cumulus Media, Inc. - Class A#µ | 22,181 | |||||||||
2 | Frontier Communications Parent, Inc.#µ | 46 | |||||||||
146,450 | Meta Platforms, Inc. - Class A | 62,998,397 | |||||||||
32,360 | Netflix, Inc.# | 17,818,710 | |||||||||
| NUMBER OF SHARES | VALUE | ||||||||||
205,085 | EUR Orange, SA | $ | 2,282,654 | ||||||||
135,860 | T-Mobile U.S., Inc. | 22,304,136 | |||||||||
200,915 | Walt Disney Company^ | 22,321,657 | |||||||||
272,883,045 | |||||||||||
Consumer Discretionary (10.0%) | |||||||||||
688,315 | Amazon.com, Inc.^# | 120,455,125 | |||||||||
59,260 | Carnival Corp.# | 878,233 | |||||||||
5,245 | Chipotle Mexican Grill, Inc.# | 16,572,102 | |||||||||
243,463 | General Motors Company | 10,841,408 | |||||||||
52,240 | Home Depot, Inc. | 17,459,653 | |||||||||
54,670 | Lowe's Companies, Inc. | 12,464,213 | |||||||||
62,500 | McDonald's Corp. | 17,065,000 | |||||||||
162,800 | NIKE, Inc. - Class B | 15,019,928 | |||||||||
107,325 | Starbucks Corp. | 9,497,189 | |||||||||
144,100 | Tesla, Inc.# | 26,410,648 | |||||||||
104,675 | TJX Cos., Inc. | 9,848,871 | |||||||||
256,512,370 | |||||||||||
Consumer Staples (6.8%) | |||||||||||
58,750 | Altria Group, Inc.µ | 2,573,838 | |||||||||
329,140 | Coca-Cola Company^ | 20,330,978 | |||||||||
31,575 | Costco Wholesale Corp. | 22,825,567 | |||||||||
47,280 | Estee Lauder Companies, Inc. - Class A | 6,936,449 | |||||||||
7,965 | Mallinckrodt, PLC# | 422,145 | |||||||||
113,665 | Mondelez International, Inc. - Class A^ | 8,177,060 | |||||||||
149,110 | Monster Beverage Corp.# | 7,969,929 | |||||||||
90,260 | PepsiCo, Inc. | 15,877,637 | |||||||||
179,035 | Philip Morris International, Inc.^ | 16,997,583 | |||||||||
203,745 | Procter & Gamble Company^ | 33,251,184 | |||||||||
84,550 | Target Corp. | 13,610,859 | |||||||||
52,650 | Walgreens Boots Alliance, Inc. | 933,485 | |||||||||
392,370 | Walmart, Inc. | 23,287,159 | |||||||||
173,193,873 | |||||||||||
Energy (4.6%) | |||||||||||
475,000 | BP, PLC (ADR) | 18,415,750 | |||||||||
1,730 | Chesapeake Energy Corp.µ | 155,492 | |||||||||
54,445 | Chevron Corp.^~ | 8,780,345 | |||||||||
64,470 | ConocoPhillips^ | 8,098,721 | |||||||||
82,935 | Energy Transfer, LP | 1,304,568 | |||||||||
49,155 | Enterprise Products Partners, LP | 1,380,272 | |||||||||
7,920 | EP Energy Corp.&# | 18,810 | |||||||||
317,920 | Exxon Mobil Corp. | 37,600,399 | |||||||||
34 | Gulfport Energy Corp.# | 5,396 | |||||||||
56,105 | Hess Corp. | 8,835,977 | |||||||||
80,370 | Marathon Petroleum Corp.µ | 14,604,836 | |||||||||
24,975 | Pioneer Natural Resources Company | 6,726,267 | |||||||||
219,710 | Schlumberger, NV | 10,431,831 | |||||||||
116,358,664 | |||||||||||
www.calamos.com
73
| NUMBER OF SHARES | VALUE | ||||||||||
Financials (13.0%) | |||||||||||
35,430 | Affiliated Managers Group, Inc. | $ | 5,530,623 | ||||||||
59,230 | American Express Company^ | 13,861,597 | |||||||||
346,890 | American International Group, Inc. | 26,124,286 | |||||||||
29,983 | Assurant, Inc.^ | 5,229,035 | |||||||||
663,370 | Bank of America Corp.^~ | 24,551,324 | |||||||||
71,870 | Bank of New York Mellon Corp.^ | 4,059,936 | |||||||||
10,715 | BlackRock, Inc. | 8,085,968 | |||||||||
76,155 | Chubb, Ltd. | 18,935,179 | |||||||||
231,670 | Citigroup, Inc. | 14,208,321 | |||||||||
27,300 | Goldman Sachs Group, Inc.^ | 11,649,183 | |||||||||
212,020 | JPMorgan Chase & Company^ | 40,652,715 | |||||||||
120,287 | KKR & Company, Inc.µ | 11,195,111 | |||||||||
76,915 | Marsh & McLennan Cos., Inc. | 15,339,158 | |||||||||
72,315 | Mastercard, Inc. - Class A^ | 32,628,528 | |||||||||
154,465 | Morgan Stanley^ | 14,031,601 | |||||||||
26,315 | S&P Global, Inc. | 10,942,566 | |||||||||
157,631 | Starwood Property Trust, Inc.^ | 2,990,260 | |||||||||
178,525 | Visa, Inc. - Class A^ | 47,953,600 | |||||||||
411,130 | Wells Fargo & Company^ | 24,388,232 | |||||||||
332,357,223 | |||||||||||
Health Care (12.3%) | |||||||||||
82,820 | Abbott Laboratories~ | 8,776,435 | |||||||||
118,475 | AbbVie, Inc. | 19,268,774 | |||||||||
124,060 | Alcon, Inc.^ | 9,624,575 | |||||||||
267,298 | Boston Scientific Corp.^# | 19,210,707 | |||||||||
107,005 | Bristol-Myers Squibb Company^ | 4,701,800 | |||||||||
85,885 | Danaher Corp. | 21,180,959 | |||||||||
71,605 | Dexcom, Inc.# | 9,121,761 | |||||||||
23,435 | Elevance Health, Inc. | 12,387,272 | |||||||||
74,890 | Eli Lilly & Company | 58,496,579 | |||||||||
34,856 | GE Healthcare, Inc. | 2,657,421 | |||||||||
200,940 | Johnson & Johnson | 29,053,915 | |||||||||
20,020 | McKesson Corp.^ | 10,754,944 | |||||||||
142,050 | Medtronic, PLC | 11,398,092 | |||||||||
219,485 | Merck & Company, Inc. | 28,361,852 | |||||||||
20,295 | Stryker Corp. | 6,829,267 | |||||||||
30,260 | Thermo Fisher Scientific, Inc.~ | 17,209,467 | |||||||||
62,270 | UnitedHealth Group, Inc.^ | 30,119,999 | |||||||||
112,720 | Zimmer Biomet Holdings, Inc.^ | 13,557,962 | |||||||||
312,711,781 | |||||||||||
Industrials (6.2%) | |||||||||||
47,290 | Boeing Company# | 7,937,153 | |||||||||
777,890 | CSX Corp. | 25,841,506 | |||||||||
230,090 | Delta Air Lines, Inc. | 11,520,606 | |||||||||
26,142 | GE Vernova, Inc.# | 4,018,287 | |||||||||
| NUMBER OF SHARES | VALUE | ||||||||||
104,568 | General Electric Company | $ | 16,921,194 | ||||||||
104,790 | Honeywell International, Inc. | 20,196,177 | |||||||||
79,505 | JB Hunt Transport Services, Inc. | 12,925,128 | |||||||||
50,835 | Parker-Hannifin Corp. | 27,700,500 | |||||||||
56,950 | Rockwell Automation, Inc. | 15,431,172 | |||||||||
145,750 | RTX Corp.µ | 14,796,540 | |||||||||
157,288,263 | |||||||||||
Information Technology (27.4%) | |||||||||||
40,182 | Accenture, PLC - Class A | 12,091,166 | |||||||||
92,130 | Advanced Micro Devices, Inc.^# | 14,591,549 | |||||||||
888,175 | Apple, Inc.^~ | 151,282,848 | |||||||||
59,580 | Applied Materials, Inc. | 11,835,567 | |||||||||
35,949 | Broadcom, Inc.µ | 46,743,406 | |||||||||
247,515 | Cisco Systems, Inc.^ | 11,628,255 | |||||||||
58,910 | Fidelity National Information Services, Inc.^ | 4,001,167 | |||||||||
10,330 | Intuit, Inc.^ | 6,462,655 | |||||||||
16,960 | Lam Research Corp. | 15,169,194 | |||||||||
143,195 | Micron Technology, Inc.^ | 16,175,307 | |||||||||
574,150 | Microsoft Corp.^ | 223,533,819 | |||||||||
1,520,000 | Nokia Oyj (ADR) | 5,548,000 | |||||||||
161,290 | NVIDIA Corp. | 139,357,786 | |||||||||
81,370 | Oracle Corp. | 9,255,837 | |||||||||
59,985 | Salesforce, Inc. | 16,132,366 | |||||||||
21,845 | ServiceNow, Inc.# | 15,145,794 | |||||||||
698,954,716 | |||||||||||
Materials (2.9%) | |||||||||||
255,945 | Freeport-McMoRan, Inc.^ | 12,781,893 | |||||||||
56,835 | Linde, PLC | 25,061,962 | |||||||||
126,910 | PPG Industries, Inc. | 16,371,390 | |||||||||
19,725 | Sherwin-Williams Company | 5,909,807 | |||||||||
50,490 | Vulcan Materials Company | 13,007,739 | |||||||||
73,132,791 | |||||||||||
Real Estate (0.6%) | |||||||||||
70,930 | American Tower Corp.µ | 12,168,751 | |||||||||
119,195 | Invitation Homes, Inc. | 4,076,469 | |||||||||
16,245,220 | |||||||||||
Special Purpose Acquisition Company (0.0%) | |||||||||||
14,052 | Intelsat Emergence, SA&# | 509,385 | |||||||||
Utilities (1.0%) | |||||||||||
77,480 | CMS Energy Corp. | 4,696,063 | |||||||||
176,574 | DTE Energy Company | 19,479,644 | |||||||||
32,149 | NextEra Energy, Inc. | 2,153,018 | |||||||||
26,328,725 | |||||||||||
TOTAL COMMON STOCKS (Cost $1,521,875,389) | 2,436,476,056 | ||||||||||
CALAMOS CLOSED-END FAMILY OF FUNDS SEMIANNUAL REPORT
74
| NUMBER OF SHARES | VALUE | ||||||||||
WARRANTS (0.0%)# | |||||||||||
Energy (0.0%) | |||||||||||
57,470 | Mcdermott International, Ltd.& 06/30/27, Strike $15.98 | $ | 6 | ||||||||
51,723 | Mcdermott International, Ltd. 06/30/27, Strike $12.33 | 5 | |||||||||
16,676 | Tidewater, Inc.& 11/14/42, Strike $0.01 | 1 | |||||||||
TOTAL WARRANTS (Cost $369,524) | 12 | ||||||||||
EXCHANGE-TRADED FUNDS (0.3%) | |||||||||||
Other (0.3%) | |||||||||||
56,295 | iShares Biotechnology ETF^ | 7,144,961 | |||||||||
11,975 | iShares Preferred & Income Securities ETF | 370,746 | |||||||||
TOTAL EXCHANGE-TRADED FUNDS (Cost $8,140,902) | 7,515,707 | ||||||||||
PREFERRED STOCKS (0.3%) | |||||||||||
Communication Services (0.1%) | |||||||||||
8,482 | AT&T, Inc. 4.750%, 02/18/25 | 166,586 | |||||||||
3,485 | AT&T, Inc. 5.350%, 11/01/66 | 78,169 | |||||||||
14,625 | Qwest Corp. 6.500%, 09/01/56 | 142,155 | |||||||||
9,521 | Telephone & Data Systems, Inc. 6.000%, 09/30/26 | 143,196 | |||||||||
24,420 | United States Cellular Corp. 5.500%, 03/01/70 | 433,943 | |||||||||
23,445 | United States Cellular Corp. 5.500%, 06/01/70 | 413,804 | |||||||||
1,377,853 | |||||||||||
Consumer Discretionary (0.0%) | |||||||||||
2,835 | Ford Motor Company 6.200%, 06/01/59 | 68,522 | |||||||||
2,764 | Ford Motor Company 6.500%, 08/15/62 | 67,718 | |||||||||
8,177 | Guitar Center, Inc.&# | 641,895 | |||||||||
1,355 | Qurate Retail, Inc.^ 8.000%, 03/15/31 | 62,560 | |||||||||
4,100 | QVC, Inc. 6.250%, 11/26/68 | 51,373 | |||||||||
892,068 | |||||||||||
Energy (0.1%) | |||||||||||
43,730 | NuStar Energy, LP‡ 11.234%, 05/30/24 3 mo. LIBOR + 5.64% | 1,115,552 | |||||||||
9,119 | NuStar Energy, LP‡ 12.357%, 05/30/24 3 mo. LIBOR + 6.77% | 233,173 | |||||||||
| NUMBER OF SHARES | VALUE | ||||||||||
55,760 | NuStar Logistics, LP‡ 12.324%, 01/15/43 3 mo. LIBOR + 6.73% | $ | 1,414,074 | ||||||||
2,762,799 | |||||||||||
Financials (0.1%) | |||||||||||
4,200 | Affiliated Managers Group, Inc.^# 6.750%, 03/30/64 | 107,520 | |||||||||
5,970 | Annaly Capital Management, Inc.‡ 10.557%, 05/30/24 3 mo. LIBOR + 4.99% | 150,981 | |||||||||
1,350 | Capital One Financial Corp. 4.800%, 06/01/25 | 24,786 | |||||||||
10,725 | CNO Financial Group, Inc. 5.125%, 11/25/60 | 216,001 | |||||||||
1,732 | Cullen/Frost Bankers, Inc. 4.450%, 12/15/25 | 31,765 | |||||||||
3,401 | First Citizens BancShares, Inc.^ 5.625%, 01/04/27 | 74,176 | |||||||||
1,374 | Goldman Sachs Group, Inc.^‡ 6.375%, 05/17/24 3 mo. SOFR + 3.81% | 34,323 | |||||||||
11,100 | Reinsurance Group of America, Inc.‡ 7.125%, 10/15/52 5 year CMT + 3.46% | 290,709 | |||||||||
6,214 | Selective Insurance Group, Inc.^ 4.600%, 12/15/25 | 111,603 | |||||||||
1,041,864 | |||||||||||
Industrials (0.0%) | |||||||||||
5,043 | WESCO International, Inc.‡ 10.625%, 06/22/25 5 year CMT + 10.33% | 133,085 | |||||||||
Real Estate (0.0%) | |||||||||||
8,773 | Brookfield Property Partners, LP 5.750%, 03/31/25 | 109,750 | |||||||||
5,000 | Brookfield Property Partners, LP 6.375%, 09/30/24 | 67,650 | |||||||||
3,625 | Global Net Lease, Inc. 6.875%, 11/26/24 | 69,854 | |||||||||
1,951 | Global Net Lease, Inc.^ 7.500%, 05/30/24 | 40,113 | |||||||||
3,000 | Realty Income Corp. 6.000%, 05/30/24 | 70,830 | |||||||||
358,197 | |||||||||||
Utilities (0.0%) | |||||||||||
6,000 | Brookfield Renewable Partners, LP 5.250%, 03/31/25 | 102,000 | |||||||||
5,100 | DTE Energy Company 5.250%, 12/01/77 | 115,056 | |||||||||
217,056 | |||||||||||
TOTAL PREFERRED STOCKS (Cost $7,454,978) | 6,782,922 | ||||||||||
www.calamos.com
75
| NUMBER OF CONTRACTS/ NOTIONAL AMOUNT | VALUE | ||||||||||
PURCHASED OPTIONS (0.1%)# | |||||||||||
Communication Services (0.0%) | |||||||||||
3,340 | Alphabet, Inc. | ||||||||||
33,807,480 | Put, 05/03/24, Strike $155.00 | $ | 75,150 | ||||||||
Other (0.1%) | |||||||||||
130 | S&P 500 Index | ||||||||||
65,463,970 | Put, 09/20/24, Strike $5,100.00 | 2,131,350 | |||||||||
TOTAL PURCHASED OPTIONS (Cost $3,349,940) | 2,206,500 | ||||||||||
| PRINCIPAL AMOUNT | VALUE | ||||||||||
U.S. GOVERNMENT AND AGENCY SECURITY (0.0%) | |||||||||||
250,000 | CoBank ACB‡ 7.250%, 07/01/29 5 year CMT + 2.88 (Cost $250,937) | 249,080 | |||||||||
TOTAL INVESTMENTS (140.2%) (Cost $2,671,923,425) | 3,577,640,100 | ||||||||||
| MANDATORY REDEEMABLE PREFERRED SHARES, AT LIQUIDATION VALUE (-12.7%) | (323,500,000 | ) | |||||||||
LIABILITIES, LESS OTHER ASSETS (-27.5%) | (703,123,422 | ) | |||||||||
NET ASSETS (100.0%) | $ | 2,551,016,678 | |||||||||
| NUMBER OF CONTRACTS/ NOTIONAL AMOUNT | VALUE | ||||||||||
WRITTEN OPTIONS (-0.1%)# | |||||||||||
Communication Services (0.0%) | |||||||||||
3,340 | Alphabet, Inc. | ||||||||||
33,807,480 | Put, 05/03/24, Strike $147.00 | (11,690 | ) | ||||||||
Other (-0.1%) | |||||||||||
260 | S&P 500 Index | ||||||||||
130,927,940 | Put, 09/20/24, Strike $4,700.00 | (1,654,900 | ) | ||||||||
TOTAL WRITTEN OPTIONS (Premium $2,504,579) | $ | (1,666,590 | ) | ||||||||
NOTES TO SCHEDULE OF INVESTMENTS
* Securities issued and sold pursuant to a Rule 144A transaction are exempted from the registration requirement of the Securities Act of 1933, as amended. These securities may only be sold to qualified institutional buyers ("QIBs"), such as the Funds. Any resale of these securities must generally be effected through a sale that is registered under the Act or otherwise exempted from such registration requirements.
@ In default status and considered non-income producing.
^ Security, or portion of security, is on loan.
‡ Variable rate security. The rate shown is the rate in effect at April 30, 2024.
~ Security, or portion of security, is segregated as collateral (or potential collateral for future transactions) for written options. The aggregate value of such securities is $11,540,631.
¡ Bank loans generally are subject to mandatory and/or optional prepayment. As a result, the actual remaining maturity of bank loans may be substantially less than the stated maturities shown.
! This position represents an unsettled loan commitment at period end. Certain details associated with this purchase are not known prior to the settlement date, including coupon rate, which will be adjusted on settlement date.
& Illiquid security.
# Non-income producing security.
§ Securities exchangeable or convertible into securities of one or more entities that are different than the issuer. Each entity is identified in the parenthetical.
** Step coupon security. Coupon changes periodically based upon a predetermined schedule. The rate shown is the rate in effect at April 30, 2024.
µ Security, or portion of security, is held in a segregated account as collateral for note payable aggregating a total value of $95,644,162.
FOREIGN CURRENCY ABBREVIATION
EUR European Monetary Unit
ABBREVIATION
ADR American Depositary Receipt
Note: Value for securities denominated in foreign currencies is shown in U.S. dollars. The principal amount for such securities is shown in the respective foreign currency. The date on options represents the expiration date of the option contract. The option contract may be exercised at any date on or before the date shown.
CALAMOS CLOSED-END FAMILY OF FUNDS SEMIANNUAL REPORT
76
The following table summarizes the Fund's investments and derivative financial instruments categorized in the fair value hierarchy as of April 30, 2024 (see Note 1):
LEVEL 1 | LEVEL 2 | LEVEL 3 | TOTAL | ||||||||||||||||
Assets: | |||||||||||||||||||
Asset Backed Securities | $ | — | $ | 867,946 | $ | — | $ | 867,946 | |||||||||||
Corporate Bonds | — | 397,272,957 | — | 397,272,957 | |||||||||||||||
Convertible Bonds | — | 530,962,103 | — | 530,962,103 | |||||||||||||||
Bank Loans | — | 156,586,892 | — | 156,586,892 | |||||||||||||||
Convertible Preferred Stocks | 31,651,445 | 7,068,480 | — | 38,719,925 | |||||||||||||||
Common Stocks | 2,433,243,062 | 3,232,994 | — | 2,436,476,056 | |||||||||||||||
Warrants | — | 12 | — | 12 | |||||||||||||||
Exchange-Traded Funds | 7,515,707 | — | — | 7,515,707 | |||||||||||||||
Preferred Stocks | 6,141,027 | 641,895 | — | 6,782,922 | |||||||||||||||
Purchased Options | 2,206,500 | — | — | 2,206,500 | |||||||||||||||
U.S. Government and Agency Securities | — | 249,080 | — | 249,080 | |||||||||||||||
Total | $ | 2,480,757,741 | $ | 1,096,882,359 | $ | — | $ | 3,577,640,100 | |||||||||||
Liabilities: | |||||||||||||||||||
Written Options | $ | 1,666,590 | $ | — | $ | — | $ | 1,666,590 | |||||||||||
Total | $ | 1,666,590 | $ | — | $ | — | $ | 1,666,590 | |||||||||||
SECTOR WEIGHTINGS
Information Technology | 24.5 | % | |||||
Financials | 12.8 | ||||||
Consumer Discretionary | 11.7 | ||||||
Health Care | 10.7 | ||||||
Communication Services | 9.6 | ||||||
Industrials | 8.2 | ||||||
Consumer Staples | 5.6 | ||||||
Energy | 4.9 | ||||||
Utilities | 2.9 | ||||||
Materials | 2.7 | ||||||
Real Estate | 1.4 | ||||||
Airlines | 0.3 | ||||||
Other | 0.3 | ||||||
Special Purpose Acquisition Companies | 0.1 | ||||||
Sector weightings are based on managed assets and may vary over time. Sector Weightings exclude any government/sovereign bonds or options on broad market indexes the Fund may hold.
ASSET ALLOCATION
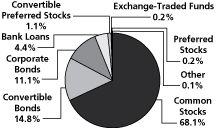
Fund asset allocations are based on total investments and may vary over time.
See accompanying Notes to Schedule of Investments
www.calamos.com
77
| PRINCIPAL AMOUNT | VALUE | ||||||||||
ASSET BACKED SECURITY (0.0%) | |||||||||||
Other (0.0%) | |||||||||||
215,000 | SVC ABS, LLC Series 2023-1A, Class C* 6.700%, 02/20/53 (Cost $199,685) | $ | 195,401 | ||||||||
CORPORATE BONDS (16.5%) | |||||||||||
Airlines (0.2%) | |||||||||||
224,949 | Alaska Airlines Pass Through Trust Series 2020-1, Class A*µ 4.800%, 02/15/29 | 218,416 | |||||||||
91,135 | Alaska Airlines Pass Through Trust Series 2020-1, Class B* 8.000%, 02/15/27 | 92,170 | |||||||||
273,340 | American Airlines Pass Through Trust Series 2021-1, Class B 3.950%, 01/11/32 | 247,810 | |||||||||
130,667 | American Airlines, Inc. / AAdvantage Loyalty IP, Ltd.* 5.500%, 04/20/26 | 129,292 | |||||||||
250,532 | British Airways Pass Through Trust Series 2021-1, Class B* 3.900%, 03/15/33 | 227,655 | |||||||||
209,530 | JetBlue Pass Through Trust Series 2020-1, Class B 7.750%, 05/15/30 | 214,492 | |||||||||
1,129,835 | |||||||||||
Communication Services (1.7%) | |||||||||||
200,000 | Altice France Holding, SA* 10.500%, 05/15/27 | 71,698 | |||||||||
300,000 | Altice France, SA* 5.500%, 10/15/29 | 196,800 | |||||||||
320,000 | APi Group DE, Inc.* 4.750%, 10/15/29 | 291,536 | |||||||||
280,000 | Ashtead Capital, Inc.* 2.450%, 08/12/31 | 222,443 | |||||||||
336,000 | Audacy Capital Corp.*@ 6.750%, 03/31/29 | 11,861 | |||||||||
131,000 | 6.500%, 05/01/27 | 4,675 | |||||||||
242,000 | Cincinnati Bell Telephone Company, LLC 6.300%, 12/01/28 | 220,840 | |||||||||
130,000 | Clear Channel Outdoor Holdings, Inc.* 7.875%, 04/01/30 | 127,551 | |||||||||
80,000 | 9.000%, 09/15/28^ | 82,350 | |||||||||
371,000 | Consolidated Communications, Inc.* 6.500%, 10/01/28 | 322,214 | |||||||||
400,000 | CSC Holdings, LLC* 5.375%, 02/01/28 | 308,480 | |||||||||
400,000 | 4.625%, 12/01/30 | 174,032 | |||||||||
400,000 | 4.500%, 11/15/31 | 254,344 | |||||||||
370,000 | 5.500%, 04/15/27 | 303,718 | |||||||||
200,000 | 5.750%, 01/15/30 | 87,776 | |||||||||
| PRINCIPAL AMOUNT | VALUE | ||||||||||
141,000 | Directv Financing, LLC / Directv Financing Co-Obligor, Inc.* 5.875%, 08/15/27 | $ | 131,509 | ||||||||
275,000 | Frontier California, Inc. 6.750%, 05/15/27 | 262,081 | |||||||||
65,000 | Frontier Communications Holdings, LLC* 8.750%, 05/15/30 | 66,240 | |||||||||
419,000 | Frontier Florida, LLC 6.860%, 02/01/28 | 399,198 | |||||||||
400,000 | Frontier North, Inc. 6.730%, 02/15/28 | 379,380 | |||||||||
235,000 | Go Daddy Operating Company, LLC / GD Finance Company, Inc.* 3.500%, 03/01/29 | 208,783 | |||||||||
69,000 | 5.250%, 12/01/27 | 66,709 | |||||||||
65,000 | Hughes Satellite Systems Corp. 6.625%, 08/01/26 | 37,445 | |||||||||
165,000 | iHeartCommunications, Inc. 8.375%, 05/01/27 | 87,947 | |||||||||
100,000 | 5.250%, 08/15/27*^ | 73,485 | |||||||||
330,000 | LCPR Senior Secured Financing DAC* 6.750%, 10/15/27 | 305,953 | |||||||||
198,330 | Ligado Networks, LLC* 15.500%, 11/01/23 PIK rate | 32,869 | |||||||||
200,000 | Lumen Technologies, Inc. 7.600%, 09/15/39 | 61,212 | |||||||||
135,000 | 4.000%, 02/15/27* | 71,875 | |||||||||
67,000 | 7.650%, 03/15/42 | 20,515 | |||||||||
130,000 | Match Group Holdings II, LLC* 3.625%, 10/01/31 | 107,466 | |||||||||
155,000 | Nexstar Media, Inc.* 5.625%, 07/15/27 | 145,874 | |||||||||
260,000 | Paramount Global 4.900%, 08/15/44 | 182,276 | |||||||||
94,000 | Qwest Corp. 7.250%, 09/15/25 | 93,167 | |||||||||
136,000 | Scripps Escrow II, Inc.* 3.875%, 01/15/29 | 100,637 | |||||||||
68,000 | 5.375%, 01/15/31 | 40,272 | |||||||||
225,000 | Scripps Escrow, Inc.* 5.875%, 07/15/27 | 177,883 | |||||||||
345,000 | Sirius XM Radio, Inc.* 5.500%, 07/01/29 | 321,726 | |||||||||
268,000 | 4.000%, 07/15/28 | 238,941 | |||||||||
130,000 | 3.125%, 09/01/26 | 121,385 | |||||||||
65,000 | 3.875%, 09/01/31^ | 52,296 | |||||||||
242,000 | Spanish Broadcasting System, Inc.* 9.750%, 03/01/26 | 115,354 | |||||||||
680,000 | Sprint, LLCµ 7.125%, 06/15/24 | 680,938 | |||||||||
300,000 | Stagwell Global, LLC* 5.625%, 08/15/29 | 269,115 | |||||||||
130,000 | Telesat Canada / Telesat, LLC* 4.875%, 06/01/27 | 59,493 | |||||||||
CALAMOS CLOSED-END FAMILY OF FUNDS SEMIANNUAL REPORT
78
| PRINCIPAL AMOUNT | VALUE | ||||||||||
105,000 | Time Warner Cable, LLC 7.300%, 07/01/38 | $ | 101,982 | ||||||||
300,000 | United States Cellular Corp. 6.700%, 12/15/33 | 292,926 | |||||||||
202,000 | Univision Communications, Inc.* 8.000%, 08/15/28 | 202,475 | |||||||||
135,000 | Viasat, Inc.*^ 5.625%, 04/15/27 | 123,771 | |||||||||
8,313,496 | |||||||||||
Consumer Discretionary (3.4%) | |||||||||||
320,000 | Abercrombie & Fitch Management Company* 8.750%, 07/15/25 | 322,720 | |||||||||
265,000 | Adams Homes, Inc.* 9.250%, 10/15/28 | 273,960 | |||||||||
195,000 | Adient Global Holdings Company*^ 8.250%, 04/15/31 | 202,695 | |||||||||
230,000 | American Axle & Manufacturing, Inc.^ 5.000%, 10/01/29 | 207,644 | |||||||||
228,000 | Ashton Woods USA, LLC / Ashton Woods Finance Company* 4.625%, 08/01/29 | 206,532 | |||||||||
204,000 | 6.625%, 01/15/28 | 203,704 | |||||||||
325,000 | At Home Group, Inc.* 4.875%, 07/15/28 | 154,508 | |||||||||
355,000 | Bath & Body Works, Inc. 6.694%, 01/15/27 | 357,748 | |||||||||
195,000 | 6.875%, 11/01/35 | 194,152 | |||||||||
168,000 | Caesars Entertainment, Inc.* 4.625%, 10/15/29 | 149,903 | |||||||||
132,000 | 8.125%, 07/01/27 | 134,057 | |||||||||
134,000 | Carnival Corp.* 4.000%, 08/01/28 | 122,429 | |||||||||
133,000 | 7.625%, 03/01/26 | 133,898 | |||||||||
16,000 | 7.000%, 08/15/29^ | 16,441 | |||||||||
55,316 | Carvana Company* 14.000%, 06/01/31 | 55,525 | |||||||||
46,605 | 13.000%, 06/01/30 | 46,308 | |||||||||
30,585 | 12.000%, 12/01/28 | 29,961 | |||||||||
575,000 | CCO Holdings, LLC / CCO Holdings Capital Corp.* 5.125%, 05/01/27 | 539,844 | |||||||||
315,000 | 4.500%, 08/15/30 | 256,419 | |||||||||
300,000 | 6.375%, 09/01/29 | 275,013 | |||||||||
300,000 | 4.750%, 03/01/30 | 249,762 | |||||||||
266,000 | 4.250%, 02/01/31 | 209,055 | |||||||||
130,000 | 5.000%, 02/01/28 | 118,556 | |||||||||
130,000 | 4.750%, 02/01/32 | 102,328 | |||||||||
130,000 | CDI Escrow Issuer, Inc.* 5.750%, 04/01/30 | 124,054 | |||||||||
207,000 | Cedar Fair, LP 5.250%, 07/15/29 | 193,489 | |||||||||
132,000 | Churchill Downs, Inc.* 6.750%, 05/01/31 | 131,114 | |||||||||
| PRINCIPAL AMOUNT | VALUE | ||||||||||
220,000 | Dana, Inc. 4.250%, 09/01/30 | $ | 191,169 | ||||||||
195,000 | 4.500%, 02/15/32 | 165,457 | |||||||||
300,000 | DISH DBS Corp. 5.125%, 06/01/29 | 121,218 | |||||||||
190,000 | 5.250%, 12/01/26* | 149,866 | |||||||||
168,000 | 7.375%, 07/01/28 | 75,412 | |||||||||
135,000 | 5.750%, 12/01/28* | 91,626 | |||||||||
115,000 | 7.750%, 07/01/26 | 72,536 | |||||||||
265,000 | DISH Network Corp.* 11.750%, 11/15/27 | 267,427 | |||||||||
400,000 | Empire Resorts, Inc.* 7.750%, 11/01/26 | 372,984 | |||||||||
296,000 | Everi Holdings, Inc.* 5.000%, 07/15/29 | 290,752 | |||||||||
275,000 | Ford Motor Company 6.100%, 08/19/32 | 269,838 | |||||||||
425,000 | Ford Motor Credit Company, LLC 4.000%, 11/13/30 | 370,995 | |||||||||
350,000 | 5.113%, 05/03/29 | 333,613 | |||||||||
340,000 | 7.200%, 06/10/30 | 352,553 | |||||||||
240,000 | 7.350%, 11/04/27 | 248,340 | |||||||||
98,000 | Gap, Inc.* 3.875%, 10/01/31 | 80,170 | |||||||||
135,000 | General Motors Company 5.200%, 04/01/45 | 115,661 | |||||||||
455,000 | goeasy, Ltd.* 9.250%, 12/01/28 | 481,622 | |||||||||
237,000 | 7.625%, 07/01/29 | 237,389 | |||||||||
140,000 | Goodyear Tire & Rubber Company 5.250%, 07/15/31^ | 124,029 | |||||||||
135,000 | 5.625%, 04/30/33 | 118,808 | |||||||||
114,000 | Group 1 Automotive, Inc.* 4.000%, 08/15/28 | 103,997 | |||||||||
283,000 | Guitar Center, Inc.*^ 8.500%, 01/15/26 | 250,254 | |||||||||
145,000 | International Game Technology, PLC* 6.250%, 01/15/27 | 144,914 | |||||||||
72,024 | JetBlue Pass Through Trust Series 2019-2, Class B 8.000%, 11/15/27 | 72,772 | |||||||||
298,000 | Kohl's Corp. 5.550%, 07/17/45 | 204,669 | |||||||||
265,000 | LCM Investments Holdings II, LLC* 8.250%, 08/01/31 | 275,796 | |||||||||
265,000 | Liberty Interactive, LLC 8.250%, 02/01/30 | 147,215 | |||||||||
256,000 | Life Time, Inc.* 8.000%, 04/15/26 | 256,430 | |||||||||
135,000 | Light & Wonder International, Inc.* 7.500%, 09/01/31 | 137,769 | |||||||||
100,000 | Lindblad Expeditions Holdings, Inc.* 9.000%, 05/15/28 | 104,863 | |||||||||
168,000 | Lindblad Expeditions, LLC* 6.750%, 02/15/27 | 166,723 | |||||||||
www.calamos.com
79
| PRINCIPAL AMOUNT | VALUE | ||||||||||
175,000 | M/I Homes, Inc. 3.950%, 02/15/30 | $ | 151,980 | ||||||||
305,000 | Macy's Retail Holdings, LLC 6.700%, 07/15/34* | 257,060 | |||||||||
200,000 | 4.300%, 02/15/43 | 158,204 | |||||||||
332,000 | Midwest Gaming Borrower, LLC / Midwest Gaming Finance Corp.* 4.875%, 05/01/29 | 303,664 | |||||||||
160,000 | Newell Brands, Inc. 5.700%, 04/01/26 | 157,840 | |||||||||
130,000 | Nordstrom, Inc. 6.950%, 03/15/28 | 129,181 | |||||||||
130,000 | 5.000%, 01/15/44 | 98,782 | |||||||||
123,000 | 4.250%, 08/01/31 | 106,176 | |||||||||
399,000 | Patrick Industries, Inc.* 4.750%, 05/01/29 | 363,062 | |||||||||
305,000 | PENN Entertainment, Inc.* 4.125%, 07/01/29 | 255,624 | |||||||||
132,000 | Phinia, Inc.* 6.750%, 04/15/29 | 132,565 | |||||||||
365,000 | Premier Entertainment Sub, LLC / Premier Entertainment Finance Corp.*^ 5.625%, 09/01/29 | 272,724 | |||||||||
135,000 | QVC, Inc. 5.450%, 08/15/34 | 88,687 | |||||||||
130,000 | Raising Cane's Restaurants, LLC* 9.375%, 05/01/29 | 139,536 | |||||||||
529,000 | Rite Aid Corp.*@ 8.000%, 11/15/26 | 341,380 | |||||||||
132,000 | Royal Caribbean Cruises, Ltd.* 7.250%, 01/15/30 | 135,993 | |||||||||
32,000 | 6.250%, 03/15/32 | 31,550 | |||||||||
370,000 | Simmons Foods, Inc. / Simmons Prepared Foods, Inc. / Simmons Pet Food, Inc. / Simmons Feed* 4.625%, 03/01/29 | 320,050 | |||||||||
395,000 | Six Flags Entertainment Corp.*^ 7.250%, 05/15/31 | 394,534 | |||||||||
303,000 | Sonic Automotive, Inc.* 4.625%, 11/15/29 | 271,479 | |||||||||
193,000 | Speedway Motorsports, LLC / Speedway Funding II, Inc.* 4.875%, 11/01/27 | 182,146 | |||||||||
275,000 | Station Casinos, LLC* 4.500%, 02/15/28 | 255,271 | |||||||||
260,000 | STL Holding Company, LLC* 8.750%, 02/15/29 | 267,439 | |||||||||
162,000 | Taylor Morrison Communities, Inc.* 5.750%, 01/15/28 | 157,916 | |||||||||
65,000 | Viking Cruises, Ltd.* 9.125%, 07/15/31 | 69,774 | |||||||||
300,000 | Vista Outdoor, Inc.* 4.500%, 03/15/29 | 296,538 | |||||||||
265,000 | ZF North America Capital, Inc.* 7.125%, 04/14/30 | 271,402 | |||||||||
17,019,243 | |||||||||||
| PRINCIPAL AMOUNT | VALUE | ||||||||||
Consumer Staples (0.8%) | |||||||||||
303,000 | 1375209 B.C., Ltd.*^ 9.000%, 01/30/28 | $ | 297,813 | ||||||||
395,000 | Arrow Bidco, LLC* 10.750%, 06/15/25 | 407,466 | |||||||||
255,000 | B&G Foods, Inc.* 8.000%, 09/15/28 | 264,644 | |||||||||
305,000 | Central Garden & Pet Company* 4.125%, 04/30/31 | 264,716 | |||||||||
304,000 | Edgewell Personal Care Company* 4.125%, 04/01/29 | 275,691 | |||||||||
370,000 | Energizer Holdings, Inc.* 4.375%, 03/31/29 | 327,269 | |||||||||
66,000 | 6.500%, 12/31/27^ | 65,417 | |||||||||
390,000 | JBS USA Holding LUX Sarl / JBS USA Food Company / JBS LUX Company Sarl 5.500%, 01/15/30 | 376,791 | |||||||||
175,000 | 5.125%, 02/01/28µ | 170,165 | |||||||||
100,000 | 5.750%, 04/01/33 | 95,756 | |||||||||
177,000 | New Albertsons, LP 7.750%, 06/15/26 | 182,294 | |||||||||
261,000 | Performance Food Group, Inc.* 4.250%, 08/01/29 | 234,039 | |||||||||
210,000 | Pilgrim's Pride Corp. 4.250%, 04/15/31 | 185,980 | |||||||||
130,000 | Post Holdings, Inc.* 6.250%, 02/15/32 | 128,584 | |||||||||
252,000 | Prestige Brands, Inc.* 3.750%, 04/01/31 | 214,701 | |||||||||
240,000 | United Natural Foods, Inc.*^ 6.750%, 10/15/28 | 184,500 | |||||||||
278,000 | Vector Group, Ltd.* 5.750%, 02/01/29 | 252,977 | |||||||||
3,928,803 | |||||||||||
Energy (2.2%) | |||||||||||
132,000 | Antero Resources Corp.* 5.375%, 03/01/30 | 125,606 | |||||||||
268,000 | Apache Corp. 5.100%, 09/01/40 | 223,190 | |||||||||
135,000 | Buckeye Partners, LP 5.850%, 11/15/43 | 113,031 | |||||||||
129,000 | Cheniere Energy, Inc.µ 4.625%, 10/15/28 | 123,432 | |||||||||
198,000 | Chesapeake Energy Corp.* 6.750%, 04/15/29 | 198,226 | |||||||||
371,000 | Civitas Resources, Inc.* 8.750%, 07/01/31 | 394,818 | |||||||||
135,000 | Continental Resources, Inc. 4.900%, 06/01/44 | 108,848 | |||||||||
133,000 | 2.875%, 04/01/32* | 106,331 | |||||||||
202,000 | DT Midstream, Inc.* 4.125%, 06/15/29 | 183,117 | |||||||||
CALAMOS CLOSED-END FAMILY OF FUNDS SEMIANNUAL REPORT
80
Dynamic Convertible and Income Fund Schedule of Investments April 30, 2024 (Unaudited)
| PRINCIPAL AMOUNT | VALUE | ||||||||||
256,000 | Earthstone Energy Holdings, LLC* 8.000%, 04/15/27 | $ | 263,424 | ||||||||
100,000 | 9.875%, 07/15/31 | 110,657 | |||||||||
150,000 | Enbridge, Inc.‡ 7.375%, 01/15/83 5 year CMT + 3.71% | 147,641 | |||||||||
145,000 | Encino Acquisition Partners Holdings, LLC* 8.750%, 05/01/31 | 147,710 | |||||||||
390,000 | Energy Transfer, LP‡ 8.606%, 11/01/66 3 mo. SOFR + 3.28% | 354,260 | |||||||||
197,000 | 6.500%, 11/15/26 5 year CMT + 5.69% | 191,364 | |||||||||
340,000 | EnLink Midstream Partners, LP 9.701%, 05/31/24‡ 3 mo. USD LIBOR + 4.11% | 335,774 | |||||||||
285,000 | 4.850%, 07/15/26 | 277,869 | |||||||||
168,000 | Enlink Midstream, LLC* 6.500%, 09/01/30 | 170,160 | |||||||||
430,000 | EQM Midstream Partners, LP* 7.500%, 06/01/27 | 438,101 | |||||||||
135,000 | 6.375%, 04/01/29 | 134,137 | |||||||||
196,000 | Genesis Energy, LP / Genesis Energy Finance Corp. 8.875%, 04/15/30 | 203,042 | |||||||||
109,000 | 6.250%, 05/15/26 | 108,222 | |||||||||
255,000 | Gulfport Energy Corp. 8.000%, 05/17/26* | 258,838 | |||||||||
79,696 | 8.000%, 05/17/26 | 80,895 | |||||||||
365,000 | Hilcorp Energy I, LP / Hilcorp Finance Company* 6.000%, 04/15/30 | 350,725 | |||||||||
196,000 | Howard Midstream Energy Partners, LLC* 6.750%, 01/15/27 | 193,734 | |||||||||
260,000 | Kodiak Gas Services, LLC* 7.250%, 02/15/29 | 263,089 | |||||||||
262,000 | Magnolia Oil & Gas Operating, LLC / Magnolia Oil & Gas Finance Corp.* 6.000%, 08/01/26 | 258,523 | |||||||||
198,000 | Matador Resources Company* 6.500%, 04/15/32 | 196,382 | |||||||||
145,000 | Moss Creek Resources Holdings, Inc.* 10.500%, 05/15/27 | 148,467 | |||||||||
130,000 | 7.500%, 01/15/26 | 129,860 | |||||||||
200,000 | Nabors Industries, Inc.* 7.375%, 05/15/27 | 198,370 | |||||||||
100,000 | 9.125%, 01/31/30^ | 103,506 | |||||||||
200,000 | Nabors Industries, Ltd.*^ 7.500%, 01/15/28 | 189,784 | |||||||||
177,000 | New Fortress Energy, Inc.* 6.750%, 09/15/25 | 175,131 | |||||||||
275,000 | Oceaneering International, Inc. 6.000%, 02/01/28 | 265,067 | |||||||||
280,000 | Parkland Corp.* 5.875%, 07/15/27 | 273,885 | |||||||||
| PRINCIPAL AMOUNT | VALUE | ||||||||||
138,000 | Patterson-UTI Energy, Inc.^ 5.150%, 11/15/29 | $ | 131,889 | ||||||||
66,000 | Permian Resources Operating LLC* 7.000%, 01/15/32 | 67,437 | |||||||||
270,000 | Plains All American Pipeline, LP‡ 9.679%, 05/31/24 3 mo. USD LIBOR + 4.11% | 269,071 | |||||||||
365,000 | Rockcliff Energy II, LLC* 5.500%, 10/15/29 | 337,581 | |||||||||
130,000 | Southwestern Energy Company 4.750%, 02/01/32 | 117,225 | |||||||||
355,500 | Transocean, Inc.* 8.750%, 02/15/30 | 371,064 | |||||||||
130,000 | 8.250%, 05/15/29 | 129,297 | |||||||||
165,000 | Venture Global Calcasieu Pass, LLC* 6.250%, 01/15/30 | 163,588 | |||||||||
65,000 | 4.125%, 08/15/31 | 56,935 | |||||||||
65,000 | 3.875%, 08/15/29 | 57,434 | |||||||||
330,000 | Venture Global LNG, Inc.* 8.375%, 06/01/31 | 338,920 | |||||||||
200,000 | 8.125%, 06/01/28 | 204,732 | |||||||||
135,000 | 9.875%, 02/01/32 | 144,071 | |||||||||
135,000 | 9.500%, 02/01/29 | 145,222 | |||||||||
165,000 | Vital Energy, Inc. 7.750%, 07/31/29*^ | 166,223 | |||||||||
137,000 | 7.875%, 04/15/32* | 139,166 | |||||||||
103,000 | 9.750%, 10/15/30 | 112,322 | |||||||||
275,000 | VOC Escrow, Ltd.* 5.000%, 02/15/28 | 262,468 | |||||||||
327,000 | Weatherford International, Ltd.* 8.625%, 04/30/30 | 339,714 | |||||||||
11,099,575 | |||||||||||
Financials (2.8%) | |||||||||||
420,000 | Acrisure, LLC / Acrisure Finance, Inc.* 8.250%, 02/01/29 | 417,421 | |||||||||
400,000 | Aethon United BR, LP / Aethon United Finance Corp.* 8.250%, 02/15/26 | 403,244 | |||||||||
460,000 | Alliant Holdings Intermediate, LLC / Alliant Holdings Co-Issuer* 6.750%, 10/15/27 | 452,037 | |||||||||
35,000 | 7.000%, 01/15/31 | 35,214 | |||||||||
302,000 | Ally Financial, Inc. 4.700%, 05/15/26‡ 5 year CMT + 3.87% | 256,570 | |||||||||
125,000 | 4.700%, 05/15/28‡ 7 year CMT + 3.48% | 96,873 | |||||||||
110,000 | 8.000%, 11/01/31 | 119,214 | |||||||||
533,000 | AmWINS Group, Inc.* 4.875%, 06/30/29 | 485,243 | |||||||||
198,000 | Aviation Capital Group, LLC*µ 3.500%, 11/01/27 | 182,406 | |||||||||
130,000 | Brandywine Operating Partnership, LP 8.875%, 04/12/29 | 133,198 | |||||||||
www.calamos.com
81
| PRINCIPAL AMOUNT | VALUE | ||||||||||
398,000 | BroadStreet Partners, Inc.* 5.875%, 04/15/29 | $ | 363,147 | ||||||||
315,000 | Brookfield Property REIT, Inc. / BPR Cumulus, LLC / BPR Nimbus, LLC / GGSI Sellco, LLC* 4.500%, 04/01/27 | 282,209 | |||||||||
200,000 | Burford Capital Global Financial, LLC* 6.875%, 04/15/30 | 194,066 | |||||||||
255,000 | Credit Acceptance Corp. 6.625%, 03/15/26^ | 254,391 | |||||||||
180,000 | 9.250%, 12/15/28* | 191,020 | |||||||||
265,000 | Cushman & Wakefield U.S. Borrower LLC* 8.875%, 09/01/31 | 275,746 | |||||||||
344,000 | Enact Holdings, Inc.*µ 6.500%, 08/15/25 | 343,852 | |||||||||
300,000 | GGAM Finance, Ltd.* 8.000%, 02/15/27 | 308,244 | |||||||||
333,000 | Global Net Lease, Inc. / Global Net Lease Operating Partnership, LP* 3.750%, 12/15/27 | 283,623 | |||||||||
275,000 | GTCR W-2 Merger Sub, LLC* 7.500%, 01/15/31 | 283,800 | |||||||||
145,000 | HAT Holdings I LLC / HAT Holdings II LLC* 8.000%, 06/15/27 | 148,903 | |||||||||
398,000 | HUB International, Ltd.* 5.625%, 12/01/29 | 367,231 | |||||||||
130,000 | 7.375%, 01/31/32 | 129,464 | |||||||||
202,000 | Icahn Enterprises, LP / Icahn Enterprises Finance Corp. 4.375%, 02/01/29 | 170,215 | |||||||||
360,000 | ILFC E-Capital Trust II*‡ 7.395%, 12/21/65 3 mo. USD LIBOR + 1.80% | 287,626 | |||||||||
550,000 | Iron Mountain, Inc.* 5.250%, 03/15/28 | 526,966 | |||||||||
540,000 | Jefferies Finance, LLC / JFIN Co-Issuer Corp.* 5.000%, 08/15/28 | 486,400 | |||||||||
522,000 | Ladder Capital Finance Holdings, LLLP / Ladder Capital Finance Corp.* 5.250%, 10/01/25 | 513,455 | |||||||||
280,000 | 4.750%, 06/15/29 | 250,429 | |||||||||
245,000 | LD Holdings Group, LLC* 6.125%, 04/01/28 | 185,989 | |||||||||
280,000 | Level 3 Financing, Inc.* 4.250%, 07/01/28 | 109,547 | |||||||||
135,000 | 4.625%, 09/15/27 | 79,616 | |||||||||
200,000 | LPL Holdings, Inc.*µ 4.000%, 03/15/29 | 181,592 | |||||||||
265,000 | Macquarie Airfinance Holdings, Ltd.* 8.125%, 03/30/29 | 277,770 | |||||||||
129,027 | Mallinckrodt International Finance, SA / Mallinckrodt CB, LLC* 14.750%, 11/14/28 | 140,728 | |||||||||
| PRINCIPAL AMOUNT | VALUE | ||||||||||
417,000 | MetLife, Inc. 6.400%, 12/15/66 | $ | 415,970 | ||||||||
365,000 | Nationstar Mortgage Holdings, Inc.* 5.500%, 08/15/28 | 343,574 | |||||||||
288,000 | Navient Corp. 5.000%, 03/15/27 | 272,019 | |||||||||
145,000 | 4.875%, 03/15/28 | 131,248 | |||||||||
170,000 | Necessity Retail REIT, Inc. / American Finance Operating Partner, LP* 4.500%, 09/30/28 | 145,163 | |||||||||
130,000 | Newmark Group, Inc.* 7.500%, 01/12/29 | 131,438 | |||||||||
185,000 | OneMain Finance Corp. 9.000%, 01/15/29 | 194,487 | |||||||||
180,000 | 3.875%, 09/15/28 | 158,830 | |||||||||
127,000 | 7.125%, 03/15/26^ | 128,241 | |||||||||
416,000 | PHH Mortgage Corp.* 7.875%, 03/15/26 | 400,071 | |||||||||
300,000 | RHP Hotel Properties, LP / RHP Finance Corp.* 4.500%, 02/15/29 | 276,435 | |||||||||
265,000 | 6.500%, 04/01/32 | 260,047 | |||||||||
125,000 | Rocket Mortgage, LLC / Rocket Mortgage Co-Issuer, Inc.* 3.625%, 03/01/29 | 110,409 | |||||||||
120,000 | 3.875%, 03/01/31 | 102,228 | |||||||||
65,000 | 2.875%, 10/15/26 | 59,807 | |||||||||
325,000 | StoneX Group, Inc.* 7.875%, 03/01/31 | 328,893 | |||||||||
269,000 | 8.625%, 06/15/25 | 270,098 | |||||||||
310,000 | United Wholesale Mortgage, LLC* 5.500%, 04/15/29 | 288,582 | |||||||||
130,000 | 5.750%, 06/15/27 | 124,935 | |||||||||
135,000 | Uniti Group, LP / Uniti Group Finance, Inc. / CSL Capital, LLC* 6.500%, 02/15/29 | 108,639 | |||||||||
132,000 | 10.500%, 02/15/28 | 137,115 | |||||||||
300,000 | VZ Secured Financing, BV* 5.000%, 01/15/32 | 253,527 | |||||||||
280,000 | XHR, LP* 6.375%, 08/15/25 | 279,885 | |||||||||
14,139,090 | |||||||||||
Health Care (1.2%) | |||||||||||
539,000 | Bausch Health Companies, Inc.* 11.000%, 09/30/28^ | 422,220 | |||||||||
105,000 | 14.000%, 10/15/30 | 67,843 | |||||||||
98,000 | 6.125%, 02/01/27^ | 71,954 | |||||||||
533,000 | CHS/Community Health Systems, Inc.* 6.125%, 04/01/30 | 377,492 | |||||||||
151,000 | 8.000%, 03/15/26 | 150,491 | |||||||||
146,000 | 6.875%, 04/15/29 | 108,424 | |||||||||
130,000 | 10.875%, 01/15/32 | 133,338 | |||||||||
33,000 | 5.250%, 05/15/30 | 27,056 | |||||||||
CALAMOS CLOSED-END FAMILY OF FUNDS SEMIANNUAL REPORT
82
| PRINCIPAL AMOUNT | VALUE | ||||||||||
313,000 | DaVita, Inc.* 3.750%, 02/15/31 | $ | 257,996 | ||||||||
291,000 | 4.625%, 06/01/30 | 255,638 | |||||||||
195,000 | Embecta Corp.* 5.000%, 02/15/30^ | 150,460 | |||||||||
67,000 | 6.750%, 02/15/30 | 57,629 | |||||||||
130,000 | Encompass Health Corp. 4.750%, 02/01/30 | 119,473 | |||||||||
130,000 | 4.500%, 02/01/28 | 122,291 | |||||||||
282,000 | HCA, Inc. 7.500%, 11/06/33 | 307,628 | |||||||||
200,000 | Jazz Securities DAC* 4.375%, 01/15/29 | 183,236 | |||||||||
336,000 | Medline Borrower, LP* 5.250%, 10/01/29 | 313,102 | |||||||||
335,000 | 3.875%, 04/01/29 | 300,059 | |||||||||
490,000 | Organon & Company / Organon Foreign Debt Co-Issuer, BV* 5.125%, 04/30/31 | 424,105 | |||||||||
200,000 | 4.125%, 04/30/28 | 182,368 | |||||||||
302,000 | Team Health Holdings, Inc.* 6.375%, 02/01/25 | 281,241 | |||||||||
625,000 | Tenet Healthcare Corp. 6.250%, 02/01/27 | 623,681 | |||||||||
375,000 | 6.875%, 11/15/31 | 388,185 | |||||||||
335,000 | Teva Pharmaceutical Finance Netherlands III, BV 5.125%, 05/09/29 | 317,972 | |||||||||
200,000 | 4.750%, 05/09/27 | 191,628 | |||||||||
130,000 | 3.150%, 10/01/26 | 120,503 | |||||||||
5,956,013 | |||||||||||
Industrials (2.4%) | |||||||||||
260,000 | Aar Escrow Issuer, LLC* 6.750%, 03/15/29 | 262,337 | |||||||||
300,000 | ACCO Brands Corp.* 4.250%, 03/15/29 | 261,825 | |||||||||
300,000 | AerCap Holdings, NV^‡ 5.875%, 10/10/79 5 year CMT + 4.54% | 297,378 | |||||||||
265,000 | Air Lease Corp.‡ 4.125%, 12/15/26 5 year CMT + 3.15% | 229,495 | |||||||||
440,000 | Albertsons Companies, Inc. / Safeway, Inc. / New Albertsons, LP / Albertsons, LLC* 4.625%, 01/15/27 | 420,710 | |||||||||
195,000 | 5.875%, 02/15/28 | 191,270 | |||||||||
168,000 | Allegiant Travel Company*^ 7.250%, 08/15/27 | 162,735 | |||||||||
146,000 | Arcosa, Inc.* 4.375%, 04/15/29 | 133,659 | |||||||||
700,000 | ARD Finance, SA* 6.500%, 06/30/27 7.250% PIK Rate | 195,384 | |||||||||
| PRINCIPAL AMOUNT | VALUE | ||||||||||
206,000 | Beacon Roofing Supply, Inc.* 4.125%, 05/15/29 | $ | 184,376 | ||||||||
131,000 | Boeing Company* 6.388%, 05/01/31 | 131,956 | |||||||||
130,000 | Bombardier, Inc.* 8.750%, 11/15/30 | 138,403 | |||||||||
113,000 | 7.875%, 04/15/27 | 112,647 | |||||||||
81,000 | 7.250%, 07/01/31 | 81,316 | |||||||||
261,000 | BWX Technologies, Inc.* 4.125%, 04/15/29 | 238,071 | |||||||||
273,000 | Cascades, Inc. / Cascades USA, Inc.* 5.375%, 01/15/28 | 257,371 | |||||||||
68,000 | Delta Air Lines, Inc. / SkyMiles IP, Ltd.*µ 4.750%, 10/20/28 | 65,948 | |||||||||
350,000 | Deluxe Corp.* 8.000%, 06/01/29 | 317,947 | |||||||||
260,000 | Eco Material Technologies, Inc.* 7.875%, 01/31/27 | 262,210 | |||||||||
132,000 | Emerald Debt Merger Sub, LLC* 6.625%, 12/15/30 | 131,207 | |||||||||
145,000 | EnerSys* 4.375%, 12/15/27 | 135,948 | |||||||||
135,000 | 6.625%, 01/15/32 | 134,637 | |||||||||
95,000 | EquipmentShare.com, Inc.* 8.625%, 05/15/32 | 96,867 | |||||||||
161,000 | Graham Packaging Company, Inc.* 7.125%, 08/15/28 | 145,736 | |||||||||
175,000 | Graphic Packaging International, LLC* 4.750%, 07/15/27 | 167,897 | |||||||||
125,000 | 3.500%, 03/01/29 | 110,748 | |||||||||
290,000 | Great Lakes Dredge & Dock Corp.*^ 5.250%, 06/01/29 | 244,966 | |||||||||
623,000 | H&E Equipment Services, Inc.* 3.875%, 12/15/28 | 551,990 | |||||||||
337,000 | Hawaiian Brand Intellectual Property, Ltd. / HawaiianMiles Loyalty, Ltd.* 5.750%, 01/20/26 | 316,793 | |||||||||
350,000 | Herc Holdings, Inc.* 5.500%, 07/15/27 | 340,406 | |||||||||
310,000 | IEA Energy Services, LLC* 6.625%, 08/15/29 | 295,911 | |||||||||
160,000 | JELD-WEN, Inc.* 4.625%, 12/15/25 | 156,237 | |||||||||
135,000 | 4.875%, 12/15/27 | 128,346 | |||||||||
445,000 | Ken Garff Automotive, LLC* 4.875%, 09/15/28 | 414,602 | |||||||||
265,000 | Knife River Holding Company* 7.750%, 05/01/31 | 275,804 | |||||||||
69,000 | MasTec, Inc.*µ 4.500%, 08/15/28 | 64,525 | |||||||||
32,000 | Miter Brands Acquisition Holdco, Inc. / MIWD Borrower, LLC* 6.750%, 04/01/32 | 31,804 | |||||||||
www.calamos.com
83
| PRINCIPAL AMOUNT | VALUE | ||||||||||
170,000 | Moog, Inc.* 4.250%, 12/15/27 | $ | 159,081 | ||||||||
323,000 | Newfold Digital Holdings Group, Inc.* 6.000%, 02/15/29 | 242,738 | |||||||||
272,000 | Novelis Corp.* 4.750%, 01/30/30 | 248,404 | |||||||||
100,000 | OI European Group, BV* 4.750%, 02/15/30 | 91,544 | |||||||||
310,000 | Pactiv Evergreen Group Issuer, Inc. / Pactiv Evergreen Group Issuer, LLC*^ 4.000%, 10/15/27 | 288,374 | |||||||||
206,000 | Sealed Air Corp.* 6.125%, 02/01/28 | 203,715 | |||||||||
65,000 | 5.000%, 04/15/29 | 61,206 | |||||||||
65,000 | Sealed Air Corp./Sealed Air Corp. U.S.* 7.250%, 02/15/31 | 66,305 | |||||||||
247,000 | Sensata Technologies, Inc.* 3.750%, 02/15/31 | 209,271 | |||||||||
201,000 | Sinclair Television Group, Inc.* 4.125%, 12/01/30 | 138,453 | |||||||||
135,000 | 5.500%, 03/01/30 | 93,633 | |||||||||
270,000 | Standard Industries, Inc.* 5.000%, 02/15/27 | 260,580 | |||||||||
216,000 | Stericycle, Inc.* 3.875%, 01/15/29 | 193,130 | |||||||||
285,000 | TransDigm, Inc.* 6.875%, 12/15/30 | 287,163 | |||||||||
200,000 | 6.750%, 08/15/28 | 200,954 | |||||||||
100,000 | 7.125%, 12/01/31 | 102,048 | |||||||||
65,000 | 6.625%, 03/01/32 | 64,995 | |||||||||
136,000 | Tronox, Inc.* 4.625%, 03/15/29 | 121,778 | |||||||||
99,329 | United Airlines Pass Through Trust Series 2019-2, Class B 3.500%, 11/01/29 | 91,750 | |||||||||
265,000 | Vertiv Group Corp.* 4.125%, 11/15/28 | 245,578 | |||||||||
274,000 | Wabash National Corp.* 4.500%, 10/15/28 | 246,627 | |||||||||
240,000 | Waste Pro USA, Inc.* 5.500%, 02/15/26 | 235,114 | |||||||||
157,000 | Williams Scotsman, Inc.* 4.625%, 08/15/28 | 145,228 | |||||||||
130,000 | 7.375%, 10/01/31 | 132,896 | |||||||||
11,820,027 | |||||||||||
Information Technology (0.7%) | |||||||||||
66,000 | Booz Allen Hamilton, Inc.* 4.000%, 07/01/29 | 60,549 | |||||||||
153,000 | Coherent Corp.* 5.000%, 12/15/29 | 141,312 | |||||||||
245,000 | CommScope, Inc.* 4.750%, 09/01/29 | 171,316 | |||||||||
116,000 | Dell International, LLC / EMC Corp.µ 6.020%, 06/15/26 | 116,715 | |||||||||
| PRINCIPAL AMOUNT | VALUE | ||||||||||
130,000 | Dun & Bradstreet Corp.*^ 5.000%, 12/15/29 | $ | 118,479 | ||||||||
138,000 | Fair Isaac Corp.* 4.000%, 06/15/28 | 127,298 | |||||||||
300,000 | KBR, Inc.* 4.750%, 09/30/28 | 280,296 | |||||||||
300,000 | MPH Acquisition Holdings, LLC* 5.750%, 11/01/28^ | 220,938 | |||||||||
130,000 | 5.500%, 09/01/28 | 106,202 | |||||||||
132,000 | NCL Corp., Ltd.* 8.125%, 01/15/29 | 137,601 | |||||||||
130,000 | NCR Voyix Corp.* 5.125%, 04/15/29 | 119,569 | |||||||||
198,000 | ON Semiconductor Corp.* 3.875%, 09/01/28 | 179,732 | |||||||||
204,000 | Open Text Corp.* 3.875%, 02/15/28 | 186,360 | |||||||||
135,000 | 6.900%, 12/01/27 | 138,108 | |||||||||
98,000 | 3.875%, 12/01/29 | 85,929 | |||||||||
98,000 | Open Text Holdings, Inc.*^ 4.125%, 12/01/31 | 84,138 | |||||||||
230,000 | Playtika Holding Corp.* 4.250%, 03/15/29 | 198,115 | |||||||||
370,000 | TTM Technologies, Inc.* 4.000%, 03/01/29 | 331,509 | |||||||||
185,000 | Twilio, Inc. 3.625%, 03/15/29 | 164,328 | |||||||||
66,000 | 3.875%, 03/15/31 | 57,233 | |||||||||
97,000 | UKG, Inc.* 6.875%, 02/01/31 | 97,227 | |||||||||
325,000 | Viavi Solutions, Inc.* 3.750%, 10/01/29 | 275,064 | |||||||||
300,000 | ZoomInfo Technologies, LLC / ZoomInfo Finance Corp.* 3.875%, 02/01/29 | 265,299 | |||||||||
3,663,317 | |||||||||||
Materials (0.7%) | |||||||||||
140,000 | ArcelorMittal, SA 7.000%, 10/15/39 | 148,211 | |||||||||
147,000 | ATI, Inc. 5.875%, 12/01/27 | 144,403 | |||||||||
67,000 | Carpenter Technology Corp. 7.625%, 03/15/30 | 68,453 | |||||||||
260,000 | Chemours Company* 4.625%, 11/15/29 | 223,007 | |||||||||
420,000 | Clearwater Paper Corp.* 4.750%, 08/15/28 | 381,969 | |||||||||
199,000 | Cleveland-Cliffs, Inc.* 6.750%, 04/15/30 | 194,447 | |||||||||
130,000 | Commercial Metals Company 4.125%, 01/15/30 | 116,783 | |||||||||
65,000 | 4.375%, 03/15/32 | 57,335 | |||||||||
CALAMOS CLOSED-END FAMILY OF FUNDS SEMIANNUAL REPORT
84
| PRINCIPAL AMOUNT | VALUE | ||||||||||
250,000 | Constellium, SE*^ 3.750%, 04/15/29 | $ | 222,063 | ||||||||
136,000 | HB Fuller Company 4.250%, 10/15/28 | 125,669 | |||||||||
200,000 | INEOS Finance, PLC*^ 6.750%, 05/15/28 | 196,780 | |||||||||
215,000 | JW Aluminum Continuous Cast Company* 10.250%, 06/01/26 | 217,120 | |||||||||
235,000 | Kaiser Aluminum Corp.* 4.625%, 03/01/28 | 219,131 | |||||||||
63,000 | LSF11 A5 HoldCo, LLC* 6.625%, 10/15/29 | 58,761 | |||||||||
279,000 | Mercer International, Inc. 5.125%, 02/01/29 | 244,005 | |||||||||
133,000 | 12.875%, 10/01/28* | 145,338 | |||||||||
250,000 | OCI, NV* 6.700%, 03/16/33 | 240,228 | |||||||||
200,000 | Owens-Brockway Glass Container, Inc.* 7.250%, 05/15/31 | 200,568 | |||||||||
130,000 | 6.625%, 05/13/27 | 130,039 | |||||||||
305,000 | Silgan Holdings, Inc. 4.125%, 02/01/28 | 284,772 | |||||||||
131,000 | Trinseo Materials Operating SCA / Trinseo Materials Finance, Inc.* 5.125%, 04/01/29 | 33,917 | |||||||||
3,652,999 | |||||||||||
Other (0.0%) | |||||||||||
140,000 | Gen Digital, Inc.* 6.750%, 09/30/27 | 140,598 | |||||||||
75,000 | 7.125%, 09/30/30 | 75,900 | |||||||||
216,498 | |||||||||||
Real Estate (0.2%) | |||||||||||
210,000 | EPR Properties 3.750%, 08/15/29 | 182,715 | |||||||||
195,000 | Forestar Group, Inc.* 5.000%, 03/01/28 | 185,396 | |||||||||
137,000 | 3.850%, 05/15/26 | 130,244 | |||||||||
301,000 | MIWD Holdco II, LLC / MIWD Finance Corp.* 5.500%, 02/01/30 | 272,673 | |||||||||
125,000 | Service Properties Trust 5.250%, 02/15/26 | 120,320 | |||||||||
891,348 | |||||||||||
Special Purpose Acquisition Companies (0.1%) | |||||||||||
260,000 | Fertitta Entertainment, LLC / Fertitta Entertainment Finance Company, Inc.* 6.750%, 01/15/30 | 226,673 | |||||||||
131,000 | 4.625%, 01/15/29 | 118,600 | |||||||||
345,273 | |||||||||||
| PRINCIPAL AMOUNT | VALUE | ||||||||||
Utilities (0.1%) | |||||||||||
97,000 | PPL Capital Funding, Inc.‡ 8.236%, 03/30/67 3 mo. USD LIBOR + 2.67% | $ | 96,258 | ||||||||
125,000 | Vistra Corp.*‡ 7.000%, 12/15/26 5 year CMT + 5.74% | 123,101 | |||||||||
65,000 | 8.000%, 10/15/26 5 year CMT + 6.93% | 65,741 | |||||||||
285,100 | |||||||||||
TOTAL CORPORATE BONDS (Cost $72,290,709) | 82,460,617 | ||||||||||
CONVERTIBLE BONDS (129.6%) | |||||||||||
Communication Services (8.4%) | |||||||||||
264,000 | Cable One, Inc.µ 0.000%, 03/15/26 | 228,326 | |||||||||
7,250,000 | Liberty Media Corp.* 2.375%, 09/30/53 | 7,607,135 | |||||||||
7,750,000 | Liberty Media Corp.-Liberty Formula One 2.250%, 08/15/27 | 8,071,857 | |||||||||
4,500,000 | Match Group Financeco 3, Inc.*µ 2.000%, 01/15/30 | 3,673,260 | |||||||||
5,250,000 | Perficient, Inc.µ 0.125%, 11/15/26 | 4,616,220 | |||||||||
11,000,000 | Snap, Inc.µ 0.000%, 05/01/27 | 8,985,130 | |||||||||
5,000,000 | 0.750%, 08/01/26 | 5,188,500 | |||||||||
3,000,000 | Zillow Group, Inc.^ 1.375%, 09/01/26 | 3,464,070 | |||||||||
41,834,498 | |||||||||||
Consumer Discretionary (24.4%) | |||||||||||
5,000,000 | Airbnb, Inc.µ 0.000%, 03/15/26 | 4,604,650 | |||||||||
4,000,000 | Booking Holdings, Inc. 0.750%, 05/01/25 | 7,349,400 | |||||||||
3,750,000 | Carnival Corp. 5.750%, 12/01/27 | 5,297,325 | |||||||||
6,000,000 | Chegg, Inc.µ 0.000%, 09/01/26 | 4,822,500 | |||||||||
4,900,000 | DISH Network Corp.µ 0.000%, 12/15/25 | 3,596,600 | |||||||||
9,750,000 | DraftKings Holdings, Inc.µ 0.000%, 03/15/28 | 8,115,315 | |||||||||
11,250,000 | Etsy, Inc.µ 0.125%, 09/01/27 | 9,337,387 | |||||||||
14,500,000 | Ford Motor Company 0.000%, 03/15/26 | 14,474,915 | |||||||||
7,500,000 | Liberty Broadband Corp.*µ 3.125%, 03/31/53 | 6,971,475 | |||||||||
2,125,000 | Lucid Group, Inc.* 1.250%, 12/15/26 | 974,270 | |||||||||
85
| PRINCIPAL AMOUNT | VALUE | ||||||||||
9,000,000 | Marriott Vacations Worldwide Corp.µ 3.250%, 12/15/27 | $ | 8,251,650 | ||||||||
10,000,000 | Rivian Automotive, Inc. 4.625%, 03/15/29 | 6,830,600 | |||||||||
1,750,000 | Royal Caribbean Cruises, Ltd. 6.000%, 08/15/25 | 4,988,288 | |||||||||
5,000,000 | Shake Shack, Inc.µ 0.000%, 03/01/28 | 4,532,450 | |||||||||
2,750,000 | Stride, Inc. 1.125%, 09/01/27 | 3,793,048 | |||||||||
13,250,000 | Vail Resorts, Inc.µ 0.000%, 01/01/26 | 12,042,527 | |||||||||
11,750,000 | Wayfair, Inc.µ 3.250%, 09/15/27 | 12,961,072 | |||||||||
3,316,000 | Winnebago Industries, Inc.*µ 3.250%, 01/15/30 | 3,277,833 | |||||||||
122,221,305 | |||||||||||
Consumer Staples (0.9%) | |||||||||||
4,000,000 | Post Holdings, Inc. 2.500%, 08/15/27 | 4,484,400 | |||||||||
Energy (3.8%) | |||||||||||
3,500,000 | Kosmos Energy, Ltd.* 3.125%, 03/15/30 | 3,719,100 | |||||||||
4,265,000 | Nabors Industries, Inc.µ 1.750%, 06/15/29 | 3,130,681 | |||||||||
3,750,000 | Northern Oil & Gas, Inc. 3.625%, 04/15/29 | 4,642,050 | |||||||||
2,500,000 | Pioneer Natural Resources Company 0.250%, 05/15/25 | 7,341,375 | |||||||||
9,600,000 | SunEdison, Inc.@ 0.000%, 01/15/49 | 96,000 | |||||||||
18,929,206 | |||||||||||
Financials (2.1%) | |||||||||||
3,625,000 | Coinbase Global, Inc.*µ 0.250%, 04/01/30 | 3,278,305 | |||||||||
7,250,000 | Global Payments, Inc.*µ^ 1.500%, 03/01/31 | 7,231,658 | |||||||||
10,509,963 | |||||||||||
Health Care (27.3%) | |||||||||||
4,000,000 | Alnylam Pharmaceuticals, Inc.µ 1.000%, 09/15/27 | 3,686,400 | |||||||||
4,750,000 | Alphatec Holdings, Inc.µ 0.750%, 08/01/26 | 4,790,945 | |||||||||
8,250,000 | CONMED Corp.µ 2.250%, 06/15/27 | 7,281,862 | |||||||||
10,500,000 | CryoPort, Inc.*µ 0.750%, 12/01/26 | 9,145,920 | |||||||||
13,817,000 | Dexcom, Inc. 0.250%, 11/15/25 | 14,487,954 | |||||||||
7,000,000 | 0.375%, 05/15/28* | 7,111,300 | |||||||||
| PRINCIPAL AMOUNT | VALUE | ||||||||||
2,525,000 | Enovis Corp.* 3.875%, 10/15/28 | $ | 2,985,712 | ||||||||
6,000,000 | Exact Sciences Corp.µ 0.375%, 03/15/27 | 5,442,840 | |||||||||
3,250,000 | 2.000%, 03/01/30* | 3,351,270 | |||||||||
6,250,000 | Halozyme Therapeutics, Inc.µ^ 1.000%, 08/15/28 | 5,898,125 | |||||||||
1,772,000 | Immunocore Holdings, PLC*µ 2.500%, 02/01/30 | 1,754,191 | |||||||||
3,750,000 | Insmed, Inc. 0.750%, 06/01/28 | 3,841,012 | |||||||||
3,750,000 | Insulet Corp.µ 0.375%, 09/01/26 | 3,868,087 | |||||||||
7,750,000 | Integer Holdings Corp.µ 2.125%, 02/15/28 | 10,777,770 | |||||||||
3,750,000 | Ionis Pharmaceuticals, Inc.µ 0.000%, 04/01/26 | 3,637,388 | |||||||||
3,500,000 | iRhythm Technologies, Inc.*µ 1.500%, 09/01/29 | 3,550,610 | |||||||||
8,000,000 | Jazz Investments I, Ltd.µ 2.000%, 06/15/26 | 7,718,080 | |||||||||
3,189,000 | Lantheus Holdings, Inc.µ 2.625%, 12/15/27 | 3,606,536 | |||||||||
9,000,000 | NeoGenomics, Inc.µ 0.250%, 01/15/28 | 7,100,100 | |||||||||
7,500,000 | Omnicell, Inc.µ 0.250%, 09/15/25 | 7,051,125 | |||||||||
7,000,000 | Pacira BioSciences, Inc.µ 0.750%, 08/01/25 | 6,624,660 | |||||||||
3,250,000 | Sarepta Therapeutics, Inc. 1.250%, 09/15/27 | 3,729,603 | |||||||||
7,250,000 | Shockwave Medical, Inc.* 1.000%, 08/15/28 | 9,214,387 | |||||||||
136,655,877 | |||||||||||
Industrials (9.8%) | |||||||||||
3,750,000 | Axon Enterprise, Inc. 0.500%, 12/15/27 | 5,464,425 | |||||||||
3,625,000 | Fluor Corp.* 1.125%, 08/15/29 | 3,949,510 | |||||||||
6,250,000 | John Bean Technologies Corp.µ 0.250%, 05/15/26 | 5,646,625 | |||||||||
3,750,000 | Middleby Corp. 1.000%, 09/01/25 | 4,419,075 | |||||||||
3,500,000 | Tetra Tech, Inc.* 2.250%, 08/15/28 | 3,975,965 | |||||||||
17,000,000 | Uber Technologies, Inc. 0.000%, 12/15/25^ | 17,750,890 | |||||||||
6,758,000 | 0.875%, 12/01/28*µ | 7,635,526 | |||||||||
48,842,016 | |||||||||||
CALAMOS CLOSED-END FAMILY OF FUNDS SEMIANNUAL REPORT
86
| PRINCIPAL AMOUNT | VALUE | ||||||||||
Information Technology (44.3%) | |||||||||||
3,625,000 | Advanced Energy Industries, Inc.*µ 2.500%, 09/15/28 | $ | 3,593,499 | ||||||||
7,250,000 | Akamai Technologies, Inc. 1.125%, 02/15/29* | 7,142,120 | |||||||||
3,750,000 | 0.375%, 09/01/27^ | 3,807,375 | |||||||||
7,750,000 | Bentley Systems, Inc. 0.125%, 01/15/26 | 7,874,620 | |||||||||
6,500,000 | BILL Holdings, Inc.µ 0.000%, 12/01/25 | 6,014,060 | |||||||||
3,000,000 | Camtek, Ltd.* 0.000%, 12/01/26 | 4,482,600 | |||||||||
7,000,000 | Confluent, Inc.µ 0.000%, 01/15/27 | 5,948,460 | |||||||||
4,250,000 | CyberArk Software, Ltd.^ 0.000%, 11/15/24 | 6,530,210 | |||||||||
4,250,000 | Datadog, Inc. 0.125%, 06/15/25 | 6,063,942 | |||||||||
5,250,000 | DigitalOcean Holdings, Inc.µ 0.000%, 12/01/26 | 4,386,900 | |||||||||
7,927,000 | Enphase Energy, Inc.µ 0.000%, 03/01/26 | 7,174,411 | |||||||||
1,750,000 | Five9, Inc.µ 0.500%, 06/01/25 | 1,649,393 | |||||||||
5,250,000 | NCL Corp., Ltd. 1.125%, 02/15/27µ | 4,804,905 | |||||||||
4,000,000 | 2.500%, 02/15/27µ | 3,750,280 | |||||||||
2,750,000 | 5.375%, 08/01/25 | 3,381,235 | |||||||||
5,500,000 | Nutanix, Inc. 0.250%, 10/01/27 | 6,661,435 | |||||||||
3,500,000 | Okta, Inc.µ 0.375%, 06/15/26 | 3,176,495 | |||||||||
15,000,000 | ON Semiconductor Corp.µ 0.500%, 03/01/29 | 14,539,950 | |||||||||
3,750,000 | Palo Alto Networks, Inc. 0.375%, 06/01/25 | 10,977,712 | |||||||||
5,250,000 | Parsons Corp.* 2.625%, 03/01/29 | 5,505,990 | |||||||||
6,500,000 | Rapid7, Inc.*µ^ 1.250%, 03/15/29 | 6,302,335 | |||||||||
9,750,000 | Repay Holdings Corp.*µ 0.000%, 02/01/26 | 8,913,352 | |||||||||
5,000,000 | Seagate HDD Cayman* 3.500%, 06/01/28 | 5,986,300 | |||||||||
12,000,000 | Shift4 Payments, Inc.µ^ 0.000%, 12/15/25 | 12,433,440 | |||||||||
5,800,000 | SK Hynix, Inc. 1.750%, 04/11/30 | 9,097,068 | |||||||||
11,000,000 | Super Micro Computer, Inc.*µ 0.000%, 03/01/29 | 11,249,920 | |||||||||
8,500,000 | Tyler Technologies, Inc. 0.250%, 03/15/26 | 8,929,080 | |||||||||
| PRINCIPAL AMOUNT | VALUE | ||||||||||
12,500,000 | Unity Software, Inc.µ 0.000%, 11/15/26 | $ | 10,656,625 | ||||||||
3,263,000 | Vertex, Inc.* 0.750%, 05/01/29 | 3,412,282 | |||||||||
7,000,000 | Western Digital Corp.*^ 3.000%, 11/15/28 | 10,574,270 | |||||||||
5,500,000 | Wix.com, Ltd. 0.000%, 08/15/25 | 5,097,840 | |||||||||
7,750,000 | Wolfspeed, Inc. 1.875%, 12/01/29 | 4,440,053 | |||||||||
4,469,000 | 0.250%, 02/15/28 | 2,643,816 | |||||||||
3,750,000 | Zscaler, Inc.^ 0.125%, 07/01/25 | 4,751,137 | |||||||||
221,953,110 | |||||||||||
Materials (1.9%) | |||||||||||
1,250,000 | ATI, Inc.~ 3.500%, 06/15/25 | 4,814,575 | |||||||||
5,225,000 | MP Materials Corp.*µ 0.250%, 04/01/26 | 4,616,967 | |||||||||
9,431,542 | |||||||||||
Other (0.0%) | |||||||||||
135,000 | Multiplan Corp.*µ 6.000%, 10/15/27 | 96,173 | |||||||||
Real Estate (0.9%) | |||||||||||
5,250,000 | Pebblebrook Hotel Trustµ 1.750%, 12/15/26 | 4,636,485 | |||||||||
Utilities (5.8%) | |||||||||||
3,750,000 | CMS Energy Corp.* 3.375%, 05/01/28 | 3,674,288 | |||||||||
5,750,000 | PG&E Corp.*µ 4.250%, 12/01/27 | 5,770,297 | |||||||||
13,250,000 | PPL Capital Funding, Inc. 2.875%, 03/15/28 | 12,596,775 | |||||||||
7,000,000 | Southern Company 3.875%, 12/15/25 | 6,988,100 | |||||||||
29,029,460 | |||||||||||
TOTAL CONVERTIBLE BONDS (Cost $677,401,169) | 648,624,035 | ||||||||||
BANK LOANS (3.1%)¡ | |||||||||||
Airlines (0.1%) | |||||||||||
175,000 | Air Canada‡ 7.833%, 03/21/31 3 mo. SOFR + 2.50% | 176,422 | |||||||||
180,000 | American Airlines, Inc.‡ 10.336%, 04/20/28 3 mo. SOFR + 4.75% | 187,444 | |||||||||
175,500 | Mileage Plus Holdings, LLC‡ 10.733%, 06/21/27 3 mo. SOFR + 5.25% | 180,399 | |||||||||
www.calamos.com
87
| PRINCIPAL AMOUNT | VALUE | ||||||||||
180,000 | United Airlines, Inc.‡ 8.076%, 02/22/31 3 mo. SOFR + 2.75% | $ | 180,984 | ||||||||
725,249 | |||||||||||
Communication Services (0.2%) | |||||||||||
15,765 | Audacy Capital Corp.‡ 11.430%, 08/19/24 3 mo. SOFR + 6.11% | 15,804 | |||||||||
125,611 | Clear Channel Outdoor Holdings, Inc.‡ 9.430%, 08/23/28 1 mo. SOFR + 4.00% | 125,873 | |||||||||
111,210 | DIRECTV Financing, LLC! 0.000%, 08/02/27 | 111,920 | |||||||||
103,652 | DIRECTV Financing, LLC‡ 10.430%, 08/02/27 1 mo. SOFR + 5.00% | 104,314 | |||||||||
420,000 | Entercom Media Corp.‡ 8.145%, 11/18/24 3 mo. SOFR + 0.00% | 227,640 | |||||||||
258,786 | Gray Television, Inc.‡ 7.942%, 01/02/26 1 mo. SOFR + 2.50% | 255,891 | |||||||||
280,000 | Telesat Canada‡ 8.355%, 12/07/26 3 mo. SOFR + 2.75% | 142,859 | |||||||||
984,301 | |||||||||||
Consumer Discretionary (0.7%) | |||||||||||
135,000 | Adient U.S., LLC‡ 8.066%, 01/31/31 1 mo. SOFR + 2.75% | 135,759 | |||||||||
206,400 | American Axle & Manufacturing, Inc.‡ 8.921%, 12/13/29 1 mo. SOFR + 3.50% | 207,626 | |||||||||
262,350 | Caesars Entertainment, Inc.‡ 8.666%, 02/06/30 1 mo. SOFR + 3.25% | 263,220 | |||||||||
404,412 | Carnival Corp.‡ 8.067%, 08/08/27 1 mo. SOFR + 2.75% | 407,002 | |||||||||
235,963 | Carnival Corp.‡ 8.067%, 10/18/28 | 237,585 | |||||||||
235,963 | Carnival Corp.‡ 8.067%, 10/18/28 1 mo. SOFR + 3.25% | 237,217 | |||||||||
260,000 | Flutter Financing, BV! 0.000%, 11/25/30 | 260,789 | |||||||||
327,186 | Hanesbrands, Inc.‡ 9.066%, 03/08/30 1 mo. SOFR + 3.75% | 327,867 | |||||||||
153,526 | Life Time Fitness, Inc.‡ 9.591%, 01/15/26 3 mo. SOFR + 4.00% | 154,630 | |||||||||
| PRINCIPAL AMOUNT | VALUE | ||||||||||
256,100 | Light & Wonder International, Inc.‡ 8.071%, 04/14/29 1 mo. SOFR + 2.75% | $ | 256,989 | ||||||||
549,523 | PetSmart, Inc.‡ 9.166%, 02/11/28 1 mo. SOFR + 3.75% | 542,654 | |||||||||
140,000 | Station Casinos, LLC! 0.000%, 03/14/31 | 140,181 | |||||||||
120,000 | Station Casinos, LLC‡ 7.566%, 03/14/31 1 mo. SOFR + 2.25% | 120,155 | |||||||||
171,347 | TKC Holdings, Inc.‡ 10.930%, 05/15/28 1 mo. SOFR + 5.50% | 170,384 | |||||||||
264,175 | Windsor Holdings III, LLC‡ 9.319%, 08/01/30 1 mo. SOFR + 4.00% | 266,784 | |||||||||
3,728,842 | |||||||||||
Consumer Staples (0.4%) | |||||||||||
619,212 | Amneal Pharmaceuticals, LLC‡ 10.816%, 05/04/28 1 mo. SOFR + 5.50% | 620,568 | |||||||||
148,279 | Fiesta Purchaser, Inc.‡ 9.315%, 02/12/31 1 mo. SOFR + 4.00% | 149,048 | |||||||||
121,721 | Fiesta Purchaser, Inc.‡ 9.318%, 02/12/31 1 mo. SOFR + 4.00% | 122,353 | |||||||||
372,183 | Jazz Financing Lux Sarl‡ 8.430%, 05/05/28 1 mo. SOFR + 3.00% | 374,802 | |||||||||
275,000 | Star Parent, Inc.‡ 9.309%, 09/27/30 3 mo. SOFR + 4.00% | 275,258 | |||||||||
170,000 | United Natural Foods, Inc.! 0.000%, 04/25/31 | 168,513 | |||||||||
120,336 | United Natural Foods, Inc.‡ 8.680%, 10/22/25 1 mo. SOFR + 3.25% | 119,953 | |||||||||
1,830,495 | |||||||||||
Energy (0.1%) | |||||||||||
209,475 | Buckeye Partners, LP‡ 7.816%, 11/22/30 1 mo. SOFR + 2.50% | 210,471 | |||||||||
124,688 | New Fortress Energy, Inc.‡ 10.330%, 10/27/28 3 mo. SOFR + 5.00% | 125,545 | |||||||||
336,948 | Par Petroleum, LLC‡ 9.052%, 02/28/30 3 mo. SOFR + 3.75% | 338,527 | |||||||||
50,000 | Par Petroleum, LLC! 0.000%, 02/28/30 | 50,234 | |||||||||
724,777 | |||||||||||
CALAMOS CLOSED-END FAMILY OF FUNDS SEMIANNUAL REPORT
88
| PRINCIPAL AMOUNT | VALUE | ||||||||||
Financials (0.5%) | |||||||||||
300,000 | Advisor Group, Inc.! 0.000%, 08/17/28 | $ | 302,181 | ||||||||
64,838 | Advisor Group, Inc.‡ 9.816%, 08/17/28 1 mo. SOFR + 4.50% | 65,309 | |||||||||
215,520 | Alliant Holdings Intermediate, LLC‡ 8.819%, 11/06/30 1 mo. SOFR + 3.50% | 216,619 | |||||||||
203,465 | Amynta Agency Borrower, Inc.‡ 9.552%, 02/28/28 3 mo. SOFR + 4.25% | 204,410 | |||||||||
220,000 | AssuredPartners, Inc.! 0.000%, 02/14/31 | 221,212 | |||||||||
130,000 | AssuredPartners, Inc.‡ 8.816%, 02/14/31 1 mo. SOFR + 3.50% | 130,716 | |||||||||
203,976 | Avolon TLB Borrower 1 (US) LLC‡ 7.315%, 06/22/28 1 mo. SOFR + 2.00% | 204,645 | |||||||||
149,625 | Broadstreet Partners, Inc.‡ 9.066%, 01/27/29 1 mo. SOFR + 3.75% | 150,342 | |||||||||
259,350 | HUB International, Ltd.‡ 8.575%, 06/20/30 3 mo. SOFR + 3.25% | 260,954 | |||||||||
650 | HUB International, Ltd.‡ 8.565%, 06/20/30 3 mo. SOFR + 3.25% | 654 | |||||||||
194,513 | Iron Mountain, Inc.‡ 7.566%, 01/31/31 1 mo. SOFR + 2.25% | 194,350 | |||||||||
130,000 | Level 3 Financing, Inc.! 0.000%, 04/15/29 | 128,074 | |||||||||
350,197 | VFH Parent, LLC‡ 8.416%, 01/13/29 1 mo. SOFR + 3.00% | 350,691 | |||||||||
2,430,157 | |||||||||||
Health Care (0.2%) | |||||||||||
120,663 | Icon Luxembourg Sarl‡ 7.309%, 07/03/28 3 mo. SOFR + 2.00% | 121,308 | |||||||||
282,353 | Padagis, LLC‡ 10.314%, 07/06/28 3 mo. SOFR + 4.75% | 259,765 | |||||||||
30,063 | PRA Health Sciences, Inc.‡ 7.309%, 07/03/28 3 mo. SOFR + 2.00% | 30,224 | |||||||||
674,790 | Team Health Holdings, Inc.‡ 10.580%, 03/02/27 3 mo. SOFR + 5.25% | 593,211 | |||||||||
1,935 | Team Health Holdings, Inc.‡ 10.565%, 03/02/27 1 mo. SOFR + 5.25% | 1,701 | |||||||||
1,006,209 | |||||||||||
| PRINCIPAL AMOUNT | VALUE | ||||||||||
Industrials (0.2%) | |||||||||||
264,321 | ACProducts, Inc.‡ 9.814%, 05/17/28 3 mo. SOFR + 4.25% | $ | 230,223 | ||||||||
251,150 | ChampionX Corp.‡ 8.168%, 06/07/29 1 mo. SOFR + 2.75% | 252,563 | |||||||||
118,430 | Emrld Borrower, LP‡ 7.816%, 05/31/30 1 mo. SOFR + 2.50% | 118,933 | |||||||||
30,000 | MI Windows & Doors, LLC‡ 8.816%, 03/21/31 1 mo. SOFR + 3.50% | 30,175 | |||||||||
269,325 | TransDigm, Inc.‡ 8.559%, 02/28/31 1 mo. SOFR + 3.25% | 271,209 | |||||||||
903,103 | |||||||||||
Information Technology (0.3%) | |||||||||||
368,635 | Banff Merger Sub, Inc.‡ 9.566%, 12/29/28 1 mo. SOFR + 4.25% | 371,350 | |||||||||
204,988 | Camelot US Acquisition LLC‡ 8.066%, 01/31/31 1 mo. SOFR + 2.75% | 205,628 | |||||||||
249,513 | Central Parent, Inc.‡ 9.309%, 07/06/29 3 mo. SOFR + 4.00% | 250,817 | |||||||||
266,830 | Dun & Bradstreet Corp.‡ 8.068%, 01/18/29 1 mo. SOFR + 2.75% | 267,776 | |||||||||
234,864 | II-VI, Inc.‡ 7.829%, 07/02/29 1 mo. SOFR + 2.50% | 236,258 | |||||||||
130,000 | UKG, Inc.‡ 8.814%, 02/10/31 3 mo. SOFR + 3.50% | 130,745 | |||||||||
1,462,574 | |||||||||||
Materials (0.3%) | |||||||||||
199,000 | Chemours Company‡ 8.817%, 08/18/28 1 mo. SOFR + 3.50% | 199,187 | |||||||||
272,938 | Ineos US Finance, LLC‡ 8.930%, 02/18/30 1 mo. SOFR + 3.50% | 273,961 | |||||||||
195,602 | Innophos, Inc.‡ 8.930%, 02/05/27 1 mo. SOFR + 3.50% | 195,828 | |||||||||
332,488 | LSF11 A5 Holdco, LLC‡ 9.666%, 10/15/28 1 mo. SOFR + 4.25% | 333,818 | |||||||||
193,319 | Trinseo Materials Operating SCA‡ 7.824%, 05/03/28 3 mo. SOFR + 2.50% | 135,091 | |||||||||
252,118 | W.R. Grace & Co.-Conn.‡ 9.321%, 09/22/28 3 mo. SOFR + 3.75% | 252,860 | |||||||||
1,390,745 | |||||||||||
www.calamos.com
89
| PRINCIPAL AMOUNT | VALUE | ||||||||||
Special Purpose Acquisition Companies (0.1%) | |||||||||||
137,550 | Clydesdale Acquisition Holdings, Inc.‡ 9.091%, 04/13/29 1 mo. SOFR + 3.67% | $ | 138,299 | ||||||||
63,700 | Fertitta Entertainment, LLC‡ 9.069%, 01/27/29 1 mo. SOFR + 3.75% | 63,919 | |||||||||
256,100 | Patagonia Holdco, LLC‡ 11.064%, 08/01/29 3 mo. SOFR + 5.75% | 238,173 | |||||||||
440,391 | |||||||||||
TOTAL BANK LOANS (Cost $15,852,848) | 15,626,843 | ||||||||||
| NUMBER OF SHARES | VALUE | ||||||||||
CONVERTIBLE PREFERRED STOCKS (4.5%) | |||||||||||
Energy (0.0%) | |||||||||||
7 | Gulfport Energy Corp.# 10.000%, 05/31/24 15.000% PIK rate | 81,025 | |||||||||
Financials (2.5%) | |||||||||||
72,795 | Apollo Global Management, Inc.~ 6.750%, 07/31/26 | 4,439,039 | |||||||||
7,055 | Bank of America Corp.~‡‡ 7.250%, 12/31/49 | 8,113,250 | |||||||||
12,552,289 | |||||||||||
Industrials (0.7%) | |||||||||||
65,985 | Chart Industries, Inc.~ 6.750%, 12/15/25 | 3,791,498 | |||||||||
Utilities (1.3%) | |||||||||||
156,300 | NextEra Energy, Inc.^~ 6.926%, 09/01/25 | 6,369,225 | |||||||||
TOTAL CONVERTIBLE (Cost $24,914,246) | 22,794,037 | ||||||||||
COMMON STOCKS (0.2%) | |||||||||||
Communication Services (0.0%) | |||||||||||
5,620 | Altice USA, Inc. - Class A# | 10,847 | |||||||||
1,888 | Cumulus Media, Inc. - Class Aµ# | 4,965 | |||||||||
15,812 | |||||||||||
Consumer Staples (0.0%) | |||||||||||
1,926 | Mallinckrodt, PLC# | 102,078 | |||||||||
Energy (0.2%) | |||||||||||
380 | Chesapeake Energy Corp.µ | 34,154 | |||||||||
18,535 | Energy Transfer, LP | 291,556 | |||||||||
11,035 | Enterprise Products Partners, LP | 309,863 | |||||||||
1,881 | EP Energy Corp.#& | 4,467 | |||||||||
8 | Gulfport Energy Corp.µ# | 1,270 | |||||||||
641,310 | |||||||||||
| NUMBER OF SHARES | VALUE | ||||||||||
Special Purpose Acquisition Company (0.0%) | |||||||||||
3,168 | Intelsat Emergence, SA#& | $ | 114,840 | ||||||||
TOTAL COMMON STOCKS (Cost $1,063,081) | 874,040 | ||||||||||
PREFERRED STOCKS (0.2%) | |||||||||||
Communication Services (0.0%) | |||||||||||
3,265 | United States Cellular Corp.µ 5.500%, 06/01/70 | 57,627 | |||||||||
3,130 | United States Cellular Corp.µ 5.500%, 03/01/70 | 55,620 | |||||||||
113,247 | |||||||||||
Consumer Discretionary (0.1%) | |||||||||||
1,722 | Guitar Center, Inc.#& | 135,177 | |||||||||
Energy (0.1%) | |||||||||||
8,160 | NuStar Energy, LP‡ 11.234%, 05/30/24 3 mo. USD LIBOR + 5.64% | 208,162 | |||||||||
2,000 | NuStar Energy, LP‡ 12.357%, 05/30/24 3 mo. SOFR + 7.03% | 51,140 | |||||||||
12,000 | NuStar Logistics, LP‡~ 12.324%, 01/15/43 3 mo. SOFR + 6.98% | 304,320 | |||||||||
563,622 | |||||||||||
TOTAL PREFERRED STOCKS (Cost $840,192) | 812,046 | ||||||||||
WARRANTS (0.0%)# | |||||||||||
Energy (0.0%) | |||||||||||
13,522 | Mcdermott International, Ltd.& 06/30/27, Strike $15.98 | 1 | |||||||||
12,170 | Mcdermott International, Ltd. 06/30/27, Strike $12.33 | 1 | |||||||||
TOTAL WARRANTS (Cost $5,195) | 2 | ||||||||||
| NUMBER OF CONTRACTS/ NOTIONAL AMOUNT | VALUE | ||||||||||
PURCHASED OPTION (0.1%)# | |||||||||||
Industrials (0.1%) | |||||||||||
2,750 | American Airlines Group, Inc. | ||||||||||
3,715,250 | Call, 06/20/25, Strike $17.00 (Cost $672,710) | 342,375 | |||||||||
TOTAL INVESTMENTS (154.2%) (Cost $793,239,835) | 771,729,396 | ||||||||||
| MANDATORY REDEEMABLE PREFERRED SHARES, AT LIQUIDATION VALUE (-18.4%) | (92,000,000 | ) | |||||||||
LIABILITIES, LESS OTHER ASSETS (-35.8%) | (179,369,500 | ) | |||||||||
NET ASSETS (100.0%) | $ | 500,359,896 | |||||||||
CALAMOS CLOSED-END FAMILY OF FUNDS SEMIANNUAL REPORT
90
NOTES TO SCHEDULE OF INVESTMENTS
* Securities issued and sold pursuant to a Rule 144A transaction are exempted from the registration requirement of the Securities Act of 1933, as amended. These securities may only be sold to qualified institutional buyers ("QIBs"), such as the Funds. Any resale of these securities must generally be effected through a sale that is registered under the Act or otherwise exempted from such registration requirements.
µ Security, or portion of security, is held in a segregated account as collateral for note payable aggregating a total value of $333,703,129.
@ In default status and considered non-income producing.
^ Security, or portion of security, is on loan.
‡ Variable rate security. The rate shown is the rate in effect at April 30, 2024.
~ Security, or portion of security, is segregated as collateral (or collateral for potential future transactions) for written options. The aggregate value of such securities is $5,697,046.
¡ Bank loans generally are subject to mandatory and/or optional prepayment. As a result, the actual remaining maturity of bank loans may be substantially less than the stated maturities shown.
! This position represents an unsettled loan commitment at period end. Certain details associated with this purchase are not known prior to the settlement date, including coupon rate, which will be adjusted on settlement date.
# Non-income producing security.
‡‡ Perpetual maturity.
& Illiquid security.
ABBREVIATION
ADR American Depositary Receipt
Note: The date on options represents the expiration date of the option contract. The option contract may be exercised at any date on or before the date shown.
The following table summarizes the Fund's investments and derivative financial instruments categorized in the fair value hierarchy as of April 30, 2024 (see Note 1):
LEVEL 1 | LEVEL 2 | LEVEL 3 | TOTAL | ||||||||||||||||
Assets: | |||||||||||||||||||
Asset Backed Securities | $ | — | $ | 195,401 | $ | — | $ | 195,401 | |||||||||||
Corporate Bonds | — | 82,460,617 | — | 82,460,617 | |||||||||||||||
Convertible Bonds | — | 648,624,035 | — | 648,624,035 | |||||||||||||||
Bank Loans | — | 15,626,843 | — | 15,626,843 | |||||||||||||||
Convertible Preferred Stocks | 22,713,012 | 81,025 | — | 22,794,037 | |||||||||||||||
Common Stocks | 652,655 | 221,385 | — | 874,040 | |||||||||||||||
Preferred Stocks | 676,869 | 135,177 | — | 812,046 | |||||||||||||||
Warrants | — | 2 | — | 2 | |||||||||||||||
Purchased Options | 342,375 | — | — | 342,375 | |||||||||||||||
Total | $ | 24,384,911 | $ | 747,344,485 | $ | — | $ | 771,729,396 | |||||||||||
See accompanying Notes to Schedule of Investments
www.calamos.com
91
SECTOR WEIGHTINGS
Information Technology | 28.3 | % | |||||
Health Care | 17.9 | ||||||
Consumer Discretionary | 17.8 | ||||||
Industrials | 8.2 | ||||||
Communication Services | 6.4 | ||||||
Financials | 5.0 | ||||||
Utilities | 4.4 | ||||||
Energy | 4.0 | ||||||
Materials | 1.8 | ||||||
Consumer Staples | 1.2 | ||||||
Real Estate | 0.7 | ||||||
Airlines | 0.2 | ||||||
Special Purpose Acquisition Companies | 0.1 | ||||||
Sector weightings are based on managed assets and may vary over time. Sector Weightings exclude any government/sovereign bonds or options on broad market indexes the Fund may hold.
ASSET ALLOCATION
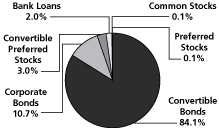
Fund asset allocations are based on total investments and may vary over time.
CALAMOS CLOSED-END FAMILY OF FUNDS SEMIANNUAL REPORT
92
| PRINCIPAL AMOUNT | VALUE | ||||||||||
ASSET BACKED SECURITY (0.0%) | |||||||||||
Other (0.0%) | |||||||||||
170,000 | SVC ABS, LLC Series 2023-1A, Class C*~ 6.700%, 02/20/53 (Cost $157,891) | $ | 154,503 | ||||||||
CORPORATE BONDS (14.4%) | |||||||||||
Airlines (0.2%) | |||||||||||
188,667 | Alaska Airlines Pass Through Trust Series 2020-1, Class A*µ 4.800%, 02/15/29 | 183,188 | |||||||||
78,331 | Alaska Airlines Pass Through Trust Series 2020-1, Class B* 8.000%, 02/15/27 | 79,220 | |||||||||
222,305 | American Airlines Pass Through Trust Series 2021-1, Class B 3.950%, 01/11/32 | 201,542 | |||||||||
112,667 | American Airlines, Inc. / AAdvantage Loyalty IP, Ltd.* 5.500%, 04/20/26 | 111,481 | |||||||||
205,354 | British Airways Pass Through Trust Series 2021-1, Class B* 3.900%, 03/15/33 | 186,603 | |||||||||
168,998 | JetBlue Pass Through Trust Series 2020-1, Class B 7.750%, 05/15/30 | 173,000 | |||||||||
935,034 | |||||||||||
Communication Services (1.3%) | |||||||||||
200,000 | Altice France Holding, SA* 10.500%, 05/15/27 | 71,698 | |||||||||
250,000 | Altice France, SA* 5.500%, 10/15/29 | 164,000 | |||||||||
260,000 | APi Group DE, Inc.* 4.750%, 10/15/29 | 236,873 | |||||||||
225,000 | Ashtead Capital, Inc.* 2.450%, 08/12/31 | 178,749 | |||||||||
273,000 | Audacy Capital Corp.*@ 6.750%, 03/31/29 | 9,637 | |||||||||
100,000 | 6.500%, 05/01/27 | 3,569 | |||||||||
195,000 | Cincinnati Bell Telephone Company, LLC 6.300%, 12/01/28 | 177,949 | |||||||||
105,000 | Clear Channel Outdoor Holdings, Inc.* 7.875%, 04/01/30 | 103,022 | |||||||||
95,000 | 9.000%, 09/15/28^ | 97,791 | |||||||||
304,000 | Consolidated Communications, Inc.* 6.500%, 10/01/28 | 264,024 | |||||||||
400,000 | CSC Holdings, LLC* 4.625%, 12/01/30 | 174,032 | |||||||||
335,000 | 5.375%, 02/01/28 | 258,352 | |||||||||
300,000 | 5.750%, 01/15/30 | 131,664 | |||||||||
200,000 | 5.500%, 04/15/27 | 164,172 | |||||||||
200,000 | 4.500%, 11/15/31 | 127,172 | |||||||||
| PRINCIPAL AMOUNT | VALUE | ||||||||||
117,000 | Directv Financing, LLC / Directv Financing Co-Obligor, Inc.* 5.875%, 08/15/27 | $ | 109,125 | ||||||||
225,000 | Frontier California, Inc. 6.750%, 05/15/27 | 214,430 | |||||||||
54,000 | Frontier Communications Holdings, LLC* 8.750%, 05/15/30 | 55,030 | |||||||||
352,000 | Frontier Florida, LLC 6.860%, 02/01/28 | 335,364 | |||||||||
330,000 | Frontier North, Inc. 6.730%, 02/15/28 | 312,989 | |||||||||
195,000 | Go Daddy Operating Company, LLC / GD Finance Company, Inc.* 3.500%, 03/01/29 | 173,246 | |||||||||
69,000 | 5.250%, 12/01/27 | 66,709 | |||||||||
52,000 | Hughes Satellite Systems Corp. 6.625%, 08/01/26 | 29,956 | |||||||||
135,000 | iHeartCommunications, Inc. 8.375%, 05/01/27 | 71,956 | |||||||||
80,000 | 5.250%, 08/15/27*^ | 58,788 | |||||||||
265,000 | LCPR Senior Secured Financing DAC* 6.750%, 10/15/27 | 245,689 | |||||||||
167,354 | Ligado Networks, LLC* 15.500%, 11/01/23 15.500% PIK rate | 27,736 | |||||||||
160,000 | Lumen Technologies, Inc. 7.600%, 09/15/39 | 48,970 | |||||||||
100,000 | 4.000%, 02/15/27* | 53,241 | |||||||||
52,000 | 7.650%, 03/15/42 | 15,922 | |||||||||
109,000 | Match Group Holdings II, LLC* 3.625%, 10/01/31 | 90,106 | |||||||||
125,000 | Nexstar Media, Inc.* 5.625%, 07/15/27 | 117,640 | |||||||||
205,000 | Paramount Global 4.900%, 08/15/44 | 143,717 | |||||||||
73,000 | Qwest Corp. 7.250%, 09/15/25 | 72,353 | |||||||||
111,000 | Scripps Escrow II, Inc.* 3.875%, 01/15/29 | 82,138 | |||||||||
56,000 | 5.375%, 01/15/31 | 33,165 | |||||||||
210,000 | Scripps Escrow, Inc.* 5.875%, 07/15/27 | 166,024 | |||||||||
225,000 | Sirius XM Radio, Inc.* 5.500%, 07/01/29 | 209,822 | |||||||||
217,000 | 4.000%, 07/15/28 | 193,471 | |||||||||
110,000 | 3.125%, 09/01/26 | 102,710 | |||||||||
54,000 | 3.875%, 09/01/31^ | 43,446 | |||||||||
202,000 | Spanish Broadcasting System, Inc.* 9.750%, 03/01/26 | 96,287 | |||||||||
245,000 | Stagwell Global, LLC* 5.625%, 08/15/29 | 219,777 | |||||||||
114,000 | Telesat Canada / Telesat, LLC* 4.875%, 06/01/27 | 52,171 | |||||||||
85,000 | Time Warner Cable, LLC 7.300%, 07/01/38 | 82,557 | |||||||||
www.calamos.com
93
| PRINCIPAL AMOUNT | VALUE | ||||||||||
245,000 | United States Cellular Corp. 6.700%, 12/15/33 | $ | 239,223 | ||||||||
160,000 | Univision Communications, Inc.* 8.000%, 08/15/28 | 160,376 | |||||||||
105,000 | Viasat, Inc.* 5.625%, 04/15/27 | 96,266 | |||||||||
6,183,104 | |||||||||||
Consumer Discretionary (3.0%) | |||||||||||
265,000 | Abercrombie & Fitch Management Company* 8.750%, 07/15/25 | 267,253 | |||||||||
210,000 | Adams Homes, Inc.* 9.250%, 10/15/28 | 217,100 | |||||||||
155,000 | Adient Global Holdings Company* 8.250%, 04/15/31 | 161,116 | |||||||||
185,000 | American Axle & Manufacturing, Inc.^ 5.000%, 10/01/29 | 167,018 | |||||||||
190,000 | Ashton Woods USA, LLC / Ashton Woods Finance Company* 4.625%, 08/01/29 | 172,110 | |||||||||
139,000 | 6.625%, 01/15/28 | 138,798 | |||||||||
267,000 | At Home Group, Inc.* 4.875%, 07/15/28 | 126,934 | |||||||||
292,000 | Bath & Body Works, Inc. 6.694%, 01/15/27 | 294,260 | |||||||||
165,000 | 6.875%, 11/01/35 | 164,282 | |||||||||
136,000 | Caesars Entertainment, Inc.* 4.625%, 10/15/29 | 121,350 | |||||||||
112,000 | 8.125%, 07/01/27 | 113,745 | |||||||||
108,000 | Carnival Corp.* 7.625%, 03/01/26 | 108,729 | |||||||||
105,000 | 4.000%, 08/01/28 | 95,933 | |||||||||
13,000 | 7.000%, 08/15/29 | 13,358 | |||||||||
46,806 | Carvana Company* 14.000%, 06/01/31 | 46,983 | |||||||||
39,191 | 13.000%, 06/01/30 | 38,941 | |||||||||
26,366 | 12.000%, 12/01/28 | 25,828 | |||||||||
470,000 | CCO Holdings, LLC / CCO Holdings Capital Corp.* 5.125%, 05/01/27 | 441,264 | |||||||||
250,000 | 6.375%, 09/01/29 | 229,178 | |||||||||
245,000 | 4.750%, 03/01/30 | 203,972 | |||||||||
215,000 | 4.250%, 02/01/31 | 168,973 | |||||||||
125,000 | 5.000%, 02/01/28 | 113,996 | |||||||||
125,000 | 4.500%, 08/15/30 | 101,754 | |||||||||
108,000 | 4.750%, 02/01/32 | 85,011 | |||||||||
108,000 | CDI Escrow Issuer, Inc.* 5.750%, 04/01/30 | 103,060 | |||||||||
137,000 | Cedar Fair, LP^ 5.250%, 07/15/29 | 128,058 | |||||||||
105,000 | Churchill Downs, Inc.* 6.750%, 05/01/31 | 104,295 | |||||||||
175,000 | Dana, Inc. 4.250%, 09/01/30 | 152,066 | |||||||||
164,000 | 4.500%, 02/15/32 | 139,154 | |||||||||
| PRINCIPAL AMOUNT | VALUE | ||||||||||
220,000 | DISH DBS Corp. 5.125%, 06/01/29 | $ | 88,893 | ||||||||
170,000 | 5.250%, 12/01/26* | 134,091 | |||||||||
133,000 | 7.375%, 07/01/28 | 59,701 | |||||||||
129,000 | 7.750%, 07/01/26 | 81,367 | |||||||||
100,000 | 5.750%, 12/01/28* | 67,871 | |||||||||
220,000 | DISH Network Corp.* 11.750%, 11/15/27 | 222,015 | |||||||||
200,000 | Empire Resorts, Inc.* 7.750%, 11/01/26 | 186,492 | |||||||||
238,000 | Everi Holdings, Inc.* 5.000%, 07/15/29 | 233,780 | |||||||||
220,000 | Ford Motor Company 6.100%, 08/19/32 | 215,871 | |||||||||
350,000 | Ford Motor Credit Company, LLC 4.000%, 11/13/30 | 305,526 | |||||||||
300,000 | 5.113%, 05/03/29 | 285,954 | |||||||||
275,000 | 7.200%, 06/10/30 | 285,153 | |||||||||
200,000 | 7.350%, 11/04/27 | 206,950 | |||||||||
82,000 | Gap, Inc.* 3.875%, 10/01/31 | 67,081 | |||||||||
110,000 | General Motors Company 5.200%, 04/01/45 | 94,243 | |||||||||
365,000 | goeasy, Ltd.* 9.250%, 12/01/28 | 386,356 | |||||||||
188,000 | 7.625%, 07/01/29 | 188,308 | |||||||||
110,000 | Goodyear Tire & Rubber Company 5.250%, 07/15/31^ | 97,451 | |||||||||
105,000 | 5.625%, 04/30/33 | 92,406 | |||||||||
93,000 | Group 1 Automotive, Inc.* 4.000%, 08/15/28 | 84,839 | |||||||||
226,000 | Guitar Center, Inc.*^& 8.500%, 01/15/26 | 199,850 | |||||||||
145,000 | International Game Technology, PLC* 6.250%, 01/15/27 | 144,914 | |||||||||
57,985 | JetBlue Pass Through Trust Series 2019-2, Class B 8.000%, 11/15/27 | 58,588 | |||||||||
230,000 | Kohl's Corp. 5.550%, 07/17/45 | 157,966 | |||||||||
210,000 | LCM Investments Holdings II, LLC* 8.250%, 08/01/31 | 218,555 | |||||||||
220,000 | Liberty Interactive, LLC 8.250%, 02/01/30 | 122,217 | |||||||||
204,000 | Life Time, Inc.* 8.000%, 04/15/26 | 204,343 | |||||||||
105,000 | Light & Wonder International, Inc.* 7.500%, 09/01/31 | 107,154 | |||||||||
80,000 | Lindblad Expeditions Holdings, Inc.* 9.000%, 05/15/28 | 83,890 | |||||||||
139,000 | Lindblad Expeditions, LLC* 6.750%, 02/15/27 | 137,944 | |||||||||
140,000 | M/I Homes, Inc. 3.950%, 02/15/30 | 121,584 | |||||||||
CALAMOS CLOSED-END FAMILY OF FUNDS SEMIANNUAL REPORT
94
| PRINCIPAL AMOUNT | VALUE | ||||||||||
261,000 | Macy's Retail Holdings, LLC 6.700%, 07/15/34* | $ | 219,976 | ||||||||
160,000 | 4.300%, 02/15/43 | 126,563 | |||||||||
287,000 | Midwest Gaming Borrower, LLC / Midwest Gaming Finance Corp.* 4.875%, 05/01/29 | 262,505 | |||||||||
125,000 | Newell Brands, Inc. 5.700%, 04/01/26 | 123,313 | |||||||||
110,000 | Nordstrom, Inc. 5.000%, 01/15/44 | 83,585 | |||||||||
105,000 | 6.950%, 03/15/28 | 104,339 | |||||||||
105,000 | 4.250%, 08/01/31 | 90,638 | |||||||||
327,000 | Patrick Industries, Inc.* 4.750%, 05/01/29 | 297,547 | |||||||||
250,000 | PENN Entertainment, Inc.*^ 4.125%, 07/01/29 | 209,528 | |||||||||
105,000 | Phinia, Inc.* 6.750%, 04/15/29 | 105,449 | |||||||||
305,000 | Premier Entertainment Sub, LLC / Premier Entertainment Finance Corp.*^ 5.625%, 09/01/29 | 227,893 | |||||||||
110,000 | QVC, Inc. 5.450%, 08/15/34 | 72,263 | |||||||||
105,000 | Raising Cane's Restaurants, LLC* 9.375%, 05/01/29 | 112,702 | |||||||||
448,000 | Rite Aid Corp.*@ 8.000%, 11/15/26 | 289,108 | |||||||||
105,000 | Royal Caribbean Cruises, Ltd.* 7.250%, 01/15/30 | 108,176 | |||||||||
26,000 | 6.250%, 03/15/32 | 25,634 | |||||||||
320,000 | Simmons Foods, Inc. / Simmons Prepared Foods, Inc. / Simmons Pet Food, Inc. / Simmons Feed* 4.625%, 03/01/29 | 276,800 | |||||||||
320,000 | Six Flags Entertainment Corp.* 7.250%, 05/15/31 | 319,622 | |||||||||
241,000 | Sonic Automotive, Inc.* 4.625%, 11/15/29 | 215,929 | |||||||||
131,000 | Speedway Motorsports, LLC / Speedway Funding II, Inc.* 4.875%, 11/01/27 | 123,633 | |||||||||
220,000 | Station Casinos, LLC* 4.500%, 02/15/28 | 204,217 | |||||||||
210,000 | STL Holding Company, LLC* 8.750%, 02/15/29 | 216,008 | |||||||||
128,000 | Taylor Morrison Communities, Inc.* 5.750%, 01/15/28 | 124,773 | |||||||||
55,000 | Viking Cruises, Ltd.* 9.125%, 07/15/31 | 59,039 | |||||||||
260,000 | Vista Outdoor, Inc.* 4.500%, 03/15/29 | 257,000 | |||||||||
210,000 | ZF North America Capital, Inc.* 7.125%, 04/14/30 | 215,074 | |||||||||
13,657,186 | |||||||||||
| PRINCIPAL AMOUNT | VALUE | ||||||||||
Consumer Staples (0.7%) | |||||||||||
224,000 | 1375209 B.C., Ltd.*^ 9.000%, 01/30/28 | $ | 220,165 | ||||||||
310,000 | Arrow Bidco, LLC* 10.750%, 06/15/25 | 319,784 | |||||||||
205,000 | B&G Foods, Inc.* 8.000%, 09/15/28 | 212,753 | |||||||||
251,000 | Central Garden & Pet Company* 4.125%, 04/30/31 | 217,848 | |||||||||
245,000 | Edgewell Personal Care Company* 4.125%, 04/01/29 | 222,186 | |||||||||
307,000 | Energizer Holdings, Inc.* 4.375%, 03/31/29 | 271,544 | |||||||||
54,000 | 6.500%, 12/31/27^ | 53,523 | |||||||||
320,000 | JBS USA LUX, SA / JBS USA Food Company / JBS USA Finance, Inc. 5.500%, 01/15/30 | 309,162 | |||||||||
135,000 | 5.125%, 02/01/28µ^ | 131,270 | |||||||||
80,000 | 5.750%, 04/01/33 | 76,605 | |||||||||
174,000 | New Albertsons, LP 7.750%, 06/15/26 | 179,204 | |||||||||
217,000 | Performance Food Group, Inc.* 4.250%, 08/01/29 | 194,584 | |||||||||
165,000 | Pilgrim's Pride Corp. 4.250%, 04/15/31 | 146,127 | |||||||||
105,000 | Post Holdings, Inc.* 6.250%, 02/15/32 | 103,856 | |||||||||
209,000 | Prestige Brands, Inc.* 3.750%, 04/01/31 | 178,066 | |||||||||
195,000 | United Natural Foods, Inc.* 6.750%, 10/15/28 | 149,906 | |||||||||
237,000 | Vector Group, Ltd.* 5.750%, 02/01/29 | 215,668 | |||||||||
3,202,251 | |||||||||||
Energy (2.0%) | |||||||||||
106,000 | Antero Resources Corp.* 5.375%, 03/01/30 | 100,865 | |||||||||
223,000 | Apache Corp. 5.100%, 09/01/40 | 185,714 | |||||||||
135,000 | Buckeye Partners, LP 5.850%, 11/15/43 | 113,031 | |||||||||
112,000 | Cheniere Energy, Inc.µ 4.625%, 10/15/28 | 107,166 | |||||||||
167,000 | Chesapeake Energy Corp.* 6.750%, 04/15/29 | 167,190 | |||||||||
297,000 | Civitas Resources, Inc.* 8.750%, 07/01/31 | 316,067 | |||||||||
110,000 | Continental Resources, Inc. 2.875%, 04/01/32* | 87,943 | |||||||||
105,000 | 4.900%, 06/01/44 | 84,659 | |||||||||
169,000 | DT Midstream, Inc.* 4.125%, 06/15/29 | 153,202 | |||||||||
www.calamos.com
95
| PRINCIPAL AMOUNT | VALUE | ||||||||||
207,000 | Earthstone Energy Holdings, LLC* 8.000%, 04/15/27 | $ | 213,003 | ||||||||
80,000 | 9.875%, 07/15/31 | 88,526 | |||||||||
120,000 | Enbridge, Inc.‡ 7.375%, 01/15/83 5 year CMT + 3.71% | 118,112 | |||||||||
115,000 | Encino Acquisition Partners Holdings, LLC* 8.750%, 05/01/31 | 117,149 | |||||||||
320,000 | Energy Transfer, LP‡ 8.606%, 11/01/66 3 mo. SOFR + 3.28% | 290,675 | |||||||||
162,000 | 6.500%, 11/15/26 5 year CMT + 5.69% | 157,365 | |||||||||
240,000 | EnLink Midstream Partners, LP 9.701%, 05/31/24‡ 3 mo. SOFR + 4.37% | 237,017 | |||||||||
224,000 | 4.850%, 07/15/26 | 218,396 | |||||||||
132,000 | Enlink Midstream, LLC* 6.500%, 09/01/30 | 133,698 | |||||||||
355,000 | EQM Midstream Partners, LP* 7.500%, 06/01/27 | 361,688 | |||||||||
110,000 | 6.375%, 04/01/29 | 109,297 | |||||||||
138,000 | Genesis Energy, LP / Genesis Energy Finance Corp. 8.875%, 04/15/30 | 142,958 | |||||||||
88,000 | 6.250%, 05/15/26 | 87,372 | |||||||||
205,000 | Gulfport Energy Corp. 8.000%, 05/17/26* | 208,085 | |||||||||
65,902 | 8.000%, 05/17/26 | 66,894 | |||||||||
305,000 | Hilcorp Energy I, LP / Hilcorp Finance Company* 6.000%, 04/15/30 | 293,072 | |||||||||
163,000 | Howard Midstream Energy Partners, LLC* 6.750%, 01/15/27 | 161,116 | |||||||||
210,000 | Kodiak Gas Services, LLC* 7.250%, 02/15/29 | 212,495 | |||||||||
217,000 | Magnolia Oil & Gas Operating, LLC / Magnolia Oil & Gas Finance Corp.* 6.000%, 08/01/26 | 214,120 | |||||||||
158,000 | Matador Resources Company* 6.500%, 04/15/32 | 156,709 | |||||||||
135,000 | Moss Creek Resources Holdings, Inc.* 10.500%, 05/15/27 | 138,228 | |||||||||
90,000 | 7.500%, 01/15/26 | 89,903 | |||||||||
160,000 | Nabors Industries, Inc.* 7.375%, 05/15/27 | 158,696 | |||||||||
80,000 | 9.125%, 01/31/30 | 82,805 | |||||||||
160,000 | Nabors Industries, Ltd.*^ 7.500%, 01/15/28 | 151,827 | |||||||||
144,000 | New Fortress Energy, Inc.* 6.750%, 09/15/25 | 142,479 | |||||||||
223,000 | Oceaneering International, Inc. 6.000%, 02/01/28 | 214,945 | |||||||||
| PRINCIPAL AMOUNT | VALUE | ||||||||||
230,000 | Parkland Corp.* 5.875%, 07/15/27 | $ | 224,977 | ||||||||
112,000 | Patterson-UTI Energy, Inc.^ 5.150%, 11/15/29 | 107,041 | |||||||||
52,000 | Permian Resources Operating LLC* 7.000%, 01/15/32 | 53,132 | |||||||||
270,000 | Plains All American Pipeline, LP‡ 9.679%, 05/31/24 3 mo. SOFR + 4.37% | 269,071 | |||||||||
305,000 | Rockcliff Energy II, LLC* 5.500%, 10/15/29 | 282,088 | |||||||||
109,000 | Southwestern Energy Company 4.750%, 02/01/32 | 98,289 | |||||||||
285,300 | Transocean, Inc.* 8.750%, 02/15/30 | 297,790 | |||||||||
105,000 | 8.250%, 05/15/29 | 104,432 | |||||||||
130,000 | Venture Global Calcasieu Pass, LLC* 6.250%, 01/15/30 | 128,887 | |||||||||
55,000 | 4.125%, 08/15/31 | 48,176 | |||||||||
55,000 | 3.875%, 08/15/29 | 48,598 | |||||||||
265,000 | Venture Global LNG, Inc.* 8.375%, 06/01/31 | 272,163 | |||||||||
155,000 | 8.125%, 06/01/28 | 158,667 | |||||||||
105,000 | 9.875%, 02/01/32 | 112,055 | |||||||||
105,000 | 9.500%, 02/01/29 | 112,951 | |||||||||
110,000 | Vital Energy, Inc. 7.875%, 04/15/32* | 111,739 | |||||||||
100,000 | 7.750%, 07/31/29* | 100,741 | |||||||||
79,000 | 9.750%, 10/15/30 | 86,150 | |||||||||
190,000 | VOC Escrow, Ltd.* 5.000%, 02/15/28 | 181,342 | |||||||||
262,000 | Weatherford International, Ltd.* 8.625%, 04/30/30 | 272,187 | |||||||||
8,952,943 | |||||||||||
Financials (2.5%) | |||||||||||
340,000 | Acrisure, LLC / Acrisure Finance, Inc.* 8.250%, 02/01/29 | 337,912 | |||||||||
323,000 | Aethon United BR, LP / Aethon United Finance Corp.* 8.250%, 02/15/26 | 325,620 | |||||||||
370,000 | Alliant Holdings Intermediate, LLC / Alliant Holdings Co-Issuer* 6.750%, 10/15/27 | 363,595 | |||||||||
30,000 | 7.000%, 01/15/31 | 30,184 | |||||||||
245,000 | Ally Financial, Inc. 4.700%, 05/15/26‡ 5 year CMT + 3.87% | 208,145 | |||||||||
100,000 | 4.700%, 05/15/28‡ 7 year CMT + 3.48% | 77,498 | |||||||||
90,000 | 8.000%, 11/01/31 | 97,538 | |||||||||
439,000 | AmWINS Group, Inc.* 4.875%, 06/30/29 | 399,666 | |||||||||
168,000 | Aviation Capital Group, LLC*^ 3.500%, 11/01/27 | 154,768 | |||||||||
CALAMOS CLOSED-END FAMILY OF FUNDS SEMIANNUAL REPORT
96
| PRINCIPAL AMOUNT | VALUE | ||||||||||
105,000 | Brandywine Operating Partnership, LP 8.875%, 04/12/29 | $ | 107,583 | ||||||||
329,000 | BroadStreet Partners, Inc.* 5.875%, 04/15/29 | 300,189 | |||||||||
255,000 | Brookfield Property REIT, Inc. / BPR Cumulus, LLC / BPR Nimbus, LLC / GGSI Sellco, LLC* 4.500%, 04/01/27 | 228,454 | |||||||||
200,000 | Burford Capital Global Financial, LLC* 6.875%, 04/15/30 | 194,066 | |||||||||
205,000 | Credit Acceptance Corp. 6.625%, 03/15/26^ | 204,510 | |||||||||
140,000 | 9.250%, 12/15/28* | 148,571 | |||||||||
210,000 | Cushman & Wakefield U.S. Borrower LLC* 8.875%, 09/01/31 | 218,515 | |||||||||
283,000 | Enact Holdings, Inc.*µ 6.500%, 08/15/25 | 282,878 | |||||||||
235,000 | GGAM Finance, Ltd.* 8.000%, 02/15/27 | 241,458 | |||||||||
278,000 | Global Net Lease, Inc. / Global Net Lease Operating Partnership, LP* 3.750%, 12/15/27 | 236,778 | |||||||||
225,000 | GTCR W-2 Merger Sub, LLC* 7.500%, 01/15/31 | 232,200 | |||||||||
120,000 | HAT Holdings I LLC / HAT Holdings II LLC* 8.000%, 06/15/27 | 123,230 | |||||||||
324,000 | HUB International, Ltd.* 5.625%, 12/01/29 | 298,952 | |||||||||
105,000 | 7.375%, 01/31/32 | 104,567 | |||||||||
164,000 | Icahn Enterprises, LP / Icahn Enterprises Finance Corp. 4.375%, 02/01/29 | 138,195 | |||||||||
275,000 | ILFC E-Capital Trust II*‡ 7.395%, 12/21/65 3 mo. SOFR + 2.06% | 219,714 | |||||||||
435,000 | Iron Mountain, Inc.* 5.250%, 03/15/28 | 416,782 | |||||||||
600,000 | Jefferies Finance, LLC / JFIN Co-Issuer Corp.* 5.000%, 08/15/28 | 540,444 | |||||||||
387,000 | Ladder Capital Finance Holdings, LLLP / Ladder Capital Finance Corp.* 5.250%, 10/01/25 | 380,665 | |||||||||
224,000 | 4.750%, 06/15/29 | 200,343 | |||||||||
205,000 | LD Holdings Group, LLC* 6.125%, 04/01/28 | 155,624 | |||||||||
235,000 | Level 3 Financing, Inc.* 4.250%, 07/01/28 | 91,941 | |||||||||
105,000 | 4.625%, 09/15/27 | 61,924 | |||||||||
162,000 | LPL Holdings, Inc.*µ 4.000%, 03/15/29 | 147,090 | |||||||||
210,000 | Macquarie Airfinance Holdings, Ltd.* 8.125%, 03/30/29 | 220,120 | |||||||||
| PRINCIPAL AMOUNT | VALUE | ||||||||||
138,952 | Mallinckrodt International Finance, SA / Mallinckrodt CB, LLC* 14.750%, 11/14/28 | $ | 151,554 | ||||||||
344,000 | MetLife, Inc. 6.400%, 12/15/66 | 343,150 | |||||||||
300,000 | Nationstar Mortgage Holdings, Inc.* 5.500%, 08/15/28 | 282,390 | |||||||||
228,000 | Navient Corp. 5.000%, 03/15/27 | 215,348 | |||||||||
115,000 | 4.875%, 03/15/28 | 104,093 | |||||||||
150,000 | Necessity Retail REIT, Inc. / American Finance Operating Partner, LP* 4.500%, 09/30/28 | 128,085 | |||||||||
105,000 | Newmark Group, Inc.* 7.500%, 01/12/29 | 106,161 | |||||||||
150,000 | OneMain Finance Corp. 3.875%, 09/15/28 | 132,359 | |||||||||
145,000 | 9.000%, 01/15/29 | 152,436 | |||||||||
108,000 | 7.125%, 03/15/26 | 109,055 | |||||||||
341,000 | PHH Mortgage Corp.* 7.875%, 03/15/26 | 327,943 | |||||||||
260,000 | RHP Hotel Properties, LP / RHP Finance Corp.* 4.500%, 02/15/29 | 239,577 | |||||||||
215,000 | 6.500%, 04/01/32 | 210,982 | |||||||||
100,000 | Rocket Mortgage, LLC / Rocket Mortgage Co-Issuer, Inc.* 3.875%, 03/01/31 | 85,190 | |||||||||
100,000 | 3.625%, 03/01/29 | 88,327 | |||||||||
50,000 | 2.875%, 10/15/26 | 46,006 | |||||||||
265,000 | StoneX Group, Inc.* 7.875%, 03/01/31 | 268,175 | |||||||||
227,000 | 8.625%, 06/15/25 | 227,926 | |||||||||
258,000 | United Wholesale Mortgage, LLC* 5.500%, 04/15/29 | 240,175 | |||||||||
105,000 | 5.750%, 06/15/27 | 100,909 | |||||||||
110,000 | Uniti Group, LP / Uniti Group Finance, Inc. / CSL Capital, LLC* 6.500%, 02/15/29 | 88,520 | |||||||||
105,000 | 10.500%, 02/15/28 | 109,069 | |||||||||
250,000 | VZ Secured Financing, BV* 5.000%, 01/15/32 | 211,273 | |||||||||
237,000 | XHR, LP* 6.375%, 08/15/25 | 236,903 | |||||||||
11,695,325 | |||||||||||
Health Care (1.0%) | |||||||||||
398,000 | Bausch Health Companies, Inc.* 11.000%, 09/30/28^ | 311,769 | |||||||||
81,000 | 6.125%, 02/01/27 | 59,472 | |||||||||
78,000 | 14.000%, 10/15/30 | 50,397 | |||||||||
435,000 | CHS/Community Health Systems, Inc.* 6.125%, 04/01/30 | 308,084 | |||||||||
127,000 | 6.875%, 04/15/29 | 94,314 | |||||||||
114,000 | 8.000%, 03/15/26 | 113,616 | |||||||||
105,000 | 10.875%, 01/15/32 | 107,696 | |||||||||
27,000 | 5.250%, 05/15/30 | 22,137 | |||||||||
www.calamos.com
97
| PRINCIPAL AMOUNT | VALUE | ||||||||||
258,000 | DaVita, Inc.* 3.750%, 02/15/31 | $ | 212,662 | ||||||||
233,000 | 4.625%, 06/01/30 | 204,686 | |||||||||
162,000 | Embecta Corp.* 5.000%, 02/15/30^ | 124,998 | |||||||||
52,000 | 6.750%, 02/15/30 | 44,727 | |||||||||
110,000 | Encompass Health Corp. 4.750%, 02/01/30 | 101,092 | |||||||||
110,000 | 4.500%, 02/01/28 | 103,477 | |||||||||
300,000 | HCA, Inc. 7.500%, 11/06/33 | 327,264 | |||||||||
200,000 | Jazz Securities DAC* 4.375%, 01/15/29 | 183,236 | |||||||||
270,000 | Medline Borrower, LP* 3.875%, 04/01/29 | 241,839 | |||||||||
267,000 | 5.250%, 10/01/29 | 248,804 | |||||||||
400,000 | Organon & Company / Organon Foreign Debt Co-Issuer, BV* 5.125%, 04/30/31 | 346,208 | |||||||||
305,000 | Team Health Holdings, Inc.* 6.375%, 02/01/25 | 284,034 | |||||||||
430,000 | Tenet Healthcare Corp. 6.250%, 02/01/27 | 429,093 | |||||||||
295,000 | 6.875%, 11/15/31 | 305,372 | |||||||||
270,000 | Teva Pharmaceutical Finance Netherlands III, BV 5.125%, 05/09/29^ | 256,276 | |||||||||
200,000 | 4.750%, 05/09/27 | 191,628 | |||||||||
100,000 | 3.150%, 10/01/26 | 92,695 | |||||||||
4,765,576 | |||||||||||
Industrials (2.1%) | |||||||||||
210,000 | Aar Escrow Issuer, LLC* 6.750%, 03/15/29 | 211,888 | |||||||||
260,000 | ACCO Brands Corp.* 4.250%, 03/15/29 | 226,915 | |||||||||
235,000 | AerCap Holdings, NV‡ 5.875%, 10/10/79 5 year CMT + 4.54% | 232,946 | |||||||||
200,000 | Air Lease Corp.‡ 4.125%, 12/15/26 5 year CMT + 3.15% | 173,204 | |||||||||
365,000 | Albertsons Companies, Inc. / Safeway, Inc. / New Albertsons, LP / Albertsons, LLC* 4.625%, 01/15/27 | 348,998 | |||||||||
155,000 | 5.875%, 02/15/28 | 152,035 | |||||||||
140,000 | Allegiant Travel Company*^ 7.250%, 08/15/27 | 135,612 | |||||||||
127,000 | Arcosa, Inc.* 4.375%, 04/15/29 | 116,265 | |||||||||
475,000 | ARD Finance, SA* 6.500%, 06/30/27 7.250% PIK rate | 132,582 | |||||||||
| PRINCIPAL AMOUNT | VALUE | ||||||||||
178,000 | Beacon Roofing Supply, Inc.* 4.125%, 05/15/29 | $ | 159,315 | ||||||||
105,000 | Boeing Company* 6.388%, 05/01/31 | 105,767 | |||||||||
105,000 | Bombardier, Inc.* 8.750%, 11/15/30 | 111,787 | |||||||||
87,000 | 7.875%, 04/15/27 | 86,729 | |||||||||
68,000 | 7.250%, 07/01/31 | 68,265 | |||||||||
226,000 | BWX Technologies, Inc.* 4.125%, 04/15/29 | 206,146 | |||||||||
215,000 | Cascades, Inc. / Cascades USA, Inc.* 5.375%, 01/15/28 | 202,691 | |||||||||
56,000 | Delta Air Lines, Inc. / SkyMiles IP, Ltd.*µ 4.750%, 10/20/28 | 54,310 | |||||||||
282,000 | Deluxe Corp.* 8.000%, 06/01/29 | 256,175 | |||||||||
213,000 | Eco Material Technologies, Inc.* 7.875%, 01/31/27 | 214,811 | |||||||||
105,000 | Emerald Debt Merger Sub, LLC* 6.625%, 12/15/30 | 104,369 | |||||||||
140,000 | EnerSys* 4.375%, 12/15/27 | 131,260 | |||||||||
110,000 | 6.625%, 01/15/32 | 109,704 | |||||||||
80,000 | EquipmentShare.com, Inc.* 8.625%, 05/15/32 | 81,572 | |||||||||
135,000 | Graham Packaging Company, Inc.* 7.125%, 08/15/28 | 122,201 | |||||||||
102,000 | Graphic Packaging International, LLC* 3.500%, 03/01/29 | 90,370 | |||||||||
85,000 | 4.750%, 07/15/27 | 81,550 | |||||||||
236,000 | Great Lakes Dredge & Dock Corp.* 5.250%, 06/01/29 | 199,352 | |||||||||
516,000 | H&E Equipment Services, Inc.* 3.875%, 12/15/28 | 457,186 | |||||||||
269,000 | Hawaiian Brand Intellectual Property, Ltd. / HawaiianMiles Loyalty, Ltd.* 5.750%, 01/20/26 | 252,871 | |||||||||
270,000 | Herc Holdings, Inc.* 5.500%, 07/15/27 | 262,599 | |||||||||
255,000 | IEA Energy Services, LLC* 6.625%, 08/15/29 | 243,410 | |||||||||
154,000 | JELD-WEN, Inc.* 4.625%, 12/15/25 | 150,378 | |||||||||
110,000 | 4.875%, 12/15/27 | 104,578 | |||||||||
360,000 | Ken Garff Automotive, LLC* 4.875%, 09/15/28 | 335,408 | |||||||||
210,000 | Knife River Holding Company* 7.750%, 05/01/31 | 218,562 | |||||||||
55,000 | MasTec, Inc.*^ 4.500%, 08/15/28 | 51,433 | |||||||||
26,000 | Miter Brands Acquisition Holdco, Inc. / MIWD Borrower, LLC* 6.750%, 04/01/32 | 25,840 | |||||||||
CALAMOS CLOSED-END FAMILY OF FUNDS SEMIANNUAL REPORT
98
| PRINCIPAL AMOUNT | VALUE | ||||||||||
135,000 | Moog, Inc.* 4.250%, 12/15/27 | $ | 126,329 | ||||||||
275,000 | Newfold Digital Holdings Group, Inc.* 6.000%, 02/15/29 | 206,665 | |||||||||
232,000 | Novelis Corp.* 4.750%, 01/30/30 | 211,874 | |||||||||
80,000 | OI European Group, BV* 4.750%, 02/15/30 | 73,235 | |||||||||
255,000 | Pactiv Evergreen Group Issuer, Inc. / Pactiv Evergreen Group Issuer, LLC* 4.000%, 10/15/27 | 237,211 | |||||||||
163,000 | Sealed Air Corp.* 6.125%, 02/01/28 | 161,192 | |||||||||
54,000 | 5.000%, 04/15/29 | 50,848 | |||||||||
50,000 | Sealed Air Corp./Sealed Air Corp. U.S.* 7.250%, 02/15/31 | 51,004 | |||||||||
210,000 | Sensata Technologies, Inc.* 3.750%, 02/15/31 | 177,923 | |||||||||
167,000 | Sinclair Television Group, Inc.* 4.125%, 12/01/30 | 115,033 | |||||||||
100,000 | 5.500%, 03/01/30 | 69,358 | |||||||||
225,000 | Standard Industries, Inc.* 5.000%, 02/15/27 | 217,150 | |||||||||
176,000 | Stericycle, Inc.* 3.875%, 01/15/29 | 157,365 | |||||||||
225,000 | TransDigm, Inc.* 6.875%, 12/15/30 | 226,708 | |||||||||
155,000 | 6.750%, 08/15/28 | 155,739 | |||||||||
80,000 | 7.125%, 12/01/31 | 81,638 | |||||||||
52,000 | 6.625%, 03/01/32 | 51,996 | |||||||||
105,000 | Tronox, Inc.* 4.625%, 03/15/29 | 94,020 | |||||||||
83,865 | United Airlines Pass Through Trust Series 2019-2, Class B 3.500%, 11/01/29 | 77,465 | |||||||||
217,000 | Vertiv Group Corp.* 4.125%, 11/15/28 | 201,096 | |||||||||
228,000 | Wabash National Corp.* 4.500%, 10/15/28 | 205,223 | |||||||||
170,000 | Waste Pro USA, Inc.* 5.500%, 02/15/26 | 166,539 | |||||||||
128,000 | Williams Scotsman, Inc.* 4.625%, 08/15/28 | 118,403 | |||||||||
105,000 | 7.375%, 10/01/31 | 107,339 | |||||||||
9,560,437 | |||||||||||
Information Technology (0.6%) | |||||||||||
54,000 | Booz Allen Hamilton, Inc.* 4.000%, 07/01/29 | 49,540 | |||||||||
126,000 | Coherent Corp.* 5.000%, 12/15/29 | 116,375 | |||||||||
200,000 | CommScope, Inc.* 4.750%, 09/01/29 | 139,850 | |||||||||
79,000 | Dell International, LLC / EMC Corp.µ 6.020%, 06/15/26 | 79,487 | |||||||||
| PRINCIPAL AMOUNT | VALUE | ||||||||||
108,000 | Dun & Bradstreet Corp.*^ 5.000%, 12/15/29 | $ | 98,429 | ||||||||
93,000 | Fair Isaac Corp.* 4.000%, 06/15/28 | 85,788 | |||||||||
245,000 | KBR, Inc.* 4.750%, 09/30/28 | 228,908 | |||||||||
245,000 | MPH Acquisition Holdings, LLC* 5.750%, 11/01/28^ | 180,433 | |||||||||
110,000 | 5.500%, 09/01/28 | 89,863 | |||||||||
105,000 | NCL Corp., Ltd.* 8.125%, 01/15/29 | 109,455 | |||||||||
113,000 | NCR Voyix Corp.* 5.125%, 04/15/29 | 103,933 | |||||||||
167,000 | ON Semiconductor Corp.* 3.875%, 09/01/28 | 151,593 | |||||||||
139,000 | Open Text Corp.* 3.875%, 02/15/28 | 126,981 | |||||||||
110,000 | 6.900%, 12/01/27 | 112,532 | |||||||||
81,000 | 3.875%, 12/01/29 | 71,023 | |||||||||
81,000 | Open Text Holdings, Inc.*^ 4.125%, 12/01/31 | 69,543 | |||||||||
193,000 | Playtika Holding Corp.* 4.250%, 03/15/29 | 166,244 | |||||||||
315,000 | TTM Technologies, Inc.* 4.000%, 03/01/29 | 282,230 | |||||||||
150,000 | Twilio, Inc. 3.625%, 03/15/29 | 133,239 | |||||||||
57,000 | 3.875%, 03/15/31 | 49,428 | |||||||||
79,000 | UKG, Inc.* 6.875%, 02/01/31 | 79,185 | |||||||||
240,000 | Viavi Solutions, Inc.* 3.750%, 10/01/29 | 203,124 | |||||||||
260,000 | ZoomInfo Technologies, LLC / ZoomInfo Finance Corp.* 3.875%, 02/01/29 | 229,926 | |||||||||
2,957,109 | |||||||||||
Materials (0.6%) | |||||||||||
130,000 | ArcelorMittal, SA 7.000%, 10/15/39 | 137,625 | |||||||||
85,000 | ATI, Inc. 5.875%, 12/01/27 | 83,498 | |||||||||
55,000 | Carpenter Technology Corp. 7.625%, 03/15/30 | 56,193 | |||||||||
220,000 | Chemours Company* 4.625%, 11/15/29 | 188,698 | |||||||||
355,000 | Clearwater Paper Corp.* 4.750%, 08/15/28 | 322,855 | |||||||||
157,000 | Cleveland-Cliffs, Inc.* 6.750%, 04/15/30 | 153,408 | |||||||||
108,000 | Commercial Metals Company 4.125%, 01/15/30 | 97,020 | |||||||||
54,000 | 4.375%, 03/15/32 | 47,632 | |||||||||
www.calamos.com
99
| PRINCIPAL AMOUNT | VALUE | ||||||||||
250,000 | Constellium, SE* 3.750%, 04/15/29 | $ | 222,062 | ||||||||
111,000 | HB Fuller Company 4.250%, 10/15/28 | 102,568 | |||||||||
215,000 | JW Aluminum Continuous Cast Company* 10.250%, 06/01/26 | 217,120 | |||||||||
190,000 | Kaiser Aluminum Corp.* 4.625%, 03/01/28 | 177,169 | |||||||||
58,000 | LSF11 A5 HoldCo, LLC* 6.625%, 10/15/29 | 54,098 | |||||||||
229,000 | Mercer International, Inc. 5.125%, 02/01/29 | 200,277 | |||||||||
107,000 | 12.875%, 10/01/28* | 116,926 | |||||||||
200,000 | OCI, NV* 6.700%, 03/16/33 | 192,182 | |||||||||
160,000 | Owens-Brockway Glass Container, Inc.* 7.250%, 05/15/31 | 160,454 | |||||||||
115,000 | 6.625%, 05/13/27 | 115,035 | |||||||||
200,000 | Silgan Holdings, Inc. 4.125%, 02/01/28 | 186,736 | |||||||||
113,000 | Trinseo Materials Operating SCA / Trinseo Materials Finance, Inc.* 5.125%, 04/01/29 | 29,257 | |||||||||
2,860,813 | |||||||||||
Other (0.0%) | |||||||||||
100,000 | Gen Digital, Inc.* 6.750%, 09/30/27 | 100,427 | |||||||||
45,000 | 7.125%, 09/30/30^ | 45,540 | |||||||||
145,967 | |||||||||||
Real Estate (0.2%) | |||||||||||
174,000 | EPR Properties 3.750%, 08/15/29 | 151,392 | |||||||||
187,000 | Forestar Group, Inc.* 5.000%, 03/01/28 | 177,790 | |||||||||
110,000 | 3.850%, 05/15/26 | 104,576 | |||||||||
248,000 | MIWD Holdco II, LLC / MIWD Finance Corp.* 5.500%, 02/01/30 | 224,661 | |||||||||
105,000 | Service Properties Trust 5.250%, 02/15/26 | 101,069 | |||||||||
759,488 | |||||||||||
Special Purpose Acquisition Companies (0.1%) | |||||||||||
220,000 | Fertitta Entertainment, LLC / Fertitta Entertainment Finance Company, Inc.* 6.750%, 01/15/30 | 191,801 | |||||||||
107,000 | 4.625%, 01/15/29 | 96,871 | |||||||||
288,672 | |||||||||||
Utilities (0.1%) | |||||||||||
79,000 | PPL Capital Funding, Inc.‡ 8.236%, 03/30/67 3 mo. SOFR + 2.93% | 78,396 | |||||||||
| PRINCIPAL AMOUNT | VALUE | ||||||||||
105,000 | Vistra Corp.*‡ 7.000%, 12/15/26 5 year CMT + 5.74% | $ | 103,405 | ||||||||
50,000 | 8.000%, 10/15/26 5 year CMT + 6.93% | 50,569 | |||||||||
232,370 | |||||||||||
TOTAL CORPORATE BONDS (Cost $66,045,248) | 66,196,275 | ||||||||||
CONVERTIBLE BONDS (30.7%) | |||||||||||
Communication Services (2.2%) | |||||||||||
325,000 | Bharti Airtel, Ltd.* 1.500%, 02/17/25 | 707,444 | |||||||||
209,000 | Cable One, Inc.µ 0.000%, 03/15/26 | 180,758 | |||||||||
20,000,000 | JPY | CyberAgent, Inc.µ 0.000%, 02/19/25 | 125,885 | ||||||||
2,185,000 | Liberty Media Corp.-Liberty Formula One 2.250%, 08/15/27 | 2,275,743 | |||||||||
5,311,000 | Sea, Ltd. 2.375%, 12/01/25 | 5,588,075 | |||||||||
604,000 | 0.250%, 09/15/26 | 519,476 | |||||||||
538,000 | Snap, Inc.µ 0.125%, 03/01/28 | 420,953 | |||||||||
157,000 | Zillow Group, Inc.µ 1.375%, 09/01/26 | 181,286 | |||||||||
9,999,620 | |||||||||||
Consumer Discretionary (6.2%) | |||||||||||
7,145,800 | EUR | Accor, SA 0.700%, 12/07/27 | 3,896,124 | ||||||||
280,000,000 | JPY | Daiwa House Ind Company, Ltd. 0.000%, 03/30/29 | 1,777,556 | ||||||||
608,000 | DISH Network Corp.µ 0.000%, 12/15/25 | 446,272 | |||||||||
410,000 | DraftKings Holdings, Inc.µ 0.000%, 03/15/28 | 341,259 | |||||||||
229,000 | Etsy, Inc.µ 0.125%, 10/01/26 | 241,442 | |||||||||
161,000 | 0.125%, 09/01/27 | 133,628 | |||||||||
251,000 | Farfetch, Ltd. 3.750%, 05/01/27 | 9,789 | |||||||||
200,000 | AUD | Flight Centre Travel Group, Ltd. 1.625%, 11/01/28 | 126,837 | ||||||||
11,210,000 | Ford Motor Company~ 0.000%, 03/15/26 | 11,190,607 | |||||||||
2,740,000 | IMAX Corp.µ 0.500%, 04/01/26 | 2,561,982 | |||||||||
161,000 | Liberty Broadband Corp.*µ 3.125%, 03/31/53 | 149,654 | |||||||||
214,000 | Lucid Group, Inc.* 1.250%, 12/15/26 | 98,115 | |||||||||
296,000 | MakeMyTrip, Ltd. 0.000%, 02/15/28 | 526,107 | |||||||||
CALAMOS CLOSED-END FAMILY OF FUNDS SEMIANNUAL REPORT
100
Global Dynamic Income Fund Schedule of Investments April 30, 2024 (Unaudited)
| PRINCIPAL AMOUNT | VALUE | ||||||||||
725,000 | Marriott Vacations Worldwide Corp.µ 0.000%, 01/15/26 | $ | 674,504 | ||||||||
400,000 | Meituan 0.000%, 04/27/28 | 354,784 | |||||||||
40,000,000 | JPY | Mercari, Inc.µ 0.000%, 07/14/28 | 204,498 | ||||||||
160,000 | NIO, Inc.* 4.625%, 10/15/30 | 101,645 | |||||||||
100,000 | GBP | Ocado Group, PLCµ 0.875%, 12/09/25 | 111,367 | ||||||||
100,000 | GBP | 0.750%, 01/18/27 | 94,993 | ||||||||
230,000 | Rivian Automotive, Inc. 4.625%, 03/15/29 | 157,104 | |||||||||
145,000 | 3.625%, 10/15/30* | 84,964 | |||||||||
194,000 | Royal Caribbean Cruises, Ltd.µ 6.000%, 08/15/25 | 552,987 | |||||||||
40,000,000 | JPY | Sanrio Company, Ltd. 0.000%, 12/14/28 | 317,672 | ||||||||
100,000 | EUR | Shop Apotheke Europe, NVµ 0.000%, 01/21/28 | 100,708 | ||||||||
162,000 | Stride, Inc. 1.125%, 09/01/27 | 223,445 | |||||||||
318,000 | Wayfair, Inc.µ 0.625%, 10/01/25 | 296,217 | |||||||||
302,000 | 3.500%, 11/15/28* | 402,412 | |||||||||
1,900,000 | GBP | WH Smith, PLCµ 1.625%, 05/07/26 | 2,171,607 | ||||||||
316,000 | Wynn Macau, Ltd.* 4.500%, 03/07/29 | 337,788 | |||||||||
5,000,000 | HKD | Zhongsheng Group Holdings, Ltd. 0.000%, 05/21/25 | 703,517 | ||||||||
28,389,584 | |||||||||||
Consumer Staples (2.3%) | |||||||||||
100,000 | EUR | Davide Campari-Milano, NVµ 2.375%, 01/17/29 | 109,785 | ||||||||
2,500,000 | EUR | Fomento Economico Mexicano SAB de CV 2.625%, 02/24/26 | 2,664,213 | ||||||||
20,000,000 | JPY | Nippn Corp. 0.000%, 06/20/25 | 143,720 | ||||||||
3,715,000 | Post Holdings, Inc.µ 2.500%, 08/15/27 | 4,164,886 | |||||||||
4,975,000 | CAD | Premium Brands Holdings Corp.µ 4.200%, 09/30/27 | 3,312,342 | ||||||||
10,394,946 | |||||||||||
Energy (1.5%) | |||||||||||
4,500,000 | EUR | Eni S.p.A 2.950%, 09/14/30 | 4,988,544 | ||||||||
1,650,000 | Nabors Industries, Inc.µ 1.750%, 06/15/29 | 1,211,166 | |||||||||
306,000 | Northern Oil & Gas, Inc. 3.625%, 04/15/29 | 378,791 | |||||||||
| PRINCIPAL AMOUNT | VALUE | ||||||||||
100,000 | Pioneer Natural Resources Company 0.250%, 05/15/25 | $ | 293,655 | ||||||||
100,000 | EUR | Saipem S.p.A 2.875%, 09/11/29 | 142,450 | ||||||||
2,261,000 | SunEdison, Inc.@ 0.000%, 01/15/49 | 22,610 | |||||||||
275,000 | 0.000%, 10/01/49 | 2,750 | |||||||||
7,039,966 | |||||||||||
Financials (1.0%) | |||||||||||
223,000 | Affirm Holdings, Inc.µ 0.000%, 11/15/26 | 185,208 | |||||||||
323,000 | Coinbase Global, Inc.*µ 0.250%, 04/01/30 | 292,108 | |||||||||
67,242 | EUR | Corestate Capital Holding, SA 8.000%, 12/31/26 9.000% PIK rate | 25,122 | ||||||||
100,000 | GBP | Cornwall Jersey, Ltd. 0.750%, 04/16/26 | 86,540 | ||||||||
3,316,000 | Global Payments, Inc.*^ 1.500%, 03/01/31 | 3,307,611 | |||||||||
200,000 | EUR | JPMorgan Chase Financial Company, LLC (Voya Financial, Inc)§ 0.000%, 01/14/25 | 215,003 | ||||||||
200,000 | EUR | LEG Immobilien, SEµ 0.875%, 09/01/25 | 206,934 | ||||||||
314,000 | Morgan Stanley Finance, LLC 1.000%, 11/23/27 | 394,855 | |||||||||
4,713,381 | |||||||||||
Health Care (1.3%) | |||||||||||
164,000 | Alnylam Pharmaceuticals, Inc.µ 1.000%, 09/15/27 | 151,142 | |||||||||
160,000 | BioMarin Pharmaceutical, Inc.µ 0.599%, 08/01/24 | 157,810 | |||||||||
135,000 | Coherus Biosciences, Inc. 1.500%, 04/15/26 | 84,762 | |||||||||
172,000 | CONMED Corp.µ 2.250%, 06/15/27 | 151,816 | |||||||||
156,000 | Dexcom, Inc. 0.375%, 05/15/28*µ | 158,480 | |||||||||
142,000 | 0.250%, 11/15/25 | 148,895 | |||||||||
154,000 | Enovis Corp.* 3.875%, 10/15/28 | 182,099 | |||||||||
161,000 | Envista Holdings Corp.*µ 1.750%, 08/15/28 | 137,391 | |||||||||
205,000 | Haemonetics Corp.µ 0.000%, 03/01/26 | 188,502 | |||||||||
206,000 | Halozyme Therapeutics, Inc.µ 0.250%, 03/01/27 | 180,582 | |||||||||
170,000 | 1.000%, 08/15/28 | 160,429 | |||||||||
81,000 | Immunocore Holdings, PLC*µ 2.500%, 02/01/30 | 80,186 | |||||||||
73,000 | Innoviva, Inc.µ 2.500%, 08/15/25 | 78,314 | |||||||||
www.calamos.com
101
| PRINCIPAL AMOUNT | VALUE | ||||||||||
158,000 | Insmed, Inc. 0.750%, 06/01/28 | $ | 161,835 | ||||||||
162,000 | Integer Holdings Corp. 2.125%, 02/15/28 | 225,290 | |||||||||
167,000 | Integra LifeSciences Holdings Corp.µ 0.500%, 08/15/25 | 156,698 | |||||||||
163,000 | Ionis Pharmaceuticals, Inc.µ 0.000%, 04/01/26 | 158,105 | |||||||||
1,632,000 | iRhythm Technologies, Inc.*µ 1.500%, 09/01/29 | 1,655,599 | |||||||||
156,000 | Jazz Investments I, Ltd.µ 2.000%, 06/15/26 | 150,502 | |||||||||
101,000 | Lantheus Holdings, Inc.µ 2.625%, 12/15/27 | 114,224 | |||||||||
30,000,000 | JPY | Menicon Company, Ltd.µ 0.000%, 01/29/25 | 189,341 | ||||||||
181,000 | NeoGenomics, Inc.µ 0.250%, 01/15/28 | 142,791 | |||||||||
165,000 | NuVasive, Inc.µ 0.375%, 03/15/25 | 157,506 | |||||||||
145,000 | Omnicell, Inc.µ 0.250%, 09/15/25 | 136,322 | |||||||||
135,000 | Pacira BioSciences, Inc.µ 0.750%, 08/01/25 | 127,761 | |||||||||
163,000 | Sarepta Therapeutics, Inc. 1.250%, 09/15/27 | 187,054 | |||||||||
242,000 | Shockwave Medical, Inc.*µ 1.000%, 08/15/28 | 307,570 | |||||||||
156,000 | TransMedics Group, Inc.*µ 1.500%, 06/01/28 | 195,139 | |||||||||
5,926,145 | |||||||||||
Industrials (6.1%) | |||||||||||
40,000,000 | JPY | Daifuku Co., Ltd. 0.000%, 09/13/30 | 295,449 | ||||||||
100,000 | EUR | Duerr, AGµ 0.750%, 01/15/26 | 103,818 | ||||||||
196,000 | John Bean Technologies Corp.µ 0.250%, 05/15/26 | 177,078 | |||||||||
200,000 | L&F Company Ltd. 2.500%, 04/26/30 | 137,416 | |||||||||
161,000 | Middleby Corp. 1.000%, 09/01/25 | 189,726 | |||||||||
4,000,000 | EUR | Prysmian S.p.A 0.000%, 02/02/26 | 5,532,795 | ||||||||
1,800,000 | EUR | Rheinmetall, AG 1.875%, 02/07/28 | 3,289,703 | ||||||||
100,000 | EUR | 2.250%, 02/07/30 | 185,839 | ||||||||
159,600 | EUR | Schneider Electric, SE 0.000%, 06/15/26 | 375,569 | ||||||||
4,100,000 | EUR | SPIE, SA 2.000%, 01/17/28 | 5,072,981 | ||||||||
| PRINCIPAL AMOUNT | VALUE | ||||||||||
3,150,000 | Tetra Tech, Inc.* 2.250%, 08/15/28 | $ | 3,578,369 | ||||||||
7,945,000 | Uber Technologies, Inc.*~ 0.875%, 12/01/28 | 8,976,658 | |||||||||
27,915,401 | |||||||||||
Information Technology (7.3%) | |||||||||||
240,000 | Akamai Technologies, Inc. 1.125%, 02/15/29* | 236,429 | |||||||||
190,000 | 0.125%, 05/01/25µ | 214,491 | |||||||||
208,000 | BILL Holdings, Inc.µ 0.000%, 04/01/27 | 177,045 | |||||||||
94,000 | 0.000%, 12/01/25 | 86,973 | |||||||||
3,175,000 | Block, Inc.µ 0.125%, 03/01/25 | 3,144,520 | |||||||||
210,000 | Cloudflare, Inc.µ 0.000%, 08/15/26 | 191,585 | |||||||||
213,000 | Confluent, Inc.µ 0.000%, 01/15/27 | 181,003 | |||||||||
162,000 | CyberArk Software, Ltd. 0.000%, 11/15/24 | 248,916 | |||||||||
146,000 | Datadog, Inc. 0.125%, 06/15/25 | 208,314 | |||||||||
447,000 | DigitalOcean Holdings, Inc.µ 0.000%, 12/01/26 | 373,513 | |||||||||
207,000 | Dropbox, Inc.µ 0.000%, 03/01/28 | 189,237 | |||||||||
411,000 | Fastly, Inc.µ 0.000%, 03/15/26 | 373,924 | |||||||||
357,000 | Five9, Inc.µ 0.500%, 06/01/25 | 336,476 | |||||||||
161,000 | 1.000%, 03/15/29* | 159,772 | |||||||||
2,900,000 | EUR | GlobalWafers GmbH 1.500%, 01/23/29 | 2,981,485 | ||||||||
700,000 | Hon Hai Precision Industry Company, Ltd. 0.000%, 08/05/26 | 686,420 | |||||||||
17,000,000 | HKD | Kingsoft Corp, Ltd. 0.625%, 04/29/25 | 2,261,676 | ||||||||
175,000 | LivePerson, Inc. 0.000%, 12/15/26 | 66,906 | |||||||||
451,000 | Microchip Technology, Inc. 0.125%, 11/15/24 | 486,922 | |||||||||
343,000 | MicroStrategy, Inc.*µ 0.875%, 03/15/31 | 273,999 | |||||||||
1,440,000 | NCL Corp., Ltd. 5.375%, 08/01/25 | 1,770,538 | |||||||||
447,000 | 1.125%, 02/15/27µ | 409,103 | |||||||||
200,000 | EUR | Nexi S.p.Aµ 1.750%, 04/24/27 | 196,708 | ||||||||
162,000 | Nice, Ltd. 0.000%, 09/15/25 | 160,675 | |||||||||
413,000 | Okta, Inc.µ 0.125%, 09/01/25 | 390,343 | |||||||||
CALAMOS CLOSED-END FAMILY OF FUNDS SEMIANNUAL REPORT
102
| PRINCIPAL AMOUNT | VALUE | ||||||||||
319,000 | ON Semiconductor Corp. 0.500%, 03/01/29µ | $ | 309,216 | ||||||||
202,000 | 0.000%, 05/01/27 | 289,751 | |||||||||
4,301,000 | Parsons Corp.* 2.625%, 03/01/29 | 4,510,717 | |||||||||
173,000 | Pegasystems, Inc.µ 0.750%, 03/01/25 | 166,187 | |||||||||
296,000 | Repay Holdings Corp.*µ 0.000%, 02/01/26 | 270,600 | |||||||||
320,000 | RingCentral, Inc.µ 0.000%, 03/15/26 | 287,062 | |||||||||
360,000,000 | JPY | Rohm Company, Ltd.µ 0.000%, 12/05/24 | 2,276,641 | ||||||||
320,000 | Seagate HDD Cayman* 3.500%, 06/01/28 | 383,123 | |||||||||
139,000 | Shift4 Payments, Inc.µ 0.000%, 12/15/25 | 144,021 | |||||||||
200,000 | SK Hynix, Inc. 1.750%, 04/11/30 | 313,692 | |||||||||
148,300 | EUR | SOITECµ 0.000%, 10/01/25 | 258,790 | ||||||||
3,815,000 | Spotify USA, Inc.µ 0.000%, 03/15/26 | 3,555,084 | |||||||||
3,687,000 | Super Micro Computer, Inc.*µ 0.000%, 03/01/29 | 3,770,769 | |||||||||
200,000 | Tyler Technologies, Inc.^ 0.250%, 03/15/26 | 210,096 | |||||||||
318,000 | Wix.com, Ltd. 0.000%, 08/15/25 | 294,748 | |||||||||
240,000 | Workiva, Inc. 1.250%, 08/15/28*µ | 216,170 | |||||||||
34,000 | 1.125%, 08/15/26 | 39,211 | |||||||||
265,000 | Xero Investments, Ltd. 0.000%, 12/02/25 | 246,392 | |||||||||
145,000 | Zscaler, Inc. 0.125%, 07/01/25 | 183,711 | |||||||||
33,532,954 | |||||||||||
Materials (1.9%) | |||||||||||
214,000 | Amyris, Inc.@ 1.500%, 11/15/26 | 7,601 | |||||||||
3,600,000 | Glencore Funding, LLC 0.000%, 03/27/25 | 3,876,984 | |||||||||
2,700,000 | LG Chem, Ltd. 1.250%, 07/18/28 | 2,564,622 | |||||||||
1,976,000 | Lithium Americas Corp.µ 1.750%, 01/15/27 | 1,505,337 | |||||||||
20,000,000 | JPY | Nippon Steel Corp. 0.000%, 10/05/26 | 183,766 | ||||||||
400,000 | EUR | POSCO Holdings, Inc. 0.000%, 09/01/26 | 441,876 | ||||||||
8,580,186 | |||||||||||
| PRINCIPAL AMOUNT | VALUE | ||||||||||
Other (0.0%) | |||||||||||
110,000 | Multiplan Corp.*µ 6.000%, 10/15/27 7.000% PIK rate | $ | 78,363 | ||||||||
Real Estate (0.7%) | |||||||||||
2,700,000 | EUR | ANLLIAN Capital, Ltd. 0.000%, 02/05/25 | 3,047,931 | ||||||||
330,000 | Redfin Corp.µ 0.000%, 10/15/25 | 287,061 | |||||||||
3,334,992 | |||||||||||
Utilities (0.2%) | |||||||||||
318,000 | American Water Capital Corp.*µ 3.625%, 06/15/26 | 309,436 | |||||||||
156,000 | CMS Energy Corp.* 3.375%, 05/01/28 | 152,851 | |||||||||
320,000 | PPL Capital Funding, Inc. 2.875%, 03/15/28 | 304,224 | |||||||||
160,000 | Southern Company 3.875%, 12/15/25 | 159,728 | |||||||||
926,239 | |||||||||||
TOTAL CONVERTIBLE BONDS (Cost $151,203,779) | 140,831,777 | ||||||||||
BANK LOANS (7.2%)¡ | |||||||||||
Airlines (0.4%) | |||||||||||
1,395,000 | Air Canada‡ 7.833%, 03/21/31 3 mo. SOFR + 2.50% | 1,406,334 | |||||||||
152,000 | American Airlines, Inc.‡ 10.336%, 04/20/28 3 mo. SOFR + 4.75% | 158,286 | |||||||||
143,000 | Mileage Plus Holdings, LLC‡ 10.733%, 06/21/27 3 mo. SOFR + 5.25% | 146,992 | |||||||||
150,000 | United Airlines, Inc.‡ 8.076%, 02/22/31 3 mo. SOFR + 2.75% | 150,821 | |||||||||
1,862,433 | |||||||||||
Communication Services (0.7%) | |||||||||||
1,250,000 | APi Group DE, Inc.‡ 7.930%, 01/03/29 1 mo. SOFR + 2.50% | 1,256,144 | |||||||||
12,011 | Audacy Capital Corp.‡ 11.430%, 08/19/24 3 mo. SOFR + 6.11% | 12,041 | |||||||||
108,011 | Clear Channel Outdoor Holdings, Inc.‡ 9.430%, 08/23/28 1 mo. SOFR + 4.00% | 108,236 | |||||||||
87,034 | Directv Financing, LLC! 0.000%, 08/02/27 | 87,590 | |||||||||
www.calamos.com
103
| PRINCIPAL AMOUNT | VALUE | ||||||||||
82,451 | Directv Financing, LLC‡ 10.430%, 08/02/27 1 mo. SOFR + 5.00% | $ | 82,977 | ||||||||
320,000 | Entercom Media Corp.‡ 8.145%, 11/18/24 3 mo. SOFR + 0.00% | 173,440 | |||||||||
1,240,641 | Go Daddy Operating Company, LLC‡ 7.316%, 11/09/29 1 mo. SOFR + 2.00% | 1,242,601 | |||||||||
210,415 | Gray Television, Inc.‡ 7.942%, 01/02/26 1 mo. SOFR + 2.50% | 208,061 | |||||||||
220,000 | Telesat Canada‡ 8.355%, 12/07/26 3 mo. SOFR + 2.75% | 112,246 | |||||||||
3,283,336 | |||||||||||
Consumer Discretionary (1.8%) | |||||||||||
120,000 | Adient U.S., LLC‡ 8.066%, 01/31/31 1 mo. SOFR + 2.75% | 120,675 | |||||||||
153,600 | American Axle & Manufacturing, Inc.‡ 8.921%, 12/13/29 1 mo. SOFR + 3.50% | 154,512 | |||||||||
207,900 | Caesars Entertainment, Inc.‡ 8.666%, 02/06/30 3 mo. SOFR + 3.25% | 208,589 | |||||||||
541,496 | Carnival Corp.‡ 8.067%, 08/08/27 1 mo. SOFR + 2.75% | 544,964 | |||||||||
181,807 | Carnival Corp.‡ 8.067%, 10/18/28 1 mo. SOFR + 3.25% | 182,774 | |||||||||
181,807 | Carnival Corp.‡ 8.067%, 10/18/28 | 183,057 | |||||||||
1,246,875 | Flutter Financing, BV‡ 7.559%, 11/25/30 | 1,250,659 | |||||||||
210,000 | Flutter Financing, BV! 0.000%, 11/25/30 | 210,637 | |||||||||
262,761 | Hanesbrands, Inc.‡ 9.066%, 03/08/30 1 mo. SOFR + 3.75% | 263,308 | |||||||||
1,250,000 | Installed Building Products, Inc.‡ 7.316%, 03/28/31 1 mo. SOFR + 2.00% | 1,256,056 | |||||||||
122,430 | Life Time Fitness, Inc.‡ 9.591%, 01/15/26 3 mo. SOFR + 4.00% | 123,310 | |||||||||
197,000 | Light & Wonder International, Inc.‡ 8.071%, 04/14/29 1 mo. SOFR + 2.75% | 197,684 | |||||||||
1,240,530 | PENN Entertainment, Inc.‡ 8.166%, 05/03/29 1 mo. SOFR + 2.75% | 1,243,694 | |||||||||
| PRINCIPAL AMOUNT | VALUE | ||||||||||
379,141 | PetSmart, Inc.‡ 9.166%, 02/11/28 1 mo. SOFR + 3.75% | $ | 374,402 | ||||||||
780,000 | Station Casinos LLC! 0.000%, 03/14/31 | 781,010 | |||||||||
680,000 | Station Casinos, LLC‡ 7.566%, 03/14/31 1 mo. SOFR + 2.25% | 680,881 | |||||||||
137,996 | TKC Holdings, Inc.‡ 10.930%, 05/15/28 1 mo. SOFR + 5.50% | 137,220 | |||||||||
224,300 | Windsor Holdings III, LLC‡ 9.319%, 08/01/30 1 mo. SOFR + 4.00% | 226,515 | |||||||||
8,139,947 | |||||||||||
Consumer Staples (0.3%) | |||||||||||
495,638 | Amneal Pharmaceuticals, LLC‡ 10.816%, 05/04/28 1 mo. SOFR + 5.50% | 496,724 | |||||||||
118,074 | Fiesta Purchaser, Inc.‡ 9.316%, 02/12/31 1 mo. SOFR + 4.00% | 118,686 | |||||||||
96,926 | Fiesta Purchaser, Inc.‡ 9.318%, 02/12/31 1 mo. SOFR + 4.00% | 97,429 | |||||||||
262,718 | Jazz Financing Lux Sarl‡ 8.430%, 05/05/28 1 mo. SOFR + 3.00% | 264,566 | |||||||||
215,000 | Star Parent, Inc.‡ 9.309%, 09/27/30 3 mo. SOFR + 4.00% | 215,202 | |||||||||
145,000 | United Natural Foods, Inc.! 0.000%, 04/25/31 | 143,731 | |||||||||
105,896 | United Natural Foods, Inc.‡ 8.680%, 10/22/25 1 mo. SOFR + 3.25% | 105,559 | |||||||||
1,441,897 | |||||||||||
Energy (0.1%) | |||||||||||
159,600 | Buckeye Partners, LP‡ 7.816%, 11/22/30 1 mo. SOFR + 2.50% | 160,359 | |||||||||
99,750 | New Fortress Energy, Inc.‡ 10.330%, 10/27/28 3 mo. SOFR + 5.00% | 100,436 | |||||||||
257,674 | Par Petroleum, LLC‡ 9.052%, 02/28/30 3 mo. SOFR + 3.75% | 258,881 | |||||||||
50,000 | Par Petroleum, LLC! 0.000%, 02/28/30 | 50,234 | |||||||||
569,910 | |||||||||||
CALAMOS CLOSED-END FAMILY OF FUNDS SEMIANNUAL REPORT
104
| PRINCIPAL AMOUNT | VALUE | ||||||||||
Financials (0.4%) | |||||||||||
230,000 | Advisor Group, Inc.! 0.000%, 08/17/28 | $ | 231,672 | ||||||||
54,863 | Advisor Group, Inc.‡ 9.816%, 08/17/28 1 mo. SOFR + 4.50% | 55,261 | |||||||||
170,789 | Alliant Holdings Intermediate, LLC‡ 8.819%, 11/06/30 1 mo. SOFR + 3.50% | 171,660 | |||||||||
163,765 | Amynta Agency Borrower, Inc.‡ 9.552%, 02/28/28 3 mo. SOFR + 4.25% | 164,525 | |||||||||
170,000 | AssuredPartners, Inc.! 0.000%, 02/14/31 | 170,937 | |||||||||
100,000 | AssuredPartners, Inc.‡ 8.816%, 02/14/31 1 mo. SOFR + 3.50% | 100,551 | |||||||||
164,176 | Avolon TLB Borrower 1 (US) LLC‡ 7.315%, 06/22/28 1 mo. SOFR + 2.00% | 164,714 | |||||||||
99,750 | Broadstreet Partners, Inc.‡ 9.066%, 01/27/29 1 mo. SOFR + 3.75% | 100,228 | |||||||||
209,475 | HUB International, Ltd.‡ 8.575%, 06/20/30 3 mo. SOFR + 3.25% | 210,771 | |||||||||
525 | HUB International, Ltd.‡ 8.565%, 06/20/30 3 mo. SOFR + 3.25% | 528 | |||||||||
159,600 | Iron Mountain, Inc.‡ 7.566%, 01/31/31 1 mo. SOFR + 2.25% | 159,467 | |||||||||
110,000 | Level 3 Financing, Inc.! 0.000%, 04/15/29 | 108,370 | |||||||||
283,036 | VFH Parent, LLC‡ 8.416%, 01/13/29 1 mo. SOFR + 3.00% | 283,435 | |||||||||
1,922,119 | |||||||||||
Health Care (1.5%) | |||||||||||
887,474 | Avantor Funding, Inc.‡ 7.416%, 11/08/27 1 mo. SOFR + 2.00% | 891,702 | |||||||||
2,195,562 | Icon Luxembourg Sarl‡ 7.309%, 07/03/28 3 mo. SOFR + 2.00% | 2,207,287 | |||||||||
1,250,000 | Organon & Company‡ 8.433%, 06/02/28 1 mo. SOFR + 3.00% | 1,258,400 | |||||||||
235,294 | Padagis, LLC‡ 10.314%, 07/06/28 3 mo. SOFR + 4.75% | 216,471 | |||||||||
1,243,687 | Perrigo Investments, LLC‡ 7.666%, 04/20/29 1 mo. SOFR + 2.25% | 1,244,079 | |||||||||
| PRINCIPAL AMOUNT | VALUE | ||||||||||
547,026 | PRA Health Sciences, Inc.‡ 7.309%, 07/03/28 3 mo. SOFR + 2.00% | $ | 549,947 | ||||||||
628,801 | Team Health Holdings, Inc.‡ 10.580%, 03/02/27 3 mo. SOFR + 5.25% | 552,782 | |||||||||
1,803 | Team Health Holdings, Inc.‡ 10.566%, 03/02/27 1 mo. SOFR + 5.25% | 1,585 | |||||||||
6,922,253 | |||||||||||
Industrials (0.7%) | |||||||||||
211,207 | ACProducts, Inc.‡ 9.814%, 05/17/28 3 mo. SOFR + 4.25% | 183,961 | |||||||||
1,240,513 | Beacon Roofing Supply, Inc.‡ 7.316%, 05/19/28 1 mo. SOFR + 2.00% | 1,245,941 | |||||||||
201,923 | ChampionX Corp.‡ 8.168%, 06/07/29 1 mo. SOFR + 2.75% | 203,059 | |||||||||
89,463 | Emrld Borrower, LP‡ 7.816%, 05/31/30 1 mo. SOFR + 2.50% | 89,843 | |||||||||
1,240,513 | JELD-WEN, Inc.‡ 7.430%, 07/28/28 1 mo. SOFR + 2.00% | 1,245,320 | |||||||||
25,000 | MI Windows & Doors, LLC‡ 8.816%, 03/21/31 1 mo. SOFR + 3.50% | 25,146 | |||||||||
209,475 | TransDigm, Inc.‡ 8.559%, 02/28/31 1 mo. SOFR + 3.25% | 210,940 | |||||||||
3,204,210 | |||||||||||
Information Technology (0.9%) | |||||||||||
291,574 | Banff Merger Sub, Inc.‡ 9.566%, 12/29/28 1 mo. SOFR + 4.25% | 293,721 | |||||||||
161,894 | Camelot US Acquisition LLC‡ 8.066%, 01/31/31 1 mo. SOFR + 2.75% | 162,400 | |||||||||
204,625 | Central Parent, Inc.‡ 9.309%, 07/06/29 3 mo. SOFR + 4.00% | 205,695 | |||||||||
202,342 | Dun & Bradstreet Corp.‡ 8.068%, 01/18/29 1 mo. SOFR + 2.75% | 203,060 | |||||||||
187,021 | II-VI, Inc.‡ 7.829%, 07/02/29 1 mo. SOFR + 2.50% | 188,132 | |||||||||
1,152,971 | Open Text Corp.‡ 8.166%, 01/31/30 1 mo. SOFR + 2.75% | 1,157,623 | |||||||||
www.calamos.com
105
| PRINCIPAL AMOUNT | VALUE | ||||||||||
737,344 | SS&C Technologies, Inc.‡ 7.666%, 03/22/29 1 mo. SOFR + 2.25% | $ | 739,774 | ||||||||
312,004 | SS&C Technologies, Inc.‡ 7.666%, 03/22/29 1 mo. SOFR + 2.25% | 313,032 | |||||||||
794,000 | TTM Technologies, Inc.‡ 8.077%, 05/30/30 1 mo. SOFR + 2.75% | 795,489 | |||||||||
110,000 | UKG, Inc.‡ 8.814%, 02/10/31 3 mo. SOFR + 3.50% | 110,631 | |||||||||
4,169,557 | |||||||||||
Materials (0.3%) | |||||||||||
159,200 | Chemours Company‡ 8.817%, 08/18/28 1 mo. SOFR + 3.50% | 159,350 | |||||||||
213,388 | Ineos US Finance, LLC‡ 8.930%, 02/18/30 1 mo. SOFR + 3.50% | 214,188 | |||||||||
161,360 | Innophos, Inc.‡ 8.930%, 02/05/27 1 mo. SOFR + 3.25% | 161,546 | |||||||||
263,013 | LSF11 A5 Holdco, LLC‡ 9.666%, 10/15/28 1 mo. SOFR + 4.25% | 264,064 | |||||||||
158,599 | Trinseo Materials Operating SCA‡ 8.105%, 05/03/28 3 mo. SOFR + 2.50% | 110,829 | |||||||||
202,674 | W.R. Grace & Co.-Conn.‡ 9.321%, 09/22/28 3 mo. SOFR + 3.75% | 203,271 | |||||||||
1,113,248 | |||||||||||
Special Purpose Acquisition Companies (0.1%) | |||||||||||
108,075 | Clydesdale Acquisition Holdings, Inc.‡ 9.091%, 04/13/29 1 mo. SOFR + 3.68% | 108,664 | |||||||||
53,900 | Fertitta Entertainment, LLC‡ 9.069%, 01/27/29 1 mo. SOFR + 3.75% | 54,085 | |||||||||
197,000 | Patagonia Holdco, LLC‡ 11.064%, 08/01/29 3 mo. SOFR + 5.75% | 183,210 | |||||||||
345,959 | |||||||||||
TOTAL BANK LOANS (Cost $33,110,623) | 32,974,869 | ||||||||||
| NUMBER OF SHARES | VALUE | ||||||||||
CONVERTIBLE PREFERRED STOCKS (1.6%) | |||||||||||
Energy (0.0%) | |||||||||||
5 | Gulfport Energy Corp.# 10.000%, 05/31/24 15.000% PIK rate | 57,875 | |||||||||
| NUMBER OF SHARES | VALUE | ||||||||||
Financials (1.3%) | |||||||||||
97,640 | Apollo Global Management, Inc.~ 6.750%, 07/31/26 | $ | 5,954,087 | ||||||||
Utilities (0.3%) | |||||||||||
35,211 | NextEra Energy, Inc.~ 6.926%, 09/01/25 | 1,434,848 | |||||||||
TOTAL CONVERTIBLE (Cost $7,535,885) | 7,446,810 | ||||||||||
COMMON STOCKS (77.8%) | |||||||||||
Communication Services (5.9%) | |||||||||||
40,650 | Alphabet, Inc. - Class A# | 6,617,007 | |||||||||
4,575 | Altice USA, Inc. - Class A^# | 8,830 | |||||||||
4,050 | Baidu, Inc. (ADR)µ# | 418,770 | |||||||||
1,735 | Cumulus Media, Inc. - Class Aµ# | 4,563 | |||||||||
1 | Frontier Communications Parent, Inc.^# | 23 | |||||||||
3,450 | SEK | Hemnet Group, AB | 89,661 | ||||||||
4,600 | Meta Platforms, Inc. - Class Aµ | 1,978,782 | |||||||||
4,250 | Netflix, Inc.µ# | 2,340,220 | |||||||||
96,000 | EUR | Orange, SAµ | 1,068,507 | ||||||||
525 | EUR | Scout24, SE*µ | 38,565 | ||||||||
12,990 | Spotify Technology, SAµ# | 3,642,916 | |||||||||
66,700 | HKD | Tencent Holdings, Ltd.µ | 2,927,008 | ||||||||
89,070 | Tencent Holdings, Ltd. (ADR)~^ | 3,896,812 | |||||||||
40,790 | GBP | Trustpilot Group, PLC*µ# | 96,320 | ||||||||
1,176,545 | GBP | Vodafone Group, PLCµ | 992,182 | ||||||||
26,395 | Walt Disney Company~ | 2,932,485 | |||||||||
27,052,651 | |||||||||||
Consumer Discretionary (11.3%) | |||||||||||
374,200 | ADT, Inc.µ | 2,432,300 | |||||||||
124,700 | HKD | Alibaba Group Holding, Ltd.µ | 1,167,574 | ||||||||
8,175 | Alibaba Group Holding, Ltd. (ADR)~ | 611,899 | |||||||||
174,450 | MXN | Alsea, SAB de CV# | 730,153 | ||||||||
37,750 | Amazon.com, Inc.µ# | 6,606,250 | |||||||||
19,240 | INR | Amber Enterprises India, Ltd.# | 889,703 | ||||||||
315,000 | SAR | Americana Restaurants International, PLC# | 286,942 | ||||||||
51,097 | Aptiv, PLCµ# | 3,627,887 | |||||||||
3,900 | BRL | Arezzo Industria e Comercio, SA | 38,996 | ||||||||
1,025 | CNY | Beijing Roborock Technology Company, Ltd. - Class A | 59,883 | ||||||||
12,500 | CNY | BYD Company, Ltd. - Class A | 375,275 | ||||||||
20,700 | CNY | China Tourism Group Duty Free Corp., Ltd. - Class A | 212,380 | ||||||||
1,195 | Chipotle Mexican Grill, Inc.# | 3,775,722 | |||||||||
15,655 | INR | Dixon Technologies India, Ltd. | 1,560,759 | ||||||||
4,050 | EUR | Ferrari, NV | 1,665,662 | ||||||||
CALAMOS CLOSED-END FAMILY OF FUNDS SEMIANNUAL REPORT
106
| NUMBER OF SHARES | VALUE | ||||||||||
149,500 | CNY | Hisense Home Appliances Group Company, Ltd. - Class A | $795,646 | ||||||||
3,050 | KRW | Hotel Shilla Company, Ltd. | 130,656 | ||||||||
112,532 | INR | Indian Hotels Company, Ltd. | 776,456 | ||||||||
161,219 | HKD | JD.com, Inc. - Class Aµ | 2,322,903 | ||||||||
173,000 | HKD | Jiumaojiu International Holdings, Ltd.*µ | 108,654 | ||||||||
334,330 | INR | Kalyan Jewellers India, Ltd. | 1,654,221 | ||||||||
8,600 | KRW | Kia Corp. | 728,614 | ||||||||
123,000 | HKD | Li Ning Company, Ltd.µ | 321,998 | ||||||||
1,020 | EUR | LVMH Moet Hennessy Louis Vuitton, SEµ | 837,865 | ||||||||
32,200 | INR | Mahindra & Mahindra, Ltd. | 831,931 | ||||||||
110,230 | MakeMyTrip, Ltd.µ# | 7,298,328 | |||||||||
11,470 | HKD | Meituan - Class B*µ# | 156,618 | ||||||||
2,855 | MercadoLibre, Inc.µ# | 4,164,589 | |||||||||
44,620 | NIO, Inc. (ADR)# | 210,606 | |||||||||
17,872 | EUR | Prosus, NV~ | 597,996 | ||||||||
236,800 | HKD | Sands China, Ltd.µ# | 558,527 | ||||||||
63,750 | INR | Tata Motors, Ltd. | 768,841 | ||||||||
2,100 | Tesla, Inc.µ# | 384,888 | |||||||||
148,600 | JPY | Toyota Motor Corp.µ | 3,389,354 | ||||||||
10,100 | HKD | Yum China Holdings, Inc.µ | 378,098 | ||||||||
593,500 | INR | Zomato, Ltd.# | 1,372,591 | ||||||||
51,830,765 | |||||||||||
Consumer Staples (3.5%) | |||||||||||
2,450 | SEK | AAK, AB | 63,018 | ||||||||
20,710 | TRY | BIM Birlesik Magazalar, A/S | 247,421 | ||||||||
77,500 | GBP | British American Tobacco, PLCµ | 2,275,111 | ||||||||
5,600 | Constellation Brands, Inc. - Class Aµ | 1,419,376 | |||||||||
5,100 | Costco Wholesale Corp.µ | 3,686,790 | |||||||||
69,120 | MXN | Grupo Comercial Chedraui, SA de CV | 508,956 | ||||||||
2,600 | CNY | Kweichow Moutai Company, Ltd. - Class A | 609,578 | ||||||||
2,062 | Mallinckrodt, PLC# | 109,286 | |||||||||
20,500 | CHF | Nestle, SAµ | 2,058,203 | ||||||||
74,568 | BRL | Raia Drogasil, SA | 367,340 | ||||||||
201,300 | JPY | Seven & i Holdings Company, Ltd.µ | 2,601,036 | ||||||||
106,000 | HKD | Smoore International Holdings, Ltd.*µ | 92,317 | ||||||||
1,100 | JPY | Toyo Suisan Kaisha, Ltd.µ | 68,788 | ||||||||
14,150 | INR | Varun Beverages, Ltd. | 250,573 | ||||||||
27,600 | Walmart, Inc.µ | 1,638,060 | |||||||||
2,000 | JPY | Yamazaki Baking Company, Ltd.µ | 48,407 | ||||||||
16,044,260 | |||||||||||
Energy (4.5%) | |||||||||||
74,600 | CAD | Canadian Natural Resources, Ltd.µ | 5,653,051 | ||||||||
12,395 | CAD | CES Energy Solutions Corp. | 51,051 | ||||||||
305 | Chesapeake Energy Corp.µ | 27,413 | |||||||||
17,600 | Chevron Corp.~µ | 2,838,352 | |||||||||
| NUMBER OF SHARES | VALUE | ||||||||||
14,985 | Energy Transfer, LP | $ | 235,714 | ||||||||
9,035 | Enterprise Products Partners, LP | 253,703 | |||||||||
1,826 | EP Energy Corp.&# | 4,337 | |||||||||
7 | Gulfport Energy Corp.µ# | 1,111 | |||||||||
42,400 | Helmerich & Payne, Inc.~µ | 1,667,592 | |||||||||
136,900 | THB | PTT Exploration & Production, PCL | 575,713 | ||||||||
38,530 | INR | Reliance Industries, Ltd. | 1,351,645 | ||||||||
24,475 | EUR | Saipem S.p.A^# | 56,164 | ||||||||
98,974 | Schlumberger, NVµ | 4,699,286 | |||||||||
82,300 | GBP | Shell, PLCµ | 2,925,649 | ||||||||
20,070 | TechnipFMC, PLCµ | 514,193 | |||||||||
20,854,974 | |||||||||||
Financials (9.4%) | |||||||||||
62,050 | INR | 360 ONE WAM, Ltd. | 580,015 | ||||||||
373,000 | HKD | AIA Group, Ltd.µ | 2,731,984 | ||||||||
10,000 | Aon, PLC - Class Aµ | 2,820,100 | |||||||||
188,400 | BRL | B3, SA - Brasil Bolsa Balcao | 391,487 | ||||||||
7,038,130 | IDR | Bank Mandiri Persero, Tbk PT | 2,974,854 | ||||||||
189,000 | Bank of America Corp.~µ | 6,994,890 | |||||||||
9,680 | Chubb, Ltd.µ | 2,406,835 | |||||||||
16,200 | JPY | Concordia Financial Group, Ltd.µ | 87,288 | ||||||||
111,948 | AED | First Abu Dhabi Bank, PJSC | 380,599 | ||||||||
224,876 | INR | HDFC Bank, Ltd. | 4,071,386 | ||||||||
2,750 | AUD | HUB24, Ltd.µ | 70,657 | ||||||||
| 133,716 | Itau Unibanco Holding, SA (ADR) | 808,982 | |||||||||
12,575 | JPMorgan Chase & Companyµ | 2,411,130 | |||||||||
156,300 | THB | Kasikornbank PCL | 548,660 | ||||||||
7,600 | KRW | KB Financial Group, Inc. | 412,200 | ||||||||
4,120,000 | GBP | Lloyds Banking Group, PLCµ | 2,658,977 | ||||||||
22,456 | KRW | Meritz Financial Group, Inc. | 1,283,976 | ||||||||
44,285 | Morgan Stanleyµ | 4,022,849 | |||||||||
124,670 | NU Holdings, Ltd. - Class Aµ# | 1,353,916 | |||||||||
260,000 | HKD | Ping An Insurance Group Company of China, Ltd. - Class Hµ | 1,178,341 | ||||||||
24,653 | SAR | Saudi National Bank | 246,788 | ||||||||
8,600 | Visa, Inc. - Class Aµ | 2,310,046 | |||||||||
41,825 | Wells Fargo & Company | 2,481,059 | |||||||||
43,227,019 | |||||||||||
Health Care (8.8%) | |||||||||||
8,400 | INR | Apollo Hospitals Enterprise, Ltd. | 598,515 | ||||||||
23,100 | GBP | AstraZeneca, PLCµ | 3,493,849 | ||||||||
14,355 | Danaher Corp.µ | 3,540,230 | |||||||||
4,738 | KRW | Dentium Company, Ltd. | 442,049 | ||||||||
15,250 | Eli Lilly & Companyµ | 11,911,775 | |||||||||
10,104 | GE Healthcare, Inc.~µ | 770,329 | |||||||||
22,400 | EUR | Gerresheimer, AGµ | 2,412,411 | ||||||||
4,860 | Humana, Inc.µ | 1,468,157 | |||||||||
8,520 | BRL | Hypera, SA | 48,436 | ||||||||
www.calamos.com
107
| NUMBER OF SHARES | VALUE | ||||||||||
1,500 | JPY | Jeol, Ltd.µ | $ | 59,429 | |||||||
4,700 | McKesson Corp. | 2,524,887 | |||||||||
99,880 | Novo Nordisk, A/S (ADR)~ | 12,815,603 | |||||||||
331 | CHF | Ypsomed Holding, AG^ | 117,982 | ||||||||
40,203,652 | |||||||||||
Industrials (9.4%) | |||||||||||
25,300 | INR | Adani Ports & Special Economic Zone, Ltd. | 400,198 | ||||||||
37,029 | EUR | Alstom, SAµ | 583,876 | ||||||||
11,125 | GBP | Ashtead Technology Holdings, PLC | 113,279 | ||||||||
28,000 | CAD | Canadian Pacific Kansas City, Ltd.µ | 2,196,637 | ||||||||
12,780 | CNY | Contemporary Amperex Technology Company, Ltd. - Class A | 357,439 | ||||||||
1,115 | EUR | DO & CO, AGµ | 171,112 | ||||||||
850 | JPY | Ebara Corp.µ | 70,069 | ||||||||
7,578 | GE Vernova, Inc.# | 1,164,814 | |||||||||
30,312 | General Electric Companyµ | 4,905,088 | |||||||||
4,095 | KRW | Hanwha Aerospace Company, Ltd. | 622,016 | ||||||||
8,277 | KRW | HD Hyundai Electric Company, Ltd. | 1,460,183 | ||||||||
89,110 | INR | Hindustan Aeronautics, Ltd. | 4,207,005 | ||||||||
41,500 | JPY | Hitachi, Ltd.µ | 3,828,818 | ||||||||
2,200 | JPY | Japan Elevator Service Holdings Company, Ltd.µ | 34,189 | ||||||||
12,490 | INR | KEI Industries, Ltd. | 596,937 | ||||||||
1,515 | EUR | KION Group, AGµ | 69,823 | ||||||||
1,900 | JPY | Kyudenko Corp.µ | 78,857 | ||||||||
3,980 | EUR | Leonardo S.p.Aµ | 91,469 | ||||||||
347,065 | GBP | Melrose Industries, PLCµ | 2,726,657 | ||||||||
10,080 | SEK | Munters Group, AB* | 200,969 | ||||||||
35,300 | CNY | Ningbo Orient Wires & Cables Company, Ltd. - Class A# | 214,591 | ||||||||
800 | nVent Electric, PLCµ | 57,656 | |||||||||
6,700 | EUR | Rheinmetall, AGµ | 3,692,000 | ||||||||
1,024,500 | GBP | Rolls-Royce Holdings, PLCµ# | 5,253,661 | ||||||||
167,200 | CNY | Sany Heavy Industry Company, Ltd. - Class A | 375,691 | ||||||||
54,502 | CNY | Shanghai International Airport Company, Ltd. - Class A# | 282,700 | ||||||||
1,410 | KRW | SK Square Company, Ltd.# | 77,469 | ||||||||
1,400 | JPY | Sojitz Corp.µ | 36,046 | ||||||||
754 | CAD | Stantec, Inc.µ | 60,034 | ||||||||
56,626 | INR | Titagarh Rail System, Ltd. | 715,881 | ||||||||
4,785 | Veralto Corp.µ | 448,259 | |||||||||
44,050 | Vertiv Holdings Company - Class A | 4,096,650 | |||||||||
16,500 | Waste Management, Inc.µ | 3,432,330 | |||||||||
134,400 | CNY | Weichai Power Company, Ltd. - Class A | 322,426 | ||||||||
42,944,829 | |||||||||||
| NUMBER OF SHARES | VALUE | ||||||||||
Information Technology (21.3%) | |||||||||||
11,500 | JPY | Advantest Corp.µ | $ | 359,957 | |||||||
42,900 | Apple, Inc.~^ | 7,307,157 | |||||||||
32,000 | TWD | Asia Vital Components Company, Ltd. | 631,223 | ||||||||
5,000 | TWD | ASMedia Technology, Inc. | 295,650 | ||||||||
9,005 | ASML Holding, NV (ADR)µ | 7,856,592 | |||||||||
3,500 | HKD | ASMPT, Ltd.µ | 43,497 | ||||||||
269 | EUR | BE Semiconductor Industries, NVµ | 35,689 | ||||||||
565 | CAD | Descartes Systems Group, Inc.µ# | 52,410 | ||||||||
400 | JPY | Horiba, Ltd.µ | 38,808 | ||||||||
14,500 | CNY | Iflytek Company, Ltd. - Class A | 89,635 | ||||||||
28,901 | Infosys, Ltd. (ADR)^ | 482,936 | |||||||||
9,600 | International Business Machines Corp.µ | 1,595,520 | |||||||||
14,900 | JPY | Keyence Corp.µ | 6,552,567 | ||||||||
270,000 | HKD | Kingdee International Software Group Company, Ltd.µ# | 284,857 | ||||||||
74,625 | INR | KPIT Technologies, Ltd. | 1,324,693 | ||||||||
1,150 | EUR | Lectraµ | 39,178 | ||||||||
20,000 | TWD | MediaTek, Inc. | 603,023 | ||||||||
800 | JPY | Micronics Japan Company, Ltd.µ | 32,955 | ||||||||
33,400 | Microsoft Corp.^ | 13,003,622 | |||||||||
930 | EUR | Nemetschek, SEµ | 82,183 | ||||||||
540,000 | EUR | Nokia Oyjµ | 1,963,090 | ||||||||
27,370 | NVIDIA Corp.µ | 23,648,227 | |||||||||
29,340 | KRW | Samsung Electronics Company, Ltd. | 1,630,912 | ||||||||
1,790 | ServiceNow, Inc.µ# | 1,241,061 | |||||||||
19,050 | CAD | Shopify, Inc. - Class Aµ# | 1,337,437 | ||||||||
13,000 | TWD | Silergy Corp. | 172,655 | ||||||||
56,300 | KRW | SK Hynix, Inc. | 6,947,735 | ||||||||
40,500 | HKD | Sunny Optical Technology Group Company, Ltd.µ | 195,928 | ||||||||
705,000 | TWD | Taiwan Semiconductor Manufacturing Company, Ltd. | 16,880,347 | ||||||||
45,000 | BRL | TOTVS, SA | 238,667 | ||||||||
1,900 | JPY | Towa Corp.µ | 109,422 | ||||||||
60,065 | Unity Software, Inc.µ# | 1,457,778 | |||||||||
93,700 | CNY | Venustech Group, Inc. - Class A | 253,423 | ||||||||
303,800 | HKD | Xiaomi Corp. - Class B*µ# | 662,262 | ||||||||
1,000 | JPY | Zuken, Inc.µ | 26,130 | ||||||||
97,477,226 | |||||||||||
Materials (1.7%) | |||||||||||
1,570 | JPY | Artience Company, Ltd.µ | 29,096 | ||||||||
145,715 | Cemex, SAB de CV (ADR)# | 1,152,606 | |||||||||
219,750 | AED | Fertiglobe, PLC | 166,547 | ||||||||
5,950 | Linde, PLCµ | 2,623,712 | |||||||||
521,200 | NOK | Norsk Hydro, ASA~ | 3,202,973 | ||||||||
CALAMOS CLOSED-END FAMILY OF FUNDS SEMIANNUAL REPORT
108
| NUMBER OF SHARES | VALUE | ||||||||||
16,900 | ZAR | Sasol, Ltd. | $ | 118,728 | |||||||
1,945 | EUR | SOL S.p.A^ | 74,822 | ||||||||
3,200 | JPY | Sumitomo Bakelite Company, Ltd.µ | 91,145 | ||||||||
21,200 | Vale, SA (ADR) | 258,004 | |||||||||
7,717,633 | |||||||||||
Real Estate (1.2%) | |||||||||||
935,500 | PHP | Ayala Land, Inc. | 463,747 | ||||||||
169,699 | MXN | Corp. Inmobiliaria Vesta SAB de CV | 601,003 | ||||||||
104,680 | INR | DLF, Ltd. | 1,116,075 | ||||||||
200,670 | INR | Macrotech Developers, Ltd.* | 2,953,341 | ||||||||
11,500 | JPY | Mirarth Holdings, Inc.µ | 35,262 | ||||||||
14,680 | INR | Prestige Estates Projects, Ltd. | 241,894 | ||||||||
410 | EUR | VGP, NV | 44,607 | ||||||||
5,455,929 | |||||||||||
Special Purpose Acquisition Company (0.0%)# | |||||||||||
2,835 | Intelsat Emergence, SA&# | 102,769 | |||||||||
Utilities (0.8%) | |||||||||||
45,801 | EUR | Engie,SA# | 795,259 | ||||||||
25,088 | NextEra Energy, Inc.µ | 1,680,143 | |||||||||
29,000 | EUR | RWE, AGµ | 1,010,231 | ||||||||
3,485,633 | |||||||||||
TOTAL COMMON STOCKS (Cost $444,022,442) | 356,397,340 | ||||||||||
PREFERRED STOCKS (0.1%) | |||||||||||
Communication Services (0.0%) | |||||||||||
2,600 | United States Cellular Corp.µ 5.500%, 06/01/70 | 45,890 | |||||||||
2,500 | United States Cellular Corp.µ 5.500%, 03/01/70 | 44,425 | |||||||||
90,315 | |||||||||||
Consumer Discretionary (0.0%) | |||||||||||
1,597 | Guitar Center, Inc.&# | 125,364 | |||||||||
Energy (0.1%) | |||||||||||
6,520 | NuStar Energy, LP‡ 11.234%, 05/30/24 3 mo. SOFR + 5.91% | 166,325 | |||||||||
1,600 | NuStar Energy, LP‡ 12.357%, 05/30/24 3 mo. SOFR + 7.03% | 40,912 | |||||||||
8,335 | NuStar Logistics, LP‡ 12.324%, 01/15/43 3 mo. SOFR + 7.00% | 211,376 | |||||||||
418,613 | |||||||||||
TOTAL PREFERRED STOCKS (Cost $688,098) | 634,292 | ||||||||||
| NUMBER OF SHARES | VALUE | ||||||||||
WARRANTS (0.0%)# | |||||||||||
Energy (0.0%) | |||||||||||
13,401 | Mcdermott International, Ltd.& 06/30/27, Strike $15.98 | $ | 2 | ||||||||
12,061 | Mcdermott International, Ltd. 06/30/27, Strike $12.33 | 1 | |||||||||
TOTAL WARRANTS (Cost $5,152) | 3 | ||||||||||
| PRINCIPAL AMOUNT | VALUE | ||||||||||
U.S. GOVERNMENT AND AGENCY SECURITIES (0.3%) | |||||||||||
Other (0.3%) | |||||||||||
914,000 | United States Treasury Note 1.750%, 03/15/25 | 886,848 | |||||||||
265,000 | 4.375%, 10/31/24 | 263,721 | |||||||||
TOTAL U.S. GOVERNMENT (Cost $1,152,076) | 1,150,569 | ||||||||||
EXCHANGE-TRADED FUNDS (7.4%) | |||||||||||
Other (7.4%) | |||||||||||
799,500 | Invesco Senior Loan ETF | 16,829,475 | |||||||||
403,500 | SPDR Blackstone Senior Loan ETF^ | 16,938,930 | |||||||||
TOTAL EXCHANGE-TRADED FUNDS (Cost $33,856,045) | 33,768,405 | ||||||||||
| NUMBER OF CONTRACTS/ NOTIONAL AMOUNT | VALUE | ||||||||||
PURCHASED OPTIONS (1.3%)# | |||||||||||
Communication Services (0.1%) | |||||||||||
705 | Tencent Music Entertainment Group, Inc. | ||||||||||
884,775 | Call, 07/19/24, Strike $10.00 | 215,025 | |||||||||
Consumer Discretionary (0.3%) | |||||||||||
67 | Alibaba Group Holding, Ltd. | ||||||||||
501,495 | Call, 06/21/24, Strike $85.00 | 8,006 | |||||||||
282 | Dr Horton, Inc. | ||||||||||
4,018,218 | Call, 01/17/25, Strike $175.00 | 159,330 | |||||||||
1,365 | MakeMyTrip, Ltd. | ||||||||||
9,037,665 | Call, 11/15/24, Strike $70.00 | 1,173,900 | |||||||||
1,341,236 | |||||||||||
Energy (0.0%) | |||||||||||
42 | Eog Resources, Inc. | ||||||||||
554,946 | Call, 01/17/25, Strike $141.00 | 39,900 | |||||||||
Financials (0.0%) | |||||||||||
590 | ICICI Bank, Ltd. | ||||||||||
1,624,270 | Call, 08/16/24, Strike $27.00 | 100,300 | |||||||||
www.calamos.com
109
| NUMBER OF CONTRACTS/ NOTIONAL AMOUNT | VALUE | ||||||||||
Health Care (0.1%) | |||||||||||
535 | Boston Scientific Corp. | ||||||||||
3,845,045 | Call, 11/15/24, Strike $70.00 | $ | 411,950 | ||||||||
160 | Icon, PLC | ||||||||||
4,766,080 | Call, 11/15/24, Strike $360.00 | 135,200 | |||||||||
547,150 | |||||||||||
Industrials (0.1%) | |||||||||||
290 | EUR | Schneider Electric, SE | |||||||||
1,325,300 | Call, 12/20/24, Strike 220.00 | 467,946 | |||||||||
240 | CHF | Swatch Group, AG | |||||||||
25,128 | Call, 09/20/24, Strike 200.00 | 20,691 | |||||||||
488,637 | |||||||||||
Information Technology (0.1%) | |||||||||||
212 | Cadence Design Systems, Inc. | ||||||||||
5,843,356 | Call, 01/17/25, Strike $335.00 | 252,280 | |||||||||
53 | |||||||||||
1,460,839 | Call, 11/15/24, Strike $300.00 | 97,255 | |||||||||
349,535 | |||||||||||
Other (0.6%) | |||||||||||
745 | Coupang, Inc. | ||||||||||
1,676,250 | Call, 08/16/24, Strike $21.00 | 230,950 | |||||||||
820 | Invesco QQQ Trust Series 1 | ||||||||||
34,816,380 | Put, 06/28/24, Strike $440.00 | 1,653,940 | |||||||||
815 | |||||||||||
34,604,085 | Put, 12/20/24, Strike $344.78 | 394,867 | |||||||||
88 | |||||||||||
3,736,392 | Put, 09/30/24, Strike $420.00 | 139,744 | |||||||||
690 | SPDR S&P 500 ETF Trust | ||||||||||
34,636,620 | Put, 12/20/24, Strike $410.00 | 274,965 | |||||||||
140 | EUR | TotalEnergies, SE | |||||||||
1,034,872 | Call, 06/21/24, Strike 60.00 | 139,062 | |||||||||
2,833,528 | |||||||||||
TOTAL PURCHASED OPTIONS (Cost $7,970,893) | 5,915,311 | ||||||||||
TOTAL INVESTMENTS (140.8%) (Cost $745,748,132) | 645,470,154 | ||||||||||
| MANDATORY REDEEMABLE PREFERRED SHARES, AT LIQUIDATION VALUE (-15.3%) | (70,000,000 | ) | |||||||||
LIABILITIES, LESS OTHER ASSETS (-25.5%) | (117,121,636 | ) | |||||||||
NET ASSETS (100.0%) | $ | 458,348,518 | |||||||||
WRITTEN OPTIONS (-0.1%)# | |||||||||||
Financials (0.0%) | |||||||||||
442 | Morgan Stanley | ||||||||||
4,015,128 | Call, 09/20/24, Strike $100.00 | (102,102 | ) | ||||||||
| NUMBER OF CONTRACTS/ NOTIONAL AMOUNT | VALUE | ||||||||||
Health Care (-0.1%) | |||||||||||
23 | GBP | Astrazeneca, PLC | |||||||||
1,745,240 | Call, 09/20/24, Strike 117.50 | $ | (247,161 | ) | |||||||
Other (0.0%) | |||||||||||
88 | Invesco QQQ Trust Series 1 | ||||||||||
3,736,392 | Put, 09/30/24, Strike $380.00 | (49,456 | ) | ||||||||
TOTAL WRITTEN OPTIONS (Premium $164,769) | $ | (398,719 | ) | ||||||||
NOTES TO SCHEDULE OF INVESTMENTS
* Securities issued and sold pursuant to a Rule 144A transaction are exempted from the registration requirement of the Securities Act of 1933, as amended. These securities may only be sold to qualified institutional buyers ("QIBs"), such as the Fund. Any resale of these securities must generally be effected through a sale that is registered under the Act or otherwise exempted from such registration requirements.
~ Security, or portion of security, is segregated as collateral (or collateral for potential future transactions) for written options and securities sold short. The aggregate value of such securities is $30,583,062.
µ Security, or portion of security, is held in a segregated account as collateral for note payable aggregating a total value of $242,957,941.
@ In default status and considered non-income producing.
^ Security, or portion of security, is on loan.
& Illiquid security.
‡ Variable rate security. The rate shown is the rate in effect at April 30, 2024.
§ Securities exchangeable or convertible into securities of one or more entities that are different than the issuer. Each entity is identified in the parenthetical.
¡ Bank loans generally are subject to mandatory and/or optional prepayment. As a result, the actual remaining maturity of bank loans may be substantially less than the stated maturities shown.
! This position represents an unsettled loan commitment at period end. Certain details associated with this purchase are not known prior to the settlement date, including coupon rate, which will be adjusted on settlement date.
# Non-income producing security.
ABBREVIATION
ADR A merican Depositary Receipt
CALAMOS CLOSED-END FAMILY OF FUNDS SEMIANNUAL REPORT
110
FOREIGN CURRENCY ABBREVIATIONS
AED UAE Dirham
AUD Australian Dollar
BRL Brazilian Real
CAD Canadian Dollar
CHF Swiss Franc
CNY Chinese Yuan Renminbi
EUR European Monetary Unit
GBP British Pound Sterling
HKD Hong Kong Dollar
IDR Indonesian Rupiah
INR Indian Rupee
JPY Japanese Yen
KRW South Korean Won
MXN Mexican Peso
NOK Norwegian Krone
PHP Philippine Peso
SAR Saudi Riyal
SEK Swedish Krona
THB Thai Baht
TRY Turkish Lira
TWD New Taiwan Dollar
ZAR South African Rand
Note: Value for securities denominated in foreign currencies is shown in U.S. dollars. The principal amount for such securities is shown in the respective foreign currency. The date on options represents the expiration date of the option contract. The option contract may be exercised at any date on or before the date shown.
CURRENCY EXPOSURE
APRIL 30, 2024
VALUE | % OF TOTAL INVESTMENTS | ||||||||||
US Dollar | $ | 443,277,574 | 68.7 | % | |||||||
European Monetary Unit | 49,773,895 | 7.7 | % | ||||||||
Indian Rupee | 26,262,660 | 4.1 | % | ||||||||
Japanese Yen | 23,092,151 | 3.6 | % | ||||||||
British Pound Sterling | 22,753,031 | 3.5 | % | ||||||||
New Taiwan Dollar | 18,582,898 | 2.9 | % | ||||||||
Hong Kong Dollar | 16,095,759 | 2.5 | % | ||||||||
South Korean Won | 13,735,810 | 2.1 | % | ||||||||
Canadian Dollar | 12,662,962 | 2.0 | % | ||||||||
Chinese Yuan Renminbi | 3,948,667 | 0.6 | % | ||||||||
Norwegian Krone | 3,202,973 | 0.5 | % | ||||||||
Indonesian Rupiah | 2,974,854 | 0.4 | % | ||||||||
Swiss Franc | 2,196,876 | 0.3 | % | ||||||||
Mexican Peso | 1,840,112 | 0.3 | % | ||||||||
Thai Baht | 1,124,373 | 0.2 | % | ||||||||
Brazilian Real | 1,084,926 | 0.2 | % | ||||||||
UAE Dirham | 547,146 | 0.1 | % | ||||||||
Saudi Riyal | 533,730 | 0.1 | % | ||||||||
Philippine Peso | 463,747 | 0.1 | % | ||||||||
Swedish Krona | 353,648 | 0.1 | % | ||||||||
Turkish Lira | 247,421 | — | % | ||||||||
Australian Dollar | 197,494 | — | % | ||||||||
South African Rand | 118,728 | — | % | ||||||||
| Total Investments Net of Written Options | $ | 645,071,435 | 100.0 | % | |||||||
Currency exposure may vary over time.
www.calamos.com
111
The following table summarizes the Fund's investments and derivative financial instruments categorized in the fair value hierarchy as of April 30, 2024 (see Note 1):
LEVEL 1 | LEVEL 2 | LEVEL 3 | TOTAL | ||||||||||||||||
Assets: | |||||||||||||||||||
Asset Backed Securities | $ | — | $ | 154,503 | $ | — | $ | 154,503 | |||||||||||
Corporate Bonds | — | 66,196,275 | — | 66,196,275 | |||||||||||||||
Convertible Bonds | — | 140,831,777 | — | 140,831,777 | |||||||||||||||
Bank Loans | — | 32,974,869 | — | 32,974,869 | |||||||||||||||
Convertible Preferred Stocks | 7,388,935 | 57,875 | — | 7,446,810 | |||||||||||||||
Common Stocks | 215,434,181 | 140,963,159 | — | 356,397,340 | |||||||||||||||
Preferred Stocks | 508,928 | 125,364 | — | 634,292 | |||||||||||||||
Warrants | — | 3 | — | 3 | |||||||||||||||
U.S. Government and Agency Securities | — | 1,150,569 | — | 1,150,569 | |||||||||||||||
Exchange-Traded Funds | 33,768,405 | — | — | 33,768,405 | |||||||||||||||
Purchased Options | 5,915,311 | — | — | 5,915,311 | |||||||||||||||
Total | $ | 263,015,760 | $ | 382,454,394 | $ | — | $ | 645,470,154 | |||||||||||
Liabilities: | |||||||||||||||||||
Written Options | $ | 398,719 | $ | — | $ | — | $ | 398,719 | |||||||||||
Total | $ | 398,719 | $ | — | $ | — | $ | 398,719 | |||||||||||
SECTOR WEIGHTINGS
Information Technology | 20.5 | % | |||||
Consumer Discretionary | 15.3 | ||||||
Industrials | 12.5 | ||||||
Financials | 10.0 | ||||||
Health Care | 8.6 | ||||||
Communication Services | 6.9 | ||||||
Energy | 5.6 | ||||||
Other | 5.4 | ||||||
Consumer Staples | 4.6 | ||||||
Materials | 3.0 | ||||||
Real Estate | 1.4 | ||||||
Utilities | 0.9 | ||||||
Airlines | 0.4 | ||||||
Special Purpose Acquisition Companies | 0.1 | ||||||
Sector weightings are based on managed assets and may vary over time. Sector Weightings exclude any government/sovereign bonds or options on broad market indexes the Fund may hold.
ASSET ALLOCATION
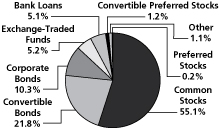
CALAMOS CLOSED-END FAMILY OF FUNDS SEMIANNUAL REPORT
112
| PRINCIPAL AMOUNT | VALUE | ||||||||||
CORPORATE BONDS (12.9%) | |||||||||||
Airlines (0.2%) | |||||||||||
39,910 | Alaska Airlines Pass Through Trust Series 2020-1, Class A* 4.800%, 02/15/29 | $ | 38,751 | ||||||||
17,700 | Alaska Airlines Pass Through Trust Series 2020-1, Class B* 8.000%, 02/15/27 | 17,901 | |||||||||
47,575 | American Airlines Pass Through Trust Series 2021-1, Class B 3.950%, 01/11/32 | 43,131 | |||||||||
22,000 | American Airlines, Inc. / AAdvantage Loyalty IP, Ltd.* 5.500%, 04/20/26 | 21,768 | |||||||||
41,071 | British Airways Pass Through Trust Series 2021-1, Class B* 3.900%, 03/15/33 | 37,321 | |||||||||
37,784 | JetBlue Pass Through Trust Series 2020-1, Class B 7.750%, 05/15/30 | 38,679 | |||||||||
197,551 | |||||||||||
Communication Services (1.2%) | |||||||||||
55,000 | APi Group DE, Inc.* 4.750%, 10/15/29 | 50,108 | |||||||||
57,000 | Audacy Capital Corp.*@ 6.750%, 03/31/29 | 2,012 | |||||||||
27,000 | 6.500%, 05/01/27 | 964 | |||||||||
36,000 | Cincinnati Bell Telephone Company, LLC 6.300%, 12/01/28 | 32,852 | |||||||||
25,000 | Clear Channel Outdoor Holdings, Inc.* 7.875%, 04/01/30 | 24,529 | |||||||||
20,000 | 9.000%, 09/15/28 | 20,588 | |||||||||
65,000 | Consolidated Communications, Inc.* 6.500%, 10/01/28 | 56,452 | |||||||||
200,000 | CSC Holdings, LLC* 5.500%, 04/15/27 | 164,172 | |||||||||
43,000 | Directv Financing, LLC / Directv Financing Co-Obligor, Inc.* 5.875%, 08/15/27 | 40,106 | |||||||||
45,000 | Frontier California, Inc. 6.750%, 05/15/27 | 42,886 | |||||||||
11,000 | Frontier Communications Holdings, LLC* 8.750%, 05/15/30 | 11,210 | |||||||||
85,000 | Frontier Florida, LLC@ 6.860%, 02/01/28 | 80,983 | |||||||||
65,000 | Frontier North, Inc.@ 6.730%, 02/15/28 | 61,649 | |||||||||
40,000 | Go Daddy Operating Company, LLC / GD Finance Company, Inc.* 3.500%, 03/01/29 | 35,538 | |||||||||
13,000 | 5.250%, 12/01/27 | 12,568 | |||||||||
10,000 | Hughes Satellite Systems Corp. 6.625%, 08/01/26 | 5,761 | |||||||||
| PRINCIPAL AMOUNT | VALUE | ||||||||||
25,000 | iHeartCommunications, Inc. 8.375%, 05/01/27 | $ | 13,325 | ||||||||
15,000 | 5.250%, 08/15/27*^ | 11,023 | |||||||||
37,759 | Ligado Networks, LLC* 15.500%, 11/01/23 PIK rate | 6,258 | |||||||||
35,000 | Lumen Technologies, Inc. 7.600%, 09/15/39 | 10,712 | |||||||||
20,000 | 4.000%, 02/15/27* | 10,648 | |||||||||
10,000 | 7.650%, 03/15/42 | 3,062 | |||||||||
22,000 | Match Group Holdings II, LLC* 3.625%, 10/01/31 | 18,186 | |||||||||
25,000 | Nexstar Media, Inc.* 5.625%, 07/15/27 | 23,528 | |||||||||
45,000 | Paramount Global 4.900%, 08/15/44 | 31,548 | |||||||||
14,000 | Qwest Corp. 7.250%, 09/15/25 | 13,876 | |||||||||
23,000 | Scripps Escrow II, Inc.* 3.875%, 01/15/29 | 17,020 | |||||||||
11,000 | 5.375%, 01/15/31 | 6,514 | |||||||||
40,000 | Scripps Escrow, Inc.* 5.875%, 07/15/27 | 31,624 | |||||||||
65,000 | Sirius XM Radio, Inc.* 5.500%, 07/01/29 | 60,615 | |||||||||
43,000 | 4.000%, 07/15/28 | 38,337 | |||||||||
20,000 | 3.125%, 09/01/26 | 18,675 | |||||||||
11,000 | 3.875%, 09/01/31^ | 8,850 | |||||||||
41,000 | Spanish Broadcasting System, Inc.* 9.750%, 03/01/26 | 19,543 | |||||||||
110,000 | Sprint, LLC 7.125%, 06/15/24 | 110,152 | |||||||||
45,000 | Stagwell Global, LLC* 5.625%, 08/15/29 | 40,367 | |||||||||
22,000 | Telesat Canada / Telesat, LLC* 4.875%, 06/01/27 | 10,068 | |||||||||
15,000 | Time Warner Cable, LLC 7.300%, 07/01/38 | 14,569 | |||||||||
54,000 | United States Cellular Corp. 6.700%, 12/15/33 | 52,727 | |||||||||
45,000 | Univision Communications, Inc.* 8.000%, 08/15/28 | 45,106 | |||||||||
20,000 | Viasat, Inc.*^ 5.625%, 04/15/27 | 18,336 | |||||||||
1,277,047 | |||||||||||
Consumer Discretionary (2.6%) | |||||||||||
53,000 | Abercrombie & Fitch Management Company* 8.750%, 07/15/25 | 53,451 | |||||||||
40,000 | Adams Homes, Inc.* 9.250%, 10/15/28 | 41,352 | |||||||||
35,000 | Adient Global Holdings Company*^ 8.250%, 04/15/31 | 36,381 | |||||||||
www.calamos.com
113
| PRINCIPAL AMOUNT | VALUE | ||||||||||
35,000 | American Axle & Manufacturing, Inc.^ 5.000%, 10/01/29 | $ | 31,598 | ||||||||
39,000 | Ashton Woods USA, LLC / Ashton Woods Finance Company* 6.625%, 01/15/28 | 38,943 | |||||||||
38,000 | 4.625%, 08/01/29 | 34,422 | |||||||||
53,000 | At Home Group, Inc.* 4.875%, 07/15/28 | 25,197 | |||||||||
57,000 | Bath & Body Works, Inc. 6.694%, 01/15/27 | 57,441 | |||||||||
35,000 | 6.875%, 11/01/35 | 34,848 | |||||||||
28,000 | Caesars Entertainment, Inc.* 4.625%, 10/15/29^ | 24,984 | |||||||||
21,000 | 8.125%, 07/01/27 | 21,327 | |||||||||
22,000 | Carnival Corp.* 4.000%, 08/01/28 | 20,100 | |||||||||
21,000 | 7.625%, 03/01/26 | 21,142 | |||||||||
3,000 | 7.000%, 08/15/29^ | 3,083 | |||||||||
8,510 | Carvana Company* 14.000%, 06/01/31 | 8,542 | |||||||||
6,355 | 13.000%, 06/01/30 | 6,314 | |||||||||
4,218 | 12.000%, 12/01/28 | 4,132 | |||||||||
95,000 | CCO Holdings, LLC / CCO Holdings Capital Corp.* 5.125%, 05/01/27 | 89,192 | |||||||||
90,000 | 4.500%, 08/15/30 | 73,263 | |||||||||
50,000 | 6.375%, 09/01/29 | 45,836 | |||||||||
50,000 | 4.750%, 03/01/30 | 41,627 | |||||||||
46,000 | 4.250%, 02/01/31 | 36,152 | |||||||||
22,000 | 4.750%, 02/01/32 | 17,317 | |||||||||
20,000 | 5.000%, 02/01/28 | 18,239 | |||||||||
22,000 | CDI Escrow Issuer, Inc.* 5.750%, 04/01/30 | 20,994 | |||||||||
39,000 | Cedar Fair, LP 5.250%, 07/15/29 | 36,455 | |||||||||
23,000 | Churchill Downs, Inc.* 6.750%, 05/01/31 | 22,846 | |||||||||
40,000 | Dana, Inc. 4.250%, 09/01/30 | 34,758 | |||||||||
32,000 | 4.500%, 02/15/32 | 27,152 | |||||||||
45,000 | DISH DBS Corp. 5.125%, 06/01/29 | 18,183 | |||||||||
30,000 | 7.375%, 07/01/28 | 13,466 | |||||||||
30,000 | 5.250%, 12/01/26* | 23,663 | |||||||||
26,000 | 7.750%, 07/01/26 | 16,400 | |||||||||
25,000 | 5.750%, 12/01/28* | 16,968 | |||||||||
46,000 | DISH Network Corp.* 11.750%, 11/15/27 | 46,421 | |||||||||
47,000 | Everi Holdings, Inc.* 5.000%, 07/15/29 | 46,167 | |||||||||
175,000 | Ford Motor Company 6.100%, 08/19/32 | 171,715 | |||||||||
200,000 | Ford Motor Credit Company, LLC 2.900%, 02/16/28 | 178,092 | |||||||||
16,000 | Gap, Inc.* 3.875%, 10/01/31 | 13,089 | |||||||||
| PRINCIPAL AMOUNT | VALUE | ||||||||||
20,000 | General Motors Company 5.200%, 04/01/45 | $ | 17,135 | ||||||||
75,000 | goeasy, Ltd.* 9.250%, 12/01/28 | 79,388 | |||||||||
41,000 | 7.625%, 07/01/29 | 41,067 | |||||||||
20,000 | Goodyear Tire & Rubber Company 5.625%, 04/30/33 | 17,601 | |||||||||
20,000 | 5.250%, 07/15/31^ | 17,718 | |||||||||
19,000 | Group 1 Automotive, Inc.* 4.000%, 08/15/28 | 17,333 | |||||||||
45,000 | Guitar Center, Inc.*^& 8.500%, 01/15/26 | 39,793 | |||||||||
11,597 | JetBlue Pass Through Trust Series 2019-2, Class B 8.000%, 11/15/27 | 11,718 | |||||||||
45,000 | Kohl's Corp. 5.550%, 07/17/45 | 30,906 | |||||||||
45,000 | LCM Investments Holdings II, LLC* 8.250%, 08/01/31 | 46,833 | |||||||||
45,000 | Liberty Interactive, LLC 8.250%, 02/01/30 | 24,999 | |||||||||
43,000 | Life Time, Inc.* 8.000%, 04/15/26 | 43,072 | |||||||||
20,000 | Light & Wonder International, Inc.* 7.500%, 09/01/31 | 20,410 | |||||||||
15,000 | Lindblad Expeditions Holdings, Inc.* 9.000%, 05/15/28 | 15,729 | |||||||||
28,000 | Lindblad Expeditions, LLC* 6.750%, 02/15/27 | 27,787 | |||||||||
30,000 | M/I Homes, Inc. 3.950%, 02/15/30 | 26,054 | |||||||||
53,000 | Macy's Retail Holdings, LLC 6.700%, 07/15/34* | 44,669 | |||||||||
35,000 | 4.300%, 02/15/43 | 27,686 | |||||||||
55,000 | Midwest Gaming Borrower, LLC / Midwest Gaming Finance Corp.* 4.875%, 05/01/29 | 50,306 | |||||||||
25,000 | Newell Brands, Inc. 5.700%, 04/01/26 | 24,663 | |||||||||
23,000 | Nordstrom, Inc. 4.250%, 08/01/31 | 19,854 | |||||||||
20,000 | 6.950%, 03/15/28 | 19,874 | |||||||||
20,000 | 5.000%, 01/15/44 | 15,197 | |||||||||
67,000 | Patrick Industries, Inc.* 4.750%, 05/01/29 | 60,965 | |||||||||
50,000 | PENN Entertainment, Inc.*^ 4.125%, 07/01/29 | 41,906 | |||||||||
21,000 | Phinia, Inc.* 6.750%, 04/15/29 | 21,090 | |||||||||
60,000 | Premier Entertainment Sub, LLC / Premier Entertainment Finance Corp.*^ 5.625%, 09/01/29 | 44,831 | |||||||||
20,000 | QVC, Inc. 5.450%, 08/15/34 | 13,139 | |||||||||
CALAMOS CLOSED-END FAMILY OF FUNDS SEMIANNUAL REPORT
114
| PRINCIPAL AMOUNT | VALUE | ||||||||||
20,000 | Raising Cane's Restaurants, LLC* 9.375%, 05/01/29 | $ | 21,467 | ||||||||
91,000 | Rite Aid Corp.*@ 8.000%, 11/15/26 | 58,725 | |||||||||
23,000 | Royal Caribbean Cruises, Ltd.* 7.250%, 01/15/30 | 23,696 | |||||||||
6,000 | 6.250%, 03/15/32 | 5,916 | |||||||||
63,000 | Simmons Foods, Inc. / Simmons Prepared Foods, Inc. / Simmons Pet Food, Inc. / Simmons Feed* 4.625%, 03/01/29 | 54,495 | |||||||||
65,000 | Six Flags Entertainment Corp.* 7.250%, 05/15/31 | 64,923 | |||||||||
50,000 | Sonic Automotive, Inc.* 4.625%, 11/15/29 | 44,799 | |||||||||
36,000 | Speedway Motorsports, LLC / Speedway Funding II, Inc.* 4.875%, 11/01/27 | 33,975 | |||||||||
40,000 | Station Casinos, LLC* 4.500%, 02/15/28 | 37,130 | |||||||||
45,000 | STL Holding Company, LLC* 8.750%, 02/15/29 | 46,287 | |||||||||
31,000 | Taylor Morrison Communities, Inc.* 5.750%, 01/15/28 | 30,219 | |||||||||
10,000 | Viking Cruises, Ltd.* 9.125%, 07/15/31 | 10,734 | |||||||||
50,000 | Vista Outdoor, Inc.* 4.500%, 03/15/29 | 49,423 | |||||||||
2,814,764 | |||||||||||
Consumer Staples (0.6%) | |||||||||||
52,000 | 1375209 B.C., Ltd.*^ 9.000%, 01/30/28 | 51,110 | |||||||||
67,000 | Arrow Bidco, LLC* 10.750%, 06/15/25 | 69,114 | |||||||||
40,000 | B&G Foods, Inc.* 8.000%, 09/15/28 | 41,513 | |||||||||
51,000 | Central Garden & Pet Company* 4.125%, 04/30/31 | 44,264 | |||||||||
53,000 | Edgewell Personal Care Company* 4.125%, 04/01/29 | 48,065 | |||||||||
59,000 | Energizer Holdings, Inc.* 4.375%, 03/31/29 | 52,186 | |||||||||
10,000 | 6.500%, 12/31/27^ | 9,912 | |||||||||
65,000 | JBS USA Holding LUX Sarl / JBS USA Food Company / JBS LUX Company Sarl 5.500%, 01/15/30^ | 62,798 | |||||||||
25,000 | 5.125%, 02/01/28^ | 24,309 | |||||||||
15,000 | 5.750%, 04/01/33 | 14,363 | |||||||||
33,000 | New Albertsons, LP 7.750%, 06/15/26 | 33,987 | |||||||||
43,000 | Performance Food Group, Inc.* 4.250%, 08/01/29 | 38,558 | |||||||||
35,000 | Pilgrim's Pride Corp. 4.250%, 04/15/31 | 30,997 | |||||||||
| PRINCIPAL AMOUNT | VALUE | ||||||||||
23,000 | Post Holdings, Inc.* 6.250%, 02/15/32 | $ | 22,750 | ||||||||
42,000 | Prestige Brands, Inc.* 3.750%, 04/01/31 | 35,784 | |||||||||
35,000 | United Natural Foods, Inc.*^ 6.750%, 10/15/28 | 26,906 | |||||||||
50,000 | Vector Group, Ltd.* 5.750%, 02/01/29 | 45,499 | |||||||||
652,115 | |||||||||||
Energy (1.7%) | |||||||||||
24,000 | Antero Resources Corp.* 5.375%, 03/01/30 | 22,837 | |||||||||
45,000 | Apache Corp. 5.100%, 09/01/40 | 37,476 | |||||||||
25,000 | Buckeye Partners, LP 5.850%, 11/15/43 | 20,932 | |||||||||
23,000 | Cheniere Energy, Inc. 4.625%, 10/15/28 | 22,007 | |||||||||
32,000 | Chesapeake Energy Corp.* 6.750%, 04/15/29 | 32,036 | |||||||||
58,000 | Civitas Resources, Inc.* 8.750%, 07/01/31 | 61,724 | |||||||||
23,000 | Continental Resources, Inc. 2.875%, 04/01/32* | 18,388 | |||||||||
20,000 | 4.900%, 06/01/44 | 16,126 | |||||||||
32,000 | DT Midstream, Inc.* 4.125%, 06/15/29 | 29,009 | |||||||||
39,000 | Earthstone Energy Holdings, LLC* 8.000%, 04/15/27 | 40,131 | |||||||||
15,000 | 9.875%, 07/15/31 | 16,599 | |||||||||
25,000 | Enbridge, Inc.‡ 7.375%, 01/15/83 5 year CMT + 3.71% | 24,607 | |||||||||
25,000 | Encino Acquisition Partners Holdings, LLC* 8.750%, 05/01/31 | 25,467 | |||||||||
65,000 | Energy Transfer, LP‡ 8.606%, 11/01/66 3 mo. USD Term SOFR + 3.28% | 59,043 | |||||||||
32,000 | 6.500%, 11/15/26 5 year CMT + 5.69% | 31,084 | |||||||||
60,000 | EnLink Midstream Partners, LP 9.701%, 05/31/24‡ 3 mo. USD LIBOR + 4.11% | 59,254 | |||||||||
50,000 | 4.850%, 07/15/26 | 48,749 | |||||||||
31,000 | Enlink Midstream, LLC* 6.500%, 09/01/30 | 31,399 | |||||||||
70,000 | EQM Midstream Partners, LP* 7.500%, 06/01/27 | 71,319 | |||||||||
20,000 | 6.375%, 04/01/29 | 19,872 | |||||||||
31,000 | Genesis Energy, LP / Genesis Energy Finance Corp. 8.875%, 04/15/30 | 32,114 | |||||||||
18,000 | 6.250%, 05/15/26 | 17,871 | |||||||||
www.calamos.com
115
| PRINCIPAL AMOUNT | VALUE | ||||||||||
40,000 | Gulfport Energy Corp. 8.000%, 05/17/26* | $ | 40,602 | ||||||||
13,792 | 8.000%, 05/17/26^ | 14,000 | |||||||||
60,000 | Hilcorp Energy I, LP / Hilcorp Finance Company* 6.000%, 04/15/30 | 57,653 | |||||||||
32,000 | Howard Midstream Energy Partners, LLC* 6.750%, 01/15/27 | 31,630 | |||||||||
45,000 | Kodiak Gas Services, LLC* 7.250%, 02/15/29 | 45,535 | |||||||||
44,000 | Magnolia Oil & Gas Operating, LLC / Magnolia Oil & Gas Finance Corp.* 6.000%, 08/01/26 | 43,416 | |||||||||
31,000 | Matador Resources Company* 6.500%, 04/15/32 | 30,747 | |||||||||
25,000 | Moss Creek Resources Holdings, Inc.* 10.500%, 05/15/27 | 25,598 | |||||||||
25,000 | 7.500%, 01/15/26 | 24,973 | |||||||||
35,000 | Nabors Industries, Inc.* 7.375%, 05/15/27 | 34,715 | |||||||||
15,000 | 9.125%, 01/31/30^ | 15,526 | |||||||||
35,000 | Nabors Industries, Ltd.*^ 7.500%, 01/15/28 | 33,212 | |||||||||
26,000 | New Fortress Energy, Inc.* 6.750%, 09/15/25 | 25,725 | |||||||||
45,000 | Oceaneering International, Inc. 6.000%, 02/01/28 | 43,375 | |||||||||
45,000 | Parkland Corp.* 5.875%, 07/15/27 | 44,017 | |||||||||
23,000 | Patterson-UTI Energy, Inc. 5.150%, 11/15/29 | 21,982 | |||||||||
12,000 | Permian Resources Operating LLC* 7.000%, 01/15/32 | 12,261 | |||||||||
50,000 | Plains All American Pipeline, LP‡ 9.679%, 05/31/24 3 mo. USD LIBOR + 4.11% | 49,828 | |||||||||
60,000 | Rockcliff Energy II, LLC* 5.500%, 10/15/29 | 55,493 | |||||||||
21,000 | Southwestern Energy Company 4.750%, 02/01/32 | 18,936 | |||||||||
58,500 | Transocean, Inc.* 8.750%, 02/15/30 | 61,061 | |||||||||
25,000 | 8.250%, 05/15/29 | 24,865 | |||||||||
30,000 | Venture Global Calcasieu Pass, LLC* 6.250%, 01/15/30 | 29,743 | |||||||||
10,000 | 4.125%, 08/15/31 | 8,759 | |||||||||
10,000 | 3.875%, 08/15/29 | 8,836 | |||||||||
55,000 | Venture Global LNG, Inc.* 8.375%, 06/01/31 | 56,487 | |||||||||
35,000 | 8.125%, 06/01/28 | 35,828 | |||||||||
20,000 | 9.875%, 02/01/32 | 21,344 | |||||||||
20,000 | 9.500%, 02/01/29 | 21,514 | |||||||||
25,000 | Vital Energy, Inc. 7.750%, 07/31/29*^ | 25,185 | |||||||||
23,000 | 7.875%, 04/15/32* | 23,364 | |||||||||
15,000 | 9.750%, 10/15/30 | 16,358 | |||||||||
| PRINCIPAL AMOUNT | VALUE | ||||||||||
45,000 | VOC Escrow, Ltd.* 5.000%, 02/15/28 | $ | 42,949 | ||||||||
50,000 | Weatherford International, Ltd.* 8.625%, 04/30/30 | 51,944 | |||||||||
1,835,505 | |||||||||||
Financials (2.0%) | |||||||||||
65,000 | Acrisure, LLC / Acrisure Finance, Inc.* 8.250%, 02/01/29 | 64,601 | |||||||||
67,000 | Aethon United BR, LP / Aethon United Finance Corp.* 8.250%, 02/15/26 | 67,543 | |||||||||
75,000 | Alliant Holdings Intermediate, LLC / Alliant Holdings Co-Issuer* 6.750%, 10/15/27 | 73,702 | |||||||||
50,000 | 7.000%, 01/15/31 | 50,306 | |||||||||
49,000 | Ally Financial, Inc. 4.700%, 05/15/26‡ ‡‡ 5 year CMT + 3.87% | 41,629 | |||||||||
20,000 | 8.000%, 11/01/31 | 21,675 | |||||||||
20,000 | 4.700%, 05/15/28‡ 7 year CMT + 3.48% | 15,500 | |||||||||
86,000 | AmWINS Group, Inc.* 4.875%, 06/30/29 | 78,294 | |||||||||
33,000 | Aviation Capital Group, LLC*^ 3.500%, 11/01/27 | 30,401 | |||||||||
23,000 | Brandywine Operating Partnership, LP 8.875%, 04/12/29 | 23,566 | |||||||||
68,000 | BroadStreet Partners, Inc.* 5.875%, 04/15/29 | 62,045 | |||||||||
50,000 | Brookfield Property REIT, Inc. / BPR Cumulus, LLC / BPR Nimbus, LLC / GGSI Sellco, LLC* 4.500%, 04/01/27 | 44,795 | |||||||||
40,000 | Credit Acceptance Corp. 6.625%, 03/15/26^ | 39,904 | |||||||||
30,000 | 9.250%, 12/15/28* | 31,837 | |||||||||
45,000 | Cushman & Wakefield U.S. Borrower LLC* 8.875%, 09/01/31 | 46,825 | |||||||||
58,000 | Enact Holdings, Inc.* 6.500%, 08/15/25 | 57,975 | |||||||||
50,000 | GGAM Finance, Ltd.* 8.000%, 02/15/27 | 51,374 | |||||||||
56,000 | Global Net Lease, Inc. / Global Net Lease Operating Partnership, LP* 3.750%, 12/15/27 | 47,696 | |||||||||
25,000 | HAT Holdings I LLC / HAT Holdings II LLC* 8.000%, 06/15/27 | 25,673 | |||||||||
66,000 | HUB International, Ltd.* 5.625%, 12/01/29 | 60,898 | |||||||||
23,000 | 7.375%, 01/31/32 | 22,905 | |||||||||
31,000 | Icahn Enterprises, LP / Icahn Enterprises Finance Corp. 4.375%, 02/01/29 | 26,122 | |||||||||
CALAMOS CLOSED-END FAMILY OF FUNDS SEMIANNUAL REPORT
116
| PRINCIPAL AMOUNT | VALUE | ||||||||||
100,000 | ILFC E-Capital Trust II*‡ 7.395%, 12/21/65 3 mo. USD LIBOR + 1.80% | $ | 79,896 | ||||||||
90,000 | Iron Mountain, Inc.* 5.250%, 03/15/28 | 86,231 | |||||||||
88,000 | Ladder Capital Finance Holdings, LLLP / Ladder Capital Finance Corp.* 5.250%, 10/01/25 | 86,559 | |||||||||
47,000 | 4.750%, 06/15/29 | 42,036 | |||||||||
40,000 | LD Holdings Group, LLC* 6.125%, 04/01/28 | 30,366 | |||||||||
45,000 | Level 3 Financing, Inc.* 4.250%, 07/01/28 | 17,606 | |||||||||
20,000 | 4.625%, 09/15/27 | 11,795 | |||||||||
30,000 | LPL Holdings, Inc.* 4.000%, 03/15/29 | 27,239 | |||||||||
40,000 | Macquarie Airfinance Holdings, Ltd.* 8.125%, 03/30/29 | 41,928 | |||||||||
70,000 | MetLife, Inc. 6.400%, 12/15/66 | 69,827 | |||||||||
60,000 | Nationstar Mortgage Holdings, Inc.* 5.500%, 08/15/28 | 56,478 | |||||||||
50,000 | Navient Corp. 5.000%, 03/15/27 | 47,226 | |||||||||
20,000 | 4.875%, 03/15/28 | 18,103 | |||||||||
30,000 | Necessity Retail REIT, Inc. / American Finance Operating Partner, LP* 4.500%, 09/30/28 | 25,617 | |||||||||
20,000 | Newmark Group, Inc.* 7.500%, 01/12/29 | 20,221 | |||||||||
30,000 | OneMain Finance Corp. 9.000%, 01/15/29 | 31,538 | |||||||||
30,000 | 3.875%, 09/15/28 | 26,472 | |||||||||
22,000 | 7.125%, 03/15/26^ | 22,215 | |||||||||
73,000 | PHH Mortgage Corp.* 7.875%, 03/15/26 | 70,205 | |||||||||
50,000 | RHP Hotel Properties, LP / RHP Finance Corp.* 4.500%, 02/15/29 | 46,073 | |||||||||
40,000 | 6.500%, 04/01/32 | 39,252 | |||||||||
20,000 | Rocket Mortgage, LLC / Rocket Mortgage Co-Issuer, Inc.* 3.875%, 03/01/31 | 17,038 | |||||||||
20,000 | 3.625%, 03/01/29 | 17,665 | |||||||||
10,000 | 2.875%, 10/15/26 | 9,201 | |||||||||
55,000 | StoneX Group, Inc.* 7.875%, 03/01/31 | 55,659 | |||||||||
43,000 | 8.625%, 06/15/25 | 43,175 | |||||||||
52,000 | United Wholesale Mortgage, LLC* 5.500%, 04/15/29 | 48,407 | |||||||||
20,000 | 5.750%, 06/15/27 | 19,221 | |||||||||
25,000 | Uniti Group, LP / Uniti Group Finance, Inc. / CSL Capital, LLC* 6.500%, 02/15/29 | 20,118 | |||||||||
22,000 | 10.500%, 02/15/28 | 22,853 | |||||||||
| PRINCIPAL AMOUNT | VALUE | ||||||||||
47,000 | XHR, LP* 6.375%, 08/15/25 | $ | 46,981 | ||||||||
2,182,467 | |||||||||||
Health Care (1.2%) | |||||||||||
95,000 | Bausch Health Companies, Inc.* 11.000%, 09/30/28^ | 74,417 | |||||||||
16,000 | 14.000%, 10/15/30 | 10,338 | |||||||||
16,000 | 6.125%, 02/01/27^ | 11,748 | |||||||||
88,000 | CHS/Community Health Systems, Inc.* 6.125%, 04/01/30 | 62,325 | |||||||||
30,000 | 8.000%, 03/15/26 | 29,899 | |||||||||
25,000 | 10.875%, 01/15/32 | 25,642 | |||||||||
25,000 | 6.875%, 04/15/29 | 18,566 | |||||||||
5,000 | 5.250%, 05/15/30 | 4,099 | |||||||||
52,000 | DaVita, Inc.* 3.750%, 02/15/31 | 42,862 | |||||||||
49,000 | 4.625%, 06/01/30 | 43,046 | |||||||||
33,000 | Embecta Corp.* 5.000%, 02/15/30^ | 25,462 | |||||||||
11,000 | 6.750%, 02/15/30 | 9,461 | |||||||||
20,000 | Encompass Health Corp. 4.750%, 02/01/30 | 18,380 | |||||||||
20,000 | 4.500%, 02/01/28 | 18,814 | |||||||||
52,000 | HCA, Inc. 7.500%, 11/06/33 | 56,726 | |||||||||
200,000 | Jazz Securities DAC* 4.375%, 01/15/29 | 183,236 | |||||||||
55,000 | Medline Borrower, LP* 3.875%, 04/01/29 | 49,264 | |||||||||
53,000 | 5.250%, 10/01/29 | 49,388 | |||||||||
200,000 | Organon & Company / Organon Foreign Debt Co-Issuer, BV* 5.125%, 04/30/31 | 173,104 | |||||||||
62,000 | Team Health Holdings, Inc.* 6.375%, 02/01/25 | 57,738 | |||||||||
120,000 | Tenet Healthcare Corp. 6.250%, 02/01/27 | 119,747 | |||||||||
70,000 | 6.875%, 11/15/31 | 72,461 | |||||||||
190,000 | Teva Pharmaceutical Finance Netherlands III, BV 3.150%, 10/01/26 | 176,121 | |||||||||
1,332,844 | |||||||||||
Industrials (1.9%) | |||||||||||
45,000 | Aar Escrow Issuer, LLC* 6.750%, 03/15/29 | 45,405 | |||||||||
50,000 | ACCO Brands Corp.* 4.250%, 03/15/29 | 43,637 | |||||||||
50,000 | Air Lease Corp.‡ 4.125%, 12/15/26 5 year CMT + 3.15% | 43,301 | |||||||||
75,000 | Albertsons Companies, Inc. / Safeway, Inc. / New Albertsons, LP / Albertsons, LLC* 4.625%, 01/15/27 | 71,712 | |||||||||
30,000 | 5.875%, 02/15/28 | 29,426 | |||||||||
www.calamos.com
117
| PRINCIPAL AMOUNT | VALUE | ||||||||||
30,000 | Allegiant Travel Company*^ 7.250%, 08/15/27 | $ | 29,060 | ||||||||
25,000 | Arcosa, Inc.* 4.375%, 04/15/29 | 22,887 | |||||||||
200,000 | ARD Finance, SA* 6.500%, 06/30/27 7.250% PIK rate | 55,824 | |||||||||
34,000 | Beacon Roofing Supply, Inc.* 4.125%, 05/15/29 | 30,431 | |||||||||
20,000 | Boeing Company* 6.388%, 05/01/31 | 20,146 | |||||||||
25,000 | Bombardier, Inc.* 8.750%, 11/15/30 | 26,616 | |||||||||
20,000 | 7.875%, 04/15/27 | 19,938 | |||||||||
13,000 | 7.250%, 07/01/31 | 13,051 | |||||||||
44,000 | BWX Technologies, Inc.* 4.125%, 04/15/29 | 40,135 | |||||||||
48,000 | Cascades, Inc. / Cascades USA, Inc.* 5.375%, 01/15/28 | 45,252 | |||||||||
11,000 | Delta Air Lines, Inc. / SkyMiles IP, Ltd.* 4.750%, 10/20/28 | 10,668 | |||||||||
58,000 | Deluxe Corp.* 8.000%, 06/01/29 | 52,688 | |||||||||
43,000 | Eco Material Technologies, Inc.* 7.875%, 01/31/27 | 43,365 | |||||||||
68,000 | Emerald Debt Merger Sub, LLC* 6.625%, 12/15/30 | 67,591 | |||||||||
25,000 | EnerSys* 4.375%, 12/15/27 | 23,439 | |||||||||
20,000 | 6.625%, 01/15/32 | 19,946 | |||||||||
15,000 | EquipmentShare.com, Inc.* 8.625%, 05/15/32 | 15,295 | |||||||||
25,000 | Graham Packaging Company, Inc.* 7.125%, 08/15/28 | 22,630 | |||||||||
30,000 | Graphic Packaging International, LLC* 4.750%, 07/15/27 | 28,782 | |||||||||
20,000 | 3.500%, 03/01/29 | 17,720 | |||||||||
51,000 | Great Lakes Dredge & Dock Corp.*^ 5.250%, 06/01/29 | 43,080 | |||||||||
101,000 | H&E Equipment Services, Inc.* 3.875%, 12/15/28 | 89,488 | |||||||||
59,000 | Hawaiian Brand Intellectual Property, Ltd. / HawaiianMiles Loyalty, Ltd.* 5.750%, 01/20/26 | 55,462 | |||||||||
65,000 | Herc Holdings, Inc.* 5.500%, 07/15/27 | 63,218 | |||||||||
50,000 | IEA Energy Services, LLC* 6.625%, 08/15/29 | 47,727 | |||||||||
34,000 | JELD-WEN, Inc.* 4.625%, 12/15/25 | 33,200 | |||||||||
25,000 | 4.875%, 12/15/27 | 23,768 | |||||||||
70,000 | Ken Garff Automotive, LLC* 4.875%, 09/15/28 | 65,218 | |||||||||
| PRINCIPAL AMOUNT | VALUE | ||||||||||
45,000 | Knife River Holding Company* 7.750%, 05/01/31 | $ | 46,835 | ||||||||
11,000 | MasTec, Inc.*^ 4.500%, 08/15/28 | 10,287 | |||||||||
6,000 | Miter Brands Acquisition Holdco, Inc. / MIWD Borrower, LLC* 6.750%, 04/01/32 | 5,963 | |||||||||
33,000 | Moog, Inc.* 4.250%, 12/15/27 | 30,880 | |||||||||
55,000 | Newfold Digital Holdings Group, Inc.* 6.000%, 02/15/29 | 41,333 | |||||||||
52,000 | Novelis Corp.* 4.750%, 01/30/30 | 47,489 | |||||||||
15,000 | OI European Group, BV* 4.750%, 02/15/30 | 13,732 | |||||||||
50,000 | Pactiv Evergreen Group Issuer, Inc. / Pactiv Evergreen Group Issuer, LLC* 4.000%, 10/15/27 | 46,512 | |||||||||
35,000 | Sealed Air Corp.* 6.125%, 02/01/28 | 34,612 | |||||||||
11,000 | 5.000%, 04/15/29 | 10,358 | |||||||||
10,000 | Sealed Air Corp./Sealed Air Corp. U.S.*^ 7.250%, 02/15/31 | 10,201 | |||||||||
40,000 | Sensata Technologies, Inc.* 3.750%, 02/15/31 | 33,890 | |||||||||
33,000 | Sinclair Television Group, Inc.* 4.125%, 12/01/30 | 22,731 | |||||||||
20,000 | 5.500%, 03/01/30^ | 13,872 | |||||||||
50,000 | Standard Industries, Inc.* 5.000%, 02/15/27 | 48,255 | |||||||||
35,000 | Stericycle, Inc.* 3.875%, 01/15/29 | 31,294 | |||||||||
45,000 | TransDigm, Inc.* 6.875%, 12/15/30 | 45,342 | |||||||||
35,000 | 6.750%, 08/15/28 | 35,167 | |||||||||
29,000 | 6.625%, 03/01/32 | 28,998 | |||||||||
15,000 | 7.125%, 12/01/31 | 15,307 | |||||||||
25,000 | Tronox, Inc.* 4.625%, 03/15/29 | 22,386 | |||||||||
17,249 | United Airlines Pass Through Trust Series 2019-2, Class B 3.500%, 11/01/29 | 15,933 | |||||||||
44,000 | Vertiv Group Corp.* 4.125%, 11/15/28 | 40,775 | |||||||||
46,000 | Wabash National Corp.* 4.500%, 10/15/28 | 41,405 | |||||||||
35,000 | Waste Pro USA, Inc.* 5.500%, 02/15/26 | 34,287 | |||||||||
27,000 | Williams Scotsman, Inc.* 4.625%, 08/15/28 | 24,975 | |||||||||
20,000 | 7.375%, 10/01/31 | 20,446 | |||||||||
2,033,371 | |||||||||||
CALAMOS CLOSED-END FAMILY OF FUNDS SEMIANNUAL REPORT
118
| PRINCIPAL AMOUNT | VALUE | ||||||||||
Information Technology (0.7%) | |||||||||||
11,000 | Booz Allen Hamilton, Inc.*^ 4.000%, 07/01/29 | $ | 10,092 | ||||||||
80,000 | Clarivate Science Holdings Corp.* 3.875%, 07/01/28 | 72,942 | |||||||||
39,000 | Clear Channel Worldwide Holdings, Inc.* 5.125%, 08/15/27 | 36,195 | |||||||||
23,000 | Coherent Corp.* 5.000%, 12/15/29 | 21,243 | |||||||||
40,000 | CommScope, Inc.*^ 4.750%, 09/01/29 | 27,970 | |||||||||
21,000 | Dell International, LLC / EMC Corp. 6.020%, 06/15/26 | 21,129 | |||||||||
22,000 | Dun & Bradstreet Corp.*^ 5.000%, 12/15/29 | 20,050 | |||||||||
26,000 | Fair Isaac Corp.* 4.000%, 06/15/28 | 23,984 | |||||||||
50,000 | KBR, Inc.* 4.750%, 09/30/28 | 46,716 | |||||||||
50,000 | MPH Acquisition Holdings, LLC* 5.750%, 11/01/28^ | 36,823 | |||||||||
20,000 | 5.500%, 09/01/28 | 16,339 | |||||||||
20,000 | NCL Corp., Ltd.* 8.125%, 01/15/29 | 20,849 | |||||||||
22,000 | NCR Voyix Corp.* 5.125%, 04/15/29 | 20,235 | |||||||||
34,000 | ON Semiconductor Corp.* 3.875%, 09/01/28 | 30,863 | |||||||||
39,000 | Open Text Corp.* 3.875%, 02/15/28 | 35,628 | |||||||||
20,000 | 6.900%, 12/01/27 | 20,460 | |||||||||
16,000 | 3.875%, 12/01/29 | 14,029 | |||||||||
16,000 | Open Text Holdings, Inc.*^ 4.125%, 12/01/31 | 13,737 | |||||||||
37,000 | Playtika Holding Corp.* 4.250%, 03/15/29 | 31,871 | |||||||||
60,000 | TTM Technologies, Inc.* 4.000%, 03/01/29 | 53,758 | |||||||||
30,000 | Twilio, Inc. 3.625%, 03/15/29 | 26,648 | |||||||||
11,000 | 3.875%, 03/15/31 | 9,539 | |||||||||
17,000 | UKG, Inc.* 6.875%, 02/01/31 | 17,040 | |||||||||
55,000 | Viavi Solutions, Inc.* 3.750%, 10/01/29 | 46,549 | |||||||||
50,000 | ZoomInfo Technologies, LLC / ZoomInfo Finance Corp.* 3.875%, 02/01/29 | 44,216 | |||||||||
718,905 | |||||||||||
Materials (0.5%) | |||||||||||
25,000 | ArcelorMittal, SA^ 7.000%, 10/15/39 | 26,466 | |||||||||
| PRINCIPAL AMOUNT | VALUE | ||||||||||
27,000 | ATI, Inc. 5.875%, 12/01/27 | $ | 26,523 | ||||||||
12,000 | Carpenter Technology Corp. 7.625%, 03/15/30 | 12,260 | |||||||||
45,000 | Chemours Company* 4.625%, 11/15/29 | 38,598 | |||||||||
65,000 | Clearwater Paper Corp.* 4.750%, 08/15/28 | 59,114 | |||||||||
34,000 | Cleveland-Cliffs, Inc.* 6.750%, 04/15/30 | 33,222 | |||||||||
22,000 | Commercial Metals Company 4.125%, 01/15/30 | 19,763 | |||||||||
11,000 | 4.375%, 03/15/32 | 9,703 | |||||||||
23,000 | HB Fuller Company 4.250%, 10/15/28 | 21,253 | |||||||||
40,000 | JW Aluminum Continuous Cast Company* 10.250%, 06/01/26 | 40,395 | |||||||||
40,000 | Kaiser Aluminum Corp.* 4.625%, 03/01/28 | 37,299 | |||||||||
10,000 | LSF11 A5 HoldCo, LLC* 6.625%, 10/15/29 | 9,327 | |||||||||
48,000 | Mercer International, Inc. 5.125%, 02/01/29^ | 41,979 | |||||||||
20,000 | 12.875%, 10/01/28* | 21,855 | |||||||||
35,000 | Owens-Brockway Glass Container, Inc.*^ 7.250%, 05/15/31 | 35,099 | |||||||||
25,000 | 6.625%, 05/13/27 | 25,008 | |||||||||
56,000 | Silgan Holdings, Inc. 4.125%, 02/01/28 | 52,286 | |||||||||
21,000 | Trinseo Materials Operating SCA / Trinseo Materials Finance, Inc.* 5.125%, 04/01/29 | 5,437 | |||||||||
515,587 | |||||||||||
Other (0.0%) | |||||||||||
25,000 | Gen Digital, Inc.* 6.750%, 09/30/27 | 25,107 | |||||||||
15,000 | 7.125%, 09/30/30^ | 15,180 | |||||||||
40,287 | |||||||||||
Real Estate (0.1%) | |||||||||||
34,000 | EPR Properties 3.750%, 08/15/29 | 29,582 | |||||||||
38,000 | Forestar Group, Inc.* 5.000%, 03/01/28 | 36,129 | |||||||||
21,000 | 3.850%, 05/15/26 | 19,964 | |||||||||
50,000 | MIWD Holdco II, LLC / MIWD Finance Corp.* 5.500%, 02/01/30 | 45,295 | |||||||||
20,000 | Service Properties Trust 5.250%, 02/15/26 | 19,251 | |||||||||
150,221 | |||||||||||
www.calamos.com
119
| PRINCIPAL AMOUNT | VALUE | ||||||||||
Special Purpose Acquisition Companies (0.1%) | |||||||||||
45,000 | Fertitta Entertainment, LLC / Fertitta Entertainment Finance Company, Inc.* 6.750%, 01/15/30 | $ | 39,232 | ||||||||
23,000 | 4.625%, 01/15/29 | 20,823 | |||||||||
50,000 | W.R. Grace Holding, LLC* 7.375%, 03/01/31 | 50,753 | |||||||||
110,808 | |||||||||||
Utilities (0.1%) | |||||||||||
16,000 | PPL Capital Funding, Inc.‡ 8.236%, 03/30/67 3 mo. USD LIBOR + 2.67% | 15,878 | |||||||||
20,000 | Vistra Corp.*‡ 7.000%, 12/15/26 5 year CMT + 5.74% | 19,696 | |||||||||
10,000 | 8.000%, 10/15/26 5 year CMT + 6.93% | 10,114 | |||||||||
45,688 | |||||||||||
TOTAL CORPORATE BONDS (Cost $13,628,112) | 13,907,160 | ||||||||||
CONVERTIBLE BONDS (29.3%) | |||||||||||
Communication Services (2.0%) | |||||||||||
44,000 | Cable One, Inc.µ 0.000%, 03/15/26 | 38,054 | |||||||||
580,000 | Liberty Media Corp.-Liberty Formula One 2.250%, 08/15/27 | 604,088 | |||||||||
1,484,000 | Sea, Ltd. 2.375%, 12/01/25 | 1,561,420 | |||||||||
2,203,562 | |||||||||||
Consumer Discretionary (6.1%) | |||||||||||
1,660,000 | EUR | Accor, SA 0.700%, 12/07/27 | 905,086 | ||||||||
90,000,000 | JPY | Daiwa House Ind Company, Ltd. 0.000%, 03/30/29 | 571,357 | ||||||||
63,000 | DISH Network Corp.µ 0.000%, 12/15/25 | 46,242 | |||||||||
3,160,000 | Ford Motor Company 0.000%, 03/15/26 | 3,154,533 | |||||||||
730,000 | IMAX Corp. 0.500%, 04/01/26 | 682,572 | |||||||||
685,000 | Marriott Vacations Worldwide Corp. 0.000%, 01/15/26 | 637,290 | |||||||||
500,000 | GBP | WH Smith, PLC 1.625%, 05/07/26 | 571,476 | ||||||||
6,568,556 | |||||||||||
Consumer Staples (2.2%) | |||||||||||
700,000 | EUR | Fomento Economico Mexicano SAB de CV 2.625%, 02/24/26 | 745,980 | ||||||||
| PRINCIPAL AMOUNT | VALUE | ||||||||||
955,000 | Post Holdings, Inc. 2.500%, 08/15/27 | $ | 1,070,650 | ||||||||
915,000 | CAD | Premium Brands Holdings Corp. 4.200%, 09/30/27 | 609,205 | ||||||||
2,425,835 | |||||||||||
Energy (1.8%) | |||||||||||
1,500,000 | EUR | Eni S.p.A 2.950%, 09/14/30 | 1,662,848 | ||||||||
400,000 | Nabors Industries, Inc.µ 1.750%, 06/15/29 | 293,616 | |||||||||
1,956,464 | |||||||||||
Financials (0.8%) | |||||||||||
820,000 | Global Payments, Inc.*^ 1.500%, 03/01/31 | 817,925 | |||||||||
Health Care (0.4%) | |||||||||||
425,000 | iRhythm Technologies, Inc.* 1.500%, 09/01/29 | 431,145 | |||||||||
Industrials (7.2%) | |||||||||||
1,000,000 | EUR | Prysmian S.p.A 0.000%, 02/02/26 | 1,383,199 | ||||||||
1,000,000 | EUR | Rheinmetall, AG 1.875%, 02/07/28 | 1,827,613 | ||||||||
1,100,000 | EUR | SPIE, SA 2.000%, 01/17/28 | 1,361,044 | ||||||||
798,000 | Tetra Tech, Inc.*^ 2.250%, 08/15/28 | 906,520 | |||||||||
1,990,000 | Uber Technologies, Inc.*~ 0.875%, 12/01/28 | 2,248,401 | |||||||||
7,726,777 | |||||||||||
Information Technology (6.1%) | |||||||||||
835,000 | Block, Inc. 0.125%, 03/01/25 | 826,984 | |||||||||
700,000 | EUR | GlobalWafers GmbH 1.500%, 01/23/29 | 719,669 | ||||||||
200,000 | Hon Hai Precision Industry Company, Ltd. 0.000%, 08/05/26 | 196,120 | |||||||||
7,000,000 | HKD | Kingsoft Corp, Ltd. 0.625%, 04/29/25 | 931,278 | ||||||||
370,000 | NCL Corp., Ltd. 5.375%, 08/01/25 | 454,930 | |||||||||
1,049,000 | Parsons Corp.* 2.625%, 03/01/29 | 1,100,149 | |||||||||
100,000,000 | JPY | Rohm Company, Ltd. 0.000%, 12/05/24 | 632,400 | ||||||||
965,000 | Spotify USA, Inc.µ 0.000%, 03/15/26 | 899,255 | |||||||||
850,000 | Super Micro Computer, Inc.* 0.000%, 03/01/29 | 869,312 | |||||||||
6,630,097 | |||||||||||
CALAMOS CLOSED-END FAMILY OF FUNDS SEMIANNUAL REPORT
120
Global Total Return Fund Schedule of Investments April 30, 2024 (Unaudited)
| PRINCIPAL AMOUNT | VALUE | ||||||||||
Materials (1.9%) | |||||||||||
1,000,000 | Glencore Funding, LLC 0.000%, 03/27/25 | $ | 1,076,940 | ||||||||
600,000 | LG Chem, Ltd. 1.250%, 07/18/28 | 569,916 | |||||||||
476,000 | Lithium Americas Corp. 1.750%, 01/15/27 | 362,621 | |||||||||
2,009,477 | |||||||||||
Other (0.0%) | |||||||||||
20,000 | Multiplan Corp.*µ 6.000%, 10/15/27 | 14,248 | |||||||||
Real Estate (0.8%) | |||||||||||
800,000 | EUR | ANLLIAN Capital, Ltd. 0.000%, 02/05/25 | 903,091 | ||||||||
TOTAL CONVERTIBLE BONDS (Cost $33,812,906) | 31,687,177 | ||||||||||
BANK LOANS (7.0%)¡ | |||||||||||
Airlines (0.4%) | |||||||||||
300,000 | Air Canada‡ 7.833%, 03/21/31 3 mo. SOFR + 2.50% | 302,437 | |||||||||
29,250 | Mileage Plus Holdings, LLC‡ 10.733%, 06/21/27 3 mo. SOFR + 5.25% | 30,067 | |||||||||
140,000 | United Airlines, Inc.‡ 8.076%, 02/22/31 3 mo. SOFR + 2.75% | 140,766 | |||||||||
473,270 | |||||||||||
Communication Services (0.7%) | |||||||||||
250,000 | APi Group DE, Inc. ‡ 7.930%, 01/03/29 1 mo. SOFR + 2.50% | 251,229 | |||||||||
1,614 | Audacy Capital Corp.‡ 11.430%, 08/19/24 3 mo. SOFR + 6.11% | 1,618 | |||||||||
43,000 | Entercom Media Corp.‡ 8.145%, 11/18/24 3 mo. SOFR + 0.00% | 23,306 | |||||||||
248,128 | Go Daddy Operating Company, LLC‡ 7.316%, 11/09/29 1 mo. SOFR + 2.00% | 248,520 | |||||||||
250,000 | Virgin Media Bristol, LLC‡ 7.936%, 01/31/28 1 mo. SOFR + 2.50% | 245,719 | |||||||||
770,392 | |||||||||||
Consumer Discretionary (1.9%) | |||||||||||
250,000 | Adient U.S., LLC‡ 8.066%, 01/31/31 1 mo. SOFR + 2.75% | 251,406 | |||||||||
| PRINCIPAL AMOUNT | VALUE | ||||||||||
267,448 | Carnival Corp.‡ 8.067%, 08/08/27 1 mo. SOFR + 2.75% | $ | 269,161 | ||||||||
249,375 | Flutter Financing, BV‡ 7.559%, 11/25/30 3 mo. SOFR + 2.25% | 250,132 | |||||||||
250,000 | Installed Building Products, Inc.‡ 7.316%, 03/28/31 1 mo. SOFR + 2.00% | 251,211 | |||||||||
248,737 | Light & Wonder International, Inc.‡ 8.071%, 04/14/29 1 mo. SOFR + 2.75% | 249,601 | |||||||||
248,082 | Murphy USA, Inc.‡ 7.192%, 01/31/28 1 mo. SOFR + 1.75% | 249,229 | |||||||||
248,106 | PENN Entertainment, Inc.‡ 8.166%, 05/03/29 1 mo. SOFR + 2.75% | 248,739 | |||||||||
160,000 | Station Casinos, LLC! 0.000%, 03/14/31 | 160,207 | |||||||||
140,000 | Station Casinos, LLC‡ 7.566%, 03/14/31 1 mo. SOFR + 2.25% | 140,181 | |||||||||
2,069,867 | |||||||||||
Consumer Staples (0.3%) | |||||||||||
99,375 | Amneal Pharmaceuticals, LLC‡ 10.816%, 05/04/28 1 mo. SOFR + 5.50% | 99,593 | |||||||||
247,877 | Jazz Financing Lux Sarl‡ 8.430%, 05/05/28 1 mo. SOFR + 3.00% | 249,621 | |||||||||
349,214 | |||||||||||
Energy (0.1%) | |||||||||||
60,000 | Par Petroleum, LLC! 0.000%, 02/28/30 | 60,281 | |||||||||
Financials (0.1%) | |||||||||||
45,000 | Advisor Group, Inc.! 0.000%, 08/17/28 | 45,327 | |||||||||
9,975 | Advisor Group, Inc.‡ 9.816%, 08/17/28 1 mo. SOFR + 4.50% | 10,048 | |||||||||
55,375 | |||||||||||
Health Care (1.5%) | |||||||||||
177,495 | Avantor Funding, Inc.‡ 7.416%, 11/08/27 1 mo. SOFR + 2.00% | 178,340 | |||||||||
247,923 | Elanco Animal Health, Inc.‡ 7.177%, 08/01/27 1 mo. SOFR + 1.75% | 247,789 | |||||||||
545,946 | Icon Luxembourg Sarl‡ 7.309%, 07/03/28 3 mo. SOFR + 2.00% | 548,861 | |||||||||
www.calamos.com
121
| PRINCIPAL AMOUNT | VALUE | ||||||||||
250,000 | Organon & Company‡ 8.433%, 06/02/28 1 mo. SOFR + 3.00% | $ | 251,680 | ||||||||
248,737 | Perrigo Investments, LLC‡ 7.666%, 04/20/29 1 mo. SOFR + 2.25% | 248,816 | |||||||||
136,023 | PRA Health Sciences, Inc.‡ 7.309%, 07/03/28 3 mo. SOFR + 2.00% | 136,749 | |||||||||
1,612,235 | |||||||||||
Industrials (0.9%) | |||||||||||
248,103 | Beacon Roofing Supply, Inc.‡ 7.316%, 05/19/28 1 mo. SOFR + 2.00% | 249,188 | |||||||||
248,750 | ChampionX Corp.‡ 8.168%, 06/07/29 1 mo. SOFR + 2.75% | 250,149 | |||||||||
248,103 | JELD-WEN, Inc.‡ 7.430%, 07/28/28 1 mo. SOFR + 2.00% | 249,064 | |||||||||
5,000 | MI Windows & Doors, LLC‡ 8.816%, 03/21/31 1 mo. SOFR + 3.50% | 5,029 | |||||||||
248,747 | TransDigm, Inc.‡ 8.059%, 08/24/28 3 mo. SOFR + 2.75% | 250,273 | |||||||||
1,003,703 | |||||||||||
Information Technology (0.8%) | |||||||||||
45,730 | Banff Merger Sub, Inc.‡ 9.566%, 12/29/28 1 mo. SOFR + 4.25% | 46,067 | |||||||||
237,240 | II-VI, Inc.‡ 7.829%, 07/02/29 1 mo. SOFR + 2.50% | 238,648 | |||||||||
230,594 | Open Text Corp.‡ 8.166%, 01/31/30 1 mo. SOFR + 2.75% | 231,525 | |||||||||
147,488 | SS&C Technologies, Inc.‡ 7.666%, 03/22/29 1 mo. SOFR + 2.25% | 147,974 | |||||||||
62,326 | SS&C Technologies, Inc.‡ 7.666%, 03/22/29 1 mo. SOFR + 2.25% | 62,531 | |||||||||
158,800 | TTM Technologies, Inc.‡ 8.077%, 05/30/30 1 mo. SOFR + 2.75% | 159,098 | |||||||||
885,843 | |||||||||||
Materials (0.3%) | |||||||||||
262,792 | Axalta Coating Systems U.S. Holdings, Inc.‡ 7.330%, 12/20/29 3 mo. SOFR + 2.00% | 263,845 | |||||||||
| PRINCIPAL AMOUNT | VALUE | ||||||||||
29,850 | Chemours Company‡ 8.817%, 08/18/28 1 mo. SOFR + 3.50% | $ | 29,878 | ||||||||
293,723 | |||||||||||
TOTAL BANK LOANS (Cost $7,569,431) | 7,573,903 | ||||||||||
| NUMBER OF SHARES | VALUE | ||||||||||
WARRANTS (0.0%)# | |||||||||||
Energy (0.0%) | |||||||||||
2,607 | Mcdermott International, Ltd.& 06/30/27, Strike $15.98 | — | |||||||||
2,347 | Mcdermott International, Ltd. 06/30/27, Strike $12.33 | — | |||||||||
TOTAL WARRANTS (Cost $1,002) | — | ||||||||||
COMMON STOCKS (80.7%) | |||||||||||
Communication Services (6.2%) | |||||||||||
10,600 | Alphabet, Inc. - Class A# | 1,725,468 | |||||||||
925 | Altice USA, Inc. - Class A^# | 1,785 | |||||||||
1,050 | Baidu, Inc. (ADR)µ# | 108,570 | |||||||||
310 | Cumulus Media, Inc. - Class Aµ# | 815 | |||||||||
1,895 | SEK | Hemnet Group, AB | 49,249 | ||||||||
1,250 | Meta Platforms, Inc. - Class Aµ | 537,713 | |||||||||
1,110 | Netflix, Inc.µ# | 611,210 | |||||||||
288 | EUR | Scout24, SE* | 21,156 | ||||||||
3,335 | Spotify Technology, SAµ# | 935,267 | |||||||||
27,000 | HKD | Tencent Holdings, Ltd. | 1,184,846 | ||||||||
15,060 | Tencent Holdings, Ltd. (ADR)^ | 658,875 | |||||||||
22,390 | GBP | Trustpilot Group, PLC*# | 52,871 | ||||||||
7,610 | Walt Disney Companyµ~ | 845,471 | |||||||||
6,733,296 | |||||||||||
Consumer Discretionary (12.5%) | |||||||||||
97,200 | ADT, Inc.µ | 631,800 | |||||||||
37,500 | HKD | Alibaba Group Holding, Ltd. | 351,115 | ||||||||
1,745 | Alibaba Group Holding, Ltd. (ADR) | 130,613 | |||||||||
50,750 | MXN | Alsea, SAB de CV# | 212,412 | ||||||||
9,750 | Amazon.com, Inc.^µ# | 1,706,250 | |||||||||
5,535 | INR | Amber Enterprises India, Ltd.# | 255,952 | ||||||||
83,000 | AED | Americana Restaurants International, PLC# | 75,251 | ||||||||
9,604 | Aptiv, PLCµ# | 681,884 | |||||||||
975 | BRL | Arezzo Industria e Comercio, SA | 9,749 | ||||||||
565 | CNY | Beijing Roborock Technology Company, Ltd. - Class A | 33,009 | ||||||||
3,400 | CNY | BYD Company, Ltd. - Class A | 102,075 | ||||||||
CALAMOS CLOSED-END FAMILY OF FUNDS SEMIANNUAL REPORT
122
| NUMBER OF SHARES | VALUE | ||||||||||
5,700 | CNY | China Tourism Group Duty Free Corp., Ltd. - Class A | $ | 58,482 | |||||||
310 | Chipotle Mexican Grill, Inc.µ# | 979,476 | |||||||||
4,300 | INR | Dixon Technologies India, Ltd. | 428,698 | ||||||||
1,050 | EUR | Ferrari, NVµ | 431,838 | ||||||||
44,600 | CNY | Hisense Home Appliances Group Company, Ltd. - Class A | 237,363 | ||||||||
790 | KRW | Hotel Shilla Company, Ltd. | 33,842 | ||||||||
28,821 | INR | Indian Hotels Company, Ltd. | 198,861 | ||||||||
45,700 | HKD | JD.com, Inc. - Class A | 658,463 | ||||||||
48,000 | HKD | Jiumaojiu International Holdings, Ltd.* | 30,147 | ||||||||
90,020 | INR | Kalyan Jewellers India, Ltd. | 445,407 | ||||||||
2,340 | KRW | Kia Corp. | 198,251 | ||||||||
33,500 | HKD | Li Ning Company, Ltd. | 87,699 | ||||||||
280 | EUR | LVMH Moet Hennessy Louis Vuitton, SE | 230,002 | ||||||||
8,310 | INR | Mahindra & Mahindra, Ltd. | 214,700 | ||||||||
28,910 | MakeMyTrip, Ltd.^# | 1,914,131 | |||||||||
4,780 | HKD | Meituan - Class B*# | 65,269 | ||||||||
745 | MercadoLibre, Inc.µ# | 1,086,731 | |||||||||
11,570 | NIO, Inc. (ADR)# | 54,610 | |||||||||
4,871 | EUR | Prosus, NV | 162,983 | ||||||||
64,000 | HKD | Sands China, Ltd.# | 150,953 | ||||||||
17,220 | INR | Tata Motors, Ltd. | 207,678 | ||||||||
38,700 | JPY | Toyota Motor Corp. | 882,692 | ||||||||
3,250 | HKD | Yum China Holdings, Inc.µ | 121,665 | ||||||||
23,000 | HKD | Zhongsheng Group Holdings, Ltd. | 41,947 | ||||||||
154,520 | INR | Zomato, Ltd.# | 357,359 | ||||||||
13,469,357 | |||||||||||
Consumer Staples (4.0%) | |||||||||||
1,345 | SEK | AAK, AB | 34,595 | ||||||||
5,590 | TRY | BIM Birlesik Magazalar, A/S | 66,783 | ||||||||
20,850 | GBP | British American Tobacco, PLC | 612,078 | ||||||||
1,500 | Constellation Brands, Inc. - Class Aµ | 380,190 | |||||||||
1,360 | Costco Wholesale Corp.µ | 983,144 | |||||||||
18,660 | MXN | Grupo Comercial Chedraui, SA de CV | 137,400 | ||||||||
700 | CNY | Kweichow Moutai Company, Ltd. - Class A | 164,117 | ||||||||
44 | Mallinckrodt, PLC# | 2,332 | |||||||||
5,900 | CHF | Nestle, SA | 592,361 | ||||||||
20,332 | BRL | Raia Drogasil, SA | 100,160 | ||||||||
54,000 | JPY | Seven & i Holdings Company, Ltd.^ | 697,745 | ||||||||
26,000 | HKD | Smoore International Holdings, Ltd.* | 22,644 | ||||||||
600 | JPY | Toyo Suisan Kaisha, Ltd. | 37,521 | ||||||||
3,820 | INR | Varun Beverages, Ltd. | 67,646 | ||||||||
7,090 | Walmart, Inc.µ | 420,792 | |||||||||
1,100 | JPY | Yamazaki Baking Company, Ltd.^ | 26,624 | ||||||||
4,346,132 | |||||||||||
| NUMBER OF SHARES | VALUE | ||||||||||
Energy (4.2%) | |||||||||||
11,650 | GBP | BP, PLC | $ | 75,092 | |||||||
22,500 | CAD | Canadian Natural Resources, Ltd.^ | 1,705,008 | ||||||||
6,815 | CAD | CES Energy Solutions Corp. | 28,069 | ||||||||
61 | Chesapeake Energy Corp.µ | 5,483 | |||||||||
8,810 | Chevron Corp. | 1,420,789 | |||||||||
3,045 | Energy Transfer, LP | 47,898 | |||||||||
1,815 | Enterprise Products Partners, LP | 50,965 | |||||||||
341 | EP Energy Corp.&# | 810 | |||||||||
1 | Gulfport Energy Corp.# | 159 | |||||||||
11,400 | Helmerich & Payne, Inc.^µ | 448,362 | |||||||||
46,000 | THB | PTT Exploration & Production, PCL | 193,446 | ||||||||
9,900 | INR | Reliance Industries, Ltd. | 347,295 | ||||||||
13,450 | EUR | Saipem S.p.A^# | 30,864 | ||||||||
8,065 | TechnipFMC, PLCµ | 206,625 | |||||||||
4,560,865 | |||||||||||
Financials (10.5%) | |||||||||||
17,720 | INR | 360 ONE WAM, Ltd. | 165,638 | ||||||||
116,000 | HKD | AIA Group, Ltd. | 849,625 | ||||||||
3,000 | Aon, PLC - Class Aµ | 846,030 | |||||||||
49,400 | BRL | B3, SA - Brasil Bolsa Balcao | 102,651 | ||||||||
1,899,285 | IDR | Bank Mandiri Persero, Tbk PT | 802,784 | ||||||||
53,325 | Bank of America Corp.µ~ | 1,973,558 | |||||||||
2,480 | Chubb, Ltd.µ | 616,627 | |||||||||
8,800 | JPY | Concordia Financial Group, Ltd. | 47,416 | ||||||||
29,304 | AED | First Abu Dhabi Bank, PJSC | 99,627 | ||||||||
39,340 | INR | HDFC Bank, Ltd. | 712,252 | ||||||||
1,510 | AUD | HUB24, Ltd. | 38,797 | ||||||||
| 35,025 | Itau Unibanco Holding, SA (ADR) | 211,901 | |||||||||
3,425 | JPMorgan Chase & Companyµ | 656,710 | |||||||||
42,800 | THB | Kasikornbank PCL | 150,241 | ||||||||
2,100 | KRW | KB Financial Group, Inc. | 113,897 | ||||||||
1,170,000 | GBP | Lloyds Banking Group, PLC | 755,098 | ||||||||
6,529 | KRW | Meritz Financial Group, Inc. | 373,311 | ||||||||
11,725 | Morgan Stanleyµ | 1,065,099 | |||||||||
33,670 | NU Holdings, Ltd. - Class A# | 365,656 | |||||||||
48,500 | HKD | Ping An Insurance Group Company of China, Ltd. - Class H | 219,806 | ||||||||
2,206 | Visa, Inc. - Class Aµ | 592,554 | |||||||||
10,945 | Wells Fargo & Company | 649,257 | |||||||||
11,408,535 | |||||||||||
Health Care (9.6%) | |||||||||||
2,230 | INR | Apollo Hospitals Enterprise, Ltd. | 158,892 | ||||||||
6,125 | GBP | AstraZeneca, PLC | 926,399 | ||||||||
3,900 | Danaher Corp.µ | 961,818 | |||||||||
1,250 | KRW | Dentium Company, Ltd. | 116,623 | ||||||||
3,900 | Eli Lilly & Companyµ | 3,046,290 | |||||||||
6,000 | EUR | Gerresheimer, AG | 646,182 | ||||||||
www.calamos.com
123
| NUMBER OF SHARES | VALUE | ||||||||||
1,310 | Humana, Inc.µ | $ | 395,738 | ||||||||
4,510 | BRL | Hypera, SA | 25,639 | ||||||||
800 | JPY | Jeol, Ltd. | 31,696 | ||||||||
1,215 | McKesson Corp.µ | 652,710 | |||||||||
26,100 | Novo Nordisk, A/S (ADR) | 3,348,891 | |||||||||
182 | CHF | Ypsomed Holding, AG^ | 64,872 | ||||||||
10,375,750 | |||||||||||
Industrials (8.2%) | |||||||||||
6,500 | INR | Adani Ports & Special Economic Zone, Ltd. | 102,818 | ||||||||
6,105 | GBP | Ashtead Technology Holdings, PLC | 62,163 | ||||||||
7,450 | CAD | Canadian Pacific Kansas City, Ltd. | 584,462 | ||||||||
2,340 | CNY | Contemporary Amperex Technology Company, Ltd. - Class A | 65,447 | ||||||||
615 | EUR | DO & CO, AG | 94,380 | ||||||||
450 | JPY | Ebara Corp. | 37,095 | ||||||||
1,105 | KRW | Hanwha Aerospace Company, Ltd. | 167,846 | ||||||||
2,367 | KRW | HD Hyundai Electric Company, Ltd. | 417,573 | ||||||||
23,420 | INR | Hindustan Aeronautics, Ltd. | 1,105,690 | ||||||||
10,800 | JPY | Hitachi, Ltd. | 996,415 | ||||||||
1,200 | JPY | Japan Elevator Service Holdings Company, Ltd. | 18,649 | ||||||||
3,600 | INR | KEI Industries, Ltd. | 172,056 | ||||||||
835 | EUR | KION Group, AG | 38,483 | ||||||||
1,100 | JPY | Kyudenko Corp. | 45,654 | ||||||||
2,180 | EUR | Leonardo S.p.A^ | 50,101 | ||||||||
94,900 | GBP | Melrose Industries, PLC | 745,566 | ||||||||
5,510 | SEK | Munters Group, AB* | 109,855 | ||||||||
8,700 | CNY | Ningbo Orient Wires & Cables Company, Ltd. - Class A# | 52,888 | ||||||||
440 | nVent Electric, PLCµ | 31,711 | |||||||||
259,500 | GBP | Rolls-Royce Holdings, PLC# | 1,330,722 | ||||||||
44,100 | CNY | Sany Heavy Industry Company, Ltd. - Class A | 99,091 | ||||||||
14,700 | CNY | Shanghai International Airport Company, Ltd. - Class A# | 76,249 | ||||||||
780 | KRW | SK Square Company, Ltd.# | 42,855 | ||||||||
800 | JPY | Sojitz Corp. | 20,598 | ||||||||
413 | CAD | Stantec, Inc. | 32,883 | ||||||||
15,710 | INR | Titagarh Rail System, Ltd. | 198,610 | ||||||||
1,300 | Veralto Corp. | 121,784 | |||||||||
11,150 | Vertiv Holdings Company - Class Aµ | 1,036,950 | |||||||||
4,250 | Waste Management, Inc. | 884,085 | |||||||||
49,700 | CNY | Weichai Power Company, Ltd. - Class A | 119,230 | ||||||||
8,861,909 | |||||||||||
Information Technology (22.4%) | |||||||||||
3,100 | JPY | Advantest Corp.^ | 97,032 | ||||||||
11,495 | Apple, Inc.^ | 1,957,943 | |||||||||
9,000 | TWD | Asia Vital Components Company, Ltd. | 177,532 | ||||||||
| NUMBER OF SHARES | VALUE | ||||||||||
1,000 | TWD | ASMedia Technology, Inc. | $ | 59,130 | |||||||
2,290 | ASML Holding, NV (ADR)µ | 1,997,956 | |||||||||
1,900 | HKD | ASMPT, Ltd. | 23,613 | ||||||||
147 | EUR | BE Semiconductor Industries, NV | 19,503 | ||||||||
310 | CAD | Descartes Systems Group, Inc.^# | 28,756 | ||||||||
200 | JPY | Horiba, Ltd. | 19,404 | ||||||||
4,100 | CNY | Iflytek Company, Ltd. - Class A | 25,345 | ||||||||
2,400 | International Business Machines Corp.µ | 398,880 | |||||||||
2,500 | JPY | Keyence Corp. | 1,099,424 | ||||||||
73,000 | HKD | Kingdee International Software Group Company, Ltd.# | 77,017 | ||||||||
21,155 | INR | KPIT Technologies, Ltd. | 375,530 | ||||||||
630 | EUR | Lectra | 21,463 | ||||||||
5,000 | TWD | MediaTek, Inc. | 150,756 | ||||||||
400 | JPY | Micronics Japan Company, Ltd. | 16,477 | ||||||||
8,780 | Microsoft Corp.^ | 3,418,317 | |||||||||
510 | EUR | Nemetschek, SE | 45,068 | ||||||||
7,080 | NVIDIA Corp.µ | 6,117,262 | |||||||||
5,480 | KRW | Samsung Electronics Company, Ltd. | 304,615 | ||||||||
460 | ServiceNow, Inc.µ# | 318,932 | |||||||||
4,950 | CAD | Shopify, Inc. - Class A# | 347,523 | ||||||||
4,000 | TWD | Silergy Corp. | 53,124 | ||||||||
15,225 | KRW | SK Hynix, Inc. | 1,878,850 | ||||||||
10,600 | HKD | Sunny Optical Technology Group Company, Ltd. | 51,280 | ||||||||
183,000 | TWD | Taiwan Semiconductor Manufacturing Company, Ltd. | 4,381,707 | ||||||||
8,300 | BRL | TOTVS, SA | 44,021 | ||||||||
1,000 | JPY | Towa Corp.^ | 57,591 | ||||||||
15,520 | Unity Software, Inc.µ# | 376,670 | |||||||||
24,000 | CNY | Venustech Group, Inc. - Class A | 64,911 | ||||||||
78,600 | HKD | Xiaomi Corp. - Class B*# | 171,342 | ||||||||
500 | JPY | Zuken, Inc. | 13,065 | ||||||||
24,190,039 | |||||||||||
Materials (1.1%) | |||||||||||
865 | JPY | Artience Company, Ltd. | 16,031 | ||||||||
38,990 | Cemex, SAB de CV (ADR)# | 308,411 | |||||||||
55,150 | AED | Fertiglobe, PLC | 41,798 | ||||||||
1,505 | Linde, PLC | 663,645 | |||||||||
5,575 | ZAR | Sasol, Ltd. | 39,166 | ||||||||
1,065 | EUR | SOL S.p.A^ | 40,969 | ||||||||
1,800 | JPY | Sumitomo Bakelite Company, Ltd. | 51,269 | ||||||||
5,250 | Vale, SA (ADR) | 63,892 | |||||||||
1,225,181 | |||||||||||
Real Estate (1.6%) | |||||||||||
179,500 | PHP | Ayala Land, Inc. | 88,982 | ||||||||
48,270 | MXN | Corp. Inmobiliaria Vesta SAB de CV | 170,952 | ||||||||
CALAMOS CLOSED-END FAMILY OF FUNDS SEMIANNUAL REPORT
124
| NUMBER OF SHARES | VALUE | ||||||||||
27,090 | INR | DLF, Ltd. | $ | 288,828 | |||||||
69,525 | INR | Macrotech Developers, Ltd.* | 1,023,227 | ||||||||
6,300 | JPY | Mirarth Holdings, Inc. | 19,317 | ||||||||
4,465 | INR | Prestige Estates Projects, Ltd. | 73,573 | ||||||||
225 | EUR | VGP, NV | 24,480 | ||||||||
1,689,359 | |||||||||||
Special Purpose Acquisition Company (0.0%) | |||||||||||
518 | Intelsat Emergence, SA&# | 18,777 | |||||||||
Utilities (0.4%) | |||||||||||
6,836 | NextEra Energy, Inc.µ | 457,807 | |||||||||
TOTAL COMMON STOCKS (Cost $94,986,915) | 87,337,007 | ||||||||||
PREFERRED STOCKS (0.1%) | |||||||||||
Communication Services (0.0%) | |||||||||||
530 | United States Cellular Corp.µ 5.500%, 06/01/70 | 9,354 | |||||||||
505 | United States Cellular Corp.µ 5.500%, 03/01/70 | 8,974 | |||||||||
18,328 | |||||||||||
Consumer Discretionary (0.0%) | |||||||||||
305 | Guitar Center, Inc.&# | 23,943 | |||||||||
Energy (0.1%) | |||||||||||
1,325 | NuStar Energy, LP‡ 11.234%, 05/30/24 3 mo. USD LIBOR + 5.64% | 33,801 | |||||||||
325 | NuStar Energy, LP‡ 12.357%, 05/30/24 3 mo. USD LIBOR + 6.77% | 8,310 | |||||||||
2,270 | NuStar Logistics, LP‡ 12.324%, 01/15/43 3 mo. USD Term SOFR + 7.00% | 57,567 | |||||||||
99,678 | |||||||||||
TOTAL PREFERRED STOCKS (Cost $147,689) | 141,949 | ||||||||||
EXCHANGE-TRADED FUNDS (7.7%) | |||||||||||
Other (7.7%) | |||||||||||
189,615 | Invesco Senior Loan ETF^ | 3,991,396 | |||||||||
6,150 | iShares MSCI Saudi Arabia ETF^ | 264,573 | |||||||||
95,750 | SPDR Blackstone Senior Loan ETF^ | 4,019,585 | |||||||||
TOTAL EXCHANGE-TRADED FUNDS (Cost $8,390,379) | 8,275,554 | ||||||||||
| NUMBER OF SHARES | VALUE | ||||||||||
CONVERTIBLE PREFERRED STOCKS (1.7%) | |||||||||||
Energy (0.0%) | |||||||||||
1 | Gulfport Energy Corp.&# 10.000%, 05/31/24 15.000% PIK rate | $ | 11,575 | ||||||||
Financials (1.3%) | |||||||||||
23,500 | Apollo Global Management, Inc. 6.750%, 07/31/26 | 1,433,030 | |||||||||
Utilities (0.4%) | |||||||||||
8,700 | NextEra Energy, Inc.^ 6.926%, 09/01/25 | 354,525 | |||||||||
TOTAL CONVERTIBLE (Cost $1,837,330) | 1,799,130 | ||||||||||
| NUMBER OF CONTRACTS/ NOTIONAL AMOUNT | VALUE | ||||||||||
PURCHASED OPTIONS (1.3%)# | |||||||||||
Communication Services (0.1%) | |||||||||||
190 | Tencent Music Entertainment Group, Inc. | ||||||||||
238,450 | Call, 07/19/24, Strike $10.00 | 57,950 | |||||||||
Consumer Discretionary (0.3%) | |||||||||||
71 | Dr Horton, Inc. | ||||||||||
1,011,679 | Call, 01/17/25, Strike $175.00 | 40,115 | |||||||||
355 | MakeMyTrip, Ltd. | ||||||||||
2,350,455 | Call, 11/15/24, Strike $70.00 | 305,300 | |||||||||
345,415 | |||||||||||
Financials (0.0%) | |||||||||||
159 | ICICI Bank, Ltd. | ||||||||||
437,727 | Call, 08/16/24, Strike $27.00 | 27,030 | |||||||||
Health Care (0.1%) | |||||||||||
135 | Boston Scientific Corp. | ||||||||||
970,245 | Call, 11/15/24, Strike $70.00 | 103,950 | |||||||||
40 | Icon, PLC | ||||||||||
1,191,520 | Call, 11/15/24, Strike $360.00 | 33,800 | |||||||||
137,750 | |||||||||||
Industrials (0.1%) | |||||||||||
75 | EUR | Schneider Electric, SE | |||||||||
342,750 | Call, 12/20/24, Strike 220.00 | 121,021 | |||||||||
Information Technology (0.1%) | |||||||||||
56 | 1,543,528 | Cadence Design Systems, Inc. Call, 01/17/25, Strike $335.00 | 66,640 | ||||||||
14 | 385,882 | Call, 11/15/24, Strike $300.00 | 25,690 | ||||||||
92,330 | |||||||||||
www.calamos.com
125
| NUMBER OF CONTRACTS/ NOTIONAL AMOUNT | VALUE | ||||||||||
Other (0.6%) | |||||||||||
200 | Coupang, Inc. | ||||||||||
450,000 | Call, 08/16/24, Strike $21.00 | $ | 62,000 | ||||||||
Invesco QQQ Trust Series 1 | |||||||||||
206 | |||||||||||
8,746,554 | Put, 06/28/24, Strike $440.00 | 415,502 | |||||||||
190 | |||||||||||
8,067,210 | Put, 12/20/24, Strike $344.78 | 92,055 | |||||||||
160 | SPDR S&P 500 ETF Trust | ||||||||||
8,031,680 | Put, 12/20/24, Strike $410.00 | 63,760 | |||||||||
633,317 | |||||||||||
TOTAL PURCHASED OPTIONS (Cost $1,905,357) | 1,414,813 | ||||||||||
TOTAL INVESTMENTS (140.7%) (Cost $162,279,121) | 152,136,693 | ||||||||||
| MANDATORY REDEEMABLE PREFERRED SHARES, AT LIQUIDATION VALUE (-15.7%) | (17,000,000 | ) | |||||||||
LIABILITIES, LESS OTHER ASSETS (-25.0%) | (26,971,924 | ) | |||||||||
NET ASSETS (100.0%) | $ | 108,164,769 | |||||||||
WRITTEN OPTIONS (-0.1%)# | |||||||||||
Financials (0.0%) | |||||||||||
117 | Morgan Stanley | ||||||||||
1,062,828 | Call, 09/20/24, Strike $100.00 | $ | (27,027 | ) | |||||||
Health Care (-0.1%) | |||||||||||
6 | GBP | Astrazeneca, PLC | |||||||||
455,280 | Call, 09/20/24, Strike 117.50 | (64,477 | ) | ||||||||
TOTAL WRITTEN OPTIONS (Premium $30,987) | $ | (91,504 | ) | ||||||||
NOTES TO SCHEDULE OF INVESTMENTS
* Securities issued and sold pursuant to a Rule 144A transaction are exempted from the registration requirement of the Securities Act of 1933, as amended. These securities may only be sold to qualified institutional buyers ("QIBs"), such as the Funds. Any resale of these securities must generally be effected through a sale that is registered under the Act or otherwise exempted from such registration requirements.
@ In default status and considered non-income producing.
^ Security, or portion of security, is on loan.
& Illiquid security.
‡ Variable rate security. The rate shown is the rate in effect at April 30, 2024.
‡‡ Perpetual maturity.
µ Security, or portion of security, is held in a segregated account as collateral for note payable aggregating a total value of $31,640,239.
~ Security, or portion of security, is segregated as collateral (or collateral for potential future transactions) for written options. The aggregate value of such securities is $1,942,358.
¡ Bank loans generally are subject to mandatory and/or optional prepayment. As a result, the actual remaining maturity of bank loans may be substantially less than the stated maturities shown.
! This position represents an unsettled loan commitment at period end. Certain details associated with this purchase are not known prior to the settlement date, including coupon rate, which will be adjusted on settlement date.
# Non-income producing security.
FOREIGN CURRENCY ABBREVIATIONS
AED UAE Dirham
AUD Australian Dollar
BRL Brazilian Real
CAD Canadian Dollar
CHF Swiss Franc
CNY Chinese Yuan Renminbi
EUR European Monetary Unit
GBP British Pound Sterling
HKD Hong Kong Dollar
IDR Indonesian Rupiah
INR Indian Rupee
JPY Japanese Yen
KRW South Korean Won
MXN Mexican Peso
PHP Philippine Peso
SEK Swedish Krona
THB Thai Baht
TRY Turkish Lira
TWD New Taiwan Dollar
ZAR South African Rand
ABBREVIATION
ADR American Depositary Receipt
CALAMOS CLOSED-END FAMILY OF FUNDS SEMIANNUAL REPORT
126
Note: Value for securities denominated in foreign currencies is shown in U.S. dollars. The principal amount for such securities is shown in the respective foreign currency. The date on options represents the expiration date of the option contract. The option contract may be exercised at any date on or before the date shown.
CURRENCY EXPOSURE
APRIL 30, 2024
VALUE | % OF TOTAL INVESTMENTS | ||||||||||
US Dollar | $ | 101,961,471 | 67.1 | % | |||||||
European Monetary Unit | 11,487,023 | 7.6 | % | ||||||||
Indian Rupee | 6,900,710 | 4.5 | % | ||||||||
Japanese Yen | 5,435,472 | 3.6 | % | ||||||||
British Pound Sterling | 5,066,988 | 3.3 | % | ||||||||
Hong Kong Dollar | 5,038,709 | 3.3 | % | ||||||||
New Taiwan Dollar | 4,822,249 | 3.2 | % | ||||||||
South Korean Won | 3,647,663 | 2.4 | % | ||||||||
Canadian Dollar | 3,335,906 | 2.2 | % | ||||||||
Chinese Yuan Renminbi | 1,098,207 | 0.7 | % | ||||||||
Indonesian Rupiah | 802,784 | 0.5 | % | ||||||||
Swiss Franc | 657,233 | 0.4 | % | ||||||||
Mexican Peso | 520,764 | 0.4 | % | ||||||||
Thai Baht | 343,687 | 0.2 | % | ||||||||
Brazilian Real | 282,220 | 0.2 | % | ||||||||
UAE Dirham | 216,676 | 0.1 | % | ||||||||
Swedish Krona | 193,699 | 0.1 | % | ||||||||
Philippine Peso | 88,982 | 0.1 | % | ||||||||
Turkish Lira | 66,783 | 0.1 | % | ||||||||
South African Rand | 39,166 | — | % | ||||||||
Australian Dollar | 38,797 | — | % | ||||||||
| Total Investments Net of Written Options | $ | 152,045,189 | 100.0 | % | |||||||
Currency exposure may vary over time.
www.calamos.com
127
The following table summarizes the Fund's investments and derivative financial instruments categorized in the fair value hierarchy as of April 30, 2024 (see Note 1):
LEVEL 1 | LEVEL 2 | LEVEL 3 | TOTAL | ||||||||||||||||
Assets: | |||||||||||||||||||
Corporate Bonds | $ | — | $ | 13,907,160 | $ | — | $ | 13,907,160 | |||||||||||
Convertible Bonds | — | 31,687,177 | — | 31,687,177 | |||||||||||||||
Bank Loans | — | 7,573,903 | — | 7,573,903 | |||||||||||||||
Common Stocks | 53,811,476 | 33,525,531 | — | 87,337,007 | |||||||||||||||
Preferred Stocks | 118,006 | 23,943 | — | 141,949 | |||||||||||||||
Exchange-Traded Funds | 8,275,554 | — | — | 8,275,554 | |||||||||||||||
Convertible Preferred Stocks | 1,787,555 | 11,575 | — | 1,799,130 | |||||||||||||||
Purchased Options | 1,414,813 | — | — | 1,414,813 | |||||||||||||||
Total | $ | 65,407,404 | $ | 86,729,289 | $ | — | $ | 152,136,693 | |||||||||||
Liabilities: | |||||||||||||||||||
Written Options | $ | 91,504 | $ | — | $ | — | $ | 91,504 | |||||||||||
Total | $ | 91,504 | $ | — | $ | — | $ | 91,504 | |||||||||||
SECTOR WEIGHTINGS
Information Technology | 20.4 | % | |||||
Consumer Discretionary | 15.9 | ||||||
Industrials | 12.4 | ||||||
Financials | 10.0 | ||||||
Health Care | 8.7 | ||||||
Communication Services | 6.9 | ||||||
Other | 5.6 | ||||||
Energy | 5.3 | ||||||
Consumer Staples | 4.9 | ||||||
Materials | 2.5 | ||||||
Real Estate | 1.7 | ||||||
Utilities | 0.5 | ||||||
Airlines | 0.4 | ||||||
Special Purpose Acquisition Companies | 0.1 | ||||||
Sector weightings are based on managed assets and may vary over time. Sector Weightings exclude any government/sovereign bonds or options on broad market indexes the Fund may hold.
ASSET ALLOCATION
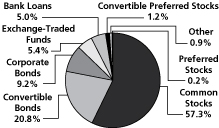
CALAMOS CLOSED-END FAMILY OF FUNDS SEMIANNUAL REPORT
128
| PRINCIPAL AMOUNT | VALUE | ||||||||||
ASSET BACKED SECURITY (0.0%) | |||||||||||
Other (0.0%) | |||||||||||
145,000 | SVC ABS, LLC Series 2023-1A, Class C* 6.700%, 02/20/53 (Cost $134,672) | $ | 131,782 | ||||||||
CORPORATE BONDS (31.4%) | |||||||||||
Airlines (0.2%) | |||||||||||
163,269 | Alaska Airlines Pass Through Trust Series 2020-1, Class A*~ 4.800%, 02/15/29 | 158,528 | |||||||||
65,527 | Alaska Airlines Pass Through Trust Series 2020-1, Class B* 8.000%, 02/15/27 | 66,271 | |||||||||
193,760 | American Airlines Pass Through Trust Series 2021-1, Class B 3.950%, 01/11/32 | 175,663 | |||||||||
96,000 | American Airlines, Inc. / AAdvantage Loyalty IP, Ltd.*~ 5.500%, 04/20/26 | 94,990 | |||||||||
176,604 | British Airways Pass Through Trust Series 2021-1, Class B* 3.900%, 03/15/33 | 160,478 | |||||||||
143,580 | JetBlue Pass Through Trust Series 2020-1, Class B 7.750%, 05/15/30 | 146,980 | |||||||||
802,910 | |||||||||||
Communication Services (2.0%) | |||||||||||
200,000 | Altice France Holding, SA* 10.500%, 05/15/27 | 71,698 | |||||||||
225,000 | Altice France, SA* 5.500%, 10/15/29 | 147,600 | |||||||||
225,000 | APi Group DE, Inc.* 4.750%, 10/15/29 | 204,986 | |||||||||
200,000 | Ashtead Capital, Inc.*~ 2.450%, 08/12/31 | 158,888 | |||||||||
231,000 | Audacy Capital Corp.*@ 6.750%, 03/31/29 | 8,154 | |||||||||
91,000 | 6.500%, 05/01/27 | 3,248 | |||||||||
162,000 | Cincinnati Bell Telephone Company, LLC 6.300%, 12/01/28 | 147,835 | |||||||||
90,000 | Clear Channel Outdoor Holdings, Inc.* 7.875%, 04/01/30 | 88,304 | |||||||||
85,000 | 9.000%, 09/15/28 | 87,497 | |||||||||
262,000 | Consolidated Communications, Inc.*~ 6.500%, 10/01/28 | 227,547 | |||||||||
285,000 | CSC Holdings, LLC* 5.375%, 02/01/28 | 219,792 | |||||||||
240,000 | 5.500%, 04/15/27~ | 197,006 | |||||||||
215,000 | 4.500%, 11/15/31 | 136,710 | |||||||||
200,000 | 5.750%, 01/15/30~ | 87,776 | |||||||||
200,000 | 4.625%, 12/01/30~ | 87,016 | |||||||||
| PRINCIPAL AMOUNT | VALUE | ||||||||||
99,000 | Directv Financing, LLC / Directv Financing Co-Obligor, Inc.*~ 5.875%, 08/15/27 | $ | 92,336 | ||||||||
195,000 | Frontier California, Inc. 6.750%, 05/15/27 | 185,839 | |||||||||
48,000 | Frontier Communications Holdings, LLC* 8.750%, 05/15/30 | 48,916 | |||||||||
292,000 | Frontier Florida, LLC 6.860%, 02/01/28 | 278,200 | |||||||||
280,000 | Frontier North, Inc. 6.730%, 02/15/28 | 265,566 | |||||||||
165,000 | Go Daddy Operating Company, LLC / GD Finance Company, Inc.*~ 3.500%, 03/01/29 | 146,593 | |||||||||
45,000 | Hughes Satellite Systems Corp. 6.625%, 08/01/26 | 25,923 | |||||||||
115,000 | iHeartCommunications, Inc.~ 8.375%, 05/01/27 | 61,296 | |||||||||
70,000 | 5.250%, 08/15/27* | 51,440 | |||||||||
230,000 | LCPR Senior Secured Financing DAC*~ 6.750%, 10/15/27 | 213,240 | |||||||||
151,589 | Ligado Networks, LLC* 15.500%, 11/01/23 PIK rate | 25,123 | |||||||||
135,000 | Lumen Technologies, Inc. 7.600%, 09/15/39 | 41,318 | |||||||||
90,000 | 4.000%, 02/15/27* | 47,917 | |||||||||
45,000 | 7.650%, 03/15/42 | 13,779 | |||||||||
95,000 | Match Group Holdings II, LLC*~ 3.625%, 10/01/31 | 78,533 | |||||||||
115,000 | Nexstar Media, Inc.*~ 5.625%, 07/15/27 | 108,229 | |||||||||
711,000 | Paramount Global~ 6.375%, 03/30/62‡ 5 year CMT + 4.00% | 658,358 | |||||||||
180,000 | 4.900%, 08/15/44 | 126,191 | |||||||||
63,000 | Qwest Corp. 7.250%, 09/15/25 | 62,442 | |||||||||
535,000 | Rogers Communications, Inc.*~‡ 5.250%, 03/15/82 5 year CMT + 3.59% | 509,010 | |||||||||
95,000 | Scripps Escrow II, Inc.* 3.875%, 01/15/29~ | 70,298 | |||||||||
48,000 | 5.375%, 01/15/31 | 28,427 | |||||||||
195,000 | Scripps Escrow, Inc.* 5.875%, 07/15/27 | 154,165 | |||||||||
195,000 | Sirius XM Radio, Inc.*~ 5.500%, 07/01/29 | 181,845 | |||||||||
185,000 | 4.000%, 07/15/28 | 164,940 | |||||||||
90,000 | 3.125%, 09/01/26 | 84,036 | |||||||||
48,000 | 3.875%, 09/01/31^ | 38,618 | |||||||||
175,000 | Spanish Broadcasting System, Inc.* 9.750%, 03/01/26 | 83,417 | |||||||||
165,000 | Sprint, LLC~ 7.125%, 06/15/24 | 165,228 | |||||||||
www.calamos.com
129
| PRINCIPAL AMOUNT | VALUE | ||||||||||
210,000 | Stagwell Global, LLC*~ 5.625%, 08/15/29 | $ | 188,380 | ||||||||
100,000 | Telesat Canada / Telesat, LLC* 4.875%, 06/01/27 | 45,764 | |||||||||
70,000 | Time Warner Cable, LLC~ 7.300%, 07/01/38 | 67,988 | |||||||||
230,000 | United States Cellular Corp.~ 6.700%, 12/15/33 | 224,577 | |||||||||
135,000 | Univision Communications, Inc.*~ 8.000%, 08/15/28 | 135,317 | |||||||||
90,000 | Viasat, Inc.* 5.625%, 04/15/27 | 82,514 | |||||||||
265,000 | Vodafone Group, PLC~‡ 7.000%, 04/04/79 U.S. 5 yr Swap + 4.87% | 270,112 | |||||||||
6,899,932 | |||||||||||
Consumer Discretionary (3.7%) | |||||||||||
228,000 | Abercrombie & Fitch Management Company* 8.750%, 07/15/25 | 229,938 | |||||||||
185,000 | Adams Homes, Inc.* 9.250%, 10/15/28 | 191,255 | |||||||||
140,000 | Adient Global Holdings Company*~ 8.250%, 04/15/31 | 145,524 | |||||||||
160,000 | American Axle & Manufacturing, Inc.~ 5.000%, 10/01/29 | 144,448 | |||||||||
167,000 | Ashton Woods USA, LLC / Ashton Woods Finance Company* 4.625%, 08/01/29 | 151,275 | |||||||||
149,000 | 6.625%, 01/15/28 | 148,784 | |||||||||
217,000 | At Home Group, Inc.* 4.875%, 07/15/28 | 103,164 | |||||||||
254,000 | Bath & Body Works, Inc. 6.694%, 01/15/27 | 255,966 | |||||||||
145,000 | 6.875%, 11/01/35~ | 144,369 | |||||||||
200,000 | Benteler International AG*~ 10.500%, 05/15/28 | 213,454 | |||||||||
118,000 | Caesars Entertainment, Inc.*~ 4.625%, 10/15/29 | 105,289 | |||||||||
93,000 | 8.125%, 07/01/27 | 94,449 | |||||||||
92,000 | Carnival Corp.*~ 7.625%, 03/01/26 | 92,621 | |||||||||
89,000 | 4.000%, 08/01/28 | 81,315 | |||||||||
12,000 | 7.000%, 08/15/29 | 12,331 | |||||||||
41,487 | Carvana Company* 14.000%, 06/01/31 | 41,644 | |||||||||
34,954 | 13.000%, 06/01/30 | 34,731 | |||||||||
23,202 | 12.000%, 12/01/28 | 22,729 | |||||||||
750,000 | CCO Holdings, LLC / CCO Holdings Capital Corp.*~ 4.750%, 03/01/30 | 624,405 | |||||||||
250,000 | 4.500%, 08/15/30 | 203,507 | |||||||||
220,000 | 6.375%, 09/01/29 | 201,676 | |||||||||
186,000 | 4.250%, 02/01/31 | 146,181 | |||||||||
96,000 | 4.750%, 02/01/32 | 75,565 | |||||||||
| PRINCIPAL AMOUNT | VALUE | ||||||||||
96,000 | CDI Escrow Issuer, Inc.*~ 5.750%, 04/01/30 | $ | 91,609 | ||||||||
115,000 | Cedar Fair, LP 5.250%, 07/15/29 | 107,494 | |||||||||
92,000 | Churchill Downs, Inc.* 6.750%, 05/01/31 | 91,383 | |||||||||
155,000 | Dana, Inc. 4.250%, 09/01/30 | 134,687 | |||||||||
140,000 | 4.500%, 02/15/32 | 118,790 | |||||||||
190,000 | DISH DBS Corp. 5.125%, 06/01/29 | 76,771 | |||||||||
140,000 | 5.250%, 12/01/26* | 110,428 | |||||||||
120,000 | 7.375%, 07/01/28 | 53,866 | |||||||||
115,000 | 7.750%, 07/01/26 | 72,536 | |||||||||
90,000 | 5.750%, 12/01/28* | 61,084 | |||||||||
186,000 | DISH Network Corp.* 11.750%, 11/15/27 | 187,704 | |||||||||
200,000 | Empire Resorts, Inc.* 7.750%, 11/01/26 | 186,492 | |||||||||
204,000 | Everi Holdings, Inc.* 5.000%, 07/15/29 | 200,383 | |||||||||
190,000 | Ford Motor Company~ 6.100%, 08/19/32 | 186,434 | |||||||||
300,000 | Ford Motor Credit Company, LLC~ 4.000%, 11/13/30 | 261,879 | |||||||||
270,000 | 5.113%, 05/03/29 | 257,359 | |||||||||
235,000 | 7.200%, 06/10/30 | 243,676 | |||||||||
200,000 | 7.350%, 11/04/27 | 206,950 | |||||||||
71,000 | Gap, Inc.*~ 3.875%, 10/01/31 | 58,082 | |||||||||
90,000 | General Motors Company~ 5.200%, 04/01/45 | 77,108 | |||||||||
690,000 | General Motors Financial Company, Inc.~‡ 5.700%, 09/30/30 5 year CMT + 5.00% | 648,690 | |||||||||
395,000 | 6.500%, 09/30/28 3 mo. USD LIBOR + 3.44% | 378,793 | |||||||||
315,000 | goeasy, Ltd.* 9.250%, 12/01/28~ | 333,431 | |||||||||
161,000 | 7.625%, 07/01/29 | 161,264 | |||||||||
100,000 | Goodyear Tire & Rubber Company 5.250%, 07/15/31^ | 88,592 | |||||||||
90,000 | 5.625%, 04/30/33 | 79,205 | |||||||||
79,000 | Group 1 Automotive, Inc.*~ 4.000%, 08/15/28 | 72,068 | |||||||||
193,000 | Guitar Center, Inc.*~ 8.500%, 01/15/26 | 170,668 | |||||||||
49,440 | JetBlue Pass Through Trust Series 2019-2, Class B 8.000%, 11/15/27 | 49,954 | |||||||||
205,000 | Kohl's Corp. 5.550%, 07/17/45 | 140,796 | |||||||||
185,000 | LCM Investments Holdings II, LLC*~ 8.250%, 08/01/31 | 192,537 | |||||||||
CALAMOS CLOSED-END FAMILY OF FUNDS SEMIANNUAL REPORT
130
| PRINCIPAL AMOUNT | VALUE | ||||||||||
190,000 | Liberty Interactive, LLC 8.250%, 02/01/30 | $ | 105,551 | ||||||||
179,000 | Life Time, Inc.* 8.000%, 04/15/26 | 179,301 | |||||||||
90,000 | Light & Wonder International, Inc.*~ 7.500%, 09/01/31 | 91,846 | |||||||||
70,000 | Lindblad Expeditions Holdings, Inc.* 9.000%, 05/15/28 | 73,404 | |||||||||
123,000 | Lindblad Expeditions, LLC* 6.750%, 02/15/27 | 122,065 | |||||||||
125,000 | M/I Homes, Inc. 3.950%, 02/15/30 | 108,557 | |||||||||
230,000 | Macy's Retail Holdings, LLC 6.700%, 07/15/34* | 193,849 | |||||||||
135,000 | 4.300%, 02/15/43 | 106,788 | |||||||||
242,000 | Midwest Gaming Borrower, LLC / Midwest Gaming Finance Corp.*~ 4.875%, 05/01/29 | 221,345 | |||||||||
110,000 | Newell Brands, Inc.~ 5.700%, 04/01/26 | 108,515 | |||||||||
90,000 | Nordstrom, Inc. 6.950%, 03/15/28 | 89,433 | |||||||||
90,000 | 5.000%, 01/15/44~ | 68,387 | |||||||||
86,000 | 4.250%, 08/01/31 | 74,237 | |||||||||
285,000 | Patrick Industries, Inc.* 4.750%, 05/01/29 | 259,330 | |||||||||
215,000 | PENN Entertainment, Inc.* 4.125%, 07/01/29 | 180,194 | |||||||||
90,000 | Phinia, Inc.* 6.750%, 04/15/29 | 90,385 | |||||||||
265,000 | Premier Entertainment Sub, LLC / Premier Entertainment Finance Corp.*~ 5.625%, 09/01/29 | 198,005 | |||||||||
95,000 | QVC, Inc. 5.450%, 08/15/34 | 62,409 | |||||||||
90,000 | Raising Cane's Restaurants, LLC*~ 9.375%, 05/01/29 | 96,601 | |||||||||
383,000 | Rite Aid Corp.*@ 8.000%, 11/15/26 | 247,161 | |||||||||
92,000 | Royal Caribbean Cruises, Ltd.* 7.250%, 01/15/30~ | 94,783 | |||||||||
23,000 | 6.250%, 03/15/32 | 22,677 | |||||||||
270,000 | Simmons Foods, Inc. / Simmons Prepared Foods, Inc. / Simmons Pet Food, Inc. / Simmons Feed*~ 4.625%, 03/01/29 | 233,550 | |||||||||
275,000 | Six Flags Entertainment Corp.*~ 7.250%, 05/15/31 | 274,675 | |||||||||
212,000 | Sonic Automotive, Inc.*~ 4.625%, 11/15/29 | 189,946 | |||||||||
147,000 | Speedway Motorsports, LLC / Speedway Funding II, Inc.* 4.875%, 11/01/27 | 138,733 | |||||||||
| PRINCIPAL AMOUNT | VALUE | ||||||||||
190,000 | Station Casinos, LLC*~ 4.500%, 02/15/28 | $ | 176,369 | ||||||||
185,000 | STL Holding Company, LLC* 8.750%, 02/15/29 | 190,293 | |||||||||
107,000 | Taylor Morrison Communities, Inc.* 5.750%, 01/15/28 | 104,303 | |||||||||
45,000 | Viking Cruises, Ltd.* 9.125%, 07/15/31 | 48,305 | |||||||||
220,000 | Vista Outdoor, Inc.* 4.500%, 03/15/29 | 217,461 | |||||||||
175,000 | ZF North America Capital, Inc.*~ 7.125%, 04/14/30 | 179,228 | |||||||||
13,113,019 | |||||||||||
Consumer Staples (0.9%) | |||||||||||
179,000 | 1375209 B.C., Ltd.* 9.000%, 01/30/28 | 175,936 | |||||||||
290,000 | Arrow Bidco, LLC* 10.750%, 06/15/25 | 299,152 | |||||||||
180,000 | B&G Foods, Inc.* 8.000%, 09/15/28 | 186,808 | |||||||||
218,000 | Central Garden & Pet Company* 4.125%, 04/30/31 | 189,207 | |||||||||
213,000 | Edgewell Personal Care Company*~ 4.125%, 04/01/29 | 193,165 | |||||||||
263,000 | Energizer Holdings, Inc.* 4.375%, 03/31/29~ | 232,626 | |||||||||
48,000 | 6.500%, 12/31/27^ | 47,576 | |||||||||
280,000 | JBS USA Holding LUX Sarl / JBS USA Food Company / JBS LUX Company Sarl 5.500%, 01/15/30~ | 270,516 | |||||||||
120,000 | 5.125%, 02/01/28^ | 116,684 | |||||||||
70,000 | 5.750%, 04/01/33 | 67,029 | |||||||||
655,000 | Land O' Lakes, Inc.* 7.000%, 09/18/28 | 509,800 | |||||||||
191,000 | Performance Food Group, Inc.*~ 4.250%, 08/01/29 | 171,270 | |||||||||
140,000 | Pilgrim's Pride Corp.~ 4.250%, 04/15/31 | 123,987 | |||||||||
92,000 | Post Holdings, Inc.*~ 6.250%, 02/15/32 | 90,998 | |||||||||
182,000 | Prestige Brands, Inc.*~ 3.750%, 04/01/31 | 155,062 | |||||||||
155,000 | United Natural Foods, Inc.*~ 6.750%, 10/15/28 | 119,156 | |||||||||
203,000 | Vector Group, Ltd.*~ 5.750%, 02/01/29 | 184,728 | |||||||||
3,133,700 | |||||||||||
Energy (3.3%) | |||||||||||
100,000 | Antero Resources Corp.*~ 5.375%, 03/01/30 | 95,156 | |||||||||
192,000 | Apache Corp.~ 5.100%, 09/01/40 | 159,898 | |||||||||
www.calamos.com
131
| PRINCIPAL AMOUNT | VALUE | ||||||||||
135,000 | Buckeye Partners, LP 5.850%, 11/15/43 | $ | 113,031 | ||||||||
96,000 | Cheniere Energy, Inc.~ 4.625%, 10/15/28 | 91,857 | |||||||||
139,000 | Chesapeake Energy Corp.*~ 6.750%, 04/15/29 | 139,158 | |||||||||
256,000 | Civitas Resources, Inc.*~ 8.750%, 07/01/31 | 272,435 | |||||||||
90,000 | Continental Resources, Inc. 4.900%, 06/01/44 | 72,565 | |||||||||
90,000 | 2.875%, 04/01/32* | 71,953 | |||||||||
150,000 | DT Midstream, Inc.*~ 4.125%, 06/15/29 | 135,978 | |||||||||
181,000 | Earthstone Energy Holdings, LLC*~ 8.000%, 04/15/27 | 186,249 | |||||||||
70,000 | 9.875%, 07/15/31 | 77,460 | |||||||||
920,000 | Enbridge, Inc.~‡ 5.750%, 07/15/80 5 year CMT + 5.31% | 843,824 | |||||||||
785,000 | 7.375%, 01/15/83 5 year CMT + 3.71% | 772,652 | |||||||||
100,000 | Encino Acquisition Partners Holdings, LLC* 8.750%, 05/01/31 | 101,869 | |||||||||
560,000 | Energy Transfer, LP~‡ 6.500%, 11/15/26 5 year CMT + 5.69% | 543,978 | |||||||||
345,000 | 8.000%, 05/15/54 | 355,785 | |||||||||
170,000 | 9.597%, 05/16/24 3 mo. USD LIBOR + 4.03% | 169,696 | |||||||||
125,000 | 8.606%, 11/01/66 3 mo. SOFR + 3.28% | 113,545 | |||||||||
835,000 | EnLink Midstream Partners, LP 9.701%, 05/31/24‡ 3 mo. SOFR + 4.37% | 824,621 | |||||||||
205,000 | 4.850%, 07/15/26 | 199,871 | |||||||||
113,000 | Enlink Midstream, LLC*~ 6.500%, 09/01/30 | 114,453 | |||||||||
205,000 | Enterprise Products Operating, LLC‡ 5.250%, 08/16/77~ 3 mo. SOFR + 3.29% | 193,215 | |||||||||
185,000 | 8.573%, 08/16/77 3 mo. SOFR + 3.25% | 184,390 | |||||||||
310,000 | EQM Midstream Partners, LP*~ 7.500%, 06/01/27 | 315,840 | |||||||||
90,000 | 6.375%, 04/01/29 | 89,425 | |||||||||
196,000 | Genesis Energy, LP / Genesis Energy Finance Corp.~ 8.875%, 04/15/30 | 203,042 | |||||||||
255,000 | Gulfport Energy Corp.*~ 8.000%, 05/17/26 | 258,838 | |||||||||
265,000 | Hilcorp Energy I, LP / Hilcorp Finance Company*~ 6.000%, 04/15/30 | 254,636 | |||||||||
144,000 | Howard Midstream Energy Partners, LLC* 6.750%, 01/15/27 | 142,335 | |||||||||
| PRINCIPAL AMOUNT | VALUE | ||||||||||
185,000 | Kodiak Gas Services, LLC*~ 7.250%, 02/15/29 | $ | 187,198 | ||||||||
186,000 | Magnolia Oil & Gas Operating, LLC / Magnolia Oil & Gas Finance Corp.* 6.000%, 08/01/26 | 183,532 | |||||||||
135,000 | Matador Resources Company* 6.500%, 04/15/32 | 133,897 | |||||||||
75,000 | Moss Creek Resources Holdings, Inc.* 7.500%, 01/15/26~ | 74,919 | |||||||||
70,000 | 10.500%, 05/15/27 | 71,674 | |||||||||
135,000 | Nabors Industries, Inc.*~ 7.375%, 05/15/27 | 133,900 | |||||||||
70,000 | 9.125%, 01/31/30 | 72,454 | |||||||||
135,000 | Nabors Industries, Ltd.*^ 7.500%, 01/15/28 | 128,104 | |||||||||
117,000 | New Fortress Energy, Inc.* 6.750%, 09/15/25 | 115,764 | |||||||||
192,000 | Oceaneering International, Inc. 6.000%, 02/01/28 | 185,065 | |||||||||
200,000 | Parkland Corp.*~ 5.875%, 07/15/27 | 195,632 | |||||||||
99,000 | Patterson-UTI Energy, Inc.^ 5.150%, 11/15/29 | 94,616 | |||||||||
46,000 | Permian Resources Operating LLC* 7.000%, 01/15/32 | 47,001 | |||||||||
750,000 | Plains All American Pipeline, LP‡ 9.679%, 05/31/24 3 mo. SOFR + 4.37% | 747,420 | |||||||||
265,000 | Rockcliff Energy II, LLC*~ 5.500%, 10/15/29 | 245,093 | |||||||||
98,000 | Southwestern Energy Company~ 4.750%, 02/01/32 | 88,370 | |||||||||
247,500 | Transocean, Inc.* 8.750%, 02/15/30~ | 258,336 | |||||||||
90,000 | 8.250%, 05/15/29 | 89,513 | |||||||||
115,000 | Venture Global Calcasieu Pass, LLC*~ 6.250%, 01/15/30 | 114,016 | |||||||||
45,000 | 4.125%, 08/15/31 | 39,416 | |||||||||
45,000 | 3.875%, 08/15/29 | 39,762 | |||||||||
230,000 | Venture Global LNG, Inc.*~ 8.375%, 06/01/31 | 236,217 | |||||||||
140,000 | 8.125%, 06/01/28 | 143,312 | |||||||||
90,000 | 9.875%, 02/01/32 | 96,047 | |||||||||
90,000 | 9.500%, 02/01/29 | 96,815 | |||||||||
115,000 | Vital Energy, Inc. 7.750%, 07/31/29* | 115,852 | |||||||||
97,000 | 7.875%, 04/15/32* | 98,534 | |||||||||
72,000 | 9.750%, 10/15/30 | 78,516 | |||||||||
280,000 | VOC Escrow, Ltd.*~ 5.000%, 02/15/28 | 267,240 | |||||||||
235,000 | Weatherford International, Ltd.*~ 8.625%, 04/30/30 | 244,137 | |||||||||
11,720,107 | |||||||||||
CALAMOS CLOSED-END FAMILY OF FUNDS SEMIANNUAL REPORT
132
| PRINCIPAL AMOUNT | VALUE | ||||||||||
Financials (13.3%) | |||||||||||
285,000 | Acrisure, LLC / Acrisure Finance, Inc.*~ 8.250%, 02/01/29 | $ | 283,250 | ||||||||
286,000 | Aethon United BR, LP / Aethon United Finance Corp.*~ 8.250%, 02/15/26 | 288,319 | |||||||||
605,000 | Aircastle, Ltd.*‡ 5.250%, 06/15/26 5 year CMT + 4.41% | 576,480 | |||||||||
315,000 | Alliant Holdings Intermediate, LLC / Alliant Holdings Co-Issuer* 6.750%, 10/15/27~ | 309,547 | |||||||||
25,000 | 7.000%, 01/15/31 | 25,153 | |||||||||
360,000 | Allstate Corp.~‡ 8.507%, 08/15/53 3 mo. SOFR + 3.20% | 360,356 | |||||||||
1,236,000 | Ally Financial, Inc.‡ 4.700%, 05/15/26 5 year CMT + 3.87% | 1,050,069 | |||||||||
740,000 | 4.700%, 05/15/28 7 year CMT + 3.48% | 573,485 | |||||||||
525,000 | American International Group, Inc.~‡ 5.750%, 04/01/48 3 mo. USD LIBOR + 2.87% | 508,851 | |||||||||
379,000 | AmWINS Group, Inc.*~ 4.875%, 06/30/29 | 345,042 | |||||||||
1,025,000 | Ares Finance Company III, LLC*‡ 4.125%, 06/30/51 5 year CMT + 3.24% | 945,296 | |||||||||
141,000 | Aviation Capital Group, LLC*~ 3.500%, 11/01/27 | 129,895 | |||||||||
835,000 | AXIS Specialty Finance, LLC‡ 4.900%, 01/15/40 5 year CMT + 3.19% | 748,820 | |||||||||
991,000 | Bank of America Corp.~‡ 6.125%, 04/27/27 5 year CMT + 3.23% | 980,922 | |||||||||
700,000 | 4.300%, 01/28/25 3 mo. USD LIBOR + 2.66% | 681,737 | |||||||||
330,000 | 6.250%, 09/05/24 3 mo. SOFR + 3.97% | 329,851 | |||||||||
330,000 | 6.100%, 03/17/25 3 mo. SOFR + 4.16% | 329,875 | |||||||||
1,560,000 | Bank of New York Mellon Corp.~‡ 4.700%, 09/20/25 5 year CMT + 4.36% | 1,528,660 | |||||||||
675,000 | BP Capital Markets, PLC‡ 4.375%, 06/22/25 5 year CMT + 4.04% | 661,210 | |||||||||
480,000 | 4.875%, 03/22/30~ 5 year CMT + 4.40% | 449,597 | |||||||||
92,000 | Brandywine Operating Partnership, LP 8.875%, 04/12/29 | 94,263 | |||||||||
| PRINCIPAL AMOUNT | VALUE | ||||||||||
285,000 | BroadStreet Partners, Inc.*~ 5.875%, 04/15/29 | $ | 260,043 | ||||||||
215,000 | Brookfield Property REIT, Inc. / BPR Cumulus, LLC / BPR Nimbus, LLC / GGSI Sellco, LLC*~ 4.500%, 04/01/27 | 192,619 | |||||||||
200,000 | Burford Capital Global Financial, LLC* 6.875%, 04/15/30 | 194,066 | |||||||||
1,028,000 | Capital One Financial Corp.~‡ 3.950%, 09/01/26 5 year CMT + 3.16% | 888,613 | |||||||||
675,000 | Charles Schwab Corp.~‡ 5.375%, 06/01/25 5 year CMT + 4.97% | 668,250 | |||||||||
338,000 | 4.000%, 12/01/30 10 year CMT + 3.08% | 275,237 | |||||||||
320,000 | 4.000%, 06/01/26 5 year CMT + 3.17% | 295,219 | |||||||||
1,141,000 | Citigroup, Inc.‡ 3.875%, 02/18/26 5 year CMT + 3.42% | 1,071,924 | |||||||||
395,000 | 4.150%, 11/15/26~ 5 year CMT + 3.00% | 362,965 | |||||||||
360,000 | 4.000%, 12/10/25 5 year CMT + 3.60% | 344,268 | |||||||||
350,000 | 7.625%, 11/15/28~ 5 year CMT + 3.21% | 362,110 | |||||||||
345,000 | 7.200%, 05/15/29 | 348,795 | |||||||||
335,000 | 5.950%, 05/15/25~ 3 mo. SOFR + 4.17% | 333,647 | |||||||||
995,000 | Citizens Financial Group, Inc.‡ 4.000%, 10/06/26 5 year CMT + 3.22% | 850,894 | |||||||||
365,000 | 5.650%, 10/06/25 5 year CMT + 5.31% | 357,361 | |||||||||
710,000 | Comerica, Inc.‡ 5.625%, 07/01/25 5 year CMT + 5.29% | 685,171 | |||||||||
365,000 | Corebridge Financial, Inc.~‡ 6.875%, 12/15/52 5 year CMT + 3.85% | 361,062 | |||||||||
175,000 | Credit Acceptance Corp. 6.625%, 03/15/26 | 174,582 | |||||||||
125,000 | 9.250%, 12/15/28*~ | 132,653 | |||||||||
180,000 | Cushman & Wakefield U.S. Borrower LLC* 8.875%, 09/01/31 | 187,299 | |||||||||
500,000 | Depository Trust & Clearing Corp.*~‡ 3.375%, 06/20/26 5 year CMT + 2.61% | 441,015 | |||||||||
650,000 | Discover Financial Services‡ 5.500%, 10/30/27 3 mo. SOFR + 3.34% | 546,123 | |||||||||
570,000 | 6.125%, 06/23/25~ 5 year CMT + 5.78% | 571,077 | |||||||||
241,000 | Enact Holdings, Inc.*~ 6.500%, 08/15/25 | 240,896 | |||||||||
www.calamos.com
133
| PRINCIPAL AMOUNT | VALUE | ||||||||||
765,000 | Enstar Finance, LLC~‡ 5.500%, 01/15/42 5 year CMT + 4.01% | $ | 722,367 | ||||||||
1,390,000 | Fifth Third Bancorp‡ 4.500%, 09/30/25 5 year CMT + 4.22% | 1,329,452 | |||||||||
160,000 | First Citizens BancShares, Inc.‡ 9.563%, 01/04/27 3 mo. SOFR + 4.23% | 161,954 | |||||||||
210,000 | GGAM Finance, Ltd.*~ 8.000%, 02/15/27 | 215,771 | |||||||||
238,000 | Global Net Lease, Inc. / Global Net Lease Operating Partnership, LP*~ 3.750%, 12/15/27 | 202,709 | |||||||||
715,000 | Goldman Sachs Group, Inc.‡ 4.400%, 02/10/25 5 year CMT + 2.85% | 696,467 | |||||||||
350,000 | 7.500%, 05/10/29 5 year CMT + 2.81 | 354,417 | |||||||||
337,000 | 4.125%, 11/10/26 5 year CMT + 2.95% | 311,560 | |||||||||
200,000 | GTCR W-2 Merger Sub, LLC*~ 7.500%, 01/15/31 | 206,400 | |||||||||
95,000 | HAT Holdings I LLC / HAT Holdings II LLC*~ 8.000%, 06/15/27 | 97,557 | |||||||||
276,000 | HUB International, Ltd.*~ 5.625%, 12/01/29 | 254,662 | |||||||||
92,000 | 7.375%, 01/31/32 | 91,621 | |||||||||
765,000 | Huntington Bancshares, Inc.~‡ 4.450%, 10/15/27 7 year CMT + 4.05% | 686,779 | |||||||||
505,000 | 5.625%, 07/15/30 10 year CMT + 4.95% | 452,591 | |||||||||
144,000 | Icahn Enterprises, LP / Icahn Enterprises Finance Corp.~ 4.375%, 02/01/29 | 121,342 | |||||||||
380,000 | Iron Mountain, Inc.*~ 5.250%, 03/15/28 | 364,086 | |||||||||
525,000 | Jefferies Finance, LLC / JFIN Co-Issuer Corp.*~ 5.000%, 08/15/28 | 472,888 | |||||||||
1,760,000 | JPMorgan Chase & Company‡ 3.650%, 06/01/26~ 5 year CMT + 2.85% | 1,650,722 | |||||||||
700,000 | 6.100%, 10/01/24 3 mo. USD LIBOR + 3.33% | 702,051 | |||||||||
430,000 | KeyCorp~‡ 5.000%, 09/15/26 3 mo. SOFR + 3.87% | 364,821 | |||||||||
379,000 | Ladder Capital Finance Holdings, LLLP / Ladder Capital Finance Corp.* 5.250%, 10/01/25 | 372,796 | |||||||||
195,000 | 4.750%, 06/15/29~ | 174,406 | |||||||||
175,000 | LD Holdings Group, LLC*~ 6.125%, 04/01/28 | 132,850 | |||||||||
| PRINCIPAL AMOUNT | VALUE | ||||||||||
200,000 | Level 3 Financing, Inc.* 4.250%, 07/01/28 | $ | 78,248 | ||||||||
90,000 | 4.625%, 09/15/27 | 53,078 | |||||||||
1,205,000 | Liberty Mutual Group, Inc.*~‡ 4.125%, 12/15/51 5 year CMT + 3.32% | 1,099,382 | |||||||||
139,000 | LPL Holdings, Inc.*~ 4.000%, 03/15/29 | 126,206 | |||||||||
270,000 | M&T Bank Corp.‡ 9.179%, 08/15/24 3 mo. SOFR + 3.87% | 270,235 | |||||||||
200,000 | 5.125%, 11/01/26~ 3 mo. USD LIBOR + 3.52% | 176,072 | |||||||||
200,000 | 5.000%, 08/01/24 5 year CMT + 3.17% | 191,280 | |||||||||
185,000 | Macquarie Airfinance Holdings, Ltd.*~ 8.125%, 03/30/29 | 193,915 | |||||||||
118,923 | Mallinckrodt International Finance, SA / Mallinckrodt CB, LLC*~ 14.750%, 11/14/28 | 129,708 | |||||||||
670,000 | Markel Corp.~‡ 6.000%, 06/01/25 5 year CMT + 5.66% | 663,668 | |||||||||
545,000 | MetLife, Inc.~ 6.400%, 12/15/66 | 543,654 | |||||||||
505,000 | 3.850%, 09/15/25‡ 5 year CMT + 3.58% | 484,113 | |||||||||
255,000 | Nationstar Mortgage Holdings, Inc.*~ 5.500%, 08/15/28 | 240,031 | |||||||||
197,000 | Navient Corp.~ 5.000%, 03/15/27 | 186,068 | |||||||||
100,000 | 4.875%, 03/15/28 | 90,516 | |||||||||
125,000 | Necessity Retail REIT, Inc. / American Finance Operating Partner, LP*~ 4.500%, 09/30/28 | 106,738 | |||||||||
95,000 | Newmark Group, Inc.*~ 7.500%, 01/12/29 | 96,051 | |||||||||
250,000 | Northern Trust Corp.‡ 4.600%, 10/01/26 3 mo. SOFR + 3.46% | 239,912 | |||||||||
130,000 | OneMain Finance Corp.~ 9.000%, 01/15/29 | 136,666 | |||||||||
130,000 | 3.875%, 09/15/28 | 114,711 | |||||||||
95,000 | 7.125%, 03/15/26 | 95,928 | |||||||||
938,000 | PartnerRe Finance B, LLC~‡ 4.500%, 10/01/50 5 year CMT + 3.82% | 848,852 | |||||||||
295,000 | PHH Mortgage Corp.* 7.875%, 03/15/26 | 283,704 | |||||||||
735,000 | PNC Financial Services Group, Inc.‡ 3.400%, 09/15/26 5 year CMT + 2.60% | 634,136 | |||||||||
360,000 | 6.200%, 09/15/27~ 5 year CMT + 3.24% | 353,437 | |||||||||
CALAMOS CLOSED-END FAMILY OF FUNDS SEMIANNUAL REPORT
134
| PRINCIPAL AMOUNT | VALUE | ||||||||||
280,000 | 6.000%, 05/15/27~ 5 year CMT + 3.00% | $ | 270,617 | ||||||||
785,000 | QBE Insurance Group, Ltd.*~‡ 5.875%, 05/12/25 5 year CMT + 5.51% | 776,671 | |||||||||
220,000 | RHP Hotel Properties, LP / RHP Finance Corp.* 4.500%, 02/15/29~ | 202,719 | |||||||||
185,000 | 6.500%, 04/01/32 | 181,542 | |||||||||
85,000 | Rocket Mortgage, LLC / Rocket Mortgage Co-Issuer, Inc.*~ 3.875%, 03/01/31 | 72,412 | |||||||||
85,000 | 3.625%, 03/01/29 | 75,078 | |||||||||
45,000 | 2.875%, 10/15/26 | 41,405 | |||||||||
230,000 | StoneX Group, Inc.* 7.875%, 03/01/31 | 232,755 | |||||||||
199,000 | 8.625%, 06/15/25 | 199,812 | |||||||||
685,000 | Truist Financial Corp.~‡ 4.950%, 09/01/25 5 year CMT + 4.61% | 667,286 | |||||||||
530,000 | 4.800%, 09/01/24 5 year CMT + 3.00% | 512,886 | |||||||||
256,000 | 5.100%, 03/01/30 10 year CMT + 4.35% | 232,440 | |||||||||
765,000 | U.S. Bancorp~‡ 5.300%, 04/15/27 3 mo. SOFR + 3.18% | 717,922 | |||||||||
221,000 | United Wholesale Mortgage, LLC*~ 5.500%, 04/15/29 | 205,731 | |||||||||
90,000 | 5.750%, 06/15/27 | 86,494 | |||||||||
93,000 | Uniti Group, LP / Uniti Group Finance, Inc. / CSL Capital, LLC*~ 10.500%, 02/15/28 | 96,604 | |||||||||
90,000 | 6.500%, 02/15/29 | 72,426 | |||||||||
210,000 | VZ Secured Financing, BV*~ 5.000%, 01/15/32 | 177,469 | |||||||||
1,425,000 | Wells Fargo & Company‡ 3.900%, 03/15/26 5 year CMT + 3.45% | 1,351,498 | |||||||||
1,340,000 | 7.625%, 09/15/28~ 5 year CMT + 3.61% | 1,401,854 | |||||||||
208,000 | XHR, LP*~ 6.375%, 08/15/25 | 207,915 | |||||||||
46,706,681 | |||||||||||
Health Care (1.0%) | |||||||||||
318,000 | Bausch Health Companies, Inc.* 11.000%, 09/30/28^ | 249,102 | |||||||||
72,000 | 6.125%, 02/01/27 | 52,864 | |||||||||
62,000 | 14.000%, 10/15/30 | 40,059 | |||||||||
377,000 | CHS/Community Health Systems, Inc.* 6.125%, 04/01/30~ | 267,007 | |||||||||
108,000 | 6.875%, 04/15/29 | 80,204 | |||||||||
104,000 | 8.000%, 03/15/26~ | 103,650 | |||||||||
90,000 | 10.875%, 01/15/32~ | 92,311 | |||||||||
24,000 | 5.250%, 05/15/30 | 19,677 | |||||||||
| PRINCIPAL AMOUNT | VALUE | ||||||||||
222,000 | DaVita, Inc.*~ 3.750%, 02/15/31 | $ | 182,988 | ||||||||
197,000 | 4.625%, 06/01/30 | 173,061 | |||||||||
144,000 | Embecta Corp.* 5.000%, 02/15/30~^ | 111,109 | |||||||||
48,000 | 6.750%, 02/15/30 | 41,286 | |||||||||
100,000 | Encompass Health Corp.~ 4.750%, 02/01/30 | 91,902 | |||||||||
100,000 | 4.500%, 02/01/28 | 94,070 | |||||||||
200,000 | Jazz Securities DAC*~ 4.375%, 01/15/29 | 183,236 | |||||||||
233,000 | Medline Borrower, LP*~ 5.250%, 10/01/29 | 217,121 | |||||||||
230,000 | 3.875%, 04/01/29 | 206,011 | |||||||||
350,000 | Organon & Company / Organon Foreign Debt Co-Issuer, BV*~ 5.125%, 04/30/31 | 302,932 | |||||||||
470,000 | Tenet Healthcare Corp. 6.875%, 11/15/31 | 486,525 | |||||||||
230,000 | Teva Pharmaceutical Finance Netherlands III, BV~ 5.125%, 05/09/29 | 218,309 | |||||||||
200,000 | 4.750%, 05/09/27 | 191,628 | |||||||||
115,000 | 3.150%, 10/01/26 | 106,599 | |||||||||
3,511,651 | |||||||||||
Industrials (2.8%) | |||||||||||
185,000 | Aar Escrow Issuer, LLC* 6.750%, 03/15/29 | 186,663 | |||||||||
220,000 | ACCO Brands Corp.*~ 4.250%, 03/15/29 | 192,005 | |||||||||
800,000 | AerCap Holdings, NV~‡ 5.875%, 10/10/79 5 year CMT + 4.54% | 793,008 | |||||||||
810,000 | Air Lease Corp.‡ 4.650%, 06/15/26 5 year CMT + 4.08% | 763,417 | |||||||||
485,000 | 4.125%, 12/15/26 5 year CMT + 3.15% | 420,020 | |||||||||
315,000 | Albertsons Companies, Inc. / Safeway, Inc. / New Albertsons, LP / Albertsons, LLC*~ 4.625%, 01/15/27 | 301,190 | |||||||||
145,000 | 5.875%, 02/15/28 | 142,226 | |||||||||
130,000 | Allegiant Travel Company*~ 7.250%, 08/15/27 | 125,926 | |||||||||
108,000 | Arcosa, Inc.* 4.375%, 04/15/29 | 98,871 | |||||||||
740,000 | ARD Finance, SA* 6.500%, 06/30/27 7.250% PIK rate | 206,549 | |||||||||
151,000 | Beacon Roofing Supply, Inc.* 4.125%, 05/15/29 | 135,150 | |||||||||
95,000 | Boeing Company* 6.388%, 05/01/31 | 95,694 | |||||||||
www.calamos.com
135
| PRINCIPAL AMOUNT | VALUE | ||||||||||
90,000 | Bombardier, Inc.* 8.750%, 11/15/30~ | $ | 95,818 | ||||||||
75,000 | 7.875%, 04/15/27 | 74,766 | |||||||||
56,000 | 7.250%, 07/01/31 | 56,218 | |||||||||
191,000 | BWX Technologies, Inc.* 4.125%, 04/15/29 | 174,221 | |||||||||
185,000 | Cascades, Inc. / Cascades USA, Inc.* 5.375%, 01/15/28 | 174,409 | |||||||||
48,000 | Delta Air Lines, Inc. / SkyMiles IP, Ltd.*~ 4.750%, 10/20/28 | 46,551 | |||||||||
245,000 | Deluxe Corp.* 8.000%, 06/01/29 | 222,563 | |||||||||
188,000 | Eco Material Technologies, Inc.*~ 7.875%, 01/31/27 | 189,598 | |||||||||
92,000 | Emerald Debt Merger Sub, LLC*~ 6.625%, 12/15/30 | 91,447 | |||||||||
90,000 | EnerSys* 6.625%, 01/15/32 | 89,758 | |||||||||
85,000 | 4.375%, 12/15/27 | 79,693 | |||||||||
70,000 | EquipmentShare.com, Inc.* 8.625%, 05/15/32 | 71,376 | |||||||||
118,000 | Graham Packaging Company, Inc.*~ 7.125%, 08/15/28 | 106,812 | |||||||||
88,000 | Graphic Packaging International, LLC* 3.500%, 03/01/29 | 77,966 | |||||||||
203,000 | Great Lakes Dredge & Dock Corp.* 5.250%, 06/01/29 | 171,476 | |||||||||
443,000 | H&E Equipment Services, Inc.*~ 3.875%, 12/15/28 | 392,507 | |||||||||
236,000 | Hawaiian Brand Intellectual Property, Ltd. / HawaiianMiles Loyalty, Ltd.*~ 5.750%, 01/20/26 | 221,849 | |||||||||
290,000 | Herc Holdings, Inc.*~ 5.500%, 07/15/27 | 282,051 | |||||||||
220,000 | IEA Energy Services, LLC* 6.625%, 08/15/29 | 210,001 | |||||||||
110,000 | JELD-WEN, Inc.* 4.625%, 12/15/25 | 107,413 | |||||||||
95,000 | 4.875%, 12/15/27 | 90,317 | |||||||||
305,000 | Ken Garff Automotive, LLC* 4.875%, 09/15/28 | 284,165 | |||||||||
185,000 | Knife River Holding Company* 7.750%, 05/01/31 | 192,542 | |||||||||
51,000 | MasTec, Inc.* 4.500%, 08/15/28 | 47,693 | |||||||||
23,000 | Miter Brands Acquisition Holdco, Inc. / MIWD Borrower, LLC* 6.750%, 04/01/32 | 22,859 | |||||||||
107,000 | Moog, Inc.*~ 4.250%, 12/15/27 | 100,127 | |||||||||
230,000 | Newfold Digital Holdings Group, Inc.*~ 6.000%, 02/15/29 | 172,847 | |||||||||
172,000 | Novelis Corp.*~ 4.750%, 01/30/30 | 157,079 | |||||||||
| PRINCIPAL AMOUNT | VALUE | ||||||||||
70,000 | OI European Group, BV* 4.750%, 02/15/30 | $ | 64,081 | ||||||||
225,000 | Pactiv Evergreen Group Issuer, Inc. / Pactiv Evergreen Group Issuer, LLC*~ 4.000%, 10/15/27 | 209,304 | |||||||||
144,000 | Sealed Air Corp.* 6.125%, 02/01/28~ | 142,403 | |||||||||
48,000 | 5.000%, 04/15/29 | 45,198 | |||||||||
50,000 | Sealed Air Corp./Sealed Air Corp. U.S.* 7.250%, 02/15/31 | 51,004 | |||||||||
98,000 | Sensata Technologies, Inc.*~ 3.750%, 02/15/31 | 83,031 | |||||||||
141,000 | Sinclair Television Group, Inc.* 4.125%, 12/01/30~ | 97,124 | |||||||||
100,000 | 5.500%, 03/01/30 | 69,358 | |||||||||
195,000 | Standard Industries, Inc.*~ 5.000%, 02/15/27 | 188,196 | |||||||||
195,000 | Stanley Black & Decker, Inc.‡ 4.000%, 03/15/60 5 year CMT + 2.66% | 171,534 | |||||||||
150,000 | Stericycle, Inc.*~ 3.875%, 01/15/29 | 134,118 | |||||||||
195,000 | TransDigm, Inc.* 6.875%, 12/15/30~ | 196,480 | |||||||||
140,000 | 6.750%, 08/15/28~ | 140,668 | |||||||||
70,000 | 7.125%, 12/01/31~ | 71,434 | |||||||||
44,000 | 6.625%, 03/01/32 | 43,997 | |||||||||
96,000 | Tronox, Inc.*~ 4.625%, 03/15/29 | 85,961 | |||||||||
70,780 | United Airlines Pass Through Trust Series 2019-2, Class B 3.500%, 11/01/29 | 65,378 | |||||||||
187,000 | Vertiv Group Corp.*~ 4.125%, 11/15/28 | 173,295 | |||||||||
201,000 | Wabash National Corp.* 4.500%, 10/15/28 | 180,920 | |||||||||
150,000 | Waste Pro USA, Inc.*~ 5.500%, 02/15/26 | 146,946 | |||||||||
107,000 | Williams Scotsman, Inc.*~ 4.625%, 08/15/28 | 98,977 | |||||||||
90,000 | 7.375%, 10/01/31 | 92,005 | |||||||||
10,016,253 | |||||||||||
Information Technology (0.7%) | |||||||||||
46,000 | Booz Allen Hamilton, Inc.* 4.000%, 07/01/29 | 42,201 | |||||||||
112,000 | Coherent Corp.*~ 5.000%, 12/15/29 | 103,444 | |||||||||
175,000 | CommScope, Inc.*~ 4.750%, 09/01/29 | 122,369 | |||||||||
96,000 | Dun & Bradstreet Corp.*^ 5.000%, 12/15/29 | 87,492 | |||||||||
56,000 | Fair Isaac Corp.*~ 4.000%, 06/15/28 | 51,657 | |||||||||
CALAMOS CLOSED-END FAMILY OF FUNDS SEMIANNUAL REPORT
136
| PRINCIPAL AMOUNT | VALUE | ||||||||||
210,000 | KBR, Inc.* 4.750%, 09/30/28 | $ | 196,207 | ||||||||
210,000 | MPH Acquisition Holdings, LLC*~ 5.750%, 11/01/28 | 154,657 | |||||||||
95,000 | 5.500%, 09/01/28 | 77,609 | |||||||||
93,000 | NCL Corp., Ltd.*~ 8.125%, 01/15/29 | 96,946 | |||||||||
96,000 | NCR Voyix Corp.*~ 5.125%, 04/15/29 | 88,297 | |||||||||
143,000 | ON Semiconductor Corp.*~ 3.875%, 09/01/28 | 129,807 | |||||||||
129,000 | Open Text Corp.*~ 3.875%, 02/15/28 | 117,845 | |||||||||
90,000 | 6.900%, 12/01/27 | 92,072 | |||||||||
72,000 | 3.875%, 12/01/29 | 63,132 | |||||||||
72,000 | Open Text Holdings, Inc.*~^ 4.125%, 12/01/31 | 61,816 | |||||||||
161,000 | Playtika Holding Corp.*~ 4.250%, 03/15/29 | 138,681 | |||||||||
265,000 | TTM Technologies, Inc.*~ 4.000%, 03/01/29 | 237,432 | |||||||||
130,000 | Twilio, Inc.~ 3.625%, 03/15/29 | 115,474 | |||||||||
47,000 | 3.875%, 03/15/31 | 40,756 | |||||||||
69,000 | UKG, Inc.*~ 6.875%, 02/01/31 | 69,161 | |||||||||
205,000 | Viavi Solutions, Inc.* 3.750%, 10/01/29 | 173,502 | |||||||||
220,000 | ZoomInfo Technologies, LLC / ZoomInfo Finance Corp.*~ 3.875%, 02/01/29 | 194,553 | |||||||||
2,455,110 | |||||||||||
Materials (0.7%) | |||||||||||
150,000 | ArcelorMittal, SA~ 7.000%, 10/15/39 | 158,798 | |||||||||
90,000 | ATI, Inc. 5.875%, 12/01/27 | 88,410 | |||||||||
46,000 | Carpenter Technology Corp. 7.625%, 03/15/30 | 46,998 | |||||||||
190,000 | Chemours Company*~ 4.625%, 11/15/29 | 162,967 | |||||||||
300,000 | Clearwater Paper Corp.* 4.750%, 08/15/28 | 272,835 | |||||||||
139,000 | Cleveland-Cliffs, Inc.*~ 6.750%, 04/15/30 | 135,820 | |||||||||
96,000 | Commercial Metals Company 4.125%, 01/15/30 | 86,240 | |||||||||
48,000 | 4.375%, 03/15/32 | 42,340 | |||||||||
250,000 | Constellium, SE*~ 3.750%, 04/15/29 | 222,062 | |||||||||
96,000 | HB Fuller Company 4.250%, 10/15/28 | 88,708 | |||||||||
| PRINCIPAL AMOUNT | VALUE | ||||||||||
165,000 | Kaiser Aluminum Corp.*~ 4.625%, 03/01/28 | $ | 153,858 | ||||||||
53,000 | LSF11 A5 HoldCo, LLC* 6.625%, 10/15/29 | 49,434 | |||||||||
199,000 | Mercer International, Inc. 5.125%, 02/01/29~ | 174,039 | |||||||||
90,000 | 12.875%, 10/01/28* | 98,349 | |||||||||
200,000 | OCI, NV*~ 6.700%, 03/16/33 | 192,182 | |||||||||
135,000 | Owens-Brockway Glass Container, Inc.*~ 7.250%, 05/15/31 | 135,383 | |||||||||
100,000 | 6.625%, 05/13/27 | 100,030 | |||||||||
80,000 | Silgan Holdings, Inc.~ 4.125%, 02/01/28 | 74,694 | |||||||||
96,000 | Trinseo Materials Operating SCA / Trinseo Materials Finance, Inc.* 5.125%, 04/01/29 | 24,855 | |||||||||
2,308,002 | |||||||||||
Other (0.0%) | |||||||||||
90,000 | Gen Digital, Inc.* 6.750%, 09/30/27 | 90,384 | |||||||||
45,000 | 7.125%, 09/30/30 | 45,540 | |||||||||
135,924 | |||||||||||
Real Estate (0.2%) | |||||||||||
152,000 | EPR Properties~ 3.750%, 08/15/29 | 132,251 | |||||||||
139,000 | Forestar Group, Inc.* 5.000%, 03/01/28 | 132,154 | |||||||||
97,000 | 3.850%, 05/15/26 | 92,217 | |||||||||
211,000 | MIWD Holdco II, LLC / MIWD Finance Corp.*~ 5.500%, 02/01/30 | 191,143 | |||||||||
95,000 | Service Properties Trust 5.250%, 02/15/26 | 91,443 | |||||||||
639,208 | |||||||||||
Special Purpose Acquisition Companies (0.1%) | |||||||||||
185,000 | Fertitta Entertainment, LLC / Fertitta Entertainment Finance Company, Inc.*~ 6.750%, 01/15/30 | 161,287 | |||||||||
96,000 | 4.625%, 01/15/29 | 86,912 | |||||||||
248,199 | |||||||||||
Utilities (2.5%) | |||||||||||
785,000 | Algonquin Power & Utilities Corp.~‡ 4.750%, 01/18/82 5 year CMT + 3.25% | 681,003 | |||||||||
200,000 | American Electric Power Company, Inc.‡ 3.875%, 02/15/62 5 year CMT + 2.68% | 179,672 | |||||||||
515,000 | CMS Energy Corp.~‡ 4.750%, 06/01/50 5 year CMT + 4.12% | 465,720 | |||||||||
www.calamos.com
137
| PRINCIPAL AMOUNT | VALUE | ||||||||||
580,000 | Dominion Energy, Inc.~‡ 4.650%, 12/15/24 5 year CMT + 2.99% | $ | 567,918 | ||||||||
287,000 | 4.350%, 01/15/27 5 year CMT + 3.20% | 263,891 | |||||||||
800,000 | Duke Energy Corp.~‡ 4.875%, 09/16/24 5 year CMT + 3.39% | 794,176 | |||||||||
273,000 | 3.250%, 01/15/82 5 year CMT + 2.32% | 240,881 | |||||||||
655,000 | Emera, Inc.~‡ 6.750%, 06/15/76 3 mo. USD LIBOR + 5.44% | 649,210 | |||||||||
632,000 | National Rural Utilities Cooperative Finance Corp.‡ 7.125%, 09/15/53 5 year CMT + 3.53% | 646,776 | |||||||||
385,000 | 5.250%, 04/20/46 3 mo. USD LIBOR + 3.63% | 372,638 | |||||||||
770,000 | NextEra Energy Capital Holdings, Inc.‡ 3.800%, 03/15/82~ 5 year CMT + 2.55% | 697,912 | |||||||||
345,000 | 6.700%, 09/01/54 | 341,902 | |||||||||
434,000 | PPL Capital Funding, Inc.‡ 8.236%, 03/30/67 3 mo. SOFR + 2.93% | 430,680 | |||||||||
490,000 | Sempra~‡ 4.875%, 10/15/25 5 year CMT + 4.55% | 478,980 | |||||||||
240,000 | 4.125%, 04/01/52 5 year CMT + 2.87% | 218,218 | |||||||||
1,028,000 | Southern Company~‡ 4.000%, 01/15/51 5 year CMT + 3.73% | 982,788 | |||||||||
220,000 | 3.750%, 09/15/51 5 year CMT + 2.92% | 202,066 | |||||||||
225,000 | Vistra Corp.*‡ 7.000%, 12/15/26 5 year CMT + 5.74% | 221,582 | |||||||||
185,000 | 8.000%, 10/15/26 5 year CMT + 6.93% | 187,107 | |||||||||
205,000 | WEC Energy Group, Inc.‡ 7.681%, 05/15/67 3 mo. SOFR + 2.37% | 199,824 | |||||||||
8,822,944 | |||||||||||
TOTAL CORPORATE BONDS (Cost $117,385,814) | 110,513,640 | ||||||||||
CONVERTIBLE BONDS (0.1%) | |||||||||||
Communication Services (0.0%) | |||||||||||
183,000 | Cable One, Inc.µ 0.000%, 03/15/26 | 158,271 | |||||||||
| PRINCIPAL AMOUNT | VALUE | ||||||||||
Consumer Discretionary (0.1%) | |||||||||||
272,000 | DISH Network Corp.µ 0.000%, 12/15/25 | $ | 199,648 | ||||||||
Other (0.0%) | |||||||||||
95,000 | Multiplan Corp.*µ 6.000%, 10/15/27 | 67,677 | |||||||||
TOTAL CONVERTIBLE BONDS (Cost $444,684) | 425,596 | ||||||||||
BANK LOANS (3.9%)¡ | |||||||||||
Airlines (0.1%) | |||||||||||
125,000 | Air Canada‡ 7.833%, 03/21/31 3 mo. SOFR + 2.50% | 126,016 | |||||||||
132,000 | American Airlines, Inc.‡ 10.336%, 04/20/28 3 mo. SOFR + 4.75% | 137,459 | |||||||||
120,250 | Mileage Plus Holdings, LLC‡ 10.733%, 06/21/27 3 mo. SOFR + 5.25% | 123,607 | |||||||||
135,000 | United Airlines, Inc.‡ 8.076%, 02/22/31 3 mo. SOFR + 2.75% | 135,738 | |||||||||
522,820 | |||||||||||
Communication Services (0.4%) | |||||||||||
300,000 | APi Group DE, Inc.! 0.000%, 01/03/29 | 301,475 | |||||||||
10,660 | Audacy Capital Corp.‡ 11.430%, 08/19/24 3 mo. SOFR + 6.11% | 10,687 | |||||||||
110,330 | Clear Channel Outdoor Holdings, Inc.‡ 9.430%, 08/23/28 1 mo. SOFR + 4.00% | 110,560 | |||||||||
77,363 | DIRECTV Financing, LLC! 0.000%, 08/02/27 | 77,857 | |||||||||
68,316 | DIRECTV Financing, LLC‡ 10.430%, 08/02/27 1 mo. SOFR + 5.00% | 68,752 | |||||||||
284,000 | Entercom Media Corp.‡& 0.000%, 11/18/24 3 mo. SOFR + 0.00% | 153,928 | |||||||||
300,000 | Go Daddy Operating Company, LLC‡! 0.000%, 11/09/29 | 300,474 | |||||||||
181,392 | Gray Television, Inc.‡ 7.942%, 01/02/26 1 mo. SOFR + 2.50% | 179,363 | |||||||||
180,000 | Telesat Canada‡ 8.355%, 12/07/26 3 mo. SOFR + 2.75% | 91,838 | |||||||||
1,294,934 | |||||||||||
CALAMOS CLOSED-END FAMILY OF FUNDS SEMIANNUAL REPORT
138
| PRINCIPAL AMOUNT | VALUE | ||||||||||
Consumer Discretionary (0.9%) | |||||||||||
90,000 | Adient U.S., LLC‡ 8.066%, 01/31/31 1 mo. SOFR + 2.75% | $ | 90,506 | ||||||||
144,000 | American Axle & Manufacturing, Inc.‡ 8.921%, 12/13/29 1 mo. SOFR + 3.50% | 144,855 | |||||||||
178,200 | Caesars Entertainment, Inc.‡ 8.666%, 02/06/30 1 mo. SOFR + 3.25% | 178,791 | |||||||||
282,326 | Carnival Corp.‡ 8.067%, 08/08/27 1 mo. SOFR + 2.75% | 284,134 | |||||||||
162,466 | Carnival Corp.‡ 8.067%, 10/18/28 1 mo. SOFR + 2.75% | 163,329 | |||||||||
300,000 | Cedar Fair, LP‡! 0.000%, 04/18/31 | 300,375 | |||||||||
200,000 | Flutter Financing, BV‡! 0.000%, 11/25/30 | 200,607 | |||||||||
232,987 | Hanesbrands, Inc.‡ 9.066%, 03/08/30 1 mo. SOFR + 3.75% | 233,471 | |||||||||
300,000 | Hilton Domestic Operating Company, Inc.‡! 0.000%, 11/08/30 | 301,007 | |||||||||
300,000 | Installed Building Products, Inc.‡! 0.000%, 03/28/31 | 301,453 | |||||||||
109,382 | Life Time Fitness, Inc.‡ 9.591%, 01/15/26 3 mo. SOFR + 4.00% | 110,169 | |||||||||
197,000 | Light & Wonder International, Inc.‡ 8.071%, 04/14/29 1 mo. SOFR + 2.75% | 197,684 | |||||||||
311,042 | PetSmart, Inc.‡ 9.166%, 02/11/28 1 mo. SOFR + 3.75% | 307,154 | |||||||||
95,000 | Station Casinos, LLC! 0.000%, 03/14/31 | 95,123 | |||||||||
85,000 | Station Casinos, LLC‡ 7.566%, 03/14/31 1 mo. SOFR + 2.25% | 85,110 | |||||||||
123,485 | TKC Holdings, Inc.‡ 10.930%, 05/15/28 1 mo. SOFR + 5.50% | 122,791 | |||||||||
184,425 | Windsor Holdings III, LLC‡ 9.319%, 08/01/30 1 mo. SOFR + 4.00% | 186,246 | |||||||||
3,302,805 | |||||||||||
Consumer Staples (0.3%) | |||||||||||
420,180 | Amneal Pharmaceuticals, LLC‡ 10.816%, 05/04/28 1 mo. SOFR + 5.50% | 421,101 | |||||||||
| PRINCIPAL AMOUNT | VALUE | ||||||||||
98,852 | Fiesta Purchaser, Inc.‡ 9.316%, 02/12/31 | $ | 99,365 | ||||||||
81,148 | Fiesta Purchaser, Inc.‡ 9.318%, 02/12/31 1 mo. SOFR + 3.75% | 81,569 | |||||||||
185,000 | Star Parent, Inc.‡ 9.309%, 09/27/30 3 mo. SOFR + 4.00% | 185,174 | |||||||||
115,000 | United Natural Foods, Inc.! 0.000%, 04/25/31 | 113,994 | |||||||||
96,269 | United Natural Foods, Inc.‡! 8.680%, 10/22/25 1 mo. SOFR + 3.25% | 95,962 | |||||||||
997,165 | |||||||||||
Energy (0.1%) | |||||||||||
139,650 | Buckeye Partners, LP‡ 7.816%, 11/22/30 1 mo. SOFR + 2.50% | 140,314 | |||||||||
99,750 | New Fortress Energy, Inc.‡ 10.330%, 10/27/28 3 mo. SOFR + 5.00% | 100,436 | |||||||||
237,824 | Par Petroleum, LLC‡ 9.052%, 02/28/30 3 mo. SOFR + 3.75% | 238,938 | |||||||||
45,000 | Par Petroleum, LLC! 0.000%, 02/28/30 3 mo. SOFR + 4.25% | 45,211 | |||||||||
524,899 | |||||||||||
Financials (0.5%) | |||||||||||
200,000 | Advisor Group, Inc.! 0.000%, 08/17/28 | 201,454 | |||||||||
44,888 | Advisor Group, Inc.‡ 9.816%, 08/17/28 1 mo. SOFR + 4.50% | 45,214 | |||||||||
150,457 | Alliant Holdings Intermediate, LLC‡ 8.819%, 11/06/30 1 mo. SOFR + 3.50% | 151,225 | |||||||||
133,989 | Amynta Agency Borrower, Inc.‡ 9.552%, 02/28/28 3 mo. SOFR + 4.25% | 134,612 | |||||||||
140,000 | AssuredPartners, Inc.! 0.000%, 02/14/31 | 140,771 | |||||||||
85,000 | AssuredPartners, Inc.‡ 8.816%, 02/14/31 1 mo. SOFR + 3.50% | 85,468 | |||||||||
139,301 | Avolon TLB Borrower 1 (US) LLC‡ 7.315%, 06/22/28 1 mo. SOFR + 2.00% | 139,758 | |||||||||
99,750 | Broadstreet Partners, Inc.‡ 9.066%, 01/27/29 1 mo. SOFR + 3.75% | 100,228 | |||||||||
179,550 | HUB International, Ltd.‡ 8.575%, 06/20/30 3 mo. SOFR + 3.25% | 180,661 | |||||||||
www.calamos.com
139
| PRINCIPAL AMOUNT | VALUE | ||||||||||
450 | HUB International, Ltd.‡ 8.565%, 06/20/30 | $ | 453 | ||||||||
139,650 | Iron Mountain, Inc.‡ 7.566%, 01/31/31 1 mo. SOFR + 2.25% | 139,533 | |||||||||
197,038 | Jazz Financing Lux Sarl‡ 8.430%, 05/05/28 1 mo. SOFR + 3.00% | 198,424 | |||||||||
100,000 | Level 3 Financing, Inc.! 0.000%, 04/15/29 | 98,518 | |||||||||
249,456 | VFH Parent, LLC‡ 8.416%, 01/13/29 1 mo. SOFR + 3.00% | 249,807 | |||||||||
1,866,126 | |||||||||||
Health Care (0.5%) | |||||||||||
300,000 | DaVita, Inc.‡! 0.000%, 04/25/31 | 298,641 | |||||||||
88,343 | Icon Luxembourg Sarl‡ 7.309%, 07/03/28 3 mo. SOFR + 2.00% | 88,814 | |||||||||
300,000 | Organon & Company‡! 0.000%, 06/02/28 | 302,016 | |||||||||
207,059 | Padagis, LLC‡ 10.314%, 07/06/28 3 mo. SOFR + 4.75% | 190,494 | |||||||||
22,011 | PRA Health Sciences, Inc.‡ 7.309%, 07/03/28 3 mo. SOFR + 2.00% | 22,128 | |||||||||
806,692 | Team Health Holdings, Inc.‡ 10.580%, 03/02/27 3 mo. SOFR + 5.25% | 709,167 | |||||||||
2,313 | Team Health Holdings, Inc.‡ 10.566%, 03/02/27 1 mo. SOFR + 5.25% | 2,034 | |||||||||
1,613,294 | |||||||||||
Industrials (0.3%) | |||||||||||
182,331 | ACProducts, Inc.‡ 9.814%, 05/17/28 3 mo. SOFR + 4.25% | 158,810 | |||||||||
172,371 | ChampionX Corp.‡ 8.168%, 06/07/29 1 mo. SOFR + 2.75% | 173,341 | |||||||||
81,181 | Emrld Borrower, LP‡ 7.816%, 05/31/30 1 mo. SOFR + 3.00% | 81,526 | |||||||||
20,000 | MI Windows & Doors, LLC‡ 8.816%, 03/21/31 1 mo. SOFR + 3.50% | 20,117 | |||||||||
179,550 | TransDigm, Inc.‡ 8.559%, 02/28/31 1 mo. SOFR + 3.25% | 180,806 | |||||||||
300,000 | Vertiv Group Corp.‡! 0.000%, 03/02/27 | 301,465 | |||||||||
916,065 | |||||||||||
| PRINCIPAL AMOUNT | VALUE | ||||||||||
Information Technology (0.3%) | |||||||||||
241,180 | Banff Merger Sub, Inc.‡ 9.566%, 12/29/28 1 mo. SOFR + 4.25% | $ | 242,957 | ||||||||
196,369 | Camelot US Acquisition LLC‡ 8.066%, 01/31/31 1 mo. SOFR + 2.75% | 196,982 | |||||||||
169,663 | Central Parent, Inc.‡ 9.309%, 07/06/29 3 mo. SOFR + 4.00% | 170,550 | |||||||||
173,282 | Dun & Bradstreet Corp.‡ 8.068%, 01/18/29 1 mo. SOFR + 2.75% | 173,896 | |||||||||
169,624 | II-VI, Inc.‡ 7.829%, 07/02/29 1 mo. SOFR + 2.50% | 170,631 | |||||||||
100,000 | UKG, Inc.‡ 8.814%, 02/10/31 3 mo. SOFR + 3.50% | 100,573 | |||||||||
1,055,589 | |||||||||||
Materials (0.4%) | |||||||||||
300,000 | Axalta Coating Systems U.S. Holdings, Inc.‡! 0.000%, 12/20/29 | 301,202 | |||||||||
134,325 | Chemours Company‡ 8.817%, 08/18/28 1 mo. SOFR + 3.50% | 134,451 | |||||||||
183,613 | Ineos US Finance, LLC‡ 8.930%, 02/18/30 1 mo. SOFR + 3.50% | 184,301 | |||||||||
138,600 | Innophos, Inc.‡ 8.930%, 02/05/27 1 mo. SOFR + 3.50% | 138,759 | |||||||||
233,238 | LSF11 A5 Holdco, LLC‡ 9.666%, 10/15/28 1 mo. SOFR + 4.25% | 234,170 | |||||||||
133,854 | Trinseo Materials Operating SCA‡ 8.105%, 05/03/28 3 mo. SOFR + 2.50% | 93,537 | |||||||||
187,826 | W.R. Grace & Co.-Conn.‡ 9.321%, 09/22/28 3 mo. SOFR + 3.75% | 188,379 | |||||||||
1,274,799 | |||||||||||
Special Purpose Acquisition Companies (0.1%) | |||||||||||
98,250 | Clydesdale Acquisition Holdings, Inc.‡ 9.091%, 04/13/29 1 mo. SOFR + 3.67% | 98,785 | |||||||||
44,100 | Fertitta Entertainment, LLC‡ 9.069%, 01/27/29 1 mo. SOFR + 4.00% | 44,252 | |||||||||
177,300 | Patagonia Holdco, LLC‡ 11.064%, 08/01/29 3 mo. SOFR + 5.75% | 164,889 | |||||||||
307,926 | |||||||||||
TOTAL BANK LOANS (Cost $13,871,881) | 13,676,422 | ||||||||||
CALAMOS CLOSED-END FAMILY OF FUNDS SEMIANNUAL REPORT
140
Long/Short Equity & Dynamic Income Trust Schedule of Investments April 30, 2024 (Unaudited)
| NUMBER OF SHARES |
VALUE |
||||||||||
|
CONVERTIBLE PREFERRED STOCK (0.1%) |
|||||||||||
|
Energy (0.1%) |
|||||||||||
|
14,700 |
Equitrans Midstream Corp.~‡ 13.740%, 05/15/24 (Cost $323,400) |
$ |
323,400 |
||||||||
|
PREFERRED STOCKS (2.4%) |
|||||||||||
|
Communication Services (0.6%) |
|||||||||||
|
21,155 |
AT&T, Inc.µ 4.750%, 02/18/25 |
415,484 |
|||||||||
|
9,450 |
AT&T, Inc.µ 5.350%, 11/01/66 |
211,964 |
|||||||||
|
36,510 |
Qwest Corp.µ 6.500%, 09/01/56 |
354,877 |
|||||||||
|
22,306 |
Telephone & Data Systems, Inc.µ 6.000%, 09/30/26 |
335,482 |
|||||||||
|
26,898 |
United States Cellular Corp.µ 5.500%, 03/01/70 |
477,977 |
|||||||||
|
22,660 |
United States Cellular Corp.µ 5.500%, 06/01/70 |
399,949 |
|||||||||
|
2,195,733 |
|||||||||||
|
Consumer Discretionary (0.2%) |
|||||||||||
|
7,236 |
Ford Motor Companyµ 6.500%, 08/15/62 |
177,282 |
|||||||||
|
5,800 |
Ford Motor Companyµ 6.200%, 06/01/59 |
140,186 |
|||||||||
|
3,615 |
Guitar Center, Inc.&# |
283,778 |
|||||||||
|
3,120 |
Qurate Retail, Inc.µ 8.000%, 03/15/31 |
144,050 |
|||||||||
|
9,600 |
QVC, Inc.µ 6.250%, 11/26/68 |
120,288 |
|||||||||
|
865,584 |
|||||||||||
|
Energy (0.3%) |
|||||||||||
|
22,515 |
NuStar Energy, LP~‡ 11.234%, 05/30/24 3 mo. SOFR + 5.90% |
574,358 |
|||||||||
|
17,500 |
NuStar Logistics, LP~‡ 12.324%, 01/15/43 3 mo. SOFR + 7.00% |
443,800 |
|||||||||
|
1,018,158 |
|||||||||||
|
Financials (0.7%) |
|||||||||||
|
9,800 |
Affiliated Managers Group, Inc.µ# 6.750%, 03/30/64 |
250,880 |
|||||||||
|
15,560 |
Annaly Capital Management, Inc.~‡ 10.557%, 05/30/24 3 mo. USD LIBOR + 4.99% |
393,512 |
|||||||||
|
3,675 |
Capital One Financial Corp.µ 4.800%, 06/01/25 |
67,473 |
|||||||||
|
24,345 |
CNO Financial Group, Inc.µ 5.125%, 11/25/60 |
490,308 |
|||||||||
| NUMBER OF SHARES |
VALUE |
||||||||||
|
4,608 |
Cullen/Frost Bankers, Inc.µ 4.450%, 12/15/25 |
$ |
84,511 |
||||||||
|
8,134 |
First Citizens BancShares, Inc.µ 5.625%, 01/04/27 |
177,403 |
|||||||||
|
3,288 |
Goldman Sachs Group, Inc.ൠ6.375%, 05/17/24 3 mo. SOFR + 3.81% |
82,134 |
|||||||||
|
23,595 |
Reinsurance Group of America, Inc.ൠ7.125%, 10/15/52 5 year CMT + 3.46% |
617,953 |
|||||||||
|
14,526 |
Selective Insurance Group, Inc.µ 4.600%, 12/15/25 |
260,887 |
|||||||||
|
2,425,061 |
|||||||||||
|
Industrials (0.1%) |
|||||||||||
|
12,312 |
WESCO International, Inc.ൠ10.625%, 06/22/25 5 year CMT + 10.33% |
324,914 |
|||||||||
|
Real Estate (0.3%) |
|||||||||||
|
23,352 |
Brookfield Property Partners, LP 5.750%, 03/31/25 |
292,134 |
|||||||||
|
12,800 |
Brookfield Property Partners, LP 6.375%, 09/30/24 |
173,184 |
|||||||||
|
6,245 |
Global Net Lease, Inc.µ 6.875%, 11/26/24 |
120,341 |
|||||||||
|
5,466 |
Global Net Lease, Inc.µ 7.500%, 05/30/24 |
112,381 |
|||||||||
|
8,025 |
Realty Income Corp.µ 6.000%, 05/30/24 |
189,470 |
|||||||||
|
887,510 |
|||||||||||
|
Utilities (0.2%) |
|||||||||||
|
14,975 |
Brookfield Renewable Partners, LP 5.250%, 03/31/25 |
254,575 |
|||||||||
|
13,450 |
DTE Energy Company~µ 5.250%, 12/01/77 |
303,432 |
|||||||||
|
558,007 |
|||||||||||
|
TOTAL PREFERRED STOCKS (Cost $9,471,916) |
8,274,967 |
||||||||||
|
COMMON STOCKS (92.6%) |
|||||||||||
|
Communication Services (6.3%) |
|||||||||||
|
111,000 |
Alphabet, Inc. - Class Aµ# |
18,068,580 |
|||||||||
|
3,935 |
Altice USA, Inc. - Class A# |
7,595 |
|||||||||
|
1,322 |
Cumulus Media, Inc. - Class Aµ# |
3,477 |
|||||||||
|
126,500 |
Pinterest, Inc. - Class Aµ# |
4,231,425 |
|||||||||
|
22,311,077 |
|||||||||||
|
Consumer Discretionary (10.7%) |
|||||||||||
|
100,000 |
Amazon.com, Inc.~µ# |
17,500,000 |
|||||||||
|
71,000 |
Hyatt Hotels Corp. - Class A~µ |
10,564,090 |
|||||||||
|
40,500 |
Marriott International, Inc. - Class A~µ |
9,563,265 |
|||||||||
|
37,627,355 |
|||||||||||
www.calamos.com
141
| NUMBER OF SHARES |
VALUE |
||||||||||
|
Consumer Staples (0.0%) |
|||||||||||
|
1,522 |
Mallinckrodt, PLC# |
$ |
80,666 |
||||||||
|
Energy (3.0%) |
|||||||||||
|
266,000 |
BP, PLC (ADR)~ |
10,312,820 |
|||||||||
|
260 |
Chesapeake Energy Corp.µ |
23,369 |
|||||||||
|
12,950 |
Energy Transfer, LP~ |
203,703 |
|||||||||
|
3,970 |
Enterprise Products Partners, LP~ |
111,478 |
|||||||||
|
10,651,370 |
|||||||||||
|
Financials (7.9%) |
|||||||||||
|
89,500 |
Charles Schwab Corp.µ |
6,618,525 |
|||||||||
|
139,000 |
Morgan Stanley~µ |
12,626,760 |
|||||||||
|
143,000 |
Wells Fargo & Companyµ |
8,482,760 |
|||||||||
|
27,728,045 |
|||||||||||
|
Health Care (15.9%) |
|||||||||||
|
48,500 |
Danaher Corp.µ |
11,961,070 |
|||||||||
|
11,000 |
ICON, PLCµ# |
3,276,680 |
|||||||||
|
14,400 |
IQVIA Holdings, Inc.µ# |
3,337,488 |
|||||||||
|
119,500 |
Medtronic, PLCµ |
9,588,680 |
|||||||||
|
109,000 |
Merck & Company, Inc.µ |
14,084,980 |
|||||||||
|
113,000 |
Zimmer Biomet Holdings, Inc.~µ |
13,591,640 |
|||||||||
|
55,840,538 |
|||||||||||
|
Industrials (29.3%) |
|||||||||||
|
77,000 |
3M Companyµ |
7,431,270 |
|||||||||
|
40,000 |
EUR |
Airbus, SE |
6,582,309 |
||||||||
|
777,000 |
American Airlines Group, Inc.~µ# |
10,497,270 |
|||||||||
|
65,000 |
Boeing Companyµ# |
10,909,600 |
|||||||||
|
375,000 |
CSX Corp.~ |
12,457,500 |
|||||||||
|
66,000 |
Delta Air Lines, Inc.µ |
3,304,620 |
|||||||||
|
35,800 |
General Dynamics Corp.µ |
10,277,822 |
|||||||||
|
50,000 |
Honeywell International, Inc.~µ |
9,636,500 |
|||||||||
|
62,900 |
L3Harris Technologies, Inc.µ |
13,463,745 |
|||||||||
|
30,500 |
Union Pacific Corp.µ |
7,233,380 |
|||||||||
|
221,500 |
United Airlines Holdings, Inc.µ# |
11,398,390 |
|||||||||
|
103,192,406 |
|||||||||||
|
Information Technology (19.5%) |
|||||||||||
|
43,000 |
Advanced Micro Devices, Inc.µ# |
6,810,340 |
|||||||||
|
71,000 |
Analog Devices, Inc.µ |
14,243,310 |
|||||||||
|
39,100 |
Microsoft Corp.^ |
15,222,803 |
|||||||||
|
130,000 |
Oracle Corp.µ |
14,787,500 |
|||||||||
|
27,000 |
EUR |
SAP, SE~ |
4,875,313 |
||||||||
|
91,000 |
Taiwan Semiconductor Manufacturing Company, Ltd. (ADR)~ |
12,497,940 |
|||||||||
|
68,437,206 |
|||||||||||
| NUMBER OF SHARES |
VALUE |
||||||||||
|
Special Purpose Acquisition Company (0.0%) |
|||||||||||
|
1,380 |
Intelsat Emergence, SA~&# |
$ |
50,025 |
||||||||
|
TOTAL COMMON STOCKS (Cost $328,499,853) |
325,918,688 |
||||||||||
| NUMBER OF CONTRACTS/ NOTIONAL AMOUNT |
VALUE |
||||||||||
|
PURCHASED OPTIONS (1.1%)# |
|||||||||||
|
Communication Services (0.1%) |
|||||||||||
|
1,800 |
Pinterest, Inc. |
||||||||||
|
6,021,000 |
Call, 05/17/24, Strike $37.00 |
189,000 |
|||||||||
|
Consumer Discretionary (0.3%) |
|||||||||||
|
1,000 |
Amazon.com, Inc. |
||||||||||
|
17,500,000 |
Put, 05/03/24, Strike $177.50 |
922,500 |
|||||||||
|
405 |
Marriott International, Inc. |
||||||||||
|
9,563,265 |
Put, 05/03/24, Strike $235.00 |
178,200 |
|||||||||
|
1,100,700 |
|||||||||||
|
Industrials (0.2%) |
|||||||||||
|
770 |
3M Company | ||||||||||
|
7,431,270 |
Call, 05/03/24, Strike $95.00 |
174,405 |
|||||||||
|
770 |
|||||||||||
|
7,431,270 |
Put, 05/03/24, Strike $89.00 |
4,235 |
|||||||||
|
2,910 |
Delta Air Lines, Inc. |
||||||||||
|
14,570,370 |
Call, 05/10/24, Strike $50.00 |
343,380 |
|||||||||
|
522,020 |
|||||||||||
|
Information Technology (0.2%) |
|||||||||||
|
430 |
Advanced Micro Devices, Inc. |
||||||||||
|
6,810,340 |
Put, 05/03/24, Strike $160.00 |
319,275 |
|||||||||
|
115 |
Arista Networks, Inc. |
||||||||||
|
2,950,440 |
Put, 05/10/24, Strike $250.00 |
120,750 |
|||||||||
|
95 |
Monolithic Power Systems, Inc. |
||||||||||
|
6,358,635 |
Call, 05/17/24, Strike $700.00 |
220,400 |
|||||||||
|
145 |
NVIDIA Corp. |
||||||||||
|
3,755,500 |
Put, 05/17/24, Strike $800.00 |
160,588 |
|||||||||
|
821,013 |
|||||||||||
|
Other (0.3%) |
|||||||||||
|
3,900 |
iShares 20+ Year Treasury Bond |
||||||||||
|
34,405,800 |
Put, 06/21/24, Strike $85.00 |
298,350 |
|||||||||
|
2,120 |
SPDR S&P 500 ETF Trust | ||||||||||
|
106,419,760 |
Put, 05/03/24, Strike $497.00 |
331,780 |
|||||||||
|
1,340 |
|||||||||||
|
67,265,320 |
Put, 05/24/24, Strike $495.00 |
589,600 |
|||||||||
|
1,219,730 |
|||||||||||
|
TOTAL PURCHASED OPTIONS (Cost $3,931,045) |
3,852,463 |
||||||||||
CALAMOS CLOSED-END FAMILY OF FUNDS SEMIANNUAL REPORT
142
| PRINCIPAL AMOUNT |
VALUE |
||||||||||
|
U.S. GOVERNMENT AND AGENCY SECURITY (0.1%) |
|||||||||||
|
Other (0.1%) |
|||||||||||
|
500,000 |
CoBank ACB‡ 7.250%, 07/01/29 (Cost $500,938) |
$ |
498,160 |
||||||||
|
TOTAL INVESTMENTS (131.7%) (Cost $474,564,203) |
463,615,118 |
||||||||||
|
LIABILITIES, LESS OTHER ASSETS (-31.7%) |
(111,566,648 |
) |
|||||||||
|
NET ASSETS (100.0%) |
$ |
352,048,470 |
|||||||||
| NUMBER OF SHARES |
VALUE |
||||||||||
|
COMMON STOCKS SOLD SHORT (-8.0%)# |
|||||||||||
|
Health Care (-0.8%) |
|||||||||||
|
(2,400 |
) |
Mettler-Toledo International, Inc. |
(2,951,280 |
) |
|||||||
|
Industrials (-1.2%) |
|||||||||||
|
(13,500 |
) |
Eaton Corp., PLC |
(4,296,510 |
) |
|||||||
|
Information Technology (-6.0%) |
|||||||||||
|
(26,700 |
) |
Apple, Inc. |
(4,547,811 |
) |
|||||||
|
(11,500 |
) |
Arista Networks, Inc. |
(2,950,440 |
) |
|||||||
|
(2,900 |
) |
KLA Corp. |
(1,998,941 |
) |
|||||||
|
(9,400 |
) |
Lam Research Corp. |
(8,407,454 |
) |
|||||||
|
(11,900 |
) |
Salesforce, Inc. |
(3,200,386 |
) |
|||||||
|
(21,105,032 |
) |
||||||||||
|
TOTAL COMMON STOCKS (Proceeds $23,586,091) |
(28,352,822 |
) |
|||||||||
|
EXCHANGE-TRADED FUNDS SOLD SHORT (-56.5%)# |
|||||||||||
|
Other (-56.5%) |
|||||||||||
|
(361,000 |
) |
SPDR S&P 500 ETF Trust |
(181,214,780 |
) |
|||||||
|
(82,000 |
) |
VanEck Semiconductor ETF |
(17,555,380 |
) |
|||||||
|
TOTAL EXCHANGE-TRADED (Proceeds $187,469,441) |
(198,770,160 |
) |
|||||||||
|
TOTAL SECURITIES SOLD SHORT (Proceeds $211,055,532) |
(227,122,982 |
) |
|||||||||
| NUMBER OF CONTRACTS/ NOTIONAL AMOUNT |
VALUE |
||||||||||
|
WRITTEN OPTIONS (-1.3%)# |
|||||||||||
|
Communication Services (-0.1%) |
|||||||||||
|
Pinterest, Inc. |
|||||||||||
|
1,265 |
|
||||||||||
|
4,231,425 |
Call, 05/17/24, Strike $36.00 |
(170,142 |
) |
||||||||
|
360 |
|||||||||||
|
1,204,200 |
Put, 05/17/24, Strike $30.00 |
(32,040 |
) |
||||||||
|
(202,182 |
) |
||||||||||
| NUMBER OF CONTRACTS/ NOTIONAL AMOUNT |
VALUE |
||||||||||
|
Consumer Discretionary (-0.2%) |
|||||||||||
|
1,250 |
Amazon.com, Inc. | ||||||||||
|
21,875,000 |
Call, 06/21/24, Strike $200.00 |
$ |
(362,500 |
) |
|||||||
|
1,000 |
|
||||||||||
|
17,500,000 |
Put, 06/21/24, Strike $160.00 |
(350,000 |
) |
||||||||
|
235 |
Hyatt Hotels Corp. |
||||||||||
|
3,496,565 |
Put, 05/17/24, Strike $140.00 |
(36,425 |
) |
||||||||
|
405 |
Marriott International, Inc. |
||||||||||
|
9,563,265 |
Put, 05/17/24, Strike $220.00 |
(59,737 |
) |
||||||||
|
(808,662 |
) |
||||||||||
|
Industrials (-0.1%) |
|||||||||||
|
1,150 |
United Airlines Holdings, Inc. |
||||||||||
|
5,917,900 |
Call, 09/20/24, Strike $55.00 |
(431,250 |
) |
||||||||
|
Information Technology (-0.6%) |
|||||||||||
|
Advanced Micro Devices, Inc. |
|||||||||||
|
430 |
|
||||||||||
|
6,810,340 |
Put, 05/03/24, Strike $152.50 |
(166,625 |
) |
||||||||
|
430 |
|||||||||||
|
6,810,340 |
Call, 06/21/24, Strike $185.00 |
(173,075 |
) |
||||||||
|
Arista Networks, Inc. |
|||||||||||
|
115 |
|
||||||||||
|
2,950,440 |
Put, 05/10/24, Strike $235.00 |
(58,650 |
) |
||||||||
|
115 |
|
||||||||||
|
2,950,440 |
Put, 05/24/24, Strike $230.00 |
(61,525 |
) |
||||||||
|
190 |
Monolithic Power Systems, Inc. |
||||||||||
|
12,717,270 |
Call, 06/21/24, Strike $800.00 |
(268,850 |
) |
||||||||
|
NVIDIA Corp. |
|||||||||||
|
220 |
|
||||||||||
|
5,698,000 |
Put, 05/24/24, Strike $700.00 |
(168,850 |
) |
||||||||
|
145 |
|
||||||||||
|
3,755,500 |
Put, 05/24/24, Strike $900.00 |
(1,143,688 |
) |
||||||||
|
(2,041,263 |
) |
||||||||||
|
Other (-0.3%) |
|||||||||||
|
3,900 |
iShares 20+ Year Treasury Bond |
||||||||||
|
34,405,800 |
Call, 05/03/24, Strike $88.00 |
(249,600 |
) |
||||||||
|
SPDR S&P 500 ETF Trust |
|||||||||||
|
2,210 |
|
||||||||||
|
110,937,580 |
Put, 06/28/24, Strike $460.00 |
(416,585 |
) |
||||||||
|
935 |
|
||||||||||
|
46,935,130 |
Put, 05/31/24, Strike $460.00 |
(61,710 |
) |
||||||||
|
4,800 |
Stellantis, NV |
||||||||||
|
10,704,000 |
Put, 06/21/24, Strike $21.00 |
(216,000 |
) |
||||||||
|
(943,895 |
) |
||||||||||
| TOTAL WRITTEN OPTIONS (Premium $4,853,310) |
$ |
(4,427,252 |
) |
||||||||
www.calamos.com
143
NOTES TO SCHEDULE OF INVESTMENTS
* Securities issued and sold pursuant to a Rule 144A transaction are exempted from the registration requirement of the Securities Act of 1933, as amended. These securities may only be sold to qualified institutional buyers ("QIBs"), such as the Fund. Any resale of these securities must generally be effected through a sale that is registered under the Act or otherwise exempted from such registration requirements.
~ Security, or portion of security, is segregated as collateral (or potential collateral for future transactions) for written options. The aggregate value of such securities is $140,406,913.
@ In default status and considered non-income producing.
‡ Variable rate security. The rate shown is the rate in effect at April 30, 2024.
^ Security, or portion of security, is on loan.
µ Security, or portion of security, is held in a segregated account as collateral for note payable aggregating a total value of $235,381,456.
¡ Bank loans generally are subject to mandatory and/or optional prepayment. As a result, the actual remaining maturity of bank loans may be substantially less than the stated maturities shown.
! This position represents an unsettled loan commitment at period end. Certain details associated with this purchase are not known prior to the settlement date, including coupon rate, which will be adjusted on settlement date.
& Illiquid security.
# Non-income producing security.
FOREIGN CURRENCY ABBREVIATION
EUR European Monetary Unit
ABBREVIATION
ADR American Depositary Receipt
Note: Value for securities denominated in foreign currencies is shown in U.S. dollars. The date on options represents the expiration date of the option contract. The option contract may be exercised at any date on or before the date shown.
CALAMOS CLOSED-END FAMILY OF FUNDS SEMIANNUAL REPORT
144
The following table summarizes the Fund's investments and derivative financial instruments categorized in the fair value hierarchy as of April 30, 2024 (see Note 1):
|
LEVEL 1 |
LEVEL 2 |
LEVEL 3 |
TOTAL |
||||||||||||||||
|
Assets: |
|||||||||||||||||||
|
Asset Backed Security |
$ |
— |
$ |
131,782 |
$ |
— |
$ |
131,782 |
|||||||||||
|
Corporate Bonds |
— |
110,513,640 |
— |
110,513,640 |
|||||||||||||||
|
Convertible Bonds |
— |
425,596 |
— |
425,596 |
|||||||||||||||
|
Bank Loans |
— |
13,676,422 |
— |
13,676,422 |
|||||||||||||||
|
Convertible Preferred Stock |
— |
323,400 |
— |
323,400 |
|||||||||||||||
|
Preferred Stocks |
7,991,189 |
283,778 |
— |
8,274,967 |
|||||||||||||||
|
Common Stocks |
314,330,375 |
11,588,313 |
— |
325,918,688 |
|||||||||||||||
|
Purchased Options |
3,852,463 |
— |
— |
3,852,463 |
|||||||||||||||
|
U.S. Government and Agency Security |
— |
498,160 |
— |
498,160 |
|||||||||||||||
|
Total |
$ |
326,174,027 |
$ |
137,441,091 |
$ |
— |
$ |
463,615,118 |
|||||||||||
|
Liabilities: |
|||||||||||||||||||
|
Common Stocks Sold Short |
$ |
28,352,822 |
$ |
— |
$ |
— |
$ |
28,352,822 |
|||||||||||
|
Exchange-Traded Funds Sold Short |
198,770,160 |
— |
— |
198,770,160 |
|||||||||||||||
|
Written Options |
4,427,252 |
— |
— |
4,427,252 |
|||||||||||||||
|
Total |
$ |
231,550,234 |
$ |
— |
$ |
— |
$ |
231,550,234 |
|||||||||||
SECTOR WEIGHTINGS
|
Industrials |
24.4 |
% |
|||||
|
Financials |
16.7 |
||||||
|
Information Technology |
15.4 |
||||||
|
Health Care |
12.9 |
||||||
|
Consumer Discretionary |
11.9 |
||||||
|
Communication Services |
7.0 |
||||||
|
Energy |
5.1 |
||||||
|
Utilities |
2.0 |
||||||
|
Consumer Staples |
0.9 |
||||||
|
Materials |
0.8 |
||||||
|
Real Estate |
0.3 |
||||||
|
Airlines |
0.3 |
||||||
|
Special Purpose Acquisition Companies |
0.1 |
||||||
Sector Weightings are based on managed assets and may vary over time. Sector Weightings exclude any government/sovereign bonds or options on broad market indexes the Fund may hold.
ASSET ALLOCATION
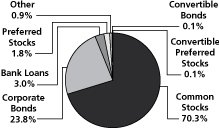
Fund asset allocations are based on total investments and may vary over time.
See accompanying Notes to Schedule of Investments
www.calamos.com
145
Notes to Financial Statements (Unaudited)
Note 1 – Organization and Significant Accounting Policies
Organization. Calamos Convertible Opportunities and Income Fund ("CHI"), Calamos Convertible and High Income Fund ("CHY"), Calamos Strategic Total Return Fund ("CSQ"), Calamos Dynamic Convertible and Income Fund ("CCD"), Calamos Global Dynamic Income Fund ("CHW"), Calamos Global Total Return Fund ("CGO"), and Calamos Long/Short Equity & Dynamic Income Trust ("CPZ") (each a "Fund", and collectively, the "Funds") were each organized as Delaware statutory trusts and are each registered under the Investment Company Act of 1940, as amended (the "1940 Act") as a diversified, closed-end management investment company.
Significant Accounting Policies. The financial statements have been prepared in conformity with accounting principles generally accepted in the United States of America (U.S. GAAP), and the Funds are each considered an investment company under U.S. GAAP and follow the accounting and reporting guidance set forth by the Financial Accounting Standards Board in Accounting Standards Codification (ASC) Topic 946: Financial Services—Investment Companies. Under U.S. GAAP, management is required to make certain estimates and assumptions at the date of the financial statements and actual results may differ from those estimates. Subsequent events, if any, through the date that the financial statements were issued, have been evaluated in the preparation of the financial statements. The following summarizes the significant accounting policies of the Funds:
Fund Valuation. Each Board of Trustees ("Board" or "Trustees"), including a majority of the Trustees who are not "interested persons" of each Fund, have designated Calamos Advisors LLC ("Calamos Advisors", or the "Advisor") to perform fair valuation determinations related to all Funds' investments under the oversight of the Board. As "valuation designee" Calamos Advisors has adopted policies and procedures to guide the determination of the net asset value ("NAV") on any day on which each Fund's NAV is determined. The valuation of each Fund's investments is in accordance with these procedures.
Funds' securities that are traded on U.S. securities exchanges, except option securities, are valued at the official closing price, which is the last current reported sales price on its principal exchange at the time the Fund determines its NAV. Securities traded in the over-the-counter market and quoted on The NASDAQ Stock Market are valued at the NASDAQ Official Closing Price, as determined by NASDAQ, or lacking a NASDAQ Official Closing Price, the last current reported sale price on NASDAQ at the time the Fund determines its NAV. When a last sale or closing price is not available, equity securities, other than option securities, that are traded on a U.S. securities exchange and other equity securities traded in the over-the-counter market are valued at the mean between the most recent bid and asked quotations on its principal exchange in accordance with guidelines adopted by the Board. Each option security traded on a U.S. securities exchange is valued at the mid-point of the consolidated bid/ask quote for the option security, also in accordance with guidelines adopted by the Board of Trustees. Each over-the-counter option that is not traded through the Options Clearing Corporation is valued either by an independent pricing agent approved by the Board or based on a quotation provided by the counterparty to such option under the ultimate supervision of the Board.
Fixed income securities, bank loans, certain convertible preferred securities, and non-exchange traded derivatives are normally valued by independent pricing services or by dealers or brokers who make markets in such securities. Valuations of such fixed income securities, bank loans, certain convertible preferred securities, and non-exchange traded derivatives consider yield or price of equivalent securities of comparable quality, coupon rate, maturity, type of issue, trading characteristics and other market data and do not rely exclusively upon exchange or over-the-counter prices.
Trading on European and Far Eastern exchanges and over-the-counter markets is typically completed at various times before the close of business on each day on which the New York Stock Exchange ("NYSE") is open. Each security trading on these exchanges or in over-the-counter markets may be valued utilizing a systematic fair valuation model provided by an independent pricing service approved by the Board of Trustees. The valuation of each security that meets certain criteria in relation to the valuation model is systematically adjusted to reflect the impact of movement in the U.S. market after the foreign markets close. Securities that do not meet the criteria, or that are principally traded in other foreign markets, are valued as of the last reported sale price at the time each Fund determines its NAV, or when reliable market prices or quotations are not readily available, at the mean between the most recent bid and asked quotations as of the close of the appropriate exchange or other designated time. Trading of foreign securities may not take place on every NYSE business day. In addition, trading may take place in various foreign markets on Saturdays or on other days when the NYSE is not open and on which each Fund's NAV is not calculated.
If the Advisor's pricing committee determines that the valuation of a security in accordance with the methods described above is not reflective of a fair value for such security, the security is valued at a fair value by the pricing committee.
CALAMOS CLOSED-END FAMILY OF FUNDS SEMIANNUAL REPORT
146
Notes to Financial Statements (Unaudited)
The Funds also may use fair value pricing, pursuant to policies and procedures adopted by Calamos Advisors, if trading in the security is halted or if the value of a security it holds is materially affected by events occurring before a Fund's pricing time but after the close of the primary market or exchange on which the security is listed. Those procedures may utilize valuations furnished by pricing services approved by Calamos Advisors, which may be based on market transactions for comparable securities and various relationships between securities that are generally recognized by institutional traders, a computerized matrix system, or appraisals derived from information concerning the securities or similar securities received from recognized dealers in those securities.
When fair value pricing of securities is employed, the prices of securities used by each Fund to calculate its NAV may differ from market quotations or official closing prices. There can be no assurance that each Fund could purchase or sell a portfolio security at the price used to calculate each Fund's NAV.
Various inputs are used to determine the value of each Fund's investments. These inputs are categorized into three broad levels as follows:
• Level 1 – Prices are determined using inputs from unadjusted quoted prices from active markets (including securities actively traded on a securities exchange) for identical assets.
• Level 2 – Prices are determined using significant observable market inputs other than unadjusted quoted prices, including quoted prices of similar securities, fair value adjustments to quoted foreign securities, interest rates, credit risk, prepayment speeds, and other relevant data.
• Level 3 – Prices reflect unobservable market inputs (including each Fund's own judgments about assumptions market participants would use in determining fair value) when observable inputs are unavailable.
Debt securities are valued based upon evaluated prices received from an independent pricing service or from a dealer or broker who makes markets in such securities. Pricing services utilize various observable market data and as such, debt securities are generally categorized as Level 2. The levels are not necessarily an indication of the risk or liquidity of each Fund's investments. The summary of the inputs used in valuing each Fund's holdings are available after each Fund's Schedule of Investments.
Investment Transactions. Investment transactions are recorded on a trade date basis as of April 30, 2024. Net realized gains and losses from investment transactions are reported on an identified cost basis. Interest income is recognized using the accrual method and includes accretion of original issue and market discount and amortization of premium. Dividend income is recognized on the ex-dividend date, except that certain dividends from foreign securities are recorded as soon as the information becomes available after the ex-dividend date.
Foreign Currency Translation. Values of investments and other assets and liabilities denominated in foreign currencies are translated into U.S. dollars using a rate quoted by a major bank or dealer in the particular currency market, as reported by a recognized quotation dissemination service.
The Funds do not isolate that portion of the results of operations resulting from changes in foreign exchange rates on investments from the fluctuations arising from changes in market prices of securities held. Such fluctuations are included with the net realized and unrealized gain or loss from investments.
Reported net realized foreign currency gains or losses arise from disposition of foreign currency, the difference in the foreign exchange rates between the trade and settlement dates on securities transactions, and the difference between the amounts of dividends, interest and foreign withholding taxes recorded on the ex-date or accrual date and the U.S. dollar equivalent of the amounts actually received or paid. Net unrealized foreign exchange gains and losses arise from changes (due to the changes in the exchange rate) in the value of foreign currency and other assets and liabilities denominated in foreign currencies held at period end.
Allocation of Expenses Among Funds. Expenses directly attributable to each respective Fund are charged to the Fund; certain other common expenses of Calamos Advisors Trust, Calamos Investment Trust, Calamos Convertible Opportunities and Income Fund, Calamos Convertible and High Income Fund, Calamos Strategic Total Return Fund, Calamos Global Total Return Fund, Calamos Global Dynamic Income Fund, Calamos Dynamic Convertible and Income Fund, Calamos Long/Short Equity & Dynamic Income Trust, Calamos Antetokounmpo Sustainable Equities Trust, and Calamos ETF Trust are allocated proportionately among each fund to which the expenses relate in relation to the net assets of each fund or on another reasonable basis.
www.calamos.com
147
Notes to Financial Statements (Unaudited)
Income Taxes. No provision has been made for U.S. income taxes because each Funds' policy is to continue to qualify as a regulated investment company under the Internal Revenue Code of 1986, as amended, and distribute to shareholders substantially all of the respective Funds' taxable income and net realized gains.
Dividends and distributions paid to common shareholders are recorded on the ex-dividend date. The amount of dividends and distributions from net investment income and net realized capital gains is determined in accordance with federal income tax regulations, which may differ from U.S. generally accepted accounting principles. To the extent these "book and tax" differences are permanent in nature, such amounts are reclassified within the capital accounts based on their federal tax-basis treatment. These differences are primarily due to differing treatments for foreign currency transactions, contingent payment debt instruments and methods of amortizing and accreting for fixed income securities. The financial statements are not adjusted for temporary differences.
Distributions to holders of Mandatory Redeemable Preferred Shares ("MRPS") as described in Note 8 are accrued on a daily basis and are treated as an operating expense due to the fixed term of the obligation. The distributions are shown on the Statement of Operations as Interest expense and amortization of offering costs on MRPS. For tax purposes, the distributions made to the holders of the MRPS are treated as dividends.
The Funds recognized no liability for uncertain tax positions. A reconciliation is not provided as the beginning and ending amounts of unrecognized benefits are zero, with no interim additions, reductions or settlements. Tax years 2021 – 2023 remain subject to examination by the U.S. and the State of Illinois tax jurisdictions.
Indemnifications. Under the Funds' organizational documents, each Fund is obligated to indemnify its officers and trustees against certain liabilities incurred by them by reason of having been an officer or trustee of the Fund. In addition, in the normal course of business, a Fund may enter into contracts that provide general indemnifications to other parties. A Fund's maximum exposure under these arrangements is unknown as this would involve future claims that may be made against a Fund that have not yet occurred. Currently, the Funds' management expects the risk of material loss in connection to a potential claim to be remote.
Note 2 – Investment Adviser and Transactions With Affiliates Or Certain Other Parties
Pursuant to an investment advisory agreement with Calamos Advisors, each Fund pays an annual fee, payable monthly based on the average weekly managed assets of the Fund, as shown below:
|
FUND |
ANNUAL RATE |
||||||
|
Convertible Opportunities and Income Fund |
0.80 |
% |
|||||
|
Convertible and High Income Fund |
0.80 |
% |
|||||
|
Strategic Total Return Fund |
1.00 |
% |
|||||
|
Dynamic Convertible and Income Fund |
1.00 |
% |
|||||
|
Global Dynamic Income Fund |
1.00 |
% |
|||||
|
Global Total Return Fund |
1.00 |
% |
|||||
|
Long/Short Equity & Dynamic Income Trust |
1.35 |
% |
|||||
Each Fund reimburses Calamos Advisors for a portion of compensation paid to each Trust's Chief Compliance Officer. This compensation is reported as part of the "Trustees' fees and officer compensation" expense on the Funds' Statements of Operations.
The Funds have adopted a deferred compensation plan (the "Plan"). Under the Plan, a trustee who is not an "interested person" (as defined in the 1940 Act) and has elected to participate in the Plan (a "participating trustee") may defer receipt of all or a portion of his compensation from the Trust. The deferred compensation payable to the participating trustee is credited to the trustee's deferral account as of the business day such compensation would have been paid to the participating trustee. The value of amounts deferred for a participating trustee is determined by reference to the change in value of Class I shares of one or more funds of the Calamos Investment Trust designated by the participant. The value of the account increases with contributions to the account or with increases in the value of the measuring shares, and the value of the account decreases with withdrawals from the account or with declines in the value of the measuring shares.
CALAMOS CLOSED-END FAMILY OF FUNDS SEMIANNUAL REPORT
148
Notes to Financial Statements (Unaudited)
At April 30, 2024, the Funds had deferred compensation balances, which are included in "Other assets" on the Statements of Assets and Liabilities, as follows:
|
FUND |
AMOUNT |
||||||
|
Convertible Opportunities and Income Fund |
$ |
202,110 |
|||||
|
Convertible and High Income Fund |
174,425 |
||||||
|
Strategic Total Return Fund |
246,919 |
||||||
|
Dynamic Convertible and Income Fund |
0 |
||||||
|
Global Dynamic Income Fund |
93,822 |
||||||
|
Global Total Return Fund |
59,621 |
||||||
|
Long/Short Equity & Dynamic Income Trust |
0 |
||||||
Each Fund's obligation to make payments under the Plan is a general obligation of the Fund and is included in "Payable for deferred compensation to trustees" on the Statements of Assets and Liabilities at April 30, 2024.
Note 3 – Investments
The cost of purchases and proceeds from sales of long-term investments, excluding investments sold short, for the period ended April 30, 2024 are shown in the table below. Furthermore, the cost of purchases to cover short sales and the proceeds of short sales were $362,303,957 and $301,661,173 for Long/Short Equity & Dynamic Income Fund, respectively.
|
COST OF PURCHASES |
PROCEEDS FROM SALES |
||||||||||||||||||
|
FUND |
U.S. GOV'T SECURITIES |
OTHER |
U.S. GOV'T SECURITIES |
OTHER |
|||||||||||||||
|
Convertible Opportunities and Income Fund |
$ |
— |
$ |
178,127,069 |
$ |
— |
$ |
222,952,592 |
|||||||||||
|
Convertible and High Income Fund |
— |
193,047,002 |
— |
242,308,301 |
|||||||||||||||
|
Strategic Total Return Fund |
250,938 |
388,223,447 |
66,901,030 |
459,504,697 |
|||||||||||||||
|
Dynamic Convertible and Income Fund |
— |
123,430,062 |
— |
158,335,120 |
|||||||||||||||
|
Global Dynamic Income Fund |
— |
699,116,938 |
309,673 |
734,036,611 |
|||||||||||||||
|
Global Total Return Fund |
— |
147,413,571 |
— |
153,314,381 |
|||||||||||||||
|
Long/Short Equity & Dynamic Income Trust |
500,938 |
575,205,241 |
— |
625,997,256 |
|||||||||||||||
Note 4 – Income Taxes
The cost basis of investments for federal income tax purposes at April 30, 2024 was as follows*:
|
FUND |
COST BASIS OF INVESTMENTS |
GROSS UNREALIZED APPRECIATION |
GROSS UNREALIZED DEPRECIATION |
NET UNREALIZED APPRECIATION (DEPRECIATION) |
|||||||||||||||
|
Convertible Opportunities and Income Fund |
$ |
1,185,400,692 |
$ |
57,300,432 |
$ |
(104,004,770 |
) |
$ |
(46,704,338 |
) |
|||||||||
|
Convertible and High Income Fund |
1,291,268,212 |
61,345,959 |
(113,551,179 |
) |
(52,205,220 |
) |
|||||||||||||
|
Strategic Total Return Fund |
2,669,418,846 |
1,104,318,563 |
(197,763,899 |
) |
906,554,664 |
||||||||||||||
|
Dynamic Convertible and Income Fund |
793,239,835 |
46,787,504 |
(68,297,943 |
) |
(21,510,439 |
) |
|||||||||||||
|
Global Dynamic Income Fund |
745,583,363 |
17,757,338 |
(118,269,266 |
) |
(100,511,928 |
) |
|||||||||||||
|
Global Total Return Fund |
162,248,134 |
6,150,625 |
(16,353,570 |
) |
(10,202,945 |
) |
|||||||||||||
|
Long/Short Equity & Dynamic Income Trust |
258,655,361 |
13,144,858 |
(39,735,335 |
) |
(26,590,477 |
) |
|||||||||||||
* Because tax adjustments are calculated annually, the above table does not reflect tax adjustments. For the previous fiscal year's federal income tax information, please refer to the Notes to Financial Statements section in the Funds' most recent annual report.
Each Fund intends to make monthly distributions from its income available for distribution, which consists of each Fund's dividends and interest income after payment of Fund expenses, and net realized gains on investments. At least annually, each Fund intends to distribute all or substantially all of its net realized capital gains, if any. Distributions are recorded on the ex-dividend date. Each Fund distinguishes between distributions on a tax basis and a financial reporting basis. Accounting principles generally accepted in the United States of America require that only distributions in excess of tax basis earnings
www.calamos.com
149
Notes to Financial Statements (Unaudited)
and profits be reported in the financial statements as a return of capital. Permanent differences between book and tax accounting relating to distributions are reclassified to paid-in-capital. For tax purposes, distributions from short-term capital gains are considered to be from ordinary income. Distributions in any year may include a return of capital component.
The tax character of distributions for the period ended April 30, 2024 will be determined at the end of each Fund's current fiscal year. Distributions during the fiscal period ended October 31, 2023 were characterized for federal income tax purposes as follows:
| YEAR ENDED OCTOBER 31, 2023 |
|||||||||||||||
|
FUND |
ORDINARY INCOME |
LONG-TERM CAPITAL GAIN |
RETURN OF CAPITAL |
||||||||||||
|
Convertible Opportunities and Income Fund |
$ |
30,821,886 |
$ |
58,448,531 |
$ |
— |
|||||||||
|
Convertible and High Income Fund |
32,248,272 |
63,794,457 |
— |
||||||||||||
|
Strategic Total Return Fund |
17,803,791 |
190,612,272 |
— |
||||||||||||
|
Dynamic Convertible and Income Fund |
16,264,044 |
48,555,021 |
— |
||||||||||||
|
Global Dynamic Income Fund |
21,588,110 |
— |
19,222,158 |
||||||||||||
|
Global Total Return Fund |
5,888,148 |
1,289,760 |
2,813,588 |
||||||||||||
|
Long/Short Equity & Dynamic Income Trust |
32,183,213 |
798,873 |
— |
||||||||||||
As of October 31, 2023, the components of accumulated earnings/(loss) on a tax basis were as follows:
| CONVERTIBLE OPPORTUNITIES AND INCOME FUND |
CONVERTIBLE AND HIGH INCOME FUND |
STRATEGIC TOTAL RETURN FUND |
DYNAMIC CONVERTIBLE AND INCOME FUND |
||||||||||||||||
|
Undistributed ordinary income |
$ |
— |
$ |
— |
$ |
— |
$ |
— |
|||||||||||
|
Undistributed capital gains |
2,231,502 |
442,758 |
4,141,607 |
4,987,751 |
|||||||||||||||
|
Total undistributed earnings |
2,231,502 |
442,758 |
4,141,607 |
4,987,751 |
|||||||||||||||
|
Accumulated capital and other losses |
— |
— |
(8,231,699 |
) |
— |
||||||||||||||
|
Net unrealized gains/(losses) |
(165,873,337 |
) |
(182,602,517 |
) |
264,399,772 |
(108,722,163 |
) |
||||||||||||
|
Total accumulated earnings/(losses) |
(163,641,835 |
) |
(182,159,759 |
) |
260,309,680 |
(103,734,412 |
) |
||||||||||||
|
Other |
(104,840 |
) |
(136,044 |
) |
(123,631 |
) |
— |
||||||||||||
|
Paid-in-capital |
836,528,404 |
907,116,571 |
1,889,816,626 |
563,099,438 |
|||||||||||||||
|
Net assets applicable to common shareholders |
$ |
672,781,729 |
$ |
724,820,768 |
$ |
2,150,002,675 |
$ |
459,365,026 |
|||||||||||
| GLOBAL DYNAMIC INCOME FUND |
GLOBAL TOTAL RETURN FUND |
LONG/SHORT EQUITY & DYNAMIC INCOME TRUST |
|||||||||||||
|
Undistributed ordinary income |
$ |
— |
$ |
— |
$ |
4,767,671 |
|||||||||
|
Undistributed capital gains |
— |
— |
— |
||||||||||||
|
Total undistributed earnings |
— |
— |
4,767,671 |
||||||||||||
|
Accumulated capital and other losses |
— |
— |
— |
||||||||||||
|
Net unrealized gains/(losses) |
(163,667,896 |
) |
(25,255,338 |
) |
(68,500,156 |
) |
|||||||||
|
Total accumulated earnings/(losses) |
(163,667,896 |
) |
(25,255,338 |
) |
(63,732,485 |
) |
|||||||||
|
Other |
(206,675 |
) |
(91,992 |
) |
(4,118,672 |
) |
|||||||||
|
Paid-in-capital |
546,739,904 |
114,926,525 |
392,628,225 |
||||||||||||
|
Net assets applicable to common shareholders |
$ |
382,865,333 |
$ |
89,579,195 |
$ |
324,777,068 |
|||||||||
Note 5 – Short Sales
Calamos Global Dynamic Income Fund and Calamos Long/Short Equity & Dynamic Income Trust may sell securities short. Securities sold short represent obligations to deliver the securities at a future date. Each Fund may sell a security it does not own in anticipation of a decline in the value of that security before the delivery date. When a Fund sells a security short, it must borrow the security sold short and deliver it to the broker-dealer through which it made the short sale. Dividends paid
CALAMOS CLOSED-END FAMILY OF FUNDS SEMIANNUAL REPORT
150
Notes to Financial Statements (Unaudited)
on securities sold short are disclosed as an expense on the Statements of Operations. A gain, limited to the price at which a Fund sold the security short, or a loss, unlimited in size, will be realized upon the termination of a short sale.
To secure its obligation to deliver to the broker-dealer the securities sold short, a Fund must segregate an amount of cash or liquid securities with its custodian equal to any excess of the current market value of the securities sold short over any cash or liquid securities deposited as collateral with the broker in connection with the short sale (not including the proceeds of the short sale). As a result of that requirement, a Fund will not gain any leverage merely by selling short, except to the extent that it earns interest or other income or gains on the segregated cash or liquid securities while also being subject to the possibility of gain or loss from the securities sold short.
Note 6 – Derivative Instruments
Foreign Currency Risk. Each Fund may engage in portfolio hedging with respect to changes in currency exchange rates by entering into forward foreign currency contracts to purchase or sell currencies. A forward foreign currency contract is a commitment to purchase or sell a foreign currency at a future date at a negotiated forward rate. Risks associated with such contracts include, among other things, movement in the value of the foreign currency relative to the U.S. dollar and the ability of the counterparty to perform.
To mitigate the counterparty risk, a Fund may enter into an International Swaps and Derivatives Association, Inc. Master Agreement ("ISDA Master Agreement") or similar agreement with its derivative contract counterparties. An ISDA Master Agreement is a bilateral agreement between a Fund and a counterparty that governs over-the-counter derivatives and foreign exchange contracts and typically contains, among other things, collateral posting terms and netting provisions in the event of a default and/or termination event. Under an ISDA Master Agreement, a Fund may, under certain circumstances, offset with the counterparty certain derivative financial instrument's payables and/or receivables with collateral held and/or posted and create one single net payment. The provisions of the ISDA Master Agreement typically permit a single net payment in the event of default (close-out netting) including the bankruptcy or insolvency of the counterparty. Generally, collateral is exchanged between a Fund and the counterparty and the amount of collateral due from a Fund or to a counterparty has to exceed a minimum transfer amount threshold before a transfer has to be made. To the extent amounts due to the Fund from its counterparties are not fully collateralized, contractually or otherwise, the Fund bears the risk of loss from counterparty nonperformance. When a Fund is required to post collateral under the terms of a derivatives transaction and master netting agreement, a Fund's custodian holds the collateral in a segregated account, subject to the terms of a tri-party agreement among a Fund, the custodian and the counterparty. The master netting agreement and tri-party agreement provide, in relevant part, that the counterparty may have rights to the amounts in the segregated account in the event that a Fund defaults in its obligation with respect to the derivative instrument that is subject to the collateral requirement. When a counterparty is required to post collateral under the terms of a derivatives transaction and master netting agreement, the counterparty delivers such amount to a Fund's custodian. The master netting agreement provides, in relevant part, that the Fund may have rights to such collateral in the event that the counterparty defaults in its obligation with respect to the derivative instrument that is subject to the collateral requirement. Generally before a default, neither a Fund nor the counterparty may resell, rehypothecate, or repledge any collateral that it receives.
For financial reporting purposes, the Funds do not offset derivative assets and derivative liabilities that are subject to netting arrangements in the Statements of Assets and Liabilities. Each Fund's net counterparty exposure, if any, is reflected in the Schedules of Investments. The net unrealized gain, if any, represents the credit risk to the Fund on a forward foreign currency contract. The contracts are valued daily at forward foreign exchange rates. The Fund realizes a gain or loss when a position is closed or upon settlement of the contracts. There were no open forward foreign currency contracts for any of the Funds at April 30, 2024.
Equity Risk. Each Fund may engage in option transactions and in doing so achieves similar objectives to what it would achieve through the sale or purchase of individual securities. A call option, upon payment of a premium, gives the purchaser of the option the right to buy, and the seller of the option the obligation to sell, the underlying security, index or other instrument at the exercise price. A put option gives the purchaser of the option, upon payment of a premium, the right to sell, and the seller the obligation to buy, the underlying security, index, or other instrument at the exercise price.
To seek to offset some of the risk of a potential decline in value of certain long positions, each Fund may also purchase put options on individual securities, broad-based securities indexes or certain exchange-traded funds ("ETFs"). Each Fund may also seek to generate income from option premiums by writing (selling) options on a portion of the equity securities (including securities that are convertible into equity securities) in a Fund's portfolio, on broad-based securities indexes, or certain ETFs.
www.calamos.com
151
Notes to Financial Statements (Unaudited)
When a Fund purchases an option, it pays a premium and an amount equal to that premium is recorded as an asset. When a Fund writes an option, it receives a premium and an amount equal to that premium is recorded as a liability. The asset or liability is adjusted daily to reflect the current market value of the option. If an option expires unexercised, a Fund realizes a gain or loss to the extent of the premium received or paid. If an option is exercised, the premium received or paid is recorded as an adjustment to the proceeds from the sale or the cost basis of the purchase. The difference between the premium and the amount received or paid on a closing purchase or sale transaction is also treated as a realized gain or loss. The cost of securities acquired through the exercise of call options is increased by premiums paid. The proceeds from securities sold through the exercise of put options are decreased by the premiums paid. Gain or loss on written options and purchased options is presented separately on the Statements of Operations as net realized gain or loss on written options and net realized gain or loss on purchased options, respectively.
Options written by each Fund do not typically give rise to counterparty credit risk since options written obligate each Fund and not the counterparty to perform. Exchange traded purchased options have minimal counterparty credit risk to each Fund since the exchange's clearinghouse, as counterparty to such instruments, guarantees against a possible default. As of April 30, 2024, the Funds had outstanding purchased options and/or written options as listed on the Schedules of Investments.
Interest Rate Risk. Each Fund may engage in interest rate swaps primarily to hedge the interest rate risk on the Fund's borrowings (see Note 7—Notes Payable). An interest rate swap is a contract that involves the exchange of one type of interest rate for another type of interest rate. If interest rates rise, resulting in a diminution in the value of the Fund's portfolio, the Fund would receive payments under the swap that would offset, in whole or in part, such diminution in value; if interest rates fall, the Fund would likely lose money on the swap transaction. Unrealized gains are reported as an asset, and unrealized losses are reported as a liability on the Statements of Assets and Liabilities. The change in value of swaps, including accruals of periodic amounts of interest to be paid or received on swaps, is reported as change in net unrealized appreciation/depreciation on interest rate swaps in the Statements of Operations. A realized gain or loss is recorded in net realized gain (loss) on interest rate swaps in the Statements of Operations upon payment or receipt of a periodic payment or termination of the swap agreements. Swap agreements are stated at fair value. Notional principal amounts are used to express the extent of involvement in these transactions, but the amounts potentially subject to credit risk are much smaller. In connection with these contracts, securities may be identified as collateral in accordance with the terms of the respective swap contracts in the event of default or bankruptcy of each Fund. Please see the disclosure regarding ISDA Master Agreements under Foreign Currency Risk within this note.
Premiums paid to or by a Fund are accrued daily and included in realized gain (loss) when paid on swaps in the accompanying Statements of Operations. The contracts are marked-to-market daily based upon third party vendor valuations and changes in value are recorded as unrealized appreciation (depreciation). Gains or losses are realized upon early termination of the contract. Risks may exceed amounts recognized in the Statements of Assets and Liabilities. These risks include changes in the returns of the underlying instruments, failure of the counterparties to perform under the contracts' terms, counterparty's creditworthiness, and the possible lack of liquidity with respect to the contracts.
As of April 30, 2024, the Funds had no outstanding interest rate swap agreements.
As of April 30, 2024, the Funds had outstanding derivative contracts which are reflected on the Statements of Assets and Liabilities as follows:
| ASSET DERIVATIVES |
LIABILITY DERIVATIVES |
||||||||||
| CONVERTIBLE OPPORTUNITIES AND INCOME FUND |
|||||||||||
|
Gross amounts at fair value: |
|||||||||||
|
Purchased Options(1) |
$ |
404,625 |
$ |
— |
|||||||
|
$ |
404,625 |
$ |
— |
||||||||
| CONVERTIBLE AND HIGH INCOME FUND |
|||||||||||
|
Gross amounts at fair value: |
|||||||||||
|
Purchased Options(1) |
$ |
435,750 |
$ |
— |
|||||||
|
$ |
435,750 |
$ |
— |
||||||||
CALAMOS CLOSED-END FAMILY OF FUNDS SEMIANNUAL REPORT
152
Notes to Financial Statements (Unaudited)
| ASSET DERIVATIVES |
LIABILITY DERIVATIVES |
||||||||||
|
STRATEGIC TOTAL RETURN FUND |
|||||||||||
|
Gross amounts at fair value: |
|||||||||||
|
Purchased Options(1) |
$ |
2,206,500 |
$ |
— |
|||||||
|
Written Options(2) |
— |
1,666,590 |
|||||||||
|
$ |
2,206,500 |
$ |
1,666,590 |
||||||||
| DYNAMIC CONVERTIBLE AND INCOME FUND |
|||||||||||
|
Gross amounts at fair value: |
|||||||||||
|
Purchased Options(1) |
$ |
342,375 |
$ |
— |
|||||||
|
$ |
342,375 |
$ |
— |
||||||||
|
GLOBAL DYNAMIC INCOME FUND |
|||||||||||
|
Gross amounts at fair value: |
|||||||||||
|
Purchased Options(1) |
$ |
5,915,311 |
$ |
— |
|||||||
|
Written Options(2) |
— |
398,719 |
|||||||||
|
$ |
5,915,311 |
$ |
398,719 |
||||||||
|
GLOBAL TOTAL RETURN FUND |
|||||||||||
|
Gross amounts at fair value: |
|||||||||||
|
Purchased Options(1) |
$ |
1,414,813 |
$ |
— |
|||||||
|
Written Options(2) |
— |
91,504 |
|||||||||
|
$ |
1,414,813 |
$ |
91,504 |
||||||||
| LONG/SHORT EQUITY & DYNAMIC INCOME TRUST |
|||||||||||
|
Gross amounts at fair value: |
|||||||||||
|
Purchased Options(1) |
$ |
3,852,463 |
$ |
— |
|||||||
|
Written Options(2) |
— |
4,427,252 |
|||||||||
|
$ |
3,852,463 |
$ |
4,427,252 |
||||||||
For the period ended April 30, 2024, the volume of derivative activity for the Fund is reflected below:*
|
FUND |
PURCHASED OPTIONS(1) |
WRITTEN OPTIONS(2) |
|||||||||
|
Convertible Opportunities and Income Fund |
5,225 |
— |
|||||||||
|
Convertible and High Income Fund |
5,650 |
— |
|||||||||
|
Strategic Total Return Fund |
20,660 |
9,340 |
|||||||||
|
Dynamic Convertible and Income Fund |
4,475 |
— |
|||||||||
|
Global Dynamic Income Fund |
26,954 |
4,756 |
|||||||||
|
Global Total Return Fund |
6,733 |
1,175 |
|||||||||
|
Long/Short Equity & Dynamic Income Trust |
194,576 |
208,866 |
|||||||||
* Activity during the period is measured by opened number of contracts for options purchased or written.
(1) Generally, the Statement of Assets and Liabilities location for Purchased Options is "Investments in securities, at value".
(2) Generally, the Statement of Assets and Liabilities location for Written Options is "Options written, at value".
www.calamos.com
153
Notes to Financial Statements (Unaudited)
Note 7 – Notes Payable
The Funds have each entered into an Amended and Restated Liquidity Agreement (the "SSB Agreement") with State Street Bank and Trust Company ("SSB") that allows each Fund to borrow up to a certain limit as shown in the table below, as well as engage in securities lending and securities repurchase transactions.
|
FUND |
BORROWING LIMIT (IN MILLIONS) |
||||||
|
Convertible Opportunities and Income Fund |
$ |
430.0 |
|||||
|
Convertible and High Income Fund |
480.0 |
||||||
|
Strategic Total Return Fund |
1,130.0 |
||||||
|
Dynamic Convertible and Income Fund |
370.0 |
||||||
|
Global Dynamic Income Fund |
265.0 |
||||||
|
Global Total Return Fund |
55.0 |
||||||
|
Long/Short Equity & Dynamic Income Trust |
150.0 |
||||||
Advances under the SSB Agreement are secured by assets of the Funds that are held with the Funds' custodian in a separate account (the "pledged collateral"). Interest on the SSB Agreement was charged on the drawn amount at the rate of OBFR plus 0.52%. A commitment fee of 0.10% is payable on any undrawn balance. For the period ended April 30, 2024, the Funds borrowed according to the table below:
|
FUND |
AVERAGE BORROWINGS (IN MILLIONS) |
AVERAGE INTEREST RATE |
TOTAL OUTSTANDING BORROWINGS (IN MILLIONS) |
INTEREST RATE APPLICABLE TO BORROWINGS |
|||||||||||||||
|
Convertible Opportunities and Income Fund |
$ |
314.4 |
5.94 |
% |
$ |
314.4 |
5.84 |
% |
|||||||||||
|
Convertible and High Income Fund |
340.4 |
5.94 |
% |
340.4 |
5.84 |
% |
|||||||||||||
|
Strategic Total Return Fund |
819.3 |
5.94 |
% |
860.5 |
5.84 |
% |
|||||||||||||
|
Dynamic Convertible and Income Fund |
210.0 |
5.94 |
% |
210.0 |
5.84 |
% |
|||||||||||||
|
Global Dynamic Income Fund |
135.7 |
5.94 |
% |
147.1 |
5.84 |
% |
|||||||||||||
|
Global Total Return Fund |
31.4 |
5.94 |
% |
34.4 |
5.84 |
% |
|||||||||||||
|
Long/Short Equity & Dynamic Income Trust |
120.0 |
5.94 |
% |
120.0 |
5.84 |
% |
|||||||||||||
Under the terms of the SSB Agreement, all securities lent through SSB must be secured continuously by collateral received in cash. Cash collateral received by SSB on behalf of the Fund is deposited by SSB in a custodial account of the Fund and then applied to repay borrowings under the SSB Agreement, such that the cash advanced to the Fund remains unchanged. Upon termination of a securities loan, SSB will advance to the Fund the cash collateral required to be returned by the Fund, or secure the appropriate amount through one or more securities lending transactions as the Fund's agent, and deposit the amount to a custodial account of the Fund and then subsequently return such amount to the securities borrower against return of the securities on loan. Again, the net cash to the Fund is unaltered. Only the composition of the advance is changed, and regardless of the composition of advances as between cash collateral for securities lending transactions or borrowings from SSB, they are not reflected separately in the Statement of Assets and Liabilities but as a component of the Notes Payable. The Fund has the right to recall securities which have been lent at any time. The securities lending arrangement with SSB involves characteristics common in arm's length relationships in which one party may benefit at the expense of the other party. As of April 30, 2024, the Funds had securities on loan under the SSB Agreement which are reflected in the Investment in securities, at value on the Statement of Assets and Liabilities and are shown in the table below. The borrowings are categorized as Level 2 within the fair value hierarchy.
CALAMOS CLOSED-END FAMILY OF FUNDS SEMIANNUAL REPORT
154
Notes to Financial Statements (Unaudited)
The composition of the securities on loan was as follows:
|
FUND |
SECURITIES ON LOAN (IN MIILIONS) |
FIXED INCOME SECURITIES (IN MILLIONS) |
EQUITY SECURITIES (IN MILLIONS) |
||||||||||||
|
Convertible Opportunities and Income Fund |
$ |
52.8 |
$ |
45.4 |
$ |
7.4 |
|||||||||
|
Convertible and High Income Fund |
52.2 |
44.3 |
7.9 |
||||||||||||
|
Strategic Total Return Fund |
773.6 |
13.3 |
760.3 |
||||||||||||
|
Dynamic Convertible and Income Fund |
24.8 |
19.1 |
5.7 |
||||||||||||
|
Global Dynamic Income Fund |
20.7 |
6.3 |
14.4 |
||||||||||||
|
Global Total Return Fund |
17.7 |
2.8 |
14.9 |
||||||||||||
|
Long/Short Equity & Dynamic Income Trust |
0.8 |
0.7 |
0.1 |
||||||||||||
Note 8 – Mandatory Redeemable Preferred Shares
All Funds except Long/Short Equity & Dynamic Income Trust have MRPS issued and outstanding, each divided into four series with different mandatory redemption dates and dividend rates. The tables below summarize the key terms of each series of the MRPS at April 30, 2024.
The MRPS are divided into four series with different mandatory redemption dates and dividend rates. The tables below summarizes the key terms of each Fund's series of the MRPS at April 30, 2024.
CONVERTIBLE OPPORTUNITIES AND INCOME FUND
|
SERIES |
ISSUE DATE |
TERM REDEMPTION DATE |
DIVIDEND RATE |
SHARES (000'S) |
LIQUIDATION PREFERENCE PER SHARE |
AGGREGATE LIQUIDATION PREFERENCE |
|||||||||||||||||||||
|
Series B |
9/6/17 |
9/6/24 |
4.00 |
% |
1,330 |
$ |
25 |
$ |
33,250,000 |
||||||||||||||||||
|
Series C |
9/6/17 |
9/6/27 |
4.24 |
% |
1,340 |
$ |
25 |
$ |
33,500,000 |
||||||||||||||||||
|
Series D |
8/24/21 |
8/24/26 |
2.45 |
% |
1,320 |
$ |
25 |
$ |
33,000,000 |
||||||||||||||||||
|
Series E |
3/8/22 |
5/24/27 |
2.68 |
% |
1,330 |
$ |
25 |
$ |
33,250,000 |
||||||||||||||||||
|
Total |
$ |
133,000,000 |
|||||||||||||||||||||||||
CONVERTIBLE AND HIGH INCOME FUND
|
SERIES |
ISSUE DATE |
TERM REDEMPTION DATE |
DIVIDEND RATE |
SHARES (000'S) |
LIQUIDATION PREFERENCE PER SHARE |
AGGREGATE LIQUIDATION PREFERENCE |
|||||||||||||||||||||
|
Series B |
9/6/17 |
9/6/24 |
4.00 |
% |
1,460 |
$ |
25 |
$ |
36,500,000 |
||||||||||||||||||
|
Series C |
9/6/17 |
9/6/27 |
4.24 |
% |
1,480 |
$ |
25 |
$ |
37,000,000 |
||||||||||||||||||
|
Series D |
8/24/21 |
8/24/26 |
2.45 |
% |
1,400 |
$ |
25 |
$ |
35,000,000 |
||||||||||||||||||
|
Series E |
3/8/22 |
5/24/27 |
2.68 |
% |
1,460 |
$ |
25 |
$ |
36,500,000 |
||||||||||||||||||
|
Total |
$ |
145,000,000 |
|||||||||||||||||||||||||
STRATEGIC TOTAL RETURN FUND
|
SERIES |
ISSUE DATE |
TERM REDEMPTION DATE |
DIVIDEND RATE |
SHARES (000'S) |
LIQUIDATION PREFERENCE PER SHARE |
AGGREGATE LIQUIDATION PREFERENCE |
|||||||||||||||||||||
|
Series B |
9/6/17 |
9/6/24 |
4.00 |
% |
3,220 |
$ |
25 |
$ |
80,500,000 |
||||||||||||||||||
|
Series C |
9/6/17 |
9/6/27 |
4.24 |
% |
3,240 |
$ |
25 |
$ |
81,000,000 |
||||||||||||||||||
|
Series D |
8/24/21 |
8/24/26 |
2.45 |
% |
2,480 |
$ |
25 |
$ |
62,000,000 |
||||||||||||||||||
|
Series F |
5/24/22 |
5/24/27 |
3.66 |
% |
4,000 |
$ |
25 |
$ |
100,000,000 |
||||||||||||||||||
|
Total |
$ |
323,500,000 |
|||||||||||||||||||||||||
www.calamos.com
155
Notes to Financial Statements (Unaudited)
DYNAMIC CONVERTIBLE AND INCOME FUND
|
SERIES |
ISSUE DATE |
TERM REDEMPTION DATE |
DIVIDEND RATE |
SHARES (000'S) |
LIQUIDATION PREFERENCE PER SHARE |
AGGREGATE LIQUIDATION PREFERENCE |
|||||||||||||||||||||
|
Series B |
9/6/17 |
9/6/24 |
4.00 |
% |
850 |
$ |
25 |
$ |
21,250,000 |
||||||||||||||||||
|
Series C |
9/6/17 |
9/6/27 |
4.24 |
% |
860 |
$ |
25 |
$ |
21,500,000 |
||||||||||||||||||
|
Series D |
8/24/21 |
8/24/26 |
2.45 |
% |
1,120 |
$ |
25 |
$ |
28,000,000 |
||||||||||||||||||
|
Series E |
3/8/22 |
5/24/27 |
2.68 |
% |
850 |
$ |
25 |
$ |
21,250,000 |
||||||||||||||||||
|
Total |
$ |
92,000,000 |
|||||||||||||||||||||||||
GLOBAL DYNAMIC INCOME FUND
|
SERIES |
ISSUE DATE |
TERM REDEMPTION DATE |
DIVIDEND RATE |
SHARES (000'S) |
LIQUIDATION PREFERENCE PER SHARE |
AGGREGATE LIQUIDATION PREFERENCE |
|||||||||||||||||||||
|
Series B |
9/6/17 |
9/6/24 |
4.00 |
% |
860 |
$ |
25 |
$ |
21,500,000 |
||||||||||||||||||
|
Series C |
9/6/17 |
9/6/27 |
4.24 |
% |
880 |
$ |
25 |
$ |
22,000,000 |
||||||||||||||||||
|
Series D |
8/24/21 |
8/24/26 |
2.45 |
% |
200 |
$ |
25 |
$ |
5,000,000 |
||||||||||||||||||
|
Series E |
3/8/22 |
5/24/27 |
2.68 |
% |
860 |
$ |
25 |
$ |
21,500,000 |
||||||||||||||||||
|
Total |
$ |
70,000,000 |
|||||||||||||||||||||||||
GLOBAL TOTAL RETURN FUND
|
SERIES |
ISSUE DATE |
TERM REDEMPTION DATE |
DIVIDEND RATE |
SHARES (000'S) |
LIQUIDATION PREFERENCE PER SHARE |
AGGREGATE LIQUIDATION PREFERENCE |
|||||||||||||||||||||
|
Series B |
9/6/17 |
9/6/24 |
4.00 |
% |
160 |
$ |
25 |
$ |
4,000,000 |
||||||||||||||||||
|
Series C |
9/6/17 |
9/6/27 |
4.24 |
% |
160 |
$ |
25 |
$ |
4,000,000 |
||||||||||||||||||
|
Series D |
8/24/21 |
8/24/26 |
2.45 |
% |
200 |
$ |
25 |
$ |
5,000,000 |
||||||||||||||||||
|
Series E |
3/8/22 |
5/24/27 |
2.68 |
% |
160 |
$ |
25 |
$ |
4,000,000 |
||||||||||||||||||
|
Total |
$ |
17,000,000 |
|||||||||||||||||||||||||
Offering costs incurred by the Funds in connection with the MRPS issuance are aggregated with the outstanding liability and are being amortized to interest expense and amortization of offering costs on MRPS over the respective life of each series of MRPS and shown in the Statement of operations.
The MRPS are not listed on any exchange or automated quotation system. The MRPS are considered debt of the issuer; therefore, the liquidation preference, which approximates fair value of the MRPS, is recorded as a liability in each Fund's Statement of Assets and Liabilities net of deferred offering costs. The MRPS are categorized as Level 2 within the fair value hierarchy.
During the period ended April 30, 2024, all MRPS were rated `AA-' by Kroll Bond Rating Agency LLC ("KBRA"). If the ratings of the MRPS are downgraded, each Fund's dividend expense may increase, as described below.
Holders of MRPS are entitled to receive monthly cumulative cash dividends payable on the first business day of each month. The MRPS currently are rated "AA-" by KBRA. If on the first day of a monthly dividend period the MRPS of any class are rated lower than "A" by KBRA, the dividend rate for such period shall be increased by 0.5%, 2.0% or 4.0% according to an agreed upon schedule. The MRPS' dividend rate is also subject to increase during periods when a Fund has not made timely payments to MRPS holders and/or the MRPS do not have a current credit rating, subject to various terms and conditions. Dividends accrued and paid to the shareholders of MRPS are included in "Interest expense and amortization of offering costs on Mandatory Redeemable Preferred Shares" with each Fund's Statement of Operations.
With regard to the Series B and C MRPS, so long as any MRPS are outstanding, a Fund will not declare, pay or set apart for payment any dividend or other distribution (other than non-cash distributions) with respect to Fund shares ranking junior to or on parity with the MRPS, unless (1) the Fund has satisfied the MRPS Overcollateralization Test (as defined below) on at least one "valuation date" in the preceding 65 calendar days, (2) immediately after such transaction the Fund would satisfy the MRPS Asset Coverage Test (as defined below), (3) full cumulative dividends on the MRPS due on or prior to the date of the transaction have been declared and paid to the holders of MRPS and (4) the Fund has redeemed the full number of
CALAMOS CLOSED-END FAMILY OF FUNDS SEMIANNUAL REPORT
156
Notes to Financial Statements (Unaudited)
MRPS required to be redeemed by any provision for mandatory redemption or deposited sufficient monies with the Fund's paying agent for that purpose, subject to certain grace periods and exceptions.
MRPS Asset Coverage Test: Asset coverage with respect to all outstanding senior securities and preferred shares, including the MRPS, determined in accordance with Section 18(h) of the 1940 Act, on the basis of values calculated as of a time within 48 hours (not including Sundays or holidays) next preceding the time of determination, must be greater than or equal to 225%.
MRPS Overcollateralization Test: So long as Fitch or any other NSRSO, such as KBRA, is then rating any class of the outstanding MRPS pursuant to the request of the Fund, satisfaction of only those overcollateralization ratios applicable to closed-end fund issuers with the same rating(s) as the Fund's MRPS' then-current rating(s) issued by Fitch or such other NSRSO, such as KBRA, by application of the applicable rating agency guidelines.
In accordance with that certain Statement of Preferences governing the Series D, E and F MRPS, for so long as any MRPS are outstanding, a Fund will not declare, pay or set apart for payment any dividend or other distribution (other than a dividend or distribution paid in shares of, or options, warrants or rights to subscribe for or purchase, Common Shares or other shares of beneficial interest, if any, ranking junior to the MRPS as to dividends or upon liquidation (collectively "non-cash distributions") with respect to Common Shares or any other shares of the Series or Fund ranking junior to or on a parity with the MRPS as to dividends or upon liquidation, or call for redemption, redeem, purchase or otherwise acquire for consideration any Common Shares or any other such junior shares (except by conversion into or exchange for shares of the Fund ranking junior to the MRPS as to dividends and upon liquidation) or any such parity shares (except by conversion into or exchange for shares of the Fund ranking junior to or on a parity with the MRPS as to dividends and upon liquidation), unless (1) immediately after such transaction the Fund would satisfy the MRPS Asset Coverage Test, (2) full cumulative dividends on the MRPS due on or prior to the date of the transaction have been declared and paid to the Holders of MRPS, and (3) the Fund has redeemed the full number of MRPS required to be redeemed by any provision for mandatory redemption contained in Section 3(a) or deposited sufficient monies with the Paying Agent for that purpose (without regard to the provisions of the Special Proviso); provided that the Fund may make any distributions reasonably necessary for the Fund to continue to qualify as a "regulated investment company" under Subchapter M of the Internal Revenue Code and to avoid excise tax under Section 4982 of the Internal Revenue Code ("Tax Required Payments"). For the avoidance of doubt, any such Tax Required Payments would only be paid to holders of Common Shares after full cumulative dividends due on or prior to the date of the applicable distribution and any mandatory redemptions occurring on or prior to the date of the applicable distribution have been paid to the holders of MRPS.
Except as otherwise required pursuant to the Funds' governing documents or applicable law, the holders of the MRPS have one vote per share and vote together with the holders of common stock of the Funds as a single class except on matters affecting only the holders of MRPS or the holders of common stock. Pursuant to the 1940 Act, holders of the MRPS have the right to elect at least two trustees of a Fund, voting separately as a class. Except during any time when a Fund has failed to make a dividend or redemption payment in respect of MRPS outstanding, the holders of MRPS have agreed to vote in accordance with the recommendation of the Board on any matter submitted to them for their vote or to the vote of shareholders of a Fund generally.
Note 9 – Common Shares
Each Fund has unlimited common shares of beneficial interest authorized at April 30, 2024. Transactions in common shares for each fund at April 30, 2024 were as follows:
|
CONVERTIBLE OPPORTUNITIES AND INCOME FUND |
SIX MONTHS ENDED APRIL 30, 2024 |
YEAR ENDED OCTOBER 31, 2023 |
|||||||||
|
Beginning shares |
74,818,167 |
74,081,296 |
|||||||||
|
Shares sold |
— |
— |
|||||||||
|
Shares issued through reinvestment of distributions |
419,858 |
736,871 |
|||||||||
|
Ending shares |
75,238,025 |
74,818,167 |
|||||||||
www.calamos.com
157
Notes to Financial Statements (Unaudited)
|
CONVERTIBLE AND HIGH INCOME FUND |
SIX MONTHS ENDED APRIL 30, 2024 |
YEAR ENDED OCTOBER 31, 2023 |
|||||||||
|
Beginning shares |
76,379,270 |
75,661,499 |
|||||||||
|
Shares sold |
— |
— |
|||||||||
|
Shares issued through reinvestment of distributions |
383,304 |
717,771 |
|||||||||
|
Ending shares |
76,762,574 |
76,379,270 |
|||||||||
|
STRATEGIC TOTAL RETURN FUND |
SIX MONTHS ENDED APRIL 30, 2024 |
YEAR ENDED OCTOBER 31, 2023 |
|||||||||
|
Beginning shares |
160,335,126 |
158,887,622 |
|||||||||
|
Shares sold |
— |
702,814 |
|||||||||
|
Shares issued through reinvestment of distributions |
34,509 |
744,690 |
|||||||||
|
Ending shares |
160,369,635 |
160,335,126 |
|||||||||
|
DYNAMIC CONVERTIBLE AND INCOME FUND |
SIX MONTHS ENDED APRIL 30, 2024 |
YEAR ENDED OCTOBER 31, 2023 |
|||||||||
|
Beginning shares |
26,644,318 |
26,080,838 |
|||||||||
|
Shares sold |
— |
206,742 |
|||||||||
|
Shares issued through reinvestment of distributions |
128,264 |
356,738 |
|||||||||
|
Ending shares |
26,772,582 |
26,644,318 |
|||||||||
|
GLOBAL DYNAMIC INCOME FUND |
SIX MONTHS ENDED APRIL 30, 2024 |
YEAR ENDED OCTOBER 31, 2023 |
|||||||||
|
Beginning shares |
63,864,387 |
63,864,387 |
|||||||||
|
Shares sold |
— |
— |
|||||||||
|
Shares issued through reinvestment of distributions |
— |
— |
|||||||||
|
Ending shares |
63,864,387 |
63,864,387 |
|||||||||
|
GLOBAL TOTAL RETURN FUND |
SIX MONTHS ENDED APRIL 30, 2024 |
YEAR ENDED OCTOBER 31, 2023 |
|||||||||
|
Beginning shares |
9,825,838 |
9,823,566 |
|||||||||
|
Shares sold |
— |
— |
|||||||||
|
Shares issued through reinvestment of distributions |
— |
2,272 |
|||||||||
|
Ending shares |
9,825,838 |
9,825,838 |
|||||||||
|
LONG/SHORT EQUITY & DYNAMIC INCOME TRUST |
SIX MONTHS ENDED APRIL 30, 2024 |
YEAR ENDED OCTOBER 31, 2023 |
|||||||||
|
Beginning shares |
|
|
|||||||||
|
Shares sold |
— |
— |
|||||||||
|
Shares issued through reinvestment of distributions |
— |
— |
|||||||||
|
Ending shares |
|
|
|||||||||
Notice is hereby given in accordance with Section 23(c) of the 1940 Act that each Fund may from time to time purchase its shares of common stock in the open market.
The Funds also may offer and sell common shares from time to time at an offering price equal to or in excess of the net asset value per share of each Fund's common shares at the time such common shares are initially sold.
CALAMOS CLOSED-END FAMILY OF FUNDS SEMIANNUAL REPORT
158
Report of Independent Registered Public Accounting Firm
To the Shareholders and the Board of Trustees of Calamos Convertible Opportunities and Income Fund, Calamos Convertible and High Income Fund, Calamos Strategic Total Return Fund, Calamos Dynamic Convertible and Income Fund, Calamos Global Dynamic Income Fund, Calamos Global Total Return Fund, and Calamos Long/Short Equity & Dynamic Income Trust
Results of Review of Interim Financial Information
We have reviewed the accompanying statements of assets and liabilities of Calamos Convertible Opportunities and Income Fund, Calamos Convertible and High Income Fund, Calamos Strategic Total Return Fund, Calamos Dynamic Convertible and Income Fund, Calamos Global Dynamic Income Fund, Calamos Global Total Return Fund, and Calamos Long/Short Equity & Dynamic Income Trust (the "Funds"), including the schedules of investments, as of April 30, 2024, the related statements of operations, changes in net assets, and the financial highlights for the six month period then ended; and the related notes (collectively referred to as the "interim financial information"). Based on our reviews, we are not aware of any material modifications that should be made to the accompanying interim financial information for it to be in conformity with accounting principles generally accepted in the United States of America.
We have previously audited, in accordance with the standards of the Public Company Accounting Oversight Board (United States) (PCAOB), the statements of changes in net assets of the Funds and the financial highlights for each of the periods listed in the table below; and in our report dated December 20, 2023, we expressed an unqualified opinion on such statements of changes in net assets and financial highlights.
| Individual Fund Comprising the Calamos Investment Trust |
Statement of Changes in Net Assets |
Financial Highlights |
|||||||||
|
Calamos Convertible Opportunities and Income Fund, Calamos Convertible and High Income Fund, Calamos Strategic Total Return Fund, Calamos Global Dynamic Income Fund, and Calamos Global Total Return Fund |
For the years ended October 31, 2023 and 2022 |
For the years ended October 31, 2023, 2022, 2021, 2020, 2019, 2018, 2017, 2016, 2015, and 2014 |
|||||||||
|
Calamos Dynamic Convertible and Income Fund |
For the years ended October 31, 2023 and 2022 |
For the years ended October 31, 2023, 2022, 2021, 2020, 2019, 2018, 2017, 2016, and the period from March 27, 2015 (commencement of operations) through October 31, 2015 |
|||||||||
|
Calamos Long/Short Equity & Dynamic Income Trust |
For the years ended October 31, 2023 and 2022 |
For the years ended October 31, 2023, 2022, 2021, and the period from November 29, 2019 (commencement of operations) through October 31, 2020 |
|||||||||
Basis for Review Results
This interim financial information is the responsibility of the Funds' management. We are a public accounting firm registered with the PCAOB and are required to be independent with respect to the Funds in accordance with the U.S. federal securities laws and the applicable rules and regulations of the Securities and Exchange Commission and the PCAOB.
We conducted our reviews in accordance with standards of the PCAOB. A review of interim financial information consists principally of applying analytical procedures and making inquiries of persons responsible for financial and accounting matters. It is substantially less in scope than an audit conducted in accordance with the standards of the PCAOB, the objective of which is the expression of an opinion regarding the financial statements and financial highlights taken as a whole. Accordingly, we do not express such an opinion.

June 20, 2024
Chicago, Illinois
We have served as the auditor of one or more Calamos investment companies since 2003.
www.calamos.com
159
About Closed-End Funds
What is a Closed-End Fund?
A closed-end fund is a publicly traded investment company that raises its initial investment capital through the issuance of a fixed number of shares to investors in a public offering. Shares of a closed-end fund are listed on a stock exchange or traded in the over-the-counter market. Like all investment companies, a closed-end fund is professionally managed and offers investors a unique investment solution based on its investment objective approved by the fund's Board of Trustees.
Potential Advantages of Closed-End Fund Investing
• Defined Asset Pool Allows Efficient Portfolio Management—Although closed-end fund shares trade actively on a securities exchange, this doesn't affect the closed-end fund manager because there are no new investors buying into or selling out of the fund's portfolio.
• More Flexibility in the Timing and Price of Trades—Investors can purchase and sell shares of closed-end funds throughout the trading day, just like the shares of other publicly traded securities.
• Lower Expense Ratios—The expense ratios of closed-end funds are oftentimes less than those of mutual funds. Over time, a lower expense ratio could enhance investment performance.
• Closed-End Structure Makes Sense for Less-Liquid Asset Classes—A closed-end structure makes sense for investors considering less-liquid asset classes, such as high-yield bonds or micro-cap stocks.
• Ability to Put Leverage to Work—Closed-end funds may issue senior securities (such as preferred shares or debentures) or borrow money to "leverage" their investment positions.
• No Minimum Investment Requirements
OPEN-END MUTUAL FUNDS VERSUS CLOSED-END FUNDS
|
OPEN-END FUND |
CLOSED-END FUND |
||||||
|
Issues new shares on an ongoing basis |
Generally issues a fixed number of shares |
||||||
|
Issues common equity shares |
Can issue common equity shares and senior securities such as preferred shares and bonds |
||||||
|
Sold at NAV plus any sales charge |
Price determined by the marketplace |
||||||
|
Sold through the fund's distributor |
Traded in the secondary market |
||||||
|
Fund redeems shares at NAV calculated at the close of business day |
Fund does not redeem shares |
||||||
You can purchase or sell common shares of closed-end funds daily. Like any other stock, market price will fluctuate with the market. Upon sale, your shares may have a market price that is above or below net asset value and may be worth more or less than your original investment. Shares of closed-end funds frequently trade at a discount, which is a market price that is below their net asset value.
Leverage creates risks which may adversely affect return, including the likelihood of greater volatility of net asset value and market price of common shares and fluctuations in the variable rates of the leverage financing.
Each open-end or closed-end fund should be evaluated individually. Before investing carefully consider the fund's investment objectives, risks, charges and expenses.
CALAMOS CLOSED-END FAMILY OF FUNDS SEMIANNUAL REPORT
160
Level Rate Distribution Policy
Using a Level Rate Distribution Policy to Promote Dependable Income and Total Return
Calamos Global Total Return Fund and Calamos Global Dynamic Income Fund have implemented a level rate distribution policy. The goal of the level rate distribution policy is to provide investors a predictable, though not assured, level of cash flow, which can either serve as a stable income stream or, through reinvestment, may contribute significantly to long-term total return.
We understand the importance that investors place on the stability of dividends and their ability to contribute to long-term total return, which is why we have instituted a level rate distribution policy for Calamos Global Total Return Fund and Calamos Global Dynamic Income Fund. Under the policy, monthly distributions paid may include net investment income, net realized short-term capital gains, and, if necessary, return of capital. In addition, a limited number of distributions per calendar year may include net realized long-term capital gains. Please refer to each Fund's financial statements for specific information about distributions made during the last fiscal year.
There is no guarantee that the Funds will realize capital gains in any given year. Distributions are subject to recharacterization for tax purposes after the end of the fiscal year. All shareholders with taxable accounts will receive written notification regarding the components and tax treatment for distributions via Form 1099-DIV. For purposes of maintaining the level rate distribution policy, the Funds may realize short-term capital gains on securities that, if sold at a later date, would have resulted in long-term capital gains. Maintenance of a level rate distribution policy may increase transaction and tax costs associated with the Funds.
Distributions from the Funds are generally subject to Federal income taxes.
Managed Distribution Policy
Using a Managed Distribution Policy to Promote Dependable Income and Total Return
Calamos Convertible Opportunities and Income Fund, Calamos Convertible and High Income Fund, Calamos Strategic Total Return Fund, Calamos Dynamic Convertible and Income Fund, and Calamos Long/Short Equity & Dynamic Income Trust have implemented a managed distribution policy. The goal of the managed distribution policy is to provide investors a predictable, though not assured, level of cash flow, which can serve either as a stable income stream or, through reinvestment, may contribute significantly to long-term total return.
We understand the importance that investors place on the stability of dividends and their ability to contribute to long-term total return, which is why we have instituted a managed distribution policy for Calamos Convertible Opportunities and Income Fund, Calamos Convertible and High Income Fund, Calamos Strategic Total Return Fund, Calamos Dynamic Convertible and Income Fund and Calamos Long/Short Equity & Dynamic Income Trust. Under the policy, monthly distributions paid may include net investment income, net realized short-term capital gains, net realized long-term capital gains and, if necessary, return of capital. Please refer to each Fund's financial statements for specific information about distributions made during the last fiscal year.
Distributions of capital decrease a Fund's total assets and total assets per share and, therefore, could have the effect of increasing a Fund's expense ratio. In general, the policy of fixing a Fund's distributions at a targeted rate does not affect a Fund's investment strategy. However, in order to make these distributions, on occasion the Funds may have to sell portfolio securities at a less than opportune time.
There is no guarantee that the Funds will realize capital gains in any given year. Distributions are subject to re-characterization for tax purposes after the end of the fiscal year. All shareholders with taxable accounts will receive written notification regarding the components and tax treatment for distributions via Form 1099-DIV.
Distributions from the Funds are generally subject to Federal income taxes.
www.calamos.com
161
Automatic Dividend Reinvestment Plan
Maximizing Investment with an Automatic Dividend Reinvestment Plan
The Automatic Dividend Reinvestment Plan offers a simple, cost-efficient and convenient way to reinvest your dividends and capital gains distributions in additional shares of each Fund, allowing you to increase your investment in the Fund.
Potential Benefits
• Compounded Growth: By automatically reinvesting with the Plan, you gain the potential to allow your dividends and capital gains to compound over time.
• Potential for Lower Commission Costs: Additional shares are purchased in large blocks, with brokerage commissions shared among all plan participants. There is no cost to enroll in the Plan.
• Convenience: After enrollment, the Plan is automatic and includes detailed statements for participants. Participants can terminate their enrollment at any time.
Pursuant to the Plan, unless a shareholder is ineligible or elects otherwise, all dividend and capital gains on common shares distributions are automatically reinvested by Computershare, as agent for shareholders in administering the Plan ("Plan Agent"), in additional common shares of the Fund. Shareholders who elect not to participate in the Plan will receive all dividends and distributions payable in cash paid by check mailed directly to the shareholder of record (or, if the shares are held in street or other nominee name, then to such nominee) by Plan Agent, as dividend paying agent. Shareholders may elect not to participate in the Plan and to receive all dividends and distributions in cash by sending written instructions to the Plan Agent, as dividend paying agent, at: Dividend Reinvestment Department, P.O. Box 43078, Providence RI 02940-3078. Participation in the Plan is completely voluntary and may be terminated or resumed at any time without penalty by giving notice in writing to the Plan Agent; such termination will be effective with respect to a particular dividend or distribution if notice is received prior to the record date for the applicable distribution.
The shares are acquired by the Plan Agent for the participant's account either (i) through receipt of additional common shares from the Fund ("newly issued shares") or (ii) by purchase of outstanding common shares on the open market ("open-market purchases") on the NASDAQ or elsewhere. If, on the payment date, the net asset value per share of the common shares is equal to or less than the market price per common share plus estimated brokerage commissions (a "market premium"), the Plan Agent will receive newly issued shares from the Fund for each participant's account. The number of newly issued common shares to be credited to the participant's account will be determined by dividing the dollar amount of the dividend or distribution by the greater of (i) the net asset value per common share on the payment date, or (ii) 95% of the market price per common share on the payment date.
If, on the payment date, the net asset value per common share exceeds the market price plus estimated brokerage commissions (a "market discount"), the Plan Agent has a limited period of time to invest the dividend or distribution amount in shares acquired in open-market purchases. If, before the Plan Agent has completed its open-market purchases, the market price plus estimated brokerage commissions exceeds the net asset value of the common shares as of the payment date, the purchase price paid by Plan Agent may exceed the net asset value of the common shares, resulting in the acquisition of fewer common shares than if such dividend or distribution had been paid in common shares issued by the Fund. The weighted average price (including brokerage commissions) of all common shares purchased by the Plan Agent as Plan Agent will be the price per common share allocable to each participant. If the Plan Agent is unable to invest the full dividend amount in open-market purchases during the purchase period or if the market discount shifts to a market premium during the purchase period, the Plan Agent will cease making open-market purchases and will invest the uninvested portion of the dividend or distribution amount in newly issued shares at the net asset value per common share at the close of business on the last purchase date.
The automatic reinvestment of dividends and distributions will not relieve participants of any federal, state or local income tax that may be payable (or required to be withheld) on such dividends even though no cash is received by participants.
CALAMOS CLOSED-END FAMILY OF FUNDS SEMIANNUAL REPORT
162
Automatic Dividend Reinvestment Plan
There are no brokerage charges with respect to shares issued directly by the Fund as a result of dividends or distributions payable either in shares or in cash. However, each participant will pay a pro rata share of brokerage commissions incurred with respect to the Plan Agent's open-market purchases in connection with the reinvestment of dividends or distributions. If a participant elects to have the Plan Agent sell part or all of his or her common shares and remit the proceeds, such participant will be charged his or her pro rata share of brokerage commissions on the shares sold, plus a $15 transaction fee. There is no direct service charge to participants in the Plan; however, the Fund reserves the right to amend the Plan to include a service charge payable by the participants.
A participant may request the sale of all of the common shares held by the Plan Agent in his or her Plan account in order to terminate participation in the Plan. If such participant elects in advance of such termination to have the Plan Agent sell part or all of his shares, the Plan Agent is authorized to deduct from the proceeds a $15.00 fee plus the brokerage commissions incurred for the transaction. A participant may re-enroll in the Plan in limited circumstances.
The terms and conditions of the Plan may be amended by the Plan Agent or the Fund at any time upon notice as required by the Plan.
This discussion of the Plan is only summary, and is qualified in its entirety by the Terms and Conditions of the Dividend Reinvestment Plan filed as part of the Fund's registration statement.
For additional information about the Plan, please contact the Plan Agent, Computershare, at 866.226.8016. If you wish to participate in the Plan and your shares are held in your own name, simply call the Plan Agent. If your shares are not held in your name, please contact your brokerage firm, bank, or other nominee to request that they participate in the Plan on your behalf. If your brokerage firm, bank, or other nominee is unable to participate on your behalf, you may request that your shares be re-registered in your own name.
We're pleased to provide our shareholders with the additional benefit of the Fund's Dividend Reinvestment Plan and hope that it may serve your financial plan.
Additional Fund Information: Delaware Statutory Trust Act – Control Share Acquisitions
Each Fund is organized as a Delaware statutory trust and thus is subject to the control share acquisition statute contained in Subchapter III of the Delaware Statutory Trust Act (the DSTA Control Share Statute). The DSTA Control Share Statute applies to any closed-end investment company organized as a Delaware statutory trust and listed on a national securities exchange, such as the Fund. The DSTA Control Share Statute became automatically applicable to the Funds on August 1, 2022.
The DSTA Control Share Statute defines "control beneficial interests" (referred to as "control shares" herein) by reference to a series of voting power thresholds and provides that a holder of control shares acquired in a control share acquisition has no voting rights under the Delaware Statutory Trust Act (DSTA) or each Fund's Governing Documents (as used herein, "Governing Documents" means each Fund's Agreement and Declaration of Trust and By-Laws, together with any amendments or supplements thereto, including any Statement of Preferences establishing a series of preferred shares, as applicable) with respect to the control shares acquired in the control share acquisition, except to the extent approved by a Fund's shareholders by the affirmative vote of two—thirds of all the votes entitled to be cast on the matter, excluding all interested shares (generally, shares held by the acquiring person and their associates and shares held by Fund insiders).
The DSTA Control Share Statute provides for a series of voting power thresholds above which shares are considered control shares. Whether one of these thresholds of voting power is met is determined by
www.calamos.com
163
Additional Fund Information: Delaware Statutory Trust Act – Control Share Acquisitions
aggregating the holdings of the acquiring person as well as those of his, her or its "associates." These thresholds are:
• 10% or more, but less than 15% of all voting power;
• 15% or more, but less than 20% of all voting power;
• 20% or more, but less than 25% of all voting power;
• 25% or more, but less than 30% of all voting power;
• 30% or more, but less than a majority of all voting power; or
• a majority or more of all voting power.
Under the DSTA Control Share Statute, once a threshold is reached, an acquirer has no voting rights with respect to shares in excess of that threshold (i.e., the "control shares") until approved by a vote of shareholders, as described above, or otherwise exempted by the Funds' Board of Trustees. The DSTA Control Share Statute contains a statutory process for an acquiring person to request a shareholder meeting for the purpose of considering the voting rights to be accorded control shares. An acquiring person must repeat this process at each threshold level.
Under the DSTA Control Share Statute, an acquiring person's "associates" are broadly defined to include, among others, relatives of the acquiring person, anyone in a control relationship with the acquiring person, any investment fund or other collective investment vehicle that has the same investment adviser as the acquiring person, any investment adviser of an acquiring person that is an investment fund or other collective investment vehicle and any other person acting or intending to act jointly or in concert with the acquiring person.
Voting power under the DSTA Control Share Statute is the power (whether such power is direct or indirect or through any contract, arrangement, understanding, relationship or otherwise) to directly or indirectly exercise or direct the exercise of the voting power of shares of a Fund in the election of each Fund's Trustees (either generally or with respect to any subset, series or class of trustees, including any Trustees elected solely by a particular series or class of shares, such as the preferred shares). Thus, a Fund's preferred shares, as applicable, acquired in excess of the above thresholds would be considered control shares with respect to the preferred share class vote for two Trustees.
Any control shares of the Fund acquired before August 1, 2022 are not subject to the DSTA Control Share Statute; however, any further acquisitions on or after August 1, 2022 are considered control shares subject to the DSTA Control Share Statute.
The DSTA Control Share Statute requires shareholders to disclose to a Fund any control share acquisition within 10 days of such acquisition, and also permits the Fund to require a shareholder or an associate of such person to disclose the number of shares owned or with respect to which such person or an associate thereof can directly or indirectly exercise voting power. Further, the DSTA Control Share Statute requires a shareholder or an associate of such person to provide to the Fund within 10 days of receiving a request therefor from the Fund any information that the Fund's Trustees reasonably believe is necessary or desirable to determine whether a control share acquisition has occurred.
The DSTA Control Share Statute permits the Funds' Board of Trustees, through a provision in each Fund's Governing Documents or by Board action alone, to eliminate the application of the DSTA Control Share Statute to the acquisition of control shares in the Fund specifically, generally, or generally by types, as to specifically identified or unidentified existing or future beneficial owners or their affiliates or associates or as to any series or classes of shares. The DSTA Control Share Statute does not provide that the Fund can generally "opt out" of the application of the DSTA Control Share Statute; rather, specific acquisitions or classes of acquisitions may be exempted by the Board of Trustees, either in advance or retroactively, but other aspects of the DSTA Control Share Statute, which are summarized above, would continue to apply.
CALAMOS CLOSED-END FAMILY OF FUNDS SEMIANNUAL REPORT
164
Additional Fund Information: Delaware Statutory Trust Act – Control Share Acquisitions
The DSTA Control Share Statute further provides that the Board of Trustees is under no obligation to grant any such exemptions.
The foregoing is only a summary of the material terms of the DSTA Control Share Statute. Shareholders should consult their own counsel with respect to the application of the DSTA Control Share Statute to any particular circumstance.
www.calamos.com
165
This page intentionally left blank.
MANAGING YOUR CALAMOS FUNDS INVESTMENTS
Calamos Investments offers several convenient means to monitor, manage and feel confident about your Calamos investment choice.
PERSONAL ASSISTANCE: 800.582.6959
Dial this toll-free number to speak with a knowledgeable Client Services Representative who can help answer questions or address issues concerning your Calamos Fund.
ONLINE ACCOUNT MANAGEMENT:
www.calamos.com
Manage your personal account of Calamos Funds online at www.calamos.com. On your account access page, you can view account history and download data.
YOUR FINANCIAL ADVISOR
We encourage you to talk to your financial advisor to determine how the Calamos Funds can benefit your investment portfolio based on your financial goals, risk tolerance, time horizon and income needs.
A description of the Calamos Proxy Voting Policies and Procedures and the Funds' proxy voting record for the 12-month period ended June 30 are available free of charge upon request by calling 800.582.6959, by visiting the Calamos Web site at www.calamos.com, or by writing Calamos at: Calamos Investments, Attn: Client Services, 2020 Calamos Court, Naperville, IL 60563. The Funds' proxy voting record is also available free of charge by visiting the SEC Web site at www.sec.gov.
The Funds file a complete list of their portfolio holdings with the SEC for the first and third quarters each fiscal year as an exhibit to its reports on Form N-PORT. The Forms N-PORT are available free of charge, upon request, by calling or writing Calamos Investments at the phone number or address provided above or by visiting the SEC Web site at www.sec.gov.
The Fund's report to the SEC on Form N-CSR contains certifications by the fund's principal executive officer and principal financial officer as required by Rule 30a-2(a) under the 1940 Act, relating to, among other things, the quality of the Fund's disclosure controls and procedures and internal control over financial reporting.
FOR 24-HOUR AUTOMATED SHAREHOLDER ASSISTANCE: 866.226.8016
TO OBTAIN INFORMATION ABOUT YOUR INVESTMENTS: 800.582.6959
VISIT OUR WEB SITE: www.calamos.com
INVESTMENT ADVISER:
Calamos Advisors LLC
2020 Calamos Court
Naperville, IL 60563-2787
CUSTODIAN AND FUND ACCOUNTING AGENT:
State Street Bank and Trust Company
Boston, MA
TRANSFER AGENT:
Computershare
P.O. Box 43078
Providence RI 02940-3078
866.226.8016
INDEPENDENT REGISTERED PUBLIC ACCOUNTING FIRM:
Deloitte & Touche LLP
Chicago, IL
LEGAL COUNSEL:
Ropes & Gray LLP
Chicago, IL

Visit our Web site for timely fund performance, detailed fund profiles, fund news and insightful market commentary.
2020 Calamos Court
Naperville, IL 60563-2787
800.582.6959
www.calamos.com
© 2024 Calamos Investments LLC. All Rights Reserved. Calamos® and Calamos Investments® are registered trademarks of Calamos Investments LLC.
CEFSAR 822293 043024