Exhibit 99.2

Borr Drilling Limited
Unaudited Condensed Consolidated Financial Statements
For the second quarter of 2019 and the six months ended June 30, 2019
(Comparatives for the second quarter of 2018 and the six months ended June 30, 2018)
Borr Drilling Limited
Unaudited Consolidated Financial Statements
Unaudited Condensed Consolidated Statement of Operations
(In $ millions except per share data)
|
Notes
|
3 months to
June 30,
2019
|
3 months to
June 30,
2018
|
6 months to
June 30,
2019
|
6 months to
June 30,
2018
|
||||||||||||||||
|
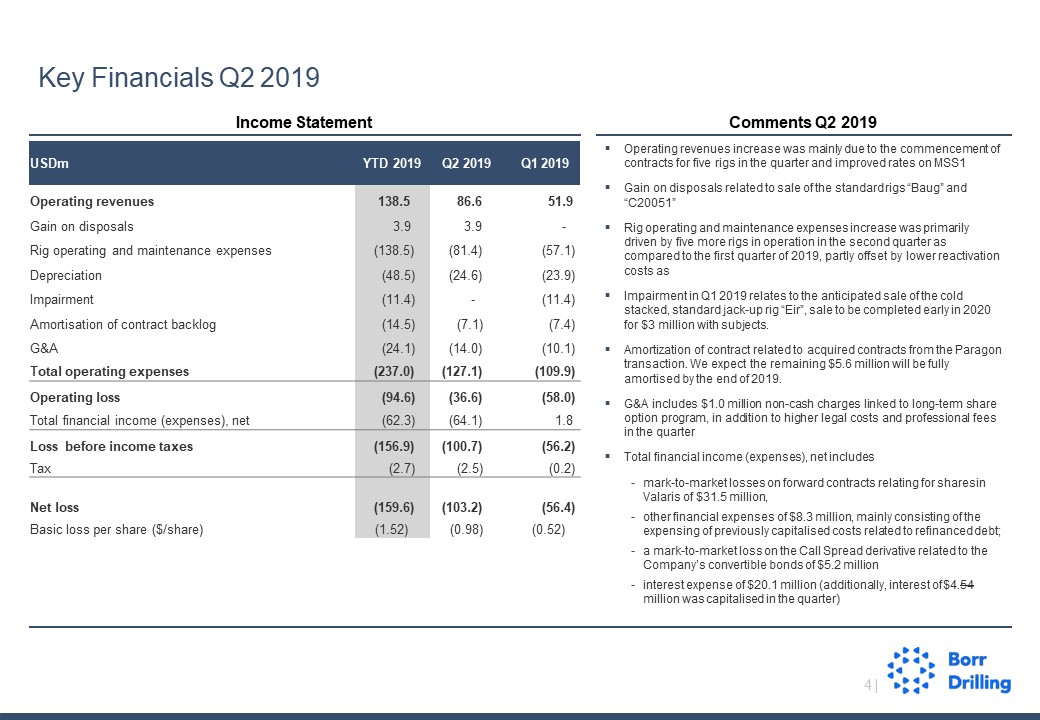
Operating revenues
|
3
|
86.6
|
51.1
|
138.5
|
61.7
|
|||||||||||||||
|
Gain from bargain purchase
|
11
|
-
|
-
|
-
|
38.1
|
|||||||||||||||
|
Gain on disposals
|
3.9
|
17.5
|
3.9
|
17.5
|
||||||||||||||||
|
Operating expenses
|
||||||||||||||||||||
|
Rig operating and maintenance expenses
|
(81.4
|
)
|
(52.4
|
)
|
(138.5
|
)
|
(74.9
|
)
|
||||||||||||
|
Depreciation of non-current assets
|
7
|
(24.6
|
)
|
(22.0
|
)
|
(48.5
|
)
|
(34.2
|
)
|
|||||||||||
|
Impairment of non-current assets
|
7
|
-
|
-
|
(11.4
|
)
|
-
|
||||||||||||||
|
Amortisation of contract backlog
|
11
|
(7.1
|
)
|
(6.0
|
)
|
(14.5
|
)
|
(6.0
|
)
|
|||||||||||
|
General and administrative expenses
|
(14.0
|
)
|
(8.0
|
)
|
(24.1
|
)
|
(18.2
|
)
|
||||||||||||
|
Restructuring costs
|
11
|
-
|
(5.0
|
)
|
-
|
(22.9
|
)
|
|||||||||||||
|
Total operating expenses
|
(127.1
|
)
|
(93.4
|
)
|
(237.0
|
)
|
(156.2
|
)
|
||||||||||||
|
Operating loss
|
(36.6
|
)
|
(24.8
|
)
|
(94.6
|
)
|
(38.9
|
)
|
||||||||||||
|
Financial income (expenses), net
|
||||||||||||||||||||
|
Interest income
|
0.2
|
0.4
|
0.5
|
0.9
|
||||||||||||||||
|
Interest expense
|
18
|
(20.1
|
)
|
-
|
(33.1
|
)
|
-
|
|||||||||||||
|
Other financial income (expenses), net
|
4,14
|
(44.2
|
)
|
17.0
|
(29.7
|
)
|
(3.2
|
)
|
||||||||||||
|
Total financial income (expenses), net
|
(64.1
|
)
|
17.4
|
(62.3
|
)
|
(2.3
|
)
|
|||||||||||||
|
Loss before income taxes
|
(100.7
|
)
|
(7.4
|
)
|
(156.9
|
)
|
(41.2
|
)
|
||||||||||||
|
Income tax expense
|
5
|
(2.5
|
)
|
-
|
(2.7
|
)
|
-
|
|||||||||||||
|
Net loss
|
(103.2
|
)
|
(7.4
|
)
|
(159.6
|
)
|
(41.2
|
)
|
||||||||||||
|
Net (loss) income attributable to non-controlling interests
|
-
|
(0.2
|
)
|
(1.5
|
)
|
(0.3
|
)
|
|||||||||||||
|
Net loss attributable to shareholders of Borr Drilling Limited
|
(103.2
|
)
|
(7.2
|
)
|
(158.1
|
)
|
(40.9
|
)
|
||||||||||||
|
Basic loss per share
|
6
|
(0.98
|
)
|
(0.07
|
)
|
(1.52
|
)
|
(0.40
|
)
|
|||||||||||
|
Diluted loss per share
|
6
|
(0.98
|
)
|
(0.07
|
)
|
(1.52
|
)
|
(0.40
|
)
|
|||||||||||
|
Weighted-average shares outstanding
|
105,068,351
|
105,520,550
|
105,068,351
|
101,029,652
|
||||||||||||||||
|
Condensed Consolidated Statement of Comprehensive Income (Loss)
|
||||||||||||||||||||
|
Loss after income taxes
|
(103.2
|
)
|
(7.4
|
)
|
(159.6
|
)
|
(41.2
|
)
|
||||||||||||
|
Unrealised gain (loss) from marketable securities
|
13
|
3.2
|
-
|
(4.1
|
)
|
-
|
||||||||||||||
|
Other comprehensive gain (loss)
|
3.2
|
-
|
(4.1
|
)
|
-
|
|||||||||||||||
|
Total comprehensive loss
|
(100.0
|
)
|
(7.4
|
)
|
(163.7
|
)
|
(41.2
|
)
|
||||||||||||
|
Comprehensive loss for the period attributable to
|
||||||||||||||||||||
|
Shareholders of Borr Drilling Limited
|
(100.0
|
)
|
(7.2
|
)
|
(162.2
|
)
|
(40.9
|
)
|
||||||||||||
|
Non-controlling interests
|
-
|
(0.2
|
)
|
(1.5
|
)
|
(0.3
|
)
|
|||||||||||||
|
Total comprehensive loss
|
(100.0
|
)
|
(7.4
|
)
|
(163.7
|
)
|
(41.2
|
)
|
||||||||||||
See accompanying notes that are an integral part of these Unaudited Condensed Consolidated Financial Statements
Borr Drilling Limited
Unaudited Consolidated Financial Statements
Unaudited Condensed Consolidated Balance Sheet
(In $ millions except number of shares)
|
Notes
|
June 30,
2019
|
December 31,
2018
|
||||||||||
|
ASSETS
|
||||||||||||
|
Current assets
|
||||||||||||
|
Cash and cash equivalents
|
44.8
|
27.9
|
||||||||||
|
Restricted cash
|
12
|
62.0
|
63.4
|
|||||||||
|
Trade receivables
|
46.4
|
25.1
|
||||||||||
|
Jack-up drilling rigs held for sale
|
7
|
3.0
|
-
|
|||||||||
|
Marketable securities
|
13
|
32.9
|
4.2
|
|||||||||
|
Prepaid expenses
|
10.3
|
10.8
|
||||||||||
|
Acquired contract backlog
|
5.6
|
20.2
|
||||||||||
|
Deferred mobilization and contract preparation cost
|
20.4
|
6.0
|
||||||||||
|
Accrued revenue
|
36.2
|
18.9
|
||||||||||
|
Tax retentions receivable
|
11.6
|
11.6
|
||||||||||
|
Due from related parties
|
22
|
5.2
|
-
|
|||||||||
|
Other current assets
|
15
|
34.4
|
20.5
|
|||||||||
|
Total current assets
|
312.8
|
208.6
|
||||||||||
|
Non-current assets
|
||||||||||||
|
Property, Plant and Equipment
|
6.9
|
9.5
|
||||||||||
|
Jack-up rigs
|
7
|
2,535.6
|
2,278.1
|
|||||||||
|
Newbuildings
|
8
|
315.1
|
361.8
|
|||||||||
|
Deferred mobilization and contract preparation cost
|
9.0
|
5.1
|
||||||||||
|
Marketable securities
|
13
|
-
|
31.0
|
|||||||||
|
Other long-term assets
|
16
|
16.6
|
19.6
|
|||||||||
|
Total non-current assets
|
2,883.2
|
2.705.1
|
||||||||||
|
Total assets
|
3,196.0
|
2,913.7
|
||||||||||
|
LIABILITIES AND EQUITY
|
||||||||||||
|
Current liabilities
|
||||||||||||
|
Trade accounts payables
|
10.3
|
9.6
|
||||||||||
|
Amounts due to related parties
|
22
|
1.1
|
0.4
|
|||||||||
|
Unrealized loss on forward contracts
|
14
|
55.1
|
35.1
|
|||||||||
|
Accrued expenses
|
61.4
|
63.7
|
||||||||||
|
Onerous contracts
|
17
|
-
|
3.2
|
|||||||||
|
Other current liabilities
|
21
|
32.0
|
7.3
|
|||||||||
|
Total current liabilities
|
159.9
|
119.3
|
||||||||||
|
Non-Current liabilities
|
||||||||||||
|
Long-term debt
|
18
|
1,572.9
|
1,174.6
|
|||||||||
|
Other liabilities
|
19.0
|
8.0
|
||||||||||
|
Onerous contracts
|
17
|
71.3
|
78.3
|
|||||||||
|
Total non-current liabilities
|
1,663.2
|
1,260.9
|
||||||||||
|
Total liabilities
|
1,823.1
|
1,380.2
|
||||||||||
|
Commitments and contingencies
|
23
|
|||||||||||
|
Stockholders’ Equity
|
||||||||||||
|
Common shares of par value $0.01 per share: authorized 125,000,000 (2018: 125,000,000) shares, issued 106,528,065 (2018: 106,528,065) shares and outstanding
105,068,351 (2018: 105,068,351) shares at June 30, 2019
|
5.3
|
5.3
|
||||||||||
|
Additional paid in capital
|
1,840.5
|
1,837.5
|
||||||||||
|
Treasury shares
|
(26.2
|
)
|
(26.2
|
)
|
||||||||
|
Other comprehensive loss
|
(9.6
|
)
|
(5.6
|
)
|
||||||||
|
Accumulated deficit
|
(437.3
|
)
|
(279.2
|
)
|
||||||||
|
Equity attributable to the Company
|
1,372.7
|
1,531.8
|
||||||||||
|
Non-controlling interest
|
0.2
|
1.7
|
||||||||||
|
Total equity
|
1,372.9
|
1,533.5
|
||||||||||
|
Total liabilities and equity
|
3,196.0
|
2,913.7
|
See accompanying notes that are an integral part of these Unaudited Condensed Consolidated Financial Statements.
Borr Drilling Limited
Unaudited Consolidated Financial Statements
Unaudited Condensed Consolidated Statement of Cash Flows
(In $ millions)
|
Notes
|
3 months to
June 30,
2019
|
3 months to
June 30,
2018
|
6 months to
June 30,
2019
|
6 months to
June 30,
2018
|
||||||||||||||||
|
Cash Flows from Operating Activities
|
||||||||||||||||||||
|
Net (loss)/income
|
(103.2
|
)
|
(7.4
|
)
|
(159.6
|
)
|
(41.2
|
)
|
||||||||||||
|
Adjustments to reconcile net (loss)/income to net cash provided by operating activities:
|
||||||||||||||||||||
|
Non-cash compensation expense related to stock options and warrants
|
19
|
1.0
|
0.5
|
3.0
|
0.9
|
|||||||||||||||
|
Depreciation of non-current assets
|
7
|
24.6
|
22.0
|
48.5
|
34.2
|
|||||||||||||||
|
Impairment of non-current assets
|
7
|
-
|
-
|
11.4
|
-
|
|||||||||||||||
|
Amortisation of acquired contract backlog
|
11
|
7.1
|
6.0
|
14.6
|
6.0
|
|||||||||||||||
|
Gain on sale of rigs
|
7
|
(3.9
|
)
|
(17.5
|
)
|
(3.9
|
)
|
(17.5
|
)
|
|||||||||||
|
Change in financial instruments
|
4
|
36.7
|
(18.2
|
)
|
21.6
|
1.8
|
||||||||||||||
|
Non-cash loan fees related to settled debt
|
4
|
5.6
|
-
|
5.6
|
-
|
|||||||||||||||
|
Bargain purchase gain
|
11
|
-
|
-
|
-
|
(38.1
|
)
|
||||||||||||||
|
Deferred income tax
|
5
|
(0.2
|
)
|
0.3
|
(0.5
|
)
|
0.3
|
|||||||||||||
|
Change in other current and non-current assets
|
(27.6
|
)
|
(4.0
|
)
|
(29.6
|
)
|
(14.6
|
)
|
||||||||||||
|
Change in other current and non-current liabilities
|
4.9
|
(26.8
|
)
|
25.7
|
(22.2
|
)
|
||||||||||||||
|
Net cash (used in)/provided by operating activities
|
(54.9
|
)
|
(45.1
|
)
|
(68.8
|
)
|
(90.4
|
)
|
||||||||||||
|
Cash Flows from Investing Activities
|
||||||||||||||||||||
|
Purchase of plant and equipment
|
(0.6
|
)
|
(2.3
|
)
|
(0.6
|
)
|
(2.3
|
)
|
||||||||||||
|
Proceeds from sale of fixed assets
|
6.2
|
38.1
|
6.8
|
38.1
|
||||||||||||||||
|
Purchase business combination (acquisition), net of cash acquired
|
11
|
-
|
-
|
-
|
(194.1
|
)
|
||||||||||||||
|
Purchase of marketable securities
|
13
|
(2.9
|
)
|
-
|
(6.9
|
)
|
-
|
|||||||||||||
|
Proceeds from sale of marketable securities
|
13
|
-
|
-
|
4.2
|
-
|
|||||||||||||||
|
Payment and costs in respect of newbuildings
|
8
|
(4.6
|
)
|
(361.7
|
)
|
(133.6
|
)
|
(362.3
|
)
|
|||||||||||
|
Payments and costs in respect of jack-up rigs
|
7
|
(49.8
|
)
|
(2.8
|
)
|
(93.7
|
)
|
(6.9
|
)
|
|||||||||||
|
Net cash (used in)/provided by investing activities
|
(51.7
|
)
|
(328.7
|
)
|
(223.8
|
)
|
(527.5
|
)
|
||||||||||||
|
Cash Flows from Financing Activities
|
||||||||||||||||||||
|
Proceeds from share issuance, net of issuance costs and conversion of shareholders loans
|
-
|
7.4
|
-
|
218.9
|
||||||||||||||||
|
Proceeds from related party shareholder loan
|
22
|
-
|
-
|
-
|
27.7
|
|||||||||||||||
|
Purchase of treasury shares
|
-
|
-
|
-
|
(2.3
|
)
|
|||||||||||||||
|
Repayment of long-term debt
|
18
|
(390.0
|
)
|
-
|
(390.0
|
)
|
(89.3
|
)
|
||||||||||||
|
Purchase of financial instruments
|
13
|
-
|
(28.5
|
)
|
-
|
(28.5
|
)
|
|||||||||||||
|
Proceeds, net of deferred loan costs, from issuance of long-term debt
|
18
|
544.6
|
374.5
|
639.6
|
374.4
|
|||||||||||||||
|
Proceeds, net of deferred loan costs, from issuance of short-term debt
|
18
|
-
|
-
|
58.5
|
-
|
|||||||||||||||
|
Net cash (used in)/provided by financing activities
|
154.6
|
353.4
|
308.1
|
500.9
|
||||||||||||||||
|
Net increase (decrease) in cash and cash equivalents
|
48.0
|
(20.4
|
)
|
15.5
|
(117.0
|
)
|
||||||||||||||
|
Foreign exchange translation difference
|
-
|
-
|
-
|
-
|
||||||||||||||||
|
Cash and cash equivalents and restricted cash at beginning of the period
|
58.8
|
106.5
|
91.3
|
203.1
|
||||||||||||||||
|
Cash, cash equivalents and restricted cash at the end of period
|
106.8
|
86.1
|
106.8
|
86.1
|
||||||||||||||||
|
Supplementary disclosure of cash flow information
|
||||||||||||||||||||
|
Interest paid, net of capitalized interest
|
(20.0
|
)
|
(6.7
|
)
|
(28.7
|
)
|
(9.4
|
)
|
||||||||||||
|
Income taxes paid
|
(0.3
|
)
|
(0.6
|
)
|
(2.0
|
)
|
(0.6
|
)
|
||||||||||||
|
Issuance of long-term debt as non-cash settlement for newbuild delivery instalment
|
-
|
174.0
|
87.0
|
348.0
|
||||||||||||||||
|
Non-cash settlement of related party shareholder loan
|
-
|
27.7
|
-
|
27.7
|
||||||||||||||||
|
Non-cash payments and cost in respect of jack-up rigs
|
25.4
|
-
|
42.4
|
-
|
||||||||||||||||
See accompanying notes that are an integral part of these Unaudited Condensed Consolidated Financial Statements.
Borr Drilling Limited
Unaudited Consolidated Financial Statements
Unaudited Condensed Consolidated Statement of Changes in Shareholders’ Equity
(In $ millions except share and per share data)
|
Number of
shares
|
Common
shares
|
Treasury
shares
|
Additional
paid in
capital
|
Other
Comprehensive
Loss
|
Accumulated
Deficit
|
Non-
controlling
interest
|
Total
equity
|
|||||||||||||||||||||||||
|
Consolidated balance at December 31, 2017
|
95,264,500
|
4.8
|
(6.7
|
)
|
1,587.8
|
(6.2
|
)
|
(88.8
|
)
|
2.0
|
1,492.9
|
|||||||||||||||||||||
|
Issue of common shares
|
9,341,500
|
0.4
|
-
|
214.3
|
-
|
-
|
-
|
214.7
|
||||||||||||||||||||||||
|
Equity issuance costs
|
-
|
-
|
-
|
(3.3
|
)
|
(3.3
|
)
|
|||||||||||||||||||||||||
|
Issue of common shares
|
1,528,065
|
0.1
|
-
|
35.1
|
-
|
-
|
-
|
35.2
|
||||||||||||||||||||||||
|
Equity issuance costs
|
-
|
-
|
-
|
(0.1
|
)
|
(0.1
|
)
|
|||||||||||||||||||||||||
|
Other transactions:
|
||||||||||||||||||||||||||||||||
|
Share-based compensation
|
-
|
-
|
-
|
0.4
|
-
|
-
|
-
|
0.4
|
||||||||||||||||||||||||
|
Purchase of treasury shares
|
(100,000
|
)
|
-
|
(2.3
|
)
|
-
|
-
|
-
|
-
|
(2.3
|
)
|
|||||||||||||||||||||
|
Total comprehensive loss
|
-
|
-
|
-
|
-
|
-
|
(33.7
|
)
|
(0.1
|
)
|
(33.8
|
)
|
|||||||||||||||||||||
|
Non-controlling interest
|
-
|
-
|
-
|
-
|
-
|
-
|
1.3
|
1.3
|
||||||||||||||||||||||||
|
Other, net
|
0.1
|
-
|
-
|
0.1
|
||||||||||||||||||||||||||||
|
Consolidated balance at June 30, 2018
|
106,034,065
|
5.3
|
(9.0
|
)
|
1,834.3
|
(6.2
|
)
|
(122.5
|
)
|
3.2
|
1,705.1
|
|||||||||||||||||||||
|
Share-based compensation
|
-
|
-
|
-
|
3.4
|
-
|
-
|
-
|
3.4
|
||||||||||||||||||||||||
|
Settlement of directors’ fees
|
-
|
-
|
0.2
|
(0.2
|
)
|
-
|
-
|
-
|
-
|
|||||||||||||||||||||||
|
Purchase of treasury shares
|
(965,714
|
)
|
-
|
(17.4
|
)
|
-
|
-
|
-
|
-
|
(17.4
|
)
|
|||||||||||||||||||||
|
Total comprehensive loss
|
-
|
-
|
-
|
-
|
0.6
|
(156.8
|
)
|
(0.4
|
)
|
(156.6
|
)
|
|||||||||||||||||||||
|
Non-controlling interest
|
-
|
-
|
-
|
-
|
-
|
0.1
|
(1.1
|
)
|
(1.0
|
)
|
||||||||||||||||||||||
|
Other, net
|
-
|
-
|
-
|
-
|
||||||||||||||||||||||||||||
|
Consolidated balance at December 31, 2018
|
105,068,351
|
5.3
|
(26.2
|
)
|
1,837.5
|
(5.6
|
)
|
(279.2
|
)
|
1.7
|
1,533.5
|
|||||||||||||||||||||
|
Share-based compensation
|
-
|
-
|
-
|
3.0
|
-
|
-
|
-
|
3.0
|
||||||||||||||||||||||||
|
Total comprehensive loss
|
-
|
-
|
-
|
-
|
(4.1
|
)
|
(158.1
|
)
|
(1.5
|
)
|
(163.7
|
)
|
||||||||||||||||||||
|
Other, net
|
-
|
-
|
-
|
-
|
0.1
|
-
|
-
|
0.1
|
||||||||||||||||||||||||
|
Consolidated balance at June 30, 2019
|
105,068,351
|
5.3
|
(26.2
|
)
|
1,840.5
|
(9.6
|
)
|
(437.3
|
)
|
0.2
|
1,372.9
|
|||||||||||||||||||||
See accompanying notes that are an integral part of these Unaudited Condensed Consolidated Financial Statements
Borr Drilling Limited
Unaudited Consolidated Financial Statements
Notes to the Unaudited Condensed Consolidated Financial Statements
for the period ended June 30, 2019
Note 1 - General information
Borr Drilling Limited was incorporated in Bermuda on August 8, 2016. The company is listed on the Oslo Stock Exchange, under the ticker BDRILL and since July 31, 2019, on the New York
Stock Exchange under the ticker BORR. Borr Drilling Limited is an international offshore drilling contractor providing services to the oil and gas industry, with the ambition of acquiring and operating modern jack-up drilling rigs. As of
June 30, 2019, the total fleet consisted of 35 jack-up drilling rigs and one semi-submersible drilling rig, of which 8 jack-up drilling rigs are scheduled for delivery between 2019 and 2020.
As used herein, and unless otherwise required by the context, the term “Borr Drilling” refers to Borr Drilling Limited and the terms “Company,”, “Borr”, “we,” “Group,” “our” and words of similar
import refer to Borr Drilling and its consolidated companies. The use herein of such terms as “group”, “organisation”, “we”, “us”, “our” and “its”, or references to specific entities, is not intended to be a precise description of corporate
relationships.
Basis of presentation
We have prepared our accompanying unaudited condensed consolidated financial statements in accordance with accounting principles generally accepted in the United States (“U.S.”) for
interim financial information. Pursuant to such rules and regulations, these financial statements do not include all disclosures required by accounting principles generally accepted in the U.S. for complete financial statements. The condensed
consolidated financial statements reflect all adjustments, which are, in the opinion of management, necessary for a fair statement of financial position, results of operations and cash flows for the interim periods. Such adjustments are
considered to be of a normal recurring nature unless otherwise noted. Operating results for the three and six months ended June 30, 2019, are not necessarily indicative of the results that may be expected for the year ending December 31, 2019, or
for any future period. The accompanying condensed consolidated financial statements and notes thereto should be read in conjunction with the audited consolidated financial statements and notes thereto including the Company’s annual report for the
year ended December 31, 2018. The annual report and F-1 can be found on our website, www.borrdrilling.com. The amounts are presented in millions of United States dollar (U.S. dollar), unless otherwise stated. The financial statements have
been prepared on a going concern basis.
Certain amounts in prior periods have been reclassified to conform to current presentation, including the bargain purchase gain reported in the first quarter of 2018 that has been reclassified as part
of operating items. Such reclassifications did not have a material effect on our consolidated statement of financial position, results of operations or cash flows.
The Condensed Consolidated Financial Statements present the financial position of Borr Drilling Limited and its subsidiaries. Investments in companies in which the Company
controls, or directly or indirectly holds more than 50% of the voting control of, are consolidated in the financial statements.
Subsequent events have been reviewed from the period end to the issuance of the Condensed Consolidated Financial Statements on August [29], 2019.
Basis of consolidation
The consolidated financial statements include the assets and liabilities of the Company. All intercompany balances, transactions and internal sales have been eliminated on consolidation.
Unrealized gains and losses arising from transactions with affiliates are eliminated to the extent of the Company’s interest in the entity. The non-controlling interests of subsidiaries were included in the Consolidated Balance Sheets and
Statements of Operations as "Non-controlling interests". Profit or loss and each component of other comprehensive income are attributed to the equity holders of the parent of the Group and to the non-controlling interests, even if this results in
the non-controlling interests having a deficit balance.
Going concern
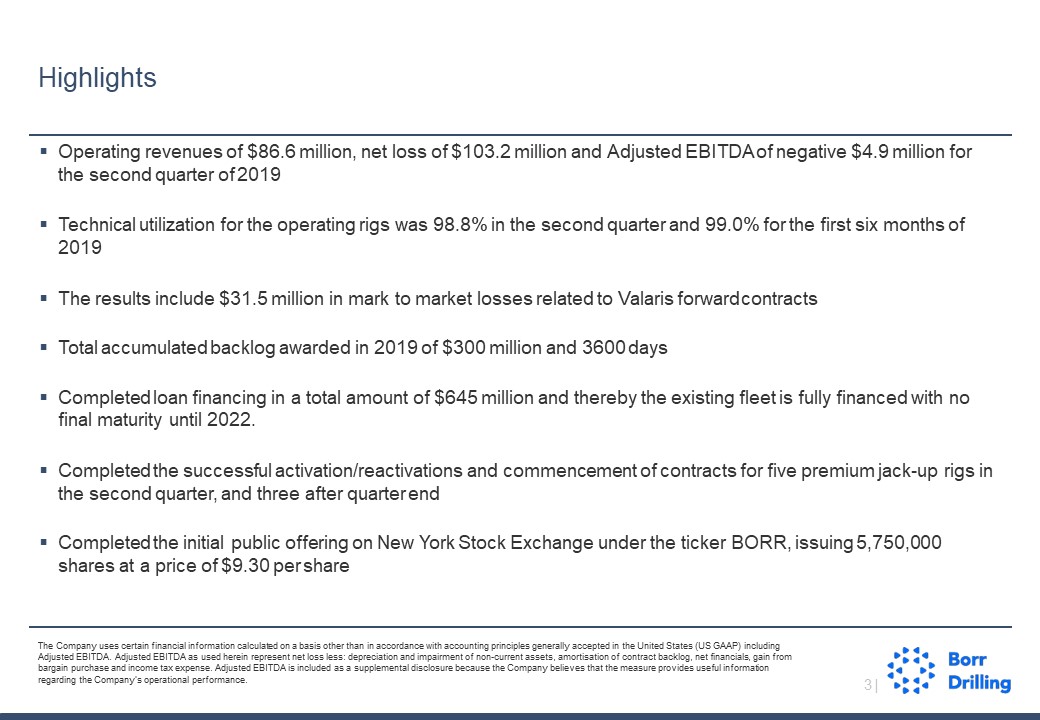
The consolidated financial statements have been prepared on a going concern basis. The Company has, as of June 28, 2019 finalized and partly drawn on secured financing arrangements in the total amount of $645
million, which were used to refinance all of its credit facilities of $510 million. The Company’s new financing arrangements include a $195 million senior secured term loan facility agreement with funds managed by Hayfin Capital Management LLP, as
lenders, among others, a $450 million senior secured credit facilities agreement with DNB Bank ASA, Danske Bank, Citibank N.A., Jersey Branch and Goldman Sachs Bank USA, as lenders, among others (consisting of a $230 million credit facility, $50
million newbuild facility, $70 million for the issuance of guarantees and other trade finance instruments as required in the ordinary course of business and a $100 million incremental facility) and a $100 million senior secured revolving facility
agreement with Danske Bank and DNB Bank ASA, as lenders, among others. The financing arrangements contain certain financial and non-financial covenants, including restrictions that require the approval of our lenders prior to the distribution of
any dividend. The outstanding obligations under the new financing arrangements will mature in 2022. In addition, the Company raised approximately $53.5 million gross in July 2019 from an initial public offering of 5,750,000 shares on the New York
Stock Exchange. Based on the execution of the financing arrangements and the July 2019 equity raise, we believe the prior conclusion on April 29, 2019 of substantial doubt over going concern has been alleviated.
Reverse share split
We have effected a conversion of each of our Shares into 0.20 Shares, resulting in a reverse share split at a ratio of 5-for-1. Our post-Reverse Share Split Shares began to trade on the Oslo Børs on June 26, 2019.
All share and per share data in these financial statements have been adjusted to give effect to our Reverse Share Split and is approximate due to fractional shares.
Borr Drilling Limited
Unaudited Consolidated Financial Statements
Notes to the Unaudited Condensed Consolidated Financial Statements
for the period ended June 30, 2019
Use of estimates
Preparation of financial statements in accordance with U.S. GAAP requires management to make estimates and assumptions that affect the reported amounts of assets and liabilities and disclosure of
contingent assets and liabilities at the date of the financial statements and the reported amounts of revenues and expenses during the reporting period. Actual results could differ from those estimates.
Note 2 - Accounting policies
The accounting policies used in the preparation of the condensed interim consolidated financial statements are consistent with those followed in the preparation of the Company’s consolidated financial
statements for the year ended December 31, 2018, except as described below. None of the new accounting standards or amendments that were adopted as of the first half of 2019 had a significant effect on the condensed interim consolidated financial
statements, except as described below.
Recently Issued Accounting Standards
Adoption of new accounting standards
In February 2016, the Financial Accounting Standards Board (“FASB”) issued Accounting Standards Update (“ASU”) No. 2016-02 (Topic 842,
“Leases”), as amended, which generally requires lessees to recognize operating and financing lease liabilities and corresponding right-of-use (ROU) assets on the balance sheet and to provide enhanced disclosures
surrounding the amount, time and uncertainty of cash flows arising from lease agreements. We adopted this standard, on a modified retrospective basis, effective January 1, 2019 and will not restate comparative periods. With respect to leases in
which we are the lessee, we recognized a lease liability of $12.1 million and a corresponding right-of-use asset of approximately $2.0 million as of January 1, 2019. Adoption of this standard did not materially impact our Consolidated Statement of
Operations and had no impact on our Consolidated Statement of Cash Flows.
We have elected the package of practical expedients that permits us to not reassess (1) whether previously expired or existing contracts are or contain leases, (2) the lease classification for any expired or existing
leases, and (3) any initial direct costs for any existing leases as of the effective date. In addition, we have elected the hindsight practical expedient in connection with our adoption of the new lease standard. As lessee, we have made the
accounting policy election to not recognize a right-of-use asset lease and lease liability for leases with a term of 12 months or less. We will recognize lease payments in the Consolidated Statements of Operations on a straight-line basis over the
lease term. We have also elected the practical expedient to not separate lease and non-lease components.
Many of our leases contain variable non-lease components such as maintenance, taxes, insurance, and similar costs for the spaces we occupy. For new and amended leases beginning in 2019 and after, the Company has elected
the practical expedient not to separate these non-lease components of leases for classes of all underlying assets and instead account for them as a single lease component for all leases. We straight-line the net fixed payments of operating leases
over the lease term and expense the variable lease payments in the period in which we incur the obligation to pay such variable amounts. These variable lease payments are not included in our calculation of our ROU assets or lease liabilities.
As most of our leases do not provide an implicit rate, we use our incremental borrowing rate based on the information available at commencement date in determining the present value of lease payments. Certain of our lease
agreements include options to extend or terminate the lease, which we do not include in our minimum lease terms unless management is reasonably certain to exercise.
Our drilling contracts contain a lease component related to the underlying drilling equipment, in addition to the service component provided by our crews and our expertise to operate such drilling equipment. We have
concluded the non-lease service of operating our equipment and providing expertise in the drilling of the client’s well is predominant in our drilling contracts. We have applied the practical expedient to account for the lease and associated
non-lease components as a single component. With the election of the practical expedient, we will continue to present a single performance obligation under the new revenue guidance in Accounting Standards Codification (“ASC”) Topic 606, “Revenue
from Contracts with Customers.”
In June 2018, the FASB issued ASU No. 2018-07, Compensation – Stock Compensation (Topic 718): Improvements to Nonemployee Share Based-Payment Accounting. This ASU intends to improve the usefulness of information provided
and reducing the cost and complexity of financial reporting. A main objective of this ASU is to substantially align the accounting for share-based payments to employees and non-employees. The guidance is effective for annual reporting periods
beginning after December 15, 2018 for public entities, including interim periods within that period. Our adoption did not have a material effect on our Condensed Consolidated Financial Statements.
Issued not effective accounting standards
In June 2016, the FASB issued ASU No. 2016-13, Financial Instruments-Credit Losses (Topic 326): Measurement of Credit Losses on Financial Instruments, which revises guidance for the accounting for
credit losses on financial instruments within its scope. The new standard introduces an approach, based on expected losses, to estimate credit losses on certain types of financial instruments and modifies the impairment model for available-for-sale
debt securities. The guidance will be effective January 1, 2020, with early adoption permitted. Entities are required to apply the standard’s provisions as a cumulative-effect adjustment to retained earnings as of the beginning of the first
reporting period in which the guidance is adopted. We continue to evaluate the requirements and do not expect our adoption to have a material effect on our condensed consolidated statements of financial position, operations or cash flows or on the
disclosures contained in our notes to condensed consolidated financial statements.
Borr Drilling Limited
Unaudited Consolidated Financial Statements
Notes to the Unaudited Condensed Consolidated Financial Statements
for the period ended June 30, 2019
Note 3 - Revenues
In the three months ended June 30, 2019 and June 30, 2018 and the six months ended June 30, 2019 and June 30, 2018, the Company recognised revenues of $86.6 million, $51.1 million, $138.5 million and
$61.7 million, respectively, primarily relating to dayrates.
To obtain contracts with our customers, the Company incurs costs to prepare a rig for contract and deliver or mobilise a rig to the drilling location. The Company defers pre‑operating costs, such as
contract preparation and mobilisation costs, and recognise such costs on a straight‑line basis, consistent with the general pace of activity, in rig operating and maintenance costs over the estimated firm period of drilling. In the three months
ended June 30, 2019, June 30, 2018 and six months ended June 30, 2019 and June 30, 2018, the Company recognised $6.4 million, $6.9 million, $2.3 million and $4.4 million, respectively, of pre-operating expenses included in rig operating and
maintenance expenses in the Unaudited Condensed Consolidated Statements of Operations.
The Company has one operating segment, and this is reviewed by the Chief Operating Decision Maker, which is the Company’s board of directors (the “Board”), as an aggregated sum of assets, liabilities
and activities that exists to generate cash flows.
Geographic data
Revenues are attributed to geographical location based on the country of operations for drilling activities, i.e. the country where the revenues are generated.
|
The following presents our revenues by geographic area:
|
3 months to
June 30,
2019
|
3 months to
June 30,
2018
|
6 months to
June 30,
2019
|
6 months to
June 30,
2018
|
||||||||||||
|
(In $ millions)
|
||||||||||||||||
|
North Sea
|
30.4
|
25.2
|
55.7
|
26.1
|
||||||||||||
|
West Africa
|
23.0
|
11.5
|
34.5
|
20.7
|
||||||||||||
|
Middle East
|
11.7
|
14.4
|
22.2
|
14.9
|
||||||||||||
|
South East Asia
|
2.2
|
-
|
5.7
|
-
|
||||||||||||
|
Mexico
|
19.3
|
-
|
20.4
|
-
|
||||||||||||
|
Total
|
86.6
|
51.1
|
138.5
|
61.7
|
||||||||||||
Major customers
|
Following customers accounted for more than 10% of our contract revenues:
|
3 months to
June 30,
2019
|
3 months to
June 30,
2018
|
6 months to
June 30,
2019
|
6 months to
June 30,
2018
|
||||||||||||
|
(In % of operating revenues)
|
||||||||||||||||
|
National Drilling Company (ADOC)
|
14
|
%
|
21
|
%
|
16
|
%
|
21
|
%
|
||||||||
|
TAQA Bratani Limited
|
13
|
%
|
16
|
%
|
15
|
%
|
17
|
%
|
||||||||
|
Pan American Energy
|
21
|
%
|
-
|
14
|
%
|
-
|
||||||||||
|
ExxonMobil
|
15
|
%
|
-
|
9
|
%
|
-
|
||||||||||
|
Centrica North Sea Limited (Spirit Energy)
|
12
|
%
|
10
|
%
|
11
|
%
|
10
|
%
|
||||||||
|
Total
|
75
|
%
|
47
|
%
|
65
|
%
|
48
|
%
|
||||||||
Fixed Assets — Jack-up rigs(1)
|
The following presents the net book value of our jack-up rigs by geographic area
|
As of June 30, 2019
|
As of December 31, 2018
|
||||||
|
(In $ millions)
|
||||||||
|
Middle East
|
38.5
|
42.0
|
||||||
|
North Sea
|
298.7
|
320.0
|
||||||
|
West Africa
|
656.6
|
203.0
|
||||||
|
South East Asia
|
1,134.5
|
1,713.1
|
||||||
|
Mexico
|
407.3
|
-
|
||||||
|
Total
|
2,535.6
|
2,278.1
|
||||||
Borr Drilling Limited
Unaudited Consolidated Financial Statements
Notes to the Unaudited Condensed Consolidated Financial Statements
for the period ended June 30, 2019
(1)The fixed assets referred to in the table above exclude assets under construction. Asset locations at the end of a period are not necessarily indicative of the geographic distribution of the revenues or operating profits generated by such
assets during such period.
Contract balances
Accounts receivable are recognized when the right to consideration becomes unconditional based upon contractual billing schedules.
Payment terms on invoiced amounts are typically 30 days. Current contract asset balances are included in “Deferred mobilization costs, Acquired contract backlog and Accrued revenue” and non-current contract assets are
included in “Other assets” on our Consolidated Balance Sheets.
The following table provides information about contract assets from contracts with customers:
|
As of June 30, 2019
|
As of December 31, 2018
|
|||||||
|
(In $ millions)
|
||||||||
|
Current contract assets
|
62.2
|
45.1
|
||||||
|
Non-current contract assets
|
9.0
|
5.1
|
||||||
|
Total contract assets
|
71.2
|
50.2
|
||||||
Significant changes in the remaining performance obligation contract assets balances for the period ended June 30, 2019 are as follows:
|
(In $ millions)
|
Contract assets
|
|||
|
Net balance at January 1, 2019
|
50.2
|
|||
|
Additions to deferred costs and accrued revenue
|
61.0
|
|||
|
Amortization of deferred costs
|
(40.0
|
)
|
||
|
Total contract assets
|
71.2
|
|||
Contract Costs
Certain direct and incremental costs incurred for upfront preparation, initial rig mobilization and modifications are costs of fulfilling a contract and are recoverable. These recoverable costs are deferred and amortized
ratably to contract drilling expense as services are rendered over the initial term of the related drilling contract. Costs incurred for the demobilization of rigs at contract completion are recognized as incurred during the demobilization process.
Note 4 - Other income (expenses)
Other income (expense) is comprised of the following:
|
3 months to
June 30,
2019
|
3 months to
June 30,
2018
|
6 months to
June 30, 2019
|
6 months to
June 30, 2018
|
|||||||||||||
|
(In $ millions)
|
||||||||||||||||
|
Foreign exchange gain/(loss), net
|
0.8
|
(0.3
|
)
|
1.0
|
(0.5
|
)
|
||||||||||
|
Other financial expenses
|
(8.3
|
)
|
(0.9
|
)
|
(9.1
|
)
|
(0.9
|
)
|
||||||||
|
Change in unrealised (loss)/gain on call spread (note 14)
|
(5.2
|
)
|
(7.1
|
)
|
(1.6
|
)
|
(7.1
|
)
|
||||||||
|
(Loss)/gain on forward contracts (note 14)
|
(31.5
|
)
|
25.3
|
(20.0
|
)
|
11.7
|
||||||||||
|
Total
|
(44.2
|
)
|
17.0
|
(29.7
|
)
|
(3.2
|
)
|
|||||||||
(Loss)/gain on forward contracts is presented net for the three months ended June 30, 2019. We did not realize any gains or losses in the second quarter of 2019.
During the second quarter of 2019, we refinanced our existing credit facilities. As part of the refinancing, any capitalized borrowing costs related to the existing credit facilities were expensed,
amounting to a total non-cash charge of $5.6 million with $4.1 million recorded within other financial expenses and $1.5 million recorded within interest expenses.
Note 5 - Taxation
Borr Drilling Limited is a Bermuda company not required to pay taxes in Bermuda on ordinary income or capital gains as it qualifies as an Exempted Company. We operate through various subsidiaries in numerous
countries throughout the world and are subject to tax laws, policies, treaties and regulations, as well as the interpretation or enforcement thereof, in jurisdictions in which we or any of our subsidiaries operate, were incorporated, or otherwise
considered to have a tax presence. Our income tax expense is based upon our interpretation of the tax laws in effect in various countries at the time that the expense was incurred.
Borr Drilling Limited
Unaudited Consolidated Financial Statements
Notes to the Unaudited Condensed Consolidated Financial Statements
for the period ended June 30, 2019
The change in the effective tax rate from period to period is primarily attributable to changes in the profitability or loss mix of our operations in various jurisdictions. As our operations continually change among
numerous jurisdictions, and methods of taxation in these jurisdictions vary greatly, there is little direct correlation between the income tax provision or benefit and income or loss before taxes. We used a discrete effective tax rate method to
calculate income taxes.
|
Income tax expense is comprised of the following:
|
3 months to
June 30,
2019
|
3 months to
June 30,
2018
|
6 months to
June 30,
2019
|
6 months to
June 30,
2018
|
||||||||||||
|
(In $ millions)
|
||||||||||||||||
|
Current tax
|
2.7
|
(0.3
|
)
|
3.2
|
(0.3
|
)
|
||||||||||
|
Change in deferred tax
|
(0.2
|
)
|
0.3
|
(0.5
|
)
|
0.3
|
||||||||||
|
Total
|
2.5
|
-
|
2.7
|
-
|
||||||||||||
Note 6 - Earnings/(Loss) per share
The computation of basic earnings/(loss) per share (“EPS”) is based on the weighted average number of shares outstanding during the period. Diluted EPS does not include the effect of the
assumed conversion of potentially dilutive instruments which are 2,875,000 share options outstanding issued to employees and directors and convertible bonds with a conversion price of $33.4815 for a total of 10,453,534 shares. Due to the
Company’s current loss-making position and the share price being less than the conversion price of the convertible bonds these are deemed to have an anti-dilutive effect on the EPS of the Company.
All periods presented have been adjusted for our 5 for 1 reverse share split in June 2019.
|
3 months to
June 30,
2019
|
3 months to
June 30,
2018
|
6 months to
June 30,
2019
|
6 months to
June 30,
2018
|
|||||||||||||
|
Basic loss per share
|
(0.98
|
)
|
(0.07
|
)
|
(1.52
|
)
|
(0.40
|
)
|
||||||||
|
Diluted loss per share
|
(0.98
|
)
|
(0.07
|
)
|
(1.52
|
)
|
(0.40
|
)
|
||||||||
|
Issued ordinary shares at the end of the period
|
106,528,065
|
106,528,065
|
106,528,065
|
106,528,065
|
||||||||||||
|
Weighted average numbers of shares outstanding for the period
|
105,068,351
|
105,520,550
|
105,068,351
|
101,029,652
|
||||||||||||
The number of share options that would be considered dilutive under the “if converted method” for the three months ended June 30, 2019 is 0 (three months ended June 30, 2018: 270,073).
Note 7 - Jack-up rigs
|
Cost
|
Accumulated
depreciation
|
Net carrying value
|
||||||||||
|
(In $ millions)
|
||||||||||||
|
Balance at December 31, 2018
|
2,366.6
|
(88.5
|
)
|
2,278.1
|
||||||||
|
Additions
|
53.7
|
-
|
53.7
|
|||||||||
|
Asset transfers (note 8)
|
268.0
|
-
|
268.0
|
|||||||||
|
Depreciation and amortisation
|
-
|
(47.7
|
)
|
(47.7
|
)
|
|||||||
|
Disposals
|
(2.1
|
)
|
(2.1
|
)
|
||||||||
|
Reclassification to asset held for sale
|
(3.0
|
)
|
(3.0
|
)
|
||||||||
|
Impairment
|
(14.8
|
)
|
3.4
|
(11.4
|
)
|
|||||||
|
Balance at June 30, 2019
|
2,668.4
|
(132.8
|
)
|
2,535.6
|
||||||||
The Company took delivery of the “Njord” in the first quarter of 2019. The final delivery instalment was funded by delivery financing from PPL Shipyard of $87.0 million.
The Company entered into a sale agreement for the “Baug”, “C20051” and “Eir” in May 2019. The sale of “Baug” and “C20051” closed in May 2019 and we recorded a gain of $3.9 million in connection with
the transaction.
In addition, the Company recorded a depreciation charge of $0.4 million in the second quarter of 2019, $2.8 million in the second quarter of 2018, $0.8 million in the first half of 2019 and $2.8 million for the first
half of 2018 related to property, plant and equipment.
Borr Drilling Limited
Unaudited Consolidated Financial Statements
Notes to the Unaudited Condensed Consolidated Financial Statements
for the period ended June 30, 2019
Impairment assessment
During the second quarter of 2019, the Company evaluated the carrying value of our drilling rigs due to continuing impairment indicators. Based on our assumptions and analysis at that time, we determined that the
undiscounted probability-weighted cash flows for each rig were in excess of their respective carrying values. As a result, we concluded that no impairment of these rigs had occurred at June 30, 2019
An impairment loss of $11.4 million was recognized for the “Eir” in the first quarter of 2019 as a result of entering into a sale agreement, which resulted in the Company reducing the book value to
the expected sale value. As of June 30, 2019, the Company consider that the consideration for held for sale presentation were achieved and the “Eir” has been reclassified to jack-up drilling rigs held for sale.
Note 8 - Newbuildings
|
June 30, 2019
|
December 31, 2018
|
|||||||
|
(In $ millions)
|
||||||||
|
Balance at January 1st
|
361.8
|
642.7
|
||||||
|
Additions
|
211.1
|
971.4
|
||||||
|
Capitalized interest
|
10.2
|
23.4
|
||||||
|
Asset transfers
|
(268.0
|
)
|
(1,275.7
|
)
|
||||
|
Total
|
315.1
|
361.8
|
||||||
The Company took delivery of the “Njord” in the first quarter 2019. The delivery instalment was funded by delivery financing from PPL Shipyard Ltd of $87.0 million. Also in the first quarter of 2019,
the Company entered into a novation agreement to acquire Hull No. B378 from Keppel Shipyard Ltd (see note 10) for a purchase price of $122.1 million. The acquisition was partly funded by a new bridge financing facility from Danske Bank A/S and
partly by drawing down on the $160 million Senior secured revolving loan facility entered into in the first quarter (see note 18). The rig was subsequently renamed “Thor” and was delivered on May 9, 2019.
Note 9 - Leases
We have operating leases expiring at various dates, principally for real estate, office space, storage facilities and operating equipment. For our Houston office space, we have previously deemed the
lease as an onerous lease as a result of change in our operating strategy, it is expected that the lease will expire on March 1, 2022. For this operating lease, upon adoption of the new standard, we offset the right-of-use asset of the lease by
the existing carrying amount of the liability previously recorded on the date of adoption.
Supplemental balance sheet information related to leases was as follows:
|
June 30, 2019
|
||||
|
(In $ millions)
|
||||
|
Operating leases
|
||||
|
Operating leases right-of-use assets
|
3.0
|
|||
|
Current operating lease liabilities
|
3.4
|
|||
|
Long-term operating lease liabilities
|
8.2
|
|||
The current portion of the ROU asset is recognized within other current assets (see note 15) and the non-current portion is recognized within other long-term assets (see note 16). The current lease liabilities are
recognized within other current liabilities (see note 21) and the non-current lease liabilities are recognized within other liabilities.
|
Components of lease cost is comprised of the following:
|
Three months ended
June 30, 2019
|
Six months ended
June 30, 2019
|
||||||
|
(In $ millions)
|
||||||||
|
Operating lease cost
|
0.6
|
1.1
|
||||||
|
Short-term lease cost
|
2.3
|
4.6
|
||||||
|
Variable lease cost
|
-
|
-
|
||||||
|
Total lease cost
|
2.9
|
5.7
|
||||||
|
Sublease income
|
0.2
|
0.4
|
||||||
Borr Drilling Limited
Unaudited Consolidated Financial Statements
Notes to the Unaudited Condensed Consolidated Financial Statements
for the period ended June 30, 2019
|
Supplemental cash flow information related to leases was as follows:
|
June 30, 2019
|
|||
|
(In $ millions)
|
||||
|
Cash payments for onerous lease contracts
|
0.9
|
|||
|
Operating cash flows from operating leases
|
0.3
|
|||
|
Total lease payments
|
1.2
|
|||
|
Weighted average remaining lease term for operating leases (years)
|
11.38
|
|||
|
Weighted average discount rate for operating leases
|
6.38
|
%
|
||
|
Maturities of lease liabilities were as follows:
|
June 30, 2019
|
|||
|
(In $ millions)
|
||||
|
2019
|
4.7
|
|||
|
2020
|
3.9
|
|||
|
2021
|
2.8
|
|||
|
2022
|
0.3
|
|||
|
2023
|
0.3
|
|||
|
Thereafter
|
1.5
|
|||
|
Total lease payments
|
13.5
|
|||
|
Less interest
|
1.9
|
|||
|
Present value of lease liability
|
11.6
|
|||
|
Maturities of lease liabilities were as follows:
|
December 31, 2018
|
|||
|
(In $ millions)
|
||||
|
2019
|
4.6
|
|||
|
2020
|
3.6
|
|||
|
2021
|
3.6
|
|||
|
2022
|
0.5
|
|||
|
2023
|
-
|
|||
|
Thereafter
|
-
|
|||
|
Total lease payments
|
12.3
|
|||
Note 10 - Asset acquisition
Acquisition of Keppel’s Hull B378
In March 2019, the Company entered into an assignment agreement with the original owner for the assignment of the rights and obligations under a construction contract to take delivery of one KFELS
Super B Bigfoot premium jack-up rig identified as Keppel’s Hull No. B378 from Keppel for a purchase price of $122.1 million. The construction contract was, at the same time, novated to our subsidiary, Borr Jack-Up XXXII Inc., and amended. Borr
Jack-Up XXXII Inc. took delivery of the rig on May 9, 2019. The rig has been renamed ‘‘Thor.’’
Acquisition of Keppel Rigs
In May 2018, the Company signed a master agreement to acquire five premium newbuild jack-up drilling rigs from Keppel FELS Limited. Total consideration for the transaction will be approximately $742.5
million. In the second quarter of 2018, the Company paid a pre-delivery instalment of $288.0 million. The pre-delivery instalment is secured by a parent guarantee from Keppel Offshore & Marine Ltd. The Company has secured financing of the
delivery payment for each Keppel Rig from Offshore Partners Pte. Ltd (formerly Caspian Rigbuilders Pte. Ltd). Each loan is non-amortizing and matures five years after the respective delivery dates. The delivery financing will be secured by a first
priority mortgage, an assignment of earnings, an assignment of insurance and a charge over shares and parent guarantee from the Company. The Company expects to take delivery of the first rig in the fourth quarter of 2019, with the remaining rigs
scheduled to be delivered quarterly thereafter until the last rig is delivered in the fourth quarter of 2020. The remaining contracted instalments, payable on delivery, for the Keppel newbuilds acquired in 2018 are approximately $454.5 million as
of June 30, 2019.
Borr Drilling Limited
Unaudited Consolidated Financial Statements
Notes to the Unaudited Condensed Consolidated Financial Statements
for the period ended June 30, 2019
Note 11 - Business acquisition
Paragon Offshore Limited
The Company announced a binding tender offer agreement (the “Tender Offer Agreement”) on February 21, 2018 to offer to purchase all outstanding shares in Paragon Offshore Limited (“Paragon”) (“the
Offer”). The total acquisition price to purchase all outstanding shares was $241.3 million. The transaction was subject to the satisfaction of the offer conditions, customary closing conditions, including, among other customary conditions, that (a)
at least 67% of the outstanding Paragon shares were validly tendered and not withdrawn before the expiration date, (b) no material adverse change shall have occurred prior to closing, and (c) Paragon shall have completed all actions necessary to
acquire ownership of certain Prospector drilling rigs and legal entities currently subject to Chapter 11 proceedings in the United States Bankruptcy Court in the District of Delaware. On March 29, 2018, all of the conditions to the Offer were
satisfied and the transaction closed. Shareholders holding 99.41% of the shares accepted the offer for a total payment of approximately $240.0 million.
Recognised amounts of identifiable assets acquired and liabilities assumed at fair value:
|
March 29,
2018
|
||||
|
(In $ millions)
|
||||
|
Cash and Cash equivalents
|
41.7
|
|||
|
Restricted cash
|
4.2
|
|||
|
Trade receivables
|
31.0
|
|||
|
Other current assets (including contract backlog of $31.6 million)
|
53.4
|
|||
|
Jack-up drilling rigs
|
246.0
|
|||
|
Assets held for sale
|
15.0
|
|||
|
Property, Plant and Equipment
|
16.1
|
|||
|
Other long-term assets (including contract backlog of $12.8 million)
|
24.8
|
|||
|
Trade payables
|
(10.5
|
)
|
||
|
Accruals and other current liabilities
|
(40.9
|
)
|
||
|
Long term debt
|
(87.7
|
)
|
||
|
Other non-current liabilities
|
(13.7
|
)
|
||
|
Total
|
279.4
|
|||
|
Fair value of consideration satisfied by cash:
|
||||
|
Payment upon completion by the Company (March 29, 2018)
|
240.0
|
|||
|
Payment to non-controlling interest
|
1.3
|
|||
|
Total
|
241.3
|
|||
|
Total fair value of purchase consideration
|
241.3
|
|||
|
Fair value of net assets acquired
|
279.4
|
|||
|
Bargain Gain
|
(38.1
|
)
|
||
At the time of the acquisition, Paragon was an international driller with a fleet of 23 drilling units. This fleet included two modern jack-up drilling rigs, the Prospector 1 and Prospector 5, built
in 2013 and 2014, respectively. The fleet also included a semi-submersible drilling rig, MSS1, with a long-term contract for TAQA in the North Sea which commenced on March 6, 2018. We disposed of 16 jack-up rigs acquired in the Paragon transaction
during 2018.
The Paragon transaction is accounted for as a business combination. The estimated fair value of the individual rigs was derived by using a market and income-based approach with market
participant-based assumptions. A bargain purchase gain of $38.1 million was recognized in the Consolidated Statement of Operations. A bargain purchase gain arises when fair value of the net assets acquired is higher than total fair value of
purchase consideration.
Immediately following the closing of the Paragon transaction, the Company settled the long-term debt of $87.7 million plus $1.6 million of accrued interest and brokerage fees.
During 2018, the Company purchased the remaining outstanding shares in Paragon Offshore limited for $1.0 million.
Borr Drilling Limited
Unaudited Consolidated Financial Statements
Notes to the Unaudited Condensed Consolidated Financial Statements
for the period ended June 30, 2019
Paragon pro forma information (unaudited)
Basis of preparation
The unaudited pro forma financial information is based on Borr Drilling’s and Paragon’s historical consolidated financial statements as adjusted to give effect to the acquisition of Paragon. The
unaudited revenue and net income (loss) for the six months ended June 30, 2018 give effect to the Paragon acquisition as if it had occurred on January 1, 2017.
|
Pro forma for the six months ended
June 30, 2018
|
||||
|
(In $ millions)
|
(unaudited)
|
|||
|
Revenue
|
88.9
|
|||
|
Net income (loss)
|
(152.6
|
)
|
||
Certain one-time adjustments were included in the pro forma financial information.
Note 12 - Restricted cash
|
June 30, 2019
|
December 31, 2018
|
|||||||
|
(In $ millions)
|
||||||||
|
Opening balance
|
63.4
|
39.1
|
||||||
|
Transfer to (from) restricted cash
|
(1.4
|
)
|
24.3
|
|||||
|
Total
|
62.0
|
63.4
|
||||||
All restricted cash is recorded within current assets and consist of deposits in margin accounts and bank deposits in relation to forward contracts and deposits made for issued guarantees and letters
of credits.
Note 13 - Marketable Securities
Our marketable securities consist of debt securities and equity securities. Debt securities are marked to market, with changes in fair value recognised in “Other comprehensive income” (“OCI”). Equity
securities are re-measured at fair value with unrealized gains and losses recognized under other income (expenses), net. The Company acquired debt securities for a consideration of $2.9 million in the second quarter of 2019. In the first quarter of
2019, the Company purchased debt securities for $3.1 million.
As of December 31, 2018, an accumulated unrealised loss of $5.6 million was recognised in OCI for the non-current marketable securities. In the second quarter of 2019, we recorded an unrealised gain
of $3.2 million through OCI, partially offsetting an unrealised loss of $7.3 million recorded in the first quarter of 2019.
The following table sets forth Marketable securities, non-current
|
(In $ millions)
|
June 30, 2019
|
December 31, 2018
|
||||||
|
Opening balance January 1st
|
31.0
|
20.7
|
||||||
|
Purchase of marketable securities
|
3.1
|
9.7
|
||||||
|
Unrealized gain/(loss) on marketable securities
|
(7.3
|
)
|
0.6
|
|||||
|
Reclassification to marketable securities, current
|
(26.8
|
)
|
-
|
|||||
|
Total marketable securities, non-current
|
-
|
31.0
|
||||||
The following table sets forth Marketable securities, current
|
(In $ millions)
|
June 30, 2019
|
December 31, 2018
|
||||||
|
Opening balance January 1st
|
4.2
|
-
|
||||||
|
Purchase of marketable securities
|
2.9
|
4.2
|
||||||
|
Sale of marketable securities
|
(4.2
|
)
|
-
|
|||||
|
Unrealized gain/(loss) on marketable securities
|
3.2
|
-
|
||||||
|
Reclassification from marketable securities, non-current
|
26.8
|
|||||||
|
Total marketable securities, current
|
32.9
|
4.2
|
||||||
We reclassified $26.8 million of our debt securities from non-current to current in the first quarter of 2019 due to developments in the issuer of the debt securities. Realization of the investment is
estimated to take place within the next 12 months.
Borr Drilling Limited
Unaudited Consolidated Financial Statements
Notes to the Unaudited Condensed Consolidated Financial Statements
for the period ended June 30, 2019
Note 14 - Financial Instruments
Forward contracts
As of June 30, 2019, the Company has forward contracts to purchase shares in a listed drilling company for an aggregate amount of approximately $91.4 million. The forward contracts consist of forward assets of $36.3 million and forward liabilities of $91.4 million and are presented as a net unrealized loss of $55.1 million under accrued expenses and other current liabilities (see note 20)
in the Consolidated Balance Sheets as of June 30, 2019. During the first quarter of 2019, the Company sold shares resulting in net cash proceeds of $4.2 million (see note 13) and simultaneously purchased forward contracts with exposure to the
same amount.
Call Spread
Fair value adjustments during the second quarter of 2019 resulted in an unrealised loss recognised in the Condensed Consolidated Statements of Operations in other income (expense), net, of $5.2
million. As of June 30, 2019, aggregated fair value adjustments were unrealised loss of $27.3 million related to one-off costs for entering the position and subsequent fair value adjustments. The Call Spread is presented under other long-term
assets, see note 16
Note 15 - Other current assets
|
June 30, 2019
|
December 31, 2018
|
|||||||
|
Other current assets are comprised of the following:
|
||||||||
|
(In $ millions)
|
||||||||
|
Client rechargeable
|
5.5
|
5.1
|
||||||
|
Other receivables
|
8.1
|
7.9
|
||||||
|
VAT and other tax receivable
|
17.1
|
4.3
|
||||||
|
Deferred financing fee
|
3.0
|
3.2
|
||||||
|
Right-of-use lease asset, current
|
0.7
|
-
|
||||||
|
Total
|
34.4
|
20.5
|
||||||
Note 16 - Other long-term assets
|
June 30, 2019
|
December 31, 2018
|
|||||||
|
Other long-term assets are comprised of the following:
|
||||||||
|
(In $ millions)
|
||||||||
|
Other receivables
|
-
|
0.5
|
||||||
|
Deferred tax asset
|
3.2
|
2.6
|
||||||
|
Call Spread (note 14)
|
1.2
|
2.8
|
||||||
|
Tax refunds
|
-
|
4.2
|
||||||
|
Prepaid fees
|
9.9
|
9.5
|
||||||
|
Right-of-use lease asset, non-current
|
2.3
|
-
|
||||||
|
Total
|
16.6
|
19.6
|
||||||
Note 17 - Onerous contracts
|
June 30, 2019
|
December 31, 2018
|
|||||||
|
(In $ millions)
|
||||||||
|
Onerous lease commitments
|
-
|
10.2
|
||||||
|
Onerous rig contracts
|
71.3
|
71.3
|
||||||
|
Total
|
71.3
|
81.5
|
||||||
Onerous contracts for Hull B366 (TBN “Tivar”) of $16.8 million, Hull B367 (TBN “Vale”) of $26.9 million and Hull B368 (TBN “Var”) of $27.6 million, in total $71.3 million, relate to the estimated excess of remaining
shipyard instalments to be made to Keppel FELS over the value in use estimate for the jack-up drilling rigs to be delivered. Remaining shipyard instalments and onerous contract are expected to be settled when the newbuildings are delivered and paid
in 2020. As a result of the adoption of the new lease standard from January 1, 2019, the onerous lease commitments for our office space in Houston and Beverwijk are now included in our lease liabilities (see note 9 and 21).
Borr Drilling Limited
Unaudited Consolidated Financial Statements
Notes to the Unaudited Condensed Consolidated Financial Statements
for the period ended June 30, 2019
Note 18 - Long-term debt
Long-term debt is comprised of the following:
|
Carrying amount
|
Principal amount
|
Back end fee
|
||||||||||||||||||||||
|
June 30,
2019
|
December 31,
2018 |
June 30,
2019
|
December 31,
2018
|
June 30,
2019
|
December 31,
2018
|
|||||||||||||||||||
|
(In $ millions)
|
||||||||||||||||||||||||
|
$200 DNB Revolving Credit Facility
|
-
|
130.0
|
-
|
130.0
|
-
|
-
|
||||||||||||||||||
|
$195 Hayfin Loan Facility
|
191.7
|
-
|
195.0
|
-
|
-
|
-
|
||||||||||||||||||
|
$450 Syndicated Senior Secured Credit Facilities
|
222.9
|
-
|
230.0
|
-
|
-
|
-
|
||||||||||||||||||
|
$100 New Bridge Revolving Credit Facility
|
25.0
|
-
|
25.0
|
-
|
-
|
-
|
||||||||||||||||||
|
$350 Convertible bonds
|
346.0
|
346.5
|
350.0
|
350.0
|
-
|
-
|
||||||||||||||||||
|
PPL Delivery Financing
|
787.3
|
698.1
|
753.3
|
669.6
|
29.6
|
26.1
|
||||||||||||||||||
|
Total
|
1,572.9
|
1,174.6
|
1,553.3
|
1,149.6
|
29.6
|
26.1
|
||||||||||||||||||
|
At June 30, 2019 the scheduled maturities of our debt were as follows:
|
Maturities
|
|||
|
(In $ millions)
|
||||
|
2019
|
-
|
|||
|
2020
|
-
|
|||
|
2021
|
53.3
|
|||
|
2022
|
480.4
|
|||
|
2023
|
935.9
|
|||
|
2024
|
83.7
|
|||
|
Thereafter
|
-
|
|||
|
Total principal amount of debt
|
1,553.3
|
|||
|
Total debt-related balances, net
|
19.6
|
|||
|
Total carrying amount of debt
|
1,572.9
|
|||
Our Revolving and Term Loan Credit Facilities
During the first half of 2019, we refinanced our historical revolving credit facilities, including our DNB RCF, Guarantee Facility, DC RCF and Bridge RCF. Following the signing of our Hayfin Facility,
Syndicated Facility and New Bridge Facility agreements on June 25, 2019, which collectively provided $645 million in financing, we paid the outstanding balance due under our DNB RCF, Guarantee Facility, DC RCF and Bridge RCF, respectively, which
were subsequently cancelled.
Hayfin Loan Facility
On June 25, 2019, we entered into a $195 million senior secured term loan facility agreement with funds managed by Hayfin Capital Management LLP, as lenders, among others. Our wholly-owned subsidiary,
Borr Midgard Assets Ltd., is the borrower under the Hayfin Facility, which is guaranteed by Borr Drilling Limited and secured by mortgages over three of our jack-up rigs, pledges over shares of and related guarantees from certain of our rig-owning
subsidiaries who provide this security as owners of the mortgaged rigs and general assignments of rig insurances, certain rig earnings, charters, intragroup loans and management agreements from our related rig-owning subsidiaries. Our Hayfin
Facility matures in June 2022 and bears interest at a rate of LIBOR plus a specified margin. The Hayfin Facility agreement includes a make-whole obligation if repaid during the first twelve months and, thereafter, a fee for early prepayment and
final repayment. As of June 30, 2019, our Hayfin Facility was fully drawn.
Our Hayfin Facility agreement contains various financial covenants, including requirements that we maintain minimum liquidity equal to three months interest on the facility when the jack-up rigs
providing security are not actively operating under an approved drilling contract (as defined in the Hayfin Facility agreement). Our Hayfin Facility agreement also contains a loan to value clause requiring that the fair market value of our rigs
shall at all times cover at least 175% of the aggregate outstanding facility amount. The facility also contains various covenants which restrict distributions of cash from Borr Midgard Holding Ltd., Borr Midgard Assets Ltd. and our related
rig-owning subsidiaries to us or our other subsidiaries and the management fees payable to Borr Midgard Assets Ltd.’s directly-owned subsidiaries. Our Hayfin Facility agreement also contains customary events of default which include any change of
control, non-payment, cross default, breach of covenants, insolvency and changes which have or are likely to have a material adverse effect on the relevant obligor’s business, ability to perform its obligations under the Hayfin Facility agreement
or security documents or jeopardize the security provided thereunder. If there is an event of default, the lenders under our Hayfin Facility may have the right to declare a default or may seek to negotiate changes to the covenants and/or require
additional security as a condition of not doing so. The lenders under our Hayfin Facility may also require replacement or additional security if the fair market value of the jack-up rigs over which security is provided is insufficient to meet our
market value-to-loan covenant. As of June 30, 2019, we were in compliance with the covenants and our obligations under the Hayfin Facility agreement and we expect to remain in compliance with the covenants and our obligations under our Hayfin
Facility in 2019.
As of June 30, 2019, “Saga”, “Skald” and “Thor” were pledged as collateral for the $195 million Hayfin loan facility. Total book value of the encumbered rigs was $382.0 million as of June 30, 2019.
Borr Drilling Limited
Unaudited Consolidated Financial Statements
Notes to the Unaudited Condensed Consolidated Financial Statements
for the period ended June 30, 2019
Syndicated Senior Secured Credit Facilities
On June 25, 2019, we entered into a $450 million senior secured credit facilities agreement with DNB Bank ASA, Danske Bank, Citibank N.A., Jersey Branch and Goldman Sachs Bank USA, as lenders,
among others (consisting of a $230 million credit facility, $50 million newbuild facility, $70 million for the issuance of guarantees and other trade finance instruments as required in the ordinary course of business and, assuming certain
conditions are met, a $100 million incremental facility), secured by mortgages over six of our jack-up rigs and, when delivered, one of our newbuild jack-up rigs under construction, pledges over shares of and related guarantees from certain of our
rig-owning subsidiaries who provide this security as owners of the mortgaged rigs and general assignments of rig insurances, certain rig earnings, charters, intragroup loans and management agreements from our related rig-owning subsidiaries. In
connection with the drawdown of the $100 million incremental facility, two additional jack-up rigs will be mortgaged as security, in addition to assignments, pledges and guarantees from the related rig-owning subsidiaries that are identical to
those described in the preceding sentence, and we are obligated to repay any amounts outstanding under our New Bridge Facility. Our Syndicated Facility matures in June 2022 and bears interest at a rate of LIBOR plus a specified margin. The $50
million newbuild facility will be available to draw upon delivery of the newbuild rig “Tivar”, and the $100 million incremental facility will be available to draw upon repayment of the New Bridge Revolving Credit Facility.
Our Syndicated Facility agreement contains various financial covenants, including requirements that we maintain a minimum book equity ratio of 40%, positive working capital, a debt service cover
ratio in excess of 1.25x our interest and related expenses, from the end of 2020, and minimum liquidity equal to the greater of $50 million and 4% of net interest-bearing debt. Our Syndicated Facility agreement also contains a loan to value clause
requiring that the fair market value of our rigs shall at all times cover at least 175% of the aggregate outstanding facility amount and any undrawn and uncancelled part of the facility. The Syndicated Facility agreement also contains various
covenants, including, among others, restrictions on incurring additional indebtedness and entering into joint ventures; covenants subjecting dividends to certain conditions which, if not met, would require the approval of our lenders prior to the
distribution of any dividend; restrictions on the repurchase of our Shares; restrictions on changing the general nature of our business; and restrictions on removing Tor Olav Trøim from our Board. Furthermore, Tor Olav Trøim is required to maintain
ownership of at least six million Shares (subject to adjustment for certain transactions). Our Syndicated Facility agreement also contains customary events of default which include non-payment, cross default, breach of covenants, insolvency and
changes which have or are likely to have a material adverse effect on the relevant obligor’s business, ability to perform its obligations under the Syndicated Facility agreement or security documents or jeopardize the security provided thereunder.
If there is an event of default, the lenders may have the right to declare a default or may seek to negotiate changes to the covenants and/or require additional security as a condition of not doing so. The lenders may also require replacement or
additional security if the fair market value of the jack-up rigs over which security is provided is insufficient to meet our market value-to-loan covenant. In addition, our Syndicated Facility contains a “Most Favoured Nation” clause giving the
lenders a right to amend the financial covenants to reflect any more lender-favourable covenants in any other agreement pursuant to which loan or guarantee facilities are provided to us, including amendments to our Financing Arrangements. As of
June 30, 2019, we were in compliance with the covenants and our obligations under the Syndicated Facility agreement and we expect to remain in compliance with the covenants and our obligations under our Syndicated Facility in 2019.
As of June 30, 2019, “Frigg”, “Idun”, “Norve”, “Prospector 1”, “Prospector 5” and “Mist” were pledged as collateral for the $450 million Syndicated Senior Secured Credit Facilities. Total book
value of the encumbered rigs was $572.1 million as of June 30, 2019.
New Bridge Revolving Credit Facility
On June 25, 2019, we entered into a $100 million senior secured revolving loan facility agreement with DNB Bank ASA and Danske Bank, as lenders, secured by mortgages over two of our jack-up rigs,
assignments of intra-group loans, rig insurances and certain rig earnings and pledges over shares of and related guarantees from certain of our rig-owning subsidiaries who provide this security as owners of the mortgaged rigs. Our New Bridge
Facility matures in June 2022 and bears interest at a rate of LIBOR plus a variable margin. As of June 30, 2019, $75 million remained undrawn under our New Bridge Facility.
Our New Bridge Facility agreement contains various financial covenants, including requirements that we maintain a minimum book equity ratio of 40%, positive working capital, a debt service cover ratio
in excess of 1.25x our interest and related expenses, from the end of 2020, and minimum liquidity equal to the greater of $50 million and 4% of net interest-bearing debt. Our New Bridge Facility agreement also contains a loan to value clause
requiring that the fair market value of our rigs shall at all times cover at least 175% of the aggregate outstanding facility amount and any undrawn and uncancelled part of the facility. The agreement also contains various covenants, including,
among others, restrictions on incurring additional indebtedness and entering into joint ventures; covenants requiring the approval of our lenders prior to the distribution of any dividends; and restrictions on the repurchase of our Shares;
restrictions on changing the general nature of our business; restrictions on removing Tor Olav Trøim from our Board. Furthermore, Tor Olav Trøim is required to maintain ownership of at least six million Shares (subject to adjustment for certain
transactions). Our New Bridge Facility agreement also contains customary events of default which include non-payment, cross default, breach of covenants, insolvency and changes which have or are likely to have a material adverse effect on the
relevant obligor’s business, ability to perform its obligations under the New Bridge Facility agreement or security documents or jeopardize the security provided thereunder. If there is an event of default, the lenders may have the right to declare
a default or may seek to negotiate changes to the covenants and/or require additional security as a condition of not doing so. The lenders may also require replacement or additional security if the fair market value of the jack-up rigs over which
security is provided is insufficient to meet our market value-to-loan covenant. In addition, our New Bridge Facility contains a “Most Favored Nation” clause giving the lenders a right to amend the financial covenants to reflect any more
lender-favorable covenants in any other agreement pursuant to which loan or guarantee facilities are provided to us, including amendments to our Financing Arrangements. As of June 30, 2019, we were in compliance with the covenants and our
obligations under the New Bridge Facility agreement and we expect to remain in compliance with the covenants and our obligations under our New Bridge Facility in 2019.
Borr Drilling Limited
Unaudited Consolidated Financial Statements
Notes to the Unaudited Condensed Consolidated Financial Statements
for the period ended June 30, 2019
As of June 30, 2019, “Odin” and “Ran” were pledged as collateral for the $100 million New Bridge Revolving Credit Facility. Total book value of the encumbered rigs was $161.6 million as of June 30,
2019.
$350 million Convertible Bonds
In May 2018 we raised $350.0 million through the issuance of our Convertible Bonds, which mature in 2023. The initial conversion price (which is subject to adjustment) is $6.6963 per Share, for a
total of 52,267,670 Shares. Following the of 5-for-1 Reverse Share Spilt by the Company on June 26, 2019, the conversion price is $33.4815 per Share for a total of 10,456,534 Shares. The Convertible Bonds have a coupon of 3.875% per annum payable
semi-annually in arrears in equal instalments. The terms and conditions governing our Convertible Bonds contain customary events of default, including failure to pay any amount due on the bonds when due, and certain restrictions, including, among
others, restrictions on our ability and the ability of our subsidiaries to incur secured capital markets indebtedness. The Company has entered into Call Spreads to mitigate the effect of conversion – see note 14 for details.
As of June 30, 2019, we were compliant with the covenants and our obligations under our Convertible Bonds. We expect to remain compliant with our obligations under our Convertible Bonds in 2019.
Our Delivery Financing Arrangements
In addition to three jack-up rigs which we have taken delivery of against full payment from Keppel, we have contracts with Keppel to purchase eight jack-up rigs under construction. We have the option
to accept delivery financing for two of the jack-up rigs to be delivered from Keppel. For five of our newbuild jack-up rigs under construction and nine additional jack-up rigs which have been delivered from PPL, we have agreed to accept and
accepted, respectively, delivery financing from PPL and Keppel.
PPL Newbuild Financing
In October 2017, we agreed to acquire nine premium “Pacific Class 400” jack-up rigs from PPL (the “PPL Rigs”). We accepted delivery of eight of the PPL Rigs as of December 31, 2018 and all nine PPL
Rigs had been delivered as of January 31, 2019. In connection with delivery of the PPL Rigs, our rig-owning subsidiaries as buyers of the PPL Rigs agreed to accept delivery financing for a portion of the purchase price equal to $87.0 million per
jack-up rig (the “PPL Financing”). The PPL Financing for each PPL Rig is an interest-bearing secured seller’s credit, guaranteed by the Company which matures on the date falling 60 months from the delivery date of the respective PPL Rig.
The PPL Financing for each respective PPL Rig is secured by a mortgage on such PPL Rig and an assignment of the insurances in respect of such PPL Rig. The PPL Financing also contains various covenants
and the events of default include non-payment, cross default, breach of covenants, insolvency and changes which have or are likely to have a material adverse effect on the relevant obligor’s business, ability to perform its obligations under the
PPL Financing agreements or security documents, or jeopardize the security. In addition, each rig-owning subsidiary is subject to covenants which management considered to be customary in a transaction of this nature.
As of June 30, 2019, and December 31, 2018, we had $782.9 and $695.6 million, respectively, of PPL Financing outstanding and were compliant with the covenants and our obligations under the PPL
Financing agreements. We expect to remain compliant with the covenants and our obligations under the PPL Financing agreements in 2019. We expect to satisfy our obligations under the PPL Financing for each respective PPL Rig with cash flow from
operations when due.
As of June 30, 2019, “Galar”, “Gerd”, “Gersemi”, “Grid”, “Gunnlod”, “Groa”, “Gyme”, “Natt” and “Njord” were pledged as collateral for the PPL financing. Total book value for the encumbered rigs was
$1,318.2 million as of June 30, 2019.
Interest
Average interest rate for all our interest-bearing debt, excluding Convertible Bonds, was 6.21% for the period ended June 30, 2019.
Note 19 - Share-based compensation
Share-based payment charges for the period ending:
|
3 months to
June 30,
2019
|
3 months to
June 30, 2018
|
6 months to
June 30,
2019
|
6 months to
June 30, 2018
|
|||||||||||||
|
(In $ millions)
|
||||||||||||||||
|
Total
|
1.0
|
0.5
|
3.0
|
0.9
|
||||||||||||
At March 11, 2019, the Company issued 460,000 share options to certain employees and directors of the Company. The awards were granted under the existing approved share option scheme. The options have
a strike price of $17.50 per share, which compares to the Company's share's closing price of $14.2 on March 8, 2019. The options will expire after five years and have a four-year vesting period. Expected life after vesting is estimated at two
years. Risk free interest rate is set to 2% and expected future volatility is estimated at 32%. Total number of options authorised by the Board is 3,494,000 and 2,875,000 have been awarded as of June 30, 2019.
Borr Drilling Limited
Unaudited Consolidated Financial Statements
Notes to the Unaudited Condensed Consolidated Financial Statements
for the period ended June 30, 2019
Note 20 - Fair values of financial instruments
The carrying value and estimated fair value of the Company’s cash and financial instruments were as follows:
|
As at June 30,
2019
|
As at December 31,
2018
|
|||||||||||||||||||
|
(In $ millions)
|
Hierarchy
|
Fair value
|
Carrying
value
|
Fair value
|
Carrying
value
|
|||||||||||||||
|
Assets
|
||||||||||||||||||||
|
Cash and cash equivalents
|
44.8
|
44.8
|
27.9
|
27.9
|
||||||||||||||||
|
Restricted cash
|
62.0
|
62.0
|
63.4
|
63.4
|
||||||||||||||||
|
Marketable securities – non-current
|
1
|
-
|
-
|
31.0
|
31.0
|
|||||||||||||||
|
Marketable securities – current
|
1
|
32.9
|
32.9
|
4.2
|
4.2
|
|||||||||||||||
|
Trade receivables
|
46.4
|
46.4
|
25.1
|
25.1
|
||||||||||||||||
|
Accrued revenue
|
36.2
|
36.2
|
18.9
|
18.9
|
||||||||||||||||
|
Tax retentions receivable
|
11.6
|
11.6
|
11.6
|
11.6
|
||||||||||||||||
|
Other current assets (excluding deferred costs)
|
31.4
|
31.4
|
17.3
|
17.3
|
||||||||||||||||
|
Due from related parties
|
5.2
|
5.2
|
-
|
-
|
||||||||||||||||
|
Forward contracts (note 14)
|
2
|
36.3
|
36.3
|
50.3
|
50.3
|
|||||||||||||||
|
Liabilities
|
||||||||||||||||||||
|
Long-term liabilities
|
2
|
1,503.8
|
1,572.9
|
1,113.6
|
1,174.6
|
|||||||||||||||
|
Trade payables
|
11.4
|
11.4
|
10.0
|
10.0
|
||||||||||||||||
|
Accruals and other current liabilities
|
93.3
|
93.3
|
71.0
|
71.0
|
||||||||||||||||
|
Forward contracts (note 14)
|
2
|
91.4
|
91.4
|
85.4
|
85.4
|
|||||||||||||||
Financial instruments included in the consolidated accounts within ‘Level 1 and 2’ of the fair value hierarchy are valued using quoted market prices, broker or dealer quotations or alternative pricing
sources with reasonable levels of price transparency.
Included in “Level 1” are cash and cash equivalents, restricted cash, trade receivables, marketable securities, other current assets (excluding prepayments and deferred costs), trade payables,
accruals and other current liabilities. The carrying value of any accounts receivable and payables approximates fair value due to the short time to expected payment or receipt of cash.
Included in “Level 2” are forward contracts and Call Spread (note 14). No assets or liabilities have been transferred from one level to another during the quarter.
Note 21 - Other current liabilities
|
June 30, 2019
|
December 31, 2018
|
|||||||
|
Accruals and other current liabilities are comprised of the following:
|
||||||||
|
(In $ millions)
|
||||||||
|
Accrued payroll and severance
|
11.0
|
3.1
|
||||||
|
VAT and current taxes payable
|
11.6
|
4.2
|
||||||
|
Operating lease liability, current
|
3.4
|
-
|
||||||
|
Deferred mob revenue
|
6.0
|
-
|
||||||
|
Total accruals and other current liabilities
|
32.0
|
7.3
|
||||||
Note 22 - Related party transactions
Transactions with those holding significant influence over the Company
2018 Equity offering
At March 22, 2018, the Company announced that it would raise up to $250 million in an equity offering divided in two tranches. Tranche 2 of (the “Equity Offering”) was subject to approval by the
extraordinary general meeting to be held on 5 April 2018 and subsequent share issue. In connection with the settlement of Tranche 2, $27.7 million was registered as liability to shareholders including $20.0 million to Drew Holdings Ltd (“Drew”) as
of March 31, 2018. Drew is a trust established for the benefit of Tor Olav Trøim, the Chairman of the Company. As of May 30, 2018, the 7,640,327 new shares allocated in Tranche 2 of the Equity Offering were validly issued and fully paid.
Borr Drilling Limited
Unaudited Consolidated Financial Statements
Notes to the Unaudited Condensed Consolidated Financial Statements
for the period ended June 30, 2019
Commercial Arrangements
We have obtained certain rig and other operating supplies from Schlumberger and may continue to obtain such supplies in the future. Purchases from Schlumberger were $4.3 million during the second
quarter of 2019, $0.2 million during the second quarter of 2018, $10.4 million during the first half of 2019 and $0.8 million during the first half of 2018. $0.8 million and $0.4 million were outstanding at June 30, 2019 and December 31, 2018,
respectively.
Pursuant to the corporate support agreement with Magni Partners Limited, which provides for reimbursement of costs with Borr board approval, $1.0 million was paid during the second quarter 2019 under the agreement. $nil
was outstanding at June 30, 2019 and June 30, 2018.
Mexico Joint Venture
On June 28, 2019, we entered into a binding agreement to acquire 49% of the shares in Perforaciones Estratégicas e Integrales Mexicana, S.A. de C.V. and OPEX Perforadora S.A. de C.V, entities incorporated in 2019 by
Proyectos Globales de Energia y Servicos CME, S.A. DE C.V. (“CME”) , a Mexican oil and gas services company, for the purposes of performing integrated drilling services under contracts with Petroleo Mexicanos (“Pemex”). In the second quarter 2019
we provided services of $1.1 million to these entities and had $5.2 million loan receivable outstanding at June 30, 2019.
Note 23 - Commitments and contingencies
The Company has the following commitments as of June 30, 2019:
|
(in $ millions)
Delivery instalments for jack-up drilling rigs
|
Delivery instalment
|
Back-end fee
|
||||||
|
Total
|
886.2
|
22.5
|
||||||
In addition, under the PPL Financing, PPL Shipyard is entitled to certain fees payable in connection with the increase in market value of the relevant PPL Shipyard Rig from October 31, 2017 until the repayment date, less
the relevant rig owner’s equity cost of ownership of each jack-up rig and any interest paid on the delivery financing. No provision has been made for such fees as of June 30, 2019.
The following table sets forth when our commitments fall due as of June 30, 2019
|
(In $ millions)
|
||||||||||||||||||||
|
Less than 1
year
|
1–3 years
|
3–5 years
|
More than 5
years
|
Total
|
||||||||||||||||
|
Delivery instalments for jack-up rigs
|
259.2
|
627.0
|
0.0
|
0.0
|
886.2
|
|||||||||||||||
Other commercial commitments
We have other commercial commitments which contractually obligate us to settle with cash under certain circumstances. Surety bonds and parent company guarantees entered into between certain customers and governmental
bodies guarantee our performance regarding certain drilling contracts, customs import duties and other obligations in various jurisdictions.
The principal amounts of the outstanding surety bonds, customs bonds, bank guarantees, letters of credits and performance bonds were $71.1 million and $23.0 million as of June 30, 2019 and December 31, 2018,
respectively. $70.0 million are covered by security under the guarantee facility under one of our loan agreements.
As of June 30, 2019, these obligations and their expiration dates are as follows:
|
(In $ millions)
|
1 year
|
1-3 years
|
3-5 years
|
Thereafter
|
Total
|
|||||||||||||||
|
Surety bonds and other guarantees
|
71.1
|
—
|
—
|
—
|
71.1
|
|||||||||||||||
Note 24 - Subsequent events
Listing of the Company’s shares in New York Stock Exchange
On July 31, 2019, the company issued 5,000,000 new shares in the Company in its initial public offering on the New York Stock Exchange at a price of $9.30 per share. On 2 August, 2019, the Company was
informed that the underwriters in the initial public offering had exercised their overallotment option and purchased an additional 750,000 shares from the Company at the same price per share.