Net income attributable to Canon Inc.
As a result, net income attributable to Canon Inc. in 2021 increased by 157.7% to ¥214,718 million, which represents 6.1% of net sales. Net income attributable to Canon Inc. as a percentage of net sales increased by 2.6 points from 2019 before
COVID-19
infections due to the structural reform and measures to improve profitability. Segment information
Canon operates four segments: the Printing Business Unit, the Imaging Business Unit, the Medical Business Unit and the Industrial Business Unit.
| • | The Printing Business Unit mainly includes office MFDs, document solutions, laser MFPs, laser printers, inkjet printers, image scanners, calculators, digital continuous feed presses, digital sheet-fed presses and large format printers. |
| • | The Imaging Business Unit mainly includes interchangeable-lens digital cameras, interchangeable lenses, digital compact cameras, compact photo printers, MR Systems, network cameras, video management software, video content analytics software, digital camcorders, digital cinema cameras, broadcast equipment and projectors. |
| • | The Medical Business Unit mainly includes CT systems, diagnostic ultrasound systems, diagnostic X-ray systems, MRI systems, clinical chemistry analyzers, digital radiography systems and ophthalmic equipment. |
| • | The Industrial Business Unit mainly includes semiconductor lithography equipment, FPD lithography equipment, OLED display manufacturing equipment, vacuum thin-film deposition equipment and die bonders. |
Operating results by segment
Please refer to the table of sales by segment in Note 23 of the Notes to Consolidated Financial Statements.
Canon’s sales by segment are summarized as follows:
2021 |
Change |
2020 |
||||||||||
(Millions of yen, except percentage data) |
||||||||||||
Printing |
1,938,847 | +7.4 | % | 1,804,427 | ||||||||
Imaging |
653,532 | +20.7 | 541,314 | |||||||||
Medical |
480,362 | +10.2 | 436,074 | |||||||||
Industrial |
337,721 | +22.0 | 276,806 | |||||||||
Others and Corporate |
186,593 | +10.3 | 169,140 | |||||||||
Eliminations |
(83,698 | ) | — | (67,518 | ) | |||||||
Total |
3,513,357 | +11.2 | % | 3,160,243 | ||||||||
| Note: | Based on the realignment of Canon’s internal management structure, from 2022, Canon has changed the name and structure of segments from Industrial and Others Business Unit and Corporate and eliminations to Industrial Business Unit, Others and Corporate and Eliminations. Sales by segment amounts for the years ended December 31, 2021 and 2020 also have been reclassified. |
46
Printing Business Unit |
2021 |
Change |
2020 |
|||||||||
(Millions of yen, except percentage data) |
||||||||||||
Net sales: |
||||||||||||
Office |
756,366 | +4.7 | % | 722,480 | ||||||||
Prosumer |
889,091 | +7.4 | 828,198 | |||||||||
Production |
288,555 | +15.3 | 250,220 | |||||||||
External customers total |
1,934,012 | +7.4 | 1,800,898 | |||||||||
Intersegment |
4,835 | +37.0 | 3,529 | |||||||||
Total |
1,938,847 | +7.4 | 1,804,427 | |||||||||
Operating cost and expenses |
1,713,154 | +3.4 | 1,657,319 | |||||||||
Operating profit |
225,693 | +53.4 | 147,108 | |||||||||
Income before income taxes |
232,952 | +53.1 | 152,184 | |||||||||
Within the Printing Business Unit, unit sales of office MFDs increased compared with the previous year as the imageRUNNER ADVANCE DX series saw solid demand and demand for MFDs continued to recover despite the shortage of semiconductor chips. Sales of services and consumables increased due to a recovery in office occupancy rates. For equipment in the production printing market, the varioPRINT iX series of high-speed increase of 7.4%, while income before income taxes increased by 53.1% to ¥232,952 million.
sheet-fed
color inkjet presses earned favorable reviews, and sales of services and consumables increased due to the recovery. As for laser printers, unit sales decreased compared with the previous year due to stagnation of production activity resulting from the resurgence of COVID-19
infections in Southeast Asia. However, sales of consumables increased significantly compared with the previous year, during which time demand had decreased. For inkjet printers, unit sales were below those of the previous year due to stagnation of production activity in Southeast Asia. However, unit sales of refillable ink tank printers were above those of the previous year due to solid global demand. Total sales were above those of the previous year due to a focus on higher-priced models. In addition, profitability improved due to a cost reduction as a result of common platformization and product mix as a result of increase of service profit due to a recovery in office occupancy rates, although operating costs increased due to a rebound from the previous year, when sales activities were severely restricted due to the spread of COVID-19.
These factors resulted in total sales for the business unit of ¥1,938,847 million, a year-on-year
year-on-year
Imaging Business Unit |
2021 |
Change |
2020 |
|||||||||
(Millions of yen, except percentage data) |
||||||||||||
Net sales: |
||||||||||||
Cameras |
432,885 | +24.7 | % | 347,240 | ||||||||
Network cameras and Others |
218,609 | +13.7 | 192,320 | |||||||||
External customers total |
651,494 | +20.7 | 539,560 | |||||||||
Intersegment |
2,038 | +16.2 | 1,754 | |||||||||
Total |
653,532 | +20.7 | 541,314 | |||||||||
Operating cost and expenses |
574,814 | +7.3 | 535,584 | |||||||||
Operating profit |
78,718 | +1,273.8 | 5,730 | |||||||||
Income before income taxes |
78,462 | +1,484.5 | 4,952 | |||||||||
As for the Imaging Business Unit, unit sales of interchangeable-lens digital cameras were the same level as the previous year, despite the shortage of semiconductor chips. The price level was maintained even after more than a year since the EOS R5 and EOS R6 full-frame mirrorless cameras were released. In addition, unit sales of
RF-series
interchangeable lenses increased significantly due to the synergistic effects with the cameras. As for network cameras, despite the continued impact of COVID-19,
sales increased mainly as a result of strengthening sales activities for such diversified applications as monitoring of congested and confined spaces as well as conventional market needs including crime prevention and disaster monitoring tools. In addition, profitability 47
improved due to the accelerated shift to highly profitable products such as EOS R system cameras and interchangeable lenses, although operating costs increased due to a rebound from the previous year, when sales activities were severely restricted due to the spread of increase of 20.7%, while income before income taxes increased by 1,484.5% to ¥78,462 million.
COVID-19.
These factors resulted in total sales for the business unit of ¥653,532 million, a year-on-year
year-on-year
Medical Business Unit |
2021 |
Change |
2020 |
|||||||||
(Millions of yen, except percentage data) |
||||||||||||
Net sales: |
||||||||||||
External customers total |
480,029 | +10.3 | % | 435,368 | ||||||||
Intersegment |
333 | -52.8 | 706 | |||||||||
Total |
480,362 | +10.2 | 436,074 | |||||||||
Operating cost and expenses |
450,942 | +9.8 | 410,830 | |||||||||
Operating profit |
29,420 | +16.5 | 25,244 | |||||||||
Income before income taxes |
34,296 | +34.3 | 25,544 | |||||||||
As for the Medical Business Unit, although the resurgence of increase of 10.2%, while income before income taxes increased by 34.3% to ¥34,296 million, recording highs for both sales and income before income taxes for the Medical Business Unit.
COVID-19
infections and the shortage of semiconductor chips and shipping containers had an impact on production and installation, sales remained solid due to returning routine examinations at medical institutions. Sales of CT systems and diagnostic ultrasound systems increased mainly due to capitalizing on opportunities with medical institutions in Japan supported by the government and recovering demand in the North America. In addition, profitability improved due to a cost reduction as a result of volume discount based on business expansion. These factors resulted in total sales for the business unit of ¥480,362 million, a year-on-year
year-on-year
Industrial Business Unit |
2021 |
Change |
2020 |
|||||||||
(Millions of yen, except percentage data) |
||||||||||||
Net sales: |
||||||||||||
Optical equipment |
215,890 | +49.5 | % | 144,387 | ||||||||
Industrial equipment |
112,274 | -11.4 | 126,762 | |||||||||
External customers total |
328,164 | +21.0 | 271,149 | |||||||||
Intersegment |
9,557 | +68.9 | 5,657 | |||||||||
Total |
337,721 | +22.0 | 276,806 | |||||||||
Operating cost and expenses |
292,854 | +17.4 | 249,346 | |||||||||
Operating profit |
44,867 | +63.4 | 27,460 | |||||||||
Income before income taxes |
45,301 | +61.0 | 28,137 | |||||||||
As for the Industrial Business Unit, regarding semiconductor lithography equipment, unit sales increased compared with the previous year due to strong demand in a wide range of products such as sensors and memory. For FPD lithography equipment, demand for panels used in devices including laptops, tablets and high-resolution display panels remained strong. As a result, unit sales increased significantly compared with the previous year, when equipment installation stagnated due to circumstances related to increase of 22.0%, while income before income taxes totaled ¥45,301 million, a increase of 61.0%.
COVID-19.
In addition, these products are mostly manufactured at the domestic manufacturing facilities where impacts of COVID-19
related production disruption were very limited resulting in continuous production activities with better cost reduction. These factors resulted in total sales for the business unit of ¥337,721 million, a year-on-year
year-on-year
48
Sales by geographic area
Please refer to the table of sales by geographic area in Note 23 of the Notes to Consolidated Financial Statements.
A summary of net sales by geographic area in 2021 and 2020 is provided below:
2021 |
Change |
2020 |
||||||||||
(Millions of yen, except percentage data) |
||||||||||||
Japan |
830,378 | +3.0 | % | 806,305 | ||||||||
Americas |
968,839 | +13.7 | 852,451 | |||||||||
Europe |
894,898 | +12.5 | 795,616 | |||||||||
Asia and Oceania |
819,242 | +16.1 | 705,871 | |||||||||
Total |
3,513,357 | +11.2 | % | 3,160,243 | ||||||||
| Note: | This summary of net sales by geographic area is determined by the location where the product is shipped to the customers. |
A geographical analysis indicates that net sales in 2021 are summarized as follows.
In Japan, net sales increased by 3.0% from the previous year mainly owing to an increase in sales of CT systems and diagnostic ultrasound systems mainly due to capitalizing on opportunities with medical institutions.
In the Americas, net sales increased by 13.7% from the previous year mainly owing to an increase in sales of most products mainly due to the recovery from the decline of the demand caused by
COVID-19.
In Europe, net sales increased by 12.5% from the previous year mainly owing to an increase in sales of most products mainly due to the recovery from the decline of the demand caused by
COVID-19.
In Asia and Oceania, net sales increased by 16.1% from the previous year mainly owing to an increase in sales of most products mainly due to the recovery from the decline of the demand caused by
COVID-19.
Foreign operations and foreign currency transactions
Canon’s marketing activities are performed by subsidiaries in various regions in local currencies, while the cost of sales is generally in yen. Given Canon’s current operating structure, appreciation of the yen has a negative impact on net sales and the gross profit to net sales ratio. To reduce the financial risks from changes in foreign exchange rates, Canon utilizes derivative financial instruments, which consist principally of foreign currency exchange contracts.
The operating profit on foreign operation sales is usually lower than that from domestic operations because foreign operations consist mainly of marketing activities. Marketing activities are generally less profitable than production activities, which are mainly conducted by the Company and its domestic subsidiaries. Please refer to the table of geographic information in Note 23 of the Notes to Consolidated Financial Statements.
B. Liquidity and capital resources
Canon’s basic policy for financial strategies is to maintain a sound financial position through consistent cash flow management, and the two basic principles of cash flow management are as follows:
| • | Canon strives to improve a highly profitable structure by further improving the profitability of existing businesses and accelerating the growth of new businesses. |
49
| • | Canon strives to maintain financial soundness by keeping total capital investments for medium-term business expansion and growth within the range of depreciation and amortization expenses. However, Canon plans to actively engage in large-scale M&A for growth strategies, and also raises external funds as needed. |
Raising Funds
(Cash-In)
Canon is basically funded by net cash provided by operating activities. In procuring funds, Canon considers terms, currencies and methods in light of financial market conditions, and selects the most appropriate instrument from a variety of options.
Use of Funds
(Cash-Out)
The principal use of cash is determined in accordance with the following priorities.
| • | Investment for growth such as capital investment, R&D, M&A, etc.: |
Canon values M&A as an option for early development and expansion of new businesses. The selection of investment targets is based on the growth potential and size of the market, and on the market being highly compatible with the Canon’s business domains and technologies.
| • | Return to shareholders: |
Canon returns profits to shareholders stably and aggressively, mainly in the form of a dividend, taking into consideration medium- to long-term business prospects, planned future investments, cash flow and other factors.
| • | Repayment of borrowings: |
Canon has been repaying borrowings steadily to have sufficient financial strength, following investment for growth and return to shareholders.
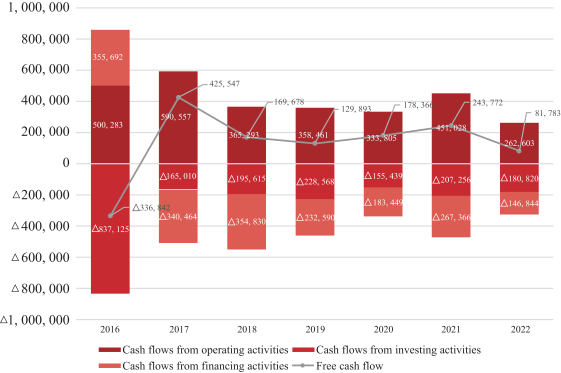
Cash flows (Millions of yen)
50