000169442612/312024Q2FALSEhttp://fasb.org/us-gaap/2023#CostOfRevenuehttp://fasb.org/us-gaap/2023#CostOfRevenuehttp://fasb.org/us-gaap/2023#CostOfRevenuehttp://fasb.org/us-gaap/2023#OtherLiabilitiesCurrentP5Yxbrli:sharesiso4217:USDiso4217:USDxbrli:sharesxbrli:puredk:subsidiarydk:storedk:segmentdk:facilitydk:jointVenturedk:barrelutr:bblutr:MMBTUdk:rINdk:installment00016944262024-01-012024-06-3000016944262024-08-0100016944262024-06-3000016944262023-12-3100016944262024-04-012024-06-3000016944262023-04-012023-06-3000016944262023-01-012023-06-300001694426us-gaap:CommonStockMember2024-03-310001694426us-gaap:AdditionalPaidInCapitalMember2024-03-310001694426us-gaap:AccumulatedOtherComprehensiveIncomeMember2024-03-310001694426us-gaap:RetainedEarningsMember2024-03-310001694426us-gaap:TreasuryStockCommonMember2024-03-310001694426us-gaap:NoncontrollingInterestMember2024-03-3100016944262024-03-310001694426us-gaap:RetainedEarningsMember2024-04-012024-06-300001694426us-gaap:NoncontrollingInterestMember2024-04-012024-06-300001694426us-gaap:AdditionalPaidInCapitalMember2024-04-012024-06-300001694426us-gaap:CommonStockMember2024-04-012024-06-300001694426us-gaap:CommonStockMember2024-06-300001694426us-gaap:AdditionalPaidInCapitalMember2024-06-300001694426us-gaap:AccumulatedOtherComprehensiveIncomeMember2024-06-300001694426us-gaap:RetainedEarningsMember2024-06-300001694426us-gaap:TreasuryStockCommonMember2024-06-300001694426us-gaap:NoncontrollingInterestMember2024-06-300001694426us-gaap:CommonStockMember2023-03-310001694426us-gaap:AdditionalPaidInCapitalMember2023-03-310001694426us-gaap:AccumulatedOtherComprehensiveIncomeMember2023-03-310001694426us-gaap:RetainedEarningsMember2023-03-310001694426us-gaap:TreasuryStockCommonMember2023-03-310001694426us-gaap:NoncontrollingInterestMember2023-03-3100016944262023-03-310001694426us-gaap:RetainedEarningsMember2023-04-012023-06-300001694426us-gaap:NoncontrollingInterestMember2023-04-012023-06-300001694426us-gaap:AdditionalPaidInCapitalMember2023-04-012023-06-300001694426us-gaap:CommonStockMember2023-04-012023-06-300001694426us-gaap:AccumulatedOtherComprehensiveIncomeMember2023-04-012023-06-300001694426us-gaap:CommonStockMember2023-06-300001694426us-gaap:AdditionalPaidInCapitalMember2023-06-300001694426us-gaap:AccumulatedOtherComprehensiveIncomeMember2023-06-300001694426us-gaap:RetainedEarningsMember2023-06-300001694426us-gaap:TreasuryStockCommonMember2023-06-300001694426us-gaap:NoncontrollingInterestMember2023-06-3000016944262023-06-300001694426us-gaap:CommonStockMember2023-12-310001694426us-gaap:AdditionalPaidInCapitalMember2023-12-310001694426us-gaap:AccumulatedOtherComprehensiveIncomeMember2023-12-310001694426us-gaap:RetainedEarningsMember2023-12-310001694426us-gaap:TreasuryStockCommonMember2023-12-310001694426us-gaap:NoncontrollingInterestMember2023-12-310001694426us-gaap:RetainedEarningsMember2024-01-012024-06-300001694426us-gaap:NoncontrollingInterestMember2024-01-012024-06-300001694426us-gaap:AdditionalPaidInCapitalMember2024-01-012024-06-300001694426us-gaap:CommonStockMember2024-01-012024-06-300001694426us-gaap:CommonStockMember2022-12-310001694426us-gaap:AdditionalPaidInCapitalMember2022-12-310001694426us-gaap:AccumulatedOtherComprehensiveIncomeMember2022-12-310001694426us-gaap:RetainedEarningsMember2022-12-310001694426us-gaap:TreasuryStockCommonMember2022-12-310001694426us-gaap:NoncontrollingInterestMember2022-12-3100016944262022-12-310001694426us-gaap:RetainedEarningsMember2023-01-012023-06-300001694426us-gaap:NoncontrollingInterestMember2023-01-012023-06-300001694426us-gaap:AdditionalPaidInCapitalMember2023-01-012023-06-300001694426us-gaap:CommonStockMember2023-01-012023-06-300001694426us-gaap:AccumulatedOtherComprehensiveIncomeMember2023-01-012023-06-300001694426us-gaap:SubsequentEventMemberus-gaap:DisposalGroupNotDiscontinuedOperationsMemberdk:RetailStoresRetailPurchaseAgreementMember2024-07-310001694426us-gaap:SubsequentEventMemberus-gaap:DisposalGroupNotDiscontinuedOperationsMemberdk:RetailStoresRetailPurchaseAgreementMember2024-07-312024-07-310001694426us-gaap:SubsequentEventMemberdk:H2OMidstreamMemberdk:DelekLogisticsMember2024-08-020001694426us-gaap:SubsequentEventMemberdk:H2OMidstreamMembersrt:ScenarioForecastMemberdk:DelekLogisticsMember2024-08-022024-12-310001694426dk:AsphaltTerminalJointVentureMember2024-06-300001694426dk:RefiningMember2024-01-012024-06-300001694426dk:RefiningMemberus-gaap:OperatingSegmentsMember2024-04-012024-06-300001694426us-gaap:OperatingSegmentsMemberdk:LogisticsMember2024-04-012024-06-300001694426dk:RetailSegmentMemberus-gaap:OperatingSegmentsMember2024-04-012024-06-300001694426us-gaap:CorporateNonSegmentMember2024-04-012024-06-300001694426dk:RefiningMemberus-gaap:IntersegmentEliminationMember2024-04-012024-06-300001694426us-gaap:IntersegmentEliminationMemberdk:LogisticsMember2024-04-012024-06-300001694426dk:RetailSegmentMemberus-gaap:IntersegmentEliminationMember2024-04-012024-06-300001694426us-gaap:IntersegmentEliminationMember2024-04-012024-06-300001694426dk:RefiningMemberus-gaap:OperatingSegmentsMember2023-04-012023-06-300001694426us-gaap:OperatingSegmentsMemberdk:LogisticsMember2023-04-012023-06-300001694426dk:RetailSegmentMemberus-gaap:OperatingSegmentsMember2023-04-012023-06-300001694426us-gaap:CorporateNonSegmentMember2023-04-012023-06-300001694426dk:RefiningMemberus-gaap:IntersegmentEliminationMember2023-04-012023-06-300001694426us-gaap:IntersegmentEliminationMemberdk:LogisticsMember2023-04-012023-06-300001694426dk:RetailSegmentMemberus-gaap:IntersegmentEliminationMember2023-04-012023-06-300001694426us-gaap:IntersegmentEliminationMember2023-04-012023-06-300001694426dk:RefiningMemberus-gaap:OperatingSegmentsMember2024-01-012024-06-300001694426us-gaap:OperatingSegmentsMemberdk:LogisticsMember2024-01-012024-06-300001694426dk:RetailSegmentMemberus-gaap:OperatingSegmentsMember2024-01-012024-06-300001694426us-gaap:CorporateNonSegmentMember2024-01-012024-06-300001694426dk:RefiningMemberus-gaap:IntersegmentEliminationMember2024-01-012024-06-300001694426us-gaap:IntersegmentEliminationMemberdk:LogisticsMember2024-01-012024-06-300001694426dk:RetailSegmentMemberus-gaap:IntersegmentEliminationMember2024-01-012024-06-300001694426us-gaap:IntersegmentEliminationMember2024-01-012024-06-300001694426dk:RefiningMemberus-gaap:OperatingSegmentsMember2023-01-012023-06-300001694426us-gaap:OperatingSegmentsMemberdk:LogisticsMember2023-01-012023-06-300001694426dk:RetailSegmentMemberus-gaap:OperatingSegmentsMember2023-01-012023-06-300001694426us-gaap:CorporateNonSegmentMember2023-01-012023-06-300001694426dk:RefiningMemberus-gaap:IntersegmentEliminationMember2023-01-012023-06-300001694426us-gaap:IntersegmentEliminationMemberdk:LogisticsMember2023-01-012023-06-300001694426dk:RetailSegmentMemberus-gaap:IntersegmentEliminationMember2023-01-012023-06-300001694426us-gaap:IntersegmentEliminationMember2023-01-012023-06-300001694426dk:StockCompensationPlanExcludingLossMember2024-04-012024-06-300001694426dk:StockCompensationPlanExcludingLossMember2023-04-012023-06-300001694426dk:StockCompensationPlanExcludingLossMember2024-01-012024-06-300001694426dk:StockCompensationPlanExcludingLossMember2023-01-012023-06-300001694426dk:StockCompensationPlanLossMember2024-04-012024-06-300001694426dk:StockCompensationPlanLossMember2023-04-012023-06-300001694426dk:StockCompensationPlanLossMember2024-01-012024-06-300001694426dk:StockCompensationPlanLossMember2023-01-012023-06-300001694426us-gaap:StockCompensationPlanMember2024-04-012024-06-300001694426us-gaap:StockCompensationPlanMember2023-04-012023-06-300001694426us-gaap:StockCompensationPlanMember2024-01-012024-06-300001694426us-gaap:StockCompensationPlanMember2023-01-012023-06-300001694426dk:DelekLogisticsMemberus-gaap:VariableInterestEntityPrimaryBeneficiaryMember2024-01-012024-06-300001694426us-gaap:VariableInterestEntityPrimaryBeneficiaryMemberdk:DelekLogisticsMember2024-06-300001694426dk:PublicStockOfferingMemberdk:DelekLogisticsMember2024-03-122024-03-120001694426us-gaap:OverAllotmentOptionMemberdk:DelekLogisticsMember2024-03-122024-03-120001694426dk:DelekLogisticsMember2024-03-120001694426us-gaap:VariableInterestEntityPrimaryBeneficiaryMemberdk:DelekLogisticsPartnersLPMember2024-06-300001694426us-gaap:VariableInterestEntityPrimaryBeneficiaryMemberdk:DelekLogisticsPartnersLPMember2023-12-310001694426us-gaap:VariableInterestEntityPrimaryBeneficiaryMemberdk:DelekLogisticsPartnersLPMemberus-gaap:NonrelatedPartyMember2024-06-300001694426us-gaap:VariableInterestEntityPrimaryBeneficiaryMemberdk:DelekLogisticsPartnersLPMemberus-gaap:NonrelatedPartyMember2023-12-310001694426us-gaap:RelatedPartyMemberus-gaap:VariableInterestEntityPrimaryBeneficiaryMemberdk:DelekLogisticsPartnersLPMember2024-06-300001694426us-gaap:RelatedPartyMemberus-gaap:VariableInterestEntityPrimaryBeneficiaryMemberdk:DelekLogisticsPartnersLPMember2023-12-310001694426dk:W2WHoldingsLLCMember2024-06-300001694426dk:WinktoWebsterPipelineLLCMember2024-06-300001694426dk:WinktoWebsterPipelineLLCMember2023-12-310001694426dk:RedRiverPipelineCompanyLLCMemberdk:DelekLogisticsPartnersLPMember2024-06-300001694426dk:RedRiverPipelineCompanyLLCMemberdk:DelekLogisticsPartnersLPMember2023-12-310001694426dk:DelekLogisticsPartnersLPMemberdk:PlainsAllAmericanPipelineAndAndeavorLogisticsMember2024-01-012024-06-300001694426dk:DelekLogisticsPartnersLPMemberdk:PlainsAllAmericanPipelineMember2024-06-300001694426dk:DelekLogisticsPartnersLPMemberdk:AndeavorLogisticsMember2024-06-300001694426dk:DelekLogisticsPartnersLPMemberdk:PlainsAllAmericanPipelineAndAndeavorLogisticsMember2024-06-300001694426dk:DelekLogisticsPartnersLPMemberdk:PlainsAllAmericanPipelineAndAndeavorLogisticsMember2023-12-310001694426dk:EthanolUnitTrainFacilityAndTankJointVentureMember2024-06-300001694426dk:OtherJointVentureInvestmentsMember2024-06-300001694426dk:OtherJointVentureInvestmentsMember2023-12-310001694426dk:TitledInventoryMember2024-06-300001694426dk:InventoryIntermediationAgreementMember2024-06-300001694426dk:TitledInventoryMember2023-12-310001694426dk:InventoryIntermediationAgreementMember2023-12-3100016944262022-12-2200016944262023-12-202023-12-2000016944262023-12-212023-12-2100016944262023-12-2000016944262023-12-210001694426dk:DelekTermLoanCreditFacilityMemberus-gaap:SecuredDebtMember2024-06-300001694426dk:DelekTermLoanCreditFacilityMemberus-gaap:SecuredDebtMember2023-12-310001694426us-gaap:RevolvingCreditFacilityMemberdk:DklRevolverMemberus-gaap:LineOfCreditMember2024-06-300001694426us-gaap:RevolvingCreditFacilityMemberdk:DklRevolverMemberus-gaap:LineOfCreditMember2023-12-310001694426us-gaap:RevolvingCreditFacilityMemberdk:DKLTermFacilityMemberus-gaap:LineOfCreditMember2024-06-300001694426us-gaap:RevolvingCreditFacilityMemberdk:DKLTermFacilityMemberus-gaap:LineOfCreditMember2023-12-310001694426us-gaap:SeniorNotesMemberdk:A2025NotesMember2024-06-300001694426us-gaap:SeniorNotesMemberdk:A2025NotesMember2023-12-310001694426us-gaap:SeniorNotesMemberdk:A2028NotesMember2024-06-300001694426us-gaap:SeniorNotesMemberdk:A2028NotesMember2023-12-310001694426us-gaap:SeniorNotesMemberdk:DelekLogistics2029NotesMember2024-06-300001694426us-gaap:SeniorNotesMemberdk:DelekLogistics2029NotesMember2023-12-310001694426us-gaap:RevolvingCreditFacilityMemberus-gaap:LineOfCreditMemberdk:UnitedCommunityBankRevolverMember2024-06-300001694426us-gaap:RevolvingCreditFacilityMemberus-gaap:LineOfCreditMemberdk:UnitedCommunityBankRevolverMember2023-12-310001694426dk:DelekTermLoanCreditFacilityMemberus-gaap:SecuredDebtMember2022-11-180001694426us-gaap:SecuredDebtMember2022-11-180001694426us-gaap:SecuredDebtMemberdk:IncrementalTermLoansMember2022-11-182022-11-180001694426us-gaap:BaseRateMemberus-gaap:RevolvingCreditFacilityMemberus-gaap:LineOfCreditMemberdk:IncrementalTermLoansMember2024-01-012024-06-300001694426us-gaap:RevolvingCreditFacilityMemberdk:SecuredOvernightFinancingRateSOFRMemberus-gaap:LineOfCreditMemberdk:IncrementalTermLoansMember2024-01-012024-06-300001694426us-gaap:SecuredDebtMember2024-06-300001694426us-gaap:SecuredDebtMember2023-12-310001694426us-gaap:RevolvingCreditFacilityMemberus-gaap:LineOfCreditMember2024-06-300001694426us-gaap:RevolvingCreditFacilityMemberdk:DKLRevolverDelekLogisticsTermFacilityMemberus-gaap:SecuredDebtMemberdk:FifthThirdBankMember2022-10-130001694426us-gaap:RevolvingCreditFacilityMemberdk:DKLRevolverDelekLogisticsTermFacilityMemberus-gaap:SecuredDebtMemberdk:FifthThirdBankMember2024-03-132024-03-130001694426dk:DKLRevolverDelekLogisticsTermFacilityMemberus-gaap:SecuredDebtMemberus-gaap:PrimeRateMemberdk:FifthThirdBankMemberdk:DebtInstrumentInterestRatePeriodOneMember2022-10-132022-10-130001694426dk:DKLRevolverDelekLogisticsTermFacilityMemberus-gaap:SecuredDebtMemberus-gaap:PrimeRateMemberdk:DebtInstrumentInterestRatePeriodTwoMemberdk:FifthThirdBankMember2022-10-132022-10-130001694426srt:MinimumMemberdk:DKLRevolverDelekLogisticsTermFacilityMemberus-gaap:SecuredDebtMemberdk:SecuredOvernightFinancingRateSOFRMemberdk:FifthThirdBankMemberdk:DebtInstrumentInterestRatePeriodOneMember2024-01-012024-06-300001694426dk:DKLRevolverDelekLogisticsTermFacilityMemberus-gaap:SecuredDebtMemberdk:SecuredOvernightFinancingRateSOFRMembersrt:MaximumMemberdk:FifthThirdBankMemberdk:DebtInstrumentInterestRatePeriodOneMember2024-01-012024-06-300001694426dk:DKLRevolverDelekLogisticsTermFacilityMemberus-gaap:SecuredDebtMemberdk:FifthThirdBankMemberdk:DebtInstrumentInterestRatePeriodOneMember2022-10-132022-10-130001694426dk:DKLRevolverDelekLogisticsTermFacilityMemberus-gaap:SecuredDebtMemberdk:DebtInstrumentInterestRatePeriodTwoMemberdk:FifthThirdBankMember2022-10-132022-10-130001694426us-gaap:RevolvingCreditFacilityMemberdk:DKLRevolverDelekLogisticsTermFacilityMemberus-gaap:SecuredDebtMemberdk:FifthThirdBankMember2024-01-012024-06-300001694426dk:DelekRevolverMemberus-gaap:RevolvingCreditFacilityMemberus-gaap:LineOfCreditMember2024-06-300001694426us-gaap:RevolvingCreditFacilityMemberdk:FifthThirdBankMemberdk:DklRevolverMemberus-gaap:LineOfCreditMember2024-06-300001694426us-gaap:RevolvingCreditFacilityMemberus-gaap:LetterOfCreditMember2024-06-300001694426us-gaap:RevolvingCreditFacilityMembersrt:MaximumMemberus-gaap:LineOfCreditMember2024-01-012024-06-300001694426us-gaap:BaseRateMemberus-gaap:RevolvingCreditFacilityMembersrt:MinimumMemberus-gaap:LineOfCreditMember2024-01-012024-06-300001694426us-gaap:BaseRateMemberus-gaap:RevolvingCreditFacilityMembersrt:MaximumMemberus-gaap:LineOfCreditMember2024-01-012024-06-300001694426us-gaap:RevolvingCreditFacilityMembersrt:MinimumMemberdk:SecuredOvernightFinancingRateSOFRAndCanadianOvernightFinancingRateCDORMemberus-gaap:LineOfCreditMember2024-01-012024-06-300001694426us-gaap:RevolvingCreditFacilityMemberdk:SecuredOvernightFinancingRateSOFRAndCanadianOvernightFinancingRateCDORMembersrt:MaximumMemberus-gaap:LineOfCreditMember2024-01-012024-06-300001694426us-gaap:LetterOfCreditMemberdk:FifthThirdBankMemberdk:DklRevolverMemberus-gaap:LineOfCreditMember2024-06-300001694426dk:USSwingLineSublimitMemberdk:FifthThirdBankMemberdk:DklRevolverMemberus-gaap:LineOfCreditMember2024-06-300001694426srt:MaximumMemberdk:FifthThirdBankMemberdk:DklRevolverMember2024-01-012024-06-300001694426srt:MinimumMemberus-gaap:PrimeRateMemberdk:DKLRevolverSeniorSecuredRevolvingCommitmentMemberdk:FifthThirdBankMemberus-gaap:LineOfCreditMember2024-01-012024-06-300001694426us-gaap:PrimeRateMembersrt:MaximumMemberdk:DKLRevolverSeniorSecuredRevolvingCommitmentMemberdk:FifthThirdBankMemberus-gaap:LineOfCreditMember2024-01-012024-06-300001694426srt:MinimumMemberus-gaap:SecuredDebtMemberdk:SecuredOvernightFinancingRateSOFRMemberdk:DKLRevolverSeniorSecuredRevolvingCommitmentMemberdk:FifthThirdBankMember2024-01-012024-06-300001694426us-gaap:SecuredDebtMemberdk:SecuredOvernightFinancingRateSOFRMembersrt:MaximumMemberdk:DKLRevolverSeniorSecuredRevolvingCommitmentMemberdk:FifthThirdBankMember2024-01-012024-06-300001694426srt:MinimumMemberdk:DKLRevolverSeniorSecuredRevolvingCommitmentMemberdk:FifthThirdBankMemberus-gaap:LineOfCreditMemberdk:TotalLeverageRatioInterestRateMember2024-01-012024-06-300001694426srt:MaximumMemberdk:DKLRevolverSeniorSecuredRevolvingCommitmentMemberdk:FifthThirdBankMemberus-gaap:LineOfCreditMemberdk:TotalLeverageRatioInterestRateMember2024-01-012024-06-300001694426us-gaap:RevolvingCreditFacilityMemberdk:FifthThirdBankMemberdk:DKLRevolverSeniorSecuredRevolvingCommitmentMemberus-gaap:LineOfCreditMember2024-06-300001694426us-gaap:RevolvingCreditFacilityMemberdk:FifthThirdBankMemberdk:DKLRevolverSeniorSecuredRevolvingCommitmentMemberus-gaap:LineOfCreditMember2023-12-310001694426us-gaap:RevolvingCreditFacilityMemberdk:WallStreetJournalPrimeRateMemberus-gaap:LineOfCreditMemberdk:UnitedCommunityBankRevolverMember2024-01-012024-06-300001694426us-gaap:RevolvingCreditFacilityMemberus-gaap:LineOfCreditMemberdk:UnitedCommunityBankRevolverMember2024-01-012024-06-300001694426us-gaap:RevolvingCreditFacilityMemberdk:FifthThirdBankMemberdk:DklRevolverMemberus-gaap:LineOfCreditMember2024-03-292024-03-290001694426us-gaap:RevolvingCreditFacilityMemberdk:FifthThirdBankMemberdk:DklRevolverMemberus-gaap:LineOfCreditMember2024-03-290001694426us-gaap:SeniorNotesMemberdk:DelekLogistics2029NotesMember2024-03-130001694426us-gaap:SeniorNotesMemberdk:Additional2029NotesMember2024-04-170001694426us-gaap:SeniorNotesMemberdk:DelekLogistics2029NotesMember2024-03-132024-03-130001694426us-gaap:SeniorNotesMemberdk:DelekLogistics2029NotesMemberus-gaap:DebtInstrumentRedemptionPeriodOneMember2024-03-132024-03-130001694426us-gaap:SeniorNotesMemberdk:DelekLogistics2029NotesMemberus-gaap:DebtInstrumentRedemptionPeriodTwoMember2024-03-132024-03-130001694426us-gaap:SeniorNotesMemberdk:DelekLogistics2029NotesMemberus-gaap:DebtInstrumentRedemptionPeriodThreeMember2024-03-132024-03-130001694426us-gaap:DebtInstrumentRedemptionPeriodFourMemberus-gaap:SeniorNotesMemberdk:DelekLogistics2029NotesMember2024-03-132024-03-130001694426us-gaap:SeniorNotesMemberdk:A2028NotesMember2021-05-240001694426us-gaap:SeniorNotesMemberdk:A2025NotesMember2018-05-310001694426us-gaap:SeniorNotesMemberdk:A2025NotesMember2024-01-012024-06-300001694426us-gaap:CommodityContractMember2024-01-012024-06-300001694426us-gaap:OtherCurrentAssetsMemberus-gaap:NondesignatedMemberus-gaap:CommodityContractMember2024-06-300001694426us-gaap:OtherCurrentAssetsMemberus-gaap:NondesignatedMemberus-gaap:CommodityContractMember2023-12-310001694426us-gaap:NondesignatedMemberus-gaap:OtherCurrentLiabilitiesMemberus-gaap:CommodityContractMember2024-06-300001694426us-gaap:NondesignatedMemberus-gaap:OtherCurrentLiabilitiesMemberus-gaap:CommodityContractMember2023-12-310001694426us-gaap:OtherCurrentAssetsMemberus-gaap:NondesignatedMemberdk:RINCommitmentContractsMember2024-06-300001694426us-gaap:OtherCurrentAssetsMemberus-gaap:NondesignatedMemberdk:RINCommitmentContractsMember2023-12-310001694426us-gaap:NondesignatedMemberus-gaap:OtherCurrentLiabilitiesMemberdk:RINCommitmentContractsMember2024-06-300001694426us-gaap:NondesignatedMemberus-gaap:OtherCurrentLiabilitiesMemberdk:RINCommitmentContractsMember2023-12-310001694426us-gaap:CommodityContractMember2024-06-300001694426us-gaap:CommodityContractMember2023-12-310001694426us-gaap:NondesignatedMemberus-gaap:CommodityContractMember2024-04-012024-06-300001694426us-gaap:NondesignatedMemberus-gaap:CommodityContractMember2023-04-012023-06-300001694426us-gaap:NondesignatedMemberus-gaap:CommodityContractMember2024-01-012024-06-300001694426us-gaap:NondesignatedMemberus-gaap:CommodityContractMember2023-01-012023-06-3000016944262022-01-012022-06-300001694426us-gaap:NondesignatedMemberus-gaap:ForwardContractsMember2024-04-012024-06-300001694426us-gaap:NondesignatedMemberus-gaap:ForwardContractsMember2023-04-012023-06-300001694426us-gaap:NondesignatedMemberus-gaap:ForwardContractsMember2024-01-012024-06-300001694426us-gaap:NondesignatedMemberus-gaap:ForwardContractsMember2023-01-012023-06-300001694426us-gaap:NondesignatedMember2024-04-012024-06-300001694426us-gaap:NondesignatedMember2023-04-012023-06-300001694426us-gaap:NondesignatedMember2024-01-012024-06-300001694426us-gaap:NondesignatedMember2023-01-012023-06-300001694426us-gaap:ForwardContractsMember2024-04-012024-06-300001694426us-gaap:ForwardContractsMember2023-04-012023-06-300001694426us-gaap:ForwardContractsMember2024-01-012024-06-300001694426us-gaap:ForwardContractsMember2023-01-012023-06-300001694426us-gaap:CommodityContractMember2024-04-012024-06-300001694426us-gaap:CommodityContractMember2023-04-012023-06-300001694426us-gaap:CommodityContractMember2023-01-012023-06-300001694426dk:RINCommitmentContractsMember2024-01-012024-06-300001694426dk:RINCommitmentContractsMember2024-04-012024-06-300001694426dk:RINCommitmentContractsMember2023-04-012023-06-300001694426dk:RINCommitmentContractsMember2023-01-012023-06-300001694426us-gaap:FairValueInputsLevel1Memberus-gaap:SeniorNotesMemberdk:A2028NotesMember2024-06-300001694426us-gaap:FairValueInputsLevel1Memberus-gaap:SeniorNotesMemberdk:A2028NotesMember2023-12-310001694426us-gaap:FairValueInputsLevel1Memberus-gaap:SeniorNotesMemberdk:DelekLogistics2029NotesMember2024-06-300001694426us-gaap:FairValueInputsLevel1Memberus-gaap:FairValueMeasurementsRecurringMemberus-gaap:CommodityContractMember2024-06-300001694426us-gaap:FairValueMeasurementsRecurringMemberus-gaap:FairValueInputsLevel2Memberus-gaap:CommodityContractMember2024-06-300001694426us-gaap:FairValueMeasurementsRecurringMemberus-gaap:FairValueInputsLevel3Memberus-gaap:CommodityContractMember2024-06-300001694426us-gaap:FairValueMeasurementsRecurringMemberus-gaap:CommodityContractMember2024-06-300001694426us-gaap:FairValueInputsLevel1Memberus-gaap:FairValueMeasurementsRecurringMemberdk:RINCommitmentContractsMember2024-06-300001694426us-gaap:FairValueMeasurementsRecurringMemberdk:RINCommitmentContractsMemberus-gaap:FairValueInputsLevel2Member2024-06-300001694426us-gaap:FairValueMeasurementsRecurringMemberdk:RINCommitmentContractsMemberus-gaap:FairValueInputsLevel3Member2024-06-300001694426us-gaap:FairValueMeasurementsRecurringMemberdk:RINCommitmentContractsMember2024-06-300001694426us-gaap:FairValueInputsLevel1Memberus-gaap:FairValueMeasurementsRecurringMember2024-06-300001694426us-gaap:FairValueMeasurementsRecurringMemberus-gaap:FairValueInputsLevel2Member2024-06-300001694426us-gaap:FairValueMeasurementsRecurringMemberus-gaap:FairValueInputsLevel3Member2024-06-300001694426us-gaap:FairValueMeasurementsRecurringMember2024-06-300001694426us-gaap:FairValueInputsLevel1Memberus-gaap:FairValueMeasurementsRecurringMemberdk:EnvironmentalCreditsObligationMember2024-06-300001694426us-gaap:FairValueMeasurementsRecurringMemberus-gaap:FairValueInputsLevel2Memberdk:EnvironmentalCreditsObligationMember2024-06-300001694426us-gaap:FairValueMeasurementsRecurringMemberdk:EnvironmentalCreditsObligationMemberus-gaap:FairValueInputsLevel3Member2024-06-300001694426us-gaap:FairValueMeasurementsRecurringMemberdk:EnvironmentalCreditsObligationMember2024-06-300001694426us-gaap:FairValueInputsLevel1Memberus-gaap:FairValueMeasurementsRecurringMemberdk:InventoryIntermediationAgreementMember2024-06-300001694426us-gaap:FairValueMeasurementsRecurringMemberdk:InventoryIntermediationAgreementMemberus-gaap:FairValueInputsLevel2Member2024-06-300001694426us-gaap:FairValueMeasurementsRecurringMemberdk:InventoryIntermediationAgreementMemberus-gaap:FairValueInputsLevel3Member2024-06-300001694426us-gaap:FairValueMeasurementsRecurringMemberdk:InventoryIntermediationAgreementMember2024-06-300001694426us-gaap:FairValueInputsLevel1Memberus-gaap:FairValueMeasurementsRecurringMemberus-gaap:CommodityContractMember2023-12-310001694426us-gaap:FairValueMeasurementsRecurringMemberus-gaap:FairValueInputsLevel2Memberus-gaap:CommodityContractMember2023-12-310001694426us-gaap:FairValueMeasurementsRecurringMemberus-gaap:FairValueInputsLevel3Memberus-gaap:CommodityContractMember2023-12-310001694426us-gaap:FairValueMeasurementsRecurringMemberus-gaap:CommodityContractMember2023-12-310001694426us-gaap:FairValueInputsLevel1Memberus-gaap:FairValueMeasurementsRecurringMemberdk:RINCommitmentContractsMember2023-12-310001694426us-gaap:FairValueMeasurementsRecurringMemberdk:RINCommitmentContractsMemberus-gaap:FairValueInputsLevel2Member2023-12-310001694426us-gaap:FairValueMeasurementsRecurringMemberdk:RINCommitmentContractsMemberus-gaap:FairValueInputsLevel3Member2023-12-310001694426us-gaap:FairValueMeasurementsRecurringMemberdk:RINCommitmentContractsMember2023-12-310001694426us-gaap:FairValueInputsLevel1Memberus-gaap:FairValueMeasurementsRecurringMember2023-12-310001694426us-gaap:FairValueMeasurementsRecurringMemberus-gaap:FairValueInputsLevel2Member2023-12-310001694426us-gaap:FairValueMeasurementsRecurringMemberus-gaap:FairValueInputsLevel3Member2023-12-310001694426us-gaap:FairValueMeasurementsRecurringMember2023-12-310001694426us-gaap:FairValueInputsLevel1Memberus-gaap:FairValueMeasurementsRecurringMemberdk:EnvironmentalCreditsObligationMember2023-12-310001694426us-gaap:FairValueMeasurementsRecurringMemberus-gaap:FairValueInputsLevel2Memberdk:EnvironmentalCreditsObligationMember2023-12-310001694426us-gaap:FairValueMeasurementsRecurringMemberdk:EnvironmentalCreditsObligationMemberus-gaap:FairValueInputsLevel3Member2023-12-310001694426us-gaap:FairValueMeasurementsRecurringMemberdk:EnvironmentalCreditsObligationMember2023-12-310001694426us-gaap:FairValueInputsLevel1Memberus-gaap:FairValueMeasurementsRecurringMemberdk:InventoryIntermediationAgreementMember2023-12-310001694426us-gaap:FairValueMeasurementsRecurringMemberdk:InventoryIntermediationAgreementMemberus-gaap:FairValueInputsLevel2Member2023-12-310001694426us-gaap:FairValueMeasurementsRecurringMemberdk:InventoryIntermediationAgreementMemberus-gaap:FairValueInputsLevel3Member2023-12-310001694426us-gaap:FairValueMeasurementsRecurringMemberdk:InventoryIntermediationAgreementMember2023-12-310001694426us-gaap:PropertyPlantAndEquipmentMember2024-06-300001694426srt:MaximumMember2024-01-012024-06-3000016944262024-06-2700016944262024-06-272024-06-2700016944262020-06-300001694426dk:ElDoradoRefineryFireMember2024-01-012024-06-300001694426dk:ElDoradoRefineryFireMember2024-04-012024-06-300001694426dk:ElDoradoRefineryFireMember2023-04-012023-06-300001694426dk:ElDoradoRefineryFireMember2023-01-012023-06-300001694426us-gaap:RelatedPartyMember2024-04-012024-06-300001694426us-gaap:RelatedPartyMember2023-04-012023-06-300001694426us-gaap:RelatedPartyMember2024-01-012024-06-300001694426us-gaap:RelatedPartyMember2023-01-012023-06-300001694426us-gaap:GeneralAndAdministrativeExpenseMemberdk:DelekUS2006And2016AndAlonUSAEnergy2005LongTermIncentivePlanMember2024-04-012024-06-300001694426us-gaap:GeneralAndAdministrativeExpenseMemberdk:DelekUS2006And2016AndAlonUSAEnergy2005LongTermIncentivePlanMember2024-01-012024-06-300001694426us-gaap:GeneralAndAdministrativeExpenseMemberdk:DelekUS2006And2016AndAlonUSAEnergy2005LongTermIncentivePlanMember2023-04-012023-06-300001694426us-gaap:GeneralAndAdministrativeExpenseMemberdk:DelekUS2006And2016AndAlonUSAEnergy2005LongTermIncentivePlanMember2023-01-012023-06-300001694426dk:DelekUS2006And2016AndAlonUSAEnergy2005LongTermIncentivePlanMember2024-06-300001694426dk:DelekUS2006And2016AndAlonUSAEnergy2005LongTermIncentivePlanMember2024-01-012024-06-300001694426dk:DelekUS2006And2016AndAlonUSAEnergy2005LongTermIncentivePlanMember2024-04-012024-06-300001694426dk:DelekUS2006And2016AndAlonUSAEnergy2005LongTermIncentivePlanMember2023-04-012023-06-300001694426dk:DelekUS2006And2016AndAlonUSAEnergy2005LongTermIncentivePlanMember2023-01-012023-06-3000016944262024-02-202024-02-2000016944262024-05-022024-05-020001694426us-gaap:SubsequentEventMember2024-07-312024-07-310001694426us-gaap:SubsequentEventMemberdk:H2OMidstreamMemberdk:DelekLogisticsMember2024-08-022024-08-020001694426us-gaap:SubsequentEventMemberdk:WinktoWebsterPipelineLLCMember2024-08-010001694426us-gaap:SubsequentEventMemberdk:WinktoWebsterPipelineLLCMember2024-08-012024-08-010001694426dk:W2WHoldingsLLCMemberus-gaap:SubsequentEventMember2024-08-050001694426us-gaap:SubsequentEventMemberdk:WinktoWebsterPipelineLLCMember2024-08-050001694426dk:W2WHoldingsLLCMemberus-gaap:SubsequentEventMember2024-08-052024-08-050001694426us-gaap:SubsequentEventMembersrt:MinimumMember2024-08-050001694426us-gaap:SubsequentEventMembersrt:MaximumMember2024-08-050001694426us-gaap:SubsequentEventMember2024-08-05
UNITED STATES
SECURITIES AND EXCHANGE COMMISSION
Washington, D.C. 20549
Form 10-Q
(Mark One)
| | | | | | | | | | | | | | |
| ☑ | | QUARTERLY REPORT PURSUANT TO SECTION 13 OR 15(d) OF THE SECURITIES EXCHANGE ACT OF 1934 |
| | | | |
| | For the quarterly period ended | June 30, 2024 | |
or
| | | | | | | | |
| ☐ | | TRANSITION REPORT PURSUANT TO SECTION 13 OR 15(d) OF THE SECURITIES EXCHANGE ACT OF 1934 |
| | |
| | For the transition period from to |
Commission file number 001-38142
DELEK US HOLDINGS, INC.
(Exact name of registrant as specified in its charter)
| | | | | | | | | | | |
| Delaware | | 35-2581557 |
| (State or other jurisdiction of incorporation or organization) | (I.R.S. Employer Identification No.) |
| |
310 Seven Springs Way, Suite 500 | Brentwood | Tennessee | 37027 |
(Address of principal executive offices) | | | (Zip Code) |
(615) 771-6701
(Registrant’s telephone number, including area code)
Not Applicable
(Former name, former address and former fiscal year, if changed since last report)
Indicate by check mark whether the registrant: (1) has filed all reports required to be filed by Section 13 or 15(d) of the Securities Exchange Act of 1934 during the preceding 12 months (or for such shorter period that the registrant was required to file such reports), and (2) has been subject to such filing requirements for the past 90 days. Yes ☑ No ☐
Indicate by check mark whether the registrant has submitted electronically every Interactive Data File required to be submitted pursuant to Rule 405 of Regulation S-T during the preceding 12 months (or for such shorter period that the registrant was required to submit such files). Yes ☑ No ☐
Indicate by check mark whether the registrant is a large accelerated filer, an accelerated filer, a non-accelerated filer, a smaller reporting company or an emerging growth company. See the definitions of "large accelerated filer," "accelerated filer," "smaller reporting company" and "emerging growth company" in Rule 12b-2 of the Exchange Act.
| | | | | | | | | | | | | | | | | | | | | | | | | | | | | |
| Large accelerated filer | ☑ | Accelerated filer | ☐ | Non-accelerated filer | ☐ | Smaller reporting company | ☐ | Emerging growth company | ☐ |
If an emerging growth company, indicate by check mark if the registrant has elected not to use the extended transition period for complying with any new or revised financial accounting standards provided pursuant to Section 13(a) of the Exchange Act. ☐
Indicate by check mark whether the registrant is a shell company (as defined in Rule 12b-2 of the Exchange Act). Yes ☐ No ☑
Securities registered pursuant to Section 12(b) of the Act:
| | | | | | | | | | | | | | |
| Title of Each Class | | Trading Symbol | | Name of Each Exchange on Which Registered |
| Common Stock, par value $0.01 | | DK | | New York Stock Exchange |
| | | | |
|
At August 1, 2024, there were 64,538,625 shares of common stock, $0.01 par value, outstanding (excluding securities held by, or for the account of, the Company or its subsidiaries).
Delek US Holdings, Inc.
Quarterly Report on Form 10-Q
For the Quarterly Period Ended June 30, 2024
Part I - FINANCIAL INFORMATION
ITEM 1. FINANCIAL STATEMENTS
Delek US Holdings, Inc.
Condensed Consolidated Balance Sheets (unaudited)
(In millions, except share and per share data)
| | | | | | | | | | | | | | |
| | June 30, 2024 | | December 31, 2023 |
| ASSETS | | | | |
| Current assets: | | | | |
| Cash and cash equivalents | | $ | 657.9 | | | $ | 822.2 | |
| Accounts receivable, net | | 771.4 | | | 783.7 | |
| | | | |
| | | | |
| Inventories, net of inventory valuation reserves | | 1,010.4 | | | 981.9 | |
| | | | |
| Other current assets | | 61.2 | | | 78.2 | |
| Total current assets | | 2,500.9 | | | 2,666.0 | |
| Property, plant and equipment: | | | | |
| Property, plant and equipment | | 4,799.4 | | | 4,690.7 | |
| Less: accumulated depreciation | | (2,013.6) | | | (1,845.5) | |
| Property, plant and equipment, net | | 2,785.8 | | | 2,845.2 | |
| Operating lease right-of-use assets | | 133.5 | | | 148.2 | |
| Goodwill | | 729.4 | | | 729.4 | |
| Other intangibles, net | | 284.3 | | | 296.2 | |
| Equity method investments | | 386.9 | | | 360.7 | |
| Other non-current assets | | 122.7 | | | 126.1 | |
| Total assets | | $ | 6,943.5 | | | $ | 7,171.8 | |
| LIABILITIES AND STOCKHOLDERS’ EQUITY | | | | |
| Current liabilities: | | | | |
| Accounts payable | | $ | 1,861.4 | | | $ | 1,814.3 | |
| | | | |
| | | | |
| Current portion of long-term debt | | 9.5 | | | 44.5 | |
| Current portion of obligation under Inventory Intermediation Agreement | | — | | | 0.4 | |
| Current portion of operating lease liabilities | | 51.0 | | | 54.7 | |
| Accrued expenses and other current liabilities | | 642.9 | | | 771.2 | |
| Total current liabilities | | 2,564.8 | | | 2,685.1 | |
| Non-current liabilities: | | | | |
| Long-term debt, net of current portion | | 2,452.2 | | | 2,555.3 | |
| Obligation under Inventory Intermediation Agreement | | 472.2 | | | 407.2 | |
| Environmental liabilities, net of current portion | | 32.8 | | | 110.9 | |
| Asset retirement obligations | | 26.2 | | | 43.3 | |
| Deferred tax liabilities | | 262.1 | | | 264.1 | |
| Operating lease liabilities, net of current portion | | 96.0 | | | 111.2 | |
| Other non-current liabilities | | 54.4 | | | 35.0 | |
| Total non-current liabilities | | 3,395.9 | | | 3,527.0 | |
| Stockholders’ equity: | | | | |
Preferred stock, $0.01 par value, 10,000,000 shares authorized, no shares issued and outstanding | | — | | | — | |
Common stock, $0.01 par value, 110,000,000 shares authorized, 82,085,570 shares and 81,539,871 shares issued at June 30, 2024 and December 31, 2023, respectively | | 0.8 | | | 0.8 | |
| Additional paid-in capital | | 1,175.8 | | | 1,113.6 | |
| Accumulated other comprehensive loss | | (4.8) | | | (4.8) | |
Treasury stock, 17,575,527 shares, at cost, at June 30, 2024 and December 31, 2023, respectively | | (694.1) | | | (694.1) | |
| Retained earnings | | 328.1 | | | 430.0 | |
| Non-controlling interests in subsidiaries | | 177.0 | | | 114.2 | |
| Total stockholders’ equity | | 982.8 | | | 959.7 | |
| Total liabilities and stockholders’ equity | | $ | 6,943.5 | | | $ | 7,171.8 | |
See accompanying notes to the condensed consolidated financial statements
Delek US Holdings, Inc.
Condensed Consolidated Statements of Income (unaudited)
(In millions, except share and per share data)
| | | | | | | | | | | | | | | | | | | | | | | | | | | | |
| | Three Months Ended June 30, | | Six Months Ended June 30, |
| | | | | | | | | | |
| | | 2024 | | 2023 | | 2024 | | 2023 | | |
| Net revenues | | $ | 3,421.7 | | | $ | 4,195.6 | | | $ | 6,649.3 | | | $ | 8,119.9 | | | |
| Cost of sales: | | | | | | | | | | |
| Cost of materials and other | | 3,099.4 | | | 3,766.6 | | | 5,896.7 | | | 7,206.2 | | | |
| Operating expenses (excluding depreciation and amortization presented below) | | 185.1 | | | 188.7 | | | 398.9 | | | 359.5 | | | |
| Depreciation and amortization | | 80.7 | | | 82.6 | | | 167.1 | | | 159.4 | | | |
| Total cost of sales | | 3,365.2 | | | 4,037.9 | | | 6,462.7 | | | 7,725.1 | | | |
| | | | | | | | | | |
| | | | | | | | | | |
| Operating expenses related to retail and wholesale business (excluding depreciation and amortization presented below) | | 26.3 | | | 31.1 | | | 52.1 | | | 58.1 | | | |
| General and administrative expenses | | 63.1 | | | 75.8 | | | 127.5 | | | 147.3 | | | |
| Depreciation and amortization | | 11.4 | | | 6.8 | | | 20.2 | | | 13.4 | | | |
| Asset impairment | | 22.1 | | | — | | | 22.1 | | | — | | | |
| Other operating income, net | | (79.9) | | | (6.1) | | | (81.5) | | | (16.9) | | | |
| Total operating costs and expenses | | 3,408.2 | | | 4,145.5 | | | 6,603.1 | | | 7,927.0 | | | |
| Operating income | | 13.5 | | | 50.1 | | | 46.2 | | | 192.9 | | | |
| Interest expense, net | | 77.7 | | | 80.4 | | | 165.4 | | | 156.9 | | | |
| Income from equity method investments | | (30.4) | | | (25.5) | | | (52.3) | | | (40.1) | | | |
| | | | | | | | | | |
| | | | | | | | | | |
| | | | | | | | | | |
| | | | | | | | | | |
| | | | | | | | | | |
| | | | | | | | | | |
| Other expense (income), net | | — | | | 0.5 | | | (0.7) | | | (6.6) | | | |
| Total non-operating expense, net | | 47.3 | | | 55.4 | | | 112.4 | | | 110.2 | | | |
| (Loss) income before income tax (benefit) expense | | (33.8) | | | (5.3) | | | (66.2) | | | 82.7 | | | |
| Income tax (benefit) expense | | (7.7) | | | (3.8) | | | (14.9) | | | 12.0 | | | |
| | | | | | | | | | |
| | | | | | | | | | |
| | | | | | | | | | |
| | | | | | | | | | |
| | | | | | | | | | |
| Net (loss) income | | (26.1) | | | (1.5) | | | (51.3) | | | 70.7 | | | |
| Net income attributed to non-controlling interests | | 11.1 | | | 6.8 | | | 18.5 | | | 14.7 | | | |
| Net (loss) income attributable to Delek | | $ | (37.2) | | | $ | (8.3) | | | $ | (69.8) | | | $ | 56.0 | | | |
| | | | | | | | | | |
| | | | | | | | | | |
| | | | | | | | | | |
| Basic (loss) income per share | | $ | (0.58) | | | $ | (0.13) | | | $ | (1.09) | | | $ | 0.84 | | | |
| | | | | | | | | | |
| | | | | | | | | | |
| | | | | | | | | | |
| Diluted (loss) income per share | | $ | (0.58) | | | $ | (0.13) | | | $ | (1.09) | | | $ | 0.84 | | | |
| Weighted average common shares outstanding: | | | | | | | | | | |
| Basic | | 64,213,899 | | | 65,773,609 | | | 64,117,943 | | | 66,359,537 | | | |
| Diluted | | 64,213,899 | | | 65,773,609 | | | 64,117,943 | | | 66,835,322 | | | |
See accompanying notes to the condensed consolidated financial statements
Delek US Holdings, Inc.
Condensed Consolidated Statements of Comprehensive Income (Loss) (unaudited)
(In millions)
| | | | | | | | | | | | | | | | | | | | | | | | | | | | |
| | Three Months Ended June 30, | | Six Months Ended June 30, |
| | | | | | | | | | |
| | | 2024 | | 2023 | | 2024 | | 2023 | | |
| Net (loss) income | | $ | (26.1) | | | $ | (1.5) | | | $ | (51.3) | | | $ | 70.7 | | | |
| Other comprehensive (loss) income: | | | | | | | | | | |
| | | | | | | | | | |
| | | | | | | | | | |
| | | | | | | | | | |
| | | | | | | | | | |
| | | | | | | | | | |
| | | | | | | | | | |
| | | | | | | | | | |
| | | | | | | | | | |
| | | | | | | | | | |
| | | | | | | | | | |
| | | | | | | | | | |
| | | | | | | | | | |
| | | | | | | | | | |
| | | | | | | | | | |
| | | | | | | | | | |
| | | | | | | | | | |
| | | | | | | | | | |
| | | | | | | | | | |
| | | | | | | | | | |
| | | | | | | | | | |
| | | | | | | | | | |
| | | | | | | | | | |
| | | | | | | | | | |
| | | | | | | | | | |
| | | | | | | | | | |
| Other loss, net of taxes | | — | | | (0.1) | | | — | | | (0.1) | | | |
| Total other comprehensive loss | | — | | | (0.1) | | | — | | | (0.1) | | | |
| | | | | | | | | | |
| Comprehensive (loss) income | | $ | (26.1) | | | $ | (1.6) | | | $ | (51.3) | | | $ | 70.6 | | | |
| Comprehensive income attributable to non-controlling interest | | 11.1 | | | 6.8 | | | 18.5 | | | 14.7 | | | |
| Comprehensive (loss) income attributable to Delek | | $ | (37.2) | | | $ | (8.4) | | | $ | (69.8) | | | $ | 55.9 | | | |
See accompanying notes to the condensed consolidated financial statements
Delek US Holdings, Inc.
Condensed Consolidated Statements of Changes in Stockholders' Equity (unaudited)
(In millions, except share and per share data)
| | | | | | | | | | | | | | | | | | | | | | | | | | | | | | | | | | | | | | | | | | | | | | | | | | | | | | | | |
| | Three Months Ended June 30, 2024 |
| | Common Stock | | Additional Paid-in Capital | | Accumulated Other Comprehensive Loss | | Retained Earnings | | Treasury Stock | | Non-Controlling Interest in Subsidiaries | | Total Stockholders' Equity |
| | Shares | | Amount | | Shares | | Amount | |
Balance at March 31, 2024 | | 81,626,016 | | $ | 0.8 | | | $ | 1,171.8 | | | $ | (4.8) | | | $ | 381.5 | | | (17,575,527) | | $ | (694.1) | | | $ | 179.9 | | | $ | 1,035.1 | |
| | | | | | | | | | | | | | | | | | |
| | | | | | | | | | | | | | | | | | |
| Net (loss) income | | — | | — | | | — | | | — | | | (37.2) | | | — | | | — | | | 11.1 | | | (26.1) | |
| | | | | | | | | | | | | | | | | | |
| | | | | | | | | | | | | | | | | | |
Common stock dividends ($0.25 per share) | | — | | — | | | — | | | — | | | (16.0) | | | — | | | — | | | — | | | (16.0) | |
| Distributions to non-controlling interests | | — | | — | | | — | | | — | | | — | | | — | | | — | | | (13.8) | | | (13.8) | |
| Equity-based compensation expense | | — | | — | | | 7.3 | | | — | | | — | | | — | | | — | | | 0.3 | | | 7.6 | |
| | | | | | | | | | | | | | | | | | |
| | | | | | | | | | | | | | | | | | |
| | | | | | | | | | | | | | | | | | |
| | | | | | | | | | | | | | | | | | |
| Taxes paid due to the net settlement of equity-based compensation | | — | | — | | | (3.9) | | | — | | | — | | | — | | | — | | | (0.2) | | | (4.1) | |
| Exercise of equity-based awards | | 402,665 | | — | | | — | | | — | | | — | | | — | | | — | | | — | | | — | |
| | | | | | | | | | | | | | | | | | |
| Other | | 56,889 | | — | | | 0.6 | | | — | | | (0.2) | | | — | | | — | | | (0.3) | | | 0.1 | |
Balance at June 30, 2024 | | 82,085,570 | | | $ | 0.8 | | | $ | 1,175.8 | | | $ | (4.8) | | | $ | 328.1 | | | (17,575,527) | | | $ | (694.1) | | | $ | 177.0 | | | $ | 982.8 | |
| | | | | | | | | | | | | | | | | | | | | | | | | | | | | | | | | | | | | | | | | | | | | | | | | | | | | | | | |
| | Three Months Ended June 30, 2023 |
| | Common Stock | | Additional Paid-in Capital | | Accumulated Other Comprehensive Loss | | Retained Earnings | | Treasury Stock | | Non-Controlling Interest in Subsidiaries | | Total Stockholders' Equity |
| | Shares | | Amount | | Shares | | Amount | |
Balance at March 31, 2023 | | 84,569,103 | | $ | 0.9 | | | $ | 1,141.2 | | | $ | (5.2) | | | $ | 557.2 | | | (17,575,527) | | $ | (694.1) | | | $ | 124.3 | | | $ | 1,124.3 | |
| | | | | | | | | | | | | | | | | | |
| | | | | | | | | | | | | | | | | | |
| Net (loss) income | | — | | — | | | — | | | — | | | (8.3) | | | — | | | — | | | 6.8 | | | (1.5) | |
| | | | | | | | | | | | | | | | | | |
| | | | | | | | | | | | | | | | | | |
Common stock dividends ($0.23 per share) | | — | | — | | | — | | | — | | | (15.0) | | | — | | | — | | | — | | | (15.0) | |
| Distributions to non-controlling interests | | — | | — | | | — | | | — | | | — | | | — | | | — | | | (9.6) | | | (9.6) | |
| Equity-based compensation expense | | — | | — | | | 5.7 | | | — | | | — | | | — | | | — | | | 0.2 | | | 5.9 | |
| | | | | | | | | | | | | | | | | | |
| | | | | | | | | | | | | | | | | | |
| Repurchase of common stock | | (1,795,335) | | | (0.1) | | | (24.2) | | | — | | | (15.7) | | | — | | | — | | | — | | | (40.0) | |
| | | | | | | | | | | | | | | | | | |
| Taxes paid due to the net settlement of equity-based compensation | | — | | — | | | (2.9) | | | — | | | — | | | — | | | — | | | (0.1) | | | (3.0) | |
| Exercise of equity-based awards | | 308,196 | | — | | | — | | | — | | | — | | | — | | | — | | | — | | | — | |
| Other | | 68,331 | | — | | | 2.0 | | | (0.1) | | | (0.1) | | | — | | | — | | | — | | | 1.8 | |
Balance at June 30, 2023 | | 83,150,295 | | | $ | 0.8 | | | $ | 1,121.8 | | | $ | (5.3) | | | $ | 518.1 | | | (17,575,527) | | | $ | (694.1) | | | $ | 121.6 | | | $ | 1,062.9 | |
Delek US Holdings, Inc.
Condensed Consolidated Statements of Changes in Stockholders' Equity (unaudited)
(In millions, except share and per share data)
| | | | | | | | | | | | | | | | | | | | | | | | | | | | | | | | | | | | | | | | | | | | | | | | | | | | | | | | |
| | Six Months Ended June 30, 2024 |
| | Common Stock | | Additional Paid-in Capital | | Accumulated Other Comprehensive Loss | | Retained Earnings | | Treasury Shares | | Non-Controlling Interest in Subsidiaries | | Total Stockholders' Equity |
| | Shares | | Amount | | | | | Shares | | Amount | | |
| Balance at December 31, 2023 | | 81,539,871 | | | $ | 0.8 | | | $ | 1,113.6 | | | $ | (4.8) | | | $ | 430.0 | | | (17,575,527) | | | $ | (694.1) | | | $ | 114.2 | | | $ | 959.7 | |
| | | | | | | | | | | | | | | | | | |
| | | | | | | | | | | | | | | | | | |
| Net (loss) income | | — | | | — | | | — | | | — | | | (69.8) | | | — | | | — | | | 18.5 | | | (51.3) | |
| | | | | | | | | | | | | | | | | | |
| | | | | | | | | | | | | | | | | | |
| | | | | | | | | | | | | | | | | | |
Common stock dividends ($0.495 per share) | | — | | | — | | | — | | | — | | | (31.7) | | | — | | | — | | | — | | | (31.7) | |
| Distributions to non-controlling interests | | — | | | — | | | — | | | — | | | — | | | — | | | — | | | (23.6) | | | (23.6) | |
| Equity-based compensation expense | | — | | | — | | | 14.3 | | | — | | | — | | | — | | | — | | | 0.5 | | | 14.8 | |
| | | | | | | | | | | | | | | | | | |
| | | | | | | | | | | | | | | | | | |
| | | | | | | | | | | | | | | | | | |
| | | | | | | | | | | | | | | | | | |
| | | | | | | | | | | | | | | | | | |
| | | | | | | | | | | | | | | | | | |
| Taxes paid due to the net settlement of equity-based compensation | | — | | | — | | | (4.4) | | | — | | | — | | | — | | | — | | | (0.5) | | | (4.9) | |
| Exercise of equity-based awards | | 447,039 | | | — | | | — | | | — | | | — | | | — | | | — | | | — | | | — | |
| Equity attributable to issuance of Delek Logistics common limited partner units, net of tax | | — | | | — | | | 50.5 | | | — | | | — | | | — | | | — | | | 68.3 | | | 118.8 | |
| Other | | 98,660 | | | — | | | 1.8 | | | — | | | (0.4) | | | — | | | — | | | (0.4) | | | 1.0 | |
| Balance at June 30, 2024 | | 82,085,570 | | | $ | 0.8 | | | $ | 1,175.8 | | | $ | (4.8) | | | $ | 328.1 | | | (17,575,527) | | | $ | (694.1) | | | $ | 177.0 | | | $ | 982.8 | |
| | | | | | | | | | | | | | | | | | | | | | | | | | | | | | | | | | | | | | | | | | | | | | | | | | | | | | | | |
| | Six Months Ended June 30, 2023 |
| | Common Stock | | Additional Paid-in Capital | | Accumulated Other Comprehensive Loss | | Retained Earnings | | Treasury Stock | | Non-Controlling Interest in Subsidiaries | | Total Stockholders' Equity |
| | Shares | | Amount | | | | | Shares | | Amount | | |
| Balance at December 31, 2022 | | 84,509,517 | | | $ | 0.9 | | | $ | 1,134.1 | | | $ | (5.2) | | | $ | 507.9 | | | (17,575,527) | | | $ | (694.1) | | | $ | 125.9 | | | $ | 1,069.5 | |
| Net income | | — | | | — | | | — | | | — | | | 56.0 | | | — | | | — | | | 14.7 | | | 70.7 | |
Common stock dividends ($0.45 per share) | | — | | | — | | | — | | | — | | | (29.7) | | | — | | | — | | | — | | | (29.7) | |
| Equity-based compensation expense | | — | | | — | | | 12.0 | | | — | | | — | | | — | | | — | | | 0.3 | | | 12.3 | |
| Distributions to non-controlling interests | | — | | | — | | | — | | | — | | | — | | | — | | | — | | | (19.1) | | | (19.1) | |
| | | | | | | | | | | | | | | | | | |
| Repurchase of common stock | | (1,811,627) | | | (0.1) | | | (24.4) | | | — | | | (15.9) | | | — | | | — | | | — | | | (40.4) | |
| | | | | | | | | | | | | | | | | | |
| Taxes paid due to the net settlement of equity-based compensation | | — | | | — | | | (3.4) | | | — | | | — | | | — | | | — | | | (0.2) | | | (3.6) | |
| Exercise of equity-based awards | | 361,839 | | | — | | | — | | | — | | | — | | | — | | | — | | | — | | | — | |
| Other | | 90,566 | | | — | | | 3.5 | | | (0.1) | | | (0.2) | | | — | | | — | | | — | | | 3.2 | |
| Balance at June 30, 2023 | | 83,150,295 | | | $ | 0.8 | | | $ | 1,121.8 | | | $ | (5.3) | | | $ | 518.1 | | | (17,575,527) | | | $ | (694.1) | | | $ | 121.6 | | | $ | 1,062.9 | |
See accompanying notes to the condensed consolidated financial statements
Delek US Holdings, Inc.
Condensed Consolidated Statements of Cash Flows (unaudited)
(In millions)
| | | | | | | | | | | | | | | | |
| | Six Months Ended June 30, |
| | | | | | |
| | 2024 | | 2023 | | |
| Cash flows from operating activities: | | | | | | |
| Net (loss) income | | $ | (51.3) | | | $ | 70.7 | | | |
| Adjustments to reconcile net (loss) income to net cash provided by operating activities: | | | | | | |
| Depreciation and amortization | | 187.3 | | | 172.8 | | | |
| | | | | | |
| Non-cash lease expense | | 27.6 | | | 30.2 | | | |
| Deferred income taxes | | (15.9) | | | 12.0 | | | |
| Asset impairment | | 22.1 | | | — | | | |
| Income from equity method investments | | (52.3) | | | (40.1) | | | |
| Dividends from equity method investments | | 22.7 | | | 19.5 | | | |
| Non-cash lower of cost or market/net realizable value adjustment | | (10.7) | | | (9.6) | | | |
| | | | | | |
| | | | | | |
| Loss on extinguishment of debt | | 3.6 | | | — | | | |
| | | | | | |
| | | | | | |
| | | | | | |
| Equity-based compensation expense | | 14.8 | | | 12.3 | | | |
| Other | | (19.0) | | | 6.3 | | | |
| Changes in assets and liabilities: | | | | | | |
| Accounts receivable | | 12.3 | | | 240.2 | | | |
| Inventories and other current assets | | (2.9) | | | 280.6 | | | |
| Fair value of derivatives | | 7.1 | | | (19.4) | | | |
| Accounts payable and other current liabilities | | (5.0) | | | (134.9) | | | |
| Obligation under Inventory Intermediation Agreements | | 64.6 | | | (146.3) | | | |
| Non-current assets and liabilities, net | | (86.7) | | | (4.1) | | | |
| | | | | | |
| | | | | | |
| Net cash provided by operating activities | | 118.3 | | | 490.2 | | | |
| Cash flows from investing activities: | | | | | | |
| | | | | | |
| | | | | | |
| Distributions from equity method investments | | 3.4 | | | 7.3 | | | |
| Purchases of property, plant and equipment | | (133.3) | | | (277.6) | | | |
| Purchase of equity securities | | (0.4) | | | (9.0) | | | |
| Purchases of intangible assets | | (1.3) | | | (1.3) | | | |
| Proceeds from sale of property, plant and equipment | | 9.5 | | | 0.7 | | | |
| Insurance proceeds | | 18.0 | | | — | | | |
| | | | | | |
| | | | | | |
| | | | | | |
| | | | | | |
| Net cash used in investing activities | | (104.1) | | | (279.9) | | | |
| Cash flows from financing activities: | | | | | | |
| Proceeds from long-term revolvers | | 3,013.1 | | | 1,547.0 | | | |
| Payments on long-term revolvers | | (3,463.4) | | | (1,781.5) | | | |
| Proceeds from term debt | | 852.5 | | | — | | | |
| Payments on term debt | | (536.1) | | | (12.3) | | | |
| | | | | | |
| Proceeds from product and other financing agreements | | 259.7 | | | 656.0 | | | |
| Repayments of product and other financing agreements | | (361.8) | | | (603.2) | | | |
| Proceeds from Inventory Intermediation Agreement | | — | | | 32.2 | | | |
| Proceeds from termination of Supply & Offtake Obligation | | — | | | 25.8 | | | |
| Taxes paid due to the net settlement of equity-based compensation | | (4.9) | | | (3.6) | | | |
| | | | | | |
| Repurchase of common stock | | — | | | (40.4) | | | |
| | | | | | |
| Distribution to non-controlling interest | | (23.6) | | | (19.1) | | | |
| | | | | | |
| Proceeds from issuance of Delek Logistic common limited partner units, net | | 132.2 | | | — | | | |
| | | | | | |
| Payment of debt extinguishment costs | | (0.3) | | | — | | | |
| Dividends paid | | (31.7) | | | (29.7) | | | |
| | | | | | |
| Deferred financing costs paid | | (14.2) | | | (1.2) | | | |
| | | | | | |
| | | | | | |
| Net used in financing activities | | (178.5) | | | (230.0) | | | |
| Net increase (decrease) in cash and cash equivalents | | (164.3) | | | (19.7) | | | |
| Cash and cash equivalents at the beginning of the period | | 822.2 | | | 841.3 | | | |
| | | | | | |
| | | | | | |
| Cash and cash equivalents at the end of the period | | $ | 657.9 | | | $ | 821.6 | | | |
Delek US Holdings, Inc.
Condensed Consolidated Statements of Cash Flows (unaudited) (Continued)
(In millions)
| | | | | | | | | | | | | | | | |
| | Six Months Ended June 30, |
| | 2024 | | 2023 | | |
| | | | | | |
| | | | | | |
| | | | | | |
| | | | | | |
| | | | | | |
| | | | | | |
| | | | | | |
| | | | | | |
| | | | | | |
| | | | | | |
| | | | | | |
| | | | | | |
| | | | | | |
| | | | | | |
| | | | | | |
| | | | | | |
| | | | | | |
| | | | | | |
| | | | | | |
| | | | | | |
| | | | | | |
| | | | | | |
| | | | | | |
| | | | | | |
| | | | | | |
| | | | | | |
| | | | | | |
| | | | | | |
| | | | | | |
| | | | | | |
| | | | | | |
| | | | | | |
| | | | | | |
| | | | | | |
| | | | | | |
| | | | | | |
| | | | | | |
| | | | | | |
| | | | | | |
| | | | | | |
| | | | | | |
| | | | | | |
| | | | | | |
| | | | | | |
| | | | | | |
| | | | | | |
| | | | | | |
| | | | | | |
| | | | | | |
| | | | | | |
| | | | | | |
| | | | | | |
| | | | | | |
| | | | | | |
| | | | | | |
| | | | | | |
| | | | | | |
| | | | | | |
| | | | | | |
| | | | | | |
| | | | | | |
| | | | | | |
| | | | | | |
| | | | | | |
| | | | | | |
| | | | | | |
| | | | | | |
| | | | | | |
| | | | | | |
| | | | | | |
| | | | | | |
| Supplemental disclosures of cash flow information: | | | | | | |
| Cash paid during the period for: | | | | | | |
Interest, net of capitalized interest of $0.7 million and $0.7 million in the 2024 and 2023 periods, respectively | | $ | 145.2 | | | 159.9 | | | |
| Income taxes | | $ | 3.2 | | | $ | 6.6 | | | |
| Non-cash investing activities: | | | | | | |
| | | | | | |
| | | | | | |
| Decrease in accrued capital expenditures | | $ | (6.6) | | | $ | (24.3) | | | |
| Non-cash financing activities: | | | | | | |
| | | | | | |
| Non-cash lease liability arising from obtaining right-of-use assets during the period | | $ | 14.1 | | | $ | 22.9 | | | |
| | | | | | |
| | | | | | |
See accompanying notes to the condensed consolidated financial statements
Notes to Consolidated Financial Statements
Delek US Holdings, Inc.
Notes to Condensed Consolidated Financial Statements (unaudited)
1. Organization and Basis of Presentation
Delek US Holdings, Inc. operates through its consolidated subsidiaries, which include Delek US Energy, Inc. ("Delek Energy") (and its subsidiaries) and Alon USA Energy, Inc. ("Alon") (and its subsidiaries). The terms "we," "our," "us," "Delek" and the "Company" are used in this report to refer to Delek and its consolidated subsidiaries. Delek's common stock is listed on the New York Stock Exchange ("NYSE") under the symbol "DK."
Our condensed consolidated financial statements include the accounts of Delek and its subsidiaries. Certain information and footnote disclosures normally included in annual financial statements prepared in accordance with United States ("U.S.") Generally Accepted Accounting Principles ("GAAP") have been condensed or omitted, although management believes that the disclosures herein are adequate to make the financial information presented not misleading. Our unaudited condensed consolidated financial statements have been prepared in conformity with GAAP applied on a consistent basis with those of the annual audited consolidated financial statements included in our Annual Report on Form 10-K filed with the Securities and Exchange Commission ("SEC") on February 28, 2024 (the "Annual Report on Form 10-K") and in accordance with the rules and regulations of the SEC. These unaudited condensed consolidated financial statements should be read in conjunction with the audited consolidated financial statements and the notes thereto for the year ended December 31, 2023 included in our Annual Report on Form 10-K.
Our condensed consolidated financial statements include Delek Logistics Partners, LP ("Delek Logistics", NYSE:DKL), which is a variable interest entity ("VIE"). As the indirect owner of the general partner of Delek Logistics, we have the ability to direct the activities of this entity that most significantly impact its economic performance. We are also considered to be the primary beneficiary for accounting purposes for this entity and are Delek Logistics' primary customer. In the event that Delek Logistics incurs a loss, our operating results will reflect such loss, net of intercompany eliminations, to the extent of our ownership interest in this entity.
On July 31, 2024, a wholly owned subsidiary of Delek, entered into a definitive equity purchase agreement (the "Retail Purchase Agreement") with a subsidiary of Fomento Económico Mexicano, S.A.B. de C.V. (“FEMSA”). Under the terms of the Retail Purchase Agreement, Delek agreed to sell, and FEMSA has agreed to purchase, 100% of the equity interests in four of Delek’s wholly-owned subsidiaries that own and operate 249 retail fuel and convenience stores (the "Retail Stores") under the Delek US Retail brand for a cash consideration of $350.0 million plus the purchase of inventory and other customary adjustments under the Retail Purchase Agreement for indebtedness (the “Retail Transaction”). See Note 18 for further information.
On August 2, 2024, Delek Logistics entered into a Purchase and Sale Agreement with H2O Midstream Holdings, LLC (the “Seller”) to purchase 100% of the limited liability company interests in H2O Midstream Intermediate, LLC, H2O Midstream Permian LLC, and H2O Midstream LLC (the “Purchased Interests” or "H2O Midstream"), related to the Seller’s water disposal and recycling operations, in the Midland Basin in Texas (the “H2O Purchase Agreement”) for total consideration of $230.0 million, subject to customary adjustments under the H2O Purchase Agreement for net working capital and indebtedness. See Note 18 for further information.
In the opinion of management, all adjustments necessary for a fair presentation of the financial condition and the results of operations for the interim periods have been included. All significant intercompany transactions and account balances have been eliminated in consolidation. All adjustments are of a normal, recurring nature. Operating results for the interim period should not be viewed as representative of results that may be expected for any future interim period or for the full year.
Reclassifications
Certain prior period amounts have been reclassified in order to conform to the current period presentation.
Accounting Pronouncements Not Yet Adopted
ASU 2024-02, Codification Improvements - Amendments to Remove References to the Concepts Statements
In March 2024, the Financial Accounting Standards Board (“FASB”) issued Accounting Standards Update (“ASU”) 2024-02 Codification Improvements - Amendments to Remove References to the Concepts Statements ("ASU 2024-02"), which amends the Accounting Standards Codification ("Codification") to remove references to various concepts statements and impacts a variety of topics in the Codification. The ASU is intended to simplify the Codification and draw a distinction between authoritative and non-authoritative literature. ASU 2024-02 is effective for annual reporting periods beginning after December 15, 2024, with early adoption permitted and can be applied on either a prospective or retroactive basis. The Company does not expect this update to have a material impact on our condensed consolidated financial statements and related disclosures.
Notes to Consolidated Financial Statements
ASU 2023-09, Income Taxes(Topic 740): Improvements to Income Tax Disclosures
In December 2023, the FASB issued ASU 2023-09 Income Taxes(Topic 740): Improvements to Income Tax Disclosures ("ASU 2023-09"). The standard is intended to enhance the transparency and decision usefulness of income tax disclosures. ASU 2023-09 requires disaggregated information about a reporting entity's effective tax rate reconciliation as well as information on income taxes paid. The amendments in this ASU are effective for annual periods beginning after December 15, 2024, with early adoption permitted, and should be applied on a prospective basis with the option to apply the standard retrospectively. The Company is currently evaluating the provisions of the amendments and the impact on its future condensed consolidated financial statements, but does not currently expect adopting this new guidance will have a material impact on our condensed consolidated financial statements and related disclosures.
ASU 2023-07, Segment Reporting (Topic 280): Improvements to Reportable Segment Disclosures
In November 2023, the FASB issued ASU 2023-07 Segment Reporting (Topic 280): Improvements to Reportable Segment Disclosures ("ASU 2023-07"). ASU 2023-07 expands reportable segment disclosure requirements by requiring disclosures of significant reportable segment expenses that are regularly provided to the chief decision maker ("CODM") and included within each reported measure of a segment's profit or loss, an amount and description of its composition for other segment items, and interim disclosures of a reportable segment's profit or loss and assets. The ASU also requires disclosure of the title and position of the individual or group identified as the CODM and an explanation of how the CODM uses the reported measures of a segment's profit or loss in assessing segment performance and deciding how to allocate resources. ASU 2023-07 is effective for fiscal years beginning after December 15, 2023 and interim periods within fiscal years beginning after December 15, 2024, and should be applied retrospectively to all prior periods presented in the financial statements. The adoption of ASU 2023-07 should not have a material impact on our condensed consolidated financial statements and related disclosures. See Note 2 for further information.
ASU 2023-06, Codification Amendments in Response to the SEC's Disclosure Update and Simplification Initiative
In October 2023, the FASB issued ASU 2023-06 Codification Amendments in Response to the SEC's Disclosure Update and Simplification Initiative ("ASU 2023-06"). The main provision of ASU 2023-06 is to clarify or improve disclosure and presentation requirements of a variety of topics, which will allow users to more easily compare entities subject to the SEC's existing disclosures with those entities that were not previously subject to the requirements, and align the requirements in the FASB accounting standard codification with the SEC's regulations. The effective date for each amendment will be the date on which the SEC’s removal of that related disclosure from Regulation S-X or Regulation S-K becomes effective, with early adoption prohibited. The Company is currently evaluating the provisions of the amendments and the impact on its future condensed consolidated financial statements, but does not currently expect adopting this new guidance will have a material impact on our condensed consolidated financial statements and related disclosures.
2. Segment Data
We aggregate our operating units into three reportable segments: Refining, Logistics, and Retail. Operations that are not specifically included in the reportable segments are included in Corporate, Other and Eliminations, which consist of the following:
•our corporate activities;
•results of certain immaterial operating segments, including our Canadian crude trading operations (as discussed in Note 9); and
•intercompany eliminations.
During the second quarter 2024, we realigned our reportable segments for financial reporting purposes to reflect changes in the manner in which our chief operating decision maker, or CODM, assesses financial information for decision-making purposes. The change represents reporting the operating results of our 50% interest in a joint venture that owns asphalt terminals located in the southwestern region of the U.S. within the refining segment. Prior to this change, these operating results were reported as part of corporate, other and eliminations. While this reporting change did not change our consolidated results, segment data for previous years has been restated and is consistent with the current year presentation throughout the financial statements and the accompanying notes.
The disaggregated financial results for the reporting segments have been prepared using a management approach, which is consistent with the basis and manner in which management internally disaggregates financial information for the purposes of assisting internal operating decisions. The CODM evaluates performance based upon EBITDA attributable to Delek. We define EBITDA attributable to Delek for any period as net income (loss) attributable to Delek plus interest expense, income tax expense (benefit), depreciation and amortization. Segment EBITDA should not be considered a substitute for results prepared in accordance with U.S. GAAP and should not be considered alternatives to net income (loss), which is the most directly comparable financial measure to EBITDA that is in accordance with U.S. GAAP. Segment EBITDA, as determined and measured by us, should also not be compared to similarly titled measures reported by other companies.
Assets by segment are not a measure used to assess the performance of the Company by the CODM and thus are not disclosed.
Refining Segment
The refining segment processes crude oil and other feedstocks for the manufacture of transportation motor fuels, including various grades of gasoline, diesel fuel and aviation fuel, asphalt and other petroleum-based products that are distributed through owned and third-party product terminals. The refining segment includes the following:
Notes to Consolidated Financial Statements
•Tyler, Texas refinery (the "Tyler refinery");
•El Dorado, Arkansas refinery (the "El Dorado refinery");
•Big Spring, Texas refinery (the "Big Spring refinery"); and
•Krotz Springs, Louisiana refinery (the "Krotz Springs refinery").
The refining segment also owns three biodiesel facilities, located in Crossett, Arkansas, Cleburne, Texas and New Albany, Mississippi. During the second quarter of 2024, we made the decision to idle the biodiesel facilities, while exploring viable and sustainable alternatives. See Note 15 for further information. In addition, the refining segment includes our wholesale crude operations and our 50% interest in a joint venture that owns asphalt terminals located in the southwestern region of the U.S.
Logistics Segment
Our logistics segment owns and operates crude oil, refined products and natural gas logistics and marketing assets as well as water disposal and recycling assets. The logistics segment generates revenue by charging fees for gathering, transporting and storing crude oil and natural gas, marketing, distributing, transporting and storing intermediate and refined products and disposing and recycling water in select regions of the southeastern United States, the Delaware Basin in New Mexico and West Texas for our refining segment and third parties, and sales of wholesale products in the West Texas market.
Retail Segment
Our retail segment consists of 250 owned and leased convenience store sites as of June 30, 2024, located primarily in West Texas and New Mexico. These convenience stores typically offer various grades of fuel, food and beverage products, general merchandise, and certain food and other services. Substantially all of the motor fuel sold through our retail segment is supplied by our Big Spring refinery, which is transferred to the retail segment at prices substantially determined by reference to published commodity pricing information.
Business Segment Operating Performance
The following is a summary of business segment operating performance as measured by EBITDA attributable to Delek for the period indicated (in millions):
| | | | | | | | | | | | | | | | | | | | | | | | | | | | | | | | |
| | | Three Months Ended June 30, 2024 |
| (In millions) | | Refining | | Logistics | | Retail | | Corporate,
Other and Eliminations | | Consolidated |
| Net revenues (excluding intercompany fees and revenues) | | $ | 3,097.9 | | | $ | 107.7 | | | $ | 216.1 | | | $ | — | | | $ | 3,421.7 | |
| Inter-segment fees and revenues | | 209.3 | | | 156.9 | | | — | | | (366.2) | | | — | |
| Total revenues | | $ | 3,307.2 | | | $ | 264.6 | | | $ | 216.1 | | | $ | (366.2) | | | $ | 3,421.7 | |
| | | | | | | | | | |
| Segment EBITDA attributable to Delek | | $ | 17.3 | | | $ | 100.6 | | | $ | 12.4 | | | $ | (5.4) | | | $ | 124.9 | |
| Depreciation and amortization | | (57.4) | | | (24.2) | | | (3.7) | | | (6.8) | | | (92.1) | |
| Interest expense, net | | (7.0) | | | (35.2) | | | (0.1) | | | (35.4) | | | (77.7) | |
| Income tax benefit | | | | | | | | | | 7.7 | |
| Net loss attributable to Delek | | | | | | | | | | $ | (37.2) | |
| | | | | | | | | | |
| Income from equity method investments | | $ | 11.9 | | | $ | 7.9 | | | $ | — | | | $ | 10.6 | | | $ | 30.4 | |
Capital spending (1) | | $ | 47.0 | | | $ | 10.2 | | | $ | 6.5 | | | $ | 7.1 | | | $ | 70.8 | |
| | | | | | | | | | | | | | | | | | | | | | | | | | | | | | | | |
| | | Three Months Ended June 30, 2023 |
| (In millions) | | Refining | | Logistics | | Retail | | Corporate,
Other and Eliminations | | Consolidated |
| Net revenues (excluding intercompany fees and revenues) | | $ | 3,849.0 | | | $ | 113.9 | | | $ | 232.7 | | | $ | — | | | $ | 4,195.6 | |
| Inter-segment fees and revenues | | 203.5 | | | 133.0 | | | — | | | (336.5) | | | — | |
| Total revenues | | $ | 4,052.5 | | | $ | 246.9 | | | $ | 232.7 | | | $ | (336.5) | | | $ | 4,195.6 | |
| | | | | | | | | | |
| Segment EBITDA attributable to Delek | | $ | 121.8 | | | $ | 90.9 | | | $ | 15.0 | | | $ | (70.0) | | | $ | 157.7 | |
| Depreciation and amortization | | (59.8) | | | (23.7) | | | (2.6) | | | (3.3) | | | (89.4) | |
| Interest expense, net | | (12.2) | | | (35.0) | | | — | | | (33.2) | | | (80.4) | |
| Income tax benefit | | | | | | | | | | 3.8 | |
| Net loss attributable to Delek | | | | | | | | | | $ | (8.3) | |
| | | | | | | | | | |
| Income from equity method investments | | $ | 11.4 | | | $ | 7.3 | | | $ | — | | | $ | 6.8 | | | $ | 25.5 | |
Capital spending (1) | | $ | 29.5 | | | $ | 19.4 | | | $ | 5.3 | | | $ | 7.0 | | | $ | 61.2 | |
Notes to Consolidated Financial Statements
| | | | | | | | | | | | | | | | | | | | | | | | | | | | | | | | |
| | | Six Months Ended June 30, 2024 |
| (In millions) | | Refining | | Logistics | | Retail | | Corporate,
Other and Eliminations | | Consolidated |
| Net revenues (excluding intercompany fees and revenues) | | $ | 6,019.5 | | | $ | 220.2 | | | $ | 409.6 | | | $ | — | | | $ | 6,649.3 | |
| Inter-segment fees and revenues | | 396.0 | | | 296.5 | | | — | | | (692.5) | | | — | |
| Total revenues | | $ | 6,415.5 | | | $ | 516.7 | | | $ | 409.6 | | | $ | (692.5) | | | $ | 6,649.3 | |
| | | | | | | | | | |
| Segment EBITDA attributable to Delek | | $ | 122.4 | | | $ | 200.3 | | | $ | 18.9 | | | $ | (73.6) | | | $ | 268.0 | |
| Depreciation and amortization | | (118.8) | | | (50.7) | | | (7.2) | | | (10.6) | | | (187.3) | |
| Interest expense, net | | (19.1) | | | (75.5) | | | (0.1) | | | (70.7) | | | (165.4) | |
| Income tax benefit | | | | | | | | | | 14.9 | |
| Net loss attributable to Delek | | | | | | | | | | $ | (69.8) | |
| | | | | | | | | | |
| Income from equity method investments | | $ | 15.9 | | | $ | 16.4 | | | $ | — | | | $ | 20.0 | | | $ | 52.3 | |
Capital spending (1) | | $ | 68.5 | | | $ | 25.4 | | | $ | 10.6 | | | $ | 12.2 | | | $ | 116.7 | |
| | | | | | | | | | | | | | | | | | | | | | | | | | | | | | | | |
| | | Six Months Ended June 30, 2023 |
| (In millions) | | Refining | | Logistics | | Retail | | Corporate,
Other and Eliminations | | Consolidated |
| Net revenues (excluding intercompany fees and revenues) | | $ | 7,449.8 | | | $ | 232.4 | | | $ | 437.7 | | | $ | — | | | $ | 8,119.9 | |
| Inter-segment fees and revenues | | 397.2 | | | 258.0 | | | — | | | (655.2) | | | — | |
| Total revenues | | $ | 7,847.0 | | | $ | 490.4 | | | $ | 437.7 | | | $ | (655.2) | | | $ | 8,119.9 | |
| | | | | | | | | | |
| Segment EBITDA attributable to Delek | | $ | 317.3 | | | $ | 182.3 | | | $ | 21.4 | | | $ | (123.3) | | | $ | 397.7 | |
| Depreciation and amortization | | (116.4) | | | (44.8) | | | (5.3) | | | (6.3) | | | (172.8) | |
| Interest expense, net | | (21.2) | | | (67.6) | | | (0.2) | | | (67.9) | | | (156.9) | |
| Income tax expense | | | | | | | | | | (12.0) | |
| Net income attributable to Delek | | | | | | | | | | $ | 56.0 | |
| | | | | | | | | | |
| Income from equity method investments | | $ | 15.2 | | | $ | 13.6 | | | $ | — | | | $ | 11.3 | | | $ | 40.1 | |
Capital spending (1) | | $ | 177.1 | | | $ | 55.5 | | | $ | 8.0 | | | $ | 12.7 | | | $ | 253.3 | |
(1) Capital spending includes additions on an accrual basis.
3. Earnings Per Share
Basic earnings per share (or "EPS") is computed by dividing net income (loss) by the weighted average common shares outstanding. Diluted earnings per share is computed by dividing net income, as adjusted for changes to income that would result from the assumed settlement of the dilutive equity instruments included in diluted weighted average common shares outstanding, by the diluted weighted average common shares outstanding. For all periods presented, we have outstanding various equity-based compensation awards that are considered in our diluted EPS calculation (when to do so would be dilutive), and is inclusive of awards disclosed in Note 16 to these condensed consolidated financial statements. For those instruments that are indexed to our common stock, they are generally dilutive when the market price of the underlying indexed share of common stock is in excess of the exercise price.
Notes to Consolidated Financial Statements
The following table sets forth the computation of basic and diluted earnings per share.
| | | | | | | | | | | | | | | | | | | | | | | | | | | | |
| | Three Months Ended June 30, | | Six Months Ended June 30, |
| | 2024 | | 2023 | | 2024 | | 2023 | | |
| Numerator: | | | | | | | | | | |
| Numerator for EPS | | | | | | | | | | |
| Net (loss) income | | $ | (26.1) | | | $ | (1.5) | | | $ | (51.3) | | | $ | 70.7 | | | |
| Less: Income attributed to non-controlling interests | | 11.1 | | | 6.8 | | | 18.5 | | | 14.7 | | | |
| | | | | | | | | | |
| | | | | | | | | | |
| Numerator for basic and diluted EPS attributable to Delek | | $ | (37.2) | | | $ | (8.3) | | | $ | (69.8) | | | $ | 56.0 | | | |
| | | | | | | | | | |
| | | | | | | | | | |
| | | | | | | | | | |
| | | | | | | | | | |
| | | | | | | | | | |
| | | | | | | | | | |
| | | | | | | | | | |
| | | | | | | | | | |
| Denominator: | | | | | | | | | | |
| Weighted average common shares outstanding (denominator for basic EPS) | | 64,213,899 | | | 65,773,609 | | | 64,117,943 | | | 66,359,537 | | | |
| | | | | | | | | | |
| | | | | | | | | | |
| Dilutive effect of stock-based awards | | — | | | — | | | — | | | 475,785 | | | |
| Weighted average common shares outstanding, assuming dilution (denominator for diluted EPS) | | 64,213,899 | | | 65,773,609 | | | 64,117,943 | | | 66,835,322 | | | |
| | | | | | | | | | |
| EPS: | | | | | | | | | | |
| | | | | | | | | | |
| | | | | | | | | | |
| | | | | | | | | | |
| Basic (loss) income per share | | $ | (0.58) | | | $ | (0.13) | | | $ | (1.09) | | | $ | 0.84 | | | |
| | | | | | | | | | |
| | | | | | | | | | |
| | | | | | | | | | |
| Diluted (loss) income per share | | $ | (0.58) | | | $ | (0.13) | | | $ | (1.09) | | | $ | 0.84 | | | |
| | | | | | | | | | |
| The following equity instruments were excluded from the diluted weighted average common shares outstanding because their effect would be anti-dilutive: | | | | | | | | | | |
| Antidilutive stock-based compensation (because average share price is less than exercise price) | | 1,397,499 | | | 2,572,768 | | | 1,250,217 | | | 2,149,803 | | | |
| Antidilutive due to loss | | 664,225 | | | 464,170 | | | 660,263 | | | — | | | |
| Total antidilutive stock-based compensation | | 2,061,724 | | | 3,036,938 | | | 1,910,480 | | | 2,149,803 | | | |
| | | | | | | | | | |
| | | | | | | | | | |
| | | | | | | | | | |
| | | | | | | | | | |
| | | | | | | | | | |
| | | | | | | | | | |
| | | | | | | | | | |
| | | | | | | | | | |
4. Delek Logistics
Delek Logistics is a publicly traded limited partnership formed by Delek in 2012 that owns and operates crude oil, refined products and natural gas logistics and marketing assets as well as water disposal and recycling assets. A substantial majority of Delek Logistics' assets are integral to Delek’s refining and marketing operations. As of June 30, 2024, we owned a 72.6% interest in Delek Logistics, consisting of 34,311,278 common limited partner units and the non-economic general partner interest. The limited partner interests in Delek Logistics not owned by us are reflected in net income attributable to non-controlling interest in the accompanying condensed consolidated statements of income and in non-controlling interest in subsidiaries in the accompanying condensed consolidated balance sheets.
On March 12, 2024, Delek Logistics completed a public offering of its common units in which it sold 3,584,416 common units (including an overallotment option of 467,532 common units) to the underwriters of the offering at a price to the public of $38.50 per unit. The proceeds received from this offering (net of underwriting discounts, commissions and expenses) were $132.2 million and were used to repay a portion of the outstanding borrowings under the Delek Logistics Revolving Facility (defined below). Underwriting discounts totaled $5.5 million.
As a result of this common unit issuance and our resulting Delek Logistics ownership change, we adjusted additional paid-in capital and equity attributable to Delek Logistics’ non-controlling interest holders to reallocate Delek Logistics' equity among its unitholders.
Delek Logistics is a VIE, as defined under GAAP, and is consolidated into our condensed consolidated financial statements, representing our logistics segment. The assets of Delek Logistics can only be used to settle its own obligations and its creditors have no recourse to our assets. Exclusive of intercompany balances and the marketing agreement intangible asset between Delek Logistics and Delek which are eliminated in consolidation, the Delek Logistics condensed consolidated balance sheets are included in the condensed consolidated balance sheets of Delek. The Delek Logistics condensed consolidated balance sheets are presented below (in millions):
Notes to Consolidated Financial Statements
| | | | | | | | | | | | | | |
| | As of June 30, 2024 | | As of December 31, 2023 |
| ASSETS | | | | |
| Cash and cash equivalents | | $ | 5.1 | | | $ | 3.8 | |
| Accounts receivable | | 49.0 | | | 41.1 | |
| Accounts receivable from related parties | | 39.5 | | | 28.4 | |
| Inventory | | 1.8 | | | 2.3 | |
| Other current assets | | 1.2 | | | 0.7 | |
| Property, plant and equipment, net | | 919.1 | | | 936.2 | |
| Equity method investments | | 235.9 | | | 241.3 | |
| Operating lease right-of-use assets | | 16.6 | | | 19.0 | |
| Goodwill | | 12.2 | | | 12.2 | |
| Intangible assets, net | | 331.2 | | | 343.0 | |
| Other non-current assets | | 11.7 | | | 14.2 | |
| Total assets | | $ | 1,623.3 | | | $ | 1,642.2 | |
| LIABILITIES AND DEFICIT | | | | |
| Accounts payable | | $ | 26.2 | | | $ | 26.3 | |
| | | | |
| Current portion of long-term debt | | — | | | 30.0 | |
| Current portion of operating lease liabilities | | 6.0 | | | 6.7 | |
| Accrued expenses and other current liabilities | | 37.8 | | | 27.6 | |
| Long-term debt, net of current portion | | 1,566.3 | | | 1,673.8 | |
| Asset retirement obligations | | 10.4 | | | 10.0 | |
| Operating lease liabilities, net of current portion | | 6.7 | | | 8.3 | |
| Other non-current liabilities | | 21.2 | | | 21.4 | |
| Deficit | | (51.3) | | | (161.9) | |
| Total liabilities and deficit | | $ | 1,623.3 | | | $ | 1,642.2 | |
5. Equity Method Investments
Wink to Webster Pipeline
Prior to its contribution to Delek Logistics on August 5, 2024 (see Note 18 for additional information), we owned a 50% investment in W2W Holdings LLC ("HoldCo") which was formed by us and MPLX Operations LLC ("MPLX") to obtain financing and fund capital calls associated with our collective and contributed interests in the Wink to Webster Pipeline LLC ("WWP") joint venture. The Company had previously determined that HoldCo is a VIE. While we had the ability to exert significant influence through participation in board and management committees, we were not the primary beneficiary since we did not have a controlling financial interest in HoldCo, and no single party had the power to direct the activities that most significantly impact HoldCo's economic performance.
Distributions received from WWP were first applied to service the debt of HoldCo's wholly owned finance LLC, with excess distributions made to the HoldCo members as provided for in the W2W Holdings LLC Agreement and as allowed for under its debt agreements. The obligations of the HoldCo members under the W2W Holdings LLC Agreement were guaranteed by the parents of the member entities.
As of June 30, 2024, except for the guarantee of member obligations under the joint venture, we do not have other guarantees with or to HoldCo, nor any third-party associated with HoldCo contracted work. The Company's maximum exposure to any losses incurred by HoldCo is limited to its investment.
As of June 30, 2024 and December 31, 2023, Delek's HoldCo investment balance totaled $70.3 million and $51.4 million, respectively.
Delek Logistics Investments
Delek Logistics has a 33% membership interest in Red River Pipeline Company LLC (“Red River”), which owns a 16-inch crude oil pipeline running from Cushing, Oklahoma to Longview, Texas. As of June 30, 2024 and December 31, 2023, Delek's investment balance in Red River totaled $139.1 million and $141.1 million, respectively.
In addition to Red River, Delek Logistics has two other pipeline joint ventures in which we own a 50% membership interest in the entity formed with an affiliate of Plains All American Pipeline, L.P. to operate one of these pipeline systems and a 33% membership interest in Andeavor Logistics Rio Pipeline LLC which operates the other pipeline system. As of June 30, 2024 and December 31, 2023, Delek Logistics' investment balance in these joint ventures was $96.8 million and $100.3 million, respectively.
Notes to Consolidated Financial Statements
Other Investments
In addition to our pipeline joint ventures, we also have a 50% interest in a joint venture that owns asphalt terminals located in the southwestern region of the U.S., as well as a 50% interest in a joint venture that owns, operates and maintains a terminal consisting of an ethanol unit train facility with an ethanol tank in Arkansas. As of June 30, 2024 and December 31, 2023, Delek's investment balance in these joint ventures was $80.7 million and $67.9 million, respectively.
6. Inventory
Crude oil feedstocks, refined products, blendstocks and asphalt inventory for all of our operations, excluding merchandise inventory in our retail segment, are stated at the lower of cost determined using the first-in, first-out ("FIFO") basis or net realizable value. Retail merchandise inventory consists of cigarettes, beer, convenience merchandise and food service merchandise and is stated at estimated cost as determined by the retail inventory method.
The following table presents the components of inventory for each period presented:
| | | | | | | | | | | | | | | | | |
| Titled Inventory | | Inventory Intermediation Agreement (1) | | Total |
| June 30, 2024 | | | | | |
| Feedstocks, raw materials and supplies | $ | 258.8 | | | $ | 143.6 | | | $ | 402.4 | |
| Refined products and blendstock | 266.7 | | | 306.3 | | | 573.0 | |
| Merchandise inventory and other | 35.0 | | | — | | | 35.0 | |
| Total | $ | 560.5 | | | $ | 449.9 | | | $ | 1,010.4 | |
| | | | | |
December 31, 2023 | | | | | |
| Feedstocks, raw materials and supplies | $ | 250.2 | | | $ | 116.9 | | | $ | 367.1 | |
| Refined products and blendstock | 278.6 | | | 304.8 | | | 583.4 | |
| Merchandise inventory and other | 31.4 | | | — | | | 31.4 | |
| Total | $ | 560.2 | | | $ | 421.7 | | | $ | 981.9 | |
(1) Refer to Note 7 - Inventory Intermediation Obligations for further information.
At June 30, 2024, we recorded a pre-tax inventory valuation reserve of $0.9 million due to a market price decline below our cost of certain inventory products. At December 31, 2023, we recorded a pre-tax inventory valuation reserve of $11.6 million. We recognized a net reduction in cost of materials and other in the accompanying condensed consolidated statements of income related to the change in pre-tax inventory valuation of $1.9 million and $10.7 million for the three and six months ended June 30, 2024, respectively, and $7.9 million and $9.6 million for the three and six months ended June 30, 2023, respectively.
Notes to Consolidated Financial Statements
7. Inventory Intermediation Obligations
The following table summarizes our outstanding obligations under our Inventory Intermediation Agreement:
| | | | | | | | | | | | | | |
| | As of June 30, 2024 | | As of December 31, 2023 |
| Obligations under Inventory Intermediation Agreement | | | | |
| Obligations related to Base Layer Volumes | | $ | 472.2 | | | $ | 407.2 | |
| Current portion | | — | | | 0.4 | |
| Total obligations under Inventory Intermediation Agreement | | $ | 472.2 | | | $ | 407.6 | |
| Other (receivable) payable for monthly activity true-up | | $ | (0.6) | | | $ | (9.3) | |
Included in the Inventory Intermediation Agreement are cost of financing associated with the value of the inventory and other periodic charges, which we include in interest expense, net in the condensed consolidated statements of income. In addition to the cost of financing charges, we have other intermediation fees which include market structure settlements, where we may pay or receive amounts based on market conditions and volumes subject to the intermediation agreement. These market structure settlements are recorded in cost of materials and other in the condensed consolidated statements of income. The following table summarizes these fees:
| | | | | | | | | | | | | | | | | | | | | | | | | | | | |
| | Three Months Ended June 30, | | Six Months Ended June 30, |
| | 2024 | | 2023 | | 2024 | | 2023 | | |
| Net fees and (income) expenses: | | | | | | | | | | |
| Inventory intermediation fees | | $ | 10.1 | | | $ | 7.6 | | | $ | 4.5 | | | $ | 13.5 | | | |
| Interest expense, net | | $ | 15.0 | | | $ | 15.6 | | | $ | 31.5 | | | $ | 29.6 | | | |
Inventory Intermediation Agreement
On December 22, 2022, Delek entered into an inventory intermediation agreement ("Inventory Intermediation Agreement") with Citigroup Energy Inc. ("Citi") in connection with DK Trading & Supply, LLC ("DKTS"), an indirect subsidiary of Delek. Pursuant to the Inventory Intermediation Agreement, Citi will (i) purchase from and sell to DKTS crude oil and other petroleum feedstocks in connection with refining processing operations at El Dorado, Big Spring, and Krotz Springs, (ii) purchase from and sell to DKTS all refined products produced by such refineries other than certain excluded products and (iii) in connection with such purchases and sales, DKTS will enter into certain market risk hedges in each case, on the terms and subject to certain conditions. The Inventory Intermediation Agreement results in up to $800 million of working capital capacity for DKTS.
On December 21, 2023, DKTS amended the Inventory Intermediation Agreement to among other things, (i) extend the term of the Inventory Intermediation Agreement from December 30, 2024 to January 31, 2026, (ii) reduce Citi’s unilateral term extension option from a twelve month extension period to a six month extension period and (iii) increase the amount of the payment deferral mechanism from $70 million to $250 million. As of June 30, 2024 and December 31, 2023, we had letters of credit outstanding of $195.0 million and $230.0 million, respectively, supporting the Inventory Intermediation Agreement.
The Inventory Intermediation Agreement provides for the lease to Citi of crude oil and refined product storage facilities. At the inception of the Inventory Intermediation Agreement, we transferred title to a certain number of barrels of crude and other inventories to Citi, and the Inventory Intermediation Agreement requires the repurchase of the remaining inventory (including certain "Base Layer Volumes") at termination. As of June 30, 2024 and December 31, 2023, the volumes subject to the Inventory Intermediation Agreement totaled 5.4 million barrels and 5.4 million barrels, including Base Layer Volumes associated with our non-current inventory intermediation obligation of 5.5 million barrels.
The Inventory Intermediation Agreement is accounted for as an inventory financing arrangement under the fair value election provided by Accounting Standards Codification ("ASC") 815 Derivatives and Hedging ("ASC 815") and ASC 825, Financial Instruments ("ASC 825"). Therefore, the crude oil and refined products barrels subject to the Inventory Intermediation Agreement will continue to be reported in our condensed consolidated balance sheets until processed and sold to a third party. At each reporting period, we record a liability equal to the repurchase obligation to Citi at current market prices. The repurchase obligations associated with the Base Layer Volumes are reflected as non-current liabilities on our condensed consolidated balance sheets to the extent that they are not contractually due within twelve months. The remaining obligation resulting from our monthly activity, including long and short inventory positions valued at market-indexed pricing, are included in current liabilities (or receivables) on our condensed consolidated balance sheets.
Gains (losses) related to changes in fair value due to commodity-index price are recorded as a component of cost of materials and other in the condensed consolidated statements of income. With respect to the repurchase obligation, we recognized gains (losses) attributable to changes in fair value due to commodity-index price totaling $19.3 million and $(62.5) million during the three and six months ended June 30, 2024, respectively, and totaling $26.3 million and $39.0 million during the three and six months ended June 30, 2023, respectively.
Notes to Consolidated Financial Statements
8. Long-Term Obligations
Outstanding borrowings under debt instruments are as follows (in millions):
| | | | | | | | | | | | | | |
| | June 30, 2024 | | December 31, 2023 |
| | | | |
| Delek Term Loan Credit Facility | | 935.7 | | | 940.5 | |
| Delek Logistics Revolving Facility | | 330.2 | | | 780.5 | |
| Delek Logistics Term Loan Facility | | — | | | 281.3 | |
| Delek Logistics 2025 Notes | | — | | | 250.0 | |
| Delek Logistics 2028 Notes | | 400.0 | | | 400.0 | |
| Delek Logistics 2029 Notes | | 850.0 | | | — | |
| United Community Bank Revolver | | 5.0 | | | 5.0 | |
| Principle amount of long-term debt | | 2,520.9 | | | 2,657.3 | |
| Less: Unamortized discount and premium and deferred financing costs | | (59.2) | | | (57.5) | |
| Total debt, net of unamortized discount and premium and deferred financing costs | | 2,461.7 | | | 2,599.8 | |
| Less: Current portion of long-term debt | | 9.5 | | | 44.5 | |
| Long-term debt, net of current portion | | $ | 2,452.2 | | | $ | 2,555.3 | |
Delek Term Loan Credit Facility
On November 18, 2022, Delek entered into an amended and restated term loan credit agreement (the "Delek Term Loan Credit Facility") providing for a senior secured term loan facility with an initial principal of $950.0 million at a discount of 4.00%. This senior secured facility allows for $400.0 million in incremental loans subject to certain restrictions. Repayment terms include quarterly principal payments of $2.4 million with the balance of principal due on November 19, 2029. At Delek’s option, borrowings bear interest at either the Adjusted Term Secured Overnight Financing Rate ("SOFR") or base rate as defined by the agreement, plus an applicable margin of 2.50% per annum with respect to base rate borrowings and 3.50% per annum with respect to SOFR borrowings. At June 30, 2024 and December 31, 2023, the weighted average borrowing rate was approximately 8.94% and 8.96%, respectively. The effective interest rate was 10.23% as of June 30, 2024.
Delek Logistics Term Loan Facility
On October 13, 2022, Delek Logistics entered into a senior secured term loan with an original principal of $300.0 million ("the Delek Logistics Term Loan Facility"). The outstanding principal balance of $281.3 million was paid on March 13, 2024 from a portion of the proceeds received from the issuance of the Delek Logistics 2029 Notes as indicated below. At Delek Logistics' option, borrowings bore interest at either the SOFR or U.S. dollar prime rate, plus an applicable margin. The applicable margin was 2.50% for the first year and 3.00% for the second year for U.S. dollar primate rate borrowings. SOFR borrowings include a credit spread adjustment of 0.10% to 0.25% plus an applicable margin of 3.50% for the first year and 4.00% for the second year. Debt extinguishment costs were $2.1 million and are recorded in interest expense, net in the accompanying condensed consolidated statements of income.
Revolving Credit Facilities
Available capacity and amounts outstanding for each of our revolving credit facilities as of June 30, 2024 are shown below (in millions):
| | | | | | | | | | | | | | | | | | | | | | | | | | | | | | | | |
| | Total Capacity | | Outstanding Borrowings | | Outstanding Letters of Credit | | Available Capacity | | Maturity Date |
Delek Revolving Credit Facility (1) | | $ | 1,100.0 | | | $ | — | | | $ | 269.5 | | | $ | 830.5 | | | October 26, 2027 |
Delek Logistics Revolving Facility (2) | | $ | 1,150.0 | | | $ | 330.2 | | | $ | — | | | $ | 819.8 | | | October 13, 2027 |
United Community Bank Revolver (3) | | $ | 25.0 | | | $ | 5.0 | | | $ | — | | | $ | 20.0 | | | June 30, 2026 |
| | | | | | | | | | |
(1) Total capacity includes letters of credit up to $500.0 million. This facility requires a quarterly unused commitment fee based on average commitment usage, currently at 0.30% per annum. Interest is measured at either the SOFR, base rate, or Canadian dollar bankers’ acceptances rate (“CDOR”), plus an applicable margin of 0.25% to 0.75% per annum with respect to base rate borrowings or 1.25% to 1.75% per annum with respect to SOFR and CDOR. |
(2) Total capacity includes letters of credit up to $146.9 million and $31.9 million for swing line loans. This facility requires a quarterly unused commitment fee based on average commitment usage, currently at 0.40% per annum. Interest is measured at either the U.S. dollar prime rate plus an applicable margin of 1.00% to 2.00% depending on Delek Logistics’ leverage ratio, or a SOFR rate plus a credit spread adjustment of 0.10% to 0.25% and an applicable margin ranging from 2.00% to 3.00% depending on the leverage ratio. As of June 30, 2024 and December 31, 2023, the weighted average interest rate was 8.00% and 8.46%, respectively. |
(3) Interest is measured as a variable rate equal to the Wall Street Journal Prime Rate minus 0.50%. Requires a quarterly fee of 0.25% per year on the average unused revolving commitment. The weighted average borrowing rate as of June 30, 2024 and December 31, 2023 was 7.75% and 7.75%, respectively. |
Notes to Consolidated Financial Statements
Delek Logistics Revolving Facility
On March 29, 2024, Delek Logistics entered into a fourth amendment to the Delek Logistics Revolving Facility which among other things increased the U.S. Revolving Credit Commitments (as defined in the Delek Logistics Credit Facility) by an amount equal to $100.0 million resulting in aggregate lender commitments under the Delek Logistics Revolving Credit Facility in an amount of $1,150.0 million.
United Community Bank Revolver
On June 20, 2024, we amended the United Community Bank Revolver to extend the maturity date to June 30, 2026.
Delek Logistics 2029 Notes
On March 13, 2024, Delek Logistics and its wholly owned subsidiary Delek Logistics Finance Corp. (“Finance Corp.” and together with Delek Logistics, the “Co-issuers”), sold $650.0 million in aggregate principal amount of the Co-issuers 8.625% Senior Notes due 2029 (the “Delek Logistics 2029 Notes”), at par, pursuant to an indenture with U.S. Bank Trust Company, National Association as trustee. Net proceeds were used to redeem the Delek Logistics 2025 Notes including accrued interest, pay off the Delek Logistics Term Loan Facility including accrued interest and to repay a portion of the outstanding borrowings under the Delek Logistics Revolving Facility.
On April 17, 2024, the Co-issuers sold $200.0 million in aggregate principal amount of additional 8.625% senior notes due 2029 (the “Additional 2029 Notes”), at 101.25%. The Additional 2029 Notes were issued under the same indenture as the Delek Logistics 2029 Notes and formed a part of the same series of notes as the Delek Logistics 2029 Notes. The net proceeds were used to repay a portion of the outstanding borrowings under the Delek Logistics Revolving Facility.
The Delek Logistics 2029 Notes are general unsecured senior obligations of the Co-issuers and are unconditionally guaranteed jointly and severally on a senior unsecured basis by Delek Logistics’ subsidiaries other than Finance Corp. and will be unconditionally guaranteed on the same basis by certain of Delek Logistics’ future subsidiaries. The Delek Logistics 2029 Notes rank equal in right of payment with all existing and future senior indebtedness of the Co-issuers, and senior in right of payment to any future subordinated indebtedness of the Co-issuers. Delek Logistics recorded $13.5 million of debt issuance costs and will be amortized over the term of the Delek Logistics 2029 Notes and included in interest expense in the condensed consolidated statements of income. The premium recognized for the Additional 2029 Notes was $2.5 million and will be amortized over the term of the Delek Logistics 2029 Notes and included in interest expense in the condensed consolidated statements of income. The Delek Logistics 2029 Notes will mature on March 15, 2029, and interest is payable semi-annually in arrears on each March 15 and September 15, commencing September 15, 2024.
At any time prior to March 15, 2026, the Co-issuers may redeem up to 35% of the aggregate principal amount of the Delek Logistics 2029 Notes with the net cash proceeds of one or more equity offerings by Delek Logistics at a redemption price of 108.625% of the redeemed principal amount, plus accrued and unpaid interest, if any, subject to certain conditions and limitations. Prior to March 15, 2026, the Co-issuers may also redeem all or part of the Delek Logistics 2029 Notes at a redemption price of the principal amount plus accrued and unpaid interest, if any, plus a "make whole" premium, subject to certain conditions and limitations. In addition, beginning on March 15, 2026, the Co-issuers may, subject to certain conditions and limitations, redeem all or part of the Delek Logistics 2029 Notes, at a redemption price of 104.313% of the redeemed principal for the twelve-month period beginning on March 15, 2026, 102.156% for the twelve-month period beginning on March 15, 2027, and 100.00% beginning on March 15, 2028 and thereafter, plus accrued and unpaid interest, if any.
In the event of a change of control, accompanied or followed by a ratings downgrade within a certain period of time, subject to certain conditions and limitations, the Co-issuers will be obligated to make an offer for the purchase of the Delek Logistics 2029 Notes from holders at a price equal to 101.00% of the principal amount thereof, plus accrued and unpaid interest.
As of June 30, 2024, the effective interest rate was 8.95%.
Delek Logistics 2028 Notes
On May 24, 2021, Delek Logistics and Finance Corp. issued general unsecured senior obligations comprised of $400.0 million in aggregate principal amount of 7.125% senior notes maturing June 1, 2028 ("the Delek Logistics 2028 Notes"). The Delek Logistics 2028 Notes are unconditionally guaranteed jointly and severally on a senior unsecured basis by Delek Logistics’ subsidiaries (other than Finance Corp.) and will be unconditionally guaranteed on the same basis by certain of Delek Logistics’ future subsidiaries. Interest is payable semi-annually in arrears on June 1 and December 1. As of June 30, 2024, the effective interest rate was 7.39%.
Delek Logistics 2025 Notes
In May 2018, Delek Logistics and Finance Corp. issued general unsecured senior obligations comprised of $250.0 million in aggregate principal of 6.75% senior notes maturing on May 15, 2025 ("the Delek Logistics 2025 Notes"). Concurrent with the issuance of the Delek Logistics 2029 Notes, Delek Logistics made a cash tender offer (the "Offer") for all of the outstanding Delek Logistic 2025 Notes with a conditional notice of full redemption for the remaining balance not received from the Offer. The Company received tenders from holders of approximately $156.2 million in aggregate principal amount. All the remaining Delek Logistic 2025 Notes were redeemed by March 29, 2024, pursuant to the notice of conditional redemption. Debt extinguishment costs were $1.5 million and are recorded in interest expense, net in the accompanying condensed consolidated statements of income.
Notes to Consolidated Financial Statements
Guarantees Under Revolver and Term Facilities
The obligations of the borrowers under the Delek Term Loan Credit Facility and the Delek Revolving Credit Facility are guaranteed by Delek and each of its direct and indirect, existing and future, wholly-owned domestic subsidiaries, subject to customary exceptions and limitations, and excluding Delek Logistics Partners, LP, Delek Logistics GP, LLC, and each subsidiary of the foregoing (collectively, the "MLP Subsidiaries"). Borrowings under the Delek Term Loan Credit Facility and the Delek Revolving Credit Facility are also guaranteed by DK Canada Energy ULC, a British Columbia unlimited liability company and a wholly-owned restricted subsidiary of Delek.
The obligations under the Delek Logistics Revolving Facility are secured by first priority liens on substantially all of Delek Logistics' tangible and intangible assets.
Restrictive Terms and Covenants
Under the terms of our debt facilities, we are required to comply with usual and customary financial and non-financial covenants. Certain of our debt facilities contain limitations on future transactions such as incurrence of additional indebtedness, investments, affiliate transactions, asset acquisitions or dispositions, and dividends or distributions. As of June 30, 2024, we were in compliance with covenants on all of our debt instruments.
Some of Delek's subsidiaries have restrictions in their respective credit facilities limiting their use of assets. As of June 30, 2024, we had no subsidiaries with restricted net assets which would prohibit earnings from being transferred to the parent company for its use.
9. Derivative Instruments
We use the majority of our derivatives to reduce normal operating and market risks with the primary objective of reducing the impact of market price volatility on our results of operations. As such, our use of derivative contracts is aimed at:
•limiting our exposure to commodity price fluctuations on inventory above or below target levels (where appropriate) within each of our segments;
•managing our exposure to commodity price risk associated with the purchase or sale of crude oil, feedstocks/intermediates and finished grade fuel within each of our segments;
•managing our exposure to market crack spread fluctuations;
•managing the cost of our Renewable Identification Numbers ("RINs") credits required by the U.S. Environmental Protection Agency ("EPA") to blend biofuels into fuel products ("RINs Obligation") using future commitments to purchase or sell RINs at fixed prices and quantities; and
•limiting the exposure to interest rate fluctuations on our floating rate borrowings.
We primarily utilize commodity swaps, futures, forward contracts and options contracts, generally with maturity dates of three years or less, and from time to time interest rate swaps or caps to achieve these objectives. Futures contracts are standardized agreements, traded on a futures exchange, to buy or sell the commodity at a predetermined price and location at a specified future date. Options provide the right, but not the obligation to buy or sell a commodity at a specified price in the future. Commodity swaps and futures contracts require cash settlement for the commodity based on the difference between a fixed or floating price and the market price on the settlement date, and options require payment/receipt of an upfront premium. Because these derivatives are entered into to achieve objectives specifically related to our inventory and production risks, such gains and losses (to the extent not designated as accounting hedges and recognized on an unrealized basis in other comprehensive income) are recognized in cost of materials and other.
Forward contracts are agreements to buy or sell a commodity at a predetermined price at a specified future date, and for our transactions, generally require physical delivery. Forward contracts where the underlying commodity will be used or sold in the normal course of business qualify as normal purchases and normal sales ("NPNS") pursuant to ASC 815. If we elect the NPNS exception, such forward contracts are not accounted for as derivative instruments but rather are accounted for under other applicable GAAP. Commodity forward contracts accounted for as derivative instruments are recorded at fair value with changes in fair value recognized in earnings in the period of change. Our Canadian crude trading operations are accounted for as derivative instruments, and the related unrealized and realized gains and losses are recognized in other operating income, net on the condensed consolidated statements of income. Additionally, as of and for the three and six months ended June 30, 2024, other forward contracts accounted for as derivatives that are specific to managing crude costs rather than for trading purposes are recognized in cost of materials and other on the condensed consolidated statements of income in our refining segment, and are included in our disclosures of commodity derivatives in the tables below.
Futures, swaps or other commodity related derivative instruments that are utilized to specifically provide economic hedges on our Canadian forward contract or investment positions are recognized in other operating income, net because that is where the related underlying transactions are reflected.
Notes to Consolidated Financial Statements
From time to time, we also enter into future commitments to purchase or sell RINs at fixed prices and quantities, which are used to manage the costs associated with our RINs Obligation. These future RINs commitment contracts meet the definition of derivative instruments under ASC 815, and are recorded at estimated fair value in accordance with the provisions of ASC 815. Changes in the fair value of these future RINs commitment contracts are recorded in cost of materials and other on the condensed consolidated statements of income. As of June 30, 2024, we do not believe there is any material credit risk with respect to the counterparties to any of our derivative contracts.
The following table presents the fair value of our derivative instruments as of June 30, 2024 and December 31, 2023. The fair value amounts below are presented on a gross basis and do not reflect the netting of asset and liability positions permitted under our master netting arrangements, including cash collateral on deposit with our counterparties. We have elected to offset the recognized fair value amounts for multiple derivative instruments executed with the same counterparty in our financial statements. As a result, the asset and liability amounts below differ from the amounts presented in our condensed consolidated balance sheets. See Note 10 for further information regarding the fair value of derivative instruments (in millions).
| | | | | | | | | | | | | | | | | | | | | | | | | | | | | |
| | | June 30, 2024 | | December 31, 2023 |
| Derivative Type | Balance Sheet Location | | Assets | | Liabilities | | Assets | | Liabilities |
| Derivatives not designated as hedging instruments: | | | | | | | | |
Commodity derivatives (1) | Other current assets | | $ | — | | | $ | — | | | $ | 6.6 | | | $ | (7.1) | |
Commodity derivatives (1) | Other current liabilities | | 27.8 | | | (38.3) | | | — | | | (0.8) | |
| | | | | | | | | |
| | | | | | | | | |
RINs commitment contracts (2) | Other current assets | | 0.3 | | | — | | | — | | | — | |
RINs commitment contracts (2) | Other current liabilities | | — | | | (7.5) | | | — | | | (3.1) | |
| Total gross fair value of derivatives | | 28.1 | | | (45.8) | | | 6.6 | | | (11.0) | |
Less: Counterparty netting and cash collateral (3) | | 27.8 | | | (35.8) | | | 5.3 | | | (7.1) | |
| Total net fair value of derivatives | | $ | 0.3 | | | $ | (10.0) | | | $ | 1.3 | | | $ | (3.9) | |
(1)As of June 30, 2024 and December 31, 2023, we had open derivative positions representing 33,183,000 and 55,336,870 barrels, respectively, of crude oil and refined petroleum products. Additionally, as of June 30, 2024, we had open derivative positions representing 4,005,000 million British Thermal Units ("MMBTU") of natural gas products. We had no open derivative positions of natural gas products as of December 31, 2023.
(2)As of June 30, 2024 and December 31, 2023, we had open RINs commitment contracts representing 50,750,000 and 41,636,461 RINs, respectively.
(3)As of June 30, 2024 and December 31, 2023, $8.0 million and $1.8 million, respectively, of cash collateral held by counterparties has been netted with the derivatives with each counterparty.
Total gains (losses) on our non-trading commodity derivatives and RINs commitment contracts recorded in the condensed consolidated statements of income are as follows (in millions) (2):
| | | | | | | | | | | | | | | | | | | | | | | | | | | | |
| | Three Months Ended June 30, | | Six Months Ended June 30, |
| | 2024 | | 2023 | | 2024 | | 2023 | | |
(Losses) gains on hedging derivatives not designated as hedging instruments recognized in cost of materials and other (1) | | $ | (7.5) | | | $ | 5.3 | | | $ | (29.2) | | | $ | 10.7 | | | |
| Losses on non-trading physical forward contract commodity derivatives in cost of materials and other | | — | | | — | | | — | | | (2.4) | | | |
| | | | | | | | | | |
| | | | | | | | | | |
| | | | | | | | | | |
| Total (losses) gains | | $ | (7.5) | | | 5.3 | | | $ | (29.2) | | | $ | 8.3 | | | |
| | | | | | | | | | |
(1) (Losses) gains on commodity derivatives that are economic hedges but not designated as hedging instruments include unrealized (losses) gains of $(0.2) million and $(9.2) million for the three and six months ended June 30, 2024, respectively, and $(6.6) million and $23.3 million for the three and six months ended June 30, 2023, respectively.
(2) See separate table below for disclosures about "trading derivatives".
Notes to Consolidated Financial Statements
Total gains (losses) on our trading derivatives (none of which were designated as hedging instruments) recorded in other operating (income) expense, net on the condensed consolidated statements of income are as follows (in millions):
| | | | | | | | | | | | | | | | | | | | | | | | | | | | | | |
| | Three Months Ended June 30, | | Six Months Ended June 30, |
| | 2024 | | 2023 | | 2024 | | 2023 | | | | |
| | | | | | | | | | | | |
| Trading Physical Forward Contract Commodity Derivatives | | | | | | | | | | | | |
| Realized gains | | $ | 0.1 | | | $ | 5.9 | | | $ | (0.1) | | | $ | 7.2 | | | | | |
| Unrealized gains | | — | | | 1.9 | | | — | | | 0.1 | | | | | |
| Total | | $ | 0.1 | | | $ | 7.8 | | | $ | (0.1) | | | $ | 7.3 | | | | | |
| | | | | | | | | | | | |
| Trading Hedging Commodity Derivatives | | | | | | | | | | | | |
| Realized losses | | $ | — | | | $ | (3.1) | | | $ | — | | | $ | (1.7) | | | | | |
| Unrealized gains | | — | | | 1.2 | | | — | | | 2.3 | | | | | |
| Total | | $ | — | | | $ | (1.9) | | | $ | — | | | $ | 0.6 | | | | | |
10. Fair Value Measurements
Our assets and liabilities that are measured at fair value include commodity derivatives, investment commodities, environmental credits obligations, and our Inventory Intermediation Agreement. ASC 820, Fair Value Measurements ("ASC 820") requires disclosures that categorize assets and liabilities measured at fair value into one of three different levels depending on the observability of the inputs employed in the measurement. Level 1 inputs are quoted prices in active markets for identical assets or liabilities. Level 2 inputs are observable inputs other than quoted prices included within Level 1 for the asset or liability, either directly or indirectly through market-corroborated inputs. Level 3 inputs are unobservable inputs for the asset or liability reflecting our assumptions about pricing by market participants.
Our commodity derivative contracts, which consist of commodity swaps, exchange-traded futures, options and physical commodity forward purchase and sale contracts (that do not qualify for the NPNS exception under ASC 815), are valued based on exchange pricing and/or price index developers such as Platts or Argus and are, therefore, classified as Level 2.
Our RINs commitment contracts are future commitments to purchase or sell RINs at fixed prices and quantities and are used to manage the costs associated with our "Consolidated Net RINs Obligation" which is the sum of our individual obligated parties’ Net RINs Obligations as well as RINs held by our non-obligated parties which meet our recognition criteria. These RINs commitment contracts (which are forward contracts accounted for as derivatives – see Note 9) are categorized as Level 2, and are measured at fair value based on quoted prices from an independent pricing service.
Our environmental credits obligation includes the Consolidated Net RINs Obligation, as well as other environmental credit obligation positions subject to fair value accounting pursuant to our accounting policy. The environmental credits obligation is categorized as Level 2, if measured at fair value either directly through observable inputs or indirectly through market-corroborated inputs, and gains (losses) related to changes in fair value are recorded as a component of cost of materials and other in the condensed consolidated statements of income. With respect to our Consolidated Net RINs Obligation, we recognized gains (losses) of $0.3 million on changes in fair value for the three and six months ended June 30, 2024, and totaling $(2.1) million and $(1.8) million for the three and six months ended June 30, 2023, respectively, primarily attributable to changes in the market prices of the underlying credits that occurred at the end of each quarter.
We elected to account for our Inventory Intermediation step-out liability at fair value in accordance with ASC 825, as it pertains to the fair value option. This standard permits the election to carry financial instruments and certain other items similar to financial instruments at fair value on the balance sheet, with all changes in fair value reported in earnings. With respect to the Inventory Intermediation Agreement, we apply fair value measurement as follows: (1) we determine fair value for our amended variable step-out liability based on changes in fair value related to market volatility based on a floating commodity-index price, and for our amended fixed step-out liability based on changes to interest rates and the timing and amount of expected future cash settlements where such obligation is categorized as Level 2. Gains (losses) related to changes in fair value due to commodity-index price are recorded as a component of cost of materials and other, and changes in fair value due to interest rate risk are recorded as a component of interest expense in the condensed consolidated statements of income; and (2) we determine fair value of the commodity-indexed revolving over/short inventory financing liability based on the market prices for the consigned crude oil and refined products collateralizing the financing/funding where such obligation is categorized as Level 2 and is presented in the current portion of the obligation under Inventory Intermediation Agreement on our condensed consolidated balance sheets. Gains (losses) related to the change in fair value are recorded as a component of cost of materials and other in the condensed consolidated statements of income. See Note 7 for discussion of gains and losses recognized from changes in fair value.
Notes to Consolidated Financial Statements
The fair value of the Delek Logistics 2028 Notes is measured based on quoted market prices in an active market, defined as Level 1 in the fair value hierarchy. The carrying value (excluding unamortized debt issuance costs) and estimated fair value of these notes was $400.0 million and $394.9 million, respectively, as of June 30, 2024, and $400.0 million and $380.4 million, respectively, at December 31, 2023.
Also, the fair value of the Delek Logistics 2029 Notes is measured based on quoted market prices in an active market, defined as Level 1 in the fair value hierarchy. The carrying value (excluding unamortized debt issuance costs) and estimated fair value of these notes was $850.0 million and $874.2 million, respectively, as of June 30, 2024.
The fair value approximates the historical or amortized cost basis comprising our carrying value for all other financial instruments and therefore are not included in the table below. The fair value hierarchy for our financial assets and liabilities accounted for at fair value on a recurring basis was as follows (in millions):
| | | | | | | | | | | | | | | | | | | | | | | | | | |
| | | As of June 30, 2024 |
| | | Level 1 | | Level 2 | | Level 3 | | Total |
| Assets | | | | | | | | |
| Commodity derivatives | | $ | — | | | $ | 27.8 | | | $ | — | | | $ | 27.8 | |
| | | | | | | | |
| RINs commitment contracts | | — | | | 0.3 | | | — | | | 0.3 | |
| | | | | | | | |
| | | | | | | | |
| Total assets | | — | | | 28.1 | | | — | | | 28.1 | |
| Liabilities | | | | | | | | |
| | | | | | | | |
| Commodity derivatives | | — | | | (38.3) | | | — | | | (38.3) | |
| RINs commitment contracts | | — | | | (7.5) | | | — | | | (7.5) | |
| Environmental credits obligation deficit | | — | | | (62.8) | | | — | | | (62.8) | |
| Inventory Intermediation Agreement obligation | | — | | | (472.2) | | | — | | | (472.2) | |
| Total liabilities | | — | | | (580.8) | | | — | | | (580.8) | |
| Net liabilities | | $ | — | | | $ | (552.7) | | | $ | — | | | $ | (552.7) | |
| | | | | | | | | | | | | | | | | | | | | | | | | | |
| | | As of December 31, 2023 |
| | | Level 1 | | Level 2 | | Level 3 | | Total |
| Assets | | | | | | | | |
| Commodity derivatives | | $ | — | | | $ | 6.6 | | | $ | — | | | $ | 6.6 | |
| | | | | | | | |
| RINs commitment contracts | | — | | | — | | | — | | | — | |
| | | | | | | | |
| Total assets | | — | | | 6.6 | | | — | | | 6.6 | |
| Liabilities | | | | | | | | |
| Commodity derivatives | | — | | | (7.9) | | | — | | | (7.9) | |
| | | | | | | | |
| RINs commitment contracts | | — | | | (3.1) | | | — | | | (3.1) | |
| Environmental credits obligation deficit | | — | | | (39.6) | | | — | | | (39.6) | |
| Inventory Intermediation Agreement obligation | | — | | | (407.6) | | | — | | | (407.6) | |
| Total liabilities | | — | | | (458.2) | | | — | | | (458.2) | |
| Net liabilities | | $ | — | | | $ | (451.6) | | | $ | — | | | $ | (451.6) | |
The derivative values above are based on analysis of each contract as the fundamental unit of account as required by ASC 820. In the table above, derivative assets and liabilities with the same counterparty are not netted where the legal right of offset exists. This differs from the presentation in the financial statements which reflects our policy, wherein we have elected to offset the fair value amounts recognized for multiple derivative instruments executed with the same counterparty and where the legal right of offset exists. As of June 30, 2024 and December 31, 2023, $8.0 million and $1.8 million, respectively, of cash collateral was held by counterparty brokerage firms and has been netted with the net derivative positions with each counterparty. See Note 9 for further information regarding derivative instruments.
Non-Recurring Fair Value Measurements
During the second quarter of 2024, we recorded an impairment for our three biodiesel facilities. Our estimate of the fair value of the impaired long-lived assets as of June 30, 2024, were primarily based on the expectation that these assets are unlikely to generate future cash flows either through continued operation or through proceeds from the sale of the assets and thus they were written down to $0.5 million, which is the estimated fair value of the land. See Note 15 for further information regarding the asset impairment recorded.
Notes to Consolidated Financial Statements
11. Commitments and Contingencies
Litigation
In the ordinary conduct of our business, we are from time to time subject to lawsuits, investigations and claims, including environmental claims and employee-related matters. Although we cannot predict with certainty the ultimate resolution of lawsuits, investigations and claims asserted against us, including civil penalties or other enforcement actions, we do not believe that any currently pending legal proceeding or proceedings to which we are a party will have a material adverse effect on our financial statements. Certain environmental matters that have or may result in penalties or assessments are discussed below in the "Environmental, Health and Safety" section of this note.
Environmental, Health and Safety
We are subject to extensive federal, state and local environmental and safety laws and regulations enforced by various agencies, including the EPA, the U.S. Department of Transportation and the Occupational Safety and Health Administration, as well as numerous state, regional and local environmental, safety and pipeline agencies. These laws and regulations govern the discharge of materials into the environment, waste management practices, pollution prevention measures and the composition of the fuels we produce, as well as the safe operation of our plants and pipelines and the safety of our workers and the public. Numerous permits or other authorizations are required under these laws and regulations for the operation of our refineries, renewable fuels facilities, terminals, pipelines, underground storage tanks, trucks, rail cars and related operations, and may be subject to revocation, modification and renewal.
These laws and permits raise potential exposure to future claims and lawsuits involving environmental and safety matters which could include soil and water contamination, air pollution, personal injury and property damage allegedly caused by substances which we manufactured, handled, used, released or disposed of, transported, or that relate to pre-existing conditions for which we have assumed responsibility. We believe that our current operations are in substantial compliance with existing environmental and safety requirements. However, there have been and will continue to be ongoing discussions about environmental and safety matters between us and federal and state authorities, including notices of violations, citations and other enforcement actions, some of which have resulted or may result in changes to operating procedures and in capital expenditures. While it is often difficult to quantify future environmental or safety related expenditures, we anticipate that continuing capital investments and changes in operating procedures will be required for the foreseeable future to comply with existing and new requirements, as well as evolving interpretations and more strict enforcement of existing laws and regulations.
As of June 30, 2024, we have recorded an environmental liability of approximately $35.5 million, primarily related to the estimated probable costs of remediating or otherwise addressing certain environmental issues of a non-capital nature at our refineries, as well as terminals, some of which we no longer own. This liability includes estimated costs for ongoing investigation and remediation efforts for known contamination of soil and groundwater. Approximately $2.7 million of the total liability is expected to be expended over the next 12 months, with most of the balance expended by 2032, although some costs may extend up to 30 years. In the future, we could be required to extend the expected remediation period or undertake additional investigations of our refineries, pipelines and terminal facilities, which could result in the recognition of additional remediation liabilities.
On June 27, 2024, we settled a dispute that was in litigation related to a property that we historically operated as an asphalt and marine fuel terminal both as an owner and, subsequently, as a lessee under an in-substance lease agreement (the “License Agreement”). The settlement included the purchase of the property for $10.0 million and $42.0 million for settlement of the litigation for a total of $52.0 million. The total settlement was comprised of $24.0 million of cash paid at closing and a promissory note for $28.0 million to be paid in three equal installments of $9.3 million on each of April 1, 2025, April 1, 2026 and April 1, 2027, plus accrued interest. The settlement charge is recorded in other operating income, net in the condensed consolidated statements of income.
The License Agreement, which provided us the license to continue operating our asphalt and marine fuel terminal operations on the property for a term of ten years and expired in June 2020, also ascribed a contractual noncontingent indemnification guarantee to certain of our wholly-owned subsidiaries related to certain incremental environmental remediation activities, predicated on the completion of certain property development activities ascribed to the lessor was formally terminated in the settlement. As a result of the termination of the License Agreement, we are no longer obligated to remove equipment from the property for certain development activities and as a result we have reversed the $17.9 million asset retirement obligation recorded in connection with the Delek/Alon Merger, effective July 1, 2017, since we own the property and intend to operate the property as an asphalt and marine fuel terminal and there was no remaining basis in the equipment. Additionally, as a result of the settlement we reduced the non-contingent guarantee and environmental liability to $1.0 million since our risk of a contingent guarantee was eliminated and determined it appropriate to retain an accrual based on what we can reasonably estimate as the cost of the initial steps once operations cease or a cleanup is ordered. Total net gain from the property settlement was $53.4 million and is recorded in other operating income, net in the condensed consolidated statements of income.
Notes to Consolidated Financial Statements
We are also subject to various regulatory requirements related to carbon emissions and the compliance requirements to remit environmental credit obligations due to the EPA or other regulatory agencies, the most significant of which relates to the RINs Obligation subject to the EPA’s Renewable Fuel Standard - 2 ("RFS-2") regulations. The RFS-2 regulations are highly complex and evolving, requiring us to periodically update our compliance systems. As part of our on-going monitoring and compliance efforts, on an annual basis we engage a third party to perform procedures to review our RINs inventory, processes and compliance. The results of such procedures may include procedural findings but may also include findings regarding the usage of RINs to meet past obligations, the treatment of exported RINs, and the propriety of RINs on-hand and related adjustments to our RINs inventory, which (to the extent they are valued) offset our RINs Obligation. Such adjustments may also require communication with the EPA if they involve reportable non-compliance which could lead to the assessment of penalties.
Other Losses and Contingencies
Delek maintains property damage insurance policies which have varying deductibles. Delek also maintains business interruption insurance policies, with varying coverage limits and waiting periods. Covered losses in excess of the deductible and outside of the waiting period will be recoverable under the property and business interruption insurance policies.
El Dorado Refinery Fire
On February 27, 2021, our El Dorado refinery experienced a fire in its Penex unit. Contrary to initial assessments, and despite occurring during the early stages of turnaround activity, the facility did suffer operational disruptions as a result of the fire. An additional $10.5 million of insurance proceeds and other recoveries was recognized as a gain, in excess of property damage losses, during the three and six months ended June 30, 2024. An additional $10.6 million of other recoveries was recognized as a gain, related to business interruption claims, during the three and six months ended June 30, 2024. We recognized a gain of $0.9 million during the three and six months ended June 30, 2023, respectively, related to business interruption claims. Such gains are included in other operating income, net in the condensed consolidated statements of income.
12. Income Taxes
Under ASC 740, Income Taxes (“ASC 740”), we generally use an estimated annual tax rate to record income taxes. For interim financial reporting, except in specified cases, the quarterly income tax provision aligns with the estimated annual tax rate, updated each quarter based on revised full-year pre-tax book earnings. In certain situations, the estimated annual tax rate may distort the interim income tax provision due to significant permanent differences. In such cases, the interim income tax provision is based on the year-to-date effective tax rate, adjusting for permanent differences proportionally. In the three and six months ended June 30, 2024, income taxes were calculated based on the estimated annual effective tax rate versus the year-to-date effective tax rate. In the three and six months ended June 30, 2023, income taxes were calculated based on the estimated annual tax rate. Our effective tax rate was 22.8% and 22.5% for the three and six months ended June 30, 2024, respectively, and 71.7% and 14.5% for the three and six months ended June 30, 2023, respectively. The difference between the effective tax rate and the statutory rate is generally attributable to permanent differences and discrete items. The change in our effective tax rate for the three and six months ended June 30, 2024 as compared to the three and six months ended June 30, 2023 was primarily due to a decrease in quarter to date pre-tax earnings and the impact of fixed dollar favorable permanent adjustments on the quarter.
13. Related Party Transactions
Our related party transactions consist primarily of transactions with our equity method investees (See Note 5). Transactions with our related parties were as follows for the periods presented (in millions):
| | | | | | | | | | | | | | | | | | | | | | | | | | | | |
| | Three Months Ended June 30, | | Six Months Ended June 30, |
| | 2024 | | 2023 | | 2024 | | 2023 | | |
Revenues (1) | | $ | 39.5 | | | $ | 32.0 | | | $ | 61.5 | | | $ | 49.9 | | | |
Cost of materials and other (2) | | $ | 48.2 | | | $ | 52.8 | | | $ | 106.0 | | | $ | 98.2 | | | |
(1)Consists primarily of asphalt sales which are recorded in the refining segment.
(2)Consists primarily of pipeline throughput fees paid by the refining segment and asphalt purchases.
Notes to Consolidated Financial Statements
14. Other Current Assets and Liabilities
The detail of other current assets is as follows (in millions):
| | | | | | | | | | | |
| Other Current Assets | June 30, 2024 | | December 31, 2023 |
| Prepaid expenses | $ | 45.3 | | | $ | 47.8 | |
| Income and other tax receivables | 7.9 | | | 15.5 | |
Short-term derivative assets (see Note 9) | 0.3 | | | 1.3 | |
| Investment commodities | — | | | 4.0 | |
| | | |
| | | |
| | | |
| Other | 7.7 | | | 9.6 | |
| Total | $ | 61.2 | | | $ | 78.2 | |
The detail of accrued expenses and other current liabilities is as follows (in millions):
| | | | | | | | | | | |
| Accrued Expenses and Other Current Liabilities | June 30, 2024 | | December 31, 2023 |
| | | |
| Crude purchase liabilities | $ | 180.0 | | | $ | 190.7 | |
| Income and other taxes payable | 136.2 | | | 166.9 | |
| Product financing agreements | 110.7 | | | 224.2 | |
Consolidated Net RINs Obligation deficit (see Note 10) | 62.8 | | | 39.6 | |
| Employee costs | 47.8 | | | 67.0 | |
Short-term derivative liabilities (see Note 9) | 10.0 | | | 3.9 | |
| Deferred revenue | 7.2 | | | 16.0 | |
| Other | 88.2 | | | 62.9 | |
| Total | $ | 642.9 | | | $ | 771.2 | |
15. Restructuring and Other Charges
During the fiscal year 2022, we initiated a cost optimization plan to improve efficiencies and align our workforce with strategic activities and operations.
During the second quarter of 2024, we made the decision to idle the Crossett, Arkansas, Cleburne, Texas and New Albany, Mississippi biodiesel facilities, while exploring viable and sustainable alternatives. Those alternatives could include restarting if market conditions improve, marketing for sale or permanently closing any of the facilities. Our decision to idle these facilities was driven by the decline in the overall biodiesel market and aligns with our continued operational and cost optimization efforts. As a result, we conducted an evaluation of impairment and based on our review we recorded a $22.1 million impairment which included property, plant and equipment and right of use assets. In addition, $0.4 million of severance and benefit expenses were recognized in the three and six months ended June 30, 2024.
The detail of restructuring costs is as follows (in millions):
| | | | | | | | | | | | | | | | | | | | | | | | | | | | | | | | |
| | Three Months Ended June 30, 2024 |
| Type of Costs | Statement of Income Location | Refining | | Logistics | | Retail | | Corporate,
Other and Eliminations | | Consolidated |
| Consulting fees and severance costs | General and administrative expenses | $ | — | | | $ | — | | | $ | — | | | $ | 0.1 | | | $ | 0.1 | |
| Severance costs | Operating expenses | 0.4 | | | — | | | — | | | — | | | 0.4 | |
| Impairment | Asset impairment | 22.1 | | | — | | | — | | | — | | | 22.1 | |
| Total | | $ | 22.5 | | | $ | — | | | $ | — | | | $ | 0.1 | | | $ | 22.6 | |
| | | | | | | | | | | | | | | | | | | | | | | | | | | | | | | | |
| | Three Months Ended June 30, 2023 |
| Type of Costs | Statement of Income Location | Refining | | Logistics | | Retail | | Corporate,
Other and Eliminations | | Consolidated |
| Consulting fees and severance costs | General and administrative expenses | $ | — | | | $ | — | | | $ | — | | | 4.3 | | | $ | 4.3 | |
| | | | | | | | | | |
| | | | | | | | | | |
| | | | | | | | | | |
| Total | | $ | — | | | $ | — | | | $ | — | | | $ | 4.3 | | | $ | 4.3 | |
Notes to Consolidated Financial Statements
| | | | | | | | | | | | | | | | | | | | | | | | | | | | | | | | |
| | Six Months Ended June 30, 2024 |
| Type of Costs | Statement of Income Location | Refining | | Logistics | | Retail | | Corporate,
Other and Eliminations | | Consolidated |
| Consulting fees and severance costs | General and administrative expenses | $ | — | | | $ | — | | | $ | — | | | $ | 3.3 | | | $ | 3.3 | |
| Severance costs | Operating expenses | 0.4 | | | — | | | — | | | — | | | 0.4 | |
| Impairment | Asset impairment | 22.1 | | | — | | | — | | | — | | | 22.1 | |
| Total | | $ | 22.5 | | | $ | — | | | $ | — | | | $ | 3.3 | | | $ | 25.8 | |
| | | | | | | | | | | | | | | | | | | | | | | | | | | | | | | | |
| | Six Months Ended June 30, 2023 |
| Type of Costs | Statement of Income Location | Refining | | Logistics | | Retail | | Corporate,
Other and Eliminations | | Consolidated |
| Consulting fees and severance costs | General and administrative expenses | $ | — | | | $ | — | | | $ | — | | | $ | 2.9 | | | $ | 2.9 | |
| | | | | | | | | | |
| | | | | | | | | | |
| | | | | | | | | | |
| Total | | $ | — | | | $ | — | | | $ | — | | | $ | 2.9 | | | $ | 2.9 | |
16. Equity-Based Compensation
Delek US Holdings, Inc. 2006 and 2016 and Alon USA Energy, Inc. 2005 Long-Term Incentive Plans (collectively, the "Incentive Plans")
Compensation expense related to equity-based awards granted under the Incentive Plans amounted to $6.5 million and $12.8 million for the three and six months ended June 30, 2024, respectively, and $4.9 million and $10.8 million for the three and six months ended June 30, 2023, respectively. These amounts are included in general and administrative expenses and operating expenses in the accompanying condensed consolidated statements of income. As of June 30, 2024, there was $54.4 million of total unrecognized compensation cost related to non-vested share-based compensation arrangements, which is expected to be recognized over a weighted-average period of 1.8 years.
We issued net shares of common stock of 402,665 and 447,039 as a result of exercised or vested equity-based awards during the three and six months ended June 30, 2024, respectively, and 308,196 and 361,839 for the three and six months ended June 30, 2023, respectively. These amounts are net of 167,658 and 203,092 shares withheld to satisfy employee tax obligations related to the exercises and vesting during the three and six months ended June 30, 2024, respectively, and 125,645 and 146,108 shares during the three and six months ended June 30, 2023, respectively.
17. Shareholders' Equity
Dividends
For 2024, our Board of Directors declared the following dividends:
| | | | | | | | | | | | | | | | | | | | |
| Approval Date | | Dividend Amount Per Share | | Record Date | | Payment Date |
| | | | | | |
| | | | | | |
| | | | | | |
| | | | | | |
| | | | | | |
| | | | | | |
| | | | | | |
| February 20, 2024 | | $0.245 | | March 1, 2024 | | March 8, 2024 |
| May 2, 2024 | | $0.250 | | May 17, 2024 | | May 24, 2024 |
| July 31, 2024 | | $0.255 | | August 12, 2024 | | August 19, 2024 |
Stock Repurchase Program
Our Board of Directors has authorized a share repurchase program under which repurchases of Delek common stock may be executed through open market transactions or privately negotiated transactions, in accordance with applicable securities laws. The timing, price and size of repurchases are made at the discretion of management and will depend on prevailing share prices, general economic and market conditions and other considerations. The authorization has no expiration date. During the three and six months ended June 30, 2023, 1,795,335 and 1,811,627 shares of our common stock were repurchased and cancelled at the time of the transaction for a total of $40.0 million and $40.4 million, respectively. No common stock repurchases were made in the three and six month ended June 30, 2024. As of June 30, 2024, there was $185.1 million of authorization remaining under Delek's aggregate stock repurchase program.
Notes to Consolidated Financial Statements
18. Subsequent Events
Planned Sale of Retail
On July 31, 2024, a wholly owned subsidiary of Delek, entered into a definitive equity purchase agreement (the "Retail Purchase Agreement") with a subsidiary of FEMSA. Under the terms of the Retail Purchase Agreement, Delek agreed to sell, and FEMSA has agreed to purchase, 100% of the equity interests in four of Delek’s wholly-owned subsidiaries that own and operate 249 Retail Stores under the Delek US Retail brand for a cash consideration of $350.0 million plus the purchase of inventory and other customary adjustments under the Retail Purchase Agreement for indebtedness (the “Retail Transaction”). The closing of the Retail Transaction is currently anticipated to occur by the end of 2024, subject to certain customary closing conditions, including, among other things, the receipt of required governmental and other third party approvals (or the termination or expiration of applicable waiting periods). The Retail Transaction includes a long-term agreement whereby Delek will sell to FEMSA certain motor fuel products for use at the Retail Stores.
Planned H2O Midstream Acquisition
On August 2, 2024, Delek Logistics entered into a Purchase and Sale Agreement with H2O Midstream Holdings, LLC (the “Seller”) to purchase 100% of the limited liability company interests in H2O Midstream Intermediate, LLC, H2O Midstream Permian LLC, and H2O Midstream LLC (the “Purchased Interests” or "H2O Midstream"), related to the Seller’s water disposal and recycling operations, in the Midland Basin in Texas (the “H2O Purchase Agreement”) for total consideration of $230.0 million, subject to customary adjustments under the H2O Purchase Agreement for net working capital and indebtedness ("H2O Transaction"). The purchase price is comprised of approximately $160.0 million in cash and $70.0 million of preferred equity. Delek Logistics paid a deposit under the H2O Purchase Agreement of $23.0 million. The deposit may be retained by the Seller upon certain termination events described in the H2O Purchase Agreement. At closing, the deposit will be applied to the purchase price to be paid under the H2O Purchase Agreement. The closing of the H2O Transaction is currently anticipated to occur by the end of 2024.
Wink to Webster Pipeline
On August 1, 2024, we purchased an additional 0.6% indirect investment in Wink to Webster Pipeline LLC for $18.6 million, bringing our total indirect ownership in the pipeline joint venture to 15.6%. On August 5, 2024, we contributed all of our 50% investment in HoldCo which includes our 15.6% indirect interest in the Wink to Webster Pipeline LLC joint venture and related joint venture indebtedness, to a subsidiary of Delek Logistics. Total consideration was comprised of $86.6 million in cash, forgiveness of a $60.0 million payable to Delek Logistics and 2,300,000 of Delek Logistics common units.
Delek Logistics
On August 5, 2024, we amended and extended expired, or soon to be expired, commercial agreements with subsidiaries of Delek Logistics under which the Delek Logistics subsidiaries provide various services, including crude oil gathering and crude oil, intermediate and refined products transportation and storage services, and marketing, terminalling and offloading services to us. These agreements have an initial term of five to seven years, with the ability to extend for an additional five years at our option. In addition, we also entered into an assignment agreement with a subsidiary of Delek Logistics to assign the Big Spring Refinery Marketing Agreement to Delek Holdings. As a result of these agreements, we transferred 2,500,000 of our Delek Logistics common units to Delek Logistics to be retired.
We also entered into an amended and restated Omnibus Agreement with Delek Logistics that provides us an option to purchase certain critical assets from Delek Logistics at market value during the period beginning upon any change in control or sale of substantially all assets involving Delek Logistics and extending (i) in the case of a transaction involving a third party, for six months following closing, and (ii) for any other transaction, for four years following closing.
Management's Discussion and Analysis
ITEM 2. MANAGEMENT'S DISCUSSION AND ANALYSIS OF FINANCIAL CONDITION AND RESULTS OF OPERATIONS
Management’s Discussion and Analysis of Financial Condition and Results of Operations ("MD&A") is management’s analysis of our financial performance and of significant trends that may affect our future performance. The MD&A should be read in conjunction with our condensed consolidated financial statements and related notes included elsewhere in this Quarterly Report on Form 10-Q and in the Annual Report on Form 10-K filed with the Securities and Exchange Commission ("SEC") on February 28, 2024 (the "Annual Report on Form 10-K"). Those statements in the MD&A that are not historical in nature should be deemed forward-looking statements that are inherently uncertain.
Delek US Holdings, Inc. is a registrant pursuant to the Securities Act of 1933, as amended ("Securities Act") and is listed on the New York Stock Exchange ("NYSE") under the ticker symbol "DK". Unless otherwise noted or the context requires otherwise, the terms "we," "our," "us," "Delek" and the "Company" are used in this report to refer to Delek US Holdings, Inc. and its consolidated subsidiaries for all periods presented. You should read the following discussion of our financial condition and results of operations in conjunction with our historical condensed consolidated financial statements and notes thereto.
The Company announces material information to the public about the Company, its products and services and other matters through a variety of means, including filings with the SEC, press releases, public conference calls, the Company’s website (www.delekus.com), the investor relations section of its website (ir.delekus.com), the news section of its website (www.delekus.com/news), and/or social media, including its X (previously known as Twitter) account (@DelekUSHoldings). The Company encourages investors and others to review the information it makes public in these locations, as such information could be deemed to be material information. Please note that this list may be updated from time to time.
Forward-Looking Statements
This Quarterly Report on Form 10-Q contains "forward-looking statements" within the meaning of Section 27A of the Securities Act of 1933, as amended, and Section 21E of the Securities Exchange Act of 1934 ("Exchange Act"). These forward-looking statements reflect our current estimates, expectations and projections about our future results, performance, prospects and opportunities. Forward-looking statements include, among other things, statements that refer to the acquisition of 3 Bear (subsequently renamed to Delek Delaware Gathering ("Delaware Gathering")) (the "Delaware Gathering Acquisition"), including any statements regarding the expected benefits, synergies, growth opportunities, impact on liquidity and prospects, and other financial and operating benefits thereof, the information concerning possible future results of operations, business and growth strategies, including as the same may be impacted by any ongoing military conflict, such as the war between Russia and Ukraine ("the Russia-Ukraine War"), financing plans, expectations that regulatory developments or other matters will or will not have a material adverse effect on our business or financial condition, our competitive position and the effects of competition, the projected growth of the industry in which we operate, and the benefits and synergies to be obtained from our completed and any future acquisitions or dispositions, including the planned sale of our Retail Stores and H2O Midstream acquisition, statements of management’s goals and objectives, and other similar expressions concerning matters that are not historical facts. Words such as "may," "will," "should," "could," "would," "predicts," "potential," "continue," "expects," "anticipates," "future," "intends," "plans," "believes," "estimates," "appears," "projects" and similar expressions, as well as statements in future tense, identify forward-looking statements.
Forward-looking statements should not be read as a guarantee of future performance or results, and will not necessarily be accurate indications of the times at, or by, which such performance or results will be achieved. Forward-looking information is based on information available at the time and/or management’s good faith belief with respect to future events, and is subject to risks and uncertainties that could cause actual performance or results to differ materially from those expressed in the statements. Important factors that, individually or in the aggregate, could cause such differences include, but are not limited to:
•volatility in our refining margins or fuel gross profit as a result of changes in the prices of crude oil, other feedstocks and refined petroleum products;
•reliability of our operating assets;
•actions of our competitors and customers;
•changes in, or the failure to comply with, the extensive government regulations applicable to our industry segments, including current and future restrictions on commercial and economic activities in response to future public health crises;
•our ability to execute our long-term sustainability strategy and growth through acquisitions and dispositions such as the planned sale of our Retail Stores, the planned H20 Midstream acquisition, the Delaware Gathering Acquisition and joint ventures, including our ability to successfully integrate acquisitions, complete strategic transactions, safety initiatives and capital projects, realize expected synergies, cost savings and other benefits therefrom, return value to shareholders, or achieve operational efficiencies;
•diminishment in value of long-lived assets may result in an impairment in the carrying value of the assets on our balance sheet and a resultant loss recognized in the statement of operations;
•the impact on commercial activity and other economic effects of any widespread public health crisis, including uncertainty regarding the timing, pace and extent of economic recovery following any such crisis;
•general economic and business conditions affecting the southern, southwestern and western United States ("U.S")., particularly levels of spending related to travel and tourism;
•volatility under our derivative instruments;
•deterioration of creditworthiness or overall financial condition of a material counterparty (or counterparties);
•unanticipated increases in cost or scope of, or significant delays in the completion of, our capital improvement safety initiative and periodic turnaround projects;
•risks and uncertainties with respect to the quantities and costs of refined petroleum products supplied to our pipelines and/or held in our terminals;
•operating hazards, natural disasters, weather related disruptions, casualty losses and other matters beyond our control;
•increases in our debt levels or costs;
•possibility of accelerated repayment on a portion of our Inventory Intermediation Agreement obligation if the purchase price adjustment feature triggers a change on the re-pricing dates;
•changes in our ability to continue to access the credit markets;
•compliance, or failure to comply, with restrictive and financial covenants in our various debt agreements;
•changes in our ability to pay dividends;
Management's Discussion and Analysis
•seasonality;
•earthquakes, hurricanes, tornadoes, and other weather events, which can unforeseeably affect the price or availability of electricity, natural gas, crude oil, and other feedstocks, critical supplies, refined petroleum products and ethanol;
•increases in costs of compliance with, or liability for violation of, existing or future laws, regulations and other requirements;
•societal, legislative and regulatory measures to address climate change and greenhouse gases emissions ("GHG");
•our ability to execute our sustainability improvement plans, including greenhouse gas reduction targets;
•acts of terrorism (including cyber-terrorism) aimed at either our facilities or other facilities;
•impacts of global conflicts such as the war between Israel and Hamas and the Russia-Ukraine War;
•future decisions by the Organization of Petroleum Exporting Countries ("OPEC") and the members of other leading oil producing countries (together with OPEC, “OPEC+”) regarding production and pricing and disputes between OPEC+ members regarding the same;
•disruption, failure, or cybersecurity breaches affecting or targeting our information technology ("IT"), systems and controls, our infrastructure, or the infrastructure of our cloud-based IT service providers;
•changes in the cost or availability of transportation for feedstocks and refined products; and
•other factors discussed under Item 1A. Risk Factors and Item 7. Management’s Discussion and Analysis of Financial Condition and Results of Operations and in our other filings with the SEC.
In light of these risks, uncertainties and assumptions, our actual results of operations and execution of our business strategy could differ materially from those expressed in, or implied by, the forward-looking statements, and you should not place undue reliance upon them. In addition, past financial and/or operating performance is not necessarily a reliable indicator of future performance, and you should not use our historical performance to anticipate future results or period trends. We can give no assurances that any of the events anticipated by any forward-looking statements will occur or, if any of them do, what impact they will have on our results of operations and financial condition. All forward-looking statements included in this report are based on information available to us on the date of this report. We undertake no obligation to revise or update any forward-looking statements as a result of new information, future events or otherwise.
Management's Discussion and Analysis
Executive Summary: Management's View of Our Business and Strategic Overview
| | |
| Management's View of Our Business |
We are an integrated downstream energy business focused on petroleum refining, the transportation, storage and wholesale distribution of crude oil, intermediate and refined products and convenience store retailing. Our operating segments consist of refining, logistics, and retail, and are discussed in the sections that follow.
During the second quarter 2024, we realigned our reportable segments for financial reporting purposes to reflect changes in the manner in which our chief operating decision maker, or CODM, assesses financial information for decision-making purposes. The change represents reporting the operating results of our 50% interest in a joint venture that owns asphalt terminals located in the southwestern region of the U.S. within the refining segment. Prior to this change, these operating results were reported as part of corporate, other and eliminations. While this reporting change did not change our consolidated results, segment data for previous years has been restated and is consistent with the current year presentation.
Business and Economic Environment Overview
Our focus on safe and reliable operations is a pillar which underlines all of our business activities. We continue to identify opportunities to mitigate market risk and focus on efforts that improve our overall cost structure while not compromising operational excellence. During the second quarter of 2024, we experienced narrowing crack spreads. The domestic West Texas Intermediate ("WTI") differentials compared to Brent continued to be favorable, and the WTI Midland to Cushing differential narrowed favorably during the quarter. The differentials remained relatively consistent with 2023. Along with lower crack spreads driven by higher inventories, the industry experienced lower natural gas costs and lower RINs costs, which counterbalanced lower crack spreads. Though refining margins softened, demand for refined products continues to be robust driven by the continued constrained supply in the markets we serve. We achieved record throughput in the second quarter 2024, driven by increased reliability and we will continue to identify opportunities for operational efficiency improvements. Our logistics segment (or "Logistics") continued to contributed strong results driven by increased volumes from the Delaware Basin and rate increases. Logistics also continues to benefit from strong performance amongst our pipeline joint venture investments. The retail segment experienced decreased sales due to the remodeling of stores which limited some store availability during quarter. We expect to begin seeing benefits from successful re-branding and remodeling in future periods.
The near term economic outlook still has some uncertainty with geopolitical instability and commodity market volatility, and as a result we continue to progress our business transformation focused on enterprise-wide opportunities to improve the efficiency of our cost structure. During 2024, we have implemented additional cost reduction measures across the organization, including reducing contract services and reducing or eliminating non-critical travel. By executing on our initiatives to optimize our cost structure, we are positioning the Company in the event of lower crack spreads and volatility in the commodity markets.
The energy-related legislation passed with the Inflation Reduction Act ("IRA") encompasses clean energy financial incentives that are expected to increase capital investment opportunities that focus on the development of production capacity for liquid fuels with lower GHG. Gulf coast industries should be well positioned for growth, particularly if global trade becomes tied to environmental attributes. Following the enactment of the IRA, Delek is investing in carbon capture technology. We were selected by the Department of Energy's ("DOE") Office of Clean Energy Demonstrations to negotiate a cost-sharing agreement in support of a carbon capture pilot project at the Big Spring, Texas refinery. The DOE Carbon Capture Large-Scale Pilot Project program provides 70% cost-share for up to $95 million of federal funding to support project development. The project will deploy carbon capture technology at the Big Spring refinery's Fluid Catalytic Cracking unit, while maintaining existing production capabilities and turnaround schedule. Expectations for the project are to capture 145,000 metric tons of carbon dioxide per year, as well as reduce health-harming pollutants, such as sulfur oxide and particulate matter. Carbon dioxide is expected to be transported by existing pipelines for permanent storage or utilization.
Our focus on reduction of GHG is a key objective as we strive to be a leader in the transition to a carbon neutral future. Delek's Sustainable Operations Team ("SOT") which is led by our Executive Vice President, Operations coordinates execution of our sustainability objectives including ensuring enterprise strategies, business unit operations, capital spending plans, supply chain and personnel pipeline are in alignment and operating as needed to meet established goals. Delek prioritizes stewardship of the environment, and we focus on how to positively impact our shareholders, employees, customers, and the communities where we operate.
We want to reward our shareholders with a disciplined and balanced capital allocation framework. As we strengthen our relative financial position, we believe a balanced approach between shareholder returns and balance sheet improvement is appropriate. In 2024 to date, we have returned $31.7 million of capital to shareholders through dividends.
Our near-term focus is centered around the following: (1) operations excellence, (2) financial strength and flexibility and (3) strategic initiatives which includes unlocking the "sum of the parts" value of our existing business while identifying growth opportunities to enhance the Company's scale and diversify revenue streams. In first half of 2024, we took steps to refinance the Delek Logistics Partners, LP ("Delek Logistics") long term debt, ending with a more attractive maturity profile. Delek Logistics also completed a public equity offering of its common units in March 2024. These steps allowed us to further execute on our "sum of the parts" plan by facilitating Delek Logistics' planned acquisition of H2O Midstream, purchase of the Wink to Webster Pipeline joint venture and planned expansion of its natural gas processing plant. These Delek Logistics transactions will enhance Delek Logistics position as a full service (crude, natural gas and water) provider in the most prolific areas of
Management's Discussion and Analysis
the Permian basin while increasing third party revenue. In addition, the Retail Transaction will allow us to strengthen our balance sheet. We believe each of these steps is consistent with our focus on strategic initiatives which includes unlocking the "sum of the parts". See further discussion in the "Strategic Objectives" section below.
See further discussion on macroeconomic factors and market trends, including the impact on 2024, in the ‘Market Trends’ section below.
Other 2024 Developments
Delek Logistics Equity Offering
On March 12, 2024, Delek Logistics completed a public offering of its common units in which it sold 3,584,416 common units (including an overallotment option of 467,532 common units) to the underwriters of the offering at a price to the public of $38.50 per unit. The proceeds received from this offering (net of underwriting discounts, commissions and expenses) were $132.2 million and were used to repay a portion of the outstanding borrowings under the Delek Logistics Revolving Facility (as defined in Note 8 of the condensed consolidated financial statements in Item 1. Financial Statements, of this Quarterly Report on Form 10-Q).
Delek Logistics Debt Agreements
On March 13, 2024, Delek Logistics sold $650.0 million in aggregate principal amount of 8.625% Senior Notes due 2029 (the “Delek Logistics 2029 Notes”), at par. Net proceeds were used to redeem the Delek Logistics 2025 Notes including accrued interest, pay off the Delek Logistics Term Loan Facility (as defined in Note 8 of the condensed consolidated financial statements in Item 1. Financial Statements, of this Quarterly Report on Form 10-Q) including accrued interest and to repay a portion of the outstanding borrowings under the Delek Logistics Revolving Facility.
On March 29, 2024, Delek Logistics entered into a fourth amendment to the Delek Logistics Revolving Facility which among other things increased the U.S. Revolving Credit Commitments (as defined in the Delek Logistics Credit Facility) by an amount equal to $100.0 million resulting in aggregate lender commitments under the Delek Logistics Revolving Credit Facility in an amount of $1,150.0 million.
On April 17, 2024, Delek Logistics sold $200 million in aggregate principal amount of additional 8.625% senior notes due 2029 (the “Additional 2029 Notes”), at 101.25%. The Additional 2029 Notes were issued under the same indenture as the Delek Logistics 2029 Notes and formed a part of the same series of notes as the Delek Logistics 2029 Notes. The net proceeds were used to repay a portion of the outstanding borrowings under the Delek Logistics Revolving Facility.
These steps improved availability under the Delek Logistics Revolving Facility to approximately $800 million and helped create the foundation for a "sum of the parts" initiative.
Renewables
During the second quarter of 2024, we made the decision to idle the Crossett, Arkansas, Cleburne, Texas and New Albany, Mississippi biodiesel facilities, while exploring viable and sustainable alternatives. Those alternatives could include restarting if market conditions improve, marketing for sale or permanently closing any of the facilities. Our decision to idle these facilities was driven by the decline in the overall biodiesel market and aligns with our continued operational and cost optimization efforts. As a result, we conducted an evaluation of impairment and based on our review we recorded a $22.1 million impairment which included property, plant and equipment and right of use assets. In addition, $0.4 million of severance and benefit expenses were recognized in the three and six months ended June 30, 2024.
Property Settlement
On June 27, 2024, we settled a dispute that was in litigation related to a property that we historically operated as an asphalt and marine fuel terminal both as an owner and, subsequently, as a lessee under an in-substance lease agreement (the “License Agreement”). The settlement included the purchase of the property for $10.0 million and $42.0 million for settlement of the litigation for a total of $52.0 million. The total settlement was comprised of $24.0 million of cash paid at closing and a promissory note for $28.0 million to be paid in three equal installments of $9.3 million on each of April 1, 2025, April 1, 2026 and April 1, 2027, plus accrued interest.
As a result of the termination of the License Agreement, we are no longer obligated to remove equipment from the property for certain development activities and as a result we reversed the $17.9 million asset retirement obligation since we intend to operate the property as an asphalt and marine fuel terminal. Additionally, as a result of the settlement we reduced the non-contingent guarantee and environmental liability to $1.0 million since our risk of a contingent guarantee was eliminated and determined it appropriate to retain an accrual based on what we can reasonably estimate as the cost of the initial steps once operations cease or a cleanup is ordered. Total net gain from the property settlement was $53.4 million and is recorded in other operating income, net in the condensed consolidated statements of income. Refer to Note 11 of the condensed consolidated financial statements in Item 1. Financial Statements, of this Quarterly Report on Form 10-Q for further information.
Delek Logistics Gas Plant Expansion
In Q2 2024, Delek Logistics made the final investment decision to build a new natural gas processing plant adjacent to its plant in the Permian Basin. The plant is expected to have a capacity of approximately 110 MMcf/d (as defined below) and aims to meet the rising demand for natural gas in the region. Total estimated cost is between $160.0 and $165.0 million with an anticipated start-up of early 2025. This expansion project will also increase Delek Logistics' third party revenue. Expected annual EBITDA is estimated to be approximately $40.0 million.
Management's Discussion and Analysis
Planned Sale of Retail
On July 31, 2024, a wholly owned subsidiary of Delek, entered into a definitive equity purchase agreement (the "Retail Purchase Agreement") with a subsidiary of Fomento Económico Mexicano, S.A.B. de C.V. (“FEMSA”). Under the terms of the Retail Purchase Agreement, Delek agreed to sell, and FEMSA has agreed to purchase, 100% of the equity interests in four of Delek’s wholly-owned subsidiaries that own and operate 249 retail fuel and convenience stores (the "Retail Stores") under the Delek US Retail brand for a cash consideration of $350.0 million plus the purchase of inventory and other customary adjustments under the Retail Purchase Agreement for indebtedness (the “Retail Transaction”). The closing of the Retail Transaction is currently anticipated to occur by the end of 2024, subject to certain customary closing conditions, including, among other things, the receipt of required governmental and other third party approvals (or the termination or expiration of applicable waiting periods). The Retail Transaction includes a long-term agreement whereby Delek will sell to FEMSA certain motor fuel products for use at the Retail Stores. Refer to Note 18 of the condensed consolidated financial statements in Item 1. Financial Statements, of this Quarterly Report on Form 10-Q for further information.
Planned Acquisition of H2O Midstream
On August 2, 2024, Delek Logistics entered into a Purchase and Sale Agreement with H2O Midstream Holdings, LLC (the “Seller”) to purchase 100% of the limited liability company interests in H2O Midstream Intermediate, LLC, H2O Midstream Permian LLC, and H2O Midstream LLC (the “Purchased Interests” or "H2O Midstream"), related to the Seller’s water disposal and recycling operations, in the Midland Basin in Texas (the “H2O Purchase Agreement”) for total consideration of $230.0 million, subject to customary adjustments under the H2O Purchase Agreement for net working capital and indebtedness (the "H2O Transaction"). The purchase price is comprised of approximately $160.0 million in cash and $70.0 million of preferred equity. Delek Logistics paid a deposit under the H2O Purchase Agreement of $23.0 million. The closing of the H2O Transaction is currently anticipated to occur by the end of 2024. Refer to Note 18 of the condensed consolidated financial statements in Item 1. Financial Statements, of this Quarterly Report on Form 10-Q for further information.
Wink to Webster Pipeline
On August 1, 2024, we purchased an additional 0.6% indirect investment in Wink to Webster Pipeline LLC for $18.6 million, bringing our total indirect ownership in the pipeline joint venture to 15.6%. On August 5, 2024, we contributed all of our 50% investment in W2W Holdings LLC ("HoldCo") which includes our 15.6% indirect interest in the Wink to Webster Pipeline LLC joint venture and related joint venture indebtedness, to a subsidiary of Delek Logistics. Total consideration was comprised of $86.6 million in cash, forgiveness of a $60.0 million payable to Delek Logistics and 2,300,000 of Delek Logistics common units.
Delek Logistics Commercial Agreements
On August 5, 2024, we amended and extended expired, or soon to be expired, commercial agreements with subsidiaries of Delek Logistics under which the Delek Logistics subsidiaries provide various services, including crude oil gathering and crude oil, intermediate and refined products transportation and storage services, and marketing, terminalling and offloading services to us. These agreements have an initial term of five to seven years, with the ability to extend for an additional five years at our option. In addition, we also entered into an assignment agreement with a subsidiary of Delek Logistics to assign the Big Spring Refinery Marketing Agreement to Delek Holdings. As a result of these agreements, we transferred 2,500,000 of our Delek Logistics common units to Delek Logistics to be retired.
We also entered into an amended and restated Omnibus Agreement with Delek Logistics that provides us an option to purchase certain critical assets from Delek Logistics at market value during the period beginning upon any change in control, sale of substantially all assets, or other deconsolidation transaction involving Delek Logistics and extending (i) in the case of a deconsolidation involving a third party, for six months following closing, and (ii) for any other deconsolidation, for four years following closing.
Management's Discussion and Analysis
The refining segment (or "Refining") processes crude oil and other feedstocks for the manufacture of transportation motor fuels, including various grades of gasoline, diesel fuel, aviation fuel, asphalt and other petroleum-based products that are distributed through owned and third-party product terminals. The refining segment has a combined nameplate capacity of 302,000 barrels per day ("bpd") as of June 30, 2024. A high-level summary of the refinery activities is presented below:
| | | | | | | | | | | | | | |
| Tyler, Texas refinery
(the "Tyler refinery") | El Dorado, Arkansas refinery
(the "El Dorado refinery") | Big Spring, Texas refinery (the "Big Spring refinery") | Krotz Springs, Louisiana refinery
(the "Krotz Springs refinery") |
| Total Nameplate Capacity (bpd) | 75,000 | 80,000 | 73,000 | 74,000 |
| Primary Products | Gasoline, jet fuel, ultra-low-sulfur diesel, liquefied petroleum gases, propylene, petroleum coke and sulfur | Gasoline, ultra-low-sulfur diesel, liquefied petroleum gases, propylene, asphalt and sulfur | Gasoline, jet fuel, ultra-low-sulfur diesel, liquefied petroleum gases, propylene, aromatics and sulfur | Gasoline, jet fuel, high-sulfur diesel, light cycle oil, liquefied petroleum gases, propylene and ammonium thiosulfate |
| Relevant Crack Spread Benchmark | Gulf Coast 5-3-2 | Gulf Coast 5-3-2 (1) | Gulf Coast 3-2-1 (2) | Gulf Coast 2-1-1 (3) |
| Marketing and Distribution | The refining segment's petroleum-based products are marketed primarily in the south central and southwestern regions of the United States, and the refining segment also ships and sells gasoline into wholesale markets in the southern and eastern United States. Motor fuels are sold under the Alon or Delek brand through various terminals to supply Alon or Delek branded retail sites. In addition, we sell motor fuels through our wholesale distribution network on an unbranded basis. |
(1) While there is variability in the crude slate and the product output at the El Dorado refinery, we compare our per barrel refined product margin to the U.S. Gulf Coast ("Gulf Coast") 5-3-2 crack spread because we believe it to be the most closely aligned benchmark.
(2) Our Big Spring refinery is capable of processing substantial volumes of sour crude oil, which has historically cost less than intermediate, and/or substantial volumes of sweet crude oil, and therefore the WTI Cushing/ West Texas Sour ("WTS") price differential, taking into account differences in production yield, is an important measure for helping us make strategic, market-respondent production decisions.
(3) The Krotz Springs refinery has the capability to process substantial volumes of light sweet crude oil to produce a high percentage of refined light products.
Our refining segment also owns three biodiesel facilities involved in the production of biodiesel fuels and related activities, located in Crossett, Arkansas, Cleburne, Texas, and New Albany, Mississippi. During the second quarter of 2024, we made the decision to idle the biodiesel facilities, while exploring viable and sustainable alternatives. See Note 15 of the condensed consolidated financial statements in Item 1. Financial Statements, of this Quarterly Report on Form 10-Q for further information. In addition, the refining segment includes our wholesale crude operations and our 50% interest in a joint venture that owns asphalt terminals located in the southwestern region of the U.S.
Our logistics segment gathers, transports and stores crude oil and natural gas; markets, distributes, transports and stores refined products; and disposes and recycles water in select regions of the southeastern United States, West Texas and New Mexico for our refining segment and third parties. It is comprised of the consolidated balance sheet and results of operations of Delek Logistics (NYSE: DKL), where we owned a 72.6% interest at June 30, 2024. Delek Logistics was formed by Delek in 2012 to own, operate, acquire and construct crude oil and refined products logistics and marketing assets. A substantial majority of Delek Logistics' assets are currently integral to our refining and marketing operations. The logistics segment's gathering and processing business owns or leases capacity on approximately 398 miles of crude oil transportation pipelines, approximately 406 miles of refined product pipelines, and an approximately 1,400-mile crude oil gathering system of which 489 miles is decommissioned. The storage and transportation business owns or leases associated crude oil storage tanks with an aggregate of approximately 10.0 million barrels of active shell capacity. It also owns and operates nine light product terminals and markets light products using third-party terminals. Logistics has strategic investments in pipeline joint ventures that provide access to pipeline capacity as well as the potential for earnings from joint venture operations. The logistics segment owns or leases approximately 199 tractors and 353 trailers used to haul primarily crude oil and other products for related and third parties.
Our retail segment (or "Retail") at June 30, 2024 includes the operations of 250 owned and leased convenience store sites located primarily in West Texas and New Mexico. Our convenience stores typically offer various grades of gasoline and diesel under the DK or Alon brand name and food products, food service, tobacco products, non-alcoholic and alcoholic beverages, general merchandise as well as money orders to the public, primarily under the DK or Alon brand names. Substantially all of the motor fuel sold through our retail segment is supplied by our Big Spring refinery, which is transferred to the retail segment at prices substantially determined by reference to published commodity pricing information.
| | |
| Corporate and Other Overview |
Our corporate activities, results of certain immaterial operating segments, and intercompany eliminations are reported in 'corporate, other and eliminations' in our segment disclosures. Additionally, our corporate activities include certain of our commodity and other hedging activities.
Management's Discussion and Analysis
It is vitally important that our strategic objectives, especially in view of the evolutionary direction of our macroeconomic and geopolitical environment, involves a process of continuous evaluation of our business model in terms of cost structure, as well as long-term economic and operational sustainability. More consolidation in our industry is expected from increased cost pressures due in part to the regulatory environment continuing to move towards reducing carbon emissions and transitioning to renewable energy in the long-term. However, we believe we are uniquely positioned as a leader in operating and excelling in niche markets and could continue capitalizing on and growing our integrated business model. To compete under historic environmental and regulatory changes, companies in our industry will need to be adaptive, forward-thinking and strategic in their approach to long-term sustainability.
The emphasis on environmental responsibility and long-term economic and environmental sustainability has increased. Demand for additional transparency continues to evolve. As we evaluate our current sustainability and Environmental, Social and Governance ("ESG") positioning in the market, we also must integrate a broader sustainability view into all of our activities, both operational and strategic. We have developed overarching key objectives that guide us when we formulate our strategic plans.
Key Objectives
Certain fundamental principles are foundational to our long-term strategy and direct us as we develop our strategic objectives. With that in mind, we have identified the following overarching key objectives:
I. Operational Excellence
II. Financial Strength and Flexibility
III. Strategic Initiatives
Operational Excellence
We are committed to operational excellence which includes maintaining safe, reliable, and environmentally responsible operations. It also encompasses the dedication and drive for constant improvement across our operations in reliability, safety, and efficiency. Delek prioritizes stewardship of the environment, and we focus on how to positively impact our shareholders, employees, customers, and the communities where we operate. We understand that if our assets run reliably and safely, it is better for the safety of our employees, communities, and environment. We believe that focusing on people, processes and equipment will lead to improved utilization and yields and ultimately better employee retention and lower costs, which translates to improved returns for our shareholders. For 2024, we are focused on the following:
•Prioritize safety and environmental compliance by implementing foundational best practices to increase operations ability to provide safe, compliant, and reliable operations.
•Focus on operational excellence by building out our operations centric area business teams, frontline supervisor training as well as other key competency training.
•Execute a major turnaround at the Krotz Springs refinery, focusing on outage spend and optimizing downtime and implementing margin enhancement.
•Identify and evaluate organic growth projects that improve yield and increase utilization.
•Continue our progression of digital system implementations that will improve our ability to understand all aspects of our business as well as our ability to make real-time and forward-looking operational decisions. Automate processes and shift operational roles to higher value-added activities.
Financial Strength and Flexibility
In our industry, as with many volatile businesses, it is very important to make capital investments with accretive returns and maintain a debt balance at a comfortable leverage ratio. We want to reward our shareholders and investors with a disciplined and balanced capital allocation framework, which we believe will strengthen shareholder value by, among other things, a stable dividend complemented by opportunistic share repurchases. We are also committed to lowering costs and improving the efficiency of our cost structure in all aspects of our business. For 2024, we are focused on the following:
•Reward our shareholders and investors with a disciplined and balanced capital allocation framework, including opportunities to strengthen our balance sheet by reducing debt or opportunistically repurchasing shares with excess cash.
•Pursue strategic investments and acquisitions with a focus on geographic and revenue stream diversity.
•Build upon the zero-based budget foundation set in 2022 by implementing phase 2, which includes further improvements to our operating and general and administrative cost structure.
Management's Discussion and Analysis
Strategic Initiatives
One of our near-term strategic initiatives is centered around unlocking the "sum of the parts" value of our existing business while identifying growth opportunities to diversify the Company’s geographic footprint and revenue stream, including in the alternative energy markets, as well as enhance its scale, compensate investors and develop other areas of its business. For 2024, we are focused on the following:
•Execute on our strategic initiatives, which may include opportunities to monetize our retail operations or some of our investment in Delek Logistics. The goal being, to help unlock value embedded in the Delek valuation, while also improving liquidity in the market for Delek Logistics units without diluting overall Delek Logistics market capitalization.
•Identify and evaluate investment opportunities that fit our sustainability view and integrate into our current asset footprint, including strategic investments or joint ventures in renewables, incubator investments in new technologies, and other core-business investments that could improve our scalability and agility.
•Deploy integrated solutions to simplify architecture, data management and cybersecurity.
Management's Discussion and Analysis
| | |
| 2024 Strategic Developments |
The following table highlights our 2024 Strategic Developments:
| | | | | | | | | | | | | | |
| | 2024 Key Initiatives |
2024 Strategic Developments | | Operational Excellence | Financial Strength & Flexibility | Strategic Initiatives |
Investing in Energy Transition: We were selected by the DOE Office of Clean Energy Demonstrations to negotiate a cost-sharing agreement in support of a carbon capture pilot project at the Big Spring refinery. The DOE Carbon Capture Large-Scale Pilot Project program provides 70% cost-share for up to $95 million of federal funding to support project development. | | | | ü |
Extending Long Term Debt Maturities: On March 13, 2024, Delek Logistics sold $650.0 million in aggregate principal amount of 8.625% Senior Notes due 2029, at par. Net proceeds were used to redeem the Delek Logistics 2025 Notes including accrued interest, pay off the Delek Logistics Term Loan Facility including accrued interest and to repay borrowings under the Delek Logistics Revolving Facility. On April 17, 2024, Delek Logistics sold $200 million in aggregate principal amount of additional 8.625% senior notes due 2029, at 101.25%. The Additional 2029 Notes were issued under the same indenture as the Delek Logistics 2029 Notes and formed a part of the same series of notes as the Delek Logistics 2029 Notes. The net proceeds were used to repay a portion of the outstanding borrowings under the Delek Logistics Revolving Facility. | | | ü | |
Strengthening the Balance Sheet: On March 12, 2024, Delek Logistics completed a public offering of its common units in which it sold 3,584,416 common units (including an overallotment option of 467,532 common units) to the underwriters of the offering at a price to the public of $38.50 per unit. The proceeds received from this offering (net of underwriting discounts, commissions and expenses) were $132.2 million and were used to repay borrowings under the Delek Logistics Revolving Facility. | | | ü | |
Executing Safe and Reliable Operations: Our focus on safe and reliable operations allowed us to achieve record throughput for the second quarter of 2024 as reliability continues to increase. | | ü | | |
Enhancing Environmental Standards with Capital Expenditures: We successfully completed a benzene stripper project at the Big Spring Refinery, which supports achievement of our Clean Air Act Consent Decree requirements related to benzene in wastewater. | | ü | | |
Expanding Delek Logistics' Natural Gas Processing: In Q2 2024, Delek Logistics made the final investment decision to build a new natural gas processing plant adjacent to its plant in the Permian Basin. The plant is expected to have a capacity of approximately 110 MMcf/d (as defined below) and aims to meet the rising demand for natural gas in the region.(1) Total estimated cost is between $160.0 and $165.0 million with an anticipated start-up of early 2025. This expansion project will also increase Delek Logistics' third party revenue. | | | ü | ü |
Monetizing Our Retail Operations: On July 31, 2024, we entered into the Retail Purchase Agreement with FEMSA to sell 249 retail fuel and convenience stores that we own and operate under the DK brand for a cash consideration of $350.0 million plus the purchase of inventory and other customary adjustments under the Retail Purchase Agreement for indebtedness. The Retail Stores are located in Texas, New Mexico, and Arkansas. The Retail Transaction includes a long-term agreement whereby Delek will sell to FEMSA certain motor fuel products for use at the Retail Stores. The closing of the Retail Transaction is currently anticipated to occur by the end of 2024, subject to certain customary closing conditions. | | | ü | ü |
Executing Strategic Midstream Acquisition: On August 2, 2024, Delek Logistics entered into the H2O Purchase Agreement related to the Seller’s water disposal and recycling operations, in the Midland Basin in Texas for total consideration of $230.0 million, subject to customary adjustments under the H2O Purchase Agreement for net working capital and indebtedness. The purchase price is comprised of approximately $160.0 million in cash and $70.0 million of preferred equity. This transaction will enhance Delek Logistics' position as a full service (crude, natural gas and water) provider in the most prolific areas of the Permian basin. The closing of the H2O Transaction is currently anticipated to occur by the end of 2024. | | | ü | ü |
Maximizing Shareholder Value: On August 1, 2024, we purchased an additional 0.6% indirect investment in Wink to Webster Pipeline LLC for $18.6 million, bringing our total indirect ownership in the pipeline joint venture to 15.6%. On August 5, 2024, we contributed all of our 50% investment in HoldCo which includes our 15.6% indirect interest in the Wink to Webster Pipeline LLC joint venture and related joint venture indebtedness, to a subsidiary of Delek Logistics. Total consideration was comprised of $86.6 million in cash, forgiveness of a $60.0 million payable to Delek Logistics and 2,300,000 of Delek Logistics common units. | | | | ü |
(1) Million cubic feet ("MMcf") per day ("MMcf/d").
Management's Discussion and Analysis
Market Trends
Our results of operations are significantly affected by fluctuations in the prices of certain commodities, including, but not limited to, crude oil, gasoline, distillate fuel, biofuels, natural gas and electricity, among others. Historically, the impact of commodity price volatility on our refining margins (as defined in our "Non-GAAP Measures" in MD&A Item 2), specifically as it relates to the price of crude oil as compared to the price of refined products and timing differences in the movements of those prices (subject to our inventory costing methodology), as well as location differentials, may be favorable or unfavorable compared to peers. Additionally, our refining margin profitability is impacted by regulatory factors, including the cost of renewable identification numbers ("RINs").
We have positioned the Company to continue to run safely, reliably and environmentally responsibly at near or above nameplate capacity while leveraging our Delek Logistics and retail lines of business with an eye towards the One Delek vision. Increased geopolitical risks and general elevated tensions in the Middle East have put upward pressure on crude oil prices. Many uncertainties remain with respect to the global supply and demand of the crude oil and refined products markets and it is difficult to predict the ultimate economic impacts this may have on our operations. We expect gasoline and diesel demand to continue to follow typical seasonal patterns as we continue through the summer driving season.
See below for further discussion on how certain key market trends impact our operating results.
WTI crude oil represents the largest component of our crude slate at all of our refineries, and can be sourced through our gathering channels or optimization efforts from Midland, Texas or Cushing, Oklahoma or other locations. We manage our supply chain risk to ensure that we have the barrels to meet our crude slate consumption plan for each month through gathering supply contracts and throughput agreements on various strategic pipelines, some of which include those where we hold equity method investments. We manage market price risk on crude oil through financial derivative hedges, in accordance with our risk management strategies.
The table below reflects the quarterly average prices of WTI Midland and WTI Cushing crude oil for each of the quarterly periods in 2023 and for the two quarterly periods in 2024.
| | |
| Crude Pricing Differentials |
Historically, domestic refiners have benefited from the discount for WTI Cushing compared to Brent, a global benchmark crude. This generally leads to higher margins in our refineries, as refined product prices are influenced by Brent crude prices and the majority of our crude supply is WTI-linked. Because of our positioning in the Permian basin, including our access to significant sources of WTI Midland crude through our gathering system, we are even further benefited by discounts for WTI Midland/WTI Cushing differentials. When these discounts shrink or become premiums, our reliance on WTI-linked crude pricing, and specifically WTI Midland crude, can negatively impact our refining margins. Conversely, as these price discounts widen, so does our competitive advantage, created specifically by our access to WTI Midland crude sourced through our gathering systems.
Management's Discussion and Analysis
The chart below illustrates the key differentials impacting our refining operations, including WTI Cushing to Brent, WTI Midland to WTI Cushing, and Louisiana Light Sweet crude oil ("LLS") to WTI Cushing for each of the quarterly periods in 2023 and for the two quarterly periods in 2024.
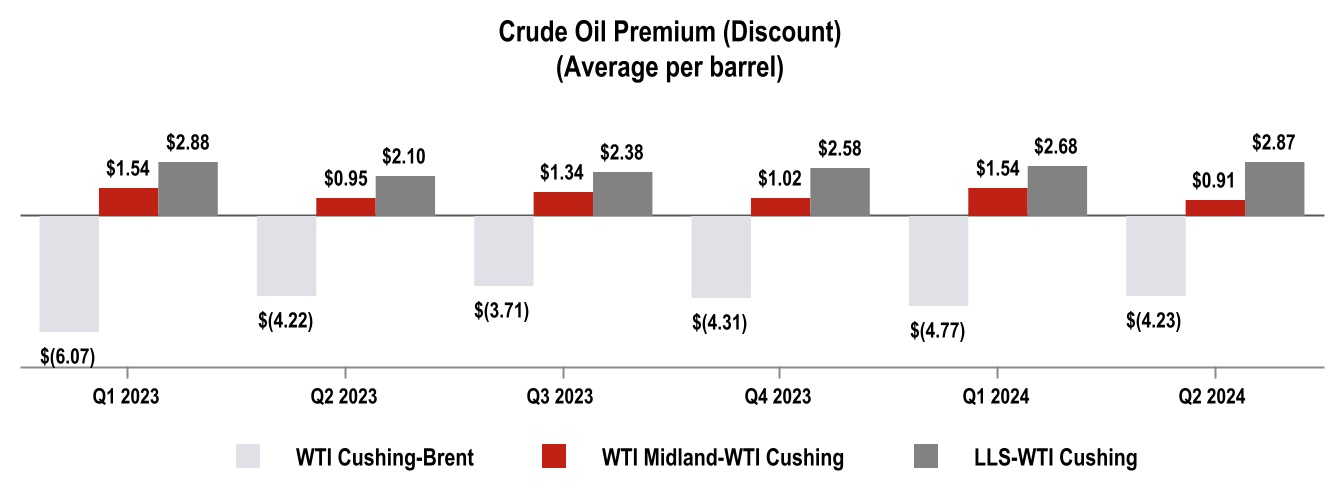
We are impacted by refined product prices in two ways: (1) in terms of the prices we are able to sell our refined product for in our refining segment, and (2) in terms of the cost to acquire the refined products to meet Refining production shortfalls (e.g., when we have outages), or to acquire refined fuel products we sell to our wholesale customers in our logistics segment and at our convenience stores in our retail segment. These prices largely depend on numerous factors beyond our control, including the supply of, and demand for, crude oil, gasoline and other refined petroleum products which, in turn, depend on, among other factors, changes in domestic and foreign economies, weather conditions, domestic and foreign political affairs, production levels, the availability of imports, the marketing of competitive fuels and government regulation.
Our refineries produce the following products:
| | | | | | | | | | | | | | |
| Tyler Refinery | El Dorado Refinery | Big Spring Refinery | Krotz Springs Refinery |
| Primary Products | Gasoline, jet fuel, ultra-low-sulfur diesel, liquefied petroleum gases, propylene, petroleum coke and sulfur | Gasoline, ultra-low-sulfur diesel, liquefied petroleum gases, propylene, asphalt and sulfur | Gasoline, jet fuel, ultra-low-sulfur diesel, liquefied petroleum gases, propylene, aromatics and sulfur | Gasoline, jet fuel, high-sulfur diesel, light cycle oil, liquefied petroleum gases, propylene and ammonium thiosulfate |
The charts below illustrate the quarterly average prices of Gulf Coast Gasoline ("CBOB"), U.S. High Sulfur Diesel ("HSD") and U.S. Ultra Low Sulfur Diesel ("ULSD") for each of the quarterly periods in 2023 and for the two quarterly periods in 2024.
Management's Discussion and Analysis
Crack spreads are used as benchmarks for predicting and evaluating a refinery's product margins by measuring the difference between the market price of feedstocks/crude oil and the resultant refined products. Generally, a crack spread represents the approximate refining margin resulting from processing one barrel of crude oil into its outputs, generally gasoline and diesel fuel. The table below reflects the quarterly average Gulf Coast 5-3-2 ULSD, 3-2-1 ULSD and 2-1-1 HSD/LLS crack spreads for each of the quarterly periods in 2023 and for the two quarterly periods in 2024.
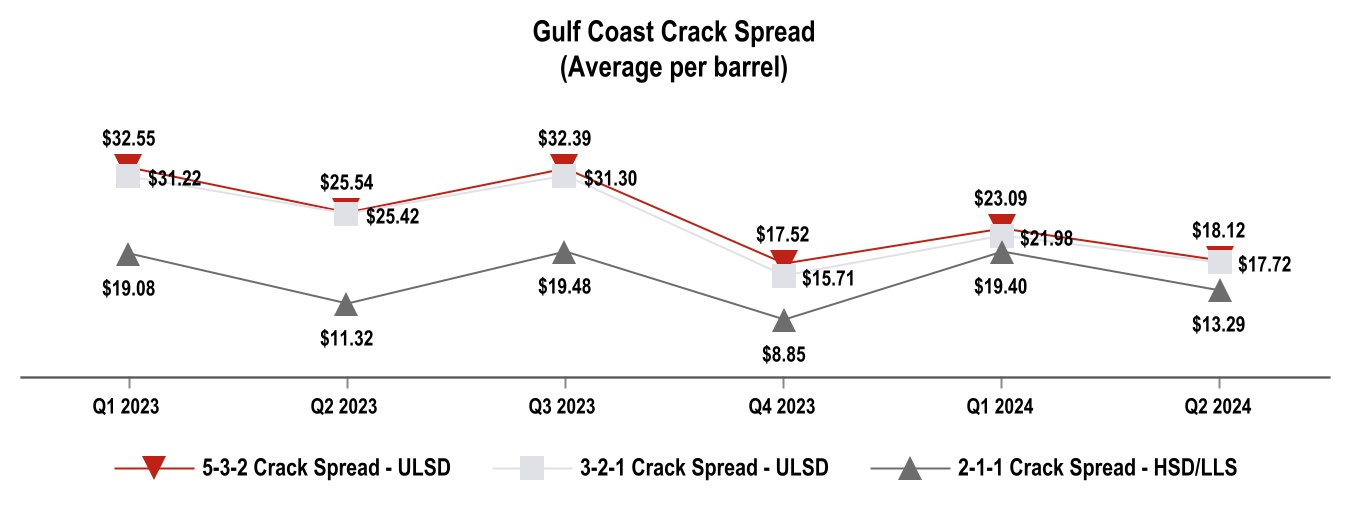
Environmental regulations and the political environment continue to affect our refining margins in the form of volatility in the price of RINs. We enter into future commitments to purchase or sell RINs at fixed prices and quantities, which are used to manage the costs of our credits for commitments required by the U.S. Environmental Protection Agency (“EPA”) to blend biofuels into fuel products ("RINs Obligation"). On a consolidated basis, we work to balance our RINs Obligation in order to minimize the effect of RINs prices on our results. While we obtain RINs in our refining and logistics segments through our ethanol and biodiesel blending and generate RINs through biodiesel production, our refining segment still must purchase additional RINs to satisfy its obligations. Additionally, our ability to obtain RINs through blending is limited by our refined product slate, blending capabilities and market constraints. The cost to purchase these additional RINs is a significant cash outflow for our business. Increases in the market prices of RINs generally adversely affect our results of operations through changes in fair value to our existing RINs Obligation, to the extent we do not have offsetting RINs inventory on hand or effective economic hedges through net forward purchase commitments. RINs prices are highly sensitive to regulatory and political influence and conditions, and therefore often do not correlate to movements in crude oil prices, refined product prices or crack spreads. Because of the volatility in RINs prices, it is not possible to predict future RINs cost with certainty, and movements in RINs prices can have significant and unanticipated adverse effects on our refining margins that are outside of our control.
The chart below illustrates the volatility in RINs for each of the quarterly periods in 2023 and for the two quarterly periods in 2024.
Management's Discussion and Analysis
Energy costs are a significant element of our Refining Earnings before interest, taxes, depreciation and amortization ("EBITDA") and can significantly impact our ability to capture crack spreads, with natural gas representing the largest component. Natural gas prices are driven by supply-side factors such as amount of natural gas production, level of natural gas in storage and import and export activity, while demand-side factors include variability of weather, economic growth and the availability and price of other fuels. Refiners and other large-volume fuel consumers may be more or less susceptible to volatility in natural gas prices depending on their consumption levels as well as their capabilities to switch to more economical sources of fuel/energy. Additionally, geographic location of facilities make consumers vulnerable to price differentials of natural gas available at different supply hubs. Within Delek’s geographic footprint, we source the majority of our natural gas from the Gulf Coast, and secondarily from the Permian, coinciding with the physical locations of our refineries. We manage our risk around natural gas prices by entering into variable and fixed-price supply contracts in both the Gulf and Permian Basin or by entering into derivative hedges based on forecasted consumption and forward curve prices, as appropriate, in accordance with our risk policy.
The chart below illustrates the quarterly average prices of Waha (Permian Basin) and Henry Hub (Gulf Coast) per million British Thermal Units ("MMBtu") beginning with the first quarter of 2023 through the second quarter of 2024.
Non-GAAP Measures
Our management uses certain non-Generally Accepted Accounting Principles (“non-GAAP”) operational measures to evaluate our operating segment performance and non-GAAP financial measures to evaluate past performance and prospects for the future to supplement our GAAP financial information presented in accordance with U.S. GAAP. These financial and operational non-GAAP measures are important factors in assessing our operating results and profitability and include:
•EBITDA - calculated as net income (loss) attributable to Delek adjusted to add back interest expense, income tax expense, depreciation and amortization; and
•Refining margin - calculated as gross margin (which we define as sales minus cost of sales) adjusted for operating expenses and depreciation and amortization included in cost of sales.
We believe these non-GAAP operational and financial measures are useful to investors, lenders, ratings agencies and analysts to assess our ongoing performance because, when reconciled to their most comparable GAAP financial measure, they provide improved comparability between periods through the exclusion of certain items that we believe are not indicative of our core operating performance and they may obscure our underlying results and trends.
Non-GAAP measures have important limitations as analytical tools, because they exclude some, but not all, items that affect net earnings and operating income. These measures should not be considered substitutes for their most directly comparable U.S. GAAP financial measures.
Management's Discussion and Analysis
Non-GAAP Reconciliations
The following table provides a reconciliation of segment EBITDA to the most directly comparable U.S. GAAP measure, net (loss) income attributable to Delek:
Reconciliation of segment EBITDA to net (loss) income attributable to Delek (in millions)
| | | | | | | | | | | | | | | | | | | | | | | | | | | | |
| | | Three Months Ended June 30, | | Six Months Ended June 30, |
| | 2024 | | 2023 | | 2024 | | 2023 | | |
| Refining segment EBITDA | | $ | 17.3 | | | $ | 121.8 | | | $ | 122.4 | | | $ | 317.3 | | | |
| Logistics segment EBITDA | | 100.6 | | | 90.9 | | | 200.3 | | | 182.3 | | | |
| Retail segment EBITDA | | 12.4 | | | 15.0 | | | 18.9 | | | 21.4 | | | |
| Corporate, Other and Eliminations EBITDA | | (5.4) | | | (70.0) | | | (73.6) | | | (123.3) | | | |
| EBITDA attributable to Delek | | $ | 124.9 | | | $ | 157.7 | | | $ | 268.0 | | | $ | 397.7 | | | |
| Interest expense, net | | (77.7) | | | (80.4) | | | (165.4) | | | (156.9) | | | |
| Income tax benefit (expense) | | 7.7 | | | 3.8 | | | 14.9 | | | (12.0) | | | |
| Depreciation and amortization | | (92.1) | | | (89.4) | | | (187.3) | | | (172.8) | | | |
| Net (loss) income attributable to Delek | | $ | (37.2) | | | $ | (8.3) | | | $ | (69.8) | | | $ | 56.0 | | | |
The following table provides a reconciliation of refining margin to the most directly comparable U.S. GAAP measure, gross margin:
Reconciliation of refining margin to gross margin (in millions)
| | | | | | | | | | | | | | | | | | | | | | | | | | | | |
| Refining Segment |
| | Three Months Ended June 30, | | Six Months Ended June 30, |
| | 2024 | | 2023 | | 2024 | | 2023 | | |
| Total revenues | | $ | 3,307.2 | | | $ | 4,052.5 | | | $ | 6,415.5 | | | $ | 7,847.0 | | | |
| Cost of sales | | 3,356.4 | | | 3,996.9 | | | 6,423.5 | | | 7,651.4 | | | |
| Gross margin | | $ | (49.2) | | | $ | 55.6 | | | $ | (8.0) | | | $ | 195.6 | | | |
| Add back (items included in cost of sales): | | | | | | | | | | |
| Operating expenses (excluding depreciation and amortization) | | 148.6 | | | 153.8 | | | 314.4 | | | 292.9 | | | |
| Depreciation and amortization | | 57.4 | | | 59.8 | | | 118.8 | | | 116.4 | | | |
| Refining margin | | $ | 156.8 | | | $ | 269.2 | | | $ | 425.2 | | | $ | 604.9 | | | |
Management's Discussion and Analysis
Summary Financial and Other Information
The following table provides summary financial data for Delek (in millions):
| | | | | | | | | | | | | | | | | | | | | | | | | | | | |
Summary Statement of Operations Data (1) | | Three Months Ended June 30, | | Six Months Ended June 30, |
| | | | | | | | | | |
| | 2024 | | 2023 | | 2024 | | 2023 | | |
| Net revenues | | $ | 3,421.7 | | | $ | 4,195.6 | | | $ | 6,649.3 | | | $ | 8,119.9 | | | |
| Cost of sales: | | | | | | | | | | |
| Cost of materials and other | | 3,099.4 | | | 3,766.6 | | | 5,896.7 | | | 7,206.2 | | | |
| Operating expenses (excluding depreciation and amortization presented below) | | 185.1 | | | 188.7 | | | 398.9 | | | 359.5 | | | |
| Depreciation and amortization | | 80.7 | | | 82.6 | | | 167.1 | | | 159.4 | | | |
| Total cost of sales | | 3,365.2 | | | 4,037.9 | | | 6,462.7 | | | 7,725.1 | | | |
| Insurance proceeds | | — | | | — | | | — | | | — | | | |
| | | | | | | | | | |
| Operating expenses related to retail and wholesale business (excluding depreciation and amortization presented below) | | 26.3 | | | 31.1 | | | 52.1 | | | 58.1 | | | |
| General and administrative expenses | | 63.1 | | | 75.8 | | | 127.5 | | | 147.3 | | | |
| Depreciation and amortization | | 11.4 | | | 6.8 | | | 20.2 | | | 13.4 | | | |
| Asset impairment | | 22.1 | | | — | | | 22.1 | | | — | | | |
| Other operating income, net | | (79.9) | | | (6.1) | | | (81.5) | | | (16.9) | | | |
| Total operating costs and expenses | | 3,408.2 | | | 4,145.5 | | | 6,603.1 | | | 7,927.0 | | | |
| Operating income | | 13.5 | | | 50.1 | | | 46.2 | | | 192.9 | | | |
| Interest expense, net | | 77.7 | | | 80.4 | | | 165.4 | | | 156.9 | | | |
| Income from equity method investments | | (30.4) | | | (25.5) | | | (52.3) | | | (40.1) | | | |
| | | | | | | | | | |
| | | | | | | | | | |
| | | | | | | | | | |
| | | | | | | | | | |
| | | | | | | | | | |
| | | | | | | | | | |
| Other expense (income), net | | — | | | 0.5 | | | (0.7) | | | (6.6) | | | |
| Total non-operating expenses, net | | 47.3 | | | 55.4 | | | 112.4 | | | 110.2 | | | |
| (Loss) income before income tax (benefit) expense | | (33.8) | | | (5.3) | | | (66.2) | | | 82.7 | | | |
| Income tax (benefit) expense | | (7.7) | | | (3.8) | | | (14.9) | | | 12.0 | | | |
| | | | | | | | | | |
| | | | | | | | | | |
| | | | | | | | | | |
| | | | | | | | | | |
| | | | | | | | | | |
| Net (loss) income | | (26.1) | | | (1.5) | | | (51.3) | | | 70.7 | | | |
| Net income attributed to non-controlling interests | | 11.1 | | | 6.8 | | | 18.5 | | | 14.7 | | | |
| Net (loss) income attributable to Delek | | $ | (37.2) | | | $ | (8.3) | | | $ | (69.8) | | | $ | 56.0 | | | |
(1) This information is presented at a summary level for your reference. See the Condensed Consolidated Statements of Income in Item 1. to this Quarterly Report on Form 10-Q for more detail regarding our results of operations and net income per share.
We report operating results in three reportable segments:
•Refining
•Logistics
•Retail
Decisions concerning the allocation of resources and assessment of operating performance are made based on this segmentation. Management measures the operating performance of each of its reportable segments based on the segment EBITDA.
Results of Operations
Consolidated Results of Operations — Comparison of the Three and Six Months Ended June 30, 2024 versus the Three and Six Months Ended June 30, 2023.
Net (Loss) Income
Q2 2024 vs. Q2 2023
Consolidated net loss for the second quarter of 2024 was $26.1 million compared to net loss of $1.5 million for the second quarter of 2023. Consolidated net loss attributable to Delek for the second quarter of June 30, 2024 was $37.2 million, or $(0.58) per basic share, compared to a net loss of $8.3 million, or $(0.13) per basic share, for the second quarter 2023. Explanations for significant drivers impacting net loss as compared to the comparable period of the prior year are discussed in the sections below.
Management's Discussion and Analysis
YTD 2024 vs. YTD 2023
Consolidated net loss for the six months ended June 30, 2024 was $51.3 million compared to a net income of $70.7 million for the six months ended June 30, 2023. Consolidated net loss attributable to Delek for the six months ended June 30, 2024 was $69.8 million, or $(1.09) per basic share, compared to income of $56.0 million, or $0.84 per basic share, for the six months ended June 30, 2023. Explanations for significant drivers impacting net (loss) income as compared to the comparable period of the prior year are discussed in the sections below.
Net Revenues
Q2 2024 vs. Q2 2023
In the second quarter of 2024 and 2023, we generated net revenues of $3,421.7 million and $4,195.6 million, respectively, a decrease of $773.9 million, or 18.4%. The decrease in net revenues was primarily driven by the following factors:
•in our refining segment, decreases in the average price of U.S. Gulf Coast gasoline of 1.7% and decreases in wholesale activity, partially offset by increased sales volume and increases in the average price of U.S. Gulf Coast ULSD of 2.5% and HSD of 30.3%;
•in our logistics segment, increases in our West Texas marketing operations and an increase in terminalling and marketing fees due to rate increases as well as higher volumes; and
•in our retail segment, a decrease in total fuel sales primarily attributable to a 2.9% decrease in average price charged per gallon sold and a decrease in merchandise sales primarily driven by the same-store sales decrease of 5.2%.
YTD 2024 vs. YTD 2023
We generated net revenues of $6,649.3 million and $8,119.9 million during the six months ended June 30, 2024 and 2023, respectively, a decrease of $1,470.6 million, or 18.1%. The decrease in net revenues was primarily due to the following:
•in our refining segment, decreases in the average price of U.S. Gulf Coast gasoline of 4.6% and ULSD of 3.4% and decreases in wholesale activity, partially offset by increased sales volume and an increase in the average price of U.S. Gulf Coast HSD of 14.3%;
•in our logistics segment, increases in our West Texas marketing operations and an increase in terminalling and marketing fees due to rate increases as well as higher volumes; and
•in our retail segment, a decrease in total fuel sales primarily attributable to a $0.13 decrease in average price charged per gallon sold and a decrease in merchandise sales primarily driven by the same-store sales decrease of 4.7%.
Total Operating Costs and Expenses Cost of Materials and Other
Q2 2024 vs. Q2 2023
Cost of materials and other was $3,099.4 million for the second quarter of 2024 compared to $3,766.6 million for the second quarter of 2023, a decrease of $667.2 million, or 17.7%. The net decrease in cost of materials and other was primarily driven by the following:
•decreased wholesale activity and decreased RINs pricing, partially offset by increases in cost of crude oil feedstocks at the refineries, including a 9.9% increase in the average cost of WTI Cushing crude oil and a 9.9% increase in the average cost of WTI Midland crude oil and an increase in sales volume;
•increase in logistics costs due to increased costs of materials and other in our West Texas marketing operations primarily driven by increases in the volumes of gasoline and diesel sold, partially offset by decreases in the average cost per gallon; and
•a decrease in retail cost of materials and other due to 2.1% decrease in average cost per gallon sold applied to lower fuel sales volumes.
YTD 2024 vs. YTD 2023
Cost of materials and other was $5,896.7 million for the six months ended June 30, 2024, compared to $7,206.2 million for six months ended June 30, 2023, a decrease of $1,309.5 million, or 18.2%. The net decrease in cost of materials and other primarily related to the following:
•decreased wholesale activity and decreased RINs pricing, partially offset by an increase in the cost of crude oil feedstocks at the refineries, including a 5.6% increase in the average cost of WTI Cushing crude oil and a 5.5% increase in the average cost of WTI Midland crude oil and an increase in sales volume;
•increase in logistics costs due to increased costs of materials and other in our West Texas marketing operations primarily driven by increases in the average volumes of gasoline and diesel sold, partially offset by decreased costs per gallon; and
•a decrease in retail cost of materials and other due to 4.3% decrease in average cost per gallon sold applied to lower fuel sales volumes.
Management's Discussion and Analysis
Operating Expenses
Q2 2024 vs. Q2 2023
Operating expenses (included in both cost of sales and other operating expenses) were $211.4 million for the second quarter of 2024 compared to $219.8 million for the second quarter of 2023, a decrease of $8.4 million, or 3.8%. The decrease in operating expenses was primarily driven by the following:
•a decrease in employee costs.
These decreases were partially offset by the following:
•an increase in maintenance costs.
YTD 2024 vs. YTD 2023
Operating expenses (included in both cost of sales and other operating expenses) were $451.0 million for the six months ended June 30, 2024 compared to $417.6 million in six months ended June 30, 2023, an increase of $33.4 million, or 8.0%. The increase in operating expenses was primarily driven by the following:
•an increase in maintenance costs; and
•an increase in employee costs.
These increases were partially offset by the following:
•lower natural gas prices.
General and Administrative Expenses
Q2 2024 vs. Q2 2023
General and administrative expenses were $63.1 million for the second quarter of 2024 compared to $75.8 million for the second quarter of 2023, a decrease of $12.7 million, or 16.8%. The decrease was primarily driven by a decrease in employee costs including incentive compensation costs and decreased restructuring costs.
YTD 2024 vs. YTD 2023
General and administrative expenses were $127.5 million for the six months ended June 30, 2024 compared to $147.3 million in six months ended June 30, 2023, a decrease of $19.8 million, or 13.4%. The decrease was primarily driven by a decrease in employee costs including incentive compensation costs.
Depreciation and Amortization
Q2 2024 vs. Q2 2023
Depreciation and amortization (included in both cost of sales and other operating expenses) was $92.1 million for the second quarter of 2024 compared to $89.4 million for the second quarter of 2023, an increase of $2.7 million, or 3.0%.
YTD 2024 vs. YTD 2023
Depreciation and amortization (included in both cost of sales and other operating expenses) was $187.3 million and $172.8 million for the six months ended June 30, 2024 and 2023, respectively, an increase of $14.5 million, or 8.4%. The increase was a result of a general increase in our fixed asset base due to capital projects and turnarounds completed.
Management's Discussion and Analysis
Asset Impairment
Q2 2024 vs. Q2 2023
Asset impairment was $22.1 million for the three months ended June 30, 2024. We recorded $22.1 million asset impairment as a result of our second quarter 2024 decision to idle the biodiesel facilities, while exploring viable and sustainable alternatives. There was no asset impairment in the three months ended June 30, 2023.
YTD 2024 vs. YTD 2023
Asset impairment was $22.1 million for the six months ended June 30, 2024. We recorded $22.1 million asset impairment as a result of our second quarter 2024 decision to idle the biodiesel facilities, while exploring viable and sustainable alternatives. There was no asset impairment in the six months ended June 30, 2023.
Refer to Note 15 condensed consolidated financial statements in Item 1. Financial Statements, of this Quarterly Report on Form 10-Q for further information.
Other Operating Income, Net
Q2 2024 vs. Q2 2023
Other operating income, net increased by $73.8 million in the second quarter of 2024 to $79.9 million compared to $6.1 million in the second quarter of 2023. The increase was primarily driven by the following:
•for the three months ended June 30, 2024, we recorded a net gain of $53.4 million in the 2024 period related to a property settlement;
•for the three months ended June 30, 2024, we recorded a gain of $25.1 million related to insurance proceeds and other third party recoveries related to the 2021 El Dorado refinery fire and the 2022 Big Spring refinery fire related to property damage and business interruption claims, compared to $4.7 million of business interruption and property damage insurance recoveries in the 2023 period related to the fire and freeze events that occurred in 2021; and
•for the three months ended June 30, 2024, we recorded a gain of $8.3 million related to Delek Logistics' sale of storage tanks in Texas due an eminent domain settlement.
Refer to Note 11 of the condensed consolidated financial statements in Item 1. Financial Statements, of this Quarterly Report on Form 10-Q for further information.
YTD 2024 vs. YTD 2023
Other operating income, net was $81.5 million and $16.9 million for the six months ended June 30, 2024 and 2023, respectively, an increase of $64.6 million. The increase was primarily driven by the following:
•for the six months ended June 30, 2024, we recorded a net gain of $53.4 million in the 2024 period related to a property settlement;
•for the six months ended June 30, 2024, we recorded a gain of $28.7 million related to insurance proceeds and other third party recoveries related to the 2021 El Dorado refinery fire, the 2021 freeze events and the 2022 Big Spring refinery fire related to property damage and business interruption claims, compared to $9.8 million of business interruption and property damage insurance recoveries in the 2023 period related to the fire and freeze events that occurred in 2021;
•for the six months ended June 30, 2024, we recorded a gain of $8.3 million related to Delek Logistics' sale of storage tanks in Texas due to an eminent domain settlement; and
•decreased hedge gains in 2024 compared to 2023 associated with our derivatives.
Refer to Note 11 of the condensed consolidated financial statements in Item 1. Financial Statements, of this Quarterly Report on Form 10-Q for further information.
Non-Operating Expenses, Net
Interest Expense, Net
Q2 2024 vs. Q2 2023
Interest expense, net decreased by $2.7 million, or (3.4)%, to $77.7 million in the second quarter of 2024 compared to $80.4 million in the second quarter of 2023, primarily driven by the following:
•a decrease in net average borrowings outstanding (including the obligations under the inventory intermediation agreements which have an associated interest charge) of approximately $326.0 million in the second quarter of 2024 (calculated as a simple average of beginning borrowings/obligations and ending borrowings/obligations for the period) compared to the second quarter of 2023; and
Management's Discussion and Analysis
•an increase in the average effective interest rate of 92 basis points in the second quarter of 2024 compared to the second quarter of 2023 (where effective interest rate is calculated as interest expense divided by the net average borrowings/obligations outstanding).
YTD 2024 vs. YTD 2023
Interest expense, net was $165.4 million in the six months ended June 30, 2024, compared to $156.9 million for six months ended June 30, 2023, an increase of $8.5 million, or 5.4% primarily due to the following:
•an increase in the average effective interest rate of 197 basis points during the six months ended June 30, 2024 compared to the six months ended June 30, 2023 (where effective interest rate is calculated as interest expense divided by the net average borrowings/obligations outstanding);
•debt extinguishment costs of $3.6 million in the six months ended June 30, 2024 related to the payoff of the Delek Logistics Term Loan Facility and Delek Logistics 2025 Notes with proceeds from the Delek Logistics 2029 Notes issued in March 2024; and
•a decrease in net average borrowings outstanding (including the obligations under the inventory intermediation agreements which have an associated interest charge) of approximately $459.2 million during the six months ended June 30, 2024 (calculated as a simple average of beginning borrowings/obligations and ending borrowings/obligations for the period) compared to the six months ended June 30, 2023.
Results from Equity Method Investments
Q2 2024 vs. Q2 2023
We recognized income of $30.4 million from equity method investments during the second quarter of 2024, compared to $25.5 million for the second quarter of 2023, an increase of $4.9 million. This increase was primarily driven by the following:
•an increase in income from our investment in W2W Holdings LLC to income of $10.6 million in the second quarter of 2024 from income of $6.8 million in the second quarter of 2023.
YTD 2024 vs. YTD 2023
We recognized income from equity method investments of $52.3 million for the six months ended June 30, 2024, compared to $40.1 million for the six months ended June 30, 2023, an increase of $12.2 million. This increase was primarily driven by the following:
•an increase in income from our investment in W2W Holdings LLC to $20.0 million during the six months ended June 30, 2024 from $11.3 million in the six months ended June 30, 2023.
Income Taxes
Q2 2024 vs. Q2 2023
For the second quarter of 2024, we recorded an income tax benefit of $7.7 million compared to $3.8 million for the second quarter of 2023, primarily driven by the following:
•a decrease in pre-tax net income of $28.5 million; and
•our effective tax rates were 22.8% and 71.7% for the three months ended June 30, 2024 and 2023, respectively, due to the impact of fixed dollar permanent differences on the tax rate and changes to valuation allowances on certain attributes.
YTD 2024 vs. YTD 2023
For the six months ended June 30, 2024, we recorded an income tax benefit of $14.9 million compared to expense of $12.0 million for the six months ended June 30, 2023, primarily driven by the following:
•a decrease in pre-tax net income of $148.9 million, and
•our effective tax rates were 22.5% and 14.5% for the six months ended June 30, 2024 and 2023, respectively, due to the impact of fixed dollar favorable permanent differences on the tax rate and changes in valuation allowance on certain attributes.
Management's Discussion and Analysis
The tables and charts below set forth selected information concerning our refining segment operations ($ in millions, except per barrel amounts):
| | | | | | | | | | | | | | | | | | | | | | | | | | | | |
| Selected Refining Financial Information |
| | Three Months Ended June 30, | Six Months Ended June 30, |
| | 2024 | | 2023 | | 2024 | | 2023 | | |
| Revenues | | $ | 3,307.2 | | | $ | 4,052.5 | | | $ | 6,415.5 | | | $ | 7,847.0 | | | |
| Cost of materials and other | | 3,150.4 | | | 3,783.3 | | | 5,990.3 | | | 7,242.1 | | | |
| Refining Margin | | $ | 156.8 | | | $ | 269.2 | | | $ | 425.2 | | | $ | 604.9 | | | |
| | | | | | | | | | |
| Operating expenses (excluding depreciation and amortization) | | $ | 148.6 | | | $ | 153.8 | | | $ | 314.4 | | | $ | 292.9 | | | |
| | | | | | | | | | |
| Refining segment EBITDA | | $ | 17.3 | | | $ | 121.8 | | | $ | 122.4 | | | $ | 317.3 | | | |
| | | | | | | | | | |
| | | | | | | | | | |
| | | | | | | | | | |
Factors Impacting Refining Profitability
Our profitability in the refining segment is substantially determined by the difference between the cost of the crude oil feedstocks we purchase and the price of the refined products we sell, referred to as the "crack spread", "refining margin" or "refined product margin". Refining margin is used as a metric to assess a refinery's product margins against market crack spread trends, where "crack spread" is a measure of the difference between market prices for crude oil and refined products and is a commonly used proxy within the industry to estimate or identify trends in refining margins.
The cost to acquire feedstocks and the price of the refined petroleum products we ultimately sell from our refineries depend on numerous factors beyond our control, including the supply of, and demand for, crude oil, gasoline and other refined petroleum products which, in turn, depend on, among other factors, changes in domestic and foreign economies, weather conditions such as hurricanes or tornadoes, local, domestic and foreign political affairs, global conflict, production levels, the availability of imports, the marketing of competitive fuels and government regulation. Other significant factors that influence our results in the refining segment include operating costs (particularly the cost of natural gas used for fuel and the cost of electricity), seasonal factors, refinery utilization rates and planned or unplanned maintenance activities or turnarounds. Moreover, while the fluctuations in the cost of crude oil are typically reflected in the prices of light refined products, such as gasoline and diesel fuel, the price of other residual products, such as asphalt, coke, carbon black oil and liquefied petroleum gas ("LPG") are less likely to move in parallel with crude cost. This could cause additional pressure on our realized margin during periods of rising or falling crude oil prices.
Additionally, our margins are impacted by the pricing differentials of the various types and sources of crude oil we use at our refineries and their relation to product pricing. Our crude slate is predominantly comprised of WTI crude oil. Therefore, favorable differentials of WTI compared to other crude will favorably impact our operating results, and vice versa. Additionally, because of our gathering system presence in the Midland area and the significant source of crude specifically from that region into our network, a widening of the WTI Cushing less WTI Midland spread will favorably influence the operating margin for our refineries. Alternatively, a narrowing of this differential will have an adverse effect on our operating margins. Global product prices are influenced by the price of Brent which is a global benchmark crude. Global product prices influence product prices in the U.S. As a result, our refineries are influenced by the spread between Brent and WTI Midland. The Brent less WTI Midland spread represents the differential between the average per barrel price of Brent crude oil and the average per barrel price of WTI Midland crude oil. A widening of the spread between Brent and WTI Midland will favorably influence our refineries' operating margins. Also, the Krotz Springs refinery is influenced by the spread between Brent and LLS. The Brent less LLS spread represents the differential between the average per barrel price of Brent and the average per barrel price of LLS crude oil. A discount in LLS relative to Brent will favorably influence the Krotz Springs refinery operating margin.
Finally, Refining EBITDA is impacted by regulatory costs associated with the cost of RINs as well as energy costs, including the cost of natural gas. In periods of unfavorable regulatory sentiment, RINs prices can increase at higher rates than crack spreads, or even when crack spreads are declining. This can be particularly impactful on smaller refineries, where the operating cost structure does not have as much scalability as larger refineries. Additionally, volatility in energy costs, which are captured in our operating expenses and impact our Refining EBITDA, can significantly impact our ability to capture crack spreads, with natural gas representing the most significant component. Within Delek’s geographic footprint, we source the majority of our natural gas from the Gulf Coast, and secondarily from the Permian, and we do not currently have the capability at our refineries to switch our energy consumption to utilize alternative sources of fuel. For this reason, unfavorable Gulf Coast (Henry Hub) differentials can impact our crack spread capture.
Management's Discussion and Analysis
The cost to acquire the refined fuel products we sell to our wholesale customers in our logistics segment and at our convenience stores in our retail segment largely depends on numerous factors beyond our control, including the supply of, and demand for, crude oil, gasoline and other refined petroleum products which, in turn, depend on, among other factors, changes in domestic and foreign economies, weather conditions, domestic and foreign political affairs, production levels, the availability of imports, the marketing of competitive fuels and government regulation.
In addition to the above, it continues to be a strategic and operational objective to manage price and supply risk related to crude oil that is used in refinery production, and to develop strategic sourcing relationships. For that purpose, from a pricing perspective, we enter into commodity derivative contracts to manage our price exposure to our inventory positions, future purchases of crude oil and ethanol, future sales of refined products or to fix margins on future production. We also enter into future commitments to purchase or sell RINs at fixed prices and quantities, which are used to manage our RINs Obligation. Additionally, from a sourcing perspective, we often enter into purchase and sale contracts with vendors and customers or take physical or financial commodity positions for crude oil that may not be used immediately in production, but that may be used to manage the overall supply and availability of crude expected to ultimately be needed for production and/or to meet minimum requirements under strategic pipeline arrangements, and also to optimize and hedge availability risks associated with crude that we ultimately expect to use in production. Such transactions are inherently based on certain assumptions and judgments made about the current and possible future availability of crude. Therefore, when we take physical or financial positions for optimization purposes, our intent is generally to take offsetting positions in quantities and at prices that will advance these objectives while minimizing our positional and financial statement risk. However, because of the volatility of the market in terms of pricing and availability, it is possible that we may have material positions with timing differences or, more rarely, that we are unable to cover a position with an offsetting position as intended. Such differences could have a material impact on the classification of resulting gains/losses, assets or liabilities, and could also significantly impact Refining EBITDA.
| | | | | | | | | | | | | | | | | | | | | | | | | | | |
| Refinery Statistics |
| | | | | | | | | |
| | Three Months Ended June 30, | | Six Months Ended June 30, |
| | | | | | | | | |
| | 2024 | | 2023 | | 2024 | | 2023 | |
| Total Refining Segment | | | | | | | | | |
| Days in period | | 91 | | | 91 | | | 182 | | | 181 | | |
Total sales volume - refined product (average bpd) (1) | | 320,514 | | | 305,688 | | | 313,541 | | | 288,795 | | |
| Total production (average bpd) | | 311,957 | | | 291,715 | | | 302,340 | | | 279,230 | | |
| Crude oil | | 303,177 | | | 282,493 | | | 288,865 | | | 265,441 | | |
| Other feedstocks | | 12,877 | | | 12,988 | | | 17,487 | | | 16,642 | | |
| Total throughput (average bpd): | | 316,054 | | | 295,481 | | | 306,352 | | | 282,083 | | |
| | | | | | | | | |
| Crude Slate: (% based on amount received in period) | | | | | | | | | |
| WTI crude oil | | 72.0 | % | | 75.9 | % | | 71.7 | % | | 73.2 | % | |
| Gulf Coast Sweet Crude | | 7.5 | % | | 4.0 | % | | 6.9 | % | | 4.3 | % | |
| Local Arkansas crude oil | | 3.2 | % | | 3.9 | % | | 3.3 | % | | 4.2 | % | |
| Other | | 17.3 | % | | 16.2 | % | | 18.1 | % | | 18.3 | % | |
| | | | | | | | | |
| Crude utilization (% based on nameplate capacity) | | 100.4 | % | | 93.5 | % | | 95.7 | % | | 87.9 | % | |
| | | | | | | | | |
| | | | | | | | | |
| | | | | | | | | |
| | | | | | | | | |
| | | | | | | | | |
| | | | | | | | | |
| | | | | | | | | |
| | | | | | | | | |
| | | | | | | | | |
| | | | | | | | | |
| | | | | | | | | |
| | | | | | | | | |
| | | | | | | | | |
Management's Discussion and Analysis
| | | | | | | | | | | | | | | | | | | | | | | | | | | |
| | | | | | | | | |
| Refinery Statistics (continued) |
| | Three Months Ended June 30, | | Six Months Ended June 30, |
| | | | | | | | | |
| | 2024 | | 2023 | | 2024 | | 2023 | |
| | | | |
| Tyler, TX Refinery | | | | | | | | | |
| Days in period | | 91 | | | 91 | | | 182 | | | 181 | | |
| Products manufactured (average bpd): | | | | | | | | | |
| Gasoline | | 36,539 | | | 37,672 | | | 36,953 | | | 28,276 | | |
| Diesel/Jet | | 33,705 | | | 33,029 | | | 31,905 | | | 23,091 | | |
| Petrochemicals, LPG, natural gas liquids ("NGLs") | | 1,873 | | | 3,031 | | | 1,928 | | | 1,890 | | |
| Other | | 1,674 | | | 1,829 | | | 1,445 | | | 1,803 | | |
| Total production | | 73,791 | | | 75,561 | | | 72,231 | | | 55,060 | | |
| Throughput (average bpd): | | | | | | | | | |
| Crude Oil | | 73,818 | | | 72,955 | | | 70,805 | | | 51,501 | | |
| Other feedstocks | | 1,849 | | | 3,955 | | | 3,161 | | | 4,323 | | |
| Total throughput | | 75,667 | | | 76,910 | | | 73,966 | | | 55,824 | | |
| Per barrel of throughput: | | | | | | | | | |
| Operating expenses | | $ | 4.83 | | | $ | 3.78 | | | $ | 5.05 | | | $ | 5.29 | | |
| Crude Slate: (% based on amount received in period) | | | | | | | | | |
| WTI crude oil | | 80.1 | % | | 86.5 | % | | 81.3 | % | | 78.7 | % | |
| East Texas crude oil | | 19.9 | % | | 13.5 | % | | 18.7 | % | | 21.3 | % | |
| | | | | | | | | |
| | | | | | | | | |
| El Dorado, AR Refinery | | | | | | | | | |
| Days in period | | 91 | | | 91 | | | 182 | | | 181 | | |
| Products manufactured (average bpd): | | | | | | | | | |
| Gasoline | | 38,659 | | | 34,220 | | | 40,100 | | | 36,121 | | |
| Diesel | | 31,880 | | | 27,948 | | | 30,958 | | | 27,830 | | |
| Petrochemicals, LPG, NGLs | | 1,003 | | | 1,521 | | | 1,293 | | | 1,406 | | |
| Asphalt | | 9,193 | | | 6,641 | | | 8,749 | | | 7,177 | | |
| Other | | 2,089 | | | 1,185 | | | 1,442 | | | 967 | | |
| Total production | | 82,824 | | | 71,515 | | | 82,542 | | | 73,501 | | |
| Throughput (average bpd): | | | | | | | | | |
| Crude Oil | | 83,312 | | | 71,449 | | | 81,747 | | | 72,040 | | |
| Other feedstocks | | 1,421 | | | 2,011 | | | 2,412 | | | 3,278 | | |
| Total throughput | | 84,733 | | | 73,460 | | | 84,159 | | | 75,318 | | |
| Per barrel of throughput: | | | | | | | | | |
| Operating expenses | | $ | 4.12 | | | $ | 5.00 | | | $ | 4.41 | | | $ | 4.73 | | |
| Crude Slate: (% based on amount received in period) | | | | | | | | | |
| WTI crude oil | | 66.5 | % | | 68.4 | % | | 66.5 | % | | 65.2 | % | |
| Local Arkansas crude oil | | 11.7 | % | | 16.6 | % | | 11.6 | % | | 15.6 | % | |
| Other | | 21.8 | % | | 15.0 | % | | 21.9 | % | | 19.2 | % | |
Management's Discussion and Analysis
| | | | | | | | | | | | | | | | | | | | | | | | | | | | |
| Refinery Statistics (continued) |
| | Three Months Ended June 30, | | Six Months Ended June 30, |
| | | | | | | | | | |
| | 2024 | | 2023 | | 2024 | | 2023 | | |
| | | | |
| Big Spring, TX Refinery | | | | | | | | | | |
| Days in period | | 91 | | | 91 | | 182 | | | 181 | | | |
| Products manufactured (average bpd): | | | | | | | | | | |
| Gasoline | | 34,271 | | | 33,582 | | | 32,123 | | | 36,032 | | | |
| Diesel/Jet | | 27,086 | | | 20,774 | | | 24,766 | | | 23,194 | | | |
| Petrochemicals, LPG, NGLs | | 3,287 | | | 3,034 | | | 4,362 | | | 3,083 | | | |
| Asphalt | | 2,841 | | | 1,630 | | | 2,464 | | | 1,636 | | | |
| Other | | 5,928 | | | 1,907 | | | 4,795 | | | 2,272 | | | |
| Total production | | 73,413 | | | 60,927 | | | 68,510 | | | 66,217 | | | |
| Throughput (average bpd): | | | | | | | | | | |
Crude oil | | 69,342 | | | 59,240 | | | 64,395 | | | 63,590 | | | |
Other feedstocks | | 4,701 | | | 3,020 | | | 5,053 | | | 3,818 | | | |
| Total throughput | | 74,043 | | | 62,260 | | | 69,448 | | | 67,408 | | | |
| Per barrel of refined throughput: | | | | | | | | | | |
| Operating expenses | | $ | 6.35 | | | $ | 8.91 | | | $ | 7.15 | | | $ | 7.24 | | | |
| Crude Slate: (% based on amount received in period) | | | | | | | | | | |
WTI crude oil | | 70.2 | % | | 66.7 | % | | 71.4 | % | | 71.0 | % | | |
WTS crude oil | | 29.8 | % | | 33.3 | % | | 28.6 | % | | 29.0 | % | | |
| | | | | | | | | | |
| Krotz Springs, LA Refinery | | | | | | | | | | |
| Days in period | | 91 | | | 91 | | | 182 | | | 181 | | | |
| Products manufactured (average bpd): | | | | | | | | | | |
Gasoline | | 39,037 | | | 41,191 | | | 38,907 | | | 41,517 | | | |
Diesel/Jet | | 32,468 | | | 31,968 | | | 30,356 | | | 32,373 | | | |
Heavy Oils | | 1,033 | | | 3,725 | | | 1,882 | | | 3,618 | | | |
Petrochemicals, LPG, NGLs | | 4,924 | | | 6,588 | | | 5,328 | | | 6,730 | | | |
Other | | 4,467 | | | 240 | | | 2,584 | | | 214 | | | |
Total production | | 81,929 | | | 83,712 | | | 79,057 | | | 84,452 | | | |
| Throughput (average bpd): | | | | | | | | | | |
Crude Oil | | 76,705 | | | 78,848 | | | 71,918 | | | 78,309 | | | |
Other feedstocks | | 4,906 | | | 4,002 | | | 6,861 | | | 5,224 | | | |
Total throughput | | 81,611 | | | 82,850 | | | 78,779 | | | 83,533 | | | |
| Per barrel of throughput: | | | | | | | | | | |
| Operating expenses | | $ | 4.95 | | | $ | 4.74 | | | $ | 5.43 | | | $ | 4.97 | | | |
| Crude Slate: (% based on amount received in period) | | | | | | | | | | |
WTI Crude | | 72.1 | % | | 77.4 | % | | 68.6 | % | | 78.5 | % | | |
Gulf Coast Sweet Crude | | 27.2 | % | | 15.0 | % | | 26.2 | % | | 14.7 | % | | |
| Other | | 0.7 | % | | 7.6 | % | | 5.2 | % | | 6.8 | % | | |
(1) Includes inter-refinery sales and sales to other segments which are eliminated in consolidation. See tables below.
Management's Discussion and Analysis
Included in the refinery statistics above are the following sales to other segments:
| | | | | | | | | | | | | | | | | | | | | | | | | | | | |
| Refinery Sales to Other Segments |
| | Three Months Ended June 30, | | Six Months Ended June 30, |
| (in barrels per day) | | 2024 | | 2023 | | 2024 | | 2023 | | |
| | | | | | |
| | | | | | | | | | |
| | | | | | | | | | |
| | | | | | | | | | |
| Big Spring refined product sales to other Delek segments | | 23,157 | | | — | | | 21,742 | | | 9,663 | | | |
| | | | | | | | | | |
| | | | | | | | | | | | | | | | | | | | | | | | | | | | |
| Pricing Statistics (average for the period presented) |
| | Three Months Ended June 30, | | Six Months Ended June 30, |
| | 2024 | | 2023 | | 2024 | | 2023 | | |
| | | | |
| | | | | | | | | | |
| WTI — Cushing crude oil (per barrel) | | $ | 80.83 | | | $ | 73.57 | | | $ | 78.95 | | | $ | 74.78 | | | |
| WTI — Midland crude oil (per barrel) | | $ | 81.73 | | | $ | 74.40 | | | $ | 80.17 | | | $ | 75.98 | | | |
| WTS — Midland crude oil (per barrel) | | $ | 80.99 | | | $ | 73.55 | | | $ | 79.26 | | | $ | 74.48 | | | |
| LLS (per barrel) | | $ | 83.69 | | | $ | 75.67 | | | $ | 81.73 | | | $ | 77.27 | | | |
| Brent (per barrel) | | $ | 85.06 | | | $ | 77.74 | | | $ | 83.42 | | | $ | 79.94 | | | |
| | | | | | | | | | |
U.S. Gulf Coast 5-3-2 crack spread (per barrel) (1) | | $ | 18.12 | | | $ | 25.54 | | | $ | 20.55 | | | $ | 29.04 | | | |
U.S. Gulf Coast 3-2-1 crack spread (per barrel) (1) | | $ | 17.72 | | | $ | 25.42 | | | $ | 19.80 | | | $ | 28.32 | | | |
U.S. Gulf Coast 2-1-1 crack spread (per barrel) (1) | | $ | 13.29 | | | $ | 11.32 | | | $ | 16.29 | | | $ | 15.23 | | | |
| | | | | | | | | | |
| U.S. Gulf Coast unleaded gasoline (per gallon) | | $ | 2.30 | | | $ | 2.34 | | | $ | 2.26 | | | $ | 2.37 | | | |
| Gulf Coast ultra-low sulfur diesel (per gallon) | | $ | 2.44 | | | $ | 2.38 | | | $ | 2.53 | | | $ | 2.62 | | | |
| U.S. Gulf Coast high sulfur diesel (per gallon) | | $ | 1.89 | | | $ | 1.45 | | | $ | 1.92 | | | $ | 1.68 | | | |
Natural gas (per MMBTU) | | $ | 2.37 | | | $ | 2.33 | | | $ | 2.24 | | | $ | 2.53 | | | |
(1)For our Tyler and El Dorado refineries, we compare our per barrel refining product margin to the Gulf Coast 5-3-2 crack spread consisting of (Argus pricing) WTI Cushing crude, U.S. Gulf Coast CBOB gasoline and U.S. Gulf Coast Pipeline No. 2 heating oil (ultra-low sulfur diesel). For our Big Spring refinery, we compare our per barrel refining margin to the Gulf Coast 3-2-1 crack spread consisting of (Argus pricing) WTI Cushing crude, U.S. Gulf Coast CBOB gasoline and Gulf Coast ultra-low sulfur diesel. For 2023, for our Krotz Springs refinery, we compare our per barrel refining margin to the Gulf Coast 2-1-1 crack spread consisting of (Argus pricing) LLS crude oil, (Argus pricing) U.S. Gulf Coast CBOB gasoline and 50% of (Argus pricing) U.S. Gulf Coast Pipeline No. 2 heating oil (high sulfur diesel) and 50% of (Platts pricing) U.S. Gulf Coast Pipeline No. 2 heating oil (high sulfur diesel). For 2024, for our Krotz Springs refinery, we compare our per barrel refining margin to the Gulf Coast 2-1-1 crack spread consisting of (Argus pricing) LLS crude oil, (Argus pricing) U.S. Gulf Coast CBOB gasoline and (Platts pricing) U.S. Gulf Coast Pipeline No. 2 heating oil (high sulfur diesel). The Tyler refinery's crude oil input is primarily WTI Midland and East Texas, while the El Dorado refinery's crude input is primarily a combination of WTI Midland, local Arkansas and other domestic inland crude oil. The Big Spring refinery’s crude oil input is primarily comprised of WTS and WTI Midland. The Krotz Springs refinery’s crude oil input is primarily comprised of LLS and WTI Midland.
Management's Discussion and Analysis
Refining Segment Operational Comparison of the Three and Six Months Ended June 30, 2024 versus the Three and Six Months Ended June 30, 2023
Revenues
Q2 2024 vs. Q2 2023
Net revenues for the refining segment decreased by $745.3 million, or 18.4%, in the second quarter of 2024 compared to the second quarter of 2023. The decrease was primarily driven by the following:
•a decrease in the average price of U.S. Gulf Coast gasoline of 1.7%; and
•a decrease in wholesale activity.
These decreases were partially offset by the following:
•an increase in sales volumes; and
•an increase in the average price of U.S. Gulf Coast ULSD of 2.5% and HSD of 30.3%.
Net revenues included sales to our retail segment of $102.6 million and $111.5 million and sales to our logistics segment of $106.7 million and $92.0 million for the three months ended June 30, 2024 and June 30, 2023, respectively. We eliminate this intercompany revenue in consolidation.
YTD 2024 vs. YTD 2023
Revenues for the refining segment decreased $1,431.5 million, or 18.2%, in the six months ended June 30, 2024 compared to the six months ended June 30, 2023. The decrease was primarily driven by the following:
•a decrease in the average price of U.S. Gulf Coast gasoline of 4.6% and ULSD of 3.4%; and
•a decrease in wholesale activity.
These decreases were partially offset by the following:
•an increase in sales volumes; and
•an increase in the average price of U.S. Gulf Coast HSD of 14.3%.
Revenues included sales to our retail segment of $196.4 million and $214.1 million and sales to our logistics segment of $199.6 million and $183.1 million for the six months ended June 30, 2024 and 2023, respectively. We eliminate this intercompany revenue in consolidation.
Cost of Materials and Other
Q2 2024 vs. Q2 2023
Cost of materials and other decreased by $632.9 million, or 16.7%, in the second quarter of 2024 compared to the second quarter of 2023. The decrease was primarily driven by the following:
•a decrease in wholesale activity; and
•a decrease in RINs pricing
These decreases were partially offset by the following:
•increases in the cost of WTI Cushing crude oil, from an average of $73.57 per barrel to an average of $80.83, or 9.9%, and increases in the cost of WTI Midland crude oil, from an average of $74.40 per barrel to an average of $81.73, or 9.9%; and
•an increase in sales volume.
YTD 2024 vs. YTD 2023
Cost of materials and other decreased $1,251.8 million, or 17.3%, in the six months ended June 30, 2024 compared to the six months ended June 30, 2023. This decrease was primarily driven by the following:
•a decrease in wholesale activity; and
•a decrease in RINs pricing.
These decreases were partially offset by the following:
•increases in the cost of WTI Cushing crude oil, from an average of $74.78 per barrel to an average of $78.95, or 5.6%, and increases in the cost of WTI Midland crude oil, from an average of $75.98 per barrel to an average of $80.17, or 5.5%.
•an increase in sales volumes primarily associated with Tyler Refinery operations which were negatively impacted in prior year as a result of turnaround activities.
Management's Discussion and Analysis
Our refining segment purchases finished product from our logistics segment and has multiple service agreements with our logistics segment which, among other things, require the refining segment to pay terminalling and storage fees based on the throughput volume of crude and finished product in the logistics segment pipelines and the volume of crude and finished product stored in the logistics segment storage tanks, subject to minimum volume commitments. These costs and fees were $156.5 million and $132.6 million during the three months ended June 30, 2024 and 2023, respectively. These costs and fees were $295.7 million and $257.2 million during the six months ended June 30, 2024 and 2023, respectively. We eliminate these intercompany fees in consolidation.
Refining Margin
Q2 2024 vs. Q2 2023
Refining segment margin decreased by $112.4 million, or 41.8%, in the second quarter of 2024 compared to the second quarter of 2023, with a refining margin percentage of 4.7% as compared to 6.6% for the second quarter of 2024 and 2023, respectively, primarily driven by the following:
•a 29.1% decrease in the 5-3-2 crack spread (the primary measure for the Tyler refinery and El Dorado refinery), and a 30.3% decrease in the average Gulf Coast 3-2-1 crack spread (the primary measure for the Big Spring refinery).
These decreases were partially offset by the following:
•a 17.4% increase in the average Gulf Coast 2-1-1 crack spread (the primary measure for the Krotz Springs refinery);
•an increase in sales volume; and
•lower RINs pricing.
YTD 2024 vs. YTD 2023
Refining margin decreased by $179.7 million, or 29.7%, for the six months ended June 30, 2024 compared to the six months ended June 30, 2023, with a refining margin percentage of 6.6% as compared to 7.7% for the six months ended June 30, 2024 and 2023, respectively, primarily driven by the following:
•a 29.2% decrease in the 5-3-2 crack spread (the primary measure for the Tyler refinery and El Dorado refinery) and a 30.1% decrease in the average Gulf Coast 3-2-1 crack spread (the primary measure for the Big Spring refinery).
These decreases were partially offset by the following:
•a 7.0% increase in the average Gulf Coast 2-1-1 crack spread (the primary measure for the Krotz Springs refinery);
•an increase in sales volumes primarily associated with Tyler Refinery operations which were negatively impacted in prior year as a result of turnaround activities; and
•lower RINs pricing.
Operating Expenses
Q2 2024 vs. Q2 2023
Operating expenses decreased by $5.2 million, or 3.4%, in the second quarter of 2024 compared to the second quarter of 2023. The decrease in operating expenses was primarily driven by the following:
•decrease in outside services.
YTD 2024 vs. YTD 2023
Operating expenses increased by $21.5 million, or 7.3%, in the six months ended June 30, 2024, compared to six months ended June 30, 2023. The increase in operating expenses was primarily driven by the following:
•higher employee, outside service and maintenance costs.
These increases were partially offset by the following:
•lower natural gas prices in 2024.
EBITDA
Q2 2024 vs. Q2 2023
EBITDA decreased by $104.5 million, or 85.8%, in the three months ended June 30, 2024 compared to the three months ended June 30, 2023, primarily due to a decrease in refining margin driven by decreased crack spreads, partially offset by an increase in sales volume and insurance and third party proceeds related to the fires in 2021 and 2022.
Management's Discussion and Analysis
YTD 2024 vs. YTD 2023
EBITDA decreased by $194.9 million, for the six months ended June 30, 2024 compared to the six months ended June 30, 2023, primarily due to a decrease in refining margin driven by decreased crack spreads, partially offset by an increase in sales volume and insurance and third party proceeds related to the fires in 2021 and 2022.
Management's Discussion and Analysis
The table below sets forth certain information concerning our logistics segment operations ($ in millions, except per barrel amounts):
| | | | | | | | | | | | | | | | | | | | | | | | | | | | |
| Selected Logistics Financial and Operating Information |
| | Three Months Ended June 30, | Six Months Ended June 30, |
| | 2024 | | 2023 | | 2024 | | 2023 | | |
| Revenues | | $ | 264.6 | | | $ | 246.9 | | | $ | 516.7 | | | $ | 490.4 | | | |
| Cost of materials and other | | $ | 138.1 | | | $ | 128.1 | | | $ | 261.8 | | | $ | 254.2 | | | |
| Operating expenses (excluding depreciation and amortization) | | $ | 29.6 | | | $ | 29.0 | | | $ | 61.5 | | | $ | 53.7 | | | |
| EBITDA | | $ | 100.6 | | | $ | 90.9 | | | $ | 200.3 | | | $ | 182.3 | | | |
| | | | | | | | | | |
| Operating Information: | | | | | | | | | | |
| Gathering & Processing: (average bpd) | | | | | | | | | | |
| Lion Pipeline System: | | | | | | | | | | |
| Crude pipelines (non-gathered) | | 73,320 | | | 61,260 | | | 73,166 | | | 62,131 | | | |
| Refined products pipelines | | 60,575 | | | 44,966 | | | 61,904 | | | 49,957 | | | |
| SALA Gathering System | | 13,024 | | | 13,041 | | 13,005 | | | 13,509 | | |
| East Texas Crude Logistics System | | 23,259 | | | 30,666 | | 21,481 | | | 26,690 | | |
| Midland Gathering Assets | | 206,933 | | | 221,876 | | 210,196 | | | 221,993 | | |
| Plains Connection System | | 210,033 | | | 255,035 | | | 233,438 | | | 247,856 | | | |
| Delaware Gathering Assets: | | | | | | | | | | |
Natural gas gathering and processing (Mcfd) (1) | | 76,237 | | | 73,309 | | | 76,280 | | | 74,008 | | | |
| Crude oil gathering (average bpd) | | 123,927 | | | 117,017 | | | 123,718 | | | 110,408 | | | |
| Water disposal and recycling (average bpd) | | 116,916 | | | 127,195 | | | 118,592 | | | 107,848 | | | |
| | | | | | | | | | |
| Wholesale Marketing & Terminalling: | | | | | | | | | | |
East Texas - Tyler refinery sales volumes (average bpd) (2) | | 71,082 | | | 69,310 | | | 68,779 | | | 52,158 | | | |
| Big Spring wholesale marketing throughputs (average bpd) | | 81,422 | | | 75,164 | | | 79,019 | | | 76,763 | | | |
| West Texas wholesale marketing throughputs (average bpd) | | 11,381 | | | 9,985 | | | 10,678 | | | 9,454 | | | |
| West Texas wholesale marketing margin per barrel | | $ | 2.99 | | | $ | 7.01 | | | $ | 2.60 | | | $ | 6.27 | | | |
Terminalling throughputs (average bpd) (3) | | 159,260 | | | 134,323 | | | 147,937 | | | 113,926 | | | |
(1) Mcfd - average thousand cubic feet per day.
(2) Excludes jet fuel and petroleum coke.
(3) Consists of terminalling throughputs at our Tyler, Big Spring, Big Sandy and Mount Pleasant, Texas terminals, El Dorado and North Little Rock, Arkansas terminals and Memphis and Nashville, Tennessee terminals.
Logistics revenue is largely based on fixed-fee or tariff rates charged for throughput volumes running through our logistics network, where many of those volumes are contractually protected by minimum volume commitments ("MVCs"). To the extent that our logistics volumes are not subject to MVCs, our Logistics revenue may be negatively impacted in periods where our customers are experiencing economic pressures or reductions in demand for their products. Additionally, certain of our throughput arrangements contain deficiency credit provisions that may require us to defer excess MVC fees collected over actual throughputs to apply toward MVC deficiencies in future periods. With respect to our equity method investments in pipeline joint ventures, our earnings from those investments (which is based on our pro rata ownership percentage of the joint venture's recognized net income or loss) are directly impacted by the operations of those joint ventures. Items impacting the joint venture net income (loss) may include (but are not limited to) the following: long-term throughput contractual arrangements and related MVCs and, in some cases, deficiency credit provisions; the demand for walk-up nominations; applicable rates or tariffs; long-lived asset or other impairments assessed at the joint venture level; and pipeline releases or other contingent liabilities. With respect to our West Texas marketing activities, our profitability is dependent upon the cost of landed product versus the rack price of refined product sold. Our logistics segment is generally protected from commodity price risk because inventory is purchased and then immediately sold at the rack.
Management's Discussion and Analysis
Logistics Segment Operational Comparison of the Three and Six Months Ended June 30, 2024 versus the Three and Six Months Ended June 30, 2023
Revenues
Q2 2024 vs. Q2 2023
Net revenues increased by $17.7 million, or 7.2%, in the second quarter of 2024 compared to the second quarter of 2023, primarily driven by:
•increased revenue of $11.4 million in our West Texas marketing operations primarily driven by increases in volumes sold, partially offset by a decrease in average sales prices per gallon and decrease in RINs revenue:
◦the volumes of gasoline and diesel sold increased by 3.6 million and 3.4 million gallons, respectively;
◦the average sales prices per gallon of gasoline and diesel sold decreased by $0.14 and $0.06 per gallon, respectively; and
•increase in terminalling and marketing revenue primarily due to rate increases and increased volumes.
Net revenues included sales to our refining segment of $156.5 million and $132.6 million for the three months ended June 30, 2024 and June 30, 2023, respectively, and sales to our other segment of $0.4 million and $0.4 million for the three months June 30, 2024 and 2023, respectively. We eliminate this intercompany revenue in consolidation.
YTD 2024 vs. YTD 2023
Net revenues increased by $26.3 million, or 5.4%, in the six months ended June 30, 2024 compared to the six months ended June 30, 2023 primarily driven by the following:
•increased revenue of $10.8 million in our West Texas marketing operations primarily driven by increases in volumes sold, partially offset by a decrease in average sales prices per gallon and decrease in RINs revenue:
◦the volumes of gasoline and diesel sold increased by 7.6 million and 3.9 million gallons, respectively;
◦the average sales prices per gallon of gasoline and diesel sold decreased by $0.19 and $0.19 per gallon, respectively; and
•increase in terminalling and marketing revenue primarily due to rate increases and increased volumes.
Revenues included sales to our refining segment of $295.7 million and $257.2 million for the six months ended June 30, 2024 and 2023, respectively, and sales to our other segment of $0.8 million and $0.8 million for the six months ended June 30, 2024 and 2023, respectively. We eliminate this intercompany revenue in consolidation.
Cost of Materials and Other
Q2 2024 vs. Q2 2023
Cost of materials and other for the logistics segment increased by $10.0 million, or 7.8%, in the second quarter of 2024 compared to the second quarter of 2023. The increase was primarily driven by the following:
•increased costs of materials and other of $14.4 million in our West Texas marketing operations primarily driven by increases in the volumes of gasoline and diesel sold, partially offset by decreases in the average cost per gallon:
◦the volumes of gasoline and diesel sold increased by 3.6 million and 3.4 million gallons, respectively; and
◦the average cost per gallon of gasoline sold decreased by $0.14 per gallon, partially offset by an increase in average cost per gallon of diesel sold of $0.03 per gallon.
Our logistics segment purchased product from our refining segment of $106.7 million and $92.0 million for the three months ended June 30, 2024 and June 30, 2023, respectively. We eliminate these intercompany costs in consolidation.
YTD 2024 vs. YTD 2023
Cost of materials and other for the logistics segment increased by $7.6 million, or 3.0%, in the six months ended June 30, 2024 compared to the six months ended June 30, 2023. This increase was primarily driven by the following:
•increased costs of materials and other of $16.2 million in our West Texas marketing operations primarily driven by increases in the average volumes of gasoline and diesel sold, partially offset by decreased costs per gallon:
◦the volumes of gasoline and diesel sold increased by 7.6 million and 3.9 million gallons, respectively; and
◦the average cost per gallon of gasoline and diesel sold decreased by $0.21 per gallon and $0.10 per gallon, respectively.
These increase was partially offset by the following:
•decrease of $7.4 million in our gathering and processing segment driven primarily by lower natural gas costs.
Management's Discussion and Analysis
Our logistics segment purchased product from our refining segment of $199.6 million and $183.1 million for the six months ended June 30, 2024 and 2023, respectively. We eliminate these intercompany costs in consolidation.
Operating Expenses
Q2 2024 vs. Q2 2023
Operating expenses increased by $0.6 million, or 2.1%, in the second quarter of 2024 compared to the second quarter of 2023.
YTD 2024 vs. YTD 2023
Operating expenses increased by $7.8 million, or 14.5%, in the six months ended June 30, 2024 compared to the six months ended June 30, 2023, primarily driven by an increase in contract services.
EBITDA
Q2 2024 vs. Q2 2023
EBITDA increased by $9.7 million, or 10.7%, in the three months ended June 30, 2024 compared to the three months ended June 30, 2023, primarily driven by higher contributions from the Delaware Gathering systems and terminalling and marketing rate increases.
YTD 2024 vs. YTD 2023
EBITDA increased by $18.0 million, or 9.9%, in the six months ended June 30, 2024 compared to the six months ended June 30, 2023, primarily driven by higher terminalling and marketing fees due to rate increases as well as higher throughput volumes primarily associated with the Tyler Refinery operations which were negatively impacted in the prior year as a result of turnaround activities, partially offset by increases in operating expenses primarily due to contract services.
Management's Discussion and Analysis
The tables below set forth certain information concerning our retail segment operations ($ in millions):
| | | | | | | | | | | | | | | | | | | | | | | | | | | | |
| Selected Retail Financial and Operating Information |
| | Three Months Ended June 30, | | Six Months Ended June 30, |
| | 2024 | | 2023 | | 2024 | | 2023 | | |
| Revenues | | $ | 216.1 | | | $ | 232.7 | | | $ | 409.6 | | | $ | 437.7 | | | |
| Cost of materials and other | | $ | 176.4 | | | $ | 188.5 | | | $ | 334.7 | | | $ | 358.5 | | | |
| Operating expenses (excluding depreciation and amortization) | | $ | 25.4 | | | $ | 25.9 | | | $ | 50.5 | | | $ | 50.5 | | | |
| | | | | | | | | | |
| EBITDA | | $ | 12.4 | | | $ | 15.0 | | | $ | 18.9 | | | $ | 21.4 | | | |
| | | | | | | | | | | | | | | | | | | | | | | | | | | | |
| Operating Information |
| | Three Months Ended June 30, | | Six Months Ended June 30, |
| | | 2024 | | 2023 | | 2024 | | 2023 | | |
| Number of stores (end of period) | | 250 | | | 247 | | | 250 | | | 247 | | | |
| Average number of stores | | 250 | | | 247 | | | 250 | | | 247 | | | |
| Average number of fuel stores | | 245 | | | 242 | | | 245 | | | 242 | | | |
| Retail fuel sales | | $ | 136.4 | | | $ | 148.4 | | | $ | 259.2 | | | $ | 279.5 | | | |
| Retail fuel sales (thousands of gallons) | | 43,126 | | | 45,687 | | | 82,809 | | | 85,651 | | | |
Average retail gallons per average number of stores (in thousands) | | 176 | | | 189 | | | 339 | | | 354 | | | |
| Average retail sales price per gallon sold | | $ | 3.16 | | | $ | 3.25 | | | $ | 3.13 | | | $ | 3.26 | | | |
Retail fuel margin ($ per gallon) (1) | | $ | 0.312 | | | $ | 0.342 | | | $ | 0.302 | | | $ | 0.307 | | | |
| Merchandise sales (in millions) | | $ | 79.6 | | | $ | 84.3 | | | $ | 150.4 | | | $ | 158.2 | | | |
| Merchandise sales per average number of stores (in millions) | | $ | 0.3 | | | $ | 0.3 | | | $ | 0.6 | | | $ | 0.6 | | | |
| Merchandise margin % | | 32.9 | % | | 33.9 | % | | 33.2 | % | | 33.5 | % | | |
| | | | | | | | | | | | | | | | | | | | | | | | | | | | |
Same-Store Comparison (2) | | |
| | Three Months Ended June 30, | Six Months Ended June 30, |
| | 2024 | | 2023 | | 2024 | | 2023 | | |
| | | | | | | | | | |
| Change in same-store retail fuel gallons sold | | (4.0) | % | | (1.5) | % | | (1.8) | % | | (1.6) | % | | |
| Change in same-store merchandise sales | | (5.2) | % | | 0.1 | % | | (4.7) | % | | 2.4 | % | | |
(1)Retail fuel margin represents gross margin on fuel sales in the retail segment, and is calculated as retail fuel sales revenue less retail fuel cost of sales. The retail fuel margin per gallon calculation is derived by dividing retail fuel margin by the total retail fuel gallons sold for the period.
(2)Same-store comparisons include year-over-year changes in specified metrics for stores that were in service at both the beginning of the year and the end of the most recent year used in the comparison.
Our retail merchandise sales are driven by convenience, customer service, competitive pricing and branding. Motor fuel margin is sales less the delivered cost of fuel and motor fuel taxes, measured on a cents per gallon basis. Our motor fuel margins are impacted by local supply, demand, weather, competitor pricing and product brand.
Management's Discussion and Analysis
Retail Segment Operational Comparison of the Three and Six Months Ended June 30, 2024 versus the Three and Six Months Ended June 30, 2023
Revenues
Q2 2024 vs. Q2 2023
Net revenues for the retail segment decreased by $16.6 million, or 7.1%, in the second quarter of 2024 compared to the second quarter of 2023, primarily driven by the following:
•a decrease in total fuel sales which were $136.4 million in the second quarter of 2024 compared to $148.4 million in the second quarter of 2023, primarily attributable to a decrease of $0.09 in average price charged per gallon sold and decreased volume; and
•a decrease in merchandise sales to $79.6 million in the second quarter of 2024 compared to $84.3 million in the second quarter of 2023, primarily driven by the same-store sales decrease of 5.2% as a result of remodeling activities.
YTD 2024 vs. YTD 2023
Revenues for the retail segment decreased by $28.1 million, or 6.4%, for the six months ended June 30, 2024 compared to the six months ended June 30, 2023, primarily driven by the following:
•a decrease in total fuel sales which were $259.2 million for the six months ended June 30, 2024 compared to $279.5 million for the six months ended June 30, 2023, primarily attributable to a $0.13 decrease in average price charged per gallon sold and decreased volume; and
•a decrease in merchandise sales to $150.4 million for the six months ended June 30, 2024 compared to $158.2 million for the six months ended June 30, 2023, primarily driven by the same-store sales decrease of 4.7% mostly attributable to tobacco sales.
Cost of Materials and Other
Q2 2024 vs. Q2 2023
Cost of materials and other for the retail segment decreased by $12.1 million, or 6.4%, in the second quarter of 2024 compared to the second quarter of 2023, primarily driven by the following:
•a decrease in average cost per gallon of $0.06, or 2.1%, applied to fuel sales volumes that decreased period over period.
Our retail segment purchased finished product from our refining segment of $102.6 million and $111.5 million for the three months ended June 30, 2024 and June 30, 2023, respectively, which is eliminated in consolidation.
YTD 2024 vs. YTD 2023
Cost of materials and other for the retail segment decreased by $23.8 million, or 6.6%, for the six months ended June 30, 2024 compared to the six months ended June 30, 2023, primarily driven by the following:
•a decrease in average cost per gallon of $0.13, or 4.3%, applied to fuel sales volumes that decreased period over period.
Our retail segment purchased finished product from our refining segment of $196.4 million and $214.1 million for the six months ended June 30, 2024 and 2023, respectively. We eliminate this intercompany cost in consolidation.
Operating Expenses
Q2 2024 vs. Q2 2023
Retail segment operating expenses decreased by $0.5 million, or 1.9%, in the second quarter of 2024 compared to the second quarter of 2023.
YTD 2024 vs. YTD 2023
Operating expenses for the retail segment remained consistent at $50.5 million for the six months ended June 30, 2024 compared to the six months ended June 30, 2023.
Management's Discussion and Analysis
EBITDA
Q2 2024 vs. Q2 2023
EBITDA for the retail segment decreased by $2.6 million, or 17.3%, for the three months ended June 30, 2024 compared to the three months ended June 30, 2023, primarily driven by the following:
•a decrease in average fuel margin of $0.030 per gallon and a decrease in fuel sales volume; and
•a decrease in merchandise margin percentage of 1.0%.
YTD 2024 vs. YTD 2023
EBITDA for the retail segment decreased by $2.5 million, or 11.7%, for the six months ended June 30, 2024 compared to the six months ended June 30, 2023, primarily driven by the following:
•a decrease in sales volume and a decrease in average fuel margin of $0.005; and
•a 5.0% decrease in merchandise sales.
Management's Discussion and Analysis
Liquidity and Capital Resources
Sources of Capital
Our primary sources of liquidity and capital resources are
•cash generated from our operating activities;
•borrowings under our debt facilities; and
•potential issuances of additional equity and debt securities.
At June 30, 2024 our total liquidity amounted to $2,328.2 million comprised primarily of $1,670.3 million in unused credit commitments under our revolving credit facilities (as discussed in Note 8 of our condensed consolidated financial statements in Item 1. Financial Statements, of this Quarterly Report on Form 10-Q) and $657.9 million in cash and cash equivalents. Historically, we have generated adequate cash from operations to fund ongoing working capital requirements, pay quarterly cash dividends and fund operational capital expenditures. On July 31, 2024, our Board of Directors approved a quarterly cash dividend of $0.255 per share of our common stock.
Other funding sources including borrowings under existing credit agreements, and issuance of equity and debt securities have been utilized to meet our funding requirements and support our growth capital projects and acquisitions. In addition, we have historically been able to source funding at terms that reflect market conditions, our financial position and our credit ratings and expect future funding sources to be at terms that are sustainable and profitable for the Company. However, there can be no assurances regarding the availability of future debt or equity financings or whether such financings can be made available on terms that are acceptable to us; any execution of such financing activities will be dependent on the contemporaneous availability of functioning debt or equity markets. Additionally, new debt financing activities will be subject to the satisfaction of any debt incurrence limitation covenants in our existing financing agreements. Our debt limitation covenants in our existing financing documents are usual and customary for credit agreements of our type and reflective of market conditions at the time of their execution. Additionally, our ability to satisfy working capital requirements, to service our debt obligations, to fund planned capital expenditures, or to pay dividends will depend upon future operating performance, which will be affected by prevailing economic conditions in the oil industry and other financial and business factors, including oil prices, some of which are beyond our control.
As of June 30, 2024, we believe we were in compliance with all of our debt maintenance covenants, where the most significant long-term obligation subject to such covenants was the Delek Term Loan Credit Facility (see further discussion in Note 8 of our condensed consolidated financial statements in Item 1. Financial Statements, of this Quarterly Report on Form 10-Q). Additionally, we were in compliance with covenants during the quarter ended June 30, 2024. Failure to meet the incurrence covenants could impose certain incremental restrictions on our ability to incur new debt and also may limit whether and the extent to which we may pay dividends, as well as impose additional restrictions on our ability to repurchase our stock, make new investments and incur new liens (among others). Such restrictions would generally remain in place until such quarter that we return to compliance under the applicable incurrence based covenants. In the event that we are subject to these incremental restrictions, we believe that we have sufficient current and alternative sources of liquidity, including (but not limited to): available borrowings under our existing Delek Revolving Credit Facility, and for Delek Logistics, under its Delek Logistics Revolving Facility; the allowance to incur an additional $400.0 million of secured debt under the Delek Term Loan Credit Facility (see further discussion of these facilities in Note 8 of our condensed consolidated financial statements in Item 1. Financial Statements, of this Quarterly Report on Form 10-Q); as well as the possibility of obtaining other secured and unsecured debt, raising capital through equity issuance, or taking advantage of transactional financing opportunities such as sale-leasebacks or joint ventures, as otherwise contemplated and allowed under our incurrence covenants.
Cash Position and Indebtedness
As of June 30, 2024, our total cash and cash equivalents were $657.9 million and we had total long-term indebtedness of approximately $2,461.7 million. The total long-term indebtedness is net of deferred financing costs and debt discount of $59.2 million. Additionally, we had letters of credit issued of approximately $269.5 million. Total unused credit commitments or borrowing base availability, as applicable, under our revolving credit facilities was approximately $1,670.3 million. The decrease of $136.4 million in total long-term principle indebtedness as of June 30, 2024 compared to December 31, 2023 resulted primarily from a decrease in net borrowings under the Delek Logistics Revolving Facility, payment of the outstanding balance of the Delek Logistics Term Loan Facility, and extinguishment of the Delek Logistics 2028 Notes, partially offset by the issuance of the Delek Logistics 2029 Notes. As of June 30, 2024, our total long-term indebtedness (as defined in Note 8 of the condensed consolidated financial statements in Item 1. Financial Statements, of this Quarterly Report on Form 10-Q) consisted of the following:
•the Delek Revolving Credit Facility with no outstanding borrowings (maturity of October 26, 2027);
•aggregate principal of $935.7 million under the Delek Term Loan Credit Facility (maturity of November 19, 2029 and effective interest of 10.23%);
•aggregate principal of $330.2 million under the Delek Logistics Revolving Facility (maturity of October 13, 2027 and average borrowing rate of 8.00%);
•aggregate principal of $400.0 million under the Delek Logistics 2028 Notes (due in 2028, with effective interest rate of 7.39%);
•aggregate principal of $850.0 million under the Delek Logistics 2029 Notes (due in 2029, with effective interest rate of 8.95%); and
•aggregate principal of $5.0 million under the United Community Bank Revolver (maturity of June 30, 2026 and average borrowing rate of 7.75%).
Management's Discussion and Analysis
On March 13, 2024, Delek Logistics sold $650.0 million in aggregate principal amount of 8.625% Senior Notes due 2029, at par. Net proceeds were used to redeem the Delek Logistics 2025 Notes including accrued interest, pay off the Delek Logistics Term Loan Facility including accrued interest and to repay a portion of the outstanding borrowings under the Delek Logistics Revolving Facility.
See Note 8 to our accompanying condensed consolidated financial statements in Item 1. Financial Statements, of this Quarterly Report on Form 10-Q for additional information about our separate debt and credit facilities.
Additionally, we utilize other financing arrangements to finance operating assets and/or, from time to time, to monetize other assets that may not be needed in the near term, when internal cost of capital and other criteria are met. Such arrangements include our inventory intermediation arrangement, which finances a significant portion of our first-in, first-out inventory at the refineries and, from time to time, RINs or other non-inventory product financing liabilities and funded letters of credit. Our inventory intermediation obligation with Citigroup Energy Inc. ("Citi") was $472.2 million at June 30, 2024. See Note 7 of the accompanying condensed consolidated financial statements in Item 1. Financial Statements, of this Quarterly Report on Form 10-Q for additional information about our inventory intermediation agreement. Our product financing liabilities consisted primarily of RIN financings as of June 30, 2024, and totaled $110.7 million, all of which is due in the next 12 months. See further description of these types of arrangements in the Environmental Credits and Related Regulatory Obligations accounting policy disclosed in Note 2 to our accompanying consolidated financial statements included in Item 8. Financial Statements and Supplementary Data, of our December 31, 2023 Annual Report on Form 10-K. For both arrangements and the related commitments, see also our "Cash Requirements" section below.
Debt Ratings
We receive debt ratings from the major ratings agencies in the U.S. In determining our debt ratings, the agencies consider a number of qualitative and quantitative items including, but not limited to, commodity pricing levels, our liquidity, asset quality, reserve mix, debt levels and seniorities, cost structure, planned asset sales and production growth opportunities.
There are no "rating triggers" in any of our contractual debt obligations that would accelerate scheduled maturities should our debt rating fall below a specified level. However, a downgrade could adversely impact our interest rate on new credit facility borrowings and the ability to economically access debt markets in the future. Additionally, any rating downgrades may increase the likelihood of us having to post additional letters of credit or cash collateral under certain contractual arrangements.
Cash Flows
The following table sets forth a summary of our consolidated cash flows (in millions):
| | | | | | | | | | | | | | | | |
| Consolidated |
| | | Six Months Ended June 30, |
| | | 2024 | | 2023 | | |
| Cash Flow Data: | | | | | | |
| Operating activities | | $ | 118.3 | | | $ | 490.2 | | | |
| Investing activities | | (104.1) | | | (279.9) | | | |
| Financing activities | | (178.5) | | | (230.0) | | | |
| Net decrease | | $ | (164.3) | | | $ | (19.7) | | | |
Cash Flows from Operating Activities
Net cash provided by operating activities was $118.3 million for the six months ended June 30, 2024, compared to $490.2 million for the comparable period of 2023. Decreases were a result of cash receipts from customers and cash payments to suppliers and for salaries resulting in a net $393.2 million decrease in cash provided by operating activities, partially offset by a decrease in cash paid for debt interest of $14.7 million.
Cash Flows from Investing Activities
Net cash used in investing activities was $104.1 million for the six months ended June 30, 2024, compared to $279.9 million in the comparable period of 2023. The decrease in cash flows used in investing activities was primarily due to a $144.3 million decrease in purchases of property, plant and equipment, substantially driven by maintenance projects associated with the Tyler turnaround in 2023, $18.0 million of insurance proceeds in 2024 and decrease of $8.6 million for equity interests investments and other.
Cash Flows from Financing Activities
Net cash used in financing activities was $178.5 million for the six months ended June 30, 2024, compared to $230.0 million in the comparable 2023 period. The decrease in cash used was primarily due to the receipt of net proceeds of $132.2 million from the Delek Logistics' public offering of common units in the six months ended June 30, 2024, net proceeds from term debt of $316.4 million for the six months ended June 30, 2024 compared to net payments on term debt of $12.3 million in the comparable 2023 period, primarily related to the issuance of the Delek Logistics 2029 Notes and the related repayment of the Delek Logistics Term Loan Facility and Delek Logistics 2025 Notes and $40.4 million of share buybacks in 2023.
Management's Discussion and Analysis
These decreases in cash flows were partially offset by the net payments from product and other financing arrangements of $102.1 million for the six months ended June 30, 2024 compared to net proceeds of $52.8 million in the comparable 2023 period, an increase in net payments on long-term revolvers of $215.8 million, the receipt of settlement proceeds of $58.0 million during the first quarter of 2023 associated with the termination of the J. Aron Supply & Offtake Agreements (as defined in Note 2 to the audited consolidated financial statements included in Item. 8 Financial Statements and Supplementary Data, of our December 31, 2023 Annual Report on Form 10-K) and origination of the Citi Inventory Intermediation Agreement (as defined in Note 7 of the condensed consolidated financial statements in Item 1. Financial Statements, of this Quarterly Report on Form 10-Q) and an increase of $13.0 million related to the payment of deferred financing costs primarily related to the issuance of the Delek Logistics 2029 Notes.
Capital Spending
A key component of our long-term strategy is our capital expenditure program. The following table summarizes our actual capital expenditures for the six months ended June 30, 2024, by operating segment and major category (in millions):
| | | | | | | | | | | | | | |
| | 2024 Forecast (1) | | Six Months Ended June 30, 2024 Actual (2) |
| Refining |
| Regulatory | | $ | 42 | | | $ | 22.2 | |
| Sustaining maintenance, including turnaround activities | | 163 | | | 46.2 | |
| Growth projects | | 15 | | | 0.1 | |
| Refining segment total | | 220 | | | 68.5 | |
| Logistics |
| Regulatory | | 5 | | | 0.4 | |
| Sustaining maintenance | | 15 | | | 4.1 | |
| Growth projects | | 50 | | | 20.9 | |
| Logistics segment total | | 70 | | | 25.4 | |
| Retail |
| Regulatory | | — | | | — | |
| Sustaining maintenance | | 5 | | | 3.2 | |
| Growth projects | | 10 | | | 7.4 | |
| Retail segment total | | 15 | | | 10.6 | |
| Corporate and Other |
| Regulatory | | 2 | | | 0.1 | |
| Sustaining maintenance | | 23 | | | 11.3 | |
| Growth projects | | — | | | 0.8 | |
| Other total | | 25 | | | 12.2 | |
| Total capital spending | | $ | 330 | | | $ | 116.7 | |
(1) Excludes estimated 2024 costs of $90.0 million to $100.0 million related to the new Delek Logistics natural gas processing plant. Refer to 'Other 2024 Developments' section of Item 2. Management's Discussion and Analysis, of this Quarterly Report on Form 10-Q for further information.
(2) Excludes a $10.0 million land purchase in connection with a settlement that was in litigation related to a property that we historically operated as an asphalt and marine fuel terminal. Refer to Note 11 of the condensed consolidated financial statements in Item 1. Financial Statements, of this Quarterly Report on Form 10-Q for further information.
The amount of our capital expenditure forecast is subject to change due to unanticipated increases in the cost, scope and completion time for our capital projects and subject to the changes and uncertainties discussed under the 'Forward-Looking Statements' section of Item 2. Management's Discussion and Analysis, of this Quarterly Report on Form 10-Q. For further information, please refer to our discussion in Item 1A. Risk Factors, of our December 31, 2023 Annual Report on Form 10-K.
Management's Discussion and Analysis
Cash Requirements
Long-Term Cash Requirements Under Contractual Obligations
Information regarding our known cash requirements under contractual obligations of the types described below as of June 30, 2024, is set forth in the following table (in millions):
| | | | | | | | | | | | | | | | | | | | | | | | | | | | | | | | |
| | Payments Due by Period |
| | <1 Year | | 1-3 Years | | 3-5 Years | | >5 Years | | Total |
Long-term debt and notes payable obligations | | $ | 9.5 | | | $ | 24.0 | | | $ | 1,599.2 | | | $ | 888.2 | | | $ | 2,520.9 | |
Interest (1) | | 213.5 | | | 423.1 | | | 360.0 | | | 31.3 | | | 1,027.9 | |
Operating lease commitments (2) | | 58.5 | | | 69.8 | | | 23.6 | | | 17.9 | | | 169.8 | |
Purchase commitments (3) | | 360.2 | | | — | | | — | | | — | | | 360.2 | |
Product financing agreements (4) | | 110.7 | | | — | | | — | | | — | | | 110.7 | |
Transportation agreements (5) | | 252.3 | | | 342.9 | | | 207.2 | | | 250.9 | | | 1,053.3 | |
Inventory intermediation obligation (6) | | 45.1 | | | 26.6 | | | — | | | — | | | 71.7 | |
| Total | | $ | 1,049.8 | | | $ | 886.4 | | | $ | 2,190.0 | | | $ | 1,188.3 | | | $ | 5,314.5 | |
(1) Expected interest payments on debt outstanding at June 30, 2024. Floating interest rate debt is calculated using June 30, 2024 rates. For additional information, see Note 8 to the condensed consolidated financial statements in Item 1. Financial Statements, of this Quarterly Report on Form 10-Q.
(2) Amounts reflect future estimated lease payments under operating leases having remaining non-cancelable terms in excess of one year as of June 30, 2024.
(3) We have purchase commitments to secure certain quantities of crude oil, finished product and other resources used in production at both fixed and market prices. We have estimated future payments under the market-based agreements using current market rates. Excludes purchase commitments in buy-sell transactions which have matching notional amounts with the same counterparty and are generally net settled in exchanges.
(4) Balances consist of obligations under RINs product financing arrangements, as described in Note 11 to the condensed consolidated financial statements in Item 1. Financial Statements, of this Quarterly Report on Form 10-Q and further discussed in the ''Environmental Credits and Related Regulatory Obligations" accounting policy included in Note 2 to our consolidated financial statements in Item 8. Financial Statements and Supplementary Data, of our December 31, 2023 Annual Report on Form 10-K.
(5) Balances consist of contractual obligations under agreements with third parties (not including Delek Logistics) for the transportation of crude oil to our refineries.
(6) Balances consist of contractual obligations under the Citi Inventory Intermediation Agreement, including principal obligation for the Baseline Volume Step-Out Liability and other recurring fees. For additional information, see Note 7 to the condensed consolidated financial statements in Item 1. Financial Statements, of this Quarterly Report on Form 10-Q.
Other Cash Requirements
Our material short-term cash requirements under contractual obligations are presented above, and we expect to fund the majority of those requirements with cash flows from operations. Our other cash requirements consisted of operating activities and capital expenditures. Operating activities include cash outflows related to payments to suppliers for crude and other inventories (which are largely reflected in our contractual purchase commitments in the table above) and payments for salaries and other employee related costs. Cash outlays in 2024 are planned to include incentive compensation payments that were earned and accrued in 2023. In line with our long-term sustainable strategy, future cash requirements will include initiatives to build on our long-term sustainable business model, ESG initiatives and sum of the parts initiatives.
Refer to the cash flow section for our operating activities spend during the six months ended June 30, 2024. While many of the expenses related to the operating activities are variable in nature, some of the expenditures can be somewhat fixed in the short-term due to forward planning on our level of activity.
Refer to the 'Capital Spending' section for our capital expenditures for the six months ended June 30, 2024 and our anticipated cash requirements for planned capital expenditures for the full year 2024.
ITEM 3. QUANTITATIVE AND QUALITATIVE DISCLOSURES ABOUT MARKET RISK
Changes in commodity prices (mainly crude oil and refined products) and interest rates are our primary sources of market risk. When we make the decision to manage our market exposure, our objective is generally to avoid losses from adverse price changes, realizing we will not obtain the gains of beneficial price changes.
Management's Discussion and Analysis
Price Risk Management Activities
At times, we enter into the following instruments/transactions in order to manage our market-indexed pricing risk: commodity derivative contracts which we use to manage our price exposure to our inventory positions, future purchases of crude oil and ethanol, future sales of refined products or to fix margins on future production; and future commitments to purchase or sell RINs at fixed prices and quantities, which are used to manage the costs associated with our RINs Obligations and meet the definition of derivative instruments under Accounting Standards Codification ("ASC") 815, Derivatives and Hedging ("ASC 815"). In accordance with ASC 815, all of these commodity contracts and future purchase commitments are recorded at fair value, and any change in fair value between periods has historically been recorded in the profit and loss section of our condensed consolidated financial statements. Occasionally, at inception, the Company will elect to designate the commodity derivative contracts as cash flow hedges under ASC 815. Gains or losses on commodity derivative contracts accounted for as cash flow hedges are recognized in other comprehensive income on the condensed consolidated balance sheets and, ultimately, when the forecasted transactions are completed in net revenues or cost of materials and other in the condensed consolidated statements of income.
The following table sets forth information relating to our open commodity derivative contracts, excluding our trading derivative contracts (which are discussed separately below), as of June 30, 2024 ($ in millions):
| | | | | | | | | | | | | | | | | | | | | | | | | | | | | |
| | Total Outstanding | | Notional Contract Volume by Year of Maturity |
| Contract Description | | Fair Value | | Notional Contract Volume | | 2024 | 2025 | | | | | | |
| Contracts not designated as hedging instruments: | | | | | | | | | | | | | |
Crude oil price swaps - long (1) | | $ | 0.1 | | | 12,764,000 | | | 12,764,000 | | — | | | | | | | |
Crude oil price swaps - short (1) | | (5.7) | | | 13,559,000 | | | 13,559,000 | | — | | | | | | | |
Inventory, refined product and crack spread swaps - long (1) | | 4.3 | | | 2,951,000 | | | 2,951,000 | | — | | | | | | | |
Inventory, refined product and crack spread swaps - short (1) | | (9.0) | | | 3,909,000 | | | 3,909,000 | | — | | | | | | | |
Natural gas swaps - long (3) | | — | | | 2,002,500 | | | 1,255,000 | | 747,500 | | | | | | | |
Natural gas swaps - short (3) | | (0.2) | | | 2,002,500 | | | 1,255,000 | | 747,500 | | | | | | | |
RINs commitment contracts - long (2) | | (7.2) | | | 50,750,000 | | | 30,750,000 | | 20,000,000 | | | | | | | |
| | | | | | | | | | | | | |
| Total | | $ | (17.7) | | | | | | | | | | | | |
| | | | | | | | | | | | | |
| | | | | | | | | | | | | |
| | | | | | | | | | | | | |
| | | | | | | | | | | | | |
| | | | | | | | | | | | | |
| | | | | | | | | | | | | |
(1) Volume in barrels.
(2) Volume in RINs.
(3) Volume in MMBtu.
Interest Rate Risk
We have market exposure to changes in interest rates relating to our outstanding floating rate borrowings, which totaled approximately $1,270.9 million as of June 30, 2024. The annualized impact of a hypothetical one percent change in interest rates on our floating rate debt outstanding as of June 30, 2024 would be to change interest expense by approximately $12.7 million.
We also have interest rate exposure in connection with our Inventory Intermediation Agreement under which we pay a time value of money charge based on Secured Overnight Financing Rate.
Inflation
Inflationary factors, such as increases in the costs of our inputs, operating expenses, and interest rates may adversely affect our operating results. In addition, current or future governmental policies may increase or decrease the risk of inflation, which could further increase costs and may have an adverse effect on our ability to maintain current levels of gross margin and operating expenses as a percentage of sales if the prices at which we are able to sell our products and services do not increase in line with increases in costs.
Commodity Derivatives Trading Activities
From time to time, we enter into active trading positions in a variety of commodity derivatives, which include forward physical contracts, swap contracts, and futures contracts. These trading activities are undertaken by using a range of contract types in combination to create incremental gains by capitalizing on crude oil supply and pricing seasonality. These contracts are classified as held for trading and are recognized at fair value with changes in fair value recognized in the income statement. We had no outstanding trading commodity derivative contracts as of June 30, 2024.
ITEM 4. CONTROLS AND PROCEDURES
Our disclosure controls and procedures are designed to provide reasonable assurance that the information that we are required to disclose in reports we file under the Exchange Act is accumulated and appropriately communicated to management. We carried out an evaluation required by Rule 13a-15(b) of the Exchange Act, under the supervision and with the participation of our management, including the Chief Executive Officer and Chief Financial Officer, of the effectiveness of the design and operation of our disclosure controls and procedures at the end of the reporting period. Based on that evaluation, the Chief Executive Officer and Chief Financial Officer concluded that our disclosure controls and procedures were effective as of the end of the reporting period.
There have been no changes in our internal control over financial reporting (as defined in Rule 13a-15(f) under the Exchange Act) that occurred during the second quarter of 2024 that have materially affected or are reasonably likely to materially affect our internal control over financial reporting.
Part II - OTHER INFORMATION
ITEM 1. LEGAL PROCEEDINGS
In the ordinary conduct of our business, we are from time to time subject to lawsuits, investigations and claims, including, environmental claims and employee-related matters. Although we cannot predict with certainty the ultimate resolution of lawsuits, investigations and claims asserted against us, including civil penalties or other enforcement actions, we do not believe that any currently pending legal proceeding or proceedings to which we are a party will have a material adverse effect on our business, financial condition or results of operations. See Note 11 to our accompanying condensed consolidated financial statements, which is incorporated by reference in this Item 1, for additional information. Aside from the disclosure updated in Note 11, there have been no material developments to the proceedings previously reported in our Annual Report on Form 10-K filed on February 28, 2024.
ITEM 1A. RISK FACTORS
There were no material changes during the six months ended June 30, 2024 to the risk factors identified in the Company’s fiscal 2023 Annual Report on Form 10-K, except as follows:
Failure to complete the pending sale of the Retail Stores could negatively affect us.
On July 31, 2024, we entered into the Retail Purchase Agreement with a subsidiary of FEMSA, pursuant to which FEMSA will acquire the Retail Stores, which comprise our retail segment and a portion of our corporate, other and eliminations segment, subject to certain customary closing conditions. There is no assurance that the conditions to the completion of the sale of the Retail Stores will be satisfied. In connection with the sale of the Retail Entities, we and our stockholders will be subject to risks, including the following:
•the market price of our common stock may reflect assumptions that the Retail Transaction will occur, and a failure to complete the Retail Transaction could result in a decline in the market price of our common stock;
•if the Retail Transaction is not completed, we may not be able to realize the expected proceeds in a subsequent sale transaction;
•we and/or FEMSA may be unable to obtain the approvals, consents or authorizations required to complete the Retail Transaction;
•the closing of the Retail Transaction may result in disruption to our business and distraction of our management and employees from day-to-day operations because matters related to the Retail Transaction may require substantial commitments of their time and resources, which could adversely affect our business, financial condition, and results of operations;
•pending the closing of the Retail Transaction, the Retail Purchase Agreement restricts us from engaging in certain actions without FEMSA’s consent, which could prevent us from pursuing business opportunities that may arise prior to the closing, and we will be subject to business uncertainties that could affect our business, financial condition, and results of operations;
•uncertainty about the effect of the Retail Transaction may adversely affect our relationships with our employees, customers, suppliers and other persons with whom we have business relationships;
•any event that results in a right for FEMSA to seek indemnity from us could result in a substantial payment from us to FEMSA and could adversely affect our business, financial condition, and results of operations;
•certain costs relating to the Retail Transaction, such as legal and accounting fees, are payable by us whether or not the Retail Transaction is completed, and we could incur additional costs in connection with the Retail Transaction;
•if we successfully complete the Retail Transaction, certain terms of the Retail Purchase Agreement may preclude us from engaging in or pursuing certain business opportunities; and
•if we successfully complete the Retail Transaction, our revenues will decrease accordingly and our business will be subject to an increased concentration of the risks that affect our refining and logistics segments.
We may be unsuccessful in integrating the operations of the assets we have acquired or may acquire with our operations, and in realizing all or any part of the anticipated benefits of any such acquisitions.
From time to time, we evaluate and acquire assets and businesses that we believe complement our existing assets and businesses. Acquisitions may require substantial capital or the incurrence of substantial indebtedness. Our capitalization and results of operations may change significantly as a result of completed or future acquisitions. Acquisitions and business expansions involve numerous risks, including difficulties in the assimilation of the assets and operations of the acquired businesses, inefficiencies and difficulties that arise because of unfamiliarity with new assets and the businesses associated with them, and new geographic areas and the diversion of management's attention from other business concerns. Further, unexpected costs and challenges may arise whenever businesses with different operations or management are combined, and we may experience unanticipated delays in realizing the benefits of an acquisition. Also, following an
acquisition, we may discover previously unknown liabilities associated with the acquired business or assets for which we have no recourse under applicable indemnification provisions.
On August 2, 2024, Delek Logistics entered into the H2O Purchase Agreement for the acquisition of H2O Midstream. Delek Logistics expects the transaction to close by the end of 2024, subject to closing conditions. If these conditions are not satisfied or waived, the acquisition of H2O Midstream will not be consummated. If the closing of the H2O Midstream acquisition is substantially delayed or does not occur at all, or if the terms of the acquisition are required to be modified substantially, we may not realize the anticipated benefits of the acquisition fully or at all, or they may take longer to realize than expected.
The H2O Midstream acquisition will require management to devote significant attention and resources to integrating the H2O Midstream business with our business. Potential difficulties that may be encountered in the integration process include, among others:
•the inability to successfully integrate the H2O Midstream business into our business in a manner that permits us to achieve the revenue and cost savings that we announced as anticipated from the acquisition;
•complexities associated with managing the larger, integrated business;
•potential unknown liabilities and unforeseen expenses, delays or regulatory conditions associated with the acquisition;
•integrating personnel from the two companies while maintaining focus on providing consistent, high-quality products and services;
•loss of key employees;
•integrating relationships with customers, vendors and business partners;
•performance shortfalls at one or both of the companies as a result of the diversion of management’s attention caused by completing the acquisition and integration of H2O Midstream’s operations into Delek Logistics; and
•the disruption in each company’s ongoing business or inconsistencies in standards, controls, procedures and policies.
Furthermore, delays or difficulties in the integration process could adversely affect our business, financial results, financial condition and stock price. Even if we are able to integrate our business operations successfully, there can be no assurance that the integration will result in the realization of the full benefits of synergies, cost savings, innovation and operational efficiencies that we currently expect or have communicated from this integration or that these benefits will be achieved within the anticipated timeframe.
ITEM 5. OTHER INFORMATION
Rule 10b5-1 Trading Plans
During the quarter ended June 30, 2024, none of our directors or officers (as defined in Rule 16a-1 under the Exchange Act) adopted, modified or terminated a "Rule 10b5-1 trading arrangement" or "non-Rule 105b-1 trading arrangement" (as those terms are defined in Item 408 of Regulation S-K).
Intercompany Transactions
On August 5, 2024, the Company and certain of its subsidiaries entered into a series of intercompany transactions with Delek Logistics and certain of its subsidiaries, as described below. The transactions, including the consideration therefor, were negotiated and approved by the Audit Committee of the Board of Directors of the Company, which is comprised solely of independent directors, and by the Conflicts Committee of the Board of Directors of Delek Logistics’ general partner, which is also comprised solely of independent directors. The Board of Directors of the Company engaged Barclays to act as its exclusive financial advisor and Bradley Arant Boult Cummings LLP to act as its legal counsel. The Conflicts Committee engaged Intrepid Partners, LLC to act as its exclusive financial advisor and Gibson, Dunn & Crutcher LLP to act as its legal counsel.
Wink to Webster Contribution
On August 5, 2024, the Company contributed all of its interest in the Wink to Webster pipeline joint venture (the “Contribution”) to Delek Logistics. The Contribution was made pursuant to a Contribution Agreement (the “Contribution Agreement”) between Delek Energy, a wholly-owned subsidiary of the Company, and Delek Logistics. Total consideration for the Contribution was approximately $500 million, subject to post-closing adjustment, comprised of (i) approximately $280 million of joint venture indebtedness, (ii) $68 million in cash, (iii) 2,300,000 newly issued common units of limited partnership interest in Delek Logistics (“common units”) and (iv) cancellation of a $60 million intercompany receivable owed by the Company to Delek Logistics. The Partnership also paid the Company approximately $18.6 million for an additional 0.6% interest in the Wink to Webster pipeline joint venture that was acquired by the Company from a joint venture partner on August 1, 2024, bringing the total interest in the Wink to Webster pipeline joint venture contributed to Delek Logistics to 15.6%.
The Contribution was effected by Delek Energy transferring 100% of the limited liability company interests in Delek Permian Pipeline Holdings, LLC, which holds certain subsidiaries that collectively included joint venture financing entities and the 15.6% Wink to Webster pipeline joint venture interest. The offering and sale of the common units pursuant to the Contribution Agreement are intended to be exempt under the
Securities Act of 1933, as amended (the “Securities Act”), by virtue of the exemption afforded by Section 4(2) and Rule 506 of Regulation D promulgated under the Securities Act and corresponding provisions of state securities or “blue sky” laws.
The foregoing description of the Contribution Agreement is not complete and is qualified in its entirety by reference to the full text of the Contribution Agreement, which is attached as Exhibit 2.1 to this Quarterly Report on Form 10-Q.
Fourth Amended and Restated Omnibus Agreement
On August 5, 2024, the Company and Delek Logistics entered into a Fourth Amended and Restated Omnibus Agreement with certain of their respective subsidiaries (the “Amended Omnibus Agreement”). The Amended Omnibus provides the Company an option to purchase certain critical assets from Delek Logistics at market value during the period beginning upon any change in control or sale of substantially all assets transaction involving Delek Logistics and extending (i) in the case of a transaction involving a third party, for six months following closing, and (ii) for any other transaction, for four years following closing.
The foregoing description of the Amended Omnibus Agreement is not complete and is qualified in its entirety by reference to the full text of the Amended Omnibus Agreement, which is attached as Exhibit 10.1 to this Quarterly Report on Form 10-Q.
Amended and Restated Intercompany Agreements
On August 5, 2024, certain subsidiaries of the Company and Delek Logistics agreed to amend and restate 12 intercompany services agreements as listed below. The amendments, among other things, extend the terms of the respective agreements for up to 7 years, with an option for the Company to extend such agreements for an additional 5 years. Certain of the agreements also have revised financial terms which will phase in over the time periods noted below.
The following is a list of the 12 intercompany services agreements which were amended and restated:
(1)Second Amendment and Restatement of the Throughput and Tankage Agreement (Tyler Terminal and Tankage) between DKTS and Delek Marketing & Supply, LP (“DMS”) – seven year term extension effective July 1, 2024, decrease of throughput and storage fees become effective April 1, 2026;
(2)Amended and Restated Terminalling Services Agreement (Memphis Terminal) between DKTS, Delek Logistics Operating, LLC (“DLO”), and, for limited purposes, Citigroup Energy Inc. (“Citi”) – seven year term extension effective July 1, 2024;
(3)Amended and Restated Terminalling Services Agreement (North Little Rock Terminal) between DKTS, DLO, and, for limited purposes, CEI – seven year term extension effective July 1, 2024;
(4)Amended and Restated Throughput and Tankage Agreement (El Dorado Terminal and Tankage) between DKTS, DLO, and, for limited purposes, Citi – seven year term extension effective July 1, 2024, with decrease of throughput and storage fee to become effective February 1, 2025;
(5)Amended and Restated Throughput Agreement (El Dorado Rail Offloading Facility) between DKTS and DLO – seven year term extension effective July 1, 2024, with decrease of throughput fee and removal of minimum volume commitment to become effective August 1, 2025;
(6)Amended and Restated Tankage Agreement (Tyler Crude Storage Tank 701) between DKTS and Delek Marketing & Supply, LP – seven year term extension effective July 1, 2024, with decrease in storage fees to become effective April 1, 2026;
(7)Second Amended and Restated Services Agreement (Big Sandy Terminal and Pipeline) between DKTS and Delek Marketing-Big Sandy, LLC (“DMBS”) – seven year term extension effective July 1, 2024;
(8)Amended and Restated Pipelines and Storage Facilities Agreement between DKTS, Delek Logistics, SALA Gathering Systems LLC (“SALA”), El Dorado Pipeline Company, LLC (“EDR”), Magnolia Pipeline Company, LLC (“MPC”), and, for limited purposes, Citi – seven year term extension effective July 1, 2024, with decrease of crude oil throughput fees to become effective September 1, 2026;
(9)Amended and Restated Pipelines and Tankage Agreement (East Texas Crude Logistics System) between DKTS and Delek Crude Logistics, LLC – seven year term extension effective July 1, 2024;
(10)Amended and Restated Terminalling Services Agreement (Mt. Pleasant Terminal) between DKTS and DMBS – seven year term extension effective July 1, 2024;
(11)Amended and Restated Services Agreement (Greenville Facility) between DKTS and DMBS – seven year term extension effective July 1, 2024; and
(12)Amended and Restated Slurry Clarifying Services Agreement (Krotz Springs) between DKTS, DLO, and DKE – five year term extension effective July 1, 2024.
Assignment of Big Spring Refinery Marketing Agreement
On August 5, 2024, DKL Big Spring, LLC (“DKL Big Spring”), a subsidiary of Delek Logistics, entered into an assignment and assumption agreement (the “Assignment Agreement”) with Alon USA, LP (“Alon LP”), DKTS, and Delek Logistics Services Company (“DLSC”). Under the Assignment Agreement, DKL Big Spring assigned to DLSC its right, title, and interest in that certain Marketing Agreement dated as of March 1, 2018, as amended to date, and as consideration for such assignment, Alon LP caused 2,500,000 of our common units to be transferred to Delek Logistics from DLSC and subsequently cancelled.
Relationships
Prior to the transaction, the Company owned the general partner interest and a 72.6% limited partnership interest in Delek Logistics. Each of Delek Logistics and the other parties to the Contribution Agreement, Omnibus Agreement, Intercompany Agreements and Assignment Agreement are direct or indirect subsidiaries of the Company. As a result, certain individuals, including officers and directors of the Company, serve as officers and/or directors of more than one of such other entities. Additionally, Delek Logistics and the Company have certain commercial relationships as further described in Delek Logistics’ Annual Report on Form 10-K for the year ended December 31, 2023.
ITEM 6. EXHIBITS
| | | | | | | | | | | |
| Exhibit No. | | Description |
| | | |
| | | |
| | | |
| | | |
| | | |
| * | | |
| | | |
| *# | | |
| | | |
| | | |
| | | |
| **# | | Fourth Amended and Restated Omnibus Agreement dated August 5, 2024, among Delek US Holdings, Inc., Delek Refining, Ltd., Lion Oil Company, LLC, Delek Logistics Partners, LP, Paline Pipeline Company, LLC, SALA Gathering Systems, LLC, Magnolia Pipeline Company, LLC, El Dorado Pipeline Company, LLC, Delek Crude Logistics, LLC, Delek Marketing-Big Sandy, LLC, Delek Marketing & Supply, LP, DKL Transportation, LLC, Delek Logistics Operating, LLC, and Delek Logistics GP, LLC. |
| | | |
| # | | |
| | | |
| # | | |
| | | |
| ## | | |
| | | |
| ## | | |
| | | |
| 101 | | | The following materials from Delek US Holdings, Inc.’s Quarterly Report on Form 10-Q for the quarterly period ended June 30, 2024, formatted in Inline XBRL (eXtensible Business Reporting Language): (i) Condensed Consolidated Balance Sheets as of June 30, 2024 and June 30, 2023 (Unaudited), (ii) Condensed Consolidated Statements of Income for the three and six months ended June 30, 2024 and 2023 (Unaudited), (iii) Condensed Consolidated Statements of Comprehensive Income for the three and six months ended June 30, 2024 and 2023 (Unaudited), (iv) Condensed Consolidated Statements of Changes in Stockholders' Equity for the three and six months ended June 30, 2024 and 2023 (Unaudited), (v) Condensed Consolidated Statements of Cash Flows for the six months ended June 30, 2024 and 2023 (Unaudited), and (vi) Notes to Condensed Consolidated Financial Statements (Unaudited). |
| | | |
| 104 | | | The cover page from Delek US Holdings, Inc.'s Quarterly Report on Form 10-Q for the quarter ended June 30, 2024, has been formatted in Inline XBRL. |
| | | | | | | | |
| | |
| | |
| # | | Filed herewith |
| ## | | Furnished herewith |
| * | | Certain schedules and exhibits have been omitted pursuant to Item 601(b)(2) of Regulation S-K. The Partnership agrees to furnish supplementally a copy of any of the omitted schedules or exhibits upon request by the United States Securities and Exchange Commission, provided, however, that the Partnership may request confidential treatment pursuant to Rule 24b-2 of the Exchange Act, as amended, for any schedules or exhibits so furnished. |
| ** | | Certain of the exhibits and schedules have been omitted in accordance with Regulation S-K Item 601(a)(5). The Partnership agrees to furnish a copy of all omitted exhibits and schedules upon request by the United States Securities and Exchange Commission, provided, however, that the Partnership may request confidential treatment pursuant to Rule 24b-2 of the Exchange Act, as amended, for any schedules or exhibits so furnished. |
SIGNATURES
Pursuant to the requirements of the Securities Exchange Act of 1934, the registrant has duly caused this report to be signed on its behalf by the undersigned, thereunto duly authorized.
| | | | | |
| Delek US Holdings, Inc. |
| |
| By: | /s/ Avigal Soreq |
| | Avigal Soreq |
| | President and Chief Executive Officer
(Principal Executive Officer) |
| |
| By: | /s/ Reuven Spiegel |
| | Reuven Spiegel |
| | Executive Vice President, Chief Financial Officer
(Principal Financial Officer) |
| |
| By: | /s/ Robert Wright |
| Robert Wright |
| Senior Vice President and Deputy Chief Financial Officer
(Principal Accounting Officer) |
| |
Dated: August 7, 2024