UNITED STATES
SECURITIES AND EXCHANGE COMMISSION
Washington, D.C. 20549
FORM
(Mark One)
the Securities Exchange Act of 1934
For the quarterly period ended
OR
the Securities Exchange Act of 1934
For the transition period from ______ to ______
Commission file number:
NCS Multistage Holdings, Inc.
(Exact name of registrant as specified in its charter)
| | | |||
| (State or other jurisdiction of incorporation or organization) | (IRS Employer Identification number) | |||
| | ||||
| | | |||
| (Address of principal executive offices) | (Zip Code) |
Registrant’s telephone number, including area code: (
Securities registered pursuant to Section 12(b) of the Act:
| Title of each class | Trading Symbol(s) | Name of each exchange on which registered |
| | | |
Indicate by check mark whether the registrant (1) has filed all reports required to be filed by Section 13 or 15(d) of the Securities Exchange Act of 1934 during the preceding 12 months (or for such shorter period that the registrant was required to file such reports), and (2) has been subject to such filing requirements for the past 90 days.
Indicate by check mark whether the registrant has submitted electronically every Interactive Data File required to be submitted pursuant to Rule 405 of Regulation S-T (§232.405 of this chapter) during the preceding 12 months (or for such shorter period that the registrant was required to submit such files).
Indicate by check mark whether the registrant is a large accelerated filer, an accelerated filer, a non-accelerated filer, a smaller reporting company, or an emerging growth company. See the definitions of “large accelerated filer,” “accelerated filer,” “smaller reporting company,” and “emerging growth company” in Rule 12b-2 of the Exchange Act.
| Large accelerated filer | ☐ | Accelerated filer | ☐ | ||
| | ☑ | Smaller reporting company | | ||
| Emerging growth company | |
If an emerging growth company, indicate by check mark if the registrant has elected not to use the extended transition period for complying with any new or revised financial accounting standards provided pursuant to Section 13(a) of the Exchange Act. ☐
Indicate by check mark whether the registrant is a shell company (as defined in Rule 12b-2 of the Act). Yes
As of July 30, 2024, there were
| Page |
||
| Item 1. |
||
| Notes to Unaudited Condensed Consolidated Financial Statements |
||
| Item 2. |
Management’s Discussion and Analysis of Financial Condition and Results of Operations |
|
| Item 3. |
||
| Item 4. |
||
| Item 1. |
||
| Item 1A. |
||
| Item 5. | Other Information | 31 |
| Item 6. |
||
CONDENSED CONSOLIDATED BALANCE SHEETS
(In thousands, except share data)
(Unaudited)
| June 30, | December 31, | |||||||
| 2024 | 2023 | |||||||
| Assets | ||||||||
| Current assets | ||||||||
| Cash and cash equivalents | $ | $ | ||||||
| Accounts receivable—trade, net | ||||||||
| Inventories, net | ||||||||
| Prepaid expenses and other current assets | ||||||||
| Other current receivables | ||||||||
| Insurance receivable | ||||||||
| Total current assets | ||||||||
| Noncurrent assets | ||||||||
| Property and equipment, net | ||||||||
| Goodwill | ||||||||
| Identifiable intangibles, net | ||||||||
| Operating lease assets | ||||||||
| Deposits and other assets | ||||||||
| Deferred income taxes, net | ||||||||
| Total noncurrent assets | ||||||||
| Total assets | $ | $ | ||||||
| Liabilities and Stockholders’ Equity | ||||||||
| Current liabilities | ||||||||
| Accounts payable—trade | $ | $ | ||||||
| Accrued expenses | ||||||||
| Income taxes payable | ||||||||
| Operating lease liabilities | ||||||||
| Accrual for legal contingencies | ||||||||
| Current maturities of long-term debt | ||||||||
| Other current liabilities | ||||||||
| Total current liabilities | ||||||||
| Noncurrent liabilities | ||||||||
| Long-term debt, less current maturities | ||||||||
| Operating lease liabilities, long-term | ||||||||
| Other long-term liabilities | ||||||||
| Deferred income taxes, net | ||||||||
| Total noncurrent liabilities | ||||||||
| Total liabilities | ||||||||
| Commitments and contingencies (Note 10) | ||||||||
| Stockholders’ equity | ||||||||
| Preferred stock, $ par value, shares authorized, shares issued and outstanding at June 30, 2024 and December 31, 2023 | ||||||||
| Common stock, $ par value, shares authorized, shares issued and shares outstanding at June 30, 2024 and shares issued and shares outstanding at December 31, 2023 | ||||||||
| Additional paid-in capital | ||||||||
| Accumulated other comprehensive loss | ( | ) | ( | ) | ||||
| Retained deficit | ( | ) | ( | ) | ||||
| Treasury stock, at cost, shares at June 30, 2024 and shares at December 31, 2023 | ( | ) | ( | ) | ||||
| Total stockholders' equity | ||||||||
| Non-controlling interest | ||||||||
| Total equity | ||||||||
| Total liabilities and stockholders' equity | $ | $ | ||||||
The accompanying notes are an integral part of these condensed consolidated financial statements.
CONDENSED CONSOLIDATED STATEMENTS OF OPERATIONS
(In thousands, except per share data)
(Unaudited)
| Three Months Ended |
Six Months Ended |
|||||||||||||||
| June 30, |
June 30, |
|||||||||||||||
| 2024 |
2023 |
2024 |
2023 |
|||||||||||||
| Revenues |
||||||||||||||||
| Product sales |
$ | $ | $ | $ | ||||||||||||
| Services |
||||||||||||||||
| Total revenues |
||||||||||||||||
| Cost of sales |
||||||||||||||||
| Cost of product sales, exclusive of depreciation and amortization expense shown below |
||||||||||||||||
| Cost of services, exclusive of depreciation and amortization expense shown below |
||||||||||||||||
| Total cost of sales, exclusive of depreciation and amortization expense shown below |
||||||||||||||||
| Selling, general and administrative expenses |
||||||||||||||||
| Depreciation |
||||||||||||||||
| Amortization |
||||||||||||||||
| Loss from operations |
( |
) | ( |
) | ( |
) | ( |
) | ||||||||
| Other income (expense) |
||||||||||||||||
| Interest expense, net |
( |
) | ( |
) | ( |
) | ( |
) | ||||||||
| Provision for litigation, net of recoveries |
( |
) | ( |
) | ||||||||||||
| Other income, net |
||||||||||||||||
| Foreign currency exchange (loss) gain |
( |
) | ( |
) | ||||||||||||
| Total other income (expense) |
( |
) | ( |
) | ||||||||||||
| (Loss) income before income tax |
( |
) | ( |
) | ( |
) | ||||||||||
| Income tax expense |
||||||||||||||||
| Net loss |
( |
) | ( |
) | ( |
) | ( |
) | ||||||||
| Net income attributable to non-controlling interest |
||||||||||||||||
| Net loss attributable to NCS Multistage Holdings, Inc. |
$ | ( |
) | $ | ( |
) | $ | ( |
) | $ | ( |
) | ||||
| Loss per common share |
||||||||||||||||
| Basic loss per common share attributable to NCS Multistage Holdings, Inc. |
$ | ( |
) | $ | ( |
) | $ | ( |
) | $ | ( |
) | ||||
| Diluted loss per common share attributable to NCS Multistage Holdings, Inc. |
$ | ( |
) | $ | ( |
) | $ | ( |
) | $ | ( |
) | ||||
| Weighted average common shares outstanding |
||||||||||||||||
| Basic |
||||||||||||||||
| Diluted |
||||||||||||||||
The accompanying notes are an integral part of these condensed consolidated financial statements.
CONDENSED CONSOLIDATED STATEMENTS OF COMPREHENSIVE LOSS
(In thousands)
(Unaudited)
| Three Months Ended | Six Months Ended | |||||||||||||||
| June 30, | June 30, | |||||||||||||||
| 2024 | 2023 | 2024 | 2023 | |||||||||||||
| Net loss | $ | ( | ) | $ | ( | ) | $ | ( | ) | $ | ( | ) | ||||
| Foreign currency translation adjustments, net of tax of $ | ( | ) | ( | ) | ||||||||||||
| Comprehensive loss | ( | ) | ( | ) | ( | ) | ( | ) | ||||||||
| Less: Comprehensive income attributable to non-controlling interest | ||||||||||||||||
| Comprehensive loss attributable to NCS Multistage Holdings, Inc. | $ | ( | ) | $ | ( | ) | $ | ( | ) | $ | ( | ) | ||||
The accompanying notes are an integral part of these condensed consolidated financial statements.
CONDENSED CONSOLIDATED STATEMENTS OF STOCKHOLDERS’ EQUITY
(In thousands, except share data)
(Unaudited)
| Three and Six Months Ended June 30, 2024 |
||||||||||||||||||||||||||||||||||||||||||||
| Preferred Stock |
Common Stock |
Additional |
Accumulated |
Retained |
Treasury Stock |
Non-controlling |
Total |
|||||||||||||||||||||||||||||||||||||
| Shares |
Amount |
Shares |
Amount |
Capital |
Loss |
Deficit |
Shares |
Amount |
Interest |
Equity |
||||||||||||||||||||||||||||||||||
| Balances as of December 31, 2023 |
$ | $ | $ | $ | ( |
) | $ | ( |
) | ( |
) | $ | ( |
) | $ | $ | ||||||||||||||||||||||||||||
| Share-based compensation |
— | — | — | |||||||||||||||||||||||||||||||||||||||||
| Net income |
— | — | — | |||||||||||||||||||||||||||||||||||||||||
| Distribution to noncontrolling interest |
— | — | — | ( |
) | ( |
) | |||||||||||||||||||||||||||||||||||||
| Vesting of restricted stock |
||||||||||||||||||||||||||||||||||||||||||||
| Shares withheld |
( |
) | ( |
) | ( |
) | ||||||||||||||||||||||||||||||||||||||
| Currency translation adjustment |
— | — | ( |
) | — | ( |
) | |||||||||||||||||||||||||||||||||||||
| Balances as of March 31, 2024 |
$ | $ | $ | $ | ( |
) | $ | ( |
) | ( |
) | $ | ( |
) | $ | $ | ||||||||||||||||||||||||||||
| Share-based compensation |
— | — | — | |||||||||||||||||||||||||||||||||||||||||
| Net (loss) income |
— | — | ( |
) | — | ( |
) | |||||||||||||||||||||||||||||||||||||
| Release of restricted stock |
( |
) | ||||||||||||||||||||||||||||||||||||||||||
| Currency translation adjustment |
— | — | ( |
) | — | ( |
) | |||||||||||||||||||||||||||||||||||||
| Balances as of June 30, 2024 |
$ | $ | $ | $ | ( |
) | $ | ( |
) | ( |
) | $ | ( |
) | $ | $ | ||||||||||||||||||||||||||||
| Three and Six Months Ended June 30, 2023 |
||||||||||||||||||||||||||||||||||||||||||||
| Preferred Stock |
Common Stock |
Additional |
Accumulated |
Retained |
Treasury Stock |
Non-controlling |
Total |
|||||||||||||||||||||||||||||||||||||
| Shares |
Amount |
Shares |
Amount |
Capital |
Loss |
Deficit |
Shares |
Amount |
Interest |
Equity |
||||||||||||||||||||||||||||||||||
| Balances as of December 31, 2022 |
$ | $ | $ | $ | ( |
) | $ | ( |
) | ( |
) | $ | ( |
) | $ | $ | ||||||||||||||||||||||||||||
| Share-based compensation |
— | — | — | |||||||||||||||||||||||||||||||||||||||||
| Net loss |
— | — | ( |
) | — | ( |
) | ( |
) | |||||||||||||||||||||||||||||||||||
| Vesting of restricted stock |
( |
) | ||||||||||||||||||||||||||||||||||||||||||
| Shares withheld |
( |
) | ( |
) | ( |
) | ||||||||||||||||||||||||||||||||||||||
| Currency translation adjustment |
— | — | ( |
) | — | ( |
) | |||||||||||||||||||||||||||||||||||||
| Balances as of March 31, 2023 |
$ | $ | $ | $ | ( |
) | $ | ( |
) | ( |
) | $ | ( |
) | $ | $ | ||||||||||||||||||||||||||||
| Share-based compensation |
— | — | — | |||||||||||||||||||||||||||||||||||||||||
| Net (loss) income |
— | — | ( |
) | — | ( |
) | |||||||||||||||||||||||||||||||||||||
| Currency translation adjustment |
— | — | — | |||||||||||||||||||||||||||||||||||||||||
| Balances as of June 30, 2023 |
$ | $ | $ | $ | ( |
) | $ | ( |
) | ( |
) | $ | ( |
) | $ | $ | ||||||||||||||||||||||||||||
The accompanying notes are an integral part of these condensed consolidated financial statements.
CONDENSED CONSOLIDATED STATEMENTS OF CASH FLOWS
(In thousands)
(Unaudited)
| Six Months Ended |
||||||||
| June 30, |
||||||||
| 2024 |
2023 |
|||||||
| Cash flows from operating activities |
||||||||
| Net loss |
$ | ( |
) | $ | ( |
) | ||
| Adjustments to reconcile net loss to net cash provided by (used in) operating activities: |
||||||||
| Depreciation and amortization |
||||||||
| Amortization of deferred loan costs |
||||||||
| Share-based compensation |
||||||||
| Provision for inventory obsolescence |
||||||||
| Deferred income tax expense |
||||||||
| Gain on sale of property and equipment |
( |
) | ( |
) | ||||
| (Recovery of) provision for credit losses |
( |
) | ||||||
| Provision for litigation, net of recoveries |
||||||||
| Net foreign currency unrealized loss (gain) |
( |
) | ||||||
| Proceeds from note receivable |
||||||||
| Changes in operating assets and liabilities: |
||||||||
| Accounts receivable—trade |
( |
) | ||||||
| Inventories, net |
( |
) | ( |
) | ||||
| Prepaid expenses and other assets |
( |
) | ||||||
| Accounts payable—trade |
||||||||
| Accrued expenses |
( |
) | ||||||
| Other liabilities |
( |
) | ( |
) | ||||
| Income taxes receivable/payable |
( |
) | ||||||
| Net cash provided by (used in) operating activities |
( |
) | ||||||
| Cash flows from investing activities |
||||||||
| Purchases of property and equipment |
( |
) | ( |
) | ||||
| Purchase and development of software and technology |
( |
) | ( |
) | ||||
| Proceeds from sales of property and equipment |
||||||||
| Net cash used in investing activities |
( |
) | ( |
) | ||||
| Cash flows from financing activities |
||||||||
| Payments on finance leases |
( |
) | ( |
) | ||||
| Line of credit borrowings |
||||||||
| Payments of line of credit borrowings |
( |
) | ( |
) | ||||
| Treasury shares withheld |
( |
) | ( |
) | ||||
| Distribution to noncontrolling interest |
( |
) | ||||||
| Net cash used in financing activities |
( |
) | ( |
) | ||||
| Effect of exchange rate changes on cash and cash equivalents |
( |
) | ( |
) | ||||
| Net change in cash and cash equivalents |
( |
) | ||||||
| Cash and cash equivalents beginning of period |
||||||||
| Cash and cash equivalents end of period |
$ | $ | ||||||
| Noncash investing and financing activities |
||||||||
| Assets obtained in exchange for new finance lease liabilities |
$ | $ | ||||||
| Assets obtained in exchange for new operating lease liabilities |
$ | $ | ||||||
The accompanying notes are an integral part of these condensed consolidated financial statements.
Nature of Business
NCS Multistage Holdings, Inc., a Delaware corporation, through its wholly owned subsidiaries and subsidiaries for which it has a controlling voting interest (collectively referred to as the “Company,” “NCS,” “we,” “our” and “us”), is primarily engaged in providing engineered products and support services for oil and natural gas well construction, well completions and field development strategies. We offer our products and services primarily to exploration and production companies for use both in onshore and offshore wells. We operate through service facilities principally located in Houston and Odessa, Texas; Tulsa, Oklahoma; Calgary, Red Deer, Grande Prairie and Estevan, Canada; Neuquén, Argentina and Stavanger, Norway.
Basis of Presentation
Our accompanying condensed consolidated financial statements have been prepared in accordance with accounting principles generally accepted in the United States (“GAAP”) for interim financial information and with the instructions to Form 10-Q and Article 8 of Regulation S-X of the Securities Exchange Act of 1934, as amended, issued by the Securities Exchange Commission (“SEC”) and have not been audited by our independent registered public accounting firm. Certain information and footnote disclosures normally included in financial statements prepared in accordance with GAAP have been condensed or omitted. These condensed consolidated financial statements should be read in conjunction with our financial statements and related notes thereto included in our Annual Report on Form 10-K for the year ended December 31, 2023 (“Annual Report”). We consolidate Repeat Precision, LLC and its subsidiary (“Repeat Precision”), a
Significant Accounting Policies
Our significant accounting policies are described in “Note 2. Summary of Significant Accounting Policies” in our Annual Report.
Recent Accounting Pronouncements
In December 2023, the FASB issued ASU No. 2023-09, Income Taxes (Topic 740): Improvements to Income Tax Disclosures. This ASU improves income tax disclosures including a requirement for specific categories in the effective tax rate reconciliation, additional information for reconciling items that meet a quantitative threshold, certain disclosures pertaining to income taxes paid (net of refunds received) and amendments to other disclosure requirements. The new standard is effective for fiscal years beginning after December 15, 2024 and should be applied prospectively although retrospective application is permitted. Early adoption is also permitted for financial statements that have not yet been issued. We are currently evaluating the impact of the adoption of this guidance.
In November 2023, the FASB issued ASU No. 2023-07, Segment Reporting (Topic 280): Improvements to Reportable Segment Disclosures. This ASU improves reportable segment disclosure requirements on an annual and interim basis and includes requirements for entities with a single reportable segment. The improvements include disclosure of significant segment expenses that are regularly provided to the chief operating decision maker (“CODM”), the title and position of the CODM and an explanation of how the CODM uses the reported measure of segment profit or loss in assessing performance and allocating resources, as well as other disclosure requirements. The new standard is effective for fiscal years beginning after December 15, 2023, and interim periods within fiscal years beginning after December 15, 2024, and should be applied retrospectively. Early adoption is permitted. We are currently evaluating the impact of the adoption of this guidance.
Note 2. Segment and Geographic Information
We have determined that we operate in reportable segment that has been identified based on how our chief operating decision maker manages our business.
We aggregate revenue for presentation based on qualitative factors including the nature of the products and services, the nature and commonality of production processes, a shared customer base primarily in North America, the scope of geographic operations and a common industry and regulatory environment. However, we present revenue on a geographic basis, segregated between product sale and service revenues.
The following table summarizes revenue by geographic area attributed based on the current billing address of the customer (in thousands):
| Three Months Ended | Six Months Ended | ||||||||||
| June 30, | June 30, | ||||||||||
| 2024 | 2023 | 2024 | 2023 | ||||||||
| United States | |||||||||||
| Product sales | $ | $ | $ | $ | |||||||
| Services | |||||||||||
| Total United States | |||||||||||
| Canada | |||||||||||
| Product sales | |||||||||||
| Services | |||||||||||
| Total Canada | |||||||||||
| Other Countries | |||||||||||
| Product sales | |||||||||||
| Services | |||||||||||
| Total other countries | |||||||||||
| Total | |||||||||||
| Product sales | |||||||||||
| Services | |||||||||||
| Total revenues | $ | $ | $ | $ | |||||||
Note 3. Revenues
Disaggregation of Revenue
We sell our products and services primarily in North America and in selected international markets. See above "Note 2. Segment and Geographic Information" for our disaggregated revenue by geographic area.
Contract Balances
If the timing of the delivery of products and provision of services is different from the timing of the customer payments, we recognize either a contract asset (performance precedes contractual due date in connection with estimates of variable consideration) or a contract liability (customer payment precedes performance) on our condensed consolidated balance sheet.
The following table presents the current contract liabilities as of June 30, 2024 and December 31, 2023 (in thousands):
| Balance at December 31, 2023 | $ | |||
| Additions | ||||
| Revenue recognized | ( | ) | ||
| Balance at June 30, 2024 | $ |
We currently do have any contract assets or non-current contract liabilities. Our contract liability as of June 30, 2024 and December 31, 2023 is included in other current liabilities on the condensed consolidated balance sheets. Our performance obligations for our product and services revenues are typically satisfied before the customer’s payment; however, prepayments may occasionally be required. Revenue recognized from the contract liability balance was $
Practical Expedient
We do not disclose the value of unsatisfied performance obligations when the related contract has a duration of one year or less. We recognize revenue equal to what we have the right to invoice when that amount corresponds directly with the value to the customer of our performance to date.
Note 4. Inventories, net
Inventories consist of the following as of June 30, 2024 and December 31, 2023 (in thousands):
| June 30, | December 31, | |||||||
| 2024 | 2023 | |||||||
| Raw materials | $ | $ | ||||||
| Work in process | ||||||||
| Finished goods | ||||||||
| Total inventories, net | $ | $ | ||||||
Note 5. Other Current Receivables
Other current receivables consist of the following as of June 30, 2024 and December 31, 2023 (in thousands):
| June 30, | December 31, | |||||||
| 2024 | 2023 | |||||||
| Current income tax receivables | $ | $ | ||||||
| Employee receivables | ||||||||
| Other receivables | ||||||||
| Total other current receivables | $ | $ | ||||||
Employee receivables primarily consist of amounts paid by us for foreign withholding tax paid on behalf of employees working on international assignments, which is expected to be reimbursed to us by the employees when refunded as foreign tax credits on their home-country tax returns. As of June 30, 2024 and December 31, 2023, a component of the other receivables balance is $
Note 6. Property and Equipment
Property and equipment by major asset class consist of the following as of June 30, 2024 and December 31, 2023 (in thousands):
| June 30, | December 31, | |||||||
| 2024 | 2023 | |||||||
| Land | $ | $ | ||||||
| Building and improvements | ||||||||
| Machinery and equipment | ||||||||
| Computers and software | ||||||||
| Furniture and fixtures | ||||||||
| Vehicles | ||||||||
| Right of use assets - finance leases | ||||||||
| Service equipment | ||||||||
| Less: Accumulated depreciation and amortization | ( | ) | ( | ) | ||||
| Construction in progress | ||||||||
| Property and equipment, net | $ | $ | ||||||
The following table presents the depreciation expense associated with the respective income statement line items for the three and six months ended June 30, 2024 and 2023 (in thousands):
| Three Months Ended | Six Months Ended | |||||||||||||||
| June 30, | June 30, | |||||||||||||||
| 2024 | 2023 | 2024 | 2023 | |||||||||||||
| Cost of sales | ||||||||||||||||
| Cost of product sales | $ | $ | $ | $ | ||||||||||||
| Cost of services | ||||||||||||||||
| Selling, general and administrative expenses | ||||||||||||||||
| Total depreciation | $ | $ | $ | $ | ||||||||||||
We evaluate our property and equipment for impairment whenever changes in circumstances indicate that the carrying amount of an asset group may not be recoverable. We determined there were no triggering events that indicated potential impairment of our property and equipment for the three and six months ended June 30, 2024 and 2023, and accordingly
Note 7. Goodwill and Identifiable Intangibles
The carrying amount of goodwill is summarized as follows (in thousands):
| June 30, | December 31, | |||||||
| 2024 | 2023 | |||||||
| Gross value | $ | $ | ||||||
| Accumulated impairment | ( | ) | ( | ) | ||||
| Net | $ | $ | ||||||
We perform an annual impairment analysis of goodwill as of December 31, or whenever there is a triggering event that indicates an impairment loss may have been incurred. As of June 30, 2024 and 2023, we did not identify any triggering events for Repeat Precision, our only reportable unit with goodwill, that would indicate potential impairment. Therefore,
Identifiable intangibles by major asset class consist of the following (in thousands):
| June 30, 2024 | |||||||||||||
| Estimated | Gross | ||||||||||||
| Useful | Carrying | Accumulated | Net | ||||||||||
| Lives (Years) | Amount | Amortization | Balance | ||||||||||
| Technology | | $ | $ | ( | ) | $ | |||||||
| Customer relationships | | ( | ) | ||||||||||
| Total amortizable intangible assets | ( | ) | |||||||||||
| Technology - not subject to amortization | Indefinite | — | |||||||||||
| Total identifiable intangibles | $ | $ | ( | ) | $ | ||||||||
| December 31, 2023 | |||||||||||||
| Estimated | Gross | ||||||||||||
| Useful | Carrying | Accumulated | Net | ||||||||||
| Lives (Years) | Amount | Amortization | Balance | ||||||||||
| Technology | | $ | $ | ( | ) | $ | |||||||
| Customer relationships | | ( | ) | ||||||||||
| Total amortizable intangible assets | ( | ) | |||||||||||
| Technology - not subject to amortization | Indefinite | — | |||||||||||
| Total identifiable intangibles | $ | $ | ( | ) | $ | ||||||||
Total amortization expense, which is associated with selling, general and administrative expenses on the condensed consolidated statements of operations, was $
Identifiable intangibles are tested for impairment whenever events or changes in circumstances indicate that their carrying amount may not be recoverable. As of June 30, 2024 and 2023, we evaluated potential triggering events and determined that there were no triggering events which indicated potential impairment of our intangibles, which are substantially related to our Repeat Precision asset group. Therefore, we did record any impairment charges related to our identifiable intangibles for the three and six months ended June 30, 2024 and 2023.
Note 8. Accrued Expenses
Accrued expenses consist of the following as of June 30, 2024 and December 31, 2023 (in thousands):
| June 30, | December 31, | |||||||
| 2024 | 2023 | |||||||
| Accrued payroll and bonus | $ | $ | ||||||
| Property and franchise taxes accrual | ||||||||
| Severance and other termination benefits | ||||||||
| Accrued other miscellaneous liabilities | ||||||||
| Total accrued expenses | $ | $ | ||||||
As previously disclosed in our Annual Report, we implemented certain restructuring efforts during 2023 to streamline our tracer diagnostics operations in the United States, consolidate Repeat Precision facilities in Mexico, and eliminate redundancies in the structure of certain U.S. and international operations management and support functions. In addition, in July 2023, an executive officer and NCS agreed that he would leave his position. In connection with these restructuring efforts, we incurred severance and other charges of $
In June 2024, we entered into a sublease agreement as the lessor of a portion of the space associated with a U.S. facility closed during our 2023 restructuring efforts. This sublease covers the remaining 28-month lease term. We will apply the sublease rental income to offset the operating lease expense associated with this facility.
Note 9. Debt
Our long-term debt consists of the following as of June 30, 2024 and December 31, 2023 (in thousands):
| June 30, | December 31, | |||||||
| 2024 | 2023 | |||||||
| ABL Facility | $ | $ | ||||||
| Repeat Precision Promissory Note | ||||||||
| Finance leases | ||||||||
| Total debt | ||||||||
| Less: current portion | ( | ) | ( | ) | ||||
| Long-term debt | $ | $ | ||||||
The estimated fair value of total debt as of June 30, 2024 and December 31, 2023 was $
Below is a description of our financing arrangements.
ABL Facility
On May 3, 2022, we entered into a secured asset-based revolving credit facility (the “ABL Facility”) under which credit availability is subject to a borrowing base calculation. The ABL Facility is governed by the Credit Agreement dated as of May 3, 2022, by and between NCS Multistage Holdings, Inc. (“NCSH”), Pioneer Investment, Inc. (“Pioneer”), NCS Multistage, LLC, NCS Multistage Inc. (“NCS Canada”), the other loan parties thereto, the lenders party thereto, and JPMorgan Chase Bank, N.A., as administrative agent and as a lender under the facility provided therein (the “Credit Agreement”). Concurrent with the entry into our Credit Agreement on May 3, 2022, our prior ABL facility was terminated. On April 16, 2024, we amended the Credit Agreement to modify the benchmark that may be used for loans in Canadian dollars in connection with the cessation of the CDOR Rate and transition to the CORRA Rate.
The ABL Facility consists of a revolving credit facility in an aggregate principal amount of $
Borrowings under the ABL Facility may be made in U.S. dollars with interest calculated using either the “ABR”, the “Adjusted Daily Simple SOFR” or the “Adjusted Term SOFR Rate”, and in Canadian dollars with interest calculated using the “Canadian Prime Rate” or the “Adjusted Term CORRA Rate” (each as defined in the amended and restated Credit Agreement). Borrowings bear interest plus a margin that varies depending on our leverage ratio as follows: (i) for ABR based loans, between
The obligations of the borrowers under the ABL Facility are guaranteed by NCSH and each of our U.S. and Canadian subsidiaries (other than Repeat Precision), as well as each of our future direct and indirect subsidiaries organized under the laws of the United States or Canada (subject to certain exceptions), and are secured by substantially all of the assets of NCSH and its subsidiaries, in each case, subject to certain exceptions and permitted liens.
The Credit Agreement requires, as a condition to borrowing, that available cash on hand after borrowings does not exceed $
The Credit Agreement includes customary events of default for facilities of this type (with customary materiality thresholds and grace periods, as applicable). If an event of default occurs, the lenders party to the Credit Agreement may elect (after the expiration of any applicable notice or grace periods) to declare all outstanding borrowings under such facility, together with accrued and unpaid interest and other amounts payable thereunder, to be immediately due and payable. The lenders party to the Credit Agreement also have the right upon an event of default thereunder to terminate any commitments to provide further borrowings, or to provide additional financing in excess of the borrowing base limit, or to proceed against the collateral securing the ABL Facility.
We capitalized direct costs of $
Repeat Precision Promissory Note
On February 16, 2018, Repeat Precision entered into a promissory note with Security State Bank & Trust, Fredericksburg (the “Repeat Precision Promissory Note”). The Repeat Precision Promissory Note had been renewed several times. In May 2024, the Repeat Precision Promissory Note was again renewed with a reduced aggregate borrowing capacity of $
Finance Leases
We lease assets under finance lease arrangements including an office and laboratory in Tulsa, Oklahoma, as well as facilities in Odessa, Texas, and certain operating equipment and software. We also maintain a vehicle leasing arrangement with a fleet management company through which we lease light vehicles and trucks that meet the finance lease criteria.
Note 10. Commitments and Contingencies
Litigation
In the ordinary course of our business, from time to time, we have various claims, lawsuits and administrative proceedings that are pending or threatened with respect to commercial, intellectual property and employee matters.
Texas Matter
NCS was a defendant in a lawsuit in the District Court of Winkler County, Texas (the “Texas Matter”) that was settled in December 2023, where the insurance carrier agreed to pay the mutually-agreed settlement amounts to the plaintiff in settlement of all liabilities, resulting in no cash payments by NCS. The lawsuit was filed in September 2019 by plaintiffs Boyd & McWilliams Energy Group, Inc. et. al. claiming damage to their wells in 2018 resulting from an alleged product defect related to components provided by a third-party supplier. In May 2023, a jury awarded damages against us to the plaintiff, and a judgment was rendered, above our initial expectations from the jury verdict, awarding the plaintiff total damages of $
Wyoming Matter
NCS was a defendant in a lawsuit in a state district court in Wyoming, which settled in August 2023 (the “Wyoming Matter”). The claim related to an alleged service issue by our personnel during completions operations. The parties agreed to a settlement that included a payment to the plaintiff of $
As of June 30, 2023, we accrued a provision for the Wyoming Matter of $
Canada Patent Matters
● On July 24, 2018, we filed a patent infringement lawsuit seeking unspecified damages against Kobold Corporation, Kobold Completions Inc. and 2039974 Alberta Ltd. (“Kobold”) in the Federal Court of Canada (“Canada Court”), alleging that Kobold’s fracturing tools and methods infringe on several of our Canadian patents. On July 12, 2019, Kobold filed a counterclaim seeking unspecified damages alleging that our fracturing tools and methods infringe on their patent. The patent infringement litigation against Kobold and their counterclaim was heard in early 2022.
On October 10, 2023, the judge rendered a decision against us holding that our asserted patents are invalid and that we are infringing the Kobold asserted patent. The Canada Court ordered us to pay Kobold approximately $
We believe that applicable law supports strong grounds to appeal the decision by the Canada Court as well as to reduce the costs award significantly. We have appealed the judgment and believe we have strong arguments that may lead to a reversal of substantial portions of the decision, although a loss may be reasonably possible. We expect the appeal to be heard by late 2024, and a decision granted by mid-2025. If we do not prevail in the appeal phase, the damages portion would then be decided by the Canada Court and we do not know what damages, if any, will be awarded to Kobold. We would expect any damages awarded to be more modest because of the relative ease and minimal cost in implementing changes to our product to comply with the injunction, with such changes resulting in no significant commercial impact to date. In July 2024, Kobold filed a motion with the Canada Court regarding the scope of the injunction. If the Canada Court agrees with Kobold, it may impose a fine or other remedy against the Company.
● On April 6, 2020, Kobold filed a separate patent infringement lawsuit seeking unspecified damages against us in the Canada Court, alleging that our fracturing tools infringe on their Canadian patents. We believe we have strong arguments of invalidity and non-infringement in this matter. This patent infringement litigation has not yet been assigned a trial date.
In connection with our patent infringement jury verdict against Nine Energy Services, Inc. (“Nine”), in January 2022 in the Western District of Texas, Waco Division (“Waco District Court”) the jury awarded NCS approximately $
In accordance with GAAP, we accrue for contingencies where the occurrence of a material loss is probable and can be reasonably estimated. Our legal contingencies may increase or decrease, on a matter-by-matter basis, to account for future developments. Although the outcome of any legal proceeding cannot be predicted with any certainty, our assessment of the likely outcome of litigation matters is based on our judgment of a number of factors, including experience with similar matters, past history, precedents, relevant financial information and other evidence and facts specific to each matter.
Note 11. Share-Based Compensation
During the six months ended June 30, 2024, we granted
During the six months ended June 30, 2024, we granted
In addition, during the six months ended June 30, 2024, we granted
Total share-based compensation expense for all awards was $
Note 12. Income Taxes
The computation of the annual estimated effective tax rate at each interim period requires certain estimates and assumptions including, but not limited to, the expected operating income (or loss) for the year, projections of the proportion of income (or loss) earned and taxed in foreign jurisdictions, permanent and temporary differences and the likelihood of recovering deferred tax assets generated in the current year. The accounting estimates used to compute the provision for income taxes may change as new events occur, more experience is acquired or additional information is obtained. The computation of the annual estimated effective tax rate includes applicable modifications, which were projected for the year, such as certain book expenses not deductible for tax, tax credits and foreign deemed dividends.
Our effective tax rate (“ETR”) from continuing operations was (
Note 13. Loss Per Common Share
The following table presents the reconciliation of the numerator and denominator for calculating loss per common share (in thousands, except per share data):
| Three Months Ended |
Six Months Ended |
|||||||||||||||
| June 30, |
June 30, |
|||||||||||||||
| 2024 |
2023 |
2024 |
2023 |
|||||||||||||
| Numerator |
||||||||||||||||
| Net loss |
$ | ( |
) | $ | ( |
) | $ | ( |
) | $ | ( |
) | ||||
| Less: income attributable to non-controlling interest |
||||||||||||||||
| Net loss attributable to NCS Multistage Holdings, Inc. |
$ | ( |
) | $ | ( |
) | $ | ( |
) | $ | ( |
) | ||||
| Denominator |
||||||||||||||||
| Basic weighted average number of shares |
||||||||||||||||
| Dilutive effect of stock options, RSUs and PSUs |
||||||||||||||||
| Diluted weighted average number of shares |
||||||||||||||||
| Loss per common share |
||||||||||||||||
| Basic |
$ | ( |
) | $ | ( |
) | $ | ( |
) | $ | ( |
) | ||||
| Diluted |
$ | ( |
) | $ | ( |
) | $ | ( |
) | $ | ( |
) | ||||
| Potentially dilutive securities excluded as anti-dilutive |
||||||||||||||||
Item 2. Management’s Discussion and Analysis of Financial Condition and Results of Operations
The following discussion and analysis of our financial condition and results of operations should be read together with our financial statements and the related notes thereto included in this Quarterly Report on Form 10-Q (“Quarterly Report”) and with our audited financial statements and the related notes thereto included in our Annual Report on Form 10-K (“Annual Report”), filed with the Securities and Exchange Commission (the “SEC”). This discussion and analysis contains forward-looking statements regarding the industry outlook, estimates and assumptions concerning events and financial and industry trends that may affect our future results of operations or financial condition and other non-historical statements. These forward-looking statements are subject to numerous risks and uncertainties, including but not limited to the risks and uncertainties described in “—Cautionary Note Regarding Forward-Looking Statements” and “Risk Factors.” Our actual results may differ materially from those contained in or implied by these forward-looking statements. As used in this Quarterly Report, except where the context otherwise requires or where otherwise indicated, the terms “Company,” “NCS,” “we,” “our” and “us” refer to NCS Multistage Holdings, Inc.
Overview and Outlook
We are a leading provider of highly engineered products and support services that facilitate the optimization of oil and natural gas well construction, well completions and field development strategies. We provide our products and services primarily to exploration and production (“E&P”) companies for use in onshore and offshore wells, predominantly wells that have been drilled with horizontal laterals in both unconventional and conventional oil and natural gas formations. Our products and services are utilized in oil and natural gas basins throughout North America and in selected international markets, including the North Sea, the Middle East, Argentina and China. We provide our products and services to various customers, including leading large independent oil and natural gas companies and major oil companies.
Our primary offering is our fracturing systems products and services, which enable efficient pinpoint stimulation: the process of individually stimulating each entry point into a formation targeted by an oil or natural gas well. Our fracturing systems products and services can be used in both cemented and open-hole wellbores and enable our customers to precisely place stimulation treatments in a more controlled and repeatable manner as compared with traditional completion techniques. Our fracturing systems products and services are utilized in conjunction with third-party providers of pressure pumping, coiled tubing and other services. As an extension of fracturing systems, we offer enhanced recovery systems, which enable our customers to inject water, other fluids, or gases in a controlled manner with the objective of increasing the number of hydrocarbons produced from their assets.
We own a 50% interest in Repeat Precision, LLC (“Repeat Precision”), which sells composite frac plugs, perforating guns and related products. We provide tracer diagnostics services for well completion and reservoir characterization that utilize downhole chemical and radioactive tracers. We sell products for well construction, including casing buoyancy systems, liner hanger systems and toe initiation sleeves. We operate in one reportable segment that has been identified based on how our chief operating decision maker manages our business.
Our products and services are primarily sold to North American E&P companies and our ability to generate revenues from our products and services depends upon oil and natural gas drilling and completion activity in North America. Oil and natural gas drilling and completion activity is directly influenced by oil and natural gas prices.
Based on E&P company activity to date and expected capital budgets for the remainder of 2024, as well as industry reports, we believe that annual average industry drilling and completion activity in Canada will be approximately flat or slightly higher compared to 2023. However, potential fresh water rationing in certain regions in Canada due to recent drought conditions could reduce completions activity. In the United States, we expect a decline in activity by 5% to 10% on average compared to 2023 due in part to reduced natural gas prices and E&P consolidation. International industry activity is expected to improve by approximately 5% on average in 2024 as compared to 2023.
Oil and natural gas prices were volatile in 2023, and this volatility continued into 2024 due to unrest associated with the ongoing war between Russia and Ukraine and the Israeli-Hamas conflict. If the Israeli-Hamas conflict further escalates in the Middle East, it could result in further commodity price volatility. To mitigate the impact of uncertain economic conditions on the oil market, certain countries continue to extend voluntary crude oil output cuts and maintain spare capacity, enabling the producers to adjust production levels relatively quickly. See further discussion below on oil and natural gas pricing.
We continue to face intense competitive pressure across all of our product and services offerings, which has and may continue to have a negative impact on market share and operating margins for certain product lines. Furthermore, this competitive pressure constrains our ability to raise prices in an inflationary environment, which was more pronounced in early to mid-2023 but has since partially improved.
Over the past two years, we have experienced modest supply chain disruptions and higher prices for certain raw materials, including steel and chemicals, as well as purchased components and outsourced services. This cost inflation persisted throughout 2022, continued into 2023, then moderated somewhat in 2024. Prices for steel have declined from their highs as U.S. rig counts have decreased. While we have endeavored to increase customer prices to defray our higher raw material and component costs, these price increases have not always fully offset our higher input costs. We also experienced tight labor conditions starting in 2022, which has led to increased employee turnover, delays in filling open positions and labor cost inflation, which impacted both our cost of sales and selling, general and administrative (“SG&A”) expenses and resulted in higher salaries, hourly pay rates and benefit costs. However, labor cost inflation, while still elevated, began to decrease during the latter part of 2023.
To counter inflationary pressures on the economy, central banks, including the U.S. Federal Reserve, increased reference interest rates several times between March 2022 and July 2023, actions typically expected to increase borrowing costs and restrain economic activity. In June 2024, the U.S. Federal Reserve did not increase the benchmark interest rate, which remains unchanged in 2024 to date, amid signs of more persistent inflation and strong economic growth. While the U.S. Federal Reserve has not changed the benchmark interest rate recently and rate cuts are possible later in 2024, unfavorable inflation data could delay any action.
Market Conditions
Oil and Natural Gas Drilling and Completion Activity
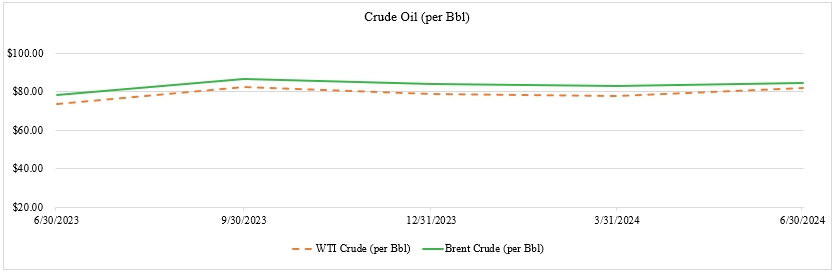
While oil and natural gas prices remain volatile, the average WTI crude oil pricing increased in the second quarter of 2024 as compared to the first quarter of 2024. During the second quarter of 2024, members of OPEC and certain other countries, including Russia (informally known as “OPEC+”), agreed to extend additional crude oil production cuts of 2.2 MMBBL/D until the end of September 2024 as well as prolonged other production cuts until the end of 2025. Since 2022, OPEC + has implemented various production cuts to address the uncertain outlook in the global economic and oil markets.
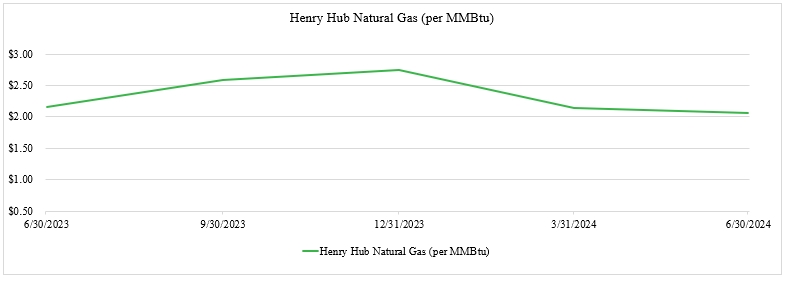
Natural gas pricing continues to be volatile and has decreased for the second quarter of 2024 to an average of $2.07 per MMBtu compared to an average of $2.15 per MMBtu for the first quarter of 2024. Realized natural gas prices for Canadian E&P customers are typically at a discount to U.S. Henry Hub pricing. The natural gas price declines in 2024 are due to a mild winter and continued high surplus levels in natural gas storage, negatively impacting drilling and completion activity in certain regions, particularly in the United States.
Sustained significant declines in commodity prices, or sustained periods when the local pricing received in regional markets is below benchmark pricing, known in the industry as high differentials, would be expected to lead North American E&P companies to reduce drilling and completion activity, which could negatively impact our business.
Listed and depicted below are recent crude oil and natural gas pricing trends, as provided by the Energy Information Administration (“EIA”) of the U.S. Department of Energy:
| Average Price |
||||||||||||
| Quarter Ended |
WTI Crude (per Bbl) |
Brent Crude (per Bbl) |
Henry Hub Natural Gas (per MMBtu) |
|||||||||
| 6/30/2023 |
$ | 73.54 | $ | 77.99 | $ | 2.16 | ||||||
| 9/30/2023 |
82.25 | 86.65 | 2.59 | |||||||||
| 12/31/2023 |
78.53 | 84.01 | 2.74 | |||||||||
| 3/31/2024 |
77.50 | 82.92 | 2.15 | |||||||||
| 6/30/2024 |
81.81 | 84.68 | 2.07 | |||||||||
Listed and depicted below are the average number of operating onshore rigs in the United States and in Canada per quarter since the second quarter of 2023, as provided by Baker Hughes Company. The quarterly changes, particularly for the second quarter Canadian land rig count, can be partially attributed to seasonality of activity in that market:
| Average Drilling Rig Count |
||||||||||||
| Quarter Ended |
U.S. Land |
Canada Land |
North America Land |
|||||||||
| 6/30/2023 |
699 | 116 | 815 | |||||||||
| 9/30/2023 |
630 | 187 | 817 | |||||||||
| 12/31/2023 |
601 | 180 | 781 | |||||||||
| 3/31/2024 |
602 | 208 | 810 | |||||||||
| 6/30/2024 |
583 | 134 | 717 | |||||||||
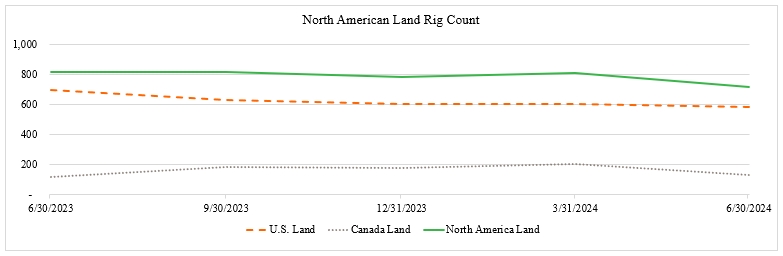
A substantial portion of our business is subject to seasonality, which results in quarterly variability. In Canada, we typically experience higher activity levels in the first quarter of each year, as our customers take advantage of the winter freeze to gain access to remote drilling and production areas. In the past, our revenue in Canada has declined during the second quarter due to warming weather conditions that result in thawing, softer ground, difficulty accessing well sites and road bans that curtail drilling and completion activity. Access to well sites typically improves throughout the third and fourth quarters in Canada, leading to activity levels that are higher than in the second quarter, but usually lower than activity in the first quarter. Canadian completions activity could be impacted by wildfires that are usually experienced in the spring and summer seasons. In addition, certain regions in Canada may ration the use of fresh water if there are drought conditions. Our business can be impacted by a reduction in customer activity during the winter holidays in late December and early January. In some years, customers in the United States and Canada may exhaust their capital budgets before year-end, resulting in lower drilling and completion activity during the fourth quarter.
How We Generate Revenues
We derive our revenues from the sale of our fracturing systems and enhanced recovery systems products and the provision of related services, casing buoyancy systems, liner hanger systems and toe initiation sleeves products and from sales of our tracer diagnostics services in addition to the sale of composite frac plugs, perforating guns and related products through Repeat Precision.
Product sales represented 64% and 69% of our revenues for the three months ended June 30, 2024 and 2023, respectively, and 69% and 71% for the six months ended June 30, 2024 and 2023, respectively. Most of our sales are on a just-in-time basis, as specified in individual purchase orders, with a fixed price for our products. We occasionally supply our customers with large orders that may be filled on negotiated terms. Services represented 36% and 31% of our revenues for the three months ended June 30, 2024 and 2023, respectively, and 31% and 29% for the six months ended June 30, 2024 and 2023, respectively. Services include tool charges and associated personnel costs related to fracturing systems and tracer diagnostics services. Our services are provided at agreed-upon rates to customers for the provision of our downhole frac isolation assembly, which may include our personnel, and for the provision of tracer diagnostics services.
During periods of low drilling and well completion activity, or as may be needed to compete in certain markets, we may, in some instances, lower the prices of our products and services. Our revenues are also impacted by well complexity since wells with more stages typically result in longer jobs, which may increase revenue attributable to the use of more sliding sleeves or increase composite frac plug sales, and increase the volume of services we provide.
The percentages of our revenues derived from sales in Canada and denominated in Canadian dollars were approximately 41% and 56% for the three months ended June 30, 2024 and 2023, respectively, and approximately 59% and 65% for the six months then ended. Our Canadian contracts are typically invoiced in Canadian dollars; therefore, the effects of foreign currency fluctuations impact our revenues and are regularly monitored. Strengthening of the U.S. dollar, our reporting currency, relative to the Canadian dollar would result in lower reported revenues, partially offset by lower reported cost of sales and SG&A expenses.
Although most of our sales are to North American E&P companies, we also have sales to customers outside of North America, and we expect sales to international customers to increase over time. These international sales are made through local NCS entities or to our local operating partners typically on a free on board or free carrier basis with a point of sale in the United States. Some of the locations in which we have operating partners or sales representatives include the Middle East and China. Our operating partners and representatives do not have authority to contractually bind NCS but market our products in their respective territories as part of their product or services offering.
Costs of Conducting our Business
Our cost of sales is comprised of expenses relating to the manufacture of our products in addition to the costs of our support services. Manufacturing cost of sales includes payments made to our suppliers for raw materials and payments made to machine shops for the manufacture of product components and finished assemblies and costs related to our employees that perform quality control analysis, assemble and test our products. In addition, Repeat Precision operates a manufacturing facility with supporting personnel in Mexico, which has allowed us to reduce our costs for certain product categories. We review forecasted activity levels in our business and either directly procure or support our vendors in procuring the required raw materials with sufficient lead time to meet our business requirements. We obtain certain chemicals utilized in our tracer diagnostics services business from suppliers in China, which are subject to tariffs that increase our costs, although these tariffs have recently declined. Prices for certain raw materials, including steel and chemicals and for purchased components and outsourced services, have increased in recent years due to inflation, exacerbated by the impacts resulting from Russia’s continuing invasion of Ukraine, although prices for steel have declined from their highs as U.S. rig counts have decreased. Cost of sales for support services includes compensation and benefit-related expenses for employees who provide direct revenue generating services to customers in addition to the costs incurred by these employees for travel and subsistence while on site. Cost of sales includes other variable manufacturing costs, such as shrinkage, obsolescence, revaluation and scrap related to our existing inventory and costs related to the chemicals used and laboratory analysis associated with our tracer diagnostics services.
Our SG&A expenses are comprised of compensation expense, which includes compensation and benefit-related expenses for our employees who are not directly involved in revenue generating activities, including those involved in our research and development activities, as well as our general operating costs. These general operating costs include, but are not limited to: rent and occupancy for our facilities, information technology infrastructure services, software licensing, advertising and marketing, third party research and development, risk insurance and professional service fees for audit, legal and other consulting services. Our SG&A expenses also include litigation expenses, severance expenses and expected credit losses.
In an effort to streamline operations and gain efficiencies, in 2023 we implemented several cost reduction initiatives, including consolidation of our tracer diagnostics operations, consolidation of Repeat’s manufacturing footprint in Mexico, restructuring of certain U.S. and international operations, and the elimination of various support positions. As a result of these efforts, we expect to realize annualized cost savings of approximately $4.0 million in 2024. See “Note 8. Accrued Expenses” to the accompanying unaudited condensed consolidated financial statements for further discussion.
The percentage of our operating costs denominated in Canadian dollars (including cost of sales and SG&A expenses but excluding depreciation and amortization expense) approximated 24% and 19% for the three months ended June 30, 2024 and 2023, respectively, and 26% and 29% for the six months then ended.
Results of Operations
Three Months Ended June 30, 2024 Compared to Three Months Ended June 30, 2023
The following tables summarize our results of operations, gross margins and revenues by geographic area for the periods presented (dollars in thousands):
| Three Months Ended |
||||||||||||||||
| June 30, |
Variance |
|||||||||||||||
| 2024 |
2023 |
$ |
% (1) |
|||||||||||||
| Revenues |
||||||||||||||||
| Product sales |
$ | 19,022 | $ | 17,433 | $ | 1,589 | 9.1 | % | ||||||||
| Services |
10,668 | 7,958 | 2,710 | 34.1 | % | |||||||||||
| Total revenues |
29,690 | 25,391 | 4,299 | 16.9 | % | |||||||||||
| Cost of sales |
||||||||||||||||
| Cost of product sales, exclusive of depreciation and amortization expense shown below |
12,209 | 11,994 | 215 | 1.8 | % | |||||||||||
| Cost of services, exclusive of depreciation and amortization expense shown below |
5,510 | 4,935 | 575 | 11.7 | % | |||||||||||
| Total cost of sales, exclusive of depreciation and amortization expense shown below |
17,719 | 16,929 | 790 | 4.7 | % | |||||||||||
| Selling, general and administrative expenses |
14,820 | 14,477 | 343 | 2.4 | % | |||||||||||
| Depreciation |
1,134 | 948 | 186 | 19.6 | % | |||||||||||
| Amortization |
167 | 167 | — | — | % | |||||||||||
| Loss from operations |
(4,150 | ) | (7,130 | ) | 2,980 | 41.8 | % | |||||||||
| Other income (expense) |
||||||||||||||||
| Interest expense, net |
(115 | ) | (211 | ) | 96 | 45.5 | % | |||||||||
| Provision for litigation, net of recoveries |
— | (24,886 | ) | 24,886 | 100.0 | % | ||||||||||
| Other income, net |
2,203 | 1,478 | 725 | 49.1 | % | |||||||||||
| Foreign currency exchange (loss) gain, net |
(507 | ) | 23 | (530 | ) | NM | ||||||||||
| Total other income (expense) |
1,581 | (23,596 | ) | 25,177 | 106.7 | % | ||||||||||
| Loss before income tax |
(2,569 | ) | (30,726 | ) | 28,157 | 91.6 | % | |||||||||
| Income tax expense |
270 | 1,350 | (1,080 | ) | (80.0 | )% | ||||||||||
| Net loss |
(2,839 | ) | (32,076 | ) | 29,237 | 91.1 | % | |||||||||
| Net income attributable to non-controlling interest |
256 | 155 | 101 | 65.2 | % | |||||||||||
| Net loss attributable to NCS Multistage Holdings, Inc. |
$ | (3,095 | ) | $ | (32,231 | ) | $ | 29,136 | 90.4 | % | ||||||
| (1) |
NM – Percentage not meaningful |
| Three Months Ended |
||||||||||||||||
| June 30, |
Variance |
|||||||||||||||
| 2024 |
2023 |
$ |
% |
|||||||||||||
| Gross Margin and Gross Margin Percentage: |
||||||||||||||||
| Cost of product sales, exclusive of depreciation and amortization expense |
$ | 12,209 | $ | 11,994 | $ | 215 | 1.8 | % | ||||||||
| Depreciation and amortization attributable to cost of product sales |
459 | 382 | 77 | 20.2 | % | |||||||||||
| Cost of product sales |
12,668 | 12,376 | 292 | 2.4 | % | |||||||||||
| Product sales gross profit |
$ | 6,354 | $ | 5,057 | $ | 1,297 | 25.6 | % | ||||||||
| Product sales gross margin |
33.4 | % | 29.0 | % | ||||||||||||
| Cost of services, exclusive of depreciation and amortization expense |
$ | 5,510 | $ | 4,935 | $ | 575 | 11.7 | % | ||||||||
| Depreciation and amortization attributable to cost of services |
194 | 145 | 49 | 33.8 | % | |||||||||||
| Cost of services |
5,704 | 5,080 | 624 | 12.3 | % | |||||||||||
| Services gross profit |
$ | 4,964 | $ | 2,878 | $ | 2,086 | 72.5 | % | ||||||||
| Services gross margin |
46.5 | % | 36.2 | % | ||||||||||||
| Total cost of sales |
$ | 18,372 | $ | 17,456 | $ | 916 | 5.2 | % | ||||||||
| Total gross profit |
$ | 11,318 | $ | 7,935 | $ | 3,383 | 42.6 | % | ||||||||
| Total gross margin |
38.1 | % | 31.3 | % | ||||||||||||
| Three Months Ended |
||||||||||||||||
| June 30, |
Variance |
|||||||||||||||
| 2024 |
2023 |
$ |
% |
|||||||||||||
| Revenues by Geographic Area: |
||||||||||||||||
| United States |
||||||||||||||||
| Product sales |
$ | 8,550 | $ | 6,942 | $ | 1,608 | 23.2 | % | ||||||||
| Services |
3,241 | 2,440 | 801 | 32.8 | % | |||||||||||
| Total United States |
11,791 | 9,382 | 2,409 | 25.7 | % | |||||||||||
| Canada |
||||||||||||||||
| Product sales |
8,263 | 9,970 | (1,707 | ) | (17.1 | )% | ||||||||||
| Services |
3,795 | 4,351 | (556 | ) | (12.8 | )% | ||||||||||
| Total Canada |
12,058 | 14,321 | (2,263 | ) | (15.8 | )% | ||||||||||
| Other Countries |
||||||||||||||||
| Product sales |
2,209 | 521 | 1,688 | 324.0 | % | |||||||||||
| Services |
3,632 | 1,167 | 2,465 | 211.2 | % | |||||||||||
| Total other countries |
5,841 | 1,688 | 4,153 | 246.0 | % | |||||||||||
| Total |
||||||||||||||||
| Product sales |
19,022 | 17,433 | 1,589 | 9.1 | % | |||||||||||
| Services |
10,668 | 7,958 | 2,710 | 34.1 | % | |||||||||||
| Total revenues |
$ | 29,690 | $ | 25,391 | $ | 4,299 | 16.9 | % | ||||||||
Revenues
Revenues were $29.7 million for the three months ended June 30, 2024 as compared to $25.4 million for the three months ended June 30, 2023. Increases in international and U.S. revenues were partially offset by a decrease in Canada revenues. The significant increase in international revenues was driven by North Sea frac systems and Middle East tracer work, and the increase in the United States was driven by frac systems sales. Despite the increase in our U.S. revenues, customer activity continues to be negatively impacted by lower natural gas prices. The decline in our Canada revenues was due in part to certain customers deferring planned frac systems work into the second half of the year due to wet weather conditions and E&P consolidation transactions. Overall, product sales for the three months ended June 30, 2024 were $19.0 million compared to $17.4 million for the three months ended June 30, 2023. Services revenues totaled $10.7 million compared to $8.0 million for the same periods.
Cost of sales
Cost of sales was $18.4 million, or 61.9% of revenues, for the three months ended June 30, 2024 compared to $17.5 million, or 68.7% of revenues, for the three months ended June 30, 2023. The decrease in the cost of sales as a percentage of revenues was primarily due to an increase in higher-margin international work in the North Sea and Middle East, the increase in activity for the United States and the impact of operational restructuring efforts implemented in 2023. For the three months ended June 30, 2024, cost of product sales was $12.7 million, or 66.6% of product sales revenue, and cost of services was $5.7 million, or 53.5% of services revenue. For the three months ended June 30, 2023, cost of product sales was $12.4 million, or 71.0% of product sales revenue, and cost of services was $5.1 million, or 63.8% of services revenue.
Selling, general and administrative expenses
Selling, general and administrative expenses were $14.8 million for the three months ended June 30, 2024 compared to $14.5 million for the three months ended June 30, 2023. This increase in expense reflects a higher annual incentive bonus accrual of $1.0 million year-over-year partially offset by the realization of cost-savings associated with restructuring efforts during 2023.
Provision for litigation, net of recoveries
Provision for litigation totaled $24.9 million during the three months ended June 30, 2023 and related to the Texas Matter, for which we accrued a judgment that was later settled by all parties during the fourth quarter of 2023, resulting in no cash payments by NCS and a reversal of this accrual. The settlement was fully paid by the insurance carrier in January 2024. The provision also includes an amount which represented our best estimate of loss, at the time, within the range of possible outcomes in the Wyoming Matter, which was settled and fully paid by our insurance company in the third quarter of 2023. These matters have been previously described in our Annual Report. See “Note 10. Commitments and Contingencies” to the accompanying unaudited condensed consolidated financial statements for further discussion.
Other income, net
Other income, net was $2.2 million for the three months ended June 30, 2024 compared to $1.5 million for the three months ended June 30, 2023. The increase in other income was primarily attributable to royalty income from licensees.
Foreign currency exchange (loss) gain, net
Foreign currency exchange (loss) gain, net was $(0.5) million for the three months ended June 30, 2024 compared to less than $0.1 million for the three months ended June 30, 2023. The change was due to the movement in the foreign currency exchange rates between the periods, primarily the Canadian dollar relative to the U.S. dollar.
Income tax expense
Income tax expense was $0.3 million for the three months ended June 30, 2024 as compared to $1.4 million for the three months ended June 30, 2023. Our effective tax rate (“ETR”) from continuing operations was (10.5%) and (4.4%) for the three months ended June 30, 2024 and 2023, respectively. The income tax expense for these periods primarily relates to results generated by our United States, Canada, and certain other foreign businesses, and the income tax provision for each three-month period excludes the effects of losses within the United States, Canada, or other jurisdictions, from which we cannot currently benefit. In addition, the income tax provision includes the effects of changes in valuation allowances established against our previously recognized deferred tax assets, some of which are derived from net operating loss carryforwards in the United States, Canada, or other jurisdictions. Therefore, significant variations exist in the customary relationship between income tax expense and pretax accounting income for the three month periods ended June 30, 2024 and 2023.
Six Months Ended June 30, 2024 Compared to Six Months Ended June 30, 2023
The following tables summarize our results of operations, gross margins and revenues by geographic area for the periods presented (dollars in thousands):
| Six Months Ended |
||||||||||||||||
| June 30, |
Variance |
|||||||||||||||
| 2024 |
2023 |
$ |
% (1) |
|||||||||||||
| Revenues |
||||||||||||||||
| Product sales |
$ | 50,780 | $ | 48,863 | $ | 1,917 | 3.9 | % | ||||||||
| Services |
22,768 | 20,082 | 2,686 | 13.4 | % | |||||||||||
| Total revenues |
73,548 | 68,945 | 4,603 | 6.7 | % | |||||||||||
| Cost of sales |
||||||||||||||||
| Cost of product sales, exclusive of depreciation and amortization expense shown below |
31,901 | 30,827 | 1,074 | 3.5 | % | |||||||||||
| Cost of services, exclusive of depreciation and amortization expense shown below |
12,105 | 11,115 | 990 | 8.9 | % | |||||||||||
| Total cost of sales, exclusive of depreciation and amortization expense shown below |
44,006 | 41,942 | 2,064 | 4.9 | % | |||||||||||
| Selling, general and administrative expenses |
28,650 | 30,628 | (1,978 | ) | (6.5 | )% | ||||||||||
| Depreciation |
2,207 | 1,891 | 316 | 16.7 | % | |||||||||||
| Amortization |
334 | 334 | — | — | % | |||||||||||
| Loss from operations |
(1,649 | ) | (5,850 | ) | 4,201 | 71.8 | % | |||||||||
| Other income (expense) |
||||||||||||||||
| Interest expense, net |
(215 | ) | (420 | ) | 205 | 48.8 | % | |||||||||
| Provision for litigation, net of recoveries |
— | (42,400 | ) | 42,400 | 100.0 | % | ||||||||||
| Other income, net |
3,340 | 1,770 | 1,570 | 88.7 | % | |||||||||||
| Foreign currency exchange (loss) gain, net |
(1,005 | ) | 78 | (1,083 | ) | NM | ||||||||||
| Total other income (expense) |
2,120 | (40,972 | ) | 43,092 | 105.2 | % | ||||||||||
| Income (loss) before income tax |
471 | (46,822 | ) | 47,293 | 101.0 | % | ||||||||||
| Income tax expense |
757 | 250 | 507 | 202.8 | % | |||||||||||
| Net loss |
(286 | ) | (47,072 | ) | 46,786 | 99.4 | % | |||||||||
| Net income attributable to non-controlling interest |
739 | 128 | 611 | NM | ||||||||||||
| Net loss attributable to NCS Multistage Holdings, Inc. |
$ | (1,025 | ) | $ | (47,200 | ) | $ | 46,175 | 97.8 | % | ||||||
| (1) |
NM – Percentage not meaningful |
| Six Months Ended |
||||||||||||||||
| June 30, |
Variance |
|||||||||||||||
| 2024 |
2023 |
$ |
% |
|||||||||||||
| Gross Margin and Gross Margin Percentage: |
||||||||||||||||
| Cost of product sales, exclusive of depreciation and amortization expense |
$ | 31,901 | $ | 30,827 | $ | 1,074 | 3.5 | % | ||||||||
| Depreciation and amortization attributable to cost of product sales |
927 | 744 | 183 | 24.6 | % | |||||||||||
| Cost of product sales |
32,828 | 31,571 | 1,257 | 4.0 | % | |||||||||||
| Product sales gross profit |
$ | 17,952 | $ | 17,292 | $ | 660 | 3.8 | % | ||||||||
| Product sales gross margin |
35.4 | % | 35.4 | % | ||||||||||||
| Cost of services, exclusive of depreciation and amortization expense |
$ | 12,105 | $ | 11,115 | $ | 990 | 8.9 | % | ||||||||
| Depreciation and amortization attributable to cost of services |
342 | 299 | 43 | 14.4 | % | |||||||||||
| Cost of services |
12,447 | 11,414 | 1,033 | 9.1 | % | |||||||||||
| Services gross profit |
$ | 10,321 | $ | 8,668 | $ | 1,653 | 19.1 | % | ||||||||
| Services gross margin |
45.3 | % | 43.2 | % | ||||||||||||
| Total cost of sales |
$ | 45,275 | $ | 42,985 | $ | 2,290 | 5.3 | % | ||||||||
| Total gross profit |
$ | 28,273 | $ | 25,960 | $ | 2,313 | 8.9 | % | ||||||||
| Total gross margin |
38.4 | % | 37.7 | % | ||||||||||||
| Six Months Ended |
||||||||||||||||
| June 30, |
Variance |
|||||||||||||||
| 2024 |
2023 |
$ |
% |
|||||||||||||
| Revenues by Geographic Area: |
||||||||||||||||
| United States |
||||||||||||||||
| Product sales |
$ | 16,317 | $ | 15,002 | $ | 1,315 | 8.8 | % | ||||||||
| Services |
5,485 | 5,699 | (214 | ) | (3.8 | )% | ||||||||||
| Total United States |
21,802 | 20,701 | 1,101 | 5.3 | % | |||||||||||
| Canada |
||||||||||||||||
| Product sales |
30,938 | 32,531 | (1,593 | ) | (4.9 | )% | ||||||||||
| Services |
12,789 | 12,461 | 328 | 2.6 | % | |||||||||||
| Total Canada |
43,727 | 44,992 | (1,265 | ) | (2.8 | )% | ||||||||||
| Other Countries |
||||||||||||||||
| Product sales |
3,525 | 1,330 | 2,195 | 165.0 | % | |||||||||||
| Services |
4,494 | 1,922 | 2,572 | 133.8 | % | |||||||||||
| Total other countries |
8,019 | 3,252 | 4,767 | 146.6 | % | |||||||||||
| Total |
||||||||||||||||
| Product sales |
50,780 | 48,863 | 1,917 | 3.9 | % | |||||||||||
| Services |
22,768 | 20,082 | 2,686 | 13.4 | % | |||||||||||
| Total revenues |
$ | 73,548 | $ | 68,945 | $ | 4,603 | 6.7 | % | ||||||||
Revenues
Revenues were $73.5 million for the six months ended June 30, 2024 compared to $68.9 million for the six months ended June 30, 2023. Increases in international product sales and services revenues, U.S. product sales, and Canada services revenues were partially offset by a decrease in U.S. services revenues and Canada product sales. The significant increase in international revenues was driven by North Sea frac systems and Middle East tracer work, and U.S. revenues increased despite a reduction in industry rig count, primarily due to stronger frac systems revenue. Overall, product sales for the six months ended June 30, 2024 were $50.8 million as compared to $48.9 million for the six months ended June 30, 2023. Services revenues totaled $22.8 million and $20.1 million for the same periods.
Cost of sales
Cost of sales was $45.3 million, or 61.6% of revenues, for the six months ended June 30, 2024 compared to $43.0 million, or 62.3% of revenues, for the six months ended June 30, 2023. The decrease in the cost of sales as a percentage of revenues was primarily due to an increase in higher-margin international work in the North Sea and Middle East and the benefits from cost saving initiatives implemented in 2023. For the six months ended June 30, 2024, cost of product sales was $32.8 million, or 64.6% of product sales revenue, and cost of services was $12.5 million, or 54.7% of services revenue. For the six months ended June 30, 2023, cost of product sales was $31.6 million, or 64.6% of product sales revenue, and cost of services was $11.4 million, or 56.8% of services revenue.
Selling, general and administrative expenses
Selling, general and administrative expenses were $28.7 million for the six months ended June 30, 2024 compared to $30.6 million for the six months ended June 30, 2023. This decrease in expense reflects the realization of cost-savings associated with restructuring efforts during 2023, as well as lower professional fees, share-based compensation, insurance, and travel and entertainment expenses of $0.7 million, $0.5 million, $0.3 million, and $0.3 million, respectively. The decrease in expense was partially offset by a $0.4 million increase in relative annual incentive bonus accruals year-over-year.
Provision for litigation, net of recoveries
Provision for litigation totaled $42.4 million during the six months ended June 30, 2023 and related to the Texas Matter for which we accrued a judgment that was later settled by all parties during the fourth quarter of 2023, resulting in no cash payments by NCS and a reversal of this accrual. The settlement was fully paid by the insurance carrier in January 2024. The provision also includes an amount which represented our best estimate of loss, at the time, within the range of possible outcomes in the Wyoming Matter, which was settled and fully paid by our insurance company in the third quarter of 2023. These matters have been previously described in our Annual Report. See “Note 10. Commitments and Contingencies” to the accompanying unaudited condensed consolidated financial statements for further discussion.
Other income, net
Other income, net was $3.3 million for the six months ended June 30, 2024 compared to $1.8 million for the six months ended June 30, 2023. The increase in other income was primarily attributable to royalty income from licensees and an increase in the benefit associated with our technical services and assistance agreement with our local Oman partner.
Foreign currency exchange (loss) gain, net
Foreign currency exchange (loss) gain, net was $(1.0) million for the six months ended June 30, 2024 compared to $0.1 million for the six months ended June 30, 2023. The change was due to the movement in the foreign currency exchange rates between the periods, primarily the Canadian dollar relative to the U.S. dollar.
Income tax expense
Income tax expense was $0.8 million for the six months ended June 30, 2024 compared to $0.3 million for the six months ended June 30, 2023. Our effective tax rate (“ETR”) from continuing operations was 160.7% and (0.5%) for the six months ended June 30, 2024 and 2023, respectively. The income tax expense for these periods primarily relates to results generated by our United States, Canada, and certain other foreign businesses, and the income tax provision for each period excludes the effects of losses within the United States, Canada, or other jurisdictions from which we cannot currently benefit. In addition, for each of the six-month periods, the income tax provision includes the effects of changes in valuation allowances established against our previously recognized deferred tax assets, including against net operating loss carryforwards, in the United States, Canada, or other jurisdictions. Therefore, significant variations exist in the customary relationship between income tax expense and pretax accounting income for the six months ended June 30, 2024 and 2023.
Liquidity and Capital Resources
Our primary sources of liquidity are our existing cash and cash equivalents, cash flows from operations and potential borrowings under our ABL Facility and the Repeat Precision Promissory Note (as defined below). As of June 30, 2024, we had cash and cash equivalents of $18.6 million, and total outstanding indebtedness of $8.9 million related to finance lease obligations. Our secured asset-based revolving credit facility (the “ABL Facility”) consists of an asset-based revolving credit facility in an aggregate principal amount of $35.0 million. Total borrowings are limited to a borrowing base calculated on the sum of cash in a specified pledged account, eligible accounts receivable and eligible inventory, provided it does not include credit for the assets of Repeat Precision. At June 30, 2024, our available borrowing base under the ABL Facility was $14.4 million, with no outstanding borrowings. The amount available to be drawn under the ABL Facility may decline from current levels due to reductions in our borrowing base or a springing financial covenant if our business were to be adversely impacted by a decline in market conditions. We were in compliance with our debt covenants at June 30, 2024.
In addition, Repeat Precision’s promissory note with Security State Bank & Trust, Fredericksburg (the “Repeat Precision Promissory Note”) has total aggregate borrowing capacity of $2.5 million, lowered from an aggregate borrowing capacity of $4.3 million upon renewal in May 2024, as discussed at "Note 9. Debt, Repeat Precision Promissory Note" in our unaudited condensed consolidated financial statements. As of June 30, 2024, Repeat Precision has no outstanding indebtedness under the promissory note.
We believe that our cash on hand, cash flows from operations and potential borrowings under our ABL Facility and the Repeat Precision Promissory Note will be sufficient to fund our capital expenditure and liquidity requirements for the next twelve months and after. Our principal liquidity needs have been, and are expected to continue to be, capital expenditures, working capital, debt service and potential mergers and acquisitions.
Our capital expenditures for the six months ended June 30, 2024 and 2023 were $0.7 million and $1.3 million, respectively. We plan to incur approximately $1.5 million to $2.0 million in capital expenditures during 2024, which includes (i) new computing equipment, (ii) upgrades to our tracer diagnostics deployment, sampling and laboratory equipment and (iii) upgrades to our manufacturing and field service equipment to support North American fracturing systems and well construction businesses.
To the extent we require additional liquidity to fund our capital requirements, including our finance lease obligations, or repay existing indebtedness, we would expect to obtain it through the incurrence of additional indebtedness, the proceeds of equity issuances, or a combination thereof. We cannot provide assurance that we will be able to obtain this additional liquidity on reasonable terms, or at all. Our liquidity and ability to meet our obligations and fund capital requirements also depend on our future financial performance including the ability to manage costs, which is subject to general economic, financial and other factors that are beyond our control. Accordingly, we cannot provide assurance that our business will generate sufficient cash flow from operations or that funds will be available from additional indebtedness, the capital markets or otherwise to meet our liquidity needs. If we decide to pursue one or more significant acquisitions, we may incur additional debt or sell equity to finance such acquisitions, which could result in incremental expenses or dilution.
Cash Flows
The following table provides a summary of cash flows from operating, investing and financing activities for the periods presented (in thousands):
| Six Months Ended |
||||||||
| June 30, |
||||||||
| 2024 |
2023 |
|||||||
| Net cash provided by (used in) operating activities |
$ | 4,099 | $ | (1,042 | ) | |||
| Net cash used in investing activities |
(393 | ) | (978 | ) | ||||
| Net cash used in financing activities |
(1,669 | ) | (273 | ) | ||||
| Effect of exchange rate changes on cash and cash equivalents |
(143 | ) | (195 | ) | ||||
| Net change in cash and cash equivalents |
$ | 1,894 | $ | (2,488 | ) | |||
Operating Activities
Net cash provided by operating activities was $4.1 million compared to a use of $(1.0) million for the six months ended June 30, 2024 and 2023, respectively. Our net loss was significantly lower in 2024 compared to 2023. During the first six months of 2023, we recorded a net loss associated with a $42.4 million provision for litigation, which subsequently settled and for which the provision was reversed during the second half of 2023. Excluding the impact of this provision from the 2023 results, our year-over-year net loss would have been lower in 2023 by $4.4 million. In 2023, our change in trade receivables was a source of funds. For 2024, we had a use of funds related to trade receivables due in part to a relative increase in international activity, which can take longer to collect, and also reflecting higher revenue during the second quarter of 2024 as compared to 2023. This was offset somewhat by the corresponding timing associated with payments for materials and other components of cost of goods sold and favorable inventory management in 2024 as compared to 2023.
Investing Activities
Net cash used in investing activities was $0.4 million and $1.0 million for the six months ended June 30, 2024 and 2023, respectively, reflecting a lower level of investment in property and equipment and software and technology.
Financing Activities
Net cash used in financing activities was $1.7 million and $0.3 million for the six months ended June 30, 2024 and 2023. Our primary uses of funds for the six months ended June 30, 2024 and 2023 were principal payments of $0.9 million and $0.7 million, respectively, payments of $0.2 million and $0.3 million, respectively, for treasury shares withheld to settle withholding tax requirements for equity-settled share-based compensation, and a distribution of $0.5 million to Repeat Precision's other joint venture partner for the six months ended June 30, 2024. Under the Repeat Promissory Note, all borrowings were repaid for the six months ended June 30, 2024 compared to net borrowings of $0.7 million for the six months ended June 30, 2023.
Material Cash Requirements
There have been no significant changes in our material cash requirements from those disclosed in the Annual Report for the year ended December 31, 2023.
Critical Accounting Estimates
There are no material changes to our critical accounting estimates from those included in the Annual Report for the year ended December 31, 2023.
Recently Issued Accounting Pronouncements
See “Note 1. Basis of Presentation” to our unaudited condensed consolidated financial statements for a discussion of the recent accounting pronouncements issued by the Financial Accounting Standards Board.
Smaller Reporting Company Status
We are a “smaller reporting company” as defined by Section 12b-2 of the Exchange Act, meaning that we are not an investment company, an asset-backed issuer, or a majority-owned subsidiary of a parent company that is not a smaller reporting company and have a public float of less than $250 million. As a smaller reporting company, we may take advantage of specified reduced reporting and other burdens that are otherwise applicable generally to public companies that do not qualify for the classification, including among other things, providing only two years of audited financial statements.
Cautionary Note Regarding Forward-Looking Statements
This Quarterly Report includes certain forward-looking statements within the meaning of the Private Securities Litigation Reform Act of 1995. Forward-looking statements can be identified by words such as “anticipates,” “intends,” “plans,” “seeks,” “believes,” “estimates,” “expects” and similar references to future periods, or by the inclusion of forecasts or projections. Examples of forward-looking statements include, but are not limited to, statements we make regarding the outlook for our future business and financial performance, such as those contained in Item 2. “Management’s Discussion and Analysis of Financial Condition and Results of Operations.”
Forward-looking statements are based on our current expectations and assumptions regarding our business, the economy and other future conditions. Because forward-looking statements relate to the future, by their nature, they are subject to inherent uncertainties, risks and changes in circumstances that are difficult to predict. As a result, our actual results may differ materially from those contemplated by the forward-looking statements. Important factors that could cause our actual results to differ materially from those in the forward-looking statements include regional, national or global political, economic, business, competitive, market and regulatory conditions and the following:
| ● |
declines in the level of oil and natural E&P activity in Canada, the United States and internationally; |
| ● |
oil and natural gas price fluctuations; |
| ● |
significant competition for our products and services that results in pricing pressures, reduced sales, or reduced market share; |
| ● |
inability to successfully implement our strategy of increasing sales of products and services into the U.S. and international markets; |
| ● |
loss of significant customers; |
| ● |
losses and liabilities from uninsured or underinsured business activities and litigation; |
| ● |
our failure to identify and consummate potential acquisitions; |
| ● |
the financial health of our customers including their ability to pay for products or services provided; |
| ● |
our inability to integrate or realize the expected benefits from acquisitions; |
| ● |
our inability to achieve suitable price increases to offset the impacts of cost inflation; |
| ● |
loss of any of our key suppliers or significant disruptions negatively impacting our supply chain; |
| ● |
risks in attracting and retaining qualified employees and key personnel; |
| ● |
risks resulting from the operations of our joint venture arrangement; |
| ● |
currency exchange rate fluctuations; |
| ● |
impact of severe weather conditions; |
| ● |
our inability to accurately predict customer demand, which may result in us holding excess or obsolete inventory; |
| ● |
impairment in the carrying value of long-lived assets including goodwill; |
| ● |
failure to comply with or changes to federal, state and local and non-U.S. laws and other regulations, including anti-corruption and environmental regulations, guidelines and regulations for the use of explosives; |
| ● |
change in trade policy, including the impact of tariffs; |
| ● |
our inability to successfully develop and implement new technologies, products and services that align with the needs of our customers, including addressing the shift to more non-traditional energy markets as part of the energy transition; |
| ● |
our inability to protect and maintain critical intellectual property assets or losses and liabilities from adverse decisions in intellectual property disputes; |
| ● |
loss of, or interruption to, our information and computer systems; |
| ● |
system interruptions or failures, including complications with our enterprise resource planning system, cybersecurity breaches, identity theft or other disruptions that could compromise our information; |
| ● |
our failure to establish and maintain effective internal control over financial reporting; |
| ● |
restrictions on the availability of our customers to obtain water essential to the drilling and hydraulic fracturing processes; |
| ● |
changes in legislation or regulation governing the oil and natural gas industry, including restrictions on emissions of greenhouse gases; |
| ● |
our inability to meet regulatory requirements for use of certain chemicals by our tracer diagnostics business; |
| ● |
the reduction in our asset-based revolving credit facility borrowing base or our inability to comply with the covenants in our debt agreements; and |
| ● |
our inability to obtain sufficient liquidity on reasonable terms, or at all. |
For the reasons described above, as well as factors identified in “Item 1A. Risk Factors” in this Quarterly Report and the section of the Annual Report entitled “Risk Factors,” we caution you against relying on any forward-looking statements. Any forward-looking statement made by us in this Quarterly Report speaks only as of the date on which we make it. Factors or events that could cause our actual results to differ may emerge from time to time, and it is not possible for us to predict all of them. We undertake no obligation to publicly update or revise any forward-looking statement, whether as a result of new information, future developments or otherwise, except as may be required by law.
Item 3. Quantitative and Qualitative Disclosures About Market Risk
For our quantitative and qualitative disclosures about market risk, see Item 7A, “Quantitative and Qualitative Disclosures About Market Risk,” in our Annual Report for the year ended December 31, 2023. Our exposure to market risk has not changed materially since December 31, 2023.
Item 4. Controls and Procedures
Evaluation of Disclosure Controls and Procedures
Our management, including our Chief Executive Officer and Chief Financial Officer, conducted an evaluation of the effectiveness of our disclosure controls and procedures (as defined in Rules 13a-15(e) and 15d-15(e) under the Exchange Act) as of June 30, 2024. Based on this evaluation, our Chief Executive Officer and Chief Financial Officer, concluded that, as of June 30, 2024, our disclosure controls and procedures were effective to provide reasonable assurance that information required to be disclosed in the reports we file or submit under the Exchange Act is recorded, processed, summarized and reported within the time periods specified in the SEC’s rules and forms and that such information is accumulated and communicated to management, including our Chief Executive Officer and Chief Financial Officer, to allow timely decisions regarding required disclosure.
Changes in Internal Control Over Financial Reporting
There were no changes to our internal control over financial reporting that occurred during the quarter ended June 30, 2024 that have materially affected, or are reasonably likely to materially affect, our internal control over financial reporting.
See “Note 10. Commitments and Contingencies” of our unaudited condensed consolidated financial statements for further information regarding our legal proceedings.
There have been no material changes from the risk factors disclosed in our Annual Report for the year ended December 31, 2023.
During the quarter ended June 30, 2024, director or officer of the Company adopted or terminated a “Rule 10b5-1 trading arrangement” or “non-Rule 10b5-1 trading arrangement,” as each term is defined in Item 408(a) of Regulation S-K.
Pursuant to the requirements of the Securities Exchange Act of 1934, the registrant has duly caused this report to be signed on its behalf by the undersigned thereunto duly authorized.
| Date: August 1, 2024 |
NCS Multistage Holdings, Inc. |
|
| By: |
/s/ Mike Morrison |
|
| Mike Morrison |
||
| Chief Financial Officer and Treasurer |
||
| (Principal Financial Officer and Authorized Signatory) |
||