UNITED STATES
SECURITIES AND EXCHANGE COMMISSION
Washington, D.C. 20549
_____________________________________________________________________________
FORM 10-K
_____________________________________________________________________________
ý | ANNUAL REPORT PURSUANT TO SECTION 13 OR 15(d) OF THE SECURITIES EXCHANGE ACT OF 1934 |
For the fiscal year ended December 31, 2018
OR
¨ | TRANSITION REPORT PURSUANT TO SECTION 13 OR 15(d) OF THE SECURITIES EXCHANGE ACT OF 1934 |
For the transition period from to
Commission File Number: 001-38054
_____________________________________________________________________________
Schneider National, Inc.
(Exact Name of Registrant as Specified in Its Charter)
_____________________________________________________________________________
Wisconsin | 39-1258315 | |
(State or Other Jurisdiction of Incorporation or Organization) | (I.R.S. Employer Identification Number) | |
3101 South Packerland Drive | ||
Green Bay, Wisconsin | 54313 | |
(Address of Registrant’s Principal Executive Offices) | (Zip Code) | |
(920) 592-2000
(Registrant’s Telephone Number, Including Area Code)
_____________________________________________________________________________
Securities registered pursuant to Section 12(b) of the Act:
Title of each class | Name of each exchange on which registered | |
Class B common stock, no par value | New York Stock Exchange | |
Securities registered pursuant to Section 12(g) of the Act: None
Indicate by check mark if the registrant is a well-known seasoned issuer, as defined in Rule 405 of the Securities Act.
Yes ý No ¨
Indicate by check mark if the registrant is not required to file reports pursuant to Section 13 or Section 15(d) of the Act.
Yes ¨ No ý
Indicate by check mark whether the registrant (1) has filed all reports required to be filed by Section 13 or 15(d) of the Securities Exchange Act of 1934 during the preceding 12 months (or for such shorter period that the registrant was required to file such reports), and (2) has been subject to such filing requirements for the past 90 days.
Yes ý No ¨
Indicate by check mark whether the registrant has submitted electronically every Interactive Data File required to be submitted pursuant to Rule 405 of Regulation S-T during the preceding 12 months (or for such shorter period that the registrant was required to submit such files).
Yes ý No ¨
Indicate by check mark if disclosure of delinquent filers pursuant to Item 405 of Regulation S-K (§ 229.405 of this chapter) is not contained herein, and will not be contained, to the best of registrant’s knowledge, in definitive proxy or information statements incorporated by reference in Part III of this Form 10-K or any amendment to this Form 10-K. ¨
Indicate by check mark whether the registrant is a large accelerated filer, an accelerated filer, a non-accelerated filer, a smaller reporting company, or an emerging growth company. See the definitions of “large accelerated filer,” “accelerated filer,” “smaller reporting company,” and “emerging growth company” in Rule 12b-2 of the Exchange Act.
Large accelerated filer | ý | Accelerated filer | ¨ | |
Non-accelerated filer | ¨ | (Do not check if a smaller reporting company) | Smaller reporting company | ¨ |
Emerging growth company | ¨ | |||
If an emerging growth company, indicate by check mark if the registrant has elected not to use the extended transition period for complying with any new or revised financial accounting standards provided pursuant to Section 13(a) of the Exchange Act. ☐
Indicate by check mark whether the registrant is a shell company (as defined in Rule 12b-2 of the Exchange Act).
Yes ¨ No ý
The aggregate market value of Class B common stock held by non-affiliates on June 29, 2018, the last business day of the registrant's most recently completed second fiscal quarter, was approximately $1.3 billion. The registrant's Class A common stock is not listed on a national securities exchange or traded in an organized over-the-counter market, but each share of the registrant's Class A common stock is convertible into one share of the registrant's Class B common stock.
As of February 19, 2019, the registrant had 83,029,500 shares of Class A common stock, no par value, outstanding and 93,995,072 shares of Class B common stock, no par value, outstanding.
DOCUMENTS INCORPORATED BY REFERENCE
Portions of the Proxy Statement for the registrant's 2019 Annual Meeting of Shareholders are incorporated by reference into Part III of this Form 10-K.
SCHNEIDER NATIONAL, INC.
ANNUAL REPORT ON FORM 10-K
For the Fiscal Year Ended December 31, 2018
TABLE OF CONTENTS
Page | |||||
ITEM 1. | |||||
ITEM 1A. | |||||
ITEM 1B. | |||||
ITEM 2. | |||||
ITEM 3. | |||||
ITEM 4. | |||||
ITEM 5. | |||||
ITEM 6. | |||||
ITEM 7. | |||||
ITEM 7A. | |||||
ITEM 8. | |||||
Page | |||||
Note 1 | |||||
Note 2 | |||||
Note 3 | |||||
Note 4 | |||||
Note 5 | |||||
Note 6 | |||||
Note 7 | |||||
Note 8 | |||||
Note 9 | |||||
Note 10 | |||||
Note 11 | |||||
Note 12 | |||||
Note 13 | |||||
Note 14 | |||||
Note 15 | |||||
Note 16 | |||||
Note 17 | |||||
Note 18 | |||||
ITEM 9. | |||||
ITEM 9A. | |||||
ITEM 9B. | |||||
i
ITEM 10. | |||||
ITEM 11. | |||||
ITEM 12. | |||||
ITEM 13. | |||||
ITEM 14. | |||||
ITEM 15. | |||||
ii
GLOSSARY OF TERMS
3PL | Provider of outsourced logistics services. In logistics and supply chain management, it means a company’s use of third-party businesses, the 3PL(s), to outsource elements of the company’s distribution, fulfillment, and supply chain management services. |
ASC | Accounting Standards Codification |
ASU | Accounting Standards Update |
CSA | Comprehensive Safety Analysis |
DOE | Department of Energy |
DOT | Department of Transportation |
EPA | United States Environmental Protection Agency |
FASB | Financial Accounting Standards Board |
FDIC | Federal Deposit Insurance Corporation |
FMCSA | Federal Motor Carrier Safety Administration |
FTFM | First to Final Mile operating segment |
GAAP | United States Generally Accepted Accounting Principles |
GDP | Gross Domestic Product. The total value of all the goods and services produced within a country's borders. |
HOS | Hours of Service |
IPO | Initial Public Offering |
LIBOR | London InterBank Offered Rate |
LTL | Less Than Load. LTL carriers pick up and deliver multiple shipments, each typically weighing less than 10,000 pounds, for multiple customers in a single trailer. |
NHTSA | National Highway Traffic Safety Administration |
NYSE | New York Stock Exchange |
SEC | United States Securities and Exchange Commission |
VTL | Van Truckload operating segment |
WSL | Watkins and Shepard Trucking, Inc. and Lodeso, Inc. These businesses were acquired simultaneously in June 2016. |
iii
CAUTIONARY NOTE REGARDING FORWARD-LOOKING STATEMENTS
This report contains forward-looking statements, within the meaning of the United States Private Securities Litigation Reform Act of 1995, which are intended to come within the safe harbor protection provided by such Act. These forward-looking statements reflect our current expectations, beliefs, plans, or forecasts with respect to, among other things, future events and financial performance and trends in our business and industry. Forward-looking statements are often characterized by words or phrases such as “may,” “will,” “could,” “should,” “would,” “anticipate,” “estimate,” “expect,” “project,” “intend,” “plan,” “believe,” “target,” “prospects,” “potential,” “forecast,” and other words, terms, and phrases of similar meaning. Forward-looking statements involve estimates, expectations, projections, goals, forecasts, assumptions, risks, and uncertainties. We caution readers that a forward-looking statement is not a guarantee of future performance and that actual results could differ materially from those contained in the forward-looking statement.
Such risks and uncertainties include, among others, those discussed in Part I, Item 1A, “Risk Factors,” of this report, as such may be amended or supplemented in Part II, Item 1A, “Risk Factors,” of our subsequently filed Quarterly Reports on Form 10-Q, as well as those discussed in our consolidated financial statements, related notes, and the other information appearing elsewhere in this report and our other filings with the SEC. In addition to any such risks, uncertainties, and other factors discussed elsewhere herein, risks, uncertainties, and other factors that could cause or contribute to actual results differing materially from those expressed or implied by the forward-looking statements include, but are not limited to, the following:
• | Economic and business risks inherent in the truckload and transportation industry, including competitive pressures pertaining to pricing, capacity, and service; |
• | Our ability to manage and implement effectively our growth and diversification strategies and cost saving initiatives; |
• | Our dependence on our reputation and the Schneider brand and the potential for adverse publicity, damage to our reputation, and the loss of brand equity; |
• | Risks related to demand for our service offerings; |
• | Risks associated with the loss of a significant customer or customers; |
• | Capital investments that fail to match customer demand or for which we cannot obtain adequate funding; |
• | Fluctuations in the price or availability of fuel, the volume and terms of diesel fuel purchase commitments, and our ability to recover fuel costs through our fuel surcharge programs; |
• | Our ability to attract and retain qualified drivers and owner-operators; |
• | Our reliance on owner-operators to provide a portion of our truck fleet; |
• | Our dependence on railroads in the operation of our intermodal business; |
• | Service instability from third-party capacity providers used by our logistics brokerage business; |
• | Changes in the outsourcing practices of our third-party logistics customers; |
• | Difficulty in obtaining material, equipment, goods, and services from our vendors and suppliers; |
• | Our ability to recruit, develop, and retain our key associates; |
• | Labor relations; |
• | Variability in insurance and claims expenses and the risks of insuring claims through our captive insurance company; |
• | The impact of laws and regulations that apply to our business, including those that relate to the environment, taxes, employees, owner-operators, and our captive insurance company; changes to those laws and regulations; and the increased costs of compliance with existing or future federal, state, and local regulations; |
• | Political, economic, and other risks from cross-border operations and operations in multiple countries; |
• | Risks associated with financial, credit, and equity markets, including our ability to service indebtedness and fund capital expenditures and strategic initiatives; |
• | Negative seasonal patterns generally experienced in the trucking industry during traditionally slower shipping periods and winter months; |
• | Risks associated with severe weather and similar events; |
• | Significant systems disruptions, including those caused by cybersecurity events; |
1
• | The potential that we will not successfully identify, negotiate, consummate, or integrate acquisitions; |
• | Exposure to claims and lawsuits in the ordinary course of business; and |
• | Our ability to adapt to new technologies and new participants in the truckload and transportation industry. |
We do not intend, and undertake no obligation, to update any of our forward-looking statements after the date of this report to reflect actual results or future events or circumstances. Given these risks and uncertainties, readers are cautioned not to place undue reliance on such forward-looking statements.
2
PART I
Item 1. Business
In this report, when we refer to “the Company,” “us,” “we,” “our,” “ours,” or “Schneider,” we are referring to Schneider National, Inc. and its subsidiaries. References to “notes” are to the notes to consolidated financial statements included in this Annual Report on Form 10-K.
Company Overview
We are a leading transportation and logistics services company providing a broad portfolio of premier truckload, intermodal, and logistics solutions and operating one of the largest for-hire trucking fleets in North America. We were founded in 1935 by Al J. Schneider in Green Bay, Wisconsin. In April 2017, we completed our IPO.
We believe we have developed a differentiated business model that is difficult to replicate due to our scale, breadth of complementary service offerings, and proprietary technology platform. Our highly flexible and balanced business combines asset-based truckload services with asset-light intermodal and non-asset logistics offerings, enabling us to serve our customers’ diverse transportation needs. We believe we have become an iconic and trusted brand within the transportation industry by adhering to a culture of “safety first and always” and upholding our responsibility to our customers, our associates, and the communities that we serve.
Our service offerings include dry van, bulk transport, intermodal, supply chain management, and FTFM “white glove” delivery. We categorize our operations into the following reportable segments:
• | Truckload – which consists of freight transported and delivered with standard and specialty equipment by our company-employed drivers in company trucks and by owner-operators. These services are executed through either for-hire or dedicated contracts. Our truckload services include standard long-haul and regional shipping services primarily using dry van equipment, bulk, temperature-controlled, FTFM “white glove” delivery, and customized solutions for high-value and time-sensitive loads. With our acquisition of WSL, we established a national footprint and expertise in shipping large parcel consumer items, such as furniture, mattresses, and other household goods. |
• | Intermodal – which consists of door-to-door container on flat car service by a combination of rail and over-the-road transportation, in association with our rail carrier partners. Our intermodal service uses company-owned containers, chassis, and trucks, using primarily company dray drivers to offer vast coverage throughout North America, including cross border. |
• | Logistics – which consists of non-asset freight brokerage services, supply chain services (including 3PL), and import/export services. Our logistics business typically provides value-added services using third-party capacity, augmented by our assets, to manage and move our customers’ freight. |
For more information on our reportable segments, see Note 17, Segment Reporting.
In addition, we engage in equipment leasing to third parties through our wholly owned subsidiary Schneider Finance, Inc., which is primarily engaged in leasing trucks to owner-operators, including owner-operators with whom we contract. We also provide insurance for both company drivers and owner-operators through our wholly owned insurance subsidiary. Finally, we conduct limited China-based trucking operations consisting primarily of brokerage services.
We have established a network of facilities across North America to maximize the geographic reach of our company trucks and owner-operators and provide maintenance services, driver training, and personal amenities for our drivers. Our portfolio diversity, network density throughout North America, and large fleet allow us to provide an exceptional level of service to our customers and consistently excel as a reliable partner, especially at times of peak demand. Our early investment and adoption of next generation technology and data analytics is a competitive advantage. Our custom quote-to-cash Quest platform leverages proprietary decision science algorithms and real-time data analytics to optimize network density and equipment use across our entire network. This state-of-the-art platform allows us to make informed decisions at every level of our business.
3
Industry and Competition
Truckload
Trucking is the primary means of serving the North American transportation market and hauls a large percentage of freight volume within the United States. Trucking continues to attract shippers due to the mode’s cost advantages relative to air transportation and flexibility relative to rail. Truckload growth is largely tied to U.S. economic activity, such as GDP growth and industrial production, and moves in line with changes in sales, inventory, and production within various sectors of the U.S. economy, including manufactured goods, construction products, and bulk commodities.
In the U.S. truckload industry sector, both dry van and specialty equipment are used to transport goods over a long haul and on a regional basis. Dry van carriers represent an integral component of the transportation supply chain for most retail and manufactured goods in North America. Specialty carriers employ equipment such as flat-bed trucks, straight trucks, temperature-controlled trailers, over-sized trailers, and bulk transport, dump, and waste equipment. These carriers can transport temperature-controlled products and bulk commodities such as specialty chemicals and petrochemicals. Specialty equipment offerings are characterized by higher equipment costs and more extensive driver training requirements relative to dry van offerings, resulting in higher barriers to entry and creating opportunities for differentiated value propositions for customers.
The U.S. truckload industry is highly competitive and fragmented, characterized by many small carriers with revenues of less than $1 million per year, fewer than 60 carriers with revenues exceeding $100 million per year, and fewer than 10 carriers with revenues exceeding $1 billion per year, according to the most recent rankings published by Transport Topics, an American Trucking Association publication.
Regulations and initiatives to improve the safety of the U.S. trucking industry have impacted industry dynamics. We believe the recent trend is for industry regulation to become progressively more restrictive and complex, which constrains the overall supply of trucks and drivers in the industry.
Domestic Intermodal
“Domestic” or “North American domestic” intermodal is the term used within the trucking industry to refer to intermodal operations within North America (such as a shipment by rail and by truck either all within the United States or throughout North America). Freight is transported in a 53-foot container or trailer, combining multiple modes of transportation (rail and truck) within the United States, Canada, and Mexico. Intermodal transportation eliminates the need for customers to directly handle freight when changing modes between rail and truck, and holds significant productivity, cost, and fuel-efficiency advantages when moving mass freight. Containers are typically moved from truck onto rail and then back onto trucks before they reach their final destination. Domestic intermodal volumes are largely driven by over-the-road conversions from truckload to intermodal and from the volume of overseas imports into the United States, such as from China.
The domestic intermodal market is comprised of service providers of differing asset intensity, with customers being served by either non-asset intermodal marketing companies (IMCs) or asset-light network intermodal providers, such as Schneider. While IMCs are the most prevalent intermodal solution providers, asset-light network intermodal providers offer differentiated higher-value solutions to customers given the reliability and high service levels of company assets (trucks, containers, and even chassis) compared to non-asset IMCs.
The domestic intermodal segment is highly consolidated, where the top three intermodal providers, including our Intermodal segment, operate a significant portion of the U.S. dry van domestic container fleet. Network density, size, and scale are critical barriers to entry in the intermodal market. Increasing sophistication and complexity of shippers’ needs require network density and the ability to deliver reliable capacity. Railroads have been spending significant amounts in recent years to maintain and improve their infrastructure and equipment, which we believe supports growth of the intermodal industry and improves the efficiency and reliability of the railroad component of our intermodal service.
We are currently one of the largest domestic intermodal providers in North America by revenue and are well positioned for future growth in intermodal freight through our nationwide network and company-owned container/chassis model. We focus on intermodal service as an alternative to placing additional trucks and drivers in lanes for which rail service otherwise provides competitive service or that are significantly longer in distance. Our longstanding railroad relationships with Burlington Northern Santa Fe (BNSF) Railway, CSX Transportation, Canadian National Railway, Kansas City Southern Railway, and other regional rail carriers, such as Florida East Coast Railway, provide rail access nationwide. Our customers value our intermodal network over IMCs due to our consistent access to capacity through our company assets and high-quality drayage services that provide a larger geographic reach around intermodal terminals. In 2017, we completed the process of converting
4
from a rented chassis to a company-owned chassis model. This conversion has lowered our all-in chassis operating costs, improved service reliability, and increased driver efficiency and satisfaction by increasing our control over the chassis operations of our intermodal business. We believe that our balanced network and large base of company assets provide a significant competitive advantage that would be difficult for other carriers to replicate.
Logistics
The logistics industry is a large, fast-growing, and fragmented market that represents an integral part of the global economy. Increased material costs combined with enhanced global competition impose margin pressure on manufacturers, often resulting in the outsourcing of noncore transportation logistics to supply chain specialists who offer a combination of scale, expertise, strong technology platforms, and lower costs. Additionally, more shipments are transported using multiple modes and technical expertise, driving shipper preferences for logistics providers with an asset-based network to complement their third-party capacity. Transportation asset owners often provide logistics services to meet excess demand and provide customers with greater breadth of services. Our logistics business provides additional services to existing customers and incremental freight to our assets, which helps to facilitate the expansion of our customer base and offers opportunities for cross-selling our suite of services.
Customers
As of December 31, 2018, we offered our services to approximately 17,000 customers across our portfolio, including nearly 200 Fortune 500 companies. We believe customers value our breadth of services, demonstrated by 21 of our top 25 customers using services from all three of our reportable segments. Our Logistics segment manages over 27,500 qualified carrier relationships and managed approximately $2.5 billion of third-party freight in 2018.
Our broad portfolio limits our customer and industry concentration as compared to other carriers. We receive revenue from a diversified customer base, none of which generated revenues in excess of 10% in 2018. We maintain a broad end-market footprint, encompassing over ten distinct industries including general merchandise, chemicals, electronics and appliances, and food and beverage, among others. Our diversified revenue mix and customer base drive stability throughout the fiscal year, even though many of our customers are affected by seasonal fluctuations. For example, our consumer goods and big box retail sales experience the greatest demand in the fourth quarter, our food and beverage sales peak during the summer, and home improvement sales peak in spring and early summer, creating more balanced year-round demand. Our balanced customer base allows for stable revenue and yield management through the fiscal year, allowing for more efficient seasonality management.
Revenue Equipment
Our revenue equipment fleet was comprised of the following equipment at December 31, 2018:
Revenue Equipment Type | Approximate Number of Units | |
Over-the-road sleeper cab tractors | 8,300 | |
Day cab tractors | 1,700 | |
Other tractors (yard tractors, straight trucks, and training tractors) | 500 | |
Trailers | 37,800 | |
Containers | 22,200 | |
Chassis | 18,800 | |
Employees
As of December 31, 2018, we employed approximately 19,400 associates, 62% of whom are drivers and the remaining 38% are managers, support personnel, and other corporate office employees. Approximately 14% of our associates are based in our headquarters in Brown County, Wisconsin. We have not experienced any work stoppages and consider our associate relations to be good. Currently, eight of our company drivers are members of an organized labor union, as a result of a commitment we made in the 1980s to allow this group of drivers to finish their careers at Schneider while remaining union members. None of our other associates are represented by a labor union.
5
Owner-Operators
In addition to the company drivers that we employ, we enter into contracts with owner-operators. Owner-operators are small business owners who operate their own trucks (some may employ drivers they hire) and provide us with services under a contractual arrangement whereby they are generally responsible for the ownership and operating expenses and are compensated on a percentage of revenue basis. Owner-operators select their own load assignments and have control over their schedule.
Owner-operators tend to be experienced drivers and represented approximately 21% of driver capacity as of December 31, 2018. By operating safely and productively, owner-operators can improve their own profitability and ours.
We believe our various operating arrangements, which include self-dispatch, percentage of revenue settlement, and truck financing, are unique in our industry and position us as a preferred partner for owner-operators.
Safety
“Safety first and always” is a Schneider core value. We believe we have a responsibility to our associates, customers, and the community to operate safely. Our safety culture is built on five key components:
• | Driver hiring and drug testing. We complement our comprehensive driver hiring with physical testing. We voluntarily choose to use hair follicle testing in addition to urine-based drug testing. While costing more per driver, hair follicle testing is generally more accurate than the alternative. |
• | Military drivers. We have a strong relationship with the United States military and employ many drivers with military experience. This experience produces quality truck drivers due to the discipline instilled through the military training programs. |
• | Training. Initial training is complemented by regularly scheduled follow-up training to sustain and enhance basic skills. We hire both experienced drivers and drivers new to the industry. We operate company-sponsored driver training facilities and have invested in simulators for both initial and sustainment training. |
• | Equipment and technology. We invest in trucks that are configured with roll stability capability, collision mitigation, and forward-facing cameras. Driving behavior is electronically monitored, alerts are provided to the driver situationally, and performance is documented for subsequent coaching. We also employ electronic logging, which ensures HOS compliance and reduces the instance of fatigue. |
• | Active management. Driver leaders and safety coordinators have real-time access to activity in the truck, facilitating situational and scheduled coaching. We have invested in predictive analytics that assist in proactively identifying drivers with potential safety issues and recommending a remediation path. |
Truckload carriers share safety performance information in monitored peer-to-peer forums. These comparisons show that we are one of the safest truckload carriers on the road today. We have, and have always maintained, a satisfactory DOT safety rating, which is the highest available rating.
Fuel
We actively manage our fuel purchasing network in an effort to maintain adequate fuel supplies. In 2018, we made 99% of our fuel purchases through negotiated volume purchase discounts. We store fuel in underground storage tanks at eleven locations and in above-ground storage tanks at one location. We believe that we are in substantive compliance with applicable environmental laws relating to the storage of fuel.
In response to fluctuations in fuel prices, we use surcharge programs to adjust fuel costs charged to our customers. We believe the most cost effective protection against variability in fuel costs is to continue the fuel surcharge programs and to invest in a fuel-efficient fleet. However, fuel surcharges may not adequately cover potential future increases in fuel prices. As an additional measure, we leverage fuel consumption metrics in driver evaluation.
6
Regulation
Industry Regulation
Our operations are regulated and licensed by various agencies in the United States, Mexico, and Canada. Our company drivers and owner-operators must comply with the safety and fitness regulations of the DOT, including those relating to drug and alcohol testing and HOS. Weight and equipment dimensions are also subject to government regulations. Other agencies, such as the EPA and Department of Homeland Security, also regulate equipment. We believe regulation in the transportation industry may become progressively more restrictive and complex. The following discussion presents recently enacted federal, state, and local regulations that have an impact on our operations.
Hours of Service
We are subject to the FMCSA's HOS rule, which was effective on July 1, 2013. The key provisions include:
• | an 11-hour daily driving time limit; |
• | a maximum number of hours a truck driver can work within a week of 70 hours; and |
• | a limit of eight consecutive driving hours a truck driver can work before being required to take a 30-minute break. |
BASICs
Since December 2010, the FMCSA has ranked both fleets and individual drivers on seven categories of safety-related data. These categories, known as BASICs, currently include Unsafe Driving, Fatigued Driving (HOS), Driver Fitness, Controlled Substances/Alcohol, Vehicle Maintenance, Hazardous Materials Compliance, and Crash Indicator.
Certain BASICs information was initially published and made available to carriers, as well as the general public. However, in December 2015, as part of the Fixing America’s Surface Transportation Act, Congress mandated that the FMCSA remove all CSA scores from public view until a more comprehensive study regarding the effectiveness of BASICs improving truck safety can be completed, and the recommendations from that study are evaluated for implementation.
Implementation and effective dates of these recommended changes are unclear, as there is currently no proposed rulemaking with respect to BASICs. This leaves SafeStat, a national system instituted by the Federal Highway Administration for evaluating the safety of motor carriers, as the authoritative safety measurement system in effect. We currently have a satisfactory SafeStat DOT rating, which is the best available rating under the current safety rating scale.
Moving Ahead for Progress in the 21st Century Bill
The FMCSA issued its final rule mandating the use of electronic logging devices in December 2015. Under the rule, carriers were required to adopt and use compliant devices beginning in December 2017. No significant actions were required by the Company, as we were already compliant with the rule's requirements.
Prohibiting Coercion of Commercial Motor Vehicle Drivers
The Prohibiting Coercion of Commercial Motor Vehicle Drivers rule, as published in the Federal Register and adopted by the FMCSA, explicitly prohibits motor carriers and other parties in the supply chain from coercing drivers to violate certain FMCSA regulations, including driver HOS limits, commercial driver's license regulations, drug and alcohol testing rules, and hazardous materials regulations, among others. Under the rule, drivers can report incidents of coercion to the FMCSA, which is authorized to issue penalties against the offending party.
7
Environmental Regulation
We are subject to various environmental laws and regulations dealing with the hauling and handling of hazardous materials, fuel storage tanks, emissions from our vehicles and facilities, engine idling, discharge and retention of storm water, and other environmental matters that involve inherent environmental risk. We maintain bulk fuel storage and fuel islands at many of our terminals. We also have vehicle maintenance, repair, and washing operations at some of our facilities. Our operations involve the risks of fuel spillage and seepage, discharge of contaminants, environmental damage, and hazardous waste disposal, among others. We have instituted programs to monitor and control environmental risks and maintain compliance with applicable environmental laws. As part of our safety and risk management program, we periodically perform environmental reviews. We are a partner in the EPA’s SmartWay Transport Partnership, a voluntary program promoting energy efficiency and air quality. We believe that our operations are in substantial compliance with current laws and regulations and do not know of any existing environmental condition that would be reasonably expected to have a material adverse effect on our business or operating results.
If we are held responsible for the cleanup of any environmental incidents caused by our operations or business or if we are found to be in violation of applicable laws or regulations, we could be subject to liabilities, including substantial fines or penalties, or civil and criminal liability. We have paid penalties for, and have incurred costs to remediate, spills and violations in the past.
In 2008 the State of California’s Air Resources Board (ARB) approved the Heavy-Duty Vehicle Greenhouse Gas (GHG) Emission Reduction Regulation in efforts to reduce GHG emissions from certain long-haul tractor-trailers that operate in California by requiring them to use technologies that improve fuel efficiency (regardless of where the vehicle is registered). The regulation required owners of long-haul tractors and 53-foot trailers to replace or retrofit their vehicles with aerodynamic technologies and low rolling resistance tires. The regulation also contained certain emissions and registration standards for temperature controlled trailer operators.
Thereafter, the United States EPA and the NHTSA began taking coordinated steps at a national level in support of a new generation of clean vehicles and engines through reduced GHG emissions and improved fuel efficiency. In September 2011, the United States EPA finalized federal regulations for controlling GHG emissions, beginning with model year 2014 medium and heavy-duty engines and vehicles and increasing in stringency through model year 2018. The federal regulations relate to efficient engines, use of auxiliary power units, mass reduction, low rolling resistance tires, improved aerodynamics, improved transmissions, and reduced accessory loads.
In December 2013, California’s ARB approved regulations to align its GHG emission standards and test procedures, as well as its tractor-trailer GHG regulation, with the federal Phase 1 GHG regulation, which applied fuel efficiency standards to vehicles for model years 2014 to 2018.
In October 2016, the EPA and the NHTSA published a Final Rule for Phase 2 of the GHG emissions and fuel efficiency standards for medium and heavy-duty engines and vehicles. The Final Rule, which became effective as of December 27, 2016, is expected by the EPA to lower CO2 emissions by 1.1 billion metric tons and reduce oil consumption by up to 2 billion barrels over the lifetime of vehicles sold under the Phase 2 program. First-time GHG and fuel efficiency standards for trailers began with model year 2018 for EPA and will start with model year 2021 for NHSTA, and CO2 and fuel consumption standards for combination tractors and engines (which are subject to individual and separate regulatory requirements) commence with model year 2021, increase incrementally with model year 2024, and achieve a fully phased-in requirement with model year 2027. EPA and NHSTA expect that motor carriers will meet the increased standards using technology improvements in multiple areas, including the engine, transmission, driveline, aerodynamic design, extended idle reduction technologies, and the use of other accessories.
Since its adoption of the Phase 2 Final Rule, the EPA has received various petitions for reconsideration based on the position that the EPA lacked legal authority to regulate certain types of vehicles, including glider vehicles and trailers. In light of these petitions, the EPA decided to revisit certain provisions in the Phase 2 Final Rule. In November 2017, the EPA issued a proposal to repeal the emissions standards and other requirements for heavy-duty glider vehicles, glider engines, and glider kits based upon a proposed interpretation of the Clean Air Act (CAA) under which glider vehicles would be found not to constitute “new motor vehicles” within the meaning of CAA Section 216(3), glider engines would be found not to constitute “new motor vehicle engines” within the meaning of CAA Section 216(3), and glider kits would not be treated as “incomplete” new motor vehicles. Under this proposal interpretation, the EPA would lack authority to regulate glider vehicles, glider engines, and glider kits under CAA Section 202(a)(1). The public comment period for this proposal expired on January 5, 2018.
8
Current and proposed GHG regulations could impact us by increasing the cost of new trucks, impairing productivity, and increasing our operating expenses.
Federal and state lawmakers are considering a variety of climate-change proposals related to carbon emissions and GHG emissions. The proposals could potentially limit carbon emissions for certain states and municipalities, which continue to restrict the location and amount of time that diesel-powered trucks (like ours) may idle.
Other Regulation
In the aftermath of the September 11, 2001 terrorist attacks, federal, state, and municipal authorities implemented and continue to implement various security measures on large trucks, including checkpoints and travel restrictions. The Transportation Security Administration (TSA) adopted regulations that require drivers applying for or renewing a license for carrying hazardous materials to obtain a TSA determination that they are not a security threat.
Technology and Research and Development
We are a technology leader in the truckload industry. Our in-cab telematics platform delivers customer location specific step-by-step work assignments to our company driver fleet. Our trailer and container fleets are equipped with monitoring devices which function both when tethered to a tractor and standing alone. Our tractors are equipped with stability and collision avoidance technology. All tractor technology interfaces with the in-cab device and provides the driver and the driver leader with real-time performance data.
We execute our business on Quest, an integrated technology platform that encompasses an end-to-end process design with focus on information accessibility and insight across our value chain. Quest enables an integrated approach to cash process including load/order acceptance based on driver and network optimization, vehicle dispatch, continuous quote monitoring, and visibility to the load from pick-up to delivery and customer billing. Our technology is enhanced by the work of a team of operations research engineers and data scientists. Proprietary decision support tools are embedded throughout the Quest platform. Decision support tools improve our ability to, among other things, situationally coach drivers, minimize fuel costs, and maintain the fleet in the most cost effective manner. The most significant application of such “decision science” technology is in planning and dispatch. These tools assist our associates in making the right trade-offs among drivers’ needs for earnings and work-life balance, customers’ needs for reliable capacity and service, and our business and its shareholders’ needs for an adequate return.
We continue to expand business capabilities by extending the foundational Quest platform. Development of the next generation of in-cab technology is well underway. We have committed to purchase a limited amount of Tesla's electric semi trucks to improve the driver experience, decrease our carbon footprint, and lower operating costs. We are also leveraging mobile applications to better connect with company drivers and customers. One example is a mobile application that prompts our company drivers to rate the shipping, receiving, and driver support locations that they visit. Our gathering and sharing of this information with customers and providers has been well received and is driving action to improve the drivers' experience.
Available Information
We file annual, quarterly, and current reports and other information with the SEC. Our filings with the SEC are made available to the public as soon as reasonably practicable on our website for free via the “Investors” section at
https://investors.schneider.com/investors/overview/default.aspx. The information we file with the SEC or contained on or accessible through our corporate website or any other website that we may maintain is not incorporated by reference herein and is not part of this Annual Report on Form 10-K.
9
Executive Officers of the Registrant
The names of our executive officers as of February 26, 2019, together with their ages, positions, and business experience are below:
Name | Age | Position | ||
Christopher B. Lofgren | 60 | President, Chief Executive Officer and Director | ||
Mark B. Rourke | 54 | Executive Vice President, Chief Operating Officer | ||
Stephen L. Bruffett | 55 | Executive Vice President, Chief Financial Officer | ||
Shaleen Devgun | 46 | Executive Vice President, Chief Information Officer | ||
Steven J. Matheys | 60 | Executive Vice President, Chief Administrative Officer | ||
Christopher B. Lofgren has served as our Chief Executive Officer and President, and as a Director, since August 2002. On October 30, 2018, he announced his intention to retire following the Annual Meeting of Shareholders in April 2019. He joined Schneider Logistics in 1994 as vice president of engineering and systems. He later served as Chief Information Officer and Chief Operating Officer before being named President and Chief Executive Officer of Schneider in 2002. Dr. Lofgren currently serves on the Board of Directors of the U.S. Chamber of Commerce. Before joining the company, Dr. Lofgren held positions at Symantec Corporation, Motorola, and CAPS Logistics. He holds a bachelor’s degree and a master’s degree in industrial and management engineering from Montana State University and a doctorate in industrial and systems engineering from The Georgia Institute of Technology. In October 2009, Dr. Lofgren was inducted into the National Academy of Engineering.
Mark B. Rourke has served as our Executive Vice President and Chief Operating Officer since September 2015. The Company's Board of Directors has selected him to succeed Dr. Lofgren as the Company's President and Chief Executive Officer beginning in April 2019. Mr. Rourke previously served as President of our Truckload Services Division and General Manager of Schneider Transportation Management, where he was responsible for the effective delivery to market of sole source, promotional, and brokerage service offerings. Prior to that, he held a variety of leadership roles with increasing responsibility at Schneider, including Vice President of Customer Service, Director of Transportation Planning for Customer Service, Midwest Area Service Manager for Customer Service, and Director of Driver Training. Mr. Rourke joined our company in 1987 as a service team leader in the company’s Seville, Ohio, location. His earlier roles with the company included on-site account manager for B.F. Goodrich in Cleveland, Ohio, Dedicated team operations manager, and van support manager. He holds a bachelor’s degree in marketing from the University of Akron, Ohio. He also serves on the Board of Directors for New North, Inc.
Stephen L. Bruffett has served as our Chief Financial Officer and Executive Vice President since April 2018. Prior to joining Schneider, Mr. Bruffett served as Executive Vice President and Chief Financial Officer of Con-way Inc. Before joining Con-way in 2008, Mr. Bruffett held senior leadership positions at YRC Worldwide Inc., rising to the role of Executive Vice President and CFO, and various finance positions at American Freightways. Mr. Bruffett holds a bachelor's degree in business administration from the University of Arkansas and a master's degree in business administration from the University of Texas.
Shaleen Devgun has served as our Executive Vice President and Chief Information Officer since July 2015. Mr. Devgun previously served as Vice President for Strategy, Planning and Solution Delivery. Prior to joining our company in 2009, Mr. Devgun spent twelve years in management consulting roles with DiamondCluster International and Deloitte, specializing in corporate venturing, formulation and execution of business and technology strategy, program leadership, and operational design. He holds bachelor’s degrees in economics and math from the University of Pune and a master’s degree in business administration from the University of Detroit Mercy. He also serves on the Board of Directors for the Fox Cities Performing Arts Center.
Steven J. Matheys has served as our Executive Vice President and Chief Administrative Officer since October 2009. On September 5, 2018, he announced his intention to retire after a transition period expected to run through April 1, 2019. Mr. Matheys joined our company in 1994 and held progressive leadership roles in the Information Technology department before being promoted to Executive Vice President and Chief Information Officer in 2001. Subsequently, he was promoted to Executive Vice President, Sales and Marketing in 2004, added customer service to his responsibilities in 2006, and then refocused his accountability on our largest customers in 2008 prior to moving into his current role in 2009. In addition to his leadership roles at the Company, Mr. Matheys spent the first thirteen years of his career with Nielson Marketing Research, The Trane Company, and General Motors in a variety of information technology roles. He holds a bachelor’s degree in business administration from the University of Wisconsin-La Crosse, with a minor in computer science, and actively serves on the Brown County United Way Board of Directors, of which he was previously chair, and the Wharton Research Advisory Group (RAG) for Human Resources.
10
Item 1A. Risk Factors
Set forth below are material risks and uncertainties that could cause our actual business results to differ materially from any forward-looking statements contained in this report and that could individually, or in combination, have a materially adverse effect on our results of operations, financial position, or cash flows. You should carefully consider each of the risks described below, together with all the other information contained in this Annual Report on Form 10-K, before making an investment decision with respect to our securities. In addition to the risks described below, you should consider our cautionary comments concerning forward-looking statements in this report, including our separate section above, “CAUTIONARY NOTE REGARDING FORWARD-LOOKING STATEMENTS.”
Risks Relating to Our Business and Industry
The truckload and transportation industry is affected by economic and business risks that are largely beyond our control.
The truckload industry is highly cyclical, and our business is dependent on a number of factors that may have a negative impact on our operating results, many of which are beyond our control. A substantial portion of our freight is from customers in the general merchandise and consumer products industries. As such, our volumes are largely dependent on consumer spending and retail sales, and our results may be more susceptible to trends in unemployment and retail sales than carriers that do not have this concentration.
We believe that some of the most significant factors beyond our control that may negatively impact our operating results are economic changes that affect supply and demand in transportation markets, including:
• recessionary economic cycles, such as the period from 2007 to 2009;
• changes in customers’ inventory levels, including shrinking product/package sizes, and in the availability of funding for
their working capital;
• commercial (Class A) driver shortages;
• industry compliance with an ongoing regulatory environment;
• excess truck capacity in comparison with shipping demand; and
• downturns in customers’ business cycles, which may be caused by declines in consumer spending.
The risks associated with these factors are heightened when the United States economy is weakened. Some of the principal risks during such times are as follows:
• low overall freight levels, which may impair our asset utilization;
• customers with credit issues and cash flow problems;
• changing freight patterns resulting from redesigned supply chains, leading to an imbalance between our capacity and
customer demand;
• increased competition resulting in pricing pressure and lost business; and
• more unbilled miles incurred to obtain loads.
Economic conditions that decrease shipping demand or increase the supply of capacity in the truckload transportation industry can exert downward pressure on rates and equipment utilization, thereby decreasing asset productivity. Declining freight levels and rates, a prolonged recession, or general economic instability could result in declines in our results of operations which may be material.
We are also subject to cost increases outside our control that could materially reduce our profitability if we are unable to increase our rates sufficiently. Such cost increases include, but are not limited to, fuel and energy prices, driver wages, taxes and interest rates, tolls, license and registration fees, insurance premiums, regulations, revenue equipment and related maintenance costs, and healthcare and other benefits for our associates. We cannot predict whether, or in what form, any such cost increase or event could occur. Any such cost increase or event could adversely affect our profitability.
In addition, events outside our control, such as strikes or other work stoppages at our facilities or at customer, port, border or other shipping locations, weather, actual or threatened armed conflicts or terrorist attacks, efforts to combat terrorism, military action against a foreign state or group located in a foreign state, or heightened security requirements could lead to reduced economic demand, reduced availability of credit, or temporary closing of shipping locations or United States borders. Such events or enhanced security measures in connection with such events could impair our operations and result in higher operating costs.
11
The truckload and transportation industry is highly competitive and fragmented, which subjects us to competitive pressures pertaining to pricing, capacity, and service.
Our operating segments compete with many truckload carriers, some LTL carriers, railroads, logistics, brokerage, freight forwarding, and other transportation companies. The North American surface transportation market is highly competitive and fragmented. Some of our customers may use their own private fleets rather than outsourcing loads to us. Some of our competitors may have greater access to equipment, a larger fleet, a wider range of services, preferential dedicated customer contracts, greater capital resources, or other competitive advantages. Numerous competitive factors could impair our ability to maintain or improve our profitability. These factors include the following:
• | Many of our competitors periodically reduce their freight rates to gain business, especially during times of reduced growth in the economy. This may make it difficult for us to maintain or increase freight rates or may require us to reduce our freight rates. Additionally, it may limit our ability to maintain or expand our business. |
• | We expanded our presence in the first to final mile market through our acquisition of WSL in 2016. With this growth opportunity comes variability as this supply chain is being defined in the market. |
• | Since some of our customers also operate their own private trucking fleets, they may decide to transport more of their own freight. |
• | Some shippers have selected core carriers for their shipping needs, for which we may not be selected. |
• | Many customers periodically solicit bids from multiple carriers for their shipping needs, despite the existence of dedicated contracts, which may depress freight rates or result in a loss of business to our competitors. |
• | The continuing trend toward consolidation in the trucking industry may result in more large carriers with greater financial resources and other competitive advantages, with which we may have difficulty competing. |
• | Higher fuel prices and higher fuel surcharges to our customers may cause some of our customers to consider freight transportation alternatives, including rail transportation. |
• | Advancements in technology may necessitate that we increase investments in order to remain competitive, and our customers may not be willing to accept higher freight rates to cover the cost of these investments. |
• | Competition from freight logistics and brokerage companies may negatively impact our customer relationships and freight rates. |
• | Smaller carriers may build economies of scale with procurement aggregation providers, which may improve such carriers’ abilities to compete with us. |
We may not be able to effectively manage and implement our organic growth strategies.
While we currently believe we can grow our profits and cash flows organically through further penetration of existing customers and by expanding our customer base, we may not be able to effectively and successfully implement such strategies and realize our stated goals. Our goals may be negatively affected by a failure to further penetrate our existing customer base, cross-sell our service offerings, pursue new customer opportunities, manage the operations and expenses of new or growing service offerings, or otherwise achieve growth of our service offerings. Successful execution of our business strategies may not result in us achieving our current business goals.
Our businesses depend on our strong reputation and the value of the Schneider brand.
We believe that the Schneider brand name symbolizes high-quality service, reliability, and efficiency and is one of our most important and valuable assets. The Schneider brand name and our corporate reputation are significant sales and marketing tools, and we devote substantial resources to promoting and protecting them. Adverse publicity (whether or not justified) relating to activities by our associates, contractors or agents, such as accidents, customer service mishaps, or noncompliance with laws, could tarnish our reputation and reduce the value of our brand. With the increased use of social media outlets such as Facebook, YouTube, Instagram, and Twitter, adverse publicity can be disseminated quickly and broadly, making it increasingly difficult for us to effectively respond. Damage to our reputation and loss of brand equity could reduce demand for our services and thus have an adverse effect on our financial condition, liquidity, and results of operations, as well as require additional resources to rebuild our reputation and restore the value of our brand.
We have several major customers, the loss of one or more of which could have a materially adverse effect on our business.
A significant portion of our operating revenue is generated from a limited number of major customers, the loss of one or more of which could have a materially adverse effect on our business. In 2018, we had no customers from whom we generated at least 10% of our revenue, while in 2017 we had one customer slightly in excess of 10% of our total revenues. Economic and capital markets conditions may adversely affect our customers and their ability to remain solvent. Our customers’ financial difficulties can negatively impact our business, operating results, and financial condition. Generally, we do not have contractual relationships with our customers that guarantee any minimum volumes, and our customer relationships may not continue as presently in effect. We generally do not have long-term contractual relationships with our customers, including our dedicated customers, and certain of these contracts contain clauses that permit cancellation on a short-term basis without cause, and accordingly any of our customers may not continue to utilize our services, renew our existing contracts, or continue at the same
12
volume levels. Despite the existence of contract arrangements with our customers, certain of our customers may nonetheless engage in competitive bidding processes that could negatively impact our contractual relationship. In addition, certain of our major customers may increasingly use their own truckload and delivery fleets, which would reduce our freight volumes. A reduction in or termination of our services by one or more of our major customers could have a materially adverse effect on our business and operating results.
Our profitability may be materially adversely impacted if our capital investments do not match customer demand for invested resources or if there is a decline in the availability of funding sources for these investments.
Our operations require significant investments. The amount and timing of capital investments depend on various factors, including anticipated volume levels and the price and availability of assets. If anticipated demand differs materially from actual usage, our capital-intensive truckload segment may have too much or too little capacity. Moreover, across our three reportable segments, resource requirements vary with customer demand, which may be subject to seasonal or general economic conditions. Our ability to properly select freight and adapt to changes in customer transportation requirements is important to efficiently deploy resources and make capital investments in trucks, trailers, containers, and chassis (with respect to our truckload and intermodal segments) or obtain qualified third-party capacity at a reasonable price (with respect to our logistics segment).
We may not be able to successfully implement our company enterprise strategy of diversifying our revenue base and expanding our capabilities.
Our company enterprise strategy entails selectively diversifying our revenue base, as we have done, by entering the over-dimensional consumer freight market, increasingly becoming part of the e-commerce supply chain, and growing our market share in specialty equipment services. This strategy involves certain risks, and we may not overcome these risks, in which case our business, financial position, and operating results could be materially and adversely affected. In connection with our company enterprise strategy, we have in the past made selective acquisitions, made new investments in technology and in office, service, and warehouse centers, increased sales and marketing efforts, and hired new drivers and associates. We expect to continue to pursue our company enterprise strategy, and this exposes us to certain risks, including:
• | making significant capital expenditures, which could require substantial capital and cash flow that we may not have or may not be able to obtain on satisfactory terms; |
• | growth may strain our management, capital resources, information systems, and customer service; |
• | hiring new managers, drivers, and other associates, including in specialty equipment services, may increase training and compliance costs, and may result in temporary inefficiencies until those associates become proficient in their jobs; |
• | specialty transport of bulk chemicals and other hazardous materials, which subjects us to environmental, health, and safety laws and regulations by governmental authorities and, in the event of an accidental release of these commodities, could result in significant loss of life and extensive property damage, as well as environmental remediation obligations; and |
• | expanding our service offerings may require us to encounter new competitive challenges in markets in which we have not previously operated or with which we are unfamiliar. |
Fluctuations in the price or availability of fuel, the volume and terms of diesel fuel purchase commitments, and surcharge collection may increase our costs of operation, which could materially and adversely affect our margins.
Fuel represents a significant expense for us. Diesel fuel prices fluctuate greatly due to factors beyond our control, such as political events, terrorist activities, armed conflicts, depreciation of the dollar against other currencies, weather, such as hurricanes, and other natural or man-made disasters, each of which may lead to an increase in the cost of fuel. Fuel prices are also affected by the rising demand in developing countries and could be adversely impacted by diminished drilling activity and by the use of crude oil and oil reserves for other purposes. Such events may lead not only to increases in fuel prices, but also to fuel shortages and disruptions in the fuel supply chain. Because our operations are dependent upon diesel fuel, and a portion of our business is based on fuel purchased on the spot market at prevailing market rates, significant diesel fuel cost increases, shortages, or supply disruptions could materially and adversely affect our operating results and financial condition.
Increases in fuel costs, to the extent not offset by rate per mile increases or fuel surcharges, have an adverse effect on our operations and profitability. While a portion of our fuel costs are covered by pass-through provisions in customer contracts and compensatory fuel surcharge programs, we also incur fuel costs that cannot be recovered even with respect to customers with which we maintain fuel surcharge programs, such as those associated with unbilled miles or times when our engines are idling. Because our fuel surcharge recovery lags behind changes in fuel prices, our fuel surcharge recovery may not capture the increased costs we pay for fuel, especially when prices are rising, leading to fluctuations in our levels of reimbursement. Our levels of reimbursement have fluctuated in the past. During periods of low freight volumes, shippers can use their negotiating leverage to impose less compensatory fuel surcharge policies. In addition, the terms of each customer’s fuel surcharge agreement varies, and customers may seek to modify the terms of their fuel surcharge agreements to minimize recoverability
13
for fuel price increases. Such fuel surcharges may not be maintained indefinitely or may not be sufficiently effective. As of December 31, 2018, we had no derivative financial instruments to reduce our exposure to fuel price fluctuations.
Difficulties attracting and retaining qualified drivers, including owner-operators, could materially adversely affect our profitability and ability to maintain or grow our fleet.
Like many truckload carriers, from time to time, we may experience difficulty in attracting and retaining sufficient numbers of qualified drivers, including owner-operators, and driver shortages may recur in the future. Our challenge with attracting and retaining qualified drivers stems from intense market competition and our driver quality standards, which subjects us to increased payments for driver compensation and owner-operator contracted rates. Our specialty equipment services require special training to handle unique operating requirements. We use physical function, hair follicle, and urine testing to screen and test all driver applicants, which we believe is a rigorous standard relative to others in our industry and could decrease the pool of qualified applicants available to us. Failure to recruit high-quality, safe drivers that meet our testing standards could diminish the safety of our fleet and could have a materially adverse effect on our customer relationships and our business.
Our company drivers are generally compensated on a per-mile basis, and the rate per-mile generally increases with the drivers’ length of service. Owner-operators contracting with us are generally compensated on a percentage of revenue basis. The compensation we offer our drivers and owner-operators is also subject to market conditions and labor supply. We may in future periods increase company driver and owner-operator compensation, which will be more likely to the extent that economic conditions improve and industry regulation exacerbates driver shortages forcing driver compensation higher. The electronic logging device regulations that recently became effective are expected to further tighten the market for eligible drivers. Like most in our industry, we suffer from a high voluntary turnover rate of company drivers, especially in the first 90 days of employment. Our turnover rate requires us to continually recruit a substantial number of company drivers in order to operate our revenue-producing fleet equipment, including trucks, chassis, and specialty equipment. If we are unable to continue to attract and retain a sufficient number of high-quality company drivers and contract with suitable owner-operators, we could be required to adjust our compensation packages or operate with fewer trucks and face difficulty meeting shipper demands, all of which could adversely affect our profitability and ability to maintain our size or grow.
Our use of owner-operators to provide a portion of our truck fleet exposes us to different risks than we face with our owned trucks.
We may contract with more owner-operators and use more owner-operator trucks than some of our competitors. We are therefore more dependent on owner-operator trucks than some of our competitors. Failure to maintain owner-operator business and relationships and increased industry competition for owner-operators could have a materially adverse effect on our operating results.
During times of increased economic activity, we face heightened competition for owner-operators from other carriers. To the extent our turnover increases, we may be required to increase owner-operator compensation or take other measures to remain an attractive option for owner-operators. If we cannot attract sufficient owner-operators or it becomes economically difficult for owner-operators to continue in business, we may not be able to maintain the percentage of our fleet provided by owner-operators or maintain our delivery schedules.
We provide financing to certain qualified owner-operators to lease trucks from us. If we are unable to provide such financing in the future, due to liquidity constraints or other restrictions, we may experience a decrease in the number of owner-operators available to fully operate our assets. Further, if owner-operators, operating trucks we finance, default under or otherwise terminate the financing arrangement and we are unable to find a replacement owner-operator, we may incur losses on amounts owed to us with respect to the truck in addition to any losses we may incur as a result of idling the truck.
Our lease contracts with owner-operators are governed by federal and other leasing regulations, which impose specific requirements on us and owner-operators. It is possible that we could face lawsuits alleging the violation of leasing obligations or failure to follow the contractual terms, which could result in liability.
We utilize owner-operators to complete our services. These owner-operators are subject to similar regulation requirements, such as the electronic on-board recording (EOBR) and driver HOS requirements that apply to larger carriers, which may have a more significant impact on their operations, causing them to exit the transportation industry. Aside from when these third parties may use our trailing equipment to fulfill loads, we do not own the revenue equipment or control the drivers delivering these loads. The inability to obtain reliable third-party owner-operators could have a materially adverse effect on our operating results and business growth.
14
We depend on railroads in the operation of our intermodal business, and therefore, our ability to offer intermodal services could be limited if we experience instability from third parties we use in that business.
Our intermodal segment utilizes railroads in the performance of its transportation services. The majority of these services are provided pursuant to contractual relationships with the railroads. While we have agreements with a number of Class I railroads, the majority of our business travels on the Burlington Northern Santa Fe (BNSF) and the CSX Transportation (CSX) railways, with which we have established relationships. One of our competitors has a preferential contractual arrangement with BNSF, which limits the market share and relative profitability of the services we provide through BNSF. Our contracts with the railroads are subject to periodic renewal, and there is no guarantee that our negotiations to renew the contracts will be successful. Our intermodal business may be affected by any adverse change to relationships with railroad service providers.
Pricing arrangements with these Class I railroads generally permit pricing to be adjusted based on market conditions, and an unfavorable change in future market conditions could adversely affect pricing. In addition, a material change in our relationship with, the overall service levels provided by, or our inability to utilize one or more of these railroads could have a materially adverse effect on our business and operating results. Future declines in overall service and volume levels provided by these railroads could have a materially adverse effect on our intermodal segment. In addition, a portion of the freight we deliver through both our intermodal and trucking segments is imported to the United States through ports of call that are subject to labor union contracts. Work stoppages or other disruptions at any of these ports could have a materially adverse effect on our business.
We depend on third-party capacity providers for logistics brokerage business, and service instability from these providers could limit growth and profitability of our logistics segment, which could adversely affect our revenue, operating results, and customer relationships.
Our brokerage business is dependent upon the services of third-party capacity providers, including other truckload carriers. These third-party providers may seek other freight opportunities and may require increased compensation in times of improved freight demand or tight trucking capacity. Our third-party truckload carriers may also be affected by certain factors to which our drivers and owner-operators are subject, including, but not limited to, driver shortage, alternative employment opportunities, varying freight market conditions, high capital expenditures, and trucking industry regulations. Most of our third-party capacity provider transportation services contracts are cancelable on a short-term basis without cause. Our inability to secure the services of these third-parties, or increases in the prices we must pay to secure such services, could have an adverse effect on our operations and profitability to the extent we are not able to obtain corresponding customer rate increases.
If our third-party logistics customers are able to reduce their total cost structure and improve their internal logistics operations and transportation services, our third-party logistics business and operating results may be materially adversely affected.
A major driver for customers to use third-party logistics providers instead of their own personnel is their inherent high cost and difficulty in attaining logistics expertise and operational efficiencies. Our third-party logistics service is generally able to provide such services more efficiently than otherwise could be provided “in-house,” primarily as a result of our technological efficiencies, lower and more flexible associate cost structure, and our existing industry relationships and expertise. If, however, our third-party logistics customers are able to reduce their “in-house” logistics cost structures, especially by reducing associate costs, we may not be able to provide our customers with an attractive alternative for their logistics needs, and our third-party logistics business and operating results may be materially adversely affected.
Difficulty in obtaining material, equipment, goods, and services from our vendors and suppliers could adversely affect our business.
We are dependent upon our suppliers for certain products and materials, including our trucks, trailers, chassis, and containers. We believe that we have positive relationships with our vendors and suppliers and are generally able to obtain favorable pricing and other terms from such parties. If we fail to maintain these relationships with our vendors and suppliers, or if our vendors and suppliers are unable to provide the products and materials we need or undergo financial hardship, we could experience difficulty in obtaining needed goods and services because of production interruptions, limited material availability, or other reasons. Subsequently, our business and operations could be adversely affected.
If we are unable to recruit, develop, and retain our key associates, our business, financial condition, and operating results could be adversely affected.
We are highly dependent upon the services of certain key employees, including our team of executive officers and managers. We currently do not have employment agreements with any of our executive officers, and the loss of any of their services could negatively impact our operations and future profitability. Inadequate succession planning or unexpected departure of key executive officers could cause substantial disruption to our business operations, deplete our institutional knowledge base, and erode our competitive advantage. Additionally, we must continue to recruit, develop, and retain skilled and experienced service center managers if we are to realize our goal of expanding our operations and continuing our growth, including internationally.
15
Failure to recruit, develop, and retain a core group of service center managers could have a materially adverse effect on our business.
Efforts by labor unions could divert management’s attention and could have a materially adverse effect on our operating results.
We face the risk that Congress or one or more states will approve legislation significantly affecting our business and our relationship with our associates, such as the previously proposed federal legislation referred to as the Employee Free Choice Act, which would substantially liberalize the procedures for union organization. We also face the risk that our associates, including drivers, may attempt to organize. Currently, eight of our company drivers are members of an organized labor union as a result of a commitment from the 1980s to allow this group of drivers to finish their careers with Schneider. Any attempt to organize by our associates could result in increased legal and other associated costs. In addition, if we were to enter into a collective bargaining agreement, the terms could negatively affect our costs, efficiency, and ability to generate acceptable returns on the affected operations. Moreover, any labor disputes or work stoppages, whether or not our other associates unionize, could disrupt our operations and reduce our revenues.
Insurance and claims expenses could significantly reduce our earnings.
Our future insurance and claims expense might exceed historical levels, which could reduce our earnings. We self-insure or maintain a high deductible for a portion of our claims exposure resulting from workers’ compensation, auto liability, general liability, cargo, and property damage claims, as well as associate health insurance. Estimating the number and severity of claims, as well as related judgment or settlement amounts is inherently difficult. This, along with legal expenses, incurred but not reported claims, and other uncertainties can cause unfavorable differences between actual claim costs and our reserve estimates. We reserve for anticipated losses and expenses and periodically evaluate and adjust our claims reserves to reflect our experience. However, ultimate results may differ from our estimates, which could result in losses over our reserved amounts.
We maintain insurance with licensed insurance carriers above the amounts which we retain. Although we believe our aggregate insurance limits should be sufficient to cover reasonably expected claims, it is possible that the amount of one or more claims could exceed our aggregate coverage limits. If any claim were to exceed our coverage, we would bear the excess, in addition to our other self-insured/retained amounts. Insurance carriers have raised premiums for many businesses, including transportation companies. As a result, our insurance and claims expense could increase, or we could raise our self-insured retention or deductible when our policies are renewed or replaced. Our operating results and financial condition could be materially and adversely affected if (1) cost per claim, premiums, or the number of claims significantly exceeds our estimates, (2) we experience a claim in excess of our coverage limits, (3) our insurance carriers fail to pay on our insurance claims, or (4) we experience a claim for which coverage is not provided.
Insuring risk through our captive insurance company could adversely impact our operations.
We insure a significant portion of our risk through our wholly owned and consolidated captive insurance company, INS Insurance, Inc. (INS). In addition to insuring portions of our own risk, INS provides insurance coverage to owner-operators. Our captive insurance company accesses the reinsurance markets and may increase retention amounts to offset the insurance market pressures, which could expose us to volatility in claims expenses.
To comply with certain state insurance regulatory requirements, cash and cash equivalents must be paid to INS as capital investments and to cover insurance premiums, which deployed assets may be restricted as collateral for anticipated losses. In addition, we must deploy from our balance sheet the cash used for payment of insured claims. In the future, we may continue to insure our risk through our captive insurance subsidiary, which may cause increases in the required amount of cash or other collateral, such as letters of credit. Significant increases in the amount of collateral required by third-party insurance carriers and regulators would reduce our liquidity and could adversely affect our results of operations.
Our captive insurance company is subject to substantial government regulation.
Our captive insurance company is domiciled in Vermont and regulated by state authorities. State regulations generally provide protection to policy holders, rather than shareholders, and generally involve:
• approval of premium rates for insurance;
• standards of solvency;
• minimum amounts of statutory capital surplus that must be maintained;
• limitations on types and amounts of investments;
• regulation of dividend payments and other transactions between affiliates;
• regulation of reinsurance;
• regulation of underwriting and marketing practices;
• approval of policy forms;
16
• methods of accounting; and
• filing of annual and other reports with respect to financial condition and other matters.
These regulations may increase our costs of regulatory compliance, limit our ability to change premiums, restrict our ability to access cash held in our captive insurance company, and otherwise impede our ability to take actions we would otherwise take.
We operate in a highly-regulated industry, and increased costs of compliance with, or liability for violation of, existing or future federal or state regulations could have a materially adverse effect on our business.
We are subject to regulation at the federal and state levels. We may incur additional expenses associated with state wage, driver meal, and rest break regulation such as that which has been enacted in California. In addition, we operate in the United States pursuant to federal operating authority granted by the DOT. Our company drivers and owner-operator drivers with whom we contract also must comply with the safety and fitness regulations of the DOT, implemented through the FMCSA, including those relating to CSA safety performance and measurements, drug and alcohol testing, and HOS. Weight and equipment dimensions also are subject to government regulations. We also may become subject to new or more restrictive regulations relating to exhaust emissions, drivers’ HOS, ergonomics, collective bargaining, security at ports, and other matters affecting safety or operating methods. In addition, the rules regarding how carriers are assigned their “safety fitness” scores could change in a way that would increase the likelihood of carriers being determined to be unfit, which could adversely affect us, including our ability to maintain or grow our fleet, as well as our customer relationships. The FMCSA withdrew a proposed rulemaking on this topic in March 2017 but could propose similar rule changes in the future.
In December 2017, the FMCSA final rule requiring the electronic logging devices (ELDs) by nearly all carriers came into effect. Nearly all of our trucks, including all the owner-operator trucks used by us, were already equipped with electronic on-board recorders (EOBRs). In December 2019, the next phase of the ELD mandate will come into effect requiring carriers that were previously grandfathered-in using automatic on-board recording devices (AOBRDs) to switch to ELDs to log HOS. The devices required to comply with the rules have resulted in historical costs to the Company and will continue to create costs going forward. Federal law also requires major freight and commuter railroads to install and maintain new safety technology known as Positive Train Control, which is complex and can be costly to implement, and may adversely affect our railroad partners and, in turn, have a materially adverse effect on operating results of our intermodal business.
In 2008 the State of California’s Air Resources Board (ARB) approved the Heavy-Duty Vehicle Greenhouse Gas (GHG) Emission Reduction Regulation in efforts to reduce GHG emissions from certain long-haul tractor-trailers that operate in California by requiring them to utilize technologies that improve fuel efficiency (regardless of where the vehicle is registered). The regulation required owners of long-haul tractors and 53-foot trailers to replace or retrofit their vehicles with aerodynamic technologies and low rolling resistance tires. The regulation also contained certain emissions and registration standards for temperature controlled trailer operators. In December 2013, California’s ARB approved regulations to align its GHG emission standards and test procedures, as well as its tractor-trailer GHG regulation, with the federal Phase 1 GHG regulation, which applied fuel efficiency standards to vehicles for model years 2014-2018.
In October 2016, the EPA and the NHTSA published a Final Rule for Phase 2 of the GHG emissions and fuel efficiency standards for medium and heavy-duty engines and vehicles. The Final Rule, which became effective as of December 27, 2016, is expected by the EPA to lower CO2 emissions by 1.1 billion metric tons and reduce oil consumption by up to 2 billion barrels over the lifetime of vehicles sold under the Phase 2 program. First-time GHG and fuel efficiency standards for trailers started in model year 2018 for EPA and will start for model year 2021 for NHSTA, and CO2 and fuel consumption standards for combination tractors and engines, which are subject to individual and separate regulatory requirements, commence in model year 2021, increase incrementally in model year 2024, and achieve a fully phased-in requirement by model year 2027. EPA and
NHSTA expect that motor carriers will meet the increased standards through the use of technology improvements in multiple areas, including the engine, transmission, driveline, aerodynamic design, extended idle reduction technologies, and the use of other accessories. These regulations could adversely affect us by increasing the cost of new trucks, impairing productivity, and increasing our operating expenses.
In addition to the United States, we also have the authority to operate in Mexico, various Canadian provinces, and China. We, as well as our drivers and owner-operators, must comply with enacted governmental regulations regarding safety, equipment, environmental protection, and operating methods. Examples include regulation of equipment weight, equipment dimensions, fuel emissions, driver HOS, driver eligibility requirements, on-board reporting of operations, and ergonomics. We may also become subject to new or more restrictive regulations related to safety or operating methods, which could adversely affect our fleet and operations in those jurisdictions.
17
If current or future legislation or judicial decisions deem that independent contractors (owner-operators) or contingent workers are equivalent to employees, we would incur more employee-related expenses.
We face a complex and increasingly stringent regulatory and statutory scheme relating to wages, classification of employees, and alternate work arrangements. Tax, federal and other regulatory authorities, and private plaintiffs have argued that owner- operator drivers in the trucking and transportation industries are employees, rather than independent contractors. In April 2010, federal legislation was proposed that increased the recordkeeping requirements for companies that engage independent contractors and heightened the penalties to employers that misclassify individuals or violate overtime and/or wage requirements. There have been and may continue to be lawsuits concerning the appropriate worker classification of individuals that provide delivery services, and the outcomes of such cases may be adverse to us. Further, class action and other lawsuits have been filed against us and others in our industry seeking to reclassify owner-operator drivers as employees for a variety of purposes, including workers’ compensation and health care coverage. If any such cases are judicially determined in a manner adverse to us or our businesses, there could be an adverse impact on our operations in the affected jurisdictions. Taxing and other regulatory authorities and courts apply a variety of standards in their determination of independent contractor status. If the owner-operator drivers we contract with are deemed employees, we would incur additional exposure under laws for federal and state tax, workers’ compensation, unemployment benefits, labor, employment, and tort. The exposure could include prior period compensation, as well as potential liability for employee benefits and tax withholdings.
Our operations in Mexico, Canada, and China, including our cross-border operations with Canada and Mexico, make us vulnerable to risks associated with doing business in foreign countries.
As a result of our operations in Mexico, Canada, and China, including our cross-border intermodal operations with Canada and Mexico, we are subject to certain risks inherent in doing business abroad, including:
• | exposure to local economic and political conditions; |
• | foreign exchange rate fluctuations and currency controls; |
• | withholding and other taxes on remittances and other payments by subsidiaries; |
• | difficulties in enforcing contractual obligations and intellectual property rights; |
• | investment restrictions or requirements; and |
• | export and import restrictions. |
In addition, if we are unable to maintain our Customs Trade Partner Against Terrorism (C-TPAT), Free and Secure Trade (FAST), and Partners in Protection (PIP) status, we may have significant border delays. This could cause our Mexican and Canadian operations to be less efficient than those of competitor truckload carriers that have such status and operate in Mexico or Canada. We also face additional risks associated with our foreign operations, including restrictive trade policies and imposition of duties, taxes, or government royalties imposed by the Mexican or Canadian government, to the extent not preempted by the terms of the North American Free Trade Agreement (NAFTA). In addition, changes to NAFTA or other treaties governing our business could adversely impact our international business. Failure to comply with trade compliance laws and regulations applicable to our international operations may subject us to liability.
Further changes in U.S. tax laws and regulations may impact our effective tax rate and may adversely affect our business, financial condition, and operating results.
The Tax Cuts and Jobs Act had an impact on our net income for 2017 and is expected to affect our future effective tax rate. We also have benefited from certain other tax provisions, such as those relating to capital expenditure deductions. Further changes in the U.S. tax laws, including any changes related to capital expenditure deductions or any significant changes to federal tax rates, interest expense deductions, or the taxation of business entities, could have a materially adverse effect on our growth opportunities, business, and results of operations.
Our operations are subject to various environmental laws and regulations, the violation of which could result in substantial fines or penalties.
We are subject to various environmental laws and regulations dealing with the hauling and handling of hazardous materials, waste and other oil, fuel storage tanks, air emissions from our vehicles and facilities, engine idling, and discharge and retention of storm water. Our truck terminals often are located in industrial areas where groundwater or other forms of environmental contamination could occur. Our operations involve the risks of fuel spillage or seepage, environmental damage, and hazardous waste disposal, among others. Certain of our facilities have waste oil or fuel storage tanks and fueling islands. If we are involved in a spill or other accident involving hazardous substances, if there are releases of hazardous substances we transport, if soil or groundwater contamination is found at our facilities or results from our operations, or if we are found to be in violation of applicable environmental laws or regulations, we could owe cleanup costs and incur related liabilities, including substantial fines or penalties or civil and criminal liability, any of which could have a materially adverse effect on our business and operating results.
18
EPA regulations limiting exhaust emissions became more restrictive in 2010. In 2010, an executive memorandum was signed directing the NHTSA and the EPA to develop new, stricter fuel efficiency standards for heavy trucks. In 2011, the NHTSA and the EPA adopted final rules that established the first-ever fuel economy and greenhouse gas standards for medium-and heavy-duty vehicles. These standards apply to model years 2014 to 2018, which are required to achieve an approximate 20 percent reduction in fuel consumption by model year 2018 and equates to approximately four gallons of fuel for every 100 miles traveled. In June 2015, the EPA and NHTSA jointly proposed new stricter standards that would apply to trailers beginning with model year 2018 and tractors beginning with model year 2021.
For information on other regulatory developments, see the risk factor titled, “We operate in a highly-regulated industry, and increased costs of compliance with, or liability for violation of, existing or future federal or state regulations could have a materially adverse effect on our business.”
We have significant ongoing capital requirements that could affect our profitability if we are unable to generate sufficient cash from operations or obtain financing on favorable terms.
The truckload industry generally, and our trucking and intermodal segments in particular, are capital intensive and asset heavy, and our policy of maintaining a young, technology-equipped fleet requires us to incur significant amounts in capital expenditures annually. We expect to pay for projected capital expenditures with cash flows from operations, proceeds from equity sales, or financing available under our existing debt instruments. If we were unable to generate sufficient cash from operations, we would need to seek alternative sources of capital, including financing, to meet our capital requirements. In the event that we are unable to generate sufficient cash from operations or obtain financing with favorable terms in the future, we may have to limit our fleet size, enter into less favorable financing arrangements, or operate our equipment for longer periods, any of which could have a materially adverse effect on our profitability.
We may need to obtain additional financing which may not be available or, if it is available, may result in a reduction in the percentage ownership of our then-existing shareholders.
We may need to raise additional funds in order to:
• finance unanticipated working capital requirements or refinance existing indebtedness;
• develop or enhance our technological infrastructure and our existing products and services;
• fund strategic relationships;
• respond to competitive pressures; and
• acquire complementary businesses, technologies, products, or services.
Additional financing may not be available on terms favorable to us or at all. If adequate funds are not available or are not available on acceptable terms, our ability to fund our expansion strategy, take advantage of unanticipated opportunities, develop or enhance technology or services, or otherwise respond to competitive pressures could be significantly limited. If we raise additional funds by issuing equity or convertible debt securities, the percentage ownership of our then-existing shareholders may be reduced, and holders of these securities may have rights, preferences, or privileges senior to those of our then-existing shareholders.
Our existing and future indebtedness could limit our flexibility in operating our business or adversely affect our business and our liquidity position.
As of December 31, 2018, we had $411.9 million in aggregate principal indebtedness for borrowed money outstanding, consisting of $400.0 million outstanding under our senior notes, $5.0 million in equipment financing notes outstanding, and $6.9 million in obligations outstanding under capital leases.
Our indebtedness may increase from time to time in the future for various reasons, including fluctuations in operating results, capital expenditures, and potential acquisitions. Any indebtedness we incur and restrictive covenants contained in the agreements related thereto could:
• | make it difficult for us to satisfy our obligations, including making interest payments on our debt obligations; |
• | limit our ability to obtain additional financing to operate our business; |
• | require us to dedicate a substantial portion of our cash flow to payments on our debt, reducing our ability to use our cash flow to fund capital expenditures, working capital, and other general operational requirements; |
• | limit our flexibility to plan for and react to changes in our business; |
• | place us at a competitive disadvantage relative to some of our competitors that have less, or less restrictive, debt than us; |
• | limit our ability to pursue acquisitions; and |
• | increase our vulnerability to general adverse economic and industry conditions, including changes in interest rates or a downturn in our business or the economy. |
19
The occurrence of any one of these events could have a materially adverse effect on our business, financial condition, and operating results or cause a significant decrease in our liquidity and impair our ability to pay amounts due on our indebtedness. Significant repayment penalties may limit our flexibility.
In addition, our credit facility contains, among other things, restrictive covenants that limit our and our subsidiaries’ ability to finance future operations or capital needs or to engage in other business activities. The credit facility restricts, among other things, our ability and the ability of our subsidiaries to incur additional indebtedness or issue guarantees, create liens on our assets, make distributions on or redeem equity interests, make investments, transfer or sell properties or other assets, and engage in mergers, consolidations, or acquisitions. In addition, our credit facility requires us to meet specified financial ratios and tests.
The seasonal pattern generally experienced in the trucking industry may affect our periodic results during traditionally slower shipping periods and winter months.
In the trucking industry, revenue generally follows a seasonal pattern which may affect our operating results. We typically experience a seasonal surge in sales during the fourth quarter of our fiscal year as a result of holiday sales. After the December holiday season and during the remaining winter months, our freight volumes are typically lower because some customers reduce shipment levels. Our operating expenses have historically been higher in the winter months because of cold temperatures and other adverse winter weather conditions which result in decreased fuel efficiency, increased cold weather-related maintenance costs of revenue equipment, and increased insurance and claims costs. Revenue can also be affected by adverse weather conditions, holidays, and the number of business days during a given period because revenue is directly related to the available working days of shippers.
Severe weather and similar events could harm our results of operations or make our results more volatile.
From time to time, we may suffer impacts from severe weather and similar events, such as tornadoes, hurricanes, blizzards, ice storms, floods, fires, earthquakes, and explosions. These events may disrupt freight shipments or routes, affect regional economies, destroy our assets, disrupt fuel supplies, increase fuel costs, cause lost revenue and productivity, increase our maintenance costs, or adversely affect the business or financial condition of our customers, any of which could harm our results of operations or make our results of operations more volatile.
We are increasingly dependent on data networks and systems, including tracking and communications systems, and significant systems disruptions, including those caused by cybersecurity breaches, could adversely affect our business.
Our policy of increasingly using technology to improve productivity and reduce costs through our Quest platform means that our business is reliant on the efficient, stable, and uninterrupted operation of our data networks and systems, including tracking and communications systems. Our computer systems and telematics technology are used in various aspects of our business, including load planning and receiving, dispatch of drivers and third-party capacity providers, freight and container tracking, customer billing and account monitoring, automation of tasks, producing financial and other reports, and other general functions and purposes. We are currently dependent on a single vendor for asset management, driver communication, and critical load planning data. If the stability or capability of such vendor is compromised, it could adversely affect our revenue, customer service, driver turnover rates, and data preservation. Additionally, if any of our critical information or communications systems fail or become unavailable, we could have to perform certain functions manually, which could temporarily affect the efficiency and effectiveness of our operations.
Our operations and those of our technology and communications service providers are vulnerable to interruption by fire, earthquake, power loss, telecommunications failure, terrorist attacks, internet failures, computer viruses, malware, hacking, and other events beyond our control. More sophisticated and frequent cyberattacks within the United States in recent years have also increased security risks associated with information technology systems. Although we maintain information security processes and policies to protect our information, computer systems, and data from cybersecurity threats, breaches, and other such events, we have experienced cyber-attacks in the past that we were able to mitigate without a materially adverse effect on our business and results of operations. Although we believe that any disruption would be minimal, moderate, or temporary, we cannot predict the likelihood or extent to which such alternate location or our information and communication systems would be affected. Our business and operations could be adversely affected in the event of a system failure, disruption, or security breach that causes a delay, interruption, or impairment of our services and operations.
20
Historically we have not made a significant number of acquisitions, and we may not make acquisitions in the future; or if we do, we may not be successful in integrating the acquired company, either of which could have a materially adverse effect on our business.
Historically, acquisitions have not been a significant part of our growth strategy. From 2008 to 2015 we did not complete any significant acquisitions. In 2016, we acquired WSL. We may not be successful in identifying, negotiating, or consummating any acquisitions, and we may not successfully complete the integration of these businesses or achieve the synergies and operating results anticipated in connection with these acquisitions. The continuing trend toward consolidation in the trucking industry may result in the acquisitions of smaller carriers by large carriers that gain market share and other competitive advantages through such acquisitions. If we fail to make or successfully execute future acquisitions, our growth rate could be materially and adversely affected.
In addition, any acquisitions we undertake could involve numerous risks that could have a materially adverse effect on our business and operating results, including:
• | difficulties in integrating the acquired company’s operations and in realizing anticipated economic, operational, and other benefits in a timely manner that could result in substantial costs and delays or other operational, technical, or financial problems; |
• | challenges in achieving anticipated revenue, earnings, or cash flows; |
• | assumption of liabilities that may exceed our estimates or what was disclosed to us; |
• | the diversion of our management’s attention from other business concerns; |
• | the potential loss of customers, key associates, and drivers of the acquired company; |
• | difficulties operating in markets in which we have had no or only limited direct experience; |
• | the incurrence of additional indebtedness; and |
• | the issuance of additional shares of our common stock, which would dilute shareholders' ownership in the company. |
We are subject to various claims and lawsuits in the ordinary course of business, and increases in the amount or severity of these claims and lawsuits could adversely affect us.
We are exposed to various claims and litigation related to commercial disputes, personal injury, property damage, environmental liability, and other matters. Proceedings include claims by third parties, and certain proceedings have been certified or purport to be class actions. Developments in regulatory, legislative or judicial standards, material changes to litigation trends, or a catastrophic accident or series of accidents, including railroad derailments that afflict our intermodal railroad operating partners, involving any or all of property damage, personal injury, and environmental liability could have a materially adverse effect on our operating results, financial condition, and liquidity.
We may be exposed to interest rate risk with regard to any indebtedness outstanding under our revolving credit facility.
The interest rate under the credit agreement governing our revolving credit facility is based on the Prime Rate, the Federal Funds Rate, or LIBOR, depending upon the specific type of borrowing, plus an applicable margin. To the extent we incur borrowings under our revolving credit facility, increases in any of these rates may increase our interest expense relating to these borrowings. As a result, we are exposed to interest rate risk. If interest rates were to increase, our debt service obligations could increase even though the amount borrowed remained the same, and our net income and cash flows, including cash available for servicing our indebtedness, would correspondingly decrease. We are not a party to an interest rate swap contract or other derivative instruments designed to hedge our exposure to interest rate fluctuation risk.
If we do not adapt to new technologies and new participants in the truckload and transportation industry, our business could suffer.
The truckload and transportation industry may experience significant change in the coming years. Non-traditional participants may seek to enter the industry, as in the case of technology firms that have introduced, or are in the process of introducing, load-matching technologies for freight or other new technologies. These non-traditional participants may seek to disrupt the historic business model of the industry through such new technologies, products, services, or business models. Our traditional competitors also may introduce or adopt new technologies, which could increase competitive pressures. If we do not appropriately predict, prepare for, and respond to new kinds of technological innovations and market developments, our business, financial condition, operating results, and long-term competitiveness may be harmed.
21
Risks Relating to Ownership of Our Class B Common Stock
The dual class structure of our common stock has the effect of concentrating voting control with the Schneider family and the trustees under the Schneider National, Inc. Voting Trust and limiting the ability of our other shareholders to influence corporate matters. Their interests may conflict with the interests of our other shareholders in the future.
We currently have two classes of authorized and outstanding common stock:
• | Class A common stock, entitled to ten votes per share, of which there were 83,029,500 shares outstanding as of December 31, 2018; and |
• | Class B common stock, entitled to one vote per share, of which there were 93,969,268 shares outstanding as of December 31, 2018. |
All holders of Class A common stock and all holders of Class B common stock vote together as a single group on all matters submitted to a vote or consent of our shareholders. The Schneider family, including trusts established for the benefit of members of the Schneider family, collectively beneficially own 100% of our outstanding Class A common stock and approximately 44% of our outstanding Class B common stock, representing approximately 94% of the total voting power of all of our outstanding common stock and approximately 70% of our total outstanding common stock.
The Voting Trust holds the shares of Class A common stock. The trustees of the Voting Trust (the “Voting Trustees”) and certain members of the Schneider family have entered into the Amended and Restated 1995 Schneider National, Inc. Voting Trust Agreement and Voting Agreement (the “Voting Trust Agreement”). Under the Voting Trust Agreement, the Voting Trustees exercise all voting power with respect to shares of Class A common stock, except that on votes with respect to Major Transactions (as defined under our Amended and Restated Bylaws), the Voting Trustees must take direction from the holders of trust certificates, voting in the same proportion as the vote of the holders of trust certificates. As a result, the vote on any Major Transaction will not be controlled by the Voting Trustees, but instead will be controlled by certain trusts for the benefit of Schneider family members holding the trust certificates issued by the Voting Trust.
Under the Voting Trust Agreement, the Voting Trustees have agreed to vote the shares of Class A common stock in favor of our Chief Executive Officer and designated members of the Schneider family in any election of members of our Board of Directors in accordance with the nomination process agreement described below. This Voting Trust Agreement provides that the members of our corporate governance committee (other than Schneider family members) will serve as trustees of the Voting Trust. Schneider family members have entered into a nomination process agreement with us pursuant to which our corporate governance committee will recommend, and our Board of Directors will include in the slate of director nominees recommended to our shareholders, two specified Schneider family members to be nominated to serve on our Board of Directors on an annual, rotating basis.
Our Articles of Incorporation provide that each share of Class A common stock withdrawn from, or otherwise transferred out of, the Voting Trust will automatically be converted into a share of Class B common stock.
As a result of these arrangements, the Voting Trust’s voting control of our company allows it to control the outcome of corporate actions that require or may be accomplished by shareholder approval, including the election and removal of directors and transactions resulting in a change in control of the company. For so long as the Voting Trust maintains control of us, our shareholders other than those members of the Schneider family will be unable to affect the outcome of proposed corporate actions supported by the Schneider family, including a change in control of the company.
The interests of the Schneider family may not be the same as ours or those of our other shareholders. For example, the Schneider family may have an interest in pursuing transactions that could enhance its investment even though such transactions might involve risks to the company and to our other shareholders. The Schneider family may also have an interest in delaying, deterring, or preventing a change in control or business combination that might otherwise be beneficial to our company and to our other shareholders.
We are a “controlled company” within the meaning of the rules of the NYSE and, as a result, qualify for, and intend to rely on, exemptions from certain corporate governance requirements relating to our corporate governance committee. Our shareholders will not have the same protections afforded to shareholders of other companies that are subject to such requirements.
The Voting Trust has more than 50% of the voting power for the election of directors. As a result, we qualify as a “controlled company” under the corporate governance rules for NYSE-listed companies. As a controlled company, certain exemptions under the NYSE listing standards exempt us from the obligation to comply with certain NYSE corporate governance
22
requirements, including the requirement that we have a corporate governance committee that is composed entirely of independent directors.
We have elected to take advantage of this “controlled company” exemption, and the holders of our Class B common stock, therefore may not have the same protections afforded to shareholders of companies that are subject to all of the corporate governance rules for NYSE-listed companies. Our status as a controlled company could therefore make our Class B common stock less attractive to some investors or otherwise harm our stock price.
Our internal controls over financial reporting may not be effective, and our independent registered public accounting firm may not be able to certify as to their effectiveness, which could have a significant and adverse effect on our business, reputation, and stock price.
As a public company, we are required, pursuant to SEC rules that implement Section 404 of the Sarbanes-Oxley Act, or Section 404, to furnish a report by management in this Form 10-K, certifying among other things, the effectiveness of our internal control over financial reporting.
The process of designing and implementing effective internal controls is a continuous effort that requires us to anticipate and react to changes in our business and the economic and regulatory environments and to expend significant resources to maintain a system of internal controls that is adequate to satisfy our reporting obligations as a public company. If we are unable to establish or maintain appropriate internal financial reporting controls and procedures, it could cause us to fail to meet our reporting obligations on a timely basis, result in material misstatements in our consolidated financial statements, and harm our operating results.
When evaluating our internal controls over financial reporting, we may identify material weaknesses that we may not be able to remediate in time to meet the applicable deadline imposed upon us for compliance with the requirements of Section 404. In addition, if we fail to achieve and maintain the adequacy of our internal controls, as such standards are modified, supplemented, or amended from time to time, we may not be able to ensure that we can conclude, on an ongoing basis, that we have effective internal controls over financial reporting in accordance with Section 404. We cannot be certain as to the timing of completion of our evaluation, testing, and any remediation actions or the impact of the same on our operations. If we are not able to implement the requirements of Section 404 in a timely manner or with adequate compliance, we may be subject to sanctions or investigation by regulatory authorities, such as the SEC. If either we are unable to conclude that we have effective internal control over financial reporting, or our independent registered public accounting firm is unable to provide us with an unqualified opinion on internal control over financial reporting, investors could lose confidence in our reported financial information, which could have a materially adverse effect on the trading price of our Class B common stock.
The price of our Class B common stock price may fluctuate significantly.
The trading price of our Class B common stock has been, and is likely to continue to be, volatile. Since shares of our Class B common stock were sold in our initial public offering at a price of $19.00 per share, our closing stock price ranged from $17.95 to $30.24 through December 31, 2018. In addition to the factors discussed in this Annual Report on Form 10-K, the trading price of our Class B common stock may fluctuate significantly in response to numerous factors, many of which are beyond our control, including:
• | market conditions in the broader stock market in general, or in our industry in particular; |
• | actual or anticipated fluctuations in our guidance, quarterly financial reports, and operating results; |
• | our ability to satisfy our ongoing capital needs and unanticipated cash requirements; |
• | adverse market reaction to any additional indebtedness incurred or securities we may issue in the future; |
• | introduction of new products and services by us or our competitors; |
• | announcements by our competitors of acquisitions, dispositions, strategic partnerships, joint ventures, or capital |
commitments;
• | issuance of new or changed securities analysts’ reports or recommendations; |
• | sales of large blocks of our stock; |
• | additions or departures of key personnel; |
• | changes or proposed changes in laws or regulations or differing interpretations or enforcement thereof affecting our business; |
• | adverse publicity about our industry or individual scandals; |
• | litigation and governmental investigations; and |
• | economic and political conditions or events. |
These and other factors may cause the market price and demand for our Class B common stock to fluctuate substantially, which may limit or prevent investors from readily selling their shares of Class B common stock and may otherwise negatively affect
23
the liquidity of our Class B common stock. In the past few years, stock markets have experienced extreme price and volume fluctuations. In the past, following periods of volatility in the overall market and the market price of a company’s securities, securities class action litigation has often been instituted against these companies. If any of our shareholders brought a lawsuit against us, we could incur substantial costs defending the lawsuit. Such a lawsuit could also divert the time and attention of our management from our business.
Future sales, or the perception of future sales, by us or our existing shareholders in the public market could cause the market price of our Class B common stock to decline.
If our existing shareholders sell substantial amounts of our Class B common stock in the public market in the future, or transfer substantial amounts of our Class A common stock in a manner that would cause such Class A common stock to automatically convert into newly issued shares of Class B common stock, the market price of our Class B common stock could decrease significantly. The perception in the public market that our existing shareholders might sell shares of Class B common stock or transfer shares of Class A common stock could also depress our market price. As of December 31, 2018, we had 83,029,500 shares of Class A common stock outstanding and 93,969,268 shares of Class B common stock outstanding.
Some provisions of Wisconsin law and our Amended and Restated Articles of Incorporation and Amended and Restated Bylaws could make a merger, tender offer, or proxy contest difficult, thereby depressing the trading price of our Class B common stock.
Our status as a Wisconsin corporation and the anti-takeover provisions of the Wisconsin Business Corporation Law (“WBCL”) may discourage, delay, or prevent a change in control even if a change in control would be beneficial to our shareholders by prohibiting us from engaging in a business combination with an interested shareholder for a period of three years after the person becomes an interested shareholder. We may engage in a business combination with an interested shareholder after the expiration of the three-year period with respect to that shareholder only if one or more of the following conditions is satisfied: (1) our Board of Directors approved the acquisition of the stock before the date on which the shareholder acquired the shares, (2) the business combination is approved by a majority of our outstanding voting stock not beneficially owned by the interested shareholder, or (3) the consideration to be received by shareholders meets certain fair price requirements of the WBCL with respect to form and amount.
In addition, our Amended and Restated Articles of Incorporation and Amended and Restated Bylaws contain provisions that may make the acquisition of our company more difficult, including the following:
• | a dual class common stock structure, which provides the Schneider National, Inc. Voting Trust with the ability to control the outcome of matters requiring shareholder approval, even if the Schneider National, Inc. Voting Trust beneficially owns significantly less than a majority of the shares of our outstanding Class A and Class B common stock; |
• | require that certain transactions be conditioned upon approval by 60 percent of the voting power of our capital stock, including any transaction which results in the Schneider family holding less than 40 percent of the voting power of our capital stock, a sale of substantially all of our assets, and a dissolution; |
• | do not provide for cumulative voting in the election of directors, which would otherwise allow holders of less than a majority of stock to elect some directors; |
• | provide that special meetings of shareholders may be called only by the Board of Directors and the chief executive officer and by our shareholders only if holders of at least ten percent of all votes entitled to be cast on the proposed issue submit a written demand in accordance with the WBCL and the other provisions of our Amended and Restated Articles of Incorporation and our Amended and Restated Bylaws; |
• | establish advance notice procedures for the nomination of candidates for election as directors or for proposing matters that can be acted upon at shareholder meetings; and |
• | authorize undesignated preferred stock, the terms of which may be established and shares of which may be issued by our Board of Directors without shareholder approval. |
These provisions could have the effect of discouraging, delaying, or preventing a transaction involving a change in control of our company. These provisions could also have the effect of discouraging proxy contests and make it more difficult for our non-controlling shareholders to elect directors of their choosing and cause us to take other corporate actions.
We may change our dividend policy at any time.
Although we expect to continue to pay dividends to holders of our Class A and Class B common stock, we have no obligation to pay any dividend, and our dividend policy may change at any time without notice. The declaration and amount of any future dividends is subject to the discretion of our Board of Directors in determining whether dividends are in the best interest of our shareholders and are in compliance with all laws and agreements applicable to the declaration and payment of cash dividends by us. Future dividends may also be affected by factors that our Board of Directors deems relevant, including our potential
24
future capital requirements for investments, legal risks, changes in federal and state income tax laws, or corporate laws and contractual restrictions such as financial or operating covenants in our debt arrangements. As a result, we may not pay dividends at any rate or at all.
Our Amended and Restated Bylaws designate courts in the State of Wisconsin as the exclusive forum for certain types of actions and proceedings that may be initiated by our shareholders, which could limit our shareholders' ability to obtain a favorable judicial forum for disputes with us or our directors, officers, or employees.
Our Amended and Restated Bylaws provide that, unless the company consents in writing to the selection of an alternative forum, one of the Circuit Court for Brown County, Wisconsin or the U.S. District Court for the Eastern District of Wisconsin—Green Bay Division will be the exclusive forum for (a) any derivative action or proceeding brought on our behalf, (b) any action asserting a breach of fiduciary duty, (c) any action asserting a claim against us arising pursuant to the WBCL, our Amended and Restated Articles of Incorporation, or our Amended and Restated Bylaws, and (d) any action asserting a claim against us that is governed by the internal affairs doctrine, in all cases subject to the applicable court having personal jurisdiction over the indispensable parties named as defendants. Any person or entity purchasing or otherwise acquiring any interest in shares of our capital stock will be deemed to have notice of and to have consented to this exclusive forum provision. This exclusive forum provision may limit a shareholder’s ability to bring a claim in a judicial forum that it finds favorable for disputes with us or our directors, officers, or other employees, which may discourage such lawsuits against us and our directors, officers, and employees.
Alternatively, if a court were to find this exclusive forum provision inapplicable to, or unenforceable in respect of, one or more of the specified types of actions or proceedings, we may incur additional costs associated with resolving such matters in other jurisdictions, which could adversely affect our business and financial condition. In addition, the enforceability of similar choice of forum provisions in other companies’ articles of incorporation and bylaws has been challenged in legal proceedings, and it is possible that a court could find this exclusive forum provision to be inapplicable or unenforceable.
Item 1B. Unresolved Staff Comments
None.
25
Item 2. Properties
As of December 31, 2018, we owned or leased over two hundred properties across 36 states, Canada, and Mexico. Our expansive network includes approximately 40 operating centers and 35 distribution warehouses, 11 offices, and over 100 drop yards. In addition, we physically operate at a number of customer locations.
The operating centers we own or lease throughout the United States offer on-site management to support our transportation network for our Truckload and Intermodal segments. Often, our facilities include customer service centers, where our customers may contact a company representative to discuss their loads/orders, fuel and maintenance stations, and other amenities to support our drivers. Our facility network also includes warehouse capacity to further enhance our supply chain solutions. The following table provides a list of 30 properties that are central to our transportation network and indicates the functional capability at each site. Approximately 40% of the properties are owned and approximately 60% are leased.
As of December 31, 2018 | Facility Capabilities | |||||||||||
Location | Owned or Leased | Segment | Customer Service | Operations | Fuel | Maintenance | ||||||
Atlanta, GA | Owned | Truckload | X | X | X | X | ||||||
Carlisle/Harrisburg, PA | Leased | Truckload | X | X | X | X | ||||||
Charlotte, NC | Owned | Truckload | X | X | X | X | ||||||
Chicago, IL | Leased | Logistics | X | X | ||||||||
Chicago, IL | Leased | Intermodal | X | X | X | |||||||
Dallas, TX | Leased | Truckload | X | X | X | X | ||||||
Dallas, TX | Leased | Logistics | X | X | ||||||||
Des Moines, IA | Leased | Truckload | X | |||||||||
Edwardsville, IL | Owned | Truckload | X | X | X | X | ||||||
Farmington Hills, MI | Leased | Logistics | X | X | ||||||||
Gary, IN | Owned | Truckload | X | X | X | X | ||||||
Green Bay, WI | Owned | Truckload | X | |||||||||
Green Bay, WI (three facilities) | Both | Other | X | X | ||||||||
Helena, MT | Leased | Truckload | X | X | X | X | ||||||
Houston, TX | Leased | Truckload | X | X | X | X | ||||||
Houston, TX | Leased | Truckload | X | X | ||||||||
Indianapolis, IN | Owned | Truckload | X | X | X | X | ||||||
Laredo, TX | Leased | Truckload | X | X | X | X | ||||||
Missoula, MT | Leased | Truckload | X | X | ||||||||
Phoenix, AZ | Owned | Truckload | X | X | X | |||||||
Port Wentworth, GA | Leased | Logistics | X | |||||||||
Portland, OR | Owned | Truckload | X | X | X | X | ||||||
Puslinch/Guelph, ON | Owned | Truckload | X | X | X | X | ||||||
Reserve, LA | Leased | Truckload | X | X | ||||||||
San Bernardino, CA | Leased | Intermodal | X | |||||||||
Santa Fe/Mexico City, Mexico | Leased | Multiple | X | X | ||||||||
West Memphis, AR | Owned | Truckload | X | X | X | X | ||||||
Zeeland, MI | Leased | Truckload | X | X | ||||||||
26
Item 3. Legal Proceedings
In the ordinary course of conducting our business we become involved in certain legal matters and investigations on a number of matters, including liability claims, taxes other than income taxes, contract disputes, employment, and other litigation matters. We accrue for anticipated costs to defend and resolve matters that are probable and estimable. We believe the outcomes of these matters will not have a material impact on our business or our financial statements.
For a description of our legal proceedings, see Note 16, Commitments and Contingencies, of the notes to consolidated financial statements, which is incorporated herein by reference.
Item 4. Mine Safety Disclosures
Not applicable.
27
PART II
Item 5. Market for Registrant's Common Equity, Related Stockholder Matters, and Issuer Purchases of Equity Securities
Our common equity consists of our Class B common stock, entitled to one vote per share, and our Class A common stock, entitled to 10 votes per share. Our Class B common stock has traded on the NYSE under the symbol “SNDR” since our IPO in April 2017. Our Class A common stock is held by the Schneider National, Inc. Voting Trust for the benefit of members of the Schneider family. Each share of Class A common stock is convertible into one share of Class B common stock. There is no public trading market for our Class A common stock.
Holders of Record
As of February 19, 2019, there was one holder of record of our Class A common stock, and there were 66 holders of record of our Class B common stock. Because many of our shares of common stock are held by brokers and other institutions on behalf of shareholders, we are unable to estimate the total number of shareholders represented by these record holders.
Dividend Policy
We have paid quarterly cash dividends on our common stock since our IPO in April 2017, and we intend to continue paying regular quarterly dividends. We cannot give any assurance that dividends will be paid in the future or the amount of dividends because the declaration and payment of all future dividends will be at the discretion of our Board of Directors and will depend on our financial condition, earnings, legal requirements, certain debt agreements we are then party to, and other factors our Board of Directors deems relevant. Our Amended and Restated Articles of Incorporation provide that holders of our Class A common stock and holders of our Class B common stock will be treated equally and ratably on a per share basis with respect to any such dividends, unless disparate treatment is approved in advance by the vote of the holders of a majority of the outstanding shares of our Class A common stock and Class B common stock, each voting as a separate group.
Purchases of Equity Securities by the Issuer and Affiliated Purchasers
The following table sets forth information regarding the purchases of our equity securities made by or on behalf of us or any affiliated purchaser (as defined in Exchange Act Rule 10b-18) during the three months ended December 31, 2018.
2018 Fiscal Month | Total Number of Shares Purchased(a) | Average Price Paid per Share | Total Number of Shares Purchased as Part of Publicly Announced Plans or Programs(b) | Maximum Approximate Dollar Value of Shares that May Yet Be Purchased Under the Plans or Programs | ||||||||||
October 1 - October 31 | — | $ | — | — | $ | — | ||||||||
November 1 - November 30 | — | — | — | — | ||||||||||
December 1 - December 31 | 33 | 17.95 | — | — | ||||||||||
Total | 33 | $ | 17.95 | — | $ | — | ||||||||
(a) Represents shares of common stock that employees surrendered to satisfy withholding taxes related to the vesting of restricted stock. The 2017 Omnibus Incentive Plan and the award agreements allow participants to elect to satisfy, in whole or in part, any applicable U.S. Federal, state, and local tax withholding obligations arising in connection with plan awards by authorizing the Company to withhold a number of Restricted Shares that would otherwise vest, with a Fair Market Value equal to such withholding liability. During the year ended December 31, 2018, the Company withheld 38,296 shares that employees presented to the Company to satisfy withholding taxes for the vesting of restricted stock.
(b) | The Company is not currently participating in a share repurchase program. |
28
Stock Performance Graph
The following performance graph and related information shall not be deemed “soliciting material” or to be “filed” with the SEC, nor shall such information be incorporated by reference into any future filing under the Securities Act of 1933 or Securities Exchange Act of 1934, each as amended, except to the extent that the Company specifically incorporates such information by reference into such filing.
The following graph compares the cumulative total shareholder return on our Class B common stock to the cumulative total return of the Standard and Poor’s 500 Stock Index, the Dow Jones Transportation Index, and a customized peer group for the period from April 6, 2017 through December 31, 2018. The peer group consists of ArcBest Corp., JB Hunt Transport Services, Inc., Ryder System, Inc., Avis Budget Group, Inc., Knight Transportation, Inc.,1 Swift Transportation Co.,1 C.H. Robinson Worldwide, Landstar System, Inc., Werner Enterprises, Inc., Expeditors International of Washington, Inc., Old Dominion Freight Line, Inc., XPO Logistics, Hub Group, Inc., Roadrunner Transportation Systems, Inc., and YRC Worldwide. The comparison assumes $100 was invested on April 6, 2017 in our Class B common stock and in each of the foregoing indices and peer group and assumes reinvestment of dividends. The stock performance shown on the graph below represents historical stock performance and is not necessarily indicative of future stock price performance.
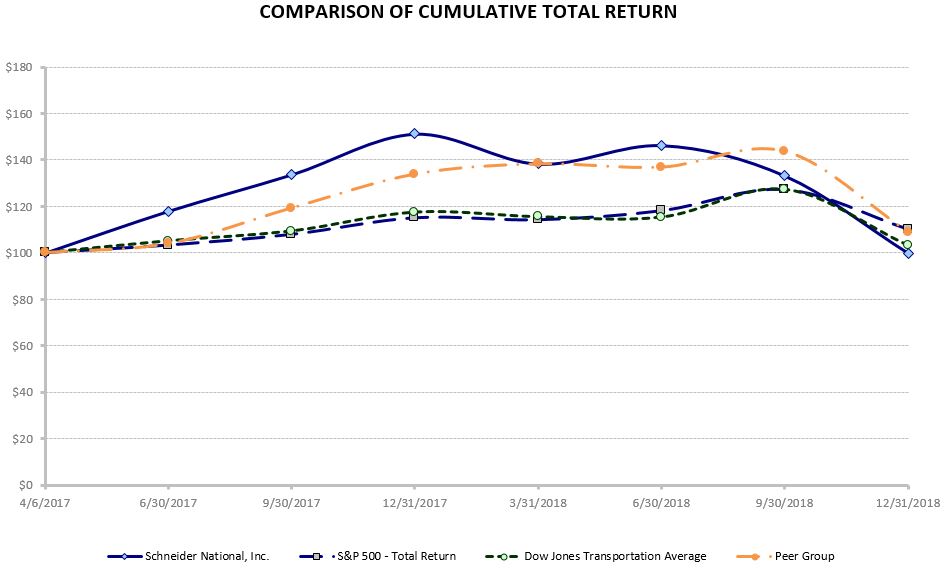
4/6/2017 | 6/30/2017 | 9/30/2017 | 12/31/2017 | 3/31/2018 | 6/30/2018 | 9/30/2018 | 12/31/2018 | ||||||||||||||||||||||||
Schneider National, Inc. | $ | 100.00 | $ | 118.01 | $ | 133.75 | $ | 151.26 | $ | 138.33 | $ | 146.33 | $ | 133.17 | $ | 99.83 | |||||||||||||||
S&P 500 - Total Returns | 100.00 | 103.25 | 107.88 | 115.05 | 114.18 | 118.10 | 127.20 | 110.00 | |||||||||||||||||||||||
Dow Jones Transportation Average | 100.00 | 105.10 | 109.34 | 117.46 | 115.46 | 115.31 | 127.28 | 102.98 | |||||||||||||||||||||||
Peer Group | 100.00 | 103.93 | 119.33 | 133.96 | 138.36 | 136.94 | 143.74 | 108.81 | |||||||||||||||||||||||
1 | Effective September 8, 2017, the businesses of Knight Transportation, Inc. and Swift Transportation Co. were merged under a single parent company, Knight-Swift Transportation Holding Inc. |
29
Item 6. Selected Financial Data
The following selected financial data should be read in conjunction with the consolidated financial statements and notes under Item 8 of Part II of this Form 10-K.
(Dollars in millions, except per share amounts and ratios)
Consolidated Statement of Comprehensive Income GAAP Data | 2018 | 2017 | 2016 | 2015 | 2014 | |||||||||||||||
Operating revenues | $ | 4,977.0 | $ | 4,383.6 | $ | 4,045.7 | $ | 3,959.4 | $ | 3,940.6 | ||||||||||
Income from operations | 375.8 | 280.3 | 290.4 | 260.2 | 239.4 | |||||||||||||||
Net income (1) | 268.9 | 389.9 | 156.9 | 140.9 | 133.6 | |||||||||||||||
Basic earnings per share (1) | 1.52 | 2.28 | 1.00 | 0.91 | 0.86 | |||||||||||||||
Diluted earnings per share (1) | 1.52 | 2.28 | 1.00 | 0.91 | 0.86 | |||||||||||||||
Cash dividends per share | 0.24 | 0.20 | 0.20 | 0.16 | 0.13 | |||||||||||||||
Operating ratio (2) | 92.4 | % | 93.6 | % | 92.8 | % | 93.4 | % | 93.9 | % | ||||||||||
Non-GAAP Financial Data (Unaudited) | 2018 | 2017 | 2016 | 2015 | 2014 | |||||||||||||||
Revenues (excluding fuel surcharge) (3) | $ | 4,454.2 | $ | 3,997.3 | $ | 3,751.7 | $ | 3,588.2 | $ | 3,333.7 | ||||||||||
Adjusted income from operations (4) | 383.6 | 281.7 | 293.1 | 293.0 | 244.3 | |||||||||||||||
Adjusted net income (5) | 275.2 | 161.2 | 158.5 | 162.7 | 136.5 | |||||||||||||||
Adjusted operating ratio (6) | 91.4 | % | 93.0 | % | 92.2 | % | 91.8 | % | 92.7 | % | ||||||||||
Consolidated Balance Sheet GAAP Data | 2018 | 2017 | 2016 | 2015 | 2014 | |||||||||||||||
Total assets | $ | 3,624.5 | $ | 3,330.5 | $ | 3,054.6 | $ | 2,621.9 | $ | 2,320.2 | ||||||||||
Debt and capital lease obligations (7) | 411.3 | 439.7 | 698.3 | 545.6 | 514.4 | |||||||||||||||
Key Operating Metrics | 2018 | 2017 | 2016 | 2015 | 2014 | |||||||||||||||
Average trucks (8) (9) | 11,568 | 11,860 | 11,722 | 10,982 | 10,385 | |||||||||||||||
Revenue per truck per week (10) | $ | 3,840 | $ | 3,619 | $ | 3,488 | $ | 3,520 | $ | 3,518 | ||||||||||
Containers | 21,790 | 17,535 | 17,653 | 17,397 | 17,280 | |||||||||||||||
(1) | Includes the $229.5 million, or $1.34 per share, reduction in income tax expense in 2017 resulting from the revaluation of net deferred tax liabilities due to the Tax Cuts and Jobs Act. |
(2) | Operating ratio is calculated as total operating expenses as a percentage of operating revenues. |
(3) | Revenues (excluding fuel surcharge) represents operating revenues less fuel surcharge revenues. Refer to the Non-GAAP Financial Measures discussion within MD&A for a reconciliation of operating revenues, the most closely comparable GAAP financial measure, to revenues (excluding fuel surcharge). |
(4) | Adjusted income from operations is defined as income from operations, adjusted to exclude material items that do not reflect our core operating performance. Refer to the Non-GAAP Financial Measures discussion within MD&A for a reconciliation of income from operations, which is the most directly comparable GAAP measure, to adjusted income from operations. |
(5) | Adjusted net income is adjusted to exclude material items that do not reflect our core operating performance. Refer to the Non-GAAP Financial Measures discussion within MD&A for a reconciliation of net income, which is the most directly comparable GAAP measure, to adjusted net income. |
(6) | Adjusted operating ratio is adjusted to exclude material items that do not reflect our core operating performance, divided by revenues (excluding fuel surcharge). Refer to the Non-GAAP Financial Measures discussion within MD&A for a reconciliation of operating ratio, which is the most directly comparable GAAP measure, to adjusted operating ratio. |
(7) | Includes current and noncurrent portions of unsecured senior notes, accounts receivable facility, equipment financing agreements, and capital leases. |
(8) | Includes company trucks and owner-operator trucks. |
(9) | Calculated based on beginning and end of month counts and represents the average number of trucks available to haul freight over the specified timeframe. |
(10) | Calculated excluding fuel surcharge, consistent with how revenue is reported internally for segment purposes. |
30
Item 7. Management’s Discussion and Analysis of Financial Condition and Results of Operations
The following discussion and analysis should be read in conjunction with the accompanying financial statements and related notes.
INTRODUCTION
Company Overview
We are a leading transportation and logistics services company providing a broad portfolio of premier truckload, intermodal, and logistics solutions and operating one of the largest for-hire trucking fleets in North America. Our highly flexible and balanced business combines asset-based truckload services with asset-light intermodal and non-asset logistics offerings, enabling us to serve our customers’ diverse transportation needs.
Strategy
Our goals are to grow revenue and profitability, drive strong and consistent return on capital, and increase stakeholder value resiliently through economic cycles. We believe our competitive strengths position us to pursue our goals by way of the following strategies:
Strengthen core operations to drive organic growth and maintain a leading market position
We intend to drive organic growth through leveraging our existing customer relationships, as well as expanding our customer base. We believe our broad portfolio of services with different asset intensities and our North American footprint, allow for supply chain alternatives which enable new and existing customer growth with the potential to capture a greater share of each customers’ annual transportation and logistics spend. We also plan to drive revenue growth by increasing our marketing to customers that seek to outsource their transportation services. Our growth decisions are based on our “Value Triangle”, which represents profitable growth while balancing the needs of our customers, our associates, and our shareholders. Our Quest platform serves as an instrumental factor which drives profitability as it enables real-time, data-driven decision support science on every load/order, and assists our associates to proactively manage our services across our network. Together with our highly incentivized and proactive sales organization, our Quest platform will provide better service and organic growth in each of our reportable segments.
Expand capabilities in the specialty equipment freight market and continue growing our asset-light and non-asset businesses
We believe that our specialty freight capabilities position us to grow in the specialty equipment market, which has higher barriers to entry and favors enhanced pricing and lasting customer relationships. The complexity and time-sensitivity of the loads often require increased collaboration with, and greater understanding of, our customers’ business needs and processes. The transportation of specialty equipment freight requires specially trained drivers with appropriate licenses and special hauling permits, as well as equipment that can handle items with unique requirements in terms of temperature, freight treatment, size, and shape. As such, there are few carriers that have comparable network scale and capabilities in the specialty equipment market, which we believe will allow us to grow profitably in that business.
We have seen strong growth in our Intermodal business and expect it will continue. As an asset-based provider we have more control over our equipment to include containers and chassis, perform most of our own drays, and have strong contractual rail relationships. We believe our Quest platform will enable us to enjoy certain benefits of complete end-to-end control, including increased pick–up and delivery predictability, better visibility, and more capacity when driver capacity is constrained.
Freight brokerage, which is a significant part of our Logistics segment, is another business where we have seen strong growth, which we expect will continue. As shippers increasingly consolidate their business with fewer freight brokers, we are well-positioned to become one of their select providers due to our customer service, innovative technology, and an established dense network of qualified third-party carriers. Large shippers in particular see the value of working with providers like us that have scale, capacity, and lane density, as they are more reliable, efficient, and cost effective at covering loads. Brokerage serves as a non-asset innovation hub for Schneider, particularly in the areas of predictive analytics, process automation, and new customer relationship generation.
31
Capitalize on the growth of e-commerce fulfillment
As a “first, middle, and final mile” carrier for large parcel consumer items, such as furniture, appliances, electronics, and mattresses, in one of the fastest-growing e-commerce markets, we are positioned to grow. We have the technological capability, national footprint, and the ability to use multiple modes of capacity to provide network breadth and density to meet growing e-commerce fulfillment needs. We provide services for many online retailers, offering first to final mile delivery from warehouses to consumer living rooms. We intend to leverage our end-market expertise, leading technology platform, density, and end-to-end integrated capabilities to continue taking the complexity out of the supply chain for omni-channel retailers, further driving our growth.
Continue to improve our operations and margins by leveraging benefits from investments in our Quest technology and business transformation
We continue to benefit from our Quest technology and business transformation by improving the effectiveness with which we use data to increase revenue and lower costs. Full visibility into each driver’s profile allows us to increase driver satisfaction and retention by matching drivers to loads and routes that better fit their individual needs. We can improve our customer service, retain drivers, lower costs, and generate business by anticipating our customers’ and drivers’ needs and preferences in a dynamic network. We believe the implementation of simple and intuitive customer interfaces will also enable a stronger connection with our customers through increased interaction and an enhanced user experience. We expect additional margin improvement as we continue to leverage data analytics within the Quest platform. Along with our revenue management discipline, the strong foundation we have established with our continuing Quest transformation will allow us to incorporate new technologies and build additional capabilities into the platform over time, maintaining our competitive edge and setting the foundation for future growth.
Allocate capital across businesses to maximize return on capital, and selectively pursue opportunistic acquisitions
Our broad portfolio of services provides us with a greater opportunity to allocate capital within our portfolio of services in a manner that maximizes returns across all market cycles and economic conditions. For example, we can efficiently move our equipment between services and regions when we see opportunities to maximize our return on capital. We continually monitor our performance and market conditions to ensure appropriate allocation of capital and resources to grow our businesses, while optimizing returns across reportable segments. Furthermore, our strong balance sheet enables us to carry out an acquisition strategy that strengthens our overall portfolio. We are positioned to leverage our scalable platform and experienced operations team to acquire high-quality businesses that meet our disciplined selection criteria to broaden our service offerings and customer base.
Attract and retain top talent at all levels to ensure sustainable growth
Our people are our strongest assets, and we believe they are key to growing our customer base and driving our performance. Our goal is to be the employer of choice; attract, develop, engage, and retain the best talent in the industry. We strive for a high-performance culture with operational excellence and to foster a collaborative environment which seeks individuals who are passionate about our business and fit within our culture. We value the direct relationship we have with our associates, and we intend to continue working together to provide professional growth and a quality work environment without third party representation. Our compensation structure is performance-based and aligns with our strategic objectives. In today’s driver constrained environment, we seek to maintain our reputation as a preferred carrier of choice within the driver community and attract and retain high-quality, safe drivers that meet or exceed our qualification standards. We invest in the well-being of our associates through our commitment to ensuring a differentiated driver experience and efforts to improve the quality of drivers’ touchpoints. We provide mandatory physical check-ups which cover sleep apnea and urine and hair follicle drug testing, among other things. We believe that investing in the health of our associates helps maintain a high-quality driver base.
Our leading technology platform facilitates the application, screening, and onboarding of top talent. As an industry leader with a respected safety culture and underlying core values, we believe that we will continue to be the employer of choice for both driving and non-driving associates.
RESULTS OF OPERATIONS
Non-GAAP Financial Measures
In this section of our report we present the following non-GAAP financial measures: (1) revenues (excluding fuel surcharge), (2) adjusted income from operations, (3) adjusted operating ratio, (4) adjusted net income, and (5) adjusted effective tax rate. We also provide reconciliations of these measures to the most directly comparable financial measures calculated and presented in accordance with GAAP.
32
Management believes the use of each of these non-GAAP measures assists investors in understanding our business by (a) removing the impact of items from our operating results that, in our opinion, do not reflect our core operating performance, (b) providing investors with the same information our management uses internally to assess our core operating performance, and (c) presenting comparable financial results between periods. In addition, in the case of revenues (excluding fuel surcharge), we believe the measure is useful to investors because it isolates volume, price, and cost changes directly related to industry demand and the way we operate our business from the external factor of fluctuating fuel prices and the programs we have in place to manage fuel price fluctuations. Fuel-related costs and their impact on our industry are important to our results of operations, but they are often independent of other, more germane factors affecting our results of operations and our industry. Although we believe these non-GAAP measures are useful to investors, they have limitations as analytical tools and may not be comparable to similar measures disclosed by other companies. You should not consider the non-GAAP measures in this report in isolation or as substitutes for, or alternatives to, analysis of our results as reported under GAAP. The exclusion of unusual or infrequent items or other adjustments reflected in the non-GAAP measures should not be construed as an inference that our future results will not be affected by unusual or infrequent items or by other items similar to such adjustments. Our management compensates for these limitations by relying primarily on our GAAP results in addition to using the non-GAAP measures.
Enterprise Summary
The following table includes key GAAP and non-GAAP financial measures for the consolidated enterprise.
Year Ended December 31, | ||||||||||||
(in millions, except ratios) | 2018 | 2017 | 2016 | |||||||||
Operating revenues | $ | 4,977.0 | $ | 4,383.6 | $ | 4,045.7 | ||||||
Revenues (excluding fuel surcharge) (1) | 4,454.2 | 3,997.3 | 3,751.7 | |||||||||
Income from operations | 375.8 | 280.3 | 290.4 | |||||||||
Adjusted income from operations (2) | 383.6 | 281.7 | 293.1 | |||||||||
Operating ratio | 92.4 | % | 93.6 | % | 92.8 | % | ||||||
Adjusted operating ratio (3) | 91.4 | % | 93.0 | % | 92.2 | % | ||||||
Net income | $ | 268.9 | $ | 389.9 | $ | 156.9 | ||||||
Adjusted net income (4) | 275.2 | 161.2 | 158.5 | |||||||||
Effective tax rate | 26.2 | % | (48.0 | )% | 40.9 | % | ||||||
Adjusted effective tax rate (5) | 26.2 | % | 39.1 | % | 40.9 | % | ||||||
(1) | We define “revenues (excluding fuel surcharge)” as operating revenues less fuel surcharge revenues. Included below is a reconciliation of operating revenues, the most closely comparable GAAP financial measure, to revenues (excluding fuel surcharge). |
(2) | We define “adjusted income from operations” as income from operations, adjusted to exclude material items that do not reflect our core operating performance. Included below is a reconciliation of income from operations, which is the most directly comparable GAAP measure, to adjusted income from operations. Excluded items for the periods shown are explained in the table and notes below. |
(3) | We define “adjusted operating ratio” as operating expenses, adjusted to exclude material items that do not reflect our core operating performance, divided by revenues (excluding fuel surcharge). Included below is a reconciliation of operating ratio, which is the most directly comparable GAAP measure, to adjusted operating ratio. Excluded items for the periods shown are explained below under our explanation of “adjusted income from operations.” |
(4) | We define “adjusted net income” as net income, adjusted to exclude material items that do not reflect our core operating performance. Included below is a reconciliation of net income, which is the most directly comparable GAAP measure, to adjusted net income. Excluded items for the periods shown are explained below under our explanation of “adjusted income from operations.” |
(5) | “Adjusted effective tax rate” represents our effective tax rate prior to the effect on our deferred tax assets and liabilities of the change in the federal income tax rate due to the Tax Cuts and Jobs Act. Included below is a reconciliation of our effective tax rate, which is the most directly comparable GAAP measure, to the adjusted effective tax rate. |
33
Revenues (excluding fuel surcharge)
Year Ended December 31, | ||||||||||||
(in millions) | 2018 | 2017 | 2016 | |||||||||
Operating revenues | $ | 4,977.0 | $ | 4,383.6 | $ | 4,045.7 | ||||||
Less: Fuel surcharge revenues | 522.8 | 386.3 | 294.0 | |||||||||
Revenues (excluding fuel surcharge) | $ | 4,454.2 | $ | 3,997.3 | $ | 3,751.7 | ||||||
Adjusted income from operations
Year Ended December 31, | ||||||||||||
(in millions) | 2018 | 2017 | 2016 | |||||||||
Income from operations | $ | 375.8 | $ | 280.3 | $ | 290.4 | ||||||
Litigation (1) | 5.8 | — | — | |||||||||
Duplicate chassis costs (2) | — | 14.9 | — | |||||||||
WSL contingent consideration adjustment (3) | — | (13.5 | ) | — | ||||||||
Acquisition costs (4) | — | — | 1.4 | |||||||||
IPO costs (5) | — | — | 1.3 | |||||||||
Goodwill impairment (6) | 2.0 | — | — | |||||||||
Adjusted income from operations | $ | 383.6 | $ | 281.7 | $ | 293.1 | ||||||
(1) | Costs associated with the settlement of a lawsuit that challenged Washington State labor law compliance during 2018. |
(2) | As of December 31, 2017, we completed our migration to an owned chassis model, which required the replacement of rented chassis with owned chassis. Accordingly, we adjusted our income from operations for rental costs related to idle chassis as rental units were replaced. |
(3) | In 2017, we recorded fair value adjustments to the contingent consideration related to the acquisition of WSL. See Note 4, Acquisition, and Note 5, Fair Value, for more information. |
(4) | Costs related to the June 1, 2016 acquisition of WSL. |
(5) | Costs related to our IPO. |
(6) | As a result of our annual goodwill impairment test in the fourth quarter of 2018, we recorded an impairment charge for our Asia reporting unit. |
34
Adjusted operating ratio
Year Ended December 31, | ||||||||||||
(in millions, except ratios) | 2018 | 2017 | 2016 | |||||||||
Total operating expenses | $ | 4,601.2 | $ | 4,103.3 | $ | 3,755.3 | ||||||
Divide by: Operating revenues | 4,977.0 | 4,383.6 | 4,045.7 | |||||||||
Operating ratio | 92.4 | % | 93.6 | % | 92.8 | % | ||||||
Total operating expenses | $ | 4,601.2 | $ | 4,103.3 | $ | 3,755.3 | ||||||
Adjusted for: | ||||||||||||
Fuel surcharge revenues | (522.8 | ) | (386.3 | ) | (294.0 | ) | ||||||
Litigation | (5.8 | ) | — | — | ||||||||
Duplicate chassis costs | — | (14.9 | ) | — | ||||||||
WSL contingent consideration adjustment | — | 13.5 | — | |||||||||
Acquisition costs | — | — | (1.4 | ) | ||||||||
IPO costs | — | — | (1.3 | ) | ||||||||
Goodwill impairment | (2.0 | ) | — | — | ||||||||
Adjusted total operating expenses | $ | 4,070.6 | $ | 3,715.6 | $ | 3,458.6 | ||||||
Operating revenues | $ | 4,977.0 | $ | 4,383.6 | $ | 4,045.7 | ||||||
Less: Fuel surcharge revenues | 522.8 | 386.3 | 294.0 | |||||||||
Revenues (excluding fuel surcharge) | $ | 4,454.2 | $ | 3,997.3 | $ | 3,751.7 | ||||||
Adjusted operating ratio | 91.4 | % | 93.0 | % | 92.2 | % | ||||||
Adjusted net income
Year Ended December 31, | ||||||||||||
(in millions) | 2018 | 2017 | 2016 | |||||||||
Net income | $ | 268.9 | $ | 389.9 | $ | 156.9 | ||||||
Impact of Tax Cuts and Jobs Act (1) | — | (229.5 | ) | — | ||||||||
Litigation | 5.8 | — | — | |||||||||
Duplicate chassis costs | — | 14.9 | — | |||||||||
WSL contingent consideration adjustment | — | (13.5 | ) | — | ||||||||
Acquisition costs | — | — | 1.4 | |||||||||
IPO costs | — | — | 1.3 | |||||||||
Goodwill impairment | 2.0 | — | — | |||||||||
Income tax effect of non-GAAP adjustments(2) | (1.5 | ) | (0.6 | ) | (1.1 | ) | ||||||
Adjusted net income | $ | 275.2 | $ | 161.2 | $ | 158.5 | ||||||
(1) This amount represents the effect on deferred tax assets and liabilities of the change in the federal income tax rate from 35% to 21% as a result of the Tax Cuts and Jobs Act enacted in December 2017.
(2) | Tax impacts are calculated using the applicable consolidated federal and state effective tax rate, modified to remove the impact of tax credits and adjustments (such as the impact of the Tax Cuts and Jobs Act in 2017) that are not applicable to the item in question. If the underlying item has a materially different tax treatment, the actual or estimated tax rate applicable to the adjustment is used. A tax rate of 0% was used for the 2018 goodwill impairment. |
Adjusted effective tax rate
Year Ended December 31, | |||||||||
(in millions) | 2018 | 2017 | 2016 | ||||||
Effective tax rate | 26.2 | % | (48.0 | )% | 40.9 | % | |||
Impact of Tax Cuts and Jobs Act | — | % | 87.1 | % | — | % | |||
Adjusted effective tax rate | 26.2 | % | 39.1 | % | 40.9 | % | |||
35
Year Ended December 31, 2018 Compared to Year Ended December 31, 2017
Enterprise Results Summary
Enterprise net income decreased $121.0 million, approximately 31%, in the year ended December 31, 2018 compared to 2017, primarily due to a $229.5 million favorable adjustment to our net deferred tax liabilities as a result of the Tax Cuts and Jobs Act enacted in December 2017, partially offset by strong pricing and market demand in 2018.
Adjusted net income increased $114.0 million, approximately 71%.
Components of Enterprise Net Income
Enterprise Revenues
Enterprise operating revenues increased $593.4 million, approximately 14%, in the year ended December 31, 2018 compared to 2017. Increased revenues (excluding fuel surcharge) resulted from strong pricing and volume increases in the Logistics and Intermodal segments, which increased $190.3 million and $173.6 million, respectively, driven by an industry-wide shortage in driver capacity and increased customer demand. Other factors contributing to the increase in revenues were as follows:
• | a $136.5 million increase in fuel surcharge revenues, and |
• | a $80.6 million increase in our Truckload segment revenues (excluding fuel surcharge), primarily due to price. |
Enterprise revenues (excluding fuel surcharge) increased $456.9 million, approximately 11%.
Enterprise Income from Operations and Operating Ratio
Enterprise income from operations increased $95.5 million, approximately 34%, in the year ended December 31, 2018 compared to 2017, primarily due to an increase in revenue and improved profitability across the segments. The largest contributor to improved profitability was the Intermodal segment, which was due in part to an improved cost position from the conversion from leased to owned chassis and growth from investments in containers. These factors were partially offset by increased purchased transportation and driver related costs, as well as increased FTFM losses in 2018.
Adjusted income from operations increased $101.9 million, approximately 36%.
Enterprise operating ratio improved on both a GAAP basis and an adjusted basis. Our operating ratio can be negatively impacted when our lower margin, less asset-focused Logistics segment grows faster than our higher margin, capital-intensive Truckload segment.
Enterprise Operating Expenses
Key operating expense items that impacted our income from operations are described below.
• | Purchased transportation costs increased $360.6 million, or 22%, year over year. The largest drivers of the increase were an increase in brokerage volumes in our Logistics segment, which relies heavily on third-party carriers, and increased third-party prices across all segments. As a percentage of revenues, purchased transportation costs increased 3% period over period. |
• | Salaries, wages, and benefits increased $35.9 million, or 3%, year over year, largely due to increased driver wages offset by lower driver counts caused by the industry wide shortage in driver capacity. Additional reasons for the increase included increased incentive compensation resulting from improved company performance and higher commissions in our brokerage business. As a percentage of revenues, salaries, wages, and benefits decreased 3% period over period. |
• | Fuel and fuel taxes increased $39.3 million, or 13%, year over year, driven by an increase in the cost of fuel per gallon, partially offset by decreased company driver miles in our Truckload segment. A significant portion of changes in fuel costs is recovered through our fuel surcharge programs, however there can be timing differences between when we incur fuel costs and when they are recovered. |
• | Depreciation and amortization increased $12.3 million, or 4%, year over year, primarily driven by increased trailer and tractor depreciation, as we replaced older units to maintain an appropriate age of fleet. The 2017 conversion from leased to owned chassis in our Intermodal segment also resulted in increased depreciation. |
• | Operating supplies and expenses decreased $2.6 million, or 1%, year over year. The decrease was mainly due to $26.2 million lower rent expense, primarily due to our 2017 conversion from leased to owned chassis, and a reduction in |
36
temporary worker pay in our FTFM terminal operations due to the conversion from an agent to company driver model. This was offset by an increase in the amount of sales-type lease equipment sold by our leasing business, resulting in higher cost of goods sold, which is part of the operating supplies and expense line item, an increase in Intermodal rail yard ramp storage costs largely attributed to increased volumes, and a decrease in gains on sales of equipment.
• | Insurance and related expenses increased $11.9 million, or 13%, year over year, primarily due to increased severity of auto losses and increased volume of cargo losses. |
• | Other general expenses increased $38.5 million, or 36%, year over year. In 2017, other general expenses were lowered by $13.5 million for the reduction of the contingent liability related to the WSL acquisition adjustment, while there was no comparable reduction in 2018. There was also $8.9 million higher driver recruiting and training costs, an increase in professional services fees, including additional costs associated with operating as a public company, and a $5.8 million increase in litigation costs. |
Total Other Expenses
Other expenses decreased $5.7 million, approximately 34%, in the year ended December 31, 2018 compared to 2017, primarily from a $4.9 million decrease in net interest expense due to lower debt levels and increased interest income, and the recognition of a $3.5 million pre-tax gain related to our ownership interest in Platform Science, Inc. See Note 6, Investments, for more information on Platform Science. These items were partially offset by a $2.4 million increase in net foreign currency losses.
Income Tax Expense
Our provision for income taxes increased $222.2 million in the year ended December 31, 2018 compared to 2017, primarily due to the revaluation of net deferred tax liabilities due to the Tax Cuts and Jobs Act in 2017 offset by higher taxable income in 2018. Our effective income tax rate was 26.2% for the year ended December 31, 2018 compared to (48.0)% for 2017, due to the reduction in the income tax rate and the revaluation of net deferred tax liabilities from the enactment of the Tax Cuts and Job Act in December 2017. We anticipate that our ongoing effective tax rate will be 25.5% - 26.5% subject to further changes in law.
Segment Contributions to Income from Operations
The following tables summarize revenue and earnings by segment:
Revenues by Segment | Year Ended December 31, | ||||||||
(in millions) | 2018 | 2017 | |||||||
Truckload | $ | 2,268.0 | $ | 2,187.4 | |||||
Intermodal | 953.5 | 779.9 | |||||||
Logistics | 1,024.6 | 834.3 | |||||||
Other | 322.0 | 293.6 | |||||||
Fuel surcharge | 522.8 | 386.3 | |||||||
Inter-segment eliminations | (113.9 | ) | (97.9 | ) | |||||
Operating revenues | $ | 4,977.0 | $ | 4,383.6 | |||||
Income (Loss) from Operations by Segment | Year Ended December 31, | ||||||||
(in millions) | 2018 | 2017 | |||||||
Truckload | $ | 240.5 | $ | 196.2 | |||||
Intermodal | 130.2 | 52.3 | |||||||
Logistics | 47.4 | 34.2 | |||||||
Other | (42.3 | ) | (2.4 | ) | |||||
Income from operations | 375.8 | 280.3 | |||||||
Adjustments: | |||||||||
Litigation | 5.8 | — | |||||||
Duplicate chassis costs | — | 14.9 | |||||||
WSL contingent consideration adjustment | — | (13.5 | ) | ||||||
Goodwill impairment | 2.0 | — | |||||||
Adjusted income from operations | $ | 383.6 | $ | 281.7 | |||||
37
Truckload
The following table presents our key performance metrics for our Truckload segment for the periods indicated, consistent with how revenues and expenses are reported internally for segment purposes:
Year Ended December 31, | ||||||||
2018 | 2017 | |||||||
Dedicated standard | ||||||||
Revenues (excluding fuel surcharge) (1) | $ | 327.1 | $ | 291.8 | ||||
Average trucks (2) (3) | 1,678 | 1,645 | ||||||
Revenue per truck per week (4) | $ | 3,819 | $ | 3,480 | ||||
Dedicated specialty | ||||||||
Revenues (excluding fuel surcharge) (1) | $ | 405.5 | $ | 424.4 | ||||
Average trucks (2) (3) | 2,239 | 2,285 | ||||||
Revenue per truck per week (4) | $ | 3,546 | $ | 3,645 | ||||
For-hire standard | ||||||||
Revenues (excluding fuel surcharge) (1) | $ | 1,219.2 | $ | 1,162.8 | ||||
Average trucks (2) (3) | 6,105 | 6,340 | ||||||
Revenue per truck per week (4) | $ | 3,911 | $ | 3,599 | ||||
For-hire specialty | ||||||||
Revenues (excluding fuel surcharge) (1) | $ | 316.2 | $ | 308.4 | ||||
Average trucks (2) (3) | 1,546 | 1,590 | ||||||
Revenue per truck per week (4) | $ | 4,006 | $ | 3,807 | ||||
Total Truckload | ||||||||
Revenues (excluding fuel surcharge) (1) | $ | 2,268.0 | $ | 2,187.4 | ||||
Average trucks (2) (3) * | 11,568 | 11,860 | ||||||
Revenue per truck per week (4) | $ | 3,840 | $ | 3,619 | ||||
Average company trucks (3) | 8,814 | 9,101 | ||||||
Average owner-operator trucks (3) | 2,753 | 2,758 | ||||||
Trailers | 37,464 | 37,637 | ||||||
Operating ratio (5) | 89.4 | % | 91.0 | % | ||||
(1) | Revenues (excluding fuel surcharge) in millions. |
(2) | Includes company trucks and owner-operator trucks. |
(3) | Calculated based on beginning and end of month counts and represents the average number of trucks available to haul freight over the specified time frame. |
(4) | Calculated excluding fuel surcharge, consistent with how revenue is reported internally for segment purposes, using weighted workdays. |
(5) | Calculated as segment operating expenses divided by segment revenues (excluding fuel surcharge). |
* | Amounts may not sum due to rounding. |
Truckload revenues (excluding fuel surcharge) increased $80.6 million, or 4%, in the year ended December 31, 2018 compared to 2017, primarily due to price growth. Effective freight selection and favorable contract pricing resulted in an increase in revenue per truck per week of $221, or 6%, over 2017.
Truckload income from operations increased $44.3 million, or 23%, in the year ended December 31, 2018 compared to 2017, primarily due to contract price improvements, partially offset by increased driver costs and FTFM losses. The Company is adjusting its FTFM execution model to improve financial performance which centers around reducing variability in the first and middle mile operations, converting more freight to intermodal, for-hire truck and third party capacity, and refining its commercial focus.
38
Intermodal
The following table presents our key performance indicators for our Intermodal segment for the periods indicated.
Year Ended December 31, | ||||||||
2018 | 2017 | |||||||
Orders | 449,330 | 408,928 | ||||||
Containers | 21,790 | 17,535 | ||||||
Trucks (1) | 1,474 | 1,283 | ||||||
Revenue per order (2) | $ | 2,122 | $ | 1,907 | ||||
Operating ratio (3) | 86.4 | % | 93.3 | % | ||||
(1) | Includes company trucks and owner-operator trucks at the end of the period. |
(2) | Calculated excluding fuel surcharge, consistent with how revenue is reported internally for segment purposes. |
(3) | Calculated as segment operating expenses divided by segment revenues (excluding fuel surcharge). |
Intermodal revenues (excluding fuel surcharge) increased $173.6 million, or 22%, in the year ended December 31, 2018 compared to 2017. The increase was driven by growth in orders due to the conversion of over-the-road freight to intermodal and an increase in revenue per order of $215, or 11%, over 2017 due to strong price growth and freight mix.
Intermodal income from operations increased $77.9 million, or 149%, in the year ended December 31, 2018 compared to 2017. The 2017 conversion to owned chassis, which reduced chassis rental costs, as well as dray execution and network optimization enabled by Quest, all contributed to this increase.
Logistics
The following table presents our key performance indicator for our Logistics segment for the periods indicated.
Year Ended December 31, | ||||||
2018 | 2017 | |||||
Operating ratio (1) | 95.4 | % | 95.9 | % | ||
(1) | Calculated as segment operating expenses divided by segment revenues (excluding fuel surcharge), consistent with how revenue is reported internally for segment purposes. |
Logistics revenues (excluding fuel surcharge) increased $190.3 million, or 23%, in the year ended December 31, 2018 compared to 2017, primarily due to growth in our brokerage business. Brokerage volumes increased approximately 17% over 2017 due to favorable market conditions.
Logistics income from operations increased $13.2 million, or 39%, in the year ended December 31, 2018 compared to 2017. The growth in revenues (excluding fuel surcharge) cited above was partially offset by increased third-party transportation costs and increased seller and broker commissions due to improved operating results.
Other
Our Other segment's loss from operations increased $39.9 million year over year. The $39.9 million increase was driven by the year over year $13.5 million reduction of a contingent liability from the WSL acquisition in 2017 resulting in decreased costs, an increase in incentive compensation due to improved enterprise results, and the $5.8 million settlement of a lawsuit that challenged Washington State labor law compliance. An increase in professional services fees, including additional costs associated with operating as a public company, and Asia goodwill impairment charges of $2.0 million also contributed to the increased loss from operations in our Other segment.
Year Ended December 31, 2017 Compared to Year Ended December 31, 2016
Enterprise Results Summary
Enterprise net income increased $233.0 million, approximately 149%, in the year ended December 31, 2017 compared to 2016. We recorded a $229.5 million favorable adjustment to our net deferred tax liabilities to reflect the decrease in the federal income tax rate effective January 1, 2018 as a result of the Tax Cuts and Jobs Act enacted in December 2017. We also recorded
39
an $8.1 million after-tax adjustment to a contingent liability related to the WSL acquisition, resulting in a favorable impact on net income.
Adjusted net income increased $2.7 million, approximately 2%. Higher volumes across all of our segments, productivity improvements, and lower interest expense were partially offset by lower gains on sales of equipment and higher driver and fuel costs.
Components of Enterprise Net Income
Enterprise Revenues
Enterprise operating revenues increased $337.9 million, approximately 8%, in the year ended December 31, 2017 compared to 2016. Significant factors contributing to the increase in revenues were as follows:
• | A $97.1 million increase in revenues in our Logistics segment, driven by growth in our brokerage business, |
• | An $81.7 million increase in fuel surcharge revenues, excluding Logistics and WSL, |
• | A $68.7 million increase in revenues from WSL, which was acquired on June 1, 2016, |
• | A $42.8 million increase in revenues excluding fuel surcharge, driven by growth in Dedicated Specialty accounts, and |
• | A $22.4 million increase in revenues excluding fuel surcharge in our Intermodal segment, driven by a 7% increase in volumes offset by a 4% decrease in revenue per order. |
Enterprise revenues (excluding fuel surcharge) increased $245.6 million, approximately 7%.
Enterprise Income from Operations and Operating Ratio
Enterprise income from operations decreased $10.1 million, approximately 3%, in the year ended December 31, 2017 compared to 2016, primarily due to duplicate chassis costs of $14.9 million and $8.8 million lower gains on sales of equipment, partially offset by the impact of the $13.5 million adjustment of a WSL contingent liability. See Note 4, Acquisition, and Note 5, Fair Value, for more information on the contingent liability adjustment.
Adjusted income from operations decreased $11.4 million, approximately 4%. This decrease was primarily driven by the lower gains on sales of equipment mentioned above, as well as increased driver and fuel costs. The majority of our operating costs, with the exception of driver costs and fuel costs, increased in line with the increase in revenues.
Enterprise operating ratio increased on both a GAAP basis and an adjusted basis. In addition to the decrease in income from operations year over year, our operating ratio was negatively impacted due to changes in our mix of business when our lower margin, less asset-focused Logistics segment grows faster than our higher margin, capital-intensive Truckload segment.
Enterprise Operating Expenses
Key operating expense items that impacted our income from operations are described below.
• | Purchased transportation costs increased $139.3 million, or 10%, year over year. The largest driver of the increase was an increase in volumes in our Logistics segment, which relies heavily on third-party carriers, resulting in $84.8 million higher purchased transportation costs. Truckload and Intermodal segments' purchased transportation costs also increased year over year due to growth in those segments. As a percentage of revenues, purchased transportation costs remained flat. |
• | Salaries, wages, and benefits increased $94.2 million, or 8%, year over year, driven by increased driver and administrative labor costs, and an increase in non-driver associate count. Overall, as a percentage of revenues, total salaries, wages, and benefits remained flat year over year. |
• | Fuel and fuel taxes increased $52.6 million, or 21%, year over year, driven by an increase in the cost of fuel per gallon and a full year of WSL business. A significant portion of changes in fuel costs is recovered through our fuel surcharge programs. |
• | Depreciation and amortization increased $13.0 million, or 5%, year over year. The main driver of the increase was additional depreciation for capital investments in trailers and owned chassis. |
• | Operating supplies and expenses increased $44.0 million, or 10%, year over year. $27.6 million of the increase was due to an increase in the amount of equipment sold by our leasing business, resulting in higher cost of goods sold, which flows through operating supplies and expenses. There were also $8.8 million lower gains on sales of equipment year over year. |
40
• | Insurance and related expenses increased $1.2 million year over year. |
• | Other general expenses increased $3.7 million, or 4%, year over year. The primary reasons for the increase were $9.4 million higher driver recruiting and training costs, $4.5 million higher professional fees, and $4.1 million higher bad debt expense, partially offset by the $13.5 million adjustment of a contingent liability related to the WSL acquisition. See Note 4, Acquisition, and Note 5, Fair Value, for more information. As a percentage of revenues, other general expenses remained flat year over year. |
Total Other Expenses
Other expenses decreased $7.9 million, approximately 32%, in the year ended December 31, 2017 compared to 2016, primarily due to a $4.0 million decrease in net interest expense due to lower debt levels, and realized gains from foreign currency exchange rate changes.
Income Tax Expense
Our provision for income taxes decreased $235.2 million, or 216% in the year ended December 31, 2017 compared to 2016, primarily due to the favorable impact of lowering our net deferred tax liabilities to reflect the federal income tax rate decrease as a result of the Tax Cuts and Jobs Act enacted in December 2017. Our effective income tax rate was (48.0)% for the year ended December 31, 2017 compared to 40.9% for 2016. Our 2017 adjusted effective tax rate, after considering the impact of the Tax Cuts and Jobs Act, was 39.1%.
Segment Contributions to Income from Operations
The following tables summarize revenue and earnings by segment:
Revenues by Segment | Year Ended December 31, | ||||||||
(in millions) | 2017 | 2016 | |||||||
Truckload | $ | 2,187.4 | $ | 2,091.0 | |||||
Intermodal | 779.9 | 757.5 | |||||||
Logistics | 834.3 | 737.7 | |||||||
Other | 293.6 | 240.5 | |||||||
Fuel surcharge | 386.3 | 294.0 | |||||||
Inter-segment eliminations | (97.9 | ) | (75.0 | ) | |||||
Operating revenues | $ | 4,383.6 | $ | 4,045.7 | |||||
Income (Loss) from Operations by Segment | Year Ended December 31, | |||||||
(in millions) | 2017 | 2016 | ||||||
Truckload | $ | 196.2 | $ | 221.1 | ||||
Intermodal | 52.3 | 46.1 | ||||||
Logistics | 34.2 | 30.7 | ||||||
Other | (2.4 | ) | (7.5 | ) | ||||
Income from operations | 280.3 | 290.4 | ||||||
Adjustments: | ||||||||
Duplicate chassis costs | 14.9 | — | ||||||
WSL contingent consideration adjustment | (13.5 | ) | — | |||||
Acquisition costs | — | 1.4 | ||||||
IPO costs | — | 1.3 | ||||||
Adjusted income from operations | $ | 281.7 | $ | 293.1 | ||||
41
Truckload
The following table presents our key performance metrics for our truckload segment for the periods indicated, consistent with how revenues and expenses are reported internally for segment purposes:
Year Ended December 31, | |||||||
2017 | 2016 | ||||||
Dedicated standard | |||||||
Revenues (excluding fuel surcharge) (1) | $ | 291.8 | $ | 300.9 | |||
Average trucks (2) (3) | 1,645 | 1,758 | |||||
Revenue per truck per week (4) | $ | 3,480 | $ | 3,348 | |||
Dedicated specialty | |||||||
Revenues (excluding fuel surcharge) (1) | $ | 424.4 | $ | 381.6 | |||
Average trucks (2) (3) | 2,285 | 2,050 | |||||
Revenue per truck per week (4) | $ | 3,645 | $ | 3,639 | |||
For-hire standard | |||||||
Revenues (excluding fuel surcharge) (1) | $ | 1,162.8 | $ | 1,168.8 | |||
Average trucks (2) (3) | 6,340 | 6,641 | |||||
Revenue per truck per week (4) | $ | 3,599 | $ | 3,442 | |||
For-hire specialty | |||||||
Revenues (excluding fuel surcharge) (1) | $ | 308.4 | $ | 239.7 | |||
Average trucks (2) (3) | 1,590 | 1,274 | |||||
Revenue per truck per week (4) | $ | 3,807 | $ | 3,679 | |||
Total Truckload | |||||||
Revenues (excluding fuel surcharge) (1) | $ | 2,187.4 | $ | 2,091.0 | |||
Average trucks (2) (3) * | 11,860 | 11,722 | |||||
Revenue per truck per week (4) | $ | 3,619 | $ | 3,488 | |||
Average company trucks (3) | 9,101 | 9,026 | |||||
Average owner-operator trucks (3) | 2,758 | 2,696 | |||||
Trailers | 37,637 | 37,575 | |||||
Operating ratio (5) | 91.0 | % | 89.4 | % | |||
(1) | Revenues (excluding fuel surcharge) in millions. |
(2) | Includes company trucks and owner-operator trucks. |
(3) | Calculated based on beginning and end of month counts and represents the average number of trucks available to haul freight over the specified timeframe. |
(4) | Calculated excluding fuel surcharge, consistent with how revenue is reported internally for segment purposes. |
(5) | Calculated as segment operating expenses divided by segment revenues (excluding fuel surcharge). |
* | Amounts may not sum due to rounding. |
Truckload revenues (excluding fuel surcharge) increased $96.4 million, approximately 5%, in the year ended December 31, 2017 compared to 2016, primarily due to $58.7 million more revenues (excluding fuel surcharge) from WSL (which was acquired in June 2016), as well as growth in Dedicated Specialty accounts, partially offset by decreased freight volumes in our Dedicated Standard and For-hire Standard businesses. Effective freight selection in a strengthening market in the second half of 2017, truck productivity improvements throughout the year, and a favorable year over year price impact resulted in an increase in revenue per truck per week of $131, approximately 4%, over 2016.
Truckload income from operations decreased $24.9 million, approximately 11%, in the year ended December 31, 2017 compared to 2016, primarily due to increased driver costs, increased FTFM network buildout costs, the net negative impact of two major hurricanes in the third quarter of 2017, and lower gains on sales of equipment, partially offset by operational efficiencies driven by effective fleet sizing and freight selection.
42
Intermodal
The following table presents our key performance indicators for our intermodal segment for the periods indicated.
Year Ended December 31, | ||||||||
2017 | 2016 | |||||||
Orders | 408,928 | 381,425 | ||||||
Containers | 17,535 | 17,653 | ||||||
Trucks (1) | 1,283 | 1,244 | ||||||
Revenue per order (2) | $ | 1,907 | $ | 1,986 | ||||
Operating ratio (3) | 93.3 | % | 93.9 | % | ||||
(1) | Includes company trucks and owner-operator trucks at the end of the period. |
(2) | Calculated excluding fuel surcharge, consistent with how revenue is reported internally for segment purposes. |
(3) | Calculated as segment operating expenses divided by segment revenues (excluding fuel surcharge). |
Intermodal revenues (excluding fuel surcharge) increased $22.4 million, approximately 3%, in the year ended December 31, 2017 compared to 2016. The increase was driven by 7% higher volumes, partially offset by a 4% decrease in revenue per order due to both the competitive pricing environment for most of 2017 and growth in the East, which has a shorter length of haul.
Intermodal income from operations increased $6.2 million, approximately 13%, in the year ended December 31, 2017 compared 2016. The increase was driven by higher volumes and tractor and container productivity improvements, partially offset by the increase in duplicate costs due to the 2017 chassis conversion project. Lease costs related to duplicative idle chassis amounted to $14.9 million for the year ended December 31, 2017.
Logistics
The following table presents our key performance indicator for our logistics segment for the periods indicated.
Year Ended December 31, | ||||||
2017 | 2016 | |||||
Operating ratio (1) | 95.9 | % | 95.8 | % | ||
(1) | Calculated as segment operating expenses divided by segment revenues (excluding fuel surcharge), consistent with how revenue is reported internally for segment purposes. |
Logistics revenues (excluding fuel surcharge) increased $96.9 million, approximately 13%, in the year ended December 31, 2017 compared to 2016, primarily due to growth in our brokerage business. Brokerage volumes increased approximately 12% over 2016.
Logistics income from operations increased $3.5 million, approximately 11%, in the year ended December 31, 2017 compared to 2016. The growth in revenues (excluding fuel surcharge) cited above was partially offset by increased third-party transportation costs.
Other
Our Other segment's expense from operations decreased $5.1 million, in the year ended December 31, 2017 compared to 2016, driven primarily by the $13.5 million adjustment of a contingent liability from the WSL acquisition. This decrease was partially offset by higher auto insurance losses year over year and higher professional fees, primarily for transition costs related to public company requirements.
43
LIQUIDITY AND CAPITAL RESOURCES
Our primary uses of cash are working capital requirements, capital expenditures, and debt service requirements. Additionally, from time to time, we may use cash for acquisitions and other investing and financing activities. Working capital is required principally to ensure we are able to run the business and have sufficient funds to satisfy maturing short-term debt and operational expenses. Our capital expenditures consist primarily of transportation equipment and information technology.
Historically, our primary source of liquidity has been cash flow from operations. In addition, we have a $250.0 million revolving credit facility and a $200.0 million accounts receivable facility. We anticipate that cash generated from operations, together with amounts available under our credit facilities, will be sufficient to meet our requirements for the foreseeable future. To the extent additional funds are necessary to meet our long-term liquidity needs as we continue to execute our business strategy, we anticipate that these funds will be obtained through additional indebtedness, additional equity offerings, or a combination of these potential sources of funds. Our ability to fund future operating expenses and capital expenditures, as well as our ability to meet future debt service obligations or refinance our indebtedness, will depend on our future operating performance, which will be affected by general economic, financial, and other factors beyond our control.
The following table presents our cash and debt outstanding as of the dates shown.
(in millions) | December 31, 2018 | December 31, 2017 | ||||||
Cash and cash equivalents | $ | 378.7 | $ | 238.5 | ||||
Marketable securities | 51.3 | 41.6 | ||||||
Total cash, cash equivalents, and marketable securities | $ | 430.0 | $ | 280.1 | ||||
Debt: | ||||||||
Senior notes | $ | 400.0 | $ | 400.0 | ||||
Equipment financing | 5.0 | 29.8 | ||||||
Capital leases | 6.9 | 10.8 | ||||||
Total debt (1) | $ | 411.9 | $ | 440.6 | ||||
(1) | Debt on our consolidated balance sheets is presented net of deferred financing costs. |
Debt
At December 31, 2018, we were in compliance with all covenants and financial ratios under our credit agreements and the indentures governing our senior notes. See Note 8, Debt and Credit Facilities, for more information about our short-term and long-term financing arrangements.
Cash Flows
The following table summarizes the changes to our cash flows provided by (used in) operating, investing, and financing activities for the periods indicated:
Year Ended December 31, | |||||||||||||
(in millions) | 2018 | 2017 | 2016 | ||||||||||
Cash provided by operating activities | $ | 566.5 | $ | 461.3 | $ | 455.3 | |||||||
Cash used in investing activities | (337.6 | ) | (390.5 | ) | (513.3 | ) | |||||||
Cash provided by (used in) financing activities | (88.7 | ) | 36.9 | 28.1 | |||||||||
Operating Activities
2018 Compared to 2017
Cash provided by operating activities increased $105.2 million, approximately 23%, during 2018 compared to 2017. The increase was primarily due to an increase in income before taxes of $101.2 million.
44
2017 Compared to 2016
Cash provided by operating activities increased $6.0 million, approximately 1%, during 2017 compared to 2016, driven by the timing of cash payables and other individually insignificant items.
Investing Activities
2018 Compared to 2017
Cash used in investing activities decreased $52.9 million, approximately 14%, during 2018 compared to 2017. The decrease was driven by increased proceeds from the sale of equipment and lease receipts, offset by increased purchases of marketable securities.
2017 Compared to 2016
Cash used in investing activities decreased $122.8 million, approximately 24%, during 2017 compared to 2016. The main driver of the decrease in cash used was the impact of the June 2016 acquisition of WSL, which resulted in a net cash outflow of $78.2 million in 2016. The remaining decrease in cash used was driven by lower transportation equipment purchases in 2017.
Capital Expenditures
The following table sets forth, for the periods indicated, our net capital expenditures.
Year Ended December 31, | |||||||||||||
(in millions) | 2018 | 2017 | 2016 | ||||||||||
Transportation equipment | $ | 385.1 | $ | 388.5 | $ | 422.1 | |||||||
Other property and equipment | 36.9 | 33.4 | 37.0 | ||||||||||
Proceeds from sale of property and equipment | (90.5 | ) | (70.0 | ) | (52.0 | ) | |||||||
Net capital expenditures | $ | 331.5 | $ | 351.9 | $ | 407.1 | |||||||
Annual transportation equipment purchases have decreased since 2016. Our expenditures were higher in 2016 in order to reduce average tractor age within the fleet, which resulted in lower 2017 and 2018 replacements, and also to take advantage of a strong used tractor and trailer market. In addition, in 2016 we had an initiative to grow trailer count in order to reduce unbilled miles.
We currently anticipate net capital expenditures in 2019 to be approximately $340 million.
Financing Activities
2018 Compared to 2017
Cash used in financing activities in 2018 was $88.7 million compared to cash provided by financing activities in 2017 of $36.9 million resulting in a decrease of $125.6 million in cash provided by financing activities. We received approximately $341.0 million of proceeds from our IPO in April 2017 which was partially offset by 2017 one-time payments on the revolver and private placement debt of $235.0 million. In 2018, four quarterly dividend payments at $0.06 per outstanding share were made compared to only three payments at $0.05 per outstanding share in 2017, resulting in a $15.2 million increased use of cash.
2017 Compared to 2016
Cash provided by financing activities increased $8.8 million, approximately 31%, during 2017 compared to 2016. We received approximately $341.0 million of proceeds from our IPO in April 2017, and we paid $5.8 million less in dividends year over year because our fourth quarter 2017 dividend was paid in January 2018. Significant factors that offset the increase in cash from the IPO were:
• | A $240.0 million net cash outflow related to our accounts receivable facility. We borrowed a net $105.0 million during 2016 and repaid $135.0 million during 2017 using IPO proceeds. |
• | The repayment of a $100.0 million senior note using IPO proceeds. |
• | A deferred payment of approximately $19.0 million to the former owners of WSL, which included a reduction for a working capital adjustment. |
45
Other Considerations That Could Affect Our Results, Liquidity, and Capital Resources
Driver Capacity and Wage Cost
Our professional driver workforce is one of our most valuable assets. Recruiting and retaining sufficient numbers of qualified drivers is challenging in an increasingly competitive driver market and has a significant impact on our operating costs and ability to serve our customers. Changes in the demographic composition of the workforce, alternative employment opportunities that become available in the economy, and individual drivers’ desire to be home more frequently can affect availability of drivers, including by increasing the wages our drivers require.
Off-Balance Sheet Arrangements
We have no arrangements that meet the definition of off-balance sheet arrangements.
Contractual Obligations
The following table sets forth our contractual obligations as of December 31, 2018:
Payments Due by Period | ||||||||||||||||||||||||
(in millions) | Total Amounts Committed | 2019 | 2020-2021 | 2022-2023 | After 2023 | Other | ||||||||||||||||||
Long-term debt principal and interest obligations (1) | $ | 461.3 | $ | 58.5 | $ | 117.3 | $ | 144.8 | $ | 140.7 | $ | — | ||||||||||||
Purchase obligations (2) | 265.5 | 265.5 | — | — | — | — | ||||||||||||||||||
Capital lease obligations | 7.1 | 6.9 | 0.2 | — | — | — | ||||||||||||||||||
Operating lease obligations | 104.3 | 35.8 | 40.6 | 15.2 | 12.7 | — | ||||||||||||||||||
WSL guaranteed payments | 20.0 | 20.0 | — | — | — | — | ||||||||||||||||||
Unrecognized tax benefits (3) | 3.3 | — | — | — | — | 3.3 | ||||||||||||||||||
Total | $ | 861.5 | $ | 386.7 | $ | 158.1 | $ | 160.0 | $ | 153.4 | $ | 3.3 | ||||||||||||
(1) Includes unsecured senior notes and equipment financing notes
(2) Includes firm commitments to purchase transportation equipment
(3) This amount is shown in the other column because the year of settlement cannot be reasonably estimated. See Note 10, Income Taxes, for additional information.
CRITICAL ACCOUNTING POLICIES
The preparation of our financial statements in accordance with GAAP requires that management make estimates and assumptions that impact the amounts reported in our consolidated financial statements and accompanying notes. Therefore, these estimates and assumptions affect reported amounts of assets, liabilities, revenue, expenses, and associated disclosures of contingent liabilities. Management evaluates these estimates on an ongoing basis, using historical experience, consultation with third parties, and other methods considered reasonable in the particular circumstances. Nevertheless, actual results may differ significantly from our estimates. Any effects on our business, financial position, or results of operations resulting from revisions to these estimates are recognized in the accounting period in which the facts that give rise to the revision become known.
The estimates discussed below include the financial statement elements that are either the most judgmental or involve the selection or application of alternative accounting policies and are material to our financial statements. Management has discussed the development and selection of these critical accounting estimates with the Audit Committee of our Board of Directors and with our independent registered public accounting firm.
Claims Accruals
Reserves are established based on estimated or expected losses for claims. The primary claims arising for the Company consist of accident-related claims for personal injury, collision, and comprehensive compensation, in addition to workers' compensation and cargo liability. We maintain self-insurance levels for these various areas of risk and have established reserves to cover these self-insured liabilities. We also maintain insurance to cover liabilities in excess of the self-insurance amounts.
46
The reserves represent accruals for the estimated self-insured and re-insured portions of pending claims, including adverse development of known claims, as well as incurred but not reported claims. Our estimates require judgments concerning the nature and severity of the claim, historical trends, advice from third-party administrators and insurers, consultation with actuarial experts, the specific facts of individual cases, the jurisdictions involved, estimates of future claims development, and the legal and other costs to settle or defend the claims. The actual cost to settle our self-insured claim liabilities can differ from our reserve estimates because of a number of uncertainties, including the inherent difficulty in estimating the severity of a claim and the potential amount to defend and settle a claim. At December 31, 2018 and 2017, we had an accrual of approximately $156.0 million and $147.2 million, respectively, for estimated claims net of reinsurance receivables.
We have significant exposure to fluctuations in the number and severity of claims. If there is an increase in the frequency and severity of claims, or we are required to accrue or pay additional amounts if the claims prove to be more severe than originally assessed, or any of the claims would exceed the limits of our insurance coverage, our profitability would be adversely affected. In addition to estimates within our self-insured retention, we also must make judgments concerning our coverage limits. If any claim were to exceed our coverage limits, we would have to accrue for the excess amount. Our critical estimates include evaluating whether a claim may exceed such limits and, if so, by how much. Currently, we are not aware of any such claims. If one or more claims were to exceed our effective coverage limits, our financial condition and results of operations could be materially and adversely affected.
Depreciation of Property and Equipment
We operate a significant number of trucks, trailers, containers, chassis, and other equipment in connection with our business and must select estimated useful lives and salvage values for calculating depreciation. Property and equipment is stated at cost less accumulated depreciation and depreciated to an estimated salvage value using the straight-line method over the asset's estimated useful life. Depreciable lives of revenue equipment range from 2 to 20 years and are based on historical experience, as well as future expectations regarding the period we expect to benefit from the assets and company policies around maintenance and asset replacement. Estimates of salvage value at the expected date of sale are based on the expected market values of equipment at the expected time of disposal. We consider our experience with similar assets, conditions in the used revenue equipment market, and operational information such as average annual miles. We periodically review the reasonableness of our estimates regarding useful lives and salvage values of our revenue equipment and adjust these assumptions appropriately when warranted. We review our property and equipment whenever events or circumstances indicate the carrying amount of the asset may not be recoverable. An impairment loss equal to the excess of carrying amount over fair value would be recognized if the carrying amount of the asset is not recoverable.
Goodwill
To expand our business offerings, we have, on occasion, acquired other companies. In a business combination, the consideration is first assigned to identifiable assets and liabilities, based on estimated fair values, with any excess recorded as goodwill. Determining fair value requires significant estimates and assumptions based on an evaluation of a number of factors, such as marketplace participants, history, future expansion and profitability expectations, amount and timing of future cash flows, and the discount rate applied to the cash flows. Goodwill is not amortized but is assessed for impairment at least annually, and more frequently if a triggering event indicates that impairment may exist.
Our total goodwill balance at December 31, 2018 and 2017 was $162.2 million and $164.8 million, respectively. Goodwill is evaluated at the reporting unit level. A reporting unit can be a segment or business within a segment. As of December 31, 2017, our reporting units with goodwill were Dedicated, Import/Export, and Asia. During 2018, we reorganized the structure of the operating segments within our Truckload reportable segment, separating FTFM into its own operating segment and integrating the remaining Dedicated business into the VTL operating segment. Each Truckload operating segment was determined to be its own reporting unit due to the level at which financial information is available and management's review of that information. As a result of the reorganization, goodwill previously attributed to the Dedicated reporting unit was reallocated to the VTL-Dedicated Services and FTFM reporting units on a relative fair value basis. Of the $138.2 million previously attributed to the Dedicated reporting unit, VTL-Dedicated Services and FTFM reporting units were allocated $103.6 million and $34.6 million, respectively. After the reallocation of goodwill, an impairment test was performed for these reporting units, and it was determined that, as of April 1, 2018, goodwill was not impaired as each reporting unit had an estimated fair value in excess of its respective carrying amount.
In the impairment evaluation, the carrying value of a reporting unit, including goodwill, is compared with its fair value. We base our fair value estimation on an independent valuation report, which uses a combination of (1) an income approach based on the present value of estimated future cash flows, and (2) a market approach based on market price data of shares of our company and others in our industry, to value our reporting units. If the carrying value of a reporting unit exceeds its fair value,
47
an impairment loss is recorded equal to that excess. Significant judgment is necessary to evaluate the impact of operating and macroeconomic changes and to estimate future cash flows. Assumptions used in impairment evaluations, such as forecasted growth rates and our cost of capital, are based on the best available market information and are consistent with our internal forecasts and operating plans. These assumptions could be adversely impacted by certain risks discussed earlier in this document.
We completed the required annual goodwill impairment test for all four of our reporting units with goodwill as of October 31, 2018. The fair values of our VTL-Dedicated Services and Import/Export reporting units were significantly in excess of their respective carrying values, while our Asia reporting unit had a carrying value in excess of its fair value. The Asia reporting unit's revenue is performing below expectations, however better than the previous year. The yuan, or CNY, continued to weaken in the fourth quarter, as trade tensions between the US and China escalated. There are ongoing discussions on current tariffs between the US and China that remain uncertain which have also had an impact on current market conditions in Asia. While our long-term growth rate remains unchanged from the prior year, we reassessed our Asia performance projections given the current market and economy in China. The operations of the Asia reporting unit are still projected to be favorable in the long-term based on the customer pipeline activity and carrier cost management, however this was not enough to recover the carrying value. As such, a goodwill impairment loss of $2.0 million was recorded for our Asia reporting unit. As of December 31, 2018, the remaining goodwill attributed to our Asia reporting unit was $9.8 million. Continued challenges for the Chinese economy and our inability to retain and attract profitable customers could result in future goodwill impairments for our Asia reporting unit. Key assumptions used in both the 2018 and 2017 Asia goodwill impairment analyses are as follows:
Asia Goodwill Assumptions | October 31, 2018 | October 31, 2017 | ||
Discount rate (1) | 13.0% | 12.0% | ||
Long-term growth rate (2) | 5.0% | 5.0% | ||
(1) | The discount rate is based on the Company's Weighted Average Cost of Capital (WACC) which increased from the analysis performed in the prior year primarily due to an increase in the risk-free interest rate. A 1.0% increase in the discount rate at October 31, 2018, would result in a decrease in fair value of approximately $2.1 million. |
(2) | The long-term growth rate applied to the terminal period in our discounted cash flow was 5.0%. In the forecasted periods leading up to the terminal period, the revenue growth rates ranged from 4.8% to 7.8% based on our current estimates for growth in those periods. |
The fair value of FTFM exceeded its carrying value by $17.5 million, or 10%, which reflects a decrease in the fair value as compared to the impairment analysis performed during the second quarter of 2018 as described above. The decrease in fair value was primarily due to recent revenues not meeting projections and operational inefficiencies, which management is addressing through a revised comprehensive operating plan. This operating plan centers around reducing variability in the first and middle mile operations, converting more freight to intermodal, for-hire truck, and third-party capacity, as well as refining its commercial focus. While management has made adjustments to FTFM's operating plan, future financial performance that doesn't meet management expectations may result in the carrying value of this reporting unit exceeding its fair value which would result in an impairment of goodwill. Key assumptions used in each of the 2018 FTFM goodwill impairment analyses are as follows:
FTFM Goodwill Assumptions | October 31, 2018 | April 1, 2018 | ||
Discount rate (1) | 12.5% | 12.0% | ||
Long-term growth rate (2) | 3.0% | 3.0% | ||
(1) | The discount rate is based on the Company's Weighted Average Cost of Capital (WACC) which increased from the analysis performed earlier in 2018 primarily due to an increase in the risk-free interest rate. A 1.0% increase in the discount rate at October 31, 2018, would result in a decrease in fair value of approximately $20.0 million. |
(2) | The long-term growth rate applied to the terminal period in our discounted cash flow was 3.0%. In the forecasted periods leading up to the terminal period, the revenue growth rates ranged from (0.2%) to 10.7% based on our current estimates for growth in those periods. |
There were no triggering events identified from the date of our assessment through December 31, 2018 that would require an update to our annual impairment test. If future operating performance of any of our reporting units is below our expectations or there are changes to forecasted growth rates or our cost of capital, a decline in the fair value of the reporting units could result, and we may be required to record a goodwill impairment charge. See Note 7, Goodwill and Other Intangible Assets, for more information.
48
Income Taxes
We account for income taxes under the asset and liability method, in accordance with ASC 740-10, Income Taxes. We recognize deferred tax assets and liabilities for the future tax consequences attributable to differences between the financial statement carrying amounts of existing assets and liabilities and their respective tax bases. Significant management judgment is required in determining our provision for income taxes and in determining whether deferred tax assets will be realized in full or in part. We measure deferred tax assets and liabilities using enacted tax rates expected to apply to taxable income in the years in which those temporary differences are expected to be recovered or settled. If we ever estimated that it is more likely than not that all or some portion of specific deferred tax assets will not be realized, we must establish a valuation allowance for the amount of the deferred tax assets that are determined not to be realizable. Accordingly, if the facts or financial results were to
change in such a way as to impact the likelihood of realizing the deferred tax assets, we would have to apply judgment to determine the amount of valuation allowance required in the appropriate period.
We recognize a liability for unrecognized tax benefits when the benefits of tax positions taken on a tax return are not likely to be sustained upon examination, including resolutions of any related appeals or litigation processes, based on the technical merits. See Note 10, Income Taxes, for a discussion of our current tax contingencies.
49
Item 7A. Quantitative and Qualitative Disclosures About Market Risk
We are exposed to market risk from changes in certain commodity prices, interest rates, inflation, and foreign currency exchange rates. All of these market risks arise in the normal course of business, as we do not engage in speculative trading activities. We have established policies, procedures, and internal processes governing our management of market risk and the use of financial instruments to manage our exposure to such risk.
Commodity Risk
We have commodity exposure with respect to fuel used in company-owned tractors. Further increases in fuel prices will continue to raise our operating costs, even after applying fuel surcharge revenues. Historically, we have been able to recover a majority of fuel price increases from our customers in the form of fuel surcharges. The average diesel price per gallon in the United States, as reported by the DOE, increased from an average of $2.65 per gallon for fiscal year 2017 to an average of $3.18 per gallon for fiscal year 2018. We cannot predict the extent or speed of potential changes in fuel price levels in the future, the degree to which the lag effect of our fuel surcharge programs will impact us as a result of the timing and magnitude of such changes, or the extent to which effective fuel surcharges can be maintained and collected to offset future increases. We generally have not used derivative financial instruments to hedge our fuel price exposure in the past, but continue to evaluate this possibility.
Interest Rate Risk
We had cash and cash equivalents of $378.7 million as of December 31, 2018, which consists of bank deposits with FDIC participating banks and money market accounts of $295.9 million. The cash on deposit with banks is not susceptible to interest rate risk. At December 31, 2018, we had no outstanding variable rate borrowings under either our accounts receivable securitization facility or our revolving credit facility. In the future, if we borrow under either our accounts receivable securitization facility or our revolving credit facility, we will have interest rate exposure arising from variable interest rates. These variable interest rates are impacted by changes in short-term interest rates. We manage interest rate exposure through a mix of variable rate debt, fixed rate senior debt, fixed rate financing, and fixed rate lease financing.
Inflation Risk
Inflation can have an impact on our operating costs. A prolonged period of inflation could cause interest rates, fuel, wages, and other costs to increase, which would adversely affect our results of operations unless freight rates correspondingly increase. However, we do not believe that inflation has had a material effect on our business, financial condition, or results of operations. If our costs were to become subject to significant inflationary pressures, we may not be able to fully offset such higher costs through price increases. Our inability or failure to do so could harm our business, financial condition, and results of operations.
Foreign Currency Exchange Risk
Although we conduct business in foreign countries, international operations are not material to our consolidated financial position, results of operations, or cash flows. Foreign currency transaction gains and losses have not been material to our results of operations. We are not currently subject to material foreign currency exchange rate risks from the effects that exchange rate movements of foreign currencies would have on our future costs or on future cash flows we would receive from our foreign investments. To date, we have not entered into any foreign currency forward exchange contracts or other derivative financial instruments to hedge the effects of adverse fluctuations in foreign currency exchange rates.
50
Item 8. Financial Statements and Supplementary Data
REPORT OF INDEPENDENT REGISTERED PUBLIC ACCOUNTING FIRM
To the shareholders and the Board of Directors of Schneider National, Inc.
Opinion on the Financial Statements
We have audited the accompanying consolidated balance sheets of Schneider National, Inc. and subsidiaries (the “Company”) as of December 31, 2018 and 2017, the related consolidated statements of comprehensive income, cash flows, and shareholders’ equity, for each of the three years in the period ended December 31, 2018, and the related notes and the schedule listed in the Index at Item 15 (collectively referred to as the “financial statements”). In our opinion, the financial statements present fairly, in all material respects, the financial position of the Company as of December 31, 2018 and 2017, and the results of its operations and its cash flows for each of the three years in the period ended December 31, 2018, in conformity with accounting principles generally accepted in the United States of America.
We have also audited, in accordance with the standards of the Public Company Accounting Oversight Board (United States) (PCAOB), the Company's internal control over financial reporting as of December 31, 2018, based on criteria established in Internal Control - Integrated Framework (2013) issued by the Committee of Sponsoring Organizations of the Treadway Commission and our report dated February 26, 2019, expressed an unqualified opinion on the Company's internal control over financial reporting.
Basis for Opinion
These financial statements are the responsibility of the Company's management. Our responsibility is to express an opinion on the Company’s financial statements based on our audits. We are a public accounting firm registered with the PCAOB and are required to be independent with respect to the Company in accordance with the U.S. federal securities laws and the applicable rules and regulations of the Securities and Exchange Commission and the PCAOB.
We conducted our audits in accordance with the standards of the PCAOB. Those standards require that we plan and perform the audit to obtain reasonable assurance about whether the financial statements are free of material misstatement, whether due to error or fraud. Our audits included performing procedures to assess the risks of material misstatement of the financial statements, whether due to error or fraud, and performing procedures that respond to those risks. Such procedures included examining, on a test basis, evidence regarding the amounts and disclosures in the financial statements. Our audits also included evaluating the accounting principles used and significant estimates made by management, as well as evaluating the overall presentation of the financial statements. We believe that our audits provide a reasonable basis for our opinion.
/s/ Deloitte & Touche LLP
Milwaukee, Wisconsin
February 26, 2019
We have served as the Company’s auditor since 2002.
51
REPORT OF INDEPENDENT REGISTERED PUBLIC ACCOUNTING FIRM
To the shareholders and the Board of Directors of Schneider National, Inc.
Opinion on Internal Control over Financial Reporting
We have audited the internal control over financial reporting of Schneider National, Inc. and subsidiaries (the “Company”) as of December 31, 2018, based on criteria established in Internal Control - Integrated Framework (2013) issued by the Committee of Sponsoring Organizations of the Treadway Commission (COSO). In our opinion, the Company maintained, in all material respects, effective internal control over financial reporting as of December 31, 2018, based on criteria established in Internal Control - Integrated Framework (2013) issued by COSO.
We have also audited, in accordance with the standards of the Public Company Accounting Oversight Board (United States) (PCAOB), the consolidated financial statements as of and for the year ended December 31, 2018, of the Company and our report dated February 26, 2019, expressed an unqualified opinion on those financial statements.
Basis for Opinion
The Company’s management is responsible for maintaining effective internal control over financial reporting and for its assessment of the effectiveness of internal control over financial reporting, included in the accompanying Management’s Report on Internal Control over Financial Reporting. Our responsibility is to express an opinion on the Company’s internal control over financial reporting based on our audit. We are a public accounting firm registered with the PCAOB and are required to be independent with respect to the Company in accordance with the U.S. federal securities laws and the applicable rules and regulations of the Securities and Exchange Commission and the PCAOB.
We conducted our audit in accordance with the standards of the PCAOB. Those standards require that we plan and perform the audit to obtain reasonable assurance about whether effective internal control over financial reporting was maintained in all material respects. Our audit included obtaining an understanding of internal control over financial reporting, assessing the risk that a material weakness exists, testing and evaluating the design and operating effectiveness of internal control based on the assessed risk, and performing such other procedures as we considered necessary in the circumstances. We believe that our audit provides a reasonable basis for our opinion.
Definition and Limitations of Internal Control over Financial Reporting
A company’s internal control over financial reporting is a process designed to provide reasonable assurance regarding the reliability of financial reporting and the preparation of financial statements for external purposes in accordance with generally accepted accounting principles. A company’s internal control over financial reporting includes those policies and procedures that (1) pertain to the maintenance of records that, in reasonable detail, accurately and fairly reflect the transactions and dispositions of the assets of the company; (2) provide reasonable assurance that transactions are recorded as necessary to permit preparation of financial statements in accordance with generally accepted accounting principles, and that receipts and expenditures of the company are being made only in accordance with authorizations of management and directors of the company; and (3) provide reasonable assurance regarding prevention or timely detection of unauthorized acquisition, use, or disposition of the company’s assets that could have a material effect on the financial statements.
Because of its inherent limitations, internal control over financial reporting may not prevent or detect misstatements. Also, projections of any evaluation of effectiveness to future periods are subject to the risk that controls may become inadequate because of changes in conditions, or that the degree of compliance with the policies or procedures may deteriorate.
/s/ Deloitte & Touche LLP
Milwaukee, Wisconsin
February 26, 2019
52
SCHNEIDER NATIONAL, INC.
CONSOLIDATED STATEMENTS OF COMPREHENSIVE INCOME
(in millions, except per share data)
Year Ended December 31, | |||||||||||
2018 | 2017 | 2016 | |||||||||
Operating revenues | $ | 4,977.0 | $ | 4,383.6 | $ | 4,045.7 | |||||
Operating expenses: | |||||||||||
Purchased transportation | 1,965.9 | 1,605.3 | 1,466.0 | ||||||||
Salaries, wages, and benefits | 1,259.4 | 1,223.5 | 1,129.3 | ||||||||
Fuel and fuel taxes | 344.8 | 305.5 | 252.9 | ||||||||
Depreciation and amortization | 291.3 | 279.0 | 266.0 | ||||||||
Operating supplies and expenses | 491.3 | 493.9 | 449.9 | ||||||||
Insurance and related expenses | 102.2 | 90.3 | 89.1 | ||||||||
Other general expenses | 144.3 | 105.8 | 102.1 | ||||||||
Goodwill impairment charge | 2.0 | — | — | ||||||||
Total operating expenses | 4,601.2 | 4,103.3 | 3,755.3 | ||||||||
Income from operations | 375.8 | 280.3 | 290.4 | ||||||||
Other expenses (income): | |||||||||||
Interest expense—net | 12.5 | 17.4 | 21.4 | ||||||||
Other expense (income)—net | (1.3 | ) | (0.5 | ) | 3.4 | ||||||
Total other expenses | 11.2 | 16.9 | 24.8 | ||||||||
Income before income taxes | 364.6 | 263.4 | 265.6 | ||||||||
Provision for (benefit from) income taxes | 95.7 | (126.5 | ) | 108.7 | |||||||
Net income | 268.9 | 389.9 | 156.9 | ||||||||
Other comprehensive income (loss): | |||||||||||
Foreign currency translation adjustments | (1.0 | ) | (0.9 | ) | 0.7 | ||||||
Unrealized loss on marketable securities—net of tax | — | — | (0.2 | ) | |||||||
Total other comprehensive income (loss) | (1.0 | ) | (0.9 | ) | 0.5 | ||||||
Comprehensive income | $ | 267.9 | $ | 389.0 | $ | 157.4 | |||||
Weighted average common shares outstanding | 177.0 | 171.1 | 156.6 | ||||||||
Basic earnings per share | $ | 1.52 | $ | 2.28 | $ | 1.00 | |||||
Weighted average diluted shares outstanding | 177.2 | 171.3 | 156.8 | ||||||||
Diluted earnings per share | $ | 1.52 | $ | 2.28 | $ | 1.00 | |||||
Dividends per share of common stock | $ | 0.24 | $ | 0.20 | $ | 0.20 | |||||
See notes to consolidated financial statements.
53
SCHNEIDER NATIONAL, INC.
CONSOLIDATED BALANCE SHEETS
(in millions, except share data)
December 31, 2018 | December 31, 2017 | ||||||
Assets | |||||||
Current Assets: | |||||||
Cash and cash equivalents | $ | 378.7 | $ | 238.5 | |||
Marketable securities | 51.3 | 41.6 | |||||
Trade accounts receivable—net of allowance of $6.8 million and $5.2, million, respectively | 593.1 | 527.9 | |||||
Other receivables | 31.8 | 22.4 | |||||
Current portion of lease receivables—net of allowance of $0.5 million and $1.7 million, respectively | 129.1 | 104.9 | |||||
Inventories | 60.8 | 83.1 | |||||
Prepaid expenses and other current assets | 79.5 | 75.6 | |||||
Total current assets | 1,324.3 | 1,094.0 | |||||
Noncurrent Assets: | |||||||
Property and equipment: | |||||||
Transportation equipment | 2,900.2 | 2,770.1 | |||||
Land, buildings, and improvements | 177.2 | 183.8 | |||||
Other property and equipment | 157.6 | 175.7 | |||||
Total property and equipment | 3,235.0 | 3,129.6 | |||||
Accumulated depreciation | 1,312.8 | 1,271.5 | |||||
Net property and equipment | 1,922.2 | 1,858.1 | |||||
Lease receivables | 133.2 | 138.9 | |||||
Capitalized software and other noncurrent assets | 82.6 | 74.7 | |||||
Goodwill | 162.2 | 164.8 | |||||
Total noncurrent assets | 2,300.2 | 2,236.5 | |||||
Total Assets | $ | 3,624.5 | $ | 3,330.5 | |||
Liabilities and Shareholders' Equity | |||||||
Current Liabilities: | |||||||
Trade accounts payable | $ | 226.0 | $ | 230.4 | |||
Accrued salaries and wages | 94.8 | 85.8 | |||||
Claims accruals—current | 58.3 | 48.3 | |||||
Current maturities of debt and capital lease obligations | 51.7 | 19.1 | |||||
Dividends payable | 10.6 | 8.8 | |||||
Other current liabilities | 81.2 | 69.6 | |||||
Total current liabilities | 522.6 | 462.0 | |||||
Noncurrent Liabilities: | |||||||
Long-term debt and capital lease obligations | 359.6 | 420.6 | |||||
Claims accruals—noncurrent | 113.3 | 102.5 | |||||
Deferred income taxes | 450.6 | 386.6 | |||||
Other | 46.1 | 68.6 | |||||
Total noncurrent liabilities | 969.6 | 978.3 | |||||
Commitments and Contingencies (Note 16) | |||||||
Shareholders' Equity: | |||||||
Class A common shares, no par value, 250,000,000 shares authorized, 83,029,500 shares issued and outstanding | — | — | |||||
Class B common shares, no par value, 750,000,000 shares authorized, 94,593,588 and 93,850,011 shares issued, and 93,969,268 and 93,850,011 shares outstanding, respectively | — | — | |||||
Additional paid-in capital | 1,544.0 | 1,534.6 | |||||
Retained earnings | 589.3 | 355.6 | |||||
Accumulated other comprehensive income | (1.0 | ) | — | ||||
Total shareholders' equity | 2,132.3 | 1,890.2 | |||||
Total Liabilities and Shareholders' Equity | $ | 3,624.5 | $ | 3,330.5 | |||
54
SCHNEIDER NATIONAL, INC.
CONSOLIDATED STATEMENTS OF CASH FLOWS
(in millions)
Year Ended December 31, | |||||||||||
2018 | 2017 | 2016 | |||||||||
Operating Activities: | |||||||||||
Net income | $ | 268.9 | $ | 389.9 | $ | 156.9 | |||||
Adjustments to reconcile net income to net cash provided by operating activities: | |||||||||||
Depreciation and amortization | 291.3 | 279.0 | 266.0 | ||||||||
Gains on sales of property and equipment | (8.1 | ) | (9.4 | ) | (18.3 | ) | |||||
Goodwill impairment charge | 2.0 | — | — | ||||||||
Deferred income taxes | 62.2 | (152.0 | ) | 75.6 | |||||||
WSL contingent consideration adjustment | — | (13.5 | ) | — | |||||||
Long-term incentive compensation expense | 22.8 | 17.0 | 18.3 | ||||||||
Other noncash items | (3.5 | ) | (0.7 | ) | (1.4 | ) | |||||
Changes in operating assets and liabilities: | |||||||||||
Receivables | (74.8 | ) | (64.4 | ) | 1.1 | ||||||
Other assets | (9.0 | ) | 1.4 | (4.9 | ) | ||||||
Payables | 3.0 | 16.0 | (0.6 | ) | |||||||
Other liabilities | 11.7 | (2.0 | ) | (37.4 | ) | ||||||
Net cash provided by operating activities | 566.5 | 461.3 | 455.3 | ||||||||
Investing Activities: | |||||||||||
Purchases of transportation equipment | (385.1 | ) | (388.5 | ) | (422.1 | ) | |||||
Purchases of other property and equipment | (36.9 | ) | (33.4 | ) | (37.0 | ) | |||||
Proceeds from sale of property and equipment | 90.5 | 70.0 | 52.0 | ||||||||
Proceeds from lease receipts and sale of off-lease inventory | 94.6 | 61.0 | 63.5 | ||||||||
Purchases of lease equipment | (90.5 | ) | (110.1 | ) | (88.4 | ) | |||||
Sales of marketable securities | 9.9 | 10.5 | 11.1 | ||||||||
Purchases of marketable securities | (20.1 | ) | — | (14.2 | ) | ||||||
Acquisition of businesses, net of cash acquired | — | — | (78.2 | ) | |||||||
Net cash used in investing activities | (337.6 | ) | (390.5 | ) | (513.3 | ) | |||||
Financing Activities: | |||||||||||
Proceeds under revolving credit agreements | — | — | 176.0 | ||||||||
Payments under revolving credit agreements | — | (135.0 | ) | (89.9 | ) | ||||||
Proceeds from other debt | — | — | 0.5 | ||||||||
Payments of debt and capital lease obligations | (28.7 | ) | (123.7 | ) | (28.1 | ) | |||||
Payment of deferred consideration related to acquisition | (19.3 | ) | (19.4 | ) | — | ||||||
Proceeds from IPO, net of issuance costs | — | 340.6 | — | ||||||||
Dividends paid | (40.7 | ) | (25.5 | ) | (31.3 | ) | |||||
Redemptions of redeemable common shares | — | (0.1 | ) | (1.4 | ) | ||||||
Proceeds from issuances of redeemable common shares | — | — | 2.3 | ||||||||
Net cash provided by (used in) financing activities | (88.7 | ) | 36.9 | 28.1 | |||||||
Net increase (decrease) in cash and cash equivalents | 140.2 | 107.7 | (29.9 | ) | |||||||
Cash and Cash Equivalents: | |||||||||||
Beginning of period | 238.5 | 130.8 | 160.7 | ||||||||
End of period | $ | 378.7 | $ | 238.5 | $ | 130.8 | |||||
Additional Cash Flow Information: | |||||||||||
Noncash investing and financing activity: | |||||||||||
Equipment purchases in accounts payable | $ | 2.1 | $ | 9.5 | $ | 22.4 | |||||
Dividends declared but not yet paid | 10.6 | 8.8 | — | ||||||||
Costs in accounts payable related to our IPO | — | — | 2.3 | ||||||||
Increase in redemption value of redeemable common shares | — | 126.6 | 110.0 | ||||||||
Ownership interest in Platform Science, Inc. | 3.5 | — | — | ||||||||
Cash paid (refunded) during the year for: | |||||||||||
Interest | 15.5 | 19.2 | 21.6 | ||||||||
Income taxes—net of refunds | 39.0 | (4.2 | ) | 5.0 | |||||||
See notes to consolidated financial statements.
55
SCHNEIDER NATIONAL, INC.
CONSOLIDATED STATEMENTS OF SHAREHOLDERS' EQUITY
(in millions, except per share data)
Common Stock | Additional Paid-In Capital | Retained Earnings | Accumulated Other Comprehensive Income | Total | |||||||||||||||||
Balance—December 31, 2015 | $ | — | $ | — | $ | — | $ | — | $ | — | |||||||||||
Balance—December 31, 2016 | — | — | — | — | — | ||||||||||||||||
Repurchases and retirements of stock related to pre-IPO share-based awards | — | (0.1 | ) | — | — | (0.1 | ) | ||||||||||||||
Share issuances related to pre-IPO share-based awards | — | 2.9 | — | — | 2.9 | ||||||||||||||||
Share issuances - IPO | — | 340.6 | — | — | 340.6 | ||||||||||||||||
Transfer from temporary equity to permanent equity See Note 11, Temporary Equity | — | 1,187.0 | 13.3 | 0.9 | 1,201.2 | ||||||||||||||||
Net income - post-IPO | — | — | 367.4 | — | 367.4 | ||||||||||||||||
Other comprehensive loss - post-IPO | — | — | — | (0.9 | ) | (0.9 | ) | ||||||||||||||
Share-based compensation expense | — | 4.8 | — | — | 4.8 | ||||||||||||||||
Post-IPO dividends declared at $0.15 per share | — | — | (26.5 | ) | — | (26.5 | ) | ||||||||||||||
Post-IPO issuance of stock | — | 0.8 | — | — | 0.8 | ||||||||||||||||
Other | — | (1.4 | ) | 1.4 | — | — | |||||||||||||||
Balance—December 31, 2017 | — | 1,534.6 | 355.6 | — | 1,890.2 | ||||||||||||||||
Net income | — | — | 268.9 | — | 268.9 | ||||||||||||||||
Other comprehensive loss | — | — | — | (1.0 | ) | (1.0 | ) | ||||||||||||||
Share-based compensation expense | — | 10.9 | — | — | 10.9 | ||||||||||||||||
Dividends declared at $0.24 per share | — | — | (42.5 | ) | — | (42.5 | ) | ||||||||||||||
Share issuances | — | 0.5 | — | — | 0.5 | ||||||||||||||||
Exercise of employee stock options | — | 0.2 | — | — | 0.2 | ||||||||||||||||
Shares withheld for employee taxes | — | (2.3 | ) | — | — | (2.3 | ) | ||||||||||||||
Cumulative–effect adjustment of ASU 2014-09 adoption See Note 2, Revenue Recognition | — | — | 7.3 | — | 7.3 | ||||||||||||||||
Other | — | 0.1 | — | — | 0.1 | ||||||||||||||||
Balance—December 31, 2018 | $ | — | $ | 1,544.0 | $ | 589.3 | $ | (1.0 | ) | $ | 2,132.3 | ||||||||||
See notes to consolidated financial statements.
56
SCHNEIDER NATIONAL, INC.
NOTES TO CONSOLIDATED FINANCIAL STATEMENTS
1. Summary of Significant Accounting Policies
(a) Nature of Operations
We are a leading transportation and logistics services company providing a broad portfolio of premier truckload, intermodal, and logistics solutions and operating one of the largest for-hire trucking fleets in North America.
(b) Basis of Presentation
As used in these notes, the term “financial statements” refers to the consolidated financial statements. This includes the consolidated statements of comprehensive income, consolidated balance sheets, consolidated statements of cash flows, and consolidated statements of shareholders' equity unless otherwise noted.
Our consolidated financial statements include all of our wholly owned subsidiaries. All intercompany balances and transactions have been eliminated in consolidation.
(c) Use of Estimates
The consolidated financial statements contained in this report have been prepared in conformity with GAAP. We make estimates and assumptions that affect assets, liabilities, the disclosure of contingent liabilities at the date of the financial statements, and the reported amounts of revenues and expenses during the reporting period. Actual results may differ from these estimates.
(d) Cash and Cash Equivalents
Cash in excess of current operating requirements is invested in short-term, highly liquid investments. We consider all highly liquid investments purchased with original maturities of three months or less to be cash equivalents.
(e) Receivables and Allowance for Doubtful Accounts
Our trade accounts receivable and lease receivables are recorded net of an allowance for uncollectible accounts and revenue adjustments. The allowance is based on historical experience and an aging analysis, as well as any known trends or uncertainties related to customer billing and account collectability. The adequacy of our allowance is reviewed at least quarterly. Receivables are reserved when it is probable that amounts related to the receivable will not be collected. In circumstances where we are aware of a specific customer's inability to meet its financial obligations, a specific reserve is recorded against amounts due to reduce the net receivable to the amount reasonably expected to be collected. Bad debt expense is included in other general expenses in the consolidated statements of comprehensive income.
(f) Inventory
Our inventories consist of tractors and trailing equipment owned by our equipment leasing company to be sold or leased to independent contractors, as well as parts, tires, supplies, and fuel. These inventories are valued at the lower of cost or market using specific identification or average cost. The following table shows the components of our inventory balances as of December 31:
(in millions) | 2018 | 2017 | ||||||
Tractors and trailing equipment for sale or lease | $ | 48.1 | $ | 69.8 | ||||
Replacement parts | 11.4 | 11.8 | ||||||
Tires and other | 1.3 | 1.5 | ||||||
Total | $ | 60.8 | $ | 83.1 | ||||
57
(g) Investments in Marketable Securities
Our marketable securities are classified as available for sale and carried at fair value in current assets on the consolidated balance sheets. Our portfolio of securities has maturities ranging from 2 months to 81 months. While our intent is to hold our securities to maturity, sudden changes in the market or to our liquidity needs may cause us to sell certain securities in advance of their maturity date.
Any unrealized gains and losses, net of tax, are included as a component of accumulated other comprehensive income on our consolidated balance sheets, unless we determine that an unrealized loss is other-than-temporary. If we determine that an unrealized loss is other-than-temporary, we recognize the loss in earnings. Cost basis is determined using the specific identification method.
(h) Fair Value
Fair value focuses on the estimated price that would be received to sell an asset or paid to transfer a liability, which is referred to as the exit price. Inputs to valuation techniques used to measure fair value fall into three broad levels (Levels 1, 2, and 3) as follows:
Level 1—Observable inputs that reflect quoted prices for identical assets or liabilities in active markets that we have the ability to access at the measurement date.
Level 2—Observable inputs, other than quoted prices included in Level 1, for the asset or liability or prices for similar assets and liabilities.
Level 3—Unobservable inputs reflecting the reporting entity’s estimates of the assumptions that market participants would use in pricing the asset or liability (including assumptions about risk).
Assets and liabilities are classified in their entirety based on the lowest level of input that is significant to the fair value measurement. All marketable securities were valued based on quoted prices for similar assets in active markets or quoted prices for identical or similar assets in markets that are not active (Level 2 in the fair value hierarchy). We measure our marketable securities on a recurring, monthly basis.
(i) Property and Equipment
Property and equipment are recorded at cost. Depreciation is calculated using the straight-line method based on the estimated useful lives and residual values. Generally, the estimated useful lives are as follows:
2018 | |
Tractors | 2 - 10 years |
Trailing equipment | 6 - 20 years |
Other transportation equipment | 4 - 5 years |
Buildings and improvements | 5 - 25 years |
Other property | 3 - 10 years |
Salvage values, when applicable, generally don't exceed 25% of original cost for tractors and trailing equipment and reflect any agreements with tractor suppliers for residual or trade-in values for certain new equipment. Gains and losses on the sale or other disposition of equipment are based on the difference between the proceeds received less costs to sell and the net book value of the assets disposed. Gains and losses are recognized at the time of the sale or disposition and are classified in operating supplies and expenses in the consolidated statements of comprehensive income.
(j) Assets Held for Sale
Assets held for sale consist of revenue equipment and are included in prepaid expenses and other current assets in the consolidated balance sheets. Reclassification to assets held for sale occurs when the required criteria, as defined by ASC 360, Property, Plant and Equipment, are satisfied. As of December 31, 2018 and 2017, assets held for sale by segment were as follows:
58
(in millions) | 2018 | 2017 | ||||||
Truckload | $ | 19.5 | $ | 35.2 | ||||
Intermodal | 2.4 | 0.7 | ||||||
Total | $ | 21.9 | $ | 35.9 | ||||
(k) Asset Impairment
Goodwill and other intangible assets with indefinite lives are subject to an annual impairment test. Interim impairment tests are performed when impairment indicators are present. Intangible assets with definite lives are reviewed for impairment on an annual basis. Other long-lived assets require an impairment review when events or circumstances indicate that the carrying amount may not be recoverable. We base our evaluation of other long-lived assets on the presence of impairment indicators such as the future economic benefit of the assets, any historical or future profitability measurements, and other external market conditions or factors.
We perform annual goodwill impairment tests for each of our reporting units containing goodwill during the fourth quarter of each year. Beginning in 2017, we changed our annual goodwill impairment testing date from December 31 to October 31 to better align the testing date with our financial planning process and alleviate resource constraints. We would not expect a materially different outcome in any given year as a result of testing on October 31 as compared to December 31.
The carrying amount of a reporting unit's goodwill is considered not recoverable, and an impairment loss is recorded if the carrying amount of the reporting unit exceeds the reporting unit's fair value, as determined based on a combination of an income approach and a market approach. See Note 7, Goodwill and Other Intangible Assets, for more information on our goodwill and other intangible assets.
The carrying amount of tangible long-lived assets held and used is considered not recoverable if the carrying amount exceeds the undiscounted sum of cash flows expected to result from the use and eventual disposition of the asset. If the carrying amount is not recoverable, the impairment loss is measured as the excess of the asset's carrying amount over its fair value.
Assets held for sale are evaluated for impairment at least annually and as impairment indicators are present. The carrying amount of assets held for sale is not recoverable if the carrying amount exceeds the fair value less estimated costs to sell the asset. An impairment loss is recorded for the excess of the asset’s carrying amount over the fair value less estimated costs to sell. Impairment losses are recorded in operating supplies and expenses in the consolidated statements of comprehensive income. Impairment losses were immaterial in 2018, 2017 and 2016.
(l) Revenue Recognition
Through December 31, 2017, we recorded transportation revenue at the time of delivery. Beginning in 2018, we implemented ASU 2014-09, Revenue from Contracts with Customers, which is codified as ASC 606 and replaces ASC 605, Revenue Recognition. With the adoption of ASC 606, we began recognizing revenue during the delivery period based on relative transit time in each reporting period, with expenses recognized as incurred. Accordingly, a portion of the total revenue that will be billed to the customer once a load is delivered is recognized in each reporting period based on the percentage of the freight pickup and delivery service that has been completed at the end of the reporting period. See Note 2, Revenue Recognition, for more information on the adoption of ASC 606.
When we use third-party carriers, we generally record revenues on the gross basis at amounts charged to our customers because we are the primary obligor, we are a principal in the transaction, we invoice our customers and retain all credit risks, and we maintain discretion over pricing. Additionally, we are responsible for selection of third-party transportation providers to the extent used to satisfy customer freight requirements.
We record revenues net of pass-through taxes in our consolidated statements of comprehensive income.
For the year ended December 31, 2018, no customer accounted for more than 10% of our consolidated revenues. We had one customer who accounted for slightly more than 10% of our consolidated revenues in 2017. No customer accounted for more than 10% of our consolidated revenues in 2016.
59
(m) Income Taxes
Income taxes are accounted for under the liability method. Deferred tax assets and liabilities are recognized for the future tax consequences attributable to differences between the financial statement carrying amounts of existing assets and liabilities and their respective tax bases and operating loss and tax credit carryforwards. Deferred tax assets and liabilities are measured using enacted tax rates expected to apply to taxable income in the years in which those temporary differences are expected to be recovered or settled. The effect on deferred tax assets and liabilities of a change in tax rates is recognized as income or expense in the period that includes the enactment date. We record valuation allowances for deferred tax assets to the extent we believe these assets are not more likely than not to be realized through the reversal of existing taxable temporary differences, projected future taxable income, or tax-planning strategies. We record a liability for unrecognized tax benefits when the benefits of tax positions taken on a tax return are not more likely than not to be sustained upon audit. Interest and penalties related to uncertain tax positions are classified as income tax expense in the consolidated statements of comprehensive income.
(n) Earnings Per Share
We compute basic earnings per share by dividing net earnings available to common stockholders by the actual weighted average number of common shares outstanding for the reporting period. Diluted earnings per share reflect the potential dilution that could occur if holders of unvested restricted and performance share units or options exercised or converted their holdings into common stock. Awards that would have an antidilutive impact are excluded from the calculation and have been deemed immaterial.
As disclosed in Note 3, IPO, our IPO of shares of Class B Common Stock was effective in April 2017. In connection with the offering, we subsequently sold additional shares of common stock.
(o) Share-based Compensation
We have share-based compensation plans covering certain employees, including officers and directors. We account for share-based compensation using the fair value recognition provisions of current accounting standards for share-based payments. We grant restricted share units, restricted shares, performance share units, performance shares, and nonqualified stock options. We recognize compensation expense over the requisite service periods within each award. See Note 14, Share-Based Compensation, for more information about our plans.
(p) Claims Accruals
We are self-insured for loss of and damage to our owned and leased revenue equipment. We purchase insurance coverage for a portion of expenses related to employee injuries, vehicular collisions, accidents, and cargo damage. Certain insurance arrangements include a level of self-insurance (deductible) coverage applicable to each claim. We have excess policies to limit our exposure to catastrophic claim costs. The amounts of self-insurance change from time to time based on measurement dates, policy expiration dates, and claim type.
Our claims accrual policy for all self-insured claims is to recognize a liability at the time of the incident based on our analysis of the nature and severity of the claims and analyses provided by third-party claims administrators, as well as legal, economic, and regulatory factors. The ultimate cost of a claim develops over time as additional information regarding the nature, timing, and extent of damages claimed becomes available. Accordingly, we use an actuarial method to develop current claim information to derive an estimate of our ultimate claim liability. This process involves the use of loss-development factors based on our historical claims experience and includes a contractual premium adjustment factor, if applicable. In doing so, the recorded liability considers future claims growth and provides an allowance for incurred-but-not-reported claims. We do not discount our estimated losses. At December 31, 2018 and 2017, we had an accrual of approximately $156.0 million and $147.2 million, respectively, for estimated claims net of reinsurance receivables. In addition, we are required to pay certain advanced deposits and monthly premiums. At December 31, 2018 and 2017, we had an aggregate prepaid insurance asset of approximately $9.2 million and $7.9 million, respectively, which represented prefunded premiums and deposits.
(q) Accounting Standards Issued but Not Yet Adopted
In August 2018, the FASB issued ASU 2018-15, Customer's Accounting for Implementation Costs Incurred in a Cloud Computing Arrangement That Is a Service Contract, which aligns the capitalization requirements for implementation costs incurred in a hosting arrangement that is a service contract with the existing capitalization requirements for implementation costs incurred to develop or obtain internal-use software. ASU 2018-15 is effective for us as of January 1, 2020 with early
60
adoption permitted. We currently cannot reasonably estimate the impact the adoption of this ASU will have on our consolidated financial statements.
In August 2018, the FASB issued ASU 2018-13, Fair Value Measurement - Disclosure Requirements, which removes, modifies, and adds certain disclosure requirements for fair value measurements. ASU 2018-13 is effective for us January 1, 2020 with early adoption permitted. We are currently evaluating the impact the adoption of this ASU will have on our consolidated financial statements and do not believe the impact will be material.
In June 2016, the FASB issued ASU 2016-13, Financial Instruments – Credit Losses: Measurement of Credit Losses on Financial Instruments, which requires companies to use a forward-looking, expected loss model to estimate credit losses on various types of financial assets and net investments in leases. It also requires additional disclosure related to credit quality of trade and other receivables, including information related to management’s estimate of credit allowances. ASU 2016-13 is effective for us January 1, 2020. We currently cannot reasonably estimate the impact the adoption of this ASU will have on our consolidated financial statements.
In February 2016, the FASB issued ASU 2016-02, Leases, which amended authoritative guidance on leases and is codified in ASC 842. The amended guidance requires lessees to recognize most leases on their balance sheets as right-of-use assets along with corresponding lease liabilities. The new standard also requires new disclosures to help financial statement users better understand the amount, timing, and uncertainty of cash flows arising from leases. This guidance was effective for us January 1, 2019. In July 2018, the FASB issued additional authoritative guidance providing companies with the option to apply this ASU to new and existing leases within the scope of the guidance as of the beginning of the period of adoption. We elected this transition method of applying the new lease standard and recognized right-of-use assets, lease liabilities, and any cumulative-effect adjustments to the opening balance of retained earnings as of January 1, 2019. Prior period amounts will not be adjusted and will continue to be reported under the accounting standards in effect for those periods. Upon adoption of the new standard on January 1, 2019, we elected the package of practical expedients provided under the guidance. The practical expedient package applied to leases that commenced prior to adoption of the new standard and permitted companies not to reassess whether existing or expired contracts are or contain a lease, the lease classification, and any initial direct costs for any existing leases. The Company also elected the recognition exemption for equipment leases, which allows the Company to not recognize right-of-use assets and liabilities for leases with an initial term of 12 months or less. Additionally, the Company elected to take the practical expedient to include non-lease components as part of the right-of-use asset and lease liability. A cross-functional implementation team identified the Company's lease population, leveraged and expanded the use of our existing lease software to assist with the reporting and disclosure requirements under the standard, and abstracted and validated our lease information. The adoption of the standard added approximately $80 million in right-of-use assets and related lease obligations to our consolidated balance sheet for operating leases in which we were the lessee as of January 1, 2019. The adoption of this standard did not have a material impact on our consolidated statements of comprehensive income. Leasing activities in which we are the lessor in the transaction are also subject to ASC 842. As a lessor, adopting this standard did not have a material impact on our consolidated balance sheets but will add to both operating revenues and expenses in the consolidated statements of comprehensive income, as certain leases previously treated as direct financing leases will become sales-type leases.
2. REVENUE RECOGNITION
We implemented ASU 2014-09, Revenue from Contracts with Customers, which is codified as ASC 606 as of January 1, 2018 and replaces ASC 605, Revenue Recognition. We used the modified retrospective approach for adoption, which required us to record the cumulative effect of the transition through retained earnings as of January 1, 2018. Retained earnings increased by $7.3 million upon adoption. The adjustment related only to contracts that were not completed as of January 1, 2018. The following table shows the amount by which financial statement lines were affected by the adoption of the new standard. The changes relate to the recognition of transportation revenue over time rather than at delivery, as explained below under the Transportation heading. Revenue in transit and the related expenses are recorded within our Other segment, except for FTFM which is recorded within the Truckload segment.
61
Year Ended December 31, 2018 | ||||||||||||
Financial Statement Line Item (in millions) | Under ASC 605 | Adjustment | As Reported | |||||||||
Consolidated Statement of Comprehensive Income | ||||||||||||
Operating revenues | $ | 4,977.6 | $ | (0.6 | ) | $ | 4,977.0 | |||||
Purchased transportation | 1,965.2 | 0.7 | 1,965.9 | |||||||||
Salaries, wages, and benefits | 1,260.3 | (0.9 | ) | 1,259.4 | ||||||||
Total operating expenses | 4,601.4 | (0.2 | ) | 4,601.2 | ||||||||
Income from operations | 376.2 | (0.4 | ) | 375.8 | ||||||||
Provision for income taxes | 364.6 | — | 364.6 | |||||||||
Net income | 269.3 | (0.4 | ) | 268.9 | ||||||||
Comprehensive income | 268.3 | (0.4 | ) | 267.9 | ||||||||
December 31, 2018 | ||||||||||||
Financial Statement Line Item (in millions) | Under ASC 605 | Adjustment | As Reported | |||||||||
Consolidated Balance Sheet | ||||||||||||
Prepaid expenses and other current assets | $ | 59.8 | $ | 19.7 | $ | 79.5 | ||||||
Total current assets | 1,304.6 | 19.7 | 1,324.3 | |||||||||
Total assets | 3,604.8 | 19.7 | 3,624.5 | |||||||||
Other current liabilities | 70.8 | 10.4 | 81.2 | |||||||||
Total current liabilities | 512.2 | 10.4 | 522.6 | |||||||||
Deferred income taxes | 448.2 | 2.4 | 450.6 | |||||||||
Total noncurrent liabilities | 967.2 | 2.4 | 969.6 | |||||||||
Retained earnings | 582.4 | 6.9 | 589.3 | |||||||||
Total shareholders' equity | 2,125.4 | 6.9 | 2,132.3 | |||||||||
Total liabilities and shareholders' equity | 3,604.8 | 19.7 | 3,624.5 | |||||||||
Year Ended December 31, 2018 | ||||||||||||
Financial Statement Line Item (in millions) | Under ASC 605 | Adjustment | As Reported | |||||||||
Consolidated Statement of Cash Flows | ||||||||||||
Operating Cash Flows | ||||||||||||
Net income | $ | 269.3 | $ | (0.4 | ) | $ | 268.9 | |||||
Change in: Other assets | (8.7 | ) | (0.3 | ) | (9.0 | ) | ||||||
Change in: Payables | 3.0 | — | 3.0 | |||||||||
Change in: Other liabilities | 11.0 | 0.7 | 11.7 | |||||||||
ASC 606 requires us to look at revenue from customers at a contract level to determine the appropriate accounting. As defined by the new standard, a “contract” can range from an individual order to a multi-year agreement with a customer, depending on the specific arrangement. The majority of our revenues are related to transportation and have similar characteristics. The
62
following table breaks down our revenues by type of service, and each type of service is further described below.
Year Ended December 31, | ||||||||
Disaggregated Revenues (in millions) | 2018 | 2017 | ||||||
Transportation | $ | 4,589.7 | $ | 4,012.4 | ||||
Logistics management | 228.3 | 220.2 | ||||||
Other | 159.0 | 151.0 | ||||||
Total operating revenues | $ | 4,977.0 | $ | 4,383.6 | ||||
Transportation
Transportation revenues relate to the Truckload and Intermodal reportable segments, as well as to our Brokerage business, which is included in the Logistics reportable segment.
In the Transportation portfolio, our service obligation to customers is satisfied over time. We do not believe there is a significant impact on the nature, amount, timing, and uncertainty of revenue or cash flows based on the mode of transportation. The economic factors that impact our transportation revenue are generally consistent across these modes given the relatively short term nature of each contract. For the majority of our transportation business, the “contract with a customer” is identified as an individual order under a negotiated agreement. Some consideration is variable in that a final transaction price is uncertain and is susceptible to factors outside of the Company's influence, such as the weather or the accumulation of accessorial charges. Pricing information is supplied by the rate schedules that accompany negotiated contracts.
Transportation orders are short-term in nature and generally have terms of significantly less than one year. They do not include significant financing components. A small portion of revenues in our transportation business relate to fixed payments in our Truckload segment. These payments are due regardless of volumes, and in these arrangements, the master agreement rather than the individual order may be considered the “contract.” See the Remaining Performance Obligations table below for more information on fixed payments.
Prior to the adoption of ASC 606, we recognized revenue from transportation services when we completed our obligation to the customer, upon delivery. In accordance with the new standard, we now recognize revenue over the period transportation services are provided to the customer, including service performed as of the end of the reporting period for loads currently in transit, in order to recognize the value that is transferred to a customer over the course of the transportation service.
We determine revenue in transit using the input method, under which revenue is recognized based on time lapsed from the departure date (start of transportation services) to the arrival date (completion of transportation services). Measurement of revenue in transit requires the application of significant judgment. We calculate the estimated percentage of an order's transit time that is complete at period end, and we apply that percentage of completion to the order's estimated revenue. Revenue recognized in the period ended December 31, 2018 includes amounts related to orders that were partially completed (in transit) in prior periods.
In certain transportation arrangements, an unrelated party contributes a specified service to our customer. For example, we contract with third-party carriers to perform transportation services on behalf of our customers in our Brokerage business, and we use third-party rail carriers in our Intermodal segment. In situations that include the contributions of third parties, we act as principal in the arrangement, and, accordingly, we recognize gross revenues from these transactions.
Logistics Management
Logistics Management revenues relate to our Supply Chain Management and Import/Export Services operating segments, both of which are included in our Logistics reportable segment. Within this portfolio, the key service we provide to the customer is management of freight shipping and/or storage.
The “contracts” in our Logistics Management portfolio are the negotiated agreements, which contain both fixed and variable components. The variability of revenues is driven by volumes and transactions, which are known as of an invoice date. See the Remaining Performance Obligations table below for additional information. Supply Chain Management and Import/Export Services contracts typically have terms that extend beyond one year, and they do not include financing components.
Prior to the adoption of ASC 606, we recognized revenue under these contracts over time, based on pricing terms within the arrangements. Our recognition model will remain the same under the new standard, as we have elected to use the right to
63
invoice practical expedient, which reflects the fact that a customer obtains the benefit associated with logistics services as they are provided (output method).
In our Supply Chain Management business, we subcontract third parties to perform a portion of the services. We are responsible for ensuring the services are performed and that they are acceptable to the customer, and we are, therefore, considered to be the principal in these arrangements.
Other
Other revenues relate to activities that are out of scope for purposes of ASC 606, including our leasing and captive insurance businesses.
Quantitative Disclosure
The following table provides information related to transactions and expected timing of revenue recognition related to performance obligations that are fixed in nature and relate to contracts with terms greater than one year.
Remaining Performance Obligations (in millions) | December 31, 2018 | |||
Expected to be recognized within one year | ||||
Transportation | $ | 5.6 | ||
Logistics Management | 17.4 | |||
Expected to be recognized after one year | ||||
Transportation | 2.2 | |||
Logistics Management | 4.0 | |||
Total | $ | 29.2 | ||
This disclosure does not include revenue related to performance obligations that are part of a contract whose original expected duration is one year or less. In addition, this disclosure does not include expected consideration related to performance obligations for which the Company elects to recognize revenue in the amount it has a right to invoice (e.g., usage-based pricing terms).
The following table provides information related to contract balances associated with our contracts with customers as of the dates shown.
Contract Balances (in millions) | December 31, 2018 | January 1, 2018 | ||||||
Other current assets - Contract assets | $ | 21.7 | $ | 22.2 | ||||
Other current liabilities - Contract liabilities | — | — | ||||||
We generally receive payment within 40 days of completion of performance obligations. Contract assets in the table above relate to revenue in transit at the end of the reporting period. Contract liabilities relate to amounts that customers paid in advance of the associated service.
For certain of our contracts, we incur upfront costs to fulfill the master agreement, including driver recruiting and equipment relocation, that are capitalized and amortized over the master contract term, which has been deemed to be the period of benefit. These costs usually relate to dedicated transportation arrangements. The following table presents the amounts capitalized for contract fulfillment costs as of the dates shown.
(in millions) | December 31, 2018 | January 1, 2018 | ||||||
Capitalized contract fulfillment costs | $ | 5.0 | $ | 3.7 | ||||
Amortization of capitalized contract fulfillment costs was as shown:
Year Ended December 31, | ||||||||
(in millions) | 2018 | 2017 | ||||||
Amortization of contract fulfillment costs | $ | 2.5 | $ | 2.0 | ||||
64
Impairment losses for the periods ended December 31, 2018 and December 31, 2017 were immaterial.
Practical Expedients
We elected to use the following practical expedients that are available under ASC 606: (i) not to adjust the promised amount of consideration for the effects of a significant financing component when we expect, at contract inception, that the period between our transfer of a promised service to a customer and when the customer pays for that service will be one year or less; (ii) to apply the new revenue standard to a portfolio of contracts (or performance obligations) with similar characteristics, as we reasonably expect that the effects on the consolidated financial statements of applying this guidance to the portfolio would not differ materially from applying this guidance to the individual contracts (or performance obligations) within that portfolio; and (iii) to recognize revenue in the Logistics Management portfolio in the amount of consideration to which we have a right to invoice, that corresponds directly with the value to the customer of the service completed to date.
3. IPO
Our IPO of shares of Class B Common Stock was completed in early April 2017, and additional shares were sold in May 2017 under an option granted to the underwriters. In connection with the offering, we sold a total of 20,145,000 shares of Class B common stock at $19 per share and received proceeds of $382.7 million. Expenses related to the offering totaled approximately $42.1 million, resulting in net proceeds of $340.6 million.
4. ACQUISITION
On June 1, 2016, we acquired 100% of the shares of WSL for $150.4 million in cash and future payments. WSL combines final-mile delivery with an innovative technology platform to provide LTL, truckload, and logistics services for large parcel goods, such as furniture and floor coverings, across North America. It uses proprietary technology to handle supply chain complexities within the national home delivery industry. We acquired WSL because it creates integrated first to final mile delivery capabilities, which reduce supply chain complexities for omnichannel retailers and manufacturers.
The acquisition was accounted for as a purchase in accordance with ASC Topic 805, Business Combinations. Assets acquired and liabilities assumed were recorded in the Truckload segment at their fair values as of the acquisition date, as shown in the table below. The fair values of identifiable intangible assets, which were primarily customer relationships and trade names, were based on valuations using the income approach. The excess of the purchase price over the estimated fair values of tangible assets, identifiable intangible assets, and assumed liabilities was recorded as goodwill. The goodwill is attributable to expected synergies and expected growth opportunities. We believe that 100% of the goodwill will be deductible for United States income tax purposes.
(in millions) | ||||
Recognized amounts of identifiable assets acquired and liabilities assumed | As of June 1, 2016 | |||
Cash | $ | 1.3 | ||
Receivables | 16.2 | |||
Inventories | 0.5 | |||
Prepaid expenses and other current assets | 4.4 | |||
Property and equipment | 81.8 | |||
Capitalized software and other noncurrent assets | 5.8 | |||
Intangible assets | 10.9 | |||
Goodwill | 138.2 | |||
Total assets acquired | 259.1 | |||
Payables assumed | 7.8 | |||
Accrued liabilities assumed | 5.3 | |||
Current maturities of debt and capital lease obligations assumed | 47.7 | |||
Debt and capital lease obligations assumed | 46.2 | |||
Other noncurrent liabilities assumed | 1.7 | |||
Fair value of total consideration transferred | $ | 150.4 | ||
65
In addition to cash of $79.5 million paid at closing, the purchase and sale agreement included guaranteed payments of $20.0 million to the former owners of WSL on each of the first three anniversary dates of the closing. The liability recorded was discounted between one percent and three percent, based on credit-adjusted discount rates. The initial payment in the amount of $19.7 million, including calculated interest based on the discounted amount recorded, was made in June 2017 and reflected an adjustment for a working capital true-up. The second payment in the amount of $20.0 million was made in June 2018. The present value of the remaining payment was $18.7 million at December 31, 2018, which is recorded in other current liabilities on the consolidated balance sheet.
A contingent payment arrangement based on the achievement of specified earnings targets is also in place for three consecutive 12-month periods after the closing, with the aggregate payment total not to exceed $40.0 million. No payments have been made through December 31, 2018. See Note 5, Fair Value, for information regarding the fair value of this contingent arrangement.
Acquisition-related costs included in other general expenses in our consolidated statements of comprehensive income for the year ended December 31, 2016, were $1.4 million.
The representative of the former owners of WSL has claimed that we have not fulfilled certain obligations under the purchase and sale agreement relating to the post-closing operation of the business and that, as a result, the former owners are entitled to an accelerated payment of the contingent amount described above without regard to whether the specified earnings targets are met. We believe this claim is meritless and have filed an action in the Delaware Court of Chancery seeking a declaratory judgment that we have complied with our obligations under the agreement and that no accelerated payment is owed. The representative of the former owners has filed a counterclaim seeking the full amount of the accelerated payment.
The following unaudited pro forma condensed combined financial information presents our results as if we had acquired WSL on January 1, 2016.
(in millions, except per share data) | Year Ended December 31, 2016 | |||
Pro forma net sales | $ | 4,119.3 | ||
Pro forma net income | 155.0 | |||
Basic earnings per share as reported | 1.00 | |||
Pro forma basic earnings per share | 0.99 | |||
Diluted earnings per share as reported | 1.00 | |||
Pro forma diluted earnings per share | 0.99 | |||
5. FAIR VALUE
Fair Value of WSL Contingent Consideration
The fair value of the contingent consideration related to the 2016 acquisition of WSL was zero at December 31, 2018. This valuation was based on significant inputs that are not observable in the market, which are referred to as Level 3 inputs. One of the key assumptions was a probability-adjusted level of earnings before interest, taxes, depreciation, and amortization. The following table sets forth a reconciliation of changes in the fair value of the contingent consideration:
(in millions) | 2018 | 2017 | ||||||
Beginning balance | $ | — | $ | 13.5 | ||||
Change in fair value | — | (13.5 | ) | |||||
Ending balance | $ | — | $ | — | ||||
We recorded adjustments to the contingent consideration liability in the second, third, and fourth quarters of 2017, resulting in an increase in income from operations. The adjustments were caused by a change in the fair value of the contingent liability, which reflected three-year growth targets established by the seller prior to the close of the acquisition. No payments have been made through December 31, 2018.
See Note 6, Investments, for information on the fair value of our marketable securities.
Our ownership interest in Platform Science, Inc. discussed in Note 6, Investments, was valued based on Level 3 inputs.
66
There were no transfers between levels for the periods shown.
Fair Value of Other Financial Instruments
The recorded value of cash, trade accounts receivable, and trade accounts payable approximates fair value.
The table below presents the carrying value of our debt portfolio along with the fair value of a fixed-rate debt portfolio with similar terms and maturities, which is based on borrowing rates available to us in the applicable year. This valuation used Level 2 inputs.
December 31, 2018 | December 31, 2017 | |||||||||||||||
(in millions) | Carrying Amount | Fair Value | Carrying Amount | Fair Value | ||||||||||||
Fixed-rate debt portfolio | $ | 405.0 | $ | 398.4 | $ | 429.8 | $ | 432.4 | ||||||||
6. INVESTMENTS
Marketable Securities
The following table presents the values of our marketable securities as of the dates shown.
December 31, 2018 | December 31, 2017 | |||||||||||||||
(in millions) | Amortized Cost | Fair Value | Amortized Cost | Fair Value | ||||||||||||
Zero coupon bonds | $ | 3.9 | $ | 3.9 | $ | 3.8 | $ | 3.9 | ||||||||
U.S. treasury and government agencies | 20.0 | 19.8 | 6.0 | 6.0 | ||||||||||||
Asset-backed securities | 0.1 | 0.1 | 0.3 | 0.3 | ||||||||||||
Corporate debt securities | 15.1 | 15.0 | 9.1 | 9.2 | ||||||||||||
State and municipal bonds | 12.5 | 12.5 | 22.7 | 22.2 | ||||||||||||
Total marketable securities | $ | 51.6 | $ | 51.3 | $ | 41.9 | $ | 41.6 | ||||||||
Gross realized gains and losses on marketable securities were not material for the years ended December 31, 2018, 2017, and 2016, respectively. Unrealized gains and losses on marketable securities were not material for the years ended December 31, 2018, and 2017, respectively.
67
Ownership Interest in Platform Science, Inc.
In 2018, we received a 30% ownership interest in Platform Science, Inc. in exchange for our contribution of a non-exclusive license for telematics mobile software that was developed to enable driver productivity and ensure regulatory compliance. Our ownership interest in Platform Science, Inc. is being accounted for under ASC 321, Investments - Equity Securities and is recorded at fair value in other noncurrent assets on the consolidated balance sheets. The fair value of our ownership interest at December 31, 2018 was determined to be $3.5 million through an independent valuation and is recorded in other income in the consolidated statements of comprehensive income.
7. GOODWILL AND OTHER INTANGIBLE ASSETS
Goodwill represents the excess of the purchase price of our acquisitions over the fair value of the identifiable net assets acquired. The following table shows changes to our goodwill balances by segment during the years ended December 31, 2018 and December 31, 2017.
(in millions) | Truckload | Logistics | Other | Total | ||||||||||||
Balance at December 31, 2016 | $ | 138.2 | $ | 14.2 | $ | 11.6 | $ | 164.0 | ||||||||
Foreign currency translation | — | — | 0.8 | 0.8 | ||||||||||||
Balance at December 31, 2017 | 138.2 | 14.2 | 12.4 | 164.8 | ||||||||||||
Goodwill impairment charge | — | — | (2.0 | ) | (2.0 | ) | ||||||||||
Foreign currency translation | — | — | (0.6 | ) | (0.6 | ) | ||||||||||
Balance at December 31, 2018 | $ | 138.2 | $ | 14.2 | $ | 9.8 | $ | 162.2 | ||||||||
At December 31, 2018 and 2017, we had accumulated goodwill impairment charges of $8.0 million and $6.0 million, respectively.
During the second quarter of 2018, we reorganized the structure of the operating segments within the Truckload reportable segment to include FTFM as a separate operating segment and integrated the remaining Dedicated activities into the VTL operating segment. Each Truckload operating segment was determined to be its own reporting unit due to the level at which financial information is available and management reviews that information. As a result of the reorganization, goodwill within the Truckload reportable segment, which was previously attributable to the Dedicated reporting unit, was reallocated to the VTL-Dedicated Services and FTFM reporting units on a relative fair value basis. After the reallocation of goodwill, an impairment test was performed for these reporting units, and it was determined that goodwill was not impaired as each reporting unit had an estimated fair value in excess of its respective carrying amount.
In the fourth quarter of 2018, annual impairment tests were performed on all four of our reporting units with goodwill. As a result of the testing performed, an impairment loss of $2.0 million was recorded for our Asia reporting unit as the discounted cash flows expected to be generated by this reporting unit were not sufficient to recover its carrying value.
The identifiable intangible assets other than goodwill listed below are included in capitalized software and other noncurrent assets on the consolidated balance sheets. Our customer lists and trade names are amortized over weighted-average amortization periods of ten and three years, respectively.
December 31, 2018 | December 31, 2017 | |||||||||||||||||||||||
(in millions) | Gross Carrying Amount | Accumulated Amortization | Net Carrying Amount | Gross Carrying Amount | Accumulated Amortization | Net Carrying Amount | ||||||||||||||||||
Customer lists | $ | 10.5 | $ | 3.5 | $ | 7.0 | $ | 10.5 | $ | 2.5 | $ | 8.0 | ||||||||||||
Trade names | 1.4 | 1.2 | 0.2 | 1.4 | 0.7 | 0.7 | ||||||||||||||||||
Total intangible assets | $ | 11.9 | $ | 4.7 | $ | 7.2 | $ | 11.9 | $ | 3.2 | $ | 8.7 | ||||||||||||
Amortization expense for intangible assets was $1.4 million, $1.5 million and $0.9 million for the years ended December 31, 2018, 2017, and 2016, respectively. Accumulated amortization in the table above includes foreign currency translation related to a customer list.
68
Estimated future amortization expense related to intangible assets is as follows (in millions):
2019 | $ | 1.1 | |
2020 | 1.0 | ||
2021 | 1.0 | ||
2022 | 1.0 | ||
2023 | 1.0 | ||
2024 and thereafter | 2.1 | ||
Total | $ | 7.2 | |
8. DEBT AND CREDIT FACILITIES
As of December 31, 2018 and 2017, debt included the following:
(in millions) | December 31, 2018 | December 31, 2017 | ||||||
Unsecured senior notes: principal payable at maturities ranging from 2019 through 2025; interest payable in semiannual installments through the same time frame; weighted-average interest rate of 3.36% for both 2018 and 2017 | $ | 400.0 | $ | 400.0 | ||||
Equipment financing notes: principal and interest payable in monthly installments through 2019; weighted average interest rate of 3.72% and 3.76% for 2018 and 2017, respectively | 5.0 | 29.8 | ||||||
Total principal outstanding | 405.0 | 429.8 | ||||||
Current maturities of debt | (45.0 | ) | (15.2 | ) | ||||
Debt issuance costs | (0.6 | ) | (0.9 | ) | ||||
Long-term debt | $ | 359.4 | $ | 413.7 | ||||
Scheduled principal payments of debt subsequent to December 31, 2018 are as follows:
Years ending December 31, | (in millions) | |||
2019 | $ | 45.0 | ||
2020 | 55.0 | |||
2021 | 40.0 | |||
2022 | 60.0 | |||
2023 | 70.0 | |||
2024 and thereafter | 135.0 | |||
Total | $ | 405.0 | ||
On August 6, 2018, we entered into a $250.0 million Credit Agreement (the “2018 Credit Facility”) among us, the lenders party thereto (the “Lenders”) and JPMorgan Chase Bank, N.A., as administrative agent, and terminated our prior $250.0 million Credit Agreement dated February 18, 2011 (as amended). The 2018 Credit Facility is a revolving credit facility that matures on August 6, 2023 and allows us to request an increase in total commitment by up to $150.0 million for a total potential commitment of $400.0 million. The 2018 Credit Facility also provides a sublimit of $100.0 million to be used for the issuance of letters of credit. The applicable interest rate under the 2018 Credit Facility is based on the Prime Rate, the Federal Funds Rate, or the LIBOR, depending upon the type of borrowing, plus an applicable margin based on our consolidated net debt coverage ratio as of the end of each fiscal quarter. We had no outstanding borrowings under this agreement as of December 31, 2018 or 2017. Standby letters of credit under this agreement amounted to $3.9 million at both December 31, 2018 and 2017, respectively, and were primarily related to the requirements of certain of our real estate leases.
On September 5, 2018, we entered into a Joinder and Amendment No. 2 to our Amended and Restated Receivables Purchase Agreement (the “2018 Receivables Purchase Agreement”) relating to our $200.0 million secured accounts receivable facility. The 2018 Receivables Purchase Agreement has a scheduled maturity date of September 3, 2021, allows us to borrow funds against qualifying trade receivables at rates based on one-month LIBOR, and provides for the issuance of standby letters of credit. We had no outstanding borrowings under this facility at December 31, 2018 or 2017. At December 31, 2018 and 2017,
69
standby letters of credit under this agreement amounted to $65.3 million and $63.8 million, respectively, and were primarily related to the requirements of certain of our insurance obligations.
Financing arrangements require us to maintain certain covenants and financial ratios. The credit agreements contain various financial and other covenants, including required minimum consolidated net worth, consolidated net debt, limitations on indebtedness, transactions with affiliates, shareholder debt, and restricted payments. The credit agreements and senior notes contain change of control provisions pursuant to which a change of control is defined to mean the Schneider family no longer owns more than 50% of the combined voting power of our capital shares. A change of control event causes an immediate termination of unused commitments under the credit agreements as well as requires repayment of all outstanding borrowings plus accrued interest and fees. The senior notes require us to provide notice to the note holders offering prepayment of the outstanding principal along with interest accrued to the date of prepayment. The prepayment date is required to be within 20 to 60 days from the date of notice. At December 31, 2018, the Company was in compliance with all financial covenants.
9. LEASES
As lessee — We have various real estate and equipment lease agreements. At December 31, 2018, scheduled future minimum lease payments under operating leases having initial or remaining noncancelable lease terms of more than one year and capital leases were as follows:
(in millions) | Operating Leases | Capital Leases | ||||||
2019 | $ | 35.8 | $ | 6.9 | ||||
2020 | 25.7 | 0.2 | ||||||
2021 | 14.9 | — | ||||||
2022 | 8.4 | — | ||||||
2023 | 6.8 | — | ||||||
2024 and thereafter | 12.7 | — | ||||||
Total | $ | 104.3 | 7.1 | |||||
Amount representing interest | (0.2 | ) | ||||||
Present value of minimum lease payments | 6.9 | |||||||
Current maturities | (6.7 | ) | ||||||
Long-term capital lease obligations | $ | 0.2 | ||||||
Lease expense for all operating leases was $37.0 million, $38.0 million, and $45.6 million in 2018, 2017, and 2016, respectively, and is classified in operating supplies and expenses in the consolidated statements of comprehensive income.
The consolidated balance sheets include assets acquired under capital leases as components of property and equipment as of December 31, 2018 and 2017, as follows:
(in millions) | 2018 | 2017 | ||||||
Transportation equipment | $ | 19.9 | $ | 25.0 | ||||
Real property | 0.8 | 0.8 | ||||||
Other property | 0.6 | 0.6 | ||||||
Accumulated amortization | (11.2 | ) | (12.6 | ) | ||||
Total | $ | 10.1 | $ | 13.8 | ||||
70
As lessor — We finance various types of transportation-related equipment for independent third parties. The transactions are generally for one year to five years and are accounted for as sales-type leases with fully guaranteed residual values or direct financing leases. As of December 31, 2018 and 2017, the investment in lease receivables was as follows:
(in millions) | 2018 | 2017 | ||||||
Future minimum payments to be received on leases | $ | 140.0 | $ | 141.2 | ||||
Guaranteed residual lease values | 151.0 | 130.7 | ||||||
Total minimum lease payments to be received | 291.0 | 271.9 | ||||||
Unearned income | (28.7 | ) | (28.1 | ) | ||||
Net investment in leases | 262.3 | 243.8 | ||||||
Current maturities of lease receivables | 129.6 | 106.6 | ||||||
Less—allowance for doubtful accounts | (0.5 | ) | (1.7 | ) | ||||
Current portion of lease receivables—net of allowance | 129.1 | 104.9 | ||||||
Lease receivables—noncurrent | $ | 133.2 | $ | 138.9 | ||||
The principal amounts to be received on lease receivables as of December 31, 2018, were as follows:
Years ending December 31 | (in millions) | ||
2019 | $ | 149.0 | |
2020 | 112.7 | ||
2021 | 29.0 | ||
2022 | 0.3 | ||
2023 | — | ||
2024 and thereafter | — | ||
Total | $ | 291.0 | |
Leases are generally placed on nonaccrual status (nonaccrual of interest and other fees) when a payment becomes 90 days past due or upon receipt of notification of bankruptcy, upon the death of a customer, or in other instances in which management concludes collectability is not reasonably assured. The accrual of interest and other fees is resumed when all payments are less than 60 days past due. At December 31, 2018, there were $0.3 million of lease payments greater than 90 days past due.
The terms of the lease agreements generally give us the ability to take possession of the underlying asset in the event of default. We may incur credit losses in excess of recorded allowances if the full amount of any anticipated proceeds from the sale or re-lease of the asset supporting the third party’s financial obligation is not realized. Costs to repossess and estimated reconditioning costs are recorded in the consolidated statements of comprehensive income in the period incurred.
10. INCOME TAXES
On December 22, 2017, the Tax Cuts and Jobs Act (the “Act”) was signed into law. In accordance with GAAP, the effects of this legislation were recognized in 2017 upon enactment. The primary impact of the Act for us related to the reduction of the Federal corporate income tax rate from 35% to 21% beginning in 2018. At December 31, 2017, our previously recorded deferred tax assets and liabilities were remeasured to reflect the 21% rate at which these assets and liabilities would be realized in future periods. The net change in deferred taxes was recorded through our provision for income taxes.
The provisional amounts recorded at December 31, 2017, in accordance with SEC Staff Accounting Bulletin No. 118, were finalized during the fourth quarter of 2018 and had an immaterial impact on the consolidated financial statements.
In February 2018, the FASB issued ASU 2018-02, Income Statement - Reporting Comprehensive Income, which allowed for a reclassification from accumulated other comprehensive income to retained earnings of stranded tax effects resulting from the Act. We early adopted this ASU during the fourth quarter of 2018, and the reclassification of stranded income tax effects had an immaterial impact on our consolidated financial statements.
71
The components of the provision for income taxes as of December 31, 2018, 2017 and 2016, were as follows:
(in millions) | 2018 | 2017 | 2016 | ||||||||||
Current: | |||||||||||||
Federal | $ | 21.7 | $ | 19.3 | $ | 24.4 | |||||||
State and other | 11.8 | 5.6 | 7.5 | ||||||||||
33.5 | 24.9 | 31.9 | |||||||||||
Deferred: | |||||||||||||
Federal | 54.2 | 71.4 | 71.2 | ||||||||||
State and other | 6.7 | 6.7 | 5.6 | ||||||||||
Impact of the Tax Cuts and Jobs Act | 1.3 | (229.5 | ) | — | |||||||||
62.2 | (151.4 | ) | 76.8 | ||||||||||
Total provision for (benefit from) income taxes | $ | 95.7 | $ | (126.5 | ) | $ | 108.7 | ||||||
Foreign operations of the Company are insignificant in relation to our overall operating results.
The provision for income taxes as of December 31, 2018, 2017, and 2016 differed from the amounts computed using the federal statutory rates in effect of 21% for December 31, 2018 and 35% for December 31, 2017 and 2016, as follows:
2018 | 2017 | 2016 | |||||||||||||||||
(in millions, except percentages) | Dollar Impact | Rate | Dollar Impact | Rate | Dollar Impact | Rate | |||||||||||||
Income tax at federal statutory rate | $ | 76.6 | 21.0 | % | $ | 92.2 | 35.0 | % | $ | 93.0 | 35.0 | % | |||||||
State tax, net of federal effect | 15.4 | 4.2 | % | 8.6 | 3.3 | % | 10.5 | 3.9 | % | ||||||||||
Nondeductible meals and entertainment | 2.1 | 0.6 | % | 3.4 | 1.3 | % | 3.4 | 1.3 | % | ||||||||||
Impact of the Tax Cuts and Jobs Act | 1.3 | 0.3 | % | (229.5 | ) | (87.1 | )% | — | — | ||||||||||
Other, net | 0.3 | 0.1 | % | (1.2 | ) | (0.5 | )% | 1.8 | 0.7 | % | |||||||||
Total provision for (benefit from) income taxes | $ | 95.7 | 26.2 | % | $ | (126.5 | ) | (48.0 | )% | $ | 108.7 | 40.9 | % | ||||||
The components of the net deferred tax liability included in deferred income taxes in the consolidated balance sheets as of December 31, 2018 and 2017, were as follows:
(in millions) | 2018 | 2017 | |||||||
Deferred tax assets: | |||||||||
Allowances for doubtful accounts | $ | 1.1 | $ | 1.1 | |||||
Compensation and employee benefits | 14.7 | 15.6 | |||||||
Insurance and claims accruals | 2.6 | 2.8 | |||||||
State net operating losses and credit carryforwards | 18.2 | 17.7 | |||||||
Other | 5.0 | 4.0 | |||||||
Total gross deferred tax assets | 41.6 | 41.2 | |||||||
Valuation allowance | (5.8 | ) | (4.4 | ) | |||||
Total deferred tax assets, net of valuation allowance | 35.8 | 36.8 | |||||||
Deferred tax liabilities: | |||||||||
Property and equipment | 466.5 | 410.8 | |||||||
Prepaid expenses | 4.3 | 3.6 | |||||||
Intangibles | 11.1 | 8.7 | |||||||
Other | 4.5 | 0.3 | |||||||
Total gross deferred tax liabilities | 486.4 | 423.4 | |||||||
Net deferred tax liability | $ | 450.6 | $ | 386.6 | |||||
72
Unrecognized Tax Benefits
Our unrecognized tax benefits as of December 31, 2018 would reduce the provision for income taxes if subsequently recognized. Potential interest and penalties related to unrecognized tax benefits are recorded in income tax expense. Interest and penalties recorded in income tax expense for the years ended December 31, 2018, 2017, and 2016 were immaterial. Accrued interest and penalties for such unrecognized tax benefits as of December 31, 2018 and 2017 were $1.4 million and $1.2 million, respectively. We expect no significant increases or decreases for unrecognized tax benefits during the twelve months immediately following the December 31, 2018 reporting date.
As of December 31, 2018, 2017, and 2016, a reconciliation of the beginning and ending amount of unrecognized tax benefits, which is recorded as other noncurrent liabilities in the consolidated balance sheets, is as follows:
(in millions) | 2018 | 2017 | 2016 | ||||||||||
Gross unrecognized tax benefits - beginning of year | $ | 2.8 | $ | 2.4 | $ | 2.0 | |||||||
Gross increases - tax positions related to current year | 0.8 | 0.4 | 0.5 | ||||||||||
Gross decreases - tax positions taken in prior years | — | — | (0.1 | ) | |||||||||
Lapse of statutes | (0.3 | ) | — | — | |||||||||
Gross unrecognized tax benefits - end of year | $ | 3.3 | $ | 2.8 | $ | 2.4 | |||||||
Tax Examinations
We file a U.S. federal income tax return, as well as income tax returns in a majority of state tax jurisdictions. We also file returns in foreign jurisdictions. The years 2015, 2016 and 2017 are open for examination by the Internal Revenue Service (“IRS”), and various years are open for examination by state and foreign tax authorities. In September 2018, the statute for 2014 expired. State and foreign jurisdictional statutes of limitations generally range from three to four years.
Carryforwards
As of December 31, 2018, we had $224.7 million of state net operating loss carryforwards which are subject to expiration from 2019 to 2039. We also had state credit carryforwards of $0.4 million, which are subject to expiration from 2019 to 2027, and no capital loss carryforwards. The deferred tax assets related to carryforwards at December 31, 2018 were $17.9 million for state net operating loss carryforwards and $0.3 million for state credit carryforwards. Carryforwards are reviewed for recoverability based on historical taxable income, the expected reversals of existing temporary differences, tax-planning strategies, and projections of future taxable income. At December 31, 2018, we carried a total valuation allowance of $5.8 million, which represents $5.5 million against state deferred tax assets and $0.3 million against state credit carryforwards.
11. TEMPORARY EQUITY
Prior to our IPO in April 2017, our Class A and Class B Common Stock was considered redeemable under GAAP because of certain repurchase rights granted to our shareholders pursuant to the Schneider National, Inc. Employee Stock Purchase Plan and certain agreements governing ownership of our common stock held by existing shareholders, including members of the Schneider family and their family trusts. As a result, all vested Class A and Class B common shares were recorded as temporary equity (redeemable common shares) on the consolidated balance sheets at their redemption value as of the respective balance sheet dates. Accumulated earnings on the consolidated balance sheets were adjusted for the changes during the period in the current redemption value of vested Class A and Class B redeemable common shares.
All contractual redemption features were removed at the time of the IPO. As a consequence, all outstanding shares of Class A and Class B Common Stock ceased to be considered temporary equity and were reclassified to Shareholders’ Equity, including the associated balances of accumulated earnings and accumulated other comprehensive income. As the common shares have no par value, the amounts recorded in temporary equity for the share redemption value were recorded to additional paid-in capital within Shareholders’ Equity upon the transfer.
73
The following table shows changes to temporary equity during the year ended December 31, 2017.
Class A Redeemable Common Shares | Class B Redeemable Common Shares | Accumulated Earnings | Accumulated Other Comprehensive Income | |||||||||||||||||||||||
(in millions) | Shares | Amount | Shares | Amount | Total | |||||||||||||||||||||
Balance—December 31, 2016 | 83.0 | $ | 563.2 | 73.3 | $ | 497.2 | $ | 125.1 | $ | 0.9 | $ | 1,186.4 | ||||||||||||||
Net income | — | — | — | — | 22.6 | — | 22.6 | |||||||||||||||||||
Other comprehensive income | — | — | — | — | — | — | — | |||||||||||||||||||
Dividends declared at $0.05 per share | — | — | — | — | (7.8 | ) | — | (7.8 | ) | |||||||||||||||||
Change in redemption value of redeemable common shares | — | 67.3 | — | 59.3 | (126.6 | ) | — | — | ||||||||||||||||||
Transfer from temporary equity to common equity | (83.0 | ) | (630.5 | ) | (73.3 | ) | (556.5 | ) | (13.3 | ) | (0.9 | ) | (1,201.2 | ) | ||||||||||||
Balance—December 31, 2017 | — | $ | — | — | $ | — | $ | — | $ | — | $ | — | ||||||||||||||
12. COMMON EQUITY
On March 21, 2017, the Board declared pro rata share dividends entitling each holder of our Class A and Class B common stock outstanding as of March 21, 2017 to receive 29 shares of Class A or Class B common stock for each share of Class A or Class B common stock held by the shareholder. The share dividend was accounted for as a 30-for-1 stock split and is retroactively reflected in these consolidated financial statements.
All share redemption provisions mentioned in Note 11, Temporary Equity, were removed effective with the IPO of Class B common shares in April 2017. Therefore, all Class A and Class B common shares were reclassified from temporary equity to permanent equity as of April 2017.
Prior to the IPO, restricted share awards that were not yet vested and held for more than 180 days were classified as liabilities at their redemption values, taking into consideration the portion of the requisite service that had been provided as of the reporting date. At the IPO date, these unvested shares were reclassified to equity.
Earnings Per Share
As disclosed in Note 3, IPO, our IPO of shares of Class B Common Stock was effective in April 2017. In connection with the offering, we sold additional shares of common stock.
Year Ended December 31, | ||||||||||||
(in millions, except per share data) | 2018 | 2017 | 2016 | |||||||||
Numerator: | ||||||||||||
Net income available to common shareholders | $ | 268.9 | $ | 389.9 | $ | 156.9 | ||||||
Denominator: | ||||||||||||
Weighted average common shares issued and outstanding | 177.0 | 171.1 | 156.6 | |||||||||
Effect of dilutive restricted share units | 0.2 | 0.2 | 0.2 | |||||||||
Weighted average diluted common shares issued and outstanding | 177.2 | 171.3 | 156.8 | |||||||||
Basic earnings per common share | $ | 1.52 | $ | 2.28 | $ | 1.00 | ||||||
Diluted earnings per common share | $ | 1.52 | $ | 2.28 | $ | 1.00 | ||||||
The calculation of diluted earnings per share for the twelve months ended December 31, 2018 excluded an immaterial amount of share-based compensation awards that had an anti-dilutive effect.
74
Subsequent Event - Dividends Declared
In January 2019, our Board of Directors declared a quarterly cash dividend for the first fiscal quarter of 2019 in the amount of $0.06 per share to holders of our Class A and Class B common stock. The dividend is payable to shareholders of record at the close of business on March 15, 2019, and is expected to be paid on April 8, 2019.
13. EMPLOYEE BENEFIT PLANS
We sponsor defined contribution plans for certain eligible employees. Under these plans, annual contribution levels, as defined in the plan agreements, are based upon years of service. Expense under these plans totaled $12.0 million, $11.2 million, and $10.7 million in 2018, 2017, and 2016, respectively, and is classified in salaries, wages, and benefits in the consolidated statements of comprehensive income.
We also have a savings plan, organized pursuant to Section 401(k) of the Internal Revenue Code, to provide employees with additional income upon retirement. Under the terms of the plan, substantially all employees may contribute a percentage of their annual compensation, as defined, to the plan. We make contributions to the plan, up to a maximum amount per employee, based upon a percentage of employee contributions. Our net expense under this plan was $12.1 million, $10.7 million, and $10.0 million in 2018, 2017, and 2016, respectively.
14. SHARE-BASED COMPENSATION
We grant various equity-based awards relating to Class B Common Stock under our 2017 Omnibus Incentive Plan (“the Plan”). These awards consist of the following: restricted shares, restricted stock units (“RSUs”), performance-based restricted shares (“Performance Shares”), performance-based restricted stock units (“PSUs”), and non-qualified stock options.
Prior to our IPO, we granted restricted shares of Class B Common Stock. The pre-IPO restricted shares must be paid out in shares and are accounted for as equity awards.
We account for our restricted shares, RSUs, performance shares, PSUs, and non-qualified stock options granted as equity awards in accordance with the applicable accounting standards for these types of share-based payments. These standards require that the cost of the awards be recognized in our consolidated financial statements based on the grant date fair value of those awards. This cost is recognized over the period for which an employee is required to provide service in exchange for the award, subject to the attainment of performance metrics established for performance-based restricted shares and PSUs. Share-based compensation expense is recorded in salaries, wages, and benefits in our consolidated statements of comprehensive income, along with other compensation expenses to employees.
The following table summarizes the components of our share-based compensation program expense:
(in millions) | Year Ended December 31, | |||||||||||
2018 | 2017 | 2016 | ||||||||||
Restricted Shares and RSUs | $ | 3.1 | $ | 1.5 | $ | — | ||||||
Pre-IPO Restricted Shares | 0.9 | 1.9 | 2.2 | |||||||||
Performance Shares and PSUs | 5.5 | 1.2 | — | |||||||||
Nonqualified Stock Options | 1.4 | 0.6 | — | |||||||||
Share-based compensation expense | $ | 10.9 | $ | 5.2 | $ | 2.2 | ||||||
Related tax benefit | $ | 2.8 | $ | 2.0 | $ | 0.9 | ||||||
As of December 31, 2018, we had $11.6 million of pre-tax unrecognized compensation cost related to outstanding share-based compensation awards that is expected to be recognized over a weighted-average period of 2.5 years.
Restricted Shares and RSUs
Under the Plan, the majority of the restricted shares and RSUs granted in 2017 and 2018 vest ratably over a four-year period, with the first 25% of the grant vesting approximately one year after the date of grant, subject to continued employment through the vesting date or retirement eligibility. Dividend equivalents equal to dividends paid on our common shares during the vesting
75
period are tracked and accumulated for each restricted share and RSU. The dividend equivalents are forfeitable and are distributed to participants in cash consistent with the date the awards vest.
A portion of the restricted shares relate to a one-time 2018 grant, which vests 50% after a five-year period, with the remaining 50% vesting after a six-year period after the grant date, subject to continued employment through the vesting date. Dividend equivalents equal to dividends paid on our common shares during the vesting period are tracked and accumulated for each restricted share. The dividend equivalents are distributed to participants in cash consistent with the date the awards vest.
Restricted Shares and RSUs | Number of Awards | Weighted Average Grant Date Fair Value | |||||
Unvested at December 31, 2016 | — | $ | — | ||||
Granted | 246,516 | 19.00 | |||||
Vested | — | — | |||||
Forfeited | (6,500 | ) | 19.00 | ||||
Unvested at December 31, 2017 | 240,016 | 19.00 | |||||
Granted | 229,272 | 26.82 | |||||
Vested | (74,828 | ) | 19.00 | ||||
Forfeited | (24,983 | ) | 21.26 | ||||
Unvested at December 31, 2018 | 369,477 | $ | 23.70 | ||||
Prior to our IPO, we granted restricted shares of Class B Common Stock. Shares included in the pre-IPO restricted share grants vest ratably over a three-year period. Cash dividends are not paid on the unvested pre-IPO restricted shares, nor do they accumulate during the vesting period.
Pre-IPO Restricted Shares | Number of Awards | Weighted Average Grant Date Fair Value | |||||
Unvested at January 1, 2016 | 798,960 | $ | 5.63 | ||||
Granted | 386,370 | 6.78 | |||||
Vested | (398,220 | ) | 5.42 | ||||
Forfeited | (9,900 | ) | 6.17 | ||||
Unvested at December 31, 2016 | 777,210 | 6.31 | |||||
Granted | — | — | |||||
Vested | (621,722 | ) | 7.59 | ||||
Forfeited (a) | (3,289 | ) | 19.00 | ||||
Unvested at December 31, 2017 | 152,199 | 19.00 | |||||
Granted | — | — | |||||
Vested | (101,643 | ) | 19.00 | ||||
Forfeited | (6,225 | ) | 19.00 | ||||
Unvested at December 31, 2018 | 44,331 | $ | 19.00 | ||||
(a) In April 2017, unvested restricted shares were adjusted to the IPO share price of $19.00.
Performance Shares and PSUs
Performance shares and PSUs include a three-year performance period with vesting based on attainment of threshold performance of earnings and return on capital targets. These awards cliff-vest at the end of the three-year performance period, subject to continued employment through the vesting date or retirement eligibility, and payout ranges from 0%-200% for PSUs and from 0%-100% for performance shares. Dividend equivalents equal to dividends paid on our common shares during the vesting period are tracked and accumulated for each award. The dividend equivalents are forfeitable and are distributed to participants in cash consistent with the date the awards vest.
76
Performance Shares and PSUs | Number of Awards | Weighted Average Grant Date Fair Value | |||||
Unvested at December 31, 2016 | — | $ | — | ||||
Granted | 396,201 | 19.00 | |||||
Vested | — | — | |||||
Forfeited | (4,660 | ) | 19.00 | ||||
Unvested at December 31, 2017 | 391,541 | 19.00 | |||||
Granted | 303,228 | 26.78 | |||||
Vested | — | — | |||||
Forfeited | (56,390 | ) | 19.65 | ||||
Unvested at December 31, 2018 | 638,379 | $ | 22.64 | ||||
Nonqualified Stock Options
The options granted under the Plan have an exercise price equal to the fair market value of the underlying stock at the date of grant and vest ratably over a four-year period, with the first 25% of the grant becoming exercisable approximately one year after the date of grant. The options expire ten years from the date of grant.
Nonqualified Stock Options Outstanding | Number of Awards | Weighted Average Exercise Price | Weighted Average Remaining Contractual Term | Aggregate Intrinsic Value (1) | ||||||||||
(In years) | (In thousands) | |||||||||||||
Outstanding at December 31, 2016 | — | $ | — | — | $ | — | ||||||||
Granted | 229,620 | 19.00 | — | — | ||||||||||
Exercised (2) | — | — | — | — | ||||||||||
Forfeited | — | — | — | — | ||||||||||
Outstanding at December 31, 2017 | 229,620 | $ | 19.00 | 9.3 | $ | 2,195 | ||||||||
Granted | 173,024 | 26.74 | — | — | ||||||||||
Exercised (2) | (8,410 | ) | 19.00 | — | 67 | |||||||||
Forfeited | (25,230 | ) | 19.00 | — | — | |||||||||
Outstanding at December 31, 2018 | 369,004 | $ | 22.63 | 8.7 | $ | — | ||||||||
Exercisable as of: | ||||||||||||||
December 31, 2017 | — | — | — | — | ||||||||||
December 31, 2018 | 48,995 | $ | 19.00 | 8.3 | $ | — | ||||||||
(1) | The aggregate intrinsic value was computed using the closing share price on December 31, 2018 of $18.67 and on December 29, 2017 of $28.56, as applicable. |
(2) | Cash received upon exercise of stock options was $0.2 million in 2018 and $0 in 2017. |
77
Unvested Nonqualified Stock Options | Number of Awards | Weighted Average Grant Date Fair Value | |||||
Unvested at December 31, 2016 | — | $ | — | ||||
Granted | 229,620 | 6.37 | |||||
Vested | — | — | |||||
Forfeited | — | — | |||||
Unvested at December 31, 2017 | 229,620 | 6.37 | |||||
Granted | 173,024 | 8.96 | |||||
Vested | (57,405 | ) | 6.37 | ||||
Forfeited | (25,230 | ) | 6.37 | ||||
Unvested at December 31, 2018 | 320,009 | $ | 7.77 | ||||
We estimated the grant date fair value of option awards using the Black-Scholes option pricing model. The Black-Scholes option valuation model uses assumptions over the expected term of the options. We used volatility analysis of comparable companies to determine the expected volatility of the stock. We used market data to estimate option exercise and employee termination within the valuation model. The expected term of options granted was based on the average of the contractual term and the weighted average of the vesting term, and it represents the average period of time that options granted are expected to be outstanding. The risk-free rate for periods within the contractual life of the option is based on the U.S. Treasury yield curve in effect at the time of grant.
Assumptions used in calculating the Black-Scholes value of options granted during 2018 and 2017 were as follows:
Year Ended December 31, 2018 | Year Ended December 31, 2017 | |||||||
Weighted-average Black-Scholes value | $ | 8.96 | $ | 6.37 | ||||
Black-Scholes Assumptions: | ||||||||
Expected term | 6.25 years | 6.25 years | ||||||
Expected volatility | 32.2 | % | 35.0 | % | ||||
Expected dividend yield | 0.9 | % | 1.1 | % | ||||
Risk-free interest rate | 2.8 | % | 2.2 | % | ||||
Director Share Awards and Deferred Stock Units
Equity awards are granted to each director annually on the date of our annual shareholder meeting, prospectively for the year of service following the annual shareholder meeting, and will vest on the earlier of (1) the one-year anniversary of the grant date and (2) the following year's shareholder meeting, subject to continued service. Any director who joins our Board mid-year will receive a pro-rata portion of equity-based compensation for service during the balance of the director's service year, which will vest on the date of the next annual meeting.
We also grant equity retainer awards, or shares in lieu of cash retainer awards, on a quarterly basis to our non-employee directors. These awards consist of fully vested shares of our Class B Common Stock or deferred stock units (“DSUs”) that are granted in arrears on the first business day following a quarter close. The number of shares or DSUs granted each quarter is determined by dividing the quarterly retainer amount by the fair market value of the shares of common stock as of the grant date. We account for both the annual and quarterly director share awards and DSUs as liability awards in accordance with the applicable accounting standards for these types of share-based payments. Expense associated with director equity awards was $1.4 million in both 2018 and 2017.
78
15. OTHER LONG-TERM INCENTIVE COMPENSATION
We maintain legacy long-term cash incentive compensation plans. The total expense recognized for the plans that include executives was $11.2 million in 2018, $10.8 million in 2017, and $13.7 million in 2016.
Under the 2011 Omnibus Long-term Incentive Plan (the “LTIP”), performance-based Long-Term Cash Awards (“Cash Plan Awards”) and service-based Stock Appreciation Rights (“SARs”) were granted to eligible employees, including our executive officers. Our Board of Directors originally adopted and approved the LTIP on February 7, 2011 and approved an amended and restated LTIP on November 8, 2011 and December 31, 2012.
Payout on our Cash Plan Awards, which were granted annually from 2013-2016, is contingent on attainment of two pre-established performance metrics, measured over a five-year period: compounded net income growth (determined on the basis of GAAP with adjustments for significant, nonrecurring items approved by the Compensation Committee of the Board of Directors) and return on capital (“ROC”). While each grant is expressed as a fixed dollar amount, the actual amount earned may range from 0% to 250% of target for superior performance. The awards cliff-vest after three years, with payout occurring after completion of the five-year performance period, subject to compliance with certain restrictive covenants. Vested awards are paid out 90 days following completion of the five-year performance period, or on a subsequent deferral date elected by the executive pursuant to our 2005 Supplemental Savings Plan. The liability for the Cash Plan Awards was $22.7 million and $25.6 million at December 31, 2018 and 2017, respectively.
SARs awards, which were granted in 2011 and 2012, became 100% vested on the date provided in the applicable award agreement (a three-year vesting period). Vested SARs were to be paid out on March 1 of the fifth year following the year of such grant (or as soon as practicable thereafter, but in no event later than June 1), or will be paid out on a subsequent deferral date elected by the participant (or within 90 days following a termination of employment or change in control, if earlier, subject to Internal Revenue Code Section 409A). Until payment, SARs will continue to appreciate (or depreciate) with changes in book value of outstanding common shares of company stock. The value of the SARs upon payment will equal the excess, if any, of the book value of a common share on the date of payment over the grant price set forth in the applicable award agreement, multiplied by the number of vested SARs, and subject to the discretion of the Compensation Committee. As of December 31, 2018, 2.5 million SARs units were outstanding. The liability for the SARs awards was $9.0 million and $8.4 million at December 31, 2018 and 2017, respectively.
Under the 2005 Schneider National, Inc. Long-Term Incentive Plan (the “2005 LTIP”), awards of cash-settled retention credits were granted, including to certain of our named executive officers. Our Board of Directors adopted and approved the 2005 LTIP effective January 1, 2005. The retention credits are mandatorily deferred time-based cash credits which typically vest in 20% increments over a five-year period based on continued employment. Vested retention credits are paid out in March following the second anniversary of the date of the employee’s termination of employment, provided the employee has not violated the terms of their restrictive covenant agreements. The liability for the retention credits was $8.6 million and $8.8 million at December 31, 2018 and 2017, respectively.
16. COMMITMENTS AND CONTINGENCIES
In the ordinary course of conducting our business we become involved in certain legal matters and investigations on a number of matters, including liability claims, taxes other than income taxes, contract disputes, employment, and other litigation matters. We accrue for anticipated costs to defend and resolve matters that are probable and estimable. We believe the outcomes of these matters will not have a material impact on our business or our financial statements.
At December 31, 2018, our firm commitments to purchase transportation equipment totaled approximately $265.5 million.
17. SEGMENT REPORTING
We have three reportable segments – Truckload, Intermodal, and Logistics – which are based primarily on the services each segment provides.
As of December 31, 2017, our operating segments within the Truckload reportable segment were VTL, Dedicated, and Bulk. During the second quarter of 2018, we reorganized the structure of the Truckload reportable segment, separating FTFM into its own operating segment and moving the remaining business that was previously under the Dedicated operating segment into the VTL operating segment. The Truckload reportable segment now consists of three operating segments (VTL, FTFM, and Bulk) that are aggregated because they have similar economic characteristics and meet the other aggregation criteria described in the accounting guidance for segment reporting. Van Truckload delivers truckload quantities over irregular routes using dry van
79
trailers. First to Final Mile is similar except that it delivers large parcel consumer items, such as furniture, mattresses, and other household goods. Bulk transports key inputs to manufacturing processes, such as specialty chemicals using specialty trailers.
The Intermodal reportable segment provides rail intermodal and drayage services to our customers. Company-owned containers, chassis, and dray tractors are used to provide these transportation services.
The Logistics reportable segment consists of three operating segments (Brokerage, Supply Chain Management, and Import/Export Services) that are aggregated because they have similar economic characteristics and meet the other aggregation criteria described in the accounting guidance for segment reporting. In the Logistics segment, we provide additional sources of truck capacity, manage transportation-systems analysis requirements for individual customers, and provide trans-loading and warehousing services.
We generate other revenues from a captive insurance business and from a leasing business which are operated by wholly owned subsidiaries. We also have operations in Asia that meet the definition of an operating segment. None of these operations meets the quantitative reporting thresholds. As a result, these operations are grouped in “Other” in the tables below. We have also included in “Other” revenues and expenses that are incidental to our activities and are not attributable to any of the reportable segments.
The chief operating decision maker (CODM) reviews revenue for each segment without the inclusion of fuel surcharge revenue. For segment purposes, any fuel surcharge revenues earned are recorded as a reduction of the segment’s fuel expenses. For all operating segments except FTFM, revenue is recognized upon delivery, and in-transit revenue is not reflected in segment results. Income from operations at a segment level reflects the measures presented to the CODM for each segment.
Separate balance sheets are not prepared by segment and, as a result, assets are not separately identifiable by segment. All transactions between reporting segments are eliminated in consolidation.
The following tables summarize our segment information. Intersegment revenues were immaterial for all segments, with the exception of Other, which included revenues from insurance premiums charged to other segments for workers’ compensation, auto, and other types of insurance. Intersegment revenues included in Other revenues below were $82.7 million, $78.4 million and $54.4 million for the years ended December 31, 2018, 2017, and 2016 respectively.
Revenues by Segment (in millions) | Year Ended December 31, | |||||||||||
2018 | 2017 | 2016 | ||||||||||
Truckload | $ | 2,268.0 | $ | 2,187.4 | $ | 2,091.0 | ||||||
Intermodal | 953.5 | 779.9 | 757.5 | |||||||||
Logistics | 1,024.6 | 834.3 | 737.7 | |||||||||
Other | 322.0 | 293.6 | 240.5 | |||||||||
Fuel surcharge | 522.8 | 386.3 | 294.0 | |||||||||
Inter-segment eliminations | (113.9 | ) | (97.9 | ) | (75.0 | ) | ||||||
Operating revenues | $ | 4,977.0 | $ | 4,383.6 | $ | 4,045.7 | ||||||
Income (Loss) from Operations by Segment (in millions) | Year Ended December 31, | |||||||||||
2018 | 2017 | 2016 | ||||||||||
Truckload | $ | 240.5 | $ | 196.2 | $ | 221.1 | ||||||
Intermodal | 130.2 | 52.3 | 46.1 | |||||||||
Logistics | 47.4 | 34.2 | 30.7 | |||||||||
Other | (42.3 | ) | (2.4 | ) | (7.5 | ) | ||||||
Income from operations | $ | 375.8 | $ | 280.3 | $ | 290.4 | ||||||
80
Depreciation and Amortization Expense by Segment (in millions) | Year Ended December 31, | |||||||||||
2018 | 2017 | 2015 | ||||||||||
Truckload | $ | 211.0 | $ | 205.9 | $ | 192.6 | ||||||
Intermodal | 39.8 | 34.5 | 30.9 | |||||||||
Logistics | 0.4 | 0.4 | 0.4 | |||||||||
Other | 40.1 | 38.2 | 42.1 | |||||||||
Depreciation and amortization expense | $ | 291.3 | $ | 279.0 | $ | 266.0 | ||||||
Substantially all of our revenues and assets were generated or located within the United States.
18. QUARTERLY RESULTS OF OPERATIONS (Unaudited)
(in millions, except per share amounts)* | First Quarter | Second Quarter | Third Quarter | Fourth Quarter | Full Year | |||||||||||||||
2018 | ||||||||||||||||||||
Operating revenues | $ | 1,139.0 | $ | 1,236.3 | $ | 1,280.1 | $ | 1,321.6 | $ | 4,977.0 | ||||||||||
Income from operations | 67.6 | 91.7 | 97.9 | 118.6 | 375.8 | |||||||||||||||
Net income | 47.6 | 65.8 | 70.7 | 84.8 | 268.9 | |||||||||||||||
Basic earnings per share | 0.27 | 0.37 | 0.40 | 0.48 | 1.52 | |||||||||||||||
Diluted earnings per share | 0.27 | 0.37 | 0.40 | 0.48 | 1.52 | |||||||||||||||
2017 | ||||||||||||||||||||
Operating revenues | $ | 1,006.4 | $ | 1,075.2 | $ | 1,110.8 | $ | 1,191.2 | $ | 4,383.6 | ||||||||||
Income from operations | 43.5 | 79.0 | 64.1 | 93.7 | 280.3 | |||||||||||||||
Net income** | 22.6 | 46.5 | 36.9 | 283.9 | 389.9 | |||||||||||||||
Basic earnings per share** | 0.14 | 0.27 | 0.21 | 1.60 | 2.28 | |||||||||||||||
Diluted earnings per share** | 0.14 | 0.27 | 0.21 | 1.60 | 2.28 | |||||||||||||||
* | Table may not sum due to rounding |
** | Fourth quarter 2017 results include the impact of the Tax Cuts and Jobs Act, see Note 10, Income Taxes, for more information. |
81
Item 9. Changes in and Disagreements with Accountants on Accounting and Financial Disclosure
There have been no disagreements with accountants on accounting or financial disclosure matters.
Item 9A. Controls and Procedures
Evaluation of Disclosure Controls and Procedures
Our management, including our Chief Executive Officer and Chief Financial Officer, has evaluated the effectiveness of our disclosure controls and procedures (as defined in Rules 13a-15(e) and 15d-15(e) under the Securities Exchange Act of 1934, as amended), as of the end of the period covered by this report. The Company’s disclosure controls and procedures are designed to ensure that information required to be disclosed by the Company in the reports that it files or submits under the Exchange Act is recorded, processed, summarized, and reported within the time periods specified in the U.S. Securities and Exchange Commission’s rules and forms, and that such information is accumulated and communicated to the Company’s management, including the Company’s Chief Executive Officer and Chief Financial Officer, to allow timely decisions regarding required disclosure. Based upon their evaluation, our Chief Executive Officer and Chief Financial Officer have concluded that our disclosure controls and procedures were effective as of the end of the period covered by this report.
Changes in Internal Control
There were no changes in our internal control over financial reporting (as defined in Rules 13a-15(f) and 15d-15(f) under the Securities Exchange Act of 1934, as amended) during the fiscal quarter ended December 31, 2018, that have materially affected, or are reasonably likely to materially affect, our internal control over financial reporting.
Management's Report on Internal Control Over Financial Reporting
Our management is responsible for establishing and maintaining effective internal control over financial reporting as defined in Rules 13a-15(f) under the Securities Exchange Act of 1934. Our internal control over financial reporting is a process designed under the supervision of the Company's Chief Executive Officer and Chief Financial Officer to provide reasonable assurance regarding the reliability of financial reporting and the preparation of the Company's financial statements for external purposes in accordance with U.S. GAAP.
Because of its inherent limitation, internal control over financial reporting may not prevent or detect misstatements. Therefore, even those systems determined to be effective can provide only reasonable assurance with respect to financial statement preparation and presentation.
Management assessed the effectiveness of our internal control over financial reporting as of December 31, 2018. In making this assessment, management used the criteria set forth by the Committee of Sponsoring Organizations of the Treadway Commission (COSO) in Internal Control – Integrated Framework (2013 Framework). Based on this assessment, management believes that as of December 31, 2018, our internal control over financial reporting was effective.
The effectiveness of internal control over financial reporting as of December 31, 2018, has been audited by Deloitte & Touche LLP, an independent registered public accounting firm that also audited our consolidated financial statements. Deloitte & Touche LLP’s report on internal control over financial reporting is included herein.
Item 9B. Other Information
None.
82
PART III
Item 10. Directors, Executive Officers and Corporate Governance
Except for information concerning our executive officers included in Part I of this Form 10-K under the caption “Executive Officers of the Registrant,” which is incorporated by reference herein, and the information regarding our Code of Conduct below, the information required by Item 10 is incorporated herein by reference to the information set forth under the captions “Election of Directors,” “Corporate Governance,” and “Section 16(a) Beneficial Ownership Reporting Compliance” in our definitive proxy statement for our 2018 annual meeting of shareholders (the “Proxy Statement”), which will be filed with the SEC no later than 120 days after the close of the fiscal year ended December 31, 2018.
Our board of directors has adopted a Code of Conduct that applies to all of our directors and employees, including our chief executive officer, chief financial officer, chief accounting officer, and other persons performing similar functions. We have posted a copy of our Code of Conduct on the “Investors – Governance” section of our website at www.schneider.com. We intend to satisfy the disclosure requirements under Item 5.05 of Form 8-K regarding amendments to, or waivers from, the Code of Conduct by posting such information on the “Investors” section of our website at www.schneider.com. We are not including the information contained on our website as part of, or incorporating it by reference into, this report.
Item 11. Executive Compensation
The information required by Item 11 is incorporated herein by reference to the information set forth under the captions “Corporate Governance - Compensation Committee Interlocks and Insider Participation,” “Compensation of Directors,” “Compensation Discussion and Analysis,” “Compensation Committee Report,” “Executive Compensation Tables and Narrative,” and “Risk Considerations Relating to Compensation” in the Proxy Statement, which will be filed with the SEC no later than 120 days after the close of the fiscal year ended December 31, 2018.
Item 12. Security Ownership of Certain Beneficial Owners and Management and Related Stockholder Matters
Equity Compensation Plan Information
The following table summarizes share and exercise price information about our equity compensation plans as of December 31, 2018. All of our equity compensation plans pursuant to which grants are currently being made have been approved by our shareholders.
Plan Category | Number of Securities to be Issued Upon Exercise of Outstanding Options, Warrants and Rights | Weighted Average Exercise Price of Outstanding Options, Warrants and Rights (1) | Number of Securities Remaining Available for Future Issuance Under Equity Compensation Plans (Excluding Securities Reflected in the First Column) | |||||||
Equity compensation plans approved by security holders | 931,615 | $ | 22.63 | 6,283,529 | ||||||
Equity compensation plans not approved by security holders | — | — | — | |||||||
Total | 931,615 | $ | 22.63 | 6,283,529 | ||||||
(1) The calculation of the weighted average exercise price includes only stock options and does not include the outstanding deferred stock units, restricted stock units, pre-IPO restricted shares, and performance-based restricted stock units reflected in the first column.
The remaining information required by Item 12 is incorporated herein by reference to the information set forth under the caption “Information Regarding Beneficial Ownership of Principal Shareholders, the Board and Management” in the Proxy Statement, which will be filed with the SEC no later than 120 days after the close of the fiscal year ended December 31, 2018.
Item 13. Certain Relationships and Related Transactions and Director Independence
The information required by Item 13 is incorporated herein by reference to the information set forth under the caption “Corporate Governance” in the Proxy Statement, which will be filed with the SEC no later than 120 days after the close of the fiscal year ended December 31, 2018.
83
Item 14. Principal Accounting Fees and Services
The information required by Item 14 is incorporated herein by reference to the information set forth under the captions “Ratification of Appointment of Independent Registered Public Accounting Firm” and “Audit Committee Report” in the Proxy Statement, which will be filed with the SEC no later than 120 days after the close of the fiscal year ended December 31, 2018.
84
PART IV
Item 15. Exhibits and Financial Statement Schedules
(1) Financial Statements
Our consolidated financial statements are included in Part II, Item 8, above.
(2) Financial Statement Schedules
Schedule II - Valuation and Qualifying Accounts (in Million
Allowance for Doubtful Accounts and Revenue Adjustments for the Year Ended | Balance at Beginning of Year | Charged to Expense / Against Revenue | Write-offs, Net of Recoveries | Balance at End of Year | ||||||||||||
December 31, 2016 | $ | 3.6 | $ | (0.3 | ) | $ | 0.2 | $ | 3.5 | |||||||
December 31, 2017 | 3.5 | 3.7 | (2.0 | ) | 5.2 | |||||||||||
December 31, 2018 | 5.2 | 3.7 | (2.1 | ) | 6.8 | |||||||||||
All other schedules have been omitted either because they are not applicable or because the required information is included in our consolidated financial statements or the notes thereto.
(3) Exhibits
Exhibit Number | Exhibit Description | |
3.1 | ||
3.2 | ||
9.1 | ||
9.2 | ||
10.1 | ||
10.2 | ||
10.3 | ||
10.4 | ||
10.5 | ||
10.6 | ||
85
10.7 | ||
10.8 | ||
10.9+ | ||
10.10+ | ||
10.11+ | ||
10.12+ | ||
10.13+ | ||
10.14+ | ||
10.15+ | ||
10.16+ | ||
10.17+ | ||
10.18+ | ||
10.19+ | ||
10.20+ | ||
10.21+ | ||
10.22+ | ||
10.23+ | ||
86
10.24+ | ||
10.25+ | ||
10.26+ | ||
10.27+ | ||
10.28+ | ||
10.29+ | ||
10.30+ | ||
10.31+ | ||
10.32+ | ||
10.33+ | ||
10.34+ | ||
10.35+ | ||
10.36+ | ||
10.37+ | ||
10.38+ | ||
21.1* | ||
23.1* | ||
24.1* | ||
31.1* | ||
31.2* | ||
32.1** | ||
32.2** | ||
101* | Interactive Data File | |
* Filed herewith.
** Furnished herewith.
+ Constitutes a management contract or compensatory plan or arrangement.
87
SIGNATURES
Pursuant to the requirements of Section 13 or 15(d) of the Securities Exchange Act of 1934, the registrant has duly caused this report to be signed on its behalf by the undersigned, thereunto duly authorized.
SCHNEIDER NATIONAL, INC. | ||
Date: | February 26, 2019 | /s/ Christopher B. Lofgren |
Christopher B. Lofgren | ||
President and Chief Executive Officer | ||
(Principal Executive Officer) | ||
Pursuant to the requirements of the Securities Exchange Act of 1934, this report has been signed below by the following persons on behalf of the registrant and in the capacities indicated on February 26, 2019.
88
Signature | Title | |
*/s/ Daniel J. Sullivan | ||
Daniel J. Sullivan | Chairman of the Board of Directors | |
*/s/ Mary P. DePrey | ||
Mary P. DePrey | Director | |
*/s/ Thomas A. Gannon | ||
Thomas A. Gannon | Director | |
*/s/ James R. Giertz | ||
James R. Giertz | Director | |
*/s/ Adam P. Godfrey | ||
Adam P. Godfrey | Director | |
*/s/ Robert W. Grubbs | ||
Robert W. Grubbs | Director | |
*/s/ Norman E. Johnson | ||
Norman E. Johnson | Director | |
*/s/ Christopher B. Lofgren | ||
Christopher B. Lofgren | Director | |
*/s/ James L. Welch | ||
James L. Welch | Director | |
*/s/ Kathleen M. Zimmermann | ||
Kathleen M. Zimmermann | Director | |
/s/ Christopher B. Lofgren | ||
Christopher B. Lofgren | President and Chief Executive Officer (Principal Executive Officer) | |
/s/ Stephen L. Bruffett | ||
Stephen L. Bruffett | Executive Vice President and Chief Financial Officer (Principal Financial Officer) | |
/s/ Amy G. Schilling | ||
Amy G. Schilling | Vice President and Controller (Principal Accounting Officer) | |
* By: | /s/ Amy G. Schilling | |
Amy G. Schilling | Attorney-in-fact | |
89