Pay vs Performance Disclosure - USD ($)
|
12 Months Ended |
Dec. 31, 2022 |
Dec. 31, 2021 |
Dec. 31, 2020 |
| Pay vs Performance Disclosure [Table] |
|
|
|
| Pay vs Performance [Table Text Block] |
| | | | | | | | | | | | | | | | | | | | | | | | | | | | | | | | | | | Value of Initial Fixed
$100 Investment Based On: | | | | | Year | | SCT Total
for PEO(1) | | CAP for
PEO(2) | | Average
SCT Total
for Non-
PEO NEOs | | Average
CAP for
Non-PEO NEOs(4) | | Total
Shareholder
Return | | Peer Group
Total
Shareholder
Return(5) | | Net Income
(Loss) (in
millions) | | Adjusted
EBITDA (in
millions)(6) | 2022 | | $ | 5,867,771 | | $ | (894,648) | (3) | $ | 2,552,075 | | $ | 469,773 | | $ | 245.87 | | $ | 183.90 | | $ | 116.0 | | $ | 214.1 | 2021 | | $ | 4,355,848 | | $ | 16,280,449 | | $ | 2,292,126 | | $ | 7,158,856 | | $ | 379.89 | | $ | 99.73 | | $ | 39.8 | | $ | 79.0 | 2020 | | $ | 2,521,400 | | $ | 1,987,124 | | $ | 1,916,400 | | $ | 1,556,635 | | $ | 80.45 | | $ | 52.90 | | $ | (4.9) | | $ | 18.5 |
| (1) | Mr. Atkins was our PEO for fiscal years 2022, 2021, and 2021. For fiscal year 2022, the non-PEO NEOs of the Company were Messrs. Sussman, Blanchard, Fannin and Marcum. For fiscal year 2021, the non-PEO NEOs of the Company were Messrs. Blanchard and Sussman. For fiscal year 2020, the non-PEO NEOs of the Company were Messrs. Blanchard and Michael D. Bauersachs (the Former President, Chief Executive Officer and Director). |
| (2) | The following table sets forth adjustments made to the SCT Total for our PEO during each year to determine compensation actually paid, with “fair value” calculated in accordance with ASC Topic 718 as of the end of the specified period. Since the Company did not report a change in pension value for the CEO for any years reflected in the Summary Compensation Table, adjustments for pension are not needed. |
| (3) | The negative CAP is primarily due to the decline in fair value from December 31, 2021 to December 31, 2022 of awards granted in years prior to 2022. |
| | | | | | | | | | | | | | | | | | | | | | 2022 | | 2021 | | 2020 | SCT Total for PEO | | $ | 5,867,771 | | $ | 4,355,848 | | $ | 2,521,400 | (Deduct) amounts reported under “Stock Awards” Column of the SCT | | $ | (3,505,571) | | $ | (2,094,248) | | $ | (1,350,000) | (Deduct) amounts reported under “Option Awards” Column of the SCT | | $ | 0 | | $ | 0 | | $ | 0 | Add the fair value of awards granted in the covered year that remain outstanding and unvested as of covered year-end (a) | | $ | 1,001,859 | | $ | 6,517,569 | | $ | 1,270,587 | Add(Subtract) change in fair value of awards granted in any prior year that remain outstanding and unvested as of the covered year-end (b) | | $ | (4,427,167) | | $ | 7,179,141 | | $ | (247,029) | Add the fair value of awards granted and vested during the covered year (c) | | $ | 271,295 | | $ | 0 | | $ | 0 | Add(Subtract) change in fair value from prior year-end to vesting date of awards granted in any prior year that vested during the covered year (d) | | $ | (102,834) | | $ | 322,139 | | $ | (207,835) | Subtract fair value of awards granted in any prior year that were forfeited or failed to vest during the covered year | | $ | 0 | | $ | 0 | | $ | 0 | Add dividends on unvested awards paid during the covered year | | $ | 0 | | $ | 0 | | $ | 0 | Add incremental fair value of awards modified during the covered year | | $ | 0 | | $ | 0 | | $ | 0 | CAP for PEO (e) | | $ | (894,648) | | $ | 16,280,449 | | $ | 1,987,124 |
| a. | For 2022, the value includes the fair value of RSU and PSU awards granted in February 2022 that are unvested as of December 31, 2022. For 2021, the value includes the fair value of restricted stock awards granted in February 2021 with a vesting date of June 30, 2024. For 2020, the value includes the fair value of restricted stock awards granted in February 2020 with a vesting date of June 30, 2023. Restricted stock and RSUs were valued using the year-end closing stock price. PSUs were valued using a Monte Carlo simulation performed as of December 31, 2022. |
| b. | For 2022, the value includes the change in fair value of restricted stock awards granted in February 2020 and February 2021 with vesting dates of June 30, 2023 and June 30, 2024, respectively. For 2021, the value includes the change in fair value of restricted stock awards granted in January 2019 and February 2020 with vesting dates of June 30, 2022 and June 30, 2023, respectively. For 2020, the value includes the change in fair value of restricted stock awards granted in January 2018 and January 2019 with vesting dates of June 30, 2021 and June 30, 2022, respectively. Restricted stock was valued using the year-end closing stock price. |
| c. | For 2022, the value is related to 30,864 RSUs that were granted in February 2022 and vested at year-end 2022. The fair value is based on the closing stock price on the vesting date. |
| d. | For 2022, the value includes the change in fair value of 228,520 restricted shares granted in January 2019 that vested on June 30, 2022. For 2021, the value includes the change in fair value of 124,378 restricted shares granted in January 2018 that vested on June 30, 2021. For 2020, the value includes the change in fair value of 144,330 restricted shares granted in previous years that vested on June 30, 2020. |
| e. | The negative CAP is primarily due to the decline in fair value from December 31, 2021 to December 31, 2022 of awards granted in years prior to 2022. |
| (4) | The following table sets forth adjustments made to the SCT Total during each year to determine average CAP to the Non-PEO NEOs, with “fair value” calculated in accordance with ASC Topic 718 as of the end of the specified period. Since the Company did not report a change in pension value for any of the Non-PEO NEOs for any years reflected in the Summary Compensation Table, adjustments for pension are not needed. |
| | | | | | | | | | | | | | | | | | | | | | 2022 | | 2021 | | 2020 | Average total SCT for non-PEO NEOs | | $ | 2,552,075 | | $ | 2,292,126 | | $ | 1,916,400 | (Deduct) amounts reported under “Stock Awards” Column of the SCT | | $ | (1,293,563) | | $ | (900,526) | | $ | (958,500) | (Deduct) amounts reported under “Option Awards” Column of the SCT | | $ | 0 | | $ | 0 | | $ | 0 | Add the fair value of awards granted in the covered year that remain outstanding and unvested as of covered year-end (a) | | $ | 369,685 | | $ | 2,802,552 | | $ | 902,117 | Add(Subtract) change in fair value of awards granted in any prior year that remain outstanding and unvested as of the covered year-end (b) | | $ | (1,239,100) | | $ | 2,912,356 | | $ | (171,255) | Add the fair value of awards granted and vested during the covered year (c) | | $ | 100,112 | | $ | 0 | | $ | 0 | Add(Subtract) change in fair value from prior year-end to vesting date of awards granted in any prior year that vested during the covered year (d) | | $ | (19,436) | | $ | 52,348 | | $ | (132,126) | Subtract fair value of awards granted in any prior year that were forfeited or failed to vest during the covered year | | $ | 0 | | $ | 0 | | $ | 0 | Add dividends on unvested awards paid during the covered year | | $ | 0 | | $ | 0 | | $ | 0 | Add incremental fair value of awards modified during the covered year | | $ | 0 | | $ | 0 | | $ | 0 | Average CAP for non-PEO NEOs | | $ | 469,773 | | $ | 7,158,856 | | $ | 1,556,635 |
| a. | For 2022, the value is related to the fair value of RSU and PSU awards granted in February 2022 that are unvested as of December 31, 2022. For 2021, the value is related to the fair value of restricted stock awards granted in February 2021 with a vesting date of June 30, 2024. For 2020, the value is related to the fair value of restricted stock awards granted in February 2020 with a vesting date of June 30, 2023. Restricted stock and RSUs were valued using the year-end closing stock price. PSUs were valued using a Monte Carlo simulation performed as of December 31, 2022. |
| b. | For 2022, the value is related to the change in fair value of restricted stock awards granted in February or April of 2020 and February 2021 with vesting dates of June 30, 2023 and June 30, 2024, respectively. For 2021, the value is related to the change in fair value of restricted stock awards granted in 2019 and 2020 with vesting dates of June 30, 2022 and June 30, 2023, respectively. For 2020, the value includes the change in fair value of restricted stock awards granted in January 2018 |
| | and January 2019 with vesting dates of June 30, 2021 and June 30, 2022, respectively. Restricted stock was valued using the year-end closing stock price. |
| c. | For 2022, the value is related to RSUs that were granted in February 2022 and vested at year-end 2022. The fair value is based on the closing stock price on the vesting date. |
| d. | For 2022, the value is related to the change in fair value of restricted shares granted in 2019 that vested on June 30, 2022. For 2021, the value is related to the change in fair value of restricted shares granted in January 2018 that vested on June 30, 2021. For 2020, the value is related to the change in fair value of restricted shares granted in previous years that vested on June 30, 2020. |
| (5) | We used our compensation peer group to calculate our peer group total shareholder return (“TSR”) for purposes of this table (i.e., Peabody Energy Corporation, Alliance Resource Partners, L.P., Alpha Metallurgical Resources, Inc., Talos Energy Inc., CONSOL Energy Inc., Arch Resources, Inc., Coronado Global Resources, Inc., Warrior Met Coal, Inc., SunCoke Energy, Inc., Berry Corporation, and Contango Oil and Gas Company (2020 only)). |
| (6) | We have selected Adjusted EBITDA as our most important financial performance measure used by us to link compensation actually paid to our Named Executive Officers to Company performance for fiscal year 2022. |
| ● | Adjusted EBITDA for 2022 is calculated as EBITDA of $194.2M (net income ($116.0M), plus depreciation, depletion and amortization ($41.2M), net interest expense ($6.8M), and income tax expense ($30.2M)), adjusted for stock-based compensation ($8.2M), charitable contributions ($1.0M), accretion of asset retirement obligations ($1.1M) and Berwind mine idle costs ($9.5M). |
| ● | Adjusted EBITDA for 2021 is calculated as EBTIDA of $73.2M (net income ($39.8M), plus depreciation, depletion and amortization ($26.2M), net interest expense ($2.6M), and income tax expense ($4.6M)), adjusted for stock-based compensation ($5.3M) and accretion of asset retirement obligations ($0.6M). |
| ● | Adjusted EBITDA for 2020 is calculated as EBTIDA of $13.7M (net loss ($-4.9M), plus depreciation, depletion and amortization ($20.9M) and net interest expense ($1.2M), minus income tax benefit ($3.5M)), adjusted for stock-based compensation ($4.1M) and accretion of asset retirement obligations ($0.6M). |
|
|
|
| Company Selected Measure Name |
Adjusted EBITDA
|
|
|
| Named Executive Officers, Footnote [Text Block] |
| (1) | Mr. Atkins was our PEO for fiscal years 2022, 2021, and 2021. For fiscal year 2022, the non-PEO NEOs of the Company were Messrs. Sussman, Blanchard, Fannin and Marcum. For fiscal year 2021, the non-PEO NEOs of the Company were Messrs. Blanchard and Sussman. For fiscal year 2020, the non-PEO NEOs of the Company were Messrs. Blanchard and Michael D. Bauersachs (the Former President, Chief Executive Officer and Director). |
|
|
|
| Peer Group Issuers, Footnote [Text Block] |
| (5) | We used our compensation peer group to calculate our peer group total shareholder return (“TSR”) for purposes of this table (i.e., Peabody Energy Corporation, Alliance Resource Partners, L.P., Alpha Metallurgical Resources, Inc., Talos Energy Inc., CONSOL Energy Inc., Arch Resources, Inc., Coronado Global Resources, Inc., Warrior Met Coal, Inc., SunCoke Energy, Inc., Berry Corporation, and Contango Oil and Gas Company (2020 only)). |
|
|
|
| PEO Total Compensation Amount |
$ 5,867,771
|
$ 4,355,848
|
$ 2,521,400
|
| PEO Actually Paid Compensation Amount |
$ (894,648)
|
16,280,449
|
1,987,124
|
| Adjustment To PEO Compensation, Footnote [Text Block] |
| (3) | The negative CAP is primarily due to the decline in fair value from December 31, 2021 to December 31, 2022 of awards granted in years prior to 2022. |
| | | | | | | | | | | | | | | | | | | | | | 2022 | | 2021 | | 2020 | SCT Total for PEO | | $ | 5,867,771 | | $ | 4,355,848 | | $ | 2,521,400 | (Deduct) amounts reported under “Stock Awards” Column of the SCT | | $ | (3,505,571) | | $ | (2,094,248) | | $ | (1,350,000) | (Deduct) amounts reported under “Option Awards” Column of the SCT | | $ | 0 | | $ | 0 | | $ | 0 | Add the fair value of awards granted in the covered year that remain outstanding and unvested as of covered year-end (a) | | $ | 1,001,859 | | $ | 6,517,569 | | $ | 1,270,587 | Add(Subtract) change in fair value of awards granted in any prior year that remain outstanding and unvested as of the covered year-end (b) | | $ | (4,427,167) | | $ | 7,179,141 | | $ | (247,029) | Add the fair value of awards granted and vested during the covered year (c) | | $ | 271,295 | | $ | 0 | | $ | 0 | Add(Subtract) change in fair value from prior year-end to vesting date of awards granted in any prior year that vested during the covered year (d) | | $ | (102,834) | | $ | 322,139 | | $ | (207,835) | Subtract fair value of awards granted in any prior year that were forfeited or failed to vest during the covered year | | $ | 0 | | $ | 0 | | $ | 0 | Add dividends on unvested awards paid during the covered year | | $ | 0 | | $ | 0 | | $ | 0 | Add incremental fair value of awards modified during the covered year | | $ | 0 | | $ | 0 | | $ | 0 | CAP for PEO (e) | | $ | (894,648) | | $ | 16,280,449 | | $ | 1,987,124 |
| a. | For 2022, the value includes the fair value of RSU and PSU awards granted in February 2022 that are unvested as of December 31, 2022. For 2021, the value includes the fair value of restricted stock awards granted in February 2021 with a vesting date of June 30, 2024. For 2020, the value includes the fair value of restricted stock awards granted in February 2020 with a vesting date of June 30, 2023. Restricted stock and RSUs were valued using the year-end closing stock price. PSUs were valued using a Monte Carlo simulation performed as of December 31, 2022. |
| b. | For 2022, the value includes the change in fair value of restricted stock awards granted in February 2020 and February 2021 with vesting dates of June 30, 2023 and June 30, 2024, respectively. For 2021, the value includes the change in fair value of restricted stock awards granted in January 2019 and February 2020 with vesting dates of June 30, 2022 and June 30, 2023, respectively. For 2020, the value includes the change in fair value of restricted stock awards granted in January 2018 and January 2019 with vesting dates of June 30, 2021 and June 30, 2022, respectively. Restricted stock was valued using the year-end closing stock price. |
| c. | For 2022, the value is related to 30,864 RSUs that were granted in February 2022 and vested at year-end 2022. The fair value is based on the closing stock price on the vesting date. |
| d. | For 2022, the value includes the change in fair value of 228,520 restricted shares granted in January 2019 that vested on June 30, 2022. For 2021, the value includes the change in fair value of 124,378 restricted shares granted in January 2018 that vested on June 30, 2021. For 2020, the value includes the change in fair value of 144,330 restricted shares granted in previous years that vested on June 30, 2020. |
| e. | The negative CAP is primarily due to the decline in fair value from December 31, 2021 to December 31, 2022 of awards granted in years prior to 2022. |
|
|
|
| Non-PEO NEO Average Total Compensation Amount |
$ 2,552,075
|
2,292,126
|
1,916,400
|
| Non-PEO NEO Average Compensation Actually Paid Amount |
$ 469,773
|
7,158,856
|
1,556,635
|
| Adjustment to Non-PEO NEO Compensation Footnote [Text Block] |
| (4) | The following table sets forth adjustments made to the SCT Total during each year to determine average CAP to the Non-PEO NEOs, with “fair value” calculated in accordance with ASC Topic 718 as of the end of the specified period. Since the Company did not report a change in pension value for any of the Non-PEO NEOs for any years reflected in the Summary Compensation Table, adjustments for pension are not needed. |
| | | | | | | | | | | | | | | | | | | | | | 2022 | | 2021 | | 2020 | Average total SCT for non-PEO NEOs | | $ | 2,552,075 | | $ | 2,292,126 | | $ | 1,916,400 | (Deduct) amounts reported under “Stock Awards” Column of the SCT | | $ | (1,293,563) | | $ | (900,526) | | $ | (958,500) | (Deduct) amounts reported under “Option Awards” Column of the SCT | | $ | 0 | | $ | 0 | | $ | 0 | Add the fair value of awards granted in the covered year that remain outstanding and unvested as of covered year-end (a) | | $ | 369,685 | | $ | 2,802,552 | | $ | 902,117 | Add(Subtract) change in fair value of awards granted in any prior year that remain outstanding and unvested as of the covered year-end (b) | | $ | (1,239,100) | | $ | 2,912,356 | | $ | (171,255) | Add the fair value of awards granted and vested during the covered year (c) | | $ | 100,112 | | $ | 0 | | $ | 0 | Add(Subtract) change in fair value from prior year-end to vesting date of awards granted in any prior year that vested during the covered year (d) | | $ | (19,436) | | $ | 52,348 | | $ | (132,126) | Subtract fair value of awards granted in any prior year that were forfeited or failed to vest during the covered year | | $ | 0 | | $ | 0 | | $ | 0 | Add dividends on unvested awards paid during the covered year | | $ | 0 | | $ | 0 | | $ | 0 | Add incremental fair value of awards modified during the covered year | | $ | 0 | | $ | 0 | | $ | 0 | Average CAP for non-PEO NEOs | | $ | 469,773 | | $ | 7,158,856 | | $ | 1,556,635 |
| a. | For 2022, the value is related to the fair value of RSU and PSU awards granted in February 2022 that are unvested as of December 31, 2022. For 2021, the value is related to the fair value of restricted stock awards granted in February 2021 with a vesting date of June 30, 2024. For 2020, the value is related to the fair value of restricted stock awards granted in February 2020 with a vesting date of June 30, 2023. Restricted stock and RSUs were valued using the year-end closing stock price. PSUs were valued using a Monte Carlo simulation performed as of December 31, 2022. |
| b. | For 2022, the value is related to the change in fair value of restricted stock awards granted in February or April of 2020 and February 2021 with vesting dates of June 30, 2023 and June 30, 2024, respectively. For 2021, the value is related to the change in fair value of restricted stock awards granted in 2019 and 2020 with vesting dates of June 30, 2022 and June 30, 2023, respectively. For 2020, the value includes the change in fair value of restricted stock awards granted in January 2018 |
| | and January 2019 with vesting dates of June 30, 2021 and June 30, 2022, respectively. Restricted stock was valued using the year-end closing stock price. |
| c. | For 2022, the value is related to RSUs that were granted in February 2022 and vested at year-end 2022. The fair value is based on the closing stock price on the vesting date. |
| d. | For 2022, the value is related to the change in fair value of restricted shares granted in 2019 that vested on June 30, 2022. For 2021, the value is related to the change in fair value of restricted shares granted in January 2018 that vested on June 30, 2021. For 2020, the value is related to the change in fair value of restricted shares granted in previous years that vested on June 30, 2020. |
|
|
|
| Compensation Actually Paid vs. Total Shareholder Return [Text Block] |
The following graph sets forth the relationship between TSR and amount of compensation actually paid (CAP) to the PEO and Non-PEO NEOs for the years ended on December 31, 2022, December 31, 2021 and December 31, 2020. 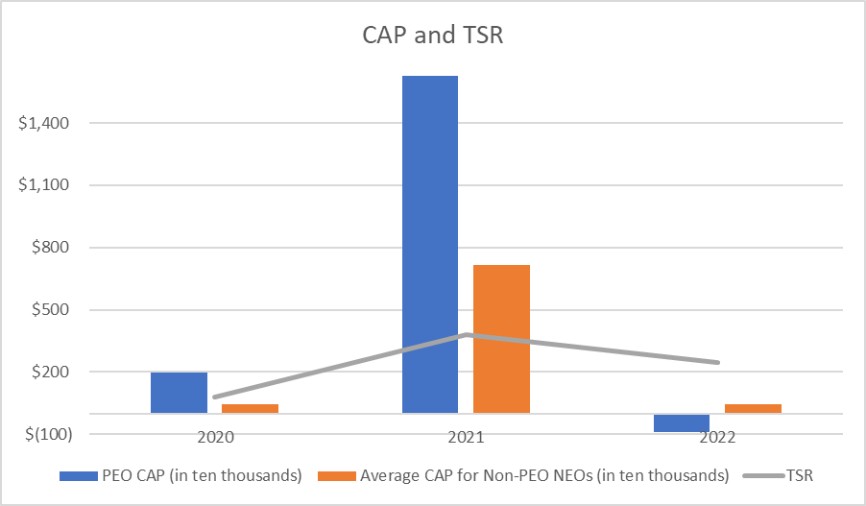
|
|
|
| Compensation Actually Paid vs. Net Income [Text Block] |
The following graph sets forth the relationship between Net Income and amount of compensation actually paid (CAP) to the PEO and Non-PEO NEOs for the years ended on December 31, 2022, December 31, 2021 and December 31, 2020. 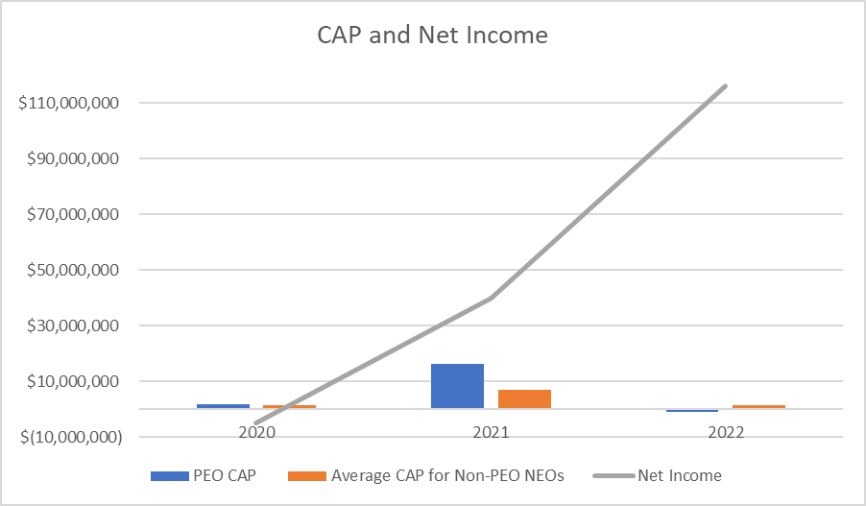
|
|
|
| Compensation Actually Paid vs. Company Selected Measure [Text Block] |
The following graph sets forth the relationship between Adjusted EBITDA and amount of compensation actually paid (CAP) to the PEO and Non-PEO NEOs for the years ended on December 31, 2022, December 31, 2021 and December 31, 2020. 
|
|
|
| Total Shareholder Return Vs Peer Group [Text Block] |
The following graph sets forth the relationship between our TSR and our peer group TSR for the years ended on December 31, 2022, December 31, 2021 and December 31, 2020. 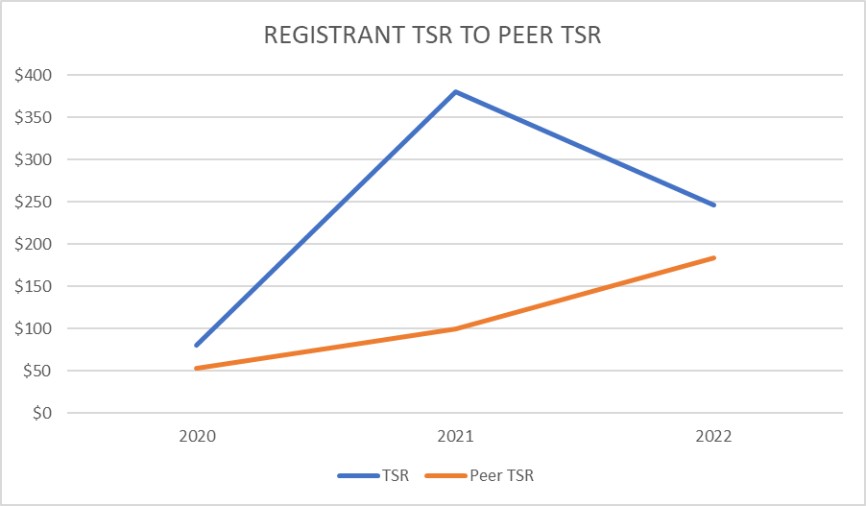
|
|
|
| Tabular List [Table Text Block] |
Financial Performance Measures The four items listed below represent measured the most important metrics used to link CAP to Company performance for the 2022 fiscal year as further described in the section titled “Annual Cash Incentive Bonus” of the Compensation Discussion and Analysis. Most Important Performance Measures | Adjusted EBITDA | Cost of Coal Sales Per Ton | Safety - TRIR | Environmental |
|
|
|
| Total Shareholder Return Amount |
$ 245.87
|
379.89
|
80.45
|
| Peer Group Total Shareholder Return Amount |
183.90
|
99.73
|
52.90
|
| Net Income (Loss) |
$ 116,000,000.0
|
$ 39,800,000
|
$ (4,900,000)
|
| Company Selected Measure Amount |
214,100,000
|
79,000,000.0
|
18,500,000
|
| PEO Name |
Mr. Atkins
|
|
|
| EBITDA |
$ 194,200,000
|
$ 73,200,000
|
$ 13,700,000
|
| Depreciation, depletion and amortization |
41,200,000
|
26,200,000
|
20,900,000
|
| Net interest expense |
6,800,000
|
2,600,000
|
1,200,000
|
| Income tax expense |
30,200,000
|
4,600,000
|
3,500,000
|
| Adjusted for stock-based compensation |
8,200,000
|
5,300,000
|
4,100,000
|
| Charitable contributions |
1,000,000.0
|
|
|
| Accretion of asset retirement obligations |
1,100,000
|
$ 600,000
|
$ 600,000
|
| Berwind mine idle costs |
$ 9,500,000
|
|
|
| Measure [Axis]: 1 |
|
|
|
| Pay vs Performance Disclosure [Table] |
|
|
|
| Measure Name |
Adjusted EBITDA
|
|
|
| Non-GAAP Measure Description [Text Block] |
| (6) | We have selected Adjusted EBITDA as our most important financial performance measure used by us to link compensation actually paid to our Named Executive Officers to Company performance for fiscal year 2022. |
| ● | Adjusted EBITDA for 2022 is calculated as EBITDA of $194.2M (net income ($116.0M), plus depreciation, depletion and amortization ($41.2M), net interest expense ($6.8M), and income tax expense ($30.2M)), adjusted for stock-based compensation ($8.2M), charitable contributions ($1.0M), accretion of asset retirement obligations ($1.1M) and Berwind mine idle costs ($9.5M). |
| ● | Adjusted EBITDA for 2021 is calculated as EBTIDA of $73.2M (net income ($39.8M), plus depreciation, depletion and amortization ($26.2M), net interest expense ($2.6M), and income tax expense ($4.6M)), adjusted for stock-based compensation ($5.3M) and accretion of asset retirement obligations ($0.6M). |
| ● | Adjusted EBITDA for 2020 is calculated as EBTIDA of $13.7M (net loss ($-4.9M), plus depreciation, depletion and amortization ($20.9M) and net interest expense ($1.2M), minus income tax benefit ($3.5M)), adjusted for stock-based compensation ($4.1M) and accretion of asset retirement obligations ($0.6M). |
|
|
|
| Measure [Axis]: 2 |
|
|
|
| Pay vs Performance Disclosure [Table] |
|
|
|
| Measure Name |
Cost of Coal Sales Per Ton
|
|
|
| Measure [Axis]: 3 |
|
|
|
| Pay vs Performance Disclosure [Table] |
|
|
|
| Measure Name |
Safety - TRIR
|
|
|
| Measure [Axis]: 4 |
|
|
|
| Pay vs Performance Disclosure [Table] |
|
|
|
| Measure Name |
Environmental
|
|
|
| RSUs |
|
|
|
| Pay vs Performance Disclosure [Table] |
|
|
|
| Granted |
30,864
|
|
|
| Restricted stock |
|
|
|
| Pay vs Performance Disclosure [Table] |
|
|
|
| Granted |
228,520
|
124,378
|
144,330
|
| PEO [Member] | (Deduct) amounts reported under "Stock Awards" Column of the SCT |
|
|
|
| Pay vs Performance Disclosure [Table] |
|
|
|
| Adjustment to Compensation Amount |
$ (3,505,571)
|
$ (2,094,248)
|
$ (1,350,000)
|
| PEO [Member] | (Deduct) amounts reported under "Option Awards" Column of the SCT |
|
|
|
| Pay vs Performance Disclosure [Table] |
|
|
|
| Adjustment to Compensation Amount |
0
|
0
|
0
|
| PEO [Member] | Add the fair value of awards granted in the covered year that remain outstanding and unvested as of covered year-end (a) |
|
|
|
| Pay vs Performance Disclosure [Table] |
|
|
|
| Adjustment to Compensation Amount |
1,001,859
|
6,517,569
|
1,270,587
|
| PEO [Member] | Add(Subtract) change in fair value of awards granted in any prior year that remain outstanding and unvested as of the covered year-end (b) |
|
|
|
| Pay vs Performance Disclosure [Table] |
|
|
|
| Adjustment to Compensation Amount |
(4,427,167)
|
7,179,141
|
(247,029)
|
| PEO [Member] | Add the fair value of awards granted and vested during the covered year (c) |
|
|
|
| Pay vs Performance Disclosure [Table] |
|
|
|
| Adjustment to Compensation Amount |
271,295
|
0
|
0
|
| PEO [Member] | Add(Subtract) change in fair value from prior year-end to vesting date of awards granted in any prior year that vested during the covered year (d) |
|
|
|
| Pay vs Performance Disclosure [Table] |
|
|
|
| Adjustment to Compensation Amount |
(102,834)
|
322,139
|
(207,835)
|
| PEO [Member] | Subtract fair value of awards granted in any prior year that were forfeited or failed to vest during the covered year |
|
|
|
| Pay vs Performance Disclosure [Table] |
|
|
|
| Adjustment to Compensation Amount |
0
|
0
|
0
|
| PEO [Member] | Add dividends on unvested awards paid during the covered year |
|
|
|
| Pay vs Performance Disclosure [Table] |
|
|
|
| Adjustment to Compensation Amount |
0
|
0
|
0
|
| PEO [Member] | Add incremental fair value of awards modified during the covered year |
|
|
|
| Pay vs Performance Disclosure [Table] |
|
|
|
| Adjustment to Compensation Amount |
0
|
0
|
0
|
| Non-PEO NEO [Member] | (Deduct) amounts reported under "Stock Awards" Column of the SCT |
|
|
|
| Pay vs Performance Disclosure [Table] |
|
|
|
| Adjustment to Compensation Amount |
(1,293,563)
|
(900,526)
|
(958,500)
|
| Non-PEO NEO [Member] | (Deduct) amounts reported under "Option Awards" Column of the SCT |
|
|
|
| Pay vs Performance Disclosure [Table] |
|
|
|
| Adjustment to Compensation Amount |
0
|
0
|
0
|
| Non-PEO NEO [Member] | Add the fair value of awards granted in the covered year that remain outstanding and unvested as of covered year-end (a) |
|
|
|
| Pay vs Performance Disclosure [Table] |
|
|
|
| Adjustment to Compensation Amount |
369,685
|
2,802,552
|
902,117
|
| Non-PEO NEO [Member] | Add(Subtract) change in fair value of awards granted in any prior year that remain outstanding and unvested as of the covered year-end (b) |
|
|
|
| Pay vs Performance Disclosure [Table] |
|
|
|
| Adjustment to Compensation Amount |
(1,239,100)
|
2,912,356
|
(171,255)
|
| Non-PEO NEO [Member] | Add the fair value of awards granted and vested during the covered year (c) |
|
|
|
| Pay vs Performance Disclosure [Table] |
|
|
|
| Adjustment to Compensation Amount |
100,112
|
0
|
0
|
| Non-PEO NEO [Member] | Add(Subtract) change in fair value from prior year-end to vesting date of awards granted in any prior year that vested during the covered year (d) |
|
|
|
| Pay vs Performance Disclosure [Table] |
|
|
|
| Adjustment to Compensation Amount |
(19,436)
|
52,348
|
(132,126)
|
| Non-PEO NEO [Member] | Subtract fair value of awards granted in any prior year that were forfeited or failed to vest during the covered year |
|
|
|
| Pay vs Performance Disclosure [Table] |
|
|
|
| Adjustment to Compensation Amount |
0
|
0
|
0
|
| Non-PEO NEO [Member] | Add dividends on unvested awards paid during the covered year |
|
|
|
| Pay vs Performance Disclosure [Table] |
|
|
|
| Adjustment to Compensation Amount |
0
|
0
|
0
|
| Non-PEO NEO [Member] | Add incremental fair value of awards modified during the covered year |
|
|
|
| Pay vs Performance Disclosure [Table] |
|
|
|
| Adjustment to Compensation Amount |
$ 0
|
$ 0
|
$ 0
|