|
Massachusetts
|
| |
6770
|
| |
83-2860149
|
|
|
(State or other jurisdiction of
incorporation or organization) |
| |
(Primary Standard Industrial
Classification Code Number) |
| |
(I.R.S. Employer
Identification Number) |
|
| Large accelerated filer ☐ | | | Accelerated filer ☐ | | | Non-accelerated filer ☒ | |
| Smaller reporting company ☒ | | | Emerging growth company ☒ | | |
CALCULATION OF REGISTRATION FEE
|
| ||||||||||||||||||||||||
Title of Each Class of Securities to be Registered
|
| |
Amount to be
Registered |
| |
Proposed
Maximum Offering Price Per Share |
| |
Proposed
Maximum Aggregate Offering Price |
| |
Amount of
Registration Fee |
| ||||||||||||
Shares of common stock, par value $0.0001 per share(1)(2)
|
| | | | 41,644,700 | | | | | $ | 10.10(3) | | | | | $ | 420,611,470.00(3) | | | | | $ | 50,978.11 | | |
Shares of common stock underlying warrants(4)
|
| | | | 18,400,000 | | | | | $ | 11.50(5) | | | | | $ | 211,600,000.00(5) | | | | | $ | 25,645.92 | | |
Total
|
| | | | | | | | | | | | | | | $ | 632,211,470.00 | | | | | $ | 76,624.03 | | |
|
| | | | | 1 | | | |
| | | | | 2 | | | |
| | | | | 4 | | | |
| | | | | 22 | | | |
| | | | | 45 | | | |
| | | | | 46 | | | |
| | | | | 47 | | | |
| | | | | 65 | | | |
| | | | | 72 | | | |
| | | | | 74 | | | |
| | | | | 99 | | | |
| | | | | 107 | | | |
| | | | | 109 | | | |
| | | | | 115 | | | |
| | | | | 116 | | | |
| | | | | 120 | | | |
| | | | | 122 | | | |
| | | | | 123 | | | |
| | | | | 134 | | | |
| | | | | 136 | | | |
| | | | | 146 | | | |
| | | | | 153 | | | |
| | | | | 157 | | | |
| | | | | 164 | | | |
| | | | | 168 | | | |
| | | | | 178 | | | |
| | | | | 181 | | | |
| | | | | 190 | | | |
| | | | | 192 | | | |
| | | | | 198 | | | |
| | | | | 202 | | | |
| | | | | 208 | | | |
| | | | | 212 | | | |
| | | | | 217 | | | |
| | | | | 221 | | | |
| | | | | 231 | | | |
| | | | | 234 | | |
| | | | | 245 | | | |
| | | | | 256 | | | |
| | | | | 257 | | | |
| | | | | 264 | | | |
| | | | | 264 | | | |
| | | | | 266 | | | |
| | | | | 266 | | | |
| | | | | 266 | | | |
| | | | | 267 | | | |
| | | | | 267 | | | |
| | | | | 267 | | | |
| | | | | F-1 | | |
| | | | | A-1 | | | |
| | | | | B-1 | | | |
| | | | | C-1 | | | |
| | | | | D-1 | | | |
| | | | | E-1 | | | |
| | | | | F-1 | | | |
| | | | | G-1 | | | |
| | | | | H-1 | | | |
| | | | | I-1 | | | |
| | | | | J-1 | | | |
| | | | | K-1 | | | |
| | | | | L-1 | | | |
| | | | | M-1 | | |
(U.S. dollars in thousands)
Sources |
| | | | | | | |
Uses
|
| | | | | | |
Trust Account(1)
|
| | | $ | 216.8 | | | |
Cash Consideration to Targets
|
| | | $ | 229.9 | | |
Subscription Agreements
|
| | | $ | 66.6 | | | |
CityBase Earn-out Payment
|
| | | $ | 5.3 | | |
| | | | | | | | |
Warrant Exchange(2)
|
| | | $ | 4.3 | | |
| | | | | | | | |
Fees and Expenses
|
| | | $ | 12.3 | | |
| | | | | | | | |
Cash to Balance Sheet
|
| | | $ | 31.6 | | |
Total sources
|
| | | $ | 283.4 | | | |
Total uses
|
| | | $ | 283.4 | | |
|
| | |
GTY
(Historical) |
| |
Bonfire
(Historical) |
| |
CityBase
(Historical) |
| |
eCivis
(Historical) |
| |
Open Counter
(Historical) |
| |
Questica
(Historical) |
| |
Sherpa
(Historical)(1) |
| |
Pro Forma
Based on Redemptions in Connection With the Extension Amendment Proposal |
| |
Pro Forma
(Assuming Maximum Redemptions in Connection With the Business Combination) |
| |||||||||||||||||||||||||||
As of and for the nine months ended September 30, 2018
|
| | | | | | | | | | | | | | | | | | | | | | | | | | | | | | | | | | | | | | | | | | | | | | | | | | | | | | |
Shares or units outstanding
|
| | | | 69,000,000 | | | | | | 9,904,615 | | | | | | 82,202 | | | | | | 48,644,348 | | | | | | 65,483,100 | | | | | | 108,108 | | | | | | (n/a) | | | | | | 55,150,372 | | | | | | 55,040,524 | | |
Earnings (loss) per share:
|
| | | | | | | | | | | | | | | | | | | | | | | | | | | | | | | | | | | | | | | | | | | | | | | | | | | | | | |
Basic
|
| | | $ | 0.21 | | | | | $ | (0.33) | | | | | $ | (133.53) | | | | | $ | (0.02) | | | | | $ | (0.01) | | | | | $ | 15.08 | | | | | | | | | | | $ | (0.31) | | | | | $ | (0.31) | | |
Diluted
|
| | | $ | 0.05 | | | | | $ | (0.33) | | | | | $ | (133.53) | | | | | $ | (0.02) | | | | | $ | (0.01) | | | | | $ | 15.08 | | | | | | | | | | | $ | (0.31) | | | | | $ | (0.31) | | |
Cash dividend declared,
per share |
| | | $ | — | | | | | $ | — | | | | | $ | — | | | | | $ | — | | | | | $ | — | | | | | $ | — | | | | | | | | | | | $ | — | | | | | $ | — | | |
| | |
Year Ending December 31,
|
| ||||||||||||
($ in millions)
|
| |
2017
|
| |
2018E
|
| |
2019E
|
| |
2020E
|
| |
2021E
|
|
Annual Recurring Revenue
|
| |
$18
|
| |
$34
|
| |
$86
|
| |
$138
|
| |
$202
|
|
Revenue
|
| |
$22
|
| |
$32
|
| |
$76
|
| |
$124
|
| |
$186
|
|
Gross Profit
|
| |
$14
|
| |
$20
|
| |
$55
|
| |
$96
|
| |
$147
|
|
S&M Expense
|
| |
$5
|
| |
$9
|
| |
$21
|
| |
$31
|
| |
$43
|
|
R&D Expense
|
| |
$6
|
| |
$9
|
| |
$16
|
| |
$22
|
| |
$32
|
|
G&A Expense
|
| |
$9
|
| |
$12
|
| |
$21
|
| |
$26
|
| |
$38
|
|
EBIT
|
| |
($7)
|
| |
($11)
|
| |
($5)
|
| |
$16
|
| |
$32
|
|
Unlevered Free Cash Flow
|
| |
($5)
|
| |
($10)
|
| |
($0)
|
| |
$26
|
| |
$43
|
|
(U.S. dollars in thousands)
Sources |
| | | | | | | |
Uses
|
| | | | | | |
Trust Account(1)
|
| | | $ | 216.8 | | | |
Cash Consideration to Targets
|
| | | $ | 229.9 | | |
Subscription Agreements
|
| | | $ | 66.6 | | | |
CityBase Earn-out Payment
|
| | | $ | 5.3 | | |
| | | | | | | | |
Warrant Exchange(2)
|
| | | $ | 4.3 | | |
| | | | | | | | |
Fees and Expenses
|
| | | $ | 12.3 | | |
| | | | | | | | |
Cash to Balance Sheet
|
| | | $ | 31.6 | | |
Total sources
|
| | | $ | 283.4 | | | |
Total uses
|
| | | $ | 283.4 | | |
|
| | |
Existing Organizational Documents
|
| |
Proposed Organizational Documents
|
|
Authorized Capital Stock
(Organizational Documents Proposal A)
|
| |
The Existing Organizational Documents provide for share capital of $45,100 divided into 400,000,000 Class A ordinary shares of a par value of $0.0001 each, 50,000,000 Class B ordinary shares of a par value of $0.0001 each and 1,000,000 preferred shares of a par value of $0.0001 each.
See paragraph 5 of the Existing Organizational Documents.
|
| |
The Proposed Charter provides authorization to issue 425,000,000 shares consisting of (x) 400,000,000 common shares with a par value of $0.0001 and (y) 25,000,000 preferred shares with a par value of $0.0001.
See Article III of the Proposed Charter.
|
|
Vote Standard for Director Elections
(Organizational Documents Proposal B)
|
| |
The Existing Organizational Documents provide that directors may be appointed by ordinary resolution, being the affirmative vote of the holders of a majority of the ordinary shares entitled to vote and actually cast thereon.
See Article 29.3 of the Existing Organizational Documents.
|
| |
The Proposed Bylaws provide that directors will be elected if “for” votes exceed “against” votes in uncontested elections and by plurality vote in contested elections.
See Section 3.7(a) of the Proposed Bylaws.
|
|
Removal of Directors
(Organizational Documents Proposal C)
|
| |
The Existing Organizational Documents provide that directors may be removed by ordinary resolution, being the affirmative vote of the holders of a majority of the ordinary shares entitled to vote and actually cast thereon, or by a resolution passed by all of the other directors.
See Article 29.3 and Article 30 of the Existing Organizational Documents.
|
| |
The Proposed Bylaws provide that a director may be removed only for cause by the affirmative vote of a majority of the shares entitled to vote at an election of directors and only at a shareholder meeting called for the purpose of removing such director.
See Section 4.4 of the Proposed Bylaws.
|
|
Advance Notice Procedures for Business
(Organizational Documents Proposal D)
|
| |
The Existing Organizational Documents provide that the shareholder requisition relating to a special meeting must state the objects of such meeting and must be signed by the requisitionists and deposited at the registered office.
See Article 20.5 of the Existing
|
| |
The Proposed Bylaws provide that in order to be timely given, a shareholder’s notice of business to be brought before a shareholder meeting must be delivered to or mailed and received at the principal executive offices not less than 95 nor more than 125 days prior to the anniversary date of the immediately preceding annual
|
|
| | |
Existing Organizational Documents
|
| |
Proposed Organizational Documents
|
|
| | |
Organizational Documents.
|
| |
meeting, or in case of a special meeting or an annual meeting called for a date not within 30 days before after such anniversary date, not later than the close of business on the 10th day following date on which notice of the date such meeting was mailed or publicly disclosed. Such shareholder’s notice must include certain information as set forth in the Proposed Bylaws.
See Section 3.4(c) of the Proposed Bylaws.
|
|
Advance Notice Procedures for Director Nominations
(Organizational Documents Proposal D)
|
| |
The Existing Organizational Documents provide that members seeking to nominating candidates for election as directors at a general meeting must deliver a written notice to the principal executive offices not later than the close of business on the 90th day nor earlier than close of business on the 120th day prior to scheduled date of such meeting. The Existing Organizational Documents do not include information requirements with respect to such notice.
See Article 20.8 of the Existing Organizational Documents.
|
| |
The Proposed Bylaws provide that director nominations by shareholders will be made only if written notice is delivered to or mailed and received at the principal executive officers not less than 95 nor more than 125 days prior to the anniversary date of the immediately preceding annual meeting, or in case of a special meeting or an annual meeting called for a date not within 30 days before or after such anniversary date, not later than the close of business on 10th day following the date on which notice of such meeting was mailed or publicly disclosed. Such shareholder’s notice must include certain information as set forth in the Proposed Bylaws.
See Section 4.2 of the Proposed Bylaws.
|
|
Exclusive Forum Provision
(Organizational Documents Proposal E)
|
| |
The Existing Organizational Documents do not include an exclusive forum provision.
|
| |
The Proposed Charter provides that, unless New GTY consents in writing to an alternative forum, the Business Litigation Session of the Superior Court for Suffolk County, Massachusetts and United States District Court for the District of Massachusetts sitting in Boston, Massachusetts will be the sole and exclusive forum for (a) any derivative action or proceeding brought on behalf of New GTY, (b) any action asserting a claim for
|
|
| | |
Existing Organizational Documents
|
| |
Proposed Organizational Documents
|
|
| | | | | |
breach of a fiduciary duty owed by any director, officer, employee, or agent of New GTY to New GTY or New GTY’s shareholders, (c) any action asserting a claim arising pursuant to any provision of the MBCA, the articles of organization, or the bylaws of New GTY, or (d) any action asserting a claim governed by the internal affairs doctrine, in each case subject to said courts having personal jurisdiction over the indispensable parties named as defendants therein, except that the United States District Court of Massachusetts in Boston shall be the sole and exclusive forum for any claim arising under the Securities Act of 1933, as amended, or any claim for which such other courts do not have subject matter jurisdiction including, without limitation, any claim arising under The Securities Exchange Act of 1934, as amended.
See Article IV(D)(8) of the Proposed Charter.
|
|
Amendments to Proposed Charter
(Organizational Documents Proposal F)
|
| |
The Existing Organizational Documents provide that, subject to certain exceptions, alterations or additions to the Existing Organizational Documents may be made by special resolution, being the affirmative vote of the holders of two-thirds of the ordinary shares entitled to vote and actually cast thereon.
See Article 18 of the Existing Organizational Documents.
|
| |
The Proposed Charter provides that amendments to the Proposed Charter generally requires the affirmative vote of at least a majority of all shares entitled generally to vote on such matter and a majority of the shares of any voting group entitled to vote separately on the matter pursuant to the MBCA, the Proposed Charter or the Proposed Bylaws, or action of the board of directors taken pursuant to Subsection (c) of Section 10.03 of the MBCA.
See Article IV(D)(1) of the Proposed Charter.
|
|
Amendments to Proposed Bylaws
(Organizational Documents Proposal G)
|
| |
The Existing Organizational Documents provide that, subject to certain exceptions, alterations or additions to the Existing Organizational Documents may
|
| |
The Proposed Bylaws provide that amendments to the Proposed Bylaws may generally be amended by a majority vote of the directors or by a majority vote of
|
|
| | |
Existing Organizational Documents
|
| |
Proposed Organizational Documents
|
|
| | |
be made by special resolution, being the affirmative vote of the holders of two-thirds of the ordinary shares entitled to vote and actually cast thereon.
See Article 18 of the Existing Organizational Documents.
|
| |
shareholders at a shareholder meeting called for such purpose.
See Section 12.1 of the Proposed Bylaws and Article VI(d) of the Proposed Charter.
|
|
Shareholder Right to Call Special Meetings
(Organizational Documents Proposal H)
|
| |
The Existing Organizational Documents provide that directors must call a shareholder meeting if requested by shareholders holding not less than 30% in par value of issued shares that carry the right to vote at general meetings.
See Article 20.4 of the Existing Organizational Documents.
|
| |
The Proposed Bylaws provide that a special meeting must be called upon written request of shareholders who hold an aggregate of at least 40% of all votes entitled to be cast on any issue to be considered at the proposed special meeting. Notwithstanding the foregoing, a special meeting requested by shareholders will not be held if (a) the stated business to be brought before the special meeting is not a proper subject for shareholder action under applicable law, (b) the board of directors has called or calls for an annual meeting of shareholders to be held within 90 days and the board of directors determines in good faith that the business of such annual meeting includes the business specified in the shareholders' request, or (c) an annual or special meeting that included the business specified in the request (as determined in good faith by the board of directors) was held not more than 90 days before the request to call the special meeting was received.
See Section 3.2(a) of the Proposed Bylaws.
|
|
Corporate Name
(Organizational Documents Proposal I)
|
| |
The Existing Organizational Documents provide the name of GTY is “GTY Technology Holdings Inc.”
See paragraph 1 of the Existing Organizational Documents.
|
| |
The Proposed Charter provides the new name of the corporation to be “GTY Technology Holdings Inc.”.
See Article I of the Proposed Charter.
|
|
Perpetual Existence
(Organizational Documents Proposal I)
|
| |
The Existing Organizational Documents provide that if we do not consummate a business
|
| |
The Proposed Charter does not include any provisions relating to New GTY’s ongoing existence,
|
|
| | |
Existing Organizational Documents
|
| |
Proposed Organizational Documents
|
|
| | |
combination (as defined in our Existing Organizational Documents) by May 1, 2019, GTY shall cease all operations except for the purposes of winding up and shall redeem the shares issued in our initial public offering and liquidate our trust account.
See Article 49.4 of the Existing Organizational Documents.
|
| |
under the MBCA, New GTY’s existence will be perpetual
|
|
Provisions Related to Status as Blank Check Company
(Organizational Documents Proposal I)
|
| |
The Existing Organizational Documents set forth various provisions related to our status as a blank check company prior to the consummation of a business combination.
See Article 49 of the Existing Organizational Documents.
|
| |
The Proposed Charter does not include such provisions related to our status as a blank check company, which do not apply to New GTY.
|
|
| | |
Number of securities to
be issued upon exercise of outstanding options, warrants and rights (a) (#) |
| |
Weighted average
exercise price of outstanding options, warrants and rights (b) ($) |
| |
Number of securities
remaining available for future issuance under equity compensation plans (excluding securities reflected in column (a)) (c) (#) |
| |||||||||
Equity compensation plans approved by security
holders |
| | | | — | | | | | | — | | | | | | — | | |
Equity compensation plans not approved by security holders
|
| | | | — | | | | | | — | | | | | | — | | |
Total
|
| | | | — | | | | | | — | | | | | | — | | |
| | |
GTY(1)
|
| |
Bonfire(1)
|
| |
CityBase(1)
|
| |
eCivis(1)
|
| |
Open Counter(1)
|
| |
Questica(1)
|
| |
Sherpa(1)
|
| |
Pro Forma
Adjustments |
| |
Pro Forma
Combined |
| |
Pro Forma
Adjustments Based on Redemptions in Connection With the Extension Amendment |
| |
Pro Forma
Balance Sheet (Assuming No Additional Redemptions in Connection With the Business Combination) |
| |
Pro Forma
Adjustments (Assuming Maximum Redemptions in Connection With the Business Combination) |
| |
Pro Forma
Balance Sheet (Assuming Maximum Redemptions in Connection With the Business Combination) |
| |||||||||||||||||||||||||||||||||||||||
ASSETS | | | | | | | | | | | | | | | | | | | | | | | | | | | | | | | | | | | | | | | | | | | | | | | | | | | | | | | | | | | | | | | | | | | | | | | | | | | | | | | |
Current assets | | | | | | | | | | | | | | | | | | | | | | | | | | | | | | | | | | | | | | | | | | | | | | | | | | | | | | | | | | | | | | | | | | | | | | | | | | | | | | | |
Cash and cash equivalents
|
| | | $ | 373,532 | | | | | | 6,251,607 | | | | | | 10,177,975 | | | | | | 99,685 | | | | | | 76,943 | | | | | | 4,250,794 | | | | | | 799,808 | | | | | | 563,736,096(2) | | | | | | 316,633,903 | | | | | | (346,900,000)(8) | | | | | | 36,296,283 | | | | | | (1,098,476)(10) | | | | | | 35,197,807 | | |
| | | | | | | | | | | | | | | | | | | | | | | | | | | | | | | | | | | | | | | | | | | | | | | (3,157,878)(3) | | | | | | | | | | | | 66,562,380(9) | | | | | | | | | | | | | | | | | | | | |
| | | | | | | | | | | | | | | | | | | | | | | | | | | | | | | | | | | | | | | | | | | | | | | (12,300,000)(4) | | | | | | | | | | | | | | | | | | | | | | | | | | | | | | | | |
| | | | | | | | | | | | | | | | | | | | | | | | | | | | | | | | | | | | | | | | | | | | | | | (18,471,379)(5) | | | | | | | | | | | | | | | | | | | | | | | | | | | | | | | | |
| | | | | | | | | | | | | | | | | | | | | | | | | | | | | | | | | | | | | | | | | | | | | | | (229,943,280)(6) | | | | | | | | | | | | | | | | | | | | | | | | | | | | | | | | |
| | | | | | | | | | | | | | | | | | | | | | | | | | | | | | | | | | | | | | | | | | | | | | | (5,260,000)(6) | | | | | | | | | | | | | | | | | | | | | | | | | | | | | | | | |
Investments
|
| | | | — | | | | | | — | | | | | | — | | | | | | — | | | | | | — | | | | | | 1,520,575 | | | | | | — | | | | | | (1,520,575)(5) | | | | | | — | | | | | | — | | | | | | — | | | | | | — | | | | | | — | | |
Accounts receivable, net
|
| | | | — | | | | | | 382,628 | | | | | | 735,830 | | | | | | 1,011,671 | | | | | | 371,280 | | | | | | 3,318,797 | | | | | | 595,517 | | | | | | — | | | | | | 6,415,723 | | | | | | — | | | | | | 6,415,723 | | | | | | — | | | | | | 6,415,723 | | |
Prepaid expense and other current assets
|
| | | | 45,448 | | | | | | 507,675 | | | | | | 136,912 | | | | | | 461,464 | | | | | | — | | | | | | 108,390 | | | | | | 31,644 | | | | | | — | | | | | | 1,291,533 | | | | | | — | | | | | | 1,291,533 | | | | | | — | | | | | | 1,291,533 | | |
Total current assets
|
| | | | 418,980 | | | | | | 7,141,910 | | | | | | 11,050,717 | | | | | | 1,572,820 | | | | | | 448,223 | | | | | | 9,198,556 | | | | | | 1,426,969 | | | | | | 293,082,984 | | | | | | 324,341,159 | | | | | | (280,337,620) | | | | | | 44,003,539 | | | | | | (1,098,476) | | | | | | 42,905,063 | | |
Fixed assets
|
| | | | — | | | | | | 127,609 | | | | | | 620,625 | | | | | | 61,734 | | | | | | 31,246 | | | | | | 440,289 | | | | | | 2,688 | | | | | | — | | | | | | 1,284,191 | | | | | | — | | | | | | 1,284,191 | | | | | | — | | | | | | 1,284,191 | | |
Loan receivable – related party
|
| | | | — | | | | | | — | | | | | | 176,401 | | | | | | — | | | | | | — | | | | | | — | | | | | | — | | | | | | — | | | | | | 176,401 | | | | | | — | | | | | | 176,401 | | | | | | — | | | | | | 176,401 | | |
Other assets
|
| | | | — | | | | | | 279,679 | | | | | | 500,854 | | | | | | 51,053 | | | | | | 350 | | | | | | 1,052,863 | | | | | | — | | | | | | — | | | | | | 1,884,799 | | | | | | — | | | | | | 1,884,799 | | | | | | — | | | | | | 1,884,799 | | |
Intangible assets
|
| | | | — | | | | | | — | | | | | | 402,784 | | | | | | 335,996 | | | | | | — | | | | | | 978,695 | | | | | | — | | | | | | 111,052,525(6) | | | | | | 112,770,000 | | | | | | — | | | | | | 112,770,000 | | | | | | — | | | | | | 112,770,000 | | |
Goodwill
|
| | | | — | | | | | | — | | | | | | 122,933 | | | | | | 585,000 | | | | | | — | | | | | | 1,911,403 | | | | | | — | | | | | | 377,304,819(6) | | | | | | 379,924,155 | | | | | | — | | | | | | 379,924,155 | | | | | | — | | | | | | 379,924,155 | | |
Cash and cash equivalents held in Trust Account
|
| | | | 563,736,096 | | | | | | — | | | | | | — | | | | | | — | | | | | | — | | | | | | — | | | | | | — | | | | | | (563,736,096)(2) | | | | | | — | | | | | | — | | | | | | — | | | | | | — | | | | | | — | | |
Total assets
|
| | | $ | 564,155,076 | | | | | | 7,549,198 | | | | | | 12,874,314 | | | | | | 2,606,603 | | | | | | 479,819 | | | | | | 13,581,806 | | | | | | 1,429,657 | | | | | | 217,704,232 | | | | | | 820,380,705 | | | | | | (280,337,620) | | | | | | 540,043,085 | | | | | | (1,098,476) | | | | | | 538,944,609 | | |
LIABILITIES AND STOCKHOLDERS’ EQUITY | | | | | | | | | | | | | | | | | | | | | | | | | | | | | | | | | | | | | | | | | | | | | | | | | | | | | | | | | | | | | | | | | | | | | | | | | | | | | | | |
Current liabilities | | | | | | | | | | | | | | | | | | | | | | | | | | | | | | | | | | | | | | | | | | | | | | | | | | | | | | | | | | | | | | | | | | | | | | | | | | | | | | | |
Accounts payable and accrued expenses
|
| | | $ | 3,127,878 | | | | | | 342,090 | | | | | | 2,576,017 | | | | | | 546,234 | | | | | | 249,909 | | | | | | 431,896 | | | | | | 119,140 | | | | | | (3,127,878)(3) | | | | | | 4,265,286 | | | | | | — | | | | | | 4,265,286 | | | | | | — | | | | | | 4,265,286 | | |
Contract liabilities
|
| | | | — | | | | | | — | | | | | | 1,120,628 | | | | | | — | | | | | | 1,101,359 | | | | | | 5,636,800 | | | | | | — | | | | | | — | | | | | | 7,858,787 | | | | | | — | | | | | | 7,858,787 | | | | | | — | | | | | | 7,858,787 | | |
Other current liabilities
|
| | | | — | | | | | | 1,832,337 | | | | | | — | | | | | | 2,438,935 | | | | | | — | | | | | | 958,245 | | | | | | 43,865 | | | | | | — | | | | | | 5,273,382 | | | | | | — | | | | | | 5,273,382 | | | | | | — | | | | | | 5,273,382 | | |
Notes payable and accrued expenses – related party
|
| | | | 430,000 | | | | | | — | | | | | | — | | | | | | — | | | | | | — | | | | | | — | | | | | | — | | | | | | (430,000)(3) | | | | | | — | | | | | | — | | | | | | — | | | | | | — | | | | | | — | | |
Long-term debt – current portion
|
| | | | — | | | | | | — | | | | | | 400,000 | | | | | | — | | | | | | — | | | | | | — | | | | | | — | | | | | | (400,000)(5) | | | | | | — | | | | | | — | | | | | | — | | | | | | — | | | | | | — | | |
Capital lease obligations – current portion
|
| | | | — | | | | | | — | | | | | | 143,545 | | | | | | — | | | | | | — | | | | | | — | | | | | | — | | | | | | — | | | | | | 143,545 | | | | | | — | | | | | | 143,545 | | | | | | — | | | | | | 143,545 | | |
Short term notes payable
|
| | | | — | | | | | | — | | | | | | 1,574,284 | | | | | | — | | | | | | 450,000 | | | | | | — | | | | | | — | | | | | | (2,024,284)(5) | | | | | | — | | | | | | — | | | | | | — | | | | | | — | | | | | | — | | |
Total current liabilities
|
| | | | 3,557,878 | | | | | | 2,174,427 | | | | | | 5,814,474 | | | | | | 2,985,169 | | | | | | 1,801,268 | | | | | | 7,026,941 | | | | | | 163,005 | | | | | | (5,982,162) | | | | | | 17,541,000 | | | | | | — | | | | | | 17,541,000 | | | | | | — | | | | | | 17,541,000 | | |
Deferred underwriting fees
|
| | | | 19,320,000 | | | | | | — | | | | | | — | | | | | | — | | | | | | — | | | | | | — | | | | | | — | | | | | | (19,320,000)(4) | | | | | | — | | | | | | — | | | | | | — | | | | | | — | | | | | | — | | |
Contract and other long-term liabilities
|
| | | | — | | | | | | 62,395 | | | | | | 3,164,157 | | | | | | 97,201 | | | | | | — | | | | | | 296,225 | | | | | | — | | | | | | — | | | | | | 3,619,978 | | | | | | — | | | | | | 3,619,978 | | | | | | — | | | | | | 3,619,978 | | |
Deferred rent
|
| | | | — | | | | | | 40,427 | | | | | | — | | | | | | — | | | | | | — | | | | | | — | | | | | | — | | | | | | — | | | | | | 40,427 | | | | | | — | | | | | | 40,427 | | | | | | — | | | | | | 40,427 | | |
Long-term debt, less current portion
|
| | | | — | | | | | | — | | | | | | 310,076 | | | | | | — | | | | | | 451,073 | | | | | | — | | | | | | — | | | | | | (761,149)(5) | | | | | | — | | | | | | — | | | | | | — | | | | | | — | | | | | | — | | |
Capital lease obligation, less current portion
|
| | | | — | | | | | | — | | | | | | 299,517 | | | | | | — | | | | | | — | | | | | | — | | | | | | — | | | | | | — | | | | | | 299,517 | | | | | | — | | | | | | 299,517 | | | | | | — | | | | | | 299,517 | | |
Contingent consideration
|
| | | | — | | | | | | — | | | | | | — | | | | | | 836,000 | | | | | | — | | | | | | 2,060,007 | | | | | | — | | | | | | 2,002,000(6) | | | | | | 4,898,007 | | | | | | — | | | | | | 4,898,007 | | | | | | — | | | | | | 4,898,007 | | |
Total long-term liabilities
|
| | | | 19,320,000 | | | | | | 102,822 | | | | | | 3,773,750 | | | | | | 933,201 | | | | | | 451,073 | | | | | | 2,356,232 | | | | | | — | | | | | | (18,079,149) | | | | | | 8,857,929 | | | | | | — | | | | | | 8,857,929 | | | | | | — | | | | | | 8,857,929 | | |
Total liabilities
|
| | | | 22,877,878 | | | | | | 2,277,249 | | | | | | 9,588,224 | | | | | | 3,918,370 | | | | | | 2,252,341 | | | | | | 9,383,173 | | | | | | 163,005 | | | | | | (24,061,311) | | | | | | 26,398,929 | | | | | | — | | | | | | 26,398,929 | | | | | | — | | | | | | 26,398,929 | | |
|
| | |
GTY(1)
|
| |
Bonfire(1)
|
| |
CityBase(1)
|
| |
eCivis(1)
|
| |
Open Counter(1)
|
| |
Questica(1)
|
| |
Sherpa(1)
|
| |
Pro Forma
Adjustments |
| |
Pro Forma
Combined |
| |
Pro Forma
Adjustments Based on Redemptions in Connection With the Extension Amendment |
| |
Pro Forma
Balance Sheet (Assuming No Additional Redemptions in Connection With the Business Combination) |
| |
Pro Forma
Adjustments (Assuming Maximum Redemptions in Connection With the Business Combination) |
| |
Pro Forma
Balance Sheet (Assuming Maximum Redemptions in Connection With the Business Combination) |
| | | |||||||||||||||||||||||||||||||||||||||||||
Commitments and contingencies | | | | | | | | | | | | | | | | | | | | | | | | | | | | | | | | | | | | | | | | | | | | | | | | | | | | | | | | | | | | | | | | | | | | | | | | | | | | | | | | | | ||||
Temporary equity | | | | | | | | | | | | | | | | | | | | | | | | | | | | | | | | | | | | | | | | | | | | | | | | | | | | | | | | | | | | | | | | | | | | | | | | | | | | | | | | | | ||||
Preferred stock
|
| | | | — | | | | | | 11,210,916 | | | | | | 30,803,780 | | | | | | — | | | | | | — | | | | | | — | | | | | | — | | | | | | (42,014,696)(6) | | | | | | — | | | | | | — | | | | | | — | | | | | | — | | | | | | — | | | | | ||||
Ordinary shares subject to possible redemption
|
| | | | 536,277,190 | | | | | | — | | | | | | — | | | | | | — | | | | | | — | | | | | | — | | | | | | — | | | | | | (536,277,190)(7) | | | | | | — | | | | | | — | | | | | | — | | | | | | — | | | | | | — | | | | | ||||
Stockholders’ equity | | | | | | | | | | | | | | | | | | | | | | | | | | | | | | | | | | | | | | | | | | | | | | | | | | | | | | | | | | | | | | | | | | | | | | | | | | | | | | | | | | ||||
Members’ capital
|
| | | | — | | | | | | — | | | | | | — | | | | | | — | | | | | | — | | | | | | — | | | | | | 1,266,652 | | | | | | (1,266,652)(6) | | | | | | — | | | | | | — | | | | | | — | | | | | | — | | | | | | — | | | | | ||||
Common Stock, $0.0001 par value
|
| | | | 1,537 | | | | | | 1,272 | | | | | | 1 | | | | | | 48,645 | | | | | | 6,548 | | | | | | 484,219 | | | | | | — | | | | | | (533,972)(6) | | | | | | 8,250 | | | | | | (2,736)(8) | | | | | | 5,514 | | | | | | (11)(10) | | | | | | 5,503 | | | | | ||||
Additional paid-in-capital
|
| | | | — | | | | | | 455,438 | | | | | | 1,554,750 | | | | | | 3,826,358 | | | | | | 120,379 | | | | | | — | | | | | | — | | | | | | 400,000(3) | | | | | | 780,290,197 | | | | | | 2,736(8) | | | | | | 499,955,313 | | | | | | 11(10) | | | | | | 498,856,848 | | | | | ||||
| | | | | | | | | | | | | | | | | | | | | | | | | | | | | | | | | | | | | | | | | | | | | | | 209,788,720(6) | | | | | | | | | | | | (346,900,000)(8) | | | | | | | | | | | | (1,098,476)(10) | | | | | | | | | | | | | | |
| | | | | | | | | | | | | | | | | | | | | | | | | | | | | | | | | | | | | | | | | | | | | | | (5,963,638)(6) | | | | | | | | | | | | 66,562,380(9) | | | | | | | | | | | | | | | | | | | | | | | | | ||
| | | | | | | | | | | | | | | | | | | | | | | | | | | | | | | | | | | | | | | | | | | | | | | 33,831,000(6) | | | | | | | | | | | | | | | | | | | | | | | | | | | | | | | | | | | ||||
| | | | | | | | | | | | | | | | | | | | | | | | | | | | | | | | | | | | | | | | | | | | | | | 536,277,190(7) | | | | | | | | | | | | | | | | | | | | | | | | | | | | | | | | | | | ||||
Accumulated other comprehensive income
|
| | | | — | | | | | | — | | | | | | — | | | | | | — | | | | | | — | | | | | | (26,128) | | | | | | — | | | | | | 26,128(6) | | | | | | — | | | | | | — | | | | | | — | | | | | | — | | | | | | — | | | | | ||||
Retained earnings (accumulated deficit)
|
| | | | 4,998,471 | | | | | | (6,395,677) | | | | | | (29,072,441) | | | | | | (5,186,770) | | | | | | (1,899,449) | | | | | | 3,740,542 | | | | | | — | | | | | | (16,806,521)(5) | | | | | | 13,683,329 | | | | | | — | | | | | | 13,683,329 | | | | | | — | | | | | | 13,683,329 | | | | | ||||
| | | | | | | | | | | | | | | | | | | | | | | | | | | | | | | | | | | | | | | | | | | | | | | 57,285,174(6) | | | | | | | | | | | | | | | | | | | | | | | | | | | | | | | | | | | ||||
| | | | | | | | | | | | | | | | | | | | | | | | | | | | | | | | | | | | | | | | | | | | | | | 7,020,000(4) | | | | | | | | | | | | | | | | | | | | | | | | | | | | | | | | | | | ||||
Total stockholders’ equity (deficit)
|
| | | | 5,000,008 | | | | | | (5,938,967) | | | | | | (27,517,690) | | | | | | (1,311,767) | | | | | | (1,772,522) | | | | | | 4,198,633 | | | | | | 1,266,652 | | | | | | 820,057,429 | | | | | | 793,981,776 | | | | | | (280,337,620) | | | | | | 513,644,156 | | | | | | (1,098,476) | | | | | | 512,545,680 | | | | | ||||
Total liabilities and stockholders’ equity
|
| | | $ | 564,155,076 | | | | | | 7,549,198 | | | | | | 12,874,314 | | | | | | 2,606,603 | | | | | | 479,819 | | | | | | 13,581,806 | | | | | | 1,429,657 | | | | | | 217,704,232 | | | | | | 820,380,705 | | | | | | (280,337,620) | | | | | | 540,043,085 | | | | | | (1,098,476) | | | | | | 538,944,609 | | | | | ||||
|
| | |
Cash
Consideration |
| |
Stock
Consideration |
| |
Cash
Earn-out |
| |
Stock
Earn-out (paid in a fixed number of shares) |
| |
Stock
Earn-out (paid in a variable number of shares) |
| |
Total
|
| |
Adjusted
Net Assets |
| |
Goodwill
|
| |
Intangibles
|
| |
Deferred
Tax Liability |
| ||||||||||||||||||||||||||||||
Bonfire
|
| | | $ | 47,000,000 | | | | | $ | 51,000,000 | | | | | $ | 101,000 | | | | | $ | — | | | | | $ | 101,000 | | | | | $ | 98,202,000 | | | | | $ | (979,658) | | | | | $ | 88,092,958 | | | | | $ | 15,841,000 | | | | | $ | 4,752,300 | | |
CityBase | | | | | 83,443,280 | | | | | | 16,556,720 | | | | | | 5,260,000 | | | | | | 46,211,000 | | | | | | — | | | | | | 151,471,000 | | | | | | (5,133,242) | | | | | | 143,552,742 | | | | | | 18,645,000 | | | | | | 5,593,500 | | |
eCivis | | | | | 25,000,000 | | | | | | 25,000,000 | | | | | | — | | | | | | 19,475,000 | | | | | | — | | | | | | 69,475,000 | | | | | | (2,332,448) | | | | | | 62,754,348 | | | | | | 12,933,000 | | | | | | 3,879,900 | | |
OpenCounter | | | | | 12,500,000 | | | | | | 16,500,000 | | | | | | — | | | | | | — | | | | | | — | | | | | | 29,000,000 | | | | | | (948,392) | | | | | | 24,787,292 | | | | | | 7,373,000 | | | | | | 2,211,900 | | |
Questica | | | | | 54,000,000 | | | | | | 26,000,000 | | | | | | — | | | | | | 9,046,000(x) | | | | | | — | | | | | | 89,046,000 | | | | | | (2,942,259) | | | | | | 59,406,059 | | | | | | 46,546,000 | | | | | | 13,963,800 | | |
Sherpa | | | | | 8,000,000 | | | | | | — | | | | | | — | | | | | | — | | | | | | 1,800,000 | | | | | | 9,800,000 | | | | | | 466,844 | | | | | | 1,330,756 | | | | | | 11,432,000 | | | | | | 3,429,600 | | |
Total | | | | $ | 229,943,280 | | | | | $ | 135,056,720 | | | | | $ | 5,361,000 | | | | | $ | 74,732,000 | | | | | $ | 1,901,000 | | | | | $ | 446,994,000 | | | | | $ | (11,869,155) | | | | | $ | 379,924,155 | | | | | $ | 112,770,000 | | | | | $ | 33,831,000 | | |
|
| | |
Bonfire
|
| |
CityBase
|
| |
eCivis
|
| |
OpenCounter
|
| |
Questica
|
| |
Sherpa
|
| |
Total
|
| |||||||||||||||||||||
Cash and cash equivalents
|
| | | $ | — | | | | | $ | — | | | | | $ | — | | | | | $ | — | | | | | $ | — | | | | | $ | — | | | | | $ | — | | |
Investments | | | | | — | | | | | | — | | | | | | — | | | | | | 1,520,575 | | | | | | — | | | | | | — | | | | | | 1,520,575 | | |
Accounts receivable, net
|
| | | | 382,628 | | | | | | 735,830 | | | | | | 1,011,671 | | | | | | 371,280 | | | | | | 3,318,797 | | | | | | 595,517 | | | | | | 6,415,723 | | |
Prepaid expense and other current assets
|
| | | | 507,675 | | | | | | 136,912 | | | | | | 461,464 | | | | | | — | | | | | | 108,390 | | | | | | 31,644 | | | | | | 1,246,085 | | |
Fixed assets
|
| | | | 127,609 | | | | | | 620,625 | | | | | | 61,734 | | | | | | 31,246 | | | | | | 440,289 | | | | | | 2,688 | | | | | | 1,284,191 | | |
Loan receivable – related party
|
| | | | — | | | | | | 176,401 | | | | | | — | | | | | | — | | | | | | — | | | | | | — | | | | | | 176,401 | | |
Other assets
|
| | | | 279,679 | | | | | | 500,854 | | | | | | 51,053 | | | | | | 350 | | | | | | 1,052,863 | | | | | | — | | | | | | 1,884,799 | | |
Intangible assets
|
| | | | 15,841,000 | | | | | | 18,645,000 | | | | | | 12,933,000 | | | | | | 7,373,000 | | | | | | 46,546,000 | | | | | | 11,432,000 | | | | | | 112,770,000 | | |
Goodwill | | | | | 88,092,958 | | | | | | 143,552,742 | | | | | | 62,754,348 | | | | | | 24,787,292 | | | | | | 59,406,059 | | | | | | 1,330,756 | | | | | | 379,924,155 | | |
Accounts payable and accrued expenses
|
| | | | (342,090) | | | | | | (2,576,017) | | | | | | (546,234) | | | | | | (249,909) | | | | | | (431,896) | | | | | | (119,140) | | | | | | (4,265,286) | | |
Contract liabilities
|
| | | | — | | | | | | (1,120,628) | | | | | | — | | | | | | (1,101,359) | | | | | | (5,636,800) | | | | | | — | | | | | | (7,858,787) | | |
Deferred rent
|
| | | | (40,427) | | | | | | — | | | | | | — | | | | | | — | | | | | | — | | | | | | — | | | | | | (40,427) | | |
Deferred tax liability
|
| | | | (4,752,300) | | | | | | (5,593,500) | | | | | | (3,879,900) | | | | | | (2,211,900) | | | | | | (13,963,800) | | | | | | (3,429,600) | | | | | | (33,831,000) | | |
Other current liabilities
|
| | | | (1,832,337) | | | | | | — | | | | | | (2,438,935) | | | | | | — | | | | | | (958,245) | | | | | | (43,865) | | | | | | (5,273,382) | | |
Capital lease obligations – current portion
|
| | | | — | | | | | | (143,545) | | | | | | — | | | | | | — | | | | | | — | | | | | | — | | | | | | (143,545) | | |
Contract and other long-term
liabilities |
| | | | (62,395) | | | | | | (3,164,157) | | | | | | (97,201) | | | | | | — | | | | | | (296,225) | | | | | | — | | | | | | (3,619,978) | | |
Capital lease obligation, less current portion
|
| | | | — | | | | | | (299,517) | | | | | | — | | | | | | — | | | | | | — | | | | | | — | | | | | | (299,517) | | |
Contingent consideration
|
| | | | — | | | | | | — | | | | | | (836,000) | | | | | | — | | | | | | (2,060,007) | | | | | | — | | | | | | (2,896,007) | | |
Total consideration
|
| | | $ | 98,202,000 | | | | | $ | 151,471,000 | | | | | $ | 69,475,000 | | | | | $ | 30,520,575 | | | | | $ | 87,525,425 | | | | | $ | 9,800,000 | | | | | $ | 446,994,000 | | |
|
| | | | | | | | | | | | | | |
Impact of Earnings per Share
|
| |||||||||
Change in stock price
|
| |
Stock price
|
| |
Change in number of
shares issued |
| |
Pro Forma
(Assuming No Additional Redemptions in Connection With the Business Combination) |
| |
Pro Forma
(Assuming Maximum Redemptions in Connection With the Business Combination) |
| ||||||||||||
Increase of 10%
|
| | | $ | 11.00 | | | | | | (1,227,788) | | | | | $ | (0.01) | | | | | $ | (0.01) | | |
Decrease of 10%
|
| | | $ | 9.00 | | | | | | 1,500,630 | | | | | $ | 0.01 | | | | | $ | 0.01 | | |
Increase of 20%
|
| | | $ | 12.00 | | | | | | (2,250,945) | | | | | $ | (0.01) | | | | | $ | (0.01) | | |
Decrease of 20%
|
| | | $ | 8.00 | | | | | | 3,376,418 | | | | | $ | 0.02 | | | | | $ | 0.02 | | |
Increase of 30%
|
| | | $ | 13.00 | | | | | | (3,116,694) | | | | | $ | (0.02) | | | | | $ | (0.02) | | |
Decrease of 30%
|
| | | $ | 7.00 | | | | | | 5,788,145 | | | | | $ | 0.03 | | | | | $ | 0.03 | | |
Increase of 50%
|
| | | $ | 15.00 | | | | | | (4,501,891) | | | | | $ | (0.03) | | | | | $ | (0.03) | | |
Decrease of 50%
|
| | | $ | 5.00 | | | | | | 13,505,672 | | | | | $ | 0.06 | | | | | $ | 0.06 | | |
| | |
Adjusted
Equity |
| |
Adjust
Par Value |
| |
Acquisition
|
| |
Net
Pro forma Adjustment |
| ||||||||||||
Cash | | | | | — | | | | | | — | | | | | | (229,943,280) | | | | | | (229,943,280) | | |
Intangible assets
|
| | | | (1,717,475) | | | | | | — | | | | | | 112,770,000 | | | | | | 111,052,525 | | |
Goodwill | | | | | (2,619,336) | | | | | | | | | | | | 379,924,155 | | | | | | 377,304,819 | | |
Contingent consideration
|
| | | | — | | | | | | — | | | | | | (5,361,000) | | | | | | (5,361,000) | | |
Preferred stock
|
| | | | 42,014,696 | | | | | | — | | | | | | — | | | | | | 42,014,696 | | |
Members’ capital
|
| | | | 1,266,652 | | | | | | — | | | | | | — | | | | | | 1,266,652 | | |
Common Stock, $0.0001 par value
|
| | | | 540,685 | | | | | | (6,713) | | | | | | — | | | | | | 533,972 | | |
Stock consideration
|
| | | | — | | | | | | | | | | | | (209,788,720) | | | | | | (209,788,720) | | |
Additional paid in capital
|
| | | | 5,956,925 | | | | | | 6,713 | | | | | | — | | | | | | 5,963,638 | | |
Stock earn-out
|
| | | | — | | | | | | — | | | | | | (1,901,000) | | | | | | (1,901,000) | | |
Deferred tax liability
|
| | | | — | | | | | | — | | | | | | (33,831,000) | | | | | | (33,831,000) | | |
Accumulated other comprehensive income
|
| | | | (26,128) | | | | | | — | | | | | | — | | | | | | (26,128) | | |
Retained earnings (accumulated deficit)
|
| | | | (57,285,174) | | | | | | — | | | | | | — | | | | | | (57,285,174) | | |
Adjusted equity
|
| | | | 11,869,155 | | | | | | — | | | | | | (11,869,155) | | | | | | — | | |
| | |
GTY(1)
|
| |
Bonfire(1)
|
| |
CityBase(1)
|
| |
eCivis(1)
|
| |
OpenCounter(1)
|
| |
Questica(1)
|
| |
Sherpa(1)
|
| |
Pro Forma
Adjustments |
| |
Pro Forma
Combined |
| |
Pro Forma
Adjustments Based on Redemptions in Connection With the Extension Amendment Proposal |
| |
Pro Forma
(Assuming No Additional Redemptions in Connection With the Business Combination) |
| |
Pro Forma
Adjustments (Assuming Maximum Redemptions in Connection With the Business Combination) |
| |
Pro Forma
(Assuming Maximum Redemptions in Connection With the Business Combination) |
| |||||||||||||||||||||||||||||||||||||||
Total revenue
|
| | | $ | — | | | | | | 2,258,612 | | | | | | 4,081,116 | | | | | | 3,744,912 | | | | | | 1,212,853 | | | | | | 7,583,170 | | | | | | 2,142,986 | | | | | | — | | | | | | 21,023,649 | | | | | | — | | | | | | 21,023,649 | | | | | | — | | | | | | 21,023,649 | | |
Cost of goods sold
|
| | | | — | | | | | | 555,435 | | | | | | 3,023,387 | | | | | | 1,282,733 | | | | | | 372,746 | | | | | | 704,734 | | | | | | 171,049 | | | | | | — | | | | | | 6,110,084 | | | | | | — | | | | | | 6,110,084 | | | | | | — | | | | | | 6,110,084 | | |
Gross profit
|
| | | | — | | | | | | 1,703,177 | | | | | | 1,057,729 | | | | | | 2,462,179 | | | | | | 840,107 | | | | | | 6,878,436 | | | | | | 1,971,937 | | | | | | — | | | | | | 14,913,565 | | | | | | — | | | | | | 14,913,565 | | | | | | — | | | | | | 14,913,565 | | |
Costs and Expenses: | | | | | | | | | | | | | | | |||||||||||||||||||||||||||||||||||||||||||||||||||||||||||||||||
General and administrative
|
| | | | 3,598,337 | | | | | | 1,925,493 | | | | | | 4,679,132 | | | | | | 1,262,399 | | | | | | 1,174,297 | | | | | | 5,944,947 | | | | | | 758,047 | | | | | | — | | | | | | 19,342,652 | | | | | | — | | | | | | 19,342,652 | | | | | | — | | | | | | 19,342,652 | | |
Amortization of intangible assets
|
| | | | — | | | | | | — | | | | | | — | | | | | | — | | | | | | — | | | | | | — | | | | | | — | | | | | | 9,001,010(2) | | | | | | 9,001,010 | | | | | | — | | | | | | 9,001,010 | | | | | | — | | | | | | 9,001,010 | | |
Sales and marketing
|
| | | | — | | | | | | 2,134,454 | | | | | | 938,656 | | | | | | 888,442 | | | | | | 14,049 | | | | | | — | | | | | | — | | | | | | — | | | | | | 3,975,601 | | | | | | — | | | | | | 3,975,601 | | | | | | — | | | | | | 3,975,601 | | |
Research and development
|
| | | | — | | | | | | 1,228,924 | | | | | | 3,128,351 | | | | | | 973,436 | | | | | | — | | | | | | — | | | | | | — | | | | | | — | | | | | | 5,330,711 | | | | | | — | | | | | | 5,330,711 | | | | | | — | | | | | | 5,330,711 | | |
| | | | | 3,598,337 | | | | | | 5,288,871 | | | | | | 8,746,139 | | | | | | 3,124,277 | | | | | | 1,188,346 | | | | | | 5,944,947 | | | | | | 758,047 | | | | | | 9,001,010 | | | | | | 37,649,974 | | | | | | — | | | | | | 37,649,974 | | | | | | — | | | | | | 37,649,974 | | |
Operating Income (loss)
|
| | | | (3,598,337) | | | | | | (3,585,694) | | | | | | (7,688,410) | | | | | | (662,098) | | | | | | (348,239) | | | | | | 933,489 | | | | | | 1,213,890 | | | | | | (9,001,010) | | | | | | (22,736,409) | | | | | | — | | | | | | (22,736,409) | | | | | | — | | | | | | (22,736,409) | | |
Other expenses (income): | | | | | | | | | | | | | | | |||||||||||||||||||||||||||||||||||||||||||||||||||||||||||||||||
Interest expense (income)
|
| | | | (6,919,340) | | | | | | (37,191) | | | | | | 300,096 | | | | | | 4,961 | | | | | | 81,889 | | | | | | (5,563) | | | | | | (1,526) | | | | | | — | | | | | | (6,576,674) | | | | | | — | | | | | | (6,576,674) | | | | | | — | | | | | | (6,576,674) | | |
Grant income
|
| | | | — | | | | | | (101,490) | | | | | | — | | | | | | — | | | | | | — | | | | | | — | | | | | | — | | | | | | — | | | | | | (101,490) | | | | | | — | | | | | | (101,490) | | | | | | — | | | | | | (101,490) | | |
Other expense
|
| | | | — | | | | | | 6,932 | | | | | | 1,326,849 | | | | | | — | | | | | | 807 | | | | | | — | | | | | | — | | | | | | — | | | | | | 1,334,588 | | | | | | — | | | | | | 1,334,588 | | | | | | — | | | | | | 1,334,588 | | |
Foreign exchange (gain) loss
|
| | | | — | | | | | | (211,034) | | | | | | — | | | | | | — | | | | | | — | | | | | | (481,914) | | | | | | — | | | | | | — | | | | | | (692,948) | | | | | | — | | | | | | (692,948) | | | | | | — | | | | | | (692,948) | | |
Acquisition costs
|
| | | | — | | | | | | — | | | | | | — | | | | | | 159,696 | | | | | | — | | | | | | — | | | | | | 159,696 | | | | | | — | | | | | | 159,696 | | | | | | — | | | | | | 159,696 | | | | | ||||||||||
Gain on sale of ETO buisness
|
| | | | — | | | | | | — | | | | | | — | | | | | | — | | | | | | — | | | | | | (873,734) | | | | | | — | | | | | | — | | | | | | (873,734) | | | | | | — | | | | | | (873,734) | | | | | | — | | | | | | (873,734) | | |
Other income
|
| | | | — | | | | | | — | | | | | | — | | | | | | (57,532) | | | | | | (10,000) | | | | | | (3,297) | | | | | | — | | | | | | — | | | | | | (70,829) | | | | | | — | | | | | | (70,829) | | | | | | — | | | | | | (70,829) | | |
Total other expense (income), net
|
| | | | (6,919,340) | | | | | | (342,783) | | | | | | 1,626,945 | | | | | | 107,125 | | | | | | 72,696 | | | | | | (1,364,508) | | | | | | (1,526) | | | | | | — | | | | | | (6,821,391) | | | | | | — | | | | | | (6,821,391) | | | | | | — | | | | | | (6,821,391) | | |
Income (loss) before income taxes
|
| | | | 3,321,003 | | | | | | (3,242,911) | | | | | | (9,315,355) | | | | | | (769,223) | | | | | | (420,935) | | | | | | 2,297,997 | | | | | | 1,215,416 | | | | | | (9,001,010) | | | | | | (15,915,018) | | | | | | — | | | | | | (15,915,018) | | | | | | — | | | | | | (15,915,018) | | |
Income tax expense
|
| | | | — | | | | | | — | | | | | | — | | | | | | — | | | | | | — | | | | | | (667,642) | | | | | | — | | | | | | (303,854)(3) | | | | | | (971,496) | | | | | | — | | | | | | (971,496) | | | | | | — | | | | | | (971,496) | | |
Net income (loss)
|
| | | | 3,321,003 | | | | | | (3,242,911) | | | | | | (9,315,355) | | | | | | (769,223) | | | | | | (420,935) | | | | | | 1,630,355 | | | | | | 1,215,416 | | | | | | (9,304,864) | | | | | | (16,886,514) | | | | | | — | | | | | | (16,886,514) | | | | | | — | | | | | | (16,886,514) | | |
Net income (loss) per common share: | | | | | | | | | | | | | | | |||||||||||||||||||||||||||||||||||||||||||||||||||||||||||||||||
Basic
|
| | | $ | 0.21 | | | | | | | | | | | | | | | | | | | | | | | | | | | | | | | | | | | | | | | | | | | | | | | $ | (1.09) | | | | | | | | | | | $ | (0.31) | | | | | | | | | | | $ | (0.31) | | |
Diluted
|
| | | $ | 0.05 | | | | | | | | | | | | | | | | | | | | | | | | | | | | | | | | | | | | | | | | | | | | | | | $ | (1.09) | | | | | | | | | | | $ | (0.31) | | | | | | | | | | | $ | (0.31) | | |
Weighted average common shares outstanding(4): | | | | | | | | | | | | | | | |||||||||||||||||||||||||||||||||||||||||||||||||||||||||||||||||
Basic
|
| | | | 15,526,979 | | | | | | | | | | | | | | | | | | | | | | | | | | | | | | | | | | | | | | | | | | | | | | | | 15,526,979 | | | | | | 39,623,393 | | | | | | 55,150,372 | | | | | | (109,848) | | | | | | 55,040,524 | | |
Diluted
|
| | | | 69,000,000 | | | | | | | | | | | | | | | | | | | | | | | | | | | | | | | | | | | | | | | | | | | | | | | | 69,000,000 | | | | | | (13,849,628) | | | | | | 55,150,372 | | | | | | (109,848) | | | | | | 55,040,524 | | |
|
| | |
Economic
Life (Years) |
| |
Bonfire
|
| |
CityBase
|
| |
eCivis
|
| |
Open Counter
|
| |
Questica
|
| |
Sherpa
|
| |
Total
|
| |
Nine Months
Ended September 30, 2018 Amortization |
| ||||||||||||||||||||||||
Patents / Developed Technology
|
| |
6 – 10
|
| | | $ | 7,504,000 | | | | | $ | 10,761,000 | | | | | $ | 4,455,000 | | | | | $ | 3,795,000 | | | | | $ | 14,980,000 | | | | | $ | 1,232,000 | | | | | $ | 42,727,000 | | | | | $ | 3,573,197 | | |
Trade Names / Trademarks
|
| |
1 – 13
|
| | | | 2,984,000 | | | | | | 6,287,000 | | | | | | 2,354,000 | | | | | | 998,000 | | | | | | 8,990,000 | | | | | | 352,000 | | | | | | 21,965,000 | | | | | | 1,486,313 | | |
Customer Relationships
|
| |
10
|
| | | | 5,174,000 | | | | | | 1,317,000 | | | | | | 6,009,000 | | | | | | 2,511,000 | | | | | | 21,566,000 | | | | | | 9,583,000 | | | | | | 46,160,000 | | | | | | 3,462,000 | | |
Non-Compete Agreements
|
| |
3
|
| | | | 179,000 | | | | | | 280,000 | | | | | | 115,000 | | | | | | 69,000 | | | | | | 1,010,000 | | | | | | 265,000 | | | | | | 1,918,000 | | | | | | 479,500 | | |
| | | | | | | $ | 15,841,000 | | | | | $ | 18,645,000 | | | | | $ | 12,933,000 | | | | | $ | 7,373,000 | | | | | $ | 46,546,000 | | | | | $ | 11,432,000 | | | | | $ | 112,770,000 | | | | | $ | 9,001,010 | | |
|
| | |
Pro Forma
(Assuming No Additional Redemptions in Connection With the Business Combination) |
| |
Pro Forma
(Assuming Maximum Redemptions in Connection With the Business Combination) |
| ||||||
Nine Months Ended September 30, 2018 | | | | ||||||||||
GTY public shares electing cash conversion
|
| | | | (34,011,538) | | | | | | (55,200,000) | | |
GTY PIPE investors
|
| | | | 7,708,410 | | | | | | 29,392,020 | | |
GTY shareholders
|
| | | | 69,000,000 | | | | | | 69,000,000 | | |
Shares outstanding
|
| | | | 42,696,872 | | | | | | 43,192,020 | | |
Weighted average share calculation, basic and diluted | | | | ||||||||||
Target Company Shareholders
|
| | | | 13,378,000 | | | | | | 13,378,000 | | |
GTY shareholders
|
| | | | 42,696,872 | | | | | | 43,192,020 | | |
Weighted average shares, basic and diluted
|
| | | | 56,074,872 | | | | | | 56,570,020 | | |
Ownership percentages | | | | ||||||||||
Target Company Shareholders
|
| | | | 24% | | | | | | 24% | | |
GTY shareholders
|
| | | | 76% | | | | | | 76% | | |
| | | | | 100% | | | | | | 100% | | |
|
| | |
Massachusetts
|
| |
Cayman Islands
|
|
Stockholder/Shareholder Approval of Business Combinations
|
| |
Mergers generally require approval of two-thirds of all outstanding shares entitled generally to vote on the matter unless a greater or lesser percentage is provided for in the articles of organization.
|
| |
Mergers require a special resolution, and any other authorization as may be specified in the relevant articles of association. Parties holding certain security interests in the constituent companies must also consent.
|
|
| | |
Mergers in which less than 20% of the acquirer’s stock of the same class or series that is issued do not require acquirer stockholder approval.
|
| |
All mergers (other than parent/subsidiary mergers) require shareholder approval — there is no exception for smaller mergers.
|
|
| | |
Mergers in which one corporation owns 90% or more of a second corporation may be completed without the vote of the second corporation’s stockholders.
Mergers in which the corporation survives or is the acquiring corporation in a share exchange do not require stockholder approval.
|
| |
Where a bidder has acquired 90% or more of the shares in a Cayman Islands company, it can compel the acquisition of the shares of the remaining shareholders and thereby become the sole shareholder. A Cayman Islands company may also be acquired through a “scheme of arrangement” sanctioned by a Cayman Islands court and approved by 50%+1 in number and 75% in value of shareholders in attendance and voting at a shareholders’ meeting.
|
|
Stockholder/Shareholder Votes for Routine Matters
|
| |
Generally approval of routine corporate matters that are put to a stockholder vote require the affirmative vote of the majority of stockholders entitled to generally vote on the matter.
|
| |
Under the Cayman Islands Companies Law the Existing Organizational Documents, routine corporate matters may be approved by an ordinary resolution (being a resolution passed by a simple majority of the shareholders as being entitled to do so).
|
|
| | |
Massachusetts
|
| |
Cayman Islands
|
|
Appraisal Rights
|
| |
Generally, a stockholder of a publicly traded corporation does have appraisal rights in connection with a merger.
|
| |
Minority shareholders that dissent from a merger are entitled to be paid the fair market value of their shares, which if necessary may ultimately be determined by the court.
|
|
Inspection of Books and Records
|
| |
Any stockholder may inspect the corporation’s books and records for a proper purpose during the usual hours for business.
|
| |
Shareholders generally do not have any rights to inspect or obtain copies of the register of shareholders or other corporate records of a company.
|
|
Stockholder/Shareholder Lawsuits
|
| |
Because directors of a Massachusetts company generally owe fiduciary duties only to the corporation and not directly to shareholders, claims that the price paid in a merger is too low may only be brought as derivative claims, not as a direct claims.
|
| |
In the Cayman Islands, the decision to institute proceedings on behalf of a company is generally taken by the company’s board of directors. A shareholder may be entitled to bring a derivative action on behalf of the company, but only in certain limited circumstances.
|
|
Fiduciary Duties of Directors
|
| |
Directors must discharge duties: (i) in good faith, (ii) with the care a person in a similar position reasonably believes is appropriate under similar circumstances. (ii) the directors reasonably believe to be in the corporation’s best interests (the directors owe these duties to the corporation). Directors may consider the interests of the corporation’s employees, suppliers, creditors and customers, the economy, community and societal considerations, and long-term and short-term interests.
|
| |
A director owes fiduciary duties to a company, including to exercise loyalty, honesty and good faith to the company as a whole. In addition to fiduciary duties, directors owe a duty of care, diligence and skill. Such duties are owed to the company but may be owed direct to creditors or shareholders in certain limited circumstances.
|
|
Indemnification of Directors and Officers
|
| |
A corporation is generally permitted to indemnify its directors and officers acting in good faith.
|
| |
A Cayman Islands company generally may indemnify its directors or officers except with regard to actual fraud or willful default or to protect from the consequences of committing a crime.
|
|
Limited Liability of Directors
|
| |
Permits limiting or eliminating the monetary liability of a director to a corporation or its stockholders, except with regard to breaches of duty of loyalty, acts taken in bad faith, intentional misconduct, unlawful repurchases or dividends, or improper personal benefit.
|
| |
Liability of directors may be limited, except with regard to their actual fraud or willful default.
|
|
Name
|
| |
Age
|
| |
Position
|
|
William D. Green | | |
65
|
| | Co-Chief Executive Offıcer and Co-Chairman | |
Joseph M. Tucci | | |
71
|
| | Co-Chief Executive Offıcer and Co-Chairman | |
Harry L. You | | |
59
|
| | President, Chief Financial Officer and Director | |
Randolph Cowen | | |
67
|
| | Director | |
Paul T. Dacier | | |
60
|
| | Director | |
Stephen Rohleder | | |
61
|
| | Director | |
Charles Wert | | |
74
|
| | Director | |
| eRFx & eTendering | | |
•
Control for requests for proposals, or RFPs or RFx, and bids, streamlining the entire sourcing workflow from posting to award
•
Vendor-friendly online portal to post opportunities and receive structured submissions
•
Evaluation tools that give deep insights into suppliers’ relative strengths/weaknesses, pricing, and other areas
•
Real-time overview of projects and key performance indicators, or KPIs
|
|
| Contracts | | |
•
Contract information in one centralized, searchable, online platform
•
Heat-mapped calendar view, reminders and KPIs
•
Easy creation of contracts from completed projects
|
|
|
Vendor Performance
|
| |
•
Visibility into vendor performance
•
Configure custom surveys for end users and set a cadence to automatically send
•
Real-time insights to address issues immediately
|
|
| | |
Nine Months ended
September 30, 2018 |
| |
Nine Months ended
September 30, 2017 |
| |
Amount
Change |
| |
Percentage
Change |
| ||||||||||||
| | | | | | | | |
(Unaudited)
|
| | | | | | | | | | | | | |||
Revenue
|
| | | $ | 2,908,139 | | | | | $ | 1,322,296 | | | | | $ | 1,585,843 | | | | | | 120% | | |
Cost of sales
|
| | | | 715,166 | | | | | | 115,501 | | | | | | 599,665 | | | | | | 519% | | |
Gross profit
|
| | | | 2,192,973 | | | | | | 1,206,795 | | | | | | 986,178 | | | | | | 82% | | |
Operating expenses: | | | | | | | | | | | | | | | | | | | | | | | | | |
General and administrative
|
| | | | 2,479,222 | | | | | | 975,592 | | | | | | 1,503,630 | | | | | | 154% | | |
Sales and marketing
|
| | | | 2,748,276 | | | | | | 983,198 | | | | | | 1,765,078 | | | | | | 180% | | |
Research and development
|
| | | | 1,582,335 | | | | | | 436,290 | | | | | | 1,146,045 | | | | | | 263% | | |
Total operating expenses
|
| | | | 6,809,833 | | | | | | 2,395,080 | | | | | | 4,414,753 | | | | | | 184% | | |
Loss from operations
|
| | | | (4,616,860) | | | | | | (1,188,285) | | | | | | (3,428,575) | | | | | | 289% | | |
Other income (expenses) | | | | | | | | | | | | | | | | | | | | | | | | | |
Interest income
|
| | | | 47,886 | | | | | | — | | | | | | 47,886 | | | | | | NA | | |
Grant income
|
| | | | 130,676 | | | | | | 15,000 | | | | | | 115,676 | | | | | | 771% | | |
Other (expense) income
|
| | | | (8,925) | | | | | | — | | | | | | (8,925) | | | | | | NA | | |
Loss on disposal of capital assets
|
| | | | — | | | | | | (12,223) | | | | | | 12,223 | | | | | | -100% | | |
Foreign exchange gain (loss)
|
| | | | 271,723 | | | | | | (907,617) | | | | | | 1,179,340 | | | | | | -130% | | |
Total other income (expense), net
|
| | | | 441,360 | | | | | | (904,840) | | | | | | 1,346,200 | | | | | | -149% | | |
Net loss
|
| | | $ | (4,175,500) | | | | | $ | (2,093,125) | | | | | $ | (2,082,375) | | | | | | 99% | | |
Deemed dividend on Series Seed preferred stock
|
| | | | (48,128) | | | | | | 190,316 | | | | | | (238,444) | | | | | | -125% | | |
Net loss applicable to common stockholders
|
| | | $ | (4,223,628) | | | | | $ | (1,902,809) | | | | | $ | (2,320,819) | | | | | | 122% | | |
|
| | |
Nine Months ended
September 30, 2018 |
| |
Nine Months ended
September 30, 2017 |
| ||||||
Net cash (used in) provided by: | | | | | | | | | | | | | |
Operating activities
|
| | | $ | (2,859,668) | | | | | $ | (1,581,417) | | |
Investing activities
|
| | | | (102,587) | | | | | | (42,884) | | |
Financing activities
|
| | | | 2,323 | | | | | | 10,937,187 | | |
Net (decrease) increase in cash and cash equivalents
|
| | | $ | (2,959,932) | | | | | $ | 9,312,886 | | |
|
|
October 1, 2018 – December 31, 2018
|
| | | $ | 359,991 | | |
|
2019
|
| | | | 582,225 | | |
|
2020
|
| | | | 596,146 | | |
|
2021
|
| | | | 607,227 | | |
|
2022
|
| | | | 487,828 | | |
|
Total
|
| | | $ | 2,633,417 | | |
|
| | |
Nine months ended September 30,
|
| |
Change
|
| ||||||||||||||||||
| | |
2018
|
| |
2017
(unaudited) |
| |
$
|
| |
%
|
| ||||||||||||
Revenues | | | | | | | | | | | | | | | | | | | | | | | | | |
Subscription and support
|
| | | $ | 3,759,981 | | | | | $ | 2,146,870 | | | | | $ | 1,613,111 | | | | | | 75% | | |
Sale of kiosks
|
| | | | 321,135 | | | | | | 1,090,500 | | | | | | (769,365) | | | | | | -71% | | |
Total revenues
|
| | | | 4,081,116 | | | | | | 3,237,370 | | | | | | 843,746 | | | | | | 26% | | |
Cost of revenues | | | | | | | | | | | | | | | | | | | | | | | | | |
Subscription and support
|
| | | | 2,700,941 | | | | | | 1,920,646 | | | | | | 780,295 | | | | | | 41% | | |
Sale of kiosks
|
| | | | 322,446 | | | | | | 902,466 | | | | | | (580,020) | | | | | | -64% | | |
Total cost of revenues
|
| | | | 3,023,387 | | | | | | 2,823,112 | | | | | | 200,275 | | | | | | 7% | | |
Gross Profit
|
| | | | 1,057,729 | | | | | | 414,258 | | | | | | 643,471 | | | | | | 155% | | |
Operating expenses | | | | | | | | | | | | | | | | | | | | | | | | | |
Sales and marketing
|
| | | | 938,656 | | | | | | 756,042 | | | | | | 182,614 | | | | | | 24% | | |
Research and development
|
| | | | 3,128,351 | | | | | | 2,571,076 | | | | | | 557,275 | | | | | | 22% | | |
General and administrative
|
| | | | 4,679,132 | | | | | | 2,732,056 | | | | | | 1,947,076 | | | | | | 71% | | |
Total operating expenses
|
| | | | 8,746,139 | | | | | | 6,059,174 | | | | | | 2,686,965 | | | | | | 44% | | |
Loss from operations
|
| | | | (7,688,410) | | | | | | (5,644,916) | | | | | | (2,043,494) | | | | | | 36% | | |
Other income (expenses) | | | | | | | | | | | | | | | | | | | | | | | | | |
Interest income
|
| | | | 1,521 | | | | | | 773 | | | | | | 748 | | | | | | 97% | | |
Interest expense
|
| | | | (301,617) | | | | | | (3,002) | | | | | | (298,615) | | | | | | 9947% | | |
Sublease loss
|
| | | | — | | | | | | (16,052) | | | | | | 16,052 | | | | | | -100% | | |
Change in fair value of notes payable
|
| | | | (1,386,503) | | | | | | — | | | | | | (1,386,503) | | | | | | n/a | | |
Change in fair value of put option
|
| | | | 98,808 | | | | | | — | | | | | | 98,808 | | | | | | n/a | | |
Change in fair value of warrant liability
|
| | | | (39,154) | | | | | | (78) | | | | | | (39,076) | | | | | | 50097% | | |
Other income (expense), net
|
| | | | (1,626,945) | | | | | | (18,359) | | | | | | (1,608,586) | | | | | | 8762% | | |
Net loss
|
| | | | (9,315,355) | | | | | | (5,663,275) | | | | | | (3,652,080) | | | | | | 64% | | |
Cumulative preferred stock dividends
|
| | | | (856,925) | | | | | | (756,065) | | | | | | (100,860) | | | | | | 13% | | |
Net loss applicable to common stockholders
|
| | | $ | (10,172,280) | | | | | $ | (6,419,340) | | | | | $ | (3,752,940) | | | | | | 58% | | |
Basic and diluted loss per share attributable to common stockholders:
|
| | | $ | (133.53) | | | | | $ | (91.29) | | | | | $ | (42.24) | | | | | | 46% | | |
Basic and diluted weighted average shares used to compute earnings per share:
|
| | | | 76,182 | | | | | | 70,319 | | | | | | 5,863 | | | | | | 8% | | |
|
| | |
Nine months ended September 30,
|
| |||||||||
| | |
2018
|
| |
2017
(unaudited) |
| ||||||
Net cash (used in) provided by: | | | | | | | | | | | | | |
Operating activities
|
| | | $ | (5,774,770) | | | | | $ | (2,825,973) | | |
Investing activities
|
| | | | (249,719) | | | | | | (200,738) | | |
Financing activities
|
| | | | 15,439,688 | | | | | | 3,217,099 | | |
Net increase in cash and cash equivalents
|
| | | $ | 9,415,199 | | | | | $ | 190,388 | | |
| | |
Principal Payments
|
| |||
2018
|
| | | $ | — | | |
2019
|
| | | | — | | |
2020
|
| | | | 150,000 | | |
2021
|
| | | | 25,000 | | |
Total
|
| | | $ | 175,000 | | |
|
| | |
Amount
|
| |||
2018
|
| | | $ | 160,791 | | |
2019
|
| | | | 649,641 | | |
2020
|
| | | | 661,845 | | |
2021
|
| | | | 458,033 | | |
Total
|
| | | $ | 1,930,310 | | |
|
Year
|
| |
Amount
|
| |||
2018
|
| | | $ | 36,474 | | |
2019
|
| | | | 146,890 | | |
2020
|
| | | | 149,868 | | |
Total
|
| | | $ | 333,232 | | |
|
|
2018
|
| | | $ | 64,150 | | |
|
2019
|
| | | | 227,150 | | |
|
2020
|
| | | | 175,274 | | |
|
2021
|
| | | | 140,400 | | |
|
2022
|
| | | | 33,290 | | |
|
2023
|
| | | | 666 | | |
|
Total minimum lease payments
|
| | | | 640,930 | | |
|
Less: amount representing interest, maintenance, and warranties
|
| | | | (197,868) | | |
|
Present value of minimum lease payments
|
| | | | 443,062 | | |
|
Less: current portion
|
| | | | (143,545) | | |
|
Non current portion
|
| | | $ | 299,517 | | |
|
| | |
Nine months ended
September 30, 2018 |
| |
Nine months ended
September 30, 2017 |
| |
Change
|
| |||||||||||||||
|
$
|
| |
%
|
| ||||||||||||||||||||
| | | | | | | | |
(Unaudited)
|
| | | | | | | | | | | | | |||
Revenues | | | | | | | | | | | | | | | | | | | | | | | | | |
Subscription and support
|
| | | $ | 3,351,432 | | | | | $ | 3,251,491 | | | | | $ | 99,941 | | | | | | 3% | | |
Professional services
|
| | | | 393,480 | | | | | | 235,793 | | | | | | 157,687 | | | | | | 67% | | |
Total revenues
|
| | | | 3,744,912 | | | | | | 3,487,284 | | | | | | 257,628 | | | | | | 7% | | |
Cost of revenues | | | | | | | | | | | | | | | | | | | | | | | | | |
Subscription and support
|
| | | | 953,769 | | | | | | 640,984 | | | | | | 312,785 | | | | | | 49% | | |
Professional services
|
| | | | 328,964 | | | | | | 302,011 | | | | | | 26,953 | | | | | | 9% | | |
Total cost of revenues
|
| | | | 1,282,733 | | | | | | 942,995 | | | | | | 339,738 | | | | | | 36% | | |
Gross profit
|
| | | | 2,462,179 | | | | | | 2,544,289 | | | | | | (82,110) | | | | | | -3% | | |
Operating expenses | | | | | | | | | | | | | | | | | | | | | | | | | |
Sales and marketing
|
| | | | 888,442 | | | | | | 748,077 | | | | | | 140,365 | | | | | | 19% | | |
Research and development
|
| | | | 973,436 | | | | | | 805,785 | | | | | | 167,651 | | | | | | 21% | | |
General and administrative
|
| | | | 1,262,399 | | | | | | 1,192,505 | | | | | | 69,894 | | | | | | 6% | | |
Total operating expenses
|
| | | | 3,124,277 | | | | | | 2,746,367 | | | | | | 377,910 | | | | | | 14% | | |
Loss from operations
|
| | | | (662,098) | | | | | | (202,078) | | | | | | (460,020) | | | | | | 228% | | |
Other income (expense) | | | | | | | | | | | | | | | | | | | | | | | | | |
Interest income
|
| | | | 11,785 | | | | | | 36,566 | | | | | | (24,781) | | | | | | -68% | | |
Interest expense
|
| | | | (16,746) | | | | | | (7,268) | | | | | | (9,478) | | | | | | 130% | | |
Sublease income
|
| | | | 54,934 | | | | | | 46,570 | | | | | | 8,364 | | | | | | 18% | | |
Loss on sublease
|
| | | | — | | | | | | (75,755) | | | | | | 75,755 | | | | | | -100% | | |
Acquisition costs
|
| | | | (159,696) | | | | | | — | | | | | | (159,696) | | | | | | 100% | | |
Gain (loss) on sales of marketable securities
|
| | | | 2,598 | | | | | | 8,774 | | | | | | (6,176) | | | | | | -70% | | |
Other income (expense), net
|
| | | | (107,125) | | | | | | 8,887 | | | | | | (116,012) | | | | | | -1305% | | |
Net loss
|
| | | $ | (769,223) | | | | | $ | (193,191) | | | | | $ | (576,032) | | | | | | 298% | | |
|
| | |
Nine months ended
September 30, 2018 |
| |
Nine months ended
September 30, 2017 |
| ||||||
| | | | | | | | |
(Unaudited)
|
| |||
Net cash flows used in operating activities
|
| | | $ | (612,505) | | | | | $ | (248,699) | | |
Net cash flows provided by investing activities
|
| | | $ | 662,824 | | | | | $ | 1,027,670 | | |
Net cash flows used in financing activities
|
| | | $ | (252,176) | | | | | $ | (943,583) | | |
|
For the three months ended December 31, 2018
|
| | | $ | 77,181 | | |
| For the years ended December 31, | | | | | | | |
|
2019
|
| | | | 308,723 | | |
|
2020
|
| | | | 308,723 | | |
|
2021
|
| | | | 308,723 | | |
|
2022
|
| | | | 128,635 | | |
| | | | | $ | 1,131,985 | | |
|
|
For the three months ended December 31, 2018
|
| | | $ | 20,450 | | |
| For the years ended December 31, | | | | | | | |
|
2019
|
| | | | 62,882 | | |
|
2020
|
| | | | 64,771 | | |
|
2021
|
| | | | 66,713 | | |
|
2022
|
| | | | 28,138 | | |
| | | | | $ | 242,954 | | |
|
| | |
For the nine months ended September 30,
|
| |
Dollar Change
|
| |
Percentage
Change |
| |||||||||||||||
| | |
2018
|
| |
2017
|
| ||||||||||||||||||
| | | | | | | | |
(Unaudited)
|
| | | | | | | | | | | | | |||
Revenues | | | | | | | | | | | | | | | | | | | | | | | | | |
Subscription services
|
| | | $ | 1,026,703 | | | | | $ | 752,890 | | | | | $ | 273,813 | | | | | | 36% | | |
Professional services
|
| | | | 186,150 | | | | | | 356,815 | | | | | | (170,665) | | | | | | -48% | | |
Total revenues
|
| | | | 1,212,853 | | | | | | 1,109,705 | | | | | | 103,148 | | | | | | 9% | | |
Cost of revenues | | | | | | | | | | | | | | | | | | | | | | | | | |
Cost of subscription services
|
| | | | 159,195 | | | | | | 123,438 | | | | | | 35,757 | | | | | | 29% | | |
Cost of professional services
|
| | | | 213,551 | | | | | | 177,037 | | | | | | 36,514 | | | | | | 21% | | |
Total costs of revenues
|
| | | | 372,746 | | | | | | 300,475 | | | | | | 72,271 | | | | | | 24% | | |
Gross profit
|
| | | | 840,107 | | | | | | 809,230 | | | | | | 30,877 | | | | | | 4% | | |
Operating expenses | | | | | | | | | | | | | | | | | | | | | | | | | |
Sales and marketing
|
| | | | 14,049 | | | | | | 38,612 | | | | | | (24,563) | | | | | | -64% | | |
General and administrative
|
| | | | 1,174,297 | | | | | | 1,288,774 | | | | | | (114,477) | | | | | | -9% | | |
Total operating expenses
|
| | | | 1,188,346 | | | | | | 1,327,386 | | | | | | (139,040) | | | | | | -10% | | |
Loss from operations
|
| | | | (348,239) | | | | | | (518,156) | | | | | | 169,917 | | | | | | -33% | | |
Other income (expense): | | | | | | | | | | | | | | | | | | | | | | | | | |
Interest income
|
| | | | — | | | | | | 35 | | | | | | (35) | | | | | | -100% | | |
Interest expense
|
| | | | (81,889) | | | | | | (59,252) | | | | | | (22,637) | | | | | | 38% | | |
Other income
|
| | | | 10,000 | | | | | | — | | | | | | 10,000 | | | | | | 0% | | |
Loss on sale of asset
|
| | | | (807) | | | | | | — | | | | | | (807) | | | | | | 0% | | |
Total other income (expense)
|
| | | | (72,696) | | | | | | (59,217) | | | | | | (13,479) | | | | | | 23% | | |
Net loss
|
| | | $ | (420,935) | | | | | $ | (577,373) | | | | | $ | 156,438 | | | | |
|
-27%
|
| |
|
| | |
For the nine months ended September 30,
|
| |||||||||
| | |
2018
|
| |
2017
|
| ||||||
| | | | | | | | |
(Unaudited)
|
| |||
Net cash (used in) provided by: | | | | | | | | | | | | | |
Operating activities
|
| | | $ | (77,370) | | | | | $ | (341,651) | | |
Investing activities
|
| | | | 1,200 | | | | | | (5,696) | | |
Financing activities
|
| | | | (37,772) | | | | | | (54,418) | | |
Net decrease in cash
|
| | | $ | (113,942) | | | | | $ | (401,765) | | |
|
| | |
Nine Months Ended September 30,
|
| |
Increase/
(Decrease) |
| ||||||||||||
| | |
2018
|
| |
2017
|
| ||||||||||||
Revenues
|
| | | $ | 9,763,921 | | | | | $ | 7,983,220 | | | | | | 22% | | |
Cost of revenue
|
| | | | 907,400 | | | | | | 647,303 | | | | | | 40% | | |
Selling, general and administrative
|
| | | | 7,654,581 | | | | | | 5,360,180 | | | | | | 43% | | |
Income from operations
|
| | | | 1,201,940 | | | | | | 1,975,737 | | | | | | -39% | | |
Other income (expense)
|
| | | | 1,756,909 | | | | | | (114,703) | | | | | | 1632% | | |
Income before income taxes
|
| | | | 2,958,849 | | | | | | 1,861,034 | | | | | | 59% | | |
Income tax expense
|
| | | | (859,641) | | | | | | (663,920) | | | | | | -30% | | |
Net income
|
| | | $ | 2,099,208 | | | | | $ | 1,197,114 | | | | | | 90% | | |
|
| | |
Nine Months Ended September 30,
|
| |||||||||
| | |
2018
|
| |
2017
|
| ||||||
Cash and cash equivalents at the beginning of the period
|
| | | $ | 2,236,096 | | | | | $ | 1,933,223 | | |
Net cash provided by operating activities
|
| | | | 4,845,812 | | | | | | 1,342,649 | | |
Net cash (used in) provided by investing activities
|
| | | | (399,031) | | | | | | 2,127,761 | | |
Net cash (used in) provided by financing activities
|
| | | | (1,190,000) | | | | | | 108 | | |
Cash and cash equivalents at the end of the period
|
| | | $ | 5,492,876 | | | | | $ | 5,403,741 | | |
|
| | |
Nine months ended September 30,
|
| |
Dollar
Change |
| |
Percentage
Change |
| |||||||||||||||
| | |
2018
|
| |
2017
|
| ||||||||||||||||||
| | | | | | | | |
(Unaudited)
|
| | | | | | | | | | | | | |||
Revenues | | | | | | | | | | | | | | | | | | | | | | | | | |
Professional services
|
| | | $ | 1,321,225 | | | | | $ | 946,198 | | | | | $ | 375,027 | | | | | | 40% | | |
Licenses
|
| | | | 678,046 | | | | | | 307,813 | | | | | | 370,233 | | | | | | 120% | | |
Hosting
|
| | | | 143,715 | | | | | | 79,658 | | | | | | 64,057 | | | | | | 80% | | |
Total revenues
|
| | | | 2,142,986 | | | | | | 1,333,669 | | | | | | 809,317 | | | | | | 61% | | |
Cost of revenues
|
| | | | 171,049 | | | | | | 47,789 | | | | | | 123,260 | | | | | | 258% | | |
Gross profit
|
| | | | 1,971,937 | | | | | | 1,285,880 | | | | | | 686,057 | | | | | | 53% | | |
Operating expenses | | | | | | | | | | | | | | | | | | | | | | | | | |
General and administrative
|
| | | | 758,047 | | | | | | 931,914 | | | | | | (173,867) | | | | | | -19% | | |
Total operating expenses
|
| | | | 758,047 | | | | | | 931,914 | | | | | | (173,867) | | | | | | -19% | | |
Operating income
|
| | | | 1,213,890 | | | | | | 353,966 | | | | | | 859,924 | | | | | | 243% | | |
Other income: | | | | | | | | | | | | | | | | | | | | | | | | | |
Interest income
|
| | | | 1,526 | | | | | | 592 | | | | | | 934 | | | | | | 158% | | |
Total other income
|
| | | | 1,526 | | | | | | 592 | | | | | | 934 | | | | | | 158% | | |
Net income
|
| | | $ | 1,215,416 | | | | | $ | 354,558 | | | | | $ | 860,858 | | | | | | 243% | | |
|
| | |
Nine months ended September 30,
|
| |||||||||
| | |
2018
|
| |
2017
|
| ||||||
| | | | | | | | |
(Unaudited)
|
| |||
Net cash provided (used in): | | | | | | | | | | | | | |
Operating activities
|
| | | $ | 959,748 | | | | | $ | 289,545 | | |
Financing activities
|
| | | | (858,000) | | | | | | (260,000) | | |
Net increase in cash and cash equivalents
|
| | | $ | 101,748 | | | | | $ | 29,545 | | |
|
Name
|
| |
Age
|
| |
Position
|
| |
Class
|
| | ||
Stephen Rohleder | | |
61
|
| |
Chief Executive Officer and Chairman
|
| | | | | ||
Harry You | | |
59
|
| |
Chief Financial Officer and Director
|
| | | | | | |
Paul Dacier | | |
60
|
| |
Director
|
| | | | | ||
Randy Cowen | | |
67
|
| |
Director
|
| | | | | ||
William D. Green | | |
65
|
| |
Director
|
| | | | | ||
Joseph M. Tucci | | |
71
|
| |
Director
|
| | | | | ||
Charles Wert | | |
74
|
| |
Director
|
| | | | |
Executives
|
| |
Year
|
| |
Base Salary
CAD |
| |
Option Awards
USD |
| |
Total
|
| ||||||||||||
Corry Flatt
Chief Executive Officer |
| | | | 2016 | | | | | | 71,910.26 | | | | | | | | | | | | 71,910.26 | | |
| | | 2017 | | | | | | 87,266.70 | | | | | | | | | | | | 87,266.70 | | | ||
Alexander Millar
Chief Technology Officer |
| | | | 2016 | | | | | | 87,820.45 | | | | | | | | | | | | 87,820.45 | | |
| | | 2017 | | | | | | 100,599.96 | | | | | | | | | | | | 100,599.96 | | | ||
Trisha Jack
Chief Financial Officer |
| | | | 2016 | | | | | | 61,999.97 | | | | | | | | | | | | 61,999.97 | | |
| | | 2017 | | | | | | 106,000.00 | | | | | | 175,125.17 | | | | | | 106,000.00 CAD | | | ||
| | | | | | | | | | | | | | | | | | | | | | | 175,125.17USD | | |
| | |
Option Awards(a)
|
| |
Stock Awards(b)
|
| ||||||||||||||||||||||||||||||||||||||||||||||||
| | |
# Securities
Underlying Unexercised Options – # Exerciseable |
| |
# Securities
Underlying Unexercised Options – # Unexerciseable |
| |
Equity
Incentive Plan Awards: Number of Securities Underlying Unexercised Unearned Options # |
| |
Option Exercise
Price (USD) |
| |
Option
Expiration date |
| |
Number of
Shares or Units of Stock that have not vested |
| |
Market
Value of Shares or Units of Stock That have not vested (USD) |
| |
Equity
incentive plan awards: Number of unearned shares, units or other rights that have not yet vested # |
| |
Equity
incentive plan awards: Market or payout value of unearned shares, units or other rights that have not vested $ |
| |||||||||||||||||||||||||||
Alexander Millar
Chief Technology Officer |
| | | | — | | | | | | — | | | | | | — | | | | | | — | | | | | | — | | | |
387,500
common shares |
| | | $ | 154,225 | | | | | | 0 | | | | | | 0 | | | |||
Trisha Jack
Chief Financial Officer |
| |
164,988
common shares |
| |
275,025
common shares |
| | | | — | | | | | | 0.398 | | | |
July 26, 2027
|
| | | | — | | | | | | — | | | | | | — | | | | | | — | | | |||||||||
|
Name
|
| |
Fees earned
or paid in cash ($) |
| |
Stock
awards ($) |
| |
Option awards
(USD)(a) |
| |
Non-equity
incentive plan compensation ($) |
| |
Nonqualified
deferred compensation earnings ($) |
| |
All other
compensation ($) |
| |
Total
(USD) |
| |||||||||||||||||||||
Thomas Aitchison
|
| | | | — | | | | | | — | | | | | | 66,458.04 | | | | | | — | | | | | | — | | | | | | — | | | | | | 66,458.04 | | |
|
2017 Summary Compensation Table
|
| ||||||||||||||||||||||||
Name and Principal Position
|
| |
Year
|
| |
Salary
($) |
| |
Stock
Awards ($) |
| |
Total
($) |
| ||||||||||||
Michael Duffy
Chief Executive Officer |
| | | | 2017 | | | | | $ | 199,999.92 | | | | | | — | | | | | $ | 199,999.92 | | |
| | | 2016 | | | | | $ | 198,958.36 | | | | | | 292,243.16(1) | | | |
2017 Director Compensation
|
| ||||||||||||||||||
Name
|
| |
Fees Earned
or Paid in Cash(1) ($) |
| |
Stock Awards(2)
($) |
| |
Total
($) |
| |||||||||
William Conroy
|
| | | | 50,000 | | | | | | 23,333.33 | | | | | | 73,333.33 | | |
Terry Diamond
|
| | | | — | | | | | | — | | | | | | — | | |
Daniel Diermeier
|
| | | | — | | | | | | — | | | | | | — | | |
Michael Moskow
|
| | | | — | | | | | | — | | | | | | — | | |
Jeffrey Taylor
|
| | | | — | | | | | | — | | | | | | — | | |
Name and Principal Position
|
| |
Year
|
| |
Base Salary
($) |
| |
Bonus
($) |
| |
Option Awards
($) |
| |
Total
($) |
| |||||||||||||||
James Ha (Chief Executive Officer)
|
| | | | 2017 | | | | | $ | 150,000.00 | | | | | | — | | | | | | — | | | | | $ | 150,000.00 | | |
James Ha (Chief Executive Officer)
|
| | | | 2016 | | | | | $ | 150,000.00 | | | | | | — | | | | | $ | 168,937.74 | | | | | $ | 318,937.74 | | |
Merril Oliver (Chief Operating Officer)
|
| | | | 2017 | | | | | $ | 147,789.81 | | | | | $ | 12,000.00 | | | | | $ | 54,000.00 | | | | | $ | 213,789.81 | | |
Name
|
| |
Number of
securities underlying unexercised options (#) exercisable |
| |
Number of
securities underlying unexercised options (#) unexercisable |
| |
Equity
incentive plan awards: Number of securities underlying unexercised unearned options # |
| |
Option
exercise price ($) |
| |
Option
expiration date |
| ||||||||||||
James Ha
|
| | | | 1,564,239 | | | | | | — | | | | | | — | | | | | $ | 0.05 | | | |
7/31/2020
|
|
James Ha
|
| | | | 449,684 | | | | | | 488,859 | | | | | | — | | | | | $ | 0.18 | | | |
1/1/2026
|
|
Merril Oliver
|
| | | | — | | | | | | 300,000 | | | | | | — | | | | | $ | 0.18 | | | |
4/13/2027
|
|
Name
|
| |
Fees
Earned or Paid in cash ($) |
| |
Stock
awards ($) |
| |
Option
awards ($) |
| |
Non-equity
incentive plan compensation ($) |
| |
Nonqualified
deferred compensation earnings ($) |
| |
All other
compensation ($) |
| |
Total
($) |
| |||||||||||||||||||||
Kirk Fernandez
|
| | | $ | 55,200.00 | | | | | | — | | | | | | — | | | | | | — | | | | | | — | | | | | | — | | | | | $ | 55,200.00 | | |
Name and Principal Position
|
| |
Year
|
| |
Base Salary
($) |
| |
Total
($) |
| |||||||||
Joel Mahoney
Chief Executive Officer |
| | | | 2017 | | | | | $ | 179,917 | | | | | $ | 179,917 | | |
| | | 2016 | | | | | | 163,542 | | | | | | 163,542 | | | ||
Peter Koht
Chief Operating Officer |
| | | | 2017 | | | | | | 178,417 | | | | | | 178,417 | | |
| | | 2016 | | | | | | 157,292 | | | | | | 157,292 | | |
Name and Principal Position
|
| |
Year
|
| |
Base Salary
($CAD) |
| |
Bonus/
Commission ($CAD) |
| |
All Other
Compensation ($CAD) |
| |
Total
($CAD) |
| |||||||||||||||
TJ Parass
President and Chief Executive Officer |
| | | | 2017 | | | | | $ | 136,333.27 | | | | | $ | 90,663.57 | | | | | $ | 3,296.16 | | | | | $ | 230,293.00 | | |
| | | 2016 | | | | | $ | 124,999.92 | | | | | $ | 101,677.14 | | | | | $ | 3,256.04 | | | | | $ | 229,933.10 | | | ||
Craig Ross
Chief Revenue Officer |
| | | | 2017 | | | | | $ | 163,200.00 | | | | | $ | 66,100.00 | | | | | $ | 3,708.96 | | | | | $ | 233,008.96 | | |
| | | 2016 | | | | | $ | 160,000.08 | | | | | $ | 64,725.00 | | | | | $ | 3,513.19 | | | | | $ | 228,238.27 | | |
2017 Summary Compensation Table
|
| ||||||||||||||||||||||||
Name and Principal Position
|
| |
Year
|
| |
Salary
($) |
| |
Bonus
($) |
| |
Total
($) |
| ||||||||||||
David Farrell
Chief Executive Officer |
| | | | 2017 | | | | | $ | 200,000 | | | | | $ | 389,994 | | | | | $ | 589,994 | | |
| | | 2016 | | | | | | — | | | | | | 360,048 | | | | | | 360,048 | | |
| | |
Before the Business
Combination |
| |
After the Business Combination
|
| ||||||||||||||||||||||||||||||
| | | | | | | | | | | | | | |
Assuming No
Redemption |
| |
Assuming Maximum
Redemption |
| ||||||||||||||||||
Name and Address of Beneficial Owner(1)
|
| |
Number of
shares(2) |
| |
%
|
| |
Number of
shares |
| |
%
|
| |
Number of
shares |
| |
%
|
| ||||||||||||||||||
Directors, Executive Officers and Founders
|
| | | | | | | | | | | | | | | | | | | | | | | | | | | | | | | | | | | | |
GTY Investors, LLC(3)
|
| | | | 13,680,000 | | | | | | 39.1% | | | | | | 13,680,000 | | | | | | 24.80% | | | | | | 13,680,000 | | | | | | 24.85% | | |
William D. Green(3)
|
| | | | 13,680,000 | | | | | | 39.1% | | | | | | 13,680,000 | | | | | | 24.80% | | | | | | 13,680,000 | | | | | | 24.85% | | |
Joseph M. Tucci(3)
|
| | | | 13,680,000 | | | | | | 39.1% | | | | | | 13,680,000 | | | | | | 24.80% | | | | | | 13,680,000 | | | | | | 24.85% | | |
Harry L. You(3)
|
| | | | 13,680,000 | | | | | | 39.1% | | | | | | 13,680,000 | | | | | | 24.80% | | | | | | 13,680,000 | | | | | | 24.85% | | |
Randolph Cowen
|
| | | | 30,000 | | | | | | * | | | | | | 30,000 | | | | | | * | | | | | | 30,000 | | | | | | * | | |
Paul Dacier
|
| | | | 30,000 | | | | | | * | | | | | | 30,000 | | | | | | * | | | | | | 30,000 | | | | | | * | | |
Stephen Rohleder(3)
|
| | | | 30,000 | | | | | | * | | | | | | 30,000 | | | | | | * | | | | | | 30,000 | | | | | | * | | |
Charles Wert
|
| | | | 30,000 | | | | | | * | | | | | | 30,000 | | | | | | * | | | | | | 30,000 | | | | | | * | | |
All Directors and Executive Officers as a Group (Seven Individuals)
|
| | | | 13,800,000 | | | | | | 39.44% | | | | | | 13,800,000 | | | | | | 25.02% | | | | | | 13,800,000 | | | | | | 25.07% | | |
| | |
Before the Business
Combination |
| |
After the Business Combination
|
| ||||||||||||||||||||||||||||||
| | | | | | | | | | | | | | |
Assuming No
Redemption |
| |
Assuming Maximum
Redemption |
| ||||||||||||||||||
Name and Address of Beneficial Owner(1)
|
| |
Number of
shares(2) |
| |
%
|
| |
Number of
shares |
| |
%
|
| |
Number of
shares |
| |
%
|
| ||||||||||||||||||
Five Percent Holders: | | | | | | | | | | | | | | | | | | | | | | | | | | | | | | | | | | | | | |
Elliot Management Corp.(4)
|
| | | | 4,400,000 | | | | | | 12.6% | | | | | | 4,400,000 | | | | | | 7.98% | | | | | | 4,400,000 | | | | | | 7.99% | | |
Glazer Capital, LLC(5)
|
| | | | 4,305,143 | | | | | | 12.3% | | | | | | 4,305,143 | | | | | | 7.81% | | | | | | 4,305,143 | | | | | | 7.82% | | |
Arrowgrass Capital Partners (US) LP(6)
|
| | | | 2,900,000 | | | | | | 8.3% | | | | | | 2,900,000 | | | | | | 5.26% | | | | | | 2,900,000 | | | | | | 5.27% | | |
Governors Lane LP(7)
|
| | | | 2,400,000 | | | | | | 6.9% | | | | | | 2,400,000 | | | | | | 4.35% | | | | | | 2,400,000 | | | | | | 4.36% | | |
|
Grant Date
|
| |
Name
|
| |
Position
(Executive Officer/ Director) |
| |
Number of
Options to Purchase Common Shares |
| |
Exercise
Price (USD) |
| |
Vesting Start
Date |
| |
Vesting Terms
|
| |
Expiry Date
|
|
|
July 26, 2017
|
| |
Trisha Jack
|
| |
Chief Financial
Officer |
| |
440,013
|
| |
0.398
|
| |
June 27, 2016
|
| |
4 year, monthly
(no cliff), single trigger acceleration on change of control |
| |
July 26, 2027
|
|
|
October 18, 2017
|
| |
Thomas
Aitchison |
| |
Director
|
| |
166,980
|
| |
0.398
|
| |
October 18, 2017
|
| |
4 year, monthly
(no cliff), single trigger acceleration on change of control |
| |
October 18, 2027
|
|
Name
|
| |
Date Issued
|
| |
Number of Shares of
Series B Preferred Stock |
| |
Aggregate Purchase
Price ($) |
| ||||||
Shirley Tark Grandchildren’s Trust for Jeffrey U/A/D 1/20/87(1)
|
| |
February 24, 2017
|
| | | | 966.38 | | | | | | 81,175.92 | | |
| | |
March 20, 2017
|
| | | | 521.72 | | | | | | 43,824.48 | | |
Conroy Investments, LLC(2)
|
| |
March 20, 2017
|
| | | | 1,190.48 | | | | | | 100,000.32 | | |
Daniel Diermeier(3)
|
| |
July 5, 2016
|
| | | | 595.24 | | | | | | 50,000.16 | | |
| | |
February 24, 2017
|
| | | | 175.72 | | | | | | 14,760.48 | | |
| | |
March 20, 2017
|
| | | | 297.62 | | | | | | 25,000.08 | | |
Diamond Consolidated L.P.(4)
|
| |
August 3, 2016
|
| | | | 803.57 | | | | | | 67,499.88 | | |
| | |
February 24, 2017
|
| | | | 237.22 | | | | | | 19,926.48 | | |
Terry Diamond Trust(5)
|
| |
August 3, 2016
|
| | | | 1,190.48 | | | | | | 100,000.32 | | |
| | |
February 24, 2017
|
| | | | 351.43 | | | | | | 29,520.12 | | |
Method One, LLC(6)
|
| |
August 3, 2016
|
| | | | 23,809.53 | | | | | | 1,999,999.52 | | |
| | |
September 30, 2016
|
| | | | 2,976.19 | | | | | | 249,999.96 | | |
| | |
February 24, 2017
|
| | | | 14,935.89 | | | | | | 1,254,614.76 | | |
Michael Madden(7)
|
| |
July 1, 2016
|
| | | | 119.05 | | | | | | 10,000.20 | | |
| | |
February 24, 2017
|
| | | | 35.14 | | | | | | 2,951.76 | | |
Michael H. Moskow Trust(8)
|
| |
March 20, 2017
|
| | | | 1,190.48 | | | | | | 100,000.32 | | |
Joseph Duffy(9)
|
| |
July 8, 2016
|
| | | | 1,190.48 | | | | | | 100,000.32 | | |
| | |
February 24, 2017
|
| | | | 351.43 | | | | | | 29,520.12 | | |
Name
|
| |
Date Issued
|
| |
Aggregate Principal
Amount ($) |
| |||
Method One, LLC(1)
|
| |
January 12, 2018
|
| | | | 1,000,000 | | |
| | |
March 7, 2018
|
| | | | 500,000 | | |
Shirley Tark Grandchildren’s Trust for Jeffrey U/A/D 1/20/87(2)
|
| |
March 7, 2018
|
| | | | 150,000 | | |
Conroy Investments, LLC(3)
|
| |
March 7, 2018
|
| | | | 500,000 | | |
Terry Diamond Trust(4)
|
| |
March 7, 2018
|
| | | | 75,000 | | |
Diamond Consolidated L.P.(5)
|
| |
March 7, 2018
|
| | | | 75,000 | | |
Daniel Diermeier(6)
|
| |
March 7, 2018
|
| | | | 50,000 | | |
Joseph Duffy(7)
|
| |
April 27, 2018
|
| | | | 80,000 | | |
BW Financial Services LLC(8)
|
| |
April 27, 2018
|
| | | | 200,000 | | |
|
Unaudited Condensed Financial Statements as of September 30, 2018 and for the three and nine months ended September 30, 2018 and 2017
|
| | | | | | |
| | | | | F-3 | | | |
| | | | | F-4 | | | |
| | | | | F-5 | | | |
| | | | | F-6 | | |
|
Financial Statements as of December 31, 2017 and 2016 and the year ended December 31, 2017 and
for the period from August 11, 2016 (inception) through December 31, 2016 |
| | | | | | |
| | | | | F-26 | | | |
| | | | | F-27 | | | |
| | | | | F-28 | | | |
| | | | | F-29 | | | |
| | | | | F-30 | | | |
| | | | | F-31 | | |
|
Consolidated Financial Statements as of September 30, 2018 and December 31, 2017 and for the
nine months ended September 30, 2018 and 2017 (unaudited) and year ended December 31, 2017 |
| | | | | | |
| | | | | F-42 | | | |
| | | | | F-43 | | | |
| | | | | F-44 | | | |
| | | | | F-45 | | | |
| | | | | F-47 | | | |
| | | | | F-48 | | |
|
Consolidated Financial Statements as of September 30, 2018 and December 31, 2017 and for the
nine months ended September 30, 2018 and 2017 (unaudited) and year ended December 31, 2017 |
| | | | | | |
| | | | | F-66 | | | |
| | | | | F-67 | | | |
| | | | | F-68 | | | |
| | | | | F-69 | | | |
| | | | | F-71 | | | |
| | | | | F-73 | | |
|
Financial Statements as of September 30, 2018 and December 31, 2017 and for the nine months ended September 30, 2018 and 2017 (unaudited) and year ended December 31, 2017
|
| | | | | | |
| | | | | F-97 | | | |
| | | | | F-98 | | | |
| | | | | F-99 | | | |
| | | | | F-100 | | | |
| | | | | F-101 | | | |
| | | | | F-102 | | | |
| | | | | F-103 | | |
|
Financial Statements as of September 30, 2018 and for the nine months ended September 30, 2018 and 2017 (unaudited)
|
| | | | | | |
| | | | | F-122 | | | |
| | | | | F-123 | | | |
| | | | | F-124 | | | |
| | | | | F-125 | | | |
| | | | | F-126 | | | |
| | | | | F-127 | | |
|
Combined Financial Statements as of September 30, 2018 and December 31, 2017 and for the nine months ended September 30, 2018 and 2017 (unaudited) and year ended December 31, 2017
|
| | | | | | |
| | | | | F-139 | | | |
| | | | | F-140 | | | |
| | | | | F-141 | | | |
| | | | | F-143 | | | |
| | | | | F-144 | | | |
| | | | | F-145 | | |
|
Financial Statements as of September 30, 2018 and for the nine months ended September 30, 2018 and 2017 (unaudited)
|
| | | | | | |
| | | | | F-160 | | | |
| | | | | F-161 | | | |
| | | | | F-162 | | | |
| | | | | F-163 | | | |
| | | | | F-164 | | | |
| | | | | F-165 | | |
| | |
September 30,
2018 |
| |
December 31,
2017 |
| ||||||
| | |
(Unaudited)
|
| | | | | | | |||
Assets | | | | | | | | | | | | | |
Current assets: | | | | | | | | | | | | | |
Cash
|
| | | $ | 373,532 | | | | | $ | 561,434 | | |
Prepaid expenses
|
| | | | 45,448 | | | | | | 66,907 | | |
Total current assets
|
| | | | 418,980 | | | | | | 628,341 | | |
Cash and cash equivalents held in Trust Account
|
| | | | 563,736,096 | | | | | | 556,817,512 | | |
Total Assets
|
| | | $ | 564,155,076 | | | | | $ | 557,445,853 | | |
Liabilities and Shareholders’ Equity | | | | | | | | | | | | | |
Accounts payable
|
| | | $ | 3,117,878 | | | | | $ | 29,658 | | |
Accrued expenses
|
| | | | 10,000 | | | | | | — | | |
Accrued expenses – related party
|
| | | | 30,000 | | | | | | 140,000 | | |
Note payable – related party
|
| | | | 400,000 | | | | | | — | | |
Total current liabilities
|
| | | | 3,557,878 | | | | | | 169,658 | | |
Deferred underwriting fees
|
| | | | 19,320,000 | | | | | | 19,320,000 | | |
Total Liabilities
|
| | | | 22,877,878 | | | | | | 19,489,658 | | |
Commitments | | | | | | | | | | | | | |
Class A ordinary shares subject to possible redemption, $0.0001 par value; 53,627,719 and 53,295,619 shares at redemption value at September 30, 2018 and December 31, 2017, respectively
|
| | | | 536,277,190 | | | | | | 532,956,190 | | |
Shareholders’ Equity: | | | | | | | | | | | | | |
Preferred shares, $0.0001 par value; 1,000,000 shares authorized; no shares issued and outstanding
|
| | | | — | | | | | | — | | |
Class A ordinary shares, $0.0001 par value; 400,000,000 shares authorized; 1,572,281 and 1,904,381 shares issued and outstanding (excluding 53,627,719 and 53,295,619 shares subject to possible redemption, respectively) at September 30, 2018 and December 31, 2017, respectively
|
| | | | 157 | | | | | | 190 | | |
Class B ordinary shares, $0.0001 par value; 50,000,000 shares authorized;
13,800,000 shares issued and outstanding at September 30, 2018 and December 31, 2017 |
| | | | 1,380 | | | | | | 1,380 | | |
Additional paid-in capital
|
| | | | — | | | | | | 1,074,317 | | |
Retained earnings
|
| | | | 4,998,471 | | | | | | 3,924,118 | | |
Total Shareholders’ Equity
|
| | | | 5,000,008 | | | | | | 5,000,005 | | |
Total Liabilities and Shareholders’ Equity
|
| | | $ | 564,155,076 | | | | | $ | 557,445,853 | | |
|
| | |
For the Three Months Ended
September 30, |
| |
For the Nine Months Ended
September 30, |
| ||||||||||||||||||
| | |
2018
|
| |
2017
|
| |
2018
|
| |
2017
|
| ||||||||||||
General and administrative expenses
|
| | | $ | 3,077,815 | | | | | $ | 143,531 | | | | | $ | 3,598,337 | | | | | $ | 569,237 | | |
Loss from operations
|
| | | | (3,077,815) | | | | | | (143,531) | | | | | | (3,598,337) | | | | | | (569,237) | | |
Interest income
|
| | | | 2,668,488 | | | | | | 1,426,226 | | | | | | 6,919,340 | | | | | | 3,139,044 | | |
Net income (loss)
|
| | | $ | (409,327) | | | | | $ | 1,282,695 | | | | | $ | 3,321,003 | | | | | $ | 2,569,807 | | |
Weighted average shares outstanding | | | | | | | | | | | | | | | | | | | | | | | | | |
Basic(1)
|
| | | | 15,331,793 | | | | | | 15,960,293 | | | | | | 15,526,979 | | | | | | 16,033,767 | | |
Diluted
|
| | | | 15,331,793 | | | | | | 69,000,000 | | | | | | 69,000,000 | | | | | | 69,000,000 | | |
Net income (loss) per share | | | | | | | | | | | | | | | | | | | | | | | | | |
Basic
|
| | | $ | (0.03) | | | | | $ | 0.08 | | | | | $ | 0.21 | | | | | $ | 0.16 | | |
Diluted
|
| | | $ | (0.03) | | | | | $ | 0.02 | | | | | $ | 0.05 | | | | | $ | 0.04 | | |
|
| | |
For the Nine Months ended
September 30, |
| |||||||||
| | |
2018
|
| |
2017
|
| ||||||
Cash Flows from Operating Activities | | | | | | | | | | | | | |
Net income
|
| | | $ | 3,321,003 | | | | | $ | 2,569,807 | | |
Adjustments to reconcile net income to net cash used in operating activities: | | | | | | | | | | | | | |
Interest earned on cash and cash equivalents held in Trust Account
|
| | | | (6,918,584) | | | | | | (3,138,686) | | |
Changes in operating assets and liabilities: | | | | | | | | | | | | | |
Prepaid expenses
|
| | | | 21,459 | | | | | | (30,954) | | |
Accounts payable
|
| | | | 3,088,220 | | | | | | (42,826) | | |
Accrued expenses
|
| | | | 10,000 | | | | | | — | | |
Accrued expenses – related party
|
| | | | (110,000) | | | | | | 90,000 | | |
Net cash used in operating activities
|
| | | | (587,902) | | | | | | (552,659) | | |
Cash Flows from Financing Activities: | | | | | | | | | | | | | |
Proceeds from note payable issued to related party
|
| | | | 400,000 | | | | | | — | | |
Net cash provided by financing activities
|
| | | | 400,000 | | | | | | — | | |
Net change in cash and cash equivalents
|
| | | | (187,902) | | | | | | (552,659) | | |
Cash and cash equivalents – beginning of the period
|
| | |
|
561,434
|
| | | |
|
1,219,822
|
| |
Cash and cash equivalents – end of the period
|
| | | $ | 373,532 | | | | | $ | 667,163 | | |
Supplemental disclosure of noncash investing and financing activities: | | | | | | | | | | | | | |
Change in value of Class A ordinary shares subject to possible redemption
|
| | | $ | 3,321,000 | | | | | $ | 2,569,800 | | |
|
September 30, 2018 Description |
| |
Quoted Prices
in Active Markets (Level 1) |
| |
Significant Other
Observable Inputs (Level 2) |
| |
Significant Other
Unobservable Inputs (Level 3) |
| |||||||||
Cash and U.S. Treasury Bills
|
| | | $ | 563,736,096 | | | | | $ | — | | | | | $ | — | | |
|
December 31, 2017 Description |
| |
Quoted Prices
in Active Markets (Level 1) |
| |
Significant Other
Observable Inputs (Level 2) |
| |
Significant Other
Unobservable Inputs (Level 3) |
| |||||||||
Cash and U.S. Treasury Bills
|
| | | $ | 556,817,512 | | | | | $ | — | | | | | $ | — | | |
|
| | |
As of December 31,
|
| |||||||||
| | |
2017
|
| |
2016
|
| ||||||
Assets | | | | | | | | | | | | | |
Current assets: | | | | | | | | | | | | | |
Cash and cash equivalents
|
| | | $ | 561,434 | | | | | $ | 1,219,822 | | |
Prepaid expenses
|
| | | | 66,907 | | | | | | 21,164 | | |
Total current assets
|
| | | | 628,341 | | | | | | 1,240,986 | | |
Cash and cash equivalents held in Trust Account
|
| | | | 556,817,512 | | | | | | 552,263,774 | | |
Total Assets
|
| | | $ | 557,445,853 | | | | | $ | 553,504,760 | | |
Liabilities and Shareholders’ Equity | | | | | | | | | | | | | |
Accounts payable and accrued expenses
|
| | | $ | 29,658 | | | | | $ | 68,739 | | |
Accrued expenses – related party
|
| | | | 140,000 | | | | | | 20,000 | | |
Total current liabilities
|
| | | | 169,658 | | | | | | 88,739 | | |
Deferred underwriting fees
|
| | | | 19,320,000 | | | | | | 19,320,000 | | |
Total Liabilities
|
| | | | 19,489,658 | | | | | | 19,408,739 | | |
Commitments | | | | | | | | | | | | | |
Class A ordinary shares subject to possible redemption, $0.0001 par value; 53,295,619 and 52,909,602 shares at redemption value at December 31, 2017 and December 31, 2016, respectively
|
| | | | 532,956,190 | | | | | | 529,096,020 | | |
Shareholders’ Equity: | | | | | | | | | | | | | |
Preferred shares, $0.0001 par value; 1,000,000 shares authorized; no shares issued and outstanding
|
| | | | — | | | | | | — | | |
Class A ordinary shares, $0.0001 par value; 400,000,000 shares authorized;
1,904,381 and 2,290,398 shares issued and outstanding (excluding 53,295,619 and 52,909,602 shares subject to possible redemption, respectively) at December 31, 2017 and December 31, 2016, respectively |
| | | | 190 | | | | | | 229 | | |
Class B ordinary shares, $0.0001 par value; 50,000,000 shares authorized; 13,800,000 shares issued and outstanding at December 31, 2017 and December 31, 2016
|
| | | | 1,380 | | | | | | 1,380 | | |
Additional paid-in capital
|
| | | | 1,074,317 | | | | | | 4,934,449 | | |
Retained earnings
|
| | | | 3,924,118 | | | | | | 63,943 | | |
Total Shareholders’ Equity
|
| | | | 5,000,005 | | | | | | 5,000,001 | | |
Total Liabilities and Shareholders’ Equity
|
| | | $ | 557,445,853 | | | | | $ | 553,504,760 | | |
|
| | |
For the Year Ended,
December 31, 2017 |
| |
For the Period from August 11,
2016 (Inception) through December 31, 2016 |
| ||||||
General and administrative expenses
|
| | | $ | 694,226 | | | | | $ | 199,834 | | |
Loss from operations
|
| | | | (694,226) | | | | | | (199,834) | | |
Interest income
|
| | | | 4,554,401 | | | | | | 263,777 | | |
Net income
|
| | | $ | 3,860,175 | | | | | $ | 63,943 | | |
Weighted average shares outstanding | | | | | | | | | | | | | |
Basic(1)
|
| | | | 15,982,914 | | | | | | 14,870,338 | | |
Diluted
|
| | | | 69,000,000 | | | | | | 38,024,460 | | |
Net earnings per share | | | | | | | | | | | | | |
Basic
|
| | | $ | 0.24 | | | | | $ | 0.00 | | |
Diluted
|
| | | $ | 0.06 | | | | | $ | 0.00 | | |
|
| | |
Ordinary Shares
|
| |
Additional
Paid-In Capital |
| |
Retained
Earnings |
| |
Total
Shareholders’ Equity |
| ||||||||||||||||||||||||||||||
| | |
Class A
|
| |
Class B
|
| ||||||||||||||||||||||||||||||||||||
| | |
Shares
|
| |
Amount
|
| |
Shares
|
| |
Amount
|
| ||||||||||||||||||||||||||||||
Balance – August 11, 2016 (inception)
|
| | | | — | | | | | $ | — | | | | | | — | | | | | $ | — | | | | | $ | — | | | | | $ | — | | | | | $ | — | | |
Issuance of Class B ordinary shares to Sponsor
|
| | | | — | | | | | | — | | | | | | 13,800,000 | | | | | | 1,380 | | | | | | 23,620 | | | | | | — | | | | | | 25,000 | | |
Sale of units in initial public offering, net of offering costs
|
| | | | 55,200,000 | | | | | | 5,520 | | | | | | — | | | | | | — | | | | | | 520,961,557 | | | | | | — | | | | | | 520,967,077 | | |
Sale of private placement warrants to Sponsor in
private placement |
| | | | — | | | | | | — | | | | | | — | | | | | | — | | | | | | 13,040,001 | | | | | | — | | | | | | 13,040,001 | | |
Ordinary shares subject to possible redemption
|
| | | | (52,909,602) | | | | | | (5,291) | | | | | | — | | | | | | — | | | | | | (529,090,729) | | | | | | — | | | | | | (529,096,020) | | |
Net income
|
| | | | — | | | | | | — | | | | | | — | | | | | | — | | | | | | — | | | | | | 63,943 | | | | | | 63,943 | | |
Balance – December 31, 2016
|
| | | | 2,290,398 | | | | | | 229 | | | | | | 13,800,000 | | | | | | 1,380 | | | | | | 4,934,449 | | | | | | 63,943 | | | | | | 5,000,001 | | |
Ordinary shares subject to possible redemption
|
| | | | (386,017) | | | | | | (39) | | | | | | — | | | | | | — | | | | | | (3,860,132) | | | | | | — | | | | | | (3,860,171) | | |
Net income
|
| | | | — | | | | | | — | | | | | | — | | | | | | — | | | | | | — | | | | | | 3,860,175 | | | | | | 3,860,175 | | |
Balance – December 31, 2017
|
| | | | 1,904,381 | | | | | $ | 190 | | | | | | 13,800,000 | | | | | $ | 1,380 | | | | | $ | 1,074,317 | | | | | $ | 3,924,118 | | | | | $ | 5,000,005 | | |
|
| | |
For the Year Ended
December 31, 2017 |
| |
For the Period from August 11,
2016 (Inception) through December 31, 2016 |
| ||||||
Cash Flows from Operating Activities | | | | | | | | | | | | | |
Net income
|
| | | $ | 3,860,175 | | | | | $ | 63,943 | | |
Adjustments to reconcile net income to net cash used in operating activities:
|
| | | | | | | | | | | | |
Formation and operating costs paid by Sponsor
|
| | | | — | | | | | | 67,133 | | |
Interest earned on cash and cash equivalents held in Trust Account
|
| | | | (4,553,739) | | | | | | (263,774) | | |
Changes in operating assets and liabilities: | | | | | | | | | | | | | |
Prepaid expenses
|
| | | | (45,743) | | | | | | (21,164) | | |
Accounts payable
|
| | | | (39,081) | | | | | | 47,989 | | |
Accrued expenses – related party
|
| | | | 120,000 | | | | | | 20,000 | | |
Net cash used in operating activities
|
| | | | (658,388) | | | | | | (85,873) | | |
Cash Flows from Investing Activities | | | | | | | | | | | | | |
Principal deposited in Trust Account
|
| | | | — | | | | | | (552,000,000) | | |
Net cash used in investing activities
|
| | | | — | | | | | | (552,000,000) | | |
Cash Flows from Financing Activities | | | | | | | | | | | | | |
Proceeds received from initial public offering
|
| | | | — | | | | | | 552,000,000 | | |
Payment of offering costs
|
| | | | — | | | | | | (27,500) | | |
Proceeds received from private placement, net of expense said
by Sponsor |
| | | | — | | | | | | 1,333,195 | | |
Net cash provided by financing activities
|
| | | | — | | | | | | 553,305,695 | | |
Net change in cash and cash equivalents
|
| | | | (658,388) | | | | | | 1,219,822 | | |
Cash and cash equivalents – beginning of the period
|
| | |
|
1,219,822
|
| | | |
|
—
|
| |
Cash and cash equivalents – end of the period
|
| | | $ | 561,434 | | | | | $ | 1,219,822 | | |
Supplemental disclosure of noncash investing and financing activities:
|
| | | | | | | | | | | | |
Change in value of Class A ordinary shares subject to possible redemption
|
| | | $ | 3,860,171 | | | | | $ | — | | |
Offering costs paid by Sponsor in exchange for founder shares
|
| | | $ | — | | | | | $ | 20,000 | | |
Formation and offering costs paid by Sponsor in exchange for founder shares
|
| | | $ | — | | | | | $ | 11,644,673 | | |
Value of Class A ordinary shares subject to possible redemption
|
| | | $ | — | | | | | $ | 529,096,020 | | |
Deferred offering costs included in accounts payable and accrued expenses
|
| | | $ | — | | | | | $ | 20,750 | | |
December 31, 2017 Description |
| |
Quoted Prices
in Active Markets (Level 1) |
| |
Significant Other
Observable Inputs (Level 2) |
| |
Significant Other
Unobservable Inputs (Level 3) |
| |||||||||
U.S. Treasury Bills
|
| | | $ | 556,817,512 | | | | | $ | — | | | | | $ | — | | |
December 31, 2016 Description |
| |
Quoted Prices
in Active Markets (Level 1) |
| |
Significant Other
Observable Inputs (Level 2) |
| |
Significant Other
Unobservable Inputs (Level 3) |
| |||||||||
U.S. Treasury Bills
|
| | | $ | 552,263,774 | | | | | $ | — | | | | | $ | — | | |
| | |
September 30,
2018 |
| |
December 31,
2017 |
| ||||||
ASSETS | | | | | | | | | | | | | |
Current assets | | | | | | | | | | | | | |
Cash and cash equivalents
|
| | | $ | 8,078,327 | | | | | $ | 11,038,259 | | |
Accounts receivable, net
|
| | | | 494,431 | | | | | | 618,025 | | |
Prepaid expenses
|
| | | | 471,335 | | | | | | 231,035 | | |
Other current assets
|
| | | | 184,682 | | | | | | 151,081 | | |
Total current assets
|
| | | | 9,228,775 | | | | | | 12,038,400 | | |
Property and equipment, net
|
| | | | 164,896 | | | | | | 105,208 | | |
Other assets
|
| | | | 361,403 | | | | | | 113,918 | | |
TOTAL ASSETS
|
| | | $ | 9,755,074 | | | | | $ | 12,257,526 | | |
LIABILITIES, TEMPORARY EQUITY AND STOCKHOLDERS’ DEFICIT
|
| | | | | | | | | | | | |
Current liabilities | | | | | | | | | | | | | |
Accounts payable and accrued expenses
|
| | | $ | 396,012 | | | | | $ | 206,378 | | |
Contract liabilities
|
| | | | 2,367,746 | | | | | | 1,446,607 | | |
Warrant liability
|
| | | | 46,037 | | | | | | — | | |
Total current liabilities
|
| | | | 2,809,795 | | | | | | 1,652,985 | | |
Contract liabilities – long-term
|
| | | | 80,627 | | | | | | 54,382 | | |
Deferred rent
|
| | | | 52,240 | | | | | | 37,881 | | |
Total liabilities
|
| | | | 2,942,662 | | | | | | 1,745,248 | | |
COMMITMENTS AND CONTINGENCIES | | | | | | | | | | | | | |
Temporary equity | | | | | | | | | | | | | |
Series Seed I preferred stock, no par value; 4,992,930 shares authorized, issued and outstanding as of September 30, 2018 and December 31, 2017
|
| | | | 635,968 | | | | | | 624,556 | | |
Series Seed II preferred stock, no par value; 2,938,710 shares authorized, issued and outstanding as of September 30, 2018 and December 31, 2017
|
| | | | 1,768,367 | | | | | | 1,735,590 | | |
Series Seed III preferred stock, no par value; 172,285 shares authorized, issued and outstanding as of September 30, 2018 and December 31, 2017
|
| | | | 128,295 | | | | | | 125,917 | | |
Series Seed IV preferred stock, no par value; 1,833,375 shares authorized, issued and outstanding as of September 30, 2018 and December 31, 2017
|
| | | | 1,282,942 | | | | | | 1,281,381 | | |
Series A preferred stock, no par value; 9,541,984 shares authorized, issued and outstanding as of September 30, 2018 and December 31, 2017
|
| | | | 10,671,173 | | | | | | 10,671,173 | | |
Total temporary equity
|
| | | | 14,486,745 | | | | | | 14,438,617 | | |
Stockholders’ deficit | | | | | | | | | | | | | |
Common stock, no par value; 40,000,000 shares authorized; 9,904,615 and 9,899,929 shares issued and outstanding as of September 30, 2018 and December 31, 2017, respectively
|
| | | | 1,643 | | | | | | 990 | | |
Additional paid-in capital
|
| | | | 588,517 | | | | | | 113,536 | | |
Accumulated deficit
|
| | | | (8,264,493) | | | | | | (4,040,865) | | |
Total stockholders’ deficit
|
| | | | (7,674,333) | | | | | | (3,926,339) | | |
TOTAL LIABILITIES, TEMPORARY EQUITY AND STOCKHOLDERS’ DEFICIT
|
| | | $ | 9,755,074 | | | | | $ | 12,257,526 | | |
|
| | |
Nine Months ended
September 30, 2018 |
| |
Nine Months ended
September 30, 2017 |
| |
For the Year ended
December 31, 2017 |
| |||||||||
| | |
(Unaudited)
|
| |||||||||||||||
Revenue
|
| | | $ | 2,908,139 | | | | | $ | 1,322,296 | | | | | $ | 1,993,805 | | |
Cost of sales
|
| | | | 715,166 | | | | | | 115,501 | | | | | | 210,684 | | |
Gross profit
|
| | | | 2,192,973 | | | | | | 1,206,795 | | | | | | 1,783,121 | | |
Operating expenses: | | | | | | | | | | | | | | | | | | | |
General and administrative
|
| | | | 2,479,222 | | | | | | 975,592 | | | | | | 1,656,911 | | |
Sales and marketing
|
| | | | 2,748,276 | | | | | | 983,198 | | | | | | 1,329,037 | | |
Research and development
|
| | | | 1,582,335 | | | | | | 436,290 | | | | | | 667,201 | | |
Total operating expenses
|
| | | | 6,809,833 | | | | | | 2,395,080 | | | | | | 3,653,149 | | |
Loss from operations
|
| | | | (4,616,860) | | | | | | (1,188,285) | | | | | | (1,870,028) | | |
Other income (expenses) | | | | | | | | | | | | | | | | | | | |
Interest income
|
| | | | 47,886 | | | | | | — | | | | | | 9,317 | | |
Grant income
|
| | | | 130,676 | | | | | | 15,000 | | | | | | 152,615 | | |
Other (expense) income
|
| | | | (8,925) | | | | | | — | | | | | | 15,206 | | |
Loss on disposal of capital assets
|
| | | | — | | | | | | (12,223) | | | | | | (12,223) | | |
Foreign exchange gain (loss)
|
| | | | 271,723 | | | | | | (907,617) | | | | | | (779,083) | | |
Total other income (expense), net
|
| | | | 441,360 | | | | | | (904,840) | | | | | | (614,168) | | |
Net loss
|
| | | $ | (4,175,500) | | | | | $ | (2,093,125) | | | | | $ | (2,484,196) | | |
Deemed dividend on Series Seed preferred stock
|
| | | | (48,128) | | | | | | 190,316 | | | | | | 167,990 | | |
Net loss applicable to common stockholders
|
| | | $ | (4,223,628) | | | | | $ | (1,902,809) | | | | | $ | (2,316,206) | | |
Net loss per share, basic and diluted
|
| | | $ | (0.43) | | | | | $ | (0.19) | | | | | $ | (0.23) | | |
Weighted average common shares outstanding, basic
and diluted |
| | | | 9,901,949 | | | | | | 9,899,929 | | | | | | 9,899,929 | | |
|
| | |
Series Seed I
Preferred Stock |
| |
Series Seed II
Preferred Stock |
| |
Series Seed III
Preferred Stock |
| |
Series Seed IV
Preferred Stock |
| |
Series A
Preferred Stock |
| |
Total
Temporary Equity |
| ||||||||||||||||||||||||||||||||||||||||||||||||
| | |
Shares
|
| |
Amount
|
| |
Shares
|
| |
Amount
|
| |
Shares
|
| |
Amount
|
| |
Shares
|
| |
Amount
|
| |
Shares
|
| |
Amount
|
| ||||||||||||||||||||||||||||||||||||
Balance as of January 1, 2017
|
| | | | 4,992,930 | | | | | $ | 608,537 | | | | | | 2,938,710 | | | | | $ | 1,852,309 | | | | | | 172,285 | | | | | $ | 134,385 | | | | | | 1,466,708 | | | | | $ | 1,075,079 | | | | | | — | | | | | $ | — | | | | | $ | 3,670,310 | | |
Issuance of Series Seed IV preferred stock for cash
|
| | | | — | | | | | | — | | | | | | — | | | | | | — | | | | | | — | | | | | | — | | | | | | 366,667 | | | | | | 265,124 | | | | | | — | | | | | | — | | | | | | 265,124 | | |
Issuance of Series A preferred stock for cash
|
| | | | — | | | | | | — | | | | | | — | | | | | | — | | | | | | — | | | | | | — | | | | | | — | | | | | | — | | | | | | 9,541,984 | | | | | | 10,671,173 | | | | | | 10,671,173 | | |
Accrete redemption value on Series Seed preferred stock
|
| | | | — | | | | | | 16,019 | | | | | | — | | | | | | (116,719) | | | | | | — | | | | | | (8,468) | | | | | | — | | | | | | (58,822) | | | | | | — | | | | | | — | | | | | | (167,990) | | |
Balance as of December 31,
2017 |
| | | | 4,992,930 | | | | | | 624,556 | | | | | | 2,938,710 | | | | | | 1,735,590 | | | | | | 172,285 | | | | | | 125,917 | | | | | | 1,833,375 | | | | | | 1,281,381 | | | | | | 9,541,984 | | | | | | 10,671,173 | | | | | | 14,438,617 | | |
Accrete redemption value on Series Seed preferred stock
|
| | | | — | | | | | | 11,412 | | | | | | — | | | | | | 32,777 | | | | | | — | | | | | | 2,378 | | | | | | — | | | | | | 1,561 | | | | | | — | | | | | | — | | | | | | 48,128 | | |
Balance as of September 30,
2018 |
| | | | 4,992,930 | | | | | $ | 635,968 | | | | | | 2,938,710 | | | | | $ | 1,768,367 | | | | | | 172,285 | | | | | $ | 128,295 | | | | | | 1,833,375 | | | | | $ | 1,282,942 | | | | | | 9,541,984 | | | | | $ | 10,671,173 | | | | | $ | 14,486,745 | | |
|
| | |
Common Stock
|
| |
Subscription
Receivable |
| |
Additional
Paid in Capital |
| |
Accumulated
Deficit |
| |
Total
Stockholders’ Deficit |
| |||||||||||||||||||||
| | |
Shares
|
| |
Amount
|
| ||||||||||||||||||||||||||||||
Balance as of January 1, 2017
|
| | | | 9,899,929 | | | | | $ | 990 | | | | | $ | (890) | | | | | $ | — | | | | | $ | (1,724,659) | | | | | $ | (1,724,559) | | |
Cash received to offset subscription receivable from issuance of common stock
|
| | | | — | | | | | | — | | | | | | 890 | | | | | | — | | | | | | — | | | | | | 890 | | |
Stock based compensation
|
| | | | — | | | | | | — | | | | | | — | | | | | | 113,536 | | | | | | — | | | | | | 113,536 | | |
Accrete redemption value on Series Seed preferred stock
|
| | | | — | | | | | | — | | | | | | — | | | | | | — | | | | | | 167,990 | | | | | | 167,990 | | |
Net loss
|
| | | | — | | | | | | — | | | | | | — | | | | | | — | | | | | | (2,484,196) | | | | | | (2,484,196) | | |
Balance as of December 31, 2017
|
| | | | 9,899,929 | | | | | | 990 | | | | | | — | | | | | | 113,536 | | | | | | (4,040,865) | | | | | | (3,926,339) | | |
Stock options exercised for cash
|
| | | | 4,686 | | | | | | 653 | | | | | | — | | | | | | 1,670 | | | | | | — | | | | | | 2,323 | | |
Stock based compensation
|
| | | | — | | | | | | — | | | | | | — | | | | | | 473,311 | | | | | | — | | | | | | 473,311 | | |
Accrete redemption value on Series Seed preferred stock
|
| | | | — | | | | | | — | | | | | | — | | | | | | — | | | | | | (48,128) | | | | | | (48,128) | | |
Net loss
|
| | | | — | | | | | | — | | | | | | — | | | | | | — | | | | | | (4,175,500) | | | | | | (4,175,500) | | |
Balance as of September 30, 2018
|
| | | | 9,904,615 | | | | | $ | 1,643 | | | | | $ | — | | | | | $ | 588,517 | | | | | $ | (8,264,493) | | | | | $ | (7,674,333) | | |
|
| | |
Nine Months ended
September 30, 2018 |
| |
Nine Months ended
September 30, 2017 |
| |
For the Year ended
December 31, 2017 |
| |||||||||
| | |
(Unaudited)
|
| |||||||||||||||
Cash flows from operating activities | | | | | | | | | | | | | | | | | | | |
Net loss
|
| | | $ | (4,175,500) | | | | | $ | (2,093,125) | | | | | $ | (2,484,196) | | |
Adjustments to reconcile net loss to net cash used
in operating activities: |
| | | | | | | | | | | | | | | | | | |
Depreciation and amortization
|
| | | | 42,899 | | | | | | 2,631 | | | | | | 27,129 | | |
Amortization on debt issuance cost
|
| | | | 8,851 | | | | | | — | | | | | | — | | |
Stock-based compensation expense
|
| | | | 473,311 | | | | | | 75,363 | | | | | | 113,536 | | |
Loss on diposal of property and equipment
|
| | | | — | | | | | | 12,224 | | | | | | 12,223 | | |
Changes in operating assets and liabilities:
|
| | | | | | | | | | | | | | | | | | |
Accounts receivable
|
| | | | 123,594 | | | | | | (52,210) | | | | | | (321,020) | | |
Prepaid expenses
|
| | | | (240,300) | | | | | | (61,410) | | | | | | (184,074) | | |
Other current assets
|
| | | | (10,020) | | | | | | (38,529) | | | | | | 82,945 | | |
Other assets
|
| | | | (188,500) | | | | | | (60,617) | | | | | | (81,769) | | |
Accounts payable and accrued expenses
|
| | | | 144,254 | | | | | | 17,454 | | | | | | 117,698 | | |
Contract liabilities
|
| | | | 947,384 | | | | | | 584,097 | | | | | | 922,096 | | |
Deferred rent
|
| | | | 14,359 | | | | | | 32,705 | | | | | | 37,881 | | |
Net cash used in operating activities
|
| | | | (2,859,668) | | | | | | (1,581,417) | | | | | | (1,757,551) | | |
Cash flows from investing activities
|
| | | | | | | | | | | | | | | | | | |
Purchase of property and equipment
|
| | | | (102,587) | | | | | | (47,309) | | | | | | (103,369) | | |
Proceeds from sale of property and equipment
|
| | | | — | | | | | | 4,425 | | | | | | 4,425 | | |
Net cash used in investing activities
|
| | | | (102,587) | | | | | | (42,884) | | | | | | (98,944) | | |
Cash flows from financing activities
|
| | | | | | | | | | | | | | | | | | |
Proceeds from issuance of Series A preferred stock, net of offering cost
|
| | | | — | | | | | | 10,671,173 | | | | | | 10,671,173 | | |
Proceeds from issuance of Seed Series IV preferred stock, net of offering cost
|
| | | | — | | | | | | 265,124 | | | | | | 265,124 | | |
Proceeds from exercise of stock options
|
| | | | 2,323 | | | | | | — | | | | | | — | | |
Proceeds from collection of subscription receivable
|
| | | | — | | | | | | 890 | | | | | | 890 | | |
Net cash provided by financing activities
|
| | | | 2,323 | | | | | | 10,937,187 | | | | | | 10,937,187 | | |
(Decrease) increase in cash and cash equivalents
|
| | | | (2,959,932) | | | | | | 9,312,886 | | | | | | 9,080,692 | | |
Cash and cash equivalents, at the beginning of the
period |
| | | | 11,038,259 | | | | | | 1,957,567 | | | | | | 1,957,567 | | |
Cash and cash equivalents, at the end of the
period |
| | | $ | 8,078,327 | | | | | $ | 11,270,453 | | | | | $ | 11,038,259 | | |
Supplemental disclosure of noncash investing and financing activities:
|
| | | | | | | | | | | | | | | | | | |
Issuance of common stock warrants with liability treatment in connection with loan facility
|
| | | $ | 46,037 | | | | | $ | — | | | | | $ | — | | |
Deemed dividend on Series Seed preferred stock
|
| | | $ | 48,128 | | | | | $ | 190,316 | | | | | $ | 167,990 | | |
Supplemental disclosure of cash flow information:
|
| | | | | | | | | | | | | | | | | | |
Cash paid for interest
|
| | | $ | — | | | | | $ | — | | | | | $ | — | | |
Cash paid for taxes
|
| | | $ | — | | | | | $ | — | | | | | $ | — | | |
| | |
September 30,
2018 |
| |
December 31,
2017 |
| ||||||
Cash (US institution)
|
| | | $ | 518,509 | | | | | $ | — | | |
Cash (CDN institution)
|
| | | | 7,559,818 | | | | | | 11,038,259 | | |
| | | | $ | 8,078,327 | | | | | $ | 11,038,259 | | |
|
| | |
September 30,
2018 |
| |
December 31,
2017 |
| ||||||
Customer A
|
| | | | 10% | | | | | $ | — | | |
Customer B
|
| | | | 11% | | | | | | — | | |
Customer C
|
| | | | — | | | | | | 14% | | |
| | |
Nine Months ended
September 30, 2018 |
| |
Nine Months ended
September 30, 2017 |
| |
For the Year ended
December 31, 2017 |
| |||||||||
Net loss
|
| | | $ | (4,175,500) | | | | | $ | (2,093,125) | | | | | $ | (2,484,196) | | |
Net loss per share, basic and diluted
|
| | | $ | (0.42) | | | | | $ | 0.21 | | | | | $ | (0.25) | | |
Weighted average common shares outstanding, basic and diluted
|
| | | | 9,901,949 | | | | | | 9,899,929 | | | | | | 9,899,929 | | |
|
| | |
Nine Months ended
September 30, 2018 |
| |
Nine Months ended
September 30, 2017 |
| |
For the Year ended
December 31, 2017 |
| |||||||||
Series Seed I preferred stock
|
| | | | 4,992,930 | | | | | | 4,992,930 | | | | | | 4,992,930 | | |
Series Seed II preferred stock
|
| | | | 2,938,710 | | | | | | 2,938,710 | | | | | | 2,938,710 | | |
Series Seed III preferred stock
|
| | | | 172,285 | | | | | | 172,285 | | | | | | 172,285 | | |
Series Seed IV preferred stock
|
| | | | 1,833,375 | | | | | | 1,833,375 | | | | | | 1,833,375 | | |
Series A preferred stock
|
| | | | 9,541,984 | | | | | | 9,541,984 | | | | | | 9,541,984 | | |
Common stock options
|
| | | | 2,467,247 | | | | | | 667,513 | | | | | | 943,555 | | |
Warrants – liability treatment
|
| | | | 43,415 | | | | | | — | | | | | | — | | |
Potentially dilutive securities
|
| | | | 21,989,946 | | | | | | 20,146,797 | | | | | | 20,422,839 | | |
|
| | |
September 30,
2018 |
| |
December 31,
2017 |
| ||||||
Computer equipment
|
| | | $ | 200,655 | | | | | $ | 114,802 | | |
Furniture and fixtures
|
| | | | 43,211 | | | | | | 26,477 | | |
| | | | | 243,866 | | | | | | 141,279 | | |
Accumulated depreciation
|
| | | | (78,970) | | | | | | (36,071) | | |
Total property and equipment, net
|
| | | $ | 164,896 | | | | | $ | 105,208 | | |
|
|
Exercise price
|
| | | $ | 0.51 | | |
|
Expected term in years
|
| | | | 10.0 | | |
|
Expected volatility (annual)
|
| | | | 50% | | |
|
Risk-free interest rate
|
| | | | 3% | | |
|
Expected dividend yield (per share)
|
| | | | 0% | | |
| | |
Fair value measured at September 30, 2018
|
| |||||||||||||||||||||
| | |
Fair value at
September 30, 2018 |
| |
Quoted prices in active
markets (Level 1) |
| |
Significant other
observable inputs (Level 2) |
| |
Significant
unobservable inputs (Level 3) |
| ||||||||||||
Warrant liability
|
| | | $ | 46,037 | | | | | $ | — | | | | | $ | — | | | | | $ | 46,037 | | |
| | |
May 16, 2018
|
| |||
SVB warrants
|
| | | $ | 46,037 | | |
SVB fees
|
| | | | 31,241 | | |
Legal costs
|
| | | | 14,139 | | |
| | | | $ | 91,417 | | |
|
| | |
Short-term
Portion |
| |
Long-term
Portion |
| ||||||
Beginning balance, May 16, 2018
|
| | | $ | 22,547 | | | | | $ | 68,870 | | |
Amortization
|
| | | | (8,851) | | | | | | — | | |
Reclass between short-term and long-term
|
| | | | 9,885 | | | | | | (9,885) | | |
Ending balance, September 30, 2018
|
| | | $ | 23,581 | | | | | $ | 58,985 | | |
|
Series
|
| |
Original Issue
Price |
| |
Liquidation
Value per Share |
|
Series Seed I preferred stock
|
| |
C$ 0.138685
|
| |
C$ 0.138685
|
|
Series Seed II preferred stock
|
| |
US$ 0.469036
|
| |
US$ 0.469036
|
|
Series Seed III preferred stock
|
| |
US$ 0.580434
|
| |
US$ 0.580434
|
|
Series Seed IV preferred stock
|
| |
US$ 0.545439
|
| |
US$ 0.545439
|
|
Series A preferred stock
|
| |
US$ 0.838400
|
| |
US$ 0.838400
|
|
Series
|
| |
Conversion
Price |
|
Series Seed I preferred stock
|
| |
C$ 0.138685
|
|
Series Seed II preferred stock
|
| |
US$ 0.469036
|
|
Series Seed III preferred stock
|
| |
US$ 0.580434
|
|
Series Seed IV preferred stock
|
| |
US$ 0.545439
|
|
Series A preferred stock
|
| |
US$ 0.838400
|
|
| | |
Number of
Shares |
| |
Weighted Average
Exercise Price |
| |
Weighted Average
Remaining Contractual Life (in years) |
| |
Total Intrinsic
Value |
|||||||||||
Outstanding as of January 1, 2017
|
| | | | — | | | | | $ | — | | | | | | — | | | | | $ | — |
Granted
|
| | | | 956,993 | | | | | | 0.50 | | | | | | 10.0 | | | | | | 42,554 |
Forfeited/expired
|
| | | | (13,438) | | | | | | 0.50 | | | | | | — | | | | | | — |
Outstanding as of December 31, 2017
|
| | | | 943,555 | | | | | | 0.50 | | | | | | 9.64 | | | | | | 41,953 |
Granted
|
| | | | 1,565,254 | | | | | | 0.51 | | | | | | 10.0 | | | | | | 843,294 |
Exercised
|
| | | | (4,686) | | | | | | 0.50 | | | | | | — | | | | | | — |
Forfeited/expired
|
| | | | (36,876) | | | | | | 0.49 | | | | | | — | | | | | | — |
Outstanding as of September 30, 2018
|
| | | | 2,467,247 | | | | | $ | 0.51 | | | | | | 9.2 | | | | | $ | 1,343,573 |
Options vested and exercisable as of September 30, 2018
|
| | | | 567,193 | | | | | $ | 0.50 | | | | | | 9.0 | | | | | $ | 314,565 |
|
| | |
Nine Months ended
September 30, 2018 |
| |
Nine Months ended
September 30, 2017 |
| |
For the Year Ended
December 31, 2017 |
| |||||||||
| | |
(Unaudited)
|
| |||||||||||||||
Exercise price
|
| | | $ | 0.51 | | | | | $ | 0.50 | | | | | $ | 0.49 | | |
Expected term in years
|
| | | | 5.9 | | | | | | 5.6 | | | | | | 5.8 | | |
Expected volatility (annual)
|
| | | | 50% | | | | | | 50% | | | | | | 50% | | |
Risk-free interest rate
|
| | | | 2% | | | | | | 2% | | | | | | 2% | | |
Expected dividend yield (per share)
|
| | | | 0% | | | | | | 0% | | | | | | 0% | | |
| | |
Nine Months ended
September 30, 2018 |
| |
Nine Months ended
September 30, 2017 |
| |
For the Year ended
December 31, 2017 |
| |||||||||
| | |
(Unaudited)
|
| |||||||||||||||
General and administrative
|
| | | $ | 180,819 | | | | | $ | 54,687 | | | | | $ | 85,936 | | |
Sales and marketing
|
| | | | 40,675 | | | | | | 4,142 | | | | | | 7,153 | | |
Research and development
|
| | | | 251,817 | | | | | | 16,534 | | | | | | 20,447 | | |
Total stock-based compensation
|
| | | $ | 473,311 | | | | | $ | 75,363 | | | | | $ | 113,536 | | |
|
| | |
As of
September 30, 2018 |
| |
As of
December 31, 2017 |
| ||||||
Unrecognized stock-based compensation cost:
|
| | | $ | 784,031 | | | | | $ | 148,197 | | |
Expected weighted average period compensation costs to be recognized (years):
|
| | | | 1.5 | | | | | | 1.5 | | |
| | |
September 30,
2018 |
| |
December 31,
2017 |
| ||||||
Advertising
|
| | | $ | 56,879 | | | | | $ | 10,028 | | |
IT
|
| | | | 13,521 | | | | | | 55,845 | | |
Office & Insurance
|
| | | | 59,075 | | | | | | 17,158 | | |
Rent
|
| | | | 73,154 | | | | | | 63,634 | | |
Tools
|
| | | | 268,706 | | | | | | 84,370 | | |
| | | | $ | 471,335 | | | | | $ | 231,035 | | |
|
| | |
As of
September 30, 2018 |
| |
As of
December 31, 2017 |
| ||||||
Deferred tax assets: | | | | | | | | | | | | | |
Unrecognized non-capital loss available for carryforward
|
| | | $ | 2,011,330 | | | | | $ | 1,027,358 | | |
SR&ED carryover
|
| | | | 43,188 | | | | | | 53,202 | | |
Reserve for doubtful accounts
|
| | | | — | | | | | | 2,503 | | |
Unrealized gain/loss on investment/currency
|
| | | | 844 | | | | | | 2 | | |
Total deferred income tax assets
|
| | | | 2,055,363 | | | | | | 1,083,065 | | |
Deferred tax liabilities: | | | | | | | | | | | | | |
Commissions
|
| | | | (111,179) | | | | | | (52,189) | | |
Property and equipment
|
| | | | (6,059) | | | | | | (5,336) | | |
Total deferred income tax liabilities
|
| | | | (117,239) | | | | | | (57,524) | | |
Net deferred tax assets
|
| | | | 1,938,124 | | | | | | 1,025,540 | | |
Valuation allowance
|
| | | | (1,938,124) | | | | | | (1,025,540) | | |
Deferred tax assets, net of allowance
|
| | | $ | — | | | | | $ | — | | |
|
| | |
For the Nine Months ended
September 30, 2018 |
| |
For the Year Ended
December 31, 2017 |
| ||||||
Statutory federal income tax rate (Canada)
|
| | | | (15.0)% | | | | | | (15.0)% | | |
Statutory provincial income tax rate (Canada)
|
| | | | (11.5)% | | | | | | (11.5)% | | |
Non-deductible stock-based compensation
|
| | | | 3.0% | | | | | | 1.2% | | |
Other non-deductible expense
|
| | | | 1.7% | | | | | | (0.6)% | | |
Change in valuation allowance
|
| | | | 21.8% | | | | | | 25.9% | | |
Income taxes provision (benefit)
|
| | | | —% | | | | | | —% | | |
|
| | |
Nine Months ended
September 30, 2018 |
| |
Nine Months ended
September 30, 2017 |
| |
For the Year ended
December 31, 2017 |
| |||||||||
Rent expenses
|
| | | $ | 278,817 | | | | | $ | 61,959 | | | | | $ | 154,898 | | |
|
October 1, 2018 – December 31, 2018
|
| | | $ | 359,991 | | |
|
2019
|
| | | | 582,225 | | |
|
2020
|
| | | | 596,146 | | |
|
2021
|
| | | | 607,227 | | |
|
2022
|
| | | | 487,828 | | |
|
Total
|
| | | $ | 2,633,417 | | |
|
| | |
September 30,
2018 |
| |
December 31,
2017 |
| ||||||
ASSETS
|
| | | | | | | | | | | | |
Current assets: | | | | | | | | | | | | | |
Cash and cash equivalents
|
| | | $ | 10,177,975 | | | | | $ | 762,776 | | |
Accounts receivable
|
| | | | 735,830 | | | | | | 804,564 | | |
Prepaid expenses and other current assets
|
| | | | 136,912 | | | | | | 96,189 | | |
Total current assets
|
| | | | 11,050,717 | | | | | | 1,663,529 | | |
Property and equipment, net
|
| | | | 620,625 | | | | | | 648,803 | | |
Intangible assets, net
|
| | | | 402,784 | | | | | | 477,887 | | |
Goodwill
|
| | | | 122,933 | | | | | | 122,933 | | |
Loan receivable from related party
|
| | | | 176,401 | | | | | | 151,134 | | |
Other assets
|
| | | | 500,854 | | | | | | 464,180 | | |
Total assets
|
| | | $ | 12,874,314 | | | | | $ | 3,528,466 | | |
LIABILITIES, TEMPORARY EQUITY AND STOCKHOLDERS’ DEFICIT
|
| | | | | | | | | | | | |
Current liabilities: | | | | | | | | | | | | | |
Accounts payable
|
| | | $ | 553,590 | | | | | $ | 325,918 | | |
Accrued expenses and other current liabilities
|
| | | | 1,966,410 | | | | | | 1,017,470 | | |
Deferred revenue
|
| | | | 1,120,628 | | | | | | 1,014,983 | | |
Current portion of capital lease obligations
|
| | | | 143,545 | | | | | | 134,479 | | |
Warrants liability
|
| | | | 56,017 | | | | | | 16,863 | | |
Subordinated notes payable
|
| | | | 1,574,284 | | | | | | — | | |
Current portion of debt
|
| | | | 400,000 | | | | | | 366,667 | | |
Total current liabilities
|
| | | | 5,814,474 | | | | | | 2,876,380 | | |
Deferred revenue, non current
|
| | | | 3,164,157 | | | | | | 3,297,601 | | |
Capital lease obligations, non current
|
| | | | 299,517 | | | | | | 382,277 | | |
Debt, non current
|
| | | | 310,076 | | | | | | 600,979 | | |
Total liabilities
|
| | | | 9,588,224 | | | | | | 7,157,237 | | |
Commitments and contingencies | | | | | | | | | | | | | |
Temporary equity | | | | | | | | | | | | | |
Series A preferred stock, $0.00001 value, 66,337 and 70,000 shares
authorized; 66,337 shares issued and outstanding as of September 30, 2018 and December 31, 2017, respectively. $734,007 liquidation preference at September 30, 2018. |
| | | | 4,763,980 | | | | | | 4,522,844 | | |
Series B preferred stock, $0.00001, 108,736 and 111,000 shares authorized; 108,379 shares issued and outstanding as of September 30, 2018 and December 31, 2017, respectively. $1,512,654 liquidation preference at September 30, 2018.
|
| | | | 10,464,793 | | | | | | 9,920,061 | | |
Series C preferred stock, $0.00001, 70,000 and 0 shares authorized; 66,829 and 0 shares issued and outstanding as of September 30, 2018 and December 31, 2017, respectively. $71,057 liquidation preference at September 30, 2018.
|
| | | | 15,575,007 | | | | | | — | | |
Total temporary equity
|
| | | | 30,803,780 | | | | | | 14,442,905 | | |
Stockholders’ deficit | | | | | | | | | | | | | |
Common stock $0.00001 par value, 400,000 and 290,550 shares authorized; 82,202 and 73,499 shares outstanding at September 30, 2018 and December 31, 2017, respectively
|
| | | | 1 | | | | | | 1 | | |
Additional paid in capital
|
| | | | 1,554,750 | | | | | | 828,484 | | |
Accumulated deficit
|
| | | | (29,072,441) | | | | | | (18,900,161) | | |
Total stockholders’ deficit
|
| | | | (27,517,690) | | | | | | (18,071,676) | | |
Total liabilities, temporary equity and stockholders’ deficit
|
| | | $ | 12,874,314 | | | | | $ | 3,528,466 | | |
|
| | |
Nine months ended September 30,
|
| |
Year ended
December 31, 2017 |
| ||||||||||||
| | |
2018
|
| |
2017
(unaudited) |
| ||||||||||||
Revenues | | | | | | | | | | | | | | | | | | | |
Subscription and support
|
| | | $ | 3,759,981 | | | | | $ | 2,146,870 | | | | | $ | 3,195,784 | | |
Sale of kiosks
|
| | | | 321,135 | | | | | | 1,090,500 | | | | | | 1,090,500 | | |
Total revenues
|
| | | | 4,081,116 | | | | | | 3,237,370 | | | | | | 4,286,284 | | |
Cost of revenues | | | | | | | | | | | | | | | | | | | |
Subscription and support
|
| | | | 2,700,941 | | | | | | 1,920,646 | | | | | | 2,496,088 | | |
Sale of kiosks
|
| | | | 322,446 | | | | | | 902,466 | | | | | | 885,401 | | |
Total cost of revenues
|
| | | | 3,023,387 | | | | | | 2,823,112 | | | | | | 3,381,489 | | |
Gross Profit
|
| | | | 1,057,729 | | | | | | 414,258 | | | | | | 904,795 | | |
Operating expenses | | | | | | | | | | | | | | | | | | | |
Sales and marketing
|
| | | | 938,656 | | | | | | 756,042 | | | | | | 1,018,332 | | |
Research and development
|
| | | | 3,128,351 | | | | | | 2,571,076 | | | | | | 3,482,164 | | |
General and administrative
|
| | | | 4,679,132 | | | | | | 2,732,056 | | | | | | 3,763,002 | | |
Total operating expenses
|
| | | | 8,746,139 | | | | | | 6,059,174 | | | | | | 8,263,498 | | |
Loss from operations
|
| | | | (7,688,410) | | | | | | (5,644,916) | | | | | | (7,358,703) | | |
Other income (expenses) | | | | | | | | | | | | | | | | | | | |
Interest income
|
| | | | 1,521 | | | | | | 773 | | | | | | 1,218 | | |
Interest expense
|
| | | | (301,617) | | | | | | (3,002) | | | | | | (23,475) | | |
Sublease loss
|
| | | | — | | | | | | (16,052) | | | | | | (71,203) | | |
Change in fair value of notes payable
|
| | | | (1,386,503) | | | | | | — | | | | | | — | | |
Change in fair value of put option
|
| | | | 98,808 | | | | | | — | | | | | | — | | |
Change in fair value of warrant liability
|
| | | | (39,154) | | | | | | (78) | | | | | | 63 | | |
Other income (expenses), net
|
| | | | (1,626,945) | | | | | | (18,359) | | | | | | (93,397) | | |
Net loss
|
| | | | (9,315,355) | | | | | | (5,663,275) | | | | | | (7,452,100) | | |
Cumulative preferred stock dividends
|
| | | | (856,925) | | | | | | (756,065) | | | | | | (1,020,900) | | |
Net loss applicable to common stockholders
|
| | | $ | (10,172,280) | | | | | $ | (6,419,340) | | | | | $ | (8,473,000) | | |
Basic and diluted loss per share attributable to common stockholders:
|
| | | $ | (133.53) | | | | | $ | (91.29) | | | | | $ | (118.50) | | |
Basic and diluted weighted average shares used to compute earnings per share:
|
| | | | 76,182 | | | | | | 70,319 | | | | | | 71,502 | | |
|
| | |
Series A
Preferred Stock |
| |
Series B
Preferred Stock |
| |
Series C
Preferred Stock |
| |
Total
Temporary Equity |
| ||||||||||||||||||||||||||||||
| | |
Shares
|
| |
Amount
|
| |
Shares
|
| |
Amount
|
| |
Shares
|
| |
Amount
|
| ||||||||||||||||||||||||
Balance as of January 1, 2017
|
| | | | 66,337 | | | | | $ | 4,200,446 | | | | | | 80,655 | | | | | $ | 6,905,513 | | | | | | — | | | | | $ | — | | | | | $ | 11,105,959 | | |
Issuance of Series B preferred stock for cash, net of offering cost
|
| | | | — | | | | | | — | | | | | | 27,724 | | | | | | 2,316,046 | | | | | | — | | | | | | — | | | | | | 2,316,046 | | |
Cumulative dividend on preferred stock
|
| | | | — | | | | | | 322,398 | | | | | | — | | | | | | 698,502 | | | | | | — | | | | | | — | | | | | | 1,020,900 | | |
Balance as of December 31, 2017
|
| | | | 66,337 | | | | | | 4,522,844 | | | | | | 108,379 | | | | | | 9,920,061 | | | | | | — | | | | | | — | | | | | | 14,442,905 | | |
Conversion of notes payable for
Series C |
| | | | — | | | | | | — | | | | | | — | | | | | | — | | | | | | 22,807 | | | | | | 5,543,775 | | | | | | 5,543,775 | | |
Issuance of Series C preferred stock for cash, net of offering cost
|
| | | | — | | | | | | — | | | | | | — | | | | | | — | | | | | | 44,022 | | | | | | 9,960,175 | | | | | | 9,960,175 | | |
Cumulative dividend on preferred stock
|
| | | | — | | | | | | 241,136 | | | | | | — | | | | | | 544,732 | | | | | | — | | | | | | 71,057 | | | | | | 856,925 | | |
Balances as of September 30, 2018
|
| | | | 66,337 | | | | | $ | 4,763,980 | | | | | | 108,379 | | | | | $ | 10,464,793 | | | | | | 66,829 | | | | | $ | 15,575,007 | | | | | $ | 30,803,780 | | |
|
| | |
Common Stock
|
| |
Additional
Paid-in Capital |
| |
Accumulated
Deficit |
| |
Total
Stockholders’ Deficit |
| ||||||||||||||||||
| | |
Shares
|
| |
Amount
|
| ||||||||||||||||||||||||
Balance as of January 1, 2017
|
| | | | 66,270 | | | | | $ | 1 | | | | | $ | 481,385 | | | | | $ | (10,427,161) | | | | | $ | (9,945,775) | | |
Stock options exercised for cash
|
| | | | 284 | | | | | | — | | | | | | 2,298 | | | | | | — | | | | | | 2,298 | | |
Stock-based compensation
|
| | | | — | | | | | | — | | | | | | 65,839 | | | | | | — | | | | | | 65,839 | | |
Issuance of restricted stock
|
| | | | 5,865 | | | | | | — | | | | | | 102,052 | | | | | | | | | | | | 102,052 | | |
Restricted stock forfeitures
|
| | | | (7,050) | | | | | | — | | | | | | — | | | | | | — | | | | | | — | | |
Cumulative dividend on preferred stock
|
| | | | — | | | | | | — | | | | | | — | | | | | | (1,020,900) | | | | | | (1,020,900) | | |
Issuance of common stock in connection
with acquisition |
| | | | 8,130 | | | | | | — | | | | | | 176,910 | | | | | | — | | | | | | 176,910 | | |
Net loss
|
| | | | — | | | | | | — | | | | | | — | | | | | | (7,452,100) | | | | | | (7,452,100) | | |
Balance as of December 31, 2017
|
| | | | 73,499 | | | | | | 1 | | | | | | 828,484 | | | | | | (18,900,161) | | | | | | (18,071,676) | | |
Exercise of warrants for common stock
|
| | | | 6,500 | | | | | | | | | | | | 453,960 | | | | | | — | | | | | | 453,960 | | |
Stock options exercised for cash
|
| | | | 2,620 | | | | | | — | | | | | | 21,196 | | | | | | — | | | | | | 21,196 | | |
Stock-based compensation
|
| | | | — | | | | | | — | | | | | | 212,616 | | | | | | — | | | | | | 212,616 | | |
Issuance of restricted stock
|
| | | | 1,750 | | | | | | — | | | | | | 38,494 | | | | | | | | | | | | 38,494 | | |
Restricted stock forfeitures
|
| | | | (2,167) | | | | | | — | | | | | | — | | | | | | — | | | | | | — | | |
Cumulative dividend on preferred stock
|
| | | | — | | | | | | — | | | | | | — | | | | | | (856,925) | | | | | | (856,925) | | |
Net loss
|
| | | | — | | | | | | — | | | | | | — | | | | | | (9,315,355) | | | | | | (9,315,355) | | |
Balances as of September 30, 2018
|
| | | | 82,202 | | | | | $ | 1 | | | | | $ | 1,554,750 | | | | | $ | (29,072,441) | | | | | $ | (27,517,690) | | |
|
| | |
Nine months ended September 30,
|
| |
Year ended
December 31, 2017 |
| ||||||||||||
| | |
2018
|
| |
2017
(unaudited) |
| ||||||||||||
Cash flows from operating activities | | | | | | | | | | | | | | | | | | | |
Net loss
|
| | | $ | (9,315,355) | | | | | $ | (5,663,275) | | | | | $ | (7,452,100) | | |
Adjustments to reconcile net loss to net cash used in operating activities:
|
| | | | | | | | | | | | | | | | | | |
Depreciation and amortization
|
| | | | 355,753 | | | | | | 251,374 | | | | | | 371,859 | | |
Stock-based compensation expense
|
| | | | 251,110 | | | | | | 121,939 | | | | | | 167,891 | | |
Change in fair market value of warrants liability
|
| | | | 39,154 | | | | | | 78 | | | | | | (63) | | |
Change in fair value of notes payable converted to Series C
|
| | | | 1,386,503 | | | | | | — | | | | | | — | | |
Interest expense from notes payable converted to Series C
|
| | | | 159,510 | | | | | | — | | | | | | — | | |
Change in fair value of put options
|
| | | | (98,808) | | | | | | — | | | | | | — | | |
Changes in operating assets and liabilities:
|
| | | | | | | | | | | | | | | | | | |
Accounts receivable
|
| | | | 68,734 | | | | | | (1,694,468) | | | | | | (117,763) | | |
Prepaid expenses and other current assets
|
| | | | (40,723) | | | | | | (11,488) | | | | | | (59,249) | | |
Other assets
|
| | | | (27,272) | | | | | | (282,674) | | | | | | (325,644) | | |
Accounts payable
|
| | | | 227,672 | | | | | | (98,205) | | | | | | (159,017) | | |
Accrued expenses and other current liabilities
|
| | | | 1,222,046 | | | | | | 113,465 | | | | | | 225,837 | | |
Deferred revenue
|
| | | | (27,799) | | | | | | 4,437,980 | | | | | | 4,247,133 | | |
Accrued interest expense
|
| | | | 24,972 | | | | | | — | | | | | | — | | |
Accrued interest income
|
| | | | (267) | | | | | | (699) | | | | | | (1,134) | | |
Net cash used in operating activities
|
| | | | (5,774,770) | | | | | | (2,825,973) | | | | | | (3,102,250) | | |
Cash flows from investing activities | | | | | | | | | | | | | | | | | | | |
Purchases of property and equipment
|
| | | | (224,719) | | | | | | (161,670) | | | | | | (173,108) | | |
Cash acquired in DOBT acquisition
|
| | | | — | | | | | | 110,932 | | | | | | 110,932 | | |
Purchase of loan receivable from related party
|
| | | | (25,000) | | | | | | (150,000) | | | | | | (150,000) | | |
Net cash used in investing activities
|
| | | | (249,719) | | | | | | (200,738) | | | | | | (212,176) | | |
Cash flows from financing activities | | | | | | | | | | | | | | | | | | | |
Proceeds from issuance of credit facility
|
| | | | — | | | | | | 1,000,000 | | | | | | 1,000,000 | | |
Issuance cost for credit facility
|
| | | | (18,804) | | | | | | (37,242) | | | | | | (37,242) | | |
Repayments of credit facility
|
| | | | (266,667) | | | | | | — | | | | | | — | | |
Proceeds from issuance of subordinated debt and common stock warrants
|
| | | | 2,000,000 | | | | | | — | | | | | | — | | |
Issuance cost for subordinated debt
|
| | | | (4,831) | | | | | | — | | | | | | — | | |
Proceeds from issuance of convertible debt
|
| | | | 4,000,000 | | | | | | — | | | | | | — | | |
Proceeds from issuance of Series B preferred stock, net of offering cost
|
| | | | — | | | | | | 2,316,046 | | | | | | 2,316,046 | | |
Proceeds from issuance of Series C preferred stock, net of offering cost
|
| | | | 9,960,175 | | | | | | — | | | | | | — | | |
Proceeds from exercise of stock options and warrants
|
| | | | 21,261 | | | | | | 2,298 | | | | | | 2,298 | | |
| | |
Nine months ended September 30,
|
| |
Year ended
December 31, 2017 |
| ||||||||||||
| | |
2018
|
| |
2017
(unaudited) |
| ||||||||||||
Deferred cash payments made for DOBT acquisition
|
| | | | (150,000) | | | | | | — | | | | | | — | | |
Repayments of capital lease obligations
|
| | | | (101,446) | | | | | | (64,003) | | | | | | (92,894) | | |
Net cash provided by financing activities
|
| | | | 15,439,688 | | | | | | 3,217,099 | | | | | | 3,188,208 | | |
Net increase (decrease) in cash and cash equivalents
|
| | | | 9,415,199 | | | | | | 190,388 | | | | | | (126,218) | | |
Cash and cash equivalents, beginning of the period
|
| | | | 762,776 | | | | | | 888,994 | | | | | | 888,994 | | |
Cash and cash equivalents, end of the period
|
| | | $ | 10,177,975 | | | | | $ | 1,079,382 | | | | | $ | 762,776 | | |
Supplemental disclosure of cash flow information: | | | | | | | | | | | | | | | | | | | |
Cash paid during the period for interest expense
|
| | | $ | 130,242 | | | | | $ | 78,415 | | | | | $ | 122,752 | | |
Supplemental disclosure of non-cash investing and financing activities:
|
| | | | | | | | | | | | | | | | | | |
Contingent consideration of acquisition
|
| | | $ | — | | | | | $ | 568,228 | | | | | $ | 568,228 | | |
Issuance of common stock in connection with acquisition
|
| | | $ | — | | | | | $ | 176,910 | | | | | $ | 176,910 | | |
Conversion of debt to Series C preferred stock
|
| | | $ | 4,000,000 | | | | | $ | — | | | | | $ | — | | |
Cumulative preferred stock dividend
|
| | | $ | 856,925 | | | | | $ | 756,065 | | | | | $ | 1,020,900 | | |
Field equipment financed through capital leases
|
| | | $ | 27,752 | | | | | $ | 327,977 | | | | | $ | 367,242 | | |
| | |
Years
|
|
Kiosks and field equipment | | |
3
|
|
Furniture and fixtures | | |
3
|
|
Leasehold improvements | | |
Lesser of useful life or life of the lease
|
|
| | |
Nine months ended
September 30, 2018 |
| |
Nine months ended
September 30, 2017 |
| |
For the year ended
December 31, 2017 |
| |||||||||
Net loss applicable to common stockholders
|
| | | $ | (10,172,280) | | | | | $ | (6,419,340) | | | | | $ | (8,473,000) | | |
Net loss per share, basic and diluted
|
| | | $ | (133.53) | | | | | $ | (91.29) | | | | | $ | (118.50) | | |
Weighted average common shares outstanding, basic and diluted
|
| | | | 76,182 | | | | | | 70,319 | | | | | | 71,502 | | |
|
| | |
Nine months ended
September 30, 2018 |
| |
Nine months ended
September 30, 2017 |
| |
For the year ended
December 31, 2017 |
| |||||||||
Series A preferred stock
|
| | | | 66,337 | | | | | | 66,337 | | | | | | 66,337 | | |
Series B preferred stock
|
| | | | 108,379 | | | | | | 108,379 | | | | | | 108,379 | | |
Series C preferred stock
|
| | | | 66,829 | | | | | | — | | | | | | — | | |
Common stock options
|
| | | | 40,889 | | | | | | 34,595 | | | | | | 32,920 | | |
Series B Warrants
|
| | | | 357 | | | | | | 357 | | | | | | 357 | | |
Potentially dilutive securities
|
| | | | 282,791 | | | | | | 209,668 | | | | | | 207,993 | | |
|
|
Fair value of 1,000 Series B put options
|
| | | $ | 98,808 | | |
|
Deferred cash payments at present value
|
| | | | 292,510 | | |
|
Fair value of common stock
|
| | | | 176,910 | | |
|
Total consideration
|
| | | $ | 568,228 | | |
|
Acquisition transaction costs
|
| | | $ | 42,888 | | |
| Assets assumed at fair value | | | | | | | |
|
Cash
|
| | | $ | 110,932 | | |
|
Accounts and other receivables
|
| | | | 50,491 | | |
|
Other assets
|
| | | | 3,422 | | |
|
Trade names
|
| | | | 29,504 | | |
|
Technology
|
| | | | 485,933 | | |
|
Total assets acquired at fair value
|
| | | | 680,282 | | |
| Liabilities assumed at fair value | | | | | | | |
|
Accounts and other payables
|
| | | | 133,473 | | |
|
Deferred revenues
|
| | | | 34,726 | | |
|
Payments to former shareholders
|
| | | | 66,788 | | |
|
Total liabilities assumed at fair value
|
| | | | 234,987 | | |
|
Net assets acquired at fair value
|
| | | | 445,295 | | |
|
Total consideration
|
| | | | 568,228 | | |
|
Goodwill
|
| | | $ | 122,933 | | |
|
| | |
September 30,
2018 |
| |
December 31,
2017 |
| ||||||
Cost: | | | | | | | | | | | | | |
Technology
|
| | | $ | 485,933 | | | | | $ | 485,933 | | |
Trade name
|
| | | | 29,505 | | | | | | 29,505 | | |
Intangible assets, net
|
| | | $ | 515,438 | | | | | $ | 515,438 | | |
|
| | |
September 30,
2018 |
| |
December 31,
2017 |
| ||||||
Accumulated amortization: | | | | | | | | | | | | | |
Technology
|
| | | $ | 109,335 | | | | | $ | 36,445 | | |
Trade name
|
| | | | 3,319 | | | | | | 1,106 | | |
Total accumulated amortization
|
| | | $ | 112,654 | | | | | $ | 37,551 | | |
|
| | |
September 30,
2018 |
| |
December 31,
2017 |
| ||||||
Intangible assets, net | | | | | | | | | | | | | |
Technology
|
| | | $ | 376,598 | | | | | $ | 449,488 | | |
Trade name
|
| | | | 26,186 | | | | | | 28,399 | | |
Total intangible assets, net
|
| | | $ | 402,784 | | | | | $ | 477,887 | | |
|
| | |
Amortization
Expense |
| |||
2018
|
| | | $ | 25,034 | | |
2019
|
| | | | 100,137 | | |
2020
|
| | | | 100,137 | | |
2021
|
| | | | 100,137 | | |
2022
|
| | | | 63,692 | | |
2023
|
| | | | 2,951 | | |
Thereafter
|
| | | | 10,696 | | |
Total
|
| | | $ | 402,784 | | |
|
| | |
September 30,
2018 |
| |
December 31,
2017 |
| ||||||
Kiosks and field equipment
|
| | | $ | 1,463,579 | | | | | $ | 1,222,097 | | |
Furniture and fixtures
|
| | | | 22,952 | | | | | | 15,515 | | |
Leasehold improvements
|
| | | | 7,553 | | | | | | 4,000 | | |
Total
|
| | | | 1,494,084 | | | | | | 1,241,612 | | |
Less – accumulated depreciation
|
| | | | 873,459 | | | | | | 592,809 | | |
Property and equipment, net
|
| | | $ | 620,625 | | | | | $ | 648,803 | | |
|
| | |
Principal Payments
|
| |||
2018
|
| | | $ | — | | |
2019
|
| | | | — | | |
2020
|
| | | | 150,000 | | |
2021
|
| | | | 25,000 | | |
Total
|
| | | $ | 175,000 | | |
|
| | |
September 30,
2018 |
| |
December 31,
2017 |
| ||||||
Credit Facility | | | | | | | | | | | | | |
Principal balance outstanding
|
| | | $ | 733,333 | | | | | $ | 1,000,000 | | |
Unamortized debt discount
|
| | | | (23,257) | | | | | | (32,354) | | |
Net carrying value
|
| | | | 710,076 | | | | | | 967,646 | | |
Subordinated Notes Payable | | | | | | | | | | | | | |
Principal balance outstanding
|
| | | | 2,000,000 | | | | | | — | | |
Unamortized debt discount
|
| | | | (425,716) | | | | | | — | | |
Net carrying value
|
| | | | 1,574,284 | | | | | | — | | |
Carrying Value of Debt
|
| | | $ | 2,284,360 | | | | | $ | 967,646 | | |
Subordinated notes payable, current
|
| | | $ | 1,574,284 | | | | | $ | — | | |
Current portion of long-term debt
|
| | | $ | 400,000 | | | | | $ | 366,667 | | |
Long-term debt
|
| | | $ | 310,076 | | | | | $ | 600,979 | | |
| | |
Amount
|
| |||
2018
|
| | | $ | 100,000 | | |
2019
|
| | | | 400,000 | | |
2020
|
| | | | 233,333 | | |
Term Loan
|
| | | $ | 733,333 | | |
|
September 30, 2018
|
| |
Total
|
| |
Quoted Prices in
Active Markets for identical assets (Level 1) |
| |
Significant Other
Observable Inputs (Level 2) |
| |
Significant
Unobservable Inputs (Level 3) |
| ||||||||||||
Warrants liability
|
| | | $ | 56,017 | | | | | $ | — | | | | | $ | — | | | | | $ | 56,017 | | |
|
December 31, 2017
|
| |
Total
|
| |
Quoted Prices in
Active Markets for identical assets (Level 1) |
| |
Significant Other
Observable Inputs (Level 2) |
| |
Significant
Unobservable Inputs (Level 3) |
| ||||||||||||
Put options liability
|
| | | $ | 98,808 | | | | | $ | — | | | | | $ | — | | | | | $ | 98,808 | | |
Warrants liability
|
| | | | 16,863 | | | | | | — | | | | | | — | | | | | | 16,863 | | |
| | | | $ | 115,671 | | | | | $ | — | | | | | $ | — | | | | | $ | 115,671 | | |
|
|
Series B put options liability at January 1, 2017
|
| | | $ | — | | |
|
Issuance of Series B put options
|
| | | | 98,808 | | |
|
Series B put options liability at December 31, 2017
|
| | | $ | 98,808 | | |
|
Decrease in fair value included in other (income) expense
|
| | | | (98,808) | | |
|
Series B put options liability at September 30, 2018
|
| | | $ | — | | |
|
|
Warrant liability at January 1, 2017
|
| | | $ | — | | |
|
Issuance of Series B warrants
|
| | | | 16,927 | | |
|
Change in fair value included in other (income) expense
|
| | | | (63) | | |
|
Warrant liability at December 31, 2017
|
| | | | 16,863 | | |
|
Change in fair value of Series B warrant liability included in other (income) expense
|
| | | | 39,154 | | |
|
Issuance of common stock warrant
|
| | | | 453,960 | | |
|
Exercise of common stock warrant
|
| | | | (453,960) | | |
|
Series B warrant liability at September 30, 2018
|
| | | $ | 56,017 | | |
|
| | |
Amount
|
| |||
2018
|
| | | $ | 160,791 | | |
2019
|
| | | | 649,641 | | |
2020
|
| | | | 661,845 | | |
2021
|
| | | | 458,033 | | |
Total
|
| | | $ | 1,930,310 | | |
|
Year
|
| |
Amount
|
| |||
2018
|
| | | $ | 36,474 | | |
2019
|
| | | | 146,890 | | |
2020
|
| | | | 149,868 | | |
Total
|
| | | $ | 333,232 | | |
|
|
2018
|
| | | $ | 64,150 | | |
|
2019
|
| | | | 227,150 | | |
|
2020
|
| | | | 175,274 | | |
|
2021
|
| | | | 140,400 | | |
|
2022
|
| | | | 33,290 | | |
|
2023
|
| | | | 666 | | |
|
Total minimum lease payments
|
| | | | 640,930 | | |
|
Less: amount representing interest, maintenance and warranties
|
| | | | (197,868) | | |
|
Present value of minimum lease payments
|
| | | | 443,062 | | |
|
Less: current portion
|
| | | | (143,545) | | |
|
Non current portion
|
| | | $ | 299,517 | | |
|
| | |
Year ended
December 31, 2017 |
| |
Nine months ended September 30,
|
| |||
| | |
2018
|
| |
2017
|
| |||
Expected dividend yield
|
| |
0.00%
|
| |
0.00%
|
| |
0.00%
|
|
Expected stock-price volatility
|
| |
77.36% – 85.95%
|
| |
83.50% – 89.27%
|
| |
77.36% – 84.72%
|
|
Risk-free interest rate
|
| |
1.76% – 2.34%
|
| |
2.20% – 2.94%
|
| |
1.76% – 2.34%
|
|
Expected term of options
|
| |
6.18
|
| |
6.18
|
| |
6.18
|
|
Stock price at date of grant
|
| |
$8.09 – $13.06
|
| |
$13.06 – $210.61
|
| |
$8.09 – $13.06
|
|
| | |
Options
|
| |
Weighted
Average Exercise Price Per Share |
| |
Aggregate
Intrinsic Value |
| |
Weighted
Average Remaining Contractual Life (in years) |
| ||||||||||||
Outstanding at December 31, 2016
|
| | | | 17,260 | | | | | $ | 8.09 | | | | | $ | — | | | | | | 9.83 | | |
Granted
|
| | | | 23,337 | | | | | | 11.38 | | | | | | 39,263 | | | | | | 8.85 | | |
Exercised/Expired/Forfeited
|
| | | | (7,677) | | | | | | 8.09 | | | | | | — | | | | | | — | | |
Outstanding at December 31, 2017
|
| | | | 32,920 | | | | | | 10.42 | | | | | | 86,891 | | | | | | 9.33 | | |
Granted
|
| | | | 22,620 | | | | | | 13.06 | | | | | | 4,468,581 | | | | | | 9.44 | | |
Exercised/Expired/Forfeited
|
| | | | (14,651) | | | | | | 11.39 | | | | | | 2,918,792 | | | | | | — | | |
Outstanding at September 30, 2018
|
| | | | 40,889 | | | | | | 11.53 | | | | | | 8,140,025 | | | | | | 9.15 | | |
Exercisable at September 30, 2018
|
| | | | 12,999 | | | | | $ | 9.66 | | | | | $ | 2,612,126 | | | | | | 8.42 | | |
|
| | |
Number of shares
|
| |
Weighted
Average Grant Date Fair Value |
| |
Total
Grant Date Fair Value |
||||||||
Unvested balance at December 31, 2016
|
| | | | 25,287 | | | | | $ | 8.09 | | | | | $ | 204,572 |
Granted
|
| | | | 5,865 | | | | | | 8.09 | | | | | | 47,448 |
Vested
|
| | | | (8,782) | | | | | | 8.09 | | | | | | (71,046) |
Repurchased
|
| | | | (7,050) | | | | | | 8.09 | | | | | | (57,035) |
Unvested balance at December 31, 2017
|
| | | | 15,320 | | | | | | 8.09 | | | | | | 123,939 |
Granted
|
| | | | 1,750 | | | | | | — | | | | | | — |
Vested
|
| | | | (6,116) | | | | | | 8.91 | | | | | | (54,478) |
Repurchased
|
| | | | (2,167) | | | | | | 8.09 | | | | | | (17,531) |
Unvested balance at September 30, 2018
|
| | | | 8,787 | | | | | $ | 8.51 | | | | | $ | 51,930 |
|
| | |
September 30,
2018 |
| |
December 31,
2017 |
| ||||||
Deferred income tax assets: | | | | | | | | | | | | | |
Net operating loss carryforwards
|
| | | $ | 5,257,696 | | | | | $ | 3,085,873 | | |
Deferred rent
|
| | | | 27,834 | | | | | | 28,034 | | |
Amortization intangibles
|
| | | | 216,903 | | | | | | 224,062 | | |
Incentive stock options
|
| | | | 156,349 | | | | | | 139,314 | | |
Tax credits
|
| | | | 9,451 | | | | | | 9,451 | | |
Total deferred income tax assets
|
| | | | 5,668,233 | | | | | | 3,486,734 | | |
Deferred income tax assets liabilities: | | | | | | | | | | | | | |
Depreciation fixed assets
|
| | | | (55,475) | | | | | | (95,785) | | |
Prepaids
|
| | | | (37,865) | | | | | | (9,011) | | |
Intangible assets from the stock acquisition of DOBT
|
| | | | (114,845) | | | | | | (132,937) | | |
Total deferred income tax liabilities
|
| | | | (208,185) | | | | | | (237,733) | | |
Net deferred income tax assets
|
| | | | 5,460,048 | | | | | | 3,249,001 | | |
Valuation allowance
|
| | | | (5,460,048) | | | | | | (3,249,001) | | |
Deferred income tax assets, net of allowance
|
| | | $ | — | | | | | $ | — | | |
|
| | |
For the nine months ended
September 30, 2018 |
| |
For the year ended
December 31, 2017 |
| ||||||
Statutory federal income tax rate
|
| | | | (21.0)% | | | | | | (34.0)% | | |
State taxes, net of federal tax benefit
|
| | | | (7.5)% | | | | | | (5.1)% | | |
Federal tax rate change
|
| | | | —% | | | | | | 11.9% | | |
State rate change
|
| | | | —% | | | | | | (1.2)% | | |
Stock-based compensation expense
|
| | | | 0.6% | | | | | | 0.1% | | |
Other items
|
| | | | 5.0% | | | | | | 0.4% | | |
Change in valuation allowance
|
| | | | 22.9% | | | | | | 27.9% | | |
Income taxes provision (benefit)
|
| | | | —% | | | | | | —% | | |
|
|
2018
|
| | | $ | 51,925 | | |
|
2019
|
| | | | 623,090 | | |
|
2020
|
| | | | 623,090 | | |
|
2021
|
| | | | 571,166 | | |
|
Total minimum lease payments
|
| | | $ | 1,869,271 | | |
|
| | |
September 30,
2018 |
| |
December 31,
2017 |
| ||||||
ASSETS
|
| | | | | | | | | | | | |
Current assets: | | | | | | | | | | | | | |
Cash and cash equivalents
|
| | | $ | 99,685 | | | | | $ | 301,542 | | |
Marketable securities
|
| | | | — | | | | | | 662,079 | | |
Accounts receivable, net of allowances for doubtful accounts of $86,672 and
$82,072 at September 30, 2018 and December 31, 2017, respectively |
| | | | 1,011,671 | | | | | | 786,976 | | |
Prepaid expenses and other current assets
|
| | | | 461,464 | | | | | | 487,523 | | |
Total current assets
|
| | | | 1,572,820 | | | | | | 2,238,120 | | |
Property and equipment, net
|
| | | | 61,734 | | | | | | 84,983 | | |
Intangible assets subject to amortization, net
|
| | | | 335,996 | | | | | | — | | |
Goodwill
|
| | | | 585,000 | | | | | | — | | |
Other assets
|
| | | | 51,053 | | | | | | 52,615 | | |
Total assets
|
| | | $ | 2,606,603 | | | | | $ | 2,375,718 | | |
LIABILITIES AND STOCKHOLDERS’ DEFICIT
|
| | | | | | | | | | | | |
Current liabilities: | | | | | | | | | | | | | |
Accounts payable
|
| | | $ | 260,747 | | | | | $ | 85,952 | | |
Accrued expenses and other current liabilities
|
| | | | 199,487 | | | | | | 90,891 | | |
Contract liabilities
|
| | | | 2,438,935 | | | | | | 2,470,282 | | |
Contingent consideration
|
| | | | 86,000 | | | | | | — | | |
Line of credit
|
| | | | — | | | | | | 204,492 | | |
Total current liabilities
|
| | | | 2,985,169 | | | | | | 2,851,617 | | |
Contract liabilities, noncurrent
|
| | | | 36,647 | | | | | | 12,459 | | |
Contingent consideration, noncurrent
|
| | | | 836,000 | | | | | | — | | |
Other long-term liabilities
|
| | | | 60,554 | | | | | | 79,699 | | |
Total liabilities
|
| | | | 3,918,370 | | | | | | 2,943,775 | | |
Stockholders’ deficit | | | | | | | | | | | | | |
Common stock $0.001 par value, 75,000,000 shares authorized; 48,644,348 shares issued and outstanding at September 30, 2018 and December 31, 2017
|
| | | | 48,645 | | | | | | 48,645 | | |
Additional paid-in capital
|
| | | | 3,826,358 | | | | | | 3,801,541 | | |
Accumulated other comprehensive income
|
| | | | — | | | | | | 76,647 | | |
Accumulated deficit
|
| | | | (5,186,770) | | | | | | (4,494,890) | | |
Total stockholders’ deficit
|
| | | | (1,311,767) | | | | | | (568,057) | | |
Total liabilities and stockholders’ deficit
|
| | | $ | 2,606,603 | | | | | $ | 2,375,718 | | |
|
| | |
Nine months ended
September 30, 2018 |
| |
Nine months ended
September 30, 2017 |
| |
Year ended
December 31, 2017 |
| |||||||||
| | |
(Unaudited)
|
| |||||||||||||||
Revenues | | | | | | | | | | | | | | | | | | | |
Subscription and support
|
| | | $ | 3,351,432 | | | | | $ | 3,251,491 | | | | | $ | 4,340,344 | | |
Professional services
|
| | | | 393,480 | | | | | | 235,793 | | | | | | 254,154 | | |
Total revenues
|
| | | | 3,744,912 | | | | | | 3,487,284 | | | | | | 4,594,498 | | |
Cost of revenues | | | | | | | | | | | | | | | | | | | |
Subscription and support
|
| | | | 953,769 | | | | | | 640,984 | | | | | | 849,348 | | |
Professional services
|
| | | | 328,964 | | | | | | 302,011 | | | | | | 382,756 | | |
Total cost of revenues
|
| | | | 1,282,733 | | | | | | 942,995 | | | | | | 1,232,104 | | |
Gross profit
|
| | | | 2,462,179 | | | | | | 2,544,289 | | | | | | 3,362,394 | | |
Operating expenses | | | | | | | | | | | | | | | | | | | |
Sales and marketing
|
| | | | 888,442 | | | | | | 748,077 | | | | | | 991,105 | | |
Research and development
|
| | | | 973,436 | | | | | | 805,785 | | | | | | 1,101,827 | | |
General and administrative
|
| | | | 1,262,399 | | | | | | 1,192,505 | | | | | | 1,394,517 | | |
Total operating expenses
|
| | | | 3,124,277 | | | | | | 2,746,367 | | | | | | 3,487,449 | | |
Loss from operations
|
| | | | (662,098) | | | | | | (202,078) | | | | | | (125,055) | | |
Other income (expense) | | | | | | | | | | | | | | | | | | | |
Interest income
|
| | | | 11,785 | | | | | | 36,566 | | | | | | 46,815 | | |
Interest expense
|
| | | | (16,746) | | | | | | (7,268) | | | | | | (8,414) | | |
Sublease income
|
| | | | 54,934 | | | | | | 46,570 | | | | | | 99,111 | | |
Loss on sublease
|
| | | | — | | | | | | (75,755) | | | | | | (75,755) | | |
Acquisition costs
|
| | | | (159,696) | | | | | | — | | | | | | — | | |
Gain (loss) on sales of marketable securities
|
| | | | 2,598 | | | | | | 8,774 | | | | | | (163,137) | | |
Other income (expense), net
|
| | | | (107,125) | | | | | | 8,887 | | | | | | (101,380) | | |
Net loss
|
| | | $ | (769,223) | | | | | $ | (193,191) | | | | | $ | (226,435) | | |
Net loss per share, basic and diluted
|
| | | $ | (0.02) | | | | | $ | (0.00) | | | | | $ | (0.00) | | |
Weighted average common shares outstanding, basic
and diluted |
| | | | 48,644,348 | | | | | | 48,644,348 | | | | | | 48,644,348 | | |
|
| | |
Nine months ended
September 30, 2018 |
| |
Nine months ended
September 30, 2017 |
| |
Year ended
December 31, 2017 |
| |||||||||
| | |
(Unaudited)
|
| |||||||||||||||
Net loss
|
| | | $ | (769,223) | | | | | $ | (193,191) | | | | | $ | (226,435) | | |
Other comprehensive income | | | | | | | | | | | | | | | | | | | |
Net change in unrealized gain/loss on marketable securities
|
| | | | 696 | | | | | | 50,041 | | | | | | 203,213 | | |
Other comprehensive income
|
| | | | 696 | | | | | | 50,041 | | | | | | 203,213 | | |
Comprehensive loss
|
| | | $ | (768,527) | | | | | $ | (143,150) | | | | | $ | (23,222) | | |
|
| | |
Common Stock
|
| |
Additional
Paid-in Capital |
| |
Accumulated
Other Comprehensive Income (Loss) |
| |
Accumulated
Deficit |
| |
Total
|
| |||||||||||||||||||||
| | |
Shares
|
| |
Amount
|
| ||||||||||||||||||||||||||||||
Balance at January 1, 2017
|
| | | | 48,644,348 | | | | | $ | 48,645 | | | | | $ | 3,769,078 | | | | | $ | (126,566) | | | | | $ | (4,268,455) | | | | | $ | (577,298) | | |
Stock-based compensation
|
| | | | — | | | | | | — | | | | | | 32,463 | | | | | | — | | | | | | — | | | | | | 32,463 | | |
Other comprehensive income
|
| | | | — | | | | | | — | | | | | | — | | | | | | 203,213 | | | | | | — | | | | | | 203,213 | | |
Net loss
|
| | | | — | | | | | | — | | | | | | — | | | | | | — | | | | | | (226,435) | | | | | | (226,435) | | |
Balance at December 31, 2017
|
| | | | 48,644,348 | | | | | | 48,645 | | | | | | 3,801,541 | | | | | | 76,647 | | | | | | (4,494,890) | | | | | | (568,057) | | |
Cumulative effect of accounting
change |
| | | | — | | | | | | — | | | | | | — | | | | | | (77,343) | | | | | | 77,343 | | | | | | — | | |
Stock-based compensation
|
| | | | — | | | | | | — | | | | | | 24,817 | | | | | | — | | | | | | — | | | | | | 24,817 | | |
Other comprehensive gain
|
| | | | — | | | | | | — | | | | | | — | | | | | | 696 | | | | | | — | | | | | | 696 | | |
Net loss
|
| | | | — | | | | | | — | | | | | | — | | | | | | — | | | | | | (769,223) | | | | | | (769,223) | | |
Balance at September 30, 2018
|
| | | | 48,644,348 | | | | | $ | 48,645 | | | | | $ | 3,826,358 | | | | | $ | — | | | | | $ | (5,186,770) | | | | | $ | (1,311,767) | | |
|
| | |
Nine months ended
September 30, 2018 |
| |
Nine months ended
September 30, 2017 |
| |
Year ended
December 31, 2017 |
| |||||||||
| | |
(Unaudited)
|
| |||||||||||||||
Cash flows from operating activities | | | | | | | | | | | | | | | | | | | |
Net loss
|
| | | $ | (769,223) | | | | | $ | (193,191) | | | | | $ | (226,435) | | |
Adjustments to reconcile net loss to net cash used in
operating activities: |
| | | | | | | | | | | | | | | | | | |
Depreciation and amortization
|
| | | | 139,802 | | | | | | 30,246 | | | | | | 41,424 | | |
Stock-based compensation expense
|
| | | | 24,817 | | | | | | 26,476 | | | | | | 32,463 | | |
Provision for doubtful accounts receivable
|
| | | | 15,800 | | | | | | — | | | | | | 42,045 | | |
(Gain) loss from sales of marketable securities
|
| | | | (2,598) | | | | | | (8,774) | | | | | | 163,137 | | |
Accrual of payment in kind interest
|
| | | | 12,177 | | | | | | 8,511 | | | | | | 10,690 | | |
Repayment of payment in kind interest
|
| | | | (22,867) | | | | | | — | | | | | | — | | |
Changes in operating assets and liabilities:
|
| | | | | | | | | | | | | | | | | | |
Accounts receivable
|
| | | | (233,495) | | | | | | 268,412 | | | | | | 157,872 | | |
Prepaid expenses and other current assets
|
| | | | 26,059 | | | | | | (129,061) | | | | | | (319,494) | | |
Other assets
|
| | | | 1,562 | | | | | | 13,379 | | | | | | (26,855) | | |
Accounts payable
|
| | | | 174,795 | | | | | | 131,499 | | | | | | 52,094 | | |
Accrued expenses and other current liabilities
|
| | | | 108,596 | | | | | | 135,819 | | | | | | (37,759) | | |
Contract liabilities
|
| | | | (77,159) | | | | | | (607,094) | | | | | | (268,969) | | |
Other long-term liabilities
|
| | | | (10,771) | | | | | | 75,079 | | | | | | 71,074 | | |
Net cash used in operating activities
|
| | | | (612,505) | | | | | | (248,699) | | | | | | (308,713) | | |
Cash flows from investing activities | | | | | | | | | | | | | | | | | | | |
Purchases of property and equipment
|
| | | | (2,549) | | | | | | (29,066) | | | | | | (31,790) | | |
Purchase of marketable securities
|
| | | | (335,541) | | | | | | (258,071) | | | | | | (469,330) | | |
Proceeds from sales of marketable securities
|
| | | | 1,000,914 | | | | | | 1,314,807 | | | | | | 1,786,497 | | |
Net cash provided by investing activities
|
| | | | 662,824 | | | | | | 1,027,670 | | | | | | 1,285,377 | | |
Cash flows from financing activities | | | | | | | | | | | | | | | | | | | |
Payments of contingent consideration
|
| | | | (50,000) | | | | | | — | | | | | | — | | |
Proceeds from line of credit
|
| | | | 269,000 | | | | | | 200,000 | | | | | | 200,000 | | |
Repayments of line of credit
|
| | | | (462,802) | | | | | | (1,135,835) | | | | | | (1,135,835) | | |
Repayments of capital lease obligation
|
| | | | (8,374) | | | | | | (7,748) | | | | | | (10,432) | | |
Net cash used in financing activities
|
| | | | (252,176) | | | | | | (943,583) | | | | | | (946,267) | | |
Net increase (decrease) in cash and cash
equivalents |
| | | | (201,857) | | | | | | (164,612) | | | | | | 30,397 | | |
Cash and cash equivalents, beginning of period
|
| | | | 301,542 | | | | | | 271,145 | | | | | | 271,145 | | |
Cash and cash equivalents, end of period
|
| | | $ | 99,685 | | | | | $ | 106,533 | | | | | $ | 301,542 | | |
Supplemental disclosure of cash flow information: | | | | | | | | | | | | | | | | | | | |
Cash paid during the year for interest expense
|
| | | $ | 22,867 | | | | | $ | 6,199 | | | | | $ | 6,199 | | |
Supplemental disclosure of non-cash investing activities
|
| | | | | | | | | | | | | | | | | | |
Contingent consideration of acquisition
|
| | | $ | 972,000 | | | | | $ | — | | | | | $ | — | | |
|
Asset
|
| |
Useful lives
|
|
Furniture, fixtures and computers | | | 5 – 10 years | |
Software | | | 3 – 5 years | |
Leasehold improvements | | |
Lesser of the life of the lease or estimated useful life
|
|
| | |
Nine months ended
September 30, 2018 |
| |||
Fair value on acquisition date
|
| | | $ | 972,000 | | |
Cash advances
|
| | | | (50,000) | | |
Ending fair value
|
| | | $ | 922,000 | | |
|
| | |
September 30, 2018
|
| |||||||||||||||||||||
| | |
Level 1
|
| |
Level 2
|
| |
Level 3
|
| |
Total
|
| ||||||||||||
Liabilities | | | | | | | | | | | | | | | | | | | | | | | | | |
Contingent consideration
|
| | | $ | — | | | | | $ | — | | | | | $ | 922,000 | | | | | $ | 922,000 | | |
Total liabilities
|
| | | $ | — | | | | | $ | — | | | | | $ | 922,000 | | | | | $ | 922,000 | | |
|
| | |
December 31, 2017
|
| |||||||||||||||||||||
| | |
Level 1
|
| |
Level 2
|
| |
Level 3
|
| |
Total
|
| ||||||||||||
Marketable securities | | | | | | | | | | | | | | | | | | | | | | | | | |
Stocks
|
| | | $ | 93,838 | | | | | $ | — | | | | | $ | — | | | | | $ | 93,838 | | |
Exchange traded and closed end funds
|
| | | | 145,601 | | | | | | 152,831 | | | | | | — | | | | | | 298,432 | | |
Unit investment trusts
|
| | | | — | | | | | | 173,863 | | | | | | — | | | | | | 173,863 | | |
Corporate debt securities
|
| | | | 95,946 | | | | | | — | | | | | | — | | | | | | 95,946 | | |
Total assets
|
| | | $ | 335,385 | | | | | $ | 326,694 | | | | | $ | — | | | | | $ | 662,079 | | |
|
| | |
Nine months ended
|
| |
Year ended
December 31, 2017 |
| ||||||||||||
| | |
September 30,
2018 |
| |
September 30,
2017 |
| ||||||||||||
| | |
(unaudited)
|
| |||||||||||||||
Grants management
|
| | | $ | 3,239,964 | | | | | $ | 3,251,491 | | | | | $ | 4,340,344 | | |
Cost allocation
|
| | | | 111,468 | | | | | | — | | | | | | — | | |
Professional services
|
| | | | 393,480 | | | | | | 235,793 | | | | | | 254,154 | | |
| | | | $ | 3,744,912 | | | | | $ | 3,487,284 | | | | | $ | 4,594,498 | | |
|
| | |
December 31, 2017
|
| |||||||||||||||
| | |
As Previously
Reported |
| |
Adjustments
|
| |
As Adjusted
|
| |||||||||
Assets | | | | | | | | | | | | | | | | | | | |
Prepaid expenses and other current assets
|
| | | $ | 458,886 | | | | | $ | 28,637 | | | | | $ | 487,523 | | |
Other assets
|
| | | $ | 38,432 | | | | | $ | 14,183 | | | | | $ | 52,615 | | |
Stockholders’ Deficit | | | | | | | | | | | | | | | | | | | |
Accumulated deficit
|
| | | $ | (4,554,160) | | | | | $ | 59,270 | | | | | $ | (4,494,890) | | |
| | |
Year ended December 31, 2017
|
| |||||||||||||||
| | |
As Previously
Reported |
| |
Adjustments
|
| |
As Adjusted
|
| |||||||||
Operating expenses | | | | | | | | | | | | | | | | | | | |
Sales and marketing
|
| | | $ | 974,655 | | | | | $ | 16,450 | | | | | $ | 991,105 | | |
Loss from operations
|
| | | $ | (108,605) | | | | | $ | (16,450) | | | | | $ | (125,055) | | |
Net loss
|
| | | $ | (209,985) | | | | | $ | (16,450) | | | | | $ | (226,435) | | |
Net loss per share, basic and diluted
|
| | | $ | (0.00) | | | | | $ | (0.00) | | | | | $ | (0.00) | | |
| | |
Nine months ended September 30, 2017
|
| |||||||||||||||
| | |
As Previously
Reported |
| |
Adjustments
|
| |
As Adjusted
|
| |||||||||
Operating expenses | | | | | | | | | | | | | | | | | | | |
Sales and marketing
|
| | | $ | 727,422 | | | | | $ | 20,655 | | | | | $ | 748,077 | | |
Loss from operations
|
| | | $ | (181,423) | | | | | $ | (20,655) | | | | | $ | (202,078) | | |
Net loss
|
| | | $ | (172,536) | | | | | $ | (20,655) | | | | | $ | (193,191) | | |
Net loss per share, basic and diluted
|
| | | $ | (0.00) | | | | | $ | (0.00) | | | | | $ | (0.00) | | |
| | |
Year ended December 31, 2017
|
| |||||||||||||||
| | |
As Previously
Reported |
| |
Adjustments
|
| |
As Adjusted
|
| |||||||||
Cash flows from operating activities | | | | | | | | | | | | | | | | | | | |
Net loss
|
| | | $ | (209,985) | | | | | $ | (16,450) | | | | | $ | (226,435) | | |
Adjustments to reconcile net loss to net cash used in operating activities:
|
| | | | | | | | | | | | | | | | | | |
Prepaid expenses and other assets
|
| | | $ | (327,408) | | | | | $ | 7,914 | | | | | $ | (319,494) | | |
Other assets
|
| | | $ | (35,391) | | | | | $ | 8,536 | | | | | $ | (26,855) | | |
| | |
Nine months ended September 30, 2017
|
| |||||||||||||||
| | |
As Previously
Reported |
| |
Adjustments
|
| |
As Adjusted
|
| |||||||||
Cash flows from operating activities | | | | | | | | | | | | | | | | | | | |
Net loss
|
| | | $ | (172,536) | | | | | $ | (20,655) | | | | | $ | (193,191) | | |
Adjustments to reconcile net loss to net cash used in operating activities:
|
| | | | | | | | | | | | | | | | | | |
Prepaid expenses and other assets
|
| | | | (141,145) | | | | | | 12,084 | | | | | | (129,061) | | |
Other assets
|
| | | | 4,808 | | | | | | 8,571 | | | | | | 13,379 | | |
| | |
September 30,
2018 |
| |
December 31,
2017 |
| ||||||
Prepaid royalty expense
|
| | | $ | 242,847 | | | | | $ | 202,881 | | |
Prepaid insurance
|
| | | | 61,132 | | | | | | 176,753 | | |
Prepaid commissions
|
| | | | 41,558 | | | | | | 28,637 | | |
Advances to employees
|
| | | | 36,521 | | | | | | 16,125 | | |
Other
|
| | | | 79,406 | | | | | | 63,127 | | |
| | | | $ | 461,464 | | | | | $ | 487,523 | | |
|
| | |
September 30,
2018 |
| |
December 31,
2017 |
| ||||||
Furniture, fixtures and computers
|
| | | $ | 396,839 | | | | | $ | 378,288 | | |
Software
|
| | | | 73,114 | | | | | | 73,114 | | |
Leasehold improvements
|
| | | | 64,924 | | | | | | 64,924 | | |
| | | | | 534,877 | | | | | | 516,326 | | |
Less: accumulated depreciation and amortization
|
| | | | (473,143) | | | | | | (431,343) | | |
| | | | $ | 61,734 | | | | | $ | 84,983 | | |
|
| | |
September 30,
2018 |
| |
December 31,
2017 |
| ||||||
Deposits
|
| | | $ | 22,826 | | | | | $ | 22,826 | | |
Prepaid commissions, non-current
|
| | | | 16,871 | | | | | | 14,183 | | |
Sublease deferred rent
|
| | | | 11,356 | | | | | | 15,606 | | |
| | | | $ | 51,053 | | | | | $ | 52,615 | | |
|
| | |
September 30,
2018 |
| |
December 31,
2017 |
| ||||||
Accrued vacation and employee benefits
|
| | | $ | 87,672 | | | | | $ | 69,393 | | |
Accrued commissions
|
| | | | 17,280 | | | | | | 6,160 | | |
Short-term portion of capital lease
|
| | | | 10,683 | | | | | | 11,276 | | |
Accrued professional fees
|
| | | | 53,941 | | | | | | — | | |
Other current liabilities
|
| | | | 29,911 | | | | | | 4,062 | | |
| | | | $ | 199,487 | | | | | $ | 90,891 | | |
|
|
For the three months ended December 31, 2018
|
| | | $ | 77,181 | | |
| For the years ended December 31, | | | | | | | |
|
2019
|
| | | | 308,723 | | |
|
2020
|
| | | | 308,723 | | |
|
2021
|
| | | | 308,723 | | |
|
2022
|
| | | | 128,635 | | |
| | | | | $ | 1,131,985 | | |
|
|
For the three months ended December 31, 2018
|
| | | $ | 20,450 | | |
| For the years ended December 31, | | | | | | | |
|
2019
|
| | | | 62,882 | | |
|
2020
|
| | | | 64,771 | | |
|
2021
|
| | | | 66,713 | | |
|
2022
|
| | | | 28,138 | | |
| | | | | $ | 242,954 | | |
|
|
Total contingent consideration to selling shareholders
|
| | | $ | 972,000 | | |
| Assets acquired and liabilities assumed | | | | | | | |
|
Accounts receivable
|
| | | | 7,000 | | |
|
Property and equipment
|
| | | | 16,000 | | |
|
Intangible assets subject to amortization
|
| | | | 434,000 | | |
|
Contract liabilities
|
| | | | (70,000) | | |
|
Net assets
|
| | | | 387,000 | | |
|
Goodwill
|
| | | $ | 585,000 | | |
|
| | |
Amortization
Period |
| |
Fair Value
|
| |||
Trade name
|
| |
2 Years
|
| | | $ | 13,000 | | |
Developed technology
|
| |
3 Years
|
| | | | 257,000 | | |
Non-compete agreements
|
| |
5 Years
|
| | | | 9,000 | | |
Customer relationships
|
| |
3 Years
|
| | | | 155,000 | | |
| | | | | | | $ | 434,000 | | |
|
| | |
September 30, 2018
|
| |||||||||||||||
| | |
Gross carrying
amount |
| |
Accumulated
amortization |
| |
Net carrying
amount |
| |||||||||
Trade name
|
| | | $ | 13,000 | | | | | $ | (13,000) | | | | | $ | — | | |
Developed technology
|
| | | | 257,000 | | | | | | (47,410) | | | | | | 209,590 | | |
Non-compete agreements
|
| | | | 9,000 | | | | | | (9,000) | | | | | | — | | |
Customer relationships
|
| | | | 155,000 | | | | | | (28,594) | | | | | | 126,406 | | |
| | | | $ | 434,000 | | | | | $ | (98,004) | | | | | $ | 335,996 | | |
|
|
Cost of revenue
|
| | | $ | 47,410 | | |
|
Sales and marketing
|
| | | | 28,594 | | |
|
General and administrative
|
| | | | 22,000 | | |
| | | | | $ | 98,004 | | |
|
|
2018
|
| | | $ | 34,615 | | |
|
2019
|
| | | | 137,333 | | |
|
2020
|
| | | | 137,710 | | |
|
2021
|
| | | | 26,338 | | |
| | | | | $ | 335,996 | | |
|
| | |
Nine months ended
|
| |
Year ended
December 31, 2017 |
| ||||||||||||
| | |
September 30,
2018 |
| |
September 30,
2017 |
| ||||||||||||
| | |
(unaudited)
|
| |||||||||||||||
Sales and marketing
|
| | | $ | 637 | | | | | $ | — | | | | | $ | — | | |
Research and development
|
| | | | 2,868 | | | | | | 2,249 | | | | | | 2,971 | | |
General and administrative
|
| | | | 21,312 | | | | | | 24,227 | | | | | | 29,492 | | |
| | | | $ | 24,817 | | | | | $ | 26,476 | | | | | $ | 32,463 | | |
|
| | |
Nine months ended
|
| |
Year ended
December 31, 2017 |
| |||
| | |
September 30,
2018 |
| |
September 30,
2017 |
| |||
| | |
(unaudited)
|
| ||||||
Expected dividend yield
|
| |
0.00%
|
| |
0.00%
|
| |
0.00%
|
|
Expected stock-price volatility
|
| |
88.63% – 89.27%
|
| |
77.36% – 78.85%
|
| |
77.36% – 85.95%
|
|
Risk-free interest rate
|
| |
2.67% – 2.73%
|
| |
2.43%
|
| |
2.28% – 2.43%
|
|
Expected term of options
|
| |
6.31
|
| |
6.24
|
| |
6.32
|
|
Stock price
|
| |
$0.18
|
| |
$0.18
|
| |
$0.18
|
|
| | |
Options
|
| |
Weighted
Average Exercise Price |
| |
Aggregate
Intrinsic Value |
| |
Weighted Average
Remaining Contractual Life (in years) |
| |||||||||
Outstanding at December 31, 2016
|
| | | | 3,021,959 | | | | | $ | 0.11 | | | | | $ | 308,570 | | | |
5.9
|
|
Granted
|
| | | | 360,000 | | | | | | 0.18 | | | | | | — | | | |
9.3
|
|
Outstanding at December 31, 2017
|
| | | | 3,381,959 | | | | | | 0.12 | | | | | | 217,912 | | | |
5.3
|
|
Granted
|
| | | | 160,000 | | | | | | 0.18 | | | | | | — | | | |
9.5
|
|
Forfeited
|
| | | | (100,000) | | | | | | 0.18 | | | | | | — | | | |
—
|
|
Outstanding at September 30, 2018
|
| | | | 3,441,959 | | | | | $ | 0.12 | | | | | $ | 217,912 | | | |
4.8
|
|
Exercisable at September 30, 2018
|
| | | | 2,609,439 | | | | | $ | 0.10 | | | | | $ | 217,673 | | | |
3.7
|
|
|
| | |
September 30,
2018 |
| |||
ASSETS | | | | | | | |
Current assets: | | | | | | | |
Cash
|
| | | $ | 76,943 | | |
Accounts receivable
|
| | | | 371,279 | | |
Total current assets
|
| | | | 448,222 | | |
Property and equipment, net
|
| | | | 31,247 | | |
Security deposit
|
| | | | 350 | | |
Total assets
|
| | | $ | 479,819 | | |
LIABILITIES AND STOCKHOLDERS’ DEFICIT | | | | | | | |
Current liabilities: | | | | | | | |
Accounts payable
|
| | | $ | 189,800 | | |
Accrued interest
|
| | | | 32,039 | | |
Accrued payroll
|
| | | | 28,070 | | |
Contract liabilities
|
| | | | 1,101,359 | | |
Short-term notes payable
|
| | | | 450,000 | | |
Total current liabilities
|
| | | | 1,801,268 | | |
Long-term liabilities: | | | | | | | |
Notes payable
|
| | | | 451,073 | | |
Total liabilities
|
| | | | 2,252,341 | | |
Commitments and contingencies (Note 6) | | | | | | | |
Stockholders’ deficit | | | | | | | |
Common stock, $0.0001 par value, 78,000,000 shares authorized, 65,483,100 shares issued
and outstanding as of September 30, 2018 |
| | | | 6,548 | | |
Additional paid-in capital
|
| | | | 120,379 | | |
Accumulated deficit
|
| | | | (1,899,449) | | |
Total stockholders’ deficit
|
| | | | (1,772,522) | | |
Total liabilities and stockholders’ deficit
|
| | | $ | 479,819 | | |
|
| | |
For the nine months ended September 30,
|
| |||||||||
| | |
2018
|
| |
2017
|
| ||||||
| | | | | | | | |
(Unaudited)
|
| |||
Revenues | | | | | | | | | | | | | |
Subscription services
|
| | | $ | 1,026,703 | | | | | $ | 752,890 | | |
Professional services
|
| | | | 186,150 | | | | | | 356,815 | | |
Total revenues
|
| | | | 1,212,853 | | | | | | 1,109,705 | | |
Cost of revenues | | | | | | | | | | | | | |
Cost of subscription services
|
| | | | 159,195 | | | | | | 123,438 | | |
Cost of professional services
|
| | | | 213,551 | | | | | | 177,037 | | |
Total costs of revenues
|
| | | | 372,746 | | | | | | 300,475 | | |
Gross profit
|
| | | | 840,107 | | | | | | 809,230 | | |
Operating expenses | | | | | | | | | | | | | |
Sales and marketing
|
| | | | 14,049 | | | | | | 38,612 | | |
General and administrative
|
| | | | 1,174,297 | | | | | | 1,288,774 | | |
Total operating expenses
|
| | | | 1,188,346 | | | | | | 1,327,386 | | |
Loss from operations
|
| | | | (348,239) | | | | | | (518,156) | | |
Other income (expense): | | | | | | | | | | | | | |
Interest income
|
| | | | — | | | | | | 35 | | |
Interest expense
|
| | | | (81,889) | | | | | | (59,252) | | |
Other income
|
| | | | 10,000 | | | | | | — | | |
Loss on sale of asset
|
| | | | (807) | | | | | | — | | |
Total other income (expense)
|
| | | | (72,696) | | | | | | (59,217) | | |
Net loss
|
| | | $ | (420,935) | | | | | $ | (577,373) | | |
Basic and diluted net loss per share
|
| | | $ | (0.01) | | | | | $ | (0.01) | | |
Weighted average shares outstanding, basic and diluted
|
| | | | 65,483,100 | | | | | | 65,280,000 | | |
Weighted average shares outstanding, diluted
|
| | | | 66,413,322 | | | | | | 65,280,000 | | |
|
| | |
Common Stock
|
| |
Additional
Paid-in Capital |
| |
Accumulated
Deficit |
| |
Total
Stockholders’ Deficit |
| ||||||||||||||||||
| | |
Shares
|
| |
Amount
|
| ||||||||||||||||||||||||
Balance at December 31, 2017
|
| | | | 65,483,100 | | | | | $ | 6,548 | | | | | $ | 116,458 | | | | | $ | (1,478,514) | | | | | $ | (1,355,508) | | |
Stock-based compensation
|
| | | | — | | | | | | — | | | | | | 3,921 | | | | | | — | | | | | | 3,921 | | |
Net loss
|
| | | | — | | | | | | — | | | | | | — | | | | | | (420,935) | | | | | | (420,935) | | |
Balance at September 30, 2018
|
| | | | 65,483,100 | | | | | $ | 6,548 | | | | | $ | 120,379 | | | | | $ | (1,899,449) | | | | | $ | (1,772,522) | | |
|
| | |
For the nine months ended September 30,
|
| |||||||||
| | |
2018
|
| |
2017
|
| ||||||
| | | | | | | | |
(Unaudited)
|
| |||
Cash flows from operating activities | | | | | | | | | | | | | |
Net loss
|
| | | $ | (420,935) | | | | | $ | (577,373) | | |
Adjustments to reconcile net loss to net cash used in operating activities:
|
| | | | | | | | | | | | |
Depreciation and amortization
|
| | | | 5,261 | | | | | | 4,485 | | |
Loss on sale of asset
|
| | | | 807 | | | | | | — | | |
Stock-based compensation expense
|
| | | | 3,921 | | | | | | 26,896 | | |
Changes in operating assets and liabilities:
|
| | | | | | | | | | | | |
Accounts receivable
|
| | | | (247,999) | | | | | | (227,970) | | |
Other current assets
|
| | | | — | | | | | | 689 | | |
Accounts payable
|
| | | | 111,089 | | | | | | 5,978 | | |
Accrued interest
|
| | | | 8,282 | | | | | | 6,223 | | |
Accrued payroll
|
| | | | 457 | | | | | | 48,199 | | |
Contract liabilities
|
| | | | 461,747 | | | | | | 371,222 | | |
Net cash used in operating activities
|
| | | | (77,370) | | | | | | (341,651) | | |
Cash flows from investing activities | | | | | | | | | | | | | |
Purchases of property and equipment
|
| | | | — | | | | | | (5,346) | | |
Proceeds from disposition of property and equipment
|
| | | | 1,200 | | | | | | — | | |
Payment of security deposit
|
| | | | — | | | | | | (350) | | |
Net cash provided by (used in) investing activities
|
| | | | 1,200 | | | | | | (5,696) | | |
Cash flows from financing activities | | | | | | | | | | | | | |
Principal payments on notes payable
|
| | | | (37,772) | | | | | | (54,418) | | |
Net decrease in cash
|
| | | | (113,942) | | | | | | (401,765) | | |
Cash at beginning of period
|
| | | | 190,885 | | | | | | 459,120 | | |
Cash at end of period
|
| | | $ | 76,943 | | | | | $ | 57,355 | | |
Cash paid for interest
|
| | | $ | 76,356 | | | | | $ | 53,719 | | |
Cash paid for income taxes
|
| | | $ | — | | | | | $ | — | | |
| Computer equipment | | | 5 years | |
| Furniture and fixtures | | | 7 years | |
| Website domain | | | 15 years | |
| | |
Nine months ended September 30,
|
| |||||||||
| | |
2018
|
| |
2017
|
| ||||||
Options
|
| | | | 1,868,595 | | | | | | 2,245,901 | | |
| | |
September 30,
2018 |
| |||
Computer equipment
|
| | | $ | 21,951 | | |
Furniture and fixtures
|
| | | | 9,084 | | |
Website domain
|
| | | | 20,263 | | |
| | | | | 51,298 | | |
Less: accumulated depreciation and amortization
|
| | | | (20,052) | | |
| | | | $ | 31,246 | | |
|
| | |
Options
|
| |
Weighted Average
Exercise Price |
| |
Aggregate
Intrinsic Value |
| |
Weighted Average
Remaining Contractual Life (in years) |
| ||||||||||||
Outstanding at December 31, 2017
|
| | | | 2,093,449 | | | | | $ | 0.05 | | | | | $ | 75,348 | | | | | | 8.6 | | |
Granted
|
| | | | — | | | | | | — | | | | | | — | | | | | | — | | |
Expired/Forfeited
|
| | | | (224,854) | | | | | | 0.08 | | | | | | — | | | | | | — | | |
Outstanding at September 30, 2018
|
| | | | 1,868,595 | | | | | | 0.04 | | | | | | 75,348 | | | | | | 7.8 | | |
Exercisable at September 30, 2018
|
| | | | 292,364 | | | | | $ | 0.05 | | | | | $ | 10,390 | | | | | | 6.8 | | |
|
| | |
Nine months ended
September 30, 2017 |
|
Expected dividend yield
|
| |
0.00%
|
|
Expected stock-price volatility
|
| |
79.35% – 84.72%
|
|
Risk-free interest rate
|
| |
1.81% – 2.25%
|
|
Expected term
|
| |
4.7 – 7.0
|
|
Stock price
|
| |
$0.08
|
|
| | |
As of September 30,
2018 |
| |||
Deferred tax assets: | | | | | | | |
Net operating loss carryforwards
|
| | | $ | 490,589 | | |
Charitable contribution carryover
|
| | | | 280 | | |
Stock-based compensation
|
| | | | 12,518 | | |
Total deferred income tax assets
|
| | | $ | 503,387 | | |
Deferred tax liabilities: | | | | | | | |
Fixed assets
|
| | | | (3,419) | | |
Net deferred tax assets
|
| | | | 499,968 | | |
Valuation allowance
|
| | | | (499,968) | | |
Deferred tax assets, net of allowance
|
| | | $ | — | | |
|
| | |
For the nine months
ended September 30, 2018 |
| |||
Statutory Federal income tax rate
|
| | | | (21.0)% | | |
State taxes, net of Federal tax benefit
|
| | | | (7.0)% | | |
Legal fees relating to GTY acquisition
|
| | | | 12.8% | | |
Stock-based compensation
|
| | | | 0.1% | | |
Other items
|
| | | | 0.1% | | |
Change in valuation allowance
|
| | | | 15.0% | | |
Income taxes provision (benefit)
|
| | | | —% | | |
|
| | |
September 30,
2018 |
| |
December 31,
2017 |
| ||||||
ASSETS | | | | | | | | | | | | | |
Current assets: | | | | | | | | | | | | | |
Cash and cash equivalents
|
| | | $ | 5,492,876 | | | | | $ | 2,236,096 | | |
Marketable securities
|
| | | | 1,964,887 | | | | | | 1,599,589 | | |
Accounts receivable
|
| | | | 4,288,550 | | | | | | 4,288,822 | | |
Prepaid and other current assets
|
| | | | 140,062 | | | | | | 123,225 | | |
Total current assets
|
| | | | 11,886,375 | | | | | | 8,247,732 | | |
Property & equipment, net
|
| | | | 568,942 | | | | | | 677,396 | | |
Intangibles, net
|
| | | | 1,264,670 | | | | | | 1,429,036 | | |
Goodwill
|
| | | | 2,469,915 | | | | | | 2,469,915 | | |
Deferred commissions
|
| | | | 1,360,509 | | | | | | 1,061,356 | | |
TOTAL ASSETS
|
| | | $ | 17,550,411 | | | | | $ | 13,885,434 | | |
LIABILITIES AND STOCKHOLDERS’ EQUITY | | | | | | | | | | | | | |
Current liabilities: | | | | | | | | | | | | | |
Accounts payable
|
| | | $ | 368,004 | | | | | $ | 60,334 | | |
Accrued expenses
|
| | | | 190,093 | | | | | | 162,483 | | |
Deferred revenue
|
| | | | 7,283,873 | | | | | | 5,546,130 | | |
Deferred rent
|
| | | | 93,333 | | | | | | 135,333 | | |
Contingent consideration – current portion
|
| | | | 514,238 | | | | | | 477,087 | | |
Taxes payable
|
| | | | 630,674 | | | | | | 112,518 | | |
Total current liabilities
|
| | | | 9,080,215 | | | | | | 6,493,885 | | |
Long-term liabilities | | | | | | | | | | | | | |
Deferred tax liability
|
| | | | 382,781 | | | | | | 322,601 | | |
Contingent consideration, less current portion
|
| | | | 2,661,941 | | | | | | 2,498,188 | | |
Total liabilities
|
| | | | 12,124,937 | | | | | | 9,314,674 | | |
Commitments and Contingencies (Note 12) | | | | | | | | | | | | | |
Stockholders’ Equity: | | | | | | | | | | | | | |
Common stock, no par value: unlimited shares authorized; 108,000 shares outstanding as of September 30, 2018 and December 31, 2017
|
| | | | 108 | | | | | | 108 | | |
Class A common stock, no par value; unlimited shares authorized; 100 shares outstanding as of September 30, 2018 and December 31, 2017
|
| | | | 100 | | | | | | 100 | | |
Class B common stock, no par value; unlimited shares authorized; 8 shares
outstanding as of September 30, 2018 and December 31, 2017 |
| | | | 625,500 | | | | | | 625,500 | | |
Retained earnings
|
| | | | 4,833,529 | | | | | | 3,924,321 | | |
Accumulated other comprehensive income (loss)
|
| | | | (33,763) | | | | | | 20,731 | | |
Total stockholders’ equity
|
| | | | 5,425,474 | | | | | | 4,570,760 | | |
TOTAL LIABILITIES AND STOCKHOLDERS’ EQUITY
|
| | | $ | 17,550,411 | | | | | $ | 13,885,434 | | |
|
| | |
Nine Months Ended September 30,
|
| |
Year Ended
December 31, 2017 |
| ||||||||||||
| | |
2018
|
| |
2017
|
| ||||||||||||
| | |
(Unaudited)
|
| |||||||||||||||
Revenue: | | | | | | | | | | | | | | | | | | | |
License
|
| | | $ | 1,275,403 | | | | | $ | 1,262,209 | | | | | $ | 1,965,350 | | |
Maintenance
|
| | | | 4,037,817 | | | | | | 2,848,143 | | | | | | 3,956,719 | | |
Professional Services
|
| | | | 3,481,574 | | | | | | 3,091,012 | | | | | | 4,042,183 | | |
Subscription
|
| | | | 969,127 | | | | | | 781,856 | | | | | | 1,098,081 | | |
Total revenue
|
| | | | 9,763,921 | | | | | | 7,983,220 | | | | | | 11,062,333 | | |
Cost of revenue
|
| | | | 907,400 | | | | | | 647,303 | | | | | | 815,280 | | |
Gross Profit
|
| | | | 8,856,521 | | | | | | 7,335,917 | | | | | | 10,247,053 | | |
Operating expenses: | | | | | | | | | | | | | | | | | | | |
Selling, general and administrative
|
| | | | 7,654,581 | | | | | | 5,360,180 | | | | | | 7,799,686 | | |
Total operating expenses
|
| | | | 7,654,581 | | | | | | 5,360,180 | | | | | | 7,799,686 | | |
Income from operations
|
| | | | 1,201,940 | | | | | | 1,975,737 | | | | | | 2,447,367 | | |
Other income (expense): | | | | | | | | | | | | | | | | | | | |
Gain on sale of ETO business
|
| | | | 1,125,000 | | | | | | — | | | | | | — | | |
Gain (loss) on marketable securities
|
| | | | (3,489) | | | | | | 74,022 | | | | | | 156,750 | | |
Interest income
|
| | | | 14,405 | | | | | | 4,953 | | | | | | 9,374 | | |
Interest expense
|
| | | | (7,243) | | | | | | (2,343) | | | | | | (5,495) | | |
Other income (expense)
|
| | | | 7,734 | | | | | | — | | | | | | (15,107) | | |
Foreign currency transaction gain (loss)
|
| | | | 620,502 | | | | | | (191,335) | | | | | | (131,029) | | |
Total other income (expense)
|
| | | | 1,756,909 | | | | | | (114,703) | | | | | | 14,493 | | |
Income before income taxes
|
| | | | 2,958,849 | | | | | | 1,861,034 | | | | | | 2,461,860 | | |
Income tax expense
|
| | | | (859,641) | | | | | | (663,920) | | | | | | (864,758) | | |
Net income
|
| | | $ | 2,099,208 | | | | | $ | 1,197,114 | | | | | $ | 1,597,102 | | |
Net income per share, basic and diluted:
|
| | | $ | 19.42 | | | | | $ | 16.97 | | | | | $ | 19.96 | | |
Weighted average shares outstanding, basic and diluted:
|
| | | | 108,108 | | | | | | 70,526 | | | | | | 79,998 | | |
|
| | |
Nine Months Ended September 30,
|
| |
Year Ended
December 31, 2017 |
| ||||||||||||
| | |
2018
|
| |
2017
|
| ||||||||||||
| | |
(Unaudited)
|
| |||||||||||||||
Net income
|
| | | $ | 2,099,208 | | | | | $ | 1,197,114 | | | | | $ | 1,597,102 | | |
Foreign currency translation adjustment
|
| | | | (54,494) | | | | | | 23,099 | | | | | | 20,731 | | |
Comprehensive income
|
| | | $ | 2,044,714 | | | | | $ | 1,220,212 | | | | | $ | 1,617,833 | | |
|
| | |
Shares
|
| |
Amount
|
| | | | | | | | | | | | | | | | | ||||||||||||||||||||||||||||||
| | |
Common
Stock |
| |
Class A
Common Stock |
| |
Class B
Common Stock |
| |
Common
Stock |
| |
Class A
Common Stock |
| |
Class B
Common Stock |
| |
Retained
Earnings |
| |
Accumulated
Comprehensive Income (Loss) |
| |
Total
Stockholders’ Equity |
||||||||||||||||||||||||||
Balance as of December 31, 2016
|
| | | | — | | | | | | 100 | | | | | | 8 | | | | | $ | — | | | | | $ | 100 | | | | | $ | 625,500 | | | | | $ | 5,827,219 | | | | | $ | — | | | | | $ | 6,452,819 |
Issuance of common stock
|
| | | | 108,000 | | | | | | | | | | | | — | | | | | | 108 | | | | | | — | | | | | | — | | | | | | — | | | | | | — | | | | | | 108 |
Dividends paid
|
| | | | — | | | | | | — | | | | | | — | | | | | | — | | | | | | — | | | | | | — | | | | | | (3,500,000) | | | | | | — | | | | | | (3,500,000) |
Foreign currency translation adjustment
|
| | | | — | | | | | | — | | | | | | — | | | | | | — | | | | | | — | | | | | | — | | | | | | — | | | | | | 20,731 | | | | | | 20,731 |
Net income
|
| | | | — | | | | | | — | | | | | | — | | | | | | — | | | | | | — | | | | | | — | | | | | | 1,597,102 | | | | | | — | | | | | | 1,597,102 |
Balance as of December 31, 2017
|
| | | | 108,000 | | | | | | 100 | | | | | | 8 | | | | | $ | 108 | | | | | $ | 100 | | | | | $ | 625,500 | | | | | $ | 3,924,321 | | | | | $ | 20,731 | | | | | $ | 4,570,760 |
Dividends paid
|
| | | | — | | | | | | — | | | | | | — | | | | | | — | | | | | | — | | | | | | — | | | | | | (1,190,000) | | | | | | | | | | | | (1,190,000) |
Foreign currency translation adjustment
|
| | | | — | | | | | | — | | | | | | — | | | | | | — | | | | | | — | | | | | | — | | | | | | — | | | | | | (54,494) | | | | | | (54,494) |
Net income
|
| | | | — | | | | | | — | | | | | | — | | | | | | — | | | | | | — | | | | | | — | | | | | | 2,099,208 | | | | | | — | | | | | | 2,099,208 |
Balance as of September 30, 2018
|
| | | | 108,000 | | | | | | 100 | | | | | | 8 | | | | | $ | 108 | | | | | $ | 100 | | | | | $ | 625,500 | | | | | $ | 4,833,259 | | | | | $ | (33,763) | | | | | $ | 5,425,474 |
|
| | |
Nine Months Ended September 30,
|
| |
December 31,
2017 |
| ||||||||||||
| | |
2018
|
| |
2017
|
| ||||||||||||
| | |
(Unaudited)
|
| |||||||||||||||
CASH FLOWS FROM OPERATING ACTIVITIES | | | | | | | | | | | | | | | | | | | |
Net income
|
| | | $ | 2,099,208 | | | | | $ | 1,197,114 | | | | | $ | 1,597,102 | | |
Adjustment to reconcile net income to cash provided by operating activities:
|
| | | | | | | | | | | | | | | | | | |
Depreciation and amortization
|
| | | | 142,187 | | | | | | 94,983 | | | | | | 143,464 | | |
Intangible amortization
|
| | | | 164,366 | | | | | | 59,221 | | | | | | 113,419 | | |
Change in fair value of contingent consideration
|
| | | | 200,904 | | | | | | 66,092 | | | | | | 127,962 | | |
Foreign currency translation adjustment
|
| | | | (54,494) | | | | | | 23,099 | | | | | | 20,731 | | |
Unrealized loss (gain) on marketable securities
|
| | | | — | | | | | | 69,242 | | | | | | (123,950) | | |
Deferred income taxes
|
| | | | 60,180 | | | | | | 9,289 | | | | | | 12,385 | | |
Changes in operating assets and liabilities: | | | | | | | | | | | | | | | | | | | |
Accounts receivable
|
| | | | 272 | | | | | | (805,732) | | | | | | (827,629) | | |
Prepaid and other current assets
|
| | | | (16,837) | | | | | | 7,679 | | | | | | (22,131) | | |
Deferred commissions
|
| | | | (299,154) | | | | | | (190,362) | | | | | | (261,145) | | |
Account payable
|
| | | | 307,670 | | | | | | 47,304 | | | | | | (38,531) | | |
Accrued expenses
|
| | | | 27,610 | | | | | | 57,670 | | | | | | 14,809 | | |
Deferred revenue
|
| | | | 1,737,743 | | | | | | 767,828 | | | | | | 778,887 | | |
Deferred rent
|
| | | | (42,000) | | | | | | (37,333) | | | | | | (37,333) | | |
Taxes payable
|
| | | | 518,156 | | | | | | (23,443) | | | | | | 83,258 | | |
Net cash provided by operating activities
|
| | | | 4,845,812 | | | | | | 1,342,649 | | | | | | 1,581,298 | | |
CASH FLOWS FROM INVESTING ACTIVITIES | | | | | | | | | | | | | | | | | | | |
Purchase of equipment
|
| | | | (33,734) | | | | | | (128,787) | | | | | | (196,240) | | |
Proceeds from the sales of marketable securities
|
| | | | 199,202 | | | | | | 3,807,448 | | | | | | 3,968,607 | | |
Purchase of marketable securities
|
| | | | (564,500) | | | | | | (887,500) | | | | | | (887,500) | | |
Acquisition of Power Plan net of cash received
|
| | | | — | | | | | | (663,400) | | | | | | (663,400) | | |
Net cash (used in) provided by investing activities
|
| | | | (399,032) | | | | | | 2,127,761 | | | | | | 2,221,467 | | |
CASH FLOWS FROM FINANCING ACTIVITIES | | | | | | | | | | | | | | | | | | | |
Dividends paid
|
| | | | (1,190,000) | | | | | | — | | | | | | (3,500,000) | | |
Proceeds from issuance of common stock
|
| | | | — | | | | | | 108 | | | | | | 108 | | |
Net cash (used in) provided by financing activities
|
| | | | (1,190,000) | | | | | | 108 | | | | | | (3,499,892) | | |
Net increase in cash and cash equivalents
|
| | | | 3,256,780 | | | | | | 3,470,518 | | | | | | 302,873 | | |
Cash and cash equivalents – beginning of period
|
| | | | 2,236,096 | | | | | | 1,933,223 | | | | | | 1,933,223 | | |
Cash and cash equivalents – end of period
|
| | | $ | 5,492,876 | | | | | $ | 5,403,741 | | | | | $ | 2,236,096 | | |
Supplemental disclosure of noncash investing activities contingent consideration of Power Plan acquisition
|
| | | | — | | | | | $ | 2,847,313 | | | | | $ | 2,847,313 | | |
Cash paid for interest
|
| | | $ | — | | | | | $ | — | | | | | $ | — | | |
Cash paid income taxes
|
| | | $ | 400,000 | | | | | $ | 590,000 | | | | | $ | 740,000 | | |
|
| Office equipment | | | 5 years | |
| Furniture and fixtures | | | 5 years | |
| Computer equipment | | | 3 years | |
| Computer software | | | 5 years | |
| Leasehold improvements | | |
Term of the lease
|
|
|
Total cash and contingent consideration to selling shareholders
|
| | | $ | 3,510,713 | | |
| Assets acquired and liabilities assumed | | | | | | | |
|
Other assets
|
| | | $ | 94,203 | | |
|
Property and equipment
|
| | | | 33,170 | | |
|
Intangible assets subject to amortization
|
| | | | 1,549,702 | | |
|
Net assets
|
| | | | 1,677,075 | | |
|
Goodwill
|
| | | $ | 1,833,638 | | |
|
| | |
Amortization
Period |
| |
Fair Value
|
| |||
Patents/Developed technology
|
| |
4 – 5 Years
|
| | | $ | 376,811 | | |
Trade names/Trademarks
|
| |
6 – 7 Years
|
| | | | 92,876 | | |
Customer contracts/relationships
|
| |
7 – 9 Years
|
| | | | 1,080,015 | | |
| | | | | | | $ | 1,549,702 | | |
|
September 30, 2018
|
| |
Level 1
|
| |
Level 2
|
| |
Level 3
|
| |
Total
|
| ||||||||||||
Securities owned: | | | | | | | | | | | | | | | | | | | | | | | | | |
Fixed income
|
| | | $ | — | | | | | $ | 1,389,441 | | | | | $ | — | | | | | $ | 1,389,441 | | |
Equity
|
| | | | 519,405 | | | | | | — | | | | | | — | | | | | | 519,405 | | |
Other
|
| | | | — | | | | | | 56,041 | | | | | | | | | | | | 56,041 | | |
Marketable Securities
|
| | | $ | 519,405 | | | | | $ | 1,445,482 | | | | | $ | — | | | | | $ | 1,964,887 | | |
|
December 31, 2017
|
| |
Level 1
|
| |
Level 2
|
| |
Level 3
|
| |
Total
|
| ||||||||||||
Money market funds
|
| | | $ | 523,122 | | | | | $ | — | | | | | $ | — | | | | | $ | 523,122 | | |
Cash Equivalents
|
| | | | 523,122 | | | | | | — | | | | | | — | | | | | | 523,122 | | |
Securities owned: | | | | | | | | | | | | | | | | | | | | | | | | | |
Fixed income
|
| | | | — | | | | | | 957,258 | | | | | | — | | | | | | 957,258 | | |
Equity
|
| | | | 453,367 | | | | | | — | | | | | | — | | | | | | 453,367 | | |
Other
|
| | | | — | | | | | | 188,964 | | | | | | | | | | | | 188,964 | | |
Marketable Securities
|
| | | $ | 453,367 | | | | | $ | 1,146,222 | | | | | $ | — | | | | | $ | 1,599,589 | | |
|
| | |
September 30, 2018
|
| |
December 31, 2017
|
| ||||||
Leasehold improvements
|
| | | $ | 542,742 | | | | | $ | 542,742 | | |
Office equipment
|
| | | | 88,942 | | | | | | 88,043 | | |
Furniture and fixtures
|
| | | | 220,476 | | | | | | 202,513 | | |
Computers
|
| | | | 404,820 | | | | | | 390,068 | | |
Computer software
|
| | | | 451,294 | | | | | | 451,294 | | |
Total
|
| | | | 1,708,274 | | | | | | 1,674,660 | | |
Less accumulated depreciation and amortization
|
| | | | (1,139,332) | | | | | | (997,264) | | |
Property and equipment, net
|
| | | $ | 568,942 | | | | | $ | 677,396 | | |
|
| | |
September 30, 2018
|
| |||||||||||||||
| | |
Gross carrying
amount |
| |
Accumulated
amortization |
| |
Net carrying
amount |
| |||||||||
Patents/Developed Technology
|
| | | $ | 376,811 | | | | | $ | 102,819 | | | | | $ | 273,992 | | |
Trade Names/Trademarks
|
| | | | 92,876 | | | | | | 17,033 | | | | | | 75,843 | | |
Customer contracts/relationships
|
| | | | 1,080,015 | | | | | | 165,180 | | | | | | 914,836 | | |
| | | | $ | 1,549,702 | | | | | $ | 280,785 | | | | | $ | 1,264,670 | | |
|
| | |
December 31,
2017 |
| |||||||||||||||
| | |
Gross carrying
amount |
| |
Accumulated
amortization |
| |
Net carrying
amount |
| |||||||||
Patents/Developed Technology
|
| | | $ | 376,811 | | | | | $ | 43,756 | | | | | $ | 333,055 | | |
Trade Names/Trademarks
|
| | | | 92,876 | | | | | | 6,955 | | | | | | 85,921 | | |
Customer contracts/relationships
|
| | | | 1,080,015 | | | | | | 69,956 | | | | | | 1,010,059 | | |
| | | | $ | 1,549,702 | | | | | $ | 120,667 | | | | | $ | 1,429,036 | | |
|
|
Remainder of 2018
|
| | | $ | 54,198 | | |
|
2019
|
| | | | 218,564 | | |
|
2020
|
| | | | 218,564 | | |
|
2021
|
| | | | 218,564 | | |
|
2022
|
| | | | 218,564 | | |
|
2023
|
| | | | 218,564 | | |
|
Thereafter
|
| | | | 121,899 | | |
| | | | | $ | 1,268,917 | | |
|
| | |
September 30,
2018 |
| |
December 31,
2017 |
| ||||||
Payroll and employee benefits
|
| | | $ | 66,022 | | | | | $ | 112,653 | | |
Commissions
|
| | | | 73,414 | | | | | | 31,446 | | |
Professional fees
|
| | | | 34,583 | | | | | | 18,384 | | |
Others
|
| | | | 16,074 | | | | | | — | | |
Total
|
| | | $ | 190,093 | | | | | $ | 162,483 | | |
|
| | |
As of September 30,
2018 |
| |
As of December 31,
2017 |
| ||||||
Current | | | | | | | | | | | | | |
US Federal
|
| | | $ | — | | | | | $ | — | | |
US State
|
| | | | — | | | | | | — | | |
Canada Federal
|
| | | | 452,525 | | | | | | 482,475 | | |
Canada Province
|
| | | | 346,937 | | | | | | 369,898 | | |
Total current provision
|
| | | | 799,461 | | | | | | 852,373 | | |
Deferred | | | | | | | | | | | | | |
US Federal
|
| | | | — | | | | | | — | | |
US State
|
| | | | — | | | | | | — | | |
Canada Federal
|
| | | | 34,064 | | | | | | 7,011 | | |
Canada Province
|
| | | | 26,116 | | | | | | 5,375 | | |
Total deferred benefit
|
| | | | 60,180 | | | | | | 12,385 | | |
Total provision for income taxes
|
| | | $ | 859,641 | | | | | $ | 864,758 | | |
|
| | |
As of September 30,
2018 |
| |
As of December 31,
2017 |
| ||||||
Deferred income tax assets: | | | | | | | | | | | | | |
Net operating loss carryforwards
|
| | | $ | 202,647 | | | | | $ | 172,177 | | |
Intangible assets
|
| | | | 55,852 | | | | | | 22,854 | | |
Contingent consideration relating to PowerPlan acquisition
|
| | | | 70,881 | | | | | | 27,580 | | |
Total deferred income tax assets
|
| | | | 329,381 | | | | | | 222,611 | | |
Valuation allowance
|
| | | | (324,558) | | | | | | (220,702) | | |
Net deferred income tax assets
|
| | | | 4,823 | | | | | | 1,909 | | |
Deferred income tax liabilities: | | | | | | | | | | | | | |
Goodwill
|
| | | | (4,823) | | | | | | (1,909) | | |
Commissions
|
| | | | (360,535) | | | | | | (281,259) | | |
Unrealized gain
|
| | | | (22,246) | | | | | | (41,342) | | |
Total deferred income tax liabilities
|
| | | | (387,604) | | | | | | (324,510) | | |
Net deferred income tax liability
|
| | | $ | (382,781) | | | | | $ | (322,601) | | |
|
| | |
For the nine months ended
September 30, 2018 |
| |
For the year ended
December 31, 2017 |
| ||||||
Statutory US Federal income tax rate
|
| | | | (21.0)% | | | | | | (34.0)% | | |
US State taxes, net of Federal tax benefit
|
| | | | (0.6)% | | | | | | (0.5)% | | |
US Federal tax rate change
|
| | | | —% | | | | | | 12.9% | | |
Change in valuation allowance
|
| | | | 21.6% | | | | | | 21.6% | | |
Income taxes provision (benefit)
|
| | | | —% | | | | | | —% | | |
|
| | |
For the nine months ended
September 30, 2018 |
| |
For the year ended
December 31, 2017 |
| ||||||
Statutory federal income tax rate (Canada)
|
| | | | 15.0% | | | | | | 15.0% | | |
Statutory provincial income tax rate (Canada)
|
| | | | 11.5% | | | | | | 11.5% | | |
Legal fees relating to GTY
|
| | | | 1.6% | | | | | | —% | | |
Meals
|
| | | | 0.0% | | | | | | 0.1% | | |
Income taxes provision
|
| | | | 28.1% | | | | | | 26.6% | | |
|
| | |
Questica Inc.
|
| |
Questica Ltd.
|
| ||||||
2018
|
| | | $ | 59,379 | | | | | $ | 16,669 | | |
2019
|
| | | | 237,516 | | | | | | 68,186 | | |
2020
|
| | | | — | | | | | | 70,233 | | |
2021
|
| | | | — | | | | | | 72,337 | | |
2022
|
| | | | — | | | | | | 74,503 | | |
2023
|
| | | | — | | | | | | 18,762 | | |
Total
|
| | | $ | 296,895 | | | | | $ | 320,691 | | |
|
| | |
September 30,
2018 |
| |||
ASSETS | | | | | | | |
Current assets: | | | | | | | |
Cash and cash equivalents
|
| | | $ | 799,808 | | |
Accounts receivable
|
| | | | 595,517 | | |
Prepaid expenses and other current assets
|
| | | | 31,644 | | |
Total current assets
|
| | | | 1,426,969 | | |
Property and equipment, net
|
| | | | 2,688 | | |
Total Assets
|
| | | $ | 1,429,657 | | |
LIABILITIES AND MEMBERS’ CAPITAL | | | | | | | |
Current liabilities: | | | | | | | |
Accounts payable
|
| | | $ | 3,895 | | |
Accrued expenses
|
| | | | 115,245 | | |
Contract liabilites
|
| | | | 43,865 | | |
Total current liabilities
|
| | | | 163,005 | | |
Commitments and contingencies | | | | | | | |
Members’ capital
|
| | | | 1,266,652 | | |
Total liabilities and members’ capital
|
| | | $ | 1,429,657 | | |
|
| | |
Nine months ended September 30,
|
| |||||||||
| | |
2018
|
| |
2017
|
| ||||||
| | | | | | | | |
(Unaudited)
|
| |||
Revenues | | | | | | | | | | | | | |
Professional services
|
| | | $ | 1,321,225 | | | | | $ | 946,198 | | |
Licenses
|
| | | | 678,046 | | | | | | 307,813 | | |
Hosting
|
| | | | 143,715 | | | | | | 79,658 | | |
Total revenues
|
| | | | 2,142,986 | | | | | | 1,333,669 | | |
Cost of revenues
|
| | | | 171,049 | | | | | | 47,789 | | |
Gross profit
|
| | | | 1,971,937 | | | | | | 1,285,880 | | |
Operating expenses | | | | | | | | | | | | | |
General and administrative
|
| | | | 758,047 | | | | | | 931,914 | | |
Total operating expenses
|
| | | | 758,047 | | | | | | 931,914 | | |
Operating income
|
| | | | 1,213,890 | | | | | | 353,966 | | |
Other income: | | | | | | | | | | | | | |
Interest income
|
| | | | 1,526 | | | | | | 592 | | |
Total other income
|
| | | | 1,526 | | | | | | 592 | | |
Net income
|
| | | $ | 1,215,416 | | | | | $ | 354,558 | | |
|
| | |
Members’
Capital |
| |||
Balance at December 31, 2017
|
| | | $ | 909,236 | | |
Contributions
|
| | | | 1,000 | | |
Distributions
|
| | | | (859,000) | | |
Net Income
|
| | | | 1,215,416 | | |
Balance at September 30, 2018
|
| | | $ | 1,266,652 | | |
|
| | |
Nine months ended September 30,
|
| |||||||||
| | |
2018
|
| |
2017
|
| ||||||
| | | | | | | | |
(Unaudited)
|
| |||
Cash flows from operating activities | | | | | | | | | | | | | |
Net income
|
| | | $ | 1,215,416 | | | | | $ | 354,558 | | |
Non-cash adjustments | | | | | | | | | | | | | |
Depreciation and amortization
|
| | | | 1,854 | | | | | | 14,386 | | |
Changes in operating assets/liabilities | | | | | | | | | | | | | |
Accounts receivable
|
| | | | (325,837) | | | | | | (93,654) | | |
Prepaid expenses and other current assets
|
| | | | 11,417 | | | | | | (1,960) | | |
Accounts payable
|
| | | | (6,421) | | | | | | (4,551) | | |
Accrued expenses
|
| | | | 48,854 | | | | | | 324 | | |
Contract liabilities
|
| | | | 14,465 | | | | | | 20,442 | | |
Net cash provided by operating activities
|
| | | | 959,748 | | | | | | 289,545 | | |
Cash flows from financing activities | | | | | | | | | | | | | |
Proceeds received from members’ contributions
|
| | | | 1,000 | | | | | | — | | |
Members’ distributions
|
| | | | (859,000) | | | | | | (260,000) | | |
Net cash used in financing activities
|
| | | | (858,000) | | | | | | (260,000) | | |
Net increase in cash and cash equivalents
|
| | | | 101,748 | | | | | | 29,545 | | |
Cash and cash equivalents, beginning of period
|
| | | | 698,060 | | | | | | 520,994 | | |
Cash and cash equivalents, end of period
|
| | | $ | 799,808 | | | | | $ | 550,539 | | |
Cash paid for interest
|
| | | $ | 472 | | | | | $ | — | | |
| Computer hardware and equipment | | |
3 – 5 years
|
|
| | |
September 30,
2018 |
| |
December 31,
2017 |
| ||||||
Computer & equipment
|
| | | $ | 127,675 | | | | | $ | 127,675 | | |
Less: accumulated depreciation
|
| | | | (124,987) | | | | | | (123,133) | | |
| | | | $ | 2,688 | | | | | $ | 4,542 | | |
|
| | |
Page
|
| |||
| | | | B-7 | | | |
| | | | B-7 | | | |
| | | | B-9 | | | |
| | | | B-10 | | | |
| | | | B-11 | | | |
| | | | B-11 | | | |
| | | | B-11 | | | |
| | | | B-13 | | | |
| | | | B-13 | | | |
| | | | B-13 | | | |
| | | | B-14 | | | |
| | | | B-14 | | | |
| | | | B-15 | | | |
| | | | B-15 | | | |
| | | | B-15 | | | |
| | | | B-16 | | | |
| | | | B-16 | | | |
| | | | B-17 | | | |
| | | | B-17 | | | |
| | | | B-17 | | | |
| | | | B-19 | | | |
| | | | B-20 | | | |
| | | | B-20 | | | |
| | | | B-21 | | | |
| | | | B-22 | | | |
| | | | B-25 | | | |
| | | | B-26 | | | |
| | | | B-27 | | | |
| | | | B-28 | | | |
| | | | B-29 | | | |
| | | | B-31 | | | |
| | | | B-32 | | | |
| | | | B-32 | | | |
| | | | B-32 | | | |
| | | | B-32 | | | |
| | | | B-33 | | | |
| | | | B-33 | | | |
| | | | B-34 | | |
| | |
Page
|
| |||
| | | | B-34 | | | |
| | | | B-34 | | | |
| | | | B-35 | | | |
| | | | B-35 | | | |
| | | | B-35 | | | |
| | | | B-35 | | | |
| | | | B-35 | | | |
| | | | B-36 | | | |
| | | | B-36 | | | |
| | | | B-36 | | | |
| | | | B-36 | | | |
| | | | B-36 | | | |
| | | | B-37 | | | |
| | | | B-38 | | | |
| | | | B-38 | | | |
| | | | B-39 | | | |
| | | | B-39 | | | |
| | | | B-40 | | | |
| | | | B-40 | | | |
| | | | B-40 | | | |
| | | | B-40 | | | |
| | | | B-41 | | | |
| | | | B-41 | | | |
| | | | B-41 | | | |
| | | | B-42 | | | |
| | | | B-44 | | | |
| | | | B-45 | | | |
| | | | B-45 | | | |
| | | | B-45 | | | |
| | | | B-45 | | | |
| | | | B-45 | | | |
| | | | B-45 | | | |
| | | | B-46 | | | |
| | | | B-46 | | | |
| | | | B-46 | | | |
| | | | B-46 | | | |
| | | | B-47 | | |
| | |
Page
|
| |||
| | | | B-47 | | | |
| | | | B-47 | | | |
| | | | B-47 | | | |
| | | | B-47 | | | |
| | | | B-47 | | | |
| | | | B-48 | | | |
| | | | B-49 | | | |
| | | | B-50 | | | |
| | | | B-50 | | | |
| | | | B-51 | | | |
| | | | B-52 | | | |
| | | | B-54 | | | |
| | | | B-54 | | | |
| | | | B-55 | | | |
| | | | B-55 | | | |
| | | | B-55 | | | |
| | | | B-55 | | | |
| | | | B-56 | | | |
| | | | B-57 | | | |
| | | | B-71 | | | |
| | | | B-71 | | | |
| | | | B-71 | | | |
| | | | B-71 | | | |
| | | | B-71 | | | |
| | | | B-71 | | | |
| | | | B-72 | | | |
| | | | B-72 | | | |
| | | | B-72 | | | |
| | | | B-72 | | | |
| | | | B-73 | | | |
| | | | B-73 | | | |
| | | | B-73 | | | |
| | | | B-73 | | | |
| | | | B-74 | | | |
| | | | B-74 | | | |
| | | | B-74 | | |
|
Exhibit A
|
| | Plan of Arrangement | |
|
Exhibit B
|
| | Earnout Payment | |
|
Exhibit C
|
| | Arrangement Resolution | |
|
Exhibit D
|
| | Form Escrow Agreement | |
|
Exhibit E
|
| | Registration Rights | |
|
Exhibit F
|
| | Pre-Closing Reorganization | |
|
Exhibit G
|
| | GTY Equity Incentive Plan | |
|
Exhibit H
|
| | Form of Voting & Support Agreement | |
|
Exhibit I
|
| | Form of Lock Up Agreement | |
|
Exhibit J
|
| | Form of Letter of Transmittal | |
|
Exhibit K
|
| | Form of Employment Agreement | |
|
Exhibit L
|
| | Support Agreement | |
| If to Bonfire Holders or the Company Parties, then to Bonfire Holders’ Representative: | | | 121 Charles St. W. #C429, Kitchener ON N2G 1H6 Attention: Corry Flatt, President Facsimile: N/A Email: cflatt@gobonfire.com |
|
| with a copy to: | | | LaBarge Weinstein LLP 375 Water Street, Suite 501 Vancouver, British Columbia V68 1B8 Attention: James Smith Facsimile: 604.484.1064 Email: js@lwlaw.com |
|
| If to any of the GTY Parties or the Company following Closing: | | | Harry You 1180 North Town Center Drive, Suite 100 Las Vegas, Nevada 89144 Email: Harry@gtytechnology.com |
|
| with a copy to: | | | Winston & Strawn LLP 200 Park Avenue New York, NY 10166-4193 Attention: Joel L. Rubinstein, Esq. Jason D. Osborn, Esq. Facsimile: (212) 294-5336 Email: JRubinstein@winston.com JOsborn@winston.com |
|
| with a copy to: | | | Stikeman Elliott LLP 1155 René-Lévesque Blvd. West 41st Floor Montréal, Quebec H3B 3V2 Attention: John Leopold Facsimile: (514) 397-3222 Email: JLeopold@stikeman.com |
|
| | |
Page
|
| |||
| | | | C-7 | | | |
| | | | C-7 | | | |
| | | | C-7 | | | |
| | | | C-8 | | | |
| | | | C-8 | | | |
| | | | C-9 | | | |
| | | | C-9 | | | |
| | | | C-11 | | | |
| | | | C-11 | | | |
| | | | C-13 | | | |
| | | | C-13 | | | |
| | | | C-13 | | | |
| | | | C-14 | | | |
| | | | C-14 | | | |
| | | | C-14 | | | |
| | | | C-14 | | | |
| | | | C-14 | | | |
| | | | C-15 | | | |
| | | | C-15 | | | |
| | | | C-16 | | | |
| | | | C-18 | | | |
| | | | C-18 | | | |
| | | | C-19 | | | |
| | | | C-20 | | | |
| | | | C-21 | | | |
| | | | C-23 | | | |
| | | | C-24 | | | |
| | | | C-26 | | | |
| | | | C-26 | | | |
| | | | C-27 | | | |
| | | | C-28 | | | |
| | | | C-29 | | | |
| | | | C-29 | | | |
| | | | C-29 | | | |
| | | | C-30 | | | |
| | | | C-30 | | | |
| | | | C-30 | | | |
| | | | C-30 | | |
| | |
Page
|
| |||
| | | | C-31 | | | |
| | | | C-31 | | | |
| | | | C-31 | | | |
| | | | C-31 | | | |
| | | | C-31 | | | |
| | | | C-32 | | | |
| | | | C-32 | | | |
| | | | C-33 | | | |
| | | | C-33 | | | |
| | | | C-33 | | | |
| | | | C-33 | | | |
| | | | C-33 | | | |
| | | | C-34 | | | |
| | | | C-34 | | | |
| | | | C-34 | | | |
| | | | C-34 | | | |
| | | | C-35 | | | |
| | | | C-35 | | | |
| | | | C-35 | | | |
| | | | C-35 | | | |
| | | | C-36 | | | |
| | | | C-36 | | | |
| | | | C-37 | | | |
| | | | C-37 | | | |
| | | | C-38 | | | |
| | | | C-39 | | | |
| | | | C-39 | | | |
| | | | C-39 | | | |
| | | | C-39 | | | |
| | | | C-40 | | | |
| | | | C-40 | | | |
| | | | C-40 | | | |
| | | | C-40 | | | |
| | | | C-40 | | | |
| | | | C-40 | | | |
| | | | C-41 | | | |
| | | | C-41 | | |
| | |
Page
|
| |||
| | | | C-42 | | | |
| | | | C-44 | | | |
| | | | C-45 | | | |
| | | | C-45 | | | |
| | | | C-45 | | | |
| | | | C-46 | | | |
| | | | C-47 | | | |
| | | | C-47 | | | |
| | | | C-47 | | | |
| | | | C-50 | | | |
| | | | C-51 | | | |
| | | | C-51 | | | |
| | | | C-52 | | | |
| | | | C-52 | | | |
| | | | C-52 | | | |
| | | | C-53 | | | |
| | | | C-54 | | | |
| | | | C-67 | | | |
| | | | C-67 | | | |
| | | | C-67 | | | |
| | | | C-67 | | | |
| | | | C-68 | | | |
| | | | C-68 | | | |
| | | | C-68 | | | |
| | | | C-68 | | | |
| | | | C-69 | | | |
| | | | C-69 | | | |
| | | | C-69 | | | |
| | | | C-69 | | | |
| | | | C-69 | | | |
| | | | C-70 | | | |
| | | | C-70 | | | |
| | | | C-70 | | | |
| | | | C-70 | | | |
| | | | C-71 | | | |
| | | | C-71 | | | |
| | | | C-73 | | |
| Exhibit A | | | Form of Letter of Transmittal | |
| Exhibit B | | | Earnout | |
| Exhibit C | | | Registration Rights | |
| Exhibit D | | | Form of CB Holders Written Consent | |
| Exhibit E | | | Form of Escrow Agreement | |
| Exhibit F | | | GTY Equity Incentive Plan | |
| Exhibit G | | | Form of Lock Up Agreement | |
| Company’s Disclosure Schedule | | |||
| GTY’s Disclosure Schedule | | |||
|
Schedule 1.2(b)
|
| | Per Share Closing Cash Consideration and Per Option Closing Cash Consideration Calculation | |
|
Schedule 6.2(e)
|
| | Consents or Permits | |
|
Schedule 6.2(h)
|
| | Lockup Agreements and Letters of Transmittal | |
|
Schedule 6.2(o)
|
| | Restrictive Covenants Agreements | |
|
Schedule 7.1(a)
|
| | Indemnity Matters | |
| Schedule 9.1 | | | Company Knowledge Parties | |
| Schedule 9.2 | | | Key Executives | |
|
If to the Company Parties:
|
| | CityBase, Inc. 30 North LaSalle Street Chicago, IL 60602 Attention: Leo Brubaker Email: lbrubaker@thecitybase.com |
|
|
Copy to:
|
| | Perkins Coie LLP 1201 Third Avenue Suite 4900 Seattle, WA 98101-3099 Attention: Stewart M. Landefeld, Esq. Gina K. Eiben, Esq. Facsimile: (206) 359-9430 Email: SLandefeld@perkinscoie.com GEiben@perkinscoie.com |
|
|
If to the CB Holders’ Representative or, after the Closing, to the CB Holders, to:
|
| | Shareholder Representative Services LLC 950 17th Street, Suite 1400 Denver, CO 80202 Attention: Managing Director Email: deals@srsacquiom.com Facsimile: (303) 623-0294 Telephone: (303) 648-4085 |
|
|
If to GTY, Holdings, Merger Sub or the Surviving Company:
|
| | Harry You 1180 North Town Center Drive, Suite 100 Las Vegas, Nevada 89144 Email: Harry@gtytechnology |
|
|
Copy to:
|
| | Winston & Strawn LLP 200 Park Avenue New York, NY 10166-4193 Attention: Joel L. Rubinstein, Esq. Jason D. Osborn, Esq. Facsimile: (212) 294-5336 Email: JRubinstein@winston.com JOsborn@winston.com |
|
|
(i)
Cash Purchase Price
|
| | | $ | 100,000,000.00 | | |
|
(ii)
Plus: Aggregate Exercise Price
|
| | | $ | | | |
|
(iii)
Plus: Closing Date Cash
|
| | | $ | | | |
|
(iv)
Less: Closing Date Indebtedness
|
| | | $ | | | |
|
(v)
Subtotal: Aggregate Distributable Amount
|
| | | $ | | | |
|
(vi)
Divided by: Participating Common Stock Equivalents
|
| | | | | | |
|
Per Share Cash Amount
|
| | | $ | | | |
| | |
Page
|
| |||
| | | | D-7 | | | |
| | | | D-7 | | | |
| | | | D-7 | | | |
| | | | D-9 | | | |
| | | | D-11 | | | |
| | | | D-11 | | | |
| | | | D-13 | | | |
| | | | D-13 | | | |
| | | | D-13 | | | |
| | | | D-14 | | | |
| | | | D-14 | | | |
| | | | D-14 | | | |
| | | | D-14 | | | |
| | | | D-14 | | | |
| | | | D-15 | | | |
| | | | D-15 | | | |
| | | | D-16 | | | |
| | | | D-16 | | | |
| | | | D-18 | | | |
| | | | D-18 | | | |
| | | | D-19 | | | |
| | | | D-20 | | | |
| | | | D-21 | | | |
| | | | D-24 | | | |
| | | | D-25 | | | |
| | | | D-27 | | | |
| | | | D-27 | | | |
| | | | D-28 | | | |
| | | | D-29 | | | |
| | | | D-30 | | | |
| | | | D-30 | | | |
| | | | D-30 | | | |
| | | | D-31 | | | |
| | | | D-31 | | | |
| | | | D-32 | | | |
| | | | D-32 | | | |
| | | | D-32 | | | |
| | | | D-32 | | | |
| | | | D-33 | | | |
| | | | D-33 | | |
| | |
Page
|
| |||
| | | | D-34 | | | |
| | | | D-34 | | | |
| | | | D-34 | | | |
| | | | D-34 | | | |
| | | | D-34 | | | |
| | | | D-35 | | | |
| | | | D-35 | | | |
| | | | D-36 | | | |
| | | | D-36 | | | |
| | | | D-36 | | | |
| | | | D-36 | | | |
| | | | D-37 | | | |
| | | | D-37 | | | |
| | | | D-38 | | | |
| | | | D-39 | | | |
| | | | D-40 | | | |
| | | | D-40 | | | |
| | | | D-40 | | | |
| | | | D-40 | | | |
| | | | D-40 | | | |
| | | | D-41 | | | |
| | | | D-41 | | | |
| | | | D-41 | | | |
| | | | D-41 | | | |
| | | | D-41 | | | |
| | | | D-42 | | | |
| | | | D-42 | | | |
| | | | D-43 | | | |
| | | | D-46 | | | |
| | | | D-46 | | | |
| | | | D-46 | | | |
| | | | D-48 | | | |
| | | | D-48 | | | |
| | | | D-48 | | | |
| | | | D-49 | | | |
| | | | D-50 | | | |
| | | | D-51 | | | |
| | | | D-52 | | | |
| | | | D-52 | | |
| | |
Page
|
| |||
| | | | D-53 | | | |
| | | | D-53 | | | |
| | | | D-53 | | | |
| | | | D-53 | | | |
| | | | D-53 | | | |
| | | | D-54 | | | |
| | | | D-55 | | | |
| | | | D-67 | | | |
| | | | D-67 | | | |
| | | | D-67 | | | |
| | | | D-67 | | | |
| | | | D-67 | | | |
| | | | D-67 | | | |
| | | | D-67 | | | |
| | | | D-67 | | | |
| | | | D-68 | | | |
| | | | D-68 | | | |
| | | | D-68 | | | |
| | | | D-68 | | | |
| | | | D-69 | | | |
| | | | D-69 | | | |
| | | | D-69 | | | |
| | | | D-69 | | | |
| | | | D-70 | | | |
| | | | D-70 | | | |
| | | | D-70 | | | |
| | | | D-71 | | |
| Exhibit A | | | Earnout | |
| Exhibit B | | | Form of Letter of Transmittal | |
| Exhibit C | | | Registration Rights | |
| Exhibit D | | | Form of eCivis Holders Written Consent | |
| Exhibit E | | | Form of Escrow Agreement | |
| Exhibit F | | | GTY Equity Incentive Plan | |
| Exhibit G | | | Form of Lock Up Agreement | |
| Exhibit H | | | eCivis Holders Entering Restrictive Covenant Agreements | |
| If to eCivis Holders or the Company Parties, then to eCivis Holders’ Representative: | | | Kirk Fernandez 901 Bringham Ave. Los Angeles, CA 90049 Facsimile: (310) 694-9806 Email: kirk@fernandezholdings.com |
|
| with a copy to: | | | LKP Global Law, LLP 1901 Avenue of the Stars, Suite 480 Los Angeles, CA 90067 Attention: Young Jun Kim, Esq. Email: ykim@lkpgl.com Facsimile No.:(424) 239-1882 |
|
| If to GTY, Merger Sub or the Surviving Company: | | | Harry You 1180 North Town Center Drive, Suite 100 Las Vegas, Nevada 89144 Email: Harry@gtytechnology |
|
| Copy to: | | | Winston & Strawn LLP 200 Park Avenue New York, NY 10166-4193 Attention: Joel L. Rubinstein, Esq. Jason D. Osborn, Esq. Facsimile: (212) 294-5336 Email: JRubinstein@winston.com JOsborn@winston.com |
|
Tier
|
| |
2020 Revenues
|
| |
2020 EBITDA
|
| |
Earnout Amount
|
| |||||||||
Tier 1
|
| | | $ | 14,500,000 | | | | | $ | 2,900,000 | | | | | $ | 10,000,000 | | |
Tier 2
|
| | | $ | 17,500,000 | | | | | $ | 3,500,000 | | | | | $ | 20,000,000 | | |
Tier 3
|
| | | $ | 20,500,000 | | | | | $ | 4,100,000 | | | | | $ | 30,000,000 | | |
Tier 4
|
| | | $ | 23,500,000 | | | | | $ | 4,700,000 | | | | | $ | 40,000,000 | | |
Tier 5
|
| | | $ | 26,500,000 | | | | | $ | 5,300,000 | | | | | $ | 50,000,000 | | |
| | | | ECIVIS INC. | | ||||||
| | | | By: | | | /s/ James Ha | | |||
| | | | | | | Name: | | | James Ha | |
| | | | | | | Title: | | | Chief Executive Officer | |
| | | | GTY TECHNOLOGY HOLDINGS INC. | | ||||||
| | | | By: | | | /s/ Harry L. You | | |||
| | | | | | | Name: | | | Harry L. You | |
| | | | | | | Title: | | | President and CFO | |
| | | | GTY EC MERGER SUB, INC. | | ||||||
| | | | By: | | | /s/ Harry L. You | | |||
| | | | | | | Name: | | | Harry L. You | |
| | | | | | | Title: | | | | |
| | | |
KIRK FERNANDEZ, in his capacity as eCivis Holders’ Representative (and, pursuant to Sections 1.11(c) and 1.11(f) of the Merger Agreement as set forth in Section 6 of this Amendment, in his individual capacity)
|
| ||||||
| | | | By: | | | /s/ Kirk Fernandez | | |||
| | | | | | | Name: | | | Kirk Fernandez | |
| | |
Page
|
| |||
| | | | E-7 | | | |
| | | | E-7 | | | |
| | | | E-8 | | | |
| | | | E-9 | | | |
| | | | E-11 | | | |
| | | | E-11 | | | |
| | | | E-13 | | | |
| | | | E-13 | | | |
| | | | E-13 | | | |
| | | | E-14 | | | |
| | | | E-14 | | | |
| | | | E-14 | | | |
| | | | E-14 | | | |
| | | | E-15 | | | |
| | | | E-15 | | | |
| | | | E-16 | | | |
| | | | E-16 | | | |
| | | | E-18 | | | |
| | | | E-18 | | | |
| | | | E-19 | | | |
| | | | E-21 | | | |
| | | | E-22 | | | |
| | | | E-24 | | | |
| | | | E-25 | | | |
| | | | E-27 | | | |
| | | | E-27 | | | |
| | | | E-28 | | | |
| | | | E-30 | | | |
| | | | E-30 | | | |
| | | | E-31 | | | |
| | | | E-31 | | | |
| | | | E-31 | | | |
| | | | E-32 | | | |
| | | | E-32 | | |
| | |
Page
|
| |||
| | | | E-33 | | | |
| | | | E-33 | | | |
| | | | E-33 | | | |
| | | | E-33 | | | |
| | | | E-34 | | | |
| | | | E-34 | | | |
| | | | E-34 | | | |
| | | | E-35 | | | |
| | | | E-35 | | | |
| | | | E-35 | | | |
| | | | E-35 | | | |
| | | | E-35 | | | |
| | | | E-36 | | | |
| | | | E-37 | | | |
| | | | E-37 | | | |
4.6
No Solicitation of Transaction; No Trading
|
| | | | E-37 | | |
| | | | E-38 | | | |
| | | | E-40 | | | |
| | | | E-40 | | | |
| | | | E-40 | | | |
| | | | E-40 | | | |
| | | | E-40 | | | |
| | | | E-41 | | | |
| | | | E-41 | | | |
| | | | E-41 | | | |
| | | | E-41 | | | |
| | | | E-41 | | | |
| | | | E-41 | | | |
| | | | E-41 | | | |
| | | | E-42 | | | |
| | | | E-45 | | | |
| | | | E-45 | | | |
| | | | E-45 | | | |
| | | | E-47 | | |
| | |
Page
|
| |||
| | | | E-47 | | | |
| | | | E-47 | | | |
| | | | E-48 | | | |
| | | | E-49 | | | |
| | | | E-50 | | | |
| | | | E-51 | | | |
| | | | E-51 | | | |
| | | | E-52 | | | |
| | | | E-52 | | | |
| | | | E-52 | | | |
| | | | E-53 | | | |
| | | | E-53 | | | |
| | | | E-65 | | | |
| | | | E-65 | | | |
| | | | E-65 | | | |
| | | | E-66 | | | |
| | | | E-66 | | | |
| | | | E-66 | | | |
| | | | E-66 | | | |
| | | | E-66 | | | |
| | | | E-67 | | | |
| | | | E-67 | | | |
| | | | E-67 | | | |
| | | | E-67 | | | |
| | | | E-67 | | | |
| | | | E-68 | | | |
| | | | E-68 | | | |
| | | | E-68 | | | |
| | | | E-69 | | | |
| | | | E-69 | | | |
| | | | E-70 | | | |
10.20
OC Holders’ Representative
|
| | | | E-70 | | |
| Exhibit A | | | Form of Letter of Transmittal | |
| Exhibit B | | | Registration Rights | |
| Exhibit C | | | Form of OC Holder Consent | |
| Exhibit D | | | Form of Escrow Agreement | |
| Exhibit E | | | GTY Equity Incentive Plan | |
| Exhibit F | | | Form of Founder Lock-Up Agreement | |
| Exhibits G | | | Employment Agreements of the Founders | |
| Exhibits H | | | Restrictive Covenant Agreements of the Founders | |
| Exhibit I | | | OC Holders Allocation Percentages | |
| Company’s Disclosure Schedule | | |||
| GTY’s Disclosure Schedule | |
| If to the Company (prior to the Closing), to: | | | Open Counter Enterprises Inc. 25 Taylor Street San Francisco, CA 94102 Attention: Chief Executive Officer Email: joel@opencounter.com Facsimile: (800) 216-7360 Telephone: (415) 404-8733 |
|
| Copy to: | | | VLP Law Group LLP 555 Bryant Street, Suite 820 Palo Alto, CA 94301 Attention: Whit Bissell (with only email constituting notice) Email: wbissell@vlplawgroup.com Telephone: (415) 684-7440 |
|
| If to OC Holders’ Representative or to the OC Holders (after the Closing), to: | | | Shareholder Representative Services LLC 950 17th Street, Suite 1400 Denver, CO 80202 Attention: Managing Director Email: deals@srsacquiom.com Facsimile: (303) 623-0294 Telephone: (303) 648-4085 |
|
| If to GTY, Merger Sub or the Surviving Company: | | | Harry You 1180 North Town Center Drive, Suite 100 Las Vegas, Nevada 89144 Email: Harry@gtytechnology |
|
| Copy to: | | | Winston & Strawn LLP 200 Park Avenue New York, NY 10166-4193 Attention: Joel L. Rubinstein, Esq. Jason D. Osborn, Esq. Facsimile: (212) 294-5336 Email: JRubinstein@winston.com JOsborn@winston.com |
|
| | | | OPEN COUNTER ENTERPRISES INC. | |
| | | |
By:
/s/ Joel Mahoney
Name: Joel Mahoney
Title: CEO |
|
| | | | GTY TECHNOLOGY HOLDINGS INC. | |
| | | |
By:
/s/ Harry You
Name: Harry You
Title: President & CFO |
|
| | | | GTY OC MERGER SUB, INC. | |
| | | |
By:
/s/ Harry You
Name: Harry You
Title: President & CFO |
|
| | | | SHAREHOLDER REPRESENTATIVE SERVICES LLC, solely in its capacity as OC Holders’ Representative | |
| | | |
By:
/s/ Kimberley Angilly
Name: Kimberley Angilly
Title: Director |
|
OC Holder
|
| |
Cash Allocation Percentage
|
| |
OC Shares Allocation Percentage
|
| ||||||
Joel Y. Mahoney
|
| | | | 49.82% | | | | | | 49.86% | | |
Peter J. Koht
|
| | | | 49.82% | | | | | | 49.86% | | |
Mun May Tee
|
| | | | 0.07% | | | | | | 0.05% | | |
Talin Salway
|
| | | | 0.29% | | | | | | 0.22% | | |
| | |
Page
|
| |||
| | | | F-7 | | | |
| | | | F-7 | | | |
| | | | F-7 | | | |
| | | | F-7 | | | |
| | | | F-8 | | | |
| | | | F-8 | | | |
| | | | F-8 | | | |
| | | | F-10 | | | |
| | | | F-10 | | | |
| | | | F-11 | | | |
| | | | F-11 | | | |
| | | | F-11 | | | |
| | | | F-11 | | | |
| | | | F-11 | | | |
| | | | F-11 | | | |
| | | | F-11 | | | |
| | | | F-12 | | | |
| | | | F-12 | | | |
| | | | F-12 | | | |
| | | | F-13 | | | |
| | | | F-13 | | | |
| | | | F-14 | | | |
| | | | F-14 | | | |
| | | | F-14 | | | |
| | | | F-14 | | | |
| | | | F-15 | | | |
| | | | F-16 | | | |
| | | | F-16 | | | |
| | | | F-18 | | | |
| | | | F-18 | | | |
| | | | F-19 | | | |
| | | | F-20 | | | |
| | | | F-21 | | | |
| | | | F-24 | | | |
| | | | F-25 | | | |
| | | | F-27 | | | |
| | | | F-27 | | | |
| | | | F-29 | | | |
| | | | F-31 | | | |
| | | | F-31 | | |
| | |
Page
|
| |||
| | | | F-31 | | | |
| | | | F-32 | | | |
| | | | F-32 | | | |
| | | | F-32 | | | |
| | | | F-33 | | | |
| | | | F-33 | | | |
| | | | F-34 | | | |
| | | | F-34 | | | |
| | | | F-34 | | | |
| | | | F-34 | | | |
| | | | F-35 | | | |
| | | | F-35 | | | |
| | | | F-35 | | | |
| | | | F-36 | | | |
| | | | F-36 | | | |
| | | | F-36 | | | |
| | | | F-37 | | | |
| | | | F-37 | | | |
| | | | F-37 | | | |
| | | | F-37 | | | |
| | | | F-38 | | | |
| | | | F-39 | | | |
| | | | F-39 | | | |
| | | | F-40 | | | |
| | | | F-42 | | | |
| | | | F-42 | | | |
| | | | F-42 | | | |
| | | | F-43 | | | |
| | | | F-43 | | | |
| | | | F-43 | | | |
| | | | F-45 | | | |
| | | | F-45 | | | |
| | | | F-45 | | | |
| | | | F-47 | | | |
| | | | F-48 | | | |
| | | | F-48 | | | |
| | | | F-49 | | | |
| | | | F-50 | | | |
| | | | F-51 | | | |
| | | | F-51 | | | |
| | | | F-53 | | | |
| | | | F-53 | | |
| | |
Page
|
| |||
| | | | F-54 | | | |
| | | | F-54 | | | |
| | | | F-54 | | | |
| | | | F-55 | | | |
| | | | F-65 | | | |
| | | | F-65 | | | |
| | | | F-66 | | | |
| | | | F-66 | | | |
| | | | F-66 | | | |
| | | | F-66 | | | |
| | | | F-66 | | | |
| | | | F-67 | | | |
| | | | F-67 | | | |
| | | | F-67 | | | |
| | | | F-68 | | | |
| | | | F-68 | | | |
| | | | F-68 | | | |
| | | | F-68 | | | |
| | | | F-68 | | | |
| | | | F-68 | | | |
| | | | F-69 | | | |
| | | | F-69 | | | |
| | | | F-69 | | | |
| | | | F-70 | | |
| Exhibit A | | | Form of Restrictive Covenant Agreement | |
| Exhibit B | | | Form of Employment Agreement | |
| Exhibit C | | | Class B Exchange | |
| Exhibit D | | | Form of Escrow Agreement | |
| Exhibit E | | | Registration Rights | |
| Exhibit F | | | Principles of GTY Equity Incentive Plan | |
| Exhibit G | | | Pre-Closing Reorganization | |
| Exhibit H | | | Exchangeable Share Provisions and Support Agreement | |
| Exhibit I | | | Form of Questica Holders Lockup Agreement | |
| Questica Holders’ Disclosure Schedule | | | | |
| GTY’s Disclosure Schedule | | | | |
| If to Questica Holders or the Company Parties before Closing, then to Questica Holders’ Representative: |
| | Craig Ross 980 Fraser Drive, Unit 105 Burlington, ON, Canada L7L5P5 Facsimile: (905) 634-0110 x 513 Email: Roscoconsulting@gmail.com |
|
| with a copy to: | | | Torkin Manes LLP 151 Yonge Street, Suite 1500 Toronto, Ontario, M5C 2W7 |
|
| | | | Attention: Allan Bronstein Facsimile: 1-888-463-8129 Email: abronstein@torkinmanes.com |
|
| If to GTY, Exchangeco or the Company Parties after Closing: |
| | Harry You 1180 North Town Center Drive, Suite 100 Las Vegas, Nevada 89144 Email: Harry@gtytechnology |
|
| with a copy to: | | | Winston & Strawn LLP 200 Park Avenue New York, NY 10166-4193 Attention: Joel L. Rubinstein, Esq. Jason D. Osborn, Esq. Facsimile: (212) 294-5336 Email: JRubinstein@winston.com JOsborn@winston.com |
|
| with a copy to: | | | Stikeman Elliott LLP 1155 René-Lévesque Blvd. West 41st Floor Montréal, Quebec H3B 3V2 Attention: John Leopold Facsimile: (514) 397-3222 Email: JLeopold@stikeman.com |
|
| | | | GTY TECHNOLOGY HOLDINGS INC. | |
| | | |
By:
/s/ Harry L. You
Name: Harry L. You
Title: President and Chief Financial Officer |
|
| | | | 1176368 B.C. LTD. | |
| | | |
By:
/s/ Harry L. You
Name: Harry L. You
Title: Director |
|
| | | | QUESTICA INC. | |
| | | |
By:
/s/ Timothy J. Parass
Name: Timothy J. Parass
Title: President |
|
| | | | QUESTICA USCDN INC. | |
| | | |
By:
/s/ Timothy J. Parass
Name: Timothy J. Parass
Title: President |
|
| | | | CRAIG ROSS, as Questica Holders’ Representative | |
| | | |
/s/ Craig Ross
Craig Ross
|
|
| | | | QUESTICA HOLDERS: | |
| | | | SHOCKT INC. | |
| | | |
By:
/s/ Timothy J. Parass
Name: Timothy J. Parass
Title: President and Secretary |
|
| | | | FERNBROOK HOMES (HI-TECH) LIMITED | |
| | | |
By:
/s/ Howard Steinberg
Name: Howard Steinberg
Title: Authorized Signing Officer |
|
| | | | ROSS SOFT INC. | |
| | | |
By:
/s/ Craig Ross
Name: Craig Ross
Title: President |
|
| | | |
/s/ Dennis Parass
Dennis Parass
|
|
| | | |
/s/ Allan Booth
Allan Booth
|
|
| | | | GTY TECHNOLOGY HOLDINGS INC. | |
| | | |
By:
/s/ Harry L. You
Name: Harry L. You
Title: President & CFO |
|
| | | | 1176368 B.C. LTD. | |
| | | |
By:
/s/ Harry L. You
Name: Harry L. You
Title: President & CFO |
|
| | | | QUESTICA INC. | |
| | | |
By:
/s/ TJ Parass
Name: TJ Parass
Title: President and CEO |
|
| | | | QUESTICA USCDN INC. | |
| | | |
By:
/s/ TJ Parass
Name: TJ Parass
Title: President and CEO |
|
| | | | CRAIG ROSS, as Questica Holders’ Representative | |
| | | |
By:
/s/ Craig Ross
Name: Craig Ross
Title: Chief Revenue Officer |
|
| | | | QUESTICA HOLDERS: | |
| | | | SHOCKT INC. | |
| | | |
By:
/s/ TJ Parass
Name: TJ Parass
Title: President and CEO |
|
| | | |
/s/ Dennis Parass
Dennis Parass
|
|
| | | | FERNBROOK HOMES (HI-TECH) LIMITED | |
| | | |
By:
/s/ Howard Steinberg
Name: Howard Steinberg
Title: Authorized Signing Officer |
|
| | | |
/s/ Allan Booth
Allan Booth
|
|
| | | | ROSS SOFT INC. | |
| | | |
By:
/s/ Craig Ross
Name: Craig Ross
Title: President |
|
| | |
Page
|
| |||
| | | | G-6 | | | |
| | | | G-6 | | | |
| | | | G-6 | | | |
| | | | G-7 | | | |
| | | | G-7 | | | |
| | | | G-8 | | | |
| | | | G-9 | | | |
| | | | G-9 | | | |
| | | | G-9 | | | |
| | | | G-9 | | | |
| | | | G-9 | | | |
| | | | G-9 | | | |
| | | | G-10 | | | |
| | | | G-10 | | | |
| | | | G-10 | | | |
| | | | G-11 | | | |
| | | | G-11 | | | |
| | | | G-13 | | | |
| | | | G-13 | | | |
| | | | G-14 | | | |
| | | | G-15 | | | |
| | | | G-16 | | | |
| | | | G-18 | | | |
| | | | G-20 | | | |
| | | | G-21 | | | |
| | | | G-21 | | | |
| | | | G-22 | | | |
| | | | G-24 | | | |
| | | | G-25 | | | |
| | | | G-25 | | | |
| | | | G-25 | | | |
| | | | G-26 | | | |
| | | | G-26 | | | |
| | | | G-27 | | | |
| | | | G-27 | | | |
| | | | G-27 | | |
| | |
Page
|
| |||
| | | | G-27 | | | |
| | | | G-27 | | | |
| | | | G-27 | | | |
| | | | G-27 | | | |
| | | | G-28 | | | |
| | | | G-28 | | | |
| | | | G-28 | | | |
| | | | G-28 | | | |
| | | | G-28 | | | |
| | | | G-28 | | | |
| | | | G-28 | | | |
| | | | G-29 | | | |
| | | | G-29 | | | |
| | | | G-29 | | | |
| | | | G-29 | | | |
| | | | G-30 | | | |
| | | | G-30 | | | |
| | | | G-30 | | | |
| | | | G-31 | | | |
| | | | G-31 | | | |
| | | | G-31 | | | |
| | | | G-31 | | | |
| | | | G-31 | | | |
| | | | G-31 | | | |
| | | | G-33 | | | |
| | | | G-33 | | | |
| | | | G-33 | | | |
| | | | G-34 | | | |
| | | | G-35 | | | |
| | | | G-36 | | | |
| | | | G-36 | | | |
| | | | G-36 | | | |
| | | | G-36 | | | |
| | | | G-36 | | | |
| | | | G-36 | | | |
| | | | G-36 | | | |
| | | | G-37 | | | |
| | | | G-37 | | |
| | |
Page
|
| |||
| | | | G-40 | | | |
| | | | G-40 | | | |
| | | | G-40 | | | |
| | | | G-41 | | | |
| | | | G-42 | | | |
| | | | G-42 | | | |
| | | | G-43 | | | |
| | | | G-43 | | | |
| | | | G-45 | | | |
| | | | G-45 | | | |
| | | | G-45 | | | |
| | | | G-45 | | | |
| | | | G-46 | | | |
| | | | G-46 | | | |
| | | | G-46 | | | |
| | | | G-46 | | | |
| | | | G-47 | | | |
| | | | G-57 | | | |
| | | | G-57 | | | |
| | | | G-57 | | | |
| | | | G-58 | | | |
| | | | G-58 | | | |
| | | | G-58 | | | |
| | | | G-58 | | | |
| | | | G-58 | | | |
| | | | G-58 | | | |
| | | | G-59 | | | |
| | | | G-59 | | | |
| | | | G-59 | | | |
| | | | G-59 | | | |
| | | | G-60 | | | |
| | | | G-60 | | | |
| | | | G-60 | | | |
| | | | G-60 | | | |
| | | | G-60 | | | |
| | | | G-61 | | | |
| | | | G-61 | | |
| Exhibit A | | | Earnout Payment | |
| Exhibit B | | | Registration Rights | |
| Exhibit C | | | Form of Escrow Agreement | |
| Exhibit D | | | GTY Equity Incentive Plan | |
| Exhibit E | | | Form of Lock Up Agreement | |
| Exhibit F | | | Accounts Receivable | |
| If to the Sherpa Holders or the Company: | | | Sherpa Government Solutions LLC 2990 Osceola St Denver, Colorado 80212 Attention: David Farrell Facsimile: (949) 266-5783 Email: david.farrell@sherpagov.com |
|
| If to GTY: | | | Harry You 1180 North Town Center Drive, Suite 100 Las Vegas, Nevada 89144 Email: Harry@gtytechnology |
|
| Copy to: | | | Winston & Strawn LLP 200 Park Avenue New York, NY 10166-4193 Attention: Joel L. Rubinstein, Esq. Jason D. Osborn, Esq. Facsimile: (212) 294-5336 Email: JRubinstein@winston.com JOsborn@winston.com |
|
| | | | SHERPA GOVERNMENT SOLUTIONS LLC | |
| | | |
By:
/s/ David Farrell
Name: David Farrell
Title: Managing Member |
|
| | | | GTY TECHNOLOGY HOLDINGS INC. | |
| | | |
By:
/s/ Harry You
Name: Harry You
Title: President & CFO |
|
| | | | SHERPA HOLDERS’ REPRESENTATIVE | |
| | | |
By:
/s/ David Farrell
Name: David Farrell
|
|
| | | | (Being all of the SHERPA HOLDERS) | |
| | | |
/s/ David Farrell
David Farrell
|
|
| | | |
/s/ Bryan Reed
Bryan Reed
|
|
| | | |
/s/ Mar Taloma
Mar Taloma
|
|
| | | |
/s/ Ted Lewis
Ted Lewis
|
|
| | | |
/s/ Steven Magida
Steven Magida
|
|
|
“Articles”
|
| | means these articles of association of the Company. | |
|
“Audit Committee”
|
| |
means the audit committee of the Company formed pursuant to Article 41.2 hereof, or any successor audit committee.
|
|
|
“Auditor”
|
| |
means the person for the time being performing the duties of auditor of the Company (if any).
|
|
|
“Business Combination”
|
| |
means a merger, share exchange, asset acquisition, share purchase, reorganisation or similar business combination, with one or more businesses or entities (the “target business”).
|
|
|
“business day”
|
| |
means any day other than a Saturday, a Sunday or a legal holiday or a day on which banking institutions or trust companies are authorised or obligated by law to close in New York City.
|
|
|
“Class A Shares”
|
| |
means Class A Ordinary Shares of a par value of US$0.0001 each in the share capital of the Company.
|
|
|
“Class B Shares”
|
| |
means Class B Ordinary Shares of a par value of US$0.0001 each in the share capital of the Company.
|
|
|
“Company”
|
| | means the above named company. | |
|
“Designated Stock Exchange”
|
| |
means any national securities exchange in the United States on which Shares are listed for trading, including the NASDAQ Stock Market LLC, the NYSE MKT LLC, The New York Stock Exchange LLC or any OTC market.
|
|
|
“Directors”
|
| | means the directors for the time being of the Company. | |
|
“Dividend”
|
| |
means any dividend (whether interim or final) resolved to be paid on Shares pursuant to the Articles.
|
|
|
“Electronic Record”
|
| |
has the same meaning as in the Electronic Transactions Law.
|
|
|
“Electronic Transactions Law”
|
| |
means the Electronic Transactions Law (2003 Revision) of the Cayman Islands.
|
|
|
“Founders”
|
| |
means the Sponsor and all Members immediately prior to the consummation of the IPO.
|
|
|
“IPO”
|
| | means the Company’s initial public offering of securities. | |
|
“IPO Repurchase”
|
| | has the meaning given to it in Article 49.3. | |
|
“Member”
|
| | has the same meaning as in the Statute. | |
|
“Memorandum”
|
| | means the memorandum of association of the Company. | |
|
“Ordinary Resolution”
|
| |
means a resolution passed by a simple majority of the Members as, being entitled to do so, vote in person or, where
|
|
| | | |
proxies are allowed, by proxy at a general meeting, and includes a unanimous written resolution. In computing the majority when a poll is demanded regard shall be had to the number of votes to which each Member is entitled by the Articles.
|
|
|
“Ordinary Shares”
|
| | means the Class A Shares and the Class B Shares. | |
|
“Over-allotment Option”
|
| |
means the option of the Underwriters to purchase up to an additional 15% of the units (as described at Article 3.3) sold in the IPO at a price equal to US$10.00 per unit, less underwriting discounts and commissions.
|
|
|
“Preferred Shares”
|
| |
means Preferred Shares of a par value of US$0.0001 each in the share capital of the Company.
|
|
|
“Public Shares”
|
| |
means Class A Ordinary Shares issued as part of the units sold in the IPO.
|
|
|
“Register of Members”
|
| |
means the register of Members maintained in accordance with the Statute and includes (except where otherwise stated) any branch or duplicate register of Members.
|
|
|
“Registered Office”
|
| |
means the registered office for the time being of the Company.
|
|
|
“Repurchase Limitation”
|
| | has the meaning given to it in Article 49.2. | |
|
“Repurchase Price”
|
| | has the meaning given to it in Article 49.3. | |
|
“Seal”
|
| |
means the common seal of the Company and includes every duplicate seal.
|
|
|
“SEC”
|
| |
means the United States Securities and Exchange Commission.
|
|
|
“Share”
|
| |
means a Class A Share, a Class B Share or a Preferred Share in the Company.
|
|
|
“Special Resolution”
|
| |
subject to Article 29.4, has the same meaning as in the Statute, and includes a unanimous written resolution.
|
|
|
“Sponsor”
|
| |
means GTY Investors, LLC, a Delaware limited liability company.
|
|
|
“Statute”
|
| |
means the Companies Law (2016 Revision) of the Cayman Islands.
|
|
|
“Subscriber”
|
| | means the subscriber to the Memorandum. | |
|
“Treasury Share”
|
| |
means a Share held in the name of the Company as a treasury share in accordance with the Statute.
|
|
|
“Trust Fund”
|
| |
means the trust account established by the Company upon the consummation of its IPO and into which a certain amount of the net proceeds of the IPO, together with the proceeds of the private placement of the warrants (the “Private Placement Warrants”) simultaneously with the closing date of the IPO, will be deposited.
|
|
|
“Underwriters”
|
| | means the underwriters of the IPO. | |
|
FORM MUST BE TYPED
|
| |
Restated Articles of Organization
|
| |
FORM MUST BE TYPED
|
|
|
(General Laws Chapter 156D, Section 10.07; 950 CMR 113.35)
|
|
|
(1)
Exact name of corporation:
|
| |
GTY GovTech Inc.
|
|
|
(2)
Registered office address:
|
| |
155 Federal Street, Suite 700, Boston, MA 02110
(number, street, city or town, state, zip code)
|
|
|
(3)
Date adopted:
|
| |
(month, day, year)
|
|
|
(4)
Approved by:
|
| | ||
| (check appropriate box) | | |
WITHOUT PAR VALUE
|
| |
WITH PAR VALUE
|
| |||||||||
TYPE
|
| |
NUMBER OF
SHARES |
| |
TYPE
|
| |
NUMBER OF
SHARES |
| |
PAR VALUE
|
|
| | | | | | Common | | | 400,000,000 | | | $0.0001 | |
| | | | | | Preferred | | | 25,000,000 | | | $0.0001 | |
|
Specify the number(s) of the article(s) being amended:
|
| |
Article I, Article III, Article IV and Article VI
|
|
| Signed by: | | |
,
|
|
| | | |
(signature of authorized individual)
|
|
|
☐
Chairman of the board of directors,
|
| |||
|
☐
President,
|
| |||
|
☐
Other officer,
|
| |||
|
☐
Court-appointed fiduciary,
|
|
| on this day of , . | |
|
WILLIAM FRANCIS GALVIN
|
| |||
|
Examiner
|
| | Secretary of the Commonwealth | |
|
Name approval
|
| | Filing fee: Minimum filing fee $200, plus $100 per article amended, stock increases $100 per 100,000 shares, plus $100 for each additional 100,000 shares or any fraction thereof. | |
|
C
|
| | | |
|
M
|
| | ||
| | | |
TO BE FILLED IN BY CORPORATION
Contact Information: |
|
| | | |
|
|
| | | |
|
|
| | | |
|
|
| | | |
Telephone:
|
|
| | | |
Email:
|
|
| | | | Upon filing, a copy of this filing will be available at www.sec.state.ma.us/cor. If the document is rejected, a copy of the rejection sheet and rejected document will be available in the rejected queue. | |
| | | | GTY TECHNOLOGY HOLDINGS INC. | | ||||||
| | | | By: | | | | ||||
| | | | | | | Name: | | | | |
| | | | | | | Title: | | | | |
| | | | CONTINENTAL STOCK TRANSFER & TRUST COMPANY, as Warrant Agent | | ||||||
| | | | By: | | | | ||||
| | | | | | | Name: | | | | |
| | | | | | | Title: | | | | |
| | | | ||
| Name of Investor: ____________________ | | | State/Country of Formation or Domicile: _________________________________ | |
| By: ______________________________ | | | ||
| Name: ___________________________ | | | ||
| Title: ____________________________ | | | ||
| Name in which shares are to be registered (if different): ______________________ | | | Date: ____________________________ | |
| Investor’s EIN: ____________________ | | | ||
| Business Address-Street: | | | Address-Street for Notices (if different): | |
| __________________________________ | | | __________________________________ | |
| __________________________________ | | | __________________________________ | |
| City, State, Zip: | | | City, State, Zip: | |
| ________________________________ | | | __________________________________ | |
| Attn: ____________________________ | | | Attn:_____________________________ | |
| Telephone No.: ____________________ | | | Telephone No.: ____________________ | |
| Facsimile No.: _____________________ | | | Facsimile No.: ____________________ | |
| E-Mail: __________________________ | | | E-Mail: __________________________ | |
| Number of Class A Ordinary Shares subscribed for: ____________________ | | | ||
| Aggregate Subscription Amount: $________________________________ | | | Price Per Share: $10.00 | |
| Number of Owned Shares: _________ | | |
|
Exhibit
Number |
| |
Description
|
|
| | | Transaction Documents (included as Annexes A, B, C, D, E, F and G to the proxy statement/prospectus). | | |
| | | | ||
| | | Form of Articles of Organization of New GTY (included as Annex I to the proxy statement/prospectus) | | |
| | | Form of Bylaws of New GTY (included as Annex J to the proxy statement/prospectus) | | |
| | | | ||
| | | | ||
| | | | ||
| | | | ||
|
4.5
|
| |
Form of Amendment No. 1 to Warrant Agreement between GTY Technology Holdings, Inc. and Continental Stock Transfer & Trust Company (included as Annex L to the proxy statement/prospectus)
|
|
| | | Specimen Stock Certificate of New GTY. | | |
| | | Opinion of TCF Law Group PLLC | | |
| | | | ||
| | | | ||
| | | | ||
| | | | ||
| | | | ||
| | | | ||
| | | | ||
| | | | ||
| | | |
|
Exhibit
Number |
| |
Description
|
|
| | | | ||
| | | | ||
| | | | ||
| | | | ||
| | | | ||
| | | | ||
| | | | ||
| | | | ||
| | | | ||
| | | | ||
| | | Consent of WithumSmith+Brown, PC independent registered public accounting firm of eCivis, Inc. | | |
| | | | ||
| | | | ||
| | | | ||
| | | Consent of TCF Law Group PLLC (included as part of Exhibit 5.1). | | |
| | | Power of Attorney (included on signature page to this registration statement). | | |
| | | | ||
| | | |
Signature
|
| |
Title
|
| |
Date
|
|
/s/ Harry L. You
Harry L. You
|
| | President, Chief Financial Officer and Director (Principal Executive Officer and Principal Financial and Accounting Officer) | | |
January 11, 2019
|
|
/s/ Paul Dacier
Paul Dacier
|
| | Director | | |
January 11, 2019
|
|
/s/ Charles Wert
Charles Wert
|
| | Director | | |
January 11, 2019
|
|
Exhibit 4.5
STOCK CERTIFICATE
Common Stock Par value $0.0001 |
Number of Shares: ****0**** |
GTY Govtech, Inc.
INCORPORATED UNDER THE LAWS OF THE COMMONWEALTH OF MASSACHUSETTS
This certifies that [Name] is the owner of [Number of Shares] fully paid and non-assessable shares of the common stock of GTY Govtech, Inc. (hereinafter called the “Corporation”) transferable on the books of the Corporation in person or by duly authorized attorney, upon surrender of this Certificate properly endorsed. This Certificate and the shares represented hereby, are issued and shall be held subject to all of the provisions of the Articles of Incorporation, as amended, and the Bylaws, as amended, of the Corporation, to all of which each holder, by acceptance hereof, assents.
The Corporation is authorized to issue and sell more than one class or series of stock. The Corporation will furnish, without charge, to each stockholder who so requests in writing a summary of the powers, designations, preferences and relative, participating, optional or other special rights of each class of stock of the Corporation and the qualifications, limitations or restrictions of such powers, preferences or rights, and the variations in powers, preferences or rights and limitations determined for each series which are fixed by the Articles of Incorporation, as amended, the Bylaws, as amended, and the resolutions of the Board of Directors of the Corporation and the authority of the Board of Directors to determine such variations for future series. Such request may be made in writing to the office of the Secretary of the Corporation or the Transfer Agent.
IN WITNESS THEREOF, the facsimile seal of the Corporation and the facsimile signatures of its duly authorized officers are set forth herein.
Treasurer or Assistant Treasurer |
President or Vice President | |
Exhibit 5.1
155 Federal Street, Suite 1302
Boston, Massachusetts 02110
January 9, 2019
GTY GovTech, Inc.
1180 North Town Center Drive, Suite 100
Las Vegas, Nevada 89144
Re: GTY GovTech, Inc. Registration Statement on Form S-4
Ladies and Gentlemen:
We have acted as special Massachusetts counsel to GTY GovTech, Inc., a Massachusetts company (the “Company”) that is a wholly-owned subsidiary of GTY Technology Holdings Inc. (“GTY”), in connection with the Company’s Registration Statement on Form S-4, filed with the United States Securities and Exchange Commission (the “Commission”) on January [9], 2019, as amended and supplemented through the date hereof, under the Securities Act of 1933, as amended (the “Securities Act”) (such Registration Statement, as amended or supplemented, is hereinafter referred to as the “Registration Statement”), relating to, among other things, a business combination, pursuant to which (i) GTY will merge with and into GTY Technology Merger Sub, Inc. (“GTY Merger Sub”), a Delaware corporation and wholly-owned subsidiary of the Company, with GTY surviving the merger (the “GTY Merger”) and all of the issued and outstanding ordinary shares, par value $0.0001 per share, of GTY being exchanged for an equal number of shares of common stock, par value $0.0001 per share (the “Company Common Stock”), of the Company, and, (ii) if the warrant amendment proposal described in the Registration Statement is not approved, all of the outstanding warrants to purchase ordinary shares of GTY will become exercisable to purchase an equal number of shares of Company Common Stock on the existing terms and conditions of such warrants. As a result of the GTY Merger and related transactions, (i) GTY will become a wholly-owned subsidiary of the Company, (ii) the Company will change its name to “GTY Technology Holdings Inc.” and will succeed to GTY’s obligations as a public reporting company, and (iii) the current security holders of GTY who do not exercise their redemption rights will become security holders of the Company.
This opinion letter is being furnished in accordance with the requirements of Item 601(b)(5) of Regulation S-K promulgated under the Securities Act.
In rendering the opinions set forth below, we have examined originals or copies, certified or otherwise identified to our satisfaction, of: (i) the Registration Statement; (ii) the Agreement and Plan of Merger (ii) the current Amended Articles of Organization of the Company adopted November 8, 2018, (iii) the Proposed Articles to be adopted upon the approval and adoption of the GTY merger proposal; (iv) the form of bylaws of the Company to be adopted upon the approval and adoption of the GTY merger proposal (“Proposed Bylaws”), (v) board resolutions of the Company appointing the directors, (vi) shareholder resolutions of the Company approving the GTY Merger, the issuance of the Company’s common stock in exchange for the outstanding Class A ordinary shares and Class B ordinary shares of GTY, and the issuance of warrants for the Company’s common stock (the “Warrants”) in exchange for GTY’s outstanding warrants, and (vii) board of director resolutions of the Company authorizing the Business Combination.
TCF Law Group, PLLC
We also have examined originals or copies, certified or otherwise identified to our satisfaction, of such records of the Company and such agreements, certificates and receipts of public officials, certificates of officers or other representatives of the Company and others, and such other documents, certificates and records as we have deemed necessary or appropriate as a basis for the opinions set forth below.
In our examination, we have assumed the legal capacity of all natural persons, the genuineness of all signatures, the authenticity of all documents submitted to us as originals, the conformity to original documents of all documents submitted to us as facsimile, electronic, certified or photo copies, and the authenticity of the originals of such copies. In making our examination of executed documents, we have assumed that the parties thereto had the power, corporate or other, to enter into and perform all obligations thereunder and have also assumed the due authorization by all requisite action, corporate or other, and the execution and delivery by such parties of such documents and the validity and binding effect thereof on such parties. As to any facts material to the opinions expressed herein that we did not independently establish or verify, we have relied upon statements and representations of officers and other representatives of the Company and others and of public officials.
In addition to the foregoing, for the purpose of rendering our opinions as expressed herein, we have assumed that:
1. Prior to effecting the GTY Merger: (i) the Registration Statement, as finally amended, will have become effective under the Securities Act; (ii) the shareholders of the Company will have approved, among other things, the Proposed Articles and the Proposed Bylaws; and (iii) all other necessary action will have been taken under the applicable laws of the Commonwealth of Massachusetts to authorize and permit the GTY Merger, and any and all consents, approvals and authorizations from applicable Massachusetts governmental and regulatory authorities required to authorize and permit the GTY Merger will have been obtained;
2. The current draft of each of the Proposed Articles and Proposed Bylaws, in the form thereof submitted for our review, without alteration or amendment (other than identifying the appropriate date), will be duly authorized and executed and thereafter the Proposed Articles shall be duly filed with the Massachusetts Secretary of State in accordance with M.G.L.A. c156D § 10.07, that no other certificate or document, has been, or prior to the filing of the Proposed Articles will be, filed by or in respect of the Company with the Massachusetts Secretary of State and that the Company will pay all fees and other charges required to be paid in connection with the filing of the Proposed Articles; and
Based upon and subject to the foregoing, it is our opinion that when issued and delivered as contemplated in the Registration Statement and in accordance with the terms of the GTY Merger Agreement or upon exercise of the Warrants, the Company Common Stock will be validly issued, fully paid and non-assessable.
-2-
TCF Law Group, PLLC
The opinions expressed herein are based upon and limited to the laws of the Commonwealth of Massachusetts (including the statutory provisions, the applicable provisions of the Massachusetts Constitution and reported judicial decisions interpreting the foregoing). We express no opinion herein as to any other laws, statutes, regulations or ordinances.
We consent to the filing of this opinion as an exhibit to the Registration Statement and to the reference to us under the heading “Legal Matters” in the prospectus forming part of the Registration Statement. In giving such consent, we do not thereby admit that we are in the category of persons whose consent is required under Section 7 of the Securities Act or the rules and regulations of the Securities and Exchange Commission.
Very truly yours, | |
/s/ TCF Law Group, PLLC |
-3-
Exhibit 23.1
CONSENT OF INDEPENDENT REGISTERED PUBLIC ACCOUNTING FIRM
We hereby consent to the use in this Proxy Statement/Prospectus constituting a part of this Registration Statement on Form S-4 of GTY Govtech Inc. of our report dated March 14, 2018 relating to the balance sheet of GTY Technology Holding, Inc. as of December 31, 2017 and 2016, and the related statements of operations, changes in stockholders’ equity and cash flows for the year ended December 31, 2017 and for the period from August 11, 2016 (date of inception) through December 31, 2016, and to the reference to our Firm under the caption “Experts” in the Registration Statement.
/s/ WithumSmith+Brown, PC | |
Whippany, New Jersey | |
January 9, 2019 |
Exhibit 23.2
CONSENT OF INDEPENDENT REGISTERED PUBLIC ACCOUNTING FIRM
We hereby consent to the use in this Proxy Statement/Prospectus constituting a part of this Registration Statement on Form S-4 of GTY Govtech, Inc. of our report dated November 21, 2018 relating to the consolidated balance sheets of Bonfire Interactive Ltd. and Subsidiary as of September 30, 2018 and December 31, 2017, and the related consolidated statements of operations, changes in temporary equity and stockholders’ deficit and cash flows for the nine months ended September 30, 2018 and the year ended December 31, 2017, and to the reference to our Firm under the caption “Experts” in the Registration Statement.
/s/ WithumSmith+Brown, PC | |
Whippany, New Jersey | |
January 9, 2019 |
Exhibit 23.3
CONSENT OF INDEPENDENT REGISTERED PUBLIC ACCOUNTING FIRM
We hereby consent to the use in this Proxy Statement/Prospectus constituting a part of this Registration Statement on Form S-4 of GTY Govtech, Inc. of our report dated November 21, 2018 relating to the consolidated balance sheets of Citybase Inc. and Subsidiary as of September 30, 2018 and December 31, 2017, and the related consolidated statements of operations, changes in temporary equity and stockholders’ deficit and cash flows for the nine months ended September 30, 2018 and the year ended December 31, 2017, and to the reference to our Firm under the caption “Experts” in the Registration Statement.
/s/ WithumSmith+Brown, PC | |
Whippany, New Jersey | |
January 9, 2019 |
Exhibit 23.4
CONSENT OF INDEPENDENT REGISTERED PUBLIC ACCOUNTING FIRM
We hereby consent to the use in this Proxy Statement/Prospectus constituting a part of this Registration Statement on Form S-4 of GTY Govtech, Inc. of our report dated November 21, 2018 relating to the balance sheets of eCivis, Inc. as of September 30, 2018 and December 31, 2017, and the related statements of operations, comprehensive income (loss), changes in stockholders’ deficit and cash flows for the nine months ended September 30, 2018 and the year ended December 31, 2017, and to the reference to our Firm under the caption “Experts” in the Registration Statement.
/s/ WithumSmith+Brown, PC | |
Whippany, New Jersey | |
January 9, 2019 |
Exhibit 23.5
CONSENT OF INDEPENDENT REGISTERED PUBLIC ACCOUNTING FIRM
We hereby consent to the use in this Proxy Statement/Prospectus constituting a part of this Registration Statement on Form S-4 of GTY Govtech, Inc. of our report dated November 21, 2018 relating to the balance sheet of Open Counter Enterprises, Inc. as of September 30, 2018, and the related statements of operations, changes in stockholders’ deficit and cash flows for the nine months ended September 30, 2018, and to the reference to our Firm under the caption “Experts” in the Registration Statement.
/s/ WithumSmith+Brown, PC | |
Whippany, New Jersey | |
January 9, 2019 |
Exhibit 23.6
CONSENT OF INDEPENDENT REGISTERED PUBLIC ACCOUNTING FIRM
We hereby consent to the use in this Proxy Statement/Prospectus constituting a part of this Registration Statement on Form S-4 of GTY Govtech, Inc. of our report dated November 21, 2018 relating to the combined balance sheets of Questica Inc. and Questica USCDN Inc. as of September 30, 2018 and December 31, 2017, and the related combined statements of operations, comprehensive income, changes in stockholders’ equity and cash flows for the nine months ended September 30, 2018 and the year ended December 31, 2017, and to the reference to our Firm under the caption “Experts” in the Registration Statement.
/s/ WithumSmith+Brown, PC | |
Whippany, New Jersey | |
January 9, 2019 |
Exhibit 23.7
CONSENT OF INDEPENDENT REGISTERED PUBLIC ACCOUNTING FIRM
We hereby consent to the use in this Proxy Statement/Prospectus constituting a part of this Registration Statement on Form S-4 of GTY Govtech, Inc. of our report dated November 21, 2018 relating to the balance sheet of Sherpa Government Solutions, LLC as of September 30, 2018, and the related statements of operations, changes in members’ capital and cash flows for the nine months ended September 30, 2018, and to the reference to our Firm under the caption “Experts” in the Registration Statement.
/s/ WithumSmith+Brown, PC | |
Whippany, New Jersey | |
January 9, 2019 |
Exhibit 99.1
FOR THE EXTRAORDINARY GENERAL MEETING OF SHAREHOLDERS OF GTY TECHNOLOGY HOLDINGS INC. THIS PROXY IS SOLICITED ON BEHALF OF THE BOARD OF DIRECTORS The undersigned hereby appoints William D. Green and Harry L. You (the “Proxies”), and each of them independently, with full power of substitution, as proxies to vote all of the ordinary shares of GTY Technology Holdings Inc., a Cayman Islands exempted company (the “Company”), that the undersigned is entitled to vote (the “Shares”) at the Extraordinary General Meeting of Shareholders of the Company to be held on _______________, 2019 at _________ a.m. Local Time at the offices of Winston & Strawn LLP, 200 Park Avenue, New York, New York 10166, and at any adjournments and/or postponements thereof. The undersigned acknowledges receipt of the enclosed proxy statement and revokes all prior proxies for said meeting. THE SHARES REPRESENTED BY THIS PROXY WHEN PROPERLY EXECUTED WILL BE VOTED IN THE MANNER DIRECTED HEREIN BY THE UNDERSIGNED SHAREHOLDER(S). IF NO SPECIFIC DIRECTION IS GIVEN AS TO THE PROPOSALS ON THE REVERSE SIDE, THIS PROXY WILL BE VOTED “FOR” PROPOSALS 1, 2, 3, 4, 5, 6, 7, 8, 9, 10, 11, 12, 13 AND 14. PLEASE MARK, SIGN, DATE, AND RETURN THE PROXY CARD PROMPTLY. (Continued and to be marked, dated and signed on the reverse side) P R O X Y C A R D Important Notice Regarding the Availability of Proxy Materials for the 2019 Extraordinary General Meeting of Shareholders to be held on ___________, 2019. This notice of Extraordinary General Meeting, the accompanying Proxy Statement is available at: https://www.cstproxy.com/gtytechnologyholdings/sm2019
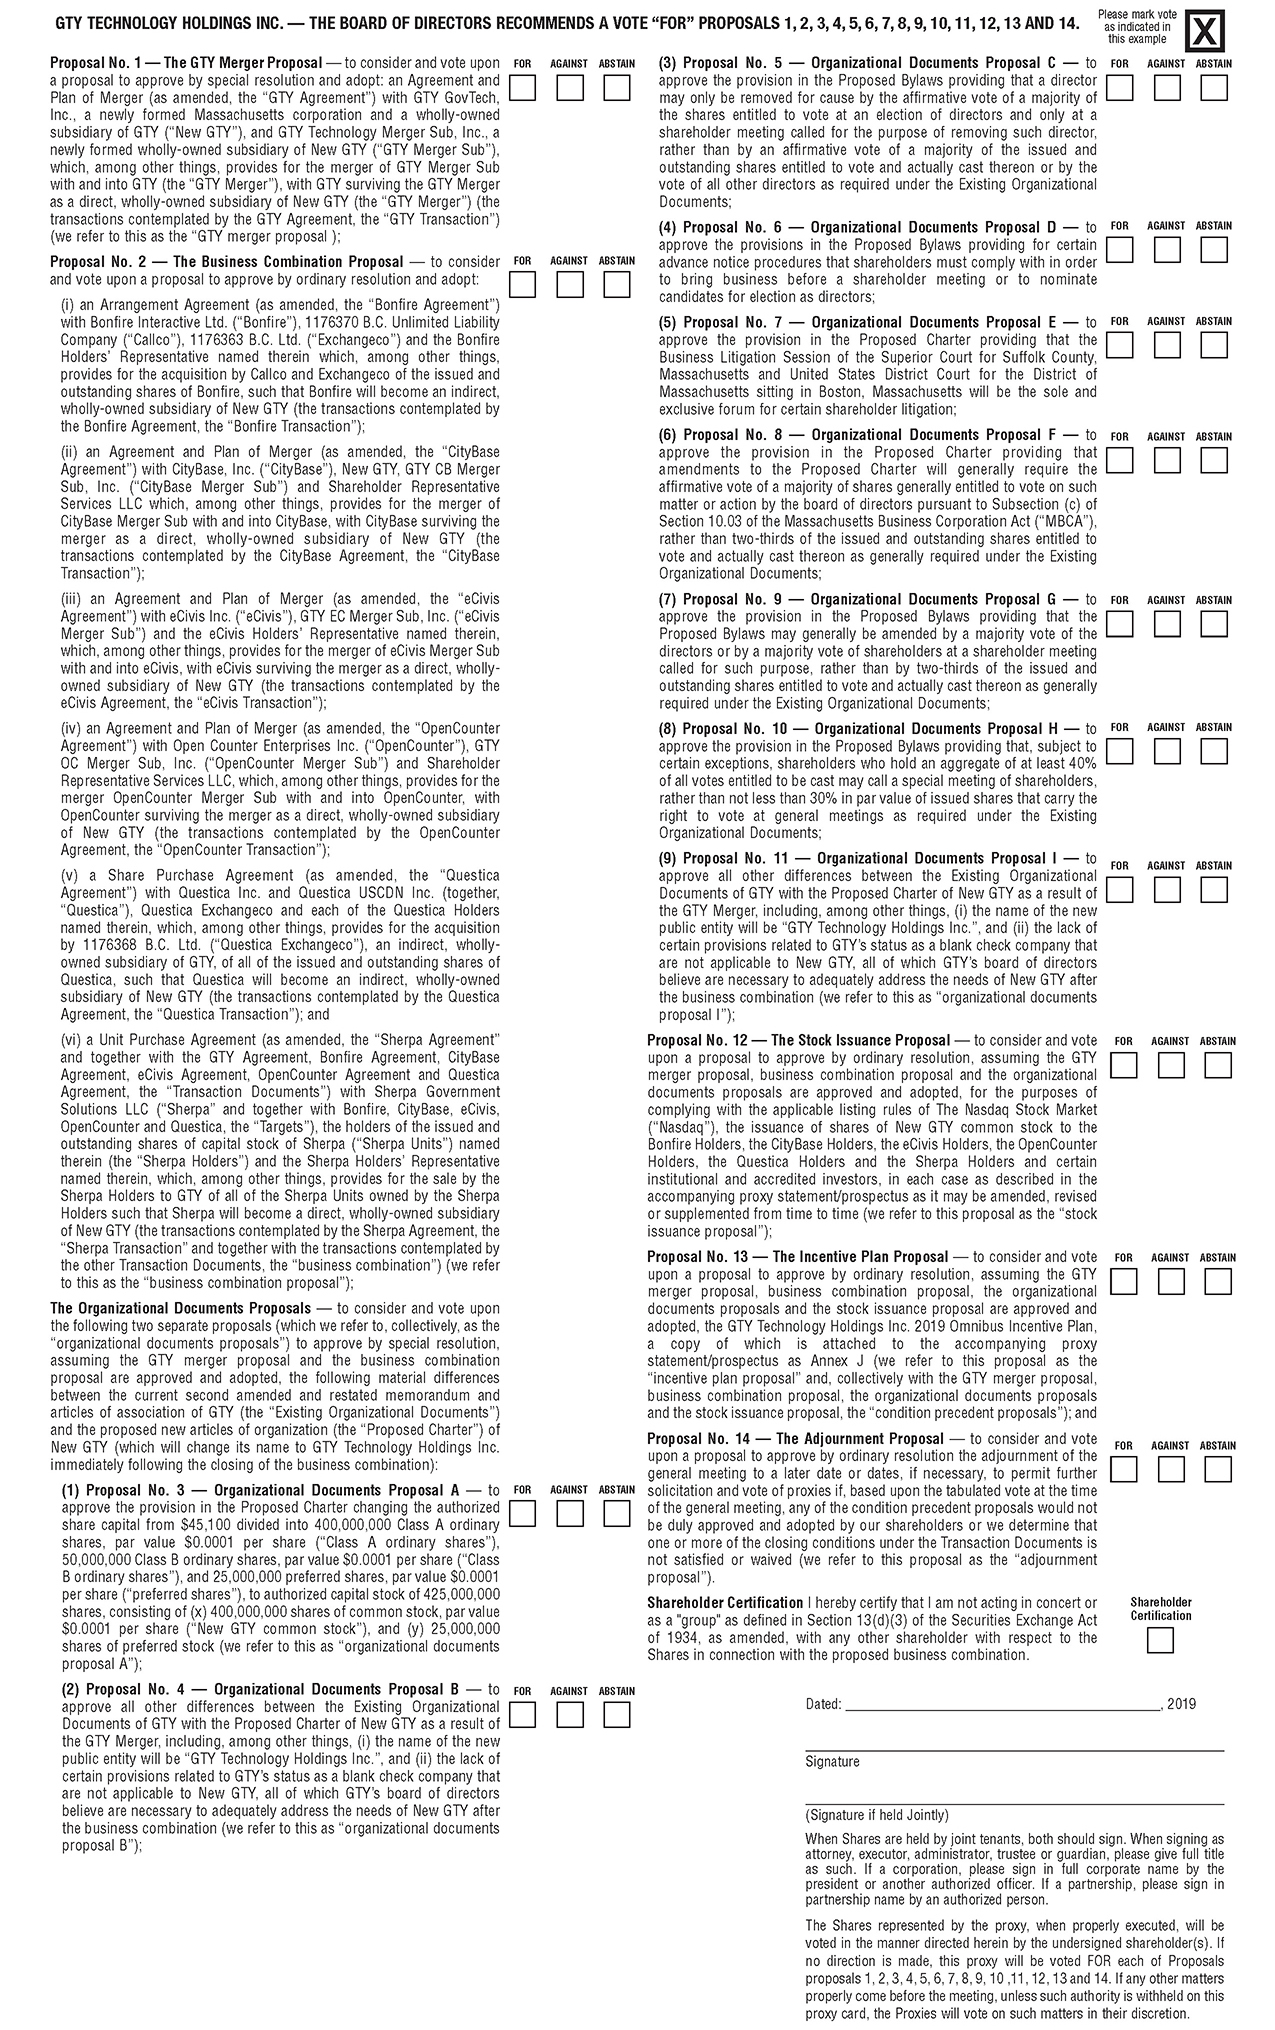
Please mark vote as indicated in this example GTY TECHNOLOGY HOLDINGS INC. — THE BOARD OF DIRECTORS RECOMMENDS A VOTE “FOR” PROPOSALS 1, 2, 3, 4, 5, 6, 7, 8, 9, 10, 11, 12, 13 AND 14. X FOR AGAINST ABSTAIN FOR AGAINST ABSTAIN FOR AGAINST ABSTAIN Shareholder Certification Proposal No. 1 — The GTY Merger Proposal — to consider and vote upon a proposal to approve by special resolution and adopt: an Agreement and Plan of Merger (as amended, the “GTY Agreement”) with GTY GovTech, Inc., a newly formed Massachusetts corporation and a wholly-owned subsidiary of GTY (“New GTY”), and GTY Technology Merger Sub, Inc., a newly formed wholly-owned subsidiary of New GTY (“GTY Merger Sub”), which, among other things, provides for the merger of GTY Merger Sub with and into GTY (the “GTY Merger”), with GTY surviving the GTY Merger as a direct, wholly-owned subsidiary of New GTY (the “GTY Merger”) (the transactions contemplated by the GTY Agreement, the “GTY Transaction”) (we refer to this as the “GTY merger proposal ); Proposal No. 2 — The Business Combination Proposal — to consider and vote upon a proposal to approve by ordinary resolution and adopt: (i) an Arrangement Agreement (as amended, the “Bonfire Agreement”) with Bonfire Interactive Ltd. (“Bonfire”), 1176370 B.C. Unlimited Liability Company (“Callco”), 1176363 B.C. Ltd. (“Exchangeco”) and the Bonfire Holders’ Representative named therein which, among other things, provides for the acquisition by Callco and Exchangeco of the issued and outstanding shares of Bonfire, such that Bonfire will become an indirect, wholly-owned subsidiary of New GTY (the transactions contemplated by the Bonfire Agreement, the “Bonfire Transaction”); (ii) an Agreement and Plan of Merger (as amended, the “CityBase Agreement”) with CityBase, Inc. (“CityBase”), New GTY, GTY CB Merger Sub, Inc. (“CityBase Merger Sub”) and Shareholder Representative Services LLC which, among other things, provides for the merger of CityBase Merger Sub with and into CityBase, with CityBase surviving the merger as a direct, wholly-owned subsidiary of New GTY (the transactions contemplated by the CityBase Agreement, the “CityBase Transaction”); (iii) an Agreement and Plan of Merger (as amended, the “eCivis Agreement”) with eCivis Inc. (“eCivis”), GTY EC Merger Sub, Inc. (“eCivis Merger Sub”) and the eCivis Holders’ Representative named therein, which, among other things, provides for the merger of eCivis Merger Sub with and into eCivis, with eCivis surviving the merger as a direct, whollyowned subsidiary of New GTY (the transactions contemplated by the eCivis Agreement, the “eCivis Transaction”); (iv) an Agreement and Plan of Merger (as amended, the “OpenCounter Agreement”) with Open Counter Enterprises Inc. (“OpenCounter”), GTY OC Merger Sub, Inc. (“OpenCounter Merger Sub”) and Shareholder Representative Services LLC, which, among other things, provides for the merger OpenCounter Merger Sub with and into OpenCounter, with OpenCounter surviving the merger as a direct, wholly-owned subsidiary of New GTY (the transactions contemplated by the OpenCounter Agreement, the “OpenCounter Transaction”); (v) a Share Purchase Agreement (as amended, the “Questica Agreement”) with Questica Inc. and Questica USCDN Inc. (together, “Questica”), Questica Exchangeco and each of the Questica Holders named therein, which, among other things, provides for the acquisition by 1176368 B.C. Ltd. (“Questica Exchangeco”), an indirect, whollyowned subsidiary of GTY, of all of the issued and outstanding shares of Questica, such that Questica will become an indirect, wholly-owned subsidiary of New GTY (the transactions contemplated by the Questica Agreement, the “Questica Transaction”); and (vi) a Unit Purchase Agreement (as amended, the “Sherpa Agreement” and together with the GTY Agreement, Bonfire Agreement, CityBase Agreement, eCivis Agreement, OpenCounter Agreement and Questica Agreement, the “Transaction Documents”) with Sherpa Government Solutions LLC (“Sherpa” and together with Bonfire, CityBase, eCivis, OpenCounter and Questica, the “Targets”), the holders of the issued and outstanding shares of capital stock of Sherpa (“Sherpa Units”) named therein (the “Sherpa Holders”) and the Sherpa Holders’ Representative named therein, which, among other things, provides for the sale by the Sherpa Holders to GTY of all of the Sherpa Units owned by the Sherpa Holders such that Sherpa will become a direct, wholly-owned subsidiary of New GTY (the transactions contemplated by the Sherpa Agreement, the “Sherpa Transaction” and together with the transactions contemplated by the other Transaction Documents, the “business combination”) (we refer to this as the “business combination proposal”); The Organizational Documents Proposals — to consider and vote upon the following two separate proposals (which we refer to, collectively, as the “organizational documents proposals”) to approve by special resolution, assuming the GTY merger proposal and the business combination proposal are approved and adopted, the following material differences between the current second amended and restated memorandum and articles of association of GTY (the “Existing Organizational Documents”) and the proposed new articles of organization (the “Proposed Charter”) of New GTY (which will change its name to GTY Technology Holdings Inc. immediately following the closing of the business combination): (1) Proposal No. 3 — Organizational Documents Proposal A — to approve the provision in the Proposed Charter changing the authorized share capital from $45,100 divided into 400,000,000 Class A ordinary shares, par value $0.0001 per share (“Class A ordinary shares”), 50,000,000 Class B ordinary shares, par value $0.0001 per share (“Class B ordinary shares”), and 25,000,000 preferred shares, par value $0.0001 per share (“preferred shares”), to authorized capital stock of 425,000,000 shares, consisting of (x) 400,000,000 shares of common stock, par value $0.0001 per share (“New GTY common stock”), and (y) 25,000,000 shares of preferred stock (we refer to this as “organizational documents proposal A”); (2) Proposal No. 4 — Organizational Documents Proposal B — to approve all other differences between the Existing Organizational Documents of GTY with the Proposed Charter of New GTY as a result of the GTY Merger, including, among other things, (i) the name of the new public entity will be “GTY Technology Holdings Inc.”, and (ii) the lack of certain provisions related to GTY’s status as a blank check company that are not applicable to New GTY, all of which GTY’s board of directors believe are necessary to adequately address the needs of New GTY after the business combination (we refer to this as “organizational documents proposal B”); (3) Proposal No. 5 — Organizational Documents Proposal C — to approve the provision in the Proposed Bylaws providing that a director may only be removed for cause by the affirmative vote of a majority of the shares entitled to vote at an election of directors and only at a shareholder meeting called for the purpose of removing such director, rather than by an affirmative vote of a majority of the issued and outstanding shares entitled to vote and actually cast thereon or by the vote of all other directors as required under the Existing Organizational Documents; (4) Proposal No. 6 — Organizational Documents Proposal D — to approve the provisions in the Proposed Bylaws providing for certain advance notice procedures that shareholders must comply with in order to bring business before a shareholder meeting or to nominate candidates for election as directors; (5) Proposal No. 7 — Organizational Documents Proposal E — to approve the provision in the Proposed Charter providing that the Business Litigation Session of the Superior Court for Suffolk County, Massachusetts and United States District Court for the District of Massachusetts sitting in Boston, Massachusetts will be the sole and exclusive forum for certain shareholder litigation; (6) Proposal No. 8 — Organizational Documents Proposal F — to approve the provision in the Proposed Charter providing that amendments to the Proposed Charter will generally require the affirmative vote of a majority of shares generally entitled to vote on such matter or action by the board of directors pursuant to Subsection (c) of Section 10.03 of the Massachusetts Business Corporation Act (“MBCA”), rather than two-thirds of the issued and outstanding shares entitled to vote and actually cast thereon as generally required under the Existing Organizational Documents; (7) Proposal No. 9 — Organizational Documents Proposal G — to approve the provision in the Proposed Bylaws providing that the Proposed Bylaws may generally be amended by a majority vote of the directors or by a majority vote of shareholders at a shareholder meeting called for such purpose, rather than by two-thirds of the issued and outstanding shares entitled to vote and actually cast thereon as generally required under the Existing Organizational Documents; (8) Proposal No. 10 — Organizational Documents Proposal H — to approve the provision in the Proposed Bylaws providing that, subject to certain exceptions, shareholders who hold an aggregate of at least 40% of all votes entitled to be cast may call a special meeting of shareholders, rather than not less than 30% in par value of issued shares that carry the right to vote at general meetings as required under the Existing Organizational Documents; (9) Proposal No. 11 — Organizational Documents Proposal I — to approve all other differences between the Existing Organizational Documents of GTY with the Proposed Charter of New GTY as a result of the GTY Merger, including, among other things, (i) the name of the new public entity will be “GTY Technology Holdings Inc.”, and (ii) the lack of certain provisions related to GTY’s status as a blank check company that are not applicable to New GTY, all of which GTY’s board of directors believe are necessary to adequately address the needs of New GTY after the business combination (we refer to this as “organizational documents proposal I”); Proposal No. 12 — The Stock Issuance Proposal — to consider and vote upon a proposal to approve by ordinary resolution, assuming the GTY merger proposal, business combination proposal and the organizational documents proposals are approved and adopted, for the purposes of complying with the applicable listing rules of The Nasdaq Stock Market (“Nasdaq”), the issuance of shares of New GTY common stock to the Bonfire Holders, the CityBase Holders, the eCivis Holders, the OpenCounter Holders, the Questica Holders and the Sherpa Holders and certain institutional and accredited investors, in each case as described in the accompanying proxy statement/prospectus as it may be amended, revised or supplemented from time to time (we refer to this proposal as the “stock issuance proposal”); Proposal No. 13 — The Incentive Plan Proposal — to consider and vote upon a proposal to approve by ordinary resolution, assuming the GTY merger proposal, business combination proposal, the organizational documents proposals and the stock issuance proposal are approved and adopted, the GTY Technology Holdings Inc. 2019 Omnibus Incentive Plan, a copy of which is attached to the accompanying proxy statement/prospectus as Annex J (we refer to this proposal as the “incentive plan proposal” and, collectively with the GTY merger proposal, business combination proposal, the organizational documents proposals and the stock issuance proposal, the “condition precedent proposals”); and Proposal No. 14 — The Adjournment Proposal — to consider and vote upon a proposal to approve by ordinary resolution the adjournment of the general meeting to a later date or dates, if necessary, to permit further solicitation and vote of proxies if, based upon the tabulated vote at the time of the general meeting, any of the condition precedent proposals would not be duly approved and adopted by our shareholders or we determine that one or more of the closing conditions under the Transaction Documents is not satisfied or waived (we refer to this proposal as the “adjournment proposal”). Shareholder Certification I hereby certify that I am not acting in concert or as a "group" as defined in Section 13(d)(3) of the Securities Exchange Act of 1934, as amended, with any other shareholder with respect to the Shares in connection with the proposed business combination. Dated: , 2019 Signature (Signature if held Jointly) When Shares are held by joint tenants, both should sign. When signing as attorney, executor, administrator, trustee or guardian, please give full title as such. If a corporation, please sign in full corporate name by the president or another authorized officer. If a partnership, please sign in partnership name by an authorized person. The Shares represented by the proxy, when properly executed, will be voted in the manner directed herein by the undersigned shareholder(s). If no direction is made, this proxy will be voted FOR each of Proposals proposals 1, 2, 3, 4, 5, 6, 7, 8, 9, 10 ,11, 12, 13 and 14. If any other matters properly come before the meeting, unless such authority is withheld on this proxy card, the Proxies will vote on such matters in their discretion. FOR AGAINST ABSTAIN FOR AGAINST ABSTAIN FOR AGAINST ABSTAIN FOR AGAINST ABSTAIN FOR AGAINST ABSTAIN FOR AGAINST ABSTAIN FOR AGAINST ABSTAIN FOR AGAINST ABSTAIN FOR AGAINST ABSTAIN FOR AGAINST ABSTAIN FOR AGAINST ABSTAIN
Exhibit 99.2
XO S[(8MB1@,R@#DD].]<'\-_$&I:'
MX U2Y@\.W>H6]O?74N^WFC!;#9(VD[N/8&O0O!FA7?A/P)I^CS%+JZLX6!\H
MX5V+%L MCUQDUE_##0=:\,Z!/IFL6L,
6*B(?D:QE)082;QKIXPU
M FKD'#29&
M1!XHDP(UFT#NYCG[ENDFW<8 .9#(Z(@N!"^B7;%-'I%*I;#TIY^K7/3Q!R7^;Q>P;S;
M/MI9=W8A4*[B\MJU05:1Z4UF*=9C57>J6 ;HLL?15SE?73?4.RN7W:8-ZC&@RZJV*)^TPL>>S<;/E]
M-(1@I&99A
M/#A' 3#1&0B)R!FXIP[C)>'E6#A-=LY;JJ(KH[Z[Z;;:YQG(=YX#P'@/ > \
M!X#P'@/ > \!X#P'@/ > \!X#P'@/ > \!X#P'@/ > \!X#P'@/ > \!X#P'
M@/ > \!X#P'@/ > \!X#P'@/ > \!X#P'@/ > \!X#P'@/ > \!X#P'@/ >
M\!X#P'@>,#V7-125]Y/83VRJ5J'HMB"?Q\RPF!ZLOTDA X.H+->@HM74G"3H!9-C!58
MP40".9^U1E_)F#2?.VBSMO(-HMDFS36W3=JJ:Z)*!67HK^1WRMSM9AR&27.W
M7)T#4B&\OG?3-UA%?ATA77.P_P!/R4:;2A$T:S#YKNU9**L \!X#P'@/ C^V?_ 'E=E_\ LOS+_P")R2\#^8YZN('M
M"^/3E?O)7-OIJ .OHV[+(M@1CNUR^TJ8@GE5%)0*@4;EM#!AK!1!4F05?OHV
MF8N4P3-&3=^Y35REMJBKHJ']!;U/\IV%Q!ZZN4.5[8FXF?LFH:US$FCZ!>.9
M&$;3TV1SI:\@HB1=I(+2$:+[$&(Q%Q]-/19-IC?3333;77 ;#? H)[2N:;%[
M&]>_5W,-2+C;:R+HJN0#0]
KAGE\JK'[N%-4?GQJF
MH%79GU8='D$6.79_1?S,,38;V"'6]_1A"=/6(X<6'5$=R99?-Q6Z+^IU1AFZ
M_<9$VLY8D'FVK+[)K!1R#!VY544RW2"9H7U5]',>>+UKA"&Y\"""VO3#<7$<
M,'US*S\16X=T);1YT*?:0<;E[ N9':LQ]6WV;1:>WTV>OUD'#K9CIE3&G@7Z
M[]H7J6R^0:KK#F^2<+%0I8] OKI !^YR/GZ6NZBA!TV:V]38[>0M'KD==J&C
M+Z?U'S;+15PP;KM?JZ8
$5="#]^L&NQZ<@I/[O;"FR,6U?:J*;/\ =LT#K>P:U(^+
MO4M@&)S8+'^Q!?M^Y^D^(HN'6=E&]D]&$??MP]8T34HM$+QS!P4$ECUF8[#\
MU&81QHDT?R?^]^W;;N]0VVU5R2O2WKF'>,!!VQ?$(QRD]IC\](/'GVI-8TK7
M#Z%)C2:D5TW;[98R/I-W+/W&VFZFRKQ3?Y/CGY? KSRBX]G50\Z 5&%W'G+$
M3)43SQ5=< 9=&=OF9>RLDNKS2N %TB0C>>/Q!>OX>6!FTU-Z.DI*;W;R#%M'
M915T=[OFP;,[3#6MBUC8U?/HZ+F&1T!EX:\B9Q!-S"RC4G'Y&$<1TNV61<(N
M(MZB^RDXTW3WUW2VVQG7;&?AD-'\9PAU/S-4WIN.J&JNH;>NSUU1J7I^PH&LA0W%X6=>$XK3:[]X@BQ:NG"(99$^T:D8.$M^S[7,D1BN
M@D5Y.?#]>-:-Z;C.D&YKT\V(6 > 3-5EM8Q!.8EUCE<$"VG+WL=Z0C?XU^QTU)&TI53-!++K#AK]NY6^9+._R
M;:!&-8^WO@BWK!WKT.M8N;[J1-X2D4>'%&7K5U0E&_-*SG2_XD-MFS*X$0(P
MFJB;,U74VA&OG/VK-/9;X[)XSGP)BY'[]YH[>P8:4(0G#M\%0X(62,-8]16I
M3,]*5W:C*8D*MM06@K8$ Z6*:OL=J.R&T-.,45F+W[%;&N^,ZX^(7/\ H\(
M^Q+ELXZ=?\D#Q*=.+7:DU@ K"3
FCF& YB9S*RTJFBY;SC!%-L
MD&/T3SC,RWL5X&H5.;#E4*IY&Y/OCV"TZ.'HR8SM2=+>O&J3&CJ#CS=V&S,W
M#1KZQ"?I" EVC-175>0;5:@Z1UV025WP%T.+N#NEJ;AO6 S/@Z)BU^9NBO:1
M85OZMB\8D\0 MTZ>=,SM.O6.T?)N-9Y8@C;*B-UT6?UE6&5]M7&J>R2F-0UC
M63ZZ_:;^Q].<]I4,;V2( - <[* T$ ]85+3]0@]UUGUA8UP7(WOZ"3,($NOF
M4*:U1@&8,T7TGPN&EG:KMRFS>Z?>M@V8U]PGTY&/MY.8!8V,^\]]YSWONTW,
MQ)VLUYO(Z_(H5B3J[LI=P@I-:RLFDEO%)[;2&/[=_I?)CX^!L:[\I&Q+YK6C
M1NM(EK,2P1W+P==Q$@[E8Z(T:5W1?6=2VM9$LDO)N6R+MU$!0H]