00016800622024False--12-31Q2http://fasb.org/us-gaap/2024#AccountingStandardsUpdate201613Member351367364202xbrli:sharesiso4217:USDiso4217:USDxbrli:sharesxbrli:pureacmr:classiso4217:CNYacmr:installmentacmr:loanacmr:voteacmr:subsidiaryacmr:legalProceedingacmr:segmentutr:sqft00016800622024-01-012024-06-300001680062us-gaap:CommonClassAMember2024-08-020001680062us-gaap:CommonClassBMember2024-08-0200016800622024-06-3000016800622023-12-310001680062us-gaap:NonrelatedPartyMember2024-06-300001680062us-gaap:NonrelatedPartyMember2023-12-310001680062us-gaap:RelatedPartyMember2024-06-300001680062us-gaap:RelatedPartyMember2023-12-310001680062us-gaap:CommonClassAMember2024-06-300001680062us-gaap:CommonClassAMember2023-12-310001680062us-gaap:CommonClassBMember2024-06-300001680062us-gaap:CommonClassBMember2023-12-3100016800622024-04-012024-06-3000016800622023-04-012023-06-3000016800622023-01-012023-06-300001680062us-gaap:RelatedPartyMember2024-04-012024-06-300001680062us-gaap:RelatedPartyMember2024-01-012024-06-300001680062us-gaap:RelatedPartyMember2023-04-012023-06-300001680062us-gaap:RelatedPartyMember2023-01-012023-06-300001680062us-gaap:CommonStockMemberus-gaap:CommonClassAMember2022-12-310001680062us-gaap:CommonStockMemberus-gaap:CommonClassBMember2022-12-310001680062us-gaap:AdditionalPaidInCapitalMember2022-12-310001680062us-gaap:RetainedEarningsMember2022-12-310001680062us-gaap:RetainedEarningsAppropriatedMember2022-12-310001680062us-gaap:AccumulatedOtherComprehensiveIncomeMember2022-12-310001680062us-gaap:NoncontrollingInterestMember2022-12-3100016800622022-12-3100016800622022-01-012022-12-310001680062srt:CumulativeEffectPeriodOfAdoptionAdjustmentMemberus-gaap:RetainedEarningsMember2022-12-310001680062srt:CumulativeEffectPeriodOfAdoptionAdjustmentMember2022-12-310001680062us-gaap:RetainedEarningsMember2023-01-012023-06-300001680062us-gaap:NoncontrollingInterestMember2023-01-012023-06-300001680062us-gaap:AccumulatedOtherComprehensiveIncomeMember2023-01-012023-06-300001680062us-gaap:CommonStockMemberus-gaap:CommonClassAMember2023-01-012023-06-300001680062us-gaap:AdditionalPaidInCapitalMember2023-01-012023-06-300001680062us-gaap:CommonStockMemberus-gaap:CommonClassAMember2023-06-300001680062us-gaap:CommonStockMemberus-gaap:CommonClassBMember2023-06-300001680062us-gaap:AdditionalPaidInCapitalMember2023-06-300001680062us-gaap:RetainedEarningsMember2023-06-300001680062us-gaap:RetainedEarningsAppropriatedMember2023-06-300001680062us-gaap:AccumulatedOtherComprehensiveIncomeMember2023-06-300001680062us-gaap:NoncontrollingInterestMember2023-06-3000016800622023-06-300001680062us-gaap:CommonStockMemberus-gaap:CommonClassAMember2023-12-310001680062us-gaap:CommonStockMemberus-gaap:CommonClassBMember2023-12-310001680062us-gaap:AdditionalPaidInCapitalMember2023-12-310001680062us-gaap:RetainedEarningsMember2023-12-310001680062us-gaap:RetainedEarningsAppropriatedMember2023-12-310001680062us-gaap:AccumulatedOtherComprehensiveIncomeMember2023-12-310001680062us-gaap:NoncontrollingInterestMember2023-12-310001680062us-gaap:RetainedEarningsMember2024-01-012024-06-300001680062us-gaap:NoncontrollingInterestMember2024-01-012024-06-300001680062us-gaap:AccumulatedOtherComprehensiveIncomeMember2024-01-012024-06-300001680062us-gaap:CommonClassAMember2024-01-012024-06-300001680062us-gaap:AdditionalPaidInCapitalMember2024-01-012024-06-300001680062us-gaap:CommonStockMemberus-gaap:CommonClassAMember2024-06-300001680062us-gaap:CommonStockMemberus-gaap:CommonClassBMember2024-06-300001680062us-gaap:AdditionalPaidInCapitalMember2024-06-300001680062us-gaap:RetainedEarningsMember2024-06-300001680062us-gaap:RetainedEarningsAppropriatedMember2024-06-300001680062us-gaap:AccumulatedOtherComprehensiveIncomeMember2024-06-300001680062us-gaap:NoncontrollingInterestMember2024-06-300001680062us-gaap:CommonStockMemberus-gaap:CommonClassAMember2023-03-310001680062us-gaap:CommonStockMemberus-gaap:CommonClassBMember2023-03-310001680062us-gaap:AdditionalPaidInCapitalMember2023-03-310001680062us-gaap:RetainedEarningsMember2023-03-310001680062us-gaap:RetainedEarningsAppropriatedMember2023-03-310001680062us-gaap:AccumulatedOtherComprehensiveIncomeMember2023-03-310001680062us-gaap:NoncontrollingInterestMember2023-03-3100016800622023-03-310001680062us-gaap:RetainedEarningsMember2023-04-012023-06-300001680062us-gaap:NoncontrollingInterestMember2023-04-012023-06-300001680062us-gaap:AccumulatedOtherComprehensiveIncomeMember2023-04-012023-06-300001680062us-gaap:CommonClassAMember2023-04-012023-06-300001680062us-gaap:AdditionalPaidInCapitalMember2023-04-012023-06-300001680062us-gaap:CommonStockMemberus-gaap:CommonClassAMember2024-03-310001680062us-gaap:CommonStockMemberus-gaap:CommonClassBMember2024-03-310001680062us-gaap:AdditionalPaidInCapitalMember2024-03-310001680062us-gaap:RetainedEarningsMember2024-03-310001680062us-gaap:RetainedEarningsAppropriatedMember2024-03-310001680062us-gaap:AccumulatedOtherComprehensiveIncomeMember2024-03-310001680062us-gaap:NoncontrollingInterestMember2024-03-3100016800622024-03-310001680062us-gaap:RetainedEarningsMember2024-04-012024-06-300001680062us-gaap:NoncontrollingInterestMember2024-04-012024-06-300001680062us-gaap:AccumulatedOtherComprehensiveIncomeMember2024-04-012024-06-300001680062us-gaap:CommonStockMemberus-gaap:CommonClassAMember2024-04-012024-06-300001680062us-gaap:AdditionalPaidInCapitalMember2024-04-012024-06-300001680062acmr:ACMResearchShanghaiIncMember2024-06-300001680062acmr:ACMResearchShanghaiIncMember2023-12-310001680062acmr:ACMResearchWuxiIncMember2024-06-300001680062acmr:ACMResearchWuxiIncMember2023-12-310001680062acmr:CleanChipTechnologiesLimitedMember2024-06-300001680062acmr:CleanChipTechnologiesLimitedMember2023-12-310001680062acmr:ACMResearchKoreaCOLTDMember2024-06-300001680062acmr:ACMResearchKoreaCOLTDMember2023-12-310001680062acmr:ShengweiResearchShanghaiIncMember2024-06-300001680062acmr:ShengweiResearchShanghaiIncMember2023-12-310001680062acmr:ACMResearchCAIncMember2024-06-300001680062acmr:ACMResearchCAIncMember2023-12-310001680062acmr:ACMResearchCaymanIncMember2024-06-300001680062acmr:ACMResearchCaymanIncMember2023-12-310001680062acmr:ACMResearchSingaporePTELTDMember2024-06-300001680062acmr:ACMResearchSingaporePTELTDMember2023-12-310001680062acmr:ACMResearchBeijingIncMember2024-06-300001680062acmr:ACMResearchBeijingIncMember2023-12-310001680062acmr:HangukACMCOLTDMember2024-06-300001680062acmr:HangukACMCOLTDMember2023-12-310001680062acmr:YushengMicroSemiconductorShanghaiCoLtdMember2024-06-300001680062acmr:YushengMicroSemiconductorShanghaiCoLtdMember2023-12-310001680062acmr:ACMWooliMicroelectronicsShanghaiCoLtdMember2024-06-300001680062acmr:ACMWooliMicroelectronicsShanghaiCoLtdMember2023-12-310001680062country:US2024-06-300001680062country:US2023-12-310001680062country:CN2024-06-300001680062country:CN2023-12-310001680062country:HK2024-06-300001680062country:HK2023-12-310001680062country:KR2024-06-300001680062country:KR2023-12-310001680062country:SG2024-06-300001680062country:SG2023-12-310001680062acmr:ACMShanghaiMember2024-04-012024-06-300001680062acmr:ACMShanghaiMember2023-04-012023-06-300001680062acmr:ACMShanghaiMember2024-01-012024-06-300001680062acmr:ACMShanghaiMember2023-01-012023-06-300001680062acmr:ChinaMerchantBankDepositsMaturingOnJanuary292023Member2024-01-012024-06-300001680062acmr:ChinaMerchantBankDepositsMaturingOnJanuary292023Member2024-06-300001680062acmr:ChinaMerchantBankDepositsMaturingOnJanuary292023Member2023-12-310001680062acmr:BankOfNingboDepositMaturingOnFebruary172024Member2024-01-012024-06-300001680062acmr:BankOfNingboDepositMaturingOnFebruary172024Member2024-06-300001680062acmr:BankOfNingboDepositMaturingOnFebruary172024Member2023-12-310001680062acmr:ShanghaiPudongDevelopmentBankDepositMaturingOctober202025Member2024-01-012024-06-300001680062acmr:ShanghaiPudongDevelopmentBankDepositMaturingOctober202025Member2024-06-300001680062acmr:ShanghaiPudongDevelopmentBankDepositMaturingOctober202025Member2023-12-310001680062acmr:ShanghaiPudongDevelopmentBankDepositMaturingNovember142025Member2024-01-012024-06-300001680062acmr:ShanghaiPudongDevelopmentBankDepositMaturingNovember142025Member2024-06-300001680062acmr:ShanghaiPudongDevelopmentBankDepositMaturingNovember142025Member2023-12-310001680062acmr:ShanghaiPudongDevelopmentBankDepositMaturingDecember82025Member2024-01-012024-06-300001680062acmr:ShanghaiPudongDevelopmentBankDepositMaturingDecember82025Member2024-06-300001680062acmr:ShanghaiPudongDevelopmentBankDepositMaturingDecember82025Member2023-12-310001680062acmr:ShanghaiPudongDevelopmentBankDepositMaturingOnDecember252025Member2024-01-012024-06-300001680062acmr:ShanghaiPudongDevelopmentBankDepositMaturingOnDecember252025Member2024-06-300001680062acmr:ShanghaiPudongDevelopmentBankDepositMaturingOnDecember252025Member2023-12-310001680062acmr:ShanghaiPudongDevelopmentBankDepositMaturingDecember302025Member2024-01-012024-06-300001680062acmr:ShanghaiPudongDevelopmentBankDepositMaturingDecember302025Member2024-06-300001680062acmr:ShanghaiPudongDevelopmentBankDepositMaturingDecember302025Member2023-12-310001680062acmr:ChinaIndustrialBankDepositMaturingJanuary32026Member2024-01-012024-06-300001680062acmr:ChinaIndustrialBankDepositMaturingJanuary32026Member2024-06-300001680062acmr:ChinaIndustrialBankDepositMaturingJanuary32026Member2023-12-310001680062acmr:ChinaEverbrightBankDepositMaturingDecember52024Member2024-01-012024-06-300001680062acmr:ChinaEverbrightBankDepositMaturingDecember52024Member2024-06-300001680062acmr:ChinaEverbrightBankDepositMaturingDecember52024Member2023-12-310001680062acmr:ChinaEverbrightBankDepositMaturingMay222024Member2024-01-012024-06-300001680062acmr:ChinaEverbrightBankDepositMaturingMay222024Member2024-06-300001680062acmr:ChinaEverbrightBankDepositMaturingMay222024Member2023-12-310001680062acmr:ChinaEverbrightBankDepositMaturingApril52024Member2024-01-012024-06-300001680062acmr:ChinaEverbrightBankDepositMaturingApril52024Member2024-06-300001680062acmr:ChinaEverbrightBankDepositMaturingApril52024Member2023-12-310001680062acmr:ChinaMerchantBankLujiazuiBranchDepositMaturingMay272024Member2024-01-012024-06-300001680062acmr:ChinaMerchantBankLujiazuiBranchDepositMaturingMay272024Member2024-06-300001680062acmr:ChinaMerchantBankLujiazuiBranchDepositMaturingMay272024Member2023-12-310001680062acmr:BankOfNingboDepositMaturingSeptember112024Member2024-01-012024-06-300001680062acmr:BankOfNingboDepositMaturingSeptember112024Member2024-06-300001680062acmr:BankOfNingboDepositMaturingSeptember112024Member2023-12-310001680062us-gaap:FairValueInputsLevel1Memberus-gaap:FairValueMeasurementsRecurringMember2024-06-300001680062us-gaap:FairValueInputsLevel2Memberus-gaap:FairValueMeasurementsRecurringMember2024-06-300001680062us-gaap:FairValueInputsLevel3Memberus-gaap:FairValueMeasurementsRecurringMember2024-06-300001680062us-gaap:FairValueMeasurementsRecurringMember2024-06-300001680062us-gaap:FairValueInputsLevel1Memberus-gaap:FairValueMeasurementsRecurringMember2023-12-310001680062us-gaap:FairValueInputsLevel2Memberus-gaap:FairValueMeasurementsRecurringMember2023-12-310001680062us-gaap:FairValueInputsLevel3Memberus-gaap:FairValueMeasurementsRecurringMember2023-12-310001680062us-gaap:FairValueMeasurementsRecurringMember2023-12-310001680062us-gaap:FairValueInputsLevel1Memberus-gaap:FairValueMeasurementsNonrecurringMember2023-12-310001680062us-gaap:FairValueInputsLevel2Memberus-gaap:FairValueMeasurementsNonrecurringMember2023-12-310001680062us-gaap:FairValueInputsLevel3Memberus-gaap:FairValueMeasurementsNonrecurringMember2023-12-310001680062us-gaap:FairValueMeasurementsNonrecurringMember2023-12-310001680062acmr:FourCustomersMemberus-gaap:CustomerConcentrationRiskMemberus-gaap:SalesRevenueNetMember2024-04-012024-06-300001680062acmr:ThreeCustomersMemberus-gaap:CustomerConcentrationRiskMemberus-gaap:SalesRevenueNetMember2023-04-012023-06-300001680062acmr:ThreeCustomersMemberus-gaap:CustomerConcentrationRiskMemberus-gaap:SalesRevenueNetMember2024-01-012024-06-300001680062acmr:OneCustomerMemberus-gaap:CustomerConcentrationRiskMemberus-gaap:SalesRevenueNetMember2023-01-012023-06-300001680062acmr:FourCustomersMemberus-gaap:CustomerConcentrationRiskMemberus-gaap:AccountsReceivableMember2024-01-012024-06-300001680062acmr:FourCustomersMemberus-gaap:CustomerConcentrationRiskMemberus-gaap:AccountsReceivableMember2024-01-012024-03-310001680062acmr:TotalSingleWaferAndSemiCriticalCleaningEquipmentMember2024-04-012024-06-300001680062acmr:TotalSingleWaferAndSemiCriticalCleaningEquipmentMember2023-04-012023-06-300001680062acmr:TotalSingleWaferAndSemiCriticalCleaningEquipmentMember2024-01-012024-06-300001680062acmr:TotalSingleWaferAndSemiCriticalCleaningEquipmentMember2023-01-012023-06-300001680062acmr:ECPFrontEndAndPackagingFurnaceAndOtherTechnologiesMember2024-04-012024-06-300001680062acmr:ECPFrontEndAndPackagingFurnaceAndOtherTechnologiesMember2023-04-012023-06-300001680062acmr:ECPFrontEndAndPackagingFurnaceAndOtherTechnologiesMember2024-01-012024-06-300001680062acmr:ECPFrontEndAndPackagingFurnaceAndOtherTechnologiesMember2023-01-012023-06-300001680062acmr:AdvancedPackagingExcludeECPServicesSparesMember2024-04-012024-06-300001680062acmr:AdvancedPackagingExcludeECPServicesSparesMember2023-04-012023-06-300001680062acmr:AdvancedPackagingExcludeECPServicesSparesMember2024-01-012024-06-300001680062acmr:AdvancedPackagingExcludeECPServicesSparesMember2023-01-012023-06-300001680062country:CN2024-04-012024-06-300001680062country:CN2023-04-012023-06-300001680062country:CN2024-01-012024-06-300001680062country:CN2023-01-012023-06-300001680062acmr:OherRegionsMember2024-04-012024-06-300001680062acmr:OherRegionsMember2023-04-012023-06-300001680062acmr:OherRegionsMember2024-01-012024-06-300001680062acmr:OherRegionsMember2023-01-012023-06-300001680062acmr:FirstToolsMember2024-01-012024-06-300001680062acmr:FirstToolsCustomerOwnershipMember2024-06-300001680062acmr:FirstToolsCustomerOwnershipMember2023-12-310001680062acmr:BuildingsAndPlantsMember2024-06-300001680062acmr:BuildingsAndPlantsMember2023-12-310001680062us-gaap:EquipmentMember2024-06-300001680062us-gaap:EquipmentMember2023-12-310001680062us-gaap:OfficeEquipmentMember2024-06-300001680062us-gaap:OfficeEquipmentMember2023-12-310001680062us-gaap:TransportationEquipmentMember2024-06-300001680062us-gaap:TransportationEquipmentMember2023-12-310001680062us-gaap:LeaseholdImprovementsMember2024-06-300001680062us-gaap:LeaseholdImprovementsMember2023-12-310001680062acmr:ACMLingangMemberacmr:BuildingsAndPlantsMember2024-06-300001680062acmr:ACMShanghaiMemberacmr:BuildingsAndPlantsMember2024-06-300001680062acmr:LineOfCreditUpToRMB150000FromChinaEverbrightBankMember2024-06-300001680062acmr:LineOfCreditUpToRMB150000FromChinaEverbrightBankMember2023-12-310001680062acmr:LineOfCreditDueOnAugust292024WithAnAnnualInterestRateOf3.00Member2023-01-012023-12-310001680062acmr:LineOfCreditDueOnAugust292024WithAnAnnualInterestRateOf3.00Member2024-01-012024-06-300001680062acmr:LineOfCreditDueOnAugust292024WithAnAnnualInterestRateOf3.00Member2024-06-300001680062acmr:LineOfCreditDueOnAugust292024WithAnAnnualInterestRateOf3.00Member2023-12-310001680062acmr:LineOfCreditUpToRMB40000FromBankOfChinaMember2024-06-300001680062acmr:LineOfCreditUpToRMB40000FromBankOfChinaMember2023-12-310001680062acmr:LineOfCreditDueOnSeptember72024WithAnAnnualInterestRateOf2.87.Member2024-01-012024-06-300001680062acmr:LineOfCreditDueOnSeptember72024WithAnAnnualInterestRateOf2.87.Member2023-01-012023-12-310001680062acmr:LineOfCreditDueOnSeptember72024WithAnAnnualInterestRateOf2.87.Member2024-06-300001680062acmr:LineOfCreditDueOnSeptember72024WithAnAnnualInterestRateOf2.87.Member2023-12-310001680062acmr:LineOfCreditUpToRMB200000FromChinaMerchantsBankMember2023-12-310001680062acmr:LineOfCreditUpToRMB200000FromChinaMerchantsBankMember2024-06-300001680062acmr:LineOfCreditChinaMerchantsBankDueOnAugust72024WithAnAnnualInterestRateOf300Member2023-01-012023-12-310001680062acmr:LineOfCreditChinaMerchantsBankDueOnAugust72024WithAnAnnualInterestRateOf300Member2024-01-012024-06-300001680062acmr:LineOfCreditChinaMerchantsBankDueOnAugust72024WithAnAnnualInterestRateOf300Member2024-06-300001680062acmr:LineOfCreditChinaMerchantsBankDueOnAugust72024WithAnAnnualInterestRateOf300Member2023-12-310001680062acmr:LineOfCreditChinaMerchantsBankDueOnAugust82024WithAnAnnualInterestRateOf300Member2023-01-012023-12-310001680062acmr:LineOfCreditChinaMerchantsBankDueOnAugust82024WithAnAnnualInterestRateOf300Member2024-01-012024-06-300001680062acmr:LineOfCreditChinaMerchantsBankDueOnAugust82024WithAnAnnualInterestRateOf300Member2024-06-300001680062acmr:LineOfCreditChinaMerchantsBankDueOnAugust82024WithAnAnnualInterestRateOf300Member2023-12-310001680062acmr:LineOfCreditChinaMerchantsBankDueOnAugust92024WithAnAnnualInterestRateOf300Member2023-01-012023-12-310001680062acmr:LineOfCreditChinaMerchantsBankDueOnAugust92024WithAnAnnualInterestRateOf300Member2024-01-012024-06-300001680062acmr:LineOfCreditChinaMerchantsBankDueOnAugust92024WithAnAnnualInterestRateOf300Member2024-06-300001680062acmr:LineOfCreditChinaMerchantsBankDueOnAugust92024WithAnAnnualInterestRateOf300Member2023-12-310001680062acmr:LineOfCreditChinaMerchantsBankDueOnAugust142024WithAnAnnualInterestRateOf300Member2023-01-012023-12-310001680062acmr:LineOfCreditChinaMerchantsBankDueOnAugust142024WithAnAnnualInterestRateOf300Member2024-01-012024-06-300001680062acmr:LineOfCreditChinaMerchantsBankDueOnAugust142024WithAnAnnualInterestRateOf300Member2024-06-300001680062acmr:LineOfCreditChinaMerchantsBankDueOnAugust142024WithAnAnnualInterestRateOf300Member2023-12-310001680062acmr:LineOfCreditChinaMerchantsBankDueOnAugust172024WithAnAnnualInterestRateOf300Member2023-01-012023-12-310001680062acmr:LineOfCreditChinaMerchantsBankDueOnAugust172024WithAnAnnualInterestRateOf300Member2024-01-012024-06-300001680062acmr:LineOfCreditChinaMerchantsBankDueOnAugust172024WithAnAnnualInterestRateOf300Member2024-06-300001680062acmr:LineOfCreditChinaMerchantsBankDueOnAugust172024WithAnAnnualInterestRateOf300Member2023-12-310001680062acmr:LineOfCreditChinaMerchantsBankDueOnAugust202024WithAnAnnualInterestRateOf300Member2023-01-012023-12-310001680062acmr:LineOfCreditChinaMerchantsBankDueOnAugust202024WithAnAnnualInterestRateOf300Member2024-01-012024-06-300001680062acmr:LineOfCreditChinaMerchantsBankDueOnAugust202024WithAnAnnualInterestRateOf300Member2024-06-300001680062acmr:LineOfCreditChinaMerchantsBankDueOnAugust202024WithAnAnnualInterestRateOf300Member2023-12-310001680062acmr:LineOfCreditChinaMerchantsBankDueOnAugust212024WithAnAnnualInterestRateOf300Member2023-01-012023-12-310001680062acmr:LineOfCreditChinaMerchantsBankDueOnAugust212024WithAnAnnualInterestRateOf300Member2024-01-012024-06-300001680062acmr:LineOfCreditChinaMerchantsBankDueOnAugust212024WithAnAnnualInterestRateOf300Member2024-06-300001680062acmr:LineOfCreditChinaMerchantsBankDueOnAugust212024WithAnAnnualInterestRateOf300Member2023-12-310001680062acmr:LineOfCreditChinaMerchantsBankDueOnAugust222024WithAnAnnualInterestRateOf300Member2023-01-012023-12-310001680062acmr:LineOfCreditChinaMerchantsBankDueOnAugust222024WithAnAnnualInterestRateOf300Member2024-01-012024-06-300001680062acmr:LineOfCreditChinaMerchantsBankDueOnAugust222024WithAnAnnualInterestRateOf300Member2024-06-300001680062acmr:LineOfCreditChinaMerchantsBankDueOnAugust222024WithAnAnnualInterestRateOf300Member2023-12-310001680062acmr:LineOfCreditChinaMerchantsBankDueOnAugust242024WithAnAnnualInterestRateOf300Member2023-01-012023-12-310001680062acmr:LineOfCreditChinaMerchantsBankDueOnAugust242024WithAnAnnualInterestRateOf300Member2024-01-012024-06-300001680062acmr:LineOfCreditChinaMerchantsBankDueOnAugust242024WithAnAnnualInterestRateOf300Member2024-06-300001680062acmr:LineOfCreditChinaMerchantsBankDueOnAugust242024WithAnAnnualInterestRateOf300Member2023-12-310001680062acmr:LineOfCreditChinaMerchantsBankDueOnAugust272024WithAnAnnualInterestRateOf300Member2024-01-012024-06-300001680062acmr:LineOfCreditChinaMerchantsBankDueOnAugust272024WithAnAnnualInterestRateOf300Member2023-01-012023-12-310001680062acmr:LineOfCreditChinaMerchantsBankDueOnAugust272024WithAnAnnualInterestRateOf300Member2024-06-300001680062acmr:LineOfCreditChinaMerchantsBankDueOnAugust272024WithAnAnnualInterestRateOf300Member2023-12-310001680062acmr:LineOfCreditChinaMerchantsBankDueOnAugust292024WithAnAnnualInterestRateOf300Member2023-01-012023-12-310001680062acmr:LineOfCreditChinaMerchantsBankDueOnAugust292024WithAnAnnualInterestRateOf300Member2024-01-012024-06-300001680062acmr:LineOfCreditChinaMerchantsBankDueOnAugust292024WithAnAnnualInterestRateOf300Member2024-06-300001680062acmr:LineOfCreditChinaMerchantsBankDueOnAugust292024WithAnAnnualInterestRateOf300Member2023-12-310001680062acmr:LineOfCreditChinaMerchantsBankDueOnAugust302024WithAnAnnualInterestRateOf300Member2023-01-012023-12-310001680062acmr:LineOfCreditChinaMerchantsBankDueOnAugust302024WithAnAnnualInterestRateOf300Member2024-01-012024-06-300001680062acmr:LineOfCreditChinaMerchantsBankDueOnAugust302024WithAnAnnualInterestRateOf300Member2024-06-300001680062acmr:LineOfCreditChinaMerchantsBankDueOnAugust302024WithAnAnnualInterestRateOf300Member2023-12-310001680062acmr:LineOfCreditChinaMerchantsBankDueOnSeptember32024WithAnAnnualInterestRateOf300Member2023-01-012023-12-310001680062acmr:LineOfCreditChinaMerchantsBankDueOnSeptember32024WithAnAnnualInterestRateOf300Member2024-01-012024-06-300001680062acmr:LineOfCreditChinaMerchantsBankDueOnSeptember32024WithAnAnnualInterestRateOf300Member2024-06-300001680062acmr:LineOfCreditChinaMerchantsBankDueOnSeptember32024WithAnAnnualInterestRateOf300Member2023-12-310001680062acmr:LineOfCreditChinaMerchantsBankDueOnSeptember52024WithAnAnnualInterestRateOf300Member2023-01-012023-12-310001680062acmr:LineOfCreditChinaMerchantsBankDueOnSeptember52024WithAnAnnualInterestRateOf300Member2024-01-012024-06-300001680062acmr:LineOfCreditChinaMerchantsBankDueOnSeptember52024WithAnAnnualInterestRateOf300Member2024-06-300001680062acmr:LineOfCreditChinaMerchantsBankDueOnSeptember52024WithAnAnnualInterestRateOf300Member2023-12-310001680062acmr:LineOfCreditChinaMerchantsBankDueOnSeptember62024WithAnAnnualInterestRateOf300Member2023-01-012023-12-310001680062acmr:LineOfCreditChinaMerchantsBankDueOnSeptember62024WithAnAnnualInterestRateOf300Member2024-01-012024-06-300001680062acmr:LineOfCreditChinaMerchantsBankDueOnSeptember62024WithAnAnnualInterestRateOf300Member2024-06-300001680062acmr:LineOfCreditChinaMerchantsBankDueOnSeptember62024WithAnAnnualInterestRateOf300Member2023-12-310001680062acmr:LineOfCreditChinaMerchantsBankDueOnSeptember102024WithAnAnnualInterestRateOf300Member2023-01-012023-12-310001680062acmr:LineOfCreditChinaMerchantsBankDueOnSeptember102024WithAnAnnualInterestRateOf300Member2024-01-012024-06-300001680062acmr:LineOfCreditChinaMerchantsBankDueOnSeptember102024WithAnAnnualInterestRateOf300Member2024-06-300001680062acmr:LineOfCreditChinaMerchantsBankDueOnSeptember102024WithAnAnnualInterestRateOf300Member2023-12-310001680062acmr:LineOfCreditChinaMerchantsBankDueOnSeptember122024WithAnAnnualInterestRateOf300Member2023-01-012023-12-310001680062acmr:LineOfCreditChinaMerchantsBankDueOnSeptember122024WithAnAnnualInterestRateOf300Member2024-01-012024-06-300001680062acmr:LineOfCreditChinaMerchantsBankDueOnSeptember122024WithAnAnnualInterestRateOf300Member2024-06-300001680062acmr:LineOfCreditChinaMerchantsBankDueOnSeptember122024WithAnAnnualInterestRateOf300Member2023-12-310001680062acmr:LineOfCreditChinaMerchantsBankDueOnFebruary272025WithAnAnnualInterestRateOf2.60Member2024-01-012024-06-300001680062acmr:LineOfCreditChinaMerchantsBankDueOnFebruary272025WithAnAnnualInterestRateOf2.60Member2023-01-012023-12-310001680062acmr:LineOfCreditChinaMerchantsBankDueOnFebruary272025WithAnAnnualInterestRateOf2.60Member2024-06-300001680062acmr:LineOfCreditChinaMerchantsBankDueOnFebruary272025WithAnAnnualInterestRateOf2.60Member2023-12-310001680062acmr:LineOfCreditChinaMerchantsBankDueOnFebruary282025WithAnAnnualInterestRateOf2.60Member2023-01-012023-12-310001680062acmr:LineOfCreditChinaMerchantsBankDueOnFebruary282025WithAnAnnualInterestRateOf2.60Member2024-01-012024-06-300001680062acmr:LineOfCreditChinaMerchantsBankDueOnFebruary282025WithAnAnnualInterestRateOf2.60Member2024-06-300001680062acmr:LineOfCreditChinaMerchantsBankDueOnFebruary282025WithAnAnnualInterestRateOf2.60Member2023-12-310001680062acmr:LineOfCreditChinaMerchantsBankDueOnMarch12025WithAnAnnualInterestRateOf2.60Member2023-01-012023-12-310001680062acmr:LineOfCreditChinaMerchantsBankDueOnMarch12025WithAnAnnualInterestRateOf2.60Member2024-01-012024-06-300001680062acmr:LineOfCreditChinaMerchantsBankDueOnMarch12025WithAnAnnualInterestRateOf2.60Member2024-06-300001680062acmr:LineOfCreditChinaMerchantsBankDueOnMarch12025WithAnAnnualInterestRateOf2.60Member2023-12-310001680062acmr:LineOfCreditChinaMerchantsBankDueOnMarch52025WithAnAnnualInterestRateOf2.60Member2023-01-012023-12-310001680062acmr:LineOfCreditChinaMerchantsBankDueOnMarch52025WithAnAnnualInterestRateOf2.60Member2024-01-012024-06-300001680062acmr:LineOfCreditChinaMerchantsBankDueOnMarch52025WithAnAnnualInterestRateOf2.60Member2024-06-300001680062acmr:LineOfCreditChinaMerchantsBankDueOnMarch52025WithAnAnnualInterestRateOf2.60Member2023-12-310001680062acmr:LineOfCreditChinaMerchantsBankDueOnMarch82025WithAnAnnualInterestRateOf2.60Member2023-01-012023-12-310001680062acmr:LineOfCreditChinaMerchantsBankDueOnMarch82025WithAnAnnualInterestRateOf2.60Member2024-01-012024-06-300001680062acmr:LineOfCreditChinaMerchantsBankDueOnMarch82025WithAnAnnualInterestRateOf2.60Member2024-06-300001680062acmr:LineOfCreditChinaMerchantsBankDueOnMarch82025WithAnAnnualInterestRateOf2.60Member2023-12-310001680062acmr:LineOfCreditUpToRMB120000FromBankOfChinaMember2023-12-310001680062acmr:LineOfCreditUpToRMB120000FromBankOfChinaMember2024-06-300001680062acmr:LineOfCreditBankOfChinaDueOnMarch202025WithAnAnnualInterestRateOf2.75Member2023-01-012023-12-310001680062acmr:LineOfCreditBankOfChinaDueOnMarch202025WithAnAnnualInterestRateOf2.75Member2024-01-012024-06-300001680062acmr:LineOfCreditBankOfChinaDueOnMarch202025WithAnAnnualInterestRateOf2.75Member2024-06-300001680062acmr:LineOfCreditBankOfChinaDueOnMarch202025WithAnAnnualInterestRateOf2.75Member2023-12-310001680062acmr:LineOfCreditUpToKRW500000FromIndustrialBankOfKoreaMember2023-12-310001680062acmr:LineOfCreditUpToKRW500000FromIndustrialBankOfKoreaMember2024-06-300001680062acmr:LineOfCreditDueOnJuly122024WithAnAnnualInterestRateOf6.03Member2023-01-012023-12-310001680062acmr:LineOfCreditDueOnJuly122024WithAnAnnualInterestRateOf6.03Member2024-01-012024-06-300001680062acmr:LineOfCreditDueOnJuly122024WithAnAnnualInterestRateOf6.03Member2024-06-300001680062acmr:LineOfCreditDueOnJuly122024WithAnAnnualInterestRateOf6.03Member2023-12-310001680062acmr:LineOfCreditUpToKRW2000000FromIndustrialBankOfKoreaMember2024-06-300001680062acmr:LineOfCreditUpToKRW2000000FromIndustrialBankOfKoreaMember2023-12-310001680062acmr:LineOfCreditDueOnDecember152024WithAnAnnualInterestRateOf4.29Member2023-01-012023-12-310001680062acmr:LineOfCreditDueOnDecember152024WithAnAnnualInterestRateOf4.29Member2024-01-012024-06-300001680062acmr:LineOfCreditDueOnDecember152024WithAnAnnualInterestRateOf4.29Member2024-06-300001680062acmr:LineOfCreditDueOnDecember152024WithAnAnnualInterestRateOf4.29Member2023-12-310001680062acmr:ChinaMerchantsBankMember2024-06-300001680062acmr:ChinaMerchantsBankMember2023-12-310001680062acmr:BankOfChinaMember2024-06-300001680062acmr:BankOfChinaMember2023-12-310001680062acmr:BankOfShanghaiMember2024-06-300001680062acmr:BankOfShanghaiMember2023-12-310001680062acmr:CiticBankMember2024-06-300001680062acmr:CiticBankMember2023-12-310001680062acmr:EverbrightBankMember2024-06-300001680062acmr:EverbrightBankMember2023-12-310001680062acmr:ChinaMerchantsBankMember2024-01-012024-06-300001680062acmr:BankOfChinaMember2024-01-012024-06-300001680062acmr:BankOfChinaMemberacmr:LoanTwoMember2024-01-012024-06-300001680062acmr:BankOfShanghaiMember2024-01-012024-06-300001680062acmr:CiticBankMemberacmr:LoneOneMember2024-01-012024-06-300001680062acmr:CiticBankMemberacmr:LoanTwoMember2024-01-012024-06-300001680062acmr:EverbrightBankMember2024-01-012024-06-300001680062acmr:SubsidiesCommencedIn2020AndPriorMember2024-06-300001680062acmr:SubsidiesCommencedIn2020AndPriorMember2023-12-310001680062acmr:SubsidiesToSWLingangRDDevelopmentIn2021Member2024-06-300001680062acmr:SubsidiesToSWLingangRDDevelopmentIn2021Member2023-12-310001680062acmr:OtherMember2024-06-300001680062acmr:OtherMember2023-12-310001680062acmr:CompanyCMemberus-gaap:CommonClassAMember2024-01-120001680062acmr:CompanyDMemberus-gaap:CommonClassAMember2024-01-190001680062acmr:CompanyEMemberus-gaap:CommonClassAMember2024-01-190001680062acmr:CompanyEMemberus-gaap:CommonClassAMember2024-06-300001680062acmr:NinebellCompanyLimitedMemberus-gaap:CommonClassAMember2024-06-300001680062acmr:WooilFluconCompanyLimitedMemberus-gaap:CommonClassAMember2024-06-300001680062acmr:HefeiShixiChanhengIntegratedCircuitIndustryVentureCapitalFundPartnershipMemberus-gaap:CommonClassAMember2024-06-300001680062acmr:ShengyiSemiconductorTechnologyCompanyLimitedMemberus-gaap:CommonClassAMember2024-06-300001680062acmr:CompanyDMemberus-gaap:CommonClassAMember2024-06-300001680062acmr:WaferworksCompanyLimitedMemberus-gaap:CommonClassAMember2024-06-300001680062acmr:ShengyiMemberus-gaap:CommonClassAMember2024-06-300001680062acmr:CompanyAMemberus-gaap:CommonClassAMember2024-06-300001680062acmr:CompanyBMemberus-gaap:CommonClassAMember2024-06-300001680062acmr:CompanyCMemberus-gaap:CommonClassAMember2024-06-300001680062acmr:NinebellCompanyLimitedMemberacmr:InvestmentExcludingOtherMember2024-06-300001680062acmr:NinebellCompanyLimitedMemberacmr:InvestmentExcludingOtherMember2023-12-310001680062acmr:WooilFluconCompanyLimitedMemberacmr:InvestmentExcludingOtherMember2024-06-300001680062acmr:WooilFluconCompanyLimitedMemberacmr:InvestmentExcludingOtherMember2023-12-310001680062acmr:ShengyiSemiconductorTechnologyCompanyLimitedMemberacmr:InvestmentExcludingOtherMember2024-06-300001680062acmr:ShengyiSemiconductorTechnologyCompanyLimitedMemberacmr:InvestmentExcludingOtherMember2023-12-310001680062acmr:HefeiShixiChanhengIntegratedCircuitIndustryVentureCapitalFundPartnershipMemberacmr:InvestmentExcludingOtherMember2024-06-300001680062acmr:HefeiShixiChanhengIntegratedCircuitIndustryVentureCapitalFundPartnershipMemberacmr:InvestmentExcludingOtherMember2023-12-310001680062acmr:CompanyDMemberacmr:InvestmentExcludingOtherMember2024-06-300001680062acmr:CompanyDMemberacmr:InvestmentExcludingOtherMember2023-12-310001680062acmr:InvestmentExcludingOtherMember2024-06-300001680062acmr:InvestmentExcludingOtherMember2023-12-310001680062acmr:WaferworksCompanyLimitedMemberus-gaap:OtherLongTermInvestmentsMember2024-06-300001680062acmr:WaferworksCompanyLimitedMemberus-gaap:OtherLongTermInvestmentsMember2023-12-310001680062acmr:ShengyiSemiconductorTechnologyCompanyLimitedMemberus-gaap:OtherLongTermInvestmentsMember2024-06-300001680062acmr:ShengyiSemiconductorTechnologyCompanyLimitedMemberus-gaap:OtherLongTermInvestmentsMember2023-12-310001680062acmr:CompanyAMemberus-gaap:OtherLongTermInvestmentsMember2024-06-300001680062acmr:CompanyAMemberus-gaap:OtherLongTermInvestmentsMember2023-12-310001680062acmr:CompanyBMemberus-gaap:OtherLongTermInvestmentsMember2024-06-300001680062acmr:CompanyBMemberus-gaap:OtherLongTermInvestmentsMember2023-12-310001680062acmr:CompanyCMemberus-gaap:OtherLongTermInvestmentsMember2024-06-300001680062acmr:CompanyCMemberus-gaap:OtherLongTermInvestmentsMember2023-12-310001680062acmr:CompanyEMemberus-gaap:OtherLongTermInvestmentsMember2024-06-300001680062acmr:CompanyEMemberus-gaap:OtherLongTermInvestmentsMember2023-12-310001680062acmr:OtherMemberus-gaap:OtherLongTermInvestmentsMember2024-06-300001680062acmr:OtherMemberus-gaap:OtherLongTermInvestmentsMember2023-12-310001680062acmr:SubtotalMeasurementAlternativeMemberus-gaap:OtherLongTermInvestmentsMember2024-06-300001680062acmr:SubtotalMeasurementAlternativeMemberus-gaap:OtherLongTermInvestmentsMember2023-12-310001680062us-gaap:OtherLongTermInvestmentsMember2024-06-300001680062us-gaap:OtherLongTermInvestmentsMember2023-12-310001680062acmr:NuodeAssetManagementCompanyLimitedMember2022-09-190001680062acmr:NuodeAssetManagementCompanyLimitedMember2022-09-270001680062acmr:NuodeAssetManagementCompanyLimitedMember2022-12-310001680062acmr:NuodeAssetManagementCompanyLimitedMember2024-06-300001680062acmr:HuahongSemiconductorLimitedMember2023-07-310001680062acmr:ZhongiuxinLimitedCompanyMember2023-09-300001680062acmr:ShanghaiSyncrystallineSiliconMaterialsCo.LtdMember2024-02-290001680062acmr:ShanghaiSyncrystallineSiliconMaterialsCo.LtdMember2024-06-300001680062acmr:SemiconductorManufacturingInternationalCorporationMember2023-04-012023-06-300001680062acmr:SemiconductorManufacturingInternationalCorporationMember2023-01-012023-06-300001680062us-gaap:RelatedPartyMemberacmr:NinebellCoLtdMember2024-06-300001680062us-gaap:RelatedPartyMemberacmr:NinebellCoLtdMember2023-12-310001680062us-gaap:RelatedPartyMemberacmr:ShengyiSemiconductorTechnologyCoLtdMember2024-06-300001680062us-gaap:RelatedPartyMemberacmr:ShengyiSemiconductorTechnologyCoLtdMember2023-12-310001680062acmr:NinebellCoLtdMember2024-04-012024-06-300001680062acmr:NinebellCoLtdMember2023-04-012023-06-300001680062acmr:NinebellCoLtdMember2024-01-012024-06-300001680062acmr:NinebellCoLtdMember2023-01-012023-06-300001680062acmr:ShengyiSemiconductorTechnologyCoLtdMember2024-04-012024-06-300001680062acmr:ShengyiSemiconductorTechnologyCoLtdMember2023-04-012023-06-300001680062acmr:ShengyiSemiconductorTechnologyCoLtdMember2024-01-012024-06-300001680062acmr:ShengyiSemiconductorTechnologyCoLtdMember2023-01-012023-06-300001680062us-gaap:RelatedPartyMemberacmr:ShengyiSemiconductorTechnologyCoLtdMember2024-04-012024-06-300001680062us-gaap:RelatedPartyMemberacmr:ShengyiSemiconductorTechnologyCoLtdMember2023-04-012023-06-300001680062us-gaap:RelatedPartyMemberacmr:ShengyiSemiconductorTechnologyCoLtdMember2024-01-012024-06-300001680062us-gaap:RelatedPartyMemberacmr:ShengyiSemiconductorTechnologyCoLtdMember2023-01-012023-06-300001680062us-gaap:CommonClassBMember2024-01-012024-06-300001680062us-gaap:CommonStockMemberus-gaap:CommonClassAMember2024-01-012024-06-300001680062us-gaap:CommonStockMemberus-gaap:CommonClassAMember2023-04-012023-06-300001680062us-gaap:EmployeeStockOptionMember2023-12-310001680062us-gaap:EmployeeStockOptionMember2023-01-012023-12-310001680062us-gaap:EmployeeStockOptionMember2024-01-012024-06-300001680062us-gaap:EmployeeStockOptionMember2024-06-300001680062us-gaap:EmployeeStockOptionMember2024-04-012024-06-300001680062acmr:ServicePeriodBasedApproachMemberus-gaap:EmployeeStockOptionMembersrt:MinimumMember2024-06-300001680062acmr:ServicePeriodBasedApproachMemberus-gaap:EmployeeStockOptionMembersrt:MaximumMember2024-06-300001680062acmr:ServicePeriodBasedApproachMemberus-gaap:EmployeeStockOptionMembersrt:MinimumMember2024-01-012024-06-300001680062acmr:ServicePeriodBasedApproachMemberus-gaap:EmployeeStockOptionMembersrt:MaximumMember2024-01-012024-06-300001680062us-gaap:EmployeeStockOptionMemberacmr:ServicePeriodBasedApproachMember2024-01-012024-06-300001680062acmr:ShareBasedPaymentArrangementNonEmployeeStockOptionMember2023-12-310001680062acmr:ShareBasedPaymentArrangementNonEmployeeStockOptionMember2023-01-012023-12-310001680062acmr:ShareBasedPaymentArrangementNonEmployeeStockOptionMember2024-01-012024-06-300001680062acmr:ShareBasedPaymentArrangementNonEmployeeStockOptionMember2024-06-300001680062acmr:ShareBasedPaymentArrangementNonEmployeeStockOptionMember2024-04-012024-06-300001680062acmr:A2019StockOptionIncentivePlanMemberacmr:ACMResearchShanghaiIncMemberus-gaap:EmployeeStockOptionMember2023-12-310001680062acmr:A2019StockOptionIncentivePlanMemberacmr:ACMResearchShanghaiIncMemberus-gaap:EmployeeStockOptionMember2023-01-012023-12-310001680062acmr:A2019StockOptionIncentivePlanMemberacmr:ACMResearchShanghaiIncMemberus-gaap:EmployeeStockOptionMember2024-01-012024-06-300001680062acmr:A2019StockOptionIncentivePlanMemberacmr:ACMResearchShanghaiIncMemberus-gaap:EmployeeStockOptionMember2024-06-300001680062acmr:A2019StockOptionIncentivePlanMemberacmr:ACMResearchShanghaiIncMemberus-gaap:EmployeeStockOptionMember2024-04-012024-06-300001680062acmr:A2023SubsidiaryStockOptionPlanMemberacmr:ACMResearchShanghaiIncMemberus-gaap:EmployeeStockOptionMember2023-12-310001680062acmr:A2023SubsidiaryStockOptionPlanMemberacmr:ACMResearchShanghaiIncMemberus-gaap:EmployeeStockOptionMember2023-01-012023-12-310001680062acmr:A2023SubsidiaryStockOptionPlanMemberacmr:ACMResearchShanghaiIncMemberus-gaap:EmployeeStockOptionMember2024-01-012024-06-300001680062acmr:A2023SubsidiaryStockOptionPlanMemberacmr:ACMResearchShanghaiIncMemberus-gaap:EmployeeStockOptionMember2024-06-300001680062acmr:A2023SubsidiaryStockOptionPlanMemberacmr:ACMResearchShanghaiIncMemberus-gaap:EmployeeStockOptionMembersrt:MinimumMember2024-06-300001680062acmr:A2023SubsidiaryStockOptionPlanMemberacmr:ACMResearchShanghaiIncMemberus-gaap:EmployeeStockOptionMembersrt:MaximumMember2024-06-300001680062acmr:A2023SubsidiaryStockOptionPlanMemberacmr:ACMResearchShanghaiIncMemberus-gaap:EmployeeStockOptionMembersrt:MinimumMember2024-01-012024-06-300001680062acmr:A2023SubsidiaryStockOptionPlanMemberacmr:ACMResearchShanghaiIncMemberus-gaap:EmployeeStockOptionMembersrt:MaximumMember2024-01-012024-06-300001680062us-gaap:EmployeeStockOptionMemberacmr:ACMResearchShanghaiIncMember2024-06-300001680062us-gaap:EmployeeStockOptionMemberacmr:ACMResearchShanghaiIncMember2024-01-012024-06-300001680062acmr:A2023StockOptionIncentivePlanMemberacmr:ACMResearchShanghaiIncMemberus-gaap:EmployeeStockOptionMember2024-04-012024-06-300001680062acmr:A2023StockOptionIncentivePlanMemberacmr:ACMResearchShanghaiIncMemberus-gaap:EmployeeStockOptionMember2024-01-012024-06-300001680062acmr:A2023StockOptionIncentivePlanMemberacmr:ACMResearchShanghaiIncMemberus-gaap:EmployeeStockOptionMember2024-06-300001680062us-gaap:CostOfSalesMember2024-04-012024-06-300001680062us-gaap:CostOfSalesMember2023-04-012023-06-300001680062us-gaap:CostOfSalesMember2024-01-012024-06-300001680062us-gaap:CostOfSalesMember2023-01-012023-06-300001680062us-gaap:SellingAndMarketingExpenseMember2024-04-012024-06-300001680062us-gaap:SellingAndMarketingExpenseMember2023-04-012023-06-300001680062us-gaap:SellingAndMarketingExpenseMember2024-01-012024-06-300001680062us-gaap:SellingAndMarketingExpenseMember2023-01-012023-06-300001680062us-gaap:ResearchAndDevelopmentExpenseMember2024-04-012024-06-300001680062us-gaap:ResearchAndDevelopmentExpenseMember2023-04-012023-06-300001680062us-gaap:ResearchAndDevelopmentExpenseMember2024-01-012024-06-300001680062us-gaap:ResearchAndDevelopmentExpenseMember2023-01-012023-06-300001680062us-gaap:GeneralAndAdministrativeExpenseMember2024-04-012024-06-300001680062us-gaap:GeneralAndAdministrativeExpenseMember2023-04-012023-06-300001680062us-gaap:GeneralAndAdministrativeExpenseMember2024-01-012024-06-300001680062us-gaap:GeneralAndAdministrativeExpenseMember2023-01-012023-06-300001680062us-gaap:EmployeeStockOptionMember2023-04-012023-06-300001680062us-gaap:EmployeeStockOptionMember2023-01-012023-06-300001680062acmr:ShareBasedPaymentArrangementNonEmployeeStockOptionMember2023-04-012023-06-300001680062acmr:ShareBasedPaymentArrangementNonEmployeeStockOptionMember2023-01-012023-06-300001680062us-gaap:EmployeeStockOptionMemberacmr:ACMResearchShanghaiIncMember2024-04-012024-06-300001680062us-gaap:EmployeeStockOptionMemberacmr:ACMResearchShanghaiIncMember2023-04-012023-06-300001680062us-gaap:EmployeeStockOptionMemberacmr:ACMResearchShanghaiIncMember2023-01-012023-06-300001680062srt:MinimumMemberus-gaap:ForeignCountryMember2024-01-012024-06-300001680062srt:MaximumMemberus-gaap:ForeignCountryMember2024-01-012024-06-300001680062acmr:ACMResearchShanghaiIncMemberus-gaap:ForeignCountryMembersrt:MinimumMember2024-01-012024-06-300001680062acmr:ACMResearchWuxiIncMemberus-gaap:ForeignCountryMember2024-01-012024-06-300001680062acmr:ACMResearchBeijingIncMemberus-gaap:ForeignCountryMember2024-01-012024-06-300001680062acmr:ShengweiResearchShanghaiIncMemberus-gaap:ForeignCountryMember2024-01-012024-06-300001680062us-gaap:ForeignCountryMember2024-01-012024-06-300001680062acmr:ACMResearchShanghaiIncMember2024-01-012024-06-300001680062acmr:ACMResearchShanghaiIncMemberus-gaap:ForeignCountryMember2020-01-012022-12-310001680062us-gaap:SubsequentEventMember2024-07-300001680062acmr:DavidWangMember2024-01-012024-06-300001680062acmr:DavidWangMember2024-04-012024-06-300001680062acmr:DavidWangMember2024-06-300001680062acmr:TracyLiuMember2024-01-012024-06-300001680062acmr:TracyLiuMember2024-04-012024-06-300001680062acmr:TracyLiuMember2024-06-300001680062acmr:FupingChenMember2024-01-012024-06-300001680062acmr:FupingChenMember2024-04-012024-06-300001680062acmr:FupingChenMember2024-06-300001680062acmr:ShanghaiScienceAndTechnologyVentureCapitalCo.LtdMember2024-01-012024-06-300001680062acmr:ShanghaiScienceAndTechnologyVentureCapitalCo.LtdMember2024-04-012024-06-300001680062acmr:ShanghaiScienceAndTechnologyVentureCapitalCo.LtdMember2024-06-30
UNITED STATES SECURITIES AND EXCHANGE COMMISSION
Washington, D.C. 20549
FORM 10-Q
(Mark One)
| | | | | |
| þ | QUARTERLY REPORT PURSUANT TO SECTION 13 OR 15(d) OF THE SECURITIES EXCHANGE ACT OF 1934 |
For the quarterly period ended June 30, 2024
or
| | | | | |
| o | TRANSITION REPORT PURSUANT TO SECTION 13 OR 15(d) OF THE SECURITIES EXCHANGE ACT OF 1934 |
For the transition period from _________ to _____________
Commission file number: 001-38273
ACM Research, Inc.
(Exact Name of Registrant as Specified in Its Charter)
| | | | | |
| Delaware | 94-3290283 |
| (State or Other Jurisdiction of Incorporation or Organization) | (I.R.S. Employer Identification No.) |
| |
42307 Osgood Road, Suite I Fremont, California | 94539 |
| (Address of Principal Executive Offices) | (Zip Code) |
Registrant’s telephone number, including area code: (510) 445-3700
Securities registered pursuant to Section 12(b) of the Act:
| | | | | | | | | | | | | | |
| Title of Each Class | | Trading Symbol | | Name of Each Exchange on which Registered |
| Class A Common Stock, $0.0001 par value | | ACMR | | The NASDAQ Stock Market LLC
|
Indicate by check mark whether the registrant (1) has filed all reports required to be filed by Section 13 or 15(d) of the Securities Exchange Act of 1934 during the preceding 12 months (or for such shorter period that the registrant was required to file such reports), and (2) has been subject to such filing requirements for the past 90 days. Yes þ No o
Indicate by check mark whether the registrant has submitted electronically every Interactive Data file required to be submitted pursuant to Rule 405 of Regulation S-T (§232.405 of this chapter) during the preceding 12 months (or for such shorter period that the registrant was required to submit such files). Yes þ No o
Indicate by check mark whether the registrant is a large accelerated filer, an accelerated filer, a non-accelerated filer, a smaller reporting company or an emerging growth company. See definitions of “large accelerated filer,” “accelerated filer,” “smaller reporting company” and “emerging growth company” in Rule 12b-2 of the Exchange Act.
| | | | | | | | | | | | | | | | | |
| Large accelerated filer | þ | | Accelerated filer | o |
| Non-accelerated filer | o | | Smaller reporting company | o |
| | | | Emerging growth company | o |
If an emerging growth company, indicate by check mark if the registrant has elected not to use the extended transition period for complying with any new or revised financial accounting standards provided pursuant to Section 13(a) of the Exchange Act. o
Indicate by check mark whether the registrant is a shell company (as defined in Rule 12b-2 of the Exchange Act). Yes o No þ
Indicate the number of shares outstanding of each of the registrant’s classes of common stock, as of the latest practicable date.
| | | | | | | | |
| Class | | Number of Shares Outstanding |
| Class A Common Stock, $0.0001 par value | | 57,449,013 shares outstanding as of August 2, 2024 |
| Class B Common Stock, $0.0001 par value | | 5,021,811 shares outstanding as of August 2, 2024 |
TABLE OF CONTENTS
ACM Research, Inc., or ACM Research, is a Delaware corporation founded in California in 1998 to supply capital equipment developed for the global semiconductor industry. Since 2005, ACM Research has conducted its business operations principally through its subsidiary ACM Research (Shanghai), Inc., or ACM Shanghai, a limited liability corporation formed by ACM Research in the People’s Republic of China, or mainland China, in 2005. Unless the context requires otherwise, references in this report to “our company,” “our,” “us,” “we” and similar terms refer to ACM Research, Inc. and its subsidiaries, including ACM Shanghai, collectively.
We conduct a substantial majority of our product development, manufacturing, support and services in mainland China through ACM Shanghai. We are not a mainland China operating company, and we do not conduct our operations in mainland China through the use of a variable interest entity or any other structure designed for the purpose of avoiding mainland China legal restrictions on direct foreign investments in mainland China-based companies. For a description of certain matters relating to our operations in mainland China, including our corporate structure, the movement of cash throughout our organization, certain audit and regulatory matters, and risks associated therewith, please see “Item 2—Management’s Discussion and Analysis of Financial Condition and Results of Operations” in this report, the disclosure at the forefront of our Annual Report on Form 10-K for the fiscal year ended December 31, 2023, and the Risk Factors included therein, as referenced or updated by the disclosure included in “Part II. Item 1A—Risk Factors” in this report.
For purposes of this report, certain amounts in Renminbi, or RMB, have been translated into U.S. dollars solely for the convenience of the reader. The translations have been made based on the conversion rates published by the State Administration of Foreign Exchange of the People’s Republic of China.
SAPS, TEBO, ULTRA C, ULTRA Fn, Ultra ECP, Ultra ECP map, and Ultra ECP ap are trademarks of ACM Research. For convenience, these trademarks appear in this report without ™ symbols, but that practice does not mean that ACM Research will not assert, to the fullest extent under applicable law, ACM Research’s rights to the trademarks. This report also contains other companies’ trademarks, registered marks and trade names, which are the property of those companies.
FORWARD-LOOKING STATEMENTS AND STATISTICAL DATA
This report contains forward-looking statements within the meaning of the Private Securities Litigation Reform Act of 1995. All statements, other than statements of historical facts, included in this report regarding our strategy, future operations, future financial position, future revenue, projected costs, prospects, plans and objectives of management are forward-looking statements. In some cases, you can identify forward-looking statements by terms such as “may,” “might,” “will,” “objective,” “intend,” “should,” “could,” “can,” “would,” “expect,” “believe,” “anticipate,” “project,” “target,” “design,” “estimate,” “predict,” “potential,” “plan” or the negative of these terms, and similar expressions intended to identify forward-looking statements. These statements reflect our current views with respect to future events and are based on our management’s belief and assumptions and on information currently available to our management. Although we believe that the expectations reflected in these forward-looking statements are reasonable, these statements relate to future events or our future operational or financial performance, and involve known and unknown risks, uncertainties and other factors, including those described or incorporated by reference in “Item 1A. Risk Factors” of Part II of this report, that may cause our actual results, performance or achievements to be materially different from any future results, performance or achievements expressed or implied by these forward-looking statements.
The information included under the heading “Item 2. Management’s Discussion and Analysis of Financial Condition and Results of Operations – Overview,” of Part I of this report contains statistical data and estimates, including forecasts, that are based on information provided by Gartner, Inc., or Gartner, in “Forecast: Semiconductor Wafer Fab Equipment, Worldwide, 4Q23 Update” (December 2023), or the Gartner Report. The Gartner Report represents research opinions or viewpoints that are published, as part of a syndicated subscription service, by Gartner and are not representations of fact. The Gartner Report speaks as of its original publication date (and not as of the date of this report), and the opinions expressed in the Gartner Report are subject to change without notice. While we are not aware of any misstatements regarding any of the data presented from the Gartner Report, estimates, and in particular forecasts, involve numerous assumptions and are subject to risks and uncertainties, as well as change based on various factors, that could cause results to differ materially from those expressed in the data presented below.
Any forward-looking statement made by us in this report speaks only as of the date on which it is made. Except as required by law, we assume no obligation to update these statements publicly or to update the reasons actual results could differ materially from those anticipated in these statements, even if new information becomes available in the future.
You should read this report, and the documents that we reference in this report and have filed as exhibits to this report, completely and with the understanding that our actual future results may be materially different from what we expect. We qualify all of our forward-looking statements by these cautionary statements.
PART I. FINANCIAL INFORMATION
Item 1. Financial Statements
ACM RESEARCH, INC.
Condensed Consolidated Balance Sheets
(In thousands, except per share data)
| | | | | | | | | | | |
| June 30, | | December 31, |
| 2024 | | 2023 |
| Assets | (Unaudited) | | |
| Current assets: | | | |
| Cash and cash equivalents (note 2) | $ | 324,031 | | | $ | 182,090 | |
| Restricted cash | 881 | | | 1,083 | |
| Short-term time deposits (note 2) | 27,183 | | | 80,524 | |
| Short-term investments (note 15) | 19,597 | | | 21,312 | |
| Accounts receivable, net (note 4) | 293,499 | | | 283,186 | |
| Other receivables | 53,694 | | | 40,065 | |
| Inventories, net (note 5) | 602,927 | | | 545,395 | |
| Advances to related party (note 16) | 2,756 | | | 2,432 | |
| Prepaid expenses | 18,594 | | | 20,023 | |
| Total current assets | 1,343,162 | | | 1,176,110 | |
| Property, plant and equipment, net (note 6) | 228,731 | | | 201,848 | |
| Land use right, net (note 7) | 8,225 | | | 8,367 | |
| Operating lease right-of-use assets, net (note 11) | 6,252 | | | 7,026 | |
| Intangible assets, net | 2,836 | | | 2,538 | |
| Long-term time deposits (note 2) | 14,656 | | | 40,818 | |
| Deferred tax assets (note 19) | 20,898 | | | 20,271 | |
| Long-term investments (note 14) | 31,898 | | | 27,880 | |
| Other long-term assets (note 8) | 10,917 | | | 6,050 | |
| Total assets | $ | 1,667,575 | | | $ | 1,490,908 | |
| Liabilities and Equity | | | |
| Current liabilities: | | | |
| Short-term borrowings (note 9) | $ | 54,439 | | | $ | 31,335 | |
| Current portion of long-term borrowings (note 12) | 19,671 | | | 6,783 | |
| Related party accounts payable (note 16) | 18,012 | | | 11,407 | |
| Accounts payable | 142,418 | | | 141,814 | |
| Advances from customers (note 3) | 205,609 | | | 181,368 | |
| Deferred revenue (note 3) | 5,279 | | | 3,687 | |
| Income taxes payable (note 19) | 11,136 | | | 6,401 | |
| FIN-48 payable (note 19) | 12,093 | | | 12,149 | |
| Other payables and accrued expenses (note 10) | 114,940 | | | 102,951 | |
| Current portion of operating lease liabilities (note 11) | 2,573 | | | 2,764 | |
| Total current liabilities | 586,170 | | | 500,659 | |
| Long-term borrowings (note 12) | 70,833 | | | 53,952 | |
| Long-term operating lease liabilities (note 11) | 3,679 | | | 4,262 | |
| Other long-term liabilities (note 13) | 5,505 | | | 5,873 | |
| Total liabilities | 666,187 | | | 564,746 | |
| Commitments and contingencies (note 21) | | | |
| Equity: | | | |
| Stockholders’ equity: | | | |
| Class A Common stock (note 17) | 6 | | | 6 | |
| Class B Common stock (note 17) | 1 | | | 1 | |
| Additional paid-in capital | 659,462 | | | 629,845 | |
| Retained earnings | 198,470 | | | 156,827 | |
| Statutory surplus reserve (note 22) | 30,060 | | | 30,060 | |
| Accumulated other comprehensive loss | (54,830) | | | (49,349) | |
| Total ACM Research, Inc. stockholders’ equity | 833,169 | | | 767,390 | |
| Non-controlling interests | 168,219 | | | 158,772 | |
| Total equity | 1,001,388 | | | 926,162 | |
| Total liabilities and equity | $ | 1,667,575 | | | $ | 1,490,908 | |
The accompanying notes are an integral part of these condensed consolidated financial statements.
ACM RESEARCH, INC.
Condensed Consolidated Statements of Comprehensive Income (Loss)
(In thousands, except share and per share data)
(Unaudited) | | | | | | | | | | | | | | | | | | | | | | | |
| Three Months Ended June 30, | | Six Months Ended June 30, |
| 2024 | | 2023 | | 2024 | | 2023 |
| Revenue (note 3) | $ | 202,480 | | | $ | 144,577 | | | $ | 354,671 | | | $ | 218,833 | |
Cost of revenue, including cost of revenue from related parties of $16.1 million and $31.3 million for the three and six months ended June 30, 2024, respectively and $11.3 and $29.7 million for the three and six months ended June 30, 2023, respectively (note 16) | 105,696 | | | 75,938 | | | 178,766 | | | 110,208 | |
| Gross profit | 96,784 | | | 68,639 | | | 175,905 | | | 108,625 | |
| Operating expenses: | | | | | | | |
| Sales and marketing | 17,135 | | | 11,439 | | | 31,308 | | | 20,776 | |
| Research and development | 25,968 | | | 20,064 | | | 49,886 | | | 34,093 | |
| General and administrative | 16,088 | | | 6,706 | | | 31,886 | | | 14,464 | |
| Total operating expenses | 59,191 | | | 38,209 | | | 113,080 | | | 69,333 | |
| Income from operations | 37,593 | | | 30,430 | | | 62,825 | | | 39,292 | |
| Interest income | 2,381 | | | 2,346 | | | 4,155 | | | 4,131 | |
| Interest expense | (932) | | | (649) | | | (1,715) | | | (1,344) | |
| Realized gain from sale of short-term investments (note 15) | — | | | 3,919 | | | 273 | | | 7,913 | |
Unrealized gain (loss) on short-term investments (note 15) | 1,031 | | | (2,455) | | | (1,564) | | | (3,109) | |
Other income, net | 1,357 | | | 3,724 | | | 4,437 | | | 2,306 | |
| Income (loss) from equity method investments (note 15) | (695) | | | 3,920 | | | (1,215) | | | 3,888 | |
| Income before income taxes | 40,735 | | | 41,235 | | | 67,196 | | | 53,077 | |
| Income tax expense (note 19) | (9,336) | | | (7,638) | | | (13,705) | | | (10,517) | |
| Net income | 31,399 | | | 33,597 | | | 53,491 | | | 42,560 | |
| Less: Net income attributable to non-controlling interests | 7,189 | | | 6,772 | | | 11,848 | | | 8,590 | |
| Net income attributable to ACM Research, Inc. | $ | 24,210 | | | $ | 26,825 | | | $ | 41,643 | | | $ | 33,970 | |
| | | | | | | |
Comprehensive income (loss): | | | | | | | |
| Net income | 31,399 | | | 33,597 | | | 53,491 | | | 42,560 | |
| Foreign currency translation adjustment, net of tax | 116 | | | (35,269) | | | (6,713) | | | (25,846) | |
Comprehensive income (loss) | 31,515 | | | (1,672) | | | 46,778 | | | 16,714 | |
| Less: Comprehensive income attributable to non-controlling interests | 7,210 | | | 652 | | | 10,616 | | | 4,114 | |
Comprehensive income (loss) attributable to ACM Research, Inc. | $ | 24,305 | | | $ | (2,324) | | | $ | 36,162 | | | $ | 12,600 | |
| | | | | | | |
| Net income attributable to ACM Research, Inc. per share of common stock (note 2): | | | | | | | |
| Basic | $ | 0.39 | | | $ | 0.45 | | | $ | 0.67 | | | $ | 0.57 | |
| Diluted | $ | 0.35 | | | $ | 0.41 | | | $ | 0.61 | | | $ | 0.52 | |
| | | | | | | |
| Weighted average shares of common stock outstanding used in computing per share amounts (note 2): | | | | | | | |
| Basic | 62,178,369 | | 59,898,149 | | 61,772,776 | | 59,817,903 |
| Diluted | 67,057,846 | | 64,929,638 | | 66,520,706 | | 64,968,900 |
The accompanying notes are an integral part of these condensed consolidated financial statements.
ACM RESEARCH, INC.
Condensed Consolidated Statements of Changes in Equity
For the Six Months Ended June 30, 2024 and 2023
(In thousands, except share and per share data)
(Unaudited)
| | | | | | | | | | | | | | | | | | | | | | | | | | | | | | | | | | | | | | | | | | | | | | | | | | | | | | | | | | | |
| Common
Stock Class A | | Common
Stock Class B | | | | | | | | | | | | |
| Shares | | Amount | | Shares | | Amount | | Additional Paid-
in Capital | | Retained
Earnings | | Statutory
Surplus
Reserve | | Accumulated Other Comprehensive Income (Loss) | | Non-controlling
Interests | | Total
Equity |
| Balance at December 31, 2022 | 54,655,286 | | $ | 5 | | | 5,021,811 | | $ | 1 | | | $ | 604,089 | | | $ | 94,426 | | | $ | 16,881 | | | $ | (40,546) | | | $ | 137,315 | | | $ | 812,171 | |
| Cumulative effect of change in accounting principle under ASC 326, net of tax | - | | - | | | - | | - | | | - | | | (1,769) | | | - | | | - | | | — | | | (1,769) | |
| Net income | - | | - | | | - | | - | | | - | | | 33,970 | | | - | | | — | | | 8,590 | | | 42,560 | |
| Foreign currency translation adjustment | - | | - | | | - | | - | | | - | | | - | | | - | | | (21,370) | | | (4,476) | | | (25,846) | |
| Exercise of stock options | 296,204 | | - | | | - | | - | | | 691 | | | - | | | - | | | - | | | 3,834 | | | 4,525 | |
| Stock-based compensation | - | | - | | | - | | - | | | 4,085 | | | - | | | - | | | - | | | - | | | 4,085 | |
| ACM Shanghai dividend | - | | - | | | - | | - | | | - | | | - | | | - | | | - | | | (3,951) | | | (3,951) | |
| Balance at June 30, 2023 | 54,951,490 | | $ | 5 | | | 5,021,811 | | $ | 1 | | | $ | 608,865 | | | $ | 126,627 | | | $ | 16,881 | | | $ | (61,916) | | | $ | 141,312 | | | $ | 831,775 | |
| | | | | | | | | | | | | | | | | | | | | | | | | | | | | | | | |
| Common
Stock Class A | Common
Stock Class B | | | | | | |
| Shares | Amount | Shares | Amount | Additional Paid-
in Capital | Retained Earnings | Statutory Surplus
Reserve | Accumulated Other Comprehensive Loss | Non-controlling Interests | Total
Equity |
| Balance at December 31, 2023 | 56,036,172 | 6 | | 5,021,811 | 1 | | 629,845 | | 156,827 | | 30,060 | | (49,349) | | 158,772 | | 926,162 | |
| Net income | - | - | | - | | - | | - | | 41,643 | | - | | - | | 11,848 | | 53,491 | |
| Foreign currency translation adjustment | - | - | | - | | - | | - | | - | | - | | (5,481) | | (1,232) | | (6,713) | |
| Exercise of stock options | 1,366,081 | - | | - | | - | | 5,645 | | - | | - | | - | | 792 | | 6,437 | |
| Stock-based compensation | - | - | | - | - | | 23,972 | | - | | - | | - | | 4,939 | | 28,911 | |
| ACM Shanghai dividend | - | - | - | - | - | - | - | - | (6,900) | | (6,900) | |
| Balance at June 30, 2024 | 57,402,253 | $ | 6 | | 5,021,811 | $ | 1 | | $ | 659,462 | | $ | 198,470 | | $ | 30,060 | | $ | (54,830) | | $ | 168,219 | | $ | 1,001,388 | |
ACM RESEARCH, INC.
Condensed Consolidated Statements of Changes in Equity
For the Three Months Ended June 30, 2024 and 2023
(In thousands, except share and per share data)
(Unaudited)
| | | | | | | | | | | | | | | | | | | | | | | | | | | | | | | | | | | | | | | | | | | | | | | | | | | | | | | | | | | |
| Common
Stock Class A | | Common
Stock Class B | | Additional Paid-
in Capital | | Retained Earnings | | Statutory
Surplus
Reserve | | Accumulated
Other
Comprehensive
Income (loss) | | Non-controlling Interests | | Total
Equity |
| Shares | | Amount | | Shares | | Amount | | | | | | |
| Balance at March 31, 2023 | 54,818,355 | | $ | 5 | | | 5,021,811 | | $ | 1 | | | $ | 606,398 | | | $ | 99,802 | | | $ | 16,881 | | | $ | (32,768) | | | $ | 140,778 | | | $ | 831,097 | |
| Net income | - | | - | | | - | | - | | | - | | | 26,825 | | | - | | | — | | | 6,772 | | | 33,597 | |
| Foreign currency translation adjustment | - | | - | | | - | | - | | | - | | | - | | | - | | | (29,148) | | | (6,121) | | | (35,269) | |
| Exercise of stock options | 133,135 | | - | | | - | | - | | | 450 | | | - | | | - | | | - | | | 3,834 | | | 4,284 | |
| Stock-based compensation | - | | - | | | - | | - | | | 2,017 | | | - | | | - | | | - | | | - | | | 2,017 | |
| ACM Shanghai dividend | - | | - | | | - | | - | | | - | | | - | | | - | | | - | | | (3,951) | | | (3,951) | |
| Balance at June 30, 2023 | 54,951,490 | | $ | 5 | | | 5,021,811 | | $ | 1 | | | $ | 608,865 | | | $ | 126,627 | | | $ | 16,881 | | | $ | (61,916) | | | $ | 141,312 | | | $ | 831,775 | |
| | | | | | | | | | | | | | | | | | | |
| Common
Stock Class A | | Common
Stock Class B | | Additional Paid-
in Capital | | Retained
earnings | | Statutory
Surplus
Reserve | | Accumulated
Other
Comprehensive
Loss | | Non-controlling
interests | | Total
Equity |
| Shares | | Amount | | Shares | | Amount | | | | | | |
| Balance at March 31, 2024 | 56,986,777 | | $ | 6 | | | 5,021,811 | | $ | 1 | | | $ | 646,800 | | | $ | 174,260 | | | $ | 30,060 | | | $ | (54,925) | | | $ | 164,591 | | | $ | 960,793 | |
| Net income | - | | - | | | - | | - | | | - | | | 24,210 | | | - | | | — | | | 7,189 | | | 31,399 | |
| Foreign currency translation adjustment | - | | - | | | - | | - | | | - | | | - | | | - | | | 95 | | | 21 | | | 116 | |
| Exercise of stock options | 415,476 | | - | | | - | | - | | | 846 | | | - | | | - | | | - | | | 792 | | | 1,638 | |
| Stock-based compensation | - | | - | | | - | | - | | | 11,816 | | | - | | | - | | | - | | | 2,526 | | | 14,342 | |
| ACM Shanghai dividend | - | | - | | | - | | - | | | - | | | - | | | - | | | - | | | (6,900) | | | (6,900) | |
| Balance at June 30, 2024 | 57,402,253 | | $ | 6 | | | 5,021,811 | | $ | 1 | | | $ | 659,462 | | | $ | 198,470 | | | $ | 30,060 | | | $ | (54,830) | | | $ | 168,219 | | | $ | 1,001,388 | |
The accompanying notes are an integral part of these condensed consolidated financial statements.
ACM RESEARCH, INC.
Condensed Consolidated Statements of Cash Flows
(In thousands)
(Unaudited)
| | | | | | | | | | | | | | | | | |
| Six Months Ended June 30, | | | | | | |
| 2024 | | 2023 | | | | | | |
| Cash flows from operating activities: | | | | | | | | | |
| Net income | $ | 53,491 | | | $ | 42,560 | | | | | | | |
| Adjustments to reconcile net income from operations to net cash used in operating activities | | | | | | | | | |
| Non-cash operating lease cost | 2,004 | | | 1,740 | | | | | | | |
| Depreciation and amortization | 4,684 | | | 3,955 | | | | | | | |
| Loss on disposals of property, plant and equipment | (1) | | | (1) | | | | | | | |
| Realized gain on short-term investments | (273) | | | (7,913) | | | | | | | |
| Loss (income) from equity method investments | 1,215 | | | (3,888) | | | | | | | |
| Unrealized loss on short-term investments | 1,564 | | | 3,109 | | | | | | | |
| Inventory provision | 3,009 | | | 3,224 | | | | | | | |
| Provision for credit losses | 1,954 | | | 496 | | | | | | | |
| Deferred income taxes | (720) | | | (4,711) | | | | | | | |
| | | | | | | | | |
| Stock-based compensation | 28,911 | | | 4,085 | | | | | | | |
| | | | | | | | | |
| Dividends from unconsolidated affiliates | 600 | | | 5,095 | | | | | | | |
| Net changes in operating assets and liabilities: | | | | | | | | | |
| Accounts receivable | (14,842) | | | (28,630) | | | | | | | |
| Other receivables | (11,686) | | | (8,252) | | | | | | | |
| Inventories | (64,889) | | | (99,963) | | | | | | | |
| | | | | | | | | |
| Advances to related party (note 16) | (324) | | | 2,167 | | | | | | | |
| Prepaid expenses | 1,164 | | | (4,749) | | | | | | | |
| Related party accounts payable (note 16) | 6,605 | | | (2,589) | | | | | | | |
| Accounts payable | 2,400 | | | 9,963 | | | | | | | |
| Advances from customers | 26,333 | | | 46,611 | | | | | | | |
| Deferred revenue | 1,592 | | | 4,056 | | | | | | | |
| Income taxes payable | 4,755 | | | 8,629 | | | | | | | |
| FIN-48 payable | (56) | | | (240) | | | | | | | |
| Other payables and accrued expenses | 6,824 | | | 10,004 | | | | | | | |
| Operating lease liabilities | (2,004) | | | (1,740) | | | | | | | |
| Other long-term liabilities | (368) | | | (2,163) | | | | | | | |
| Net cash provided by (used in) operating activities | 51,942 | | | (19,145) | | | | | | | |
| | | | | | | | | |
| | | | | | | | | |
| Cash flows from investing activities: | | | | | | | | | |
| | | | | | | | | |
| Purchase of property and equipment | $ | (38,512) | | | (21,633) | | | | | | | |
| Purchase of intangible assets | (1,152) | | | (1,285) | | | | | | | |
| Purchase of short-term investments (note 15) | (1,403) | | | — | | | | | | | |
| | | | | | | | | |
| | | | | | | | | |
| Purchase of time deposits | (58,090) | | | (13,840) | | | | | | | |
| Proceeds from maturity of time deposits | 138,412 | | | 62,048 | | | | | | | |
| Proceeds from sale of short-term investments (note 15) | — | | | 17,709 | | | | | | | |
| Purchase of long-term investments (note 14) | (7,366) | | | (1,453) | | | | | | | |
| Net cash provided by investing activities | 31,889 | | | 41,546 | | | | | | | |
| Cash flows from financing activities: | | | | | | | | | |
| Proceeds from short-term borrowings | 23,936 | | | — | | | | | | | |
| Repayments of short-term borrowings | (1,197) | | | — | | | | | | | |
| Proceeds from long-term borrowings | 32,277 | | | — | | | | | | | |
| Repayments of long-term borrowings | (3,202) | | | (1,111) | | | | | | | |
| Proceeds from exercise of stock options | 6,437 | | | 4,525 | | | | | | | |
| Net cash provided by financing activities | 58,251 | | | 3,414 | | | | | | | |
| | | | | | | | | |
| Effect of exchange rate changes on cash, cash equivalents and restricted cash | $ | (343) | | | $ | (16,264) | | | | | | | |
| Net increase in cash, cash equivalents and restricted cash | 141,739 | | | $ | 9,551 | | | | | | | |
| Cash, cash equivalents and restricted cash at beginning of period | 183,173 | | | 248,451 | | | | | | | |
| Cash, cash equivalents and restricted cash at end of period | $ | 324,912 | | | $ | 258,002 | | | | | | | |
| | | | | | | | | |
| Supplemental disclosure of cash flow information: | | | | | | | | | |
| Interest paid, net of capitalized interest | $ | 1,715 | | | $ | 1,344 | | | | | | | |
| Cash paid for income taxes | $ | 9,109 | | | $ | 7,243 | | | | | | | |
| | | | | | | | | |
| Reconciliation of cash, cash equivalents and restricted cash in consolidated statements of cash flows: | | | | | | | | | |
| Cash and cash equivalents | $ | 324,031 | | | $ | 257,420 | | | | | | | |
| Restricted cash | 881 | | | 582 | | | | | | | |
| | | | | | | | | |
| Cash, cash equivalents and restricted cash | $ | 324,912 | | | $ | 258,002 | | | | | | | |
| | | | | | | | | |
| Non-cash financing activities: | | | | | | | | | |
| Cashless exercise of stock options | $ | 262 | | | $ | 79 | | | | | | | |
| Non-cash investing activities: | | | | | | | | | |
| Proceeds from sale of short-term investments included in other receivables | $ | 3,167 | | | $ | — | | | | | | | |
| | | | | | | | | |
| Transfer from inventory to property, plant and equipment | $ | — | | | $ | 4,557 | | | | | | | |
| Transfer of prepayment for property to property, plant, and equipment | $ | 5,490 | | | $ | 177 | | | | | | | |
The accompanying notes are an integral part of these condensed consolidated financial statements.
ACM RESEARCH, INC.
Notes to the Condensed Consolidated Financial Statements
(In thousands, except share, percentage and per share data)
NOTE 1 – DESCRIPTION OF BUSINESS
ACM Research, Inc. (“ACM” or “ACM Research”) and its subsidiaries (collectively with ACM, the “Company”) develop, manufacture and sell capital equipment to the global semiconductor industry.
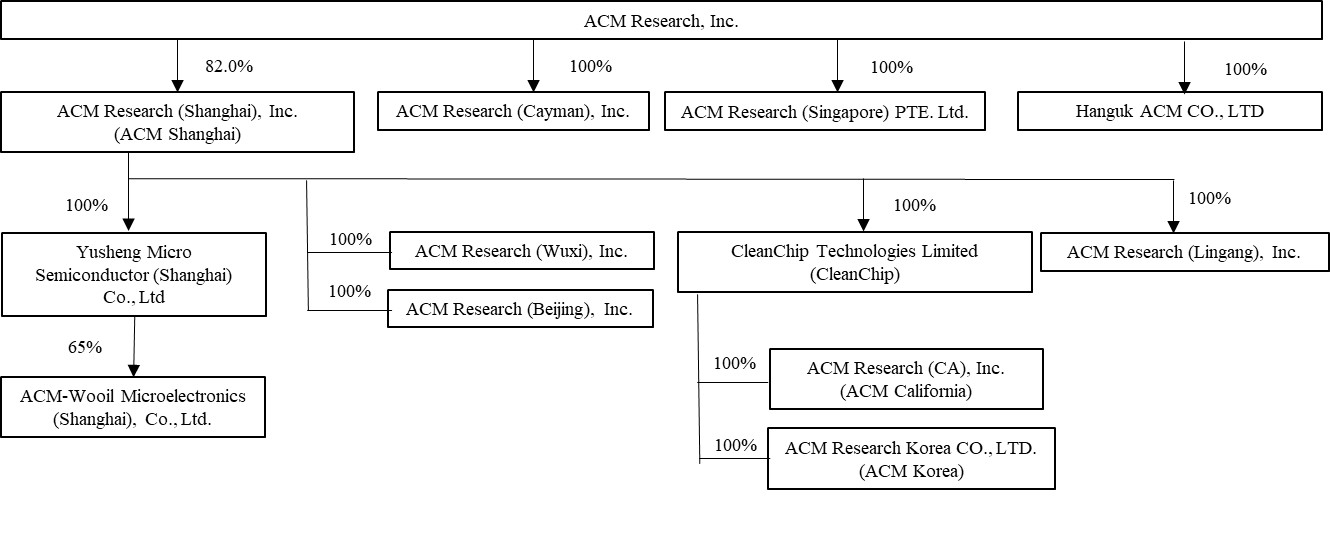
The Company has direct or indirect interests in the following subsidiaries:
| | | | | | | | | | | | | | |
| | | Effective interest held as at |
| Name of subsidiaries | Place and date of incorporation | Principal Activities | June 30,
2024 | December 31,
2023 |
| ACM Research (Shanghai), Inc. ("ACM Shanghai") | Mainland China, May 2005 | Principal operating subsidiary | 82.0 | % | 82.1 | % |
| ACM Research (Wuxi), Inc. ("ACM Wuxi") | Mainland China, July 2011 | Sales and services | 82.0 | % | 82.1 | % |
| CleanChip Technologies Limited ("CleanChip") | Hong Kong, June 2017 | Trading partner between ACM Shanghai and its customers | 82.0 | % | 82.1 | % |
| ACM Research Korea CO., LTD. | Korea, December 2017 | Sales, marketing, R&D, production | 82.0 | % | 82.1 | % |
| ACM Research ( Lingang), Inc. ("ACM Lingang") (1) | Mainland China, March 2019 | Management of production activities | 82.0 | % | 82.1 | % |
| ACM Research (CA), Inc. ("ACM California") | USA, April 2019 | Procurement for ACM Shanghai | 82.0 | % | 82.1 | % |
| ACM Research (Cayman), Inc. | Cayman Islands, April 2019 | Administrative function (inactive) | 100.0 | % | 100.0 | % |
| ACM Research (Singapore) PTE. Ltd. ("ACM Singapore") | Singapore, August 2021 | Sales, marketing, business development | 100.0 | % | 100.0 | % |
| ACM Research (Beijing), Inc. ("ACM Beijing") | Mainland China, February 2022 | Sales, marketing, business development | 82.0 | % | 82.1 | % |
| Hanguk ACM CO., LTD | Korea, March 2022 | Sales, services, business development | 100.0 | % | 100.0 | % |
| Yusheng Micro Semiconductor (Shanghai) Co., Ltd. | Mainland China, June 2023 | Business development | 82.0 | % | 82.1 | % |
| ACM-Wooil Microelectronics (Shanghai) Co., Ltd. | Mainland China, June 2023 | Component development and production | 59.3 | % | 59.4 | % |
(1) ACM Research (Lingang) Inc. is the English name referred to by its Chinese language name Shengwei Research (Shanghai), Inc., or ACM Shengwei in prior filings. ACM Research (Lingang), Inc. and Shengwei Research (Shanghai), Inc. refer to the same entity.
ACM RESEARCH, INC.
Notes to the Condensed Consolidated Financial Statements
(In thousands, except share, percentage and per share data)
NOTE 2 – SUMMARY OF SIGNIFICANT ACCOUNTING POLICIES
Basis of Presentation and Principles of Consolidation
The Company’s condensed consolidated financial statements include the accounts of ACM and its subsidiaries. ACM’s subsidiaries are those entities in which ACM, directly or indirectly, controls a majority of the voting power. All significant intercompany transactions and balances have been eliminated upon consolidation.
The accompanying condensed consolidated financial statements of the Company have been prepared in accordance with U.S. generally accepted accounting principles (“GAAP”) for interim financial information and the rules and regulations of the Securities and Exchange Commission (the “SEC”) for reporting on Form 10-Q. Accordingly, they do not include all the information and footnotes required by GAAP for complete financial statements. The accompanying condensed consolidated financial statements should be read in conjunction with the historical consolidated financial statements of the Company for the year ended December 31, 2023 included in ACM’s Annual Report on Form 10-K for the fiscal year ended December 31, 2023.
The accompanying condensed consolidated financial statements are unaudited. In the opinion of management, these unaudited condensed consolidated financial statements of the Company reflect all adjustments that are necessary for a fair presentation of the Company’s financial position and results of operations. Such adjustments are of a normal recurring nature, unless otherwise noted. The balance sheet as of June 30, 2024 and the results of operations for the three and six months ended June 30, 2024 are not necessarily indicative of the results to be expected for any future period.
Use of Estimates
The preparation of the condensed consolidated financial statements in conformity with GAAP requires management to make estimates and assumptions that affect the reported amounts of assets and liabilities and disclosure of contingent assets and liabilities at the balance sheet date and the reported revenues and expenses during the reported period in the condensed consolidated financial statements and accompanying notes. The Company’s significant accounting estimates and assumptions include, but are not limited to, those used for revenue recognition and deferred revenue, the valuation and recognition of fair value of certain short-term investments and long-term investments, stock-based compensation arrangements, realization of deferred tax assets, assessment for impairment of long-lived assets and long-term investments, allowance for credit losses, inventory valuation, useful lives of property, plant and equipment and useful lives of intangible assets.
Management evaluates these estimates and assumptions on a regular basis. Actual results could differ from those estimates and assumptions.
Cash and Cash Equivalents
Cash and cash equivalents consist of cash on hand, bank deposits that are unrestricted as to withdrawal and use, and highly liquid investments with an original maturity date of three months or less at the date of purchase. At times, cash deposits may exceed government-insured limits.
ACM RESEARCH, INC.
Notes to the Condensed Consolidated Financial Statements
(In thousands, except share, percentage and per share data)
The following table presents cash and cash equivalents, according to jurisdiction as of June 30, 2024 and December 31, 2023:
| | | | | | | | | | | |
| June 30,
2024 | | December 31,
2023 |
| United States | $ | 40,515 | | | $ | 43,614 | |
| Mainland China | 87,733 | | | 70,418 | |
| China Hong Kong | 194,979 | | | 64,057 | |
| Korea | 737 | | | 3,934 | |
| Singapore | 67 | | | 67 | |
| Total | $ | 324,031 | | | $ | 182,090 | |
The amounts in mainland China do not include short-term and long-term time deposits which totaled $41,839 and $121,342 at June 30, 2024 and December 31, 2023, respectively.
Cash held in the U.S. exceeds the Federal Deposit Insurance Corporation insurance limits and is subject to risk of loss. No losses have been experienced to date.
Cash amounts held in mainland China are subject to a series of risk control regulatory standards from mainland China bank regulatory authorities. ACM’s subsidiaries in mainland China are required to obtain approval from the State Administration of Foreign Exchange (“SAFE”) to transfer funds into or out of mainland China. SAFE requires a valid agreement to approve the transfers, which are processed through a bank. Other than these mainland China foreign exchange restrictions, ACM’s subsidiaries in mainland China are not subject to any restrictions and limitations on its ability to transfer funds to ACM or among our other subsidiaries. However, cash held in mainland China does exceed applicable insurance limits and is subject to risk of loss, although no such losses have been experienced to date.
ACM California periodically procures goods and services on behalf of ACM Shanghai and ACM Lingang. For these transactions, ACM Shanghai and ACM Lingang make cash payments to ACM California in accordance with applicable transfer pricing arrangements. For the three months ended June 30, 2024 and 2023, cash payments from ACM Shanghai and ACM Lingang to ACM California for the procurement of goods and services was $9,751 and $14,500, respectively. For the six months ended June 30, 2024 and 2023, cash payments from ACM Shanghai and ACM Lingang to ACM California for the procurement of goods and services was $14,399 and $25,431, respectively. ACM California periodically borrows funds for working capital advances from its direct parent, CleanChip. ACM California repays or renews these intercompany loans in accordance with their terms.
For sales through CleanChip and ACM Research, a certain amount of sales or advanced payments from customers is repatriated back to ACM Shanghai in accordance with applicable transfer pricing arrangements in the ordinary course of business. ACM Research provides services to certain customers located in the U.S., Europe and other regions outside of mainland China to support the evaluation of first tools and provide support for tools under warranty on behalf of ACM Shanghai. For these transactions, ACM Shanghai makes cash payments to ACM Research in accordance with applicable transfer pricing arrangements.
Amounts held in Korea exceed the Korea Deposit Insurance Corporation insurance limits and is subject to risk of loss. No losses have been experienced to date. There is no additional restriction for the transfer of cash from bank accounts in the U.S., Korea, Singapore and Hong Kong.
For the six months ended June 30, 2024 and 2023, with the exception of sales and services-related transfer-pricing payments in the ordinary course of business, no transfers, or distributions have been made between ACM Research and its subsidiaries, including ACM Shanghai, or to holders of ACM Research Class A common stock.
ACM RESEARCH, INC.
Notes to the Condensed Consolidated Financial Statements
(In thousands, except share, percentage and per share data)
Time Deposits
Time deposits are deposited with banks in mainland China with fixed terms and interest rates which cannot be withdrawn before maturity, and are presented as short-term deposits and long-term deposits in the condensed consolidated financial statements based on their expected time of collection. They are also subject to the risk control regulatory standards described above upon maturity.
At June 30, 2024 and December 31, 2023, time deposits consisted of the following:
| | | | | | | | |
| June 30,
2024 | December 31,
2023 |
Deposit in China Merchant Bank which matured on January 29, 2024 with an annual interest rate of 2.85% | $ | — | | $ | 29,797 | |
Deposit in Bank of Ningbo which matured on February 17, 2024 with an annual interest rate of 2.85% | $ | — | | $ | 44,630 | |
Deposit in Shanghai Pudong Development Bank which was redeemed on June 20, 2024 with an annual interest rate of 3.10% | $ | — | | $ | 7,322 | |
Deposit in Shanghai Pudong Development Bank which was redeemed on May 28, 2024 with an annual interest rate of 3.10% | $ | — | | $ | 7,307 | |
Deposit in Shanghai Pudong Development Bank which was redeemed on March 7, 2024 with an annual interest rate of 3.10% | $ | — | | $ | 4,376 | |
Deposit in Shanghai Pudong Development Bank which was redeemed on March 22, 2024 with an annual interest rate of 3.10% | $ | — | | $ | 4,373 | |
Deposit in Shanghai Pudong Development Bank which was redeemed on January 29, 2024 with an annual interest rate of 3.10% | $ | — | | $ | 2,912 | |
Deposit in China Industrial Bank which matures on January 30, 2026 with an annual interest rate of 3.15% | $ | 14,656 | | $ | 14,528 | |
Deposit in China Everbright Bank which matured on January 5, 2024 with an annual interest rate of 5.38% | $ | — | | $ | 3,079 | |
Deposit in China Everbright Bank which matured on May 22, 2024 with an annual interest rate of 5.28% | $ | — | | $ | 3,018 | |
Deposit in China Everbright Bank which matures on July 8, 2024 with an annual interest rate of 5.29% | $ | 3,036 | | $ | — | |
Deposit in China Everbright Bank which matures on November 23, 2024 with an annual interest rate of 5.28% | $ | 10,055 | | $ | — | |
Deposit in Bank of Ningbo which matures on September 11, 2024 with an annual interest rate of 1.50% | $ | 14,092 | | $ | — | |
| $ | 41,839 | | $ | 121,342 | |
For the three months ended June 30, 2024 and 2023, interest income related to time deposits was $622 and $937, respectively. For the six months ended June 30, 2024 and 2023, interest income related to time deposits was $1,246 and $1,912, respectively.
Financial Instruments
The Company periodically invests in equity securities, and maintains an investment portfolio of various holdings, types, and maturities. For equity investments that do not have a readily determinable fair value, the Company classified them as long-term investments, and records them using either: 1) the measurement alternative which measures the equity investments at cost minus impairment, if any, plus or minus changes resulting from qualifying observable price changes; or 2) the equity method whereby the Company recognizes its proportional share of the income or loss from the equity method investment. The equity method is utilized when the equity investments are common stock or in substance common stock,
ACM RESEARCH, INC.
Notes to the Condensed Consolidated Financial Statements
(In thousands, except share, percentage and per share data)
and the Company does not have the ability to control the investee but is deemed to have the ability to exercise significant influence over the investee’s operating or financial policies. For equity investments that have a readily determinable fair value, the Company classified them as short-term investments, and records them at fair market value on a recurring basis based upon quoted market prices. Realized and unrealized gains and losses resulting from application of the measurement alternative, the impact of the application of the equity method to the Company’s equity investments, and recognition of changes in fair market value, as applicable, are recognized as non-operating income (expenses), net in the condensed consolidated statements of comprehensive income (loss).
The Company defines fair value as the price that would be received from selling an asset or paid to transfer a liability in an orderly transaction between market participants at the measurement date. When determining the fair value measurements for assets and liabilities required or permitted to be recorded at fair value, the Company considers the principal or most advantageous market in which it would transact, and it considers assumptions that market participants would use when pricing the asset or liability.
A fair value hierarchy has been established that prioritizes the inputs to valuation techniques used to measure fair value. The level of an asset or liability in the hierarchy is based on the lowest level of input that is significant to the fair value measurement. Assets and liabilities carried at fair value are classified and disclosed in one of the following three categories:
Level 1: Valuations based on quoted prices in active markets for identical assets or liabilities with sufficient volume and frequency of transactions.
Level 2: Valuations based on observable inputs other than Level 1 prices such as quoted prices for similar assets or liabilities, quoted prices in markets that are not active for identical assets or liabilities, or model-derived valuations techniques for which all significant inputs are observable in the market or can be corroborated by observable market data for substantially the full term of the assets or liabilities.
Level 3: Valuations based on unobservable inputs to the valuation methodology that are significant to the measurement of fair value of assets or liabilities and based on non-binding, broker-provided price quotes and may not have been corroborated by observable market data.
The Company’s primary financial instruments include its cash, cash equivalents, short term and long term deposits, restricted cash, short-term and long-term investments, other receivables, accounts receivable, accounts payable, and short-term and long-term borrowings. The estimated fair value of cash and cash equivalents, short-term time deposits, accounts receivable, other receivables, accounts payable, and short-term borrowings approximates their carrying value due to the short period of time to their maturities.
All transfers between fair value hierarchy levels are recognized by the Company at the end of each reporting period. In certain cases, the inputs used to measure fair value may fall into different levels of the fair value hierarchy. In such cases, an investment’s level within the fair value hierarchy is based on the lowest level of input that is significant to the fair value
measurement in its entirety, requires judgment and considers factors specific to the investment. The inputs or methodology
used for valuing financial instruments are not necessarily an indication of the risks associated with investment in those instruments.
Assets and liabilities measured at fair value on a recurring basis:
ACM RESEARCH, INC.
Notes to the Condensed Consolidated Financial Statements
(In thousands, except share, percentage and per share data)
| | | | | | | | | | | | | | |
| Quoted Prices in Active Markets for Identical Liabilities (Level 1) | Significant Other Observable Inputs (Level 2) | Significant Unobservable Inputs (Level 3) | Total |
| As of June 30, 2024: | | | | |
| Assets | | | | |
| Cash and Cash equivalents | $ | 35,494 | | $ | — | | $ | — | | $ | 35,494 | |
| Short-term investments | 19,597 | | — | | — | | 19,597 | |
| $ | 55,091 | | $ | — | | $ | — | | $ | 55,091 | |
| As of December 31, 2023: | | | | |
| Assets | | | | |
| Cash and Cash equivalents | $ | 37,518 | | $ | — | | $ | — | | $ | 37,518 | |
| Short-term investments | 21,312 | | — | | — | | 21,312 | |
| $ | 58,830 | | $ | — | | $ | — | | $ | 58,830 | |
Assets and liabilities measured at fair value on a non-recurring basis:
| | | | | | | | | | | | | | | | | | | | | | | |
| Quoted Prices in Active Markets for Identical Liabilities (Level 1) | | Significant Other Observable Inputs (Level 2) | | Significant Unobservable Inputs (Level 3) | | Total |
| As of December 31, 2023: | | | | | | | |
| Assets | | | | | | | |
Investments accounted for using measurement alternative | $ | — | | | $ | — | | | $ | 10,378 | | | $ | 10,378 | |
| $ | — | | | $ | — | | | $ | 10,378 | | | $ | 10,378 | |
The Company did not have any assets and liabilities measured at fair value on a non-recurring basis as of June 30, 2024, and the Company did not recognize any unrealized gains (upward adjustments) or unrealized losses (downward adjustments) resulting from observable price changes in orderly transactions for an identical or similar investment of the same issuer for its long-term investments accounted for using measurement alternatives during the three and six months ended June 30, 2024 and 2023.
Refer to Note 12 for fair value information related to the Company’s outstanding long-term borrowings as of June 30, 2024 and December 31, 2023.
ACM RESEARCH, INC.
Notes to the Condensed Consolidated Financial Statements
(In thousands, except share, percentage and per share data)
Basic and Diluted Net Income per Share of Common Stock
Basic and diluted net income per share of common stock are calculated as follows:
| | | | | | | | | | | | | | | | | | | | | | | | | | | | |
| Three Months Ended June 30, | | Six Months Ended June 30, | | |
| 2024 | | 2023 | | 2024 | | 2023 | | | | | |
| Numerator: | | | | | | | | | | | | |
| Net income | $ | 31,399 | | | $ | 33,597 | | | $ | 53,491 | | | $ | 42,560 | | | | | | |
| Less: Net income attributable to non-controlling interests | 7,189 | | | 6,772 | | | 11,848 | | | 8,590 | | | | | | |
| Net income available to common stockholders, basic | $ | 24,210 | | | $ | 26,825 | | | $ | 41,643 | | | $ | 33,970 | | | | | | |
| Less: Dilutive effect arising from stock-based awards by ACM Shanghai | 525 | | | 303 | | | 920 | | | 395 | | | | | | |
| Net income available to common stockholders, diluted | $ | 23,685 | | | $ | 26,522 | | | $ | 40,723 | | | $ | 33,575 | | | | | | |
| | | | | | | | | | | | |
| Weighted average shares outstanding, basic | 62,178,369 | | 59,898,149 | | 61,772,776 | | 59,817,903 | | | | | |
| Effect of dilutive securities | 4,879,477 | | 5,031,489 | | 4,747,930 | | 5,150,997 | | | | | |
| Weighted average shares outstanding, diluted | 67,057,846 | | 64,929,638 | | 66,520,706 | | 64,968,900 | | | | | |
| | | | | | | | | | | | |
| Net income per share of common stock: | | | | | | | | | | | | |
| Basic | $ | 0.39 | | | $ | 0.45 | | | $ | 0.67 | | | $ | 0.57 | | | | | | |
| Diluted | $ | 0.35 | | | $ | 0.41 | | | $ | 0.61 | | | $ | 0.52 | | | | | | |
Basic and diluted net income per share of common stock is presented using the two-class method, which allocates undistributed earnings to common stock and any participating securities according to dividend rights and participation rights on a proportionate basis. Under the two-class method, basic net income per share of common stock is computed by dividing the sum of distributed and undistributed earnings attributable to common stockholders by the weighted average number of shares of common stock outstanding during the period. ACM Research did not have any participating securities outstanding during the three and six months ended June 30, 2024 and 2023.
ACM Research has been authorized to issue Class A and Class B common stock since redomesticating in Delaware in November 2016. The two classes of common stock are substantially identical in all material respects, except for voting rights. Since ACM Research did not declare cash dividends during the six months ended June 30, 2024 or 2023, the net income per share of common stock attributable to each class is the same under the “two-class” method. As such, the two classes of common stock have been presented on a combined basis in the condensed consolidated statements of comprehensive income (loss) and in the above computation of net income per share of common stock.
Diluted net income per share of common stock reflects the potential dilution from securities, such as stock options that could share in ACM Research’s earnings. Certain potential dilutive securities were excluded from the net income per share calculation because the impact would be anti-dilutive. The number of potentially dilutive shares that were not included in the calculation of diluted net income per share in the periods presented where their inclusion would be anti-dilutive were 702,850 and 714,850 stock options for the three and six months ended June 30, 2024, respectively, and 302,561 and 394,756 stock options for the three and six months ended June 30, 2023, respectively.
ACM RESEARCH, INC.
Notes to the Condensed Consolidated Financial Statements
(In thousands, except share, percentage and per share data)
Concentration of Credit Risk
Financial instruments that potentially subject the Company to credit risk consist principally of cash and cash equivalents, time deposits, and accounts receivable. The Company deposits and invests its cash and cash equivalents and time deposits with financial institutions that management believes are creditworthy.
The Company is potentially subject to concentrations of credit risks in its revenue and accounts receivable. For the three months ended June 30, 2024 and 2023, four customers accounted for 57.9% and three customers accounted for 52.1% of revenue, respectively. For the six months ended June 30, 2024 and 2023, three customers accounted for 51.9% and one customer accounted for 17.5% of revenue, respectively.
As of June 30, 2024 and December 31, 2023, four customers accounted for 55.9% and four customers accounted for 59.1%, respectively, of the Company’s accounts receivables. The Company believes that the receivable balances from these largest customers do not represent a significant credit risk based on past collection experience.
Recently issued accounting pronouncements not yet adopted
In November 2023, the FASB issued ASU No. 2023-07, Improvements to Reportable Segment Disclosures. This ASU updates reportable segment disclosure requirements by requiring disclosures of significant reportable segment expenses that are regularly provided to the Chief Operating Decision Maker (“CODM”) and included within each reported measure of a segment's profit or loss. This ASU also requires disclosure of the title and position of the individual identified as the CODM and an explanation of how the CODM uses the reported measures of a segment’s profit or loss in assessing segment performance and deciding how to allocate resources. The ASU is effective for annual periods beginning after December 15, 2023, and interim periods within fiscal years beginning after December 15, 2024. Adoption of the ASU should be applied retrospectively to all prior periods presented in the financial statements. Early adoption is also permitted. The Company is currently evaluating the provisions of this ASU and expect to adopt it for the year ending December 31, 2024.
In December 2023, the FASB issued ASU No. 2023-09, Improvements to Income Tax Disclosures (Topic 740). The ASU requires disaggregated information about a reporting entity’s effective tax rate reconciliation as well as additional information on income taxes paid. The ASU is effective on a prospective basis for annual periods beginning after December 15, 2024. Retrospective application is permitted. Early adoption is also permitted for annual financial statements that have not yet been issued or made available for issuance. The Company is currently evaluating the provisions of this ASU.
NOTE 3 – REVENUE FROM CONTRACTS WITH CUSTOMERS
The Company assesses revenues based upon the nature or type of goods or services it provides and the geographic location of the customer facility. The following tables present disaggregated revenue information:
| | | | | | | | | | | | | | | | | | | | | | | | | | | | | | |
| Three Months Ended June 30, | | Six Months Ended June 30, | | | |
| 2024 | | 2023 | | 2024 | | 2023 | | | | | | | |
| Single Wafer Cleaning, Tahoe and Semi-Critical Cleaning Equipment | $ | 153,221 | | | $ | 112,528 | | | $ | 262,691 | | | $ | 149,142 | | | | | | | | |
| ECP (front-end and packaging), Furnace and Other Technologies | 38,962 | | | 19,117 | | | 64,762 | | | 45,715 | | | | | | | | |
| Advanced Packaging (excluding ECP), Services & Spares | 10,297 | | | 12,932 | | | 27,218 | | | 23,976 | | | | | | | | |
| Total Revenue by Product Category | $ | 202,480 | | | $ | 144,577 | | | $ | 354,671 | | | $ | 218,833 | | | | | | | | |
ACM RESEARCH, INC.
Notes to the Condensed Consolidated Financial Statements
(In thousands, except share, percentage and per share data)
| | | | | | | | | | | | | | | | | | | | | | | | | | | | | | | | | | |
| Three Months Ended June 30, | | Six Months Ended June 30, | | | | | | | |
| 2024 | | 2023 | | 2024 | | 2023 | | | | | | | | | | | |
| Mainland China | $ | 196,835 | | | $ | 134,767 | | | $ | 348,970 | | | $ | 207,226 | | | | | | | | | | | | |
| Other regions | 5,645 | | | 9,810 | | | 5,701 | | | 11,607 | | | | | | | | | | | | |
| $ | 202,480 | | | $ | 144,577 | | | $ | 354,671 | | | $ | 218,833 | | | | | | | | | | | | |
Below are the accounts receivables and contract liabilities balances as of:
| | | | | | | | | | | |
| June 30,
2024 | | December 31,
2023 |
| Accounts receivable | 293,499 | | | 283,186 | |
| Advances from customers | 205,609 | | | 181,368 | |
| Deferred revenue | 5,279 | | | 3,687 | |
During the six months ended June 30, 2024, advances from customers increased by $24.2 million, due to an increase of payments made by customers for first tools under evaluation, offset by a decrease in customer pre-payments for tools prior to delivery.
Below are revenues recognized from amounts included in contract liabilities at the beginning of the year:
| | | | | | | | | | | | | | | | | | | | | | | |
| Three Months Ended June 30, | | Six Months Ended June 30, |
| 2024 | | 2023 | | 2024 | | 2023 |
| Revenue recognized from amounts included in contract liabilities at the beginning of the year | $ | 56,995 | | | $ | 30,673 | | | $ | 86,183 | | | $ | 45,885 | |
NOTE 4 – ACCOUNTS RECEIVABLE
At June 30, 2024 and December 31, 2023, accounts receivable consisted of the following:
| | | | | | | | | | | |
| June 30,
2024 | | December 31,
2023 |
| Accounts receivable | $ | 300,283 | | | $ | 288,016 | |
| Less: Allowance for credit losses | (6,784) | | | (4,830) | |
Total accounts receivable, net | $ | 293,499 | | | $ | 283,186 | |
The $10.3 million increase in accounts receivable, net for the first six months of 2024 corresponds to a $135.8 million increase in revenue compared to the six months ended June 30, 2023.
ACM RESEARCH, INC.
Notes to the Condensed Consolidated Financial Statements
(In thousands, except share, percentage and per share data)
The movement of the allowance for credit losses for the six months ended June 30, 2024 is as follows:
| | |
|
| Allowance for credit losses, before tax, as of December 31, 2023 |
| Provision for credit losses |
| Allowance for credit losses, before tax, as of June 30, 2024 |
| | |
June 30,
2024 |
| $ | (4,830) | |
| (1,954) | |
| $ | (6,784) | |
The Company assesses collectability by reviewing accounts receivable on a general basis where similar characteristics exist and on an individual basis when the Company identifies specific customers with known disputes or collectability issues. In determining the amount of the allowance for credit losses, the Company considers historical collectability based on past due status, the age of the accounts receivable balances, credit quality of the Company’s customers based on ongoing credit evaluations, current economic conditions, reasonable and supportable forecasts of future economic conditions, and other factors that may affect the Company’s ability to collect from customers.
NOTE 5 – INVENTORIES
At June 30, 2024 and December 31, 2023, inventories consisted of the following:
| | | | | | | | | | | |
| June 30,
2024 | | December 31,
2023 |
| Raw materials | $ | 248,443 | | | $ | 235,062 | |
| Work-in-process | 75,569 | | | 81,438 | |
| Finished goods | 278,915 | | | 228,895 | |
| Total inventory, net | $ | 602,927 | | | $ | 545,395 | |
At June 30, 2024 and December 31, 2023, the value of finished goods inventory of which were first-tools at customer physical locations for which customers were contractually obligated to take ownership upon acceptance totaled $167,356 and $123,390, respectively.
The $13,381 increase in raw materials at June 30, 2024 compared to December 31, 2023 was due to additional purchase of supplies to support a higher level of expected total shipments for the next several quarters, and to reduce the risk of supply chain delays to meet anticipated customer demand for the Company’s products.
The $50,020 increase in finished goods inventory at June 30, 2024 compared to December 31, 2023 primarily reflects a higher value of first-tools under evaluation by existing or prospective customers, due to shipments made, net of customer acceptances during the period.
The Company’s products each require a certain degree of customization, and the substantial majority of the work-in-process inventory and finished goods inventory is built to meet a specific customer order for a repeat shipment or a first tool shipment. At the end of each period, the Company assesses the status of each item in work-in-process and finished goods inventory. The Company recognizes a loss or impairment if in management’s judgement the inventory cannot be sold or used for production, if it has been damaged or should be considered as obsolete, or if the net realizable value is lower than the cost.
At the end of each period, the Company also assesses the status of its raw materials. The Company recognizes a loss or impairment for any raw materials aged more than three years. The three-year aging is based on the Company’s assessment of technology change, its requirement to maintain stock for warranty coverage, and other factors.
ACM RESEARCH, INC.
Notes to the Condensed Consolidated Financial Statements
(In thousands, except share, percentage and per share data)
During the three months ended June 30, 2024 and 2023, provision for inventory of $1,984 and $2,919 were recognized in cost of revenue, respectively. During the six months ended June 30, 2024 and 2023, provision for inventory of $3,009 and $3,224 were recognized in cost of revenue, respectively. Write-downs were due to an internal assessment that certain inventory could not be sold or used for production due to damage or obsolescence.
NOTE 6 – PROPERTY, PLANT AND EQUIPMENT, NET
At June 30, 2024 and December 31, 2023, property, plant and equipment consisted of the following:
| | | | | | | | | | | |
| June 30,
2024 | | December 31,
2023 |
| Buildings and plants | $ | 82,579 | | | $ | 83,109 | |
| Manufacturing equipment | 17,235 | | | 16,556 | |
| Office equipment | 5,260 | | | 4,953 | |
| Transportation equipment | 401 | | | 404 | |
| Leasehold improvement | 8,075 | | | 7,889 | |
| Total cost | 113,550 | | | 112,911 | |
| Less: Total accumulated depreciation and amortization | (21,194) | | | (17,503) | |
| Construction in progress | 136,375 | | | 106,440 | |
| Total property, plant and equipment, net | $ | 228,731 | | | $ | 201,848 | |
Depreciation expense for the three months ended June 30, 2024 and 2023 was $2,209 and $2,241, respectively, and $4,684 and $3,955 for the six months ended June 30, 2024 and 2023, respectively. Buildings and plants represent Lingang housing property owned by ACM Lingang at a value of RMB 249,746 ($35,039), and facilities for the new headquarters of ACM Shanghai ("Zhangjiang New Building") at a value of RMB 338,848 ($47,540), as of June 30, 2024. The Lingang housing property is pledged as security for loans from China Merchants Bank (Note 12).
Construction in progress primarily reflects costs incurred related to the construction of ACM Shanghai’s Lingang development and production center, which is scheduled to begin initial production in the second half of 2024.
NOTE 7 – LAND USE RIGHT, NET
A summary of land use right is as follows:
| | | | | | | | | | | |
| June 30,
2024 | | December 31,
2023 |
| Land use right purchase amount | $ | 8,939 | | | $ | 8,996 | |
| Less: accumulated amortization | (714) | | | (629) | |
| Land use right, net | $ | 8,225 | | | $ | 8,367 | |
The amortization for the three months ended June 30, 2024 and 2023 was $42 and $38, respectively, and the six months ended June 30, 2024 and 2023 was $85 and $88.
ACM RESEARCH, INC.
Notes to the Condensed Consolidated Financial Statements
(In thousands, except share, percentage and per share data)
The annual amortization of land use right is as follows:
| | | | | |
| Year ending December 31, | |
| remainder of 2024 | $ | 90 | |
| 2025 | 179 | |
| 2026 | 179 | |
| 2027 | 179 | |
| 2028 | 179 | |
| 2029 and thereafter | 7,419 | |
| Total | $ | 8,225 | |
NOTE 8 – OTHER LONG-TERM ASSETS
At June 30, 2024 and December 31, 2023, other long-term assets consisted of the following:
| | | | | | | | | | | |
| June 30,
2024 | | December 31,
2023 |
| Prepayments for property, plant and equipment | $ | 7,988 | | | $ | 3,380 | |
| Lease deposits | 884 | | | 834 | |
| Security deposit for land use right | 692 | | | 696 | |
| Others | 1,353 | | | 1,140 | |
| Total other long-term assets | $ | 10,917 | | | $ | 6,050 | |
ACM RESEARCH, INC.
Notes to the Condensed Consolidated Financial Statements
(In thousands, except share, percentage and per share data)
NOTE 9 – SHORT-TERM BORROWINGS
At June 30, 2024 and December 31, 2023, short-term borrowings consisted of the following:
| | | | | | | | |
| June 30,
2024 | December 31,
2023 |
Line of credit up to RMB 150,000 from China Everbright Bank, | | |
1)due on August 29, 2024 with an annual interest rate of 3.00%. | 2,449 | | 2,463 | |
Line of credit up to RMB 40,000 from Bank of China, | | |
1)due on September 7, 2024 with an annual interest rate of 2.87%. | 5,616 | | 5,648 | |
Line of credit up to RMB 200,000 from China Merchants Bank, | | |
1)due on August 7, 2024 with an annual interest rate of 3.00%. | 1,264 | | 1,271 | |
2)due on August 8, 2024 with an annual interest rate of 3.00%. | 1,264 | | 1,271 | |
3)due on August 9, 2024 with an annual interest rate of 3.00%. | 1,264 | | 1,271 | |
4)due on August 14, 2024 with an annual interest rate of 3.00%. | 1,264 | | 1,271 | |
5)due on August 17, 2024 with an annual interest rate of 3.00%. | 1,264 | | 1,271 | |
6)due on August 20, 2024 with an annual interest rate of 3.00%. | 1,264 | | 1,271 | |
7)due on August 21, 2024 with an annual interest rate of 3.00%. | 1,264 | | 1,271 | |
8)due on August 22, 2024 with an annual interest rate of 3.00%. | 1,264 | | 1,271 | |
9)due on August 24, 2024 with an annual interest rate of 3.00%. | 1,264 | | 1,271 | |
10)due on August 27, 2024 with an annual interest rate of 3.00%. | 1,264 | | 1,271 | |
11)due on August 29, 2024 with an annual interest rate of 3.00%. | 1,264 | | 1,271 | |
12)due on August 30, 2024 with an annual interest rate of 3.00%. | 1,264 | | 1,271 | |
13)due on September 3, 2024 with an annual interest rate of 3.00%. | 1,264 | | 1,271 | |
14)due on September 5, 2024 with an annual interest rate of 3.00%. | 1,264 | | 1,270 | |
15)due on September 6, 2024 with an annual interest rate of 3.00%. | 1,263 | | 1,270 | |
16)due on September 10, 2024 with an annual interest rate of 3.00%. | 1,263 | | 1,270 | |
17)due on September 12, 2024 with an annual interest rate of 3.00%. | 1,263 | | 1,270 | |
18)due on February 27, 2025 with an annual interest rate of 2.60%. | 1,333 | | — | |
19)due on February 28, 2025 with an annual interest rate of 2.60%. | 1,333 | | — | |
20)due on March 1, 2025 with an annual interest rate of 2.60%. | 1,333 | | — | |
21)due on March 5, 2025 with an annual interest rate of 2.60%. | 1,333 | | — | |
22)due on March 8, 2025 with an annual interest rate of 2.60%. | 1,263 | | — | |
Line of credit up to RMB 120,000 from Bank of China, | | |
1)due on March 20, 2025 with an annual interest rate of 2.75%. | 16,848 | | — | |
Line of credit up to KRW 500,000 from Industrial Bank of Korea, | | |
1)due on July 12, 2024 with an annual interest rate of 6.03%. | — | | 77 | |
Line of credit up to KRW 2,000,000 from Industrial Bank of Korea, | | |
1)due on December 15, 2024 with an annual interest rate of 4.27%. | 1,446 | | 1,544 | |
| Total | $ | 54,439 | | $ | 31,335 | |
For the three months ended June 30, 2024 and 2023, interest expense related to short-term borrowings amounted to $425 and $484, respectively, and for the six months ended June 30, 2024 and 2023, interest expense related to short-term borrowings amounted to $638 and $974, respectively.
ACM RESEARCH, INC.
Notes to the Condensed Consolidated Financial Statements
(In thousands, except share, percentage and per share data)
NOTE 10 – OTHER PAYABLES AND ACCRUED EXPENSES
At June 30, 2024 and December 31, 2023, other payables and accrued expenses consisted of the following:
| | | | | | | | |
| June 30,
2024 | December 31,
2023 |
| Accrued commissions | $ | 17,814 | | $ | 15,572 | |
| Accrued warranty | 11,273 | | 9,834 | |
| Accrued payroll | 13,062 | | 14,840 | |
| Accrued professional fees | 713 | | 696 | |
| Accrued machine testing fees | 1,581 | | 1,762 | |
| Accrued machine sales fees | 6,411 | | 6,010 | |
| Accrued Lingang construction fees | 33,447 | | 33,729 | |
| Others | 30,639 | | 20,508 | |
| Total | $ | 114,940 | | $ | 102,951 | |
Warranties
The Company provides standard warranties on its products. The liability amount is based on actual historical warranty spending activity by type of product, customer, and geographic region, modified for any known differences such as the impact of product reliability improvements.
Changes in the Company’s accrued warranty were as follows:
| | | | | | | | | | | | | | | | | |
| Three Months Ended June 30, | | Six Months Ended June 30, |
| 2024 | 2023 | | 2024 | 2023 |
| Balance at beginning of period | $ | 11,339 | | $ | 9,240 | | | $ | 9,834 | | $ | 8,780 | |
| Additions | 2,802 | | 1,682 | | | $ | 5,098 | | $ | 2,510 | |
| Utilized | (2,868) | | (1,743) | | | $ | (3,659) | | $ | (2,111) | |
| Balance at end of period | $ | 11,273 | | $ | 9,179 | | | $ | 11,273 | | $ | 9,179 | |
NOTE 11 – LEASES
The Company leases space under non-cancelable operating leases for several offices and manufacturing locations. These leases do not have significant rent escalation holidays, concessions, leasehold improvement incentives, or other build-out clauses. Further, the leases do not contain contingent rent provisions.
Most leases include one or more options to renew. The Company regularly evaluates the renewal options, and when they are reasonably certain of exercise, the Company includes the renewal period in its lease term.
ACM RESEARCH, INC.
Notes to the Condensed Consolidated Financial Statements
(In thousands, except share, percentage and per share data)
The components of lease expense were as follows:
| | | | | | | | | | | | | | | | | | | | |
| Three Months Ended June 30, | | Six Months Ended June 30, | | |
| 2024 | 2023 | | 2024 | 2023 | | | |
| Operating lease cost | $ | 1,031 | | $ | 1,252 | | | $ | 2,004 | | $ | 1,740 | | | | |
| Short-term lease cost | 352 | | 310 | | | 673 | | 592 | | | | |
| Total lease cost | $ | 1,383 | | $ | 1,562 | | | $ | 2,677 | | $ | 2,332 | | | | |
Supplemental cash flow information related to operating leases was as follows:
| | | | | | | | | | | | | | | | | | | | |
| Three Months Ended June 30, | | Six Months Ended June 30, | | |
| 2024 | 2023 | | 2024 | 2023 | | | |
| Operating cash outflow from operating leases | $ | 1,031 | | $ | 1,252 | | | $ | 2,004 | | $ | 1,740 | | | | |
| Operating lease right-of-use assets obtained in exchange for new operating lease liabilities | $ | 541 | | $ | — | | | $ | 621 | | $ | 6,592 | | | | |
As of June 30, 2024, maturities of outstanding lease liabilities for all operating leases were as follows:
| | | | | |
| December 31, |
| remainder of 2024 | $ | 1,610 | |
| 2025 | 2,082 | |
| 2026 | 1,317 | |
| 2027 | 1,177 | |
| 2028 and thereafter | 634 | |
| Total lease payments | $ | 6,820 | |
| Less: Interest | (568) | |
| Present value of lease liabilities | $ | 6,252 | |
The weighted average remaining lease terms and discount rates for all operating leases were as follows:
| | | | | | | | |
| June 30,
2024 | December 31,
2023 |
| Remaining lease term and discount rate: | | |
| Weighted average remaining lease term (years) | 3.29 | 3.44 |
| Weighted average discount rate | 3.84 | % | 3.91 | % |
ACM RESEARCH, INC.
Notes to the Condensed Consolidated Financial Statements
(In thousands, except share, percentage and per share data)
NOTE 12 – LONG-TERM BORROWINGS
At June 30, 2024 and December 31, 2023, long-term borrowings consisted of the following:
| | | | | | | | |
| June 30,
2024 | December 31,
2023 |
| Loan from China Merchants Bank | $ | 12,441 | | $ | 13,362 | |
| Loans from Bank of China | 17,370 | | 5,013 | |
| Loan from Bank of Shanghai | 14,040 | | 14,120 | |
| Loans from China CITIC Bank | 28,043 | | 28,240 | |
| Loan from China Everbright Bank | 18,610 | | — | |
| Less: Current portion | (19,671) | | (6,783) | |
| Total | $ | 70,833 | | $ | 53,952 | |
The loan from China Merchants Bank is for the purpose of purchasing housing property in Lingang, Shanghai. The loan is repayable in 120 total installments with the last installment due in November 2030, with an annual interest rate of 3.95%. The loan is pledged by the property of ACM Lingang and guaranteed by ACM Shanghai.
Two loans from Bank of China are for the purpose of funding ACM Shanghai project expenditures. The first loans bears interest at an annual rate of 2.6% and are repayable in 6 installments, with the last installments due in September 2024.
The second loan from Bank of China is for the purpose of funding ACM Shanghai's general corporate expenses and working capital. The loan bears interest at an annual rate of 2.62% and is payable in 6 installments, with the last installment due in June 2027.
The loan from Bank of Shanghai is for the purpose of funding ACM Shanghai project expenditures. The loan bears interest at an annual rate of 2.85%, and will be fully repaid in April 2025.
The first loan from China CITIC Bank is for the purpose of funding ACM Shanghai project expenditures. The loan bears interest at an annual rate of 3.1% and is repayable in 4 installments, with the last installment due in August 2025.
The second loan from China CITIC bank is for the purpose of funding ACM's general corporate expenses and working
capital. The loan bears interest at an annual rate of 4.50% payable quarterly, and the principal amount is repayable in 4
installments, with the last installment due in December 2025.
The loan from the China Everbright Bank is for the purpose of funding ACM's general corporate expenses and working
capital. The loan bears interest at an annual floating rate of 2.60% and is payable in 6 installments, with the last installment due in June 2027.
In April 2024, ACM entered into a loan facility with the Agricultural Bank of China for the purpose of funding ACM's general corporate expenses and working capital. As of June 30, 2024, ACM has not made any borrowings from the loan facility.
As of June 30, 2024 and December 31, 2023, the total carrying amount of long-term loans was $90,504 and $60,735, compared with an estimated fair value of $84,672 and $56,462, respectively. The fair value of the long-term loans is estimated by discounting cash flows using interest rates currently available for debts with similar terms and maturities (Level 2 fair value measurement). Refer to Note 2 for an explanation of the fair value hierarchy structure.
ACM RESEARCH, INC.
Notes to the Condensed Consolidated Financial Statements
(In thousands, except share, percentage and per share data)
Scheduled principal payments for the outstanding long-term loan, including the current portion, as of June 30, 2024 are as follows:
| | | | | |
| Year ending December 31 | |
| remainder of 2024 | $ | 4,690 | |
| 2025 | $ | 43,952 | |
| 2026 | 1,989 | |
| 2027 | 33,829 | |
| 2028 | 1,994 | |
| Thereafter | 4,050 | |
| $ | 90,504 | |
For the three months ended June 30, 2024 and 2023, respectively, interest related to long-term borrowings of $507 and $181 was incurred and all of them were charged to interest expenses.
For the six months ended June 30, 2024 and 2023, respectively, interest related to long-term borrowings of $1,077 and $370 was incurred, and all of them were charged to interest expenses.
NOTE 13 – OTHER LONG-TERM LIABILITIES
Other long-term liabilities represent government subsidies received from mainland China governmental authorities for development and commercialization of certain technology but not yet recognized. At June 30, 2024 and December 31, 2023, other long-term liabilities consisted of the following unearned government subsidies:
| | | | | | | | |
| June 30, 2024 | December 31, 2023 |
| Subsidies commenced in 2020 and prior | $ | 769 | | $ | 1,107 | |
| Subsidies to SW Lingang R&D development commenced in 2021 | 3,433 | | 3,467 | |
| Other | 1,303 | | 1,299 | |
| Total | $ | 5,505 | | $ | 5,873 | |
NOTE 14 – LONG-TERM INVESTMENTS
On January 12, 2024, ACM Shanghai entered into an investment agreement with Company C to invest RMB 12,500 ($1,760), which represented 5.0% of the Company C's total equity interest. Since there is no readily determinable fair value, the Company measures the investments at measurement alternative.
On January 19, 2024, ACM Shanghai entered into a limited partnership agreement with Company D to invest RMB 30,000 ($4,230), which represented 16.7% of the partnership's total equity interest. The investment in the limited partnership with Company D is accounted for under the equity method in accordance with ASC323-30-S99-1.
On January 22, 2024, ACM Shanghai entered into an investment agreement with Company E to invest RMB 10,000 ($1,403) which represented 0.6% of the Company E's total equity interest. The transaction was closed in April 2024. Since there is no readily determinable fair value, the Company measures the investments at measurement alternative.
ACM RESEARCH, INC.
Notes to the Condensed Consolidated Financial Statements
(In thousands, except share, percentage and per share data)
| | | | | | | | | | | | | | |
| Equity investee: | Initial investment dates | Investment entity | Percent ownership by ACM and subsidiaries | Investment purchase price |
| Ninebell Co., Ltd. ("Ninebell") | September 2017 | ACM | 20.0% | $ | 1,200 | |
| Wooil Flucon Co. ("Wooil") | August 2022 | ACM Singapore | 20.0% | $ | 1,000 | |
| Hefei Shixi Chanheng Integrated Circuit Industry Venture Capital FundPartnership (LP) (“Hefei Shixi”) | September 2019 | ACM Shanghai | 10.0% | RMB 30,000 ($4,200) |
| Shengyi Semiconductor Technology Co., Ltd. ("Shengyi") | June 2019 | ACM Shanghai | 14.0% | $ | 109 | |
| Company D | February 2024 | ACM Shanghai | 16.7% | RMB 30,000 ($4,230) |
| Investments accounted for using measurement alternative: | | | | |
| Waferworks (Shanghai) Co., Ltd. (“Waferworks”) | October 2021 | ACM Shanghai | 0.3% | $ | 1,568 | |
| Shengyi | September 2023 | ACM Shanghai | 1.0% | RMB 6,100 ($860) |
| Company A | September 2023 | ACM Shanghai | 4.4% | RMB 30,000 ($4,200) |
| Company B | November 2023 | ACM Shanghai | 1.4% | RMB 6,600 ($930) |
| Company C | February 2024 | ACM Shanghai | 5.0% | RMB 12,500 ($1,760) |
| Company E | April 2024 | ACM Shanghai | 0.6% | RMB 10,000 ($1,403) |
| | | | | | | | |
| Equity investee: | June 30,
2024 | December 31,
2023 |
| Ninebell | $ | 5,923 | | $ | 5,632 | |
| Wooil | 975 | | 1,003 | |
| Shengyi | 2,257 | | 1,693 | |
| Hefei Shixi | 6,469 | | 9,174 | |
| Company D | 4,209 | | — | |
| Subtotal | 19,833 | | 17,502 | |
| Investments accounted for using measurement alternative: | | |
| Waferworks | — | | 1,412 | |
| Shengyi | 852 | | 857 | |
| Company A | 4,209 | | 4,236 | |
| Company B | 926 | | 932 | |
| Company C | 1,754 | | — | |
| Company E | 1,403 | | — | |
| Other | 2,921 | | 2,941 | |
Subtotal measurement alternative | 12,065 | | 10,378 | |
| Total | 31,898 | | 27,880 | |
ACM RESEARCH, INC.
Notes to the Condensed Consolidated Financial Statements
(In thousands, except share, percentage and per share data)
For the three months ended June 30, 2024 and 2023, the Company’s share of equity investees’ net income (loss) was $(695) and $3,920, respectively, and $(1,215) and $3,888 for the six months ended June 30, 2024 and 2023, respectively, which amounts were included in loss from equity method investments in the accompanying condensed consolidated statements of comprehensive income (loss). For the three months ended June 30, 2024 and 2023, the Company received $0 and $5,095 dividends from equity investee. For the six months ended June 30, 2024 and 2023, the Company received $600 and $5,095 dividends from equity investee.
NOTE 15 – SHORT-TERM INVESTMENTS
Pursuant to an Agreement entered into on September 19, 2022 (the ‘‘Agreement’’), ACM Shanghai became a limited partner of the Nuode Asset Fund Pujiang No. 783 Single Asset Management Plan (‘‘Nuode Asset Fund’’), a Chinese limited partnership formed by Nuode Asset Management Co., Ltd, a financial services firm based in Shanghai, China. Nuode Asset Fund was formed to establish a special fund with the purpose to participate in certain technology related investments in mainland China. Subsequent to the future purchase, any investment will be held by Nuode Asset Fund and restricted for a minimum period of nine months. The limited partners of the Nuode Asset Fund contributed a total RMB 160 million ($22,160) to the fund, of which ACM Shanghai contributed RMB 30 million ($4,196), or 18.75% of the contribution on September 27, 2022.
In December 2022, the Nuode Asset Fund purchased shares in the secondary stock offering of a publicly traded mainland China-stock listing. The number of shares owned by Nuode Asset Fund was apportioned to all of the limited partners in proportion to their respective capital contributions which is 18.75% in the case of ACM Shanghai. The investments were fully disposed during the six months ended June 30, 2024. The Company has not received the proceeds and a receivable of RMB 22,478 ($3,167) was recorded as of June 30, 2024.
Pursuant to a Share Purchase Agreement dated June 2023, ACM Shanghai acquired shares of Huahong Semiconductor Limited (“Huahong”) in July 2023 with amount of RMB 100 million ($13,930). The shares held by ACM Shanghai are restricted for sale for a minimum period of twelve months. Huahong completed its STAR IPO in August 2023.
Pursuant to a Share Purchase Agreement dated August 2023, ACM Shanghai acquired shares of Zhongjuxin Limited Company (“Zhongjuxin”) in September 2023 with amount of RMB 30 million ($4,179). The shares held by ACM Shanghai are restricted for sale for a minimum period of twelve months. Zhongjuxin completed its STAR IPO in September 2023.
Pursuant to a Share Purchase Agreement dated January 2024, ACM Shanghai acquired shares of Shanghai Syncrystalline Silicon Materials Co., Ltd. (“Syncrystalline”) in February 2024 with amount of RMB 10 million ($1,409). The shares held by ACM Shanghai are restricted for sale for a minimum period of twelve months. Syncrystalline completed its STAR IPO in February 2024. As of June 30, 2024, the Company's total investment costs in Syncrystalline were RMB 20,000 ($2,818), including RMB 10 million ($1,409) invested by ACM Shanghai in 2021 and RMB 10 million ($1,409) invested by ACM Shanghai in February 2024.
At June 30, 2024 and December 31, 2023, the components of short-term investments were as follows:
| | | | | | | | |
| June 30,
2024 | December 31,
2023 |
| Short-term investments listed in Shanghai Stock Exchange | | |
| Cost | $ | 21,045 | | $ | 20,155 | |
| Market value | 19,597 | | 21,312 | |
For the three and six months ended June 30, 2024 and 2023, the net gains (losses) recognized on equity securities were as follows:
ACM RESEARCH, INC.
Notes to the Condensed Consolidated Financial Statements
(In thousands, except share, percentage and per share data)
| | | | | | | | | | | | | | | | | |
| Three Months Ended June 30, | | Six Months Ended June 30, |
| 2024 | 2023 | | 2024 | 2023 |
| Unrealized gain (loss) recognized during the reporting period on short-term investment still held at June 30 | $ | 1,031 | | $ | (2,455) | | | $ | (1,564) | | $ | (3,109) | |
| Net gain recognized during the period on short-term sold during the period | $ | — | | $ | 3,919 | | | $ | 273 | | $ | 7,913 | |
| Total net gain (loss) recognized at June 30 on short-term investment | $ | 1,031 | | $ | 1,464 | | | $ | (1,291) | | $ | 4,804 | |
For the three and six months ended June 30, 2024, the Company did not receive proceeds from the sale of short-term investments.
For the three and six months ended June 30, 2023, the Company recognized $6,637 and $17,709 in proceeds from the sale of short-term investments, including a realized gain of $3,919 and $7,913.
NOTE 16 – RELATED PARTY BALANCES AND TRANSACTIONS
Ninebell
Ninebell is an equity investee of ACM (note 14) and is the Company’s principal supplier of robotic delivery system subassemblies used in our single-wafer cleaning equipment. The Company purchases equipment from Ninebell for production in the ordinary course of business. The Company pays for a portion of the equipment in advance and is obligated for the remaining amounts upon receipt of the product.
Shengyi
Shengyi is an equity investee of ACM Shanghai (note 14) and is one of the Company’s component suppliers in mainland China. The Company purchases components from Shengyi for production in the ordinary course of business. The Company incurs a service fee related to installation and hook-up fees which is recorded within cost of revenue on the Company’s condensed consolidated statements of comprehensive income (loss). The Company pays for a portion of the raw materials in advance and is obligated for the remaining amounts upon receipt of the product.
All related party outstanding balances are short-term in nature and are expected to be settled in cash.
The following tables reflect related party transactions in our condensed consolidated financial statements:
| | | | | | | | |
| Advances to related party | June 30,
2024 | December 31,
2023 |
| Ninebell | $ | 2,756 | | $ | 2,432 | |
| | | | | | | | |
| Accounts payable | June 30,
2024 | December 31,
2023 |
| Ninebell | $ | 12,247 | | $ | 7,624 | |
| Shengyi | 5,765 | | 3,783 | |
| Total | $ | 18,012 | | $ | 11,407 | |
ACM RESEARCH, INC.
Notes to the Condensed Consolidated Financial Statements
(In thousands, except share, percentage and per share data)
| | | | | | | | | | | | | | | | | | | | |
| Three Months Ended June 30, | | Six Months Ended June 30, | |
| Purchase of materials | 2024 | 2023 | | 2024 | 2023 | | | |
| Ninebell | $ | 13,778 | | $ | 10,604 | | | $ | 27,930 | | $ | 27,001 | | | | |
| Shengyi | 2,349 | | 706 | | | 3,341 | | 2,679 | | | | |
| Total | $ | 16,127 | | $ | 11,310 | | | $ | 31,271 | | $ | 29,680 | | | | |
| | | | | | | | | | | | | | | | | | | | | | | | | | |
| Three Months Ended June 30, | | Six Months Ended June 30, | |
| Service fee charged by | 2024 | | 2023 | | 2024 | | 2023 | | | |
| Shengyi | $ | 154 | | | $ | 452 | | | $ | 227 | | | $ | 730 | | | | |
NOTE 17 – COMMON STOCK
ACM is authorized to issue 150,000,000 shares of Class A common stock and 5,307,816 shares of Class B common stock, each with a par value of $0.0001. Each share of Class A common stock is entitled to one vote, and each share of Class B common stock is entitled to twenty votes and is convertible at any time into one share of Class A common stock. Shares of Class A common stock and Class B common stock are treated equally, identically and ratably with respect to any dividends declared by the Board of Directors of ACM unless such Board of Directors declares different dividends to the Class A common stock and Class B common stock, which is subject to approval from a majority of common stockholders.
During the three months ended June 30, 2024, ACM issued 415,476 shares of Class A common stock upon option exercises by employees and non-employees. During the six months ended June 30, 2024, ACM issued 1,366,081 shares of Class A common stock upon option exercises by employees and non-employees.
During the three months ended June 30, 2023, ACM issued 133,135 shares of Class A common stock upon option exercises by employees and non-employees. During the six months ended June 30, 2023, ACM issued 296,204 shares of Class A common stock upon option exercises by employees and non-employees
At June 30, 2024 and December 31, 2023, the number of shares of Class A common stock issued and outstanding was 57,402,253 and 56,036,172, respectively.
At June 30, 2024 and December 31, 2023, the number of shares of Class B common stock issued and outstanding was 5,021,811 and 5,021,811, respectively.
NOTE 18 – STOCK-BASED COMPENSATION
ACM’s stock-based compensation consists of employee and non-employee awards issued under its 1998 Stock Option Plan and its 2016 Omnibus Incentive Plan. The vesting condition may consist of a service period condition determined by the Board of Directors for a grant or certain performance conditions determined by the Board of Directors for a grant. The fair value of the stock options granted with a service period based condition and/or performance condition is estimated at the date of grant using the Black-Scholes option pricing model. The fair value of the stock options granted with a market based condition is estimated at the date of grant using the Monte Carlo simulation model.
ACM RESEARCH, INC.
Notes to the Condensed Consolidated Financial Statements
(In thousands, except share, percentage and per share data)
Employee Awards
The following table summarizes the Company’s employee share option activities during the six months ended June 30, 2024:
| | | | | | | | | | | | | | |
| Number of
Option Shares | Weighted
Average Grant
Date Fair Value | Weighted
Average Exercise Price | Weighted Average
Remaining
Contractual Term |
| Outstanding at December 31, 2023 | 9,998,637 | $ | 5.15 | | $ | 9.59 | | 6.17 years |
| Granted | 194,500 | 17.27 | 23.16 | | |
| Exercised | (1,205,938) | 2.25 | 4.83 | | |
| Forfeited/cancelled | (43,735) | 11.08 | 23.34 | | |
| Outstanding at June 30, 2024 | 8,943,464 | $ | 5.77 | | $ | 10.33 | | 6.03 years |
| Vested and exercisable at June 30, 2024 | 5,052,597 | | | |
As of June 30, 2024, $25,217 of total unrecognized employee stock-based compensation expense, net of estimated forfeitures, related to employee stock-based awards for ACM were expected to be recognized over a weighted-average period of 3.6 years, after June 30, 2024. Total recognized compensation cost may be adjusted for future changes in estimated forfeitures.
The aggregate intrinsic value of options exercised in the three and six months ended June 30, 2024 was $7,212 and $29,077. The aggregate intrinsic value of options outstanding and exercisable as of June 30, 2024 were $119,032 and $81,303, respectively.
The fair value of options granted to employees is estimated on the grant date using the Black-Scholes valuation with following assumptions:
| | | | | |
| Six Months Ended
June 30, 2024 |
| Fair value of share of common stock(1) | $23.02-$31.92 |
| Expected term in years(2) | 5.81-6.25 |
| Volatility(3) | 84.87%-85.48% |
| Risk-free interest rate(4) | 4.23%-4.49% |
| Expected dividend(5) | —% |
(1)Fair value of Class A common stock value was closing market price of the Class A common stock on the grant date.
(2)Expected term of share options is based on the average of the vesting period and the contractual term for each grant.
(3)Volatility is calculated based on the historical volatility of ACM in the period equal to the expected term of each grant.
(4)Risk-free interest rate is based on the yields of U.S. Treasury securities with maturities similar to the expected term of the share options in effect at the time of grant.
(5)Expected dividend is assumed to be 0% as ACM has no history or expectation of paying a dividend on its common stock.
ACM RESEARCH, INC.
Notes to the Condensed Consolidated Financial Statements
(In thousands, except share, percentage and per share data)
Non-employee Awards
The following table summarizes the Company’s non-employee share option activities during the six months ended June 30, 2024:
| | | | | | | | | | | | | | |
| Number of
Option Shares | Weighted
Average Grant
Date Fair Value | Weighted
Average
Exercise Price | Weighted
Average
Remaining
Contractual Term |
| Outstanding at December 31, 2023 | 1,170,795 | $ | 0.42 | | $ | 1.31 | | 2.66 years |
| Exercised | (160,143) | 0.22 | 0.50 | | |
| Forfeited/cancelled | (3,188) | 0.22 | 0.50 | | |
| Outstanding at June 30, 2024 | 1,007,464 | $ | 0.45 | | $ | 1.44 | | 2.34 years |
| Vested and exercisable at June 30, 2024 | 1,007,464 | | | |
As of June 30, 2024 $0 of total unrecognized non-employee stock-based compensation expense, net of estimated forfeitures, related to stock-based awards were expected to be recognized over a weighted-average period of 0 years, after June 30, 2024. Total recognized compensation cost may be adjusted for future changes in estimated forfeitures.
The aggregate intrinsic value of options exercised in the three and six months ended June 30, 2024 was $1,511 and $4,267, respectively. The aggregate intrinsic value of options outstanding and exercisable as of June 30, 2024 was $21,778.
ACM Shanghai 2019 Option Grants
In January 2020, ACM Shanghai adopted a 2019 Stock Option Incentive Plan (the “2019 Subsidiary Stock Option Plan”) that provides for, among other incentives, the granting to officers, directors, and employees of options to purchase shares of ACM Shanghai’s common stock.
The following table summarizes the stock option activities of the ACM Shanghai 2019 Subsidiary Stock Option Plan during the six months ended June 30, 2024:
| | | | | | | | | | | | | | | | | |
| Number of
Option Shares in
ACM Shanghai | Weighted
Average Grant
Date Fair Value | Weighted
Average
Exercise Price | Weighted
Average
Remaining
Contractual Term | |
| Outstanding at December 31, 2023 | 3,134,883 | $ | 0.24 | | $ | 1.85 | | 0.85 years | |
| Exercised | (446,154) | $ | 0.24 | | $ | 1.85 | | | |
| Forfeited/cancelled | (92,308) | $ | 0.24 | | $ | 1.85 | | | |
| Outstanding at June 30, 2024 | 2,596,421 | $ | 0.24 | | $ | 1.85 | | 0.51 years | |
| Vested and exercisable at June 30, 2024 | 2,596,421 | | | | |
The aggregate intrinsic value of options exercised in the three and six months ended June 30, 2024 was both $5,198. The aggregate intrinsic value of options outstanding and exercisable as of June 30, 2024 was $26,124.
ACM Shanghai 2023 Option Grants
In June 2023, ACM Shanghai adopted a 2023 Stock Option Incentive Plan (the "2023 Subsidiary Stock Option Plan”) that provides for, among other incentives, the granting to officers, directors, and employees of options to purchase shares of ACM Shanghai’s common stock. The vesting conditions consist of service periods conditions and performance conditions
ACM RESEARCH, INC.
Notes to the Condensed Consolidated Financial Statements
(In thousands, except share, percentage and per share data)
related to certain sales and research and development progress targets determined by the Board of Directors of ACM Shanghai.
The following table summarizes the ACM Shanghai 2023 Subsidiary Stock Option Plan’s stock option activities during the three months ended June 30, 2024:
| | | | | | | | | | | | | | | | | | | | | | | |
| Number of Option Shares in ACM Shanghai | | Weighted
Average Grant
Date Fair Value | | Weighted
Average
Exercise Price | | Weighted
Average
Remaining
Contractual Term |
Outstanding at December 31, 2023 | 10,575,500 | | $ | 9.49 | | | $ | 7.06 | | | 3.09 years |
| Granted | 1,391,000 | | $ | 6.04 | | | $ | 7.00 | | | |
| Forfeited/cancelled | (201,065) | | $ | 9.09 | | | $ | 7.06 | | | |
| Outstanding at June 30, 2024 | 11,765,435 | | $ | 9.01 | | | $ | 7.00 | | | 2.70 years |
| Vested and exercisable at June 30, 2024 | - | | | | | | |
The fair value of options granted to employees is estimated on the grant date using the Black-Scholes valuation with following assumptions:
| | | | | |
| Six Months Ended June 30, 2024 |
Fair value of share of common stock (1) | $4.93-$6.89 |
Expected term in years (2) | 1.50-4.50 |
Volatility (3) | 45.92%-56.18% |
Risk-free interest rate (4) | 1.50%-2.75% |
Expected dividend (5) | —% |
(1) Equal to closing value on the grant date.
(2) Expected term of share options is based on the average of the vesting period and the contractual term for each grant.
(3) Volatility is calculated based on the historical volatility of ACM Shanghai in the period equal to the expected term of each grant.
(4) Risk-free interest rate is based on the yields of RMB deposit in mainland China with maturities similar to the expected term of the share options in effect at the time of grant.
(5) Expected dividend is assumed to be 0% as the impact is adjusted on the value of share of common stock.
As of June 30, 2024, $60,798 of total unrecognized non-employee stock-based compensation expense, net of estimated forfeitures, related to ACM Shanghai stock-based awards were expected to be recognized over a weighted-average period of 1.7 years. Total recognized compensation cost may be adjusted for future changes in estimated forfeitures.
The aggregate intrinsic value of options exercised in the three and six months ended June 30, 2024 was $0 as there were no options exercised during the periods. As there were no options exercisable during the periods, the aggregate intrinsic value of options outstanding and exercisable as of June 30, 2024 were $57,491 and $0, respectively.
The following table summarizes the components of stock-based compensation expense included in the condensed consolidated statements of comprehensive income (loss):
ACM RESEARCH, INC.
Notes to the Condensed Consolidated Financial Statements
(In thousands, except share, percentage and per share data)
| | | | | | | | | | | | | | | | | |
| Three Months Ended June 30, | | Six Months Ended June 30, |
| 2024 | 2023 | | 2024 | 2023 |
| Stock-Based Compensation Expense: | | | | | |
| Cost of revenue | $ | 792 | | $ | 125 | | | $ | 1,573 | | $ | 250 | |
| Sales and marketing expense | 3,024 | | 431 | | | 6,051 | | 862 | |
| Research and development expense | 4,206 | | 709 | | | 8,709 | | 1,410 | |
| General and administrative expense | 6,320 | | 752 | | | 12,578 | | 1,563 | |
| $ | 14,342 | | $ | 2,017 | | | $ | 28,911 | | $ | 4,085 | |
| | | | | | | | | | | | | | | | | |
| Three Months Ended June 30, | | Six Months Ended June 30, |
| 2024 | 2023 | | 2024 | 2023 |
| Stock-based compensation expense by type: | | | | | |
| Employee stock purchase plan | $ | 2,389 | | $ | 1,975 | | | $ | 4,742 | | $ | 3,993 | |
| Non-employee stock purchase plan | — | | 12 | | | 9 | | 23 | |
| 2019 and 2023 Subsidiary option grants | 11,953 | | 30 | | | 24,160 | | 69 | |
| $ | 14,342 | | $ | 2,017 | | | $ | 28,911 | | $ | 4,085 | |
NOTE 19 – INCOME TAXES
Income taxes are accounted for under the asset and liability method. Deferred tax assets and liabilities are recognized for the future tax consequences attributable to differences between the financial statement carrying amounts of existing assets and liabilities and their respective tax bases and operating loss and tax credit carry-forwards. Deferred tax assets and liabilities are measured using enacted tax rates expected to apply to taxable income in the years in which those temporary differences are expected to be recovered or settled. The effect of a change in tax rates on deferred tax assets and liabilities is recognized in income in the period during which such rates are enacted.
The Company considers all available evidence to determine whether it is more likely than not that some portion or all of the deferred tax assets will be realized. The ultimate realization of deferred tax assets is dependent upon the generation of future taxable income during the periods in which those temporary differences become realizable. Management considers the scheduled reversal of deferred tax liabilities (including the impact of available carryback and carry-forward periods) and projected taxable income in assessing the realizability of deferred tax assets. In making such judgments, significant weight is given to evidence that can be objectively verified.
As of each reporting date, management considers new evidence, both positive and negative, that could affect its view of the future realization of deferred tax assets. Prior to September 30, 2019, the Company had recorded a valuation allowance for the full amount of net deferred tax assets in the United States, as the realization of deferred tax assets was uncertain. Since September 30, 2019, the Company has not maintained a valuation allowance except for a partial valuation allowance on certain U.S. and foreign deferred tax assets. In order to recognize the remaining U.S. deferred tax assets that continue to be subject to a valuation allowance, the Company will need to generate sufficient U.S. taxable income in future periods before the expiration of the deferred tax assets governed by the tax code.
ACM Shanghai has shown a three-year historical cumulative profit and has projections of future income. As a result, the Company does not maintain a valuation allowance. The Company accounts for uncertain tax positions in accordance with the authoritative guidance on income taxes under which the Company may only recognize or continue to recognize tax positions that meet a more likely than not threshold. The Company recognizes accrued interest and penalties related to unrecognized tax benefits as a component of the provision for income taxes.
The Company’s effective tax rate differs from statutory rates of 21% for U.S. federal income tax purposes and 15% to 25% for Chinese income tax purposes due to the effects of the valuation allowance and certain permanent differences from book-tax differences, including stock based compensation, deemed dividend income under Subchapter F of the U.S. Internal Revenue Code of 1986, as amended (Subpart F), and global intangible low-taxed income (GILTI) inclusions, and
ACM RESEARCH, INC.
Notes to the Condensed Consolidated Financial Statements
(In thousands, except share, percentage and per share data)
R&D super deduction. As a result, the Company recorded income tax expense of $13,705 and $10,517 during the six months ended June 30, 2024 and 2023, respectively. The decrease in the Company's effective income tax rate for the six months ended June 30, 2024 compared to the same period of the prior year was primarily due to an increased benefit from certain permanent deductions in a foreign jurisdiction.
Under the change in Section 174 made by the Tax Cuts and Jobs Act of 2017 which became effective on January 1, 2022, the Company is required to capitalize, and subsequently amortize R&D expenses over fifteen years for research activities conducted outside of the U.S. The capitalization of overseas R&D expenses results in a significant increase in the Company’s global intangible low-taxed income inclusion.
The Company had total unrecognized tax benefits of $13,026 as of both June 30, 2024 and December 31, 2023. If recognized, the net impact to effective rate, after indirect offset, would be $12,943. The Company did not expect any reversal of unrecognized tax benefits in the next 12 months. The Company will recognize interest and penalties, when they occur, related to uncertain tax provisions as a component of tax expense. For the six months ended June 30, 2024 and 2023, $677 and $569 of interest and penalties was recognized, respectively.
The Company is subject to taxation in the United States, state, and foreign jurisdictions. All tax returns will remain open for examination by the federal and state authorities for three and four years, respectively, from the date of utilization of any net operating loss or credits. Certain tax years are subject to foreign income tax examinations by tax authorities until the statute of limitations expire.
The Company’s four principal mainland China subsidiaries, ACM Shanghai, ACM Wuxi, ACM Beijing and ACM Lingang, are liable for mainland China corporate income taxes at the rates of 15%, 25%, 25% and 15%, respectively. Pursuant to the Corporate Income Tax Law of mainland China, ACM’s mainland China subsidiaries generally would be liable for mainland China corporate income taxes as a rate of 25%. According to Guoshuihan 2009 No. 203, an entity certified as an “advanced and new technology enterprise” is entitled to a preferential income tax rate of 15%. ACM Shanghai was certified as an “advanced and new technology enterprise” in 2012 and again in 2016, 2018, and 2021, with an effective period of three years and is expected to be re-certified for future years in 2024. In 2021, ACM Shanghai was certified as an eligible integrated circuit production enterprise and was entitled to a preferential income tax rate of 12.5% from January 1, 2020 to December 31, 2022. Certain entities which meet requirements according to the Policy of the Lingang New area in China (Shanghai) Pilot Free Trade Zone are entitled to a preferential income tax rate of 15%. ACM Lingang was certified for this in 2021, and this preferential income tax rate is valid from January 1, 2020 until December 31, 2024.
Income tax expense was as follows:
| | | | | | | | | | | | | | | | | | | | |
| Three Months Ended June 30, | | Six Months Ended June 30, | |
| 2024 | 2023 | | 2024 | 2023 | | | |
| Total income tax expense | $ | (9,336) | | $ | (7,638) | | | $ | (13,705) | | $ | (10,517) | | | | |
NOTE 20 – Commitments and Contingencies
The Company leases offices under non-cancelable operating lease agreements. See Note 11 for future minimum lease payments under non-cancelable operating lease agreements with initial terms of one year or more.
As of June 30, 2024, the Company had $16,293 of open capital commitments to construction contracts and had additional $16,737 of capital investment commitments to Ninebell in April 2024; however, as of June 30, 2024, the investment still has not been approved by the People's Republic of China Business Bureau. As of December 31, 2023, the Company had $30,936 of open commitments to construction contracts and had additional $7,413 of capital investment commitments.
Covenants in ACM Lingang’s Grant Contract for State-owned Construction Land Use Right in Shanghai City (Category of R&D Headquarters and Industrial Projects) with the China (Shanghai) Pilot Free Trade Zone Lingang Special Area Administration require, among other things, that ACM Lingang pay liquidated damages in the event that within 7 years after the land use right is obtained, or prior to July 9, 2027, the Company does not (i) generate a minimum specified
ACM RESEARCH, INC.
Notes to the Condensed Consolidated Financial Statements
(In thousands, except share, percentage and per share data)
amount of annual sales of products manufactured on the granted land or (ii) pay to mainland China at least RMB 157.6 million ($22,000) in annual total taxes (including value-added taxes, corporate income tax, personal income taxes, urban maintenance and construction taxes, education surcharges, stamp taxes, and vehicle and shipping taxes) as a result of operations in connection with the granted land.
The Construction Completion Milestone was required to be met by January 9, 2024 but was not achieved. However, ACM Lingang believes it will receive the refund without penalty based on its explanation to the respective regulatory authorities and expects that it will meet the milestone in 2024. The Company cannot guarantee that ACM Lingang will achieve the missed milestone in 2024, or even if it does achieve the milestone in 2024, that it will be refunded some or all of the 20% portion of the performance deposit of RMB 2.5 million ($0.4 million).
In the normal course of business, the Company is subject to contingencies, including legal proceedings and environmental claims arising out of the normal course of businesses that relate to a wide range of matters, including among others, contracts breach liability. The Company records accruals for such contingencies based upon the assessment of the probability of occurrence and, where determinable, an estimate of the liability. Management may consider many factors in making these assessments including past history, scientific evidence and the specifics of each matter. Some of these contingencies involve claims that are subject to substantial uncertainties and un-estimable damages.
The Company’s management has evaluated all such proceedings and claims that existed as of June 30, 2024 and December 31, 2023. In the opinion of management, no provision for liability nor disclosure was required as of June 30, 2024 related to any claim against the Company because: (a) there is not a reasonable possibility that a loss exceeding amounts already recognized (if any) may be incurred with respect to such claim; (b) a reasonably possible loss or range of loss cannot be estimated; or (c) such estimate is immaterial.
As of June 30, 2024, the Company had no outstanding legal proceedings.
NOTE 21 – SEGMENT INFORMATION
The Company identifies operating segments according to how the business activities are managed and evaluated. The Company’s chief operating decision maker (“CODM”) has been identified as ACM’s Chief Executive Officer. The Company's operating segments include ACM Research and ACM Shanghai. As the Company is engaged in the developing, manufacture and sale of capital equipment to global semiconductor manufacturers, and each of the operating segments share similar economic and other qualitative characteristics, the results of the Company’s operating segments are aggregated into one reportable segment.
For geographical reporting, revenue by geographic location is determined by the location of customers’ facilities to which products were shipped. Long-lived assets consist primarily of property, plant and equipment, land use right, and right-of-use assets and are attributed to the geographic location in which they are located.
Long-lived assets by geographic region as of the periods ended were as follows:
| | | | | | | | |
| June 30,
2024 | December 31,
2023 |
| Long-lived assets by geography: | | |
| Mainland China | $ | 241,246 | | $ | 209,725 | |
| Korea | 11,631 | | 12,190 | |
| United States | 1,248 | | 1,276 | |
| Total | $ | 254,125 | | $ | 223,191 | |
ACM RESEARCH, INC.
Notes to the Condensed Consolidated Financial Statements
(In thousands, except share, percentage and per share data)
NOTE 22 – STATUTORY SURPLUS RESERVE
In accordance with mainland China’s Foreign Enterprise Law, ACM Shanghai, ACM Lingang, and ACM Wuxi are required to make appropriation to reserve funds, comprising the statutory surplus reserve and discretionary surplus reserve, based on after-tax net income in accordance with generally accepted accounting principles of mainland China (“mainland China GAAP”).
Appropriations to the statutory surplus reserve are required to be at least 10% of the after-tax net income determined in accordance with mainland China GAAP until the reserve is equal to 50% of the entities’ registered capital. The amount is calculated annually at the end of each calendar year. The balances of statutory reserve funds was $30,060 as of both June 30, 2024 and December 31, 2023, and is presented as statutory surplus reserve on the Company’s condensed consolidated balance sheets.
NOTE 23 - SUBSEQUENT EVENTS
On July 30, 2024, the Company entered into an agreement to acquire a commercial facility, comprised of 39,500 square foot total floor space and which includes a 5,200 square foot functional clean room, for a price of $7.75 million. This facility is located in the City of Hillsboro in Oregon, and is intended to further expand ACM’s R&D and demonstration capability in the U.S. market. The purchase is scheduled to close in the fourth quarter of 2024.
Item 2. Management’s Discussion and Analysis of Financial Condition and Results of Operations
You should read the following discussion of our financial condition and results of operations together with our condensed consolidated financial statements and the related notes and other financial information included elsewhere in this report and our Annual Report on Form 10-K for the fiscal year ended December 31, 2023, or our Annual Report. The following discussion contains forward‑looking statements that reflect our plans, estimates, and beliefs. Our actual results could differ materially from those discussed in the forward‑looking statements. Factors that could cause or contribute to these differences include those discussed in Part I, Item 1A. “Risk Factors” in our Annual Report, as well as those discussed below and elsewhere in this report, particularly in the section titled “Item 1A – Risk Factors” in Part II below.
ACM Research, Inc., or ACM Research, is a Delaware corporation founded in California in 1998 to supply capital equipment developed for the global semiconductor industry. Since 2005, ACM Research has conducted its business operations principally through its subsidiary ACM Research (Shanghai), Inc., or ACM Shanghai, a limited liability corporation formed by ACM Research in the People’s Republic of China, or mainland China, in 2005. Unless the context requires otherwise, references in this report to “our company,” “our,” “us,” “we” and similar terms refer to ACM Research, Inc. and its subsidiaries, including ACM Shanghai, collectively.
Our principal corporate office is located in Fremont, California. We conduct a substantial majority of our product development, manufacturing, support and services in mainland China through ACM Shanghai. We perform, through a subsidiary of ACM Shanghai, additional product development and subsystem production in Korea, and we conduct, through ACM Research, sales and marketing activities focused on sales of ACM Shanghai products in North America, Europe and certain regions in Asia outside mainland China.
ACM Research is not a mainland China operating company, and we do not conduct our operations in mainland China through the use of a variable interest entity, or VIE, or any other structure designed for the purpose of avoiding mainland China legal restrictions on direct foreign investments in mainland China-based companies. ACM Research has a direct ownership interest in ACM Shanghai as the result of its holding 82.0% of the outstanding shares of ACM Shanghai. Stockholders of ACM Research may never directly own equity interests in ACM Shanghai. We do not believe that our corporate structure or any other matters relating to our business operations require that we obtain any permissions or approvals from the China Securities Regulatory Commission, the Cyberspace Administration of China, or any other mainland China central government authority in order to continue to list shares of Class A common stock of ACM Research on the Nasdaq Global Select Market. This determination was based on the facts aforementioned and mainland China Company Law, mainland China Securities Law, cybersecurity regulations and other relevant laws, regulations and regulatory requirements in mainland China currently in effect. However, if this determination proves to be incorrect, then it could have a material adverse effect on ACM Research. See “Item IA. Risk Factors—Risks Related to International Aspects of Our Business—If any mainland China central government authority were to determine that existing mainland China laws or regulations require that ACM Shanghai obtain the authority’s permission or approval to continue the listing of ACM Research’s Class A common stock in the United States or if those existing mainland China laws and regulations, or interpretations thereof, were to change to require such permission or approval, or if we inadvertently conclude that permissions or approvals are not required, ACM Shanghai may be unable to obtain the required permission or approval or may only be able to obtain such permission or approval on terms and conditions that impose material new restrictions and limitations on operation of ACM Shanghai, either of which could have a material adverse effect on our business, financial condition, results of operations, reputation and prospects and on the trading price of ACM Research Class A common stock, which could decline in value or become worthless” in our Annual Report.
The business of ACM Shanghai is subject to complex laws and regulations in mainland China that can change quickly with little or no advance notice. To date, beyond the COVID-19-related restrictions in 2022, we have not experienced such intervention or influence by mainland China central government authorities or a change in those authorities’ rules and regulations that have had a material impact on ACM Shanghai or ACM Research.
In addition, in the ordinary course of business, ACM Shanghai is required to obtain certain operating permits and licenses necessary for it to operate in mainland China, including business licenses, certifications relating to quality management standards, import and export-related qualifications from customs, as well as environmental and construction permits, licenses and approvals relating to construction projects. We believe ACM Shanghai has all such required permits and licenses. However, from time to time mainland China government issues new regulations, which may require additional actions on the part of ACM Shanghai to comply. If ACM Shanghai does not, or is unable to, obtain any such additional permits or licenses, ACM Shanghai may be subjected to restrictions and penalties imposed by the relevant mainland China
regulatory authorities, and it could have a material adverse effect on our business, financial condition, results of operations, reputation and prospects and on the trading price of ACM Research Class A common stock, which could decline in value or become worthless.
The following chart depicts our corporate organization as of June 30, 2024:
A detailed description of how cash is transferred through our organization is set forth under “Note 2 – Summary of Significant Accounting Policies – Cash and Cash Equivalents” to the Condensed Consolidated Financial Statements of this report.
The U.S. Holding Foreign Companies Accountable Act, or the HFCA Act, requires that the Public Company Accounting Oversight Board, or the PCAOB, determine whether it is unable to inspect or investigate completely registered public accounting firms located in a non-U.S. jurisdiction because of a position taken by one or more authorities in any non-U.S. jurisdiction. Under current regulations, if ACM Research were to be included on the SEC's "Conclusive list of issuers identified under the HFCA Act" for two consecutive years due to our independent auditor being located in a jurisdiction that does not allow for PCAOB inspections, the SEC would prohibit trading in our securities and this ultimately could cause our securities to be delisted in the U.S., and their value may significantly decline or become worthless. See “Item 1A. Risk Factors—Risks Related to International Aspects of Our Business—We could be adversely affected if we are unable to comply with legislation and regulations regarding improved access to audit and other information and audit inspections of accounting firms, including registered public accounting firms, such as our prior and current audit firms, operating in mainland China” in our Annual Report for more information.
In addition to the matters discussed above, we are also subject to a number of legal and operational risks associated with our corporate structure, including as the result of a substantial portion of our operations being conducted in mainland China. Consequences of any of those risks could result in a material adverse change in our operations or cause the value of ACM Research Class A common stock to significantly decline in value or become worthless. Please carefully read the information included in “Item 1A. Risk Factors” in our Annual Report, in particular the risk factors addressing the following issues:
•If any mainland China central government authority were to determine that existing mainland China laws or regulations require that ACM Shanghai obtain the authority’s permission or approval to continue the listing of ACM Research’s Class A common stock in the United States or if those existing mainland China laws and regulations, or interpretations thereof, were to change to require such permission or approval, or if we inadvertently conclude that permissions or approvals are not required, ACM Shanghai may be unable to obtain the required permission or approval or may only be able to obtain such permission or approval on terms and conditions that impose material new restrictions and limitations on operation of ACM Shanghai, either of which could have a material adverse effect on our business, financial condition, results of operations, reputation and prospects and on the trading price of ACM Research Class A common stock, which could decline in value or become worthless.
•Mainland China central government authorities may intervene in, or influence, ACM Shanghai’s mainland China-based operations at any time, and those authorities’ rules and regulations in mainland China can change quickly with little or no advance notice.
•The mainland China central government may determine to exert additional control over offerings conducted overseas or foreign investment in mainland China-based issuers, which could result in a material change in operations of ACM Shanghai and cause significant declines in the value of ACM Research Class A common stock, or make them worthless.
Past statements and regulatory actions by mainland China central government authorities with respect to the use of VIEs and to data security and anti-monopoly concerns have not affected our ability to conduct our business operations in mainland China. For further information, see “Item 1A. Risk Factors —Risks Related to International Aspects of Our Business” in our Annual Report for more information.
Overview
We supply advanced, innovative capital equipment developed for the global semiconductor industry. Fabricators of advanced integrated circuits, or chips, can use our wet-cleaning and other front-end processing tools in numerous steps to improve product yield, even at increasingly advanced process nodes. We have designed these tools for use in fabricating foundry, logic and memory chips, including dynamic random-access memory, or DRAM, and 3D NAND-flash memory chips. We also develop, manufacture and sell a range of advanced packaging tools to wafer assembly and packaging customers.
Since 2009 we have delivered more than 925 tools to our customers, more than 765 of which were repeat orders or acceptances upon contractual performance obligations having been met and thereby generated revenue to us. The balance of the delivered tools is subject to the customer's acceptance of the tool upon the tool's satisfaction of applicable contractual requirements or subject to the customer's subsequent discretionary commitment to purchase the tool. To date, substantially all of our sales of equipment for semiconductor-manufacturing have been to customers located in Asia, and we anticipate that a substantial majority of our revenue from these products will continue to come from customers located in this region for the foreseeable future. We have begun to add to our efforts to further address customers in North America, Western Europe and Southeast Asia, by expanding our direct sales teams and increasing our global marketing activities.
Recent Developments
ACM Shanghai Dividend
In June 2024, ACM Research's principal operating subsidiary, ACM Shanghai (SSEC: 688082.SS) held its Annual Stockholder Meeting in Shanghai, China and approved to pay a cash dividend for an aggregate total of approximately RMB 273.2 million (approximately $38.4 million) to the stockholders of ACM Shanghai. The dividend is expected to be paid by the end of 2024. ACM Research owns 82.0% of the outstanding shares of ACM Shanghai. It is possible that ACM Shanghai may not pay the dividend per the approved resolutions, and even if paid, the net amount and the timing of any proceeds to be repatriated by ACM Research to the United States would be uncertain. If the dividend is paid, ACM Research intends to use the net proceeds, if any, for working capital and general corporate purposes.
ACM Shanghai Proposed Private Offering
In January 2024, ACM Research announced that ACM Shanghai intends to offer up to 43.6 million of its ordinary shares, subject to market conditions, the approval of ACM Shanghai’s stockholders, completion of the review process by the Shanghai Stock Exchange, completion of the registration process by the China Securities Regulatory Commission, and other factors, in a private offering to qualified buyers, in compliance with the requirements of the China Securities Regulatory Commission, which would constitute up to 10% of ACM Shanghai’s share capital prior to the transaction (the “Private Offering”).
ACM Research estimates that if consummated in full, the proposed Private Offering would generate gross proceeds of up to RMB 4.5 billion ($625 million) to ACM Shanghai, whose management would have broad discretion over the use of such proceeds. It is unlikely that any of such proceeds would be distributed to ACM Research, and that its equity interest in
ACM Shanghai would decline from 82.0% to approximately 74.6%. As of June 30, 2024 and the date of this report, the proposed Private Offering has not been completed.
Mainland China Government Research and Development Funding
Since 2008, ACM Shanghai has received various government grants for the development and commercialization of certain technologies and the development of the R&D and production center in the Lingang Special Area of Shanghai (note 13). The governmental grants contain certain operating conditions, in some cases require us to also invest certain amounts, and are subject to a government due-diligence review process upon completion of the project. The grants are recorded as long-term liabilities upon receipt, although we are not required to return any funds. Other subsidies are the subsidies received from government without further performance obligation.
Grant amounts are recognized in our statements of comprehensive income (loss) as follows:
•Government subsidies are recorded as reductions of current expenses in the periods in which the qualified expenses are incurred. For the six months ended June 30, 2024 and 2023, government subsidies recognized as reductions of relevant expenses in the condensed consolidated statements of comprehensive income (loss) were $0.6 million and $0.8 million, respectively.
•Other subsidies are recorded as other income in the periods as incurred. For the six months ended June 30, 2024 and 2023, related government subsidies recognized as other income in the condensed consolidated statements of comprehensive income (loss) were $1.8 million and $0.2 million, respectively.
Net Income Attributable to Non-Controlling Interests
In 2019 ACM Shanghai sold a total number of shares representing 8.3% of its outstanding ACM Shanghai shares, after which ACM Research held the remaining 91.7% of ACM Shanghai’s outstanding shares. In 2021 ACM Shanghai sold a total number of shares representing an additional 10% of its outstanding ACM Shanghai shares in its STAR IPO, after which ACM Research held the remaining 82.5% of ACM Shanghai’s outstanding shares. However, in May 2023, ACM Research's ownership declined to 82.1% due to the exercise of 2,150,309 stock options related to ACM Shanghai shares. In June 2024, ACM Research's ownership further declined to 82.0% due to the exercise of 446,154 stock options related to ACM Shanghai shares. As a result, we reflect the portion of our net income allocable to the minority holders of ACM Shanghai shares as net income attributable to non-controlling interests.
Critical Accounting Policies and Estimates
In preparing our condensed consolidated financial statements in conformity with GAAP, we make assumptions, judgments and estimates in applying our accounting policies that can have a significant impact on our revenue, operating income and net income, as well as on the value of certain assets and liabilities on our condensed consolidated balance sheets. We base our assumptions, judgments and estimates on historical experience and various other factors that we believe to be reasonable under the circumstances. At least quarterly, we evaluate our assumptions, judgments and estimates and make changes as deemed necessary. Actual results could differ materially from these estimates under different assumptions or conditions.
We believe that the assumptions, judgments and estimates involved in the accounting for the following accounting policies have the greatest potential impact on our condensed consolidated financial statements, and we therefore consider these to be our critical accounting estimates. For information on our significant accounting policies, see Note 2 in the notes to condensed consolidated financial statements in Part I, Item 1 of this report and in the Notes to Condensed Consolidated Financial Statements in Part II, Item 8 of our Annual Report, describe the significant accounting policies and methods used in the preparation of the Company’s condensed consolidated financial statements. There have been no material changes to the Company’s critical accounting estimates included in our Annual Report.
Recent Accounting Pronouncements
A discussion of recent accounting pronouncements is included in our Annual Report and is updated in Note 2 to the condensed consolidated financial statements included in this report.
Results of Operations
The following table sets forth our results of operations for the periods presented, as percentages of revenue.
| | | | | | | | | | | | | | | | | | | | | | | | | | |
| Three Months Ended June 30, | | Six Months Ended June 30, | |
| 2024 | | 2023 | | 2024 | | 2023 | | | |
| Revenue | 100.0 | % | | 100.0 | % | | 100.0 | % | | 100.0 | % | | | |
| Cost of revenue | 52.2 | | 52.5 | | 50.4 | | 50.4 | | | |
| Gross margin | 47.8 | | 47.5 | | 49.6 | | 49.6 | | | |
| Operating expenses: | | | | | | | | | | |
| Sales and marketing | 8.5 | | 7.9 | | 8.8 | | 9.5 | | | |
| Research and development | 12.8 | | 13.9 | | 14.1 | | 15.6 | | | |
| General and administrative | 7.9 | | 4.6 | | 9.0 | | 6.6 | | | |
| Total operating expenses, net | 29.2 | | 26.4 | | 31.9 | | 31.7 | | | |
| Income from operations | 18.6 | | 21.1 | | 17.7 | | 17.9 | | | |
| Interest income, net | 0.7 | | 1.2 | | 0.7 | | 1.3 | | | |
| Realized gain from sale of short-term investments | 0.0 | | 2.7 | | 0.1 | | 3.6 | | | |
| Unrealized gain (loss) on short-term investments | 0.5 | | -1.7 | | -0.4 | | -1.4 | | | |
| Other income, net | 0.7 | | 2.6 | | 1.3 | | 1.1 | | | |
| Income (loss) from equity method investments | -0.3 | | 2.7 | | -0.3 | | 1.8 | | | |
| Income before income taxes | 20.2 | | 28.6 | | 19.1 | | 24.3 | | | |
| Income tax expense | -4.6 | | -5.3 | | -3.9 | | -4.8 | | | |
| Net income | 15.6 | | 23.3 | | 15.2 | | 19.5 | | | |
| Less: Net income attributable to non-controlling interests | 3.6 | | 4.7 | | 3.3 | | 3.9 | | | |
| Net income attributable to ACM Research, Inc. | 12.0 | % | | 18.6 | % | | 11.9 | % | | 15.6 | % | | | |
Comparison of Three Months Ended June 30, 2024 and 2023
Revenue
| | | | | | | | | | | | | | | | | | | | | | | |
| Three Months Ended June 30, | | | | |
| 2024 | | 2023 | | % Change
2024 v 2023 | | Absolute Change
2024 v 2023 |
| (in thousands) | | | | |
| Single wafer cleaning, Tahoe and semi-critical cleaning equipment | $ | 153,221 | | | $ | 112,528 | | | 36.2 | % | | $ | 40,693 | |
| ECP (front-end and packaging), furnace and other technologies | 38,962 | | | 19,117 | | | 103.8 | % | | 19,845 | |
| Advanced packaging (excluding ECP), services & spares | 10,297 | | | 12,932 | | | (20.4) | % | | (2,635) | |
| Total Revenue by Product Category | $ | 202,480 | | | $ | 144,577 | | | 40.0 | % | | $ | 57,903 | |
The increase in revenue for three months ended June 30, 2024 as compared to the same period in 2023 reflects higher sales of single wafer cleaning, Tahoe and semi-critical cleaning equipment, and ECP (front-end and packaging), furnace and other technologies, partly offset by lower Advanced packaging (excluding ECP), services and spares. The increased
demand from is due in part to a longer term commitment by our mainland China-based customers to increase production capacity to achieve a greater share of the global semiconductor market.
Cost of Revenue and Gross Margin
| | | | | | | | | | | | | | | | | | | | | | | |
| Three Months Ended June 30, | | | | |
| 2024 | | 2023 | | % Change
2024 v 2023 | | Absolute Change
2024 v 2023 |
| | | | | |
| Cost of revenue | $ | 105,696 | | | $ | 75,938 | | | 39.2 | % | | $ | 29,758 | |
| Gross profit | 96,784 | | | 68,639 | | | 41.0 | % | | 28,145 | |
| Gross margin | 47.8 | % | | 47.5 | % | | 0.3 | % | | 32bps |
Cost of revenue and gross profit increased in the three months ended June 30, 2024 as compared to the corresponding period in 2023 due to the increased sales volume together with a slight increase in gross margin. The increase in gross margin versus the prior-year period was primarily due to revenue mix between product categories, net of a favorable impact from fluctuations in the RMB to U.S. dollar exchange rate. Gross margin may vary from period to period, primarily related to the level of utilization and the timing and mix of revenue. We expect gross margin to be between 40.0% and 45.0% for the foreseeable future, with direct manufacturing costs approximating 50.0% to 55.0% of revenue and overhead costs totaling 5.0% of revenue.
Operating Expenses
| | | | | | | | | | | | | | | | | | | | | | | |
| Three Months Ended June 30, | | | | |
| 2024 | | 2023 | | % Change
2024 v 2023 | | Absolute Change
2024 v 2023 |
| (in thousands) | | | | |
| Sales and marketing expense | $ | 17,135 | | | $ | 11,439 | | | 49.8 | % | | $ | 5,696 | |
| Research and development expense | 25,968 | | | 20,064 | | | 29.4 | % | | 5,904 | |
| General and administrative expense | 16,088 | | | 6,706 | | | 139.9 | % | | 9,382 | |
| Total operating expenses | $ | 59,191 | | | $ | 38,209 | | | 54.9 | % | | $ | 20,982 | |
Sales and marketing expense increased in the three months ended June 30, 2024 as compared to the corresponding period in 2023, reflecting an increase of $3.5 million due to increased costs for personnel, commissions, travel & entertainment, outside service, and professional services, and $2.6 million in stock-based compensation, offset by $0.4 million decrease in warranty expense.
Sales and marketing expense consists primarily of:
•compensation of personnel associated with pre-sale and after-sale services and support and other sales and marketing activities, including stock-based compensation;
•sales commissions paid to independent sales representatives;
•fees paid to sales consultants;
•cost of trade shows;
•costs of tools built for promotional purposes for potential new customers;
•travel and entertainment; and
•allocated overhead for rent and utilities.
We expect that, for the foreseeable future, sales and marketing expenses will increase in dollars, as we incur additional costs associated with growing our customer base in mainland China and regions outside of mainland China.
Research and development expense increased in the three months ended June 30, 2024 as compared to the corresponding period in 2023, reflecting an increase of $3.5 million in stock-based compensation, $2.0 million in R&D-related personnel costs, and $1.6 million in depreciation, outside services and other R&D-related costs, offset by a $1.2 million decrease in costs of components for tools built for product development purposes.
Research and development expense represented 12.8% and 13.9% of our revenue in the three months ended June 30, 2024 and 2023, respectively. Without reduction by grant amounts received from mainland China governmental authorities (see ‘–Mainland China Government Research and Development Funding’’), gross research and development expense totaled $26.1 million, or 12.9% of total revenue, in the three months ended June 30, 2024 as compared to $20.3 million, or 14.1% of revenue, in the corresponding period in 2023.
Research and development expense consists primarily of:
•compensation of personnel associated with our research and development activities, including stock based compensation;
•costs of components and other research and development supplies;
•costs of tools built for product development purposes;
•travel expense associated with the research of technical requirements for product development purposes and testing of concepts under consideration;
•amortization of costs of software used for research and development purposes; and
•allocated overhead for rent and utilities.
We expect that, for the foreseeable future, research and development expenses will increase in dollars, as we incur additional costs to expand our product portfolio to address additional production steps and expand our research and development team to new regions.
General and administrative expense increased in the three months ended June 30, 2024 as compared to the corresponding period in 2023, primarily reflecting a $5.6 million increase in stock based compensation, a $3.2 million in personnel and other costs related to general and administrative costs, and a $0.6 million increase in allowance for credit losses.
General and administrative expense consists primarily of:
•compensation of executive, accounting and finance, human resources, information technology, and other administrative personnel, including stock-based compensation;
•professional fees, including accounting and corporate legal and defense fees;
•other corporate expenses including insurance;
•allowance for credit losses; and
•allocated overhead for rent and utilities.
We expect that, for the foreseeable future, general and administrative expenses will increase in dollars, as we incur additional costs associated with growing our business, operating ACM Research, as a public company in the United States and operating ACM Shanghai as a public company in mainland China.
Interest income, net, Other Income, net
| | | | | | | | | | | | | | | | | | | | | | | |
| Three Months Ended June 30, | | | | |
| 2024 | | 2023 | | % Change
2024 v 2023 | | Absolute Change
2024 v 2023 |
| (in thousands) | | | | |
| Interest Income | $ | 2,381 | | | $ | 2,346 | | | 1.5 | % | | $ | 35 | |
| Interest Expense | (932) | | | (649) | | | 43.6 | % | | (283) | |
| Interest Income, net | $ | 1,449 | | | $ | 1,697 | | | -14.6 | % | | $ | (248) | |
| | | | | | | |
| Other income, net | $ | 1,357 | | | $ | 3,724 | | | -63.6 | % | | $ | (2,367) | |
Interest income (expense), net consists of interest earned on our cash and cash equivalents, restricted cash accounts, and short-term and long-term time deposits, offset by interest expense incurred from outstanding short-term and long-term borrowings. Interest income (expense), net decreased in the three months ended June 30, 2024 as compared to the corresponding period in 2023, as a result of changes in balances of cash, cash equivalents, time deposits, and debt, together with changes in interest rates earned or expensed on the respective balances.
Other income, net primarily reflects (a) gain recognized from the impact of exchange rates on our working-capital which was $1.3 million for the three months ended June 30, 2024 compared to $1.5 million loss recognized from the impact of exchange rates on our working capital for the three months ended June 30, 2023, (b) government subsidies, as described under “—Mainland China Government Research and Development Funding” above, and other factors.
Realized gain and unrealized loss from short-term investment, and income (loss) from equity investments.
| | | | | | | | | | | | | | | | | | | | | | | |
| Three Months Ended June 30, | | | | |
| 2024 | | 2023 | | % Change
2024 v 2023 | | Absolute Change
2024 v 2023 |
| (in thousands) | | | | |
| Realized gain from sale of short term investments | $ | — | | | $ | 3,919 | | | (100.0) | % | | $ | (3,919) | |
| Unrealized gain (loss) on short term investments | 1,031 | | | (2,455) | | | (142.0) | % | | $ | 3,486 | |
| Income (loss) from equity method investments | $ | (695) | | | $ | 3,920 | | | (117.7) | % | | $ | (4,615) | |
We did not record a realized gain from sale of short term investments for the three months ended June 30, 2024 as compared to $3.9 million in the prior-year period due to a sale of short-term investments (note 15).
We recorded an unrealized gain on short term investments of $1.0 million for the three months ended June 30, 2024 as compared to an unrealized loss of $2.5 million for the same period in 2023, based on a change in market value of ACM Shanghai’s short-term investments (note 15).
Loss from equity investments was $0.7 million for the three months ended June 30, 2024 as compared to income from equity method investments of $3.9 million in the same period in 2023 due to a decrease of net income from investments in affiliates (note 14).
Income Tax Expense
The following presents components of income tax expense for the indicated periods:
| | | | | | | | | | | |
| Three Months Ended June 30, |
| 2024 | | 2023 |
| (in thousands) |
| Total income tax expense | $ | (9,336) | | | $ | (7,638) | |
We recognized a tax expense of $9.3 million for the three months ended June 30, 2024 as compared to a tax expense of $7.6 million for the prior year period. The tax expense for the three months ended June 30, 2024 primarily resulted from the tax effect of an increase in our effective income tax rate applied to an increase in operating profit for the period. The increase in our effective income tax rate for the three months ended June 30, 2023 compared to the same period of the prior year was primarily due to an increase in capitalized R&D expenses in certain foreign jurisdictions.
Our effective tax rate differs from statutory rates of 21% for U.S. federal income tax purposes and 12.5% to 25% for mainland China income tax purposes due to the effects of the valuation allowance and certain permanent differences as it pertains to book-tax differences in the treatment of stock-based compensation and non-U.S. research expenses. Our four
mainland China subsidiaries, ACM Shanghai, ACM Wuxi, ACM Beijing, and ACM Lingang, are liable for mainland China corporate income taxes at the rates of 15%, 25%, 25%, and 15%, respectively. Pursuant to the Corporate Income Tax Law of mainland China, our mainland China subsidiaries generally would be liable for mainland China corporate income taxes at a rate of 25%. According to Guoshuihan 2009 No. 203, an entity certified as an “advanced and new technology enterprise” is entitled to a preferential income tax rate of 15%. ACM Shanghai was certified as an “advanced and new technology enterprise” in 2012 and again in 2016, 2018, and 2021, with an effective period of three years, and is expected to be re-certified for future years in 2024. In 2021, ACM Shanghai was certified as an eligible integrated circuit production enterprise and was entitled to a preferential income tax rate of 12.5% from January 1, 2020 to December 31, 2022. Certain entities which meet requirements according to the Policy of the Lingang New area in China (Shanghai) Pilot Free Trade Zone are entitled to a preferential income tax rate of 15%. ACM Lingang was certified for this in 2021, and this preferential income tax rate is valid from January 1, 2020 until December 31, 2024. We file income tax returns in the United States and state and foreign jurisdictions.
All tax returns will remain open for examination by the federal and state authorities for three and four years, respectively, from the date of utilization of any net operating loss or credits. Certain tax years are subject to foreign income tax examinations by tax authorities until the statute of limitations expire.
Net Income Attributable to Non-Controlling Interests
| | | | | | | | | | | | | | | | | | | | | | | |
| Three Months Ended June 30, | | | | |
| 2024 | | 2023 | | % Change
2024 v 2023 | | Absolute Change
2024 v 2023 |
| (in thousands) | | | | |
| Net income attributable to non-controlling interests | $ | 7,189 | | | $ | 6,772 | | | 6.2 | % | | $ | 417 | |
ACM Research owns 82.0% of ACM Shanghai’s (note 1) outstanding shares which is reflected in our condensed consolidated financial statements. We reflect the portion of net income allocable to the minority holders of ACM Shanghai shares as net income attributable to non-controlling interests.
Foreign currency translation adjustment
| | | | | | | | | | | | | | | | | | | | | | | |
| Three Months Ended June 30, | | | | |
| 2024 | | 2023 | | % Change
2024 v 2023 | | Absolute Change
2024 v 2023 |
| (in thousands) | | | | |
| Foreign currency translation adjustment | $ | 116 | | | $ | (35,269) | | | (100.3) | % | | $ | 35,385 | |
We recorded a gain of foreign currency translation adjustment of $0.1 million for the three months ended June 30, 2024, as compared to a loss of $35.3 million for the same period in 2023, primarily based on the net effect of RMB to dollar exchange rate fluctuations for the period on the converted value of ACM Shanghai’s RMB-denominated balances to U.S. dollar equivalents.
Comprehensive income attributable to non-controlling interests
| | | | | | | | | | | | | | | | | | | | | | | |
| Three Months Ended June 30, | | | | |
| 2024 | | 2023 | | % Change
2024 v 2023 | | Absolute Change
2024 v 2023 |
| (in thousands) | | | | |
| Comprehensive income attributable to non-controlling interests | $ | 7,210 | | | $ | 652 | | | 1005.8 | % | | $ | 6,558 | |
Comprehensive income attributable to non-controlling interests for the three months ended June 30, 2024 increased by $6.6 million as compared to the same period in 2023, reflecting a change in net income attributable to the non-controlling interests for the period together with the impact of foreign exchange rate fluctuations on the cumulative balance.
Comparison of Six Months Ended June 30, 2024 and 2023
Revenue
| | | | | | | | | | | | | | | | | | | | | | | |
| Six Months Ended June 30, | | | | |
| 2024 | | 2023 | | % Change
2024 v 2023 | | Absolute Change
2024 v 2023 |
| (in thousands) | | | | |
| Single wafer cleaning, Tahoe and semi-critical cleaning equipment | $ | 262,691 | | | $ | 149,142 | | | 76.1 | % | | $ | 113,549 | |
| ECP (front-end and packaging), furnace and other technologies | 64,762 | | | 45,715 | | | 41.7 | % | | 19,047 | |
| Advanced packaging (excluding ECP), services & spares | 27,218 | | | 23,976 | | | 13.5 | % | | 3,242 | |
| Total Revenue by Product Category | $ | 354,671 | | | $ | 218,833 | | | 62.1 | % | | $ | 135,838 | |
The increase in revenue for six months ended June 30, 2024 as compared to the same period in 2023 reflects higher sales of single wafer cleaning, Tahoe and semi-critical cleaning equipment, ECP (front-end and packaging), furnace and other technologies, and Advanced packaging (excluding ECP), services and spares. The increased demand from is due in part to a longer term commitment by our mainland China-based customers to increase production capacity to achieve a greater share of the global semiconductor market.
Cost of Revenue and Gross Margin
| | | | | | | | | | | | | | | | | | | | | | | |
| Six Months Ended June 30, | | | | |
| 2024 | | 2023 | | % Change
2024 v 2023 | | Absolute Change
2024 v 2023 |
| (in thousands) | | | | |
| Cost of revenue | $ | 178,766 | | | $ | 110,208 | | | 62.2 | % | | $ | 68,558 | |
| Gross profit | 175,905 | | | 108,625 | | | 61.9 | % | | 67,280 | |
| Gross margin | 49.6 | % | | 49.6 | % | | — | % | | (4)bps |
Cost of revenue and gross profit increased in the six months ended June 30, 2024 as compared to the corresponding period in 2023 due to the increased sales volume, and consistent gross margin. The decrease in gross margin versus the prior-year
period was primarily due to revenue mix between product categories, net of a favorable impact from fluctuations in the RMB to U.S. dollar exchange rate.
Gross margin may vary from period to period, primarily related to the level of utilization and the timing and mix of revenue. We expect gross margin to be between 40.0% and 45.0% for the foreseeable future, with direct manufacturing costs approximating 50.0% to 55.0% of revenue and overhead costs totaling 5.0% of revenue.
Operating Expenses
| | | | | | | | | | | | | | | | | | | | | | | |
| Six Months Ended June 30, | | | | |
| 2024 | | 2023 | | % Change
2024 v 2023 | | Absolute Change
2024 v 2023 |
| (in thousands) | | | | |
| Sales and marketing expense | $ | 31,308 | | | $ | 20,776 | | | 50.7 | % | | $ | 10,532 | |
| Research and development expense | 49,886 | | | 34,093 | | | 46.3 | % | | 15,793 | |
| General and administrative expense | 31,886 | | | 14,464 | | | 120.5 | % | | 17,422 | |
| Total operating expenses | $ | 113,080 | | | $ | 69,333 | | | 63.1 | % | | $ | 43,747 | |
Sales and marketing expense increased in the six months ended June 30, 2024 as compared to the corresponding period in 2023, reflecting an increase of $5.7 million due to increased costs for personnel, commissions, travel & entertainment and professional services, $5.2 million in stock-based compensation, $0.6 million in office and outside service, offset by a decrease of $1.0 million from promotional tools.
We expect that, for the foreseeable future, sales and marketing expenses will increase in dollars, as we incur additional costs associated with growing our customer base in mainland China and regions outside of mainland China.
Research and development expense increased in the six months ended June 30, 2024 as compared to the corresponding period in 2023, reflecting an increase of $7.3 million in stock-based compensation, $4.5 million in R&D-related personnel costs, $2.4 million in costs of components for tools built for product development purposes, and a$2.6 million increase in other R&D-related costs, travel and entertainment, and depreciation, offset by a $1.0 million decrease in outside service.
Research and development expense represented 14.1% and 15.6% of our revenue in the six months ended June 30, 2024 and 2023, respectively. Without reduction by grant amounts received from mainland China governmental authorities (see ‘–Mainland China Government Research and Development Funding’’), gross research and development expense totaled $50.5 million, or 14.2% of total revenue, in the six months ended June 30, 2024 as compared to $34.8 million, or 15.9% of revenue, in the corresponding period in 2023.
General and administrative expense increased in the six months ended June 30, 2024 as compared to the corresponding period in 2023, primarily reflecting a $11.0 million increase in stock based compensation, a $1.5 million increase in
allowance for credit losses, and $5.1 million in personnel and other costs related to general and administrative costs, offset by $0.2 million decrease in professional services expenses.
We expect that, for the foreseeable future, general and administrative expenses will increase in dollars, as we incur additional costs associated with growing our business, ACM Research operating a public company in the United States and ACM Shanghai operating as a public company in China.
Interest income, net, Other Income, net
| | | | | | | | | | | | | | | | | | | | | | | |
| Six Months Ended June 30, | | | | |
| 2024 | | 2023 | | % Change
2024 v 2023 | | Absolute Change
2024 v 2023 |
| (in thousands) | | | | |
| Interest income | $ | 4,155 | | | $ | 4,131 | | | 0.6 | % | | $ | 24 | |
| Interest expense | (1,715) | | | (1,344) | | | 27.6 | % | | (371) | |
| Interest income, net | $ | 2,440 | | | $ | 2,787 | | | -12.5 | % | | $ | (347) | |
| | | | | | | |
| Other income, net | $ | 4,437 | | | $ | 2,306 | | | 92.4 | % | | $ | 2,131 | |
Interest income (expense), net consists of interest earned on our cash and cash equivalents, restricted cash accounts, and short-term and long-term time deposits, offset by interest expense incurred from outstanding short-term and long-term borrowings. Interest income (expense), net decreased in the six months ended June 30, 2024 as compared to the corresponding period in 2023, as a result of changes in balances of cash, cash equivalents, time deposits, and debt, together with changes in interest rates earned or expensed on the respective balances.
Other income, net primarily reflects (a) gain recognized from the impact of exchange rates on our working-capital which was $2.7 million for the six months ended June 30, 2024 compared to $1.7 million gain recognized from the impact of exchange rates on our working capital for the six months ended June 30, 2023, (b) government subsidies, as described under “—Mainland China Government Research and Development Funding” above, and other factors.
Realized gain and unrealized loss from short-term investment, and income (loss) from equity investments.
| | | | | | | | | | | | | | | | | | | | | | | |
| Six Months Ended June 30, | | | | |
| 2024 | | 2023 | | % Change
2024 v 2023 | | Absolute Change
2024 v 2023 |
| (in thousands) | | | | |
| Realized gain from sale of short-term investments | $ | 273 | | | $ | 7,913 | | | (96.5) | % | | $ | (7,640) | |
| Unrealized loss on short-term investments | $ | (1,564) | | | $ | (3,109) | | | (49.7) | % | | $ | 1,545 | |
| Gain (loss) from equity method investments | $ | (1,215) | | | $ | 3,888 | | | (131.3) | % | | $ | (5,103) | |
We recorded a realized gain from sale of equity investment of $0.3 million for the six months ended June 30, 2024 as compared to $7.9 million in the prior-year period due to a sale of short-term investments (note 15).
We recorded an unrealized loss on short-term investments of $1.6 million for the six months ended June 30, 2024 as compared to an unrealized loss of $3.1 million for the same period in 2023, based on a change in market value of ACM Shanghai’s short-term investments (note 15).
Loss from equity investments was $1.2 million for the six months ended June 30, 2024 as compared to income from equity method investments of $3.9 million in the same period in 2023 due to a decrease of net income from investments in affiliates (note 14).
Income Tax Expense
The following presents components of income tax expense for the indicated periods:
| | | | | | | | | | | | | | | | | | | | | | | |
| Six Months Ended June 30, | | | | |
| 2024 | | 2023 | | % Change
2024 v 2023 | | Absolute Change
2024 v 2023 |
| (in thousands) | | | | |
Total income tax expense | $ | (13,705) | | | $ | (10,517) | | | 30.3 | % | | $ | (3,188) | |
We recognized a tax expense of $13.7 million for the six months ended June 30, 2024 as compared to a tax expense of $10.5 million for the prior year period. The tax expense for the six months ended June 30, 2024 primarily resulted from the tax effect of an increase in our effective income tax rate applied to an increase in operating profit for the period. The increase in our effective income tax rate for the six months ended June 30, 2024 compared to the same period of the prior year was primarily due to an increase in capitalized R&D expenses in certain foreign jurisdictions.
Net Income Attributable to Non-Controlling Interests
| | | | | | | | | | | | | | | | | | | | | | | |
| Six Months Ended June 30, | | | | |
| 2024 | | 2023 | | % Change
2024 v 2023 | | Absolute Change
2024 v 2023 |
| (in thousands) | | | | |
| Net income attributable to non-controlling interests | $ | 11,848 | | | $ | 8,590 | | | 37.9 | % | | $ | 3,258 | |
ACM Research owns 82.0% of ACM Shanghai’s (note 1) outstanding shares which is reflected in our condensed consolidated financial statements. We reflect the portion of net income allocatable to the minority holders of ACM Shanghai shares as net income attributable to non-controlling interests.
Foreign currency translation adjustment
| | | | | | | | | | | | | | | | | | | | | | | |
| Six Months Ended June 30, | | | | |
| 2024 | | 2023 | | % Change
2024 v 2023 | | Absolute Change
2024 v 2023 |
| (in thousands) | | | | |
Foreign currency translation adjustment
| $ | (6,713) | | | $ | (25,846) | | | (74.0) | % | | $ | 19,133 | |
We recorded a loss of foreign currency translation adjustment of ($6.7 million) for the six months ended June 30, 2024, as compared to $(25.8 million) for the same period in 2023, primarily based on the net effect of RMB to dollar exchange rate
fluctuations for the period on the converted value of ACM Shanghai’s RMB-denominated balances to U.S. dollar equivalents.
Comprehensive income attributable to non-controlling interests
| | | | | | | | | | | | | | | | | | | | | | | |
| Six Months Ended June 30, | | | | |
| 2024 | | 2023 | | % Change
2024 v 2023 | | Absolute Change
2024 v 2023 |
| (in thousands) | | | | |
| Comprehensive income attributable to non-controlling interests | $ | 10,616 | | | $ | 4,114 | | | 158.0 | % | | $ | 6,502 | |
Comprehensive income attributable to non-controlling interests for the six months ended June 30, 2024 increased as compared to the prior-year period, reflecting a change in net income attributable to the non-controlling interests for the period together with the impact of foreign exchange rate fluctuations on the cumulative balance.
Liquidity and Capital Resources
During the first six months of 2024, we funded our technology development and operations principally through our beginning global cash balances, including the cash balances at ACM Shanghai, borrowings by ACM Shanghai from local financial institutions, and our loan from China CITIC Bank, and cash flow from operations.
Cash and cash equivalents, restricted cash, short-term time deposits and long-term time deposits were $366.8 million at June 30, 2024, compared to $304.5 million at December 31, 2023. The $62.3 million increase was primarily driven by $51.9 million of cash provided by operations, ($48.4 million), excluding the change in net cash related to time deposits, used in investing activities, $58.3 million net cash provided by financing activities, and a $0.5 million increase from the effect of exchange rate on cash, cash equivalents, restricted cash and non-cash items.
| | | | | | | | | | | |
| June 30,
2024 | | December 31,
2023 |
| (In thousands) |
| Cash and cash equivalents, restricted cash, and time deposits: | | | |
| Cash and cash equivalents and restricted cash | $ | 324,912 | | | $ | 183,173 | |
| Short-term time deposits | 27,183 | | | 80,524 | |
| Long-term time deposits | 14,656 | | | 40,818 | |
| Total | $ | 366,751 | | | $ | 304,515 | |
Our future working capital needs beyond the next twelve months will depend on many factors, including the rate of our business and revenue growth, the payment schedules of our customers, the timing and magnitude of our capital expenditures, and the timing of investment in our research and development as well as sales and marketing. We believe our existing cash and cash equivalents and short-term and long-term time deposits, our cash flow from operating activities, and bank borrowings by us and ACM Shanghai will be sufficient to meet our anticipated cash needs within our longer term planning horizon.
ACM Shanghai has historically participated in certain mainland China government-sponsored grant and subsidy programs, as described under “—Mainland China Government Research and Development Funding” and “—Contractual Obligations” and we expect that ACM Shanghai will continue to take advantage of these programs when they are available and fit with our business strategy. ACM Shanghai generally applies for these grants and subsidies through the applicable mainland China government agency’s defined processes. Periodically, the public relations department researches the availability of these grants and subsidies through mainland China government agencies with whom ACM Shanghai files business surveys and taxes. Management of ACM Shanghai then assesses which grants and subsidies for which ACM Shanghai may be eligible and submits the relevant application. The decision to award the grant to ACM Shanghai is made by the relevant mainland China government agencies based on suitability and the merits of the application. Neither ACM
Research, nor ACM Shanghai or any of our other subsidiaries, has any direct relationship with any mainland China government agency, and our anticipated cash needs for the next twelve months neither anticipate, nor require, receipt of any mainland China government grants or subsidies.
To the extent our cash and cash equivalents, cash flow from operating activities and short-term bank borrowings are insufficient to fund our future activities in accordance with our strategic plan, we may determine to raise additional funds through public or private debt or equity financings or additional bank credit arrangements. We also may need to raise additional funds in the event we determine in the future to effect one or more acquisitions of businesses, technologies and products. If additional funding is necessary or desirable, we may not be able to obtain bank credit arrangements or to obtain an equity or debt financing on terms acceptable to us or at all.
Restrictions under mainland China laws and regulations as well as restrictions under ACM Shanghai’s bank loan agreements, may significantly restrict ACM Shanghai’s ability to transfer a portion of ACM Shanghai’s net assets to ACM Research, other subsidiaries of ACM Research and to holders of ACM Research Class A common stock. See “Item 1A. Risk Factors – Regulatory Risks – Mainland China's currency exchange control and government restrictions on investment repatriation may impact our ability to transfer funds outside of mainland China, which could materially and adversely affect our ability to grow, make investments or acquisitions that could benefit our business, otherwise fund and conduct our business, or pay dividends on our common stock” in our Annual Report.
For the six months ended June 30, 2024 and 2023, with the exception of sales and services-related transfer-pricing payments in the ordinary course of business, no transfers, distributions have been made between ACM Research, and its subsidiaries, including ACM Shanghai, or to holders of ACM Research Class A common stock.
Our cash and cash equivalents at June 30, 2024 were held for working capital purposes and other potential investments. ACM Shanghai, our only direct mainland China subsidiary, is, however, subject to mainland China restrictions on distributions to equity holders. The use of proceeds raised by the STAR Market IPO, without further approvals, are limited to specific usage. Our accounts receivable balance fluctuates from period to period, which affects our cash flow from operating activities. Fluctuations vary depending on cash collections, client mix, and the timing of shipment and acceptance of our tools.
ACM Research has never declared or paid cash dividends on our capital stock. AMC Research intends to retain all available funds and any future earnings to support the operation of and to finance the growth and development of our business and do not anticipate paying any cash dividends in the foreseeable future.
Cash Flow Provided by (used in) Operating Activities. Net cash provided by operating activities of $51.9 million during the six months ended June 30, 2024 consisted of:
| | | | | | | | | | | | | | | | | |
| Six Months Ended June 30, | | |
| 2024 | | 2023 | | |
| (In thousands) | | |
| Net Income | $ | 53,491 | | | $ | 42,560 | | | |
| Non-cash operating lease cost | 2,004 | | | 1,740 | | | |
| Provision for inventory | 3,009 | | | 3,224 | | | |
| Provision for credit losses | 1,954 | | | 496 | | | |
| Depreciation and amortization | 4,684 | | | 3,955 | | | |
| Gain on disposals of property, plant and equipment | (1) | | | (1) | | | |
| Realized gain on short-term investment | (273) | | | (7,913) | | | |
| Loss (income) from equity method investments | 1,215 | | | (3,888) | | | |
| Unrealized loss on short-term investments | 1,564 | | | 3,109 | | | |
| Deferred income taxes | (720) | | | (4,711) | | | |
| Stock-based compensation | 28,911 | | | 4,085 | | | |
| Dividends from unconsolidated affiliates | 600 | | | 5,095 | | | |
| Net changes in operating assets and liabilities | (44,496) | | | (66,896) | | | |
| Net cash flow provided by (used in) operating activities | 51,942 | | | (19,145) | | | |
Significant net changes in operating asset and liability accounts primarily include the following uses of cash: an increase of inventories, net ($64.9 million) (note 5), an increase of accounts receivable of ($14.8 million) (note 4), and an increase in other receivable ($11.7 million) and the following sources of cash: a $26.3 million increase in customer advances and a $6.8 million increase in other payable and accrued expense.
Cash Flow Used in Investing Activities. Net cash used in investing activities, excluding the change in net cash related to time deposits, for the six months ended June 30, 2024 was ($48.4 million), primarily consisting of ($39.7 million) for purchase of property and intangible assets, ($7.4 million) for purchase of long-term investments, and ($1.4 million) for purchase of short-term investment (note 15).
Cash Flow Provided by Financing Activities. Net cash provided by financing activities for the six months ended June 30, 2024 was $58.3 million, primarily consisting of $32.3 million proceeds from long-term borrowing (note 12), $23.9 million proceeds from short-term borrowing, and $6.4 million proceeds from exercise of stock options, partly offset by ($4.4 million) repayment of short-term and long-term borrowings.
We and ACM Shanghai, together with the subsidiaries of ACM Shanghai, have short-term and long-term borrowings with the following banks:
| | | | | | | | | | | | | | | | | | | | | | | | | | | | | | | | |
| Lender | | Agreement Date | | Maturity Date | | Annual
Interest Rate | | Maximum Borrowing
Amount(1) | | Amount Outstanding
at June 30, 2024 |
| | | | | | | | (in thousands) |
| China CITIC Bank (2) | | July 2023 | | Repayable by installments and the last installments repayable in December 2025 | | 4.50% | | RMB200,000 | | RMB99,900 |
| | | | | | | | $ | 28,060 | | | $ | 14,016 | |
| China Everbright Bank | | July 2021 | | August 2024 | | 3.00% | | RMB150,000 | | RMB17,453 |
| | | | | | | | | | | | | | | | | | | | | | | | | | | | | | | | |
| | | | | | | | $ | 21,045 | | | $ | 2,449 | |
| Bank of China | | September 2023 | | September 2024 | | 2.87% | | RMB40,000 | | RMB40,028 |
| | | | | | | | $ | 5,612 | | | $ | 5,616 | |
| China Merchants Bank | | August 2023 | | September 2024 | | 2.60%~3.00% | | RMB200,000 | | RMB200,145 |
| | | | | | | | $ | 28,060 | | | $ | 28,080 | |
| Bank of China | | March 2024 | | March 2025 | | 2.75% | | RMB120,000 | | RMB120,082 |
| | | | | | | | $ | 16,836 | | | $ | 16,848 | |
| China Merchants Bank | | November 2020 | | Repayable by installments and the last installments repayable in November 2030 | | 3.95% | | RMB128,500 | | RMB88,673 |
| | | | | | | | $ | 18,029 | | | $ | 12,441 | |
| Agricultural Bank of China | | June 2024 | | N/A until drawn | | N/A until drawn | | RMB300,000 | | RMB— | |
| | | | | | | | $ | 42,090 | | | $ | — | |
| Bank of China | | September 2021 | | Repayable by installments and the last installments repayable in September 2024 | | 2.60% | | RMB35,000 | | RMB26,267 |
| | | | | | | | $ | 4,911 | | | $ | 3,685 | |
| Bank of Shanghai | | December 2022 | | October 2024 | | 2.85% | | RMB100,000 | | RMB100,071 |
| | | | | | | | $ | 14,030 | | | $ | 14,040 | |
| China CITIC Bank | | August 2023 | | Repayable by installments and the last installments repayable in August,2025 | | 3.10% | | RMB100,000 | | RMB99,978 |
| | | | | | | | RMB14,030 | | | $ | 14,027 | |
| Bank of China | | June 2024 | | June 2027 | | 2.62% | | RMB97,500 | | RMB97,543 |
| | | | | | | | $ | 13,679 | | | $ | 13,685 | |
| China Everbright Bank | | June 2024 | | June 2027 | | 2.60% | | RMB150,000 | | RMB132,645 | |
| | | | | | | | $ | 21,045 | | | $ | 18,610 | |
| Industrial Bank of Korea | | December 2023 | | December 2024 | | 4.27% | | KRW2,000,000 | | KRW2,000,000 |
| | | | | | | | | | | | | | | | | | | | | | | | | | | | | | | | |
| | | | | | | | $ | 1,446 | | | $ | 1,446 | |
| | | | | | Total | | $ | 228,872 | | | $ | 144,943 | |
(1)Converted from RMB to dollars as of June 30, 2024. The loan from China Merchants Bank is secured by a pledge of the property of ACM Lingang and guaranteed by ACM Shanghai, as described above under “—Contractual Obligations.”
(2)This China CITIC bank facility agreement is with ACM Research, Inc.
Effect of exchange rate changes on cash, cash equivalents and restricted cash. The effect of exchange rate cash, and cash equivalents was ($0.5) million during the first six months ended June 30, 2024. The impact of fluctuations of the RMB to U.S. dollar currency exchange rate on a significant balance of these items held in RMB-denominated accounts (note 2) contributed to the change.
Contractual Obligations
Grant Contract for State-owned Construction Land Use Right in Shanghai City
In 2020 ACM Shanghai, through its wholly-owned subsidiary ACM Lingang, entered into a Grant Contract for State-owned Construction Land Use Right in Shanghai City (Category of R&D Headquarters and Industrial Projects), or the Grant Agreement, with the China (Shanghai) Pilot Free Trade Zone Lin-gang Special Area Administration, or the Grantor. ACM Lingang obtained rights to use approximately 43,000 square meters (10.6 acres) of land in the Lingang Heavy Equipment Industrial Zone of Lin-gang Special Area of China (Shanghai) Pilot Free Trade Zone, or the Land Use Right, for a period of fifty years, commencing on the date of delivery of the land in July 2020, which we refer to as the Delivery Date.
In exchange for its land use rights, ACM Lingang paid aggregate grant fees of RMB 61.7 million ($9.5 million), or the Grant Fees, and a performance deposit of RMB 12.3 million ($1.9 million), which is equal to 20% of the aggregate grant fees, to secure its achievement of the following performance milestones:
•the start of construction within 6 months after the Delivery Date (60% of the performance deposit), or Construction Start Milestone;
•the completion of construction within 30 months after the Delivery Date (20% of the performance deposit), or Construction Completion Milestone; and
•the start of production within 42 months after the Delivery Date (20% of the performance deposit), or Production Start Milestone.
Upon satisfaction of a milestone, the portion of the performance deposit attributable to that milestone will be repayable to ACM Lingang within ten business days. If the achievement of any of the above milestones is delayed or abandoned, ACM Lingang may be subject to additional penalties and may lose its rights to both the use of the granted land and any partially completed facilities on that land.
The status of the performance milestones for the period ended June 30, 2024 is as follows:
•ACM Lingang achieved the Construction Start Milestone and 60% of the performance deposit was refunded to ACM Shanghai in 2020.
•The Construction Completion Milestone was required to be met by January 9, 2024 but was not achieved. However, ACM Lingang believes it will receive the refund without penalty based on its explanation to the respective regulatory authorities of logistics-related delays and expectations that it will meet the milestone in 2024. We cannot guarantee that ACM Lingang will achieve the missed milestone in 2024, or even if it does achieve the milestone in 2024, that it will be refunded some or all of the 20% portion of the performance deposit of RMB 2.5 million ($0.4 million).
Contractual penalties in the case of a delay of Construction Completion Milestone:
◦If ACM Lingang fails to complete the construction pursuant to the date agreed under the Grant Agreement or any extended completion date approved by the Grantor, ACM Lingang shall pay 50% of the deposit for timely completion of construction as liquidated damages.
◦If ACM Lingang delays the completion for more than six months beyond the date agreed under the Grant Agreement, or beyond any extended completion date approved by the Grantor, it shall pay the total deposit for timely completion of construction as liquidated damages.
◦If the delay is more than one year, the Grantor is entitled to terminate the Grant Agreement and take back the Land Use Right. In such case, the Grantor shall refund the Grant Fees for the remaining land use term after deducting the deposit agreed under the Grant Agreement and refund the deposit for timely commencement of production and relevant bank interests in full to ACM Lingang.
•The Production Start Milestone is now required to be met by January 9, 2025. The Production Start Milestone was originally required to be met prior to January 9, 2024, but due to COVID-related delays, ACM filed multiple requests for extensions, the latest of which was granted on July 7, 2023. We cannot guarantee that ACM Lingang will meet any extended deadline or be refunded this 20% portion of the performance deposit.
Contractual penalties in the case of a delay of Production Start Milestone:
◦If ACM Lingang fails to commence production pursuant to the date agreed under the Grant Agreement or any extended commencement date approved by the Grantor, ACM Lingang shall pay the total deposit for timely commencement of production as liquidated damages;
◦If ACM Lingang fails to commence production pursuant to the extended commencement of production date (more than six months beyond the production start milestone), the Grantor is entitled to terminate the Grant Agreement and take back the Land Use Right. In such case, the Grantor shall refund the Grant Fees for the remaining land use term after deducting the deposit agreed under the Grant Agreement to ACM Lingang.
In addition to the milestones, covenants in the Grant Agreement require that, among other things, ACM Lingang will be required to pay liquidated damages in the event that within seven years after the Delivery Date, or prior to July 9, 2027, it does not (i) generate a minimum specified amount of annual sales of products manufactured on the granted land or (ii) pay at least RMB 157.6 million ($22.2 million) in annual total taxes (including value-added taxes, corporate income tax, personal income taxes, urban maintenance and construction taxes, education surcharges, stamp taxes, and vehicle and shipping taxes) as a result of operations in connection with the granted land.
If the total tax revenue of the project fails to reach but is no less than 80% of the standard agreed under the Grant Agreement, ACM Lingang shall pay 20% of the actual shortfall amount of the tax revenue as liquidated damages. If the total tax revenue of the project fails to reach 80% of the standard agreed under the Grant Agreement within 1 month after the agreed date of reaching target production, the Grantor is entitled to terminate the Grant Agreement, take back the Land Use Right, and shall refund the Grant Fees for the remaining land use term to ACM Lingang.
If the Grant Agreement is terminated because of breach of any terms above, the Grantor shall take back the buildings, fixtures and auxiliary facilities on the land area and provide ACM Lingang with corresponding compensation according to the residual value of the buildings, fixtures and auxiliary facilities when they are taken back. The total cumulative investment of land, buildings and construction in progress related to ACM Lingang amounted to $141.8 million and $116.9 million at June 30, 2024 and December 31, 2023, respectively.
How We Evaluate Our Operations
We present information below with respect to four measures of financial performance:
•We define shipments of tools to include (a) a repeat shipment to a customer of a type of tool that the customer has previously accepted, for which we recognize revenue upon shipment or delivery, and (b) a first-time shipment of a first tool to a customer on an approval basis, for which we may recognize revenue in the future if contractual conditions are met, or if a purchase order is received.
•We define “adjusted EBITDA” as net income excluding interest expense (net), income tax benefit (expense), depreciation and amortization, unrealized (gain) loss on short-term investments, and stock-based compensation.
We define adjusted EBITDA to also exclude restructuring costs, although we have not incurred any such costs to date.
•We define “free cash flow” as net cash provided by operating activities less purchases of property and equipment (net of proceeds from disposals) and purchase of short-term and long-term investments.
•We define “adjusted operating income (loss)” as our income (loss) from operations excluding stock-based compensation.
These financial measures are not based on any standardized methodologies prescribed by accounting principles generally accepted in the United States, or GAAP, and are not necessarily comparable to similarly titled measures presented by other companies.
We have presented shipments, adjusted EBITDA, free cash flow and adjusted operating income (loss) because they are key measures used by our management and board of directors to understand and evaluate our operating performance, to establish budgets and to develop operational goals for managing our business. We believe that these financial measures help identify underlying trends in our business that could otherwise be masked by the effect of the expenses that we exclude. In particular, we believe that the exclusion of the expenses eliminated in calculating adjusted EBITDA and adjusted operating income (loss) can provide useful measures for period-to-period comparisons of our core operating performance and that the exclusion of property and equipment purchases from operating cash flow can provide a usual means to gauge our capability to generate cash. Accordingly, we believe that these financial measures provide useful information to investors and others in understanding and evaluating our operating results, enhancing the overall understanding of our past performance and future prospects, and allowing for greater transparency with respect to key financial metrics used by our management in its financial and operational decision-making.
Shipments, adjusted EBITDA, free cash flow and adjusted operating income (loss) are not prepared in accordance with GAAP, and should not be considered in isolation of, or as an alternative to, measures prepared in accordance with GAAP.
Shipments
We consider shipments a key operating metric as it reflects the total value of products delivered to customers and prospective customers by our productive assets.
Shipments consist of two components:
•a shipment to a customer of a type of tool that the customer has previously accepted, for which we recognize revenue when the tool is delivered; and
•a shipment to a customer of a type of tool that the customer is receiving and evaluating for the first time, in each case a first tool, for which we may recognize revenue at a later date, subject to the customer’s acceptance of the tool upon the tool’s satisfaction of applicable contractual requirements or subject to the customer’s subsequent discretionary commitment to purchase the tool.
First tool shipments can be made to either an existing customer that has not previously accepted that specific type of tool in the past ─ for example, a delivery of a SAPS V tool to a customer that previously had received only SAPS II tools ─ or to a new customer that has never purchased any tool from us.
Shipments in the six months ended June 30, 2024 totaled $448.1 million, as compared to $242.6 million for the same periods in 2023. Repeat tool shipments in the six months ended June 30, 2024 totaled $230.4 million, as compared to $100.3 million for same periods in 2023. First tool shipments in the six months ended June 30, 2024 totaled $217.7 million, as compared to $142.3 million for the same periods in 2023.
The dollar amount attributed to a first tool shipment is equal to the consideration we expect to receive if any and all contractual requirements are satisfied and the customer accepts the tool, or if the customer subsequently determines in its discretion to purchase the tool. There are a number of limitations related to the use of shipments in evaluating our business, including that customers have significant, or in some cases total, discretion in determining whether to accept or purchase our tools after evaluation and their decision not to accept or purchase delivered tools is likely to result in our inability to recognize revenue from the delivered tools. “First tool” shipments reflect the value of incremental new products under evaluation delivered to our customers or prospective customers for a given period and is used as an internal key metric to reflect future potential revenue opportunity. The cumulative cost of “first tool” shipments under evaluation at customers which have not been accepted by the customer is carried at cost and reflected in finished goods inventory (see Note 5 to the
condensed consolidated financial statements included in this report). “First tool” shipments exclude deliveries to customers for which ACM Research does not have a basis to expect future revenue.
Adjusted EBITDA
There are a number of limitations related to the use of adjusted EBITDA rather than net income (loss), which is the nearest GAAP equivalent. Some of these limitations are:
•adjusted EBITDA excludes depreciation and amortization and, although these are non-cash expenses, the assets being depreciated or amortized may have to be replaced in the future;
•we exclude stock-based compensation expense from adjusted EBITDA and adjusted operating income (loss), although (a) it has been, and will continue to be for the foreseeable future, a significant recurring expense for our business and an important part of our compensation strategy and (b) if we did not pay out a portion of our compensation in the form of stock-based compensation, the cash salary expense included in operating expenses would be higher, which would affect our cash position;
•the expenses and other items that we exclude in our calculation of adjusted EBITDA may differ from the expenses and other items, if any, that other companies may exclude from adjusted EBITDA when they report their operating results;
•adjusted EBITDA does not reflect changes in, or cash requirements for, working capital needs;
•adjusted EBITDA does not reflect interest expense, or the requirements necessary to service interest or principal payments on debt;
•adjusted EBITDA does not reflect income tax expense (benefit) or the cash requirements to pay taxes;
•adjusted EBITDA does not reflect historical cash expenditures or future requirements for capital expenditures or contractual commitments; and
•adjusted EBITDA includes expense reductions and non-operating other income attributable to mainland China governmental grants, which may mask the effect of underlying developments in net income, including trends in current expenses and interest expense, and free cash flow includes mainland China governmental grants, the amount and timing of which can be difficult to predict and are outside our control.
The following table reconciles net income, the most directly comparable GAAP financial measure, to adjusted EBITDA:
| | | | | | | | | | | | | | | | | | | | | | | |
| Six Months Ended June 30, |
| 2024 | | 2023 | | % Change
2024 v 2023 | | Absolute Change
2024 v 2023 |
| (in thousands) | | | | |
| Adjusted EBITDA Data: | | | | | | | |
| Net Income | $ | 53,491 | | | $ | 42,560 | | | 25.7 | % | | $ | 10,931 | |
| Interest expense (income), net | (2,440) | | | (2,787) | | | -12.5 | % | | 347 | |
| Income tax expense | 13,705 | | | 10,517 | | | 30.3 | % | | 3,188 | |
| Depreciation and amortization | 4,684 | | | 3,955 | | | 18.4 | % | | 729 | |
| Stock based compensation | 28,911 | | | 4,085 | | | 607.7 | % | | 24,826 | |
| Unrealized loss on short-term investments | 1,564 | | | 3,109 | | | -49.7 | % | | (1,545) | |
| Adjusted EBITDA | $ | 99,915 | | | $ | 61,439 | | | 62.6 | % | | $ | 38,476 | |
The increase in adjusted EBITDA for the six months ended June 30, 2024 as compared to the same period in 2023 reflects a $10.9 million increase in net income, a $24.8 million increase in stock based compensation, a $0.7 million increase in depreciation and amortization, a $3.2 million impact from a change in income tax expense, offset by a $1.5 million decrease in unrealized loss on short-term investment, and other items.
We do not exclude from adjusted EBITDA expense reductions and non-operating other income attributable to mainland China governmental grants because we consider and incorporate the expected amounts and timing of those grants in incurring expenses and capital expenditures. If we did not receive the grants, our cash expenses therefore would be lower, and our cash position would not be affected, to the extent we have accurately anticipated the amounts of the grants. For
additional information regarding our mainland China grants, please see “—Mainland China Government Research and Development Funding.”
Free Cash Flow
The following table reconciles net cash provided by (used in) operating activities, the most directly comparable GAAP financial measure, to free cash flow:
| | | | | | | | | | | | | | | | | | | | | | | |
| Six Months Ended June 30, |
| 2024 | | 2023 | | % Change
2024 v 2023 | | Absolute Change
2024 v 2023 |
| (in thousands) | | | | |
| Free Cash Flow Data: | | | | | | | |
| Net cash provided by (used in) operating activities | $ | 51,942 | | | $ | (19,145) | | | (371.3 | %) | | $ | 71,087 | |
| Purchase of property and equipment | (38,512) | | | (21,633) | | | 78.0 | % | | (16,879) | |
| Purchase of short-term and long-term investments | (8,769) | | | (1,453) | | | 503.5 | % | | (7,316) | |
| Free cash flow | $ | 4,661 | | | $ | (42,231) | | | (111.0 | %) | | $ | 46,892 | |
The increase in free cash flow for the six months ended June 30, 2024 as compared to the same period in 2023 reflected the factors driving net cash used in operating activities, an increase of purchases of property and equipment, and long-term investment. Consistent with our methodology for calculating adjusted EBITDA, we do not adjust free cash flow for the effects of mainland China government subsidies, because we take those subsidies into account in incurring expenses and capital expenditures. We do not adjust free cash flow for the effects of time-deposits, which for our internal purposes are considered as largely similar to cash.
Adjusted Operating Income
Adjusted operating income excludes stock-based compensation from income from operations. Although stock-based compensation is an important aspect of the compensation of our employees and executives, determining the fair value of certain of the stock-based instruments we utilize involves judgment and estimation and the expense recorded may bear little resemblance to the actual value realized upon the vesting or future exercise of the related stock-based awards. Furthermore, unlike cash compensation, the value of stock options, which is an element of our ongoing stock-based compensation expense, is determined using a complex formula that incorporates factors. Management believes it is useful to exclude stock-based compensation in order to better understand the long-term performance of our core business and to facilitate comparison of our results to those of peer companies. The use of non-GAAP financial measures excluding stock-based compensation has limitations, however. If we did not pay out a portion of our compensation in the form of stock-based compensation, the cash salary expense included in operating expenses would be higher and our cash holdings would be
less. The following tables reflect the exclusion of stock-based compensation, or SBC, from line items comprising income from operations:
| | | | | | | | | | | | | | | | | | | | | | | | | | | | | | | | | | | |
| Six Months Ended June 30, |
| 2024 | | 2023 |
| Actual
(GAAP) | | SBC | | Adjusted
(Non-
GAAP) | | Actual
(GAAP) | | SBC | | Adjusted
(Non-GAAP) |
| (in thousands) |
| Revenue | $ | 354,671 | | | $ | - | | | $ | 354,671 | | | $ | 218,833 | | | $ | - | | | $ | 218,833 | |
| Cost of revenue | (178,766) | | | (1,573) | | | (177,193) | | | (110,208) | | | (250) | | | (109,958) | |
| Gross profit | 175,905 | | | (1,573) | | | 177,478 | | | 108,625 | | | (250) | | | 108,875 | |
| Operating expenses: | | | | | | | | | | | |
| Sales and marketing | (31,308) | | | (6,051) | | | (25,257) | | | (20,776) | | | (862) | | | (19,914) | |
| Research and development | (49,886) | | | (8,709) | | | (41,177) | | | (34,093) | | | (1,410) | | | (32,683) | |
| General and administrative | (31,886) | | | (12,578) | | | (19,308) | | | (14,464) | | | (1,563) | | | (12,901) | |
| Income (loss) from operations | $ | 62,825 | | | $ | (28,911) | | | $ | 91,736 | | | $ | 39,292 | | | $ | (4,085) | | | $ | 43,377 | |
Adjusted operating income for the six months ended June 30, 2024 increased by $48.3 million, as compared with the same period in 2023, due to a $23.5 million increase in income from operations and a $24.8 million increase in stock-based compensation expense.
Item 3. Quantitative and Qualitative Disclosures About Market Risks
Our market risks and the ways we manage them are summarized in the section captioned “Part II, Item 7A. Quantitative and Qualitative Disclosures About Market Risk” in our Annual Report. There have been no material changes in the first six months of 2024 to our market risks or to our management of such risks.
Item 4. Controls and Procedures
Evaluation of Disclosure Controls and Procedures
Our management, with the participation of our Chief Executive Officer and Chief Financial Officer, evaluated the effectiveness of our disclosure controls and procedures pursuant to Rule 13a-15 under the Securities Exchange Act of 1934, or the Exchange Act, as of June 30, 2024. In designing and evaluating the disclosure controls and procedures, our management recognizes that any controls and procedures, no matter how well designed and operated, can provide only reasonable assurance of achieving the desired control objectives. In addition, the design of disclosure controls and procedures must reflect the fact that there are resource constraints and that our management is required to apply its judgment in evaluating the benefits of possible controls and procedures relative to their costs.
Based on such evaluation, our Chief Executive Officer and Chief Financial Officer concluded that, as of June 30, 2024, our disclosure controls and procedures were effective to provide reasonable assurance that information we are required to disclose in reports that we file or submit under the Exchange Act is recorded, processed, summarized and reported within the time periods specified in the Securities and Exchange Commission rules and forms, and that such information is accumulated and communicated to our management, including our Chief Executive Officer and Chief Financial Officer, as appropriate, to allow timely decisions regarding required disclosure.
Changes in Internal Control Over Financial Reporting
There were no changes in our internal control over financial reporting that occurred during the quarter ended June 30, 2024, that have materially affected, or are reasonably likely to materially affect, our internal control over financial reporting, except the remediation efforts as described below.
Remediation Efforts
As previously reported, during the quarter ended March 31, 2024, management identified a deficiency constituting a material weakness in our internal control over financial reporting related to the design and implementation of information technology general controls ("ITGCs") related to the implementation of our new enterprise resource planning ("ERP") system in mainland China utilized in the preparation of our consolidated financial statements. Specifically, we did not (1) establish and maintain adequate pre-approval policy and process for the system changes; and (2) maintain a complete system change log.
Our management, under the oversight of our Audit Committee, has implemented the following remediation measures designed to improve our internal control over financial reporting and to remediate the material weakness noted above:
•Corporate Governance and Oversight: We have implemented a plan to stabilize the ERP system and correct the identified control deficiency. Additionally, we have engaged an outside professional firm to assist management overseeing the efforts to design, implement and ensure the ongoing execution of our ITGCs of the ERP system.
•Change Management: We have designed and implemented an improved process for requesting, testing, authorizing, and reviewing system changes. This implementation includes enabling a complete activity log of accessing and/or making changes to the system and the addition of detection controls which include the review of such activity logs. We have also established policies and processes surrounding the testing, approval, and implementation of system changes to ERP system.
•End User Training: We have enhanced the training of our personnel regarding their roles and responsibilities within the ITGCs objectives and activities.
During the quarter ended June 30, 2024, we completed our testing of the operating effectiveness of internal controls impacted by these remediation efforts and concluded that as a result of the measures described above, the material weakness has been remediated and our internal control over financial reporting was effective as of June 30, 2024.
PART II. OTHER INFORMATION
Item 1. Legal Proceedings
From time to time, we may become involved in legal proceedings or may be subject to claims arising in the ordinary course of our business. Although the results of these proceedings and claims cannot be predicted with certainty, we currently believe that the final outcome of these ordinary course matters will not have a material adverse effect on our business, operating results, financial condition or cash flows. Regardless of the outcome, litigation can have an adverse impact on us because of defense and settlement costs, diversion of management resources and other factors.
Item 1A. Risk Factors
Except as set forth below, there were no material changes to the risk factors discussed in Item 1A. “Risk Factors” of Part I in our Annual Report. In addition to the other information set forth in this report, you should carefully consider those risk factors, which could materially affect our business, financial condition and future operating results. Those risk factors are not the only risks facing our company. Additional risks and uncertainties not currently known to us or that we currently deem to be immaterial also may have a material adverse effect on our business, financial condition and operating results.
Regulatory Risks
The U.S. Government is reportedly considering an outbound investment review mechanism, which may prevent us from taking advantage of investment opportunities outside the United States that could otherwise be advantageous to our stockholders
On June 21, 2024, the Office of Investment Security of the U.S. Department of the Treasury issued a proposed rule to implement President Biden’s August 2023 Executive Order on Addressing United States Investments in Certain National Security Technologies and Products in Countries of Concern (the EO). The EO provided for
the establishment of a new and targeted national security regulatory framework directed at controlling outbound investment from the United States in certain sensitive industry sectors in the People’s Republic of China (PRC) and the Special Administrative Regions of Hong Kong and Macau (collectively, China). As implemented by the proposed rule, the new framework would impose notification requirements and prohibitions on specified investments by U.S. persons in the semiconductor and microelectronics sector, quantum information technologies, and artificial intelligence (AI) systems.
Within the semiconductor and microelectronics sector, prohibited investments would include certain covered investments in electronic design automation software; certain fabrication and advanced packaging tools; the design, fabrication, or packaging of certain advanced integrated circuits, and supercomputers. Notifiable investments would include any covered investments related to the design, fabrication, or packaging of integrated circuits not otherwise covered by the prohibition.
If the outbound investment regime is implemented as set out in the proposed rule, given the breadth of the notification requirement as applicable within the semiconductor industry, we will likely be subject to increased regulatory burden to engage in certain investments in the PRC. Such a mechanism could negatively impact our ability to realize value from certain existing and future investments, including by limiting exit opportunities or causing us to favor buyers that may avoid complex notification requirements, even in circumstances where other buyers may offer better terms or more consideration. There can be no assurances that we will be able to maintain or proceed with investments on terms acceptable to us. Furthermore, while the requirements are still in proposed form, the range or extent of possible effects that could flow from such a measure cannot be determined with any degree of certainty at this time. It is possible that the outbound investment reporting requirements and prohibitions could adversely affect our business, financial condition, and operating results.
Item 2. Unregistered Sales of Equity Securities and Use of Proceeds
During the six months ended June 30, 2024, ACM Research issued, pursuant to the exercise of stock options at a per share exercise price of $0.50 per share, an aggregate of 513,322 shares of Class A common stock that were not registered under the Securities Act of 1933, as amended. We believe the offer and sale of those shares were exempt from registration under the Securities Act of 1933, as amended, by virtue of Section 4(a)(2) thereof (or Regulation D promulgated thereunder) because they did not involve a public offering. The recipients of the shares acquired the securities for investment only and not with a view to or for sale in connection with any distribution thereof, and appropriate legends were recorded with respect to the shares. The recipients of the shares were accredited investors under Rule 501 of Regulation D.
| | | | | | | | | | | | | | |
Sale Date | | Exercised Shares (Net) | |
| January 3, 2024 | | | 27,033 | |
| March 1, 2024 | | | 34,434 | |
| March 1, 2024 | | | 177,089 | |
| March 5, 2024 | | | 9,843 | |
| March 5, 2024 | | | 27,341 | |
| May 3, 2024 | | | 27,253 | |
| May 14, 2024 | | | 176,090 | |
| May 14, 2024 | | | 34,239 | |
Total | | | 513,322 | |
Item 3. Defaults Upon Senior Securities
None
Item 4. Mine Safety Disclosures
None
Item 5. Other Information
On May 14, 2024, David Wang, President, Chief Executive Officer and a member of the Board of Directors of ACM Research, adopted a Rule 10b5-1 trading arrangement (the “Wang Plan”) that is intended to satisfy the affirmative defense of Rule 10b5-1(c) of the Exchange Act. The Wang Plan allows for the contemporaneous exercise of options and sale of up to 480,000 shares of Class A Common Stock, at specific market prices, commencing on August 22, 2024, and continuing until (i) all such options are exercised and the underlying shares are sold, (ii) April 30, 2025, or (iii) such date that the Wang Plan is otherwise terminated according to its terms, whichever comes first.
On May 17, 2024, Tracy Liu, a member of the Board of Directors of ACM Research, adopted a Rule 10b5-1 trading arrangement (the “Liu Plan”) that is intended to satisfy the affirmative defense of Rule 10b5-1(c) of the Exchange Act. The Liu Plan allows for the contemporaneous exercise of options and sale of up to 19,500 shares of Class A Common Stock, at specific market prices, commencing on August 16, 2024, and continuing until (i) all such options are exercised and the underlying shares are sold, (ii) May 19, 2025, or (iii) such date that the Liu Plan is otherwise terminated according to its terms, whichever comes first.
On May 31, 2024, Fuping Chen, Vice President, Sales—China of ACM Shanghai, adopted a Rule 10b5-1 trading arrangement (the “Chen Plan”) that is intended to satisfy the affirmative defense of Rule 10b5-1(c) of the Exchange Act. The Chen Plan allows for the contemporaneous exercise of options and sale of up to 100,000 shares of Class A Common Stock, at specific market prices, commencing on August 30, 2024, and continuing until (i) all such options are exercised and the underlying shares are sold, (ii) May 30, 2025, or (iii) such date that the Chen Plan is otherwise terminated according to its terms, whichever comes first.
On June 12, 2024, Shanghai Science and Technology Venture Capital Co., Ltd. ("SSTVC"), adopted a Rule 10b5-1 trading arrangement (the “SSTVC Plan”) that is intended to satisfy the affirmative defense of Rule 10b5-1(c) of the Exchange Act. The SSTVC Plan allows for the sale of up to 1.1 million shares of Class A Common Stock, at specific market prices, commencing on September 10, 2024, and continuing until (i) all such shares are sold, (ii) December 31, 2024, or (iii) such date that the SSTVC Plan is otherwise terminated according to its terms, whichever comes first. Xia Xing, a member of the Board of Directors of ACM Research, is an employee of an affiliate of SSTVC.
Item 6. Exhibits
The following exhibits are filed as part of this report:
| | | | | | | | |
Exhibit No. | | Description |
| | Purchase and Sale Agreement and Receipt for Earnest Money, dated July 30, 2024, by and among ACM Research, Inc. and William R. O’Neill, Lynda E. O’Neill and Gordon A. Harris |
| | Certification of Principal Executive Officer Pursuant to Rules 13a-14(a) and 15d-14(a) under the Securities Exchange Act of 1934, as Adopted Pursuant to Section 302 of the Sarbanes-Oxley Act of 2002 |
| | Certification of Principal Financial Officer Pursuant to Rules 13a-14(a) and 15d-14(a) under the Securities Exchange Act of 1934, as Adopted Pursuant to Section 302 of the Sarbanes-Oxley Act of 2002 |
| | Certification of Principal Executive Officer and Principal Financial Officer Pursuant to 18 U.S.C. Section 1350, as Adopted Pursuant to Section 906 of the Sarbanes-Oxley Act of 2002 |
| 101.INS | | Inline XBRL Instance Document (the instance document does not appear in the Interactive Data File because its XBRL tags are embedded within the Inline XBRL document) |
| 101.SCH | | Inline XBRL Taxonomy Extension Schema Document |
| 101.CAL | | Inline XBRL Taxonomy Extension Calculation Linkbase Document |
| 101.DEF | | Inline XBRL Taxonomy Extension Definition Linkbase Document |
| 101.LAB | | Inline XBRL Taxonomy Extension Label Linkbase Document |
| 101.PRE | | Inline XBRL Taxonomy Extension Presentation Linkbase Document |
| 104 | | Cover Page Interactive Data File (formatted as inline XBRL and contained in exhibit 101) |
| | |
SIGNATURES
Pursuant to the requirements of the Securities Exchange Act of 1934, the registrant has duly caused this report to be signed on its behalf by the undersigned, thereunto duly authorized.
| | | | | | | | |
| ACM RESEARCH, INC. |
Date: August 7, 2024 | By: | /s/ Mark McKechnie |
| | Mark McKechnie |
| | Chief Financial Officer, Executive Vice President and Treasurer (Principal Financial Officer) |