five years6 years0.01
Exhibit 99.1
 

Unaudited Interim Report
for the
six-month
period ended 30 June 2023


4

The following is a review of our financial condition and results of operations as of 30 June 2023 and for the
six-month
periods ended 30 June 2023 and 2022, and of the key factors that have affected or are expected to be likely to affect our ongoing and future operations.
This document includes information from the previously published results announcement and unaudited interim report of Anheuser-Busch InBev SA/NV for the
six-month
period ended 30 June 2023, as amended to comply with the requirements of Regulation G and Item 10(e) of Regulation
S-K
promulgated by the U.S. Securities and Exchange Commission (“SEC”). The purpose of this document is to provide such additional disclosure as may be required by Regulation G and Item 10(e) and to delete certain information not in compliance with SEC regulations. This document does not update or otherwise supplement the information contained in the previously published results announcement and unaudited interim report.
Some of the information contained in this discussion, including information with respect to our plans and strategies for our business and our expected sources of financing, contain forward-looking statements that involve risk and uncertainties. You should read “Forward-Looking Statements” below for a discussion of the risks related to those statements. You should also read “Item 3. Key Information—D. Risk Factors” of our Annual Report on Form
20-F
for the year ended 31 December 2022 filed with the SEC on 17 March 2023 (“
2022
Annual Report
”) for a discussion of certain factors that may affect our business, financial condition and results of operations. See “Presentation of Financial and Other Data” in our 2022 Annual Report for further information on our presentation of financial information.
We have prepared our interim unaudited condensed consolidated financial statements as of 30 June 2023 and for the
six-month
period ended 30 June 2023 and 2022 in accordance with International Financial Reporting Standards as issued by the International Accounting Standards Board and in conformity with International Financial Reporting Standards as adopted by the European Union (“
IFRS
”). The financial information and related discussion and analysis contained in this report are presented in U.S. dollars except as otherwise specified. Unless otherwise specified the financial information analysis in this Form
6-K
is based on interim unaudited condensed financial statements as of 30 June 2023 and for the
six-month
period ended 30 June 2023 and 2022. The reported numbers as of 30 June 2023 and for the
six-month
period ended 30 June 2023 and 2022 are unaudited, and in the opinion of management, include all normal adjustments that are necessary to present fairly the results for the interim periods. Due to seasonal fluctuations and other factors, the results of operations for the
six-month
period ended 30 June 2023 and 2022 are not necessarily indicative of the results to be expected for the full year. Certain monetary amounts and other figures included in this report have been subject to rounding adjustments. Accordingly, any discrepancies in any tables between the totals and the sums of amounts listed are due to rounding.
Anheuser-Busch InBev is a publicly traded company (Euronext: ABI) based in Leuven, Belgium, with secondary listings on the Mexico (MEXBOL: ANB) and South Africa (JSE: ANH) stock exchanges and with American Depositary Receipts on the New York Stock Exchange (NYSE: BUD). As a company, we dream big to create a future with more cheers. We are always looking to serve up new ways to meet life’s moments, move our industry forward and make a meaningful impact in the world. We are committed to building great brands that stand the test of time and to brewing the best beers using the finest ingredients. Our diverse portfolio of well over 500 beer brands includes global brands Budweiser
®
, Corona
®
and Stella Artois
®
; multi-country brands Beck’s
®
, Hoegaarden
®
, Leffe
®
and Michelob Ultra
®
; and local champions such as Aguila
®
, Antarctica
®
, Bud Light
®
, Brahma
®
, Cass
®
, Castle
®
, Castle Lite
®
, Cristal
®
, Harbin
®
, Jupiler
®
, Modelo Especial
®
, Quilmes
®
, Victoria
®
, Sedrin
®
and Skol
®
. Our brewing heritage dates back more than 600 years, spanning continents and generations. From our European roots at the Den Hoorn brewery in Leuven, Belgium. To the pioneering spirit of the Anheuser & Co brewery in St. Louis, US. To the creation of the Castle Brewery in South Africa during the Johannesburg gold rush. To Bohemia, the first brewery in Brazil. Geographically diversified with a balanced exposure to developed and developing markets, we leverage the collective strengths of approximately 167,000 employees based in nearly 50 countries worldwide. For 2022, AB InBev’s reported revenue was USD 57.8 billion (excluding joint ventures and associates).
Capitalized terms used herein and not defined have the meanings given to them in the 2022 Annual Report.
 
5

Forward-Looking Statements
There are statements in this document, such as statements that include the words or phrases “will likely result,” “are expected to,” “will continue,” “is anticipated,” “anticipate,” “estimate,” “project,” “may,” “might,” “could,” “believe,” “expect,” “plan,” “potential,” “we aim,” “our goal,” “our vision,” “we intend” or similar expressions that are forward-looking statements. These statements are subject to certain risks and uncertainties. Actual results may differ materially from those suggested by these statements due to, among others, the risks or uncertainties listed below. See also “Item 3. Key Information—D. Risk Factors” of our 2022 Annual Report for further discussion of risks and uncertainties that could impact our business.
These forward-looking statements are not guarantees of future performance. Rather, they are based on current views and assumptions and involve known and unknown risks, uncertainties and other factors, many of which are outside our control and are difficult to predict, that may cause actual results or developments to differ materially from any future results or developments expressed or implied by the forward-looking statements. Factors that could cause actual results to differ materially from those contemplated by the forward-looking statements include, among others:
 
   
global, regional and local economic weakness and uncertainty, including the risks of an economic downturn, recession and/or inflationary pressures in one or more of our key markets, and the impact they may have on us, our customers and our suppliers and our assessment of that impact;
 
   
continued geopolitical instability (including as a result of the ongoing conflict between Russia and Ukraine), which may have a substantial impact on the economies of one or more of our key markets and may result in, among other things, disruptions to global supply chains, increases in commodity and energy prices with
follow-on
inflationary impacts, and economic and political sanctions;
 
   
financial risks, such as interest rate risk, foreign exchange rate risk (in particular as against the U.S. dollar, our reporting currency), commodity risk, asset price risk, equity market risk, counterparty risk, sovereign risk, liquidity risk, inflation or deflation, including inability to achieve our optimal net debt level;
 
   
changes in government policies and currency controls;
 
   
continued availability of financing and our ability to achieve our targeted coverage and debt levels and terms, including the risk of constraints on financing in the event of a credit rating downgrade;
 
   
the monetary and interest rate policies of central banks, in particular the European Central Bank, the Board of Governors of the U.S. Federal Reserve System, the Bank of England,
Banco Central do Brasil, Banco Central de la República Argentina
, the Central Bank of China, the South African Reserve Bank,
Banco de la República
in Colombia, the Bank of Mexico and other central banks;
 
   
changes in applicable laws, regulations and taxes in jurisdictions in which we operate, including the laws and regulations governing our operations and changes to tax benefit programs, as well as actions or decisions of courts and regulators;
 
   
limitations on our ability to contain costs and expenses or increase our prices to offset increased costs;
 
   
failure to meet our expectations with respect to expansion plans, premium growth, accretion to reported earnings, working capital improvements and investment income or cash flow projections;
 
   
our ability to continue to introduce competitive new products and services on a timely, cost-effective basis;
 
   
the effects of competition and consolidation in the markets in which we operate, which may be influenced by regulation, deregulation or enforcement policies;
 
6

   
changes in consumer spending;
 
   
changes in pricing environments;
 
   
volatility in the availability or prices of raw materials, commodities and energy;
 
   
difficulties in maintaining relationships with employees;
 
   
regional or general changes in asset valuations;
 
   
greater than expected costs (including taxes) and expenses;
 
   
damage to our reputation or brand image;
 
   
climate change and other environmental concerns;
 
   
the risk of unexpected consequences resulting from acquisitions, joint ventures, strategic alliances, corporate reorganizations or divestiture plans, and our ability to successfully and cost-effectively implement these transactions and integrate the operations of businesses or other assets we have acquired;
 
   
the outcome of pending and future litigation, investigations and governmental proceedings;
 
   
natural and other disasters, including widespread health emergencies such as the
COVID-19
pandemic, cyberattacks and military conflict and political instability;
 
   
any inability to economically hedge certain risks;
 
   
inadequate impairment provisions and loss reserves;
 
   
technological disruptions, threats to cybersecurity and the risk of loss or misuse of personal data;
 
   
other statements included in this document that are not historical; and
 
   
our success in managing the risks involved in the foregoing.
Many of these risks and uncertainties are, and will be, exacerbated by the ongoing conflict between Russia and Ukraine and any worsening of the global business and economic environment as a result. Our statements regarding financial risks, including interest rate risk, foreign exchange rate risk, commodity risk, asset price risk, equity market risk, counterparty risk, sovereign risk, inflation and deflation, are subject to uncertainty. For example, certain market and financial risk disclosures are dependent on choices about key model characteristics and assumptions and are subject to various limitations. By their nature, certain of the market or financial risk disclosures are only estimates and,
as
a result, actual future gains and losses could differ materially from those that have been estimated.
We caution that the forward-looking statements in this document are further qualified by the risk factors disclosed in “Item 3. Key Information—D. Risk Factors” of our 2022 Annual Report that could cause actual results to differ materially from those in the forward-looking statements. Subject to our obligations under Belgian and U.S. law in relation to disclosure and ongoing information, we undertake no obligation to update publicly or revise any forward-looking statements, whether as a result of new information, future events or otherwise.
 
7

Management Comments
Continued global momentum, partially offset by US performance, delivered high-single digit revenue growth
We delivered a
top-line
increase of 7.2%
1
, with revenue growth in more than 85% of our markets in the second quarter of 2023 driven by a revenue per hl increase of 9.0%
1
, as a result of pricing actions, ongoing premiumization and other revenue management initiatives. Volumes declined by 1.4%
2
in the second quarter of 2023, as growth in the majority of our markets was offset by performance in the US. Normalized EBITDA increased by 5.0%
3
in the second quarter of 2023 compared to the same period of 2022, despite anticipated commodity cost headwinds and increased sales and marketing investments. Underlying EPS for the first six months of 2023 was USD 1.37
4
.
Progressing our strategic priorities
We continue to execute on and invest in three key strategic pillars to deliver consistent growth and long-term value creation.
 
   
Lead and grow the category
: In the first six months of 2023, we invested approximately USD 3.5 billion in sales and marketing, an increase of 12.8% versus the same period in 2022, driving an increase of our portfolio brand power
5
in approximately 60% of our key markets. We are executing on five proven and scalable levers to drive category expansion:


Inclusive Category
: In the second quarter of 2023, the percentage of consumers purchasing our portfolio of brands increased across key markets in Latin America and Africa, according to our estimates. This increase in participation was led by female and lower income consumer groups, driven by continued brand and pack innovation.


Core Superiority
: In the second quarter of 2023, our mainstream portfolio delivered
mid-single
digit
1
revenue increase, as double-digit growth in South Africa and Colombia was partially offset by the revenue decline of Bud Light in the US. Our mainstream brands gained or maintained share of segment in two thirds of our key markets, according to our estimates.


Occasions Development
: Our global
no-alcohol
beer portfolio delivered approximately 30%
1
revenue growth in the second quarter of 2023, with our performance driven by Budweiser Zero in Brazil and the growth of Corona Cero in Canada and Europe. Leveraging our digital
direct-to-consumer
products we are investing in and developing new consumption occasions. For example, in Brazil, Zé Delivery enabled the launch of Corona Sunset Hours, an everyday activation encouraging consumers to disconnect from work and reconnect with friends in the early evening.


Premiumization
: Our above core beer portfolio grew revenue by more than 10%
1
in the second quarter of 2023, led by our global brands and double-digit
1
growth of Modelo in Mexico and Spaten in Brazil. Our global brands grew revenue by 18.4%
1,6
outside of their home markets in the second quarter of 2023, led by Corona, which was recently recognized by Kantar BrandZ as the #1 fastest growing global beer brand by value, which grew 23.7%
1,
6
. Budweiser delivered a revenue increase of 16.9%
1,6
with broad-based growth in 25 markets and supported by the return of consumer demand in China. Stella Artois grew by 14.5%
1,6.


Beyond Beer
: Our global Beyond Beer business contributed over USD 385 million of revenue in the second quarter of 2023 and grew by mid-single digits
1
as growth globally was partially offset by a soft malt-based seltzer industry in the US. Global growth was primarily driven by the expansion of Brutal Fruit in Africa and the Vicky portfolio in Mexico.
 
   
Digitize and monetize our ecosystem
:


Digitizing our relationships with more than 6
 million customers globally
: As of 30 June 2023, BEES is live in 23 markets with approximately 64% of our revenues in the second quarter of
 
 
1
Excluding the effects of the 2022 and 2023 acquisitions and disposals and currency translation effects, see “—Revenue” below.
2
Excluding volume changes attributable to the 2022 and 2023 acquisitions and disposals and transfers of businesses, see “—Volumes” below.
3
Normalized EBITDA is a
non-IFRS
measure. For a discussion of how we use Normalized EBITDA, and its limitations, and a table showing the calculation of our Normalized EBITDA, for the periods shown, see “—Normalized EBITDA” below.
4
Underlying EPS is a
non-IFRS
measure. For a discussion of how we use Underlying EPS, and its limitations, and a table showing the calculation of our Underlying EPS, for the periods shown, see “—Profit Attributable to our Equity Holders” below.
5
The Brand Power of our portfolio of beer and Beyond Beer brands is assessed based on data sourced from reports published by Kantar Worldpanel.
6
The growth of our global brands (excluding the effects of the 2022 and 2023 acquisitions and disposals and currency translation effects, see “—Revenue” below), Budweiser, Stella Artois and Corona, excludes exports to Australia for which a perpetual license was granted to a third party upon disposal of the Australia operations in 2020.
 
8

 
2023 captured through B2B digital platforms. In the second quarter of 2023, BEES had 3.3 million monthly active users and captured approximately USD 9.2 billion in gross merchandise value (GMV), growth of 15% and 30% versus the second quarter of 2022 respectively. BEES Marketplace is live in 15 markets with 63% of BEES customers also Marketplace buyers. Marketplace captured approximately USD 340 million in GMV from sales of third-party products in the second quarter of 2023, growth of 41% versus the same period last year.


Leading the way in DTC solutions
: Our omnichannel
direct-to-consumer
(DTC) ecosystem of digital and physical products generated revenue of more than USD 385 million in the second quarter of 2023. Our digital DTC products, Ze Delivery, TaDa and PerfectDraft are available in 20 markets, generated 16.5 million ecommerce orders and delivered over USD 115 million in revenue this quarter, representing 18% growth versus the second quarter of 2023.
 
   
Optimize our business
: In the first six months of 2023, disciplined overhead management and efficient allocation of resources across our operations, enabled us to invest approximately USD 2.1 billion in capex and USD 3.5 billion in sales and marketing to drive the organic growth of our business, while managing the continued elevated cost environment. Underlying EPS
4
for the first six months of 2023 was USD 1.37, an increase of USD 0.04 per same period of 2022, cycling a USD 0.05 per share net benefit from tax credits in Brazil year-over-year.
Advancing our sustainability priorities
We continued to innovate and make progress towards our 2025 Sustainability Goals through key local initiatives with the potential to scale globally. For Climate Action, we invested in a biomass processor in our Jupille brewery in Belgium to produce thermal energy from malt husks, which is expected to reduce our gas consumption by more than 15% and lower our carbon emissions. In Sustainable Agriculture, to strengthen local supply chains we provided technical and financial training to over 900 smallholder barley farmers in Uganda. In Water Stewardship, we installed new vacuum pump technology in breweries across several markets to reduce water usage in bottle fillers by approximately 50%. For Circular Packaging, our business in Brazil launched a nationwide returnable bottle campaign to help increase the use of returnable packaging
by
promoting affordability and sustainability.
Creating a future with more cheers
In the first six months of 2023, we delivered 10.0%
1
revenue growth and 9.1%
3,7
Normalized EBITDA growth while continuing to invest for the long-term in our brands, facilities and digital transformation. We remain focused on brewing high quality beer, providing
best-in-class
service to our customers, generating value for our stakeholders and delivering on our purpose to create a future with more cheers.


7
Excluding the effects of the 2022 and 2023 acquisitions and disposals, the 2022 Brazilian tax credits and currency translation, see “—Normalized EBITDA” below.
 
9

Results of Operations for the
Six-Month
Period Ended 30 June 2023 Compared to
Six-Month
Period Ended 30 June 2022
Effective 1 January 2023,
mark-to-market
gains/(losses) on derivatives related to the hedging of our share-based payment programs are reported in exceptional net finance income/(cost). As a result, the relevant financial information for the
six-month
period ended 30 June 2022 has been amended to conform to the basis of presentation for the
six-month
period ended 30 June 2023 to reflect this change in classification.
Brazilian tax credits
In the
six-month
period ended 30 June 2023,
Ambev, our subsidiary, recognized USD 78 million of interest income in Finance income related to tax credits in Brazil. In the
six-month
period ended 30 June 2022,
Ambev, our subsidiary, recognized USD 201 million income in Other operating income and USD 113 million of interest income in Finance income related to tax credits in Brazil.
The table below presents our condensed consolidated results of operations for the
six-month
periods ended 30 June 2023 and 2022.
 
    
Six-month period
    ended 30 June 2023    
   
Six-month period
    ended 30 June 2022    
   
        Change        


(USD million, except volumes)
   
(%)
(1)
 
Volumes (thousand hectoliters)
     288,131     289,074     (0.3
Revenue
     29,333     28,027     4.7
Cost of sales
     (13,536     (12,784     (5.9
Gross profit
     15,796     15,243     3.6
Selling, General and Administrative expenses
     (9,051     (8,616     (5.0
Other operating income/(expenses)
     327     478     (31.6
Exceptional items
     (107     (105     (1.9
Profit from operations
     6,965     7,000     (0.5
Normalized EBITDA
(²)
     9,668     9,583     0.9
 
 
Note:
 
(1)
The percentage change reflects the improvement (or worsening) of results for the period as a result of the change in each item.
 
(2)
Normalized EBITDA is a
non-IFRS
measure. For a discussion of how we use Normalized EBITDA and its limitations, and a table showing the calculation of our Normalized EBITDA, for the periods shown, see “—Normalized EBITDA” below.
 
10

Volumes
Our reported volumes include both beer and beyond beer and
non-beer
(primarily carbonated soft drinks) volumes. In addition, volumes include not only brands that we own or license, but also third-party brands that we brew or otherwise produce as a subcontractor and third-party products that we sell through our distribution network, particularly in Europe and Middle Americas. Volumes sold by the Global Export and Holding Companies businesses are shown separately.
The table below summarizes the volume evolution by business segment.
 
    
Six-month period
ended 30 June 2023
 
Six-month period
ended 30 June 2022
 
Change


(thousand hectoliters)
 
(%)
(1)
North America
     47,395      51,448        (7.9
Middle Americas
     72,164      72,024        0.2
South America
     76,023      76,815        (1.0
EMEA
     42,842      42,962        (0.3
Asia Pacific
     49,589      45,385        9.3
Global Export and Holding Companies
     117      440        (73.4


Total


                    288,131 


                    289,074 


        (0.3


Note:
 
  (1)
The percentage change reflects the improvement (or worsening) of results for the period as a result of the change in each item.
Our consolidated volumes for the
six-month
period ended 30 June 2023 decreased by 0.9 million hectoliters, or 0.3%, to 288.1 million hectoliters compared to our consolidated volumes for the
six-month
period ended 30 June 2022, as growth in the majority of our markets in the second quarter of 2023 was offset by performance in the US. The results for the
six-month
period ended 30 June 2023 reflect the performance of our business after the completion of certain acquisitions and disposals we undertook in 2022 and 2023 (collectively, the “2022 and 2023 acquisitions and disposals”).
The 2022 and 2023 acquisitions and disposals include acquisitions and disposals which were individually not significant and had no significant impact on our volumes for the
six-month
period ended 30 June 2023 compared to the
six-month
period ended 30 June 2022.
Excluding volume changes attributable to the 2022 and 2023 acquisitions and disposals, our own beer volumes decreased 0.8% in the
six-month
period ended 30 June 2023 compared to the
six-month
period ended 30 June 2022. On the same basis, in the
six-month
period ended 30 June 2023, our
non-beer
volumes increased 2.1% compared to the same period in 2022.
North America
In the
six-month
period ended 30 June 2023, our volumes in North America decreased by 4.1 million hectoliters, or 7.9%, compared to the
six-month
period ended 30 June 2022. Excluding volume changes attributable to transfers of businesses from the Global Export and Holding Companies, our total volumes decreased by 8.0% in the
six-month
period ended 30 June 2023, compared to the same period last year.
In the United States, our
sales-to-wholesalers
(“STWs”) declined by 8.6% and our
sales-to-retailers
(“STRs”) declined by 9.2%, underperforming the industry, primarily due to the volume decline of Bud Light. The beer industry continued to demonstrate resilience in the first half of 2023, delivering revenue growth of 2.6%, while volumes declined 2.7% according to Circana. Our total beer industry share declined in the second quarter of 2023, but has been stable since the last week of April through the end of June. Since April, we actively engaged with over 170,000 consumers across the country through a third-party research firm and the data shows that most consumers surveyed are favorable towards the Bud Light brand and approximately 80% are favorable or neutral. As part of our long-term plan, we increased investments in our key brands, invested in measures to support our wholesalers and continued key initiatives such as partnerships with NFL, NBA, Folds of Honor and Farm Rescue.
In Canada, volumes declined by
low-single
digits.
Middle Americas
In the
six-month
period ended 30 June 2023, our volumes
in
Middle Americas increased by 0.2%, compared to the
six-month
period ended 30 June 2022.
In Mexico, volumes were flat. Our performance in the first six months of 2023 was driven by ongoing portfolio development and digital transformation. Our above core portfolio continued to outperform, growing revenue by
mid-teens,
led by the strong performance of Modelo, Michelob Ultra and Pacifico. We continued to progress our digital and physical DTC initiatives in the second quarter of 2023 with our digital DTC platform, TaDa, now operating in over 60 major cities and fulfilling on average over 300 000 orders per month and the opening of a further 150 Modelorama stores.
 
11

In Colombia, volumes declined by
low-single
digits and in Peru volumes declined by
low-single
digits.
In Ecuador, our volumes increased by low-single digits, supported by continued share of total alcohol gains. Our above core brands continued to lead our growth in the first half of 2023, delivering a double-digit revenue increase.
South America
In the
six-month
period ended 30 June 2023, our volumes in South America decreased by 0.8 million hectoliters, or 1.0%, compared to the
six-month
period ended 30 June 2022, with our beer volumes decreasing 1.7% and soft drinks increasing 0.7%.
In Brazil, our total volumes were flat with beer volumes down 0.9% and
non-beer
volumes up 2.5%. Our premium and super premium brands continued to outperform in the first six months of 2023, delivering volume growth in the
mid-thirties,
led by Original, Spaten and Corona. BEES Marketplace continued to expand, reaching over 700,000 customers, a 29% increase versus the second quarter of 2022, and growing GMV by 64%. Our digital DTC platform, Zé Delivery, reached 4.6 million monthly active users this quarter, a 12% increase versus the second quarter of 2022, and increased GMV by 12%.
In Argentina, volumes declined by
mid-single
digits in the first six months of 2023.
EMEA
In EMEA, our volumes, including subcontracted volumes, for the
six-month
period ended 30 June 2023 decreased by 0.1 million hectoliters, or 0.3%, with our own beer volumes increasing by 0.9%, compared to the
six-month
period ended 30 June 2022. Excluding volume changes attributable to transfers of businesses from the Global Export and Holding Companies, our total volumes decreased by 0.5% in the
six-month
period ended 30 June 2023, compared to the same period last year.
On the same basis, in Europe, our volumes declined by
low-single
digits in the first six months of 2023. We continue to drive premiumization across Europe. Our premium and super premium brands delivered double-digit revenue growth in the first six months of 2023, led by Corona and Budweiser.
In South Africa, volumes grew by
mid-single
digits in the first six months of 2023. We continue to see strong consumer demand for our portfolio, gaining share of beer and total alcohol according to our estimates. Carling Black Label, the #1 beer brand in the country, led our performance in the
six-month
period of 2023, with
low-teens
volume growth and our global brands grew volumes by more than 40%, driven by Corona.
In Africa excluding South Africa, volumes declined by low teens in Nigeria in the first six months of 2023, driven by a soft industry which was impacted by the continued challenging operating environment. In our other markets, we grew volumes in aggregate by low-single digits in the first six months of 2023, driven primarily by Tanzania, Ghana and Uganda.
Asia Pacific
For the
six-month
period ended 30 June 2023, our volumes increased by 4.2 million hectoliters, or 9.3%, compared to the
six-month
period ended 30 June 2022.
In China, volumes grew by 9.4% in the first six months of 2023, outperforming the industry according to our estimates. We delivered volume growth across all segments of our portfolio in the first six months of 2023, led by high-teens volume growth in both our premium and super premium portfolios. The roll out and adoption of the BEES platform continued, with BEES now present in over 220 cities and over 45% of our revenue through digital channels in June.
In South Korea, volumes grew by low single-digits in the first
six
months of 2023.
Global Export & Holding Companies
For the
six-month
period ended 30 June 2023, Global Export and Holding Companies volumes decreased by 0.3 million hectoliters, or 73.4% compared to the same period last year.
Excluding transfer of businesses mainly to the Europe and North America zone, our total volumes decreased by 58.9% in the
six-month
period ended 30 June 2023, compared to the same period last year.
 
12

Revenue
The following table reflects changes in revenue across our business segments for the
six-month
period ended 30 June 2023 as compared to our revenue for the
six-month
period ended 30 June 2022:
 
    
Six-month period
ended 30 June 2023
  
Six-month period
ended 30 June 2022
  
Change


(USD million)
  
(%)
(1)
North America
     7,926       8,192       (3.2
Middle Americas
     7,573       6,693       13.1
South America
     5,849       5,333       9.7
EMEA
     4,070       3,940       3.3
Asia Pacific
     3,679       3,471       6.0
Global Export & Holding Companies
     236       399       (40.9


Total


                    29,333 


                    28,027 


        4.7


Note:
 
(1)
The percentage change reflects the improvement (or worsening) of results for the period as a result of the change in each item.
Our consolidated revenue was USD 29,333 million for the
six-month
period ended 30 June 2023. This represented an increase of USD 1,306 million, or 4.7%, compared to our consolidated revenue for the
six-month
period ended 30 June 2022 of USD 28,027 million. The results for the
six-month
period ended 30 June 2023 reflect (i) the performance of our business after the completion of certain acquisitions and disposals we undertook in 2022 and 2023 and (ii) currency translation effects.
 
 
·
 
The 2022 and 2023 acquisitions and disposals had no significant impact on our consolidated revenue for the
six-month
period ended 30 June 2023 compared to the
six-month
period ended 30 June 2022.
 
 
·
 
Our consolidated revenue for the
six-month
period ended 30 June 2023 also reflects a negative currency translation impact of USD 1,459 million mainly arising from currency translation effects in EMEA, South America and Asia Pacific.
Excluding the effects of the 2022 and 2023 acquisitions and disposals and currency translation, our revenue increased 10.0% and by 10.6% on a per hectoliter basis in the
six-month
period ended 30 June 2023 compared to the same period in 2022. Despite the decrease in volumes discussed above, the increase in our consolidated revenue was driven by the increase in our revenue on a per hectoliter basis, as a result of pricing actions, ongoing premiumization and other revenue management initiatives.
The growth in our revenue per hectoliter in the
six-month
period ended 30 June 2023 was most significant in South America, EMEA and Middle Americas.
 
 
·
 
In South America, the growth in the revenue per hectoliter in Argentina was driven primarily by revenue management initiatives in a highly inflationary environment. In Brazil, we reported double-digit revenue per hectoliter growth, driven by revenue management initiatives and continued premiumization.
 
 
·
 
In Middle Americas, the growth in the revenue per hectoliter was driven by pricing actions and other revenue management initiatives.
 
 
·
 
In EMEA, the growth in the revenue per hectoliter was driven by pricing actions. In Europe, there was also continued momentum of our premium and super premium brands.
On the same basis, combined revenues of our global brands, Budweiser, Stella Artois and Corona, increased by 16.9% outside their home markets in the
six-month
period ended 30 June 2023 compared to the same period of 2022.
We are reporting our Argentinean operation applying hyperinflation accounting under IAS 29, following the categorization of Argentina as a country with a three-year cumulative inflation rate greater than 100%, since 2018. Inflation in Argentina has accelerated over the past 12 months, resulting in a more significant impact on the revenue growth (excluding the effects of the 2022 and 2023 acquisitions and disposals and currency translation effects) of AB InBev than historically. For illustrative purposes, fully excluding the Argentinean operation, the revenue growth (excluding the effects of the 2022 and 2023 acquisitions and disposals and currency translation effects) for AB InBev for
six-month
period ended 30 June 2023 would be 6.7%.
 
13

Cost of Sales
The following table reflects changes in cost of sales across our business segments for the
six-month
period ended 30 June 2023 as compared to the
six-month
period ended 30 June 2022:
 
    
Six-month period
ended 30 June 2023
 
Six-month period
ended 30 June 2022
 
Change


(USD million)
 
(%)
(1)
North America
     (3,420     (3,349     (2.1
Middle Americas
     (2,926     (2,625     (11.5
South America
     (2,949     (2,792     (5.6
EMEA
     (2,210     (2,000     (10.5
Asia Pacific
     (1,750     (1,655     (5.7
Global Export & Holding Companies
     (281     (362     22.4


Total


                    (13,536


                    (12,784


        (5.9


Note:
 
(1)
The percentage change reflects the improvement (or worsening) of results for the period as a result of the change in each item.
Our consolidated cost of sales was USD 13,536 million for the
six-month
period ended 30 June 2023. This represented an increase of USD 752 million, or 5.9% compared to our consolidated cost of sales for the
six-month
period ended 30 June 2022. The results for the
six-month
period ended 30 June 2023 reflect (i) the performance of our business after the completion of certain acquisitions and disposals we undertook in 2022 and 2023 and (ii) currency translation effects.
 
 
·
 
The 2022 and 2023 acquisitions and disposals did not have a significant impact on our consolidated cost of sales for the
six-month
period ended 30 June 2023 compared to the
six-month
period ended 30 June 2022.
 
 
·
 
Our consolidated cost of sales for the
six-month
period ended 30 June 2023 also reflects a positive currency translation impact of USD 690 million mainly arising from currency translation effects in South America, EMEA and Asia Pacific.
Excluding the effects of the 2022 and 2023 acquisitions and disposals and currency translation, our cost of sales increased by USD 1,463 million or 11.5%. Our consolidated cost of sales for the
six-month
period ended 30 June 2023 was partially impacted by decrease in volumes discussed above. On the same basis, our consolidated cost of sales per hectoliter increased by 12.2%. This was primarily driven by anticipated commodity cost headwinds. The increase in cost of sales per hectoliter was most significant in South America, with Argentina in a high inflationary environment, EMEA and North America.
 
14

Operating Expenses
The discussion below relates to our operating expenses, which equal the sum of our distribution, sales and marketing expenses, administrative expenses and other operating income and expenses (net), for the
six-month
period ended 30 June 2023 as compared to the
six-month
period ended 30 June 2022. Our operating expenses do not include exceptional charges, which are reported separately.
Our operating expenses for the
six-month
period ended 30 June 2023 were USD 8,724 million, representing an increase of USD 586 million, compared to our operating expenses for the same period in 2022.
 
    
Six-month
period
    ended 30 June 2023    
   
Six-month
period
    ended 30 June 2022    
   
    Change    


(USD million)
   
(%)
(1)
 
Selling, General and Administrative expenses
     (9,051     (8,616     (5.0
Other operating income/(expenses)
     327     478     (31.6


Total Operating Expenses
  
 
(8,724
 
 
(8,138
 
 
(7.2


Note:
 
(1)
The percentage change reflects the improvement (or worsening) of results for the period as a result of the change in each item.
Selling, General and Administrative Expenses
The following table reflects changes in our distribution expenses, sales and marketing expenses and administrative expenses (our “selling, general and administrative expenses”) across our business segments for the
six-month
period ended 30 June 2023 as compared to the
six-month
period ended 30 June 2022:
 
    
Six-month
period
    ended 30 June 2023    
   
Six-month
period
    ended 30 June 2022    
   
    Change    


(USD million)
   
(%)
(1)
 
North America
     (2,354     (2,279     (3.3
Middle Americas
     (1,863     (1,631     (14.2
South America
     (1,804     (1,609     (12.1
EMEA
     (1,307     (1,341     2.5
Asia Pacific
     (1,033     (999     (3.4
Global Export & Holding Companies
     (692     (756     8.5


Total
  
 
(9,051
 
 
(8,616
 
 
(5.0


Note:
 
(1)
The percentage change reflects the improvement (or worsening) of results for the period as a result of the change in each item.
Our consolidated selling, general and administrative expenses were USD 9,051 million for the
six-month
period ended 30 June 2023. This represented an increase of USD 435 million, or 5.0%, as compared to the
six-month
period ended 30 June 2022. The results for the
six-month
period ended 30 June 2023 reflect (i) the performance of our business after the completion of certain acquisitions and disposals we undertook in 2022 and 2023 and (ii) currency translation effects.
 
   
The 2022 and 2023 acquisitions and disposals had no significant impact on our consolidated selling, general and administrative expenses for the
six-month
period ended 30 June 2023 compared to the
six-month
period ended 30 June 2022.
 
   
Our consolidated selling, general and administrative expenses for the
six-month
period ended 30 June 2023 also reflects a positive currency translation impact of USD 426 million mainly arising from currency translation effects in South America, EMEA and Asia Pacific.
 
15

Excluding the effects of the 2022 and 2023 acquisitions and disposals and currency translation, our consolidated selling, general and administrative expenses increased by 9.8%, due primarily to increased sales and marketing investments.
Other operating income/(expense)
The following table reflects changes in other operating income and expenses across our business segments for the
six-month
period ended 30 June 2023 as compared to the
six-month
period ended 30 June 2022:
 
    
Six-month period

    ended 30 June 2023    
   
Six-month period

    ended 30 June 2022    
   
    Change    


(USD million)
   
(%)
(1)
 
North America
     18     28     (35.7
Middle Americas
     8     (12     -
South America
     171     312     (45.2
EMEA
     83     88     (5.7
Asia Pacific
     53     67     (20.9
Global Export & Holding Companies
     (6     (5     (20.0


Total
  
 
327
 
 
478
 
 
(31.6


Note:
 
(1)
The percentage change reflects the improvement (or worsening) of results for the period as a result of the change in each item.
The net positive effect of our consolidated other operating income and expenses for the
six-month
period ended 30 June 2023 was USD 327 million. This represented a decrease of USD 151 million, as compared to the
six-month
period ended 30 June 2022. The results for the
six-month
period ended 30 June 2023 reflect (i) the performance of our business after the completion of certain acquisitions and disposals we undertook in 2022 and 2023, (ii) the tax credits in Brazil recognized by our subsidiary, Ambev in 2022 and (iii) currency translation effects.
 
   
The 2022 and 2023 acquisitions and disposals and the 2022 Brazilian tax credits negatively impacted our net consolidated other operating income and expenses by USD 204 million on a net basis for the
six-month
period ended 30 June 2023 compared to the
six-month
period ended 30 June 2022.
 
   
Our net consolidated other operating income and expenses for the
six-month
period ended 30 June 2023 had no significant currency translation impact.
Excluding the effects of the 2022 and 2023 acquisitions and disposals, Brazilian tax credits and currency translation, our net consolidated other operating income and expenses increased by 26.2%, mainly driven by higher government grants and the impact of disposal of
non-core
assets year-over-year.
Exceptional Items
Exceptional items are items which, in our management’s judgment, need to be disclosed separately by virtue of their size and incidence in order to obtain a proper understanding of our financial information. We consider these items to be significant in nature.
For the
six-month
period ended 30 June 2023, exceptional items included in profit from operations consisted of restructuring charges, business and asset disposal (including impairment losses) and legal costs. Exceptional items were as follows for
six-month
period ended 30 June 2023 and 2022:
 
    
Six-month period

    ended 30 June 2023    
   
Six-month
period

    ended 30 June 2022    


(USD million)
 
COVID-19
costs
     -       (13
Restructuring
     (50     (51
Business and asset disposal (including impairment losses)
     (38     6
Legal costs
     (19     -
AB InBev Efes related costs
     -       (47


Total
  
 
(107
 
 
(105


16

Restructuring
Exceptional restructuring charges amounted to a net cost of USD 50 million for the
six-month
period ended 30 June 2023 as compared to a net cost of USD 51 million for the
six-month
period ended 30 June 2022. These charges primarily relate to exceptional organizational alignments resulting from improvement in efficiency and aim to eliminate overlapping organizations or duplicated and manual processes, taking into account the right match of employee profiles with the new organizational requirements.
Business and assets disposals (including impairment losses)
Business and assets disposals (including impairment losses) amounted to a net cost of USD 38 million for the
six-month
period ended 30 June 2023 mainly comprising impairment of intangible assets and other
non-core
assets sold in the period.
Legal costs
The company recorded exceptional legal costs of USD 19 million for the
six-month
period ended 30 June 2023 related to the successful outcome of series of lawsuits regarding Ambev warrants.
AB InBev Efes related costs
During the
six-month
period ended 30 June 2022, we incurred exceptional costs of USD 47 million related to AB InBev Efes, following the discontinuation of exports to Russia and our forfeiture of benefits from the operations of the associate.
Profit from Operations
The following table reflects changes in profit from operations across our business segments for the
six-month
period ended 30 June 2023 as compared to the
six-month
period ended 30 June 2022:
 
    
Six-month
period
    ended 30 June 2023    
   
Six-month
period
    ended 30 June 2022    
   
    Change    


(USD million)
   
(%)
(1)
 
North America
     2,131     2,570     (17.1
Middle Americas
     2,781     2,416     15.1
South America
     1,241     1,234     0.6
EMEA
     618     667     (7.4
Asia Pacific
     944     879     7.4
Global Export & Holding Companies
     (749     (766     2.2


Total
  
 
6,965
 
 
7,000
 
 
(0.5


Note:
 
(1)
The percentage change reflects the improvement (or worsening) of results for the period as a result of the change in each item.
Our profit from operations amounted to USD 6,965 million for the
six-month
period ended 30 June 2023. This represented a decrease of USD 35 million, as compared to our profit from operations for the
six-month
period ended 30 June 2022. The results for the
six-month
period ended 30 June 2023 reflect (i) the performance of our business after the completion of certain acquisitions and disposals we undertook in 2022 and 2023, (ii) the 2022 Brazilian tax credits, (iii) currency translation effects and (iv) the effects of certain exceptional items as described above.
 
   
The 2022 and 2023 acquisitions and disposals and the Brazilian tax credits negatively impacted our consolidated profit from operations by USD 239 million for the
six-month
period ended 30 June 2023 compared to the
six-month
period ended 30 June 2022.
 
   
Our consolidated profit from operations for the
six-month
period ended 30 June 2023 also reflects a negative currency translation impact of USD 358 million.
 
   
Our profit from operations for the
six-month
period ended 30 June 2023 was negatively impacted by USD 107 million of certain exceptional items, as compared to a negative impact of USD 105 million for the
six-month
period ended 30 June 2022. See “Exceptional Items” above for a description of exceptional items that impacted our profit from operations for the
six-month
period ended 30 June 2023 and 2022.
Excluding the effects of the 2022 and 2023 acquisitions and disposals, the 2022 Brazilian tax credits and currency translation, our profit from operations increased by 8.3%. This increase was most significant in South America, APAC
 
17

and Middle Americas, mainly due to revenue growth that was partially offset by anticipated commodity cost headwinds and higher selling, general and administrative expenses due primarily to increased sales and marketing investments.
Normalized EBITDA
The following table reflects changes in our Normalized EBITDA, for the
six-month
period ended 30 June 2023 as compared to the
six-month
period ended 30 June 2022:
 
    
    Six-month period ended    

30 June 2023
   
    Six-month period ended    

30 June 2022
   
Change  


(USD million)
   
(%)
(1)
 
Profit attributable to equity holders of AB InBev
     1,977     1,692  
 
16.8
Profit attributable to
non-controlling
interests
     678     782  
 
(13.3


Profit of the period
  
 
2,655
 
 
2,474
 
 
7.3
Net finance cost
     3,223     2,268  
 
(42.1
Income tax expense
     1,192     1,244  
 
4.2
Share of result of associates
     (105     (129  
 
(18.6
Exceptional share of results of associates
  
 
-
 
    1,143  
 
-


Profit from operations
  
 
6,965
 
 
7,000
 
 
(0.5
Exceptional items
     107     105     (1.9
Profit from operations, before exceptional items
(2)
  
 
7,072
 
 
7,105
 
 
(0.5


Depreciation, amortization and impairment
     2,596     2,477  
 
(4.8


Normalized EBITDA
(3)
  
 
9,668
 
 
9,583
 
 
0.9


Note:
 
(1)
The percentage change reflects the improvement (or worsening) of results for the period as a result of the change in each item.
(2)
Profit from operations, before exceptional items is a
non-IFRS
measure. See “Item 5. Operating and Financial Review and Results of Operations—Results of Operations—Year Ended 31 December 2022 Compared to Year Ended 31 December 2021—Normalized EBITDA” of our 2022 Annual Report for additional information on our definition and use of Profit from operations, before exceptional items.
(3)
Normalized EBITDA is a
non-IFRS
measure. See “Item 5. Operating and Financial Review and Results of Operations—Results of Operations—Year Ended 31 December 2022 Compared to Year Ended 31 December 2021—Normalized EBITDA” of our 2022 Annual Report for additional information on our definition and use of Normalized EBITDA.
Our Normalized EBITDA amounted to USD 9,668 million for the
six-month
period ended 30 June 2023. This represented an increase of USD 85 million, or 0.9%, as compared to our Normalized EBITDA for the
six-month
period ended 30 June 2022. The results for the
six-month
period ended 30 June 2023 reflect (i) the performance of our business after the completion of the acquisitions and disposals we undertook in 2022 and 2023, (ii) the Brazilian tax credits and (iii) currency translation effects. Excluding the effects of the 2022 and 2023 acquisitions and disposals, the 2022 Brazilian tax credits and currency translation, our Normalized EBITDA increased by 9.1%, despite anticipated commodity cost headwinds and increased sales and marketing investments.
 
18

Net Finance Income/(Cost)
Our net finance income/(cost) items were as follows for the
six-month
period ended 30 June 2023 and 30 June 2022:
 
    
Six-month period

    ended 30 June 2023    
        
Six-month period

    ended 30 June 2022    
        
    Change    


(USD million)
        
(%)
(1)
 
Net interest expense
     (1,630)           (1,683)           3.1  
Net interest on net defined benefit liabilities
     (42)           (37)           (13.5)   
Accretion expense
     (385)           (336)           (14.6)   
Net interest income on Brazilian tax credits
     78          113          (31.0)   
Other financial results
     (540)           (501)           (7.8)   


Net finance cost before exceptional finance results
(2)
  
 
(2,520) 


(2,444) 


(3.1) 
 
Mark-to-market
(2)
     (703)           296          -  
Gain/(loss) on bond redemption and other
     -             (120)           -    


Exceptional net finance income/(cost)
(2)


(703) 


176  
    
 
-  


Net finance income/(cost)
  
 
(3,223) 


(2,268) 


(42.1) 
 
 
Note:
 
(1)
The percentage change reflects the improvement (or worsening) of results for the period as a result of the change in each item.
 
(2)
The financial information for the
six-month
period ended 30 June 2022 has been amended to conform to the basis of presentation for the
six-month
period ended 30 June 2023 to reflect the change in classification of
mark-to-market
gains/(losses) on derivatives related to the hedging of our share-based payment programs.
Our net finance cost for the
six-month
period ended 30 June 2023 was USD 3,223 million, as compared to a net finance cost of USD 2,268 million for the
six-month
period ended 30 June 2022, representing a cost increase of USD 955 million.
The net finance costs before exceptional financial results increased from USD 2,444 million for the
six-month
period ended 30 June 2022 to USD 2,520 million for the
six-month
period ended 30 June 2023.
Exceptional net finance income/(cost) includes a negative
mark-to-market
adjustment of USD 703 million on derivative instruments related to the hedging of our share-based payment programs and on derivative instruments entered into to hedge the shares issued in relation to the combination with Grupo Modelo and SAB, compared to a positive
mark-to-market
adjustment of USD 296 million for the
six-month
period ended 30 June 2022.
The number of shares covered by the hedging of our share-based payment programs, the deferred share instrument and the restricted shares, together with the opening and closing share prices, are shown below:
 
    
Six-month period

        ended 30 June 2023        
        
Six-month period

        ended 30 June 2022        
 
                   
Share price at the start of the
six-month
period (in euro)
     56.27          53.17  
Share price at the end of the
six-month
period (in euro)
     51.83          51.36  
Number of derivative equity instruments at the end of the period (in millions)
     100.5          100.5  
Share of Results of Associates
Our share of results of associates for the
six-month
period ended 30 June 2023 was USD 105 million as compared to USD 129 million for the
six-month
period ended 30 June 2022.
Exceptional Share of Results of Associates
Our exceptional share of results of associates for the
six-month
period ended 30 June 2022 included the
non-cash
impairment of USD 1,143 million we recorded on our investment in AB InBev Efes.
 
19

Income Tax Expense
Our total income tax expense for the
six-month
period ended 30 June 2023 was USD 1,192 million, with an effective tax rate of 31.9%, as compared to an income tax expense of USD 1,244 million and an effective tax rate of 26.3% for the
six-month
period ended 30 June 2022. The effective tax rate for the
six-month
period ended 30 June 2023 was negatively impacted by the
non-deductible
losses from derivatives related to the hedging of our share-based payment programs and hedging of the shares issued in a transaction related to the combination with Grupo Modelo and SAB, while the effective tax rate of 2022 was positively impacted by
non-taxable
gains from these derivatives.
The effective tax rate for the
six-month
period ended 30 June 2023 was negatively impacted by country mix.
Profit Attributable to
Non-Controlling
Interests
Profit attributable to
non-controlling
interests was USD 678 million for the
six-month
period ended 30 June 2023, a decrease of USD 104 million from USD 782 million for the
six-month
period ended 30 June 2022.
Profit Attributable to Our Equity Holders
Profit attributable to our equity holders for the
six-month
period ended 30 June 2023 was USD 1,977 million compared to USD 1,692 million for the same period in 2022. Basic earnings per share of USD 0.98 for the
six-month
period ended 30 June 2023 is based on 2,016 million shares outstanding, representing the weighted average number of ordinary and restricted shares outstanding during this period, where weighted average number of ordinary and restricted shares means, for any period, the number of shares outstanding at the beginning of the period, adjusted by the number of shares canceled, repurchased or issued during the period, including deferred share instruments and stock lending, multiplied by a time-weighting factor.
Underlying profit, attributable to equity holders of AB InBev for the
six-month
period ended 30 June 2023 was USD 2,762 million. Items excluded from Underlying profit, attributable to equity holders of AB InBev are the
after-tax
exceptional items discussed above under “—Exceptional Items, “—Net Finance Income/(Cost)” and “—Exceptional Share of Results of Associates” and the impact of hyperinflation accounting.
Underlying EPS for the
six-month
period ended 30 June 2023 was USD 1.37. Underlying EPS is basic earnings per share excluding the
after-tax
exceptional items discussed above under “—Exceptional Items, “—Net Finance Income/(Cost)” and “—Exceptional Share of Results of Associates” and the impact of hyperinflation accounting.
The increase in profit attributable to our equity holders for the
six-month
period ended 30 June 2023 was primarily due to the exceptional share of results of associates recorded in the
six-month
period ended 30 June 2022, partially offset by the increase in the net finance cost in the
six-month
period ended 30 June 2023 compared to the same period in 2022.
 
    
    Six-month period ended    

30 June 2023
        
    Six-month period ended    

30 June 2022


(USD million)
 
Profit attributable to equity holders of AB InBev
  
 
1,977 


1,692 
 
Exceptional items, before taxes
     107           105   
Exceptional net finance cost, before taxes
 (1)
     703         (176)  
Exceptional share of results of associates
              1,143   
Exceptional taxes
     (51)          (69)  
Exceptional
non-controlling
interest
     (9)         
Hyperinflation impacts
     35         (26)  


Underlying profit, attributable to equity holders of AB InBev
(2)
  
 
2,762 


2,672 
 
Note:
 
(1)
The financial information for the
six-month
period ended 30 June 2022 has been amended to conform to the basis of presentation for the
six-month
period ended 30 June 2023 to reflect the change in classification of
mark-to-market
gains/(losses) on derivatives related to the hedging of our share-based payment programs.
 
(2)
Underlying profit, attributable to equity holders of AB InBev is a
non-IFRS
measure. See “Item 5. Operating and Financial Review and Results of Operations—Results of Operations—Year Ended 31 December 2022 Compared to Year Ended 31 December 2021—Profit Attributable to Our Equity Holders” of our 2022 Annual Report for additional information on our definition and use of Underlying profit attributable to equity holders of AB InBev.
 
20

    
Six-month period

        ended 30 June 2023        
           
Six-month period

        ended 30 June 2022        


(USD per share)
 
Basic earnings per share
  
 
0.98 
     
 
0.84 
Exceptional items, before taxes
     0.05          0.05 
Exceptional net finance cost, before taxes
(1)
     0.35          (0.09)  
Exceptional share of results of associates
               0.57 
Exceptional taxes
     (0.03)           (0.03)  
Hyperinflation accounting impacts in EPS
     0.02          (0.01)  


Underlying EPS
(2)
  
 
1.37 
     
 
1.33 
Note:
 
  (1)
The financial information for the
six-month
period ended 30 June 2022 has been amended to conform to the basis of presentation for the
six-month
period ended 30 June 2023 to reflect the change in classification of
mark-to-market
gains/(losses) on derivatives related to the hedging of our share-based payment programs.
 
  (2)
Underlying EPS is a
non-IFRS
measure. See “Item 5. Operating and Financial Review—E. Results of Operations—Year Ended 31 December 2022 Compared to the Year Ended 31 December 2021—Profit Attributable to Our Equity Holders” of our 2022 Annual Report for additional information on our definition and use of Underlying EPS.
The calculation of earnings per share is based on 2,016 million shares outstanding, representing the weighted average number of ordinary and restricted shares outstanding during the
six-month
period ended 30 June 2023 (30 June 2022: 2,012 million shares).
Impact of Changes in Foreign Exchange Rates
Foreign exchange rates have a significant impact on our consolidated financial statements. The following table sets forth the percentage of our revenue realized by currency for the
six-month
period ended 30 June 2023 and 2022:
 
    
Six-month
period ended


            30 June 2023
           
            30 June 2022
 
U.S. dollar
     27.3%           29.3%  
Brazilian real
     14.5%           13.7%  
Mexican peso
     12.3%           10.3%  
Chinese yuan
     9.6%           9.4%  
Euro
     5.5%           5.5%  
Colombian peso
     3.6%           4.1%  
South African rand
     3.6%           3.9%  
Argentinean peso
(1)
     3.4%           3.3%  
Canadian dollar
     3.2%           3.4%  
Peruvian nuevo sol
     3.1%           2.8%  
Dominican peso
     2.1%           2.0%  
Pound sterling
     1.9%           2.1%  
South Korean won
     1.9%           2.1%  
Other
     7.9%           8.0%  
Note:
 
(1)
Hyperinflation accounting was adopted starting from the September
year-to-date
2018 results.
 
21

Liquidity and Capital Resources
The following table sets forth our consolidated cash flows for the
six-month
period ended 30 June 2023 and 2022:
 
    
Six-month period

        ended 30 June 2023        
           
Six-month period

        ended 30 June 2022        


(USD million)
 
Cash flow from operating activities
     1,597          2,182 
Cash flow from/(used in) investing activities
     (2,061)           (1,917)  
Cash flow from/(used in) financing activities
     (2,823)           (5,392)  


Net increase/(decrease) in cash and cash equivalents
  
 
(3,287)


(5,128)
 
Cash flow from operating activities
The following table sets forth our cash flow from operating activities for the
six-month
period ended 30 June 2023 and 30 June 2022:
 
    
Six-month period

        ended 30 June 2023        
           
Six-month period

        ended 30 June 2022        


(USD million)
 
Profit
     2,655          2,474 
Interest, taxes and
non-cash
items included in profit
     7,512          7,015 


Cash flow from operating activities before changes in working capital and provisions
  
 
10,167 
     
 
9,489 
Change in working capital
     (4,615)           (3,339)  
Pension contributions and use of provisions
     (192)           (195)  
Interest and taxes (paid)/received
     (3,806)           (3,823)  
Dividends received
     43          50 


Cash flow from operating activities
  
 
1,597 
     
 
2,182 
Cash flow from operating activities was USD 1,597 million for the
six-month
period ended 30 June 2023 compared to USD 2,182 million for
six-month
period ended 30 June 2022. The decrease was primarily driven by changes in working capital for the first six months of 2023 compared to the same period last year as 2022.
Changes in working capital in the first half of 2023 and 2022 reflect higher working capital levels at the end of June than at
year-end
as a result of seasonality.
Cash flow from investing activities
The following table sets forth our cash flow from investing activities for the
six-month
period ended 30 June 2023 and 2022:
 
    
Six-month period

        ended 30 June 2023        
           
Six-month period

        ended 30 June 2022        


(USD million)
 
Net capital expenditure
(1)
     (2,063)           (1,939)  
Sale/(acquisition) of subsidiaries, net of cash disposed/ acquired of
     (8)           (44)  
Proceeds from sale/(acquisition) of other assets
     10          66 


Cash flow from / (used in) investing activities
  
 
(2,061)


(1,917)
 
Note:
 
  (1)
Net capital expenditure consists of acquisitions of plant, property and equipment and of intangible assets, minus proceeds from sale.
 
22

Cash flow from investing activities was a net cash outflow of USD 2,061 million for the
six-month
period ended 30 June 2023 compared to a net cash outflow of USD 1,917 million for the
six-month
period ended 30 June 2022. The increase in the cash outflow from investing activities was mainly due to higher net capital expenditures in 2023 compared to 2022.
Our net capital expenditures were USD 2,063 million for the
six-month
period ended 30 June 2023 and USD 1,939 million for the
six-month
period ended 30 June 2022. Out of the total half-year 2023 capital expenditures approximately 33% was used to improve our production facilities, 49% was used for logistics and commercial investments and 18% was used for improving administrative capabilities and the purchase of hardware and software.
Cash flow from financing activities
The following table sets forth our cash flow from financing activities for the
six-month
period ended 30 June 2023 and 2022:
 
   
Six-month
period
      ended 30 June 2023      
     
Six-month
period
      ended 30 June 2022      
             
   
(USD million)
Dividends paid
    (1,923       (1,276
Net (payments on)/proceeds from borrowings
    155       (3,452
Payments of lease liabilities
    (359       (286
Other (including purchase of
non-controlling
interests)
    (696       (378


Cash flow from / (used in) financing activities
 
 
(2,823
   
 
(5,392
Cash outflow from financing activities was USD 2,823 million for the
six-month
period ended 30 June 2023, compared to a cash outflow of USD 5,392 million for the
six-month
period ended 30 June 2022. The decrease is primarily driven by lower debt redemption in 2023 compared in 2022.
As of 30 June 2023, we had total liquidity of USD 16.9 billion, which consisted of USD 10.1 billion available under committed long-term credit facilities and USD 6.8 billion of cash, cash equivalents and short-term investments in debt securities less bank overdrafts. Although we may borrow such amounts to meet our liquidity needs, we principally rely on cash flows from operating activities to fund the company’s operations.
Capital Resources and Equity
Our net debt was USD 73.8 billion as of 30 June 2023 as compared to USD 69.7 billion as of 31 December 2022. See note 17 to our unaudited condensed consolidated interim financial statements as of 30 June 2023 and for the
six-month
period ended 30 June 2023 and 2022 for a discussion of how we use net debt and a table showing the calculation of our net debt as of 30 June 2023. Apart from operating results net of capital expenditures, the net debt was mainly impacted by payments of interests and taxes (USD 3.8 billion increase of net debt), dividend payments to shareholders of AB InBev and Ambev (USD 1.9 billion increase of net debt) and foreign exchange impact on net debt (USD 0.4 billion increase of net debt).
96% of our bond portfolio holds a fixed-interest rate, 42% is denominated in currencies other than USD and maturities are well-distributed across the next several years.
Consolidated equity attributable to our equity holders as at 30 June 2023 was USD 77,460 million, compared to USD 73,398 million as at 31 December 2022. The net increase in equity results from the profit attributable to equity shareholders and foreign exchange gains on translation of foreign operations primarily related to the combined effect of the appreciation of the closing rates of the Colombian peso, the Euro, the Mexican peso, the Peruvian sol and the weakening of the closing rate of the South African rand, which resulted in a foreign exchange translation adjustment of USD 3 610 million as of 30 June 2023 (increase of equity). This increase in equity is partially offset by dividends paid.
 
23

The chart below shows the bond repayment schedule as of 30 June 2023 (figures in USD billion):
 
Further details on interest bearing loans and borrowings, repayment schedules and liquidity risk are disclosed in notes 17 and 19 to our unaudited condensed consolidated interim financial statements as of 30 June 2023 and for the
six-month
period ended 30 June 2023 and 2022.
Adoption of hyperinflation accounting in Argentina
Since 1 January 2018, we have applied hyperinflation accounting as prescribed by IAS 29
Financial Reporting in Hyperinflationary Economies
for our Argentinean subsidiaries.
The results for the
six-month
period ended 30 June 2023 were translated at the June 2023 closing rate of 256.71 Argentinean pesos per US dollar. The results for the
six-month
period ended 30 June 2022, were translated at the June 2022 closing rate of 125.21 Argentinean pesos per US dollar.
The impact of hyperinflation accounting for the period ended 30 June 2023 amounted to USD 23 million increase in revenue, USD 66 million positive monetary adjustment reported in the finance line and represented USD (0.02) earnings per share excluding exceptional items.
 
24

Guarantor Financial Information
The debt securities issued by (i) Anheuser-Busch InBev Finance Inc. (“
ABIFI
”) under Indentures dated as of January 17, 2013, January 25, 2016 and May 15, 2017, in each case among ABIFI, Anheuser-Busch InBev SA/NV (the “
Parent Guarantor
”), the subsidiary guarantors listed therein and the Bank of New York Mellon Trust Company, N.A., as trustee (ii) Anheuser-Busch InBev Worldwide Inc. (“
ABIWW
”) under Indentures dated as of October 16, 2009, December 16, 2016 and April 4, 2018, in each case among ABIWW, the Parent Guarantor, the subsidiary guarantors listed therein and the Bank of New York Mellon Trust Company, N.A, as trustee and (iii) Anheuser-Busch Companies, LLC (“
ABC
”) and ABIWW, as
co-issuers,
under the Indenture dated as of November 13, 2018, among ABC, ABIWW, the subsidiary guarantors listed therein and the Bank of New York Mellon Trust Company, N.A., as trustee, are, in each case, fully and unconditionally guaranteed by the Parent Guarantor and jointly and severally guaranteed by Brandbrew S.A., Brandbev S.à r.l. and Cobrew NV, and by ABC (in respect of debt issued by ABIFI and/or ABIWW (as sole issuer)), ABIWW (in respect of debt issued by ABIFI) and by ABIFI (in respect of debt issued by ABIWW and/or ABC) on a full and unconditional basis. The Parent Guarantor owns, directly or indirectly, 100% of each of ABIFI, ABIWW, ABC, Brandbrew S.A., Brandbev S.à r.l. and Cobrew NV.
Each guarantee provided under the aforementioned indentures is referred to as a “
Guarantee
” and collectively, the “
Guarantees
”; the subsidiaries of the Parent Guarantor providing Guarantees are referred to as the “
Subsidiary Guarantors
” and the Parent Guarantor and Subsidiary Guarantors collectively are referred to as the “
Guarantors
”. ABIWW, ABIFI and ABC are collectively referred to as the “
Issuers
”.
For disclosure required by Rule
13-01
of Regulation
S-X
of certain terms and conditions of the guarantees and how the issuer and guarantor structure and other factors may affect payments to the holder of the debt securities see “Item 5. Operating and Financial Review—G. Liquidity and Capital Resources—Guarantor Financial Information” of our 2022 Annual Report.
Summarized financial information is presented below for Anheuser-Busch InBev SA/NV, the Issuers and the Subsidiary Guarantors on a combined basis after elimination of intercompany transactions and balances among them and does not include investments in and equity in the earnings of
non-guarantor
subsidiaries. The intercompany balances with
Non-Guarantor
Subsidiaries have been presented separately. This summarized financial information is not intended to present the financial position or results of operations of Anheuser-Busch InBev SA/NV, the Issuers and the Subsidiary Guarantors in accordance with IFRS.
 
   
Six-month
period
    ended 30 June 2023¹    


Year ended

    31 December 2022²    
 
   
USD million
         
USD million
 
Income Statement Data
     
Revenue
    7,198         15,231  
Gross profit
    3,675         8,183  
Profit for the period
    66         975  
   
Six-month
period
ended 30 June 2023
         
Year ended

31 December 2022
 
   
USD million
         
USD million
 
Statement of Financial Position Data
     
Due from
non-guarantor
subsidiaries
    95,048         99,031  
Other
non-current
assets
    62,182         61,978  
Non-current
assets
 
 
157,230


161,009
 
Due from
non-guarantor
subsidiaries
    10,064         3,595  
Other current assets
    7,044         13,367  
Current assets
 
 
17,108


16,962
 
Due to
non-guarantor
subsidiaries
    23,547         24,657  
Other
non-current
liabilities
    83,889         84,502  
Non-current
liabilities
 
 
107,435


109,159
 
Due to
non-guarantor
subsidiaries
    10,824         12,894  
Other current liabilities
    20,031         22,668  
Current liabilities
 
 
30,855


35,562
 
Notes:
 
  (1)
For the
six-month
period ended 30 June 2023, revenue, gross profit and profit of the period includes USD 104 million, USD (225) million and USD 1,130 million of intercompany transactions with
non-guarantor
subsidiaries and related parties, respectively.
 
25

  (2)
For the year ended 31 December 2022, revenue, gross profit and profit of the period includes USD 299 million, USD (439) million and USD 25 million of intercompany transactions with
non-guarantor
subsidiaries and related parties, respectively.
2023 OUTLOOK
We expect our revenue to grow from a healthy combination of volume and price.
Net pension interest expenses and accretion expenses are expected to be in the range of USD 200 to 230 million per quarter, depending on currency and interest rate fluctuations. We expect the average gross debt coupon in 2023 to be approximately 4.0%.
We expect net capital expenditure of between USD 4.5 and 5.0 billion in 2023.
 
26

Index
 
     1  
     2  
     3  
     4  
     5  
     6  

Unaudited condensed consolidated interim income statement
 
  For the
six-month
period ended 30 June
 
  Million US dollar, except earnings per shares in US dollar
  
No
te
s
  
                    
20
23
 
  
                    2022¹  


Revenue


29 333


28 027
 
Cost of sales
  
 
     (13 536)        (12 784)  
Gross profit


15 796


15 243
 
                        
Distribution expenses
  
 
     (3 183)        (3 076)  
Sales and marketing expenses
  
 
     (3 518)        (3 304)  
Administrative expenses
  
 
     (2 350)        (2 237)  
Other operating income/(expenses)
  
 
     327        478  
Exceptional costs above profit from operations
   7      (107)        (105)  
Profit from operations


6 965


7 000


Finance cost
   8      (3 608)        (2 962)  
Finance income
   8      385        694  
Net finance income/(cost)


(3 223)


(2 268)


Share of result of associates
   13      105        129  
Exceptional share of results of associates
   7 / 13      -          (1 143)  
Profit before tax


3 847


3 718


Income tax expense
   9      (1 192)        (1 244)  
Profit of the period


2 655


2 474
 
                        
Profit of the period attributable to:


Equity holders of AB InBev
  
 
     1 977        1 692  
Non-controlling
interest
  
 
     678        782  
                        
Basic earnings per share
   16      0.98        0.84  
Diluted earnings per share
   16      0.96        0.83  
The accompanying notes are an integral part of these consolidated financial statements.


1
As from 1 January 2023, mark-to-market gains/(losses) on derivatives related to the hedging of the share-based payment programs are reported in the exceptional net finance income/(cost). The 2022 presentation was amended to conform to the 2023 presentation.
 
1

Unaudited condensed consolidated interim statement of comprehensive income/(loss)
 
  For the
six-month
period ended 30 June
                  
  Million US dollar
  
Notes
  
                    2023
    
                    2022  
 
                        
Profit of the period


2 655


2 474  
 
                        
Other comprehensive income/(loss): items that will not be reclassified to profit or loss:


Re-measurements
of post-employment benefits
   16      3        1    


3
    
 
1  
 
Other comprehensive income/(loss): items that may be reclassified subsequently to profit or loss:


Exchange differences on translation of foreign operations
   16      3 574        2 412    
Effective portion of changes in fair value of net investment hedges
  
 
     (95)        (417)    
Cash flow hedges recognized in equity
  
 
     (497)        189    
Cash flow hedges reclassified from equity to profit or loss
  
 
     (103)        (451)    


2 879


1 733  
 
                        
Other comprehensive income/(loss), net of tax


2 882


1 734  
 
                        
Total comprehensive income/(loss)


5 538


4 208  
 
                        
Attributable to:


Equity holders of AB InBev
  
 
     5 049        3 584    
Non-controlling
interest
  
 
     488        624    
The accompanying notes are an integral part of these consolidated financial statements.
 
2

Unaudited condensed consolidated interim statement of financial position
 
  Million US dollar
  
Notes
  
        30 
June 
2023
    
        31 
December 
2022  
                        
ASSETS


Non-current
assets


Property, plant and equipment
   10      27 181        26 671  
Goodwill
   11      116 168        113 010  
Intangible assets
   12      40 973        40 209  
Investments in associates
   13      4 728        4 656  
Investment securities
   15      179        175  
Deferred tax assets
  
 
     2 836        2 300  
Employee benefits
  
 
     11        11  
Income tax receivables
  
 
     835        883  
Derivatives
   19      62        60  
Trade and other receivables
   14      1 895        1 782  
Total
non-current
assets


194 868
    
 
189 757
 
                        
Current assets


Investment securities
   15      85        97  
Inventories
  
 
     6 839        6 612  
Income tax receivables
  
 
     912        813  
Derivatives
   19      157        331  
Trade and other receivables
   14      6 609        5 330  
Cash and cash equivalents
   15      6 848        9 973  
Assets classified as held for sale
  
 
     35        30  
Total current assets


21 483
    
 
23 186
 
                        
Total assets


216 352
    
 
212 943
 
                        
EQUITY AND LIABILITIES


Equity


Issued capital
   16      1 736        1 736  
Share premium
  
 
     17 620        17 620  
Reserves
  
 
     18 835        15 218  
Retained earnings
  
 
     39 269        38 823  
Equity attributable to equity holders of AB InBev


77 460
    
 
73 398
 
                        
Non-controlling
interests
  
 
     11 324        10 880  
Total equity


88 783
    
 
84 278
 
                        
Non-current
liabilities


Interest-bearing loans and borrowings
   17      78 323        78 880  
Employee benefits
  
 
     1 521        1 534  
Deferred tax liabilities
  
 
     12 003        11 818  
Income tax payables
  
 
     595        610  
Derivatives
   19      113        184  
Trade and other payables
  
 
     872        859  
Provisions
  
 
     370        396  
Total
non-current
liabilities


93 796
    
 
94 282
 
                        
Current liabilities


Bank overdrafts
   15      53        83  
Interest-bearing loans and borrowings
   17      2 524        1 029  
Income tax payables
  
 
     1 263        1 438  
Derivatives
   19      6 340        5 308  
Trade and other payables
  
 
     23 347        26 349  
Provisions
  
 
     244        176  
Total current liabilities


33 773
    
 
34 383
 
                        
Total equity and liabilities


216 352
    
 
212 943
 
The accompanying notes are an integral part of these consolidated financial statements
.
 
3

Unaudited condensed consolidated interim statement of changes in equity
 
         
Attributable to equity holders of AB InBev
        
         
Issued
    
Share
    
    Treasury
           
Other
  comprehensive
income
    
    Retained
           
Non-
  controlling
    
Total  
  Million US dollar
  
Notes
  
        Capital
    
    premium
    
shares
    
    Reserves
    
reserves
    
earnings
    
        Total
    
interest
    
      Equity  
As per 1 January 2022


1 736


17 620


(3 994)


54 001


(34 577)


33 882


68 669


10 671 


79 340
 
Profit of the period
  
 
     -        -        -        -        -        1 692        1 692        782        2 474  
Other comprehensive income/(loss)
   16      -        -        -        -        1 892        -        1 892        (158)        1 734  
Total comprehensive income/(loss)


-


-


-


-


1 892


1 691


3 584


624 
    
 
4 208
 
Dividends
  
 
     -        -        -        -        -        (1 190)        (1 190)        (219)        (1 409)  
Treasury shares
  
 
     -        -        184         -        -        (112)        72         -        72   
Share-based payments
   18      -        -        -        254         -        -        254         5         259   
Hyperinflation monetary adjustments
  
 
     -        -        -        -        -        205         205         127         332   
Scope and other changes
  
 
     -        -        -        -        -        (42)        (42)        (9)        (51)  
As per 30 June 2022


1 736


17 620


(3 810)


54 254


(32 685)


34 435


71 550


11 200


82 750


Attributable to equity holders of AB InBev
        
         
Issued
    
Share
    
    Treasury
           
Other
  comprehensive
income
    
    Retained
           
Non-
  controlling
    
Total  
  Million US dollar
  
Notes
  
        Capital
    
    premium
    
shares
    
    Reserves
    
reserves
    
earnings
    
        Total
    
interest
    
      Equity  
As per 1 January 2023


1 736


17 620


(3 706)


54 477


(35 553)


38 823


73 398


10 880


84 278
 
Profit of the period
  
 
     -        -        -        -        -        1 977        1 977        678         2 655  
Other comprehensive income/(loss)
   16      -        -        -        -        3 072        -        3 072        (189)        2 882  
Total comprehensive income/(loss)


-


-


-


-


3 072


1 977


5 049


488 
    
 
5 538
 
Dividends
  
 
     -        -        -        -        -        (1 581)        (1 581)        (273)        (1 855)  
Treasury shares
  
 
     -        -        312         -        -        (230)        82         -        82   
Share-based payments
   18      -        -        -        232         -        -        232         12         244   
Hyperinflation monetary adjustments
  
 
     -        -        -        -        -        324         324         201         525   
Scope and other changes
  
 
     -        -        -        -        -        (44)        (44)        15         (29)  
As per 30 June 2023


1 736


17 620


(3 393)


54 709


(32 481)


39 269


77 460


11 324


88 783
 
The accompanying notes are an integral part of these consolidated
fina
ncial statements
 
4

Unaudited condensed consolidated interim statement of cash flows
 
  For the
six-month
period ended 30 June
                
  Million US dollar
  
Notes
  
                    2023
    
                    2022¹  
                        
OPERATING ACTIVITIES


Profit of the period


2 655


2 474
 
Depreciation, amortization and impairment
  
 
     2 595        2 477  
Net finance cost/(income)
   8      3 223        2 268  
Equity-settled share-based payment expense
   18      286         237  
Income tax expense
   9      1 192        1 244  
Other
non-cash
items
  
 
     321         (225)  
Share of result of associates
   13      (105)        1 014  
Cash flow from operating activities before changes in working capital and use of provisions


10 167


9 489
 
Decrease/(increase) in trade and other receivables
  
 
     (1 325)        (581)  
Decrease/(increase) in inventories
  
 
     (228)        (833)  
Increase/(decrease) in trade and other payables
  
 
     (3 062)        (1 925)  
Pension contributions and use of provisions
  
 
     (192)        (195)  
Cash generated from operations


5 360


5 955
 
Interest paid
  
 
     (2 322)        (2 082)  
Interest received
  
 
     512        177  
Dividends received
  
 
     43        50  
Income tax paid
  
 
     (1 996)        (1 918)  
Cash flow from/(used in) operating activities


1 597


2 182
 
                        
INVESTING ACTIVITIES


Acquisition of property, plant and equipment and of intangible assets
   10/12      (2 107)        (2 002)  
Proceeds from sale of property, plant and equipment and of intangible assets
  
 
     44         63  
Sale/(acquisition) of subsidiaries, net of cash disposed/ acquired of
  
 
     (8)        (44)  
Proceeds from sale/(acquisition) of other assets
  
 
     10         66  
Cash flow from/(used in) investing activities


(2 061)


(1 917)
 
                        
FINANCING ACTIVITIES


Sale/(purchase) of
non-controlling
interests
  
 
     (3)        (52)  
Proceeds from borrowings
   17      181         68  
Payments on borrowings
   17      (26)        (3 520)  
Cash net finance (cost)/income other than interests
  
 
     (693)        (326)  
Payment of lease liabilities
  
 
     (359)        (286)  
Dividends paid
  
 
     (1 923)        (1 276)  
Cash flow from/(used in) financing activities


(2 823)


(5 392)
 
                        
Net increase/(decrease) in cash and cash equivalents


(3 287)


(5 128)
 
Cash and cash equivalents less bank overdrafts at beginning of year
  
 
     9 890        12 043  
Effect of exchange rate fluctuations
  
 
     191         (18)  
Cash and cash equivalents less bank overdrafts at end of period
  
15
  
 
6 794


6 897
 
The accompanying notes are an integral part of these consolidated financial statements
.


1
The 2022 presentation was amended to conform to the 2023 presentation.
 
5

Notes to the consolidated financial statements


Note
 
   
Corporate information
  
 
1
 
   
Statement of compliance
  
 
2
 
   
Summary of significant accounting policies
  
 
3
 
   
Use of estimates and judgments
  
 
4
 
   
Segment reporting
  
 
5
 
   
Acquisitions and disposals of subsidiaries
  
 
6
 
   
Exceptional items
  
 
7
 
   
Finance cost and income
  
 
8
 
   
Income taxes
  
 
9
 
   
Property, plant and equipment
  
 
10
 
   
Goodwill
  
 
11
 
   
Intangible Assets
  
 
12
 
   
Investments in associates
  
 
13
 
   
Trade and other receivables
  
 
14
 
   
Cash and cash equivalents and investment securities
  
 
15
 
   
Changes in equity and earnings per share
  
 
16
 
   
Interest-bearing loans and borrowings
  
 
17
 
   
Share-based payments
  
 
18
 
   
Risks arising from financial instruments
  
 
19
 
   
Collateral and contractual commitments for the acquisition of property, plant and equipment, loans to customers and other
  
 
20
 
   
Contingencies
  
 
21
 
   
Related parties
  
 
22


6

1.
Corporate information
Anheuser-Busch InBev is a publicly traded company (Euronext: ABI) based in Leuven, Belgium, with secondary listings on the Mexico (MEXBOL: ANB) and South Africa (JSE: ANH) stock exchanges and with American Depositary Receipts on the New York Stock Exchange (NYSE: BUD). As a company, we dream big to create a future with more cheers. We are always looking to serve up new ways to meet life’s moments, move our industry forward and make a meaningful impact in the world. We are committed to building great brands that stand the test of time and to brewing the best beers using the finest ingredients. Our diverse portfolio of well over 500 beer brands includes global brands Budweiser®, Corona® and Stella Artois®; multi-country brands Beck’s®, Hoegaarden®, Leffe® and Michelob Ultra®; and local champions such as Aguila®, Antarctica®, Bud Light®, Brahma®, Cass®, Castle®, Castle Lite®, Cristal®, Harbin®, Jupiler®, Modelo Especial®, Quilmes®, Victoria®, Sedrin® and Skol®. Our brewing heritage dates back more than 600 years, spanning continents and generations. From our European roots at the Den Hoorn brewery in Leuven, Belgium. To the pioneering spirit of the Anheuser & Co brewery in St. Louis, US. To the creation of the Castle Brewery in South Africa during the Johannesburg gold rush. To Bohemia, the first brewery in Brazil. Geographically diversified with a balanced exposure to developed and developing markets, we leverage the collective strengths of approximately 167 000 employees based in nearly 50 countries worldwide. For 2022, AB InBev’s reported revenue was 57.8 billion US dollar (excluding joint ventures and associates).
The unaudited condensed consolidated interim financial statements of the company for the
six-month
period ended 30 June 2023 comprise the company and its subsidiaries (together referred to as “AB InBev” or the “company”) and the company’s interest in associates, joint ventures and operations. The condensed consolidated interim financial statements for the
six-month
period ended 30 June 2023 and 2022 are unaudited; however, in the opinion of the company, the interim data include all adjustments necessary for a fair statement of the results for the interim period.
The consolidated financial statements were authorized for issue by the Board of Directors on 2 August 2023.
 
2.
Statement of compliance
The unaudited condensed consolidated interim financial statements have been prepared in accordance with International Financial Reporting Standard (IFRS) IAS 34
Interim Financial Reporting
as issued by the International Accounting Standard Board (IASB) and as adopted by the European Union. They do not include all the information required for full annual financial statements and should be read in conjunction with the consolidated financial statements of the company as at and for the year ended 31 December 2022. AB InBev did not early apply any new IFRS requirements that were not yet effective in 2023 and did not apply any European carve-outs from IFRS.
 
7

3.
Summary of
s
ignificant accounting policies
The accounting policies applied are consistent with those applied in the annual consolidated financial statements as at and for the year ended 31 December 2022.
(A)  SUMMARY OF CHANGES IN ACCOUNTING POLICIES
A number of amendments to standards became mandatory for the first time for the financial year beginning on 1 January 2023 and have not been listed in these unaudited condensed consolidated financial statements as they either do not apply or are immaterial to AB InBev’s consolidated financial statements.
(B)  FOREIGN CURRENCIES
The most important exchange rates that have been used in preparing the financial statements are:
 
    
Closing rate
    
Average rate
 
  1 US dollar equals:
  
    30 June 2023
    
    31 December 2022
    
        30 June 2023
    
        30 June 2022
 
         
Argentinean peso
     256.709065         177.131872         -        -  
Brazilian real
     4.819192         5.217705         5.117130         5.049046   
Canadian dollar
     1.326614         1.353834         1.357985         1.268356   
Colombian peso
     4 183.19         4 807.99         4 638.30         3 920.73   
Chinese yuan
     7.268793         6.898736         6.927067         6.458363   
Euro
     0.920302         0.937559         0.927659         0.913529   
Mexican peso
     17.072031         19.361452         18.297743         20.324130   
Pound sterling
     0.789876         0.831548         0.812848         0.768921   
Peruvian nuevo sol
     3.636005         3.820004         3.773824         3.800274   
South Korean won
     1 322.27         1 260.16         1 301.06         1 221.30   
South African rand
     18.938593         16.968472         18.099957         15.476459   
The company applies hyperinflation accounting for its Argentinean subsidiaries. The 2023 results, restated for purchasing power, were translated at the June 2023 closing rate of 256.709065 Argentinean pesos per US dollar (2022 results – at the June 2022 closing rate of 125.210300 Argentinean pesos per US dollar).
 
4.
Use of estimates and judgments
As from 1 January 2023,
mark-to-market
gains/(losses) on derivatives related to the hedging of the share-based payment programs are reported in
exceptional
net finance income/(cost). The 2022 presentation was amended to conform to the 2023 presentation.
The other significant judgments made by management in applying the company’s accounting policies and the key sources of uncertainty are consistent with those applied in the annual consolidated financial statements as at and for the year ended 31 December 2022.
 
8

5.
Segment reporting
Segment information is presented by geographical segments, consistent with the information available to and regularly evaluated by the chief operating decision maker. AB InBev operates its business through six business segments. Regional and operating company management is responsible for managing performance, underlying risks, and the effectiveness of operations. Internally, AB InBev’s management uses profit from operations as a measure of the company’s segment performance which forms part of the basis for many of the company’s segment performance indicators to make decisions regarding the allocation of resources. The organizational structure comprises five regions: North America, Middle Americas, South America, EMEA and Asia Pacific. In addition to these five geographic regions, the company uses a sixth segment, Global Export and Holding Companies, for all financial reporting purposes.
All figures in the table below are stated in million US dollar, except volume (million hls). The information presented is for the
six-month
period ended 30 June 2023 and 2022, except for segment assets
(non-current)
with comparatives at 31 December 2022.
 
   
North America
   
Middle Americas
   
South America
   
EMEA
   
Asia Pacific
   
Global Export and
Holding companies
   
AB InBev Worldwide
 
    
2023
   
2022
   
2023
   
2022
   
2023
   
2022
   
2023
   
2022
   
2023
   
2022
   
2023
   
2022
   
2023
   
2022
 
                                                                                                                 
Volume
 
 
47


51


72


72


76


77


43


43


50


45


-


-


288


289
 
Revenue
 
 
7 926


8 192


7 573


6 693


5 849


5 333


4 070


3 940


3 679


3 471


236


399


29 333


28 027
 
Profit from operations
 
 
2 131


2 570


2 781


2 416


1 241


1 234


618


667


944


879


(749)


(766)


6 965


7 000
 
Net finance income/(cost)


    (3 223)       (2 268)  
Share of results of associates


    105       129  
Exceptional share of results of associates


    -       (1 143)  
Income tax expense


    (1 192)       (1 244)  
Profit


2 655


2 474
 
                                                                                                                 
Segment assets
(non-current)
    63 278       63 379       72 260       66 262       15 598       14 297       29 103       30 918       11 800       12 397       2 828       2 505       194 868       189 757  
Gross capex
    216       222       561       537       402       414       393       329       246       214       288       288       2 107       2 002  
For the
six-month
period ended 30 June 2023, net revenue from the beer business amounted to 26 071m US dollar (30 June 2022: 25 063m US dollar) while the net revenue from the
non-beer
business (soft drinks and other business) accounted for 3 262m US dollar (30 June 2022: 2 964m US dollar).
 
9

6.
Acquisi
ti
ons and disposals of subsidiaries
The company undertook a series of acquisitions and disposals and/or settled payments related to prior year acquisitions during the
six-month
period ended 30 June 2023 and 30 June 2022, with no significant impact in the consolidated financial statements.
 
7.
Exceptional items
IAS 1
Presentation of financial statements
requires that material items of income and expense be disclosed separately. Exceptional items are items that in management’s judgment need to be disclosed by virtue of their size or incidence so that a user can obtain a proper understanding of the company’s financial information.
The exceptional items included in the income statement are as follows:
 
  For the
six-month
period ended 30 June

  Million US dollar
  
2023
  
                2022¹
                   
COVID-19
costs
     -           (13)  
Restructuring
     (50)        (51)  
Business and asset disposal (including impairment losses)
     (38)        6  
Legal costs
     (19)        -     
AB InBev Efes related costs
     -           (47)  
Impact on profit from operations
  
 
(107)


(105)
 
                   
Exceptional net finance income/(cost)
     (703)        176  
Exceptional share of results of associates
     -        (1 143)  
Exceptional taxes
     51        69  
Exceptional
non-controlling
interest
     9        (3)  
Net impact on profit
  
 
(750)


(1 006)
 
The exceptional restructuring charges for the
six-month
period ended 30 June 2023 total (50)m US dollar (30 June 2022: (51)m US dollar). These charges primarily relate to organizational alignments. These changes aim to eliminate overlapping organizations or duplicated processes, taking into account the matching of employee profiles with new organizational requirements. These
one-time
expenses provide the company with a lower cost base and bring a stronger focus to AB InBev’s core activities, quicker decision-making and improvements to efficiency, service and quality.
Business and asset disposals (including impairment losses) amount to (38)m US dollar for the
six-month
period ended 30 June 2023 mainly comprising impairment of intangible assets and other
non-core
assets sold in the period.
The company recorded exceptional legal costs of (19)m
US dollar for the six-month period ended 30 June 2023 related to the successful outcome of a
series of lawsuits regarding Ambev warrants (see also Note 21
Contingencies
).

During the
six-month
period ended 30 June 2022, the company recorded
(47
)m US dollar costs related to the discontinuation of exports to Russia and the forfeiting of company benefits from the operations of the associate AB InBev Efes.
The company incurred a
n
exceptional net finance cost of (703)m US dollar for the
six-month
period ended 30 June 2023 (30 June 2022: net finance income of 176m US dollar) – see Note 8
Finance cost and income
.
During the
six-month
period ended 30 June 2022, the company recorded an impairment of (1 143)m US dollar on its investment in AB InBev Efes - see Note 13
Investments in associates
.
All the amounts referenced above are before income taxes. The exceptional income taxes amounted to 51m US dollar (decrease of income taxes) for the
six-month
period ended 30 June 2023 (30 June 2022: decrease of income taxes by 69m US dollar).
Non-controlling
interest on the exceptional items amounts to 9m US dollar for the
six-month
period
ended
30 June 2023 (30 June 2022: (3)m US dollar).
 
 
1
As from 1 January 2023, mark-to-market gains/(losses) on derivatives related to the hedging of the share-based payment programs are reported in the exceptional net finance income/(cost). The 2022 presentation was amended to conform to the 2023 presentation.
 
10

8.
Finance cost and income
The finance cost and income included in the income statement are as follows:
 
    
2023
          
2022¹
 
  Million US dollar
  
Finance
cost
    
Finance
income
    
Net


Finance
cost
    
Finance
income
    
Net
 
                                                               
Interest income/(expense)
     (1 855)        225        (1 630              (1 767)        84        (1 683
Net interest on net defined benefit liabilities
     (42)        -        (42              (37)        -        (37
Accretion expense
     (385)        -        (385              (336)        -        (336
Net interest income on Brazilian tax credits
     -        78        78                -        113        113  
Other financial results
     (622)        82        (540              (696)        194        (501
Finance income/(cost) excluding exceptional items
  
 
(2 905)


385
    
 
(2 520
          
 
(2 835)


391


(2 444
Exceptional finance income/(cost)
     (703)        -        (703              (127)        303        176  
Finance income/(cost)
  
 
(3 608)


385
    
 
(3 223


(2 962)


694
    
 
(2 268
Net finance costs, excluding exceptional items, were 2 520m US dollar in the
six-month
period ended 30 June 2023 compared to 2 444m US dollar in the
six-month
period ended 30 June 2022.
In the
six-month
period ended 30 June 2023, accretion expense includes interest on lease liabilities of 75m US dollar (30 June 2022: 60m US dollar), unwind of discounts of 262m US dollar on payables (30 June 2022: 225m US dollar), bond fees of 30m US dollar (30 June 2022: 32m US dollar) and interest on provisions of 18m US dollar (30 June 2022: 19m US dollar).
Interest expense is presented net of the effect of interest rate derivative instruments hedging AB InBev’s interest rate risk – see also Note 19
Risks arising from financial instruments
.
Other financial results for the
six-month
period ended 30 June 2023 and 30 June 2022 include:
 
    
2023


2022¹
 
  Million US dollar
  
Finance
cost
    
Finance
income
    
Net
          
Finance
cost
    
Finance
income
    
Net
 
                                                               
Net foreign exchange gains/(losses)
     (149)        -        (149              (143)        -        (143
Net gains/(losses) on hedging instruments
     (354)        -        (354              (422)        -        (422
Hyperinflation monetary adjustments
     -        66        66                -        138        138  
Other financial income/(cost), including bank fees and taxes
     (119)        16        (103              (131)        56        (75
Other financial results
  
 
(622)


82
    
 
(540


(696)


194


(501
Exceptional finance income/(cost) for the
six-month
period ended 30 June 2023 and 30 June 2022 includes:
 
   
(703)m US dollar loss resulting from
mark-to-market
adjustments on derivative instruments related to the hedging of share-based payment programs and on derivative instruments entered into to hedge the shares issued in relation to the combinations with Grupo Modelo and SAB (30 June 2022: 296m US dollar gain);
   
In the
six-month
period ended 30 June 2022, (127)m US dollar loss resulting from the early termination of certain bonds, as well as 7m US dollar gain related to the remeasurement of deferred considerations on prior year acquisitions.
No interest income was recognized on impaired financial assets.


1
As from 1 January 2023, mark-to-market gains/(losses) on derivatives related to the hedging of the share-based payment programs are reported in the exceptional net finance income/(cost). The 2022 presentation was amended to conform to the 2023 presentation.
 
11

9.
Income taxes
Income taxes recognized in the income statement can be detailed as follows:
 
  For the
six-month
period ended 30 June

  Million US dollar
  
2023
      
2022
 
                     
Current tax expense
     (1 554        (1 704)  
Deferred tax (expense)/income
     362           459  
Total income tax expense in the income statement
  
 
(1 192
    
 
(1 244)
 
The reconciliation of the effective tax rate with the
aggr
egated weighted nominal tax rate can be summa
riz
ed as follows:
 
  For the
six-month
period ended 30 June

  Million US dollar
  
2023
      
2022
 
                     
Profit/(loss) before tax
     3 847          3 718  
Deduct share of results of associates
     105          129  
Deduct exceptional share of results of associates
     -            (1 143)  
Profit before tax and before share of results of associates
  
 
3 741


4 732
 
                     
Adjustments to the tax basis


Government incentives
     (346)          (304)  
Non-deductible/(non-taxable)
mark-to-market
on derivatives
     703           (296)  
Other expenses not deductible for tax purposes
     775          962  
Other
non-taxable
income
     (291)          (346)  
Adjusted tax basis
  
 
4 582


4 748
 
                     
Aggregate weighted nominal tax rate
  
 
26.9
%


26.9%
 
                     
Tax at aggregated nominal tax rate
  
 
(1 235)


(1 277)
 
                     
Adjustments on tax expense


Recognition/(de-recognition)
of deferred tax assets on tax losses (carried forward)
     (98)          (8)  
(Underprovided)/overprovided in prior years
     (56)          24  
Deductions from interest on equity
     323          268  
Deductions from goodwill and other tax deductions
     168          5  
Change in tax rate
     -            5  
Withholding taxes
     (205)          (181)  
Other tax adjustments
     (90)          (81)  
                     
Total tax expense
  
 
(1 192)


(1 244)
 
                     
Effective tax rate
  
 
31.9
      
 
26.3%
 
The total income tax expense for the
six-month
period
ended
30 June 2023 amounts to 1 192m US dollar compared to 1 244m US dollar
for
the
six-month
period ended 30 June 2022. The effective tax rate for the
six-month
period ended 30 June 2023 was 31.9% compared to an effective tax rate of 26.3% for the
six-month
period ended 30 June 2022.
The 2023 effective tax rate was negatively impacted by
non-deductible
losses from derivatives related to hedging of share-based payment programs and hedging of the shares issued in a transaction related to the combination with Grupo Modelo and SAB, while the 2022 effective tax rate was positively impacted by
non-taxable
gains from these derivatives.
The company benefits from tax exempted income and tax credits which are expected to continue in the future. The company does not have significant benefits coming from low tax rates in any particular jurisdiction.
 
12

10.
Property, plant and equipment
Property, plant and equipment comprises owned and leased assets, as follows:
 
  Million US dollar
  
30 June 2023
      
31 December 2022
 
                     
Property, plant and equipment owned
     24 553          24 245  
Property, plant and equipment leased
(right-of-use
assets)
     2 627          2 426  
Total property, plant and equipment
  
 
27 181
      
 
26 671


30 June 2023
      
31 December 2022    
 
  Million US dollar
  
Land and
buildings
    
Plant and
equipment,
fixtures and
fittings
    
Under
construction
      
Total
      
Total
 
                                                  
Acquisition cost


Balance at end of previous year
  
 
12 591 
    
 
37 473 
    
 
2 205 
      
 
52 269 
      
 
50 742 
 
Effect of movements in foreign exchange
     211         671         52           934           (983)  
Acquisitions
     3         728         1 017           1 748           4 279   
Disposals through sale and derecognition
     (24)        (507)        -          (532)          (1 822)  
Disposals through the sale of subsidiaries
  
 
-


-


-


(13)
 
Transfer (to)/from other asset categories and other movements¹
     172         1 125         (1 130)          167           66   
Balance at end of the period
  
 
12 953 
    
 
39 491 
    
 
2 143 
      
 
54 587 
      
 
52 269 
 
                                                  
Depreciation and impairment losses


Balance at end of previous year
  
 
(4 584)


(23 440)


-


(28 024)


(26 284)
 
Effect of movements in foreign exchange
     (55)        (426)        -          (482)          507   
Depreciation
     (197)        (1 578)        -          (1 775)          (3 530)  
Disposals through sale and derecognition
     18         476         -          494           1 631   
Disposals through the sale of subsidiaries
     -        -        -          -          8   
Impairment losses
     (3)        (57)        -          (60)          (172)  
Transfer to/(from) other asset categories and other movements¹
     (6)        (180)        -          (186)          (186)  
Balance at end of the period
  
 
(4 827)


(25 206)


-


(30 033)


(28 024)
 
                                                  
Carrying amount


at 31 December 2022
     8 007         14 033         2 205           24 245           24 245   
at 30 June 2023
  
 
8 126 
    
 
14 285 
    
 
2 143 
      
 
24 553 
      
 
-
 
As at 30 June 2023 and 31 December 2022 there were no significant restrictions on title on property, plant and equipment.
Contractual commitments to purchase property, plant and equipment amounted to 1 030m US dollar as at 30 June 2023 compared to 538m US dollar as at 31 December 2022.
AB InBev’s net capital expenditures in the statement of cash flow amounted to 2 063m US dollar in 2023 compared to 1 939m US dollar for the same period last year. Out of the total 2023 capital expenditures approximately 33% was used to improve the company’s production facilities while 49% was used for logistics and commercial investments and 18% for improving administrative capabilities and for the purchase
of
hardware and software.


1
The transfer (to)/from other asset categories and other movements relates mainly to transfers from assets under construction to their respective asset categories, to contributions of assets to pension plans, to the separate presentation in the statement of financial position of property, plant and equipment held for sale in accordance with IFRS 5
Non-current assets held for sale and discontinued operations
and to the restatement of non-monetary assets under hyperinflation accounting in line with IAS 29
Financial reporting in hyperinflationary economies.
 
13

Property, plant and equipment leased by the company
(right-of-use
assets) is detailed as follows:
 
   
30 June 2023
 
  Million US dollar
 
Land and buildings
    
Machinery,
equipment and
other
      
Total 
 
                             
Net carrying amount at June 30
    1 713      914      
 
2 627  
 
Depreciation for the period ended June 30
    (223      (148)       
 
(371
 
   
31 December 2022
 
  Million US dollar
 
Land and buildings
    
Machinery,
equipment and
other
      
Total 
 
                             
Net carrying amount at 31 December
    1 640      786      
 
2 426  
 
Depreciation for the year ended 31 December
    (398      (230)       
 
(628
 
Additions to
right-of-use
assets for the
six-month
period ended 30 June 2023 were 448m US dollar (30 June 2022: 301m US dollar).
Following the sale of Dutch and Belgian pub real estate to Cofinimmo in October 2007, AB InBev entered into lease agreements with a term of 27 years. Furthermore, the company leases a number of warehouses, trucks, factory facilities and other commercial buildings, which typically run for a period of five to ten years. Lease payments are increased annually to reflect market rentals, if applicable. None of the leases include contingent rentals.
The company leases out pub real estate for an average outstanding period of 6 to 8 years and part of its own property under operating leases.
The expense related to short-term and
low-value
leases and variable lease payments that are not included in the measurement of the lease liabilities is not significant.
 
14

11.
Goodwill
 
  Million US dollar
    
30 June 2023
      
31 December 2022
 
                       
Acquisition cost


Balance at end of previous year
    
 
115 541


118 461 
 
Effect of movements in foreign exchange
       2 664          (3 147  
Disposals through the sale of subsidiaries
       -          (32  
Transfers (to)/from other asset categories
       (17)          (68  
Hyperinflation monetary adjustments
       246         328   
Balance at end of the period
    
 
118 434


115 541 
 
                       
Impairment losses


Balance at end of previous year
    
 
(2 531)


(2 665
 
Effect of movements in foreign exchange
       265         134   
Balance at end of the period
    
 
(2 266)


(2 531
 
                       
Carrying amount


Balance at end of the period
    
 
116 168 
      
 
113 010  
 
AB InBev completes a goodwill impairment testing annually, or whenever a triggering event has occurred.
The carrying amount of goodwill was allocated to the different cash-generating units as follows:
 
  Million US dollar
    
30 June 2023
      
31 December 2022
 
                       
United States
       33 562        33 578
Rest of North America
       2 022        1 981
Mexico
       14 543        12 823
Colombia
       14 588        12 692
Rest of Middle Americas
       23 904        23 242
Brazil
       3 798        3 508
Rest of South America
       1 294        1 249
Europe
       2 141        2 081
South Africa
       8 558        9 551
Rest of Africa
       4 899        5 131
China
       2 960        3 119
Rest of Asia Pacific
       3 341        3 505
Global Export and Holding Companies
       559        549
Total carrying amount of goodwill
    
 
116 168
      
 
113 010
 
 
15

12.
Intangible assets
 
    
30 June 2023
    
31 December
2022
 
Million US dollar
  
  Brands
    
Commercial
intangibles
    
Software
    
      Other
    
        Total
    
Total
 
                                                       
Acquisition cost


Balance at end of previous year
  
 
37 741


2 026


4 050


354
    
 
44 170


45 015
 
Effect of movements in foreign exchange
     461        60        149        (3)        667        (751)  
Acquisitions and expenditures
     6        166        301        9        482        978  
Disposals through sale and derecognition
     (1)        -        (33)        (6)        (40)        (1 437)  
Transfer (to)/from other asset categories and other movements¹
     23      7      338      (223)        145      365
Balance at end of period
  
 
38 229


2 259


4 805


131
    
 
45 424


44 170
 
                                                       
Amortization and impairment losses


Balance at end of previous year
  
 
(88)


(1 247)


(2 577)


(49)


(3 961)


(4 585)
 
Effect of movements in foreign exchange
     -        (47)        (100)        (3)        (150)        100  
Amortization
     -        (65)        (262)        (13)        (340)        (647)  
Impairment
     -        -        (1)        -        (1)        (4)  
Disposals through sale and derecognition
     -        -        33        1        34        1 339  
Transfer to/(from) other asset categories and other movements¹
     -        (8)        (15)        (9)        (32)        (164)  
Balance at end of period
  
 
(88)


(1 367)


(2 923)


(73)


(4 451)


(3 961)
 
                                                       
Carrying value


at 31 December 2022
  
 
37 652


779


1 473


305


40 209


40 209
 
at 30 June 2023
  
 
38 141


892


1 882


58


40 973


AB InBev is the owner of some of the world’s most valuable brands in the beer industry. As a result, brands and certain distribution rights are expected to generate positive cash flows for as long as the company owns the brands and distribution rights. Given AB InBev’s more than
600-year
history, brands and certain distribution rights have been assigned indefinite lives.
Acquisitions and expenditures of commercial intangibles mainly represent supply and distribution rights, exclusive multi-year sponsorship rights and other commercial intangibles.
Intangible assets with indefinite useful lives are comprised primarily of brands and certain distribution rights that AB InBev purchased for its own products and are tested for impairment once a year or whenever a triggering event has occurred.
 
13.
Investments in associates
A reconciliation of the summarized financial information to the carrying amount of the company’s interests in material associates is as follows:
 
    
2023
          
2022
 
  Million US dollar
  
Castel
    
Anadolu Efes
          
AB InBev
Efes
    
        Castel
    
        Anadolu
Efes
 
                                                
Balance at 1 January
  
 
3 293


171


1 143


3 400


201
 
Effect of movements in foreign exchange
     52      (48)          -         (245)        (39)  
Dividends received
          (12)          -         -         (16)  
Share of results of associates
     67      4        -        82        (5)  
Exceptional share of results of associates
     -         -           (1 143)        -         -   
Balance at 30 June
  
 
3 412


115


-   


3 237


141
 
During the
six-month
period ended 30 June 2022 the company reported a (1 143)m US dollar exceptional share of results of associates related to its investment in AB InBev Efes (Refer to Note 7
Exceptional items)
. The investment in AB InBev Efes is classified as
non-current
asset held for sale.
In the
six-month
period ended 30 June 2023, associates that are not individually material contributed 34m US dollar to the results of investment in associates (30 June 2022: 52m US dollar).
 
 
1
The transfer (to)/from other asset categories and other movements mainly relates to transfers from assets under construction to their respective asset categories, to the separate presentation in the statement of financial position of intangible assets held for sale in accordance with IFRS 5
Non-current assets held for sale and discontinued operations
and to the restatement of non-monetary assets under hyperinflation accounting in line with IAS 29
Financial reporting in hyperinflationary economies
.
 
16

14.
Trade and other receivables
 
  Million US dollar
  
30 June 2023
  
    31 December 2022
                   
Cash deposits for guarantees
     169      189
Loans to customers
     7      10
Tax receivable, other than income tax
     170      137
Brazilian tax credits and interest receivables
     1 247      1 149
Trade and other receivables
     302      298
Non-current
trade and other receivables
  
 
1 895
    
 
1 782
 
                   
Trade receivables and accrued income
     4 579      3 637
Interest receivables
     83      67
Tax receivable, other than income tax
     538      444
Loans to customers
     93      71
Prepaid expenses
     517      410
Other receivables
     798      702
Current trade and other receivables
  
 
6 609
    
 
5 330
 
Ambev’s tax credits and interest receivables are expected to be collected over a period exceeding 12 months after the reporting date. As of 30 June 2023, the total amount of such credits and interest receivables represented 1 247m US dollar (31 December 2022: 1 149m US dollar).
The carrying amount of trade and other receivables is a good approximation of their fair value as the impact of discounting is not significant. The ageing of the current trade receivables and accrued income, interest receivable, other receivables and current and
non-current
loans to customers can be detailed as follows for 30 June 2023 and 31 December 2022 respectively:
 
            
Of which:
neither
   
Of which not impaired as of the reporting
date and past due
 
  
Net carrying
amount as
of 30 June
2023
    
impaired nor
past due on
the
reporting date
   
Less than 30
days
    
Between 30
and 59 days
    
Between 60
and 89 days
    
More than
90 days
 
                                                      
Trade receivables and accrued income
     4 579      4 375       137      31      29      7  
Loans to customers
     100      84     15      1      -      -
Interest receivable
     83      83     -      -      -      -
Other receivables
     798      768     8      11      11      1


5 561
    
 
5 310
   
 
160
    
 
43
    
 
40
    
 
8
 
     
Net carrying
    
Of which:
neither
   
Of which not impaired as of the reporting
date and past due
 
  
amount as
of 31
December
2022
    
impaired nor
past due on
the
reporting date
   
Less than 30
days
    
Between 30
and 59 days
    
Between 60
and 89 days
    
More than
90 days
 
                                                      
Trade receivables and accrued income
     3 637      3 418     151      41      24      4
Loans to customers
     81      78     1      1      1      -
Interest receivable
     67      67     -      -      -      -
Other receivables
     702      684     11      4      3      -


4 487
    
 
4 247
   
 
162
    
 
46
    
 
28
    
 
4
 
The above analysis of the age of financial assets that are past due as at the reporting date but not impaired also includes
non-current
loans to customers. Past due amounts were not impaired when collection is still considered likely, for instance because the amounts can be recovered from the tax authorities, AB InBev has sufficient collateral, or the customer entered into a payment plan. Impairment losses on trade and other receivables recognized in the
six-month
period ended 30 June 2023 amount to 27m US dollar (30 June 2022: 70m US dollar).
AB InBev’s exposure to credit, currency and interest rate risks is disclosed in Note 19
Risks arising from financial instruments
.
 
17

15.
Cash and cash equivalents and investment securities
 
  Million US dollar
  
30 June 2023
   
31 December 2022
 
                  
Short-term bank deposits
     2 145       4 685  
Cash and bank accounts
     4 702       5 288  
Cash and cash equivalents
  
 
6 848
   
 
9 973
 
                  
Bank overdrafts
  
 
(53
 
 
(83
Cash and cash equivalents in the statement of cash flows
  
 
6 794
   
 
9 890
 
The cash outstanding as at 30 June 2023 includes restricted cash for an amount of 74m US dollar (31 December 2022: 73m US dollar). This restricted cash mainly relates to amounts deposited on a blocked account in respect to the state aid investigation into the Belgian excess profit ruling system (73m US dollar).
Investment securities
 
  Million US dollar
  
30 June 2023
    
31 December 2022
 
                   
Investment in unquoted companies
     150        149  
Investment on debt securities
     29        26  
Non-current
investments
  
 
   179
    
 
   175
 
                   
Investment on debt securities
     85        97  
Current investments
  
 
85
    
 
97
 
As at 30 June 2023, current debt securities of 85m US dollar mainly represented investments in government bonds (31 December 2022: 97m US dollar). The company’s investments in such short-term debt securities are primarily to facilitate liquidity and for capital preservation.
 
16.
Changes in equity and earnings per share
STATEMENT OF CAPITAL
The tables below summarize the changes in issued capital and treasury shares during the
six-month
period ended 30 June 2023:
 
    
Issued capital
 
  Issued capital
  
Million shares
    
    Million US dollar
 
                   
At the end of the previous year
     2 019         1 736   
Changes during the period
     -        -  


2 019 
    
 
1 736 
 
Of which:


Ordinary shares
     1 737      


Restricted shares
     282      


Treasury shares
   
Result on the use of
treasury shares
 
  Treasury shares
  
Million shares
   
Million US dollar
   
Million US dollar
 
                          
At the end of the previous year
     35.5       (3 706     (4 559
Changes during the period
     (3.0     312       (230
At the end of the current period
  
 
32.5
   
 
(3 393
 
 
(4 789
As of 30 June 2023, the share capital of AB InBev amounts to 1 238 608 344.12 euro (1 736 million US dollar). It is represented by 2 019 241 973 shares without nominal value, of which 32 467 809 are held in treasury by AB InBev and its subsidiaries. All shares
are
ordinary shares, except for
282 044 859 restricted shares. As of 30 June 2023, the total of authorized, unissued capital amounts to 37m euro.
The treasury shares held by the company are reported in equity in Treasury shares.
The holders of ordinary and restricted shares are entitled to receive dividends as declared from time to time and are entitled to one vote per share at meetings of the company. In respect of the company’s shares that are held by AB InBev and its subsidiaries, the economic and voting rights are suspended.
The restricted shares are unlisted, not admitted to trading on any stock exchange, and are subject to, among other things, restrictions on transfer until converted into new ordinary shares. As from 11 October 2021 (fifth anniversary of completion
 
of the SAB combination),
 
18

the restricted shares are convertible at the election of the holder into new ordinary shares on a
one-for-one
basis and they
rank equally with the ordinary shares with respect to dividends and voting rights. By 30 June 2023, from the 326 million restricted shares issued at the time of the SAB combination, 44 million restricted shares were converted into new ordinary shares.
The shareholders’ structure is based on the notifications made to the company pursuant to the Belgian Law of 2 May 2007, which governs the disclosure of significant shareholdings in listed companies. It is included in the
Corporate Governance
section of AB InBev’s annual report.
CHANGES IN OWNERSHIP INTERESTS
In accordance with IFRS 10
Consolidated Financial Statements
, the acquisition or disposal of additional shares in a subsidiary is accounted for as an equity transaction with owners.
In the
six-month
period ended 30 June 2023, there were no significant purchases or disposals of
non-controlling
interests in subsidiaries.
BORROWED SHARES
In order to fulfill AB InBev’s commitments under various outstanding share-based compensation plans, during the course of 2023, the company had stock lending arrangements in place for up to 30 million shares, which were fully used to fulfill share-based compensation plan commitments. The company shall pay any dividend equivalent after tax in respect of such borrowed shares. This payment will be reported through equity as dividend.
DIVIDENDS
On 26 April 2023, a dividend of 0.75 euro per share or
1 510m
euro was approved at the shareholders’ meeting. The dividend was paid out as of 5 May 2023.
On 27 April 2022, a dividend of 0.50 euro per share or
1 004m
euro was approved at the shareholders’ meeting. The dividend was paid out as of 5 May 2022.
TRANSLATION RESERVES
The translation reserves comprise all foreign currency exchange differences arising from the translation of the financial statements of foreign operations. The translation reserves also comprise the portion of the gain or loss on the foreign currency liabilities and on the derivative financial instruments determined to be effective net investment.
HEDGING RESERVES
The hedging reserves comprise the effective portion of the cumulative net change in the fair value of cash flow hedges to the extent that the hedged risk has not yet impacted profit or loss.
TRANSFERS FROM SUBSIDIARIES
The amount of dividends payable to AB InBev by its operating subsidiaries is subject to, among other restrictions, general limitations imposed by the corporate laws, capital transfer restrictions and exchange control restrictions of the respective jurisdictions where those subsidiaries are organized and operate. Capital transfer restrictions are also common in certain emerging market countries and may affect AB InBev’s flexibility in implementing a capital structure it believes to be efficient. As of 30 June 2023, the restrictions above mentioned were not deemed significant on the company’s ability to access or use the assets or settle the liabilities of its operating subsidiaries.
Dividends paid to AB InBev by certain of its subsidiaries are also subject to withholding taxes. Withholding taxes, if applicable, generally do not exceed 15%.
 
19

OTHER COMPREHENSIVE INCOME RESERVES
The changes in the other comprehensive income reserves are as follows:
 
  Million US dollar
  
Translation
Reserves
    
Hedging
    reserves
    
Post-
    employment
benefits
    
    Total OCI
Reserves
 
                                     
As per 1 January 2023
  
 
(34 677)


145
    
 
(1 021)


(35 553)
 
Other comprehensive income/(loss)


Exchange differences on translation of foreign operations (gains/(losses))
     3 610        -        -          3 610  
Cash flow hedges
     -        (541)        -          (541)  
Re-measurements
of post-employment benefits
     -        -        3      3
Other comprehensive income/(loss)
  
 
3 610


(541)
 
     3   
 
3 072
 
As per 30 June 2023
  
 
(31 067)


(396)


(1 018)


(32 481)
 
The decrease in translation reserves is primarily related to the combined effect of the appreciation of the closing rates of the Colombian peso, the Euro, the Mexican peso, the Peruvian sol and the weakening of the closing rate of the South African rand, which resulted in a net foreign exchange translation adjustment of 3 610m US dollar as of 30 June 2023 (increase of equity).
 
  Million US dollar
  
Translation
Reserves
    
Hedging
    reserves
    
Post-
    employment
benefits
    
    Total OCI
Reserves
 
                                     
As per 1 January 2022
  
 
(33 554)


481
    
 
(1 504)


(34 577)
 
Other comprehensive income/(loss)


Exchange differences on translation of foreign operations (gains/(losses))
     2 101        -        -        2 101  
Cash flow hedges
     -        (210)        -        (210)  
Re-measurements
of post-employment benefits
     -        -        -        -  
Other comprehensive income/(loss)
  
 
2 101


(210)


-


1 892
 
As per 30 June 2022
  
 
(31 453)


271
    
 
(1 504)


(32 685)
 
EARNINGS PER SHARE
The calculation of basic earnings per share for the
six-month
period ended 30 June 2023 is based on the profit attributable to equity holders of AB InBev of 1 977m US dollar (30 June 2022: 1 692m US dollar) and a weighted average number of ordinary and restricted shares outstanding (including deferred share instruments and stock lending) per end of the period, calculated as follows:
 
  Million shares
  
2023
    
        2022
 
                   
Issued ordinary and restricted shares at 1 January, net of treasury shares
     1 984        1 981   
Effect of stock lending
     30        30  
Effect of delivery of treasury shares
     2        1  
Weighted average number of ordinary and restricted shares at 30 June
  
 
2 016


2 012
 
The calculation of diluted earnings per share for the
six-month
period ended 30 June 2023 is based on the profit attributable to equity holders of AB InBev of 1 977m US dollar (30 June 2022: 1 692m US dollar) and a weighted average number of ordinary and restricted shares (diluted) outstanding (including deferred share instruments and stock lending) at the end of the period, calculated as follows:
 
  Million shares
  
2023
    
        2022
 
                   
Weighted average number of ordinary and restricted shares at 30 June
     2 016        2 012   
Effect of share options, warrants and restricted stock units
     38        35  
Weighted average number of ordinary and restricted shares (diluted) at 30 June
  
 
2 054


2 047
 
 
20

The calculation of the Underlying EPS is based on the profit before exceptional items and hyperinflation impacts attributable to equity holders of AB InBev. A reconciliation of the profit attributable to equity holders of AB InBev to the profit before exceptional items, attributable to equity holders of AB InBev and underlying profit is calculated as follows:
 
  For the
six-month
period ended 30 June
           
  Million US dollar
  
2023
    
            2022¹  
                   
Profit attributable to equity holders of AB InBev
  
 
1 977


1 692
 
Net impact of exceptional items on profit (refer to Note 7)
     750      1 006  
Profit before exceptional items, attributable to equity holders of AB InBev
  
 
2 727


2 698
 
Hyperinflation impacts
     35      (26)  
Underlying profit
  
 
2 762


2 672
 
The table below sets out the EPS calculation:
 
  For the
six-month
period ended 30 June
    
  Million US dollar
  
2023
  
            2022  
                   
Profit attributable to equity holders of AB InBev
     1 977        1 692  
Weighted average number of ordinary and restricted shares
     2 016        2 012  
Basic EPS
  
 
0.98
    
 
0.84
 
          
Underlying profit
     2 762        2 672  
Weighted average number of ordinary and restricted shares
     2 016        2 012  
Underlying EPS
  
 
1.37
    
 
1.33
 
                   
Profit attributable to equity holders of AB InBev
     1 977        1 692  
Weighted average number of ordinary and restricted shares (diluted)
     2 054        2 047  
Diluted EPS
  
 
0.96
    
 
0.83
 
Underlying EPS is a
non-IFRS
measure.
The average market value of the company’s shares for purposes of calculating the dilutive effect of share options and restricted stock units was based on quoted market prices for the period that the options and restricted stock units were outstanding. For the calculation of Diluted EPS, 50m share options were anti-dilutive and not included in the calculation of the dilutive effect as of 30 June 2023 (30 June 2022: 56m share options).
 
17.
Interest-bearing loans and borrowings
This note provides information about the company’s interest-bearing loans and borrowings. For more information about the company’s exposure to interest rate and foreign exposure currency risk – refer to Note 19
Risks arising from financial instruments.
 
  Million US dollar
  
30 June 2023
    
    31 December 2022  
Unsecured bond issues
     76 160      76 798 
Lease liabilities
     2 034      1 963 
Unsecured other loans
     105      95 
Secured bank loans
     23      24 
Non-current
interest-bearing loans and borrowings
  
 
78 323
    
 
78 880 
 
                   
Unsecured bond issues
     1 184      -  
Lease liabilities
     665        529  
Secured bank loans
     463        369  
Unsecured bank loans
     181        100  
Unsecured other loans
     31        30  
Current interest-bearing loans and borrowings
  
 
2 524
    
 
1 029 
 
                   
Interest-bearing loans and borrowings
  
 
80 847
    
 
79 909 
 
The current and
non-current
interest-bearing loans and borrowings amount to 80.8 billion US dollar as of 30 June 2023, compared to 79.9 billion US dollar as of 31 December 2022.
 
 
1
As from 1 January 2023, mark-to-market gains/(losses) on derivatives related to the hedging of the share-based payment programs are reported in exceptional net finance income/(cost). The 2022 presentation was amended to conform to the 2023 presentation.
 
21

As of 30 June 2023, the company had no outstanding balance on commercial papers (31 December 2022: nil). The commercial papers include programs in US dollar and euro with a total authorized issuance up to 5.0 billion US dollar and 3.0 billion euro, respectively.
Net debt is defined as
non-current
and current interest-bearing loans and borrowings and bank overdrafts minus debt securities and cash and cash equivalents. Net debt is a financial performance indicator that is used by AB InBev’s management to highlight changes in the company’s overall liquidity position.
AB InBev’s net debt increased to 73.8 billion US dollar as of 30 June 2023, from 69.7 billion US dollar as of 31 December 2022. Aside from operating results that are net of capital expenditures, the net debt is impacted mainly by the payment of interests and taxes (3.8 billion US dollar), dividend payments (1.9 billion US dollar) and foreign exchange impact on net debt (0.4
 
billion US dollar increase of net debt).
The following table provides a reconciliation of AB InBev’s net debt as at the dates indicated:
 
  Million US dollar
  
30 June 2023
    
      31 December 2022 
 
                   
Non-current
interest-bearing loans and borrowings
     78 323       78 880  
Current interest-bearing loans and borrowings
     2 524       1 029  
Interest-bearing loans and borrowings
  
 
80 847 
    
 
79 909  
 
                   
Bank overdrafts
     53        83   
Cash and cash equivalents
     (6 848)        (9 973  
Interest bearing loans granted and other deposits (included within Trade and other receivables)
     (184)        (183  
Debt securities (included within Investment securities)
     (114)        (123  
Net debt
  
 
73 755 
    
 
69 713  
 
Reconciliation of liabilities arising from financing activities
The table below details the changes in the company’s liabilities arising from financing activities, including both cash and
non-cash
changes. Liabilities arising from financing activities are those for which cash flows were, or future cash flows will be classified in the company’s consolidated cash flow statement from financing activities.
 
  Million US dollar
  
Long-term debt, net of

current portion
    
Short-term debt and 

    current portion of long- 
term debt 
 
Balance at 1 January 2023
  
 
78 880


1 029 
 
Proceeds from borrowings
     7        174   
Payments on borrowings
     -        (26  
Capitalization / (payment) of lease liabilities
     446        (323  
Amortized cost
     30        -   
Unrealized foreign exchange effects
     569       40  
Current portion of long-term debt
     (1 627)        1 627  
(Gain)/Loss on bond redemption and other movements
     17       4   
Balance at 30 June 2023
  
 
78 323


2 524 
 
 
  Million US dollar
  
Long-term debt, net of
current portion
    
Short-term debt and 
    current portion of long- 
term debt 
 
Balance at 1 January 2022
  
 
87 369


1 408 
 
Proceeds from borrowings
     41        27   
Payments on borrowings
     (3 218)        (302  
Capitalization / (payment) of lease liabilities
     356        (247  
Amortized cost
     31        -   
Unrealized foreign exchange effects
     (2 259)        (13  
Current portion of long-term debt
     (302)        302   
(Gain)/Loss on bond redemption and other movements
     99        10   
Balance at 30 June 2022
  
 
82 117


1 185 
 
 
22

18.
Share-based payments
Different share-based programs allow company senior management and members of the board of directors to receive or acquire shares of AB InBev, Ambev or Budweiser APAC. AB InBev has three primary share-based compensation plans, the share-based compensation plan (“Share-Based Compensation Plan”), the long-term restricted stock unit (“RSU”) plan for directors (“RSU Plan for Directors”), and the various long-term incentive plans for executives (“LTI Plan Executives”). Except for the ones mentioned below, there were no other grants in the
six-month
period ended 30 June 2023. Amounts have been converted to US dollar at the average rate of the period, unless otherwise indicated. There were no significant changes to the terms and conditions of the programs disclosed in the annual consolidated financial statements for the year ended 31 December 2022.
Share-based payment transactions resulted in a total expense of 286m US dollar for 2023, as compared to 237m US dollar for the
six-month
period ended 30 June 2022.
AB INBEV SHARE-BASED COMPENSATION PROGRAMS
Share-Based Compensation Plan for Executives
In the
six-month
period ended 30 June 2023, AB InBev issued 1.7m matching RSUs in relation to bonuses granted to company employees and management (30 June 2022: 4.8m matching RSUs). These matching RSUs represent a fair value of approximately 107m US dollar (30 June 2022: 293m US dollar).
RSU Plan for Directors
In the
six-month
period ended 30 June 2023, 0.1m RSUs with an estimated fair value of 4m US dollar were granted to directors (30 June 2022: 0.1m with an estimated fair value of 4m US dollar).
Annual LTI Plans for Executives
In the
six-month
period ended 30 June 2023, AB InBev did not issue RSUs under the Long-term Incentive RSUs plan (30 June 2022: 0.1m with an estimated fair value of 8m US dollar under this plan of which 0.1m RSUs were granted to members of the Executive Committee).
Other Recurring LTI RSU Plans for Executives
In the
six-month
period ended 30 June 2023, approximately 11 thousand RSUs were granted with an estimated fair value of 1m US dollar under this plan (30 June 2022: approximately
9 
thousand RSUs with an estimated fair value of 1m US dollar).
In the
six-month
period ended 30 June 2023, no RSUs were granted under the People bet share purchase program (30 June 2022: 0.1m RSUs representing a fair value of 7m dollar).
AMBEV SHARE-BASED COMPENSATION PROGRAMS
Under the 2018 Share-based compensation plan, Ambev issued 6.8m matching RSUs in the
six-month
period ended 30 June 2023 with an estimated fair value of 17m US dollar (30 June 2022: 19.5m matching RSUs with an estimated fair value of 59m US dollar).
BUDWEISER APAC SHARE-BASED COMPENSATION PROGRAM
Share-Based Compensation Plan
In the
six-month
period ended 30 June 2023, Budweiser APAC issued 4.1m matching RSUs in relation to bonuses granted to Budweiser APAC employees with an estimated fair value of 13m US dollar (30 June 2022: 12.5m matching RSUs with an estimated fair value of 39m US dollar).
People Bet Plan
In the
six-month
period ended 30 June 2023, no RSUs were granted under this program (30 June 2022:
0.5
m restricted
stock
units with an estimated fair value of 2m US dollar).
 
23

19.
Risks arising from financial instruments
A)   FINANCIAL ASSETS AND FINANCIAL LIABILITIES
Set out below is an overview of financial assets and liabilities held by the company as at the dates indicated:
 
    
30 June 2023
    
31 December 2022
 
           
At fair
                         
At fair
               
           
value
    
At fair
                  
value
    
At fair
        
    
At
    
through
    
value
           
At
    
through
    
value
        
    
amortized
    
profit or
    
through
           
amortized
    
profit or
    
through
        
  Million US dollar
  
cost
    
loss
    
OCI
    
        Total
    
cost
    
loss
    
OCI
    
        Total 
 
                                                                         
Cash and cash equivalents
     6 848        -        -     
 
6 848
 
     9 973        -        -     
 
9 973 
 
Trade and other receivables
     6 032        -        -     
 
6 032
 
     4 973        -        -     
 
4 973 
 
Investment securities
     29        85        150     
 
264
 
     25        97        149     
 
272 
 
Interest rate swaps
     -        4        -     
 
4
 
     -        -        -     
 
- 
 
Cross currency interest rate swaps
     -        -        46     
 
46
 
     -        -        63     
 
63 
 
Foreign exchange forwards
     -        10        112     
 
122
 
     -        41        182     
 
223 
 
Foreign currency futures
     -        -        3     
 
3
 
     -        -        4     
 
4 
 
Commodities
     -        -        45     
 
45
 
     -        -        101     
 
101 
 
Financial assets
  
 
12 908


98


356


13 362


14 971


139


498


15 608 
 
Non-current
     507        -        212     
 
720
 
     522        15        193     
 
730 
 
Current
     12 401        98        143     
 
12 642
 
     14 450        124        305     
 
14 878 


Trade and other payables
     19 754        773        -     
 
20 527
 
     21 983        762        -     
 
22 746 
 
Non-current
interest-bearing loans and borrowings
     77 117        1 205        -     
 
78 323
 
     78 880        -        -     
 
78 880 
 
Current interest-bearing loans and borrowings
     2 524        -        -     
 
2 524
 
     1 029        -        -     
 
1 029 
 
Bank overdrafts
     53        -        -     
 
53
 
     83        -        -     
 
83 
 
Equity swaps
     -        5 345        -     
 
5 345
 
     -        4 763        -     
 
4 763 
 
Cross currency interest rate swaps
     -        -        150     
 
150
 
     -        16        171     
 
187 
 
Foreign exchange forwards
     -        8        591     
 
599
 
     -        20        245     
 
265 
 
Foreign currency futures
     -        -        3     
 
3
 
     -        -        -     
 
- 
 
Commodities
     -        -        353     
 
353
 
     -        -        271     
 
271 
 
Interest rate swaps
     -        3        -     
 
3
 
     -        3        2     
 
5 
 
Financial liabilities
  
 
99 448


7 334


1 098


107 880


101 975


5 565


689


108 229 
 
Non-current
     77 504        1 592        113     
 
79 209
 
     79 108        473        168     
 
79 749 
 
Current
     21 944        5 741        985     
 
28 671
 
     22 867        5 092        521     
 
28 480 
 
 
24

B)   INTEREST RATE RISK
The table below reflects the effective interest rates of interest-bearing financial liabilities at the reporting date as well as the currency in which the debt is denominated.
 
  30 June 2023
  
Before hedging
    
After hedging
 
  Interest-bearing financial liabilities
  
Effective
    
                Amount
    
Effective
    
                Amount 
 
  Million US dollar
  
            interest rate
    
            interest rate
 
                                     
Floating rate


Canadian dollar
     -        -        4.73%        954  
Euro
     3.48%        1 068       3.48%        1 068  
US dollar
     5.67%        518       -         
Brazilian real
     9.58%        26       11.59%        826  
Other
     13.64%        273       13.25%        672  


1 885 


3 520  
 
Fixed rate


Canadian dollar
     4.51%        623       4.37%        3 736  
Chinese yuan
    
2.57%
       48      
2.54%
       1 428  
Euro
     2.27%        20 815       2.30%        21 699  
Pound sterling
    
5.13%
       2 322       5.55%        1 689  
South Korean won
    
5.38%
       53       1.26%        2 213  
US dollar
     4.99%        53 511       5.23%        45 269  
Other
     9.29%        1 643       10.43%        1 346  


79 015 


77 380  
 
 
  31 December 2022
  
Before hedging
    
After hedging
 
  Interest-bearing financial liabilities
  
Effective
    
                Amount
    
Effective
    
                Amount 
 
  Million US dollar
  
            interest rate
    
            interest rate
 
                                     
Floating rate


Canadian dollar
     -        -        4.34%        1 455  
Euro
     1.68%        1 048       1.68%        1 048  
Pound sterling
     -        -        3.70%        1 078  
South Korean won
     -        1       3.08%        311  
US dollar
     5.05%        430       -         
Other
     13.39%        252       11.17%        666  


1 730 


4 557  
 
Fixed rate


Canadian dollar
     4.50%        613       4.37%        3 741  
Chinese yuan
    
2.44%
       50      
2.50%
       1 230  
Euro
     2.27%        20 391       2.31%        21 242  
Pound sterling
     5.13%        2 208       5.55%        1 607  
South Korean won
     2.96%        46       0.94%        1 896  
US dollar
     4.99%        53 478       5.27%        44 547  
Other
     10.53%        1 476       12.19%        1 172  


78 261 


75 434  
 
As at 30 June 2023, the total carrying amount of the floating and fixed rate interest-bearing financial liabilities before hedging as listed above includes bank overdrafts of 53m US dollar (31 December 2022: 83m US dollar). As disclosed in the above table, 3 520m US dollar or 4.4% of the company’s interest-bearing financial liabilities bears interest at a variable rate.
 
25

Interest rate sensitivity analysis
The sensitivity analysis has been prepared based on the exposure to interest rates for the floating rate debt after hedging, assuming the amount of liability outstanding at reporting date was outstanding for the whole year to date. The company estimates that an increase or decrease of 100 basis points represents a reasonably possible change in applicable interest rates. Accordingly, if interest rates had been higher/lower by 100 basis points, with all other variables held constant, the interest expense would have been 18m US dollar higher/lower (31 December 2022: 46m US dollar). This impact would have been more than offset by 39m US dollar higher/lower interest income on interest-bearing financial assets (31 December 2022: 93m US dollar). Additionally, the
pre-tax
impact on equity reserves from the market value of hedging instruments would not have been significant.
C)  EQUITY PRICE RISK
AB InBev enters into equity swap derivatives to hedge the price risk on its shares in connection with its share-based payments programs, as disclosed in Note 18
Share-based Payments.
AB InBev also hedges its exposure arising from shares issued in connection with the Grupo Modelo and SAB combinations (see also Note 8
Finance cost and income
). These derivatives do not qualify for hedge accounting and the changes in fair value are recorded in the profit or loss.
As at 30 June 2023, an exposure for an equivalent of 100.5m of AB InBev shares was hedged, resulting in a total loss of (703)m US dollar recognized in the profit or loss account for the period in exceptional finance income/(cost). As at 30 June 2023, liabilities for equity swap derivatives amounted to 5.3 billion US dollar (31 December 2022: 4.8 billion US dollar).
Equity price sensitivity analysis
The sensitivity analysis on the equity swap derivatives, calculated based on a 20.26% (2022: 27.53%) reasonably possible volatility of the AB InBev share price, with all the other variables held constant, would show 1 158m US dollar positive/negative impact on the 2023 profit before tax (31 December 2022: 1 660m US dollar).
D)  CREDIT RISK
Credit risk encompasses all forms of counterparty exposure, i.e., where counterparties may default on their obligations to AB InBev in relation to lending, hedging, settlement and other financial activities. The company has a credit policy in place and the exposure to counterparty credit risk is monitored.
AB InBev mitigates its exposure through a variety of mechanisms. It has established minimum counterparty credit ratings and enters into transactions only with financial institutions of investment grade rating. The company monitors counterparty credit exposures closely and reviews any external downgrade in credit rating immediately. To mitigate
pre-settlement
risk, counterparty minimum credit standards become more stringent with increases in the duration of the derivatives. To minimize the concentration of counterparty credit risk, the company enters into derivative transactions with different financial institutions.
The company also has master netting agreements with all of the financial institutions that are counterparties to over the counter (OTC) derivatives. These agreements allow for the net settlement of assets and liabilities arising from different transactions with the same counterparty. Based on these factors, AB InBev considers the impact of the risk of counterparty default as at 30 June 2023 to be limited.
Exposure to credit risk
The carrying amount of financial assets represents the maximum credit exposure of the company. The carrying amount is presented net of the impairment losses recognized. The maximum exposure to credit risk at the reporting date was:
 
    
30 June 2023
    
31 December 2022
 
  Million US dollar
  
Gross
    
  Impairment
    
Net carrying
amount
    
        Gross
    
      Impairment
   
Net carrying
amount


Cash and cash equivalents
     6 848      -        6 848      9 973      -     9 973  
Trade receivables
     4 964      (385)        4 579      3 980      (343     3 637
Other receivables
     1 775      (75)        1 701      1 545      (68     1 477
Derivatives
     219      -        219      391      -     391
Cash deposits for guarantees
     169      -        169      189      -     189
Investment in unquoted companies
     156      (5)        150      155      (5     149
Investment in debt securities
     114      -        114      123      -     123
Loans to customers
     100      -        100      81      -     81


14 345
    
 
(466)


13 879
    
 
16 434
    
 
(416
 
 
16 019
 
 
26

There was no significant concentration of credit risks with any single counterparty as at 30 June 2023 and no single customer represented more than 10% of the total revenue of the group in 2023.
Impairment losses
The allowance for impairment recognized during the period on financial assets was as follows:
 
     
30 June 2023
    
31 December 2022
 
Balance at end of previous year
  
 
(416)


(402)
  
Impairment losses
     (27)        (38)  
Derecognition
     6        24  
Currency translation and other
     (28)        1  
Balance at end of period
  
 
(466)


(416)
 
E)  LIQUIDITY RISK
Historically, AB InBev’s primary sources of cash flow have been cash flows from operating activities, the issuance of debt, bank borrowings and equity securities. AB InBev’s material cash requirements have included the following:
 
 
·
 
Debt servicing;
 
 
·
 
Capital expenditures;
 
 
·
 
Investments in companies;
 
 
·
 
Increases in ownership of AB InBev’s subsidiaries or companies in which it holds equity investments;
 
 
·
 
Share buyback programs; and
 
 
·
 
Payments of dividends and interest on shareholders’ equity.
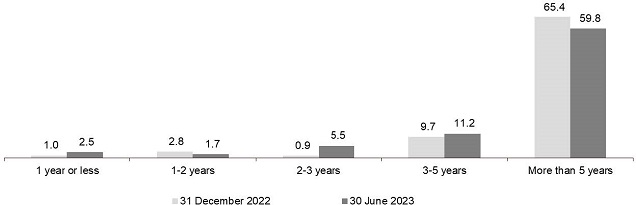
The company believes that cash flows from operating activities, available cash and cash equivalents as well as short term investments, along with related derivatives and access to borrowing facilities, will be sufficient to fund capital expenditures, financial instrument liabilities and dividend payments going forward. It is the intention of the company to continue to reduce its financial indebtedness through a combination of strong operating cash flow generation and continued refinancing.
 
27

The following are the nominal contractual maturities of
non-derivative
financial liabilities including interest payments and derivative liabilities:
 
    
30 June 2023
 
  Million US dollar
  
Carrying
amount¹
    
Contractual
cash
flows
    
Less
than
1 year
    
  1-2 years
    
  2-3 years
    
  3-5 years
    
More
than
5 years
 
                                                                
Non-derivative
financial liabilities


Unsecured bond issues
     (77 344)        (132 501)        (4 496)        (4 575)        (8 393)        (16 859)        (98 177)   
Trade and other payables
     (24 219)        (24 507)        (23 388)        (263)        (197)        (312)        (348)  
Lease liabilities
     (2 699)        (3 149)        (781)        (580)        (452)        (561)        (776)  
Secured bank loans
     (487)        (497)        (466)        (5)        (5)        (10)        (10)  
Unsecured bank loans
     (181)        (181)        (181)        -        -        -        -  
Unsecured other loans
     (136)        (209)        (36)        (88)        (33)        (24)        (27)  
Bank overdraft
     (53)        (53)        (53)        -        -        -        -  


(105 119)


(161 097)


  (29 400)


(5 512)


(9 079)


(17 767)


(99 339)
 
                                                                
Derivative financial liabilities


Equity derivatives
     (5 345)        (5 345)        (5 345)        -        -        -        -  
Foreign exchange derivatives
     (602)        (602)        (602)        -        -        -        -  
Cross currency interest rate swaps
     (153)        (153)        (9)        (41)        (57)        (47)        -  
Commodity derivatives
     (353)        (353)        (353)        -        -        -        -  


(6 453)


(6 453)


(6 308)


(41)


(57)


(47)


-
 
                                                                
Of which: related to cash flow hedges
     (961)        (961)        (907)        -        (33)        (20)        -  
    
31 December 2022
 
  Million US dollar
  
Carrying
amount¹
    
Contractual
cash
flows
    
Less
than
1 year
    
1-2
years
    
2-3
years
    
3-5
years
    
More
than
5 years
 
                                                                
Non-derivative
financial liabilities


Unsecured bond issues
     (76 798)        (133 670)        (3 273)        (5 683)        (3 783)        (15 482)        (105 450)  
Trade and other payables
     (27 208)        (27 453)        (26 376)        (170)        (349)        (260)        (297)  
Lease liabilities
     (2 492)        (2 840)        (618)        (566)        (414)        (531)        (712)  
Secured bank loans
     (393)        (405)        (371)        (5)        (5)        (10)        (14)  
Unsecured bank loans
     (100)        (100)        (100)        -        -        -        -  
Unsecured other loans
     (125)        (193)        (34)        (78)        (28)        (31)        (23)  
Bank overdraft
     (83)        (83)        (83)        -        -        -        -  


(107 199)


(164 745)


(30 856)


(6 501)


(4 579)


(16 313)


(106 496)
 
                                                                
Derivative financial liabilities


Equity derivatives
     (4 763)        (4 763)        (4 763)        -        -        -        -  
Foreign exchange derivatives
     (265)        (265)        (265)        -        -        -        -  
Cross currency interest rate swaps
     (192)        (191)        (9)        (43)        (47)        (62)        (30)  
Commodity derivatives
     (271)        (251)        (249)        (2)        -        -        -  


(5 492)


(5 471)


(5 287)


(45)


(47)


(62)


(30)
 
                                                                
Of which: related to cash flow hedges
     (551)        (530)        (469)        -        (43)        (17)        -  
 
 
1
“Carrying amount” refers to the net book value as recognized in the statement of financial position at each reporting date.
 
28

F)  FAIR VALUE
The following table summarizes for each type of derivative the fair values recognized as assets or liabilities in the statement of financial position:
 
    
Assets
    
Liabilities
    
Net
 
  Million US dollar
  
30 June
2023
    
31 December
2022
    
    30 June
2023
    
31 December
2022
    
    30 June
2023
    
31 December
2022
 
                                                       
Foreign currency


Foreign exchange forwards
     122      223        (599)        (265)        (477)        (42)   
Foreign currency futures
     3      4        (3)        -        -        4
                                                       
Interest rate


Interest rate swaps
     4      -        (3)        (5)        1      (5)  
Cross currency interest rate swaps
     46      63        (150)        (187)        (104)        (124)  
                                                       
Commodities


Aluminum swaps
     6      52        (181)        (174)        (175)        (122)  
Sugar futures
     19      4        -        -        19      4  
Energy
     5      12        (49)        (28)        (44)        (16)  
Other commodity derivatives
     15      32        (123)        (69)        (109)        (37)  
                                                       
Equity


Equity derivatives
     -        -        (5 345)        (4 763)        (5 345)        (4 763)  


219
    
 
391


(6 453)


(5 492)


(6 234)


(5 101)
 
Of which:


Non-current
     62      60        (113)        (184)        (50)        (124)  
Current
     157      331        (6 340)        (5 308)        (6 184)        (4 977)  
The following table summarizes the carrying amount and the fair value of the fixed rate interest-bearing financial liabilities as recognized in the statement of financial position. Floating rate interest-bearing financial liabilities, trade and other receivables and trade and other payables, lease liabilities and derivative financial instruments have been excluded from the analysis as their carrying amount is a reasonable approximation of their fair value:
 
  Interest-bearing financial liabilities
  
30 June 2023
    
31 December 2022
 
  Million US dollar
  
Carrying amount¹
    
        Fair value
    
Carrying amount¹
    
        Fair value
 
                                     
Fixed rate


US dollar
     (53 029)        (53 976)        (52 993)        (52 158)   
Euro
     (20 032)        (18 637)        (19 655)        (17 926)  
Pound sterling
     (2 263)        (2 078)        (2 148)        (2 039)  
Canadian dollar
     (525)        (478)        (515)        (437)  
Other
     (465)        (456)        (458)        (448)  


(76 315)


(75 624)


(75 769)


(73 008)


1
“Carrying amount” refers to the net book value as recognized in the statement of financial position at each reporting date.
 
29

The table sets out the fair value hierarchy based on the degree to which significant market inputs are observable:
 
  Fair value hierarchy 30 June 2023

  Million US dollar
  
Quoted (unadjusted)
prices - level 1
    
Observable market
inputs - level 2
    
Unobservable market
inputs - level 3
 
                            
Financial Assets


Held for trading
(non-derivatives)
     -        9         -   
Derivatives at fair value through profit and loss
     -        10         -  
Derivatives in a cash flow hedge relationship
     45         86         -  
Derivatives in a fair value hedge relationship
     -        4         -  
Derivatives in a net investment hedge relationship
     -        74         -  


45 
    
 
183 
    
 
-
 
Financial Liabilities


Deferred consideration on acquisitions at fair value
     -        -        773   
Derivatives at fair value through profit and loss
     -        5 352         -  
Derivatives in a cash flow hedge relationship
     34         927         -  
Derivatives in a fair value hedge relationship
     -        3         -  
Derivatives in a net investment hedge relationship
     -        136         -  


34 
    
 
6 419 
    
 
773 
 
       
  Fair value hierarchy 31 December 2022

  Million US dollar
  
Quoted (unadjusted)
prices - level 1
    
            Observable market
inputs - level 2
    
      Unobservable market
inputs - level 3
 
                            
Financial Assets


Held for trading
(non-derivatives)
     -        9         -  
Derivatives at fair value through profit and loss
     -        41         -  
Derivatives in a cash flow hedge relationship
     36         219         -  
Derivatives in a net investment hedge relationship
     -        94         -  


36 
    
 
364 
    
 
-
 
Financial Liabilities


Deferred consideration on acquisitions at fair value
     -        -        762   
Derivatives at fair value through profit and loss
     -        4 799         -  
Derivatives in a cash flow hedge relationship
     26         525         -  
Derivatives in a fair value hedge relationship
     -        4         -  
Derivatives in a net investment hedge relationship
     -        138         -  


26 
    
 
5 466 
    
 
762 
 
There were no significant changes in the measurement and valuation techniques, or significant transfers between the levels of the financial assets and liabilities during the period.
Non-derivative
financial liabilities
As part of the 2012 shareholders agreement between Ambev and ELJ, following the acquisition of Cervecería Nacional Dominicana S.A. (“CND”), a forward-purchase contract (combination of a put option and purchased call option) was put in place which may result in Ambev acquiring additional shares in CND. In July 2020, Ambev and ELJ amended the Shareholders’ Agreement to extend their partnership and change the terms and the exercise date of the call and put options. ELJ currently holds 15% of CND and the put option is exercisable in 2023, 2024 and 2026. As at 30 June 2023, the put option on the remaining shares held by ELJ was valued at 590m US dollar (31 December 2022: 585m US dollar) and recognized as a deferred consideration on acquisitions at fair value in the “level 3” category above.
 
20.
Collateral and contractual commitments for the acquisition of property, plant and equipment, loans to customers and other
In the
six-month
period ended 30 June 2023, there were no significant changes in collateral and contractual commitments. The commitments to purchase property, plant and equipment increased from 538m US dollar as of 31 December 2022 to 1 030m US dollar as of 30 June 2023.
 
30

21.
Contingencies
The company has contingencies for which, in the opinion of management and its legal counsel, the risk of loss is possible but not probable and therefore no provisions have been recorded. Due to their nature, such legal proceedings and tax matters involve inherent uncertainties including, but not limited to, court rulings, negotiations between affected parties and governmental actions, and as a consequence AB InBev’s management cannot at this stage estimate the likely timing of resolution of these matters. The most significant contingencies are discussed below. Amounts have been converted to US dollar at the closing rate of the respective period.
AMBEV TAX MATTERS
As of 30 June 2023 and 31 December 2022, AB InBev’s material tax proceedings are related to Ambev and its subsidiaries. Estimates of amounts of possible loss are as follows:
 
  Million US dollar
    
30 June 2023
      
31 December 2022
 
                       
Income tax and social contribution
       11 322          11 586  
Value-added and excise taxes
       5 576          4 965  
Other taxes
       923          854  


17 821


17 405
 
The most significant tax proceedings of Ambev are discussed below.
The company and its subsidiaries have insurance guarantees and letters of guarantee for certain legal proceedings, which are presented as guarantees in civil, labor and tax proceedings.
INCOME TAX AND SOCIAL CONTRIBUTION
Foreign Earnings
Since 2005, Ambev and certain of its subsidiaries have been receiving assessments from the Brazilian Federal Tax Authorities relating to the profits of its foreign subsidiaries. The cases are being challenged at both the administrative and judicial levels of the courts in Brazil.
The administrative proceedings have resulted in partially favorable decisions, most of which are still subject to review by the Administrative Court. In October 2022, the Lower Administrative Court rendered a favorable decision to Ambev in one case. In March 2023, the Lower Administrative Court rendered two favorable decisions and one partially favorable decision to Ambev on three cases related to the taxation of profits of foreign subsidiaries. Ambev is awaiting formal notification of these decisions to analyze the contents and any applicable legal motions or appeals before the judicial level. In the judicial proceedings, Ambev has received favorable injunctions that suspend the enforceability of the tax credit, as well as favorable first level decisions, which remain subject to review by the second-level judicial court.
The updated assessed amount related to this uncertain tax position as of 30 June 2023 is approximately 6.6 billion Brazilian real (1.4
 billion US dollar) and Ambev has not recorded any provisions in connection therewith as it considers the chance of loss to be possible. For proceedings where it considers the chance of loss to be probable, Ambev has recorded a provision in the total amount of 60 million Brazilian real (12 million US dollar).
Goodwill InBev Holding
In December 2011, Ambev received a tax assessment related to the goodwill amortization in calendar years 2005 to 2010 resulting from the InBev Holding Brasil S.A. merger with Ambev. At the administrative level, Ambev received partially favorable decisions at both the Lower and Upper Administrative Court. Ambev filed judicial proceedings to discuss the unfavorable portion of the decisions of the Lower and the Upper Administrative Court and requested injunctions to suspend the enforceability of the remaining tax credit, which were granted.
In June 2016, Ambev received a new tax assessment charging the remaining value of the goodwill amortization in calendar years 2011 to 2013 and filed a defense. Ambev received partially favorable decisions at the first level administrative court and Lower Administrative Court. Ambev filed a Special Appeal which was partially admitted by the Upper Administrative Court. For the unfavorable portion of the decision which became final at the administrative level, Ambev filed a judicial proceeding requesting an injunction to suspend the enforceability of the remaining tax credit, which was granted.
In April 2023, Ambev received a partially favorable decision at the Upper Administrative Court for the portion of the tax assessment which was still awaiting judgment In June 2023, Ambev filed a judicial proceeding to appeal the unfavorable portion of the decision, which awaits judgment by the first judicial level.
 
31

The updated assessed amount related to this uncertain tax position as of 30 June 2023 is approximately 10.7 billion Brazilian real (2.2 billion US dollar) and Ambev has not recorded any provisions for this matter as it considers the chances of loss to be possible. In the event Ambev is required to pay these amounts, AB InBev will reimburse the amount proportional to the benefit received by AB InBev pursuant to the merger protocol as well as the related costs.
Goodwill Beverage Associate Holding (BAH)
In October 2013, Ambev received a tax assessment related to the goodwill amortization in calendar years 2007 to 2012 resulting from the merger of Beverage Associates Holding Limited (“BAH”) into Ambev. The decision from the first level administrative court was unfavorable to Ambev. Ambev filed an appeal to the Lower Administrative Court against the decision, which was partially granted. Ambev and the tax authorities filed Special Appeals to the Upper Administrative Court. In July 2022, the Upper Administrative Court rendered a partially favorable decision to Ambev. The decision did not recognize the Special Appeal filed by the tax authorities, thereby preserving the portion of the decision rendered by the Lower Administrative Court that was favorable to Ambev with respect to the qualified penalties applied and the statute of limitations for one of the calendar years under discussion; this portion of the decision is final. In January 2023, Ambev filed a judicial proceeding to appeal the unfavorable portion of the decision.
In April and August 2018, Ambev received new tax assessments charging the remaining value of the goodwill amortization in calendar years 2013 to 2014 and filed defenses. In April 2019, the first level administrative court rendered unfavorable decisions to Ambev. As a result thereof, Ambev appealed to the Lower Administrative Court. In November and December 2019, Ambev received partially favorable decisions at the Lower Administrative Court. Ambev and the tax authorities filed Special Appeals to the Upper Administrative Court. In April 2023, the Upper Administrative Court rendered partially favorable decisions to Ambev, related to the qualified penalties, in the Special Appeals. In June 2023, Ambev filed a judicial proceeding to appeal the unfavorable portion of the decisions, which awaits judgment by the first judicial level. 
The updated assessed amount related to this uncertain tax position as of 30 June 2023 is approximately 2.3 billion Brazilian real (0.5 billion US dollar). Ambev has not recorded any provisions for this matter as it considers the chance of loss to be possible.
Goodwill CND Holdings
In November 2017, Ambev received a tax assessment related to the goodwill amortization in calendar years 2012 to 2016 resulting from the merger of CND Holdings into Ambev. The decision from the first level administrative court was unfavorable to Ambev. Ambev filed an appeal to the Lower Administrative Court. In February 2020, the Lower Administrative Court rendered a partially favorable decision. Ambev and the tax authorities filed Special Appeals to the Upper Administrative Court. The Special Appeal filed by Ambev was partially admitted and is awaiting judgment.
In October 2022, Ambev received a new tax assessment charging the remaining value of the goodwill amortization in calendar year 2017. Ambev has filed a defense and awaits judgment by the first level administrative court.
The updated assessed amount related to this uncertain tax position as of 30 June 2023 is approximately 1.3 billion Brazilian real (0.3 billion US dollar). Ambev has not recorded any provisions for this matter as it considers the chances of loss to be possible.
Goodwill MAG
In December 2022, CRBS S.A (a subsidiary of Ambev) received a tax assessment related to the goodwill amortization in calendar years 2017 to 2020, resulting from the merger of RTD Barbados into CRBS. Ambev filed a defense in January 2023, and awaits judgement by the first level administrative court.
The updated assessed amount as of 30 June 2023 is approximately 0.3 billion Brazilian real (0.1 billion US dollar). Ambev has not recorded any provisions for this matter as it considers the chance of loss to be possible.
Ambev has continued to take the same deductions for the calendar years following the assessed periods (2021 to February 2022). Therefore, if Ambev receives similar tax assessments for this period, Ambev management believes the outcome would be consistent with the already assessed periods.
Disallowance of financial expenses
In 2015, 2016 and 2020, Ambev received tax assessments related to the disallowance of alleged
non-deductible
expenses and the deduction of certain losses mainly associated to financial investments and loans. Ambev presented defenses and, in November 2019, received a favorable decision at the first level administrative court regarding the 2016 case, which was confirmed by the Upper Administrative Court in April 2023.
In June 2021, Ambev received a partially favorable decision for the 2020 case at the first level administrative court and filed an appeal to the Lower Administrative Court. In March 2023, Ambev received a favorable decision from the Lower
 
32

Administrative Court, which fully canceled the tax assessment related to 2020, and this decision became final in May 2023. In June 2022, Ambev received a partially favorable decision at the first level administrative court regarding the 2015 case and filed an appeal to the Lower Administrative Court. The favorable portion of the decision is also subject to mandatory review by the Lower Administrative Court.
The updated assessed amount related to this uncertain tax position as of 30 June 2023 is approximately 0.3 billion Brazilian real (0.1 billion US dollar). Ambev has not recorded any provisions for this matter as it considers the chance of loss to be possible.
Disallowance of tax paid abroad
Since 2014, Ambev has been receiving tax assessments from the Brazilian Federal Tax Authorities, for calendar years as of 2007, related to the disallowance of deductions associated with alleged unproven taxes paid abroad by its subsidiaries and has been filing defenses. The cases are being challenged at both the administrative and judicial levels. In November 2019, the Lower Administrative Court rendered a favorable decision to Ambev in one of the cases (related to the 2010 tax period), which became definitive.
In January 2020, the Lower Administrative Court rendered unfavorable decisions regarding four of these assessments related to the periods of 2015 and 2016, for which Ambev filed Special Appeals to the Upper Administrative Court. In April 2023, Ambev received unfavorable decisions at the Upper Administrative Court in respect of the Special Appeals. Ambev is awaiting formal notification of these decisions, which are not final and remain subject to appeal at the judicial level.
In connection with the tax assessments related to the periods of 2015 and 2016, additional tax assessments were filed to charge isolated fines due to the lack of monthly prepayments of income tax as a result of allegedly undue deductions of taxes paid abroad. In 2021, Ambev received unfavorable decisions from the first level administrative court in two of these assessments with respect to the 2015 and 2016 isolated fine cases, and filed appeals in connection therewith, which are pending judgment by the Lower Administrative Court. In 2022, Ambev received an unfavorable decision from the first level administrative court in the second assessment related to the 2016 isolated fine case, and filed an appeal in connection therewith which awaits judgment by the Lower Administrative Court. In October 2022, Ambev received a new tax assessment charging such isolated fine related to calendar year 2017. Ambev has filed a defense in this case, and awaits judgment by the first level administrative court.
The other cases are still awaiting final decisions at both administrative and judicial courts.
The updated assessed amount as of 30 June 2023 is approximately 13.1 billion Brazilian real (2.7 billion US dollar). Ambev has not recorded any provisions for this matter as it considers the chance of loss to be possible.
The company has continued to take the same deductions for the calendar years following the assessed periods (2018 to
2023
). Therefore, if Ambev receives similar tax assessments for this period, Ambev management believes the outcome would be the same as those tax years already assessed.
Presumed Profit
In April 2016, Arosuco (a subsidiary of Ambev) received a tax assessment regarding the use of the “presumed profit” method for the calculation of income tax and the social contribution on net profits instead of the “real profit” method. In September 2017, Arosuco received an unfavorable first level administrative decision and filed an appeal. In January 2019, the Lower Administrative Court rendered a favorable decision to Arosuco, which became definitive.
In March 2019, Arosuco received a new tax assessment regarding the same subject and filed a defense. In October 2019, Arosuco received an unfavorable first level administrative decision and filed an appeal which is pending judgment.
The updated assessed amount related to this uncertain tax position as of 30 June 2023 is approximately 0.6 billion Brazilian real (0.1 billion US dollar). Arosuco has not recorded any provisions for this matter as it considers the chance of loss to be possible.
Deductibility of IOC expenses
In 2013, as approved in a Shareholders Meeting, Ambev implemented a corporate restructuring with the purpose of simplifying its corporate structure and converting into a single class of shares company, among other factors. One of the steps of such restructuring involved a contribution of shares followed by the merger of shares of its controlled entity, Companhia de Bebidas das Américas, into Ambev. As one of the results of such restructuring, the counterpart register of the positive difference between the value of shares issued for the merger and the net equity value of its controlled entity’s share was accounted, as per IFRS 10/CPC 36 and ICPC09, in an equity account of Ambev referred to as carrying value adjustment.
 
33

In November 2019, Ambev received a tax assessment from the Brazilian Federal Tax Authorities related to the interest on capital (“IOC”) deduction in 2014. The assessment refers primarily to the accounting and corporate effects of the restructuring carried out by Ambev in 2013 and its impact on the increase in the deductibility of IOC expenses. In August 2020, Ambev received a partially favorable decision at the first level administrative court and filed an Appeal to the Lower Administrative Court, which awaits judgement. The favorable portion of the decision is subject to mandatory review by the Lower Administrative Court.
In December 2020, Ambev received a new tax assessment related to the deduction of the IOC in 2015 and 2016. The defense against such new tax assessment was filed by Ambev in January 2021. In June 2021, Ambev received a partially favorable decision and filed an appeal to the Lower Administrative Court, which also awaits judgment. Similar to the first tax assessment, the favorable portion of the decision is also subject to mandatory review by the Lower Administrative Court.
In December 2022, Ambev received a new tax assessment related to the deduction of the IOC in 2017. The defense against this new tax assessment was filed by Ambev in January 2023, which is pending judgment by the first level administrative court.
The updated assessed amount as of 30 June 2023 is approximately 14.5 billion Brazilian real (3.0 billion US dollar). Ambev has not recorded any provisions for this matter as it considers the chance of loss to be possible.
The uncertain tax position continued to be adopted by Ambev as it also distributed or accrued IOC in the years following the assessed period (2018-
2023
) and deducted such amounts from its Corporate Income Taxes taxable basis. Therefore, in a scenario where the IOC deductibility would also be questioned for the period after 2017, on the same basis and arguments as the aforementioned tax assessments, Ambev management estimates that the outcome of such potential further assessments would be consistent with the already assessed periods.
Disallowance on Income Tax deduction
In January 2020, Arosuco, a subsidiary of Ambev, received a tax assessment from the Brazilian Federal Tax Authorities regarding the disallowance of the income tax reduction benefit provided for in Provisional Measure
No. 2199-14/2001,
for calendar years 2015 to 2018, and an administrative defense was filed. In October
202
0, the first level administrative court rendered an unfavorable decision to Arosuco. Arosuco filed an appeal against the aforementioned decision and awaits judgment by the Lower Administrative Court. The updated assessed amount as of 30 June 2023 is approximately 2.5 billion Brazilian real (0.5 billion US dollar). Ambev has not recorded any provisions for this matter as it considers the chance of loss to be possible.
This uncertain tax position continued to be applied by the Company impacting calendar years following those assessed (2019-
2023
) in which it benefited from the income tax reduction provided for in Provisional Measure
No. 2199-14/2001.
In a scenario Arosuco is questioned on this matter for future periods, on the same basis and arguments as the aforementioned tax assessment, Arosuco management estimates that the outcome of such potential further assessments would be consistent to the already assessed periods.
Tax Loss Offset
Ambev and certain of its subsidiaries received a number of assessments from the Brazilian Federal Tax Authorities relating to the offset of tax losses carried forward in the context of business combinations.
In February 2016, the Upper Administrative Court ruled unfavorably to Ambev in two of these cases, following which Ambev filed judicial proceedings. In September 2016, Ambev received a favorable first level decision in one of the judicial claims which was confirmed by the second-level judicial court in December 2022. This decision is subject to appeal by the tax authorities. In March 2017, Ambev received an unfavorable first level decision with respect to the second judicial case and filed an appeal, which is pending judgment by the second-level judicial court.
There is a third case being challenged at the administrative level in which Ambev appealed to the Upper Administrative Court against an unfavorable decision rendered by the Lower Administrative Court in June 2019. In January 2023, Ambev received an unfavourable decision at the Upper Administrative Court and has filed a motion for clarification. The amount related to this uncertain tax position as of 30 June 2023 is approximately 0.6 billion Brazilian real (0.1 billion US dollar). Ambev has not recorded any provisions for this matter as it considers the chance of loss to be possible.
ICMS VALUE ADDED TAX, EXCISE TAX (“IPI”) AND TAXES ON NET SALES
Manaus Free Trade Zone – IPI / Social contributions
In Brazil, goods manufactured within the Manaus Free Trade Zone intended for remittance elsewhere in Brazil are exempt and/ or
zero-rated
from excise tax (“IPI”) and social contributions (“PIS/COFINS”). With respect to IPI, Ambev’s subsidiaries
 
34

have been registering IPI presumed tax credits upon the acquisition of exempted goods manufactured therein. Since 2009, Ambev has been receiving a number of tax assessments from the Brazilian Federal Tax Authorities relating to the disallowance of such credits.
Ambev and its subsidiaries have also been receiving charges from the Brazilian Federal Tax Authorities in relation to (i) federal taxes allegedly unduly offset with the disallowed presumed IPI excise tax credits that are under discussion in these proceedings and (ii) PIS/COFINS amounts allegedly due on Arosuco’s remittance to Ambev subsidiaries.
In April 2019, the Federal Supreme Court (“STF”) announced its judgment on Extraordinary Appeal No. 592.891/ /SP, with binding effects, deciding on the rights of taxpayers registering IPI excise tax presumed credits on acquisitions of raw materials and exempted inputs originating from the Manaus Free Trade Zone. As a result of this decision, Ambev reclassified part of the amounts related to the IPI cases as remote losses maintaining as possible losses only issues related to other additional discussions that were not included in the analysis of the STF. The cases are being challenged at both the administrative and judicial levels.
Ambev management estimates the possible loss related to these proceedings to be approximately 6.2 billion Brazilian real (1.3 billion US dollar) as of 30 June 2023. Ambev has not recorded any provision in connection therewith.
IPI Suspension
In 2014 and 2015, Ambev received tax assessments from the Brazilian Federal Tax Authorities relating to IPI allegedly due over remittances of manufactured goods to other related factories. The cases are being challenged at both the administrative and judicial levels. In 2020, Ambev received a final partially favorable decision at the administrative level in one of the cases. In July 2022, Ambev received the first judicial decision on this matter; the decision was unfavorable to Ambev and it has filed an appeal.
In October 2022, the Upper Administrative Court rendered a partially favorable decision to Ambev in one of the cases related to this matter. Ambev awaits formal notification of this decision to assess whether any portion of the tax assessment may be challenged at the judicial level.
Ambev management estimates the possible loss related to these assessments to be approximately 1.8 billion Brazilian real (0.4 billion US dollar) as of 30 June 2023. Ambev has not recorded any provision in connection therewith.
ICMS tax credits
Ambev is currently challenging tax assessments issued by the states of São Paulo, Rio de Janeiro, Minas Gerais, among others, questioning the legality of ICMS tax credits arising from transactions with companies that have tax incentives granted by other states. The cases are being challenged at both the administrative and judicial level of the courts. On August 2020, the STF issued a binding decision (Extraordinary Appeal No. 628.075) ruling that tax credits granted by the states in the context of the ICMS tax war shall be considered unlawful. The decision also recognized that the states should abide by the tax incentives validation process provided for in Complementary Law No. 160/17. This decision became final (and no longer subject to appeal) in December 2021 and it does not change the likelihood of loss in Ambev’s tax assessments. With respect to the assessments issued by the State of São Paulo, Ambev received unfavorable decisions at the second administrative level in April, May and June 2022. In these cases, Ambev has filed motions for reconsideration to the second administrative level.
Ambev management estimates the possible losses related to these assessments to be approximately 1.7 billion Brazilian real (0.4 billion US dollar) as of 30 June 2023. Ambev has not recorded any provision in connection therewith.
In addition, in 2018 and 2021, Ambev received tax assessments from the States of Rio Grande do Sul and São Paulo charging alleged differences in ICMS due to the disallowance of credits arising from transactions with suppliers located in the Manaus Free Trade Zone. With regard to the assessment issued by the State of Rio Grande do Sul, Ambev received a favourable judgment at the second administrative level, which was amended by the third administrative level in favour of the tax authorities. This decision is not final and remain subject to appeal at the judicial level. With respect to the assessments issued by the State of São Paulo, Ambev received unfavourable decisions at the first administrative level in May and June 2022. In these cases, Ambev has filed appeals to the second administrative level. Ambev management estimates the possible losses related to these assessments to be approximately 0.8 billion Brazilian real (0.2 billion US dollar) as of 30 June 2023.
ICMS-ST
Trigger
Over the years, Ambev has received tax assessments to charge supposed ICMS differences considered due when the price of the products sold by Ambev is above the fixed price table basis established by the relevant states, cases in which the state tax authorities understand that the calculation basis should be based on a value-added percentage over the
 
35

actual prices and not the fixed table price. Ambev is currently challenging those charges before the courts. The cases are being challenged at both the administrative and judicial levels.
Ambev management estimates the total possible loss related to this issue to be approximately 10.0 billion Brazilian real (2.1 billion US dollar) as of 30 June 2023. Ambev has not recorded any provisions for this matter.
SOCIAL CONTRIBUTIONS
Since 2015, Ambev has received tax assessments issued by the Brazilian Federal Tax Authorities relating to PIS/COFINS amounts allegedly due over bonus products granted to its customers. The cases are being challenged at both the administrative and judicial levels of the courts. In 2019, 2020 and 2023, Ambev received final favorable decisions at the administrative level in some of these cases. In 2023, the Lower Administrative Court rendered favorable decisions to Ambev in two other cases and Ambev is awaiting formal notification of these decisions, which are not final and remain subject to appeal. At the judicial level, one case is pending decision by the second level judicial court after the first level judicial court rendered an unfavorable decision to Ambev.
Ambev management estimates the possible loss related to these assessments to be approximately 1.6 billion Brazilian real (0.3 billion US dollar) as of 30 June 2023. Ambev has not recorded any provisions for this matter.
AB INBEV’S TANZANIA TAX MATTERS
Tanzania Breweries Limited (“TBL”), a subsidiary of AB InBev in Tanzania, received a tax assessment for 850 billion Tanzanian shillings (0.4 billion US dollar) related to income tax on the alleged capital gain derived from the change in underlying ownership of TBL which the Tanzania Revenue Authority claims was more than 50% following the 2016 combination of SAB and AB InBev. TBL filed an appeal to the Tax Revenue Appeals Board. TBL believes that the assessment is without merit and will vigorously defend against the assessment. No related provision has been made.
AB INBEV’S SOUTH AFRICA TAX MATTERS
The South African Revenue Service (“SARS”) conducted an audit of AB InBev’s South African subsidiary, the South African Breweries (Pty) Ltd. (“SAB”), in relation to the 2017 repurchase of SAB’s equity stake in Coca-Cola Beverages Africa (Pty) Ltd (“CCBA”), the Coca-Cola bottling business in Africa, by CCBA. The assessment from SARS claims that SAB owes
 6.4 billion South African Rand (0.4 
billion US dollar) in taxes plus penalties and interest, which as at the time of assessment total 17.7 billion Rand (1 billion US dollar).
The repurchase transaction also included an indemnity for certain tax liabilities of CCBA. CCBA has notified SAB that CCBA has received an assessment from SARS for 8.9 billion Rand (0.5 billion US dollar). Both of
 these
assessments are contested
, but
 SAB
may be required to secure or pre-pay some or all of the amounts assessed, pending the outcome of
the
challenge and any appeal
(s)
. No related provision
for these matters 
has been made
 as the chances of loss are not considered to be probable.
OTHER TAX MATTERS
In February 2015, the European Commission opened an
in-depth
state aid investigation into the Belgian excess profit ruling system. On 11 January 2016, the European Commission adopted a negative decision finding that the Belgian excess profit ruling system constitutes an aid scheme incompatible with the internal market and ordering Belgium to recover the incompatible aid from a number of aid beneficiaries. The Belgian authorities contacted the companies that had benefitted from the system and advised each company of the amount of incompatible aid that is potentially subject to recovery. The European Commission’s decision was appealed to the European Union’s General Court by Belgium on 22 March 2016 and by AB InBev on 12 July 2016. On 14 February 2019, the European General Court concluded that the Belgian excess profit ruling system does not constitute illegal state aid. The European Commission appealed the judgment to the European Court of Justice. The public hearing in the framework of the appeal proceedings took place on 24 September 2020 and AB InBev was heard as an intervening party.
On 3 December 2020, the Advocate General (AG) of the European Court of Justice presented her
non-binding
opinion on the appeal procedure related to the 11 January 2016 opening decision, stating that, contrary to the 14 February 2019 judgment of the European General Court, the Belgian excess profit ruling system would fulfil the legal requirements for an “aid scheme”. In the initial European General Court judgment, the court limited itself to finding the Belgian excess profit rulings were not an “aid scheme”, but did not consider whether they constituted State aid. Consequently, the AG advised the European Court of Justice to refer the case back to the European General Court to review whether the Belgian excess profit rulings constitute State aid. On 16 September 2021, the European Court of Justice agreed with the AG and concluded that the excess profit ruling system constitutes an aid scheme and set aside the judgment of the European General Court. The case has been referred back to the European General Court to decide whether the Belgian excess profit ruling system constitutes illegal State aid as well as the other remaining open issues in the appeal, where it remains ongoing along with other pending appeals related to the matter.
 
36

Following the initial annulment of the European Commission’s decision by the European General Court in 2019, the European Commission opened new state aid investigations into the individual Belgian tax rulings, including the one issued to AB InBev in September 2019, to remedy the concerns that had led to the annulment. These investigations relate to the same rulings that were the subject of the European Commission’s decision issued on 11 January 2016. AB InBev has filed its observations in respect of the opening decisions with the European Commission. On 28 October 2021, the European Commission stayed the new state aid investigations into the individual Belgian tax rulings pending final resolution of the case.
In addition, the Belgian tax authorities have also questioned the validity and the actual application of the excess profit ruling that was issued in favor of AB InBev and have refused the actual tax exemption which it confers. AB InBev has filed a court claim against such decision before the Brussels court of first instance which ruled in favor of AB InBev on 21 June 2019, and again on 9 July 2021 for subsequent years. The Belgian tax authorities appealed both judgments.
In January 2019, AB InBev deposited 68 million euro (73 million US dollar) on a blocked account. Depending on the final outcome of the European Court procedures on the Belgian excess profit ruling system, as well as the pending Belgian court cases, this amount will either be slightly modified, or released back to the company or paid over to the Belgian State. In connection with the European Court procedures, AB InBev recognized a provision of 68 million euro (73 million US dollar) in 2020.
CERBUCO BREWING ARBITRATION
Cerbuco Brewing Inc., (“Cerbuco”) a Canadian subsidiary of Ambev, owns a 50% equity ownership in Cerveceria Bucanero S.A. (“Bucanero”), a joint venture in Cuba. In 2021, Cerbuco initiated an arbitration proceeding at the International Chamber of Commerce (“ICC”), relating to the potential breach of certain obligations relating to the joint venture, with the terms of reference being formally executed in 2022. Depending on the outcome of the arbitration, there may be an impact on Cerbuco’s rights. As a result, Ambev’s ability to continue consolidating Bucanero into its financial statements may also be affected. The financial impact has not yet been ascertained, as it depends on the outcome of the arbitration.
WARRANTS
Certain holders of warrants issued by Ambev in 1996 for exercise in 2003 proposed lawsuits to
subscribe
correspondent shares for an amount lower than Ambev considers as established upon the warrant issuance. If Ambev was defeated in all lawsuits related to this issue, it would be necessary to issue
172,831,574
shares and Ambev would receive, in return, funds significantly lower than the current market value. This could result in a dilution of about
1%
to all Ambev’s shareholders. Furthermore, the holders of these warrants claimed that they should receive the dividends relative to these shares since
2003, approximately
1.2
 billion Brazilian real (
0.2
 billion US dollar) in addition to legal fees. Among the seven cases related to this topic, one was settled in previous years. Five cases have been ruled irrevocably favorably to Ambev, with 3 decisions in 2023. The last case has already received a favorable decision and is pending before the Superior Court of Justice. Considering all these facts, Ambev and its external counsels strongly believe that the chance of loss in the remaining case is remote and therefore we have not established a provision for this litigation.
PROPOSED
CLASS ACTION
 IN QUEBEC
Labatt and other, third-party defendants have been named in a proposed class action lawsuit in the
Superior
Court of Quebec seeking unquantified compensatory and punitive damages. The plaintiffs allege that the defendants failed to warn of certain specific health risks of consuming defendants’ alcoholic beverages. A sub-class of plaintiffs further alleges that their diseases were caused by the consumption of defendants’ products. The proposed class action has not yet been authorized by the Superior Court.
 
22.
Related parties
There are no material changes in the company’s related party transactions during the
six-month
period ended 30 June 2023 as compared to 31 December 2022
.
 
37