Exhibit (c)(2) PRELIMINARY MATERIALS – CONFIDENTIAL Confidential Treatment Requested. Confidential portions of this document have been redacted and have been separately filed with the Securities and Exchange Commission. PROJECT AVALANCHE PRESENTATION TO THE AFFILIATE TRANSACTIONS COMMITTEE August 19, 2020 For Affiliate Transactions Committee Use OnlyExhibit (c)(2) PRELIMINARY MATERIALS – CONFIDENTIAL Confidential Treatment Requested. Confidential portions of this document have been redacted and have been separately filed with the Securities and Exchange Commission. PROJECT AVALANCHE PRESENTATION TO THE AFFILIATE TRANSACTIONS COMMITTEE August 19, 2020 For Affiliate Transactions Committee Use Only
PRELIMINARY MATERIALS – CONFIDENTIAL Disclaimer The following materials were prepared solely for discussion at the meeting of the Affiliate Transactions Committee (the “Committee”) of the Board of Directors of AVALANCHE (“AVALANCHE” or the “Company”) scheduled for August 19, 2020. The following materials are for discussion purposes only and are incomplete without reference to, and should be viewed in conjunction with, the oral presentation provided by Cowen and Company, LLC (“Cowen”) to the Committee. This presentation and the information contained herein has been prepared in order to assist the Affiliate Transactions Committee in evaluating, on a preliminary basis, the feasibility of a possible transaction with ISLANDERS. Cowen expresses no view as to the Committee’s underlying business decision to effect any such possible transaction, the relative merits of any such possible transaction as compared to other business strategies or transactions that might be available to AVALANCHE or to any other aspect or implication of any such possible transaction or any agreement, arrangement or understanding entered into in connection with any such possible transaction or otherwise. In preparing this presentation, Cowen has, with the Committee’s consent, relied upon information provided to Cowen by AVALANCHE, or publicly available information or information otherwise reviewed by Cowen. Cowen has not independently verified any such information, and has relied on it being accurate and complete in all material respects. To the extent such information includes estimates and forecasts of future financial performance prepared by AVALANCHE (“Company Forecasts”) or obtained from public sources, Cowen has utilized such estimates and forecasts at the Committee’s direction and has assumed that such estimates and forecasts have been reasonably prepared on bases reflecting the best currently available estimates and judgments of AVALANCHE or, with respect to estimates and forecasts obtained from public sources, represent reasonable estimates. Please note that this presentation is based on the business and operations of AVALANCHE as represented to Cowen as of the date hereof, and does not purport to take into consideration any information or events arising subsequent to such date. Cowen makes no representation or warranty that there has been no material change in the information provided or reviewed by Cowen in connection herewith. Cowen has no obligation to update this presentation. The information contained herein is confidential and has been prepared exclusively for the benefit and use of the Committee in its consideration of any such possible transaction, and may not be used for any other purpose or reproduced, disseminated, quoted or referred to at any time, in any manner or for any purpose without Cowen’s prior written consent, except as specifically set forth in the engagement letter between Cowen and the Company. This presentation is not for the benefit of, and does not convey any rights or remedies to, any holder of securities of AVALANCHE or any other person. This presentation is subject to the assumptions, qualifications and limitations set forth herein and does not constitute a recommendation by Cowen to the Committee or any other person on how to act with respect to any such possible transaction. Cowen does not address any legal, regulatory, tax, or accounting effects of any such possible transaction and nothing contained herein should be construed as legal, regulatory, tax or accounting advice. For Affiliate Transactions Committee Use Only 2PRELIMINARY MATERIALS – CONFIDENTIAL Disclaimer The following materials were prepared solely for discussion at the meeting of the Affiliate Transactions Committee (the “Committee”) of the Board of Directors of AVALANCHE (“AVALANCHE” or the “Company”) scheduled for August 19, 2020. The following materials are for discussion purposes only and are incomplete without reference to, and should be viewed in conjunction with, the oral presentation provided by Cowen and Company, LLC (“Cowen”) to the Committee. This presentation and the information contained herein has been prepared in order to assist the Affiliate Transactions Committee in evaluating, on a preliminary basis, the feasibility of a possible transaction with ISLANDERS. Cowen expresses no view as to the Committee’s underlying business decision to effect any such possible transaction, the relative merits of any such possible transaction as compared to other business strategies or transactions that might be available to AVALANCHE or to any other aspect or implication of any such possible transaction or any agreement, arrangement or understanding entered into in connection with any such possible transaction or otherwise. In preparing this presentation, Cowen has, with the Committee’s consent, relied upon information provided to Cowen by AVALANCHE, or publicly available information or information otherwise reviewed by Cowen. Cowen has not independently verified any such information, and has relied on it being accurate and complete in all material respects. To the extent such information includes estimates and forecasts of future financial performance prepared by AVALANCHE (“Company Forecasts”) or obtained from public sources, Cowen has utilized such estimates and forecasts at the Committee’s direction and has assumed that such estimates and forecasts have been reasonably prepared on bases reflecting the best currently available estimates and judgments of AVALANCHE or, with respect to estimates and forecasts obtained from public sources, represent reasonable estimates. Please note that this presentation is based on the business and operations of AVALANCHE as represented to Cowen as of the date hereof, and does not purport to take into consideration any information or events arising subsequent to such date. Cowen makes no representation or warranty that there has been no material change in the information provided or reviewed by Cowen in connection herewith. Cowen has no obligation to update this presentation. The information contained herein is confidential and has been prepared exclusively for the benefit and use of the Committee in its consideration of any such possible transaction, and may not be used for any other purpose or reproduced, disseminated, quoted or referred to at any time, in any manner or for any purpose without Cowen’s prior written consent, except as specifically set forth in the engagement letter between Cowen and the Company. This presentation is not for the benefit of, and does not convey any rights or remedies to, any holder of securities of AVALANCHE or any other person. This presentation is subject to the assumptions, qualifications and limitations set forth herein and does not constitute a recommendation by Cowen to the Committee or any other person on how to act with respect to any such possible transaction. Cowen does not address any legal, regulatory, tax, or accounting effects of any such possible transaction and nothing contained herein should be construed as legal, regulatory, tax or accounting advice. For Affiliate Transactions Committee Use Only 2
PRELIMINARY MATERIALS – CONFIDENTIAL 1. AVALANCHE PUBLIC MARKET PERSPECTIVES 4 TABLE OF CONTENTS 2. FINANCIAL ANALYSIS 11 3. APPENDIX 22 3PRELIMINARY MATERIALS – CONFIDENTIAL 1. AVALANCHE PUBLIC MARKET PERSPECTIVES 4 TABLE OF CONTENTS 2. FINANCIAL ANALYSIS 11 3. APPENDIX 22 3

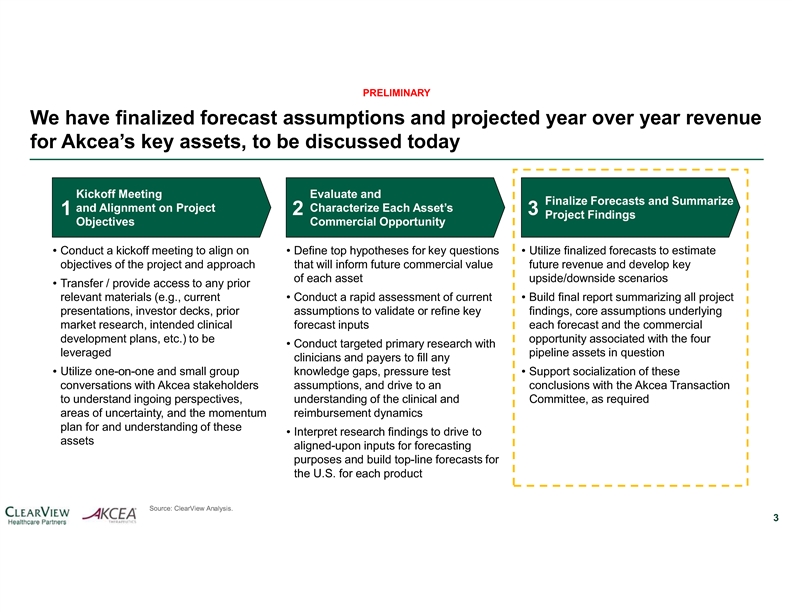
PRELIMINARY MATERIALS – CONFIDENTIAL 1. AVALANCHE PUBLIC MARKET PERSPECTIVESPRELIMINARY MATERIALS – CONFIDENTIAL 1. AVALANCHE PUBLIC MARKET PERSPECTIVES
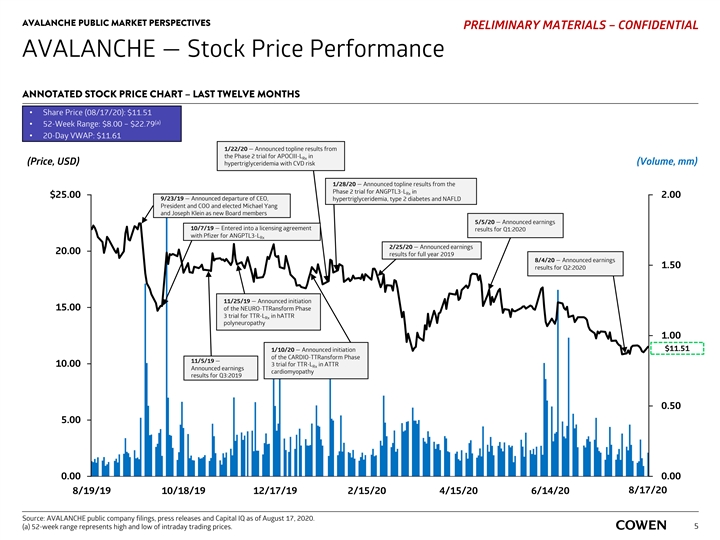
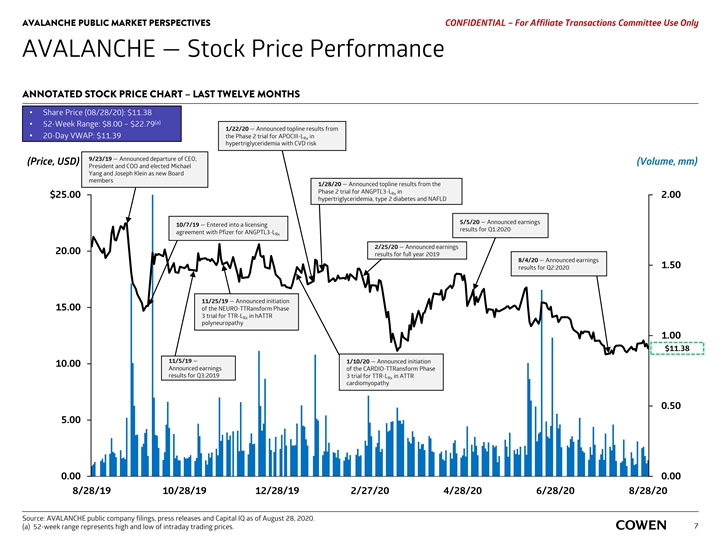
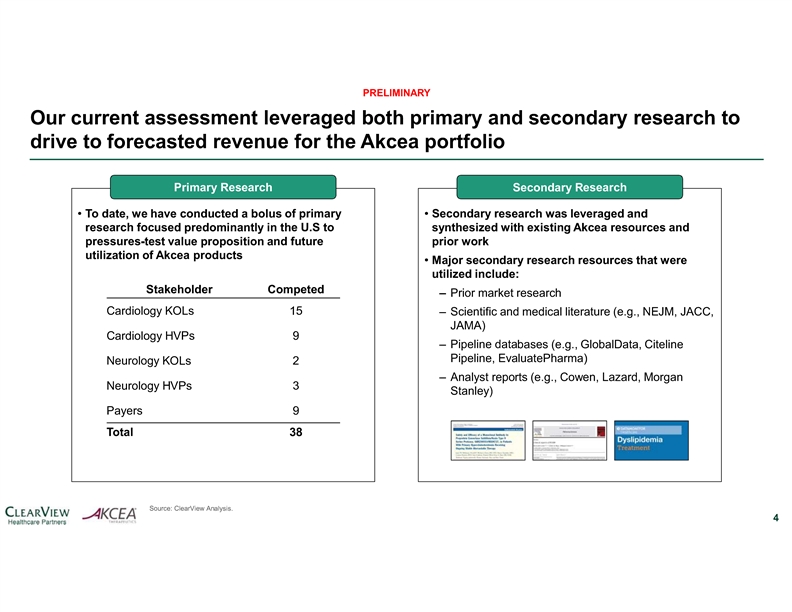
AVALANCHE PUBLIC MARKET PERSPECTIVES PRELIMINARY MATERIALS – CONFIDENTIAL AVALANCHE — Stock Price Performance ANNOTATED STOCK PRICE CHART – LAST TWELVE MONTHS • Share Price (08/17/20): $11.51 (a) • 52-Week Range: $8.00 – $22.79 • 20-Day VWAP: $11.61 1/22/20 — Announced topline results from the Phase 2 trial for APOCIII-L in Rx (Price, USD) (Volume, mm) hypertriglyceridemia with CVD risk 1/28/20 — Announced topline results from the Phase 2 trial for ANGPTL3-L in Rx $25.00 2.00 9/23/19 — Announced departure of CEO, hypertriglyceridemia, type 2 diabetes and NAFLD President and COO and elected Michael Yang and Joseph Klein as new Board members 5/5/20 — Announced earnings 10/7/19 — Entered into a licensing agreement results for Q1:2020 with Pfizer for ANGPTL3-L Rx 2/25/20 — Announced earnings 20.00 results for full year 2019 8/4/20 — Announced earnings 1.50 results for Q2:2020 11/25/19 — Announced initiation 15.00 of the NEURO-TTRansform Phase 3 trial for TTR-L in hATTR Rx polyneuropathy 1.00 $11.51 1/10/20 — Announced initiation of the CARDIO-TTRansform Phase 11/5/19 — 10.00 3 trial for TTR-L in ATTR Rx Announced earnings cardiomyopathy results for Q3:2019 0.50 5.00 0.00 0.00 8/17/20 8/19/19 10/18/19 12/17/19 2/15/20 4/15/20 6/14/20 8/13/20 Source: AVALANCHE public company filings, press releases and Capital IQ as of August 17, 2020. (a) 52-week range represents high and low of intraday trading prices. 5AVALANCHE PUBLIC MARKET PERSPECTIVES PRELIMINARY MATERIALS – CONFIDENTIAL AVALANCHE — Stock Price Performance ANNOTATED STOCK PRICE CHART – LAST TWELVE MONTHS • Share Price (08/17/20): $11.51 (a) • 52-Week Range: $8.00 – $22.79 • 20-Day VWAP: $11.61 1/22/20 — Announced topline results from the Phase 2 trial for APOCIII-L in Rx (Price, USD) (Volume, mm) hypertriglyceridemia with CVD risk 1/28/20 — Announced topline results from the Phase 2 trial for ANGPTL3-L in Rx $25.00 2.00 9/23/19 — Announced departure of CEO, hypertriglyceridemia, type 2 diabetes and NAFLD President and COO and elected Michael Yang and Joseph Klein as new Board members 5/5/20 — Announced earnings 10/7/19 — Entered into a licensing agreement results for Q1:2020 with Pfizer for ANGPTL3-L Rx 2/25/20 — Announced earnings 20.00 results for full year 2019 8/4/20 — Announced earnings 1.50 results for Q2:2020 11/25/19 — Announced initiation 15.00 of the NEURO-TTRansform Phase 3 trial for TTR-L in hATTR Rx polyneuropathy 1.00 $11.51 1/10/20 — Announced initiation of the CARDIO-TTRansform Phase 11/5/19 — 10.00 3 trial for TTR-L in ATTR Rx Announced earnings cardiomyopathy results for Q3:2019 0.50 5.00 0.00 0.00 8/17/20 8/19/19 10/18/19 12/17/19 2/15/20 4/15/20 6/14/20 8/13/20 Source: AVALANCHE public company filings, press releases and Capital IQ as of August 17, 2020. (a) 52-week range represents high and low of intraday trading prices. 5
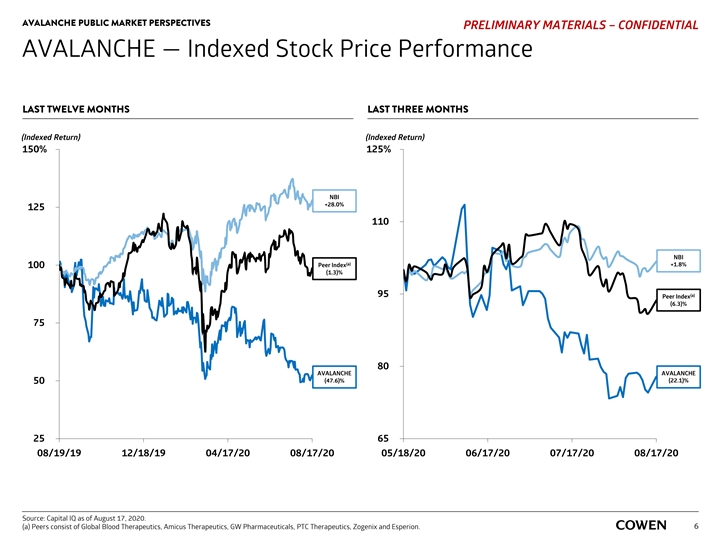
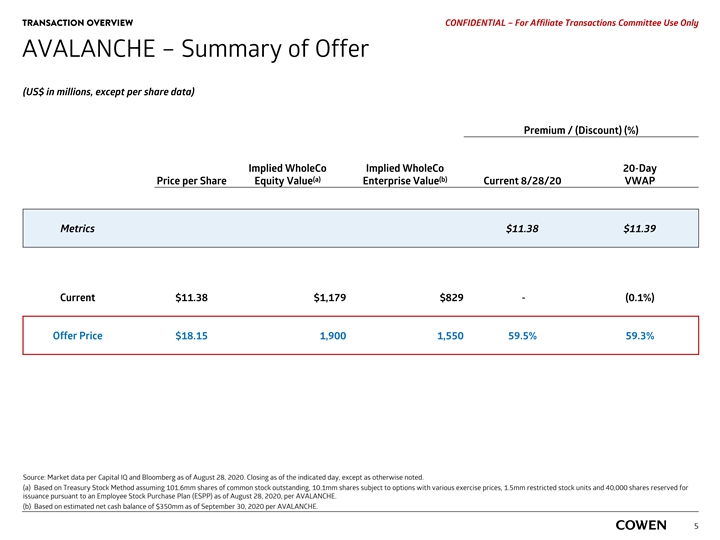
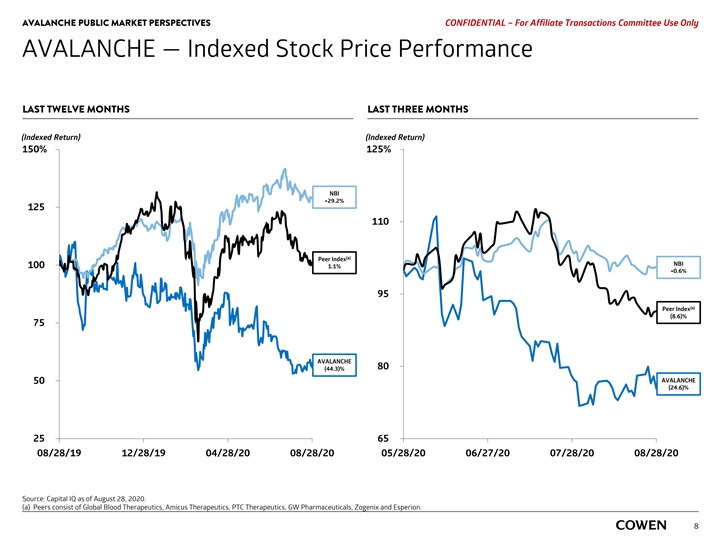
AVALANCHE PUBLIC MARKET PERSPECTIVES PRELIMINARY MATERIALS – CONFIDENTIAL AVALANCHE — Indexed Stock Price Performance LAST TWELVE MONTHS LAST THREE MONTHS (Indexed Return) (Indexed Return) 150% 125% NBI +28.0% 125 110 NBI (a) Peer Index +1.8% 100 (1.3)% 95 (a) Peer Index (6.3)% 75 80 AVALANCHE AVALANCHE (47.6)% (22.1)% 50 25 65 08/19/19 12/18/19 04/17/20 08/17/20 05/18/20 06/17/20 07/17/20 08/17/20 Source: Capital IQ as of August 17, 2020. (a) Peers consist of Global Blood Therapeutics, Amicus Therapeutics, GW Pharmaceuticals, PTC Therapeutics, Zogenix and Esperion. 6AVALANCHE PUBLIC MARKET PERSPECTIVES PRELIMINARY MATERIALS – CONFIDENTIAL AVALANCHE — Indexed Stock Price Performance LAST TWELVE MONTHS LAST THREE MONTHS (Indexed Return) (Indexed Return) 150% 125% NBI +28.0% 125 110 NBI (a) Peer Index +1.8% 100 (1.3)% 95 (a) Peer Index (6.3)% 75 80 AVALANCHE AVALANCHE (47.6)% (22.1)% 50 25 65 08/19/19 12/18/19 04/17/20 08/17/20 05/18/20 06/17/20 07/17/20 08/17/20 Source: Capital IQ as of August 17, 2020. (a) Peers consist of Global Blood Therapeutics, Amicus Therapeutics, GW Pharmaceuticals, PTC Therapeutics, Zogenix and Esperion. 6
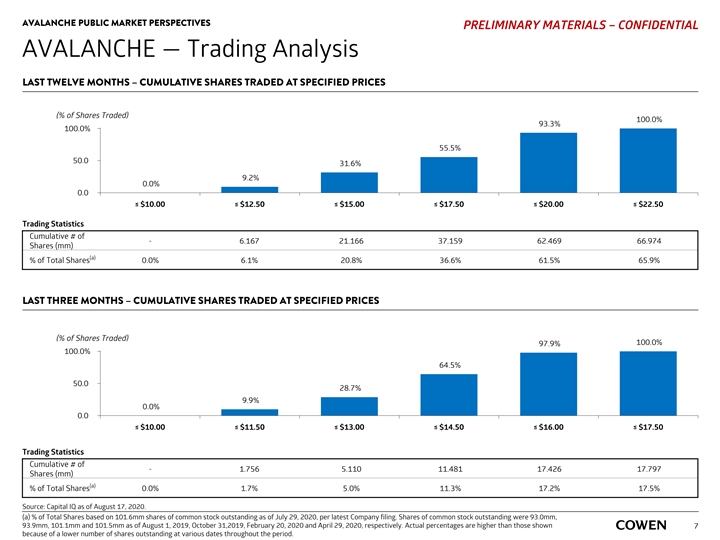
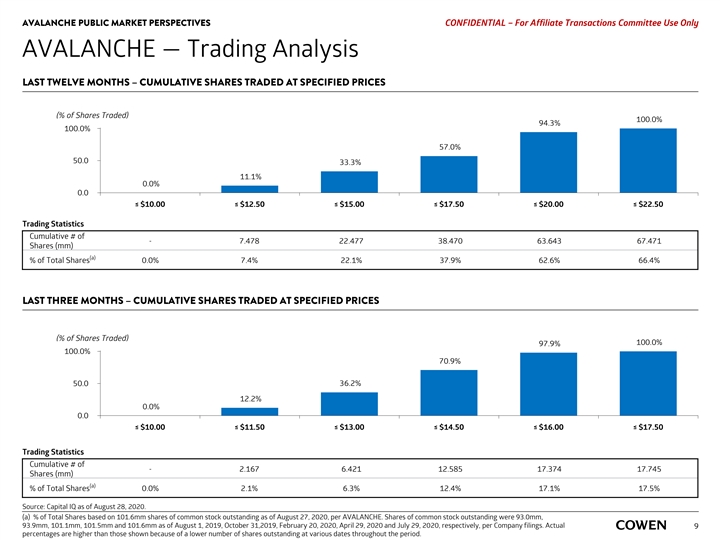
AVALANCHE PUBLIC MARKET PERSPECTIVES PRELIMINARY MATERIALS – CONFIDENTIAL AVALANCHE — Trading Analysis LAST TWELVE MONTHS– CUMULATIVE SHARES TRADED AT SPECIFIED PRICES (% of Shares Traded) 100.0% 93.3% 100.0% 55.5% 50.0 31.6% 9.2% 0.0% 0.0 ≤ $10.00 ≤ $12.50 ≤ $15.00 ≤ $17.50 ≤ $20.00 ≤ $22.50 Trading Statistics Cumulative # of - 6.167 21.166 37.159 62.469 66.974 Shares (mm) (a) % of Total Shares 0.0% 6.1% 20.8% 36.6% 61.5% 65.9% LAST THREE MONTHS – CUMULATIVE SHARES TRADED AT SPECIFIED PRICES (% of Shares Traded) 100.0% 97.9% 100.0% 64.5% 50.0 28.7% 9.9% 0.0% 0.0 ≤ $10.00 ≤ $11.50 ≤ $13.00 ≤ $14.50 ≤ $16.00 ≤ $17.50 Trading Statistics Cumulative # of - 1.756 5.110 11.481 17.426 17.797 Shares (mm) (a) % of Total Shares 0.0% 1.7% 5.0% 11.3% 17.2% 17.5% Source: Capital IQ as of August 17, 2020. (a) % of Total Shares based on 101.6mm shares of common stock outstanding as of July 29, 2020, per latest Company filing. Shares of common stock outstanding were 93.0mm, 93.9mm, 101.1mm and 101.5mm as of August 1, 2019, October 31,2019, February 20, 2020 and April 29, 2020, respectively. Actual percentages are higher than those shown 7 because of a lower number of shares outstanding at various dates throughout the period.AVALANCHE PUBLIC MARKET PERSPECTIVES PRELIMINARY MATERIALS – CONFIDENTIAL AVALANCHE — Trading Analysis LAST TWELVE MONTHS– CUMULATIVE SHARES TRADED AT SPECIFIED PRICES (% of Shares Traded) 100.0% 93.3% 100.0% 55.5% 50.0 31.6% 9.2% 0.0% 0.0 ≤ $10.00 ≤ $12.50 ≤ $15.00 ≤ $17.50 ≤ $20.00 ≤ $22.50 Trading Statistics Cumulative # of - 6.167 21.166 37.159 62.469 66.974 Shares (mm) (a) % of Total Shares 0.0% 6.1% 20.8% 36.6% 61.5% 65.9% LAST THREE MONTHS – CUMULATIVE SHARES TRADED AT SPECIFIED PRICES (% of Shares Traded) 100.0% 97.9% 100.0% 64.5% 50.0 28.7% 9.9% 0.0% 0.0 ≤ $10.00 ≤ $11.50 ≤ $13.00 ≤ $14.50 ≤ $16.00 ≤ $17.50 Trading Statistics Cumulative # of - 1.756 5.110 11.481 17.426 17.797 Shares (mm) (a) % of Total Shares 0.0% 1.7% 5.0% 11.3% 17.2% 17.5% Source: Capital IQ as of August 17, 2020. (a) % of Total Shares based on 101.6mm shares of common stock outstanding as of July 29, 2020, per latest Company filing. Shares of common stock outstanding were 93.0mm, 93.9mm, 101.1mm and 101.5mm as of August 1, 2019, October 31,2019, February 20, 2020 and April 29, 2020, respectively. Actual percentages are higher than those shown 7 because of a lower number of shares outstanding at various dates throughout the period.

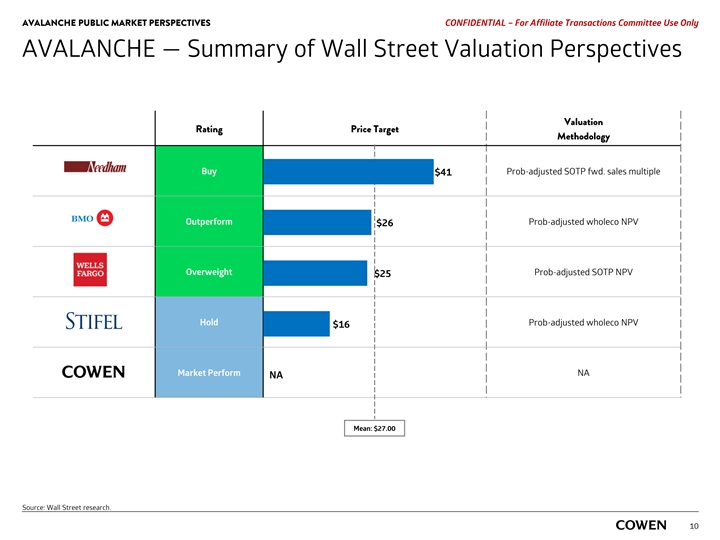
AVALANCHE PUBLIC MARKET PERSPECTIVES PRELIMINARY MATERIALS – CONFIDENTIAL AVALANCHE — Summary of Wall Street Valuation Perspectives Price Target Valuation Rating Price Target As Of Methodology Buy 12/20/19 Prob-adjusted SOTP fwd. sales multiple $41 Outperform 08/04/20 Prob-adjusted wholeco NPV $26 Overweight 10/07/19 Prob-adjusted SOTP NPV $25 Hold 08/05/20 Prob-adjusted wholeco NPV $16 Market Perform NA NA NA Mean: $27.00 Source: Wall Street research. 8AVALANCHE PUBLIC MARKET PERSPECTIVES PRELIMINARY MATERIALS – CONFIDENTIAL AVALANCHE — Summary of Wall Street Valuation Perspectives Price Target Valuation Rating Price Target As Of Methodology Buy 12/20/19 Prob-adjusted SOTP fwd. sales multiple $41 Outperform 08/04/20 Prob-adjusted wholeco NPV $26 Overweight 10/07/19 Prob-adjusted SOTP NPV $25 Hold 08/05/20 Prob-adjusted wholeco NPV $16 Market Perform NA NA NA Mean: $27.00 Source: Wall Street research. 8
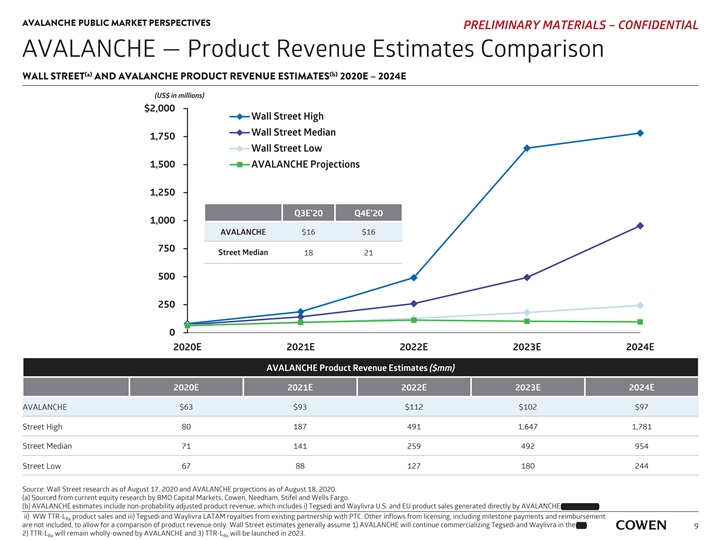
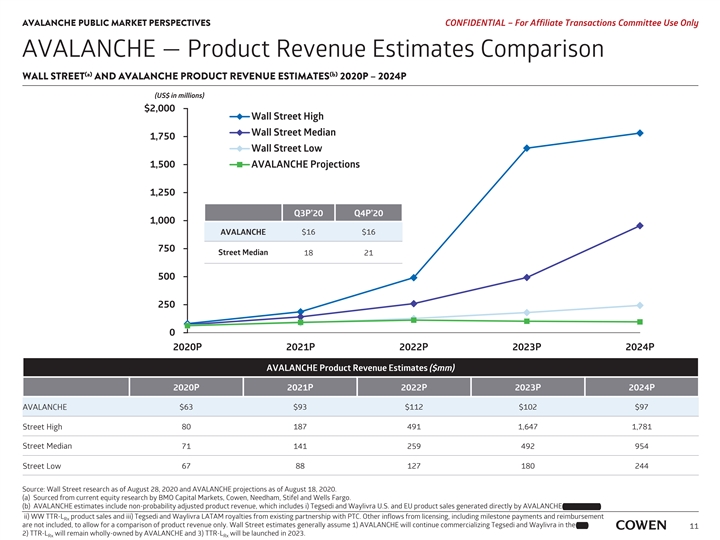
AVALANCHE PUBLIC MARKET PERSPECTIVES PRELIMINARY MATERIALS – CONFIDENTIAL AVALANCHE — Product Revenue Estimates Comparison (a) (b) WALL STREET AND AVALANCHE PRODUCT REVENUE ESTIMATES 2020E – 2024E (US$ in millions) $2,000 Wall Street High Wall Street Median 1,750 Wall Street Low 1,500 AVALANCHE Projections 1,250 Q3E’20 Q4E’20 1,000 AVALANCHE $16 $16 750 Street Median 18 21 500 250 0 2020E 2021E 2022E 2023E 2024E AVALANCHE Product Revenue Estimates ($mm) 2020E 2021E 2022E 2023E 2024E AVALANCHE $63 $93 $112 $102 $97 80 187 491 1,647 1,781 Street High Street Median 71 141 259 492 954 Street Low 67 88 127 180 244 Source: Wall Street research as of August 17, 2020 and AVALANCHE projections as of August 18, 2020. (a) Sourced from current equity research by BMO Capital Markets, Cowen, Needham, Stifel and Wells Fargo. and Partner, (b) AVALANCHE estimates include non-probability adjusted product revenue, which includes i) Tegsedi and Waylivra U.S. and EU product sales generated directly by AVALANCHE and Partner, ii) WW TTR-L product sales and iii) Tegsedi and Waylivra LATAM royalties from existing partnership with PTC. Other inflows from licensing, including milestone payments and reimbursement Rx are not included, to allow for a comparison of product revenue only. Wall Street estimates generally assume 1) AVALANCHE will continue commercializing Tegsedi and Waylivra in the EU, EU, 9 2) TTR-L will remain wholly-owned by AVALANCHE and 3) TTR-L will be launched in 2023. Rx RxAVALANCHE PUBLIC MARKET PERSPECTIVES PRELIMINARY MATERIALS – CONFIDENTIAL AVALANCHE — Product Revenue Estimates Comparison (a) (b) WALL STREET AND AVALANCHE PRODUCT REVENUE ESTIMATES 2020E – 2024E (US$ in millions) $2,000 Wall Street High Wall Street Median 1,750 Wall Street Low 1,500 AVALANCHE Projections 1,250 Q3E’20 Q4E’20 1,000 AVALANCHE $16 $16 750 Street Median 18 21 500 250 0 2020E 2021E 2022E 2023E 2024E AVALANCHE Product Revenue Estimates ($mm) 2020E 2021E 2022E 2023E 2024E AVALANCHE $63 $93 $112 $102 $97 80 187 491 1,647 1,781 Street High Street Median 71 141 259 492 954 Street Low 67 88 127 180 244 Source: Wall Street research as of August 17, 2020 and AVALANCHE projections as of August 18, 2020. (a) Sourced from current equity research by BMO Capital Markets, Cowen, Needham, Stifel and Wells Fargo. and Partner, (b) AVALANCHE estimates include non-probability adjusted product revenue, which includes i) Tegsedi and Waylivra U.S. and EU product sales generated directly by AVALANCHE and Partner, ii) WW TTR-L product sales and iii) Tegsedi and Waylivra LATAM royalties from existing partnership with PTC. Other inflows from licensing, including milestone payments and reimbursement Rx are not included, to allow for a comparison of product revenue only. Wall Street estimates generally assume 1) AVALANCHE will continue commercializing Tegsedi and Waylivra in the EU, EU, 9 2) TTR-L will remain wholly-owned by AVALANCHE and 3) TTR-L will be launched in 2023. Rx Rx
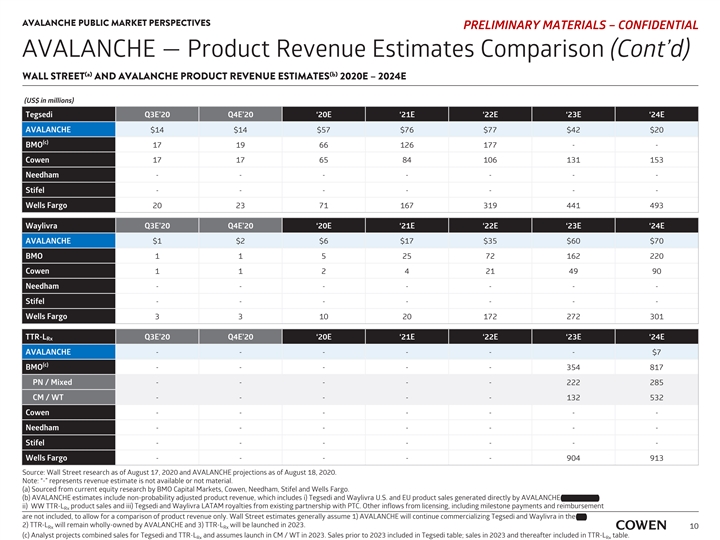
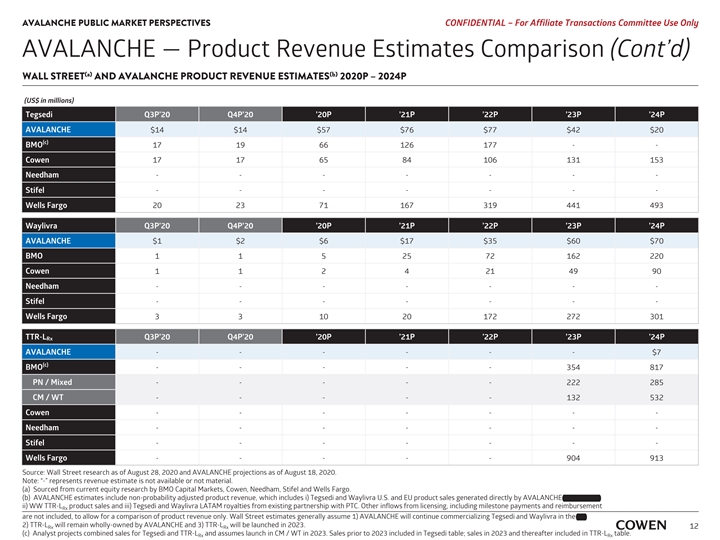
AVALANCHE PUBLIC MARKET PERSPECTIVES PRELIMINARY MATERIALS – CONFIDENTIAL AVALANCHE — Product Revenue Estimates Comparison (Cont’d) (a) (b) WALL STREET AND AVALANCHE PRODUCT REVENUE ESTIMATES 2020E – 2024E (US$ in millions) Tegsedi Q3E’20 Q4E’20 ‘20E ‘21E ‘22E ‘23E ‘24E AVALANCHE $14 $14 $57 $76 $77 $42 $20 (c) BMO 17 19 66 126 177 - - Cowen 17 17 65 84 106 131 153 Needham ------- Stifel ------- Wells Fargo 20 23 71 167 319 441 493 Waylivra Q3E’20 Q4E’20 ‘20E ‘21E ‘22E ‘23E ‘24E AVALANCHE $1 $2 $6 $17 $35 $60 $70 BMO 1 1 5 25 72 162 220 Cowen 1 1 2 4 21 49 90 Needham ------- Stifel ------- Wells Fargo 3 3 10 20 172 272 301 TTR-L Q3E’20 Q4E’20 ‘20E ‘21E ‘22E ‘23E ‘24E Rx AVALANCHE ------ $7 (c) BMO - - - - - 354 817 PN / Mixed - - - - - 222 285 CM / WT - - - - - 132 532 Cowen ------- Needham ------- Stifel ------- Wells Fargo - - - - - 904 913 Source: Wall Street research as of August 17, 2020 and AVALANCHE projections as of August 18, 2020. Note: “-” represents revenue estimate is not available or not material. (a) Sourced from current equity research by BMO Capital Markets, Cowen, Needham, Stifel and Wells Fargo. (b) AVALANCHE estimates include non-probability adjusted product revenue, which includes i) Tegsedi and Waylivra U.S. and EU product sales generated directly by AVALANCHE and Partner, ii) WW TTR-L product sales and iii) Tegsedi and Waylivra LATAM royalties from existing partnership with PTC. Other inflows from licensing, including milestone payments and reimbursement Rx are not included, to allow for a comparison of product revenue only. Wall Street estimates generally assume 1) AVALANCHE will continue commercializing Tegsedi and Waylivra in the EU, 2) TTR-L will remain wholly-owned by AVALANCHE and 3) TTR-L will be launched in 2023. Rx Rx 10 (c) Analyst projects combined sales for Tegsedi and TTR-L and assumes launch in CM / WT in 2023. Sales prior to 2023 included in Tegsedi table; sales in 2023 and thereafter included in TTR-L table. Rx RxAVALANCHE PUBLIC MARKET PERSPECTIVES PRELIMINARY MATERIALS – CONFIDENTIAL AVALANCHE — Product Revenue Estimates Comparison (Cont’d) (a) (b) WALL STREET AND AVALANCHE PRODUCT REVENUE ESTIMATES 2020E – 2024E (US$ in millions) Tegsedi Q3E’20 Q4E’20 ‘20E ‘21E ‘22E ‘23E ‘24E AVALANCHE $14 $14 $57 $76 $77 $42 $20 (c) BMO 17 19 66 126 177 - - Cowen 17 17 65 84 106 131 153 Needham ------- Stifel ------- Wells Fargo 20 23 71 167 319 441 493 Waylivra Q3E’20 Q4E’20 ‘20E ‘21E ‘22E ‘23E ‘24E AVALANCHE $1 $2 $6 $17 $35 $60 $70 BMO 1 1 5 25 72 162 220 Cowen 1 1 2 4 21 49 90 Needham ------- Stifel ------- Wells Fargo 3 3 10 20 172 272 301 TTR-L Q3E’20 Q4E’20 ‘20E ‘21E ‘22E ‘23E ‘24E Rx AVALANCHE ------ $7 (c) BMO - - - - - 354 817 PN / Mixed - - - - - 222 285 CM / WT - - - - - 132 532 Cowen ------- Needham ------- Stifel ------- Wells Fargo - - - - - 904 913 Source: Wall Street research as of August 17, 2020 and AVALANCHE projections as of August 18, 2020. Note: “-” represents revenue estimate is not available or not material. (a) Sourced from current equity research by BMO Capital Markets, Cowen, Needham, Stifel and Wells Fargo. (b) AVALANCHE estimates include non-probability adjusted product revenue, which includes i) Tegsedi and Waylivra U.S. and EU product sales generated directly by AVALANCHE and Partner, ii) WW TTR-L product sales and iii) Tegsedi and Waylivra LATAM royalties from existing partnership with PTC. Other inflows from licensing, including milestone payments and reimbursement Rx are not included, to allow for a comparison of product revenue only. Wall Street estimates generally assume 1) AVALANCHE will continue commercializing Tegsedi and Waylivra in the EU, 2) TTR-L will remain wholly-owned by AVALANCHE and 3) TTR-L will be launched in 2023. Rx Rx 10 (c) Analyst projects combined sales for Tegsedi and TTR-L and assumes launch in CM / WT in 2023. Sales prior to 2023 included in Tegsedi table; sales in 2023 and thereafter included in TTR-L table. Rx Rx
PRELIMINARY MATERIALS – CONFIDENTIAL 2. FINANCIAL ANALYSISPRELIMINARY MATERIALS – CONFIDENTIAL 2. FINANCIAL ANALYSIS
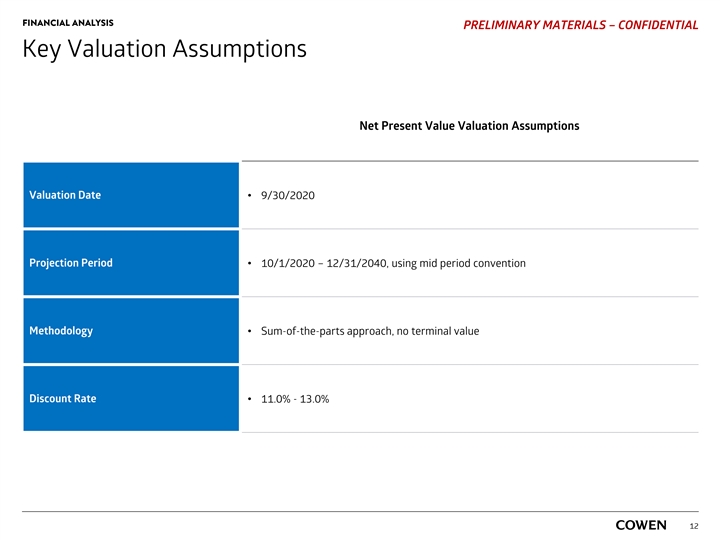
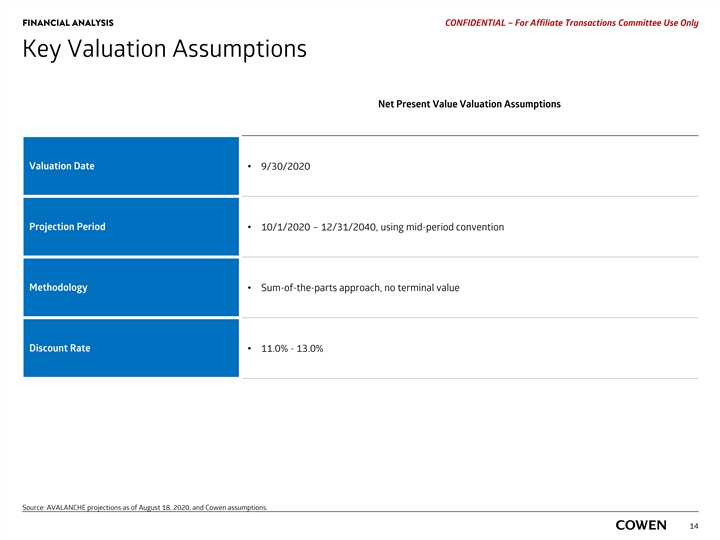
FINANCIAL ANALYSIS PRELIMINARY MATERIALS – CONFIDENTIAL Key Valuation Assumptions Net Present Value Valuation Assumptions Valuation Date• 9/30/2020 Projection Period• 10/1/2020 – 12/31/2040, using mid period convention Methodology • Sum-of-the-parts approach, no terminal value Discount Rate • 11.0% - 13.0% 12FINANCIAL ANALYSIS PRELIMINARY MATERIALS – CONFIDENTIAL Key Valuation Assumptions Net Present Value Valuation Assumptions Valuation Date• 9/30/2020 Projection Period• 10/1/2020 – 12/31/2040, using mid period convention Methodology • Sum-of-the-parts approach, no terminal value Discount Rate • 11.0% - 13.0% 12
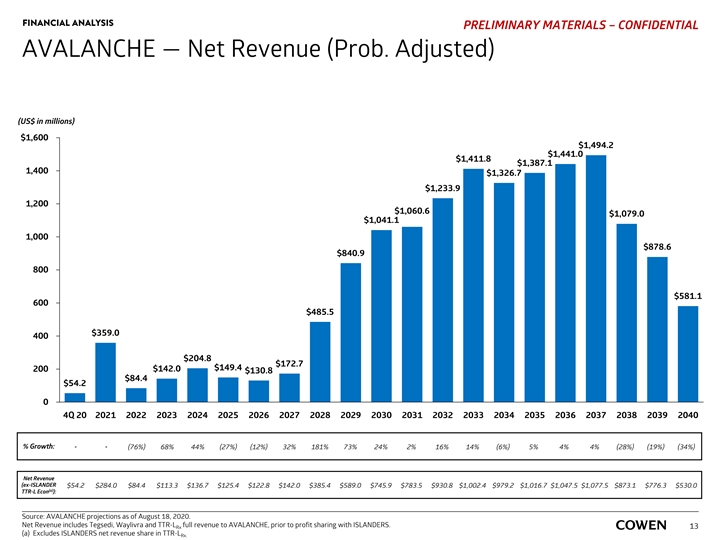
FINANCIAL ANALYSIS PRELIMINARY MATERIALS – CONFIDENTIAL AVALANCHE — Net Revenue (Prob. Adjusted) (US$ in millions) $1,600 $1,494.2 $1,441.0 $1,411.8 $1,387.1 1,400 $1,326.7 $1,233.9 1,200 $1,060.6 $1,079.0 $1,041.1 1,000 $878.6 $840.9 800 $581.1 600 $485.5 $359.0 400 $204.8 $172.7 $149.4 200 $142.0 $130.8 $84.4 $54.2 0 4Q 20 2021 2022 2023 2024 2025 2026 2027 2028 2029 2030 2031 2032 2033 2034 2035 2036 2037 2038 2039 2040 % Growth: - - (76%) 68% 44% (27%) (12%) 32% 181% 73% 24% 2% 16% 14% (6%) 5% 4% 4% (28%) (19%) (34%) Net Revenue (ex-ISLANDER $54.2 $284.0 $84.4 $113.3 $136.7 $125.4 $122.8 $142.0 $385.4 $589.0 $745.9 $783.5 $930.8 $1,002.4 $979.2 $1,016.7 $1,047.5 $1,077.5 $873.1 $776.3 $530.0 (a) TTR-L Econ ): Source: AVALANCHE projections as of August 18, 2020. Net Revenue includes Tegsedi, Waylivra and TTR-L full revenue to AVALANCHE, prior to profit sharing with ISLANDERS. Rx 13 (a) Excludes ISLANDERS net revenue share in TTR-L Rx.FINANCIAL ANALYSIS PRELIMINARY MATERIALS – CONFIDENTIAL AVALANCHE — Net Revenue (Prob. Adjusted) (US$ in millions) $1,600 $1,494.2 $1,441.0 $1,411.8 $1,387.1 1,400 $1,326.7 $1,233.9 1,200 $1,060.6 $1,079.0 $1,041.1 1,000 $878.6 $840.9 800 $581.1 600 $485.5 $359.0 400 $204.8 $172.7 $149.4 200 $142.0 $130.8 $84.4 $54.2 0 4Q 20 2021 2022 2023 2024 2025 2026 2027 2028 2029 2030 2031 2032 2033 2034 2035 2036 2037 2038 2039 2040 % Growth: - - (76%) 68% 44% (27%) (12%) 32% 181% 73% 24% 2% 16% 14% (6%) 5% 4% 4% (28%) (19%) (34%) Net Revenue (ex-ISLANDER $54.2 $284.0 $84.4 $113.3 $136.7 $125.4 $122.8 $142.0 $385.4 $589.0 $745.9 $783.5 $930.8 $1,002.4 $979.2 $1,016.7 $1,047.5 $1,077.5 $873.1 $776.3 $530.0 (a) TTR-L Econ ): Source: AVALANCHE projections as of August 18, 2020. Net Revenue includes Tegsedi, Waylivra and TTR-L full revenue to AVALANCHE, prior to profit sharing with ISLANDERS. Rx 13 (a) Excludes ISLANDERS net revenue share in TTR-L Rx.

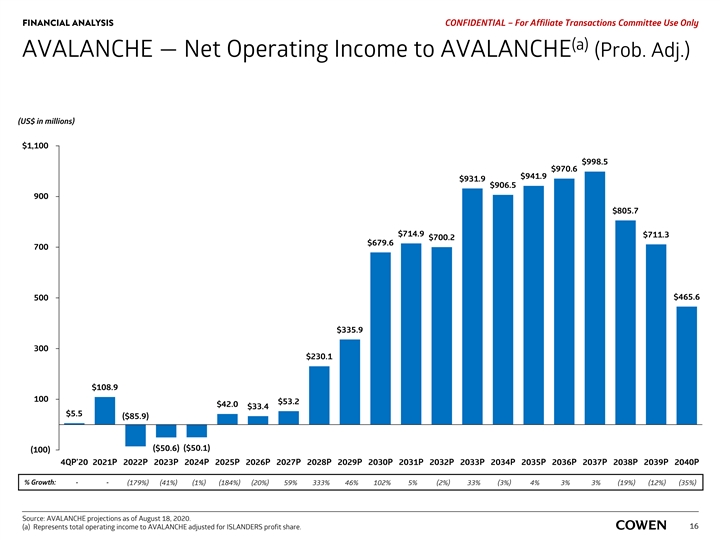
FINANCIAL ANALYSIS PRELIMINARY MATERIALS – CONFIDENTIAL AVALANCHE — Net Operating Income to AVALANCHE (Prob. Adj.) (US$ in millions) $1,100 $998.5 $970.6 $941.9 $931.9 $906.5 900 $805.7 $714.9 $711.3 $700.2 $679.6 700 $465.6 500 $335.9 300 $230.1 $108.9 100 $53.2 $42.0 $33.4 $5.5 ($85.9) ($50.1) ($50.6) (100) 4Q 20 2021 2022 2023 2024 2025 2026 2027 2028 2029 2030 2031 2032 2033 2034 2035 2036 2037 2038 2039 2040 % Growth: - - (179%) (41%) (1%) (184%) (20%) 59% 333% 46% 102% 5% (2%) 33% (3%) 4% 3% 3% (19%) (12%) (35%) Source: AVALANCHE projections as of August 18, 2020. Note: Represents total operating income to AVALANCHE adjusted for ISLANDERS profit share. 14FINANCIAL ANALYSIS PRELIMINARY MATERIALS – CONFIDENTIAL AVALANCHE — Net Operating Income to AVALANCHE (Prob. Adj.) (US$ in millions) $1,100 $998.5 $970.6 $941.9 $931.9 $906.5 900 $805.7 $714.9 $711.3 $700.2 $679.6 700 $465.6 500 $335.9 300 $230.1 $108.9 100 $53.2 $42.0 $33.4 $5.5 ($85.9) ($50.1) ($50.6) (100) 4Q 20 2021 2022 2023 2024 2025 2026 2027 2028 2029 2030 2031 2032 2033 2034 2035 2036 2037 2038 2039 2040 % Growth: - - (179%) (41%) (1%) (184%) (20%) 59% 333% 46% 102% 5% (2%) 33% (3%) 4% 3% 3% (19%) (12%) (35%) Source: AVALANCHE projections as of August 18, 2020. Note: Represents total operating income to AVALANCHE adjusted for ISLANDERS profit share. 14
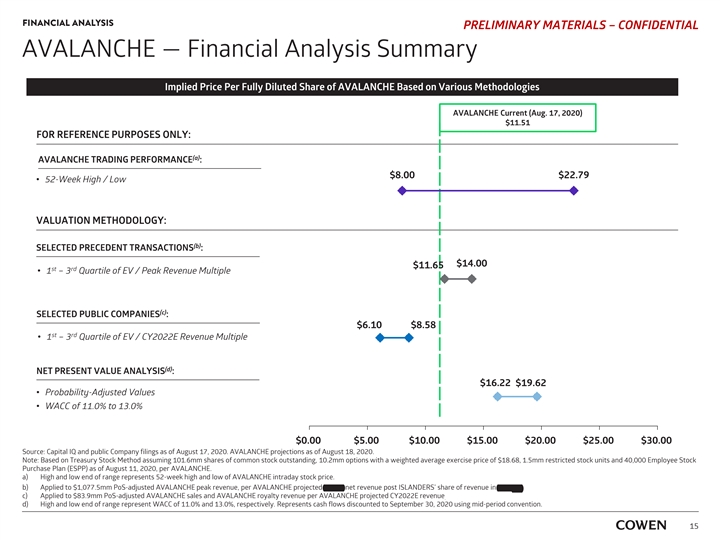
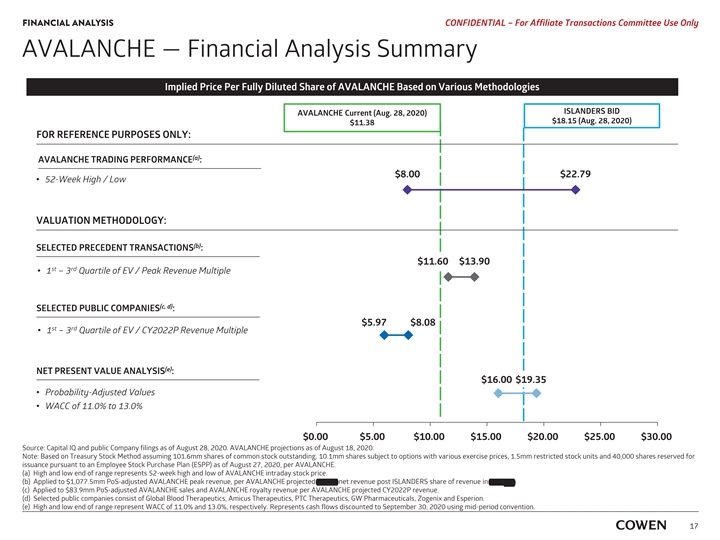
FINANCIAL ANALYSIS PRELIMINARY MATERIALS – CONFIDENTIAL AVALANCHE — Financial Analysis Summary Implied Price Per Fully Diluted Share of AVALANCHE Based on Various Methodologies AVALANCHE Current (Aug. 17, 2020) $11.51 FOR REFERENCE PURPOSES ONLY: (a) AVALANCHE TRADING PERFORMANCE : $8.00 $22.79 ‡ 52-Week High / Low VALUATION METHODOLOGY: (b) SELECTED PRECEDENT TRANSACTIONS : $14.00 $11.65 st rd ‡ 1 – 3 Quartile of EV / Peak Revenue Multiple (c) SELECTED PUBLIC COMPANIES : $6.10 $8.58 st rd ‡ 1 – 3 Quartile of EV / CY2022E Revenue Multiple (d) NET PRESENT VALUE ANALYSIS : $16.22 $19.62 ‡ Probability-Adjusted Values ‡ WACC of 11.0% to 13.0% $0.00 $5.00 $10.00 $15.00 $20.00 $25.00 $30.00 Source: Capital IQ and public Company filings as of August 17, 2020. AVALANCHE projections as of August 18, 2020. Note: Based on Treasury Stock Method assuming 101.6mm shares of common stock outstanding, 10.2mm options with a weighted average exercise price of $18.68, 1.5mm restricted stock units and 40,000 Employee Stock Purchase Plan (ESPP) as of August 11, 2020, per AVALANCHE. a) High and low end of range represents 52-week high and low of AVALANCHE intraday stock price. b) Applied to $1,077.5mm PoS-adjusted AVALANCHE peak revenue, per AVALANCHE projected 2037E net revenue post ISLANDERS’ share of revenue in TTR-L Rx. c) Applied to $83.9mm PoS-adjusted AVALANCHE sales and AVALANCHE royalty revenue per AVALANCHE projected CY2022E revenue . d) High and low end of range represent WACC of 11.0% and 13.0%, respectively. Represents cash flows discounted to September 30, 2020 using mid-period convention. 15FINANCIAL ANALYSIS PRELIMINARY MATERIALS – CONFIDENTIAL AVALANCHE — Financial Analysis Summary Implied Price Per Fully Diluted Share of AVALANCHE Based on Various Methodologies AVALANCHE Current (Aug. 17, 2020) $11.51 FOR REFERENCE PURPOSES ONLY: (a) AVALANCHE TRADING PERFORMANCE : $8.00 $22.79 ‡ 52-Week High / Low VALUATION METHODOLOGY: (b) SELECTED PRECEDENT TRANSACTIONS : $14.00 $11.65 st rd ‡ 1 – 3 Quartile of EV / Peak Revenue Multiple (c) SELECTED PUBLIC COMPANIES : $6.10 $8.58 st rd ‡ 1 – 3 Quartile of EV / CY2022E Revenue Multiple (d) NET PRESENT VALUE ANALYSIS : $16.22 $19.62 ‡ Probability-Adjusted Values ‡ WACC of 11.0% to 13.0% $0.00 $5.00 $10.00 $15.00 $20.00 $25.00 $30.00 Source: Capital IQ and public Company filings as of August 17, 2020. AVALANCHE projections as of August 18, 2020. Note: Based on Treasury Stock Method assuming 101.6mm shares of common stock outstanding, 10.2mm options with a weighted average exercise price of $18.68, 1.5mm restricted stock units and 40,000 Employee Stock Purchase Plan (ESPP) as of August 11, 2020, per AVALANCHE. a) High and low end of range represents 52-week high and low of AVALANCHE intraday stock price. b) Applied to $1,077.5mm PoS-adjusted AVALANCHE peak revenue, per AVALANCHE projected 2037E net revenue post ISLANDERS’ share of revenue in TTR-L Rx. c) Applied to $83.9mm PoS-adjusted AVALANCHE sales and AVALANCHE royalty revenue per AVALANCHE projected CY2022E revenue . d) High and low end of range represent WACC of 11.0% and 13.0%, respectively. Represents cash flows discounted to September 30, 2020 using mid-period convention. 15

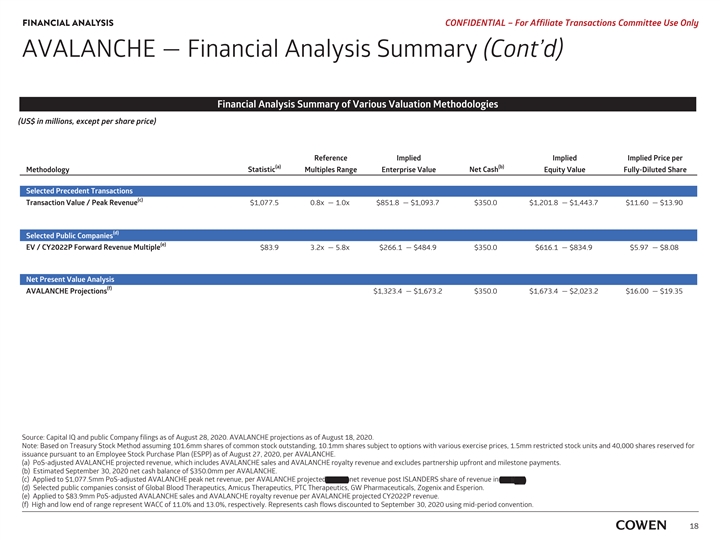
FINANCIAL ANALYSIS PRELIMINARY MATERIALS – CONFIDENTIAL AVALANCHE — Financial Analysis Summary (Cont’d) Financial Analysis Summary of Various Valuation Methodologies (US$ in millions, except per share price) Reference Implied Implied Implied Price per (a) (b) Methodology Statistic Multiples Range Enterprise Value Net Cash Equity Value Fully-Diluted Share Selected Precedent Transactions (c) Transaction Value /Peak Revenue $1,077.5 0.8x — 1.0x $851.8 — $1,093.7 $350.0 $1,201.8 — $1,443.7 $11.65 — $14.00 Selected Public Companies (d) TEV / 2022 Forward Revenue Multiple $83.9 3.3x — 6.4x $279.1 — $534.5 $350.0 $629.1 — $884.5 $6.10 — $8.58 Net Present Value Analysis (e) AVALANCHE Projections $1,323.4 — $1,673.2 $350.0 $1,673.4 — $2,023.2 $16.22 — $19.62 Source: Capital IQ and public Company filings as of August 17, 2020. AVALANCHE projections as of August 18, 2020. Note: Based on Treasury Stock Method assuming 101.6mm shares of common stock outstanding, 10.2mm options with a weighted average exercise price of $18.68, 1.5mm restricted stock units and 40,000 Employee Stock Purchase Plan (ESPP) as of August 11, 2020, per AVALANCHE. a) PoS-adjusted AVALANCHE projected revenue, which includes AVALANCHE sales and AVALANCHE royalty revenue and excludes partnership upfront and milestone payments . b) Estimated September 30, 2019 net cash balance of $350.0mm per AVALANCHE. c) Applied to $1,077.5mm PoS-adjusted AVALANCHE peak net revenue, per AVALANCHE projected 2037E net revenue post ISLANDERS’ share of revenue in TTR-L Rx. d) Applied to $83.9mm PoS-adjusted AVALANCHE sales and AVALANCHE royalty revenue per AVALANCHE projected CY2022E revenue . e) High and low end of range represent WACC of 11.0% and 13.0%, respectively. Represents cash flows discounted to September 30, 2020 using mid-period convention. 16FINANCIAL ANALYSIS PRELIMINARY MATERIALS – CONFIDENTIAL AVALANCHE — Financial Analysis Summary (Cont’d) Financial Analysis Summary of Various Valuation Methodologies (US$ in millions, except per share price) Reference Implied Implied Implied Price per (a) (b) Methodology Statistic Multiples Range Enterprise Value Net Cash Equity Value Fully-Diluted Share Selected Precedent Transactions (c) Transaction Value /Peak Revenue $1,077.5 0.8x — 1.0x $851.8 — $1,093.7 $350.0 $1,201.8 — $1,443.7 $11.65 — $14.00 Selected Public Companies (d) TEV / 2022 Forward Revenue Multiple $83.9 3.3x — 6.4x $279.1 — $534.5 $350.0 $629.1 — $884.5 $6.10 — $8.58 Net Present Value Analysis (e) AVALANCHE Projections $1,323.4 — $1,673.2 $350.0 $1,673.4 — $2,023.2 $16.22 — $19.62 Source: Capital IQ and public Company filings as of August 17, 2020. AVALANCHE projections as of August 18, 2020. Note: Based on Treasury Stock Method assuming 101.6mm shares of common stock outstanding, 10.2mm options with a weighted average exercise price of $18.68, 1.5mm restricted stock units and 40,000 Employee Stock Purchase Plan (ESPP) as of August 11, 2020, per AVALANCHE. a) PoS-adjusted AVALANCHE projected revenue, which includes AVALANCHE sales and AVALANCHE royalty revenue and excludes partnership upfront and milestone payments . b) Estimated September 30, 2019 net cash balance of $350.0mm per AVALANCHE. c) Applied to $1,077.5mm PoS-adjusted AVALANCHE peak net revenue, per AVALANCHE projected 2037E net revenue post ISLANDERS’ share of revenue in TTR-L Rx. d) Applied to $83.9mm PoS-adjusted AVALANCHE sales and AVALANCHE royalty revenue per AVALANCHE projected CY2022E revenue . e) High and low end of range represent WACC of 11.0% and 13.0%, respectively. Represents cash flows discounted to September 30, 2020 using mid-period convention. 16

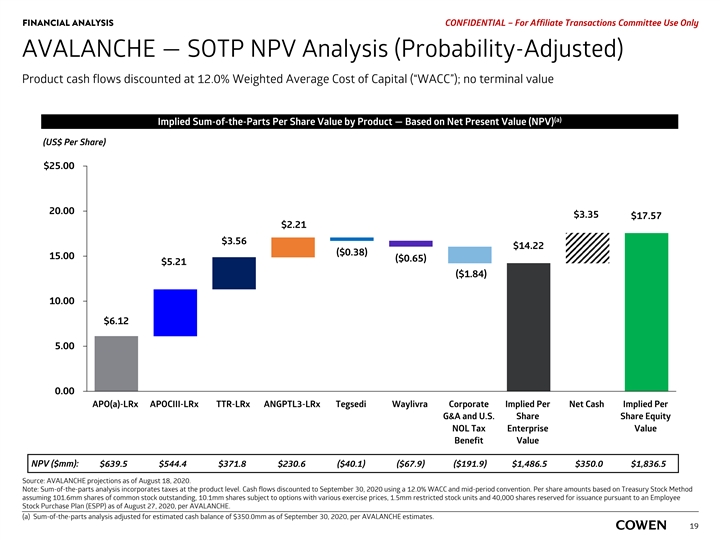
FINANCIAL ANALYSIS PRELIMINARY MATERIALS – CONFIDENTIAL AVALANCHE — SOTP NPV Analysis (Probability-Adjusted) Product cash flows discounted at 12.0% Weighted Average Cost of Capital (“WACC”); no terminal value (a) Implied Sum-of-the-Parts Per Share Value by Product — Based on Net Present Value (NPV) (US$ Per Share) $25.00 20.00 $3.39 $17.81 $2.24 $3.60 $14.41 ($0.39) 15.00 ($0.66) ($1.86) $5.28 10.00 $6.20 5.00 0.00 APO(a)-LRx APOCIII-LRx TTR-LRx ANGPTL3-LRx Tegsedi Waylivra Corporate Implied Per Net Cash Implied Per G&A and U.S. Share Share Equity NOL Tax Enterprise Value Benefit Value NPV ($mm): $639.5 $544.4 $371.8 $230.6 ($40.1) ($67.9) ($191.9) $1,486.5 $350.0 $1,836.5 Source: AVALANCHE projections as of August 18, 2020. Note: Sum-of-the-parts analysis incorporates taxes at the product level. Cash flows discounted to September 30, 2020 using a 12.0% WACC and mid-period convention. a) Sum-of-the-parts analysis adjusted for estimated cash balance of $350.0mm as of September 30, 2020, per AVALANCHE estimates. 17FINANCIAL ANALYSIS PRELIMINARY MATERIALS – CONFIDENTIAL AVALANCHE — SOTP NPV Analysis (Probability-Adjusted) Product cash flows discounted at 12.0% Weighted Average Cost of Capital (“WACC”); no terminal value (a) Implied Sum-of-the-Parts Per Share Value by Product — Based on Net Present Value (NPV) (US$ Per Share) $25.00 20.00 $3.39 $17.81 $2.24 $3.60 $14.41 ($0.39) 15.00 ($0.66) ($1.86) $5.28 10.00 $6.20 5.00 0.00 APO(a)-LRx APOCIII-LRx TTR-LRx ANGPTL3-LRx Tegsedi Waylivra Corporate Implied Per Net Cash Implied Per G&A and U.S. Share Share Equity NOL Tax Enterprise Value Benefit Value NPV ($mm): $639.5 $544.4 $371.8 $230.6 ($40.1) ($67.9) ($191.9) $1,486.5 $350.0 $1,836.5 Source: AVALANCHE projections as of August 18, 2020. Note: Sum-of-the-parts analysis incorporates taxes at the product level. Cash flows discounted to September 30, 2020 using a 12.0% WACC and mid-period convention. a) Sum-of-the-parts analysis adjusted for estimated cash balance of $350.0mm as of September 30, 2020, per AVALANCHE estimates. 17
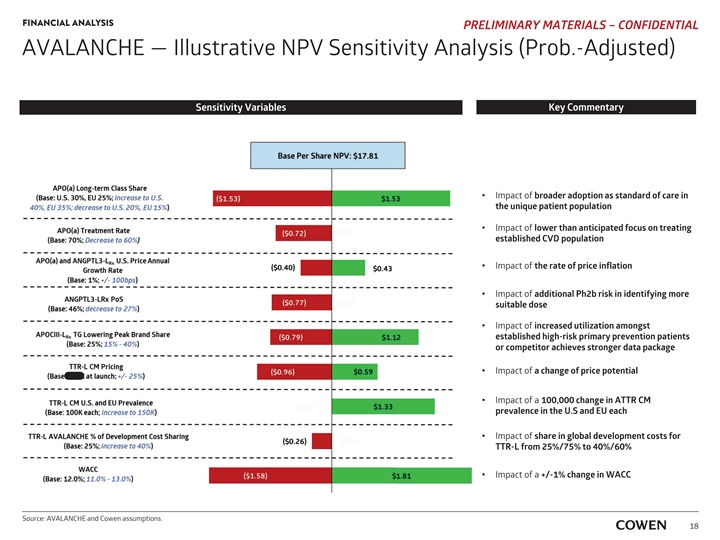
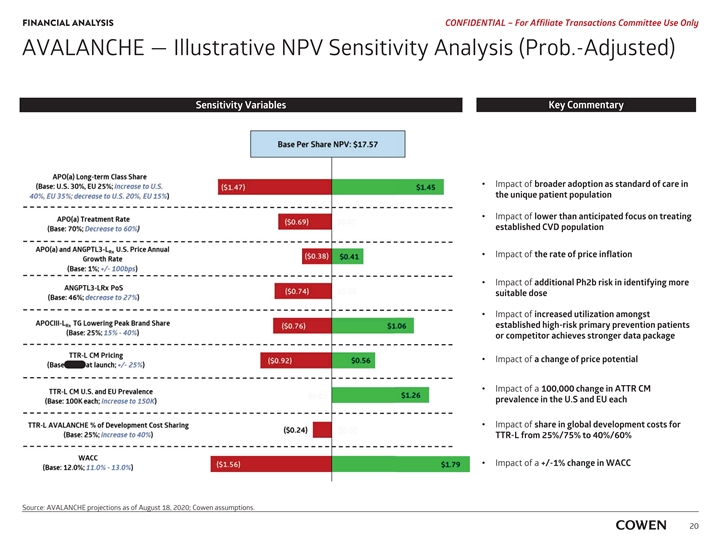
‡‡‡‡‡‡‡‡‡‡‡‡‡‡‡‡‡‡ FINANCIAL ANALYSIS PRELIMINARY MATERIALS – CONFIDENTIAL AVALANCHE — Illustrative NPV Sensitivity Analysis (Prob.-Adjusted) Sensitivity Variables Key Commentary I Impact of broader adoption as standard of care in the unique t patient population Impact of I lower than anticipated focus on treating e established CVD population Impact of I the rate of price inflation I Impact of additional Ph2b risk in identifying more s suitable dose Impact of I increased utilization amongst e established high-risk primary prevention patients o or competitor achieves stronger data package I Impact of a change of price potential I Impact of a 100,000 change in ATTR CM p prevalence in the U.S and EU each I Impact of share in global development costs for T TTR-L from 25%/75% to 40%/60% I Impact of a +/-1% change in WACC Source: AVALANCHE and Cowen assumptions. 18‡‡‡‡‡‡‡‡‡‡‡‡‡‡‡‡‡‡ FINANCIAL ANALYSIS PRELIMINARY MATERIALS – CONFIDENTIAL AVALANCHE — Illustrative NPV Sensitivity Analysis (Prob.-Adjusted) Sensitivity Variables Key Commentary I Impact of broader adoption as standard of care in the unique t patient population Impact of I lower than anticipated focus on treating e established CVD population Impact of I the rate of price inflation I Impact of additional Ph2b risk in identifying more s suitable dose Impact of I increased utilization amongst e established high-risk primary prevention patients o or competitor achieves stronger data package I Impact of a change of price potential I Impact of a 100,000 change in ATTR CM p prevalence in the U.S and EU each I Impact of share in global development costs for T TTR-L from 25%/75% to 40%/60% I Impact of a +/-1% change in WACC Source: AVALANCHE and Cowen assumptions. 18
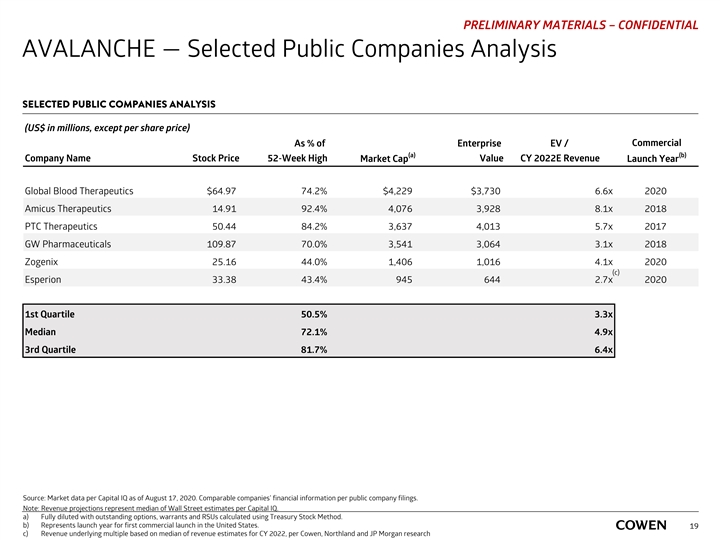
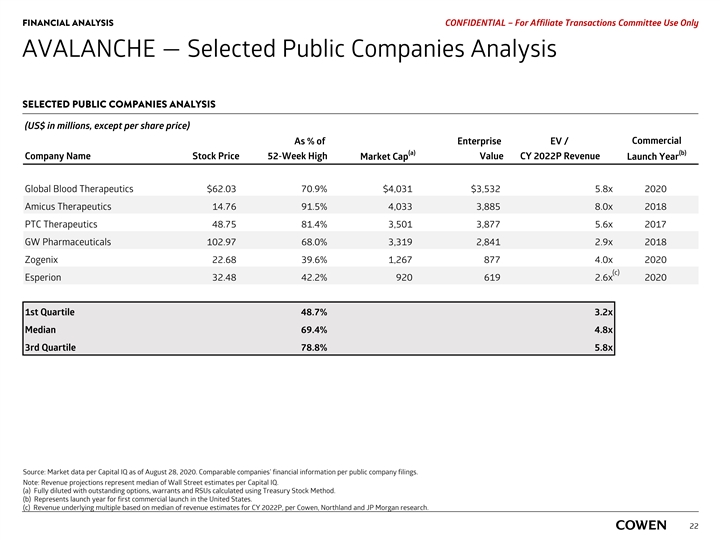
PRELIMINARY MATERIALS – CONFIDENTIAL AVALANCHE — Selected Public Companies Analysis SELECTED PUBLIC COMPANIES ANALYSIS (US$ in millions, except per share price) Commercial As % of Enterprise EV / (a) (b) Company Name Stock Price 52-Week High Market Cap Value CY 2022E Revenue Launch Year Global Blood Therapeutics $64.97 74.2% $4,229 $3,730 6.6x 2020 Amicus Therapeutics 14.91 92.4% 4,076 3,928 8.1x 2018 PTC Therapeutics 50.44 84.2% 3,637 4,013 5.7x 2017 GW Pharmaceuticals 109.87 70.0% 3,541 3,064 3.1x 2018 Zogenix 25.16 44.0% 1,406 1,016 4.1x 2020 (c) Esperion 33.38 43.4% 945 644 2.7x 2020 1st Quartile 50.5% 3.3x Median 72.1% 4.9x 3rd Quartile 81.7% 6.4x Source: Market data per Capital IQ as of August 17, 2020. Comparable companies’ financial information per public company filings. Note: Revenue projections represent median of Wall Street estimates per Capital IQ. a) Fully diluted with outstanding options, warrants and RSUs calculated using Treasury Stock Method. b) Represents launch year for first commercial launch in the United States. 19 c) Revenue underlying multiple based on median of revenue estimates for CY 2022, per Cowen, Northland and JP Morgan researchPRELIMINARY MATERIALS – CONFIDENTIAL AVALANCHE — Selected Public Companies Analysis SELECTED PUBLIC COMPANIES ANALYSIS (US$ in millions, except per share price) Commercial As % of Enterprise EV / (a) (b) Company Name Stock Price 52-Week High Market Cap Value CY 2022E Revenue Launch Year Global Blood Therapeutics $64.97 74.2% $4,229 $3,730 6.6x 2020 Amicus Therapeutics 14.91 92.4% 4,076 3,928 8.1x 2018 PTC Therapeutics 50.44 84.2% 3,637 4,013 5.7x 2017 GW Pharmaceuticals 109.87 70.0% 3,541 3,064 3.1x 2018 Zogenix 25.16 44.0% 1,406 1,016 4.1x 2020 (c) Esperion 33.38 43.4% 945 644 2.7x 2020 1st Quartile 50.5% 3.3x Median 72.1% 4.9x 3rd Quartile 81.7% 6.4x Source: Market data per Capital IQ as of August 17, 2020. Comparable companies’ financial information per public company filings. Note: Revenue projections represent median of Wall Street estimates per Capital IQ. a) Fully diluted with outstanding options, warrants and RSUs calculated using Treasury Stock Method. b) Represents launch year for first commercial launch in the United States. 19 c) Revenue underlying multiple based on median of revenue estimates for CY 2022, per Cowen, Northland and JP Morgan research
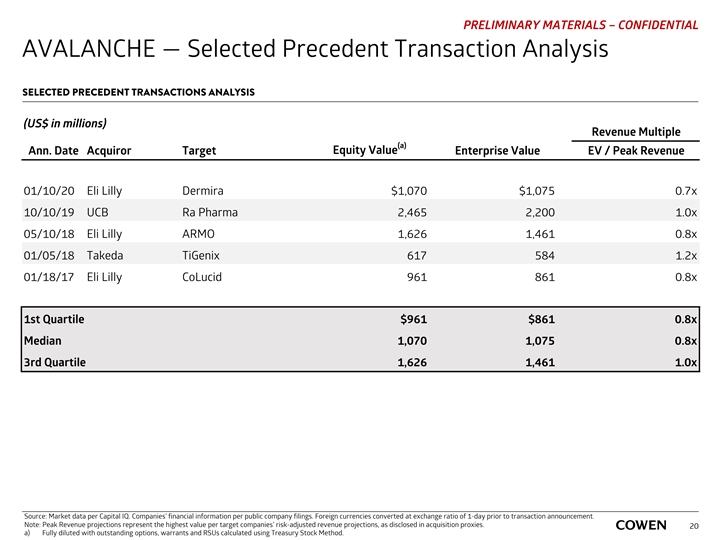
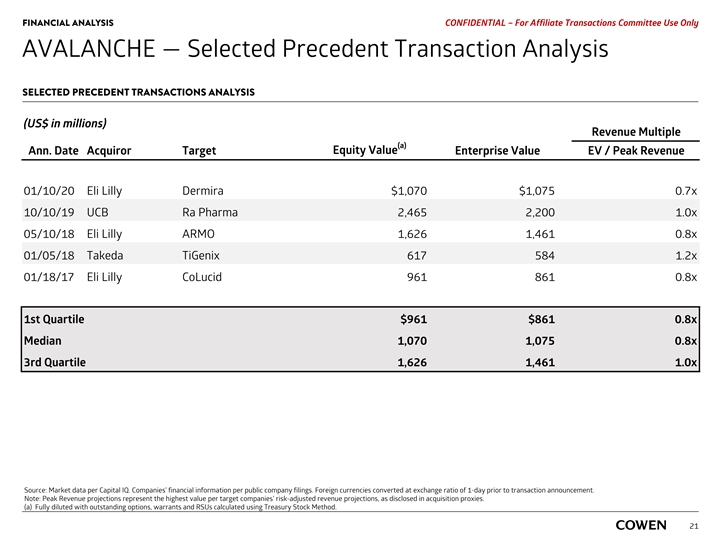
PRELIMINARY MATERIALS – CONFIDENTIAL AVALANCHE — Selected Precedent Transaction Analysis SELECTED PRECEDENT TRANSACTIONS ANALYSIS (US$ in millions) Revenue Multiple (a) Equity Value Ann. Date Acquiror Target Enterprise Value EV / Peak Revenue 01/10/20 Eli Lilly Dermira $1,070 $1,075 0.7x 10/10/19 UCB Ra Pharma 2,465 2,200 1.0x 05/10/18 Eli Lilly ARMO 1,626 1,461 0.8x 01/05/18 Takeda TiGenix 617 584 1.2x 01/18/17 Eli Lilly CoLucid 961 861 0.8x 1st Quartile $961 $861 0.8x Median 1,070 1,075 0.8x 3rd Quartile 1,626 1,461 1.0x Source: Market data per Capital IQ. Companies’ financial information per public company filings. Foreign currencies converted at exchange ratio of 1-day prior to transaction announcement. Note: Peak Revenue projections represent the highest value per target companies’ risk-adjusted revenue projections, as disclosed in acquisition proxies. 20 a) Fully diluted with outstanding options, warrants and RSUs calculated using Treasury Stock Method.PRELIMINARY MATERIALS – CONFIDENTIAL AVALANCHE — Selected Precedent Transaction Analysis SELECTED PRECEDENT TRANSACTIONS ANALYSIS (US$ in millions) Revenue Multiple (a) Equity Value Ann. Date Acquiror Target Enterprise Value EV / Peak Revenue 01/10/20 Eli Lilly Dermira $1,070 $1,075 0.7x 10/10/19 UCB Ra Pharma 2,465 2,200 1.0x 05/10/18 Eli Lilly ARMO 1,626 1,461 0.8x 01/05/18 Takeda TiGenix 617 584 1.2x 01/18/17 Eli Lilly CoLucid 961 861 0.8x 1st Quartile $961 $861 0.8x Median 1,070 1,075 0.8x 3rd Quartile 1,626 1,461 1.0x Source: Market data per Capital IQ. Companies’ financial information per public company filings. Foreign currencies converted at exchange ratio of 1-day prior to transaction announcement. Note: Peak Revenue projections represent the highest value per target companies’ risk-adjusted revenue projections, as disclosed in acquisition proxies. 20 a) Fully diluted with outstanding options, warrants and RSUs calculated using Treasury Stock Method.

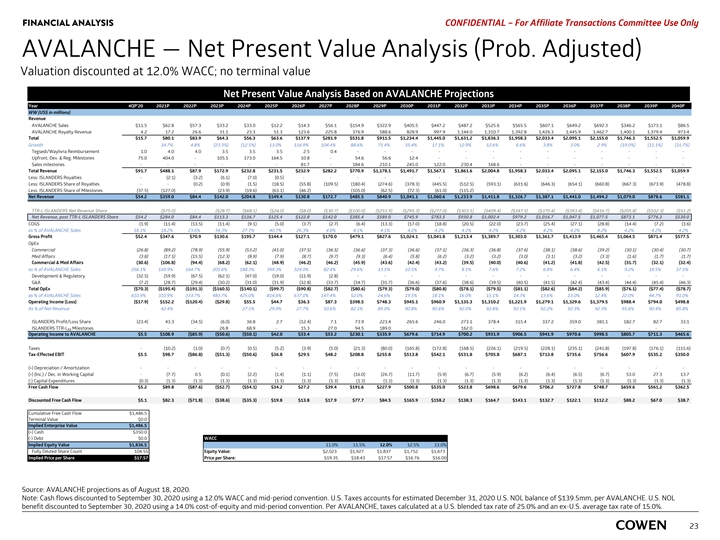
FINANCIAL ANALYSIS PRELIMINARY MATERIALS – CONFIDENTIAL AVALANCHE — Net Present Value Analysis (Prob. Adjusted) Valuation discounted at 12.0% WACC; no terminal value Net Present Value Analysis Based on AVALANCHE Case Year 4Q 20 2021 2022 2023 2024 2025 2026 2027 2028 2029 2030 2031 2032 2033 2034 2035 2036 2037 2038 2039 2040 WW (US$ in millions) Revenue AVALANCHE Sales $11.5 $62.8 $57.3 $33.2 $33.0 $12.2 $14.3 $56.1 $ 154.9 $ 322.9 $405.5 $447.2 $487.2 $525.6 $ 565.5 $607.1 $649.2 $ 692.3 $346.2 $ 173.1 $86.5 AVALANCHE Royalty Revenue 4 .2 17.2 26.6 31.1 23.3 51.3 123.6 225.8 376.9 588.6 828.9 997.9 1 ,144.0 1,310.7 1,392.8 1 ,426.3 1,445.9 1,462.7 1,400.1 1,379.4 973.4 Total $15.7 $80.1 $83.9 $64.3 $56.3 $63.6 $137.9 $ 281.9 $531.8 $ 911.5 $1,234.4 $1,445.0 $1,631.2 $1,836.3 $1,958.3 $2,033.4 $2,095.1 $2,155.0 $1,746.3 $1,552.5 $1,059.9 Growth 34.7% 4.8% (23.3%) (12.5%) 13.0% 116.9% 104.4% 88.6% 71.4% 35.4% 17.1% 12.9% 12.6% 6.6% 3.8% 3.0% 2.9% (19.0%) (11.1%) (31.7%) Tegsedi/Waylivra Reimbursement 1.0 4 .0 4 .0 3.5 3.5 3 .5 2.5 0.4 - - - - - - - - - - - - - Upfront, Dev. & Reg. Milestones 75.0 404.0 - 105.1 173.0 164.5 10.8 - 54.6 56.6 12.4 - - - - - - - - - - Sales milestones - - - - - - 81.7 - 184.6 210.1 245.0 122.0 230.4 168.6 - - - - - - - Total Revenue $91.7 $488.1 $87.9 $172.9 $ 232.8 $231.5 $232.9 $ 282.2 $770.9 $1,178.1 $1,491.7 $1,567.1 $1,861.6 $2,004.8 $1,958.3 $2,033.4 $2,095.1 $2,155.0 $1,746.3 $1,552.5 $1,059.9 Less: ISLANDERS Royalties - (2.1) (3.2) (6.1) (7.0) (0.5) - - - - - - - - - - - - - - - Less: ISLANDERS Share of Royalties - - (0.2) (0.9) (1.5) (18.5) (55.8) (109.5) (180.4) (274.6) (378.3) (445.5) (512.5) ( 593.1) (631.6) (646.3) ( 654.1) ( 660.8) ( 667.3) ( 673.9) (478.8) Less: ISLANDERS Share of Milestones (37.5) (127.0) - (23.9) (19.6) (63.1) (46.2) - (105.0) (62.5) (72.3) (61.0) (115.2) - - - - - - - - Net Revenue $54.2 $359.0 $84.4 $ 142.0 $ 204.8 $ 149.4 $ 130.8 $ 172.7 $485.5 $840.9 $1,041.1 $1,060.6 $1,233.9 $1,411.8 $1,326.7 $1,387.1 $1,441.0 $1,494.2 $1,079.0 $878.6 $581.1 TTR-L ISLANDERS Net Revenue Share - ($75.0) - ($28.7) ($68.1) ($24.0) ($8.0) ($30.7) ($100.0) ($251.9) ($295.3) ($277.0) ($303.1) ($409.4) ($347.5) ($370.4) ($393.4) ($416.7) ($205.8) ($102.3) ($51.2) Net Revenue, post TTR-L ISLANDERS Share $54.2 $284.0 $84.4 $113.3 $136.7 $125.4 $122.8 $142.0 $385.4 $589.0 $745.9 $783.5 $930.8 $1,002.4 $979.2 $1,016.7 $1,047.5 $1,077.5 $873.1 $776.3 $530.0 COGS (1.9) (11.4) (13.5) (11.4) (9.1) (5.0) (3.7) (2.7) (6.4) (13.3) (17.0) (18.8) (20.5) (22.0) (23.7) (25.4) (27.1) (28.8) (14.4) (7.2) (3.6) as % of AVALANCHE Sales 16.1% 18.2% 23.6% 34.3% 27.7% 40.7% 26.3% 4.8% 4.1% 4.1% 4.2% 4.2% 4.2% 4.2% 4.2% 4.2% 4.2% 4.2% 4.2% 4.2% 4.2% Gross Profit $52.4 $347.6 $70.9 $130.6 $195.7 $144.4 $127.1 $170.0 $479.1 $827.6 $1,024.1 $1,041.8 $1,213.4 $1,389.7 $1,303.0 $1,361.7 $1,413.9 $1,465.4 $1,064.5 $871.4 $577.5 OpEx Commercial (26.8) (89.2) (78.9) (55.9) (53.2) (41.0) (37.5) (36.5) (36.6) (37.3) (36.6) (37.1) (36.3) (36.8) (37.6) (38.1) (38.6) (39.2) (30.1) (30.4) (30.7) Med Affairs (3.8) (17.5) (15.5) (12.3) (8.9) (7.9) (8.7) (9.7) (9.3) (6.4) (5.8) (6.2) (3.2) (3.2) (3.0) (3.1) (3.2) (3.3) (1.6) (1.7) (1.7) Commercial & Med Affairs (30.6) (106.8) (94.4) (68.2) (62.1) (48.9) (46.2) (46.2) (45.9) (43.6) (42.4) (43.2) (39.5) (40.0) (40.6) (41.2) (41.8) (42.5) (31.7) (32.1) (32.4) as % of AVALANCHE Sales 266.1% 169.9% 164.7% 205.6% 188.3% 399.3% 324.0% 82.4% 29.6% 13.5% 10.5% 9.7% 8.1% 7.6% 7.2% 6.8% 6.4% 6.1% 9.2% 18.5% 37.5% Development & Regulatory (32.5) (59.9) (67.5) (62.1) (47.0) (19.0) (11.9) (2.8) - - - - - - - - - - - - - G&A (7.2) (28.7) (29.4) (30.2) (31.0) (31.9) (32.8) (33.7) (34.7) (35.7) (36.6) (37.6) (38.6) (39.5) (40.5) (41.5) (42.4) (43.4) (44.4) (45.4) (46.3) Total OpEx ($70.3) ($195.4) ($191.3) ($160.5) ($140.1) ($99.7) ($90.8) ($82.7) ($80.6) ($79.3) ($79.0) ($80.8) ($78.1) ($79.5) ($81.1) ($82.6) ($84.2) ($85.9) ($76.1) ($77.4) ($78.7) as % of AVALANCHE Sales 610.9% 310.9% 333.7% 483.7% 425.0% 814.6% 637.0% 147.4% 52.0% 24.6% 19.5% 18.1% 16.0% 15.1% 14.3% 13.6% 13.0% 12.4% 22.0% 44.7% 91.0% Operating Income (Loss) ($17.9) $152.2 ($120.4) ($29.8) $55.5 $44.7 $36.3 $87.3 $398.5 $748.3 $945.1 $960.9 $1,135.3 $1,310.2 $1,221.9 $1,279.1 $1,329.6 $1,379.5 $988.4 $794.0 $498.8 As % of Net Revenue - 42.4% - - 27.1% 29.9% 27.7% 50.6% 82.1% 89.0% 90.8% 90.6% 92.0% 92.8% 92.1% 92.2% 92.3% 92.3% 91.6% 90.4% 85.8% ISLANDERS Profit/Loss Share (23.4) 43.3 (34.5) (6.0) 36.8 2 .7 (12.4) 7 .1 73.9 223.4 265.6 246.0 273.1 378.4 315.4 337.2 359.0 381.1 182.7 82.7 33.1 ISLANDERS TTR-L Milestones - - - 26.8 68.9 - 15.3 27.0 94.5 189.0 - - 162.0 - - - - - - - - RX Operating Income to AVALANCHE $5.5 $ 108.9 ( $85.9) ($50.6) ($50.1) $42.0 $33.4 $53.2 $230.1 $335.9 $ 679.6 $ 714.9 $ 700.2 $931.9 $ 906.5 $941.9 $970.6 $998.5 $805.7 $711.3 $ 465.6 Taxes - (10.2) (1.0) (0.7) (0.5) (5.2) (3.9) (5.0) (21.3) (80.0) ( 165.8) ( 172.8) ( 168.5) (226.1) ( 219.5) ( 228.1) ( 235.1) (241.8) ( 197.8) ( 176.1) ( 115.6) Tax-Effected EBIT $5.5 $98.7 ($86.8) ($51.3) ($50.6) $36.8 $29.5 $48.2 $208.8 $255.8 $513.8 $542.1 $531.8 $705.8 $687.1 $713.8 $735.6 $756.6 $607.9 $535.2 $350.0 (+) Depreciation / Amortization - - - - - - - - - - - - - - - - - - - - - (+) (Inc.) / Dec. in Working Capital - (7.7) 0 .5 (0.1) (2.2) (1.4) (1.1) (7.5) (16.0) (26.7) (11.7) (5.9) (6.7) (5.9) (6.2) (6.4) (6.5) (6.7) 53.0 27.3 13.7 (-) Capital Expenditures (0.3) (1.3) (1.3) (1.3) (1.3) (1.3) (1.3) (1.3) (1.3) (1.3) (1.3) (1.3) (1.3) (1.3) (1.3) (1.3) (1.3) (1.3) (1.3) (1.3) (1.3) Free Cash Flow $5.2 $89.8 ($87.6) ($52.7) ($54.1) $34.2 $27.2 $39.4 $191.6 $227.9 $500.8 $535.0 $523.8 $698.6 $679.6 $706.2 $727.8 $748.7 $659.6 $561.2 $362.5 Discounted Free Cash Flow $5.1 $82.3 ($71.8) ($38.6) ($35.3) $19.8 $13.8 $17.9 $77.7 $84.5 $165.9 $158.2 $138.3 $164.7 $143.1 $132.7 $122.1 $112.2 $88.2 $67.0 $38.7 Cumulative Free Cash Flow $1,486.5 Terminal Value $0.0 Implied Enterprise Value $1,486.5 (+) Cash $350.0 (-) Debt $0.0 WACC Implied Equity Value $1,836.5 11.0% 11.5% 12.0% 12.5% 13.0% Fully Diluted Share Count 103.14 Equity Value: $1,837 $2,023 $1,927 $1,837 $1,752 $1,673 Implied Price per Share $17.81 Price per Share: $19.62 $18.68 $17.81 $16.99 $16.22 Source: AVALANCHE as of August 18, 2020. Note: Cash flows discounted to September 30, 2020 using a 12.0% WACC and mid-period convention. U.S. Taxes accounts for estimated December 31, 2020 U.S. NOL balance of $139.5mm, per AVALANCHE. U.S. NOL benefit discounted to September 30, 2020 using a 14.0% cost-of-equity and mid-period convention. Per AVALANCHE, taxes calculated at a U.S. blended tax rate of 25.0% 21 and an ex-U.S. average tax rate of 15.0%.FINANCIAL ANALYSIS PRELIMINARY MATERIALS – CONFIDENTIAL AVALANCHE — Net Present Value Analysis (Prob. Adjusted) Valuation discounted at 12.0% WACC; no terminal value Net Present Value Analysis Based on AVALANCHE Case Year 4Q 20 2021 2022 2023 2024 2025 2026 2027 2028 2029 2030 2031 2032 2033 2034 2035 2036 2037 2038 2039 2040 WW (US$ in millions) Revenue AVALANCHE Sales $11.5 $62.8 $57.3 $33.2 $33.0 $12.2 $14.3 $56.1 $ 154.9 $ 322.9 $405.5 $447.2 $487.2 $525.6 $ 565.5 $607.1 $649.2 $ 692.3 $346.2 $ 173.1 $86.5 AVALANCHE Royalty Revenue 4 .2 17.2 26.6 31.1 23.3 51.3 123.6 225.8 376.9 588.6 828.9 997.9 1 ,144.0 1,310.7 1,392.8 1 ,426.3 1,445.9 1,462.7 1,400.1 1,379.4 973.4 Total $15.7 $80.1 $83.9 $64.3 $56.3 $63.6 $137.9 $ 281.9 $531.8 $ 911.5 $1,234.4 $1,445.0 $1,631.2 $1,836.3 $1,958.3 $2,033.4 $2,095.1 $2,155.0 $1,746.3 $1,552.5 $1,059.9 Growth 34.7% 4.8% (23.3%) (12.5%) 13.0% 116.9% 104.4% 88.6% 71.4% 35.4% 17.1% 12.9% 12.6% 6.6% 3.8% 3.0% 2.9% (19.0%) (11.1%) (31.7%) Tegsedi/Waylivra Reimbursement 1.0 4 .0 4 .0 3.5 3.5 3 .5 2.5 0.4 - - - - - - - - - - - - - Upfront, Dev. & Reg. Milestones 75.0 404.0 - 105.1 173.0 164.5 10.8 - 54.6 56.6 12.4 - - - - - - - - - - Sales milestones - - - - - - 81.7 - 184.6 210.1 245.0 122.0 230.4 168.6 - - - - - - - Total Revenue $91.7 $488.1 $87.9 $172.9 $ 232.8 $231.5 $232.9 $ 282.2 $770.9 $1,178.1 $1,491.7 $1,567.1 $1,861.6 $2,004.8 $1,958.3 $2,033.4 $2,095.1 $2,155.0 $1,746.3 $1,552.5 $1,059.9 Less: ISLANDERS Royalties - (2.1) (3.2) (6.1) (7.0) (0.5) - - - - - - - - - - - - - - - Less: ISLANDERS Share of Royalties - - (0.2) (0.9) (1.5) (18.5) (55.8) (109.5) (180.4) (274.6) (378.3) (445.5) (512.5) ( 593.1) (631.6) (646.3) ( 654.1) ( 660.8) ( 667.3) ( 673.9) (478.8) Less: ISLANDERS Share of Milestones (37.5) (127.0) - (23.9) (19.6) (63.1) (46.2) - (105.0) (62.5) (72.3) (61.0) (115.2) - - - - - - - - Net Revenue $54.2 $359.0 $84.4 $ 142.0 $ 204.8 $ 149.4 $ 130.8 $ 172.7 $485.5 $840.9 $1,041.1 $1,060.6 $1,233.9 $1,411.8 $1,326.7 $1,387.1 $1,441.0 $1,494.2 $1,079.0 $878.6 $581.1 TTR-L ISLANDERS Net Revenue Share - ($75.0) - ($28.7) ($68.1) ($24.0) ($8.0) ($30.7) ($100.0) ($251.9) ($295.3) ($277.0) ($303.1) ($409.4) ($347.5) ($370.4) ($393.4) ($416.7) ($205.8) ($102.3) ($51.2) Net Revenue, post TTR-L ISLANDERS Share $54.2 $284.0 $84.4 $113.3 $136.7 $125.4 $122.8 $142.0 $385.4 $589.0 $745.9 $783.5 $930.8 $1,002.4 $979.2 $1,016.7 $1,047.5 $1,077.5 $873.1 $776.3 $530.0 COGS (1.9) (11.4) (13.5) (11.4) (9.1) (5.0) (3.7) (2.7) (6.4) (13.3) (17.0) (18.8) (20.5) (22.0) (23.7) (25.4) (27.1) (28.8) (14.4) (7.2) (3.6) as % of AVALANCHE Sales 16.1% 18.2% 23.6% 34.3% 27.7% 40.7% 26.3% 4.8% 4.1% 4.1% 4.2% 4.2% 4.2% 4.2% 4.2% 4.2% 4.2% 4.2% 4.2% 4.2% 4.2% Gross Profit $52.4 $347.6 $70.9 $130.6 $195.7 $144.4 $127.1 $170.0 $479.1 $827.6 $1,024.1 $1,041.8 $1,213.4 $1,389.7 $1,303.0 $1,361.7 $1,413.9 $1,465.4 $1,064.5 $871.4 $577.5 OpEx Commercial (26.8) (89.2) (78.9) (55.9) (53.2) (41.0) (37.5) (36.5) (36.6) (37.3) (36.6) (37.1) (36.3) (36.8) (37.6) (38.1) (38.6) (39.2) (30.1) (30.4) (30.7) Med Affairs (3.8) (17.5) (15.5) (12.3) (8.9) (7.9) (8.7) (9.7) (9.3) (6.4) (5.8) (6.2) (3.2) (3.2) (3.0) (3.1) (3.2) (3.3) (1.6) (1.7) (1.7) Commercial & Med Affairs (30.6) (106.8) (94.4) (68.2) (62.1) (48.9) (46.2) (46.2) (45.9) (43.6) (42.4) (43.2) (39.5) (40.0) (40.6) (41.2) (41.8) (42.5) (31.7) (32.1) (32.4) as % of AVALANCHE Sales 266.1% 169.9% 164.7% 205.6% 188.3% 399.3% 324.0% 82.4% 29.6% 13.5% 10.5% 9.7% 8.1% 7.6% 7.2% 6.8% 6.4% 6.1% 9.2% 18.5% 37.5% Development & Regulatory (32.5) (59.9) (67.5) (62.1) (47.0) (19.0) (11.9) (2.8) - - - - - - - - - - - - - G&A (7.2) (28.7) (29.4) (30.2) (31.0) (31.9) (32.8) (33.7) (34.7) (35.7) (36.6) (37.6) (38.6) (39.5) (40.5) (41.5) (42.4) (43.4) (44.4) (45.4) (46.3) Total OpEx ($70.3) ($195.4) ($191.3) ($160.5) ($140.1) ($99.7) ($90.8) ($82.7) ($80.6) ($79.3) ($79.0) ($80.8) ($78.1) ($79.5) ($81.1) ($82.6) ($84.2) ($85.9) ($76.1) ($77.4) ($78.7) as % of AVALANCHE Sales 610.9% 310.9% 333.7% 483.7% 425.0% 814.6% 637.0% 147.4% 52.0% 24.6% 19.5% 18.1% 16.0% 15.1% 14.3% 13.6% 13.0% 12.4% 22.0% 44.7% 91.0% Operating Income (Loss) ($17.9) $152.2 ($120.4) ($29.8) $55.5 $44.7 $36.3 $87.3 $398.5 $748.3 $945.1 $960.9 $1,135.3 $1,310.2 $1,221.9 $1,279.1 $1,329.6 $1,379.5 $988.4 $794.0 $498.8 As % of Net Revenue - 42.4% - - 27.1% 29.9% 27.7% 50.6% 82.1% 89.0% 90.8% 90.6% 92.0% 92.8% 92.1% 92.2% 92.3% 92.3% 91.6% 90.4% 85.8% ISLANDERS Profit/Loss Share (23.4) 43.3 (34.5) (6.0) 36.8 2 .7 (12.4) 7 .1 73.9 223.4 265.6 246.0 273.1 378.4 315.4 337.2 359.0 381.1 182.7 82.7 33.1 ISLANDERS TTR-L Milestones - - - 26.8 68.9 - 15.3 27.0 94.5 189.0 - - 162.0 - - - - - - - - RX Operating Income to AVALANCHE $5.5 $ 108.9 ( $85.9) ($50.6) ($50.1) $42.0 $33.4 $53.2 $230.1 $335.9 $ 679.6 $ 714.9 $ 700.2 $931.9 $ 906.5 $941.9 $970.6 $998.5 $805.7 $711.3 $ 465.6 Taxes - (10.2) (1.0) (0.7) (0.5) (5.2) (3.9) (5.0) (21.3) (80.0) ( 165.8) ( 172.8) ( 168.5) (226.1) ( 219.5) ( 228.1) ( 235.1) (241.8) ( 197.8) ( 176.1) ( 115.6) Tax-Effected EBIT $5.5 $98.7 ($86.8) ($51.3) ($50.6) $36.8 $29.5 $48.2 $208.8 $255.8 $513.8 $542.1 $531.8 $705.8 $687.1 $713.8 $735.6 $756.6 $607.9 $535.2 $350.0 (+) Depreciation / Amortization - - - - - - - - - - - - - - - - - - - - - (+) (Inc.) / Dec. in Working Capital - (7.7) 0 .5 (0.1) (2.2) (1.4) (1.1) (7.5) (16.0) (26.7) (11.7) (5.9) (6.7) (5.9) (6.2) (6.4) (6.5) (6.7) 53.0 27.3 13.7 (-) Capital Expenditures (0.3) (1.3) (1.3) (1.3) (1.3) (1.3) (1.3) (1.3) (1.3) (1.3) (1.3) (1.3) (1.3) (1.3) (1.3) (1.3) (1.3) (1.3) (1.3) (1.3) (1.3) Free Cash Flow $5.2 $89.8 ($87.6) ($52.7) ($54.1) $34.2 $27.2 $39.4 $191.6 $227.9 $500.8 $535.0 $523.8 $698.6 $679.6 $706.2 $727.8 $748.7 $659.6 $561.2 $362.5 Discounted Free Cash Flow $5.1 $82.3 ($71.8) ($38.6) ($35.3) $19.8 $13.8 $17.9 $77.7 $84.5 $165.9 $158.2 $138.3 $164.7 $143.1 $132.7 $122.1 $112.2 $88.2 $67.0 $38.7 Cumulative Free Cash Flow $1,486.5 Terminal Value $0.0 Implied Enterprise Value $1,486.5 (+) Cash $350.0 (-) Debt $0.0 WACC Implied Equity Value $1,836.5 11.0% 11.5% 12.0% 12.5% 13.0% Fully Diluted Share Count 103.14 Equity Value: $1,837 $2,023 $1,927 $1,837 $1,752 $1,673 Implied Price per Share $17.81 Price per Share: $19.62 $18.68 $17.81 $16.99 $16.22 Source: AVALANCHE as of August 18, 2020. Note: Cash flows discounted to September 30, 2020 using a 12.0% WACC and mid-period convention. U.S. Taxes accounts for estimated December 31, 2020 U.S. NOL balance of $139.5mm, per AVALANCHE. U.S. NOL benefit discounted to September 30, 2020 using a 14.0% cost-of-equity and mid-period convention. Per AVALANCHE, taxes calculated at a U.S. blended tax rate of 25.0% 21 and an ex-U.S. average tax rate of 15.0%.
PRELIMINARY MATERIALS – CONFIDENTIAL 3. APPENDIXPRELIMINARY MATERIALS – CONFIDENTIAL 3. APPENDIX
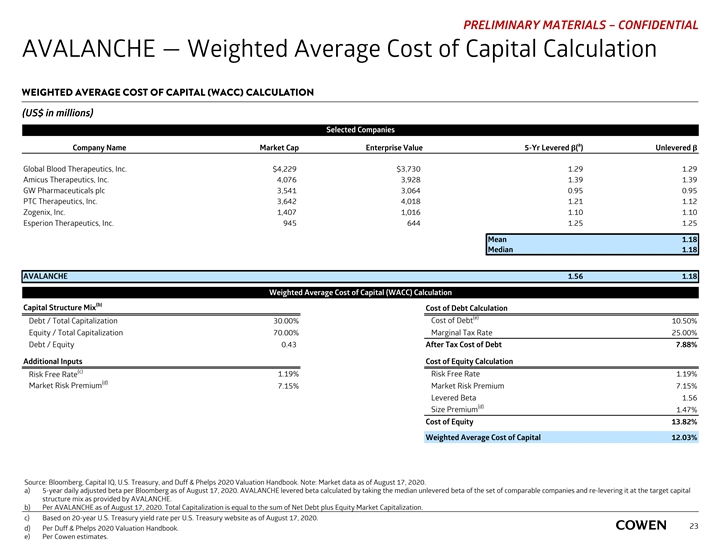
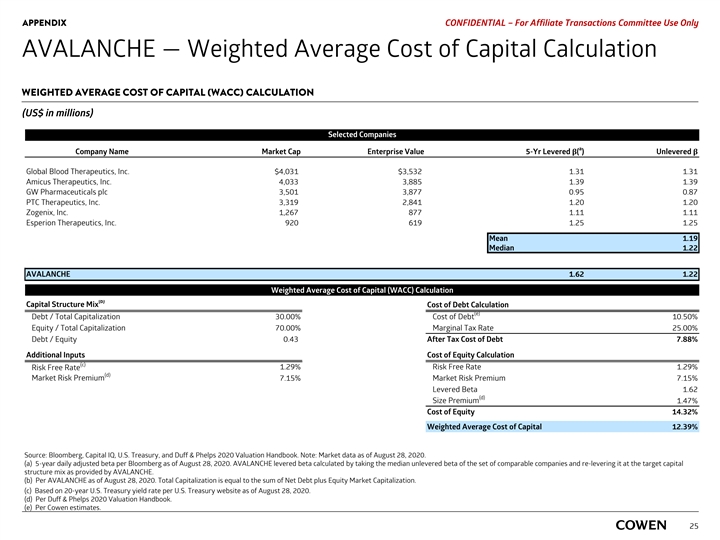
PRELIMINARY MATERIALS – CONFIDENTIAL AVALANCHE — Weighted Average Cost of Capital Calculation WEIGHTED AVERAGE COST OF CAPITAL (WACC) CALCULATION (US$ in millions) Selected Companies a Company Name Market Cap Enterprise Value 5-Yr Levered β( ) Unlevered β Global Blood Therapeutics, Inc. $4,229 $3,730 1.29 1.29 Amicus Therapeutics, Inc. 4,076 3,928 1.39 1.39 GW Pharmaceuticals plc 3,541 3,064 0.95 0.95 PTC Therapeutics, Inc. 3,642 4,018 1.21 1.12 Zogenix, Inc. 1,407 1,016 1.10 1.10 Esperion Therapeutics, Inc. 945 644 1.25 1.25 Mean 1.18 Median 1.18 AVALANCHE 1.56 1.18 Weighted Average Cost of Capital (WACC) Calculation (b) Capital Structure Mix Cost of Debt Calculation (e) Cost of Debt Debt / Total Capitalization 30.00% 10.50% Equity / Total Capitalization 70.00% Marginal Tax Rate 25.00% Debt / Equity 0.43 After Tax Cost of Debt 7.88% Additional Inputs Cost of Equity Calculation (c) Risk Free Rate 1.19% Risk Free Rate 1.19% (d) Market Risk Premium 7.15% Market Risk Premium 7.15% Levered Beta 1.56 (d) Size Premium 1.47% Cost of Equity 13.82% Weighted Average Cost of Capital 12.03% Source: Bloomberg, Capital IQ, U.S. Treasury, and Duff & Phelps 2020 Valuation Handbook. Note: Market data as of August 17, 2020. a) 5-year daily adjusted beta per Bloomberg as of August 17, 2020. AVALANCHE levered beta calculated by taking the median unlevered beta of the set of comparable companies and re-levering it at the target capital structure mix as provided by AVALANCHE. b) Per AVALANCHE as of August 17, 2020. Total Capitalization is equal to the sum of Net Debt plus Equity Market Capitalization. c) Based on 20-year U.S. Treasury yield rate per U.S. Treasury website as of August 17, 2020. 23 d) Per Duff & Phelps 2020 Valuation Handbook. e) Per Cowen estimates.PRELIMINARY MATERIALS – CONFIDENTIAL AVALANCHE — Weighted Average Cost of Capital Calculation WEIGHTED AVERAGE COST OF CAPITAL (WACC) CALCULATION (US$ in millions) Selected Companies a Company Name Market Cap Enterprise Value 5-Yr Levered β( ) Unlevered β Global Blood Therapeutics, Inc. $4,229 $3,730 1.29 1.29 Amicus Therapeutics, Inc. 4,076 3,928 1.39 1.39 GW Pharmaceuticals plc 3,541 3,064 0.95 0.95 PTC Therapeutics, Inc. 3,642 4,018 1.21 1.12 Zogenix, Inc. 1,407 1,016 1.10 1.10 Esperion Therapeutics, Inc. 945 644 1.25 1.25 Mean 1.18 Median 1.18 AVALANCHE 1.56 1.18 Weighted Average Cost of Capital (WACC) Calculation (b) Capital Structure Mix Cost of Debt Calculation (e) Cost of Debt Debt / Total Capitalization 30.00% 10.50% Equity / Total Capitalization 70.00% Marginal Tax Rate 25.00% Debt / Equity 0.43 After Tax Cost of Debt 7.88% Additional Inputs Cost of Equity Calculation (c) Risk Free Rate 1.19% Risk Free Rate 1.19% (d) Market Risk Premium 7.15% Market Risk Premium 7.15% Levered Beta 1.56 (d) Size Premium 1.47% Cost of Equity 13.82% Weighted Average Cost of Capital 12.03% Source: Bloomberg, Capital IQ, U.S. Treasury, and Duff & Phelps 2020 Valuation Handbook. Note: Market data as of August 17, 2020. a) 5-year daily adjusted beta per Bloomberg as of August 17, 2020. AVALANCHE levered beta calculated by taking the median unlevered beta of the set of comparable companies and re-levering it at the target capital structure mix as provided by AVALANCHE. b) Per AVALANCHE as of August 17, 2020. Total Capitalization is equal to the sum of Net Debt plus Equity Market Capitalization. c) Based on 20-year U.S. Treasury yield rate per U.S. Treasury website as of August 17, 2020. 23 d) Per Duff & Phelps 2020 Valuation Handbook. e) Per Cowen estimates.
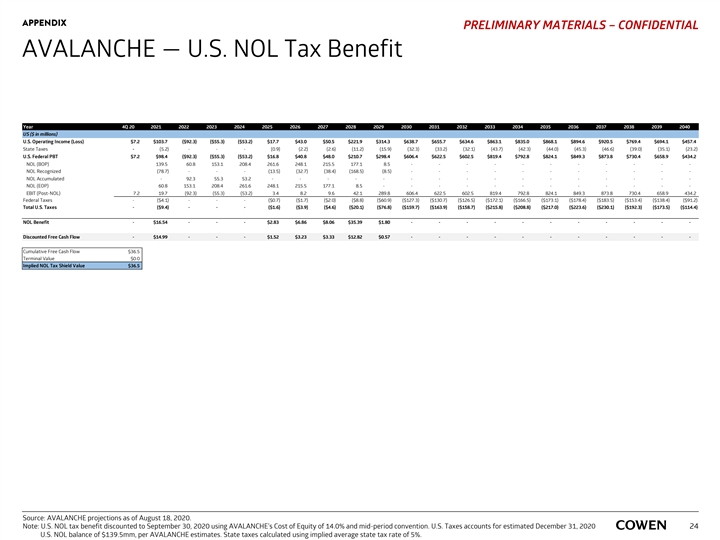
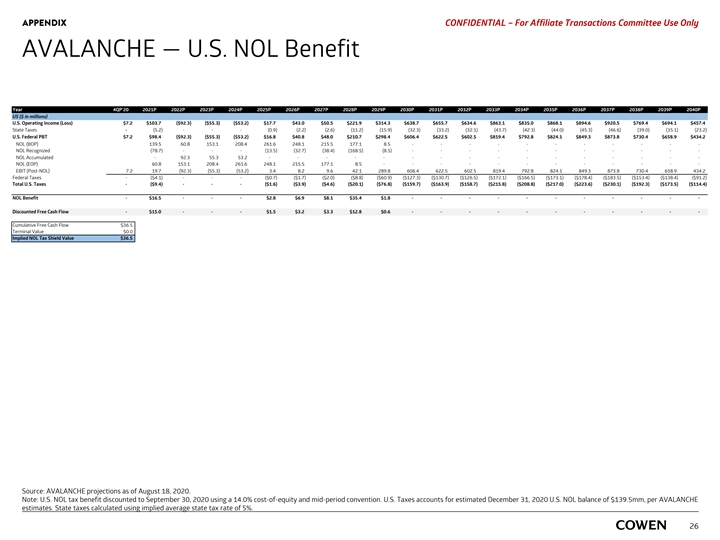
APPENDIX PRELIMINARY MATERIALS – CONFIDENTIAL AVALANCHE — U.S. NOL Tax Benefit Year 4Q 20 2021 2022 2023 2024 2025 2026 2027 2028 2029 2030 2031 2032 2033 2034 2035 2036 2037 2038 2039 2040 US ($ in millions) U.S. Operating Income (Loss) $7.2 $103.7 ( $92.3) ($55.3) ( $53.2) $17.7 $43.0 $50.5 $ 221.9 $314.3 $ 638.7 $655.7 $634.6 $863.1 $ 835.0 $868.1 $894.6 $920.5 $ 769.4 $694.1 $ 457.4 State Taxes - (5.2) - - - (0.9) (2.2) (2.6) (11.2) (15.9) (32.3) (33.2) (32.1) (43.7) (42.3) (44.0) (45.3) (46.6) (39.0) (35.1) (23.2) U.S. Federal PBT $7.2 $98.4 ( $92.3) ( $55.3) ($53.2) $16.8 $40.8 $48.0 $210.7 $ 298.4 $606.4 $ 622.5 $602.5 $819.4 $ 792.8 $ 824.1 $ 849.3 $ 873.8 $730.4 $658.9 $434.2 NOL (BOP) 139.5 60.8 153.1 208.4 261.6 248.1 215.5 177.1 8 .5 - - - - - - - - - - - NOL Recognized (78.7) - - - (13.5) (32.7) (38.4) (168.5) (8.5) - - - - - - - - - - - NOL Accumulated - 92.3 55.3 53.2 - - - - - - - - - - - - - - - - NOL (EOP) 60.8 153.1 208.4 261.6 248.1 215.5 177.1 8 .5 - - - - - - - - - - - - EBIT (Post-NOL) 7.2 19.7 (92.3) (55.3) (53.2) 3.4 8.2 9.6 42.1 289.8 606.4 622.5 602.5 819.4 792.8 824.1 849.3 873.8 730.4 658.9 434.2 Federal Taxes - ($4.1) - - - ($0.7) ($1.7) ($2.0) ($8.8) ($60.9) ($127.3) ($130.7) ($126.5) ($172.1) ($166.5) ($173.1) ($178.4) ($183.5) ($153.4) ($138.4) ( $91.2) Total U.S. Taxes - ($9.4) - - - ($1.6) ($3.9) ($4.6) ( $20.1) ($76.8) ($159.7) ($163.9) ($158.7) ($215.8) ($208.8) ($217.0) ($223.6) ($230.1) ($192.3) ($173.5) ($114.4) NOL Benefit - $16.54 - - - $2.83 $6.86 $8.06 $35.39 $1.80 - - - - - - - - - - - Discounted Free Cash Flow - $ 14.99 - - - $1.52 $3.23 $3.33 $12.82 $ 0.57 - - - - - - - - - - - Cumulative Free Cash Flow $36.5 Terminal Value $0.0 Implied NOL Tax Shield Value $36.5 Source: AVALANCHE projections as of August 18, 2020. Note: U.S. NOL tax benefit discounted to September 30, 2020 using AVALANCHE’s Cost of Equity of 14.0% and mid-period convention. U.S. Taxes accounts for estimated December 31, 2020 24 U.S. NOL balance of $139.5mm, per AVALANCHE estimates. State taxes calculated using implied average state tax rate of 5%.APPENDIX PRELIMINARY MATERIALS – CONFIDENTIAL AVALANCHE — U.S. NOL Tax Benefit Year 4Q 20 2021 2022 2023 2024 2025 2026 2027 2028 2029 2030 2031 2032 2033 2034 2035 2036 2037 2038 2039 2040 US ($ in millions) U.S. Operating Income (Loss) $7.2 $103.7 ( $92.3) ($55.3) ( $53.2) $17.7 $43.0 $50.5 $ 221.9 $314.3 $ 638.7 $655.7 $634.6 $863.1 $ 835.0 $868.1 $894.6 $920.5 $ 769.4 $694.1 $ 457.4 State Taxes - (5.2) - - - (0.9) (2.2) (2.6) (11.2) (15.9) (32.3) (33.2) (32.1) (43.7) (42.3) (44.0) (45.3) (46.6) (39.0) (35.1) (23.2) U.S. Federal PBT $7.2 $98.4 ( $92.3) ( $55.3) ($53.2) $16.8 $40.8 $48.0 $210.7 $ 298.4 $606.4 $ 622.5 $602.5 $819.4 $ 792.8 $ 824.1 $ 849.3 $ 873.8 $730.4 $658.9 $434.2 NOL (BOP) 139.5 60.8 153.1 208.4 261.6 248.1 215.5 177.1 8 .5 - - - - - - - - - - - NOL Recognized (78.7) - - - (13.5) (32.7) (38.4) (168.5) (8.5) - - - - - - - - - - - NOL Accumulated - 92.3 55.3 53.2 - - - - - - - - - - - - - - - - NOL (EOP) 60.8 153.1 208.4 261.6 248.1 215.5 177.1 8 .5 - - - - - - - - - - - - EBIT (Post-NOL) 7.2 19.7 (92.3) (55.3) (53.2) 3.4 8.2 9.6 42.1 289.8 606.4 622.5 602.5 819.4 792.8 824.1 849.3 873.8 730.4 658.9 434.2 Federal Taxes - ($4.1) - - - ($0.7) ($1.7) ($2.0) ($8.8) ($60.9) ($127.3) ($130.7) ($126.5) ($172.1) ($166.5) ($173.1) ($178.4) ($183.5) ($153.4) ($138.4) ( $91.2) Total U.S. Taxes - ($9.4) - - - ($1.6) ($3.9) ($4.6) ( $20.1) ($76.8) ($159.7) ($163.9) ($158.7) ($215.8) ($208.8) ($217.0) ($223.6) ($230.1) ($192.3) ($173.5) ($114.4) NOL Benefit - $16.54 - - - $2.83 $6.86 $8.06 $35.39 $1.80 - - - - - - - - - - - Discounted Free Cash Flow - $ 14.99 - - - $1.52 $3.23 $3.33 $12.82 $ 0.57 - - - - - - - - - - - Cumulative Free Cash Flow $36.5 Terminal Value $0.0 Implied NOL Tax Shield Value $36.5 Source: AVALANCHE projections as of August 18, 2020. Note: U.S. NOL tax benefit discounted to September 30, 2020 using AVALANCHE’s Cost of Equity of 14.0% and mid-period convention. U.S. Taxes accounts for estimated December 31, 2020 24 U.S. NOL balance of $139.5mm, per AVALANCHE estimates. State taxes calculated using implied average state tax rate of 5%.
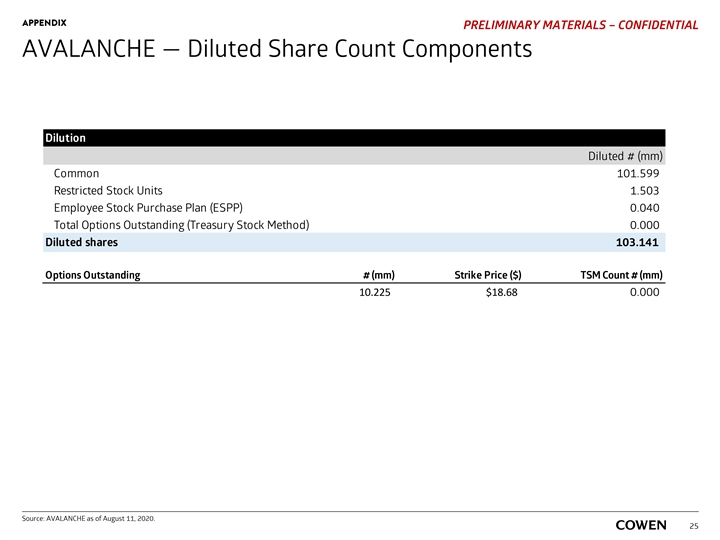
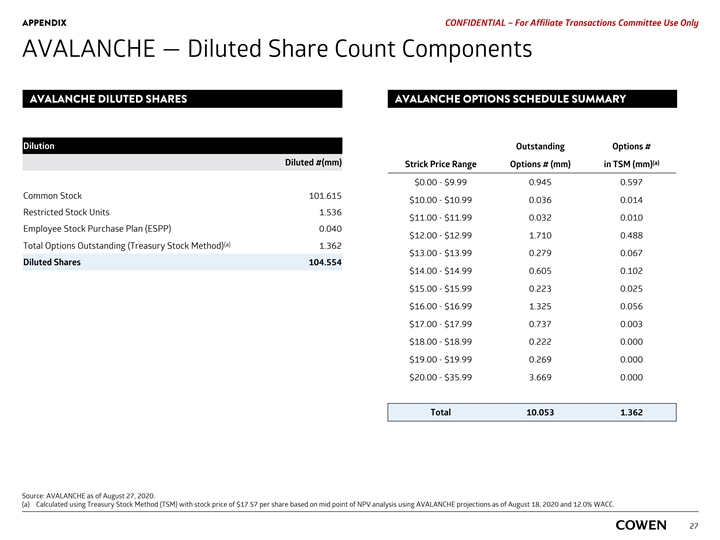
APPENDIX PRELIMINARY MATERIALS – CONFIDENTIAL AVALANCHE — Diluted Share Count Components Dilution Diluted # (mm) Common 101.599 Restricted Stock Units 1.503 Employee Stock Purchase Plan (ESPP) 0.040 Total Options Outstanding (Treasury Stock Method) 0.000 Diluted shares 103.141 Options Outstanding # (mm) Strike Price ($) TSM Count # (mm) 10.225 $18.68 0.000 Source: AVALANCHE as of August 11, 2020. 25APPENDIX PRELIMINARY MATERIALS – CONFIDENTIAL AVALANCHE — Diluted Share Count Components Dilution Diluted # (mm) Common 101.599 Restricted Stock Units 1.503 Employee Stock Purchase Plan (ESPP) 0.040 Total Options Outstanding (Treasury Stock Method) 0.000 Diluted shares 103.141 Options Outstanding # (mm) Strike Price ($) TSM Count # (mm) 10.225 $18.68 0.000 Source: AVALANCHE as of August 11, 2020. 25
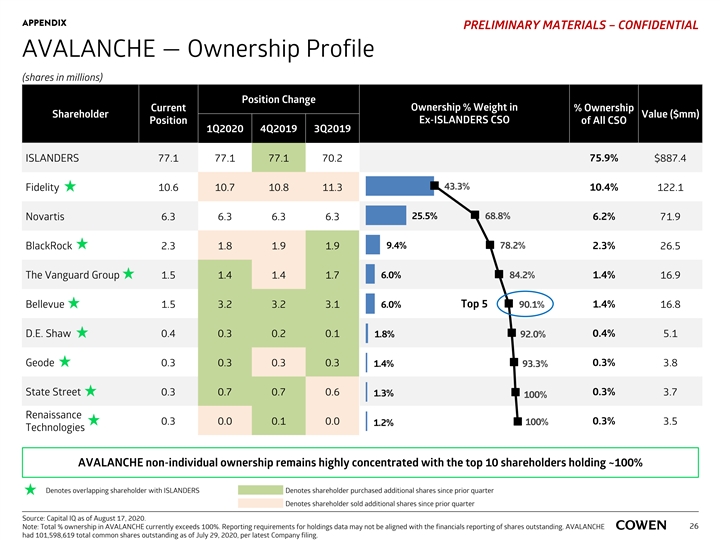
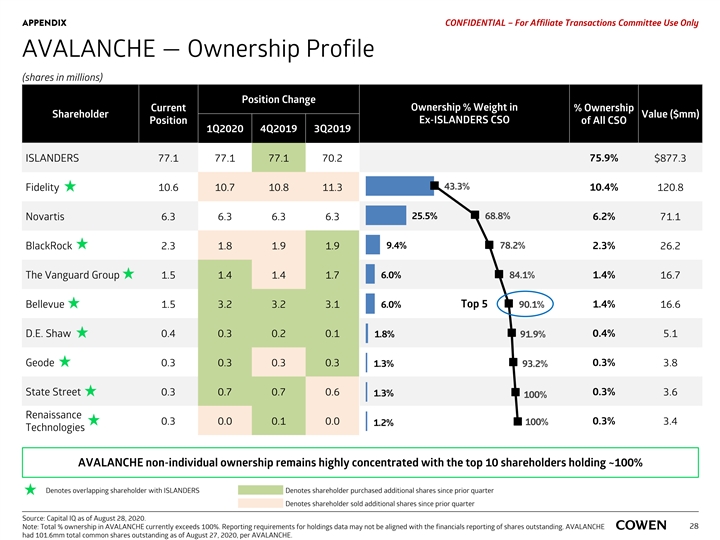
APPENDIX PRELIMINARY MATERIALS – CONFIDENTIAL AVALANCHE — Ownership Profile (shares in millions) Position Change Current Ownership % Weight in % Ownership Shareholder Value ($mm) Ex-ISLANDERS CSO Position of All CSO 1Q2020 4Q2019 3Q2019 ISLANDERS 77.1 77.1 77.1 70.2 75.9% $887.4 43.3% Fidelity 10.6 10.7 10.8 11.3 10.4% 122.1 25.5% 68.8% Novartis 6.3 6.3 6.3 6.3 6.2% 71.9 BlackRock 2.3 1.8 1.9 1.9 9.4% 78.2% 2.3% 26.5 6.0% 84.2% 1.4% The Vanguard Group 1.5 1.4 1.4 1.7 16.9 Bellevue 1.5 3.2 3.2 3.1 6.0% Top 5 90.1% 1.4% 16.8 D.E. Shaw 0.4 0.3 0.2 0.1 1.8% 0.4% 5.1 92.0% Geode 0.3 0.3 0.3 0.3 0.3% 3.8 1.4% 93.3% 0.3% State Street 0.3 0.7 0.7 0.6 1.3% 3.7 100% Renaissance 0.3 0.0 0.1 0.0 100% 0.3% 3.5 1.2% Technologies AVALANCHE non-individual ownership remains highly concentrated with the top 10 shareholders holding ~100% Denotes overlapping shareholder with ISLANDERS Denotes shareholder purchased additional shares since prior quarter Denotes shareholder sold additional shares since prior quarter Source: Capital IQ as of August 17, 2020. Note: Total % ownership in AVALANCHE currently exceeds 100%. Reporting requirements for holdings data may not be aligned with the financials reporting of shares outstanding. AVALANCHE 26 had 101,598,619 total common shares outstanding as of July 29, 2020, per latest Company filing. APPENDIX PRELIMINARY MATERIALS – CONFIDENTIAL AVALANCHE — Ownership Profile (shares in millions) Position Change Current Ownership % Weight in % Ownership Shareholder Value ($mm) Ex-ISLANDERS CSO Position of All CSO 1Q2020 4Q2019 3Q2019 ISLANDERS 77.1 77.1 77.1 70.2 75.9% $887.4 43.3% Fidelity 10.6 10.7 10.8 11.3 10.4% 122.1 25.5% 68.8% Novartis 6.3 6.3 6.3 6.3 6.2% 71.9 BlackRock 2.3 1.8 1.9 1.9 9.4% 78.2% 2.3% 26.5 6.0% 84.2% 1.4% The Vanguard Group 1.5 1.4 1.4 1.7 16.9 Bellevue 1.5 3.2 3.2 3.1 6.0% Top 5 90.1% 1.4% 16.8 D.E. Shaw 0.4 0.3 0.2 0.1 1.8% 0.4% 5.1 92.0% Geode 0.3 0.3 0.3 0.3 0.3% 3.8 1.4% 93.3% 0.3% State Street 0.3 0.7 0.7 0.6 1.3% 3.7 100% Renaissance 0.3 0.0 0.1 0.0 100% 0.3% 3.5 1.2% Technologies AVALANCHE non-individual ownership remains highly concentrated with the top 10 shareholders holding ~100% Denotes overlapping shareholder with ISLANDERS Denotes shareholder purchased additional shares since prior quarter Denotes shareholder sold additional shares since prior quarter Source: Capital IQ as of August 17, 2020. Note: Total % ownership in AVALANCHE currently exceeds 100%. Reporting requirements for holdings data may not be aligned with the financials reporting of shares outstanding. AVALANCHE 26 had 101,598,619 total common shares outstanding as of July 29, 2020, per latest Company filing.

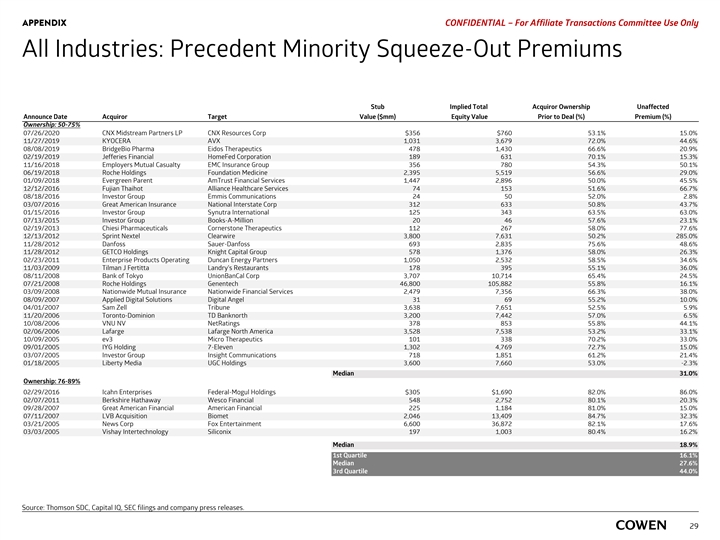
PRELIMINARY MATERIALS – CONFIDENTIAL All Industries: Precedent Minority Squeeze-Out Premiums Stub Implied Total Acquiror Ownership Unaffected Announce Date Acquiror Target Value ($mm) Equity Value Prior to Deal (%) Premium (%) Ownership: 50-75% 07/26/2020 CNX Midstream Partners LP CNX Resources Corp $356 $760 53.1% 15.0% 11/27/2019 KYOCERA AVX 1,031 3,679 72.0% 44.6% 08/08/2019 BridgeBio Pharma Eidos Therapeutics 478 1,430 66.6% 20.9% 02/19/2019 Jefferies Financial HomeFed Corporation 189 631 70.1% 15.3% 11/16/2018 Employers Mutual Casualty EMC Insurance Group 356 780 54.3% 50.1% 06/19/2018 Roche Holdings Foundation Medicine 2,395 5,519 56.6% 29.0% 01/09/2018 Evergreen Parent AmTrust Financial Services 1,447 2,896 50.0% 45.5% 12/12/2016 Fujian Thaihot Alliance Healthcare Services 74 153 51.6% 66.7% 08/18/2016 Investor Group Emmis Communications 24 50 52.0% 2.8% 03/07/2016 Great American Insurance National Interstate Corp 312 633 50.8% 43.7% 01/15/2016 Investor Group Synutra International 125 343 63.5% 63.0% 07/13/2015 Investor Group Books-A-Million 20 46 57.6% 23.1% 02/19/2013 Chiesi Pharmaceuticals Cornerstone Therapeutics 112 267 58.0% 77.6% 12/13/2012 Sprint Nextel Clearwire 3,800 7,631 50.2% 285.0% 11/28/2012 Danfoss Sauer-Danfoss 693 2,835 75.6% 48.6% 11/28/2012 GETCO Holdings Knight Capital Group 578 1,376 58.0% 26.3% 02/23/2011 Enterprise Products Operating Duncan Energy Partners 1,050 2,532 58.5% 34.6% 11/03/2009 Tilman J Fertitta Landry's Restaurants 178 395 55.1% 36.0% 08/11/2008 Bank of Tokyo UnionBanCal Corp 3,707 10,714 65.4% 24.5% 07/21/2008 Roche Holdings Genentech 46,800 105,882 55.8% 16.1% 03/09/2008 Nationwide Mutual Insurance Nationwide Financial Services 2,479 7,356 66.3% 38.0% 08/09/2007 Applied Digital Solutions Digital Angel 31 69 55.2% 10.0% 04/01/2007 Sam Zell Tribune 3,638 7,651 52.5% 5.9% 11/20/2006 Toronto-Dominion TD Banknorth 3,200 7,442 57.0% 6.5% 10/08/2006 VNU NV NetRatings 378 853 55.8% 44.1% 02/06/2006 Lafarge Lafarge North America 3,528 7,538 53.2% 33.1% 10/09/2005 ev3 Micro Therapeutics 101 338 70.2% 33.0% 09/01/2005 IYG Holding 7-Eleven 1,302 4,769 72.7% 15.0% 03/07/2005 Investor Group Insight Communications 718 1,851 61.2% 21.4% 01/18/2005 Liberty Media UGC Holdings 3,600 7,660 53.0% -2.3% Median 31.0% Ownership: 76-89% 02/29/2016 Icahn Enterprises Federal-Mogul Holdings $305 $1,690 82.0% 86.0% 02/07/2011 Berkshire Hathaway Wesco Financial 548 2,752 80.1% 20.3% 09/28/2007 Great American Financial American Financial 225 1,184 81.0% 15.0% 07/11/2007 LVB Acquisition Biomet 2,046 13,409 84.7% 32.3% 03/21/2005 News Corp Fox Entertainment 6,600 36,872 82.1% 17.6% 03/03/2005 Vishay Intertechnology Siliconix 197 1,003 80.4% 16.2% Median 18.9% 1st Quartile 16.1% Median 27.6% 3rd Quartile 44.0% Source: Thomson SDC, Capital IQ, SEC filings and company press releases. 27PRELIMINARY MATERIALS – CONFIDENTIAL All Industries: Precedent Minority Squeeze-Out Premiums Stub Implied Total Acquiror Ownership Unaffected Announce Date Acquiror Target Value ($mm) Equity Value Prior to Deal (%) Premium (%) Ownership: 50-75% 07/26/2020 CNX Midstream Partners LP CNX Resources Corp $356 $760 53.1% 15.0% 11/27/2019 KYOCERA AVX 1,031 3,679 72.0% 44.6% 08/08/2019 BridgeBio Pharma Eidos Therapeutics 478 1,430 66.6% 20.9% 02/19/2019 Jefferies Financial HomeFed Corporation 189 631 70.1% 15.3% 11/16/2018 Employers Mutual Casualty EMC Insurance Group 356 780 54.3% 50.1% 06/19/2018 Roche Holdings Foundation Medicine 2,395 5,519 56.6% 29.0% 01/09/2018 Evergreen Parent AmTrust Financial Services 1,447 2,896 50.0% 45.5% 12/12/2016 Fujian Thaihot Alliance Healthcare Services 74 153 51.6% 66.7% 08/18/2016 Investor Group Emmis Communications 24 50 52.0% 2.8% 03/07/2016 Great American Insurance National Interstate Corp 312 633 50.8% 43.7% 01/15/2016 Investor Group Synutra International 125 343 63.5% 63.0% 07/13/2015 Investor Group Books-A-Million 20 46 57.6% 23.1% 02/19/2013 Chiesi Pharmaceuticals Cornerstone Therapeutics 112 267 58.0% 77.6% 12/13/2012 Sprint Nextel Clearwire 3,800 7,631 50.2% 285.0% 11/28/2012 Danfoss Sauer-Danfoss 693 2,835 75.6% 48.6% 11/28/2012 GETCO Holdings Knight Capital Group 578 1,376 58.0% 26.3% 02/23/2011 Enterprise Products Operating Duncan Energy Partners 1,050 2,532 58.5% 34.6% 11/03/2009 Tilman J Fertitta Landry's Restaurants 178 395 55.1% 36.0% 08/11/2008 Bank of Tokyo UnionBanCal Corp 3,707 10,714 65.4% 24.5% 07/21/2008 Roche Holdings Genentech 46,800 105,882 55.8% 16.1% 03/09/2008 Nationwide Mutual Insurance Nationwide Financial Services 2,479 7,356 66.3% 38.0% 08/09/2007 Applied Digital Solutions Digital Angel 31 69 55.2% 10.0% 04/01/2007 Sam Zell Tribune 3,638 7,651 52.5% 5.9% 11/20/2006 Toronto-Dominion TD Banknorth 3,200 7,442 57.0% 6.5% 10/08/2006 VNU NV NetRatings 378 853 55.8% 44.1% 02/06/2006 Lafarge Lafarge North America 3,528 7,538 53.2% 33.1% 10/09/2005 ev3 Micro Therapeutics 101 338 70.2% 33.0% 09/01/2005 IYG Holding 7-Eleven 1,302 4,769 72.7% 15.0% 03/07/2005 Investor Group Insight Communications 718 1,851 61.2% 21.4% 01/18/2005 Liberty Media UGC Holdings 3,600 7,660 53.0% -2.3% Median 31.0% Ownership: 76-89% 02/29/2016 Icahn Enterprises Federal-Mogul Holdings $305 $1,690 82.0% 86.0% 02/07/2011 Berkshire Hathaway Wesco Financial 548 2,752 80.1% 20.3% 09/28/2007 Great American Financial American Financial 225 1,184 81.0% 15.0% 07/11/2007 LVB Acquisition Biomet 2,046 13,409 84.7% 32.3% 03/21/2005 News Corp Fox Entertainment 6,600 36,872 82.1% 17.6% 03/03/2005 Vishay Intertechnology Siliconix 197 1,003 80.4% 16.2% Median 18.9% 1st Quartile 16.1% Median 27.6% 3rd Quartile 44.0% Source: Thomson SDC, Capital IQ, SEC filings and company press releases. 27

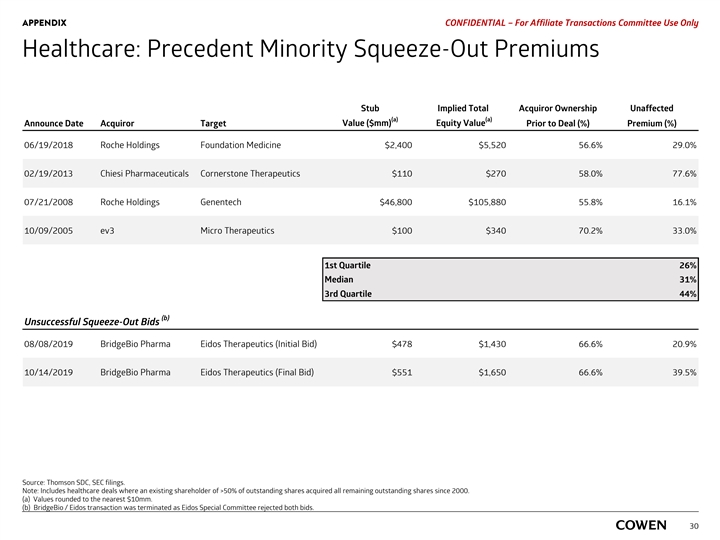
PRELIMINARY MATERIALS – CONFIDENTIAL Healthcare: Precedent Minority Squeeze-Out Premiums Stub Implied Total Acquiror Ownership Unaffected (a) (a) Value ($mm) Equity Value Announce Date Acquiror Target Prior to Deal (%) Premium (%) 06/19/2018 Roche Holdings Foundation Medicine $2,400 $5,520 56.6% 29.0% 02/19/2013 Chiesi Pharmaceuticals Cornerstone Therapeutics $110 $270 58.0% 77.6% 07/21/2008 Roche Holdings Genentech $46,800 $105,880 55.8% 16.1% 10/09/2005 ev3 Micro Therapeutics $100 $340 70.2% 33.0% 1st Quartile 26% Median 31% 3rd Quartile 44% (b) Unsuccessful Squeeze-Out Bids 08/08/2019 BridgeBio Pharma Eidos Therapeutics (Initial Bid) $478 $1,430 66.6% 20.9% 10/14/2019 BridgeBio Pharma Eidos Therapeutics (Final Bid) $551 $1,650 66.6% 39.5% Source: Thomson SDC, SEC filings. Note: Includes healthcare deals where an existing shareholder of >50% of outstanding shares acquired all remaining outstanding shares since 2000. a) Values rounded to the nearest $10mm. 28 b) BridgeBio / Eidos transaction was terminated as Eidos Special Committee rejected both bids.PRELIMINARY MATERIALS – CONFIDENTIAL Healthcare: Precedent Minority Squeeze-Out Premiums Stub Implied Total Acquiror Ownership Unaffected (a) (a) Value ($mm) Equity Value Announce Date Acquiror Target Prior to Deal (%) Premium (%) 06/19/2018 Roche Holdings Foundation Medicine $2,400 $5,520 56.6% 29.0% 02/19/2013 Chiesi Pharmaceuticals Cornerstone Therapeutics $110 $270 58.0% 77.6% 07/21/2008 Roche Holdings Genentech $46,800 $105,880 55.8% 16.1% 10/09/2005 ev3 Micro Therapeutics $100 $340 70.2% 33.0% 1st Quartile 26% Median 31% 3rd Quartile 44% (b) Unsuccessful Squeeze-Out Bids 08/08/2019 BridgeBio Pharma Eidos Therapeutics (Initial Bid) $478 $1,430 66.6% 20.9% 10/14/2019 BridgeBio Pharma Eidos Therapeutics (Final Bid) $551 $1,650 66.6% 39.5% Source: Thomson SDC, SEC filings. Note: Includes healthcare deals where an existing shareholder of >50% of outstanding shares acquired all remaining outstanding shares since 2000. a) Values rounded to the nearest $10mm. 28 b) BridgeBio / Eidos transaction was terminated as Eidos Special Committee rejected both bids.

PRELIMINARY MATERIALS – CONFIDENTIAL THANK YOUPRELIMINARY MATERIALS – CONFIDENTIAL THANK YOU