UNITED STATES
SECURITIES AND EXCHANGE COMMISSION
Washington, D.C. 20549
FORM N-CSR
CERTIFIED SHAREHOLDER REPORT OF
REGISTERED MANAGEMENT INVESTMENT COMPANIES
Investment Company Act file number 811-23102
Nuveen Municipal 2021 Target Term Fund
(Exact name of registrant as specified in charter)
Nuveen Investments
333 West Wacker Drive
Chicago, IL 60606
(Address of principal executive offices) (Zip code)
Gifford R. Zimmerman
Nuveen Investments
333 West Wacker Drive
Chicago, IL 60606
(Name and address of agent for service)
Registrant’s telephone number, including area code: (312) 917-7700
Date of fiscal year end: May 31
Date of reporting period: May 31, 2018
Form N-CSR is to be used by management investment companies to file reports with the Commission not later than 10 days after the transmission to stockholders of any report that is required to be transmitted to stockholders under Rule 30e-1 under the Investment Company Act of 1940 (17 CFR 270.30e-1). The Commission may use the information provided on Form N-CSR in its regulatory, disclosure review, inspection, and policymaking roles.
A registrant is required to disclose the information specified by Form N-CSR, and the Commission will make this information public. A registrant is not required to respond to the collection of information contained in Form N-CSR unless the Form displays a currently valid Office of Management and Budget (“OMB”) control number. Please direct comments concerning the accuracy of the information collection burden estimate and any suggestions for reducing the burden to Secretary, Securities and Exchange Commission, 450 Fifth Street, NW, Washington, DC 20549-0609. The OMB has reviewed this collection of information under the clearance requirements of 44 U.S.C. ss. 3507.
ITEM 1. REPORTS TO STOCKHOLDERS.
Life is Complex.
Nuveen makes things e-simple.
It only takes a minute to sign up for e-Reports. Once enrolled, you’ll receive an e-mail as soon as your Nuveen Fund information is ready—no more waiting for delivery by regular mail. Just click on the link within the e-mail to see the report and save it on your computer if you wish.
Free e-Reports
right to your e-mail!
www.investordelivery.com
If you receive your Nuveen Fund
dividends and statements from your
financial advisor or brokerage account.
or
www.nuveen.com/client-access
If you receive your Nuveen Fund
dividends and statements directly from
Nuveen.
right to your e-mail!
www.investordelivery.com
If you receive your Nuveen Fund
dividends and statements from your
financial advisor or brokerage account.
or
www.nuveen.com/client-access
If you receive your Nuveen Fund
dividends and statements directly from
Nuveen.

Table of Contents
|
Chairman’s Letter to Shareholders
|
4
|
|
Portfolio Managers’ Comments
|
5
|
|
Common Share Information
|
8
|
|
Risk Considerations
|
10
|
|
Performance Overview and Holding Summaries
|
11
|
|
Shareholder Meeting Report
|
13
|
|
Report of Independent Registered Public Accounting Firm
|
14
|
|
Portfolio of Investments
|
15
|
|
Statement of Assets and Liabilities
|
23
|
|
Statement of Operations
|
24
|
|
Statement of Changes in Net Assets
|
25
|
|
Statement of Cash Flows
|
26
|
|
Financial Highlights
|
28
|
|
Notes to Financial Statements
|
30
|
|
Additional Fund Information
|
40
|
|
Glossary of Terms Used in this Report
|
41
|
|
Reinvest Automatically, Easily and Conveniently
|
43
|
|
Annual Investment Management Agreement Approval Process
|
44
|
|
Board Members & Officers
|
51
|
3
Chairman’s Letter
to Shareholders
to Shareholders
Dear Shareholders,
I am honored to serve as the new independent chairman of the Nuveen Fund Board, effective July 1, 2018. I’d like to gratefully acknowledge the stewardship of my predecessor William J. Schneider and, on behalf of my fellow Board members, reinforce our commitment to the legacy of strong, independent oversight of your Funds.
The increase in market volatility this year reflects greater uncertainty among investors. The global economic outlook is less clear cut than it was in 2017. U.S. growth is again decoupling from that of the rest of the world, and the U.S. dollar and interest rates have risen in response. Trade war rhetoric and the imposition of tariffs between the U.S. and its major trading partners has recently dampened business sentiment and could pose a risk to growth expectations going forward. A host of other geopolitical concerns, including the ongoing Brexit and North American Free Trade Agreement negotiations, North Korea relations and Italy’s populist government, remain on the horizon.
Despite these risks, global growth remains intact, albeit at a slower pace, providing support to corporate earnings. The U.S. economy is expected to regain momentum, boosted by fiscal stimulus, an easing regulatory environment and above-average consumer confidence. Subdued inflation pressures have kept central bank policy accommodative, even as Europe moves closer to winding down its monetary stimulus and the Federal Reserve remains on a moderate tightening course.
Headlines and political noise will continue to obscure underlying fundamentals at times and cause temporary bouts of volatility. We encourage you to work with your financial advisor to evaluate your goals, timeline and risk tolerance if short-term market fluctuations are a concern. On behalf of the other members of the Nuveen Fund Board, we look forward to continuing to earn your trust in the months and years ahead.
Sincerely,

Terence J. Toth
Chairman of the Board
July 23, 2018
Chairman of the Board
July 23, 2018
4
Portfolio Managers’ Comments
Nuveen Municipal 2021 Target Term Fund (NHA)
This Fund features portfolio management by Nuveen Asset Management, LLC (NAM), an affiliate of Nuveen, LLC. Portfolio managers John V. Miller, CFA, and Steven M. Hlavin discuss U.S. economic and municipal market conditions, key investment strategies and the twelve-month performance of NHA. John and Steve have managed NHA since its inception in 2016.
What factors affected the U.S. economy and the national municipal market during the twelve-month reporting period ended May 31, 2018?
After hovering near an annual pace of 3% for most of the reporting period, U.S. gross domestic product (GDP) growth cooled to 2.2% in the first quarter of 2018, according to the Bureau of Economic Analysis “second” estimate. GDP is the value of goods and services produced by the nation’s economy less the value of the goods and services used up in production, adjusted for price changes. A beginning-of-the-year slowdown was expected given the seasonal trend of slower first quarter growth seen over the past few years and the delayed impact of tax cuts on workers’ paychecks.
Nevertheless, consumer spending, boosted by employment and wage gains, continued to drive the economy. The Atlantic coast hurricanes in September and October temporarily weakened shopping and dining out activity, but rebuilding efforts had a positive impact on the economy. Although business investment slowed in early 2018 from the gains seen in the second half of 2017, business sentiment remained strong and hiring continued to boost employment. As reported by the Bureau of Labor Statistics, the unemployment rate fell to 3.8% in May 2018 from 4.3% in May 2017 and job gains averaged around 196,000 per month for the past twelve months. While the jobs market has continued to tighten, wage growth has remained lackluster during this economic recovery. Although the January jobs report revealed an unexpected pick-up in wages, the trend moderated in subsequent months. The Consumer Price Index (CPI) increased 2.8% over the twelve-month reporting period ended May 31, 2018 on a seasonally adjusted basis, as reported by the Bureau of Labor Statistics. The core CPI (which excludes food and energy) increased 2.2% during the same period, slightly above the Federal Reserve’s (Fed) unofficial longer term inflation objective of 2.0%.
The housing market also continued to improve with low mortgage rates and low inventory driving home prices higher. The S&P CoreLogic Case-Shiller U.S. National Home Price Index, which covers all nine U.S. census divisions, recorded a 6.4% annual gain in April 2018 (most recent data available at the time this report was prepared). The 10-City and 20-City Composites reported year-over-year increases of 6.2% and 6.6%, respectively.
With the U.S. economy delivering a sustainable growth rate and employment strengthening, the Fed’s policy making committee continued to incrementally raise its main benchmark interest rate. The most recent increase, in June 2018 (after the close of the reporting period), was the seventh rate hike since December 2015. In addition, in October 2017, the Fed began reducing its balance sheet by allowing a small amount of maturing Treasury and mortgage securities to roll off without reinvestment. The market expects the pace to remain moderate and predictable, with minimal market disruption.
This material is not intended to be a recommendation or investment advice, does not constitute a solicitation to buy or sell securities, and is not provided in a fiduciary capacity. The information provided does not take into account the specific objectives or circumstances of any particular investor, or suggest any specific course of action. Investment decisions should be made based on an investor’s objectives and circumstances and in consultation with his or her advisors.
Certain statements in this report are forward-looking statements. Discussions of specific investments are for illustration only and are not intended as recommendations of individual investments. The forward-looking statements and other views expressed herein are those of the portfolio managers as of the date of this report. Actual future results or occurrences may differ significantly from those anticipated in any forward-looking statements, and the views expressed herein are subject to change at any time, due to numerous market and other factors. The Fund disclaims any obligation to update publicly or revise any forward-looking statements or views expressed herein.
The ratings disclosed are the lowest rating given by one of the following national rating agencies: Standard & Poor’s Group (S&P), Moody’s Investors Service, Inc. (Moody’s) or Fitch, Inc. (Fitch). Credit ratings are subject to change. AAA, AA, A and BBB are investment grade ratings, while BB, B, CCC, CC, C and D are below investment grade ratings. Holdings designated N/R are not rated by these national rating agencies.
Bond insurance guarantees only the payment of principal and interest on the bond when due, and not the value of the bonds themselves, which will fluctuate with the bond market and the financial success of the issuer and the insurer. Insurance relates specifically to the bonds in the portfolio and not to the share prices of a Fund. No representation is made as to the insurers’ ability to meet their commitments.
Refer to the Glossary of Terms Used in this Report for further definition of the terms used within this section.
5
Portfolio Manager’s Comments (continued)
Fed Chair Janet Yellen’s term expired in February 2018, and incoming Chairman Jerome Powell indicated he would likely maintain the Fed’s gradual pace of interest rate hikes. At the June meeting, the Fed increased its projection to four interest rate increases in 2018, from three increases projected at the March meeting. The markets also continued to react to geopolitical news. Protectionist rhetoric had been garnering attention across Europe, as anti-European Union (EU) sentiment featured prominently (although did not win a majority) in the Dutch, French and German elections in 2017. Italy’s 2018 elections resulted in a hung parliament, and several months of negotiations resulted in a populist, euro-skeptic coalition government. The U.S. moved forward with tariffs on imported goods from China, as well as on steel and aluminum from Canada, Mexico and Europe. These countries announced retaliatory measures in kind, intensifying concerns about a trade war. Meanwhile, in March the U.K. and EU agreed in principle to the Brexit transition terms, opening the door to the next round of negotiation dealing with trade and security issues. The U.S. Treasury issued additional sanctions on Russia in April, and re-imposed sanctions on Iran after President Trump decided to withdraw from the 2015 nuclear agreement. The threat of a nuclear North Korea eased somewhat as the leaders of South Korea and North Korea met during April, while the U.S. and North Korea broadcast mixed messages about a summit scheduled for June but ultimately met as planned (after the close of the reporting period).
Municipal bonds recorded a small gain in the reporting period. Optimism about the economy was favorable for credit conditions but also drove interest rates higher, which weighed on bond prices. But, with inflation moving only incrementally higher, the increase in long-term interest rates was less dramatic than feared.
Along with the overall economic outlook, tax reform was a significant market driver for municipal bonds in this reporting period. Early drafts of the tax bill fostered significant uncertainty about the impact on the municipal bond market, leading municipal bonds to underperform taxable bonds in December and provoking issuers to rush bond offerings ahead of the pending tax law. Issuance in December reached an all-time high of $62.5 billion, exacerbating the market’s price decline during the month. However, all of the supply was absorbed and municipal bond valuations subsequently returned to more typical levels.
The final tax reform legislation signed on December 27, 2017 largely spared municipal bonds and was considered neutral to positive for the municipal market overall. Notably, a provision that would have eliminated the tax-preferred status of 20 to 30% of the municipal bond market was not included in the final bill. Moreover, investors were relieved that the adopted changes apply only to newly issued municipal bonds and also could be beneficial from a technical standpoint. Because new issue advance refunding bonds are no longer tax exempt, the total supply of municipal bonds will decrease going forward, boosting the scarcity value of existing municipal bonds. The new tax law also caps the state and local tax (SALT) deduction for individuals, which will likely increase demand for tax-exempt municipal bonds, especially in states with high income and/or property taxes.
Following the issuance surge in late 2017, issuance remained sharply lower in early 2018. However, the overall balance of municipal bond supply and demand remained advantageous for prices. Municipal bond issuance nationwide totaled $400.3 billion in this reporting period, an 8.0% drop from the issuance for the twelve-month reporting period ended May 31, 2017. The robust pace of issuance seen since the low volume depths of 2011 began to moderate in 2017 as interest rates moved higher. Despite the increase, the overall level of interest rates still remained low, encouraging issuers to continue to actively refund their outstanding debt. In these transactions, the issuers are issuing new bonds and taking the bond proceeds and redeeming (calling) old bonds. These refunding transactions have ranged from 40%-60% of total issuance over the past few years. Thus, the net issuance (all bonds issued less bonds redeemed) is actually much lower than the gross issuance. So, while gross issuance volume has been strong, the net has not, and this was an overall positive technical factor on municipal bond investment performance in recent years. Although the pace of refundings is slowing, net negative issuance is expected to continue.
Despite the volatility surrounding the potential tax law changes, demand remained robust and continued to outstrip supply. Low global interest rates have continued to drive investors toward higher after-tax yielding assets, including U.S. municipal bonds. As a result, municipal bond fund inflows steadily increased in 2017 overall.
What key strategies were used to manage the Fund during the twelve-month reporting period ended May 31, 2018?
The Fund invests in a portfolio of primarily municipal securities, the income from which is exempt from regular U.S. federal income tax. At least 65% of its managed assets are invested in low- to medium-quality municipal securities that, at the time of investment, are rated BBB/Baa or lower or unrated but judged by the portfolio managers to be of comparable quality. The Fund does not invest in
6
securities rated CCC+/Caa1 or lower, or unrated to be of comparable quality, nor does it invest in defaulted or distressed securities at the time of investment. No more than 25% will be in any one sector, no more than 5% in any one issuer and no more than 10% in tobacco settlement bonds. Up to 20% may be invested in securities that pay interest that is taxable under the federal alternative minimum tax applicable to individuals (AMT bonds).
The Fund seeks to identify municipal securities across diverse sectors and industries that the managers believe are underrated or undervalued. In seeking to return the original NAV on or about March 1, 2021, the Fund intends to utilize various portfolio and cash flow management techniques, including setting aside a portion of its net investment income, possibly retaining gains and limiting the longest maturity of any holding to no later than September 1, 2021.
As of the end of the reporting period, NHA’s maturity profile was structured with approximately 60% of the portfolio invested in bonds maturing in 2021, 34% maturing in 2020 and 6% maturing in 2019. As we continue to seek bonds that may be appropriate for the Fund, to the extent possible, we’ll focus on buying 2021 maturities while looking to sell the earlier maturities first, to continue to reduce the Fund’s interest rate sensitivity as the Fund approaches its term date.
The Fund’s credit quality and sector positioning remained in line with Nuveen’s ongoing strategic emphasis on lower rated (including below investment grade) credits and sectors offering higher yields. The Fund’s portfolio turnover was relatively muted in this reporting period as we found opportunities to sell shorter maturity structures and buy bonds maturing in 2021, as well as reinvest the small amount of proceeds from called bonds.
How did the Fund perform during the twelve-month reporting period ended May 31, 2018?
The tables in the Fund’s Performance Overview and Holding Summaries section of this report provide the Fund’s total returns for the one-year and since-inception periods ended May 31, 2018. The Fund’s total returns at common share net asset value (NAV) are compared with the performance of a corresponding market index.
For the twelve months ended May 31, 2018, the total returns at common share NAV for NHA underperformed the return for the S&P Short Duration Municipal Yield Index.
The Fund’s duration and yield curve positioning detracted from relative results. The yield curve flattened as yields on shorter maturities rose in expectation of interest rate hikes from the Federal Reserve, while longer-term yields increased by a smaller margin due to moderate inflation expectations. In this environment, the Fund’s shorter duration profile was disadvantageous to relative performance.
However, credit rating and sector allocations contributed positively to relative performance. In this reporting period, lower rated credits outperformed high grade (AAA and AA rated) credits. The Fund’s overweight allocations to BBB rated bonds and non-rated bonds added value, as these rating categories performed better than the market as a whole. On a sector basis, NHA’s underweight to the tobacco sector detracted from relative performance because the sector was among the better performers in this reporting period. The Fund’s mandate to invest in bonds with 2021 and shorter maturity profiles influences the Fund’s ability to invest in certain sectors. For example, NHA has a limited ability to invest in tobacco securitization and hospital bonds because of the relative scarcity of maturities in these sectors that fit the Fund’s term target. However, the underweight to hospitals was beneficial to performance as hospitals trailed the broad market. Positive results also came from the Fund’s overweight allocations to industrial development revenue sector and the dedicated tax sector.
During the current reporting period, the Fund utilized regulatory leverage, which had a positive impact on performance. While regulatory leverage was beneficial in the past, we do not believe that the current investment yields within the Fund’s portfolio or other available investment options in the current market support maintaining leverage. The combination of the portfolio investment limitations of a target term fund and the recent rise of short-end interest rates pressured both factors for generating incremental income from leverage capital. Given the remaining maturity tenor of the Fund, we no longer believed it prudent to take outsized credit risk in order to solely meet an investment yield hurdle and on March 13, 2018, the Fund redeemed all of its outstanding $28,300,000 Variable Rate MuniFund Term Preferred Shares and is therefore no longer levered.
7
Common Share Information
COMMON SHARE DISTRIBUTION INFORMATION
The following information regarding the Fund’s distributions is current as of May 31, 2018. The Fund’s distribution levels may vary over time based on its investment activity and portfolio investment value changes.
During the current reporting period, the Fund’s distributions to common shareholders were as shown in the accompanying table.
|
|
Per Common
|
|
Monthly Distributions (Ex-Dividend Date)
|
Share Amounts
|
|
June 2017
|
$0.0190
|
|
July
|
0.0190
|
|
August
|
0.0190
|
|
September
|
0.0175
|
|
October
|
0.0175
|
|
November
|
0.0175
|
|
December
|
0.0175
|
|
January
|
0.0175
|
|
Febuary
|
0.0175
|
|
March
|
0.0165
|
|
April
|
0.0165
|
|
May 2018
|
0.0165
|
|
Total Monthly Per Share Distributions
|
$0.2115
|
|
Ordinary Income Distribution*
|
0.0019
|
|
Total Distributions from Net Investment Income
|
$0.2134
|
|
Yields
|
|
|
Market Yield**
|
2.10%
|
|
Taxable-Equivalent Yield**
|
2.76%
|
|
*
|
Distribution paid in December 2017.
|
|
**
|
Market Yield is based on the Fund’s current annualized monthly dividend divided by the Fund’s current market price as of the end of the reporting period. Taxable-Equivalent Yield represents the yield that must be earned on a fully taxable investment in order to equal the yield of the Fund on an after-tax basis. It is based on a federal income tax rate of 24.0%. When comparing the Fund to investments that generate qualified dividend income, the Taxable-Equivalent Yield is lower.
|
The Fund seeks to pay regular monthly dividends out of its net investment income at a rate that reflects its past and projected net income performance. To permit the Fund to maintain a more stable monthly dividend, the Fund may pay dividends at a rate that may be more or less than the amount of net income actually earned by the Fund during the period. If the Fund has cumulatively earned more than it has paid in dividends, it will hold the excess in reserve as undistributed net investment income (UNII) as part of the Fund’s net asset value. Conversely, if the Fund has cumulatively paid in dividends more than it has earned, the excess will constitute a negative UNII that will likewise be reflected in the Fund’s net asset value. The Fund will, over time, pay all its net investment income as dividends to shareholders.
As of May 31, 2018, the Fund had a positive UNII balance for tax purposes and financial reporting purposes.
8
All monthly dividends paid by the Fund during the current reporting period were paid from net investment income. If a portion of the Fund’s monthly distributions was sourced from or comprised of elements other than net investment income, including capital gains and/or a return of capital, shareholders would have received a notice to that effect. For financial reporting purposes, the composition and per share amounts of the Fund’s dividends for the reporting period are presented in this report’s Statement of Changes in Net Assets and Financial Highlights, respectively. For income tax purposes, distribution information for the Fund as of its most recent tax year end is presented in Note 6 — Income Tax Information within the Notes to Financial Statements of this report.
COMMON SHARE REPURCHASES
During August 2017, the Fund’s Board of Trustees authorized an open-market share repurchase program, allowing the Fund to repurchase an aggregate of up to approximately 10% of its outstanding shares.
As of May 31, 2018, and since the inception of the Fund’s repurchase program, the Fund has cumulatively repurchased and retired its common shares as shown in the accompanying table.
|
|
NHA
|
|
Common shares cumulatively repurchased and retired
|
0
|
|
Common shares authorized for repurchase
|
860,000
|
OTHER COMMON SHARE INFORMATION
As of May 31, 2018, and during the current reporting period, the Fund’s common share price was trading at a premium/(discount) to its common share NAV as shown in the accompanying table.
|
Common share NAV
|
$9.71
|
|
Common share price
|
$9.45
|
|
Premium/(Discount) to NAV
|
(2.68)%
|
|
12-Month average premium/(discount) to NAV
|
(0.11)%
|
The Fund has an investment objective to return $9.85 (the original net asset value following the Fund’s initial public offering (the “Original NAV”)) to common shareholders on or about the end of the Fund’s term. There can be no assurance that the Fund will be able to return the Original NAV to shareholders, and such return is not backed or otherwise guaranteed by the Fund’s investment adviser, Nuveen Fund Advisors, LLC (the “Adviser”), or any other entity.
The Fund’s ability to return Original NAV to common shareholders on or about the termination date will depend on market conditions and the success of various portfolio and cash flow management techniques. The Fund currently intends to set aside and retain in its net assets a portion of its net investment income and possibly all or a portion of its gains. This will reduce the amounts otherwise available for distribution prior to the liquidation of the Fund, and the Fund may incur taxes on such retained amount, which will reduce the overall amounts that the Fund would have otherwise been able to distribute. Such retained income or gains, net of any taxes, would constitute a portion of the liquidating distribution returned to investors at the end of the Fund’s term. In addition, the Fund’s investment in shorter term and lower yielding securities, especially as the Fund nears the end of its term, may reduce investment income and, therefore, the monthly dividends during the period prior to termination. Investors that purchase common shares in the secondary market (particularly if their purchase price differs meaningfully from the Original NAV) may receive more or less than their original investment.
9
Risk Considerations
Fund shares are not guaranteed or endorsed by any bank or other insured depository institution, and are not federally insured by the Federal Deposit Insurance Corporation.
Nuveen Municipal 2021 Target Term Fund (NHA)
Investing in closed-end funds involves risk; principal loss is possible. There is no guarantee the Fund’s investment objectives will be achieved. Closed-end fund shares may frequently trade at a discount or premium to their net asset value. Debt or fixed income securities, such as those held by the Fund, are subject to market risk, credit risk, interest rate risk, derivatives risk, liquidity risk, and income risk. As interest rates rise, bond prices fall. Lower credit debt securities may be more likely to fail to make timely interest or principal payments. For these and other risks, including the Fund’s limited term and inverse floater risk, see the Fund’s web page at nuveen.com/NHA.
10
|
NHA
|
Nuveen Municipal 2021 Target Term Fund
|
|
Performance Overview and Holding Summaries as of May 31, 2018
|
|
Refer to the Glossary of Terms Used in this Report for further definition of the terms used within this section.
|
|
|
|
Average Annual Total Returns as of May 31, 2018
|
|
|
|
|
Average Annual
|
|
|
|
|
Since
|
|
|
1-Year
|
Inception
|
|
NHA at Common Share NAV
|
2.32%
|
1.64%
|
|
NHA at Common Share Price
|
(1.01)%
|
(0.16)%
|
|
S&P Short Duration Municipal Yield Index
|
3.44%
|
3.55%
|
Since inception returns are from 1/26/16. Past performance is not predictive of future results. Current performance may be higher or lower than the data shown. Returns do not reflect the deduction of taxes that shareholders may have to pay on Fund distributions or upon the sale of Fund shares. Returns at NAV are net of Fund expenses, and assume reinvestment of distributions. Comparative index return information is provided for the Fund’s shares at NAV only. Indexes are not available for direct investment.
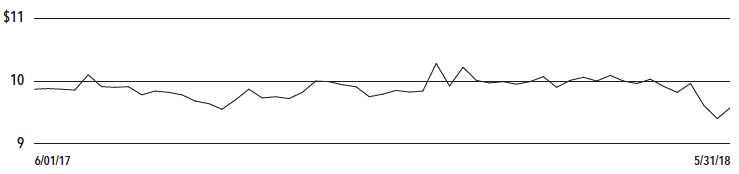
Common Share Price Performance — Weekly Closing Price
11
|
NHA
|
Performance Overview and Holding Summaries as of
May 31, 2018 (continued)
|
This data relates to the securities held in the Fund’s portfolio of investments as of the end of the reporting period. It should not be construed as a measure of performance for the Fund itself. Holdings are subject to change.
The ratings disclosed are the lowest rating given by one of the following national rating agencies: Standard & Poor’s Group, Moody’s Investors Service, Inc. or Fitch, Inc. Credit ratings are subject to change. AAA, AA, A and BBB are investment grade ratings; BB, B, CCC, CC, C and D are below investment grade ratings. Holdings designated N/R are not rated by these national rating agencies.
|
Fund Allocation
|
|
|
(% of net assets)
|
|
|
Long-Term Municipal Bonds
|
96.1%
|
|
Other Asset Less Liabilities
|
3.9%
|
|
Net Assets
|
100%
|
|
Portfolio Credit Quality
|
|
|
(% of total investment exposure)
|
|
|
U.S. Guaranteed
|
2.7%
|
|
AAA
|
0.3%
|
|
AA
|
10.2%
|
|
A
|
21.5%
|
|
BBB
|
17.8%
|
|
BB or Lower
|
23.2%
|
|
N/R (not rated)
|
24.3%
|
|
Total
|
100%
|
|
Portfolio Composition
|
|
|
(% of total investments)
|
|
|
Tax Obligation/Limited
|
30.4%
|
|
Tax Obligation/General
|
17.1%
|
|
Transportation
|
15.1%
|
|
Utilities
|
8.0%
|
|
Education and Civic Organizations
|
7.3%
|
|
Health Care
|
5.1%
|
|
Other
|
17.0%
|
|
Total
|
100%
|
|
States and Territories
|
|
|
(% of total investments)
|
|
|
Illinois
|
13.6%
|
|
New Jersey
|
11.6%
|
|
Florida
|
11.1%
|
|
California
|
10.8%
|
|
Pennsylvania
|
9.6%
|
|
New York
|
6.1%
|
|
Texas
|
6.0%
|
|
Alaska
|
3.1%
|
|
Massachusetts
|
3.0%
|
|
Indiana
|
2.9%
|
|
Tennessee
|
2.4%
|
|
Other
|
19.8%
|
|
Total
|
100%
|
12
Shareholder Meeting Report
The annual meeting of shareholders was held in the offices of Nuveen on April 11, 2018 for NHA; at this meeting the shareholders were asked to elect Board Members.
|
|
NHA
|
||
|
|
Common and
|
|
|
|
|
Preferred
|
|
|
|
|
shares voting
|
|
|
|
|
together
|
|
Preferred
|
|
|
as a class
|
|
Shares
|
|
Approval of the Board Members was reached as follows:
|
|
|
|
|
Margo L. Cook
|
|
|
|
|
For
|
7,415,554
|
|
—
|
|
Withhold
|
562,694
|
|
—
|
|
Total
|
7,978,248
|
|
—
|
|
Jack B. Evans
|
|
|
|
|
For
|
7,386,640
|
|
—
|
|
Withhold
|
591,608
|
|
—
|
|
Total
|
7,978,248
|
|
—
|
|
Albin F. Moschner
|
|
|
|
|
For
|
7,395,136
|
|
—
|
|
Withhold
|
583,112
|
|
—
|
|
Total
|
7,978,248
|
|
—
|
|
William C. Hunter
|
|
|
|
|
For
|
—
|
|
283
|
|
Withhold
|
—
|
|
—
|
|
Total
|
—
|
|
283
|
|
William J. Schneider
|
|
|
|
|
For
|
—
|
|
283
|
|
Withhold
|
—
|
|
—
|
|
Total
|
—
|
|
283
|
13
Report of Independent Registered Public Accounting Firm
To the Shareholders and Board of Trustees of
Nuveen Municipal 2021 Target Term Fund:
Opinion on the Financial Statements
Nuveen Municipal 2021 Target Term Fund:
Opinion on the Financial Statements
We have audited the accompanying statement of assets and liabilities, including the portfolio of investments, of Nuveen Municipal 2021 Target Term Fund (the “Fund”) as of May 31, 2018, the related statement of operations for the year then ended, the statements of changes in net assets for each of the years in the two-year period then ended, the statement of cash flows for the year then ended, and the related notes (collectively, the “financial statements”) and the financial highlights for each of the years in the two-year period then ended and the period January 26, 2016 (commencement of operations) through May 31, 2016. In our opinion, the financial statements and financial highlights present fairly, in all material respects, the financial position of the Fund as of May 31, 2018, the results of its operations and its cash flows for the year then ended, the changes in its net assets for each of the years in the two-year period then ended, and the financial highlights for each of the years in the two-year period then ended and the period from January 26, 2016 (commencement of operations) through May 31, 2016, in conformity with U.S. generally accepted accounting principles.
Basis for Opinion
These financial statements and financial highlights are the responsibility of the Fund’s management. Our responsibility is to express an opinion on these financial statements and financial highlights based on our audits. We are a public accounting firm registered with the Public Company Accounting Oversight Board (United States) (“PCAOB”) and are required to be independent with respect to the Fund in accordance with the U.S. federal securities laws and the applicable rules and regulations of the Securities and Exchange Commission and the PCAOB.
We conducted our audits in accordance with the standards of the PCAOB. Those standards require that we plan and perform the audit to obtain reasonable assurance about whether the financial statements and financial highlights are free of material misstatement, whether due to error or fraud. Our audits included performing procedures to assess the risks of material misstatement of the financial statements and financial highlights, whether due to error or fraud, and performing procedures that respond to those risks. Such procedures included examining, on a test basis, evidence regarding the amounts and disclosures in the financial statements and financial highlights. Such procedures also included confirmation of securities owned as of May 31, 2018, by correspondence with the custodian and brokers or other appropriate auditing procedures. Our audits also included evaluating the accounting principles used and significant estimates made by management, as well as evaluating the overall presentation of the financial statements and financial highlights. We believe that our audits provide a reasonable basis for our opinion.
/s/ KPMG LLP
We have served as the auditor of one or more Nuveen investment companies since 2014.
Chicago, Illinois
July 26, 2018
14
|
NHA
|
Nuveen Municipal 2021 Target Term Fund
Portfolio of Investments May 31, 2018
|
|
Principal
|
|
Optional Call
|
|
|
|
|
Amount (000)
|
Description (1)
|
Provisions (2)
|
Ratings (3)
|
Value
|
|
|
|
LONG-TERM INVESTMENTS – 96.1%
|
|
|
|
|
|
|
MUNICIPAL BONDS – 96.1%
|
|
|
|
|
|
|
Alabama – 0.7%
|
|
|
|
|
|
$ 600
|
The Improvement District of the City of Mobile – McGowin Park Project, Alabama, Sales Tax
|
No Opt. Call
|
N/R
|
$ 606,198
|
|
|
|
Revenue Bonds, Series 2016A, 4.000%, 8/01/20
|
|
|
|
|
|
|
Alaska – 3.0%
|
|
|
|
|
|
1,000
|
Valdez, Alaska, Marine Terminal Revenue Bonds, BP Pipelines Inc. Project, Refunding Series
|
No Opt. Call
|
A1
|
1,071,010
|
|
|
|
2003B, 5.000%, 1/01/21
|
|
|
|
|
|
1,325
|
Valdez, Alaska, Marine Terminal Revenue Bonds, BP Pipelines Inc. Project, Refunding Series
|
No Opt. Call
|
A1
|
1,419,088
|
|
|
|
2003C, 5.000%, 1/01/21
|
|
|
|
|
|
2,325
|
Total Alaska
|
|
|
2,490,098
|
|
|
|
Arizona – 1.9%
|
|
|
|
|
|
325
|
Goodyear Community Facilities Utilities District 1, Arizona, General Obligation Bonds,
|
No Opt. Call
|
A1
|
342,407
|
|
|
|
Refunding Series 2016, 4.000%, 7/15/21
|
|
|
|
|
|
1,205
|
Pima County Industrial Development Authority, Arizona, Education Revenue Bonds, Arizona
|
No Opt. Call
|
Baa3
|
1,212,592
|
|
|
|
Charter Schools Refunding Project, Series 2016R, 2.875%, 7/01/21
|
|
|
|
|
|
10
|
Salt Verde Financial Corporation, Arizona, Senior Gas Revenue Bonds, Citigroup Energy Inc.
|
No Opt. Call
|
BBB+
|
10,460
|
|
|
|
Prepay Contract Obligations, Series 2007, 5.250%, 12/01/19
|
|
|
|
|
|
1,540
|
Total Arizona
|
|
|
1,565,459
|
|
|
|
Arkansas – 0.0%
|
|
|
|
|
|
15
|
Arkansas Development Finance Authority, Hospital Revenue Bonds, Washington Regional Medical
|
No Opt. Call
|
A3
|
16,082
|
|
|
|
Center, Refunding Series 2015B, 5.000%, 2/01/21
|
|
|
|
|
|
|
California – 10.4%
|
|
|
|
|
|
1,400
|
Antelope Valley Healthcare District, California, Revenue Bonds, Series 2016A, 5.000%, 3/01/21
|
No Opt. Call
|
Ba3
|
1,472,352
|
|
|
115
|
California County Tobacco Securitization Agency, Tobacco Settlement Asset-Backed Bonds, Golden
|
7/18 at 100.00
|
N/R
|
115,056
|
|
|
|
Gate Tobacco Funding Corporation, Turbo, Series 2007A, 4.500%, 6/01/21
|
|
|
|
|
|
85
|
California Infrastructure and Economic Development Bank, Revenue Bonds, The Walt Disney Family
|
No Opt. Call
|
A+
|
89,831
|
|
|
|
Museum, Refunding Series 2016, 4.000%, 2/01/21
|
|
|
|
|
|
|
California School Finance Authority, California, Charter School Revenue Bonds, Aspire Public
|
|
|
|
|
|
|
Schools, Refunding Series 2016:
|
|
|
|
|
|
550
|
5.000%, 8/01/20, 144A
|
No Opt. Call
|
BBB
|
578,342
|
|
|
500
|
5.000%, 8/01/21, 144A
|
No Opt. Call
|
BBB
|
534,575
|
|
|
730
|
California Statewide Communities Development Authority, Revenue Bonds, American Baptist Homes
|
No Opt. Call
|
N/R
|
779,837
|
|
|
|
of the West, Refunding Series 2015, 5.000%, 10/01/20
|
|
|
|
|
|
|
California Statewide Communities Development Authority, Special Tax Bonds, Community
|
|
|
|
|
|
|
Facilities District 2015-01, Improvement Area No. 1, University District, Series 2016A:
|
|
|
|
|
|
260
|
2.000%, 9/01/20
|
No Opt. Call
|
N/R
|
258,695
|
|
|
265
|
2.125%, 9/01/21
|
No Opt. Call
|
N/R
|
263,063
|
|
|
235
|
California Statewide Communities Development Authority, Statewide Community Infrastructure
|
No Opt. Call
|
N/R
|
239,040
|
|
|
|
Program Revenue Bonds, Series 2016A, 3.000%, 9/02/20
|
|
|
|
|
|
200
|
Cucamonga School District, San Bernardino County, California, Special Tax Bonds, Community
|
No Opt. Call
|
N/R
|
205,862
|
|
|
|
Facilities District 97-1, Series 2016, 3.000%, 9/01/21
|
|
|
|
|
|
305
|
Fresno, California, Airport Revenue Bonds, Refunding Series 2013B, 5.000%, 7/01/21 – BAM
|
No Opt. Call
|
AA
|
329,498
|
|
|
|
Insured (Alternative Minimum Tax)
|
|
|
|
|
|
775
|
Inland Empire Tobacco Securitization Authority, California, Tobacco Settlement Asset-Backed
|
7/18 at 100.00
|
N/R
|
775,217
|
|
|
|
Bonds, Series 2007, 4.625%, 6/01/21
|
|
|
|
15
|
NHA
|
Nuveen Municipal 2021 Target Term Fund
Portfolio of Investments (continued) May 31, 2018
|
|
Principal
|
|
Optional Call
|
|
|
|
|
Amount (000)
|
Description (1)
|
Provisions (2)
|
Ratings (3)
|
Value
|
|
|
|
California (continued)
|
|
|
|
|
|
$ 50
|
Poway Unified School District, San Diego County, California, Special Tax Bonds, Community
|
No Opt. Call
|
N/R
|
$ 53,026
|
|
|
|
Facilities District 15 Del Sur East Improvement Area C, Series 2016, 4.000%, 9/01/21
|
|
|
|
|
|
1,250
|
Roseville, California, Special Tax Bonds, Community Facilities District 1 Hewlett Packard
|
No Opt. Call
|
N/R
|
1,270,000
|
|
|
|
Campus Oaks, Series 2016, 3.250%, 9/01/21
|
|
|
|
|
|
10
|
South Orange County Public Financing Authority, California, Special Tax Revenue Bonds, Ladera
|
No Opt. Call
|
AA
|
10,684
|
|
|
|
Ranch, Refunding Series 2014A, 5.000%, 8/15/20
|
|
|
|
|
|
1,340
|
Western Hills Water District, Stanislaus County, California, Special Tax Bonds, Diablo Grande
|
No Opt. Call
|
N/R
|
1,310,051
|
|
|
|
Community Facilities District 1, Refunding Series 2014, 4.000%, 9/01/21
|
|
|
|
|
|
420
|
Yuba City Redevelopment Agency, California, Tax Allocation Bonds, Redevelopment Project,
|
No Opt. Call
|
BBB+
|
415,044
|
|
|
|
Refunding Series 2015, 2.000%, 9/01/21
|
|
|
|
|
|
8,490
|
Total California
|
|
|
8,700,173
|
|
|
|
Colorado – 0.8%
|
|
|
|
|
|
230
|
E-470 Public Highway Authority, Colorado, Senior Revenue Bonds, Series 1997B, 0.000%,
|
No Opt. Call
|
A
|
214,183
|
|
|
|
9/01/21 – NPFG Insured
|
|
|
|
|
|
444
|
Mountain Shadows Metropolitan District, Colorado, General Obligation Limited Tax Bonds,
|
No Opt. Call
|
N/R
|
446,589
|
|
|
|
Refunding Series 2016, 3.250%, 12/01/20
|
|
|
|
|
|
674
|
Total Colorado
|
|
|
660,772
|
|
|
|
Connecticut – 0.2%
|
|
|
|
|
|
125
|
University of Connecticut, General Obligation Bonds, Series 2013A, 5.000%, 8/15/21
|
No Opt. Call
|
AA–
|
135,181
|
|
|
|
Florida – 10.6%
|
|
|
|
|
|
150
|
Bellagio Community Development District, Hialeah, Florida, Special Assessment Bonds, Series
|
No Opt. Call
|
BBB–
|
149,475
|
|
|
|
2016, 2.250%, 11/01/20
|
|
|
|
|
|
405
|
Belmont Community Development District, Florida, Capital Improvement Revenue Bonds, Series
|
No Opt. Call
|
N/R
|
406,802
|
|
|
|
2016A, 3.625%, 11/01/20
|
|
|
|
|
|
110
|
Bexley Community Development District, Pasco County, Florida, Special Assessment Revenue
|
No Opt. Call
|
N/R
|
110,296
|
|
|
|
Bonds, Series 2016, 3.500%, 5/01/21
|
|
|
|
|
|
2,000
|
Broward County, Florida, Airport Facility Revenue Bonds, Learjet Inc., Series 2000, 7.500%,
|
8/18 at 100.00
|
Caa1
|
2,000,819
|
|
|
|
11/01/20 (Alternative Minimum Tax)
|
|
|
|
|
|
107
|
Champion’s Reserve Community Development District, Florida, Special Assessment Revenue Bonds,
|
No Opt. Call
|
N/R
|
107,896
|
|
|
|
Series 2016, 3.625%, 11/01/20
|
|
|
|
|
|
305
|
Creekside at Twin Creeks Community Development District, Florida, Special Assessment Bonds,
|
No Opt. Call
|
N/R
|
306,976
|
|
|
|
Area 1 Project, Series 2016A-1, 3.700%, 11/01/20
|
|
|
|
|
|
425
|
East Homestead Community Development District, Florida, Special Assessment Revenue Bonds,
|
No Opt. Call
|
N/R
|
432,140
|
|
|
|
Refunding Series 2015, 3.750%, 5/01/20
|
|
|
|
|
|
1,035
|
Grand Bay at Doral Community Development District, Miami-Dade County, Florida, Special
|
No Opt. Call
|
N/R
|
1,042,110
|
|
|
|
Assessment Bonds, South Parcel Assessment Area Project, Series 2016, 3.500%, 5/01/21
|
|
|
|
|
|
335
|
Live Oak Community Development District 2, Hillsborough County, Florida, Special Assessment
|
No Opt. Call
|
A–
|
325,865
|
|
|
|
Bonds. Refunding Series 2016, 2.000%, 5/01/21
|
|
|
|
|
|
390
|
Miromar Lakes Community Development District, Lee County, Florida, Capital Improvement Revenue
|
No Opt. Call
|
N/R
|
391,880
|
|
|
|
Bonds, Refunding Series 2015, 3.500%, 5/01/20
|
|
|
|
|
|
15
|
Palm Beach County Health Facilities Authority, Florida, Hospital Revenue Bonds, BRCH
|
No Opt. Call
|
BBB+
|
15,957
|
|
|
|
Corporation Obligated Group, Refunding Series 2014, 5.000%, 12/01/20
|
|
|
|
|
|
|
Palm Beach County Health Facilities Authority, Florida, Revenue Bonds, Lifespace Community
|
|
|
|
|
|
|
Inc., Series 2015C:
|
|
|
|
|
|
30
|
4.000%, 5/15/19
|
No Opt. Call
|
A
|
30,551
|
|
|
70
|
5.000%, 5/15/21
|
No Opt. Call
|
A
|
75,065
|
|
|
505
|
Palm Glades Community Development District, Florida, Special Assessment Bonds, Refunding
|
No Opt. Call
|
BBB
|
502,879
|
|
|
|
Series 2016, 2.250%, 5/01/21
|
|
|
|
16
|
Principal
|
|
Optional Call
|
|
|
|
|
Amount (000)
|
Description (1)
|
Provisions (2)
|
Ratings (3)
|
Value
|
|
|
|
Florida (continued)
|
|
|
|
|
|
$ 405
|
Palm Glades Community Development District, Florida, Special Assessment Bonds, Refunding
|
No Opt. Call
|
BBB–
|
$ 405,757
|
|
|
|
Series 2017, 3.500%, 5/01/21
|
|
|
|
|
|
425
|
Reunion East Community Development District, Osceola County, Florida, Special Assessment
|
No Opt. Call
|
N/R
|
433,649
|
|
|
|
Bonds, Refunding Series 2015A, 4.000%, 5/01/20
|
|
|
|
|
|
300
|
Reunion West Community Development District, Florida, Special Assessment Bonds, Area 3
|
No Opt. Call
|
N/R
|
301,056
|
|
|
|
Project, Series 2016, 3.625%, 11/01/20
|
|
|
|
|
|
|
Rolling Hills Community Development District, Florida, Capital Improvement Revenue Bonds,
|
|
|
|
|
|
|
Series 2015A-1:
|
|
|
|
|
|
60
|
4.100%, 5/01/19
|
No Opt. Call
|
N/R
|
59,882
|
|
|
65
|
4.300%, 5/01/20
|
No Opt. Call
|
N/R
|
64,787
|
|
|
70
|
4.600%, 5/01/21
|
No Opt. Call
|
N/R
|
69,661
|
|
|
345
|
Six Mile Creek Community Development District, Florida, Capital Improvement Revenue Bonds,
|
No Opt. Call
|
N/R
|
346,435
|
|
|
|
Assessment Area 2, Series 2016, 3.750%, 11/01/20
|
|
|
|
|
|
285
|
South Fork III Community Development District, Florida, Special Assessment Revenue Bonds,
|
No Opt. Call
|
N/R
|
288,964
|
|
|
|
Refunding Series 2016, 4.000%, 5/01/20
|
|
|
|
|
|
285
|
Tapestry Community Development District, Florida, Special Assessment Revenue Bonds, Series
|
No Opt. Call
|
N/R
|
289,284
|
|
|
|
2016, 3.625%, 5/01/21
|
|
|
|
|
|
205
|
Union Park Community Development District, Florida, Capital Improvement Revenue Bonds, Series
|
No Opt. Call
|
N/R
|
205,877
|
|
|
|
2016A-1, 3.750%, 11/01/20
|
|
|
|
|
|
305
|
Windsor at Westside Community Development District, Osceola County, Florida, Special
|
No Opt. Call
|
N/R
|
309,078
|
|
|
|
Assessment Bonds, Area 2 Project, Series 2016, 3.500%, 11/01/20
|
|
|
|
|
|
235
|
Wiregrass Community Development District, Florida, Capital Improvement Revenue Bonds, Series
|
No Opt. Call
|
N/R
|
234,640
|
|
|
|
2016, 3.625%, 5/01/21
|
|
|
|
|
|
8,867
|
Total Florida
|
|
|
8,907,781
|
|
|
|
Georgia – 0.4%
|
|
|
|
|
|
275
|
Atlanta, Georgia, Tax Allocation Bonds, Eastside Project, Series 2016, 5.000%, 1/01/21
|
No Opt. Call
|
A+
|
294,027
|
|
|
|
Guam – 0.8%
|
|
|
|
|
|
690
|
Guam Government Department of Education, Certificates of Participation, John F. Kennedy High
|
No Opt. Call
|
B+
|
701,075
|
|
|
|
School Project, Series 2010A, 6.000%, 12/01/20
|
|
|
|
|
|
|
Illinois – 13.1%
|
|
|
|
|
|
255
|
Board of Trustees of Southern Illinois University, Housing and Auxiliary Facilities System
|
No Opt. Call
|
Baa2
|
242,033
|
|
|
|
Revenue Bonds, Series 1999A, 0.000%, 4/01/20 – NPFG Insured
|
|
|
|
|
|
75
|
Cary, Illinois, Special Tax Bonds, Special Service Area 2, Refunding Series 2016, 1.900%,
|
No Opt. Call
|
AA
|
72,866
|
|
|
|
3/01/21 – BAM Insured
|
|
|
|
|
|
|
Chicago Board of Education, Illinois, General Obligation Bonds, Dedicated Revenues, Refunding
|
|
|
|
|
|
|
Series 2010F:
|
|
|
|
|
|
220
|
5.000%, 12/01/18
|
No Opt. Call
|
BB–
|
222,152
|
|
|
1,565
|
5.000%, 12/01/19
|
No Opt. Call
|
B
|
1,603,185
|
|
|
405
|
5.000%, 12/01/19 (ETM)
|
No Opt. Call
|
N/R (4)
|
423,683
|
|
|
150
|
5.000%, 12/01/20
|
No Opt. Call
|
BB–
|
154,637
|
|
|
1,000
|
Chicago Board of Education, Illinois, Unlimited Tax General Obligation Bonds, Dedicated Tax
|
No Opt. Call
|
Baa2
|
1,054,370
|
|
|
|
Revenues, Series 1999A, 5.250%, 12/01/20 – NPFG Insured
|
|
|
|
|
|
1,000
|
Chicago, Illinois, General Obligation Bonds, Project and Refunding Series 2003B,
|
No Opt. Call
|
BBB+
|
1,030,210
|
|
|
|
5.000%, 1/01/20
|
|
|
|
|
|
800
|
Chicago, Illinois, General Obligation Bonds, Refunding Series 2012C, 5.000%, 1/01/21
|
No Opt. Call
|
BBB+
|
836,920
|
|
|
|
Chicago, Illinois, Motor Fuel Tax Revenue Bonds, Refunding Series 2014:
|
|
|
|
|
|
45
|
5.000%, 1/01/20
|
No Opt. Call
|
BBB–
|
46,024
|
|
|
10
|
5.000%, 1/01/21
|
No Opt. Call
|
BBB–
|
10,341
|
17
|
NHA
|
Nuveen Municipal 2021 Target Term Fund
Portfolio of Investments (continued) May 31, 2018
|
|
Principal
|
|
Optional Call
|
|
|
|
|
Amount (000)
|
Description (1)
|
Provisions (2)
|
Ratings (3)
|
Value
|
|
|
|
Illinois (continued)
|
|
|
|
|
|
$ 50
|
Chicago, Illinois, O’Hare Airport Customer Facility Charge Senior Lien Revenue Bonds, Series
|
No Opt. Call
|
Baa1
|
$ 52,155
|
|
|
|
2013A, 5.000%, 1/01/20
|
|
|
|
|
|
630
|
Cook County School District 87, Berkeley, Illinois, General Obligation Bonds, Refunding School
|
No Opt. Call
|
A1
|
629,099
|
|
|
|
Series 2012A, 3.000%, 12/01/20
|
|
|
|
|
|
300
|
Cook County, Illinois, General Obligation Bonds, Refunding Series 2012C, 5.000%, 11/15/20
|
No Opt. Call
|
AA–
|
321,165
|
|
|
620
|
Illinois Finance Authority, Revenue Bonds, Presence Health Network, Series 2016C,
|
No Opt. Call
|
AA+
|
668,757
|
|
|
|
5.000%, 2/15/21
|
|
|
|
|
|
1,000
|
Illinois Finance Authority, Revenue Bonds, Rehabilitation Institute of Chicago, Series 2013A,
|
No Opt. Call
|
A–
|
1,078,150
|
|
|
|
5.000%, 7/01/21
|
|
|
|
|
|
270
|
Illinois Finance Authority, Student Housing & Academic Facility Revenue Bonds, CHF-Collegiate
|
No Opt. Call
|
BBB–
|
279,847
|
|
|
|
Housing Foundation – Chicago LLC University of Illinois at Chicago Project, Series 2017A,
|
|
|
|
|
|
|
4.000%, 2/15/21
|
|
|
|
|
|
315
|
Illinois Sports Facility Authority, State Tax Supported Bonds, Series 2001, 0.000%, 6/15/20 –
|
No Opt. Call
|
BBB–
|
292,226
|
|
|
|
AMBAC Insured
|
|
|
|
|
|
85
|
Illinois State, General Obligation Bonds, February Series 2014, 5.000%, 2/01/21
|
No Opt. Call
|
BBB
|
88,403
|
|
|
635
|
Illinois State, General Obligation Bonds, January Series 2016, 5.000%, 1/01/21
|
No Opt. Call
|
BBB
|
659,829
|
|
|
110
|
Illinois State, General Obligation Bonds, March Series 2012, 5.000%, 3/01/21
|
No Opt. Call
|
BBB
|
114,506
|
|
|
105
|
Illinois State, General Obligation Bonds, Refunding Series 2006, 5.000%, 1/01/21
|
No Opt. Call
|
BBB
|
109,106
|
|
|
1,000
|
Winnebago-Boone Counties School District 205 Rockford, Illinois, General Obligation Bonds,
|
No Opt. Call
|
A+
|
929,240
|
|
|
|
Series 2013, 0.000%, 2/01/21
|
|
|
|
|
|
10,645
|
Total Illinois
|
|
|
10,918,904
|
|
|
|
Indiana – 2.8%
|
|
|
|
|
|
1,250
|
Indiana Finance Authority, Environmental Facilities Revenue Bonds, Indianapolis Power and
|
No Opt. Call
|
A2
|
1,323,725
|
|
|
|
Light Company Project, Refunding Series 2011A, 3.875%, 8/01/21
|
|
|
|
|
|
1,000
|
Indiana Finance Authority, Environmental Improvement Revenue Bonds, United States Steel
|
No Opt. Call
|
BB–
|
1,034,550
|
|
|
|
Corporation Project, Refunding Series 2011, 6.000%, 12/01/19
|
|
|
|
|
|
2,250
|
Total Indiana
|
|
|
2,358,275
|
|
|
|
Iowa – 0.4%
|
|
|
|
|
|
350
|
Iowa Finance Authority, Iowa, Midwestern Disaster Area Revenue Bonds, Iowa Fertilizer Company
|
6/18 at 105.00
|
B
|
367,794
|
|
|
|
Project, Series 2016, 5.875%, 12/01/26, 144A
|
|
|
|
|
|
|
Louisiana – 0.0%
|
|
|
|
|
|
15
|
Louisiana Public Facilities Authority, Revenue Bonds, Ochsner Clinic Foundation Project,
|
No Opt. Call
|
A3
|
16,188
|
|
|
|
Series 2015, 5.000%, 5/15/21
|
|
|
|
|
|
|
Maine – 0.3%
|
|
|
|
|
|
265
|
Maine Health and Higher Educational Facilities Authority, Revenue Bonds, Maine General Medical
|
No Opt. Call
|
BB
|
274,177
|
|
|
|
Center, Series 2011, 5.250%, 7/01/21
|
|
|
|
|
|
|
Massachusetts – 2.9%
|
|
|
|
|
|
50
|
Massachusetts Development Finance Agency, Revenue Bonds, UMass Memorial Health, Series 2011H,
|
No Opt. Call
|
BBB+
|
52,772
|
|
|
|
5.000%, 7/01/20
|
|
|
|
|
|
25
|
Massachusetts Health and Educational Facilities Authority, Revenue Bonds, UMass Memorial Issue
|
7/20 at 100.00
|
BBB+
|
26,355
|
|
|
|
Series 2010G, 5.000%, 7/01/21
|
|
|
|
|
|
|
Massachusetts Port Authority, Special Facilities Revenue Bonds, Delta Air Lines Inc., Series 2001A:
|
|
|
|
|
|
1,000
|
5.500%, 1/01/19 – AMBAC Insured (Alternative Minimum Tax)
|
8/18 at 100.00
|
N/R
|
1,002,200
|
|
|
1,295
|
5.000%, 1/01/21 – AMBAC Insured (Alternative Minimum Tax)
|
8/18 at 100.00
|
N/R
|
1,310,126
|
|
|
2,370
|
Total Massachusetts
|
|
|
2,391,453
|
18
|
Principal
|
|
Optional Call
|
|
|
|
Amount (000)
|
Description (1)
|
Provisions (2)
|
Ratings (3)
|
Value
|
|
|
Michigan – 0.7%
|
|
|
|
|
$ 140
|
Detroit Downtown Development Authority, Michigan, Tax Increment Refunding Bonds,
|
No Opt. Call
|
BB
|
$ 122,279
|
|
|
Development Area 1 Projects, Series 1996C-1, 0.000%, 7/01/21
|
|
|
|
|
500
|
Detroit Local Development Finance Authority, Michigan, Tax Increment Bonds, Senior Lien Series
|
8/18 at 100.00
|
B
|
499,990
|
|
|
1997A, 5.375%, 5/01/21
|
|
|
|
|
640
|
Total Michigan
|
|
|
622,269
|
|
|
Minnesota – 0.9%
|
|
|
|
|
|
Red Wing, Minnesota Senior Housing Revenue Refunding Bonds, Deer Crest Project, Series 2012A:
|
|
|
|
|
100
|
3.250%, 5/01/19
|
No Opt. Call
|
N/R
|
99,865
|
|
105
|
3.250%, 11/01/19
|
No Opt. Call
|
N/R
|
104,683
|
|
105
|
3.750%, 5/01/20
|
No Opt. Call
|
N/R
|
105,517
|
|
105
|
3.750%, 11/01/20
|
No Opt. Call
|
N/R
|
105,502
|
|
70
|
Saint Cloud, Minnesota, Charter School Lease Revenue Bonds, Stride Academy Project, Series
|
No Opt. Call
|
CCC–
|
42,866
|
|
|
2016A, 3.000%, 4/01/21
|
|
|
|
|
250
|
Saint Louis Park, Minnesota, Health Care Facilities Revenue Bonds, Mount Olivet Careview Home
|
No Opt. Call
|
N/R
|
249,568
|
|
|
Project, Series 2016C, 2.250%, 6/01/21
|
|
|
|
|
735
|
Total Minnesota
|
|
|
708,001
|
|
|
Missouri – 1.0%
|
|
|
|
|
100
|
Branson Industrial Development Authority, Missouri, Tax Increment Revenue Bonds, Branson
|
No Opt. Call
|
N/R
|
100,927
|
|
|
Shoppes Redevelopment Project, Refunding Series 2017A, 3.000%, 11/01/20
|
|
|
|
|
750
|
Saint Louis County Industrial Development Authority, Missouri, Health Facilities Revenue
|
No Opt. Call
|
N/R
|
765,165
|
|
|
Bonds, Nazareth Living Center, Series 2015A, 4.000%, 8/15/20
|
|
|
|
|
850
|
Total Missouri
|
|
|
866,092
|
|
|
Nevada – 1.9%
|
|
|
|
|
815
|
Las Vegas Redevelopment Agency, Nevada, Tax Increment Revenue Bonds, Refunding Series 2016,
|
No Opt. Call
|
BBB+
|
855,815
|
|
|
4.000%, 6/15/21
|
|
|
|
|
750
|
Las Vegas, Nevada, Sales Tax Increment Revenue Bonds, Symphony Park Tourism Improvement
|
No Opt. Call
|
N/R
|
742,455
|
|
|
District, Series 2016, 2.750%, 6/15/21, 144A
|
|
|
|
|
1,565
|
Total Nevada
|
|
|
1,598,270
|
|
|
New Hampshire – 1.0%
|
|
|
|
|
850
|
Manchester Housing and Redevelopment Authority, New Hampshire, Revenue Bonds, Series 2000B,
|
No Opt. Call
|
AA
|
802,434
|
|
|
0.000%, 1/01/20 – ACA Insured
|
|
|
|
|
|
New Jersey – 11.1%
|
|
|
|
|
|
New Jersey Building Authority, State Building Revenue Bonds, Refunding Series 2016A:
|
|
|
|
|
300
|
4.000%, 6/15/21
|
No Opt. Call
|
BBB+
|
311,097
|
|
200
|
4.000%, 6/15/21 (ETM)
|
No Opt. Call
|
N/R (4)
|
211,764
|
|
1,000
|
New Jersey Economic Development Authority, Cigarette Tax Revenue Refunding Bonds,
|
No Opt. Call
|
BBB+
|
1,067,690
|
|
|
Series 2012, 5.000%, 6/15/21
|
|
|
|
|
425
|
New Jersey Economic Development Authority, Private Activity Bonds, The Goethals Bridge
|
No Opt. Call
|
BBB
|
458,214
|
|
|
Replacement Project, Series 2013, 5.000%, 7/01/21 (Alternative Minimum Tax)
|
|
|
|
|
1,000
|
New Jersey Economic Development Authority, School Facilities Construction Bonds, Refunding
|
No Opt. Call
|
A–
|
1,063,490
|
|
|
Series 2015XX, 5.000%, 6/15/21
|
|
|
|
|
2,000
|
New Jersey Economic Development Authority, School Facilities Construction Financing Program
|
3/21 at 100.00
|
A–
|
2,114,179
|
|
|
Bonds, Refunding Series 2011GG, 5.000%, 9/01/21
|
|
|
|
|
500
|
New Jersey Economic Development Authority, School Facilities Construction Financing Program
|
No Opt. Call
|
A–
|
528,950
|
|
|
Bonds, Refunding Series 2012II, 5.000%, 3/01/21
|
|
|
|
|
540
|
New Jersey State, General Obligation Bonds, Refunding Series 2009O, 5.250%, 8/01/21
|
No Opt. Call
|
A
|
589,626
|
|
1,000
|
New Jersey State, General Obligation Bonds, Refunding Series 2016T, 5.000%, 6/01/21
|
No Opt. Call
|
A
|
1,080,340
|
19
|
NHA
|
Nuveen Municipal 2021 Target Term Fund
Portfolio of Investments (continued) May 31, 2018
|
|
Principal
|
|
Optional Call
|
|
|
|
|
Amount (000)
|
Description (1)
|
Provisions (2)
|
Ratings (3)
|
Value
|
|
|
|
New Jersey (continued)
|
|
|
|
|
|
$ 1,000
|
New Jersey Transportation Trust Fund Authority, Transportation System Bonds, Refunding Series
|
No Opt. Call
|
A–
|
$ 1,063,220
|
|
|
|
2006A, 5.250%, 12/15/20
|
|
|
|
|
|
780
|
New Jersey Transportation Trust Fund Authority, Transportation System Bonds, Series 2011B,
|
No Opt. Call
|
A–
|
816,629
|
|
|
|
5.000%, 6/15/20
|
|
|
|
|
|
8,745
|
Total New Jersey
|
|
|
9,305,199
|
|
|
|
New York – 5.9%
|
|
|
|
|
|
|
Dormitory Authority of the State of New York, Insured Revenue Bonds, Pace University, Series 2013A:
|
|
|
|
|
|
95
|
5.000%, 5/01/19
|
No Opt. Call
|
BBB–
|
97,481
|
|
|
5
|
5.000%, 5/01/19 (ETM)
|
No Opt. Call
|
N/R (4)
|
5,153
|
|
|
200
|
Franklin County Solid Waste Management Authority, New York, Solid Waste Revenue Bonds, Series
|
No Opt. Call
|
BBB
|
211,482
|
|
|
|
2015A, 5.000%, 6/01/21 (Alternative Minimum Tax)
|
|
|
|
|
|
1,000
|
New York City, New York, General Obligation Bonds, Refunding Fiscal 2015 Series A,
|
No Opt. Call
|
AA
|
1,093,920
|
|
|
|
5.000%, 8/01/21
|
|
|
|
|
|
|
New York Transportation Development Corporation, New York, Special Facility Revenue Bonds,
|
|
|
|
|
|
|
American Airlines, Inc. John F Kennedy International Airport Project, Refunding Series 2016:
|
|
|
|
|
|
85
|
5.000%, 8/01/20 (Alternative Minimum Tax)
|
No Opt. Call
|
BB–
|
89,600
|
|
|
2,000
|
5.000%, 8/01/21 (Alternative Minimum Tax)
|
No Opt. Call
|
BB–
|
2,150,238
|
|
|
185
|
Niagara Tobacco Asset Securitization Corporation, New York, Tobacco Settlement Asset-Backed
|
No Opt. Call
|
N/R
|
200,695
|
|
|
|
Bonds, Series 2014, 5.000%, 5/15/21
|
|
|
|
|
|
1,000
|
TSASC Inc., New York, Tobacco Settlement Asset-Backed Bonds, Fiscal 2017 Series B,
|
No Opt. Call
|
BB+
|
1,061,240
|
|
|
|
5.000%, 6/01/21
|
|
|
|
|
|
4,570
|
Total New York
|
|
|
4,909,809
|
|
|
|
Ohio – 2.2%
|
|
|
|
|
|
1,000
|
Ohio Air Quality Development Authority, Ohio, Air Quality Development Revenue Bonds,
|
No Opt. Call
|
N/R
|
505,000
|
|
|
|
FirstEnergy Generation Corporation Project, Series 2009A, 5.700%, 8/01/20, (5)
|
|
|
|
|
|
1,400
|
Ohio Air Quality Development Authority, Ohio, Pollution Control Revenue Bonds, FirstEnergy
|
No Opt. Call
|
N/R
|
707,000
|
|
|
|
Nuclear Generation Project, Refunding Series 2008C, 3.950%, 11/01/32 (Mandatory put 5/01/20)
|
|
|
|
|
|
|
(Alternative Minimum Tax), (5)
|
|
|
|
|
|
400
|
Scioto County, Ohio, Hospital Facilities Revenue Bonds, Southern Ohio Medical Center,
|
No Opt. Call
|
A2
|
429,272
|
|
|
|
Refunding Series 2016, 5.000%, 2/15/21
|
|
|
|
|
|
205
|
Toledo-Lucas County Port Authority, Ohio, Student Housing Revenue Bonds, CHF-Toledo, L.L.C. –
|
No Opt. Call
|
BBB–
|
217,884
|
|
|
|
The University of Toledo Project, Series 2014A, 5.000%, 7/01/21
|
|
|
|
|
|
3,005
|
Total Ohio
|
|
|
1,859,156
|
|
|
|
Pennsylvania – 9.2%
|
|
|
|
|
|
1,240
|
Bucks County Industrial Development Authority, Pennsylvania, Revenue Bonds, School Lane
|
No Opt. Call
|
BBB–
|
1,244,290
|
|
|
|
Charter School Project, Series 2016, 3.125%, 3/15/21
|
|
|
|
|
|
375
|
Northeastern Pennsylvania Hospital and Education Authority, University Revenue Bonds, Wilkes
|
No Opt. Call
|
BBB
|
398,243
|
|
|
|
University Project, Refunding Series 2016A, 5.000%, 3/01/21
|
|
|
|
|
|
2,000
|
Pennsylvania Economic Development Financing Authority, Exempt Facilities Revenue Refunding
|
No Opt. Call
|
B2
|
2,013,739
|
|
|
|
Bonds, PPL Energy Supply, LLC Project, Series 2009C, 5.000%, 12/01/37 (Mandatory put 9/01/20)
|
|
|
|
|
|
1,000
|
Pennsylvania Economic Development Financing Authority, Special Facilities Revenue Bonds, US
|
No Opt. Call
|
BB–
|
1,087,490
|
|
|
|
Airways Group Inc. Project, Series 2010A, 7.500%, 5/01/20
|
|
|
|
|
|
1,250
|
Pennsylvania State, General Obligation Bonds, First Refunding Series 2011-1, 5.000%, 7/01/21
|
No Opt. Call
|
Aa3
|
1,351,938
|
|
|
1,000
|
Pennsylvania Turnpike Commission, Turnpike Revenue Bonds, Refunding Subordinate Series 2016,
|
No Opt. Call
|
A3
|
1,081,850
|
|
|
|
5.000%, 6/01/21
|
|
|
|
|
|
500
|
Scranton, Lackawanna County, Pennsylvania, General Obligation Bonds, Refunding Series 2017,
|
No Opt. Call
|
BB+
|
531,765
|
|
|
|
5.000%, 9/01/21, 144A
|
|
|
|
|
|
7,365
|
Total Pennsylvania
|
|
|
7,709,315
|
20
|
Principal
|
|
Optional Call
|
|
|
|
|
Amount (000)
|
Description (1)
|
Provisions (2)
|
Ratings (3)
|
Value
|
|
|
|
Rhode Island – 0.5%
|
|
|
|
|
|
$ 400
|
Providence Redevelopment Agency, Rhode Island, Revenue Bonds, Public Safety and Municipal
|
No Opt. Call
|
Baa2
|
$ 429,476
|
|
|
|
Building Projects, Refunding Series 2015A, 5.000%, 4/01/21
|
|
|
|
|
|
|
South Carolina – 0.3%
|
|
|
|
|
|
230
|
South Carolina State, General Obligation State Institution Bonds, University of South
|
No Opt. Call
|
Aaa
|
249,403
|
|
|
|
Carolina, Refunding Series 2011A, 5.000%, 3/01/21
|
|
|
|
|
|
|
Tennessee – 2.3%
|
|
|
|
|
|
400
|
Memphis, Tennessee, General Obligation Bonds, Refunding General Improvement Series 2011,
|
No Opt. Call
|
AA
|
434,800
|
|
|
|
5.000%, 5/01/21
|
|
|
|
|
|
300
|
Metropolitan Government of Nashville-Davidson County Health and Educational Facilities Board,
|
No Opt. Call
|
BBB
|
318,015
|
|
|
|
Tennessee, Revenue Bonds, Lipscomb University, Refunding & Improvement Series 2016A,
|
|
|
|
|
|
|
5.000%, 10/01/20
|
|
|
|
|
|
710
|
Tennessee Housing Development Agency, Homeownership Program Bonds, Series 2011-1A, 4.125%,
|
No Opt. Call
|
AA+
|
735,709
|
|
|
|
1/01/21 (Alternative Minimum Tax)
|
|
|
|
|
|
260
|
The Tennessee Energy Acquisition Corporation, Gas Revenue Bonds, Series 2006A, 5.250%, 9/01/21
|
No Opt. Call
|
A
|
283,561
|
|
|
115
|
The Tennessee Energy Acquisition Corporation, Gas Revenue Bonds, Series 2006C, 5.000%, 2/01/21
|
No Opt. Call
|
A
|
122,990
|
|
|
1,785
|
Total Tennessee
|
|
|
1,895,075
|
|
|
|
Texas – 5.8%
|
|
|
|
|
|
195
|
Celina, Texas, Special Assessment Revenue Bonds, Glen Crossing Public Improvement District
|
No Opt. Call
|
N/R
|
194,160
|
|
|
|
Phase 1 Project, Series 2016, 3.400%, 9/01/20
|
|
|
|
|
|
|
Dallas County Schools, Texas, Public Property Finance Contractual Obligations, Series 2014:
|
|
|
|
|
|
300
|
4.000%, 6/01/20
|
No Opt. Call
|
B3
|
287,916
|
|
|
215
|
5.000%, 6/01/21
|
No Opt. Call
|
B3
|
207,823
|
|
|
1,000
|
Houston, Texas, Airport System Special Facilities Revenue Bonds, United Airlines Inc. Terminal
|
No Opt. Call
|
BB
|
1,053,250
|
|
|
|
Improvement Project, Refunding Series 2015B-2, 5.000%, 7/15/20 (Alternative Minimum Tax)
|
|
|
|
|
|
1,250
|
Houston, Texas, Airport System Special Facilities Revenue Bonds, United Airlines Inc. Terminal
|
No Opt. Call
|
BB
|
1,316,563
|
|
|
|
Improvement Project, Refunding Series 2015C, 5.000%, 7/15/20 (Alternative Minimum Tax)
|
|
|
|
|
|
500
|
Mesquite Health Facilities Development Corporation, Texas, Retirement Facility Revenue Bonds,
|
No Opt. Call
|
N/R
|
522,400
|
|
|
|
Christian Care Centers Inc., Refunding Series 2016, 5.000%, 2/15/21
|
|
|
|
|
|
175
|
Polk County, Texas, General Obligation Bonds, Series 2017, 4.000%, 8/15/21
|
No Opt. Call
|
A+
|
185,616
|
|
|
1,000
|
Texas Public Finance Authority, Revenue Bonds, Texas Southern University Financing System,
|
No Opt. Call
|
AA
|
1,068,230
|
|
|
|
Refunding Series 2013, 5.000%, 11/01/20 – BAM Insured
|
|
|
|
|
|
4,635
|
Total Texas
|
|
|
4,835,958
|
|
|
|
Utah – 1.9%
|
|
|
|
|
|
1,500
|
Salt Lake County, Utah, Research Facility Revenue Bonds, Huntsman Cancer Foundation, Series
|
12/18 at 100.00
|
N/R (4)
|
1,526,535
|
|
|
|
2013A-1, 5.000%, 12/01/33 (Mandatory put 12/15/20) (Pre-refunded 12/17/18)
|
|
|
|
|
|
30
|
Utah State Charter School Finance Authority, Charter School Revenue Bonds, Paradigm High
|
No Opt. Call
|
BB
|
30,797
|
|
|
|
School, Series 2010A, 5.750%, 7/15/20
|
|
|
|
|
|
1,530
|
Total Utah
|
|
|
1,557,332
|
|
|
|
Virgin Islands – 0.4%
|
|
|
|
|
|
425
|
Virgin Islands Water and Power Authority, Electric System Revenue Bonds, Refunding Series
|
No Opt. Call
|
CCC+
|
367,625
|
|
|
|
2012A, 4.000%, 7/01/21
|
|
|
|
|
|
|
Virginia – 1.2%
|
|
|
|
|
|
1,000
|
Richmond Redevelopment and Housing Authority, Virginia, Multi-Family Housing Revenue Bonds,
|
7/19 at 100.00
|
N/R
|
995,670
|
|
|
|
American Tobacco Apartments, Series 2017, 3.125%, 7/01/20, 144A
|
|
|
|
21
|
NHA
|
Nuveen Municipal 2021 Target Term Fund
Portfolio of Investments (continued) May 31, 2018
|
|
Principal
|
|
Optional Call
|
|
|
|
|
Amount (000)
|
Description (1)
|
Provisions (2)
|
Ratings (3)
|
Value
|
|
|
|
Washington – 0.1%
|
|
|
|
|
|
$ 100
|
Washington State Housing Finance Commission, Non-Profit Housing Revenue Bonds, Bayview
|
8/18 at 100.00
|
N/R
|
$ 99,590
|
|
|
|
Manor Senior Project, TEMPS 70 Series 2016B, 2.800%, 7/01/21, 144A
|
|
|
|
|
|
|
Wisconsin – 1.4%
|
|
|
|
|
|
10
|
Green Bay Redevelopment Authority, Wisconsin, Industrial Development Revenue Bonds, Fort James
|
No Opt. Call
|
N/R
|
10,246
|
|
|
|
Project, Series 1999, 5.600%, 5/01/19 (Alternative Minimum Tax)
|
|
|
|
|
|
1,000
|
Superior, Wisconsin, Limited Obligation Revenue Refunding Bonds, Midwest Energy Resources
|
No Opt. Call
|
Aa3
|
1,140,630
|
|
|
|
Company, Series 1991E, 6.900%, 8/01/21 – FGIC Insured
|
|
|
|
|
|
55
|
Wisconsin Health and Educational Facilities Authority, Revenue Bonds, Bellin Memorial Hospital
|
No Opt. Call
|
A2
|
56,390
|
|
|
|
Inc., Series 2003, 5.500%, 2/15/19 – AMBAC Insured
|
|
|
|
|
|
1,065
|
Total Wisconsin
|
|
|
1,207,266
|
|
|
$ 78,991
|
Total Long-Term Investments (cost $81,735,243)
|
|
|
80,421,577
|
|
|
|
Other Assets Less Liabilities – 3.9%
|
|
|
3,279,867
|
|
|
|
Net Assets Applicable to Common Shares – 100%
|
|
|
$ 83,701,444
|
|
(1)
|
All percentages shown in the Portfolio of Investments are based on net assets applicable to common shares unless otherwise noted.
|
|
(2)
|
Optional Call Provisions: Dates (month and year) and prices of the earliest optional call or redemption. There may be other call provisions at varying prices at later dates. Certain mortgage-backed securities may be subject to periodic principal paydowns. Optional Call Provisions are not covered by the report of independent registered public accounting firm.
|
|
(3)
|
The ratings disclosed are the lowest of Standard & Poor’s Group (“Standard & Poor’s”), Moody’s Investors Service, Inc. (“Moody’s”) or Fitch, Inc. (“Fitch”) rating. Ratings below BBB by Standard & Poor’s, Baa by Moody’s or BBB by Fitch are considered to be below investment grade. Holdings designated N/R are not rated by any of these national rating agencies. Ratings are not covered by the report of independent registered public accounting firm.
|
|
(4)
|
Backed by an escrow or trust containing sufficient U.S. Government or U.S. Government agency securities, which ensure the timely payment of principal and interest.
|
|
(5)
|
As of, or subsequent to, the end of the reporting period, this security is non-income producing. Non-income producing, in the case of a fixed-income security, generally denotes that the issuer has (1) default on payment of principal or interest, (2) is under the protection of the Federal Bankruptcy Court or (3) the Fund’s Adviser has concluded that the issue is not likely to meet its future interest payment obligations and has ceased accruing additional income on the Fund’s records.
|
| 144A |
Investment is exempt from registration under Rule 144A of the Securities Act of 1933, as amended. These investments may only be resold in transactions exempt from regis- tration, which are normally those transactions with qualified institutional buyers.
|
| ETM |
Escrowed to maturity.
|
See accompanying notes to financial statements.
22
Statement of Assets and Liabilities
May 31, 2018
|
Assets
|
||||
|
Long-term investments, at value (cost $81,735,243)
|
$
|
80,421,577
|
||
|
Cash
|
910,523
|
|||
|
Receivable for:
|
||||
|
Interest
|
1,157,781
|
|||
|
Investments sold
|
1,455,000
|
|||
|
Other
|
4,130
|
|||
|
Total assets
|
83,949,011
|
|||
|
Liabilities
|
||||
|
Payable for dividends
|
137,545
|
|||
|
Accrued expenses:
|
||||
|
Management fees
|
39,661
|
|||
|
Professional fees
|
28,011
|
|||
|
Trustees fees
|
933
|
|||
|
Other
|
41,417
|
|||
|
Total liabilities
|
247,567
|
|||
|
Net assets applicable to common shares
|
$
|
83,701,444
|
||
|
Common shares outstanding
|
8,622,711
|
|||
|
Net asset value (“NAV”) per common share outstanding
|
$
|
9.71
|
||
|
Net assets applicable to common shares consist of:
|
||||
|
Common shares, $0.01 par value per share
|
$
|
86,227
|
||
|
Paid-in surplus
|
84,523,691
|
|||
|
Undistributed (Over-distribution of) net investment income
|
647,554
|
|||
|
Accumulated net realized gain (loss)
|
(242,362
|
)
|
||
|
Net unrealized appreciation (depreciation)
|
(1,313,666
|
)
|
||
|
Net assets applicable to common shares
|
$
|
83,701,444
|
||
|
Authorized shares:
|
||||
|
Common
|
Unlimited
|
|||
|
Preferred
|
Unlimited
|
|||
See accompanying notes to financial statements.
23
Statement of Operations
Year Ended May 31, 2018
|
Investment Income
|
$
|
3,407,987
|
||
|
Expenses
|
||||
|
Management fees
|
590,373
|
|||
|
Interest expense and amortization of offering costs
|
511,473
|
|||
|
Custodian fees
|
26,809
|
|||
|
Trustees fees
|
3,338
|
|||
|
Professional fees
|
33,164
|
|||
|
Shareholder reporting expenses
|
26,722
|
|||
|
Shareholder servicing agent fees
|
13,552
|
|||
|
Stock exchange listing fees
|
6,901
|
|||
|
Investor relations expenses
|
7,443
|
|||
|
Other
|
36,917
|
|||
|
Total expenses
|
1,256,692
|
|||
|
Net investment income (loss)
|
2,151,295
|
|||
|
Realized and Unrealized Gain (Loss)
|
||||
|
Net realized gain (loss) from investments
|
(280,367
|
)
|
||
|
Change in net unrealized appreciation (depreciation) of investments
|
7,327
|
|||
|
Net realized and unrealized gain (loss)
|
(273,040
|
)
|
||
|
Net increase (decrease) in net assets applicable to common shares from operations
|
$
|
1,878,255
|
||
See accompanying notes to financial statements.
24
Statement of Changes in Net Assets
|
|
Year
|
Year
|
||||||
|
|
Ended
|
Ended
|
||||||
|
|
5/31/18
|
5/31/17
|
||||||
|
Operations
|
||||||||
|
Net investment income (loss)
|
$
|
2,151,295
|
$
|
2,247,539
|
||||
|
Net realized gain (loss) from investments
|
(280,367
|
)
|
(49,647
|
)
|
||||
|
Change in net unrealized appreciation (depreciation) of investments
|
7,327
|
(1,963,864
|
)
|
|||||
|
Net increase (decrease) in net assets applicable to common shares from operations
|
1,878,255
|
234,028
|
||||||
|
Distributions to Common Shareholders
|
||||||||
|
From net investment income
|
(1,839,834
|
)
|
(2,058,764
|
)
|
||||
|
Decrease in net assets applicable to common shares from distributions to common shareholders
|
(1,839,834
|
)
|
(2,058,764
|
)
|
||||
|
Capital Share Transactions
|
||||||||
|
Net proceeds from common shares issued to shareholders due to reinvestment of distributions
|
46,078
|
71,638
|
||||||
|
Net increase (decrease) in net assets applicable to common shares from capital share transactions
|
46,078
|
71,638
|
||||||
|
Net increase (decrease) in net assets applicable to common shares
|
84,499
|
(1,753,098
|
)
|
|||||
|
Net assets applicable to common shares at the beginning of period
|
83,616,945
|
85,370,043
|
||||||
|
Net assets applicable to common shares at the end of period
|
$
|
83,701,444
|
$
|
83,616,945
|
||||
|
Undistributed (Over-distribution of) net investment income at the end of period
|
$
|
647,554
|
$
|
346,183
|
||||
See accompanying notes to financial statements.
25
Statement of Cash Flows
Year Ended May 31, 2018
|
Cash Flows from Operating Activities:
|
||||
|
Net Increase (Decrease) in Net Assets Applicable to Common Shares from Operations
|
$
|
1,878,255
|
||
|
Adjustments to reconcile the net increase (decrease) in net assets applicable to common
|
||||
|
shares from operations to net cash provided by (used in) operating activities:
|
||||
|
Purchases of investments
|
(7,969,822
|
)
|
||
|
Proceeds from sales and maturities of investments
|
35,606,996
|
|||
|
Taxes paid
|
(2,903
|
)
|
||
|
Amortization (Accretion) of premiums and discounts, net
|
1,119,579
|
|||
|
Amortization of deferred offering costs
|
86,857
|
|||
|
(Increase) Decrease in:
|
||||
|
Receivable for interest
|
430,075
|
|||
|
Receivable for investments sold
|
650,086
|
|||
|
Other assets
|
84
|
|||
|
Increase (Decrease) in:
|
||||
|
Payable for interest
|
(42,295
|
)
|
||
|
Payable for investments purchased
|
(2,342,870
|
)
|
||
|
Accrued management fees
|
(13,421
|
)
|
||
|
Accrued professional fees
|
652
|
|||
|
Accrued Trustees fees
|
(194
|
)
|
||
|
Accrued other expenses
|
11,048
|
|||
|
Net realized (gain) loss from investments
|
280,367
|
|||
|
Change in net unrealized (appreciation) depreciation of investments
|
(7,327
|
)
|
||
|
Net cash provided by (used in) operating activities
|
29,685,167
|
|||
|
Cash Flows from Financing Activities:
|
||||
|
(Payments for) VMTP Shares redeemed, at liquidation preference
|
(28,300,000
|
)
|
||
|
Cash distributions paid to common shareholders
|
(1,812,174
|
)
|
||
|
Net cash provided by (used in) financing activities
|
(30,112,174
|
)
|
||
|
Net Increase (Decrease) in Cash
|
(427,007
|
)
|
||
|
Cash at the beginning of period
|
1,337,530
|
|||
|
Cash at the end of period
|
$
|
910,523
|
||
|
Supplemental Disclosure of Cash Flow Information
|
||||
|
Cash paid for interest (excluding amortization of offering costs)
|
$
|
467,090
|
||
|
Non-cash financing activities not included herein consists of reinvestments of share distributions
|
46,078
|
|||
See accompanying notes to financial statements.
26
THIS PAGE INTENTIONALLY LEFT BLANK
27
|
Financial Highlights
|
|
Selected data for a common share outstanding throughout each period:
|
|
|
|
|
|
|
|
|
|
|
Less Distributions to
|
|
|
|
||||
|
|
|
Investment Operations
|
Common Shareholders
|
|
Common Share
|
|
||||||
|
|
Beginning
|
Net
|
Net
|
|
From
|
From
|
|
|
|
|
||
|
|
Common
|
Investment
|
Realized/
|
|
Net
|
Accumulated
|
|
|
|
Ending
|
||
|
|
Share
|
Income
|
Unrealized
|
|
Investment
|
Net Realized
|
|
Offering
|
Ending
|
Share
|
||
|
|
NAV
|
(Loss)
|
Gain (Loss)
|
Total
|
Income
|
Gains
|
Total
|
Costs
|
NAV
|
Price
|
||
|
Year Ended 5/31:
|
|
|
|
|
|
|
|
|
|
|
||
|
2018
|
$9.70
|
$0.25
|
$(0.03)
|
$0.22
|
$(0.21)
|
$ —
|
$(0.21)
|
$ —
|
$9.71
|
$9.45
|
||
|
2017
|
9.91
|
0.26
|
(0.23)
|
0.03
|
(0.24)
|
—
|
(0.24)
|
—
|
9.70
|
9.76
|
||
|
2016(e)
|
9.85
|
0.07
|
0.07
|
0.14
|
(0.06)
|
—
|
(0.06)
|
(0.02)
|
9.91
|
9.95
|
||
|
|
VMTP Shares
|
|
|
|
at the End of Period
|
|
|
|
Aggregate |
Asset
|
|
|
Amount
|
Coverage
|
|
|
Outstanding | Per $100,000 |
|
|
(000)
|
Share
|
|
Year Ended 5/31:
|
|
|
|
2018
|
$ —
|
$ —
|
|
2017
|
28,300
|
395,466
|
|
2016(e)
|
28,300
|
401,661
|
28
|
|
|
|
Common Share Supplemental Data/
|
|
|
|
|
|
|
Ratios Applicable to Common Shares
|
|
|
|
Common Share
|
|
|
|
|
|
|
Total Returns
|
|
Ratios to Average Net Assets(b)
|
|
||
|
|
Based
|
Ending
|
|
Net
|
|
|
Based
|
on
|
Net
|
|
Investment
|
Portfolio
|
|
on
|
Share
|
Assets
|
|
Income
|
Turnover
|
|
NAV(a)
|
Price(a)
|
(000)
|
Expenses(c)
|
(Loss)
|
Rate(d)
|
|
2.32%
|
(1.01)%
|
$83,701
|
1.50%
|
2.57%
|
8%
|
|
0.32
|
0.53
|
83,617
|
1.53
|
2.68
|
18
|
|
1.22
|
0.10
|
85,370
|
1.28*
|
2.15*
|
2
|
|
(a)
|
Total Return Based on Common Share NAV is the combination of changes in common share NAV, reinvested dividend income at NAV and reinvested capital gains distributions at NAV, if any. The last dividend declared in the period, which is typically paid on the first business day of the following month, is assumed to be reinvested at the ending NAV. The actual reinvest price for the last dividend declared in the period may often be based on the Fund’s market price (and not its NAV), and therefore may be different from the price used in the calculation. Total returns are not annualized.
|
|
|
Total Return Based on Common Share Price is the combination of changes in the market price per share and the effect of reinvested dividend income and reinvested capital gains distributions, if any, at the average price paid per share at the time of reinvestment. The last dividend declared in the period, which is typically paid on the first business day of the following month, is assumed to be reinvested at the ending market price. The actual reinvestment for the last dividend declared in the period may take place over several days, and in some instances may not be based on the market price, so the actual reinvestment price may be different from the price used in the calculation. Total returns are not annualized.
|
|
(b)
|
Net Investment Income (Loss) ratios reflect income earned and expenses incurred on assets attributable to preferred shares issued by the Fund.
|
|
(c)
|
The expense ratios reflect, among other things, all interest expense and other costs related to preferred shares (as described in Note 4 – Fund Shares, Preferred Shares), where applicable, as follows:
|
|
Year Ended 5/31:
|
|
|
2018
|
0.61%
|
|
2017
|
0.60
|
|
2016(e)
|
0.34*
|
|
(d)
|
Portfolio Turnover Rate is calculated based on the lesser of long-term purchases or sales (as disclosed in Note 5 – Investment Transactions) divided by the average long-term market value during the period.
|
|
(e)
|
For the period January 26, 2016 (commencement of operations) through May 31, 2016.
|
|
*
|
Annualized.
|
See accompanying notes to financial statements.
29
Notes to
Financial Statements
Financial Statements
1. General Information and Significant Accounting Policies
General Information
Fund Information
The fund covered in this report and its corresponding New York Stock Exchange (“NYSE”) symbol is Nuveen Municipal 2021 Target Term Fund (NHA) (the “Fund”). The Fund is registered under the Investment Company Act of 1940, as amended, as a diversified, closed-end management investment company. The Fund was organized as a Massachusetts business trust on October 13, 2015.
The end of the reporting period for the Fund is May 31, 2018, and the period covered by these Notes to Financial Statements is the fiscal year ended May 31, 2018 (the “current fiscal period”).
Investment Adviser
The Fund’s investment adviser is Nuveen Fund Advisors, LLC (the “Adviser”), a subsidiary of Nuveen, LLC (“Nuveen”). Nuveen is the investment management arm of Teachers Insurance and Annuity Association of America (TIAA). The Adviser has overall responsibility for management of the Fund, oversees the management of the Fund’s portfolio, manages the Fund’s business affairs and provides certain clerical, bookkeeping and other administrative services, and, if necessary, asset allocation decisions. The Adviser has entered into a sub-advisory agreement with Nuveen Asset Management, LLC (the “Sub-Adviser”), a subsidiary of the Adviser, under which the Sub-Adviser manages the investment portfolio of the Fund.
Investment Objectives and Principal Investment Strategies
The Fund seeks to provide a high level of current income exempt from federal income tax and to return the original $9.85 net asset value (“NAV”) per common share on or about March 1, 2021 (the “Termination Date”). Under normal market conditions:
|
·
|
The Fund invests at least 80% of its managed assets (as defined in Note 7 – Management Fees and Other Transactions with Affiliates) in municipal securities and other related investments, the income from which is exempt from regular U.S. federal income tax.
|
|
·
|
The Fund will invest at least 65% of its managed assets in low- to medium-quality municipal securities that, at the time of investment, are rated BBB/Baa or lower or are unrated but judged to be of comparable quality by the Sub-Adviser.
|
|
·
|
The Fund may invest without limit in below investment grade quality securities. Below investment grade securities (commonly referred to as “junk bonds”) are rated BB+/Ba1 or lower or if its unrated but judged to be of comparable quality by the Sub-Adviser.
|
|
·
|
The Fund will not invest in securities that, at the time of investment, are rated CCC+/Caa1 or lower, or are unrated but judged by the Sub-Adviser to be of comparable quality.
|
|
·
|
The Fund will not invest in defaulted securities or in the securities of an issuer that is in bankruptcy or insolvency proceedings or is otherwise experiencing financial difficulties (such securities are commonly referred to as “distressed securities”).
|
|
·
|
The Fund may invest up to 20% of its managed assets in bonds subject to the alternative minimum tax (“AMT”) bonds.
|
|
·
|
The Fund will invest no more than 25% of its managed assets in municipal securities in any one sector and no more than 5% of its managed assets in any one issuer.
|
|
·
|
The Fund will invest no more than 10% of its managed assets in “tobacco settlement bonds”.
|
|
·
|
The Fund will not invest in securities with a maturity date (or mandatory redemption date for escrowed securities or other tax exempt securities) extending beyond September 1, 2021.
|
The Fund also may invest in certain derivative instruments in pursuit of its investment objectives. Such instruments include options, financial futures contracts and options thereon, swaps (including interest rate swaps, total return swaps and credit default swaps), and options on swaps. The Sub-Adviser may use derivative instruments to attempt to hedge some of the risk of the Fund’s investments or as a substitute for a position in the underlying asset.
30
Significant Accounting Policies
The Fund is an investment company and follows accounting and reporting guidance under Financial Accounting Standards Board (“FASB”) Accounting Standards Codification (ASC) Topic 946, “Financial Services-Investment Companies.” The following is a summary of significant accounting policies followed by the Fund in the preparation of its financial statements in accordance with U.S. generally accepted accounting principles (“U.S. GAAP”).
Investment Transactions
Investment transactions are recorded on a trade date basis. Realized gains and losses from investment transactions are determined on the specific identification method, which is the same basis used for federal income tax purposes. Investments purchased on a when-issued/delayed delivery basis may have extended settlement periods. Any investments so purchased are subject to market fluctuation during this period. The Fund has earmarked securities in its portfolio with a current value at least equal to the amount of the when-issued/delayed delivery purchase commitments.
As of the end of the reporting period, the Fund did not have any outstanding when issued/delayed delivery purchase commitments.
Investment Income
Investment income is comprised of interest income, which reflects the amortization of premiums and accretion of discounts for financial reporting purposes, and is recorded on an accrual basis. Investment income also reflects payment-in-kind (“PIK”) interest and paydown gains and losses, if any. PIK interest represents income received in the form of securities in lieu of cash.
Professional Fees
Professional fees presented on the Statement of Operations consist of legal fees incurred in the normal course of operations, audit fees, tax consulting fees and, in some cases, workout expenditures. Workout expenditures are incurred in an attempt to protect or enhance an investment or to pursue other claims or legal actions on behalf of Fund shareholders. If a refund is received for workout expenditures paid in a prior reporting period, such amounts will be recognized as “Legal fee refund” on the Statement of Operations.
Dividends and Distributions to Common Shareholders
Dividends from net investment income, if any, are declared monthly. Net realized capital gains and/or market discount from investment transactions, if any, are distributed to shareholders at least annually. However, in seeking to achieve its investment objective, the Fund currently intends to set aside and retain in its net assets (and therefore its NAV) a portion of its net investment income, and possibly all or a portion of its gains. This will reduce the amounts otherwise available for distribution prior to the liquidation of the Fund, and the Fund may incur taxes on such retained amount. Such retained income or gains, net of any taxes, would constitute a portion of the liquidating distribution returned to investors on or about the Termination Date. Furthermore, capital gains are distributed only to the extent they exceed available capital loss carryforwards.
Distributions to common shareholders of net investment income, net realized capital gains and/or market discount, if any, are recorded on the ex-dividend date. The amount and timing of distributions are determined in accordance with federal income tax regulations, which may differ from U.S. GAAP.
Compensation
The Fund pays no compensation directly to those of its trustees who are affiliated with the Adviser or to its officers, all of whom receive remuneration for their services to the Fund from the Adviser or its affiliates. The Fund’s Board of Trustees (the “Board”) has adopted a deferred compensation plan for independent trustees that enables trustees to elect to defer receipt of all or a portion of the annual compensation they are entitled to receive from certain Nuveen-advised funds. Under the plan, deferred amounts are treated as though equal dollar amounts had been invested in shares of select Nuveen-advised funds.
Indemnifications
Under the Fund’s organizational documents, its officers and trustees are indemnified against certain liabilities arising out of the performance of their duties to the Fund. In addition, in the normal course of business, the Fund enters into contracts that provide general indemnifications to other parties. The Fund’s maximum exposure under these arrangements is unknown as this would involve future claims that may be made against the Fund that have not yet occurred. However, the Fund has not had prior claims or losses pursuant to these contracts and expects the risk of loss to be remote.
Netting Agreements
In the ordinary course of business, the Fund may enter into transactions subject to enforceable International Swaps and Derivatives Association, Inc. (ISDA) master agreements or other similar arrangements (“netting agreements”). Generally, the right to offset in netting agreements allows the Fund to offset certain securities and derivatives with a specific counterparty, when applicable, as well as any collateral received or delivered to that counterparty based on the terms of the agreements. Generally, the Fund manages its cash collateral and securities collateral on a counterparty basis.
The Fund’s investments subject to netting agreements as of the end of the reporting period, if any, are further described in Note 3 – Portfolio Securities and Investments in Derivatives.
31Notes to Financial Statements (continued)
Use of Estimates
The preparation of financial statements in conformity with U.S. GAAP requires management to make estimates and assumptions that affect the reported amounts of assets and liabilities at the date of the financial statements and the reported amounts of increases and decreases in net assets applicable to common shares from operations during the current fiscal period. Actual results may differ from those estimates.
2. Investment Valuation and Fair Value Measurements
The fair valuation input levels as described below are for fair value measurement purposes.
Fair value is defined as the price that would be received upon selling an investment or transferring a liability in an orderly transaction to an independent buyer in the principal or most advantageous market for the investment. A three-tier hierarchy is used to maximize the use of observable market data and minimize the use of unobservable inputs and to establish classification of fair value measurements for disclosure purposes. Observable inputs reflect the assumptions market participants would use in pricing the asset or liability. Observable inputs are based on market data obtained from sources independent of the reporting entity. Unobservable inputs reflect the reporting entity’s own assumptions about the assumptions market participants would use in pricing the asset or liability. Unobservable inputs are based on the best information available in the circumstances. The following is a summary of the three-tiered hierarchy of valuation input levels.
Level 1 – Inputs are unadjusted and prices are determined using quoted prices in active markets for identical securities.
Level 2 – Prices are determined using other significant observable inputs (including quoted prices for similar securities, interest rates, prepayment speeds, credit risk, etc.).
Level 3 – Prices are determined using significant unobservable inputs (including management’s assumptions in determining the fair value of investments).
Prices of fixed income securities are provided by an independent pricing service (“pricing service”) approved by the Board. The pricing service establishes a security’s fair value using methods that may include consideration of the following: yields or prices of investments of comparable quality, type of issue, coupon, maturity and rating, market quotes or indications of value from security dealers, evaluations of anticipated cash flows or collateral, general market conditions and other information and analysis, including the obligor’s credit characteristics considered relevant. These securities are generally classified as Level 2. In pricing certain securities, particularly less liquid and lower quality securities, the pricing service may consider information about a security, its issuer or market activity provided by the Adviser. These securities are generally classified as Level 2 or Level 3 depending on the observability of the significant inputs.
Certain securities may not be able to be priced by the pre-established pricing methods as described above. Such securities may be valued by the Board and/or its appointee at fair value. These securities generally include, but are not limited to, restricted securities (securities which may not be publicly sold without registration under the Securities Act of 1933, as amended) for which a pricing service is unable to provide a market price; securities whose trading has been formally suspended; debt securities that have gone into default and for which there is no current market quotation; a security whose market price is not available from a pre-established pricing source; a security with respect to which an event has occurred that is likely to materially affect the value of the security after the market has closed but before the calculation of the Fund’s NAV (as may be the case in non-U.S. markets on which the security is primarily traded) or make it difficult or impossible to obtain a reliable market quotation; and a security whose price, as provided by the pricing service, is not deemed to reflect the security’s fair value. As a general principle, the fair value of a security would appear to be the amount that the owner might reasonably expect to receive for it in a current sale. A variety of factors may be considered in determining the fair value of such securities, which may include consideration of the following: yields or prices of investments of comparable quality, type of issue, coupon, maturity and rating, market quotes or indications of value from security dealers, evaluations of anticipated cash flows or collateral, general market conditions and other information and analysis, including the obligor’s credit characteristics considered relevant. These securities are generally classified as Level 2 or Level 3 depending on the observability of the significant inputs. Regardless of the method employed to value a particular security, all valuations are subject to review by the Board and/or its appointee.
The inputs or methodologies used for valuing securities are not an indication of the risks associated with investing in those securities. The following is a summary of the Fund’s fair value measurements as of the end of the reporting period:
|
|
Level 1
|
Level 2
|
Level 3
|
Total
|
|
Long-Term Investments*:
|
|
|
|
|
|
Municipal Bonds
|
$ —
|
$80,421,577
|
$ —
|
$80,421,577
|
|
* Refer to the Fund’s Portfolio of Investments for state classifications.
|
|
|
|
|
The Board is responsible for the valuation process and has appointed the oversight of the daily valuation process to the Adviser’s Valuation Committee. The Valuation Committee, pursuant to the valuation policies and procedures adopted by the Board, is responsible for making fair value determinations, evaluating the effectiveness of the Fund’s pricing policies and reporting to the Board. The Valuation Committee is aided in its efforts by the Adviser’s dedicated Securities Valuation Team, which is responsible for administering the daily valuation process and applying fair value methodologies as approved by the Valuation Committee. When determining the reliability of independent pricing services for investments owned by
32
the Fund, the Valuation Committee, among other things, conducts due diligence reviews of the pricing services and monitors the quality of security prices received through various testing reports conducted by the Securities Valuation Team.
The Valuation Committee will consider pricing methodologies it deems relevant and appropriate when making a fair value determination, based on the facts and circumstances specific to the portfolio instrument. Fair value determinations generally will be derived as follows, using public or private market information:
|
(i)
|
If available, fair value determinations shall be derived by extrapolating from recent transactions or quoted prices for identical or comparable securities.
|
|
(ii)
|
If such information is not available, an analytical valuation methodology may be used based on other available information including, but not limited to: analyst appraisals, research reports, corporate action information, issuer financial statements and shelf registration statements. Such analytical valuation methodologies may include, but are not limited to: multiple of earnings, discount from market value of a similar freely-traded security, discounted cash flow analysis, book value or a multiple thereof, risk premium/yield analysis, yield to maturity and/or fundamental investment analysis.
|
The purchase price of a portfolio instrument will be used to fair value the instrument only if no other valuation methodology is available or deemed appropriate, and it is determined that the purchase price fairly reflects the instrument’s current value.
For each portfolio security that has been fair valued pursuant to the policies adopted by the Board, the fair value price is compared against the last available and next available market quotations. The Valuation Committee reviews the results of such testing and fair valuation occurrences are reported to the Board.
3. Portfolio Securities and Investments in Derivatives
Portfolio Securities
Inverse Floating Rate Securities
The Fund is authorized to invest in inverse floating rate securities. An inverse floating rate security is created by depositing a municipal bond (referred to as an “Underlying Bond”), typically with a fixed interest rate, into a special purpose tender option bond (“TOB”) trust (referred to as the “TOB Trust”) created by or at the direction of the Fund. In turn, the TOB Trust issues (a) floating rate certificates (referred to as “Floaters”) in face amounts equal to some fraction of the Underlying Bond’s par amount or market value, and (b) an inverse floating rate certificate (referred to as an “Inverse Floater”) that represents all remaining or residual interest in the TOB Trust. Floaters typically pay short-term tax-exempt interest rates to third parties who are also provided a right to tender their certificate and receive its par value, which may be paid from the proceeds of a remarketing of the Floaters, by a loan to the TOB Trust from a third party liquidity provider (“Liquidity Provider”), or by the sale of assets from the TOB Trust. The Inverse Floater is issued to a long term investor, such as the Fund. The income received by the Inverse Floater holder varies inversely with the short-term rate paid to holders of the Floaters, and in most circumstances the Inverse Floater holder bears substantially all of the Underlying Bond’s downside investment risk and also benefits disproportionately from any potential appreciation of the Underlying Bond’s value. The value of an Inverse Floater will be more volatile than that of the Underlying Bond because the interest rate is dependent on not only the fixed coupon rate of the Underlying Bond but also on the short-term interest paid on the Floaters, and because the Inverse Floater essentially bears the risk of loss (and possible gain) of the greater face value of the Underlying Bond.
The Inverse Floater held by the Fund gives the Fund the right to (a) cause the holders of the Floaters to tender their certificates at par (or slightly more than par in certain circumstances), and (b) have the trustee of the TOB Trust (the “Trustee”) transfer the Underlying Bond held by the TOB Trust to the Fund, thereby collapsing the TOB Trust.
The Fund may acquire an Inverse Floater in a transaction where it (a) transfers an Underlying Bond that it owns to a TOB Trust created by a third party or (b) transfers an Underlying Bond that it owns, or that it has purchased in a secondary market transaction for the purpose of creating an Inverse Floater, to a TOB Trust created at its direction, and in return receives the Inverse Floater of the TOB Trust (referred to as a “self-deposited Inverse Floater”). The Fund may also purchase an Inverse Floater in a secondary market transaction from a third party creator of the TOB Trust without first owning the Underlying Bond (referred to as an “externally-deposited Inverse Floater”).
An investment in a self-deposited Inverse Floater is accounted for as a “financing” transaction (i.e., a secured borrowing). For a self-deposited Inverse Floater, the Underlying Bond deposited into the TOB Trust is identified in the Fund’s Portfolio of Investments as “(UB) – Underlying bond of an inverse floating rate trust reflected as a financing transaction,” with the Fund recognizing as liabilities, labeled “Floating rate obligations” on the Statement of Assets and Liabilities, (a) the liquidation value of Floaters issued by the TOB Trust, and (b) the amount of any borrowings by the TOB Trust from a Liquidity Provider to enable the TOB Trust to purchase outstanding Floaters in lieu of a remarketing. In addition, the Fund recognizes in “Investment
33
Notes to Financial Statements (continued)
Income” the entire earnings of the Underlying Bond, and recognizes (a) the interest paid to the holders of the Floaters or on the TOB Trust’s borrowings, and (b) other expenses related to remarketing, administration, trustee, liquidity and other services to a TOB Trust, as a component of “Interest expense and amortization of offering costs” on the Statement of Operations.
In contrast, an investment in an externally-deposited Inverse Floater is accounted for as a purchase of the Inverse Floater and is identified in the Fund’s Portfolio of Investments as “(IF) – Inverse floating rate investment.” For an externally-deposited Inverse Floater, the Fund’s Statement of Assets and Liabilities recognizes the Inverse Floater and not the Underlying Bond as an asset, and the Fund does not recognize the Floaters, or any related borrowings from a Liquidity Provider, as a liability. Additionally, the Fund reflects in “Investment Income” only the net amount of earnings on the Inverse Floater (net of the interest paid to the holders of the Floaters or the Liquidity Provider as lender, and the expenses of the Trust), and does not show the amount of that interest paid or the expenses of the TOB Trust as described above as interest expense on the Statement of Operations.
Fees paid upon the creation of a TOB Trust for self-deposited Inverse Floaters and externally-deposited Inverse Floaters are recognized as part of the cost basis of the Inverse Floater and are capitalized over the term of the TOB Trust.
TOB Trusts are supported by a liquidity facility provided by a Liquidity Provider pursuant to which the Liquidity Provider agrees, in the event that Floaters are (a) tendered to the Trustee for remarketing and the remarketing does not occur, or (b) subject to mandatory tender pursuant to the terms of the TOB Trust agreement, to either purchase Floaters or to provide the Trustee with an advance from a loan facility to fund the purchase of Floaters by the TOB Trust. In certain circumstances, the Liquidity Provider may otherwise elect to have the Trustee sell the Underlying Bond to retire the Floaters that were tendered and not remarketed prior to providing such a loan. In these circumstances, the Liquidity Provider remains obligated to provide a loan to the extent that the proceeds of the sale of the Underlying Bond are not sufficient to pay the purchase price of the Floaters.
The size of the commitment under the loan facility for a given TOB Trust is at least equal to the balance of that TOB Trust’s outstanding Floaters plus any accrued interest. In consideration of the loan facility, fee schedules are in place and are charged by the Liquidity Provider(s). Any loans made by the Liquidity Provider will be secured by the purchased Floaters held by the TOB Trust. Interest paid on any outstanding loan balances will be effectively borne by the Fund that owns the Inverse Floaters of the TOB Trust that has incurred the borrowing and may be at a rate that is greater than the rate that would have been paid had the Floaters been successfully remarketed.
As described above, any amounts outstanding under a liquidity facility are recognized as a component of “Floating rate obligations” on the Statement of Assets and Liabilities by the Fund holding the corresponding Inverse Floaters issued by the borrowing TOB Trust. As of the end of the reporting period, there were no loans outstanding under any such facility.
The Fund may also enter into shortfall and forbearance agreements (sometimes referred to as a “recourse arrangement”) (TOB Trusts involving such agreements are referred to herein as “Recourse Trusts”), under which the Fund agrees to reimburse the Liquidity Provider for the Trust’s Floaters, in certain circumstances, for the amount (if any) by which the liquidation value of the Underlying Bond held by the TOB Trust may fall short of the sum of the liquidation value of the Floaters issued by the TOB Trust plus any amounts borrowed by the TOB Trust from the Liquidity Provider, plus any shortfalls in interest cash flows. Under these agreements, the Fund’s potential exposure to losses related to or on an Inverse Floater may increase beyond the value of the Inverse Floater as the Fund may potentially be liable to fulfill all amounts owed to holders of the Floaters or the Liquidity Provider. Any such shortfall amount in the aggregate is recognized as “Unrealized depreciation on Recourse Trusts” on the Statement of Assets and Liabilities.
During the current fiscal period, the Fund did not have any transactions in self-deposited Inverse Floaters and/or externally-deposited Inverse Floaters.
Zero Coupon Securities
A zero coupon security does not pay a regular interest coupon to its holders during the life of the security. Income to the holder of the security comes from accretion of the difference between the original purchase price of the security at issuance and the par value of the security at maturity and is effectively paid at maturity. The market prices of zero coupon securities generally are more volatile than the market prices of securities that pay interest periodically.
Investments in Derivatives
In addition to the inverse floating rate securities in which the Fund may invest, which are considered portfolio securities for financial reporting purposes, the Fund is authorized to invest in certain other derivative instruments such as futures, options and swap contracts. The Fund limits its investments in futures, options on futures and swap contracts to the extent necessary for the Adviser to claim the exclusion from registration by the Commodity Futures Trading Commission as a commodity pool operator with respect to the Fund. The Fund records derivative instruments at fair value, with changes in fair value recognized on the Statement of Operations, when applicable. Even though the Fund’s investments in derivatives may represent economic hedges, they are not considered to be hedge transactions for financial reporting purposes.
Although the Fund is authorized to invest in derivative instruments, and may do so in the future, it did not make any such investments during the current fiscal period.
34
Market and Counterparty Credit Risk
In the normal course of business the Fund may invest in financial instruments and enter into financial transactions where risk of potential loss exists due to changes in the market (market risk) or failure of the other party to the transaction to perform (counterparty credit risk). The potential loss could exceed the value of the financial assets recorded on the financial statements. Financial assets, which potentially expose the Fund to counterparty credit risk, consist principally of cash due from counterparties on forward, option and swap transactions, when applicable. The extent of the Fund’s exposure to counterparty credit risk in respect to these financial assets approximates their carrying value as recorded on the Statement of Assets and Liabilities.
The Fund helps manage counterparty credit risk by entering into agreements only with counterparties the Adviser believes have the financial resources to honor their obligations and by having the Adviser monitor the financial stability of the counterparties. Additionally, counterparties may be required to pledge collateral daily (based on the daily valuation of the financial asset) on behalf of the Fund with a value approximately equal to the amount of any unrealized gain above a pre-determined threshold. Reciprocally, when the Fund has an unrealized loss, the Fund has instructed the custodian to pledge assets of the Fund as collateral with a value approximately equal to the amount of the unrealized loss above a pre-determined threshold. Collateral pledges are monitored and subsequently adjusted if and when the valuations fluctuate, either up or down, by at least the pre-determined threshold amount.
4. Fund Shares
Common Share Transactions
Transactions in common shares during the Fund’s current and prior fiscal period, were as follows:
|
|
Year
|
Year
|
|
|
Ended
|
Ended
|
|
|
5/31/18
|
5/31/17
|
|
Common Shares:
|
|
|
|
Issued to shareholders due to reinvestment of distributions
|
4,728
|
7,391
|
Preferred Shares
Variable Rate MuniFund Term Preferred Shares
The Fund had issued and had outstanding Variable Rate MuniFund Term Preferred (“VMTP”) Shares, with a $100,000 liquidation preference per share. VMTP Shares were issued via private placement and had not publicly available.
On March 13, 2018, the Fund redeemed all of its outstanding Series 2019 VMTP Shares. The Fund’s VMTP Shares were redeemed at its $100,000 liquidation value per share, plus dividend amount owed. The Fund has financed the VMTP Share redemption with the proceeds of the sale of securities in its investment portfolio.
The average liquidation preference of VMTP Shares outstanding and annualized dividend rate for the Fund during the current fiscal period were as follows:
|
Average liquidation preference of VMTP Shares outstanding
|
$28,300,000*
|
|
Annualized dividend rate
|
1.92%*
|
|
* For the period June 1, 2017 through March 13, 2018.
|
|
VMTP Shares are subject to restrictions on transfer, generally do not trade, and market quotations are generally not available. VMTP Shares are short-term or short/intermediate-term instruments that pay a variable dividend rate tied to a short-term index, plus an additional fixed “spread” amount established at the time of issuance. The fair value of VMTP Shares is expected to be approximately their liquidation preference so long as the fixed “spread” on the VMTP Shares remains roughly in line with the “spread” being demanded by investors on instruments having similar terms in the current market environment. In present market conditions, the Fund’s Adviser has determined that fair value of VMTP Shares is approximately their liquidation preference, but their fair value could vary if market conditions change materially. For financial reporting purposes, the liquidation preference of VMTP Shares is a liability and is recognized as a component of “Variable Rate MuniFund Term Preferred (“VMTP”) Shares, net of deferred offering costs” on the Statement of Assets and Liabilities.
Dividends on the VMTP Shares (which are treated as interest payments for financial reporting purposes) are set weekly. Unpaid dividends on VMTP Shares are recognized as a component of “Interest payable” on the Statement of Assets and Liabilities. Dividends accrued on VMTP Shares are recognized as a component of “Interest expense and amortization of offering costs” on the Statement of Operations.
Costs incurred in connection with the Fund’s offering of VMTP Shares were recorded as a deferred charge, which are amortized over the life of the shares and are recognized as components of “Variable Rate MuniFund Term Preferred (“VMTP”) Shares, net of deferred offering costs” on the Statement of Assets and Liabilities and “Interest expense and amortization of offering costs” on the Statement of Operations.
35
Notes to Financial Statements (continued)
In conjunction with the Fund’s redemption of VMTP Shares, the remaining deferred cost of $49,909 were fully expensed during the current fiscal period, as the redemptions were deemed an extinguishing debt.
|
Preferred Share Transactions
|
|
|
|
|
Transactions in preferred shares for the Fund during the Fund’s current and prior fiscal period are noted in the following table. Transactions in VMTP Shares for the Fund were as follows:
|
|||
| Year Ended | |||
|
|
May 31, 2018
|
||
|
|
Series
|
Shares
|
Amount
|
|
VMTP Shares redeemed
|
2019
|
(283)
|
$(28,300,000)
|
|
|
|||
|
5. Investment Transactions
|
|
|
|
|
Long-term purchases and sales (including maturities) during the current fiscal period were as follows:
|
|
|
|
|
Purchases
|
|
|
$ 7,969,822
|
|
Sales and maturities
|
|
|
35,606,996
|
6. Income Tax Information
The Fund intends to comply with the requirements of Subchapter M of the Internal Revenue Code applicable to regulated investment companies. In any year, the Fund may choose to distribute all or a portion of net investment income and net capital gains to shareholders, or retain a portion of its net investment income and net capital gains and pay corporate income taxes on such retained net investment income and retained net capital gains. The Fund intends to distribute at least the percentage of its net investment income and gains to maintain its status as a regulated investment company for U.S. federal income tax purposes.
Furthermore, the Fund intends to satisfy conditions that will enable interest from municipal securities, which is exempt from regular federal income tax, to retain such tax-exempt status when distributed to shareholders of the Fund. Net realized capital gains and ordinary income distributions paid by the Fund are subject to federal taxation.
For all open tax years and all major taxing jurisdictions, management of the Fund has concluded that there are no significant uncertain tax positions that would require recognition in the financial statements. Open tax years are those that are open for examination by taxing authorities (i.e., generally the last four tax year ends and the interim tax period since then). Furthermore, management of the Fund is also not aware of any tax positions for which it is reasonably possible that the total amounts of unrecognized tax benefits will significantly change in the next twelve months.
The following information is presented on an income tax basis. Differences between amounts for financial statement and federal income tax purposes are primarily due to timing differences in recognizing taxable market discount and timing differences in recognizing certain gains and losses on investment transactions. To the extent that differences arise that are permanent in nature, such amounts are reclassified within the capital accounts as detailed below. Temporary differences do not require reclassification. Temporary and permanent differences do not impact the NAV of the Fund.
The table below presents the cost and unrealized appreciation (depreciation) of the Fund’s investment portfolio, as determined on a federal income tax basis, as of May 31, 2018.
|
Tax cost of investments
|
$
|
81,462,650
|
||
|
Gross unrealized:
|
||||
|
Appreciation
|
$
|
886,964
|
||
|
Depreciation
|
(1,928,037
|
)
|
||
|
Net unrealized appreciation (depreciation) of investments
|
$
|
(1,041,073
|
)
|
|
Permanent differences, primarily due to nondeductible offering costs, federal taxes paid and taxable market discount, resulted in reclassifications among the Fund’s components of net assets as of May 31, 2018, the Fund’s tax year end, as follows:
|
Paid-in surplus
|
$
|
(86,120
|
)
|
|
|
Undistributed (Over-distribution of) net investment income
|
(10,090
|
)
|
||
|
Accumulated net realized gain (loss)
|
96,210
|
|||
36
The tax components of undistributed net tax-exempt income, net ordinary income and net long-term capital gains as of May 31, 2018, the Fund’s tax year end, were as follows:
|
Undistributed net tax-exempt income1
|
$488,569
|
|
Undistributed net ordinary income2
|
28,667
|
|
Undistributed net long-term capital gains
|
—
|
|
1
|
Undistributed net tax-exempt income (on a tax basis) has not been reduced for the dividend declared on May 1, 2018, and paid on June 1, 2018.
|
|
2
|
Net ordinary income consists of taxable market discount income and net short-term capital gains, if any.
|
The tax character of distributions paid during the Fund’s tax years ended May 31, 2018 and May 31, 2017 was designated for purposes of the dividends paid deduction as follows:
|
2018
|
|
|
Distributions from net tax-exempt income3
|
$2,311,730
|
|
Distributions from net ordinary income2
|
16,482
|
|
Distributions from net long-term capital gains
|
—
|
|
2017
|
|
|
Distributions from net tax-exempt income
|
$2,507,185
|
|
Distributions from net ordinary income2
|
—
|
|
Distributions from net long-term capital gains
|
—
|
|
2
|
Net ordinary income consists of taxable market discount income and net short-term capital gains, if any.
|
|
3
|
The Fund hereby designates these amounts paid during the fiscal year ended May 31, 2018, as Exempt Interest Dividends.
|
As of May 31, 2018, the Fund’s tax year end, the Fund had unused capital losses carrying forward available for federal income tax purposes to be applied against future capital gains, if any. The capital losses are not subject to expiration.
|
Not subject to expiration:
|
||||
|
Short-term
|
$
|
—
|
||
|
Long-term
|
242,362
|
|||
|
Total
|
$
|
242,362
|
||
7. Management Fees and Other Transactions with Affiliates
Management Fees
The Fund’s management fee compensates the Adviser for overall investment advisory and administrative services and general office facilities. The Sub-Adviser is compensated for its services to the Fund from the management fees paid to the Adviser.
The Fund’s management fee consists of two components – a fund-level fee, based only on the amount of assets within the Fund, and a complex-level fee, based on the aggregate amount of all eligible fund assets managed by the Adviser. This pricing structure enables Fund shareholders to benefit from growth in the assets within the Fund as well as from growth in the amount of complex-wide assets managed by the Adviser.
|
The annual fund-level fee, payable monthly, is calculated according to the following schedule:
|
|
|
Average Daily Net Assets
|
Fund-Level Fee Rate
|
|
For the first $125 million
|
0.4000%
|
|
For the next $125 million
|
0.3875
|
|
For the next $250 million
|
0.3750
|
|
For the next $500 million
|
0.3625
|
|
For the next $1 billion
|
0.3500
|
|
For the next $3 billion
|
0.3250
|
|
For managed assets over $5 billion
|
0.3125
|
37
Notes to Financial Statements (continued)
The annual complex-level fee, payable monthly, is calculated by multiplying the current complex-wide fee rate, determined according to the following schedule by the Fund’s daily managed assets:
|
Complex-Level Eligible Asset Breakpoint Level*
|
Effective Complex-Level Fee Rate at Breakpoint Level
|
|
$55 billion
|
0.2000%
|
|
$56 billion
|
0.1996
|
|
$57 billion
|
0.1989
|
|
$60 billion
|
0.1961
|
|
$63 billion
|
0.1931
|
|
$66 billion
|
0.1900
|
|
$71 billion
|
0.1851
|
|
$76 billion
|
0.1806
|
|
$80 billion
|
0.1773
|
|
$91 billion
|
0.1691
|
|
$125 billion
|
0.1599
|
|
$200 billion
|
0.1505
|
|
$250 billion
|
0.1469
|
|
$300 billion
|
0.1445
|
|
*
|
For the complex-level fees, managed assets include closed-end fund assets managed by the Adviser that are attributable to certain types of leverage. For these purposes, leverage includes the fund’s use of preferred stock and borrowings and certain investments in the residual interest certificates (also called inverse floating rate securities) in tender option bond (TOB) trusts, including the portion of assets held by a TOB trust that has been effectively financed by the trust’s issuance of floating rate securities, subject to an agreement by the Adviser as to certain funds to limit the amount of such assets for determining managed assets in certain circumstances. The complex-level fee is calculated based upon the aggregate daily managed assets of all Nuveen open-end and close-end funds that constitute “eligible assets.” Eligible assets do not include assets attributable to investments in other Nuveen funds and assets in excess of a determined amount (originally $2 billion) added to the Nuveen Fund complex in connection with the Adviser’s assumption of the management of the former First American Funds effective January 1, 2011. As of May 31, 2018, the complex-level fee for the Fund was 0.1591%.
|
Other Transactions with Affiliates
The Fund is permitted to purchase or sell securities from or to certain other funds managed by the Adviser (“inter-fund trade”) under specified conditions outlined in procedures adopted by the Board. These procedures have been designed to ensure that any inter-fund trade of securities by the Fund from or to another fund that is, or could be, considered an affiliate of the Fund under certain limited circumstances by virtue of having a common investment adviser (or affiliated investment adviser), common officer and/or common trustee complies with Rule 17a-7 of the 1940 Act. Further, as defined under these procedures, each inter-fund trade is effected at the current market price as provided by an independent pricing service. Unsettled inter-fund trades as of the end of the reporting period are recognized as a component of “Receivable for investments sold” and/or “Payable for investments purchased” on the Statement of Assets and Liabilities, when applicable.
During the current fiscal period, the Fund did not engage in inter-fund trades pursuant to these procedures.
8. Borrowing Arrangements
Uncommitted Line of Credit
During the current fiscal period, the Fund participated in an unsecured bank line of credit (“Unsecured Credit Line”) under which outstanding balances would bear interest at a variable rate. Although the Funds participated in the Unsecured Credit Line, they did not have any outstanding balances during the current fiscal period.
The Unsecured Credit Line was not renewed after its scheduled termination date on July 27, 2017.
Committed Line of Credit
The Fund, along with certain other funds managed by the Adviser (“Participating Funds”), have established a 364-day, approximately $3 billion standby credit facility with a group of lenders, under which the Participating Funds may borrow for various purposes other than leveraging for investment purposes. A large portion of this facility’s capacity (and its associated costs as described below) is currently dedicated for use by a small number of Participating Funds, which does not include the Fund covered by this shareholder report. The remaining capacity under the facility (and the corresponding portion of the facility’s annual costs) is separately dedicated to most of the other open-end funds in the Nuveen fund family, along with a number of Nuveen closed-end funds, including the Fund covered by this shareholder report. The credit facility expires in July 2018 unless extended or renewed.
The credit facility has the following terms: a fee of 0.15% per annum on unused commitment amounts, and interest at a rate equal to the higher of (a) one-month LIBOR (London Inter-Bank Offered Rate) plus 1.00% (1.25% prior to July 27, 2017) per annum or (b) the Fed Funds rate plus 1.00% (1.25% prior to July 27, 2017) per annum on amounts borrowed. Participating Funds paid administration, legal and arrangement fees, which are recognized as a component of “Other expenses” on the Statement of Operations, and along with commitment fees, have been allocated among such Participating
38
Funds based upon the relative proportions of the facility’s aggregate capacity reserved for them and other factors deemed relevant by the Adviser and the Board of each Participating Fund.
During the current fiscal period, the Fund utilized this facility. The Fund’s average daily balance outstanding and average annual interest rate during the utilization period(s) was $629,890 and 2.56%, respectively. The Fund’s maximum outstanding daily balance during the utilization period was $629,890. Borrowing outstanding as of the end of the reporting period, if any, are recognized as “Borrowings” on the Statement of Assets and Liabilities.
Inter-Fund Borrowing and Lending
The Securities and Exchange Commission (“SEC”) has granted an exemptive order permitting registered open-end and closed-end Nuveen funds to participate in an inter-fund lending facility whereby the Nuveen funds may directly lend to and borrow money from each other for temporary purposes (e.g., to satisfy redemption requests or when a sale of securities “fails,” resulting in an unanticipated cash shortfall) (the “Inter-Fund Program”). The closed-end Nuveen funds, including the Fund covered by this shareholder report, will participate only as lenders, and not as borrowers, in the Inter-Fund Program because such closed-end funds rarely, if ever, need to borrow cash to meet redemptions. The Inter-Fund Program is subject to a number of conditions, including, among other things, the requirements that (1) no fund may borrow or lend money through the Inter-Fund Program unless it receives a more favorable interest rate than is typically available from a bank or other financial institution for a comparable transaction; (2) no fund may borrow on an unsecured basis through the Inter-Fund Program unless the fund’s outstanding borrowings from all sources immediately after the inter-fund borrowing total 10% or less of its total assets; provided that if the borrowing fund has a secured borrowing outstanding from any other lender, including but not limited to another fund, the inter-fund loan must be secured on at least an equal priority basis with at least an equivalent percentage of collateral to loan value; (3) if a fund’s total outstanding borrowings immediately after an inter-fund borrowing would be greater than 10% of its total assets, the fund may borrow through the inter-fund loan on a secured basis only; (4) no fund may lend money if the loan would cause its aggregate outstanding loans through the Inter-Fund Program to exceed 15% of its net assets at the time of the loan; (5) a fund’s inter-fund loans to any one fund shall not exceed 5% of the lending fund’s net assets; (6) the duration of inter-fund loans will be limited to the time required to receive payment for securities sold, but in no event more than seven days; and (7) each inter-fund loan may be called on one business day’s notice by a lending fund and may be repaid on any day by a borrowing fund. In addition, a Nuveen fund may participate in the Inter-Fund Program only if and to the extent that such participation is consistent with the fund’s investment objective and investment policies. The Board is responsible for overseeing the Inter-Fund Program.
The limitations detailed above and the other conditions of the SEC exemptive order permitting the Inter-Fund Program are designed to minimize the risks associated with Inter-Fund Program for both the lending fund and the borrowing fund. However, no borrowing or lending activity is without risk. When a fund borrows money from another fund, there is a risk that the loan could be called on one day’s notice or not renewed, in which case the fund may have to borrow from a bank at a higher rate or take other actions to payoff such loan if an inter-fund loan is not available from another fund. Any delay in repayment to a lending fund could result in a lost investment opportunity or additional borrowing costs.
During the current reporting period, the Fund did not enter into any inter-fund loan activity.
9. New Accounting Pronouncements
FASB Accounting Standards Update (“ASU”) 2017-08 (“ASU 2017-08”) Premium Amortization on Purchased Callable Debt Securities
The FASB has issued ASU 2017-08, which shortens the premium amortization period for purchased non-contingently callable debt securities. ASU 2017-08 specifies that the premium amortization period ends at the earliest call date, for purchased non-contingently callable debt securities. ASU 2017-08 is effective for fiscal years, and interim periods within those fiscal years, beginning after December 15, 2018. Management is currently evaluating the implications of ASU 2017-08, if any.
FASB ASU 2016-18: Statement of Cash Flows – Restricted Cash (“ASU 2016-18”)
The FASB issued ASU 2016-18, which will require entities to include the total of cash, cash equivalents, restricted cash and restricted cash equivalents in the beginning and ending cash balances in the Statement of Cash Flows. The guidance will be applied retrospectively and is effective for fiscal years beginning after December 15, 2017, and interim periods within those years. Management is currently evaluating the implications of ASU 2016-18, if any.
10. Subsequent Events
Borrowing Arrangements
On July 11, 2018, the Funds renewed the standby credit facility through July 2019. In conjunction with this renewal, the amount of the facility decreased to $2.65 billion, while all other terms remained unchanged.
39
Additional Fund Information (Unaudited)
|
Board of Trustees
|
|
|
|
|
|
|
Margo Cook*
|
Jack B. Evans
|
William C. Hunter
|
Albin F. Moschner
|
John K. Nelson
|
William J. Schneider
|
|
Judith M. Stockdale
|
Carole E. Stone
|
Terence J. Toth
|
Margaret L. Wolff
|
Robert L. Young
|
|
|
|
|||||
|
* Interested Board Member.
|
|
|
|
|
|
|
Fund Manager
|
Custodian
|
Legal Counsel
|
Independent Registered
|
Transfer Agent and
|
|
Nuveen Fund Advisors, LLC
|
State Street Bank
|
Chapman and Cutler LLP
|
Public Accounting Firm
|
Shareholder Services
|
|
333 West Wacker Drive
|
& Trust Company
|
Chicago, IL 60603
|
KPMG LLP
|
Computershare Trust
|
|
Chicago, IL 60606
|
One Lincoln Street
|
|
200 East Randolph Street
|
Company, N.A.
|
|
|
Boston, MA 02111
|
|
Chicago, IL 60601
|
250 Royall Street
|
|
|
|
|
|
Canton, MA 02021
|
|
|
|
|
|
(800) 257-8787
|
Quarterly Form N-Q Portfolio of Investments Information
Each Fund is required to file its complete schedule of portfolio holdings with the Securities and Exchange Commission (SEC) for the first and third quarters of each fiscal year on Form N-Q. You may obtain this information directly from the SEC. Visit the SEC on-line at http://www.sec.gov or in person at the SEC’s Public Reference Room in Washington, D.C. Call the SEC toll-free at (800) SEC-0330 for room hours and operation.
Nuveen Funds’ Proxy Voting Information
You may obtain (i) information regarding how each fund voted proxies relating to portfolio securities held during the most recent twelve-month period ended June 30, without charge, upon request, by calling Nuveen toll-free at (800) 257-8787 or on Nuveen’s website at www.nuveen.com and (ii) a description of the policies and procedures that each fund used to determine how to vote proxies relating to portfolio securities without charge, upon request, by calling Nuveen toll free at (800) 257-8787. You may also obtain this information directly from the SEC. Visit the SEC on-line at http://www.sec.gov.
CEO Certification Disclosure
Each Fund’s Chief Executive Officer (CEO) has submitted to the New York Stock Exchange (NYSE) the annual CEO certification as required by Section 303A.12(a) of the NYSE Listed Company Manual. The Fund has filed with the SEC the certification of its CEO and Chief Financial Officer required by Section 302 of the Sarbanes-Oxley Act.
Common Share Repurchases
The Fund intends to repurchase, through its open-market share repurchase program, shares of its own common stock at such times and in such amounts as is deemed advisable. During the period covered by this report, the Fund repurchased shares of its common stock, as shown in the accompanying table. Any future repurchases will be reported to shareholders in the next annual or semi-annual report.
|
Common shares repurchased
|
—
|
FINRA BrokerCheck
The Financial Industry Regulatory Authority (FINRA) provides information regarding the disciplinary history of FINRA member firms and associated investment professionals. This information as well as an investor brochure describing FINRA BrokerCheck is available to the public by calling the FINRA BrokerCheck Hotline number at (800) 289-9999 or by visiting www.FINRA.org.
40
Glossary of Terms Used in this Report (Unaudited)
|
·
|
Average Annual Total Return: This is a commonly used method to express an investment’s performance over a particular, usually multi-year time period. It expresses the return that would have been necessary each year to equal the investment’s actual cumulative performance (including change in NAV or market price and reinvested dividends and capital gains distributions, if any) over the time period being considered.
|
|
·
|
Duration: Duration is a measure of the expected period over which a bond’s principal and interest will be paid, and consequently is a measure of the sensitivity of a bond’s or bond fund’s value to changes when market interest rates change. Generally, the longer a bond’s or fund’s duration, the more the price of the bond or fund will change as interest rates change.
|
|
·
|
Effective Leverage: Effective leverage is a fund’s effective economic leverage, and includes both regulatory leverage (see leverage) and the leverage effects of certain derivative investments in a fund’s portfolio. Currently, the leverage effects of Tender Option Bond (TOB) inverse floater holdings are included in effective leverage values, in addition to any regulatory leverage.
|
|
·
|
Gross Domestic Product (GDP): The total market value of all final goods and services produced in a country/region in a given year, equal to total consumer, investment and government spending, plus the value of exports, minus the value of imports.
|
|
·
|
Industrial Development Revenue Bond (IDR): A unique type of revenue bond issued by a state or local government agency on behalf of a private sector company and intended to build or acquire factories or other heavy equipment and tools.
|
|
·
|
Inverse Floating Rate Securities: Inverse floating rate securities, also known as inverse floaters or tender option bonds (TOBs), are created by depositing a municipal bond, typically with a fixed interest rate, into a special purpose trust. This trust, in turn, (a) issues float- ing rate certificates typically paying short-term tax-exempt interest rates to third parties in amounts equal to some fraction of the deposited bond’s par amount or market value, and (b) issues an inverse floating rate certificate (sometimes referred to as an “inverse floater”) to an investor (such as a Fund) interested in gaining investment exposure to a long-term municipal bond. The income received by the holder of the inverse floater varies inversely with the short-term rate paid to the floating rate certificates’ holders, and in most circumstances the holder of the inverse floater bears substantially all of the underlying bond’s downside investment risk. The holder of the inverse floater typically also benefits disproportionately from any potential appreciation of the underlying bond’s value. Hence, an inverse floater essentially represents an investment in the underlying bond on a leveraged basis.
|
|
·
|
Leverage: Leverage is created whenever a fund has investment exposure (both reward and/or risk) equivalent to more than 100% of the investment capital.
|
|
·
|
Net Asset Value (NAV) Per Share: A fund’s Net Assets is equal to its total assets (securities, cash, accrued earnings and receivables) less its total liabilities. NAV per share is equal to the fund’s Net Assets divided by its number of shares outstanding.
|
|
·
|
Pre-Refunding: Pre-Refunding, also known as advanced refundings or refinancings, is a procedure used by state and local governments to refinance municipal bonds to lower interest expenses. The issuer sells new bonds with a lower yield and uses the proceeds to buy U.S.
Treasury securities, the interest from which is used to make payments on the higher-yielding bonds. Because of this collateral, pre-refunding generally raises a bond’s credit rating and thus its value. |
41
Glossary of Terms Used in this Report (Unaudited) (continued)
|
·
|
Regulatory Leverage: Regulatory Leverage consists of preferred shares issued by or borrowings of a fund. Both of these are part of a fund’s capital structure. Regulatory leverage is subject to asset coverage limits set in the Investment Company Act of 1940.
|
|
·
|
S&P Short Duration Municipal Yield Index: An index that contains all bonds in the S&P Municipal Bond Index that mature between 1 month and 12 years, and maintains a 10% weighting to AA rated bonds, 10% to A rated bonds, 20% to BBB rated bonds and 60% to below investment grade and non-rated bonds. Index returns assume reinvestment of distributions, but do not reflect any applicable sales charges or management fees.
|
|
·
|
Total Investment Exposure: Total investment exposure is a fund’s assets managed by the Adviser that are attributable to financial lever- age. For these purposes, financial leverage includes a fund’s use of preferred stock and borrowings and investments in the residual interest certificates (also called inverse floating rate securities) in tender option bond (TOB) trusts, including the portion of assets held by a TOB trust that has been effectively financed by the trust’s issuance of floating rate securities.
|
|
·
|
Zero Coupon Bond: A zero coupon bond does not pay a regular interest coupon to its holders during the life of the bond. Income to the holder of the bond comes from accretion of the difference between the original purchase price of the bond at issuance and the par value of the bond at maturity and is effectively paid at maturity. The market prices of zero coupon bonds generally are more volatile than the market prices of bonds that pay interest periodically.
|
42
Reinvest Automatically, Easily and Conveniently
Nuveen makes reinvesting easy. A phone call is all it takes to set up your reinvestment account.
Nuveen Closed-End Funds Automatic Reinvestment Plan
Nuveen Closed-End Fund allows you to conveniently reinvest distributions in additional Fund shares. By choosing to reinvest, you’ll be able to invest money regularly and automatically, and watch your investment grow through the power of compounding. Just like distributions in cash, there may be times when income or capital gains taxes may be payable on distributions that are reinvested. It is important to note that an automatic reinvestment plan does not ensure a profit, nor does it protect you against loss in a declining market.
Easy and convenient
To make recordkeeping easy and convenient, each month you’ll receive a statement showing your total distributions, the date of investment, the shares acquired and the price per share, and the total number of shares you own.
How shares are purchased
The shares you acquire by reinvesting will either be purchased on the open market or newly issued by the Fund. If the shares are trading at or above net asset value at the time of valuation, the Fund will issue new shares at the greater of the net asset value or 95% of the then-current market price. If the shares are trading at less than net asset value, shares for your account will be purchased on the open market. If the Plan Agent begins purchasing Fund shares on the open market while shares are trading below net asset value, but the Fund’s shares subsequently trade at or above their net asset value before the Plan Agent is able to complete its purchases, the Plan Agent may cease open-market purchases and may invest the uninvested portion of the distribution in newly-issued Fund shares at a price equal to the greater of the shares’ net asset value or 95% of the shares’ market value on the last business day immediately prior to the purchase date. Distributions received to purchase shares in the open market will normally be invested shortly after the distribution payment date. No interest will be paid on distributions awaiting reinvestment. Because the market price of the shares may increase before purchases are completed, the average purchase price per share may exceed the market price at the time of valuation, resulting in the acquisition of fewer shares than if the distribution had been paid in shares issued by the Fund. A pro rata portion of any applicable brokerage commissions on open market purchases will be paid by Plan participants. These commissions usually will be lower than those charged on individual transactions.
Flexible
You may change your distribution option or withdraw from the Plan at any time, should your needs or situation change. You can reinvest whether your shares are registered in your name, or in the name of a brokerage firm, bank, or other nominee. Ask your investment advisor if his or her firm will participate on your behalf. Participants whose shares are registered in the name of one firm may not be able to transfer the shares to another firm and continue to participate in the Plan. The Fund reserves the right to amend or terminate the Plan at any time. Although the Fund reserves the right to amend the Plan to include a service charge payable by the participants, there is no direct service charge to participants in the Plan at this time.
Call today to start reinvesting distributions
For more information on the Nuveen Automatic Reinvestment Plan or to enroll in or withdraw from the Plan, speak with your financial advisor or call us at (800) 257-8787.
43
Annual Investment Management
Agreement Approval Process (Unaudited)
Agreement Approval Process (Unaudited)
At a meeting held on May 22-24, 2018 (the “May Meeting”), the Board of Trustees (the “Board,” and each Trustee, a “Board Member”) of the Fund, including the Board Members who are not “interested persons” (as defined under the Investment Company Act of 1940 (the “1940 Act”)) (the “Independent Board Members”), approved the renewal of the management agreement (the “Investment Management Agreement”) with Nuveen Fund Advisors, LLC (the “Adviser”) pursuant to which the Adviser serves as investment adviser to the Fund and the sub-advisory agreement (the “Sub-Advisory Agreement”) with Nuveen Asset Management, LLC (the “Sub-Adviser”) pursuant to which the Sub-Adviser serves as investment sub-adviser to the Fund. Following an initial two-year period, the Board, including the Independent Board Members, is required under the 1940 Act to review and approve the Investment Management Agreement and Sub-Advisory Agreement on behalf of the Fund on an annual basis. The Investment Management Agreement and Sub-Advisory Agreement are collectively referred to as the “Advisory Agreements” and the Adviser and the Sub-Adviser are collectively, the “Fund Advisers” and each, a “Fund Adviser.”
In response to a request on behalf of the Independent Board Members by independent legal counsel, the Board received and reviewed prior to the May Meeting extensive materials specifically prepared for the annual review of Advisory Agreements by the Adviser as well as by Broadridge Financial Solutions, Inc. (“Broadridge” or “Lipper”), an independent provider of investment company data. The materials provided in connection with the annual review covered a breadth of subject matter including, but not limited to, a description of the nature, extent and quality of services provided by each Fund Adviser; a review of the Sub-Adviser and the applicable investment team(s); an analysis of fund performance in absolute terms and as compared to the performance of certain peer funds and benchmarks with a focus on any performance outliers; an analysis of the fees and expense ratios of the Nuveen funds in absolute terms and as compared to those of certain peer funds with a focus on any expense outliers; a description of portfolio manager compensation; a review of the secondary market for Nuveen closed-end funds (including, among other things an analysis of performance, distribution and valuation and capital raising trends in the broader closed-end fund market and in particular to Nuveen closed-end funds; a review of the leverage management actions taken on behalf of the Nuveen closed-end funds and the resulting impact on performance; and a description of the distribution management process and any capital management activities); a review of the performance of various service providers; a description of various initiatives Nuveen had undertaken or continued during the year for the benefit of particular Nuveen fund(s) and/or the complex; a description of the profitability or financial data of Nuveen and the various sub-advisers to the Nuveen funds; and a description of indirect benefits received by the Fund Advisers as a result of their relationships with the Nuveen funds. The Independent Board Members also received a memorandum from independent legal counsel outlining their fiduciary duties and legal standards in reviewing the Advisory Agreements. The Board Members held an in-person meeting on April 10-11, 2018 (the “April Meeting”), in part, to review and discuss the performance of the Nuveen funds and the Adviser’s evaluation of the various sub-advisers to the Nuveen funds. Prior to the May Meeting, the Board Members also received and reviewed supplemental information provided in response to questions posed by the Board Members.
The information prepared specifically for the annual review of the Advisory Agreements supplemented the information provided to the Board and its committees throughout the year. The Board and its committees met regularly during the year and the information provided and topics discussed were relevant to the review of the Advisory Agreements. Some of these reports and other data included, among other things, materials that outlined the investment performance of the Nuveen funds; strategic plans of the Adviser which may impact the services it provides to the Nuveen funds; the review of the Nuveen funds and applicable investment teams; the management of leveraging financing for the Nuveen closed-end funds; the secondary market trading of the Nuveen closed-end funds and any actions to address discounts; compliance, regulatory and risk management matters; the trading practices of the various sub-advisers; valuation of securities; fund expenses; and overall market and regulatory developments. The Board
44
further continued its practice of seeking to meet periodically with the various sub-advisers to the Nuveen funds and their investment teams, when feasible. As a result, the Independent Board Members considered the review of the Advisory Agreements to be an ongoing process and employed the accumulated information, knowledge, and experience the Board Members had gained during their tenure on the Board governing the Fund and working with the Fund Advisers in their review of the Advisory Agreements. Throughout the year and during the annual review of Advisory Agreements, the Independent Board Members met in executive sessions with independent legal counsel and had the benefit of counsel’s advice.
In deciding to renew the Advisory Agreements, the Independent Board Members did not identify a particular factor as determinative, but rather the decision reflected the comprehensive consideration of all the information provided, and each Board Member may have attributed different levels of importance to the various factors and information considered in connection with the approval process. The following summarizes the principal factors, but not all the factors, the Board considered in deciding to renew the Advisory Agreements and its conclusions.
A. Nature, Extent and Quality of Services
In evaluating the renewal of the Advisory Agreements, the Independent Board Members received and considered information regarding the nature, extent and quality of the applicable Fund Adviser’s services provided to the Fund and the resulting performance of the Fund. With respect to the Adviser, the Board recognized the comprehensive set of management, oversight and administrative services the Adviser and its affiliates provided to manage and operate the Nuveen funds in a highly regulated industry. As illustrative, these services included, but were not limited to, product management; investment oversight, risk management and securities valuation services; fund accounting and administration services; board support and administration services; compliance and regulatory oversight services; legal support; and with respect to closed-end funds, leverage, capital and distribution management services.
In addition to the services necessary to operate and maintain the Nuveen funds, the Board recognized the Adviser’s continued program of improvements and innovations to make the Nuveen fund complex more relevant and attractive to existing and new investors and to accommodate the new and changing regulatory requirements in an increasingly complex regulatory environment. The Board noted that some of the initiatives the Adviser had taken over recent years to benefit the complex and particular Nuveen funds included, among other things:
• Fund Rationalizations - continuing efforts to rationalize the product line through mergers, liquidations and repositionings in seeking to enhance shareholder value over the years through increased efficiency, reduced costs, improved performance and revised investment approaches more relevant to current shareholder needs;
• Product Innovations - developing product innovations and launching new products that will help the Nuveen fund complex offer a variety of products that will attract new investors and retain existing investors, such as launching the target term funds, exchange-traded funds (“ETFs”) and multi-asset class funds;
• Risk Management Enhancements - continuing efforts to enhance risk management, including enhancing reporting to increase the efficiency of risk monitoring, implementing programs to strengthen the ability to detect and mitigate operational risks, dedicating resources and staffing necessary to create standards to help ensure compliance with new liquidity requirements, and implementing a price verification system;
• Additional Compliance Services – the continuing investment of significant resources, time and additional staffing to meet the various new regulatory requirements affecting the Nuveen funds over the past several years, the further implementation of unified compliance policies and processes, the development of additional compliance training modules, and the reorganization of the compliance team adding further depth to its senior leadership;
• Expanded Dividend Management Services – as the Nuveen fund complex has grown, the additional services necessary to manage the distributions of the varied funds offered and investing in automated systems to assist in this process; and
• with respect specifically to closed-end funds, such initiatives also included:
45
Annual Investment Management Agreement Approval Process (Unaudited) (continued)
• Leverage Management Services - continuing activities to expand financing relationships and develop new product structures to lower fund leverage expenses and to manage associated risks, particularly in an interest rate increasing environment;
• Capital Management Services - continuing capital management activities through the share repurchase program and additional equity offerings in seeking to increase net asset value and/or improve fund performance for the respective Nuveen funds;
• Data and Market Analytics - continuing development of databases that help with obtaining and analyzing ownership data of closed-end funds;
• Enhanced Secondary Market Reporting – providing enhanced reporting and commentary on the secondary market trading of closed-end funds which permit more efficient analysis of the performance of the Nuveen funds compared to peers and of trends in the marketplace; and
• Tender Option Bond Services – providing the additional support services necessary for Nuveen funds that seek to use tender option bonds to meet new regulatory requirements.
The Board also recognized the Adviser’s investor relations program which seeks to advance the Nuveen closed-end funds through, among other things, raising awareness and delivering education regarding closed-end funds to investors and financial advisors and promoting the Nuveen closed-end funds with such investors.
In addition to the services provided by the Adviser, the Board also noted the business related risks the Adviser incurred in managing the Nuveen funds, including entrepreneurial, legal and litigation risks.
The Board further considered the division of responsibilities between the Adviser and the Sub-Adviser and the investment and compliance oversight over the Sub-Adviser provided by the Adviser. The Board recognized that the Sub-Adviser generally provided the portfolio advisory services for the Fund. The Board reviewed the Adviser’s analysis of the Sub-Adviser which evaluated, among other things, the investment team, the members’ experience and any changes to the team during the year, the team’s assets under management, the stability and history of the organization, the team’s investment approach and the performance of the Fund over various periods. The Board noted that the Adviser recommended the renewal of the Sub-Advisory Agreement.
Based on its review, the Board determined, in the exercise of its reasonable business judgment, that it was satisfied with the nature, extent and quality of services provided to the Fund under each applicable Advisory Agreement.
B. The Investment Performance of the Fund and Fund Advisers
As part of its evaluation of the services provided by the Fund Advisers, the Board considered the investment performance of the Fund. In this regard, the Board reviewed fund performance over the quarter and one-year periods ending December 31, 2017 as well as performance data for the first quarter of 2018 ending March 31, 2018. The Independent Board Members noted that they reviewed and discussed fund performance over various time periods with management at their quarterly meetings throughout the year and their review and analysis of performance during the annual review of Advisory Agreements incorporated such discussions.
The Board reviewed performance on an absolute basis and in comparison to the performance of peer funds (the “Performance Peer Group”) and recognized and/or customized benchmarks (i.e., generally benchmarks derived from multiple recognized benchmarks). The Board considered the Adviser’s analysis of each Nuveen fund’s performance, including, in particular, an analysis of the Nuveen funds determined to be performance outliers and the factors contributing to their underperformance. In addition to the foregoing, in recognizing the importance of secondary market trading to shareholders of closed-end funds, the Board reviewed, among other things, the premium or discount to net asset value of the Nuveen closed-end funds as of a specified date as well as relative to the premiums or discounts of certain peers and the funds’ total return based on net asset value and market price over various periods. The Board considers the review of premiums and discounts of the closed-end funds to be a continuing priority and as such, the Board and/or its Closed-end Fund Committee also receives an update on the second-
46
ary closed-end fund market and evaluates the premiums and discounts of the Nuveen closed-end funds at each quarterly meeting, reviewing, among other things, the premium and discount trends in the broader closed-end fund market, by asset category and by closed-end fund; the historical total return performance data for the Nuveen closed-end funds based on net asset value and price over various periods; the volatility trends in the market; the distribution data of the Nuveen closed-end funds and as compared to peer averages; and a summary of the common share shelf offerings and share repurchase activity during the applicable quarter. As the Board’s Closed-end Fund Committee oversees matters particularly impacting the closed-end fund product line, the committee further engages in more in-depth discussions of the premiums and discounts of the Nuveen closed-end funds at each of its quarterly meetings.
In reviewing performance data, the Independent Board Members appreciated some of the inherent limitations of such data. In this regard, the Independent Board Members recognized that there may be limitations with the comparative data of certain peer groups or benchmarks as they may pursue objective(s), strategies or have other characteristics that are different from the respective Nuveen fund and therefore the performance results necessarily are different and limit the value of the comparisons. As an example, some funds may utilize leverage which may add to or detract from performance compared to an unlevered benchmark. The Independent Board Members also noted that management had ranked the relevancy of the peer group as low, medium or high to help the Board evaluate the value of the comparative peer performance data. The Board was aware that the performance data was measured as of a specific date and a different time period may reflect significantly different results and a period of underperformance can significantly impact long term performance figures. The Board further recognized that a shareholder’s experience in the Fund depends on his or her own holding period which may differ from that reviewed by the Independent Board Members.
In their review of performance, the Independent Board Members focused, in particular, on the Adviser’s analysis of Nuveen funds determined to be underperforming performance outliers. The Independent Board Members noted that only a limited number of the Nuveen funds appeared to be underperforming performance outliers at the end of 2017 and considered the factors contributing to the respective fund’s performance and whether there were any performance concerns that needed to be addressed. The Board recognized that some periods of underperformance may only be temporary while other periods of underperformance may indicate a broader issue that may require a corrective action. Accordingly, with respect to any Nuveen funds for which the Board had identified performance issues, the Board monitors such funds closely until performance improves, discusses with the Adviser the reasons for such results, considers whether any steps are necessary or appropriate to address such issues, and reviews the results of any efforts undertaken.
The Board recognized that the Fund ranked in the third quartile of its Performance Peer Group in the one-year period and outperformed its benchmark during this period. The Board also recognized that the Performance Peer Group was classified as low for relevancy. The Board, however, noted that the Fund was a target term fund designed to return its original net asset value per common share to investors at the end of its term, and the Fund was on track to return the original net asset value to investors and provided current income consistent with expectations.
C. Fees, Expenses and Profitability
1. Fees and Expenses
In its annual review, the Board considered the fees paid to the Fund Advisers and the total operating expense ratio of the Fund. More specifically, the Independent Board Members reviewed, among other things, the Fund’s gross and net management fee rates and net total expense ratio in relation to those of a comparable universe of funds (the “Peer Universe”) established by Broadridge. The Independent Board Members reviewed the methodology Broadridge employed to establish its Peer Universe and recognized that differences between the applicable fund and its respective Peer Universe may limit some of the value of the comparative data. The Independent Board Members also considered a fund’s operating expense ratio as it more directly reflected the shareholder’s costs in investing in the respective fund. In their review, the Independent Board Members considered, in particular, each fund with a net expense ratio (excluding investment-related costs of leverage for closed-end funds) of six basis points or higher compared to that of its peer average (each an “Expense Outlier Fund”). The Board noted that the
47
Annual Investment Management Agreement Approval Process (Unaudited) (continued)
number of Nuveen funds classified as an Expense Outlier Fund pursuant to the foregoing criteria had decreased over the past few years with only a limited number of the Nuveen funds identified as Expense Outlier Funds in 2017. The Independent Board Members reviewed an analysis as to the factors contributing to each such fund’s higher relative net expense ratio. In addition, although the Board reviewed a fund’s total net expenses both including and excluding investment-related expenses (i.e., leverage costs) and taxes for certain of the Nuveen closed-end funds, the Board recognized that leverage expenses will vary across funds and in comparison to peers because of differences in the forms and terms of leverage employed by the respective fund. Accordingly, in reviewing the comparative data between a fund and its peers, the Board generally considered the fund’s net expense ratio and fees (excluding leverage costs and leveraged assets for the closed-end funds) to be higher if they were over 10 basis points higher, slightly higher if they were 6 to 10 basis points higher, in line if they were within approximately 5 basis points higher than the peer average and below if they were below the peer average of the Peer Universe.
In their review of the fee arrangements for the Nuveen funds, the Independent Board Members considered the management fee schedules, including the complex-wide and fund-level breakpoint schedules, as applicable. The Board considered that across the Nuveen fund complex, the complex-wide fee breakpoints reduced fees by $47.4 million and fund-level breakpoints reduced fees by $54.6 million in 2017.
The Board considered the sub-advisory fees paid to the Sub-Adviser, including any breakpoint schedule, and as described below, comparative data of the fees the Sub-Adviser charges to other clients.
The Independent Board Members noted that the Fund had a net management fee below the peer average and a net expense ratio below the peer average.
Based on their review of the information provided, the Board determined that the Fund’s management fees (as applicable) to a Fund Adviser were reasonable in light of the nature, extent and quality of services provided to the Fund.
2. Comparisons with the Fees of Other Clients
In determining the appropriateness of fees, the Board also reviewed information regarding the fee rates the respective Fund Advisers charged for certain other types of clients and the type of services provided to these other clients. With respect to the Adviser and/or affiliated sub-advisers to the municipal funds, such other clients may include retail and institutional managed accounts, passively managed ETFs sub-advised by the Sub-Adviser but that are offered by another fund complex and municipal managed accounts offered by an unaffiliated adviser.
The Board recognized that the Fund had an affiliated sub-adviser and reviewed, among other things, the range of fees and average fee rates assessed for managed accounts. In addition to the comparative fee data, the Board also reviewed, among other things, a description of the different levels of services provided to other clients compared to the services provided to the Nuveen funds as well as the differences in portfolio investment policies, investor profiles, account sizes and regulatory requirements, all of which contribute to the variations in the fee schedules. In general, the Board noted that the higher fee levels reflect higher levels of services provided by Nuveen, increased investment management complexity, greater product management requirements and higher levels of business risk or some combination of these factors. The Board further considered that the Sub-Adviser’s fee is essentially for portfolio management services and therefore more comparable to the fees it receives for retail wrap accounts and other external sub-advisory mandates. The Board concluded the varying levels of fees were justified given, among other things, the inherent differences in the products and the level of services provided to the Nuveen funds versus other clients, the differing regulatory requirements and legal liabilities and the entrepreneurial risks incurred in sponsoring and advising a registered investment company.
3. Profitability of Fund Advisers
In conjunction with their review of fees, the Independent Board Members considered Nuveen’s level of profitability for its advisory services to the Nuveen funds for the calendar years 2017 and 2016. In considering profitability, the Independent Board Members reviewed the level of profitability realized by Nuveen including and excluding any distribution expenses incurred by Nuveen from its own resources. The Independent Board Members also reviewed a description of the expense allocation
48
methodology employed to develop the financial information and a summary of the history of changes to the methodology over the years. For comparability purposes, the Board recognized that a prior year’s profitability would be restated to reflect any refinements to the methodology. The Independent Board Members were aware of the inherent limitations in calculating profitability as the use of different reasonable allocation methodologies may lead to significantly different results and in reviewing profitability margins over extended periods given the refinements to the methodology over time. The Board noted that two Independent Board Members, along with independent counsel, serve as the Board’s liaisons to review and discuss any proposed changes to the methodology prior to the full Board’s review.
In their review, the Independent Board Members evaluated, among other things, Nuveen’s adjusted operating margins, gross and net revenue margins (pre-tax and after-tax) for advisory activities for the Nuveen funds, and the revenues, expenses, and net income (pre-tax and after-tax and before distribution) of Nuveen for fund advisory services for each of the last two calendar years. The Independent Board Members also reviewed an analysis of the key drivers behind the changes in revenues and expenses that impacted profitability in 2017 versus 2016. The Board noted that Nuveen recently launched its ETF product line in 2016 and reviewed the revenues, expenses and operating margin from this product line.
In addition to reviewing Nuveen’s profitability in absolute terms, the Independent Board Members also examined comparative profitability data reviewing, among other things, the revenues, expenses and adjusted total company margins of other advisory firms that had publicly available information and comparable assets under management (based on asset size and asset composition) for 2017 and as compared to their adjusted operating margins for 2016. The Independent Board Members, however, recognized the difficulty in comparing the profitability of various fund managers given the limited public information available and the subjective nature of calculating profitability which may be affected by numerous factors including the fund manager’s organizational structure, types of funds, other lines of business, methodology used to allocate expenses and cost of capital. Nevertheless, considering such limitations and based on the information provided, the Board noted that Nuveen’s adjusted operating margins appeared reasonable when compared to the adjusted margins of the peers.
Aside from Nuveen’s profitability, the Board recognized that the Adviser is a subsidiary of Nuveen, LLC, the investment management arm of Teachers Insurance and Annuity Association of America (“TIAA”). As such, the Board also reviewed a balance sheet for TIAA reflecting its assets, liabilities and capital and contingency reserves for the 2017 and 2016 calendar years to consider the financial strength of TIAA.
In reviewing profitability, the Independent Board Members also considered the profitability of the various sub-advisers from their relationships with the respective Nuveen fund(s). The Independent Board Members reviewed the Sub-Adviser’s revenues, expenses and revenue margins (pre- and post-tax) for its advisory activities for the calendar year ended December 31, 2017. The Independent Board Members also reviewed a profitability analysis reflecting the revenues, expenses and revenue margin (pre- and post-tax) by asset type for the Sub-Adviser for the calendar year ending December 31, 2017 and the pre- and post-tax revenue margin from 2017 and 2016.
In evaluating the reasonableness of the compensation, the Independent Board Members also considered any other ancillary benefits derived by the respective Fund Adviser from its relationship with the Nuveen funds as discussed in further detail below.
Based on a consideration of all the information provided, the Board noted that Nuveen’s and the Sub-Adviser’s level of profitability was acceptable and not unreasonable in light of the services provided.
D. Economies of Scale and Whether Fee Levels Reflect These Economies of Scale
The Independent Board Members considered the extent to which economies of scale may be achieved as the Fund grows and whether these economies of scale have been shared with shareholders. Although the Board recognized that economies of scale are difficult to measure, the Independent Board Members noted that there are several methods that may be used in seeking to share economies of scale, including through breakpoints in the management fee schedule reducing the fee rates as asset levels grow, fee waivers and/or expense limitation agreements and the Adviser’s investment in its business which can enhance the
49
Annual Investment Management Agreement Approval Process (Unaudited) (continued)
services provided to the Nuveen funds. With respect to breakpoint schedules, because the Board had previously recognized that economies of scale may occur not only when the assets of a particular fund grow but also when the assets in the complex grow, the Nuveen funds generally pay the Adviser a management fee comprised of a fund-level component and a complex-level component each with its own breakpoint schedule, subject to certain exceptions. In general terms, the breakpoint schedule at the fund-level reduces fees as assets in the particular fund pass certain thresholds and the breakpoint schedule at the complex-level reduces fees on certain funds as the eligible assets in the complex pass certain thresholds. Subject to exceptions for certain Nuveen funds, the Independent Board Members reviewed the fund-level and complex-level fee schedules and any resulting savings in fees. In addition, with respect to closed-end funds, the Independent Board Members noted that, although such funds may from time-to-time make additional share offerings, the growth of their assets would occur primarily through the appreciation of such funds’ investment portfolios. Further, the Independent Board Members recognized the Adviser’s continued reinvestment in its business through, among other things, improvements in technology, additional staffing, product innovations and other organizational changes designed to expand or enhance the services provided to the benefit of all of the Nuveen funds.
Based on its review, the Board concluded that the current fee arrangements together with the Adviser’s reinvestment in its business appropriately shared any economies of scale with shareholders.
E. Indirect Benefits
The Independent Board Members received and considered information regarding other benefits the respective Fund Adviser or its affiliates may receive as a result of their relationship with the Nuveen funds. The Independent Board Members reviewed the revenues that an affiliate of the Adviser received in 2017 as a result of serving as co-manager in the initial public offerings of new closed-end funds and as the underwriter on shelf offerings of existing closed-end funds.
In addition to the above, the Independent Board Members considered whether the Sub-Adviser uses commissions paid by the Fund on portfolio transactions to obtain research products and other services (“soft dollar transactions”). The Board recognized that the Sub-Adviser may benefit from research received from broker-dealers that execute Fund portfolio transactions. The Board noted that the benefits for sub-advisers transacting in fixed-income securities may be more limited as such securities generally trade on a principal basis and therefore do not generate brokerage commissions. Further, the Board noted that although the Sub-Adviser may benefit from the receipt of research and other services that it may otherwise have to pay for out of its own resources, the research may also benefit the Fund to the extent it enhances the ability of the Sub-Adviser to manage the Fund or is acquired through the commissions paid on portfolio transactions of other funds or clients.
Based on their review, the Board concluded that any indirect benefits received by a Fund Adviser as a result of its relationship with the Fund were reasonable and within acceptable parameters.
F. Other Considerations
The Board Members did not identify any single factor discussed previously as all-important or controlling. The Board Members, including the Independent Board Members, concluded that the terms of each Advisory Agreement were fair and reasonable, that the respective Fund Adviser’s fees were reasonable in light of the services provided to the Fund and that the Advisory Agreements be renewed.
50
Board Members & Officers (Unaudited)
The management of the Funds, including general supervision of the duties performed for the Funds by the Adviser, is the responsibility of the Board of Trustees of the Funds. The number of trustees of the Funds is set at eleven. None of the trustees who are not “interested” persons of the Funds (referred to herein as “independent board members”) has ever been a director or employee of, or consultant to, Nuveen or its affiliates. The names and business addresses of the trustees and officers of the Funds, their principal occupations and other affiliations during the past five years, the number of portfolios each oversees and other directorships they hold are set forth below.
|
Name,
|
Position(s) Held
|
Year First
|
Principal
|
Number
|
|
Year of Birth
|
with the Funds
|
Elected or
|
Occupation(s)
|
of Portfolios
|
|
& Address
|
|
Appointed
|
Including other
|
in Fund Complex
|
|
|
|
and Term(1)
|
Directorships
|
Overseen by
|
|
|
|
|
During Past 5 Years
|
Board Member
|
|
|
||||
|
Independent Board Members:
|
|
|
|
|
|
|
||||
|
|
||||
|
■ TERENCE J. TOTH
|
|
|
Formerly, a Co-Founding Partner, Promus Capital (2008-2017);
|
|
|
1959
|
|
|
Director, Fulcrum IT Service LLC (since 2010) and Quality Control
|
|
|
333 W. Wacker Drive
|
Chairman and
|
2008
|
Corporation (since 2012); member: Catalyst Schools of Chicago Board
|
171
|
|
Chicago, IL 6o6o6
|
Board Member
|
Class II
|
(since 2008) and Mather Foundation Board (since 2012), and chair of
|
|
|
|
|
|
its Investment Committee; formerly, Director, Legal & General Investment
|
|
|
|
|
|
Management America, Inc. (2008-2013); formerly, CEO and President,
|
|
|
|
|
|
Northern Trust Global Investments (2004-2007): Executive Vice President,
|
|
|
|
|
|
Quantitative Management & Securities Lending (2000-2004); prior thereto,
|
|
|
|
|
|
various positions with Northern Trust Company (since 1994); formerly,
|
|
|
|
|
|
Member, Northern Trust Mutual Funds Board (2005-2007), Northern Trust
|
|
|
|
|
|
Global Investments Board (2004-2007), Northern Trust Japan Board
|
|
|
|
|
|
(2004-2007), Northern Trust Securities Inc. Board (2003-2007) and Northern
|
|
|
|
|
|
Trust Hong Kong Board (1997-2004).
|
|
|
|
||||
|
■ JACK B. EVANS
|
|
|
President, The Hall-Perrine Foundation, a private philanthropic
|
|
|
1948
|
|
|
corporation (since 1996); Director and Chairman, United Fire
|
|
|
333 W. Wacker Drive
|
Board Member
|
1999
|
Group, a publicly held company; Director, Public Member, American
|
171
|
|
Chicago, IL 6o6o6
|
|
Class III
|
Board of Orthopaedic Surgery (since 2015); Life Trustee of Coe College
|
|
|
|
|
|
and the Iowa College Foundation; formerly, President Pro-Tem of the
|
|
|
|
|
|
Board of Regents for the State of Iowa University System; formerly,
|
|
|
|
|
|
Director, Alliant Energy and The Gazette Company; formerly, Director,
|
|
|
|
|
|
Federal Reserve Bank of Chicago; formerly, President and Chief Operating
|
|
|
|
|
|
Officer, SCI Financial Group, Inc., a regional financial services firm.
|
|
|
|
||||
|
■ WILLIAM C. HUNTER
|
|
|
Dean Emeritus, formerly, Dean, Tippie College of Business, University
|
|
|
1948
|
|
|
of Iowa (2006-2012); Director (since 2004) of Xerox Corporation;
|
|
|
333 W. Wacker Drive
|
Board Member
|
2003
|
Director of Wellmark, Inc. (since 2009); past Director (2005-2015), and
|
171
|
|
Chicago, IL 6o6o6
|
|
Class I
|
past President (2010-2014) Beta Gamma Sigma, Inc., The International
|
|
|
|
|
|
Business Honor Society; formerly, Dean and Distinguished Professor
|
|
|
|
|
|
of Finance, School of Business at the University of Connecticut (2003-2006);
|
|
|
|
|
|
previously, Senior Vice President and Director of Research at the Federal
|
|
|
|
|
|
Reserve Bank of Chicago (1995-2003); formerly, Director (1997-2007),
|
|
|
|
|
|
Credit Research Center at Georgetown University.
|
|
|
|
||||
|
■ ALBIN F. MOSCHNER
|
|
|
Founder and Chief Executive Officer, Northcroft Partners, LLC, a
|
|
|
1952
|
|
|
management consulting firm (since 2012); Director, USA Technologies, Inc.,
|
|
|
333 W. Wacker Drive
|
Board Member
|
2016
|
a provider of solutions and services to facilitate electronic payment
|
171
|
|
Chicago, IL 6o6o6
|
|
Class III
|
transactions (since 2012); formerly, Director, Wintrust Financial
|
|
|
|
|
|
Corporation (1996-2016); previously, held positions at Leap Wireless
|
|
|
|
|
|
International, Inc., including Consultant (2011-2012), Chief Operating
|
|
|
|
|
|
Officer (2008-2011), and Chief Marketing Officer (2004-2008); formerly,
|
|
|
|
|
|
President, Verizon Card Services division of Verizon Communications, Inc.
|
|
|
|
|
|
(2000-2003); formerly, President, One Point Services at One Point
|
|
|
|
|
|
Communications (1999-2000); formerly, Vice Chairman of the Board, Diba,
|
|
|
|
|
|
Incorporated (1996-1997); formerly, various executive positions with Zenith
|
|
|
|
|
|
Electronics Corporation (1991-1996).
|
|
51
Board Members & Officers (Unaudited) (continued)
|
Name,
|
Position(s) Held
|
Year First
|
Principal
|
Number
|
|
Year of Birth
|
with the Funds
|
Elected or
|
Occupation(s)
|
of Portfolios
|
|
& Address
|
|
Appointed
|
Including other
|
in Fund Complex
|
|
|
|
and Term(1)
|
Directorships
|
Overseen by
|
|
|
|
|
During Past 5 Years
|
Board Member
|
|
|
||||
|
Independent Board Members (continued):
|
|
|
|
|
|
|
||||
|
■ JOHN K. NELSON
|
|
|
Member of Board of Directors of Core12 LLC (since 2008), a private firm
|
|
|
1962
|
|
|
which develops branding, marketing and communications strategies
|
|
|
333 W. Wacker Drive
|
Board Member
|
2013
|
for clients; Director of The Curran Center for Catholic American Studies
|
171
|
|
Chicago, IL 6o6o6
|
|
Class II
|
(since 2009) and The President’s Council, Fordham University (since 2010);
|
|
|
|
|
|
formerly, senior external advisor to the financial services practice of Deloitte
|
|
|
|
|
|
Consulting LLP (2012-2014): formerly, Chairman of the Board of Trustees of
|
|
|
|
|
|
Marian University (2010 as trustee, 2011-2014 as Chairman); formerly, Chief
|
|
|
|
|
|
Executive Officer of ABN AMRO N.V. North America, and Global Head of
|
|
|
|
|
|
its Financial Markets Division (2007-2008); prior senior positions held at
|
|
|
|
|
|
ABN AMRO include Corporate Executive Vice President and Head of
|
|
|
|
|
|
Global Markets-the Americas (2006-2007), CEO of Wholesale Banking
|
|
|
|
|
|
North America and Global Head of Foreign Exchange and Futures Markets
|
|
|
|
|
|
(2001-2006), and Regional Commercial Treasurer and Senior Vice President
|
|
|
|
|
|
Trading-North America (1996-2001); formerly, Trustee at St. Edmund
|
|
|
|
|
|
Preparatory School in New York City.
|
|
|
|
||||
|
■ WILLIAM J. SCHNEIDER
|
|
|
Chairman of Miller-Valentine Partners, a real estate investment
|
|
|
1944
|
|
|
company; Board Member of WDPR Public Radio station; formerly,
|
|
|
333 W. Wacker Drive
|
Board Member
|
1996
|
Senior Partner and Chief Operating Officer (retired (2004) of
|
171
|
|
Chicago, IL 6o6o6
|
|
Class III
|
Miller-Valentine Group; formerly, Board member, Business Advisory
|
|
|
|
|
|
Council of the Cleveland Federal Reserve Bank and University of
|
|
|
|
|
|
Dayton Business School Advisory Council; past Chair and Director,
|
|
|
|
|
|
Dayton Development Coalition.
|
|
|
|
||||
|
■ JUDITH M. STOCKDALE
|
|
|
Board Member, Land Trust Alliance (since 2013) and U.S. Endowment
|
|
|
1947
|
|
|
for Forestry and Communities (since 2013); formerly, Executive Director
|
|
|
333 W. Wacker Drive
|
Board Member
|
1997
|
(1994-2012), Gaylord and Dorothy Donnelley Foundation; prior thereto,
|
171
|
|
Chicago, IL 6o6o6
|
|
Class I
|
Executive Director, Great Lakes Protection Fund (1990-1994).
|
|
|
|
||||
|
■ CAROLE E. STONE
|
|
|
Former Director, Chicago Board Options Exchange, Inc. (2006-2017);
|
|
|
1947
|
|
|
and C2 Options Exchange, Incorporated (2009-2017); Director, CBOE
|
|
|
333 W. Wacker Drive
|
Board Member
|
2007
|
Global Markets, Inc., formerly, CBOE Holdings, Inc. (since 2010);
|
171
|
|
Chicago, IL 6o6o6
|
|
Class I
|
formerly, Commissioner, New York State Commission on Public
|
|
|
|
|
|
Authority Reform (2005-2010).
|
|
|
|
||||
|
■ MARGARET L. WOLFF
|
|
|
Formerly, member of the Board of Directors (2013-2017) of Travelers
|
|
|
1955
|
|
|
Insurance Company of Canada and The Dominion of Canada General
|
|
|
333 W. Wacker Drive
|
Board Member
|
2016
|
Insurance Company (each, a part of Travelers Canada, the Canadian
|
171
|
|
Chicago, IL 6o6o6
|
|
Class I
|
operation of The Travelers Companies, Inc.); formerly, Of Counsel,
|
|
|
|
|
|
Skadden, Arps, Slate, Meagher & Flom LLP (Mergers & Acquisitions
|
|
|
|
|
|
Group) (2005-2014); Member of the Board of Trustees of New York-
|
|
|
|
|
|
Presbyterian Hospital (since 2005); Member (since 2004) and Chair
|
|
|
|
|
|
(since 2015) of the Board of Trustees of The John A. Hartford Foundation
|
|
|
|
|
|
(a philanthropy dedicated to improving the care of older adults); formerly,
|
|
|
|
|
|
Member (2005-2015) and Vice Chair (2011-2015) of the Board of Trustees of
|
|
|
|
|
|
Mt. Holyoke College.
|
|
52
|
Name,
|
Position(s) Held
|
Year First
|
Principal
|
Number
|
|
Year of Birth
|
with the Funds
|
Elected or
|
Occupation(s)
|
of Portfolios
|
|
& Address
|
|
Appointed
|
Including other
|
in Fund Complex
|
|
|
|
and Term(1)
|
Directorships
|
Overseen by
|
|
|
|
|
During Past 5 Years
|
Board Member
|
|
|
||||
|
Independent Board Members (continued):
|
|
|
|
|
|
|
||||
|
■ ROBERT L. YOUNG(2)
|
|
|
Formerly, Chief Operating Officer and Director, J.P.Morgan Investment
|
|
|
1963
|
|
|
Management Inc. (2010-2016); formerly, President and Principal Executive
|
|
|
333 W. Wacker Drive
|
Board Member
|
2017
|
Officer (2013-2016), and Senior Vice President and Chief Operating Officer
|
169
|
|
Chicago, IL 6o6o6
|
|
Class II
|
(2005-2010), of J.P.Morgan Funds; formerly, Director and various officer
|
|
|
|
|
|
positions for J.P.Morgan Investment Management Inc. (formerly, JPMorgan
|
|
|
|
|
|
Funds Management, Inc. and formerly, One Group Administrative Services)
|
|
|
|
|
|
and JPMorgan Distribution Services, Inc. (formerly, One Group Dealer
|
|
|
|
|
|
Services, Inc.) (1999-2017).
|
|
|
|
||||
|
Interested Board Member:
|
|
|
|
|
|
|
||||
|
■ MARGO L. COOK(3)(4)
|
|
|
President (since April 2017), formerly, Co-Chief Executive Officer and
|
|
|
1964
|
|
|
Co-President (2016-2017), formerly, Senior Executive Vice President of
|
|
|
333 W. Wacker Drive
|
Board Member
|
2016
|
Nuveen Investments, Inc.; President, Global Products and Solutions (since
|
171
|
|
Chicago, IL 6o6o6
|
|
Class III
|
July 2017), and, Co-Chief Executive Officer (since 2015), formerly, Executive
|
|
|
|
|
|
Vice President (2013-2015), of Nuveen Securities, LLC; Executive Vice
|
|
|
|
|
|
President (since February 2017) of Nuveen, LLC; President (since August
|
|
|
|
|
|
2017), formerly Co-President (October 2016- August 2017), formerly, Senior
|
|
|
|
|
|
Executive Vice President of Nuveen Fund Advisors, LLC (Executive Vice
|
|
|
|
|
|
President since 2011); President (since 2017), Nuveen Alternative
|
|
|
|
|
|
Investments, LLC; Chartered Financial Analyst.
|
|
|
|
||||
|
Name,
|
Position(s) Held
|
Year First
|
Principal
|
Number
|
|
Year of Birth
|
with the Funds
|
Elected or
|
Occupation(s)
|
of Portfolios
|
|
& Address
|
|
Appointed(4)
|
During Past 5 Years
|
in Fund Complex
|
|
|
|
|
|
Overseen by
|
|
|
|
|
|
Officer
|
|
|
||||
|
Officers of the Funds:
|
|
|
|
|
|
|
||||
|
■ CEDRIC H. ANTOSIEWICZ
|
|
|
Senior Managing Director (since January 2017), formerly, Managing
|
|
|
1962
|
Chief
|
|
Director (2004-2017) of Nuveen Securities, LLC; Senior Managing Director
|
|
|
333 W. Wacker Drive
|
Administrative
|
2007
|
(since February 2017), formerly, Managing Director (2014-2017) of Nuveen
|
75
|
|
Chicago, IL 6o6o6
|
Officer
|
|
Fund Advisors, LLC.
|
|
|
|
||||
|
■ STEPHEN D. FOY
|
|
|
Managing Director (since 2014), formerly, Senior Vice President (2013-
|
|
|
1954
|
|
|
2014) and Vice President (2005-2013) of Nuveen Fund Advisors, LLC;
|
|
|
333 W. Wacker Drive
|
Vice President
|
1998
|
Managing Director (since 2016) of Nuveen Securities, LLC Managing
|
171
|
|
Chicago, IL 6o6o6
|
and Controller
|
|
Director (since 2016) of Nuveen Alternative Investments, LLC; Certified
|
|
|
|
|
|
Public Accountant.
|
|
|
|
||||
|
■ NATHANIEL T. JONES
|
|
|
Managing Director (since January 2017), formerly, Senior Vice President
|
|
|
1979
|
|
|
(2016-2017), formerly, Vice President (2011-2016) of Nuveen.; Chartered
|
171
|
|
333 W. Wacker Drive
|
Vice President
|
2016
|
Financial Analyst.
|
|
|
Chicago, IL 6o6o6
|
and Treasurer
|
|
|
|
|
|
||||
|
■ WALTER M. KELLY
|
|
|
Managing Director (since January 2017), formerly, Senior Vice President
|
|
|
1970
|
Chief Compliance
|
|
(2008-2017) of Nuveen.
|
171
|
|
333 W. Wacker Drive
|
Officer and
|
2003
|
|
|
|
Chicago, IL 6o6o6
|
Vice President
|
|
|
|
53
Board Members & Officers (Unaudited) (continued)
|
Name,
|
Position(s) Held
|
Year First
|
Principal
|
Number
|
|
Year of Birth
|
with the Funds
|
Elected or
|
Occupation(s)
|
of Portfolios
|
|
& Address
|
|
Appointed(4)
|
During Past 5 Years
|
in Fund Complex
|
|
|
|
|
|
Overseen by
|
|
|
|
|
|
Officer
|
|
|
||||
|
Officers of the Funds (continued):
|
|
|
|
|
|
|
||||
|
■ DAVID J. LAMB
|
|
|
Managing Director (since January 2017), formerly, Senior Vice President of
|
|
|
1963
|
|
|
Nuveen (since 2006), Vice President prior to 2006.
|
75
|
|
333 W. Wacker Drive
|
Vice President
|
2015
|
|
|
|
Chicago, IL 6o6o6
|
|
|
|
|
|
|
||||
|
■ TINA M. LAZAR
|
|
|
Managing Director (since January 2017), formerly, Senior Vice President
|
|
|
1961
|
|
|
(2014-2017) of Nuveen Securities, LLC.
|
171
|
|
333 W. Wacker Drive
|
Vice President
|
2002
|
|
|
|
Chicago, IL 6o6o6
|
|
|
|
|
|
|
||||
|
■ KEVIN J. MCCARTHY
|
|
|
Senior Managing Director (since February 2017) and Secretary and General
|
|
|
1966
|
Vice President
|
|
Counsel (since 2016) of Nuveen Investments, Inc., formerly, Executive Vice
|
|
|
333 W. Wacker Drive
|
and Assistant
|
2007
|
President (2016-2017) and Managing Director and Assistant Secretary
|
171
|
|
Chicago, IL 6o6o6
|
Secretary
|
|
(2008-2016); Senior Managing Director (since January 2017) and Assistant
|
|
|
|
|
|
Secretary (since 2008) of Nuveen Securities, LLC, formerly Executive Vice President
|
|
|
|
|
|
(2016-2017) and Managing Director (2008-2016); Senior Managing Director
|
|
|
|
|
|
(since February 2017), Secretary (since 2016) and Co-General Counsel (since
|
|
|
|
|
|
2011) of Nuveen Fund Advisors, LLC, formerly, Executive Vice President (2016-
|
|
|
|
|
|
2017), Managing Director (2008-2016) and Assistant Secretary (2007-2016);
|
|
|
|
|
|
Senior Managing Director (since February 2017), Secretary (since 2016) and
|
|
|
|
|
|
Associate General Counsel (since 2011) of Nuveen Asset Management, LLC,
|
|
|
|
|
|
formerly Executive Vice President (2016-2017) and Managing Director and
|
|
|
|
|
|
Assistant Secretary (2011-2016); Senior Managing Director (since February
|
|
|
|
|
|
2017) and Secretary (since 2016) of Nuveen Investments Advisers, LLC,
|
|
|
|
|
|
formerly Executive Vice President (2016-2017); Vice President (since 2007) and
|
|
|
|
|
|
Secretary (since 2016), formerly, Assistant Secretary, of NWQ Investment
|
|
|
|
|
|
Management Company, LLC, Symphony Asset Management LLC, Santa
|
|
|
|
|
|
Barbara Asset Management, LLC and Winslow Capital Management, LLC
|
|
|
|
|
|
(since 2010). Senior Managing Director (since 2017) and Secretary (since
|
|
|
|
|
|
2016) of Nuveen Alternative Investments, LLC.
|
|
|
|
||||
|
■ WILLIAM T. MEYERS
|
|
|
Senior Managing Director (since 2017), formerly, Managing Director
|
|
|
1966
|
Vice President
|
|
(2016-2017), Senior Vice President (2010-2016) of Nuveen Securities, LLC;
|
|
|
333 W. Wacker Drive
|
|
2018
|
Senior Managing Director (since 2017), formerly, Managing Director
|
75
|
|
Chicago, IL 60606
|
|
|
(2016-2017), Senior Vice President (2010-2016) of Nuveen, has held
|
|
|
|
|
|
various positions with Nuveen since 1991.
|
|
|
|
||||
|
■ MICHAEL A. PERRY
|
|
|
Executive Vice President since February 2017, previously Managing
|
|
|
1967
|
|
|
Director from October 2016), of Nuveen Fund Advisors, LLC and
|
|
|
333 W. Wacker Drive
|
Vice President
|
2017
|
Nuveen Alternative Investments, LLC; Executive Vice President (since
|
75
|
|
Chicago, IL 6o6o6
|
|
|
2017), formerly, Managing Director (2015-2017), of Nuveen Securities,
|
|
|
|
|
|
LLC; formerly, Managing Director (2010-2015) of UBS Securities, LLC.
|
|
|
|
||||
|
■ CHRISTOPHER M. ROHRBACHER
|
|
|
Managing Director (since January 2017) of Nuveen Securities, LLC;
|
|
|
1971
|
Vice President
|
|
2008 Managing Director (since January 2017), formerly, Senior Vice
|
|
|
333 W. Wacker Drive
|
and Assistant
|
2008
|
President (2016-2017) and Assistant Secretary (since October 2016) of
|
171
|
|
Chicago, IL 6o6o6
|
Secretary
|
|
Nuveen Fund Advisors, LLC.
|
|
|
|
||||
|
■ WILLIAM A. SIFFERMANN
|
|
|
Managing Director (since February 2017), formerly Senior Vice President
|
|
|
1975
|
|
|
(2016-2017) and Vice President (2011-2016) of Nuveen.
|
171
|
|
333 W. Wacker Drive
|
Vice President
|
2017
|
|
|
|
Chicago, IL 6o6o6
|
|
|
|
|
|
|
||||
|
■ JOEL T. SLAGER
|
|
|
Fund Tax Director for Nuveen Funds (since 2013); previously, Vice
|
|
|
1978
|
Vice President
|
|
President of Morgan Stanley Investment Management, Inc., Assistant
|
|
|
333 W. Wacker Drive
|
and Assistant
|
2013
|
Treasurer of the Morgan Stanley Funds (from 2010 to 2013).
|
171
|
|
Chicago, IL 6o6o6
|
Secretary
|
|
|
|
54
|
Name,
|
Position(s) Held
|
Year First
|
Principal
|
Number
|
|
Year of Birth
|
with the Funds
|
Elected or
|
Occupation(s)
|
of Portfolios
|
|
& Address
|
|
Appointed(4)
|
During Past 5 Years
|
in Fund Complex
|
|
|
|
|
|
Overseen by
|
|
|
|
|
|
Officer
|
|
|
||||
|
Officers of the Funds (continued):
|
|
|
|
|
|
|
||||
|
■ MARK L. WINGET
|
|
|
Vice President and Assistant Secretary of Nuveen Securities, LLC
|
|
|
1968
|
Vice President
|
|
(since 2008); Vice President (since 2010) and Associate General
|
171
|
|
333 W. Wacker Drive
|
and Assistant
|
2008
|
Counsel (since 2008) of Nuveen.
|
|
|
Chicago, IL 60606
|
Secretary
|
|
|
|
|
|
||||
|
■ GIFFORD R. ZIMMERMAN
|
|
|
Managing Director (since 2002), and Assistant Secretary of Nuveen
|
|
|
1956
|
|
|
Securities, LLC; Managing Director (since 2004) and Assistant Secretary
|
|
|
333 W. Wacker Drive
|
Vice President
|
1988
|
(since 1994) of Nuveen Investments, Inc.; Managing Director (since
|
171
|
|
Chicago, IL 6o6o6
|
Secretary
|
|
2002), Assistant Secretary (since 1997) and Co-General Counsel (since
|
|
|
|
|
|
2011) of Nuveen Fund Advisors, LLC; Managing Director, Assistant Secretary
|
|
|
|
|
|
and Associate General Counsel of Nuveen Asset Management, LLC (since
|
|
|
|
|
|
2011); Vice President (since February 2017), formerly, Managing Director
|
|
|
|
|
|
(2003-2017) and Assistant Secretary (since 2003) of Symphony Asset
|
|
|
|
|
|
Management LLC; Managing Director and Assistant Secretary (since 2002)
|
|
|
|
|
|
of Nuveen Investments Advisers, LLC; Vice President and Assistant Secretary
|
|
|
|
|
|
of NWQ Investment Management Company, LLC (since 2002), Santa Barbara
|
|
|
|
|
|
Asset Management, LLC (since 2006), and of Winslow Capital Management,
|
|
|
|
|
|
LLC, (since 2010); Chartered Financial Analyst.
|
|
|
(1)
|
The Board of Trustees is divided into three classes, Class I, Class II, and Class III, with each being elected to serve until the third succeeding annual shareholders’ meeting subsequent to its election or thereafter in each case when its respective successors are duly elected or appointed, except two board members are elected by the holders of Preferred Shares, when applicable, to serve until the next annual shareholders’ meeting subsequent to its election or thereafter in each case when its respective successors are duly elected or appointed. The year first elected or appointed represents the year in which the board member was first elected or appointed to any fund in the Nuveen Complex.
|
|
(2)
|
On May 25, 2017, Mr. Young was appointed as a Board Member, effective July 1, 2017. He is a Board Member of each of the Nuveen Funds, except Nuveen Diversified Dividend and Income Fund and Nuveen Real Estate Income Fund.
|
|
(3)
|
“Interested person” as defined in the 1940 Act, by reason of her position with Nuveen, LLC. and certain of its subsidiaries, which are affiliates of the Nuveen Funds.
|
|
(4)
|
Officers serve one year terms through August of each year. The year first elected or appointed represents the year in which the Officer was first elected or appointed to any fund in the Nuveen Complex.
|
55
Nuveen:
Serving Investors for Generations
Since 1898, financial advisors and their clients have relied on Nuveen to provide dependable investment solutions through continued adherence to proven, long-term investing principles. Today, we offer a range of high quality solutions designed to be integral components of a well-diversified core portfolio.
Focused on meeting investor needs.
Nuveen is the investment manager of TIAA. We have grown into one of the world’s premier global asset managers, with specialist knowledge across all major asset classes and particular strength in solutions that provide income for investors and that draw on our expertise in alternatives and responsible investing. Nuveen is driven not only by the independent investment processes across the firm, but also the insights, risk management, analytics and other tools and resources that a truly world-class platform provides. As a global asset manager, our mission is to work in partnership with our clients to create solutions which help them secure their financial future.
Find out how we can help you.
To learn more about how the products and services of Nuveen may be able to help you meet your financial goals, talk to your financial advisor, or call us at (800) 257-8787. Please read the information provided carefully before you invest. Investors should consider the investment objective and policies, risk considerations, charges and expenses of any investment carefully. Where applicable, be sure to obtain a prospectus, which contains this and other relevant information. To obtain a prospectus, please contact your securities representative or Nuveen, 333 W. Wacker Dr., Chicago, IL 60606. Please read the prospectus carefully before you invest or send money.
Learn more about Nuveen Funds at: www.nuveen.com/closed-end-funds
Distributed by Nuveen Securities, LLC | 333 West Wacker Drive Chicago, IL 60606 | www.nuveen.com
 EAN-D-0518D 543895-INV-Y-07/19
ITEM 2. CODE OF ETHICS.
As of the end of the period covered by this report, the registrant has adopted a code of ethics that applies to the registrant’s principal executive officer, principal financial officer, principal accounting officer or controller, or persons performing similar functions. There were no amendments to or waivers from the Code during the period covered by this report. The registrant has posted the code of ethics on its website at www.nuveen.com/CEF/Shareholder/FundGovernance.aspx. (To view the code, click on Code of Conduct.)
ITEM 3. AUDIT COMMITTEE FINANCIAL EXPERT.
As of the end of the period covered by this report, the registrant’s Board of Directors or Trustees (“Board”) determined that the registrant has at least one “audit committee financial expert” (as defined in Item 3 of Form N-CSR) serving on its Audit Committee. The registrant’s audit committee financial experts are Carole E. Stone, Jack B. Evans and William C. Hunter, who are “independent” for purposes of Item 3 of Form N-CSR.
Ms. Stone served for five years as Director of the New York State Division of the Budget. As part of her role as Director, Ms. Stone was actively involved in overseeing the development of the State’s operating, local assistance and capital budgets, its financial plan and related documents; overseeing the development of the State’s bond-related disclosure documents and certifying that they fairly presented the State’s financial position; reviewing audits of various State and local agencies and programs; and coordinating the State’s system of internal audit and control. Prior to serving as Director, Ms. Stone worked as a budget analyst/examiner with increasing levels of responsibility over a 30 year period, including approximately five years as Deputy Budget Director. Ms. Stone has also served as Chair of the New York State Racing Association Oversight Board, as Chair of the Public Authorities Control Board, as a Commissioner on the New York State Commission on Public Authority Reform and as a member of the Boards of Directors of several New York State public authorities. These positions have involved overseeing operations and finances of certain entities and assessing the adequacy of project/entity financing and financial reporting. Currently, Ms. Stone is on the Board of Directors of CBOE Holdings, Inc., of the Chicago Board Options Exchange, and of C2 Options Exchange. Ms. Stone’s position on the boards of these entities and as a member of both CBOE Holdings’ Audit Committee and its Finance Committee has involved, among other things, the oversight of audits, audit plans and preparation of financial statements.
Mr. Evans was formerly President and Chief Operating Officer of SCI Financial Group, Inc., a full service registered broker-dealer and registered investment adviser (“SCI”). As part of his role as President and Chief Operating Officer, Mr. Evans actively supervised the Chief Financial Officer (the “CFO”) and actively supervised the CFO’s preparation of financial statements and other filings with various regulatory authorities. In such capacity, Mr. Evans was actively involved in the preparation of SCI’s financial statements and the resolution of issues raised in connection therewith. Mr. Evans has also served on the audit committee of various reporting companies. At such companies, Mr. Evans was involved in the oversight of audits, audit plans, and the preparation of financial statements. Mr. Evans also formerly chaired the audit committee of the Federal Reserve Bank of Chicago.
Mr. Hunter was formerly a Senior Vice President at the Federal Reserve Bank of Chicago. As part of his role as Senior Vice President, Mr. Hunter was the senior officer responsible for all operations of each of the Economic Research, Statistics, and Community and Consumer Affairs units at the Federal Reserve Bank of Chicago. In such capacity, Mr. Hunter oversaw the subunits of the Statistics and Community and Consumer Affairs divisions responsible for the analysis and evaluation of bank and bank holding company financial statements and financial filings. Prior to serving as Senior Vice President at the Federal Reserve Bank of Chicago, Mr. Hunter was the Vice President of the Financial Markets unit at the Federal Reserve Bank of Atlanta where he supervised financial staff and bank holding company analysts who analyzed and evaluated bank and bank holding company financial statements. Mr. Hunter also currently serves on the Boards of Directors of Xerox Corporation and Wellmark, Inc. as well as on the Audit Committees of such Boards. As an Audit Committee member, Mr. Hunter’s responsibilities include, among other things, reviewing financial statements, internal audits and internal controls over financial reporting. Mr. Hunter also formerly was a Professor of Finance at the University of Connecticut School of Business and has authored numerous scholarly articles on the topics of finance, accounting and economics.
ITEM 4. PRINCIPAL ACCOUNTANT FEES AND SERVICES.
Nuveen Municipal 2021 Target Term Fund
The following tables show the amount of fees that KPMG LLP, the Fund’s auditor, billed to the Fund during the Fund’s last two full fiscal years. For engagements with KPMG LLP the Audit Committee approved in advance all audit services and non-audit services that KPMG LLP provided to the Fund, except for those non-audit services that were subject to the pre-approval exception under Rule 2-01 of Regulation S-X (the “pre-approval exception”). The pre-approval exception for services provided directly to the Fund waives the pre-approval requirement for services other than audit, review or attest services if: (A) the aggregate amount of all such services provided constitutes no more than 5% of the total amount of revenues paid by the Fund to its accountant during the fiscal year in which the services are provided; (B) the Fund did not recognize the services as non-audit services at the time of the engagement; and (C) the services are promptly brought to the Audit Committee’s attention, and the Committee (or its delegate) approves the services before the audit is completed.
The Audit Committee has delegated certain pre-approval responsibilities to its Chairman (or, in his absence, any other member of the Audit Committee).
SERVICES THAT THE FUND’S AUDITOR BILLED TO THE FUND
|
Audit Fees Billed
|
Audit-Related Fees
|
Tax Fees
|
All Other Fees
|
|||||||||||||
|
Fiscal Year Ended
|
to Fund 1
|
Billed to Fund 2
|
Billed to Fund 3
|
Billed to Fund 4
|
||||||||||||
|
May 31, 2018
|
$
|
26,970
|
$
|
0
|
$
|
0
|
$
|
0
|
||||||||
|
Percentage approved
|
0
|
%
|
0
|
%
|
0
|
%
|
0
|
%
|
||||||||
|
pursuant to
|
||||||||||||||||
|
pre-approval
|
||||||||||||||||
|
exception
|
||||||||||||||||
|
May 31, 2017
|
$
|
26,250
|
$
|
0
|
$
|
0
|
$
|
0
|
||||||||
|
Percentage approved
|
0
|
%
|
0
|
%
|
0
|
%
|
0
|
%
|
||||||||
|
pursuant to
|
||||||||||||||||
|
pre-approval
|
||||||||||||||||
|
exception
|
||||||||||||||||
|
1 “Audit Fees” are the aggregate fees billed for professional services for the audit of the Fund’s annual financial statements and services provided in
|
||||||||||||||||
|
connection with statutory and regulatory filings or engagements.
|
||||||||||||||||
|
2 “Audit Related Fees” are the aggregate fees billed for assurance and related services reasonably related to the performance of the audit or review of
|
||||||||||||||||
|
financial statements that are not reported under “Audit Fees”. These fees include offerings related to the Fund’s common shares and leverage.
|
||||||||||||||||
|
3 “Tax Fees” are the aggregate fees billed for professional services for tax advice, tax compliance, and tax planning. These fees include: all global
|
||||||||||||||||
|
withholding tax services; excise and state tax reviews; capital gain, tax equalization and taxable basis calculation performed by the principal accountant.
|
||||||||||||||||
|
4 “All Other Fees” are the aggregate fees billed for products and services other than “Audit Fees”, “Audit-Related Fees” and “Tax Fees”. These fees
|
||||||||||||||||
|
represent all engagements pertaining to the Fund’s use of leverage.
|
||||||||||||||||
SERVICES THAT THE FUND’S AUDITOR BILLED TO THE ADVISER AND AFFILIATED FUND SERVICE PROVIDERS
The following tables show the amount of fees billed by KPMG LLP to Nuveen Fund Advisors, LLC (formerly Nuveen Fund Advisors, Inc.) (the “Adviser”), and any entity controlling, controlled by or under common control with the Adviser that provides ongoing services to the Fund (“Affiliated Fund Service Provider”), for engagements directly related to the Fund’s operations and financial reporting, during the Fund’s last two full fiscal years.
The tables also show the percentage of fees subject to the pre-approval exception. The pre-approval exception for services provided to the Adviser and any Affiliated Fund Service Provider (other than audit, review or attest services) waives the pre-approval requirement if: (A) the aggregate amount of all such services provided constitutes no more than 5% of the total amount of revenues paid to KPMG LLP by the Fund, the Adviser and Affiliated Fund Service Providers during the fiscal year in which the services are provided that would have to be pre-approved by the Audit Committee; (B) the Fund did not recognize the services as non-audit services at the time of the engagement; and (C) the services are promptly brought to the Audit Committee’s attention, and the Committee (or its delegate) approves the services before the Fund’s audit is completed.
|
Audit-Related Fees
|
Tax Fees Billed to
|
All Other Fees
|
|
|
Billed to Adviser and
|
Adviser and
|
Billed to Adviser
|
|
|
Affiliated Fund
|
Affiliated Fund
|
and Affiliated Fund
|
|
|
Fiscal Year Ended
|
Service Providers
|
Service Providers
|
Service Providers
|
|
May 31, 2018
|
$ 0
|
$ 0
|
$ 0
|
|
Percentage approved
|
0%
|
0%
|
0%
|
|
pursuant to
|
|||
|
pre-approval
|
|||
|
exception
|
|||
|
May 31, 2017
|
$ 0
|
$ 0
|
$ 0
|
|
Percentage approved
|
0%
|
0%
|
0%
|
|
pursuant to
|
|||
|
pre-approval
|
|||
|
exception
|
NON-AUDIT SERVICES
The following table shows the amount of fees that KPMG LLP billed during the Fund’s last two full fiscal years for non-audit services. The Audit Committee is required to pre-approve non- audit services that KPMG LLP provides to the Adviser and any Affiliated Fund Services Provider, if the engagement related directly to the Fund’s operations and financial reporting (except for those subject to the pre-approval exception described above). The Audit Committee requested and received information from KPMG LLP about any non-audit services that KPMG LLP rendered during the Fund’s last fiscal year to the Adviser and any Affiliated Fund Service Provider. The Committee considered this information in evaluating KPMG LLP’s independence.
|
Total Non-Audit Fees
|
||||
|
billed to Adviser and
|
||||
|
Affiliated Fund Service
|
Total Non-Audit Fees
|
|||
|
Providers (engagements
|
billed to Adviser and
|
|||
|
related directly to the
|
Affiliated Fund Service
|
|||
|
Total Non-Audit Fees
|
operations and financial
|
Providers (all other
|
||
|
Fiscal Year Ended
|
Billed to Fund
|
reporting of the Fund)
|
engagements)
|
Total
|
|
May 31, 2018
|
$ 0
|
$ 0
|
$ 0
|
$ 0
|
|
May 31, 2017
|
$ 0
|
$ 0
|
$ 0
|
$ 0
|
|
“Non-Audit Fees billed to Fund” for both fiscal year ends represent “Tax Fees” and “All Other Fees” billed to Fund in their respective
|
||||
|
amounts from the previous table.
|
||||
|
Less than 50 percent of the hours expended on the principal accountant’s engagement to audit the registrant’s financial statements for the most recent
|
||||
|
fiscal year were attributed to work performed by persons other than the principal accountant’s full-time, permanent employees.
|
||||
Audit Committee Pre-Approval Policies and Procedures. Generally, the Audit Committee must approve (i) all non-audit services to be performed for the Fund by the Fund’s independent accountants and (ii) all audit and non-audit services to be performed by the Fund’s independent accountants for the Affiliated Fund Service Providers with respect to operations and financial reporting of the Fund. Regarding tax and research projects conducted by the independent accountants for the Fund and Affiliated Fund Service Providers (with respect to operations and financial reports of the Fund) such engagements will be (i) pre-approved by the Audit Committee if they are expected to be for amounts greater than $10,000; (ii) reported to the Audit Committee chairman for his verbal approval prior to engagement if they are expected to be for amounts under $10,000 but greater than $5,000; and (iii) reported to the Audit Committee at the next Audit Committee meeting if they are expected to be for an amount under $5,000.
ITEM 5. AUDIT COMMITTEE OF LISTED REGISTRANTS.
The registrant’s Board has a separately designated Audit Committee established in accordance with Section 3(a)(58)(A) of the Securities Exchange Act of 1934, as amended (15 U.S.C. 78c(a)(58)(A)). As of the end of the period covered by this report the members of the audit committee are Jack B. Evans, Chair, William C. Hunter, John K. Nelson, Carole E. Stone and Terence J. Toth.
ITEM 6. SCHEDULE OF INVESTMENTS.
a) See Portfolio of Investments in Item 1.
b) Not applicable.
ITEM 7. DISCLOSURE OF PROXY VOTING POLICIES AND PROCEDURES FOR CLOSED-END MANAGEMENT INVESTMENT COMPANIES.
Nuveen Fund Advisors, LLC is the registrant’s investment adviser (referred to herein as the “Adviser”). The Adviser is responsible for the on-going monitoring of the Fund’s investment portfolio, managing the Fund’s business affairs and providing certain clerical, bookkeeping and administrative services. The Adviser has engaged Nuveen Asset Management, LLC (“Sub-Adviser”) as Sub-Adviser to provide discretionary investment advisory services. As part of these services, the Adviser has delegated to the Sub-Adviser the full responsibility for proxy voting on securities held in the registrant’s portfolio and related duties in accordance with the Sub-Adviser’s policies and procedures. The Adviser periodically monitors the Sub-Adviser’s voting to ensure that it is carrying out its duties. The Sub-Adviser’s proxy voting policies and procedures are attached to this filing as an exhibit and incorporated herein by reference.
ITEM 8. PORTFOLIO MANAGERS OF CLOSED-END MANAGEMENT INVESTMENT COMPANIES.
Nuveen Fund Advisors, LLC is the registrant’s investment adviser (also referred to as the “Adviser”). The Adviser is responsible for the selection and on-going monitoring of the Fund’s investment portfolio, managing the Fund’s business affairs and providing certain clerical, bookkeeping and administrative services. The Adviser has engaged Nuveen Asset Management, LLC (“Nuveen Asset Management” or “Sub-Adviser”) as Sub-Adviser to provide discretionary investment advisory services. The following section provides information on the portfolio managers at the Sub-Adviser:
Item 8(a)(1). PORTFOLIO MANAGER BIOGRAPHY
Steven M. Hlavin is a Senior Vice President at Nuveen Asset Management, LLC. He manages several open-end, closed-end and exchange-traded funds as well as a number of institutional portfolios. In addition to his portfolio management duties, he manages the firm’s tender option bond program. Currently, he manages investments for 7 Nuveen-sponsored investment companies. Prior to his current position, Mr. Hlavin was a senior analyst responsible for the firm’s risk management and performance reporting process. Mr. Hlavin joined the firm in 2003.
John V. Miller, CFA, joined Nuveen's investment management team as a credit analyst in 1996, with three prior years of experience in the municipal market with C.W. Henderson & Assoc., a municipal bond manager for private accounts. He has a BA in Economics and Political Science from Duke University, and an MA in Economics from Northwestern University and an MBA with honors in Finance from the University of Chicago. He has been responsible for analysis of high yield credits in the utility, solid waste and energy related sectors. He is a Managing Director and Co-Head of Fixed Income of Nuveen Asset Management. He manages investments for 10 Nuveen-sponsored investment companies.
Item 8(a)(2). OTHER ACCOUNTS MANAGED BY THE PORTFOLIO MANAGER
Other Accounts Managed. In addition to managing the registrant, the portfolio manager is also primarily responsible for the day-to-day portfolio management of the following accounts:
|
Portfolio Manager
|
Type of Account
Managed |
Number of
Accounts |
Assets*
|
|
Steven M. Hlavin
|
Registered Investment Company
|
9
|
$12.78 billion
|
|
Other Pooled Investment Vehicles
|
0
|
$0
|
|
|
Other Accounts
|
1
|
$5.7 million
|
|
|
John V. Miller
|
Registered Investment Company
|
10
|
$29.16 billion
|
|
Other Pooled Investment Vehicles
|
8
|
$238 million
|
|
|
Other Accounts
|
13
|
$66.5 million
|
| * |
Assets are as of May 31, 2018. None of the assets in these accounts are subject to an advisory fee based on performance.
|
POTENTIAL MATERIAL CONFLICTS OF INTEREST
Actual or apparent conflicts of interest may arise when a portfolio manager has day-to-day management responsibilities with respect to more than one account. More specifically, portfolio managers who manage multiple accounts are presented a number of potential conflicts, including, among others, those discussed below.
The management of multiple accounts may result in a portfolio manager devoting unequal time and attention to the management of each account. Nuveen Asset Management seeks to manage such competing interests for the time and attention of portfolio managers by having portfolio managers focus on a particular investment discipline. Most accounts managed by a portfolio manager in a particular investment strategy are managed using the same investment models.
If a portfolio manager identifies a limited investment opportunity which may be suitable for more than one account, an account may not be able to take full advantage of that opportunity due to an allocation of filled purchase or sale orders across all eligible accounts. To deal with these situations, Nuveen Asset Management has adopted procedures for allocating limited opportunities across multiple accounts.
With respect to many of its clients’ accounts, Nuveen Asset Management determines which broker to use to execute transaction orders, consistent with its duty to seek best execution of the transaction. However, with respect to certain other accounts, Nuveen Asset Management may be limited by the client with respect to the selection of brokers or may be instructed to direct trades through a particular broker. In these cases, Nuveen Asset Management may place separate, non-simultaneous, transactions for a Fund and other accounts which may temporarily affect the market price of the security or the execution of the transaction, or both, to the detriment of the Fund or the other accounts.
Some clients are subject to different regulations. As a consequence of this difference in regulatory requirements, some clients may not be permitted to engage in all the investment techniques or transactions or to engage in these transactions to the same extent as the other accounts managed by the portfolio manager. Finally, the appearance of a conflict of interest may arise where Nuveen Asset Management has an incentive, such as a performance-based management fee, which relates to the management of some accounts, with respect to which a portfolio manager has day-to-day management responsibilities.
Nuveen Asset Management has adopted certain compliance procedures which are designed to address these types of conflicts common among investment managers. However, there is no guarantee that such procedures will detect each and every situation in which a conflict arises.
Item 8(a)(3). FUND MANAGER COMPENSATION
Portfolio manager compensation consists primarily of base pay, an annual cash bonus and long term incentive payments.
Base pay. Base pay is determined based upon an analysis of the portfolio manager’s general performance, experience, and market levels of base pay for such position.
Annual cash bonus. The Fund’s portfolio managers are eligible for an annual cash bonus based on investment performance, qualitative evaluation and financial performance of Nuveen Asset Management.
A portion of each portfolio manager’s annual cash bonus is based on the Fund’s pre-tax investment performance, generally measured over the past one- and three or five-year periods unless the portfolio manager’s tenure is shorter. Investment performance for the Fund generally is determined by evaluating the Fund’s performance relative to its benchmark(s) and/or Lipper industry peer group.
A portion of the cash bonus is based on a qualitative evaluation made by each portfolio manager’s supervisor taking into consideration a number of factors, including the portfolio manager’s team collaboration, expense management, support of personnel responsible for asset growth, and his or her compliance with Nuveen Asset Management’s policies and procedures.
The final factor influencing a portfolio manager’s cash bonus is the financial performance of Nuveen Asset Management based on its operating earnings.
Long-term incentive compensation. Certain key employees of Nuveen Asset Management, including certain portfolio managers, have received profits interests in Nuveen Asset Management which entitle their holders to participate in the firm’s growth over time.
There are generally no differences between the methods used to determine compensation with respect to the Fund and the Other Accounts shown in the table above.
Item 8(a)(4). OWNERSHIP OF REGISTRANT’S SECURITIES AS OF MAY 31, 2018
|
Name of Portfolio Manager
|
None
|
$1 - $10,000
|
$10,001-$50,000
|
$50,001-$100,000
|
$100,001-$500,000
|
$500,001-$1,000,000
|
Over $1,000,000
|
|
Steven M. Hlavin
|
X
|
||||||
|
John V. Miller
|
X
|
ITEM 9. PURCHASES OF EQUITY SECURITIES BY CLOSED-END MANAGEMENT INVESTMENT COMPANY AND AFFILIATED PURCHASERS.
Not applicable.
ITEM 10. SUBMISSION OF MATTERS TO A VOTE OF SECURITY HOLDERS.
There have been no material changes to the procedures by which shareholders may recommend nominees to the registrant’s Board implemented after the registrant last provided disclosure in response to this Item.
ITEM 11. CONTROLS AND PROCEDURES.
|
(a)
|
The registrant’s principal executive and principal financial officers, or persons performing similar functions, have concluded that the registrant’s disclosure controls and procedures (as defined in Rule 30a-3(c) under the Investment Company Act of 1940, as amended (the “1940 Act”) (17 CFR 270.30a-3(c))) are effective, as of a date within 90 days of the filing date of this report that includes the disclosure required by this paragraph, based on their evaluation of the controls and procedures required by Rule 30a-3(b) under the 1940 Act (17 CFR 270.30a-3(b)) and Rules 13a-15(b) or 15d-15(b) under the Securities Exchange Act of 1934, as amended (the “Exchange Act”) (17 CFR 240.13a-15(b) or 240.15d-15(b)).
|
|
(b)
|
There were no changes in the registrant’s internal control over financial reporting (as defined in Rule 30a-3(d) under the 1940 Act (17 CFR 270.30a-3(d)) that occurred during the second fiscal quarter of the period covered by this report that has materially affected, or is reasonably likely to materially affect, the registrant’s internal control over financial reporting.
|
ITEM 12. DISCLOSURE OF SECURITIES LENDING ACTIVITIES FOR CLOSED-END MANAGEMENT INVESTMENT COMPANIES.
Not applicable.
ITEM 13. EXHIBITS.
File the exhibits listed below as part of this Form.
|
(a)(1)
|
Any code of ethics, or amendment thereto, that is the subject of the disclosure required by Item 2, to the extent that the registrant intends to satisfy the Item 2 requirements through filing of an exhibit: Not applicable because the code is posted on registrant’s website at www.nuveen.com/CEF/Shareholder/FundGovernance.aspx and there were no amendments during the period covered by this report. (To view the code, click on Code of Conduct.)
|
|
(a)(2)
|
A separate certification for each principal executive officer and principal financial officer of the registrant as required by Rule 30a-2(a) under the 1940 Act (17 CFR 270.30a-2(a)) in the exact form set forth below: Ex-99.CERT Attached hereto.
|
|
(a)(3)
|
Any written solicitation to purchase securities under Rule 23c-1 under the 1940 Act (17 CFR 270.23c-1) sent or given during the period covered by the report by or on behalf of the registrant to 10 or more persons. Not applicable.
|
|
(b)
|
If the report is filed under Section 13(a) or 15(d) of the Exchange Act, provide the certifications required by Rule 30a-2(b) under the 1940 Act (17 CFR 270.30a-2(b)); Rule 13a-14(b) or Rule 15d-14(b) under the Exchange Act (17 CFR 240.13a-14(b) or 240.15d-14(b)), and Section 1350 of Chapter 63 of Title 18 of the United States Code (18 U.S.C. 1350) as an exhibit. A certification furnished pursuant to this paragraph will not be deemed “filed” for purposes of Section 18 of the Exchange Act (15 U.S.C. 78r), or otherwise subject to the liability of that section. Such certification will not be deemed to be incorporated by reference into any filing under the Securities Act of 1933 or the Exchange Act, except to the extent that the registrant specifically incorporates it by reference. Ex-99.906 CERT attached hereto.
|
SIGNATURES
Pursuant to the requirements of the Securities Exchange Act of 1934 and the Investment Company Act of 1940, the registrant has duly caused this report to be signed on its behalf by the undersigned, thereunto duly authorized.
(Registrant) Nuveen Municipal 2021 Target Term Fund
By (Signature and Title) /s/ Gifford R. Zimmerman
Gifford R. Zimmerman
Vice President and Secretary
Date: August 7, 2018
Pursuant to the requirements of the Securities Exchange Act of 1934 and the Investment Company Act of 1940, this report has been signed below by the following persons on behalf of the registrant and in the capacities and on the dates indicated.
By (Signature and Title) /s/ Cedric H. Antosiewicz
Cedric H. Antosiewicz
Chief Administrative Officer
(principal executive officer)
Date: August 7, 2018
By (Signature and Title) /s/ Stephen D. Foy
Stephen D. Foy
Vice President and Controller
(principal financial officer)
Date: August 7, 2018