Brookfield Business Partners L.P.
UNAUDITED INTERIM CONDENSED CONSOLIDATED FINANCIAL STATEMENTS OF
BROOKFIELD BUSINESS PARTNERS L.P.
As at September 30, 2018 and December 31, 2017 and for the
three and nine months ended September 30, 2018 and 2017
1
INDEX TO THE UNAUDITED INTERIM CONDENSED CONSOLIDATED
FINANCIAL STATEMENTS OF BROOKFIELD BUSINESS PARTNERS L.P.
Unaudited Interim Condensed Consolidated Statements of Financial Position | 3 | |
Unaudited Interim Condensed Consolidated Statements of Operating Results | 4 | |
Unaudited Interim Condensed Consolidated Statements of Comprehensive Income (Loss) | 5 | |
Unaudited Interim Condensed Consolidated Statements of Changes in Equity | 6 | |
Unaudited Interim Condensed Consolidated Statements of Cash Flow | 7 | |
Notes to Unaudited Interim Condensed Consolidated Financial Statements | 8 | |
2
BROOKFIELD BUSINESS PARTNERS L.P.
UNAUDITED INTERIM CONDENSED CONSOLIDATED STATEMENTS
OF FINANCIAL POSITION
(US$ MILLIONS) | Notes | September 30, 2018 | December 31, 2017 | |||||||
Assets | ||||||||||
Cash and cash equivalents | 4 | $ | 1,770 | $ | 1,106 | |||||
Financial assets | 5 | 795 | 361 | |||||||
Accounts and other receivable, net | 6 | 4,646 | 3,454 | |||||||
Inventory, net | 7 | 1,769 | 1,068 | |||||||
Assets held for sale | 8 | 145 | 14 | |||||||
Other assets | 9 | 1,075 | 430 | |||||||
Current assets | 10,200 | 6,433 | ||||||||
Financial assets | 5 | 457 | 423 | |||||||
Accounts and other receivable, net | 6 | 784 | 908 | |||||||
Other assets | 9 | 518 | 79 | |||||||
Property, plant and equipment | 10 | 7,067 | 2,530 | |||||||
Deferred income tax assets | 217 | 174 | ||||||||
Intangible assets | 3 | 5,427 | 3,094 | |||||||
Equity accounted investments | 11 | 536 | 609 | |||||||
Goodwill | 3 | 2,420 | 1,554 | |||||||
Total assets | $ | 27,626 | $ | 15,804 | ||||||
Liabilities and equity | ||||||||||
Liabilities | ||||||||||
Accounts payable and other | 12 | $ | 7,683 | $ | 4,865 | |||||
Liabilities associated with assets held for sale | 8 | 12 | — | |||||||
Borrowings | 14 | 1,172 | 825 | |||||||
Current liabilities | 8,867 | 5,690 | ||||||||
Accounts payable and other | 12 | 1,703 | 773 | |||||||
Borrowings | 14 | 9,693 | 2,440 | |||||||
Deferred income tax liabilities | 887 | 837 | ||||||||
Total liabilities | $ | 21,150 | $ | 9,740 | ||||||
Equity | ||||||||||
Limited partners | 17 | $ | 1,519 | $ | 1,585 | |||||
Non-controlling interests attributable to: | ||||||||||
Redemption-Exchange Units, Preferred Shares and Special Limited Partnership Units held by Brookfield Asset Management Inc. | 17 | 1,386 | 1,453 | |||||||
Interest of others in operating subsidiaries | 3,571 | 3,026 | ||||||||
Total equity | 6,476 | 6,064 | ||||||||
Total liabilities and equity | $ | 27,626 | $ | 15,804 | ||||||
The accompanying notes are an integral part of the unaudited interim condensed consolidated financial statements.
3
BROOKFIELD BUSINESS PARTNERS L.P.
UNAUDITED INTERIM CONDENSED CONSOLIDATED STATEMENTS
OF OPERATING RESULTS
Three Months Ended September 30, | Nine Months Ended September 30, | |||||||||||||||||
(US$ MILLIONS, except per unit amounts) | Notes | 2018 | 2017 | 2018 | 2017 | |||||||||||||
Revenues | 20 | $ | 9,990 | $ | 7,640 | $ | 26,959 | $ | 14,444 | |||||||||
Direct operating costs | 19 | (9,080 | ) | (7,295 | ) | (24,929 | ) | (13,842 | ) | |||||||||
General and administrative expenses | 20 | (174 | ) | (95 | ) | (434 | ) | (233 | ) | |||||||||
Depreciation and amortization expense | 20 | (251 | ) | (109 | ) | (462 | ) | (262 | ) | |||||||||
Interest income (expense), net | 20 | (148 | ) | (66 | ) | (317 | ) | (135 | ) | |||||||||
Equity accounted income (loss), net | 11 | (9 | ) | 37 | 1 | 61 | ||||||||||||
Impairment expense, net | 10 | (180 | ) | — | (180 | ) | (30 | ) | ||||||||||
Gain (loss) on acquisitions/dispositions, net | 3,8 | 247 | (14 | ) | 353 | 267 | ||||||||||||
Other income (expenses), net | (42 | ) | (41 | ) | (63 | ) | (36 | ) | ||||||||||
Income (loss) before income tax | 353 | 57 | 928 | 234 | ||||||||||||||
Income tax (expense) recovery | ||||||||||||||||||
Current | (43 | ) | (19 | ) | (123 | ) | (19 | ) | ||||||||||
Deferred | (25 | ) | 6 | 4 | 6 | |||||||||||||
Net income (loss) | $ | 285 | $ | 44 | $ | 809 | $ | 221 | ||||||||||
Attributable to: | ||||||||||||||||||
Limited partners | $ | (1 | ) | $ | (8 | ) | $ | 4 | $ | 21 | ||||||||
Non-controlling interests attributable to: | ||||||||||||||||||
Redemption-Exchange Units held by Brookfield Asset Management Inc. | — | (8 | ) | 4 | 23 | |||||||||||||
Special Limited Partners | 17 | 94 | 25 | 278 | 25 | |||||||||||||
Interest of others in operating subsidiaries | 192 | 35 | 523 | 152 | ||||||||||||||
$ | 285 | $ | 44 | $ | 809 | $ | 221 | |||||||||||
Basic and diluted earnings per limited partner unit | 17 | $ | — | $ | (0.15 | ) | $ | 0.06 | $ | 0.40 | ||||||||
The accompanying notes are an integral part of the unaudited interim condensed consolidated financial statements.
4
BROOKFIELD BUSINESS PARTNERS L.P.
UNAUDITED INTERIM CONDENSED CONSOLIDATED STATEMENTS
OF COMPREHENSIVE INCOME (LOSS)
Three Months Ended September 30, | Nine Months Ended September 30, | ||||||||||||||||
(US$ MILLIONS) | Notes | 2018 | 2017 | 2018 | 2017 | ||||||||||||
Net income (loss) | $ | 285 | $ | 44 | $ | 809 | $ | 221 | |||||||||
Other comprehensive income (loss): | |||||||||||||||||
Items that may be reclassified subsequently to profit or loss: | |||||||||||||||||
Foreign currency translation | $ | (38 | ) | $ | 179 | $ | (361 | ) | $ | 206 | |||||||
Available-for-sale securities | — | 12 | — | 7 | |||||||||||||
Net investment and cash flow hedges | 4 | (1 | ) | (25 | ) | 79 | (52 | ) | |||||||||
Equity accounted investment | 11 | 3 | (2 | ) | — | (3 | ) | ||||||||||
Taxes on the above items | (8 | ) | 2 | (12 | ) | 4 | |||||||||||
(44 | ) | 166 | (294 | ) | 162 | ||||||||||||
Items that will not be reclassified subsequently to profit or loss: | |||||||||||||||||
Fair value through OCI | 6 | — | 62 | — | |||||||||||||
Taxes on the above item | — | — | (1 | ) | — | ||||||||||||
Total other comprehensive income (loss) | (38 | ) | — | (233 | ) | — | |||||||||||
Comprehensive income (loss) | $ | 247 | $ | 210 | $ | 576 | $ | 383 | |||||||||
Attributable to: | |||||||||||||||||
Limited partners | $ | (7 | ) | $ | 17 | $ | (33 | ) | $ | 54 | |||||||
Non-controlling interests attributable to: | |||||||||||||||||
Redemption-Exchange Units held by Brookfield Asset Management Inc. | (6 | ) | 18 | (32 | ) | 58 | |||||||||||
Special Limited Partners | 94 | 25 | 278 | 25 | |||||||||||||
Interest of others in operating subsidiaries | 166 | 150 | 363 | 246 | |||||||||||||
$ | 247 | $ | 210 | $ | 576 | $ | 383 | ||||||||||
The accompanying notes are an integral part of the unaudited interim condensed consolidated financial statements.
5
BROOKFIELD BUSINESS PARTNERS L.P.
UNAUDITED INTERIM CONDENSED CONSOLIDATED STATEMENTS OF CHANGES IN EQUITY
Non-controlling interests | ||||||||||||||||||||||||||||||||||||||||||||||||
Limited Partners | Redemption-Exchange Units held by Brookfield Asset Management Inc. | Special Limited Partners | Preferred Shares | |||||||||||||||||||||||||||||||||||||||||||||
(US$ MILLIONS) | Capital | Retained earnings | Ownership change (1) | Accumulated other comprehensive income (loss) (2) | Limited Partners | Capital | Retained earnings | Ownership change (1) | Accumulated other comprehensive income (loss) (2) | Redemption- Exchange Units | Retained earnings | Capital | Interest of others in operating subsidiaries | Total Equity | ||||||||||||||||||||||||||||||||||
Balance as at January 1, 2018 | $ | 1,766 | $ | (69 | ) | $ | — | $ | (112 | ) | $ | 1,585 | $ | 1,674 | $ | (71 | ) | $ | — | $ | (165 | ) | $ | 1,438 | $ | — | $ | 15 | $ | 3,026 | $ | 6,064 | ||||||||||||||||
Adoption of new accounting standards (3) | — | (132 | ) | — | — | (132 | ) | — | (128 | ) | — | — | (128 | ) | — | — | (5 | ) | (265 | ) | ||||||||||||||||||||||||||||
Revised opening balance January 1, 2018 | 1,766 | (201 | ) | — | (112 | ) | 1,453 | 1,674 | (199 | ) | — | (165 | ) | 1,310 | — | 15 | 3,021 | 5,799 | ||||||||||||||||||||||||||||||
Net income (loss) | — | 4 | — | — | 4 | — | 4 | — | — | 4 | 278 | — | 523 | 809 | ||||||||||||||||||||||||||||||||||
Other comprehensive income (loss) | — | — | — | (37 | ) | (37 | ) | — | — | — | (36 | ) | (36 | ) | — | — | (160 | ) | (233 | ) | ||||||||||||||||||||||||||||
Total comprehensive income (loss) | — | 4 | — | (37 | ) | (33 | ) | — | 4 | — | (36 | ) | (32 | ) | 278 | — | 363 | 576 | ||||||||||||||||||||||||||||||
Contributions | — | — | — | — | — | — | — | — | — | — | — | — | 80 | 80 | ||||||||||||||||||||||||||||||||||
Distributions (4) | — | (12 | ) | — | — | (12 | ) | — | (12 | ) | — | — | (12 | ) | (278 | ) | — | (2,153 | ) | (2,455 | ) | |||||||||||||||||||||||||||
Ownership change (1) | — | (93 | ) | 205 | (1 | ) | 111 | — | (89 | ) | 195 | (1 | ) | 105 | — | — | 1,564 | 1,780 | ||||||||||||||||||||||||||||||
Acquisition of interest (5) | — | — | — | — | — | — | — | — | — | — | — | — | 696 | 696 | ||||||||||||||||||||||||||||||||||
Balance as at September 30, 2018 | $ | 1,766 | $ | (302 | ) | $ | 205 | $ | (150 | ) | $ | 1,519 | $ | 1,674 | $ | (296 | ) | $ | 195 | $ | (202 | ) | $ | 1,371 | $ | — | $ | 15 | $ | 3,571 | $ | 6,476 | ||||||||||||||||
Balance as at January 1, 2017 | $ | 1,345 | $ | 2 | $ | — | $ | (141 | ) | $ | 1,206 | $ | 1,474 | $ | 3 | $ | — | $ | (197 | ) | $ | 1,280 | $ | — | $ | 15 | $ | 1,537 | $ | 4,038 | ||||||||||||||||||
Net income (loss) | — | 21 | — | — | 21 | — | 23 | — | — | 23 | 25 | — | 152 | 221 | ||||||||||||||||||||||||||||||||||
Other comprehensive income (loss) | — | — | — | 33 | 33 | — | — | — | 35 | 35 | — | — | 94 | 162 | ||||||||||||||||||||||||||||||||||
Total comprehensive income (loss) | — | 21 | — | 33 | 54 | — | 23 | — | 35 | 58 | 25 | — | 246 | 383 | ||||||||||||||||||||||||||||||||||
Contributions | — | — | — | — | — | — | — | — | — | — | — | — | 4 | 4 | ||||||||||||||||||||||||||||||||||
Distributions | — | (11 | ) | — | — | (11 | ) | — | (10 | ) | — | — | (10 | ) | (25 | ) | — | (381 | ) | (427 | ) | |||||||||||||||||||||||||||
Ownership change | — | — | — | — | — | — | — | — | — | — | — | — | — | — | ||||||||||||||||||||||||||||||||||
Acquisition of interest | — | — | — | — | — | — | — | — | — | — | — | — | 1,444 | 1,444 | ||||||||||||||||||||||||||||||||||
Unit Issuance (3) | 392 | — | — | — | 392 | 200 | — | — | — | 200 | — | — | — | 592 | ||||||||||||||||||||||||||||||||||
Other | $ | — | $ | — | $ | — | $ | — | $ | — | $ | — | $ | (3 | ) | $ | — | $ | — | $ | (3 | ) | $ | — | $ | — | $ | — | $ | (3 | ) | |||||||||||||||||
Balance as at September 30, 2017 | $ | 1,737 | $ | 12 | $ | — | $ | (108 | ) | $ | 1,641 | $ | 1,674 | $ | 13 | $ | — | $ | (162 | ) | $ | 1,525 | $ | — | $ | 15 | $ | 2,850 | $ | 6,031 | ||||||||||||||||||
__________________________
(1) | Includes gains or losses on changes in ownership interests of consolidated subsidiaries. |
(2) | See Note 17 for additional information. |
(3) | See Note 2(c) for additional information on adoption of new accounting standards. |
(4) | See Note 17 for additional information on distributions as it relates to the Special Limited Partners. |
(5) | See Note 3 Acquisition of businesses for additional information. |
The accompanying notes are an integral part of the unaudited interim condensed consolidated financial statements.
6
BROOKFIELD BUSINESS PARTNERS L.P.
UNAUDITED INTERIM CONDENSED CONSOLIDATED STATEMENTS OF CASH FLOW
Nine Months Ended September 30, | ||||||||||
(US$ MILLIONS) | Notes | 2018 | 2017 | |||||||
Operating Activities | ||||||||||
Net income (loss) | $ | 809 | $ | 221 | ||||||
Adjusted for the following items: | ||||||||||
Share of undistributed equity accounted earnings | 23 | (61 | ) | |||||||
Impairment expense, net | 180 | 30 | ||||||||
Depreciation and amortization expense | 462 | 262 | ||||||||
Gain on acquisitions/dispositions, net | (353 | ) | (267 | ) | ||||||
Provisions and other items | 14 | 27 | ||||||||
Deferred income tax expense (recovery) | (4 | ) | (6 | ) | ||||||
Changes in non-cash working capital, net | 21 | (775 | ) | (165 | ) | |||||
Cash from operating activities | 356 | 41 | ||||||||
Financing Activities | ||||||||||
Proceeds from borrowings | 6,539 | 1,423 | ||||||||
Repayment of borrowings | (1,973 | ) | (768 | ) | ||||||
Proceeds from other credit facilities, net | 416 | 339 | ||||||||
Capital provided by limited partners and Redemption-Exchange Unitholders | — | 592 | ||||||||
Capital provided by others who have interests in operating subsidiaries | 1,386 | 699 | ||||||||
Distributions to limited partners and Redemption-Exchange Unitholders | (24 | ) | (21 | ) | ||||||
Distributions to Special Limited Partners Unitholders | (232 | ) | (25 | ) | ||||||
Distributions to others who have interests in operating subsidiaries | 17 | (1,792 | ) | (381 | ) | |||||
Cash from (used in) financing activities | 4,320 | 1,858 | ||||||||
Investing Activities | ||||||||||
Acquisitions | ||||||||||
Subsidiaries, net of cash acquired | 3 | (3,354 | ) | (1,575 | ) | |||||
Property, plant and equipment and intangible assets | (345 | ) | (168 | ) | ||||||
Equity accounted investments | (8 | ) | (208 | ) | ||||||
Financial assets | (417 | ) | (198 | ) | ||||||
Dispositions | ||||||||||
Subsidiaries, net of cash disposed | — | 382 | ||||||||
Property, plant and equipment | 66 | 16 | ||||||||
Equity accounted investments | 143 | 21 | ||||||||
Financial assets | 9 | 259 | ||||||||
Net settlement of foreign exchange hedges | 4 | (6 | ) | |||||||
Restricted cash and deposits | (59 | ) | 84 | |||||||
Cash from (used in) investing activities | (3,961 | ) | (1,393 | ) | ||||||
Cash | ||||||||||
Change during the period | 715 | 506 | ||||||||
Impact of foreign exchange on cash | (51 | ) | 17 | |||||||
Balance, beginning of year | 1,106 | 1,050 | ||||||||
Balance, end of period | $ | 1,770 | $ | 1,573 | ||||||
Supplemental cash flow information is presented in Note 21
The accompanying notes are an integral part of the unaudited interim condensed consolidated financial statements.
7
NOTES TO UNAUDITED INTERIM CONDENSED
CONSOLIDATED FINANCIAL STATEMENTS
As at September 30, 2018 and December 31, 2017 and for the three and nine months ended
September 30, 2018 and 2017
NOTE 1. NATURE AND DESCRIPTION OF THE PARTNERSHIP
Brookfield Business Partners L.P. and its subsidiaries, (collectively, "the partnership") own and operate business services and industrial operations ("the Business") on a global basis. Brookfield Business Partners L.P. was registered as a limited partnership established under the laws of Bermuda, and organized pursuant to a limited partnership agreement as amended on May 31, 2016, and as further amended on June 17, 2016. Brookfield Business Partners L.P. is a subsidiary of Brookfield Asset Management Inc. ("Brookfield Asset Management" or "Brookfield" or the "parent company"). Brookfield Business Partners L.P.'s limited partnership units are listed on the New York Stock Exchange and the Toronto Stock Exchange under the symbols "BBU" and "BBU.UN", respectively. The registered head office of Brookfield Business Partners L.P. is 73 Front Street, 5th Floor, Hamilton HM 12, Bermuda.
NOTE 2. SIGNIFICANT ACCOUNTING POLICIES
(a) | Basis of presentation |
These unaudited interim condensed consolidated financial statements of the partnership have been prepared in accordance with International Accounting Standard 34, Interim Financial Reporting, or IAS 34, as issued by the International Accounting Standards Board, or the IASB, and using the accounting policies the partnership applied in its annual consolidated financial statements as at and for the year ended December 31, 2017, except for the impact of the adoption of the accounting standards described below. The accounting policies the partnership applied in its annual consolidated financial statements as at and for the year ended December 31, 2017 are disclosed in Note 2 of such consolidated financial statements, with which reference should be made in reading these unaudited interim condensed consolidated financial statements. All defined terms are also described in the annual consolidated financial statements. The unaudited interim condensed consolidated financial statements are prepared on a going concern basis and have been presented in U.S. dollars rounded to the nearest million unless otherwise indicated.
The preparation of financial statements in accordance with IAS 34 requires the use of certain critical accounting estimates. It also requires management to exercise judgment in applying the accounting policies. The critical accounting estimates and judgments have been set out in Note 2 to the partnership's consolidated financial statements as at and for the year ended December 31, 2017. There have been no significant changes to the method of determining significant estimates and judgments since December 31, 2017, other than changes required as a result of adopting new standards as discussed below.
These unaudited interim condensed consolidated financial statements were approved by the partnership's Board of Directors and authorized for issue on November 1, 2018.
Revision of Comparatives
The comparative cash flow figures for the nine month period ended September 30, 2017, have been revised for the correction of an immaterial error identified by management related to the reclassification of cash flows from bank overdrafts, from an acquisition completed in May 2017 in our business services segment, within the unaudited interim condensed consolidated statements of cash flow. As a result, for the nine month period ended September 30, 2017, $339 million (year ended December 31, 2017: $360 million; and three month period ended March 31, 2018: $177 million), which was previously reported in accounts payable and other within the operating activities line item entitled changes in non-cash working capital, net, is now being reported within the financing activities line item entitled proceeds from credit facilities, net. The 2017 comparative figures in the supplemental cash flow information within Note 21 have also been updated to remove the bank overdraft which was previously recorded within accounts payable and other. The correction of the classification in the statement of cash flow is immaterial and had no impact on the partnership’s historical unaudited interim condensed statements of financial position, statements of operating results, statements of comprehensive income, and statements of changes in equity.
Segment Change
In connection with the acquisition of Westinghouse Electric Company ("Westinghouse"), we have realigned the organizational and governance structure of our businesses and have changed how the partnership presents information for financial reporting and management decision making which has resulted in a change in the construction services and business services segments presentation and the creation of a new infrastructure services segment.
8
NOTES TO UNAUDITED INTERIM CONDENSED
CONSOLIDATED FINANCIAL STATEMENTS
As at September 30, 2018 and December 31, 2017 and for the three and nine months ended
September 30, 2018 and 2017
Accordingly, effective for the third quarter of fiscal 2018, our construction services and business services segment are presented as a single operating segment called business services. Infrastructure services is a new operating segment, which includes our investment in Westinghouse. The infrastructure services segment had no operations prior to the acquisition of Westinghouse in the third quarter of fiscal 2018. The partnership has retrospectively applied these segment changes for all periods presented.
(b) | New accounting policies adopted |
The partnership has applied new and revised standards issued by the IASB that are effective for the period beginning on or after January 1, 2018.
(i) | Revenue from Contracts with Customers |
IFRS 15, Revenue from Contracts with Customers ("IFRS 15") specifies how and when revenue should be recognized as well as requiring additional disclosures. IFRS 15 requires disclosure regarding the nature, amount, timing and uncertainty of revenue and cash flows arising from customer contracts. IFRS 15 supersedes IAS 18, Revenue, IAS 11, Construction Contracts and a number of revenue-related interpretations. IFRS 15 applies to nearly all contracts with customers: the main exceptions are leases, financial instruments and insurance contracts.
The partnership adopted the standard using the modified retrospective approach, in which a cumulative catch-up adjustment is recorded through opening retained earnings on January 1, 2018 as if the standard had always been in effect and whereby comparative periods are not restated. The partnership elected to use the practical expedient for contract modifications. On adoption, the partnership recorded a reduction in opening retained earnings of approximatively $260 million, attributable to the partnership net of taxes, mainly from our construction services business. Under IFRS 15, revenue from the partnership’s construction services contracts will continue to be recognized over time; however, a higher threshold of probability must be achieved prior to recognizing revenue from variable consideration such as incentives and claims and variations resulting from contract modifications. Under IAS 18 and IAS 11, revenue was recognized when it is probable that work performed will result in revenue whereas under IFRS 15, revenue is recognized when it is highly probable that a significant reversal of revenue will not occur for these modifications. Refer to Note 2(c) for impact on adoption of IFRS 15.
(ii) | Financial Instruments |
In July 2014, the IASB issued the final publication of IFRS 9, Financial Instruments ("IFRS 9") superseding the current IAS 39, Financial Instruments: Recognition and Measurement. IFRS 9 establishes principles for the financial reporting of financial assets and financial liabilities that will present relevant and useful information to users of financial statements for their assessment of the amounts, timing and uncertainty of an entity's future cash flows. This new standard also includes a new general hedge accounting standard which will align hedge accounting more closely with an entity's risk management activities. It does not fully change the types of hedging relationships or the requirement to measure and recognize ineffectiveness, however, it will provide more hedging strategies that are used for risk management to qualify for hedge accounting and introduce greater judgment to assess the effectiveness of a hedging relationship. The partnership adopted the standard using the retrospective approach without restatement, in which a cumulative catch-up adjustment is recorded through opening retained earnings on January 1, 2018 as if the standard had always been in effect and whereby comparative periods are not restated. On adoption, the partnership recorded an adjustment in opening retained earnings of $nil attributable to the partnership net of taxes. Refer to Note 2(e) for impact on adoption of IFRS 9.
(iii) | Foreign Currency Transactions and Advance Consideration |
In December 2016, the IASB issued IFRIC 22, Foreign Currency Transactions and Advance Consideration ("IFRIC 22"), effective for annual reporting periods beginning on or after January 1, 2018. The interpretation clarifies that the date of the transaction for the purpose of determining the exchange rate to use on initial recognition of the related asset, expense or income (or part of it) is the date on which an entity initially recognizes the non-monetary asset or non-monetary liability arising from the payment or receipt of advance consideration. The interpretation may be applied either retrospectively or prospectively. The adoption of IFRIC 22 did not have a significant impact on the unaudited interim condensed consolidated financial statements.
9
NOTES TO UNAUDITED INTERIM CONDENSED
CONSOLIDATED FINANCIAL STATEMENTS
As at September 30, 2018 and December 31, 2017 and for the three and nine months ended
September 30, 2018 and 2017
(c) | Impact on adoption of new IFRS standards |
On adoption of IFRS 15, we recorded a total reduction in opening retained earnings of $260 million, attributable to the partnership net of taxes, mainly associated with our construction services business. The partnership also recorded the associated reduction of $125 million in accounts and other receivable, net, and an increase of $121 million in accounts payable and other.
(US$ MILLIONS) | Opening balance January 1, 2018 | Adoption of new accounting standards | Revised opening balance January 1, 2018 | ||||||||||
Assets | |||||||||||||
Cash and cash equivalents | $ | 1,106 | $ | — | $ | 1,106 | |||||||
Financial assets | 361 | — | 361 | ||||||||||
Accounts and other receivable, net | 3,454 | (98 | ) | 3,356 | |||||||||
Inventory, net | 1,068 | 4 | 1,072 | ||||||||||
Assets held for sale | 14 | — | 14 | ||||||||||
Other assets | 430 | (60 | ) | 370 | |||||||||
Current assets | 6,433 | (154 | ) | 6,279 | |||||||||
Financial assets | 423 | — | 423 | ||||||||||
Accounts and other receivable, net | 908 | (27 | ) | 881 | |||||||||
Other assets | 79 | 1 | 80 | ||||||||||
Property, plant and equipment | 2,530 | — | 2,530 | ||||||||||
Deferred income tax assets | 174 | 42 | 216 | ||||||||||
Intangible assets | 3,094 | — | 3,094 | ||||||||||
Equity accounted investments | 609 | (6 | ) | 603 | |||||||||
Goodwill | 1,554 | — | 1,554 | ||||||||||
Total assets | $ | 15,804 | $ | (144 | ) | $ | 15,660 | ||||||
Liabilities and equity | |||||||||||||
Liabilities | |||||||||||||
Accounts payable and other | $ | 4,865 | $ | 126 | $ | 4,991 | |||||||
Liabilities associated with assets held for sale | — | — | — | ||||||||||
Borrowings | 825 | — | 825 | ||||||||||
Current liabilities | 5,690 | 126 | 5,816 | ||||||||||
Accounts payable and other | 773 | (5 | ) | 768 | |||||||||
Borrowings | 2,440 | — | 2,440 | ||||||||||
Deferred income tax liabilities | 837 | — | 837 | ||||||||||
Total liabilities | $ | 9,740 | $ | 121 | $ | 9,861 | |||||||
Equity | |||||||||||||
Limited partners | $ | 1,585 | $ | (132 | ) | $ | 1,453 | ||||||
Non-controlling interests attributable to: | |||||||||||||
Redemption-Exchange Units, Preferred Shares and Special Limited Partnership Units held by Brookfield Asset Management Inc. | 1,453 | (128 | ) | 1,325 | |||||||||
Interest of others in operating subsidiaries | 3,026 | (5 | ) | 3,021 | |||||||||
Total equity | 6,064 | (265 | ) | 5,799 | |||||||||
Total liabilities and equity | $ | 15,804 | $ | (144 | ) | $ | 15,660 | ||||||
10
NOTES TO UNAUDITED INTERIM CONDENSED
CONSOLIDATED FINANCIAL STATEMENTS
As at September 30, 2018 and December 31, 2017 and for the three and nine months ended
September 30, 2018 and 2017
(d) | Revenue from contracts with customers |
Business Services
Construction Services
Our construction services business provides end-to-end design and development solutions for our customers. The work performed on these contracts creates or enhances an asset that our customer controls and accordingly we recognize revenue on these contracts over a period of time. The partnership uses an input method, the cost-to-cost method, to measure progress towards complete satisfaction of the performance obligations under IFRS 15.
As work is performed, a contract asset in the form of work-in-progress is recognized, which is reclassified to accounts receivable when invoiced to the customer. If payment is received in advance of work being completed, a contract liability is recognized. There is not considered to be a significant financing component in construction contracts as the period between the recognition of revenue under the cost-to-cost method and when payment is received is typically less than one year.
IFRS 15 requires a highly probable criterion with regards to recognizing revenue arising from variable consideration and contract modification and claims. For variable consideration, revenue is only to be recognized to the extent that it is highly probable that a significant reversal in the amount of revenue recognized will not occur when the uncertainty associated with the variable consideration is subsequently resolved.
Fuel Distribution & Marketing
The fees and related costs for providing road fuel distribution and marketing are recognized at a point in time when the services are provided.
Revenue from the sale of goods in our UK road fuel service operation represents net invoiced sales of fuel products and Renewable Transport Fuel Obligation ("RTFO") certificates, excluding value added taxes but including excise duty, which has been assessed to be a production tax and recorded as part of consideration received. Revenue is recognized at the point that title passes to the customer.
Facilities Management
The fees and related costs for providing facilities management services are recognized over the time in which the services are provided.
Real Estate Services
The fees and related costs for providing real estate and logistics services are recognized over the time in which the services are provided.
Associated with the delivery of certain service contracts, our partnership also earns revenue from home sale transactions and referral fees from suppliers utilized in servicing these contracts. These revenue transactions are recognized as follows:
• | Home Sale: The partnership earns home sale revenue from two types of contracts: cost-plus home sale and fixed fee home sale contracts. Under a cost-plus home sale contract, the partnership earns a performance fee and bears no risk of loss with respect to costs incurred. Revenues and related costs associated with the purchase and resale of residences under cost-plus contracts are recognized on a net basis over the period in which services are provided as control over the home does not pass onto the partnership. Under a fixed fee home sale contract, the partnership earns a fixed fee based upon a percentage of the acquisition cost of the residential property. This fee revenue is recognized when the home is acquired by the customer as the partnership’s performance obligation is complete at this time. The revenues and expenses related to the home sale itself are recorded on a gross basis. |
11
NOTES TO UNAUDITED INTERIM CONDENSED
CONSOLIDATED FINANCIAL STATEMENTS
As at September 30, 2018 and December 31, 2017 and for the three and nine months ended
September 30, 2018 and 2017
• | Referral fees: The partnership earns referral fees from various suppliers who provide services to customers through our service offerings. A significant portion of the referral fee revenue is generated from the closing of a home sale or purchase transaction, under which the partnership earns a percentage of the commissions received by the real estate agent on the purchase or sale of a home by the customer. Referral fees from home purchases or sales are recognized upon the closing date of the real estate transaction. The partnership recognizes referral fees from other suppliers upon completion of the services. |
Infrastructure Services
Products and Services
Sales of products are recognized at a point in time when the product is shipped and control passes to the customer. Revenue from contracts to provide engineering, design or other services are recognized and reported over-time based on an appropriate measure of progress. The partnership uses an input method, the cost-to-cost method, to measure progress towards complete satisfaction of the performance obligations under IFRS 15.
IFRS 15 requires a highly probable criterion with regards to recognizing revenue arising from variable consideration and contract modification and claims. For variable consideration, revenue is only to be recognized to the extent that it is highly probable that a significant reversal in the amount of revenue recognized will not occur when the uncertainty associated with the variable consideration is subsequently resolved.
Industrial Operations
Manufacturing
Sales of goods are recognized at a point in time when the product is shipped and control passes to the customer. Services revenues are recognized over time when the services are provided.
Mining
Revenue from our mining business is made under provisional pricing arrangements. Revenue from the sale of palladium and by-product metals is provisionally recognized based on quoted market prices upon the delivery of concentrate to the smelter or designated shipping point, which is when significant rights and obligations of ownership pass and title and control is transferred. The business’ smelter contract provides for final prices to be determined by quoted market prices in a period subsequent to the date of concentrate delivery. The period between provisional invoicing and final pricing, or settlement period, is typically between 30 and 150 days. The fair value of the final sales price adjustment is re-estimated by reference to forward market prices at each period end and changes in fair value are recognized as an adjustment to revenue. As a result, the accounts receivable amounts related to this business are recorded at fair value.
Energy
Energy Commodities and Services
Revenue from the sale of oil and gas is recognized at a point in time when title and control of the product passes to an external party, based on volumes delivered and contractual delivery points and prices. Revenue for the production in which the partnership has an interest with other producers is recognized based on the partnership’s working interest. Revenue is measured net of royalties to reflect the deduction for other parties’ proportionate share of the revenue. Revenue from the rendering of services is recognized at a point in time when significant rights and obligations of ownership pass and title and control is transferred.
Marine Energy Services
The partnership primary source of revenues is chartering its vessels and offshore units to its customers. The partnership's primary forms of contracts, consists of floating production storage and offloading (or "FPSO") contracts and contracts of affreightment (or "CoA").
12
NOTES TO UNAUDITED INTERIM CONDENSED
CONSOLIDATED FINANCIAL STATEMENTS
As at September 30, 2018 and December 31, 2017 and for the three and nine months ended
September 30, 2018 and 2017
• | FPSO contracts: Pursuant to an FPSO contract, the partnership charters an FPSO unit to a customer for a fixed period of time, generally more than one year. The performance obligations within an FPSO contract, which will include the use of the FPSO unit to the charterer as well as the operation of the FPSO unit, are satisfied as services are rendered over the duration of such contract, as measured using the time that has elapsed from commencement of performance. |
Some FPSO contacts include variable consideration components in the form of expense adjustments or reimbursements, incentive compensation and penalties. Variable consideration under the partnership’s contracts is typically recognized as incurred as either such revenues are allocated and accounted for under lease accounting requirements or alternatively such consideration is allocated to the distinct period in which such variable consideration was earned.
• | Contracts of Affreightment: Voyages performed pursuant to a CoA for the partnership’s shuttle tankers are priced based on the pre-agreed terms in the CoA. The performance obligations within a voyage performed pursuant to a CoA, which typically include the use of the vessel to the charterer as well as the operation of the vessel, are satisfied as services are rendered over the duration of the voyage, as measured using the time that has elapsed from commencement of performance. The duration of a single voyage will typically be less than two weeks. |
Remaining Performance Obligations
Business Services
In our construction services business, backlog is defined as revenue yet to be delivered (i.e. remaining performance obligations) on construction projects that have been secured via an executed contract, work order, or letter of intent. The total backlog for our construction services operations equates to approximately two years of activity.
Industrial Operations
Our Brazilian water treatment and distribution operation is party to certain remaining performance obligations which have a duration of more than one year. The most significant remaining performance obligations at January 1, 2018 relate to the service concession arrangements with various municipalities which have an average term of 25 years.
The tables below summarize our segment revenue by geography, and timing of revenue recognition for IFRS 15 revenue for the three months ending September 30, 2018:
(US$ MILLIONS) | ||||||||||||||||||||||||
Timing of Revenue Recognition | Business Services | Infrastructure Services | Industrial Operations | Energy | Corporate and Other | Total | ||||||||||||||||||
Goods/services provided at a point in time | $ | 6,223 | $ | 245 | $ | 856 | $ | 66 | $ | — | $ | 7,390 | ||||||||||||
Services transferred over a period of time | 1,696 | 495 | 81 | 309 | — | 2,581 | ||||||||||||||||||
Total IFRS 15 revenue | $ | 7,919 | $ | 740 | $ | 937 | $ | 375 | $ | — | $ | 9,971 | ||||||||||||
Other non IFRS 15 revenue | 4 | — | — | 15 | — | 19 | ||||||||||||||||||
Total revenue | $ | 7,923 | $ | 740 | $ | 937 | $ | 390 | $ | — | $ | 9,990 | ||||||||||||
13
NOTES TO UNAUDITED INTERIM CONDENSED
CONSOLIDATED FINANCIAL STATEMENTS
As at September 30, 2018 and December 31, 2017 and for the three and nine months ended
September 30, 2018 and 2017
(US$ MILLIONS) | ||||||||||||||||||||||||
Geography | Business Services | Infrastructure Services | Industrial Operations | Energy | Corporate and Other | Total (1) | ||||||||||||||||||
United Kingdom | $ | 5,640 | $ | 35 | $ | 35 | $ | 25 | $ | — | $ | 5,735 | ||||||||||||
Canada | 937 | 6 | 139 | 91 | — | 1,173 | ||||||||||||||||||
Australia | 790 | — | — | 4 | — | 794 | ||||||||||||||||||
Brazil | 102 | 1 | 232 | 71 | — | 406 | ||||||||||||||||||
USA | 154 | 348 | 133 | — | — | 635 | ||||||||||||||||||
Middle East (2) | 104 | 1 | 2 | — | — | 107 | ||||||||||||||||||
Other | 192 | 349 | 396 | 184 | — | 1,121 | ||||||||||||||||||
Total IFRS 15 revenue | $ | 7,919 | $ | 740 | $ | 937 | $ | 375 | $ | — | $ | 9,971 | ||||||||||||
__________________________________
(1) | Geography of the other non IFRS 15 revenue is as follows: United Kingdom $1 million, Canada $3 million, Australia $15 million, Brazil $nil, United States $nil, Middle East $nil and Other $nil. |
(2) | Middle East primarily consists of United Arab Emirates. |
(US$ MILLIONS) | ||||||||||||||||||||||||
Transition | Business Services | Infrastructure Services | Industrial Operations | Energy | Corporate and Other | Total | ||||||||||||||||||
Revenue as if it were under former revenue standards | $ | 7,920 | $ | 740 | $ | 937 | $ | 361 | $ | — | $ | 9,958 | ||||||||||||
IFRS 15 Impact | (1 | ) | — | — | 14 | — | 13 | |||||||||||||||||
Total IFRS 15 Revenue | $ | 7,919 | $ | 740 | $ | 937 | $ | 375 | $ | — | $ | 9,971 | ||||||||||||
The tables below summarize our segment revenue by geography, and timing of revenue recognition for IFRS 15 revenue for the nine months ending September 30, 2018:
(US$ MILLIONS) | ||||||||||||||||||||||||
Timing of Revenue Recognition | Business Services | Infrastructure Services | Industrial Operations | Energy | Corporate and Other | Total | ||||||||||||||||||
Goods/services provided at a point in time | $ | 18,281 | $ | 245 | $ | 2,329 | $ | 213 | $ | — | $ | 21,068 | ||||||||||||
Services transferred over a period of time | 4,820 | 495 | 198 | 309 | — | 5,822 | ||||||||||||||||||
Total IFRS 15 revenue | $ | 23,101 | $ | 740 | $ | 2,527 | $ | 522 | $ | — | $ | 26,890 | ||||||||||||
Other non IFRS 15 revenue | 28 | — | 12 | 22 | 7 | 69 | ||||||||||||||||||
Total revenue | $ | 23,129 | $ | 740 | $ | 2,539 | $ | 544 | $ | 7 | $ | 26,959 | ||||||||||||
14
NOTES TO UNAUDITED INTERIM CONDENSED
CONSOLIDATED FINANCIAL STATEMENTS
As at September 30, 2018 and December 31, 2017 and for the three and nine months ended
September 30, 2018 and 2017
(US$ MILLIONS) | ||||||||||||||||||||||||
Geography | Business Services | Infrastructure Services | Industrial Operations | Energy | Corporate and Other | Total (1) | ||||||||||||||||||
United Kingdom | $ | 16,311 | $ | 35 | $ | 65 | $ | 25 | $ | — | $ | 16,436 | ||||||||||||
Canada | 2,855 | 6 | 394 | 238 | — | 3,493 | ||||||||||||||||||
Australia | 2,176 | — | — | 4 | — | 2,180 | ||||||||||||||||||
Brazil | 567 | 1 | 661 | 71 | — | 1,300 | ||||||||||||||||||
USA | 328 | 347 | 350 | — | — | 1,025 | ||||||||||||||||||
Middle East (2) | 317 | 1 | 3 | — | — | 321 | ||||||||||||||||||
Other | 547 | 350 | 1,054 | 184 | — | 2,135 | ||||||||||||||||||
Total IFRS 15 revenue | $ | 23,101 | $ | 740 | $ | 2,527 | $ | 522 | $ | — | $ | 26,890 | ||||||||||||
__________________________________
(1) | Geography of the other non IFRS 15 revenue is as follows: United Kingdom $7 million, Canada $14 million, Australia $17 million, Brazil $12 million, United States $4 million, Middle East $nil and Other $15 million. |
(2) | Middle East primarily consists of United Arab Emirates. |
(US$ MILLIONS) | ||||||||||||||||||||||||
Transition | Business Services | Infrastructure Services | Industrial Operations | Energy | Corporate and Other | Total | ||||||||||||||||||
Revenue as if it were under former revenue standards | $ | 23,102 | $ | 740 | $ | 2,527 | $ | 508 | $ | — | $ | 26,877 | ||||||||||||
IFRS 15 Impact | (1 | ) | — | — | 14 | — | 13 | |||||||||||||||||
Total IFRS 15 Revenue | $ | 23,101 | $ | 740 | $ | 2,527 | $ | 522 | $ | — | $ | 26,890 | ||||||||||||
(e) | Financial instruments and hedge accounting |
Classification and measurement
The table below summarizes the partnership’s classification and measurement of financial assets and liabilities, on adoption of IFRS 9:
Classification | Measurement | Statement of Financial Position Account | ||||
Financial assets | ||||||
Cash and cash equivalents | Debt | Amortized cost | Cash and cash equivalents | |||
Accounts receivable | Debt | Amortized cost / FVTPL | Accounts and other receivable, net | |||
Restricted cash | Debt | Amortized cost | Financial assets | |||
Equity securities | Equity | FVTPL / FVOCI | Financial assets | |||
Debt securities | Debt | FVTPL / FVOCI / Amortized cost | Financial assets | |||
Derivative assets | Derivatives | FVTPL(1) | Financial assets | |||
Other financial assets | Debt / Equity | Amortized cost / FVTPL/ FVOCI | Financial assets | |||
Financial liabilities | ||||||
Borrowings | Debt | Amortized cost | Borrowings | |||
Accounts payable and other | Debt | Amortized cost | Accounts payable and other | |||
Derivative liabilities | Derivatives | FVTPL(1) | Accounts payable and other | |||
__________________________
1) Derivatives are classified and measured at FVTPL except those designated in hedging relationships.
15
NOTES TO UNAUDITED INTERIM CONDENSED
CONSOLIDATED FINANCIAL STATEMENTS
As at September 30, 2018 and December 31, 2017 and for the three and nine months ended
September 30, 2018 and 2017
The classification depends on the specific business model for managing the financial instruments and the contractual terms of the cash flows. The partnership maintains a portfolio of marketable securities comprised of equity and debt securities. The marketable securities are recognized on their trade date. They are subsequently measured at fair value at each reporting date with the change in fair value recorded in either profit or loss ("FVTPL") or other comprehensive income ("FVOCI"). For investments in debt instruments, this will depend on the business model in which the investment is held.
At initial recognition, the partnership measures a financial asset at its fair value plus, in the case of a financial asset not at fair value through profit or loss, transaction costs that are directly attributable to the acquisition of the financial asset. Transaction costs of financial assets carried at fair value through profit or loss are expensed in profit or loss.
Financial assets are classified as amortized cost based on their nature and use within the partnership’s business. Financial assets classified as amortized cost are recorded initially at fair value, then subsequently measured at amortized cost using the effective interest method, less any impairment.
Impairment
The partnership assesses on a forward-looking basis the expected credit losses associated with its debt instruments carried at amortized cost and FVOCI. The impairment methodology applied depends on whether there has been a significant increase in credit risk. Impairment charges are recognized in profit or loss based on the expected credit loss model.
Derivatives and hedging activities
The partnership selectively utilizes derivative financial instruments primarily to manage financial risks, including commodity price risk and foreign exchange risks. Derivative financial instruments are recorded at fair value. Hedge accounting is applied when the derivative is designated as a hedge of a specific exposure and there is assurance that it will continue to be highly effective as a hedge based on an expectation of offsetting cash flows or fair value. Hedge accounting is discontinued prospectively when the derivative no longer qualifies as a hedge or the hedging relationship is terminated. Once discontinued, the cumulative change in fair value of a derivative that was previously recorded in other comprehensive income by the application of hedge accounting is recognized in profit or loss over the remaining term of the original hedging relationship as amounts related to the hedged item are recognized in profit or loss. The assets or liabilities relating to unrealized mark-to-market gains and losses on derivative financial instruments are recorded in financial assets and financial liabilities, respectively.
(i) Items classified as hedges
Realized and unrealized gains and losses on foreign exchange contracts and foreign currency debt that are designated as hedges of currency risks relating to a net investment in a subsidiary with a functional currency other than the U.S. dollar are included in equity and are included in net income in the period in which the subsidiary is disposed of or to the extent partially disposed and control is not retained. Derivative financial instruments that are designated as hedges to offset corresponding changes in the fair value of assets and liabilities and cash flows are measured at estimated fair value with changes in fair value recorded in profit or loss or as a component of equity, as applicable.
Unrealized gains and losses on interest rate contracts designated as hedges of future variable interest payments are included in equity as a cash flow hedge when the interest rate risk relates to an anticipated variable interest payment. The periodic exchanges of payments on interest rate swap contracts designated as hedges of debt are recorded on an accrual basis as an adjustment to interest expense. The periodic exchanges of payments on interest rate contracts designated as hedges of future interest payments are amortized into profit or loss over the term of the corresponding interest payments.
(ii) Items not classified as hedges
Derivative financial instruments that are not designated as hedges are recorded at estimated fair value, and gains and losses arising from changes in fair value are recognized in net income in the period the changes occur. Realized and unrealized gains on other derivatives not designated as hedges are recorded in other income (expenses), net.
16
NOTES TO UNAUDITED INTERIM CONDENSED
CONSOLIDATED FINANCIAL STATEMENTS
As at September 30, 2018 and December 31, 2017 and for the three and nine months ended
September 30, 2018 and 2017
Fair value measurement
Fair value is the price that would be received to sell an asset or paid to transfer a liability in an orderly transaction between market participants at the measurement date, regardless of whether that price is directly observable or estimated using another valuation technique. In estimating the fair value of an asset or a liability, the partnership takes into account the characteristics of the asset or liability if market participants would take those characteristics into account when pricing the asset or liability at the measurement date.
Fair value measurement is disaggregated into three hierarchical levels: Level 1, 2 or 3. Fair value hierarchical levels are directly based on the degree to which the inputs to the fair value measurement are observable. The levels are as follows:
Level 1 - Inputs are unadjusted, quoted prices in active markets for identical assets or liabilities at the measurement date.
Level 2 - Inputs (other than quoted prices included in Level 1) are either directly or indirectly observable for the asset or liability through correlation with market data at the measurement date and for the duration of the asset’s or liability’s anticipated life.
Level 3 - Inputs are unobservable and reflect management’s best estimate of what market participants would use in pricing the asset or liability at the measurement date. Consideration is given to the risk inherent in the valuation technique and the risk inherent in the inputs in determining the estimate.
Summary of impact upon adoption of IFRS 9 - Classification and measurement
The table below illustrates the classification and measurement of financial assets under IFRS 9 and IAS 39 at the date of initial application. A similar table for financial liabilities has not been prepared because there have not been any reclassifications and remeasurements within financial liabilities.
The following table is as at January 1, 2018:
(US$ MILLIONS) | FVTPL | FVOCI | Amortized Cost | Total | ||||||||||||
Opening balance (IAS 39) | $ | 166 | $ | 429 | $ | 5,852 | $ | 6,447 | ||||||||
Reclassifications | 211 | (211 | ) | — | — | |||||||||||
Revised opening balance (IFRS 9) | $ | 377 | $ | 218 | $ | 5,852 | $ | 6,447 | ||||||||
The following paragraphs explain how applying the new classification requirements of IFRS 9 led to changes in classification of certain financial assets held by the partnership as shown in the table above.
Instruments reclassified from Available for Sale (IAS 39) to FVTPL (IFRS 9):
Debt Instruments previously classified as available for sale but which fail the Solely for Payment, Principal and Interest ("SPPI") test
The partnership held secured debentures and contractual rights which were reclassified from available for sale to FVTPL for $187 million. Under IFRS 9, the debentures and contractual rights do not meet the criteria to be classified as at amortized cost or FVOCI because their cash flows do not represent solely payments of principal and interest. Related fair value gains of $3 million attributable to the partnership net of taxes were transferred from the available for sale reserve to retained earnings on January 1, 2018.
Equity instruments previously classified as available for sale and for which FVOCI election is not made
The partnership held an equity instrument which was reclassified from available for sale to FVTPL for $24 million. Related fair value losses of $3 million attributable to the partnership net of taxes were transferred from the available for sale reserve to retained earnings on January 1, 2018.
17
NOTES TO UNAUDITED INTERIM CONDENSED
CONSOLIDATED FINANCIAL STATEMENTS
As at September 30, 2018 and December 31, 2017 and for the three and nine months ended
September 30, 2018 and 2017
Summary of impact upon adoption of IFRS 9 - Impairment
The partnership's opening loss allowances in accordance with IAS 39 do not differ materially from the partnership's opening expected credit losses ("ECL") determined in accordance with IFRS 9, as at January 1, 2018.
Summary of impact upon adoption of IFRS 9 - Derivatives and hedging activities
In accordance with IFRS 9’s transition provisions for hedge accounting, the partnership has applied the IFRS 9 hedge accounting requirements prospectively from the date of initial application on January 1, 2018. The partnership’s qualifying hedging relationships in place as at January 1, 2018 also qualified for hedge accounting in accordance with IFRS 9 and were therefore regarded as continuing hedging relationships.
(f) | Future changes in accounting policies |
(i) | Leases |
In January 2016, the IASB published a new standard, IFRS 16 Leases ("IFRS 16"). The new standard brings most leases on the balance sheet, eliminating the distinction between operating and finance leases. Lessor accounting, however, remains largely unchanged and the distinction between operating and finance leases is retained. IFRS 16 supersedes IAS 17 Leases and related interpretations and is effective for periods beginning on or after January 1, 2019.
The partnership has participated in strategic planning sessions with its subsidiaries and associates in order to provide guidance regarding the key considerations and to develop an adoption project plan. Using the population of existing contractual arrangements, the partnership has substantially completed its identification of leases that are required to be capitalized under the new standard. The partnership is currently quantifying the present value of the identified lease contracts to determine the impact on the January 1, 2019 balance sheet and is assessing the expected impact to our statements of operations once the standard has been adopted. The partnership is progressing as planned in our adoption project plan. Next steps involve the finalization of the documented analysis, including assessing the impact to IT system requirements and internal controls, drafting the disclosures required by the new standard and rolling-forward the analysis to include all active leases as at year-end.
IFRS 16 can either be adopted on a full retrospective method or on a modified retrospective method whereby any transitional impact is recorded in equity as at January 1, 2019 and comparative periods are not restated. The partnership currently anticipates that the modified retrospective approach will be adopted and is currently in the process of evaluating a number of practical expedients available under the new standard.
The partnership continues to evaluate the overall impact of IFRS 16 on its consolidated financial statements.
(ii) | Uncertainty over Income Tax Treatments |
In June 2017, the IASB published IFRIC 23, Uncertainty over Income Tax Treatments ("IFRIC 23") effective for annual periods beginning on or after January 1, 2019. The interpretation requires an entity to assess whether it is probable that a tax authority will accept an uncertain tax treatment used, or proposed to be used, by an entity in its income tax filings and to exercise judgment in determining whether each tax treatment should be considered independently or whether some tax treatments should be considered together. The decision should be based on which approach provides better predictions of the resolution of the uncertainty. An entity also has to consider whether it is probable that the relevant authority will accept each tax treatment, or group of tax treatments, assuming that the taxation authority with the right to examine any amounts reported to it will examine those amounts and will have full knowledge of all relevant information when doing so. The interpretation may be applied on either a fully retrospective basis or a modified retrospective basis without restatement of comparative information. The partnership is currently evaluating the impact of IFRIC 23 on its unaudited interim condensed consolidated financial statements.
NOTE 3. ACQUISITION OF BUSINESSES
When determining the basis of accounting for the partnership’s investees, the partnership evaluates the degree of influence that the partnership exerts directly or through an arrangement over the investees' relevant activities. Control is obtained when the partnership has power over the acquired entities and an ability to use its power to affect the returns of these entities.
18
NOTES TO UNAUDITED INTERIM CONDENSED
CONSOLIDATED FINANCIAL STATEMENTS
As at September 30, 2018 and December 31, 2017 and for the three and nine months ended
September 30, 2018 and 2017
The partnership accounts for business combinations using the acquisition method of accounting, pursuant to which the cost of acquiring a business is allocated to its identifiable tangible and intangible assets and liabilities on the basis of the estimated fair values at the date of acquisition.
(a) | Acquisitions completed in the nine months ended September 30, 2018 |
The following summarizes the consideration transferred, assets acquired and liabilities assumed at the applicable acquisition dates:
(US$ MILLIONS) | Business Services (1) | Infrastructure Services (1) | Industrial Operations (1) | Energy (1) | Total | |||||||||||||||
Cash | $ | 6 | $ | 1,686 | $ | 45 | $ | — | $ | 1,737 | ||||||||||
Non-cash consideration | — | — | — | 275 | 275 | |||||||||||||||
Total Consideration (2) | $ | 6 | $ | 1,686 | $ | 45 | $ | 275 | $ | 2,012 | ||||||||||
(US$ MILLIONS) | ||||||||||||||||||||
Cash and cash equivalents | $ | 2 | $ | 286 | $ | 30 | $ | 342 | $ | 660 | ||||||||||
Accounts and other receivable, net | 7 | 635 | 75 | 235 | 952 | |||||||||||||||
Inventory, net | — | 617 | 58 | — | 675 | |||||||||||||||
Equity accounted investments | — | 7 | 1 | 321 | 329 | |||||||||||||||
Property, plant and equipment | 7 | 933 | 187 | 3,738 | 4,865 | |||||||||||||||
Intangible assets | 5 | 2,613 | 231 | — | 2,849 | |||||||||||||||
Goodwill | 13 | 205 | 180 | 547 | 945 | |||||||||||||||
Deferred income tax assets | — | — | 27 | 5 | 32 | |||||||||||||||
Financial assets | — | 295 | 2 | 20 | 317 | |||||||||||||||
Other assets | — | 1,076 | — | 69 | 1,145 | |||||||||||||||
Accounts payable and other | (7 | ) | (2,725 | ) | (199 | ) | (786 | ) | (3,717 | ) | ||||||||||
Borrowings | — | (3 | ) | (266 | ) | (3,349 | ) | (3,618 | ) | |||||||||||
Deferred income tax liabilities | — | (97 | ) | (72 | ) | (2 | ) | (171 | ) | |||||||||||
Net assets acquired before non-controlling interest | 27 | 3,842 | 254 | 1,140 | 5,263 | |||||||||||||||
Non-controlling interest (3) (4) | (21 | ) | (2,156 | ) | (209 | ) | (865 | ) | (3,251 | ) | ||||||||||
Net Assets Acquired | $ | 6 | $ | 1,686 | $ | 45 | $ | 275 | $ | 2,012 | ||||||||||
__________________________________
(1) | The initial fair values of all acquired assets, liabilities and goodwill for these acquisitions have been determined on a preliminary basis at the end of the reporting period. |
(2) | Excludes consideration attributable to non-controlling interest, which represents the interest of others in operating subsidiaries. |
(3) | Non-controlling interest recognized on business combination, were measured at fair value for Business Services and Infrastructure Services. |
(4) | Non-controlling interest recognized on business combination, were measured at the proportionate share of fair value of the assets acquired and liabilities assumed for Energy and Industrial Operations. |
19
NOTES TO UNAUDITED INTERIM CONDENSED
CONSOLIDATED FINANCIAL STATEMENTS
As at September 30, 2018 and December 31, 2017 and for the three and nine months ended
September 30, 2018 and 2017
Business Services
Facilities management business ("BGIS")
On February 1, 2018, the partnership, through BGIS, completed a tuck-in acquisition, acquiring an 85% interest in Critical Solutions Group and Critical Power Testing and Maintenance ("CSG"), a US specialist provider of services for the data center market, for $4 million attributable to the partnership. On acquisition, the partnership had a 22% economic interest and an 85% voting interest in the business, which provides the partnership with control over the business. Accordingly, the partnership consolidates the business for financial reporting purposes.
Acquisition costs of less than $1 million were expensed at the acquisition date and recorded as other expenses on the unaudited interim condensed consolidated statements of operating results. Goodwill of $8 million was acquired, which represents the expected growth and synergies the partnership expects to receive from the integration of the operations. Goodwill recognized is deductible for income tax purposes.
The partnership’s results from operations for the period ended September 30, 2018 includes $1 million of revenue and less than $1 million of net loss attributable to the partnership from the acquisition. If this acquisition had been effective January 1, 2018, the partnership would have recorded revenue of $1 million for the period ended September 30, 2018 and net loss of less than $1 million attributable to the partnership for the period ended September 30, 2018.
Infrastructure Services
Westinghouse Electric Company (“Westinghouse”)
On August 1, 2018, the partnership, together with institutional investors, acquired a 100% interest in Westinghouse, a leading global provider of infrastructure services to the power generation industry. The partnership's economic interest of 44% was acquired for consideration of $1,686 million. The partnership has a 100% voting interest in this business, which provides us with control. Accordingly, the partnership consolidates this business for financial reporting purposes.
Acquisition costs of approximatively $51 million were expensed at the acquisition date and recorded as other expenses on the unaudited interim condensed consolidated statements of operating results. Goodwill of $205 million was acquired, which represents the expected growth the partnership expects to receive from the integration of the operations. Goodwill recognized is not deductible for income tax purposes. Intangible assets of $2,613 million were acquired, primarily comprised of developed technology and the Westinghouse trade name.
The partnership’s results from operations for the period ended September 30, 2018 includes $325 million of revenue and $4 million of net loss attributable to the partnership from the acquisition. If this acquisition had been effective January 1, 2018, the partnership would have recorded revenue of $1,297 million for the period ended September 30, 2018 and net loss of $95 million attributable to the partnership for the period ended September 30, 2018.
Industrial Operations
Schoeller Allibert Group B.V. ("Schoeller Allibert")
On May 15, 2018, the partnership, together with institutional investors, acquired a 70% interest in Schoeller Allibert, one of Europe's largest manufacturers of returnable plastic packaging systems. The partnership's economic interest of 14% was acquired for consideration of $45 million. The partnership has a 52% voting interest in this business, which provides us with control. Accordingly, the partnership consolidates this business for financial reporting purposes.
Acquisition costs of approximatively $9 million were expensed at the acquisition date and recorded as other expenses on the unaudited interim condensed consolidated statements of operating results. Goodwill of $180 million was acquired, which represents the expected growth the partnership expects to receive from the integration of the operations. Goodwill recognized is not deductible for income tax purposes. Intangible assets of $231 million were acquired, primarily comprised of patented technology and customer relationships.
20
NOTES TO UNAUDITED INTERIM CONDENSED
CONSOLIDATED FINANCIAL STATEMENTS
As at September 30, 2018 and December 31, 2017 and for the three and nine months ended
September 30, 2018 and 2017
The partnership’s results from operations for the period ended September 30, 2018 includes $33 million of revenue and $2 million of net loss attributable to the partnership from the acquisition. If this acquisition had been effective January 1, 2018, the partnership would have recorded revenue of $63 million for the period ended September 30, 2018 and net loss of $3 million attributable to the partnership for the period ended September 30, 2018.
Energy
Teekay Offshore Partners L.P. ("Teekay Offshore")
Prior to July 3, 2018, the partnership, together with institutional investors, had a 60% economic interest in Teekay Offshore and a 49% voting interest in Teekay Offshore's General Partner ("Teekay Offshore GP"). The 60% economic interest in Teekay Offshore was accounted for using the equity method. On July 3, 2018, the partnership, together with institutional investors, exercised its general partner option to acquire an additional 2% voting interest in Teekay Offshore GP, in exchange of one million of warrants and began consolidating the business. On acquisition, the partnership had a 60% economic interest in Teekay Offshore and a 51% voting interest in Teekay Offshore GP, which provided the partnership with control over the business. Accordingly, the partnership has consolidated this business for financial statement purposes. Total consideration for the acquisition was $275 million attributable to the partnership and acquisition costs of $nil were expensed at the acquisition date and recorded as other expenses on the unaudited interim condensed consolidated statements of operating results.
Goodwill of $547 million was acquired, which represents benefits we expect to receive from the integration of the operations. Goodwill recognized is not deductible for income tax purposes.
The partnership's results from operations for the period ended September 30, 2018 includes revenues of $77 million and approximately $9 million of net income attributable to the partnership from the acquisition. If this acquisition had been effective January 1, 2018, the partnership would have recorded revenue of $230 million for the period ended September 30, 2018 and net income of $17 million attributable to the partnership for the period ended September 30, 2018.
The following table provides details of the business combinations achieved in stages on a gross basis:
(US$ MILLIONS) | September 30, 2018 | |||
Fair value of investment immediately before acquiring control | $ | 651 | ||
Less: Carrying value of investment immediately before acquisition | 447 | |||
Add: Amounts recognized in OCI (1) | 2 | |||
Remeasurement gain | $ | 206 | ||
Gain on extinguishment (2) | 44 | |||
Gain (loss) on acquisitions/dispositions, net | $ | 250 | ||
Total gain on acquisition attributable to Non-controlling interest | $ | 135 | ||
Total gain on acquisition attributable to the partnership | $ | 115 | ||
____________________________________
(1) | Included in carrying value of the investment immediately before acquisition. |
(2) | The partnership recognized a total gain on extinguishment of $44 million at the subsidiary level ($18 million on debt and $26 million on warrants). |
21
NOTES TO UNAUDITED INTERIM CONDENSED
CONSOLIDATED FINANCIAL STATEMENTS
As at September 30, 2018 and December 31, 2017 and for the three and nine months ended
September 30, 2018 and 2017
(b) | Acquisitions completed in 2017 |
The following summarizes the consideration transferred, assets acquired and liabilities assumed at the applicable acquisition dates:
(US$ MILLIONS) | Business Services (1) | Industrial Operations | Energy (1) | Total | ||||||||||||
Cash | $ | 198 | $ | 383 | $ | 12 | $ | 593 | ||||||||
Contingent consideration | 13 | — | — | 13 | ||||||||||||
Total Consideration (2) | $ | 211 | $ | 383 | $ | 12 | $ | 606 | ||||||||
(US$ MILLIONS) | ||||||||||||||||
Cash and cash equivalents | $ | 39 | $ | 296 | $ | — | $ | 335 | ||||||||
Accounts receivable and other | 1,248 | 978 | — | 2,226 | ||||||||||||
Inventory | 690 | 10 | — | 700 | ||||||||||||
Equity accounted investments | 122 | 90 | — | 212 | ||||||||||||
Property, plant and equipment | 264 | 200 | 39 | 503 | ||||||||||||
Intangible assets | 403 | 2,436 | — | 2,839 | ||||||||||||
Goodwill | 325 | 3 | — | 328 | ||||||||||||
Deferred income tax assets | 9 | 50 | — | 59 | ||||||||||||
Financial assets | 106 | — | — | 106 | ||||||||||||
Other assets | — | 65 | — | 65 | ||||||||||||
Acquisition gain | — | — | (7 | ) | (7 | ) | ||||||||||
Accounts payable and other | (1,885 | ) | (227 | ) | — | (2,112 | ) | |||||||||
Borrowings | (210 | ) | (1,468 | ) | — | (1,678 | ) | |||||||||
Deferred income tax liabilities | (58 | ) | (729 | ) | (2 | ) | (789 | ) | ||||||||
Net assets acquired before non-controlling interest | 1,053 | 1,704 | 30 | 2,787 | ||||||||||||
Non-controlling interest (3) (4) | (842 | ) | (1,321 | ) | (18 | ) | (2,181 | ) | ||||||||
Net Assets Acquired | $ | 211 | $ | 383 | $ | 12 | $ | 606 | ||||||||
___________________________________
(1) | The initial fair values of all acquired assets, liabilities and goodwill for this acquisition have been determined on a preliminary basis at the end of the reporting period. |
(2) | Excludes consideration attributable to non-controlling interest, which represents the interest of others in operating subsidiaries. |
(3) | Non-controlling interest recognized on business combinations, were measured at fair value for Business Services and Energy. |
(4) | Non-controlling interest recognized on business combinations, were measured at the proportionate share of fair value of the assets acquired and liabilities assumed for Industrial Operations. |
Business Services
Fuel Holdings Limited ("Greenergy")
On May 10, 2017, the partnership acquired, together with institutional investors, an 85% interest in Greenergy, a U.K. road fuel business. The partnership's economic interest of 14% was acquired for consideration of $79 million attributable to the partnership. The partnership has an 85% voting interest in this business, which provides us with control over the business. Accordingly, the partnership consolidates this business for financial reporting purposes.
The contingent consideration contemplates potential earn outs based on reaching specific EBITDA targets over five years following closing, as well as achieving certain cash distribution and investment targets. Possible undiscounted earn outs payable ranges from $6 to $12 million. As of the acquisition date, the partnership has recorded contingent consideration of $11 million.
22
NOTES TO UNAUDITED INTERIM CONDENSED
CONSOLIDATED FINANCIAL STATEMENTS
As at September 30, 2018 and December 31, 2017 and for the three and nine months ended
September 30, 2018 and 2017
Prior to closing the acquisition, the partnership had entered into a cash flow hedge, which generated a gain of $12 million, on closing. The partnership had elected to recognize and accordingly, reclassify the associated gains from other comprehensive income to include them in the initial fair value of net asset acquired.
Acquisition costs of $7 million were expensed at the acquisition date and recorded as other expenses on the consolidated statement of operating results. Goodwill of $93 million was acquired, which represents the expected growth the partnership expects to receive from the integration of the operations. Goodwill recognized is not deductible for income tax purposes.
The partnership’s results from operations for the year ended December 31, 2017 includes $1,917 million of revenue and $2 million of net income attributable to the partnership from the acquisition. If the acquisition had been effective January 1, 2017, the partnership would have recorded revenue of approximately $2,865 million and net income of approximately $4 million attributable to the partnership for the year ended December 31, 2017.
On October 31, 2017, the partnership, through Greenergy, completed two separate tuck-in acquisitions, acquiring an 85% interest in Inver Energy, an Irish road fuel business, and an 85% interest in Canadian Operators Petroleum, for combined consideration of $10 million attributable to the partnership. On acquisition, the partnership, through Greenergy, had a 14% economic interest and an 85% voting interest each of these businesses, which provides the partnership with control over the businesses. Accordingly, the partnership, through Greenergy, consolidates these businesses for financial reporting purposes.
Acquisition costs of less than a million were expensed at the acquisition date and recorded as other expenses on the consolidated statement of operating results. Goodwill of $9 million was acquired, which represents the expected growth and synergies the partnership expects to receive from the integration of the operations. Goodwill recognized is not deductible for income tax purposes.
The partnership’s results from operations for the year ended December 31, 2017 includes $17 million of revenue and less than a million of net income attributable to the partnership from the two tuck-in acquisitions. If these acquisitions had been effective January 1, 2017, the partnership would have recorded revenue of approximately $92 million for the year ended December 31, 2017 and net income of less than a million attributable to the partnership for the year ended December 31, 2017.
Fuel Marketing
On July 17, 2017, together with institutional partners, the partnership acquired 213 retail gas stations and associated convenience kiosks ("fuel marketing business") across Canada for consideration of $110 million attributable to the partnership. On acquisition, the partnership had a 26% economic interest and a 100% voting interest in this business, which gives the partnership control over the business. Accordingly, the partnership consolidates this business for financial reporting purposes.
The gas stations will be rebranded as Mobil as part of an agreement with Imperial Oil, marking the introduction of the Mobil fuel brand into Canada. The gas stations will continue to allow customers to collect points through an existing loyalty program. An intangible asset was recognized on acquisition for the loyalty program.
Prior to the closing of the acquisition, the partnership had entered into a cash flow hedge, which generated a gain of $3 million on closing. The partnership elected to recognize and accordingly, reclassify the associated gains from other comprehensive income to include them in the initial fair value of net assets acquired.
Acquisition costs of $4 million were expensed at the acquisition date and recorded as other expenses in the consolidated statement of operating results. Goodwill of $211 million was acquired, which represents the expected growth and synergies the partnership expects to receive from the integration of the operations. Goodwill recognized is deductible for income tax purposes.
The partnership’s results from operations for the year ended December 31, 2017 includes $161 million of revenue and less than $2 million of net income attributable to the partnership from the acquisition. If the acquisition had been effective January 1, 2017, the partnership would have recorded revenue of approximately $353 million and net income of approximately $4 million attributable to the partnership for the year ended December 31, 2017.
23
NOTES TO UNAUDITED INTERIM CONDENSED
CONSOLIDATED FINANCIAL STATEMENTS
As at September 30, 2018 and December 31, 2017 and for the three and nine months ended
September 30, 2018 and 2017
Other
On June 19, 2017, one of the partnership's subsidiaries acquired a real estate brokerage operation in Quebec, Canada for total consideration of approximately $9 million attributable to the partnership. On acquisition, the partnership had a 100% economic interest and a 100% voting interest in this business, which gives us control over the business. Accordingly, the partnership consolidates this business for financial reporting purposes. Acquisition costs of less than $1 million were expensed at the acquisition date and recorded as other expenses on the consolidated statement of operating results.
Goodwill of $9 million was acquired, which represents the synergies the partnership expects to receive from the integration of the operations. Goodwill recognized is not deductible for income tax purposes.
The partnership’s results from operations for the year ended December 31, 2017 includes $2 million of revenue and less than $1 million of net income attributable to the partnership from the acquisition. If the acquisition had been effective January 1, 2017, the partnership would have recorded revenue of approximately $7 million and net income of approximately $1 million attributable to the partnership for the year ended December 31, 2017.
Industrial Operations
BRK Ambiental
On April 25, 2017, the partnership acquired, together with institutional investors, a 70% interest in BRK Ambiental, a wastewater and industrial water treatment business in Brazil, which had a 12.5% voting interest in BRK Ambiental - Ativos Maduros S.A. (“OAMA”), an industrial water treatment business. OAMA is accounted for by BRK Ambiental using the equity method. Subsequently, on May 30, 2017, the partnership acquired, together with institutional investors, the remaining 87.5% voting interest in OAMA and began consolidating the businesses. On acquisition of BRK Ambiental, its 12.5% voting interest in OAMA was re-measured at fair value as part of the purchase price allocation. Given the brief duration of time between the two closing dates, no remeasurement gain or loss was recognized.
On acquisition of the businesses, the partnership had approximately a 27% economic interest, which combined with our voting interest, provides us with control over both BRK Ambiental and OAMA. Accordingly, the partnership consolidates the businesses for financial statement purposes. As at December 31, 2017, the partnership holds $35 million of the consideration in escrow, which will be released to the seller over the next five years on each anniversary date of closing. Acquisition costs of $11 million were expensed at the acquisition dates and recorded as other expenses on the consolidated statement of operating results. Goodwill of approximately $3 million was acquired, which represents the expected growth that the partnership expects to receive from the integration of the operations. Goodwill recognized is not deductible for income tax purposes.
The partnership’s results from the combined operations for the year ended December 31, 2017, includes $132 million of revenue and $5 million of net income attributable to the partnership from the acquisition. If the acquisition had been effective January 1, 2017, the partnership would have recorded revenue of approximately $199 million for the year ended December 31, 2017 and net income of approximately $17 million attributable to the partnership for the year ended December 31, 2017.
Energy
On November 5, 2017, one of the partnership's subsidiaries acquired a bundle of service and swabbing rig assets in Alberta, Canada for total consideration of approximately $12 million attributable to the partnership. On acquisition, the partnership had a 40% economic interest and a 73% voting interest in this business, which give us control over the business. Accordingly, the partnership consolidates this business for financial reporting purposes. Acquisition costs of a million were expensed at the acquisition date and recorded as other expenses on the consolidated statement of operating results. A bargain purchase gain of $7 million was recognized as the seller was motivated to exit the Canadian market.
The partnership’s results from operations for the year ended December 31, 2017 includes $3 million of revenue and $1 million of net income attributable to the partnership from the acquisition. If the acquisition had been effective January 1, 2017, the partnership would have recorded revenue of approximately $13 million for the year ended December 31, 2017 and net income of approximately $2 million attributable to the partnership for the year ended December 31, 2017.
24
NOTES TO UNAUDITED INTERIM CONDENSED
CONSOLIDATED FINANCIAL STATEMENTS
As at September 30, 2018 and December 31, 2017 and for the three and nine months ended
September 30, 2018 and 2017
NOTE 4. FAIR VALUE OF FINANCIAL INSTRUMENTS
The fair value of a financial instrument is the price that would be received to sell an asset or paid to transfer a liability in an orderly transaction between market participants at the measurement date. Fair values are determined by reference to quoted bid or ask prices, as appropriate. Where bid and ask prices are unavailable, the closing price of the most recent transaction of that instrument is used. In the absence of an active market, fair values are determined based on prevailing market rates such as bid and ask prices, as appropriate for instruments with similar characteristics and risk profiles or internal or external valuation models, such as option pricing models and discounted cash flow analysis, using observable market inputs.
Fair values determined using valuation models require the use of assumptions concerning the amount and timing of estimated future cash flows and discount rates. In determining those assumptions, the partnership looks primarily to external readily observable market inputs such as interest rate yield curves, currency rates, and price and rate volatilities as applicable. Financial instruments classified as fair value through profit or loss are carried at fair value on the unaudited interim condensed consolidated statements of financial position and changes in fair values are recognized in profit or loss.
The following table provides the details of financial instruments and their associated financial instrument classifications as at September 30, 2018:
(US$ MILLIONS) | ||||||||||||||||
MEASUREMENT BASIS | FVTPL | FVOCI | Amortized Cost | Total | ||||||||||||
Financial assets | ||||||||||||||||
Cash and cash equivalents | $ | — | $ | — | $ | 1,770 | $ | 1,770 | ||||||||
Accounts receivable, net (current and non-current) (1) | 50 | — | 5,380 | 5,430 | ||||||||||||
Other assets (current and non-current) (2) | — | — | 526 | 526 | ||||||||||||
Financial assets (current and non-current) (3) | 319 | 390 | 543 | 1,252 | ||||||||||||
Total | $ | 369 | $ | 390 | $ | 8,219 | $ | 8,978 | ||||||||
Financial liabilities | ||||||||||||||||
Accounts payable and other (4) | $ | 241 | 11 | $ | 5,086 | $ | 5,338 | |||||||||
Borrowings (current and non-current) | — | — | 10,865 | 10,865 | ||||||||||||
Total | $ | 241 | $ | 11 | $ | 15,951 | $ | 16,203 | ||||||||
____________________________________
(1) | Accounts receivable recognized at fair value relates to our mining business. |
(2) | Excludes prepayments and other assets of $1,067 million. |
(3) | Refer to Hedging Activities in Note 4(a) below. |
(4) | Excludes provisions, decommissioning liabilities, deferred revenue, work in progress, post-employment benefits and various taxes and duties of $4,048 million. |
Included in cash and cash equivalents as at September 30, 2018 is $1,100 million of cash (December 31, 2017: $556 million) and $670 million of cash equivalents (December 31, 2017: $550 million) which includes $385 million on deposit with Brookfield (December 31, 2017: $384 million), as described in Note 14.
The fair value of all financial assets and accounts payable and other as at September 30, 2018 were consistent with carrying values. The fair value of borrowings is $10,870 million compared to a carrying value of $10,865 million as at September 30, 2018. As at December 31, 2017, the promissory note receivable from Teekay Offshore, had a fair value of $88 million compared to a book value of $70 million, and the Teekay Offshore warrants had a fair value of $43 million compared to a book value of $32 million. As at September 30, 2018, the promissory note and warrants are eliminated on consolidation of Teekay Offshore.
25
NOTES TO UNAUDITED INTERIM CONDENSED
CONSOLIDATED FINANCIAL STATEMENTS
As at September 30, 2018 and December 31, 2017 and for the three and nine months ended
September 30, 2018 and 2017
The following table provides the allocation of financial instruments and their associated financial instrument classifications as at December 31, 2017:
(US$ MILLIONS) | FVTPL | Available for Sale Securities | Loans and Receivables/ Other Liabilities | Total | ||||||||||||
MEASUREMENT BASIS | (Fair Value) | (Fair Value through OCI) | (Amortized Cost) | |||||||||||||
Financial assets | ||||||||||||||||
Cash and cash equivalents | $ | — | $ | — | $ | 1,106 | $ | 1,106 | ||||||||
Accounts receivable, net (current and non-current) (1) | 50 | — | 4,312 | 4,362 | ||||||||||||
Other assets (current and non-current) (2) | — | — | 195 | 195 | ||||||||||||
Financial assets (current and non-current) (3) | 116 | 429 | 239 | 784 | ||||||||||||
Total | $ | 166 | $ | 429 | $ | 5,852 | $ | 6,447 | ||||||||
Financial liabilities | ||||||||||||||||
Accounts payable and other (4) | $ | 159 | — | $ | 3,766 | $ | 3,925 | |||||||||
Borrowings (current and non-current) | — | — | 3,265 | 3,265 | ||||||||||||
Total | $ | 159 | $ | — | $ | 7,031 | $ | 7,190 | ||||||||
____________________________________
(1) | Accounts receivable recognized at fair value relates to our mining business. |
(2) | Excludes prepayments and other assets of $314 million. |
(3) | Refer to Hedging Activities in Note 4(a) below. |
(4) | Excludes provisions, decommissioning liabilities, deferred revenue, work in progress, post-employment benefits and various taxes and duties of $1,713 million. |
(a)Hedging activities
The partnership uses foreign exchange contracts and foreign currency denominated debt instruments to manage foreign currency exposures arising from net investments in foreign operations. For the three and nine months ended September 30, 2018, unrealized pre-tax net losses of $10 million and unrealized pre-tax net gains of $57 million (September 30, 2017: $31 million and $77 million unrealized pre-tax net losses, respectively) were recorded in other comprehensive income for the effective portion of hedges of net investments in foreign operations. As at September 30, 2018, there was an unrealized derivative asset balance of $31 million (December 31, 2017: $5 million) and derivative liability balance of $11 million (December 31, 2017: $27 million) relating to derivative contracts designated as net investment hedges.
The partnership uses commodity swap contracts to hedge the sale price of its gas contracts and foreign exchange contracts to hedge highly probable future transactions. A number of these contracts are designated as cash flow hedges. For the three and nine months ended September 30, 2018, unrealized pre-tax net gains of $9 million and $22 million (September 30, 2017: net gains of $6 million and $26 million) were recorded in other comprehensive income for the effective portion of cash flow hedges. As at September 30, 2018, there was an unrealized derivative asset balance of $50 million (December 31, 2017: $29 million) and derivative liability balance of $nil (December 31, 2017: $nil) relating to the derivative contracts designated as cash flow hedges.
Other derivative instruments are measured at fair value, with changes in fair value recognized in the consolidated statements of operating results.
26
NOTES TO UNAUDITED INTERIM CONDENSED
CONSOLIDATED FINANCIAL STATEMENTS
As at September 30, 2018 and December 31, 2017 and for the three and nine months ended
September 30, 2018 and 2017
(b)Fair value hierarchical levels — financial instruments
Level 3 assets and liabilities measured at fair value on a recurring basis include $252 million (December 31, 2017: $257 million) of financial assets and $73 million (December 31, 2017: $64 million) of financial liabilities, which are measured at fair value using valuation inputs based on management's best estimates.
There were no transfers between levels during the three and nine month period ended September 30, 2018. The following table categorizes financial assets and liabilities, which are carried at fair value, based upon the level of input as at September 30, 2018 and December 31, 2017:
September 30, 2018 | December 31, 2017 | |||||||||||||||||||||||
(US$ MILLIONS) | Level 1 | Level 2 | Level 3 | Level 1 | Level 2 | Level 3 | ||||||||||||||||||
Financial assets | ||||||||||||||||||||||||
Common shares | $ | 293 | $ | — | $ | — | $ | 207 | $ | — | $ | — | ||||||||||||
Accounts receivable | — | 50 | — | — | 50 | — | ||||||||||||||||||
Loans and notes receivable | — | — | 2 | — | — | 1 | ||||||||||||||||||
Derivative assets | 2 | 162 | — | 15 | 66 | 34 | ||||||||||||||||||
Other financial assets | — | — | 250 | — | — | 222 | ||||||||||||||||||
Total | $ | 295 | $ | 212 | $ | 252 | $ | 222 | $ | 116 | $ | 257 | ||||||||||||
Financial liabilities | ||||||||||||||||||||||||
Derivative liabilities | $ | 16 | $ | 163 | $ | 36 | $ | 30 | $ | 65 | $ | — | ||||||||||||
Other financial liabilities | — | — | 37 | — | — | 64 | ||||||||||||||||||
Total | $ | 16 | $ | 163 | $ | 73 | $ | 30 | $ | 65 | $ | 64 | ||||||||||||
The following table presents the change in the balance of financial assets classified as Level 3 as at September 30, 2018:
(US$ MILLIONS) | September 30, 2018 | ||
Balance at beginning of year | $ | 257 | |
Fair value change recorded in net income | (7 | ) | |
Fair value change recorded in other comprehensive income | (1 | ) | |
Additions | 42 | ||
Disposals | (39 | ) | |
Balance at end of period | $ | 252 | |
(c)Offsetting of financial assets and liabilities
Financial assets and liabilities are offset with the net amount reported in the unaudited interim condensed consolidated statements of financial position where the partnership currently has a legally enforceable right to offset and there is an intention to settle on a net basis or realize the asset and settle the liability simultaneously. As at September 30, 2018, $4 million gross, of financial assets (December 31, 2017: $21 million) and $3 million gross, of financial liabilities (December 31, 2017: $21 million) were offset in the unaudited interim condensed consolidated statements of financial position related to derivative financial instruments.
27
NOTES TO UNAUDITED INTERIM CONDENSED
CONSOLIDATED FINANCIAL STATEMENTS
As at September 30, 2018 and December 31, 2017 and for the three and nine months ended
September 30, 2018 and 2017
NOTE 5. FINANCIAL ASSETS
(US$ MILLIONS) | September 30, 2018 | December 31, 2017 | ||||||
Current | ||||||||
Marketable securities (1) | $ | 292 | $ | 207 | ||||
Restricted cash | 366 | 68 | ||||||
Derivative contracts | 106 | 75 | ||||||
Loans and notes receivable | 31 | 11 | ||||||
Total current | $ | 795 | $ | 361 | ||||
Non-current | ||||||||
Marketable securities (1) | $ | 1 | $ | 1 | ||||
Restricted cash | 27 | 11 | ||||||
Derivative contracts | 58 | 7 | ||||||
Loans and notes receivable | 121 | 150 | ||||||
Other financial assets (2) | 250 | 254 | ||||||
Total non-current | $ | 457 | $ | 423 | ||||
____________________________________
(1) | During the three and nine month period ended September 30, 2018, the partnership recognized $nil and $nil (September 30, 2017: $10 million and $49 million) of net gains on disposition of marketable securities. |
(2) | Other financial assets include secured debentures to homebuilding companies in our business services segment. |
The increase in financial assets, net from December 31, 2017, is primarily due to the acquisition of Westinghouse during the third quarter of 2018, as well as fair value adjustments on marketable securities and derivative contracts within our energy and industrial operations segments. This increase was partially offset by the elimination of Teekay Offshore's warrants on exercise of our general partner option to acquire control of Teekay Offshore's General Partner.
NOTE 6. ACCOUNTS AND OTHER RECEIVABLE, NET
(US$ MILLIONS) | September 30, 2018 | December 31, 2017 | ||||||
Current, net | $ | 4,646 | $ | 3,454 | ||||
Non-current, net | ||||||||
Retainer on customer contract | 94 | 197 | ||||||
Billing rights | 677 | 711 | ||||||
Accounts receivable | 13 | — | ||||||
Total Non-current, net | $ | 784 | $ | 908 | ||||
Total | $ | 5,430 | $ | 4,362 | ||||
The increase in accounts and other receivable, net from December 31, 2017 is primarily attributable to the acquisition of Westinghouse and the consolidation of Teekay Offshore during the third quarter of 2018, as well as higher receivables in our graphite electrode manufacturing business during the nine months ended September 30, 2018.
Billing rights represent unbilled rights arising at BRK Ambiental from revenue earned from the construction on public concessions contracts classified as financial assets, which are recognized when there is an unconditional right to receive cash or other financial assets from the concession authority for the construction services.
28
NOTES TO UNAUDITED INTERIM CONDENSED
CONSOLIDATED FINANCIAL STATEMENTS
As at September 30, 2018 and December 31, 2017 and for the three and nine months ended
September 30, 2018 and 2017
NOTE 7. INVENTORY, NET
(US$ MILLIONS) | September 30, 2018 | December 31, 2017 | ||||||
Current | ||||||||
Raw materials and consumables | $ | 290 | $ | 138 | ||||
Fuel products (1) | 563 | 612 | ||||||
Work in progress | 233 | 94 | ||||||
RTFO certificates (2) | 268 | 193 | ||||||
Finished goods and other (3) | 415 | 31 | ||||||
Carrying amount of inventories | $ | 1,769 | $ | 1,068 | ||||
____________________________________
(1) | Fuel products are traded in active markets and are purchased with a view to resale in the near future. As a result, stocks of fuel products are recorded at fair value based on quoted market prices. |
(2) | $nil of RTFO certificates (December 31, 2017: $60 million) are held for trading and recorded at fair value. There is no externally quoted marketplace for the valuation of RTFO certificates. In order to value these contracts, the partnership has adopted a pricing methodology combining both observable inputs based on market data and assumptions developed internally based on observable market activity. |
(3) | Finished goods and other is mainly composed of finished goods inventory in our infrastructure services and industrial operations segments. |
The increase in inventory from December 31, 2017 is primarily attributable to the acquisition of Westinghouse and Schoeller Allibert an increase in finished goods at our graphite electrode manufacturing business.
NOTE 8. ASSETS HELD FOR SALE
(US$ MILLIONS) | September 30, 2018 | December 31, 2017 | ||||||
Accounts receivable, net | $ | 41 | $ | — | ||||
Inventory | 10 | — | ||||||
Property, plant and equipment | 21 | 14 | ||||||
Equity accounted investments | 73 | — | ||||||
Assets held for sale | $ | 145 | $ | 14 | ||||
Accounts payable and other | $ | 12 | $ | — | ||||
Liabilities associated with assets held for sale | $ | 12 | $ | — | ||||
Industrial Operations - Infrastructure support products manufacturing
During the nine month period ended September 30, 2018 our infrastructure support products manufacturing operation sold its steel drainage assets and certain land and buildings for proceeds of $82 million. An associated loss on disposition of $3 million and gain on disposition of $48 million was recorded for the three and nine month period ended September 30, 2018. As at September 30, 2018, our infrastructure support products manufacturing operation has certain assets and liabilities related to plants within the precast and drainage operations classified as held for sale. Management is actively seeking and negotiating with potential buyers and expects to complete the sale during the year ending December 31, 2018.
Business Services - Real estate brokerage services
In April 2018, Berkshire Hathaway exercised their call option to acquire the partnership's 33% interest in the joint venture of the real estate brokerage services business, resulting in a $55 million pre-tax gain recognized by the partnership during the second quarter of 2018. As at March 31, 2018, the partnership had classified the interest in the joint venture as held for sale.
29
NOTES TO UNAUDITED INTERIM CONDENSED
CONSOLIDATED FINANCIAL STATEMENTS
As at September 30, 2018 and December 31, 2017 and for the three and nine months ended
September 30, 2018 and 2017
Energy - Australian energy operations
In August 2018, an agreement was reached to sell our Australian energy operation, which is equity accounted, by way of a full sale of the associated entity, to an Australian energy company. At September 30, 2018, the equity accounted investment was classified as held for sale. The sale is expected to close in the fourth quarter of 2018, however, it is subject to certain consents and approvals including from the Australian Competition and Consumer Commission.
NOTE 9. OTHER ASSETS
(US$ MILLIONS) | September 30, 2018 | December 31, 2017 | ||||||
Current | ||||||||
Work in progress (1) | $ | 526 | $ | 195 | ||||
Prepayments and other assets | 549 | 235 | ||||||
Total current | $ | 1,075 | $ | 430 | ||||
Non-current | ||||||||
Prepayments and other assets | $ | 518 | $ | 79 | ||||
Total non-current | $ | 518 | $ | 79 | ||||
____________________________________
(1) | See Note 13 for additional information. |
The increase in other assets, net from December 31, 2017, is primarily due to the acquisition of Westinghouse and the consolidation of Teekay Offshore during the third quarter of 2018.
NOTE 10. PROPERTY, PLANT AND EQUIPMENT
(US$ MILLIONS) | September 30, 2018 | December 31, 2017 | ||||||
Gross Carrying Amount: | ||||||||
Beginning Balance | $ | 3,425 | $ | 2,849 | ||||
Additions | 289 | 195 | ||||||
Disposals | (32 | ) | (275 | ) | ||||
Acquisitions through business combinations (1) | 4,865 | 503 | ||||||
Transfers and assets reclassified as held for sale (2) | (27 | ) | (16 | ) | ||||
Net foreign currency exchange differences | (119 | ) | 169 | |||||
Ending Balance | $ | 8,401 | $ | 3,425 | ||||
Accumulated Depreciation and Impairment | ||||||||
Beginning Balance | (895 | ) | (753 | ) | ||||
Depreciation/depletion/impairment expense | (477 | ) | (151 | ) | ||||
Disposals | 14 | 52 | ||||||
Transfers and assets reclassified as held for sale (2) | 2 | 1 | ||||||
Net foreign currency exchange differences | 22 | (44 | ) | |||||
Ending Balance | $ | (1,334 | ) | $ | (895 | ) | ||
Net Book Value | $ | 7,067 | $ | 2,530 | ||||
____________________________________
(1) | See Note 3 for additional information. |
(2) | See Note 8 for additional information. |
30
NOTES TO UNAUDITED INTERIM CONDENSED
CONSOLIDATED FINANCIAL STATEMENTS
As at September 30, 2018 and December 31, 2017 and for the three and nine months ended
September 30, 2018 and 2017
During the three and nine month period ended September 30, 2018, the partnership recorded an impairment expense of $180 million in our Canadian energy operation as a result of the continued decline in natural gas prices.
NOTE 11. EQUITY ACCOUNTED INVESTMENTS
(US$ MILLIONS) | September 30, 2018 | December 31, 2017 | ||||||
Balance at beginning of year | $ | 609 | $ | 166 | ||||
Adoption of new accounting standard | (7 | ) | — | |||||
Acquisitions through business combinations (1) | 310 | 231 | ||||||
Additions (3) | 267 | 208 | ||||||
Dispositions (3) | (447 | ) | — | |||||
Share of net income | 1 | 69 | ||||||
Share of other comprehensive income/(loss) | — | (5 | ) | |||||
Distributions received | (24 | ) | (59 | ) | ||||
Foreign currency translation | (25 | ) | (1 | ) | ||||
Reclassification to assets held for sale and subsequently disposed (2) | (148 | ) | — | |||||
Balance at end of period | $ | 536 | $ | 609 | ||||
____________________________________
(1) | See Note 3 for additional information. |
(2) | See Note 8 for additional information. |
(3) | Includes non-cash additions/ dispositions related to the consolidation of our equity accounted investment in Teekay Offshore. |
On January 23, 2018, together with institutional partners, we closed our transaction with Ontario Lottery and Gaming Corporation, in partnership with our gaming partner, to operate and manage three gaming facilities in the Greater Toronto Area for a minimum period of 22 years. The acquisition of our gaming operations resulted in an addition of $8 million to equity accounted investments from December 31, 2017.
The equity accounted investment balance decreased as a result of the finalization of the provisional amounts related to the initial accounting for the acquisition of BRK Ambiental.
Prior to July 3, 2018, the partnership, together with institutional investors, had a 60% economic interest in Teekay Offshore and a 49% voting interest in Teekay Offshore's General Partner. The 60% economic interest in Teekay Offshore was accounted for using the equity method. On July 3, 2018, the partnership, together with institutional investors, exercised its general partner option to acquire an additional 2% voting interest in Teekay Offshore GP, in exchange of one million of warrants and began consolidating the business. As a result, the partnership recorded a disposition of the equity accounted investment of Teekay Offshore and began consolidating the equity accounted investments held by Teekay Offshore.
For the nine month period ended September 30, 2018, the partnership received total distributions from equity accounted investments of $24 million.
31
NOTES TO UNAUDITED INTERIM CONDENSED
CONSOLIDATED FINANCIAL STATEMENTS
As at September 30, 2018 and December 31, 2017 and for the three and nine months ended
September 30, 2018 and 2017
NOTE 12. ACCOUNTS PAYABLE AND OTHER
(US$ MILLIONS) | September 30, 2018 | December 31, 2017 | ||||||
Current | ||||||||
Accounts payable | $ | 1,802 | $ | 1,451 | ||||
Accrued and other liabilities (1) (2) | 3,960 | 2,992 | ||||||
Work in progress (3) | 1,633 | 341 | ||||||
Provisions and decommissioning liabilities | 288 | 81 | ||||||
Total current | $ | 7,683 | $ | 4,865 | ||||
Non-current | ||||||||
Accounts payable | $ | 90 | $ | 113 | ||||
Accrued and other liabilities (2) | 1,075 | 435 | ||||||
Work in progress (3) | 58 | 86 | ||||||
Provisions and decommissioning liabilities | 480 | 139 | ||||||
Total non-current | $ | 1,703 | $ | 773 | ||||
____________________________________
(1) | Includes bank overdrafts of $1,003 million as at September 30, 2018 (December 31, 2017: $581 million). |
(2) | Includes a defined benefit pension obligation of $400 million ($14 million current and $386 million non-current) and a post-retirement benefit obligation of $67 million ($2 million current and $65 million non-current) as at September 30, 2018. |
(3) | See Note 13 for additional information. |
The increase in accounts payable and other from December 31, 2017 is primarily attributable to the acquisition of Westinghouse and the consolidation of Teekay Offshore.
NOTE 13. CONTRACTS IN PROGRESS
(US$ MILLIONS) | September 30, 2018 | December 31, 2017 | ||||||
Contract costs incurred to date | $ | 20,595 | $ | 12,129 | ||||
Profit recognized to date (less recognized losses) | 2,180 | 558 | ||||||
22,775 | 12,687 | |||||||
Less: progress billings | (23,940 | ) | (12,919 | ) | ||||
Contract work in progress (liability) | $ | (1,165 | ) | $ | (232 | ) | ||
Comprising: | ||||||||
Amounts due from customers — work in progress (current) | $ | 526 | $ | 195 | ||||
Amounts due to customers — creditors (current / non-current) | (1,691 | ) | (427 | ) | ||||
Net work in progress | $ | (1,165 | ) | $ | (232 | ) | ||
NOTE 14. BORROWINGS
Total current and non-current borrowings as at September 30, 2018 were $10,865 million (December 31, 2017: $3,265 million). The increase of $7,600 million compared to December 31, 2017 is primarily attributable to a $2,250 million senior secured term loan put in place within our graphite electrode manufacturing business, of which $358 million was used to repay existing debt, $2,950 million of term loan financing put in place within Westinghouse, and the consolidation of Teekay Offshore.
Some of the partnership's businesses have credit facilities in which they borrow and repay on a monthly basis. This movement has been shown on a net basis in the partnership's unaudited interim condensed consolidated statements of cash flow.
32
NOTES TO UNAUDITED INTERIM CONDENSED
CONSOLIDATED FINANCIAL STATEMENTS
As at September 30, 2018 and December 31, 2017 and for the three and nine months ended
September 30, 2018 and 2017
As described in Note 15, the partnership has in place, as at September 30, 2018, a credit agreement with Brookfield ("Brookfield Credit Agreement") for a three-year revolving credit facility, with variable interest rates, that permits borrowings of up to $500 million for purposes of funding acquisitions and investments. As at September 30, 2018, the credit facility under the Brookfield Credit Agreement remains undrawn.
In the second quarter of 2018, the partnership amended and restated our bilateral credit facility, increasing it by $575 million to $825 million across an expanded group of banks. In addition to U.S. or Canadian dollars, this amended credit facility is available in Euros, Sterling or Australian dollars. Advances under this amended credit facility bear interest at the specified LIBOR, EURIBOR, CDOR, BBSY or bankers' acceptance rate plus 2.50%, or the specified base rate or prime rate plus 1.50%. The credit facility's maturity date was extended by two years to August 2021. As at September 30, 2018, the facility remains undrawn.
The partnership has credit facilities within its operating businesses with major financial institutions. The credit facilities are primarily composed of revolving term credit facilities and revolving operating facilities with variable interest rates. In certain cases, the facilities may have financial covenants which are generally in the form of interest coverage ratios and leverage ratios. One of the partnership's real estate services businesses within our business services segment has a securitization program under which it transfers an undivided co-ownership interest in eligible receivables on a fully serviced basis, for cash proceeds, at their fair value under the terms of the agreement. While the sale of the co-ownership interest is considered a legal sale, the partnership has determined that the asset derecognition criteria has not been met as substantially all risk and rewards of ownership are not transferred.
The partnership was in compliance or have obtained waivers relating to all covenants.
NOTE 15. RELATED PARTY TRANSACTIONS
In the normal course of operations, the partnership entered into the transactions below with related parties on exchange value. These transactions have been measured at fair value and are recognized in the unaudited interim condensed consolidated financial statements.
(a) | Transactions with the parent company |
As at September 30, 2018, $nil (December 31, 2017: $nil) was drawn on the credit facilities under the Brookfield Credit Agreements.
The partnership has in place a Deposit Agreement with Brookfield whereby it may place funds on deposit with Brookfield, as approved by the Board of Directors. Any deposit balance is due on demand and earns an agreed upon rate of interest based on market terms. As at September 30, 2018, the amount of the deposit was $385 million (December 31, 2017: $384 million) and was included in cash and cash equivalents. For the three and nine months ended September 30, 2018, the partnership earned interest income of $3 million and $10 million, respectively (September 30, 2017: $1 million and $4 million, respectively) on these deposits.
The partnership pays Brookfield a quarterly base management fee. For purposes of calculating the base management fee, the total capitalization of Brookfield Business Partners L.P. is equal to the quarterly volume-weighted average trading price of a unit on the principal stock exchange for the partnership units (based on trading volumes) multiplied by the number of units outstanding at the end of the quarter (assuming full conversion of the redemption-exchange units into units of Brookfield Business Partners L.P.), plus the value of securities of the other Service Recipients that are not held by the partnership, plus all outstanding third party debt with recourse to a Service Recipient, less all cash held by such entities. The base management fee for the three and nine month period ended September 30, 2018 was $15 million and $41 million, respectively (September 30, 2017: $9 million and $22 million, respectively).
In its capacity as the holder of the special limited partner (“Special LP”) units of Holding LP, Brookfield is entitled to incentive distribution rights. The incentive distribution for the three and nine months ended September 30, 2018 was $94 million and $278 million (September 30, 2017: $25 million and $25 million).
The partnership previously entered into a number of hedges of net investments in foreign operations with Brookfield, all of which were settled as at December 31, 2017. For the three and nine month period ended September 30, 2018, unrealized losses of $nil (September 30, 2017: $1 million and $10 million) and realized losses of $nil (September 30, 2017: $1 million gain and $5 million loss), respectively, were recorded.
33
NOTES TO UNAUDITED INTERIM CONDENSED
CONSOLIDATED FINANCIAL STATEMENTS
As at September 30, 2018 and December 31, 2017 and for the three and nine months ended
September 30, 2018 and 2017
In addition, at the time of spin-off, the partnership entered into indemnity agreements with Brookfield that relate to certain projects in certain regions that were in place prior to the spin-off. Under these indemnity agreements, Brookfield has agreed to indemnify us for the receipt of payments relating to such projects.
(b) | Other |
The following table summarizes other transactions the partnership has entered into with related parties:
Three Months Ended | Nine Months Ended | ||||||||||||||
(US$ MILLIONS) | September 30, 2018 | September 30, 2017 | September 30, 2018 | September 30, 2017 | |||||||||||
Transactions during the period | |||||||||||||||
Construction revenues | $ | 119 | $ | 94 | $ | 343 | $ | 255 | |||||||
(US$ MILLIONS) | September 30, 2018 | December 31, 2017 | |||||
Balances at end of period | |||||||
Accounts receivable | $ | 57 | $ | 64 | |||
Accounts payable and other | $ | 153 | $ | 106 | |||
NOTE 16. DERIVATIVE FINANCIAL INSTRUMENTS
The partnership's activities expose it to a variety of financial risks, including market risk (currency risk, interest rate risk, commodity risk and other price risks), credit risk and liquidity risk. The partnership and its subsidiaries selectively use derivative financial instruments principally to manage these risks.
The aggregate amount of the partnership derivatives financial instrument position are as follows:
(US$ MILLIONS) | September 30, 2018 | December 31, 2017 | ||||||||||||||
Financial Asset | Financial Liability | Financial Asset | Financial Liability | |||||||||||||
Foreign currency forward contracts | $ | 72 | $ | 41 | $ | 9 | $ | 40 | ||||||||
Warrants | — | 36 | 32 | — | ||||||||||||
Interest rate swaps | 10 | 84 | — | — | ||||||||||||
Commodities contracts | 82 | 50 | 74 | 55 | ||||||||||||
Others | — | 4 | — | — | ||||||||||||
Total | $ | 164 | $ | 215 | $ | 115 | $ | 95 | ||||||||
Total Current | $ | 106 | $ | 90 | $ | 75 | $ | 95 | ||||||||
Total Non-current | $ | 58 | $ | 125 | $ | 40 | $ | — | ||||||||
NOTE 17. EQUITY
For the three and nine month period ended September 30, 2018, the partnership distributed dividends to limited partner, general partner and redemption-exchange unitholders of $8 million and $24 million, respectively, or approximately $0.0625 per partnership unit (September 30, 2017: $7 million and $21 million, respectively). For the three and nine month period ended September 30, 2018, the partnership distributed to others who have interests in the operating subsidiaries $495 million and $2,153 million, respectively, primarily resulting from the dividends received from our graphite electrode manufacturing business (September 30, 2017: $74 million and $381 million, respectively).
There was no change in the number of units issued and outstanding during the nine month period ended September 30, 2018.
34
NOTES TO UNAUDITED INTERIM CONDENSED
CONSOLIDATED FINANCIAL STATEMENTS
As at September 30, 2018 and December 31, 2017 and for the three and nine months ended
September 30, 2018 and 2017
(a) | Earnings per limited partner unit |
Net (loss) income attributable to limited partnership unitholders was $1 million loss and $4 million income for the three and nine month period ended September 30, 2018. The weighted average number of limited partnership units was 66 million for the three and nine month period ended September 30, 2018 (September 30, 2017: 52 million).
(b) | Incentive distribution to Special Limited Partnership Units |
In its capacity as the holder of the special limited partnership units of Holding LP, Brookfield is entitled to incentive distribution rights which are based on a 20% increase in the unit price of the partnership over an initial threshold based on the volume-weighted average price of the units, subject to a high water mark. A distribution of $94 million and $278 million (September 30, 2017: $25 million and $25 million, respectively) was declared during the three and nine month period ended September 30, 2018. The threshold was reset to $41.96/unit.
NOTE 18. ACCUMULATED OTHER COMPREHENSIVE INCOME (LOSS)
(a) | Attributable to Limited Partners |
(US$ MILLIONS) | Foreign currency translation | FVOCI | Other (1) | Accumulated other comprehensive income (loss) | ||||||||||||
Balance as at January 1, 2018 | $ | (111 | ) | $ | 6 | $ | (7 | ) | $ | (112 | ) | |||||
Other comprehensive income (loss) | (55 | ) | 7 | 11 | (37 | ) | ||||||||||
Ownership changes | $ | — | $ | — | $ | (1 | ) | $ | (1 | ) | ||||||
Balance as at September 30, 2018 | $ | (166 | ) | $ | 13 | $ | 3 | $ | (150 | ) | ||||||
____________________________________
(1) | Represents net investment hedges, cash flow hedges and other reserves. |
(US$ MILLIONS) | Foreign currency translation | Available for sale | Other (1) | Accumulated other comprehensive income (loss) | ||||||||||||
Balance as at January 1, 2017 | $ | (148 | ) | $ | 4 | $ | 3 | $ | (141 | ) | ||||||
Other comprehensive income (loss) | 47 | 2 | (16 | ) | 33 | |||||||||||
Balance as at September 30, 2017 | $ | (101 | ) | $ | 6 | $ | (13 | ) | $ | (108 | ) | |||||
____________________________________
(1) | Represents net investment hedges, cash flow hedges and other reserves. |
(b) | Attributable to Non-controlling interest — Redemption-Exchange Units held by Brookfield Asset Management Inc. |
(US$ MILLIONS) | Foreign currency translation | FVOCI | Other (1) | Accumulated other comprehensive income (loss) | ||||||||||||
Balance as at January 1, 2018 | $ | (165 | ) | $ | 4 | $ | (4 | ) | $ | (165 | ) | |||||
Other comprehensive income (loss) | (54 | ) | 7 | 11 | (36 | ) | ||||||||||
Ownership changes | $ | — | $ | — | $ | (1 | ) | $ | (1 | ) | ||||||
Balance as at September 30, 2018 | $ | (219 | ) | $ | 11 | $ | 6 | $ | (202 | ) | ||||||
____________________________________
(1) | Represents net investment hedges, cash flow hedges and other reserves. |
35
NOTES TO UNAUDITED INTERIM CONDENSED
CONSOLIDATED FINANCIAL STATEMENTS
As at September 30, 2018 and December 31, 2017 and for the three and nine months ended
September 30, 2018 and 2017
(US$ MILLIONS) | Foreign currency translation | Available for sale | Other (1) | Accumulated other comprehensive income (loss) | ||||||||||||
Balance as at January 1, 2017 | $ | (205 | ) | $ | 2 | $ | 6 | $ | (197 | ) | ||||||
Other comprehensive income (loss) | 51 | 1 | (17 | ) | 35 | |||||||||||
Balance as at September 30, 2017 | $ | (154 | ) | $ | 3 | $ | (11 | ) | $ | (162 | ) | |||||
____________________________________
(1) | Represents net investment hedges, cash flow hedges and other reserves. |
NOTE 19. DIRECT OPERATING COSTS
The partnership has no key employees or directors and does not remunerate key management personnel. Key decision makers of the partnership are all employees of the ultimate parent company or its subsidiaries, which provides management services under the master services agreement with Brookfield.
Direct operating costs include all attributable expenses except interest, depreciation and amortization, impairment expense, other expenses, and taxes and primarily relate to cost of sales and compensation. The following table lists direct operating costs for the three and nine months ended September 30, 2018, and September 30, 2017 by nature:
Three Months Ended | Nine Months Ended | |||||||||||||||
(US$ MILLIONS) | September 30, 2018 | September 30, 2017 | September 30, 2018 | September 30, 2017 | ||||||||||||
Cost of sales | $ | 8,296 | $ | 6,937 | $ | 23,211 | $ | 12,723 | ||||||||
Compensation | 770 | 353 | 1,673 | 1,082 | ||||||||||||
Property taxes, sales taxes and other | 14 | 5 | 45 | 37 | ||||||||||||
Total | $ | 9,080 | $ | 7,295 | $ | 24,929 | $ | 13,842 | ||||||||
Inventories recognized as expenses during the three and nine month period ended September 30, 2018 amounted to $5,902 million and $15,703 million, respectively (September 30, 2017: $4,435 million and $7,092 million).
NOTE 20. SEGMENT INFORMATION
Our operations are organized into five operating segments which are regularly reviewed by our Chief Operating Decision Maker (the "CODM") for the purpose of allocating resources to the segment and to assess its performance. The key measures used by the CODM in assessing performance and in making resource allocation decisions are company funds from operations, or Company FFO and Company EBITDA.
Company FFO is calculated as net income excluding the impact of depreciation and amortization, deferred income taxes, breakage and transaction costs, non-cash valuation gains or losses and other items. When determining Company FFO, we include our proportionate share of Company FFO of equity accounted investment.
Company FFO is further adjusted as Company EBITDA to exclude the impact of realized disposition gains (losses), interest expenses, current income taxes, and realized disposition gains, current income taxes and interest expenses related to equity accounted investments.
On June 20, 2016 we formed a listed issuer called Brookfield Business Partners L.P. (“BBU”) by way of a special dividend to shareholders. BBU is the primary vehicle through which we own and operate businesses within our private equity business group.
In connection with the acquisition of Westinghouse, we have realigned the organizational and governance structure of our businesses and have changed how the partnership presents information for financial reporting and management decision making which has resulted in a change in the construction services and business services segments presentation and the creation of a new infrastructure services segment.
36
NOTES TO UNAUDITED INTERIM CONDENSED
CONSOLIDATED FINANCIAL STATEMENTS
As at September 30, 2018 and December 31, 2017 and for the three and nine months ended
September 30, 2018 and 2017
Accordingly, effective for the third quarter of fiscal 2018, our construction services and business services segment are presented as a single operating segment, business services. Infrastructure services is a new operating segment, which includes our investment in Westinghouse. The infrastructure services segment had no operations prior to the acquisition of Westinghouse in the third quarter of fiscal 2018. The partnership has retrospectively applied these segment changes for all periods presented.
Three Months Ended September 30, 2018 | ||||||||||||||||||||||||
Total attributable to the partnership | ||||||||||||||||||||||||
(US$ MILLIONS) | Business Services | Infrastructure Services | Industrial Operations | Energy | Corporate and Other | Total | ||||||||||||||||||
Revenues | $ | 7,923 | $ | 740 | $ | 937 | $ | 390 | $ | — | $ | 9,990 | ||||||||||||
Direct operating costs | (7,784 | ) | (574 | ) | (504 | ) | (216 | ) | (2 | ) | (9,080 | ) | ||||||||||||
General and administrative expenses | (64 | ) | (16 | ) | (65 | ) | (11 | ) | (18 | ) | (174 | ) | ||||||||||||
Equity accounted Company EBITDA (3) | 8 | — | 3 | 23 | — | 34 | ||||||||||||||||||
Company EBITDA attributable to others (4) | (51 | ) | (84 | ) | (272 | ) | (132 | ) | — | (539 | ) | |||||||||||||
Company EBITDA (1) | 32 | 66 | 99 | 54 | (20 | ) | 231 | |||||||||||||||||
Realized disposition gain (loss), net (6) | — | — | (3 | ) | — | — | (3 | ) | ||||||||||||||||
Other income (expenses), net (5) | — | — | — | (11 | ) | — | (11 | ) | ||||||||||||||||
Interest income (expense), net | (9 | ) | (35 | ) | (60 | ) | (48 | ) | 4 | (148 | ) | |||||||||||||
Realized disposition gain, current income taxes and interest expenses related to equity accounted investment (3) | (1 | ) | — | (1 | ) | (6 | ) | — | (8 | ) | ||||||||||||||
Current income taxes | (8 | ) | (4 | ) | (26 | ) | (5 | ) | — | (43 | ) | |||||||||||||
Company FFO attributable to others (net of Company EBITDA attributable to others) (4) | 12 | 22 | 67 | 51 | — | 152 | ||||||||||||||||||
Company FFO (1) | 26 | 49 | 76 | 35 | (16 | ) | 170 | |||||||||||||||||
Depreciation and amortization expense (2) | (251 | ) | ||||||||||||||||||||||
Impairment expense, net | (180 | ) | ||||||||||||||||||||||
Gain on acquisition and disposition (6) | 250 | |||||||||||||||||||||||
Other income (expense), net (5) | (31 | ) | ||||||||||||||||||||||
Deferred income taxes | (25 | ) | ||||||||||||||||||||||
Non-cash items attributable to equity accounted investments (3) | (35 | ) | ||||||||||||||||||||||
Non-cash items attributable to others (4) | 195 | |||||||||||||||||||||||
Net income (loss) attributable to unitholders (1) | $ | 93 | ||||||||||||||||||||||
____________________________________
(1) | Company EBITDA, Company FFO and net income attributable to unitholders include Company EBITDA, Company FFO, and net income attributable to limited partnership unitholders, general partnership unitholders, redemption-exchange unitholders and special limited partnership unitholders. |
(2) | For the three month period ended September 30, 2018, depreciation and amortization by segment is as follows: Business Services $33 million, Infrastructure Services $52 million, Industrial Operations $59 million, Energy $107 million, and Corporate and Other $nil. |
(3) | The sum of these amounts equates to equity accounted loss of $9 million. |
(4) | Total cash and non-cash items attributable to the interest of others equals net gain of $192 million as per the unaudited interim condensed consolidated statements of operating results. |
(5) | The sum of these amounts equates to other expenses of $42 million. |
(6) | The sum of these amounts equates to gains on acquisitions/dispositions of $247 million. |
37
NOTES TO UNAUDITED INTERIM CONDENSED
CONSOLIDATED FINANCIAL STATEMENTS
As at September 30, 2018 and December 31, 2017 and for the three and nine months ended
September 30, 2018 and 2017
Nine Months Ended September 30, 2018 | ||||||||||||||||||||||||
Total attributable to the partnership | ||||||||||||||||||||||||
(US$ MILLIONS) | Business Services | Infrastructure Services | Industrial Operations | Energy | Corporate and Other | Total | ||||||||||||||||||
Revenues | $ | 23,129 | $ | 740 | $ | 2,539 | $ | 544 | $ | 7 | $ | 26,959 | ||||||||||||
Direct operating costs | (22,729 | ) | (574 | ) | (1,295 | ) | (325 | ) | (6 | ) | (24,929 | ) | ||||||||||||
General and administrative expenses | (203 | ) | (16 | ) | (144 | ) | (21 | ) | (50 | ) | (434 | ) | ||||||||||||
Equity accounted Company EBITDA (3) | 23 | — | 12 | 121 | — | 156 | ||||||||||||||||||
Company EBITDA attributable to others (4) | (122 | ) | (84 | ) | (786 | ) | (156 | ) | — | (1,148 | ) | |||||||||||||
Company EBITDA (1) | 98 | 66 | 326 | 163 | (49 | ) | 604 | |||||||||||||||||
Realized disposition gain (loss), net (6) | 55 | — | 48 | — | — | 103 | ||||||||||||||||||
Other income (expenses), net (5) | — | — | — | (11 | ) | — | (11 | ) | ||||||||||||||||
Interest income (expense), net | (50 | ) | (35 | ) | (174 | ) | (62 | ) | 4 | (317 | ) | |||||||||||||
Realized disposition gain, current income taxes and interest expenses related to equity accounted investments (3) | (2 | ) | — | (3 | ) | (42 | ) | — | (47 | ) | ||||||||||||||
Current income taxes | (38 | ) | (4 | ) | (75 | ) | (6 | ) | — | (123 | ) | |||||||||||||
Company FFO attributable to others (net of Company EBITDA attributable to others) (4) | 46 | 22 | 146 | 62 | — | 276 | ||||||||||||||||||
Company FFO (1) | 109 | 49 | 268 | 104 | (45 | ) | 485 | |||||||||||||||||
Depreciation and amortization expense (2) | (462 | ) | ||||||||||||||||||||||
Impairment expense, net | (180 | ) | ||||||||||||||||||||||
Gain on acquisitions and disposition (6) | 250 | |||||||||||||||||||||||
Other income (expense), net (5) | (52 | ) | ||||||||||||||||||||||
Deferred income taxes | 4 | |||||||||||||||||||||||
Non-cash items attributable to equity accounted investments (3) | (108 | ) | ||||||||||||||||||||||
Non-cash items attributable to others (4) | 349 | |||||||||||||||||||||||
Net income (loss) attributable to unitholders (1) | $ | 286 | ||||||||||||||||||||||
____________________________________
(1) | Company EBITDA, Company FFO and net income attributable to unitholders include Company EBITDA, Company FFO, and net income attributable to limited partnership unitholders, general partnership unitholders, redemption-exchange unitholders and special limited partnership unitholders. |
(2) | For the nine month period ended September 30, 2018, depreciation and amortization by segment is as follows; Business Services $100 million, Infrastructure Services $52 million, Industrial Operations $165 million, Energy $145 million, and Corporate and Other $nil. |
(3) | The sum of these amounts equates to equity accounted income of $1 million. |
(4) | Total cash and non-cash items attributable to the interest of others equals net gain of $523 million as per the unaudited interim condensed consolidated statements of operating results. |
(5) | The sum of these amounts equates to other expenses of $63 million. |
(6) | The sum of these amounts equates to gains on acquisitions/dispositions of $353 million. |
38
NOTES TO UNAUDITED INTERIM CONDENSED
CONSOLIDATED FINANCIAL STATEMENTS
As at September 30, 2018 and December 31, 2017 and for the three and nine months ended
September 30, 2018 and 2017
Three Months Ended September 30, 2017 | ||||||||||||||||||||||||
Total attributable to the partnership | ||||||||||||||||||||||||
(US$ MILLIONS) | Business Services | Infrastructure Services | Industrial Operations | Energy | Corporate and Other | Total | ||||||||||||||||||
Revenues | $ | 7,070 | $ | — | $ | 503 | $ | 66 | $ | 1 | $ | 7,640 | ||||||||||||
Direct operating costs | (6,909 | ) | — | (335 | ) | (50 | ) | (1 | ) | (7,295 | ) | |||||||||||||
General and administrative expenses | (50 | ) | — | (29 | ) | (4 | ) | (12 | ) | (95 | ) | |||||||||||||
Equity accounted Company EBITDA (3) | 8 | — | — | 14 | — | 22 | ||||||||||||||||||
Company EBITDA attributable to others (4) | (72 | ) | — | (103 | ) | (12 | ) | — | (187 | ) | ||||||||||||||
Company EBITDA (1) | 47 | — | 36 | 14 | (12 | ) | 85 | |||||||||||||||||
Realized disposition gain (loss), net (5) | 11 | — | — | (48 | ) | — | (37 | ) | ||||||||||||||||
Interest income (expense), net | (15 | ) | — | (44 | ) | (7 | ) | — | (66 | ) | ||||||||||||||
Realized disposition gain, current income taxes and interest expenses related to equity accounted investment (3) | — | — | — | (2 | ) | — | (2 | ) | ||||||||||||||||
Current income taxes | (15 | ) | — | (7 | ) | 2 | 1 | (19 | ) | |||||||||||||||
Company FFO attributable to others (net of Company EBITDA attributable to others) (4) | 12 | — | 37 | 36 | — | 85 | ||||||||||||||||||
Company FFO (1) | 40 | — | 22 | (5 | ) | (11 | ) | 46 | ||||||||||||||||
Depreciation and amortization expense (2) | (109 | ) | ||||||||||||||||||||||
Realized disposition gain (loss) recorded in prior periods (5) | 23 | |||||||||||||||||||||||
Impairment expense, net | — | |||||||||||||||||||||||
Other income (expense), net | (41 | ) | ||||||||||||||||||||||
Deferred income taxes | 6 | |||||||||||||||||||||||
Non-cash items attributable to equity accounted investments (3) | 17 | |||||||||||||||||||||||
Non-cash items attributable to others (4) | 67 | |||||||||||||||||||||||
Net income (loss) attributable to unitholders (1) | $ | 9 | ||||||||||||||||||||||
____________________________________
(1) | Company EBITDA, Company FFO and net income attributable to unitholders include Company EBITDA, Company FFO, and net income attributable to limited partnership unitholders, general partnership unitholders, redemption-exchange unitholders and special limited partnership unitholders. |
(2) | For the three month period ended September 30, 2017, depreciation and amortization by segment is as follows: Business Services $30 million, Infrastructure Services $nil, Industrial Operations $53 million, Energy $26 million, and Corporate and Other $nil. |
(3) | The sum of these amounts equates to equity accounted income of $37 million. |
(4) | Total cash and non-cash items attributable to the interest of others equals net loss of $35 million as per the unaudited interim condensed consolidated statements of operating results. |
(5) | The sum of these amounts equates to losses on acquisitions/dispositions of $14 million. |
39
NOTES TO UNAUDITED INTERIM CONDENSED
CONSOLIDATED FINANCIAL STATEMENTS
As at September 30, 2018 and December 31, 2017 and for the three and nine months ended
September 30, 2018 and 2017
Nine Months Ended September 30, 2017 | ||||||||||||||||||||||||
Total attributable to the partnership | ||||||||||||||||||||||||
(US$ MILLIONS) | Business Services | Infrastructure Services | Industrial Operations | Energy | Corporate and Other | Total | ||||||||||||||||||
Revenues | $ | 13,100 | $ | — | $ | 1,140 | $ | 199 | $ | 5 | $ | 14,444 | ||||||||||||
Direct operating costs | (12,823 | ) | — | (870 | ) | (146 | ) | (3 | ) | (13,842 | ) | |||||||||||||
General and administrative expenses | (125 | ) | — | (66 | ) | (12 | ) | (30 | ) | (233 | ) | |||||||||||||
Equity accounted Company EBITDA (3) | 23 | — | 1 | 40 | — | 64 | ||||||||||||||||||
Company EBITDA attributable to others (4) | (111 | ) | — | (154 | ) | (36 | ) | — | (301 | ) | ||||||||||||||
Company EBITDA (1) | 64 | — | 51 | 45 | (28 | ) | 132 | |||||||||||||||||
Realized disposition gain (loss), net (5) | 19 | — | 237 | (12 | ) | — | 244 | |||||||||||||||||
Interest income (expense), net | (28 | ) | — | (87 | ) | (20 | ) | — | (135 | ) | ||||||||||||||
Realized disposition gain, current income taxes and interest expenses related to equity accounted investment (3) | — | — | — | (4 | ) | — | (4 | ) | ||||||||||||||||
Current income taxes | (7 | ) | — | (20 | ) | 1 | 7 | (19 | ) | |||||||||||||||
Company FFO attributable to others (net of Company EBITDA attributable to others) (4) | 22 | — | (72 | ) | 16 | — | (34 | ) | ||||||||||||||||
Company FFO (1) | 70 | — | 109 | 26 | (21 | ) | 184 | |||||||||||||||||
Depreciation and amortization expense (2) | (262 | ) | ||||||||||||||||||||||
Realized disposition gain (loss) recorded in prior periods (5) | 23 | |||||||||||||||||||||||
Impairment expense, net | (30 | ) | ||||||||||||||||||||||
Other income (expense), net | (36 | ) | ||||||||||||||||||||||
Deferred income taxes | 6 | |||||||||||||||||||||||
Non-cash items attributable to equity accounted investments (3) | 1 | |||||||||||||||||||||||
Non-cash items attributable to others (4) | 183 | |||||||||||||||||||||||
Net income (loss) attributable to unitholders (1) | $ | 69 | ||||||||||||||||||||||
(1) | Company EBITDA, Company FFO and net income attributable to unitholders include Company EBITDA, Company FFO, and net income attributable to limited partnership unitholders, general partnership unitholders, redemption-exchange unitholders and special limited partnership unitholders. |
(2) | For the nine month period ended September 30, 2017, depreciation and amortization by segment is as follows: Business Services $64 million, Infrastructure Services $nil, Industrial Operations $122 million, Energy $76 million, and Corporate and Other $nil. |
(3) | The sum of these amounts equates to equity accounted income of $61 million. |
(4) | Total cash and non-cash items attributable to the interest of others equals net gain of $152 million as per the unaudited interim condensed consolidated statements of operating results. |
(5) | The sum of these amounts equates to gains on acquisitions/dispositions of $267 million. |
40
NOTES TO UNAUDITED INTERIM CONDENSED
CONSOLIDATED FINANCIAL STATEMENTS
As at September 30, 2018 and December 31, 2017 and for the three and nine months ended
September 30, 2018 and 2017
For the purpose of monitoring segment performance and allocating resources between segments, the CODM monitors the assets, including investments accounted for using the equity method, attributable to each segment.
The following is an analysis of the partnership's assets by reportable operating segment as at September 30, 2018 and December 31, 2017:
As at September 30, 2018 | ||||||||||||||||||||||||
Total attributable to the partnership | ||||||||||||||||||||||||
(US$ MILLIONS) | Business Services | Infrastructure Services | Industrial Operations | Energy | Corporate and Other | Total | ||||||||||||||||||
Total assets | $ | 8,130 | $ | 6,475 | $ | 6,241 | $ | 6,301 | $ | 479 | $ | 27,626 | ||||||||||||
As at December 31, 2017 | ||||||||||||||||||||||||
Total attributable to the partnership | ||||||||||||||||||||||||
(US$ MILLIONS) | Business Services | Infrastructure Services | Industrial Operations | Energy | Corporate and Other | Total | ||||||||||||||||||
Total assets | $ | 7,899 | $ | — | $ | 5,839 | $ | 1,671 | $ | 395 | $ | 15,804 | ||||||||||||
NOTE 21. SUPPLEMENTAL CASH FLOW INFORMATION
Nine Months Ended | ||||||||
(US$ MILLIONS) | September 30, 2018 | September 30, 2017 | ||||||
Interest paid | $ | 204 | $ | 61 | ||||
Income taxes paid | $ | 71 | $ | 28 | ||||
Amounts paid and received for interest were reflected as operating cash flows in the unaudited interim condensed consolidated statements of cash flow.
Details of "Changes in non-cash working capital, net" on the unaudited interim condensed consolidated statements of cash flow are as follows:
Nine Months Ended | ||||||||
(US$ MILLIONS) | September 30, 2018 | September 30, 2017 | ||||||
Accounts receivable | $ | (369 | ) | $ | (173 | ) | ||
Inventory | 59 | 10 | ||||||
Prepayments and other | (42 | ) | 145 | |||||
Accounts payable and other | (423 | ) | (147 | ) | ||||
Changes in non-cash working capital, net | $ | (775 | ) | $ | (165 | ) | ||
NOTE 22. SUBSEQUENT EVENTS
(a) | Distribution |
On November 1, 2018, the Board of Directors declared a quarterly distribution in the amount of $0.0625 per unit, payable on December 31, 2018 to unitholders of record as at the close of business on November 30, 2018.
(b) | Acquisition of Imagine |
On October 1, 2018, the partnership, together with institutional partners, completed the acquisition of a 50.1% controlling interest in Imagine Communication Group Ltd. ("Imagine"). The partnership will have 30% ownership interest.
41
NOTES TO UNAUDITED INTERIM CONDENSED
CONSOLIDATED FINANCIAL STATEMENTS
As at September 30, 2018 and December 31, 2017 and for the three and nine months ended
September 30, 2018 and 2017
Due to the recent closing of the acquisition, the complete valuation and initial purchase price accounting for the business combination is not available as at the date of release of these unaudited interim condensed consolidated financial statements. As a result, the partnership has not provided amounts recognized as at the acquisition date for certain major classes of assets acquired and liabilities assumed.
(c) | Cardone Loan |
In October 2018, we finalized a $240 million senior secured term loan to Cardone Industries ("Cardone"). The partnership funded approximately $50 million.
42
MANAGEMENT'S DISCUSSION AND ANALYSIS OF
FINANCIAL CONDITION AND RESULTS OF OPERATIONS
Introduction
This management's discussion and analysis of our operating results and financial condition, or MD&A, of Brookfield Business Partners L.P. and subsidiaries, (collectively, the partnership, or we, or our), covers the financial position of the partnership as at September 30, 2018 and December 31, 2017, and results of operations for the three and nine month period ended September 30, 2018 and 2017. The information in this MD&A should be read in conjunction with the unaudited interim condensed consolidated financial statements as at September 30, 2018 and December 31, 2017, and for the three and nine month period ended September 30, 2018 and September 30, 2017, or the interim financial statements. This MD&A was prepared as of November 8, 2018. Additional information relating to the partnership can be found at www.sedar.com or www.sec.gov.
In addition to historical information, this MD&A contains forward-looking statements. Readers are cautioned that these forward-looking statements are subject to rules and uncertainties and could cause actual results to differ materially from those reflected in the forward-looking statements.
Forward-looking Statements
This MD&A contains certain forward-looking statements. Forward-looking statements relate to expectations, beliefs, projections, future plans and strategies, anticipated events or trends and similar expressions concerning matters that are not historical facts. Forward-looking statements in this MD&A include statements regarding the quality of our assets, our financial performance, and the partnership's future growth prospects. In some cases, you can identify forward-looking statements by terms such as "anticipate", "believe", "estimate", "expect", "intend", "plan", "potential", "seek", "target", "project", "forecast", "view", "likely", or negative versions of thereof and other comparable terminology, or future or conditional verbs such as "may", "will", "should", "would", and "could".
The forward-looking statements are based on our beliefs, assumptions and expectations of our future performance, taking into account all information currently available to us. These beliefs, assumptions and expectations can change as a result of many possible events or factors, not all of which are known to us or within our control. If a change occurs, our business, financial condition, liquidity and results of operations may vary materially from those expressed in our forward-looking statements. The following factors, among others, could cause our actual results to vary from our forward-looking statements:
• | changes in the general economy; |
• | general economic and business conditions that could impact our ability to access capital markets and credit markets; |
• | the cyclical nature of most of our operations; |
• | exploration and development may not result in commercially productive assets; |
• | actions of competitors; |
• | foreign currency risk; |
• | our ability to complete previously announced acquisitions or other transactions, on the timeframe contemplated or at all; |
• | risks associated with, and our ability to derive fully anticipated benefits from, future or existing acquisitions, joint ventures, investments or dispositions; |
• | actions or potential actions that could be taken by our co-venturers, partners, fund investors or co-tenants; |
• | risks commonly associated with a separation of economic interest from control; |
• | failure to maintain effective internal controls; |
• | actions or potential actions that could be taken by our parent company, or its subsidiaries (other than the partnership); |
• | the departure of some or all of Brookfield's key professionals; |
• | pending or threatened litigation; |
• | changes to legislation and regulations; |
• | possible environmental liabilities and other contingent liabilities; |
• | our ability to obtain adequate insurance at commercially reasonable rates; |
• | our financial condition and liquidity; |
• | alternative technologies could impact the demand for, or use of, the businesses and assets that we own and operate and could impair or eliminate the competitive advantage of our businesses and assets; |
• | downgrading of credit ratings and adverse conditions in the credit markets; |
• | changes in financial markets, foreign currency exchange rates, interest rates or political conditions; |
• | the impact of the potential break-up of political-economic unions (or the departure of a union member); |
• | the general volatility of the capital markets and the market price of our limited partnership units; and |
• | other factors described elsewhere in this document and in our most recent Annual Report on Form 20-F under the heading "Risk Factors". |
1
Statements relating to "reserves" are deemed to be forward-looking statements as they involve the implied assessment, based on certain estimates and assumptions, that the reserves described herein can be profitably produced in the future. We qualify any and all of our forward-looking statements by these cautionary factors.
We caution that the foregoing list of important factors that may affect future results is not exhaustive. When relying on our forward-looking statements or information, investors and others should carefully consider the foregoing factors and other uncertainties and potential events. Except as required by law, we undertake no obligation to publicly update or revise any forward-looking statements or information, whether written or oral, that may be as a result of new information, future events or otherwise.
These risk factors and others are discussed in detail under the heading "Risk Factors" in our most recent Annual Report on Form 20-F. New risk factors may arise from time to time and it is not possible to predict all of those risk factors or the extent to which any factor or combination of factors may cause actual results, performance or achievements of the partnership to be materially different from those contained in forward-looking statements. Given these risks and uncertainties, investors should not place undue reliance on forward-looking statements as a prediction of actual results. Although the forward-looking statements contained in this MD&A are based upon what the partnership believes to be reasonable assumptions, the partnership cannot assure investors that actual results will be consistent with these forward-looking statements. These forward-looking statements are made as of the date of this MD&A.
Please refer to our most recent Annual Report on Form 20-F available on SEDAR at www.sedar.com, and EDGAR at www.sec.gov for a more comprehensive list of risks and uncertainties under the heading "Risk Factors".
Continuity of Interests
On June 20, 2016, Brookfield completed the spin-off of the partnership by way of a special dividend of a portion of our limited partnership units to holders of Brookfield's Class A and B limited voting shares (the "spin-off"). On June 1, 2016, we acquired substantially all of the business services and industrial operations, or the Business, and received $250 million in cash from Brookfield. In consideration, Brookfield received (i) approximately 55% of the limited partnership units, or LP Units, and 100% of the general partnership units, or GP Units, of the partnership (ii) special limited partnership units, or Special LP Units, and redemption-exchange units, or Redemption-Exchange Units, of Brookfield Business L.P., or Holding LP, representing an approximate 52% limited partnership interest in Holding LP, and (iii) $15 million of preferred shares of certain of our subsidiaries. As at September 30, 2018, Brookfield holds an approximate 68% ownership interest in the partnership on a fully exchanged basis. Holders of the GP Units, LP Units, Special LP Units, and Redemption-Exchange Units will be collectively referred to throughout this MD&A as "unitholders". The LP Units and Redemption-Exchange Units have the same economic attributes in all respects, except that the Redemption-Exchange Units may, at the request of Brookfield, be redeemed in whole or in part for cash in an amount equal to the market value of one LP unit multiplied by the number of Redemption-Exchange Units to be redeemed (subject to certain adjustments). As a result, Brookfield, as holder of the Redemption-Exchange Units, participates in earnings and distributions on a per unit basis equivalent to the per unit participation of the LP Units of the partnership. However, given the redemption feature referenced above and the fact that they were issued by our subsidiary, we present the Redemption-Exchange Units as a component of non-controlling interests.
Brookfield directly and indirectly controlled the Business prior to the spin-off and continues to control the partnership subsequent to the spin-off through its interests in the partnership. Accordingly, we have reflected the Business and its financial position and results of operations using Brookfield's carrying values prior to the spin-off.
Basis of Presentation
The interim financial statements have been prepared in accordance with International Accounting Standard 34, Interim Financial Reporting, or IAS 34, as issued by the International Accounting Standards Board, or the IASB, and using the accounting policies the partnership applied in its annual consolidated financial statements as at and for the year ended December 31, 2017, or the annual financial statements, except for the impact of the adoption of the accounting standard described below. The accounting policies the partnership applied in its annual financial statements as at and for the year ended December 31, 2017 are disclosed in Note 2 of the annual financial statements, to which reference should be made in reading the interim financial statements. All defined terms are also described in the annual consolidated financial statements. The interim financial statements are prepared on a going concern basis and have been presented in U.S. dollars rounded to the nearest million unless otherwise indicated. Certain comparative figures have been reclassified to conform to the current period's presentation. The interim financial statements include the accounts of the partnership and its consolidated subsidiaries, which are the entities over which the partnership has control.
We also discuss the results of operations on a segment basis, consistent with how we manage and view our business. Our operating segments are: (i) business services, (ii) infrastructure services, (iii) industrial operations, (iv) energy, and (v) corporate and other.
2
Non-IFRS measures used in this MD&A are reconciled to or calculated from such financial information. All dollar references, unless otherwise stated, are in millions of U.S. Dollars. Australian Dollars are identified as "A$", Brazilian Reais are identified as "R$", British Pounds are identified as "£", and Canadian Dollars are identified as "C$".
Overview of our Business
The partnership is a Bermuda exempted limited partnership registered under the Bermuda Limited Partnership Act of 1883, as amended, and the Bermuda Exempted Partnerships Act of 1992, as amended.
We were established by Brookfield to be its flagship public partnership for its business services and industrial operations. Our operations are primarily located in Canada, Australia, the United Kingdom, the United States, Brazil and the Middle East. The partnership is focused on owning and operating high quality businesses that are low cost producers and/or benefit from high barriers to entry. We seek to build value through enhancing the cash flows of our businesses, pursuing an operations oriented acquisition strategy and opportunistically recycling capital generated from operations and dispositions into our existing operations, new acquisitions and investments. The partnership's goal is to generate returns to unitholders primarily through capital appreciation with a modest distribution yield.
Operating Segments
We have five operating segments which are organized based on how management views business activities within particular sectors:
i. | Business services, including construction services, facilities management, road fuel distribution and marketing, residential real estate services, logistics, gaming, and financial advisory services; |
ii. | Infrastructure services, which includes a global provider of infrastructure services to the nuclear power generation industry; |
iii. | Industrial operations, including select manufacturing, mining, and distribution operations; |
iv. | Energy, including oil and gas production, marine energy services, and related businesses; and |
v. | Corporate and other, which includes corporate cash and liquidity management, and activities related to the management of the partnership's relationship with Brookfield. |
In connection with the acquisition of Westinghouse Electric Company ("Westinghouse"), we have realigned the organizational and governance structure of our businesses and have changed how the partnership presents information for financial reporting and management decision making which has resulted in a change in the construction services and business services segments presentation and the creation of a new infrastructure services segment.
Accordingly, effective for the third quarter of fiscal 2018, our construction services and business services segment are presented as a single operating segment called business services. Infrastructure services is a new operating segment, which includes our investment in Westinghouse. The infrastructure services segment had no operations prior to the acquisition of Westinghouse in the third quarter of fiscal 2018. The partnership has retrospectively applied these segment changes for all periods presented.
The charts below provide a breakdown by operating segment of total assets of $27.6 billion as at September 30, 2018 and of total revenues of $27.0 billion for the nine months ended September 30, 2018.
3
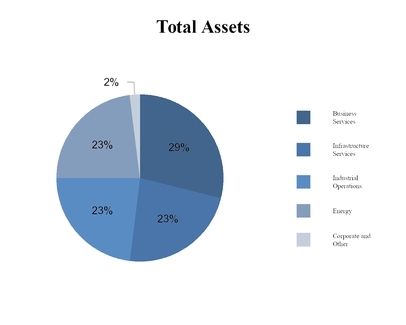
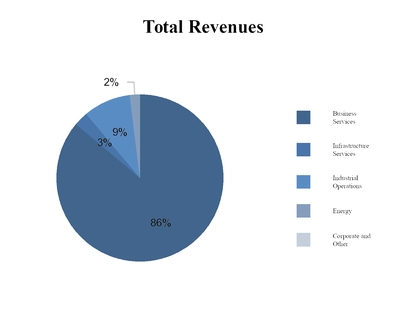
Business Services
Our business services principally provide services relating to construction, facilities management, road fuel distribution and marketing, residential real estate, logistics, gaming, and financial advisory and construction services.
Our facilities management business provides design and project management, professional services and strategic workplace consulting to customers from sectors that range from government, military, financial institutions, utilities, industrial and corporate offices. We seek to provide a cost effective outsourcing alternative for integrated facilities management ("IFM") services to our customers by leveraging our scale, expertise and self-perform capabilities. We believe that we are differentiated from our competitors as a result of over 20 years of developed best practices in our core competency of being a "hard facilities management" provider via our mobile fleet of technicians and in-house expertise and our integrated technology platform that allows customers to obtain real time insight into all aspects of their facilities. Our IFM business benefits from high retention rates, which we believe demonstrates our ability to add value to our customers.
The majority of our revenue in this segment is generated from our road fuel marketing and distribution business. We are a global provider of road fuel distribution with a focus in the United Kingdom, where we have significant import, gasoline blending and storage infrastructure, an extensive distribution network, and long-term diversified customer relationships. The company operates a global sourcing operation and an integrated supply chain which enables it to source fuel products from lower-cost global producers and efficiently transport its fuel products to customers in other regions. Included in the revenue and direct operating costs for this business is a duty payable to the government of the United Kingdom which is recorded gross within revenues and direct costs, without impact on the margin generated by the business. In addition, our fuel marketing business has strong customer loyalty through the PC Optimum loyalty program and brand recognition following the roll-out of the Mobil brand to one of the largest gas station networks in Canada, with 212 retail gas stations and associated convenience kiosks.
We provide services to residential real estate brokers through franchise arrangements under a number of brands in Canada, including the nationally recognized brand Royal Lepage, as well as Johnston & Daniel, Via Capitale and Proprio Direct. We also directly operate residential brokerages in select cities in Canada and provide valuations and related analytic services to financial institutions in Canada.
4
We are a full service provider of relocation and related consulting services to individuals, institutions, and governments on a global basis. With offices in Asia, Europe, North America and South America, we have the expertise and resources to provide comprehensive, globally integrated and customizable relocation management services to our clients. Client contracts are typically executed for three to five year terms and experience high retention rates and high customer satisfaction. We identify opportunities from different sources, including through relationships with current and former clients, subscriber services, suppliers and other partners within the industry and through internal business development. With the number of suppliers involved in an employee's relocation or assignment, effective supply chain management is crucial to the overall success of a company's mobility program. We maintain a network of independent suppliers that enables us to support our clients and their transferred employees around the world. Our dedicated supply chain management team is focused on supplier selection, training and performance and handles the screening, selection, monitoring and management of our supplier network.
In partnership with a leading Canadian gaming operator, we operate three gaming facilities in the Greater Toronto Area. Currently these facilities have a combined total of over 4,900 slot machines, 160 table games and employ more than 2,900 staff. Through a long-term contract with the Ontario Lottery and Gaming Corporation, we have the exclusive right to operate these facilities for a minimum period of 22 years. Through our partnership, we have undertaken an ambitious growth strategy where we plan to enhance the guest experience and transform each of these sites into attractive, premier entertainment destinations. This modernization and development is intended to include enhanced gaming offerings and integrated property expansions that will incorporate leading world-class amenities such as hotels, meeting and event facilities, performance venues, restaurants and retail shopping.
Our financial advisory services business provides merger and acquisition advisory, debt placement, project finance, asset brokerage and structured transaction services with expertise in real assets, particularly property, power and infrastructure. We operate on a global basis with an expanding network that includes offices in North America, South America, Europe, Asia and Australia.
Some of our business services activities are seasonal in nature and are affected by the general level of economic activity and related volume of services purchased by our clients.
Our construction services business is a global contractor with a focus on high-quality construction, primarily on large-scale, complex buildings and social infrastructure. Construction projects are generally delivered through contracts whereby we take responsibility for design, program, procurement and construction for a defined price. The majority of construction activities are subcontracted to reputable specialists whose obligations mirror those contained within our main construction contract. A smaller part of the business is construction management, whereby we charge a fee for coordination of the sub-contractors employed by either the client or ourselves. We are typically required to provide warranties for completed works, either as specifically defined in a client contract or required under local regulatory requirements. We issue bank guarantees and insurance bonds to clients and receive guarantees and/or cash retentions from subcontractors.
The construction industry is cyclical in nature due to changes in general economic conditions and economic growth, both globally and in the regions where we primarily operate, which may result in variability in our revenue due to changes in the level of work in a specific period. Our projects are typically large, multi-year developments which may lead to fluctuations in revenue, depending on the level of work completed during a period. As a global contractor, a large portion of construction revenues and costs are earned and incurred in Australia and Europe, and accordingly are impacted by fluctuations in the Australian Dollar and British Pound, respectively.
Infrastructure Services
Our new infrastructure services segment is currently comprised of Westinghouse, following the acquisition of the business on August 1, 2018. The partnership funded $405 million of the equity purchase price for a 44% ownership interest. Westinghouse is one of the world’s leading suppliers of infrastructure services to the power generation industry with significant barriers to entry and generates a significant majority of its earnings from regularly recurring refueling and maintenance, primarily under long-term contracts.
Westinghouse is the original equipment manufacturer or technology provider for approximately 50% of the global installed base and services approximately two thirds of the world’s nuclear reactors. Over decades of technological innovation and being at the forefront of the industry, Westinghouse has developed a highly-skilled workforce with know-how across a range of technologies with world-class capabilities that provide services globally. Westinghouse’s key markets are North America, Europe, the Middle East and Asia.
5
Westinghouse generates revenue through the entire life of the nuclear power plant. Its products and services help keep the existing nuclear fleet operating safely and reliably, ranging from what we believe is an industry-leading fuel offering, to ongoing maintenance services and engineering solutions that we believe contribute to enhanced reactor performance and efficiency. Westinghouse also participates in the decontamination, decommissioning and remediation of power plant sites at the end of their useful lives and new reactors are built globally using Westinghouse’s technology.
The significant majority of the profitability generated by Westinghouse’s core operating plants business is driven by regularly recurring refueling and maintenance outages. While cyclical in nature with patterns that vary from year-to-year, the outage periods and services provided are required by regulatory standards, creating a stable business demand for Westinghouse’s services. We expect there will be some inter- and intra-year seasonality, given the timing of the outage cycles at customer plants. Westinghouse generates the majority of its revenue during the fall and spring, when power plants go offline to perform maintenance and replenish their fuel, which leads to inter-year seasonality in results. In addition, as maintenance and fuel replenishment at customer plants are carried out on an 18-month cycle, there may be years where more customers go offline resulting in higher revenue for the business during those years. In addition to performing recurring services, Westinghouse delivers upgrades and event-driven work within the operating plants as well as equipment and instrumentation and controls for new power plants.
Industrial Operations
Our industrial operations segment includes manufacturing, mining, and distribution activities in a variety of businesses.
We own a controlling stake in the largest private water company in Brazil ("BRK Ambiental"). BRK Ambiental provides water and sewage services, including collection, treatment and distribution, to a broad range of residential, industrial, commercial and governmental customers through long-term, inflation-adjusted concession, Public Private Partnerships ("PPP") and take-or pay contracts throughout Brazil. We believe the business can capture a growing share of the water and sewage improvements planned in Brazil over the next two decades, enabling the deployment of significant additional capital with stable, attractive risk-adjusted returns. To date, we have been focused on improving the operational capabilities and capital allocation process at the company. Our long-term approach to creating value at BRK Ambiental involves re-establishing the business as the preferred partner to municipalities and accelerating growth by executing on the embedded growth in our existing operations and acquiring new contracts in Brazil.
Our industrial operations segment also includes a manufacturer of graphite electrodes, and needle coke products used in the production of graphite electrodes. Graphite electrodes are primarily used in electric arc furnaces (“EAF”) in mini-mill steel making and a significant portion of our sales are to the steel production industry. We completed the acquisition of this business at what we believe was a low point in the industry cycle, driven primarily by the oversupply and downward price pressure in the steel market. This is a capital-intensive business with significant barriers to entry and requires technical expertise to build and profitably operate. We have streamlined our processes with shorter lead times, lower costs, higher quality products and superior service. Since 2016, the EAF steel market has rebounded strongly and resumed its historical long-term growth trajectory. This revival in EAF steel production has resulted in increased demand for our graphite electrodes. This increased demand, along with structural reductions in supply, have contributed to recent record high prices of graphite electrodes allowing us to generate strong profits and cash flows. During the second quarter of 2018, our graphite electrode manufacturing business completed an initial public offering, including a partial exercise by the underwriters of the over-allotment option for approximately 13% of the company at $15 per share. During the third quarter of 2018, our graphite electrode manufacturing business completed a secondary offering for part of our shares. The partnership continues to have a 27% economic interest of this business.
In June 2015, we acquired operations that manufacture and market a comprehensive range of infrastructure products and engineered construction solutions. We acquired these operations by converting our term loan position, which we acquired in 2011, into an ownership position pursuant to a plan of arrangement under the Companies' Creditors Arrangement Act (Canada). Prior to the recapitalization, our consolidated results included interest and fees on our loan position. We manufacture and market corrugated high-density polyethylene pipe, or HDPE pipe, and other drainage related products, including small bridge structures. We also manufacture and market engineered precast concrete systems such as parking garages, bridges, sport venues and building envelopes. We service customers in a diverse cross-section of industries that are located in every region of Canada, including Canada's national and regional public infrastructure markets and private sector markets in agricultural drainage, building construction and natural resources. Growth and profitability in these operations are directly impacted by the demand for infrastructure, but the diverse factors driving infrastructure investment activity generally result in relative stability of demand. We are in the process of selling these operations.
In addition, we hold interests in specialty metal and aggregates mining operations in Canada. The mining operations currently consist of a limestone aggregates quarry located in northern Alberta, Canada and the Lac des Iles, or LDI, mine in Ontario, Canada. The limestone quarry has 459.2 million tonnes of proven mineral reserves and 539.5 million tonnes of probable mineral reserves. As at September 17, 2018, the LDI mine had an estimated 40.9 million tonnes of underground and surface reserves with an average grade of 2.31 g/t palladium. Decommissioning liabilities relating to legal and constructive obligations for future site
6
reclamation and closure of the mine sites are recognized when incurred and a liability and corresponding asset are recorded at management’s best estimate. Reclamation costs are secured by a letter of credit and estimated closure and restoration costs are provided for in the accounting period when the obligation arising from the related disturbance occurs. Total tonnes milled increased in the third quarter of 2018 to 1,063,446, compared to 704,287 tonnes in the same period in the prior year. This increase reflects the return to full-time milling, supplemented by an increase in underground production, Sheriff Pit ore and additional surface stockpile tonnage.
In May 2018, together with institutional partners, we acquired a controlling stake in Schoeller Allibert Group B.V. ("Schoeller Allibert"), a leading European provider of returnable plastic packaging with the remaining shares being held by the founding family of the company. The business has a strong competitive position given the company’s extensive scale, diversified base of long-term customers serving multiple industries and its strong reputation for product innovation. The business operates in a growing segment of the packaging space that has favorable long-term trends driven by an increased focus on sustainability and logistics. In addition, we view Schoeller Allibert as a company with the opportunity to become larger, both organically by entering new markets and developing new products, and through acquisitions.
The company operates 12 manufacturing sites across Europe and one in Phoenix, Arizona and employs 2,000 employees with a diverse, long-standing customer base. We believe that we can capture the meaningful growth potential of the market, driven by a shift away from one-way packaging as well as delivering on operational efficiency improvements which were identified during our due diligence. We are focused on implementing efficiencies identified during our due diligence and growing the platform.
Energy
Our energy business is comprised of oil and gas exploration and production, principally through our coal-bed methane, or CBM, platform in central Alberta, Canada, and an offshore oil and gas operation that serves the Western Australian market. Additionally, our energy business includes energy-related service operations in Canada, the North Sea and Brazil.
Our Canadian properties produce approximately 42,000 barrels of oil equivalent per day, or BOE/D, all of which is natural gas from our CBM platform. Our CBM properties are characterized by long-life, low-decline reserves located at shallow depths and are low-risk with low-cost capital projects. Revenue from the sale of oil and gas is recognized at a point in time when title and control of the product passes to an external party, based on volumes delivered and contractual delivery points and prices. Revenue for the production in which the partnership has an interest with other producers is recognized based on the partnership’s working interest. Revenue is measured net of royalties to reflect the deduction for other parties’ proportionate share of the revenue. Revenue from the rendering of services is recognized at a point in time when significant rights and obligations of ownership pass and title and control is transferred.
Our Western Australian properties were acquired in June 2015 and had been held through an investment in an associate. As at July 1, 2018 we reclassified our equity accounted investment as held for sale. An agreement was reached to sell our Western Australian properties, by way of a full sale of the associated entity, to an Australian energy company, Santos Limited, for $2.15 billion. In addition to the cash consideration, the agreement includes a contingent payment in relation to a recent oil discovery and a royalty over all other future hydrocarbons produced in the associated tenement, allowing us to maintain exposure to the upside of these exploration interests. The sale is subject to certain consents and approvals including from the Australian Competition and Consumer Commission and is expected to close in the fourth quarter of 2018 or the first quarter of 2019.
In July 2018, we increased our ownership in Teekay Offshore GP L.L.C. ("Teekay Offshore GP"), from 49% to 51%, which resulted in the acquisition of a controlling stake of Teekay Offshore Partners L.P. ("Teekay Offshore"), our marine energy services business. A substantial part of our revenue is based on contracts with customers and are fee-based which is recognized on a straight-line basis daily over the term of the contracts. As a fee-based business focused on critical services, the business has limited direct commodity exposure and has a substantial portfolio of medium to long-term, fixed-rate contracts with high quality, primarily investment grade counterparties.
In our energy segment, we expect to incur future costs associated with dismantlement, abandonment and restoration of our assets. The present value of the estimated future costs to dismantle, abandon and restore are added to the capitalized costs of our assets and recorded as a long-term liability.
7
Our energy operations also include contract drilling and well-servicing operations, primarily located in the Western Canadian Sedimentary Basin, or WCSB. Our energy-related contract drilling and well-servicing revenues are based upon orders and contracts with customers that include fixed or determinable prices and are based upon daily, hourly or contracted rates. A significant portion of the servicing revenue is derived from large national and international oil and gas companies which operate in Alberta, Canada. We experience seasonality in this business as the ability to move heavy equipment safely and efficiently in western Canadian oil and gas fields is dependent on weather conditions. Activity levels during the first and fourth quarter are typically the most robust, as the frost creates a stable ground mass that allows for easy access to well sites and easier drilling and service rig movement, while the second quarter is traditionally the slowest due to road bans during spring break up.
Corporate and Other
Corporate and other includes corporate cash and liquidity management, as well as activities related to the management of the partnership's relationship with Brookfield.
Developments in Our Business
Below are the key events in the development of our business since June 30, 2018:
Teekay Offshore completed a $500 million bond offering which yields 8.5% and comes due in 2023, enabling the company to substantially extend its debt maturities. The partnership, together with institutional partners, subscribed for $201 million of this bond, utilizing cash on hand. Concurrently, a $200 million promissory note due from the business was converted into the same series of bonds. The partnership's share was $84 million. The partnership, together with institutional partners, bought the note at $140 million when we recapitalized the business. On July 3, 2018, the partnership, together with institutional partners, exercised its general partner option to acquire control of Teekay Offshore GP. As a result, our interest in Teekay Offshore GP increased from 49% to 51% and the partnership has consolidated Teekay Offshore GP and Teekay Offshore in our third quarter results. Prior to July 3, 2018, the partnership, together with institutional partners, owned a 60% economic interest in Teekay Offshore which was accounted for using the equity method, and a 49% voting interest in Teekay Offshore GP.
In August 2018, we closed the acquisition of Westinghouse for a purchase price of approximately $4 billion. The transaction was funded with approximately $920 million of equity, of which the partnership funded $405 million for a 44% ownership interest, and the balance of equity was provided by institutional partners. The remaining capital was funded with approximately $3.1 billion of long-term debt financing.
In August 2018, together with institutional partners, we announced an agreement to sell our Australian energy operation ("Quadrant") to Santos Limited for $2.15 billion. The agreement includes a contingent payment in relation to the recent significant Dorado-1 oil discovery and a royalty over all other future hydrocarbons produced in Quadrant’s Bedout Basin tenements. The sale is expected to close in late 2018, however, it is subject to certain consents and approvals including from the Australian Competition and Consumer Commission.
Subsequent to quarter-end, we closed the acquisition of a 50.1% controlling interest in Imagine Communications Group Limited ("Imagine"), a provider of high speed fixed wireless broadband in rural Ireland. The partnership will have a 30% ownership interest.
Subsequent to quarter-end, we finalized a $240 million senior secured term loan to Cardone Industries ("Cardone"). The partnership funded approximately $50 million. We view this as an attractive investment given the low return we are generating on the substantial cash we are holding.
Outlook
We continue to execute on our strategy to recycle capital from the sale of mature operations into acquisitions of businesses that meet our return criteria. In the third quarter we announced our agreement to sell the assets of our Australian energy operation and closed the acquisition of Westinghouse, marking our entrance as a service provider in the infrastructure sector. With this acquisition we have created a new business segment called infrastructure services.
As mentioned above, we signed an agreement to sell our Australian energy operation for $2.15 billion. We acquired the business, together with institutional partners, from a global E&P operator in 2015. Our Australian energy operation has reported strong performance since acquisition with minimum commodity exposure as, at the time of acquisition, the business entered into a contract to substantially sell all of its gas reserves under a long term take-or-pay contract and entered into financial hedges for most of its oil production.
8
Concurrently, we worked with management to implement operational improvements particularly in the areas of corporate finance, technology and human resources. Taking advantage of low drilling rig rates, our Australian energy operation successfully embarked on a targeted exploration program which helped to achieve significant reserve replacement and in addition, during the third quarter, the company announced a series of significant oil discoveries. The resulting robust cash flows enabled our Australian energy operation to reduce debt and pay dividends, returning almost all of the original capital we invested in the business within three years of our acquisition.
Our Australian energy operation has been a very successful investment for us and given the company’s performance and recovering commodity price environment, we believe this is an opportune time to monetize our investment. Net sale proceeds to the partnership of our 9% ownership interest are approximately $125 million, which when combined with dividends received, equates to three times our original investment and an after-tax profit of approximately $80 million. In addition to the sale consideration, the agreement maintains our exposure to the upside in our Australian energy operation's exploration interests. Subject to regulatory approvals, we expect to close this sale during the fourth quarter.
Subsequent to quarter-end, together with institutional partners, we acquired a 50.1% controlling interest in Imagine, a provider of high speed fixed wireless broadband in rural Ireland. The partnership will own 30% of the business. Imagine is the only fixed wireless broadband provider in the country to have acquired spectrum, a finite regulated resource, in the recent 3.6GHz auction. Our investment will fund additional capital as Imagine completes its roll out to customers. Rural Ireland is characterized by relatively low penetration compared to other European countries and we believe this demand, together with Imagine’s experience in Ireland, positions it well for future growth.
Imagine provides us an initial entry point into technology services. This is an area of potential future growth for the partnership, given the increasing scale and number of opportunities we are seeing that meet our investment strategy.
The opportunities for our partnership to increase cash flows through acquisitions and organic growth are based on assumptions about our business and markets that management believes are reasonable in the circumstances. There can be no assurance as to growth in our cash flows, or capital deployed for acquisitions or organic growth. See the “Forward-Looking Statements" section included in this MD&A.
9
Unaudited Interim Condensed Consolidated Results of Operations
Comparison of the Three and Nine Months Ended September 30, 2018 and 2017
The table below summarizes our results of operations for the three and nine months ended September 30, 2018 and 2017. Further details on our results of operations and our financial performance are presented within the "Segment Analysis" section.
Three Months Ended September 30, | Nine Months Ended September 30, | |||||||||||||||
(US$ MILLIONS), except per unit amounts | 2018 | 2017 | 2018 | 2017 | ||||||||||||
Revenues | $ | 9,990 | $ | 7,640 | $ | 26,959 | $ | 14,444 | ||||||||
Direct operating costs | (9,080 | ) | (7,295 | ) | (24,929 | ) | (13,842 | ) | ||||||||
General and administrative expenses | (174 | ) | (95 | ) | (434 | ) | (233 | ) | ||||||||
Depreciation and amortization expense | (251 | ) | (109 | ) | (462 | ) | (262 | ) | ||||||||
Interest income (expense), net | (148 | ) | (66 | ) | (317 | ) | (135 | ) | ||||||||
Equity accounted income (loss), net | (9 | ) | 37 | 1 | 61 | |||||||||||
Impairment expense, net | (180 | ) | — | (180 | ) | (30 | ) | |||||||||
Gain (loss) on acquisitions/dispositions, net | 247 | (14 | ) | 353 | 267 | |||||||||||
Other income (expense), net | (42 | ) | (41 | ) | (63 | ) | (36 | ) | ||||||||
Income (loss) before income tax | 353 | 57 | 928 | 234 | ||||||||||||
Current income tax (expense) recovery | (43 | ) | (19 | ) | (123 | ) | (19 | ) | ||||||||
Deferred income tax (expense) recovery | (25 | ) | 6 | 4 | 6 | |||||||||||
Net income (loss) | $ | 285 | $ | 44 | $ | 809 | $ | 221 | ||||||||
Attributable to: | ||||||||||||||||
Limited partners | $ | (1 | ) | $ | (8 | ) | $ | 4 | $ | 21 | ||||||
Non-controlling interests attributable to: | ||||||||||||||||
Redemption-Exchange Units held by Brookfield Asset Management | — | (8 | ) | 4 | 23 | |||||||||||
Special Limited Partners | 94 | 25 | 278 | 25 | ||||||||||||
Interest of others in operating subsidiaries | 192 | 35 | 523 | 152 | ||||||||||||
Net income (loss) | $ | 285 | $ | 44 | $ | 809 | $ | 221 | ||||||||
Basic and diluted earnings per limited partner unit (1) (2) | $ | — | $ | (0.15 | ) | $ | 0.06 | $ | 0.40 | |||||||
____________________________________
(1) | Average number of partnership units outstanding on a fully diluted time weighted average basis, assuming the exchange of redemption exchange units held by Brookfield Asset Management for limited partnership units, for the three and nine months ended September 30, 2018 was 129.3 million and 129.3 million, respectively, and for the three and nine months ended September 30, 2017 108.9 million and 108.3 million, respectively. |
(2) | Income (loss) attributed to limited partnership units on a fully diluted basis is reduced by incentive distributions paid to special limited partnership unitholders during the three and nine months ended September 30, 2018. |
For the three months ended September 30, 2018, we reported net income of $285 million, with $93 million of net income attributable to unitholders. This compares to a net income of $44 million, with $9 million of net income attributable to unitholders, for the three months ended September 30, 2017. The increase in net income was primarily due to stronger results from our graphite electrode manufacturing business. The consolidation of Teekay Offshore in July 2018 also contributed positively to the increase in net income, which was partially offset by an impairment charge recognized in our Canadian energy operation. In addition, the prior period included a $16 million loss on disposition, net of taxes, of a business in our energy segment. The increase was partially offset by a lower contribution from our construction services business due to lower contribution from our Middle East operations, as well as the incremental depreciation and amortization expense and interest expense from the 2017 and 2018 acquisitions.
10
For the nine months ended September 30, 2018, we reported net income of $809 million, with $286 million of net income attributable to unitholders. This compares to net income of $221 million, with $69 million of net income attributable to unitholders for the nine months ended September 30, 2017. The increase in net income was primarily due to the same factors mentioned above as well as the net gain recognized on the disposition of our ownership interest in our real estate brokerage services business during the second quarter of 2018. The increase was partially offset by the net gain realized on the disposition of our bath and shower products manufacturing business recognized in the first quarter of 2017.
Revenue
For the three months ended September 30, 2018, revenue increased by $2,350 million to $9,990 million, compared to $7,640 million during the three months ended September 30, 2017. The increase in revenues was primarily due to an increase in pricing at Greenergy and our graphite electrode manufacturing business. Included in the revenue and direct operating costs for Greenergy is duty payable to the government of the U.K. The duty is considered a production cost, rather than a sales tax, as Greenergy is obligated for the tax and passes this cost to the customer; this flow through duty amount is recorded gross within revenues and direct costs without impact on the margin generated by the business. In addition, revenues increased as a result of the acquisitions of Schoeller Allibert and Westinghouse in May 2018 and August 2018, respectively, as well as the consolidation Teekay Offshore in July 2018.
For the nine months ended September 30, 2018, revenue increased by $12,515 million to $26,959 million, compared to $14,444 million during the nine months ended September 30, 2017. The increase in revenues for the nine months ended September 30, 2018 was primarily due to the same factors described above, as well as the incremental increase in revenues from the acquisitions of BRK Ambiental in April 2017 and our fuel marketing business in July 2017.
Direct Operating Costs
For the three months ended September 30, 2018, direct operating costs increased by $1,785 million to $9,080 million from $7,295 million in the same period of the prior year. The increase in direct operating costs was primarily related to the acquisitions of Schoeller Allibert and Westinghouse, as well as the consolidation of Teekay Offshore. In addition, increased fuel prices at Greenergy contributed to the increase in direct operating costs in the current quarter. As noted, included in the revenue and direct operating costs for Greenergy is duty payable to the government of the U.K, which is recorded gross within revenues and direct costs without impact on the margin generated by the business.
For the nine months ended September 30, 2018, direct operating costs increased by $11,087 million to $24,929 million from $13,842 million in the same period of 2017. The increase in direct operating costs was primarily related to same factors mentioned above, as well as the contribution to the increase from the acquisitions of BRK Ambietal in April 2017 and our fuel marketing business in July 2017.
General and Administrative Expenses
For the three months ended September 30, 2018, general and administrative, or G&A, expenses increased by $79 million to $174 million from $95 million in the same period in the prior year. G&A expenses increased due to the acquisitions of our fuel marketing business, Schoeller Allibert, and Westinghouse, as well as the consolidation of Teekay Offshore, which contributed a total of $70 million to G&A expenses for the three months ended September 30, 2018. In addition, management fees increased due to the growth in the partnership's total capitalization relative to the prior period.
For the nine months ended September 30, 2018, G&A expenses increased by $201 million to $434 million from $233 million for the same period of the prior year, for the same reasons mentioned above, as well as the acquisitions of Greenergy and BRK Ambiental in 2017.
Depreciation and Amortization Expense
Depreciation and amortization, or D&A, expense includes depletion related to oil and gas assets, depreciation of property, plant and equipment, or PP&E, as well as the amortization of intangible assets. The highest contribution to D&A expense is from our industrial operations, infrastructure services, and energy segments. The D&A expense from our industrial operations segment is primarily depreciation on PP&E assets at our graphite electrode manufacturing business and our water distribution, collection and treatment operation. The D&A expense from our infrastructure services segment is primarily from our machinery and equipment and developed technology. The D&A expense in our energy segment is largely from vessels and equipment at Teekay Offshore and our oil and gas assets, where PP&E is depleted on a unit-of-production basis over the proved plus probable reserves. We use National Instrument 51-101 — Standards of Disclosure for Oil and Gas Activities, or NI 51-101, as the basis for defining and calculating proved and probable reserves for purposes of the D&A calculations. D&A is generally consistent year-over-year with large changes typically due to the addition or disposal of depreciable assets.
11
For the three months ended September 30, 2018, D&A expense increased by $142 million compared to the same period ended September 30, 2017. The increase in D&A expense was mainly due to the acquisitions of Schoeller Allibert in May 2018 and Westinghouse in August 2018, as well as the consolidation of Teekay Offshore in July 2018.
For the nine months ended September 30, 2018, D&A increased by $200 million compared to the nine months ended September 30, 2017. The increase in D&A was due to similar variations described for the three months ended September 30, 2018, as well the increase from the acquisitions of Greenergy, BRK Ambiental, and our fuel marketing business in 2017.
Interest Income (Expense), net
For the three months ended September 30, 2018, net interest expense increased by $82 million when compared to the three months ended September 30, 2017. The increase was primarily due to the inclusion of the incremental borrowing costs related to the acquisition of Westinghouse and the consolidation of Teekay Offshore during the quarter. In addition, the increase was due to the additional interest expense at our graphite electrode manufacturing business as a result of the senior secured term loan facility and revolving credit facility put in place during the year.
For the nine months ended September 30, 2018, net interest expense was $317 million, an increase of $182 million when compared to the nine months ended September 30, 2017. The increase was primarily due to the same factors mentioned above, as well as the acquisitions of Greenergy and BRK Ambiental in 2017.
Equity Accounted Income, net
For the three months ended September 30, 2018, equity accounted income decreased by $46 million relative to the same period in the prior year. The decrease was primarily due to lost contribution from our Australian energy operation which was reclassified to held for sale at the beginning of the quarter. The disposition of our real estate brokerage services business during the second quarter of 2018 also contributed to the decrease in equity accounted income, but was partially offset by the incremental contribution of our gaming operations, which we acquired during the first quarter of 2018.
For the nine months ended September 30, 2018, equity accounted income decreased by $60 million relative to the same period in the prior year for the same reasons mentioned above.
Impairment Expense, net
For the three and nine months ended September 30, 2018, we recorded an impairment expense of $180 million related to the write down of property, plant and equipment in our Canadian energy operation as a result of continued weakness in natural gas prices. There was no impairment expense recorded for the three months ended September 30, 2017. For the nine months ended September 30, 2017, the impairment expense was $30 million, which related to the write-down of an investment within our energy segment that was sold in the third quarter of 2017, as well as a reduction in the value of assets held for sale within our graphite electrode manufacturing business.
Gains on Acquisitions/Dispositions, net
For the three months ended September 30, 2018, we recorded a net gain of $247 million, which was primarily related to the step-up gain recognized in Teekay Offshore from the change in control and associated change in accounting from equity accounted investment to consolidation. For the three months ended September 30, 2017, we recorded a net loss of $14 million, which was primarily related to the sale of Insignia Energy in our energy segment, partially offset by a realized gain on an investment security in our business services segment.
For the nine months ended September 30, 2018, we recorded a net gain on disposition of $353 million, which was primarily related to the aforementioned step-up gain recognized in Teekay Offshore, as well as the gain on the disposition of our 33% ownership interest in our real estate brokerage services business and on the disposition of steel drainage assets in our infrastructure support products manufacturing operation during the second quarter of 2018. For the nine months ended September 30, 2017, we recorded a net gain on disposition of $267 million which was primarily from the disposition of our bath and shower products manufacturing business and investment securities held in our energy segment, partially offset by the aforementioned net loss on the sale of Insignia Energy.
Other Income (Expenses), net
For the three months ended September 30, 2018, other expenses of $42 million were primarily related to transaction costs incurred on the acquisition of Westinghouse, partially offset by fair value movements on financial instruments in our business services and energy segments. For the three months ended September 30, 2017, other expenses of $41 million were primarily related to unrealized fair value adjustments on financial instruments in our business services, industrial operations and corporate segments, as well as transaction costs incurred on the 2017 acquisitions.
12
For the nine months ended September 30, 2018, other expenses of $63 million were primarily related to the same reasons as mentioned above. During the nine months ended September 30, 2017, other expenses of $36 million were primarily related to a loss on revaluation of an investment security within our energy segment and the aforementioned unrealized fair value adjustments, as well as transaction costs incurred on the acquisitions made during 2017.
Income Tax Expense (Recovery)
For the three months ended September 30, 2018, the current income tax expense and deferred income tax expense were $43 million and $25 million, respectively, compared to a $19 million current income tax expense and a $6 million deferred income tax recovery for the same periods in 2017. The increase in total tax expense to $68 million for the three months ended September 30, 2018 compared to a total tax expense of $13 million for the three months ended September 30, 2017, was primarily attributable to higher taxable income for the three months ended September 30, 2018, mostly in our graphite electrode manufacturing business. Also contributing to the increase in taxable income was the acquisition of Westinghouse during the quarter and the derecognition of tax attributes within our energy segment.
Our effective tax rate for the three months ended September 30, 2018 was 19%, while our composite income tax rate was 27%. We operate in countries with different tax rates, most of which vary from our domestic statutory tax rate. The difference in global tax rates gave rise to a 33% reduction in our effective tax rate. The difference will vary from period to period depending on the relative proportion of income in each country. During the third quarter of 2018, our energy segment incurred the derecognition of tax attributes which resulted in a 25% increase in our effective tax rate.
For the nine months ended September 30, 2018, the current income tax expense was $123 million, compared to a $19 million current income tax expense for the same period in 2017. The deferred income tax recovery was $4 million, compared to a $6 million deferred income tax recovery for the same period in 2017. The increase in total tax expense to $119 million for the nine months ended September 30, 2018 compared to a total tax expense of $13 million for the same period in 2017 was due to the same factors mentioned above.
13
Summary of Results
Quarterly Results
Total revenues and net income (loss) for the eight most recent quarters were as follows:
(US$ MILLIONS), except per unit amounts | 2018 | 2017 | 2016 | |||||||||||||||||||||||||||||
Q3 | Q2 | Q1 | Q4 | Q3 | Q2 | Q1 | Q4 | |||||||||||||||||||||||||
Three months ended | ||||||||||||||||||||||||||||||||
Revenues | $ | 9,990 | $ | 8,775 | $ | 8,194 | $ | 8,379 | $ | 7,640 | $ | 4,870 | $ | 1,934 | $ | 2,232 | ||||||||||||||||
Direct operating costs | (9,080 | ) | (8,200 | ) | (7,649 | ) | (8,034 | ) | (7,295 | ) | (4,673 | ) | (1,874 | ) | (2,064 | ) | ||||||||||||||||
General and administrative expenses | (174 | ) | (142 | ) | (118 | ) | (107 | ) | (95 | ) | (76 | ) | (62 | ) | (72 | ) | ||||||||||||||||
Depreciation and amortization expense | (251 | ) | (105 | ) | (106 | ) | (109 | ) | (109 | ) | (88 | ) | (65 | ) | (67 | ) | ||||||||||||||||
Interest income (expense), net | (148 | ) | (83 | ) | (86 | ) | (67 | ) | (66 | ) | (50 | ) | (19 | ) | (19 | ) | ||||||||||||||||
Equity accounted income (loss), net | (9 | ) | (7 | ) | 17 | 8 | 37 | 14 | 10 | (7 | ) | |||||||||||||||||||||
Impairment expense, net | (180 | ) | — | — | (9 | ) | — | (23 | ) | (7 | ) | (155 | ) | |||||||||||||||||||
Gain (loss) on acquisitions/dispositions, net | 247 | 90 | 16 | — | (14 | ) | 9 | 272 | — | |||||||||||||||||||||||
Other income (expense), net | (42 | ) | (7 | ) | (14 | ) | (72 | ) | (41 | ) | (9 | ) | 14 | 9 | ||||||||||||||||||
Income (loss) before income tax | 353 | 321 | 254 | (11 | ) | 57 | (26 | ) | 203 | (143 | ) | |||||||||||||||||||||
Current income tax (expense)/recovery | (43 | ) | (52 | ) | (28 | ) | (11 | ) | (19 | ) | (4 | ) | 4 | (7 | ) | |||||||||||||||||
Deferred income tax (expense)/recovery | (25 | ) | 39 | (10 | ) | 16 | 6 | 4 | (4 | ) | 16 | |||||||||||||||||||||
Net income (loss) | $ | 285 | $ | 308 | $ | 216 | $ | (6 | ) | $ | 44 | $ | (26 | ) | $ | 203 | $ | (134 | ) | |||||||||||||
Attributable to: | ||||||||||||||||||||||||||||||||
Limited partners | $ | (1 | ) | $ | 40 | $ | (35 | ) | $ | (79 | ) | $ | (8 | ) | $ | (3 | ) | $ | 32 | $ | (5 | ) | ||||||||||
Non-controlling interests attributable to: | ||||||||||||||||||||||||||||||||
Redemption-Exchange Units held by Brookfield Asset Management Inc. | — | 38 | (34 | ) | (83 | ) | (8 | ) | (3 | ) | 34 | (6 | ) | |||||||||||||||||||
Special Limited Partners | 94 | 41 | 143 | 117 | 25 | — | — | — | ||||||||||||||||||||||||
Interest of others | 192 | 189 | 142 | 39 | 35 | (20 | ) | 137 | (123 | ) | ||||||||||||||||||||||
Net income (loss) | $ | 285 | $ | 308 | $ | 216 | $ | (6 | ) | $ | 44 | $ | (26 | ) | $ | 203 | $ | (134 | ) | |||||||||||||
Basic and diluted earnings (loss) per limited partner unit (1) (2) | $ | — | $ | 0.60 | $ | (0.53 | ) | $ | (1.25 | ) | $ | (0.15 | ) | $ | (0.06 | ) | $ | 0.61 | $ | (0.13 | ) | |||||||||||
____________________________________
(1) | Average number of partnership units outstanding on a fully diluted time weighted average basis, assuming the exchange of redemption exchange units held by Brookfield Asset Management for limited partnership units, for the three and nine months ended September 30, 2018 was 129.3 million and 129.3 million, respectively, and for the three and nine months ended September 30, 2017 108.9 million and 108.3 million, respectively. |
(2) | Income (loss) attributed to limited partnership units on a fully diluted basis is reduced by incentive distributions paid to special limited partnership unitholders during the three months ended September 30, 2017, December 31, 2017, March 31, 2018, and June 30, 2018. |
Revenue and operating costs vary from quarter to quarter primarily due to acquisitions and dispositions of businesses, fluctuations in foreign exchange rates, business and economic cycles, and weather and seasonality in underlying operations. Broader economic factors and commodity market volatility, in particular, have a significant impact on a number of our operations, specifically, within our energy and industrial operations segments. Seasonality primarily affects our business services operations. Some of our business services operations will typically have stronger performance in the latter half of the year whereas others, such as our fuel distribution business, will generate stronger performance in the second and third quarters. On a consolidated basis, we do not expect seasonality to materially influence our results. Our energy operations are also impacted by seasonality, usually generating stronger results in the first and fourth quarters. Net income is impacted by periodic gains and losses on acquisitions, monetizations and impairments.
14
Review of Consolidated Financial Position
The following is a summary of the interim condensed consolidated statements of financial position as at September 30, 2018 and December 31, 2017:
(US$ MILLIONS) | September 30, 2018 | December 31, 2017 | ||||||
Assets | ||||||||
Cash and cash equivalents | $ | 1,770 | $ | 1,106 | ||||
Financial assets | 1,252 | 784 | ||||||
Accounts receivable, net | 5,430 | 4,362 | ||||||
Inventory and other assets | 3,362 | 1,577 | ||||||
Assets held for sale | 145 | 14 | ||||||
Property, plant and equipment | 7,067 | 2,530 | ||||||
Deferred income tax assets | 217 | 174 | ||||||
Intangible assets | 5,427 | 3,094 | ||||||
Equity accounted investments | 536 | 609 | ||||||
Goodwill | 2,420 | 1,554 | ||||||
Total assets | $ | 27,626 | $ | 15,804 | ||||
Liabilities and equity in net assets | ||||||||
Liabilities | ||||||||
Accounts payable and other | $ | 9,386 | $ | 5,638 | ||||
Liabilities associated with assets held for sale | 12 | — | ||||||
Borrowings | 10,865 | 3,265 | ||||||
Deferred income tax liabilities | 887 | 837 | ||||||
Total liabilities | $ | 21,150 | $ | 9,740 | ||||
Equity | ||||||||
Limited partners | $ | 1,519 | $ | 1,585 | ||||
Non-controlling interests attributable to: | ||||||||
Redemption-Exchange Units, Preferred Shares and Special Limited Partnership Units held by Brookfield Asset Management Inc. | 1,386 | 1,453 | ||||||
Interest of others in operating subsidiaries | 3,571 | 3,026 | ||||||
Total equity | 6,476 | 6,064 | ||||||
Total liabilities and equity | $ | 27,626 | $ | 15,804 | ||||
Financial Assets
Financial assets are composed of marketable securities, loans and notes receivable, derivative contracts and restricted cash. The balance increased by $468 million from $784 million as at December 31, 2017 to $1,252 million as at September 30, 2018. The increase was primarily due to the acquisition of Westinghouse at the beginning of the quarter, as well as fair value adjustments on marketable securities and derivative contracts within our energy and industrial operations segments. This increase was partially offset by the elimination of warrants held in Teekay Offshore on consolidation.
The following table presents financial assets by segment as at September 30, 2018 and December 31, 2017:
(US$ MILLIONS) | Business Services | Infrastructure Services | Industrial Operations | Energy | Corporate and Other | Total | ||||||||||||||||||
September 30, 2018 | $ | 511 | $ | 331 | $ | 92 | $ | 291 | $ | 27 | $ | 1,252 | ||||||||||||
December 31, 2017 | $ | 438 | $ | — | $ | 21 | $ | 325 | $ | — | $ | 784 | ||||||||||||
15
Accounts Receivable
Accounts receivable increased by $1,068 million from $4,362 million as at December 31, 2017 to $5,430 million as at September 30, 2018. The increase was primarily due to the acquisition of Westinghouse and consolidation of Teekay Offshore. The increase was also due to higher receivables in Greenergy as a result of increased fuel pricing.
Inventory and Other Assets
Inventory and other assets increased by $1,785 million from $1,577 million as at December 31, 2017 to $3,362 million as at September 30, 2018. The higher levels of raw material and finished goods inventory on hand at our graphite electrode manufacturing business, combined with the acquisitions of Westinghouse and Schoeller Allibert, and the consolidation of Teekay Offshore contributed to the overall increase.
Assets Held for Sale
Assets held for sale were $145 million as at September 30, 2018, compared to $14 million as at December 31, 2017. As at September 30, 2018, our equity accounted investment in our Australian energy operation was reclassified as held for sale. In addition, certain assets and liabilities relating to plants within the precast concrete and drainage operations in our infrastructure support products manufacturing operations also contributed to the increase in assets held for sale. The 2017 balance was comprised of land and buildings held for sale in the aforementioned business.
Property, Plant & Equipment and Intangible Assets
PP&E is primarily related to our industrial operations, infrastructure services, and energy segments. The PP&E balance of $7,067 million as at September 30, 2018, increased by $4,537 million when compared to $2,530 million as at December 31, 2017. The increase was primarily due to the acquisition of Westinghouse and Schoeller Allibert and the consolidation of Teekay Offshore. The increase was partially offset by an impairment recorded in our Canadian energy operation.
Intangible assets are primarily related to our industrial operations, infrastructure services and business services segments. Intangible assets increased by $2,333 million, from $3,094 million as at December 31, 2017 to $5,427 million as at September 30, 2018. The increase was primarily due to the acquisition of Westinghouse and Schoeller Allibert, offset partially by the finalization of the provisional amounts related to the initial accounting for the acquisition at BRK Ambiental.
Capital expenditures represent additions to property, plant, and equipment. Included in capital expenditures are maintenance capital expenditures, which are required to sustain the current performance of our operations, and growth capital expenditures, which are made for incrementally new assets that are expected to expand existing operations. Specific to our industrial operations segment, we include additions to intangible assets in BRK Ambiental within capital expenditures due to the nature of its concession agreements. For the three months ended September 30, 2018, total capital expenditures were $181 million, of which $63 million was incurred in our energy segment and $67 million in our industrial operations segment.
Equity Accounted Investment
Equity accounted investments decreased by $73 million from $609 million as at December 31, 2017 to $536 million as at September 30, 2018, primarily due to the reclassification of our equity accounted investment in our Australian energy operation to held for sale. The decrease is also related to the disposition of our interest in our real estate brokerage services business in May 2018. In addition, due the acquisition of a controlling stake in Teekay Offshore in July 2018, the partnership recorded a disposition of the equity accounted investment and began consolidating the equity accounted investments held by Teekay Offshore.
Goodwill
Goodwill increased by $866 million from $1,554 million as at December 31, 2017 to $2,420 million as at September 30, 2018, which was primarily due to the consolidation of Teekay Offshore and the acquisitions of Westinghouse and Schoeller Allibert during the year.
Accounts Payable and Other
Accounts payable and other increased by $3,748 million from $5,638 million as at December 31, 2017 to $9,386 million as at September 30, 2018. The increase was primarily due to the acquisitions of Westinghouse and Schoeller Allibert, as well as the consolidation of Teekay Offshore. In addition, a rise in fuel pricing at Greenergy also contributed to the increase in accounts payable and other.
Borrowings
Borrowings are discussed in the "Liquidity and Capital Resources" section of this MD&A.
16
Equity Attributable to Unitholders
As at September 30, 2018, our capital structure was comprised of two classes of partnership units, LP Units and GP Units. LP Units entitle the holder to their proportionate share of distributions. GP Units entitle the holder the right to govern our financial and operating policies. See Item 10.B., "Memorandum and Articles of Association — Description of our Units and our Limited Partnership Agreement" in our Annual Report on Form 20-F.
Holding LP's capital structure is comprised of three classes of partnership units: Special LP Units, managing general partner units and Redemption-Exchange Units held by Brookfield. In its capacity as the holder of the Special LP units of Holding LP, the special limited partner is entitled to receive incentive distributions based on a 20% increase in the unit price of the partnership over an initial threshold. See Item 10.B, "Memorandum and Articles of Association — Description of the Holding LP Limited Partnership Agreement" in our Annual Report on Form 20-F.
The Board of Directors approved a $94 million incentive distribution payment, or $23.5 million per Special LP unit, to Brookfield, payable on December 31, 2018, based on the volume weighted average price of $41.96 per unit (exceeding the previous incentive distribution threshold of $38.31 per unit) and the time weighted average of 129 million units outstanding for the quarter. Going forward the incentive distribution threshold is $41.96 per unit.
As part of the spin-off, Brookfield also subscribed for $15 million of preferred shares of our holding entities.
On August 10, 2018, the Toronto Stock Exchange accepted a notice filed by the partnership of its intention to commence a normal course issuer bid, or NCIB, for its limited partnership units. Under the NCIB, our Board of Directors authorized us to repurchase up to 10% of the issued and outstanding units as at August 9, 2018, or 3,371,900 units. No repurchases have been made under the NCIB as at the date of this MD&A.
As at September 30, 2018 and December 31, 2017, the total number of partnership units outstanding are as follows:
UNITS | September 30, 2018 | December 31, 2017 | ||||
GP Units | 4 | 4 | ||||
LP Units | 66,185,798 | 66,185,798 | ||||
Non-controlling interests: | ||||||
Redemption-Exchange Units, held by Brookfield | 63,095,497 | 63,095,497 | ||||
Special LP Units | 4 | 4 | ||||
There have been no changes in partnership units since September 30, 2018.
Segment Analysis
IFRS 8, Operating Segments, requires operating segments to be determined based on internal reports that are regularly reviewed by our chief operating decision maker, or CODM, for the purpose of allocating resources to the segment and to assessing its performance. The key measures used by the CODM in assessing performance and in making resource allocation decisions are funds from operations, or Company FFO and Company EBITDA. Company FFO is calculated as net income excluding the impact of depreciation and amortization, deferred income taxes, breakage and transaction costs, non-cash gains or losses and other items. Company FFO is presented net to unitholders, or net to parent company. When determining Company FFO, we include our proportionate share of Company FFO of equity accounted investments. Company FFO is considered a key measure of our financial performance and we use Company FFO to assess operating results and our business performance. Company FFO is further adjusted as Company EBITDA to exclude the impact of realized disposition gains (losses), interest income and expense, current income taxes, and realized disposition gains, current income taxes and interest income and expenses related to equity accounted investments. Company EBITDA is presented net to unitholders, or net to parent company. See "Reconciliation to Non-IFRS Measures" for a more fulsome discussion, including a reconciliation to the most directly comparable IFRS measures.
In connection with the acquisition of Westinghouse, we have realigned the organizational and governance structure of our businesses and have changed how the partnership presents information for financial reporting and management decision making which has resulted in a change in the construction services and business services segments presentation and the creation of our new infrastructure services segment.
17
Accordingly, effective for the third quarter of fiscal 2018, our construction services and business services segments are presented as a single operating segment, business services. Infrastructure services is our new operating segment, which includes our investment in Westinghouse. The infrastructure services segment had no operations prior to the acquisition of Westinghouse in the third quarter of fiscal 2018. The partnership has retrospectively applied these segment changes for all periods presented.
The following table presents Company EBITDA and Company FFO for the three and nine months ended September 30, 2018 and 2017:
Three Months Ended September 30, | Nine Months Ended September 30, | |||||||||||||||
(US$ MILLIONS) | 2018 | 2017 | 2018 | 2017 | ||||||||||||
Revenues | $ | 9,990 | $ | 7,640 | $ | 26,959 | $ | 14,444 | ||||||||
Direct operating costs | (9,080 | ) | (7,295 | ) | (24,929 | ) | (13,842 | ) | ||||||||
General and administrative expenses | (174 | ) | (95 | ) | (434 | ) | (233 | ) | ||||||||
Equity accounted Company EBITDA | 34 | 22 | 156 | 64 | ||||||||||||
Company EBITDA attributable to others (1) | (539 | ) | (187 | ) | (1,148 | ) | (301 | ) | ||||||||
Company EBITDA (2) | $ | 231 | $ | 85 | $ | 604 | $ | 132 | ||||||||
Realized disposition gains (loss), net | (3 | ) | (37 | ) | 103 | 244 | ||||||||||
Other income (expense), net | (11 | ) | — | (11 | ) | — | ||||||||||
Interest income (expense), net | (148 | ) | (66 | ) | (317 | ) | (135 | ) | ||||||||
Realized disposition gain, current income taxes and interest expenses related to equity accounted investments | (8 | ) | (2 | ) | (47 | ) | (4 | ) | ||||||||
Current income taxes | (43 | ) | (19 | ) | (123 | ) | (19 | ) | ||||||||
Company FFO attributable to others (net of Company EBITDA attributable to others) (1) | 152 | 85 | 276 | (34 | ) | |||||||||||
Company FFO (2) | $ | 170 | $ | 46 | $ | 485 | $ | 184 | ||||||||
____________________________________
(1) | Attributable to interests of others in our operating subsidiaries. |
(2) | Company FFO is a non-IFRS measure and is calculated as net income excluding the impact of depreciation and amortization, deferred income taxes, breakage and transaction costs, non-cash gains or losses and other items. When determining Company FFO, we include our proportionate share of Company FFO of equity accounted investments. Company FFO is further adjusted as Company EBITDA to exclude the impact of realized disposition gains (losses), interest income and expense, current income taxes, and realized disposition gain, current income taxes and interest income and expenses related to equity accounted investments. Company EBITDA and Company FFO are presented net to unitholders. For further information on Company FFO and Company EBITDA see the “Reconciliation of Non IFRS Measures” section of the MD&A. |
For the three months ended September 30, 2018, we reported Company EBITDA of $231 million, an increase of $146 million relative to the three months ended September 30, 2017. The increase in Company EBITDA was primarily due to the stronger pricing and operational performance at our graphite electrode manufacturing business. The increase was also attributable to the incremental contributions from the acquisition of Westinghouse and the consolidation of Teekay Offshore during the third quarter of 2018, as well as the acquisition of our gaming operations in the first quarter of 2018. The increase was partially offset by lower margins in the Middle East operations at our construction services business.
Company EBITDA for the nine months ended September 30, 2018 increased $472 million to $604 million from $132 million in the same period of 2017. The increase was due to the same results mentioned above as well as the improved project margins in Australia from our construction services business and the incremental contributions from BRK Ambiental which was acquired in the second quarter of 2017.
For the three months ended September 30, 2018, we reported Company FFO of $170 million, representing an increase of $124 million relative to the three months ended September 30, 2017. In addition to the factors contributing to the increase in Company EBITDA, Company FFO also benefited from the net loss that was incurred on the sale of a business in our energy segment in the prior period.
18
Company FFO for the nine months ended September 30, 2018 was $485 million, representing an increase of $301 million compared to the same period in the prior period. Company FFO increased for the same reasons mentioned above, as well as net gain recognized on the disposition of our ownership interest in our real estate brokerage services business during the second quarter of 2018. The increase was partially offset by the net realized gain recognized in the prior period from the sale of our bath and shower product manufacturing business, as well as the net gain realized on the disposition of the investment securities held in our energy segment.
Business Services
The following table presents Company EBITDA and Company FFO for our business services segment, which now includes the former construction services segment, for the periods presented:
Three Months Ended September 30, | Nine Months Ended September 30, | |||||||||||||||
(US$ MILLIONS) | 2018 | 2017 | 2018 | 2017 | ||||||||||||
Revenues | $ | 7,923 | $ | 7,070 | $ | 23,129 | $ | 13,100 | ||||||||
Direct operating costs | (7,784 | ) | (6,909 | ) | (22,729 | ) | (12,823 | ) | ||||||||
General and administrative expenses | (64 | ) | (50 | ) | (203 | ) | (125 | ) | ||||||||
Equity accounted Company EBITDA | 8 | 8 | 23 | 23 | ||||||||||||
Company EBITDA attributable to others (1) | (51 | ) | (72 | ) | (122 | ) | (111 | ) | ||||||||
Company EBITDA (2) | $ | 32 | $ | 47 | $ | 98 | $ | 64 | ||||||||
Realized disposition gain (losses), net | — | 11 | 55 | 19 | ||||||||||||
Other income (expense), net | — | — | — | — | ||||||||||||
Interest income (expense), net | (9 | ) | (15 | ) | (50 | ) | (28 | ) | ||||||||
Realized disposition gain, current income taxes and interest expenses related to equity accounted investments | (1 | ) | — | (2 | ) | — | ||||||||||
Current income taxes | (8 | ) | (15 | ) | (38 | ) | (7 | ) | ||||||||
Company FFO attributable to others (net of Company EBITDA attributable to others) (1) | 12 | 12 | 46 | 22 | ||||||||||||
Company FFO (2) | $ | 26 | $ | 40 | $ | 109 | $ | 70 | ||||||||
The following table presents equity attributable to the unitholders for our business services segment as at September 30, 2018 and December 31, 2017:
(US$ MILLIONS) | September 30, 2018 | December 31, 2017 | ||||||
Total assets | $ | 8,130 | $ | 7,899 | ||||
Total liabilities | 6,165 | 5,930 | ||||||
Interests of others in operating subsidiaries (1) | 593 | 562 | ||||||
Equity attributable to unitholders | 1,372 | 1,407 | ||||||
Total equity | $ | 1,965 | $ | 1,969 | ||||
____________________________________
(1) | Attributable to interests of others in our operating subsidiaries. |
(2) | Company FFO is a non-IFRS measure and is calculated as net income excluding the impact of depreciation and amortization, deferred income taxes, breakage and transaction costs, non-cash gains or losses and other items. When determining Company FFO, we include our proportionate share of Company FFO of equity accounted investments. Company FFO is further adjusted as Company EBITDA to exclude the impact of realized disposition gains (losses), interest income and expense, current income taxes, and realized disposition gain, current income taxes and interest income and expenses related to equity accounted investments. Company EBITDA and Company FFO are presented net to unitholders. For further information on Company FFO and Company EBITDA see the “Reconciliation of Non IFRS Measures” section of the MD&A. |
19
Comparison of the Three and Nine Months Ended September 30, 2018 and 2017
With the acquisition of Westinghouse on August 1, 2018, we introduced a new segment, infrastructure services, and given the proportionate scale of the business, we now include our construction services business within our business services segment.
Revenue from our business services segment for the three months ended September 30, 2018 was $7,923 million, an increase of $853 million compared to revenues in the same period in 2017 of $7,070 million. Direct operating costs increased by $875 million, to $7,784 million for the three months ended September 30, 2018, from $6,909 million in the same period in 2017. The increase in revenues and direct costs was primarily due to an increase in activity at Greenergy. Included in revenue and direct operating costs for Greenergy is a duty payable to the government of the U.K. which is recorded gross within revenues and direct costs without impact on the margin generated by the business. For the three months ended September 30, 2018, the duty element included in revenues and direct operating costs was approximately $2,654 million. In addition, the acquisition of our fuel marketing business in July 2017 contributed to both the increase in revenue and direct operating costs during the quarter. Revenue and direct operating costs for the nine months ended September 30, 2018 increased $10,029 million and $9,906 million, respectively, compared to the nine months ended September 30, 2017, primarily due to the same factors mentioned above.
As mentioned, our business services segment now includes our construction services business. Revenue from our construction services business, for the three and nine months ended September 30, 2018, was $1,194 million and $3,370 million, respectively, compared to $1,237 million and $3,378 in the same periods in 2017. The revenue contribution on a regional basis for the three months ended September 30, 2018 was as follows: Australia 60% (2017 - 56%); Europe 30% (2017 - 33%); the Middle East 9% (2017 - 10%); and Other 1% (2017 - 1%). Direct operating costs were $1,172 million and $3,300 million for the three and nine months ended September 30, 2018, compared to $1,206 million and $3,330 million in the same period in 2017. The decrease in revenues and direct costs was primarily due to lower activity in the Middle East.
Company EBITDA for the three months ended September 30, 2018 was $32 million, representing a decrease of $15 million when compared to the three months ended September 30, 2017. The decrease was due to the loss of contribution from the disposition of our real estate brokerage services business during the second quarter of 2018, as well as lower volumes in Brazil and a lower diesel purchase margin in the U.K. at Greenergy. The decrease in Company EBITDA was also due to lower margins in the Middle East operations from our construction services business. The decrease was partially offset by the acquisition of our gaming operations in the first quarter of 2018.
Company EBITDA for the nine months ended September 30, 2018 was $98 million, representing an increase of $34 million compared to the prior period, which was primarily due to the acquisition of our gaming operations, as well as improved project margin contributions in Australia in our construction services business during the nine months ended September 30, 2018.
Company FFO in our business services segment was $26 million for the three months ended September 30, 2018, representing a decrease of $14 million from $40 million during the three months ended September 30, 2017. The decrease was primarily due to the aforementioned lower margins in the Middle East operations of our construction services business. Company FFO for nine months ended September 30, 2018 increased $39 million primarily due to the acquisition of our gaming operations in the first quarter of 2018, as well as the net gain recognized on the disposition of our ownership interest in our real estate brokerage services business.
20
Infrastructure Services
The following table presents Company EBITDA and Company FFO for our infrastructure services segment for the periods presented:
Three Months Ended September 30, | Nine Months Ended September 30, | |||||||||||||||
(US$ MILLIONS) | 2018 | 2017 | 2018 | 2017 | ||||||||||||
Revenues | $ | 740 | $ | — | $ | 740 | $ | — | ||||||||
Direct operating costs | (574 | ) | — | (574 | ) | — | ||||||||||
General and administrative expenses | (16 | ) | — | (16 | ) | — | ||||||||||
Equity accounted Company EBITDA | — | — | — | — | ||||||||||||
Company EBITDA attributable to others (1) | (84 | ) | — | (84 | ) | — | ||||||||||
Company EBITDA (2) | $ | 66 | $ | — | $ | 66 | $ | — | ||||||||
Realized disposition gain (losses), net | — | — | — | — | ||||||||||||
Other income (expense), net | — | — | — | — | ||||||||||||
Interest income (expense), net | (35 | ) | — | (35 | ) | — | ||||||||||
Realized disposition gain, current income taxes and interest expenses related to equity accounted investments | — | — | — | — | ||||||||||||
Current income taxes | (4 | ) | — | (4 | ) | — | ||||||||||
Company FFO attributable to others (net of Company EBITDA attributable to others) (1) | 22 | — | 22 | — | ||||||||||||
Company FFO (2) | $ | 49 | $ | — | $ | 49 | $ | — | ||||||||
The following table presents equity attributable to unitholders for our infrastructure services segment as at September 30, 2018 and December 31, 2017:
(US$ MILLIONS) | September 30, 2018 | December 31, 2017 | ||||||
Total assets | $ | 6,475 | $ | — | ||||
Total liabilities | 5,557 | — | ||||||
Interests of others in operating subsidiaries (1) | 518 | — | ||||||
Equity attributable to unitholders | 400 | — | ||||||
Total equity | $ | 918 | $ | — | ||||
____________________________________
(1) | Attributable to interests of others in our operating subsidiaries. |
(2) | Company FFO is a non-IFRS measure and is calculated as net income excluding the impact of depreciation and amortization, deferred income taxes, breakage and transaction costs, non-cash gains or losses and other items. When determining Company FFO, we include our proportionate share of Company FFO of equity accounted investments. Company FFO is further adjusted as Company EBITDA to exclude the impact of realized disposition gains (losses), interest income and expense, current income taxes, and realized disposition gain, current income taxes and interest income and expenses related to equity accounted investments. Company EBITDA and Company FFO are presented net to unitholders. For further information on Company FFO and Company EBITDA see the “Reconciliation of Non IFRS Measures” section of the MD&A. |
Comparison of the Three and Nine Months Ended September 30, 2018 and 2017
Our new infrastructure services segment is currently comprised of Westinghouse, following the acquisition of the business on August 1, 2018. The partnership funded $405 million of the equity purchase price for a 44% ownership. For the three and nine months ended September 30, 2018, revenue and direct operating costs for our infrastructure services segment were $740 million and $574 million, respectively.
Company EBITDA and Company FFO for the three and nine months ended September 30, 2018 were $66 million and $49 million, respectively. The business performed well during the two months since the closing of the acquisition, with strong margins driven by the mix of work. The results in the quarter were positively impacted by a one-time recovery on the settlement on a project partially offset by higher than normal costs associated with the writeup of inventory as part of our purchase price accounting on the acquisition. The net positive impact on EBITDA of these two items was $22 million in the third quarter. We anticipate one more quarter of high costs as the current inventory flows through production.
21
Industrial Operations
The following table presents Company EBITDA and Company FFO for our industrial operations segment for the periods presented:
Three Months Ended September 30, | Nine Months Ended September 30, | |||||||||||||||
(US$ MILLIONS) | 2018 | 2017 | 2018 | 2017 | ||||||||||||
Revenues | $ | 937 | $ | 503 | $ | 2,539 | $ | 1,140 | ||||||||
Direct operating costs | (504 | ) | (335 | ) | (1,295 | ) | (870 | ) | ||||||||
General and administrative expenses | (65 | ) | (29 | ) | (144 | ) | (66 | ) | ||||||||
Equity accounted Company EBITDA | 3 | — | 12 | 1 | ||||||||||||
Company EBITDA attributable to others (1) | (272 | ) | (103 | ) | (786 | ) | (154 | ) | ||||||||
Company EBITDA (2) | $ | 99 | $ | 36 | $ | 326 | $ | 51 | ||||||||
Realized disposition gain (losses), net | (3 | ) | — | 48 | 237 | |||||||||||
Other income (expense), net | — | — | — | — | ||||||||||||
Interest income (expense), net | (60 | ) | (44 | ) | (174 | ) | (87 | ) | ||||||||
Realized disposition gain, current income taxes and interest expenses related to equity accounted investments | (1 | ) | — | (3 | ) | — | ||||||||||
Current income taxes | (26 | ) | (7 | ) | (75 | ) | (20 | ) | ||||||||
Company FFO attributable to others (net of Company EBITDA attributable to others) (1) | 67 | 37 | 146 | (72 | ) | |||||||||||
Company FFO (2) | $ | 76 | $ | 22 | $ | 268 | $ | 109 | ||||||||
The following table presents equity attributable to the parent company for our industrial operations segment as at September 30, 2018 and December 31, 2017:
(US$ MILLIONS) | September 30, 2018 | December 31, 2017 | ||||||
Total assets | $ | 6,241 | $ | 5,839 | ||||
Total liabilities | 5,250 | 3,189 | ||||||
Interests of others in operating subsidiaries (1) | 1,003 | 1,989 | ||||||
Equity attributable to unitholders | (12 | ) | 661 | |||||
Total equity | $ | 991 | $ | 2,650 | ||||
(1) | Attributable to interests of others in our operating subsidiaries. |
(2) | Company FFO is a non-IFRS measure and is calculated as net income excluding the impact of depreciation and amortization, deferred income taxes, breakage and transaction costs, non-cash gains or losses and other items. When determining Company FFO, we include our proportionate share of Company FFO of equity accounted investments. Company FFO is further adjusted as Company EBITDA to exclude the impact of realized disposition gains (losses), interest income expense, current income taxes, and realized disposition gain, current income taxes and interest income and expenses related to equity accounted investments. Company EBITDA and Company FFO are presented net to unitholders. For further information on Company FFO and Company EBITDA see the “Reconciliation of Non IFRS Measures” section of the MD&A. |
Comparison of the Three and Nine Months Ended September 30, 2018 and 2017
Revenue from our industrial operations segment for the three months ended September 30, 2018 was $937 million, representing an increase of $434 million compared to $503 million in the same period in 2017. Direct operating costs increased by $169 million, to $504 million for the three months ended September 30, 2018, from $335 million in the same period in 2017. The increase in revenue and direct operating costs was primarily due to stronger pricing at our graphite electrode manufacturing business, as well as the incremental revenues and direct operating costs from our acquisition of Schoeller Allibert in the second quarter of 2018. For the nine months ended September 30, 2018, revenue from the segment was $2,539 million, representing an increase of $1,399 million, while direct operating costs were $1,295 million, representing an increase of $425 million compared to the same period in 2017. The increase in revenue and direct operating costs was primarily due to the same factors mentioned above, as well as the contribution from BRK Ambiental which was acquired in the second quarter of 2017.
22
Company EBITDA in our industrial operations segment increased by $63 million for the three months ended September 30, 2018, compared to the three months ended September 30, 2017. The increase was primarily due to stronger pricing and performance at our graphite electrode manufacturing business, partially offset by a lower contribution from BRK Ambiental, primarily due to foreign exchange movements. Company EBITDA in the segment for the nine months ended September 30, 2018 was $326 million compared to $51 million for the nine months ended September 30, 2017. The increase was primarily due to the same factors mentioned above.
Company FFO in our industrial operations segment was $76 million for the three months ended September 30, 2018, compared to $22 million for the three months ended September 30, 2017. Company FFO for the three months ended September 30, 2018 increased primarily due to the factors described above, which was partially offset by the increased interest and current income tax expense at our graphite electrode manufacturing business as a result of increased borrowings and higher taxable income, respectively. For the nine months ended September 30, 2018, Company FFO was $268 million, representing an increase of $159 million compared to the nine months ended September 30, 2017. Company FFO increased for the same factors mentioned above, partially offset by the net gain recognized on the sale of our bath and shower products manufacturing business during the nine months ended September 30, 2017.
Energy
The following table presents Company EBITDA and Company FFO for our energy segment for the periods presented:
Three Months Ended September 30, | Nine Months Ended September 30, | |||||||||||||||
(US$ MILLIONS) | 2018 | 2017 | 2018 | 2017 | ||||||||||||
Revenues | $ | 390 | $ | 66 | $ | 544 | $ | 199 | ||||||||
Direct operating costs | (216 | ) | (50 | ) | (325 | ) | (146 | ) | ||||||||
General and administrative expenses | (11 | ) | (4 | ) | (21 | ) | (12 | ) | ||||||||
Equity accounted Company EBITDA | 23 | 14 | 121 | 40 | ||||||||||||
Company EBITDA attributable to others (1) | (132 | ) | (12 | ) | (156 | ) | (36 | ) | ||||||||
Company EBITDA (2) | $ | 54 | $ | 14 | $ | 163 | $ | 45 | ||||||||
Realized disposition gain (loss), net | — | (48 | ) | — | (12 | ) | ||||||||||
Other income (expense), net | (11 | ) | — | (11 | ) | — | ||||||||||
Interest income (expense), net | (48 | ) | (7 | ) | (62 | ) | (20 | ) | ||||||||
Realized disposition gain, current income taxes and interest expenses related to equity accounted investments | (6 | ) | (2 | ) | (42 | ) | (4 | ) | ||||||||
Current income taxes | (5 | ) | 2 | (6 | ) | 1 | ||||||||||
Company FFO attributable to others (net of Company EBITDA attributable to others) (1) | 51 | 36 | 62 | 16 | ||||||||||||
Company FFO (2) | $ | 35 | $ | (5 | ) | $ | 104 | $ | 26 | |||||||
23
The following table presents equity attributable to unitholders for our energy segment as at September 30, 2018 and December 31, 2017:
(US$ MILLIONS) | September 30, 2018 | December 31, 2017 | ||||||
Total assets | $ | 6,301 | $ | 1,671 | ||||
Total liabilities | 3,902 | 536 | ||||||
Interests of others in operating subsidiaries (1) | 1,457 | 475 | ||||||
Equity attributable to unitholders | 942 | 660 | ||||||
Total equity | $ | 2,399 | $ | 1,135 | ||||
____________________________________
(1) | Attributable to interests of others in our operating subsidiaries. |
(2) | Company FFO is a non-IFRS measure and is calculated as net income excluding the impact of depreciation and amortization, deferred income taxes, breakage and transaction costs, non-cash gains or losses and other items. When determining Company FFO, we include our proportionate share of Company FFO of equity accounted investments. Company FFO is further adjusted as Company EBITDA to exclude the impact of realized disposition gains (losses), interest income expense, current income taxes, and realized disposition gain, current income taxes and interest income and expenses related to equity accounted investments. Company EBITDA and Company FFO are presented net to unitholders. For further information on Company FFO and Company EBITDA see the “Reconciliation of Non IFRS Measures” section of the MD&A. |
Comparison of the Three and Nine Months Ended September 30, 2018 and 2017
Revenue from our energy segment for the three months ended September 30, 2018 was $390 million, representing an increase of $324 million compared to $66 million in the same period in 2017. Direct operating costs increased by $166 million, to $216 million for the three months ended September 30, 2018, from $50 million in the same period in 2017. The increase in revenue and direct operating costs was primarily due to the consolidation of Teekay Offshore in July 2018, which accounted for $309 million and $164 million of the overall increase in revenue and direct operating costs, respectively. For the nine months ended September 30, 2018, revenue from the segment was $544 million, representing an increase of $345 million compared to the nine months ended September 30, 2017, while direct operating costs were $325 million, also representing an increase of $179 million. The increase in both revenue and direct operating costs compared to the same period in 2017 was primarily due to the aforementioned consolidation of Teekay Offshore during the third quarter of 2018.
Company EBITDA in our energy segment was $54 million for the three months ended September 30, 2018, compared to $14 million for the three months ended September 30, 2017. For the nine months ended September 30, 2018, Company EBITDA was $163 million, representing an increase of $118 million. The increase in Company EBITDA for both the three and nine months ended was primarily due to the consolidation of Teekay Offshore.
Company FFO in our energy segment was $35 million for the three months ended September 30, 2018, compared to negative $5 million for the three months ended September 30, 2017. The increase was primarily due to the aforementioned consolidation of Teekay Offshore in July 2018, as well as the net loss realized on the sale of Insignia Energy during the three months ended September 30, 2017. For the nine months ended September 30, 2018, Company FFO was $104 million, compared to $26 million for the nine months ended September 30, 2017. Company FFO for the nine months ended September 30, 2018 increased due to the same factors described above, partially offset by the net gain realized on the disposition of the investment securities held at our energy segment in the nine months ended September 30, 2017.
24
Corporate and Other
The following table presents Company EBITDA and Company FFO for our corporate and other segment for the periods presented:
Three Months Ended September 30, | Nine Months Ended September 30, | |||||||||||||||
(US$ MILLIONS) | 2018 | 2017 | 2018 | 2017 | ||||||||||||
Revenues | $ | — | $ | 1 | $ | 7 | $ | 5 | ||||||||
Direct operating costs | (2 | ) | (1 | ) | (6 | ) | (3 | ) | ||||||||
General and administrative expenses | (18 | ) | (12 | ) | (50 | ) | (30 | ) | ||||||||
Equity accounted Company EBITDA | — | — | — | — | ||||||||||||
Company EBITDA attributable to others (1) | — | — | — | — | ||||||||||||
Company EBITDA (2) | $ | (20 | ) | $ | (12 | ) | $ | (49 | ) | $ | (28 | ) | ||||
Realized disposition gain (losses), net | — | — | — | — | ||||||||||||
Other income (expense), net | — | — | — | — | ||||||||||||
Interest income (expense), net | 4 | — | 4 | — | ||||||||||||
Realized disposition gain, current income taxes and interest expenses related to equity accounted investments | — | — | — | — | ||||||||||||
Current income taxes | — | 1 | — | 7 | ||||||||||||
Company FFO attributable to others (net of Company EBITDA attributable to others) (1) | — | — | — | — | ||||||||||||
Company FFO (2) | $ | (16 | ) | $ | (11 | ) | $ | (45 | ) | $ | (21 | ) | ||||
The following table presents equity attributable to unitholders for our corporate and other segment as at September 30, 2018 and December 31, 2017:
(US$ MILLIONS) | September 30, 2018 | December 31, 2017 | ||||||
Total assets | $ | 479 | $ | 395 | ||||
Total liabilities | 276 | 85 | ||||||
Interests of others in operating subsidiaries (1) | — | — | ||||||
Equity attributable to unitholders | 203 | 310 | ||||||
Total equity | $ | 203 | $ | 310 | ||||
____________________________________
(1) | Attributable to interests of others in our operating subsidiaries. |
(2) | Company FFO is a non-IFRS measure and is calculated as net income excluding the impact of depreciation and amortization, deferred income taxes, breakage and transaction costs, non-cash gains or losses and other items. When determining Company FFO, we include our proportionate share of Company FFO of equity accounted investments. Company FFO is further adjusted as Company EBITDA to exclude the impact of realized disposition gains (losses), interest income and expense, current income taxes, and realized disposition gain, current income taxes and interest income and expenses related to equity accounted investments. Company EBITDA and Company FFO are presented net to unitholders. For further information on Company FFO and Company EBITDA see the “Reconciliation of Non IFRS Measures” section of the MD&A. |
Pursuant to our Master Services Agreement, we pay Brookfield a quarterly base management fee equal to 0.3125% (1.25% annually) of our total capitalization, plus third party debt with recourse, net of cash held by corporate entities. The management fee for the three and nine months ended September 30, 2018 was $15 million and $41 million, respectively. General and administrative costs relate to corporate expenses, including audit and director fees.
The partnership has in place a Deposit Agreement with Brookfield whereby it may place funds on deposit with Brookfield, as approved by the Board of Directors. Any deposit balance is due on demand and earns an agreed upon rate of interest based on market terms. As at September 30, 2018, the amount of the deposit was $385 million and was included in cash and cash equivalents.
25
Reconciliation of Non-IFRS Measures
Company FFO
To measure our performance, amongst other measures, we focus on Company FFO. We define Company FFO as net income excluding the impact of depreciation and amortization, deferred income taxes, breakage and transaction costs, non-cash valuation gains or losses and other items. Company FFO is presented net to unitholders, or net to the parent company. Company FFO is a measure of operating performance that is not calculated in accordance with, and does not have any standardized meaning prescribed by, IFRS. Company FFO is therefore unlikely to be comparable to similar measures presented by other issuers. Company FFO has the following limitations as an analytical tool:
• | Company FFO does not include depreciation and amortization expense; because we own capital assets with finite lives, depreciation and amortization expense recognizes the fact that we must maintain or replace our asset base in order to preserve our revenue generating capability; |
• | Company FFO does not include deferred income taxes, which may become payable if we own our assets for a long period of time; and |
• | Company FFO does not include any non-cash fair value adjustments or mark-to-market adjustments recorded to net income. |
Because of these limitations, Company FFO should not be considered as the sole measure of our performance and should not be considered in isolation from, or as a substitute for, analysis of our results as reported under IFRS. However, Company FFO is a key measure that we use to evaluate the performance of our operations.
When viewed with our IFRS results, we believe that Company FFO provides a more complete understanding of factors and trends affecting our underlying operations, including the impact of borrowing. Company FFO allows us to evaluate our businesses on the basis of cash return on invested capital by removing the effect of non-cash and other items. We add back depreciation and amortization as the depreciated cost base of our assets is reflected in the ultimate realized disposition gain or loss on disposal. We add back deferred income taxes because we do not believe this item reflects the present value of the actual cash tax obligations we will be required to pay, particularly if our operations are held for a long period of time. We add back non-cash valuation gains or losses recorded in net income as these are non-cash in nature and indicate a point in time approximation of value on long-term items. We also add back breakage and transaction costs as they are capital in nature.
Company EBITDA
We also use Company EBITDA as a measure of performance. We define Company EBITDA as Company FFO excluding the impact of realized disposition gains, interest income and expense, current income taxes, realized disposition gains, current income taxes and interest expense related to equity accounted investments. Company EBITDA is presented net to unitholders, or net to the parent company. Company EBITDA has limitations as an analytical tool as it does not include realized disposition gains, interest income expense, and current income taxes, as well as depreciation and amortization expense, deferred income taxes and non-cash valuation gains/losses and impairment charges. Because of these limitations, Company EBITDA should not be considered as the sole measure of our performance and should not be considered in isolation from, or as a substitute for, analysis of our results as reported under IFRS. However, Company EBITDA is a key measure that we use to evaluate the performance of our operations.
When viewed with our IFRS results, we believe that Company EBITDA provides a more complete understanding of the ability of our businesses to generate recurring earnings which allows users to better understand and evaluate the underlying financial performance of our operations.
26
The following table reconciles Company EBITDA and Company FFO to net income attributable to unitholders for the periods indicated:
Three Months Ended September 30, | Nine Months Ended September 30, | |||||||||||||||
(US$ MILLIONS) | 2018 | 2017 | 2018 | 2017 | ||||||||||||
Revenues | $ | 9,990 | $ | 7,640 | $ | 26,959 | $ | 14,444 | ||||||||
Direct operating costs | (9,080 | ) | (7,295 | ) | (24,929 | ) | (13,842 | ) | ||||||||
General and administrative expenses | (174 | ) | (95 | ) | (434 | ) | (233 | ) | ||||||||
Equity accounted investment Company EBITDA (1) | 34 | 22 | 156 | 64 | ||||||||||||
Company EBITDA attributable to others (2) | (539 | ) | (187 | ) | (1,148 | ) | (301 | ) | ||||||||
Company EBITDA | $ | 231 | $ | 85 | $ | 604 | $ | 132 | ||||||||
Realized disposition gain (loss), net | (3 | ) | (37 | ) | 103 | 244 | ||||||||||
Other income (expense), net | (11 | ) | — | (11 | ) | — | ||||||||||
Interest income (expense), net | (148 | ) | (66 | ) | (317 | ) | (135 | ) | ||||||||
Equity accounted current taxes and interest (1) | (8 | ) | (2 | ) | (47 | ) | (4 | ) | ||||||||
Current income taxes | (43 | ) | (19 | ) | (123 | ) | (19 | ) | ||||||||
Company FFO attributable to others (2) | 152 | 85 | 276 | (34 | ) | |||||||||||
Company FFO | $ | 170 | $ | 46 | $ | 485 | $ | 184 | ||||||||
Depreciation and amortization | (251 | ) | (109 | ) | (462 | ) | (262 | ) | ||||||||
Gain on acquisition and disposition | 250 | — | 250 | — | ||||||||||||
Realized disposition (gain)/loss recorded in prior periods | — | 23 | — | 23 | ||||||||||||
Impairment expense, net | (180 | ) | — | (180 | ) | (30 | ) | |||||||||
Other income (expenses), net | (31 | ) | (41 | ) | (52 | ) | (36 | ) | ||||||||
Deferred income taxes | (25 | ) | 6 | 4 | 6 | |||||||||||
Non-cash items attributable to equity accounted investments (1) | (35 | ) | 17 | (108 | ) | 1 | ||||||||||
Non-cash items attributable to others (2) | 195 | 67 | 349 | 183 | ||||||||||||
Net income attributable to unitholders | $ | 93 | $ | 9 | $ | 286 | $ | 69 | ||||||||
____________________________________
(1) | The sum of these amounts equates to equity accounted loss of $9 million and income of $1 million as per our IFRS statement of operating results for the three and nine months ended September 30, 2018 and equity accounted income of $37 million and $61 million for the three and nine months ended September 30, 2017. |
(2) | Total cash and non-cash items attributable to the interest of others equals net gain of $192 million and $523 million as per our IFRS statement of operating results for the three and nine months ended September 30, 2018 and net gain of $35 million and net gain $152 million for the three and nine months ended September 30, 2017. |
The following table reconciles equity attributable to LP Units, GP Units, Redemption-Exchange Units, Preferred Shares and Special LP units to equity attributable to unitholders for the periods indicated:
(US$ MILLIONS) | September 30, 2018 | December 31, 2017 | ||||||
Limited partners | $ | 1,519 | $ | 1,585 | ||||
Non-controlling interests attributable to: | ||||||||
Redemption-Exchange Units, Preferred Shares and Special LP Units held by Brookfield | 1,386 | 1,453 | ||||||
Equity attributable to unitholders | $ | 2,905 | $ | 3,038 | ||||
27
The following table presents equity attributable to unitholders by segment as at September 30, 2018 and December 31, 2017:
(US$ MILLIONS) | Business Services | Infrastructure Services | Industrial Operations | Energy | Corporate and Other | Total | ||||||||||||||||||
September 30, 2018 | $ | 1,372 | $ | 400 | $ | (12 | ) | $ | 942 | $ | 203 | $ | 2,905 | |||||||||||
December 31, 2017 | $ | 1,407 | $ | — | $ | 661 | $ | 660 | $ | 310 | $ | 3,038 | ||||||||||||
Liquidity and Capital Resources
We manage our liquidity and capital requirements through cash flows from operations, opportunistically monetizing mature operations, refinancing existing debt and businesses and through the use of credit facilities. We aim to maintain sufficient financial liquidity to be able to meet our on-going operating requirements and to maintain a modest distribution.
Our principal liquidity needs for the next year include meeting debt service payments and funding recurring expenses, required capital expenditures, committed acquisitions and acquisition opportunities as they arise. In addition, an integral part of our strategy is to pursue acquisitions through Brookfield-led consortium arrangements with institutional investors or strategic partners, and to form partnerships to pursue acquisitions on a specialized or global basis. Brookfield has an established track record of leading such consortiums and partnerships and actively managing underlying assets to improve performance. The "Developments in our Business" section of the MD&A details recent acquisitions completed by the partnership. For example, the partnership, alongside institutional investors, completed the acquisition of Westinghouse on August 1, 2018 for a purchase price of approximately $4 billion, funded with approximately $920 million of equity and $3.1 billion of long-term debt financing ($2.9 billion net of financing fees). The partnership's share of the equity was approximately $405 million, which was funded with available liquidity.
Our principal sources of liquidity are financial assets, undrawn credit facilities, cash flow from our operations and access to public and private capital markets.
The following table presents borrowings by segment as at September 30, 2018 and December 31, 2017:
(US$ MILLIONS) | Business Services | Infrastructure Services | Industrial Operations | Energy | Corporate and Other | Total | ||||||||||||||||||
September 30, 2018 | $ | 1,151 | $ | 2,950 | $ | 3,564 | $ | 3,202 | $ | (2 | ) | $ | 10,865 | |||||||||||
December 31, 2017 | $ | 1,190 | $ | — | $ | 1,693 | $ | 382 | $ | — | $ | 3,265 | ||||||||||||
As at September 30, 2018, the partnership had outstanding debt of $10,865 million compared to $3,265 million as at December 31, 2017. The borrowings consist of the following:
(US$ MILLIONS) | September 30, 2018 | December 31, 2017 | ||||||
Term loans and credit facilities | $ | 8,955 | $ | 1,745 | ||||
Project financing | 525 | 449 | ||||||
Debentures | 490 | 596 | ||||||
Securitization program | 249 | 249 | ||||||
Senior notes | 646 | 226 | ||||||
Total Borrowings | $ | 10,865 | $ | 3,265 | ||||
The partnership has credit facilities within its operating businesses with major financial institutions. The credit facilities are primarily composed of revolving and term operating facilities with variable interest rates. At the operating level, we endeavor to maintain prudent levels of debt which can be serviced through on-going operations. On a consolidated basis, our operations had borrowings totaling $10,865 million as at September 30, 2018, compared to $3,265 million at December 31, 2017. The increase of $7,600 million was primarily due to $2.9 billion of long-term debt financing secured for our acquisition of Westinghouse, $2.7 billion of additional debt consolidated as a result of the exercise of our general partner option to acquire an additional 2% ownership interest in Teekay Offshore GP, and $2.2 billion of long-term debt financing secured at our graphite electrode manufacturing business, of which approximately $400 million was used to pay down existing debt.
28
We finance our assets principally at the operating company level with debt that generally is non-recourse to either the partnership or to our other operations and is generally secured against assets within the respective operating companies. Moreover, debt instruments at the operating company level do not cross-accelerate or cross-default to debt at other operating companies. This debt is in the form of revolving lines of credit, term loans and debt securities with varying maturities, ranging from 1-21 years. The weighted average maturity at September 30, 2018 was 6.1 years and the weighted average interest rate on debt outstanding was 6.4%. As at September 30, 2018, the maximum borrowing capacity of our term loans and credit facilities at the operations and other subsidiaries level was $12.6 billion, of which $10.9 billion was drawn.
The use of the term loans and credit facilities is primarily related to on-going operations and capital expenditures, and to fund acquisitions. The interest rates charged on these facilities are based on market interest rates. These borrowings include customary covenants based on fixed charge coverage, debt-to-EBITDA ratios and maintaining minimum equity or liquidity levels. Our operations are currently in compliance with or have obtained waivers related to all material covenant requirements of their term loans and credit facilities. In periods of difficult economic conditions, including challenging commodity pricing, we undertake proactive measures to avoid having any of our energy and industrial operations default under the terms of their facilities, including amending such debt instruments or, if necessary, seeking waivers from the lenders. Our ability to enter into an amendment or, if needed, obtain a waiver or otherwise refinance any such indebtedness depends on, among other things, the conditions of the capital markets and our financial conditions at such time.
One of our real estate services businesses has a securitization program under which it transfers an undivided co-ownership interest in eligible receivables on a fully serviced basis, for cash proceeds, at their fair value under the terms of the agreement. While the sale of the co-ownership interest is considered a legal sale, the partnership has determined that the asset derecognition criteria has not been met, as substantially all risk and rewards of ownership are not transferred. The program contains covenants related to maximum loss and default ratios (as defined by the agreement) and receivables turnover ratios as the debt is secured by the business' receivables. The partnership was in compliance with the covenants under the securitization program as at September 30, 2018.
The partnership has a revolving acquisition credit facility with Brookfield that permits borrowings of up to $500 million. The credit facility is guaranteed by the partnership, and each direct wholly-owned (in terms of outstanding common equity) subsidiary of the partnership or the Holding LP, that is not otherwise a borrower. The credit facility is available in U.S. or Canadian dollars, and advances are made by way of LIBOR, base rate, bankers' acceptance rate or prime rate loans. The credit facility bears interest at the specified LIBOR or bankers’ acceptance rate plus 3.75%, or the specified base rate or prime rate plus 2.75%. The credit facility also requires us to maintain a minimum deconsolidated net worth and contain restrictions on the ability of the borrowers and the guarantors to, among other things, incur liens, engage in certain mergers and consolidations or enter into speculative hedging arrangements. Net proceeds above a specified threshold that are received by the borrowers from asset dispositions, debt incurrences or equity issuances by the borrowers or their subsidiaries must be used to pay down the credit facility (which can then be redrawn to fund future investments). As at September 30, 2018, the credit facility remains undrawn.
In the second quarter of 2018, the partnership amended and restated our bilateral credit facility, increasing it by $575 million to $825 million across an expanded group of banks. In addition to U.S. or Canadian dollars, the credit facility is available in Euros, Sterling, or Australian dollars. Advances under the credit facility bear interest at the specified LIBOR, EURIBOR, CDOR, BBSY or bankers' acceptance rate plus 2.50%, or the specified base rate or prime rate plus 1.50%. The credit facility's maturity date was extended by two years to August 2021. The credit facility is for general corporate purposes and requires us to maintain a minimum tangible net worth and to maintain debt to capitalization ratios at the corporate level. As at September 30, 2018, the facility remains undrawn.
The table below outlines the partnership's consolidated net debt to capitalization as at September 30, 2018 and December 31, 2017:
(US$ MILLIONS) | September 30, 2018 | December 31, 2017 | ||||||
Borrowings | $ | 10,865 | $ | 3,265 | ||||
Cash and cash equivalents | (1,770 | ) | (1,106 | ) | ||||
Net debt | 9,095 | 2,159 | ||||||
Total equity | 6,476 | 6,064 | ||||||
Total capital and net debt | $ | 15,571 | $ | 8,223 | ||||
Net debt to capitalization ratio | 58.4 | % | 26.3 | % | ||||
29
As at September 30, 2018, our construction services business had negative net debt of $231 million, which comprised of $10 million of borrowings and $241 million of cash. As at December 31, 2017, negative net debt was $234 million, which comprised $12 million of borrowings and $246 of cash. As at September 30, 2018, equity attributable to unitholders was $832 million, compared to $959 million as at December 31, 2018.
The partnership's general partner has implemented a distribution policy pursuant to which we intend to make quarterly cash distributions in an initial amount currently anticipated to be approximately $0.25 per unit on an annualized basis. On November 1, 2018, the Board of Directors of the partnership's general partner declared a dividend of $0.0625 per unit payable on December 31, 2018 to unitholders of record as at the close of business on November 30, 2018.
In addition, on September 28, 2018, the Board of Directors, on behalf of the partnership, in its capacity as the general partner of Brookfield Business L.P. ("Holding LP"), declared a dividend of $23.5 million per Special LP unit of Holding LP, payable on December 31, 2018. The volume weighted average price was $41.96 per unit (exceeding the previous incentive distribution threshold of $38.31 per unit) and the units outstanding as at September 30, 2018 were 129 million units, resulting in a $94 million payable to Brookfield. Going forward, the incentive distribution threshold is $41.96 per unit.
Cash Flow
We believe that we currently have sufficient access to capital resources and will continue to use our available capital resources to fund our operations. Our future capital resources include cash flow from operations, borrowings, proceeds from asset monetizations and proceeds from potential future equity issuances, if required.
As at September 30, 2018, we had cash and cash equivalents of $1,770 million, compared to $1,106 million as at December 31, 2017. The net cash flows for the nine months ended September 30, 2018 and 2017 were as follows:
Nine Months Ended September 30, | ||||||||
(US$ MILLIONS) | 2018 | 2017 | ||||||
Cash flows provided by operating activities | $ | 356 | $ | 41 | ||||
Cash flows provided by (used in) investing activities | (3,961 | ) | (1,393 | ) | ||||
Cash flows provided by (used in) financing activities | 4,320 | 1,858 | ||||||
Effect of foreign exchange rates on cash | (51 | ) | 17 | |||||
Total | $ | 664 | $ | 523 | ||||
Revision of comparatives
The comparative cash flow figures for the nine months ended September 30, 2017 have been revised for the correction of an immaterial error identified by management related to the reclassification of cash flows from bank overdrafts, from an acquisition completed in May 2017 in our business services segment, within the unaudited interim condensed consolidated statements of cash flow. As a result, $339 million which was previously reported in accounts payable and other within the operating activities line item entitled changes in non-cash working capital, net, is now being reported within the financing activities line item entitled proceeds from other credit facilities, net. The 2017 comparative figures in the supplemental cash flow information within Note 21 have also been updated to remove the bank overdraft which was previously recorded within accounts payable and other. The correction of the classification in the statement of cash flow is immaterial and had no impact on the partnership’s historical unaudited interim condensed statements of financial position, statements of operating results, statements of comprehensive income, and statements of changes in equity.
The impact of the correction of the classification in the consolidated statement of cash flows for the periods ended June 30, 2017, September 30, 2017, December 31, 2017, and March 31, 2018 are detailed below:
30
(US$ MILLIONS) | June 30, 2017 | September 30, 2017 | December 31, 2017 | March 31, 2018 | |||||||||||
As reported | |||||||||||||||
Changes in non-cash working capital, net | $ | (12 | ) | $ | 174 | $ | (91 | ) | $ | (228 | ) | ||||
Proceeds from other credit facilities, net | — | — | — | — | |||||||||||
As corrected | |||||||||||||||
Changes in non-cash working capital, net | $ | (370 | ) | $ | (165 | ) | $ | (451 | ) | $ | (405 | ) | |||
Proceeds from other credit facilities, net | 358 | 339 | 360 | 177 | |||||||||||
Cash Flow Provided by Operating Activities
Total cash flow provided by operating activities for the nine months ended September 30, 2018 was $356 million compared to $41 million provided by operating activities for the nine months ended September 30, 2017. The cash provided by operating activities during the nine months ended September 30, 2018 was primarily attributable to the incremental contribution from stronger results in our graphite electrode manufacturing business as a result of stronger pricing and higher volume for the nine months ended September 30, 2018, which was partially offset by the non-cash gain recognized on the consolidation of Teekay Offshore during the third quarter of 2018.
Cash Flow Provided by (Used in) Investing Activities
Total cash flow used in investing activities was $3,961 million for the nine months ended September 30, 2018, compared to $1,393 million used during the nine months ended September 30, 2017. Our investing activities were primarily related to the acquisitions of Westinghouse and Schoeller Allibert, the tuck-in acquisition within our facilities management business and the acquisition of property, plant, and equipment and intangible assets mostly within our business services and industrial operations segments. This was partially offset by the cash proceeds received on the disposition of our interest in our real estate brokerage services business, as well as the cash assumed from the consolidation of Teekay Offshore.
Cash Flow Provided by (Used in) Financing Activities
Total cash flow provided by financing activities was $4,320 million for the nine months ended September 30, 2018, compared to $1,858 million cash flow provided by financing activities for the nine months ended September 30, 2017. During the nine months ended September 30, 2018, our borrowings, net of repayments, were $4,566 million, which primarily consisted of the $2.2 billion of senior secured term loan financing obtained by our graphite electrode manufacturing business, of which approximately $400 million was used to pay down existing debt. Also contributing to the increase in borrowings is the $2,950 million term loan financing put in place at Westinghouse. During the nine months ended September 30, 2018, distributions to others who have interests in operating subsidiaries, net of capital provided by others who have interests in our operating subsidiaries, were $406 million, which were mostly comprised of distributions from our graphite electrode manufacturing business.
Off Balance Sheet Arrangements
In the normal course of operations our operating subsidiaries have bank guarantees, insurance bonds and letters of credit outstanding to third parties. As at September 30, 2018, the total outstanding amount was approximately $1.7 billion. If these letters of credit or bonds are drawn upon, our operating subsidiaries will be obligated to reimburse the issuer of the letter of credit or bonds. The partnership does not conduct its operations, other than those of equity accounted investments, through entities that are not consolidated in the financial statements and has not guaranteed or otherwise contractually committed to support any material financial obligations not reflected in the financial statements.
Our construction businesses and other operations are called upon to give, in the ordinary course of business, guarantees and indemnities in respect of the performance of controlled entities, associates and related parties of their contractual obligations. Any known losses have been brought to account.
31
In the normal course of operations, we execute agreements that provide indemnification and guarantees to third parties in transactions such as business dispositions and acquisitions, construction projects, capital projects, and sales and purchases of assets and services. We have also agreed to indemnify our directors and a certain number of our officers and employees. The nature of substantially all of the indemnification undertakings prevents us from making a reasonable estimate of the maximum potential amount that we could be required to pay third parties, as many of the agreements do not specify a maximum amount and the amounts are dependent upon the outcome of future contingent events, the nature and likelihood of which cannot be determined at this time. Historically, we have made no significant payments under such indemnification agreements. In addition, we have also entered into indemnity agreements with Brookfield that relate to certain projects in the Middle East region that were in place prior to the spin-off. Under these indemnity agreements, Brookfield has agreed to indemnify us for the receipt of payments relating to such projects.
From time to time, we may be contingently liable with respect to litigation and claims that arise in the normal course of operations. On July 3, 2017, a customer called on the performance and advance payment bank guarantee associated with a project in the Middle East for an amount of approximately $32 million. Management successfully contested the claim, which was upheld in local courts. On February 22, 2018, the customer’s appeal of the court’s ruling resulted in the bank guarantees being paid due to the structural form of the guarantee. Management continues to counterclaim through local courts and any loss amount associated with this project cannot be measured and is not probable at this time.
Financial Instruments — Foreign Currency Hedging Strategy
To the extent that it is economical to do so, the partnership's strategy is to hedge a portion of its equity investments and/or cash flows exposed to foreign currencies. The partnerships foreign currency hedging strategy includes leveraging any natural hedges that may exist within the operations, utilizing local currency debt financing to the extent possible, and utilizing derivative contracts to the extent that natural hedges are insufficient.
The following table presents our hedged position in foreign currencies as at September 30, 2018:
Net Investment Hedges | ||||||||||||||||||||||||||||
(US$ MILLIONS) | USD | CAD | AUD | BRL | GBP | EUR | Other | |||||||||||||||||||||
Net Equity | $ | 551 | $ | 621 | $ | 437 | $ | 285 | $ | 521 | $ | 169 | $ | 321 | ||||||||||||||
FX Contracts — US$ | 587 | (372 | ) | (50 | ) | (73 | ) | (59 | ) | (33 | ) | — | ||||||||||||||||
As at September 30, 2018, we had hedges in place equal to approximately 25% of our net equity investment in foreign currencies. Our primary unhedged exposure relates to some of our Canadian operations where natural hedges exist within the businesses. For the three months ended September 30, 2018, we recorded unrealized pre-tax net losses of $10 million in other comprehensive income, related to these contracts.
Contractual Obligations
An integral part of our partnership’s strategy is to participate with institutional investors in Brookfield-sponsored private equity funds that target acquisitions that suit Brookfield private equity’s profile. In the normal course of business, our partnership has made commitments to Brookfield-sponsored private equity funds to participate in these target acquisitions in the future, if and when identified.
In the ordinary course of business, we enter into contractual arrangements that may require future cash payments. The table below outlines our contractual obligations as at September 30, 2018:
Payments as at September 30, 2018 | ||||||||||||||||||||
(US$ MILLIONS) | Total | Less than One Year | One-Two Years | Three-Five Years | Thereafter | |||||||||||||||
Borrowings | $ | 10,904 | $ | 1,179 | $ | 1,461 | $ | 2,874 | $ | 5,390 | ||||||||||
Finance lease obligations | 65 | 14 | 7 | 23 | 21 | |||||||||||||||
Operating leases | 766 | 177 | 96 | 227 | 266 | |||||||||||||||
Interest expense | 824 | 169 | 152 | 366 | 137 | |||||||||||||||
Decommissioning liabilities | 1,075 | 10 | 3 | 10 | 1,052 | |||||||||||||||
Pension obligations | 530 | 25 | 12 | 36 | 457 | |||||||||||||||
Obligations under agreements | 1,153 | 331 | 543 | 153 | 126 | |||||||||||||||
Total | $ | 15,317 | $ | 1,905 | $ | 2,274 | $ | 3,689 | $ | 7,449 | ||||||||||
32
Related Party Transactions
We entered into a number of related party transactions with Brookfield as described in Note 15 in the interim financial statements.
Subsequent Events
Subsequent to September 30, 2018, the partnership was party to a number of subsequent events as described in Note 22 in the interim financial statements.
Critical Accounting Policies, Estimates and Judgments
The preparation of financial statements requires management to make critical judgments, estimates and assumptions that affect the reported amounts of assets and liabilities and disclosure of contingent assets and liabilities at the date of the financial statements and the reported amounts of revenues and expenses that are not readily apparent from other sources, during the reporting period. These estimates and associated assumptions are based on historical experience and other factors that are considered to be relevant. Actual results may differ from these estimates.
The estimates and underlying assumptions are reviewed on an ongoing basis. Revisions to accounting estimates are recognized in the period in which the estimate is revised if the revision affects only that period, or in the period of the revision and future periods if the revision affects both current and future periods.
For further reference on accounting policies, critical judgments and estimates, see our significant accounting policies contained in Note 2 of our annual audited consolidated financial statements as at December 31, 2017 and 2016 and for the years ended December 31, 2017, 2016 and 2015.
Controls and Procedures
No changes were made in our internal control over financial reporting during the quarter ended September 30, 2018 that have materially affected, or are reasonably likely to materially affect, our internal control over financial reporting.
Excluded from our evaluation were controls over financial reporting at Schoeller Allibert Group B.V., for which control was acquired on May 15, 2018; Teekay Offshore for which control was acquired on July 3, 2018 and Westinghouse, for which control was acquired on August 1, 2018. The financial statements of these entities constitute 45% of total assets, 41% of net assets, 5% of revenue and 29% of net income of the consolidated financial statements of our partnership as of and for the nine month period ending September 30, 2018.
Future Changes in Accounting Policies
Leases
In January 2016, the IASB published a new standard, IFRS 16 Leases ("IFRS 16"). The new standard brings most leases on the balance sheet, eliminating the distinction between operating and finance leases. Lessor accounting, however, remains largely unchanged and the distinction between operating and finance leases is retained. IFRS 16 supersedes IAS 17 Leases and related interpretations and is effective for periods beginning on or after January 1, 2019.
The partnership has participated in strategic planning sessions with its subsidiaries and associates in order to provide guidance regarding the key considerations and to develop an adoption project plan. Using the population of existing contractual arrangements, the partnership has substantially completed its identification of leases that are required to be capitalized under the new standard. The partnership is currently quantifying the present value of the identified lease contracts to determine the impact on the January 1, 2019 balance sheet and is assessing the expected impact to our statements of operations once the standard has been adopted. The partnership is progressing as planned in our adoption project plan. Next steps involve the finalization of the documented analysis, including assessing the impact to IT system requirements and internal controls, drafting the disclosures required by the new standard and rolling-forward the analysis to include all active leases as at year-end.
IFRS 16 can either be adopted on a full retrospective method or on a modified retrospective method whereby any transitional impact is recorded in equity as at January 1, 2019 and comparative periods are not restated. The partnership currently anticipates that the modified retrospective approach will be adopted and is currently in the process of evaluating a number of practical expedients available under the new standard.
The partnership continues to evaluate the overall impact of IFRS 16 on its consolidated financial statements.
33
Uncertainty over Income Tax Treatments
In June 2017, the IASB published IFRIC 23, Uncertainty over Income Tax Treatments ("IFRIC 23") effective for annual periods beginning on or after January 1, 2019. The interpretation requires an entity to assess whether it is probable that a tax authority will accept an uncertain tax treatment used, or proposed to be used, by an entity in its income tax filings and to exercise judgment in determining whether each tax treatment should be considered independently or whether some tax treatments should be considered together. The decision should be based on which approach provides better predictions of the resolution of the uncertainty. An entity also has to consider whether it is probable that the relevant authority will accept each tax treatment, or group of tax treatments, assuming that the taxation authority with the right to examine any amounts reported to it will examine those amounts and will have full knowledge of all relevant information when doing so. The interpretation may be applied on either a fully retrospective basis or a modified retrospective basis without restatement of comparative information. The partnership is currently evaluating the impact of IFRIC 23 on its unaudited interim condensed consolidated financial statements.
New Accounting Policies Adopted
Revenue from Contracts with Customers
IFRS 15, Revenue from Contracts with Customers ("IFRS 15") specifies how and when revenue should be recognized as well as requiring additional disclosures. IFRS 15 requires disclosure regarding the nature, amount, timing and uncertainty of revenue and cash flows arising from customer contracts. IFRS 15 supersedes IAS 18, Revenue, IAS 11, Construction Contracts and a number of revenue-related interpretations. IFRS 15 applies to nearly all contracts with customers: the main exceptions are leases, financial instruments and insurance contracts.
The partnership adopted the standard using the modified retrospective approach, in which a cumulative catch-up adjustment is recorded through opening retained earnings on January 1, 2018 as if the standard had always been in effect and whereby comparative periods are not restated. The partnership elected to use the practical expedient for contract modifications. On adoption, the partnership recorded a reduction in opening retained earnings of approximatively $260 million, attributable to the partnership net of taxes, mainly from our construction services business. Under IFRS 15, revenue from the partnership’s construction services contracts will continue to be recognized over time; however, a higher threshold of probability must be achieved prior to recognizing revenue from variable consideration such as incentives and claims and variations resulting from contract modifications. Under IAS 18 and IAS 11, revenue was recognized when it is probable that work performed will result in revenue whereas under IFRS 15, revenue is recognized when it is highly probable that a significant reversal of revenue will not occur for these modifications. Refer to Note 2(c) of the unaudited interim condensed consolidated financial statements for impact on adoption of IFRS 15.
Financial Instruments
In July 2014, the IASB issued the final publication of IFRS 9, Financial Instruments ("IFRS 9") superseding the current IAS 39, Financial Instruments: Recognition and Measurement. IFRS 9 establishes principles for the financial reporting of financial assets and financial liabilities that will present relevant and useful information to users of financial statements for their assessment of the amounts, timing and uncertainty of an entity's future cash flows. This new standard also includes a new general hedge accounting standard which will align hedge accounting more closely with an entity's risk management activities. It does not fully change the types of hedging relationships or the requirement to measure and recognize ineffectiveness, however, it will provide more hedging strategies that are used for risk management to qualify for hedge accounting and introduce greater judgment to assess the effectiveness of a hedging relationship. The partnership adopted the standard using the retrospective approach without restatement, in which a cumulative catch-up adjustment is recorded through opening retained earnings on January 1, 2018 as if the standard had always been in effect and whereby comparative periods are not restated. On adoption, the partnership recorded an adjustment in opening retained earnings of $nil attributable to the partnership net of taxes. Refer to Note 2(e) of the unaudited interim condensed consolidated financial statements for impact on adoption of IFRS 9.
Foreign Currency Transactions and Advance Consideration
In December 2016, the IASB issued IFRIC 22, Foreign Currency Transactions and Advance Consideration ("IFRIC 22"), effective for annual reporting periods beginning on or after January 1, 2018. The interpretation clarifies that the date of the transaction for the purpose of determining the exchange rate to use on initial recognition of the related asset, expense or income (or part of it) is the date on which an entity initially recognizes the non-monetary asset or non-monetary liability arising from the payment or receipt of advance consideration. The interpretation may be applied either retrospectively or prospectively. The adoption of IFRIC 22 did not have a significant impact on the unaudited interim condensed consolidated financial statements.
34
QuickLinks
35