00016503722024FYFalseP1Mhttp://fasb.org/us-gaap/2024#PrepaidExpenseAndOtherAssetsCurrenthttp://fasb.org/us-gaap/2024#AccruedLiabilitiesCurrenthttp://fasb.org/us-gaap/2024#PrepaidExpenseAndOtherAssetsCurrenthttp://fasb.org/us-gaap/2024#AccruedLiabilitiesCurrentP4YP1Y25750.083iso4217:USDxbrli:sharesiso4217:USDxbrli:sharesteam:revenue_categoryxbrli:pureteam:extension_optionteam:lawsuitteam:vote00016503722023-07-012024-06-3000016503722023-12-310001650372us-gaap:CommonClassAMember2024-08-090001650372us-gaap:CommonClassBMember2024-08-0900016503722024-06-3000016503722023-06-300001650372us-gaap:CommonClassAMember2023-06-300001650372us-gaap:CommonClassAMember2024-06-300001650372us-gaap:CommonClassBMember2023-06-300001650372us-gaap:CommonClassBMember2024-06-300001650372us-gaap:LicenseAndServiceMember2023-07-012024-06-300001650372us-gaap:LicenseAndServiceMember2022-07-012023-06-300001650372us-gaap:LicenseAndServiceMember2021-07-012022-06-300001650372us-gaap:MaintenanceMember2023-07-012024-06-300001650372us-gaap:MaintenanceMember2022-07-012023-06-300001650372us-gaap:MaintenanceMember2021-07-012022-06-300001650372us-gaap:ProductAndServiceOtherMember2023-07-012024-06-300001650372us-gaap:ProductAndServiceOtherMember2022-07-012023-06-300001650372us-gaap:ProductAndServiceOtherMember2021-07-012022-06-3000016503722022-07-012023-06-3000016503722021-07-012022-06-300001650372us-gaap:CostOfSalesMember2023-07-012024-06-300001650372us-gaap:CostOfSalesMember2022-07-012023-06-300001650372us-gaap:CostOfSalesMember2021-07-012022-06-300001650372us-gaap:ResearchAndDevelopmentExpenseMember2023-07-012024-06-300001650372us-gaap:ResearchAndDevelopmentExpenseMember2022-07-012023-06-300001650372us-gaap:ResearchAndDevelopmentExpenseMember2021-07-012022-06-300001650372us-gaap:SellingAndMarketingExpenseMember2023-07-012024-06-300001650372us-gaap:SellingAndMarketingExpenseMember2022-07-012023-06-300001650372us-gaap:SellingAndMarketingExpenseMember2021-07-012022-06-300001650372us-gaap:GeneralAndAdministrativeExpenseMember2023-07-012024-06-300001650372us-gaap:GeneralAndAdministrativeExpenseMember2022-07-012023-06-300001650372us-gaap:GeneralAndAdministrativeExpenseMember2021-07-012022-06-300001650372us-gaap:CommonStockMemberus-gaap:CommonClassAMember2021-06-300001650372us-gaap:CommonStockMemberus-gaap:CommonClassBMember2021-06-300001650372us-gaap:AdditionalPaidInCapitalMember2021-06-300001650372us-gaap:AccumulatedOtherComprehensiveIncomeMember2021-06-300001650372us-gaap:RetainedEarningsMember2021-06-3000016503722021-06-300001650372us-gaap:CommonStockMemberus-gaap:CommonClassAMember2021-07-012022-06-300001650372us-gaap:AdditionalPaidInCapitalMember2021-07-012022-06-300001650372us-gaap:CommonStockMemberus-gaap:CommonClassBMember2021-07-012022-06-300001650372us-gaap:AccumulatedOtherComprehensiveIncomeMember2021-07-012022-06-300001650372us-gaap:RetainedEarningsMember2021-07-012022-06-300001650372us-gaap:CommonStockMemberus-gaap:CommonClassAMember2022-06-300001650372us-gaap:CommonStockMemberus-gaap:CommonClassBMember2022-06-300001650372us-gaap:AdditionalPaidInCapitalMember2022-06-300001650372us-gaap:AccumulatedOtherComprehensiveIncomeMember2022-06-300001650372us-gaap:RetainedEarningsMember2022-06-3000016503722022-06-300001650372us-gaap:CommonStockMemberus-gaap:CommonClassAMember2022-07-012023-06-300001650372us-gaap:AdditionalPaidInCapitalMember2022-07-012023-06-300001650372us-gaap:CommonStockMemberus-gaap:CommonClassBMember2022-07-012023-06-300001650372us-gaap:RetainedEarningsMember2022-07-012023-06-300001650372us-gaap:AccumulatedOtherComprehensiveIncomeMember2022-07-012023-06-300001650372us-gaap:CommonStockMemberus-gaap:CommonClassAMember2023-06-300001650372us-gaap:CommonStockMemberus-gaap:CommonClassBMember2023-06-300001650372us-gaap:AdditionalPaidInCapitalMember2023-06-300001650372us-gaap:AccumulatedOtherComprehensiveIncomeMember2023-06-300001650372us-gaap:RetainedEarningsMember2023-06-300001650372us-gaap:CommonStockMemberus-gaap:CommonClassAMember2023-07-012024-06-300001650372us-gaap:AdditionalPaidInCapitalMember2023-07-012024-06-300001650372us-gaap:CommonStockMemberus-gaap:CommonClassBMember2023-07-012024-06-300001650372us-gaap:RetainedEarningsMember2023-07-012024-06-300001650372us-gaap:AccumulatedOtherComprehensiveIncomeMember2023-07-012024-06-300001650372us-gaap:CommonStockMemberus-gaap:CommonClassAMember2024-06-300001650372us-gaap:CommonStockMemberus-gaap:CommonClassBMember2024-06-300001650372us-gaap:AdditionalPaidInCapitalMember2024-06-300001650372us-gaap:AccumulatedOtherComprehensiveIncomeMember2024-06-300001650372us-gaap:RetainedEarningsMember2024-06-3000016503722020-09-300001650372srt:MinimumMember2023-07-012024-06-300001650372srt:MaximumMember2023-07-012024-06-300001650372us-gaap:EquipmentMember2024-06-300001650372team:ComputerHardwareAndSoftwareMember2024-06-300001650372us-gaap:FurnitureAndFixturesMember2024-06-300001650372us-gaap:LeaseholdImprovementsMember2024-06-300001650372us-gaap:IntellectualPropertyMembersrt:MinimumMember2024-06-300001650372us-gaap:IntellectualPropertyMembersrt:MaximumMember2024-06-300001650372us-gaap:CustomerRelationshipsMembersrt:MinimumMember2024-06-300001650372us-gaap:CustomerRelationshipsMembersrt:MaximumMember2024-06-300001650372us-gaap:DevelopedTechnologyRightsMembersrt:MinimumMember2024-06-300001650372us-gaap:DevelopedTechnologyRightsMembersrt:MaximumMember2024-06-300001650372us-gaap:RestrictedStockUnitsRSUMember2023-07-012024-06-300001650372us-gaap:RestrictedStockMember2023-07-012024-06-300001650372us-gaap:MoneyMarketFundsMemberus-gaap:FairValueInputsLevel1Memberus-gaap:FairValueMeasurementsRecurringMember2024-06-300001650372us-gaap:MoneyMarketFundsMemberus-gaap:FairValueInputsLevel2Memberus-gaap:FairValueMeasurementsRecurringMember2024-06-300001650372us-gaap:MoneyMarketFundsMemberus-gaap:FairValueMeasurementsRecurringMember2024-06-300001650372us-gaap:FairValueInputsLevel1Memberus-gaap:FairValueMeasurementsRecurringMemberus-gaap:USTreasurySecuritiesMember2024-06-300001650372us-gaap:FairValueInputsLevel2Memberus-gaap:FairValueMeasurementsRecurringMemberus-gaap:USTreasurySecuritiesMember2024-06-300001650372us-gaap:FairValueMeasurementsRecurringMemberus-gaap:USTreasurySecuritiesMember2024-06-300001650372us-gaap:FairValueInputsLevel1Memberus-gaap:FairValueMeasurementsRecurringMemberus-gaap:USGovernmentAgenciesDebtSecuritiesMember2024-06-300001650372us-gaap:FairValueInputsLevel2Memberus-gaap:FairValueMeasurementsRecurringMemberus-gaap:USGovernmentAgenciesDebtSecuritiesMember2024-06-300001650372us-gaap:FairValueMeasurementsRecurringMemberus-gaap:USGovernmentAgenciesDebtSecuritiesMember2024-06-300001650372us-gaap:FairValueInputsLevel1Memberus-gaap:FairValueMeasurementsRecurringMemberteam:CertificatesOfDepositAndBankTimeDepositsMember2024-06-300001650372us-gaap:FairValueInputsLevel2Memberus-gaap:FairValueMeasurementsRecurringMemberteam:CertificatesOfDepositAndBankTimeDepositsMember2024-06-300001650372us-gaap:FairValueMeasurementsRecurringMemberteam:CertificatesOfDepositAndBankTimeDepositsMember2024-06-300001650372us-gaap:FairValueInputsLevel1Memberus-gaap:FairValueMeasurementsRecurringMemberus-gaap:CommercialPaperMember2024-06-300001650372us-gaap:FairValueInputsLevel2Memberus-gaap:FairValueMeasurementsRecurringMemberus-gaap:CommercialPaperMember2024-06-300001650372us-gaap:FairValueMeasurementsRecurringMemberus-gaap:CommercialPaperMember2024-06-300001650372us-gaap:FairValueInputsLevel1Memberus-gaap:FairValueMeasurementsRecurringMemberus-gaap:CorporateDebtSecuritiesMember2024-06-300001650372us-gaap:FairValueInputsLevel2Memberus-gaap:FairValueMeasurementsRecurringMemberus-gaap:CorporateDebtSecuritiesMember2024-06-300001650372us-gaap:FairValueMeasurementsRecurringMemberus-gaap:CorporateDebtSecuritiesMember2024-06-300001650372us-gaap:FairValueInputsLevel1Memberus-gaap:FairValueMeasurementsRecurringMember2024-06-300001650372us-gaap:FairValueInputsLevel2Memberus-gaap:FairValueMeasurementsRecurringMember2024-06-300001650372us-gaap:FairValueMeasurementsRecurringMember2024-06-300001650372us-gaap:MoneyMarketFundsMemberus-gaap:FairValueInputsLevel1Memberus-gaap:FairValueMeasurementsRecurringMember2023-06-300001650372us-gaap:MoneyMarketFundsMemberus-gaap:FairValueInputsLevel2Memberus-gaap:FairValueMeasurementsRecurringMember2023-06-300001650372us-gaap:MoneyMarketFundsMemberus-gaap:FairValueMeasurementsRecurringMember2023-06-300001650372us-gaap:FairValueInputsLevel1Memberus-gaap:FairValueMeasurementsRecurringMemberteam:CertificatesOfDepositAndBankTimeDepositsMember2023-06-300001650372us-gaap:FairValueInputsLevel2Memberus-gaap:FairValueMeasurementsRecurringMemberteam:CertificatesOfDepositAndBankTimeDepositsMember2023-06-300001650372us-gaap:FairValueMeasurementsRecurringMemberteam:CertificatesOfDepositAndBankTimeDepositsMember2023-06-300001650372us-gaap:FairValueInputsLevel1Memberus-gaap:FairValueMeasurementsRecurringMember2023-06-300001650372us-gaap:FairValueInputsLevel2Memberus-gaap:FairValueMeasurementsRecurringMember2023-06-300001650372us-gaap:FairValueMeasurementsRecurringMember2023-06-300001650372us-gaap:USTreasurySecuritiesMember2024-06-300001650372us-gaap:USGovernmentAgenciesDebtSecuritiesMember2024-06-300001650372team:CertificatesOfDepositAndBankTimeDepositsMember2024-06-300001650372us-gaap:CommercialPaperMember2024-06-300001650372us-gaap:DomesticCorporateDebtSecuritiesMember2024-06-300001650372team:MarketableSecuritiesMember2024-06-300001650372team:CertificatesOfDepositAndBankTimeDepositsMember2023-06-300001650372team:MarketableSecuritiesMember2023-06-300001650372team:PrivatelyHeldDebtSecuritiesMember2024-06-300001650372team:PrivatelyHeldDebtSecuritiesMember2023-06-300001650372team:PrivatelyHeldEquitySecuritiesMember2024-06-300001650372team:PubliclyTradedEquitySecuritiesMember2023-06-300001650372team:PrivatelyHeldEquitySecuritiesMember2023-06-300001650372team:VerticalFirstTrustMember2022-07-200001650372us-gaap:ForeignExchangeForwardMemberteam:DerivativeInstrumentMaturingInUnder12MonthsMember2024-06-300001650372us-gaap:ForeignExchangeForwardMemberteam:DerivativeInstrumentMaturingInOver12MonthsMember2024-06-300001650372us-gaap:ForeignExchangeForwardMember2024-06-300001650372us-gaap:ForeignExchangeForwardMemberus-gaap:DesignatedAsHedgingInstrumentMember2024-06-300001650372us-gaap:ForeignExchangeForwardMemberus-gaap:NondesignatedMember2024-06-3000016503722024-05-012024-05-310001650372us-gaap:ForeignExchangeForwardMemberteam:DerivativeInstrumentMaturingInUnder12MonthsMember2023-06-300001650372us-gaap:ForeignExchangeForwardMemberteam:DerivativeInstrumentMaturingInOver12MonthsMember2023-06-300001650372us-gaap:ForeignExchangeForwardMember2023-06-300001650372us-gaap:ForeignExchangeForwardMemberus-gaap:DesignatedAsHedgingInstrumentMember2023-06-300001650372us-gaap:ForeignExchangeForwardMemberus-gaap:NondesignatedMember2023-06-300001650372us-gaap:InterestRateSwapMemberteam:DerivativeInstrumentMaturingInUnder12MonthsMember2023-06-300001650372us-gaap:InterestRateSwapMemberteam:DerivativeInstrumentMaturingInOver12MonthsMember2023-06-300001650372us-gaap:InterestRateSwapMember2023-06-300001650372us-gaap:InterestRateSwapMemberus-gaap:DesignatedAsHedgingInstrumentMember2023-06-300001650372us-gaap:InterestRateSwapMemberus-gaap:NondesignatedMember2023-06-300001650372us-gaap:ForeignExchangeForwardMemberus-gaap:DesignatedAsHedgingInstrumentMemberus-gaap:PrepaidExpensesAndOtherCurrentAssetsMember2024-06-300001650372us-gaap:ForeignExchangeForwardMemberus-gaap:DesignatedAsHedgingInstrumentMemberus-gaap:PrepaidExpensesAndOtherCurrentAssetsMember2023-06-300001650372us-gaap:OtherNoncurrentAssetsMemberus-gaap:ForeignExchangeForwardMember2024-06-300001650372us-gaap:OtherNoncurrentAssetsMemberus-gaap:ForeignExchangeForwardMember2023-06-300001650372us-gaap:InterestRateSwapMemberus-gaap:DesignatedAsHedgingInstrumentMemberus-gaap:PrepaidExpensesAndOtherCurrentAssetsMember2024-06-300001650372us-gaap:InterestRateSwapMemberus-gaap:DesignatedAsHedgingInstrumentMemberus-gaap:PrepaidExpensesAndOtherCurrentAssetsMember2023-06-300001650372us-gaap:InterestRateSwapMemberus-gaap:DesignatedAsHedgingInstrumentMemberus-gaap:OtherNoncurrentAssetsMember2024-06-300001650372us-gaap:InterestRateSwapMemberus-gaap:DesignatedAsHedgingInstrumentMemberus-gaap:OtherNoncurrentAssetsMember2023-06-300001650372us-gaap:ForeignExchangeForwardMemberus-gaap:NondesignatedMemberus-gaap:PrepaidExpensesAndOtherCurrentAssetsMember2024-06-300001650372us-gaap:ForeignExchangeForwardMemberus-gaap:NondesignatedMemberus-gaap:PrepaidExpensesAndOtherCurrentAssetsMember2023-06-300001650372us-gaap:ForeignExchangeForwardMemberus-gaap:DesignatedAsHedgingInstrumentMemberteam:AccruedLiabilitiesCurrentMember2024-06-300001650372us-gaap:ForeignExchangeForwardMemberus-gaap:DesignatedAsHedgingInstrumentMemberteam:AccruedLiabilitiesCurrentMember2023-06-300001650372us-gaap:ForeignExchangeForwardMemberus-gaap:DesignatedAsHedgingInstrumentMemberus-gaap:OtherNoncurrentLiabilitiesMember2024-06-300001650372us-gaap:ForeignExchangeForwardMemberus-gaap:DesignatedAsHedgingInstrumentMemberus-gaap:OtherNoncurrentLiabilitiesMember2023-06-300001650372us-gaap:ForeignExchangeForwardMemberus-gaap:NondesignatedMemberteam:AccruedLiabilitiesCurrentMember2024-06-300001650372us-gaap:ForeignExchangeForwardMemberus-gaap:NondesignatedMemberteam:AccruedLiabilitiesCurrentMember2023-06-300001650372us-gaap:AccumulatedGainLossNetCashFlowHedgeParentMember2023-06-300001650372us-gaap:AccumulatedGainLossNetCashFlowHedgeParentMember2022-06-300001650372us-gaap:AccumulatedGainLossNetCashFlowHedgeParentMember2021-06-300001650372us-gaap:AccumulatedGainLossNetCashFlowHedgeParentMember2023-07-012024-06-300001650372us-gaap:AccumulatedGainLossNetCashFlowHedgeParentMember2022-07-012023-06-300001650372us-gaap:AccumulatedGainLossNetCashFlowHedgeParentMember2021-07-012022-06-300001650372us-gaap:CostOfSalesMemberus-gaap:AccumulatedGainLossNetCashFlowHedgeParentMember2023-07-012024-06-300001650372us-gaap:CostOfSalesMemberus-gaap:AccumulatedGainLossNetCashFlowHedgeParentMember2022-07-012023-06-300001650372us-gaap:CostOfSalesMemberus-gaap:AccumulatedGainLossNetCashFlowHedgeParentMember2021-07-012022-06-300001650372us-gaap:ResearchAndDevelopmentExpenseMemberus-gaap:AccumulatedGainLossNetCashFlowHedgeParentMember2023-07-012024-06-300001650372us-gaap:ResearchAndDevelopmentExpenseMemberus-gaap:AccumulatedGainLossNetCashFlowHedgeParentMember2022-07-012023-06-300001650372us-gaap:ResearchAndDevelopmentExpenseMemberus-gaap:AccumulatedGainLossNetCashFlowHedgeParentMember2021-07-012022-06-300001650372us-gaap:SellingAndMarketingExpenseMemberus-gaap:AccumulatedGainLossNetCashFlowHedgeParentMember2023-07-012024-06-300001650372us-gaap:SellingAndMarketingExpenseMemberus-gaap:AccumulatedGainLossNetCashFlowHedgeParentMember2022-07-012023-06-300001650372us-gaap:SellingAndMarketingExpenseMemberus-gaap:AccumulatedGainLossNetCashFlowHedgeParentMember2021-07-012022-06-300001650372us-gaap:GeneralAndAdministrativeExpenseMemberus-gaap:AccumulatedGainLossNetCashFlowHedgeParentMember2023-07-012024-06-300001650372us-gaap:GeneralAndAdministrativeExpenseMemberus-gaap:AccumulatedGainLossNetCashFlowHedgeParentMember2022-07-012023-06-300001650372us-gaap:GeneralAndAdministrativeExpenseMemberus-gaap:AccumulatedGainLossNetCashFlowHedgeParentMember2021-07-012022-06-300001650372us-gaap:InterestExpenseMemberus-gaap:AccumulatedGainLossNetCashFlowHedgeParentMember2023-07-012024-06-300001650372us-gaap:InterestExpenseMemberus-gaap:AccumulatedGainLossNetCashFlowHedgeParentMember2022-07-012023-06-300001650372us-gaap:InterestExpenseMemberus-gaap:AccumulatedGainLossNetCashFlowHedgeParentMember2021-07-012022-06-300001650372us-gaap:AccumulatedGainLossNetCashFlowHedgeParentMember2024-06-300001650372us-gaap:EquipmentMember2023-06-300001650372team:ComputerHardwareAndSoftwareMember2023-06-300001650372us-gaap:FurnitureAndFixturesMember2023-06-300001650372team:LeaseholdImprovementsAndOtherMember2024-06-300001650372team:LeaseholdImprovementsAndOtherMember2023-06-300001650372us-gaap:FacilityClosingMember2023-07-012024-06-300001650372team:LoomIncMember2023-11-300001650372team:LoomIncMember2023-11-302023-11-300001650372team:LoomIncMemberus-gaap:DevelopedTechnologyRightsMember2023-11-300001650372team:LoomIncMemberus-gaap:DevelopedTechnologyRightsMember2023-11-302023-11-300001650372team:LoomIncMemberus-gaap:TradeNamesMember2023-11-300001650372team:LoomIncMemberus-gaap:TradeNamesMember2023-11-302023-11-300001650372team:LoomIncMemberus-gaap:OtherIntangibleAssetsMember2023-11-300001650372team:LoomIncMemberus-gaap:OtherIntangibleAssetsMember2023-11-302023-11-300001650372us-gaap:RestrictedStockUnitsRSUMemberteam:LoomIncMember2023-11-302023-11-300001650372us-gaap:RestrictedStockMemberteam:LoomIncMember2023-11-300001650372us-gaap:DevelopedTechnologyRightsMember2024-06-300001650372us-gaap:DevelopedTechnologyRightsMember2023-06-300001650372us-gaap:IntellectualPropertyMember2024-06-300001650372us-gaap:IntellectualPropertyMember2023-06-300001650372us-gaap:CustomerRelationshipsMember2024-06-300001650372us-gaap:CustomerRelationshipsMember2023-06-300001650372us-gaap:FacilityClosingMember2022-07-012023-06-300001650372team:LeaseAgreementGlobalHeadquartersMember2024-06-300001650372team:LeaseAgreementGlobalHeadquartersMemberus-gaap:OperatingLeaseLeaseNotYetCommencedMember2024-06-300001650372team:LeaseAgreementsOfficesMemberus-gaap:OperatingLeaseLeaseNotYetCommencedMember2024-06-300001650372team:LeaseAgreementsOfficesMemberus-gaap:OperatingLeaseLeaseNotYetCommencedMembersrt:MinimumMember2024-06-300001650372team:LeaseAgreementsOfficesMemberus-gaap:OperatingLeaseLeaseNotYetCommencedMembersrt:MaximumMember2024-06-300001650372team:TheCreditFacilityMemberus-gaap:UnsecuredDebtMemberus-gaap:LineOfCreditMember2020-10-310001650372team:TheCreditFacilityMemberus-gaap:RevolvingCreditFacilityMemberus-gaap:LineOfCreditMember2020-10-310001650372team:TheCreditFacilityMemberus-gaap:LineOfCreditMember2020-10-012020-10-310001650372team:TheCreditFacilityMemberus-gaap:LineOfCreditMembersrt:MinimumMember2020-10-012020-10-310001650372team:TheCreditFacilityMemberus-gaap:LineOfCreditMembersrt:MaximumMember2020-10-012020-10-310001650372team:TheCreditFacilityMemberus-gaap:LineOfCreditMember2020-10-310001650372team:TheCreditFacilityMemberus-gaap:LineOfCreditMember2024-06-300001650372team:The2024CreditAgreementMemberus-gaap:RevolvingCreditFacilityMemberus-gaap:LineOfCreditMemberus-gaap:SubsequentEventMember2024-08-120001650372team:SeniorNoteDue2029Memberus-gaap:SeniorNotesMember2024-05-150001650372team:SeniorNoteDue2034Memberus-gaap:SeniorNotesMember2024-05-150001650372us-gaap:SeniorNotesMember2024-05-1500016503722024-05-152024-05-150001650372team:SeniorNoteDue2029Memberus-gaap:SeniorNotesMember2023-07-012024-06-300001650372team:SeniorNoteDue2029Memberus-gaap:SeniorNotesMember2024-06-300001650372team:SeniorNoteDue2034Memberus-gaap:SeniorNotesMember2023-07-012024-06-300001650372team:SeniorNoteDue2034Memberus-gaap:SeniorNotesMember2024-06-300001650372us-gaap:FairValueInputsLevel2Memberus-gaap:SeniorNotesMember2024-06-3000016503722023-08-012023-08-3100016503722024-07-012024-06-300001650372country:US2023-07-012024-06-300001650372country:US2022-07-012023-06-300001650372country:US2021-07-012022-06-300001650372team:OtherAmericasMember2023-07-012024-06-300001650372team:OtherAmericasMember2022-07-012023-06-300001650372team:OtherAmericasMember2021-07-012022-06-300001650372srt:AmericasMember2023-07-012024-06-300001650372srt:AmericasMember2022-07-012023-06-300001650372srt:AmericasMember2021-07-012022-06-300001650372country:DE2023-07-012024-06-300001650372country:DE2022-07-012023-06-300001650372country:DE2021-07-012022-06-300001650372team:OtherEMEAMember2023-07-012024-06-300001650372team:OtherEMEAMember2022-07-012023-06-300001650372team:OtherEMEAMember2021-07-012022-06-300001650372us-gaap:EMEAMember2023-07-012024-06-300001650372us-gaap:EMEAMember2022-07-012023-06-300001650372us-gaap:EMEAMember2021-07-012022-06-300001650372srt:AsiaPacificMember2023-07-012024-06-300001650372srt:AsiaPacificMember2022-07-012023-06-300001650372srt:AsiaPacificMember2021-07-012022-06-300001650372team:CloudDeploymentServicesMember2023-07-012024-06-300001650372team:CloudDeploymentServicesMember2022-07-012023-06-300001650372team:CloudDeploymentServicesMember2021-07-012022-06-300001650372team:DataCenterDeploymentMember2023-07-012024-06-300001650372team:DataCenterDeploymentMember2022-07-012023-06-300001650372team:DataCenterDeploymentMember2021-07-012022-06-300001650372team:ServerDeploymentMember2023-07-012024-06-300001650372team:ServerDeploymentMember2022-07-012023-06-300001650372team:ServerDeploymentMember2021-07-012022-06-300001650372team:MarketplaceAndServicesDeploymentMember2023-07-012024-06-300001650372team:MarketplaceAndServicesDeploymentMember2022-07-012023-06-300001650372team:MarketplaceAndServicesDeploymentMember2021-07-012022-06-300001650372country:US2024-06-300001650372country:US2023-06-300001650372country:AU2024-06-300001650372country:AU2023-06-300001650372team:AllOtherCountriesMember2024-06-300001650372team:AllOtherCountriesMember2023-06-300001650372us-gaap:CommonClassBMember2023-07-012024-06-300001650372us-gaap:CommonClassAMember2023-07-012024-06-300001650372us-gaap:RestrictedStockUnitsRSUMember2015-01-012015-12-310001650372us-gaap:RestrictedStockUnitsRSUMemberus-gaap:ShareBasedCompensationAwardTrancheOneMember2015-01-012015-12-310001650372us-gaap:RestrictedStockUnitsRSUMemberus-gaap:ShareBasedCompensationAwardTrancheTwoMember2015-01-012015-12-310001650372us-gaap:RestrictedStockUnitsRSUMember2021-04-012021-04-300001650372us-gaap:RestrictedStockUnitsRSUMember2023-06-300001650372us-gaap:RestrictedStockUnitsRSUMember2024-06-300001650372us-gaap:RestrictedStockUnitsRSUMember2022-07-012023-06-300001650372us-gaap:RestrictedStockUnitsRSUMember2021-07-012022-06-300001650372us-gaap:RestrictedStockUnitsRSUMembersrt:WeightedAverageMember2023-07-012024-06-300001650372us-gaap:RestrictedStockMember2022-07-012023-06-300001650372us-gaap:RestrictedStockMember2024-06-300001650372us-gaap:RestrictedStockMember2023-06-3000016503722023-01-310001650372us-gaap:CommonClassAMember2022-07-012023-06-300001650372us-gaap:CommonClassBMember2022-07-012023-06-300001650372us-gaap:CommonClassAMember2021-07-012022-06-300001650372us-gaap:CommonClassBMember2021-07-012022-06-300001650372us-gaap:EmployeeStockOptionMember2023-07-012024-06-300001650372us-gaap:EmployeeStockOptionMember2022-07-012023-06-300001650372us-gaap:EmployeeStockOptionMember2021-07-012022-06-300001650372us-gaap:RestrictedStockUnitsRSUMember2023-07-012024-06-300001650372us-gaap:RestrictedStockUnitsRSUMember2022-07-012023-06-300001650372us-gaap:RestrictedStockUnitsRSUMember2021-07-012022-06-300001650372us-gaap:RestrictedStockMember2023-07-012024-06-300001650372us-gaap:RestrictedStockMember2022-07-012023-06-300001650372us-gaap:RestrictedStockMember2021-07-012022-06-300001650372team:PolishRDCreditsMember2024-06-300001650372us-gaap:SettlementWithTaxingAuthorityMemberus-gaap:AustralianTaxationOfficeMember2024-06-300001650372us-gaap:SettlementWithTaxingAuthorityMember2024-06-300001650372team:The2024CreditAgreementMemberus-gaap:RevolvingCreditFacilityMemberus-gaap:LineOfCreditMemberus-gaap:SubsequentEventMembersrt:MinimumMember2024-08-122024-08-120001650372team:The2024CreditAgreementMemberus-gaap:RevolvingCreditFacilityMemberus-gaap:LineOfCreditMemberus-gaap:SubsequentEventMembersrt:MaximumMember2024-08-122024-08-120001650372team:The2024CreditAgreementMemberus-gaap:LineOfCreditMemberus-gaap:SubsequentEventMember2024-08-1200016503722024-04-012024-06-30
UNITED STATES
SECURITIES AND EXCHANGE COMMISSION
WASHINGTON, D.C. 20549
FORM 10-K
(Mark One)
☑ ANNUAL REPORT PURSUANT TO SECTION 13 OR 15(d) OF THE SECURITIES EXCHANGE ACT OF 1934
For the fiscal year ended June 30, 2024
or
☐ TRANSITION REPORT PURSUANT TO SECTION 13 OR 15(d) OF THE SECURITIES EXCHANGE ACT OF 1934
Commission File Number 001-37651
Atlassian Corporation
(Exact name of registrant as specified in its charter)
| | | | | | | | |
| Delaware | | 88-3940934 |
| (State or other jurisdiction of incorporation or organization) | | (I.R.S. Employer Identification No.) |
350 Bush Street, Floor 13
San Francisco, California 94104
(Address of principal executive offices and Zip Code)
(415) 701-1110
(Registrant's telephone number, including area code)
Securities registered pursuant to Section 12(b) of the Act: | | | | | | | | |
| Title of each class | Trading Symbol(s) | Name of each exchange on which registered |
| Class A Common Stock, par value $0.00001 per share | TEAM | Nasdaq Global Select Market |
Securities registered or to be registered pursuant to Section 12(g) of the Act: None
Indicate by check mark if the registrant is a well-known seasoned issuer, as defined in Rule 405 of the Securities Act. Yes ☑ No ☐
Indicate by check mark if the registrant is not required to file reports pursuant to Section 13 or 15(d) of the Act. Yes ☐ No ☑
Indicate by check mark whether the registrant (1) has filed all reports required to be filed by Section 13 or 15(d) of the Securities Exchange Act of 1934 during the preceding 12 months (or for such shorter period that the registrant was required to file such reports), and (2) has been subject to such filing requirements for the past 90 days. Yes ☑ No ☐
Indicate by check mark whether the registrant has submitted electronically every Interactive Data File required to be submitted pursuant to Rule 405 of Regulation S-T (§232.405 of this chapter) during the preceding 12 months (or for such shorter period that the registrant was required to submit such files). Yes ☑ No ☐
Indicate by check mark whether the registrant is a large accelerated filer, an accelerated filer, a non-accelerated filer, a smaller reporting company, or an emerging growth company. See the definitions of “large accelerated filer,” “accelerated filer,” “smaller reporting company,” and “emerging growth company” in Rule 12b-2 of the Exchange Act:
Large accelerated filer ☑ Accelerated filer ☐ Non-accelerated filer ☐ Smaller reporting company ☐ Emerging growth company ☐
If an emerging growth company, indicate by check mark if the registrant has elected not to use the extended transition period for complying with any new or revised financial accounting standards provided pursuant to Section 13(a) of the Exchange Act. ☐
Indicate by check mark whether the registrant has filed a report on and attestation to its management’s assessment of the effectiveness of its internal control over financial reporting under Section 404(b) of the Sarbanes-Oxley Act (15 U.S.C. 7262(b)) by the registered public accounting firm that prepared or issued its audit report. ☑
If securities are registered pursuant to Section 12(b) of the Act, indicate by check mark whether the financial statements of the registrant included in the filing reflect the correction of an error to previously issued financial statements. ☐
Indicate by check mark whether any of those error corrections are restatements that required a recovery analysis of incentive-based compensation received by any of the registrant’s executive officers during the relevant recovery period pursuant to §240.10D-1(b). ☐
Indicate by check mark whether the registrant is a shell company (as defined in Rule 12b-2 of the Act). Yes ☐ No ☑
The aggregate market value of the voting and non-voting stock held by non-affiliates of the registrant as of December 31, 2023, the last business day of the registrant’s most recently completed second fiscal quarter, was $37.1 billion based upon the closing price reported for such date on the Nasdaq Global Select Market.
As of August 9, 2024, there were 160,032,961 shares of the registrant’s Class A Common Stock and 99,995,049 shares of the registrant’s Class B Common Stock outstanding.
DOCUMENTS INCORPORATED BY REFERENCE
Portions of the registrant’s definitive proxy statement relating to its 2024 Annual Meeting of Stockholders (the “Proxy Statement”), to be filed within 120 days of the registrant’s fiscal year ended June 30, 2024, are incorporated by reference in Part III of this Annual Report on Form 10-K to the extent stated herein. Except with respect to information specifically incorporated by reference in this Annual Report on Form 10-K, the Proxy Statement is not deemed to be filed as part of this Annual Report on Form 10-K.
ANNUAL REPORT
TABLE OF CONTENTS | | | | | | | | | | | |
| | | |
| | | |
| | | |
| PART I. | | | |
| Item 1. | | | |
| Item 1A. | | | |
| Item 1B. | | | |
| Item 2. | | | |
| Item 3. | | | |
| Item 4. | | | |
| PART II. | | | |
| Item 5. | | | |
| Item 6. | | | |
| Item 7. | | | |
| Item 7A. | | | |
| Item 8. | | | |
| Item 9. | | | |
| Item 9A. | | | |
| Item 9B. | | | |
| Item 9C. | | | |
| PART III. | | | |
| Item 10. | | | |
| Item 11. | | | |
| Item 12. | | | |
| Item 13. | | | |
| Item 14. | | | |
| PART IV. | | | |
| Item 15. | | | |
| Item 16. | | | |
| | | |
INTRODUCTION
Our consolidated financial statements are presented in U.S. dollars. All references in this Annual Report on Form 10-K to “$,” “U.S. $,” “U.S. dollars” and “dollars” mean U.S. dollars, unless otherwise noted.
FORWARD-LOOKING STATEMENTS
This Annual Report on Form 10-K contains forward-looking statements within the meaning of Section 27A of the Securities Act of 1933, as amended (the “Securities Act”), and Section 21E of the Securities Exchange Act of 1934, as amended (the “Exchange Act”), which statements involve substantial risks and uncertainties. Forward-looking statements generally relate to future events or our future financial or operating performance. In some cases, you can identify forward-looking statements because they contain words such as “may,” “will,” “should,” “expects,” “plans,” “anticipates,” “could,” “intends,” “target,” “projects,” “contemplates,” “believes,” “estimates,” “predicts,” “potential” or “continue” or the negative of these words or other similar terms or expressions that articulate our expectations, strategy, plans or intentions. Forward-looking statements contained in this Annual Report on Form 10-K include, but are not limited to, statements about:
•our future financial performance, including our revenues, cost of revenues, gross profit or gross margin and operating expenses;
•the sufficiency of our cash and cash equivalents to meet our liquidity needs;
•our ability to increase the number of customers using our software;
•our ability to attract and retain customers to use our products and solutions;
•our ability to develop new products and enhancements to our existing products;
•our ability to successfully expand in our existing markets and into new markets;
•our ability to effectively manage our growth and future expenses;
•our ability to prevent security breaches and unauthorized access to customer data;
•our ability to maintain, protect and enhance our intellectual property;
•our ability to grow our Cloud offerings;
•our ability to incorporate artificial intelligence solutions and features into our platform;
•our future growth and profitability;
•our ability to comply with modified or new laws and regulations applying to our business, including privacy and data security regulations;
•our ability to attract and retain qualified employees and key personnel;
•the effects of our program to repurchase shares of our outstanding Class A Common Stock;
•future acquisitions of, or investments in, complementary companies, products, services or technologies; and
•the impact of general economic conditions, such as inflation and related interest rate increases, political and social unrest, armed conflict, natural disasters, climate change, diseases and pandemics, and any associated economic downturn, on our results of operations and financial performance.
We caution you that the foregoing list may not contain all of the forward-looking statements made in this Annual Report on Form 10-K.
You should not rely upon forward-looking statements as predictions of future events. We have based the forward-looking statements contained in this Annual Report on Form 10-K primarily on our current expectations and projections about future events and trends that we believe may affect our business, financial condition, results of operations and prospects. The outcome of the events described in these forward-looking statements is subject to risks, uncertainties and other factors described in “Risk Factors” and elsewhere in this Annual Report on Form 10-K. Moreover, we operate in a very competitive and rapidly changing environment. New risks and uncertainties emerge from time to time, and it is not possible for us to predict all risks and uncertainties that could have an impact on the forward-looking statements contained in this Annual Report on Form 10-K. The results, events and circumstances reflected in the forward-looking statements may not be achieved or occur, and actual results, events or circumstances could differ materially from those described in the forward-looking statements.
The forward-looking statements made in this Annual Report on Form 10-K relate only to events as of the date on which the statements are made. We undertake no obligation to update any forward-looking statements made in this Annual Report on Form 10-K to reflect events or circumstances after the date of this Annual Report on Form 10-K or to reflect new information or the occurrence of unanticipated events, except as required by law. We may not actually achieve the plans, intentions or expectations disclosed in our forward-looking statements and you should not place undue reliance on our forward-looking statements. Our forward-looking statements do not reflect the potential impact of any future acquisitions, mergers, dispositions, or investments.
PART I
ITEM 1. BUSINESS
Company Overview
Our mission is to unleash the potential of every team.
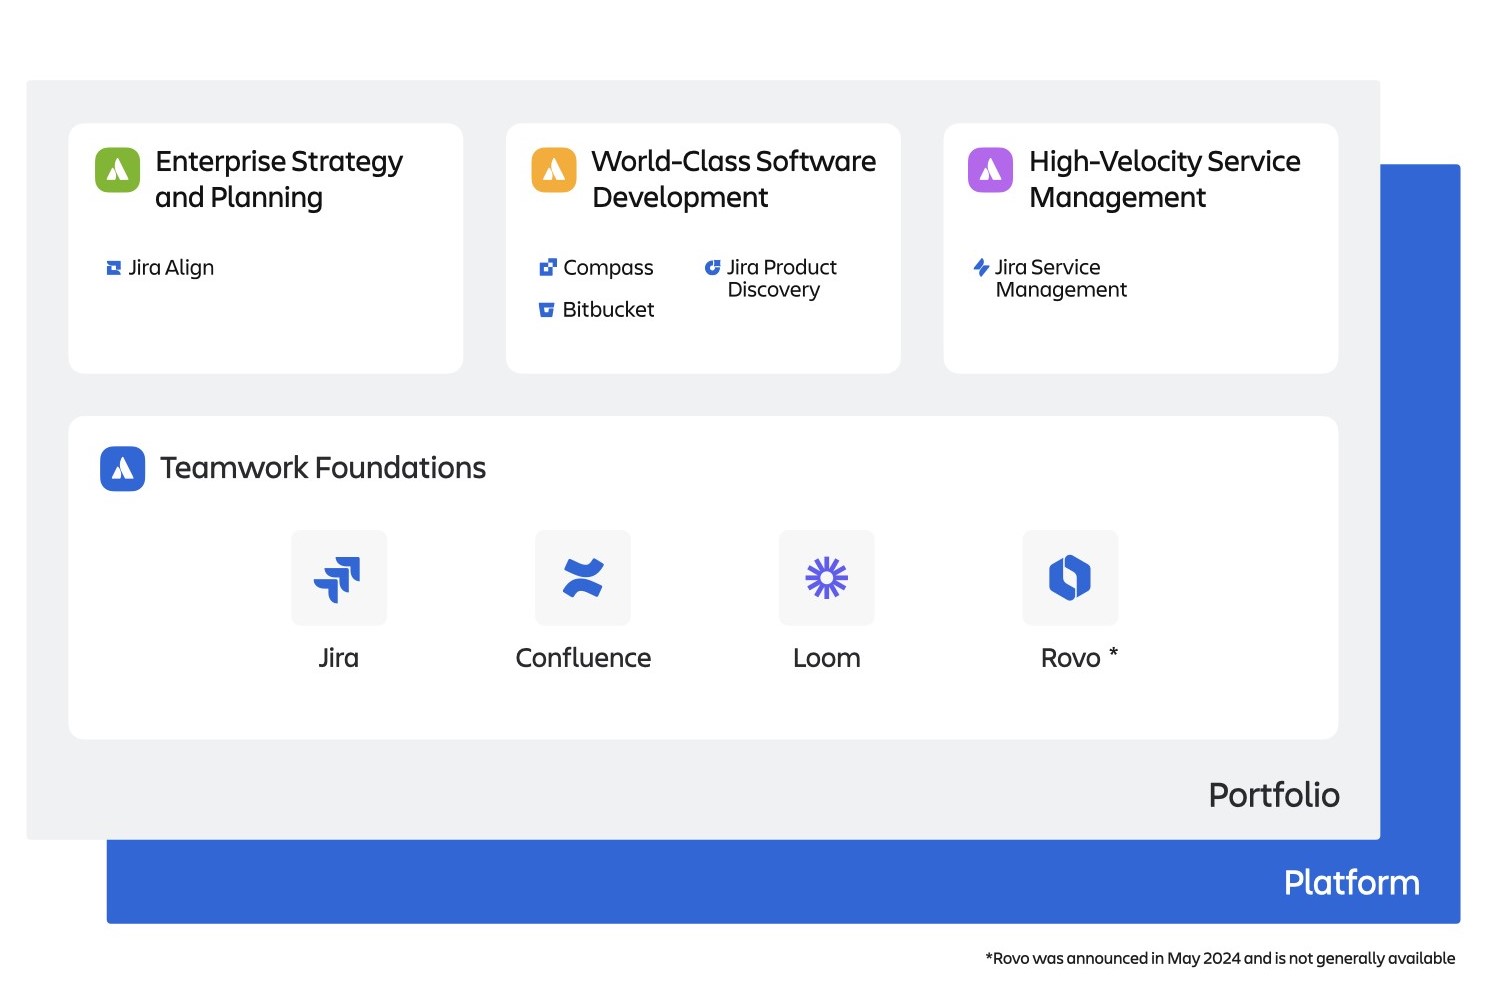
The Atlassian System of Work is our philosophy for how every team works together in technology-driven organizations to achieve impact that would be impossible alone. Through a connected portfolio of products with discrete value propositions that are built on the Atlassian platform and data model, the Atlassian System of Work gives all teams the right teamwork foundations so they can plan and track work, align on goals, and unleash knowledge across the organization.
The Atlassian platform is the common technology foundation for our products and solutions that drives connection between teams, information, and workflows across the entire organization. Additionally, we help leadership teams gain actionable insights and visibility across their organizations and deliver solutions for specialized teams, like product and development teams and IT operations and support teams.
Our primary products include Jira for planning and project management, Confluence for content creation and sharing, Jira Service Management for team service, management and support applications, and Loom, which we acquired in November 2023, for asynchronous video collaboration. Together, our connected portfolio of products form integrated solutions that are deeply entrenched in how teams collaborate and how organizations run, and provide customers all the benefits of analytics, automation, and now AI, as well as integrations with thousands of third-party apps.
Our mission is made possible by a deep investment in product development to create and refine innovative, high-value, and versatile products that users love. We make our products affordable for organizations of all sizes and transparently share our pricing online for most of our products. We aim to grow our customer base, targeting small, medium and large enterprises, in every industry, and in most geographies, and strategically expand our relationships with customers over time with our dedicated sales team. This product-led philosophy enables us to go to market in a unique and efficient way. To land new customers, we’ve engineered a frictionless flywheel with an emphasis on self-service, making it easy to try and get value first and foremost. This allows us to operate at an exceptional scale for an enterprise software company. Our customers span across virtually every industry sector, ranging from small organizations using one of our products for a small group of users to over eighty percent of the Fortune 500, many of which utilize a combination of our products across thousands of users, and across 200 countries and territories, as of June 30, 2024. By designing our products to be simple, powerful, affordable, and
easy to adopt, we generate demand through word-of-mouth and viral expansion within organizations, allowing our sales force to focus primarily on expanding and deepening strategic relationships with existing customers, particularly in the enterprise.
Our culture of innovation, transparency and dedication to customer service drives our success in implementing and refining this unique approach. We believe this approach creates a self-reinforcing effect that fosters innovation, quality, customer success, and scale. As part of this strategy, we invest significantly more in research and development activities than in traditional sales activities relative to other enterprise software companies.
Our Platform
The Atlassian Cloud Platform
The Atlassian cloud platform underpins our cloud product portfolio, allowing us to provide unified experiences, standardized data, and common enterprise infrastructure across all products and teams. It is designed to break down information silos with cross-product experiences and flexible integrations, and ensures that data remains secure, compliant, private, and available with enterprise-grade centralized admin visibility and controls. It enables modern and connected experiences across teams, tools, workflows, and data, including collaboration, analytics, automation, and artificial intelligence capabilities. The comprehensive data model, or Teamwork Graph, unifies and standardizes data across Atlassian products, third-party tools, and teams.
Our strategy is to build more common services and functionality shared across our platform. This approach allows us to develop and introduce new features and products faster, as we can leverage common foundational services that already exist. This also allows our products to more seamlessly integrate with one another, and provides customers better experiences when using multiple products.
Atlassian Intelligence is a set of artificial intelligence (“AI”) capabilities embedded into the fabric of our cloud platform, specifically our Premium and Enterprise edition cloud products. Atlassian Intelligence is designed to optimize how individuals work, teams collaborate, and organizations deliver value. With Atlassian Intelligence, teams have the assistance and generative powers of AI, built on state-of-the-art models and insights from over 20 years of teamwork data from Atlassian’s products and ecosystem. Our commitment to AI is built directly into the Atlassian platform, where it joins forces with the foundations we've laid—security, reliability, performance, and scalability.
The Atlassian platform is extensible, meaning teams have the freedom to add, integrate, customize, or build new functionality on the Atlassian platform as needed. New apps can be found on the Atlassian Marketplace or can be developed using Forge, our cloud app development platform, or Atlassian Connect, a development framework for extending Atlassian cloud products.
Our Product Strategy
We have developed and acquired a broad portfolio of products that help teams large and small to plan, track, and complete their work in a new way that is coordinated, efficient and innovative. Our products serve the needs of software, IT, and business teams. While our products can provide a range of distinct functionality to users, they share certain core attributes:
•Built for All Teams - Our products are singularly designed to help teams work better together and achieve more. We design products that help our customers collaborate more effectively, be more transparent, and operate in a coordinated manner.
•Easy to Adopt and Use - We invest significantly in research and development to enable our products to be both powerful and easy to use. Our software is designed to be accessed from the internet and immediately put to work. By reducing the friction that usually accompanies the purchasing process of business software and eliminating the need for complicated and costly implementation and training, we believe we attract more people to try, use, derive value from, and buy our software.
•Versatile and Adaptable - We design simple products that are useful in a broad range of workflows and projects. We believe that our products can improve any process involving teams, multiple work streams, and deadlines. For example, Jira, which enables software teams to plan, build, and ship code, is also used by thousands of business teams to manage non-technical workflows such as product design, supply chain management, expense management, and legal document review.
•Integrated - Our products are integrated and designed to accelerate work between teams. For example, a developer using Bitbucket can initiate a change request that automatically appears in Jira Service Management for IT Operations to review, with context about that change linked on a Confluence page, enabling teams to deploy fast while still managing risk.
•Open - We are dedicated to making our products open and interoperable with a range of other platforms and applications, such as Microsoft, Zoom, Slack, Salesforce, Workday, and Dropbox. In order to provide a platform for our partners and to promote useful products for our users, we developed the Atlassian Marketplace, an online marketplace that features thousands of apps created by a growing global network of independent developers and vendors. The Atlassian Marketplace provides customers a wide range of apps they can use to extend or enhance our products, further increasing the value of the Atlassian platform. This extensive ecosystem facilitates seamless work across different stages and tools, ensuring that work moves forward without the need to port it back and forth between different tools.
Our Products
We offer a range of team collaboration products, including:
•Jira for project management;
•Confluence for a connected workspace for team collaboration, content creation, and knowledge sharing;
•Jira Service Management for team service and support applications;
•Loom for asynchronous video communication;
•Trello for personal productivity;
•Jira Align for enterprise agile planning and value stream management;
•Bitbucket for source code management;
•Atlassian Guard for enterprise-grade security and centralized administration;
•Compass for tracking and managing software components; and
•Jira Product Discovery for prioritization and product roadmapping.
These products can be deployed by users in the cloud and many of our products can be deployed behind the firewall on the customers’ own infrastructure.
Jira. Jira provides a sophisticated and flexible project management system that connects technical and business teams so they can better plan, organize, track and manage their work and projects. Jira’s flexible ways to view work, customizable dashboards and automation, and powerful reporting features keep distributed teams aligned and on track.
Confluence. Confluence is a connected workspace that empowers organizations to create, organize, find, and share information. The product is organized into spaces that contain pages, whiteboards, video messages, and databases. Confluence ensures that information helps teams improve, connect, and simplify the work that contributes to team goals.
Jira Service Management. Jira Service Management is an intuitive and flexible solution for creating and managing service experiences for a variety of service team providers, including IT, legal, and HR teams. Jira Service Management features include virtual support agents, service portals, as well as advanced change, incident, and automation capabilities to help teams deliver high-velocity service experiences for employees and customers.
Loom. Loom is an asynchronous video communication tool that helps users communicate through instantly shareable videos. Loom videos allow teams to collaborate in richer, more human ways, and can be integrated into a variety of key workplace applications.
Trello. Trello captures and adds structure to fluid, fast-forming work for individuals and teams. A personal productivity tool that can organize your tasks into lists and boards, Trello can tell users and their teams what is being worked on, by whom, and how far along the task or project is.
Jira Align. Jira Align is an enterprise agility solution designed to help businesses quickly adapt and respond to dynamic business conditions with a focus on value-creation. Through data-driven tools, Jira Align makes cross-portfolio work visible, so leaders can identify bottlenecks, risks, and dependencies, and execution is aligned to company strategy.
Bitbucket. Bitbucket is an enterprise-ready Git solution that enables professional dev teams to manage, collaborate on, and deploy quality code.
Atlassian Guard. Atlassian Guard is an enterprise-wide product for enhanced security and centralized administration that works across all of our cloud products.
Compass. Compass is a developer portal that provides a unified real-time representation of engineering teams' output in one place. Compass helps track the components that engineering teams build. It naturally compliments Jira, which tracks the effort of engineering teams in building those components.
Jira Product Discovery. Jira Product Discovery is a prioritization and roadmapping tool. It helps transform product management into a team sport, empowering product teams to bring structure to chaos, align stakeholders on strategy and roadmaps, and bridge the gap between business and tech teams so they can build products that make an impact - all in Jira.
Other Products
We also offer additional products, including Bamboo, Crowd, Crucible, Fisheye, Opsgenie, Sourcetree, Statuspage, and Atlassian cloud apps.
Our Technology, Infrastructure and Operations
Our products and technology infrastructure are designed to provide simple-to-use and versatile products with industry-standard security and data protection that scales to organizations of all sizes, from small teams to large organizations with thousands of users. Maintaining the security and integrity of our infrastructure is an important part of our business. As such, we leverage standard security and monitoring tools to ensure performance across our network.
The Atlassian Marketplace and Ecosystem
The Atlassian Marketplace is a hosted online marketplace for free and purchasable apps to enhance our products. The Atlassian Marketplace offers thousands of apps from a large and growing ecosystem of third-party vendors and developers.
We offer the Atlassian Marketplace to customers to simplify the discovery and purchase of add-on capabilities for our products. Additionally, it serves as a platform for third-party vendors and developers to more easily reach our customer base, while also streamlining license management and renewals. In fiscal year 2024, the Atlassian Marketplace generated over $1.1 billion in gross purchases of third-party apps.
Atlassian Ventures makes strategic investments in our ecosystem, with a focus on cloud apps in the Atlassian Marketplace and products and tools that integrate with our product suite to create shared customer value. Our investments target companies at all stages and financing rounds and intend to drive deeper strategic partnerships.
Forge is our cloud app development platform designed to standardize how Atlassian cloud products are customized, extended, and integrated. Developers can rely on Forge’s hosted infrastructure, storage, and function-as-a-service to build new cloud apps for themselves or for the Atlassian Marketplace.
Research and Development
Our research and development organization is primarily responsible for the design, development, testing and delivery of our products and platform. It is also responsible for our customer services platforms, including billing and support, the Atlassian Marketplace, and marketing and sales systems that power our high-velocity, low friction distribution model.
As of June 30, 2024, over 50% of our employees were involved in research and development activities. Our research and development organization consists of flexible and dynamic teams that follow agile development methodologies to enable rapid product releases across our various products and deployment options. In addition to investing in our internal development teams, we invest in our developer ecosystem to enable external software
developers to build features and solutions on top of our platform. Given our focus on customer value, we work closely with our customers to develop our products and our development process is designed to incorporate the feedback that matters most from our users. From maintaining an active online community to measuring user satisfaction for our products, we are able to address our users’ greatest needs. We release new products, versions, features, and cloud platform capabilities to drive existing customer success and expansion as well as attract new customers to our products. We will continue to make significant investment in research and development to support these efforts.
Sales and Marketing
Our Distribution Model
Our high-velocity, low-friction distribution model is designed to drive exceptional customer scale by making products that are free to try and affordable to purchase online. We prioritize product quality, automated distribution, transparent pricing, and customer service to land new customers and expand to new teams. We also have a sales team focused primarily on expanding and deepening strategic relationships with existing customers, particularly large enterprises. We primarily rely on word-of-mouth and low-touch demand generation to drive trial, adoption, and initial expansion of our products.
The following are key attributes of our unique model:
•Innovation-driven - Relative to other enterprise software companies, we invest significantly more in research and development rather than marketing and sales. Our goal is to focus our spending on new product and feature developments that improve quality, ease of adoption, and expansion, and create organic customer demand for our products. We also invest in ways to automate and streamline distribution and customer support functions to enhance our customer experience and improve our efficiency.
•Simple and Affordable - We offer our products at affordable prices in a simple and transparent format. For example, a customer can use a free version of our products for a certain number of users. In addition, a customer coming to our website can evaluate and purchase a Jira subscription for 10 users or 50,000 users based on a transparent list price without any interaction with a salesperson. This approach is designed to complement the easy-to-use, easy-to-adopt nature of our products and accelerate adoption by large volumes of new customers.
•Organic and Expansive - Our model benefits significantly from customer word-of-mouth driving traffic to our website. The vast majority of our transactions are conducted on our website, which drastically reduces our customer acquisition costs. We also benefit from distribution leverage via our network of solution partners, who resell and customize our products. Once we have landed within a customer team, the networked nature and flexibility of our products tend to lead to adoption by other teams and departments, resulting in user growth, new use cases, and the adoption of our other products.
•Scale-oriented - Our model is designed to generate and benefit from significant customer scale. With more than 300,000 customers using our software today, we are able to reach a vast number of users, gather insights to continually improve our offerings, and generate revenue growth by expanding within our customer accounts. Many of our customers began their journey with us at a significantly smaller scale, realized the value of our products, and expanded their footprint meaningfully over time, demonstrating our ability to expand within our existing customer base. Our products drive mission-critical workflows within customers of all sizes, including enterprise customers. We offer enhanced capabilities in the premium and enterprise editions of our products, and we efficiently evolve our expansion sales motion within these larger customers. Ultimately, our model is designed to serve customers large and small and to benefit from the data, network effects, and customer insights that emerge from such scale.
•Data-driven - Our scale and the design of our model allows us to gather insights into and improve the customer experience. We track, test, nurture and refine every step of the customer journey and our users' experience. This allows us to intelligently manage our funnel of potential users, drive conversion and expansion, and promote additional products to existing users. Our scale enables us to experiment with various approaches to these motions and constantly tune our strategies for user satisfaction and growth.
Sales
Our website is our primary forum for sales and supports thousands of commercial transactions daily. We share a wide variety of information directly with prospective customers, including detailed product information and product pricing. Over the years, we have grown our sales force to augment our sales motion. Our sales team primarily focuses on expanding the relationships with our largest existing customers. We do not solely rely on a traditional, commissioned direct sales force to land new customers because our sales model focuses on enabling customer self-service, data-driven targeting and automation. We focus on allowing purchasing to be completed online through an automated, easy-to-use web-based process that permits payment using a credit card or bank/wire transfer.
We also have a global network of solution partners with unique expertise, services and products that complement the Atlassian portfolio, such as deployment and customization services, localized purchasing assistance around currency, and language and specific in-country compliance requirements. Sales programs consist of activities and teams focused on supporting our solution partners, tracking channel sales activity, supporting and servicing our largest customers by helping optimize their experience across our product portfolio, helping customers expand their use of our products across their organizations and helping product evaluators learn how they can use our tools most effectively.
Marketing
Our go-to-market approach is driven by the strength and innovation of our products and organic user demand. Our model focuses on a land-and-expand strategy, automated and low-touch customer service, superior product quality, and transparent pricing. We make our products free to try and easy to set up, which facilitates rapid and widespread adoption of our software. Our products are built for teams, and thus have natural network effects that help them spread organically, through word-of-mouth, across teams and departments. This word-of-mouth marketing increases as more individual users and teams discover our products.
Our marketing efforts focus on growing our Company brand, building broader awareness and increasing demand for each of our products. We invest in brand and product promotion, demand generation through direct marketing and advertising, and content development to help educate the market about the benefits of our products. We also leverage insights gathered from our users and customers to improve our targeting and, ultimately, the return on investment from our marketing activities. Data-driven marketing is an important part of our business model, which focuses on continuous product improvement and automation in customer engagement and service.
Customers
We serve organizations of all sizes across almost every industry worldwide. Our approach is centered on building long-term relationships with our customers and seizing growth opportunities. We are focused on expanding within our existing customer base as well as successfully shifting on-premises customers to the cloud. To attract new customers and grow within smaller organizations, we primarily utilize a self-service, low-friction distribution model that makes it easy for users to try, adopt, and use our products. Our sales team is primarily focused on expanding and deepening strategic relationships with existing customers, particularly large enterprises. See “Item 7. Management’s Discussion and Analysis of Financial Condition and Results of Operations, Key Business Metrics” for additional information about our customer base.
Our Competition
Our products serve teams of all shapes and sizes in every industry, from software and technical teams to IT and service teams, to a broad array of business teams.
Our competitors range from large technology vendors to new and emerging businesses in each of the markets we serve:
•Software Teams - Our competitors include large technology vendors, including Microsoft (including GitHub) and IBM, and smaller companies like Gitlab that offer project management, collaboration and developer tools.
•IT Teams - Our competitors range from cloud vendors, including ServiceNow, PagerDuty, and Freshworks, to legacy vendors such as BMC Software (Remedy) that offer service desk solutions.
•Business Teams - Our competitors range from large technology vendors, including Microsoft and Alphabet, that offer a suite of products, to smaller companies like Asana, Monday.com, Notion and Smartsheet, which offer point solutions for team collaboration.
In most cases, due to the flexibility and breadth of our products, we co-exist within our own customer base alongside many of our competitors’ products, such as Microsoft, Gitlab, ServiceNow and Asana.
The principal competitive factors in our markets include product capabilities, flexibility, total cost of ownership, ease of access and use, performance and scalability, integration, customer satisfaction and global reach. Our product strategy, distribution model and company culture allow us to compete favorably on all these factors. Our focus on research and development allows us to rapidly innovate and offer a breadth of powerful products that are easy to use, integrated, and delivered through multiple deployment options. Our high-velocity, low-friction online distribution model allows us to efficiently reach customers globally, and we complement this with our network solution partners and sales teams that focus on expansion within our largest customers. Our culture enables us to focus on customer success through superior products, transparent pricing and world-class customer support.
Intellectual Property
We protect our intellectual property through a combination of trademarks, domain names, copyrights, trade secrets and patents, as well as contractual provisions and restrictions governing access to our proprietary technology.
We registered ‘‘Atlassian’’ as a trademark in the United States, Australia, the EU, Russia, China, Japan, Switzerland, Norway, Singapore, Israel, Korea, and Canada, as well as other jurisdictions. We have also registered or filed for trademark registration of product-related trademarks and logos in the United States, Australia, the EU, Brazil, Russia, India, and China, and certain other jurisdictions, and will pursue additional trademark registrations to the extent we believe it would be beneficial and cost effective.
As of June 30, 2024, we had 501 issued patents and have approximately 300 applications pending in the United States. We also have a number of patent applications pending before the European Patent Office. These patents and patent applications seek to protect proprietary inventions relevant to our business. We intend to pursue additional patent protection to the extent we believe it would be beneficial and cost effective.
We are the registered holder of a variety of domain names that include ‘‘Atlassian’’ and similar variations.
In addition to the protection provided by our registered intellectual property rights, we protect our intellectual property rights by imposing contractual obligations on third parties who develop or access our technology. We enter into confidentiality agreements with our employees, consultants, contractors and business partners. Our employees, consultants and contractors are also subject to invention assignment agreements, pursuant to which we obtain rights to technology that they develop for us. We further protect our rights in our proprietary technology and intellectual property through restrictive license and service use provisions in both the general and product-specific terms of use on our website and in other business contracts.
Governmental Regulations
As a public company with global operations, we are subject to various federal, state, local, and foreign laws and regulations. These laws and regulations, which may differ among jurisdictions, include, among others, those related to financial and other disclosures, accounting standards, privacy and data protection, intellectual property, AI and machine learning, corporate governance, tax, government contracting, trade, antitrust and competition, employment, import/export, and anti-corruption. Compliance with these laws and regulations may be onerous and could, individually or in the aggregate, increase our cost of doing business, or otherwise have an adverse effect on our business, reputation, financial condition, and operating results. For a further discussion of the risks associated with government regulations that may materially impact us, see “Risk Factors” included in Part I, Item 1A of this Annual Report on Form 10-K.
Human Capital Management
We believe our employees to be our greatest asset, and we strive to foster a collaborative, productive, and fun work environment. As of June 30, 2024, we had 12,157 full-time employees. We also engage temporary employees and consultants as needed to support our operations.
In order to support a talented, global, and distributed workforce that reflects our core values and enables us to drive positive value for our customers, we emphasize building and maintaining a strong culture. We also invest in a sustainability program, diversity, equity, and inclusion initiatives, and our total rewards program, which includes competitive compensation and benefits and a distributed work approach. Our efforts have led to external recognition for our workplace and Company.
Our Culture
Our company culture is exemplified by our core values. These values guide what we do, why we create, and who we hire.
| | | | | | | | |
| | |
| Open company, no bullshit | Openness is root level for us. Information is open internally by default and sharing is a first principle. And we understand that speaking your mind requires equal parts brains (what to say), thoughtfulness (when to say it), and caring (how it’s said). |
| | |
| | |
| | |
| Play, as a team | We spend a huge amount of our time at work. So the more that time doesn’t feel like “work,” the better. We can be serious, without taking ourselves too seriously. We strive to put what’s right for the team first – whether in a meeting room or on a football pitch. |
| | |
| | |
| | |
| Build with heart and balance | “Measure twice, cut once.” Whether you're building a birdhouse or a business, this is good advice. Passion and urgency infuse everything we do, alongside the wisdom to consider options fully and with care. Then we make the cut, and we get to work. |
| | |
| | |
| | |
| Be the change you seek | All Atlassians should have the courage and resourcefulness to spark change – to make better our products, our people, our place. Continuous improvement is a shared responsibility. Action is an independent one. |
| | |
| | |
| | |
| Don’t #@!% the customer | Customers are our lifeblood. Without happy customers, we’re doomed. So considering the customer perspective - collectively, not just a handful - comes first. |
Our culture plays a key role in our ability to attract, retain, and develop a talented, global, and distributed workforce and our ability to drive customer value and achieve competitive differentiation.
Sustainability
Atlassian’s sustainability strategy is focused on the Company’s impact on our planet, people and customers. Atlassian has set science-based targets to achieve net zero emissions by 2040, invested in a diversity, equity, and inclusion program, committed to respecting human rights, and laid out guiding principles, commitments, and practices for responsible technology.
We publish an annual Sustainability Report that details our sustainability progress, including information about our strategy, workforce and emissions data, and responsible technology approaches. Our Sustainability Report aligns to leading reporting frameworks including the Greenhouse Gas Protocol and the Sustainability Accounting Standards Board. The latest Sustainability Report can be found in the Investor Relations section of our website, under the Sustainability tab. The contents of these materials, or the contents of those materials accessible through our website, are not incorporated into this Annual Report on Form 10-K.
Diversity, Equity and Inclusion
Atlassian’s diversity, equity, and inclusion (“DEI”) strategy is focused on building a diverse Atlassian team, ensuring equitable outcomes for all, and fostering inclusive experiences. Our DEI philosophy is centered around a structural approach—embedding anti-biasing principles and techniques across our talent programs. This includes conducting a global pay equity audit annually, beginning in fiscal year 2023, with the goal of ensuring that Atlassians doing like-for-like work are paid fairly and equitably. We also aim to increase inclusion across the company through remote-first employee resource groups.
Our annual Sustainability Report details the progress of our DEI strategy. The Sustainability Report can be found in the Investor Relations section of our website, under the Sustainability tab. The contents of these materials, or the contents of those materials accessible through our website, are not incorporated into this Annual Report on Form 10-K.
Team Anywhere
We call our approach to distributed work “Team Anywhere.” The vast majority of our employees are offered the choice to work from their homes, our physical office locations, or any combination of the two, within 14 countries. We strive to use an evidence-based approach to create an effective and collaborative workforce, and as such, promote programs like intentionally planned in-person team gatherings in order to foster employee engagement and connectivity. We believe our Team Anywhere approach allows for a variety benefits, including greater flexibility for our employees and broadening our talent pool beyond the urban hubs in which we have physical office locations.
Total Rewards
Atlassian aims to offer its employees competitive compensation and benefits packages, which are reviewed annually. Our employees are compensated through a combination of fixed and variable or incentive-based cash compensation. Certain employees are also awarded equity compensation in the form of restricted stock units.
We also offer a variety of benefits intended to support employees and their families and help employees engage with their local communities. These benefits vary by country and are designed to meet or exceed local laws and to be competitive in the regions in which we operate. Beyond standard benefits like paid time off and healthcare coverage, our employee benefits include paid parental leave, family formation assistance, flexible working arrangements, wellness reimbursements, mental well-being support, and learning and development resources.
Available Information
You can obtain copies of our Annual Report on Form 10-K, Quarterly Reports on Form 10-Q, Current Reports on Form 8-K, and other filings with the SEC, and all amendments to these filings, free of charge from our website at https://investors.atlassian.com/financials/sec-filings as soon as reasonably practicable after we file or furnish any of these reports with the SEC. The SEC maintains an internet site that contains reports, proxy and information statements and other information regarding issuers that file electronically with the SEC at www.sec.gov. The contents of, or accessible through, these websites are not incorporated into this filing and our references to the URLs for these websites are intended to be inactive textual references only.
ITEM 1A. RISK FACTORS
A description of the risks and uncertainties associated with our business is set forth below. You should carefully consider such risks and uncertainties, together with the other information contained in this Annual Report on Form 10-K, and in our other public filings. If any such risks and uncertainties actually occur, our business, financial condition or results of operations could differ materially from the plans, projections and other forward-looking statements included elsewhere in this Annual Report on Form 10-K and in our other public filings. In addition, if any of the following risks and uncertainties, or if any other risks and uncertainties, actually occur, our business, financial condition, or results of operations could be harmed substantially.
Risk Factor Summary
Our business is subject to numerous risks and uncertainties, including those highlighted in this section titled “Risk Factors” and summarized below. We have various categories of risks, including risks related to our business and industry, risks related to information technology, intellectual property, data security and privacy, risks related to legal, regulatory, accounting, and tax matters, risks related to ownership of our Class A Common Stock, risks related to our indebtedness, and general risks, which are discussed more fully below. As a result, this risk factor summary does not contain all of the information that may be important to you, and you should read this risk factor summary together with the more detailed discussion of risks and uncertainties set forth following this summary, as well as elsewhere in this Annual Report on Form 10-K. These risks include, but are not limited, to the following:
•Our historical rapid growth makes it difficult to evaluate our future prospects, and we may not be able to sustain our revenue growth rate or achieve profitability in the future.
•The continuing global economic and geopolitical volatility, and measures taken in response, could harm our business and results of operations.
•The markets in which we participate are intensely competitive, and if we do not compete effectively, our business, results of operations, and financial condition could be harmed.
•Our quarterly results have fluctuated in the past and may fluctuate significantly in the future and may not fully reflect the underlying performance of our business.
•Our use of generative AI and machine learning in our platform and our business, as well as our potential failure to effectively implement, use, and market these technologies, may result in reputational harm or liability, or could otherwise adversely affect our business.
•We may encounter challenges to our business as we transition our business to focusing more on our cloud offerings.
•Our business depends on our customers renewing their subscriptions and purchasing additional licenses or subscriptions from us, and any decline in our customer retention or expansion could harm our future results of operations.
•If we are not able to develop new products and enhancements to our existing products that achieve market acceptance and that keep pace with technological developments, our business and results of operations could be harmed.
•If we fail to effectively manage our growth, our business and results of operations could be harmed.
•If our marketing model is not effective in attracting new customers or we are unable to realize the benefits of our free trial strategy, our business and results of operations could be harmed.
•Our business model relies on a high volume of transactions and affordable pricing. As lower cost or free products are introduced by our competitors, our ability to generate new customers could be harmed.
•We may encounter challenges as we develop our enterprise sales force.
•If our security controls are compromised, leading to unauthorized or inappropriate access to customer data, our products could be perceived as insecure, and such perception may result in the loss of existing customers, hinder our ability to attract new ones, and expose us to significant liabilities.
•Interruptions or performance problems associated with our technology and infrastructure could harm our business and results of operations.
•Real or perceived errors, failures, vulnerabilities, or bugs in our products or in the products on Atlassian Marketplace could harm our business and results of operations.
•Privacy concerns and laws as well as evolving regulation of cloud computing, AI services, cross-border data transfer restrictions and other domestic or foreign regulations may limit the use and adoption of our services and adversely affect our business and results of operation.
•Our current and future indebtedness may limit our flexibility in obtaining additional financing and in pursuing other business opportunities or operating activities.
•Our global operations and structure subject us to potentially adverse tax consequences.
•The dual class structure of our common stock has the effect of concentrating voting control with certain stockholders, in particular, our Co-Founders and their affiliates, which will limit our other stockholders’ ability to influence the outcome of important transactions, including a change in control.
Risks Related to Our Business and Industry
Our historical rapid growth makes it difficult to evaluate our future prospects, and we may not be able to sustain our revenue growth rate or achieve profitability in the future.
We have experienced rapid growth in recent years and such growth rate should not be considered indicative of our future performance and may decline in the future. This rapid growth also makes it more challenging to evaluate our future prospects. Our revenue growth rate has fluctuated in prior periods and, in future periods, our revenue could grow more slowly than it has in the past or decline for a number of reasons, including any reduction in demand for our products, increase in competition, limitations on our ability to, or any decision not to, increase pricing, a slower than anticipated adoption of or migration to our Cloud offerings, failure to capitalize on growth opportunities, contraction in our overall market, or impact from broader macroeconomic factors. As one example, we have seen expansion from existing customers moderate in recent quarters, particularly amongst our small and medium-sized customers. Additionally, we ceased sales of new perpetual license Server offerings for our products in February 2021, and, subject to limited exceptions, ended maintenance and support for Server products in February 2024. If our Server customers did not transition to our Cloud or Data Center offerings, or if our Data Center customers do not migrate to our Cloud offerings, our revenue growth rates and profitability may be negatively impacted. We make assumptions regarding the risks and uncertainties associated with our growth as we plan and operate our business. If our assumptions are incorrect or change, or if we do not address risks successfully, our operating and financial results could differ materially from our expectations, our growth rates may slow, and our business would suffer.
In addition, we expect our expenses to increase substantially in the near term, particularly as we continue to make significant investments in research and development and technology infrastructure for our Cloud offerings, expand our operations globally and develop new products and features for, and enhancements of, our existing products, including our AI products. As a result of these significant investments, and in particular stock-based compensation associated with our growth, we have not in the past and may not in the future be able to achieve profitability as determined under U.S. generally accepted accounting principles (“GAAP”). The additional expenses we will incur may not lead to sufficient additional revenue to maintain historical revenue growth rates and profitability.
The continuing global economic and geopolitical volatility, and measures taken in response, could harm our business and results of operations.
Large-scale international events in recent years, such as the COVID-19 pandemic and geopolitical instability and war in regions including Ukraine and the Middle East, have negatively impacted the global economy, disrupted global supply chains, and created significant volatility and disruption of financial markets. There has also been historically high inflation, which caused the Federal Reserve to tighten monetary policy, including issuing a series of interest rate hikes. This has contributed to the failures of certain banking institutions and otherwise uncertain economic conditions.
Our business depends on demand for business software applications generally and for collaboration software solutions in particular. The market adoption of our products and our revenue is dependent on the number of users of our products. The continuing global economic and geopolitical volatility has and may continue to cause us and our customers to experience decreased demand for our products and services, increases in our operating costs (including our labor costs), reduced liquidity, and limits on our ability to access credit or otherwise raise capital. They could reduce the number of personnel providing development or engineering services, decrease technology spending, including the purchasing of software products, adversely affect demand for our products, affect our ability to accurately forecast our future results, cause some of our paid customers or suppliers to file for bankruptcy protection or go out of business, impact expected spending from new customers or renewals, expansions or reductions in paid seats from existing customers, negatively impact collections of accounts receivable, result in elongated sales cycles, and otherwise harm our business, results of operations, and financial condition.
In particular, we have revenue exposure to customers who are small- and medium-sized businesses. If these customers’ business operations and finances are negatively affected, they may not purchase or renew our products, may reduce or delay spending, or request extended payment terms or price concessions, which would negatively impact our business, results of operations, and financial condition. For example, rising interest rates and uncertain economic conditions have contributed to the failures of banking institutions, such as Silicon Valley Bank and First Republic Bank. While we have not had any direct exposure to failed banking institutions to date, if other banks and financial institutions enter receivership or become insolvent in the future in response to financial conditions affecting the banking system and financial markets, our ability or our customers’ ability to access existing cash, cash equivalents, and investments may be threatened and affect our customers’ ability to pay for our products and could have a material adverse effect on our business and financial condition.
The extent to which global economic and geopolitical factors ultimately impact our business, results of operations, and financial position will depend on future developments, which are uncertain and cannot be fully predicted at this time. As a result of recent events, we have seen the revenue growth from existing customers moderate and experienced volatility in the trading prices for our Class A Common Stock, and such volatility may continue in the long term. Any sustained adverse impacts from these and other recent macroeconomic events could materially and adversely affect our business, financial condition, operating results, and earnings guidance that we may issue from time to time, which could have a material effect on the value of our Class A Common Stock. They could also heighten many of the other risks described in this “Risk Factors” section.
The markets in which we participate are intensely competitive, and if we do not compete effectively, our business, results of operations, and financial condition could be harmed.
The markets for our solutions are fragmented, rapidly evolving, highly competitive, and have relatively low barriers to entry. We face competition from both traditional, larger software vendors offering full collaboration and productivity suites and smaller companies offering point products for features and use cases. Our principal competitors vary depending on the product category and include Microsoft (including GitHub), IBM, Alphabet, ServiceNow, PagerDuty, Gitlab, Freshworks, BMC Software (Remedy), Asana, Monday.com, Notion and Smartsheet. In addition, some of our competitors have made acquisitions to offer a more comprehensive product or service offering, which may allow them to compete more effectively with our products. We expect this trend to continue as companies attempt to strengthen or maintain their market positions in an evolving industry. Following such potential consolidations, companies may create more compelling product offerings and be able to offer more attractive pricing options, making it more difficult for us to compete effectively.
Our competitors, particularly our competitors with greater financial and operating resources, may be able to respond more quickly and effectively than we can to new or changing opportunities, technologies, standards, or customer requirements. With the adoption of new technologies, such as AI and machine learning, the evolution of our products, and new market entrants, we expect competition to intensify in the future. For example, our competitors may more successfully incorporate AI into their products, gain or leverage superior access to certain AI technologies, and achieve higher market acceptance of their AI solutions. In addition, as we continue to expand our focus into new use cases or other product offerings beyond software development teams, we expect competition to increase. Pricing pressures and increased competition generally could result in reduced sales, reduced margins, losses, or the failure of our products to achieve or maintain more widespread market acceptance, any of which could harm our business, results of operations and financial condition.
Many of our current and potential competitors have greater resources than we do, with established marketing relationships, large enterprise sales forces, access to larger customer bases, pre-existing customer relationships, and major distribution agreements with consultants, system integrators and resellers. Additionally, some current and potential customers, particularly large organizations, have elected, and may in the future elect, to develop or acquire their own internal collaboration and productivity software tools that would reduce or eliminate the demand for our solutions.
Our products seek to serve multiple markets, and we are subject to competition from a wide and varied field of competitors. Some competitors, particularly new and emerging companies with sizeable venture capital investment, could focus all their energy and resources on one product line or use case and, as a result, any one competitor could develop a more successful product or service in a particular market we serve which could decrease our market share and harm our brand recognition and results of operations. For all of these reasons and others we cannot anticipate today, we may not be able to compete successfully against our current and future competitors, which could harm our business, results of operations, and financial condition.
Our quarterly results have fluctuated in the past and may fluctuate significantly in the future and may not fully reflect the underlying performance of our business.
Our quarterly financial results have fluctuated in the past and may fluctuate in the future as a result of a variety of factors, many of which are outside of our control. If our quarterly financial results fall below the expectations of investors or any securities analysts who follow us, the price of our Class A Common Stock could decline substantially. Factors that may cause our revenue, results of operations and cash flows to fluctuate from quarter to quarter include, but are not limited to:
•our ability to attract new customers, retain and increase sales to existing customers, and satisfy our customers’ requirements;
•the timing of customer renewals;
•changes in our or our competitors’ pricing policies and offerings;
•new products, features, enhancements, or functionalities introduced by our competitors;
•the amount and timing of operating costs and capital expenditures related to the operations and expansion of our business;
•significant security breaches, technical difficulties, or interruptions to our products or third-party products on which we rely;
•our increased focus on our Cloud offerings, including customer migrations to our Cloud products;
•our ability to incorporate artificial intelligence solutions and features into our platform;
•the number of new employees added or, conversely, reductions in force;
•changes in foreign currency exchange rates or adding additional currencies in which our sales are denominated;
•the amount and timing of acquisitions or other strategic transactions;
•extraordinary expenses such as litigation, tax settlements, adverse audit rulings or other dispute-related settlement payments;
•general economic conditions, such as recent inflation and interest rate changes, that may adversely affect either our customers’ ability or willingness to purchase additional licenses, subscriptions, delay a prospective customer’s purchasing decisions, reduce the value of new license or subscription, or affect customer retention;
•the impact of U.S. and international political and social unrest, armed conflict, natural disasters, climate change, diseases and pandemics, and any associated economic downturn, on our results of operations and financial performance;
•seasonality in our operations;
•the impact of new accounting pronouncements and associated system implementations; and
•the timing of the grant or vesting of equity awards to employees, contractors, or directors.
Many of these factors are outside of our control, and the occurrence of one or more of them might cause our revenue, results of operations, and cash flows to vary widely. As such, we believe that quarter-to-quarter comparisons of our revenue, results of operations, and cash flows may not be meaningful and should not be relied upon as an indication of future performance.
Our use of generative AI and machine learning in our platform and our business, as well as our potential failure to effectively implement, use, and market these technologies, may result in reputational harm or liability, or could otherwise adversely affect our business.
We have incorporated and expect to continue to incorporate AI and machine learning solutions and features, including generative AI solutions and features, into our platform, and otherwise within our business, and these solutions and features may become more important to our operations or to our future growth over time. There can be no assurance that the use of AI and machine learning solutions and features will enhance our products or services, produce intended results, or be beneficial to our business, including our efficiency or profitability, and we may fail to properly implement or market our AI and machine learning solutions and features. Our investments in AI solutions and features have and may continue to negatively impact our operating margins until we are able to increase revenue enough to offset these investments. Our competitors or other third parties may incorporate AI into their products, offerings, and solutions more quickly or more successfully than us, which could impair our ability to compete effectively and adversely affect our results of operations. In addition, suppliers of the third-party AI models we use in our platform could terminate their relationship with us, cease to make certain models available to us, or make certain models more expensive for us to use. Our ability to effectively implement and market our AI solutions and features will also depend, in part, on our ability to attract and retain employees with AI expertise, and we expect significant competition for professionals with such skills and technical knowledge.
Additionally, our AI and machine learning solutions and features may expose us to additional claims, demands, and proceedings by private parties and regulatory authorities and subject us to legal liability as well as brand and reputational harm. There are significant risks involved in utilizing AI and machine learning technologies, and in particular, generative AI technologies. For example, AI and machine learning algorithms may be flawed, insufficient, or of poor quality, reflect unwanted forms of bias, or contain other errors or inadequacies, any of which may not easily be detectable. AI and machine learning technologies have also been known to produce false or “hallucinatory” inferences or outputs. Further, inappropriate or controversial data practices by developers and end-users, or other factors adversely affecting public opinion regarding the use of AI and machine learning, could impair the acceptance of AI and machine learning solutions, including those incorporated into our products and services. If the AI and machine learning tools incorporated into our platform, or the content generated by such tools, is harmful, biased, inaccurate, discriminatory or controversial, our results of operations could suffer, including due to legal, competitive and reputational harm. Our customers may be less likely to utilize our AI and machine learning tools or may cease using our platform altogether. If we do not have sufficient rights to use the output of such AI and machine learning tools, or the data or other material or content on which the AI and machine learning tools we use rely, we also may incur liability through the violation of applicable laws and regulations, third-party intellectual property, privacy or other rights, or contracts to which we are a party.
In addition, we are subject to the risks of new or enhanced governmental or regulatory scrutiny, litigation, or other legal liability, ethical concerns, negative consumer perceptions as to automation and AI and machine learning technologies, any of which could adversely affect our business, reputation, or financial results. The technologies underlying AI and machine learning and their uses are subject to a variety of laws and regulations related to online services, intermediary liability, intellectual property rights, privacy, data security and data protection, consumer protection, competition and equal opportunity laws, and are expected to be subject to increased regulation and new laws or new applications of existing laws and regulations. AI and machine learning technologies are the subject of ongoing review by various federal, state and foreign governments and regulators, which are applying, or are considering applying, their platform moderation, privacy, data security and data protection laws and regulations to such technologies or are considering general legal frameworks for the appropriate use of AI and machine learning. As the legal, regulatory, and policy environments around AI and machine learning evolve, we may become subject to new legal and regulatory obligations in connection with our use of AI and machine learning technology, which could require us to make significant changes to our policies and practices, necessitating expenditure of significant time, expense, and other resources. We may not be able to anticipate how to respond to rapidly evolving legal frameworks, and we may have to expend resources to adjust our offerings in certain jurisdictions if the legal frameworks on AI and machine learning products are not consistent across jurisdictions. Accordingly, it is not possible to predict all of the risks related to the use of AI and machine learning solutions that we may face, and changes in laws, rules, directives, and regulations governing the use of AI and machine learning solutions may adversely affect our ability to use or sell these solutions or subject us to legal liability.
We may encounter challenges to our business as we transition our business to focusing more on our Cloud offerings.
We currently offer and sell both Data Center and Cloud offerings of certain of our products. For these products, our Cloud offering enables quick setup and subscription pricing, while our Data Center offering permits more customization, a term license fee structure, and complete application control. Although a substantial majority of our revenue was historically generated from customers using our Server and Data Center products, over time our customers have moved and we expect them to continue to move to our Cloud offerings, resulting in our Cloud offerings becoming more central to our distribution model. As a part of this transition, we ceased sales of new perpetual licenses for our Server products in February 2021 and, subject to limited exceptions, ended maintenance and support for Server products in February 2024.
We may be subject to additional competitive and pricing pressures for our Cloud offerings compared to our Data Center offerings, which could harm our business. Further, revenues from our Cloud offerings are typically lower in the initial year compared to our Data Center offerings, which may impact our near-term revenue growth rates and margins, and we incur higher or additional costs to supply our Cloud offerings, such as fees associated with hosting our cloud infrastructure. We have and expect to continue to see increased expenses and lower margins due such hosting costs increasing in this transition. Additionally, we offered discounts to certain of our enterprise-level Server customers to incentivize migration to our Cloud offerings, which impacted our near-term revenue growth. If our remaining Server customers did not transition to our Cloud or Data Center offerings, or if our Data Center customers do not migrate to our Cloud offerings, our revenue growth rates and profitability may be negatively impacted. If our Cloud offerings do not develop as quickly as we expect, if we are unable to continue to scale our systems to meet the requirements of successful, large Cloud offerings, or if we lose customers currently
using our Data Center products due to our increased focus on our Cloud offerings or our inability to successfully migrate them to our Cloud products, our business could be harmed. We are directing a significant portion of our financial and operating resources to implement robust Cloud offerings for our products and to migrate our existing customers to our Cloud offerings, but even if we continue to make these investments, we may be unsuccessful in growing or implementing our Cloud offering that competes successfully against our current and future competitors and our business, results of operations, and financial condition could be harmed.
Our business depends on our customers renewing their subscriptions and purchasing additional licenses or subscriptions from us, and any decline in our customer retention or expansion could harm our future results of operations.
In order for us to maintain or improve our results of operations, it is important that our customers renew their licenses or subscriptions when existing contract terms expire and that we expand our commercial relationships with our existing customers. Our customers have no obligation to renew their licenses or subscriptions, and our customers may not renew licenses or subscriptions with a similar contract duration or with the same or greater number of users. Our customers generally do not enter into long-term contracts; rather they primarily have monthly or annual terms. Some of our customers have elected not to renew their agreements with us in the past and it is difficult to accurately predict long-term customer retention.
Our customer retention and expansion may decline or fluctuate as a result of a number of factors, including our customers’ satisfaction with our products, new market entrants, our product support, our prices and pricing plans, the prices of competing software products, reductions in our customers’ spending levels, new product releases and changes to packaging of our product offerings, mergers and acquisitions affecting our customer base, our increased focus on our Cloud offerings, our decision to end the sale of new perpetual licenses for our products, or the effects of global economic conditions, including the impacts on us or our customers, partners and suppliers from inflation and interest rate increases. We may be unable to timely address any retention issues with specific customers, which could harm our results of operations. If our customers do not purchase additional licenses or subscriptions or renew their subscriptions, renew on less favorable terms, or fail to add more users, our revenue may decline or grow less quickly, which could harm our future results of operations and prospects.
If we are not able to develop new products and enhancements to our existing products that achieve market acceptance and that keep pace with technological developments, our business and results of operations could be harmed.
Our ability to attract new customers and retain and increase revenue from existing customers depends in large part on our ability to enhance and improve our existing products and to introduce compelling new products that reflect the changing nature of our markets. The success of any enhancement to our products depends on several factors, including timely completion and delivery, competitive pricing, adequate quality testing, integration with existing technologies and our platform, and overall market acceptance. Any new product that we develop may not be introduced in a timely or cost-effective manner, may contain bugs, or may not achieve the market acceptance necessary to generate significant revenue.
The markets for our products are subject to rapid technological change, evolving industry standards, and changing regulations, as well as changing customer needs, requirements and preferences. These are all uncertain and we cannot predict the consequences, effects, or introduction of new, disruptive, emerging technologies or the manner and pace at which our markets develop over time, and our ability to compete in these markets depends on predicting and adapting to these changing circumstances. The success of our business will depend, in part, on our ability to adapt and respond effectively to these changes on a timely basis, and anticipating these factors requires that we allocate significant resources without any guarantee that any such investments and efforts will result in initial or enhanced adoption of our products in the marketplace. For example, with the development of next-generation solutions that utilize new and advanced features, including AI and machine learning, we have and expect to continue to commit significant resources to developing new products and enhancements incorporating AI and machine learning, and there is no guarantee that our investments and efforts will result in wider adoption of our products in the marketplace. If new technologies emerge that can deliver competitive products and services at lower prices, more efficiently, more reliably, more conveniently or more securely or if new products are introduced into the market that could render our existing products obsolete, such technologies and products could adversely impact our ability to compete effectively and may lead to customers reducing or terminating their usage of our products.
If we are unable to successfully develop new products, enhance our existing products to meet customer requirements, or otherwise gain market acceptance, our business, results of operations, and financial condition could be harmed.
If we cannot continue to expand the use of our products beyond our initial focus on software developers, our ability to grow our business could be harmed.
Our ability to grow our business depends in part on our ability to persuade current and future customers to expand their use of our products to additional use cases beyond software developers, including information technology and business teams. If we fail to predict customer demands or achieve further market acceptance of our products within these additional areas and teams, or if a competitor establishes a more widely adopted product for these applications, our ability to grow our business could be harmed.
We invest significantly in research and development, and to the extent our research and development investments do not translate into new products or material enhancements to our current products, or if we do not use those investments efficiently, our business and results of operations would be harmed.
A key element of our strategy is to invest significantly in our research and development efforts to develop new products and enhance our existing products to address additional applications and markets. In fiscal years 2024 and 2023, our research and development expenses were 50% and 53% of our revenue, respectively. If we do not spend our research and development budget efficiently or effectively on compelling innovation and technologies, our business could be harmed and we may not realize the expected benefits of our strategy. Moreover, research and development projects can be technically challenging and expensive. The nature of these research and development cycles may cause us to experience delays between the time we incur expenses associated with research and development and the time we are able to offer compelling products and generate revenue, if any, from such investment. Additionally, anticipated customer demand for a product we are developing could decrease after the development cycle has commenced, and we would nonetheless be unable to avoid substantial costs associated with the development of any such product. If we expend a significant amount of resources on research and development and our efforts do not lead to the successful introduction or improvement of products that are competitive in our current or future markets, it could harm our business and results of operations.
If we fail to effectively manage our growth, our business and results of operations could be harmed.
We have experienced and expect to continue to experience rapid growth, both in terms of employee headcount and number of customers, which has placed, and may continue to place, significant demands on our management, operational, and financial resources. We operate globally and sell our products to customers in approximately 200 countries and territories. Further, we have employees in Australia, Canada, France, Germany, India, Japan, the Netherlands, New Zealand, the Philippines, Poland, South Korea, Turkey, the U.S., and the United Kingdom (the “UK”), and a substantial number of our employees have been with us for fewer than 24 months. We plan to continue to invest in and grow our team, and to expand our operations into other countries in the future, which will place additional demands on our resources and operations. As our business expands across numerous jurisdictions, we may experience difficulties, including in hiring, training, and managing a diffuse and growing employee base.
We have also experienced significant growth in the number of customers, users, transactions and data that our products and our associated infrastructure support. If we fail to successfully manage our anticipated growth and change, the quality of our products may suffer, which could negatively affect our brand and reputation and harm our ability to retain and attract customers. Finally, our organizational structure is becoming more complex and if we fail to scale and adapt our operational, financial, and management controls and systems, as well as our reporting systems and procedures, to manage this complexity, our business, results of operations, and financial condition could be harmed. We will require significant capital expenditures and the allocation of management resources to grow and change in these areas.
Our corporate values have contributed to our success, and if we cannot maintain these values as we grow, we could lose the innovative approach, creativity, and teamwork fostered by our values, and our business could be harmed.
We believe that a critical contributor to our success has been our corporate values, which we believe foster innovation, teamwork, and an emphasis on customer-focused results. In addition, we believe that our values create an environment that drives and perpetuates our product strategy and low-cost distribution approach. As we undergo growth in our customers and employee base, maintain a remote-first “Team Anywhere” work environment, and continue to develop the infrastructure of a public company, we may find it difficult to maintain our corporate values. Any failure to preserve our values could harm our future success, including our ability to retain and recruit personnel, innovate and operate effectively, and execute on our business strategy.
If our marketing model is not effective in attracting new customers or we are unable to realize the benefits of our free trial strategy, our business and results of operations could be harmed.
Our marketing model has relied on the strength of our products and organic user demand, driven by word-of-mouth marketing and viral expansion within organizations. We offer free trials, limited free versions and affordable starter licenses for certain products in order to promote additional usage, brand and product awareness, and adoption. If we are not able to organically attract customers, our revenue may grow more slowly than expected, or decline. In addition, high levels of customer satisfaction and market adoption are central to our marketing model. Any decrease in our customers’ satisfaction with our products, including as a result of our own actions or actions outside of our control, could harm word-of-mouth referrals and our brand. If our customer base does not continue to grow with our marketing model, we may be required to incur significantly higher marketing and sales expenses in order to acquire new subscribers, which could harm our business and results of operations.
In addition, our strategy of offering free trials, limited free versions or affordable starter licenses for certain products could be ineffective. Users may not perceive value in the additional benefits and services we offer beyond our free trials or limited free versions and, historically, a majority of users never convert to a paid version of our products from these free trials or limited free versions or upgrade beyond the starter license. Our marketing strategy also depends in part on persuading users who use free trials, free versions or starter licenses of our products to convince others within their organization to purchase and deploy our products. To the extent that these users do not become, or lead others to become, customers, we will not realize the intended benefits of this marketing strategy, and our ability to grow our business could be harmed.
Our business model relies on a high volume of transactions and affordable pricing. As lower cost or free products are introduced by our competitors, our ability to generate new customers could be harmed.
Our business model is based in part on selling our products at prices lower than competing products from other commercial vendors. For example, we offer entry-level or free pricing for certain products for small teams at a price that typically does not require capital budget approval and is orders-of-magnitude less than the price of traditional enterprise software. As a result, our software is frequently purchased by first-time customers to solve specific problems and not as part of a strategic technology purchasing decision. We have historically increased, and will continue to increase, prices from time to time. As competitors enter the market with low cost or free alternatives to our products, it may become increasingly difficult for us to compete effectively and our ability to garner new customers could be harmed. Additionally, some customers may consider our products to be discretionary purchases, which may contribute to reduced demand for our offerings in times of economic uncertainty, inflation and interest rate increases. If we are unable to sell our software in high volume, across new and existing customers, our business, results of operations and financial condition could be harmed.
We may encounter challenges as we develop our enterprise sales force.
In recent years, we have focused on strategically growing our sales force to expand and deepen our relationships with our existing customers, particularly large enterprises. As our sales force develops, we may encounter challenges in identifying, recruiting, training, and retaining a qualified sales force, and we expect this growth to require significant time, expense, and attention. Expanding our sales infrastructure also has impacts on our cost structure and results of operations, and we may have to reduce other expenses, such as our research and development expenses, in order to accommodate a corresponding increase in marketing and sales expenses and maintain positive free cash flow.
As our sales teams grow, we may face increased costs, longer sales cycles, greater competition and less predictability in completing our sales. For enterprise customers, the evaluation process may be longer and more involved, and require us to invest more in educating our customers about our products, services, and solutions, particularly because the decision to use our products, services, and solutions is often an enterprise-wide decision. We may be required to submit more robust proposals, participate in extended proof-of-concept evaluation cycles and engage in more extensive contract negotiations. In addition, our enterprise customers often demand more complex configurations and additional integration services and product features. Adverse macroeconomic conditions have caused, and may cause in the future, delays in our enterprise customers’ purchasing decisions. Due to these factors, we often must devote greater sales support to certain enterprise customers, which increases our costs and time required to complete a sale, without assurance that potential customers will ultimately purchase our solutions. We also may be required to devote more services resources to implementation, which increases our costs, without assurance that customers receiving these services will renew or renew at the same level. Since the sales cycles for our enterprise offerings are multi-phased and complex, it is often unpredictable when a given sales cycle will close. Our revenue from enterprise customers may be affected by longer-than-expected sales and
implementation cycles, extended collection cycles, potential deferral of revenue, and alternative licensing arrangements.
We derive a majority of our revenue from Jira and Confluence.
We derive a majority of our revenue from Jira and Confluence. As such, the market acceptance of these products is critical to our success. Demand for these products and our other products is affected by a number of factors, many of which are beyond our control, such as continued market acceptance of our products by customers for existing and new use cases, the timing of development and release of new products, features, functionality and lower cost alternatives introduced by our competitors, technological changes and developments within the markets we serve, and growth or contraction in our addressable markets. If we are unable to continue to meet customer demands or to achieve more widespread market acceptance of our products, our business, results of operations, and financial condition could be harmed.
We recognize certain revenue streams over the term of our subscription contracts. Consequently, downturns in new sales may not be immediately reflected in our results of operations and may be difficult to discern.
We generally recognize subscription revenue from customers ratably over the terms of their contracts. As a result, a significant portion of the revenue we report in each quarter is derived from the recognition of deferred revenue relating to subscription plans entered into during previous quarters. Consequently, a decline in new or renewed licenses and subscriptions in any single quarter may only have a small impact on our revenue results for that quarter. However, such a decline will negatively affect our revenue in future quarters. Accordingly, the effect of significant downturns in sales and market acceptance of our products, and potential changes in our pricing policies or rate of expansion or retention, may not be fully reflected in our results of operations until future periods. For example, the impact of current economic uncertainties may cause customers to request concessions, including better pricing, which may not be reflected immediately in our results of operations. In addition, customers have in the past and may continue in the future to slow their rate of expansion or edition upgrades or reduce their number of licenses. We may also be unable to reduce our cost structure in line with a significant deterioration in sales. In addition, a significant majority of our costs are expensed as incurred, while a significant portion of our revenue is recognized over the life of the agreement with our customer. As a result, increased growth in the number of our customers could continue to result in our recognition of more costs than revenue in the earlier periods of the terms of certain of our customer agreements. Our subscription revenue also makes it more difficult for us to rapidly increase our revenue through additional sales in any period, as revenue from certain new customers must be recognized over the applicable term.
If the Atlassian Marketplace does not continue to be successful, our business and results of operations could be harmed.
We operate the Atlassian Marketplace, an online marketplace, for selling third-party, as well as Atlassian-built, apps. We rely on the Atlassian Marketplace to supplement our promotional efforts and build awareness of our products, and we believe that third-party apps from the Atlassian Marketplace facilitate greater usage and customization of our products. If we do not continue to add new vendors and developers, are unable to sufficiently grow the number of cloud apps our customers demand, or our existing vendors and developers stop developing or supporting the apps that they sell on the Atlassian Marketplace, our business could be harmed.
In addition, third-party apps on the Atlassian Marketplace may not meet the same quality standards that we apply to our own development efforts and, in the past, third-party apps have caused disruptions affecting multiple customers. To the extent these apps contain bugs, vulnerabilities, or defects, such apps have in the past and may in the future create disruptions in our customers’ use of our products, lead to data loss or unauthorized access to customer data, damage our brand and reputation, and affect the continued use of our products, which could harm our business, results of operations and financial condition.
Any failure to offer high-quality product support could harm our relationships with our customers and our business, results of operations, and financial condition.
In deploying and using our products, our customers depend on our product support teams to resolve complex technical and operational issues. We may be unable to respond quickly enough to accommodate short-term increases in customer demand for product support. We also may be unable to modify the nature, scope and delivery of our product support to compete with changes in product support services provided by our competitors. Increased customer demand for product support, without corresponding revenue, could increase costs and harm our results of operations. In addition, as we continue to grow our operations and reach a global and vast customer base, we need
to be able to provide efficient product support that meets our customers’ needs globally at scale. The number of our customers has grown significantly and that has put additional pressure on our product support organization. End customers may also reach out to us requesting support for third-party apps sold on the Atlassian Marketplace. In order to meet these needs, we have relied in the past and will continue to rely on third-party vendors to fulfill requests about third-party apps and self-service product support to resolve common or frequently asked questions for Atlassian products, which supplement our customer support teams. If we are unable to provide efficient product support globally at scale, including through the use of third-party vendors and self-service support, our ability to grow our operations could be harmed and we may need to hire additional support personnel, which could harm our results of operations. For example, in April 2022, a subset of our customers experienced a full outage across their Atlassian Cloud products due to a faulty script used during a maintenance procedure. While we restored access for these customers with minimal to no data loss, these affected customers experienced disruptions in using our Cloud products during the outage. Our sales are highly dependent on our business reputation and on positive recommendations from our existing customers. Any failure to maintain high-quality product support, or a market perception that we do not maintain high-quality product support, could harm our reputation, our ability to sell our products to existing and prospective customers, and our business, results of operations and financial condition.
If we are unable to develop and maintain successful relationships with our solution partners, our business, results of operations, and financial condition could be harmed.
We have established relationships with certain solution partners to distribute our products. We believe that continued growth in our business is dependent upon identifying, developing, and maintaining strategic relationships with our existing and potential solution partners that can drive substantial revenue and provide additional value-added services to our customers. For fiscal year 2024, we derived over 50% of our revenue from channel partners’ sales efforts.
Successfully managing our indirect channel distribution efforts is a complex process across the broad range of geographies where we do business or plan to do business. Our solution partners are independent businesses we do not control. Notwithstanding this independence, we still face legal risk and reputational harm from the activities of our solution partners including, but not limited to, export control violations, workplace conditions, corruption, and anti-competitive behavior.
Our agreements with our existing solution partners are non-exclusive, meaning they may offer customers the products of several different companies, including products that compete with ours. They may also cease marketing our products with limited or no notice and with little or no penalty. We expect that any additional solution partners we identify and develop will be similarly non-exclusive and unbound by any requirement to continue to market our products. If we fail to identify additional solution partners in a timely and cost-effective manner, or at all, or are unable to assist our current and future solution partners in independently distributing and deploying our products, our business, results of operations, and financial condition could be harmed. If our solution partners do not effectively market and sell our products, or fail to meet the needs of our customers, our reputation and ability to grow our business could also be harmed.
If we are not able to maintain and enhance our brand, our business, results of operations, and financial condition could be harmed.
We believe that maintaining and enhancing our reputation as a differentiated and category-defining company is critical to our relationships with our existing customers and to our ability to attract new customers. The successful promotion of our brand attributes will depend on a number of factors, including our and our solution partners’ marketing efforts, our ability to continue to develop high-quality products, our ability to minimize and respond to errors, failures, outages, vulnerabilities, or bugs, and our ability to successfully differentiate our products from competitive products. In addition, independent industry analysts often provide analyses of our products, as well as the products offered by our competitors, and perception of the relative value of our products in the marketplace may be significantly influenced by these analyses. If these analyses are negative, or less positive as compared to those of our competitors’ products, our brand may be harmed.
The promotion of our brand requires us to make substantial expenditures, and we anticipate that the expenditures will increase as our market becomes more competitive, as we expand into new markets, and as more sales are generated through our solution partners. To the extent that these activities yield increased revenue, this revenue may not offset the increased expenses we incur. If we do not successfully maintain and enhance our brand, our business may not grow, we may have reduced pricing power relative to competitors, and we could lose customers or fail to attract new customers, any of which could harm our business, results of operations, and financial condition.
If we fail to integrate our products with a variety of operating systems, software applications, platforms and hardware that are developed by others, our products may become less marketable, less competitive, or obsolete and our results of operations could be harmed.
Our products must integrate with a variety of network, hardware, and software platforms, and we need to continuously modify and enhance our products to adapt to changes in hardware, software, networking, browser and database technologies. In particular, we have developed our products to be able to easily integrate with third-party applications, including the applications of software providers that compete with us, through the interaction of application programming interfaces (“APIs”). In general, we rely on the fact that the providers of such software systems continue to allow us access to their APIs to enable these customer integrations. To date, we have not relied on long-term written contracts to govern our relationship with these providers. Instead, we are subject to the standard terms and conditions for application developers of such providers, which govern the distribution, operation and fees of such software systems, and which are subject to change by such providers from time to time. Our business could be harmed if any provider of such software systems:
•discontinues or limits our access to its APIs;
•modifies its terms of service or other policies, including fees charged to, or other restrictions on us or other application developers;
•changes how customer information is accessed by us or our customers;
•establishes more favorable relationships with one or more of our competitors; or
•develops or otherwise favors its own competitive offerings over ours.
We believe a significant component of our value proposition to customers is the ability to optimize and configure our products with these third-party applications through our respective APIs. If we are not permitted or able to integrate with these and other third-party applications in the future, demand for our products could decline and our business and results of operations could be harmed.
In addition, an increasing number of organizations and individuals within organizations are utilizing mobile devices to access the internet and corporate resources and to conduct business. We have designed and continue to design mobile applications to provide access to our products through these devices. If we cannot provide effective functionality through these mobile applications as required by organizations and individuals that widely use mobile devices, we may experience difficulty attracting and retaining customers. Failure of our products to operate effectively with future infrastructure platforms and technologies could also reduce the demand for our products, resulting in customer dissatisfaction and harm to our business. If we are unable to respond to changes in a cost-effective manner, our products may become less marketable, less competitive or obsolete and our results of operations could be harmed.
Acquisitions of, or investments in, other businesses, products, or technologies could disrupt our business, and we may be unable to integrate acquired businesses and technologies successfully or achieve the expected benefits of such acquisitions.
We have completed a number of acquisitions and strategic investments and continue to evaluate and consider additional strategic transactions, including acquisitions of, or investments in, businesses, technologies, services, products, and other assets in the future. For example, in fiscal year 2024, we acquired Loom, Inc., an asynchronous video messaging platform that helps users communicate through instantly shareable videos. We also may enter into strategic relationships with other businesses to expand our products, which could involve preferred or exclusive licenses, additional channels of distribution, discount pricing or investments in other companies.
Any acquisition, investment or business relationship may result in unforeseen operating difficulties and expenditures. In particular, we may encounter difficulties assimilating or integrating the businesses, technologies, products, personnel, or operations of the acquired companies, particularly if the key personnel of the acquired companies choose not to work for us, their software and services are not easily adapted to work with our products, or we have difficulty retaining the customers of any acquired business due to changes in ownership, management or otherwise. Acquisitions may also disrupt our business, divert our resources, and require significant management attention that would otherwise be available for the development of our existing business. We may not successfully evaluate or utilize the acquired technology or personnel, or accurately forecast the financial impact of an acquisition transaction, including accounting charges. Moreover, the anticipated benefits of any acquisition, investment, or business relationship may not be realized or we may be exposed to unknown risks or liabilities.
In the future, we may not be able to find suitable acquisition or strategic investment candidates, and we may not be able to complete acquisitions or strategic investments on favorable terms, or at all. Our previous and future acquisitions or strategic investments may not achieve our goals, and any future acquisitions or strategic investments we complete could be viewed negatively by users, customers, developers or investors.
Negotiating these transactions can be time consuming, difficult and expensive, and our ability to complete these transactions may often be subject to approvals that are beyond our control. Consequently, these transactions, even if announced, may not be completed. For one or more of those transactions, we may:
•issue additional equity securities that would dilute our existing stockholders;
•use cash that we may need in the future to operate our business;
•incur large charges, expenses, or substantial liabilities;
•incur debt on terms unfavorable to us or that we are unable to repay;
•encounter difficulties retaining key employees of the acquired company or integrating diverse software codes or business cultures; and
•become subject to adverse tax consequences, substantial depreciation, impairment, or deferred compensation charges.
Risks Related to Information Technology, Intellectual Property, and Data Security and Privacy
If our security controls are compromised, leading to unauthorized or inappropriate access to customer data, our products could be perceived as insecure, and such perception may result in the loss of existing customers, hinder our ability to attract new ones, and expose us to significant liabilities.
Use of our products involves the storage, transmission, and processing of our customers’ proprietary data, including potentially personal or identifying information. Unauthorized or inappropriate access to, or security breaches of, our products could result in unauthorized or inappropriate access to data and information, and the loss, compromise or corruption of such data and information. In the event of a security breach, we could suffer loss of business, severe reputational damage adversely affecting customer or investor confidence, regulatory investigations and orders, litigation, indemnity obligations, damages for contract breach, penalties for violation of applicable laws or regulations, significant costs for remediation, and other liabilities. In addition, we rely on third-party service providers to host or otherwise process some of such data, and any failure by a third party, or any other entity in our collective supply chain, to prevent or mitigate data security breaches or improper access to, or use, acquisition, disclosure, alteration, or destruction of, such data could have similar adverse consequences for us. We have incurred and expect to incur significant expenses to prevent security breaches, including costs related to deploying additional personnel and protection technologies, training employees, and engaging third-party solution providers and consultants. Our errors and omissions insurance covering certain security and privacy damages and claim expenses may not be sufficient to compensate for all liabilities we may incur.
Although we expend significant resources to create security protections that shield our customer data against potential theft and security breaches, the techniques used to obtain unauthorized access to systems or sabotage systems, or disable or degrade services, change frequently and are often unrecognizable until launched against a target, and therefore such measures cannot provide absolute security. We have in the past experienced breaches of our security measures and other inappropriate access to our systems. Certain of these incidents have resulted in unauthorized access to certain data processed through our products. Our products are at risk for future breaches and inappropriate access, including, without limitation, inappropriate access that may be caused by errors or breaches that may occur as a result of third-party action, or employee, vendor or contractor error or malfeasance, and other causes. We have in the past been, and may in the future be, a target of security threats, including from state actors. While these incidents have not materially affected our business, reputation or financial results, there is no guarantee they will not in the future. Additionally, the ongoing Russian invasion of Ukraine may result in a heightened threat environment and create unknown cyber risks, including increased risk of retaliatory cyber-attacks from Russian actors against non-Russian companies. Additionally, we have transitioned to a remote-first “Team Anywhere” work environment that may pose additional data security risks. We also continue to build AI and machine learning into our products, which may result in security incidents or otherwise increase cybersecurity risks. Further, AI technologies may be used in connection with certain cybersecurity attacks, resulting in heightened risks of security breaches and incidents.
As we further transition to selling our products via our Cloud offerings, continue to collect more personal and sensitive information, and operate in more countries, our risks continue to increase and evolve. For instance, we rely on third-party partners to develop apps on the Atlassian Marketplace that connect with and enhance our Cloud offerings for our customers. These apps may not meet the same quality standards that we apply to our own development efforts and have in the past, and may in the future, contain bugs, vulnerabilities, or defects that pose data security risks to our customer or lead to the unauthorized access of user data. Our ability to mandate security standards and ensure compliance by these third parties may be limited. Additionally, our products may be subject to vulnerabilities in the third-party software on which we rely. We have in the past identified a vulnerability in an open source software application we used and similar incidents may occur in the future and could have a material adverse effect on our business. We are likely to face increased risks that real or perceived vulnerabilities of our systems could seriously harm our business and our financial performance, by tarnishing our reputation and brand and limiting the adoption of our products.
Because the techniques used to obtain unauthorized access to or to sabotage systems change frequently and generally are not identified until they are launched against a target, we may be unable to anticipate these techniques or to implement adequate preventative measures. We may also experience security breaches that may remain undetected for an extended period and, therefore, have a greater impact on the products we offer, the proprietary data processed through our services, and, ultimately, on our business.
Data security breaches could also expose us to liability under various laws and regulations across jurisdictions and increase the risk of litigation and governmental or regulatory investigation. Due to concerns about data security and integrity, a growing number of legislative and regulatory bodies have adopted breach notification and other requirements in the event that information subject to such laws is accessed by unauthorized persons and additional regulations regarding security of such data are possible. We may need to notify governmental authorities and affected individuals with respect to such incidents. For example, laws in the EU and UK and all 50 U.S. states may require businesses to provide notice to individuals whose personal information has been disclosed as a result of a data security breach. Complying with such numerous and complex regulations in the event of a data security breach would be expensive and difficult, and failure to comply with these regulations could subject us to regulatory scrutiny and additional liability. We may also be contractually required to notify customers or other counterparties of a security incident, including a data security breach. Regardless of our contractual protections, any actual or perceived data security breach, or breach of our contractual obligations, could harm our reputation and brand, expose us to potential liability or require us to expend significant resources on data security and in responding to any such actual or perceived breach.
Interruptions or performance problems associated with our technology and infrastructure could harm our business and results of operations.
We rely heavily on our network infrastructure and information technology systems for our business operations, and our continued growth depends in part on the ability of our existing and potential customers to access our solutions at any time and within an acceptable amount of time. In addition, we rely almost exclusively on our websites for the downloading of, and payment for, all our products. We have experienced, and may in the future experience, disruptions, data loss and corruption, outages and other performance problems with our infrastructure and websites due to a variety of factors, including infrastructure changes, introductions of new functionality, human or software errors, capacity constraints, denial of service attacks, or other security-related incidents. In some instances, we have not been able to, and in the future may not be able to, identify the cause or causes of these performance problems within an acceptable period of time. It may become increasingly difficult to maintain and improve our performance, especially during peak usage times and as our products and websites become more complex and our user traffic increases.
If our products and websites are unavailable, if our users are unable to access our products within a reasonable amount of time, or at all, or if our information technology systems for our business operations experience disruptions, delays or deficiencies, our business could be harmed. Moreover, we provide service level commitments under certain of our paid customer cloud contracts, pursuant to which we guarantee specified minimum availability. If we fail to meet these contractual commitments, we could be obligated to provide credits for future service, or face contract termination with refunds of prepaid amounts related to unused subscriptions, which could harm our business, results of operations, and financial condition. From time to time, we have granted, and in the future will continue to grant, credits to paid customers pursuant to, and sometimes in addition to, the terms of these agreements. For example, in April 2022, a subset of our customers experienced a full outage across their Atlassian cloud products due to a faulty script used during a maintenance procedure. While we restored access for these customers with minimal to no data loss, these affected customers experienced disruptions in using our cloud
products during the outage. We incurred certain costs associated with offering service level credits and other concessions to these customers, although the overall impact did not have a material impact on our results of operations or financial condition. However, other future events like this may materially and adversely impact our results of operations or financial condition. Further, disruptions, data loss and corruption, outages and other performance problems in our cloud infrastructure may cause customers to delay or halt their transition to our Cloud offerings, to the detriment of our increased focus on our Cloud offerings, which could harm our business, results of operations and financial condition.
Additionally, we depend on services from various third parties, including Amazon Web Services, to maintain our infrastructure and distribute our products via the internet. Any disruptions in these services, including as a result of actions outside of our control, would significantly impact the continued performance of our products. In the future, these services may not be available to us on commercially reasonable terms, or at all. Any loss of the right to use any of these services could result in decreased functionality of our products until equivalent technology is either developed by us or, if available from another provider, is identified, obtained and integrated into our infrastructure. To the extent that we do not effectively address capacity constraints, upgrade our systems as needed, and continually develop our technology and network architecture to accommodate actual and anticipated changes in technology, our business, results of operations and financial condition could be harmed.
Real or perceived errors, failures, vulnerabilities, or bugs in our products or in the products on Atlassian Marketplace could harm our business and results of operations.
Errors, failures, vulnerabilities, or bugs may occur in our products, especially when updates are deployed or new products are rolled out. Our solutions are often used in connection with large-scale computing environments with different operating systems, system management software, equipment, and networking configurations, which may cause errors, failures of products, or other negative consequences in the computing environment into which they are deployed. In addition, deployment of our products into complicated, large-scale computing environments may expose errors, failures, vulnerabilities, or bugs in our products. Any such errors, failures, vulnerabilities, or bugs have in the past not been, and in the future may not be, found until after they are deployed to our customers. Real or perceived errors, failures, vulnerabilities, or bugs in our products have and could result in negative publicity, loss of or unauthorized access to customer data, loss of or delay in market acceptance of our products, loss of competitive position, or claims by customers for losses sustained by them, all of which could harm our business and results of operations.
In addition, third-party apps on Atlassian Marketplace may not meet the same quality standards that we apply to our own development efforts and, in the past, third-party apps have caused disruptions affecting multiple customers. To the extent these apps contain bugs, vulnerabilities, or defects, such apps may create disruptions in our customers’ use of our products, lead to data loss or unauthorized access to customer data, they may damage our brand and reputation, and affect the continued use of our products, which could harm our business, results of operations and financial condition.
Privacy concerns and laws as well as evolving regulation of cloud computing, AI services, cross-border data transfer restrictions and other domestic or foreign regulations may limit the use and adoption of our services and adversely affect our business and results of operation.
Regulation related to the provision of services over the internet is evolving, as federal, state and foreign governments continue to adopt new, or modify existing, laws and regulations addressing data privacy, cybersecurity, data protection, data sovereignty and the collection, processing, storage, hosting, transfer and use of data, generally. In the United States, the Federal Trade Commission and state regulators enforce a variety of data privacy issues, such as promises made in privacy policies or failures to appropriately protect information about individuals, as unfair or deceptive acts or practices in or affecting commerce in violation of the Federal Trade Commission Act or similar state laws. In addition, new U.S. state data privacy laws, such as the California Consumer Privacy Act as amended by the California Privacy Rights Act (“CPRA”), and laws that have recently passed and/or gone into effect in many other states similarly impose new obligations on us and many of our customers, potentially as both businesses and service providers. These laws continue to evolve, and as various states introduce similar proposals, we and our customers could be exposed to additional regulatory burdens. In the European Economic Area (“EEA”) and the U.K., data privacy laws and regulations, such as the European Union General Data Protection Regulation (“EU GDPR”) and United Kingdom General Data Protection Regulation and Data Protection Act 2018 (collectively, the “UK GDPR,” and, together with the EU GDPR, the “GDPR”), impose comprehensive obligations directly on Atlassian as both a data controller and a data processor, as well as on many of our customers, in relation to our collection, processing, sharing, disclosure and other use of personal data.
We are also subject to evolving privacy laws on cookies, tracking technologies and e-marketing. For example, the Controlling the Assault of Non-Solicited Pornography and Marketing Act of 2003 establishes certain requirements for commercial email messages and specifies penalties for the transmission of commercial email messages that are intended to deceive the recipient as to source or content. In addition, certain states and foreign jurisdictions, such as Australia, Canada and the EU, have enacted laws that regulate sending email, and some of these laws are more restrictive than U.S. laws. In the EU and U.K., informed consent is required for the placement of certain cookies or similar tracking technologies on an individual’s device and for direct electronic marketing. Consent is tightly defined and includes a prohibition on pre-checked consents and a requirement to obtain separate consents for each type of cookie or similar technology. Recent European court and regulator decisions are driving increased attention to cookies and similar tracking technologies.
In addition, various safe harbors have historically been provided to those who hosted content provided by others, such as safe harbors from monetary damages for copyright infringement arising from copyrighted content provided by customers and others, and for defamation and other torts arising from information provided by customers and others. There is an increasing demand for repealing or limiting these safe harbors by either judicial decision or legislation. Loss of these safe harbors may require altering or limiting some of our services or may require additional contractual terms to avoid liabilities for our customers’ misconduct.
Although we monitor the regulatory, judicial and legislative environment and have invested in addressing these developments, these new laws may require us to make additional changes to our practices and services to enable us or our customers to meet the new legal requirements, and may also increase our potential liability exposure through new or higher potential penalties for noncompliance, including as a result of penalties, fines and lawsuits related to data breaches. For instance, the Digital Services Act (“DSA”) in the EU, which came into force on November 16, 2022 and the majority of substantive provisions of which took effect on February 17, 2024, imposes new obligations around illegal services or content on our platform, traceability of business users, and enhanced transparency measures, and failure to comply can result in fines of up to 6% of total annual worldwide turnover. Record-breaking enforcement actions globally have shown that regulators wield their right to impose substantial fines for violations of privacy regulations, and these enforcement actions could result in guidance from regulators that would require changes to our current compliance strategy. Furthermore, privacy laws and regulations are subject to differing interpretations and may be inconsistent among jurisdictions. These and other requirements are causing increased scrutiny among customers, particularly in the public sector and highly regulated industries, and may be perceived differently from customer to customer. These developments could reduce demand for our services, require us to take on more onerous obligations in our contracts, restrict our ability to store, transfer and process data, require us to fundamentally change our business activities and practices or modify our products, or, in some cases, impact our ability or our customers' ability to offer our services in certain locations, to deploy our solutions, to reach current and prospective customers, or to derive insights from customer data globally. For example, in July 2020, the Court of Justice of the European Union (“CJEU”) invalidated the EU-U.S. Privacy Shield Framework, one of the mechanisms that allowed companies, including Atlassian, to transfer personal data from the European Economic Area (“EEA”) to the United States. Even though the CJEU decision upheld the Standard Contractual Clauses as an adequate transfer mechanism, the decision created uncertainty around the validity of all EU-to-U.S. data transfers. While the EU and U.S. governments have recently adopted the EU-U.S. Data Privacy Framework to foster EU-to-U.S. data transfers and address the concerns raised in the aforementioned CJEU decision, it is uncertain whether this framework will eventually be overturned in court like the previous two EU-U.S. bilateral cross-border transfer frameworks. Certain countries outside of the EEA have also passed or are considering passing laws requiring varying degrees of local data residency. By way of further example, statutory damages available through a private right of action for certain data breaches under the CPRA and potentially other U.S. states’ laws, may increase our and our customers’ potential liability and the demands our customers place on us. As another example, jurisdictions are considering legal frameworks on AI, which is a trend that may increase now that the EC has agreed the first such framework.
The costs of compliance with, and other burdens imposed by, privacy laws, regulations and standards may limit the use and adoption of our services, reduce overall demand for our services, make it more difficult to meet expectations from our commitments to customers and our customers’ users, lead to significant fines, penalties or liabilities for noncompliance, impact our reputation, or slow the pace at which we close sales transactions, in particular where customers request specific warranties and unlimited indemnity for noncompliance with privacy laws, any of which could harm our business. We have adopted and continue to adopt data residency in certain territories. These services may enhance our ability to attract and retain customers operating in the relevant jurisdictions, but may also increase the cost and complexity of supporting those customers, the scope of our residency offering may not align with customer needs, and our customers may request similar offerings in other territories.
In addition to government activity, privacy advocates and other industry groups have established or may establish new self-regulatory standards that may place additional burdens on our ability to provide our services globally. Our customers expect us to meet voluntary certification and other standards established by third parties. If we are unable to maintain these certifications or meet these standards, it could adversely affect our ability to provide our solutions to certain customers and could harm our business. In addition, we have seen a trend toward the private enforcement of data protection obligations, including through private actions for alleged noncompliance, which could harm our business and negatively impact our reputation. In addition, a shift in consumers’ data privacy expectations or other social, economic or political developments could impact the regulatory enforcement of privacy regulations, which could require our cooperation and increase the cost of compliance with the imposed regulations.
Further, any failure or perceived failure by us to comply with our posted privacy policies, our privacy-related obligations to users or other third parties, or any other legal obligations or regulatory requirements relating to privacy, data protection or information security may result in governmental investigations or enforcement actions, litigation, claims or public statements against us by consumer advocacy groups or others and could result in significant liability, cause our users to lose trust in us, and otherwise materially and adversely affect our reputation and business. Furthermore, the costs of compliance with, and other burdens imposed by, the laws, regulations and policies that are applicable to the businesses of our users may limit the adoption and use of, and reduce the overall demand for, our platform. Additionally, if third parties we work with violate applicable laws, regulations or agreements, such violations may put our users’ data at risk, could result in governmental investigations or enforcement actions, fines, litigation, claims, or public statements against us by consumer advocacy groups or others and could result in significant liability, cause our users to lose trust in us and otherwise materially and adversely affect our reputation and business. Further, public scrutiny of, or complaints about, technology companies or their data handling or data protection practices, even if unrelated to our business, industry or operations, may lead to increased scrutiny of technology companies, including us, and may cause government agencies to enact additional regulatory requirements, or to modify their enforcement or investigation activities, which may increase our costs and risks.
Our business also increasingly relies on artificial intelligence to improve our services and tailor our interactions with our customers. However, in recent years use of these methods has come under increased regulatory scrutiny. New laws, guidance and/or decisions in this area may limit our ability to use our artificial intelligence models, or require us to make changes to our operations that may decrease our operational efficiency, result in an increase to operating costs and/or hinder our ability to improve our services. For example, there are specific rules on the use of automated decision making under the GDPR that require the existence of automated decision making to be disclosed to the data subject with a meaningful explanation of the logic used in such decision making in certain circumstances, and safeguards must be implemented to safeguard individual rights, including the right to obtain human intervention and to contest any decision. Further, California recently introduced a law requiring disclosure of chatbot functionality.
Finally, the uncertain and shifting regulatory environment and trust climate may raise concerns regarding data privacy and cybersecurity, which may cause our customers or our customers’ users to resist providing the data necessary to allow our customers to use our services effectively. In addition, new products we develop or acquire may expose us to liability or regulatory risk. Even the perception that the privacy and security of personal information are not satisfactorily protected or do not meet regulatory requirements could inhibit sales of our products or services and could limit adoption of our cloud offerings.
We may be sued by third parties for alleged infringement or misappropriation of their intellectual property rights.
There is considerable patent and other intellectual property development activity in our industry. Our future success depends in part on not infringing upon or misappropriating the intellectual property rights of others. We have received, and may receive in the future, communications and lawsuits from third parties, including practicing entities and non-practicing entities, claiming that we are infringing upon or misappropriating their intellectual property rights, and we may be found to be infringing upon or misappropriating such rights. We may be unaware of the intellectual property rights of others that may cover some or all of our technology, or technology that we obtain from third parties. Furthermore, the intellectual property ownership and license rights, including copyright, surrounding AI technologies has not been fully addressed by courts or national or local laws or regulations, and the use or adoption of third-party AI technologies into our products and services may result in exposure to claims of copyright infringement or other intellectual property misappropriation. Any claims or litigation could cause us to incur significant expenses and, if successfully asserted against us, could require that we pay substantial damages or ongoing royalty or license payments, prevent us from offering our products or using certain technologies, require us
to implement expensive workarounds, refund fees to customers or require that we comply with other unfavorable terms. In the case of infringement or misappropriation caused by technology that we obtain from third parties, any indemnification or other contractual protections we obtain from such third parties, if any, may be insufficient to cover the liabilities we incur as a result of such infringement or misappropriation. We may also be obligated to indemnify our customers or business partners in connection with any such claims or litigation and to obtain licenses, modify our products or refund fees, which could further exhaust our resources. Even if we were to prevail in the event of claims or litigation against us, any claim or litigation regarding our intellectual property could be costly and time-consuming and divert the attention of our management and other employees from our business operations and disrupt our business.
Indemnity provisions in various agreements potentially expose us to substantial liability for intellectual property infringement and other losses.
Our agreements with customers and other third parties may include indemnification or other provisions under which we agree to indemnify or otherwise be liable to them for losses suffered or incurred as a result of claims of intellectual property infringement, damages caused by us to property or persons, or other liabilities relating to or arising from our products or other acts or omissions. The term of these contractual provisions often survives termination or expiration of the applicable agreement. Large indemnity payments or damage claims from contractual breach could harm our business, results of operations and financial condition. Although we generally contractually limit our liability with respect to such obligations, we may still incur substantial liability related to them. Any dispute with a customer with respect to such obligations could have adverse effects on our relationship with that customer and other current and prospective customers, reduce demand for our products, damage our reputation and harm our business, results of operations and financial condition.
We use open source software in our products that may subject our products to general release or require us to re-engineer our products, which could harm our business.
We use open source software in our products and expect to continue to use open source software in the future. There are uncertainties regarding the proper interpretation of and compliance with open source software licenses. Consequently, there is a risk that the owners of the copyrights in such open source software may claim that the open source licenses governing their use impose certain conditions or restrictions on our ability to use the software that we did not anticipate. Such owners may seek to enforce the terms of the applicable open source license, including by demanding release of the source code for the open source software, derivative works of such software, or, in some cases, our proprietary source code that uses or was developed using such open source software. These claims could also result in litigation, require us to purchase a costly license or require us to devote additional research and development resources to change our products, any of which could result in additional cost, liability and reputational damage to us, and harm to our business and results of operations. In addition, if the license terms for the open source software we utilize change, we may be forced to re-engineer our products or incur additional costs to comply with the changed license terms or to replace the affected open source software. Although we have implemented policies and tools to regulate the use and incorporation of open source software into our products, we cannot be certain that we have not incorporated open source software in our products in a manner that is inconsistent with such policies.
Any failure to protect our intellectual property rights could impair our ability to protect our proprietary technology and our brand.
Our success and ability to compete depend in part upon our intellectual property. We primarily rely on a combination of patent, copyright, trade secret and trademark laws, trade secret protection and confidentiality or license agreements with our employees, customers, business partners and others to protect our intellectual property rights. However, the steps we take to protect our intellectual property rights may be inadequate. We make business decisions about when to seek patent protection for a particular technology and when to rely upon trade secret protection, and the approach we select may ultimately prove to be inadequate. Even in cases where we seek patent protection, there is no assurance that the resulting patents will effectively protect every significant feature of our products. In addition, we believe that the protection of our trademark rights is an important factor in product recognition, protecting our brand and maintaining goodwill and if we do not adequately protect our rights in our trademarks from infringement, any goodwill that we have developed in those trademarks could be lost or impaired, which could harm our brand and our business. In any event, in order to protect our intellectual property rights, we may be required to spend significant resources to monitor and protect these rights.
For example, we provide certain of our customers with the ability to request a copy of the source code of those products, which they may customize for their internal use under limited license terms, subject to confidentiality
and use restrictions. If any of such customers misuse or distribute our source code in violation of our agreements with them, or anyone else obtains access to our source code, it could cost us significant time and resources to enforce our rights and remediate any resulting competitive harms.
Litigation brought to protect and enforce our intellectual property rights could be costly, time consuming and distracting to management. Furthermore, our efforts to enforce our intellectual property rights may be met with defenses, counterclaims and countersuits attacking the validity and enforceability of our intellectual property rights, which could result in the impairment or loss of portions of our intellectual property rights. Our failure to secure, protect and enforce our intellectual property rights could harm our brand and our business.
Risks Related to Financial Matters
We may require additional capital to support our operations or the growth of our business and we cannot be certain that we will be able to secure this capital on favorable terms, or at all.
We may require additional capital to respond to business opportunities, challenges, acquisitions, a decline in the level of revenue for our products, or other unforeseen circumstances. We may not be able to timely secure debt or equity financing on favorable terms, or at all. This inability to secure additional debt or equity financing could be exacerbated in times of economic uncertainty and tighter credit, such as is currently the case in the U.S. and abroad. In addition, recent increases in interest rates have and could continue in the future make any debt financing that we are able to secure much more expensive than in the past. Our current Credit Facility and the indenture governing our Senior Notes (each defined below) contain certain restrictive covenants and any future debt financing obtained by us could involve restrictive covenants relating to financial and operational matters, which may make it more difficult for us to obtain additional capital and to pursue business opportunities, including potential acquisitions. If we raise additional funds through further issuances of equity, convertible debt securities or other securities convertible into equity, our existing stockholders could suffer significant dilution in their percentage ownership of Atlassian, and any new equity or debt securities we issue could have rights, preferences and privileges senior to those of holders of our Class A Common Stock. If we are unable to obtain adequate financing or financing on terms satisfactory to us, when we require it, our ability to continue to grow or support our business and to respond to business challenges could be significantly limited.
Our current and future indebtedness may limit our flexibility in obtaining additional financing and in pursuing other business opportunities or operating activities.
In May 2024, we issued $500 million aggregate principal amount of 5.250% senior notes due 2029 (the “2029 Notes”) and $500 million aggregate principal amount of 5.500% senior notes due 2034 (together with the 2029 Notes, the “Senior Notes”). In August 2024, we amended and restated our prior credit facility to eliminate the senior unsecured delayed-draw term loan facility and provide for a $750 million senior unsecured revolving credit facility (the “Credit Facility”). As of August 14, 2024, we had no outstanding revolving loans under the Credit Facility.
Our Credit Facility requires compliance with various financial and non-financial covenants, including affirmative covenants relating to the provision of periodic financial statements, compliance certificates and other notices, maintenance of properties and insurance, payment of taxes and compliance with laws and negative covenants, including, among others, restrictions on the incurrence of certain indebtedness, granting of liens and mergers, dissolutions, consolidations and dispositions. The Credit Facility also provides for a number of events of default, including, among others, failure to make a payment, bankruptcy, breach of a covenant or representation and warranty, default under material indebtedness (other than the Credit Facility), change of control and judgment defaults. The indentures governing our Senior Notes contain certain negative covenants, including a limitation on liens and limitation on sale/leaseback covenants.
Under the terms of these covenants, we may be restricted from engaging in business or operating activities that may otherwise improve our business or from financing future operations or capital needs. Failure to comply with certain covenants, including the financial covenant, if not cured or waived, will result in an event of default that could trigger acceleration of our indebtedness, which would require us to repay all amounts owed and could have a material adverse impact on our business. In addition, our Credit Facility has a floating interest rate that is based on variable and unpredictable U.S. and international economic risks and uncertainties. If we were to draw on the Credit Facility, any increase in interest rates, as has occurred in the past and may occur in the future, may negatively impact our financial results.
We continue to have the ability to incur additional debt, subject to the limitations in our Credit Facility and the indentures governing our Senior Notes. Our level of debt could have important consequences to us, including the following:
•our ability to obtain additional financing, if necessary, for working capital, capital expenditures, acquisitions or other purposes may be impaired or such financing may not be available on favorable terms;
•we may need a substantial portion of our cash flow to make principal and interest payments on our debt, reducing the funds that would otherwise be available for investment in operations and future business opportunities;
•our debt level will make us more vulnerable than our competitors with less debt to competitive pressures or a downturn in our business or the economy generally; and
•our debt level may limit our flexibility in responding to changing business and economic conditions.
Our ability to service our debt will depend upon, among other things, our future financial and operating performance, which will be affected by prevailing economic conditions and financial, business, regulatory and other factors, some of which are beyond our control. If our operating results are not sufficient to service our current or future indebtedness, we will be forced to take actions such as reducing or delaying our business activities, acquisitions, investments or capital expenditures, selling assets, restructuring or refinancing our debt, or seeking additional equity capital or bankruptcy protection. We may not be able to effect any of these remedies on satisfactory terms to us or at all.
We are subject to risks associated with our strategic investments, including partial or complete loss of invested capital. Significant changes in the value of this portfolio could negatively impact our financial results.
We have strategic investments in privately held companies, and, in the past, publicly traded companies, in both domestic and international markets, including in emerging markets. These companies range from early-stage companies to more mature companies with established revenue streams and business models. Many such companies generate net losses and the market for their products, services or technologies may be slow to develop, and, therefore, they are dependent on the availability of later rounds of financing from banks or investors on favorable terms to continue their operations. The financial success of our investment in any privately held company is typically dependent on a liquidity event, such as a public offering, acquisition or other favorable market event reflecting appreciation relative to the cost of our initial investment. Likewise, the financial success of our investment in any publicly held company is typically dependent upon an exit in favorable market conditions, and to a lesser extent on liquidity events. The capital markets for public offerings and acquisitions are dynamic and the likelihood of successful liquidity events for the companies we have invested in could significantly worsen.
Privately held companies in which we invest have undertaken in the past and others may in the future undertake, an initial public offering. We may also decide to invest in companies in connection with or as part of such company’s initial public offering or other transactions directly or indirectly resulting in it being publicly traded. Therefore, our investment strategy and portfolio have also expanded in the past to include public companies. In certain cases, our ability to sell these investments may be constrained by contractual obligations to hold the securities for a period of time after a public offering, including market standoff agreements and lock-up agreements.
All of our investments, especially our investments in privately held companies, are subject to a risk of a partial or total loss of investment capital and a number of our investments have lost value in the past. Valuations of privately held companies are also inherently complex due to the lack of readily available market data, and, as a result, the basis for these valuations is subject to the timing and accuracy of the data received from these companies. If we determine that any of our more significant investments have experienced a decline in value, we may be required to record an impairment, which could be material and negatively impact our financial results. In addition, we have in the past, and may in the future, continue to deploy material investments in individual companies in which we have previously invested, resulting in the increasing concentration of risk in a small number of companies. Partial or complete loss of investment capital of these individual companies could be material to our financial statements.
Our global operations and structure subject us to potentially adverse tax consequences.
We are subject to income taxes as well as non-income-based taxes in the U.S., Australia and various other jurisdictions. Significant judgment is often required in the determination of our worldwide provision for income taxes. Our effective tax rate could be impacted by changes in our earnings and losses in countries with differing statutory tax rates, changes in transfer pricing, changes in operations, changes in nondeductible expenses, changes in excess tax benefits of stock-based compensation expense, changes in the valuation of deferred tax assets and liabilities and our ability to utilize them, the applicability of withholding taxes, effects from acquisitions, and changes
in accounting principles and tax laws. Any changes or uncertainty in taxing jurisdictions’ administrative interpretations, decisions, policies and positions could also materially impact our income tax liabilities. Our intercompany relationships are subject to complex transfer pricing regulations administered by taxing authorities in various jurisdictions. The relevant revenue and taxing authorities may disagree with positions we have taken generally, or our determinations as to the value of assets sold or acquired, or income and expenses attributable to specific jurisdictions. For example, during fiscal year 2024, we entered into a unilateral advanced pricing arrangement with the Australian Tax Office in relation to our transfer pricing arrangements between Australia and the U.S. for the tax years ended June 30, 2019 to June 30, 2025 that resulted in us making a tax payment of $117.4 million. In addition, in the ordinary course of our business we are subject to tax audits from various taxing authorities. Although we believe our tax positions are appropriate, the final determination of any future tax audits could be materially different from our income tax provisions, accruals and reserves. If such a disagreement were to occur, we could be required to pay additional taxes, interest and penalties, which could result in one-time tax charges, a higher effective tax rate, reduced cash flows and lower overall profitability of our operations.
Tax laws in the U.S. and in foreign jurisdictions are subject to change. For example, the Tax Cuts and Jobs Act (“TCJA”), signed into law in 2017, enacted significant tax law changes which impacted our tax obligations and effective tax rate beginning in our fiscal year 2023. The TCJA eliminates the option to deduct research and development expenditures, instead requiring taxpayers to capitalize and amortize such expenditures over five or fifteen years beginning in fiscal year 2023. Although Congress is considering legislation that would defer or eliminate the capitalization and amortization requirement, there is no assurance that the provision will be repealed or otherwise modified. The Inflation Reduction Act (“IRA”), signed into law in 2022, includes various corporate tax provisions including a new alternative corporate minimum tax on applicable corporations. The IRA tax provisions may become applicable to us in future years, which could result in additional taxes, a higher effective tax rate, reduced cash flows and lower overall profitability of our operations.
Certain government agencies in jurisdictions where we do business have had an extended focus on issues related to the taxation of multinational companies. In addition, the Organization for Economic Cooperation and Development (the “OECD”) has introduced various guidelines changing the way tax is assessed, collected and governed. Of note are the efforts around base erosion and profit shifting which seek to establish certain international standards for taxing the worldwide income of multinational companies. These measures have been endorsed by the leaders of the world’s 20 largest economies.
In March 2018, the EC proposed a series of measures aimed at ensuring a fair and efficient taxation of digital businesses operating within the EU. As collaborative efforts by the OECD and EC continue, some countries have unilaterally moved to introduce their own digital service tax or equalization levy to capture tax revenue on digital services more immediately. Notably France, Italy, Austria, Spain, the UK, Turkey and India have enacted this tax, generally 2% on specific in-scope sales above a revenue threshold. The EU and the UK have established a mandate that focuses on the transparency of cross-border arrangements concerning at least one EU member state through mandatory disclosure and exchange of cross-border arrangements rules. These regulations (known as MDR in the UK and DAC 6 in the EU) require taxpayers to disclose certain transactions to the tax authorities resulting in an additional layer of compliance and require careful consideration of the tax benefits obtained when entering into transactions that need to be disclosed.
The OECD introduced significant changes to the international tax law framework through the Pillar Two guidelines. The framework outlines a coordinated set of rules to prevent multinational enterprises from shifting profits to low-tax jurisdictions by implementing a 15% global minimum tax. Many countries in which we operate, including the member states of the EU, have enacted Pillar Two. Pillar Two rules will apply to us beginning in our fiscal year 2025. The potential effects of Pillar Two may vary depending on the specific provisions and rules implemented by each country that adopts Pillar Two and may include tax rate changes, higher effective tax rates, potential tax disputes and adverse impacts to our cash flows, tax liabilities, results of operations and financial position
Global tax developments applicable to multinational companies may continue to result in new tax regimes or changes to existing tax laws. If the U.S. or foreign taxing authorities change tax laws, our overall taxes could increase, lead to a higher effective tax rate, harm our cash flows, results of operations and financial position.
Taxing authorities may successfully assert that we should have collected or in the future should collect sales and use, value-added or similar taxes, and we could be subject to liability with respect to past or future sales, which could harm our results of operations.
We do not collect sales and use, value-added and similar taxes in all jurisdictions in which we have sales, based on our understanding that such taxes are not applicable to the products we sell in certain jurisdictions. Sales and use, value-added and similar tax laws and rates vary greatly by jurisdiction. Certain jurisdictions in which we do not collect such taxes may assert that such taxes are applicable, which could result in tax assessments, penalties, and interest, and we may be required to collect such taxes in the future. Such tax assessments, penalties and interest, or future requirements could harm our results of operations.
If we are unable to maintain effective internal control over financial reporting in the future, investors may lose confidence in the accuracy and completeness of our financial reports and the market price of our Class A Common Stock could be negatively affected.
As a public company, we are required to maintain internal controls over financial reporting and to report any material weaknesses in such internal controls. We are required to furnish a report by management on the effectiveness of our internal control over financial reporting pursuant to Section 404 of the Sarbanes-Oxley Act. If we identify material weaknesses in our internal control over financial reporting, if we are unable to comply with the requirements of Section 404 in a timely manner or assert that our internal control over financial reporting is effective, or if our independent registered public accounting firm is unable to express an opinion as to the effectiveness of our internal control over financial reporting, investors may lose confidence in the accuracy and completeness of our financial reports and the market price of Class A Common Stock could be negatively affected, and we could become subject to investigations by the stock exchange on which our securities are listed, the Securities and Exchange Commission (the “SEC”) or other regulatory authorities, which could require additional financial and management resources.
We may encounter difficulties in operating our upgraded enterprise resource planning system, which could materially adversely affect us.
During the fiscal quarter ended December 31, 2023, we upgraded our enterprise resource planning (“ERP”) system to help us manage our operations and financial reporting. Our upgraded ERP system may not operate as we expect it to and could cause disruption to our operations, which could have a material adverse effect on our business. Difficulties that may occur in connection with operating our upgraded ERP system include disruptions to business continuity, administrative or technical problems, difficulty in maintaining effective internal controls, and interruptions or delays to our sales processes. Any of these events could damage our reputation and harm our business, results of operations and financial condition.
We face exposure to foreign currency exchange rate fluctuations.
While we primarily sell our products in U.S. dollars, we incur expenses in currencies other than the U.S. dollar, which exposes us to foreign currency exchange rate fluctuations. A large percentage of our expenses are denominated in the Australian dollar and the Indian rupee, and fluctuations in these currencies could have a material negative impact on our results of operations. Moreover, our subsidiaries, other than our U.S. subsidiaries, maintain net assets that are denominated in currencies other than the U.S. dollar. In addition, we transact in non-U.S. dollar currencies for our products, and, accordingly, changes in the value of non-U.S. dollar currencies relative to the U.S. dollar could affect our revenue and results of operations due to transactional and translational remeasurements that are reflected in our results of operations.
We have a foreign exchange hedging program to hedge a portion of certain exposures to fluctuations in non-U.S. dollar currency exchange rates. We use derivative instruments, such as foreign currency forward contracts, to hedge the exposures. The use of such hedging instruments may not fully offset the adverse financial effects of unfavorable movements in foreign currency exchange rates over the limited time the hedges are in place. Moreover, the use of hedging instruments may introduce additional risks if we are unable to structure effective hedges with such instruments or if we are unable to forecast hedged exposures accurately.
If we are deemed to be an investment company under the Investment Company Act of 1940, our results of operations could be harmed.
Under Sections 3(a)(1)(A) and (C) of the Investment Company Act of 1940, as amended (the “Investment Company Act”), a company generally will be deemed to be an “investment company” for purposes of the Investment Company Act if (i) it is, or holds itself out as being, engaged primarily, or proposes to engage primarily, in the
business of investing, reinvesting, or trading in securities or (ii) it engages, or proposes to engage, in the business of investing, reinvesting, owning, holding, or trading in securities and it owns or proposes to acquire investment securities having a value exceeding 40% of the value of its total assets (exclusive of U.S. government securities and cash items) on an unconsolidated basis. We do not believe that we are an “investment company,” as such term is defined in either of these sections of the Investment Company Act. We currently conduct, and intend to continue to conduct, our operations so that neither we, nor any of our subsidiaries, is required to register as an “investment company” under the Investment Company Act. If we were obligated to register as an “investment company,” we would have to comply with a variety of substantive requirements under the Investment Company Act that impose, among other things, limitations on capital structure, restrictions on specified investments, prohibitions on transactions with affiliates, and compliance with reporting, record keeping, voting, proxy disclosure and other rules and regulations that would increase our operating and compliance costs, could make it impractical for us to continue our business as contemplated, and could harm our results of operations.
Risks Related to Legal and Regulatory Matters
The requirements of being a public company may strain our resources, divert management’s attention, and affect our ability to attract and retain executive officers and qualified board members.
We are subject to the reporting requirements of the Securities Exchange Act of 1934, as amended (the “Exchange Act”), the Sarbanes-Oxley Act, the Dodd-Frank Wall Street Reform and Consumer Protection Act of 2010, the listing requirements of Nasdaq and other applicable securities rules and regulations. Compliance with these rules and regulations has increased our legal and financial compliance costs, making some activities more difficult, time-consuming, and costly, and has increased demand on our systems and resources. The Exchange Act requires, among other things, that we file annual reports with respect to our business and results of operations. The Sarbanes-Oxley Act requires, among other things, that we maintain effective disclosure controls and procedures and internal control over financial reporting. In order to maintain and, if required, improve our disclosure controls and procedures and internal control over financial reporting to meet this standard, significant resources and management oversight is required.
We have in the past and expect to continue to incur significant legal, accounting, insurance and other expenses and to expend time and resources to comply with these requirements. Additionally, as a result of the complexity involved in complying with the rules and regulations applicable to public companies, our management’s attention may be diverted from other business concerns, which could harm our business, results of operations and financial condition. In addition, the pressures of operating a public company may divert management’s attention to delivering short-term results, instead of focusing on long-term strategy. Additionally, we may need to develop our reporting and compliance infrastructure and may face challenges in complying with new requirements that may become applicable to us over time. If we fall out of compliance, we risk becoming subject to litigation or being delisted, among other potential problems.
Further, as a public company it is more expensive for us to maintain adequate director and officer liability insurance, and we may be required to accept reduced coverage or incur substantially higher costs to obtain coverage. These factors could also make it more difficult for us to attract and retain qualified executive officers and members of our board of directors.
We and our customers are subject to increasing and changing laws and regulations that may expose us to liability and increase our costs.
Federal, state, local and foreign government bodies or agencies have in the past adopted, and may in the future adopt, laws or regulations affecting the technology industry or the industries in which our customers operate, including imposing taxes, fees, or other charges. Changes in these laws or regulations could require us to modify our products in order to comply with these changes. The costs of compliance with, and other burdens imposed by, industry-specific laws, regulations and interpretive positions may limit our customers’ use and adoption of our services and reduce overall demand for our services. Compliance with these regulations may also require us to devote greater resources to support certain customers, which may increase costs and lengthen sales cycles. For example, some financial services regulators in various jurisdictions have imposed guidelines for use of cloud computing services that mandate specific controls or require financial services enterprises to obtain regulatory approval prior to outsourcing certain functions. In the United States, the implementation of a cybersecurity Executive Order released in May 2021 may result in further changes and enhancements to compliance and incident reporting standards in order to obtain certain public sector contracts in the future. Additionally, in July 2023, the SEC adopted rules requiring the disclosure of specified elements of cybersecurity risk management, strategy and governance and requiring the disclosure of material cybersecurity incidents within a short time period. If we are unable to comply
with these rules, guidelines or controls, or if our customers are unable to obtain regulatory approval to use our services where required, our business may be harmed.
Additionally, various of our products are subject to U.S. export controls, including the U.S. Department of Commerce’s Export Administration Regulations and economic and trade sanctions regulations administered by the U.S. Treasury Department’s Office of Foreign Assets Controls. These regulations may limit the export of our products and provision of our services outside of the U.S., or may require export authorizations, including by license, a license exception, or other appropriate government authorizations, including annual or semi-annual reporting and the filing of an encryption registration. Export control and economic sanctions laws may also include prohibitions on the sale or supply of certain of our products to embargoed or sanctioned countries, regions, governments, persons and entities. In addition, various countries regulate the importation of certain products through import permitting and licensing requirements, and have enacted laws that could limit our ability to distribute our products. Import, export and economic sanctions laws may also change rapidly due to political events, such as has occurred in response to Russia’s invasion of Ukraine. The exportation, reexportation, and importation of our products, and the provision of services, including by our solution partners, must comply with these laws or else we may be adversely affected through reputational harm, government investigations, penalties, and a denial or curtailment of our ability to export our products or provide services. Complying with export control and sanctions laws can be time consuming and complex and may result in the delay or loss of sales opportunities. Although we take precautions to prevent our products from being provided in violation of such laws, we are aware of previous exports of certain of our products to a small number of persons and organizations that are the subject of U.S. sanctions or located in countries or regions subject to U.S. sanctions. If we are found to be in violation of U.S. sanctions or export control laws, it could result in substantial fines and penalties for us and for the individuals working for us. Changes in export or import laws or corresponding sanctions may delay the introduction and sale of our products in international markets, or, in some cases, prevent the export or import of our products to certain countries, regions, governments, persons or entities altogether, which could adversely affect our business, financial condition and results of operations. Changes in import and export laws are occurring in the jurisdictions in which we operate and we may fail to comply with new or changing regulations in a timely manner, which could result in substantial fines and penalties for us and could adversely affect our business, financial condition and results of operation.
We are also subject to various domestic and international anti-corruption laws, such as the U.S. Foreign Corrupt Practices Act and the UK Bribery Act, as well as other similar anti-bribery and anti-kickback laws and regulations. These laws and regulations generally prohibit companies and their employees and intermediaries from authorizing, offering, or providing improper payments or benefits to officials and other recipients for improper purposes. We rely on certain third parties to support our sales and regulatory compliance efforts and can be held liable for their corrupt or other illegal activities, even if we do not explicitly authorize or have actual knowledge of such activities. Although we take precautions to prevent violations of these laws, our exposure for violating these laws increases as our international presence expands and as we increase sales and operations in additional jurisdictions.
Finally, as we expand our products and services and evolve our business models, we may become subject to additional government regulation or increased regulatory scrutiny. Regulators (both in the U.S. and in other jurisdictions in which we operate) may adopt new laws or regulations, change existing regulations, or their interpretation of existing laws or regulations may differ from ours. For example, the regulation of emerging technologies that we may incorporate into our offerings, such as AI and machine learning, is still an evolving area, and it is possible that we could become subject to new regulations that negatively impact our plans, operations and results. Additionally, many jurisdictions across the world are currently considering, or have already begun implementing, changes to antitrust and competition laws, regulations or their enforcement to enhance competition in digital markets and address practices by certain digital platforms that they perceive to be anticompetitive, which may impact our ability to invest in, acquire or enter into joint ventures with other entities.
New legislation, regulation, public policy considerations, changes in the cybersecurity environment, litigation by governments or private entities, changes to or new interpretations of existing laws may result in greater oversight of the technology industry, restrict the types of products and services that we can offer, limit how we can distribute our products, or otherwise cause us to change the way we operate our business. We may not be able to respond quickly to such regulatory, legislative and other developments, and these changes may in turn increase our cost of doing business and limit our revenue opportunities. In addition, if our practices are not consistent with new interpretations of existing laws, we may become subject to lawsuits, penalties, and other liabilities that did not previously apply.
Investors’ and other stakeholders’ expectations of our performance relating to environmental, social and governance factors may impose additional costs and expose us to new risks.
There is an increasing focus from certain investors, customers, employees, other stakeholders and regulators concerning environmental, social and governance matters (“ESG”). Some investors may use these non-financial performance factors to guide their investment strategies and, in some cases, may choose not to invest in us if they believe our policies and actions relating to ESG are inadequate. We may face reputational damage in the event that we do not meet the ESG standards set by various constituencies.
As ESG best practices and reporting standards continue to develop, we may incur increasing costs relating to ESG monitoring and reporting and complying with ESG initiatives. For example, in recent years, there has been a proliferation of climate and other ESG disclosure requirements at the local, national and international levels, which have required and may continue to require significant effort and resources in order to comply with differing requirements. We voluntarily publish an annual Sustainability Report, which describes, among other things, the measurement of our greenhouse gas emissions and our efforts to reduce emissions. In addition, our Sustainability Report provides highlights of how we are supporting our workforce, including our efforts to promote diversity, equity, and inclusion. Our disclosures on these matters, or a failure to meet evolving stakeholder expectations for ESG practices and reporting, may potentially harm our reputation and customer relationships. Due to new regulatory standards and market standards, certain new or existing customers, particularly those in the European Union, may impose stricter ESG guidelines or mandates for, and may scrutinize relationships more closely with, their counterparties, including us, which may lengthen sales cycles or increase our costs.
Furthermore, if our competitors’ ESG performance is perceived to be better than ours, potential or current investors may elect to invest with our competitors instead. In addition, in the event that we communicate certain initiatives or goals regarding ESG matters, we could fail, or be perceived to fail, in our achievement of such initiatives or goals, or we could be criticized for the scope of such initiatives or goals. If we fail to satisfy the expectations of investors, customers, employees and other stakeholders or our initiatives are not executed as planned, our business, financial condition, results of operations, and prospects could be adversely affected.
Risks Related to Ownership of Our Class A Common Stock
The dual class structure of our common stock has the effect of concentrating voting control with certain stockholders, namely our Co-Founders and their affiliates, which will limit our other stockholders’ ability to influence the outcome of important transactions, including a change in control.
Shares of our Class B Common Stock have ten votes per share and shares of our Class A Common Stock have one vote per share. As of June 30, 2024, stockholders who hold our Class B Common Stock collectively hold approximately 86% of the voting power of our outstanding share capital and in particular, entities affiliated with our Co-Founders, Michael Cannon-Brookes and Scott Farquhar, collectively hold approximately 86% of the voting power of our outstanding share capital. The holders of our Class B Common Stock will collectively continue to control a majority of the combined voting power of our capital stock and therefore be able to control substantially all matters submitted to our stockholders for approval so long as the outstanding shares of our Class B Common Stock represent at least 10% of all shares of our outstanding Class A Common Stock and Class B Common Stock in the aggregate. These holders of our Class B Common Stock may also have interests that differ from holders of our Class A Common Stock and may vote in a way which may be adverse to such interests. This concentrated control may have the effect of delaying, preventing or deterring a change in control of Atlassian, could deprive our stockholders of an opportunity to receive a premium for their shares as part of a sale of Atlassian and might ultimately affect the market price of our Class A Common Stock.
If Messrs. Cannon-Brookes and Farquhar retain a significant portion of their holdings of our Class B Common Stock for an extended period of time, they will control a significant portion of the voting power of our capital stock for the foreseeable future. As members of our board of directors, Messrs. Cannon-Brookes and Farquhar each owe statutory and fiduciary duties to Atlassian and must act in good faith and in a manner they consider would be most likely to promote the success of Atlassian for the benefit of stockholders as a whole. As stockholders, Messrs. Cannon-Brookes and Farquhar are entitled to vote their shares in their own interests, which may not always be in the interests of our stockholders generally.
The market price of our Class A Common Stock is volatile, has fluctuated significantly in the past, and could continue to fluctuate significantly regardless of our operating performance resulting in substantial losses for the holders of our Class A Common Stock.
The trading price of our Class A Common Stock is volatile, has fluctuated significantly in the past, and could continue to fluctuate significantly, regardless of our operating performance, in response to numerous factors, many of which are beyond our control, including:
•actual or anticipated fluctuations in our results of operations;
•the financial projections we may provide to the public, any changes in these projections or our failure to meet these projections;
•failure of securities analysts to initiate or maintain coverage of Atlassian, publication of inaccurate or unfavorable research about our business, changes in financial estimates or ratings changes by any securities analysts who follow Atlassian or our failure to meet these estimates or the expectations of investors;
•announcements by us or our competitors of significant technical innovations, new products, acquisitions, pricing changes, strategic partnerships, joint ventures or capital commitments;
•changes in operating performance and stock market valuations of other technology companies generally, or those in our industry in particular;
•price and volume fluctuations in the overall stock market from time to time, including as a result of trends in the economy as a whole;
•actual or anticipated developments in our business or our competitors’ businesses or the competitive landscape generally;
•developments or disputes concerning our intellectual property or our products, or third-party proprietary rights;
•changes in accounting standards, policies, guidelines, interpretations or principles;
•new laws or regulations, new interpretations of existing laws, or the new application of existing regulations to our business;
•major changes to our board of directors or management;
•additional shares of Class A Common Stock being sold into the market by us or our existing stockholders or the anticipation of such sales;
•the existence of our program to repurchase up to $1.0 billion of our outstanding Class A Common Stock (the “Share Repurchase Program”) and purchases made pursuant to that program or any failure to repurchase shares as planned, including failure to meet expectations around the timing, price or amount of share repurchases, and any reduction, suspension or termination of our Share Repurchase Program;
•cyber-security and privacy breaches;
•lawsuits threatened or filed against us;
•general economic conditions and macroeconomic factors, such as inflationary pressures, recession or financial institution instability; and
•other events or factors, including those resulting from geopolitical risks, natural disasters, climate change, diseases and pandemics, or incidents of terrorism or war, such as in the Middle East and Ukraine, as well as responses to any of these events
In addition, the stock markets, and in particular the market on which our Class A Common Stock is listed, have experienced extreme price and volume fluctuations that have affected and continue to affect the market prices of equity securities of many technology companies. Stock prices of many technology companies have fluctuated in a manner unrelated or disproportionate to the operating performance of those companies. In the past, stockholders have instituted securities class action litigation following periods of market volatility. In February 2023, a purported securities class action complaint was filed against us and certain of our officers in U.S. federal court. Our
involvement in this or other securities litigation could subject us to substantial costs, divert resources and the attention of management from operating our business, and harm our business, results of operations and financial condition.
Substantial future sales of our common stock could cause the market price of our Class A Common Stock to decline.
The market price of our Class A Common Stock could decline as a result of substantial sales of shares of our common stock, particularly sales by our directors, executive officers and significant stockholders, or the perception in the market that holders of a large number of shares intend to sell their shares. As of June 30, 2024, we had 159,544,123 outstanding Class A Common Stock and 101,012,393 outstanding convertible Class B Common Stock. We have also registered shares of Class A Common Stock that we issue under our employee equity incentive plans. These shares may be sold freely in the public market upon issuance.
We cannot guarantee that our Share Repurchase Program will be fully consummated or that it will enhance long-term stockholder value. Repurchases of shares of our Class A Common Stock could also increase the volatility of the trading price of our Class A Common Stock and could diminish our cash reserves.
In January 2023, our board of directors authorized a Share Repurchase Program to repurchase up to $1.0 billion of our outstanding Class A Common Stock. Under the Share Repurchase Program, stock repurchases may be made from time to time through open market purchases, in privately negotiated transactions, or by other means, including through the use of trading plans intended to qualify under Rule 10b5-1 under the Exchange Act, in accordance with applicable securities laws and other restrictions. The Share Repurchase Program does not have a fixed expiration date, may be suspended or discontinued at any time, and does not obligate us to acquire any amount of Class A Common Stock. The timing, manner, price, and amount of any repurchases will be determined by us at our discretion and will depend on a variety of factors, including business, economic and market conditions, prevailing stock prices, corporate and regulatory requirements, and other considerations. We cannot guarantee that the Share Repurchase Program will be fully consummated or that it will enhance long-term stockholder value. The Share Repurchase Program could also affect the trading price of our Class A Common Stock and increase volatility, and any announcement of a reduction, suspension or termination of the Share Repurchase Program may result in a decrease in the trading price of our Class A Common Stock. In addition, repurchasing our Class A Common Stock could diminish our cash and cash equivalents and marketable securities available to fund working capital, repayment of debt, capital expenditures, strategic acquisitions, investments, or business opportunities, and other general corporate purposes.
We do not expect to declare dividends in the foreseeable future.
We currently anticipate that we will retain future earnings for the development, operation and expansion of our business and to fund our Share Repurchase Program, and do not anticipate declaring or paying any cash dividends for the foreseeable future. As a result, stockholders must rely on sales of their shares of Class A Common Stock after price appreciation, if any, as the only way to realize any future gains on their investment.
Anti-takeover provisions contained in our amended and restated certificate of incorporation, amended and restated bylaws, our Senior Notes, as well as provisions of Delaware law, could impair a takeover attempt.
Our amended and restated certificate of incorporation and amended and restated bylaws contain, and the General Corporation Law of the State of Delaware (the “Delaware General Corporation Law”) contains, provisions which could have the effect of rendering more difficult, delaying or preventing an acquisition deemed undesirable by our board of directors. These provisions provide for the following:
•a dual-class structure which provides our holders of Class B Common Stock with the ability to significantly influence the outcome of matters requiring stockholder approval, even if they own significantly less than a majority of the shares of our outstanding Class A Common Stock and Class B Common Stock;
•no cumulative voting in the election of directors, which limits the ability of minority stockholders to elect director candidates;
•the exclusive right of our board of directors to set the size of the board of directors and to elect a director to fill a vacancy, however occurring, including by an expansion of the board of directors, which prevents stockholders from being able to fill vacancies on our board of directors;
•the ability of our board of directors to authorize the issuance of shares of preferred stock and to determine the price and other terms of those shares, including voting or other rights or preferences, without stockholder approval, which could be used to significantly dilute the ownership of a hostile acquirer;
•the ability of our board of directors to alter our amended and restated bylaws without obtaining stockholder approval;
•in addition to our board of directors’ ability to adopt, amend, or repeal our amended and restated bylaws, our stockholders may adopt, amend, or repeal our amended and restated bylaws only with the affirmative vote of the holders of at least 66 2/3% of the voting power of the outstanding shares of capital stock entitled to vote generally in the election of directors, voting together as a single class;
•the required approval of at least 66 2/3% of the voting power of the outstanding shares of capital stock entitled to vote thereon, voting together as a single class, to adopt, amend, or repeal certain provisions of our amended and restated certificate of incorporation;
•the ability of stockholders to act only at an annual or special meeting of stockholders;
•the requirement that a special meeting of stockholders may be called only by certain specified officers of the Company, a majority of our board of directors then in office or the chairperson of our board of directors;
•advance notice procedures that stockholders must comply with in order to nominate candidates to our board of directors or to propose matters to be acted upon at a stockholders’ meeting, which may discourage or deter a potential acquirer from conducting a solicitation of proxies to elect the acquirer’s own slate of directors or otherwise attempting to obtain control of us; and
•the limitation of liability of, and provision of indemnification to, our directors and officers.
These provisions, alone or together, could delay or prevent hostile takeovers and changes in control or changes in our management.
In addition, the change in control repurchase event provisions of our Senior Notes may delay or prevent a change in control of the Company, because those provisions allow note holders to require us to repurchase such notes upon the occurrence of a fundamental change or change in control repurchase event. As a Delaware corporation, we are also subject to provisions of the Delaware General Corporation Law, including Section 203 thereof, which prevents some stockholders holding more than 15% of our outstanding common stock from engaging in certain business combinations without approval of the holders of substantially all of our outstanding common stock. Any provision of our amended and restated certificate of incorporation, amended and restated bylaws, Senior Notes or the Delaware General Corporation Law that has the effect of delaying or deterring a change in control could limit the opportunity for our stockholders to receive a premium for their shares of our common stock, and could also affect the price that some investors are willing to pay for our common stock.
Claims for indemnification by our directors and officers may reduce our available funds to satisfy successful third-party claims against us and may reduce the amount of money available to us.
Our amended and restated certificate of incorporation and amended and restated bylaws provide that we will indemnify our directors and officers, in each case to the fullest extent permitted by Delaware law.
In addition, as permitted by Section 145 of the Delaware General Corporation Law, our amended and restated bylaws and our indemnification agreements that we have entered or intend to enter into with our directors and officers provide that:
•we will indemnify our directors and officers to the fullest extent permitted by Delaware law. Delaware law provides that a corporation may indemnify such person if such person acted in good faith and in a manner such person reasonably believed to be in or not opposed to the best interests of the registrant and, with respect to any criminal proceeding, had no reasonable cause to believe such person’s conduct was unlawful;
•we may, in our discretion, indemnify employees and agents in those circumstances where indemnification is permitted by applicable law;
•we are required to advance expenses, as incurred, to our directors and officers in connection with defending a proceeding, except that such directors or officers will undertake to repay such advances if it is ultimately determined that such person is not entitled to indemnification;
•the rights conferred in our amended and restated bylaws are not exclusive, and we are authorized to enter into indemnification agreements with our directors, officers, employees and agents and to obtain insurance to indemnify such persons, both of which we have done; and
•we may not retroactively amend our amended and restated bylaw provisions to reduce our indemnification obligations to directors, officers, employees, and agents.
While we have procured directors’ and officers’ liability insurance policies, such insurance policies may not be available to us in the future at a reasonable rate, may not cover all potential claims for indemnification, and may not be adequate to indemnify us for all liability that may be imposed.
Our amended and restated certificate of incorporation and amended and restated bylaws provide for an exclusive forum in the Court of Chancery of the State of Delaware for certain disputes between us and our stockholders, and that the federal district courts of the United States will be the exclusive forum for the resolution of any complaint asserting a cause of action under the Securities Act.
Our amended and restated certificate of incorporation and amended and restated bylaws provide, that unless we consent in writing to the selection of an alternative forum, (a) the Court of Chancery of the State of Delaware (or, if such court does not have subject matter jurisdiction thereof, the federal district court for the District of Delaware or other state courts of the State of Delaware) will, to the fullest extent permitted by law, be the sole and exclusive forum for: (i) any derivative action, suit or proceeding brought on behalf of the Company, (ii) any action, suit or proceeding asserting a claim of breach of a fiduciary duty owed by any director, officer or stockholder to the Company or our stockholders, (iii) any action, suit or proceeding arising pursuant to any provision of the Delaware General Corporation Law or our amended and restated certificate of incorporation or amended and restated bylaws, or (iv) any action, suit or proceeding asserting a claim against the Company that is governed by the internal affairs doctrine; and (b) the federal district courts of the United States will be the exclusive forum for the resolution of any complaint asserting a cause or causes of action arising under the Securities Act, including all causes of action asserted against any defendant to such complaint. Any person or entity purchasing or otherwise acquiring any interest in any security of the Company will be deemed to have notice of and consented to these provisions. Nothing in our amended and restated certificate of incorporation or amended and restated bylaws precludes stockholders that assert claims under the Exchange Act, from bringing such claims in federal court to the extent that the Exchange Act confers exclusive federal jurisdiction over such claims, subject to applicable law.
We believe these provisions may benefit us by providing increased consistency in the application of Delaware law and federal securities laws by chancellors and judges, as applicable, particularly experienced in resolving corporate disputes, efficient administration of cases on a more expedited schedule relative to other forums and protection against the burdens of multi-forum litigation. If a court were to find the choice of forum provision that is contained in our amended and restated certificate of incorporation or amended and restated bylaws to be inapplicable or unenforceable in an action, we may incur additional costs associated with resolving such action in other jurisdictions, which could materially adversely affect our business, results of operations, and financial condition. For example, Section 22 of the Securities Act creates concurrent jurisdiction for federal and state courts over all suits brought to enforce any duty or liability created by the Securities Act or the rules and regulations thereunder. Accordingly, there is uncertainty as to whether a court would enforce such a forum selection provision as written in connection with claims arising under the Securities Act.
The choice of forum provisions may limit a stockholder’s ability to bring a claim in a judicial forum that it finds favorable for disputes with us or any of our current or former director, officer or stockholder to the Company, which may discourage such claims against us or any of our current or former director, officer or stockholder to the Company and result in increased costs for investors to bring a claim.
General Risk Factors
Our global operations subject us to risks that can harm our business, results of operations, and financial condition.
A key element of our strategy is to operate globally and sell our products to customers around the world. Operating globally requires significant resources and management attention and subjects us to regulatory, economic, geographic, and political risks. In particular, our global operations subject us to a variety of additional risks and challenges, including:
•increased management, travel, infrastructure, and legal compliance costs associated with having operations in many countries;
•difficulties in enforcing contracts, including “clickwrap” contracts that are entered into online, of which we have historically relied as part of our product licensing strategy, but which may be subject to additional legal uncertainty in some foreign jurisdictions;
•increased financial accounting and reporting burdens and complexities;
•requirements or preferences within other regions for domestic products, and difficulties in replacing products offered by more established or known regional competitors;
•differing technical standards, existing or future regulatory and certification requirements, and required features and functionality;
•communication and integration problems related to entering and serving new markets with different languages, cultures, and political systems;
•compliance with foreign privacy and security laws and regulations and the risks and costs of non-compliance;
•compliance with laws and regulations for foreign operations, including anti-bribery laws (such as the U.S. Foreign Corrupt Practices Act, the U.S. Travel Act, and the UK Bribery Act), import and export control laws, tariffs, trade barriers, economic sanctions, and other regulatory or contractual limitations on our ability to sell our products in certain foreign markets, and the risks and costs of non-compliance;
•heightened risks of unfair or corrupt business practices in certain geographies that may impact our financial results and result in restatements of our consolidated financial statements;
•fluctuations in currency exchange rates, interest rates, and related effects on our results of operations;
•difficulties in repatriating or transferring funds from, or converting currencies in certain countries;
•weak economic conditions in any country or region in which we operate or sell our products, including due to rising inflation or hyperinflation, such as is occurring in Turkey, and related interest rate increases, or general political and economic instability around the world, including in the Middle East and Russia;
•differing labor standards, including restrictions related to, and the increased cost of, terminating employees in some countries;
•difficulties in recruiting and hiring employees in certain countries;
•the preference for localized software and licensing programs and localized language support;
•reduced protection for intellectual property rights in some countries and practical difficulties associated with enforcing our legal rights abroad;
•imposition of travel restrictions, modifications of employee work locations, or cancellation or reorganization of certain sales and marketing events as a result of pandemics or public health emergencies;
•compliance with the laws of numerous foreign taxing jurisdictions, including withholding obligations, and overlapping of different tax regimes; and
•geopolitical risks, such as political and economic instability, including in the U.S., and changes in diplomatic and trade relations.
Compliance with laws and regulations applicable to our global operations substantially increases our cost of doing business in foreign jurisdictions. We may be unable to keep current with changes in government requirements as they change from time to time. Failure to comply with these laws and regulations could harm our business. In many countries, it is common for others to engage in business practices that are prohibited by our internal policies and procedures or other regulations applicable to us. Although we have implemented policies and procedures designed to ensure compliance with these regulations and policies, there can be no assurance that all of our employees, contractors, business partners and agents will comply with these regulations and policies. Violations of laws, regulations or key control policies by our employees, contractors, business partners, or agents could result in delays in revenue recognition, financial reporting misstatements, enforcement actions, reputational harm, disgorgement of profits, fines, civil and criminal penalties, damages, injunctions, other collateral consequences, or the prohibition of the importation or exportation of our products and could harm our business, results of operations, and financial condition.
We depend on our executive officers and other key employees and the loss of one or more of these employees or the inability to attract and retain highly skilled employees could harm our business.
Our success depends largely upon the continued services of our executive officers and key employees. We rely on our leadership team and other key employees in the areas of research and development, products, strategy, operations, security, go-to-market, marketing, IT, support, and general and administrative functions. From time to time, there may be changes in our executive management team resulting from the hiring or departure of executives, which could disrupt our business. For example, our Chief Revenue Officer stepped down from his role, effective December 31, 2023. We announced in April 2024 that one of our co-Chief Executive Officers intends to step down from his executive officer role and into an advisory role, effective August 31, 2024. Our Chief Sales Officer also intends to step down from his role, effective August 31, 2024. We do not have employment agreements with our executive officers or other key personnel that require them to continue to work for us for any specified period and, therefore, they are able to terminate their employment with us at any time. The loss of one or more of our executive officers, especially our Co-Chief Executive Officers, or other key employees may harm our business.
In addition, in order to execute our growth plan, we must attract and retain highly qualified personnel. Competition for these personnel is intense, and many of the companies with which we compete for experienced personnel have greater resources than we have. We have from time to time experienced, and we expect to continue to experience, difficulty hiring and retaining employees with appropriate qualifications. In particular, recruiting and hiring senior product engineering personnel, especially those with experience in designing and developing software and cloud-based services or with AI and machine learning backgrounds, has been, and we expect it to continue to be, challenging. If we are unable to hire and retain talented product engineering personnel, we may be unable to scale our operations or release new products in a timely fashion and, as a result, customer satisfaction with our products may decline. Furthermore, as we hire employees from competitors or other companies, prior employers may attempt to assert that the employees or we have breached certain legal obligations, resulting in a diversion of our time and resources.
Any reorganizational efforts we conduct, such as our March 2023 rebalancing to improve operational efficiencies and operating costs, may have an adverse effect on our ability to attract and retain employees. In addition, job candidates and existing employees often consider the value of the equity awards they receive in connection with their employment. We have experienced large fluctuations in our stock price since the end of fiscal year 2021. If the value or perceived value of our equity awards declines, it could harm our ability to recruit and retain highly skilled employees. If we fail to attract new personnel or fail to retain and motivate our current personnel, our business, results of operations and financial condition could be harmed.
Catastrophic events may disrupt our business.
Natural disasters, pandemics other public health emergencies, geopolitical conflicts, social or political unrest, or other catastrophic events may cause damage or disruption to our operations, international commerce and the global economy, and thus could harm our business. We have a large employee presence and operations in Australia and the San Francisco Bay Area of California. Australia has experienced significant wildfires and flooding that have impacted our employees. The west coast of the United States contains active earthquake zones and is often at risk from wildfires. In the event of a major earthquake, hurricane, typhoon or catastrophic event such as fire, power loss, telecommunications failure, cyber-attack, war or terrorist attack in any of the regions or localities in which we operate, we may be unable to continue our operations and may endure system interruptions, reputational harm, delays in our application development, lengthy interruptions in our product availability, breaches of data security and loss of critical data, all of which could harm our business, results of operations and financial condition.
Additionally, we rely on our network and suppliers of third-party infrastructure and applications, internal technology systems, and our websites for our development, marketing, internal controls, operational support, hosted services and sales activities. If these systems were to fail or be negatively impacted as a result of a malfunction, natural disaster, disease or pandemic, or catastrophic event, our ability to conduct normal business operations and deliver products to our customers could be impaired.
As we grow our business, the need for business continuity planning and disaster recovery plans will grow in significance. If we are unable to develop adequate plans to ensure that our business functions continue to operate during and after a disaster, disease or pandemic, or catastrophic event, or if we are unable to successfully execute on those plans, our business and reputation could be harmed.
Climate change may have a long-term impact on our business.
The long-term effects of climate change on the global economy and the technology industry in particular are unclear; however, we recognize that there are inherent climate related risks wherever business is conducted. Climate-related events, including but not limited to the increasing frequency of extreme weather events and their impact on critical infrastructure in the U.S., Australia and elsewhere, have the potential to disrupt our business, our employees, our third-party suppliers, and/or the business of our customers, and may cause us to experience extended product downtimes, higher attrition, and losses and additional costs to maintain and resume operations. Furthermore, failure to achieve or advance towards our public sustainability commitments and objectives regarding climate action may have an adverse effect on our standing with investors, suppliers, and customers, as well as on our financial results and our capacity to attract and retain skilled individuals.
We are exposed to credit risk and fluctuations in the market values of our investment portfolio.
Given the global nature of our business, we have diversified U.S. and non-U.S. investments. Credit ratings and pricing of our investments can be negatively affected by liquidity, credit deterioration, financial results, economic risk, including from impacts of inflation, recent geopolitical instability, political risk, sovereign risk or other factors. As a result, the value and liquidity of our investments may fluctuate substantially. Therefore, although we have not realized any significant losses on our investments, future fluctuations in their value could result in a significant realized loss.
ITEM 1B. UNRESOLVED STAFF COMMENTS
None.
ITEM 1C. CYBERSECURITY
Cybersecurity Risk Management and Strategy
We have developed and implemented a cybersecurity risk management program intended to protect the confidentiality, integrity, and availability of our critical systems and information. Our cybersecurity risk management program includes a cybersecurity incident response plan.
We design and assess our program based on the National Institute of Standards and Technology Cybersecurity Framework (“NIST CSF”) and Secure Software Development Framework (“SSDF”). This does not imply that we meet any particular technical standards, specifications, or requirements, only that we use the NIST CSF and SSDF as guides to help us identify, assess, and manage cybersecurity risks relevant to our business.
Cybersecurity risks are incorporated into our overall enterprise risk management program. Our Chief Trust Officer (“CTrO”), who oversees our Trust and Security organizations and reports directly to our Chief Technology Officer (“CTO”), is responsible for overseeing the identification, assessment and management of cybersecurity risks relevant to our business.
Our cybersecurity risk management program includes, among other elements:
•Risk assessments designed to help identify material cybersecurity risks to our critical systems, information, products, services, and our broader enterprise IT environment.
•A Security team, principally responsible for managing (1) our cybersecurity risk assessment processes, (2) our security controls, and (3) our response to cybersecurity incidents.
•The use of external service providers, where appropriate, to assess, test, respond to or otherwise assist with aspects of our security controls, as well as maturity assessments of our cybersecurity program.
•Implementation of new hire and annual data privacy and cybersecurity training of all employees, including senior management; annual role-based training for employees in specific incident response roles, as well as for employees with specific access to systems, devices, or locations, and targeted cybersecurity incident simulation training held on a recurring basis.
•Incident response playbooks and standard operating procedures outlining procedures for detecting, responding to, and mitigating cybersecurity incidents. Depending on the nature and severity of an incident, responses may involve escalating notification to our Co-Chief Executive Officers and our board of directors.
•Post incident reviews are conducted for major incidents, and to determine steps that may be taken to mitigate identified risks and reduce the likelihood of reoccurrence.
•A third-party risk management process for service providers, suppliers, and vendors. Such service providers are subject to risk tiering, security risk assessments, and recurring reviews, including investigation of security incidents that have impacted our third party service providers, as applicable.
We describe whether and how risks from identified cybersecurity threats, including as a result of any previous cybersecurity incidents, whether individually or in the aggregate, have materially affected or are reasonably likely to materially affect us, our business, and our results of operations in Part I, Item 1A in this Annual Report on Form 10-K, which disclosures are incorporated by reference herein.
Cybersecurity Governance
Our board of directors considers cybersecurity risk as part of its risk oversight function and has delegated to the audit committee oversight of cybersecurity and other information technology risks. The audit committee of the board of directors oversees management’s implementation of our cybersecurity risk management program. Our CTrO provides updates on significant risks to the audit committee. Our audit committee reports to the full board of directors regarding its activities, including those related to cybersecurity. The CTrO also provides updates to the full board of directors at least biannually. Outside of regular meetings, depending on the nature and severity of an incident, our CTrO will also inform the audit committee and the board of directors of significant cybersecurity incidents.
Our CTrO leads our Trust and Security organizations, which are responsible for assessing and managing cybersecurity risks. Our CTrO, who has served in his role since October 2023, has extensive experience in the cybersecurity space, including previously serving as Chief Trust Officer of another large publicly-traded enterprise software company. He oversees our efforts to prevent, detect, mitigate, and remediate cybersecurity risks and incidents through various means, which may include briefings from internal personnel, threat intelligence, and other information obtained from governmental, public, or private sources, including external consultants engaged by us, and alerts and reports produced by security tools deployed in the IT environment.
Within the Trust and Security organizations, we implement a structured approach to proactively manage cybersecurity risks. Our Security Governance, Risk and Compliance team monitors, assesses, and coordinates proactive identification and remediation efforts for all cybersecurity risks impacting Atlassian. This team partners cross-functionally with others in our Security organization and individuals from our legal, internal audit, engineering, and product development teams. Our Security team includes individuals with experience across a broad range of cybersecurity areas, including, but not limited to: product security; cloud security; infrastructure security; security monitoring and incident response; identity and access management; vulnerability management; and governance, risk, and compliance.
ITEM 2. PROPERTIES
As of June 30, 2024, our principal offices consist of approximately 146,000 and 147,000 square feet of leased office facilities in Sydney, Australia and the San Francisco Bay Area, California, United States, respectively. Excluded from this amount is approximately 52,000 square feet and 139,000 square feet in Sydney, Australia and the San Francisco Bay Area, California, United States, respectively, currently subleased or available to sublease. This is part of our lease consolidation efforts to optimize our real estate footprint, initiated in March 2023. We also lease other office facilities around the world, including Austin, Texas; Bellevue, Washington; New York, New York; the Netherlands; Melbourne, Australia; Japan; the Philippines; India; Poland; and Turkey. We believe that our existing facilities and offices are adequate to meet our current requirements.
ITEM 3. LEGAL PROCEEDINGS
On February 3, 2023, a putative securities class action (the “Putative Class Action”) was filed in the U.S. District Court for the Northern District of California, captioned City of Hollywood Firefighters’ Pension Fund vs. Atlassian Corporation, Case No. 3:23-cv-00519, naming the Company and certain of its officers as defendants. The lawsuit is purportedly brought on behalf of purchasers of the Company’s securities between August 5, 2022 and November 3, 2022 (the “Class Period”). The complaint alleges claims under Sections 10(b) and 20(a) of the Securities Exchange Act of 1934, as amended (the “Exchange Act”), and Rule 10b-5 promulgated thereunder, based on allegedly false and misleading statements about the Company’s business and prospects during the Class Period. The lawsuit seeks unspecified damages. On January 22, 2024, the court granted defendants’ motion to dismiss plaintiffs’ complaint with leave to amend. Plaintiffs filed a second amended complaint on March 1, 2024 and the defendants filed a motion to dismiss on April 19, 2024. On August 13, 2024, the court issued a ruling granting the defendants’ motion to dismiss plaintiffs’ second amended complaint, and providing the plaintiffs until September 3, 2024 to file a third amended complaint.
In March, April and August 2023, three stockholder derivative lawsuits were filed in the U.S. District Court for the District of Delaware against the members of the Company’s board of directors and certain of its officers, captioned Silva v. Cannon-Brookes, Case No. 1:23-cv-00283; Keane v. Cannon-Brookes, Case No. 1:23-cv-00399; and Azzawi v. Cannon-Brookes, Case No. 1:23-cv-00884. The Company is named as a nominal defendant. These stockholder derivative lawsuits are based largely on the same allegations as the Putative Class Action, including allegations relating to the Company’s disclosures during the Class Period as well as, in certain instances, alleged insider trading. The lawsuits purport to assert claims for, among other things, breach of fiduciary duty, corporate waste, unjust enrichment, and violations of Section 10(b) of the Exchange Act, and Rule 10b-5 promulgated thereunder. The complaints seek unspecified damages and other relief purportedly on the Company’s behalf. In May and August 2023, the Court consolidated the Silva, Keane, and Azzawi actions into In re Atlassian Corporation Stockholder Derivative Litigation, Case No. 1:23-cv-00283-GBW (the “Consolidated Action”), and stayed the Consolidated Action pending resolution of any motion(s) to dismiss in the Putative Class Action.
On September 6, 2023, a stockholder derivative lawsuit was filed in the U.S. District Court for the Northern District of California against the members of the Company’s board of directors and certain of its officers, captioned Capistrano v. Cannon-Brookes, Case No. 4:23-cv-04584 (the “Capistrano Action”). The Company is named as a nominal defendant. The complaint is based largely on the same allegations as the Putative Class Action and the Consolidated Action, including allegations relating to the Company’s disclosures during the Class Period as well as, in certain instances, alleged insider trading. The lawsuits purport to assert claims for, among other things, breach of fiduciary duty, corporate waste, unjust enrichment, and violations of Section 10(b) of the Exchange Act, and Rule 10b-5 promulgated thereunder. The complaints seek unspecified damages and other relief purportedly on the Company’s behalf. On October 31, 2023, the Court stayed the Capistrano Action pending resolution of any motion(s) to dismiss in the Putative Class Action.
The defendants have denied and intend to continue to deny the allegations of wrongdoing and vigorously defend against the claims in each of the Putative Class Action, the Consolidated Action, and the Capistrano Action.
In addition to the matters discussed above, from time to time, the Company is party to litigation and other legal proceedings in the ordinary course of business. While the Company does not believe the ultimate resolutions of these other pending legal matters not described above are likely to have a material adverse effect on the Company’s financial position, the results of any litigation or other legal proceedings are uncertain and as such the resolution of such legal proceedings, either individually or in the aggregate, could have a material adverse effect on its business, results of operations, financial condition or cash flows. The Company accrues for loss contingencies when it is both probable that it will incur the loss and when it can reasonably estimate the amount of the loss or range of loss. For the periods presented, the Company has not recorded any liabilities as a result of the litigation or other legal proceedings in its consolidated financial statements.
ITEM 4. MINE SAFETY DISCLOSURES
Not applicable.
PART II
ITEM 5. MARKET FOR REGISTRANT’S COMMON EQUITY, RELATED STOCKHOLDER MATTERS AND ISSUER PURCHASES OF EQUITY SECURITIES
Market Price of Our Class A Common Stock
Our Class A Common Stock is traded on The Nasdaq Global Select Market under the symbol “TEAM.” Our Class B Common Stock is neither listed nor traded.
Stockholders
As of June 30, 2024, there were eleven stockholders of record of our Class A Common Stock, including The Depository Trust Company, which holds shares of our Class A Common Stock on behalf of an indeterminate number of beneficial owners. As of June 30, 2024, there were three stockholders of record of our Class B Common Stock.
Dividends
While we have in the past paid limited dividends, we do not have any present or future plan to pay dividends on our shares. Any future determination as to the declaration and payment of dividends, if any, will be at the discretion of our board of directors, subject to applicable laws, and will depend on then existing conditions, including our financial condition, results of operations, contractual restrictions, capital requirements, general business conditions, business prospects and other factors our board of directors may deem relevant.
Stock Performance Graph
This performance graph shall not be deemed “soliciting material” or to be “filed” with the SEC, for purposes of Section 18 of the Exchange Act, or otherwise subject to the liabilities under that section, and shall not be deemed incorporated by reference into any of our other filings under the Securities Act or the Exchange Act except to the extent we specifically incorporate it by reference into such filing.
The graph below compares the cumulative total stockholder return on our Class A Common Stock with the cumulative total return on the Nasdaq Composite Index, S&P 500 Index, and the Standard & Poor 500 Systems Software Index for each of the last five fiscal years ended June 30, 2019 through June 30, 2024, assuming an initial investment of $100. Data for the Nasdaq Composite Index, the S&P 500 Index, and the Standard & Poor 500 Systems Software Index assume reinvestment of dividends.
The comparisons in the graph below are based upon historical data and are not indicative of, nor intended to forecast, future performance of our Class A Common Stock.
| | | | | | | | | | | | | | | | | | | | | | | | | | | | | | | | | | | |
| June 30, |
| 2019 | | 2020 | | 2021 | | 2022 | | 2023 | | 2024 |
Atlassian Corporation | $ | 100 | | | $ | 137.78 | | | $ | 196.32 | | | $ | 143.24 | | | $ | 128.27 | | | $ | 135.20 | |
Nasdaq Composite | 100 | | | 125.64 | | | 181.16 | | | 137.75 | | | 172.22 | | | 221.49 | |
S&P 500 Index | 100 | | | 105.39 | | | 146.09 | | | 128.68 | | | 151.29 | | | 185.63 | |
S&P 500 Systems Software | 100 | | | 146.57 | | | 196.65 | | | 185.60 | | | 248.17 | | | 322.67 | |
Issuer Purchases of Equity Securities
Share repurchases of our Class A Common Stock for the three months ended June 30, 2024 were as follows (in thousands, except for average price paid per share):
| | | | | | | | | | | | | | | | | | | | | | | |
| Total Number of Shares Purchased (1) | | Average Price Paid Per Share (2) | | Total Number of Shares Purchased as Part of Publicly Announced Plans or Programs (1) | | Approximate Dollar Value of Shares that May Yet Be Purchased Under the Plans or Programs |
| April 2024 | 303 | | $ | 194.30 | | | 303 | | $ | 582,471 | |
| May 2024 | 395 | | 175.60 | | | 395 | | 513,158 | |
| June 2024 | 379 | | 161.86 | | 379 | | 451,842 | |
| Total | 1,076 | | | | 1,076 | | |
(1) In January 2023, the Board of Directors authorized a program to repurchase up to $1.0 billion of our outstanding Class A Common Stock (the “Share Repurchase Program”). The Share Repurchase Program does not have a fixed expiration date, may be suspended or discontinued at any time, and does not obligate us to repurchase any specific dollar amount or to acquire any specific number of shares. We may repurchase shares of Class A Common Stock from time to time through open market purchases, in privately negotiated transactions, or by other means, including through the use of trading plans intended to qualify under Rule 10b5-1 under the Exchange Act, in accordance with applicable securities laws and other restrictions. The timing, manner, price, and amount of any repurchases will be determined by us at our discretion and will depend on a variety of factors, including business, economic and market conditions, prevailing stock prices, corporate and regulatory requirements, and other considerations.
(2) Average price paid per share includes costs associated with the repurchases, when applicable.
ITEM 6. RESERVED
ITEM 7. MANAGEMENT’S DISCUSSION AND ANALYSIS OF FINANCIAL CONDITION AND RESULTS OF OPERATIONS
This section of our Annual Report on Form 10-K discusses our financial condition and results of operations for fiscal years 2024 and 2023, and year-to-year comparisons between fiscal years 2024 and 2023, in accordance with U.S. generally accepted accounting principles (“GAAP”). A discussion of our financial condition and results of operations for the fiscal year 2022 and year-to-year comparisons between fiscal years 2023 and 2022 that is not included in this Annual Report on Form 10-K can be found in “Management’s Discussion and Analysis of Financial Condition and Results of Operations” in Part II, Item 7 of our Annual Report on Form 10-K for the fiscal year ended 2023, filed on August 18, 2023.
You should read the following discussion and analysis of our financial condition and results of operations together with our consolidated financial statements and the related notes appearing under “Financial Statements and Supplementary Data” in Item 8 in this Annual Report on Form 10-K. As discussed in the section titled “Forward-Looking Statements,” the following discussion and analysis contains forward-looking statements that involve risks and uncertainties, as well as assumptions that, if they never materialize or prove incorrect, could cause our results to differ materially from those expressed or implied by such forward-looking statements. Factors that could cause or contribute to such differences include, but are not limited to, those identified below, and those discussed in the section titled “Risk Factors” under Part I, Item 1A in this Annual Report on Form 10-K.
Company Overview
Our mission is to unleash the potential of every team.
Our products help teams plan, track and execute shared work — delivering superior outcomes for their organizations.
Our primary products include Jira for planning and project management, Confluence for content creation and sharing, Jira Service Management for team service, management and support applications, and Loom, which we acquired in November 2023, for asynchronous video collaboration. Together, our connected portfolio of products form integrated solutions and, when deployed in the cloud, provide customers all the benefits of analytics, automation, and now AI, along with integrations with thousands of third-party apps as a solution that is deeply entrenched in how teams collaborate and how organizations run. The Atlassian platform is the common technology foundation for our products that drives connection between teams, information, and workflows. It allows work to flow seamlessly across tools, automates the mundane so teams can focus on what matters, and enables better decision-making based on the data customers choose to put into our products.
Our mission is possible with a deep investment in product development to create and refine innovative, high-value, and versatile products that users love. We make our products affordable for organizations of all sizes and transparently share our pricing online for most of our products. We aim to grow our customer base, targeting organizations of all sizes, in every industry, and in most geographies, and strategically expand our relationships with customers over time with our dedicated sales team. This product-led philosophy enables us to go to market in a unique and efficient way. To land new customers, we’ve engineered a low-friction flywheel with an emphasis on self-service, making it easy to try and get value first and foremost. This allows us to operate at an unusual scale for an enterprise software company, with customers across virtually every industry sector in approximately 200 countries and territories as of June 30, 2024. Our customers range from small organizations that have adopted one of our products for a small group of users, to over eighty percent of the Fortune 500, many of which use a combination of our products across thousands of users. By designing our products to be simple, powerful, affordable, and easy to adopt, we generate demand through word-of-mouth and viral expansion within organizations, allowing our sales force to focus primarily on expanding and deepening strategic relationships with existing customers, particularly in the enterprise.
Our high-velocity, low-friction distribution model is designed to drive exceptional customer scale by making products that are free to try and affordable to purchase online. We prioritize product quality, automated distribution, transparent pricing, and customer service to land new customers and expand to new teams. We also have a sales team focused primarily on expanding and deepening strategic relationships with existing customers, particularly large enterprises. We primarily rely on word-of-mouth and low-touch demand generation to drive trial, adoption, and initial expansion of our products. A substantial majority of our sales are automated through our website, including sales of our products through our solution partners and resellers. For fiscal year 2024, we derived over 50% of our revenue from channel partners’ sales efforts. Our solution partners and resellers primarily focus on customers in regions that require local language support and other customized needs. We plan to continue to invest in our partner programs to help us enter and grow in new markets, complementing our automated, low-touch approach.
Our culture of innovation, transparency and dedication to customer service drives our success in implementing and refining this unique approach. We believe this approach creates a self-reinforcing effect that fosters innovation, quality, customer success, and scale. As part of this strategy, we invest significantly more in research and development activities than in traditional sales activities relative to other enterprise software companies.
We generate revenues primarily in the form of subscription and maintenance fees. Subscription revenues consist primarily of fees earned from subscription-based arrangements for providing customers the right to use our software in a cloud-based-infrastructure that we provide (“Cloud offerings”). We also sell on-premises term license agreements for our Data Center products (“Data Center offerings”), consisting of software licensed for a specified period and support and maintenance services that are bundled with the license for the term of the license period. Subscription revenues also include subscription-based agreements for our premier support services. From time to time, we make changes to our product offerings, prices and pricing plans for our products which may impact the growth rate of our revenue, our deferred revenue balances, and customer retention. Subscription revenue, through our Cloud and Data Center offerings, results in a large recurring revenue base.
Maintenance provides our customers with access to unspecified future updates, upgrades and enhancements and technical product support on an if-and-when-available basis for perpetual license products purchased and
operated by our customers on their premises (“Server offerings”). We no longer sell perpetual licenses for our Server offerings and generally ended maintenance and support for these Server offerings in February 2024, subject to limited exceptions for some enterprise customers that have signed an agreement for our Cloud offerings. We have helped our customers transition to other versions of our products with our migration tools and programs, customer support teams, and pricing and packaging options. Maintenance revenue no longer constitutes a material portion of our recurring revenue base after February 2024.
On November 30, 2023, we acquired 100% of the outstanding equity of Loom, Inc., an asynchronous video messaging platform that helps users communicate through instantly shareable videos. We believe the acquisition of Loom, Inc. will further elevate the collaboration experience for our customers.
Economic Conditions
Our results of operations may vary based on the impact of changes in the global economy on us or our customers. Our business depends on demand for business software applications generally and for collaboration software solutions in particular. We are subject to risks and exposures from the evolving macroeconomic environment, including the effects of rising inflation, and increases in interest rates, political instability, and geopolitical tensions. We monitor the direct and indirect impacts of these circumstances on our business and financial results. We have seen expansion from existing customers moderate in recent quarters, particularly amongst our small and medium-sized customers. The extent to which these risks ultimately impact our business, results of operations, and financial position will depend on future developments, which are uncertain and cannot be predicted at this time.
Key Business Metrics
We utilize the following key metrics to evaluate our business, measure our performance, identify trends affecting our business, formulate business plans and make strategic decisions.
Customer Base
We have a history of successfully growing both our total customer base and the spend per customer through growth in users, purchase of new licenses, and adoption of new products. We believe our ability to attract new customers is critical, and expanding within the existing customer base is the primary driver of our success as a business. Typically, new customers begin their journey with Atlassian products with a small footprint by either adopting our free editions or purchasing a single product for a limited number of users. We are focused on continuing to grow our total customer base, specifically the number of customers with more than $10,000 in annualized recurring revenue from our Cloud offerings (“Cloud ARR”), as it measures our ability to successfully expand within our existing customer base.
We define the number of total customers at the end of any particular period as the number of organizations with unique domains with an active subscription for two or more seats. We define the number of customers with Cloud ARR greater than $10,000 using the same definition as total customers with the distinction of having an active Cloud subscription and greater than $10,000 in Cloud ARR. We define Cloud ARR as the annualized recurring revenue run-rate of Cloud subscription agreements at a point in time. We calculate Cloud ARR by taking the Cloud monthly recurring revenue (“Cloud MRR”) run-rate and multiplying it by 12. Cloud MRR for each month is calculated by aggregating monthly recurring revenue from committed contractual amounts at a point in time. Cloud ARR and Cloud MRR should be viewed independently of revenue and do not represent our revenue under GAAP, as they are operational metrics that can be affected by contract start and end dates and renewal rates. While a single customer may have distinct departments, operating segments, or subsidiaries with multiple active licenses or subscriptions of our products, if the product deployments share a unique domain name, we only include the customer once for purposes of calculating a customer.
As of June 30, 2024, we had more than 300,000 customers. Including single user accounts and organizations who have only adopted our free or starter products, the active use of our products extends well beyond our total customer base. With these customers using our software today, we are able to reach a vast number of users, gather insights to refine our offerings, and generate growing revenue by expanding within our total customer base. Customers with greater than $10,000 in Cloud ARR represent the majority of our Cloud ARR. No single customer contributed more than 5% of our total revenues during fiscal year 2024.
The following table sets forth our number of customers with greater than $10,000 in Cloud ARR as of the dates presented:
| | | | | | | | | | | | | | | | | |
| | As of |
| | June 30, 2022 | | June 30, 2023 | | June 30, 2024 |
| | | | | |
| Number of customers with greater than $10,000 in Cloud ARR | 32,355 | | | 38,726 | | | 45,842 | |
Free Cash Flow
Free cash flow is a non-GAAP financial measure that we calculate as net cash provided by operating activities less net cash used in investing activities for capital expenditures. Management considers free cash flow to be a liquidity measure that provides useful information to management and investors about the amount of cash generated by our business that can be used to fund our commitments, repay our debt, and for strategic opportunities, such as reinvesting in our business, making strategic acquisitions, and strengthening our financial position. Free cash flow is not a measure calculated in accordance with GAAP and should not be considered in isolation from, or as a substitute for financial information prepared in accordance with GAAP, such as GAAP net cash provided by operating activities. In addition, free cash flow may not be comparable to similarly titled metrics of other companies due to differences among methods of calculation. The following table presents a reconciliation of net cash provided by operating activities to free cash flow for the periods presented (in thousands):
| | | | | | | | | | | | | |
| | Fiscal Year Ended June 30, | | |
| | 2024 | | 2023 | | |
| Net cash provided by operating activities | $ | 1,448,159 | | | $ | 868,111 | | | |
| Less: Capital expenditures | (32,577) | | | (25,652) | | | |
| | | | | |
| Free cash flow | $ | 1,415,582 | | | $ | 842,459 | | | |
Free cash flow increased by $573.1 million during fiscal year 2024 as compared to fiscal year 2023. The increase in free cash flow was primarily attributable to an increase in net cash provided by operating activities, offset by an increase in capital expenditures. The increase in net cash provided by operating activities was primarily attributable to an increase in cash received from customers, partially offset by an increase in cash paid to suppliers and employees and cash used to pay income taxes.
For more information about net cash provided by operating activities, please see “Liquidity and Capital Resources.”
Components of Results of Operations
Sources of Revenues
Subscription Revenues
Subscription revenues consist primarily of fees earned from subscription-based arrangements for providing customers the right to use our software in a cloud-based-infrastructure that we provide. We also sell on-premises term license agreements for our Data Center offerings, which consist of software licensed for a specified period and include support and maintenance services that are bundled with the license for the term of the license period. Subscription revenues also include subscription-based agreements for our premier support services. Subscription revenues are driven primarily by the number and size of active licenses, the type of product and the price of the licenses. Our subscription-based arrangements generally have a contractual term of one to twelve months. For Cloud offerings, subscription revenue is recognized ratably as services are performed, commencing with the date the service is made available to customers. For Data Center offerings, we recognize revenue upfront for the portion that relates to the delivery of the term license and the support and related revenue is recognized ratably as the services are delivered over the term of the arrangement. Premier support consists of subscription-based arrangements for a higher level of support across different deployment options, and revenue is recognized ratably as the services are delivered over the term of the arrangement.
Maintenance Revenues
Maintenance revenues represent fees earned from providing customers unspecified future updates, upgrades and enhancements and technical product support for our Server offerings on an if-and-when-available basis. Maintenance revenue is recognized ratably over the term of the support period.
Other Revenues
Other revenues primarily include fees received for sales of third-party apps in the Atlassian Marketplace. Advisory services and training services are also included in other revenues. Revenue from the sale of third-party apps via Atlassian Marketplace is recognized on the date of product delivery given that all of our obligations have been met at that time and on a net basis as we function as the agent in the relationship. Revenue from advisory services is recognized over the time period that the customer has access to the service. Revenue from consulting and training is recognized over time as the services are performed.
We expect subscription revenue to increase and continue to be our primary driver of revenue growth. We no longer sell perpetual licenses for our Server offerings and we generally ended maintenance and support for these Server offerings in February 2024. We have helped our Server customers migrate to our Cloud and Data Center offerings and maintenance revenue is immaterial after the Server end of support date.
Cost of Revenues
Cost of revenues primarily consists of expenses related to compensation expenses for our employees, including stock-based compensation, hosting our cloud infrastructure, which includes third-party hosting fees and depreciation associated with computer equipment and software, payment processing fees, consulting and contractors costs associated with our customer support and infrastructure service teams, amortization of acquired intangible assets, such as the amortization of the cost associated with an acquired company’s developed technology, certain IT program expenses, and facilities and related overhead costs. To support our cloud-based infrastructure, we utilize third-party managed hosting facilities. We allocate stock-based compensation based on the expense category in which the employee works. We allocate overhead such as information technology costs, rent and occupancy charges in each expense category based on headcount in that category. As such, general overhead expenses are reflected in cost of revenues and operating expense categories.
We expect cost of revenues to increase as we continue to invest in our cloud-based infrastructure to support migrations and our Cloud customers.
Gross Profit and Gross Margin
Gross profit is total revenues less total cost of revenues. Gross margin is gross profit expressed as a percentage of total revenues. Gross margin can fluctuate from period to period as a result of changes in product and services mix.
We expect gross margin to modestly decrease due to the sales mix shift from Data Center offerings to Cloud offerings. This impact will be primarily driven by increased hosting costs and personnel costs to support our Cloud customers.
Operating Expenses
Our operating expenses are classified as research and development, marketing and sales, and general and administrative. For each functional category, the largest component is compensation expenses, which include salaries and bonuses, stock-based compensation, employee benefit costs, and contractor costs. We allocate overhead, such as information technology costs, rent, and occupancy charges in each expense category based on headcount in that category.
Research and Development
Research and development expenses consist primarily of compensation expenses for our employees, including stock-based compensation, consulting and contractor costs associated with our software development teams, facilities and related overhead costs, and certain IT program expenses. We continue to focus our research and development efforts on building new products, adding new features and services, integrating acquired technologies, increasing functionality, enhancing our cloud infrastructure and developing our mobile capabilities.
Marketing and Sales
Marketing and sales expenses consist primarily of compensation expenses for our employees, including stock-based compensation, marketing and sales programs, consulting and contractor costs, facilities and related overhead costs, and certain IT program expenses. Marketing programs consist of advertising, promotional events, corporate communications, brand building and product marketing activities such as online lead generation. Sales programs consist of activities and teams focused on supporting our solution partners and resellers, tracking channel sales activity, supporting and servicing our customers by helping them optimize their experience and expand the use of our products across their organizations and helping product evaluators learn how they can use our tools most effectively.
General and Administrative
General and administrative expenses consist primarily of compensation expenses for our employees, including stock-based compensation, for finance, legal, human resources and information technology personnel, facilities and related overhead costs, consulting and contractor costs, certain IT program expenses, and other corporate expenses.
Income Taxes
Provision for income taxes consists primarily of income taxes related to federal, state, and foreign jurisdictions where we conduct business.
Critical Accounting Estimates
Our consolidated financial statements have been prepared in accordance with GAAP. The preparation of these consolidated financial statements requires us to make estimates and assumptions that affect the reported amounts of assets and liabilities and the disclosure of contingent assets and liabilities at the date of the consolidated financial statements, as well as the reported revenues and expenses during the reporting periods. These items are monitored and analyzed by us for changes in facts and circumstances, and material changes in these estimates could occur in the future. We base our estimates on historical experience and on various other factors that we believe are reasonable under the circumstances, the results of which form the basis for making judgments about the carrying value of assets and liabilities that are not readily apparent from other sources. Changes in estimates are reflected in reported results for the period in which they become known. Actual results may differ from these estimates under different assumptions or conditions and such differences could be material.
While our significant accounting policies are more fully described in Note 2, “Summary of Significant Accounting Policies” to the notes to our consolidated financial statements, the following accounting policies involve a greater degree of judgment and complexity. Accordingly, these are the accounting policies that we believe are the most critical to aid in fully understanding and evaluating our financial condition and results of operations.
Revenue Recognition
Our contracts with customers often include promises to transfer multiple products and services to a customer.
We allocate the transaction price for each contract to each performance obligation based on the relative standalone selling price (“SSP”) for each performance obligation. We use judgment in determining the SSP for products and services. We typically determine an SSP range for our products and services, which is reassessed on a periodic basis or when facts and circumstances change. For all performance obligations other than perpetual and term licenses, we are able to determine SSP based on the observable prices of products or services sold separately in comparable circumstances to similar customers. In instances where performance obligations do not have observable standalone sales, we utilize available information that may include market conditions, pricing strategies, the life of the software, and other observable inputs to estimate the price we would charge if the products and services were sold separately.
Strategic Investments
Investments in privately held equity securities without readily determinable fair values in which we do not own a controlling interest or have significant influence over are measured using the measurement alternative. In applying the measurement alternative, the carrying value of the investment is measured at cost, less impairment, if any, plus or minus changes resulting from observable price changes from orderly transactions for identical or similar investments of the same issuer in the period of occurrence. In determining the estimated fair value of our strategic investments in privately held companies, we use the most recent data available to us. Valuations of privately held
securities are inherently complex due to the lack of readily available market data and require the use of judgment. The determination of whether an orderly transaction is for an identical or similar investment requires significant judgment. In our evaluation, we consider factors such as differences in the rights and preferences of the investments and the extent to which those differences would affect the fair values of those investments.
We assess our privately held debt and equity securities’ strategic investment portfolio quarterly for impairment. Our impairment analysis encompasses an assessment of both qualitative and quantitative analyses of key factors including the investee’s financial metrics, market acceptance of the investee’s product or technology, general market conditions and liquidity considerations. If the investment is considered to be impaired, we record the investment at fair value by recognizing an impairment through the Consolidated Statements of Operations and establishing a new carrying value for the investment.
Business Combinations
The allocation of the purchase price in a business combination requires management to make significant estimates in determining the fair value of acquired assets and assumed liabilities, especially with respect to intangible assets. The excess of the purchase price in a business combination over the fair value of these tangible and intangible assets acquired and liabilities assumed is recorded as goodwill. Critical assumptions used to estimate the fair value of intangible assets include projected revenue growth, projected operating expense, and technology migration curves. These assumptions are inherently uncertain and subject to refinement and, as a result, actual results may differ from estimates. We evaluate these estimates and assumptions as new information is obtained and may record adjustments to the fair value of the tangible and intangible assets acquired and liabilities assumed but not later than one year from the acquisition date.
Income Taxes
We account for income taxes using the asset and liability method. We recognize deferred tax assets and liabilities for the future tax consequences attributable to (i) temporary differences between the financial statement carrying amounts of existing assets and liabilities and their respective tax bases and (ii) operating loss and tax credit carryforwards. Deferred tax assets are recognized subject to management’s judgment that realization is more likely than not applicable to the periods in which we expect the temporary difference will reverse. Deferred tax assets and liabilities are measured using enacted tax rates expected to apply to taxable income in the years in which those temporary differences are expected to be recovered or settled.
Valuation allowances are established when necessary to reduce deferred tax assets to the amounts that are more likely than not expected to be realized. Future realization of deferred tax assets ultimately depends on the existence of sufficient taxable income within the carryback or carryforward periods available under the applicable tax law. We regularly review the deferred tax assets for recoverability based on historical taxable income, projected future taxable income, the expected timing of the reversals of existing temporary differences and tax planning strategies. Our judgment regarding future profitability may change due to many factors, including future market conditions and the ability to successfully execute our business plans and tax planning strategies. Should there be a change in the ability to recover deferred tax assets, our income tax provision would increase or decrease in the period in which the assessment is changed.
In the multiple tax jurisdictions in which we operate, our tax returns are subject to routine audit by the Internal Revenue Service, Australian Taxation Office (“ATO”), and other taxation authorities. These audits at times may produce alternative views regarding certain tax positions taken in the year(s) of review. As a result, we record uncertain tax positions, which require recognition at the time when it is deemed more likely than not that the position in question will be upheld. Although management believes that the judgment and estimates involved are reasonable and that the necessary provisions have been recorded, changes in circumstances or unexpected events could adversely affect our financial position, results of operations, and cash flows.
New Accounting Pronouncements Pending Adoption
The impact of recently issued accounting standards is set forth in Note 2, “Summary of Significant Accounting Policies,” of the notes to our consolidated financial statements.
Results of Operations
The following table sets forth our results of operations for the periods indicated (in thousands, except for percentages of total revenues):
| | | | | | | | | | | | | | | | | | | | | | | |
| | Fiscal Year Ended June 30, |
| 2024 | | % of Total Revenues | | 2023 | | % of Total Revenues |
| Revenues: | | | | | | | |
| Subscription | $ | 3,924,389 | | | 90 | % | | $ | 2,922,576 | | | 84 | % |
| Maintenance | 177,230 | | | 4 | | | 399,738 | | | 11 | |
| Other | 256,984 | | | 6 | | | 212,333 | | | 5 | |
| Total revenues | 4,358,603 | | | 100 | | | 3,534,647 | | | 100 | |
| Cost of revenues | 803,495 | | | 18 | | | 633,765 | | | 18 | |
| Gross profit | 3,555,108 | | | 82 | | | 2,900,882 | | | 82 | |
| Operating expenses: | | | | | | | |
| Research and development | 2,184,111 | | | 50 | | | 1,869,881 | | | 53 | |
| Marketing and sales | 877,497 | | | 20 | | | 769,861 | | | 22 | |
| General and administrative | 610,577 | | | 14 | | | 606,362 | | | 17 | |
| Total operating expenses | 3,672,185 | | | 84 | | | 3,246,104 | | | 92 | |
| Operating loss | (117,077) | | | (2) | | | (345,222) | | | (10) | |
| Other income (expense), net | (30,916) | | | (1) | | | 14,501 | | | — | |
| Interest income | 96,663 | | | 2 | | | 49,732 | | | 1 | |
| Interest expense | (34,077) | | | (1) | | | (30,147) | | | (1) | |
| Loss before provision for income taxes | (85,407) | | | (2) | | | (311,136) | | | (10) | |
| Provision for income taxes | (215,112) | | | (5) | | | (175,625) | | | (4) | |
| Net loss | $ | (300,519) | | | (7) | % | | $ | (486,761) | | | (14) | % |
Fiscal Years Ended June 30, 2024 and 2023
Revenues | | | | | | | | | | | | | | | | | | | | | | | |
| | Fiscal Year Ended June 30, | | | | |
| (in thousands, except percentage data) | 2024 | | 2023 | | $ Change | | % Change |
| | | |
| Subscription | $ | 3,924,389 | | | $ | 2,922,576 | | | $ | 1,001,813 | | | 34 | % |
| Maintenance | 177,230 | | | 399,738 | | | (222,508) | | | (56) | |
| Other | 256,984 | | | 212,333 | | | 44,651 | | | 21 | |
| Total revenues | $ | 4,358,603 | | | $ | 3,534,647 | | | $ | 823,956 | | | 23 | % |
Total revenues increased $824.0 million, or 23%, in fiscal year 2024 compared to fiscal year 2023. Growth in total revenues was primarily attributable to increased demand for our products from both new and existing customers. Of total revenues recognized in fiscal year 2024, over 90% was attributable to sales to customer accounts existing on or before June 30, 2023.
Subscription revenues increased $1.0 billion, or 34%, in fiscal year 2024 compared to fiscal year 2023. The increase in subscription revenues was primarily attributable to additional subscriptions from our existing customer base, and customers migrating to subscription services for our Cloud offerings and term-based licenses for our Data Center offerings.
Maintenance revenues decreased $222.5 million, or 56%, in fiscal year 2024 compared to fiscal year 2023. We no longer offer upgrades to perpetual licenses beginning February 2022, and generally ended maintenance and support for these products in February 2024.
Other revenues increased $44.7 million, or 21%, in fiscal year 2024 compared to fiscal year 2023. The increase in other revenues was primarily attributable to an increase of $38.3 million in revenue from sales of third-
party apps through our Atlassian Marketplace.
Total revenues by deployment options were as follows:
| | | | | | | | | | | | | | | | | | | | | | | |
| | Fiscal Year Ended June 30, | | | | |
| (in thousands, except percentage data) | 2024 | | 2023 | | $ Change | | % Change |
| | | |
| Cloud | $ | 2,698,899 | | | $ | 2,085,498 | | | $ | 613,401 | | | 29 | % |
| Data Center | 1,208,498 | | | 819,251 | | | 389,247 | | | 48 | |
| Server | 177,645 | | | 400,519 | | | (222,874) | | | (56) | |
| Marketplace and other | 273,561 | | | 229,379 | | | 44,182 | | | 19 | |
| Total revenues | $ | 4,358,603 | | | $ | 3,534,647 | | | $ | 823,956 | | | 23 | % |
Total revenues by geography were as follows: | | | | | | | | | | | | | | | | | | | | | | | |
| | Fiscal Year Ended June 30, | | | | |
| (in thousands, except percentage data) | 2024 | | 2023 | | $ Change | | % Change |
| Americas | $ | 2,125,434 | | | $ | 1,765,166 | | | $ | 360,268 | | | 20 | % |
| EMEA | 1,750,910 | | | 1,366,739 | | | 384,171 | | | 28 | |
| Asia Pacific | 482,259 | | | 402,742 | | | 79,517 | | | 20 | |
| Total revenues | $ | 4,358,603 | | | $ | 3,534,647 | | | $ | 823,956 | | | 23 | % |
Cost of Revenues | | | | | | | | | | | | | | | | | | | | | | | |
| | Fiscal Year Ended June 30, | | | | |
| (in thousands, except percentage data) | 2024 | | 2023 | | $ Change | | % Change |
| | | |
| Cost of revenues | $ | 803,495 | | | $ | 633,765 | | | $ | 169,730 | | | 27 | % |
| Gross margin | 82 | % | | 82 | % | | | | |
Cost of revenues increased $169.7 million, or 27%, in fiscal year 2024 compared to fiscal year 2023. The overall increase was primarily attributable to an increase of $101.9 million in hosting fees paid to third-party providers, and an increase of $48.4 million in compensation expense for employees (which includes an increase of $8.1 million in stock-based compensation).
Operating Expenses
Research and development | | | | | | | | | | | | | | | | | | | | | | | |
| | Fiscal Year Ended June 30, | | | | |
| (in thousands, except percentage data) | 2024 | | 2023 | | $ Change | | % Change |
| | | |
| Research and development | $ | 2,184,111 | | | $ | 1,869,881 | | | $ | 314,230 | | | 17 | % |
Research and development expenses increased $314.2 million, or 17%, in fiscal year 2024 compared to fiscal year 2023. The overall increase was primarily attributable to an increase of $349.5 million in compensation expenses for employees (which includes an increase of $114.0 million in stock-based compensation), partially offset by restructuring charges of $43.1 million recorded during fiscal year 2023, and a decrease of $32.2 million in contractor costs and professional services fees.
Marketing and sales | | | | | | | | | | | | | | | | | | | | | | | |
| | Fiscal Year Ended June 30, | | | | |
| (in thousands, except percentage data) | 2024 | | 2023 | | $ Change | | % Change |
| | | |
| Marketing and sales | $ | 877,497 | | | $ | 769,861 | | | $ | 107,636 | | | 14 | % |
Marketing and sales expenses increased $107.6 million, or 14%, for fiscal year 2024 compared to fiscal year 2023. The overall increase was primarily attributable to an increase of $86.0 million in compensation expenses for employees (which includes an increase of $7.4 million in stock-based compensation), and an increase of $15.0 million in advertising and marketing event expenses.
General and administrative | | | | | | | | | | | | | | | | | | | | | | | |
| | Fiscal Year Ended June 30, | | | | |
| (in thousands, except percentage data) | 2024 | | 2023 | | $ Change | | % Change |
| | | |
| General and administrative | $ | 610,577 | | | $ | 606,362 | | | $ | 4,215 | | | 1 | % |
General and administrative expenses increased $4.2 million, or 1%, in fiscal year 2024 compared to fiscal year 2023. The overall increase was primarily attributable to an increase of $36.6 million in compensation expenses for employees (which includes an increase of $14.2 million in stock-based compensation), offset by restructuring charges of $20.7 million recorded during fiscal year 2023, and a decrease of $7.6 million in recruitment cost.
Other income (expense), net | | | | | | | | | | | | | | | | | | | | | | | |
| | Fiscal Year Ended June 30, | | | | |
| (in thousands, except percentage data) | 2024 | | 2023 | | $ Change | | % Change |
| Other income (expense), net | $ | (30,916) | | | $ | 14,501 | | | $ | (45,417) | | | (313) | % |
Other income (expense), net decreased $45.4 million in fiscal year 2024 compared to fiscal year 2023. The decrease was primarily attributable to a decrease in other income of $45.2 million from a non-cash sale of a controlling interest of a subsidiary that occurred during fiscal year 2023, and an increase in other expense of $11.3 million related to our share of loss from an equity method investment, partially offset by a decrease of $17.3 million in losses related to our other strategic investments.
Interest income
| | | | | | | | | | | | | | | | | | | | | | | |
| Fiscal Year Ended June 30, | | | | |
| (in thousands, except percentage data) | 2024 | | 2023 | | $ Change | | % Change |
| Interest Income | $ | 96,663 | | | $ | 49,732 | | | $ | 46,931 | | | 94 | % |
Interest income increased $46.9 million, or 94% in fiscal year 2024 compared to fiscal year 2023. The increase was primarily attributable to an increase in investment income as a result of increased investment balances and increased interest rates.
Interest expense | | | | | | | | | | | | | | | | | | | | | | | |
| | Fiscal Year Ended June 30, | | | | |
| (in thousands, except percentage data) | 2024 | | 2023 | | $ Change | | % Change |
| Interest expense | $ | (34,077) | | | $ | (30,147) | | | $ | (3,930) | | | 13 | % |
Interest expense increased $3.9 million, or 13%, in fiscal year 2024 compared to fiscal year 2023. The overall increase was primarily attributable to an increase in interest expense from our Credit Facility (as defined below) as a result of increased interest rates.
Provision for income taxes | | | | | | | | | | | | | | | | | | | | | | | |
| | Fiscal Year Ended June 30, | | | | |
| (in thousands, except percentage data) | 2024 | | 2023 | | $ Change | | % Change |
| Provision for income taxes | $ | (215,112) | | | $ | (175,625) | | | $ | (39,487) | | | 22 | % |
| Effective tax rate | * | | * | | | | |
** Not meaningful
We reported an income tax provision of $215.1 million on pretax loss of $85.4 million for fiscal year 2024, as compared to an income tax provision of $175.6 million on pretax loss of $311.1 million for fiscal year 2023. The increase in the income tax provision for the fiscal year ended June 30, 2024 was primarily attributable to the increase in valuation allowance and overall growth in foreign jurisdictions associated with an increase in profit and non-deductible stock-based compensation, offset by a decrease in reserves for uncertain tax positions.
We finalized an Advanced Pricing Arrangement with the ATO with respect to our transfer pricing arrangements between Australia and the U.S. that covers the tax years ended June 30, 2019 to June 30, 2025. Pursuant to the terms of the agreement, we made a cash tax payment of approximately $60.5 million during fiscal year 2024.
Our effective tax rate substantially differed from the U.S. statutory income tax rate of 21.0% primarily attributable to full valuation allowances in the U.S. and Australia, research and development tax credits and incentives, non-deductible stock-based compensation in certain foreign jurisdictions, and the recognition of reserves for uncertain tax positions. See Note 17, “Income Taxes,” to the notes to our consolidated financial statements for additional information.
We regularly assess the need for a valuation allowance against our deferred tax assets. Our assessment is based on all positive and negative evidence related to the realizability of such deferred tax assets. Based on available objective evidence as of June 30, 2024, we will continue to maintain a full valuation allowance on our U.S. federal, U.S. state, and Australian deferred tax assets as it is more likely than not that these deferred tax assets will not be realized. We intend to maintain the full valuation allowance until sufficient positive evidence exists to support the reversal of, or decrease in, the valuation allowance.
Our future effective annual tax rate may be materially impacted by the expense or benefit from tax amounts associated with our foreign earnings that are taxed at rates different from the federal statutory rate, changes in valuation allowances, level of profit before tax, accounting for uncertain tax positions, business combinations, and changes in our valuation allowances to the extent sufficient positive evidence becomes available, closure of statute of limitations or settlement of tax audits, and changes in tax laws.
A significant amount of our earnings is generated by our Australian subsidiaries. Our future effective tax rates may be adversely affected to the extent earnings are lower than anticipated in countries where we have lower statutory tax rates. See Note 17, “Income Taxes,” to the notes to our consolidated financial statements for additional information. Changes in our global operations could result in changes to our effective tax rates, future cash flows, and overall profitability of our operations.
Liquidity and Capital Resources
As of June 30, 2024, we had cash and cash equivalents totaling $2.2 billion, short-term investments totaling $162.0 million and accounts receivables totaling $628.0 million. Since our inception, we have primarily financed our operations through cash flows generated by operations and corporate debt.
Our cash flows from operating activities, investing activities, and financing activities for fiscal years 2024 and 2023 were as follows:
| | | | | | | | | | | | | |
| | Fiscal Year Ended June 30, |
| (in thousands) | 2024 | | 2023 | | |
| Net cash provided by operating activities | $ | 1,448,159 | | | $ | 868,111 | | | |
| Net cash used in investing activities | (963,746) | | | (1,258) | | | |
| Net cash used in financing activities | (408,217) | | | (148,421) | | | |
| Effect of foreign exchange rate changes on cash, cash equivalents and restricted cash | (1,989) | | | (1,805) | | | |
| Net increase in cash, cash equivalents, and restricted cash | $ | 74,207 | | | $ | 716,627 | | | |
Our primary source of cash is primarily through collections from our customers. Our primary uses of cash from operating activities are general business expenses including employment expenses, cloud platform and other infrastructure services, professional services fees, income taxes, marketing expenses, software expenses, and facility expenses.
Net cash provided by operating activities increased by $580.0 million for fiscal year 2024, compared to fiscal year 2023. The net increase was primarily attributable to an increase in cash received from customers, partially offset by an increase in cash paid to suppliers and employees and cash used to pay income taxes.
Net cash used in investing activities increased by $962.5 million for fiscal year 2024, compared to fiscal year 2023. The net increase was primarily attributable to an increase in cash consideration paid for acquisitions, net of cash acquired, of approximately $842.0 million, an increase in net outflows of $138.1 million related to marketable securities activity, partially offset by an increase in net inflows of $24.9 million related to strategic investment activity.
Net cash used in financing activities increased by $259.8 million for fiscal year 2024, compared to fiscal year 2023. The net cash used in financing activities was primarily attributable to an increase in repurchases of Class A
Common Stock of $245.3 million, and principal payments of our long term debt of $1.0 billion, offset by proceeds from issuance of debt, net of issuance costs of $987.0 million.
Material Cash Requirements
Debt
As of June 30, 2024, we had $500.0 million aggregate principal amount of 5.250% senior notes due 2029 (the “2029 Notes”) and $500.0 million aggregate principal amount of 5.500% senior notes due 2034 (the “2034 Notes,” and together with the 2029 Notes, the “Notes”). The Notes will mature on May 15, 2029, and May 15, 2034, respectively. Interest on the notes will be paid semi-annually in arrears on May 15 and November 15 of each year, starting from November 15, 2024. Refer to Note 11, “Debt,” to our consolidated financial statements for additional information.
On August 12, 2024, Atlassian US, Inc.’s prior credit facility was amended and restated to provide for a $750 million senior unsecured revolving credit facility (the “2024 Credit Facility”). We may repay outstanding loans under the 2024 Credit Facility at any time, without premium or penalty, and we have an option to request an increase of $250 million in certain circumstance. The 2024 Credit Facility matures in August 2029. Refer to Note 18, “Subsequent Events,” to our consolidated financial statements for additional information. As of June 30, 2024, there were no outstanding borrowings under the prior credit facility, and we were in compliance with all related covenants.
Share Repurchase Program
In January 2023, the Board of Directors authorized a program to repurchase up to $1.0 billion of our outstanding Class A Common Stock (the “Share Repurchase Program”). The Share Repurchase Program does not have a fixed expiration date, may be suspended or discontinued at any time, and does not obligate us to repurchase any specific dollar amount or to acquire any specific number of shares. During fiscal year 2024, we repurchased approximately 2.2 million shares of our Class A Common Stock for approximately $394.0 million at an average price per share of $182.32. All repurchases were made in open market transactions. As of June 30, 2024, we were authorized to purchase $451.8 million of our Class A Common Stock under the Share Repurchase Program. Refer to Note 15, “Stockholders' Equity,” to our consolidated financial statements for additional information.
Contractual Obligations
Our principal commitments consist of contractual commitments for cloud services platform and other infrastructure services, and obligations under leases for office space including obligations for leases that have not yet commenced. Refer to Note 10, “Leases,” and Note 12, “Commitments and Contingencies,” to our consolidated financial statements for additional information.
Other Future Obligations
We believe that our existing cash and cash equivalents, together with cash generated from operations, and borrowing capacity from the 2024 Credit Facility will be sufficient to meet our anticipated cash needs for at least the next 12 months. Our other future cash requirements will depend on many factors including our growth rate, the timing and extent of spend on research and development efforts, employee headcount, marketing and sales activities, payments to tax authorities, acquisitions of additional businesses and technologies, the introduction of new software and services offerings, enhancements to our existing software and services offerings and the continued market acceptance of our products.
As of June 30, 2024, we are not party to any off-balance sheet arrangements that have or are reasonably likely to have a current or future material effect on our financial condition, results of operations, liquidity, capital expenditures, or capital resources.
Non-GAAP Financial Measures
In addition to the measures presented in our consolidated financial statements, we regularly review other measures that are not presented in accordance with GAAP, defined as non-GAAP financial measures by the SEC, to evaluate our business, measure our performance, identify trends, prepare financial forecasts and make strategic decisions. The key measures we consider are non-GAAP gross profit and non-GAAP gross margin, non-GAAP operating income and non-GAAP operating margin, non-GAAP net income and non-GAAP net income per diluted share, and free cash flow (collectively, the “Non-GAAP Financial Measures”). These Non-GAAP Financial Measures, which may be different from similarly titled non-GAAP measures used by other companies, provide supplemental information regarding our operating performance on a non-GAAP basis that excludes certain gains,
losses and charges of a non-cash nature or that occur relatively infrequently and/or that management considers to be unrelated to our core operations. Management believes that tracking and presenting these Non-GAAP Financial Measures provides management, our board of directors, investors and the analyst community with the ability to better evaluate matters such as: our ongoing core operations, including comparisons between periods and against other companies in our industry; our ability to generate cash to service our debt and fund our operations; and the underlying business trends that are affecting our performance.
Our Non-GAAP Financial Measures include:
•Non-GAAP gross profit and non-GAAP gross margin. Excludes expenses related to stock-based compensation, amortization of acquired intangible assets, and restructuring charges.
•Non-GAAP operating income and non-GAAP operating margin. Excludes expenses related to stock-based compensation, amortization of acquired intangible assets, and restructuring charges.
•Non-GAAP net income and non-GAAP net income per diluted share. Excludes expenses related to stock-based compensation, amortization of acquired intangible assets, restructuring charges, gain on a non-cash sale of a controlling interest of a subsidiary and the related income tax adjustments.
•Free cash flow. Free cash flow is defined as net cash provided by operating activities less capital expenditures, which consists of purchases of property and equipment.
We understand that although these Non-GAAP Financial Measures are frequently used by investors and the analyst community in their evaluation of our financial performance, these measures have limitations as analytical tools, and you should not consider them in isolation or as substitutes for analysis of our results as reported under GAAP. We compensate for such limitations by reconciling these Non-GAAP Financial Measures to the most comparable GAAP financial measures.
The following table presents a reconciliation of our Non-GAAP Financial Measures to the most comparable GAAP financial measure for fiscal years 2024 and 2023 (in thousands, except percentage and per share data):
| | | | | | | | | | | | | |
| Fiscal Year Ended June 30, |
| 2024 | | 2023 | | |
| Gross profit | | | | | |
| GAAP gross profit | $ | 3,555,108 | | | $ | 2,900,882 | | | |
| Plus: Stock-based compensation | 71,691 | | | 63,625 | | | |
| Plus: Amortization of acquired intangible assets | 36,988 | | | 22,853 | | | |
| Plus: Restructuring charges (1) | — | | | 9,192 | | | |
| Non-GAAP gross profit | $ | 3,663,787 | | | $ | 2,996,552 | | | |
| Gross margin | | | | | |
| GAAP gross margin | 82% | | 82% | | |
| Plus: Stock-based compensation | 1 | | 2 | | |
| Plus: Amortization of acquired intangible assets | 1 | | 1 | | |
| Plus: Restructuring charges (1) | — | | — | | |
| Non-GAAP gross margin | 84% | | 85% | | |
| Operating income | | | | | |
| GAAP operating income (loss) | $ | (117,077) | | | $ | (345,222) | | | |
| Plus: Stock-based compensation | 1,081,433 | | | 937,812 | | | |
| Plus: Amortization of acquired intangible assets | 49,748 | | | 33,127 | | | |
| Plus: Restructuring charges (1) | — | | | 96,894 | | | |
| Non-GAAP operating income | $ | 1,014,104 | | | $ | 722,611 | | | |
| Operating margin | | | | | |
| GAAP operating margin | (3)% | | (10)% | | |
| Plus: Stock-based compensation | 25 | | 26 | | |
| Plus: Amortization of acquired intangible assets | 1 | | 1 | | |
| Plus: Restructuring charges (1) | — | | 3 | | |
| | | | | | | | | | | | | |
| Non-GAAP operating margin | 23% | | 20% | | |
| Net income | | | | | |
| GAAP net loss | $ | (300,519) | | | $ | (486,761) | | | |
| Plus: Stock-based compensation | 1,081,433 | | | 937,812 | | | |
| Plus: Amortization of acquired intangible assets | 49,748 | | | 33,127 | | | |
| Plus: Restructuring charges (1) | — | | | 96,894 | | | |
| | | | | |
| Less: Gain on a non-cash sale of a controlling interest of a subsidiary | (1,378) | | | (45,158) | | | |
| Less: Income tax adjustments (2) | (66,875) | | | (43,659) | | | |
| Non-GAAP net income | $ | 762,409 | | | $ | 492,255 | | | |
| Net income per share | | | | | |
| GAAP net loss per share - diluted | $ | (1.16) | | | $ | (1.90) | | | |
| Plus: Stock-based compensation | 4.16 | | | 3.66 | | | |
| Plus: Amortization of acquired intangible assets | 0.19 | | | 0.13 | | | |
| Plus: Restructuring charges (1) | — | | | 0.38 | | | |
| | | | | |
| Less: Gain on a non-cash sale of a controlling interest of a subsidiary | (0.01) | | | (0.18) | | | |
| Less: Income tax adjustments (2) | (0.25) | | | (0.17) | | | |
| Non-GAAP net income per share - diluted | $ | 2.93 | | | $ | 1.92 | | | |
| Weighted-average diluted shares outstanding | | | | | |
| Weighted-average shares used in computing diluted GAAP net loss per share | 259,133 | | | 256,307 | | | |
| Plus: Dilution from dilutive securities (3) | 1,076 | | | 554 | | | |
| Weighted-average shares used in computing diluted non-GAAP net income per share | 260,209 | | | 256,861 | | | |
| Free cash flow | | | | | |
| GAAP net cash provided by operating activities | $ | 1,448,159 | | | $ | 868,111 | | | |
| Less: Capital expenditures | (32,577) | | | (25,652) | | | |
| Free cash flow | $ | 1,415,582 | | | $ | 842,459 | | | |
(1) Restructuring charges include stock-based compensation expense related to the rebalancing of resources for fiscal year 2023.
(2) In fiscal year 2024, we began to utilize a fixed long-term projected non-GAAP tax rate in our computation of the non-GAAP income tax adjustments in order to provide better consistency across interim reporting periods. In projecting this long-term non-GAAP tax rate, we utilized a three-year financial projection that excludes the direct and indirect income tax effects of the other non-GAAP adjustments reflected above. Additionally, we considered our current operating structure and other factors such as our existing tax positions in various jurisdictions and key legislation in major jurisdictions where we operate. For fiscal year 2024, we determined the projected non-GAAP tax rate to be 27%. This fixed long-term projected non-GAAP tax rate eliminates the effects of non-recurring and period specific items which can vary in size and frequency. Examples of the non-recurring and period specific items include but are not limited to changes in the valuation allowance related to deferred tax assets, effects resulting from acquisitions, and unusual or infrequently occurring items. We will periodically re-evaluate this long-term rate, as necessary, for significant events. The rate could be subject to change for a variety of reasons, for example, significant changes in the geographic earnings mix or fundamental tax law changes in major jurisdictions where we operate.
(3) The effects of these dilutive securities were not included in the GAAP calculation of diluted net loss per share for fiscal years 2024 and 2023 because the effect would have been anti-dilutive.
ITEM 7A. QUANTITATIVE AND QUALITATIVE DISCLOSURE ABOUT MARKET RISK
Foreign Currency Exchange Risk
We operate globally and are exposed to foreign exchange risk arising from exposure to various currencies in the ordinary course of business. Our exposures primarily consist of the Australian dollar, Indian rupee, Euro, British pound, Japanese yen, Philippine peso, Canadian dollar, Polish zloty and New Zealand dollar. Foreign exchange risk arises from commercial transactions and recognized financial assets and liabilities denominated in a currency other than the U.S. dollar. Our financial risk management policy is reviewed annually by our audit committee and requires us to monitor our foreign exchange exposure on a regular basis.
The substantial majority of our sales contracts are denominated in U.S. dollars, and our operating expenses are generally denominated in the local currencies of the countries where our operations are located. We therefore benefit from a strengthening of the U.S. dollar and are adversely affected by the weakening of the U.S. dollar.
We have a cash flow hedging program in place and enter into derivative transactions to manage certain foreign currency exchange risks that arise in our ordinary business operations. We recognize all derivative instruments as either assets or liabilities on our consolidated statements of financial position and measure them at fair value. Gains and losses resulting from changes in fair value are accounted for depending on the use of the derivative and whether it is designated and qualifies for hedge accounting.
We enter into master netting agreements with select financial institutions to reduce our credit risk, and we trade with several counterparties to reduce our concentration risk with any single counterparty. We do not have significant exposure to counterparty credit risk at this time. We do not require nor are we required to post collateral of any kind related to our foreign currency derivatives.
Foreign currency exchange rate exposure
We hedge material foreign currency denominated monetary assets and liabilities using balance sheet hedges. The fluctuations in the fair market value of balance sheet hedges due to foreign currency rates generally offset those of the hedged items, resulting in no material effect on profit. Consequently, we are primarily exposed to significant foreign currency exchange rate fluctuations with regard to the spot component of derivatives held within a designated cash flow hedge relationship affecting other comprehensive income.
Foreign currency sensitivity
A sensitivity analysis performed on our hedging portfolio as of June 30, 2024 and 2023 indicated that a hypothetical 10% strengthening or weakening of the U.S. dollar against the foreign currencies applicable to our business would decrease or increase the fair value of our foreign currency contracts by $65.8 million and $52.2 million, respectively.
Interest Rate Risk
Our cash equivalents and investment portfolio are subject to market risk due to changes in interest rates. Fixed rate securities may have their market value adversely impacted due to a rise in interest rates. As of June 30, 2024, we had cash and cash equivalents totaling $2.2 billion and short-term investments totaling $162.0 million. A sensitivity analysis performed on our portfolio as of June 30, 2024 and 2023 indicated that a hypothetical 100 basis point increase or decrease in interest rates did not have a material impact to market value of our investments. This estimate is based on a sensitivity model that measures market value changes when changes in interest rates occur.
On May 15, 2024, we issued $500.0 million aggregate principal amount of 5.250% senior notes due 2029 (the “2029 Notes”) and $500.0 million aggregate principal amount of 5.500% senior notes due 2034 (the “2034 Notes,” and together with the 2029 Notes, the “Notes”). As of June 30, 2024, we had $985.6 million of senior Notes, net of unamortized discount and issuance costs, outstanding. The Notes have fixed annual interest rates, and therefore we do not have economic interest rate exposure on these debt obligations. However, the fair values of the Notes are exposed to interest rate risk. Generally, the fair values of the Notes will increase as interest rates fall and decrease as interest rates rise. Refer to Note 11, “Debt,” to our consolidated financial statements for additional information.
ITEM 8. FINANCIAL STATEMENT AND SUPPLEMENTARY DATA
ATLASSIAN CORPORATION
INDEX TO CONSOLIDATED FINANCIAL STATEMENTS | | | | | |
| | Page |
Reports of Independent Registered Public Accounting Firm (PCAOB ID 42) | |
| Consolidated Balance Sheets | |
| Consolidated Statements of Operations | |
| Consolidated Statements of Comprehensive Loss | |
| Consolidated Statements of Stockholder’s Equity | |
| Consolidated Statements of Cash Flows | |
| Notes to Consolidated Financial Statements | |
Report of Independent Registered Public Accounting Firm
To the Stockholders and the Board of Directors of Atlassian Corporation
Opinion on the Financial Statements
We have audited the accompanying consolidated balance sheets of Atlassian Corporation (the Company) as of June 30, 2024 and 2023, the related consolidated statements of operations, comprehensive loss, stockholders’ equity and cash flows for each of the three years in the period ended June 30, 2024, and the related notes (collectively referred to as the “consolidated financial statements”). In our opinion, the consolidated financial statements present fairly, in all material respects, the financial position of the Company at June 30, 2024 and 2023, and the results of its operations and its cash flows for each of the three years in the period ended June 30, 2024, in conformity with U.S. generally accepted accounting principles.
We also have audited, in accordance with the standards of the Public Company Accounting Oversight Board (United States) (PCAOB), the Company's internal control over financial reporting as of June 30, 2024, based on criteria established in Internal Control Integrated Framework issued by the Committee of Sponsoring Organizations of the Treadway Commission (2013 framework), and our report dated August 16, 2024 expressed an unqualified opinion thereon.
Basis for Opinion
These financial statements are the responsibility of the Company's management. Our responsibility is to express an opinion on the Company’s financial statements based on our audits. We are a public accounting firm registered with the PCAOB and are required to be independent with respect to the Company in accordance with the U.S. federal securities laws and the applicable rules and regulations of the Securities and Exchange Commission and the PCAOB.
We conducted our audits in accordance with the standards of the PCAOB. Those standards require that we plan and perform the audit to obtain reasonable assurance about whether the financial statements are free of material misstatement, whether due to error or fraud. Our audits included performing procedures to assess the risks of material misstatement of the financial statements, whether due to error or fraud, and performing procedures that respond to those risks. Such procedures included examining, on a test basis, evidence regarding the amounts and disclosures in the financial statements. Our audits also included evaluating the accounting principles used and significant estimates made by management, as well as evaluating the overall presentation of the financial statements. We believe that our audits provide a reasonable basis for our opinion.
Critical Audit Matters
The critical audit matters communicated below are matters arising from the current period audit of the financial statements that were communicated or required to be communicated to the audit committee and that: (1) relate to accounts or disclosures that are material to the financial statements and (2) involved our especially challenging, subjective or complex judgments. The communication of critical audit matters does not alter in any way our opinion on the consolidated financial statements, taken as a whole, and we are not, by communicating the critical audit matters below, providing separate audit opinions on the critical audit matters or on the accounts or disclosures to which they relate.
| | | | | | | | |
| | Revenue Recognition |
| | |
| Description of the Matter | | As described in Note 2 to the consolidated financial statements, the Company reports revenues in three categories: (i) subscriptions, (ii) maintenance, and (iii) other. The Company’s contracts often include promises to transfer multiple products and services to a customer. The Company allocates the transaction price for each contract to each performance obligation based on the relative standalone selling price (“SSP”) for each performance obligation. Auditing the Company’s revenue recognition was challenging due to the effort required to analyze the accounting treatment for contracts with multiple performance obligations. This involved assessing the impact of terms and conditions of contracts and the determination of SSP for the identified performance obligations.
|
| | | | | | | | |
| How We Addressed the Matter in Our Audit | | We obtained an understanding of the process for revenue recognition by performing a walkthrough. We also evaluated the design and tested the operating effectiveness of the Company's internal controls over the assessment of terms and conditions of contracts, which included the internal controls over the determination of SSP for the identified performance obligations. To evaluate management’s assessment of terms and conditions of contracts, we performed audit procedures that included, among others, testing a sample of contracts to understand the terms and conditions and evaluating SSP for the identified performance obligations. To evaluate management’s determination of SSP for the identified performance obligations, we performed audit procedures that included, among others, assessing the appropriateness of the methodologies used in the Company’s SSP analyses, testing the completeness and accuracy of the underlying data used, and testing the mathematical accuracy. Finally, we assessed the related disclosures in the consolidated financial statements.
|
| | | | | | | | |
| | Valuation of developed technology intangible asset in the acquisition of Loom, Inc. |
| | |
| Description of the Matter | | As described in Note 7 to the consolidated financial statements, the Company acquired Loom, Inc. (Loom) for a total purchase price consideration of approximately $885.6 million. The transaction was accounted for as a business combination. Auditing the Company’s accounting for the Loom acquisition was challenging due to the significant estimation required by management to determine the fair value of the acquired developed technology intangible asset using a discounted cash flow model. This model requires estimation, including the determination of key assumptions, which included projected revenue growth, projected research and development expenses, and a technology migration curve.
|
| | |
| How We Addressed the Matter in Our Audit | | We obtained an understanding of the process for accounting for the Loom acquisition by performing a walkthrough. We also evaluated the design and tested the operating effectiveness of the Company's internal controls over the determination of the fair value of the acquired developed technology intangible asset, which included the internal controls over the estimation process and the determination of key assumptions. To evaluate management’s determination of the fair value of the acquired developed technology intangible asset, we involved EY specialists and performed audit procedures that included, among others, assessing the Company's selection of valuation methodology, evaluating the estimation and significant assumptions used, and testing the completeness and accuracy of the underlying data supporting the fair value. Finally, we assessed the related disclosures in the consolidated financial statements.
|
/s/ Ernst & Young LLP
We have served as the Company’s auditor since 2012.
San Francisco, California
August 16, 2024
Report of Independent Registered Public Accounting Firm
To the Stockholders and the Board of Directors of Atlassian Corporation
Opinion on Internal Control Over Financial Reporting
We have audited Atlassian Corporation’s internal control over financial reporting as of June 30, 2024, based on criteria established in Internal Control Integrated Framework issued by the Committee of Sponsoring Organizations of the Treadway Commission (2013 framework) (the COSO criteria). In our opinion, Atlassian Corporation (the Company) maintained, in all material respects, effective internal control over financial reporting as of June 30, 2024, based on the COSO criteria.
We also have audited, in accordance with the standards of the Public Company Accounting Oversight Board (United States) (PCAOB), the 2024 consolidated financial statements of the Company and our report dated August 16, 2024 expressed an unqualified opinion thereon.
Basis for Opinion
The Company’s management is responsible for maintaining effective internal control over financial reporting and for its assessment of the effectiveness of internal control over financial reporting included in the accompanying Management’s Annual Report on Internal Control Over Financial Reporting. Our responsibility is to express an opinion on the Company’s internal control over financial reporting based on our audit. We are a public accounting firm registered with the PCAOB and are required to be independent with respect to the Company in accordance with the U.S. federal securities laws and the applicable rules and regulations of the Securities and Exchange Commission and the PCAOB.
We conducted our audit in accordance with the standards of the PCAOB. Those standards require that we plan and perform the audit to obtain reasonable assurance about whether effective internal control over financial reporting was maintained in all material respects.
Our audit included obtaining an understanding of internal control over financial reporting, assessing the risk that a material weakness exists, testing and evaluating the design and operating effectiveness of internal control based on the assessed risk, and performing such other procedures as we considered necessary in the circumstances. We believe that our audit provides a reasonable basis for our opinion.
Definition and Limitations of Internal Control Over Financial Reporting
A company’s internal control over financial reporting is a process designed to provide reasonable assurance regarding the reliability of financial reporting and the preparation of financial statements for external purposes in accordance with generally accepted accounting principles. A company’s internal control over financial reporting includes those policies and procedures that (1) pertain to the maintenance of records that, in reasonable detail, accurately and fairly reflect the transactions and dispositions of the assets of the company; (2) provide reasonable assurance that transactions are recorded as necessary to permit preparation of financial statements in accordance with generally accepted accounting principles, and that receipts and expenditures of the company are being made only in accordance with authorizations of management and directors of the company; and (3) provide reasonable assurance regarding prevention or timely detection of unauthorized acquisition, use, or disposition of the company’s assets that could have a material effect on the financial statements.
Because of its inherent limitations, internal control over financial reporting may not prevent or detect misstatements. Also, projections of any evaluation of effectiveness to future periods are subject to the risk that controls may become inadequate because of changes in conditions, or that the degree of compliance with the policies or procedures may deteriorate.
/s/ Ernst & Young LLP
San Francisco, California
August 16, 2024
ATLASSIAN CORPORATION
CONSOLIDATED BALANCE SHEETS
(in thousands, except par value and share data) | | | | | | | | | | | | | | |
| | June 30, |
| | 2024 | | 2023 |
| Assets | | | | |
| Current assets: | | | | |
| Cash and cash equivalents | | $ | 2,176,930 | | | $ | 2,102,550 | |
| Marketable securities | | 161,973 | | | 10,000 | |
| Accounts receivable, net | | 628,049 | | | 477,678 | |
| | | | |
| | | | |
| Prepaid expenses and other current assets | | 109,312 | | | 146,136 | |
| Total current assets | | 3,076,264 | | | 2,736,364 | |
| Non-current assets: | | | | |
| Property and equipment, net | | 86,315 | | | 81,402 | |
| Operating lease right-of-use assets | | 172,468 | | | 184,195 | |
| Strategic investments | | 223,221 | | | 225,538 | |
| Intangible assets, net | | 299,057 | | | 69,072 | |
| Goodwill | | 1,288,756 | | | 727,211 | |
| Deferred tax assets | | 3,934 | | | 9,945 | |
| Other non-current assets | | 62,118 | | | 73,052 | |
| Total assets | | $ | 5,212,133 | | | $ | 4,106,779 | |
| Liabilities and Stockholders’ Equity | | | | |
| Current liabilities: | | | | |
| Accounts payable | | $ | 177,545 | | | $ | 159,293 | |
| Accrued expenses and other current liabilities | | 577,359 | | | 423,131 | |
| Deferred revenue, current portion | | 1,806,269 | | | 1,362,736 | |
| Operating lease liabilities, current portion | | 48,953 | | | 44,930 | |
| Debt, current portion | | — | | | 37,500 | |
| | | | |
| Total current liabilities | | 2,610,126 | | | 2,027,590 | |
| Non-current liabilities: | | | | |
| Deferred revenue, net of current portion | | 308,467 | | | 182,743 | |
| Operating lease liabilities, net of current portion | | 214,474 | | | 237,835 | |
| Debt, net of current portion | | 985,911 | | | 962,093 | |
| Deferred tax liabilities | | 20,387 | | | 10,669 | |
| Other non-current liabilities | | 39,917 | | | 31,177 | |
| Total liabilities | | 4,179,282 | | | 3,452,107 | |
Commitments and contingencies (Note 12) | | | | |
| Stockholders’ equity | | | | |
Class A Common Stock, $0.00001 par value; 750,000,000 shares authorized, 159,544,123 and 152,442,673 issued and outstanding at June 30, 2024 and 2023, respectively | | 2 | | | 2 | |
Class B Common Stock, 0.00001 par value; 230,000,000 shares authorized, 101,012,393 and 105,124,103 issued and outstanding at June 30, 2024 and 2023, respectively | | 1 | | | 1 | |
| Additional paid-in capital | | 4,212,064 | | | 3,130,631 | |
| Accumulated other comprehensive income | | 25,300 | | | 34,002 | |
| Accumulated deficit | | (3,204,516) | | | (2,509,964) | |
| Total stockholders’ equity | | 1,032,851 | | | 654,672 | |
| Total liabilities and stockholders’ equity | | $ | 5,212,133 | | | $ | 4,106,779 | |
The above consolidated financial statements should be read in conjunction with the accompanying notes.
ATLASSIAN CORPORATION
CONSOLIDATED STATEMENTS OF OPERATIONS
(in thousands, except per share data) | | | | | | | | | | | | | | | | | | | | |
| | | Fiscal Year Ended June 30, |
| | | 2024 | | 2023 | | 2022 |
| Revenues: | | | | | | |
| Subscription | | $ | 3,924,389 | | | $ | 2,922,576 | | | $ | 2,096,706 | |
| Maintenance | | 177,230 | | | 399,738 | | | 495,077 | |
| Other | | 256,984 | | | 212,333 | | | 211,099 | |
| Total revenues | | 4,358,603 | | | 3,534,647 | | | 2,802,882 | |
Cost of revenues (1) (2) | | 803,495 | | | 633,765 | | | 452,914 | |
| Gross profit | | 3,555,108 | | | 2,900,882 | | | 2,349,968 | |
| Operating expenses: | | | | | | |
Research and development (1) (2) | | 2,184,111 | | | 1,869,881 | | | 1,291,877 | |
Marketing and sales (1) (2) | | 877,497 | | | 769,861 | | | 535,815 | |
General and administrative (1) | | 610,577 | | | 606,362 | | | 452,193 | |
| Total operating expenses | | 3,672,185 | | | 3,246,104 | | | 2,279,885 | |
Operating income (loss) | | (117,077) | | | (345,222) | | | 70,083 | |
| Other income (expense), net | | (30,916) | | | 14,501 | | | (501,839) | |
| Interest income | | 96,663 | | | 49,732 | | | 2,284 | |
| Interest expense | | (34,077) | | | (30,147) | | | (41,466) | |
| Loss before provision for income taxes | | (85,407) | | | (311,136) | | | (470,938) | |
| Provision for income taxes | | (215,112) | | | (175,625) | | | (48,572) | |
| Net loss | | $ | (300,519) | | | $ | (486,761) | | | $ | (519,510) | |
| | | | | | |
| | | | | | |
| Net loss per share attributable to Class A and Class B common stockholders: | | | | | | |
| Basic | | $ | (1.16) | | | $ | (1.90) | | | $ | (2.05) | |
| Diluted | | $ | (1.16) | | | $ | (1.90) | | | $ | (2.05) | |
| Weighted-average shares used in computing net loss per share attributable to Class A and Class B common stockholders: | | | | | | |
| Basic | | 259,133 | | | 256,307 | | | 253,312 | |
| Diluted | | 259,133 | | | 256,307 | | | 253,312 | |
(1) Amounts include stock-based compensation, as follows: | | | | | | | | | | | | | | | | | |
| Cost of revenues | $ | 71,691 | | | $ | 63,913 | | | $ | 31,358 | |
| Research and development | 712,409 | | | 604,301 | | | 328,978 | |
| Marketing and sales | 137,347 | | | 131,739 | | | 76,209 | |
| General and administrative | 159,986 | | | 148,134 | | | 88,258 | |
(2) Amounts include amortization of acquired intangible assets, as follows: | | | | | | | | | | | | | | | | | |
| Cost of revenues | $ | 36,988 | | | $ | 22,853 | | | $ | 22,694 | |
| Research and development | 374 | | | 374 | | | 374 | |
| Marketing and sales | 12,386 | | | 9,900 | | | 9,330 | |
The above consolidated financial statements should be read in conjunction with the accompanying notes.
ATLASSIAN CORPORATION
CONSOLIDATED STATEMENTS OF COMPREHENSIVE LOSS
(in thousands) | | | | | | | | | | | | | | | | | | | | |
| | | Fiscal Year Ended June 30, |
| | | 2024 | | 2023 | | 2022 |
| Net loss | | $ | (300,519) | | | $ | (486,761) | | | $ | (519,510) | |
| Other comprehensive income (loss), net of reclassification adjustments: | | | | | | |
| Foreign currency translation adjustment | | (2,270) | | | (5,283) | | | (15,604) | |
| Net change in unrealized gain (loss) on marketable and privately held debt securities | | 314 | | | 1,753 | | | (3,458) | |
| Net gain (loss) on cash flow hedging derivative instruments | | (6,746) | | | 23,668 | | | 27,438 | |
| Other comprehensive income (loss), before tax | | (8,702) | | | 20,138 | | | 8,376 | |
| Income tax effect | | — | | | — | | | 134 | |
| Other comprehensive income (loss), net of tax | | (8,702) | | | 20,138 | | | 8,510 | |
| Total comprehensive loss, net of tax | | $ | (309,221) | | | $ | (466,623) | | | $ | (511,000) | |
| | | | | | |
| | | | | | |
The above consolidated financial statements should be read in conjunction with the accompanying notes.
ATLASSIAN CORPORATION
CONSOLIDATED STATEMENTS OF STOCKHOLDERS’ EQUITY
(in thousands)
| | | | | | | | | | | | | | | | | | | | | | | | | | | | | | | | | | | | | | | | | | | | | | | | | | |
| | Common Stock | | Additional paid in capital | | Accumulated other comprehensive income | | Accumulated Deficit | | Total stockholders’ equity |
| | Class A | | Class B | | | | |
| | Shares | | Amount | | Shares | | Amount | | | | |
| Balance at June 30, 2021 | | $ | 137,038 | | | $ | 1 | | | $ | 114,610 | | | $ | 1 | | | $ | 1,657,426 | | | $ | 5,354 | | | $ | (1,349,520) | | | $ | 313,262 | |
| Common stock issued | | 3,208 | | | — | | | — | | | — | | | 32 | | | — | | | — | | | 32 | |
| Conversion from Class B Common Stock to Class A Common Stock | | 4,574 | | — | | | (4,574) | | | — | | | — | | | — | | | — | | | — | |
| Stock-based compensation | | — | | — | | | — | | — | | 525,078 | | — | | — | | 525,078 | |
| Other comprehensive income, net of tax | | — | | — | | | — | | — | | — | | 8,510 | | — | | 8,510 | |
| Net loss | | — | | — | | | — | | — | | — | | — | | (519,510) | | (519,510) | |
| Balance at June 30, 2022 | | 144,820 | | | 1 | | | 110,036 | | | 1 | | | 2,182,536 | | | 13,864 | | | (1,869,030) | | | 327,372 | |
| Common stock issued | | 3,684 | | | 1 | | | — | | | — | | | 8 | | | — | | | — | | | 9 | |
| Conversion from Class B Common Stock to Class A Common Stock | | 4,912 | | | — | | | (4,912) | | | — | | | — | | | — | | | — | | | — | |
| Stock-based compensation | | — | | | — | | | — | | | — | | | 948,087 | | | — | | | — | | | 948,087 | |
| Repurchases of Class A Common Stock | | (979) | | | — | | | — | | | — | | | — | | | — | | | (154,173) | | | (154,173) | |
| Other comprehensive income, net of tax | | — | | | — | | | — | | | — | | | — | | | 20,138 | | | — | | | 20,138 | |
| Net Loss | | — | | | — | | | — | | | — | | | — | | | — | | | (486,761) | | | (486,761) | |
| Balance at June 30, 2023 | | 152,437 | | | 2 | | | 105,124 | | | 1 | | | 3,130,631 | | | 34,002 | | | (2,509,964) | | | 654,672 | |
| Common stock issued | | 5,000 | | — | | — | | — | | — | | — | | — | | — |
| Conversion from Class B Common Stock to Class A Common Stock | | 4,112 | | — | | (4,112) | | — | | — | | — | | — | | — |
| Stock-based compensation | | — | | — | | — | | — | | 1,081,433 | | — | | — | | 1,081,433 |
| Repurchases of Class A Common Stock | | (2,161) | | — | | — | | — | | — | | — | | (394,033) | | (394,033) |
| Other comprehensive loss, net of tax | | — | | — | | — | | — | | — | | (8,702) | | — | | (8,702) |
| Net loss | | — | | — | | — | | — | | — | | — | | (300,519) | | (300,519) |
| Balance at June 30, 2024 | | 159,388 | | 2 | | 101,012 | | 1 | | 4,212,064 | | 25,300 | | (3,204,516) | | 1,032,851 |
The above consolidated financial statements should be read in conjunction with the accompanying notes.
ATLASSIAN CORPORATION
CONSOLIDATED STATEMENTS OF CASH FLOWS
(in thousands) | | | | | | | | | | | | | | | | | |
| Fiscal Year Ended June 30, |
| 2024 | | 2023 | | 2022 |
| Cash flows from operating activities: | | | | | |
| Net loss | $ | (300,519) | | | $ | (486,761) | | | $ | (519,510) | |
| Adjustments to reconcile net loss to net cash provided by operating activities: | | | | | |
| Depreciation and amortization | 78,738 | | | 60,923 | | | 51,739 | |
| Stock-based compensation | 1,081,433 | | | 948,087 | | | 524,803 | |
| Impairment charges for leases and leasehold improvements | — | | | 61,098 | | | — | |
| Deferred income taxes | 119 | | | 10,613 | | | (2,002) | |
| Gain on a non-cash sale of a controlling interest of a subsidiary | (1,378) | | | (45,158) | | | — | |
| Amortization of interest rate swap contracts | (4,166) | | | — | | | — | |
| Net loss on exchange derivative and capped call transactions | — | | | — | | | 424,482 | |
| Amortization of debt discount and issuance cost | 919 | | | 471 | | | 27,051 | |
| Net loss on strategic investments | 13,337 | | | 19,407 | | | 72,663 | |
| Net foreign currency loss (gain) | 2,301 | | | (10,613) | | | (12,065) | |
| Other | 386 | | | 1,488 | | | 646 | |
| Changes in operating assets and liabilities, net of business combinations: | | | | | |
| Accounts receivable, net | (148,469) | | | (169,526) | | | (134,764) | |
| Prepaid expenses and other assets | (3,122) | | | (38,230) | | | (21,927) | |
| Accounts payable | 18,150 | | | 78,902 | | | 31,741 | |
| Accrued expenses and other liabilities | 158,123 | | | 74,611 | | | 93,250 | |
| Deferred revenue | 552,307 | | | 362,799 | | | 284,937 | |
| Net cash provided by operating activities | 1,448,159 | | | 868,111 | | | 821,044 | |
| Cash flows from investing activities: | | | | | |
| Business combinations, net of cash acquired | (847,767) | | | (5,775) | | | (19,411) | |
| Purchases of intangible assets | (535) | | | (160) | | | (4,018) | |
| Purchases of property and equipment | (32,577) | | | (25,652) | | | (70,583) | |
| Purchases of strategic investments | (14,400) | | | (19,450) | | | (111,668) | |
| Purchases of marketable securities | (248,897) | | | (24,800) | | | (21,003) | |
| Proceeds from maturities of marketable securities | 116,537 | | | 73,950 | | | 76,937 | |
| Proceeds from sales of marketable securities and strategic investments | 63,893 | | | 629 | | | 186,262 | |
| Net cash provided by (used in) investing activities | (963,746) | | | (1,258) | | | 36,516 | |
| Cash flows from financing activities: | | | | | |
| Proceeds from Term Loan Facility | — | | | — | | | 1,000,000 | |
| Repayment of Term Loan Facility | (1,000,000) | | | — | | | |
| Proceeds from issuance of debt, net of issuance costs | 987,039 | | | — | | | — | |
| Repayment of exchangeable senior notes | — | | | — | | | (1,548,686) | |
| Proceeds from settlement of capped call transactions | — | | | — | | | 135,497 | |
| Repurchases of Class A Common Stock | (395,256) | | | (150,006) | | | — | |
| Proceeds from other financing arrangements | — | | | 1,585 | | | 13,909 | |
| Net cash used in financing activities | (408,217) | | | (148,421) | | | (399,280) | |
| Effect of foreign exchange rate changes on cash and cash equivalents | (1,989) | | | (1,805) | | | (9,233) | |
| Net increase in cash, cash equivalents, and restricted cash | 74,207 | | | 716,627 | | | 449,047 | |
| Cash, cash equivalents, and restricted cash at beginning of period | 2,103,915 | | | 1,386,686 | | | 931,023 | |
| Net decrease in cash and cash equivalents included in assets held for sale | — | | | 602 | | | 6,616 | |
| Cash, cash equivalents, and restricted cash at end of period | $ | 2,178,122 | | | $ | 2,103,915 | | | $ | 1,386,686 | |
| | | | | |
| Reconciliation of cash, cash equivalents, and restricted cash within the consolidated balance sheets to the amounts shown in the consolidated statements of cash flows above: | | | | | |
| Cash and cash equivalents | $ | 2,176,930 | | | $ | 2,102,550 | | | $ | 1,385,265 | |
| Restricted cash included in other non-current assets | 1,192 | | | 1,365 | | | 1,421 | |
| Total cash, cash equivalents, and restricted cash | $ | 2,178,122 | | | $ | 2,103,915 | | | $ | 1,386,686 | |
| | | | | | | | | | | | | | | | | | | | |
| Supplemental disclosures of cash flow information: | | | | | | |
| Income taxes paid, net of refunds | | $ | 253,828 | | | $ | 102,156 | | | $ | 66,648 | |
| Interest paid | | 61,339 | | | 46,247 | | | 10,027 | |
| Settlement of (received from) interest rate swap contracts | | (65,734) | | | (17,754) | | | 3,283 | |
| Non-cash investing and financing activities: | | | | | | |
| Purchase of property and equipment included in accrued expenses and other current liabilities | | 1,263 | | | 844 | | | 10,740 | |
| Repurchases of Class A Common Stock included in accrued expenses and other current liabilities | | 2,943 | | | 4,167 | | | — | |
| Debt issuance costs included in accrued expenses and other current liabilities | | 1,344 | | | — | | | — | |
| | | | | | |
| | | | | | |
The above consolidated financial statements should be read in conjunction with the accompanying notes.
ATLASSIAN CORPORATION
NOTES TO CONSOLIDATED FINANCIAL STATEMENTS
1. Description of Business
Atlassian Corporation (the “Company”) is a global technology company with a mission to unleash the potential of every team. Through a connected portfolio of products with discrete value propositions and built on the Atlassian platform and data model, Atlassian gives all teams the right teamwork foundations so they can plan and track work, align on goals, and unleash knowledge across the organization. Our primary products include Jira for planning and project management, Confluence for content creation and sharing, Jira Service Management for team service, management and support applications, and Loom, which we acquired in November 2023, for asynchronous video collaboration. The Company is the successor parent entity to Atlassian Corporation Plc, which was a public company limited by shares, incorporated under the laws of England and Wales.
The Company’s fiscal year ends on June 30 of each year. References to fiscal year 2024, for example, refer to the fiscal year ended June 30, 2024.
On September 30, 2022, Atlassian Corporation Plc completed a redomestication, which was approved by the shareholders of Atlassian Corporation Plc, resulting in Atlassian Corporation becoming our publicly traded parent company (the “U.S. Domestication”). Atlassian Corporation Plc’s stockholders and the High Court of Justice of England and Wales approved the scheme of arrangement effecting the U.S. Domestication. Effective after the close of market trading on September 30, 2022, all issued and outstanding ordinary shares of Atlassian Corporation Plc were exchanged on a one-for-one basis for newly issued shares of corresponding common stock of Atlassian Corporation, and all issued and outstanding equity awards of Atlassian Corporation Plc were assumed by Atlassian Corporation and were converted into rights to acquire Atlassian Corporation shares of Class A Common Stock on the same terms. The Class A Common Stock of Atlassian Corporation began trading on October 3, 2022 (the first trading day following the U.S. Domestication), and the Company’s trading symbol on The Nasdaq Global Select Market remained unchanged as “TEAM.”
2. Summary of Significant Accounting Policies
Basis of Preparation
The accompanying consolidated financial statements have been prepared in accordance with U.S. generally accepted accounting principles (“GAAP”). These principles are established primarily by the Financial Accounting Standards Board (“FASB”).
Principles of Consolidation
The accompanying consolidated financial statements include the accounts of the Company and its wholly owned subsidiaries. All significant intercompany balances and transactions have been eliminated in consolidation.
Use of Estimates
The preparation of the consolidated financial statements in conformity with GAAP requires management to make certain estimates and assumptions in the Company’s consolidated financial statements. These estimates are based on information available as of the date of the consolidated financial statements. Such management estimates and assumptions include, but are not limited to the determination of:
•the standalone selling price (“SSP”) of performance obligations for revenue contracts with multiple performance obligations;
•the fair value of assets acquired and liabilities assumed for business combinations;
•the recognition, measurement and valuation of current and deferred income taxes and uncertain tax positions.
Actual results could differ materially from these estimates.
Segment
The Company operates as a single operating segment. An operating segment is defined as a component of an entity for which discrete financial information is available and whose results of operations are regularly reviewed
by the chief operating decision maker (“CODM”). The Company’s CODMs are its Co-Chief Executive Officers, who review its results of operations to make decisions about allocating resources and assessing performance based on consolidated financial information. Accordingly, the Company has determined it operates as a single operating and reportable segment.
Foreign Currency
The Company’s consolidated financial statements are presented using the U.S. dollar, which is its reporting currency. The functional currency for certain of the Company’s foreign subsidiaries is the U.S. dollar, while others use local currencies. The Company translates the foreign functional currency financial statements to U.S. dollars for those entities that do not have the U.S. dollar as their functional currency using the exchange rates at the balance sheet date for assets and liabilities, the period average exchange rates for revenues and expenses, and the historical exchange rates for equity transactions. The effects of foreign currency translation adjustments are recorded in accumulated other comprehensive income in the Consolidated Statements of Comprehensive Loss. Foreign currency transaction gains and losses are included in other income (expense), net on the Consolidated Statements of Operations.
Revenue from Contracts with Customers
Policies, Estimates and Judgments
Revenues are generally recognized upon the transfer of control of promised products or services provided to customers, reflecting the amount of consideration the Company expects to receive for those products or services. The Company enters into contracts that can include various combinations of products and services, which are generally capable of being distinct and accounted for as separate performance obligations. Revenue is recognized net of sales and other similar taxes collected from customers, which are subsequently remitted to governmental authorities.
Revenues are recognized upon the application of the following steps:
1.Identification of the contract or contracts with a customer;
2.Identification of the performance obligations in the contract;
3.Determination of the transaction price;
4.Allocation of the transaction price to the performance obligations in the contract; and
5.Recognition of revenue when, or as, the performance obligation is satisfied.
The timing of revenue recognition may differ from the timing of billing to our customers. The Company receives payments from customers based on a billing schedule as established in its contracts. Contract assets are recognized when performance is completed in advance of billings. Deferred revenue is recorded when billings are in advance of performance under the contract. The Company’s revenue arrangements include standard warranty provisions that the products and services will perform and operate in all material respects with the applicable published specifications, the financial impacts of which have historically been and are expected to continue to be insignificant. The Company’s contracts do not include a significant financing component.
Customer contracts often include promises to transfer multiple products and services to a customer.
The Company allocates the transaction price for each customer contract to each performance obligation based on the relative SSP for each distinct performance obligation. Judgment is required in determining the SSP for each distinct performance obligation. The Company typically determines an SSP range for its products and services, which is reassessed on a periodic basis or when facts and circumstances change. In most cases, the Company is able to determine SSP based on the observable prices of products or services sold separately. In instances where performance obligations do not have observable standalone sales, the Company utilizes available information that may include market conditions, pricing strategies, the life of the software, and other observable inputs to estimate the price that it would charge if the products and services were sold separately.
Recognition of Revenue
Revenue recognized from contracts with customers is disaggregated into categories that depict how the nature, amount, timing and uncertainty of revenue and cash flows are affected by economic factors. The Company reports revenues in three categories: (i) subscription, (ii) maintenance, and (iii) other. In addition, revenue is presented by geographic region and deployment option in Note 13, “Revenue.”
Subscription Revenues
Subscription revenues consist primarily of fees earned from subscription-based arrangements for providing customers the right to use the Company’s software in a cloud-based-infrastructure that the Company provides (“Cloud offerings”). The Company also sells on-premises term license agreements for its Data Center products (“Data Center offerings”), consisting of software licensed for a specified period and support and maintenance services that are bundled with the license for the term of the license period. Subscription revenues are driven primarily by the number and size of active licenses, the type of product and the price of the licenses. Subscription-based arrangements generally have a contractual term of one to twelve months. For Cloud offerings, subscription revenue is recognized ratably as services are delivered, commencing with the date the service is made available to customers. For Data Center offerings, the Company recognizes revenue upfront for the portion that relates to the delivery of the term license and the support revenue is recognized ratably as the services are delivered over the term of the arrangement. The revenue recognition policy is consistent for subscription sales generated directly with customers and sales generated indirectly through solution partners and resellers.
Maintenance Revenues
Maintenance revenues represented fees earned from providing customers with unspecified future updates, upgrades and enhancements and technical product support on an if-and-when-available basis for perpetual license products purchased and operated by our customers on their premises (“Server offerings”). Maintenance revenue was recognized ratably over the term of the support period. The Company generally ended maintenance and support for Server offerings in February 2024.
Other Revenues
Other revenues primarily include fees received for sales of third-party apps in the Atlassian Marketplace. Advisory services and training services are also included in other revenues. Revenue from the sale of third-party apps via the Atlassian Marketplace is recognized on the date of product delivery given that all of our obligations have been met at that time and on a net basis as the Company functions as the agent in the relationship. Revenue from advisory services is recognized over the time period that the customer has access to the service. Revenue from consulting and training is recognized over time as the services are performed.
Deferred Contract Acquisition Costs
Deferred contract acquisition costs are costs incurred to obtain a contract, if such costs are recoverable, and consist primarily of sales commissions and related payroll taxes. Incremental costs of obtaining a contract are earned on new and expansion contracts which are capitalized and amortized over the average period of benefit, which the Company estimates to be four years. The Company does not pay sales commissions upon contract renewal.
The Company determines the period of benefit for commissions paid for the acquisition of the customer contract by taking into consideration the initial estimated customer life, anticipated renewals, and the technological life of our software. The Company includes the deferred contract costs in prepaid expense and other current assets and other non-current assets on the Consolidated Balance Sheets and the amortization of deferred contract acquisition costs in marketing and sales expense on the Consolidated Statements of Operations.
Cash, Cash Equivalents and Restricted Cash
Cash and cash equivalents consist of highly liquid investments with an original maturity of three months or less at the date of purchase. Cash equivalents also include amounts due from third-party credit card processors as they are both short-term and highly liquid in nature and are typically converted to cash within three days of the sales transaction. Cash and cash equivalents are stated at fair value.
As of June 30, 2024 and 2023, the Company had restricted cash of $1.2 million and $1.4 million, respectively, primarily used for the benefit of employees through a deferred compensation plan, and such amounts were not available for use in the Company’s operations. Restricted cash is included in other non-current assets in the Consolidated Balance Sheets.
Accounts Receivable, net
The Company records trade accounts receivable at the invoice value, and such receivables are non-interest bearing. The Company considers receivables past due based on the contractual payment terms. The Company makes estimates of expected credit and collectability trends based on an assessment of various factors including
historical credit loss experience, adjusted for forward-looking factors specific to the debtors and the economic environment that may affect our ability to collect from customers. The allowance for credit losses and write offs were not material for each of the periods as of June 30, 2024, 2023 and 2022.
Fair Value Measurements
Fair value is defined as the exchange price that would be received to sell an asset or paid to transfer a liability in the principal or most advantageous market for the asset or liability in an orderly transaction between market participants at the measurement date. The fair value hierarchy prioritizes the quality and reliability of the information used to determine fair values. Categorization within the fair value hierarchy is based on the lowest level of input that is significant to the fair value measurement. The fair value hierarchy is defined into the following three categories of inputs:
•Level 1 - Quoted (unadjusted) market prices in active markets for identical assets or liabilities;
•Level 2 - Observable inputs (other than Level 1 prices) such as quoted prices for similar assets or liabilities, quoted prices in markets that are not active, or other inputs that are observable or can be corroborated by observable market data for substantially the full term of the assets or liabilities;
•Level 3 - Unobservable inputs that are supported by little or no market activity and that are significant to the fair value of the assets or liabilities. Level 3 assets and liabilities include financial instruments whose value is determined using pricing models, discounted cash flow methodologies, or similar techniques, as well as instruments for which the determination of fair value requires significant management judgment or examination.
Marketable Securities
The Company classifies all marketable debt securities that have original stated maturities of greater than three months as marketable securities on its Consolidated Balance Sheets. The Company determines the appropriate classification of its investments in marketable debt securities at the time of purchase and reevaluates such designation at each balance sheet date. The Company has classified and accounted for its marketable debt securities as available-for-sale (“AFS”). After consideration of its risk versus reward objectives, as well as its liquidity requirements, the Company may sell these debt securities prior to their stated maturities. The Company considers all of our marketable securities as funds available for use in current operations, including those with maturity dates beyond one year, and therefore classifies these securities as current assets on the Consolidated Balance Sheets.
The Company evaluates AFS securities with unrealized loss positions for credit loss by assessing whether the decline in fair value below the amortized cost basis has resulted from a credit loss or other factors, whether the Company expects to recover the entire amortized cost basis of the security, its intent to sell and whether it is more likely than not that the Company will be required to sell the securities before the recovery of their amortized cost basis. The Company carries these securities at fair value, and reports the unrealized gains and losses, net of taxes, as a component of accumulated other comprehensive income except for the changes in allowance for expected credit losses, which are recorded in other income (expense), net. Realized gains and losses are determined based on the specific identification method and are reported in other income (expense), net on the Consolidated Statements of Operations.
Strategic Investments
The Company holds strategic investments in privately held debt and equity securities, as well as publicly held equity securities in which the Company does not have a controlling interest.
Investments in privately held debt securities are classified as AFS securities. Investments in publicly held equity securities are recorded at fair value with changes in the fair value of the investments recorded in other income (expense), net in the Consolidated Statements of Operations.
Investments in privately held equity securities without readily determinable fair values in which the Company does not own a controlling interest or have significant influence over are measured in accordance with the measurement alternative. In applying the measurement alternative, the carrying value of the investment is measured at cost, less impairment, if any, plus or minus changes resulting from observable price changes from orderly transactions for the identical or a similar investment of the same issuer in the period of occurrence. Changes to the carrying value of these investments are recorded through other income (expense), net on the Consolidated Statements of Operations.
In determining adjustments to the carrying value of its strategic investments in privately held companies, the Company uses the most recent data available to the Company. Valuations of privately held securities are inherently complex and the determination of whether an orderly transaction is for an identical or similar investment requires judgment. In its evaluation, the Company considers factors such as differences in the rights and preferences of the investments and the extent to which those differences would affect the fair values of those investments. The Company’s impairment analysis encompasses an assessment of both qualitative and quantitative factors including the investee’s financial metrics, market acceptance of the investee’s product or technology, general market conditions and liquidity considerations.
Equity Method Investments
Privately held equity securities in which the Company does not have a controlling financial interest but does exercise significant influence over the investment are accounted for under the equity method. The Company records a proportionate share of the investment’s earnings or losses, and impairment, if any, as a component of other income (expense), net in the Consolidated Statements of Operations. These investments are included in strategic investments in the Consolidated Balance Sheets.
For entities that meet the definition of a variable interest entity (“VIE”), the Company consolidates those entities when the Company is the primary beneficiary of the entity. The Company is determined to be the primary beneficiary when it possesses both the unilateral power to direct activities that most significantly impact the economic performance of the VIE and the obligation to absorb losses or the right to receive benefits that could potentially be significant to the VIE. The Company continually evaluates whether it qualifies as the primary beneficiary and reconsiders its determination of whether an entity is a VIE upon reconsideration events. As of June 30, 2024, the Company has one investment in an unconsolidated VIE for which it exercises significant influence over their operations and accordingly accounts for it as an equity method investment.
Derivative Financial Instruments
The Company enters into foreign exchange forward contracts with the objective to mitigate certain currency risks associated with cost of revenues and operating expenses denominated in foreign currencies. These foreign exchange forward contracts are designated as cash flow hedges. The Company also enters into foreign exchange forward contracts to hedge a portion of certain foreign currency denominated as monetary assets and liabilities to reduce the risk that such foreign currency will be adversely affected by changes in exchange rates. The Company uses interest rate swaps to hedge the variability of cash flows in the interest payments associated with its variable-rate debt due to changes in the Secured Overnight Financing Rate (“SOFR”) based floating interest rate. The interest rate swaps are designated as cash flow hedges and involve interest obligations for U.S. dollar-denominated amounts. The Company does not enter into derivative instrument transactions for trading or speculative purposes. In May 2024, the Company settled its then existing interest rate swap contracts prior to their stated termination dates as a result of the repayment of the Term Loan (defined in Note 11, “Debt.”). Gains resulting from the early termination of interest rate swap contracts are deferred and amortized as adjustments to interest expense over the remaining period of the debt originally covered by the terminated swap contracts.
Hedging derivative instruments are recognized as either assets or liabilities and are measured at fair value. For derivative instruments designated as cash flow hedges, the gains (losses) on the derivatives are initially reported as a component of other comprehensive income and are subsequently recognized in earnings when the hedged exposure is recognized in earnings. For derivative instruments that are not designated as hedges, gains (losses) from changes in fair values are primarily recognized in other income (expense), net. The Company enters into master netting agreements with financial institutions to execute its hedging program. The master netting agreements are with select financial institutions to reduce the Company’s credit risk, as well as to reduce its concentration of risk with any single counterparty.
Property and Equipment
Property and equipment are stated at cost, net of accumulated depreciation. Depreciation is calculated using the straight-line method to allocate the cost over the estimated useful lives. The estimated useful lives for each asset class are as follows:
| | | | | |
| Equipment | 3 years |
| Computer hardware and computer-related software | 3 years |
| Furniture and fittings | 5 years |
| Leasehold improvements | Shorter of the remaining lease term or 7 years |
Leases
The Company determines if an arrangement is a lease at inception. The Company’s lease agreements generally contain lease and non-lease components. Payments under the Company’s lease arrangements are primarily fixed. Non-lease components primarily include payments for maintenance and utilities. The Company combines fixed payments for non-lease components with lease payments and account for them together as a single lease component which increases the amount of its lease assets and liabilities.
Certain lease agreements contain variable payments, which are expensed as incurred and not included in the lease assets and liabilities. These amounts include payments affected by the Consumer Price Index and payments for maintenance and utilities.
Lease assets and liabilities are recognized at the present value of the future lease payments at the lease commencement date. The interest rate used to determine the present value of the future lease payments is the Company’s incremental borrowing rate, because the interest rate implicit in the Company’s leases is not readily determinable. The Company’s incremental borrowing rate is estimated to approximate the interest rate on a collateralized basis with similar terms and payments, and in economic environments where the leased asset is located. The Company’s lease terms include periods under options to extend or terminate the lease when it is reasonably certain that the Company will exercise that option. The Company generally uses the base, non-cancelable, lease term when determining the lease assets and liabilities. The Company reassesses the lease term if and when a significant event or change in circumstances occurs. Lease assets also include any prepaid lease payments and lease incentives. Operating lease expense (excluding variable lease costs) is recognized on a straight-line basis over the lease term.
The Company applies the short-term lease recognition exemption for short-term leases, which are leases with a lease term of 12 months or less. Payments associated with short-term leases are recognized on a straight-line basis over the lease term.
The Company did not have any finance lease arrangements for fiscal years 2024, 2023, and 2022.
Business Combinations
The Company allocates the purchase price of acquired companies to the tangible and intangible assets acquired and liabilities assumed, based on their estimated fair values. The excess of the purchase price over the fair values of these identifiable assets and liabilities is recorded as goodwill. Acquisition-related expenses are recognized separately from the business combination and are expensed as incurred.
The Company uses its best estimates and assumptions to assign fair value to the tangible and intangible assets acquired and liabilities assumed at the acquisition date. Assumptions used to estimate the fair value of the intangible assets include, but are not limited to, projected revenue growth, projected operating expenses, and technology migration curves. These estimates are inherently uncertain and subject to refinement and, as a result, actual results may differ from estimates.
During the measurement period, which may not be later than one year from the acquisition date, the Company may record adjustments to the fair value of these tangible and intangible assets acquired and liabilities assumed, with the corresponding offset to goodwill. Upon the conclusion of the measurement period or final determination of the fair value of assets acquired or liabilities assumed, whichever comes first, any subsequent adjustments are recorded to the Consolidated Statements of Operations.
Intangible Assets
The Company acquires intangible assets separately or in connection with business combinations. Intangible assets are measured at cost initially. Intangible assets with finite lives are amortized over their estimated useful life using the straight-line method. The amortization expense on intangible assets is recognized in the Consolidated Statements of Operations in the expense category consistent with the function of the intangible asset.
The estimated useful lives for each intangible asset class are as follows:
| | | | | |
| Patents, trademarks and other rights | 5 - 12 years |
| Customer relationships | 5 - 10 years |
| Acquired developed technology | 4 - 7 years |
Impairment of Long-Lived Assets
Long-lived assets are reviewed for impairment whenever events or changes in circumstances indicate an asset’s carrying value may not be recoverable. When the projected undiscounted cash flows estimated to be generated by those assets are less than their carrying amounts, the assets are adjusted to their estimated fair value and an impairment loss is recorded as a component of operating income (expense).
Goodwill
Goodwill is the excess of the aggregate of the consideration transferred over the identifiable assets acquired and liabilities assumed.
Goodwill is tested for impairment at least annually during the fourth quarter of the Company’s fiscal year and more often if and when circumstances indicate that the carrying value may be impaired. The Company’s reporting unit is at the operating segment level. The Company performs its goodwill impairment test at the level of its operating segment, as there are no levels below the operating segment level for which discrete financial information is prepared and regularly reviewed by the Company’s CODMs. A qualitative assessment is performed to determine whether it is more likely than not that the fair value of its operating segment is less than it’s carrying amount. If the operating segment does not pass the qualitative assessment, the carrying amount of the operating segment, including goodwill, is compared to fair value and goodwill is considered impaired if the carrying value exceeds its fair value. Any excess is recognized as an impairment loss in current period earnings.
Stock-based Compensation
The Company recognizes compensation expense related to all stock-based awards, including restricted stock units (“RSU”), and restricted stock awards (“RSA”) issued to the Company’s employees in exchange for their service, based on the estimated fair value of the awards on the grant date. The fair value of each RSU or RSA is based on the fair value of the Company’s Class A Common Stock on the date of grant.
The Company recognizes costs related to stock-based awards, net of estimated forfeitures, over the awards’ requisite service period on a straight-line basis, which is generally four years. The Company estimates forfeitures based on historical experience. The respective expenses are recognized as employee benefits and classified in the Consolidated Statements of Operations according to the activities that the employees perform.
Defined Contribution Plan
The Company offers various defined contribution plans for our U.S. and non-U.S. employees. The Company matches a portion of employee contributions each pay period, subject to maximum aggregate matching amounts, or contributes based on local legislative rates for eligible employees. Total defined contribution plan expense was $96.3 million, $78.2 million, and $58.7 million for fiscal years 2024, 2023, and 2022, respectively.
Advertising Costs
Advertising costs are expensed as incurred as a component of marketing and sales expense in the Consolidated Statements of Operations. Advertising expense was $100.2 million, $89.5 million and $90.3 million for fiscal years 2024, 2023, and 2022, respectively.
Research and Development
Research and development costs are expensed as incurred and consists of the employee, software, and hardware costs incurred for the development of new products, enhancements and updates of existing products and quality assurance activities. The costs incurred for the development of the Company’s cloud-based platform and internal use software are evaluated for capitalization during the development phase. Capitalized software development costs on the Company’s Consolidated Balance Sheet were not material for the periods presented.
Concentration of Credit Risk and Significant Customers
Financial instruments potentially exposing the Company to credit risk consist primarily of cash, cash equivalents, accounts receivable, derivative contracts and investments. The Company holds cash at financial institutions that management believes are high credit, quality financial institutions and invests in investment grade securities rated A- and above and debt securities. The Company’s derivative contracts expose it to credit risk to the extent that the counterparties may be unable to meet the terms of the arrangement. The Company enters into master netting agreements with select financial institutions to reduce its credit risk and trades with several counterparties to reduce its concentration risk with any single counterparty. The Company does not have significant exposure to counterparty credit risk at this time. In addition, the Company does not require nor is required to post collateral of any kind related to any foreign currency derivatives.
Credit risk arising from accounts receivable is mitigated to a certain extent due to our large number of customers and their dispersion across various industries and geographies. The Company’s customer base is highly diversified, thereby limiting credit risk. The Company manages credit risk with customers by closely monitoring its receivables and contract assets. The Company continuously monitors outstanding receivables locally to assess whether there is objective evidence that outstanding accounts receivables and contract assets are credit-impaired. As of June 30, 2024 and June 30, 2023, no customer represented more than 10% of the total accounts receivable balance. For fiscal years ended June 30, 2024, 2023, and 2022, no customer represented more than 10% of the total revenues.
Income Taxes
The Company uses the asset and liability method of accounting for income taxes. Under this method, deferred income tax assets and liabilities represent temporary differences between the carrying amounts of assets and liabilities in the consolidated financial statements and their corresponding tax basis used in the computation of taxable income. The Company measures deferred tax assets and liabilities using enacted tax rates expected to apply to taxable income in the years in which those temporary differences are expected to be reversed. The Company recognizes the effect on deferred tax assets and liabilities of a change in tax rates within the provision for income taxes as expense and income in the period that includes the enactment date. The Company accounts for the tax impact of including Global Intangible Low-Taxed Income in U.S. taxable income as a period cost. A valuation allowance is established if it is more likely than not that all or a portion of the deferred tax asset will not be realized.
Changes in deferred tax assets or liabilities are recognized as a component of benefit from (provision for) income taxes in the Consolidated Statements of Operations, except where they relate to items that are recognized in other comprehensive income or directly in equity, in which case the related deferred tax is also recognized in other comprehensive income or equity, respectively. Where deferred tax arises from the initial accounting for a business combination, the tax effect is included in the accounting for the business combination.
Deferred tax assets are regularly evaluated for future realization and reduced by a valuation allowance to an amount for which realization is more likely than not. In making such a determination, the Company considers all available positive and negative evidence, including future reversals of existing temporary differences, projected future taxable income, tax planning strategies, carry back potential if permitted under the tax law, and results of recent operations. Significant management judgment is required to determine the amount of deferred tax assets that can be recognized, based upon the likely timing and the amount of future taxable income, together with future tax-planning strategies. Assumptions about the generation of future taxable income depend on management’s estimates of future cash flows, future business expectations, capital expenditures, dividends, and other capital management transactions. Management judgment is also required in relation to the application of income tax legislation, which involves complexity and an element of uncertainty. In the event there is a change in the Company’s assessment of its ability to recover deferred tax assets, the income tax provision would be adjusted accordingly, resulting in a corresponding adjustment to the Consolidated Statements of Operations.
Uncertain tax positions are recorded in accordance with Accounting Standards Codification Topic 740 Income Taxes (“ASC 740”), Income Taxes. ASC 740 specifies a two-step process in which (1) the Company determines whether it’s more likely than not that tax positions will be sustained on the basis of the technical merits of the position, and (2) for those positions that meet the more-likely-than-not recognition threshold, the Company recognizes the largest amount of tax benefit that is more likely than not to be realized upon ultimate settlement with the related tax authority. The Company considers many factors when evaluating uncertain tax positions, which involve significant judgement and may require periodic reassessment. The Company recognizes interest and penalties related to unrecognized tax benefits as a component of income tax expense. For details of taxation, please refer to Note 17, “Income Taxes.”
New Accounting Standards Not Yet Adopted in Fiscal Year 2024
In June 2022, the FASB issued Accounting Standards Update (“ASU”) No. 2022-03 “Fair Value Measurement (Topic 820): Fair Value Measurement of Equity Securities Subject to Contractual Sale Restriction.” This ASU clarifies that a contractual restriction on the sale of an equity security is not considered part of the unit of account of the equity security and, therefore, is not considered in measuring fair value. This amendment also requires public entities to add certain disclosures for equity securities subject to contractual sale restrictions. This ASU is effective for fiscal years beginning after December 15, 2023. The Company is currently evaluating the impact of the new guidance and does not expect it to have a material impact on its consolidated financial statements.
In November 2023, the FASB issued ASU No. 2023-07 “Segment Reporting (Topic 280): Improvements to Reportable Segment Disclosures.” This ASU expands public entities’ segment disclosures by requiring disclosure of significant segment expenses that are regularly provided to the chief operating decision maker and included within each reported measure of segment profit or loss, an amount and description of its composition for other segment items, and interim disclosures of a reportable segment’s profit or loss and assets. All disclosure requirements under ASU 2023-07 are also required for public entities with a single reportable segment. This ASU is effective for fiscal years beginning after December 15, 2023 and interim periods within fiscal years beginning after December 15, 2024 with early adoption permitted and requires retrospective application to all prior periods. The Company is currently evaluating the impact of the new guidance and does not expect it to have a material impact on its consolidated financial statements.
In December 2023, the FASB issued ASU No. 2023-09 “Income Taxes (Topic 740): Improvements to Income Tax Disclosures.” This ASU requires disaggregated information about a reporting entity’s effective tax rate reconciliation as well as information on income taxes paid. This ASU is effective for fiscal years beginning after December 15, 2024. The Company is currently evaluating the impact of the new guidance and does not expect it to have a material impact on its consolidated financial statements.
3. Fair Value Measurements
The following table presents the Company’s financial assets and liabilities measured at fair value on a recurring basis as of June 30, 2024, by level within the fair value hierarchy (in thousands):
| | | | | | | | | | | | | | | | | | | |
| Level 1 | | Level 2 | | | | Total |
| |
| Assets measured at fair value | | | | | | | |
| Cash and cash equivalents: | | | | | | | |
| Money market funds | $ | 1,563,234 | | | $ | — | | | | | $ | 1,563,234 | |
| | | | | | | |
| | | | | | | |
| | | | | | | |
| | | | | | | |
| | | | | | | |
| Marketable securities: | | | | | | | |
| U.S. treasury securities | — | | | 52,517 | | | | | 52,517 | |
| Agency securities | — | | | 3,199 | | | | | 3,199 | |
| Certificates of deposit and time deposits | — | | | 10,000 | | | | | 10,000 | |
| Commercial paper | — | | | 20,010 | | | | | 20,010 | |
| Corporate debt securities | — | | | 76,247 | | | | | 76,247 | |
| | | | | | | |
| | | | | | | |
| | | | | | | |
| Derivative financial instruments | — | | | 9,292 | | | | | 9,292 | |
| | | | | | | |
| | | | | | | |
| | | | | | | |
| | | | | | | |
| | | | | | | |
| | | | | | | |
| Total assets measured at fair value | $ | 1,563,234 | | | $ | 171,265 | | | | | $ | 1,734,499 | |
| | | | | | | |
| Liabilities measured at fair value | | | | | | | |
| Derivative financial instruments | $ | — | | | $ | 1,701 | | | | | $ | 1,701 | |
| | | | | | | |
| | | | | | | |
| | | | | | | |
| Total liabilities measured at fair value | $ | — | | | $ | 1,701 | | | | | $ | 1,701 | |
The following table presents the Company’s financial assets and liabilities measured at fair value on a recurring basis as of June 30, 2023, by level within the fair value hierarchy (in thousands):
| | | | | | | | | | | | | | | | | | | |
| Level 1 | | Level 2 | | | | Total |
| Assets measured at fair value | | | | | | | |
| Cash and cash equivalents: | | | | | | | |
| Money market funds | $ | 1,338,509 | | | $ | — | | | | | $ | 1,338,509 | |
| | | | | | | |
| | | | | | | |
| | | | | | | |
| | | | | | | |
| | | | | | | |
| | | | | | | |
| Marketable securities: | | | | | | | |
| | | | | | | |
| | | | | | | |
| Certificates of deposit and time deposits | — | | | 10,000 | | | | | 10,000 | |
| | | | | | | |
| | | | | | | |
| | | | | | | |
| | | | | | | |
| Derivative financial instruments | — | | | 64,210 | | | | | 64,210 | |
| | | | | | | |
| | | | | | | |
| | | | | | | |
| | | | | | | |
| | | | | | | |
| Strategic investments: | | | | | | | |
| | | | | | | |
| Publicly traded equity securities | 19,365 | | | — | | | | | 19,365 | |
| | | | | | | |
| | | | | | | |
| Total assets measured at fair value | $ | 1,357,874 | | | $ | 74,210 | | | | | $ | 1,432,084 | |
| | | | | | | |
| Liabilities measured at fair value | | | | | | | |
| Derivative financial instruments | $ | — | | | $ | 10,114 | | | | | $ | 10,114 | |
| | | | | | | |
| | | | | | | |
| | | | | | | |
| | | | | | | |
| | | | | | | |
| | | | | | | |
| Total liabilities measured at fair value | $ | — | | | $ | 10,114 | | | | | $ | 10,114 | |
Due to the short-term nature of accounts receivables, net, contract assets, accounts payable, accrued expenses, and other current liabilities, their carrying amount is assumed to approximate their fair value.
Determination of Fair Value
The Company uses quoted prices in active markets for identical assets to determine the fair value of the Company’s Level 1 investments. The fair value of the Company’s Level 2 investments is determined based on quoted market prices or alternative market observable inputs.
Strategic Investments Measured and Recorded at Fair Value on a Non-Recurring Basis
The Company’s investments in privately held companies are not included in the tables above and are discussed in Note 4, “Investments.” The carrying value of the Company’s privately held equity securities are adjusted on a non-recurring basis upon observable price changes in orderly transactions for identical or similar investments of the same issuer, or impairment (referred to as the measurement alternative). Privately held equity securities that have been remeasured during the period based on observable price changes in orderly transactions are classified within Level 2 or Level 3 in the fair value hierarchy because the Company estimates the value based on valuation methods which may include a combination of the observable transaction price at the transaction date and other unobservable inputs including volatility, rights and preferences of the investments, and obligations of the securities the Company holds. The fair value of privately held equity securities that have been remeasured due to impairment are classified within Level 3. The Company’s privately held debt and equity securities amounted to $148.7 million and $140.1 million as of June 30, 2024 and June 30, 2023, respectively.
4. Investments
Marketable Securities
The Company’s investments of marketable securities as of June 30, 2024, consisted of the following (in thousands):
| | | | | | | | | | | | | | | | | | | | | | | |
| | Amortized Cost | | Unrealized Gains | | Unrealized Losses | | Fair Value |
| Marketable securities | | | | | | | |
| U.S. treasury securities | $ | 52,570 | | | $ | 30 | | | $ | (83) | | | $ | 52,517 | |
| Agency securities | 3,194 | | | 5 | | | — | | | 3,199 | |
| Certificates of deposit and time deposits | 10,000 | | | — | | | — | | | 10,000 | |
| Commercial paper | 20,010 | | | — | | | — | | | 20,010 | |
| Corporate debt securities | 76,386 | | | 7 | | | (146) | | | 76,247 | |
| | | | | | | |
| | | | | | | |
| Total marketable securities | $ | 162,160 | | | $ | 42 | | | $ | (229) | | | $ | 161,973 | |
The Company’s investments of marketable securities as of June 30, 2023, consisted of the following (in thousands):
| | | | | | | | | | | | | | | | | | | | | | | |
| | Amortized Cost | | Unrealized Gains | | Unrealized Losses | | Fair Value |
| | | | | | | |
| | | | | | | |
| Certificates of deposit and time deposits | $ | 10,000 | | | — | | | — | | | $ | 10,000 | |
| | | | | | | |
| | | | | | | |
| | | | | | | |
| | | | | | | |
| | | | | | | |
| Total marketable securities | $ | 10,000 | | | $ | — | | | $ | — | | | $ | 10,000 | |
The table below summarizes the Company’s marketable securities by remaining contractual maturity based on their effective maturity dates (in thousands):
| | | | | | | | | | | |
| June 30, 2024 | | June 30, 2023 |
| Due in one year or less | $ | 101,543 | | | $ | 10,000 | |
| Due in one year through five years | 60,430 | | | — | |
| Total marketable debt investments | $ | 161,973 | | | $ | 10,000 | |
The Company regularly reviews the changes to the rating of its marketable securities by rating agencies and monitors the surrounding economic conditions to assess the risk of expected credit losses. As of June 30, 2024, unrealized losses and the related risk of expected credit losses were not material, and as of June 30, 2023, no unrealized losses were recorded.
Strategic Investments
Carrying value of privately held debt securities
The Company’s investments of privately held debt securities as of June 30, 2024, consisted of the following (in thousands):
| | | | | | | | | | | | | | | | | | | | | | | |
| Amortized Cost | | Unrealized Gains | | Unrealized Losses | | Fair Value |
| Privately held debt securities | $ | 6,800 | | | $ | — | | | $ | (3,350) | | | $ | 3,450 | |
The Company’s investments of privately held debt securities as of June 30, 2023, consisted of the following (in thousands):
| | | | | | | | | | | | | | | | | | | | | | | |
| Amortized Cost | | Unrealized Gains | | Unrealized Losses | | Fair Value |
| Privately held debt securities | $ | 8,800 | | | $ | — | | | $ | (3,350) | | | $ | 5,450 | |
Carrying value of publicly traded and privately held equity securities
The carrying value is measured as the total initial cost plus the cumulative net gain (loss). Publicly traded equity securities are recorded at fair value and privately held equity securities are measured using the measurement alternative.
The Company did not have any publicly traded equity securities as of June 30, 2024 and the carrying values for privately held equity securities as of June 30, 2024 are summarized below (in thousands):
| | | | | | | | | |
| | | Privately held equity securities | | |
| Initial total cost | | | $ | 147,752 | | | |
| Cumulative net losses | | | (2,491) | | | |
| Carrying value | | | $ | 145,261 | | | |
Privately held equity securities cumulative net losses were comprised of downward adjustments and impairment of $7.5 million and upward adjustments of $5.0 million as of June 30, 2024.
The carrying values for publicly traded and privately held equity securities as of June 30, 2023 are summarized below (in thousands):
| | | | | | | | | | | | | | | | | |
| Publicly traded equity securities | | Privately held
equity securities | | Total |
| Initial total cost | $ | 10,270 | | | $ | 135,050 | | | $ | 145,320 | |
| Cumulative net gains (losses) | 9,095 | | | (398) | | | $ | 8,697 | |
| Carrying value | $ | 19,365 | | | $ | 134,652 | | | $ | 154,017 | |
Privately held equity securities cumulative net losses were comprised of downward adjustments and impairment of $5.9 million and upward adjustments of $5.5 million as of June 30, 2023. As of June 30, 2023, publicly traded equity securities were classified as prepaid expenses and other current assets on the Company’s Consolidated Balance Sheets.
Gains and Losses on Strategic Investments
The components of gains and losses on strategic investments were as follows (in thousands):
| | | | | | | | | | | | | | | | | |
| Fiscal Year Ended June 30, |
| 2024 | | 2023 | | 2022 |
| Unrealized losses recognized on publicly traded equity securities | $ | — | | | $ | (11,437) | | | $ | (79,608) | |
| Unrealized gains recognized on privately held equity securities | 2,084 | | | 307 | | | 6,945 | |
| Unrealized losses recognized on privately held equity securities including impairment | (1,628) | | | (7,642) | | | — | |
| Unrealized losses on privately held debt securities | (500) | | | (350) | | | — | |
| Unrealized losses, net | $ | (44) | | | $ | (19,122) | | | $ | (72,663) | |
| Realized gains recognized on publicly traded equity securities | 515 | | | — | | | — | |
| Realized losses recognized on privately held equity securities | (2,546) | | | — | | | — | |
| Realized losses on debt securities | — | | | (285) | | | — | |
| Losses on strategic investments, net | $ | (2,075) | | | $ | (19,407) | | | $ | (72,663) | |
| Unrealized gains (losses) recognized during the reporting period on privately held equity securities still held at the reporting date | $ | 456 | | | $ | (6,986) | | | $ | 6,945 | |
Unrealized gains recognized on privately held equity securities includes upward adjustments from equity securities accounted for under the measurement alternative while unrealized losses recognized on privately held equity securities includes downward adjustments and impairment.
Realized gains on sales of securities, net reflects the difference between the sale proceeds and the carrying value of the security at the beginning of the period or the purchase date, if later.
Equity Method Investment
On July 20, 2022, the Company completed a non-cash sale of its controlling interest of Vertical First Trust (“VFT”) to a third-party buyer. The Company retained a minority equity interest of 13% in the form of ordinary units and has significant influence in VFT. The Company’s interest in VFT is accounted for using the equity method in the consolidated financial statements.
As of the date of sale, the Company used a discounted cash flow model to calculate the fair value of its retained equity interest. The fair value of the retained interest was $88.9 million, and is classified as a Level 3 investment in the fair value hierarchy. The inputs to the valuation included observable inputs, including capitalization rate, discount rate, and other management inputs, including the underlying building practical completion date. The maximum exposure to loss related to the Company’s investment in VFT equals the Company’s capital investment.
The following table sets forth the carrying amounts of the equity method investment and the movements during fiscal years 2023 and 2024 (in thousands):
| | | | | | |
| | Equity Method Investment |
| Balance as of July 20, 2022 | | $ | 88,853 | |
| Effect of change in exchange rates | | (3,417) | |
| Balance as of June 30, 2023 | | 85,436 | |
Share of losses | | (11,262) | |
| Effect of change in exchange rates | | 336 | |
| Balance as of June 30, 2024 | | $ | 74,510 | |
The carrying amount of the Company’s investment in VFT was reported within strategic investments in the Company’s Consolidated Balance Sheets.
5. Derivative Contracts
The Company has derivative instruments that are used for hedging activities as discussed below.
The following table sets forth the notional amounts of the Company’s hedging derivative instruments as of June 30, 2024 (in thousands):
| | | | | | | | | | | | | | | | | | | | | | | | | | | | | | | | | | | |
| Notional Amounts of Derivative Instruments |
| Notional Amount by Term to Maturity | | Classification by Notional Amount |
| Under 12 months | | Over 12 months | | Total | | Cash Flow Hedge | | Non Hedge | | Total |
| Forward contracts | $ | 837,182 | | | $ | 71,701 | | $ | 908,883 | | $ | 651,303 | | $ | 257,580 | | | $ | 908,883 |
| | | | | | | | | | | |
| | | | | | | | | | | |
| | | | | | | | | | | |
In May 2024, the Company settled its then existing interest rate swap contracts prior to their stated termination dates as a result of the repayment of the Term Loan (defined in Note 11, “Debt.”) and received cash proceeds of $37.7 million from the counterparties. The cash proceeds are reported within net cash provided by operating activities in the Company’s Consolidated Statements of Cash Flows in fiscal year 2024.
The following table sets forth the notional amounts of the Company’s hedging derivative instruments as of June 30, 2023 (in thousands, except for average interest rate):
| | | | | | | | | | | | | | | | | | | | | | | | | | | | | | | | | | | |
| Notional Amounts of Derivative Instruments |
| Notional Amount by Term to Maturity | | Classification by Notional Amount |
| Under 12 months | | Over 12 months | | Total | | Cash Flow Hedge | | Non Hedge | | Total |
| Forward contracts | $ | 849,811 | | | $ | 35,181 | | $ | 884,992 | | $ | 532,059 | | $ | 352,933 | | | $ | 884,992 |
| Interest rate swaps: | | | | | | | | | | | |
| Notional amount | $ | — | | | $ | 650,000 | | $ | 650,000 | | $ | 650,000 | | $ | — | | $ | 650,000 |
| Average fixed interest rate | | | 0.81 | % | | 0.81 | % | | 0.81 | % | | | | 0.81 | % |
The fair value of the Company’s derivative instruments were as follows (in thousands):
| | | | | | | | | | | | | | | | | | | | |
| | | | As of June 30, |
| | Balance Sheet Location | | 2024 | | 2023 |
| Derivative assets | | | | | | |
| Derivatives designated as hedging instruments: | | | | |
| Foreign exchange forward contracts | | Prepaid expenses and other current assets | | $ | 8,255 | | | $ | 3,177 | |
| Foreign exchange forward contracts | | Other non-current assets | | 867 | | | — | |
| Interest rate swaps | | Prepaid expenses and other current assets | | — | | | 28,926 | |
| Interest rate swaps | | Other non-current assets | | — | | | 28,215 | |
| Derivatives not designated as hedging instruments: | | | | |
| Foreign exchange forward contracts | | Prepaid expenses and other current assets | | 170 | | | 3,892 | |
| Total derivative assets | | | | $ | 9,292 | | | $ | 64,210 | |
| Derivative liabilities | | | | | | |
| Derivatives designated as hedging instruments: | | | | |
| Foreign exchange forward contracts | | Accrued expenses and other current liabilities | | $ | 1,197 | | | $ | 9,657 | |
| Foreign exchange forward contracts | | Other non-current liabilities | | 7 | | | 209 | |
| Derivatives not designated as hedging instruments: | | | | |
| Foreign exchange forward contracts | | Accrued expenses and other current liabilities | | 497 | | | 248 | |
| Total derivative liabilities | | | | $ | 1,701 | | | $ | 10,114 | |
The pre-tax effects of derivatives designated as cash flow hedging instruments on the consolidated financial statements were as follows (in thousands):
| | | | | | | | | | | | | | | | | |
| |
| Fiscal Year Ended June 30, |
| 2024 | | 2023 | | 2022 |
| | | | | |
| Beginning balance of accumulated gains (losses) in accumulated other comprehensive income | $ | 48,170 | | | $ | 24,502 | | | $ | (2,936) | |
| Gross unrealized gains recognized in other comprehensive income | 10,826 | | | 17,952 | | | 11,421 | |
| | | | | |
| Net losses (gains) reclassified from cash flow hedge in accumulated other comprehensive income into profit or loss: | | | | | |
| Recognized in cost of revenues | 1,072 | | | 1,831 | | | 525 | |
| Recognized in research and development | 7,718 | | | 16,890 | | | 10,513 | |
| Recognized in marketing and sales | 1,264 | | | 1,337 | | | 220 | |
| Recognized in general and administrative | 2,320 | | | 5,563 | | | 1,606 | |
| Recognized in interest | (29,946) | | | (19,905) | | | 3,153 | |
| Ending balance of accumulated gains in accumulated other comprehensive income | $ | 41,424 | | | $ | 48,170 | | | $ | 24,502 | |
Amortization of the gains related to early settlement of interest rate swap contracts was $4.2 million for fiscal year 2024.
6. Property and Equipment
Property and equipment, net consisted of the following (in thousands): | | | | | | | | | | | |
| As of June 30, |
| 2024 | | 2023 |
| Equipment | $ | 11,200 | | | $ | 9,298 | |
| Computer hardware and software | 40,824 | | | 29,801 | |
| Furniture and fittings | 25,172 | | | 24,773 | |
| Leasehold improvements and other | 137,944 | | | 123,125 | |
| | | |
| Property and equipment, gross | 215,140 | | | 186,997 | |
| Less: accumulated depreciation and impairment | (128,825) | | | (105,595) | |
| Property and equipment, net | $ | 86,315 | | | $ | 81,402 | |
Depreciation expense was $29.0 million, $27.8 million and $19.3 million for fiscal years 2024, 2023, and 2022, respectively.
During fiscal year 2023, the Company recorded an $8.4 million impairment charge for leasehold improvements as a result of our restructuring efforts.
7. Business Combinations
Loom, Inc.
On November 30, 2023, the Company acquired 100% of the outstanding equity of Loom, Inc. (“Loom”), an asynchronous video messaging platform that helps users communicate through instantly shareable videos. The Company believes the acquisition of Loom further elevates the collaboration experience of Atlassian customers. Total purchase price consideration for Loom was approximately $885.6 million and consisted of cash. The Company has included the financial results of Loom in its consolidated financial statements from the date of acquisition, which were not material for the fiscal year 2024. Pro forma results of operations have not been presented for the fiscal year 2024 and 2023 because the effect of the acquisition was not material to our consolidated financial statements.
The following table summarizes the preliminary fair values of assets acquired and liabilities assumed as of the date of acquisition (in thousands):
| | | | | | | | |
| | Fair Value |
| Cash and cash equivalents | | $ | 59,265 | |
| Marketable securities | | 43,494 | |
| | |
| | |
| | |
| | |
| Intangible assets, net | | 272,300 | |
| Goodwill | | 544,828 | |
| Other assets | | 3,941 | |
| | |
| Deferred revenue, current portion | | (16,145) | |
| | |
| | |
| Deferred tax liabilities | | (15,668) | |
| Other liabilities | | (6,391) | |
| Net assets acquired | | $ | 885,624 | |
The excess of purchase consideration over the fair value of assets acquired and liabilities assumed was recorded as goodwill. The resulting goodwill is primarily attributed to the assembled workforce and expanded market opportunities, including integrating the Loom product offering with existing Company services to enhance asynchronous collaboration among distributed teams. The goodwill is not deductible in the U.S. for income tax purposes. The fair values assigned to assets acquired and liabilities assumed are preliminary based on management’s estimates and assumptions and may be subject to change as additional information is received. The primary areas that remain preliminary relate to the fair values of certain intangible assets acquired, certain tangible assets and liabilities acquired, contingencies as of the acquisition date, income tax, including deferred taxes, and residual goodwill. The Company expects to finalize the valuation not later than one year from the acquisition date.
The following table sets forth the components of identifiable intangible assets acquired and their estimated useful lives as of the date of acquisition: | | | | | | | | | | | |
| Fair Value | | Useful Life |
| Developed technology | $ | 230,000 | | | 7 |
| Trade name | 37,000 | | | 8 |
| Other purchased intangible assets | 5,300 | | | 5 |
Developed technology represents the estimated fair value of Loom’s asynchronous video technology. Trade name represents the estimated fair value of the Loom trade name.
In connection with the transaction, the Company granted $30.2 million worth of replacement awards in the form of RSUs to Loom employees and $54.7 million worth of RSAs to certain key Loom employees. The fair value of the replacement awards and RSAs was based on the stock price of the Company on the grant date. Both the replacement awards and RSAs are subject to future vesting provisions based on service conditions and the related expense is accounted for as stock-based compensation.
Other fiscal year 2024, 2023 and 2022 business combinations
During the fiscal years 2024, 2023 and 2022, the Company also completed certain acquisitions to expand our product and service offerings. These transaction were accounted for as business combinations and were not material to the Company’s consolidated financial statements.
8. Goodwill and Intangible Assets
Goodwill
Goodwill represents the excess of the purchase price in a business combination over the fair value of net tangible and intangible assets acquired. Goodwill amounts are not amortized, but rather are tested for impairment at least annually during the fourth quarter, or when indicators of impairment exist.
Goodwill consisted of the following (in thousands): | | | | | | |
| | | Goodwill |
| Balance as of June 30, 2022 | | $ | 722,838 | |
| Additions | | 3,300 | |
| Effect of change in exchange rates | | 1,073 | |
| Balance as of June 30, 2023 | | 727,211 | |
| Additions | | 561,372 | |
| Effect of change in exchange rates | | 173 | |
| Balance as of June 30, 2024 | | $ | 1,288,756 | |
Intangible Assets
Intangible assets consisted of the following (in thousands): | | | | | | | | | | | | | | | | | |
| As of June 30, | | Weighted-Average Remaining Useful Lives (Years) |
| 2024 | | 2023 | |
| Acquired developed technology | $ | 469,752 | | | $ | 235,818 | | | 6 |
| Patents, trade names, and other rights | 70,928 | | | 33,393 | | | 7 |
| Customer relationships | 135,687 | | | 129,502 | | | 4 |
| Intangible assets, gross | 676,367 | | | 398,713 | | | |
| Less: accumulated amortization | (377,310) | | | (329,641) | | | |
| Intangible assets, net | $ | 299,057 | | | $ | 69,072 | | | |
Amortization expense for intangible assets was approximately $49.7 million, $33.1 million and $32.4 million for fiscal years 2024, 2023, and 2022, respectively.
The following table presents the estimated future amortization expense related to intangible assets held as of June 30, 2024 (in thousands):
| | | | | | | | |
| Fiscal Years: | | |
| 2025 | | $ | 55,243 | |
| 2026 | | 52,705 | |
| 2027 | | 47,536 | |
| 2028 | | 45,309 | |
| 2029 | | 40,076 | |
| Thereafter | | 58,188 | |
| Total future amortization expense | | $ | 299,057 | |
9. Accrued Expenses and Other Current Liabilities
Accrued expenses and other current liabilities consist of the following (in thousands): | | | | | | | | | | | |
| As of June 30, |
| | 2024 | | 2023 |
| Accrued expenses | $ | 149,046 | | | $ | 107,479 | |
| Employee benefits | 332,518 | | | 191,801 | |
| Tax liabilities | 55,203 | | | 88,748 | |
| Customer deposits | 19,279 | | | 11,784 | |
| | | |
| | | |
| Other payables | 21,313 | | | 23,319 | |
| Total accrued expenses and other current liabilities | $ | 577,359 | | | $ | 423,131 | |
10. Leases
The Company rents office space and equipment under non-cancelable operating leases with various expiration dates through fiscal year 2034. Certain lease agreements include varying terms, escalation clauses and renewal rights. The Company does not assume renewals in its determination of the lease term unless the renewals are deemed to be reasonably certain at lease commencement. The Company’s lease agreements generally do not contain any material residual value guarantees or material restrictive covenants.
The components of lease costs and other information related to leases were as follows (in thousands):
| | | | | | | | | | | | | | | | | |
| | Fiscal Year Ended June 30, |
| | 2024 | | 2023 | | 2022 |
Operating lease costs | $ | 41,426 | | | $ | 50,134 | | | $ | 49,647 | |
| Variable lease costs | 11,908 | | | 13,094 | | | 12,077 | |
| Total lease costs | $ | 53,334 | | | $ | 63,228 | | | $ | 61,724 | |
| | | | | |
| Weighted average remaining lease term (in years) | 6 | | 7 | | 8 |
| Weighted average discount rate | 2.9 | % | | 2.5 | % | | 2.4 | % |
Supplemental cash flow information related to operating leases were as follows (in thousands):
| | | | | | | | | | | | | | | | | |
| Fiscal Year Ended June 30, |
| | 2024 | | 2023 | | 2022 |
| Cash payments for operating leases | $ | 49,803 | | | $ | 41,493 | | | $ | 49,142 | |
| Right-of-use assets obtained in exchange for new operating lease liabilities | $ | 23,265 | | | $ | 3,580 | | | $ | 105,961 | |
Future lease payments under non-cancelable operating leases with initial lease terms in excess of one year included in the Company’s lease liabilities as of June 30, 2024 were as follows (in thousands):
| | | | | | | | |
| Fiscal years: | | Operating Lease Payments |
| 2025 | | $ | 55,735 | |
| 2026 | | 50,502 | |
| 2027 | | 49,489 | |
| 2028 | | 38,875 | |
| 2029 | | 38,436 | |
| Thereafter | | 53,285 | |
| Total future operating lease payments | | 286,322 | |
| Less: imputed interest | | (22,895) | |
| | |
| Total lease liability balance | | $ | 263,427 | |
During fiscal year 2023, in addition to operating lease costs disclosed above, the Company recorded an impairment charge of $52.7 million in aggregate for operating lease right-of-use assets as part of our lease consolidation efforts.
The Company entered into an Agreement for Lease (the “AFL”) for the Company’s new global headquarters in Sydney, Australia (the “Australian HQ Property”) in March 2022. Following completion of the development of the Australian HQ Property, the AFL requires the Company to enter into a lease agreement for the planned headquarters office space. The lease is expected to commence in fiscal year 2027 and will continue for fifteen years, with the Company’s option to extend the term for up to two additional ten-year periods. Future lease payments are approximately $925.8 million as of June 30, 2024, for the initial term of fifteen years. Please refer to Note 4, “Investments,” for details of the transaction.
In addition, the Company entered into other operating leases, primarily for offices, that have not yet commenced with future lease payments of approximately $39.0 million as of June 30, 2024. These operating leases are expected to commence in fiscal year 2025 with lease terms of four to five years.
11. Debt
Credit Facility
In October 2020, the Company’s principal U.S. operating subsidiary, Atlassian US, Inc., entered into a credit agreement (the “2020 Credit Agreement”) establishing a $1 billion senior unsecured delayed-draw term loan facility (the “Term Loan Facility”) and a $500.0 million senior unsecured revolving credit facility (the “Revolving Credit Facility,” and together with the Term Loan Facility, the “2020 Credit Facility”). The Company used the net proceeds of the 2020 Credit Facility for general corporate purposes, including repayment of the then existing indebtedness. The 2020 Credit Facility bore interest, at the Company’s option, at a base rate plus a margin up to 0.50% or the Secured Overnight Financing Rate, plus a credit spread adjustment of 0.10% plus a spread of 0.875% to 1.50%, in each case with such margin being determined by the Company’s consolidated leverage ratio. The Revolving Credit Facility could have been borrowed, repaid, and re-borrowed until its maturity, and the Company had the option to request an increase of $250 million in certain circumstances.
The 2020 Credit Facility would have matured in October 2025 and the Company could prepay the 2020 Credit Facility at its discretion without penalty. Commencing on October 31, 2023, the Company was obligated to repay the outstanding principal amount of the Term Loan Facility in installments on a quarterly basis in an amount equal to 1.25% of the Term Loan Facility borrowing amount until the maturity of the Term Loan Facility.
The Company was also obligated to pay a commitment fee on the undrawn amounts of the Revolving Credit Facility at an annual rate ranging from 0.075% to 0.20%, determined by the Company’s consolidated leverage ratio.
The 2020 Credit Facility required compliance with various financial and non-financial covenants, including affirmative and negative covenants. The financial covenants included a maximum consolidated leverage ratio of 3.5x, which ratio would increase to 4.5x during the period of four fiscal quarters immediately following a material acquisition. As of June 30, 2024, the Company was in compliance with all related covenants.
In May 2024, the Company repaid in full the Term Loan Facility. There were no outstanding borrowings under the Credit Facility as of June 30, 2024. In August 2024, the 2020 Credit Facility was amended and restated to eliminate the Term Loan Facility and provide for a $750 million senior unsecured revolving credit facility. Please refer to Note 18, “Subsequent Events,” for details of the transaction.
The Notes
On May 15, 2024, the Company issued $500.0 million aggregate principal amount of 5.250% senior notes due 2029 (the “2029 Notes”) and $500.0 million aggregate principal amount of 5.500% senior notes due 2034 (the “2034 Notes,” and together with the 2029 Notes, the “Notes”). The Notes will mature on May 15, 2029 and May 15, 2034 respectively. The 2029 Notes bear interest at a rate of 5.250% per year. The 2034 Notes bear interest at a rate of 5.500% per year. Interest on the Notes is paid semi-annually in arrears on May 15 and November 15 of each year, beginning on November 15, 2024.
The Notes are senior unsecured obligations of the Company. The Company may redeem either series of the Notes, in whole or in part, at any time or from time to time at the applicable redemption price. Upon the occurrence of a change of control event, the Company will be required to make an offer to repurchase all outstanding notes from their holders at a price equal to 101% of their principal amount thereof, plus accrued and unpaid interest to, but not including, the date of repurchase. The indenture governing the Notes also includes covenants (including certain limited covenants restricting our ability to incur certain liens and enter into certain sale and leaseback transactions), events of default, and other customary provisions. As of June 30, 2024, the Company was in compliance with all covenants associated with the Notes.
The Company incurred debt discount and issuance costs of approximately $14.3 million in connection with the Notes offering, which were allocated on a pro rata basis to the 2029 Notes and 2034 Notes. The debt discount and issuance costs are amortized on an effective interest rate method to interest expense over the contractual term of the Notes. The proceeds from this offering, net of debt discounts and issuance costs, was $985.7 million. The net proceeds were used primarily to repay the Term Loan Facility.
The carrying values of the Notes were as follows (in thousands):
| | | | | | | | | | | | | | | | | | | | |
| Instrument | | Expected Remaining Term (years) | | Effective Interest Rate | | June 30, 2024 |
5.250% 2029 Notes | | 4.9 | | 5.55 | % | | $ | 500,000 | |
5.500% 2034 Notes | | 9.9 | | 5.71 | % | | 500,000 | |
| Unamortized debt discount and issuance costs | | | | (14,089) | |
| | | | | |
| Debt, net of current portion | | | | $ | 985,911 | |
As of June 30, 2024, the total estimated fair value of the Notes was $1.0 billion. The estimated fair values of the Notes, which the Company deems Level 2 financial instruments, were determined based on quoted bid prices in an over-the-counter market on the last trading day of the reporting period.
12. Commitments and Contingencies
Noncancellable Purchase Obligations
The Company has contractual commitments for services with third-parties related to its cloud services platform and other infrastructure services. These commitments are non-cancellable and expire within one to four years. There were no material contractual commitments that were entered into during fiscal year 2024 that were outside the ordinary course of business.
The following table sets forth contractual commitments as of June 30, 2024 and 2023 (in thousands):
| | | | | | | | | | | |
| Fiscal Year Ended June 30, |
| 2024 | | 2023 |
| Contractual purchase obligations | $ | 1,415,724 | | | $ | 1,788,740 | |
| Obligations for leases that have not yet commenced | 964,825 | | | 919,333 | |
| Total purchase obligation | $ | 2,380,549 | | | $ | 2,708,073 | |
Maturities of purchase obligations as of June 30, 2024 were as follows (in thousands):
| | | | | | | | | | | | | | | | | |
| | Other contractual
commitments | | Leases not commenced | | Total |
| Fiscal Years: | | | | | |
| 2025 | $ | 462,187 | | | $ | 1,116 | | | $ | 463,303 | |
| 2026 | 378,631 | | | 5,641 | | | 384,272 | |
| 2027 | 434,406 | | | 36,518 | | | 470,924 | |
| 2028 | 140,500 | | | 58,125 | | | 198,625 | |
| 2029 | — | | | 60,295 | | | 60,295 | |
| Thereafter | — | | | 803,130 | | | 803,130 | |
| Total commitments | $ | 1,415,724 | | | $ | 964,825 | | | $ | 2,380,549 | |
Please refer to Note 10, “Leases,” for discussion of lease commitments that the Company has entered but the leases have not yet commenced.
Legal Proceedings
On February 3, 2023, a putative securities class action (the “Putative Class Action”) was filed in the U.S. District Court for the Northern District of California, captioned City of Hollywood Firefighters’ Pension Fund vs. Atlassian Corporation, Case No. 3:23-cv-00519, naming the Company and certain of its officers as defendants. The lawsuit is purportedly brought on behalf of purchasers of the Company’s securities between August 5, 2022 and November 3, 2022 (the “Class Period”). The complaint alleges claims under Sections 10(b) and 20(a) of the Securities Exchange Act of 1934, as amended (the “Exchange Act”), and Rule 10b-5 promulgated thereunder, based on allegedly false and misleading statements about the Company’s business and prospects during the Class Period. The lawsuit seeks unspecified damages. On January 22, 2024, the court granted the defendants’ motion to dismiss plaintiffs’ complaint with leave to amend. Plaintiffs filed a second amended complaint on March 1, 2024 and the defendants filed a motion to dismiss on April 19, 2024. On August 13, 2024, the court issued a ruling granting
the defendants’ motion to dismiss plaintiffs’ second amended complaint, and providing the plaintiffs until September 3, 2024 to file a third amended complaint.
In March, April and August 2023, three stockholder derivative lawsuits were filed in the U.S. District Court for the District of Delaware against the members of the Company’s board of directors and certain of its officers, captioned Silva v. Cannon-Brookes, Case No. 1:23-cv-00283; Keane v. Cannon-Brookes, Case No. 1:23-cv-00399; and Azzawi v. Cannon-Brookes, Case No. 1:23-cv-00884. The Company is named as a nominal defendant. These stockholder derivative lawsuits are based largely on the same allegations as the Putative Class Action, including allegations relating to the Company’s disclosures during the Class Period as well as, in certain instances, alleged insider trading. The lawsuits purport to assert claims for, among other things, breach of fiduciary duty, corporate waste, unjust enrichment, and violations of Section 10(b) of the Exchange Act, and Rule 10b-5 promulgated thereunder. The complaints seek unspecified damages and other relief purportedly on the Company’s behalf. In May and August 2023, the Court consolidated the Silva, Keane, and Azzawi actions into In re Atlassian Corporation Stockholder Derivative Litigation, Case No. 1:23-cv-00283-GBW (the “Consolidated Action”), and stayed the Consolidated Action pending resolution of any motion(s) to dismiss in the Putative Class Action.
On September 6, 2023, a stockholder derivative lawsuit was filed in the U.S. District Court for the Northern District of California against the members of the Company’s board of directors and certain of its officers, captioned Capistrano v. Cannon-Brookes, Case No. 4:23-cv-04584 (the “Capistrano Action”). The Company is named as a nominal defendant. The complaint is based largely on the same allegations as the Putative Class Action and the Consolidated Action, including allegations relating to the Company’s disclosures during the Class Period as well as, in certain instances, alleged insider trading. The lawsuits purport to assert claims for, among other things, breach of fiduciary duty, corporate waste, unjust enrichment, and violations of Section 10(b) of the Exchange Act, and Rule 10b-5 promulgated thereunder. The complaints seek unspecified damages and other relief purportedly on the Company’s behalf. On October 31, 2023, the Court stayed the Capistrano Action pending resolution of any motion(s) to dismiss in the Putative Class Action.
The defendants have denied and intend to continue to deny the allegations of wrongdoing and vigorously defend against the claims in each of the Putative Class Action, the Consolidated Action, and the Capistrano Action.
In addition to the matters discussed above, from time to time, the Company is party to litigation and other legal proceedings in the ordinary course of business. While the Company does not believe the ultimate resolutions of these other pending legal matters not described above are likely to have a material adverse effect on the Company’s financial position, the results of any litigation or other legal proceedings are uncertain and as such the resolution of such legal proceedings, either individually or in the aggregate, could have a material adverse effect on its business, results of operations, financial condition or cash flows. The Company accrues for loss contingencies when it is both probable that it will incur the loss and when it can reasonably estimate the amount of the loss or range of loss. For the periods presented, the Company has not recorded any liabilities as a result of the litigation or other legal proceedings in its consolidated financial statements.
Indemnification Provisions
The Company’s agreements include provisions indemnifying customers against intellectual property and other third-party claims. In addition, the Company has entered into indemnification agreements with its directors, executive officers and certain other officers that will require the Company to, among other things, indemnify these individuals for certain liabilities that may arise as a result of their affiliation with the Company. For the periods presented, the Company has not incurred any costs as a result of such indemnification obligations and has not recorded any liabilities related to such obligations in the consolidated financial statements.
13. Revenue
Remaining Performance Obligations
Transaction price allocated to the remaining performance obligations represents contracted revenue that has not yet been recognized, which includes deferred revenue and unbilled amounts that will be recognized as revenue in future periods. Transaction price allocated to the remaining performance obligations is influenced by several factors, including the timing of renewals, the timing of delivery of software licenses, average contract terms, and foreign currency exchange rates. Unbilled portions of the remaining performance obligations are subject to future economic risks including bankruptcies, regulatory changes and other market factors.
As of June 30, 2024, approximately $2.4 billion of revenue is expected to be recognized from transaction price allocated to remaining performance obligations. The Company expects to recognize revenue on approximately 79% of these remaining performance obligations over the next 12 months with the balance recognized thereafter.
Disaggregated Revenue
The Company’s revenues by geographic region based on end-users who purchased the Company’s products or services are as follows (in thousands): | | | | | | | | | | | | | | | | | |
| | Fiscal Year Ended June 30, |
| | 2024 | | 2023 | | 2022 |
| Americas | | | | | |
| United States | $ | 1,847,194 | | | $ | 1,537,328 | | | $ | 1,230,801 | |
| Other Americas | 278,240 | | | 227,838 | | | 178,067 | |
| Total Americas | 2,125,434 | | | 1,765,166 | | | 1,408,868 | |
| EMEA | | | | | |
| Germany | 442,063 | | | 330,046 | | | 249,227 | |
| Other EMEA | 1,308,847 | | | 1,036,693 | | | 828,111 | |
| Total EMEA | 1,750,910 | | | 1,366,739 | | | 1,077,338 | |
| Asia Pacific | 482,259 | | | 402,742 | | | 316,676 | |
| Total revenues | $ | 4,358,603 | | | $ | 3,534,647 | | | $ | 2,802,882 | |
The Company provides different deployment options for its product offerings. Cloud offerings provide customers the right to use the Company’s software in a cloud-based infrastructure that the Company provides. Data Center offerings are on-premises term license agreements for the Company’s Data Center products, which are software licensed for a specified period, and include support and maintenance services that are bundled with the license for the term of the license period. Marketplace and other offerings mainly include fees received for sales of third-party apps in the Atlassian Marketplace and services like premier support, advisory services and training services. Premier support consists of subscription-based arrangements for a higher level of support across different deployment options, and revenues from this offering are included in Subscription revenues within the Company’s Consolidated Statements of Operations.
The revenues from Server offerings consists of revenue from maintenance services since the Company no longer sells perpetual licenses for its Server offerings. The Company generally ended maintenance and support for these Server offerings in February 2024.
The Company’s revenues by deployment options are as follows (in thousands):
| | | | | | | | | | | | | | | | | |
| | Fiscal Year Ended June 30, |
| | 2024 | | 2023 | | 2022 |
| Cloud | $ | 2,698,899 | | | $ | 2,085,498 | | | $ | 1,515,424 | |
| Data Center | 1,208,498 | | | 819,251 | | | 560,319 | |
| Server | 177,645 | | | 400,519 | | | 525,028 | |
| Marketplace and other | 273,561 | | | 229,379 | | | 202,111 | |
| Total revenues | $ | 4,358,603 | | | $ | 3,534,647 | | | $ | 2,802,882 | |
Deferred Revenue
The Company records deferred revenues when cash payments are received or due in advance of the Company satisfying its performance obligations, including amounts which are refundable. The changes in the deferred revenue are as follows (in thousands):
| | | | | | | | | | | |
| Fiscal Year Ended June 30, |
| 2024 | | 2023 |
| Balance, beginning of period | $ | 1,545,479 | | | $ | 1,182,680 | |
| Additions | 4,927,860 | | | 3,897,446 | |
| Revenue | (4,358,603) | | | (3,534,647) | |
| Balance, end of period | $ | 2,114,736 | | | $ | 1,545,479 | |
For fiscal years 2024 and 2023, approximately 31% and 30% of revenue recognized was from the deferred revenue balances at the beginning of each fiscal year, respectively.
Deferred Contract Acquisition Costs
The changes in the balances of deferred contract acquisition costs are as follows (in thousands):
| | | | | | | | | | | |
| Fiscal Year Ended June 30, |
| 2024 | | 2023 |
| Balance, beginning of period | $ | 53,604 | | | $ | 27,141 | |
| Additions | 51,326 | | | 40,060 | |
| Amortization expense | (25,219) | | | (13,597) | |
| Balance, end of period | $ | 79,711 | | | $ | 53,604 | |
| Deferred contract acquisition costs included in: | | | |
| Prepaid expenses and other current assets | $ | 29,170 | | | $ | 18,027 | |
| Other non-current assets | 50,541 | | | 35,577 | |
| Total | $ | 79,711 | | | $ | 53,604 | |
The Company periodically reviews these deferred contract acquisition costs to determine whether events or changes in circumstances have occurred that could impact the period of benefit. There were no impairment losses recorded during the periods presented.
14. Geographic Information
The Company’s long-lived assets by geographic regions are as follows (in thousands):
| | | | | | | | | | | |
| As of June 30, |
| 2024 | | 2023 |
| | | |
| United States | $ | 189,468 | | | $ | 213,567 | |
| Australia | 47,082 | | | 37,891 | |
| All other countries | 22,234 | | | 14,139 | |
| Total long-lived assets | $ | 258,784 | | | $ | 265,597 | |
Long-lived assets for this purpose consist of property and equipment and operating lease right-of-use assets.
15. Stockholders' Equity
Common Stock
As discussed in Note 1, “Description of Business,” the Company completed the U.S. Domestication after the close of market trading on September 30, 2022. At that time all issued and outstanding ordinary shares of Atlassian Corporation Plc were exchanged on a one-for-one basis for newly issued shares of corresponding common stock of Atlassian Corporation, and all issued and outstanding equity awards of Atlassian Corporation Plc were assumed by
Atlassian Corporation and were converted into rights to acquire Atlassian Corporation shares of Class A Common Stock on the same terms.
As of June 30, 2024, the Company’s common stock consists of Class A Common Stock and Class B Common Stock, each of which has a par value of $0.00001. Each share of Class B Common Stock will convert automatically into one share of Class A Common Stock in the following circumstances: (1) upon the written consent of the holders of at least 66.66% of the total number of outstanding shares of Class B Common Stock; (2) if the aggregate number of shares of Class B Common Stock then outstanding comprises less than ten percent (10%) of the total number of shares of Class A Common Stock and Class B Common Stock then outstanding; and (3) upon any transfer to a person that is not a permitted transferee described in the Company’s amended and restated certificate of incorporation.
Any dividend declared by the Company must be paid on the Class A Common Stock and the Class B Common Stock pari passu as if they were all stock of the same class. Additionally, upon the liquidation, dissolution, or winding up of the Company, whether voluntary or involuntary, holders of Class A Common Stock and Class B Common Stock will be entitled to receive ratably on a per share basis all assets of the Company available for distribution to its stockholders, unless disparate or different treatment of the shares of each such class is approved by the affirmative vote of the holders of a majority of the outstanding shares of Class A Common Stock and by the affirmative vote of the holders of a majority of the outstanding shares of Class B Common Stock, each voting separately as a class.
Each share of Class A Common Stock is entitled to one vote. Each share of Class B Common Stock is entitled to 10 votes.
Preferred Stock
The Company’s board of directors has the authority to issue up to 10 million shares of preferred stock in one or more series. The Company’s board of directors may designate the rights, preferences, privileges and restrictions of the preferred stock, including voting rights, dividend rights, conversion rights, redemption privileges and liquidation preferences, the right to elect directors to and increase or decrease the number of shares of any series. As of June 30, 2024 and 2023, no shares of preferred stock were outstanding.
Stock-based Compensation
Upon the completion of the U.S. Domestication, the Company assumed the following plans: the Atlassian Corporation Plc 2015 Share Incentive Plan (as amended, the “2015 Plan”); and the 2015 Employee Share Purchase Plan (as amended, the “ESPP” and, together with the 2015 Plan, the “Incentive Plans”). In connection with its assumption of the Incentive Plans, the Company amended and restated the 2015 Plan as the Atlassian Corporation Amended and Restated 2015 Share Incentive Plan, and the ESPP as the Atlassian Corporation Amended and Restated 2015 Employee Share Purchase Plan, in each case to reflect the assumption and changes in applicable law and to provide that the securities to be issuable in connection with equity awards will be shares of the Company’s Class A Common Stock instead of Atlassian Corporation Plc Class A ordinary shares.
In addition, Atlassian Corporation assumed each RSU award covering Atlassian Corporation Plc Class A ordinary shares that was outstanding under an equity incentive plan and amended such RSU award to reflect the assumption by Atlassian Corporation and to provide for the securities issuable in connection with the exercise or settlement of the award to be shares of Atlassian Corporation’s Class A Common Stock.
At June 30, 2024, the Company had 30,425,646 shares of its common stock available for future issuance under the 2015 Plan. The Company currently does not have common stock outstanding or open offering periods under the ESPP.
RSU grants generally vest over four years with 25% vesting on the one year anniversary of the date of grant and 1/12th of the remaining RSUs vest over the remaining three years, on a quarterly basis thereafter. Effective from April 2021 for existing employees and September 2023 for new employees, new RSU grants generally vest evenly over four years on a quarterly basis.
A summary of RSU activity for fiscal year 2024 is as follows (in thousands except share and per share data):
| | | | | | | | | | | | | | | | | | | |
| Number of Shares | | Weighted Average Grant Date Fair Value | | | | Aggregate Intrinsic Value |
| | | | | | | |
| | | | | | | |
| | | | | | | |
| | | | | | | |
| | | | | | | |
| | | | | | | |
| | | | | | | |
| | | | | | | |
| | | | | | | |
| | | | | | | |
| | | | | | | |
| | | | | | | |
| Balance as of June 30, 2023 | 9,562,918 | | | $ | 235.16 | | | | | $ | 1,604,753 | |
| Granted | 9,809,695 | | | 199.66 | | | | | — | |
| Vested | (4,994,610) | | | 223.40 | | | | | $ | 950,263 | |
| Forfeited or cancelled | (1,681,039) | | | 229.31 | | | | | — | |
| Balance as of June 30, 2024 | 12,696,964 | | | $ | 213.13 | | | | | $ | 2,245,839 | |
The weighted-average grant date fair value of RSUs granted in fiscal years 2023 and 2022 was $221.87 and $332.43, respectively. The total intrinsic value of the RSUs vested in fiscal years 2023 and 2022 was 617.0 million and 925.8 million, respectively. The income tax benefit recognized related to awards vested in fiscal years 2024, 2023 and 2022 was $218.7 million, $156.5 million, and $242.8 million, respectively. As of June 30, 2024, total compensation cost not yet recognized in the consolidated financial statements related to employee and director RSU awards was $2.1 billion, which is expected to be recognized over a weighted-average period of 1.8 years.
During fiscal year 2024, the Company granted RSAs for 301,751 shares of Class A Common Stock. During fiscal year 2023, the Company did not grant any RSAs. As of June 30, 2024 and 2023, there were RSAs for 156,856 and 6,131 shares of Class A Common Stock outstanding, respectively. These outstanding RSAs are subject to forfeiture or repurchase at the original exercise price during the repurchase period following employee termination, as applicable. The total aggregate intrinsic value of outstanding RSAs were $27.7 million and $1.0 million as of June 30, 2024 and 2023, respectively.
Of the total stock-based compensation expense, costs recognized for awards granted to non-employees were immaterial for all periods presented.
Share Repurchase Program
In January 2023, the Board of Directors authorized a program to repurchase up to $1.0 billion of the Company’s outstanding Class A Common Stock (the “Share Repurchase Program”). The Share Repurchase Program does not have a fixed expiration date, may be suspended or discontinued at any time, and does not obligate the Company to repurchase any specific dollar amount or to acquire any specific number of shares. The Company may repurchase shares of Class A Common Stock from time to time through open market purchases, in privately negotiated transactions, or by other means, including through the use of trading plans intended to qualify under Rule 10b5-1 under the Exchange Act, in accordance with applicable securities laws and other restrictions. The timing, manner, price, and amount of any repurchases will be determined by the Company at its discretion and will depend on a variety of factors, including business, economic and market conditions, prevailing stock prices, corporate and regulatory requirements, and other considerations.
During fiscal year 2024, the Company repurchased and subsequently retired approximately 2.2 million shares of its Class A Common Stock for approximately $394.0 million at an average price per share of $182.32. All repurchases were made in open market transactions. As of June 30, 2024, the Company was authorized to purchase a remaining $451.8 million of its Class A Common Stock under the Share Repurchase Program.
16. Net Loss Per Share
The Company computes net loss per share of Class A and Class B Common Stock using the two-class method. As the liquidation and dividend rights for both Class A and Class B Common Stock are identical, the net loss is allocated on a proportionate basis to the weighted-average number of shares of common stock outstanding for the period. Basic net loss per share attributable to Class A and Class B stockholders is computed by dividing the net loss by the weighted-average number of Class A and Class B Common Stock outstanding during the period.
For the calculation of diluted net loss per share, net loss for basic EPS is adjusted by the effect of dilutive securities, including awards under the Company’s equity compensation plans. The dilutive potential shares of common stock are computed using the treasury stock method or the as-if converted method, as applicable. Since the Company is in a loss position for all periods reported, basic and diluted net loss per share are the same for all periods as the inclusion of potential dilutive shares would have been anti-dilutive.
The following tables present the calculation of basic and diluted net loss per share attributable to common stockholders (in thousands, except per share data):
| | | | | | | | | | | | | | | | | | | | | | | | | | | | | | | | | | | |
| | Fiscal Year Ended June 30, |
| | 2024 | | 2023 | | 2022 |
| Class A | | Class B | | Class A | | Class B | | Class A | | Class B |
| Numerator: | | | | | | | | | | | |
| Net Loss | $ | (181,587) | | | $ | (118,932) | | | $ | (283,907) | | | $ | (202,854) | | | $ | (290,290) | | | $ | (229,220) | |
| Denominator: | | | | | | | | | | | |
| Weighted-average shares outstanding, basic and diluted | 156,580 | | 102,553 | | 149,493 | | 106,814 | | 141,545 | | 111,767 |
| Net loss per share, basic and diluted | $ | (1.16) | | | $ | (1.16) | | | $ | (1.90) | | | $ | (1.90) | | | $ | (2.05) | | | $ | (2.05) | |
The potential weighted average dilutive securities that were not included in the dilutive earnings per share calculation because the effect would be anti-dilutive are as follows (shares in thousands):
| | | | | | | | | | | | | | | | | |
| Fiscal Year Ended June 30, |
| 2024 | | 2023 | | 2022 |
| Class A Common Stock options | — | | — | | 1 |
| Class A Common Stock RSU awards | 8,320 | | 7,426 | | 3,736 |
| Class A Common Stock restricted stock awards | 23 | | 17 | | 82 |
| Total potentially dilutive securities | 8,343 | | 7,443 | | 3,819 |
17. Income Taxes
The components of loss before provision for income taxes by U.S. and foreign jurisdictions consist of the following (in thousands):
| | | | | | | | | | | | | | | | | |
| | Fiscal Year Ended June 30, |
| | 2024 | | 2023 | | 2022 |
| Domestic | $ | (139,687) | | | $ | (25,250) | | | $ | (480,982) | |
| Foreign | 54,280 | | | (285,886) | | | 10,044 | |
| Total | $ | (85,407) | | | $ | (311,136) | | | $ | (470,938) | |
The provision for income taxes consists of the following (in thousands):
| | | | | | | | | | | | | | | | | |
| | Fiscal Year Ended June 30, |
| | 2024 | | 2023 | | 2022 |
| Current: | | | | | |
| Federal | $ | 2,134 | | | $ | 4,327 | | | $ | 280 | |
| State | 3,969 | | | 1,045 | | | 570 | |
| Foreign | 209,002 | | | 162,072 | | | 51,040 | |
| Total | 215,105 | | | 167,444 | | | 51,890 | |
| Deferred: | | | | | |
| Federal | (14,030) | | | 1,467 | | | (44) | |
| State | 3,680 | | | (1,066) | | | (1,641) | |
| Foreign | 10,357 | | | 7,780 | | | (1,633) | |
| Total | 7 | | | 8,181 | | | (3,318) | |
| Total provision for income taxes | $ | 215,112 | | | $ | 175,625 | | | $ | 48,572 | |
The effective income tax rate differs from the federal statutory income tax rate applied to the loss before income taxes due to the following (in thousands):
| | | | | | | | | | | | | | | | | |
| | Fiscal Year Ended June 30, |
| | 2024 | | 2023 | | 2022 |
| Tax at federal statutory rate | $ | (17,935) | | | $ | (65,339) | | | $ | (98,897) | |
| State, net of the federal benefit | 16,362 | | | 13,042 | | | 13,363 | |
| Effects of non-U.S. operations | (14,575) | | | 15,163 | | | (6,879) | |
| Tax credits | (151,912) | | | (99,398) | | | (107,956) | |
| Stock-based compensation | 123,719 | | | 80,471 | | | (41,692) | |
| Non-deductible executive compensation | 6,721 | | | 6,022 | | | 13,580 | |
| Non-deductible charges relating to the exchangeable senior notes | — | | | — | | | 89,188 | |
| | | | | |
| Australian R&D deductions forgone in lieu of R&D credit | 29,502 | | | 30,303 | | | 32,661 | |
| Foreign taxes | (131) | | | 2,457 | | | 4,491 | |
| Basis difference in investments | 14,615 | | | (43,564) | | | (36,853) | |
| Change in reserves | 32,505 | | | 132,528 | | | 14,179 | |
| Change in valuation allowance | 174,994 | | | 98,613 | | | 172,033 | |
| Other | 1,247 | | | 5,327 | | | 1,354 | |
| Provision for income taxes | $ | 215,112 | | | $ | 175,625 | | | $ | 48,572 | |
| Effective Tax Rate (%) | (252) | % | | (56) | % | | (10) | % |
Significant components of the Company's deferred tax assets and deferred tax liabilities are shown below (in thousands). Where necessary, a valuation allowance has been recognized to offset our deferred tax assets by the amount of any tax benefits that are not expected to be realized.
| | | | | | | | | | | |
| | As of June 30, |
| | 2024 | | 2023 |
| Deferred tax assets: | | | |
| Property and equipment | $ | 7,748 | | | $ | 5,528 | |
| Net operating loss carryforwards | 779,554 | | | 857,944 | |
| Credit carryforwards | 252,444 | | | 183,520 | |
| Operating lease liabilities | 62,300 | | | 64,774 | |
| Basis differences in investments | 1,811,999 | | | 1,690,440 | |
| Provisions, accruals and prepayments | 58,820 | | | 36,255 | |
| Deferred revenue | 306,629 | | | 208,541 | |
| Capitalized research and development | 81,503 | | | 28,330 | |
| Other, net | 717 | | | (1,973) | |
| Total deferred tax assets | 3,361,714 | | | 3,073,359 | |
| Less valuation allowance | (3,268,643) | | | (3,019,080) | |
| Total deferred tax assets, net of valuation allowance | 93,071 | | | 54,279 | |
| | | |
| Deferred tax liabilities: | | | |
| Unrealized foreign currency exchange losses | 2,705 | | | 3,087 | |
| Unrealized investment gains | 1,007 | | | 11,684 | |
| Operating right of use assets | 47,825 | | | 48,119 | |
| Stock-based compensation | 5,526 | | | (7,246) | |
| Intangible assets | 52,461 | | | (641) | |
| Total deferred tax liabilities | 109,524 | | | 55,003 | |
| Net deferred tax liabilities | $ | (16,453) | | | $ | (724) | |
The Company recorded a valuation allowance of $3.3 billion, $3.0 billion and $2.9 billion as of June 30, 2024, 2023, and 2022, respectively, primarily relating to the basis difference of the U.S. investment in a wholly owned partnership, U.S. and Australian net operating loss and credit carryforwards, and the deferred revenue deferred tax assets. The change in valuation allowance as of June 30, 2024, 2023 and 2022, was primarily related to an increase in the basis difference of the US investment in a wholly owned partnership and an increase in the deferred revenue deferred tax assets and certain credit carryforwards, offset by the utilization of U.S. federal and state net operating losses. The Company regularly assesses the realizability of its deferred tax assets and establishes a valuation allowance if it is more likely than not that some or all of its deferred tax assets will not be realized. The Company evaluates and weighs all positive and negative evidence such as historic results, future reversals of deferred tax liabilities, projected future taxable income, as well as prudent and feasible tax planning strategies. The assessment requires significant judgement and is performed in each of the applicable jurisdictions. The Company intends to maintain a full valuation allowance on its federal deferred tax assets in the U.S. and Australia until there is sufficient positive evidence to support their reversal.
As of June 30, 2024, the Company had U.S. federal, state, and foreign net operating loss carryforwards of $799.8 million tax effected. Of the $701.1 million tax effected U.S. federal net operating loss carryforwards, $700.8 million may be carried forward indefinitely, and the remaining $0.3 million will begin to expire in 2032. The state net operating loss carryforwards of $96.4 million tax effected begin to expire in 2024. As of June 30, 2024, the Company also had research and development federal and state tax credits of $263.1 million. The federal tax credit carryforwards will expire beginning in 2035 if not utilized. The state tax credit carryforwards do not expire except for the State research and development credits of Texas which begins to expire in June 2038. Utilization of the Company’s US net operating loss and tax credit carryforwards may be subject to annual limitation due to the ownership change limitations provided by the Internal Revenue Code and similar state provisions. Such an annual limitation could result in the expiration of the net operating loss and tax credit carryforwards before utilization. As of June 30, 2024, the Company also had Polish R&D credits of $8.3 million, which will begin to expire in 2027, but which may also be used to satisfy payroll tax liabilities in the future.
The Inflation Reduction Act of 2022 (the “IRA”) was enacted on August 16, 2022 and includes various corporate tax provisions, including a new Corporate Alternative Minimum Tax (“Corporate AMT”) on applicable corporations with adjusted financial statement income exceeding $1 billion, on average, over the last three years. The Corporate AMT is effective for tax years beginning after December 31, 2022. As of June 30, 2024, the newly enacted IRA tax provisions are not material to the Company.
The Organization for Economic Cooperation and Development released Pillar Two model rules defining a 15% global minimum tax for multinational corporations. Many countries in which we operate, including the member states of the EU, have enacted Pillar Two. Pillar Two rules apply to us beginning in our fiscal year 2025. Based on enacted laws, Pillar Two is not expected to materially impact our effective tax rate or cash flows in fiscal year 2025. New legislation or guidance could change our current assessment.
U.S. income tax has not been recognized on the excess of the amount for financial reporting over the tax basis of investment in foreign subsidiaries that is indefinitely reinvested outside the United States. Un-remitted earnings become taxable upon repatriation of assets from the subsidiary or a sale or liquidation of the subsidiary. The amount of such un-remitted earnings is approximately $802.6 million as of June 30, 2024, and the corresponding unrecognized deferred tax liability is not material.
The Company recognizes the tax benefit of an uncertain tax position only if it concludes it is more likely than not that the position is sustainable upon examination by the taxing authority, based on the technical merits. The tax benefit recognized is measured as the largest amount of benefit which is greater than 50 percent likely to be realized upon settlement with the taxing authority. A reconciliation of the beginning and ending balance of total unrecognized tax benefits is as follows (in thousands):
| | | | | | | | | | | | | | | | | |
| | Fiscal Year Ended June 30, |
| | 2024 | | 2023 | | 2022 |
| Beginning of the period | $ | 122,302 | | | $ | 53,483 | | | $ | 37,944 | |
| Tax positions taken in prior period: | | | | | |
| Gross increases | 10,887 | | | 112,781 | | | 1,031 | |
| Gross decreases | — | | | (198) | | | — | |
| Tax positions taken in current period: | | | | | |
| Gross increases | 25,707 | | | 15,171 | | | 14,542 | |
| Settlements | (53,648) | | | (57,004) | | | — | |
| Lapse of statute of limitations | — | | | (32) | | | (34) | |
| Currency translation effect | (795) | | | (1,899) | | | — | |
| End of period | $ | 104,453 | | | $ | 122,302 | | | $ | 53,483 | |
As of June 30, 2024, 2023 and 2022, the Company had gross unrecognized tax benefits of approximately $10.9 million, $113.2 million, and $2.5 million, respectively, that would impact the effective tax rate if recognized.
The Company files income tax returns in the U.S. federal jurisdiction, various state jurisdictions, Australia, and in various other international jurisdictions. Tax years 2012 and forward generally remain open for examination for federal and state tax purposes. Tax years 2017 and forward generally remain open for examination for foreign tax purposes. To the extent utilized in future years’ tax returns, net operating loss carryforwards as of June 30, 2024 and 2023 will remain subject to examination until the respective tax year is closed.
There are differing interpretations of tax laws and regulations, and as a result, disputes may arise with tax authorities involving issues of the timing and amount of deductions and allocations of income among various tax jurisdictions. The Company believes that adequate amounts have been reserved for any adjustments that may ultimately result from these examinations. It is reasonably possible that an immaterial decrease in unrecognized tax benefits may occur during the next 12 months.
During the year ended June 30, 2024, the Company finalized an Advanced Pricing Arrangement with the Australian Taxation Office with respect to its transfer pricing arrangements between Australia and the U.S. that covers the tax years ended June 30, 2019 to June 30, 2025. Pursuant to the terms of the agreement, the Company made a cash settlement payment of approximately $60.5 million of taxes and interest.
The Company believes it is reasonably possible the balance of unrecognized tax benefits could change in the next 12 months due to the completion of ongoing income tax audits. The estimated range of the change is a decrease of $4.2 million to an increase of $4.5 million.
The Company has recognized interest and penalties related to unrecognized tax benefits in the income tax provision of approximately $0.6 million and $5.8 million during fiscal year 2024 and fiscal year 2023, respectively. As of June 30, 2024, there were no accrual balances, and as of June 30, 2023, the accrual balances were $5.8 million. The Company had not recognized any interest and penalties related to unrecognized tax benefits during fiscal year 2022.
18. Subsequent Events
On August 12, 2024, the Company’s principal U.S. operating subsidiary, Atlassian US, Inc., amended and restated the 2020 Credit Facility to eliminate the term loan facility and establish a $750 million senior unsecured revolving credit facility (the “2024 Credit Facility”). The 2024 Credit Facility bears interest, at the Company’s option, at a base rate or the Secured Overnight Financing Rate, plus, in each case, a spread of 0.875% to 1.50% per annum. In each case the applicable margin will be determined by the consolidated leverage ratio of the Company and its subsidiaries, or, following the Company’s one time option, the Company’s credit rating. The Company may repay outstanding loans under the 2024 Credit Facility at any time, without premium or penalty, and the Company has the option to request an increase of $250 million in certain circumstances. The 2024 Credit Facility matures in August 2029.
The Company is also obligated to pay a commitment fee on the undrawn amounts of the 2024 Credit Facility at an annual rate ranging from 0.075% to 0.20%, determined by the Company’s consolidated leverage ratio, or, following the Company’s one time option, the Company’s credit rating.
The 2024 Credit Facility requires compliance with various financial and non-financial covenants, including affirmative and negative covenants. The financial covenants include a maximum consolidated leverage ratio of 3.5x, which increases to 4.5x during the period of four fiscal quarters immediately following a material acquisition.
ITEM 9. CHANGE IN AND DISAGREEMENTS WITH ACCOUNTANTS ON ACCOUNTING AND FINANCIAL DISCLOSURE
Not applicable.
ITEM 9A. CONTROLS AND PROCEDURES
Disclosure Controls and Procedures
Our Co-Chief Executive Officers and Chief Financial Officer, after evaluating the effectiveness of our disclosure controls and procedures (as defined in Rules 13a-15(e) and 15d-15(e) of the Exchange Act) as of June 30, 2024, have concluded that, as of such date, our disclosure controls and procedures were effective to provide reasonable assurance that the information required to be disclosed by us in reports that we file or submit under the Exchange Act is (1) recorded, processed, summarized and reported within the time periods specified by the SEC’s rules and forms, and (2) accumulated and communicated to our management, including our Co-Chief Executive Officers and Chief Financial Officer, as appropriate to allow timely decisions regarding required disclosure.
Management’s Annual Report on Internal Control Over Financial Reporting
Our management is responsible for establishing and maintaining adequate internal control over financial reporting (as defined in Rules 13a-15(f) and 15d-15(f) under the Exchange Act). Our management conducted an evaluation of the effectiveness of our internal control over financial reporting based on the framework in Internal Control-Integrated Framework issued by the Committee of Sponsoring Organizations of the Treadway Commission in “Internal Control—Integrated Framework” (2013). Our internal control over financial reporting includes policies and procedures that provide reasonable assurance regarding the reliability of financial reporting and the preparation of financial statements for external reporting purposes in accordance with GAAP. Based on this evaluation, management concluded that our internal control over financial reporting was effective as of June 30, 2024. Our independent registered public accounting firm, Ernst & Young LLP, has issued an attestation report with respect to the effectiveness of our internal control over financial reporting, which appears in Part II, Item 8 of this Annual Report on Form 10-K.
Changes in Internal Control Over Financial Reporting
There were no changes in our internal control over financial reporting identified in connection with the evaluation required by Rules 13a-15(d) and 15d-15(d) under the Exchange Act that occurred during the quarter ended June 30, 2024 that has materially affected, or are reasonably likely to materially affect, our internal control over financial reporting.
Limitations on Effectiveness of Controls and Procedures
In designing and evaluating the disclosure controls and procedures and internal control over financial reporting, management recognizes that any controls and procedures, no matter how well designed and operated, can provide only reasonable assurance of achieving the desired control objectives. In addition, the design of disclosure controls and procedures and internal control over financial reporting must reflect the fact that there are resource constraints and that management is required to apply its judgment in evaluating the benefits of possible controls and procedures relative to their costs.
ITEM 9B. OTHER INFORMATION
None.
ITEM 9C. DISCLOSURES REGARDING FOREIGN JURISDICTIONS THAT PREVENT INSPECTIONS
None.
PART III
ITEM 10. DIRECTORS, EXECUTIVE OFFICERS AND CORPORATE GOVERNANCE
The information required by this item is incorporated by reference to our Proxy Statement for the 2024 Annual Meeting of Stockholders to be filed with the SEC within 120 days of the fiscal year ended June 30, 2024.
ITEM 11. EXECUTIVE COMPENSATION
The information required by this item is incorporated by reference to our Proxy Statement for the 2024 Annual Meeting of Stockholders to be filed with the SEC within 120 days of the fiscal year ended June 30, 2024.
ITEM 12. SECURITY OWNERSHIP OF CERTAIN BENEFICIAL OWNERS AND MANAGEMENT AND RELATED STOCKHOLDER MATTERS
The information required by this item is incorporated by reference to our Proxy Statement for the 2024 Annual Meeting of Stockholders to be filed with the SEC within 120 days of the fiscal year ended June 30, 2024.
ITEM 13. CERTAIN RELATIONSHIPS AND RELATED TRANSACTIONS, AND DIRECTOR INDEPENDENCE.
The information required by this item is incorporated by reference to our Proxy Statement for the 2024 Annual Meeting of Stockholders to be filed with the SEC within 120 days of the fiscal year ended June 30, 2024.
ITEM 14. PRINCIPAL ACCOUNTANT FEES AND SERVICES
The information required by this item is incorporated by reference to our Proxy Statement for the 2024 Annual Meeting of Stockholders to be filed with the SEC within 120 days of the fiscal year ended June 30, 2024.
PART IV
ITEM 15. EXHIBIT AND FINANCIAL STATEMENT SCHEDULE
(a) The following documents are filed as part of this report:
1.Financial Statements
See Index to Financial Statements in “Item 8. Financial Statements” to this Annual Report on Form 10-K.
2. Financial Statement Schedules
Schedules not listed above have been omitted because they are not required, not applicable, or the required information is otherwise included.
3. Exhibits
The exhibits listed below are filed as part of this Annual Report on Form 10-K or are incorporated herein by reference, in each case as indicated below.
Exhibits
| | | | | | | | | | | | | | | | | | | | | | | | | | | | | | | | | | | | | | |
| | | | | | Incorporated by Reference |
Exhibit
Number | | Description | | Provided Herewith | | Form | | SEC File No. | | Exhibit | | Filing Date |
| | | | | | | | | | | | |
| 3.1 | | | | | | | 8-K | | 001-37651 | | 3.1 | | 10/03/2022 |
| | | | | | | | | | | | |
| 3.2 | | | | | | | 8-K | | 001-37651 | | 3.2 | | 10/03/2022 |
| | | | | | | | | | | | |
| 4.1 | | | | | | | S-8 | | 333-266998 | | 4.3 | | 10/04/2022 |
| | | | | | | | | | | | |
| 4.2 | | | | | | 8-K | | 001-37651 | | 4.1 | | 05/15/2024 |
| | | | | | | | | | | | |
| 4.3 | | | | | | | 8-K | | 001-37651 | | 4.2 | | 05/15/2024 |
| | | | | | | | | | | | |
| 4.4 | | | | | | | 8-K | | 001-37651 | | 4.2 | | 05/15/2024 |
| | | | | | | | | | | | |
| 4.5 | | | | | | | 8-K | | 001-37651 | | 4.2 | | 05/15/2024 |
| | | | | | | | | | | | |
| 4.6 | | | | | X | | | | | | | | |
| | | | | | | | | | | | |
| | | | | | | | | | | | | | | | | | | | | | | | | | | | | | | | | | | | | | |
| 10.1 | | | Amended and Restated Credit Agreement, dated as of August 12, 2024, by and among the Company, Atlassian US, Inc., Bank of America, N.A., as Administrative Agent, Swing Line Lender and L/C Issuer, JPMorgan Chase Bank, N.A. and Morgan Stanley Senior Funding, Inc., as Co-Syndication Agents and L/C Issuers, and the other L/C Issuers and lenders party thereto | | X | | | | | | | | |
| | | | | | | | | | | | |
| 10.2 | | # | | | | | 8-K | | 001-37651 | | 10.2 | | 10/03/2022 |
| | | | | | | | | | | | |
| 10.3 | # | | | | | 10-Q | | 001-37651 | | 10.3 | | 11/04/2022 |
| | | | | | | | | | | | |
| 10.4 | | # | | | | | 8-K | | 001-37651 | | 10.3 | | 10/03/2022 |
| | | | | | | | | | | | |
| 10.5 | | # | | | | | 8-K | | 001-37651 | | 10.5 | | 10/03/2022 |
| | | | | | | | | | | | |
| 10.6 | | # | | | | | 8-K | | 001-37651 | | 10.6 | | 10/03/2022 |
| | | | | | | | | | | | |
| 10.7 | | # | | | | | 8-K | | 001-37651 | | 10.7 | | 10/03/2022 |
| | | | | | | | | | | | |
| 10.8 | | # | | | X | | | | | | | | |
| | | | | | | | | | | | |
| 10.9 | | | | | | | 6-K | | 001-37651 | | 10.1 | | 11/27/2017 |
| | | | | | | | | | | | |
| 10.10 | †« | | | | | 6-K | | 001-37651 | | 10.1 | | 03/25/2022 |
| | | | | | | | | | | | |
| 10.11 | † | Deed of Amendment, dated April 30, 2022, to Agreement for Lease, dated March 23, 2022, by and among Atlassian Corporation Plc, Atlassian Pty Ltd, Vertical First Pty Ltd as trustee for the Vertical First Trust, Dexus Property Services Pty Limited, Dexus Funds Management Limited as responsible entity for Dexus Property Trust and Dexus Funds Management Limited as responsible entity for Dexus Operations Trust. | | | | 20-F | | 001-37651 | | 10.22 | | 08/19/2022 |
| | | | | | | | | | | | |
| 10.12 | | Guarantor Replacement Deed, dated November 8, 2022, to the Agreement for Lease, dated March 23, 2022, by and among Atlassian Corporation Limited (formerly Atlassian Corporation Plc), Atlassian Pty Ltd, Atlassian Corporation, Vertical First Pty Ltd as trustee for the Vertical First Trust, Dexus Property Services Pty Limited, Dexus Funds Management Limited as responsible entity for Dexus Property Trust and Dexus Funds Management Limited as responsible entity for Dexus Operations Trust. | | | | 10-Q | | 001-37651 | | 10.1 | | 02/03/2023 |
| | | | | | | | | | | | |
| | | | | | | | | | | | | | | | | | | | | | | | | | | | | | | | | | | | | | |
| 10.1 | | †« | Deed of Amendment (No. 2), dated August 28, 2023, to Agreement for Lease, dated March 23, 2022, by and among Atlassian Corporation Plc, Atlassian Pty Ltd, Vertical First Pty Ltd as trustee for the Vertical First Trust, Dexus Property Services Pty Limited, Dexus Funds Management Limited as responsible entity for Dexus Property Trust and Dexus Funds Management Limited as responsible entity for Dexus Operations Trust. | | | | 10-Q | | 001-37651 | | 10.1 | | 11/03/2023 |
| | | | | | | | | | | | |
| 19.1 | | | | | X | | | | | | | | |
| | | | | | | | | | | | |
| 21.1 | | | | | X | | | | | | | | |
| | | | | | | | | | | | |
| 23.1 | | | | | X | | | | | | | | |
| | | | | | | | | | | | |
| 24.1 | | | | | X | | | | | | | | |
| | | | | | | | | | | | |
| 31.1 | | | | | X | | | | | | | | |
| | | | | | | | | | | | |
| 31.2 | | | | | X | | | | | | | | |
| | | | | | | | | | | | |
| 31.3 | | | | | X | | | | | | | | |
| | | | | | | | | | | | |
| 32.1 | | ‡ | | | X | | | | | | | | |
| | | | | | | | | | | | |
| 97 | # | | | | | 10-K | | 001-37651 | | 10.11 | | 08/18/2023 |
| | | | | | | | | | | | |
| 101.INS | | Inline XBRL Instance Document. The instance document does not appear in the interactive data file because its XBRL tags are embedded within the inline XBRL document. | | X | | | | | | | | |
| | | | | | | | | | | | |
| 101.SCH | | Inline XBRL Taxonomy Extension Schema Document. | | X | | | | | | | | |
| | | | | | | | | | | | |
| 101.CAL | | Inline XBRL Taxonomy Extension Calculation Linkbase Document. | | X | | | | | | | | |
| | | | | | | | | | | | |
| 101.DEF | | Inline XBRL Taxonomy Extension Definition Linkbase Document. | | X | | | | | | | | |
| | | | | | | | | | | | |
| 101.LAB | | Inline XBRL Taxonomy Extension Label Linkbase Document. | | X | | | | | | | | |
| | | | | | | | | | | | |
| 101.PRE | | Inline XBRL Taxonomy Extension Presentation Linkbase Document. | | X | | | | | | | | |
| | | | | | | | | | | | |
| 104 | | Cover Page Interactive Data File (formatted as Inline XBRL and contained in Exhibit 101 filed herewith). | | X | | | | | | | | |
# Indicates management contract or compensatory plan, contract or agreement.
† Portions of this exhibit have been redacted.
« Certain exhibits and schedules to this agreement have been omitted.
‡ The certification attached as Exhibit 32.1 that accompanies this Annual Report on Form 10-K pursuant to 18 U.S.C. Section 1350, as adopted pursuant to Section 906 of the Sarbanes-Oxley Act of 2002, is not deemed “filed” by the registrant for purposes of Section 18 of the Securities Exchange Act of 1934, as amended.
____________________________
ITEM 16. FORM 10-K SUMMARY
None.
SIGNATURES
Pursuant to the requirements of Section 13 or 15(d) of the Securities Exchange Act of 1934, the Registrant has duly caused this Annual Report on Form 10-K to be signed on its behalf by the undersigned, thereunto duly authorized.
| | | | | | | | | | | | | | | | | |
| | ATLASSIAN CORPORATION |
| | | |
Date: August 16, 2024 | By: | | /s/ Michael Cannon-Brookes |
| | | | Name: | | Michael Cannon-Brookes |
| | | | Title: | | Co-Chief Executive Officer (Co-Principal Executive Officer) |
| | | | | |
| | By: | | /s/ Scott Farquhar |
| | | | Name: | | Scott Farquhar |
| | | | Title: | | Co-Chief Executive Officer (Co-Principal Executive Officer) |
| | | | | |
| By: | | /s/ Joseph Binz |
| | | Name: | | Joseph Binz |
| | | Title: | | Chief Financial Officer (Principal Financial Officer) |
POWER OF ATTORNEY AND SIGNATURES
KNOW ALL PERSONS BY THESE PRESENTS, that each person whose signature appears below constitutes and appoints Scott Farquhar, Michael Cannon-Brookes, and Joseph Binz, and each of them, as his or her true and lawful attorneys-in-fact and agents, with full power of substitution and resubstitution, for him or her and in his or her name, place and stead, in any and all capacities, to sign this Annual Report on Form 10-K of Atlassian Corporation, and any or all amendments, and to file the same, with all exhibits thereto, and other documents in connection therewith, with the Securities and Exchange Commission, granting unto said attorneys-in-fact and agents, and each or any of them, full power and authority to do and perform each and every act and thing requisite or necessary to be done in connection therewith, as fully to all intents and purposes as he or she might or could do in person, hereby ratifying and confirming all that said attorneys-in-fact and agents, or their substitute or substitutes, may lawfully do or cause to be done by virtue hereof.
Pursuant to the requirements of Section 13 or 15(d) of the Securities Exchange Act of 1934, the Registrant has duly caused this Annual Report on Form 10-K to be signed on its behalf by the undersigned, thereunto duly authorized.
| | | | | | | | | | | | | | |
| Signature | | Title | | Date |
| | | | |
| /s/ Michael Cannon-Brookes | | Co-Chief Executive Officer and Director | | August 16, 2024 |
| Michael Cannon-Brookes | | (Co-Principal Executive Officer) | | |
| | | | |
| /s/ Scott Farquhar | | Co-Chief Executive Officer and Director | | August 16, 2024 |
| Scott Farquhar | | (Co-Principal Executive Officer) | | |
| | | | |
| /s/ Joseph Binz | | Chief Financial Officer | | August 16, 2024 |
| Joseph Binz | | (Principal Financial Officer) | | |
| | | | |
| /s/ Gene Liu | | Chief Accounting Officer | | August 16, 2024 |
| Gene Liu | | (Principal Accounting Officer) | | |
| | | | |
| /s/ Shona L. Brown | | Director and Chair | | August 16, 2024 |
| Shona L. Brown | | | | |
| | | | |
| /s/ Scott Belsky | | Director | | August 16, 2024 |
| Scott Belsky | | | | |
| | | | |
| /s/ Heather Mirjahangir Fernandez | | Director | | August 16, 2024 |
Heather Mirjahangir Fernandez | | | | |
| | | | |
| /s/ Sasan Goodarzi | | Director | | August 16, 2024 |
| Sasan Goodarzi | | | | |
| | | | |
| /s/ Jay Parikh | | Director | | August 16, 2024 |
| Jay Parikh | | | | |
| | | | |
| /s/ Enrique Salem | | Director | | August 16, 2024 |
| Enrique Salem | | | | |
| | | | |
| /s/ Steven Sordello | | Director | | August 16, 2024 |
| Steven Sordello | | | | |
| | | | |
| /s/ Richard P. Wong | | Director | | August 16, 2024 |
Richard P. Wong | | | | |
| | | | |
| /s/ Michelle Zatlyn | | Director | | August 16, 2024 |
Michelle Zatlyn | | | | |