Exhibit 99.3

First Quarter 2018 Earnings Presentation April 24, 2018
Certain statements contained in this presentation are forward-looking statements within the meaning of Section 27A of the Securities Act of 1933, as amended, and Section 21E of the Securities Exchange Act of 1934, as amended. These forward-looking statements include, without limitation, statements relating to the Company’s business, cash flows, condition (financial or otherwise), credit quality, financial performance, liquidity, long-term performance goals, prospects, results of operations, strategic initiatives and the timing, benefits, costs and synergies of future acquisition, disposition and other growth opportunities. These statements, which are based upon certain assumptions and estimates and describe the Company’s future plans, results, strategies and expectations, can generally be identified by the use of the words and phrases “may,” “will,” “should,” “could,” “would,” “goal,” “plan,” “potential,” “estimate,” “project,” “believe,” “intend,” “anticipate,” “expect,” “target,” “aim,” “predict,” “continue,” “seek,” “projection” and other variations of such words and phrases and similar expressions. These forward-looking statements are not historical facts, and are based upon current expectations, estimates and projections about the Company’s industry, management’s beliefs and certain assumptions made by management, many of which, by their nature, are inherently uncertain and beyond the Company’s control. The inclusion of these forward-looking statements should not be regarded as a representation by the Company or any other person that such expectations, estimates and projections will be achieved. Accordingly, the Company cautions investors that any such forward-looking statements are not guarantees of future performance and are subject to risks, assumptions and uncertainties that are difficult to predict and that are beyond the Company’s control. Although the Company believes that the expectations reflected in these forward-looking statements are reasonable as of the date of this presentation, actual results may prove to be materially different from the results expressed or implied by the forward-looking statements. A number of factors could cause actual results to differ materially from those contemplated by the forward-looking statements in this presentation including, without limitation, the risks and other factors set forth in the Company’s Annual Report on Form 10-K for the year ended December 31, 2017, filed with the SEC on March 16, 2018 under the captions “Cautionary note regarding forward-looking statements” and “Risk factors.” Many of these factors are beyond the Company’s ability to control or predict. If one or more events related to these or other risks or uncertainties materialize, or if the Company’s underlying assumptions prove to be incorrect, actual results may differ materially from the forward-looking statements. Accordingly, investors should not place undue reliance on any such forward-looking statements. Any forward-looking statement speaks only as of the date of this presentation, and the Company does not undertake any obligation to publicly update or review any forward-looking statement, whether as a result of new information, future developments or otherwise, except as required by law. New risks and uncertainties may emerge from time to time, and it is not possible for the Company to predict their occurrence or how they will affect the Company. Forward looking statements
Use of non-GAAP financial measures This presentation contains certain financial measures that are not measures recognized under U.S. generally accepted accounting principles (“GAAP”) and therefore are considered non-GAAP financial measures. These non‐GAAP financial measures include, without limitation, adjusted net income and earnings per share, pro forma adjusted net income and earnings per share, core efficiency ratio (tax equivalent basis), Banking segment core efficiency ratio (tax equivalent basis), Mortgage segment core efficiency ratio (tax equivalent basis), adjusted return on average assets and equity, pro forma adjusted return on average assets and equity, and pro forma adjusted total revenue. Each of these non-GAAP metrics excludes certain income and expense items that the Company’s management considers to be non‐core in nature. The Company refers to these non‐GAAP measures as adjusted measures. This presentation also presents tangible assets, tangible common equity, tangible book value per common share, tangible common equity to tangible assets, return on average tangible common equity, adjusted return on average tangible common equity and pro forma adjusted return on average tangible common equity. Each of these non-GAAP metrics excludes the impact of goodwill and other intangibles.The Company’s management uses these non-GAAP financial measures in their analysis of the Company’s performance, financial condition and the efficiency of its operations as management believes such measures facilitate period-to-period comparisons and provide meaningful indications of its operating performance as they eliminate both gains and charges that management views as non-recurring or not indicative of operating performance. Management believes that these non-GAAP financial measures provide a greater understanding of ongoing operations and enhance comparability of results with prior periods as well as demonstrating the effects of significant non-core gains and charges in the current and prior periods. The Company’s management also believes that investors find these non-GAAP financial measures useful as they assist investors in understanding the Company’s underlying operating performance and in the analysis of ongoing operating trends. In addition, because intangible assets such as goodwill and other intangibles, and the other items excluded each vary extensively from company to company, the Company believes that the presentation of this information allows investors to more easily compare the Company’s results to the results of other companies. However, the non-GAAP financial measures discussed herein should not be considered in isolation or as a substitute for the most directly comparable or other financial measures calculated in accordance with GAAP. Moreover, the manner in which the Company calculates the non-GAAP financial measures discussed herein may differ from that of other companies reporting measures with similar names. You should understand how such other banking organizations calculate their financial measures similar or with names similar to the non-GAAP financial measures the Company has discussed herein when comparing such non-GAAP financial measures. The following tables in the Appendix provide a reconciliation of these measures to the most directly comparable GAAP financial measures.
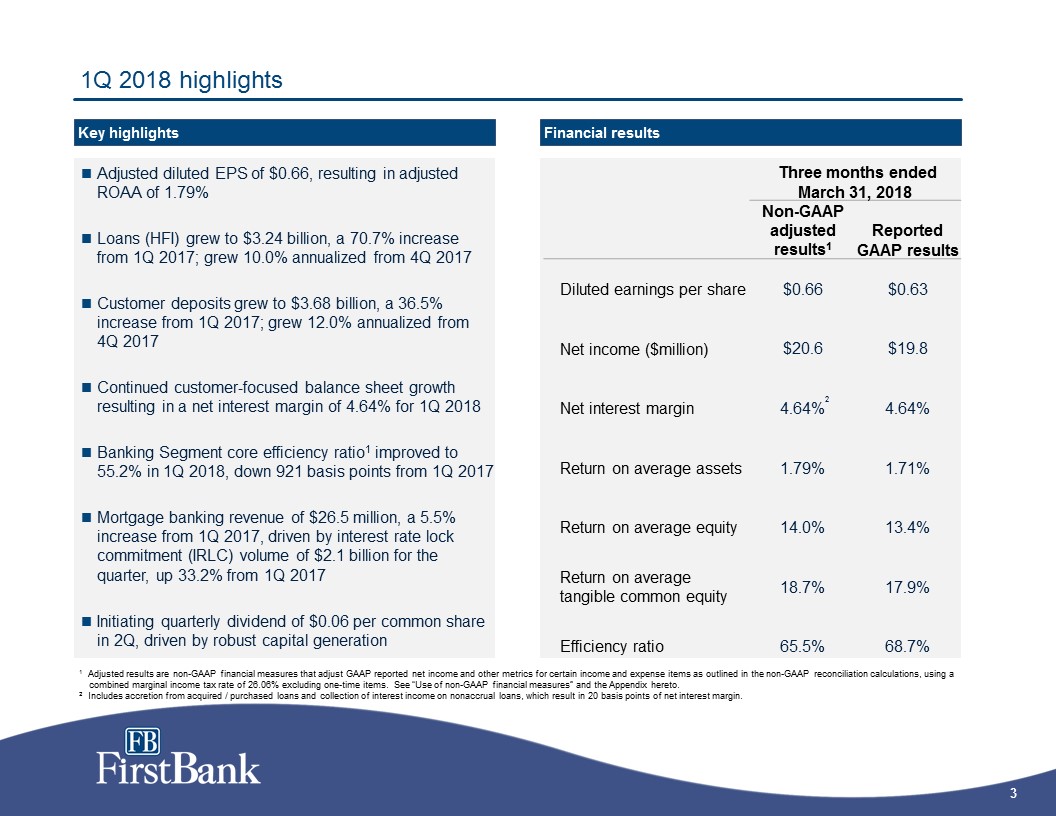
Three months endedMarch 31, 2018 Non-GAAP adjusted results1 Reported GAAP results Diluted earnings per share $0.66 $0.63 Net income ($million) $20.6 $19.8 Net interest margin 4.64% 4.64% Return on average assets 1.79% 1.71% Return on average equity 14.0% 13.4% Return on average tangible common equity 18.7% 17.9% Efficiency ratio 65.5% 68.7% 1Q 2018 highlights Key highlights Financial results 1 Adjusted results are non-GAAP financial measures that adjust GAAP reported net income and other metrics for certain income and expense items as outlined in the non-GAAP reconciliation calculations, using a combined marginal income tax rate of 26.06% excluding one-time items. See “Use of non-GAAP financial measures” and the Appendix hereto.2 Includes accretion from acquired / purchased loans and collection of interest income on nonaccrual loans, which result in 20 basis points of net interest margin. Adjusted diluted EPS of $0.66, resulting in adjusted ROAA of 1.79%Loans (HFI) grew to $3.24 billion, a 70.7% increase from 1Q 2017; grew 10.0% annualized from 4Q 2017Customer deposits grew to $3.68 billion, a 36.5% increase from 1Q 2017; grew 12.0% annualized from 4Q 2017Continued customer-focused balance sheet growth resulting in a net interest margin of 4.64% for 1Q 2018Banking Segment core efficiency ratio1 improved to 55.2% in 1Q 2018, down 921 basis points from 1Q 2017Mortgage banking revenue of $26.5 million, a 5.5% increase from 1Q 2017, driven by interest rate lock commitment (IRLC) volume of $2.1 billion for the quarter, up 33.2% from 1Q 2017Initiating quarterly dividend of $0.06 per common share in 2Q, driven by robust capital generation 2
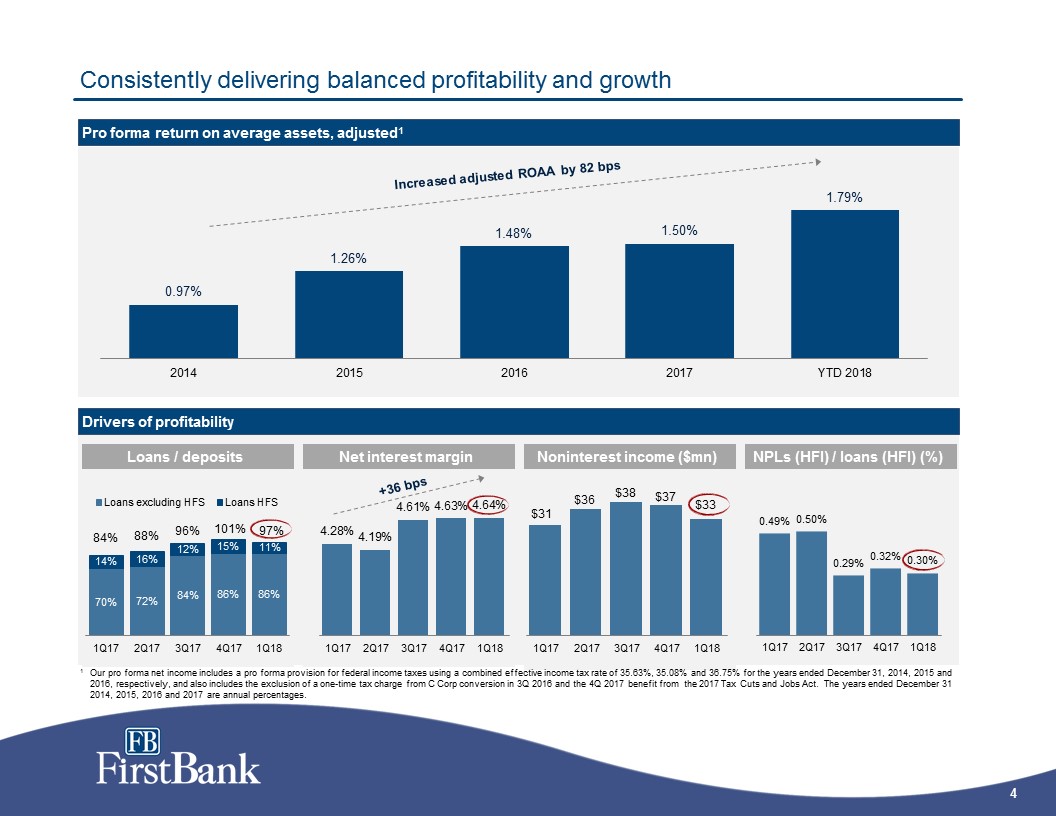
Consistently delivering balanced profitability and growth Drivers of profitability Pro forma return on average assets, adjusted1 Net interest margin Noninterest income ($mn) Loans / deposits 1 Our pro forma net income includes a pro forma provision for federal income taxes using a combined effective income tax rate of 35.63%, 35.08% and 36.75% for the years ended December 31, 2014, 2015 and 2016, respectively, and also includes the exclusion of a one-time tax charge from C Corp conversion in 3Q 2016 and the 4Q 2017 benefit from the 2017 Tax Cuts and Jobs Act. The years ended December 31 2014, 2015, 2016 and 2017 are annual percentages. +36 bps NPLs (HFI) / loans (HFI) (%)
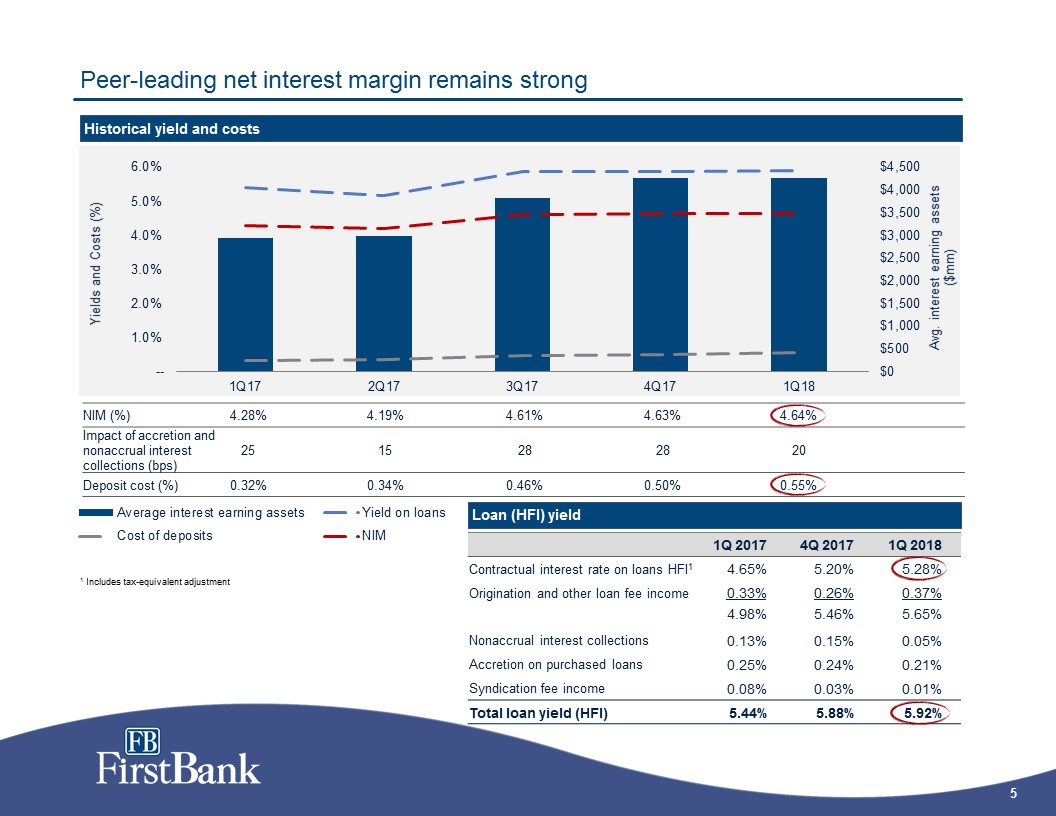
Peer-leading net interest margin remains strong Historical yield and costs 1 Includes tax-equivalent adjustment NIM (%) 4.28% 4.19% 4.61% 4.63% 4.64% Impact of accretion and nonaccrual interest collections (bps) 25 15 28 28 20 Deposit cost (%) 0.32% 0.34% 0.46% 0.50% 0.55% Loan (HFI) yield 1Q 2017 4Q 2017 1Q 2018 Contractual interest rate on loans HFI1 4.65% 5.20% 5.28% Origination and other loan fee income 0.33% 0.26% 0.37% 4.98% 5.46% 5.65% Nonaccrual interest collections 0.13% 0.15% 0.05% Accretion on purchased loans 0.25% 0.24% 0.21% Syndication fee income 0.08% 0.03% 0.01% Total loan yield (HFI) 5.44% 5.88% 5.92%
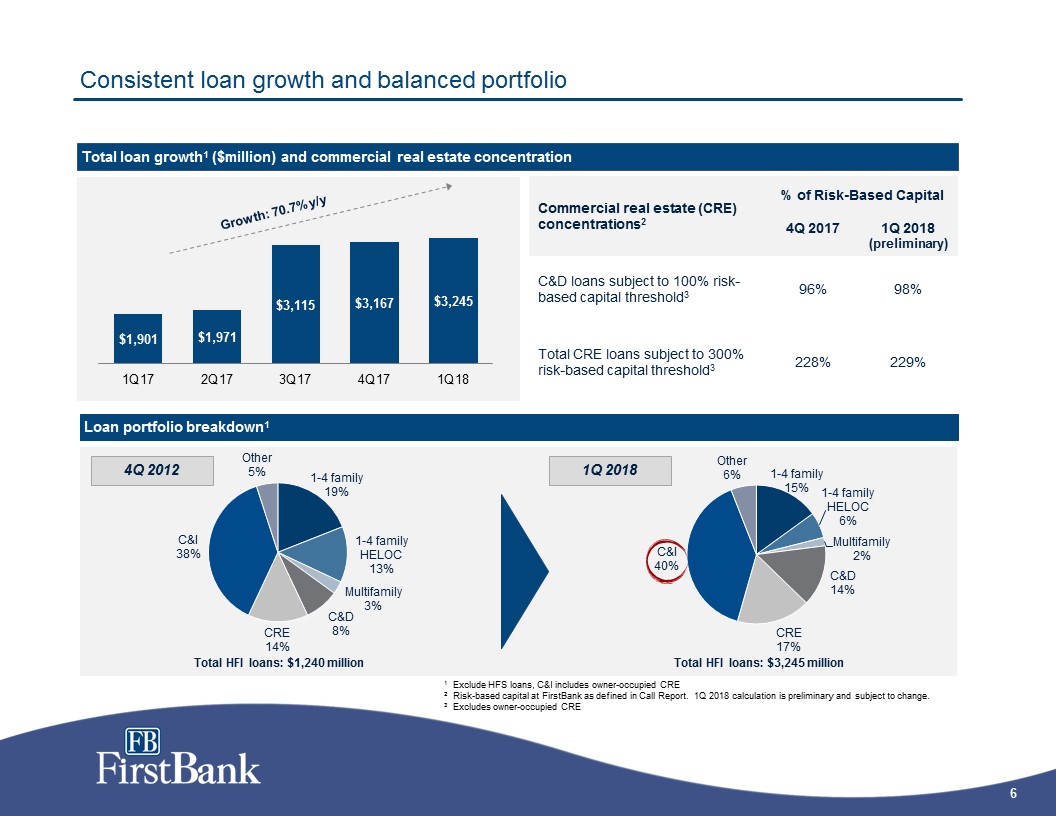
Consistent loan growth and balanced portfolio Total loan growth1 ($million) and commercial real estate concentration Loan portfolio breakdown1 4Q 2012 1Q 2018 Total HFI loans: $3,245 million 1 Exclude HFS loans, C&I includes owner-occupied CRE2 Risk-based capital at FirstBank as defined in Call Report. 1Q 2018 calculation is preliminary and subject to change.3 Excludes owner-occupied CRE Commercial real estate (CRE) concentrations2 % of Risk-Based Capital 4Q 2017 1Q 2018(preliminary) C&D loans subject to 100% risk-based capital threshold3 96% 98% Total CRE loans subject to 300% risk-based capital threshold3 228% 229%
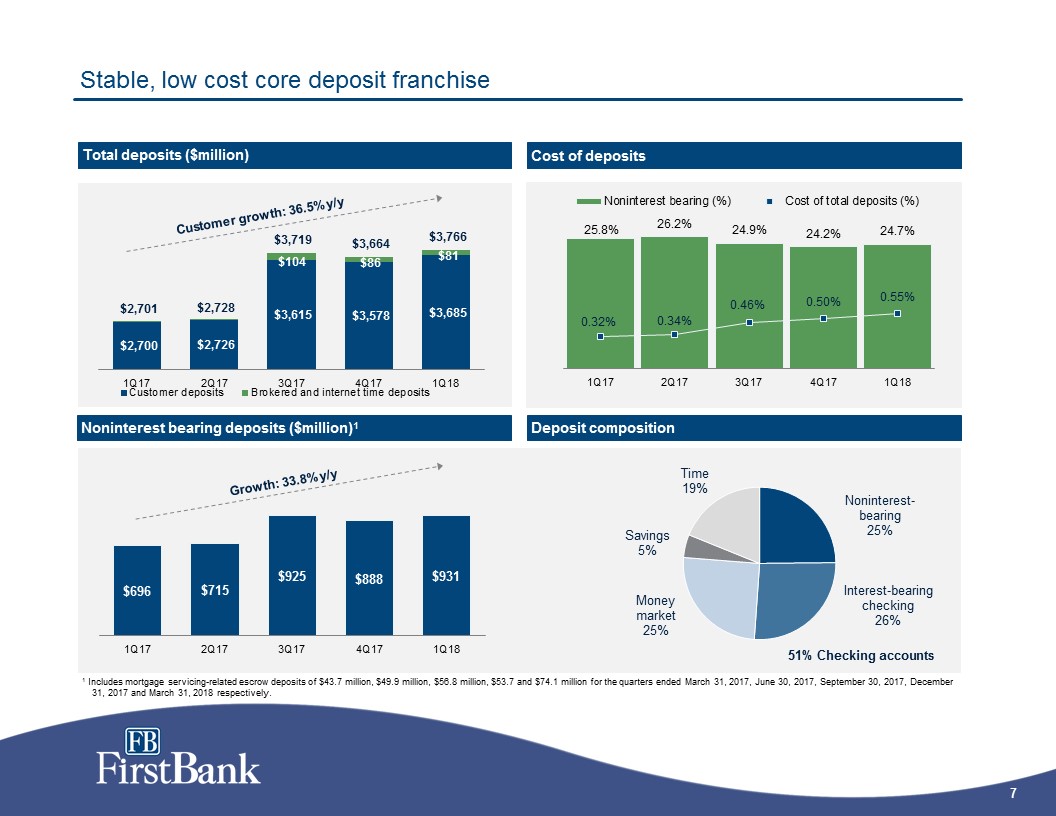
Stable, low cost core deposit franchise Total deposits ($million) 1 Includes mortgage servicing-related escrow deposits of $43.7 million, $49.9 million, $56.8 million, $53.7 and $74.1 million for the quarters ended March 31, 2017, June 30, 2017, September 30, 2017, December 31, 2017 and March 31, 2018 respectively. Noninterest bearing deposits ($million)1 Growth: 33.8% y/y Deposit composition Cost of deposits Customer growth: 36.5% y/y
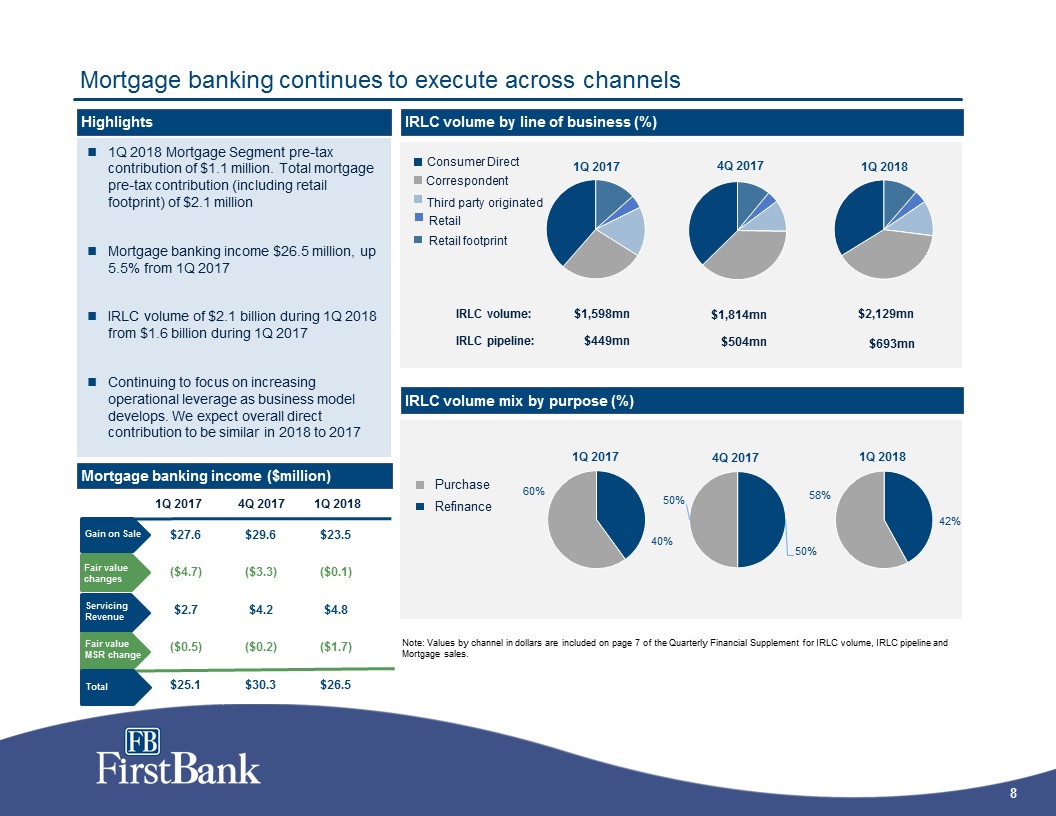
$27.6 $29.6 $23.5 ($4.7) ($3.3) ($0.1) $2.7 $4.2 $4.8 ($0.5) ($0.2) ($1.7) $25.1 $30.3 $26.5 Mortgage banking continues to execute across channels 1Q 2018 Mortgage Segment pre-tax contribution of $1.1 million. Total mortgage pre-tax contribution (including retail footprint) of $2.1 millionMortgage banking income $26.5 million, up 5.5% from 1Q 2017IRLC volume of $2.1 billion during 1Q 2018 from $1.6 billion during 1Q 2017Continuing to focus on increasing operational leverage as business model develops. We expect overall direct contribution to be similar in 2018 to 2017 Highlights Note: Values by channel in dollars are included on page 7 of the Quarterly Financial Supplement for IRLC volume, IRLC pipeline and Mortgage sales. Gain on Sale IRLC volume mix by purpose (%) IRLC volume by line of business (%) Consumer Direct Correspondent Third party originated Retail Retail footprint Refinance Purchase 1Q 2017 4Q 2017 1Q 2018 $1,598mn $1,814mn $2,129mn IRLC volume: IRLC pipeline: $449mn $504mn $693mn Fair value changes Fair value MSR change Mortgage banking income ($million) Total Servicing Revenue
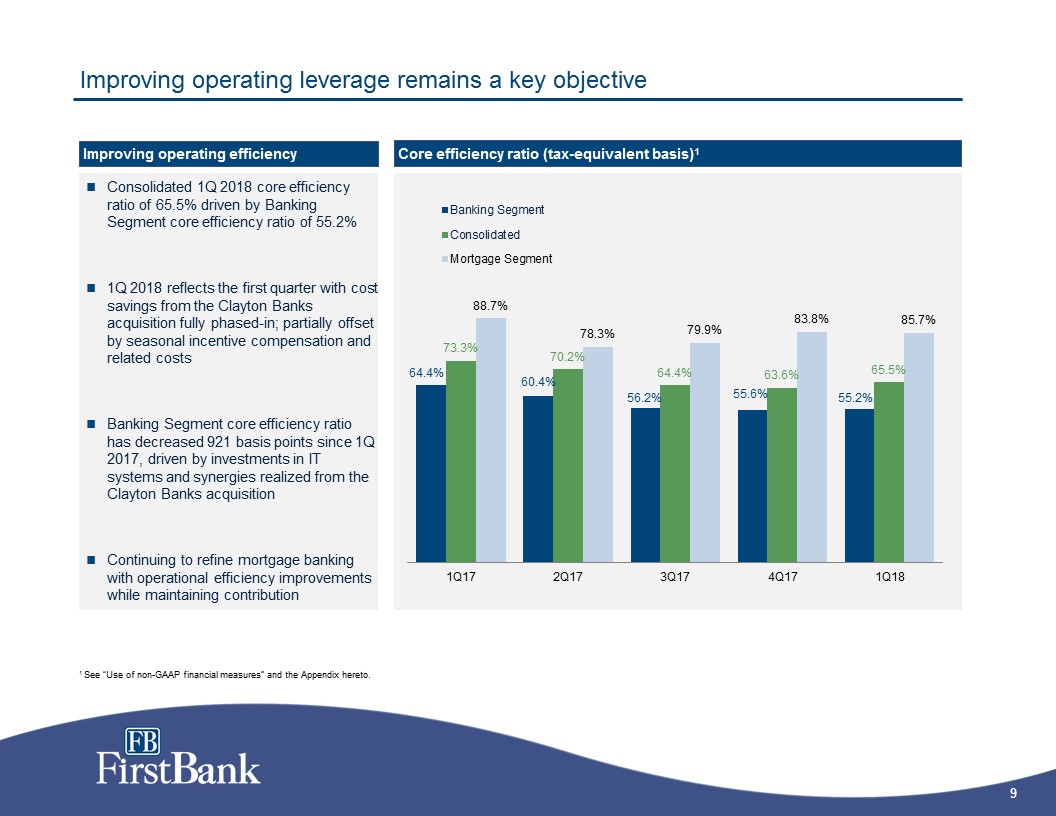
Improving operating leverage remains a key objective Consolidated 1Q 2018 core efficiency ratio of 65.5% driven by Banking Segment core efficiency ratio of 55.2% 1Q 2018 reflects the first quarter with cost savings from the Clayton Banks acquisition fully phased-in; partially offset by seasonal incentive compensation and related costsBanking Segment core efficiency ratio has decreased 921 basis points since 1Q 2017, driven by investments in IT systems and synergies realized from the Clayton Banks acquisition Continuing to refine mortgage banking with operational efficiency improvements while maintaining contribution Core efficiency ratio (tax-equivalent basis)1 Improving operating efficiency 1 See “Use of non-GAAP financial measures” and the Appendix hereto.
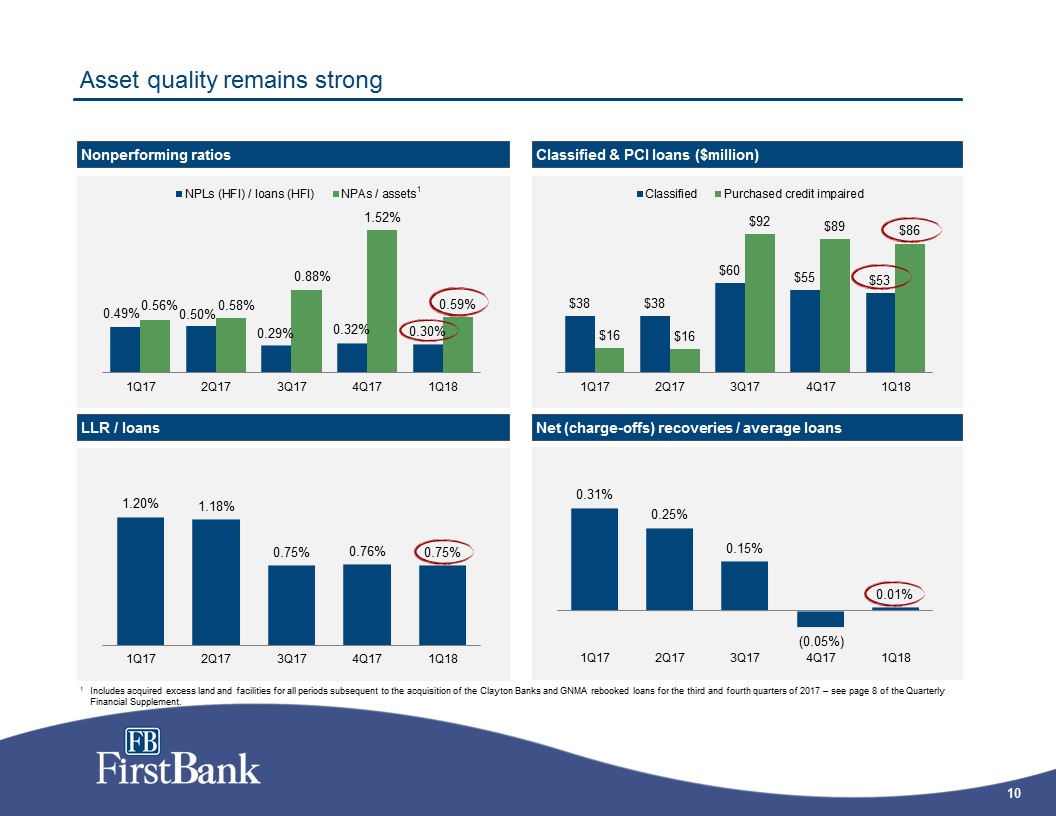
Asset quality remains strong Classified & PCI loans ($million) Net (charge-offs) recoveries / average loans Nonperforming ratios LLR / loans 1 Includes acquired excess land and facilities for all periods subsequent to the acquisition of the Clayton Banks and GNMA rebooked loans for the third and fourth quarters of 2017 – see page 8 of the Quarterly Financial Supplement. 1
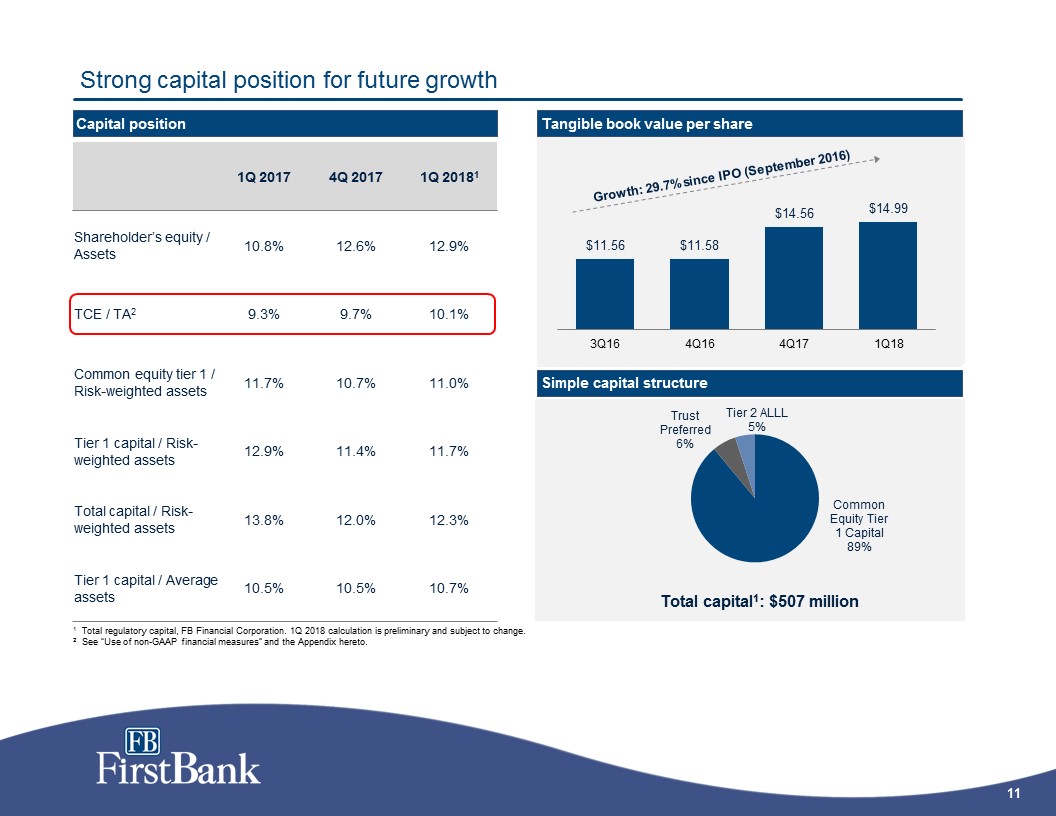
Strong capital position for future growth 1 Total regulatory capital, FB Financial Corporation. 1Q 2018 calculation is preliminary and subject to change.2 See “Use of non-GAAP financial measures” and the Appendix hereto. Capital position Simple capital structure 1Q 2017 4Q 2017 1Q 20181 Shareholder’s equity / Assets 10.8% 12.6% 12.9% TCE / TA2 9.3% 9.7% 10.1% Common equity tier 1 / Risk-weighted assets 11.7% 10.7% 11.0% Tier 1 capital / Risk-weighted assets 12.9% 11.4% 11.7% Total capital / Risk-weighted assets 13.8% 12.0% 12.3% Tier 1 capital / Average assets 10.5% 10.5% 10.7% Tangible book value per share Growth: 29.7% since IPO (September 2016)

Appendix
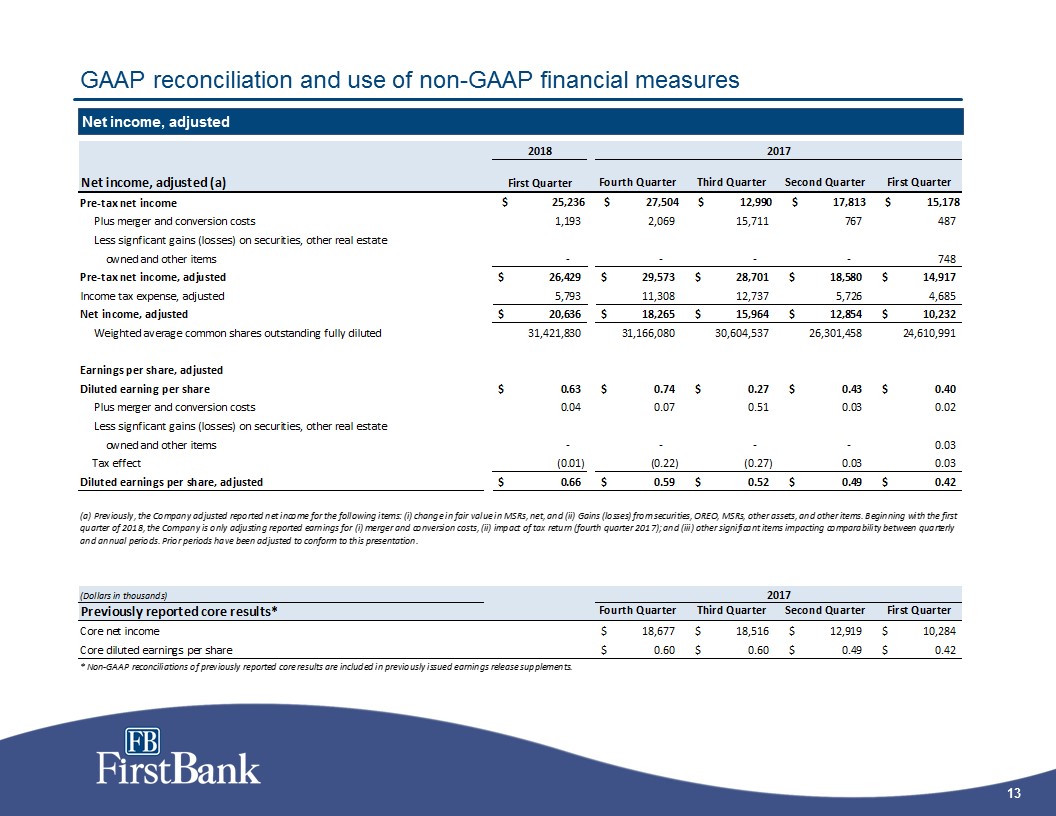
GAAP reconciliation and use of non-GAAP financial measures Net income, adjusted

GAAP reconciliation and use of non-GAAP financial measures Pro forma net income, adjusted
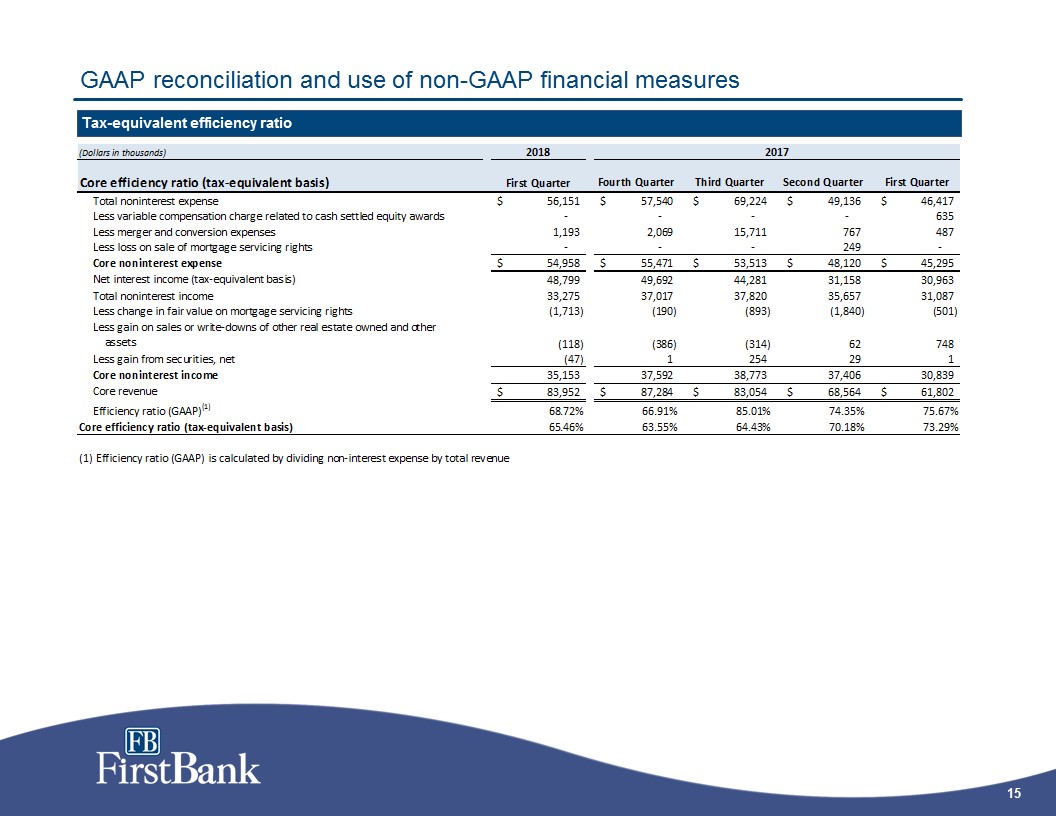
GAAP reconciliation and use of non-GAAP financial measures Tax-equivalent efficiency ratio
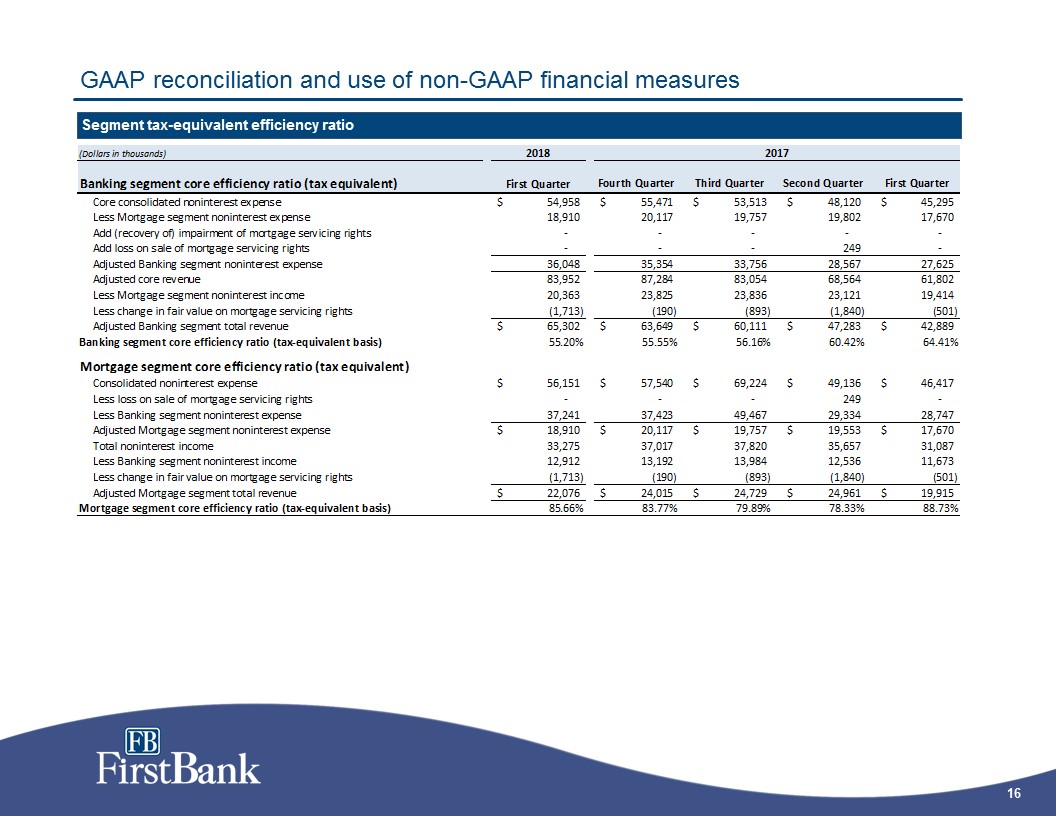
GAAP reconciliation and use of non-GAAP financial measures Segment tax-equivalent efficiency ratio
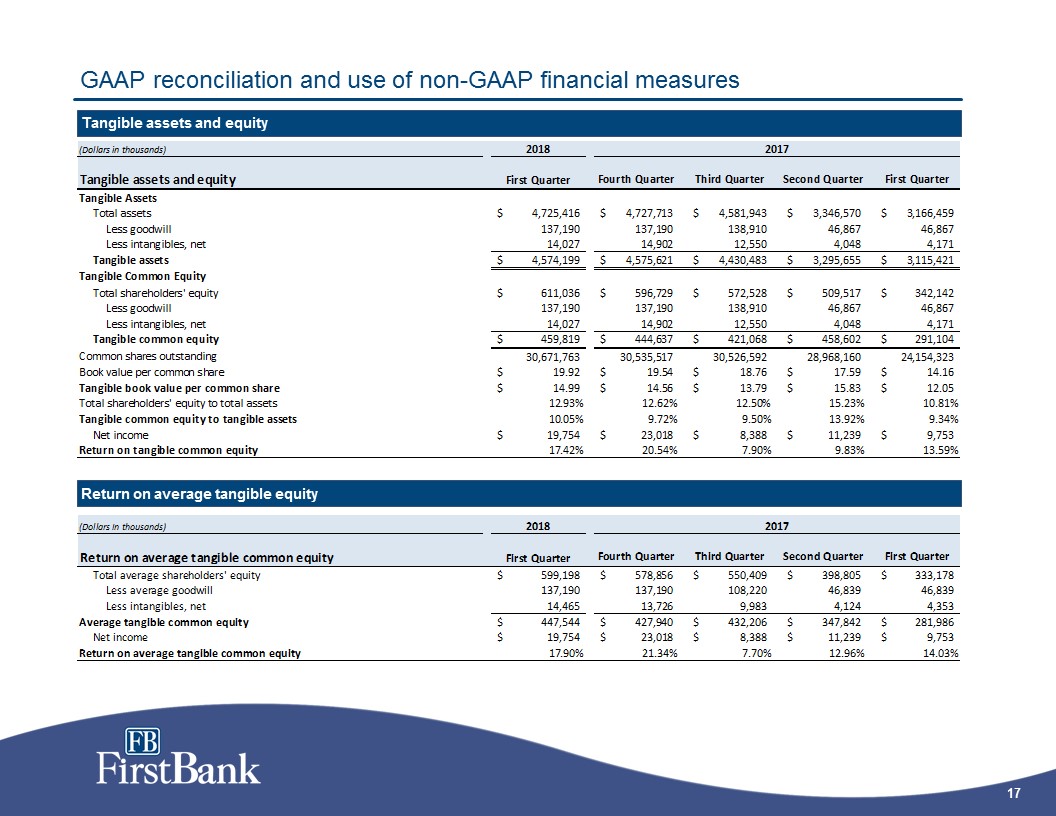
GAAP reconciliation and use of non-GAAP financial measures Tangible assets and equity Return on average tangible equity
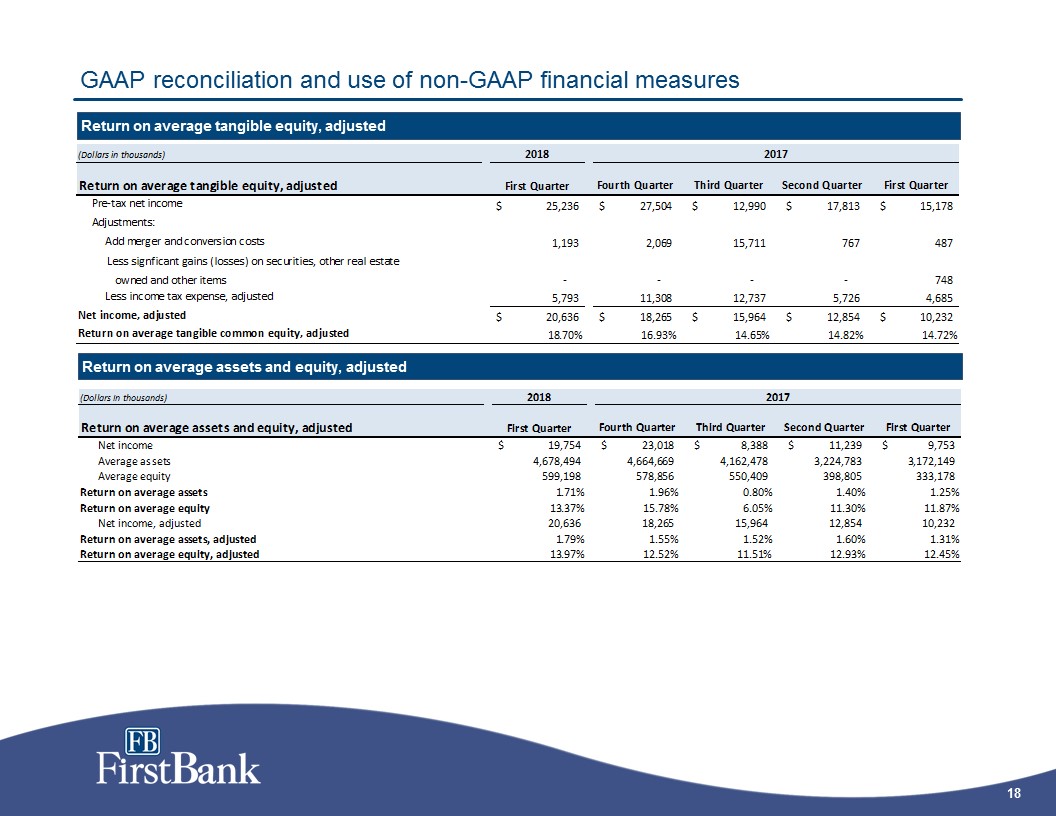
GAAP reconciliation and use of non-GAAP financial measures Return on average tangible equity, adjusted Return on average assets and equity, adjusted
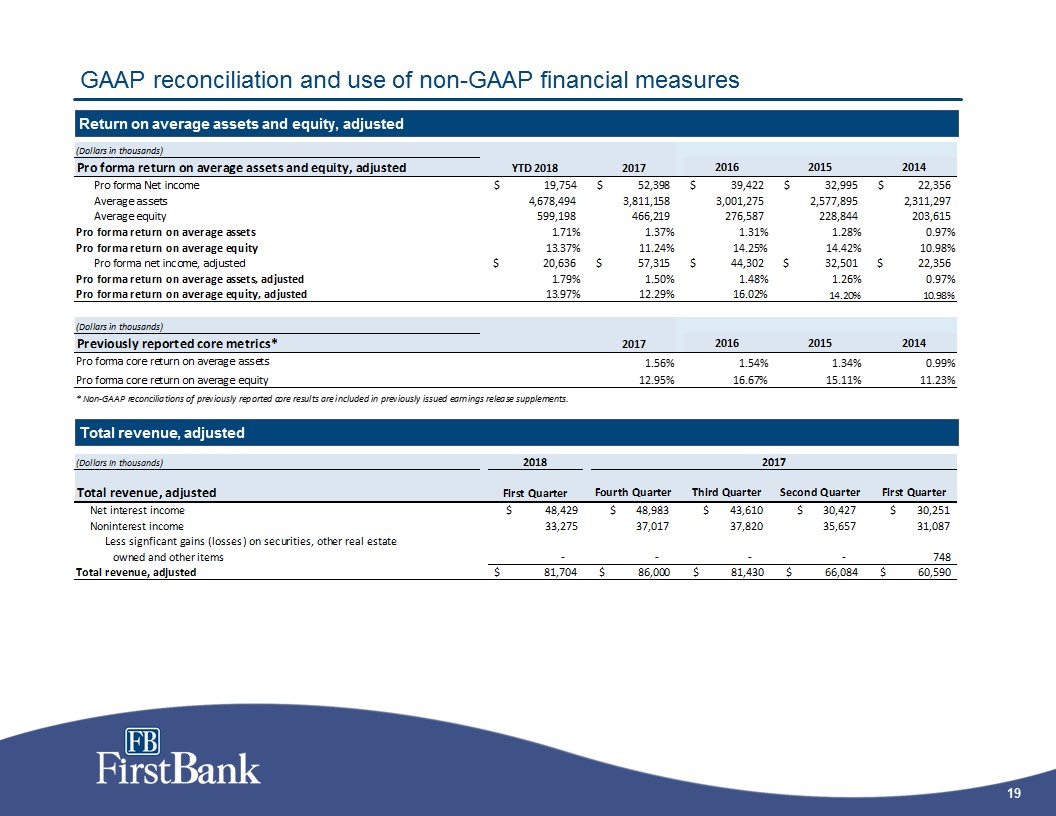
GAAP reconciliation and use of non-GAAP financial measures Return on average assets and equity, adjusted Total revenue, adjusted